Embed Size (px)
Citation preview

arX
iv:0
901.
4527
v1 [
astr
o-ph
.HE
] 2
8 Ja
n 20
09
VERITAS Observations of a Very High Energy γ-ray Flare from the Blazar
3C66A
V. A. Acciari1, E. Aliu2, T. Arlen3, M. Beilicke4 , W. Benbow5, M. Bottcher6, S. M. Bradbury7, J.
H. Buckley4, V. Bugaev4, Y. Butt8, K. Byrum9, A. Cannon10, O. Celik3, A. Cesarini11, Y. C.
Chow3, L. Ciupik12, P. Cogan13, W. Cui14, M. K. Daniel7,†, R. Dickherber4, T. Ergin8, A.
Falcone15, S. J. Fegan3, J. P. Finley14, P. Fortin16, L. Fortson12, A. Furniss17, D. Gall14, K.
Gibbs5, G. H. Gillanders11, S. Godambe18, J. Grube10, R. Guenette13, G. Gyuk12, D. Hanna13, E.
Hays19, J. Holder2, D. Horan20, C. M. Hui18, T. B. Humensky21, A. Imran22, P. Kaaret23, N.
Karlsson12, M. Kertzman24, D. Kieda18, J. Kildea5, A. Konopelko25, H. Krawczynski4, F.
Krennrich22, M. J. Lang11, S. LeBohec18, G. Maier13, A. McCann13, M. McCutcheon13, J.
Millis26, P. Moriarty1, R. Mukherjee16, T. Nagai22, R. A. Ong3, A. N. Otte17, D. Pandel23, J. S.
Perkins5,∗, D. Petry27, F. Pizlo14, M. Pohl22, J. Quinn10, K. Ragan13, L. C. Reyes28, P. T.
Reynolds29, E. Roache5, H. J. Rose7, M. Schroedter22, G. H. Sembroski14, A. W. Smith9, D.
Steele12, S. P. Swordy21, M. Theiling5, J. A. Toner11, A. Varlotta14, V. V. Vassiliev3, R. G.
Wagner9, S. P. Wakely21, J. E. Ward10, T. C. Weekes5, A. Weinstein3, D. A. Williams17, S.
Wissel21, M. Wood3, B. Zitzer14

– 2 –
1Department of Life and Physical Sciences, Galway-Mayo Institute of Technology, Dublin Road, Galway, Ireland
2Department of Physics and Astronomy and the Bartol Research Institute, University of Delaware, Newark, DE
19716, USA
3Department of Physics and Astronomy, University of California, Los Angeles, CA 90095, USA
4Department of Physics, Washington University, St. Louis, MO 63130, USA
5Fred Lawrence Whipple Observatory, Harvard-Smithsonian Center for Astrophysics, Amado, AZ 85645, USA
6Astrophysical Institute, Department of Physics and Astronomy, Ohio University, Athens, OH 45701
7School of Physics and Astronomy, University of Leeds, Leeds, LS2 9JT, UK
8Harvard-Smithsonian Center for Astrophysics, 60 Garden Street, Cambridge, MA 02138, USA
9Argonne National Laboratory, 9700 S. Cass Avenue, Argonne, IL 60439, USA
10School of Physics, University College Dublin, Belfield, Dublin 4, Ireland
11School of Physics, National University of Ireland, Galway, Ireland
12Astronomy Department, Adler Planetarium and Astronomy Museum, Chicago, IL 60605, USA
13Physics Department, McGill University, Montreal, QC H3A 2T8, Canada
14Department of Physics, Purdue University, West Lafayette, IN 47907, USA
15Department of Astronomy and Astrophysics, 525 Davey Lab, Pennsylvania State University, University Park, PA
16802, USA
16Department of Physics and Astronomy, Barnard College, Columbia University, NY 10027, USA
17Santa Cruz Institute for Particle Physics and Department of Physics, University of California, Santa Cruz, CA
95064, USA
18Physics Department, University of Utah, Salt Lake City, UT 84112, USA
19N.A.S.A./Goddard Space-Flight Center, Code 661, Greenbelt, MD 20771, USA
20Laboratoire Leprince-Ringuet, Ecole Polytechnique, CNRS/IN2P3, F-91128 Palaiseau, France
21Enrico Fermi Institute, University of Chicago, Chicago, IL 60637, USA
22Department of Physics and Astronomy, Iowa State University, Ames, IA 50011, USA
23Department of Physics and Astronomy, University of Iowa, Van Allen Hall, Iowa City, IA 52242, USA
24Department of Physics and Astronomy, DePauw University, Greencastle, IN 46135-0037, USA
25Department of Physics, Pittsburg State University, 1701 South Broadway, Pittsburg, KS 66762, USA
26Department of Physics, Anderson University, 1100 East 5th Street, Anderson, IN 46012
27European Southern Observatory, Karl-Schwarzchild-Strasse 2, 85748 Garching, Germany
28Kavli Institute for Cosmological Physics, University of Chicago, Chicago, IL 60637, USA
29Department of Applied Physics and Instumentation, Cork Institute of Technology, Bishopstown, Cork, Ireland
†Now at: Department of Physics, Durham University, South Road, Durham, DH1 3LE, U.K.
*Corresponding author: [email protected]

– 3 –
ABSTRACT
The intermediate-frequency peaked BL Lacertae (IBL) object 3C 66A is detected
during 2007 - 2008 in VHE (very high energy: E > 100 GeV) γ-rays with the VERITAS
stereoscopic array of imaging atmospheric Cherenkov telescopes. An excess of 1791
events is detected, corresponding to a significance of 21.2 standard deviations (σ), in
these observations (32.8 hours live time). The observed integral flux above 200 GeV is
6% of the Crab Nebula’s flux and shows evidence for variability on the time-scale of
days. The measured energy spectrum is characterized by a soft power law with photon
index Γ = 4.1±0.4stat±0.6sys. The radio galaxy 3C 66B is excluded as a possible source
of the VHE emission.
Subject headings: galaxies: active — BL Lacertae objects: individual (3C 66A) —
gamma rays: observations
1. Introduction
Wills & Wills (1974) first identified 3C 66A as a QSO using optical observations. It was
subsequently classified as a BL Lac object based on its significant optical and X-ray variability
(Maccagni et al. 1987). BL Lac objects are characterized by a double-humped spectral energy
distribution (SED) and are further classified according to the location of the lower energy hump,
usually interpreted as synchrotron emission from relativistic electrons. Perri et al. (2003) locate
the synchrotron peak between 1015 and 1016 Hz. Therefore 3C 66A is classified as an intermediate-
frequency peaked BL Lac (IBL). To date, the majority of BL Lacs detected at VHE (very high
energy: E > 100 GeV) are HBLs (high-frequency peaked BL Lacs). Only one other IBL, W Comae,
has been detected above 100 GeV (Acciari et al. 2008).
During states of high flux, continuum emission from the jet is dominant and overshadows the
few emission lines from the rest of the galaxy. Blazars have few, if any, detectable emission lines,
which makes determining the redshift difficult even under the best conditions. Based on a single
line, interpreted as Mg II, 3C 66A was determined to be at a redshift of z = 0.444 (Miller et al.
1978). In addition to this, Lanzetta et al. (1993) identified a weak Ly-alpha line corroborating these
results. Since both measurements rely on a single line, the redshift of this BL Lac is considered
uncertain. Finke et al. (2008) recently derived a lower limit of z = 0.096. The determination of the
redshift is crucial to understanding this source at VHE energies due to the effect of the extragalactic
background light (EBL) (Hauser & Dwek 2001). VHE γ rays are absorbed via pair production
interactions with the infrared component of the EBL (γvheγebl → e+e−) (Gould & Schreder 1967).
At VHE energies, this absorption causes a decrease in the observed flux and a softening of the
observed spectrum. One can calculate an optical depth (τ(z,E)) based on an EBL density model,
the redshift and the γ-ray energy. The optical depth can be used to calculate the flux corrected

– 4 –
for extragalactic absorption from the observed flux at a given energy (Fint = eτ(z,E)Fobs). Without
an accurate measure of the redshift, an accurate photon spectrum intrinsic to the blazar cannot be
calculated or modeled.
The EGRET source 3EG J0222+4253, detected at an integral flux between (12.1 ± 3.9) ×
10−8 and (25.3 ± 5.8) × 10−8 photons cm−2 s−1, is associated with 3C 66A (Hartman et al. 1999).
Measurements of the spectrum indicated that the spectral index of 2.01 ± 0.14 was influenced by
the nearby pulsar PSR 0218+42, which is also inside the EGRET error box. A detailed study of the
energy-dependent position of the EGRET source shows that the highest energy photons are coming
from the BL Lac and thus the spectrum is thought to continue out to the VHE band (Kuiper et al.
2000). A re-analysis of the EGRET data by Nandikotkur et al. (2007) finds a harder spectral index
of 1.95 ± 0.14 and a flux above 100 MeV of (17.7 ± 2.8) × 10−8 photons cm−2 s−1. Recently, the
Fermi Gamma-ray Space Telescope also reported a detection of 3C 66A, contemporaneous with
VHE data taken by VERITAS in the 2008-2009 season, at a higher flux than previously reported
by EGRET (Tosti 2008).
There have been several attempts to detect 3C 66A in VHE γ rays. The Crimean Astrophysical
Observatory reported a 5.1 σ detection above 900 GeV at an average integral flux of 2.4 × 10⁻¹¹
cm−2 s−1 (Stepanyan et al. 2002). Additionally, both the Whipple 10 m telescope (Horan et al.
2004) and HEGRA telescope array (Aharonian et al. 2000) observed 3C 66A and reported upper
limits of < 0.35×10⁻¹¹cm−2s−1 (99.9% confidence; above 350 GeV) and < 1.4×10⁻¹¹cm−2s−1 (99%
confidence; above 630 GeV), respectively. STACEE reported several upper limits between < 1.0 and
< 1.8×10⁻¹⁰ cm−2 s−1 above 150 - 200 GeV depending on the source spectrum (Bramel et al. 2005).
Recently, MAGIC reported a 5.4 σ detection of VHE emission above 150 GeV from observations
in September to December 2007 coincident with 3C 66B. They exclude 3C 66A as the source of the
VHE emission at an 85% confidence level (Aliu et al. 2009).
2. VERITAS Detector & Observations
The VERITAS detector is an array of four 12 m diameter imaging atmospheric Cherenkov
telescopes located in southern Arizona (Weekes et al. 2002). Designed to detect emission from
astrophysical objects in the energy range from 100 GeV to greater than 30 TeV, VERITAS has an
energy resolution of ∼15% and an angular resolution (68% containment) of ∼ 0.1◦ per event. A
source with a flux of 1% of the Crab Nebula is detected in ∼ 50 hours of observations while a 5%
Crab Nebula flux source is detected in ∼ 2.5 hours. The field of view of the VERITAS telescopes
is 3.5◦. For more details on the VERITAS instrument and technique, see Holder et al. (2008).
VERITAS observed 3C 66A for 14 hours from September 2007 through January 2008 (hereafter,
the 2007-2008 season). From September through November 2008 (hereafter, the 2008-2009 season),
a further 46 hours of data were taken. In total, 180 twenty-minute exposures were made, where
109 exposures passed selection criteria which remove data with poor weather (based on infrared

– 5 –
sky-temperature measurements) or with hardware-related problems. Data collection frequently
occurred during poor weather conditions causing the lower selection throughput demonstrated
here. In total, the 2007-2008 season resulted in 4.7 hours live time and the recent 2008-2009 season
produced 28.1 hours live time. The average zenith angle was 17.3◦. All data were taken on moonless
nights in “wobble” mode where the telescopes are pointed away from the source by ±0.5◦ to allow
for simultaneous background estimation (Berge et al. 2007).
3. Analysis Methods
Prior to event selection and background subtraction, the shower images are calibrated and
cleaned as described in Cogan (2006) and Daniel et al. (2007). Several noise-reducing event-
selection cuts are made at this point, including rejecting those events where only the two closest-
spaced telescopes participated in the trigger. Following the calibration and cleaning of the data, the
events are parametrized using a moment analysis (Hillas 1985). From this moment analysis, scaled
parameters are calculated and used for event selection (Aharonian et al. 1997; Krawczynski et al.
2006). The event selection cuts are optimized a priori using data taken on the Crab Nebula, scaling
the background and excess rates to account for a weaker source. These selection criteria are termed
the “standard cuts”. Since 3C 66A is possibly very distant and the observed spectrum is expected
to be soft, a modified “soft cuts” applies a further a priori optimization of increasing the θ2 cut
(the angular distance squared from the position of 3C 66A and the reconstructed shower direction)
and decreasing the size cut (the number of photo-electrons in an event) for sources with a soft
spectrum (see Table 1). Unless stated otherwise, the “soft cuts” were used to generate the results
presented in this paper.
The reflected-region model (Berge et al. 2007) is used for background subtraction. The total
number of events in the on-source region is then compared to the total number of events in the
more numerous off-source regions, scaled by the ratio (called α) of the solid angles, to produce a
final excess.
4. VERITAS Results
An excess of 1791 events is observed from the direction of 3C 66A (7257 on events, 31201 off
events with an off-source normalization ratio α of 0.1752). The excess corresponds to a statistical
significance of 21.1 σ using Equation 17 from Li & Ma (1983). The distribution of θ2 is shown
in Figure 1. The shape of the excess is consistent with that expected from a point source (68%
containment in 0.16◦). Since lower-energy events are more poorly reconstructed and this data set
is dominated by low-energy events, the θ2 distribution is wider than that of a harder-spectrum
source. Table 1 details the results using soft cuts as well as standard cuts. Note that the use of
two different sets of cuts has an associated trials factor of two, which has negligible impact on the

– 6 –
Table 1: Selection cuts applied to the data for the soft cuts as well as the standard cutsa . Also
shown are the results of the VERITAS observations of 3C 66A using both the standard analysis
cuts and soft spectrum cuts.
Cuts θ2 Sizeb Ethc Ond Offe Alphaf Excessg Sig.
[deg2] [DC] [GeV] [σ]
Soft < 0.020 > 200 120 7257 31201 0.1752 1791 21.1
Std. < 0.013 > 400 170 1258 5282 0.1400 518 16.0
aAll other cuts outside of those shown here are the samebThe photo-electron to digital count ratio is approximately fourcPost-cuts energy threshold derived using a spectral index of 4.1dNumber of on-source events passing cutseNumber of off-source events passing cutsfNormalization for the off-source eventsgObserved Excess
Fig. 1.— The distribution of θ2 for on-source events (points) and normalized off-source events
(shaded region) from observations of 3C 66A. The dashed line represents the cut on θ2 applied to
the data.

– 7 –
1e-12
1e-11
1e-10
1e-09
0.2 0.3 0.4 0.5 0.6 0.7 0.8 0.9
dN/d
E [T
eV-1
cm
-2 s
-1]
Energy [TeV]
Fig. 2.— The energy spectrum of 3C 66A shown as solid points. The spectrum is well fitted by a
power law with index Γ = 4.1±0.4stat ±0.6sys (solid line). The shaded area outlines the systematic
error in the spectral index. Using the models of Franceschini et al. (2008) and assuming a redshift
of z = 0.444, the de-absorbed spectral index is calculated to be 1.1±0.4 showing that the very steep
measured spectrum could be due to the distance of 3C 66A. This de-absorbed spectrum is shown as
a dashed-dotted line and points. The MAGIC spectrum with index Γ = 3.1 from Aliu et al. (2009)
is shown as a dotted line. The Crab Nebula’s spectrum divided by 10 is also shown for comparison
(dashed line).
– 8 –
0
1
2
3
4
5
54350 54400 54450 54500 54550 54600 54650 54700 54750 54800 54850
1/19/0810/11/087/3/20083/25/0812/16/079/7/07
Φ (
E >
200
GeV
) [1
0-11 c
m-2
s-1
]
MJD
0
1
2
3
4
5
54735 54740 54745 54750
10/1110/610/19/26
Φ (
E >
200
GeV
) [1
0-11 c
m-2
s-1
]
MJD
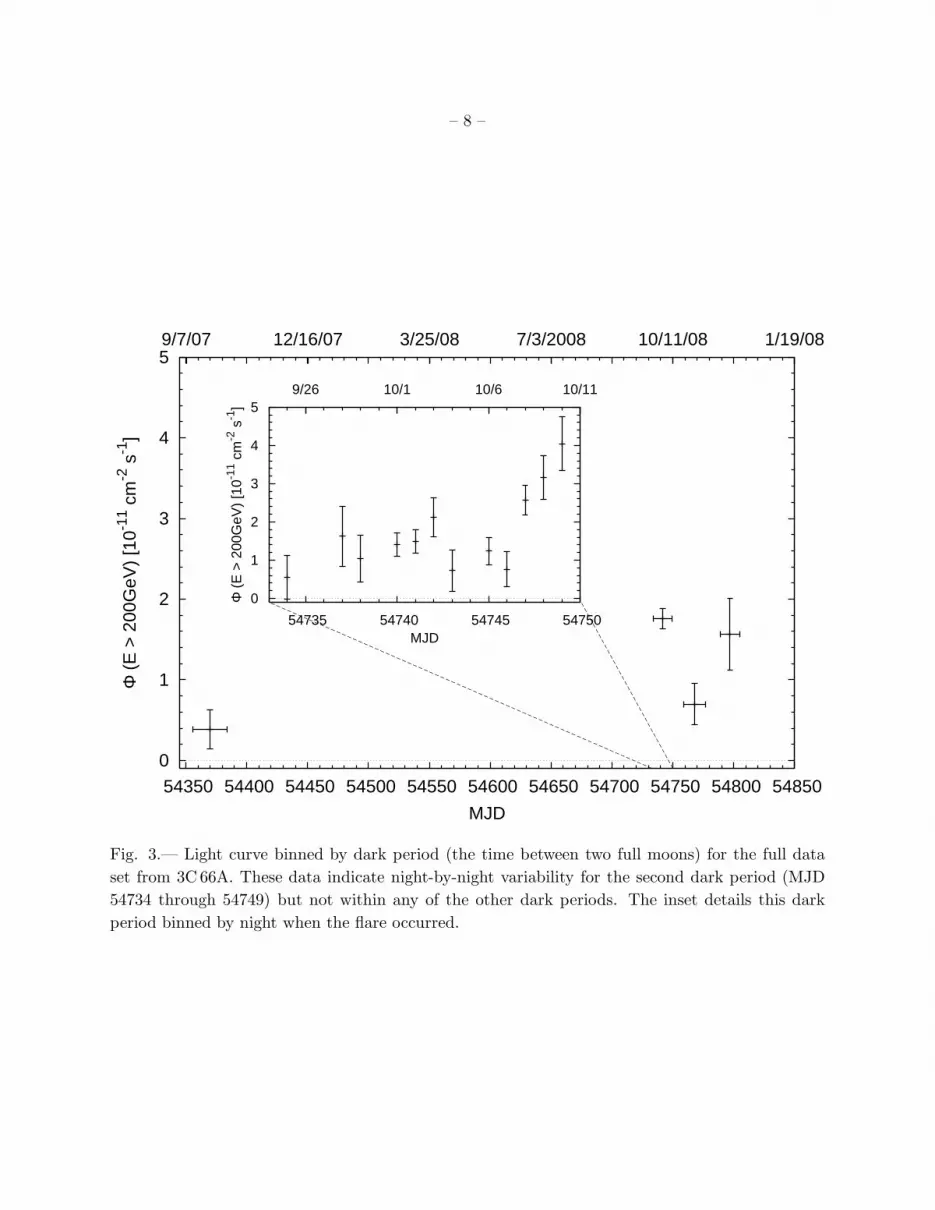
Fig. 3.— Light curve binned by dark period (the time between two full moons) for the full data
set from 3C 66A. These data indicate night-by-night variability for the second dark period (MJD
54734 through 54749) but not within any of the other dark periods. The inset details this dark
period binned by night when the flare occurred.

– 9 –
Fig. 4.— Smoothed significance map of 3C 66A. The location of 3C 66A is shown as an open star
and 3C 66B as the closed star. The cross is the fit to the excess VHE emission resulting in a
localization of 2h 22m 41.6s ± 1.7s ± 6.0s, 43o 02’ 35.5” ± 21” ± 1’30”. These data strongly favor
3C 66A as the source of the γ-ray emission at a significance level of 4.3 σ. Note that the bins are
highly correlated due to an integration over angular space.

– 10 –
significance.
Using the soft cuts, the differential energy spectrum over the energy range ∼ 200 GeV to ∼ 500
GeV is determined and is shown in Figure 2. The best fit of a power-law to these data yields an
index Γ = 4.1 ± 0.4stat ± 0.6sys with a chi-square of 1.94 for 2 degrees of freedom. An alternative
analysis chain confirms this very soft spectrum. Note that there were 1431 excess events detected
during the flaring period from MJD 54740 through MJD 54749 which accounts for 80% of the
total. Thus, while the spectrum calculated here is for the full data set, it is dominated by the flare.
Assuming this power-law spectrum, the observed integral flux for the full data set above 200 GeV is
(1.3± 0.1)× 10−11 cm−2 s−1 (6% of the Crab Nebula’s flux). By comparison, the 2007-2008 season
yielded a significance of 2.6 σ at a lower average flux above 200 GeV of (3.9± 1.6)× 10−12 photons
cm−2 s−1, which is 26% of the flux seen in 2008-2009. Figure 3 shows the integral flux above 200
GeV from 3C 66A for each dark period (the time between two full moons). The highest flux seen
from 3C 66A occurred on MJD 54749. Significant variability is seen only during the dark period
spanning September 25 through October 10 (shown in the inset in Figure 3), with a chi-squared
probability of 0.009% for a fit to a constant flux. No statistically significant evidence for variability
is seen within any of the individual nights. Fits of a constant to the nightly flux in any other dark
period do not yield a chi-squared probability less than 10%.
The radio galaxy 3C 66B lies in the same field of view as 3C 66A at a separation of 0.12◦ and is
also a plausible source of VHE radiation (Tavecchio & Ghisellini 2008). With the recent detection
of VHE emission from the 3C 66A/B region by MAGIC (Aliu et al. 2009) favoring 3C 66B as the
source and excluding 3C 66A at an 85% confidence level, it is important to determine which of
these objects is the source of the emission reported here. Thus, a 2-dimensional Gaussian shape
was fit to the uncorrelated excess of γ rays, yielding a position of 2h 22m 41.6s ± 1.7s, 43o 02’
35.5” ± 21”, with an additional systematic angular uncertainty of 90”. The systematic error has
been confirmed via optical pointing monitors which are mounted to each telescope. This rules out
3C 66B as the source of the VHE emission reported here at a significance level of 4.3 σ. 3C 66A
lies 0.01◦ from the fit position while 3C 66B lies 0.13◦ away and the total error on the fit is 0.03◦
(see Figure 4). In addition to fitting the full data set, fits were made to the data divided into
high (> 300 GeV) and low (< 300 GeV) energy bands under the assumption that the high-energy
emission might originate from 3C 66B while the low energy emission might come from 3C 66A (see
Tavecchio & Ghisellini 2008). The fit to the position did not deviate from the measurement using
the full data set. Correlated variability studies utilizing optical, VHE and HE (30 MeV - 100 GeV)
bands are underway to verify 3C 66A as the source of VHE γ rays and will be the subject of a future
paper. Further restricting the VERITAS data to observations contemporaneous with MAGIC in
September to December 2007, we calculate an upper limit, assuming the reported MAGIC spectrum
of Γ = 3.10, on the flux above 300 GeV from 3C 66B to be 1.8 × 10⁻¹² photons cm−2 s−1 at the
99% confidence level based on ∼ 5 hours of data. MAGIC reported an integral flux based on a
∼ 50 hour exposure above 150 GeV of (7.3 ± 1.5) × 10−12 photons cm−2 s−1 for their full data set
(approximately 1.7× 10⁻¹² photons cm−2 s−1 above 300 GeV). Unfortunately, it is not possible to

– 11 –
calculate a spectrum from the 2007-2008 season data due to low statistics. Although VERITAS
is more sensitive (∼ 2x) than MAGIC the brief (∼ 5 hour) exposure on the 3C 66A/B region in
2007 does not enable a clear determination of which object was the source of VHE emission in
2007. However, based on the MAGIC flux, VERITAS expects ∼ 700 excess events at the location
of 3C 66B in the full data set, whereas only ∼ 300 are detected and the latter is consistent with
expectations for spill over from 3C 66A due to the VERITAS point spread function. Therefore,
if the MAGIC claims of VHE emission from 3C 66B are correct, it must have been considerably
brighter in 2007 than 2008, and similarly 3C 66A must have been considerably brighter in 2008
than 2007.
5. Summary & Conclusion
VERITAS has observed the IBL 3C 66A for a total of 32.8 hours good-quality live time from
September 2007 through November 2008, resulting in the detection of VHE γ rays with a statistical
significance of 21.1 σ. The average integral flux above 200 GeV is (1.3±0.1)×10−11 cm−2 s−1 (6%
of the Crab Nebula’s flux). The differential energy spectrum is well fit by a soft power law with
index Γ = 4.1 ± 0.4stat ± 0.6sys between 200 and 500 GeV.
It is thought that the redshift of 3C 66A is z = 0.444 but this measurement is based upon a
single, poorly detected line (Miller et al. 1978). A definitive measurement of the redshift is needed
to determine the intrinsic spectrum of 3C 66A, corrected for EBL absorption. The extreme distance
of 3C 66A, if true, will allow modelers to probe the evolution of the EBL with redshift. Assuming
the current redshift measurement of z = 0.444, we calculate a de-absorbed spectrum based on
the EBL models of Franceschini et al. (2008) which are based upon recent measurements from the
optical to the sub-millimeter. The original spectrum along with the corrected spectrum can be
seen in Figure 2. While this is not a definitive calculation of the intrinsic spectrum, due to the
uncertainties in the redshift measurement and in the modeling of the EBL, it illustrates that the
steepness of the measured spectrum could be due to the distance of 3C 66A.
The initial announcement of a detection of VHE emission from 3C 66A (Swordy 2008) prompted
several other groups and instruments to also observe this object (Tosti 2008; Larionov et al. 2008).
In addition, the Fermi Gamma-ray Space Telescope detected 3C 66A at a level higher than that
reported by EGRET. The Swift observatory also monitored 3C 66A over this time period, in the
X-ray and UV bands. A future paper by the Fermi collaboration, VERITAS collaboration and
multi-wavelength partners will describe these results and provide details on correlated variability
as well as a broadband spectral energy distribution for the 2008 data set.
This research was supported by grants from the U.S. Department of Energy, the U.S. National
Science Foundation and the Smithsonian Institution, by NSERC in Canada, by Science Foundation
Ireland and by STFC in the UK.
– 12 –
REFERENCES
Acciari, V. A., et al. 2008, ApJL, 684, L73
Aharonian, F. A., et al. 2000, A&A, 353, 847
Aharonian, F. A., Hofmann, W., Konopelko, A. K., & Volk, H. J. 1997, Astroparticle Physics, 6,
343
Aliu, E., et al. 2009, ApJL, 692, L29
Berge, D., Funk, S., & Hinton, J. 2007, A&A, 466, 1219
Bramel, D. A., et al. 2005, ApJ, 629, 108
Cogan, P. 2006, Ph.D. thesis, School of Physics, University College Dublin
Daniel, M. K., et al. 2007, in 30th ICRC, Merida Mexico
Finke, J. D., Shields, J. C., Bottcher, M., & Basu, S. 2008, A&A, 477, 513
Franceschini, A., Rodighiero, G., & Vaccari, M. 2008, A&A, 487, 837
Gould, R. J., & Schreder, G. P. 1967, Physical Review, 155, 1408
Hartman, R. C., et al. 1999, ApJS, 123, 79
Hauser, M. G., & Dwek, E. 2001, ARA&A, 39, 249
Hillas, A. M. 1985, in International Cosmic Ray Conference, Vol. 3, International Cosmic Ray
Conference, ed. F. C. Jones, 445
Holder, J., et al. 2008, in 4th Heidelberg International Symposium on High Energy Gamma-Ray
Astronomy
Horan, D., et al. 2004, ApJ, 603, 51
Krawczynski, H., Carter-Lewis, D. A., Duke, C., Holder, J., Maier, G., Le Bohec, S., & Sembroski,
G. 2006, Astroparticle Physics, 25, 380
Kuiper, L., Hermsen, W., Verbunt, F., Thompson, D. J., Stairs, I. H., Lyne, A. G., Strickman,
M. S., & Cusumano, G. 2000, A&A, 359, 615
Lanzetta, K. M., Turnshek, D. A., & Sandoval, J. 1993, ApJS, 84, 109
Larionov, V. M., et al. 2008, The Astronomer’s Telegram 1759
Li, T.-P., & Ma, Y.-Q. 1983, ApJ, 272, 317
Maccagni, D., Garilli, B., Schild, R., & Tarenghi, M. 1987, A&A, 178, 21

– 13 –
Miller, J. S., French, H. B., & Hawley, S. A. 1978, in BL Lac Objects, ed. A. M. Wolfe, 176
Nandikotkur, G., Jahoda, K. M., Hartman, R. C., Mukherjee, R., Sreekumar, P., Bottcher, M.,
Sambruna, R. M., & Swank, J. H. 2007, ApJ, 657, 706
Perri, M., et al. 2003, A&A, 407, 453
Stepanyan, A. A., Neshpor, Y. I., Andreeva, N. A., Kalekin, O. R., Zhogolev, N. A., Fomin, V. P.,
& Shitov, V. G. 2002, Astronomy Reports, 46, 634
Swordy, S. P. 2008, The Astronomer’s Telegram 1753
Tavecchio, F., & Ghisellini, G. 2008, ArXiv e-prints
Tosti, G. 2008, The Astronomer’s Telegram, 1759
Weekes, T. C., et al. 2002, Astroparticle Physics, 17, 221
Wills, B. J., & Wills, D. 1974, ApJ, 190, L97
This preprint was prepared with the AAS LATEX macros v5.2.


![9`T\Vj @]j 3c`_kV cV]ZVgVd % UVTRUVd `W aRZ_](https://img.pdfslide.net/doc/110x75/63279e81e491bcb36c0b5efd/9tvj-j-3ckv-cvzvgvd-uvtruvd-w-arz.jpg)