Embed Size (px)
Citation preview

Vertical separation vs. independent downstream entry in the Spanish electricity network:
An experimental approach
Nikolaos Georgantzís*
Enrique Fatás#
José Carlos Pernías*
Abstract In this paper we present experimental results from a series of sessions organized using the
Power Market simulator; a software, which is designed to realistically replicate the Spanish
Electricity Market allowing interactive management by real human agents. In the
experiments reported here we compare the status quo (baseline treatment) to two
alternative treatments which represent alternative market structures. In one of them, labeled
as vertical separation, we assume that power generating firms and electricity distributors
belong to separate business groups. In the second alternative market structure, we study the
effect of independent entry by independent distributors. Both alternative scenarios
dominate the stats quo in terms of market efficiency, whereas the latter of them moderately
dominates the former. However, this is achieved at the cost of a higher number of energy
supply interruptions.
* LEE/LINEEX & Economics Dept., Universitat Jaume I, Avda. Sos Baynat s/n, Castellón 12071, Spain. # LINEEX/LEE & Applied Economics (I), University of Valencia, Campus Avda. Tarongers, Valencia, Spain.

1. Introduction
The main objective of the present study is to compare the status quo
industry structure of the Spanish Electricity Market with two alternative
structures involving independent entry in the distribution sector and vertical
separation between producers and distributors. Comparisons will be
performed using the experimental data obtained from three implementations
of the PM software corresponding to three alternative treatments: T1 (Status
Quo), T2 (Vertical Separation) and T3 (Independent Entry). Our aim is to
study the effects of vertical separation and independent entry not only on the
market clearing price, but also on the following aspects of the market which
have been neglected in all previous work so far:
• The ability of the sector to deal with demand- and supply-specific
uncertainty with special emphasis to daily and seasonal
variations.
and
• The frequency with which unfavorable demand or supply
conditions lead to the interruption of electric energy provision.
Recently, several authors have studied the implications of the current
conduct and performance of firms involved in the production and distribution
of electric energy in Spain. Most of them warn us on the possibility that the
market clearing mechanism used to determine electricity prices may facilitate
collusion.1 A somehow different approach is used by Ciarreta and Gutiérrez-
Hita (2005, 2006), to reach a similar conclusion, according to which collusive
1 See for example the work by Fabra and co-authors (Fabra, 2003; Fabra et al., 2002; Fabra and Toro, 2006, Fabra et al., 2006), arguing that the auction used to clear the market may be responsible for the firms’ increased ability to sustain prices which exceed those that would be in place if a more competitive mechanism were adopted.

outcomes are favored by the way in which firms submit their bids to the
market. In this paper, we explore a different way of improving the efficiency
of the electric market in Spain, focusing on structural changes rather than
studying collusion-facilitating aspects of firms’ conduct. We propose and
study two alternative market structures in comparison to the status quo. The
first of them concerns the result of breaking the vertical links between
producers and distributors of electric energy. A similar suggestion emerges
from the analysis by Gutiérrez-Hita (2006), although his approach is very
different to ours. A second structural change proposed here is the result of
entry by independent firms in the distribution of electric energy. Given the
dynamic and complex nature of the market, none of the two types of changes
is expected to cause results which can be trivially predictable from textbook
Industrial Organization. In fact, in all the studies mentioned so far, the
methodology used rules out some important features of the real world industry
inspiring them, like, for example, the demand and supply dynamics and the
asymmetries in firms’ production plant configurations.
The research whose results are reported here is the first experimental
economics approach to alternative scenarios on the future of the Spanish
electricity network based on specifically programmed software which closely
replicates all the features of the market in its present form. The difference
between this study and all previous work on the Spanish Electricity Market
(SEM, hereafter) is that, rather than an abstract auction market setup, it is
based on a realistic and detailed description of all the features characterizing
the supply and demand conditions of the network. In a similar way, the study
is different to all previous experimental work on energy and other resource
markets, which are based on abstract, noncomplex auction setups.

Without underestimating what can be understood on real world markets
from abstract setups of reduced complexity, we claim that the experiments
proposed here can account for important but greatly ignored details which are
central in the case of an electricity market. Among them, daily and seasonal
fluctuations affecting the demand and supply conditions seem to be the most
important. However, supplier asymmetries and vertical relations between
producers and distributors, respectively selling to and buying from a pool are
even more neglected and more central to the case of an Electric network.
For obvious methodological reasons, the resulting complexity regarding
the combination of the aforementioned factors with the market clearing
mechanism has not been studied so far. Needless to say that none of the
numerous recent studies on this issue has taken into account these important
aspects in their recommendations for economic policy and (de)regulation.
The Experimental Economics Laboratories of Valencia (LINEEX,
http://www.uv.es/lineex) and Castellón (LEE, http://www.lee.uji.es) possess a
unique experimental environment which was constructed, following
engineering advice, to simulate the exact supply and demand conditions
(including weather variations and daily and/or seasonal demand fluctuations)
experienced by the producers and distributors of electric energy in Spain. At
the same time, experimental subjects’ interface has been developed in a way
which reflects the productive structures, technological specifications,
capacities and restrictions of each one of the producers of electric energy in
Spain. The result of this effort has been materialized in the experimental
software PM which is joint intellectual property of the two laboratories. The
market-clearing mechanism implemented reproduces all the details of the
auction adopted in the Spanish electricity pool.

A first set of sessions has been run confirming the experimental
subjects’ ability to learn and behave in an economically meaningful way,
which reproduces the current situation of the market. Daily demand
fluctuations produce prices which follow the usual pattern: “Extreme Peak”
prices are higher than “Peak” prices, the latter are higher than “Semi-valley”
prices which are higher than “Valley” prices.
In the study proposed here, we aim at studying two alternative scenarios
concerning the future of the industry. In the first alternative scenario
(Treatment 2), we implement a market structure in which producers and
distributors of electric energy are (vertically) independent entities. In the
second alternative scenario (Treatment 3), we consider a more competitive
distribution with a number of small but independent firms entering the
downstream (distribution) market. Results from both alternative treatments
will be compared to the benchmark case (Tretament 1) representing the status
quo of the sector.
Hopefully, our results will contribute to fill the gap between theoretical
results based mainly on simple, abstract, symmetric setups and a complex
reality with asymmetric producers and distributors facing a complex and
uncertain economic system.

2. Methodology and Experimental Design
The experiment proposed here is based on a three-treatment design. The
first treatment (T1) is based on sessions which implement an industry
structure which closely replicates the current status of the SEM. The two
alternative treatments are inspired on the recommendations by several authors
favoring either vertical separation of between producers and distributors (T2)
or independent entry (T3) in the distribution market. In fact, the two scenarios
have never been compared to each other so far. Furthermore, from a
methodological point of view, it has been impossible so far to study these two
alternatives in the presence of all the complexity governing the demand and
supply conditions of the SEM.
In all our treatments we captured the essence of the market dynamics by
focusing on the four common price auctions that generate power prices in
Spain. Our main scope was to analyze the introduction of competition in the
auction to analyze its effect on market prices. For this reason, while offers
(bids) producers (sellers) were chosen by human subjects, the technological
side of production was simulated in our servers using data coming from actual
Spanish firms and final demand conditions were also simulated using data
from the Spanish power market.
We ran three different treatments; every treatment simulated a different
market condition. In the first one, every market included ten firms, half of
them selling electric power to the market, the remaining five distributing
power to final consumers. Table 1 summarizes the main features of the other
two treatments relative to our baseline:

Treatment 1 Treatment 2 Treatment 3
# of producers 5 5 5
# of sellers 5 5 7
Vertical teams Yes No No
# of markets 5 5 5
# of sessions 1 1 1
Table 1. Experimental Design
The main differences between treatments are the following. In the
baseline condition (Treatment 1), all participants participated in teams made
up of one producer and one seller. Earnings were equally divided among each
team’s members at the end of the experiment. In the other two experimental
treatments, competition was introduced by breaking the vertical linkages
between firms (subjects were paid on a purely individual basis; Treatment 2)
and increasing the number of independent sellers in the market (from 5 to 7;
Treatment 3).
We used a between-subject design, as each participant faced only one
environment and one condition. Participants were assigned to one market side
at random and played a finitely repeated (32-rounds) game with fixed roles.
Rounds reproduced the seasonal conditions of demand and production by a
sequence of seasons. Figure 1 represents this sequence.

Sessions were run at the LINEEX computer lab of the University of
Valencia. We aimed to gather data from fifty (sixty in treatment 3) firms for
each treatment, grouped in five markets. Every treatment was run in a single
session as the number of available computers in LINEEX’s main room is 64.
The realized number of firms varies across treatments due to the experimental
design.
Subjects were recruited among the graduate and undergraduate student
population of the University of Valencia and the graduate population at the
Technical University of Valencia. In the former, we recruited among
economics and business graduate and undergraduate students with at least
intermediate knowledge of industrial organization. In the latter, only graduate
students from the School of Industrial Engineers were allowed to participate
in the experiment.

The recruitment procedures were the standard ones in Valencia.
Students received an e-mail message announcing sessions. They then had to
physically sign themselves in on a bulletin board. Subjects were only allowed
to participate in a single session.
At the beginning of each session the experimenter read aloud the
instructions and subjects asked as many questions as they wish. All questions
were answered publicly by the experimenter. Before beginning to play, all
subjects were asked to complete a short quiz about the payoffs and the rules of
the experiment. The full text for the instructions and quiz are available from
authors upon request.
Rather than using abstract terminology we employ a rather naturalistic
corporate context. For example, firms were explicitly referred to as
“producers” and “sellers”. They were told to conduct a “firm” (or being part
of a holding of firms in Treatment 2). We avoided the use of terms with what
we considered strong connotations. For example, when being part of a team,
subjects were not asked to cooperate (or fight) between them. They had no
information about the rest of the treatments run in the experiment and we did
our best to minimize contamination between subjects participating in different
sessions, even when we believe that this was not a heavy issue due to the
complexity of our design.
The instructions stressed their individual roles in the experiment. As it
can be seen in the instructions, the meaning of bids and offers was carefully
explained to them, as well as the relevance of seasonality and production
technologies. For experimenters who are used to worrying about repeated
game effects, the use of fixed groups may seem like a strange design choice.
However, the field settings that we are interested in simulating involve

repeated interactions among the same agents. Repeated game effects and
history dependence are presumably quite natural in these settings.
Subjects knew in advance that there would be a total of 32 rounds and
that the demand condition would change depending on seasonal market
conditions. The cost of a power supply interruption was also kwon in advance.
In each round all participants had to simultaneously submit their bids
and offers for electric power. The screen on which subjects made their
decisions displayed information about production costs (final demand) for
producers (distributors). The PM software was developed from scratch using
Java language. Figures 10, 11 and 12 are screenshots from this software. Both
figures show the complex information available to subjects before and after
they made their decisions and the intensity of their efforts doing their job.
Once their bids and offers were submitted, the software computed
demand and supply functions and the four market prices. Firm’s payoffs were
computed according to each firm buyer (seller) constraints. Figure 12 shows a
sample output.
Separate windows on the feedback screen showed firms’ results for
each market at the aggregate level. In all rounds subjects had full information
about their own costs and profits, and market prices coming from each of the
four common price auctions. Information about the profit level of all other
participants remained unknown for them. Moreover, they had no information
about other market performances in the same session.
At the end of the session, each subject was paid in cash for all rounds
played plus a show-up fee of five euros. Payoff was done on an individual

and private basis. Recall that all payoffs are in "ECUs" (experimental
currency units) which were converted to euros. The average total payoff was
95.29 € and the average session lasted about 150 minutes (another 60 minutes
were used to explain the instructions and run the quiz). These earnings were
sufficiently large to generate a good supply of subjects.

3. Results
In this section, we present the results obtained from 17 experimental
markets: 6 under T1, 6 under T2 and 5 under T1. The discussion is based on
the evolution of period averages of prices over 32 periods, plotted in Figures
2-8 and the number of supply interruption decisions in Figure 9. The first
three of them are constructed to compare prices across the four different
phases of demand during a day within each one of the treatments. These
comparisons can be seen as a test of consistency for our experimental results,
given that the price of electric energy in the “Valley” should be lower than the
price in a “Semi-valley”, which should be lower than the price on the “Peak”
and this, in its turn should be lower than the price on the “Extreme Peak”.
Precio medio por subasta (T1)
250
300
350
400
450
500
1 3 5 7 9 11 13 15 17 19 21 23 25 27 29 31
mpv1mps1mpp1mpx1
FIGURE 2: Evolution of price averages for the four daily phases in Treatment 1 (mpv1: Average price for “Valley”, mps1: Average price for “Semi-Valley”, mpp1:
Average Price for “Peak”, mpx1: Average Price for “Extreme Peak”).
Precio medio por subasta (T2)
250
300
350
400
450
500
1 3 5 7 9 11 13 15 17 19 21 23 25 27 29 31
mpv2mps2mpp2mpx2
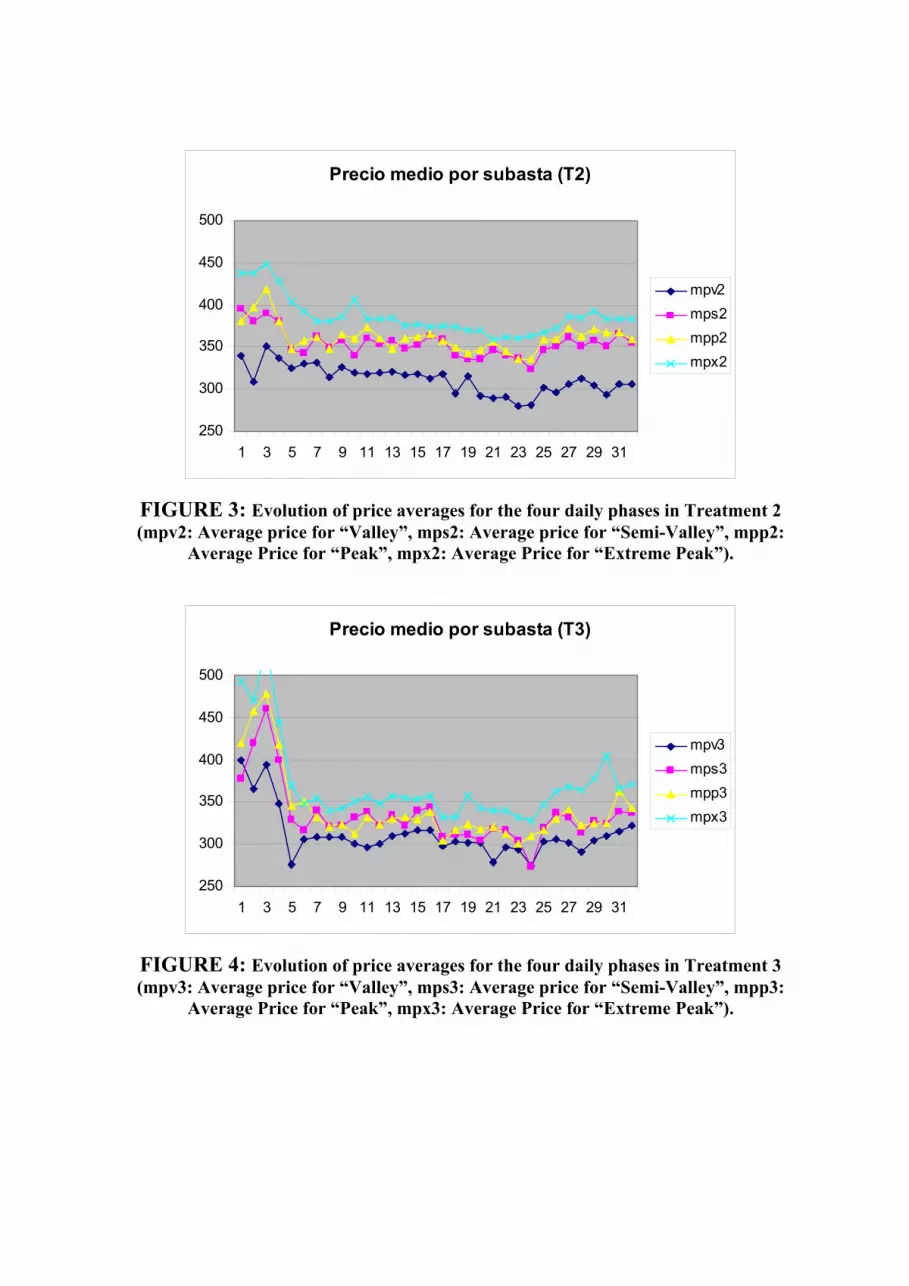
FIGURE 3: Evolution of price averages for the four daily phases in Treatment 2 (mpv2: Average price for “Valley”, mps2: Average price for “Semi-Valley”, mpp2:
Average Price for “Peak”, mpx2: Average Price for “Extreme Peak”).
Precio medio por subasta (T3)
250
300
350
400
450
500
1 3 5 7 9 11 13 15 17 19 21 23 25 27 29 31
mpv3mps3mpp3mpx3
FIGURE 4: Evolution of price averages for the four daily phases in Treatment 3 (mpv3: Average price for “Valley”, mps3: Average price for “Semi-Valley”, mpp3:
Average Price for “Peak”, mpx3: Average Price for “Extreme Peak”).

Generally speaking, this hypothesis receives support by our dataset, as
can be seen in each one of the Figures 2-4. However, if we concentrate on the
differences between “Semi-Valley” and “Peak” prices, we see that they are
often more different to distinguish and in many periods they rank in the
opposite way to that predicted by the aforementioned hypothesis. On the
contrary, “Extreme Peak” and “Valley” prices are clearly the highest and the
lowest in all periods of the experiment in all treatments, which implies a
strong confirmation of the hypothesis that our design yields meaningful
responses to the implemented daily fluctuations of demand.
Let us look now at graphs 5-8. On them, comparison of price averages
across treatments yields the main conclusions of the research report here.
Efectos de trataminto sobre precio valle
050
100150200250300350400450
1 3 5 7 9 11 13 15 17 19 21 23 25 27 29 31
mpv1mpv2mpv3
FIGURE 5: Evolution of “Valley” price averages for the three treatments (mpv1:
Average price for “Valley” in treatment 1, mpv2: Average price for “Valley” in treatment 2, mpv3: Average price for “Valley” in treatment 3).

Figure 5 indicates that both vertical separation (T2) and independent
entry (T3) in the market for electric energy distribution would reduce the
prices of electricity as compared to the status quo (T1).
Efectos de tratamiento sobre precio semivalle
050
100150200250300350400450500
1 3 5 7 9 11 13 15 17 19 21 23 25 27 29 31
mps1mps2mps3
FIGURE 6: Evolution of “Semi-Valley” price averages for the three treatments (mps1: Average price for “Semi-Valley” in treatment 1, mps2: Average price for
“Semi-Valley” in treatment 2, mps3: Average price for “Semi-Valley” in treatment 3).
Efectos de tratamiento sobre precio pico
0
100
200
300
400
500
600
1 3 5 7 9 11 13 15 17 19 21 23 25 27 29 31
mpp1mpp2mpp3
FIGURE 7: Evolution of “Peak” price averages for the three treatments (mpp1:
Average price for “Peak” in treatment 1, mpp2: Average price for “Peak” in treatment 2, mpp3: Average price for “Peak” in treatment 3).

Regarding the prices of the “Semi-Valley” phase, Figure 6 suggests that
the two alternative market structures studied here have a moderate effect on
prices as compared to the baseline treatment (T1). More specifically, only the
independent entry alternative seems to have a clear effect on prices, which are
in this case systematically, although moderately, lower than in the other two
treatments. On the contrary, vertical separation is not found to have any clear
competition-enhancing effect on the prices of this demand phase.
Figure 7 indicates a similar pattern for “Peak” prices. Independent entry
in the distribution of electric energy lowers prices, but less than in the case of
what was found in the case of the “Semi-Valley” phase. Like in the previous
case, vertical separation leads to prices which are not significantly different
from those obtained in the baseline treatment for the same demand phase.
Efectos de tratamiento sobre precio pico extremo
0
100
200
300
400
500
600
1 3 5 7 9 11 13 15 17 19 21 23 25 27 29 31
mpx1mpx2mpx3
FIGURE 8: Evolution of “Extreme Peak” price averages for the three treatments (mpx1: Average price for “Extreme Peak” in treatment 1, mpx2: Average price for
“Extreme Peak” in treatment 2, mpx3: Average price for “Extreme Peak” in treatment 3).

Finally, Figure 9 indicates that both alternative treatments (T2, T3) have
qualitatively similar effects on prices in comparison to the baseline treatment
(T1). However, vertical separation (T2) decreases prices less than independent
entry.
Therefore, our results indicate that both structural changes considered
here would lead to lower prices for electric energy. However, independent
entry into the market of electric energy distribution is found to be
systematically more effective than vertical separation in lowering prices.
Another interesting feature of our results concerns an aspect which has
not been studied so far, but constitutes a central concern of policy makers
regarding the function of the market for electric energy.

Con demanda independiente
Con beneficios compartidos (50-
50%)
Con beneficios propios
Tratamiento
0
100
200
300
400
500
Núm
ero
tota
l de
inte
rrup
cion
es p
erio
do P
ico
0%
20%
40%
60%
80%
100%
Porcentaje
199150
85
42
Distribuidor - ComercializadorComercializadorAcumulado
FIGURE 9: Total number of electric energy supply interactions per treatment. (“Con demanda independiente”: T3, “Con beneficions compartidos (50-50%)”: T1,
“Con beneficios propios”: T2).
In Figure 9, we can see that the entry of new firms in the market for
electric market distribution increases the incentives of both downstream and
upstream agents to use supply interruptions as a strategic weapon signaling
their bargaining strength. However, interestingly, the vertical separation
treatment (in which producers and distributors of electricity are independent

from each other) yields the lowest number of supply interruptions, which
indicates that it is the presence of vertical relations among incumbents that
triggers the “interruption wars” reported here.

4. Conclusions
Many experts2 have suggested restructuring the Spanish electricity
market. However, textbook industrial organization tells us little on the
direction that such restructuring should follow. More sophisticated theoretical
models systematically fail to address a number of central features of the real
world market under study. Furthermore, given the fact that historical data
cannot be used to infer anything on the effects of a given structural change,
empirical research would also fail to address the issue of what we should
expect to observe following a change in the current structure of the market.
We have reported here preliminary results from a series of experiments
designed to address the effects of two alternative structural changes: vertical
separation of corporations which are active on both sides of the market
(generation and distribution) and independent entry of firms in the market of
electric energy distribution.
Our results indicate that both measures would lead to lower prices,
although independent entry in the distribution sector would yield more
significant price decreases. However, this is achieved at some cost, as it would
increase the number of supply interruptions. Breaking the vertical links
between producers and distributors would lead to much more moderate price
decreases, but this would be combined by a decrease in the number of supply
interruptions.
2 A recent example is Vives (2006).

Policy makers need to be assisted by research instruments and
methodologies which are appropriate for addressing some central features of
the real world market under study, like demand fluctuations, production and
demand-side asymmetries and exercise of market power through implicit
recognition of strategic interdependences. Such objectives are more likely to
be achieved by appropriately designed and conducted laboratory experiments,
of which we report here preliminary findings from a first attempt.

APPENDIX: Software interface
Figure 10: Strategy-submission and feedback interface for a distributor.
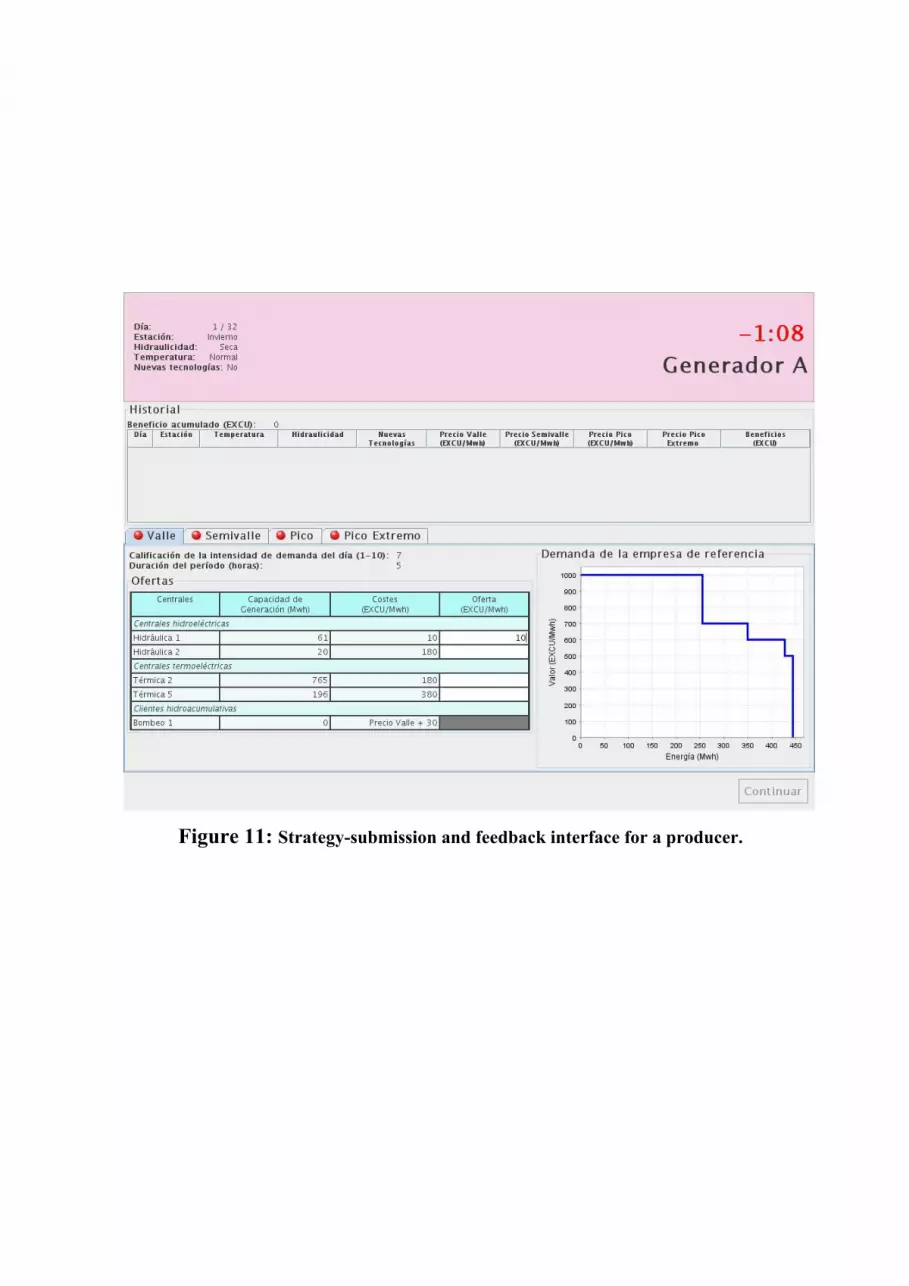
Figure 11: Strategy-submission and feedback interface for a producer.

Figure 12: Feedback screen of a producer after the clearing price has been
determined for a given period.
5. References
Ciarreta, A. and C. Gutiérrez-Hita (2005), “Strategic Behaviour and
Collusion: The Spanish Electricity Market”, REPEC 02/2005, DEFAEII
Working Papers.
Ciarreta, A. and C. Gutiérrez-Hita (2006), “Supply Function vs Quantity
Competition in Supergames”, International Journal of Industrial Organization
24, 773-783.
Fabra, N. (2003) “Tacit Collusion in Repeated Auctions: Uniform versus
Discriminatory Auctions”, Journal of Industrial Economics 51, 271-293.
Fabra, N., N.-H. von der Fehr and D. Harbord (2002), “Modeling Electricity
Auctions”. The Electricity Journal 15, 72-81.
Fabra, N., N.-H. von der Fehr and D. Harbord (2006), “Designing Electricity
Auctions”, Rand Journal of Economics, forthcoming.
Fabra, N. and J. Toro (2006), “Price Wars and Collusion in the Spanish
Electricity Market” International Journal of Industrial Organization 23, 155-
181.
Gutiérrez-Hita, C. (2006), “Liberalisation in the Spanish Electricity Market: A
Model of Vertical Relations”, Unpublished PhD Thesis, Universitat Jaume I,
Castellón (Spain).

Vives, X. (2006), “La Reestructuración del Sector Eléctrico”, Sector Público-
Sector Privado, El Mundo, October 23, 2006.