Embed Size (px)
Citation preview
Citation: Elias, E.; Biratu, G.K.;
Smaling, E.M.A. Vertisols in the
Ethiopian Highlands: Interaction
between Land Use Systems, Soil
Properties, and Different Types of
Fertilizer Applied to Teff and Wheat.
Sustainability 2022, 14, 7370.
https://doi.org/10.3390/su14127370
Academic Editor: Asad
Sarwar Qureshi
Received: 5 May 2022
Accepted: 10 June 2022
Published: 16 June 2022
Publisher’s Note: MDPI stays neutral
with regard to jurisdictional claims in
published maps and institutional affil-
iations.
Copyright: © 2022 by the authors.
Licensee MDPI, Basel, Switzerland.
This article is an open access article
distributed under the terms and
conditions of the Creative Commons
Attribution (CC BY) license (https://
creativecommons.org/licenses/by/
4.0/).
sustainability
Article
Vertisols in the Ethiopian Highlands: Interaction between LandUse Systems, Soil Properties, and Different Types of FertilizerApplied to Teff and WheatEyasu Elias 1 , Gizachew Kebede Biratu 2,* and Eric M. A. Smaling 3
1 Centre for Environmental Science, College of Natural and Computational Sciences, Addis Ababa University,Addis Ababa P.O. Box 1176, Ethiopia; [email protected]
2 Department of Natural Resource Management, School of Natural Resource, Guder Mamo Mezemir Campus,Ambo University, Ambo P.O. Box 19, Ethiopia
3 Wageningen Environmental Research, Wageningen University & Research,6708 Wageningen, The Netherlands; [email protected]
* Correspondence: [email protected]
Abstract: Vertisols are among the most extensive soil types in the Ethiopian highlands, occurringin a wide range of agro-ecological zones where complex crop–livestock-based farming systems arepracticed. Sustainable soil management on vertisols always meets with physical characteristicsthat are driven by clay mineralogy, swelling, shrinking, and risk of temporary waterlogging. Thelatter causes substantial spatial variability and turns vertisols into obnoxious study material, whencompared to other soil classification orders. In this study, we have explored soil properties acrossdifferent farming systems using soil profile and analytical data generated by the CASCAPE project;an action research project funded by the Dutch government for capacity building on the scalingup of evidence-based best practices for increased agricultural production in Ethiopia. In addition,the effects of variations in vertisol properties on crop yield and fertilizer response were examinedthrough fertilizer trials in different locations. Teff (Eragrostis teff Zucc.) and wheat (Triticum aestivium),the two cereal crops commonly grown on vertisols, were used as test crops. Five treatments ofNPSZnB—nitrogen, phosphorous, sulfur, zinc and boron containing blend (50, 100, 150, 200 and300 kg/ha)—and two treatments comparing NPS and diammonium phosphate (DAP) with the blendcontaining Zn and B were included in a randomized complete block design with three replications.Results revealed that soil quality was generally poor under the highland cereal systems, i.e., sorghum–teff–livestock mixed system (FS1) and wheat–maize–teff–barley–livestock system (FS2) compared tothe enset–coffee–cereal–livestock complex system (FS3), which cannot only be attributed to geologicalhistory, but also to the way the land use systems have shaped the soils. The emerging differencesin soil properties significantly (p < 0.01) affected crop yields. The soil properties that had thelargest influence on teff and wheat yield were soil pH, organic carbon (OC), available sulfur (S),exchangeable potassium (K) and some micronutrients (B, Fe, Mn and Cu). Teff grain and biomassyield were inversely related, unlike wheat. Regarding the rate of fertilizer application, wheatresponded significantly up to the highest level (300 kg/ha), but teff yield leveled off earlier. The blendfertilizers did not perform any better than NPS or DAP alone. Given the extent and the importance ofvertisols in Ethiopian agriculture, comprehensive future outlooks are needed, including the optionsfor cluster farming and mechanization to realize economies of scale and more efficient use of capitaland labor inputs.
Keywords: blend fertilizer; Ethiopian highlands; soil variability; vertisols; wheat; teff
1. Introduction
Understanding the interplay between land use systems and soil properties is key tofind avenues to sustainable agricultural production [1]. Vertisols generally show a large
Sustainability 2022, 14, 7370. https://doi.org/10.3390/su14127370 https://www.mdpi.com/journal/sustainability
Sustainability 2022, 14, 7370 2 of 13
spatial range in soil properties, even over relatively short distances. As a result, they remainthe most difficult land resource systems in the world to manage successfully [2,3]. The widevariability in vertisol is due to its particular clay mineralogy, which can cause shrinking andmajor water-transporting bypass flow cracks in dry conditions and churning and swellingproperties, leading to local waterlogging in wet conditions. Often, access to the land formechanized tillage is limited to particular time slots. Land use and management practicesthen also add to the spatial variation.
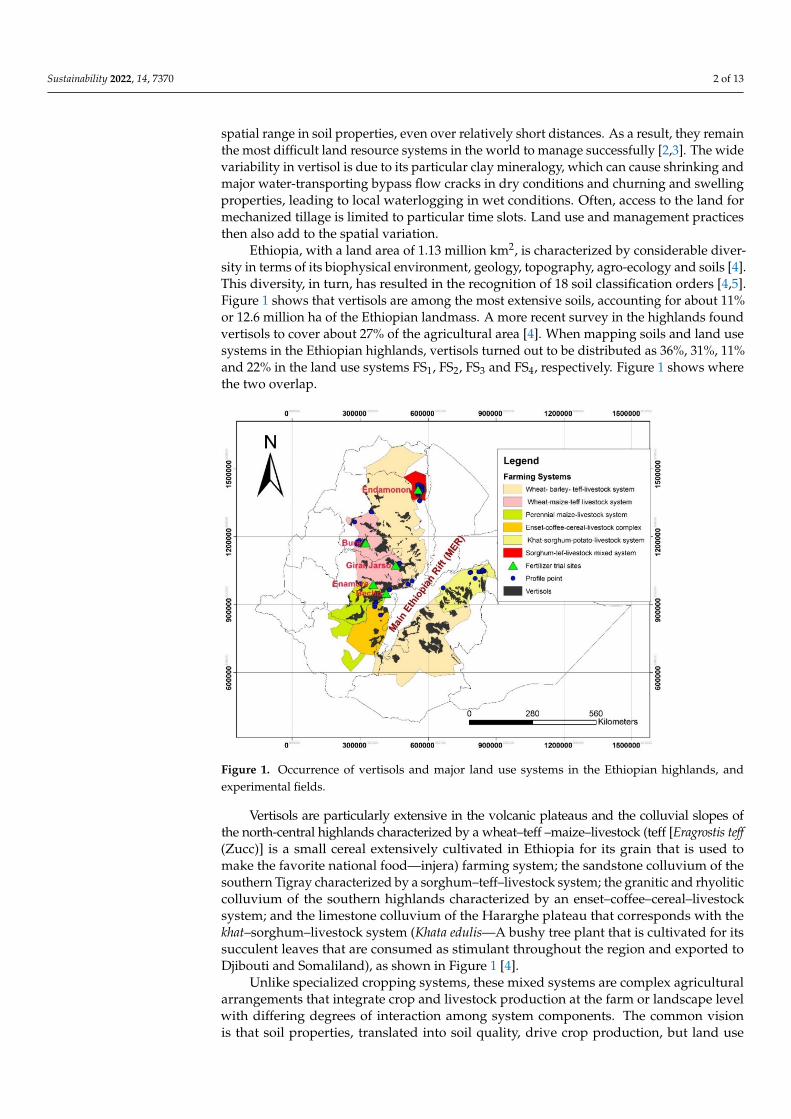
Ethiopia, with a land area of 1.13 million km2, is characterized by considerable diver-sity in terms of its biophysical environment, geology, topography, agro-ecology and soils [4].This diversity, in turn, has resulted in the recognition of 18 soil classification orders [4,5].Figure 1 shows that vertisols are among the most extensive soils, accounting for about 11%or 12.6 million ha of the Ethiopian landmass. A more recent survey in the highlands foundvertisols to cover about 27% of the agricultural area [4]. When mapping soils and land usesystems in the Ethiopian highlands, vertisols turned out to be distributed as 36%, 31%, 11%and 22% in the land use systems FS1, FS2, FS3 and FS4, respectively. Figure 1 shows wherethe two overlap.
Sustainability 2022, 14, x FOR PEER REVIEW 2 of 14
1. Introduction Understanding the interplay between land use systems and soil properties is key to
find avenues to sustainable agricultural production [1]. Vertisols generally show a large spatial range in soil properties, even over relatively short distances. As a result, they re-main the most difficult land resource systems in the world to manage successfully [2,3]. The wide variability in vertisol is due to its particular clay mineralogy, which can cause shrinking and major water-transporting bypass flow cracks in dry conditions and churn-ing and swelling properties, leading to local waterlogging in wet conditions. Often, access to the land for mechanized tillage is limited to particular time slots. Land use and man-agement practices then also add to the spatial variation.
Ethiopia, with a land area of 1.13 million km2, is characterized by considerable diver-sity in terms of its biophysical environment, geology, topography, agro-ecology and soils [4]. This diversity, in turn, has resulted in the recognition of 18 soil classification orders [4,5]. Figure 1 shows that vertisols are among the most extensive soils, accounting for about 11% or 12.6 million ha of the Ethiopian landmass. A more recent survey in the high-lands found vertisols to cover about 27% of the agricultural area [4]. When mapping soils and land use systems in the Ethiopian highlands, vertisols turned out to be distributed as 36%, 31%, 11% and 22% in the land use systems FS1, FS2, FS3 and FS4, respectively. Figure 1 shows where the two overlap.
Vertisols are particularly extensive in the volcanic plateaus and the colluvial slopes of the north-central highlands characterized by a wheat–teff –maize–livestock (teff [Erag-rostis teff (Zucc)] is a small cereal extensively cultivated in Ethiopia for its grain that is used to make the favorite national food—injera) farming system; the sandstone colluvium of the southern Tigray characterized by a sorghum–teff–livestock system; the granitic and rhyolitic colluvium of the southern highlands characterized by an enset–coffee–cereal–livestock system; and the limestone colluvium of the Hararghe plateau that corresponds with the khat–sorghum–livestock system (Khata edulis—A bushy tree plant that is culti-vated for its succulent leaves that are consumed as stimulant throughout the region and exported to Djibouti and Somaliland), as shown in Figure 1 [4].
Figure 1. Occurrence of vertisols and major land use systems in the Ethiopian highlands, and exper-imental fields.
Figure 1. Occurrence of vertisols and major land use systems in the Ethiopian highlands, andexperimental fields.
Vertisols are particularly extensive in the volcanic plateaus and the colluvial slopes ofthe north-central highlands characterized by a wheat–teff –maize–livestock (teff [Eragrostis teff(Zucc)] is a small cereal extensively cultivated in Ethiopia for its grain that is used tomake the favorite national food—injera) farming system; the sandstone colluvium of thesouthern Tigray characterized by a sorghum–teff–livestock system; the granitic and rhyoliticcolluvium of the southern highlands characterized by an enset–coffee–cereal–livestocksystem; and the limestone colluvium of the Hararghe plateau that corresponds with thekhat–sorghum–livestock system (Khata edulis—A bushy tree plant that is cultivated for itssucculent leaves that are consumed as stimulant throughout the region and exported toDjibouti and Somaliland), as shown in Figure 1 [4].
Unlike specialized cropping systems, these mixed systems are complex agriculturalarrangements that integrate crop and livestock production at the farm or landscape levelwith differing degrees of interaction among system components. The common visionis that soil properties, translated into soil quality, drive crop production, but land use
Sustainability 2022, 14, 7370 3 of 13
systems at some point also determine spatial soil quality differences, taking the shape of‘soil phenoforms’ [6,7].
A voluminous amount of literature has been produced about the physical, chemi-cal and mineralogical properties of vertisols and related management challenges in theEthiopian highlands [4,8–10]. However, the variability of vertisol properties across spatialscales and as a function of land use practices and farming systems trajectories is difficultto grasp [11,12]. This is aggravated by gully erosion, and the depletion of organic matterand nutrients (mainly N and S), accompanied by the deterioration of soil structure andincreased bulk density, including salinity build up in the irrigated lowlands [4].
Ethiopian farmers have a long-standing tradition of vertisol management. In additionto the soil burning (guie), early planting of crops with short growing periods and lateplanting to take advantage of the residual moisture after the main rainy season stops, arecommon to farmers in the highland areas. An example is wheat followed by chick pea in arelay cropping system. Drainage furrows made with the maresha, the traditional plough, arealso common practices to drain excess water from farmlands. The broad bed maker (BBM)is the contribution of the scientific community researching on the management of vertisolsin the county. It was first introduced by The International Crops Research Institute for theSemi-Arid Tropics (ICRISAT) in the 1970s [13]. The purpose was to produce broad bedsand furrows with oxen-drawn implements, reducing the labor burden on farmers. Throughcontinued research, BBM has become more efficient and affordable for farmers. Later on, the‘BBM package’ was developed, that includes moisture management, appropriate plantingtime, selection of improved crop variety and fertilizer recommendations to increase cropyield in vertisol-dominated areas of the country [14].
Such developments are good, as the vertisol area is key to the country’s future foodsecurity. Out of 17 million rural households in Ethiopia, not less than 14.5 million haveaccess to fertilizers. At the same time, some 10.5 million households have average landholdings of below 0.6 ha, at an average household of five family members [15]. This clearlyshows the need to apply fertilizers in a way that brings about yield increases that arebeneficial to farmers to achieve food self-sufficiency. On vertisols, fertilizer use is by far low,and presented as one of the major causes of low wheat (2.3 t/ha) and teff (1.3 t/ha) yields inthe Ethiopian highlands [16]. Soil fertility management has been based on the applicationof combinations of DAP (18%- N & 46%- P2O5) and urea (46% N). More recently, however,DAP has been replaced by a compound fertilizer (NPS) with additions of micronutrients.Currently, the most popular blend being promoted through the agricultural extensionsystem is the Zn-B blend (NPS + ZnB) with ratios of 17 N-34 P2O5 + 7 S + 2.2 Zn + 0.6 B. Asthis change of focus is rather recent, its added benefits still remain to be proven [17].
The present study was part of the larger CASCAPE project (Capacity Development forScaling Agricultural best practices in Ethiopia), which was meant to support Ethiopia’s Agri-cultural Growth Program. The project conducted extensive soil survey to characterize andmap major soil landscapes in the Ethiopian highlands during the 2014–2015 period [4,18].This paper is set out (i) to look for correlations between Ethiopian highland land use sys-tems and vertisol characteristics; and (ii) to examine crop response to fertilizers applicationson vertisols (mainly wheat and teff) and to derive optimum rates of fertilizers applicationfor wheat and teff production on vertisols in the Ethiopian highland land use systems.
2. Materials and Methods2.1. Soil Analytical Data
The analytical data on Vertisols were obtained from CASCAPE’s soil profile that wasgenerated as part of a major soil survey in the Ethiopian highlands [4,18], which led toseveral district-level soil maps [19]. In order to explore the vertisol spatial variability,analytical data from the topsoil (0–20 cm) of 45 vertisol profiles were collected across thedifferent land use system zones, out of a total of 204 georeferenced mapping units. Selectedphysical (particle size distribution, bulk density) and chemical properties (soil pH, organiccarbon (OC), total nitrogen (TN), available phosphorus (AP), cation exchange capacity
Sustainability 2022, 14, 7370 4 of 13
(CEC), exchangeable bases (Ca, Mg, Na, and K) and micronutrients (Fe, Mn, Zn, Cu, andB)) were considered.
Soil analysis was performed at the soil fertility laboratory of Waterworks Construc-tion and Design Supervision Enterprise in Addis Ababa, applying standard laboratoryprocedures as outlined by the International Soil Reference and Information Centre [20].Soil pH-H2O was measured using 1:2.5 soil to solution suspension using a pH meter, andthe Walkley and Black method was used to determine OC content. The TN content wasdetermined using the Macro–Kjeldahl method [21], while AP (Olsen) was measured usingsodium bicarbonate extraction solution [20]. The CEC (cmol (+)/kg) was determinedby the ammonium acetate method; exchangeable bases and S were determined usingMehlich-3 [22]. The contents of available micronutrients were extracted using the DTPAextraction method [23].
2.2. Fertilizer Trial Design
Teff trials were conducted during the 2017 and 2018 cropping seasons, while wheattrials were conducted in 2018 on vertisols. Teff trials were conducted in Burie and Bechodistricts representing FS2 and the Enamore district representing FS3. Table 1 presents sometopographic features (elevation, and slope) and climate data (mean annual rainfall, meanmin and mean max temperatures) of the study sites.
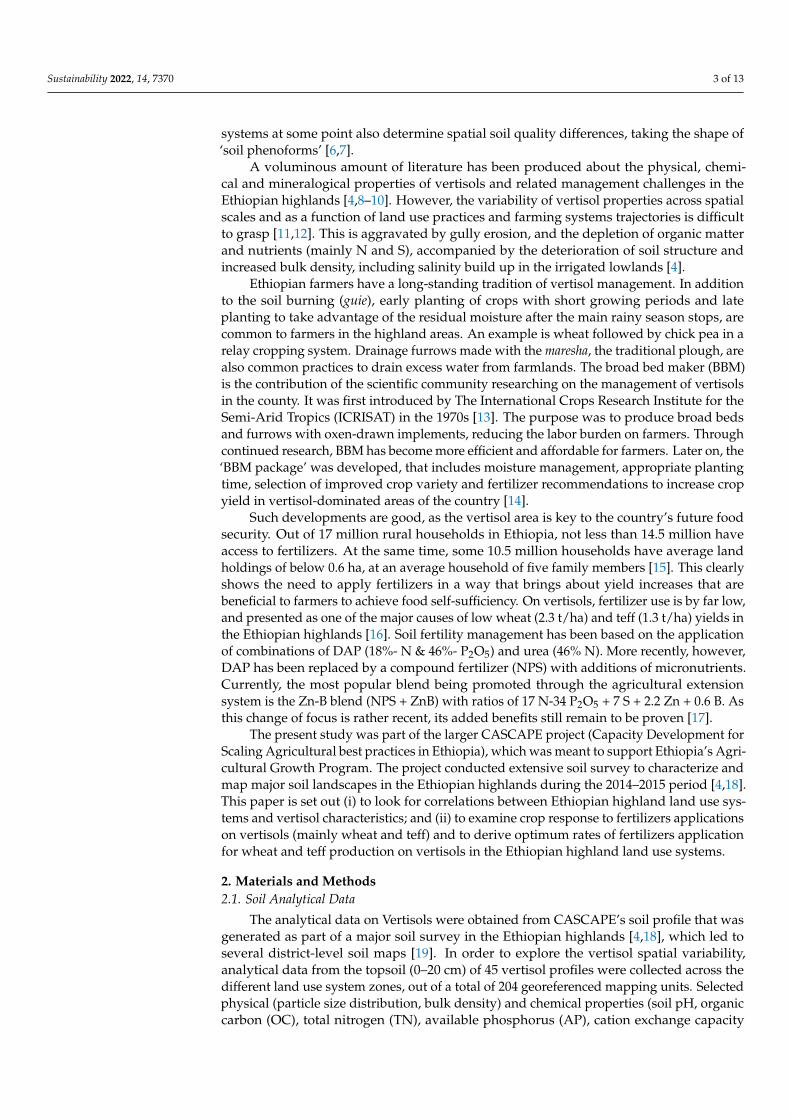
Table 1. Biophysical properties of vertisol landscapes across land use systems in the Ethiopianhighlands (location in Figure 1).
Variable Land Use System
FS1 FS2 FS3 FS4
Elevation (m)Min 1514 1599 1908 1726Max 2987 2954 2097 2339
Mean 2222 2240 976 2099
Rainfall (mm)Min 450 800 1108 750Max 800 1423 1301 975
Mean 635 1187 1195 810
Tmin (◦C)Min 11 10 15 10Max 21 16 15 13
Mean 15 13 15 11
Tmax (◦C)Min 23 20 26 24Max 28 27 26 27
Mean 25 25 26 25
Slope (%)Min 1 1 1 1Max 3 3 2 13
Mean 2 2 1 6FS1, sorghum–teff–livestock mixed system; FS2, wheat–maize–teff–barley–livestock system; FS3, enset–coffee–cereal–livestock complex; and FS4, khat–sorghum–potato–livestock system; Tmin—the mean minimum tem-perature from all the stations within the same land use system; Tmax—the mean maximum temperature indegree Celsius.
Wheat trials were conducted in Endamohoni and Girar Jarso districts representing FS1and FS2 (Figure 1). The trials involved seven treatments: five levels of NPS + ZnB blendfertilizer (50, 100, 150, 200 and 300 kg/ha), 100 kg/ha NPS, and 150 kg DAP/ha, whichis the formerly recommended blanket application rate for cereal on vertisols. This allowsproduction function analysis for the blend fertilizer, as well as comparing the full blendand NPS at 100 kg/ha, and DAP and NPS at the 150 kg/ha level.
Treatments were laid out in a randomized complete block designs (RCBD) using threefarm fields as replications on plot sizes of 5 m × 5 m. The seedbed was prepared byploughing the land four times using oxen-drawn implements, and planting was carried outin mid-July in both years. Improved varieties of teff (Kuncho in Bure and Becho, and Bosetin Enamor) and wheat variety (Hidassie) were used. Wheat was planted in rows at seeding
Sustainability 2022, 14, 7370 5 of 13
rate of 125 kg/ha, while teff was broadcast at a seeding rate of 10 kg/ha. All plots received100 kg/ha urea that was applied in three splits—one third each at planting, two weeksafter emergence and at booting stages. At crop maturity, a 2 m × 2 m plot was harvested tothe ground level to determine the biomass and grain yield per plot. Rainfall data (Table 1)were obtained from nearby meteorological stations in the trial sites.
2.3. Data Analysis
The soil profile data were subjected to statistical analysis to produce descriptive statis-tics (mean and variance) and analysis of variance using R-statistical software [24]. Given theuneven distribution of vertisols across different land use systems, ANOVA for unbalanceddesign was employed. As a result, type III sum of squares was requested, using the carpackage of R [25] while performing the ANOVA. The crop yield data from fertilizer trialswere subjected to ANOVA as well. When the ANOVA resulted in a significant difference,mean separation was achieved by means of Tukey’s honestly significant difference (HSD)at the 5% level. This explored how variation among individual soil properties and cropyields were related to each other. Soil analytical data for the different land use systemswere used to perform a correlation analysis to explain the biomass and grain yields to thetest crops.
3. Results and Discussion3.1. Variability in Biophysical Properties and Soil Management across Land Use Systems in theEthiopian Highlands
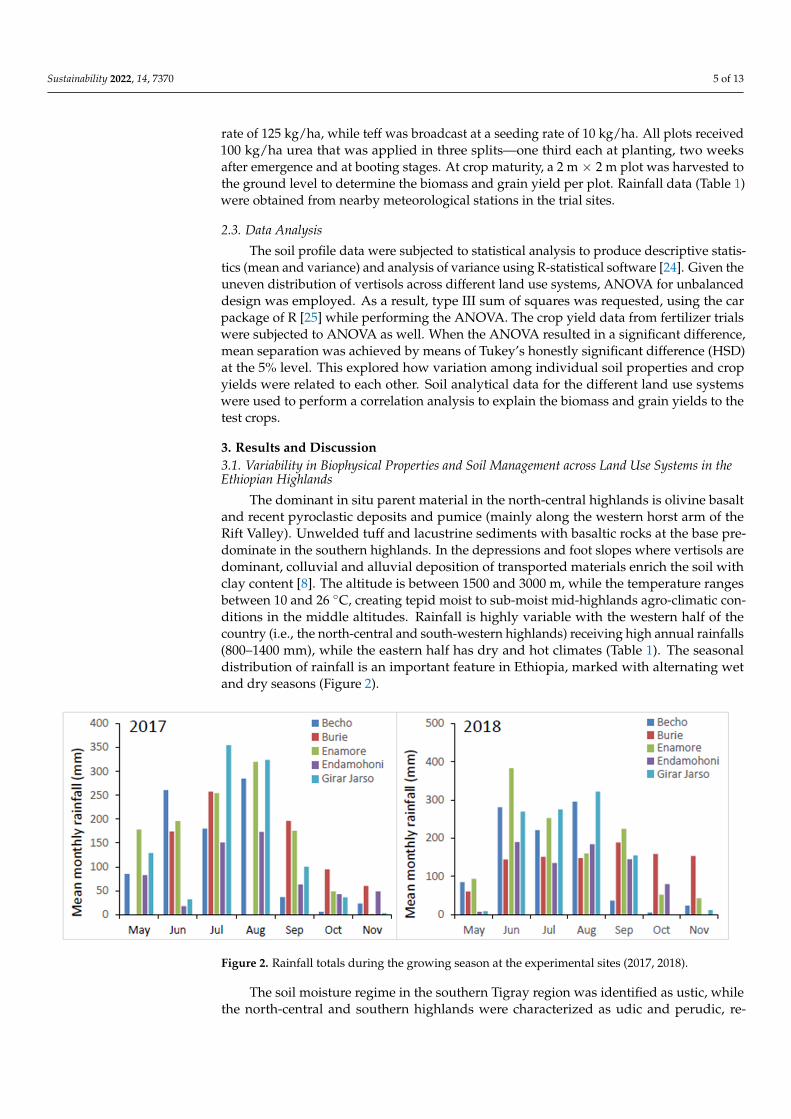
The dominant in situ parent material in the north-central highlands is olivine basaltand recent pyroclastic deposits and pumice (mainly along the western horst arm of theRift Valley). Unwelded tuff and lacustrine sediments with basaltic rocks at the base pre-dominate in the southern highlands. In the depressions and foot slopes where vertisols aredominant, colluvial and alluvial deposition of transported materials enrich the soil withclay content [8]. The altitude is between 1500 and 3000 m, while the temperature rangesbetween 10 and 26 ◦C, creating tepid moist to sub-moist mid-highlands agro-climatic con-ditions in the middle altitudes. Rainfall is highly variable with the western half of thecountry (i.e., the north-central and south-western highlands) receiving high annual rainfalls(800–1400 mm), while the eastern half has dry and hot climates (Table 1). The seasonaldistribution of rainfall is an important feature in Ethiopia, marked with alternating wetand dry seasons (Figure 2).
Sustainability 2022, 14, x FOR PEER REVIEW 6 of 14
The soil moisture regime in the southern Tigray region was identified as ustic, while the north-central and southern highlands were characterized as udic and perudic, respec-tively [26]. Similarly, the soil temperature regimes were classified as thermic for the north-central and southern highlands, and hyperthermic for the southern Tigray plateau.
Figure 2. Rainfall totals during the growing season at the experimental sites (2017, 2018).
In the sorghum–teff–livestock system (FS1), low rainfall and moisture stress is a key constraint to produce sorghum (Sorghum bicolor), teff and some vegetables. Hillside ter-races and stone bunds are used for soil and water conservation. In the FS2 areas, Vertisols are used for cultivation of wheat (Triticum aestivum) and teff. Chickpea (Cicer arietinum), lentil (Lens culinaris) and grass pea (Lathyrus sativus) are grown in the dry season as catch crops using the residual moisture. In order to drain the excess water and tackle poor soil workability during rainy season, farmers practice soil burning (locally known as gueing). The practice alters soil physical properties (i.e., soil color changes into redder hues, fused clay turns into sand-sized particles) and chemical properties, including the destruction of organic matter and loss of N and S contents, but it results in a considerable increase in the contents of AP, exchangeable K and soil pH [4,27].
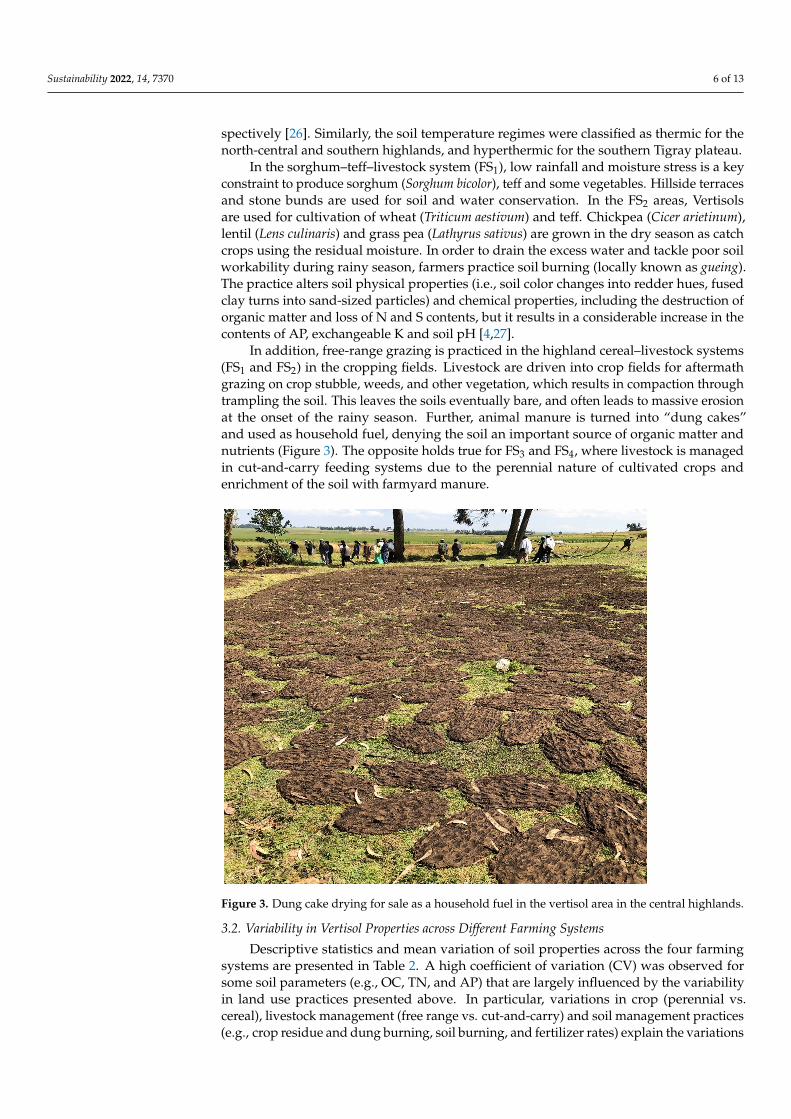
In addition, free-range grazing is practiced in the highland cereal–livestock systems (FS1 and FS2) in the cropping fields. Livestock are driven into crop fields for aftermath grazing on crop stubble, weeds, and other vegetation, which results in compaction through trampling the soil. This leaves the soils eventually bare, and often leads to mas-sive erosion at the onset of the rainy season. Further, animal manure is turned into “dung cakes” and used as household fuel, denying the soil an important source of organic matter and nutrients (Figure 3). The opposite holds true for FS3 and FS4, where livestock is man-aged in cut-and-carry feeding systems due to the perennial nature of cultivated crops and enrichment of the soil with farmyard manure.
Figure 2. Rainfall totals during the growing season at the experimental sites (2017, 2018).
The soil moisture regime in the southern Tigray region was identified as ustic, whilethe north-central and southern highlands were characterized as udic and perudic, re-
Sustainability 2022, 14, 7370 6 of 13
spectively [26]. Similarly, the soil temperature regimes were classified as thermic for thenorth-central and southern highlands, and hyperthermic for the southern Tigray plateau.
In the sorghum–teff–livestock system (FS1), low rainfall and moisture stress is a keyconstraint to produce sorghum (Sorghum bicolor), teff and some vegetables. Hillside terracesand stone bunds are used for soil and water conservation. In the FS2 areas, Vertisolsare used for cultivation of wheat (Triticum aestivum) and teff. Chickpea (Cicer arietinum),lentil (Lens culinaris) and grass pea (Lathyrus sativus) are grown in the dry season as catchcrops using the residual moisture. In order to drain the excess water and tackle poor soilworkability during rainy season, farmers practice soil burning (locally known as gueing).The practice alters soil physical properties (i.e., soil color changes into redder hues, fusedclay turns into sand-sized particles) and chemical properties, including the destruction oforganic matter and loss of N and S contents, but it results in a considerable increase in thecontents of AP, exchangeable K and soil pH [4,27].
In addition, free-range grazing is practiced in the highland cereal–livestock systems(FS1 and FS2) in the cropping fields. Livestock are driven into crop fields for aftermathgrazing on crop stubble, weeds, and other vegetation, which results in compaction throughtrampling the soil. This leaves the soils eventually bare, and often leads to massive erosionat the onset of the rainy season. Further, animal manure is turned into “dung cakes”and used as household fuel, denying the soil an important source of organic matter andnutrients (Figure 3). The opposite holds true for FS3 and FS4, where livestock is managedin cut-and-carry feeding systems due to the perennial nature of cultivated crops andenrichment of the soil with farmyard manure.
Sustainability 2022, 14, x FOR PEER REVIEW 7 of 14
Figure 3. Dung cake drying for sale as a household fuel in the vertisol area in the central highlands.
3.2. Variability in Vertisol Properties across Different Farming Systems Descriptive statistics and mean variation of soil properties across the four farming
systems are presented in Table 2. A high coefficient of variation (CV) was observed for some soil parameters (e.g., OC, TN, and AP) that are largely influenced by the variability in land use practices presented above. In particular, variations in crop (perennial vs. ce-real), livestock management (free range vs. cut-and-carry) and soil management practices (e.g., crop residue and dung burning, soil burning, and fertilizer rates) explain the varia-tions in soil properties studied. On the contrary, variations of certain soil properties, such as high clay content, neutral to slightly alkaline soil pH, high CEC and exchange complex saturated with Ca and Mg, are reflections of the inherent properties of vertisols [3].
The analysis of variance shows highly significant differences (p < 0.001) among farm-ing systems in particle size distribution (mainly sand fraction), soil pH, OC, TN, AP and micronutrients, except for Cu (Table 2). Although vertisols are known for their high clay content, there was significantly higher sand fraction under FS2 (33%), compared to that under FS3 (15%). This is associated with the practice of soil burning that is common in FS2. Guieing is reportedly known to turn fused clay into a sand-like structure. Similar findings are reported elsewhere and for other soil types [27–29]. Bulk density (BD) is significantly higher in soils under FS1 (1.44 g/m3) and FS2 (1.26 g/m3) where land is intensively culti-vated, and free grazing is common. This is in sharp contrast with the BD value (1.05 g/m3) observed under FS3, where the hoeing and cut-and-carry feeding of animals is practiced.
Soil pH ranges from strongly acidic (5.58) under FS2 to neutral (7.35) under FS4. Whereas the strongly acidic reaction may be explained by continued application of N and P fertilizers, the high pH under FS4 is the reflection of high Ca saturation and the frequent occurrence of calcareous alluvial deposits that characterize this land use system [30]. The mean values of OC (5.58%) and TN (0.51%) are rated as high for vertisols, which are usu-ally characterized as low in these properties due to intense mixing of organic matter with clay complexes under anaerobic conditions during wet seasons [3]. The significantly (p < 0.001) higher mean OC (13%) and TN (1.42%) under FS4 is attributed to the accumulation of khat leave residues that are dumped on crop fields after the succulent parts are
Figure 3. Dung cake drying for sale as a household fuel in the vertisol area in the central highlands.
3.2. Variability in Vertisol Properties across Different Farming Systems
Descriptive statistics and mean variation of soil properties across the four farmingsystems are presented in Table 2. A high coefficient of variation (CV) was observed forsome soil parameters (e.g., OC, TN, and AP) that are largely influenced by the variabilityin land use practices presented above. In particular, variations in crop (perennial vs.cereal), livestock management (free range vs. cut-and-carry) and soil management practices(e.g., crop residue and dung burning, soil burning, and fertilizer rates) explain the variations
Sustainability 2022, 14, 7370 7 of 13
in soil properties studied. On the contrary, variations of certain soil properties, such ashigh clay content, neutral to slightly alkaline soil pH, high CEC and exchange complexsaturated with Ca and Mg, are reflections of the inherent properties of vertisols [3].
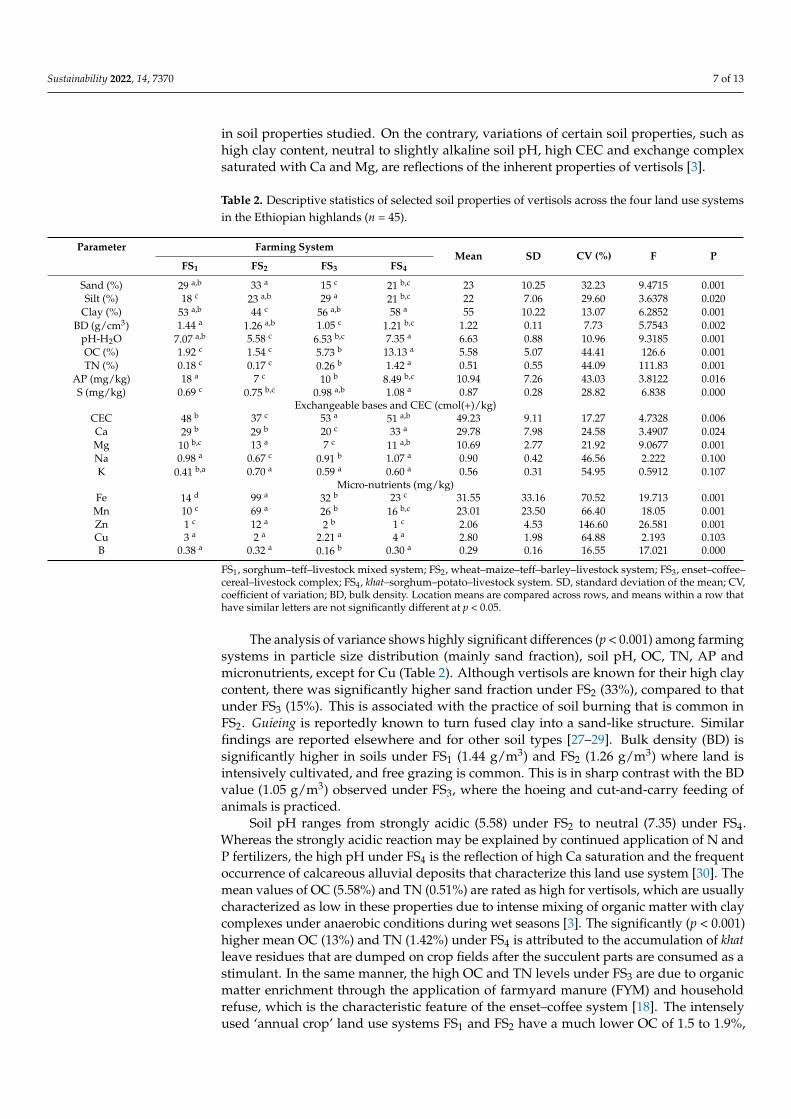
Table 2. Descriptive statistics of selected soil properties of vertisols across the four land use systemsin the Ethiopian highlands (n = 45).
Parameter Farming SystemMean SD CV (%) F P
FS1 FS2 FS3 FS4
Sand (%) 29 a,b 33 a 15 c 21 b,c 23 10.25 32.23 9.4715 0.001Silt (%) 18 c 23 a,b 29 a 21 b,c 22 7.06 29.60 3.6378 0.020
Clay (%) 53 a,b 44 c 56 a,b 58 a 55 10.22 13.07 6.2852 0.001BD (g/cm3) 1.44 a 1.26 a,b 1.05 c 1.21 b,c 1.22 0.11 7.73 5.7543 0.002
pH-H2O 7.07 a,b 5.58 c 6.53 b,c 7.35 a 6.63 0.88 10.96 9.3185 0.001OC (%) 1.92 c 1.54 c 5.73 b 13.13 a 5.58 5.07 44.41 126.6 0.001TN (%) 0.18 c 0.17 c 0.26 b 1.42 a 0.51 0.55 44.09 111.83 0.001
AP (mg/kg) 18 a 7 c 10 b 8.49 b,c 10.94 7.26 43.03 3.8122 0.016S (mg/kg) 0.69 c 0.75 b,c 0.98 a,b 1.08 a 0.87 0.28 28.82 6.838 0.000
Exchangeable bases and CEC (cmol(+)/kg)CEC 48 b 37 c 53 a 51 a,b 49.23 9.11 17.27 4.7328 0.006Ca 29 b 29 b 20 c 33 a 29.78 7.98 24.58 3.4907 0.024Mg 10 b,c 13 a 7 c 11 a,b 10.69 2.77 21.92 9.0677 0.001Na 0.98 a 0.67 c 0.91 b 1.07 a 0.90 0.42 46.56 2.222 0.100K 0.41 b,a 0.70 a 0.59 a 0.60 a 0.56 0.31 54.95 0.5912 0.107
Micro-nutrients (mg/kg)Fe 14 d 99 a 32 b 23 c 31.55 33.16 70.52 19.713 0.001Mn 10 c 69 a 26 b 16 b,c 23.01 23.50 66.40 18.05 0.001Zn 1 c 12 a 2 b 1 c 2.06 4.53 146.60 26.581 0.001Cu 3 a 2 a 2.21 a 4 a 2.80 1.98 64.88 2.193 0.103B 0.38 a 0.32 a 0.16 b 0.30 a 0.29 0.16 16.55 17.021 0.000
FS1, sorghum–teff–livestock mixed system; FS2, wheat–maize–teff–barley–livestock system; FS3, enset–coffee–cereal–livestock complex; FS4, khat–sorghum–potato–livestock system. SD, standard deviation of the mean; CV,coefficient of variation; BD, bulk density. Location means are compared across rows, and means within a row thathave similar letters are not significantly different at p < 0.05.
The analysis of variance shows highly significant differences (p < 0.001) among farmingsystems in particle size distribution (mainly sand fraction), soil pH, OC, TN, AP andmicronutrients, except for Cu (Table 2). Although vertisols are known for their high claycontent, there was significantly higher sand fraction under FS2 (33%), compared to thatunder FS3 (15%). This is associated with the practice of soil burning that is common inFS2. Guieing is reportedly known to turn fused clay into a sand-like structure. Similarfindings are reported elsewhere and for other soil types [27–29]. Bulk density (BD) issignificantly higher in soils under FS1 (1.44 g/m3) and FS2 (1.26 g/m3) where land isintensively cultivated, and free grazing is common. This is in sharp contrast with the BDvalue (1.05 g/m3) observed under FS3, where the hoeing and cut-and-carry feeding ofanimals is practiced.
Soil pH ranges from strongly acidic (5.58) under FS2 to neutral (7.35) under FS4.Whereas the strongly acidic reaction may be explained by continued application of N andP fertilizers, the high pH under FS4 is the reflection of high Ca saturation and the frequentoccurrence of calcareous alluvial deposits that characterize this land use system [30]. Themean values of OC (5.58%) and TN (0.51%) are rated as high for vertisols, which are usuallycharacterized as low in these properties due to intense mixing of organic matter with claycomplexes under anaerobic conditions during wet seasons [3]. The significantly (p < 0.001)higher mean OC (13%) and TN (1.42%) under FS4 is attributed to the accumulation of khatleave residues that are dumped on crop fields after the succulent parts are consumed as astimulant. In the same manner, the high OC and TN levels under FS3 are due to organicmatter enrichment through the application of farmyard manure (FYM) and householdrefuse, which is the characteristic feature of the enset–coffee system [18]. The intenselyused ‘annual crop’ land use systems FS1 and FS2 have a much lower OC of 1.5 to 1.9%,
Sustainability 2022, 14, 7370 8 of 13
which is still much higher than the African average of 0.8% [12,31,32]. The mean valuefor AP (11 mg/kg) is in the medium range, showing highly significant (p < 0.01) variationbetween farming systems. The highest mean AP value (18 mg/kg) was observed in FS1and the lowest (7 mg/kg) in FS2.
There was highly significant (p < 0.01) variation in the levels of CEC and exchangeablebases, except for Na that was present only in trace amounts in the soils under almost allfarming systems. The highest level of CEC (53 cmol(+)/kg) was observed in FS3, followedby FS4 (51 cmol(+)/kg), which coincides well with the high clay and OC contents inthese farming systems. The highest Ca (33 cmol(+)/kg) and Mg (13 cmol(+)/kg) contentswere observed in FS4 and FS2, and the lowest in FS3 (Table 2), which can be explainedby variations in the parent materials between the farming systems. The soils in FS4 arederived from Ca-rich calcareous materials (chiefly limestone), and those in FS2 are derivedfrom alkali basalt rocks which are rich in Mg [30]. In contrast, silica-rich parent materials(e.g., rhyolites and trachytes) are dominant under FS3.
Furthermore, the micronutrient levels are significantly (p < 0.001) varied across farmingsystems with the exception of Cu, reflecting differences in land use and parent materials.The levels of Fe and Mn are particularly high under FS2, consistent with the stronglyacidic soil reaction under this farming system (Table 2). At higher pH, the precipitation ofmicronutrients is also possible (i.e., cations are strongly bound by hydroxides or oxides),thereby reducing their availability in the soil solution [33].
3.3. Teff and Wheat Grain and Biomass Yield and Their Correlation with Soil Properties
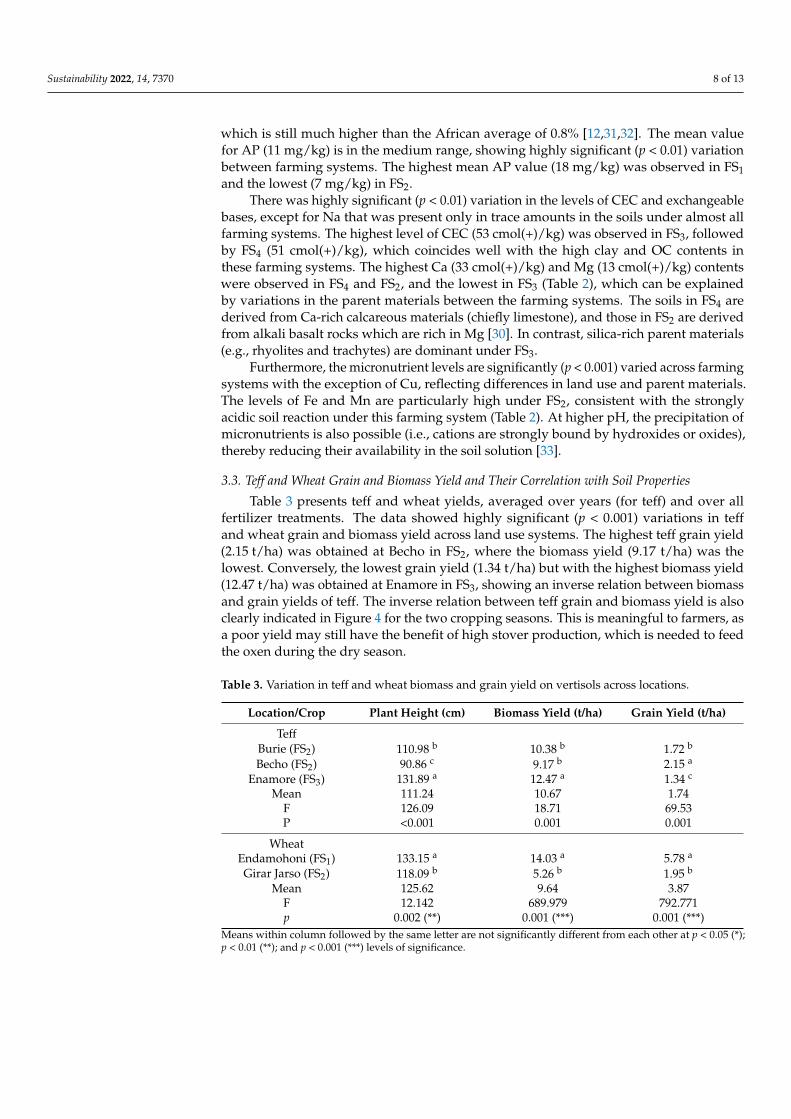
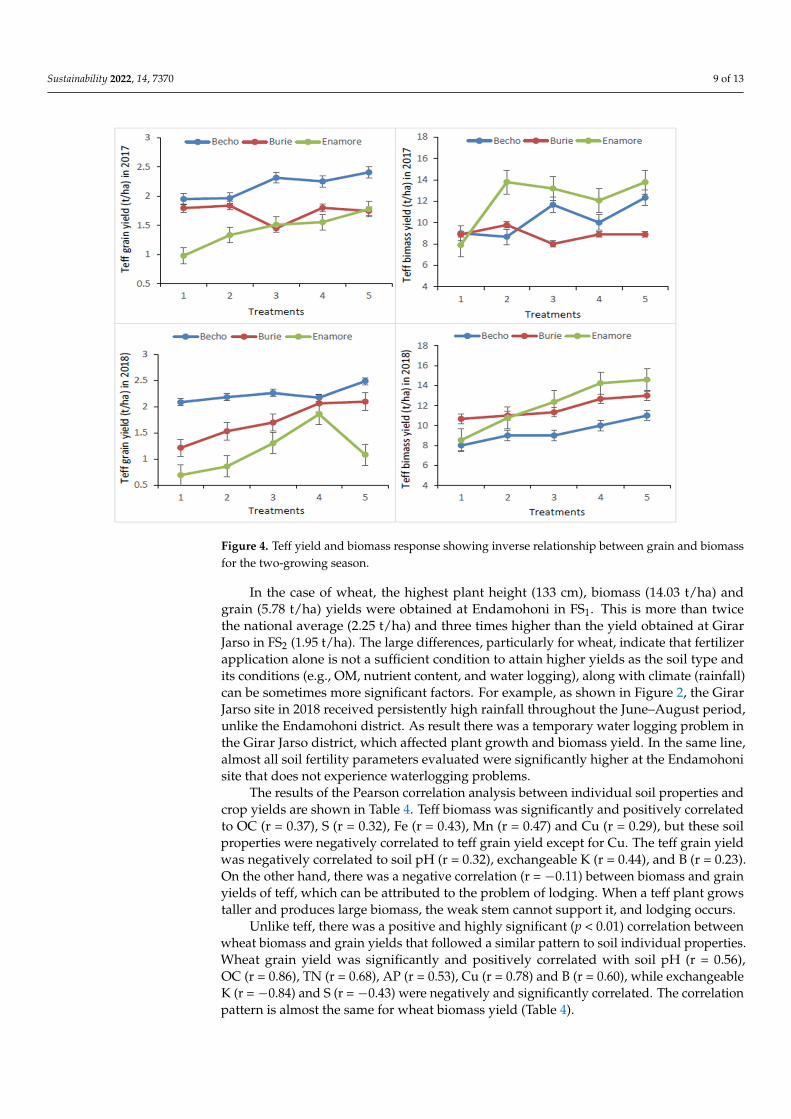
Table 3 presents teff and wheat yields, averaged over years (for teff) and over allfertilizer treatments. The data showed highly significant (p < 0.001) variations in teffand wheat grain and biomass yield across land use systems. The highest teff grain yield(2.15 t/ha) was obtained at Becho in FS2, where the biomass yield (9.17 t/ha) was thelowest. Conversely, the lowest grain yield (1.34 t/ha) but with the highest biomass yield(12.47 t/ha) was obtained at Enamore in FS3, showing an inverse relation between biomassand grain yields of teff. The inverse relation between teff grain and biomass yield is alsoclearly indicated in Figure 4 for the two cropping seasons. This is meaningful to farmers, asa poor yield may still have the benefit of high stover production, which is needed to feedthe oxen during the dry season.
Table 3. Variation in teff and wheat biomass and grain yield on vertisols across locations.
Location/Crop Plant Height (cm) Biomass Yield (t/ha) Grain Yield (t/ha)
TeffBurie (FS2) 110.98 b 10.38 b 1.72 b
Becho (FS2) 90.86 c 9.17 b 2.15 a
Enamore (FS3) 131.89 a 12.47 a 1.34 c
Mean 111.24 10.67 1.74F 126.09 18.71 69.53P <0.001 0.001 0.001
WheatEndamohoni (FS1) 133.15 a 14.03 a 5.78 a
Girar Jarso (FS2) 118.09 b 5.26 b 1.95 b
Mean 125.62 9.64 3.87F 12.142 689.979 792.771p 0.002 (**) 0.001 (***) 0.001 (***)
Means within column followed by the same letter are not significantly different from each other at p < 0.05 (*);p < 0.01 (**); and p < 0.001 (***) levels of significance.
Sustainability 2022, 14, 7370 9 of 13Sustainability 2022, 14, x FOR PEER REVIEW 10 of 14
Figure 4. Teff yield and biomass response showing inverse relationship between grain and biomass for the two-growing season.
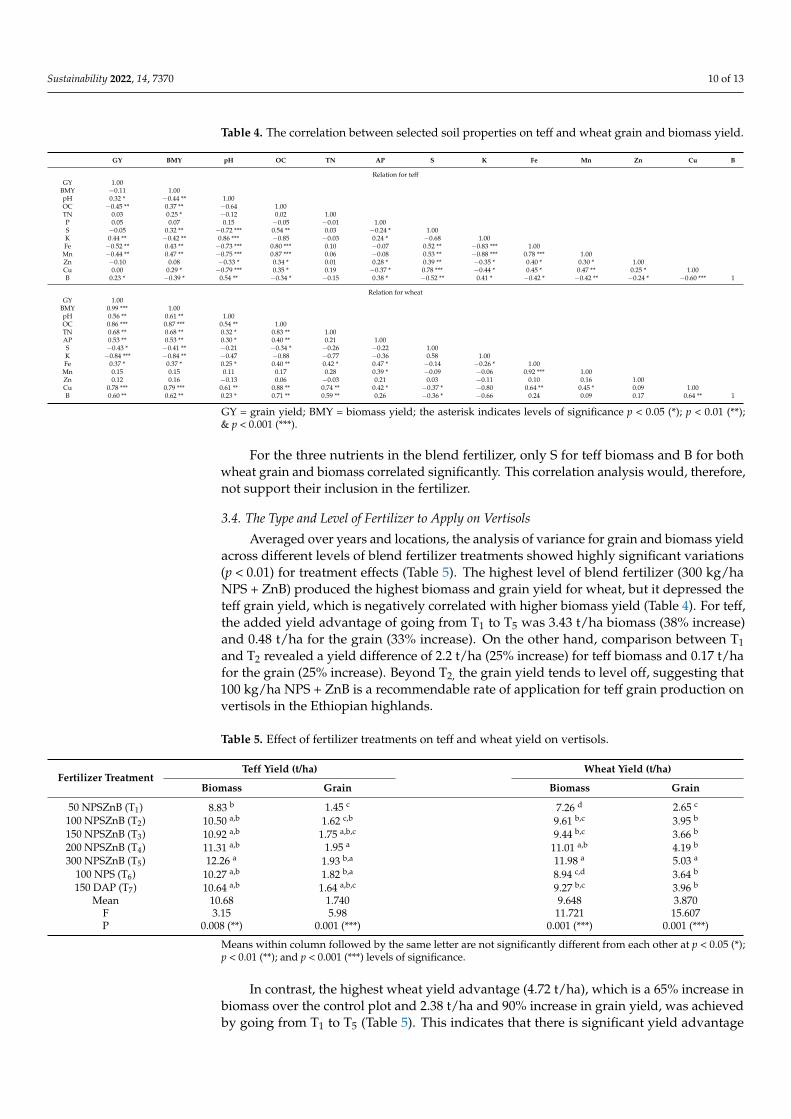
The results of the Pearson correlation analysis between individual soil properties and crop yields are shown in Table 4. Teff biomass was significantly and positively correlated to OC (r = 0.37), S (r = 0.32), Fe (r = 0.43), Mn (r = 0.47) and Cu (r = 0.29), but these soil properties were negatively correlated to teff grain yield except for Cu. The teff grain yield was negatively correlated to soil pH (r = 0.32), exchangeable K (r = 0.44), and B (r = 0.23). On the other hand, there was a negative correlation (r = −0.11) between biomass and grain yields of teff, which can be attributed to the problem of lodging. When a teff plant grows taller and produces large biomass, the weak stem cannot support it, and lodging occurs.
Unlike teff, there was a positive and highly significant (p < 0.01) correlation between wheat biomass and grain yields that followed a similar pattern to soil individual proper-ties. Wheat grain yield was significantly and positively correlated with soil pH (r = 0.56), OC (r = 0.86), TN (r = 0.68), AP (r = 0.53), Cu (r = 0.78) and B (r = 0.60), while exchangeable K (r = −0.84) and S (r = −0.43) were negatively and significantly correlated. The correlation pattern is almost the same for wheat biomass yield (Table 4).
For the three nutrients in the blend fertilizer, only S for teff biomass and B for both wheat grain and biomass correlated significantly. This correlation analysis would, there-fore, not support their inclusion in the fertilizer.
Table 4. The correlation between selected soil properties on teff and wheat grain and biomass yield.
GY BMY pH OC TN AP S K Fe Mn Zn Cu B Relation for teff
GY 1.00 BMY −0.11 1.00 pH 0.32 * −0.44 ** 1.00 OC −0.45 ** 0.37 ** −0.64 1.00 TN 0.03 0.25 * −0.12 0.02 1.00
Figure 4. Teff yield and biomass response showing inverse relationship between grain and biomassfor the two-growing season.
In the case of wheat, the highest plant height (133 cm), biomass (14.03 t/ha) andgrain (5.78 t/ha) yields were obtained at Endamohoni in FS1. This is more than twicethe national average (2.25 t/ha) and three times higher than the yield obtained at GirarJarso in FS2 (1.95 t/ha). The large differences, particularly for wheat, indicate that fertilizerapplication alone is not a sufficient condition to attain higher yields as the soil type andits conditions (e.g., OM, nutrient content, and water logging), along with climate (rainfall)can be sometimes more significant factors. For example, as shown in Figure 2, the GirarJarso site in 2018 received persistently high rainfall throughout the June–August period,unlike the Endamohoni district. As result there was a temporary water logging problem inthe Girar Jarso district, which affected plant growth and biomass yield. In the same line,almost all soil fertility parameters evaluated were significantly higher at the Endamohonisite that does not experience waterlogging problems.
The results of the Pearson correlation analysis between individual soil properties andcrop yields are shown in Table 4. Teff biomass was significantly and positively correlatedto OC (r = 0.37), S (r = 0.32), Fe (r = 0.43), Mn (r = 0.47) and Cu (r = 0.29), but these soilproperties were negatively correlated to teff grain yield except for Cu. The teff grain yieldwas negatively correlated to soil pH (r = 0.32), exchangeable K (r = 0.44), and B (r = 0.23).On the other hand, there was a negative correlation (r = −0.11) between biomass and grainyields of teff, which can be attributed to the problem of lodging. When a teff plant growstaller and produces large biomass, the weak stem cannot support it, and lodging occurs.
Unlike teff, there was a positive and highly significant (p < 0.01) correlation betweenwheat biomass and grain yields that followed a similar pattern to soil individual properties.Wheat grain yield was significantly and positively correlated with soil pH (r = 0.56),OC (r = 0.86), TN (r = 0.68), AP (r = 0.53), Cu (r = 0.78) and B (r = 0.60), while exchangeableK (r = −0.84) and S (r = −0.43) were negatively and significantly correlated. The correlationpattern is almost the same for wheat biomass yield (Table 4).
Sustainability 2022, 14, 7370 10 of 13
Table 4. The correlation between selected soil properties on teff and wheat grain and biomass yield.
GY BMY pH OC TN AP S K Fe Mn Zn Cu B
Relation for teffGY 1.00
BMY −0.11 1.00pH 0.32 * −0.44 ** 1.00OC −0.45 ** 0.37 ** −0.64 1.00TN 0.03 0.25 * −0.12 0.02 1.00P 0.05 0.07 0.15 −0.05 −0.01 1.00S −0.05 0.32 ** −0.72 *** 0.54 ** 0.03 −0.24 * 1.00K 0.44 ** −0.42 ** 0.86 *** −0.85 −0.03 0.24 * −0.68 1.00Fe −0.52 ** 0.43 ** −0.73 *** 0.80 *** 0.10 −0.07 0.52 ** −0.83 *** 1.00Mn −0.44 ** 0.47 ** −0.75 *** 0.87 *** 0.06 −0.08 0.53 ** −0.88 *** 0.78 *** 1.00Zn −0.10 0.08 −0.33 * 0.34 * 0.01 0.28 * 0.39 ** −0.35 * 0.40 * 0.30 * 1.00Cu 0.00 0.29 * −0.79 *** 0.35 * 0.19 −0.37 * 0.78 *** −0.44 * 0.45 * 0.47 ** 0.25 * 1.00B 0.23 * −0.39 * 0.54 ** −0.34 * −0.15 0.38 * −0.52 ** 0.41 * −0.42 * −0.42 ** −0.24 * −0.60 *** 1
Relation for wheatGY 1.00
BMY 0.99 *** 1.00pH 0.56 ** 0.61 ** 1.00OC 0.86 *** 0.87 *** 0.54 ** 1.00TN 0.68 ** 0.68 ** 0.32 * 0.83 ** 1.00AP 0.53 ** 0.53 ** 0.30 * 0.40 ** 0.21 1.00S −0.43 * −0.41 ** −0.21 −0.34 * −0.26 −0.22 1.00K −0.84 *** −0.84 ** −0.47 −0.88 −0.77 −0.36 0.58 1.00Fe 0.37 * 0.37 * 0.25 * 0.40 ** 0.42 * 0.47 * −0.14 −0.26 * 1.00Mn 0.15 0.15 0.11 0.17 0.28 0.39 * −0.09 −0.06 0.92 *** 1.00Zn 0.12 0.16 −0.13 0.06 −0.03 0.21 0.03 −0.11 0.10 0.16 1.00Cu 0.78 *** 0.79 *** 0.61 ** 0.88 ** 0.74 ** 0.42 * −0.37 * −0.80 0.64 ** 0.45 * 0.09 1.00B 0.60 ** 0.62 ** 0.23 * 0.71 ** 0.59 ** 0.26 −0.36 * −0.66 0.24 0.09 0.17 0.64 ** 1
GY = grain yield; BMY = biomass yield; the asterisk indicates levels of significance p < 0.05 (*); p < 0.01 (**);& p < 0.001 (***).
For the three nutrients in the blend fertilizer, only S for teff biomass and B for bothwheat grain and biomass correlated significantly. This correlation analysis would, therefore,not support their inclusion in the fertilizer.
3.4. The Type and Level of Fertilizer to Apply on Vertisols
Averaged over years and locations, the analysis of variance for grain and biomass yieldacross different levels of blend fertilizer treatments showed highly significant variations(p < 0.01) for treatment effects (Table 5). The highest level of blend fertilizer (300 kg/haNPS + ZnB) produced the highest biomass and grain yield for wheat, but it depressed theteff grain yield, which is negatively correlated with higher biomass yield (Table 4). For teff,the added yield advantage of going from T1 to T5 was 3.43 t/ha biomass (38% increase)and 0.48 t/ha for the grain (33% increase). On the other hand, comparison between T1and T2 revealed a yield difference of 2.2 t/ha (25% increase) for teff biomass and 0.17 t/hafor the grain (25% increase). Beyond T2, the grain yield tends to level off, suggesting that100 kg/ha NPS + ZnB is a recommendable rate of application for teff grain production onvertisols in the Ethiopian highlands.
Table 5. Effect of fertilizer treatments on teff and wheat yield on vertisols.
Fertilizer TreatmentTeff Yield (t/ha) Wheat Yield (t/ha)
Biomass Grain Biomass Grain
50 NPSZnB (T1) 8.83 b 1.45 c 7.26 d 2.65 c
100 NPSZnB (T2) 10.50 a,b 1.62 c,b 9.61 b,c 3.95 b
150 NPSZnB (T3) 10.92 a,b 1.75 a,b,c 9.44 b,c 3.66 b
200 NPSZnB (T4) 11.31 a,b 1.95 a 11.01 a,b 4.19 b
300 NPSZnB (T5) 12.26 a 1.93 b,a 11.98 a 5.03 a
100 NPS (T6) 10.27 a,b 1.82 b,a 8.94 c,d 3.64 b
150 DAP (T7) 10.64 a,b 1.64 a,b,c 9.27 b,c 3.96 b
Mean 10.68 1.740 9.648 3.870F 3.15 5.98 11.721 15.607P 0.008 (**) 0.001 (***) 0.001 (***) 0.001 (***)
Means within column followed by the same letter are not significantly different from each other at p < 0.05 (*);p < 0.01 (**); and p < 0.001 (***) levels of significance.
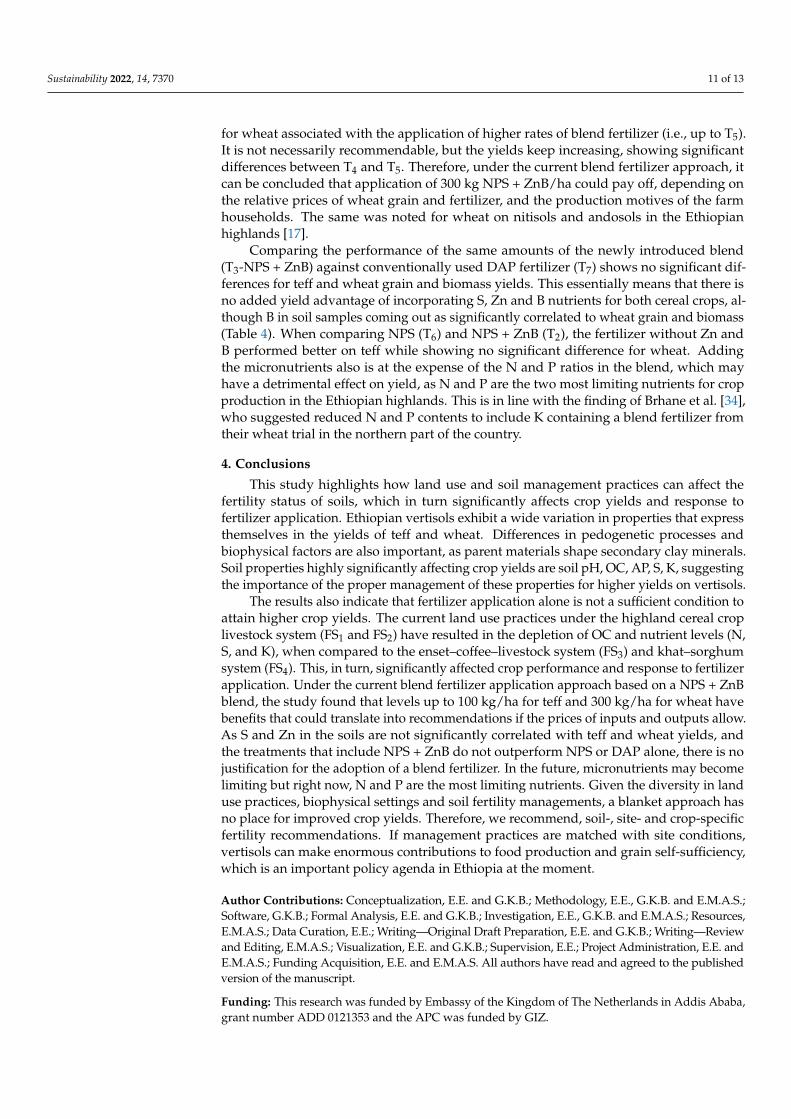
In contrast, the highest wheat yield advantage (4.72 t/ha), which is a 65% increase inbiomass over the control plot and 2.38 t/ha and 90% increase in grain yield, was achievedby going from T1 to T5 (Table 5). This indicates that there is significant yield advantage
Sustainability 2022, 14, 7370 11 of 13
for wheat associated with the application of higher rates of blend fertilizer (i.e., up to T5).It is not necessarily recommendable, but the yields keep increasing, showing significantdifferences between T4 and T5. Therefore, under the current blend fertilizer approach, itcan be concluded that application of 300 kg NPS + ZnB/ha could pay off, depending onthe relative prices of wheat grain and fertilizer, and the production motives of the farmhouseholds. The same was noted for wheat on nitisols and andosols in the Ethiopianhighlands [17].
Comparing the performance of the same amounts of the newly introduced blend(T3-NPS + ZnB) against conventionally used DAP fertilizer (T7) shows no significant dif-ferences for teff and wheat grain and biomass yields. This essentially means that there isno added yield advantage of incorporating S, Zn and B nutrients for both cereal crops, al-though B in soil samples coming out as significantly correlated to wheat grain and biomass(Table 4). When comparing NPS (T6) and NPS + ZnB (T2), the fertilizer without Zn andB performed better on teff while showing no significant difference for wheat. Addingthe micronutrients also is at the expense of the N and P ratios in the blend, which mayhave a detrimental effect on yield, as N and P are the two most limiting nutrients for cropproduction in the Ethiopian highlands. This is in line with the finding of Brhane et al. [34],who suggested reduced N and P contents to include K containing a blend fertilizer fromtheir wheat trial in the northern part of the country.
4. Conclusions
This study highlights how land use and soil management practices can affect thefertility status of soils, which in turn significantly affects crop yields and response tofertilizer application. Ethiopian vertisols exhibit a wide variation in properties that expressthemselves in the yields of teff and wheat. Differences in pedogenetic processes andbiophysical factors are also important, as parent materials shape secondary clay minerals.Soil properties highly significantly affecting crop yields are soil pH, OC, AP, S, K, suggestingthe importance of the proper management of these properties for higher yields on vertisols.
The results also indicate that fertilizer application alone is not a sufficient condition toattain higher crop yields. The current land use practices under the highland cereal croplivestock system (FS1 and FS2) have resulted in the depletion of OC and nutrient levels (N,S, and K), when compared to the enset–coffee–livestock system (FS3) and khat–sorghumsystem (FS4). This, in turn, significantly affected crop performance and response to fertilizerapplication. Under the current blend fertilizer application approach based on a NPS + ZnBblend, the study found that levels up to 100 kg/ha for teff and 300 kg/ha for wheat havebenefits that could translate into recommendations if the prices of inputs and outputs allow.As S and Zn in the soils are not significantly correlated with teff and wheat yields, andthe treatments that include NPS + ZnB do not outperform NPS or DAP alone, there is nojustification for the adoption of a blend fertilizer. In the future, micronutrients may becomelimiting but right now, N and P are the most limiting nutrients. Given the diversity in landuse practices, biophysical settings and soil fertility managements, a blanket approach hasno place for improved crop yields. Therefore, we recommend, soil-, site- and crop-specificfertility recommendations. If management practices are matched with site conditions,vertisols can make enormous contributions to food production and grain self-sufficiency,which is an important policy agenda in Ethiopia at the moment.
Author Contributions: Conceptualization, E.E. and G.K.B.; Methodology, E.E., G.K.B. and E.M.A.S.;Software, G.K.B.; Formal Analysis, E.E. and G.K.B.; Investigation, E.E., G.K.B. and E.M.A.S.; Resources,E.M.A.S.; Data Curation, E.E.; Writing—Original Draft Preparation, E.E. and G.K.B.; Writing—Reviewand Editing, E.M.A.S.; Visualization, E.E. and G.K.B.; Supervision, E.E.; Project Administration, E.E. andE.M.A.S.; Funding Acquisition, E.E. and E.M.A.S. All authors have read and agreed to the publishedversion of the manuscript.
Funding: This research was funded by Embassy of the Kingdom of The Netherlands in Addis Ababa,grant number ADD 0121353 and the APC was funded by GIZ.
Sustainability 2022, 14, 7370 12 of 13
Institutional Review Board Statement: Not applicable.
Informed Consent Statement: Not applicable.
Data Availability Statement: The data used in this paper can be accessed from the correspondingauthor up request.
Acknowledgments: The analytical data were generated as part of the BENEFIT-CASCAPE https://benefitethiopia.org/ (accessed on 20 September 2020) project (capacity building for scaling upof evidence-based best practices in agricultural production in Ethiopia) that carried out a majorsoil survey and mapping work in the Ethiopian highlands. CASCAPE is an action research projectthat was designed to assist the activities deployed under the Agricultural Growth Program. TheBENEFIT-CASCAPE project was financed by the Dutch Ministry of Foreign Affairs through theEmbassy of the Kingdom of The Netherlands in Addis Ababa for which we are grateful. We are alsothankful to the International Centre for Biosaline Agriculture (ICBA) for its technical support.
Conflicts of Interest: The authors declare no conflict of interest.
References1. Santra, P.; Kumar, M.; Panwar, N.R.; Das, B. Digital Soil Mapping and Best Management of Soil Resources: A Brief Discussion
with Few Case Studies. In Adaptive Soil Management: From Theory to Practices; Rakshit, A., Abhilash, P.C., Singh, H.B., Ghosh, S.,Eds.; Springer Nature Singapore Pte Ltd.: Singapore, 2017; pp. 3–39.
2. Somasundaram, J.; Lal, R.; Sinha, N.K.; Dalal, R.; Chitralekha, A.; Chaudhary, R.S.; Patra, A.K. Cracks and Potholes in Vertisols:Characteristics, Occurrence, and Management. Adv. Agron. 2018, 149, 93–159.
3. Kovda, I. Vertisols: Extreme features and extreme environment. Geoderma Reg. 2020, 22, e00312. [CrossRef]4. Elias, E. Soils of the Ethioian Highlands: Geomorphology and Properties; Capacity Building for Scaling Up of Evidence-Based Best
Practices for Increased Agricultural Production in Ethiopia (CASCAPE); Wageningen University and Research: Wageningen, TheNetherlands, 2016; p. 385.
5. Dinssa, B.; Elias, E. Characterization and classification of soils of Bako Tibe District, West Shewa, Ethiopia. Heliyon 2021, 7, e08279.[CrossRef] [PubMed]
6. Viaud, V.; Santillàn-Carvantes, P.; Akkal-Corfini, N.; Le Guillou, C.; Prévost-Bouré, N.; Ranjard, L.; Menasseri-Aubry, S. Landscape-scale analysis of cropping system effects on soil quality in a context of crop-livestock farming. Agric. Ecosyst. Environ. 2018, 265,166–177. [CrossRef]
7. Rossiter, D.G.; Bouma, J. A new look at soil phenoforms—Definition, identification, mapping. Geoderma 2018, 314, 113–121.[CrossRef]
8. Zewdie, E. Properties of Major Agricultural Soils of Ethiopia; LAP Lambert Academic Publishing: Saarbrucken, Germany, 2013;p. 281.
9. Shabtai, I.A.; Shenker, M.; Edeto, W.L.; Warburg, A.; Ben-Hur, M. Effects of land use on structure and hydraulic properties ofVertisols containing a sodic horizon in northern Ethiopia. Soil Tillage Res. 2014, 136, 19–27. [CrossRef]
10. Erkossa, T.; Haileslassie, A.; MacAlister, C. Enhancing farming system water productivity through alternative land use and watermanagement in vertisol areas of Ethiopian Blue Nile Basin (Abay). Agric. Water Manag. 2014, 132, 120–128. [CrossRef]
11. Hailu, H.; Mamo, T.; Keskinen, R.; Karltun, E.; Gebrekidan, H.; Bekele, T. Soil fertility status and wheat nutrient content in Vertisolcropping systems of central highlands of Ethiopia. Agric. Food Secur. 2015, 4, 19. [CrossRef]
12. Pierre, T.J.; Primus, A.T.; Simon, B.D.; Philemon, Z.Z.; Hamadjida, G.; Monique, A.; Pierre, N.J.; Lucien, B.D. Characteristics,classification, and genesis of Vertisols under seasonally contrasted climate in the Lake Chad Basin, Central Africa. J. Afr. Earth Sci.2018, 150, 176–193. [CrossRef]
13. Astatke, A.; Jabbar, M.A. Low-cost Animal-drawn Implements for Vertisol Management and Strategies for Land-use Intensification.In The Sustainable Management of Vertisols; Syers, J.K., Penning de Vries, F.W.T., Nyamudeza, P., Eds.; CABI Publisher: London, UK,2001.
14. Jabbar, M.A.; Mamo, T.; Mohamed Saleem, M.A. From Plot to Watershed Management: Experience in Farmer ParticipatoryVertisol Technology Generation and Adoption in Highland Ethiopia. In The Sustainable Management of Vertisols; Syers, J.K.,Penning de Vries, F.W.T., Nyamudeza, P., Eds.; CABI Publisher: London, UK, 2001.
15. CDCR. Poverty and Hunger Strategic Review. Ethiopia Roadmap to Achieve Zero Poverty and Hunger; Centre for Dialogue, Researchand Cooperation (CDRC): Addis Ababa, Ethiopia, 2019.
16. Abdulkadir, B.; Kassa, S.; Desalegn, T.; Tadesse, K.; Haileselassie, M.; Fana, G.; Abera, T.; Amede, T.; Tibebe, D. Crop responseto fertilizer application in Ethiopia: A review. In Proceedings of the Crop Response to Fertilizer Rapplication, Addis Ababa,Ethiopia, 1–2 December 2016.
17. Elias, E.; Okoth, P.F.; Smaling, E.M.A. Explaining bread wheat (Triticum aestivum) yield differences by soil properties and fertilizerrates in the highlands of Ethiopia. Geoderma 2019, 339, 126–133. [CrossRef]
Sustainability 2022, 14, 7370 13 of 13
18. Leenaars, J.G.B.; Elias, E.; Wösten, H.; Ruiperez, M.; Kempen, B.; Ali, A.; Brouwer, F. Major Soil-Landscape Resources of the CascapeIntervention Woredas, Ethiopia: Soil Information in Support to Scaling Up of Evidence-Based Best Practices in Agricultural Production(with Dataset); ISRIC-ALTERA, WUR: Wageningen, The Netherlands, 2016.
19. Leenaars, J.G.B.; Elias, E.; Wösten, J.H.M.; Ruiperez-González, M.; Kempen, B. Mapping the major soil-landscape resources of theEthiopian Highlands using random forest. Geoderma 2020, 361, 114067. [CrossRef]
20. Van Reeuwijk, L.P. Procedures for Soil Analysis, 6th ed.; International Soil Reference and Information Centre (ISRIC): Wageningen,The Netherlands, 2006.
21. Bremner, J.M.; Mulvaney, C.S. Total Nitrogen. In Methods of Soil Analysis II. Chemical and Microbiological Properties; Page, A.L.,Miller, R.H., Keeney, D.R., Eds.; Soil Science Society of America: Madison, WI, USA, 1982; pp. 595–642.
22. Mylavarapu, R.S.; Sanchez, J.F.; Nguyen, J.H.; Bartos, J.M. Evaluation of Mehlich-1 and Mehlich-3 extraction procedures for plantnutrients in acid mineral soils of Florida. Commun. Soil Sci. Plant Anal. 2002, 33, 807–820. [CrossRef]
23. Tan, K. Soil Smapling, Preparation, and Analysis; Marcel Dekker, Inc.: New York, NY, USA, 1996.24. R Core Team. R: A Language and Environment for Statistical Computing; R Foundation for Statistical Computing: Vienna, Austria,
2019.25. Fox, J.; Weisberg, S. An R Companion to Applied Regression, 3rd ed.; Sage: Thousand Oaks, CA, USA, 2019.26. Eswaran, H. Taxonomy and management related properties of the red soils of Africa. In Proceedings of the International
Symposium on the Red Soils of East and Southern Africa, Harare, Zimbabwe, 24–27 February 1986.27. Tadesse, K.A. Effects of Traditional Practice of Soil Burning (Guie) on Soil Chemical Properties at Sheno Areas of North Shoa,
Oromia Region, Ethiopia. J. Plant Sci. 2015, 3, 342–348.28. Negasa, T.; Ketema, H.; Legesse, A.; Sisay, M.; Temesgen, H. Variation in soil properties under different land use types managed
by smallholder farmers along the toposequence in southern Ethiopia. Geoderma 2017, 290, 40–50. [CrossRef]29. Elias, E. Characteristics of Nitisol profiles as affected by land use type and slope class in some Ethiopian highlands. Environ. Syst.
Res. 2017, 6, 20. [CrossRef]30. Elias, E. Selected chemical properties of agricultural soils in the Ethiopian highlands: A rapid assessment. S. Afr. J. Plant Soil 2018,
36, 153–156. [CrossRef]31. Elmobarak, A.A. Status, priorities and needs for sustainable soil management in Sudan. In Proceedings of the Global Soil
Partnership in East and Southern Africa, Nairobi, Kenya, 25–27 March 2013.32. Moussadek, R.; Laghrour, M.; Mrabet, R.; Van Ranst, E.; Badraoui, M.; Mekkaoui, M. Morocco’s Vertisol Characterization. J. Mater.
Environ. Sci. 2017, 8, 3932–3942.33. Fageria, N.K.; Baligar, V.C.; Jones, C.A. Growth and Mineral Nutrition of Field Crops, 3rd ed.; Taylor and Francis Group, LLC:
New York, NY, USA, 2011.34. Brhane, H.; Mamo, T.; Teka, K. Optimum potassium fertilization level for growth, yield and nutrient uptake of wheat (Triticum
aestivum) in Vertisols of Northern Ethiopia. Cogent Food Agric. 2017, 3, 1347022. [CrossRef]


