Embed Size (px)
Citation preview
E O S
Eos Vol 81 No 19 May 92000
U N I O N
OS VOLUME 81 NUMBER 19
MAY 9 2000
PAGES 209-220
VHF Radar Detects Oceanic Submesoscale Vortex Along Florida Coast PAGES 209213
Escalating national interest in the coastal ocean underscores the need for high-quality surface current data that can improve our understanding of surface circulation and its impact on societal and environmental issues related to coastal pollution beach restoration oil spill mitigation and coastal air-sea interacshytion Coastal regimes exposed to strong ocean currentssurface waves and winds during storm conditions may frequently require beach renourishment to restore valuable beaches that are key to local economies Maintaining water quality is a problem too particularly where shipping dominates the traffic in and out of har-borsThese environmental issues are increasingly difficult to manage due to evolving oceanic and atmospheric conditions Inferring evolving spatial patterns of the coastal ocean current fields from single-point measurements such as moorings or drifters that propagate away from divergent flow regimes is difficult at bestThe Doppler radar technique is one approach that effectively measures the evolution of surface current fields in near-real time
The South Florida Ocean Measurement Censhyter (SFOMC) is an observatory for coastal and deep ocean processes It requires a suite of in situ oceanographic instruments to test and evaluate the performance of autonomous underwater vehicles (Figure 1) Given the narshyrow shelf off Ft Lauderdale this observatory is ideally suited for examining a spectrum of oceanic processes that may be forced or modulated by the Florida Current an imporshytant component of the subtropical gyre circushylation in the North Atlantic Ocean basin Mesoscale variations of the Florida Current occur at many energetic current scales that impact the coastal ocean along the Florida Keys and eastern seaboard of the United States (see Hogg and Johns [1995] for a comshyprehensive review) Recent surface current observations from an Ocean Surface Current Radar (OSCR) using the Very High Frequency (VHF) mode reveal complex surface current patterns in the SFOMC area For the first time submesoscale vortices with diameters of 2-3 km were observed just inshore of the Florida
Current [Note Submesoscale refers to an oceanic feature where its horizontal scale is less than or equal to the deformation radius In the present case the deformation radius is of the order of 10 km based on conductivity-temperature-depth profiles] Now researchers are resolving even finer scales with surface current radar using the VHF mode
While the use of radio pulses to probe ocean surface currents has received attention in recent coastal oceanographic experiments using High Frequency (HF) radar [Prandle 1987 Shay et al 1995] the VHF mode provides higher-resolution surface current images The OSCR VHF mode was deployed for the SFOMC 4-Dimensional Current Experi-
26 06N
ment from June 25-August 101999 In both modes radio waves are backscattered from the moving ocean surface by surface waves of one-half the incident radar wavelengthThis Bragg scattering effect [Stewart and Joy 1974] results in two discrete peaks in the Doppler spectrum In the absence of a surface current spectral peaks are symmetric and their frequencies are offset from the origin by an amount proportional to the surface wave phase speed and the radar wavelength If there is an underlying surface current Bragg peaks in the Doppler spectrum are displaced by the radial component of current along the radars look direction Using two radar stations sequentially transmitting radio waves resolves the two-dimensional velocity vector for placshying the data into geographical context
The VHF system used at SFOMC consisted of two transmitreceive stations operating at 50 MHZ that sensed electromagnetic signals scatshytered from surface gravity waves with 3-m waveshylengths Coastal ocean currents were mapped over a 7 km x 85 km domain at 20-min
26 03N
80 06W 80 03W 80 00W
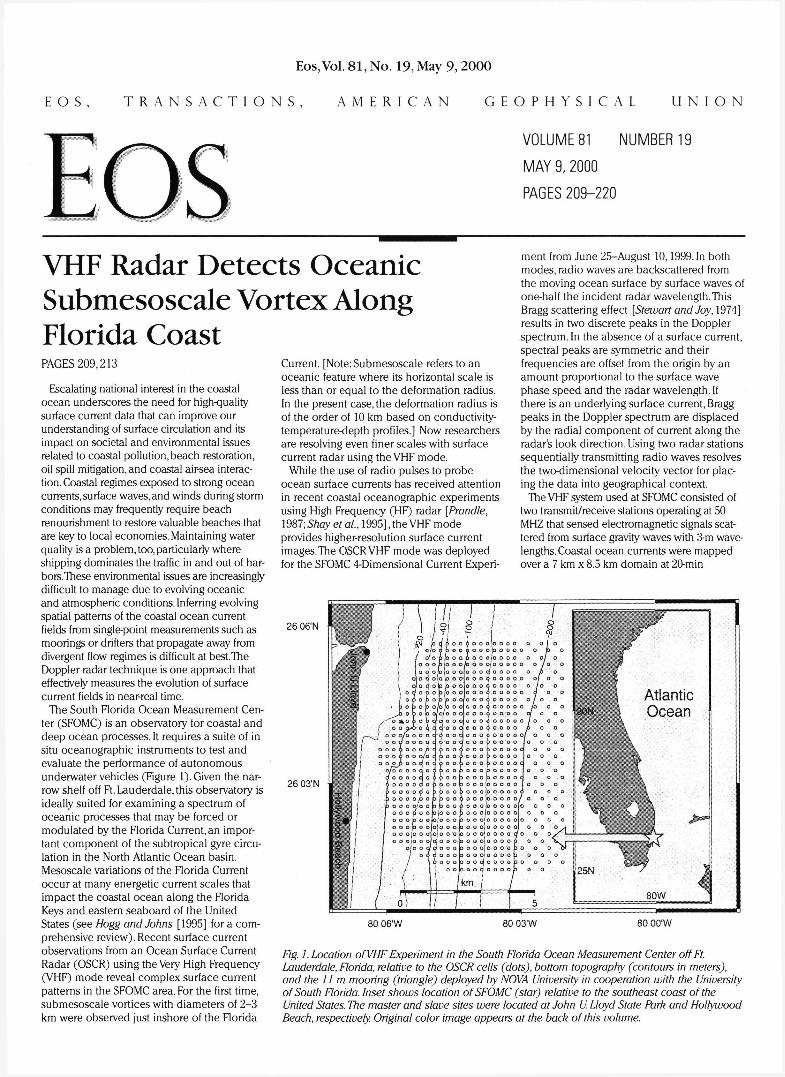
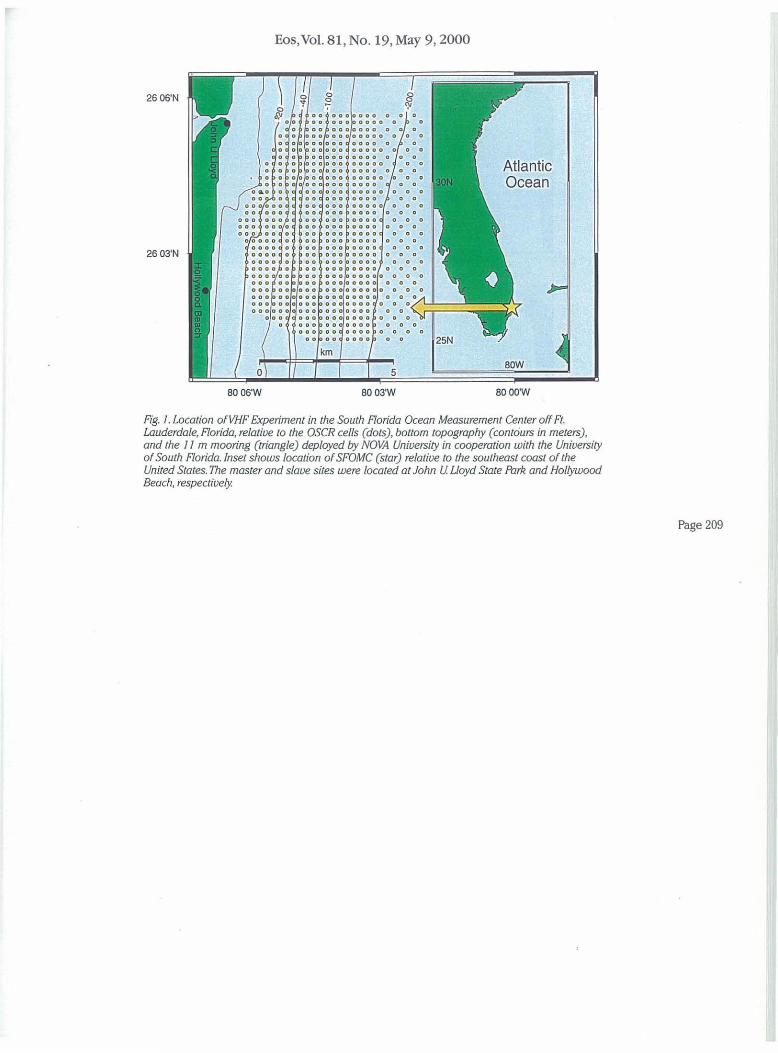
Fig 1 Location of VHF Experiment in the South Florida Ocean Measurement Center off Ft Lauderdale Florida relative to the OSCR cells (dots) bottom topography (contours in meters) and the 11 m mooring (triangle) deployed by NOVA University in cooperation with the University of South Florida Inset shows location of SFOMC (star) relative to the southeast coast of the United States The master and slave sites were located at John U Lloyd State Park and Hollywood Beach respectively Original color image appears at the back of this volume
T R A N S A C T I O N S A M E R I C A N G E O P H Y S I C A L
Eos Vol 81 No 19 May 92000
26 06N
26 03N
fester ^ - t ^ - gt ltgtf
a) 062699 0120 GMT
80 06W 80 03W
matter m UP a
~~ J w 3 k k h tf
C) 062699 0400 GMT
062699 0220 GMT
d) 062699 0520 GMT
e)
1770 1771 1772 1773 T i m e ( J D t U T C )
20 30 Velocity ( c m s 1 )
40
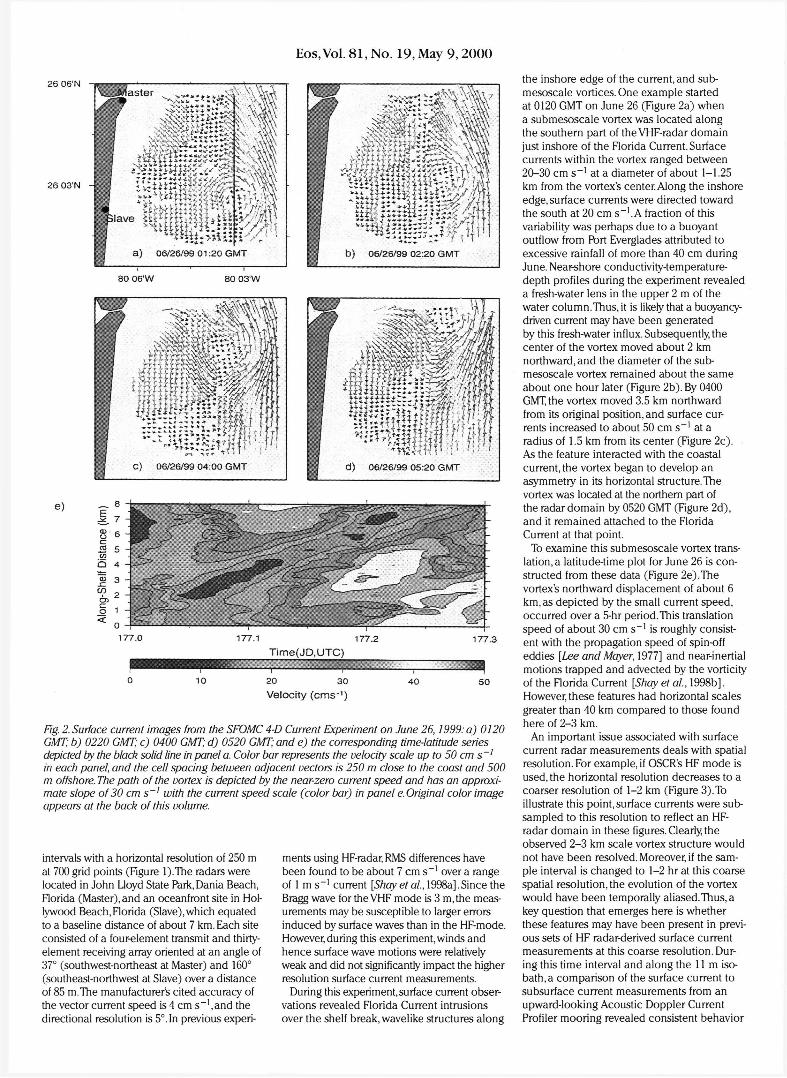
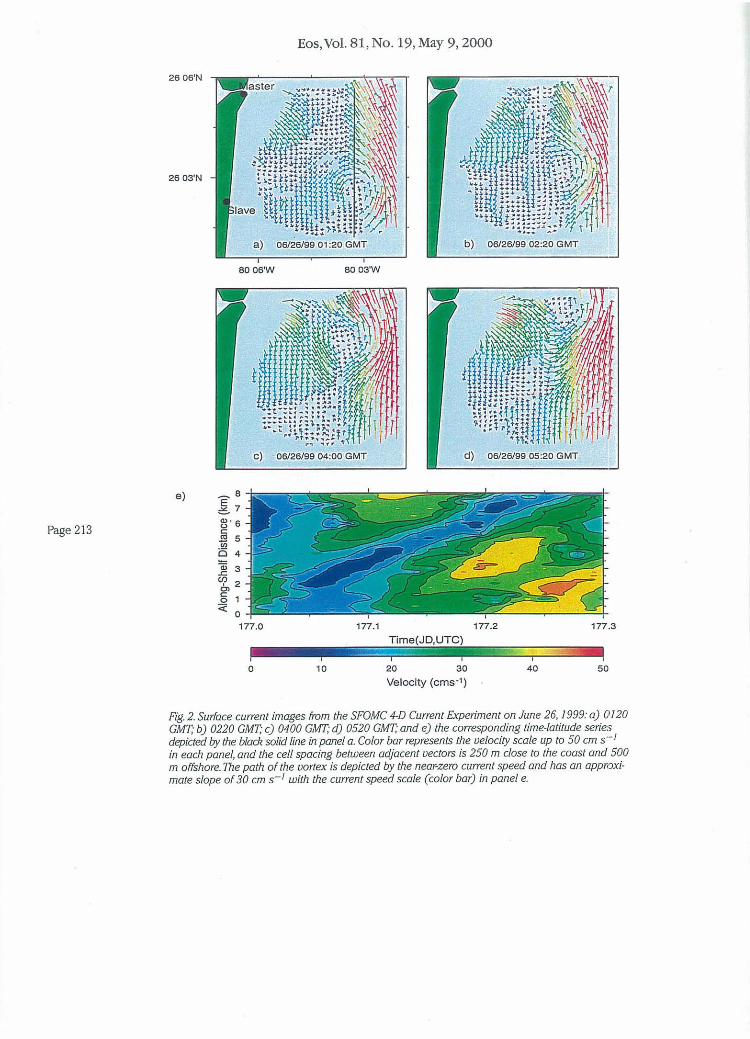
Fig 2 Surface current images from the SFOMC 4-D Current Experiment on June 261999 a) 0120 GMT b) 0220 GMT c) 0400 GMT d) 0520 GMT and e) the corresponding time-latitude series depicted by the black solid line in panel a Color bar represents the velocity scale up to 50 cm s 1
in each panel and the cell spacing between adjacent vectors is 250 m close to the coast and 500 m offshore The path of the vortex is depicted by the near-zero current speed and has an approxishymate slope of 30 cm s _ with the current speed scale (color bar) in panel e Original color image appears at the back of this volume
intervals with a horizontal resolution of 250 m at 700 grid points (Figure l)The radars were located in John Lloyd State Park Dania Beach Florida (Master) and an oceanfront site in Holshylywood Beach Florida (Slave)which equated to a baseline distance of about 7 km Each site consisted of a four-element transmit and thirty-element receiving array oriented at an angle of 37deg (southwest-northeast at Master) and 160deg (southeast-northwest at Slave) over a distance of 85 mThe manufacturers cited accuracy of the vector current speed is 4 cm s _ 1 and the directional resolution is 5deg In previous experishy
ments using HF-radar RMS differences have been found to be about 7 cm s 1 over a range of 1 m s - 1 current [Shay et al 1998a]Since the Bragg wave for the VHF mode is 3 mthe measshyurements may be susceptible to larger errors induced by surface waves than in the HF-mode However during this experiment winds and hence surface wave motions were relatively weak and did not significantly impact the higher resolution surface current measurements
During this experiment surface current obsershyvations revealed Florida Current intrusions over the shelf break wavelike structures along
the inshore edge of the current and subshymesoscale vortices One example started at 0120 GMT on June 26 (Figure 2a) when a submesoscale vortex was located along the southern part of the VHF-radar domain just inshore of the Florida Current Surface currents within the vortex ranged between 20-30 cm s _ 1 at a diameter of about 1-125 km from the vortexs center Along the inshore edgesurface currents were directed toward the south at 20 cm s - 1 A fraction of this variability was perhaps due to a buoyant outflow from Port Everglades attributed to excessive rainfall of more than 40 cm during June Near-shore conductivity-temperature-depth profiles during the experiment revealed a fresh-water lens in the upper 2 m of the water columnThus it is likely that a buoyancy-driven current may have been generated by this fresh-water influx Subsequently the center of the vortex moved about 2 km northward and the diameter of the subshymesoscale vortex remained about the same about one hour later (Figure 2b) By 0400 GMT the vortex moved 35 km northward from its original position and surface curshyrents increased to about 50 cm s 1 at a radius of 15 km from its center (Figure 2c) As the feature interacted with the coastal current the vortex began to develop an asymmetry in its horizontal structure The vortex was located at the northern part of the radar domain by 0520 GMT (Figure 2d) and it remained attached to the Florida Current at that point
To examine this submesoscale vortex transshylation^ latitude-time plot for June 26 is conshystructed from these data (Figure 2e)The vortexs northward displacement of about 6 km as depicted by the small current speed occurred over a 5-hr periodThis translation speed of about 30 cm s 1 is roughly consistshyent with the propagation speed of spin-off eddies [Lee and Mayer 1977] and near-inertial motions trapped and advected by the vorticity of the Florida Current [Shay et al 1998b] However these features had horizontal scales greater than 40 km compared to those found here of 2-3 km
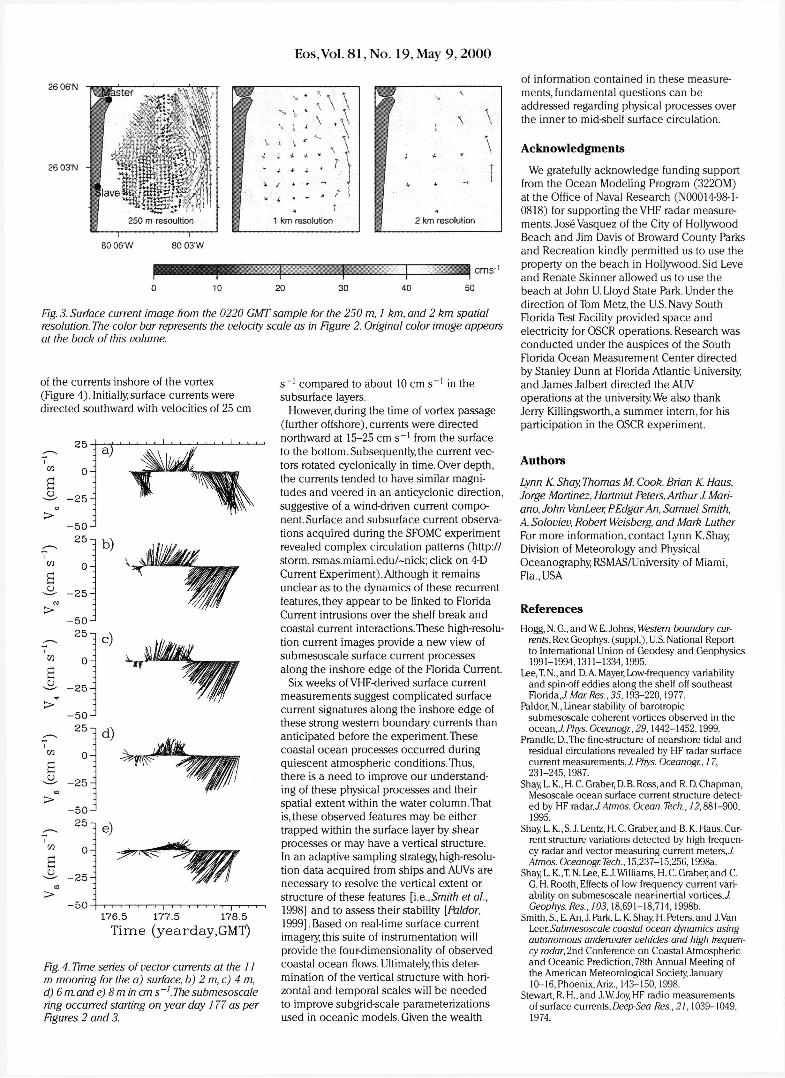
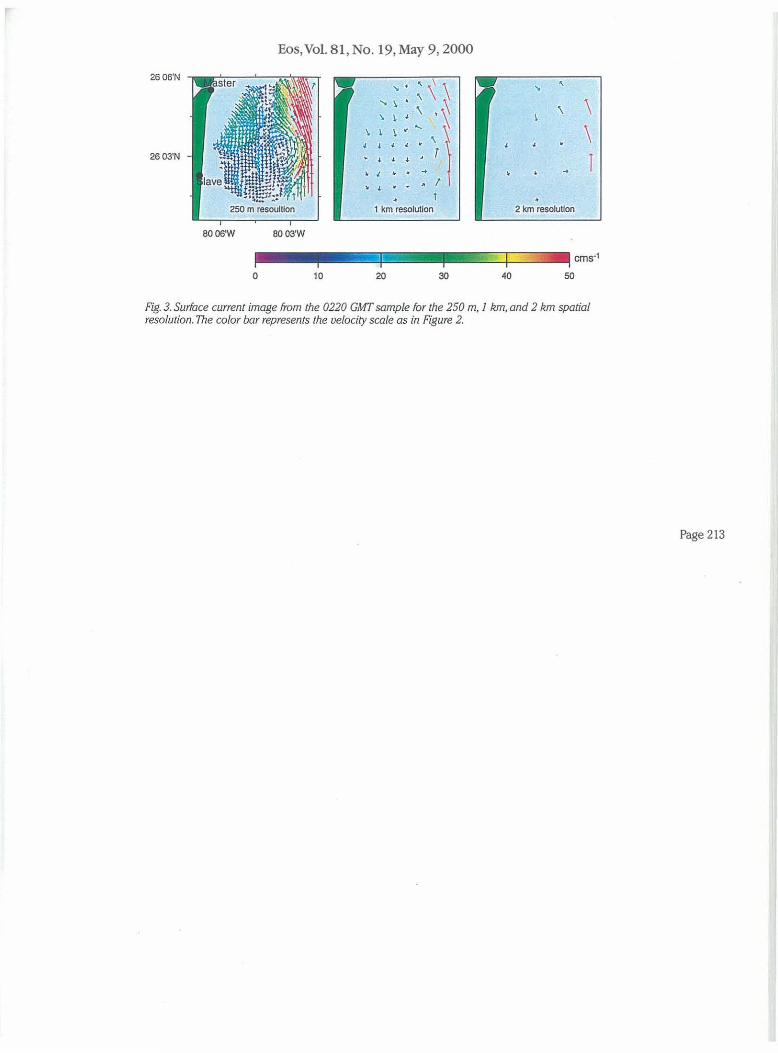
An important issue associated with surface current radar measurements deals with spatial resolution For example if OSCRs HF mode is used the horizontal resolution decreases to a coarser resolution of 1-2 km (Figure 3)To illustrate this pointsurface currents were sub-sampled to this resolution to reflect an HF-radar domain in these figures Clearly the observed 2-3 km scale vortex structure would not have been resolved Moreover if the samshyple interval is changed to 1-2 hr at this coarse spatial resolution the evolution of the vortex would have been temporally aliased Thus a key question that emerges here is whether these features may have been present in previshyous sets of HF radar-derived surface current measurements at this coarse resolution Durshying this time interval and along the 11 m isoshybath^ comparison of the surface current to subsurface current measurements from an upward-looking Acoustic Doppler Current Profiler mooring revealed consistent behavior
Eos Vol 81 No 19 May 9 2000
0 10 20 30 40 50
Fig 3 Surface current image from the 0220 GMT sample for the 250 m 1 km and 2 km spatial resolution The color bar represents the velocity scale as in Figure 2 Original color image appears at the back of this volume
of the currents inshore of the vortex (Figure 4) Initially surface currents were directed southward with velocities of 25 cm
1 1 1 1 1 1 1 i 1 i 1 1
1765 1775 1785 Time (yeardayGMT)
Fig 4 Time series of vector currents at the 11 m mooring for the a) surface b) 2 mc) 4 m d)6m and e) 8 m in cm s~ The submesoscale ring occurred starting on year day 177 as per Figures 2 and 3
s - 1 compared to about 10 cm s - 1 in the subsurface layers
However during the time of vortex passage (further offshore) currents were directed northward at 15-25 c m s 1 from the surface to the bottom Subsequently the current vecshytors rotated cyclonically in time Over depth the currents tended to have similar magnishytudes and veered in an anticyclonic direction suggestive of a wind-driven current composhynent Surface and subsurface current observashytions acquired during the SFOMC experiment revealed complex circulation patterns (http storm rsmasmiamiedu~-nick click on 4-D Current Experiment) Although it remains unclear as to the dynamics of these recurrent features they appear to be linked to Florida Current intrusions over the shelf break and coastal current interactionsThese high-resolushytion current images provide a new view of submesoscale surface current processes along the inshore edge of the Florida Current
Six weeks of VHF-derived surface current measurements suggest complicated surface current signatures along the inshore edge of these strong western boundary currents than anticipated before the experimentThese coastal ocean processes occurred during quiescent atmospheric conditionsThus there is a need to improve our understandshying of these physical processes and their spatial extent within the water columnThat is these observed features may be either trapped within the surface layer by shear processes or may have a vertical structure In an adaptive sampling strategy high-resolushytion data acquired from ships and AUVs are necessary to resolve the vertical extent or structure of these features [ieSmith etal 1998] and to assess their stability [Paldor 1999]Based on real-time surface current imagery this suite of instrumentation will provide the four-dimensionality of observed coastal ocean flows Ultimately this detershymination of the vertical structure with horishyzontal and temporal scales will be needed to improve subgrid-scale parameterizations used in oceanic models Given the wealth
of information contained in these measureshyments fundamental questions can be addressed regarding physical processes over the inner to mid-shelf surface circulation
Acknowledgments
We gratefully acknowledge funding support from the Ocean Modeling Program (3220M) at the Office of Naval Research (N00014-98-1-0818) for supporting theVHF radar measureshyments Jose Vasquez of the City of Hollywood Beach and Jim Davis of Broward County Parks and Recreation kindly permitted us to use the property on the beach in Hollywood Sid Leve and Renate Skinner allowed us to use the beach at John U Lloyd State Park Under the direction of Tom Metzthe US Navy South Florida Test Facility provided space and electricity for OSCR operations Research was conducted under the auspices of the South Florida Ocean Measurement Center directed by Stanley Dunn at Florida Atlantic University and James Jalbert directed the AUV operations at the university We also thank Jerry Killingsworth a summer intern for his participation in the OSCR experiment
Authors
Lynn K Shay Thomas M Cook Brian K Haus Jorge Martinez Hartmut Peters Arthur J Marishyano John VanLeer PEdgar An Samuel Smith A Soloviev Robert Weisberg and Mark Luther For more information contact Lynn KShay Division of Meteorology and Physical Oceanography RSMASUniversity of Miami FlaUSA
References
Hogg N G and W E Johns Western boundary curshyrents Rev Geophys (suppl) US National Report to International Union of Geodesy and Geophysics 1991-19941311-13341995
LeeT Nand D A Mayer Low-frequency variability and spin-off eddies along the shelf off southeast Florida J Mar Res 35193-2201977
Paldor N Linear stability of barotropic submesoscale coherent vortices observed in the ocean Phys Oceanogr 291442-14521999
Prandle DThe fine-structure of nearshore tidal and residual circulations revealed by HF radar surface current measurementsJ Phys Oceanogr 17 231-2451987
Shay L K H C Graber D B Ross and R D Chapman Mesoscale ocean surface current structure detectshyed by HF mddLYJAtmos OceanTech 72881-900 1995
Shay L K S J Lentz H C Graber and B K Haus Curshyrent structure variations detected by high frequenshycy radar and vector measuring current meters J Atmos OceanogrTech 15237-152561998a
Shay L KT N Lee E J Williams H C Graber and C G H Rooth Effects of low frequency current varishyability on submesoscale near-inertial vorticesi Geophys Res 10318691-187141998b
Smith S E An J Park L K Shay H Peters and JVan Leer Submesoscale coastal ocean dynamics using autonomous underwater vehicles and high frequenshycy radar 2nd Conference on Coastal Atmospheric and Oceanic Prediction 78th Annual Meeting of the American Meteorological Society January 10-16 Phoenix Ariz 143-1501998
Stewart R Hand JW Joy HF radio measurements of surface currents Deep-Sea Res 211039-1049 1974
EosVol 81 No 19 May 9 2000
2606N
2603N
8006W 8003W
Atlantic Ocean
8000W
Fig Location of VHF Experiment in the South Florida Ocean Measurement Center off Ft Lauderdale Rorida relative to the OSCR cells (dOiS) bottom topography (contours in meters) and the 1 m mooring (triangle) deployed by NOVA University in cooperation with the University of South Florida Inset shows location of SFOMC (star) relative to the southeast coast of the United Slates The master and slave sites were located at John U Lloyd State Park and Hollywood Beach respectively
Page 209
Page 213
26 C6N
2603N
e)
EosVol 81 No_ 19 May 9 2000
a) 06269901 20 GMT
aOD6W B003W
_8
~ 7
8 6
~ 5 is 4
~ 3 c I 2 0gt g 1
0
c) 0626990400 GMT
1770 1771
b) 06126990220 GMT
d) 0626990520 GMT
1772
Time(JDUTC) ---- - ~
o 10 20 30
Velocity (emsmiddot 1 )
40
1773
50
Fig 2 Surface current images from the SFOMC 4-D Current Experiment on June 26 19990) 0120 GMT b J 0220 GMT cJ 0400 GMT- dJ 0520 GMT- and eJ the correspanding time-latitude series depicted by the black solid line in panel Q Color bar represents the velocity scale up to 50 em smiddot-J in each panel and the cell spacing between adjacent vectors is 250 m close to the coast and 500 m offshore The path of the vortex is depicted by the near-zero current speed and has an approxishymate slope of 30 em 5-1 with the current speed scale (color bar) in panel e
EosVol 81 No 19 May 9 2000
2606N
2603N
~ ~ ~ l ~
~ ~ l1 I J
gt
1
1 km resolution 2 km resolution
e006W e003W
JL_ -=-_ cms-1
o 10 20 30 40 50
Fig 3 Surface current image from the 0220 GMT sample for the 250 m J km and 2 km spatial resolution The color bar represents the velocity scale as in Figure 2
Page 213
Eos Vol 81 No 19 May 92000
26 06N
26 03N
fester ^ - t ^ - gt ltgtf
a) 062699 0120 GMT
80 06W 80 03W
matter m UP a
~~ J w 3 k k h tf
C) 062699 0400 GMT
062699 0220 GMT
d) 062699 0520 GMT
e)
1770 1771 1772 1773 T i m e ( J D t U T C )
20 30 Velocity ( c m s 1 )
40
Fig 2 Surface current images from the SFOMC 4-D Current Experiment on June 261999 a) 0120 GMT b) 0220 GMT c) 0400 GMT d) 0520 GMT and e) the corresponding time-latitude series depicted by the black solid line in panel a Color bar represents the velocity scale up to 50 cm s 1
in each panel and the cell spacing between adjacent vectors is 250 m close to the coast and 500 m offshore The path of the vortex is depicted by the near-zero current speed and has an approxishymate slope of 30 cm s _ with the current speed scale (color bar) in panel e Original color image appears at the back of this volume
intervals with a horizontal resolution of 250 m at 700 grid points (Figure l)The radars were located in John Lloyd State Park Dania Beach Florida (Master) and an oceanfront site in Holshylywood Beach Florida (Slave)which equated to a baseline distance of about 7 km Each site consisted of a four-element transmit and thirty-element receiving array oriented at an angle of 37deg (southwest-northeast at Master) and 160deg (southeast-northwest at Slave) over a distance of 85 mThe manufacturers cited accuracy of the vector current speed is 4 cm s _ 1 and the directional resolution is 5deg In previous experishy
ments using HF-radar RMS differences have been found to be about 7 cm s 1 over a range of 1 m s - 1 current [Shay et al 1998a]Since the Bragg wave for the VHF mode is 3 mthe measshyurements may be susceptible to larger errors induced by surface waves than in the HF-mode However during this experiment winds and hence surface wave motions were relatively weak and did not significantly impact the higher resolution surface current measurements
During this experiment surface current obsershyvations revealed Florida Current intrusions over the shelf break wavelike structures along
the inshore edge of the current and subshymesoscale vortices One example started at 0120 GMT on June 26 (Figure 2a) when a submesoscale vortex was located along the southern part of the VHF-radar domain just inshore of the Florida Current Surface currents within the vortex ranged between 20-30 cm s _ 1 at a diameter of about 1-125 km from the vortexs center Along the inshore edgesurface currents were directed toward the south at 20 cm s - 1 A fraction of this variability was perhaps due to a buoyant outflow from Port Everglades attributed to excessive rainfall of more than 40 cm during June Near-shore conductivity-temperature-depth profiles during the experiment revealed a fresh-water lens in the upper 2 m of the water columnThus it is likely that a buoyancy-driven current may have been generated by this fresh-water influx Subsequently the center of the vortex moved about 2 km northward and the diameter of the subshymesoscale vortex remained about the same about one hour later (Figure 2b) By 0400 GMT the vortex moved 35 km northward from its original position and surface curshyrents increased to about 50 cm s 1 at a radius of 15 km from its center (Figure 2c) As the feature interacted with the coastal current the vortex began to develop an asymmetry in its horizontal structure The vortex was located at the northern part of the radar domain by 0520 GMT (Figure 2d) and it remained attached to the Florida Current at that point
To examine this submesoscale vortex transshylation^ latitude-time plot for June 26 is conshystructed from these data (Figure 2e)The vortexs northward displacement of about 6 km as depicted by the small current speed occurred over a 5-hr periodThis translation speed of about 30 cm s 1 is roughly consistshyent with the propagation speed of spin-off eddies [Lee and Mayer 1977] and near-inertial motions trapped and advected by the vorticity of the Florida Current [Shay et al 1998b] However these features had horizontal scales greater than 40 km compared to those found here of 2-3 km
An important issue associated with surface current radar measurements deals with spatial resolution For example if OSCRs HF mode is used the horizontal resolution decreases to a coarser resolution of 1-2 km (Figure 3)To illustrate this pointsurface currents were sub-sampled to this resolution to reflect an HF-radar domain in these figures Clearly the observed 2-3 km scale vortex structure would not have been resolved Moreover if the samshyple interval is changed to 1-2 hr at this coarse spatial resolution the evolution of the vortex would have been temporally aliased Thus a key question that emerges here is whether these features may have been present in previshyous sets of HF radar-derived surface current measurements at this coarse resolution Durshying this time interval and along the 11 m isoshybath^ comparison of the surface current to subsurface current measurements from an upward-looking Acoustic Doppler Current Profiler mooring revealed consistent behavior
Eos Vol 81 No 19 May 9 2000
0 10 20 30 40 50
Fig 3 Surface current image from the 0220 GMT sample for the 250 m 1 km and 2 km spatial resolution The color bar represents the velocity scale as in Figure 2 Original color image appears at the back of this volume
of the currents inshore of the vortex (Figure 4) Initially surface currents were directed southward with velocities of 25 cm
1 1 1 1 1 1 1 i 1 i 1 1
1765 1775 1785 Time (yeardayGMT)
Fig 4 Time series of vector currents at the 11 m mooring for the a) surface b) 2 mc) 4 m d)6m and e) 8 m in cm s~ The submesoscale ring occurred starting on year day 177 as per Figures 2 and 3
s - 1 compared to about 10 cm s - 1 in the subsurface layers
However during the time of vortex passage (further offshore) currents were directed northward at 15-25 c m s 1 from the surface to the bottom Subsequently the current vecshytors rotated cyclonically in time Over depth the currents tended to have similar magnishytudes and veered in an anticyclonic direction suggestive of a wind-driven current composhynent Surface and subsurface current observashytions acquired during the SFOMC experiment revealed complex circulation patterns (http storm rsmasmiamiedu~-nick click on 4-D Current Experiment) Although it remains unclear as to the dynamics of these recurrent features they appear to be linked to Florida Current intrusions over the shelf break and coastal current interactionsThese high-resolushytion current images provide a new view of submesoscale surface current processes along the inshore edge of the Florida Current
Six weeks of VHF-derived surface current measurements suggest complicated surface current signatures along the inshore edge of these strong western boundary currents than anticipated before the experimentThese coastal ocean processes occurred during quiescent atmospheric conditionsThus there is a need to improve our understandshying of these physical processes and their spatial extent within the water columnThat is these observed features may be either trapped within the surface layer by shear processes or may have a vertical structure In an adaptive sampling strategy high-resolushytion data acquired from ships and AUVs are necessary to resolve the vertical extent or structure of these features [ieSmith etal 1998] and to assess their stability [Paldor 1999]Based on real-time surface current imagery this suite of instrumentation will provide the four-dimensionality of observed coastal ocean flows Ultimately this detershymination of the vertical structure with horishyzontal and temporal scales will be needed to improve subgrid-scale parameterizations used in oceanic models Given the wealth
of information contained in these measureshyments fundamental questions can be addressed regarding physical processes over the inner to mid-shelf surface circulation
Acknowledgments
We gratefully acknowledge funding support from the Ocean Modeling Program (3220M) at the Office of Naval Research (N00014-98-1-0818) for supporting theVHF radar measureshyments Jose Vasquez of the City of Hollywood Beach and Jim Davis of Broward County Parks and Recreation kindly permitted us to use the property on the beach in Hollywood Sid Leve and Renate Skinner allowed us to use the beach at John U Lloyd State Park Under the direction of Tom Metzthe US Navy South Florida Test Facility provided space and electricity for OSCR operations Research was conducted under the auspices of the South Florida Ocean Measurement Center directed by Stanley Dunn at Florida Atlantic University and James Jalbert directed the AUV operations at the university We also thank Jerry Killingsworth a summer intern for his participation in the OSCR experiment
Authors
Lynn K Shay Thomas M Cook Brian K Haus Jorge Martinez Hartmut Peters Arthur J Marishyano John VanLeer PEdgar An Samuel Smith A Soloviev Robert Weisberg and Mark Luther For more information contact Lynn KShay Division of Meteorology and Physical Oceanography RSMASUniversity of Miami FlaUSA
References
Hogg N G and W E Johns Western boundary curshyrents Rev Geophys (suppl) US National Report to International Union of Geodesy and Geophysics 1991-19941311-13341995
LeeT Nand D A Mayer Low-frequency variability and spin-off eddies along the shelf off southeast Florida J Mar Res 35193-2201977
Paldor N Linear stability of barotropic submesoscale coherent vortices observed in the ocean Phys Oceanogr 291442-14521999
Prandle DThe fine-structure of nearshore tidal and residual circulations revealed by HF radar surface current measurementsJ Phys Oceanogr 17 231-2451987
Shay L K H C Graber D B Ross and R D Chapman Mesoscale ocean surface current structure detectshyed by HF mddLYJAtmos OceanTech 72881-900 1995
Shay L K S J Lentz H C Graber and B K Haus Curshyrent structure variations detected by high frequenshycy radar and vector measuring current meters J Atmos OceanogrTech 15237-152561998a
Shay L KT N Lee E J Williams H C Graber and C G H Rooth Effects of low frequency current varishyability on submesoscale near-inertial vorticesi Geophys Res 10318691-187141998b
Smith S E An J Park L K Shay H Peters and JVan Leer Submesoscale coastal ocean dynamics using autonomous underwater vehicles and high frequenshycy radar 2nd Conference on Coastal Atmospheric and Oceanic Prediction 78th Annual Meeting of the American Meteorological Society January 10-16 Phoenix Ariz 143-1501998
Stewart R Hand JW Joy HF radio measurements of surface currents Deep-Sea Res 211039-1049 1974
EosVol 81 No 19 May 9 2000
2606N
2603N
8006W 8003W
Atlantic Ocean
8000W
Fig Location of VHF Experiment in the South Florida Ocean Measurement Center off Ft Lauderdale Rorida relative to the OSCR cells (dOiS) bottom topography (contours in meters) and the 1 m mooring (triangle) deployed by NOVA University in cooperation with the University of South Florida Inset shows location of SFOMC (star) relative to the southeast coast of the United Slates The master and slave sites were located at John U Lloyd State Park and Hollywood Beach respectively
Page 209
Page 213
26 C6N
2603N
e)
EosVol 81 No_ 19 May 9 2000
a) 06269901 20 GMT
aOD6W B003W
_8
~ 7
8 6
~ 5 is 4
~ 3 c I 2 0gt g 1
0
c) 0626990400 GMT
1770 1771
b) 06126990220 GMT
d) 0626990520 GMT
1772
Time(JDUTC) ---- - ~
o 10 20 30
Velocity (emsmiddot 1 )
40
1773
50
Fig 2 Surface current images from the SFOMC 4-D Current Experiment on June 26 19990) 0120 GMT b J 0220 GMT cJ 0400 GMT- dJ 0520 GMT- and eJ the correspanding time-latitude series depicted by the black solid line in panel Q Color bar represents the velocity scale up to 50 em smiddot-J in each panel and the cell spacing between adjacent vectors is 250 m close to the coast and 500 m offshore The path of the vortex is depicted by the near-zero current speed and has an approxishymate slope of 30 em 5-1 with the current speed scale (color bar) in panel e
EosVol 81 No 19 May 9 2000
2606N
2603N
~ ~ ~ l ~
~ ~ l1 I J
gt
1
1 km resolution 2 km resolution
e006W e003W
JL_ -=-_ cms-1
o 10 20 30 40 50
Fig 3 Surface current image from the 0220 GMT sample for the 250 m J km and 2 km spatial resolution The color bar represents the velocity scale as in Figure 2
Page 213
EosVol 81 No 19 May 9 2000
2606N
2603N
8006W 8003W
Atlantic Ocean
8000W
Fig Location of VHF Experiment in the South Florida Ocean Measurement Center off Ft Lauderdale Rorida relative to the OSCR cells (dOiS) bottom topography (contours in meters) and the 1 m mooring (triangle) deployed by NOVA University in cooperation with the University of South Florida Inset shows location of SFOMC (star) relative to the southeast coast of the United Slates The master and slave sites were located at John U Lloyd State Park and Hollywood Beach respectively
Page 209
Page 213
26 C6N
2603N
e)
EosVol 81 No_ 19 May 9 2000
a) 06269901 20 GMT
aOD6W B003W
_8
~ 7
8 6
~ 5 is 4
~ 3 c I 2 0gt g 1
0
c) 0626990400 GMT
1770 1771
b) 06126990220 GMT
d) 0626990520 GMT
1772
Time(JDUTC) ---- - ~
o 10 20 30
Velocity (emsmiddot 1 )
40
1773
50
Fig 2 Surface current images from the SFOMC 4-D Current Experiment on June 26 19990) 0120 GMT b J 0220 GMT cJ 0400 GMT- dJ 0520 GMT- and eJ the correspanding time-latitude series depicted by the black solid line in panel Q Color bar represents the velocity scale up to 50 em smiddot-J in each panel and the cell spacing between adjacent vectors is 250 m close to the coast and 500 m offshore The path of the vortex is depicted by the near-zero current speed and has an approxishymate slope of 30 em 5-1 with the current speed scale (color bar) in panel e
EosVol 81 No 19 May 9 2000
2606N
2603N
~ ~ ~ l ~
~ ~ l1 I J
gt
1
1 km resolution 2 km resolution
e006W e003W
JL_ -=-_ cms-1
o 10 20 30 40 50
Fig 3 Surface current image from the 0220 GMT sample for the 250 m J km and 2 km spatial resolution The color bar represents the velocity scale as in Figure 2
Page 213
Page 213
26 C6N
2603N
e)
EosVol 81 No_ 19 May 9 2000
a) 06269901 20 GMT
aOD6W B003W
_8
~ 7
8 6
~ 5 is 4
~ 3 c I 2 0gt g 1
0
c) 0626990400 GMT
1770 1771
b) 06126990220 GMT
d) 0626990520 GMT
1772
Time(JDUTC) ---- - ~
o 10 20 30
Velocity (emsmiddot 1 )
40
1773
50
Fig 2 Surface current images from the SFOMC 4-D Current Experiment on June 26 19990) 0120 GMT b J 0220 GMT cJ 0400 GMT- dJ 0520 GMT- and eJ the correspanding time-latitude series depicted by the black solid line in panel Q Color bar represents the velocity scale up to 50 em smiddot-J in each panel and the cell spacing between adjacent vectors is 250 m close to the coast and 500 m offshore The path of the vortex is depicted by the near-zero current speed and has an approxishymate slope of 30 em 5-1 with the current speed scale (color bar) in panel e
EosVol 81 No 19 May 9 2000
2606N
2603N
~ ~ ~ l ~
~ ~ l1 I J
gt
1
1 km resolution 2 km resolution
e006W e003W
JL_ -=-_ cms-1
o 10 20 30 40 50
Fig 3 Surface current image from the 0220 GMT sample for the 250 m J km and 2 km spatial resolution The color bar represents the velocity scale as in Figure 2
Page 213