Embed Size (px)
Citation preview
2016 by FNT@Sea Services Ltd 1
Vibration Analysis of Rolling Element Bearings using Spectral Kurtosis and
Envelope Analysis A white paper
Prepared by Konstantinos Kamaras (BME, MSEE, MBA, VA Cat III) Ilias Dimitrakopoulos (BME, MSEE)
Jan 2016
2016 by FNT @Sea Services LTD. You may freely photocopy and distribute this white paper,
as long as you keep it intact, including this copyright notice
E-mail: [email protected], web: www.fnt.gr
2016 by FNT@Sea Services Ltd 2
Abstract The nature of the vibration signal to react in any change of equipment’s performance makes it a convenient and effective mean for monitoring. Furthermore it can precisely pinpoint defective components in rotating machines such as bearings, gears, blades etc. Although fault indications may be masked due to noise presence, there are various and efficient digital signal processing techniques that are applied in vibration analysis (Randall, 2011). In this paper spectral kurtosis and kurtogram are used as an alternative method to determine the most impulsive band prior the envelope analysis of the vibration signal. The results show that spectral kurtosis is an effective technique that can determine the band-pass filter parameters and thus enhancing the performance of envelope analysis. Keywords Vibration Analysis, Rolling Element Bearings, Fast Fourier Transform, Envelope Analysis, Spectral kurtosis, Kurtogram 1. Introduction Vibration analysis is a machinery Condition Monitoring (CM) method that is used in order to identify faults at rotating machinery such as bearing faults, misalignment, unbalance, gear faults, cavitation, rotor bar faults etc. Bearing fault diagnosis is of substantial importance as bearings are major components in any rotating machine. A survey conducted by Albrecht et al. (1986) showed that about 41% of catastrophic failures in motors are related with bearings. Furthermore, the motor reliability working group of the IEEE industry applications society had also similar findings (O’ Donnell, 1983). As bearings are basic parts in rotating machinery a method that can early identify their faults is crucial for a concrete and effective CM programme. The benefits from vibration analysis as part of ship’s rotating machinery CM plan are significant. Taking into account that Rolling Element Bearings (hereinafter REBs) are present in the vast majority of machinery in a propulsion plant (motors, generators, fans and gearboxes) a maintenance programme that monitors REBs condition can enhance the reliability and reduce the life cycle cost of equipment. Unnecessary overhauls and inspections of machinery equipment that increase the total cost ownership and the risk of maintenance induced failures, can be avoided when the decision for maintenance action is based on objective criteria. A survey conducted by Baglee and Jantunen (2014) about Condition Based Maintenance (CBM) and how it can support maintenance decisions showed that CBM in ship industry of USA was limited only in 17%. Therefore there is a lot of margin for involving vibration analysis in marine industry. Rolling bearing fault identification is achieved by detecting the characteristic defect frequencies (CDF), which are generated by its elements, in the frequency spectrum.
2016 by FNT@Sea Services Ltd 3
These frequencies can be calculated by exploiting the geometry of the REB and using kinematic equations. However, as Smith and Randall (2015) state, there is a variation of 1-2% from the expected values because of the slippage. The equations used for calculating the CDF are tabulated in table 1. The paper is organized as follows: section II presents the basic principles of the main frequency domain analysis method (envelope analysis) used for diagnosing REB faults at early stages. In section III a concept named spectral kurtosis (SK), which can enhance the performance of envelope analysis, is presented. Furthermore the properties of SK are explained using simulated signals in Matlab. Moreover the concept of kurtogram and how it is utilized in envelope analysis is presented. In section IV the vibration analysis method that is used for REBs diagnostics by FNT is described. It is an alternative technique tested on vibration data measured from motors in ships and differs from the available commercial analyzers and software. Finally the conclusions are discussed in section V.
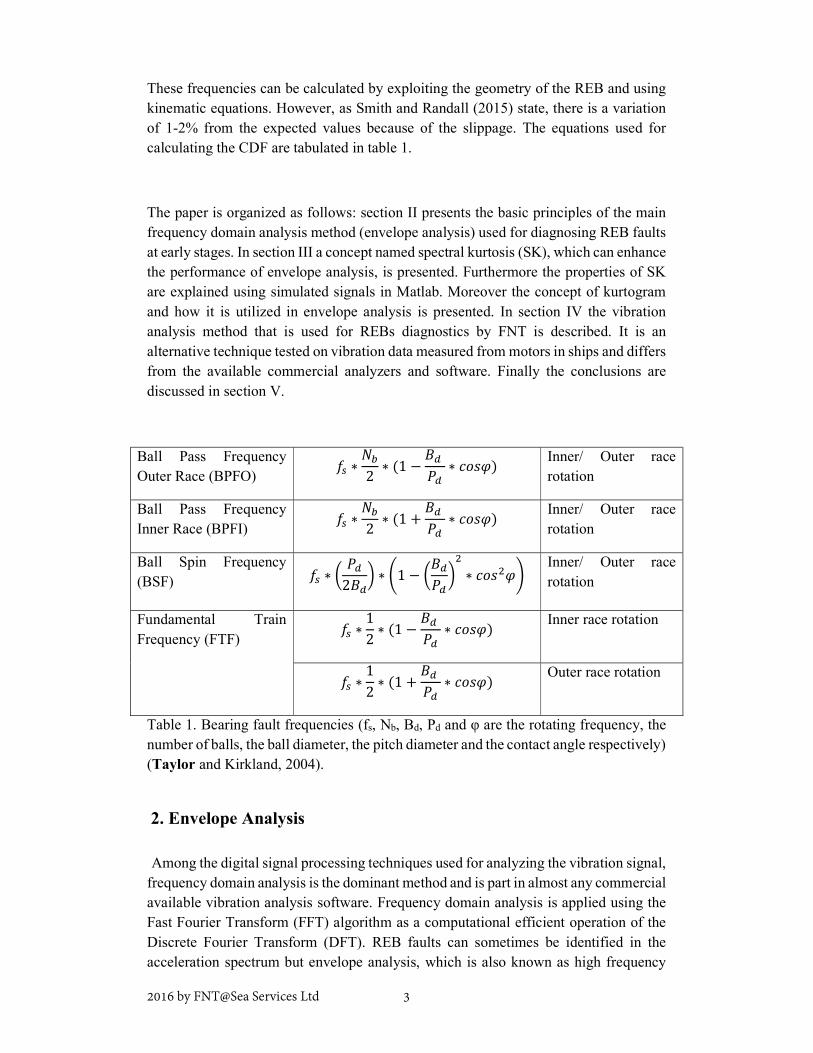
Ball Pass Frequency Outer Race (BPFO) ∗ 2 ∗ (1 − ∗ ) Inner/ Outer race
rotation Ball Pass Frequency Inner Race (BPFI) ∗ 2 ∗ (1 + ∗ ) Inner/ Outer race
rotation Ball Spin Frequency (BSF) ∗ 2 ∗ 1 − ∗ Inner/ Outer race
rotation Fundamental Train Frequency (FTF) ∗ 1
2 ∗ (1 − ∗ ) Inner race rotation
∗ 12 ∗ (1 + ∗ ) Outer race rotation
Table 1. Bearing fault frequencies (fs, Nb, Bd, Pd and φ are the rotating frequency, the number of balls, the ball diameter, the pitch diameter and the contact angle respectively) (Taylor and Kirkland, 2004). 2. Envelope Analysis Among the digital signal processing techniques used for analyzing the vibration signal, frequency domain analysis is the dominant method and is part in almost any commercial available vibration analysis software. Frequency domain analysis is applied using the Fast Fourier Transform (FFT) algorithm as a computational efficient operation of the Discrete Fourier Transform (DFT). REB faults can sometimes be identified in the acceleration spectrum but envelope analysis, which is also known as high frequency
2016 by FNT@Sea Services Ltd 4
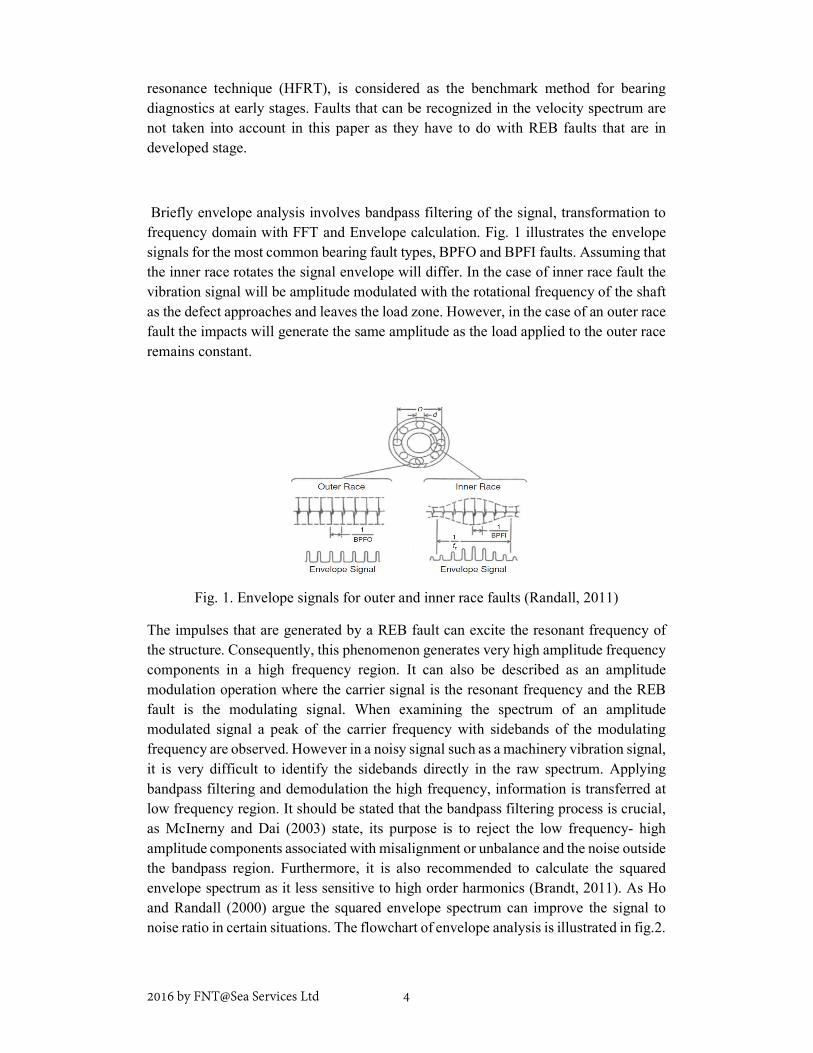
resonance technique (HFRT), is considered as the benchmark method for bearing diagnostics at early stages. Faults that can be recognized in the velocity spectrum are not taken into account in this paper as they have to do with REB faults that are in developed stage. Briefly envelope analysis involves bandpass filtering of the signal, transformation to frequency domain with FFT and Envelope calculation. Fig. 1 illustrates the envelope signals for the most common bearing fault types, BPFO and BPFI faults. Assuming that the inner race rotates the signal envelope will differ. In the case of inner race fault the vibration signal will be amplitude modulated with the rotational frequency of the shaft as the defect approaches and leaves the load zone. However, in the case of an outer race fault the impacts will generate the same amplitude as the load applied to the outer race remains constant.
Fig. 1. Envelope signals for outer and inner race faults (Randall, 2011)
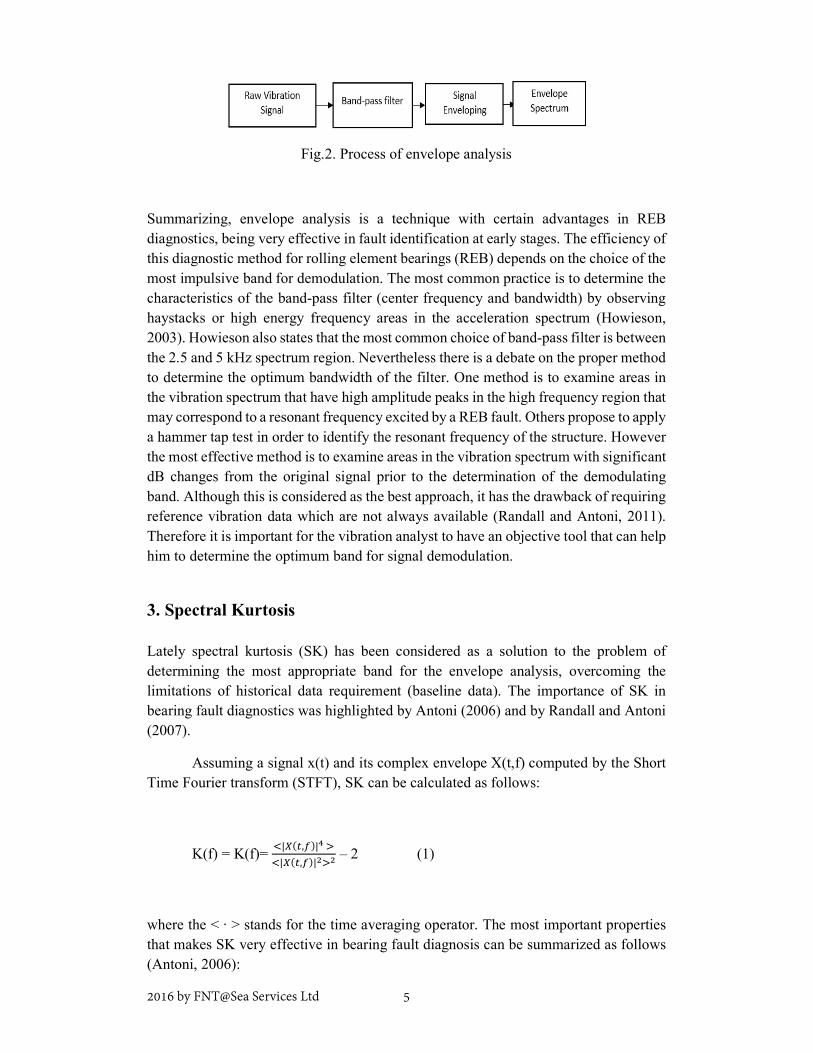
The impulses that are generated by a REB fault can excite the resonant frequency of the structure. Consequently, this phenomenon generates very high amplitude frequency components in a high frequency region. It can also be described as an amplitude modulation operation where the carrier signal is the resonant frequency and the REB fault is the modulating signal. When examining the spectrum of an amplitude modulated signal a peak of the carrier frequency with sidebands of the modulating frequency are observed. However in a noisy signal such as a machinery vibration signal, it is very difficult to identify the sidebands directly in the raw spectrum. Applying bandpass filtering and demodulation the high frequency, information is transferred at low frequency region. It should be stated that the bandpass filtering process is crucial, as McInerny and Dai (2003) state, its purpose is to reject the low frequency- high amplitude components associated with misalignment or unbalance and the noise outside the bandpass region. Furthermore, it is also recommended to calculate the squared envelope spectrum as it less sensitive to high order harmonics (Brandt, 2011). As Ho and Randall (2000) argue the squared envelope spectrum can improve the signal to noise ratio in certain situations. The flowchart of envelope analysis is illustrated in fig.2.
2016 by FNT@Sea Services Ltd 5
Fig.2. Process of envelope analysis
Summarizing, envelope analysis is a technique with certain advantages in REB diagnostics, being very effective in fault identification at early stages. The efficiency of this diagnostic method for rolling element bearings (REB) depends on the choice of the most impulsive band for demodulation. The most common practice is to determine the characteristics of the band-pass filter (center frequency and bandwidth) by observing haystacks or high energy frequency areas in the acceleration spectrum (Howieson, 2003). Howieson also states that the most common choice of band-pass filter is between the 2.5 and 5 kHz spectrum region. Nevertheless there is a debate on the proper method to determine the optimum bandwidth of the filter. One method is to examine areas in the vibration spectrum that have high amplitude peaks in the high frequency region that may correspond to a resonant frequency excited by a REB fault. Others propose to apply a hammer tap test in order to identify the resonant frequency of the structure. However the most effective method is to examine areas in the vibration spectrum with significant dB changes from the original signal prior to the determination of the demodulating band. Although this is considered as the best approach, it has the drawback of requiring reference vibration data which are not always available (Randall and Antoni, 2011). Therefore it is important for the vibration analyst to have an objective tool that can help him to determine the optimum band for signal demodulation. 3. Spectral Kurtosis Lately spectral kurtosis (SK) has been considered as a solution to the problem of determining the most appropriate band for the envelope analysis, overcoming the limitations of historical data requirement (baseline data). The importance of SK in bearing fault diagnostics was highlighted by Antoni (2006) and by Randall and Antoni (2007). Assuming a signal x(t) and its complex envelope X(t,f) computed by the Short Time Fourier transform (STFT), SK can be calculated as follows: K(f) = K(f)= | ( , )|
| ( , )| – 2 (1) where the < ∙ > stands for the time averaging operator. The most important properties that makes SK very effective in bearing fault diagnosis can be summarized as follows (Antoni, 2006):
2016 by FNT@Sea Services Ltd 6
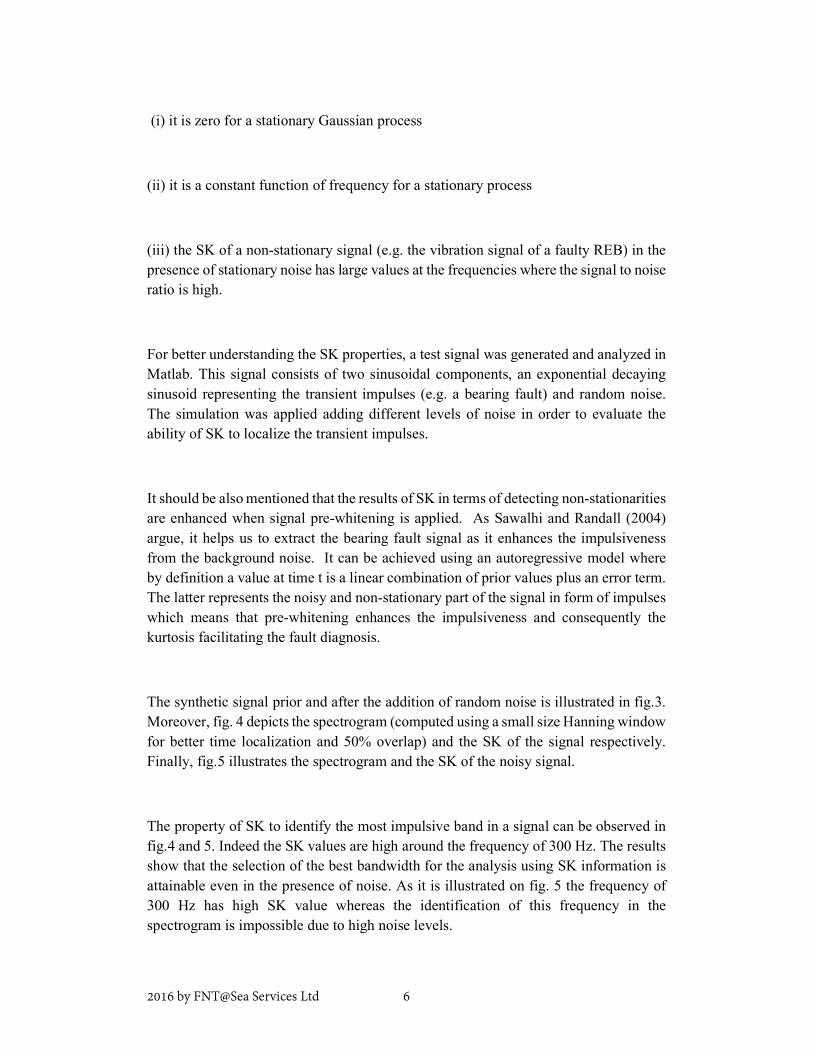
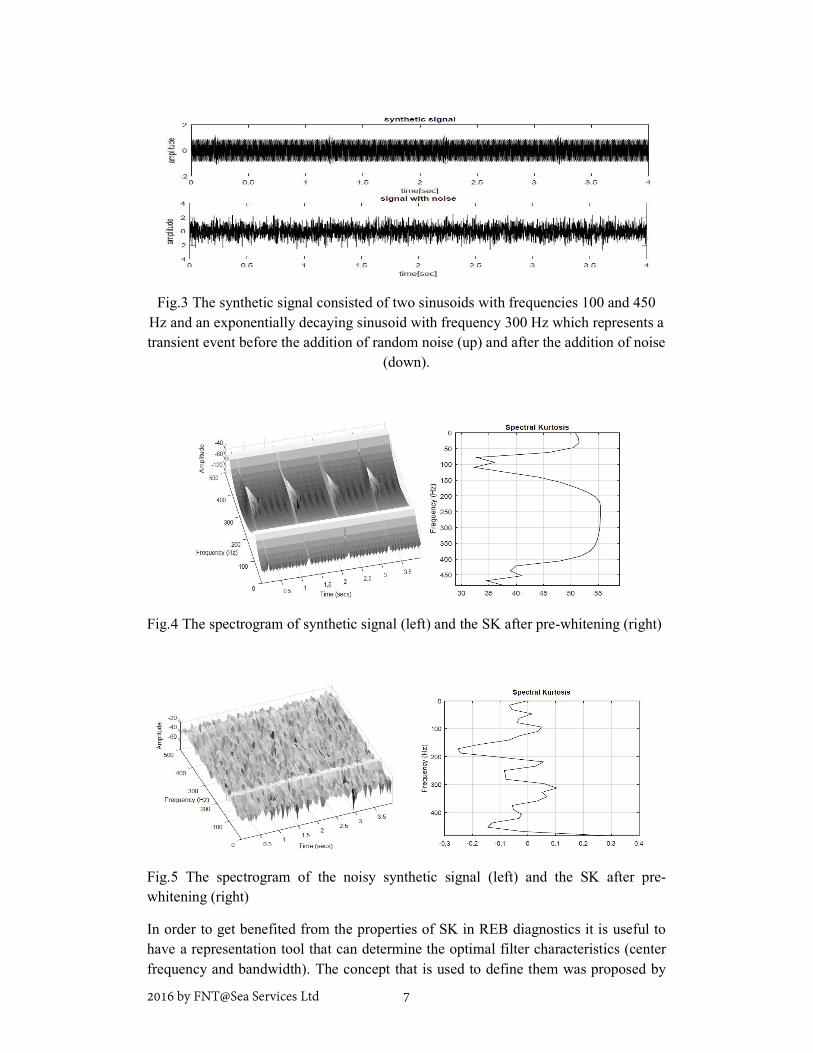
(i) it is zero for a stationary Gaussian process (ii) it is a constant function of frequency for a stationary process (iii) the SK of a non-stationary signal (e.g. the vibration signal of a faulty REB) in the presence of stationary noise has large values at the frequencies where the signal to noise ratio is high. For better understanding the SK properties, a test signal was generated and analyzed in Matlab. This signal consists of two sinusoidal components, an exponential decaying sinusoid representing the transient impulses (e.g. a bearing fault) and random noise. The simulation was applied adding different levels of noise in order to evaluate the ability of SK to localize the transient impulses. It should be also mentioned that the results of SK in terms of detecting non-stationarities are enhanced when signal pre-whitening is applied. As Sawalhi and Randall (2004) argue, it helps us to extract the bearing fault signal as it enhances the impulsiveness from the background noise. It can be achieved using an autoregressive model where by definition a value at time t is a linear combination of prior values plus an error term. The latter represents the noisy and non-stationary part of the signal in form of impulses which means that pre-whitening enhances the impulsiveness and consequently the kurtosis facilitating the fault diagnosis. The synthetic signal prior and after the addition of random noise is illustrated in fig.3. Moreover, fig. 4 depicts the spectrogram (computed using a small size Hanning window for better time localization and 50% overlap) and the SK of the signal respectively. Finally, fig.5 illustrates the spectrogram and the SK of the noisy signal. The property of SK to identify the most impulsive band in a signal can be observed in fig.4 and 5. Indeed the SK values are high around the frequency of 300 Hz. The results show that the selection of the best bandwidth for the analysis using SK information is attainable even in the presence of noise. As it is illustrated on fig. 5 the frequency of 300 Hz has high SK value whereas the identification of this frequency in the spectrogram is impossible due to high noise levels.
2016 by FNT@Sea Services Ltd 7
Fig.3 The synthetic signal consisted of two sinusoids with frequencies 100 and 450
Hz and an exponentially decaying sinusoid with frequency 300 Hz which represents a transient event before the addition of random noise (up) and after the addition of noise
(down).
Fig.4 The spectrogram of synthetic signal (left) and the SK after pre-whitening (right)
Fig.5 The spectrogram of the noisy synthetic signal (left) and the SK after pre-whitening (right) In order to get benefited from the properties of SK in REB diagnostics it is useful to have a representation tool that can determine the optimal filter characteristics (center frequency and bandwidth). The concept that is used to define them was proposed by
2016 by FNT@Sea Services Ltd 8
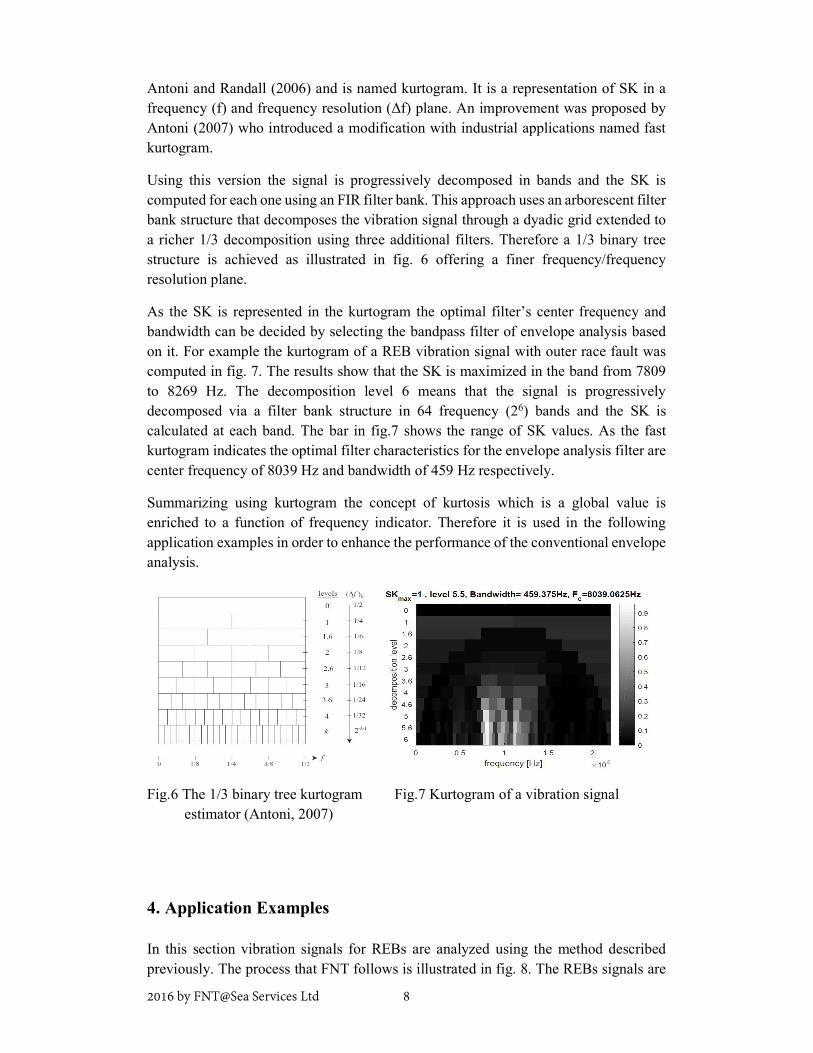
Antoni and Randall (2006) and is named kurtogram. It is a representation of SK in a frequency (f) and frequency resolution (Δf) plane. An improvement was proposed by Antoni (2007) who introduced a modification with industrial applications named fast kurtogram. Using this version the signal is progressively decomposed in bands and the SK is computed for each one using an FIR filter bank. This approach uses an arborescent filter bank structure that decomposes the vibration signal through a dyadic grid extended to a richer 1/3 decomposition using three additional filters. Therefore a 1/3 binary tree structure is achieved as illustrated in fig. 6 offering a finer frequency/frequency resolution plane. As the SK is represented in the kurtogram the optimal filter’s center frequency and bandwidth can be decided by selecting the bandpass filter of envelope analysis based on it. For example the kurtogram of a REB vibration signal with outer race fault was computed in fig. 7. The results show that the SK is maximized in the band from 7809 to 8269 Hz. The decomposition level 6 means that the signal is progressively decomposed via a filter bank structure in 64 frequency (26) bands and the SK is calculated at each band. The bar in fig.7 shows the range of SK values. As the fast kurtogram indicates the optimal filter characteristics for the envelope analysis filter are center frequency of 8039 Hz and bandwidth of 459 Hz respectively. Summarizing using kurtogram the concept of kurtosis which is a global value is enriched to a function of frequency indicator. Therefore it is used in the following application examples in order to enhance the performance of the conventional envelope analysis.
Fig.6 The 1/3 binary tree kurtogram Fig.7 Kurtogram of a vibration signal estimator (Antoni, 2007) 4. Application Examples In this section vibration signals for REBs are analyzed using the method described previously. The process that FNT follows is illustrated in fig. 8. The REBs signals are
2016 by FNT@Sea Services Ltd 9
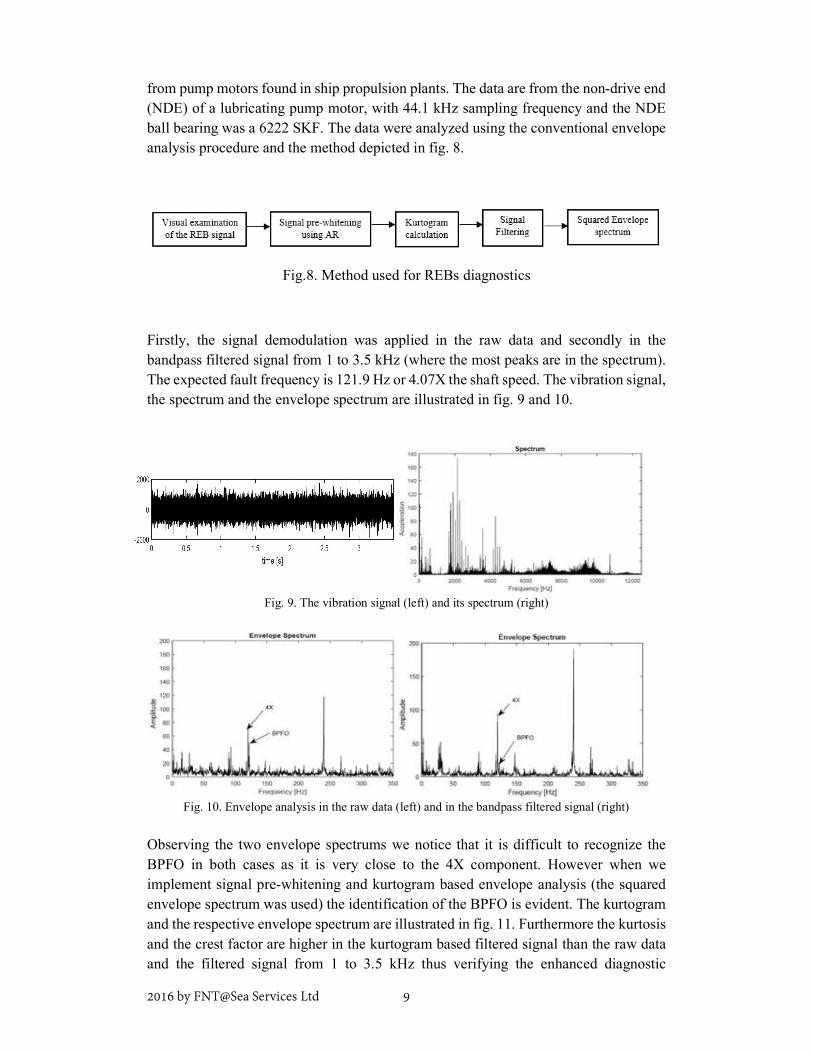
from pump motors found in ship propulsion plants. The data are from the non-drive end (NDE) of a lubricating pump motor, with 44.1 kHz sampling frequency and the NDE ball bearing was a 6222 SKF. The data were analyzed using the conventional envelope analysis procedure and the method depicted in fig. 8.
Fig.8. Method used for REBs diagnostics
Firstly, the signal demodulation was applied in the raw data and secondly in the bandpass filtered signal from 1 to 3.5 kHz (where the most peaks are in the spectrum). The expected fault frequency is 121.9 Hz or 4.07X the shaft speed. The vibration signal, the spectrum and the envelope spectrum are illustrated in fig. 9 and 10.
Fig. 9. The vibration signal (left) and its spectrum (right)
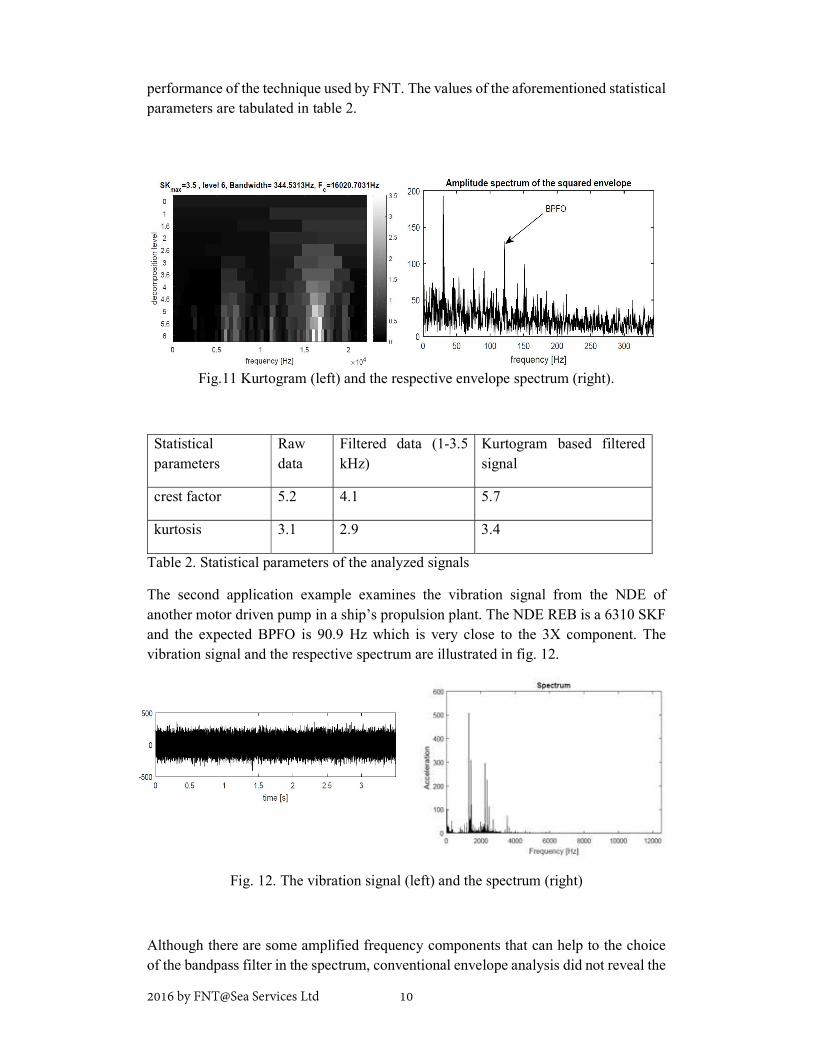
Fig. 10. Envelope analysis in the raw data (left) and in the bandpass filtered signal (right) Observing the two envelope spectrums we notice that it is difficult to recognize the BPFO in both cases as it is very close to the 4X component. However when we implement signal pre-whitening and kurtogram based envelope analysis (the squared envelope spectrum was used) the identification of the BPFO is evident. The kurtogram and the respective envelope spectrum are illustrated in fig. 11. Furthermore the kurtosis and the crest factor are higher in the kurtogram based filtered signal than the raw data and the filtered signal from 1 to 3.5 kHz thus verifying the enhanced diagnostic
2016 by FNT@Sea Services Ltd 10
performance of the technique used by FNT. The values of the aforementioned statistical parameters are tabulated in table 2.
Fig.11 Kurtogram (left) and the respective envelope spectrum (right).
Statistical parameters
Raw data
Filtered data (1-3.5 kHz)
Kurtogram based filtered signal
crest factor 5.2 4.1 5.7 kurtosis 3.1 2.9 3.4
Table 2. Statistical parameters of the analyzed signals The second application example examines the vibration signal from the NDE of another motor driven pump in a ship’s propulsion plant. The NDE REB is a 6310 SKF and the expected BPFO is 90.9 Hz which is very close to the 3X component. The vibration signal and the respective spectrum are illustrated in fig. 12.
Fig. 12. The vibration signal (left) and the spectrum (right) Although there are some amplified frequency components that can help to the choice of the bandpass filter in the spectrum, conventional envelope analysis did not reveal the
2016 by FNT@Sea Services Ltd 11
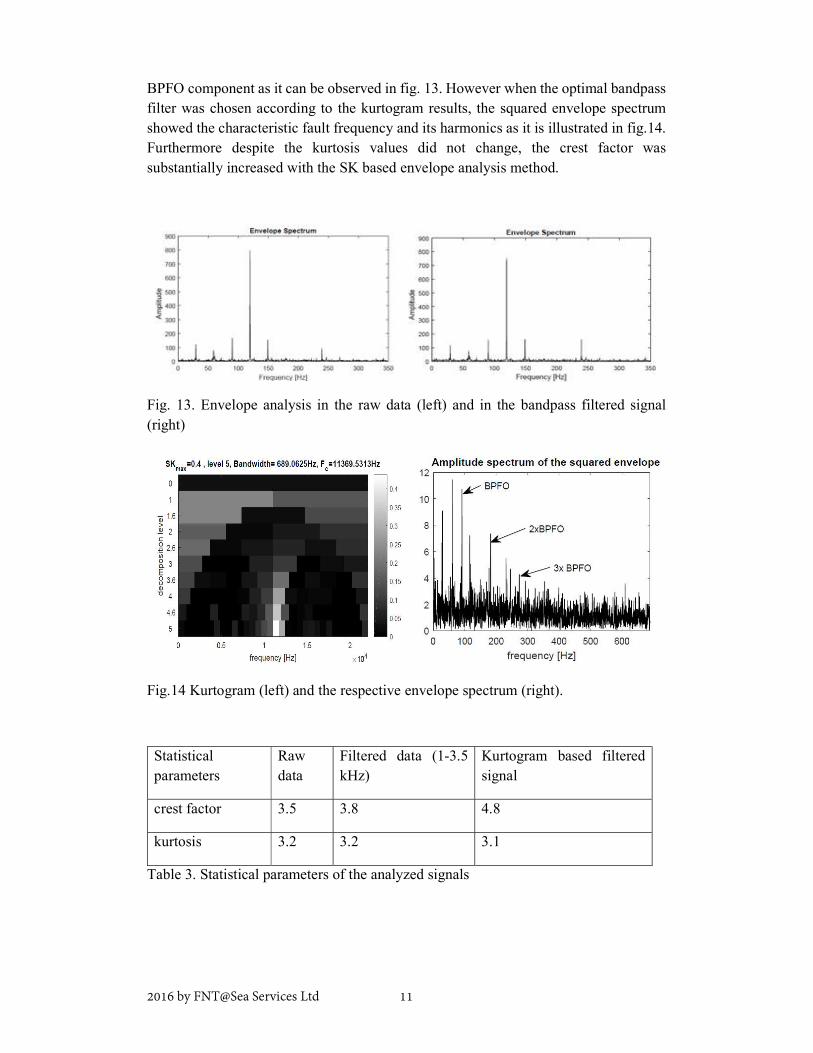
BPFO component as it can be observed in fig. 13. However when the optimal bandpass filter was chosen according to the kurtogram results, the squared envelope spectrum showed the characteristic fault frequency and its harmonics as it is illustrated in fig.14. Furthermore despite the kurtosis values did not change, the crest factor was substantially increased with the SK based envelope analysis method.
Fig. 13. Envelope analysis in the raw data (left) and in the bandpass filtered signal (right)
Fig.14 Kurtogram (left) and the respective envelope spectrum (right). Statistical parameters
Raw data
Filtered data (1-3.5 kHz)
Kurtogram based filtered signal
crest factor 3.5 3.8 4.8 kurtosis 3.2 3.2 3.1
Table 3. Statistical parameters of the analyzed signals
2016 by FNT@Sea Services Ltd 12
5. Conclusion There is already a number of publications pinpointing that the performance of envelope analysis is enhanced when SK is used for the selection of the bandpass filter. This research shows the advantages of the method in REB diagnostics compared against the conventional vibration analysis algorithms used in the vast majority of commercial analyzers. Furthermore, as this benchmark method can show very early REB faults, the reliability of any CM program is significantly improved. The method has already been applied by FNT in a large number of marine applications with satisfactory results and is a useful supplementary vibration analysis tool for rolling element bearing condition monitoring.
About FNT Advanced Services FNT Advanced Services Ltd is based in Athens, Greece. It is a brand independent Condition Monitoring Service Provider using an extensive combination of predictive maintenance techniques to optimize customer's benefits. The team of FNT Advanced Services has a demonstrable expertise in Mechanical and Electrical Engineering, with over twenty-five years of experience with mechanical and electrical systems, marine propulsion, and auxiliary systems. FNT engineers are all certified (at Level III) in Vibration Analysis, Thermal Imaging, Acoustic Emission and other NDT technologies.
2016 by FNT@Sea Services Ltd 13
ANNEX
Statistical parameters are frequently used in vibration analysis applications. Mainly they can be used for data trending and have very limited efficiency in fault localization. In rolling element bearing diagnostics the most commonly used parameters are: i) Root Mean Square (RMS): It is used to compare signals. It has a proportional relationship with the amount of energy in a vibration signal.
Xrms= ∙ ∑ ( ) (1)
ii) Crest factor (CF) is defined as the ratio of the absolute peak value to the RMS value of a signal. It is a measure that indicates the level of impacts in the signal and as Brandt (2011) states it is an indicator of how “peaky” or “smoothly”” the data are. Therefore CF tends to increase in case of faulty bearings because the impulses generate spikes in the signal.
Crest Factor= | | (2)
iii) Kurtosis is defined as follows. For a random signal x(t) with 4th central moment M4=E[(x-μ)4] and σ standard deviation the kurtosis is:
Kurtosis= (3) Kurtosis can be used as method to compare the tails of a probability density function with normal distribution (Brandt, 2011). As for the case of normal distribution kurtosis equals to three, any larger than this values indicate higher tails than the ones of normal distribution. As an alternative excess kurtosis can be used in order to provide the value of zero in the case of normal distribution and is defined as:
Excess Kurtosis= Kurtosis – 3 (4)
According to McInerny and Dai (2003) kurtosis is substantially affected from the impulses of a faulty bearing and therefore can be an effective indicator for a faulty bearing. However, Lorenzo and Calabro (2007) mention that the level of damage can affect the waveform of the vibration signal in terms of becoming continuous instead of impulsive and thus making the kurtosis values to approach the normal distributions ones as the fault is developing.
2016 by FNT@Sea Services Ltd 14
6. References Albrecht P.F., Appiarius J.C., McCoy R.M., Owen E.L., Sharma D.K. (1986) “Assessment of the Reliability of Motors in Utility Applications – Updated” IEEE Energy Conversion, Available at: http://ieeexplore.ieee.org/stamp/stamp.jsp?tp=&arnumber=4765668 Antoni J., Randall R.B. (2006), “The Spectral Kurtosis: Application to the Vibratory Surveillance and Diagnostics of Rotating Machines”, Science Direct, Mechanical Systems and Signal Processing, Available at: http://www.sciencedirect.com/science/article/pii/S0888327004001529 Antoni J. (2006), “The Spectral Kurtosis: a useful tool for characterizing non-stationary signals”, Mechanical Systems and Signal Processing, Science Direct, Available at: http://www.sciencedirect.com/science/article/pii/S0888327004001517 Antoni J. (2007), “Fast computation of the kurtogram for the detection of transient faults”, Mechanical Systems and Signal Processing, Science Direct, Available at: http://www.sciencedirect.com/science/article/pii/S0888327005002414 Baglee D., Jantunen E. (2014) “Can equipment failure modes support the use of a Condition Based Maintenance Strategy?” Science Direct, Available at: http://www.sciencedirect.com/science/article/pii/S2212827114008166 Brandt A. (2011), “Noise and Vibration Analysis”, Wiley and Sons, United Kingdom, ISBN: 978-0-470-74644-8. Howieson D. (2003), “Vibration Monitoring: Envelope Signal Processing”, Available at: http://www.maintenance-engineering.eu/downloads/public/envelope%20bearing.pdf Lorenzo F., Calabro M. (2007), “Kurtosis: A Statistical Approach to Identify Defect in Rolling Bearings”, Proceedings of 2nd International Conference on Marine Research and Transportation, Available at: http://www.icmrt07.unina.it/Proceedings/Papers/A/84.pdf McInerny S.A, Dai Y. (2003), “Basic Vibration Signal Processing for Bearing Fault Detection”, IEEE, Transactions on Education, Available at: http://ieeexplore.ieee.org/stamp/stamp.jsp?tp=&arnumber=1183679 O'Donnell P. (1983), Coordinating Author, Report on Large Motor Reliability Survey of Industrial and Commercial Installations, Presented at the IEEE Industrial and Commercial Power Systems Tech Conf., Milwaukee, Available at: http://ieeexplore.ieee.org/stamp/stamp.jsp?tp=&arnumber=4158071 Randall R.B. (2011) “Vibration-Based Condition Monitoring Industrial, Aerospace and Automotive Applications”, John Wiley & Sons, Ltd, Chichester, West Sussex, United Kingdom, ISBN 978-0-470-74785-8. Randall R.B., Antoni J. (2011), “Rolling Element Bearing Diagnostics: a Tutorial”, Science Direct, Mechanical Systems and Signal Processing, Available at: http://www.sciencedirect.com/science/article/pii/S0888327010002530 Smith W.A., Randall R.B. (2015), “Rolling Element Bearing Diagnostics Using the Case Western Reserve University Data: A Benchmark Study”, Science Direct, Mechanical Systems and Signal Processing, Available at: http://www.sciencedirect.com/science/article/pii/S0888327015002034


