Embed Size (px)
Citation preview

Vibrational analysis and conformational study of 3-dimethylamino-2-acetyl
propenenitrile and 3-dimethylamino-2-methylsulfonyl propenenitrile
J. Polovkova a, A. Gatial a,*, V. Milata b, P. Cernuchova b, N. Pronayova c, T. Liptaj c, P. Matejka d
a Department of Physical Chemistry, Slovak University of Technology, 81237 Bratislava, Slovakiab Department of Organic Chemistry, Slovak University of Technology, 81237 Bratislava, Slovakia
c Central Laboratories, Faculty of Chemical and Food Technology, Slovak University of Technology, 81237 Bratislava, Slovakiad Department of Analytical Chemistry, Institute of Chemical Technology, 16628 Prague, Czech Republic
Received 18 July 2005; received in revised form 14 September 2005; accepted 20 September 2005
Available online 4 November 2005
Abstract
The IR, Raman and NMR spectra of similar push–pull ethylenes 3-dimethylamino-2-acetyl propenenitrile (DAAPN) (H3C)2N–CHaC(CN)
(COCH3) and 3-dimethylamino-2-methylsulfonyl propenenitrile (DASPN) (H3C)2N–CHaC(CN)(SO2CH3) were measured. According to NMR
spectra both compounds were prepared as pure E-isomers.
The observed IR and Raman bands were compared with harmonic vibrational frequencies, calculated using ab initio MP2 and B3LYP density
functional methods in 6-31G** basis set, and assigned on the base of potential energy distribution. In addition, the geometries and relative
energies of possible conformers and isomers of the studied compounds were also evaluated on the same levels.
Vibrational spectra revealed that in polar solutions E-DAAPN exists as two conformers with Z or E orientation of acetyl group, the Z conformer
being about 2.2G0.3 kJ molK1 more stable than the E one. The influence of environment polarity on this conformational equilibrium is discussed
with respect to the SCRF solvent effect calculations using IPCM and PCM models.
q 2005 Elsevier B.V. All rights reserved.
Keywords: Vibrational spectra; Conformational analysis; Push–pull enamines; Ab initio calculations; Solvent effect calculations
1. Introduction
Push–pull ethylenes with diverse electron donor and
acceptor groups connected through a double CaC bond
represent an interesting group of organic molecules with
many applications [1,2]. Mainly enamines, with general
formula R1R2NCR3aCXY, where R1, R2, R3 can be hydrogen,
alkyl or hetero(aryl) group and X,Y are strong electron
acceptor groups (such as –CN, –COR, –COOR, –NO2), are
frequently used as reactants or intermediates in chemical
syntheses of drugs, polymers and dyes [3,4]. The polar
character of push–pull ethylenes and electronic interactions
between substituents and the double bond are responsible for
their non-linear optical properties and their use as new electro-
optics materials [5,6].
In past decades, intensive research has been carried out to
study the isomeric equilibria, conformations and solvent
0022-2860/$ - see front matter q 2005 Elsevier B.V. All rights reserved.
doi:10.1016/j.molstruc.2005.09.028
* Corresponding author. Tel.: C421 2 59325460; fax: C421 2 52926032.
E-mail address: [email protected] (A. Gatial).
influence on rotational barrier and reactivity of these
compounds [7–10]. However, only few works are devoted to
the vibrational analysis and interpretation of their vibrational
spectra [6,11–15] although the vibrational spectroscopy is also
an important method used for the characterization and
identification of molecules. On the other hand, the unambigu-
ous assignment of the spectral bands of these highly conjugated
and polarized systems is complicated mainly due to consider-
able mutual coupling of some stretching and deformation
bands. Therefore, the use of theoretical methods including
normal coordinate calculations is helpful tool to solve this
problem.
Previously, the detailed spectroscopic and conformational
study supported by theoretical ab initio calculations of
aminomethylene propanedinitrile [H2N–CHaC(CN)2] (AM)
and 1-aminoethylidene propanedinitrile [H2N–C(CH3)
aC(CN)2] (AE) and their N-methyl derivatives has been
performed [12,13]. We have decided to extend these studies on
enamines with cyano and acetyl or methylsulfonyl electron
withdrawing groups, respectively. Recently, some alkenyl
sulfones [16–18] and a, b unsaturated sulfones have been used
as reactants in preparation of several biologically active
Journal of Molecular Structure 785 (2006) 85–97
www.elsevier.com/locate/molstruc

J. Polovkova et al. / Journal of Molecular Structure 785 (2006) 85–9786
sulfone molecules with anticancer [19] and carcinogenesis-
supressing activity [20]. Despite the large interest in synthesis
of suitable alkenyl sulfones, there is the lack of information on
their structural parameters and spectroscopic data. The most
works are focused on the study of simple vinyl sulfones without
push–pull character [21,22] that has a significant influence on
geometry, polarization and conjugation of the whole molecule.
This work presents the vibrational spectra, conformational
study and theoretical structure investigation of 3-dimethy-
lamino-2-acetyl propenenitrile (DAAPN) (H3C)2N–
CHaC(CN)(COCH3) and 3-dimethylamino-2-methylsulfonyl
propenenitrile (DASPN) (H3C)2N–CHaC(CN)(SO2CH3).
2. Experimental and computational details
The preparation of samples has been described in our
previous paper [23]. After the isolation and purification
processes pure E-isomers (the first letter in the conformers
labelling) of both compounds were obtained and confirmed by
NMR spectroscopy. The purity of both samples was better than
97% and melting points of DAAPN and DASPN, determined
by differential scanning calorimetry on Perkin–Elmer DSC-7
calorimeter, were 68 and 130 8C, respectively. The infrared
spectra in the region 4000–400 cmK1 were recorded with a
Nicolet model NEXUS 470 FTIR spectrometer at room
temperature. The solid phase measurements were performed
after mixing the powdered samples with KBr and pressing into
a pellet. The far infrared spectra in the region 600–50 cmK1
were recorded with a Nicolet model MAGNA 750 FTIR
spectrometer in polyethylene pellet at room temperature. The
solutions of samples in acetonitrile and chloroform were
measured in cell equipped with KBr windows. Temperature-
dependent infrared spectra were recorded in acetonitrile
solution using variable temperature cell Specac in temperature
Fig. 1. Infrared (top) and Raman (bottom) spect
range 258–328 K. Raman measurements were performed using
a Bruker RFS 100 Raman spectrometer with Nd3C:YAG laser
at the wavelength of 1064 nm.
Ab initio MP2 computations and the DFT ones employing
B3LYP functional were performed using GAUSSIAN 98 [24] and
GAUSSIAN 03 [25] programs. The 6-31G** basis set was used in
both MP2 and DFT calculations. The vibrational analysis has
been also performed to convince that all normal vibrational
modes are positive and calculated structures are the ground
states (not saddle points). The SCRF theory via IPCM and
PCM model including the effect of environment was applied to
correct the relative ground state energies obtained for isolated
molecules in gas phase.
In order to obtain zero point energies (ZPE) of the studied
compounds as well as their dipole moments and harmonic
vibrational frequencies, the normal coordinate calculations
with geometries optimized at MP2 and DFT levels were also
performed. The calculated frequencies were scaled with the
scaling factors developed by the fitting the experimental and
theoretical frequencies of the model compounds. The
description of normal modes was done according to the
potential energy distribution (PED).
3. Results and discussion
3.1. IR and Raman spectra
The mid- and far-infrared and Raman solid phase spectra of
DAAPN are depicted in Fig. 1 and the same spectra of DASPN
are given in Fig. 2. Since, both samples have the small vapour
pressure, only the measurements in solid phase and in solvents
with different polarity combined with temperature IR measure-
ments have been performed. The comparison between the solid
phase IR and Raman spectra of DAAPN with those in
rum of solid DAAPN at room temperature.
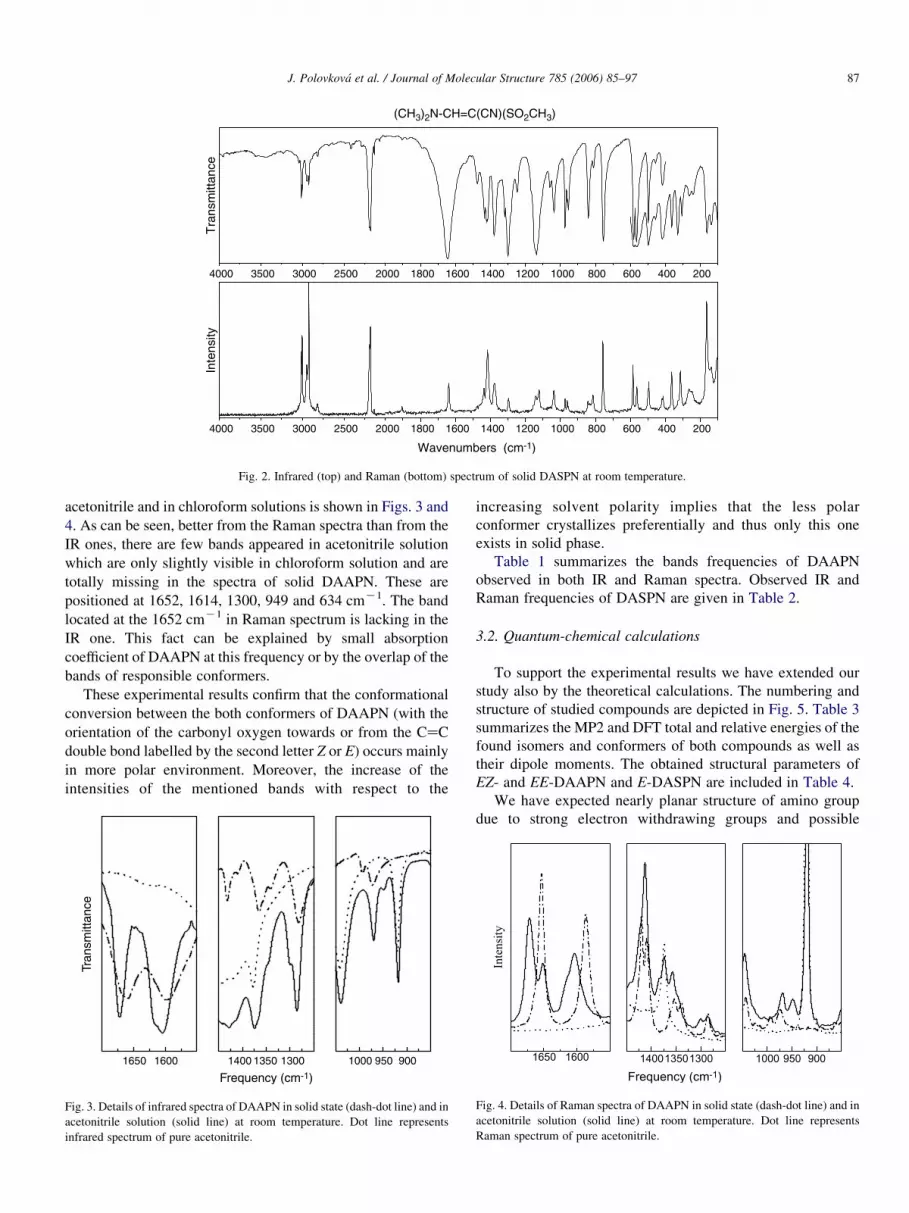
Fig. 2. Infrared (top) and Raman (bottom) spectrum of solid DASPN at room temperature.
J. Polovkova et al. / Journal of Molecular Structure 785 (2006) 85–97 87
acetonitrile and in chloroform solutions is shown in Figs. 3 and
4. As can be seen, better from the Raman spectra than from the
IR ones, there are few bands appeared in acetonitrile solution
which are only slightly visible in chloroform solution and are
totally missing in the spectra of solid DAAPN. These are
positioned at 1652, 1614, 1300, 949 and 634 cmK1. The band
located at the 1652 cmK1 in Raman spectrum is lacking in the
IR one. This fact can be explained by small absorption
coefficient of DAAPN at this frequency or by the overlap of the
bands of responsible conformers.
These experimental results confirm that the conformational
conversion between the both conformers of DAAPN (with the
orientation of the carbonyl oxygen towards or from the CaC
double bond labelled by the second letter Z or E) occurs mainly
in more polar environment. Moreover, the increase of the
intensities of the mentioned bands with respect to the
Fig. 3. Details of infrared spectra of DAAPN in solid state (dash-dot line) and in
acetonitrile solution (solid line) at room temperature. Dot line represents
infrared spectrum of pure acetonitrile.
increasing solvent polarity implies that the less polar
conformer crystallizes preferentially and thus only this one
exists in solid phase.
Table 1 summarizes the bands frequencies of DAAPN
observed in both IR and Raman spectra. Observed IR and
Raman frequencies of DASPN are given in Table 2.
3.2. Quantum-chemical calculations
To support the experimental results we have extended our
study also by the theoretical calculations. The numbering and
structure of studied compounds are depicted in Fig. 5. Table 3
summarizes the MP2 and DFT total and relative energies of the
found isomers and conformers of both compounds as well as
their dipole moments. The obtained structural parameters of
EZ- and EE-DAAPN and E-DASPN are included in Table 4.
We have expected nearly planar structure of amino group
due to strong electron withdrawing groups and possible
Fig. 4. Details of Raman spectra of DAAPN in solid state (dash-dot line) and in
acetonitrile solution (solid line) at room temperature. Dot line represents
Raman spectrum of pure acetonitrile.

Table 1
Infrared and Raman spectral data of 3-dimethylamino-2-acetyl propenenitrile
Infrared Raman Interpretation
Liquid Solid Liquid Solid EZ EE
CH3CNa CH3Cl KBr Nujol CH3CN
3076 vw, bb n1
3029 w 3031 w, sh n2, n3
3018 w, sh 3018 m n4
2989 w n5, n6
2970 w 2970 m n7
2923 vw 2925 w 2927 s n8, n9
2880 vw 2886 w, sh n10
2815 vw 2814 vw 2816 w
2197 vs 2200 m 2194 vs 2193 vs 2196 vs 2193 vs n11
2138 vw, sh 2139 vw, sh
1672 vs 1669 s 1658 vs 1657 vs 1672 s 1654 s n12
1652 m * n12
1617 vs,sh * * * 1614 m, sh * n13
1605 vs 1599 vs 1596 vs 1600 vs 1603 s 1586 s n13
1478 vw 1481 vw, sh n14
1453 w, sh 1452 w, sh n15, n16
1427 m 1432 s 1432 m, sh n17, n18, n19
1420 s n20, n21
1414 w, sh 1411 w, sh 1411 vw, sh 1413 vs 1409 s n22
1386 m, sh * n23
1367 s 1368 m 1366 s 1368 s 1357 m 1354 w n23
1346 m, sh 1345 w, sh 1341 m, sh 1341 m, sh 1344 m, sh 1339 w n24
1300 s, sh * * * 1300 w * n25
1286 vs 1286 s 1282 s 1281 s 1287 w 1286 w n25
1222 s 1218 m 1218 m 1221 vw 1221 vw n26
1139 s 1135 w 1145 m 1145 m 1139 w 1142 w n27, n28
1105 vw, sh n29
1059 vw 1056 w 1055 w 1059 w, sh n30
1041 vw, sh 1042 vw, sh 1045 m 1043 vw n31
1024 vw, sh 1023 vw, sh n32
993 w 993 w, sh 993 vw n33
970 m 971 w 973 m 971 s 969 w 973 vw n34
949 w * * * 948 w * n33
852 w,sh 854 vw 854 vw
834 vw 830 vw 829 vw 841 w 833 vw n35
807 vw 803 vw 803 vw 807 s 806 m n36
634 w, sh * 634 w, sh * n37
622 m, sh 623 s, sh n37
620 m 621 w 617 m 617 s 620 s 618 m n38
552 vw, sh 552 m 553 vw, sh n39
544 w 546 vw 541 w 541 m 545 m 543 w n40
507 vw * n40
466 w n41
453 vw 454 vw 451 w 451 vw n42
426 w 426 w 428 vw n43
366 vw 362 m, sh 369 w n44
285 vw 293 m 293 w n45, n46
180 w 177 s 187 s n47
163 w, sh n48
158 w, sh n49
111vw n50, n51
84 vvw, sh n52
76 vw n53
Weak bands in the regions 4000–3200, 2800–2300 and 2000–1800 cmK1 have been omitted. * denotes bands vanishing in the solid phase.a Solvents used.b Abbreviations: s, strong; m, medium; w, weak; v, very; sh, shoulder; b, broad.
J. Polovkova et al. / Journal of Molecular Structure 785 (2006) 85–9788
connection of the lone electron pair on nitrogen into the
conjugation. Unfortunately, the experimental structural data
for studied molecules are still not available. Therefore, it is
difficult to decide, which of the theoretically obtained
structures is more reliable. Nevertheless, we can make two
conclusions from the calculated geometries:

Table 2
Infrared and Raman spectral data of 3-dimethylamino-2-methylsulfonyl propenenitrile
Infrared Raman Interpretation
Liquid Solid Liquid Solid
CH3CNa CH3Cl KBr Nujol CH3CN
3087 vvwb
3040 vw, b n1, n2, n3
3013 w 3013 s n4, n5
3003 w 3003 s n6
2969 w 2942 w, b 2947 m n7
2930 w 2923 w 2922 vs n8
2881 vw, b n9, n10
2853 vw
2819 vw 2818 vw 2815 w
2202 m 2203 s 2193 s 2192 m, sh 2199 s 2194 s n11
2182 s 2180 m 2186 s, sh 2182 s
2135 vw 2134 vw
1638 vs 1635 vs 1645 vs 1643 s 1638 w n12
1478 w 1474 w n13
1447 vw n14, n15
1436 s 1434 m 1436 w n16, n17
1423 m 1423 m 1424 w 1423 w,sh n18
1413 m 1417 m 1416 w 1414 s 1417 m,sh n19, n20
1411 w,sh n21
1372 m 1379 m 1379 w,sh n22
1370 w,sh
1319 m 1318 vw n23
1309 s 1312 vs 1300 vs 1300 s 1308 w 1297 w n24
1282 vw, sh 1281vw, sh
1248 w 1248 w n25
1164 w 1153 w n26
1146 m, sh 1144 w n27
1140 s 1139 vs 1137 vs 1136 s 1139 s 1140 w n28
1126 m, sh 1122 w n29
1062 vw 1060 w 1060 w n30
1035 m 1037 m 1036 m 1038 w 1038 w n31
973 m 973 m 974 w n32
962 m 961 w 962 w n33
957 w 956 s 955 m 954 w 958 vw 955vw,sh n34
841 w 840 m 841 m 841 m 840 vw 842 vw,b n35
823 vw, sh 834 vw, b
811 vw 810 vw 819 vw 814 w n36
755 s 754 s 756 m 757 m n37
583 m 582 s 581 s 581 s 584 w 586 m n38
565 m 563 s 565 s 564 s 565 w 564 w n39
500 w 501 w 498 m 497 m 502 w 500 w,sh n40
496 w 492 w 494 w,sh 495 m n41
456 vw n42
418 w 419 w n43
411 vw 412 vw 414 w n44
364 w 364 m 364 m n45
330 w 327 w,sh n46
306 vw 304 w 314 m n47
263 vw 267 w,b 265 w,b n48
243 vw 249 w,b n49, n50
162 w 156 s 164 s n51
138 w 138 m n52, n53
106 m n54
89 m n55
52 vw n56, n57
Weak bands in the regions 4000–3200, 2800–2300 and 2000–1800 cmK1 have been omitted.a Solvents used.b Abbreviations: s, strong; m, medium; w, weak; v, very; sh, shoulder; b, broad.
J. Polovkova et al. / Journal of Molecular Structure 785 (2006) 85–97 89

Table 3
Calculated MP2 and DFT relative energies and dipole moments of conformers
and isomers of DAAPN and DASPN
Conformer E(MP2)
kJ molK1
E(B3LYP)
kJ molK1
mMP2
D
mB3LYP
D
DAAPN
EZ 0.00 0.00 4.97 5.15
EE 18.75 24.39 8.40 8.89
ZZ 19.56 23.55 5.61 5.74
DASPN
E 0.00 0.00 6.89 7.00
Z 23.08 23.10 5.02 4.89
J. Polovkova et al. / Journal of Molecular Structure 785 (2006) 85–9790
(i) Both MP2 and DFT methods give the more planar
structure of amino group for DAAPN than for the
DASPN conformers. The calculated structure from DFT
indicates entirely planar character of the amino group
mainly for DAAPN.
(ii) The bond lengths as well as the dihedral angles imply
that for both compounds the DFT method predicts more
conjugated structures than MP2.
The length of double CaC bond, which reflects the extent of
conjugation in such type of compounds, was found to be higher
for DAAPN as for DASPN. This is in accordance with slightly
lower CaC stretching frequency of DAAPN in comparison
with DASPN. This phenomenon can be explained by stronger
electron acceptor properties of the acetyl group than of the
methylsulfonyl one. On the contrary, the length of aC–N bond
in these compounds becomes shorter and the bond order
increases due to the connection of electron pair on nitrogen into
the conjugation with CaC bond.
Due to the conjugation effect the aC–C(O) bond length also
becomes somewhat shorter than in non-conjugated molecules
or in comparison with the experimental length of this bond of
1.494 A in parent methyl vinyl ketone [26]. This conjugation
apparently stabilizes the Z or E in-plane arrangement of CaC
and CaO bonds in both found conformers of DAAPN what is
in agreement with the series of a, b-unsaturated aldehydes and
ketones [27,28]. As it was mentioned above, DFT method gives
entirely planar structure of DAAPN whereas MP2 gives about
28 deviation from the planar arrangement. Although the main
bond lengths show on large conjugation in DAAPN, relatively
small permanent dipole moment of the most stable conformer
Fig. 5. The structure and numbering of the studied compounds.
(ca. 5 D) does not indicate that this molecule might posses
marked non-linear optical properties as for example previously
studied malononitrile derivatives [6,14].
The only stable conformation of DASPN was found at the
dihedral angle between one of the oxygen and C2 atom of
double CaC bond at approximately 38. Similar result was
obtained previously from ab inito study of 2-methylsulfonyl-2-
butene [29]. Such arrangement, when CaC and SaO bonds are
eclipsed in the same plane, is usually denoted as anticlinal
conformation and stabilizes the given configuration. According
to all preceding studies, the anticlinal conformation is the most
stable one in vinyl sulfones and in E-isomers of b-substituted
vinyl sulfones [21,29–34].
In the previous work [12] slightly non-planar character of
amino group for (dimethylamino)methylene propanedinitrile
[(H3C)2N–CHaC(CN)2] (DMAM) has been found by geome-
try optimization at Hartree–Fock level of theory in DZP basis.
Due to the different approach we could not compare the
calculated geometries of this similar compound with DAAPN
and DASPN. Therefore, we have recalculated the geometry of
DMAM by both MP2 and B3LYP methods in 6-31G** basis
set. The obtained values are 1.376 and 1.384 A for CaC and
1.346 and 1.342 A for aC–N bond lengths, respectively. The
CaC bond length of DMAM does not differ substantially from
DAAPN. It implies the similar electron acceptor properties of
both cyano and acetyl group. On the other side, the calculated
non-planarity of amino group of DMAM is slightly higher than
that obtained for our studied compounds.
The relative energies of single conformers obtained in vacuo
were corrected by including solvent effects into the calcu-
lations. For this purpose, Isodensity Surface Polarizable
Continuum Model (IPCM) and Polarizable Continuum Model
(PCM) were used for the evaluation of energy differences
between the conformers and isomers of DAAPN. The results
will be discussed later.
3.3. Conformational analysis
The conformational possibilities of the studied compounds
are evidently restricted only to the nature of electron acceptor
groups. The above mentioned high conjugation expanding
through the whole molecule can significantly influence the
rotational barriers of single and double bonds as well as the
ground and excited states energies of single conformers. So the
conformational behaviour of such types of compounds is not
easy to predict. Particularly the polarity of solvent has the great
influence on the charge distribution inside these molecules [8–
9].
As reported previously, the rotation of methylsulfonyl group
is characterized by two minima with the same energy near the
anticlinal conformations corresponding to the CaC–S–C
dihedral angles of 120 and 2408, when one of the SaO bonds
is parallel with double CaC bond [29]. So, the only stable
conformation of this group should be considered. Our
theoretical calculations also revealed only one stable confor-
mation of E-DASPN with C2aC1–S6–C9 dihedral angle of
K1188 obtained by the MP2 method. The infrared and Raman

Table 4
Optimized geometric parameters of DAAPN and DASPN (with 6-31G** basis set)
Coordinatea EZ-DAAPN EE-DAAPN E-DASPN
MP2 B3LYP MP2 B3LYP MP2 B3LYP
Bonds (A)
C1aC2 1.375 1.382 1.375 1.380 1.371 1.376
C1–C7 1.424 1.420 1.430 1.427 1.418 1.412
C2–N3 1.342 1.340 1.350 1.347 1.344 1.342
C2–H6 1.085 1.088 1.083 1.085 1.084 1.087
N3–C4 1.457 1.460 1.457 1.460 1.457 1.460
N3–C5 1.456 1.460 1.455 1.458 1.456 1.460
C4–H9 1.091 1.096 1.091 1.096 1.092 1.096
C4–H10 1.088 1.096 1.088 1.096 1.087 1.096
C4–H11 1.085 1.086 1.084 1.085 1.085 1.086
C5–H12 1.086 1.090 1.087 1.091 1.092 1.097
C5–H13 1.092 1.097 1.093 1.097 1.086 1.090
C5–H14 1.090 1.097 1.090 1.097 1.089 1.096
C16–H17 1.086 1.090 1.086 1.090 1.088 1.092
C16–H18 1.090 1.095 1.090 1.096 1.087 1.091
C16–H19 1.090 1.095 1.090 1.096 1.086 1.090
C7bN8 1.186 1.168 1.185 1.165 1.187 1.168
C1–X15 1.486 1.491 1.480 1.486 1.775 1.800
X15–C16 1.511 1.516 1.518 1.527 1.783 1.806
X15aO20 1.234 1.226 1.233 1.222 1.473 1.476
S15aO21 1.467 1.468
Angles (8)
C1aC2–N3 131.2 133.3 130.8 133.0 130.1 131.9
C2–N3–C4 123.3 125.8 123.4 126.1 122.8 125.5
C2–N3–C5 119.8 119.9 119.4 119.9 119.5 119.9
C1aC2–H6 113.8 112.3 116.6 115.2 115.0 113.9
N3–C4–H9 111.6 109.7 111.9 109.6 111.4 110.0
N3–C4–H10 108.1 109.7 107.8 109.6 108.2 109.6
N3–C4–H11 110.1 111.3 110.1 111.4 110.3 111.3
N3–C5–H12 109.5 110.2 109.6 110.5 110.9 110.4
N3–C5–H13 110.8 110.4 111.2 110.5 109.5 110.2
N3–C5–H14 109.8 110.4 109.7 110.5 109.7 110.3
C2aC1–C7 125.4 125.7 124.2 124.4 128.3 128.9
C1–C7bN8 177.3 178.2 179.2 179.8 176.7 177.3
X15–C16–H17 108.7 108.9 107.5 107.5 106.8 106.4
X15–C16–H18 110.5 110.8 111.3 111.8 108.9 108.8
X15–C16–H19 110.5 110.8 111.4 111.8 108.9 109.1
C2aC1–X15 115.9 115.3 120.9 120.7 116.3 115.5
C1–X15–C16 117.0 117.4 119.4 119.6 103.4 103.9
C1–X15aO20 121.6 121.4 120.3 120.5 107.2 106.8
C1–S15aO21 108.6 109.1
Dihedral angles (8)
C1aC2–N3–C4 K1.5 0.0 K0.9 0.0 K3.9 K1.6
C1aC2–N3–C5 K170.4 K180.0 K166.6 K180.0 K169.5 K178.6
N3–C2aC1–X15 K177.3 K180.0 K175.6 K180.0 179.5 176.7
N3–C2aC1–C7 5.7 0.0 7.6 0.0 2.6 K0.8
H6–C2–N3–C7 K179.9 180.0 K178.8 180.0 K178.1 179.5
C2–N3–C4–H9 K79.7 K120.6 K78.7 K120.6 K75.8 K114.9
C2–N3–C4–H10 160.3 120.7 161.3 120.7 164.2 126.2
C2–N3–C4–H11 41.4 0.0 42.4 0.0 45.3 5.8
C2–N3–C5–H12 K13.0 0.0 K17.9 K0.0 104.5 117.8
C2–N3–C5–H13 107.2 120.2 102.4 120.2 K15.7 K2.4
C2–N3–C5–H14 K132.7 K120.2 K137.3 K120.2 K135.3 K122.5
C2aC1–X15–O20 2.0 0.0 K178.1 K180.0 2.7 4.4
C2aC1–X15–O21 K129.6 K127.3
C2aC1–X15–C16 K177.9 K180.0 2.1 0.0 116.6 118.5
C1–C15–C16–H17 179.8 K180.0 179.6 180.0 177.1 176.5
C1–C15–C16–H18 K59.4 K59.1 K61.0 K60.6 58.1 57.6
C1–C15–C16–H19 59.0 59.1 59.9 60.6 K63.4 K64.1
Coordinates describing linear part of molecule (8)
C1C7N8X15 177.3 178.2 179.5 180.2 177.2 177.9
C1C7N8X15 180.3 180.0 181.1 180.0 177.3 177.1
J. Polovkova et al. / Journal of Molecular Structure 785 (2006) 85–97 91

J. Polovkova et al. / Journal of Molecular Structure 785 (2006) 85–9792
measurements in solid phase and in solvents of different
polarity also pointed out on the existence of single conformer
of E-DASPN either in solid and condensed phase.
In the case of DAAPN we have supposed the existence of
two E-conformers arising from the rotation of whole acetyl –
COCH3 group about the single aC–COCH3 bond and, as
already mentioned, denoted by the second Z or E letter
according to the orientation of the carbonyl oxygen (towards or
from the double CaC bond).
NMR spectroscopy, except hindered rotation, is not very
suitable method to detect the different conformations of
molecules at the room temperature due to fast exchange
between them. We have successfully used 1H NMR spec-
troscopy in our previous study of (methylamino)methylene
propanedinitrile [H3C–NH–CHaC(CN)2] [12] and 1-(methy-
lamino)ethylidene propanedinitrile [H3C–NH–C(CH3)
aC(CN)2] [13], where in DMSO solutions the rotation around
aC–N bond was sufficiently hindered even at the room
temperature. Both the anti and syn conformers arising by this
rotation could be then distinguished also by NMR. The same
behaviour was observed also for both the studied compounds.
The rotation around the aC–N bond is slow enough and two
separate signals for both methyls in amino group are visible in
NMR spectra [23].
On the contrary, the rotation of acetyl group is much faster
and results only in averaged unresolved signals in 13C NMR
spectra at ambient temperature. This means that the coalesc-
ence temperature for this conformational transition lies below
the room temperature. Therefore, we have used both IR and
Raman spectroscopy as the more suitable techniques for
conformational analysis. Carbonyl group and CaC double
bond in DAAPN molecule give very strong well separated
bands in IR and Raman spectra in the region 1680–1550 cmK1
which belong to the so-called group frequencies allowing to
observe the conformational transitions (Figs. 3 and 4).
Fig. 6. The comparison of IPCM and PCM model in evaluation of relative
energy differences between EE and EZ conformers of DAAPN depending on
relative permittivity of environment: C IPCM/MP2/6-31G**, 6 PCM/DFT,
, PCM/MP2. PCM computations were carried out in 6-31CCG** basis set
and simultaneously with geometry optimization.
Theoretical calculations show that the most stable con-
former should be the EZ-one with dipole moment of w5 D,
while the calculated dipole moment for the second EE-
conformer is about 8.5 D. The calculated relative energy of
EE-DAAPN was found to be rather high, about w19 and
w24 kJ molK1 according to MP2 and DFT methods, respect-
ively. These values are on the same level as the relative energy
for the only found ZZ conformer of Z-DAAPN isomer. The
higher dipole moment of EE-conformer comparing to ZZ-one
causes that the relative energy of EE conformer decreases and
ZZ conformer increases in more polar solvent (Fig. 7 in Ref.
[23]). Due to the presented facts and probably also due to the
height of the rotational barrier about CaC bond the probability
of the isomerization of E-DAAPN is negligible. In accordance
with it, no evidence for isomerization process of E-DAAPN in
the solvents of various polarity was found by NMR
measurements.
However, the relative energy differences between the EZ
and EE conformers in highly polar solutions obtained by IPCM
model are still somewhat overestimated. The energy difference
of w15 kJ molK1 for DMSO solution is rather high as could be
expected from experiment. It can be explained by the fact that
IPCM model is static only. It means that during calculations no
further geometry optimisation is performed. However, accord-
ing to previous reports, the polarity of solvent can significantly
affect also the geometry of some systems [35,36]. So we
employed another PCM model, which provides also the
geometry optimisation in the presence of environment.
Simultaneously, expanded 6-31CCG** basis set including
also the diffuse functions on heavy atoms and hydrogens was
used. Using such approach, the energy difference between the
EZ and EE conformers lowered to w8 kJ molK1 at DFT level
and nearly to 5 kJ molK1 at MP2 level, as depicted in Fig. 6.
Described theoretical results correlate with the behaviour of
bands intensities belonging to single conformers of DAAPN.
The identity of the appropriate conformers may be
confirmed also by Dn difference between the CaO and CaC
stretching frequencies [37]. As it has been found for series of
acyclic a, b unsaturated aldehydes and ketones, the difference
in position of these two stretching modes is higher than
60 cmK1 for Z and below the 60 cmK1 for E-conformers
according to the orientation of oxygen with respect to the
double CaC bond.
In DAAPN, Dn is 69 cmK1 for bands present both in
acetonitrile solution and in solid phase and 38 cmK1 for those,
which are present only in acetonitrile solution. Both Dn values
are taken from Raman measurements in acetonitrile solution. It
implies again that the EZ-conformer will crystallize preferen-
tially (i.e. the only solid phase conformer) while in polar
solvents there will be a mixture of both EZ and EE conformers
of DAAPN.
To obtain the experimental enthalpy difference between
both conformers we have used the change of band intensities
ratio from the temperature measurements of infrared spectrum
of DAAPN in acetonitrile. This is depicted in Fig. 7 for the
bands at 617 and 634 cmK1 related to the CaO rocking
deformation mode of EZ and EE conformers, respectively. The
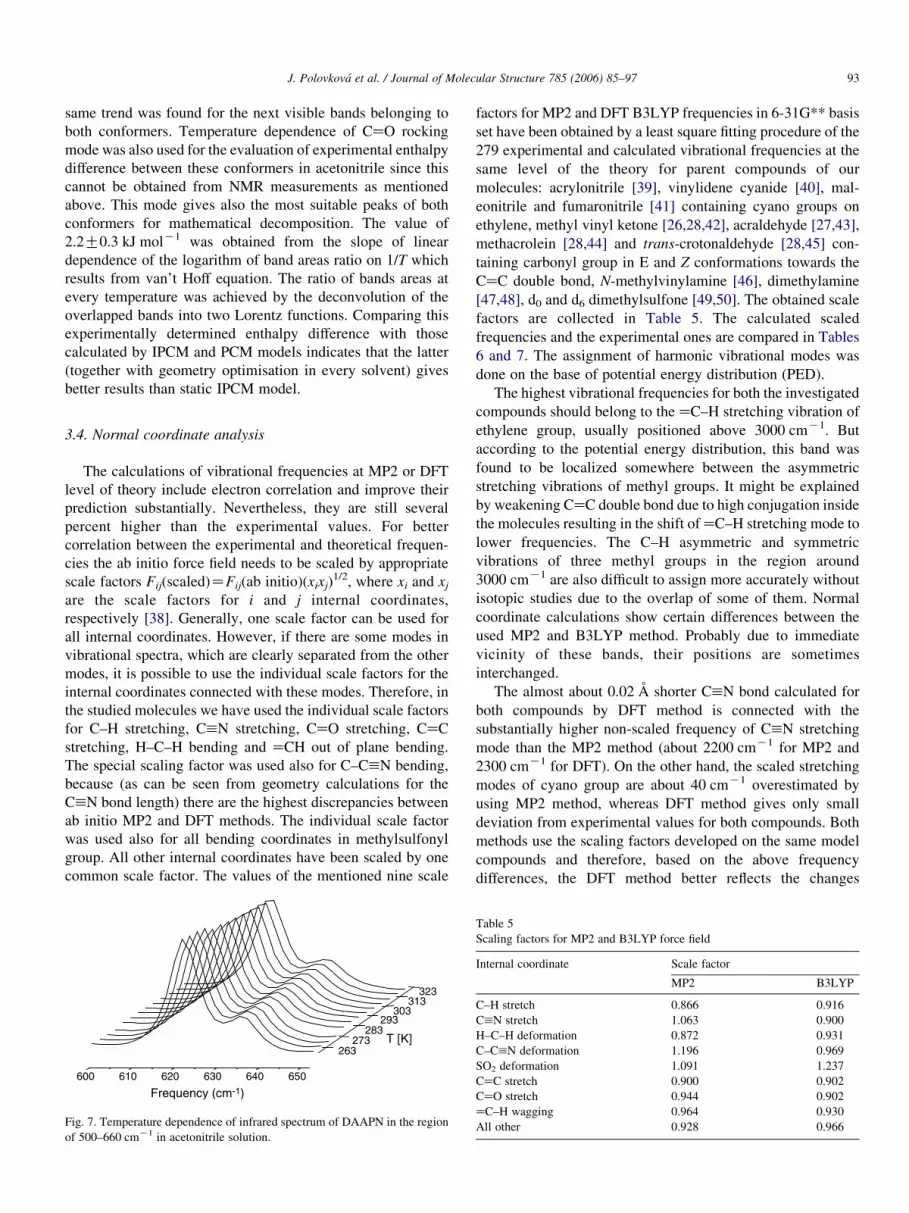
J. Polovkova et al. / Journal of Molecular Structure 785 (2006) 85–97 93
same trend was found for the next visible bands belonging to
both conformers. Temperature dependence of CaO rocking
mode was also used for the evaluation of experimental enthalpy
difference between these conformers in acetonitrile since this
cannot be obtained from NMR measurements as mentioned
above. This mode gives also the most suitable peaks of both
conformers for mathematical decomposition. The value of
2.2G0.3 kJ molK1 was obtained from the slope of linear
dependence of the logarithm of band areas ratio on 1/T which
results from van’t Hoff equation. The ratio of bands areas at
every temperature was achieved by the deconvolution of the
overlapped bands into two Lorentz functions. Comparing this
experimentally determined enthalpy difference with those
calculated by IPCM and PCM models indicates that the latter
(together with geometry optimisation in every solvent) gives
better results than static IPCM model.
3.4. Normal coordinate analysis
The calculations of vibrational frequencies at MP2 or DFT
level of theory include electron correlation and improve their
prediction substantially. Nevertheless, they are still several
percent higher than the experimental values. For better
correlation between the experimental and theoretical frequen-
cies the ab initio force field needs to be scaled by appropriate
scale factors Fij(scaled)ZFij(ab initio)(xixj)1/2, where xi and xj
are the scale factors for i and j internal coordinates,
respectively [38]. Generally, one scale factor can be used for
all internal coordinates. However, if there are some modes in
vibrational spectra, which are clearly separated from the other
modes, it is possible to use the individual scale factors for the
internal coordinates connected with these modes. Therefore, in
the studied molecules we have used the individual scale factors
for C–H stretching, CbN stretching, CaO stretching, CaC
stretching, H–C–H bending and aCH out of plane bending.
The special scaling factor was used also for C–CbN bending,
because (as can be seen from geometry calculations for the
CbN bond length) there are the highest discrepancies between
ab initio MP2 and DFT methods. The individual scale factor
was used also for all bending coordinates in methylsulfonyl
group. All other internal coordinates have been scaled by one
common scale factor. The values of the mentioned nine scale
Fig. 7. Temperature dependence of infrared spectrum of DAAPN in the region
of 500–660 cmK1 in acetonitrile solution.
factors for MP2 and DFT B3LYP frequencies in 6-31G** basis
set have been obtained by a least square fitting procedure of the
279 experimental and calculated vibrational frequencies at the
same level of the theory for parent compounds of our
molecules: acrylonitrile [39], vinylidene cyanide [40], mal-
eonitrile and fumaronitrile [41] containing cyano groups on
ethylene, methyl vinyl ketone [26,28,42], acraldehyde [27,43],
methacrolein [28,44] and trans-crotonaldehyde [28,45] con-
taining carbonyl group in E and Z conformations towards the
CaC double bond, N-methylvinylamine [46], dimethylamine
[47,48], d0 and d6 dimethylsulfone [49,50]. The obtained scale
factors are collected in Table 5. The calculated scaled
frequencies and the experimental ones are compared in Tables
6 and 7. The assignment of harmonic vibrational modes was
done on the base of potential energy distribution (PED).
The highest vibrational frequencies for both the investigated
compounds should belong to the aC–H stretching vibration of
ethylene group, usually positioned above 3000 cmK1. But
according to the potential energy distribution, this band was
found to be localized somewhere between the asymmetric
stretching vibrations of methyl groups. It might be explained
by weakening CaC double bond due to high conjugation inside
the molecules resulting in the shift of aC–H stretching mode to
lower frequencies. The C–H asymmetric and symmetric
vibrations of three methyl groups in the region around
3000 cmK1 are also difficult to assign more accurately without
isotopic studies due to the overlap of some of them. Normal
coordinate calculations show certain differences between the
used MP2 and B3LYP method. Probably due to immediate
vicinity of these bands, their positions are sometimes
interchanged.
The almost about 0.02 A shorter CbN bond calculated for
both compounds by DFT method is connected with the
substantially higher non-scaled frequency of CbN stretching
mode than the MP2 method (about 2200 cmK1 for MP2 and
2300 cmK1 for DFT). On the other hand, the scaled stretching
modes of cyano group are about 40 cmK1 overestimated by
using MP2 method, whereas DFT method gives only small
deviation from experimental values for both compounds. Both
methods use the scaling factors developed on the same model
compounds and therefore, based on the above frequency
differences, the DFT method better reflects the changes
Table 5
Scaling factors for MP2 and B3LYP force field
Internal coordinate Scale factor
MP2 B3LYP
C–H stretch 0.866 0.916
CbN stretch 1.063 0.900
H–C–H deformation 0.872 0.931
C–CbN deformation 1.196 0.969
SO2 deformation 1.091 1.237
CaC stretch 0.900 0.902
CaO stretch 0.944 0.902
aC–H wagging 0.964 0.930
All other 0.928 0.966

Table 6
Comparison of calculated and observed IR vibrational frequencies for EZ and EE conformers of DAAPN
EZ-DAAPN EE-DAAPN
No. MP2 B3LYP Observed MP2 B3LYP Observed Fundamental PED(MP2)a
n1 3046 3071 3076 3049 3077 CH3 asym stretch 86 (N)CH3 as
n2 3037 3043 3029 3042 3073 CH3 asym stretch 98 (C)CH3 as
n3 3030 3034 3029 3034 3031 CH3 asym stretch 75 (N)CH3 as, 20 aC–H s
n4 3021 3025 3018 3020 3016 C–H stretch 79 aC–H s, 19 (N)CH3 as
n5 2999 2981 2989 2998 2976 CH3 asym stretch 81 (N)CH3 as
n6 2998 2959 2989 2996 2957 CH3 asym stretch 100 (C)CH3 as
n7 2978 2955 2970 2975 2951 CH3 asym stretch 97 (N)CH3 as
n8 2916 2922 2925 2913 2915 CH3 sym stretch 98 (C)CH3 ss
n9 2912 2909 2925 2912 2907 CH3 sym stretch 91 (N)CH3 ss
n10 2899 2902 2880 2895 2899 CH3 sym stretch 93 (N)CH3 ss
n11 2241 2197 2197 2241 2216 CbN stretch 87 CbN s, 13 aC–CN s
n12 1717 1692 1672 1690 1680 1652 CaO stretch 72 CaO s, 11 CaC s
n13 1648 1616 1605 1667 1634 1614 CaC stretch 32 CaC s, 38aC–N s, 21 CaO s
n14 1486 1489 1481 1490 1500 CH3 asym bend 49 (N)CH3 ad, 14 (N)CH3 r
n15 1461 1464 1453 1461 1466 CH3 asym bend 76 (N)CH3 ad
n16 1448 1457 1453 1448 1459 CH3 asym bend 83 (N)CH3 ad
n17 1438 1439 1427 1441 1449 CH3 asym bend 79 (N)CH3 ad
n18 1433 1439 1427 1440 1448 CH3 sym bend 81 (N)CH3 sd
n19 1433 1438 1427 1437 1439 CH3 asym bend 87 (C)CH3 ad
n20 1425 1429 1420 1435 1439 CH3 asym bend 83 (C)CH3 ad
n21 1420 1424 1420 1423 1433 CH3 sym bend 57 (N)CH3 sd
n22 1416 1410 1413 1410 1417 aC–N stretch 12 aC–N s, 40 (N)CH3 sd
n23 1375 1377 1367 1393 1388 1386 aC–H rock 58 aC–H r
n24 1366 1364 1346 1357 1352 CH3 sym bend 83 (C)CH3 sd
n25 1292 1270 1286 1307 1285 1300 aC–CO stretch 30 aC–CO s, 25 NC2 as, 13 CaC–N d
n26 1233 1217 1222 1231 1211 NC2 asym stretch 26 NC2 as, 16 aC–CO s, 15 (N)CH3 r
n27 1143 1154 1139 1144 1154 CH3 rock 85 (N)CH3 r
n28 1133 1136 1139 1128 1130 CH3 rock 40 (N)CH3 r, 11 C–N s
n29 1106 1110 1105 1105 1109 CH3 rock 82 (N)CH3 r
n30 1069 1064 1056 1070 1067 CH3 rock 68 (N)CH3 r, 23 NC2 as
n31 1050 1042 1041 1048 1040 CH3 rock 24 (C)CH3 r, 14 C–CN s, 12 CC2 r
n32 1021 1027 1024 1018 1023 CH3 rock 67 (C)CH3 r, 14 CaO u
n33 967 969 993 935 926 949 CO–CH3 stretch 25 CO–CH3 s, 37 (C)CH3 r
n34 962 963 970 909 916 aC–H wag 75 aC–H u
n35 838 834 852 852 854 NC2 sym stretch 66 NC2 ss, 10 CO–CH3 s
n36 803 807 807 804 806 aC–CN stretch 23 C–CN s, 29 CaC–N d, 14 NC2 r
n37 612 636 622 621 645 634 CaO rock 28 CaO r, 18 aC–CO s
n38 571 612 617 589 622 CaO wag 54 CaO u, 24 CC2 u,?23 C–CbN d
n39 539 542 552 524 536 C–CbN bend 13 CC2 d, 23 CaO r, 19 C–CbN d
n40 528 535 544 494 488 507 C–CbN bend 37 C–CbN d, 27 CaO u
n41 463 464 466 476 468 NC2 deformation 40 NC2 d, 18 CC2 d
n42 440 437 453 399 406 NC2 rock 16 NC2 r, 18 NC2 d, 24 C–C–C d
n43 398 400 426 388 377 CaC torsion 19 CaC t,?22 C–CbN d, 20 C–N t
n44 338 342 362 364 377 C–C(O)–C deformation 48 C–C–C d, 16 NC2 r
n45 292 298 293 290 294 CaC–N deformation 15 CaC–N d,?27 NC2 r, 20 CC2 r
n46 238 275 285 230 274 CC2 wag 18 CC2 u, ?35 NC2 u, 16 N–CH3 t
n47 172 176 180 175 170 N–CH3 torsion 58 N–CH3 t, 36 CC2 u
n48 165 161 163 169 165 CC2 rock 29 CC2 r, 17 N–CH3 t, 16 NC2 d
n49 157 153 158 167 161 CC2 deformation 47 CC2 d,?42 C–CbN d
n50 135 136 112 161 159 C–CH3 torsion 87 C–CH3 t, 13 (C)CH3 r
n51 114 124 112 125 133 NC2 wag 52 NC2 u, 48 N–CH3 t
n52 99 79 84 110 74 N–CH3 torsion 70 N–CH3 t, 15 CaC–N d
n53 63 65 76 62 60 aC–CO torsion 91 aC–CO t
n54 51 51 44 49 C–N torsion 44 C–N t, 38 CaC t, 13 CC2 u
a s, symmetric; a, asymmetric; s, stretch; d, deformation; r, rocking; u, wagging; t, torsion.
J. Polovkova et al. / Journal of Molecular Structure 785 (2006) 85–9794
between the model and the studied compounds. The CbN
stretching modes were found at the same frequency of
2194 cmK1 for both the compounds, what is about 10–
20 cmK1 lower than for the AE and its N-methyl derivatives
[13] and 15–30 cmK1 lower than for the AM and its N-methyl
derivatives [12]. This downshift indicates the higher conju-
gation through a cyano group in DAAPN and DASPN than in
previously studied compounds resulting in decreasing multiple

Table 7
Comparison of calculated and observed IR vibration frequencies of E-DASPN
No. MP2 B3LYP Observed Fundamental PED (MP2)a
n1 3049 3068 3040 CH3 asym stretch 92 (S)CH3 as
n2 3042 3053 3040 CH3 asym stretch 91 (N)CH3 as
n3 3040 3052 3040 CH3 asym stretch 92 (S)CH3 as
n4 3034 3045 3040 C–H stretch 72 aC–H s, 22 (N)CH3 as
n5 3026 3023 3013 CH3 asym stretch 60 (N)CH3 as, 27 aC–H s
n6 3002 2963 3003 CH3 asym stretch 84 (N)CH3 as
n7 2981 2958 2947 CH3 asym stretch 97 (N)CH3 as
n8 2928 2944 2922 CH3 sym stretch 100 (S)CH3 ss
n9 2911 2911 2881 CH3 sym stretch 90 (N)CH3 ss
n10 2900 2903 2881 CH3 sym stretch 93 (N)CH3 ss
n11 2242 2197 2202 CbN stretch 87 CbN s, 14 aC–CN s
n12 1674 1647 1638 CaC stretch 47 CaC s, 41 aC–N s, 12 aC–H r
n13 1487 1496 1474 CH3 asym bend 43 (N)CH3 ad, 13 (N)CH3 r
n14 1461 1467 1458 CH3 asym bend 68 (N)CH3 ad
n15 1448 1457 1458 CH3 asym bend 80 (N)CH3 ad
n16 1438 1446 1434 CH3 sym bend 50 (N)CH3 sd, 36 (N)CH3 ad
n17 1437 1439 1434 CH3 asym bend 54 (N)CH3 ad, 36 (N)CH3 sd
n18 1421 1431 1423 CH3 sym bend 87 (N)CH3 sd
n19 1417 1421 1417 CH3 asym bend 85 (S)CH3 ad
n20 1413 1417 1417 CH3 asym bend 47 (S)CH3 ad, 14 (N)CH3 sd
n21 1409 1414 1411 aC–N stretch 39 (S)CH3 sd, 11 aC–N s
n22 1383 1387 1379 aC–H rock 59 aC–H r, 10 aC–CN s
n23 1335 1324 1319 CH3 sym bend 100 (S)CH3 sd
n24 1311 1290 1309 SO2 asym stretch 93 SO2 as
n25 1263 1239 1248 NC2 asym stretch 52 NC2 as, 17 (N)CH3 r,
n26 1144 1153 1153 CH3 rock 82 (N)CH3 r
n27 1129 1132 1144 CH3 rock 39 (N)CH3 r, 13 aC–N s
n28 1121 1110 1137 SO2 sym stretch 72 SO2 ss
n29 1106 1099 1122 CH3 rock 79 (N)CH3 r
n30 1069 1065 1060 CH3 rock 60 (N)CH3 r, 24 NC2 as
n31 1038 1009 1037 aC–S stretch 26 aC–S s, 22 C–CN s, 17 aC(S)C r
n32 984 978 973 CH3 rock 67 (S)CH3 r
n33 980 975 962 CH3 rock 62 (S)CH3 r
n34 958 958 957 aC–H wag 80 aC–H u
n35 845 839 841 NC2 sym stretch 63 NC2 ss, 11 aC–S s
n36 813 816 811 aC–CN stretch 29 CaC–N d, 21 aC–CN s, 13 NC2 r
n37 763 741 755 S–CH3 stretch 58 S–CH3 s, 15 SO2 u
n38 596 609 583 C–CbN bend 41 C–CbN d, 20 aC(S)C u, 12 SO2 u
n39 569 558 565 SO2 scissors 30 SO2 d, 17 aC–S s, 13 SO2 u
n40 509 500 500 SO2 wag 23 SO2 u, 16 C–CbN d
n41 497 481 496 C–CbN bend 36 SO2 d, 16 C–CbN d
n42 445 438 456 NC2 deformation 55 NC2 d
n43 415 425 418 SO2 rock 40 SO2 r, 20 NC2 r
n44 400 393 414 CaC torsion 23 CaC t, 18 aC–H u, 16 aC–N t
n45 362 367 365 NC2 rock 27 SO2 r, 18 NC2 r
n46 318 330 330 SO2 twist 76 SO2 t, 14 C–S–C d
n47 288 306 306 C–S–C deformation 43 C–S–C d, 14 SO2 t, 14 NC2 r
n48 267 264 263 CaC–N deformation 13 CaC–N d, 13 aC–S s, 11 aC(S)C r
n49 221 246 243 S–CH3 torsion 81 S–CH3 t
n50 216 207 243 NC2 wag 19 NC2 u, 34 N–CH3 t, 16 S–CH3 t
n51 156 147 162 aC(S)C rock 43 aC(S)C r, 22 NC2 d, 20 N–CH3 t
n52 145 142 138 aC(S)C deformation 32 aC(S)C d, 30 N–CH3 t,17 C–CbN d
n53 133 137 138 N–CH3 torsion 31 N–CH3 t, 22 C(S)C d, 22 NC2 u
n54 100 114 106 aC(S)C wag 25 aC(S)C u, 34 N–CH3 t, 14 NC2 u
n55 96 68 89 N–CH3 torsion 56 N–CH3 t, 13 CaC–N d, 12 NC2 u
n56 56 47 52 aC–N torsion 48 aC–N t, 36 CaC t
n57 46 30 52 C–S torsion 78 aC–S t, 22 CaC t
a s, symmetric; a, asymmetric; s, stretch; d, deformation; r, rocking; ,u wagging; t, torsion.
J. Polovkova et al. / Journal of Molecular Structure 785 (2006) 85–97 95
character of this bond. This can be caused by the different
nature of investigated compounds due to the presence of acetyl
and methylsulfonyl group, respectively. There is also the small
contribution of aC–CN stretching vibration to this mode.
The CaO stretching mode for EZ-DAAPN and EE-DAAPN
in solution was found at 1672 and 1658 cmK1. The higher
frequency of CaO mode of EZ-conformer is in agreement with
the band positions of methyl vinyl ketone: 1704 cmK1 for EZ-

J. Polovkova et al. / Journal of Molecular Structure 785 (2006) 85–9796
conformer and 1676 cmK1 for the EE-one [42]. Normal
coordinate calculations indicate the slight coupling of this
mode with CaC stretching vibration and 20–30 cmK1 down-
shift indicates higher conjugation in comparison with methyl
vinyl ketone.
The CaC stretching frequency is almost about 50 cmK1
higher for DASPN than for DAAPN. This observation
indicates higher conjugation in DAAPN than in DASPN. The
CaC frequency of DAAPN at 1596 cmK1 is significantly
lower than that of previously described DMAM and DMAE
[12,13] as well as methyl vinyl ketone at 1620 cmK1 [42]. The
strong coupling was found for CaC stretching mode and
according to PED calculations there is high contribution of
aC–N stretching mode for both compounds. As a consequence
of particularly multiple character of aC–N bond in such
conjugated molecules, the appropriate stretching vibration can
be supposed to be shifted to higher wavenumbers. We have
found this band at 1411 cmK1 for DAAPN and at 1379 cmK1
for DASPN what is also in accordance with calculated more
conjugated structure of DAAPN in comparison with DASPN.
The intense bands at 1286 cmK1 for DAAPN and
1300 cmK1 for DASPN have different origins. While for
DAAPN this band can be assigned to the aC–CO stretching
vibration coupled with N–CH3 asymmetric stretching, for
DASPN it belongs to asymmetric SO2 stretching mode.
Symmetric SO2 stretching vibration was found at
1140 cmK1. Both these values for SO2 modes are close to
that for methyl vinyl sulfone at 1303 and 1135 cmK1 [50].
The next common vibrations for both compounds are NC2
asymmetric and symmetric stretching frequencies, which
appear at 1218 and 830 cmK1 for DAAPN and about 30 and
10 cmK1, respectively, higher at 1248 and 841 cmK1 for
DASPN. Similarly, the aC–H rocking and wagging vibrations
for both the compounds occur in the same region. The former
one at 1367 and 1379 cmK1 and the latter one at 970 and
955 cmK1 for DAAPN and DASPN, respectively, indicate no
dramatic influence of acetyl and methylsulfonyl groups on
these vibrations.
The isolated band at 755 cmK1 with strong intensity can be
assigned to S–CH3 stretching frequency. On the contrary, the
aC–S stretching mode was found at rather higher frequency of
1035 cmK1. For the earlier studied methyl phenyl sulfone these
bands are at 786 and 1084 cmK1, respectively, and the latter is
strongly coupled with C–C stretching vibrations of aromatic
nucleus and C–H skeletal deformation vibrations [51]. In
DASPN the aC–S stretching mode is mixed with aC–CN
stretching vibration and aC(S)(C) rocking deformation. For
SO2 deformation vibrations usually accepted intervals are
535G40 cmK1 for scissoring, 485G50 cmK1 for wagging,
405G65 cmK1 for twisting and 320G40 cmK1 for rocking
[52]. In agreement with this the first two modes at 565 cmK1
for scissoring and at 498 cmK1 for wagging have been
calculated and assigned. Interchanged positions were obtained
for the next two modes: 418 cmK1 for rocking and 330 cmK1
for twisting. Such opposite assignment was also recently
calculated for methanesulfonic acid monomer [53].
Methyl rocking vibrations of –SO2CH3 group are according
to both MP2 and B3LYP methods separated from N(CH3)2
rocking vibrations and are located at lower frequencies. For
example, the methyl symmetric deformation mode was found
in the expected region [52] at 1346 and 1319 cmK1 for
DAAPN and DASPN, respectively, while the corresponding –
N(CH3)2 modes are over 1400 cmK1.
The assignment of other deformation bands of DAAPN and
DASPN is difficult and not very unambiguous due to large
coupling between single deformation modes and relatively
small contributions to PED. Moreover, NC2 rocking and CaC
torsion mode were determined for both the compounds at
approximately similar frequency about 400 and 360 cmK1,
respectively. In the assignment of other bands the relatively
high uncertainty can exist since the experimental frequencies
for similar compounds had not been reported and described yet.
4. Conclusions
The assignment of normal vibrational modes of two simple
push–pull ethylenes was performed. The vibrational analyses
supported by theoretical calculations in vacuo and in the
environment of various polarity revealed the existence of two
conformers of DAAPN originating in the rotation of acetyl
group. Unlike the previous study of methyl vinyl ketone, EZ-
DAAPN was proven to be the most stable conformer.
The experimental enthalpy difference in acetonitrile
solution was obtained from infrared measurements at various
temperatures. The value of 2.2G0.3 kJ molK1 is more close to
those obtained by PCM solvent effect calculations performed
with the geometry optimization at ab initio MP2 level.
Comparing with stationary IPCM model, the PCM method
seems to be more suitable in predicting energy changes
occurring due to the interactions between these compounds and
various solvents.
Acknowledgements
This work has been supported by Slovak Grant Agency
(Projects VEGA No. 1/0052/03 and 1/0058/03). We thank the
IBM Slovakia for computing facilities. Dr. Martin Breza is
gratefully acknowledged for helpful discussion.
References
[1] S. Rajappa, Tetrahedron 37 (1981) 1453.
[2] S. Rajappa, Tetrahedron 55 (1999) 7065.
[3] A.G. Cook (Ed.), Enamines: Synthesis, Structure and Reactions, Marcel
Dekker, New York, 1969.
[4] S.F. Dyke, The Chemistry of Enamines, Cambridge University Press,
London, 1973.
[5] R. Benassi, F. Taddei, J. Mol. Struct. (Theochem) 572 (2001) 169.
[6] T.M. Kolev, D.Y. Yancheva, B.A. Stamboliyska, Spectrochim. Acta A 59
(2003) 3325.
[7] I. Alkorta, C. Wentrup, J. Elguero, J. Mol. Struct. 585 (2002) 27.
[8] R.R. Pappalardo, E. Sanchez Marcos, J. Chem. Soc. Faraday Trans. 87
(11) (1991) 1719.

J. Polovkova et al. / Journal of Molecular Structure 785 (2006) 85–97 97
[9] R.R. Pappalardo, E. Sanchez Marcos, J. Chem. Research(S) (1989) 290;
R.R. Pappalardo, R.M. Parrondo, P. Karafiloglou, E. Sanchez Marcos,
J. Phys. Chem. 99 (1995) 6461.
[10] J.L. Chiara, A. Gomez-Sanchez, E. Sanchez Marcos, J. Chem. Soc. Perkin
Trans. 2 (1990) 385.
[11] N. Taoufik, R.R. Pappalardo, E. Sanchez Marcos, Chem. Phys. Lett. 323
(2000) 400.
[12] A. Gatial, S. Sklenak, V. Milata, P. Klaeboe, S. Biskupic, J. Juraskova,
Struct. Chem. 7 (1996) 17.
[13] A. Gatial, S. Sklenak, V. Milata, S. Biskupic, R. Salzer, D. Scheller,
G. Woelki, J. Mol. Struct. 509 (1999) 67.
[14] T. Kolev, D. Yancheva, B. Shivachev, R. Petrova, M. Spiteller, Acta
Crystallogr. E61 (2005) o550.
[15] J.L. Chiara, A. Gomez-Sanchez, E. Sanchez, A. Gomez-Sanchez,
E. Sanchez Marcos, J. Chem. Soc. Perkin Trans. 2 (1990) 385.
[16] A.R. Karitzky, T.-B. Huang, M.V. Voronkov, M. Wang, H. Kolb, J. Org.
Chem. 65 (2000) 8819.
[17] P.M. Freihammer, M.R. Detty, J. Org. Chem. 65 (2000) 7203.
[18] K.C. Schneider, S.A. Benner, Tetrahedron Lett. 31 (1990) 335.
[19] P.E. Reddy, R.M.V. Reddy, Chem. Abstr. 130 (1999) 281870.
[20] J.K. Konopa, M.T. Konieczny, B.J. Horowska, A.J. Kunikowski, T. Asao,
H. Nishino, Y. Yamada, Chem. Abstr. 126 (1997) 185889.
[21] E. Vajda, D. Hnyk, B. Rozsondai, J. Podlaha, J. Podlahova, J. Hasek,
J. Mol. Struct. 239 (1990) 265.
[22] G.W. Kabalka, S.K. Guchhait, Tetrahedron Lett. 45 (2004) 4021.
[23] J. Pigosova, A. Gatial, V. Milata, P. Cernuchova, N. Pronayova, T. Liptaj,
P. Matjka, J. Mol. Struct. 744–747 (2005) 315.
[24] M.J. Frisch, G.W. Trucks, H.B. Schlegel, G.E. Scuseria, M.A. Robb, J.R.
Cheeseman, V.G. Zakrzewski, J.A. Montgomery, Jr., R.E. Stratmann, J.C.
Burant, S. Dapprich, J.M. Millam, A.D. Daniels, K.N. Kudin, M.C. Strain,
O. Farkas, J. Tomasi, V. Barone, M. Cossi, R. Cammi, B. Mennucci, C.
Pomelli, C. Adamo, S. Clifford, J. Ochterski, G.A. Petersson, P.Y. Ayala,
Q. Cui, K. Morokuma, D.K. Malick, A.D. Rabuck, K. Raghavachari, J.B.
Foresman, J. Cioslowski, J.V. Ortiz, A.G. Baboul, B.B. Stefanov, G. Liu,
A. Liashenko, P. Piskorz, I. Komaromi, R. Gomperts, R.L. Martin, D.J.
Fox, T. Keith, M.A. Al-Laham, C.Y. Peng, A. Nanayakkara, M.
Challacombe, P.M.W. Gill, B. Johnson, W. Chen, M.W. Wong, J.L.
Andres, C. Gonzalez, M. Head-Gordon, E.S. Replogle, J.A. Pople,
GAUSSIAN 98, Revision A.9, Gaussian, Inc., Pittsburgh PA, 1998.
[25] M.J. Frisch, G.W. Trucks, H.B. Schlegel, G.E. Scuseria, M.A. Robb, J.R.
Cheeseman, J.A. Montgomery, Jr., T. Vreven, K.N. Kudin, J.C. Burant,
J.M. Millam, S.S. Iyengar, J. Tomasi, V. Barone, B. Mennucci, M. Cossi,
G. Scalmani, N. Rega, G.A. Petersson, H. Nakatsuji, M. Hada, M. Ehara,
K. Toyota, R. Fukuda, J. Hasegawa, M. Ishida, T. Nakajima, Y. Honda, O.
Kitao, H. Nakai, M. Klene, X. Li, J.E. Knox, H.P. Hratchian, J.B. Cross,
C. Adamo, J. Jaramillo, R. Gomperts, R.E. Stratmann, O. Yazyev, A.J.
Austin, R. Cammi, C. Pomelli, J.W. Ochterski, P.Y. Ayala, K. Morokuma,
G.A. Voth, P. Salvador, J.J. Dannenberg, V.G. Zakrzewski, S. Dapprich,
A.D. Daniels, M.C. Strain, O. Farkas, D.K. Malick, A.D. Rabuck, K.
Raghavachari, J.B. Foresman, J.V. Ortiz, Q. Cui, A.G. Baboul, S.
Clifford, J. Cioslowski, B.B. Stefanov, G. Liu, A. Liashenko, P. Piskorz, I.
Komaromi, R.L. Martin, D.J. Fox, T. Keith, M.A. Al-Laham, C.Y. Peng,
A. Nanayakkara, M. Challacombe, P.M.W. Gill, B. Johnson, W. Chen,
M.W. Wong, C. Gonzalez, J.A. Pople, GAUSSIAN 03, Revision A.1,
Gaussian, Inc., Pittsburgh PA, 2003.
[26] J. de Smedt, F. Vanhouteghem, C. van Alsenoy, H.J. Geise, B. Van der
Veken, P. Coppens, J. Mol. Struct. 195 (1989) 227.
[27] H.J. Oelichmann, D. Bougeard, B. Schrader, J. Mol. Struct. 77 (1981)
149.
[28] H.-J. Oelichmann, D. Bougeard, B. Schrader, J. Mol. Struct. 77 (1981)
179.
[29] R. Kimmelma, M. Hotokka, J. Mol. Struct. (Theochem) 418 (1997) 189.
[30] M. Hotokka, R. Kimmelma, J. Mol. Struct. (Theochem) 276 (1992) 167.
[31] M. Hotokka, R. Kimmelma, J. Mol. Struct. (Theochem) 313 (1994) 313.
[32] R. Kimmelma, Acta Chem. Scand. 47 (1993) 1201.
[33] E. Vajda, P. Friedman, I. Hargittai, D. Hnyk, L. Schafer, K. Siam, J. Mol.
Struct. 213 (1989) 309.
[34] V.A. Naumov, R.N. Ziatdinova, E.A. Berdnikov, J. Struct. Chem. (1981)
382.
[35] M.W. Wong, K.B. Wiberg, M. Frisch, J. Chem. Phys. 95 (1991) 8991.
[36] M.W. Wong, M.J. Frisch, K.B. Wiberg, J. Am. Chem. Soc. 113 (1991)
4776.
[37] H.-J. Oelichmann, D. Bougeard, B. Schrader, Angew. Chem. Suppl.
(1982) 1404.
[38] P. Pulay, G. Foragasi, G. Pongor, J.E. Boggs, A. Vargha, J. Am. Chem.
Soc. 105 (1983) 7037.
[39] F. Halverson, R.F. Stamm, J.J. Whalen, J. Chem. Phys. 16 (1948) 808.
[40] A. Rosenberg, J.P. Devlin, Spectrochim. Acta 21 (1965) 1613.
[41] F.A. Miller, O. Sala, P. Devlin, J. Overend, E. Lippert, W. Luder,
H. Moser, J. Varchmin, Spectrochim. Acta 20 (1964) 1233.
[42] J.R. Durig, T.S. Little, J. Chem. Phys. 75 (1981) 3660.
[43] Y.N. Panchenko, P. Pulay, F. Torok, J. Mol. Struct. 34 (1976) 283.
[44] J.R. Durig, J. Qiu, B. Dehoff, T.S. Little, Spectrochim. Acta 42A (1986)
89.
[45] J.R. Durig, S.C. Brown, V.F. Kalasinsky, Spectrochim. Acta 32A (1976)
807.
[46] Y. Amatatsu, Y. Hamada, M. Tsuboi, J. Mol. Spectrosc. 111 (1985) 29.
[47] G. Gamer, H. Wolff, Spectrochim. Acta 29A (1973) 129.
[48] M.J. Buttler, D.C. McKean, Spectrochim. Acta 21 (1965) 465.
[49] T. Uno, K. Machida, K. Hanai, Spectrochim. Acta 27A (1971) 107.
[50] W.R. Feairheller, J.E. Katon, Spectrochim. Acta 20 (1964) 1099.
[51] M. Bouquet, G. Chassaing, J. Corset, J. Favrot, J. Limouzi, Spectrochim.
Acta 37A (1981) 727.
[52] N.P.G. Roeges, Guide to the Complete Interpretation of Infrared Spectra
of Organic Structures, Wiley, Chichester, 1994.
[53] A. Givan, A. Loewenschuss, C.J. Nielsen, J. Mol. Struct. 748 (2005) 77.


![Synthesis and Evaluation of a Set of 4-Phenylpiperidines and 4-Phenylpiperazines as D 2 Receptor Ligands and the Discovery of the Dopaminergic Stabilizer 4-[3-(Methylsulfonyl)phenyl]-1-propylpiperidine](https://img.pdfslide.net/doc/110x75/63231654807dc363600abaaf/synthesis-and-evaluation-of-a-set-of-4-phenylpiperidines-and-4-phenylpiperazines.jpg)


![Synthesis and preliminary biological evaluation of O-2((2-[ 18F]fluoroethyl)methylamino)ethyltyrosine ([18F]FEMAET) as a potential cationic amino acid PET tracer for tumor imaging](https://img.pdfslide.net/doc/110x75/6344ee6cf474639c9b049b2b/synthesis-and-preliminary-biological-evaluation-of-o-22-18ffluoroethylmethylaminoethyltyrosine.jpg)


![Structural and Mechanical Behavior of Boron Nitride Fibers Derived from Poly[(Methylamino)Borazine] Precursors: Optimization of the Curing and Pyrolysis Procedures](https://img.pdfslide.net/doc/110x75/6343f8a258efaca902040721/structural-and-mechanical-behavior-of-boron-nitride-fibers-derived-from-polymethylaminoborazine.jpg)