Embed Size (px)
Citation preview
Chemical Physics Letters 380 (2003) 404–410
www.elsevier.com/locate/cplett
Vibrational energy relaxation pathways of water
Andrei Pakoulev, Zhaohui Wang, Yoonsoo Pang, Dana D. Dlott *
School of Chemical Sciences, University of Illinois at Urbana-Champaign, Box 01-6 CLSL, 600 S. Goodwin Ave., Urbana, IL 61801, USA
Received 2 July 2003; in final form 1 September 2003
Published online: 7 October 2003
Abstract
Vibrational energy relaxation (VR) of the OH stretch mOH and bend dH2O in water is studied by the mid-IR pump
with anti-Stokes Raman probe technique. The broad mOH band in water consists of two inhomogeneously broadened
subbands. VR in the larger red-shifted subband mROH, with T1 ¼ 0:55 ps, is shown to occur by the mechanism mOH ! dH2O
(1/3) and mOH ! ground state (2/3). VR in the smaller longer-lived blue-shifted subband mBOH, with T1 ¼ 0:75 ps,
occurs by the mechanism mOH ! ground state. The bending fundamental dH2O decays directly to the ground state with
T1 ¼ 1:4 ps.
� 2003 Elsevier B.V. All rights reserved.
1. Introduction
In this work, we use the ultrafast IR-Ramantechnique to study vibrational energy relaxation
(VR) of the water OH stretch (mOH) and bend
(dH2O). An anti-Stokes Raman probe simulta-
neously observes both the parent mOH pumped by
mid-IR and any daughter excitations generated by
VR [1,2]. Knowing anti-Stokes intensities and
Raman cross-sections, it is possible to determine
the absolute quantum yield [3–5] for mOH generationof dH2O. In previous work, De�aak et al. [6] used this
technique to estimate the quantum yield / for mOH
generation of dH2O. De�aak was unable to clearly
resolve the mOH and dH2O lifetimes, which we will
see leads to inaccuracies in /. We have recently
* Corresponding author. Fax: +1-217-2443186.
E-mail address: [email protected] (D.D. Dlott).
0009-2614/$ - see front matter � 2003 Elsevier B.V. All rights reserv
doi:10.1016/j.cplett.2003.09.002
shown that the mOH transition of water consists of
two distinct vibrational subbands [7], and we can
now investigate the different VR mechanisms ofthe individual subbands.
Because there have been more studies of the
mOH band of HOD solute in D2O [8–14], we will
frequently refer to HOD results. However in our
studies of water [6,7,15], we emphasize that VR of
water is fundamentally different. The higher fre-
quency region of HOD fundamentals consists of
three totally separate transitions: the OH stretch mOH
(3395 cm�1), the OD stretch mOD (2510 cm�1) and
the bend overtone 2dHOD (2969 cm�1) (these indi-
cate center wavenumbers of broad bands [16]).
After mid-IR pumping of mOH, there are seven pos-
sible HOD VR pathways. Four pathways are in-
tramolecular, mOH ! 2dHOD (343 cm�1), mOH ! mOD
(836 cm�1), mOH ! dHOD (1829 cm�1), and mOH !ground state (3338 cm�1), and three pathways areintermolecular (to vibrations of the D2O solvent),
ed.
A. Pakoulev et al. / Chemical Physics Letters 380 (2003) 404–410 405
mOH ! mOD (848 cm�1), mOH ! 2dD2O (968 cm�1),
and mOH ! dD2O (2140 cm�1). The numbers in pa-
rentheses indicate the approximate amount of en-
ergy dissipated to the bath for each VR transition.
There have been two theoretical investigations of
VR of HOD. The earlier work by Rey and Hynes[17] did not consider intermolecular VR. Lawrence
and Skinner [18] reexamined this problem with
progressively more sophisticated simulations that
now include flexible solute and solvent molecules
[19,20]. The contributions of the four intramolec-
ular VR pathways were: mOH ! 2dHOD (54%),
mOH ! dHOD (18%), mOH ! mOD (8%), and mOH !ground state (19%). The calculated mOH lifetime wasT1 ¼ 2:3 ps (compared to experimental values
ranging from 0.5 to 1.1 ps [8,9,21–23]), and the
calculated dHOD lifetime was T1 ¼ 0:36 ps [19].
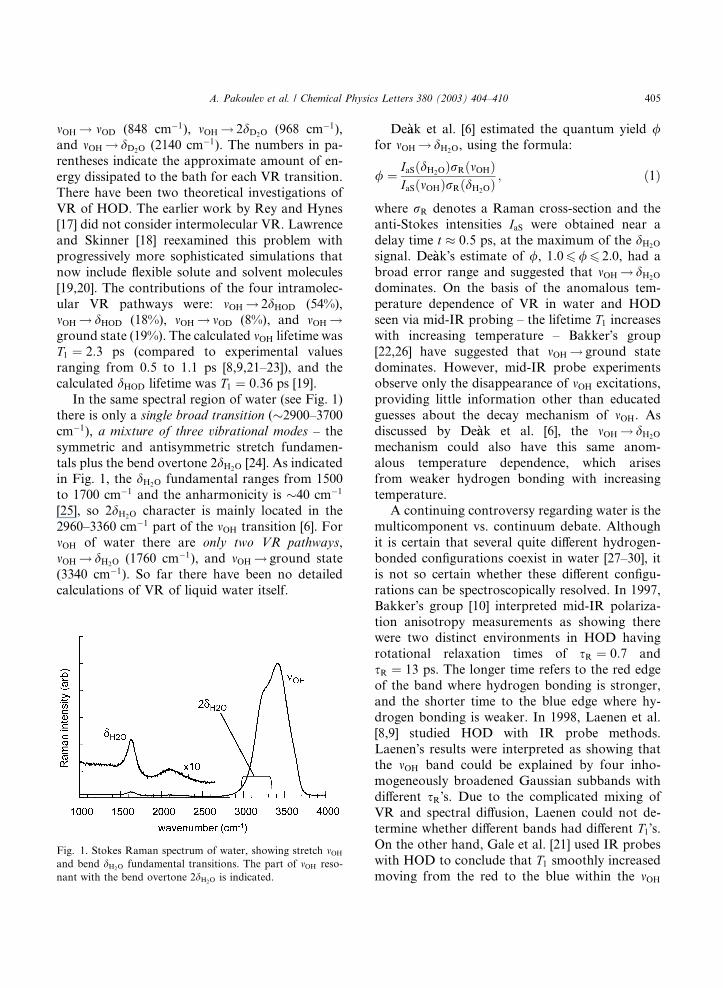
In the same spectral region of water (see Fig. 1)
there is only a single broad transition (�2900–3700
cm�1), a mixture of three vibrational modes – the
symmetric and antisymmetric stretch fundamen-
tals plus the bend overtone 2dH2O [24]. As indicatedin Fig. 1, the dH2O fundamental ranges from 1500
to 1700 cm�1 and the anharmonicity is �40 cm�1
[25], so 2dH2O character is mainly located in the
2960–3360 cm�1 part of the mOH transition [6]. For
mOH of water there are only two VR pathways,
mOH ! dH2O (1760 cm�1), and mOH ! ground state
(3340 cm�1). So far there have been no detailed
calculations of VR of liquid water itself.
Fig. 1. Stokes Raman spectrum of water, showing stretch mOH
and bend dH2O fundamental transitions. The part of mOH reso-
nant with the bend overtone 2dH2O is indicated.
De�aak et al. [6] estimated the quantum yield /for mOH ! dH2O, using the formula:
/ ¼ IaSðdH2OÞrRðmOHÞIaSðmOHÞrRðdH2OÞ
; ð1Þ
where rR denotes a Raman cross-section and the
anti-Stokes intensities IaS were obtained near a
delay time t � 0:5 ps, at the maximum of the dH2O
signal. De�aak�s estimate of /, 1:06/6 2:0, had a
broad error range and suggested that mOH ! dH2O
dominates. On the basis of the anomalous tem-
perature dependence of VR in water and HOD
seen via mid-IR probing – the lifetime T1 increaseswith increasing temperature – Bakker�s group
[22,26] have suggested that mOH ! ground state
dominates. However, mid-IR probe experimentsobserve only the disappearance of mOH excitations,
providing little information other than educated
guesses about the decay mechanism of mOH. As
discussed by De�aak et al. [6], the mOH ! dH2O
mechanism could also have this same anom-
alous temperature dependence, which arises
from weaker hydrogen bonding with increasing
temperature.A continuing controversy regarding water is the
multicomponent vs. continuum debate. Although
it is certain that several quite different hydrogen-
bonded configurations coexist in water [27–30], it
is not so certain whether these different configu-
rations can be spectroscopically resolved. In 1997,
Bakker�s group [10] interpreted mid-IR polariza-
tion anisotropy measurements as showing therewere two distinct environments in HOD having
rotational relaxation times of sR ¼ 0:7 and
sR ¼ 13 ps. The longer time refers to the red edge
of the band where hydrogen bonding is stronger,
and the shorter time to the blue edge where hy-
drogen bonding is weaker. In 1998, Laenen et al.
[8,9] studied HOD with IR probe methods.
Laenen�s results were interpreted as showing thatthe mOH band could be explained by four inho-
mogeneously broadened Gaussian subbands with
different sR�s. Due to the complicated mixing of
VR and spectral diffusion, Laenen could not de-
termine whether different bands had different T1�s.On the other hand, Gale et al. [21] used IR probes
with HOD to conclude that T1 smoothly increased
moving from the red to the blue within the mOH
406 A. Pakoulev et al. / Chemical Physics Letters 380 (2003) 404–410
band. In our recent work on water [7], we have
shown that the mOH band can be explained by two
inhomogeneously broadened Gaussian subbands
with different lifetimes, different spectral diffusion
and different vibrational Stokes shifts [7]. The
major subband is broader (FWHM �500 cm�1),red-shifted (3325 cm�1), and shorter-lived
(T1 ¼ 0:55 ps). The minor subband is narrower
(FWHM �200 cm�1), blue-shifted (�3525 cm�1),
and longer-lived (T1 ¼ 0:75 ps). Thus there are at
least two quite distinct mOH environments in water,
denoted mROH and mBOH.
Using a recently improved laser [15], we now
answer the following questions:1. What is the lifetime of dH2O?
2. What is the quantum yield / for mOH generation
of dH2O, and what VR mechanisms are implied
by this quantum yield?
3. Do mROH and mBOH, which have different lifetimes
[7], have different VR mechanisms?
2. Experimental
The apparatus [15] and experimental technique
[2,5,6] have been described previously. A tunable
mid-IR pulse xp with 25 cm�1 bandwidth pumps
the mOH transition and a 532 nm Raman probe xL
generates an anti-Stokes spectrum detected by a
multichannel spectrograph [2]. The detector�swavenumber axis was calibrated using several
atomic emission lines, and the detector�s wave-
length-dependent spectral sensitivity was corrected
with a calibrated tungsten halogen lamp (Ocean
Optics).
In IR-Raman experiments, a coherent artifact
[5,6] is generated by nonlinear light scattering
(NLS) at frequency xp þ xL, which appears in theanti-Stokes Raman spectrum at the pump pulse
wavenumber. The time and frequency dependence
of the NLS signal, which results from the pulse
duration and bandwidth plus broadening due to
dispersion or self-phase modulation in the water
sample [2,6], is used to determine the apparatus
time and frequency response [7,15]. The apparatus
response in the temporal and spectral domains is agood fit to Gaussian functions with FWHM 1.1 ps
and 35 cm�1 [7].
Of particular concern in water experiments is
the bulk temperature jump DT [7,15,26,31,32]. DTto indicates the increase in temperature after VR is
complete (a few ps) but before the sample cools by
thermal conduction (�100 ls) [2]. In previous
work [7] we have shown that mOH dynamics ofwater are largely unaffected by DT when DT 6
30 K. Increasing DT above 60 K causes the mBOH
lifetime to become noticeably longer.
3. Results
3.1. Stokes Raman cross-section ratios
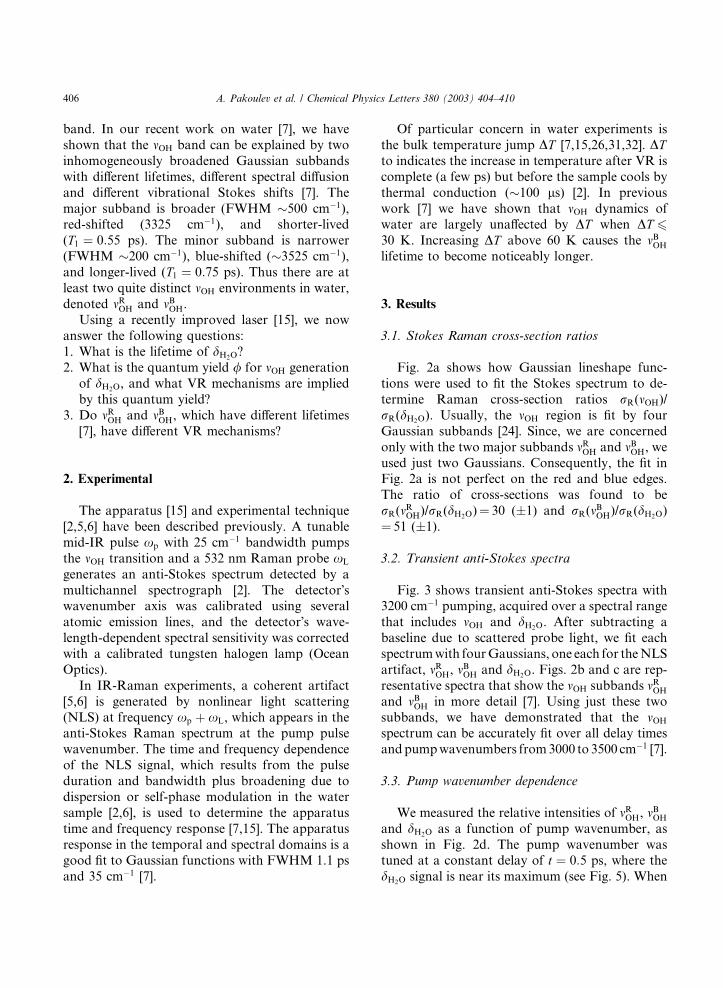
Fig. 2a shows how Gaussian lineshape func-
tions were used to fit the Stokes spectrum to de-
termine Raman cross-section ratios rR(mOH)/
rR(dH2O). Usually, the mOH region is fit by four
Gaussian subbands [24]. Since, we are concerned
only with the two major subbands mROH and mBOH, we
used just two Gaussians. Consequently, the fit inFig. 2a is not perfect on the red and blue edges.
The ratio of cross-sections was found to be
rR(mROH)/rR(dH2O)¼ 30 (�1) and rR(mBOH)/rR(dH2O)
¼ 51 (�1).
3.2. Transient anti-Stokes spectra
Fig. 3 shows transient anti-Stokes spectra with3200 cm�1 pumping, acquired over a spectral range
that includes mOH and dH2O. After subtracting a
baseline due to scattered probe light, we fit each
spectrumwith fourGaussians, one each for theNLS
artifact, mROH, mBOH and dH2O. Figs. 2b and c are rep-
resentative spectra that show the mOH subbands mROH
and mBOH in more detail [7]. Using just these two
subbands, we have demonstrated that the mOH
spectrum can be accurately fit over all delay times
andpumpwavenumbers from3000 to 3500 cm�1 [7].
3.3. Pump wavenumber dependence
We measured the relative intensities of mROH, mBOH
and dH2O as a function of pump wavenumber, as
shown in Fig. 2d. The pump wavenumber wastuned at a constant delay of t ¼ 0:5 ps, where the
dH2O signal is near its maximum (see Fig. 5). When
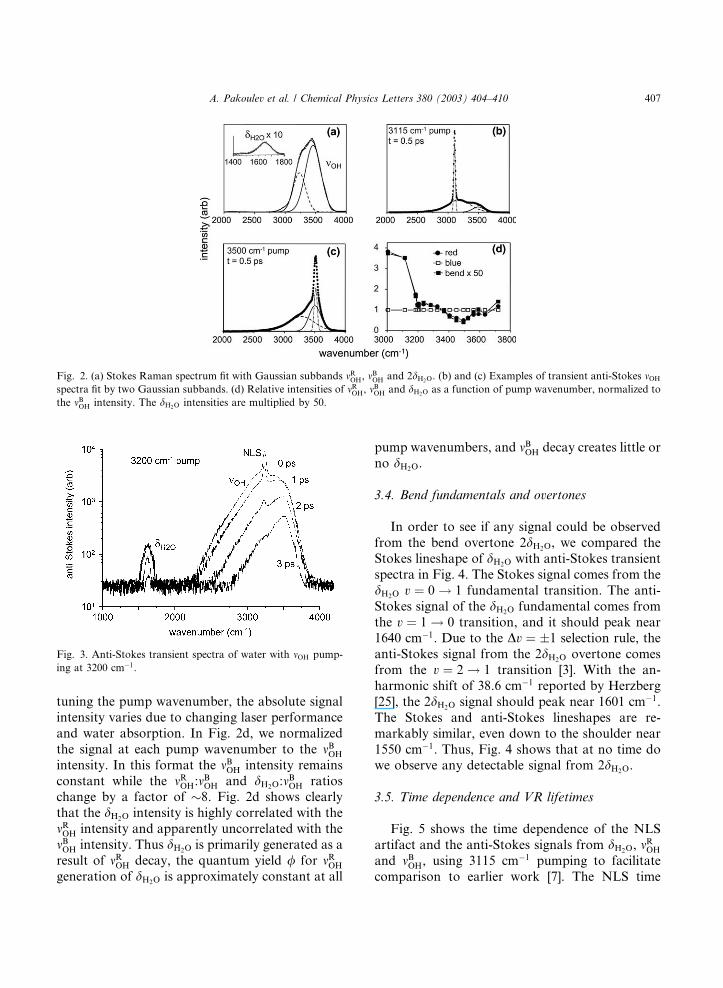
Fig. 2. (a) Stokes Raman spectrum fit with Gaussian subbands mROH, mBOH and 2dH2O. (b) and (c) Examples of transient anti-Stokes mOH
spectra fit by two Gaussian subbands. (d) Relative intensities of mROH, mBOH and dH2O as a function of pump wavenumber, normalized to
the mBOH intensity. The dH2O intensities are multiplied by 50.
Fig. 3. Anti-Stokes transient spectra of water with mOH pump-
ing at 3200 cm�1.
A. Pakoulev et al. / Chemical Physics Letters 380 (2003) 404–410 407
tuning the pump wavenumber, the absolute signal
intensity varies due to changing laser performance
and water absorption. In Fig. 2d, we normalized
the signal at each pump wavenumber to the mBOH
intensity. In this format the mBOH intensity remains
constant while the mROH:mBOH and dH2O:m
BOH ratios
change by a factor of �8. Fig. 2d shows clearly
that the dH2O intensity is highly correlated with the
mROH intensity and apparently uncorrelated with the
mBOH intensity. Thus dH2O is primarily generated as a
result of mROH decay, the quantum yield / for mROH
generation of dH2O is approximately constant at all
pump wavenumbers, and mBOH decay creates little or
no dH2O.
3.4. Bend fundamentals and overtones
In order to see if any signal could be observed
from the bend overtone 2dH2O, we compared the
Stokes lineshape of dH2O with anti-Stokes transient
spectra in Fig. 4. The Stokes signal comes from the
dH2O v ¼ 0 ! 1 fundamental transition. The anti-
Stokes signal of the dH2O fundamental comes from
the v ¼ 1 ! 0 transition, and it should peak near1640 cm�1. Due to the Dv ¼ �1 selection rule, the
anti-Stokes signal from the 2dH2O overtone comes
from the v ¼ 2 ! 1 transition [3]. With the an-
harmonic shift of 38.6 cm�1 reported by Herzberg
[25], the 2dH2O signal should peak near 1601 cm�1.
The Stokes and anti-Stokes lineshapes are re-
markably similar, even down to the shoulder near
1550 cm�1. Thus, Fig. 4 shows that at no time dowe observe any detectable signal from 2dH2O.
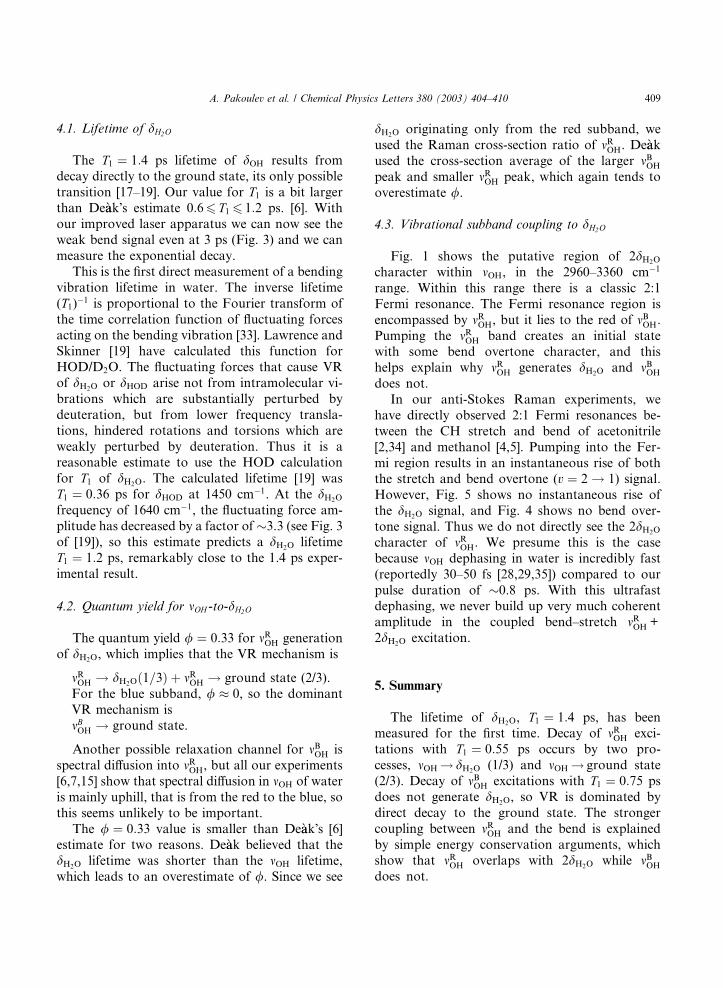
3.5. Time dependence and VR lifetimes
Fig. 5 shows the time dependence of the NLS
artifact and the anti-Stokes signals from dH2O, mROH
and mBOH, using 3115 cm�1 pumping to facilitate
comparison to earlier work [7]. The NLS time
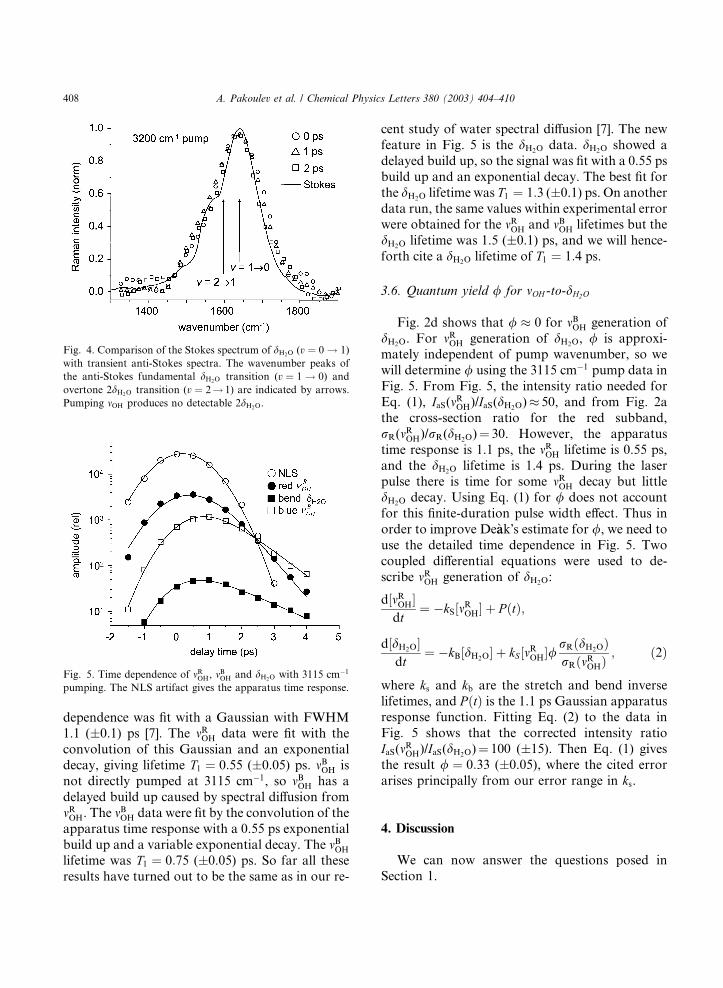
Fig. 5. Time dependence of mROH, mBOH and dH2O with 3115 cm�1
pumping. The NLS artifact gives the apparatus time response.
Fig. 4. Comparison of the Stokes spectrum of dH2O (v ¼ 0 ! 1)
with transient anti-Stokes spectra. The wavenumber peaks of
the anti-Stokes fundamental dH2O transition (v ¼ 1 ! 0) and
overtone 2dH2O transition (v ¼ 2! 1) are indicated by arrows.
Pumping mOH produces no detectable 2dH2O.
408 A. Pakoulev et al. / Chemical Physics Letters 380 (2003) 404–410
dependence was fit with a Gaussian with FWHM1.1 (�0.1) ps [7]. The mROH data were fit with the
convolution of this Gaussian and an exponential
decay, giving lifetime T1 ¼ 0:55 (�0.05) ps. mBOH is
not directly pumped at 3115 cm�1, so mBOH has a
delayed build up caused by spectral diffusion from
mROH. The mBOH data were fit by the convolution of the
apparatus time response with a 0.55 ps exponential
build up and a variable exponential decay. The mBOH
lifetime was T1 ¼ 0:75 (�0.05) ps. So far all these
results have turned out to be the same as in our re-
cent study of water spectral diffusion [7]. The new
feature in Fig. 5 is the dH2O data. dH2O showed a
delayed build up, so the signal was fit with a 0.55 ps
build up and an exponential decay. The best fit for
the dH2O lifetime was T1 ¼ 1:3 (�0.1) ps. On another
data run, the same values within experimental errorwere obtained for the mROH and mBOH lifetimes but the
dH2O lifetime was 1.5 (�0.1) ps, and we will hence-
forth cite a dH2O lifetime of T1 ¼ 1:4 ps.
3.6. Quantum yield / for mOH -to-dH2O
Fig. 2d shows that / � 0 for mBOH generation of
dH2O. For mROH generation of dH2O, / is approxi-mately independent of pump wavenumber, so we
will determine / using the 3115 cm�1 pump data in
Fig. 5. From Fig. 5, the intensity ratio needed for
Eq. (1), IaS(mROH)/IaS(dH2O)� 50, and from Fig. 2a
the cross-section ratio for the red subband,
rR(mROH)/rR(dH2O)¼ 30. However, the apparatus
time response is 1.1 ps, the mROH lifetime is 0.55 ps,
and the dH2O lifetime is 1.4 ps. During the laserpulse there is time for some mROH decay but little
dH2O decay. Using Eq. (1) for / does not account
for this finite-duration pulse width effect. Thus in
order to improve De�aak�s estimate for /, we need to
use the detailed time dependence in Fig. 5. Two
coupled differential equations were used to de-
scribe mROH generation of dH2O:
d½mROH�dt
¼ �kS½mROH� þ P ðtÞ;
d½dH2O�dt
¼ �kB½dH2O� þ kS ½mROH�/rRðdH2OÞrRðmROHÞ
; ð2Þ
where ks and kb are the stretch and bend inverse
lifetimes, and P ðtÞ is the 1.1 ps Gaussian apparatusresponse function. Fitting Eq. (2) to the data in
Fig. 5 shows that the corrected intensity ratio
IaS(mROH)/IaS(dH2O)¼ 100 (�15). Then Eq. (1) gives
the result / ¼ 0:33 (�0.05), where the cited error
arises principally from our error range in ks.
4. Discussion
We can now answer the questions posed in
Section 1.
A. Pakoulev et al. / Chemical Physics Letters 380 (2003) 404–410 409
4.1. Lifetime of dH2O
The T1 ¼ 1:4 ps lifetime of dOH results from
decay directly to the ground state, its only possible
transition [17–19]. Our value for T1 is a bit largerthan De�aak�s estimate 0:66 T1 6 1:2 ps. [6]. With
our improved laser apparatus we can now see the
weak bend signal even at 3 ps (Fig. 3) and we can
measure the exponential decay.
This is the first direct measurement of a bending
vibration lifetime in water. The inverse lifetime
(T1)�1 is proportional to the Fourier transform of
the time correlation function of fluctuating forcesacting on the bending vibration [33]. Lawrence and
Skinner [19] have calculated this function for
HOD/D2O. The fluctuating forces that cause VR
of dH2O or dHOD arise not from intramolecular vi-
brations which are substantially perturbed by
deuteration, but from lower frequency transla-
tions, hindered rotations and torsions which are
weakly perturbed by deuteration. Thus it is areasonable estimate to use the HOD calculation
for T1 of dH2O. The calculated lifetime [19] was
T1 ¼ 0:36 ps for dHOD at 1450 cm�1. At the dH2O
frequency of 1640 cm�1, the fluctuating force am-
plitude has decreased by a factor of�3.3 (see Fig. 3
of [19]), so this estimate predicts a dH2O lifetime
T1 ¼ 1:2 ps, remarkably close to the 1.4 ps exper-
imental result.
4.2. Quantum yield for mOH -to-dH2O
The quantum yield / ¼ 0:33 for mROH generation
of dH2O, which implies that the VR mechanism is
mROH ! dH2Oð1=3Þ þ mROH ! ground state (2/3).
For the blue subband, / � 0, so the dominant
VR mechanism is
mBOH ! ground state.
Another possible relaxation channel for mBOH is
spectral diffusion into mROH, but all our experiments
[6,7,15] show that spectral diffusion in mOH of water
is mainly uphill, that is from the red to the blue, so
this seems unlikely to be important.
The / ¼ 0:33 value is smaller than De�aak�s [6]estimate for two reasons. De�aak believed that the
dH2O lifetime was shorter than the mOH lifetime,
which leads to an overestimate of /. Since we see
dH2O originating only from the red subband, we
used the Raman cross-section ratio of mROH. De�aakused the cross-section average of the larger mBOH
peak and smaller mROH peak, which again tends to
overestimate /.
4.3. Vibrational subband coupling to dH2O
Fig. 1 shows the putative region of 2dH2O
character within mOH, in the 2960–3360 cm�1
range. Within this range there is a classic 2:1
Fermi resonance. The Fermi resonance region is
encompassed by mROH, but it lies to the red of mBOH.
Pumping the mROH band creates an initial statewith some bend overtone character, and this
helps explain why mROH generates dH2O and mBOH
does not.
In our anti-Stokes Raman experiments, we
have directly observed 2:1 Fermi resonances be-
tween the CH stretch and bend of acetonitrile
[2,34] and methanol [4,5]. Pumping into the Fer-
mi region results in an instantaneous rise of boththe stretch and bend overtone (v ¼ 2 ! 1) signal.
However, Fig. 5 shows no instantaneous rise of
the dH2O signal, and Fig. 4 shows no bend over-
tone signal. Thus we do not directly see the 2dH2O
character of mROH. We presume this is the case
because mOH dephasing in water is incredibly fast
(reportedly 30–50 fs [28,29,35]) compared to our
pulse duration of �0.8 ps. With this ultrafastdephasing, we never build up very much coherent
amplitude in the coupled bend–stretch mROH +
2dH2O excitation.
5. Summary
The lifetime of dH2O, T1 ¼ 1:4 ps, has beenmeasured for the first time. Decay of mROH exci-
tations with T1 ¼ 0:55 ps occurs by two pro-
cesses, mOH ! dH2O (1/3) and mOH ! ground state
(2/3). Decay of mBOH excitations with T1 ¼ 0:75 ps
does not generate dH2O, so VR is dominated by
direct decay to the ground state. The stronger
coupling between mROH and the bend is explained
by simple energy conservation arguments, whichshow that mROH overlaps with 2dH2O while mBOH
does not.
410 A. Pakoulev et al. / Chemical Physics Letters 380 (2003) 404–410
Acknowledgements
This material is based on work supported by
the National Science Foundation under award
number DMR-0096466, by Air Force Office ofScientific Research contract F49620-03-1-0032,
and by Army Research Office contract DAAD19-
00-1-0036.
References
[1] A. Laubereau, W. Kaiser, Rev. Mod. Phys. 50 (1978) 607.
[2] J.C. De�aak, L.K. Iwaki, S.T. Rhea, D.D. Dlott, J. Raman
Spectrosc. 31 (2000) 263.
[3] H. Graener, R. Z€uurl, M. Hofmann, J. Phys. Chem. 101
(1997) 1745.
[4] L.K. Iwaki, D.D. Dlott, J. Phys. Chem. A 104 (2000) 9101.
[5] D.D. Dlott, Chem. Phys. 266 (2001) 149.
[6] J.C. De�aak, L.K. Iwaki, D.D. Dlott, J. Phys. Chem. 104
(2000) 4866.
[7] Z. Wang, A. Pakoulev, Y. Pang, D.D. Dlott, Chem. Phys.
Lett. 387 (2003) 281.
[8] R. Laenen, C. Rauscher, A. Laubereau, J. Phys. Chem. B
102 (1998) 9304.
[9] R. Laenen, C. Rauscher, A. Laubereau, Phys. Rev. Lett. 80
(1998) 2622.
[10] S. Woutersen, U. Emmerichs, H.J. Bakker, Science 278
(1997) 658.
[11] S. Woutersen, H.J. Bakker, Phys. Rev. Lett. 83 (1999) 2077.
[12] G.M. Gale, G. Gallot, F. Hache, N. Lascoux, S. Bratos,
J.-C. Leicknam, Phys. Rev. Lett. 82 (1999) 1068.
[13] M. Diraison, Y. Guissani, J.-C. Leicknam, S. Bratos,
Chem. Phys. Lett. 258 (1996) 348.
[14] S. Bratos, G.M. Gale, G. Gallot, F. Hache, N.N. Lascoux,
J.-C. Leicknam, Phys. Rev. E 61 (2000) 5211.
[15] A. Pakoulev, Z. Wang, D.D. Dlott, Chem. Phys. Lett. 371
(2003) 594.
[16] C.P. Lawrence, J.L. Skinner, J. Chem. Phys. 117 (2002)
8847.
[17] R. Rey, J.T. Hynes, J. Chem. Phys. 104 (1996) 2356.
[18] C.P. Lawrence, J.L. Skinner, J. Chem. Phys. 117 (2002)
5827.
[19] C.P. Lawrence, J.L. Skinner, J. Chem. Phys. 119 (2003)
1623.
[20] C.P. Lawrence, J.L. Skinner, Chem. Phys. Lett. 372 (2003)
842.
[21] G.M. Gale, G. Gallot, N. Lascoux, Chem. Phys. Lett. 311
(1999) 123.
[22] S. Woutersen, U. Emmerichs, H.-K. Nienhuys, H.J.
Bakker, Phys. Rev. Lett. 81 (1998) 1106.
[23] H.-K. Nienhuys, S. Woutersen, R.A. van Santen, H.J.
Bakker, J. Chem. Phys. 111 (1999) 1494.
[24] S.A. Rice, in: P.E.A. Schuster (Ed.), Topics in Current
Chemistry, vol. 60, Springer, New York, 1975, p. 109.
[25] G. Herzberg, Molecular Spectra and Molecular Structure
II. Infrared and Raman Spectra of Polyatomic Molecules,
Van Nostrand Reinhold, New York, 1945.
[26] A.J. Lock, H.J. Bakker, J. Chem. Phys. 117 (2002) 1708.
[27] A. Rahman, F.H. Stillinger, J. Chem. Phys. 55 (1971) 3336.
[28] R. Rey, K.B. Møller, J.T. Hynes, J. Phys. Chem. A 106
(2002) 11993.
[29] C.P. Lawrence, J.L. Skinner, J. Chem. Phys. 118 (2003)
264.
[30] C.P. Lawrence, J.L. Skinner, Chem. Phys. Lett. 369 (2003)
472.
[31] A.J. Lock, S. Woutersen, H.J. Bakker, J. Phys. Chem. A
105 (2001) 1238.
[32] H.J. Bakker, H.-K. Nienhuys, G. Gallot, N. Lascoux,
G.M. Gale, J.-C. Leicknam, et al., J. Chem. Phys. 116
(2002) 2592.
[33] D.W. Oxtoby, in: J. Jortner, R.D. Levine, S.A. Rice (Eds.),
Photoselective Chemistry – Part 2, vol. 47, Wiley, New
York, 1981, p. 487.
[34] J.C. De�aak, L.K. Iwaki, D.D. Dlott, J. Phys. Chem. 102
(1998) 8193.
[35] S. Bratos, J.-C. Leicknam, J. Chem. Phys. 101 (1994)
4536.


