Embed Size (px)
Citation preview

Vigabatrin extracellular pharmacokinetics and
concurrent c-aminobutyric acid neurotransmitter effects
in rat frontal cortex and hippocampus using microdialysis1Xin Tong, Neville Ratnaraj, and Philip N. Patsalos
Pharmacology and Therapeutics Unit, Department of Clinical and Experimental Epilepsy, Institute of Neurology,
London, United Kingdom
SUMMARY
Purpose: To investigate the pharmacokinetic
interrelationship of vigabatrin in blood and the
brain (frontal cortex vs. hippocampus) and to
ascertain the relationship between brain extracel-
lular vigabatrin concentrations and concurrent
c-aminobutyric acid (GABA) concentrations.
Methods: Sprague-Dawley rats were implanted
with a jugular vein catheter for blood sampling,
and microdialysis probes in the frontal cortex and
hippocampus for extracellular fluid (ECF) sam-
pling. Vigabatrin was administered intraperitone-
ally at two different doses (500 and 1,000 mg/kg),
and blood and ECF were collected at timed inter-
vals up to 8 h. Rats were freely moving and behav-
ing. Vigabatrin (sera and ECF) and GABA (ECF)
concentrations were measured with use of high
performance liquid chromatography (HPLC).
Results: Vigabatrin concentrations in blood rose
linearly and dose-dependently, and vigabatrin rap-
idly appeared in the brain as evidenced by the
detection of vigabatrin in the ECF of both the
frontal cortex and hippocampus at time of first
sampling (15 min). However, frontal cortex con-
centrations were twofold greater than those of
the hippocampus. Furthermore, GABA concen-
trations increased five-fold in the frontal cortex
but were unaffected in the hippocampus. In addi-
tion, GABA concentrations began to increase
approximately 3 h after vigabatrin administration
at a time when vigabatrin concentrations were in
exponential decline.
Conclusions: Vigabatrin distribution in the brain is
region specific, with frontal cortex concentrations
substantially greater than those seen in the hippo-
campus. Elevation of GABA concentrations did
not reflect the concentration profile of vigabatrin
but reflected its regional distribution.
KEY WORDS: Vigabatrin, Antiepileptic drug,
c-Aminobutyric acid, Brain extracellular fluid,
Microdialysis.
Vigabatrin represents the first of a series of 10 novel an-tiepileptic drugs that have been licensed for clinical usesince 1989, and it is marketed in more than 60 countriesworldwide, although not in the USA. It is associated withsignificant efficacy and good tolerability in patients withpartial epilepsy (French et al., 1996; Dean et al., 1999),and with particular efficacy in patients with infantile
spasms that are associated with tuberous sclerosis (Apple-ton et al., 1999; Lux et al. 2005). However, in recent yearsthe use of vigabatrin has declined substantially consequentto the realization that its long-term use is associated withpersistent bilateral visual field problems, particularlyvisual field constrictions, in as many as 65% of childrenand 40% of adults prescribed vigabatrin, and that theeffects may be irreversible (Malmgren et al., 2001; Nou-siainen et al., 2001; Toggweiler & Wieser, 2001; McDon-agh et al., 2003). The maximum daily dose of vigabatrinappears to be a particular indicator of those patients likelyto exhibit visual field defects (Conway et al., 2008).
Vigabatrin is a structural analog of c-aminobutyric acid(GABA), the primary inhibitory neurotransmitter inthe central nervous system. Its mechanism of actionrelates to its selective inhibition of GABA-transaminase(GABA-T), the enzyme responsible for the catabolism of
Accepted August 11, 2008; Early View publication November 12,2008.
Address correspondence to Professor P.N. Patsalos, Pharmacologyand Therapeutics Unit, Department of Clinical and Experimental Epi-lepsy, UCL Institute of Neurology, Queen Square, London WC1N 3BG,U.K. E-mail: [email protected]
1Present address: GlaxoSmithKline, New Frontiers Science Park,Harlow, U.K.
Wiley Periodicals, Inc.ª 2008 International League Against Epilepsy
Epilepsia, 50(2):174–183, 2009doi: 10.1111/j.1528-1167.2008.01863.x
FULL-LENGTH ORIGINAL RESEARCH
174

GABA. Vigabatrin binds covalently and irreversibly toGABA-T and consequently destroys the enzyme, and thisaction results in an increase in brain GABA concentrations(Petroff et al., 1996a; Sills et al., 1999), which parallels theanticonvulsant effects of vigabatrin (Gale & Iadarola, 1980).
We previously reported on the kinetic interrelationshipof vigabatrin in blood and cerebrospinal fluid (CSF) andobserved that CSF kinetics paralleled that seen in blood(Tong et al., 2007). However, although the CSF compart-ment is considered to be kinetically indistinguishable fromthat of the biophase or site of action of drugs that are activein the brain (Danhof & Levy, 1984; Dingamanse et al.,1987; Klockowski & Levy, 1988; Sokomba et al., 1988),CSF concentrations may not necessarily reflect regionalconcentration differences within the brain (De Lange &Danhof, 2002). Indeed, various antiepileptic drugs, includ-ing phenytoin and lamotrigine, have been reported not to beuniformly distributed within the brain (Sechi et al., 1989;Walker et al., 1996, 2000). Because the brain extracellularfluid (ECF) is the liquid compartment where the traffic ofcompounds and the exchange of chemical informationbetween cells takes place, monitoring of the fluid by micro-dialysis has been considered to reflect synaptic events andevents at the site of the action of drugs. Thus intracerebralmicrodialysis has been used to study brain pharmacokinet-ics of numerous antiepileptic drugs (Scheyer et al., 1994a,1994b; Tong & Patsalos, 2001; Wang & Patsalos, 2003;Wang et al., 2004; Rambeck et al., 2006). Furthermore,studies of the effects of various antiepileptic drugs on neu-rochemical changes in the ECF and correlation with vari-ous pharmacodynamic paradigms have been undertaken(Timmerman et al., 2000; Ahmad et al., 2005; Clinckerset al., 2005; Hocht et al., 2007; Sierra-Paredes et al., 2007).
In the present study we investigated the pharmaco-kinetics interrelationship of vigabatrin in blood and in theECF of the frontal cortex and hippocampus of the freelybehaving rat using direct blood sampling and intracerebralmicrodialysis. The purpose of this study was to determinehow the blood compartment reflects vigabatrin brainextracellular pharmacokinetics, and to ascertain whethervigabatrin exhibits brain-region specificity in its pharma-cokinetics. Furthermore, we have systematically deter-mined the concurrent GABA extracellular concentrationprofile in the frontal cortex and hippocampus in order tocharacterize the pharmacodynamic consequence ofvigabatrin brain concentrations.
Materials and Methods
AnimalsMale Sprague-Dawley rats (Charles River, Margate,
Kent, U.K.) weighing 300–350 g were used. They weregroup-housed under a 12 h light–dark cycle in contiguouscages (three rats per cage) for 5–7 days before surgerywith free access to water and a normal laboratory diet
(SDS R and M number 1 expanded; Scientific Dietary Ser-vices, Witham, Essex, U.K.). An ambient temperature of25�C was maintained. All animal procedures strictly fol-lowed Home Office regulations and were performed underthe Animal (Scientific Procedures) Act 1986.
Surgical procedures, and blood and extracellularfluid sampling
Rats were anesthetized with 2% halothane (May andBaker Ltd, Dagenham, U.K.), and microdialysis probeswere implanted stereotaxically in the hippocampus (frombregma 5.3 mm posterior, 4.5 mm lateral, 7.5 mm ven-tral) and the frontal cortex (from bregma 3.0 mm anterior,2.5 mm lateral, and 5.0 mm ventral) as described previ-ously (Walker et al., 1996; Tong & Patsalos, 2001). Thecoordinates used were according to the atlas of Paxinosand Watson (1986). In addition, a catheter was implantedin the right jugular vein for blood sampling as describedpreviously (Patsalos et al., 1992).
Postsurgery, animals were individually housed inPerspex cages, and 2 days later, when animals were fullyrecovered from the surgical procedure, the jugular veincatheter and the microdialysis probes were checked forpatency. Artificial CSF—(composition mm) NaCl 125,KCl 2.5, MgCl2 1.18, and CaCl2 1.26—was perfusedthrough the probes at a rate of 2 ll/min. During the first2 h, dialysate samples were collected but discarded so asto allow stable sampling conditions to be established. Sub-sequently, three baseline samples (40 ll) at 20-min inter-vals were collected during a 1-h period. Rats were thenrandomly assigned to three groups and administered byintraperitoneal (i.p.) injection at 9 to 10 am, with either 500or 1,000 mg/kg vigabatrin (Marion Merrill Dow, Inc., Cin-cinnati, OH, U.S.A.) or isotonic saline. After drug adminis-tration, blood samples (100 ll) were withdrawn at 20-minintervals for the first hour and then at 30-min intervals foran additional 7 h. After each blood sampling an equivalentvolume of heparinized saline was administered in order toprevent hypovolemia. Dialysate samples were collected at20-min intervals (40 ll) for 4 h and then for 30-min inter-vals (60 ll) for an additional 4 h. Microdialysis perfusionwas achieved by use of a Harvard Apparatus 22 micro-pump (model 55-2222) (Harvard Apparatus Ltd, Eden-bridge, Kent, U.K.), which was set to flow at 2 ll/min.Blood and dialysate samples were collected into 0.5-mLpolyethylene tubes (Treff AG, Dagersheim, Switzerland).Sera were separated from whole blood by centrifugation(model 2K15; Sigma, Poole, U.K.) at 10,000 g for 5 min.Sera were then transferred to new tubes and were storedalong with the microdialysate samples at )70�C until ana-lyzed for vigabatrin and GABA content.
Measurement of vigabatrin concentrationVigabatrin concentrations in serum and ECF were
measured by high performance liquid chromatography
175
Vigabatrin and GABA in Brain Extracellular Fluid
Epilepsia, 50(2):174–183, 2009doi: 10.1111/j.1528-1167.2008.01863.x

(HPLC) as described by Ratnaraj and Patsalos (1998). AGilson HPLC system (Anachem Ltd, Luton, U.K.) com-prising the following modules was used: two pumps (aGilson 302 pump and a Gilson 305 pump), an autoinjector(Gilson model 234) and a Gilson 811C dynamic mixer,and a Perkin-Elmer fluorescence detector (Perkin-ElmerLtd, Beaconsfield, U.K.), which was set at 250 nm (exci-tation) and 550 nm (emission). A Hypersil BDS-C18,3 lm, 125 · 3 mm column (Hewlett Packard, Stockport,U.K.) and a LiChrospher select B 4 · 4 (5 lm) precolumn(Hewlett Packard) were used. Chromatograms were run at35�C using a model 7955 column chiller (JonesChromatography Ltd, Hengoed, U.K.). o-Pthalaldehyde,the derivatization agent, and l-norvaline, the internal stan-dard were, purchased from Sigma (Poole, U.K.; BDH,Dagenham, U.K.). Vigabatrin S(+) was supplied by Mar-ion Merrill Dow, Inc. All other chemicals were of analyti-cal grade.
Measurement of GABA concentrationsGABA concentrations in frontal cortex and hippocam-
pal microdialysates after vigabatrin (1,000 mg/kg) admin-istration were determined by HPLC using precolumnderivatization and fluorescence detection after binary gra-dient liquid chromatographic separation. The method wasbased on that reported by Godel et al. (1992) and describedin detail by Tong & Patsalos (2001).
Microdialysis probesConcentric microdialysis probes were constructed from
4-mm long · 200 lm diameter Filtral 12 dialysis mem-brane (Hospal, Rugby, U.K.) as described previously(Walker et al., 1996). Before use, the in vitro recovery ofeach probe was determined by placing the probes into a40 lmol/L solution of vigabatrin constituted in artificialCSF (composition in mm: NaCl 125, KCl 2.5, MgCl2 1.18,and CaCl2 1.26) and then perfusing the probes with artifi-cial CSF at 2 ll/min. Forty microliter samples was col-lected every 20 min for 60 min, and these samples, alongwith a sample of the 40 lmol/L vigabatrin solution, werestored at )70�C until analysis for vigabatrin content.
Data analysisPharmacokinetic parameters were calculated using
individual concentration versus time data sets based ona one-compartment model. Time to maximum concen-tration (Tmax) and maximum concentration (Cmax) weredetermined by visual inspection of the concentrationversus time curves. The area under the concentrationversus time curve (AUC) to the last sample concentra-tion was obtained using the linear trapezoidal rule andextrapolation to infinity by dividing the last concentra-tion by the rate constant phase (b). The eliminationhalt-life (t1/2) was calculated from the slope (kz), esti-mated by log linear regression of the terminal phase of
the concentration versus time curve. Results arepresented as mean € SEM. Data were compared usingStudents t test.
GABA ECF concentrations were calculated using eachindividual animal and concentrations at each time pointafter vigabatrin administration were compared to the meanof the three baseline values or control (isotonic saline)group. The results were generalized and are presented asmean € SEM. The Student’s t-test was used to comparethe mean of the three baseline values with that of eachtime point, and analysis of variance (ANOVA; single ortwo factor) was used for each time point AUC data to ana-lyze serial measurement of vigabatrin versus controlgroup AUC values at each time point.
Results
Serum pharmacokineticsThe vigabatrin serum concentration versus time
profiles after 500 and 1,000 mg/kg vigabatrin administra-tions are shown in Fig. 1. Intraperitoneally administeredvigabatrin demonstrated rapid absorption. Peak vigaba-trin concentrations (Tmax) were achieved at 0.4 h € 0. 07(mean € SEM) and were dose independent. Subse-quently, vigabatrin concentrations gradually declined andthe elimination half-life was 1.1 € 0.1 h after 500 mg/kgvigabatrin administration, and 1.5 € 0.1 h after1,000 mg/kg vigabatrin administration. Table 1 showsthe apparent pharmacokinetic constants for individualrats together with the mean values, as calculated fromthe concentration versus time plots. The pharmacokineticconstants for individual rats showed some variabil-ity within each dose group, and mean vigabatrin Cmax
and AUC values increased dose dependently andlinearly.
Figure 1.
Vigabatrin concentration versus time profiles in serum
after 500 mg/kg ( ) and 1,000 mg/kg (d) vigabatrin
administration. Values are mean ± of six rats.
Epilepsia ILAE
176
X. Tong et al.
Epilepsia, 50(2):174–183, 2009doi: 10.1111/j.1528-1167.2008.01863.x

Brain extracellular fluid pharmacokineticsThe mean € SEM in vitro relative recovery for vigaba-
trin from 28 microdialysis probes was 21.69 € 1.46% at adialysate flow rate of 2 ll/min. The ECF vigabatrin con-centration data shown in this study have been adjusted onthe basis of in vitro relative recovery.
The corresponding concentration versus time profilesof vigabatrin in frontal cortex and hippocampal ECF fol-lowing 500 and 1,000 mg/kg vigabatrin administrated areshown in Fig. 2. The calculated mean € SEM pharmaco-kinetic constants for frontal cortex and hippocampus, ascalculated from the log concentration versus time plots ofindividual rats, can be seen in Tables 2 and 3, respectively.It can be seen that both AUC and Cmax mean valuesincreased dose-dependently, but the increases were notdose-proportional. Furthermore, vigabatrin concentrationswere two- to three-fold higher in the frontal cortex com-pared to that of the hippocampus. Vigabatrin concentra-tions were detectable at time of first dialysate sampling(15 min), with concentrations peaking somewhat later(mean Tmax 0.7–1.0 h) than serum (0.4 h) and subse-quently declined exponentially. Mean Cmax values forfrontal cortex and hippocampal ECF were 26 to 70-foldand 70 to 127-fold lower, respectively, than those inserum; this difference may, however, be attributed to theuse of probe in vitro relative recovery characteristics tocalculate brain ECF concentrations. ECF half-life valueswere identical for the frontal cortex and hippocampus,
and, as observed for serum, values were dose-dependent.However, compared to serum, where values increaseddose-dependently, ECF half-life values decreased dose-dependently and, in addition, were significantly longer.
Fig. 3 shows the vigabatrin ECF–serum concentrationratio over time for the frontal cortex and hippocampus for500 mg/kg (A) and 1,000 mg/kg (B) vigabatrin adminis-trations. It can be seen that at 7–8 h post vigabatrin admin-istration, there was a tendency toward equilibration, asmeasured by a constant ECF–serum vigabatrin concentra-tion ratio between the blood and ECF compartments.
Fig. 4 shows the relationship between serum and frontalcortex and hippocampal ECF vigabatrin concentrations,and it can be seen that they are linearly related(r2 = 0.9593 and 0.9355, respectively).
Extracellular fluid GABA concentrationsExtracellular fluid GABA concentrations versus time
profiles in the frontal cortex and hippocampus before andafter the administration of 1,000 mg/kg vigabatrin areshown in Fig. 5, and these profiles are compared to GABA
Table 1. Pharmacokinetic parameters for
serum after 500 and 1,000 mg/kg vigabatrin
(VGB) administration
Rat Tmax (h) Cmax (lmol/L) AUC (lmol h/L) t½ (h)
VGB 500 mg/kg
1 0.3 1,279 2,760 1.0
2 0.4 1,550 3,665 1.2
3 0.3 1,800 4,002 0.8
4 0.5 1,487 3,178 1.3
5 0.7 1,942 3,670 1.2
6 0.3 1,499 3,007 1.2
Mean 0.4 1,593 3,380 1.1
±SEM 0.1 97 193 0.1
VGB 1,000 mg/kg
1 0.3 2,474 5,980 1.6
2 0.7 2,881 7,494 1.5
3 0.3 3,144 8,438 1.7
4 0.3 3,521 8,187 1.6
5 0.3 2,902 6,728 1.4
6 0.3 2,799 6,651 1.0
Mean 0.4 2,954 7,246 1.5
±SEM 0.1 144 391 0.1
Cmax, maximum concentration; Tmax, time to maximum con-
centration. AUC, area under the serum concentration-time
curve; t½, terminal half-life.
A
B
Figure 2.
Vigabatrin extracellular fluid concentrations versus
time profiles in the frontal cortex ( ) and the hippo-
campus (d) after 500 mg/kg (A) or 1,000 mg/kg (B)
vigabatrin administration. Values are mean ± of seven
rats.
Epilepsia ILAE
177
Vigabatrin and GABA in Brain Extracellular Fluid
Epilepsia, 50(2):174–183, 2009doi: 10.1111/j.1528-1167.2008.01863.x
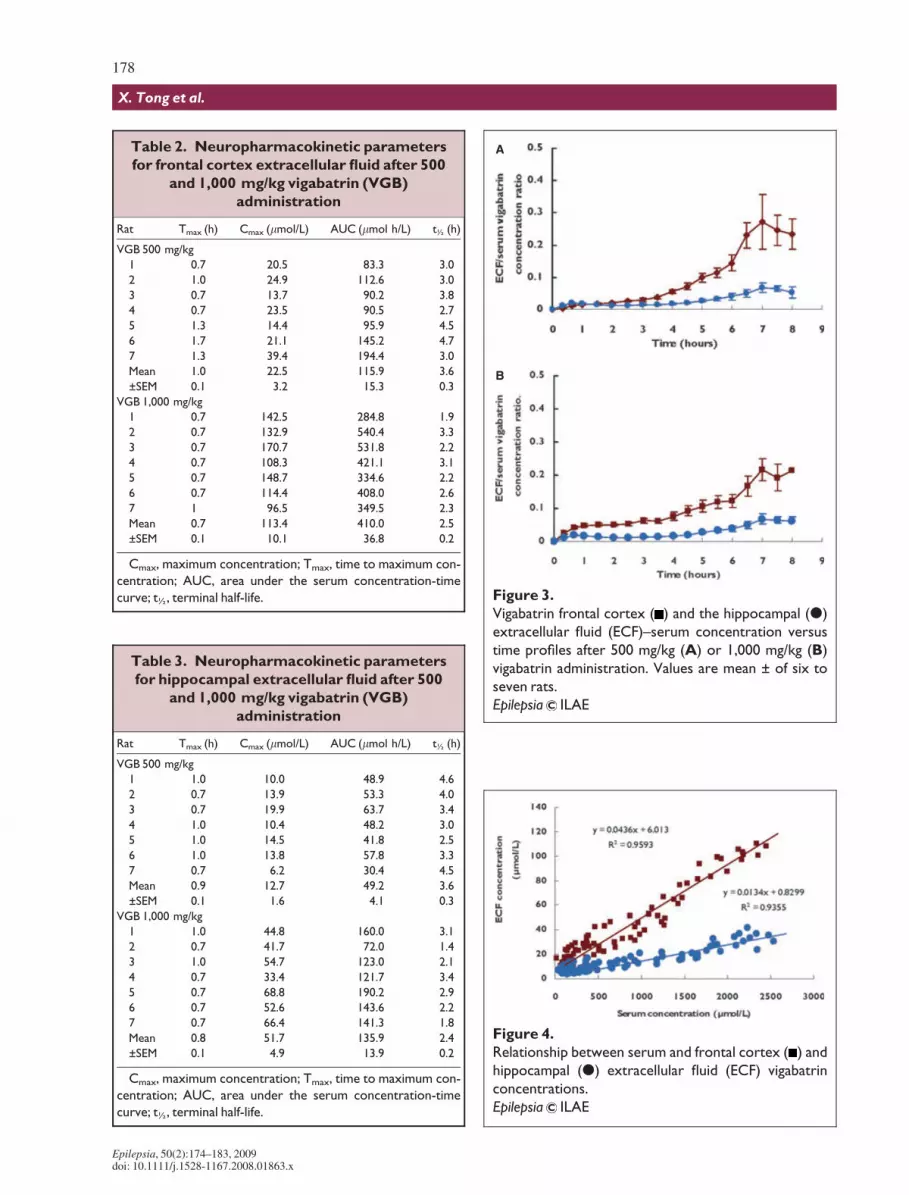
Table 2. Neuropharmacokinetic parameters
for frontal cortex extracellular fluid after 500
and 1,000 mg/kg vigabatrin (VGB)
administration
Rat Tmax (h) Cmax (lmol/L) AUC (lmol h/L) t½ (h)
VGB 500 mg/kg
1 0.7 20.5 83.3 3.0
2 1.0 24.9 112.6 3.0
3 0.7 13.7 90.2 3.8
4 0.7 23.5 90.5 2.7
5 1.3 14.4 95.9 4.5
6 1.7 21.1 145.2 4.7
7 1.3 39.4 194.4 3.0
Mean 1.0 22.5 115.9 3.6
±SEM 0.1 3.2 15.3 0.3
VGB 1,000 mg/kg
1 0.7 142.5 284.8 1.9
2 0.7 132.9 540.4 3.3
3 0.7 170.7 531.8 2.2
4 0.7 108.3 421.1 3.1
5 0.7 148.7 334.6 2.2
6 0.7 114.4 408.0 2.6
7 1 96.5 349.5 2.3
Mean 0.7 113.4 410.0 2.5
±SEM 0.1 10.1 36.8 0.2
Cmax, maximum concentration; Tmax, time to maximum con-
centration; AUC, area under the serum concentration-time
curve; t½, terminal half-life.
Table 3. Neuropharmacokinetic parameters
for hippocampal extracellular fluid after 500
and 1,000 mg/kg vigabatrin (VGB)
administration
Rat Tmax (h) Cmax (lmol/L) AUC (lmol h/L) t½ (h)
VGB 500 mg/kg
1 1.0 10.0 48.9 4.6
2 0.7 13.9 53.3 4.0
3 0.7 19.9 63.7 3.4
4 1.0 10.4 48.2 3.0
5 1.0 14.5 41.8 2.5
6 1.0 13.8 57.8 3.3
7 0.7 6.2 30.4 4.5
Mean 0.9 12.7 49.2 3.6
±SEM 0.1 1.6 4.1 0.3
VGB 1,000 mg/kg
1 1.0 44.8 160.0 3.1
2 0.7 41.7 72.0 1.4
3 1.0 54.7 123.0 2.1
4 0.7 33.4 121.7 3.4
5 0.7 68.8 190.2 2.9
6 0.7 52.6 143.6 2.2
7 0.7 66.4 141.3 1.8
Mean 0.8 51.7 135.9 2.4
±SEM 0.1 4.9 13.9 0.2
Cmax, maximum concentration; Tmax, time to maximum con-
centration; AUC, area under the serum concentration-time
curve; t½, terminal half-life.
A
B
Figure 3.
Vigabatrin frontal cortex ( ) and the hippocampal (d)
extracellular fluid (ECF)–serum concentration versus
time profiles after 500 mg/kg (A) or 1,000 mg/kg (B)
vigabatrin administration. Values are mean ± of six to
seven rats.
Epilepsia ILAE
Figure 4.
Relationship between serum and frontal cortex ( ) and
hippocampal (d) extracellular fluid (ECF) vigabatrin
concentrations.
Epilepsia ILAE
178
X. Tong et al.
Epilepsia, 50(2):174–183, 2009doi: 10.1111/j.1528-1167.2008.01863.x

profiles after administration of 0.9% saline (controls). Itcan be seen that although ECF GABA concentrations rosegradually and significantly (p < 0.001, compared to base-line and control group) in the frontal cortex over 8 h aftervigabatrin administration (Fig. 5A), ECF hippocampalconcentrations were unaffected (Fig. 5B).
Fig. 6 shows the concentration versus time interrela-tionship between ECF GABA concentrations and ECFvigabatrin concentrations in the frontal cortex (Fig. 6A)and hippocampus (Fig. 6B). It can be seen that vigabatrinconcentrations achieved in the hippocampus (mean Cmax
51.7 lmol/L) were not associated with an effect on GABAconcentrations, but, vigabatrin concentrations achieved inthe frontal cortex (mean Cmax 113.4 lmol/L) were associ-ated with a significant increase in GABA concentration.In addition, ECF GABA concentrations increased some-what later than when vigabatrin concentrations were max-imum, and indeed GABA concentrations continued to riseat a time when concurrent ECF vigabatrin concentrationshad declined to very low values.
Discussion
Using a well-validated freely moving and behaving ratmodel, which allows concurrent blood and microdialysissampling of ECF, the present study was undertaken toinvestigate the pharmacokinetic interrelationship of vig-abatrin in blood and the brain, to investigate whether vig-abatrin exhibits brain-region specificity (frontal cortex vs.hippocampus) in its pharmacokinetics, and to ascertainthe relationship between brain extracellular vigabatrinconcentrations and concurrent GABA concentrations,which may further enhance our understanding of themechanism of action of vigabatrin.
We reported previously on the temporal pharmacoki-netic interrelationship of vigabatrin in rat blood and CSF(Tong et al., 2007). In the present study we have extendedour studies to the brain by monitoring vigabatrin ECF con-centrations in the hippocampus and frontal cortex by mic-rodialysis. The pharmacokinetic profile of vigabatrin inserum, as observed in the present study, is exactly what wepreviously reported (linear and dose-dependent), andthese data not only serve to further validate the animal
A
B
Figure 5.
Extracellular fluid GABA concentrations in the frontal
cortex (A) and hippocampus (B) before and after
administration of 1,000 mg/kg vigabatrin ( ) or 0.9%
saline (d). Data are expressed as percentage of
baseline and are mean ± of six rats.
Epilepsia ILAE
A
B
Figure 6.
Extracellular fluid concentrations versus time profiles
for GABA ( ) compared to the vigabatrin (d) concen-
tration in the frontal cortex (A) and hippocampus (B)
after 1,000 mg/kg vigabatrin. Values are mean ± of six
rats.
Epilepsia ILAE
179
Vigabatrin and GABA in Brain Extracellular Fluid
Epilepsia, 50(2):174–183, 2009doi: 10.1111/j.1528-1167.2008.01863.x

model used, but also further confirm the predictable phar-macokinetic nature of vigabatrin.
In a mouse study whereby 1,500 mg/kg vigabatrin wasadministered to mice i.p. and whole brain samples weremeasured for vigabatrin content, vigabatrin was detectablewithin 1 h after drug administration (Jung et al., 1977).Using composite brain vigabatrin concentrations, thehalf-life of the drug was calculated to be 16–17 h, andvigabatrin was still detectable 3 days after administration.A similar pattern was seen by Valdizan et al. (1999), whomeasured whole brain vigabatrin concentrations after200 mg/kg (i.p.) vigabatrin administration. Their first sam-ple point was at 4-h post vigabatrin administration and thetime point represented the Cmax values for vigabatrin. Thetime course was similar to that described in mice aftersingle dose of 1,500 mg/kg (Jung et al., 1977; Schecteret al., 1977). Single time-point analysis (2 h post i.p. 250,500, or 1,000 mg/kg vigabatrin administration) of differentrat brain regions showed that vigabatrin was detectable andthat concentrations did not show significant variation in thedifferent brain regions (Sills et al., 1999, 2001, 2003).
This study is the first to study the temporal pharmacoki-netic profile of vigabatrin in frontal cortex and hippocam-pal ECF, and the data reveal some interestingcharacteristics. After i.p. administration, vigabatrin rap-idly appeared in the brain as evidenced by the detectionof vigabatrin in the ECF of both the frontal cortex andhippocampus at time of first sampling (15 min). Thesedata suggest ready penetration of the blood–brain barrierby vigabatrin. However, as might be expected, Tmax val-ues for ECF were somewhat more extended (mean Tmax
values, 0.7–1.0 h) than those for serum (mean Tmax value,0.4h) and almost identical to those previously reported forCSF (mean Tmax values, 0.8–1.0 h; Tong et al., 2007). Theobserved difference in Tmax values between the extracellu-lar–CSF and serum compartments can be attributed to thetime it takes for vigabatrin to pass from the serum com-partment through the blood–brain barrier to the extracellu-lar–CSF compartments. In contrast to the serum (Table 1)and CSF compartments (Tong et al., 2007), although thefrontal cortex and hippocampal ECF compartments exhib-ited dose-dependent pharmacokinetics, their pharmacoki-netics were not linear (Tables 2 and 3). Therefore, AUCvalues increased by approximately three-fold for bothfrontal cortex and hippocampus when the administereddose was increased twofold (500 mg/kg vs. 1,000 mg/kg).Furthermore, vigabatrin distribution in the brain is brain-region specific, with frontal cortex concentrations beingtwo- to three-fold greater than vigabatrin concentrationsachieved in the hippocampus (Tables 2 and 3). Such non-uniformity within the brain has been reported previouslyfor phenytoin and lamotrigine (Sechi et al., 1989; Walkeret al., 1996, 2000).
The efflux of vigabatrin from the brain ECF compart-ment appears to be restricted, as demonstrated by the
half-life of vigabatrin, which is approximately two- tothree-fold longer than that observed in the blood compart-ment. Surprisingly, half-life values in the ECF compart-ments of both the frontal cortex and hippocampus werelonger at the lower vigabatrin dose (500 mg/kg) comparedto the higher dose (1,000 mg/kg). This may be attributablein part to saturable brain binding of vigabatrin.
Previously we showed that the CSF–serum concentra-tion ratio was not similar to that of the blood-free fraction,and that CSF vigabatrin concentrations represented only2% of serum vigabatrin concentrations. Nevertheless, theCSF pharmacokinetics of vigabatrin paralleled that seenin serum at equilibrium (Tong et al., 2007). In the presentstudy the ECF–serum concentration ratio values indicatethat although the equilibration between the ECF and bloodcompartments occurred at 7–8 h post vigabatrin adminis-tration (Fig. 3), serum vigabatrin concentrations werehighly correlated with ECF concentrations regardless ofwhether equilibration had occurred or not (Fig. 4). Thiswould suggest that vigabatrin blood concentrations are agood index of vigabatrin concentrations at the site of vig-abatrin action in the brain.
There has been substantial interest on the effect of vig-abatrin on brain GABA concentrations in both animalsand in patients with epilepsy. Using regional brain tissuedeterminations Sills et al. (2003) observed a significantincrease in GABA concentrations throughout the eightbrain regions investigated at 2-h post vigabatrin adminis-tration (1,000 mg/kg). Although no difference wasobserved between frontal cortex and hippocampal GABAconcentrations, GABA concentrations in the hypothala-mus and striatum were greater. These dose-relatedchanges were associated with a concurrent dose-relateddecrease in GABA-T activity. Interestingly, vigabatrin(1,200 mg/kg; i.p. single dose) at 4-h post-dose not onlyproduced increases in GABA concentrations throughout11 brain regions, but the most marked GABA increasesoccurred in cerebral cortex and hippocampus, althoughthere were no differences between the two regions(Loscher & Horstermann, 1994). In mice whole-brainGABA concentrations increased in a dose-dependentmanner over the range 100 and 2,500 mg/kg i.p., and thiscorresponded to a dose-related decline in GABA-T activ-ity. The response to a single i.p. injection was rapid andsustained: whole brain GABA concentrations reached amaximum after 3 h, and these concentrations were main-tained for at least 20 h (Schecter et al., 1977). Jung et al.(1977) reported on the effect of vigabatrin (1,500 mg/kg,administered i.p.) on mouse whole-brain GABA concen-trations and reported that concentrations increased rap-idly, with peak concentrations occurring within 3–4 h.Concentration increases were five- to six-fold over controlvalues, and these increases were maintained for at least24 h, followed by a slow decrease. In another series ofexperiments, 1,900 mg/kg vigabatrin administration to
180
X. Tong et al.
Epilepsia, 50(2):174–183, 2009doi: 10.1111/j.1528-1167.2008.01863.x

mice was associated with a three-fold increase in whole-brain GABA concentrations and in synaptosomal fractions(representing purified nerve terminals) at 6-h post dose(Loscher, 1981). Palfreyman et al. (1980) measured thetime course of whole-brain homocarnosine (a GABAconjugate) in rats after i.p. administration of 500 mg/kgvigabatrin. Brain homocarnosine concentrations showed atime-related elevation, which reached peak values at 24 hfollowing vigabatrin administration. However, becausethe authors sampled at only 2, 18, and 24 h post vigabatrinadministration, the exact time course of the effects couldnot be accurately determined, particularly because at 2 hthere was no significant change in homocarnosine concen-trations compared to baseline.
There have been three studies of the effect of vigabatrinon brain GABA concentrations involving microdialysis(Jolkkonen et al., 1992; Sayin et al., 1995; Smolders et al.,1997). However, two of these studies entailed anesthe-tized animals and the vigabatrin was administered via themicrodialysis probes and GABA monitoring also occurredvia the probes (Jolkkonen et al., 1992; Smolders et al.,1997). In the study by Jolkkonen et al. (1992) microdialy-sis probes were implanted into the hippocampus of rats.Vigabatrin was perfused via the probes (1.6 or 8.0 mm)over 25 min, and both doses increased GABA concentra-tions approximately ten-fold. The lack of dose-dependentincrease in GABA concentrations may be attributable tothe already high concentrations of vigabatrin achieved atthe low dose and suggests a threshold effect as seen inpatient studies (Petroff et al., 1996c) and therapeuticallyin the clinical setting (McKee et al., 1993). In the rat mic-rodialysis study of Smolders et al. (1997), intrahippocam-pal perfusion with 5 mm vigabatrin resulted in an increasein extracellular hippocampal GABA concentrations.Sayin et al. (1995) reported that vigabatrin (1,000 mg/kg;administered i.p.) induced a three-fold increase in extra-cellular GABA concentrations in rat substantia nigra parsreticulate during the first 6 h. However the authors do notstate when the GABA increase became significant. Fur-thermore, they concluded that nonneuronal extracellularGABA dominates over the GABA that is derived fromneurotransmission because the infusion of the sodiumchannel blocker tetrodotoxin, via the microdialysis probe,had no effect on the increased GABA concentrations(Sayin et al., 1995).
With respect to the effect of vigabatrin on brain GABAconcentrations in patients, the primary technique of studyhas been nuclear magnetic resonance (NMR) spectros-copy, although there has been a report of a brain biopsyfrom a single patient taking vigabatrin and it indicated thatGABA concentrations were elevated three-fold comparedto biopsies from patients on other antiepileptic drugs(Ben-Menachem et al., 1993). Using NMR spectroscopyMueller et al. (2001) measured GABA–creatine and phos-phocreatine signal ratios in patients who responded to vig-
abatrin treatment. They observed that the signal ratios inthe occipital lobes of the epileptogenic hemispheres ofthese patients were significantly larger than in the nonre-sponders. A further NMR study of seven patients wherebyGABA concentrations were measured serially in theoccipital lobe after ingestion of a single 50 mg/kg dose ofvigabatrin, observed that GABA concentration increasedwithin 90 min but was only significantly increased at 2 h,after which concentrations plateaued and stayed elevatedfor more than 24 h (Petroff et al., 1996a). In similar studyof 18 patients in whom GABA concentrations were mea-sured serially in their occipital lobe (Petroff et al., 1996b),it was observed that brain GABA concentrations wereincreased twofold in patients prescribed vigabatrin (2–4g/day) compared with nonepileptic individuals. In addi-tion, it was observed that doubling the dose of vigabatrin(from 3 g/day to 6 g/day) failed to increase brain GABAconcentrations any further (Petroff et al., 1996c). There-fore, there appears to be a threshold concentration (dose)over which further GABA concentration increases do notoccur, and this is confirmed in the clinical setting wherebythere appears to be a ceiling with regard to a maximumtherapeutic dose (�2g/day) over and above which no addi-tional therapeutic benefit is achieved (McKee et al.,1993). A caveat to all these studies is that most of tissueGABA measured by NMR is intracellular and may notnecessarily reflect the extracellular pool of GABA that ismeasured by microdialysis (Verhoeff et al., 1999).
In order to characterize the pharmacodynamic conse-quence of vigabatrin brain concentrations we determinedthe concurrent GABA extracellular concentration profilesin the frontal cortex and hippocampus after 1,000 mg/kgvigabatrin administration. The dose was chosen because itis a dose that has been used extensively in other studies ofvigabatrin and also it was the dose at which GABAconcentrations changes within the ECF of both the frontalcortex and hippocampus were measurable. Vigabatrinadministration (1,000 mg/kg) was associated with a sig-nificant increase in ECF GABA concentrations in thefrontal cortex but not in the hippocampus (Fig. 5). How-ever, frontal cortex GABA concentrations began toincrease only at 3 h post vigabatrin administration, andGABA concentrations continued to rise so that at 8 h postdose concentrations were five-fold higher than baselinevalues. The magnitude of the increase in GABA concen-trations is in line with the whole-brain studies highlightedearlier. As to the brain region variability of these effects,the mechanism is consistent with the pharmacokinetics ofvigabatrin in the frontal cortex and hippocampus, in thatfrontal cortex vigabatrin concentrations were twofoldhigher than those seen in the hippocampus. This latterobservation has not been previously reported and thusthere appears to be not only an upper threshold wherebyGABA concentration cannot be increased further but inaddition there is a threshold vigabatrin concentration
181
Vigabatrin and GABA in Brain Extracellular Fluid
Epilepsia, 50(2):174–183, 2009doi: 10.1111/j.1528-1167.2008.01863.x

that is needed so as to increase extracellular GABAconcentrations. Finally, it is clear that brain extracellularvigabatrin concentrations and GABA concentrations donot correlate with time and that GABA concentrationsbegin to increase some 3 h after maximum vigabatrin con-centrations occur and at a time when vigabatrin concentra-tions are declining exponentially (Fig. 6). Thischaracteristic has not been described previously but it is inline with the mechanism of action of vigabatrin.
Acknowledgments
We confirm that we have read the Journal’s position on issuesinvolved in ethical publication and affirm that this report is consistentwith those guidelines.
Disclosure of conflicts of interest: The authors have no conflict of interestto declare.
References
Ahmad S, Howler LJ, Whitton PS. (2005) Effects of combined lamotri-gine and valproate on basal and stimulated extracellular amino acidsand monoamines in the hippocampus of freely moving rats. NeunynSchmiedbergs Arch Pharmacol 371:1–8.
Appleton RE, Peters AC, Mumford JP, Shaw DE. (1999) Randomized,placebo-controlled study of vigabatrin as first-line treatment of infan-tile spasms. Epilepsia 40:1627–1633.
Ben-Menachem E, Hamberger A, Mumford J. (1993) Effect of long-term vigabatrin therapy on GABA and other amino acid concentra-tions in the central nervous system – a case study. Epilepsy Res16:241–243.
Clinckers R, Smolders I, Meurs A, Ebinger G, Michotte Y. (2005) Quan-titative in vivo microdialysis study on the influence of multidrugtransporters on the blood-brain barrier passage of oxcarbazepine:concomitant use of hippocampal monoamines as pharmacodynamicmarkers of the anticonvulsant activity. J Pharmacol Exp Ther314:725–731.
Conway M, Cubbidge RP, Hosking SL. (2008) Visual field severity indi-ces demonstrate dose-dependent visual loss from vigabatrin therapy.Epilepsia 49:108–116.
Danhof M, Levy G. (1984) Kinetics of drug action in disease states. I.Effect of infusion rate on phenobarbital concentrations in serum,brain and cerebrospinal fluid of normal rats at onset of loss of rightingreflex. J Pharmacol Exp Ther 229:44–50.
Dean C, Mosier M, Penry K. (1999) Dose-response study of vigabatrin asadd-on therapy in patients with uncontrolled complex partial sei-zures. Epilepsia 40:74–82.
De Lange ECM, Danhof M. (2002) Considerations in the use of cerebro-spinal fluid pharmacokinetics to predict brain target concentrations inthe clinical setting. Clin Pharmacokinet 41:691–703.
Dingamanse J, van Bree JBMM, Danhof M. (1987) Pharmacokineticmodeling of the anticonvulsant action of phenobarbital in rats.J Pharmacol Exp Ther 249:601–608.
French JA, Mosier M, Walker S, Sommerville K, Sussman N, VigabatrinProtocol 024 Investigative Cohort. (1996) A double-blind, placebo-controlled study of vigabatrin 3 g/day in patients with uncontrolledcomplex partial seizures. Neurology 46:54–61.
Gale K, Iadarola MJ. (1980) Seizure protection and increased nerve-terminal GABA: delayed effects of GABA transaminase inhibition.Science 208:288–291.
Godel H, Seitz P, Verhoeff M. (1992) Automated amino acid analysisusing combined FMOC-CL precolumn derivatization. LC/GC Int5:44–49.
Hocht C, Lazarowski A, Gonzalez NN, Auzmendi J, Opezzo JA,Bramuglia GF, Taira CA, Girardi E. (2007) Nimodipine restores thealtered hippocampal phenytoin pharmacokinetics in a refractoryepileptic model. Neurosci Lett 423:168–172.
Jolkkonen J, Mazurkiewicz M, Lahtinen H, Riekkinen P. (1992) Acuteeffects of c-vinyl-GABA on the GABAergic system in rats as studiedby microdialysis. Eur J Pharmacol 229:269–272.
Jung MJ, Lippert B, Metcalf BW, Bohlen P, Schechter PJ. (1977) c-vinylGABA (4-amino-hex-5-enoic acid), a new selective irreversibleinhibitor of GABA-T: Effects on brain GABA metabolism in mice.J Neurochem 29:797–802.
Klockowski PM, Levy G. (1988) Kinetics of drug action in disease statesXXIV. Pharmacodynamics of diazepam and its active metabolites inrats. J Pharmacol Exp Ther 244:912–918.
Loscher W. (1981) Effects of inhibitors of GABA aminotransferase onthe metabolism of GABA in brain tissue and synaptosomal fractions.J Neurochem 36:1521–1527.
Loscher W, Horstermann D. (1994) Differential effects of vigabatrin,c-acetylenic GABA, aminooxyacetic acid, and valproate on levels ofvarious amino acids in rat brain regions and plasma. Naunyn Schmi-edebergs Arch Pharmacol 349:270–278.
Lux AL, Edwards SW, Hancock E, Johnson AL, Kennedy CR, NewtonRW, O’Callaghan FJ, Verity CM, Osborne JP, United KingdomInfantile Spasms Study. (2005) The United Kingdom InfantileSpasms Study (UKISS) comparing hormone treatment with vigaba-trin on developmental and epilepsy outcomes to age 14 months: amulticentre randomised study. Lancet Neurol 4:712–717.
Malmgren K, Ben-Menachem E, Frisen L. (2001) Vigabatrin visualtoxicity: evolution and dose dependence. Epilepsia 42:609–615.
McDonagh J, Stephen LJ, Dolan FM, Parks S, Dutton GN, Kelly K,Keating D, Sills GJ, Brodie MJ. (2003) Peripheral retinal dysfunctionin patients taking vigabatrin. Neurology 61:1690–1694.
McKee PJW, Blacklaw J, Friel E, Thompson GG, Gilham RA, BrodieMJ. (1993) Adjuvant vigabatrin in refractory epilepsy: a ceiling toeffective dosage in individual patients? Epilepsia 34:937–943.
Mueller SG, Weber OM, Duc CO, Weber B, Meier D, Russ W, BoesigerP, Wieser HG. (2001) Effects of vigabatrin on brain GABA+/CR sig-nals in patients with epilepsy monitored by 1H-NMR-spectroscopy:responder characteristics. Epilepsia 42:29–40.
Nousiainen I, Mantyjarvi M, Kalviainen R. (2001) No reversion in vig-abatrin-associated visual field defects. Neurology 57:1916–1917.
Palfreyman MG, Bohlen P, Huot S, Mellet M. (1980) The effect ofc-vinyl GABA and c-acetylenic GABA on the concentration ofhomocarnosine in brain and CSF of the rat. Brain Res 190:288–292.
Patsalos PN, Alavijeh MS, Semba J, Lolin YI. (1992) A freely movingand behaving rat model for the chronic and simultaneous study ofdrug pharmacokinetics (blood) and neuropharmacokinetics (cerebro-spinal fluid): haematological and biochemical characterization andkinetic evaluation using carbamazepine. J Pharmacol Toxicol Meth-ods 28:21–28.
Paxinos G, Watson C. (1986) The rat brain in stereotaxic coordinates.2nd ed. Academic Press, San Diego.
Petroff OAC, Rothman DL, Behar KL, Collins TL, Mattson RH. (1996a)Human brain GABA levels rise rapidly after initiation of vigabatrintherapy. Neurology 47:1567–1571.
Petroff OAC, Rothman DL, Behar KL, Mattson RH. (1996b) Humanbrain GABA levels rise after initiation of vigabatrin therapy but failto rise further with increasing dose. Neurology 46:1459–1463.
Petroff OAC, Behar KL, Mattson RH, Rothman DL. (1996c) Humanbrain c-aminobutyric acid levels and seizure control following initia-tion of vigabatrin therapy. J Neurochem 67:2399–2404.
Rambeck B, Jurgens UH, May TW, Pannek HW, Behne F, Ebner A,Gorji A, Straub H, Speckmann EJ, Pohlmann-Eden B, Loscher W.(2006) Comparison of brain extracellular fluid, brain tissue, cerebro-spinal fluid, and serum concentrations of antiepileptic drugsmeasured by intraoperatively in patients with intractable epilepsy.Epilepsia 47:681–694.
Ratnaraj N, Patsalos PN. (1998) A high-performance liquid chromatogra-phy micromethod of for the simultaneous determination of vigabatrinand gabapentin in serum. Ther Drug Monit 20:430–434.
Sayin U, Timmerman W, Weterink BHC. (1995) The significance ofextracellular GABA in the substantia nigra of the rat during seizuresand anticonvulsant treatments. Brain Res 669:67–72.
Schecter PJ, Tranier Y, Jung MJ, Bohlen P. (1977) Audiogenic seizureprotection by elevated brain GABA concentrations in mice: effects ofc-acetylenic GABA and c-vinyl GABA, two irreversible GABA-Tinhibitors. Eur J Pharmacol 45:319–328.
182
X. Tong et al.
Epilepsia, 50(2):174–183, 2009doi: 10.1111/j.1528-1167.2008.01863.x

Scheyer RD, During MJ, Hochholzer JM, Spencer DD, Cramer JA,Mattson RH. (1994a) Phenytoin concentrations in the human brain:an in vivo microdialysis study. Epilepsy Res 18:227–232.
Scheyer RD, During MJ, Spencer DD, Toftness BR, Mattson RH.(1994b) Measurement of carbamazepine and carbamazepine epoxidein the human brain using in vivo microdialysis. Neurology 44:1469–1472.
Sechi GP, Petruzzi V, Rosati G, Tanca S, Monaco F, Fonrmato M,Rubattu L, De Riu P. (1989) Brain interstitial fluid and intracellulardistribution of phenytoin. Epilepsia 30:235–239.
Sierra-Paredes G, Oreiro-Garcia MT, Vazquez-Illanes MD, Sierra-Marcuno G. (2007) Effect of eslicarbazine acetate (BIA 2-093) onlatrunculin A-induced seizures and extracellular amino acid concen-trations in the rat hippocampus. Epilepsy Res 77:36–43.
Sills GJ, Butler E, Thompson GG, Brodie MJ. (1999) Vigabatrin and ti-agabine are pharmacologically different drugs: a pre-clinical study.Seizure 8:404–411.
Sills GJ, Patsalos PN, Butler E, Forrest G, Ratnaraj N, Brodie MJ. (2001)Visual field constriction. Accumulation of vigabatrin but not tiaga-bine in the retina. Neurology 57:196–200.
Sills GJ, Butler E, Forrest G, Ratnaraj N, Patsalos PN, Brodie MJ. (2003)Vigabatrin, but not gabapentin or topiramate, produces concentra-tion-related effects on enzymes and intermediates of the GABA shuntin rat brain and retina. Epilepsia 44:886–892.
Smolders I, Khan GM, Lindekens H, Prikken S, Marvin CA, Manil J,Ebinger G, Michotte Y. (1997) Effectiveness of vigabatrin againstfocally evoked pilocarpine-induced seizures and concomitantchanges in extracellular hippocampal and cerebella glutamate,c-aminobutyric acid and dopamine levels, a microdialysis-electrocorticography study in freely moving rats. J Pharmacol ExpTher 283:1239–1248.
Sokomba EN, Patsalos PN, Lolin YI, Curzon G. (1988) Concurrent moni-toring of central carbamazepine and transmitter amine metabolism
and motor activity in individual unrestrained rats using repetitivewithdrawal of cerebrospinal fluid. Neuropharmacology 27:409–415.
Timmerman W, Bouma M, De Vries JB, Davis M, Westerink BH. (2000)A microdialysis study on the mechanism of action of gabapentin. EurJ Pharmacol 398:53–57.
Toggweiler S, Wieser HG. (2001) Concentric visual field restrictionunder vigabatrin therapy: extent depends on the duration of drugintake. Seizure 10:420–423.
Tong X, Patsalos PN. (2001) A microdialysis study of the novel anti-epileptic drug levetiracetam: extracellular pharmacokinetics andeffect on taurine in rat brain. Br J Pharmacol 133:867–874.
Tong X, Ratnaraj N, Patsalos PN. (2007) The pharmacokinetics ofvigabatrin in rat blood and cerebrospinal fluid. Seizure 16:43–49.
Valdizan EM, Garcia AP, Armijo J. (1999) Time course of GABAergiceffects of vigabatrin: is the time course of brain GABA related toplatelet GABA-transaminase inhibition? Epilepsia 40:1062–1069.
Verhoeff NPLG, Petroff OAC, Hyder F, Zoghbi SS, Fujita M, RajeevanN, Rothman DL, Seibyl JP, Mattson RH, Innis RB. (1999) Effects ofvigabatrin on the GABAergic system as determined by [123] Iomaze-nil SPECT and GABA MRS. Epilepsia 40:1433–1438.
Walker MC, Alavijeh MS, Shorvon SD, Patsalos PN. (1996) Microdialy-sis study of the neuropharmacokinetics of phenytoin in rat hippocam-pus and frontal cortex. Epilepsia 37:421–427.
Walker MC, Tong X, Perry H, Alavijeh MS, Patsalos PN. (2000) Com-parison of serum, cerebrospinal fluid and extracellular fluid pharma-cokinetics of lamotrigine. Br J Pharmacol 130:242–248.
Wang X, Patsalos PN. (2003) A comparison of central brain (cerebro-spinal and extracellular fluids) and peripheral blood kinetics ofphenytoin after intravenous phenytoin and fosphenytoin. Seizure12:330–336.
Wang X, Ratnaraj N, Patsalos PN. (2004) The pharmacokinetic inter-relationship of tiagabine in blood, cerebrospinal fluid and brain extra-cellular fluid (frontal cortex and hippocampus). Seizure 13:574–581.
183
Vigabatrin and GABA in Brain Extracellular Fluid
Epilepsia, 50(2):174–183, 2009doi: 10.1111/j.1528-1167.2008.01863.x


