Embed Size (px)
Citation preview
INIS-mf~13744
ACollection of Papers
Presented at the IAEA Technical Committee Meeting
VIII Stellarator Workshop
at
Kharkov, USSR
27-31 May 1991
International Atomic Energy AgencyVienna, Austria
July, 1991

VIIIIAEA
STMffJUtATO*WOXiC&ftOPKHARKOVJ991L
Foreword
The technical reports in this collection of papers were presentedat the "Eighth International Workshop on Stellarators," anInternational Atomic Energy Agency Technical Committee Meeting.The Workshop was hosted by the Kharkov Institute of Physics andTechnology of the Ministry of Atomic Power and Industry. TheWorkshop was attended by 125 participants and observers from fivecountries and one international organization.
A summary of the meeting, by O. S. Pavlichenko, KhPTI, willbe published in a future issue of the journal Nuclear Fusion.
This collection of papers is prepared from direct reproductionsof the authors' copies. It is hoped that publication of the documentin this way will provide timely information to participants of themeeting, as well as to others who may have not been able to attendbut are interested in the proceedings.
Inadequate, but special acknowledgements are recorded here toV. F. Zelenskij, who chaired the local organizing committee, toO. S. Pavlichenko, who chaired the International ProgrammeCommittee, and to V. I. Tereshin, who served as the local ScientificSecretary. These three, together with the members of theircommittees, efficiently handled all of the detailed preparationsnecessary for the planning and execution of a successful meeting.
INTERNATXOMAL PROGRAMME COMMITTEE
O.S.Pavlichenko (Chairman),Institute of Phya.S Techn..Kharkov,USSR
G.Grieger.tfex-PZancJc-InsCieuc fur Plasmaphysik.Garching.FRG
A.Iiyoshi,National Institute for Fusion Science.Nagoya.Japan
L.M.Kovrizhnykh,General Physics Institute,Koscov.USSR
J.F.Lyon,Oak Ridge National Laboratory. Oak Ridge.TN,USA
Scientific Secretaries:
D.L.Banner,IAEA,Vienna.Austria
v.l.Tereshin,rnst. of Phys.s Techn. .Kharkov.USSR
The Eighth International Workshop on Stellarators (Committee Meeting of the International Atomic Energy Agency) isby Kharkov Institute of Physics and Technology of the Ministryof Atomic Power and Industry of the USSR.
This Workshop is sponsored by the Ministry of Atomic Power z=ttIndustry of the USSR and the International Atomic Energy Agescy.
Abbreviations of Laboratory Names
ORHL - Oak Ridge National Laboratory, USA
RPI - Renselaer Poiitechnie Institute, USA
ZPP - Max-Plank-Institut fttr Plasaaphysik, FRG
MIFS - National Institute Cor Fusion Science, Japan
PPUCU - Plasna Physic Laboratory,Kyoto University, Japan
TO - Tohokii Univesity, Japan
CIEMAT - Asociaci6n EURATOM/CIEHAT, Spain
KhPTX - Kharkov Institute of Physics & Technology, USSR
IGP - Institute of General Physics, USSR
IAE - Kurchatov Institute of Atonic Energy, USSR
LPTI - Ioffe Institute, of Physics 6 Technics, USSR
SPTI - Sukhumi Institute of Physics & Technics, USSR
IAM - Institute of Applied Mathematics, USSR
IMR - Institute of Nuclear Research, USSR
MSU - Moscow State University, USSR
KhSU - Kharkov State University, USSR
Efremov Inst - Efremov Institute of ElectrophysicApparatus, USSR
PROGRAM
of til* VZZX International Workahop en Stellar*tor*
Kharkov. 27-31 Hay 2991
Monday. May 27
9.30 - 9.40 Opening Remark*.
O.S.Pmrllchenko
v. I. Tereshin
9.40 - 11.00 Session Z-o. Progress reports
Chairman - O.S.Parlichenko.
I-O-l. Overview of U-3M Experiment
E.D.Volkov and U-3M Group (KhPTX) (40 min.)
I-O-2. Overview of rctcent results from Advanced Toroidal Facility
J.F.Lyon and ATF Team (ORNL). (40 min.)
11.00 - 11.20 Coffee
11.20 - 13.00 Session II-O. Transport.
Chairman - K. N. Stepanov.
II-O-l.Observation of Damping of Toroidal Rotation due to Neo-
classical Parallel Viscosity in Heliotron/Torsatron CHS.
K.Ida.H.Yamada.H.Iguchi.K.Itoh and CHS Group(NIFS) (20 min.) 1 7
II-O-2.Variation of the Neoclassical Transport Level in the
Uragan-2M Torsatron.
C.D.Beidler, J.KiBlinger, F.Rau. H.Wobig (IPP).
A.A.Shishkin (KhPTI) (20 min.) Al
II-O-3.Ion heat Conductivity, Radial Electric Fields and
CX-Losses in the WVII-XS Stellarator.
H.KaaBberg. J. Junker.M. Kick.V. Olendorf. S. Zop£el.V7-AS Team.
NBI Team (IPP).Y. I. Afanasjev.A. B. Izvozchikov(LPTI) (20 min.) 25
II-O-4.Ion confinement in the Advanced Toroidal Facility.
R.J.Colchin, H.R.Vade. R.H.Fovler. R.C.Isler. J.F.Lyon. 9 Q
J. a. Home, and C.E.Thomas (ORNL). (20 min.) ^
II-O-5.Configurational effects on the confinement in W7-AS.
H.Renner#t;.Gasparino,Jl.tfell«r and V7 AS-Team.NBZ-Team (IPP).ECRH-Group (Stuttgart Univ.). (20 min.) 35
13-00 -14.30 Lunch
14.30 - 16.00 Session ZZX-F.Transport Effects
Chairman - A.A.Shiahkln.
ZII-P-1. Heoclasslcal Current and notation in a Helical System.
N.NakajlM and M.Okamoto (N1FS) 3 9
I1I-P-2. Calculation of the Amblpolar Electrical Field for Hellas
with emphasis on Vondelstein 7X
C.D.Beldler (XPP) 43
III-P-3. Heoclassical Transport Calculations using DKES codefor W7-AS.
45H.Maassberg. V7-JS Team and NBI Team (XPP)
III-P-4. Honte Carlo transport analysis in torsatron/neiiotron
systems. 4 9
H. S. Salrnora (KtiPTI).
III-P-5. Particle and energy balance in Uragan-3 torsatr.on.
N.T.Besedin, S.V.Kasilov, I.M.Pankratov, PyacaH A. I.. „
Stepanor K. W. (KtiPTI) 3
III-P-6. Heat transport in current-free/ plasma of - the L.-2
stellarator.
E.D.Andryukhina. K.S.Dyabilin, O.I.Fedyanin (ISP)
IIX-P-7. Honte Carlo studies of transport coefficients for
Uragan-ZH device.
Yu.A.Volkov (IAH), S.G.Shasharina (IGP). N.T.Besedin, fi1
I.H.Pankrator. A. A. Shishkin (KhPTI).
III-P-8. Spherical harmonies method for calculating neoclassical
transport coefficients. 65
Yti. A. Volkov (IAM)
III-P-9. Heoclassical Studies in Heliac TJ-II.
A. Rodriguez-Yunta (CXEMAT).
III-P-10.Peaked Density Profile and its Correlation with
Toroidal Rotation in the Heliotron/Torsatron CHS.
H. Iguchi. K.Ida, H.Yamada, S.Okamura. K. Hazsuoka and 7c
CHS Group (MFS).III-P-11.First results from ATF Heavy Zon Beaa Probe.
K. A.Connor.S. C. AceCo.J. G. Sctwelberger. J. J. Zielinski(RPI),
A.Carnevali (RKVC). J.C.Glovienka (ORttL).U.Okasu (PPLKU) 79
III-P-12.Probability of particle trapping and detrapping in
torsatrons. „.
I.H.Sidorenko (KhPTI)
l«.00 - 17.30 Session XV-P.Magnetic Configurations.
ConMguratlonal EffectsChairman - O. L. Qrekor.
XY-P-1. Detachable joint and currant feed Influence on the
Uragan-4 Magnetic configuration.
H.T.Beaedin. Q.Q.Lesnyakor. X.M.Pankrator (KhPTX).
IV-P-2. Suppression of Magnetic Islands in torsatrons.
A.r.zolotukhln. A. A. Shishkln (KhPTX). 93
IV-P-3-- Vacuum aagnetlc configuration control in the torsatronVragan-2M by poloidai and toroidal Magnetic fields.
7. S. Bykor.A. Y. Xhodyachlkh, Yu. K. Kuznetsov, O. S. Parllchenko. Q 7
V.G.Peletmlnskaya.Jl.A.Shishkin (KhPTZ). y/
IV-P-4. 1-3 torsatron magnetic configuration with quadrupole field.
G.G.LesnyaHor. V.I.Fetrenko (KhPTI) 'v
IV-P-5. Perturbation Field Experiments in CHS.
S.Okamura, L.Peranicti. K.Mazsuoka. H.Iguchi. K.Ida. 1Q3
H.Yamada. K.Nistiimura and CHS Group (UIFS).
IV-P-6. Effect of Magnetic Islands Produced by External
Perturbations on Plasma Confinement in TU-Heliac.
K.Watanabe, S.Kitajima, K.Takayama and T.Zaxua (TU) 1 0 7
IV-P-7. Confinement Improvement of HBI plasmas by magnetic
configuration control.F. Sano, S. Stido. H. Zushi.K. Kondo. T. Hiztzuchi. H. Okada. K. Hanatani,H.Nakasuga.S.Besshou,Y.Nakamira.H.Vakatani,T.Obiki (PPLKU). HIK. Muraoka, K. Uchino. K. Hatsuo, A. Komori (Kyushu U),». Sato(NXFS)
IV-P-8. Configuration control and modulation experiments using
long-pulse ECH discharges in the ATF torsatron.
V. R. Wing.L.R.Baylor,T.S.Bigelov.R.J.Colctii.il eC al. (ORNL) 1 1 5
IV-P-9. Creation of average magnetic well in closed magnetic traps
by a local deformation of circular magnetic surfaces.
V.M.Glagolev. A.E.Lenjora (IAE).
IV-P-10. Magnetic field perturbation's effect on particle motion in
torsatrons/heliotrons. . „_
M.S.Salrnova. A.A.Shishkin (KhPTX)
IV-P-11. Recycling in H7-AS and modeling on the basis of Degas-code.F. Sardei, H. Ringler, A. Dodhy. P. Cr igull, G. Kiihner. F. P. Peaningsfeld " 131V7-AS Teaa,NBI-Team (IPP).ECRH Group (Stuttgart Univ. ).
17.30 - 19.00 Discussion
Tuaadav. May 28
9.30 - 11.00 Session V-0. Progress reports.
Chainaan - G.Qricger.
V-O-l Progress on the stellarator Wendelatein N VIZ AS.
H.Banner*B.Maasabcrg.B.Rlngler.F.Sardel and the V7-AS Team, 135
war-Teaa (IPP).ECRU-Group (Stuttgart Untr. ) (40 min.)
V-O-2- Recent results of Heliotron E Experiment.
T.Obilci and Heliotron 5 group. (40 aln.) x
Coffee 11.00-11.20
11.20 - 13.00 Session VX-O. Fluctuations.
Chairnan - O.I.Fedyanin
VI-O-1.Magnetic fluctuation measurements in the Keliotron-E
Device. B.Zushi (PPLKU) (20 min.) 1 8 5
VI-0-2.Fluctuations and transport in low-collisionaiity plasmas
in the ATF Torsatron.
J.B.Harris.M.Murakami,B. A. Carreras et al (ORNL). Presented 191
by J.F.Lyon. (20 ain.)
VI-0-3.Plasma potential and electric field investigations in ATF.
R. c. Isler. R. J. Colchin, T. Uckan(ORltL),S. c. Aceto.J. G. Sctwelbergur. 197J.J.Zelinski (RPI).B.Okada (PPZXU). (20 min.)
VI-O-4.Edge Plasma Fluctuations in the ATF Torsatron.C.Hidalgo (CIEHAT).J.B.Harris, T.Uckar.. J.D.Bell, B.A.Carreras. 203J.L.Dunlap, G.R.Dyer (ORNL). Ch.P.Ritz. A.J.Vootzon, M. A. Meier.7. L. Rhodes (Univ. Texas). (20 min.)
13-00 -14.JO Lunch
14.30 - 16.00 Session VII-P. Plasma Production and Heating
(0H.RF and HBZ).
Chairman - V. V. Chechkin.
vil-p-i.Alfven heating in toroidal plasmas by using three half- 2o7
turn loop antenna. V.E.Moiseenko (KhPTI)
VII-P-2.Excitation of global Alfven modes in a stellarator.
A.G.Kiror.L.F.Ruchko.D. A. Voytenko.A. V. Sukachev (SPTX). 2 1 1
VII-P-3.Study of propagation and damping of FMS waves and ICR
heating on L-2 stellarator.
S.E.Grebenshehikor, A.I.Meshcheryakov, I.s. Sbitnikova. 215V. u. sukhodol'skij (IGP).
VXX-P-4. AT syatea for plasma production aad heating in
"Uragan-2M", device.
4. K. Longinor. D.V. Berezor. E. I. Kolosenko. E. D. Kramakaj, ,..
V.A.Lukinor. CM^. JUzhniJt,A.A.Chmvga (KhPTX). Z i y
VII-P-5. electron plasma component heating ln"Uragan-2MM toraatron
with FHSM l n u i u c i range.
•.C.Dyakov,Jl.ir.£onginor,S.S. Parlor (JOiPITJ. 223
VII-P-6. Propagation and absorption studies of ion Bernstein vaves
In the torsatron "Uragan-2M" by ray tracing technique.
V.E.Dyakov(jt. 7. Longinor (KhPTX). 2 2 7
VII-P-7. ICR scenarios of the ion component heating in HUragan-2Mrt
torsatron plasma. A. V. Longinor.S.S.Pavlov (KhPTX).
vn-P-a. ICSF Heating Experiments in CHS.K.Nishimira. T.Shojl, R.Ktmazara. T.Mutoh. T.Vatari and 235CHS Group (NIFS).
VII-P-9. Plasma RF-production experiments using the antenna
integrated to the U-3M torsatron helical windings.E.D.Yolkor. A.I.Lysojvan. N. I.Hazarov, tr.V.Plyusnin. -,q
r. r«x. Ranyttk, O.H.Shvecs (KhPTl).
VII-P-lO.ICRF-method for plasmas production in large stellarators.
.1. X. Lysojvan. V. E. Hoissenko.O. H. Shvets. K. N. Stepanor(KhPTI). 243
VII-P-H.Plasma production in a stellarator by using alternating
toroidal current. V. E. Koiseenko (KhPTX). 2 4 7
VII-P-12.NBI experiments in the "Uragan-3M Torsatron.
V. I. Tereshin, S.I.Karpukhin, A. 7. Klimenko, B. A. Sherchuk 251and "U-3M" Team (KhPTX).
VII-P-13.Efficiency of neutral beam injection in the "Uragan-2M"
and "Uragan-3M" torsatrons.
V. Ya. Goloborod'ko. V. P. Nagornyi. V. A. YavorsHi j ("XMR,Kiev),
S. I. Karptikhin, A. V. Klimenko. V. X. Tereshin,B. A. Shcrchuk(KhPTI). 2 5 5
VII-P-14.NBI Optimization Studies for TJ-II Helical Axis
Stellarator. J.Guasp. M.Liniers (CIEMAT) 259
VII-P-15.Peculiarity of Ohmic heating due to magnetic islands in
Uragan-2 stellarator.K. F. Perepelkin. A. Y. Arsen' er, E. D. Volkor, V. G. Konovalov, 263
A.E.Kulaga. A.N.Shapoval (KhPTI)
VII-P-16.Dynamics of periphery plasma in Uragan-3M after
termination of RF-heating pulse.
V. V. Chechkin, L. X. Grigor'era. V. V. Konoralor, u. T Nazaror.V. V. Plyusnin. A. I. Skibenko. V. S. Vojtsenya.E. D. Volk<- r(KhPTI). 2 6 9
VII-P-17.ICRF heating system on Large Helical Device.R. Kumazara.T. Vatari,T. Huloh.F. Shinbo.K. Ohkubo.S. Kubo, 275T.Kuroda (NIFS).
16-00 - 17.30 S««slon TX1I-P. Equilibrium. Stability.
Chairman- Yu.R.KuznetMor.
VIII-P-l.A criterion of ballooning flute «ode stability in
stallarator. 279
O.K. Cheremnykh (ISR). •
V11X-P-2.Internal kink Mode «»1 in atellarator. 283
O. K. Cheremnykh and A. V. PodnebesnyJ (INR).
VIXI-P-J.Dispersion relations for Suydaa problem in stellaracor. 287
O. K. Cheremnykh and S.tt.Rermchuk (INR).
VIII-P-4.Stability Studies for the Flexible Heliac TJ-II.
C.Alejaldre,.A. L.Fraguas,L. Garcia. A. Salas, A. Varias (CimAT) 2 9 1
B.Carreras. N.Dominguez. V.Linch (ORNL).
VXIX-P-S.Quasisysunetrical stellarators in paraxial approximation. 297
H.Yu. Isayer (IAE).
VIII-P-6.MHD equilibrium for Uraqan-2M torsatron. ^01
D.L.Grekor.r.E.D'yakov (KhPTI). S.P.Hirshnan (ORNL).
VIII-P-7.Study of plasma equilibrium currents in the Uragan-2H
torsatron. 305
V. N. Kalyuzhnyj,V. V. Nemov (KhPTI).
VIII-P-8.Plasma pressure ani^otropy effect on ideal HHD-modesin
stellarator type traps. 311
P.y.Demchenko.K.V.Sakhar (KhSU). A.Ya.Omel"chenko (KhPTI).
VIII-P-9.Plasma equilibria with large-scale islands (method of
basic . coordinates). _ 313
D. Yu. Sychugov (MSU). S. V. Shchepetov (IGP).
VIIX-P-10.Analytical calculations of plasma equilibrium in
torsatron "Uragan-2H". 317
Y. K. Kuznetsow, I. B. Pinos, V. I. Tytzpa (KhPTI)
VIII-P-ll.Dynamie of longitudinal current in the "Uragan-3"
torsatron. 321
Yu.V.Gutarer.V.K.Pashner (KhPTI).V.D.Ptxstovitov (IAE).
VIII-P-12.A semianalitycal approach to the Mercier criterion for
some TJ-II configurations. „..
A.Varias, A.L.Fraguas and C.Alejaldre (CIEHAT).N.Dominguez. B.Carreras and V.Linch (ORNL).
17.30 - 19.00 Discussion
W«dn«adav. Kay ftp > , ..••••
9.30 - XX.00 Session 1X-O. Progress raporta.
Chairman - J.F.Lyon.
IX-O-1. Physics Studios for U-2H Torsatron.N.T.Besedln, V.E.Dyakor, D.L.Grekor. Q.Q.Lesnyakov.I.H.PankraCor. Q.S.Parlichcnko. A,*.Shishkin,I.W. sieforenfco,M.S.Smlrnora. A.r.Zolotukhin (KhPTI), C.D.Beidler, . , „J.Ktssllnger.F.Ratx.H.Voblg (IPP),B.JL. Carreras, N. Domlnguez. J<L'
. V.Unch (ORHL). (40 Bin.)
IX-O-2. Studios on Equilibrium, Stability and Transport for tho TJ-IHolical Axis Device.Status of the Project.A.P.Nararro (40 nln.)
Coffee 11.00 - 11.20
11.20 - 13.00 Session X-O.Edge plasma.
Chairman - H.Renner.
X-O-l. Impurities and radiation in the W7-AS stellarator after
wall conditioning by carbonization and boronization.
R.Brakel, R. Burhenn, A. Eisner, P.Grigull.H. Hacker. F. Sardei,A.Veller, V7-AS Team, NBI Team (IPP), K.Kondo (PPLKU), 349
ECRH Group (Stuttgart Univ.). (20 min.)
X-O-2, Characteristics of plasma edge in the Hellotron-E device.
T.Mizuuchi,H.Jfatsuura and Heliotron-E Group. (20 min.) 3 6 5
X-O-3. Peripheral plasma characteristics near LCMS in Uragan-3M.w. T. Besedln, V. V. Chechkin,I. P. Fomin, L. I. Grigor' eVa. If. I. Nazarov,I.M.Pankratov. V.v.piyusnin, T.Yu.Ranyuk. , A. I.Skibenko, .wQS.I.Solodorchenko, V.S.Vojtsenya. E.D.Volkor (KhPTI). J
X-0-4. RF heating effects on diverted plasma flows in Uragan-3M.
v.v.chechkin, I.P.Fomin, L.I.Grigor'eva. If. I.Nazarov,V. V. Plyusnin, T. Yu. Ranyuk, A. I. Skibenko, S. I. Solodovchenko, -> 7 =V.S.Vojtsenya, E.D.Volkov (KhPTI).
Papers X-0-3 and X-0-4 are combined,total time-30 min.
13.00 -14.30 Lunch
14.30 - 16.00 Session XI-P.ECR Heating.Diagnostics.
Chairman- V. S. Voitsenya.
XI-P-l. Profile measurements and transport analysis of ECH plasmas
in Heliotron E.
S.Sudo, H.Zushi, K.Kondo. F.Sano, T.Hizuuchi, S.Besshou,H.Okada.H.Vakatani and T.Obiki (PPLKU). 3 8 1
XI-P-2. Behavior of dlaaagnotlM and toroidal, current in
Hallotron C plawua. 3 g 5
S.Beaahou and Beliotron-S Group (PPLKU).
XX-P-3. Cl«ctroo taaperature MM<ir«a«nt« by Thoaaon scattering
on tho current-free ECXfl plasmaa in tho L-2 atellarator.
N.F.Larionova, Yu. A. Orlor (IGP)
XX-P-4. ion Teaperature in L-2 stellarator with BF-heatlng from
Oopplar broadening. ».?.Oon«»caya, G.S.Yoronor (IGP).
XI-P-5. Oovolopaent of tho tranaaiaaion «y«tem for a naif megawatt
IOC GHz gyrotron.
H.Sato, H.Zushi, H.lima.S.Kobnyashl.K.Sakamoto.K.Nagasaki, 397
T.Senjtt (PPUOJ)
XZ-P-6. Mode and power aeasureaent of the HE-, transmiasion line.
It.Sato, H.Zushi, it.Ilma,S.Kobayashl.K.Sakamato,K.Nagasaki, 401
K.Hosokava.S.Kubo (PPLKV)
XI-P-7. ions behavior during the ECRM in the atellarator L-2.
r.S.Sbitnikora, V.H.Sukhodol'slcij (IGP). °
XI-P-8. Neoclassical Energy Balance Simulation for ECR Plasma In
L-2 stellarator.
S. E.Grebenshchikov, r.S. Danilkin (IGP) and ^ 0 9
A.B.Mineev (Efremor. Inst.).
XI-P-9. Multichannel far-infrared Interferometers for electron
density measurements for the Uragan-2M stellarator.
V.L.Berezhnyj, V.I.Kononenko, O. S. Parlichenko (KhPTI). , n
V.A.Epishin. V.A.MAS lor, V.A.Sricti. A.N.Topkov (KhSO).
XI-P-1O.Heavy ion bean probing optimization for stellarators.
L.I.Knzpnlk. I.S.Nedzelslcij, N.V.Samokhralor (KhPTI), 417
A.V.Helnikor (IAE), N.K.Kharehev (IGP).
Xl-P-ll.On the problem of magnetic diagnostics of a stellarator
plasma. 4 2 1
Yu. K. Kuznetsor (KhPTI), S.V.Shchepetov (IGP).
XI-P-12.The new method of the magnetic diagnostic for the
stationary operating systems. 425
E.D.Andryukhina. K.S.Dyabilin, O.I.Fedyanin (IGP).
XI-P-13.To the "stellarator diode method"In 1=3 torsatron studying.
E. D. Volkor, V. H. Zalkind. G. G. Lesnyakor, F. I. Qz tier el' ev. 4 2 9
D.P. Pogozher (KhPTI).XI-P-14.A theory of "a stellarator diode".
433A.G.Dikij, 7.H. Zalkind, G.G.Lesnyakor. O.S.Parlichenko,A.V.Pashchenko, V.K.Pashner, D.P.Pogozher (KhPTI).
XC.00 - 17.30 Session XII-P. Maw devices. Reactors.
Chairman- S.D.Yolkor.
XXX-P-1.Experimental davlca "Uragan-S" concept.Y.Z.Amelin. S.D.rolkor. A.r.GeorgierskiJ. Y.I.Koryarka. 437K.S.Rubtsor. Y.A.Rudakor. Yu.F.Sergeer (KhPTI).
XXX-P-2.Compact circular stellarator magnetic systems.Y.X.Sykort S.D.rolkor, Y.P.Yoroblora, A.Y.GeorglerskiJ,Yu.K.Kuznetsor. S.A.Hartynor,Y.Q.Peletminskaya.Y.A.Rudakor. 441Yu.F.Sergeer. H.A.Khadzhmurador. A.Y.Khodyachlkh (KhPTI).
XIX-P-3.Uragan-4 Project.Y. E. Bykor.A. Y. Georgierskij.A. V. Khodyachlkh, Yu. K. Kuznetsor.Yu. A.Lltrinenko. O.S.Pariichenko, Y. G. Peletmlnskaya, 447
Yu.F.Sergeer. A.A.Shishkin, F.A.Tkhoryak (KhPTI).
XII-P-4.Stellarator modular magnetic systems.
A. V. Georgierskij, V.A.Rudakov (KhPTI).
XII-P-5.TJ-I Upgrade : a 1=1 torsatron for stability studies.
Theoretical predictions and status of the project.E.Ascasibar, J.Alonso, C.Alejaldre. F. Castejon. J.Guasp,Y. Krirenski.A. Lopez-Fraguas, R. Hartin, A. Martinez, A. P. NararroH. A. Cchando, I. Pastor, A. Rodriguez-Yunta,J. Sanchez, F. Tabares.and Y.Tribados (CIEHAT).
XII-P-6.Stellarator reactor optimization. ,-„
J.F.Lyon, s. L. Painter (ORNL).
XII-P-7.D - He Reactor-Stellar a tor and the ash problem.
V. A. Rudakor (KhPTI).
Confinement iapr<
N. Oyahu (NIFS).
XII-P-8.Confinement improvement scenario by the LHD Oivertor.465
17.30 -19.00 . Discussion
May 30
9.30 - 11.00 Seaalon JCZXI-O. Progress reports.
Chairman - O.HotoJlma.
XXIX-0-1.Status of Stellarator Xesearch In the General Physics
Institute.
469O.tt.Batanor. S.E. Grebenshchikor. L. M. Korrlzhnykh,O.X.Fedyanln (IGP). (40 ain.)
XIZX-O-2.ReTlev of CHS Experiments. 471
K.Matsuoka and CHS Group. (40 min.)
Coffee 11.00 - 11.20
11.20 - 13.00 Tour on U-3H and U-2M site.
13.15 -19.30 Site seeing.
Friday, flay 31.
9.30 - 11.00 Seaalon XXV-O. Progress reports.
Chalman - A.P.Nararro.
XXV-O-1. Recent Statua of Largo Helical Device Project.
O.Hot6jimM,H.Fujlvaira.and LHD Design Group(NIFS). (40 mln.)
XIV-o-2. Project of the L-2/4 stellarator.
S. E. Grebenshchikor, Z.S.OanllKln.L. H. Korrizhnykh.O.1. Fedyanin.O.E.Khadin. V.A.Taygankor, I.S.Shplgel, S.V.Shchepetor (IGP).E. N. Bondarctiuk. H. H. Goloranor. V. V. Iranor.. V. A. Karnaukh,I. V. Klrpicher. B. A. Kltaer. V. S. Kuligln. V. Y. Hakaror, I. V. Markov.S.I.Hastikortser.A.B.HlM*v,A.V.Petrav(Efremor Inst. ) (40 min)
481
483
Coffee 11.00 - 11.20
11.20 - 13.00 Session XV-O. Equilibrium.
Chairman - V. D. Shafranov.
XV-O-i. Free boundary plasma equilibrium in stellarator.
V.D.Ptxstovitor (IAE). (30 min.)
XV-o-2. Global internal MHO node analysis of stellarators and
W7-X application.
C.Sctwab (IPP). (20 min.)
XV-0-3. Free boundary plasma equilibrium in- a small shear
stellarator.
A. B. Kuznetsov, S. V. Shchepetoir (iGP).Yu.K.KuzneZsor (KhPTI).D.Yu.Sychugov (HSU). (20 min.)
XV-O-4. Application of Microwave Reflectometry to Stability end
Turbulence Studies in Stellarators.
J.Sanches. B.Sraffas, T. Estrada, E. de La Luna.A.P.Nararro (CIEHAT). G.R.Hanson, J.H.Harris, J.D.Bell,J.B.Wilgen(ORNL), H.J.Hartfuss(IPP) (20min.)
487
491
499
503
13.00-14.30 Lunch
14.30 - 16.30 ••••Ion XVX-O.
Chairman - T.QbiHi.
XVI-o-l. Coll ayatwta for optlMl flexibility In N7-X.
P.Htrkal (IPP). (30 «in)
XVI-o-2. Local Ttiarsal Tranaport Analysis In th« tov-Aspect-Katio
Hellotron/Torsatron CSS.
B.Xamada, K.Ida. ff.XgUchl. B.C.Bove, S.Kubo, Y.Ogava,K.Banatanl, S.OHauura and CBS Group (N1FS). (20 aln)
XVX-O-3. Sfflclancy of alactron-cyclotron •icrovaye abaorptlon In
tho L-2 atellarator.
E. D. 4iKtryuWiina.lt. S.DyablUn.0.1. Fedyanln(IGP). (20 «in)
XVI-O-4. Colliaionleaa alfa-p*rticl« confinement in. Modular
stellar*tors.
V.Lotz,P.fferJcel,J.Muhrenl>era (IPP)- (20 Bin)XVI-o-5. On the confinement of fast part ic les in compact
stellarators.
V. Ya. Goloborod'ko,V.P.Nagornyj.r.A. YavorsftiJ(IlfR) (20 min)
507
511
515
519
525
Post Deadline Papers
I Pellet Injection Experiments of ECH Plasmas in Heliotron E.S. Sudo, T. Baba, H. Zushi, K. Kondo, F. Sano, T. Mizuuchi,S. Besshou, H. Okada, M. Wakatani, and T. Obiki (PlasmaPhysics Laboratory, Kyoto University)
II Neoclassical Transport in Stellarators - A comparison of con-ventional stellarator/torsatrons with the advanced stellaratorWendelstein 7X.C D . Beidler (IPP)
III Diagnostics Development for the Large Helical Device.H. Iguchi (Diagnostic Division and R&D Division, NationalInstitute for Fusion Science, Nagoya)
529
533
537
OVERVIEW OF URAGAN-3M EXPERIMENT
E.D.Volkov
Institute of Physics and Technology, Kharkov, USSR.
Confinement of a plasma initiated and heated by ion cyclotron
resonance frequency waves has been studied in the modified
Uragan-3M torsatron. The observed plasma parameters were:
Ti(0) = (200-600) eV, Te(O) - lOOeV, ne=(l-4)xl012cm"3 at BQ=0.45 T.
The measurements of the peripheral plasma parameters are
described.
1. URAGAN-3M (U-3M) SYSTEM.
The U-3m device is the modified U-3 torsatron [1]. The U-3
torsatron was built to operate with a magnetic field up to B =2T
and the mean radius of the last closed magnetic surface (LCMS)
a=(12-13) cm. However, an insufficient rigidness of the helical
winding support structure restricted the magnetic field value to a
level of B <1T, while inaccuracies in a magnetic
system fabriication together with a low multipolarity of the
compensation winding (p-2) restricted the average radius of the
LCMS to a < 9 cm [2].
In 1989, to improve the magnetic field structure, a new
helical winding bounded by 9 strengthening rings and 2 additional
compensation field coils were mounted on the modified U-3M
torsatron. The new magnetic system permits an operation with a
magnetic field up to B =2T.
2, THE U-3M MAGNETIC FIELD CONFIGURATION
The magnetic configuration of the U-3M device was controlled
by the vertical field B,. Changes of vacuum magnetic configuration
were experimentally studied by using two methods: the stellarator
diode [3] and luminescent probe [4] ones. These methods allowed us
to demonstrate the existence of nested magnetic surface families
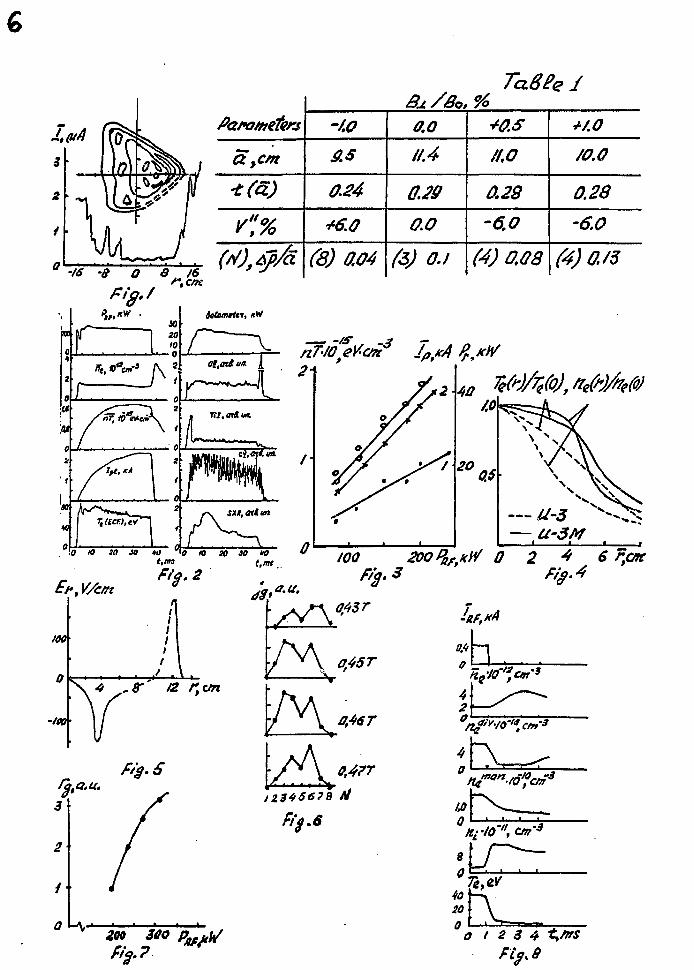
in the range of Bj /B -variants -1.0% <Bi/B <+1.5%. Fig.l shows the
magnetic configuration (luminescent probe) and emission current
profile (stellarator diode) for B1/BQ=1.0%. Table l presents the
basic parameters of magnetic configurations for different BJ^/BQ
values (Vn- magnetic well/hill value, N-number of islands adjacent
to the LCMS,Ap/a- relative size of the island).
3. RF-DISCHARGE PLASMA BEHAVIOUR IN THE PLASMA COLUMN
Like in the U-3 torsatron>v [2] the plasma in U-3M was
produced and heated by RF-waves in the w<wci range of frequencies.
The waves were generated in the plasma column by two different
helical frame-like antennae, which are installed on the low-field
side of the plasma in the meridian plane. The antenna similar to
that in U-3 was used to operate with a low density plasma
(n <5xlO~ ). The other antenna, with its current conducting
surface being formed by parts of two helical winding casings, was
used to produce a higher density plasma (n < 1.5x10 cm' ). By
means of these two antennae the plasma can be produced in U-3M in
the whole range of B^/B variations (-1.0%<B,/B <+1.5%).
The aim of the first phase experiment was to compare the
confinement properties of the RF heated plasma in the U-3 and U-3M
devices with a similar magnetic configurations (B./B =1.25%) and
the same value of B =0.45T.o
After cleaning surfaces by an RF discharge with the lowmagnetic field B =0.02T,discharges with quasistationary behaviour
— 12 —3of plasma parameters were obtained (n =(l-4)xio cm ,Ti(0)=(200-600)eV, Te(0)=100 eV, At=20-50 ms) for the input RF
power PRp<250 kW.
Fig.2 depicts the time behaviour of plasma parameters in the
discharges under study. According to measurements the energy
stored in the plasma column W=^n (Ti + Te)V as well as the
unidirectional current generated in the plasma and radiation
losses are proportional to PRF (Fig.3). The global energy
confinement time defined as T = W/PR_, does not exceed 0.2 ms.
It follows from diamagnetic measurements carried out 0.5 ms
after RF power was switched off, that energy decay time x°=-W/W
varies from 2.6 to 3.5 ms with P^^rising from 80 to 240 kW. Thevalues of zZ, and n~7Tl+Te) obtained in this range of P__ variation
it e Kr
are 1.3-1.5 times as large as those observed on the U-3 torsatron.
This result is attributed to more flattened ne and Te profiles
(Fig.4). According to diamagnetic measurements only a small
fraction of the power injected by the antenna is absorbed in the
plasma column (10 - 20)%. The rest of the RF power apparently goes
to maintain the plasma in the regions of the divertor layer and
the plasma mantle surrounding the helical winding at the active
stage of the discharge.
4. PERIPHERAL PLASMA BEHAVIOUR.
As probe measurements show, during the RF pulse a divertor
layer of the plasma is formed with a quasistationary time
behaviour of plasma parameters (Ti~100 eV, Te~20-40 eV, n er(6-10)x10 -3xlO cm ) . The width of the divertor layer in the
near-separatrix region is ~ lcm (the length of e-fold decrease in
the density and electron temperature isA =AT=lcm). Near the apex
of the separatrix this layer widens and extends behind the helical
winding (X =4cm, A_=9cm).
In all operation modes the peripheral plasma acquire a
quasistationary positive potential with respect to the walls, its
value attain ~ 200V near the separatrix surface. Our plasma
potential measurements in the peripheral plasma near the LCMS
together with computation results on the basis of neoclassical
theory for the ambipolar electric field inside the confinement
volume (the flows being determined from experimental data on the
Ti(r),T«(r) and ne(
r) profiles) enable us to construct a
qualitative picture of the radial electric field behaviour both
in- and outside the confinement valume(Fig.5).
The spatial distributions of the ion density, ion saturation
current and current on the earthed Langmuir probe are
characterized by two peaks in the space between two helical
windings (Fig.6). A special feature of these distributions is the
dependence of both absolute and relative values of the peaks and
their positions not only on the B,/B ratio but on the absolute
value of the B and R_.The total diverted plasma flow r increases
monotonously with PRF (Fig.7). Apparently, this is caused by the
effect of the E and a resonant character of RF power absorption
on the diverted plasma flows.
Fig.8 shows the plasma density time behaviour in the
column, devertor layer and mantle after switching off the RF
power. A fast decay of. the density and electron temperature takes
place in the divertor layer and in the mantle, resulting in the
increase of the working gas influx into the confinement volume. As
a consequence, a fast increase (by a factor 2-3) of the plasma
density inside the confinement volume and in the region nearest to
the LCMS occurs together with the cooling of the electrons and a
considerable increase in some impurity line radiation.
Note, that a decrease density in the mantle plasma is
observed as n increases in the plasma column.
CONCLUSION
1. In the modified U-3M torsatron the magnetic configurations with
families of nested magnetic surfaces of different well/hill values
and D-factors can be formed due to vertical magnetic field
variations.
2. A plasma with a density of (1-15) xio cm~ can be produced by
the RF method in all magnetic configurations.
3. In the case of low n the values of n?Ti+Te) and x_in U-3M aree it
1.3-1.5 times as high as in the U-3 torsatron with a similar
magnetic configuration as a result of a-increase and n - and Te-
profile flattening.
4. Clearly pronounced diverted plasma flow are observed at the
periphery; the height and position of the peaks of these flows
depend not only on the B^/B ratio, but also on the confining
magnetic field and input RF-power.
5. The value of the total diverted plasma flow increases with the
input RF power.
6. The radial electric field caused by the potential gradient near
the LCMS exceeds 100 V/cm and is directed outwards, opposite to
the radial electric field in the confinement region as computed on
the base experimentally measured density and temperature profiles
with the electron and supposed ion flow equality.
7. A qualitative analysis of density and electron temperature time
behaviour in the peripheral plasma permits to explain such effects
as more than twofold increase in the confined plasma density just
after the end of the RF pulse with a simultaneous density decay in
the diverted fluxes and in the mantle.
8. Near-term plans include the investigations at B =1.5T, where
the plasma density and temperature can be increased. That will
permit us to use the NBI heating.
LITERATURE
1. Volkov E.D. et al. Preprint KhPTI 81-45, Kharkov, 1981, 28 p.2. Berezhnyj V.L. et al. In Plasma Phys and Contr. Nucl. Fus.Res., IAEA, Vienna, 1987, V.2, p. 279.3. Dikij A.G. et al. Fizika Plazmy, 1988, V.14, p.2194. Hailer H. et al. In Contr. Fus. and Plasma Phys., EPS. 1987,V.11D, pt. 1, p.423.
-IS - a O 3 / 6
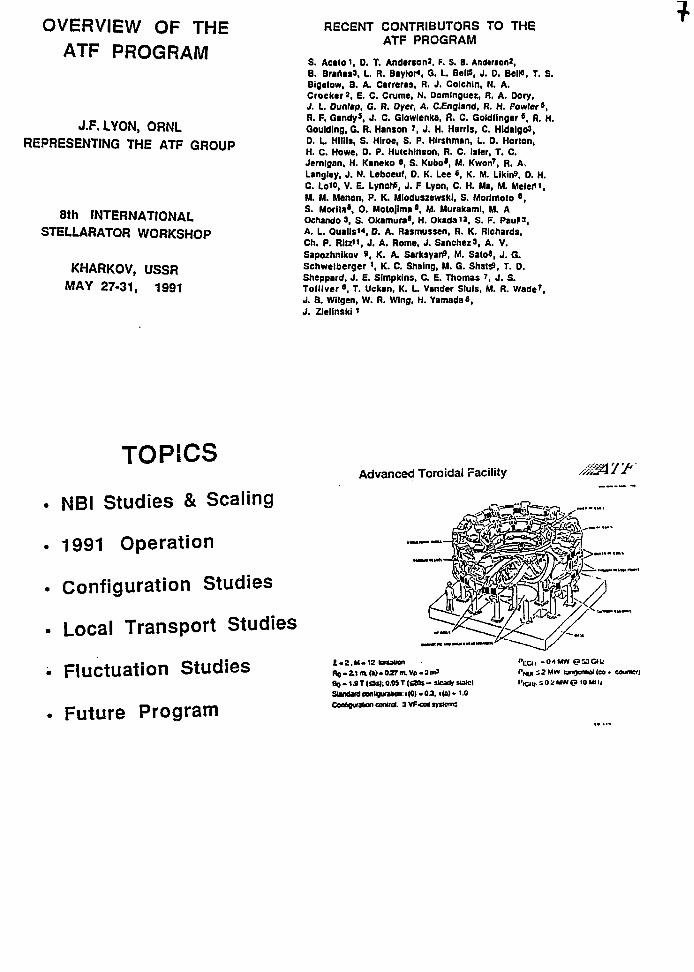
OVERVIEW OF THEATF PROGRAM
J.F. LYON, ORNL
REPRESENTING THE ATF GROUP
8th INTERNATIONALSTELLARATOR WORKSHOP
KHARKOV, USSRMAY 27-31, 1991
RECENT CONTRIBUTORS TO THEATF PROGRAM
S. Aeelo', D. T. Anderson!. F. S. a. Andir*on2,B. BraAa»3, L R. Baylor*, G. L. Bell5, j . o. BelK, T. S.Bigolow, a. A. Cirreras, R. J. Colchln, N. A.Crocker 2, E. C. Crume, N. Oomlnguez, R. A. Dory,J. I . Ounlap, G. R. Dyer, A. C.England, R. H. Fowler6,R. F. GindyS, J. C. Glowienka, R. C. Goldlinger«, R. H.Gouldlng, G. R. Hanson ' , J. H. Harris, C. Hidalgos,0. L Mllllx, S. Hlroe, S. P. Hlrshman, L. 0. Horton,H. C. Howe, D. P. Hutchlnson, R. C. Isler, T. C.Jernlgan, H. Kaneko », S. Kubo*, M. Kwon7, R. A.Langlay, J. N. Leboeuf, 0. K. Lee 6, K. M. LikinS, D. H.C. Loio, V. E. LynehS, J. F Lyon, C. H. Ma, M. Melem,M. M. Menon, P. K. Miodusiewskl, S. Morimoto «,S. Mori)**, 0. Motojima «. M. Murakami, M. AOehando3, S. Okamura*, H. Okada'2, S. F. Pau»3,A. L. Quails14, 0. A. Rasmussen, R. K. Richards,Ch. P. Ritz", J. A. Rome, J. Sanchez 3, A. V.Sapozhnikov «, K. A. Sarksyaitf, M. Sato", J. G.Schwelberger 1, K. C. Shaing, M. G. Shat£, T. 0.Sheppard, J. E. Simpkins, C. E. Thomas ?, j . s.Tolllver6, T. Uckan, K. l_ Vander Sluis, M. R. Wade7,J. B. Wilgen, W. R. Wing, H. Yamada«,J. Ziellnski'
TOPICS
. NBI Studies & Scaling
. 1991 Operation
. Configuration Studies
. Local Transport Studies
. Fluctuation Studies
. Future Program
Advanced Toroidal Facility
* - 2 . M - ! Z matronRo - 1 1 m. (1> • 027 m. Vp - 3 m>Bo - 1 •» T (as); o.os T (szos - sicadr suic)S4andvdanliginMn:t(O)>a.3. i|a|-1.0Coaligwalion control. 3 VF<g4 srsicms
I'NU i2Mw u<ncraQl(co< counter)•'ICIU s ° 2 MW «? to m 11
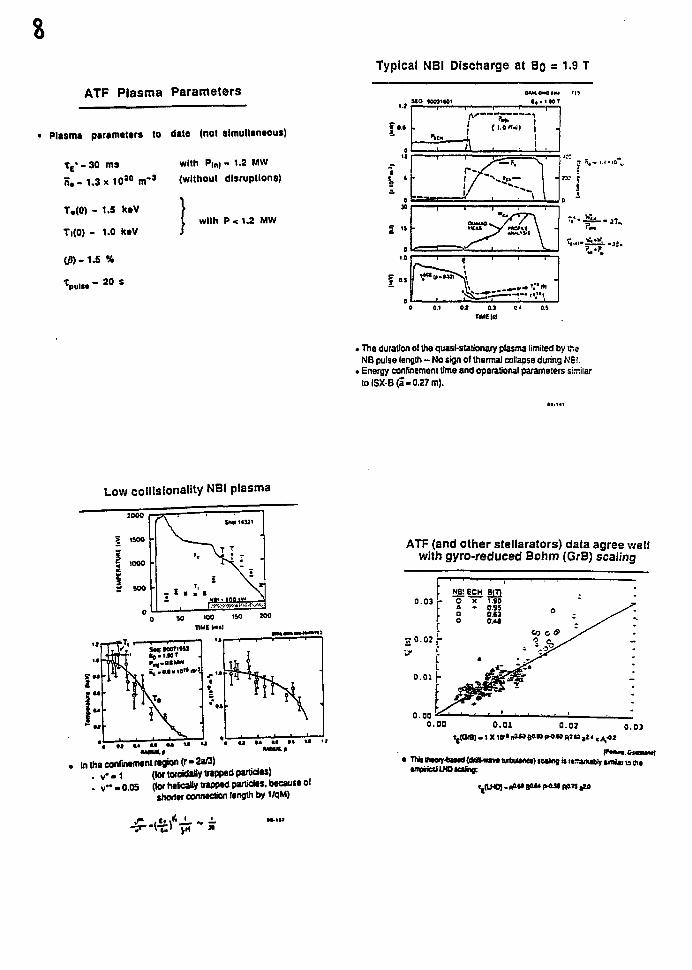
ATF Plasma Parameters
Plasma parameters to date (not simultaneous)
Te ' - 30 fflS with Pm| - 1.8 MW
H, - 1.3 x 10 8 0 m - 1 (without disruptions)
T,(0) - 1.5 ktV
Ti(0) - 1.0 keVI with P< 1.2 MW
Typical NBI Discharge at Bo = 1.9 T
£ '•
j {l.0««l) |
J ' « - I.I • • 0 ' * v
V-^-,7.
0 0.1 01 0.9 C 0.9HUE (II
• The duration ol the quasi-stationary plasma limited by v-.eNB pulse length ~ No sign of thermal collapse during N'El.
• Energy confinement time and operational parameters similartolSX-B(a-0.27m).
Low colllslonality NBI plasma
In the confinement region (r - 2a/3). v * - 1 (tor twoidaHy trapped particles). v " - 0 05 (tor helically trappy panicles, because ol
shorter connection length by 1/qM)
ATF (and other stellarators) data agree wellwith gyro-reduced Bohm (GrB) scaling
•fflpnoiLHOioing:
T(|IHO) -
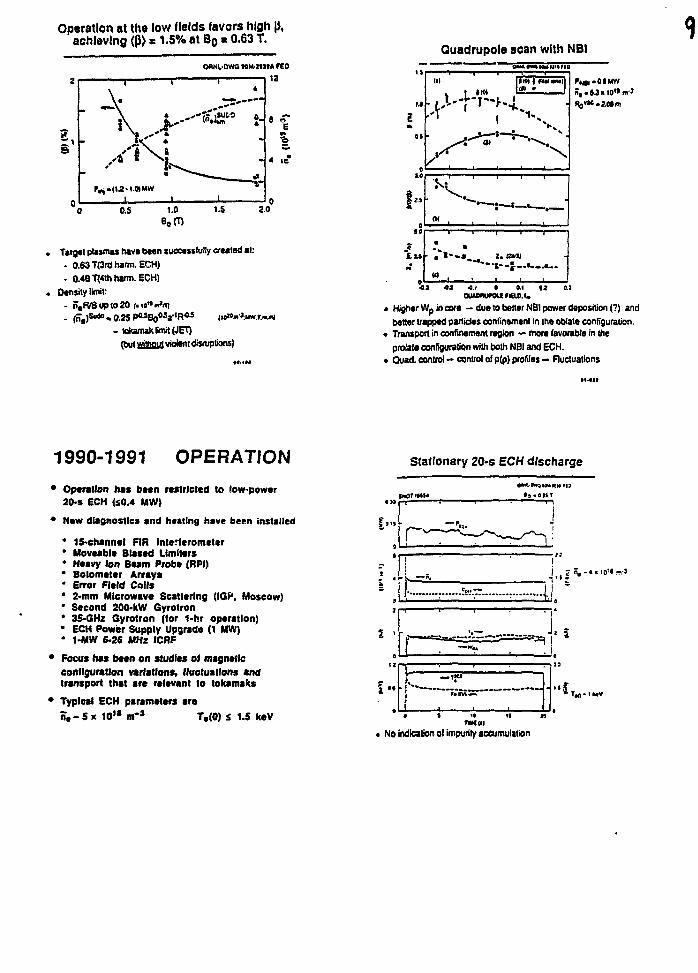
Operation at the low fields favors high |J,achieving <P> s 1.5% at Bo a 0.63 T.
ORNL-OWC MMJIHA FEO
0.S 10 1.S 2.0
Target plasmas hava been successfully created at:
- 0.63 T(3«J harm. ECH)
• 0.48 T(«h harm. ECH)
Density limit:
- n ,W8upto2O (.w»«i»/i)
- (n,)Sl ld<1-O.25P<>-5BoMa" (R*s V
- tokamak limit (JET)
(but wiinout violent disruptions)
Quadrupole scan with NB1
t1—|—• «—
4.1 0 0.1 0.1 0.JOUAMWPCUFICLO.I.
. Higher Wp in core —due to better NBI power deposition)?) and
better trapped particles confinement in the oblate configuration.
• Transport in confinement region — more favorable in the
prolate configuration with both NBI and ECH.
. Quad, control — control of p(p) profiles — Fluctuations
1990-1991 OPERATION Stationary 20-s ECH discharge
* Operation has been restricted to low-power20-s ECH (S0.4 MW)
* New diagnostics and heating have been installed
15-channel FIR InterferometerMoveable Slated UmltersHeavy Ion Beam Probe (RPI)Bolometer ArraysError Field Colls2-mm Microwave Scattering (IGP, Moscow)Second 200*kW Gyrotron35>GHz Gyrotron (lor 1-hr operation)ECH Power Supply Upgrade (1 MW)1-MW 6-26 MHz ICHF
Focus has been on studies ol magneticconfiguration variations, fluctuations andtransport that are relevant to tokamaks
Typical ECH parameters aren . - 5 x 10" m"3 7,(0) i 1.5 keV
i '
l»
? fL -«x 10** m'3
mmNo indication ol impurity accumulation
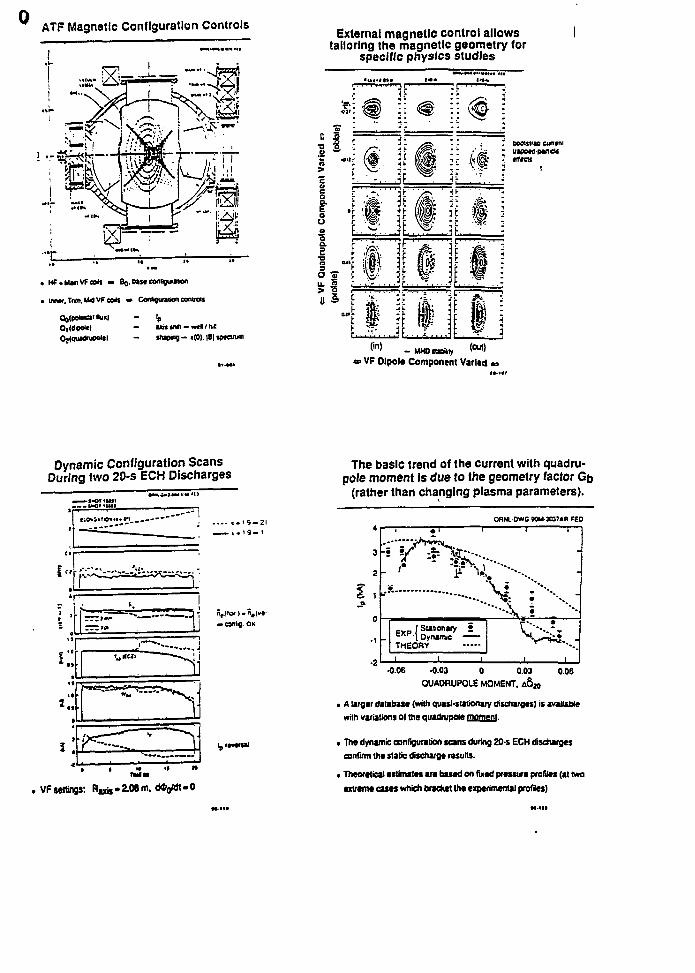
ATF Magnetic Configuration Controls
» Man vF aoit •> Bo. bast eonGgucaiion
• Configuration eanutts
- shaping-<(0).|8|spK!ru<n
External magnetic control allowstailoring the magnetic geometry for
specific physics studies
»i i 11 is i
(in)- MHOiUNty (out)
Boeui'U cuntnivappMpandctntcu
= VF Olpola Component Varied :
Dynamic Configuration ScansDuring two 20-s ECH Discharges
m anlf. OK
2 . ,
• ' r£ M -
The basic trend of the current with quadru-pole moment is due to the geometry factor Gb
(rather than changing plasma parameters).
ORNl'DWGMM301MH FED
f Stationary •= * p \ OynTHEORY
-0.06 -0.03 0 0.03
QUAORUPOLE MOMENT. tO
0.06
> A larger database (with quasi-stationaiy discharges) is available
with variations ol the quadrupofe BfiEQffii.
> The dynamic configuration scans during 2 0 s ECH discharges
confirm the static discharge results.
• Theoretical estimates are based on fued pressure profiles (at two
extreme cases which bracket the experimental profiles)
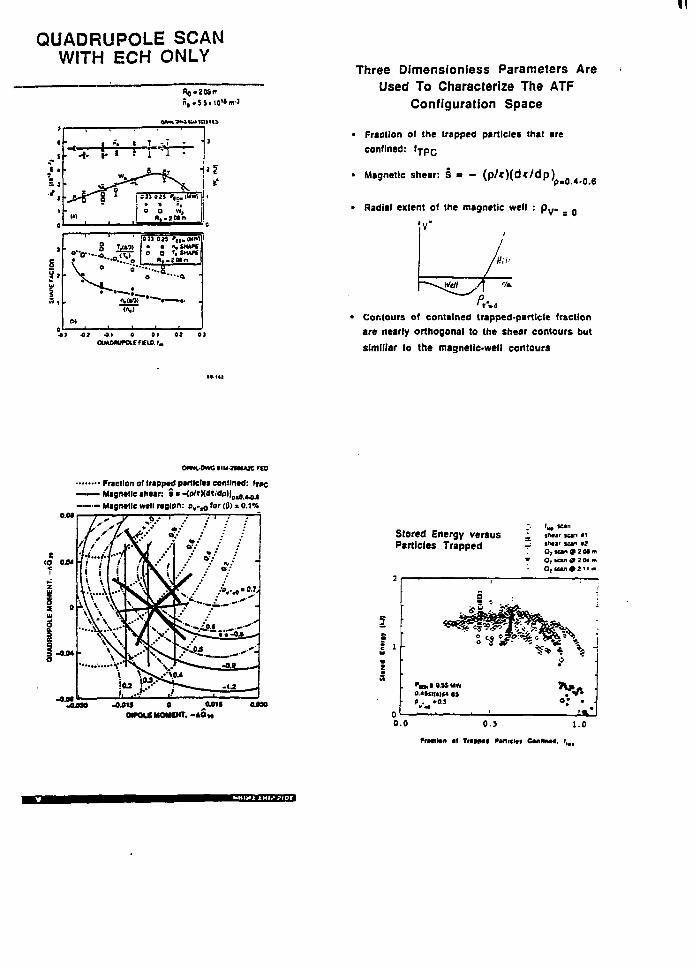
QUADRUPOLE SCANWITH ECH ONLY
n, .5SilO''m-3
Three Dimensioniess Parameters AreUsed To Characterize The ATF
Configuration Space
i
I;___4 i T -_7
A- v « '• i
B..toam
•0.1 0 01 02 03OUAOKUKXCFKIO.I.
Fraction ol the trapped particles that are
conlined:
Magnetic shear: S » - (p/t)(dt/dp)'p.0.4-0.6
Radial extent of the magnetic well : pv . . _
V"
/Hi"
Contours of contained trapped-particle fraction
are nearly orthogonal to the shear contours but
slmlllar to the magnetic-well contours
OUNL-OVK: n u a i i u c FEO
•••• Fraction of trapped partlclts conflnvd: 'T#C— Magnttle t n u r : • • -(P"Hat,dp)|omO M ^
— Magmtle wall region: p v - r t for (P> 10.1%
-OJH5 O JWPOUMOMCNT. - * 3 , ,
Stored Energy versusParticles Trapped
IW
( w leaninaar lean «lintar lean f2O, s c a n d i u mO, lean 9 2 04 mOr lean a> 2 11 m
'niUSim0.49SKI)« aiP . "0.5
0.0 o.s 1.0
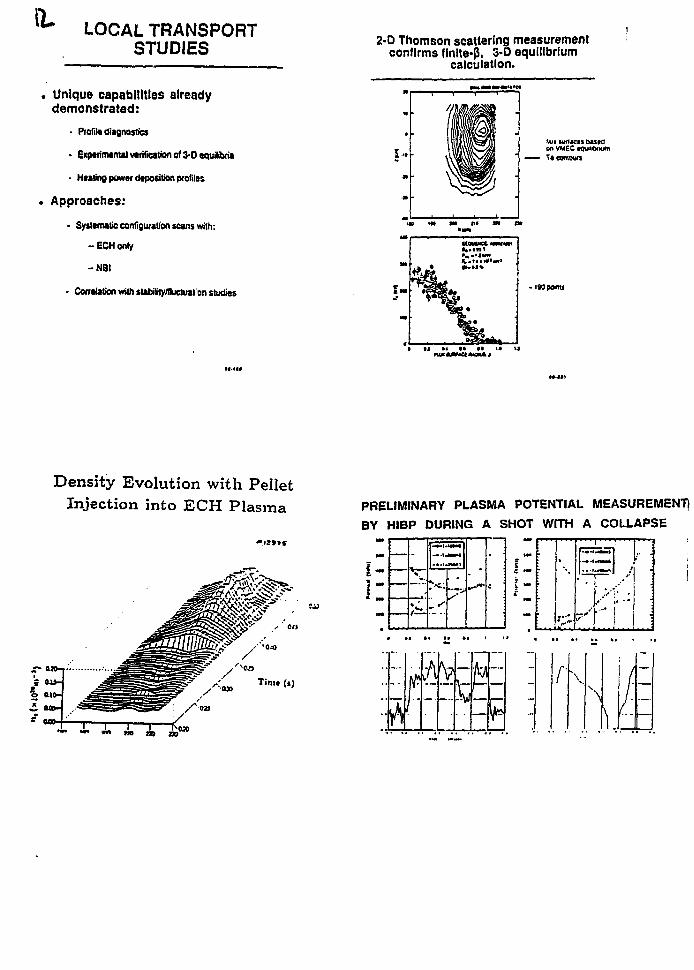
- LOCAL TRANSPORTSTUDIES
Unique capabilities alreadydemonstrated:
• Profile diagnostics
- Experimental verification of 3-0 equilibria
- Healing power deposition profiles
Approaches:
- Systematic configuration scans with:
- E C H only
- N B I
- Correlation with siabilrtyAuctuat on studies
2-D Thomson scattering measurementconfirms flnlte-p, 3-0 equilibrium
calculation.
IW VlflMU* DUtdon VMEC equaoiiumT*comouri
-190 porno
Density Evolution with PelletInjection into ECH Plasma
Time (t)
PRELIMINARY PLASMA POTENTIAL MEASUREMENT)
BY HIBP DURING A SHOT WITH A COLLAPSE
i „,
—
—
•7.
* • : - •
I - * v *
;
/ • •
\ .
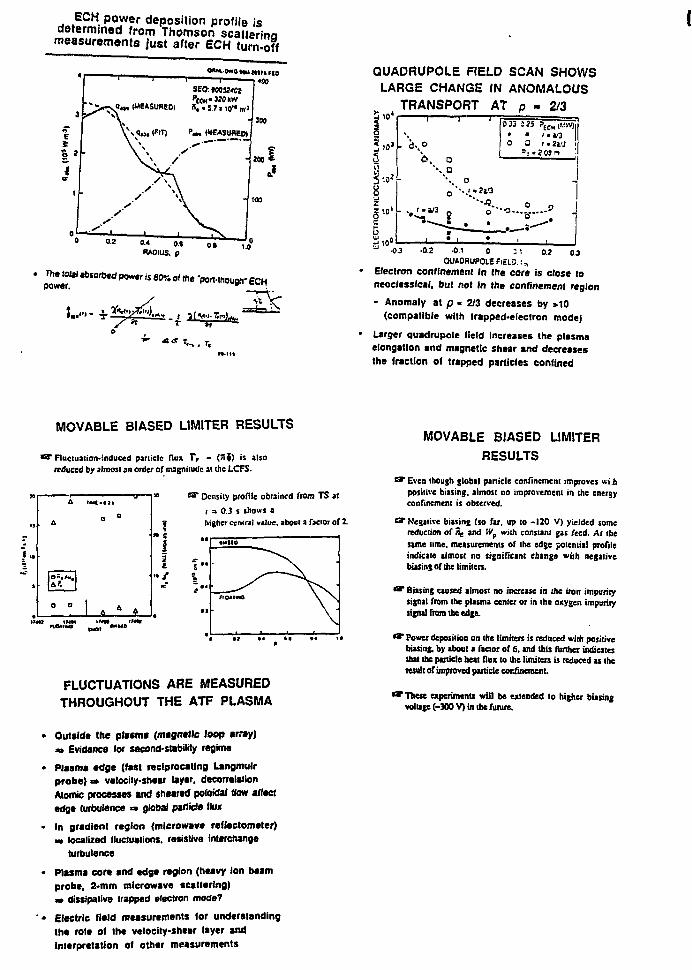
ECH power deposition profile isdetermined from Thomson scatterinameasurements just after ECH turn'off
m (MEASUAEDI R , .S7 . io"m'
o i —
The total absorbed power is 80% of the -port-though- ECHP0W6fP0W6f,
QUADRUPOLE FIELD SCAN SHOWSLARGE CHANGE IN ANOMALOUS
TRANSPORT AT p - 2/3
-03 -0.2 0.2 0.3•0.1 0
QUA0HUPOLEFI5L3.: , ,
Electron confinement In the core is close to
neoclassical, but not in the confinement region
• Anomaly at p • 2/3 decreases by >10
(compatible with trapped-electron mode)
Larger quadrupole Held Increases the plasmaelongation and magnetic shear and decreasesthe fraction of trapped particles confined
MOVABLE BIASED LIMITER RESULTS
W Fluctuation-induced panicle flux T, - ( i i f ) is alsoreduced by almost an order of magnitude at the LCFS.
B * Ocnsiiy profile obtained from TS al
r = 0.3 s shows a
higher central value, about a factor of 2.
*
to
< < •
I
\
a
oia(
a
a
;**
D
o o
- !
1 S
.KT
FLUCTUATIONS ARE MEASUREDTHROUGHOUT THE ATF PLASMA
Outside the plasma (magnetic loop array)a» Evidence lor second-stability regime
Plasma edge (fast reciprocating Langmuirprobe) m velocity-shear layer, decollationAtomic processes and sheared pofotdal flow affectedge turbulence a global particle flux
In gradient region (microwave reflectometer)*» localized fluctuations, resistive interchange
turbulence
Plasma core and edge region (heavy ion beamprobe, 2-mm microwave scattering)*» dissipative trapped electron mode?
Electric field measurements for understanding
the role of the velocity-shear layer and
interpretation of other measurements
MOVABLE BIASED LIMITERRESULTS
f Even though global panicle confinement improves wi.hpositive biasing, almost no improvement in the energyconfinement is observed.
BF Negative biising (so far. up to -120 V) yielded somereduction of \ and Ifp with constant gas feed. At thesame time, measurements of the edge potential profileindicate almost no significant change with negativebiasinj of the limiters.
•*" Biasing caused almost no increase in the iron impuritysignal from the plasma center or in the oxygen impuritysignal from the edge.
«*" Power deposition on the limiters is reduced with positivebiasing, by about a factor of 6. and this further indicatesthat the panicle heat flux to the limiten is reduced u theresult of unproved particle confinement.
"These experiments will be extended to higher biasingvoltage (-300 V) in the future.
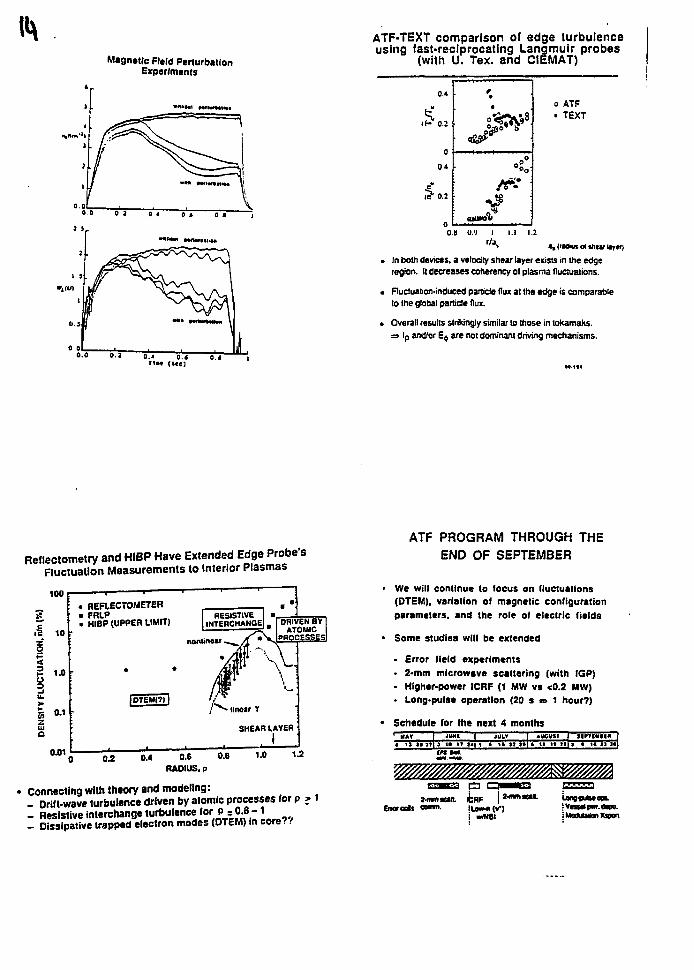
Magnetic Fltld PerturbationExperiments
ATF-TEXT comparison of edge turbulenceusing fast-reciprocating Langmuir probes
(with U. Tex. and CIEMAT)
o ATF• TEXT
*,(>«)«» otsntviaytr)
• In both devices, a velocity shear layer exists in the edgeregion. It decreases coherency of plasma fluctuations.
• Fluctuation-induced particle flux at the edge is comparableto the global panicle flux.
• Overall results strikingly similar to those in tokamaks.=» Ip and/or E$ are not dominant driving mechanisms.
Retlectometry and HIBP Have Extended Edge Probe'sFluctuation Measurements to Interior Plasmas
100
10
1.0
0.1
2o
« HEFLECTOMETER
• HIBP (UPPER LIMIT)
nonlinear
,'l>v* linear 1
SHEAR LAYER
0.4 0.6 0.8RADIUS, p
1.0 1.2
Connecting with ttwory and modeling:- Drift-wave turbulence driven by atomic processes tor p > i- Resistive interchange turbulence for• p_- 0.8 - 1- Dissipative trapped electron modes (OTEM) in core??
ATF PROGRAM THROUGH THEEND OF SEPTEMBER
• We will continue to focus on fluctuations(DTEM), variation of magnetic configurationparameters, and the role of electric fields
• Some studies will be extended
- Error field experiments
• 2-mm microwave scattering (with IGP)• Higher-power ICRF (1 MW vs <0.2 MW)• Long-pulse operation (20 s a 1 hour?)
Schedule forHAT
tn *MM.Mw,
thef
m.
nextJ
4IIT
monthsAUGUST
2-mnacan. ICBF | *•"">••«•Errorcois oomm. !Uo»«>(V)
j NBI
Uog«uMco.iVaaalpw.dipo.
FUTURE OF THE ATFPROGRAM?
DOE wants the US program to (ocus ontokamaks
• We had been Instructed to terminate theATF program at the end ot 1950
• We convinced DOE to allow reduced operationof ATF (400-kW ECH) this year and for theATP Group to then work mainly on tokamakresearch (D (Il-D, PBX-M, TFTR, etc.)
- Present plans are to mothball ATF at theend of September so that it could berestarted at a later date
• A small effort will be devoted to slellaratorresearch (mainly collaborations)
WE HOPE THAT THE ATF PROGRAMWILL BE RESTARTED
• There ties been a great deal ol support lorrestarting ATF from (he US tokamak andworld slellarator communities
- We are grateful for your continuingsupport!
We are working tor a US review (this fall?)on whether to restart the ATF program
The Issue (tor now) In restarting ATF will bewhat unique contributions ATF would make tounderstanding and Improving tokamaks, notstrictly alternate concept research
SUMMARYGood performance was obtained with NBI-heated plasmas in ATF (1990)
ATF has operated at a reduced power levelthis year (400-kW ECH)
The recent focus has been on Issues ofrelevance to tokamaks- studies oi fluctuations, magnetic
configuration parameter variations, therole of electric fields, and long-pulseoperation with ECH plasmas
Mode assignments have been made for theobserved turbulence in the plasma edge andin the gradient region
Attention is now turning to the role ot the
dissipative trapped electron mode in the
plasma core
We are scheduled to terminate operation atthe end of September and mothball ATF
n - o - /
Observation of Damping of Toroidal Rotation due toNeoclassical Parallel Viscosity
in Heliotron/Torsatron CHS
K.Ida, H.Yamada, -H-.-Iguchi, H.Arimoto, M.Hosokawa, K.Itoh,H.Idei, O.Kaneko, S.Kubo, K.Matsuoka, S.Morita,
K.Nishimura, N.Noda, S.Okamura, T.Ozaki, A.Sagara,H.Sanuki, Y.Takeiri, Y.Takita, C.Takahashi, and K.Tsuzuki
National Institute for Fusion Science,Nagoya, 4 64-01, JAPAN
1 . Inf. roriucrt-. i onIn toroidal plasma, poloidal and toroidal rotation
velocities are determined through the balance between theinput torque and damping force in steady-state. There havebeen many observation of toroidal rotation in tokamaks-'-""4,but the damping is mainly due to an anomalous perpendicularviscosity (radial diffusion of momentum). Because themagnetic field ripple in toroidal direction is so smallthat the effect of the neoclassical parallel viscosity intoroidal rotation is easily masked by the anomalousperpendicular viscosity. In helical devices, the helicalripple is large enough to affect toroidal rotation. Thepoloidal rotation have been measured on Heliotron-E^ andWenderstein VII-A^, however, toroidal rotation anddiscussions on the damping mechanism has not been reported.In this article, we investigate the toroidal rotationvelocity in a wide range of density and magnetic fieldripple, and a comparison of the measurements with theneoclassical theory is discussed.
2. Damping of toroidal rotationThe Compact Helical System (CHS) 7 is a
Heliotron/Torsatron device (the poloidal period number 1 =2 and toroidal period number m = 8) with the major radius(R) of 1 m, an average minor radius (a) of 20 cm and arotational transform at the plasma edge -fa [= RBQ/ (aB^) ,where Bm, BQ are the toroidal and poloidal magneticfields, respectively] of ~ 1. The magnetic field has ahelical ripple (fi 7"'-* ) with a toroidal periodic number of/TP= 8 and a poloidal periodic number of i= 0,±l,±2,±3, anda toroidal ripple (£^~ ap/R, where p is the averagednormalized minor radius). Modulation of the magnetic fieldstrength y is defined as 72»< {dB/9s) 2>/fl2, where s isthe length along the magnetic field line and O is a fluxsurface average operator.
Figure 1 shows the change of profiles of ion temperature,toroidal/poloidal rotation velocity, and modulation ofmagnetic field strength y, as a result of the major radius
u - u -
300
90 100R(cm)
110 0.0 0.2 0.4 0.6 0.8 1.0P
0.0 0.2 0.4 0.6 0.8 1.0
1.2
1.0
0.8
0.0
• (d)
• *
- -O
I
> '
1
/*'
/
7
A
-
•
02
0.0 0^ 0.4 0.6 0.8 1.0P
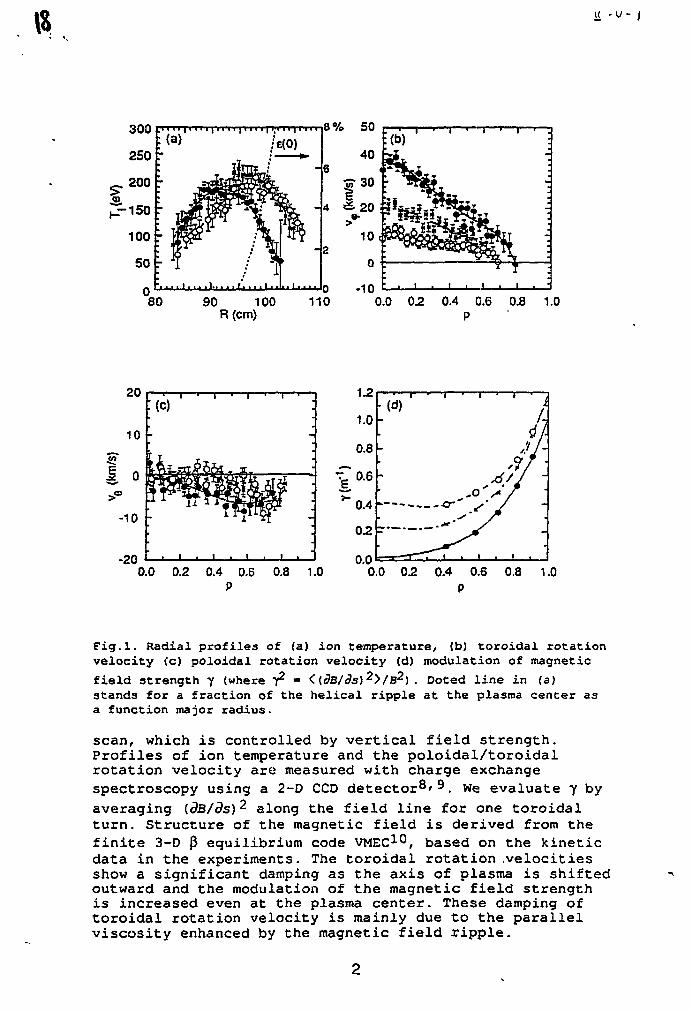
Fig.l. Radial profiles of (a) ion temperature, (b) toroidal rotationvelocity (c) poloidal rotation velocity (d) modulation of magnetic
field strength 7 (where T2 - <{dB/ds)2>/B2) . Doted line in (a)stands for a fraction of the helical ripple at the plasma center asa function major radius.
scan, which is controlled by vertical field strength.Profiles of ion temperature and the poloidal/toroidalrotation velocity are measured with charge exchangespectroscopy using a 2-D CCD detector**'9. We evaluate y by
averaging (dB/ds)2 along the field line for one toroidalturn. Structure of the magnetic field is derived from thefinite 3-D p equilibrium code VMEC1 , based on the kineticdata in the experiments. The toroidal rotation .velocitiesshow a significant damping as the axis of plasma is shiftedoutward and the modulation of the magnetic field strengthis increased even at the plasma center. These damping oftoroidal rotation velocity is mainly due to the parallelviscosity enhanced by the magnetic field ripple.
U -0-1
3. Parameter dependence of the parallel viscosityThe parameter dependence of the viscosity is studied
by changing the plasma density and the field ripple.Toroidal rotation velocity is measured for Rax - 92.1 cm
(perpendicular viscosity is dominant) and for Rax » 94.9cm (parallel viscosity becomes important) in the wide rangeof electron density from 0.7 x lO^/cm^ to 6 x 10i:Vcm3.The perpendicular viscosity is found to decrease roughlyproportional to l/ne as the global confinement is improved
by increasing the electron density. This density dependenceconcludes the existence of anomalous radial diffusion ofthe momentum as observed in tokamak plasma. However, theparallel viscosity does not change for this density scan,confirming plateau neoclassical prediction.
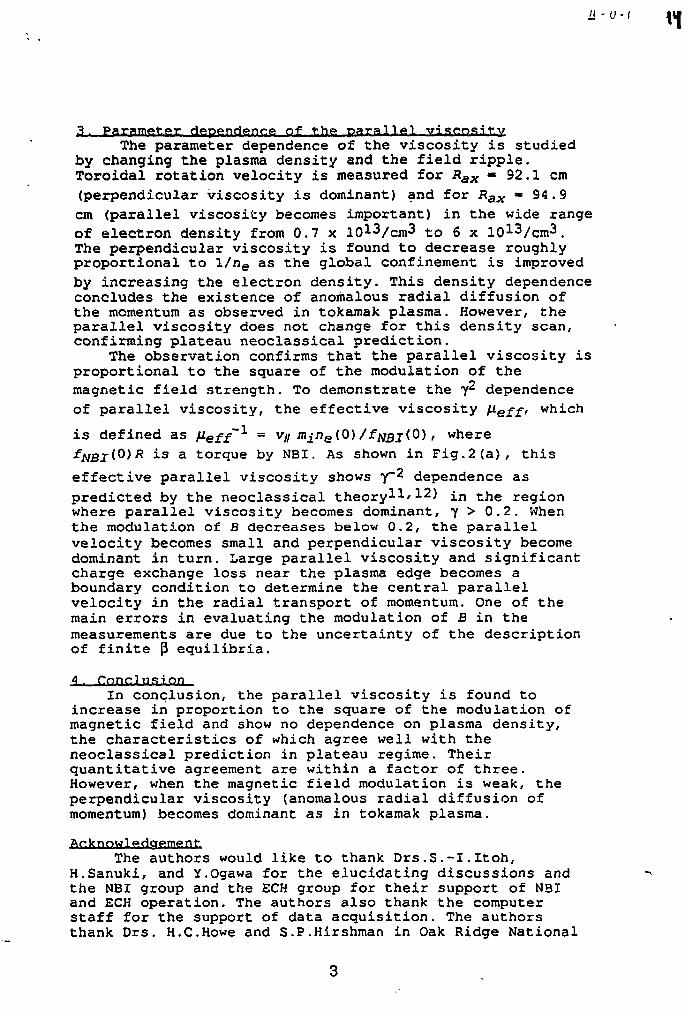
The observation confirms that the parallel viscosity isproportional to the square of the modulation of themagnetic field strength. To demonstrate the y^ dependenceof parallel viscosity, the effective viscosity Heff, which
is defined as V-eff'1 ~ v//;n^iie(0)/f^gj(O), whereis a torque by NBI. As shown in Fig.2 (a), this
effective parallel viscosity shows y~2 dependence aspredicted by the neoclassical theoryll'12) in the regionwhere parallel viscosity becomes dominant, y > 0.2. Whenthe modulation of B decreases below 0.2, the parallelvelocity becomes small and perpendicular viscosity becomedominant in turn. Large parallel viscosity and significantcharge exchange loss near the plasma edge becomes aboundary condition to determine the central parallelvelocity in the radial transport of momentum. One of themain errors in evaluating the modulation of B in themeasurements are due to the uncertainty of the descriptionof finite (J equilibria.
A . C.nncA us ionIn conclusion, the parallel viscosity is found to
increase in proportion to the square of the modulation ofmagnetic field and show no dependence on plasma density,the characteristics of which agree well with theneoclassical prediction in plateau regime. Theirquantitative agreement are within a factor of three.However, when the magnetic field modulation is weak, theperpendicular viscosity (anomalous radial diffusion ofmomentum) becomes dominant as in tokamak plasma.
Acknowledgement.The authors would like to thank Drs.S.-I.Itoh,
H.Sanuki, and Y.Ogawa for the elucidating discussions andthe NBI group and the ECH group for their support of NBIand ECH operation. The authors also thank the computerstaff for the support of data acquisition. The authorsthank Drs. H.C.Howe and S.P.Hirshman in Oak Ridge National
- u-1
0.2 0.4 0.6 0.8
Rax=97.4cm
0 1 2 3 4 5 6
ne(1013cm"3)
Fig.2. Inverted central parallel viscosity derived from the measuredcentral parallel velocity/ density and momentum input as a functionof (a) the central modulation of magnetic field strength 7 and (b)the line averaged electron density. Dashed line is an estimate bythe neoclassical parallel viscosity and the solid line shows theradial diffusion of the momentum effect on the measurements.
References1 K . H . B u r r e l l , R.J .Groebner , H.St . John, R .P .Seraydar ian ,Nucl . Fusion 28, 3 (1988).^H.Weisen, M.von Hellermann, A.Boileau, L.D.Horton,W.Mandl, H.P.Summers, Nucl. Fusion 29, 2187 (1989).^A.Kallenbach, H-M.Mayer, G.Fussmann, R.Buchse, O.Gruber,O.Kluber, V.Mertens, O.Vollmer, H.Zohm, Nucl . Fusion 30,645 (1990).4 K.Ida , S . - I . l t o h , K . I toh , S.Hidekuma, Y.Miura, N.Suzuki,M.Mori, T.Matsuda, T.Yamauchi, and JFT-2M Group, inControlled Fusion and Plasma Heating,1990 Amsterdam,(European p h y s i c a l Soc ie ty , Pe t i t -Lancy , Swi tze r land ,1990), Vol . l4B, P a r t . I , p . 2 6 7 .5K.Kondo, e t a l . , S c i . Instrum. 59, 1533 (1988).6H.Wobig, H.Maassberg, H.Renner, WVll-A Team, ECRH Group,NI Group, in Plasma Physics and Controlled Nuclear FusionResearch 1986, Kyoto , (IAEA, Vienna , 1987) , V o l . 1 1 ,7O.Kaneko, e t a l . , in Plasma Physics and ControlledNuclear Fusion Research IS90(Ref .7) , IAEA-CN-53/C-1-4.8 K.Ida and S. Hidekuma, Rev. S c i . Instrum. 60, 876 (1989).9 K.Ida , H.Yamada, H.Iguchi , S.Hidekuma, H.Sanuki,K.Yamazaki and CHS Group, t o be appear in Phys. F l u i d s .^S .P .H i r shman , W.van R i j , and P.Merkel, Comput. Phys.Commun. 43 , 143 (1986).x l T . H . S t i x , Phys. F lu ids 16, 1260 (1973).1 2K.C.Shaing and J .D .Ca l l en , Phys. F lu ids 26, 1526 (1983) .
VARIATION OF THE NEOCLASSICAL TRANSPORTLEVEL IN THE URAGAN-2M TORSATRON
CD. BEIDLER, J. KISSLINGER, P. RAU, H. WOBIGMax-Planck-Institut fur Plasmaphysik,W-8046 Garcbing bei Miinchen, Federal Republic of Germany
A.A. SHISHKINInstitute of Physics and Technology,Academy of Sciences of the Ukrainian SSR,Kharkov, USSR
The URAGAN-2M (U2M) coil system consists of toroidal, helical, vertical andcorrection (trim) field-coil systems. The currents flowing in each of these systemsmay be varied to a certain degree, giving access to a broad range of magnetic fieldconfigurations. In particular, it is found that appropriately unbalanced currents inthe two symmetric pairs of toroidal field (TF) coils which are present in each fieldperiod lead to significant reductions in the neoclassical ripple-transport rates relativeto the U2M standard configuration (equal currents in all TF coils). This reductionis large enough that it has a significant effect on the expected plasma parameterseven when accounting for the anomalous transport observed in present stellaratorexperiments. Conversely, it is also possible to change the currents in the TF coilsso as to further increase the neoclassical losses. Unbalanced TF coil currents leadto only minor changes in such global magnetic quantities as rotational transform,shear and vacuum magnetic well, however they can lead to island formation in theU2M vacuum field. These islands may be made negligibly small, in turn, by minoradjustments in the currents flowing in the vertical and correction windings.
To illustrate these points we begin by considering the standard configuration ofU2M for which the heiical windings carry a current of In — 1.6 MA (this value is heldconstant in the cases considered here), the main vertical field coils carry IVF — 300kA, the correction coils Ic — 128 kA and each of the toroidal field coils carries acurrent of ITF = 666.7 kA. The Fourier spectrum of B in magnetic coordinatesproduced by these currents is shown in the first frame of Figure 1 according tothe decomposition given in [1]. Although the harmonics associated with the helicalripple (m = 1) are all of relatively small amplitude it will be noticed that thereis a significant ripple on axis due to the so-called "mirror" harmonic, C\fi. This,together with the fact that all helical-ripple harmonics have the same sign, resultsin unfavorable neoclassical transport characteristics [2]; as shown in Figure 2 thisconfiguration has an effective ripple for 1/v transport [1] of <e/»>= 0.05 on axis.
To improve these results one makes use of the flexibility of the U2M coil system.Instead of having equal currents in all TF coils (4 TF coils equally spaced in eachof the 4 field periods) the first and last TF coil of each field period (designatedcoil pair A) carry ITF(A) — 626.7 kA while the second and third (coil pair B)are energized with a current of ITF(B) — 746.7 kA. The decomposition of B forthe resulting magnetic field is shown in the second frame of Figure 1. Note thatthe harmonic content is essentially the same as that of the standard case with theexception that Cj,o now vanishes on axis and is elsewhere negative in magnitude.This has a significant effect on neoclassical transport as illustrated by the greatlyreduced values of <th> for this configuration, especially near the magnetic axis.Because of the vanishingly small value of Ci,o on axis this version of U2M is referredto as the "No Mirror" variant. Conversely, it is also possible to create a "High
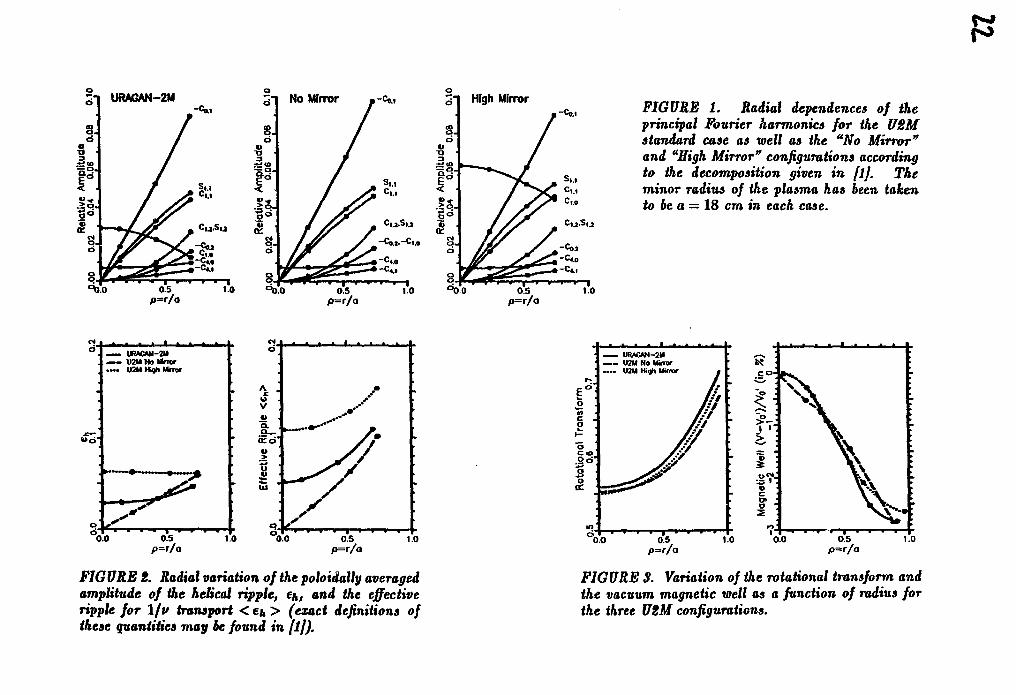
FIGURE 1. Radial dependences of theprincipal Fourier harmonics for the U2Mstandard case as well as the "No Mirror"and "High Mirror" configurations accordingto the decomposition given in flj. Theminor radius of the plasma has been takento be a — 18 cm in each case.
OSp=r/a
— URAGW-2U— U2M Ho Mrmr— U2M High Uirror
0.0 0.5p=r/a
1.0 0.0
FIGURE 2. Radial variation of the poloidally averagedamplitude of the helical ripple, e&, and the effectiveripple for \fv transport < e/k > (exact definitions ofthese quantities may be found in [1]).
, URACAM-2U. U2M No H i m
U2M High Mirror
0.0 0.5p=r/o
t.o 0.0
FIGURE 3. Variation of the rotational transform andthe vacuum magnetic well as a function of radius forthe three U2M configurations.
Mirror" version with ITF(A) — 764.7 kA and ITF(B) — 626.7 kA for which values of<€/,> greater than 0.1 are found across the entire plasma cross section.
It should be noted that the method described here for changing the neoclassicaltransport level in U2M, that of using unbalanced currents in the TF coils, hasquite different properties than the well-known approach of shifting the magneticsurfaces inwards or outwards using the vertical field coils. This latter methodgenerally results in a significant change in the harmonic content of £ as well aschanges in global magnetic field quantities such as the rotational transform, shear andvacuum magnetic well, thereby altering the MHD characteristics of tt-. configuration.Unbalanced currents in the TF coils of U2M, on the other hand, ha-v only a smallimpact on the global magnetic properties (see Figure 3) and result in a maximumaxis shift of as 1 cm.
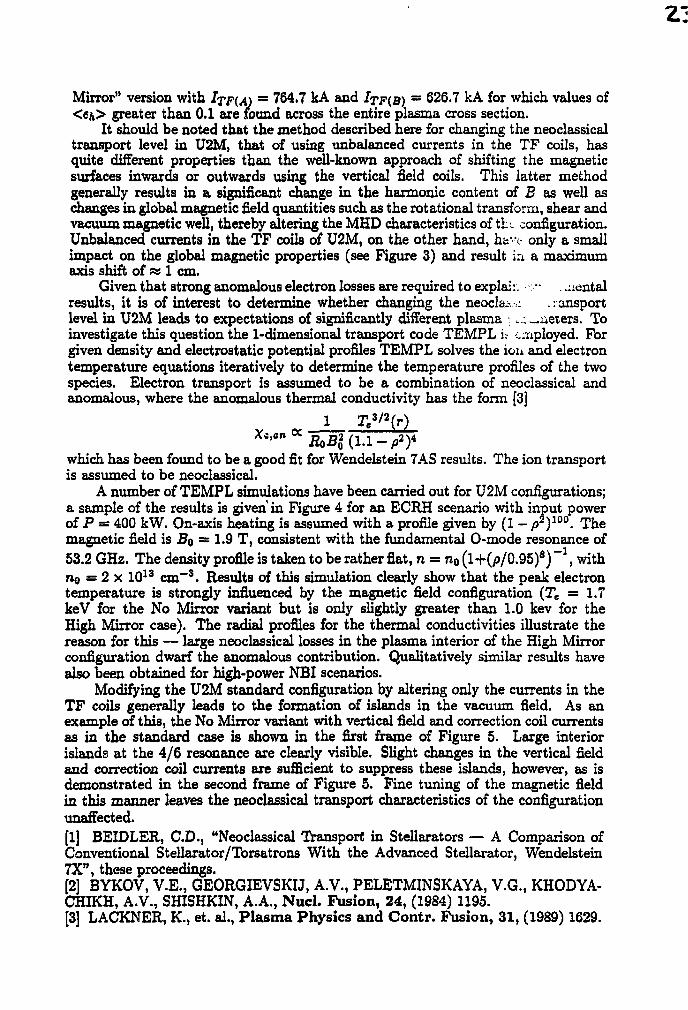
Given that strong anomalous electron losses are required to explai:. - . .centalresults, it is of interest to determine whether changing the neocla.-..-.•: . ransportlevel in U2M leads to expectations of significantly different plasma • ... —iieters. Toinvestigate this question the 1-dimensional transport code TEMPL u employed. Forgiven density and electrostatic potential profiles TEMPL solves the iou and electrontemperature equations iteratively to determine the temperature profiles of the twospecies. Electron transport is assumed to be a combination of neoclassical andanomalous, where the anomalous thermal conductivity has the form [3]
1 Te3/2(r)
Xi'an K RoB* (1.1 - /»2)4
which has been found to be a good fit for Wendelstein 7AS results. The ion transportis assumed to be neoclassical.
A number of TEMPL simulations have been carried out for U2M configurations;a sample of the results is given in Figure 4 for an ECRH scenario with input powerof P = 400 kW. On-axis heating is assumed with a profile given by (1 - p2)100. Themagnetic field is BQ = 1.9 T, consistent with the fundamental 0-mode resonance of53.2 GHz. The density profile is taken to be rather fiat, n = n0 (l+(/>/0.95)8) ~a, withno = 2 x 1013 cm"1. Results of this simulation clearly show that the peak electrontemperature is strongly influenced by the magnetic field configuration (Te = 1.7keV for the No Mirror variant but is only slightly greater than 1.0 kev for theHigh Mirror case). The radial profiles for the thermal conductivities illustrate thereason for this — large neoclassical losses in the plasma interior of the High Mirrorconfiguration dwarf the anomalous contribution. Qualitatively similar results havealso been obtained for high-power NBI scenarios.
Modifying the U2M standard configuration by altering only the currents in theTF coils generally leads to the formation of islands in the vacuum field. As anexample of this, the No Mirror variant with vertical field and correction coil currentsas in the standard case is shown in the first frame of Figure 5. Large interiorislands at the 4/6 resonance are clearly visible. Slight changes in the vertical fieldand correction coil currents are sufficient to suppress these islands, however, as isdemonstrated in the second frame of Figure 5. Fine tuning of the magnetic fieldin this manner leaves the neoclassical transport characteristics of the configurationunaffected.[1] BEIDLER, CD., "Neoclassical Transport in Stellarators — A Comparison ofConventional Stellarator/Torsatrons With the Advanced Stellarator, Wendelstein7X", these proceedings.[2] BYKOV, V.E., GEORGIEVSKIJ, A.V., PELETMINSKAYA, V.G., KHODYA-CHIKH, A.V., SHISHKIN, A.A., Nucl. Fusion, 24, (1984) 1195.[3] LACKNER, K., et. al., Plasma Physics and Contr. Fusion, 31, (1989) 1629.
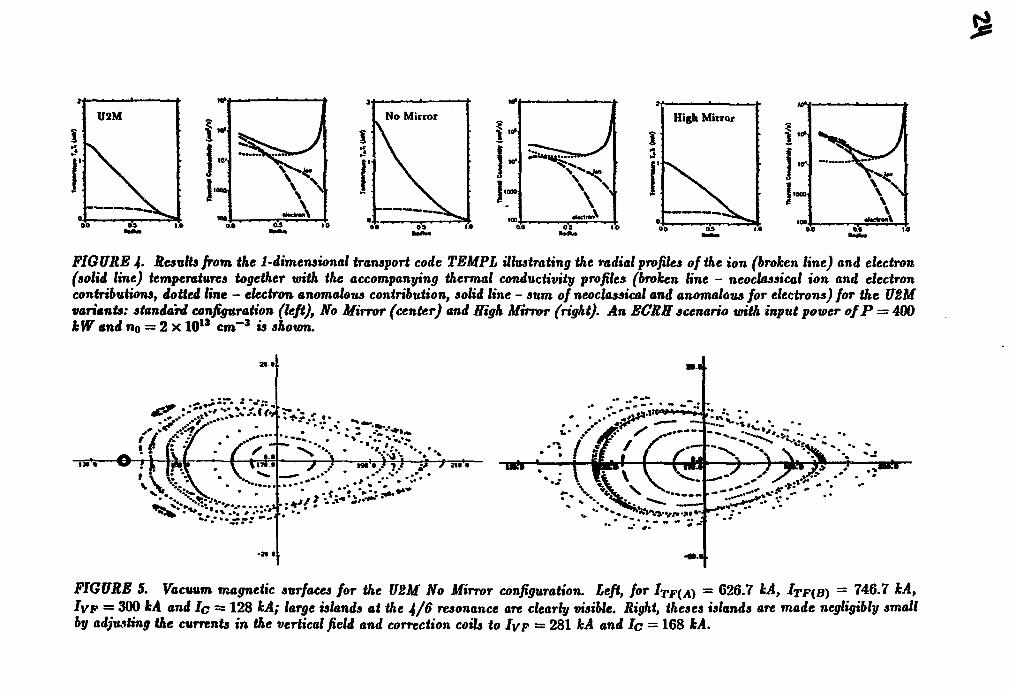
FIGURE 4- Results from the 1-dimensional transport code TEMPL illustrating the radial profiles of the ion (broken line) and electron(solid line) temperatures together with the accompanying thermal conductivity profiles (broken line - neoclassical ion and electroncontributions, dotted line - electron anomalous contribution, solid line - sum of neoclassical and anomalous for electrons) for the U2Mvariants: standard configuration (left), No Mirror (center) and High Mirror (right). An ECRS scenario with input power ofP = 400Jfc W and n0 = 2 x 1013 cm" 3 w shown.
FIGURE 5. Vacuum magnetic surfaces for the U2M No Mirror configuration, left, for ITF(A) = 626.7 kA, ITF{B) = 746.7 kA,IVF = 300 kA and IQ = 128 kA; large islands at the 4/6 resonance are clearly visible. Right, theses islands are made negligibly smallby adjusting the currents in the vertical field and correction coils to IVF = 281 kA and Ic = 168 kA.
ION HEAT CONDUCTIVITY, RADIAL ELECTRIC FIELDS
AND CX-LOSSES IN THE W7-AS STELLARATOR
H. Maafiberg, V.I. Afanasjev*, A.B. Izvozchikov*, J. Junker, M. Kick,W. Ohlendorf, F. Sardei, S. Zopfel, W7-AS Team and NBI Team
Max-Planck Institut fur PlasmaphysikAssociation EURATOM-IPP, D-8046 Garching, Germany*)• A.F.Ioffe Physical-Technical Institute, Leningrad, USSR
ECRH GroupInstitut fur Plasmaforschung der Universitat Stuttgart
D-7000 Stuttgart, Germany
Introduction
The energy balance analysis for both ECR (up to 1 MW at 70 GHz) and NBI (up to1.6 MW with tangential injection) heated discharges in the Wendelstein 7-AS stellarator(B < 3 T, R = 2 m, a < 18 cm, 5 field periods) is based on measured profiles: electrondensity and temperature by Thomson scattering, ion temperature by active CX neutralparticle analysis as well as by CXRS (CX recombination spectroscopy). A transformto magnetic co-ordintes depending on the rotational transform, the plasma pressure andan additional vertical field is applied for the measured data leading to symmetric ns,Te and Ti profiles in the effective radius, r. The CX data of local T,- exceed the realvalues for higher densities due to the attenuation of the outgoing neutral flux, and astandard procedure / I / is used for correction. Only few Ti data are measured by theCXRS diagnostic up to now, but with reasonable agreement with the CX temperatures.Furthermore, the Doppler shift of the background impurity lines of O and C excited bythe diagnostic beam can be used to estimate the poloidal rotation velocity. An accurateevaluation of the diamagnetic drift component, however, is necessary to obtain the radialelectric field. A preliminary analysis indicates rather small values of the radial electricfield for both ECRH and NBI discharges.
For NBI heated discharges at higher densities (n« %, 7 • 1013 cm"3), the temperatures arerather low (even with full heating power). So far, the maximum energy content (33 kJ)was obtained at ne(0) = 2.7 • 1014 cm"** with T,(0) ~ T*e(0) a 300 eV, the maximumion temperature was about 700 eV (with Ti < Te) at n« a 4 • 1013 cm"3 for combinedheating (ECRH and NBI). These findings are equivalent to the results of other stellaratorexperiments except W7-A, the predecessor of the W7-AS stellarator. In W7-A with onlyr k 9 cm plasma radius, Ti ~ 1 keV at ne > 1014 cm"3 at about 1 MW NBI heatingpower was found, see Fig. 3 (Ti measured by CX, CXRS and neutron analysis).
Energy Balance Analysis
For low and moderate ne (& 1014 cm"3) the electron and ion energy balance are analyzedindependently. This procedure becomes critical at higher densities where the collisionalcoupling of electrons and ions, determined by the absolute difference of Te{r) and T,(r),dominates the energy balance. Here, the correction of the CX Ti profile is essential
lio
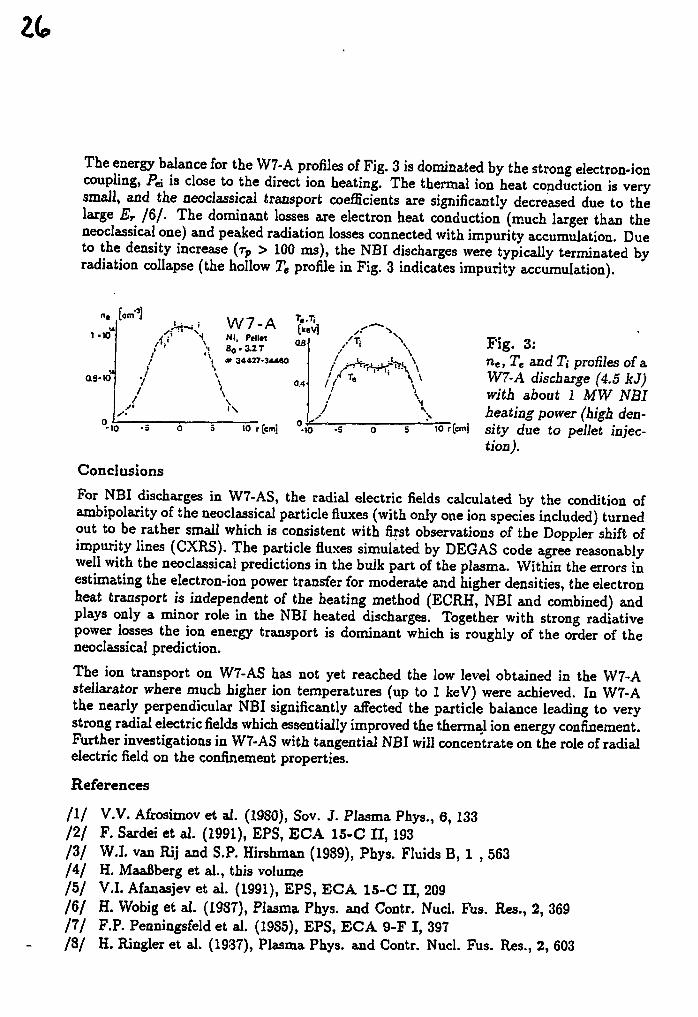
The energy balance for the W7-A profiles of Fig. 3 is dominated by the strong electron-ioncoupling, P« is close to the direct ion heating. The thermal ion heat conduction is verysmall, and the neoclassical transport coefficients are significantly decreased due to thelarge ET /6 / . The dominant losses are electron heat conduction (much larger than theneoclassical one) and peaked radiation losses connected with impurity accumulation. Dueto the density increase (TV > 100 ms), the NBI discharges were typically terminated byradiation collapse (the hollow Te profile in Fig. 3 indicates impurity accumulation).
1 -10
as-id
[cm"3)W7-ANl. Pellti
'! BO.3.2T\ * 34427-34460
as
0.4'
t \
-10 -3 10 r[em]
\
10 r(cm)
Fig. 3:ne, Tt and T,- profiles of a.W7-A discharge (4.5 kJ)with about 1 MW NBIheating power (high den-sity due to pellet injec-tion).
Conclusions
For NBI discharges in W7-AS, the radial electric fields calculated by the condition ofambipolarity of the neoclassical particle fluxes (with only one ion species included) turnedout to be rather small which is consistent with first observations of the Doppler shift ofimpurity lines (CXRS). The particle fluxes simulated by DEGAS code agree reasonablywell with the neoclassical predictions in the buik part of the plasma. Within the errors inestimating the electron-ion power transfer for moderate and higher densities, the electronheat transport is independent of the heating method (ECRH, NBI and combined) andplays only a minor role in the NBI heated discharges. Together with strong radiativepower losses the ion energy transport is dominant which is roughly of the order of theneoclassical prediction.
The ion transport on W7-AS has not yet reached the low level obtained in the W7-Astellarator where much higher ion temperatures (up to 1 keV) were achieved. In W7-Athe nearly perpendicular NBI significantly affected the particle balance leading to verystrong radial electric fields which essentially improved the thermal ion energy confinement.Further investigations in W7-AS with tangential NBI will concentrate on the role of radialelectric field on the confinement properties.
References
/ I / V.V. Afrosimov et al. (1980), Sov. J. Plasma Phys., 6, 133/2 / F. Sardei et al. (1991), EPS, ECA 15-C II, 193/ 3 / W.I. van Rij and S.P. Hirshman (1989), Phys. Fluids B, 1 , 563/4 / H. Maafiberg et al., this volume/ 5 / V.I. Afanasjev et al. (1991), EPS, ECA 15-C H, 209/ 6 / H. Wobig et al. (1987), Plasma Phys. and Contr. Nucl. Fus. Res., 2, 369/7 / F.P. Penningsfeld et al. (19S5), EPS, ECA 9-F I, 397/ 8 / H. Ringler et al. (1987), Plasma Phys. and Contr. Nucl. Fus. Res., 2, 603
ion energy balance particle fluxes
Is io«
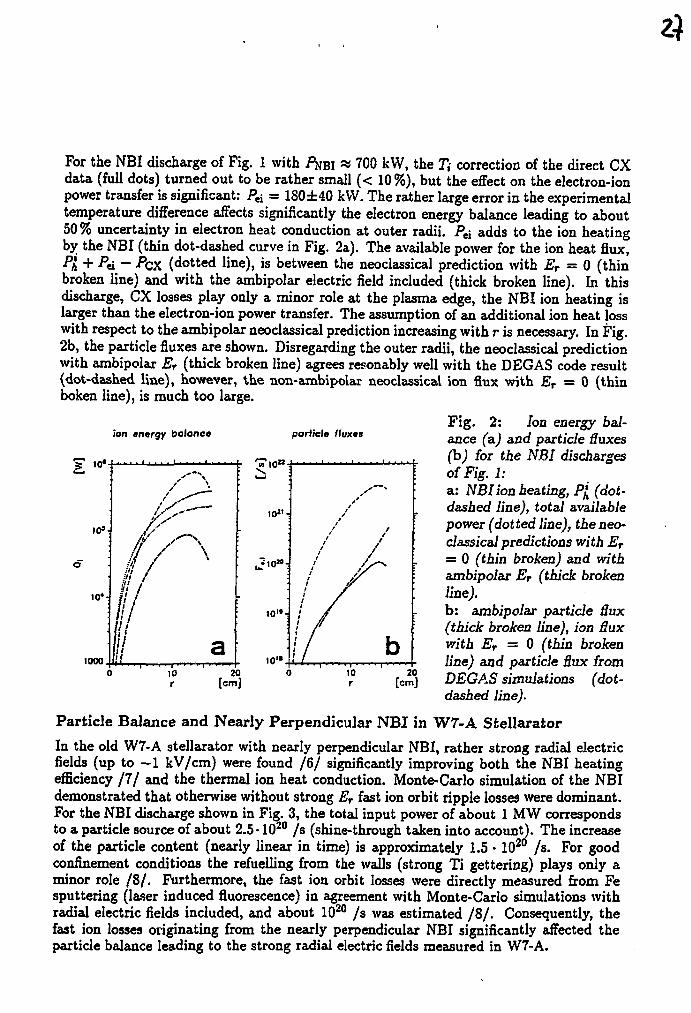
For the NBI discharge of Fig. 1 with / ^ B I « 700 kW, the T,- correction of the direct CXdata (full dots) turned out to be rather small (< 10%), but the effect on the electron-ionpower transfer is significant: Pei = 1SO±4O kVV. The rather large error in the experimentaltemperature difference affects significantly the electron energy balance leading to about50 % uncertainty in electron heat conduction at outer radii. Pej adds to the ion heatingby the NBI (thin dot-dashed curve in Fig. 2a). The available power for the ion heat flux,•Pji + Pti — Pcx (dotted line), is between the neoclassical prediction with Er = 0 (thinbroken line) and with the ambipolar electric field included (thick broken line). In thisdischarge, CX losses play only a minor role at the plasma edge, the NBI ion heating islarger than the electron-ion power transfer. The assumption of an additional ion heat losswith respect to the ambipolar neoclassical prediction increasing with r is necessary. In Fig.2b, the particle fluxes are shown. Disregarding the outer radii, the neoclassical predictionwith ambipolar Er (thick broken line) agrees resonably well with the DEGAS code result(dot-dashed line), however, the non-ambipolar neoclassical ion flux with ET = 0 (thinboken line), is much too large.
Fig. 2: Ion energy bal-ance (a.) and particle fluxes(b) for the NBI dischargesof Fig. 1:a: NBI ion heating, P{ (dot-dashed line), total availablepower (dotted line), the neo-classical predictions with ET
= 0 (thin broken) and withambipolar Er (thick brokenline).b: ambipolar particle flux(thick broken line), ion fluxwith Er = 0 (thin brokenline) and particle flux fromDEGA.S simulations (dot-dashed line).
Particle Balance and Nearly Perpendicular NBI in W7-A Stellarator
In the old W7-A stellarator with nearly perpendicular NBI, rather strong radial electricfields (up to - 1 kV/cm) were found /6 / significantly improving both the NBI heatingefficiency / 7 / and the thermal ion heat conduction. Monte-Carlo simulation of the NBIdemonstrated that otherwise without strong Er fast ion orbit ripple losses were dominant.For the NBI discharge shown in Fig. 3, the total input power of about 1 MW correspondsto a particle source of about 2.5-1020 /s (shine-through taken into account). The increaseof the particle content (nearly linear in time) is approximately 1.5 • 1020 /s. For goodconfinement conditions the refuelling from the walls (strong Ti gettering) plays only aminor role /8 / . Furthermore, the fast ion orbit losses were directly measured from Fesputtering (laser induced fluorescence) in agreement with Monte-Carlo simulations withradial electric fields included, and about 1020 /s was estimated / 8 / . Consequently, thefast ion losses originating from the nearly perpendicular NBI significantly affected theparticle balance leading to the strong radial electric fields measured in W7-A.
1000
for estimating P&. At even higher densities (ne £ 1014 cm""3), where the electron andion temperatures are nearly identical, the total energy balance in which the electron-ioncoupling disappears is carried out.
The ECRH power deposition is highly localized close to the resonance zone correspondingto 3D ray tracing calculations with typically very high single pass absorption. The NBIelectron and ion heating profiles are calculated using a 3D Monte-Carlo code, the radialelectric field is disregarded so far. Fast ion orbit losses are found to be very small for thetangential injection in W7-AS, and, as indicated by DEGAS simulations, the reduction ofNBI heating efficiency due to fast CX losses is negligible in the bulk part of the plasma.The full 3D DEGAS code is used to simulate the neutral gas densities, thermal CX lossesand particle fluxes in the complex topology of W7-AS with all main contributions to theparticle sources included /2 / . For NBI discharges at higher densities the CX losses turnout to be rather small compared to the ion transport losses in the bulk part of the plasma.In ECRH discharges at lower densities, however, CX losses can be significant for the ionenergy balance.
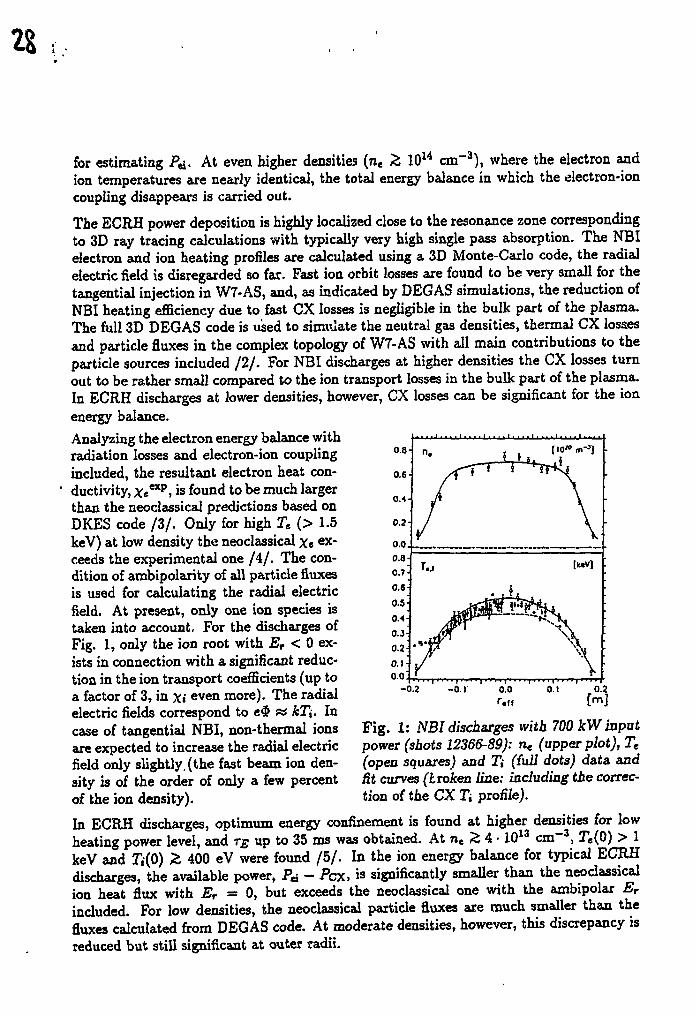
Analyzing the electron energy balance withradiation losses and electron-ion couplingincluded, the resultant electron heat con-ductivity, Xe^, is found to be much largerthan the neoclassical predictions based onDKES code / 3 / . Only for high Tt (> 1.5keV) at low density the neoclassical Xe ex-ceeds the experimental one /4/ . The con-dition of ambipolarity of all particle fluxesis used for calculating the radial electricfield. At present, only one ion species istaken into account. For the discharges ofFig. 1, only the ion root with Er < 0 ex-ists in connection with a significant reduc-tion in the ion transport coefficients (up toa factor of 3, in Xi even more). The radialelectric fields correspond to e$ « kT{. Incase of tangential NBI, non-thermal ionsare expected to increase the radial electric
0.8
0.6
0.4
-0.2
field only slightly, (the fast beam ion den-
Pig. 1: NBI discharges with 700 kW inputpower (shots 12366-89): ne (upper plot), T«(open squares) and T% (full dots) data and
sity is of the order of only a few percent fit curves (broken line: including the correc-of the ion density). tion of the CX Ti profile).
In ECRH discharges, optimum energy confinement is found at higher densities for lowheating power level, and TE up to 35 ms was obtained. At nt Z 4 • 1013 cm"3, ^(O) > 1keV and Ti{0) Z 400 eV were found / 5 / . In the ion energy balance for typical ECRHdischarges, the available power, P* - Pcx, is significantly smaller than the neoclassicalion heat flux with ET = 0, but exceeds the neoclassical one with the ambipolar Er
included. For low densities, the neoclassical particle fluxes are much smaller than thefluxes calculated from DEGAS code. At moderate densities, however, this discrepancy isreduced but still significant at outer radii.
The tubmimd manuscript has been authored by aceniractor et the U.S. Government under contractOE-AC0S-«4OR2i400. Accordingly, the U.S.Govtrnrmnt fetalna • nonexelutive, royalty lrt«NcMtM to puMith or reproduce the published termof this contribution, or allow others lo do to, far U.S.Government purposM.
ION CONFINEMENT IN THE ADVANCED TOROIDAL FACILITY'
R. J. Colchin, M. R. Wadea, R. H. Fowlcrb, R. C. Isler, J. F. Lyon, J. A. Rome, andC. E. Thomasa
Oak Ridge National Laboratory, Oak Ridge, Tennessee, USA
Ion confinement studies have been carried out in the ATF torsatron in the high density and lowdensity regimes. At high density (ng < 10^0 m*3), Monte Carlo studies show that high energyinjected ions (E £ 30 keV) slow down very quickly (» 1 ms) on the electrons and then scatter inpitch angle on the ions. The slowing down time is fast enough that few of the ions have time tocharge exchange before they join the thermal distribution. Plasma simulations using thePROCTR code show that most of the fast ion energy is deposited in the electrons, with the ionsabsorbing only about 10% of the energy.
At low density (UQ * lO1^ m'\ the slowing down time is nearly 80 ms, which is much longerthan the charge exchange time (»10 ms). Full- and half-energy injected ions begin to slowdown on the electrons, but are lost by charge exchange before they reach the critical energy forpitch angle scattering. Only the third-energy ions slow down enough to scatter in pitch angle,which causes them to become trapped and carries them toward the trapped-passing boundary.These transitional orbits go to the edge of the plasma where they either charge exchange ordirectly hit the wall. Charge-exchange neutral spectra show a "hole" in the distribution functioncorresponding to this loss. Plasma simulations show that the bulk of the injected energy is lostto shine-through (- 35%) and charge exchange (« 50%) with most of the remaining fractiongoing to heat the electrons.
The results of these studies have been applied to explain the source of the collapse of the storedenergy which is typically observed in low density plasmas when the density rises to the pointwhere ECH cut-off occurs. The fact that a large fraction of the beam heating is lost by shine-through and charge exchange while ECH heating is ineffective can explain the collapse, asconfirmed by plasma modeling.
"'Research sponsored by the Office of Fusion Energy, U. S. Department of Energy, undercontract No. DE-AC05-84OR21400 with Martin Marietta Energy Systems, Inc.Georgia Institute of Technology, Atlanta GA^Computing and Telecommunications Division, Martin Marietta Energy Systems, Inc.
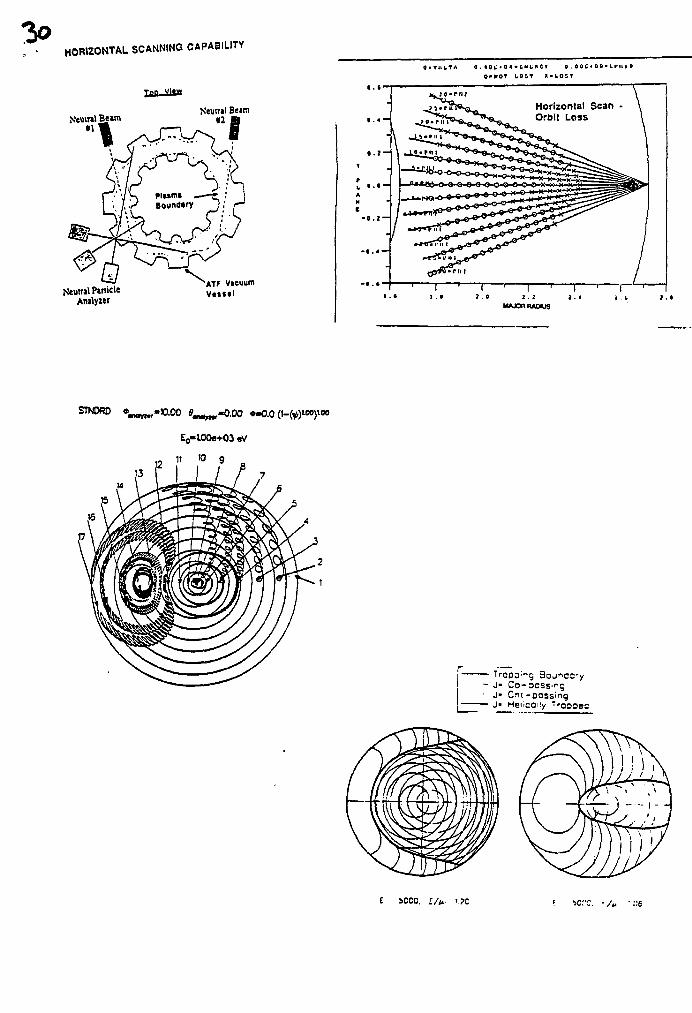
HORIZONTAL SCANNING CAPABILITY
O«NOT LOST X'lOST
y n B Vltvi
Neuml BeamNeutral Beim
Neutral PanicleAnalyzer
ATF VacuumVttttl
S T N 0 R 0 -OO «-0 .0 (1-(v,)ioo)ioo
E0-l00e+03 6/
11 '0 9
13
Horizontal ScanOrbit Loss
- J- Co-3CSS"-S• J- O
£ bOOO. E / V ore. • / „ • r.6
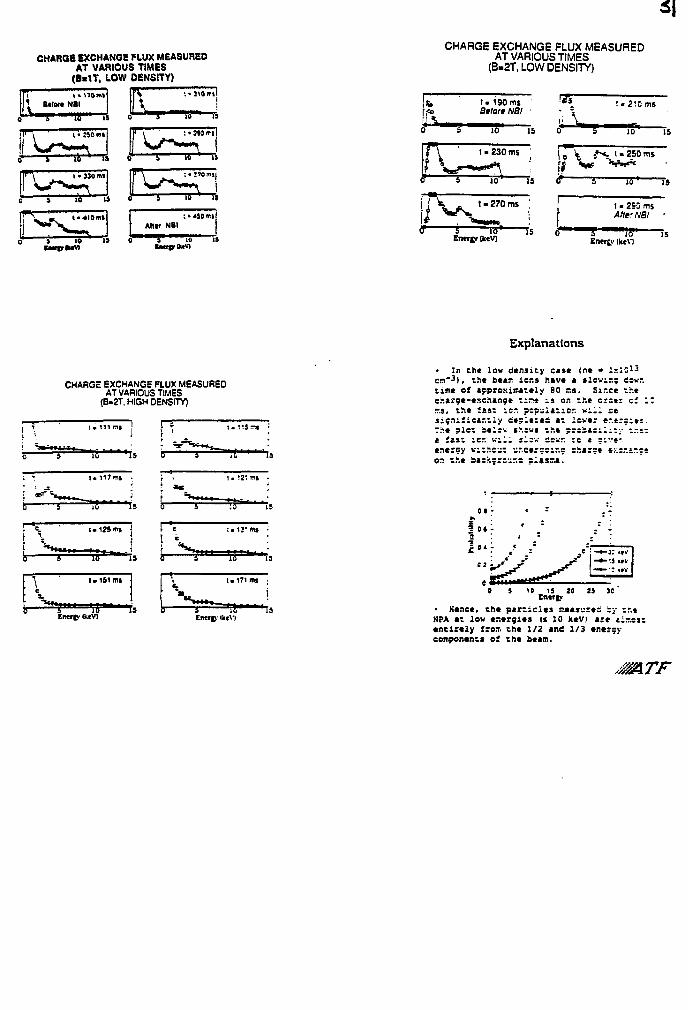
CHARGE EXCHANGE FLUX MEASUREDAT VARIOUS TIMES
(B-1T, LOW DENSITY)
Bllwt N»l
J U A i i1 S 16 is v
; is r» 0"
Alttl NB1
CHARGE EXCHANGE FLUX MEASUREDAT VARIOUS TIMES
(B-2T, HIGH DENSITY)
0 J TO HS 0 5 icr^ 14
rc ikcV)
CHARGE EXCHANGE FLUX MEASUREDAT VARIOUS TIMES
(B-2T, LOW DENSITY)
f0
i
J
I
t . 190 msflr/or* NBI
K.i 10
\ ' 1.230 ms
5 10
\ _ _ _ t-270ms
5 10
15
J
15
11
', \0*
le ^[jr 5
10'
t • 250 rr
JO '
IS
IS
IS
15
t • 2S3 msAlter NB1
EimjyfkeV) 5 I5Energy IkeXT
Explanations
• In th* low density ease (n* •en"3) , the bet* ier.s have a jlo-.-itime of approximately 60 r.s. Eir.cr.aroe-e.v.c.*.ar.o< t ; r t i s CR the err.s, the fsst :c.-. ?:?^i*tier. v i i ;si^.i if ictr.t ly c«? .e ;e i t t Icwer eTS« olet beltv s:*.cw« tr.e ? r s i t c i it ttsz icr. will s'-z-- isvr. te « ;ier.ercy w:;.-.c,; u.*.eer=sir.s cha;=eor. the ba:x:rcur.: siasna.
tiswr.the
=iȣ.
•c «tv
0 5 10 IS 20 25 3CEnergy
• Kenee. the p i n i c i e s measured iy t.-.eNPA at low energies (s 10 keV) a:e tiT.csentirely frox the 1/2 and 1/3 enersyeomponents of the scan.
JMTF
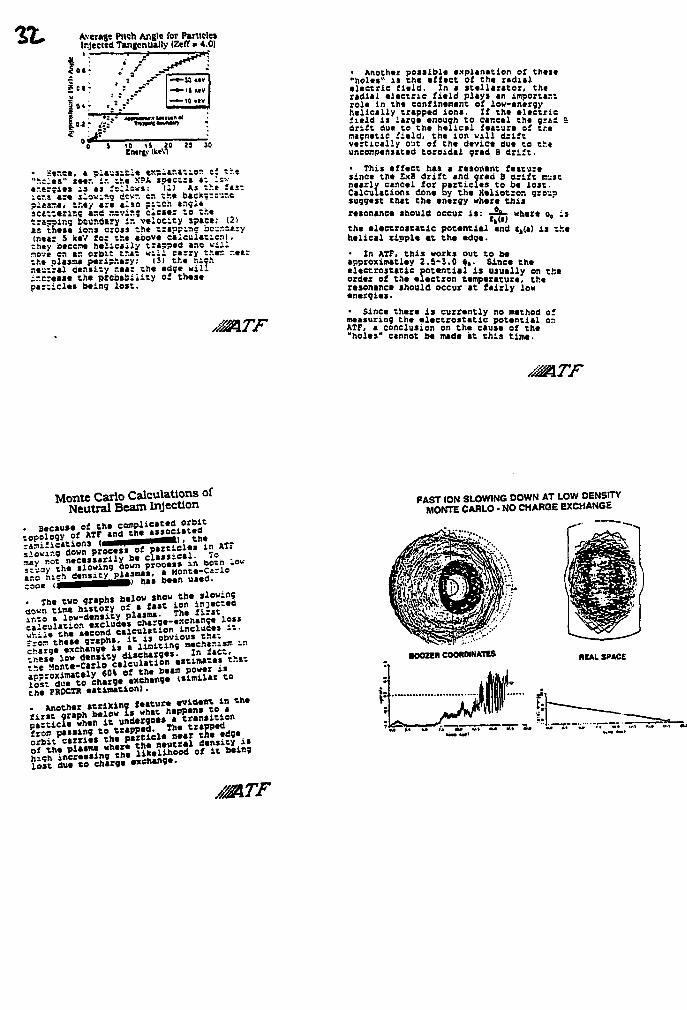
Average Pitch Angle for Particle*Injected Tanjenlially (Zeff • 4.0)
"o 5 10 15 10 }5 1CEntntf IktVl
- Ker.ee, a piausitie cKpiar.atisr. cf t"Scies" seer. i.-. the K?A spect;* at !:•-«.-.er;ies is as fsllsws: (1) As the :
trsspir.g bcur.dary ir. velocity space;is these ions cross -h« Crispin; bcur.sirvInter S ktv for the above c*icul»;;.cnl,;h«y otccrw h«iie«iiy trapped «nc n:j;r-.ov* en ar. orbit t.'.r. will carry t.u.tr. -«»rthe plasaa periphery; (3) the his.'',r.eutral cer.sity r.ear the cd;e villincrease the prcaiSiiity oi theseparticles being lest.
• Another possible explanation of tneic"holes" is the effect of the radialelectric field. In a stellarator, theradial electric field plays an importantrole in the confinement of low-energyhelically trapped ions. If the electricfield is large enough to cancel the q:ii Sdrift due to the helical feature of themagnetic field, the ion will driftvertically out of the device due to th«unconpenstted toroidal grad B drift.
• This effect has a resonant featuresince the SxS drift and grad B drift sxsznearly cancel for particles to be lost.Calculations done by the Kaliotroa gro- ssuggest that the energy where thisresonance should occur is: -^- where o, is
the electrostatic potential and tt(a) is thehelical ripple at the edge.
• In ATF, this works out to beapproximatley 2.5-3.0 *,. Since theelectrostatic potential is usually on theorder of the electron temperature, theresonance should occur at fairly lowenergies.
• Since there is currently no method ofmeisuring the electrostatic potential or.ATF, a conclusion on the cause of the"holes" cannot be made at this time.
Monte Carlo Calculations ofNeutral Beam Injection
• Because of the complicated orbittopology of ATF and the associatedratifications (eeaaavaevaeaMH, theslowing down process of particles in AT"may not necessarily be classical. ToSwusy the slowing down process in both low»r.c hic.1 density plasmas, a Monte-Carlo:ode ( a H M m H H W has been used.
• The two graphs belaw show the slowingaovr. time history of a fast ion injectedinto a low-density plasma. The firstcalculation excludes charge-exchange lossvr.ii* the second calculation includes it.?rcr. these graphs, it is obvious thatcharge exchange is a limiting mecher.isir. ir.these low density discharges. In fact,the Monte-Carlo calculation estimates z'r.t-.approximately 60% of the beam power islost due to charge exchange (similar tothe PROCIR estimation).
• Another striking feature evident in thefirst graph below is what happens to apirticle when it undergoes a transitionfrom pasting to trapped. The trappedorbit carries the particle near the edgeof the plasms where the neutral density ishigh increasing the likelihood of it beinglost due to charge exchange.
FAST ION SLOWING DOWN AT LOW DENSITYMONTE CARLO - NO CHARGE EXCHANGE
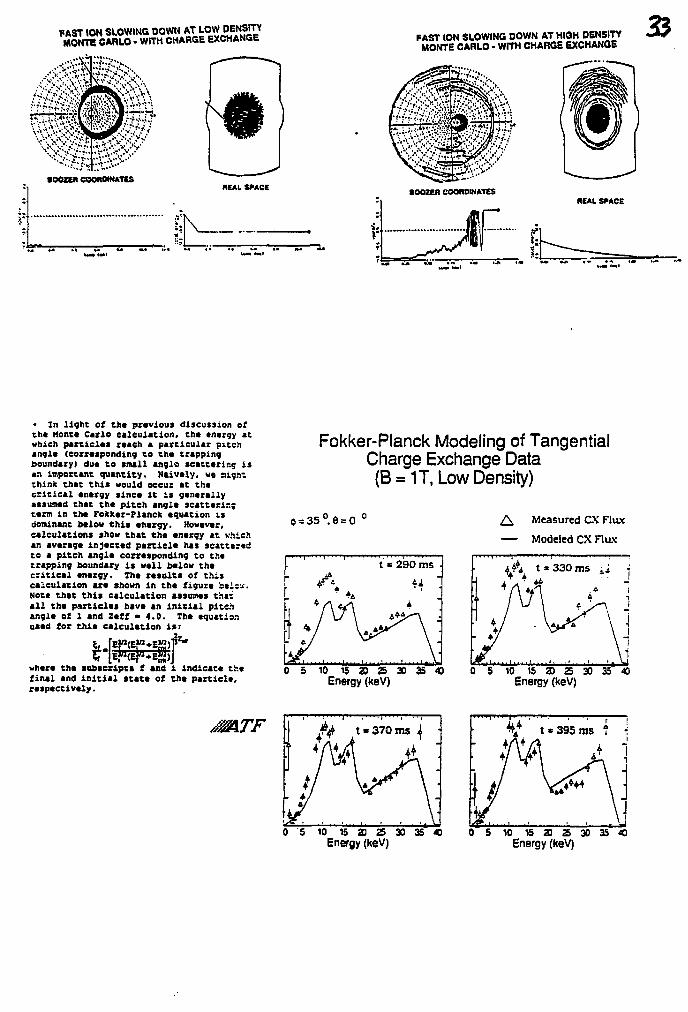
FAST ION SUOWING DOWN £T LOW DENSITYMONTE CARLO • WITH CHARGE EXCHANGE FAST ION SLOWING DOWN AT HIGH DENSITY
MONTE CARLO - WITH CHARGE EXCHANGE
CiWWs
•OOZE* COOnOWATfSREAL SPACE SOOZER COORDINATES
REAL SPACE
• In light at the previous discussion ofthe Mont* Carlo calculation, the energy atwhich particles reach a particular pitchanal* (corresponding to the trappingboundary) due to snail anglo scattering isan important quantity. Naively, we nightthink that this would occur at thecritical energy since it is generallyassumed that the pitch angle scatterir.;term in the Fokker-Planck equation isdominant below this energy. However,calculations show that the energy at vhichan average injected particle has scatteredto a pitch angle corresponding to thetrapping boundary is well below thecritical energy. The results of thiscalculation are shown in the figure btlzv.Note that this calculation assumes thatall the particles have an initial pitchangle of 1 and Zeff • 4.0. The equationused for this calculation is:
where the subscripts f and i indicate thefinal and initial state of the particle,respectively.
Fokker-Planck Modeling of TangentialCharge Exchange Data(B = 1T, Low Density)
35°.e = £± Measured CX Flux
— Modeled CX Flux
2 3 2 5 3 0 3 5 4 0Energy (keV)
0 5 10 15 20 25 30 35Energy (keV)
0 5 10 15 23 25 30 35 40Energy (keV)
0 15 2 D 2 5 3 0 3 5 OEnergy (keV)
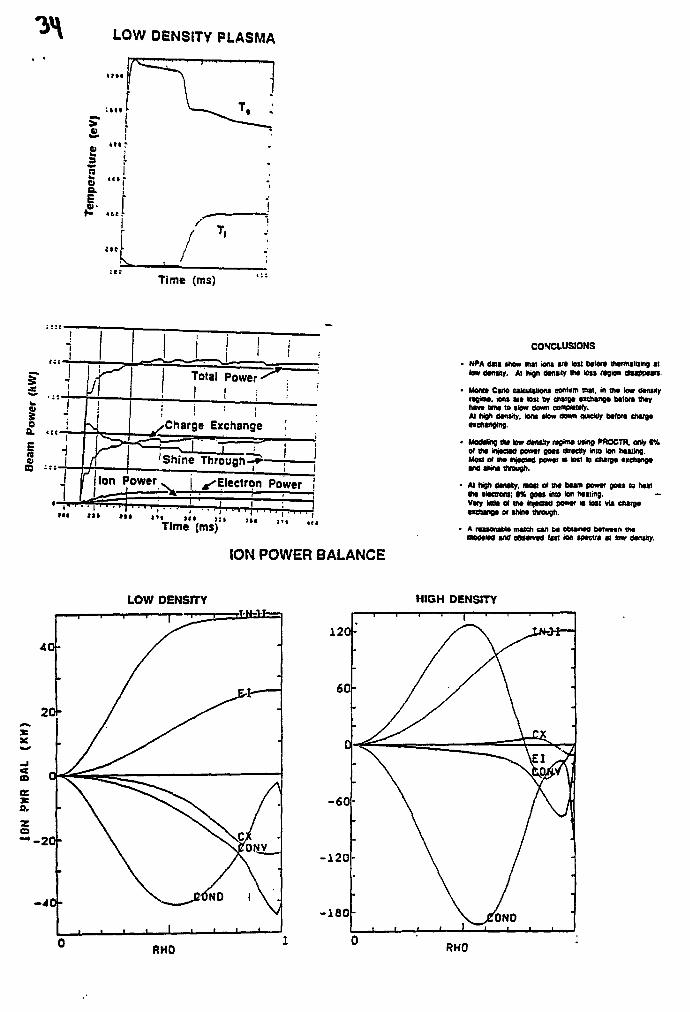
LOW DENSITY PLASMA
I i
...IL
Time (ms)
Ion Power | ^Electron Power i
Time (msj
CONCLUSIONS
• WA data thaw mat ions wo lott before mofliuuiing «low dantiiy. At hign dontny tM loii rtgion dtMWurt.
' Momo Cwto ealcululoni eenlmn mat. in in* low titnuyrogimo. «xi» vo Ion by otargo «ich»no« Mlort thtyn t n wn# to slow oown conipfctciy.At high oontity. Ion* How down qwekly btfora ehvgtfiditnging.
' ModtMig e» tow cUnHy ttgoiw ining moCTR. only t%ol tho injoaod poaoi goat *»aty into ion Mating.Most ol KM fnjocud powor n Ion n d w g * oiehango•nd aNna tsrougK.
At high danaity, maat ol UW oaam powar goaa to htatW olactront; 1% got* Into ton halting. -Vary tola of tht miaoad pootr it ton via chaigtaxenanga of thino thnugh.
A faawnahU match can M obtainM eaivmn « Mnwotiao and OUOVK) l«t ton tptctra ai low avwty.
(ON POWER BALANCE
LOW DENSITY HIGH DENSITY
120-
-60-
-120-
-180
RHO RHO
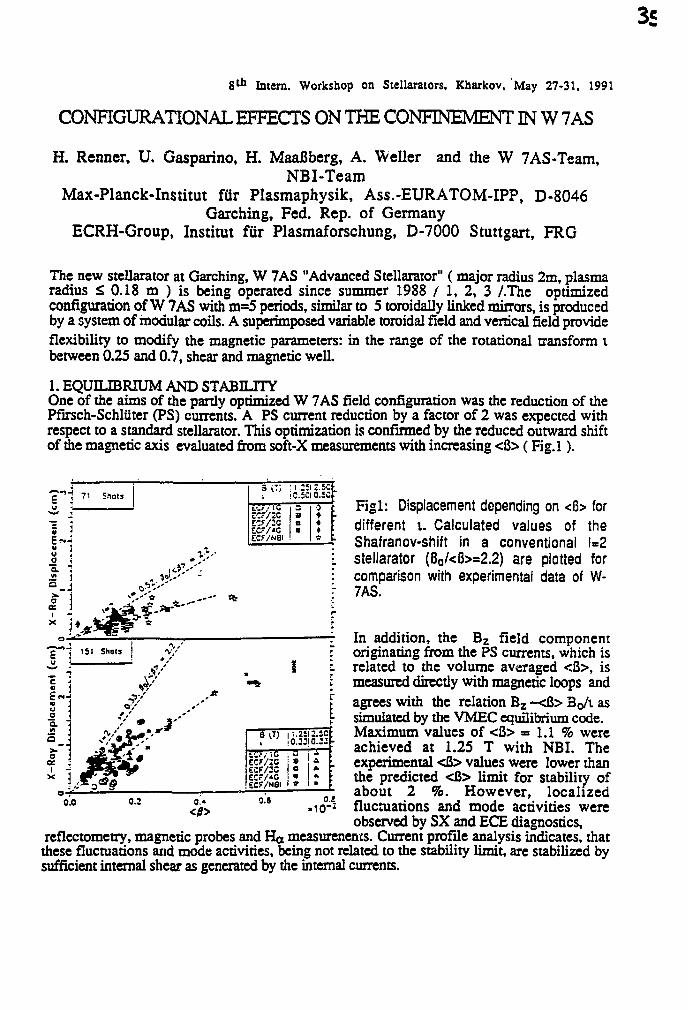
8 t h Intern. Workshop on Stellarators, Kharkov, May 27-31, 1991
CONHGURAT1ONAL EFFECTS ON THE CONFINEMENT IN W 7AS
H. Renner, U. Gasparino, H. MaaBberg, A. Weller and the W 7 AS-Team,NBI-Team
Max-Planck-Institut fur Plasmaphysik, Ass.-EURATOM-IPP, D-8046Garching, Fed. Rep. of Germany
ECRH-Group, Institut fur Plasmaforschung, D-7000 Stuttgart, FRG
The new stellarator at Garching, W 7AS "Advanced Stellarator" (major radius 2m, plasmaradius £ 0.18 m ) is being operated since summer 1988 / 1, 2, 3 /.The optimizedconfiguration of W 7AS with m=5 periods, similar to 5 toroidally linked mirrors, is producedby a system of modular coils. A superimposed variable toroidal field and vertical field provideflexibility to modify the magnetic parameters: in the range of the rotational transform tbetween 0.25 and 0.7, shear and magnetic well.
1. EQUILIBRIUM AND STABILITYOne of the aims of the partly optimized W 7AS field configuration was the reduction of thePfirsch-Schliiter (PS) currents. A PS current reduction by a factor of 2 was expected withrespect to a standard stellarator. This optimization is confirmed by the reduced outward shiftof the magnetic axis evaluated from soft-X measurements with increasing <8> (Fig.l).
71 Shots3 CJ:
ECF/2C
ECF/*CECF/NBI
:.5cC.5010.50
3BD
•
0•
a.
151 Shots •vV
Figl: Displacement depending on <8> fordifferent i. Calculated values of theShafranov-shift in a conventional 1=2stellarator (Bo/<8>=2.2) are plotted forcomparison with experimental data of W-7AS.
In addition, the Bz field componentoriginating from the PS currents, which isrelated to the volume averaged <B>, ismeasured directly with magnetic loops andagrees with the relation Bz ~<fi> BQ/I assimulated by the VMEC equilibrium code.Maximum values of <B> = 1.1 % wereachieved at 1.25 T with NBI. Theexperimental <B> values were lower thanthe predicted <B> limit for stability ofabout 2 %. However, localizedfluctuations and mode activities wereobserved by SX and ECE diagnostics,
reflectometry, magnetic probes and Ha measurenems. Current profile analysis indicates, thatthese fluctuations and mode activities, being not related to the stability limit, are stabilized bysufficient internal shear as generated by the internal currents.
o-f—0.0
i 0.33 0.22
tzr/zsecf/c
\i
0.2 0.6
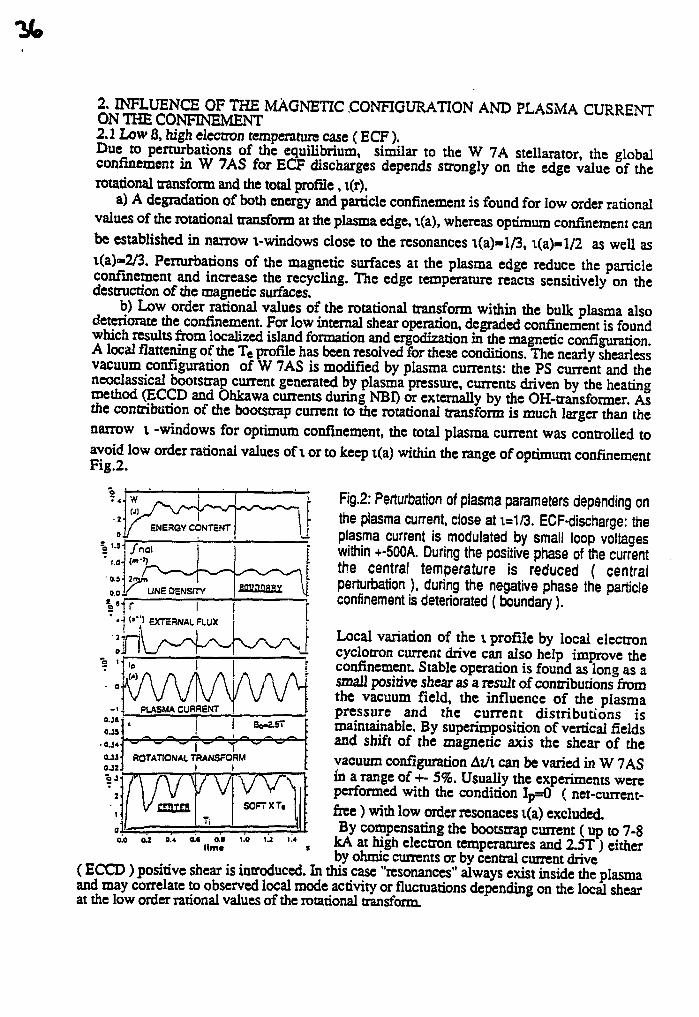
2. INFLUENCE OF THE MAGNETIC .CONFIGURATION AND PLASMA CURRENTON THE CONFINEMENT2.1 Low fl, high electron temperature case (ECF).Due to perturbations of the equilibrium, similar to the W 7A stellarator, the globalconfinement in W 7AS for ECF discharges depends strongly on the edge value of therotational transform and the total profile, i(r).
a) A degradation of both energy and particle confinement is found for low order rationalvalues of the rotational transform at the plasma edge, i(a), whereas optimum confinement canbe established in narrow i-windows close to the resonances i(a)»l/3, i(a)«l/2 as well asi(a)»2/3. Perturbations of the magnetic surfaces at the plasma edge reduce the particleconfinement and increase the recycling. The edge temperature reacts sensitively on thedestruction of the magnetic surfaces.
b) Low order rational values of the rotational transform within the bulk plasma alsodeteriorate the confinement. For low internal shear operation, degraded confinement is foundwhich results from localized island formation and ergodization in the magnetic configurationA local flattening of the Te profile has been resolved for these conditions. The nearly shearlessvacuum configuration of W 7AS is modified by plasma currents: the PS current and theneoclassical bootstrap current generated by plasma pressure, currents driven by the heatingmethod (ECCD and Ohkawa currents during NBI) or externally by the OH-transfonner. Asthe contribution of the bootstrap current to the rotational transform is much larger than thenarrow i -windows for optimum confinement, the total plasma current was controlled toavoid low order rational values of i or to keep i(a) within the range of optimum confinementFig.2.
Fig.2: Perturbation of plasma parameters depending onthe plasma current, close at i=1/3. ECF-discharge: theplasma current is modulated by small loop voltageswithin +-500A. During the positive phase of the currentthe central temperature is reduced ( centralperturbation ), during the negative phase the particleconfinement is deteriorated (boundary).
Local variation of the i profile by local electroncyclotron current drive can also help improve theconfinement. Stable operation is found as long as asmall positive shear as a result of contributions fromthe vacuum field, the influence of the plasmapressure and the current distributions ismaintainable. By superimposition of vertical fieldsand shift of the magnetic axis the shear of thevacuum configuration AUi can be varied in W 7ASin a range of +- 5%. Usually the experiments wereperformed with the condition Ip=0 ( net-current-free ) with low order resonaces i(a) excluded.By compensating the bootstrap current (up to 7-8
kA at high electron temperatures and 2.5T) either, r.~~~ x . b y ohnaic c u r r e m s or by central current drive(ECCD) positive shear is introduced. In this case "resonances" always exist inside the plasmaand may correlate to observed local mode activity or fluctuations depending on the local shearat the low order rational values of the rotational transform.
:nWVNAAAA
0.M0J»
•OJ*OJJQ.H.
PLASMA CURRENT
Bo-2.5T
ROTATIONAL TRANSFORM
vvvvSOFT XT,
Ti
0.0 0.2 0.4 I O.I 1.0Km*
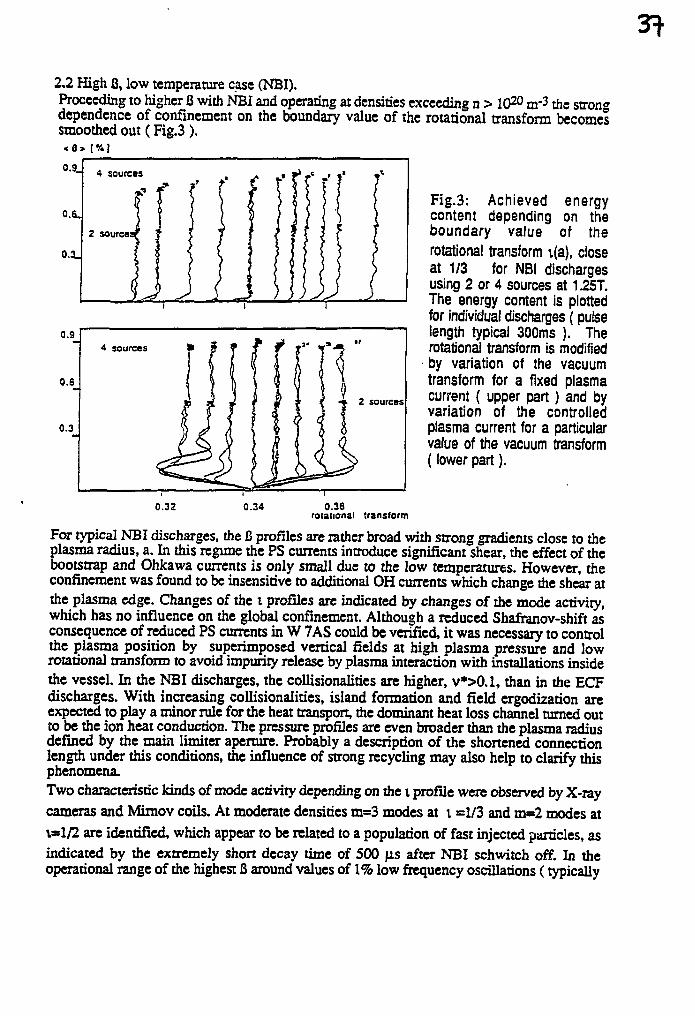
2.2 High fi, low temperature case (NBI).Proceeding to higher 3 with NBI and operating at densities exceeding n > 1020 rrr3 the stron«dependence of confinement on the boundary value of the rotational transform becomessmoothed out (Fig.3 ).
0.9.
o.s.
o.a.
2 source:
0.9
0.6
0.3
4 sources
2 sources
Fig.3: Achieved energycontent depending on theboundary value of therotational transform i(a), closeat 1/3 for NB! dischargesusing 2 or 4 sources at 1.25T.The energy content is plottedfor individual discharges (pulselength typical 300ms ). Therotational transform is modifiedby variation of the vacuumtransform for a fixed plasmacurrent ( upper part) and byvariation of the controlledplasma current for a particularvalue of the vacuum transform(lower part).
0.32 0.34 0.36rotational transform
For typical NBI discharges, the C profiles are rather broad with strong gradients close to theplasma radius, a. In this regime the PS currents introduce significant shear, the effect of thebootstrap and Ohkawa currents is only small due to the low temperatures. However, theconfinement was found to be insensitive to additional OH currents which change the shear atthe plasma edge. Changes of the i profiles are indicated by changes of the mode activity,which has no influence on the global confinement. Although a reduced Shafranov-shift asconsequence of reduced PS currents in W 7 AS could be verified, it was necessary to controlthe plasma position by superimposed vertical fields at high plasma pressure and lowrotational transform to avoid impurity release by plasma interaction with installations insidethe vessel. In the NBI discharges, the collisionalities are higher, v*>0.1, than in the ECFdischarges. With increasing collisionalities, island formation and field ergodization areexpected to play a minor rule for the heat transport, the dominant heat loss channel turned outto be the ion heat conduction. The pressure profiles are even broader than the plasma radiusdefined by the main limiter aperture. Probably a description of the shortened connectionlength under this conditions, the influence of strong recycling may also help to clarify thisphenomena.Two characteristic kinds of mode activity depending on the i profile were observed by X-raycameras and Mimov coils. At moderate densities m=3 modes at i =1/3 and m=2 modes ati=l/2 are identified, which appear to be related to a population of fast injected particles, asindicated by the extremely short decay time of 500 \is after NBI schwitch off. In theoperational range of the highest B around values of 1% low frequency oscillations (typically
4 kHz ) are analysed / 4 /. So far no influence of these modes on the global confinementcould be seen.
3. MAGNETIC CONFIGURATION AND IMPURTTTY CONTENTW 7 AS has two vertically movable limiters (TiC-coated graphit) placed in neighbouringfield periods at 'he top and bottom apexes of the elliptical cross section of the plasma. At lowrotational transform the configuration is limiter-dominated (magnetic surfaces exist outsideof the limiter), whereas at rotational transform above 1/2 it is separatrix-dominated / 5 /. Theboundary topology becomes determined by 5/m islands, which are generated as "natural"islands due to the fivefold magnetic field periodicity and the pentagonal shape of the magneticaxis in W 7AS. This enhances localized particle and energy outflow to the wall and theinternal installations depending on the particular value of the rotational transform.Additionaly, plasma-wall interaction along a helical contour at the radial outside has beenidentified independent on I / 6 /. Due to the short connection lengths the main limiter cannotsufficiently screen these fluxes. For low rotational transform, especially under conditions ofhigh power load to the limiter, sputtering of limiter material ( Ti ) is the main source ofimpurities. With increasing rotational transform impurity release from the wall, particularerosion areas, where the flux bundles intersect aperture limiting installations, becomesimportant. Obviously, the local power deposition on the wall is so strong variingsignificantly with the magnetic and the plasma parameters, that enhanced radiative lossesseverely restrict the acessible density range at higher values of the rotational transform. Sofar, wall conditioning was not very effective to prevent permanently an high content of theimpurities ( Fe, O, C ) for plasma conditions at i>l/2. In contrast to the enhancement ofconfinement with increasing values of the rotational transform for lower densities, especiallyduring NBI a deterioration of the energy confinement is observed as consequence of thedecreasing limiter action and uncontrolled impurity release at the wall. Detailed investigationsof the energy and particle flow to the wall in the boundary region are planned to elaboratemeasures for a reduction of the impurities. On the basis of these results an effective control ofimpurities and density may become possible by positioning secondary limiters anddivenorlike pumped structures inside the vessel.
CONCLUSIONThe confinement in W 7AS reacts sensitively on the particular magnetic configuration.Additionally to the vacuum field the influence of plasma currents, either as bootstrap currentor induced by the heating method, and by the plasma pressure can be demonstrated. Withinthe accessible parameter range for <S><1% the reduced Shafranov-shift of the optimized W7AS compared to a conventional 1=2 stellarator is verified. So far, the observed localizedMHD-modes and fluctuations being associated to low order rational surfaces have nosignificant effect on the confinement A deterioration of the confinement by island formationand ergodization is observed under conditions of low shear and resonances existing in theplasma region. Proceeding to high 6 with NBI at low temperatures and high densities thedependence on the rotational transform becomes less pronouced. The generation of morefavourable shear or modification of transport at the boundary may be responsible. At hightransform, presently, the plasma wall contact outside the separatxix leads to severeuncontrolled impurity flux and masks the expected reduction of transport losses byincreasing radiative losses.
REFERENCES/ 1 / Renner, H. et alt, Plasma Physics and Contr. Fusion, 21 (1989), p.1579-1596/ 2 / Ringler, H. et alt, Plasma Physics and Contr. Fusion, 2Z (1990), p. 933-948/ 3 / Renner, H. et alt, 13th Conf. PLPh. (1990), Washington, IAEA-CN 53/C-1-2/ 4 / Lazaros, A. et alt, Proc. 18th Eur. Conf. on PI. Ph., (1991), Berlin, 15£151 Grigull, P. et alt, J. Nud. Mater., 175&176 (1990), p.975-98216/ Rau, F. et alt, Proc. 17th Europ. Conf. on Pl.Ph. (1990), Amsterdam, 14B2.
p. 517
HI - p -
NEOCLASSICAL CURRENT AND PLASMA ROTATION IN HELICAL SYSTEMS
N.Nakajima and M.Okamoto
National Institute for Fusion k acrtc, Nagoya 464-01, Japan
In order to clarify geometrical effects of the magnetic field on the neocla- '.caltheory in general toroidal systems, the neoclassical parallel particle flow, heat flux,current and plasma rotation of a multispecies plasma are examined using the momentapproach on the basis of the original papers ^' ' *' under the assumptions of nofluctuations, no external sources and losses except for a fast ion beam and an externalinductive electric field, steady state, and | ua |-C vra where uo and vra are the macroand thermal velocity of species a, respectively. Hence, we might have a point of view ofunifying understanding the neoclassical theory in general toroidal systems. Threecollisionality regimes, i.e., the \/v ( in non-axisymmetric toroidal systems ) or banana (in axisymmetric toroidal systems ), plateau, and Pfirsh-Schluter collisionality regimesare examined separately.
In order to obtain the flux-surface-averaged parallel particle flow and heat flux, theflux-surface-averaged parallel momentum and heat flux balance equations are used:[1. 2. 3]
< B • v- na>- < B • V- 0a>
< B • Fal > 1 f < B • Fafl >- < B • Fa2 > J [ - < B • Fa}2 >
noeo < B •
0
(1)where IIO and 0 a are the viscosity and heat viscosity tensor, respectively. Fa] and Fajj( j = 1 or 2 ) are frictions of a species a with thermal species and fast ions due to theneutral beam injection, respectively. And E is an external inductive electric field.The friction coeffecients are classical quantities in the sense that they are independent ofthe magnetic field B and reflect the self adjointness and momentum conservation of theCoulomb collision operator. The geometrical effects of the magnetic field come from theviscosity terms. In axisymmetric toroidal systems the magnetic field strength £ is afunction with respect to the flux label and the poloidal angle, so that there is only onetype of trapped particles and the geometrical effects of the magnetic field structure in
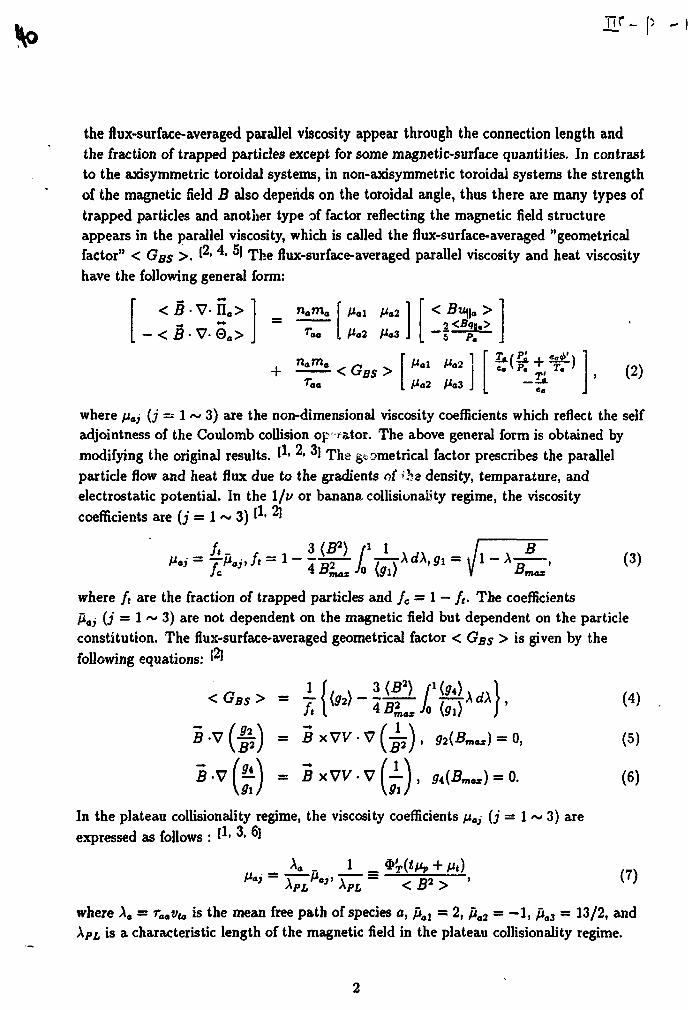
Hr -
the flux-surface-averaged parallel viscosity appear through the connection length andthe fraction of trapped particles except for some magnetic-surface quantities. In contrastto the axisymmetric toroidal systems, in non-axisymmetric toroidal systems the strengthof the magnetic field B also depends on the toroidal angle, thus there are many types oftrapped particles and another type of factor reflecting the magnetic field structureappears in the parallel viscosity, which is called the flux-surface-averaged "geometricalfactor" < Ggs >. & *' ^ The flux-surface-averaged parallel viscosity and heat viscosityhave the following general form:
< B • V- IIa>
< B • V- 0O>
< GBs >
£2fc5 P.
Ma2(2)
where naj {j — 1 ~ 3) are the non-dimensional viscosity coefficients which reflect the selfadjointness of the Coulomb collision op-rator. The above general form is obtained bymodifying the original results. ^' *• * The geometrical factor prescribes the parallelparticle flow and heat flux due to the gradients of ba density, temparature, andelectrostatic potential. In the \fv or banana collisionaiity regime, the viscositycoefficients are (j = 1 ~ 3) I1- ^
B (3)
where ft are the fraction oi trapped particles and fe = 1 — ft. The coefficientsJiaj (j = 1 ~ 3) are not dependent on the magnetic field but dependent on the particleconstitution. The flux-surface-averaged geometrical factor < GBS > is given by thefollowing equations: ™
GB5> - -
9i 9i
(4)
(5)
(6)
In the plateau collisionality regime, the viscosity coefficients na] (j = 1expressed as follows : "• "• °'
A. _ 1 _
3) are
(7)
where Xa = raavta is the mean free path of species a, pal = 2, £o2 = - 1 , fia3 = 13/2, andis a characteristic length of the magnetic field in the plateau collisionality regime.
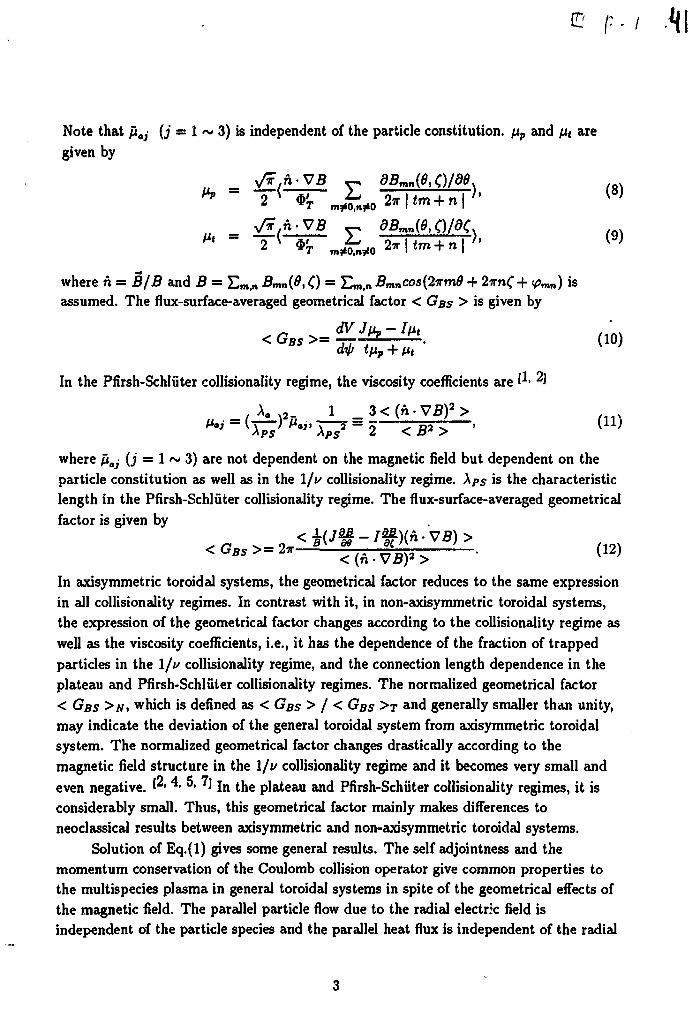
! hi M\
Note that /iaj (j = 1 ~ 3) is independent of the particle constitution. \xv and JU< aregiven by
n-VB v dBmn(6,Q/d6
where n = J?/B and £ = Em,» Bmn(8, C) = Em,n 5mncos(27rm5 + 2?rn<+ y>mn) isassumed. The flux-surface-averaged geometrical factor < GBS > is given by
>—dij; tfip + fit
In the Pfirsh-Schluter collisionality regime, the viscosity coefficients are
where Jiaj (i = 1 ~ 3) are not dependent on the magnetic field but dependent on theparticle constitution as well as in the \jv collisionality regime. Xps is the characteristiclength in the Pfirsh-Schluter collisionality regime. The flux-surface-averaged geometricalfactor is given by
(12)
In axisymmetric toroidal systems, the geometrical factor reduces to the same expressionin all collisionality regimes. In contrast with it, in non-axisymmetric toroidal systems,the expression of the geometrical factor changes according to the collisionality regime aswell as the viscosity coefficients, i.e., it has the dependence of the fraction of trappedparticles in the l/i/ collisionality regime, and the connection length dependence in theplateau and Pfirsh-Schluter collisionality regimes. The normalized geometrical factor< GBS >N, which is defined as < GBS > / < GBS >T a*>d generally smaller than unity,may indicate the deviation of the general toroidal system from axisymmetric toroidalsystem. The normalized geometrical factor changes drastically according to themagnetic field structure in the \jv collisionality regime and it becomes very small andeven negative. '*• **• **• ' ' In the plateau and Pfirsh-Schuter collisionality regimes, it isconsiderably small. Thus, this geometrical factor mainly makes differences toneoclassical results between axisymmetric and non-axisymmetric toroidal systems.
Solution of Eq.(l) gives some general results. The self adjointness and themomentum conservation of the Coulomb collision operator give common properties tothe multispecies plasma in general toroidal systems in spite of the geometrical effects ofthe magnetic field. The parallel particle flow due to the radial electric field isindependent of the particle species and the parallel heat flux is independent of the radial
TJ2 - p -
electric field, if there are no other external sources and losses without the momentumconservation, for example, the charge exchange loss. Consequently, the charge neutralityguarantees the neoclassical current (the bootstrap curent) be independent of the radialelectric field. Quantitative changes, however, appear in the neoclassical current mainlythrough the geometrical factor. $• '• *• ') The magnitude of the bootstrap current,which is proportional to the flux-surface-averaged geometrical factor, changesconsiderably in the non-axisymmetric systems according to the magnetic field structure.Moreover, the poloidal and toroidal rotations change both qualitatively andquantitatively. In the axisymmetric toroidal systems, the poloidal rotation in themultispecies plasma is independent of the radial electric field. I ' In non-axisymmetrictoroidal systems, however, the poloidal rotation has the radial electric field dependence.The radial electric field dependence becomes larger as the geometrical factor decreases.Consequently, if interactions between thermal ions and fast ions are negligible, then theion parallel flow almost disappears in non-axisymmetric toroidal systems with asufficiently small geometrical factor, which contrasts with the fact that the ion parallelflow streams to cancel the ion poloidal flow in axisymmetric toroidal systems.
References
1. S.P.Hirshman and D.J.Sigmar, Nucl.Fusion 21, 1079 (1981)
2. K.CShaing and J.D.Callen, Phys.Pluid 26, 3315 (1983)
3. K.C.Shaing, S.P.Hirshman, and J.D.Callen, Phys.Fluid 29, 521 (1986)
4. K.C.Shaing, E.C.Crume Jr., J.S.Tolliver, S.P.Hirshman, and W.I.van Rij,Phys.Fluids B 1, 148 (1989)
5. K.C.Shaing, B.A.Carreras, N.Dominguez, V.E.Lynch, and J.S.Tolliver, Phys.FluidsB 1, 1663 (1989)
6. M.Coronado and H.Wobig, Phys.Fluid 29, 527 (1986)
7. N.Nakajima, M.Okamoto, J.Todoroki, Y.Nakamura, and M.Wakatani, Nucl.Fusion29, 605 (1989)
8. R.D.Hazeltine and A.A.Ware, Nucl.Fusion 16, 538 (1976)
lll-P-2
CALCULATION OF THE AMBIPOLAR ELECTRIC FIELD FOR HEL1AS
WITH EMPHASIS ON WENDELSTEIN 7X
CD. Beidler
idax-Planck-Jmtiiut fur Plaamaphysik, 1PP-EURAT0M Association
W-8D4C Garching bei Mvnchcn, Germany
Analytical calculations of the ambipolar electric field arising in stellarator-type devices
due to neoclassical transport processes are presented, based on a general solution of
the bounce-averaged kinetic equation
r dr + ed9 + * dk* ~ tH A>{V)
for the model magnetic field
3/Bo = COto(r) - \C0,i(r)\cose + C0,3(r)coe2e - tn(r
where the helical ripple is given by
) = «*(r)(l - cri(r)co60-a3(r)cos20).
In the above equations r and 8 are radial and poloidal flux variables, respectively,
k7 is the usual bounce-averaged pitch-angle %-ariable, / is the perturbed distribution
function, Fm is a local Maxwellian, v%il = v/2eh, Atf?) = B(E(k) - (1 - k')K(k))
where K(k) and 2?(&) are the complete elliptic integrals of the first and second kinds,
respectively, a prime denotes differentiation with respect to Jfe3 and JJ is the phase
angle of the helical ripple. The solution of Equation (1) assumes no ordering of the
frequencies 0 and vtjj so that it is valid throughout the entire long-mean-free-path
regime. Furthermore, all drifts present within the framework of the bounce avca^ed
theory are accounted for; in particular B comprises both the E x B and VB drifts so
that the solution of Equation (1) is also valid in the small electric field limit. From the
ambipolarity condition, F, = F,-, it is then possible to determine the self-consistent
radial electric field for given density and temperature profiles. A particular set of
calculations is presented for the Helias configuration HS5V10C, which is the basis for
the proposed Wendelstein 7X device. Attention is draws to the differences in the
electric field profiles due to finite-^ effects on the magnetic field configuiation.
25
NEOCLASSICAL TRANSPORT CALCULATIONS
USING DKES C o . . E FOR W7-AS
H. Maaflberg, U. Gasparino, G. Kiihner, W7-AS Team and NBI TeamMax-Planck Institut fur Plasmaphysik
Association EURATOM-IPP, D-8046 Garching, Germany
ECRH GroupInstitut fur Plasmaforschung der Universitat Stuttgart
D-7000 Stuttgart, Germany
DKES Code for W7-AS
The DKES code /1,2/ is used to calculate the neoclassical transport properties in the W7-AS stellarator. In the DKES code, the linearized mono-energetic drift-kinetic equationwithout source terms is solved for a rather general magnetic field topology. The poloidalcomponent of the V2?-drift is neglected and the transport coefficients depending onlyon collisionality and radial electric field are estimated for the single flux surfaces. Byenergy convolution the full neoclassical Onsager transport matrix is calculated. As onlythe usual pitch-angle collision operator without parallel momentum conservation is used,the convolution formalism for the evaluation of the parallel flux coefficients has beenextended. On the basis of the adjoint approach / 3 / , Spitzer's function is used in theenergy convolution to obtain the electric resistivity and the bootstrap current coefficients.In this context, the mono-energetic bootstrap current coefficient is considered as a parallelmomentum source originating from the deviation of particle orbits from flux surfaces.
Up to 40 Fourier harmonics in both the poloidal and the toroidal angle (magnetic co-ordinates) are used for the representation of B on the single flux surfaces, the effect ofthe coil ripple is disregarded. This high number of Fourier harmonics is necessary todescribe correctly the gradients close to the field minimum, Bmin (see Fig. la at C — 17°).Trapped particles being highly localized in this region affect significantly the neoclassicalconfinement properties in the long mean free path (LMFP) regime. The trapped particlesin the straight parts of the W7-AS configuration (C = 0°, nearly "triangular" flux surfaces)are well confined as the poloidal components of VB are rather small.
The vacuum magnetic configuration in W7-AS is defined by the rotational transform, -*,the vertical field strength, Bz> and, additionally, by the coil current ratio, fCi of the largerspecial coils in the plane £ = 36° (nearly "elliptical" flux surfaces) to the other modu-lar coils. The confinement properties in the plateau regime (being similar to those of anequivalent axisymmetric configuration) improve at higher <e, but in the LMFP regime, thestronger effect of the drifting highly localized trapped particles counteracts this improve-ment. Generally, the neoclassical transport is reduced with Bx > 0 which correspondsto an inward shift of the plasma column (e.g., a reduction by a factor of 2 in Fig. lbcompared to the equivalent *-case with Bx = 0). Acting on the coil current ratio, theminimum in the magnetic field on axis can be shifted (e.g., from the "triangular" plane,C = 0°, to the "elliptical" plane, £ = 36°). By this option, the fraction, of trapped particlesis modified in the plane where the ECRH is launched (C = 36°). Typically, the neoclas-sical confinement properties vary only by a factor of about 2 for the different magnetic
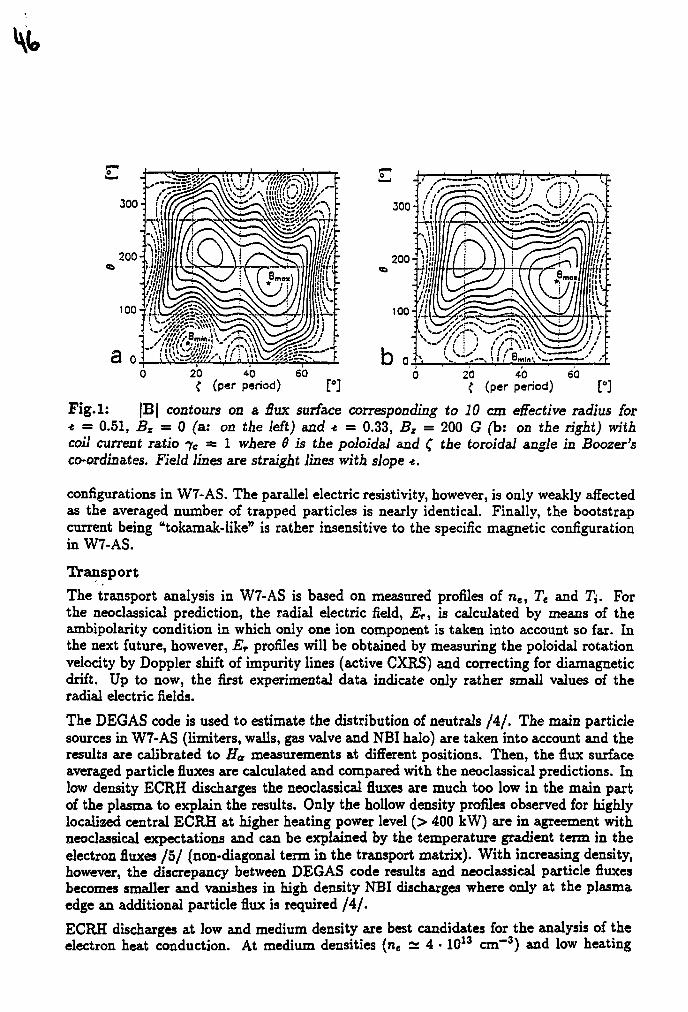
20 *0 60( (per period) [•]
20 40{ (per period) [°]
Fig.l: |B| contours on a tfux surface corresponding to 10 cm effective radius for•* = 0.51, Bz = 0 fc: on t ie /eft) and * = 0.33, Bx = 200 G (b: on the right) withcoil current ratio fe — 1 where 0 is the poloidaJ and £ the toroidal angle in Boozer'sco-ordinates. Field lines are straight lines with slope -t.
configurations in W7-AS. The parallel electric resistivity, however, is only weakly affectedas the averaged number of trapped particles is nearly identical. Finally, the bootstrapcurrent being "tokamak-like" is rather insensitive to the specific magnetic configurationin W7-AS.
Transport
The transport analysis in W7-AS is based on measured profiles of ng, Tt and Ti. Forthe neoclassical prediction, the radial electric field, ET, is calculated by means of theambipolarity condition in which only one ion component is taken into account so far. Inthe next future, however, ET profiles will be obtained by measuring the poloidal rotationvelocity by Doppler shift of impurity lines (active CXRS) and correcting for diamagneticdrift. Up to now, the first experimental data indicate only rather small values of theradial electric fields.
The DEGAS code is used to estimate the distribution of neutrals /4/ . The main particlesources in W7-AS (limiters, walls, gas valve and NBI halo) are taken into account and theresults are calibrated to Ha measurements at different positions. Then, the flux surfaceaveraged particle fluxes are calculated and compared with the neoclassical predictions. Inlow density ECRH discharges the neoclassical fluxes are much too low in the main partof the plasma to explain the results. Only the hollow density profiles observed for highlylocalized central ECRH at higher heating power level (> 400 kW) are in agreement withneoclassical expectations and can be explained by the temperature gradient term in theelectron fluxes / 5 / (non-diagonal term in the transport matrix). With increasing density,however, the discrepancy between DEGAS code results and neoclassical particle fluxesbecomes smaller and vanishes in high density NBI discharges where only at the plasmaedge an additional particle flux is required /4 / .
ECRH discharges at low and medium density are best candidates for the analysis of theelectron heat conduction. At medium densities (n« =2 4 • 1013 cm"3) and low heating
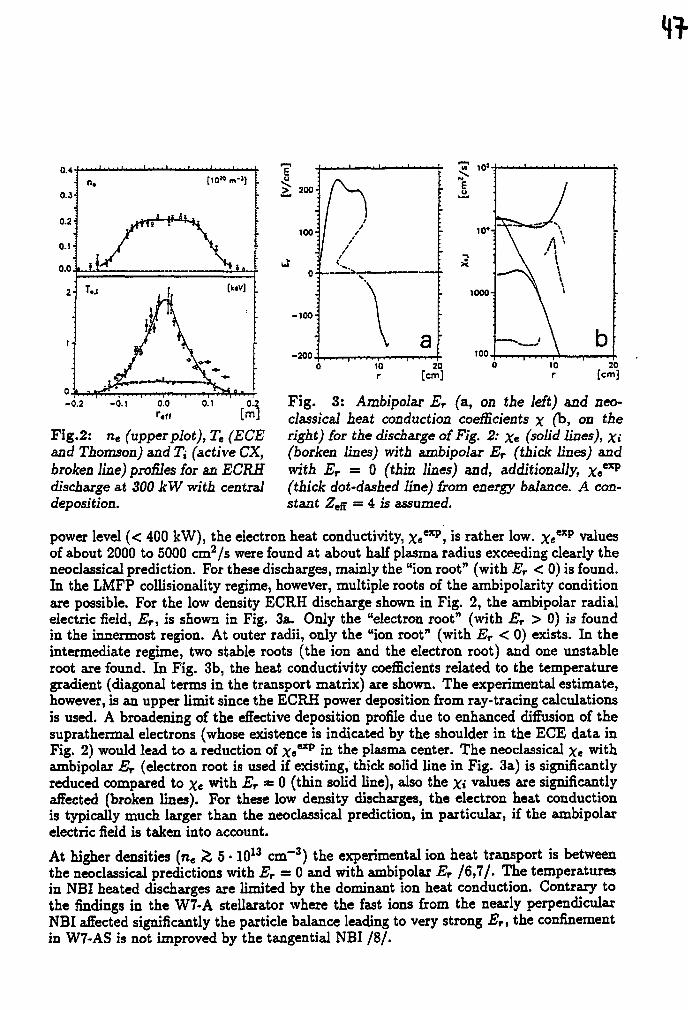
0.4
-0.2 -0.1 0.0 o.i 0.2
[m]Fig.2: ne (upper plot), Te (ECEand Thomson) and Ti (active CX,broken line) profiles for an ECRHdischarge at 300 kW with centraldeposition.
Fig. 3: Ambipolar ET (a, on the left) and neo-classical heat conduction coefficients x fo, on theright) for the discharge of Fig. 2: Xe (solid lines), Xi(borken lines) with ambipolar Er (thick lines) andwith Er = 0 (thin lines) and, additionally, Xe**9
(thick dot-dashed line) from energy balance. A con-stant Zeg = 4 is assumed.
power level (< 400 kW), the electron heat conductivity, Xetxp, is rather low. XeeJtp valuesof about 2000 to 5000 cm2/s were found at about half plasma radius exceeding clearly theneoclassical prediction. For these discharges, mainly the "ion root" (with ET < 0) is found.In the LMFP collisionality regime, however, multiple roots of the ambipolarity conditionare possible. For the low density ECRH discharge shown in Fig. 2, the ambipolar radialelectric field, ET, is shown in Fig. 3a. Only the "electron roof (with ET > 0) is foundin the innermost region. At outer radii, only the "ion root" (with ET < 0) exists. In theintermediate regime, two stable roots (the ion and the electron root) and one unstableroot are found. In Fig. 3b, the heat conductivity coefficients related to the temperaturegradient (diagonal terms in the transport matrix) are shown. The experimental estimate,however, is an upper limit since the ECRH power deposition from ray-tracing calculationsis used. A broadening of the effective deposition profile due to enhanced diffusion of thesupratherxnal electrons (whose existence is indicated by the shoulder in the ECE data inFig. 2) would lead to a reduction of Xeexp in the plasma center. The neoclassical Xe withambipolar Er (electron root is used if existing, thick solid line in Fig. 3a) is significantlyreduced compared to Xe with Er — 0 (thin solid line), also the x» values are significantlyaffected (broken lines). For these low density discharges, the electron heat conductionis typically much larger than the neoclassical prediction, in particular, if the ambipolarelectric field is taken into account.
At higher densities (ne k, 5 • 1013 cm"3) the experimental ion heat transport is betweenthe neoclassical predictions with ET = 0 and with ambipolar Er /6,7/. The temperaturesin NBI heated discharges are limited by the dominant ion heat conduction. Contrary tothe findings in the W7-A stellarator where the fast ions from the nearly perpendicularNBI affected significantly the particle balance leading to very strong ET, the confinementin W7-AS is not improved by the tangential NBI /8 / .
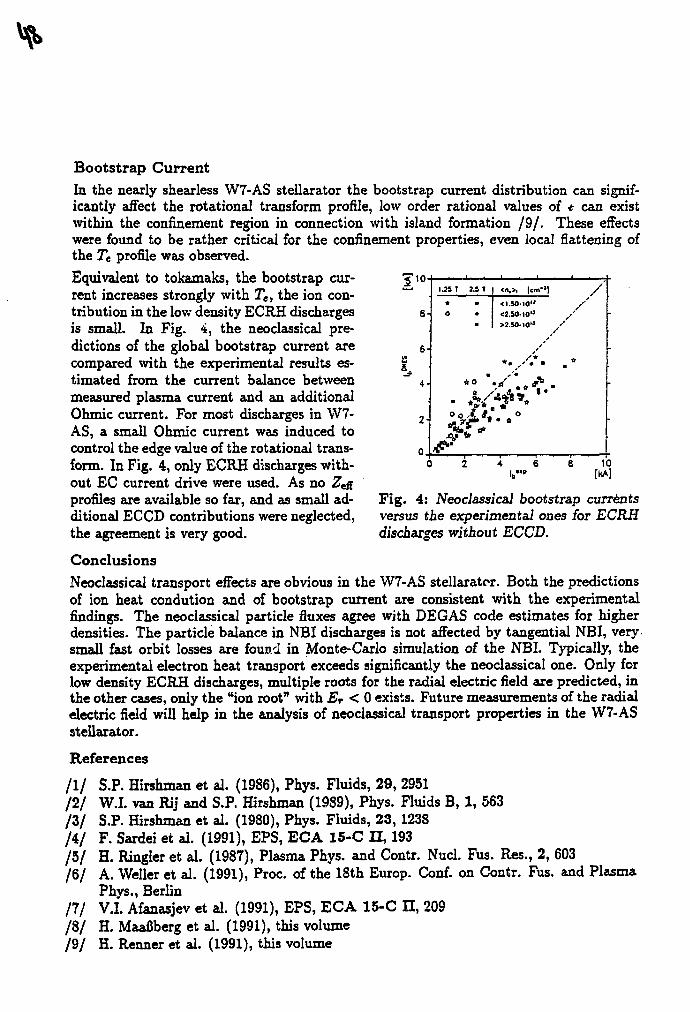
a
10-
8-
6-
4-
2-
0
1.25 T
*
0
& * '
2.5 T
;
<n.>, |cm-] / '
< 1.5010" /
>2.SO-IO" /
!„••»10
[kA]
Fig. 4: Neoclassical bootstrap currentsversus the experimental ones for ECRHdischarges without ECCD.
Bootstrap Current
In the nearly shearless W7-AS stellarator the bootstrap current distribution can signif-icantly affect the rotational transform profile, low order rational values of * can existwithin the confinement region in connection with island formation /9 / . These effectswere found to be rather critical for the confinement properties, even local flattening ofthe Tt profile was observed.
Equivalent to tokamaks, the bootstrap cur-rent increases strongly with Te, the ion con-tribution in the low density ECRH dischargesis small. In Fig. 4, the neoclassical pre-dictions of the global bootstrap current arecompared with the experimental results es-timated from the current balance betweenmeasured plasma current and an additionalOhmic current. For most discharges in W7-AS, a small Ohmic current was induced tocontrol the edge value of the rotational trans-form. In Fig. 4, only ECRH discharges with-out EC current drive were used. As no Zeffprofiles are available so far, and as small ad-ditional ECCD contributions were neglected,the agreement is very good.
ConclusionsNeoclassical transport effects are obvious in the W7-AS stellarator. Both the predictionsof ion heat condution and of bootstrap current are consistent with the experimentalfindings. The neoclassical particle fluxes agree with DEGAS code estimates for higherdensities. The particle balance in NBI discharges is not affected by tangential NBI, very-small fast orbit losses are found in Monte-Carlo simulation of the NBI. Typically, theexperimental electron heat transport exceeds significantly the neoclassical one. Only forlow density ECRH discharges, multiple roots for the radial electric field are predicted, inthe other cases, only the "ion root" with Er < 0 exists. Future measurements of the radialelectric field will help in the analysis of neoclassical transport properties in the W7-ASstellarator.
References
/ I / S.P. Hirshman et al. (1986), Phys. Fluids, 29, 2951/2 / W.I. van Rij and S.P. Hirshman (1989), Phys. Fluids B, 1, 563/ 3 / S.P. Hirshman et al. (1980), Phys. Fluids, 23, 1238/4 / F. Sardei et al. (1991), EPS, ECA 15-C II, 193/ 5 / H. Ringler et al. (1987), Plasma Phys. and Contr. Nucl. Fus. Res., 2, 603/6/ A. Weller et al. (1991), Proc. of the 18th Europ. Conf. on Contr. Fus. and Plasma
Phys., Berlin/7 / V.I. Afanasjev et al. (1991), EPS, ECA 15-C II, 209/ 8 / H. Maafiberg et al. (1991), this volume/9/ H. Renner et al. (1991), this volume
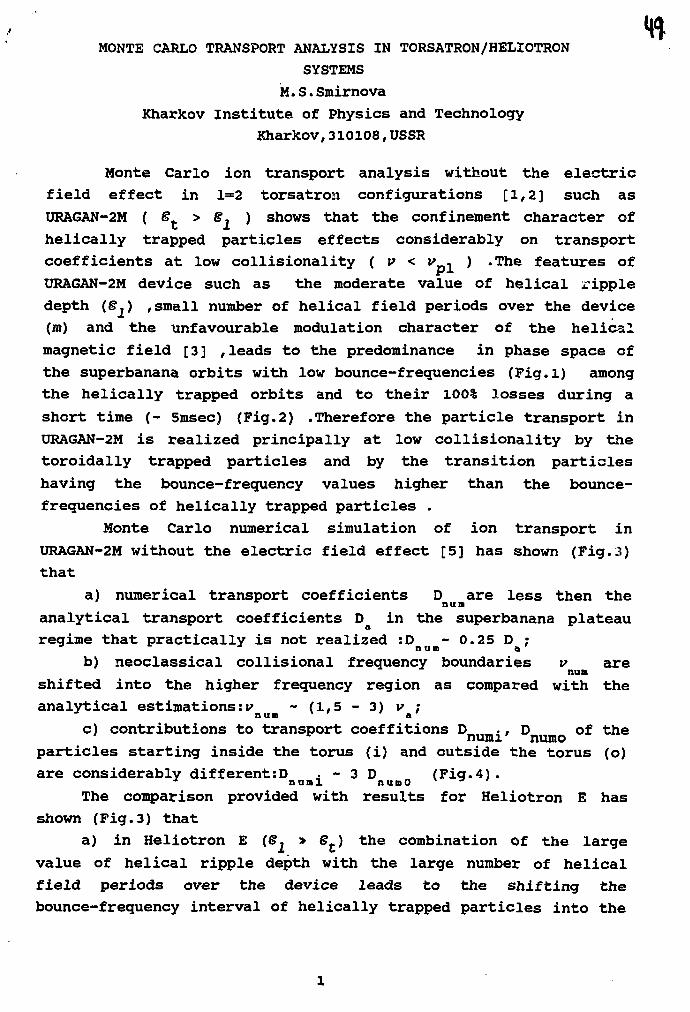
MONTE CARLO TRANSPORT ANALYSIS IN TORSATRON/HELIOTRON
SYSTEMS
M.S.Smirnova
Kharkov Institute of Physics and Technology
Kharkov,310108,USSR
Monte Carlo ion transport analysis without the electric
field effect in 1=2 torsatron configurations [1,2] such as
URAGAN-2M ( 6t > S. ) shows that the confinement character of
helically trapped particles effects considerably on transport
coefficients at low collisionality ( v < v . ) .The features of
URAGAN-2M device such as the moderate value of helical ripple
depth (Sj) ,small number of helical field periods over the device
(m) and the unfavourable modulation character of the helical
magnetic field [3] ,leads to the predominance in phase space of
the superbanana orbits with low bounce-frequencies (Fig.l) among
the helically trapped orbits and to their 100% losses during a
short time (- 5msec) (Fig.2) .Therefore the particle transport in
URAGAN-2M is realized principally at low collisionality by the
toroidally trapped particles and by the transition particles
having the bounce-frequency values higher than the bounce-
frequencies of helically trapped particles .
Monte Carlo numerical simulation of ion transport in
URAGAN-2M without the electric field effect [5] has shown (Fig.3)
that
a) numerical transport coefficients D are less then ther nun
analytical transport coefficients D in the superbanana plateau
regime that practically is not realized :D - 0.25 D ;•* nun «'
b) neoclassical collisional frequency boundaries v arenua
shifted into the higher frequency region as compared with the
analytical estimations:!' - (1,5 - 3) v ;nun a
c) contributions to transport coeffitions D ., D of thenumi numo
particles starting inside the torus (i) and outside the torus (o)
are considerably different:D . - 3 D (Fig.4).numi nunO
The comparison provided with results for Heliotron E has
shown (Fig.3) that
a) in Heliotron E (S, > &t) the combination of the large
value of helical ripple depth with the large number of helical
field periods over the device leads to the shifting the
bounce-frequency interval of helically trapped particles into the
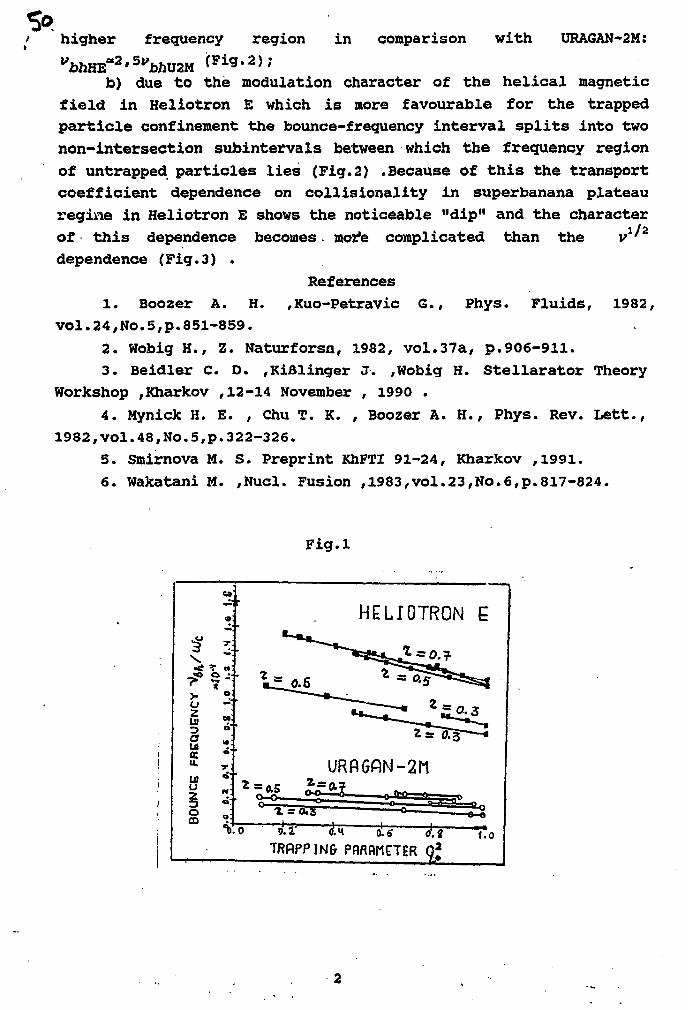
higher frequency region in comparison wi th URA6AN-2M:
b) due t o the modulation character of t h e h e l i c a l magneticf i e l d i n Hel iotron E which i s more favourable f o r the trappedp a r t i c l e confinement the bounce-frequency interval s p l i t s into twonon-intersection subintervals between which the frequency regionof untrapped part ic les l i e s (Fig.2) .Because of t h i s the transportcoef f i c ient dependence on co l l i s iona l i ty in superbanana plateauregine in Heliotron E shows the noticeable "dip11 and the characterof t h i s dependence becomes • more complicated than the v1'2
dependence (Fig.3) .References
1. Boozer A. H. ,Kuo-Petravic G., Phys. Fluids, 1982,vol .24,No.5,p.851-859.
2 . Wobig H., Z. Naturforsn, 1982, vol .37a, p.906-911.3 . Beidler C. D. ,Kifilinger J. ,Wobig H. Ste l larator Theory
Workshop ,Kharkov ,12-14 November , 1990 .4. Mynick H. E. , Chu T. K. , Boozer A. H., Phys. Rev. Let t . ,
1982,vol.48,No.5,p.322-326.5. Smirnova M. S. Preprint KhFTI 91-24, Kharkov ,1991.6. Wakatani H. ,Nucl. Fusion ,1983,vol.23,No.6,p.817-824.
Fig.l
HELIOTRON E
7RBPPIN& PflflfltiETER
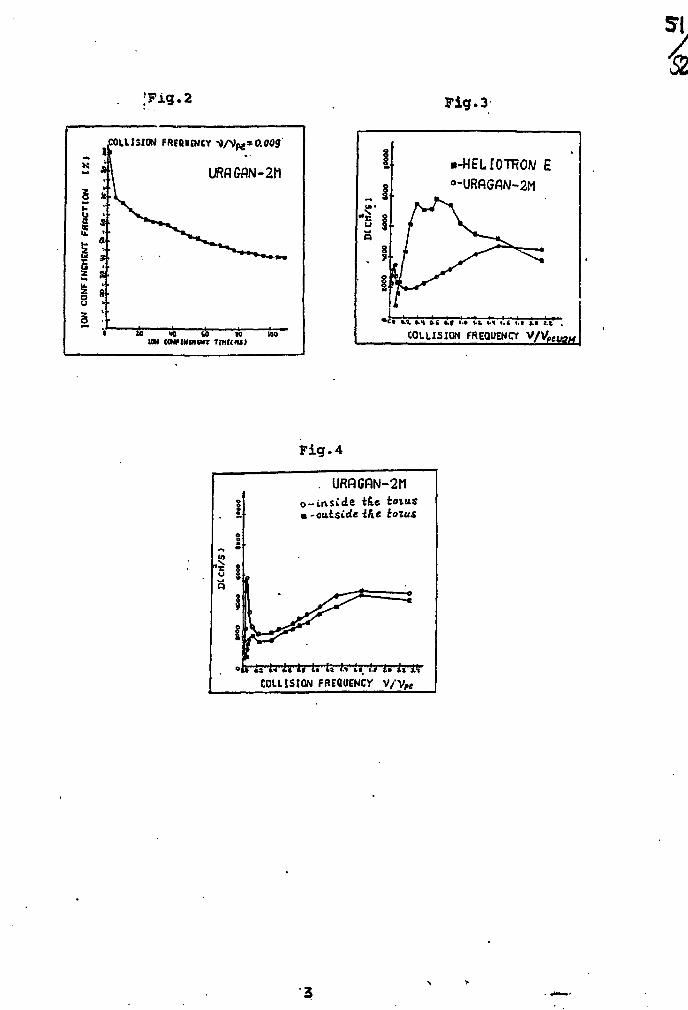
;'Fig.2
ILISION FREQUENCY -* /V p e = 0.009
JO 1 0 CO KUN CONFiNOKWT T[nK«J)
Fig.3-
•-HELIOTROW E
°-URflGflN-2M
' " IA «.t fr( t.f t.» 1.1 1.1 t.< i.t 10 I.I
COLLISION FREQUENa
F i g . 4
. URflGfiN-2Mo-inside tlie toius• -outside M i
is li i« Ir i» U It it it t» it l.'COLLIStON FREQUENCY V / V p t
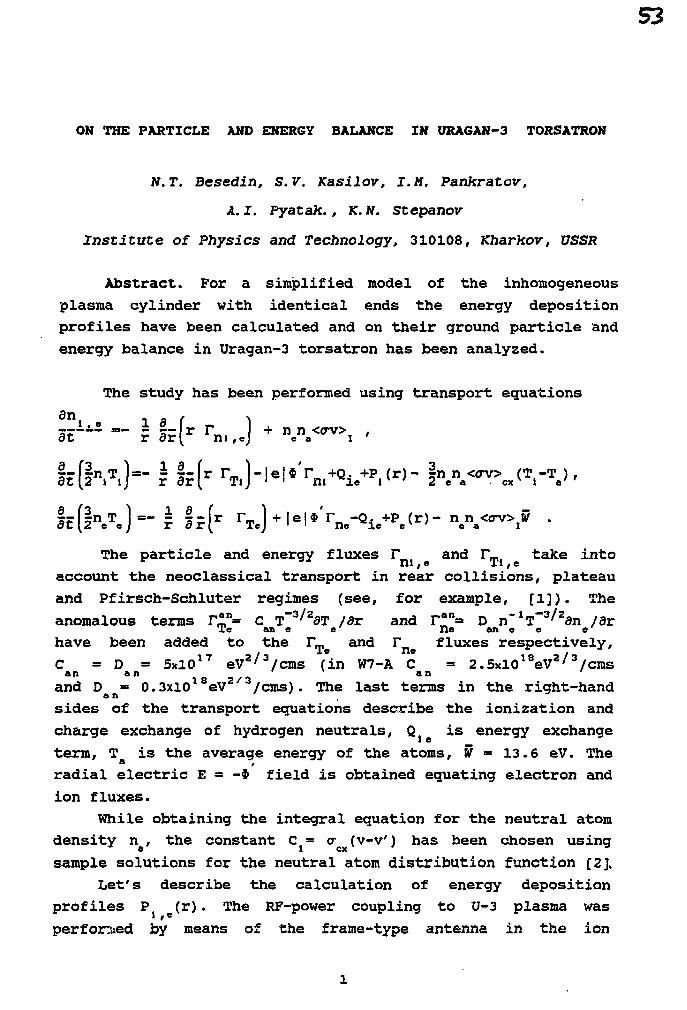
S3
ON THE PARTICLE AND ENERGY BALANCE IN URAGAN-3 TORSATRON
N.T. Besedin, S.V. Kasilov, I.M. Pankratov,
A. I. Pyatak., K. N. Stepanov
Institute of Physics and Technology, 310108, Kharkov, USSR
Abstract. For a simplified model of the inhomogeneous
plasma cylinder with identical ends the energy deposition
profiles have been calculated and on their ground particle and
energy balance in Uragan-3 torsatron has been analyzed.
The study has been performed using transport equations
an.™ i - =. 1 L( r rat r ar[r m,
8 (3 ^ 1 8 (dt \JZ e 9 j r 3 r (
The particle and energy fluxes r_ and Fm take intoIII i e XI / e
account the neoclassical transport in rear collisions, plateau
and Pfirsch-Schluter regimes (see, for example, [1])* The
anomalous terms r*n= C T"3/23T /dr and r"n= D n"x1~3^zan /drTe an e e ne an e o e
have been added to the !*„ and r fluxes respectively,
C = D = 5xlO17 eV2/3/cms (in W7-A C = 2.5xl018eV2/3/cms«n an >°
and D = 0.3x10 eV 2/cms). The last terms in the right-hand
sides of the transport equations describe the ionization and
charge exchange of hydrogen neutrals, Q is energy exchange
term, T is the average energy of the atoms, W = 13.6 eV. The
radial electric E = -* field is obtained equating electron and
ion fluxes.
While obtaining the integral equation for the neutral atom
density n , the constant C = <r (v-v') has been chosen usinga 1 ex
sample solutions for the neutral atom distribution function [2],
Let's describe the calculation of energy deposition
profiles P (r). The RF-power coupling to U-3 plasma was
perforated by means of the frame-type antenna in the ion
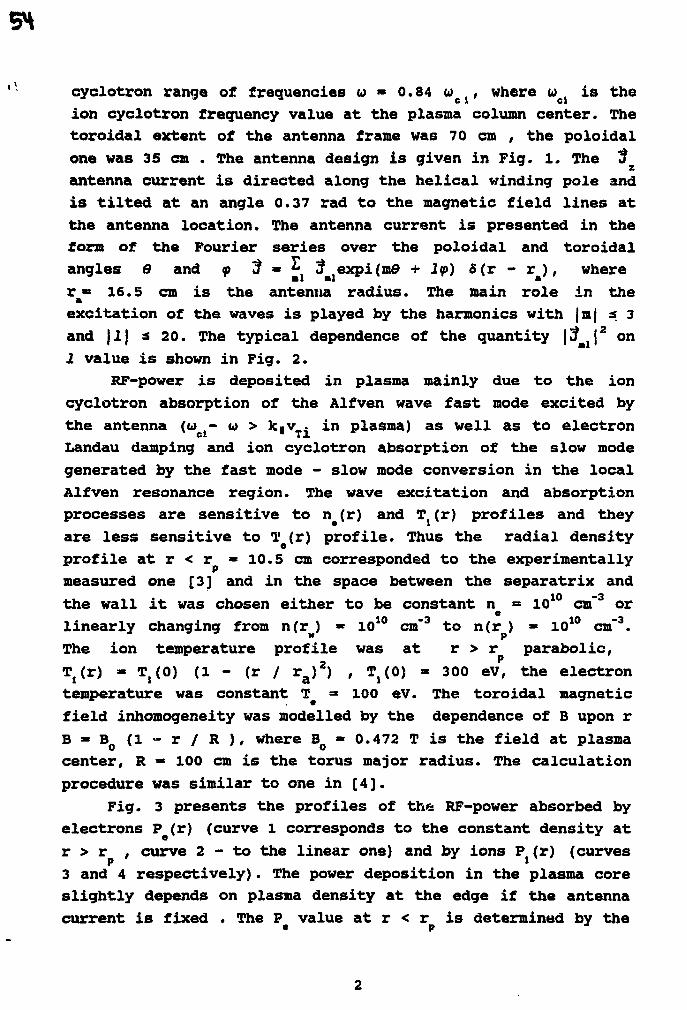
cyclotron range of frequencies u> » 0.84 ucl, where ucl is the
ion cyclotron frequency value at the plasma column center. The
toroidal extent of the antenna frame was 70 cm , the poloidal
one was 35 cm . The antenna design is given in Fig. 1. The 3
antenna current is directed along the helical winding pole and
is tilted at an angle 0.37 rad to the magnetic field lines at
the antenna location. The antenna current is presented in the
form of the Fourier series over the poloidal and toroidal
angles 0 and <p 5 » ^ d^expi^e + l<p) 5(r - r^), where
r « 16.5 cm is the antenna radius. The main role in the
excitation of the waves is played by the harmonics with |m| a 3
and \1\ s 20. The typical dependence of the quantity \$ml\z on
J value is shown in Fig. 2.
RF-power is deposited in plasma mainly due to the ion
cyclotron absorption of the Alfven wave fast mode excited by
the antenna («cl- <•> > kiv
Ti *n plasma) as well as to electron
Landau damping and ion cyclotron absorption of the slow mode
generated by the fast mode - slow mode conversion in the local
Alfven resonance region. The wave excitation and absorption
processes are sensitive to ne(r) and T}(r) profiles and they
are less sensitive to l'a(r) profile. Thus the radial density
profile at r < r = 10.5 cm corresponded to the experimentally
measured one [3] and in the space between the separatrix and
the wall it was chosen either to be constant n = 1010 cm'3 or
linearly changing from n(r ) « 1010 cm"3 to n(r ) •» 1010 cm"3.
The ion temperature profile was at r > r parabolic,
T,(r) » ^(0) (l - (r / ra)2) , T^O) - 300 eV, the electron
temperature was constant T « 100 eV. The toroidal magnetic
field inhomogeneity was modelled by the dependence of B upon r
B - BQ (1 - r / R ), where BQ - 0.472 T is the field at plasma
center, R « 100 cm is the torus major radius. The calculation
procedure was similar to one in [4].
Fig. 3 presents the profiles of tha RF-power absorbed by
electrons P (r) (curve 1 corresponds to the constant density at
r > r , curve 2 - to the linear one) and by ions P. (r) (curvesp »
3 and 4 respectively). The power deposition in the plasma core
slightly depends on plasma density at the edge if the antenna
current is fixed . The P value at r < r is determined by the
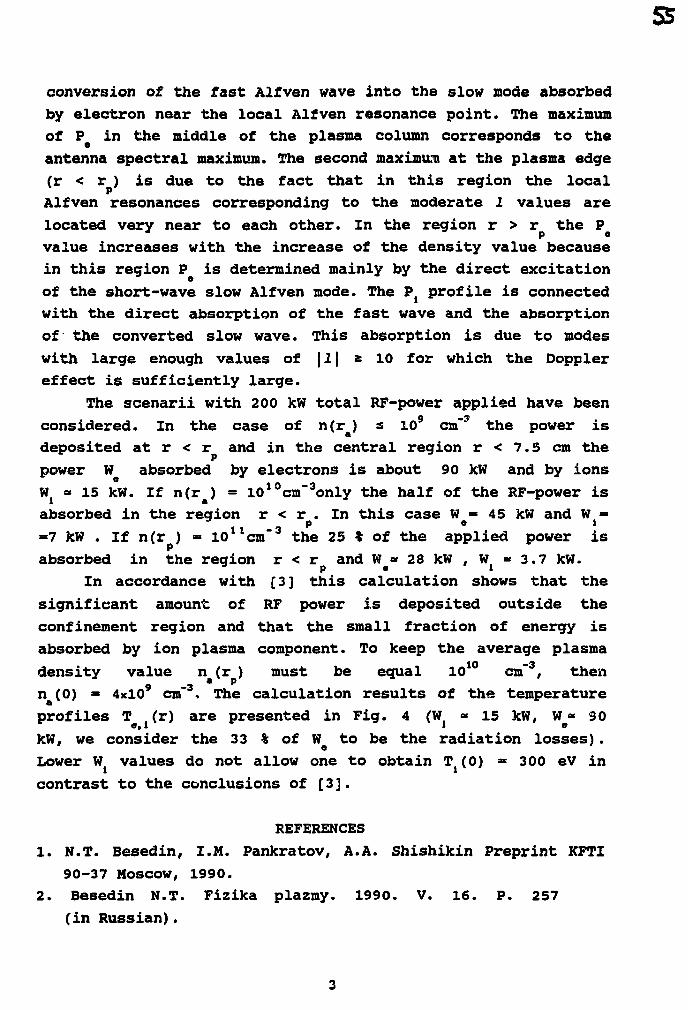
55
conversion of the fast Alfven wave into the slow mode absorbed
by electron near the local Alfven resonance point. The maximum
of P in the middle of the plasma column corresponds to the
antenna spectral maximum. The second maximum at the plasma edge
(r < r ) is due to the fact that in this region the local
Alfven resonances corresponding to the moderate 1 values are
located very near to each other. In the region r > r the Povalue increases with the increase of the density value because
in this region P is determined mainly by the direct excitation
of the short-wave slow Alfven mode. The P( profile is connected
with the direct absorption of the fast wave and the absorption
of the converted slow wave. This absorption is due to modes
with large enough values of \1\ * 10 for which the Doppler
effect is sufficiently large.
The scenarii with 200 kW total RF-power applied have been
considered. In the case of n(r ) s io9 cm~? the power is
deposited at r < r and in the central region r < 7.5 cm the
power W absorbed by electrons is about 90 kW and by ions
Vi » 15 kW. If n(ra) = 1010cm"3only the half of the RF-power is
absorbed in the region r < r . In this case W = 45 kW and W =3 p e l
=7 kW . If n(r ) = lO^cm"3 the 25 % of the applied power is
absorbed in the region r < r and W <* 28 kW , W} « 3.7 kW.
In accordance with [3] this calculation shows that the
significant amount of RF power is deposited outside the
confinement region and that the small fraction of energy is
absorbed by ion plasma component. To keep the average plasma
density value n (r ) must be equal 1010 cm"3, then
n (0) * 4xlO9 cm'3. The calculation results of the temperature
profiles T (r) are presented in Fig. 4 (W « 15 kW, W« 90
kW, we consider the 33 % of W to be the radiation losses).
Lower W values do not allow one to obtain T (0) • 300 eV in
contrast to the conclusions of [3].
REFERENCES
1. N.T. Besedin, I.M. Pankratov, A.A. Shishikin Preprint KFTI
90-37 Moscow, 1990.
2. Besedin N.T. Fizika plazmy. 1990. V. 16. P. 257
(in Russian).
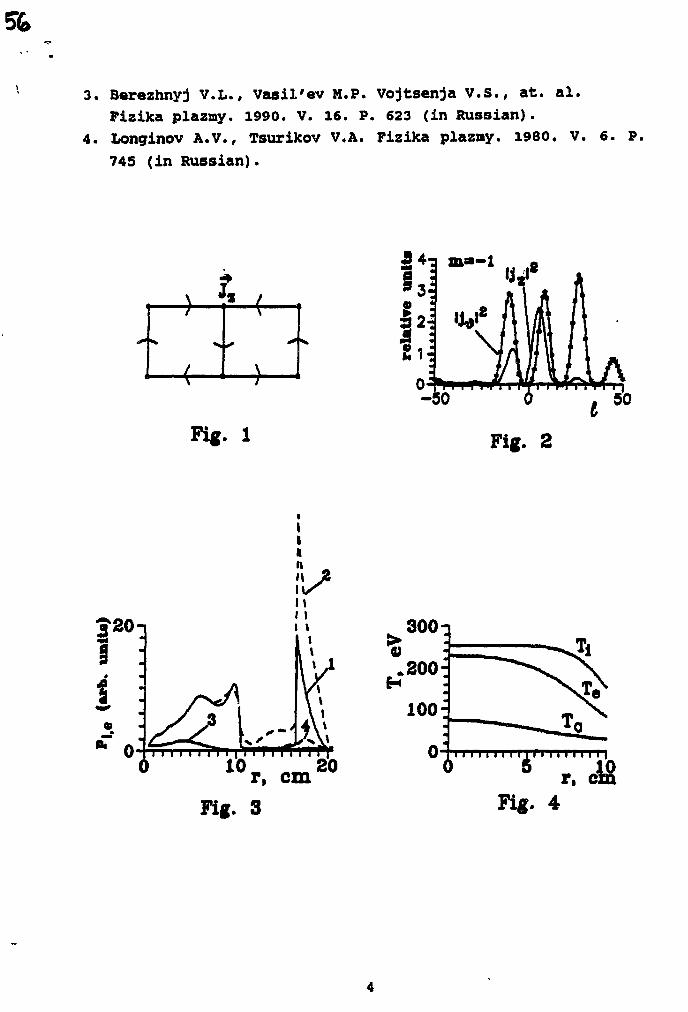
3. B«rezhnyj V.L., Vasil'ev M.P. Vojtsenja V.S., at. al.
Pizika plazxny. 1990. V. 16. P. 623 (in Russian).
4. Longinov A.V., Tsurikov V.A. Fizika plazray. 1980. V. 6. p.
745 (in Russian).
Fig. 1-50
Fig. 2
10r. c m 2 0
Fig. 3
3001
r, clFig. 4
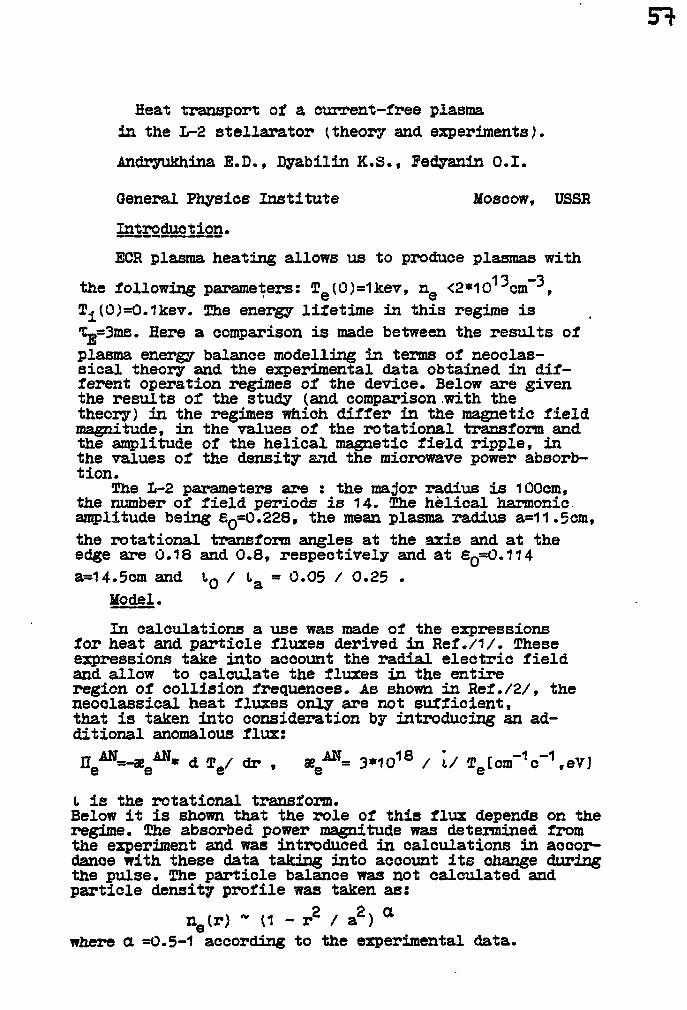
Heat transport of a overrent-free plasmain the 1-2 stellarator (theory and experiments).
Andryukhina E.D., Dyabilin K.S., Fedyanin O.I.
General Physics Institute Moscow, USSR
Introduction.
ECR plasma heating allows us to produce plasmas with
the following parameters: Te(0)=1kev, n g <2*101^cm ,
T^(0)=0.1kev. The energy lifetime in this regime isTg=3ms. Here a comparison is made between the results ofplasma energy balance modelling in terms of neoclas-sical theory and the experimental data obtained in dif-ferent operation regimes of the device. Below are giventhe results of the study (and comparison with thetheory) in the regimes which differ in the magnetic fieldmagnitude, in the values of the rotational transform andthe amplitude of the helical magnetic field ripple, inthe values of the density and the microwave power absorb-tion.
The L-2 parameters are : the major radius is 100cm,the number of field periods is 14. The helical harmonicamplitude being sQ=0.228, the mean plasma radius a=11.5cm,the rotational transform angles at the axis and at theedge are 0.18 and 0.8, respectively and at SQ=0.114a=14.5cm and lQ / l& = 0.05 / 0.25 -
Model.
In calculations a use was made of the expressionsfor heat and particle fluxes derived in Ref./1/. Theseexpressions take into account the radial electric fieldand allow to calculate the fluxes in the entireregion of collision frequences. As shown in Ref./2/, theneoclassical heat fluxes only are not sufficient,that is taken into consideration by introducing an ad-ditional anomalous flux:
n —a. d TJ dr , a / * - 3*1O18 / i / TA[cm"1c"1 ,eVJ
I is the rotational transform.Below it is shown that the role of this flux depends on theregime. The absorbed power magnitude was determined fromthe experiment and was introduced in calculations in aocor-dance with these data taking into account its change duringthe pulse. The particle balance was not calculated andparticle density profile was taken as:
netf0 - (1 - r2 / a2) a
where a =0.5-1 according to the experimental data.
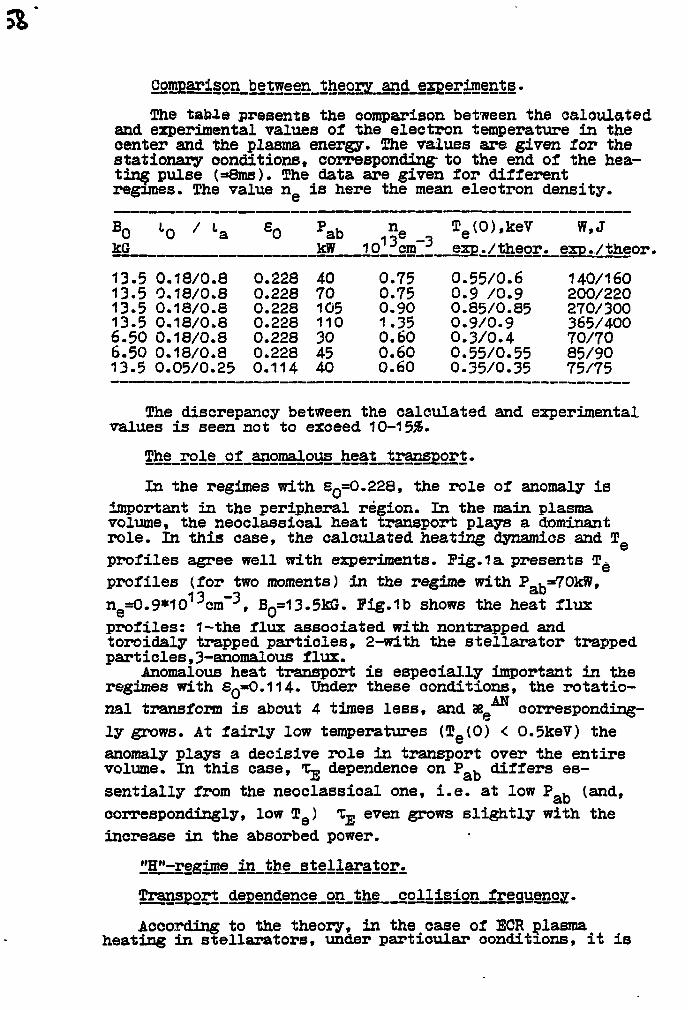
S2!SE§rison_be t g
The table presents the comparison between the calculatedand experimental values of the electron temperature in thecenter and the plasma energy. The values are given lor thestationary conditions, corresponding- to the end of the hea-ting pulse (=8ms). The data are given for differentregimes. The value n_ is here the mean electron density.
6
BokG
13.513.513.513.56.506.5013.5
t0 / ta
0.18/0.80.18/0.80.18/0.80.18/0.80.18/0.80.18/0.80.05/0.25
S0
0.2280.2280.2280.2280.2280.2280.114
Pablew
4070105110304540
ne10 3cm
0.750.750.901.350.600.600.60
Te(0),keV
exp./theor.
0.55/0.60.9 /0.90.85/0.850.9/0.90.3/0.40.55/0.550.35/0.35
W,Jexp./theor
140/160200/220270/300365/40070/7085/9075/75
The discrepancy between the calculated and experimentalvalues is seen not to exceed 10-15$.
The_role_of_anoraalous_heat_transgort.
In the regimes with SQ=0.228, the role of anomaly is
important in the peripheral region. In the main plasmavolume, the neoclassical heat transport plays a dominantrole. In this case, the calculated heating dynamics and T_
profiles agree well with experiments. Pig. 1a presents Tg
profiles (for two moments) in the regime with Pat=70kW,
ne=O.9*1O13cm"3, B0=13.5kG. Pig. 1b shows the heat flux
profiles: 1-the flux associated with nontrapped andtoroidaly trapped particles, 2-with the stellarator trappedparticles,3-anomalous flux.
Anomalous heat transport is especially important in theregimes with £Q=0.114. Under these conditions, the rotatio-
nal transform is about 4 times less, and se.AN oorresponding-
0.5keV) thely grows. At fairly low temperatures (Tg(0)
anomaly plays a decisive role in transport over the entirevolume. In this case, T E dependence on Pab differs es-sentially from the neoclassical one, i.e. at low Pab (and,correspondingly* low TQ) T E even grows slightly with theincrease in the absorbed power.
the _Btellarator.
collision_freguency.
According to the theory, in the case of ECR plasmaheating in sxellarators, under particular conditions, it is
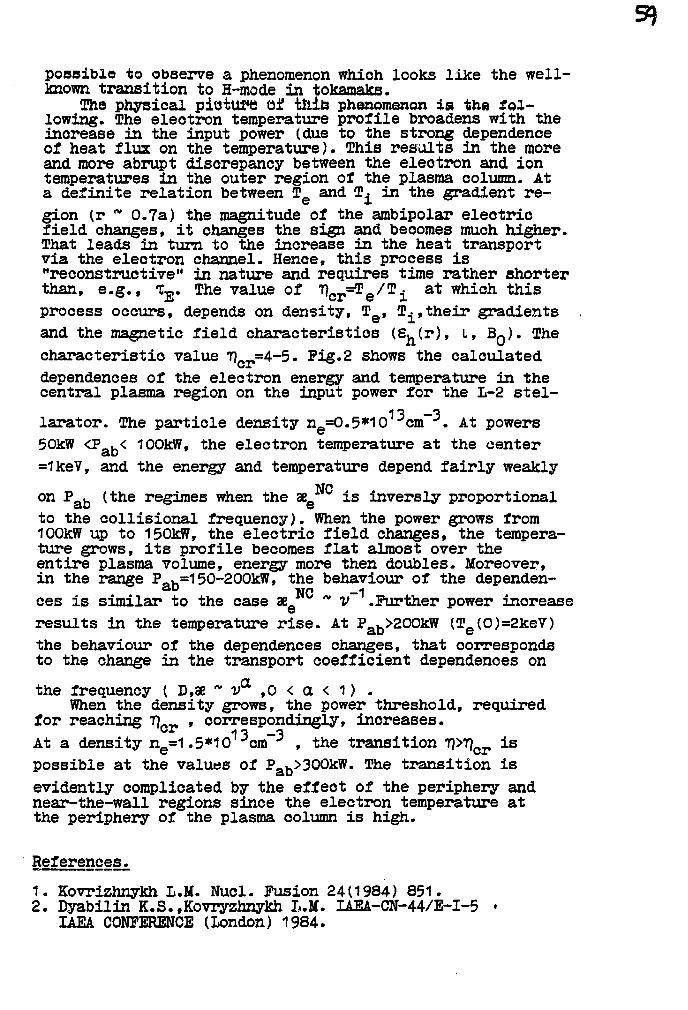
possible to observe a phenomenon which looks like the well-known transition to H-mode in tokamaks.
The physical piotui*e Of ttiib phenomenon is the fol-lowing. The electron temperature profile broadens with theincrease in the input power (due to the strong dependenceof heat flux on the temperature). This results in the moreand more abrupt discrepancy between the eleotron and iontemperatures in the outer region of the plasma column. Ata definite relation between T e and T i in the gradient re-gion (r ~ 0.7a) the magnitude of the ambipolar eleotricfield changes, it changes the sign and becomes much higher.That leads in turn to the increase in the heat transportvia the electron channel. Hence, this process is"reconstructive" in nature and requires time rather shorterthan, e.g., TJj,. The value of Tlcr
=Te/
!ri a-t which thisprocess occurs, depends on density, T e, T^,their gradientsand the magnetic field characteristics (S^r), L, B Q ) . Thecharacteristic value <nor
ss4-5. Fig.2 shows the calculateddependences of the electron energy and temperature in thecentral plasma region on the input power for the L-2 stel-
larator. The particle density n =0.5*10 ^cm •*. At powers50kW <Paw< 100kW, the electron temperature at the center=1keV, and the energy and temperature depend fairly weakly
NCon P a b (the regimes when the see is inversly proportionalto the collisional frequency). When the power grows from100kW up to 150kW, the electric field changes, the tempera-ture grows, its profile becomes flat almost over theentire plasma volume, energy more then doubles. Moreover,in the range P_K=150-200kW, the behaviour of the dependen-
NC —1
ces is similar to the case ae_ ~ v .Further power increaseresults in the temperature rise. At Pab>200kW (Te(0)=2keV)the behaviour of the dependences changes, that correspondsto the change in the transport coefficient dependences onthe frequency ( D,ae ~ va ,0 < a < 1) .
When the density grows, the power threshold, requiredfor reaching f]QV , correspondingly, increases.At a density n =1.5*i01^cm~^ , the transition T]>77__ ispossible at the values of Pab>300kW. The transition isevidently complicated by the effect of the periphery andnear-the-wall regions since the electron temperature atthe periphery of the plasma column is high.
References..
1. Kovrizhnykh L.M. Nucl. Fusion 24(1984) 851.2. Dyabilin K.S.,Kovryzhnykh L.M. IAEA-CN-44/E-I-5 •
IAEA CONFERENCE (London) 1984.
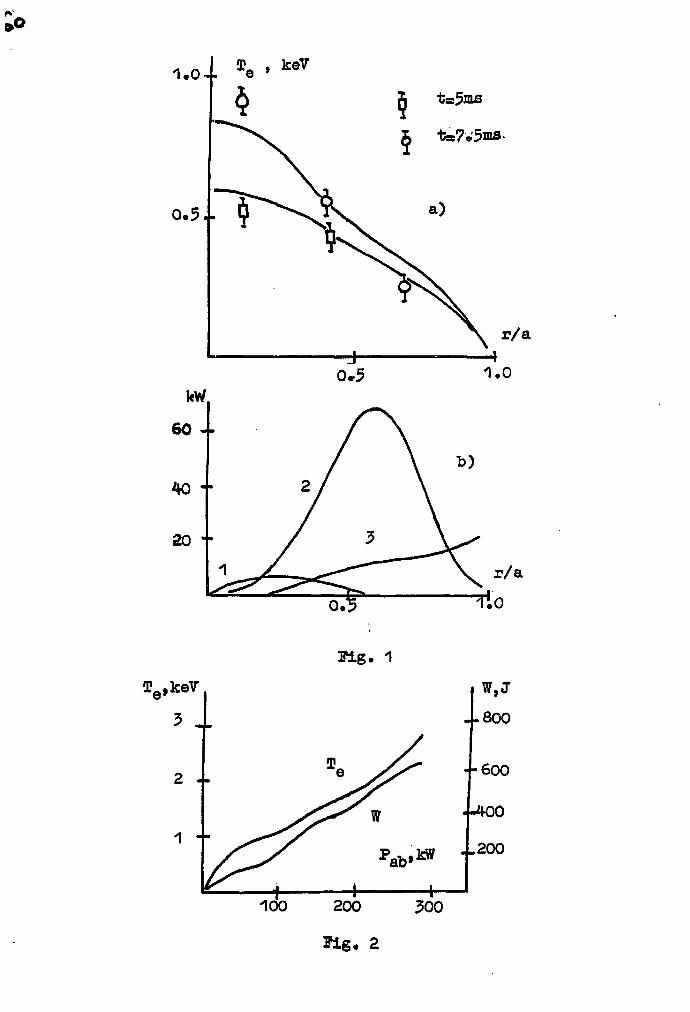
, keV
t=3ms
r/a
1.0
r/a
T.O
Big. 1
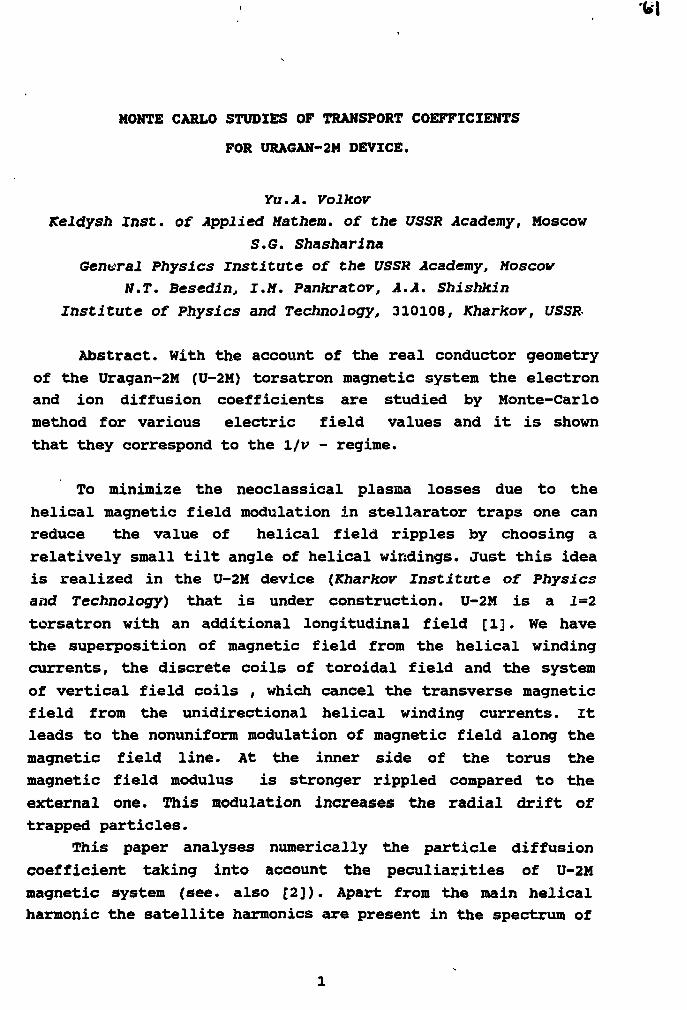
MONTE CARLO STUDIES OF TRANSPORT COEFFICIENTS
FOR URAGAN-2M DEVICE.
Vu.il. Volkov
Keldysh Inst. of Applied Mathem. of the USSR Academy, Moscow
S,G. Shasharina
General Physics Institute of the USSR Academy, Moscow
N.T. Besedin, I.M. Pankratov, A.A. Shishkin
Institute of Physics and Technology, 310108, Kharkov, USSR
Abstract. With the account of the real conductor geometry
of the Uragan-2M (U-2M) torsatron magnetic system the electron
and ion diffusion coefficients are studied by Monte-Carlo
method for various electric field values and it is shown
that they correspond to the l/v - regime.
To minimize the neoclassical plasma losses due to the
helical magnetic field modulation in stellarator traps one can
reduce the value of helical field ripples by choosing a
relatively small tilt angle of helical windings. Just this idea
is realized in the U-2M device (Kharkov Institute of Physics
and Technology) that is under construction. U-2M is a 2=2
torsatron with an additional longitudinal field [1]. We have
the superposition of magnetic field from the helical winding
currents, the discrete coils of toroidal field and the system
of vertical field coils , which cancel the transverse magnetic
field from the unidirectional helical winding currents. It
leads to the nonuniform modulation of magnetic field along the
magnetic field line. At the inner side of the torus the
magnetic field modulus is stronger rippled compared to the
external one. This modulation increases the radial drift of
trapped particles.
This paper analyses numerically the particle diffusion
coefficient taking into account the peculiarities of U-2M
magnetic system (see. also [2]). Apart from the main helical
harmonic the satellite harmonics are present in the spectrum of
1 1
8
10 "*10 -1
ELECTRONSS D
6 ?
O - cU/T=2A - eU/T=0.1D - eU/T=l
i r T
10 10 3
10 1
1 -
io -1
10
IONS
- i
0 °o * 90 8
O - eU/T=SA - eU/T=0.1a - eU/T=l
I I I i l I i l l 1
10
Fig. 1
10 10 3
l . p
magnetic field harmonics. The magnetic field modulus is put in
the form
B/B = l- etcose + jZ cj (r) cos(ie + 4p?>),
where r is the mean radius of the magnetic surfaces. The
harmonic amplitudes ch (r) are calculated with the account of
the real geometry of helical winding. The coil currents
correspond to the Standard Case [3] (K = 0.375, <Bj_>/B = 2.4%).
Apart from the external magnetic field there is the electric
field in a plasma. The electric potential is assumed to be
constant on the magnetic surface
U(r)= Uo(l - r2/a2).
The main parameters are the particle energy, E = 0.5 keV,
the rotational transform i = 0.63, the major radius of the
torus R = 170 cm. The diffusion coefficient is calculated near
the magnetic surface with the averaged radius 10 cm. In the
present case the averaged radius of a closed magnetic surface
which is nested inside the 4/6 islands is 18 cm. Two series of
calculations are made. In the first case (Fig. 1) in the sum
over l,p we retain elements with p = 1, 1 = 0, 1, 2, 3. Three
vaiues of the electric potential eU /T =0.1, 1, 2 were taken.
In the second case (Fig. 2) in addition to the series p = 1 the
next harmonics p = 0 and 1 = 2 , p = 2 and 1 = 3 , p = 4 and 1 =0
were taken into account for the electric potential eU /T = 1.
The ion transport coefficients take the form typical for
l/v - regime and in the rear collision region they strongly
depend on the electric field. The electron diffusion
coefficients slightly depend on the electric field and their
dependence on the vf& parameter is typical for l/v - regime.
In the second case the diffusion coefficients are larger
than in the first one, what is caused by the additional
modulation of the magnetic field modulus along the magnetic
field line.
REFERENCES
1 Besedin N.T., Bykov V.E., Carreras B.A. et.al. Extended
synopses of 13 Intern. Conf. on Plasma Phys. and Control. Nucl.
Fus. Res., Washington, Report C-4-6-2-(C), 1990, p. 129-130.
2. Beidler C., Kisslinger J., Wobig H. Stellarator Theory
Workship, Kharkov, November, 1990.
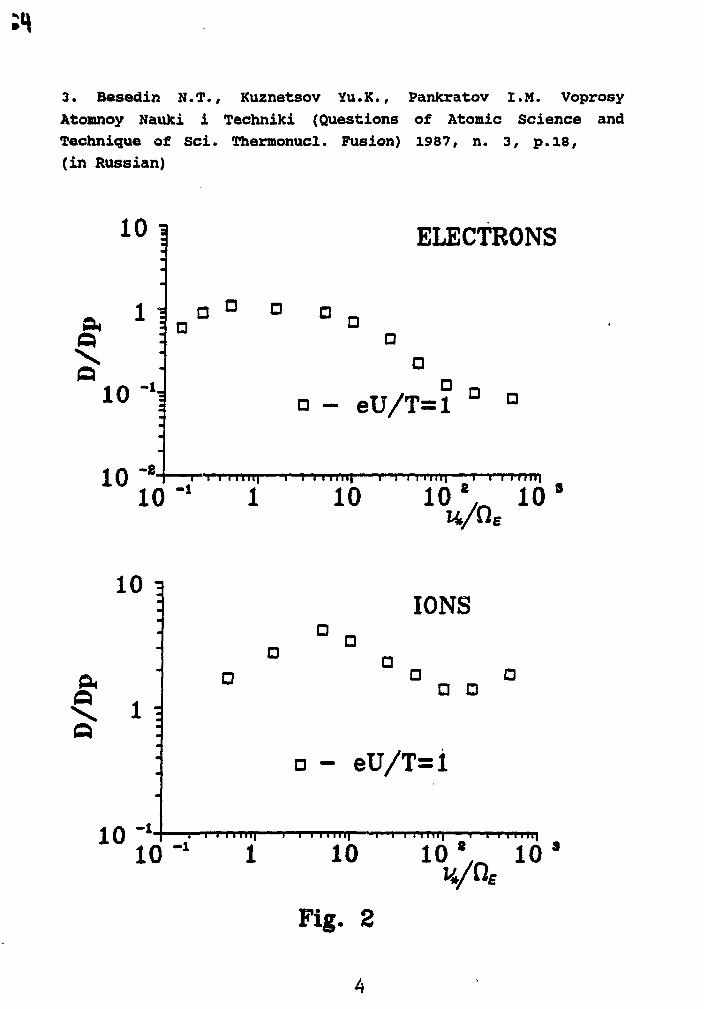
3. Besedin N.T., Kuznetsov Yu.K., Pankratov I.M. Voprosy
Atomnoy Nauki i Techniki (Questions of Atomic Science and
Technique of Sci. Thermonucl. Fusion) 1987, n. 3, p. 18,
(in Russian)
10 i
1 ]
10
10
- 1 .
-8 .
ELECTRONS
• - e U / T = l
10 -1 1 10 10 " 10
10 i
10 - i .
IONS
a aa a
D - eU/T=l
10 -1 1 10 10 * 10
Fig. 2
fob
SPtCRICAL HARMONICS rETHOD FOR CALCULATINGNEOCLASSICAL TRANSPORT COEFFICIENTS.
Yu.A. VolkouKetdysk tnst. of Appl. Mathem. of USSR Academy, Moscow
To calculate neoclassical fluxes across magnetic surfacesit is necessary to solve drift kinetic equation for thegyro tropic portion of the distribution function fj$,9,f,v,ti) ofparticles of species (a). Linearizing ffl about a Maxwell ian* W f o r *^e thermal species yields the following equation forthe first order distribution fa]
b
Here, n=B/B is the unit vector along the magnetic field, u isthe parallel component of velocity, v^ is the drift velocity ofspecies (a), function ftr,9,0) describes the magnetic surfaces,Cgf, is the linearized Coulomb collision operator, Qa is theenergy source term. Let suppose as usual
a V 3 * - '* 1 4 J*k • f . r f - . I <JJk k , b
where Jj are the thermodynam'c forces due to radial pressure andtemperature gradients and electric field potential gradient.Coefficients hjb connect these forces with the first orderdistribution. They obey following equations (see also [2])
- 1b
Further simplification of equations is possible ifrotational symmetry of the collision integral is used. Thecollision operator commutes with the group of rotations actionTAb=CabTe* w h e r e 8 ^ a rotation matrix, the group action isdetermined as T^ffg^v). This yields (indices a,b,k, areomitted) [3]
Here spherical coordinates v=(vsin/3cosa,vsinj3sina,veos£) of
e&
point are introduced, Y. are spherical harmonics, P. areLegendre polynomials. Operators CJ are one-dimensional operatorsdepending only on variable v. Note that Cj are independent onindex m. In our case operators are defined as follows (see also
Here, v^ are characteristic frequencies of a-b collisions, v b
is the thermal velocity of species (a), (b). G is Chandrasekharfunction
1 dt.
4 L2(2j+l)(2j+3)
dw,
oWe may transform left side of origin equations from
differential to algebraic form using Fourier expansion. Takinginto account that both the field on the magnetic surface anddrift velocity usually may be written in terms of the double
Fourier series
pq pq M
it is natural to present the function hjj6 in terms of expansion
M) = I I (hf^We***^). A = u/v (1)pq J
-a - lSuppose that the magnetic surfaces cross sections have a formclose to a circular one. Noting drift velocity componentsv ^ v ^ v ^ we have following equations
j u ffh*— <vrf + ueo) 5 ^ + I T IT =
Here, r, R are minor and major radii of the torus, respectively,parameter GQ characterizes poloidal magnetic field.
Substituting expansion (1) into (2) and integrating (2)with a weight p^r^*^ yields algebraic system
Jpq
i<j-l11pue/r * qu/R| jj> h« l p q = (3)
b
where Og is the electric drift frequency. Matrix elements aredefined as follows
<l1PIq1l|FMJpq> = JJ<Wd J d A e - ^ ^ P ^ F e ^ i 8 * ' ! ^ (X).-n - i J
Vector M' and transition matrix T" are defined by the radialJpq
Xdrift velocity and poloidal drift velocity, respectively
Just these values contain dependence on angular variables. Ifthe magnetic field magnitude has relatively simple form, forexample
B = BQ[1 - e.cos9 - 2, fij—^osf/fil-m^)]lm
they may be calculated analytically.Transport matrix elements averaging on the magnetic surface
can be written as follows
it 1 «
pq j - * -1 0 n j p q
It is easy to see that the matrix T* mixes harmonics h.so algebraic system is unsolvable in explicit form. This systemmay be solved numerycally.
REFERENCES
Hinton F.L, Hazeltine R.D., Rev. Mod. Phys.,42t (1978),p. 239.[21 Hirshman S.P., Sigmar D.J., Nucl. Fusion, 21, (1981),p. 1079.PI Vedenyapin V.V., Preprint Ins. Appl. Mat hem., 1981, N2 59.[4J Hirshman S.P., Sigmar D.J., Phys. Fluids, 19, (1976),p. 1532.
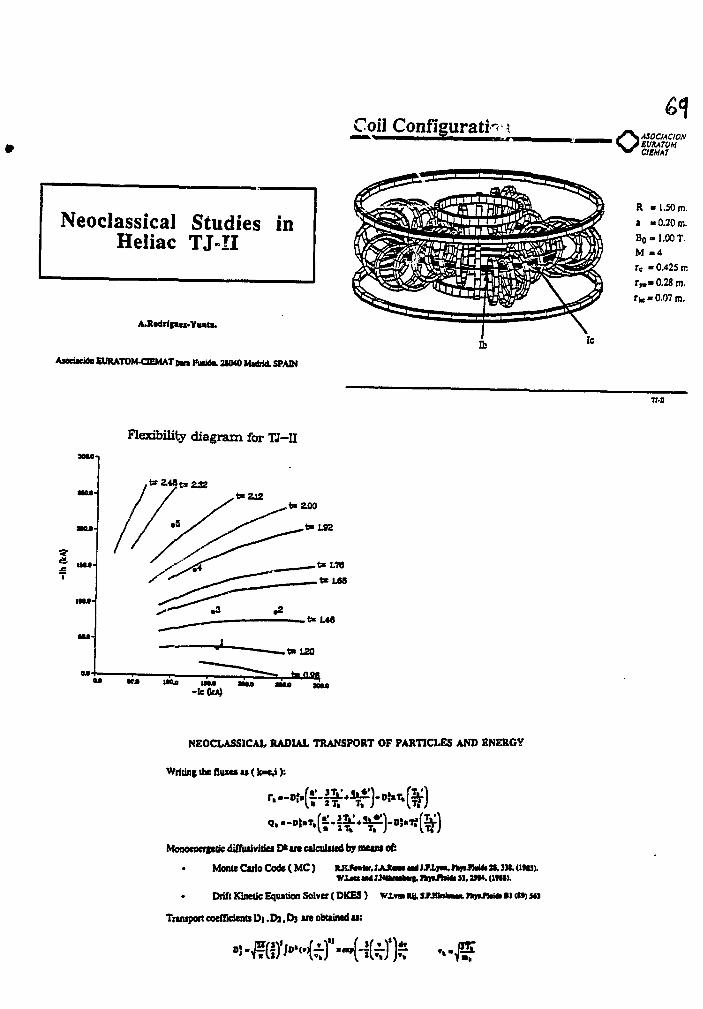
Coil Configurate
Neoclassical Studies inHeliac TJ II
AJtedrifltx-YiMU.
Anciicite EURATOM-OEMAT D n FtMite. 21040 Midrid SPAIN
oASOCIACIONEVXATOMC1EMM
R »1.50 m.
1 - 0.20 m.
Bo » LOOT.
M - 4
rc -0 .425 m
r w » 0.28 m.
r te • 0.07 m.
Flexibility diagram for TI-II
-IcOcA)
NEOCLASSICAL RADIAL TRANSPORT OF PARTICLES AND ENERGY
Writing ite fluxes u ( k - e 4 ) :
Moooeneri«ic <Siffiuivitief D* tit ealcuUtcd by muni of:
• Monte Cirio Code ( M C )WXHC mi JJWkmtait. IkytJtaMt 31.2H4. OfH).
• Drift Kinetic Equation Solver (DKES)
Transport coefficients Dj .Dj .Dj are obtained u :
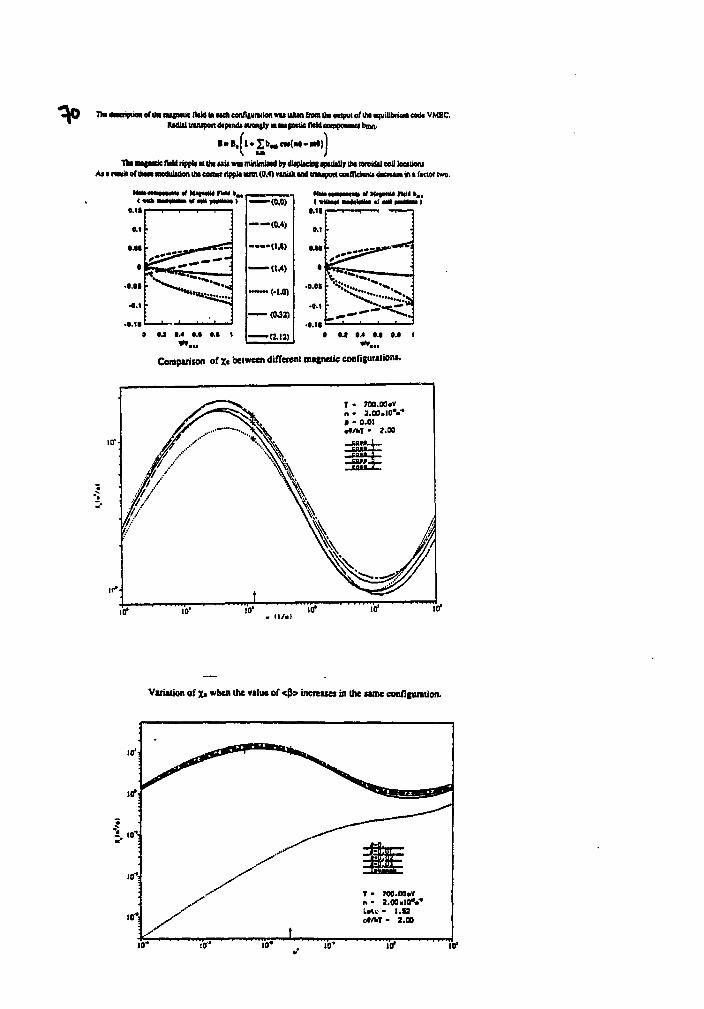
Va imcrfum *t Un migmuc IkU i* wch confl|tin<ion wu ukM Inn Da wqwi of Uw iquUibriiim oodt VMEC.MdUl tnnipon dtpradt «nii|ly in oupnic fW4 napoiiMa bna.
»"».[»*Z»- «•(••—•))
Compviion of x< between different matnetie conflguruioni.
10'-
0*
Vvialion of X« when the vilue of <(!> increues in the HUM conTifuntion.
10"
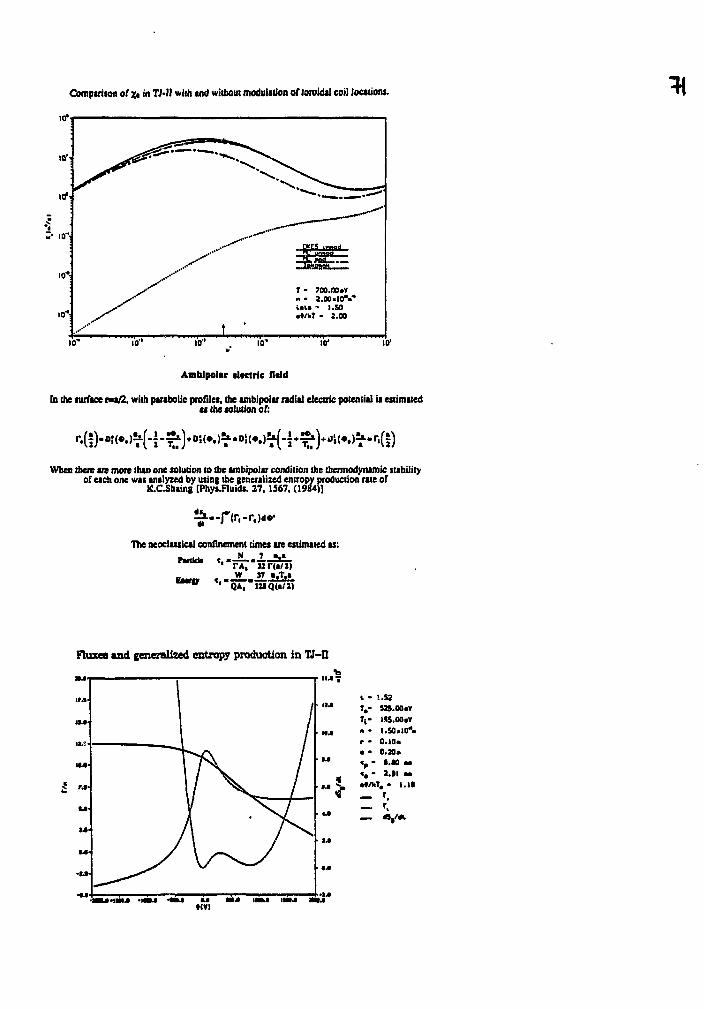
Comparison of Xt in TMI with and without modulilion of toroidal coil locations.
Amblpolar electric fleld
In the nirface r»a/2, with parabolic profiles, the ambipolar ndial electric potential U estimatedit the solution of:
When there are more ihan one solution to the ambipoUr condition the ihennodynatnic subilityof each one was analyzed by using the generalized entropy production rate of
K.CShaing [Phys.Fluids. 27. 1567. (1984)]
!£.-f'(r,-r,)d»-
The neoclassical confinement times are estinuied as:
W 3T • ,T,«• * • ^"QAr-Jife
Fluxes and generalized entropy production in TJ-ll
1.53
•IVI
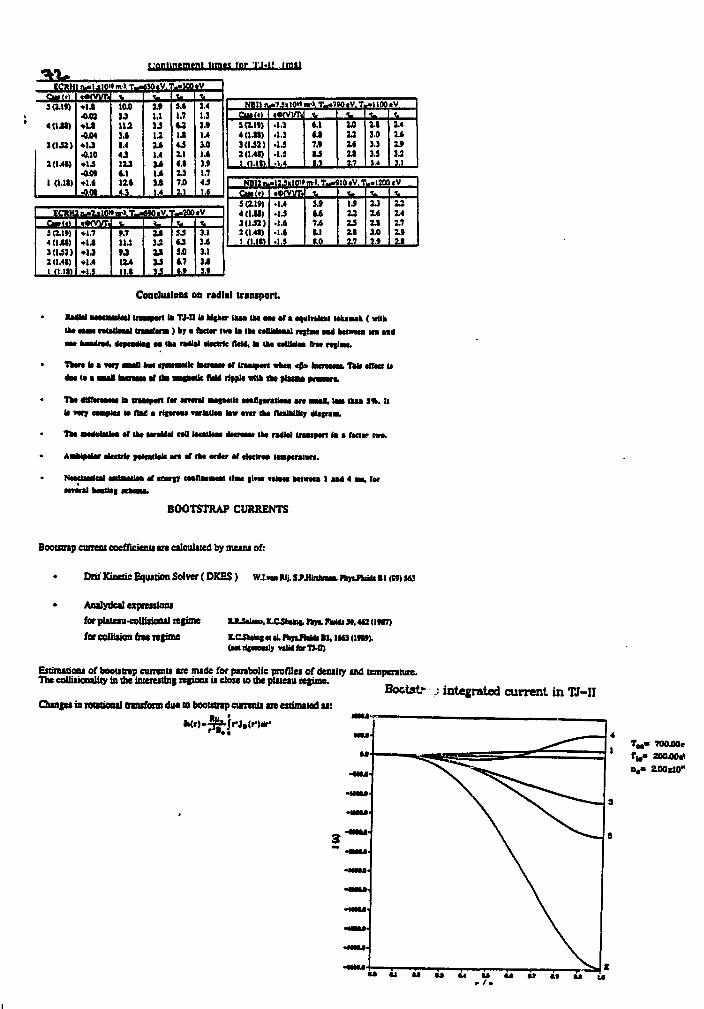
• n n l i n t m m t n m « for I I . I? ( m i l
9(119)
4(141)
KIJ2)
20.41)
1 (1.11)
*4MWT«
•oxa• I J•CM• I J4.10• I J
•IJ4.0t
10J)M>UIJ1.44Jin4.111*4.1
If1.113U1.4
UIJ| 4
a'W?S.I1.7121.14J11
117.011
•V
1.41.1
1.41.0
1.91.74.51.6
3(119)4 0.lt)10^2)20.41)1 (1.11)
«4KWTi•1.7• I J• I J•1.4
11.1M11411.1
uMUuIJ
rY*)
$J
•Vt .
3.1
1.1IJ3.9
saw)4(1.11)3(U2)2(1.41)1 (l.lti
«4XVVTi•1.1•1.1•IJ•1.9.1.4
t.6.1
7.9•J1.3
u121117
111.03.13.93.4
t.2.42.62.93.23.1
NB12wi
Ctlf (*)9 (119)
1 (1.32 )2(141)1 (l.ll>
»t5Jil0i»nr).T_-•4>{yvi»•1.4
•1.6•1.6•1.5
5.9tJt1J61.11.0
io*v.ii^
1.91215It17
...IJOOtV•
13161 13.01 9
^12141719It
Coacluiioot on radial transport
Mt la TJ.n li kbjktr fkaa DM *** *f a M^lnkal itkiuk ( wilkIk* M M ntatlnal Matfana) k)t a (KMT IW» la Ik* cdlWaaal rttlaw aaa ktfwn In aad• M kaaO»t, ««pw<laj w Ik* radial atocMc IbM, «i Ik* nUlttoa Urn rtfta*.
Ttet l i t « * 7 avail kal (fMtaalk Imam- *r tnuo«rt wkta «0> liirwMW. Tata tffKt to* » m —an lamaw »f tta —pule tWM ri»l» wtik tta>to»»a piaaiaia.
Tk* dtlTimaiM la traaaawt far amral aun«tlt cwniarailHi an nuO, laa Oaa J * . Itla nrjr caaptu M l U i rictrtu varlatlaa law anr Ik* fltxlkUU; diatraaL
Tk* •*dalallaa *T Ik* taraldal nfl Uctllut durtaii Ik* radial tnmtpm la a faclar nn.
*«>lp»l«r akcuk aWtalUa an «T Ik* *rd*r *t dMlrca Kapwaiar*.
I *«lwtlM *f <aotT M U H M I Ha* |lnt rahtu kHmn I aad 4 IM, tarancrai fcaiiiai ark—i,
BOOTSTRAP CURRENTS
Booump cmrent eoefTicicnu i n calculated by means of:
Dni Kinetic Equation Solver (DKBS) WJ.M. RIJ. srsemnm. rhytAiiA II (») 563
Analytical expressions
for plateau-collisiooal regime
for collision free regime K.CSktki|« aL ItyinaMt II , 1663 <!»»).(aaniiMouly wMforTJ-D)
EstimaD'oas of bootstrap currenu are made for parabolic profiles of density and temperature.The <*"n'T'f sliiy i s the interesting regions is close to the plateau regime.
Bootstr ; integrated current in TJ-IIChanges in roabooal mnsform du« to bootsmp currenu are estimated as:
T M - 70000*T t o> ZOOM*
n , - £00x10-
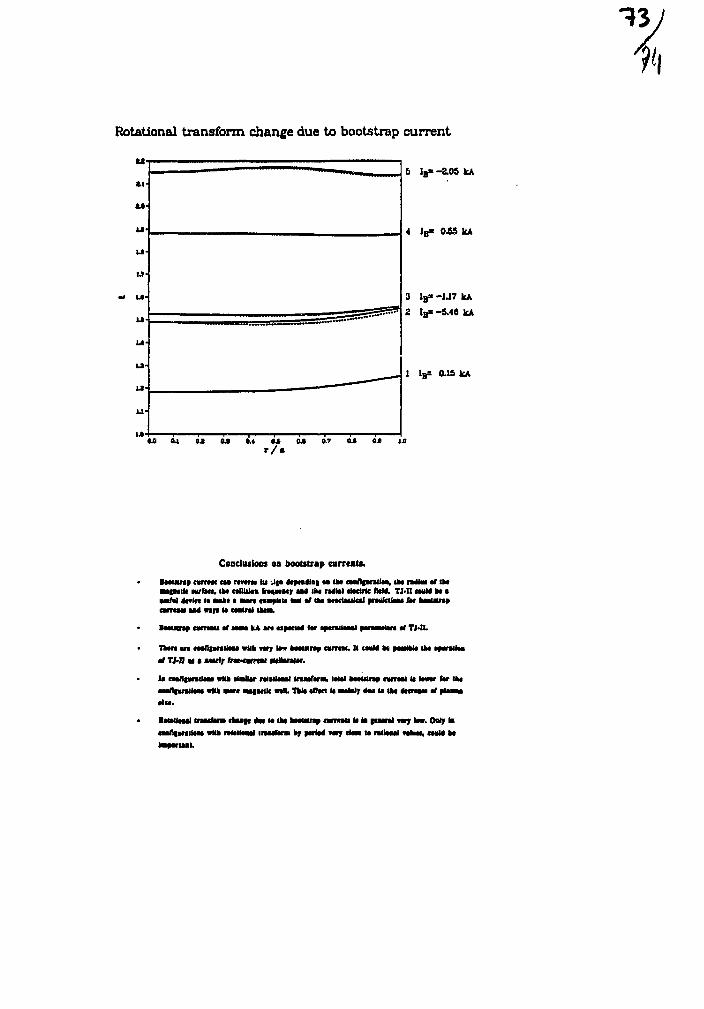
Rotational transform change due to bootstrap current
S IB» -&05 kA
4 IB» 0.55 kA
3 IB= -1.17 kA
2 IB* -5.40 kA
1 IB= 0.15 kA
Conclusions on bootstrap currents.
•aautna cwnat caa r t r tm lu -Jra 4tata4la| aa laa caaflfaratiaa, Ika nMm tl ika• a m i l t Mtffan, lat callblak (ra^aiatjr «a4 lat radial alaMfk IkM. TJ-n cavM at aHtftil *«tkt la Mat a Mart nawMt MM af laa andaukal arwilfilaai U» aaauuaaOman tMi waft I* caattal laoa.
laauuty camau tt aaaH kA an aipatiat far aairailml paraaiNm af TJ-n.
Tktn an na(I|iinUHl wttk ntj too h—UMf cwrtM. II <wM •« miilli tlw aa«wllaa•r TMI at a Mart/ frawamt MttaraMr.
la caafliarailaaa «ttk alaUlar milltaal mmltrm, IMal kaautn* a m i It k m Ur Iktaaallffallaat wtta Ban au|a*lk wttt. n i l alhcl "> awUaJj tauih airrtm tf alinw•lu.
lawiaaal iraatttra ckaaft #•» M laa aaauuaa twntau It at icaanl T«T la*. Oaly la<aal)|imiiaat *Hk mallaaal inaafara kj aarM nrj data la mlaaal wlaai, caaM aalaiairmi
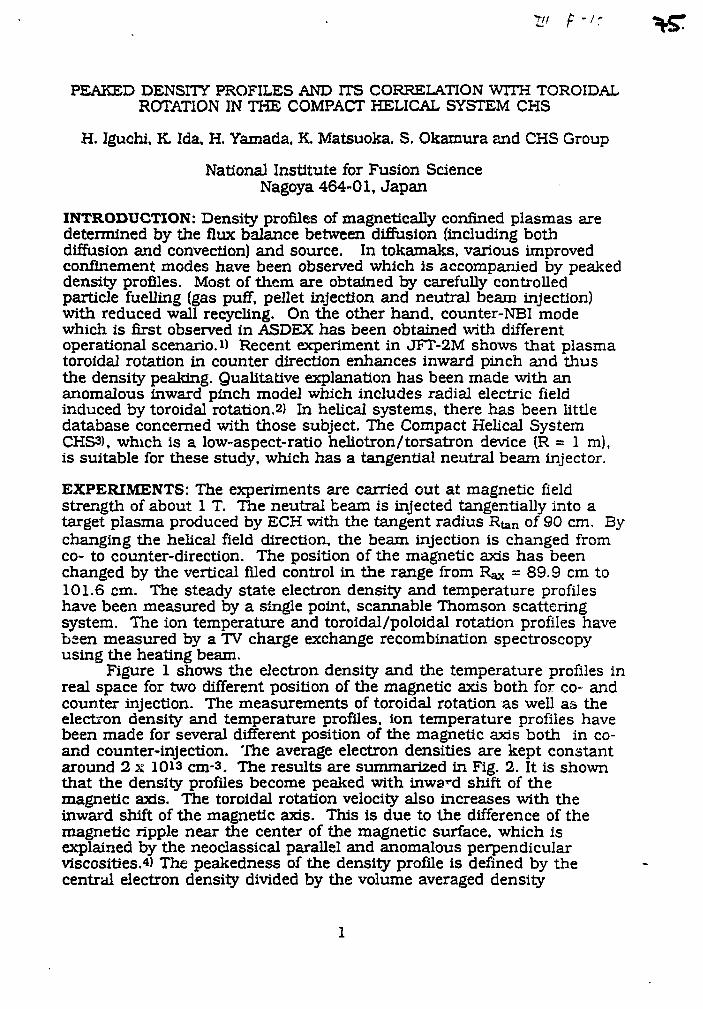
I"
PEAKED DENSITY PROFILES AND ITS CORRELATION WITH TOROIDALROTATION IN THE COMPACT HELICAL SYSTEM CHS
H. Iguchi, K Ida, H. Yamada, K. Matsuoka, S. Okamura and CHS Group
National Institute for Fusion ScienceNagoya 464-01, Japan
INTRODUCTION: Density profiles of magnetically confined plasmas aredetermined by the flux balance between diffusion (including bothdiffusion and convection) and source. In tokamaks, various improvedconfinement modes have been observed which is accompanied by peakeddensity profiles. Most of them are obtained by carefully controlledparticle fuelling (gas puff, pellet injection and neutral beam injection)with reduced wall recycling. On the other hand, counter-NBI modewhich is first observed in ASDEX has been obtained with differentoperational scenario.!) Recent experiment in JFT-2M shows that plasmatoroidal rotation in counter direction enhances inward pinch and thusthe density peaking. Qualitative explanation has been made with ananomalous inward pinch model which includes radial electric fieldinduced by toroidal rotation.2) In helical systems, there has been littledatabase concerned with those subject. The Compact Helical SystemCHS3), which is a low-aspect-ratio heliotron/torsatron device (R = 1 m),is suitable for these study, which has a tangential neutral beam injector.
EXPERIMENTS: The experiments are carried out at magnetic fieldstrength of about 1 T. The neutral beam is injected tangentially into atarget plasma produced by ECH with the tangent radius Rtan of 90 cm. Bychanging the helical field direction, the beam injection is changed fromco- to counter-direction. The position of the magnetic axis has beenchanged by the vertical filed control in the range from R^ = 89.9 cm to101.6 cm. The steady state electron density and temperature profileshave been measured by a single point, scannable Thomson scatteringsystem. The ion temperature and toroidal/poloidal rotation profiles havebsen measured by a TV charge exchange recombination spectroscopyusing the heating beam.
Figure 1 shows the electron density and the temperature profiles inreal space for two different position of the magnetic axis both for co- andcounter injection. The measurements of toroidal rotation as well as theelectron density and temperature profiles, ion temperature profiles havebeen made for several different position of the magnetic axis both in co-and counter-injection. The average electron densities are kept constantaround 2 x 10*3 cm-3. The results are summarized in Fig. 2. It is shownthat the density profiles become peaked with inward shift of themagnetic axis. The toroidal rotation velocity also increases with theinward shift of the magnetic axis. This is due to the difference of themagnetic ripple near the center of the magnetic surface, which isexplained by the neoclassical parallel and anomalous perpendicularviscosities.4) The peakedness of the density profile is defined by thecentral electron density divided by the volume averaged density
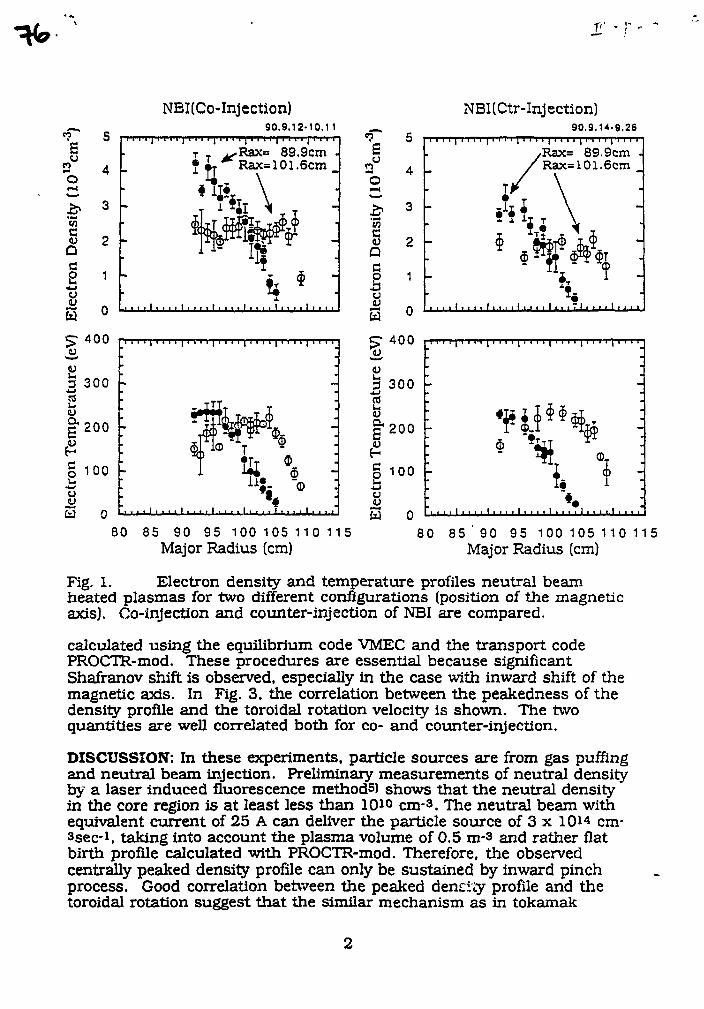
NBI(Co-Injection)90.9.12-10.11
89.9cmRax= 101.6cm
o
Q
oCJ
w
s
5
4
3
2
1
0
NBI(Ctr-Injection)90.9.14-9.26
:= 89.9cm101.6cm
£" 400
a5g<L>
a
300
200
100
uu
380 85 90 95 100 105 110 115Major Radius (cm)
8 0 8 5 ' 9 0 9 5 1 0 0 1 0 5 1 1 0 1 1 5
Major Radius (cm)
Fig. 1. Electron density and temperature profiles neutral beamheated plasmas for two different configurations (position of the magneticaxis). Co-injection and counter-injection of NBI are compared.
calculated using the equilibrium code VMEC and the transport codePROCTR-mod. These procedures are essential because significantShafranov shift is observed, especially in the case with inward shift of themagnetic axis. In Fig. 3, the correlation between the peakedness of thedensity profile and the toroidal rotation velocity is shown. The twoquantities are well correlated both for co- and counter-injection.
DISCUSSION: In these experiments, particle sources are from gas puffingand neutral beam injection. Preliminary measurements of neutral densityby a laser induced fluorescence methods) shows that the neutral densityin the core region is at least less than 10*0 cm-3. The neutral beam withequivalent current of 25 A can deliver the particle source of 3 x i on cm-3sec-i, taking into account the plasma volume of 0.5 m-3 and rather fiatbirth profile calculated with PROCTR-mod. Therefore, the observedcentrally peaked density profile can only be sustained by inward pinchprocess. Good correlation between the peaked dencriy profile and thetoroidal rotation suggest that the similar mechanism as in tokamak
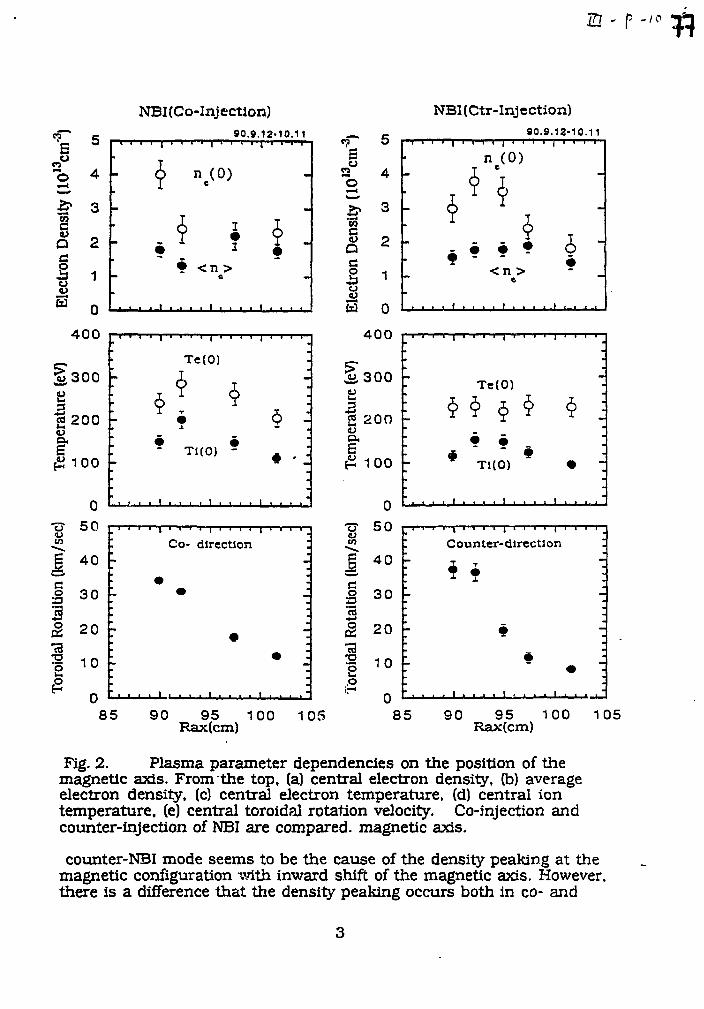
m - p -'
NBI(Co-Injection)90.9.12-10.11 _„
NBKCtr-Injection)90.9.12-10.11
90 95 100 105Rax(cm)
% 300K
2 200«J
E£ 100
n
: Te(0)
*• •
7 * TI (0) * j
85 90 95 100 105Rax(cm)
Fig. 2. Plasma parameter dependencies on the position of themagnetic axis. From the top, (a) central electron density, (b) averageelectron density, (c) central electron temperature, (d) central iontemperature, (e) central toroidal rotation velocity. Co-injection andcounter-injection of NBI are compared, magnetic axis.
counter-NBI mode seems to be the cause of the density peaking at themagnetic configuration with inward shift of the magnetic axis. However,there is a difference that the density peaking occurs both in co- and
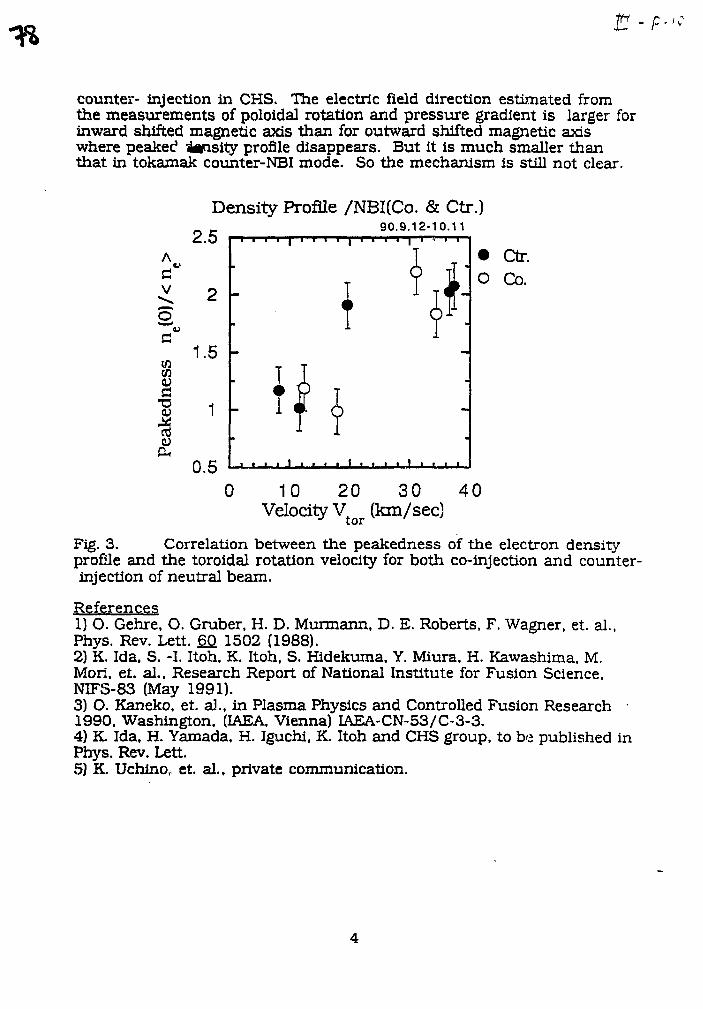
-F-
counter- injection in CHS. The electric field direction estimated fromthe measurements of poloidal rotation and pressure gradient is larger forinward shifted magnetic axis than for outward shifted magnetic axiswhere peakec? insi ty profile disappears. But it is much smaller thanthat in tokamak counter-NBI mode. So the mechanism is still not clear.
v
CO
81<uP
Density Profile /NBI(Co. & Ctr.)90.9 .12-10 .11
2.5
2 -
1.5 -
1 -
0.5
Ctr.Co.
0 10 20 30 40Velocity Vtor (km/sec)
Fig. 3. Correlation between the peakedness of the electron densityprofile and the toroidal rotation velocity for both co-injection and counter-injection of neutral beam.
References1) O. Genre, O. Gruber, H. D. Murmann, D. E. Roberts, F. Wagner, et. al.,Phys. Rev. Lett. 6£ 1502 (1988).2) K. Ida, S. -I. Itoh, K. Itoh, S. Hidekuma, Y. Miura, H. Kawashima. M.Mori, et. al.. Research Report of National Institute for Fusion Science,NIFS-83 (May 1991).3) O. Kaneko, et. al., in Plasma Physics and Controlled Fusion Research1990. Washington. (IAEA. Vienna) IAEA-CN-53/C-3-3.4) K. Ida, H. Yamada, H. Iguchi, K Itoh and CHS group, to be published inPhys. Rev. Lett.5) K Uchino, et. al., private communication.
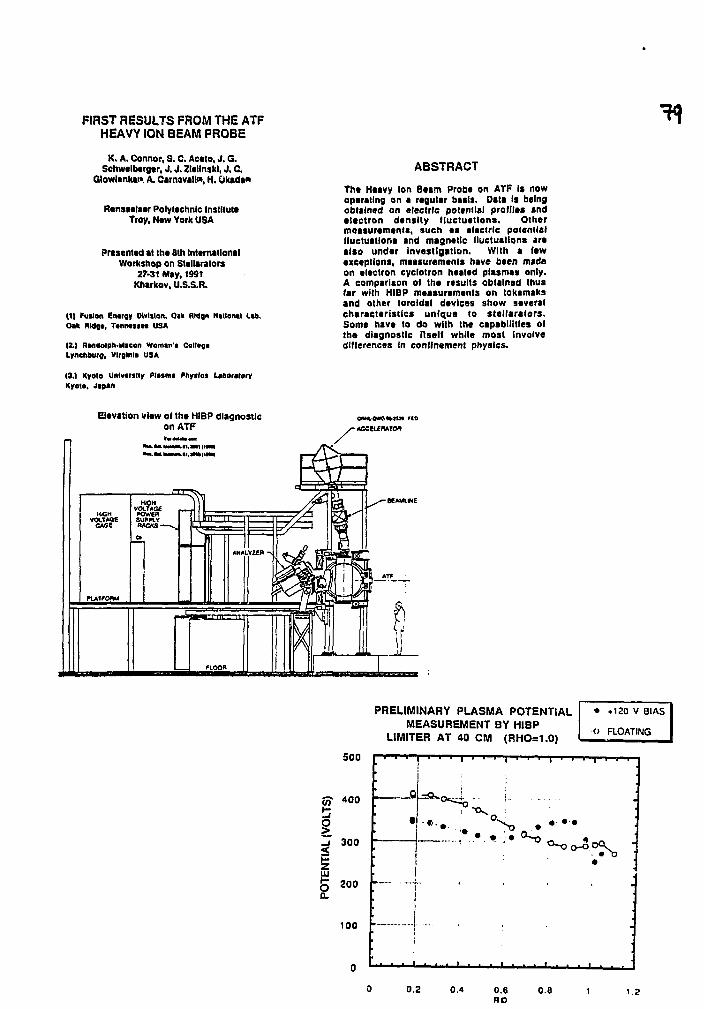
FIRST RESULTS FROM THE ATFHEAVY ION BEAM PROBE
K. A. Connor, S. C. Aceto, J. G.Schwtlbtrgtr, J. J. Zltllnskl, J. C.
Glowltntaw. A. CamavalK H. Qkada"
Renssalaer Polytechnic InstituteTroy, Naw York USA
Presented at the 8th InternationalWorkshop on Stellarators
27-31 May, 1991Kharkov, U.S.S.R.
(1) Fualon Entrgy Olvlilon, Oak Rldga National Lib.Oik NMflt, T*n iw»n USA
(2.) Rmaolph-Mieon woman's Calltgalynchburg, Virginia USA
(3.1 Kyoto Unlwilly Plasma Phytlcs taoortiaryKyoto. Japan
ABSTRACT
The Heavy Ion Beam Probe on ATF 1* nowoperating on a regular basis. Data It beingobtained on electric potenllal profiles andelectron density fluctuations. Othermeasurements, such as electric potenllalfluctuations and magnetic lluctuatlons arealso under investigation. With a fewexceptions, measurements have been madeon electron cyclotron heated plasmas only.A comparison of the results obtained thusfar with HIBP measurements on tokamaksand other toroidal devices show severalcharacteristics unique to steilaralors.Some have to do with the capabilities ofthe diagnostic iiself while most involvedifferences in confinement physics.
Elevation view of the HIBP diagnosticon ATF
oiwi«mKnit no
PRELIMINARY PLASMA POTENTIALMEASUREMENT BY HIBP
LIMITER AT 40 CM (RHO=1.0)
• *120 V BIAS
o FLOATING
500
5T *aa
300
200
100
" T T ' I ' ' • '
0.2 0.4 0.6no
0 8 1.2
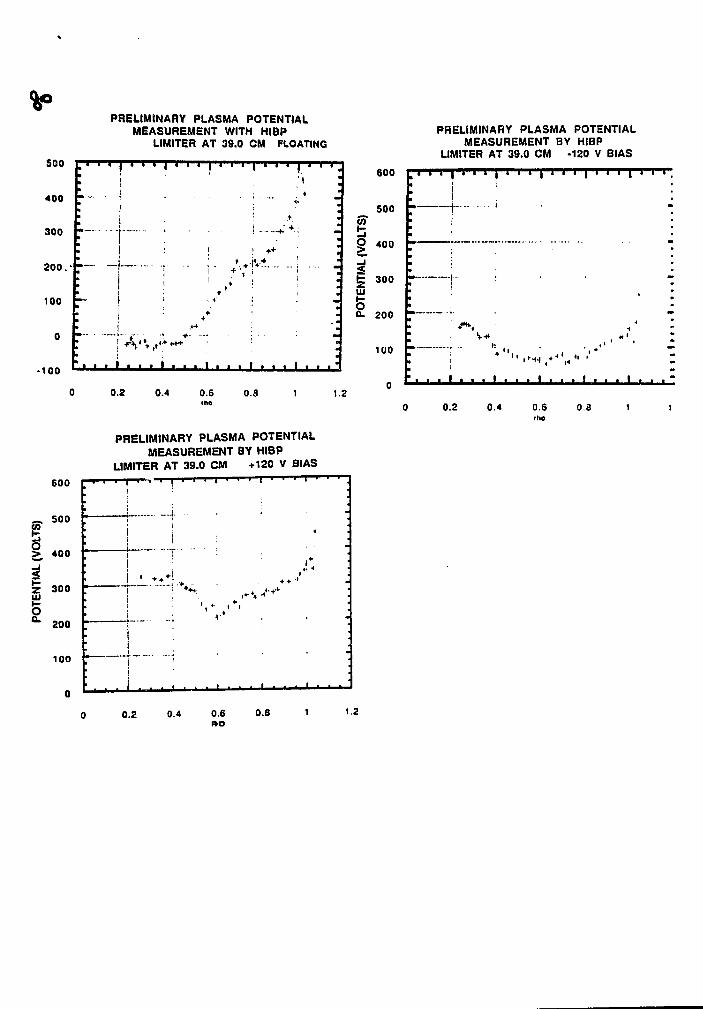
PRELIMINARY PLASMA POTENTIALMEASUREMENT WITH HIBP
LIMITER AT 39.0 CM FLOATING
SCO
400
300
200.
100
0
-100
PRELIMINARY PLASMA POTENTIALMEASUREMENT BY HIBP
LIMITER AT 39.0 CM -120 V BIAS
••iv± ;
600
500
400
300
200
100
, _ „„_ „„„. i....
600
— 500
>, 400
Z 300
i200
100
0.2 0.4 0.6 O.a•no
PRELIMINARY PLASMA POTENTIALMEASUREMENT BY HIBP
LIMITER AT 39.0 CM +120 V BIAS
1.2
0.2 0.4 0.6 0.8rllO
0.2 0.4 0.6 0.6 1.2
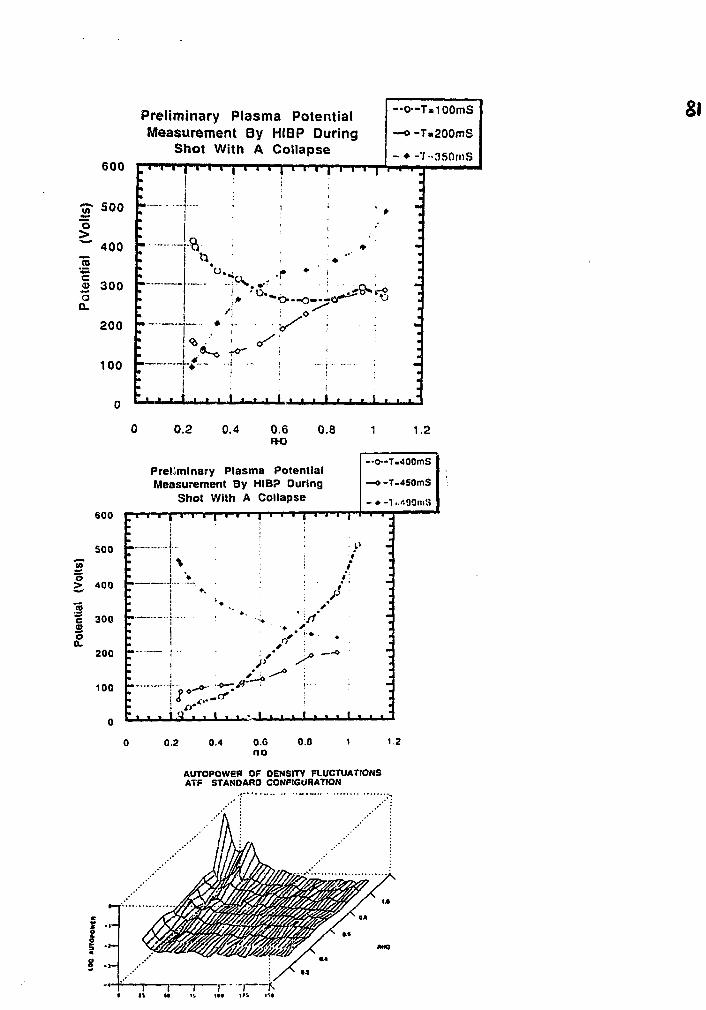
Preliminary Plasma PotentialMeasurement By HIBP During
Shot With A Collapse
o
.2"c£oo.
600
500
400
300
200
100
—o-T*100mS
—o -T»200mS
- • -7 -350mS
SI
- / • - • - ! - {
600
500 -
o
"5e2o0.
400
300
200
100
0 0.2 0.4 0.6 0FK)
Preliminary Plasma PotentialMeasurement By HIBP During
Shot With A Collapse
L | •.... .: I * >•a I
I i• > - '
1 . . . 1 .
8
1
• i>!
i
/
1 1.2
-o~T-400mS
—» -T-450mS
- •-T.,<".9Otn',5
0.2 0.4 0.6
no0.0 1.2
AUTOPOWER OF DENSITY FLUCTUATIONSATF STANOAHO CONFIGURATION
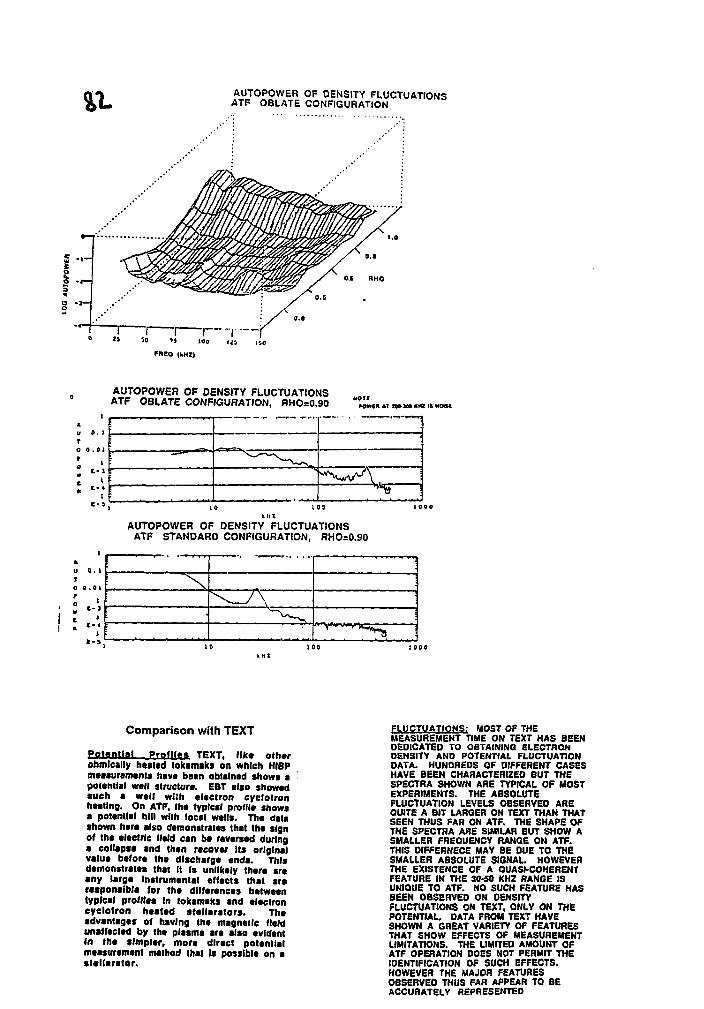
AUTOPOWER OF DENSITY FLUCTUATIONSATF OBLATE CONFIGURATION
AUTOPOWER OF DENSITY FLUCTUATIONSATF O8LATE CONFIGURATION, RHO=0.90 "%!,,«« « M « «w « «*t
AUTOPOWER OF DENSITY FLUCTUATIONSATF STANDARD CONFIGURATION, RHO=0.90
a. i
0 . 0 1
t
. . .
10 100kHZ
Comparison with TEXT
Potential Profiles TEXT, I lk* otherotimlcally hcattd tokamaks on which HIBPmeasurements have bem obtained shows apotential wall structure. EBT also showedsuch a well with electron cyclotronheating. On ATF. the typical profile showsa potential hill with local wells. The datashown her* also demonstrates that the signof the electric Held can be reversed duringa collapse and than recover Its originalvalue before the discharge ends. Thisdemonstrates that II Is unlikely there ireany large Instrumental eflects that areresponsible tor the dilferences betweentyplcsl profiles In lokamaks and electroncyclotron heated stelfarators. Theadvantages of hsving the magnetic fieldunaffected by the plasma are also evidentin the simpler, more direct potentialmeasurement method that Is possible on astellarator.
FLUCTUATIONS: MOST OF THEMEASUREMENT TIME ON TEXT HAS BEENDEDICATED TO OBTAINING ELECTRONDENSITY AND POTENTIAL FLUCTUATIONDATA. HUNDREDS OF DIFFERENT CASESHAVE BEEN CHARACTERIZED BUT THESPECTRA SHOWN ARE TYPICAL OF MOSTEXPERIMENTS. THE ABSOLUTEFLUCTUATION LEVELS OBSERVED AREQUITE A BIT LARGER ON TEXT THAN THATSEEN THUS FAR ON ATF. THE SHAPE OFTHE SPECTRA ARE SIMILAR BUT SHOW ASMALLER FREQUENCY RANGE ON ATF.THIS OIFFERNECE MAY BE DUE TO THESMALLER ABSOLUTE SIGNAL. HOWEVERTHE EXISTENCE OF A QUASI-COHERENTFEATURE IN THE 30-50 KHZ RANGE ISUNIQUE TO ATF. NO SUCH FEATURE HASBEEN OBSERVEO ON OENSITYFLUCTUATIONS ON TEXT, ONLY ON THEPOTENTIAL. DATA FROM TEXT HAVESHOWN A GREAT VARIETY OF FEATURESTHAT SHOW EFFECTS OF MEASUREMENTLIMITATIONS. THE LIMITED AMOUNT OFATF OPERATION DOES NOT PERMIT THEIDENTIFICATION OF SUCH EFFECTS.HOWEVER THE MAJOR FEATURESOBSERVEO THUS FAR APPEAR TO BEACCURATELY REPRESENTED
The plasm* potential can be calculated byseveral methods
• Calibration off of neutral gas
• Analyzer trajectory code
• In-Sllu calibration with amoveabte probe that can be biased
Summary
• The ATF HIBP has begun to lake potentialprofile and fluctuation data for ECH heatedplasmas at 0.962 Tesla.
• Preliminary potential profile data fs Inreasonable agreement with probe andspectroscopic data. See R.C. Isler paper atthis conference.
• Potential profile data Is presently beinganalyzed with the help of a calibrationsignal obtained on each shot from secondaryions produced off of neutral gas.
• In the future, attempts will be made toanalyze potential profile data by using ananalyzer trajectory code and also with thehelp of an In-situ calibration using amoveable probe which can be biased.
i
PROBABILITY OF PARTICLE COLLISSIONLESS TRAPPING/DETRAPPING
IN TORSATRONS
I.N.Sidorenko
Kharkov Institute of Physics and Technology
By applying Kruskal's theorem [1] the analytical formulas
of collisionless transition probability between classes of
locally passing particles and helical trapped ones in
magnetic configurations with complicated harmonic spectrum
with account for the radial electric field have been obtained.
The conclusions were made about the fraction of trapped
particles in "URAGAN-2M", ATF-1, HELIOTRON-E and CHS
configurations. Also obtained is the electric field potential
at which this fraction is minimum.
1. The conditions for collisionless transition between a
class of locally passing particles and barely trapped in
helical ripples ones arise due to the comparatively weak
particle drift across the magnetic surface [1-3]. The
probability of such transitions depends on the change of the
helical ripple value along the particle drift direction. On
the phase plane (g,p), where q is the particle coordinate
along the magnetic line and p = M Va is its momentum, this
change corresponds to the increase (when trapping occurs) or
decrease (when detrapping occurs) in the area, bounded by the
separatrix E - max (ixB + eS), where n is the particle
magnetic moment and B is the strength of the magnetic field
with the complicated helical spectrum
B/Bn = 1 - ccose + > c,. cos[(l±n)9 - m <p] (1)n = 1
If the phase area changes are denoted as Ah (a = + is for
positively, - is for negatively passing particles and r is for
helical ripple trapped ones then Liouville's theorem [1]
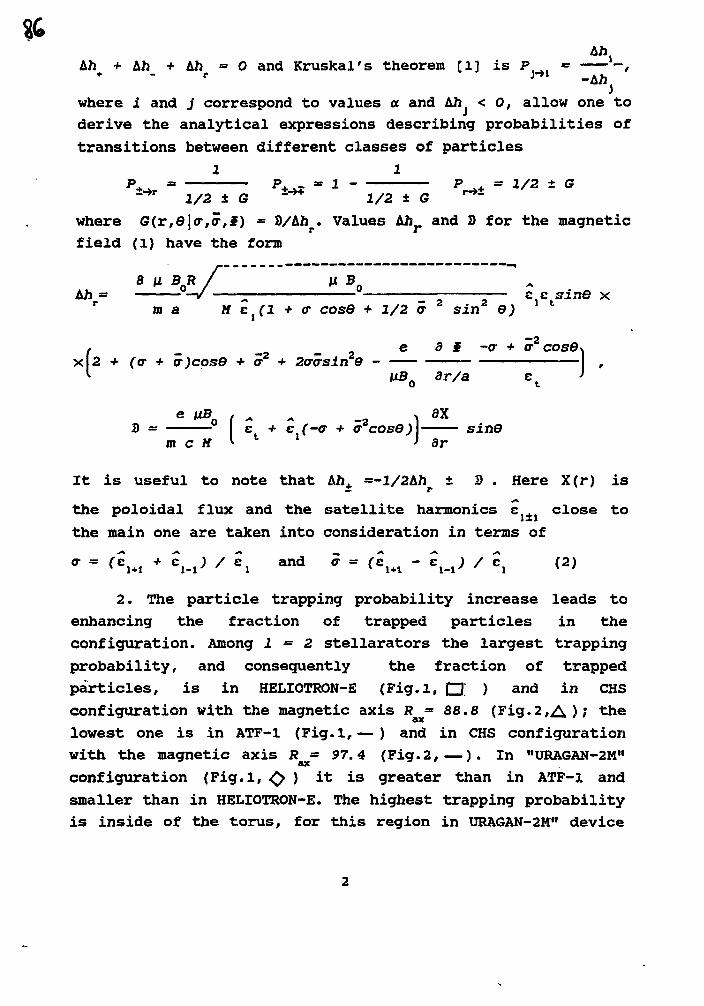
AftAh + Ah + Ah = 0 and Kruskal's theorem [1] is P_, = ,
where i and j correspond to values a and Ah < 0, allow one toderive the analytical expressions describing probabilities oftransitions between different classes of particles
l 1± G
1/2 ± G -** 1/2 t G
where G(r,e|(r,cr,f) = B/Ahp. Values Ahr and 2> for the magneticfield (1) have the form
Aft = U-V - u — _ z— e.c sin© xr
9
It is useful to note that Ah+ =-l/2Ahr ± 3 . Here X(r) is
the poloidal flux and the satellite harmonics e close to
the main one are taken into consideration in terms of
a " < i+i + Ki> / *i a n d 5 = ^ m ' S-i; '*x (2)
2. The particle trapping probability increase leads toenhancing the fraction of trapped particles in theconfiguration. Among 1=2 stellarators the largest trappingprobability, and consequently the fraction of trappedparticles, is in HELIOTRON-E (Fig.l, • ) and in CHSconfiguration with the magnetic axis R = 88.8 (Fig.2,A); thelowest one is in ATF-1 (Fig.l,— ) and in CHS configurationwith the magnetic axis R = 97.4 (Fig.2,—). In "URAGAN-2M"configuration (Fig.l, ) it is greater than in ATF-l andsmaller than in HELIOTRON-E. The highest trapping probabilityis inside of the torus, for this region in URAGAN-2M" device
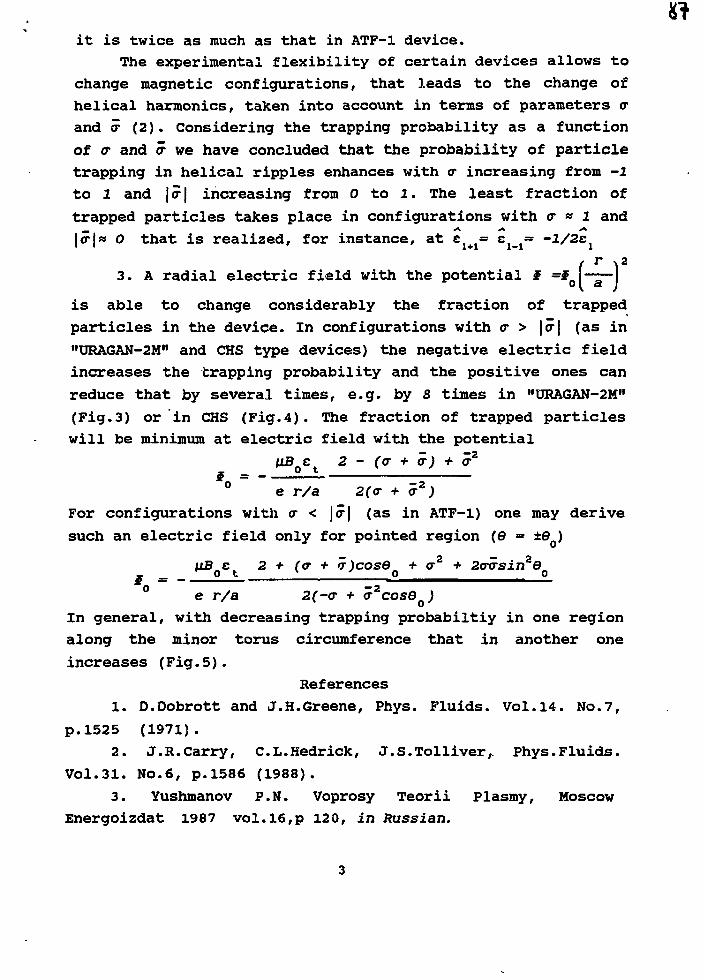
it is twice as much as that in ATF-1 device.
The experimental flexibility of certain devices allows to
change magnetic configurations, that leads to the change of
helical harmonics, taken into account in terms of parameters a
and o- (2). Considering the trapping probability as a function
of <r and a we have concluded that the probability of particle
trapping in helical ripples enhances with <r increasing from -2
to 2 and |<r| increasing from 0 to 2. The least fraction of
trapped particles takes place in configurations with <r « 2 and
|er|» 0 that is realized, for instance, at cj+i= cjl= -l/2c1
3. A radial electric field with the potential §( r ^
=*0 ~a~~
is able to change considerably the fraction of trapped
particles in the device. In configurations with cr > |cr| (as in
"URAGAN-2M11 and CHS type devices) the negative electric field
increases the trapping probability and the positive ones can
reduce that by several times, e.g. by 8 times in "URAGAN-2M"
(Fig.3) or in CHS (Fig.4). The fraction of trapped particles
will be minimum at electric field with the potential
VBQct 2 - (a + <r) + az
0 e r/a 2(<r + cr2;
For configurations with cr < jcr| (as in ATF-1) one may derive
such an electric field only for pointed region (0 = ±6 )
|iB e 2 + (<r + <r)cose + <r2 2
0 e r/a 2(-tr + G2COSB )
In general, with decreasing trapping probabiltiy in one region
along the minor torus circumference that in another one
increases (Fig.5).
References
1. D.Dobrott and J.H.Greene, Phys. Fluids. Vol.14. No.7,
p.1525 (1971).
2. J.R.Carry, C.L.Hedrick, J.S.Tolliver,. Phys.Fluids.
Vol.31. No.6, p.1586 (1988).
3. Yushmanov P.N. Voprosy Teorii Plasmy, Moscow
Energoizdat 1987 vol.16,p 120, in Russian.
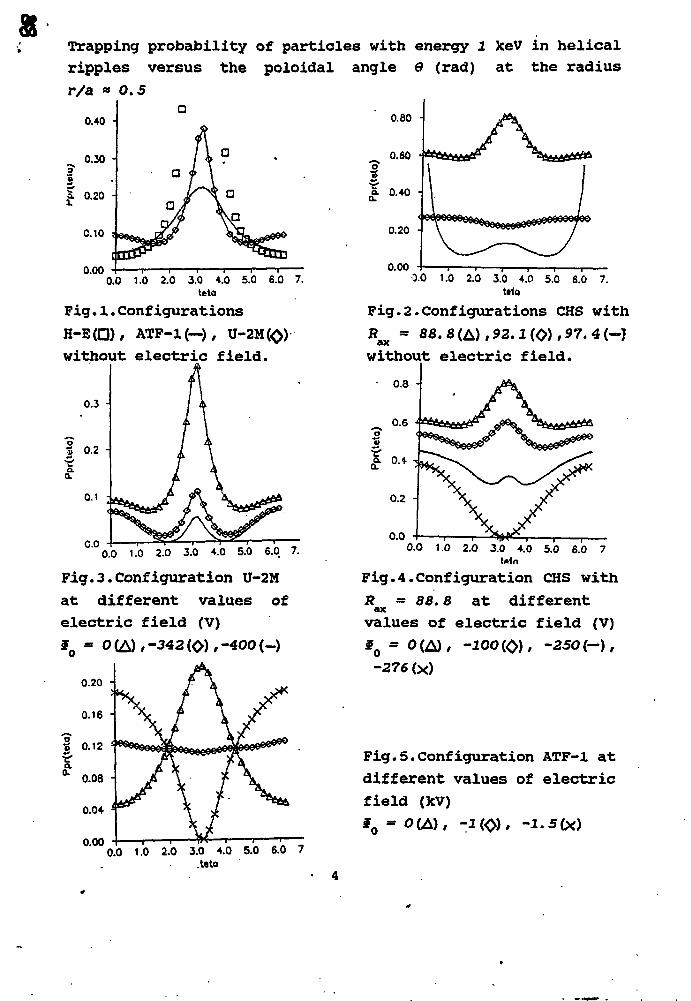
Trapping probability of particles with energy 1 keV in helical
ripples versus the poloidal angle 6 (rad) at the radius
r/a « 0.5a
0.40
0.000.0 1.0 2.0 3.0 4.0 5.0 6.0 7.
teto
Fig.1.Configurations
H-E(Q), ATF-1H)/ U-without electric field.
0.0 10 2.0 3.0 4.0 5.0 6.0 7
Fig.3.Configuration U-2M
at different values of
electric field (V)
0.000.0 1.0 2.0 3.0 4.0 5.0 6.0 7.
teto
Fig.2.Configurations CHS with
without electric field.
0.8
0.00.0 1.0 2.0 3.0 4.0 5.0 6.0 7
Fig.4.Configuration CHS with
R - 88. 8 at differentax
values of electric field (V)
-276(x)
Fig.5.Configuration ATF-l at
different values of electric
field (kV)
30 = OCA), -K0), -l.5(x)
0.0 1.0 2.0 3.0 4.0 5.0 6.0 7.teto
DETACHABLE JOINT AND CURRENTFEED INFLUENCE ON
THE URAGAN-4 MAGNETIC CONFIGURATION
N. T. Besedin, G. 6. Lesnyakov, I. M. Parikratov
Institute of Physics and Technology, 310108, Kharkov, USSR
Abstract. The influence of helical winding currentfeeds
and detachable joints on the Uragan-4 (U-4) vacuum magnetic
configuration has been studied in this work. The U-4 design is
the modification of the Uragan-2M (U-2M) torsatron.
The same problem for U-2M torsatron was studied in ref.
[1], where detachable joint and currentfeed geometry was also
described. The U-4 currentfeeds experienced slight changes in
comparison with the U-2M ones. Currentfeed position in <p
direction (<p is the toroidal angle) is such that helical
winding parts and currentfeed parts are symmetrical with
respect to the Z = 0 plane (nonsymmetrical in U-2M), Z is the
main axis of the torus. Detachable joint <p coordinates had not
changed in comparison with U-2M device but their design was
sufficiently changed. ip coordinates of the currentfeeds and
detachable joints do not coincide (coincide in U-2M). Each
helical winding conductor has been pressed by single screwpress
and has not been deviating from its trace in connection places,
in contrast to U-2M. It was shown that a new design of
detachable joints disturbs magnetic configuration less than the
old one (compare with [1]).
The magnetic configuration calculations were made using
real conductor geometry. In the first case one chose the
unperturbed configuration (Fig. l,a) with suppressed islands at
i = 4/5, 4/7 and small islands at i = 4/6, i is the rotation
transform, i(0) « 0.5. Magnetic axis average position is
displaced to the inner side of the vacuum chamber.
V V* / (V* + V °*375' <B-i->/(1W V ~ 2-4 %' V * and BTare the longitudinal fields of the helical conductors and
toroidal coils, respectively, <Bj_> is the average value of the
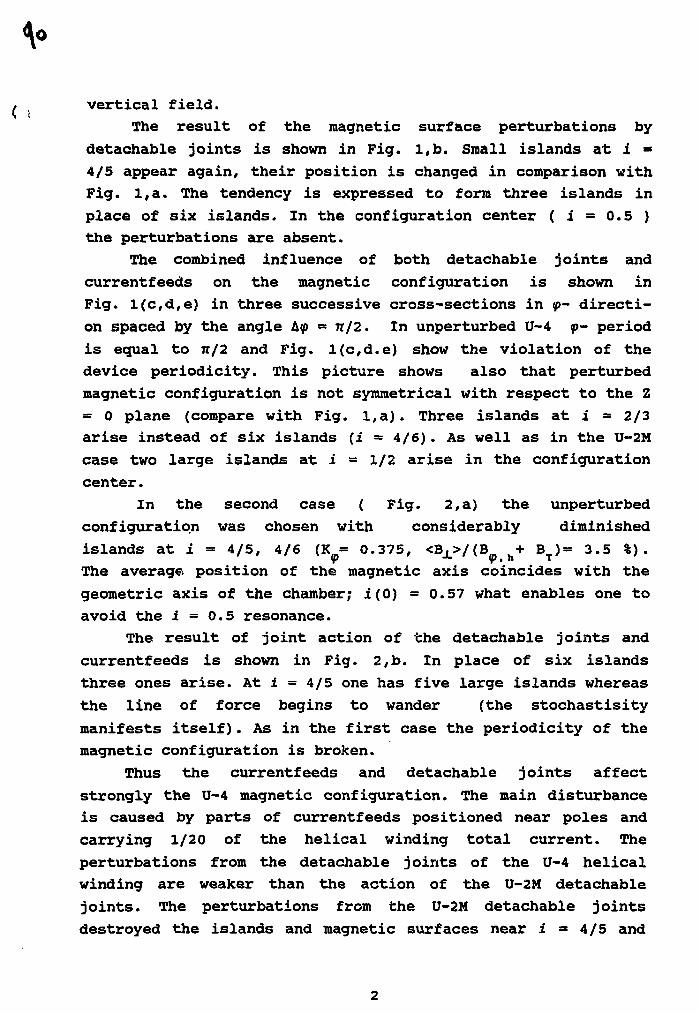
vertical field.
The result of the magnetic surface perturbations by
detachable joints is shown in Fig. l,b. Small islands at i *
4/5 appear again, their position is changed in comparison with
Fig. l,a. The tendency is expressed to form three islands in
place of six islands. In the configuration center ( i = 0.5 )
the perturbations are absent.
The combined influence of both detachable joints and
currentfeeds on the magnetic configuration is shown in
Fig. l(c,d,e) in three successive cross-sections in <p- directi-
on spaced by the angle Lip - n/2. In unperturbed U-4 <p- period
is equal to TT/2 and Fig. l(c,d.e) show the violation of the
device periodicity. This picture shows also that perturbed
magnetic configuration is not symmetrical with respect to the Z
= 0 plane (compare with Fig. l,a). Three islands at i = 2/3
arise instead of six islands (i = 4/6). As well as in the U-2M
case two large islands at i = 1/2 arise in the configuration
center.
In the second case ( Fig. 2, a) the unperturbed
configuration was chosen with considerably diminished
islands at i = 4/5, 4/6 (K - 0.375, <BJL>/(B h+ BT)= 3.5 %) .
The average position of the magnetic axis coincides with the
geometric axis of the chamber; i(0) = 0.57 what enables one to
avoid the i = 0.5 resonance.
The result of joint action of the detachable joints and
currentfeeds is shown in Fig. 2,b. In place of six islands
three ones arise. At i = 4/5 one has five large islands whereas
the line of force begins to wander (the stochastisity
manifests itself). As in the first case the periodicity of the
magnetic configuration is broken.
Thus the currentfeeds and detachable joints affect
strongly the U-4 magnetic configuration. The main disturbance
is caused by parts of currentfeeds positioned near poles and
carrying 1/20 of the helical winding total current. The
perturbations from the detachable joints of the U-4 helical
winding are weaker than the action of the U-2M detachable
joints. The perturbations from the U-2M detachable joints
destroyed the islands and magnetic surfaces near i = 4/5 and
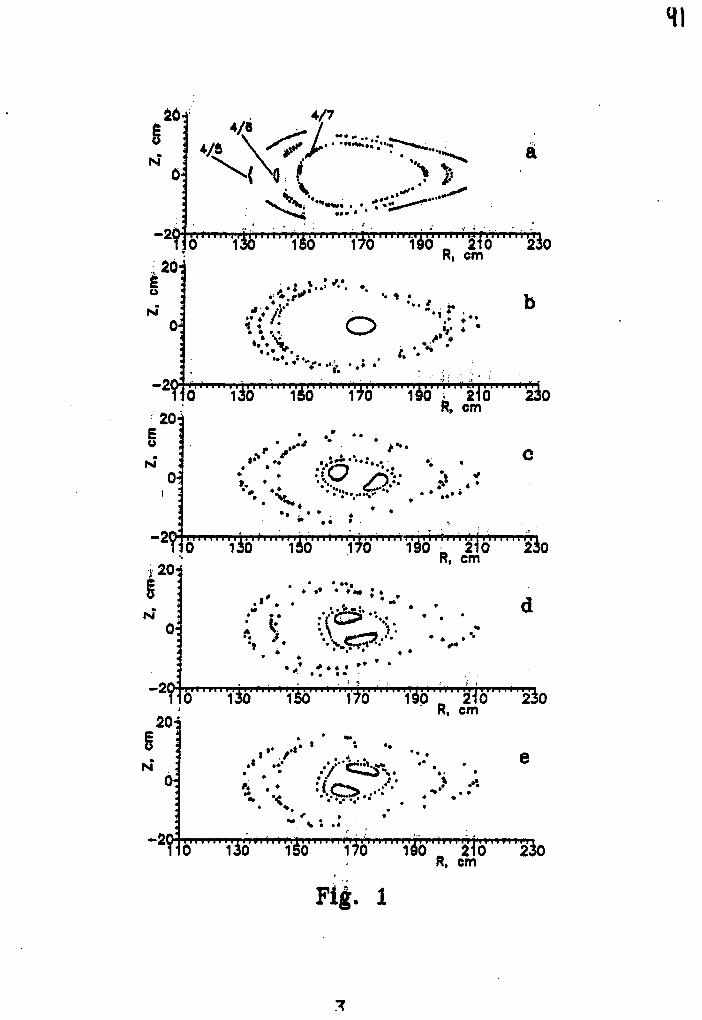
26-
N
" 2 ? J6'
ISI
-2io
20:
IM
-2o
?20i
M
20:
N" :
>
a
X1'Yio R, cm
2"3o
•"» :. A *
Yib"i,"ir2ib 'iioR
Yio Yib rtb"
> • •
/ *>*
\6 Y30 170
• • • • •
s . .<
o Y36"'liio
Fig. 1
, 2 iR, cm
l-'i\'o 2ioR, cm
a 210 230R, cm
21R, cm
the joint action of U-2M detachable joints and currentfeeds
destroyed the magnetic surfaces near i =4/6 (see [1]).
20
Nl
£20y
8/9 4/5 4/6 4/7
io Vio Ysb Y70
4/5 2/3
\ \
2R, cm
V- .h
• . •
230
10 130 150 170 "190 a 210 230R, cm
Fig. 2
REFERENCES
1. N.T. Besedin, G.G. Lesnyakov, I.M. Pankratov Voprosy atomnoi
nauki i techniki (Questions of Atomic Science and
Technique of Sci. Thermonucl. Fusion) Moscow, 1991, r. 1,
p. 48. (in Russian).
MAGNETIC ISLAND SUPPRESSION IN TORSATRON
A.V.Zolotukhin, A.A.Shishkin
Kharkov Physics and Technology Institute,
Kharkov, USSR
Magnetic resonances are studied analytically to decrease
the perturbations of torsatron magnetic configuration by
varying currents in poloidal coils.
1. The analytical approach is developed to study the
magnetic resonances in torsatrons, in the vacuum magnetic
configurations as well as the configurations with small plasma
pressure (small £). Our main aim is to give the analytical
description for the magnetic island size control: the
suppression of islands to increase the dimensions of
confinement volume or the increase of islands to form the
divertor layers.
Our approach consists in finding the inputs from
different kinds of the currents (in toroidal, helical,
poloidal coils, as well as the plasma currents) into the
magnetic field perturbations. The expressions obtained which
connect the magnetic field perturbation amplitudes with the
current values are minimized.
2. As an example we consider here the configuration of
the URAGAN-2M device. In the URAGAN-2M configurations with
rotational transform L > 1/2 the most dangerous resonances
take place at the rational values t = 4/5, 4/6, 4/7 [1]. The
magnetic islands have the radial extent of 3 cm at c - 4/6 and
approximately 6 cm at L=4/5. The size of magnetic islands at
L = 4/6 can be reduced considerably (by a factor of 10) with a
small change in the winding law of helical conductors [ 2 ]. The
same effect can be obtained also by varying the currents in
the coils of compensating and correcting magnetic fields
(poloidal coils) [3]. At the last time the results have been
obtained [4] where by the use of numerical simulation the
poloidal currents were chosen in such a way that the magnetic
islands at three resonance values of rotational transform (c)
mentioned above considerably were reduce simultaneously. The
width of magnetic islands in this case was less than 2 cm.
Nevertheless, because of the importance of resonance phenomena
at the edge of confinement volume, we consider the effect of
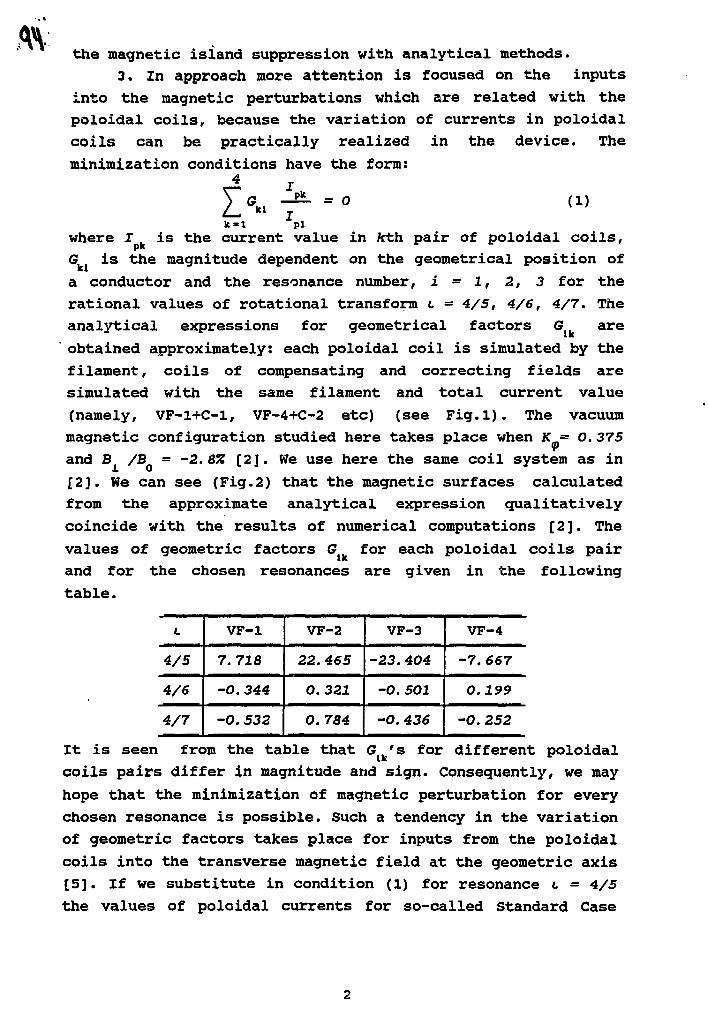
the magnetic island suppression with analytical methods.
3. In approach more attention is focused on the inputs
into the magnetic perturbations which are related with the
poloidal coils, because the variation of currents in poloidal
coils can be practically realized in the device. The
minimization conditions have the form:4
kiPit
pi
(1)
where J is the current value in kth pair of poloidal coils,
G is the magnitude dependent on the geometrical position of
a conductor and the resonance number, i = 1, 2, 3 for the
rational values of rotational transform c - 4/5, 4/6, 4/7. The
analytical expressions for geometrical factors G are
obtained approximately: each poloidal coil is simulated by the
filament, coils of compensating and correcting fields are
simulated with the same filament and total current value
(namely, VF-l+C-l, VF-4+C-2 etc) (see Fig.l). The vacuum
magnetic configuration studied here takes place when K = 0.375
and B /B = -2.8% [2]. We use here the same coil system as in
[2]. We can see (Fig.2) that the magnetic surfaces calculated
from the approximate analytical expression qualitatively
coincide with the results of numerical computations [2]. The
values of geometric factors (?jk for each poloidal coils pair
and for the chosen resonances are given in the following
table.
4/5
4/6
4/7
VF-1
7.718
-0.344
-0. 532
VF-2
22.465
0.321
0.784
VF-3
-23.404
-0.501
-0. 436
VF-4
-7. 667
0.199
-0.252
It is seen from the table that G k'& for different poloidal
coils pairs differ in magnitude and sign. Consequently, we may
hope that the minimization of magnetic perturbation for every
chosen resonance is possible. Such a tendency in the variation
of geometric factors takes place for inputs from the poloidal
coils into the transverse magnetic field at the geometric axis
[5]. If we substitute in condition (1) for resonance i = 4/5
the values of poloidal currents for so-called Standard Case
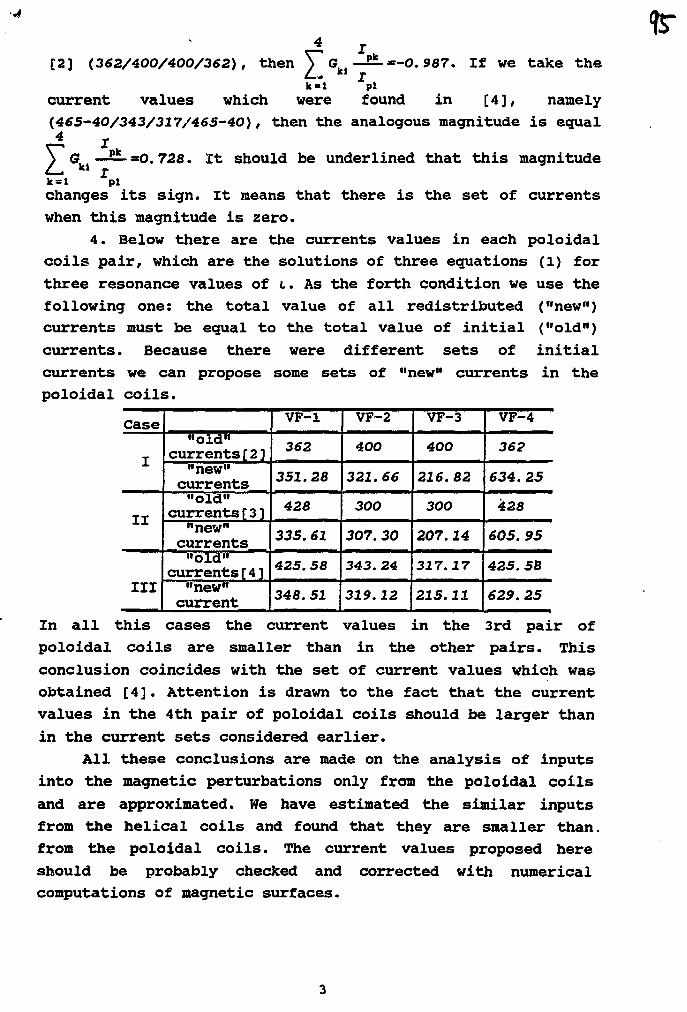
C2]
4 x
(362/400/400/362), then V G —£^-—0.9S7. If we take the
current values which were found in [4], namely
(465-40/343/327/465-40), then the analogous magnitude is equal
Gkl —=-=0. 728. It should be underlined that this magnitude
k = l pi
changes its sign. It means that there is the set of currents
when this magnitude is zero.
4. Below there are the currents values in each poloidal
coils pair, which are the solutions of three equations (1) for
three resonance values of i. As the forth condition we use the
following one: the total value of all redistributed ("new")
currents must be equal to the total value of initial ("old")
currents. Because there were different sets of initial
currents we can propose some sets of "new" currents in the
poloidal coils.
Case
I
II
III
"old"currents[2]"new"
currents"old"
currents[3]"new"
currents"old"
currents[4]"new"
current
VF-l
362
351.28
428
335.61
425.58
348. 51
VF-2
400
321.66
300
307. 30
343.24
319.12
VF-3
400
216. 82
300
207.14
317.17
215.11
VF-4
362
634.25
428
605. 95
425.58
629.25
In all this cases the current values in the 3rd pair of
poloidal coils are smaller than in the other pairs. This
conclusion coincides with the set of current values which was
obtained [4]. Attention is drawn to the fact that the current
values in the 4th pair of poloidal coils should be larger than
in the current sets considered earlier.
All these conclusions are made on the analysis of inputs
into the magnetic perturbations only from the poloidal coils
and are approximated. We have estimated the similar inputs
from the helical coils and found that they are smaller than,
from the poloidal coils. The current values proposed here
should be probably checked and corrected with numerical
computations of magnetic surfaces.
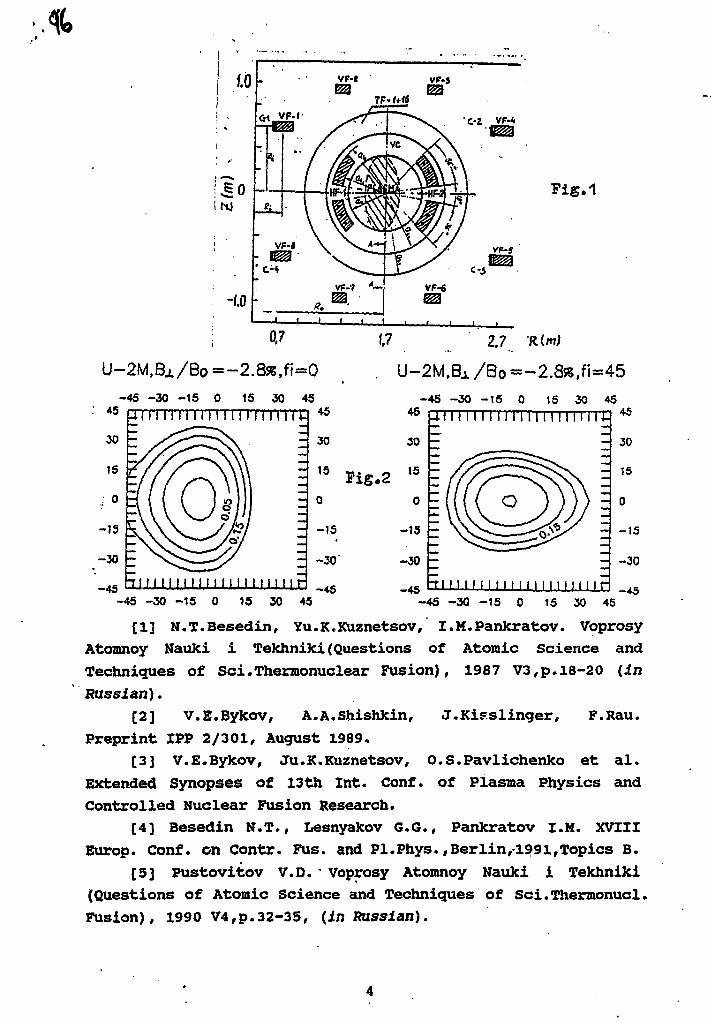
U-2M,Bj./Bo =-2.8sB,fi=02.7
U-2M,BJ. /Bo =~2.
-45 -30 -IS
11 I I I I II I I 1 I I I I riTlTTt
15 30 45
-30 -
-45 III I IHI I I I I I I I I I I I I I
+5
30
15
0
-15
-30
-45
FiS.2
45
30
0
-15
-30
-45 -30 -15 0 15 30 45
-45 -30 -15 0 15 30 45-45
111 n n 11111111111114-
ti 1111111111
-45 -30 -15 0 15 30 45
45
30
15
0
-15
-30
-45
[1] N.T.Besedin, Yu.K.Kuznetsov, I.M.Pankratov. Voprosy
Atomnoy Nauki i Tekhniki (Questions of Atomic Science and
Techniques of Sci.Thermonuclear Fusion), 1987 V3,p. 18-20 (in
Russian).
[2] V.E.Bykov, A.A.Shishkin, J.Kisslinger, F.Rau.
Preprint IPP 2/301, August 1989.
[3] V.E.Bykov, Ju.K.Kuznetsov, O.S. Pavlichenko et al.
Extended Synopses of 13th Int. Conf. of Plasma Physics and
Controlled Nuclear Fusion Research.
[4] Besedin N.T., Lesnyakov G.6., Pankratov I.M. XVIII
Europ. Conf. on Contr. Fus. and PI.Phys.,Berlin,1991,Topics B.
[5] Pustovitov V.D. • Voprosy Atomnoy Nauki i Tekhniki
(Questions of Atomic Science and Techniques of Sci.Thermonucl.
Fusion), 1990 V4,p.32-35, (in Russian).
IV-P-3VACUUM MAGNETIC CONFIGURATION CONTROL IN THE TORSATRON
URAGAN-2M BY POLOIDAL AND TOROIDAL MAGNETIC FIELDS.
Bykov V.E.fKhodyachikh A.V.,Xuznetsov Yu.K..Pavlichenko O.S.,
Peletminskaya V.G.,Shishkin A.A.
Institute of Physics and Technology,
Kharkov, Union of Soviet Socialist Republics
The Uragan~2M magnetic system allows to control vacuum magnetic
configuration parameters in wide ranges. The helical and toroidal
field change allows to control a rotational transform on an edge
surface: t(a) « 0.2 - 0.7 at the parameter changeBht
K « §~""+5— ^Bht~*s * toroidal field produced by helical winding,^ ht otB £- additional toroidal field ) in the ranges 0.2-0.4. Changing
B^ allows to control the values V and t(r).
With that there is a possibility to control a magnetic field
fine structure-island size and helical ripp 1 es amplitude - by
changing of spatial distribution Bx and B'1,2].The detailed
investigation results of this problem are given in this report.
LITERATURE
1. Bykov V.E., Kuznetsov Yu.k., Pavlichenko O.S. et al. XIII Inter.
Conf. on Plasma Physics and Control Hucl. Fusion Research,
Washington (1990). IEAE CN-53, p. 128.
2. Beidler C , KiBlinger Y., Wobig H. Stellarator Theory Workshop,
Kharkov (1990).
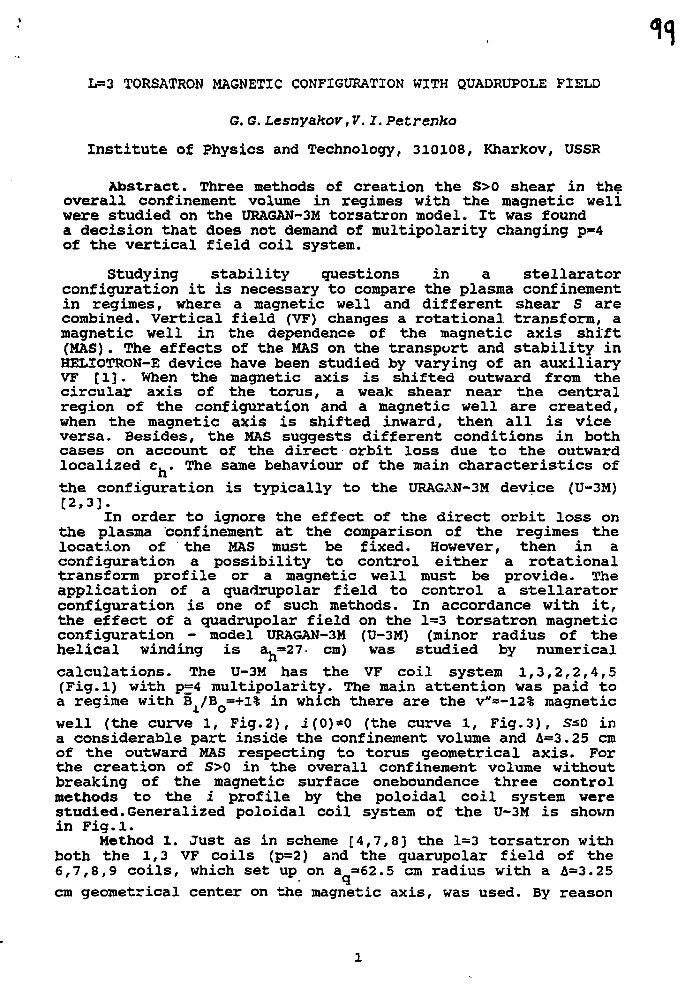
L=3 TORSATRON MAGNETIC CONFIGURATION WITH QUADRUPOLE FIELD
G. G. Lesnyakov,V. I. Petrenko
Institute of Physics and Technology, 310108, Kharkov, USSR
Abstract. Three methods of creation the S>0 shear in theoverall confinement volume in regimes with the magnetic weliwere studied on the URAGAN-3M torsatron model. It was founda decision that does not demand of multipolarity changing p=4of the vertical field coil system.
Studying stability questions in a stellaratorconfiguration it is necessary to compare the plasma confinementin regimes, where a magnetic well and different shear S arecombined. Vertical field (VF) changes a rotational transform, amagnetic well in the dependence of the magnetic axis shift(MAS). The effects of the HAS on the transport and stability inHELIOTRON-E device have been studied by varying of an auxiliaryVF [1]. When the magnetic axis is shifted outward from thecircular axis of the torus, a weak shear near the centralregion of the configuration and a magnetic well are created,when the magnetic axis is shifted inward, then all is viceversa. Besides, the MAS suggests different conditions in bothcases on account of the direct orbit loss due to the outwardlocalized Sj. The same behaviour of the main characteristics of
the configuration is typically to the URAGAN-3M device (U-3M)[2,3].
In order to ignore the effect of the direct orbit loss onthe plasma confinement at the comparison of the regimes thelocation of the MAS must be fixed. However, then in aconfiguration a possibility to control either a rotationaltransform profile or a magnetic well must be provide. Theapplication of a quadrupolar field to control a stellaratorconfiguration is one of such methods. In accordance with it,the effect of a guadrupolar field on the 1=3 torsatron magneticconfiguration - model URAGAN-3M (U-3M) (minor radius of thehelical winding is a. =27- cm) was studied by numerical
calculations. The U-3M has the VF coil system 1,3,2,2,4,5(Fig.l) with p=4 multipolarity. The main attention was paid toa regime with § /B =+l% in which there are the v"«-l2% magnetic
well (the curve 1, Fig.2), i(0)*0 (the curve l, Fig.3), S*0 ina considerable part inside the confinement volume and A=3.25 cmof the outward MAS respecting to torus geometrical axis. Forthe creation of S>0 in the overall confinement volume withoutbreaking of the magnetic surface oneboundence three controlmethods to the i profile by the poloidal coil system werestudied.Generalized poloidal coil system of the U-3M is shownin Fig.l.
Method 1. Just as in scheme [4,7,8] the 1=3 torsatron withboth the 1,3 VF coils (p=2) and the quarupolar field of the6,7,8,9 coils, which set up on a =62.5 cm radius with a A=3.25
cm geometrical center on the magnetic axis, was used. By reason
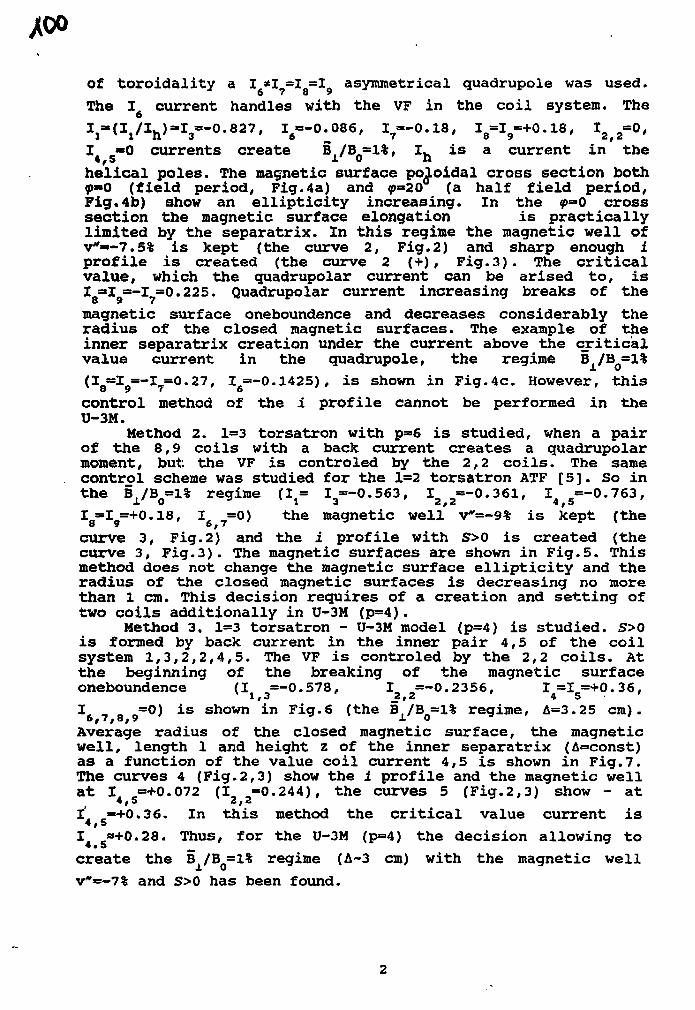
/oo
of toroidality a I *I =1 =IO asymmetrical quadrupole was used.6 7 8 9
The Ifi current handles with the VF in the coil system. TheV ^ W " ^ " ' 0 * 8 2 7 ' Vs-0'086' I7—0.18, I8=I9=+0.18, 1^2=0,I, »0 currents create B./B =1%, Iv. is a current in the* / 5 x o nhelical poles. The magnetic surface poloidal cross section bothp-0 (field period, Fig.4a) and <p=>20 (a half field period,Fig. 4b) show an ellipticity increasing. In the <p=0 crosssection the magnetic surface elongation is practicallylimited by the separatrix. In this regime the magnetic well ofv*»-7.5% is kept (the curve 2, Fig.2) and sharp enough iprofile is created (the curve 2 (+), Fig.3). The criticalvalue, which the quadrupolar current can be arised to, isI =1 =-I =0.225. Quadrupolar current increasing breaks of the8 9 7
magnetic surface oneboundence and decreases considerably theradius of the closed magnetic surfaces. The example of theinner separatrix creation under the current above the criticalvalue current in the quadrupole, the regime B1/B{J=1%(1=1 =-1=0.27, I ==-0.1425), is shown in Fig.4c. However, this
o 9 • ocontrol method of the i profile cannot be performed in theU-3M.
Method 2. 1=3 torsatron with p=6 is studied, when a pairof the 8,9 coils with a back current creates a quadrupolarmoment, but the VF is controled by the 2,2 coils. The samecontrol scheme was studied for the 1=2 torsatron ATF [5]. So inthe B,/B=l% regime (1= I =-0.563, I =-0.361, I =-0.763,
X O 1 3 2f2 4;5
I8=I9=+0.18, Ifi 7=0) the magnetic well v*=-9% is kept (thecurve 3, Fig.2) and the i profile with S>0 is created (thecurve 3, Fig.3). The magnetic surfaces are shown in Fig.5. Thismethod does not change the magnetic surface ellipticity and theradius of the closed magnetic surfaces is decreasing no morethan 1 cm. This decision requires of a creation and setting oftwo coils additionally in U-3M (p=4).
Method 3. 1=3 torsatron - U-3M model (p=4) is studied. S>0is formed by back current in the inner pair 4,5 of the coilsystem 1,3,2,2,4,5. The VF is controled by the 2,2 coils. Atthe beginning of the breaking of the magnetic surfaceoneboundence (I =-0.578, I =-0.2356, I =1 =+0.36,
1,3 _2,2 4 5
** » o n=°) *s shown in Fig.6 (the I /B =1% regime, A=3.25 cm).Average radius of the closed magnetic surface, the magneticwell, length 1 and height z of the inner separatrix (A=const)as a function of the value coil current 4,5 is shown in Fig.7.The curves 4 (Fig.2,3) show the i profile and the magnetic wellat I =+0.072 (I =0.244), the curves 5 (Fig.2,3) show - at
4,5 2,2
I =+0.36. In this method the critical value current is4,5
I *+0.28. Thus, for the U-3M (p=4) the decision allowing to
create the B /B =1% regime (A~3 cm) with the magnetic well
v"=-7% and S>0 has been found.
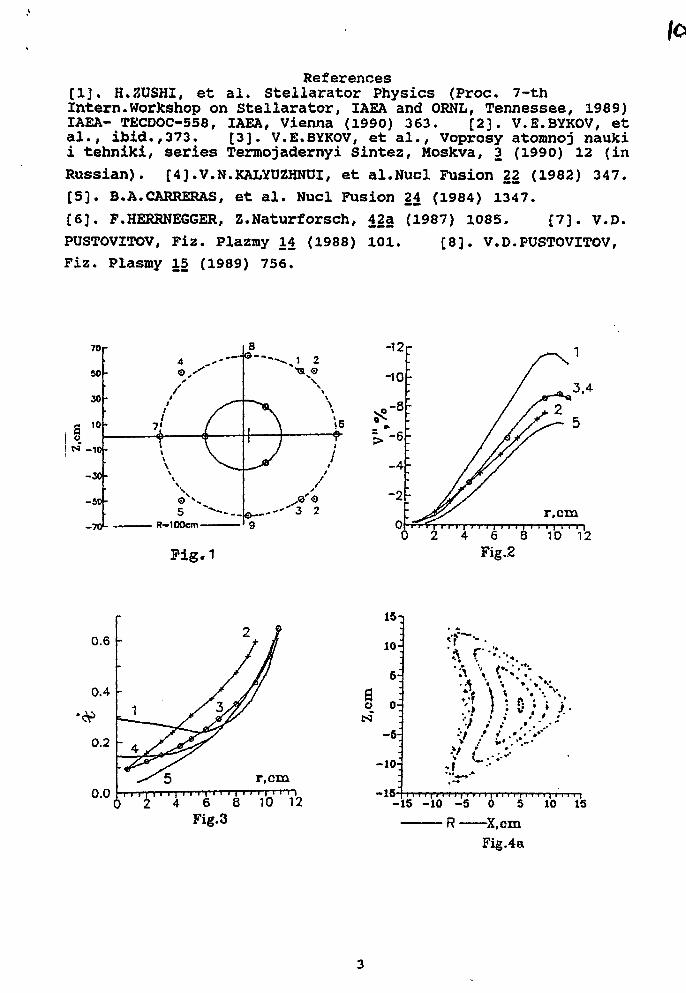
References[1]. H.2USHI, et al. Stellarator Physics (Proc. 7-thIntern.Workshop on stellarator, IAEA and ORNL, Tennessee, 1989)IAEA- TECDOC-558, IAEA, Vienna (1990) 363. [2]. V.E.BYKOV, etal., ibid.,373. [33* V.E.BYKOV, et al., Voprosy atomnoj naukii tehniki, series Termojadernyi sintez, Moskva, 3 (1990) 12 (in
Russian). [4J.V.N.XALYUZHNUI, et al.Nucl Fusion 22 (1982) 347.
[5]. B.A.CABRERAS, et al. Nucl Fusion 24 (1984) 1347.
[6]. F.HERRNEGGER, Z.Naturforsch, 42a (1987) 1085. [7]. V.D.
PUSTOVITOV, Fiz. Plazmy 14 (1988) 101. [8]. V.D.PUSTOVITOV,
Fiz. Plasmy 15 (1989) 756.
Fig.10
0.6
0.4
0.2
0.0 I I I ) I I I I I I I I ' I '0 2 4 6
Fig.3
r,cm
10:
-6-;
-10-
-16-
r •••
•7 •' ."' •''.•'*''
-15 -10 -5 0 5 10 15
R X,cmFig.4a
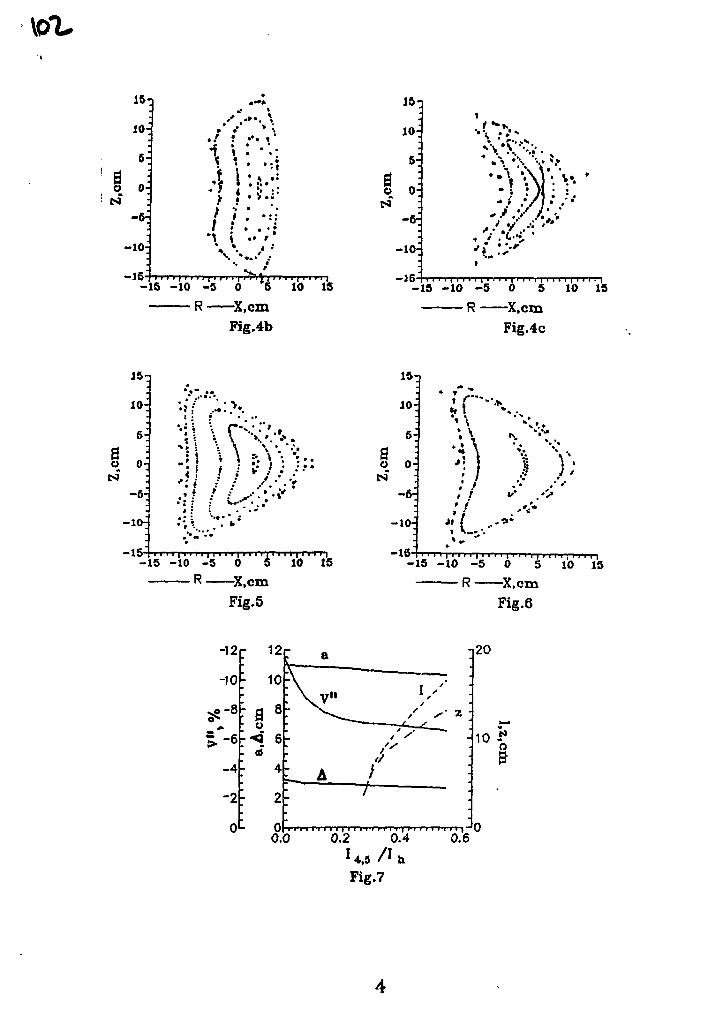
6-
§ „-6-
-10-
-15-
• '
- 5 -10 -5 0 5 10 IS
— R X.cmFig.4b
10-i
I 0:
7
-1<H
-15-
1/
.•••"•
-15 -10 -5 0 5 10 15
R X.cmFig.4c
15-
10
6
I .-6
-10-
-15
i \ \ V-/-
v • - :**'•••
-15 -10 -5 0 5 10 15
— R X,cmFig.5
ao
10-
6-
0-
-6-
-10-
-15
-12
-10
o-8
. - 6
-4
-2
00.0
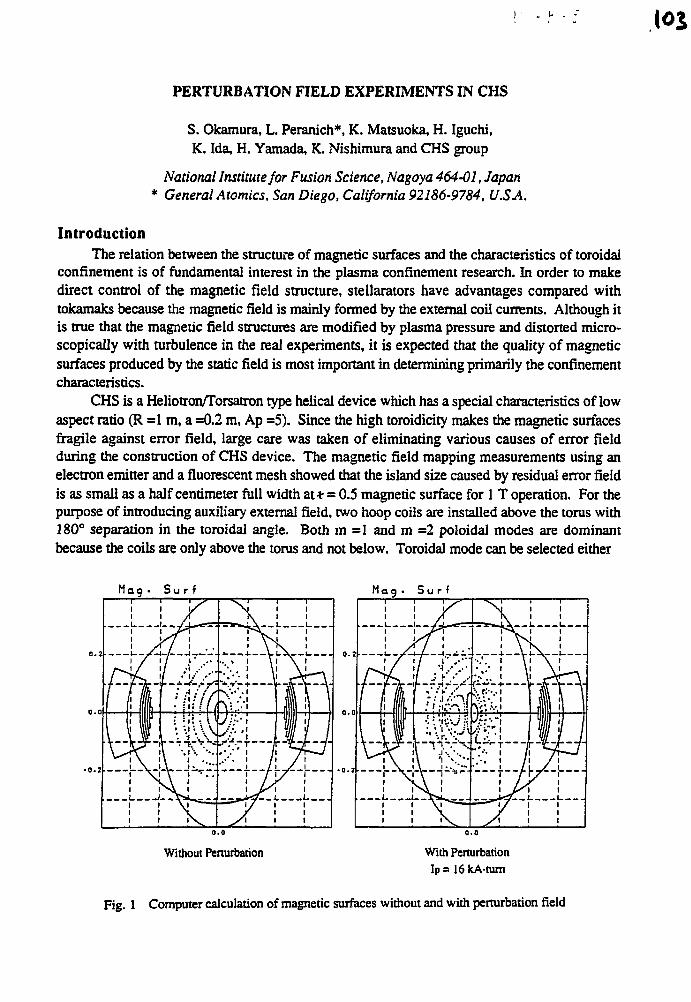
r
PERTURBATION FIELD EXPERIMENTS IN CHS
S. Okamura, L. Peranich*, K. Matsuoka, H. Iguchi,K. Ida, H. Yamada, K. Nishimura and CHS group
National Institute for Fusion Science, Nagoya 464-01, Japan* General Atomics, San Diego, California 92186-9784, U.SA.
IntroductionThe relation between the structure of magnetic surfaces and the characteristics of toroidal
confinement is of fundamental interest in the plasma confinement research. In order to makedirect control of the magnetic field structure, stellarators have advantages compared withtokamaks because the magnetic field is mainly formed by the external coil currents. Although itis true that the magnetic field structures are modified by plasma pressure and distorted micro-scopically with turbulence in the real experiments, it is expected that the quality of magneticsurfaces produced by the static field is most important in determining primarily the confinementcharacteristics.
CHS is a Heliotron/Torsatron type helical device which has a special characteristics of lowaspect ratio (R =1 m, a =0.2 m, Ap =5). Since the high toroidicity makes the magnetic surfacesfragile against error field, large care was taken of eliminating various causes of error fieldduring the construction of CHS device. The magnetic field mapping measurements using anelectron emitter and a fluorescent mesh showed that the island size caused by residual error fieldis as small as a half centimeter full width at * = 0.5 magnetic surface for 1 T operation. For thepurpose of introducing auxiliary external field, two hoop coils are installed above the torus with180° separation in the toroidal angle. Both in =1 and m =2 poloidal modes are dominantbecause the coils are only above the torus and not below. Toroidal mode can be selected either
- O . J __\--V---T + - -
0.0
Without Perturbation
0.0
With PerturbationIp= 16kAtum
Fig. 1 Computer calculation of magnetic surfaces without and with perturbation field
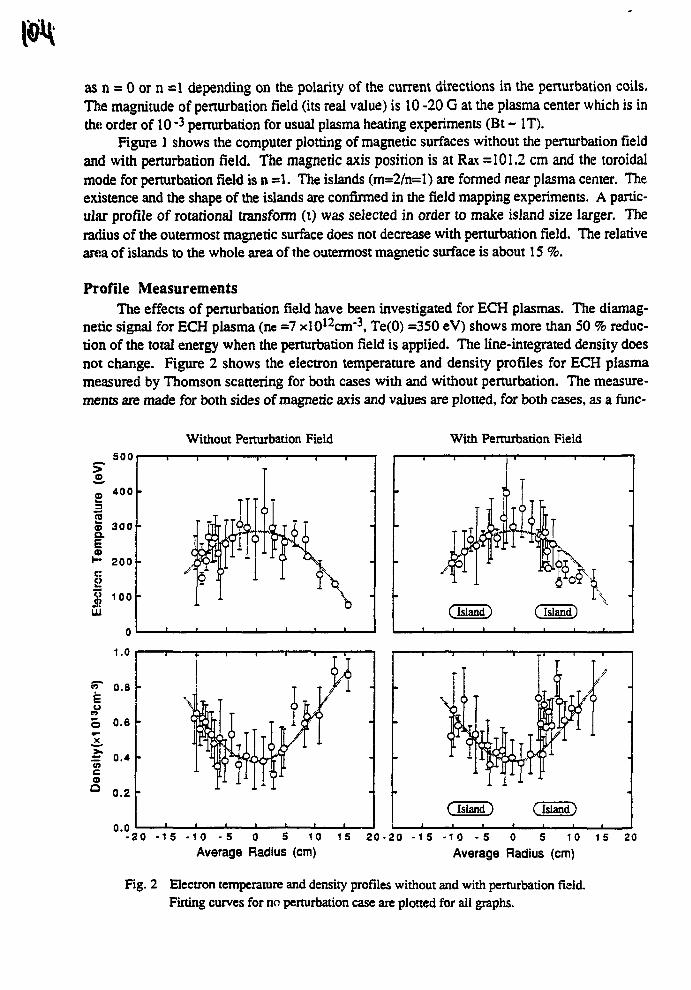
as n = 0 or n =1 depending on the polarity of the current directions in the penurbation coils.The magnitude of penurbation field (its real value) is 10 -20 G at the plasma center which is inthe order of 10 *3 perturbation for usual plasma heating experiments (Bt ~ IT).
Figure 1 shows the computer plotting of magnetic surfaces without the perturbation fieldand with penurbation field. The magnetic axis position is at Rax =101.2 cm and the toroidalmode for perturbation field is n =1. The islands (m=2/n=l) are formed near plasma center. Theexistence and the shape of the islands are confirmed in the field mapping experiments. A partic-ular profile of rotational transform (t) was selected in order to make island size larger. Theradius of the outermost magnetic surface does not decrease with perturbation field. The relativearea of islands to the whole area of the outermost magnetic surface is about 15 %.
Profile MeasurementsThe effects of perturbation field have been investigated for ECH plasmas. The diamag-
netic signal for ECH plasma (ne =7 xl012cm"3, Te(0) =350 eV) shows more than 50 % reduc-tion of the total energy when the perturbation field is applied. The line-integrated density doesnot change. Figure 2 shows the electron temperature and density profiles for ECH plasmameasured by Thomson scattering for both cases with and without perturbation. The measure-ments are made for both sides of magnetic axis and values are plotted, for both cases, as a func-
Without Perturbation Field With Perturbation Field
soo
7 -too•5(55 300a.a>H- 200
si 100ULJ
[&$(
J
)
1 f 1
- 2 0 - 1 5 - 1 0 - 5 0 5 1 0 1 5 2 0 - 2 0 - 1 5 - 1 0 - 5 0 5 1 0 1 5 2 0
Average Radius (cm) Average Radius (cm)
Fig. 2 Electron temperature and density profiles without and with perturbation field.Fining curves for no perturbation case are plotted for all graphs.
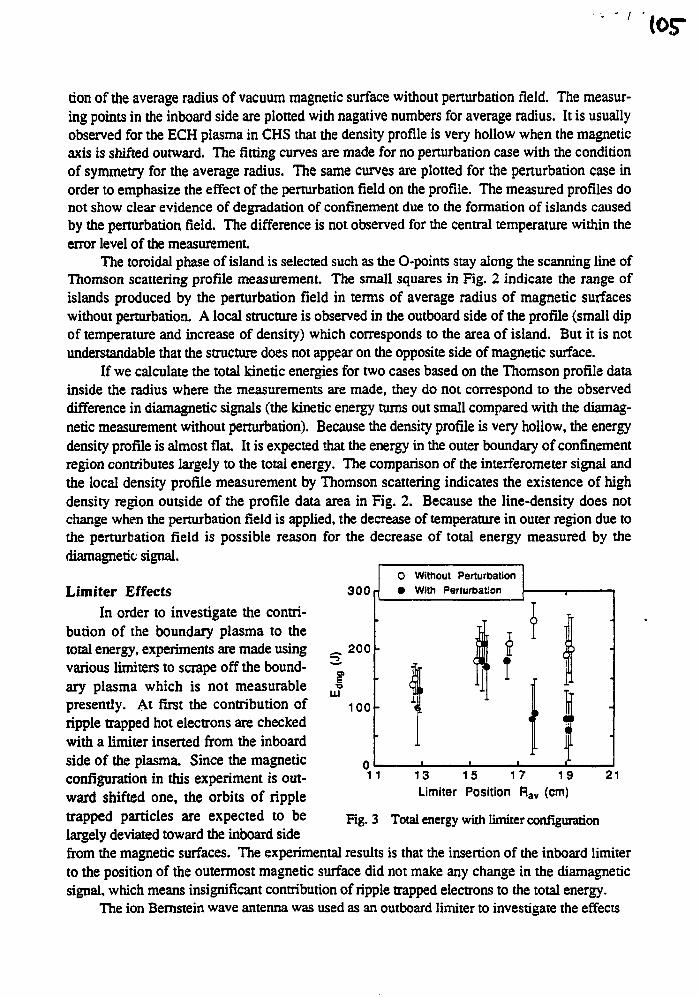
(or
don of the average radius of vacuum magnetic surface without perturbation field. The measur-ing points in the inboard side are plotted with nagative numbers for average radius. It is usuallyobserved for the ECH plasma in CHS that the density profile is very hollow when the magneticaxis is shifted outward. The fitting curves are made for no perturbation case with the conditionof symmetry for the average radius. The same curves are plotted for the perturbation case inorder to emphasize the effect of the perturbation field on the profile. The measured profiles donot show clear evidence of degradation of confinement due to the formation of islands causedby the perturbation field. The difference is not observed for the central temperature within theerror level of the measurement
The toroidal phase of island is selected such as the O-points stay along the scanning line ofThomson scattering profile measurement. The small squares in Fig. 2 indicate the range ofislands produced by the perturbation field in terms of average radius of magnetic surfaceswithout perturbation. A local structure is observed in the outboard side of the profile (small dipof temperature and increase of density) which corresponds to the area of island. But it is notunderstandable that the structure does not appear on the opposite side of magnetic surface.
If we calculate the total kinetic energies for two cases based on the Thomson profile datainside the radius where the measurements are made, they do not correspond to the observeddifference in diamagnetic signals (the kinetic energy turns out small compared with the diamag-netic measurement without perturbation). Because the density profile is very hollow, the energydensity profile is almost fiat It is expected that the energy in the outer boundary of confinementregion contributes largely to the total energy. The comparison of the interferometer signal andthe local density profile measurement by Thomson scattering indicates the existence of highdensity region outside of the profile data area in Fig. 2. Because the line-density does notchange when the perturbation field is applied, the decrease of temperature in outer region due tothe perturbation field is possible reason for the decrease of total energy measured by thediamagnetic signal.
300
- . 200
uu100
O Without Perturbation
• With Perturbation
I
Limiter EffectsIn order to investigate the contri-
bution of the boundary plasma to thetotal energy, experiments are made usingvarious limiters to scrape off the bound-ary plasma which is not measurablepresently. At first the contribution ofripple trapped hot electrons are checkedwith a limiter inserted from the inboardside of the plasma. Since the magneticconfiguration in this experiment is out-ward shifted one, the orbits of rippletrapped particles are expected to belargely deviated toward the inboard sidefrom the magnetic surfaces. The experimental results is that the insertion of the inboard limiterto the position of the outermost magnetic surface did not make any change in the diamagneticsignal, which means insignificant contribution of ripple trapped electrons to the total energy.
The ion Bernstein wave antenna was used as an outboard limiter to investigate the effects
13 15 17Limiter Position Ra
19 21
->av (cm)
Fig. 3 Total energy with limiter configuration
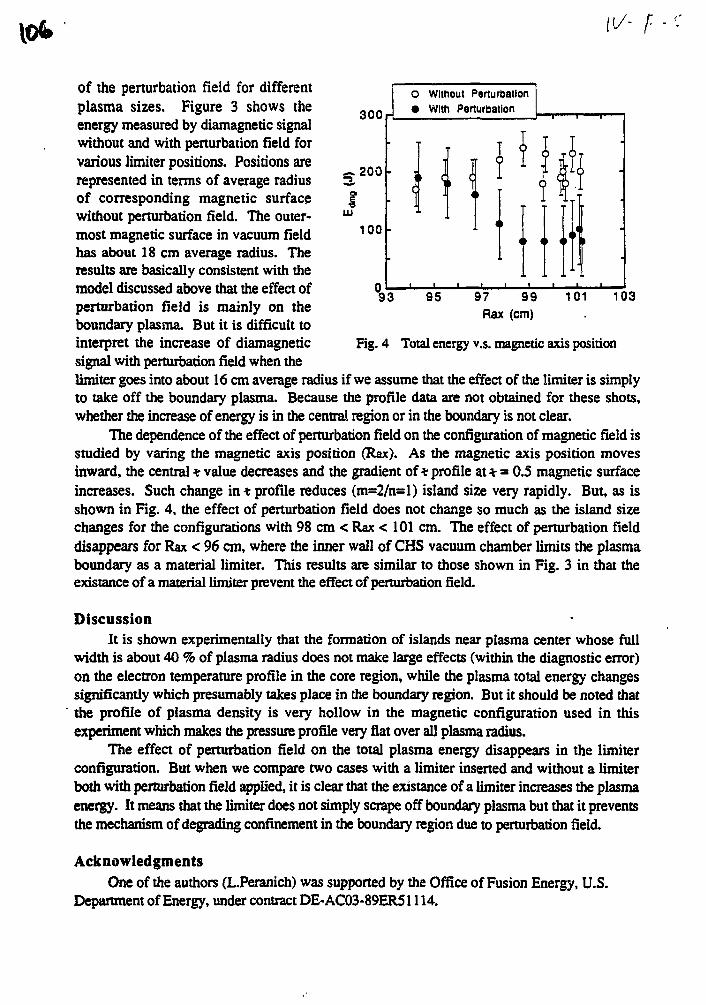
( I / - [• • -
300
- . 200
LU
100
o Without Perturbation• With Perturbation
93 95 97 99Rax (cm)
101 103
Fig. 4 Total energy v.s. magnetic axis position
of the perturbation field for differentplasma sizes. Figure 3 shows theenergy measured by diamagnetic signalwithout and with perturbation field forvarious limiter positions. Positions arerepresented in terms of average radiusof corresponding magnetic surfacewithout perturbation field. The outer-most magnetic surface in vacuum fieldhas about 18 cm average radius. Theresults are basically consistent with themodel discussed above that the effect ofperturbation field is mainly on theboundary plasma. But it is difficult tointerpret the increase of diamagneticsignal with perturbation field when thelimiter goes into about 16 cm average radius if we assume that the effect of the limiter is simplyto take off the boundary plasma. Because the profile data are not obtained for these shots,whether the increase of energy is in the central region or in the boundary is not clear.
The dependence of the effect of perturbation field on the configuration of magnetic field isstudied by varing the magnetic axis position (Rax). As the magnetic axis position movesinward, the central * value decreases and the gradient of* profile at * = 0.5 magnetic surfaceincreases. Such change in * profile reduces (m=2/n=l) island size very rapidly. But, as isshown in Fig. 4, the effect of perturbation field does not change so much as the island sizechanges for the configurations with 98 cm < Rax < 101 cm. The effect of perturbation fielddisappears for Rax < 96 cm, where the inner wall of CHS vacuum chamber limits the plasmaboundary as a material limiter. This results are similar to those shown in Fig. 3 in that theexistance of a material limiter prevent the effect of perturbation field.
DiscussionIt is shown experimentally that the formation of islands near plasma center whose full
width is about 40 % of plasma radius does not make large effects (within the diagnostic error)on the electron temperature profile in the core region, while the plasma total energy changessignificantly which presumably takes place in the boundary region. But it should be noted thatthe profile of plasma density is very hollow in the magnetic configuration used in thisexperiment which makes the pressure profile very flat over all plasma radius.
The effect of perturbation field on the total plasma energy disappears in the limiterconfiguration. But when we compare two cases with a limiter inserted and without a limiterboth with perturbation field applied, it is clear that the existance of a limiter increases the plasmaenergy. It means that the limiter does not simply scrape off boundary plasma but that it preventsthe mechanism of degrading confinement in the boundary region due to perturbation field.
AcknowledgmentsOne of the authors (L.Peranich) was supported by the Office of Fusion Energy, U.S.
Department of Energy, under contract DE-AC03-89ER51114.
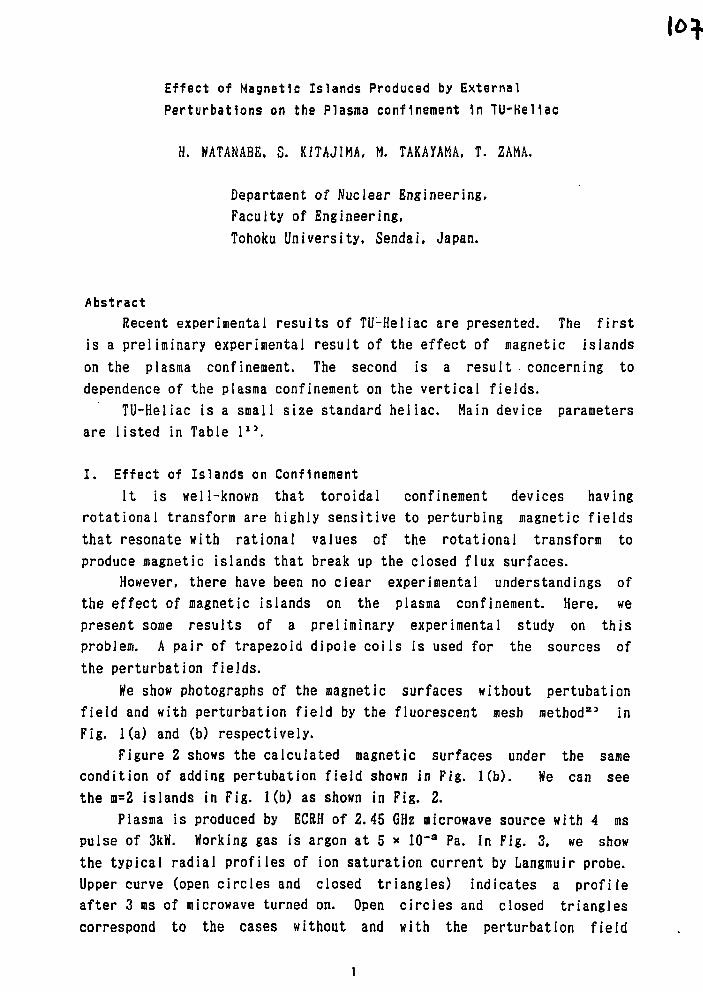
Effect of Magnetic Islands Produced by ExternalPerturbations on the Plasma confinement In TU-Heliac
H. WATANABE, S. KITAJIMA, M. TAKAYAMA. T. ZAMA.
Department of Nuclear Engineering,Faculty of Engineering.Tohoku University, Sendai, Japan.
AbstractRecent experimental results of TU-Heliac are presented. The first
is a preliminary experimental result of the effect of magnetic islandson the plasma confinement. The second is a result concerning todependence of the plasma confinement on the vertical fields.
TU-Heliac is a small size standard heliac. Main device parametersare listed in Table l a \
I. Effect of Islands on ConfinementIt is well-known that toroidal confinement devices having
rotational transform are highly sensitive to perturbing magnetic fieldsthat resonate with rational values of the rotational transform toproduce magnetic islands that break up the closed flux surfaces.
However, there have been no clear experimental understandings ofthe effect of magnetic islands on the plasma confinement. Here, wepresent some results of a preliminary experimental study on thisproblem. A pair of trapezoid dipole coils is used for the sources ofthe perturbation fields.
We show photographs of the magnetic surfaces without pertubationfield and with perturbation field by the fluorescent mesh method*5 inFig. l(a) and (b) respectively.
Figure 2 shows the calculated magnetic surfaces under the samecondition of adding pertubation field shown in Fig. K b ) . We can seethe oi=2 islands in Fig. K b ) as shown in Fig. 2.
Plasma is produced by ECRH of 2.45 GHz microwave source with 4 mspulse of 3kW. Working gas is argon at 5 * 10~3 Pa. In Fig. 3, we showthe typical radial profiles of ion saturation current by Langmuir probe.Upper curve (open circles and closed triangles) indicates a profileafter 3 ms of microwave turned on. Open circles and closed trianglescorrespond to the cases without and with the perturbation field
l
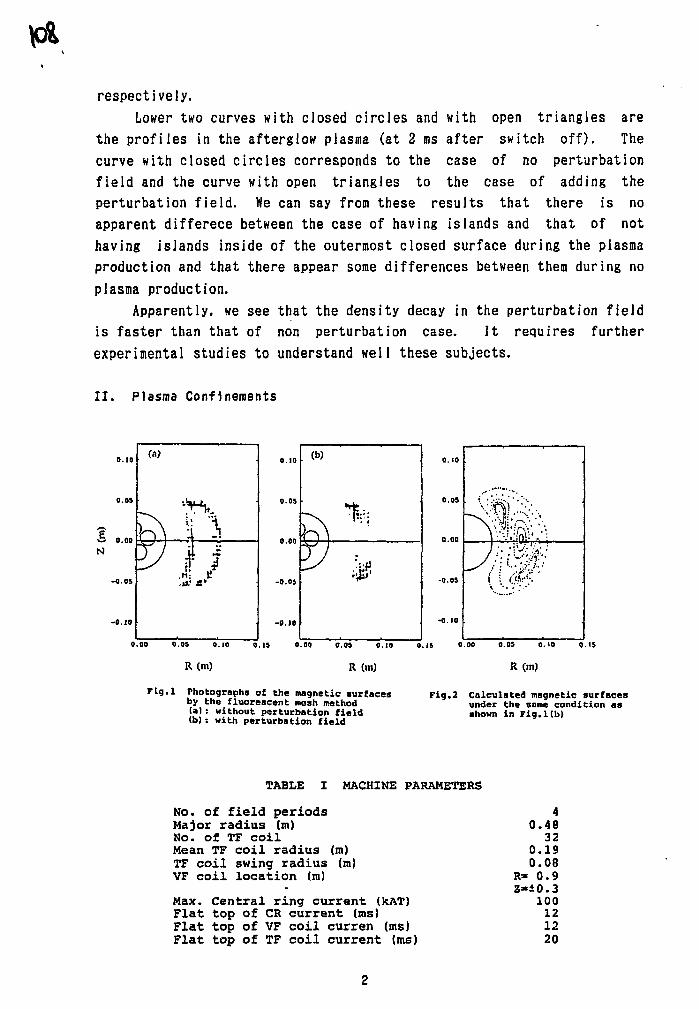
respectively.Lower two curves with closed circles and with open triangles are
the profiles in the afterglow plasma (at 2 BIS after switch off). Thecurve with closed circles corresponds to the case of no perturbationfield and the curve with open triangles to the case of adding theperturbation field. He can say from these results that there is noapparent differece between the case of having islands and that of nothaving islands inside of the outermost closed surface during the plasmaproduction and that there appear soie differences between them during noplasma production.
Apparently, we see that the density decay in the perturbation fieldis faster than that of non perturbation case. It requires furtherexperimental studies to understand well these subjects.
II. Plasma Confinements
-a.10
0.05
-0.10
0.00 0.0S O.IO 0.11 0.00 0.09 0.10
R (m)
FLg.l Photographs of the magnetic surfacesby the fluorescent mesh method(a): without perturbation field(b): with perturbation field
Fig.2 Calculated magnetic surfacesunder the same condition asshown in Fig.Kb)
TABLE I MACHINE PARAMETERS
No. of f i e l d periods 4Major radius (m) 0.48No. of TF c o i l 32Mean TF c o i l radius (m) 0.19TF c o i l swing radius (m) 0.08VF c o i l l o c a t i o n (m) R* 0.9
2-40.3Max. Central ring current (kAT) 100Flat top of CR current (ms) 12Flat top of VF coil curren (ms) 12Flat top of TF coil current (ms) 20
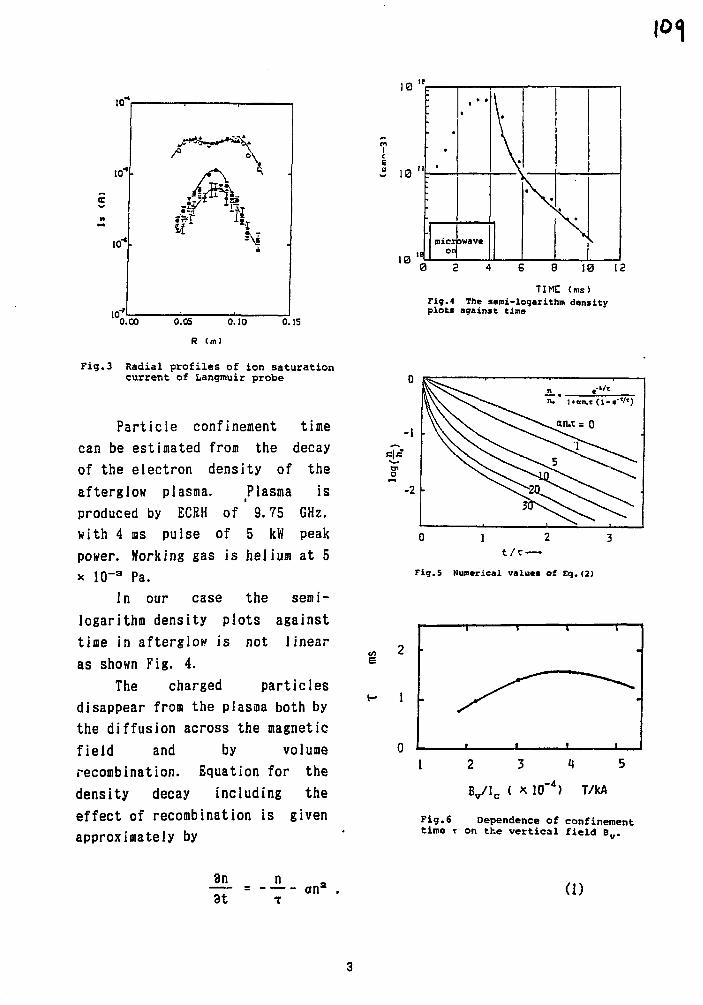
\o<\
0.1S
Fig.3 Radial profiles of ion saturationcurrent of Langmuir probe
Particle confinement time
can be estimated from the decay
of the electron density of the
afterglow plasma. Plasma is
produced by ECRH of 9.75 GHz.
with 4 ms pulse of 5 kW peak
power. Working gas is helium at 5
x 10"3 Pa.
In our case the semi-
logarithm density plots against
tine in afterglow is not linear
as shown Fig. 4.
The charged particles
disappear from the plasma both by
the diffusion across the magnetic
field and by volume
recombination. Equation for the
density decay including the
effect of recombination is given
approximately by
^ 10 r
8 10 12
TIME (ms)Fig.4 The semi-logarithm densityplots against tins
0 1 2 3
Fig.5 Numerical values of Eq.(2)
H 1
.-*%Bv/lc ( x 10 *) T/kA
Fig.6 Dependence of confinementtime T on the vertical field Bv.
gn3t
n= <xns
T(1)
where T is the particle confinement time and a is the recombination
coefficient.
The solution of this equation is
-(t-to)/Tn<>e /nv
n = — , (2)-(t-to)/T1+anoTll-e }
where no represents the density at t=to.
An example of numerical calculations of Eq. (2) is given in Fig. 5.
Plasma confinement times can he estimated from the best-fitting curve of
Eq. (2). Solid curve shown in Fig. 4 shows an example of the best-
fitting curves on the data. We get the confinement time is 1.2 ms and
value of recombination coefficient of He is 2.8 x 10~e cm*/s from this
curve.
Dependence of the confinement tine on the vertical fields is shown
in Fig. 6. There are some suitable vertical fields for the confinement
in heliac.
References
1) WATANABE, H.. et al., in Stellarator Physics (Proc.7th Int. Workshop
on Stellarators, Oak Ridge, Tenessee, 1989). IAEA-TECDOC-558. IAEA,
Vienna (1990).215.
2) K1TAJIMA. S., et al., in Plasma Physics and Controlled Nuclear
Fusion (Proc. 1st Int. Conf. Toki, 1989), N1FS-P0RC-3. National
Institute for Fusion Science, Nagoya (1990) 97.
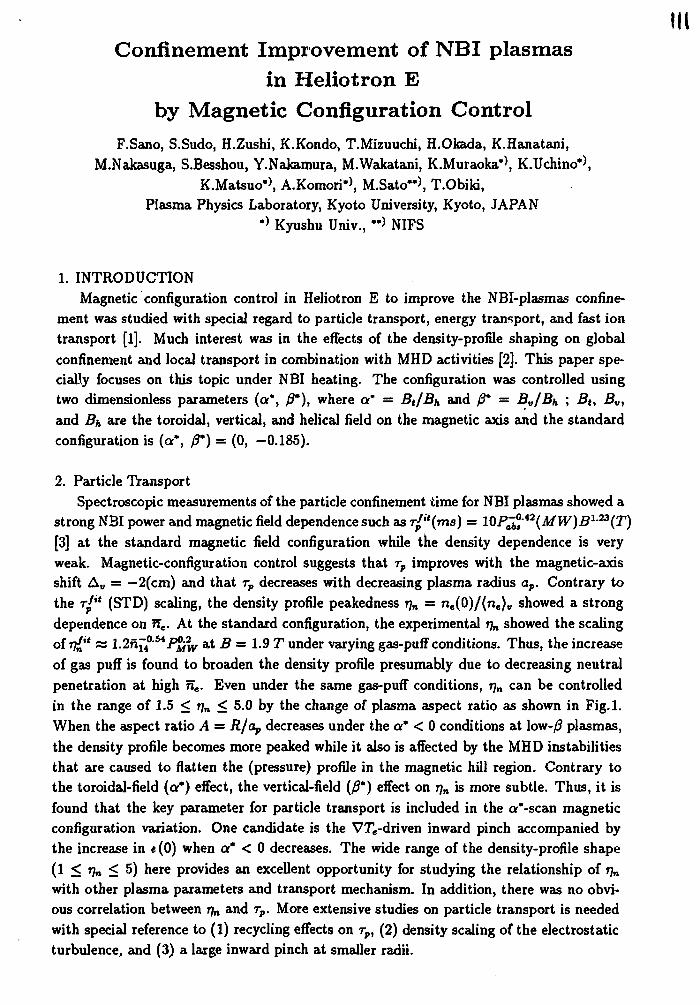
HiConfinement Improvement of NBI plasmas
in Heliotron Eby Magnetic Configuration Control
F.Sano, S.Sudo, H.Zushi, K.Kondo, T.Mizuuchi, H.Okada, K.Hanatani,M.Nakasuga, S.Besshou, Y.Nakamura, M.Wakatani, K.Muraoka**, K.Uchino*5,
K.Matsuo'\ A.Komori'), M.Sato"), T.Obiki,Plasma Physics Laboratory, Kyoto University, Kyoto, JAPAN
•> Kyushu Univ., ••> NIFS
1. INTRODUCTIONMagnetic configuration control in Heliotron E to improve the NBI-plasmas confine-
ment was studied with special regard to particle transport, energy transport, and fast iontransport [1]. Much interest was in the effects of the density-profile shaping on globalconfinement and local transport in combination with MHD activities [2]. This paper spe-cially focuses on this topic under NBI heating. The configuration was controlled usingtwo dimensionless parameters (a", /?"), where a* = Bt/Bh and /?* = BV/BH ; Bt, Bv,and Bh are the toroidal, vertical, and helical field on the magnetic axis and the standardconfiguration is (a", /?*) = (0, -0.185).
2. Particle TransportSpectroscopic measurements of the particle confinement time for NBI plasmas showed a
strong NBI power and magnetic field dependence such as ''{ms) = 10 P^>°*2(MW)B1-23(T)[3] at the standard magnetic field configuration while the density dependence is veryweak. Magnetic-configuration control suggests that rp improves with the magnetic-axisshift Av = —2(cm) and that rp decreases with decreasing plasma radius ap. Contrary tothe r*xt (STD) scaling, the density profile peakedness r)n = ne(0)/(ne)v showed a strongdependence on ne. At the standard configuration, the experimental r)n showed the scalingof 7 '* as 1.2n^aS4P^w at i? = 1.9 T under varying gas-puff conditions. Thus, the increaseof gas puff is found to broaden the density profile presumably due to decreasing neutralpenetration at high ne. Even under the same gas-puff conditions, jjn can be controlledin the range of 1.5 < r)n < 5.0 by the change of plasma aspect ratio as shown in Fig.l.When the aspect ratio A = R/ap decreases under the a* < 0 conditions at low-/? plasmas,the density profile becomes more peaked while it also is affected by the MHD instabilitiesthat are caused to flatten the (pressure) profile in the magnetic hill region. Contrary tothe toroidal-field (a*) effect, the vertical-field (/?*) effect on r\n is more subtle. Thus, it isfound that the key parameter for particle transport is included in the a'-scan magneticconfiguration variation. One candidate is the VTe-driven inward pinch accompanied bythe increase in t (0) when a* < 0 decreases. The wide range of the density-profile shape(1 5! ^n < 5) here provides an excellent opportunity for studying the relationship of rjn
with other plasma parameters and transport mechanism. In addition, there was no obvi-ous correlation between rjn and rp. More extensive studies on particle transport is neededwith special reference to (1) recycling effects on rp, (2) density scaling of the electrostaticturbulence, and (3) a large inward pinch at smaller radii.
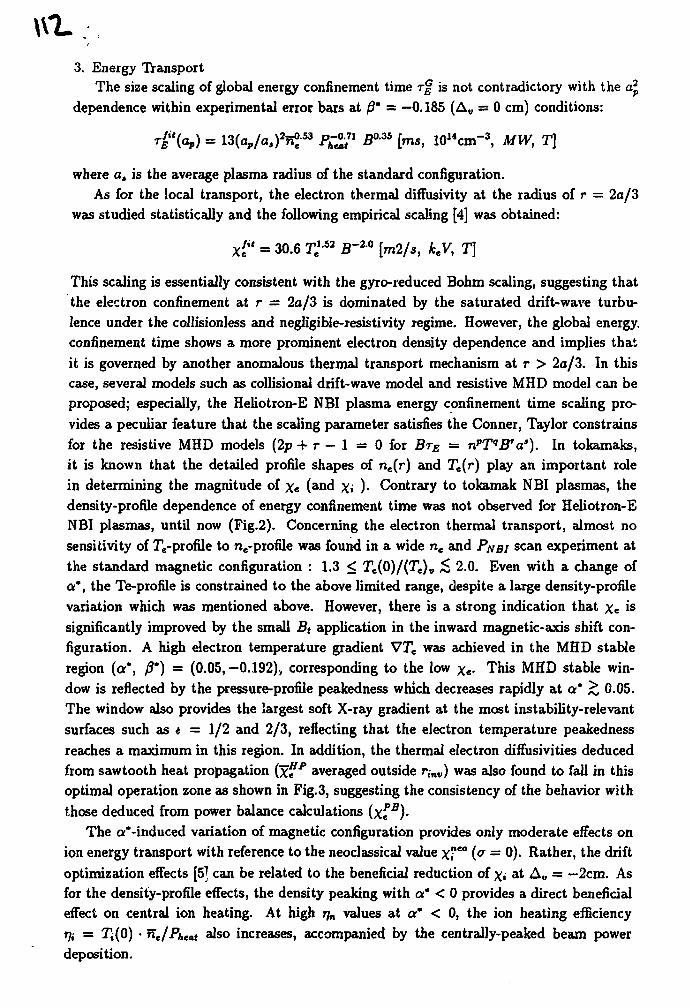
3. Energy TransportThe size scaling of global energy confinement time r% is not contradictory with the of,
dependence within experimental error bars at /?* = —0.185 (Av = 0 cm) conditions:
T^inJS — 1*Un In ^ 2 n° M p -O" DO.35 fm_ i / )H f m -3 MW TlE \^P/ ^~ ^^^'"p/ J/ *e A*iii L i v i l l i j iKi p r j J. i
where a, is the average plasma radius of the standard configuration.As for the local transport, the electron thermal diffusivity at the radius of r = 2a/3
was studied statistically and the following empirical scaling [4] was obtained:
X*' = 30.6 T.1-53 B-20 [m2/s, keV, T\
This scaling is essentially consistent with the gyro-reduced Bohm scaling, suggesting thatthe electron confinement at r = 2a/3 is dominated by the saturated drift-wave turbu-lence under the collisionless and negligible-resistivity regime. However, the global energy,confinement time shows a more prominent electron density dependence and implies thatit is governed by another anomalous thermal transport mechanism at r > 2a/3. In thiscase, several models such as collisional drift-wave model and resistive MHD model can beproposed,' especially, the Heliotron-E NBI plasma energy confinement time scaling pro-vides a peculiar feature that the scaling parameter satisfies the Conner, Taylor constrainsfor the resistive MHD models {2p + r - 1 = 0 for BTE = npTqBTa3). In tokamaks,it is known that the detailed profile shapes of nc(r) and Te(r) play an important rolein determining the magnitude of x« (and Xi )• Contrary to tokamak NBI plasmas, thedensity-profile dependence of energy confinement time was not observed for Heliotron-ENBI plasmas, until now (Fig.2). Concerning the electron thermal transport, almost nosensitivity of Te-profile to ne-profile was found in a wide ne and PNBI scan experiment atthe standard magnetic configuration : 1.3 < Te(0)/(Te)v £ 2.0. Even with a change ofa", the Te-profile is constrained to the above limited range, despite a large density-profilevariation which was mentioned above. However, there is a strong indication that x« issignificantly improved by the small Bt application in the inward magnetic-axis shift con-figuration. A high electron temperature gradient VTe was achieved in the MHD stableregion (a*, /?*) = (0.05,-0.192), corresponding to the low xe- This MHD stable win-dow is reflected by the pressure-profile peakedness which decreases rapidly at a* £ 0.05.The window also provides the largest soft X-ray gradient at the most instability-relevantsurfaces such as e = 1/2 and 2/3, reflecting that the electron temperature peakednessreaches a maximum in this region. In addition, the thermal electron diffusivities deducedfrom sawtooth heat propagation (x~{?p averaged outside rinv) was also found to fall in thisoptimal operation zone as shown in Fig.3, suggesting the consistency of the behavior withthose deduced from power balance calculations (xPB)-
The a*-induced variation of magnetic configuration provides only moderate effects onion energy transport with reference to the neoclassical value x"eo {? = 0). Rather, the driftoptimization effects [5] can be related to the beneficial reduction of xv at A« = —2cm. Asfor the density-profile effects, the density peaking with a' < 0 provides a direct beneficialeffect on central ion heating. At high rjn values at or* < 0, the ion heating efficiency*7i = ^t(0) * ne/Phcat also increases, accompanied by the centrally-peaked beam powerdeposition.
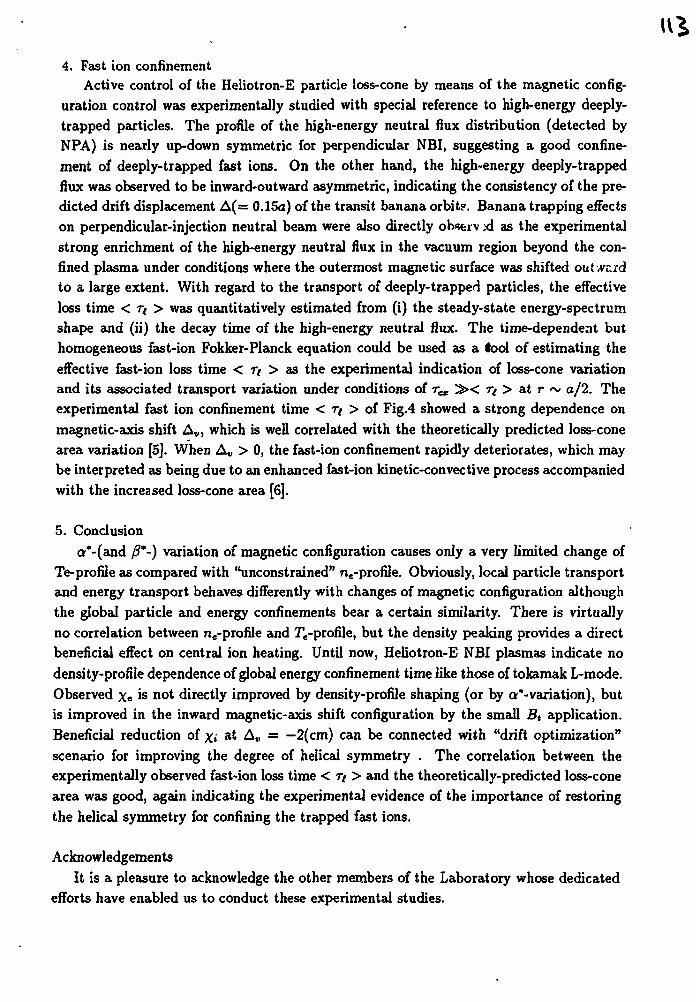
4. Fast ion confinementActive control of the Heliotron-E particle loss-cone by means of the magnetic config-
uration control was experimentally studied with special reference to high-energy deeply-trapped particles. The profile of the high-energy neutral flux distribution (detected byNPA) is nearly up-down symmetric for perpendicular NBI, suggesting a good confine-ment of deeply-trapped fast ions. On the other hand, the high-energy deeply-trappedflux was observed to be inward-outward asymmetric, indicating the consistency of the pre-dicted drift displacement A(= 0.15a) of the transit banana orbits. Banana trapping effectson perpendicular-injection neutral beam were also directly observ :d as the experimentalstrong enrichment of the high-energy neutral flux in the vacuum region beyond the con-fined plasma under conditions where the outermost magnetic surface was shifted out wcrdto a large extent. With regard to the transport of deeply-trapped particles, the effectiveloss time < r< > was quantitatively estimated from (i) the steady-state energy-spectrumshape and (ii) the decay time of the high-energy neutral flux. The time-dependent buthomogeneous fast-ion Fokker-Planck equation could be used as a tool of estimating theeffective fast-ion loss time < T/ > as the experimental indication of loss-cone variationand its associated transport variation under conditions of r^ S>< r > at r ~ a/2. Theexperimental fast ion confinement time < rt > of Fig.4 showed a strong dependence onmagnetic-axis shift Av, which is well correlated with the theoretically predicted loss-conearea variation [5]. When Av > 0, the fast-ion confinement rapidly deteriorates, which maybe interpreted as being due to an enhanced fast-ion kinetic-convective process accompaniedwith the increased loss-cone area [6].
5. Conclusiona*-(and /?*-) variation of magnetic configuration causes only a very limited change of
Te-profile as compared with "unconstrained" ne-profile. Obviously, local particle transportand energy transport behaves differently with changes of magnetic configuration althoughthe global particle and energy confinements bear a certain similarity. There is virtuallyno correlation between ne-profile and Te-profile, but the density peaking provides a directbeneficial effect on central ion heating. Until now, Heliotron-E NBI plasmas indicate nodensity-profile dependence of global energy confinement time like those of tokamak L-mode.Observed x« is not directly improved by density-profile shaping (or by a*-variation), butis improved in the inward magnetic-axis shift configuration by the small Bt application.Beneficial reduction of Xi at A« = —2(cm) can be connected with "drift optimization"scenario for improving the degree of helical symmetry . The correlation between theexperimentally observed fast-ion loss time < rt> and the theoretically-predicted loss-conearea was good, again indicating the experimental evidence of the importance of restoringthe helical symmetry for confining the trapped fast ions.
AcknowledgementsIt is a pleasure to acknowledge the other members of the Laboratory whose dedicated
efforts have enabled us to conduct these experimental studies.
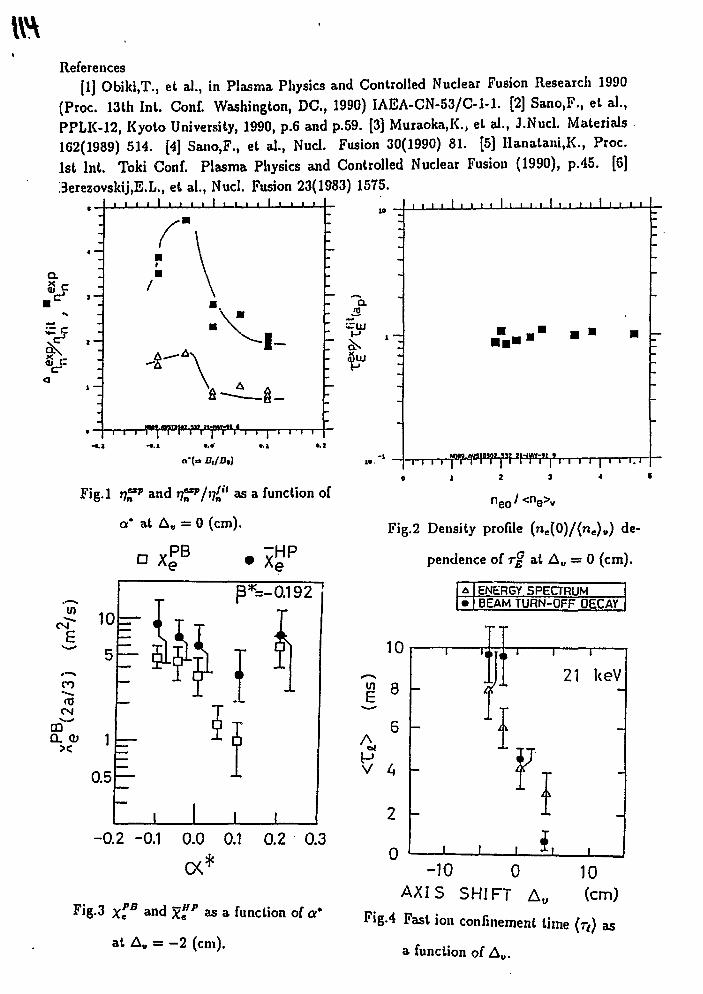
References[lj Obiki,T., et al., in Plasma Physics and Controlled Nuclear Fusion Research 1990
(Proc. 13th Int. Conf. Washington, DC, 1990) IAEA-CN-53/C-1-1. [2] Sano.F., et al.,PPLK-12, Kyoto University, 1990, p.6 and p.59. [3] Muraoka,K., et al., J.Nucl. Materials162(1989) 514. [4] Sano,F., et al., Nucl. Fusion 30(1990) 81. [5] Hanatani.K., Proc.1st Int. Toki Conf. Plasma Physics and Controlled Nuclear Fusion (1990), p.45. [6]Berezovskij,E.L., et al., Nucl. Fusion 23(1983) 1575.
I i i I _ I I i i i i I i i i i I . . . i l l • i i I i i i i I i i i • I i i i
t.i *.t
a'(= O./J3,)
• • • •
• • • • •
r i i i i i
Fig.l rj^p and rtf'/rtf' as a function of
a' at Aw = 0 (cm).
neo/<ne>v
• XPB
cvi
Fig.2 Density profile (ne(0)/(ne)u) de-
pendence of T% at A« = 0 (cm).
ENERGY SPEaRUMBEAM TURN-OFF DECAY
-0.2 -0.1 0.0 0.1 0.2 0.3
a*
Fig-3 xlB and £** as a function of a*
at Av = - 2 (cm).
-10 0 10
AXIS SHIFT Av (cm)
Fig.4 Fast ion confinement lime fa) as
a function of Ao.
CONFIGURATION CONTROL AND MODULATIONEXPERIMENTS USING LONG-PULSE ECH DISCHARGES INTHE ATF TORSATRON*
W. R. Wing, L. R. Baylor, T. S. Bigelow, R. J. Colchin, T. C. Jemigan, M.Murakami, J. B. Wilgen, S. Aceto, J. D. Bell, B. A. Carreras, E. C. Crume,Jr., R. A. Dory, J. L. Dunlap, G. R. Dyer, A. C. England, J. C. Glowienka,G. R. Hanson, R. C. Isler, J. H. Harris, D. L. Hillis, S. Hiroe, H. C.Howe, D. P. Hutchinson, R. A. Langley, D. K. Lee, J. F. Lyon, C. H. Ma,M. A. Ochando, S. Morimoto, O. Motojima, S. Paul, D. A. Rasmussen, J.E. Simkins, C. E. Thomas, T. Uckan, K. L. Vander Sluis, M. R. Wade, J.Zielinski
Oak Ridge National Laboratory, Oak Ridge, Tennessee, USA
Configuration control and modulation experiments have been carried out inATF with 20-s discharges. The configuration control experiments haveincluded scans of plasma elongation and major radius, the modulationexperiments have included runs with a set of programmable error-field coilsand modulation of the vertical fields and gas feed rates.
ATF now has pulse durations up to 20 s at 0.95 T with 400 KW of ECHpower. These quasi-stationary discharges were produced with no specialefforts to condition the vacuum vessel (beyond normal gettering), yet showedno evidence for increasing impurity accumulation (based on impurity radiationand bolometric measurements) and proved to be very reproducible. Typicalline-averaged electron densities of 4 x lO1^ m"3 with central electrontemperatures of 1 keV were obtained.
Stationary discharges of this duration allow experiments of an entirely newtype. As an example, two discharges allowed a scan of the elongation K from1.4 to 2.4. The scan was performed with no change in the net linked flux andthus allowed a direct measurement of the change in the bootstrap current,which decreased from 3.5 kA to -1 kA with decreasing vertical elongation, inagreement with the variation in neoclassical viscosity produced by the varyingIB | spectra. This scan documented (and verified) behavior of the bootstrapcurrent, which had previously required several days of operation. Similarly,two discharges sufficed to scan RQ values from 2.03 m to 2.15 m. This
experiment confirmed the RQ optimization (= 2-cm inward shift), whichpreviously had required dozens of discharges. The result is consistent with amodel based on better confinement of helically trapped particles.
A 35 GHz gyrotron is being installed to permit second harmonic ECHoperation at 0.63 T. At this field, the achievable discharge duration shoulddouble. Using discharges such as these, it will be possible to measure theresponse in terms of plasma transport to a variety of periodic perturbationssuch as modulating the ECH power, gas feed, externally produced errorfields, and limiter bias and position. Plasma optimization then becomes astraightforward exercise.
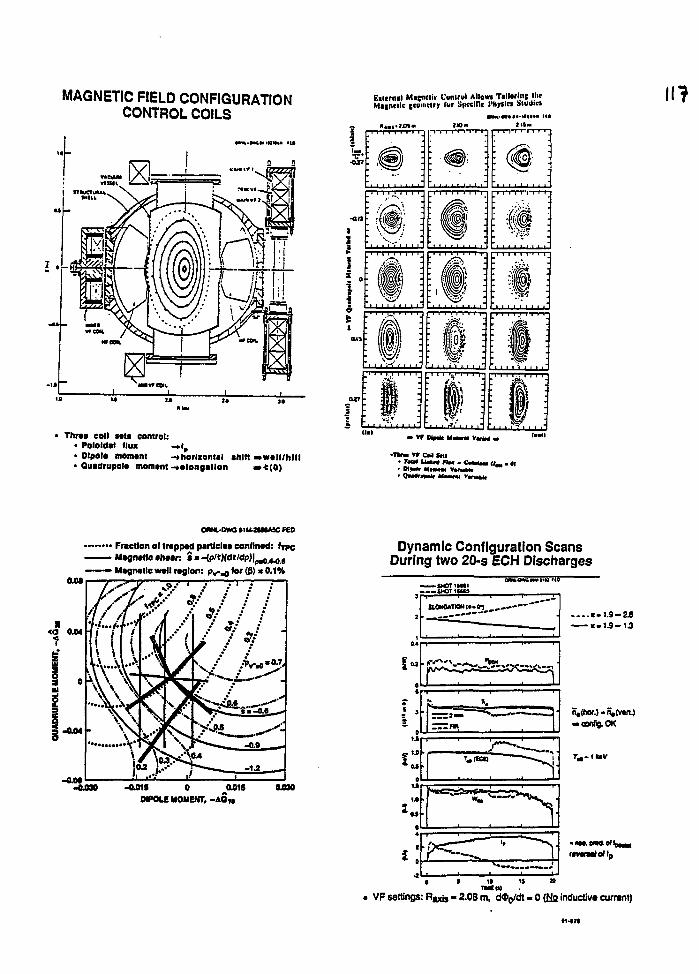
MAGNETIC FIELD CONFIGURATIONCONTROL COILS
• Thrat coll «tu control:• Pololdal flux -*lr• Dlpola monwnt -»ftorlxontal shift owtl l /hl l l• Quidrupol* moment-* elongation » * ( 0 )
Eilernil Mijnelii Cunlrul Allows Tailurluii Hit"•Jneiic iwueiry fur Simitlc l'H,.ici SluJIn ( IT
- vr vtrm H «
• Dlfrif H i m
onm-owo niuiMASc FED
• Fraction of trapped partlcltt confined: (TPC• Magnetic f hear: »*-(P/fMd*'<Jp)|()-).4<s
• Magnetic well region: p^- j for (0) a 0.1%
-O015 0 JUOM (L030
WPOLE MOMENT, - 4 0 1 f
Dynamic Configuration ScansDuring two 20-s ECH Discharges
— tHOTimi—--SMOTltMS
r " 0^
K.1.9-2JK-1.9-1J
n,(hOf.)-H,(vtrt.)
iwtraalollp
0 s w « »
VF settings: RMj , - 2.08 m, ditydt - 0 (Nfl inductive current)
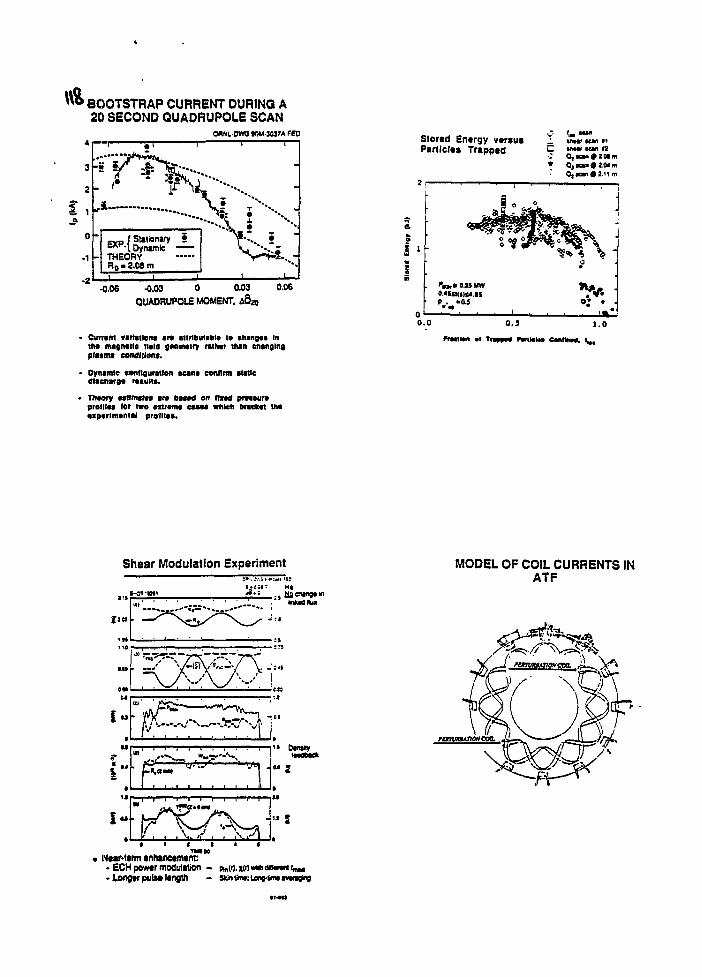
\\%800TSTRAP CURRENT DURING A20 SECOND QUADRUPOLE SCAN
OHNL0WO MM-3037A FED
- \ DynimieTHEORY
•2,08 m
•0.06 -0.03 0 0.03 0.06
QUADRUPOLE MOMENT. 4620
' Currant variation* ara attributable to changaa Inthe magnetic Held genriwtry rathar than changingplume condition*.
> Dynamic configuration ecana confirm atatlcdlacharga raaulta.
Ttieofy eatlfflataa ara bawd on flied praaauraprolllaa for two extreme caaee which bracket theeiperlmental profllaa.
Stored Energy versus 1 v«v KM •<Partfclts Trapped C •«••' •«•» «
0.0 0.5 1.0
rraomi «i Tnam ftnwira CMIIKIM. I,,.
Shear Modulation Experiment
t»<*
V1B
I "
. , * , — * ~ , .*•<
. • . \ . /,- • , iV s
<• DanMy
Neartem enhanetment:• ECH power modulation - &„«. x- i o n g t r pulse length - Skintiina:ient«naaviaging
MODEL OF COIL CURRENTS INATF
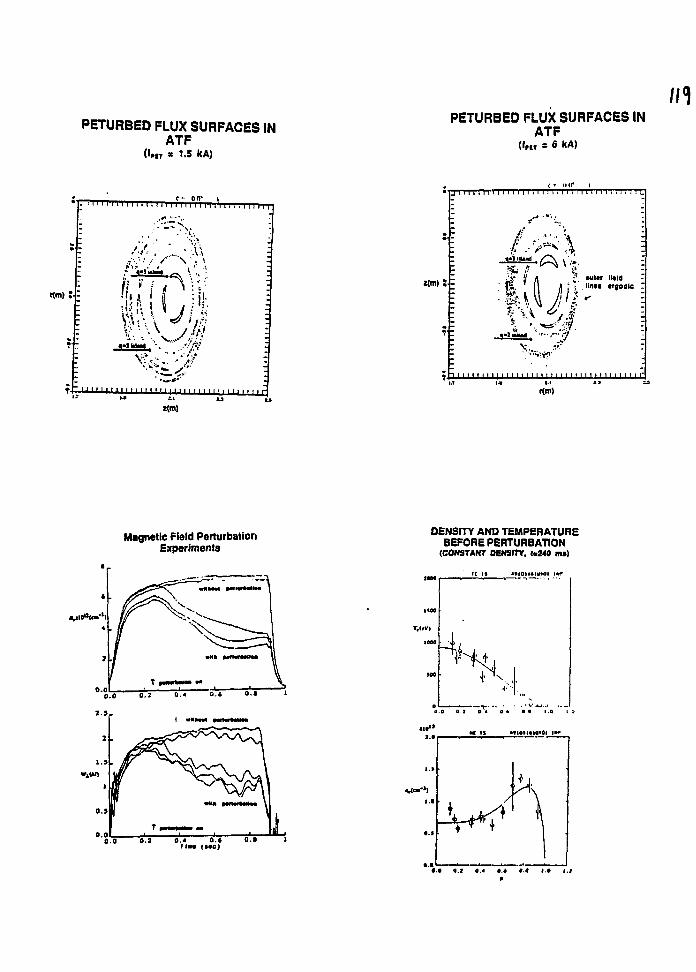
PETURBED FLUX SURFACES INATF
(I,,T x 1.5 kA)
PETURBED FLUX SURFACES INATF
(!„, = 6 kA)
rC-t
C " 0 0* II I I I I I I I I I I-
/37,V sv\
tiumt
J
Km)
1 i i i i ( i i i | i i i t i t i I i t t i t i t t i i I | i I i i i i i i i"
Magnetic Field PerturbationExperiments
DENSITY AND TEMPERATUREBEFORE PERTURBATION
(CONSTANT DENSITY, 1.240 mi)
tc is »»ioti»mvt>i i«i*
4
• I t "
w
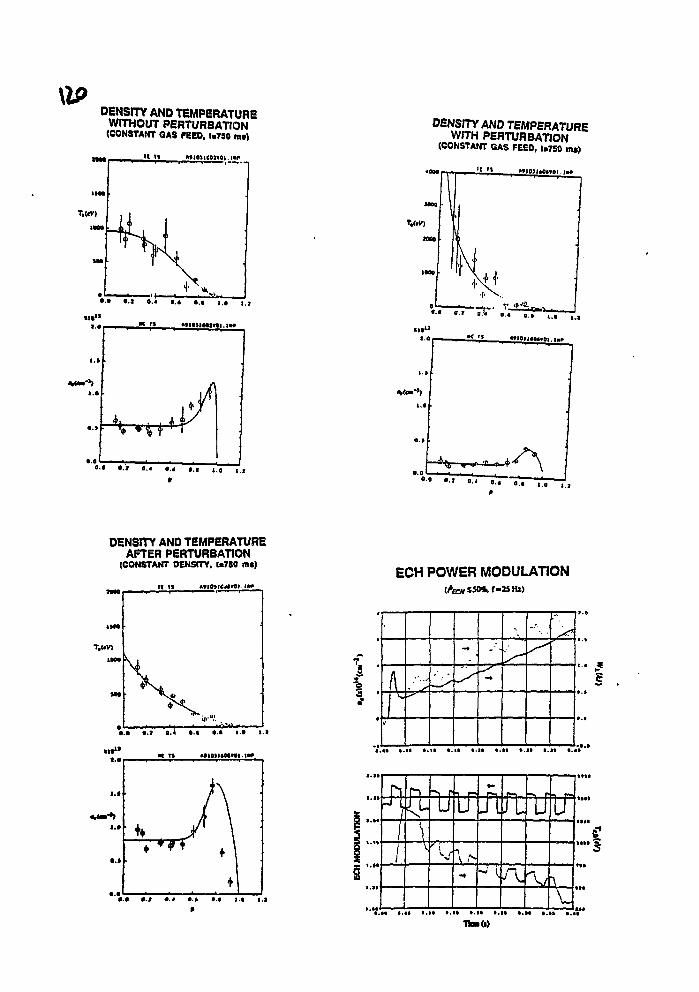
DENSITY AND TEMPERATUREWITHOUT PERTURBATION(CONSTANT GAS FEED, t.750 mt)
1IM
T.UC)
K H MIOUWfOI. tup
DENSITY AND TEMPERATUREWITH PERTURBATION
(CONSTANT GAS FEED, 1.750 RM)
• 1 0 "I
•««>"'»
'» «IH»I«»OI,
--•(-. T j S i *
.>» ^
oo o.i
DENSITY AND TEMPERATUREAFTER PERTURBATION
(CONSTANT DENSITY. U7S0 m«)ECH POWER MODULATION
i
I •s *hi
—*
•••» ».M • • ! • «•!» • • • • #<•• ».S« t.St •.«»
• • • • «.•» • . ! • • • • • t.t« • .»•
tftr
Ttatd)
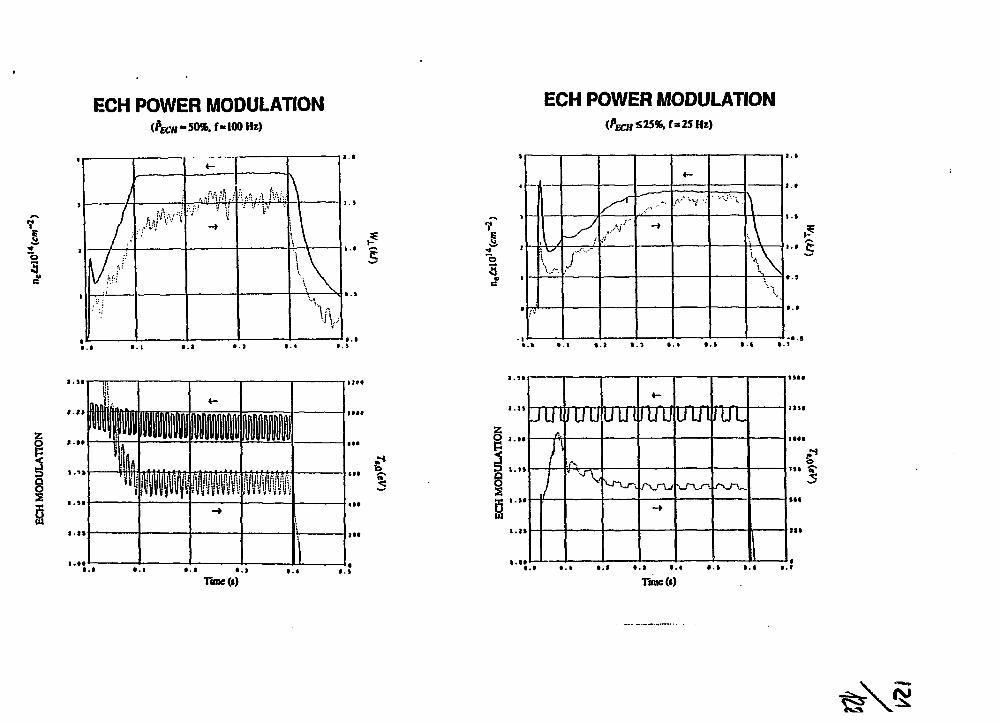
o3?
ECH POWER MODULATION(/>£CM-5O%,f*l0OHz)
1
4 -
,.MMJ,W v y
\
V I .
• I
ECH POWER MODULATION(/«£„, 525%. f*2S Hi)
V
i
I
f.N'
. ; • "
A—V '.' -••:j--\
\
A\\
.;-••
i
JUl
/
JUU
' 'A-
UUl JUU
- •
UUl JU'L
Timed) rune (i)
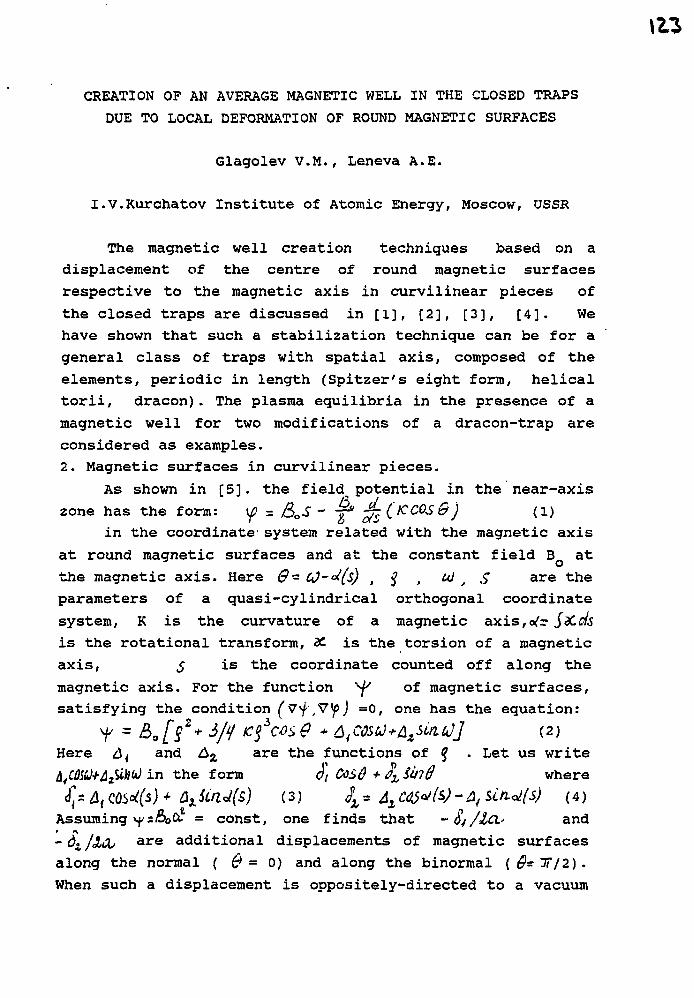
CREATION OF AN AVERAGE MAGNETIC WELL IN THE CLOSED TRAPS
DUE TO LOCAL DEFORMATION OF ROUND MAGNETIC SURFACES
Glagolev V.M., Leneva A.E.
I.V.Kurchatov Institute of Atomic Energy, Moscow, USSR
The magnetic well creation techniques based on a
displacement of the centre of round magnetic surfaces
respective to the magnetic axis in curvilinear pieces of
the closed traps are discussed in [1], [2], [3], [4]. We
have shown that such a stabilization technique can be for a
general class of traps with spatial axis, composed of the
elements, periodic in length (Spitzer's eight form, helical
torii, dracon). The plasma equilibria in the presence of a
magnetic well for two modifications of a dracon-trap are
considered as examples.
2. Magnetic surfaces in curvilinear pieces.
As shown in [5]. the field^potential in the near-axis
zone has the form: y? = &OS - y* ^(/CCOS^J (i)
in the coordinate- system related with the magnetic axis
at round magnetic surfaces and at the constant field B at
the magnetic axis. Here 0- CO-^(s) , $ } ui _, S a r e
parameters of a quasi-cylindrical orthogonal coordinate
system, K is the curvature of a magnetic axis,<^r Sdieis
is the rotational transform, X. is the torsion of a magnetic
axis, 5 is the coordinate counted off along the
magnetic axis. For the function ^f of magnetic surfaces,
satisfying the condition ("v*f,V J =0, one has the equation:2+ ift icfcos 9 * b^dsQ+b^LnLj] (2)= Bo[$
Here &{ and £ a are the functions of £ . Let us write
in the form <)) CosO + <%, &ld where
fa f ( * axiUlJ(s) (3) ^ = W°t(S) - A, Sitid(s) (4)Assuming Y 3 ^ ^ = const, one finds that - Ej/l(X> and
- dt /JLCU a r e additional displacements of magnetic surfaces
along the normal ( 0 = 0) and along the binormal ( 0- X/2) .
When such a displacement is oppositely-directed to a vacuum
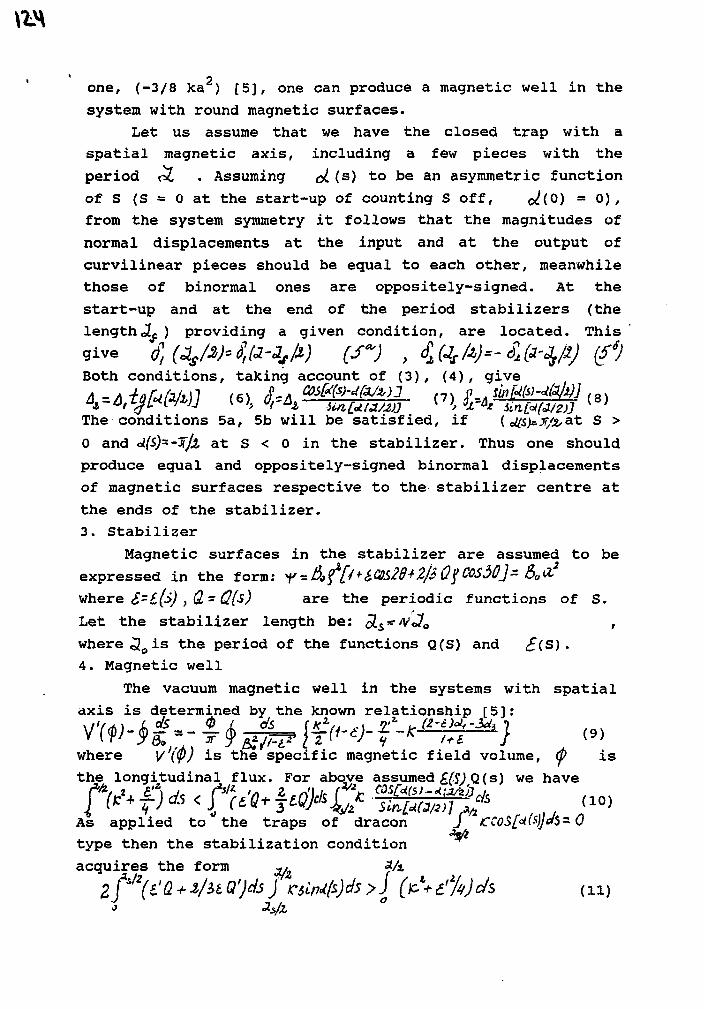
2
one, (-3/8 ka ) [5], one can produce a magnetic well in the
system with round magnetic surfaces.
Let us assume that we have the closed trap with a
spatial magnetic axis, including a few pieces with the
period o£ . Assuming oi (s) to be an asymmetric function
of S (S = 0 at the start-up of counting S off, cx!(O) = 0) ,
from the system symmetry it follows that the magnitudes of
normal displacements at the input and at the output of
curvilinear pieces should be equal to each other, meanwhile
those of binormal ones are oppositely-signed. At the
start-up and at the end of the period stabilizers (the
length J- ) providing a given condition, are located. This
give dlQ/tyfa-Offr) (SV ,£(+&)*-Zfr'^fiJ ?)Both conditions, taking account of (3), (4), give
The conditions 5a, 5b will be satisfied, if (c4s>.T/&at s >
0 and d(S)--3jjL at S < 0 in the stabilizer. Thus one should
produce equal and oppositely-signed binormal displacements
of magnetic surfaces respective to the stabilizer centre at
the ends of the stabilizer.
3. Stabilizer
Magnetic surfaces in the stabilizer are assumed to beexpressed in the form: Y = 3^i[^SCSS20^/3Ofd>s3Oj-6oCi2
where £~i(S) , Q, - Q(s) are the periodic functions of S.
Let the stabilizer length be: o£ssr/Vo70 ,
where ^ 0 i s the period of the functions Q(S) and <f(S).4. Magnetic well
The vacuum magnetic well in the systems with spatial
axis is determined by the known relationship [5]:
£ 1 ^ ft * 8 ^is determined by the known relat
-*£--1 j p ft*-* ?-V (Q) is the specific magnetiwhere V (Q) is the specific magnetic field volume, d> is
the longitudinal flux. For above assumed £(S) Q(s) we have
nfrHK;m8# ,.uAs applied to the traps of dracon J CCoS£ctis)]ai* 0
type then the stabilization condition
acquires the form j,
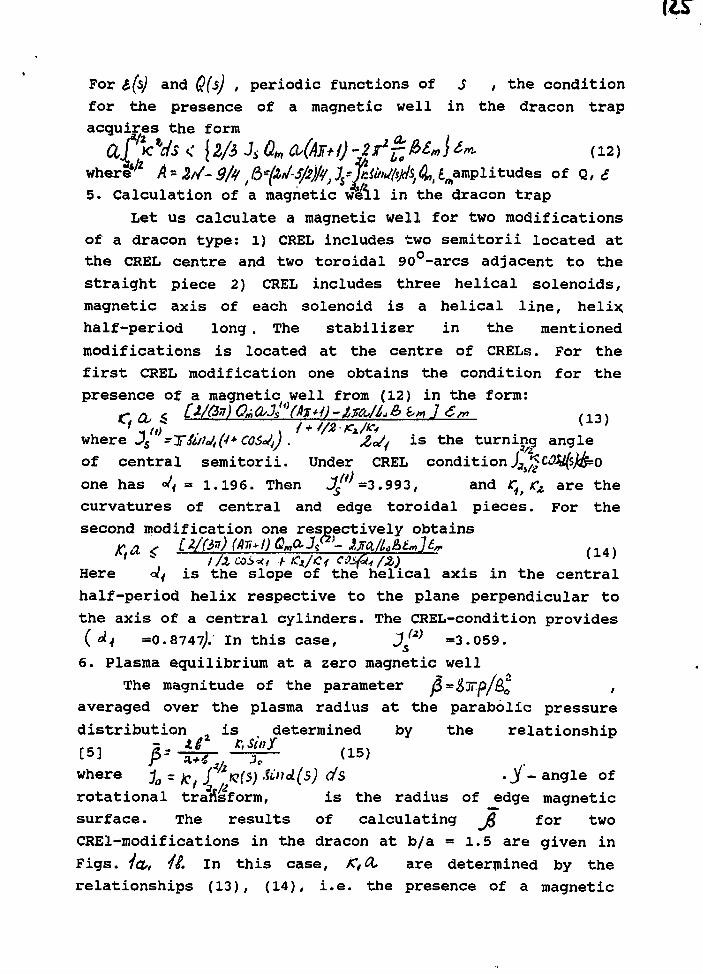
For &(s) and Q(s) , periodic functions of $ , the condition
for the presence of a magnetic well in the dracon trap
acquires the form
ar*eVs < {2/3 JsQmwhere*^ A = Zf/- 9/t/ / fcftt/S/JtJfr, JfjctbUMib, #,, amplitudes of Q, £5. Calculation of a magnetic well in the dracon trap
Let us calculate a magnetic well for two modifications
of a dracon type: 1) CREL includes two semitorii located at
the CREL centre and two toroidal 90°-arcs adjacent to the
straight piece 2) CREL includes three helical solenoids,
magnetic axis of each solenoid is a helical line, helix
half-period long . The stabilizer in the mentioned
modifications is located at the centre of CRELs. For the
first CREL modification one obtains the condition for the
presence of a magnetic well from (12) in the form:
C<%? . /+//*•*/*> (13)
where Js =TiuU4O* CQ$J4J . ZoJj is the turning angleof central semitorii. Under CREL condition J ^ ^ ^one has ° = 1.196. Then J^4'=3.992, and r^ rz are the
curvatures of central and edge toroidal pieces. For the
second modification one respectively obtains
1 ~ i/x co t / i f / )Here o/y is the slope of the helical axis in the central
half-period helix respective to the plane perpendicular to
the axis of a central cylinders. The CREL-condition provides
( J-4 =0.8747). I n t h i s c a se, jj2> =3.059.
6. Plasma equilibrium at a zero magnetic well
The magnitude of the parameter fi=&Tp/&Q ,
averaged over the plasma radius at the parabolic pressure
distribution is determined by the relationship
where jo r )C/ f/ztQ(S) SCnd(s) ds . j - angle of
t t i l t n f i th di f d i/ t
rotational transform, is the radius of edge magnetic
surface. The results of calculating J$ for two
CREl-modifications in the dracon at b/a = 1.5 are given in
Figs. /&, 4#. In this case, K,& are determined by the
relationships (13), (14), i.e. the presence of a magnetic
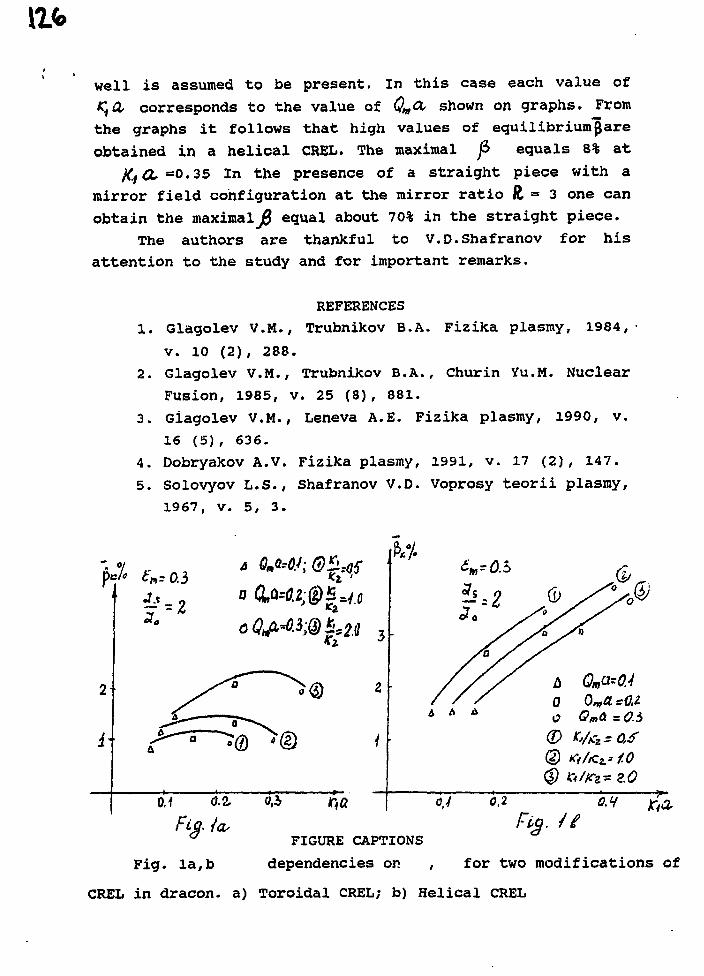
\Vo
well is assumed to be present. In this case each value of
K,d corresponds to the value of Qm<X shown on graphs. From
the graphs it follows that high values of equilibriurnjjare
obtained in a helical CREL. The maximal f> equals 8% at
X.fO* =0.35 In the presence of a straight piece with a
mirror field configuration at the mirror ratio R, = 3 one can
obtain the maximalfi equal about 70% in the straight piece.
The authors are thankful to V.D.Shafranov for his
attention to the study and for important remarks.
REFERENCES
1. Glagolev V.M., Trubnikov B.A. Fizika plasmy, 1984,
v. 10 (2), 288.
2. Glagolev V.M., Trubnikov B.A., Churin Yu.M. Nuclear
Fusion, 1985, V. 25 (8), 881.
3. Giagolev V.M., Leneva A.E. Fizika plasmy, 1990, v.
16 (5), 636.
4. Dobryakov A.V. Fizika plasmy, 1991, v. 17 (2), 147.
5. Solovyov L.S., Shafranov V.D. Voprosy teorii plasmy,
1967, V. 5, 3.
p4
o
Fit}- la,
0V; 0 W
A A
- 2.0
0,2
FIGURE CAPTIONS
Fig. la,b dependencies on , for two modifications of
CREL in dracon. a) Toroidal CREL; b) Helical CREL
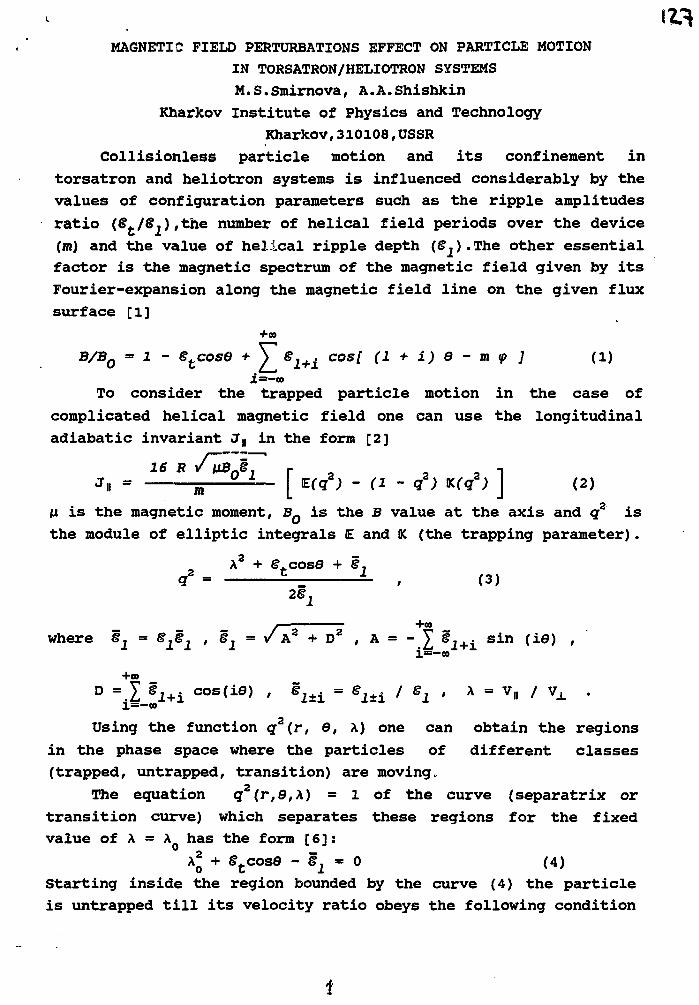
MAGNETIC FIELD PERTURBATIONS EFFECT ON PARTICLE MOTION
IN TORSATRON/HELIOTRON SYSTEMS
M.S.Smirnova, A.A.Shishkin
Kharkov Institute of Physics and Technology
Kharkov,310108,USSR
Collisionless particle motion and its confinement in
torsatron and heliotron systems is influenced considerably by the
values of configuration parameters such as the ripple amplitudes
ratio (&t/S1),the number of helical field periods over the device
(m) and the value of helical ripple depth (£j).The other essential
factor is the magnetic spectrum of the magnetic field given by its
Fourier-expansion along the magnetic field line on the given flux
surface [1]
+00
B/BQ = 1 - Stcose + y $1+i cos[ (1 + i) e - m <p ] (l)
£——»To consider the trapped particle motion in the case of
complicated helical magnetic field one can use the longitudinal
adiabatic invariant Jv in the form [2]
16 R ^ o 2 r ,^L [ ? J (2)
H is the magnetic moment, BQ is the B value at the axis and g2 is
the module of elliptic integrals £ and DC (the trapping parameter).
X + @.cos0 + S.q = £-= , (3)
where f, = 8,8. , §7 = / A2 + D2 , A = - Y §... sin (i©) ,
Using the function <j2(r, ©, X) one can obtain the regions
in the phase space where the particles of different classes
(trapped, untrapped, transition) are moving,
The equation g2(r,0,X) = 1 of the curve (separatrix or
transition curve) which separates these regions for the fixed
value of X = X has the form [6]:. 2xz + e^cose - f, = o (4)
Starting inside the region bounded by the curve (4) the particle
is untrapped till its velocity ratio obeys the following condition
1
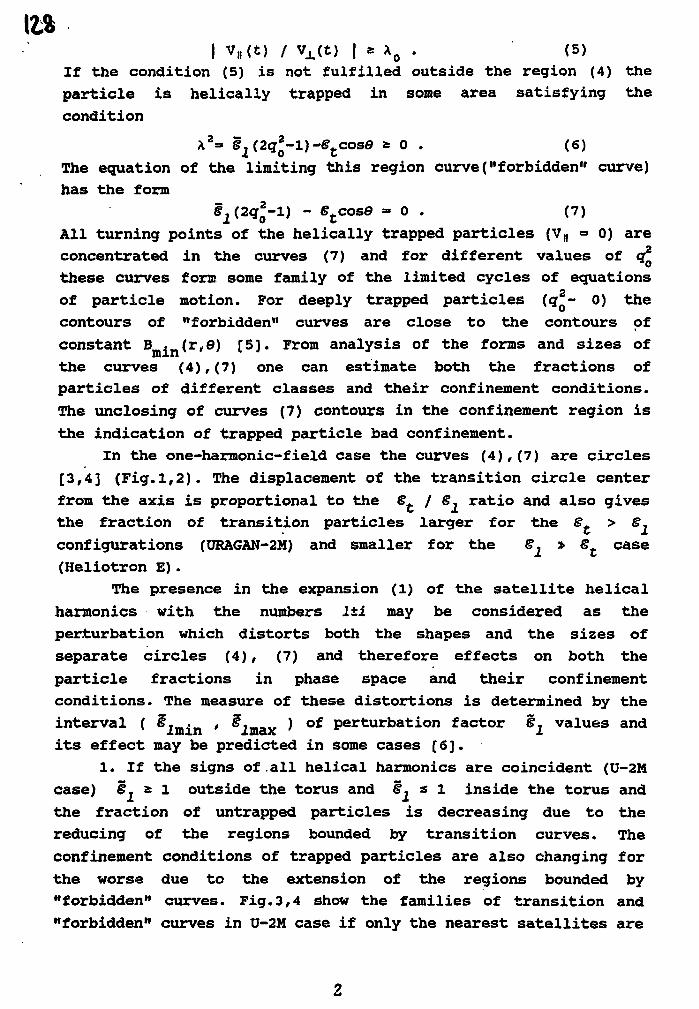
I * AQ . (5)If the condition (5) is not fulfilled outside the region (4) the
particle is helically trapped in some area satisfying the
condition
\2= f2(2qj-l)-etcos© a 0 . (6)2 j tThe equation of the limiting this region curve("forbidden" curve)
has the form
fj^gjj-l) - etcos© = 0 . (7)
All turning points of the helically trapped particles (VB = 0) are
concentrated in the curves (7) and for different values of g
these curves fora some family of the limited cycles of equations
of particle motion. For deeply trapped particles (<y|j~ 0) the
contours of "forbidden" curves are close to the contours of
constant B . (r,0) [5]. From analysis of the forms and sizes of
the curves (4),(7) one can estimate both the fractions of
particles of different classes and their confinement conditions.
The unclosing of curves (7) contours in the confinement region is
the indication of trapped particle bad confinement.
In the one-harmonic-field case the curves (4),(7) are circles
[3,4] (Fig.1,2). The displacement of the transition circle center
from the axis is proportional to the &t / S. ratio and also gives
the fraction of transition particles larger for the S > &.
configurations (URAGAN-2M) and smaller for the S^ » €£ case
(Heliotron E).
The presence in the expansion (l) of the satellite helical
harmonics with the numbers l±i may be considered as the
perturbation which distorts both the shapes and the sizes of
separate circles (4), (7) and therefore effects on both the
particle fractions in phase space and their confinement
conditions. The measure of these distortions is determined by the
interval ( min ' 2max ' o f P e r t u r b a t i o n factor 8^ values andits effect may be predicted in some cases [ 6 ].
1. If the signs of all helical harmonics are coincident (U-2M
case) S, s 1 outside the torus and ^ s l inside the torus and
the fraction of untrapped particles is decreasing due to the
reducing of the regions bounded by transition curves. The
confinement conditions of trapped particles are also changing for
the worse due to the extension of the regions bounded by
"forbidden" curves. Fig.3,4 show the families of transition and
"forbidden" curves in U-2M case if only the nearest satellites are
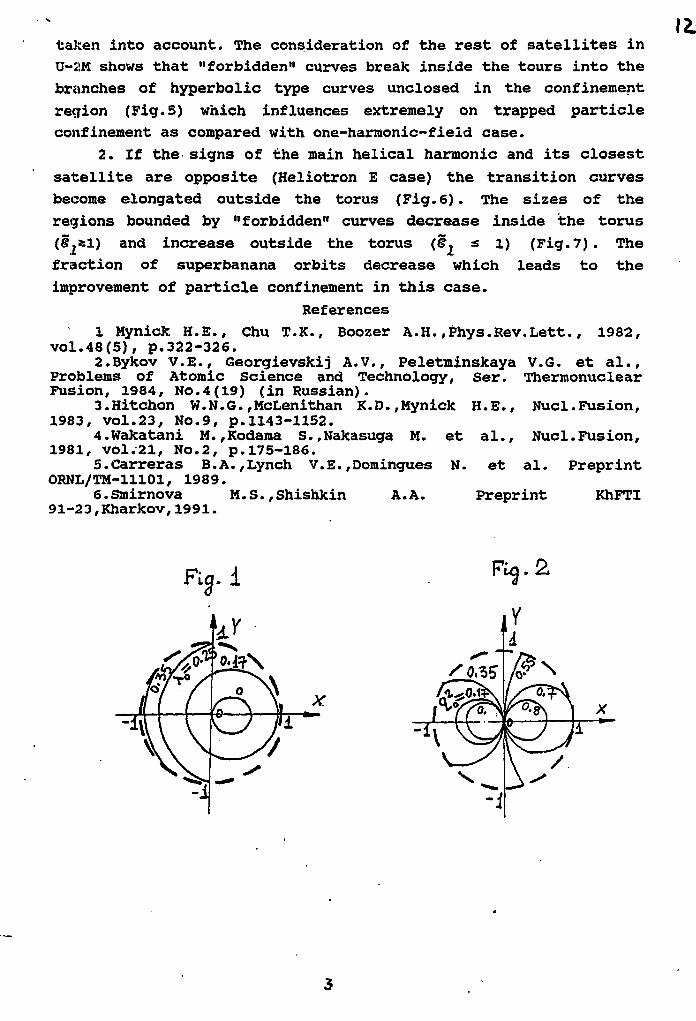
taken into account. The consideration of the rest of satellites in
U-2M shows that "forbidden" curves break inside the tours into the
branches of hyperbolic type curves unclosed in the confinement
region (Fig.5) which influences extremely on trapped particle
confinement as compared with one-harmonic-field case.
2. If the signs of the main helical harmonic and its closest
satellite are opposite (Heliotron E case) the transition curves
become elongated outside the torus (Fig.6). The sizes of the
regions bounded by "forbidden" curves decrease inside the torus
(ij&l) and increase outside the torus (S^ s i) (Fig.7). The
fraction of superbanana orbits decrease which leads to the
improvement of particle confinement in this case.
References
1 Mynick H.E., Chu T.K., Boozer A.H.,Phys.Rev.Lett., 1982,vol.48(5), p.322-326.
2.Bykov V.E., Georgievskij A.V., Peletminskaya V.G. et al.,Problems of Atomic Science and Technology, Ser. ThermonuclearFusion, 1984, No.4(19) (in Russian).
3.Hitchon W.N.G.,McLenithan K.0.,Mynick1983, VOl.23, NO.9, p.1143-1152.
4.Wakatani M.,Kodama S.,Nakasuga M. et1981, vol.21, No.2, p.175-186.
5.Carreras B.A.,Lynch V. E.,Oomingues N.ORNL/TM-11101, 1989.
6. Smirnova M.S., Shishkin A. A.91-23,Kharkov,1991.
H.E., Nucl.Fusion,
al., Nucl.Fusion,
et al. Preprint
Preprint KhFTI
Fig.l
-i
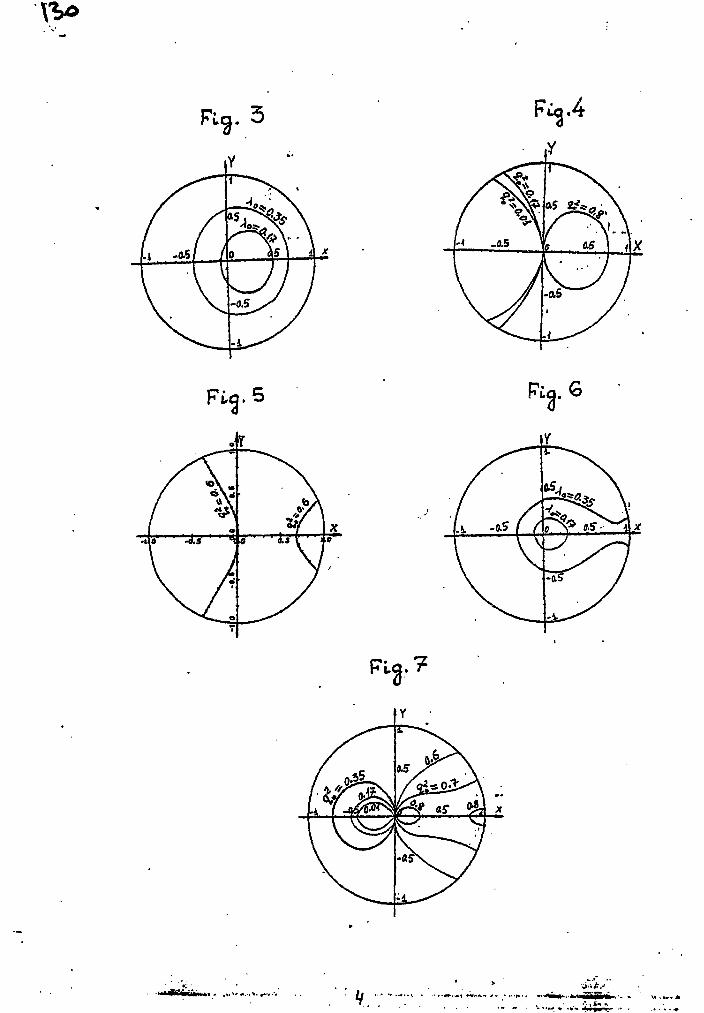
Fig. 3
.7-
> • • * . '
-- - v i .
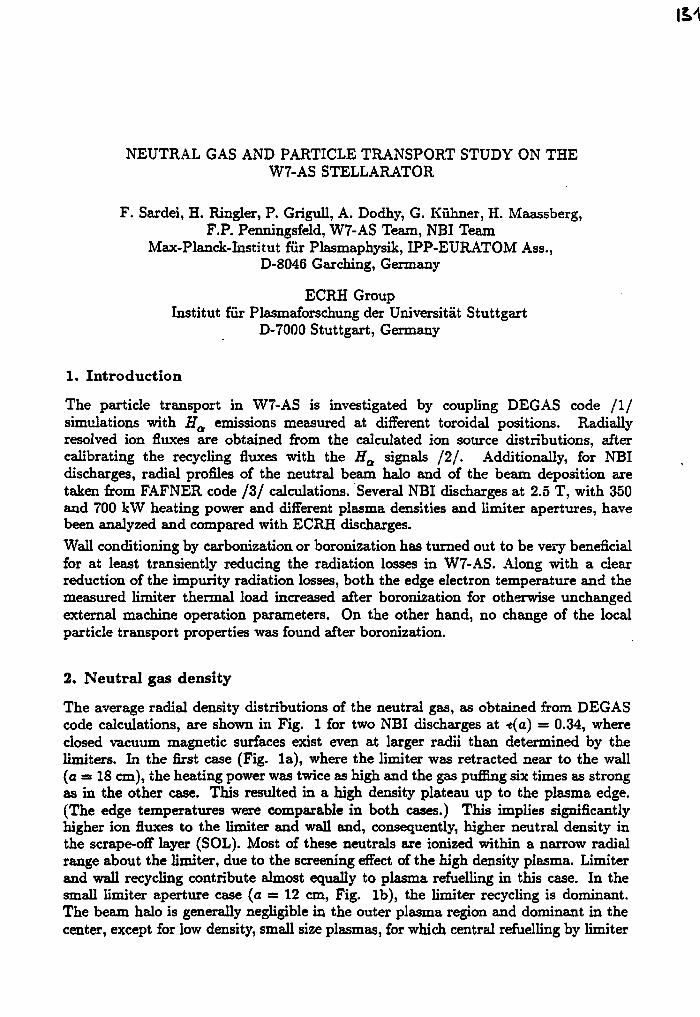
NEUTRAL GAS AND PARTICLE TRANSPORT STUDY ON THEW7-AS STELLARATOR
F. Sardei, H. Ringler, P. Grigull, A. Dodhy, G. Kuhner, H. Maassberg,F.P. Penningsfeld, W7-AS Team, NBI Team
Max-Planck-Institut fiir Plasmaphysik, IPP-EURATOM Ass.,D-8046 Garching, Germany
ECRH GroupInstitut fiir Plasmaforschung der Universitat Stuttgart
D-7000 Stuttgart, Germany
1. Introduction
The particle transport in W7-AS is investigated by coupling DEGAS code / I /simulations with Ha emissions measured at different toroidal positions. Radiallyresolved ion fluxes are obtained from the calculated ion source distributions, aftercalibrating the recycling fluxes with the Ha signals / 2 / . Additionally, for NBIdischarges, radial profiles of the neutral beam halo and of the beam deposition aretaken from FAFNER code / 3 / calculations. Several NBI discharges at 2.5 T, with 350and 700 kW heating power and different plasma densities and limiter apertures, havebeen analyzed and compared with ECRH discharges.
Wall conditioning by carbonization or boronization has turned out to be very beneficialfor at least transiently reducing the radiation losses in W7-AS. Along with a clearreduction of the impurity radiation losses, both the edge electron temperature and themeasured limiter thermal load increased after boronization for otherwise unchangedexternal machine operation parameters. On the other hand, no change of the localparticle transport properties was found after boronization.
2. Neutral gas density
The average radial density distributions of the neutral gas, as obtained from DEGAScode calculations, are shown in Fig. 1 for two NBI discharges at -t{a) = 0.34, whereclosed vacuum magnetic surfaces exist even at larger radii than determined by thelimiters. In the first case (Fig. la), where the limiter was retracted near to the wall(a = 13 cm), the heating power was twice as high and the gas puffing six times as strongas in the other case. This resulted in a high density plateau up to the plasma edge.(The edge temperatures were comparable in both cases.) This implies significantlyhigher ion fluxes to the limiter and wall and, consequently, higher neutral density inthe scrape-off layer (SOL). Most of these neutrals are ionized within a narrow radialrange about the limiter, due to the screening effect of the high density plasma. Limiterand wall recycling contribute almost equally to plasma refuelling in this case. In thesmall limiter aperture case (a = 12 cm, Fig. lb), the limiter recycling is dominant.The beam halo is generally negligible in the outer plasma region and dominant in thecenter, except for low density, small size plasmas, for which central refuelling by limiter
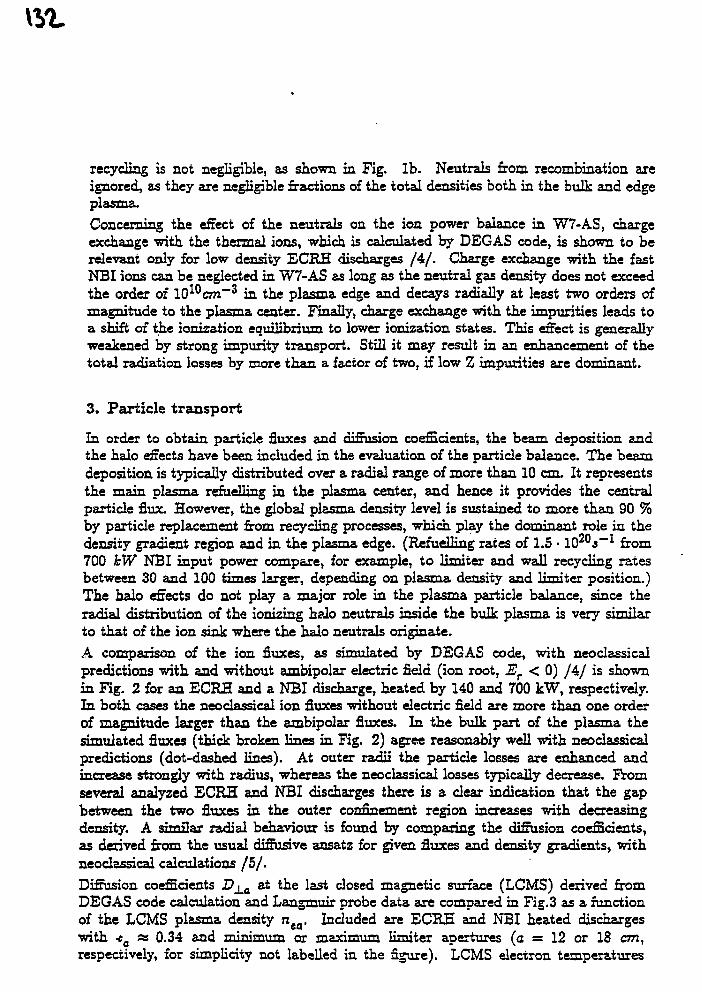
\YL
recycling is not negligible, as shown in Fig. lb. Neutrals from recombination axeignored, as they are negligible fractions of the total densities both in the bulk and edgeplasma.Concerning the effect of the neutrals on the ion power balance in W7-AS, chargeexchange with the thermal ions, which is calculated by DEGAS code, is shown to berelevant only for low density ECRH discharges /4 / . Charge exchange with the fastNBI ions can be neglected in W7-AS as long as the neutral gas density does not exceedthe order of 1010on~3 in the plasma edge and decays radially at least two orders ofmagnitude to the plasma center. Finally, charge exchange with the impurities leads toa shift of the ionization equilibrium to lower ionization states. This effect is generallyweakened by strong impurity transport. Still it may result in an enhancement of thetotal radiation losses by more than a factor of two, if low Z impurities are dominant.
3. Particle t ransport
In order to obtain particle fluxes and diffusion coefficients, the beam deposition andthe halo effects have been included in the evaluation of the particle balance. The beamdeposition is typically distributed over a radial range of more than 10 cm. It representsthe main plasma refuelling in the plasma center, and hence it provides the centralparticle flux. However, the global plasma density level is sustained to more than 90 %by particle replacement from recycling processes, which play the dominant role in thedensity gradient region and in the plasma edge. (Refuelling rates of 1.5 • 1 0 2 0 J - 1 from700 kW NBI input power compare, for example, to limiter and wall recycling ratesbetween 30 and 100 times larger, depending on plasma density and Hmiter position.)The halo effects do not play a major role in the plasma particle balance, since theradial distribution of the ionizing halo neutrals inside the bulk plasma is very similarto that of the ion sink where the halo neutrals originate.A comparison of the ion fluxes, as simulated by DEGAS code, with neoclassicalpredictions with and without ambipolar electric field (ion root, Er < 0) / 4 / is shownin Fig. 2 for an ECRH and a NBI discharge, heated by 140 and 700 kW, respectively.In both cases the neoclassical ion fluxes without electric field are more than one orderof magnitude larger than the ambipolar fluxes. In the bulk part of the plasma thesimulated fluxes (thick broken lines in Fig. 2) agree reasonably well with neoclassicalpredictions (dot-dashed lines). At outer radii the particle losses are enhanced andincrease strongly with radius, whereas the neoclassical losses typically decrease. Fromseveral analyzed ECRH and NBI discharges there is a clear indication that the gapbetween the two fluxes in the outer confinement region increases with decreasingdensity. A similar radial behaviour is found by comparing the diffusion coefncients,as derived from the usual diffusive ansatz for given fluxes and density gradients, withneoclassical calculations / 5 / .
Diffusion coefficients Dj_a at the last closed magnetic surface (LCMS) derived fromDEGAS code calculation and Langmuir probe data are compared in Fig.3 as a functionof the LCMS plasma density neQ. Included axe ECRH and NBI heated dischargeswith <0 « 0.34 and minimum or maximum limiter apertures (a = 12 or 18 cm,respectively, for simplicity not labelled in the figure). LCMS electron temperatures
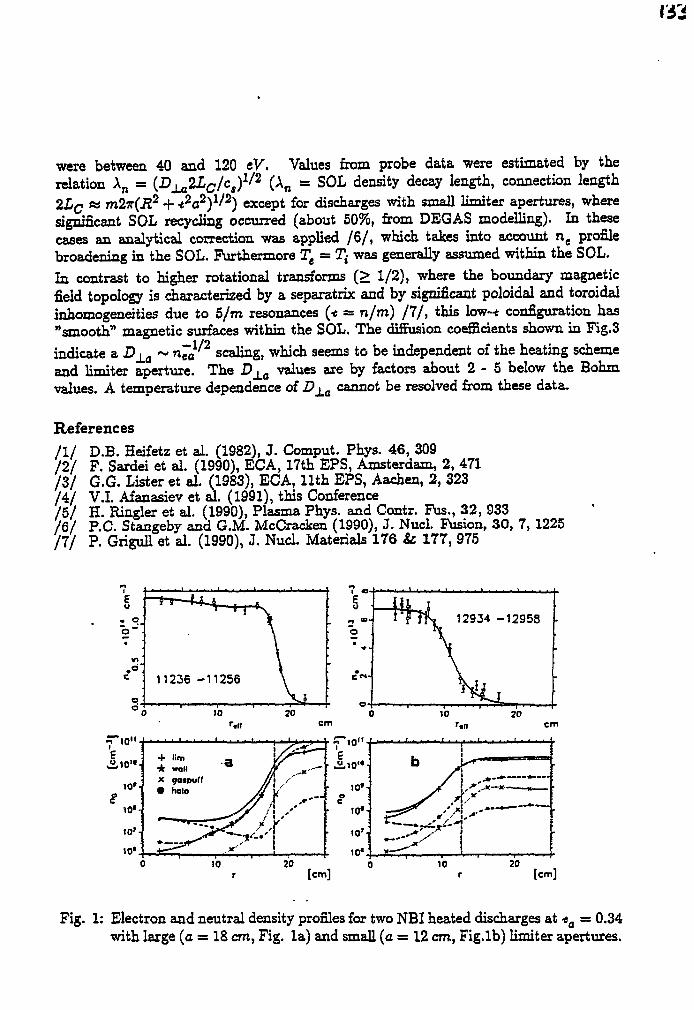
were between 40 and 120 tV. Values from probe data were estimated by therelation An = (Dj . a2l c /c s)
1 / 2 (An = SOL density decay length, connection length2LQ « m2x(R2 + •*2a2)1/'2) except for discharges with small limiter apertures, wheresignificant SOL recycling occurred (about 50%, from DEGAS modelling). In thesecases an analytical correction was applied /6 / , which takes into account ne profilebroadening in the SOL. Furthermore Te = T,- was generally assumed within the SOL.In contrast to higher rotational transforms (> 1/2), where the boundary magneticfield topology is characterized by a separatrix and by significant poloidal and toroidalinhomogeneities due to 5/m resonances (•* = n/m) /7 / , this low-* configuration has"smooth" magnetic surfaces within the SOL. The diffusion coefficients shown in Fig.3indicate a D, a ~ nJa scaling, which seems to be independent of the heating schemeand limiter aperture. The D±a values are by factors about 2 - 5 below the Bohmvalues. A temperature dependence of Dj_a cannot be resolved from these data.
References111 D.B. Heifetz et al. (1982), J. Comput. Phys. 46, 309/2 / F. Sardei et al. (1990), ECA, 17th EPS, Amsterdam, 2, 471/ 3 / G.G. Lister et al. (1983), ECA, 11th EPS, Aachen, 2, 323/ 4 / V.I. Afanasiev et al. (1991), this Conference/ 5 / H. Ringler et al. (1990), Plasma Phys. and Contr. Fus., 32, 933/ 6 / P.C. Stangeby and G.M. McCracken (1990), J. Nud. Fusion, 30, 7, 1225fll P. Grigull et al. (1990), J. Nucl. Materials 176 & 177, 975
+ lim* wollX gospufl• halo
[cm]
Fig. 1: Electron and neutral density profiles for two NBI heated discharges at «0 = 0.34with large (a = 18 cm, Fig. la) and small (a = 12 cm, Fig.lb) limiter apertures.
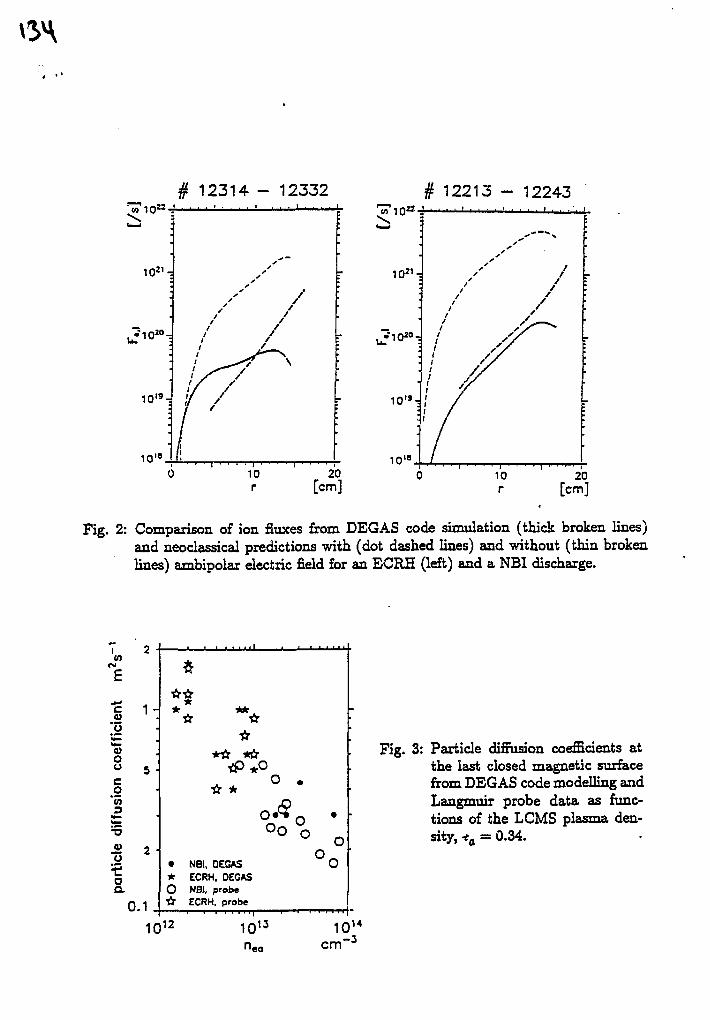
# 12314 - 12332 # 12213 - 12243i . . . . i
10
Fig. 2: Comparison of ion fluxes from DEGAS code simulation (thick broken lines)and neoclassical predictions with (dot dashed lines) and without (thin brokenlines) ambipolar electric field for an ECRH (left) and a NBI discharge.
</7
£
c
0)oo
o'«3
i i 2V"o'•5oa.
1 -
0.1
1 0 1 2
**
*tr
Oo
• NBI, DEGAS* ECRH, DEGASO NBI, probe•it ECRH. probe
Fig. 3: Particle diffusion coefficients atthe last closed magnetic surfacefrom DEGAS code modelling andLangmuir probe data as func-tions of the LCMS plasma den-sity, -t. - 0.34.
•ea
1014
cm" 3
8 t h Intern, workshop on stcllaralors, Kharkov, May 27-31, 1991
PROGRESS ON THE STELLARATOR WENDELSTEIN W 7AS
II. Renner, H. MaaBberg, II. Ringler, F. Sardei, A. Weller and the W 7AS-Team,
NBI-Team, ICRF-Group, PSI-GroupMax-Planck-Institut fur Plasmaphysik, Ass.-EURATOM-IPP, D-8046
Garching, Fed. Rep. of GermanyECRII-Group, Institut fiir Plasmaforschung, D-7000 Stuttgart, FRG
'V. Afanasiev", J. Baldzuhn, B. Bomba, R. Brakel, R. Burhenn, R. BGchse, G. Cattanei, A. Dodhy, D. Dorst, A. Eisner, M. Endler,K. Engclhardt, V. Erckmann, T. Estrada6, U. Gasparino, S. GeiDler, L. Giannone, G. Grieger, P. Grigull, H. Hacker, H.J. Hartfufl,C. Hidalgo6, D. Hildebrandtc, J. Hofcnann, A. Izvozchikov0, R. Jaenicke, J. Junker, F. Karger, M. Kick, K. Kondo*1, H. Kroiss, G. Kuhner,I. Lakicevic, A. Lazaros, H. Maaflberg, C. Mahn, K. Me Cormick, H. Niedermeyer, W. Ohlendorf, H. Renner, Ringler, N. Ruha,J. Sa/Fert, J. Sanchez6, F. Sardei, S. Saltier, F. Schneider, U. Schneider, G. Siller, U. Slroth, M. Tutter, F. Wagner . V/eller, H. WolIT5,E. Wursching, M. Zippe, S. Zopfel.2W. Ott, F.P. Penningsfeld, E. Speth.3M. Ballico, F. Hofmeister, J.M. Noterdaeme, F. Wcsner.4R. Behrisch, A. MartincUi, V. Prozesky, J. Roth, E. Taglauer.5W. Kasparek, G.A. Miiller, P.G. Schiiller, M. Thumra'"Ioffe Institute, Leningrad, USSR 6CIEMAT, Madrid, Spain eZrE Akademie der Wissenachaften, Berlin, GermanydPlasma Physics Laboratory, Kyoto University, Japan eKernforschungszentrum Karlsruhe, Germany
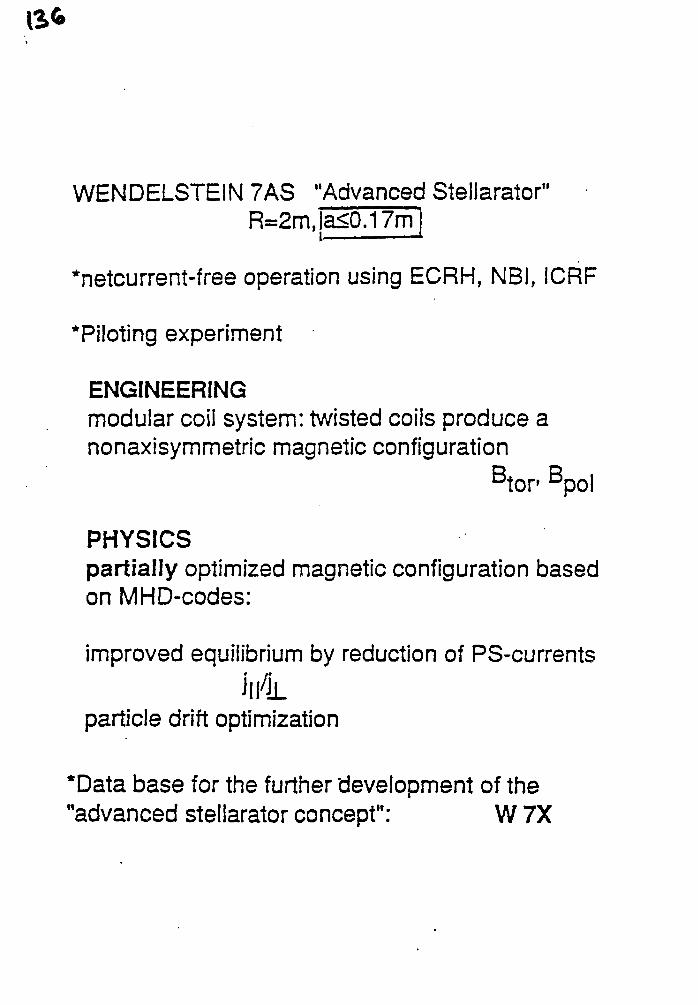
WENDELSTEIN 7AS "Advanced Steliarator"R=2m,la<0.17m
*netcurrent-free operation using ECRH, NBI, ICRF
*Piloting experiment
ENGINEERINGmodular coil system: twisted coils produce anonaxisymmetric magnetic configuration
B tor Bpol
PHYSICSpartially optimized magnetic configuration basedon MHD-codes:
improved equilibrium by reduction of PS-currents
particle drift optimization
*Data base for the further development of the"advanced stellarator concept": W 7X
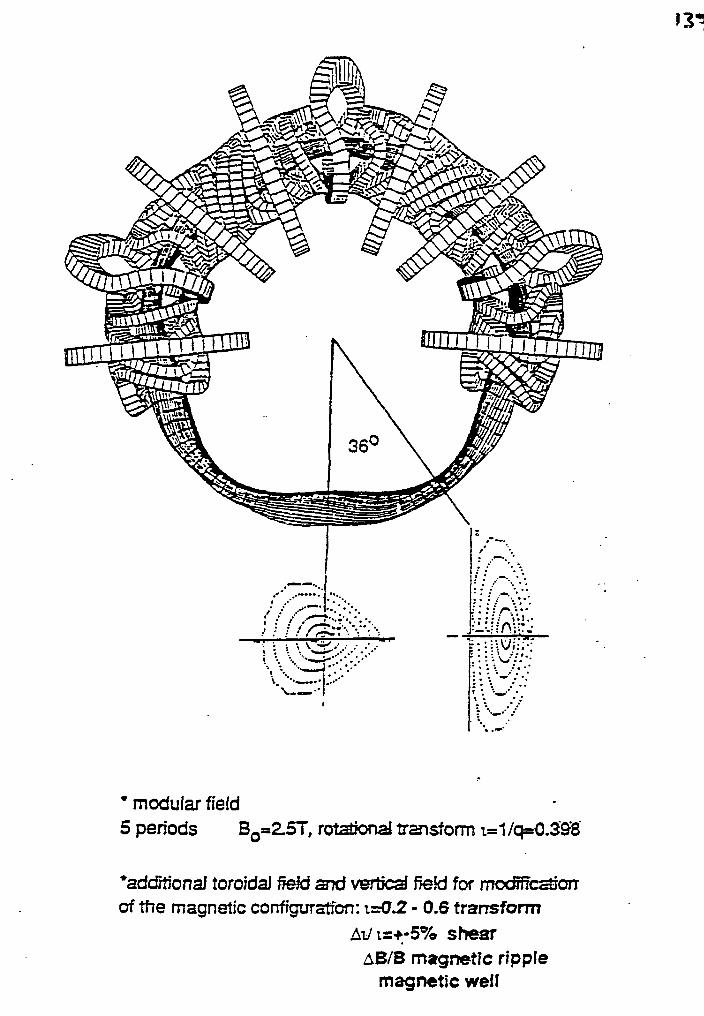
• modular field5 periods BO=2.5T, rotationai transform i=1/q«0.3'9B"
*additionai toroidal fieJd and verticai fiefd for mc<Sr?catroTrof the magnetic conffguratfon: t=0.2 - 0.6 transform
Ai/i=+-5% shearAB/B magnetic ripp\e
magnetic well
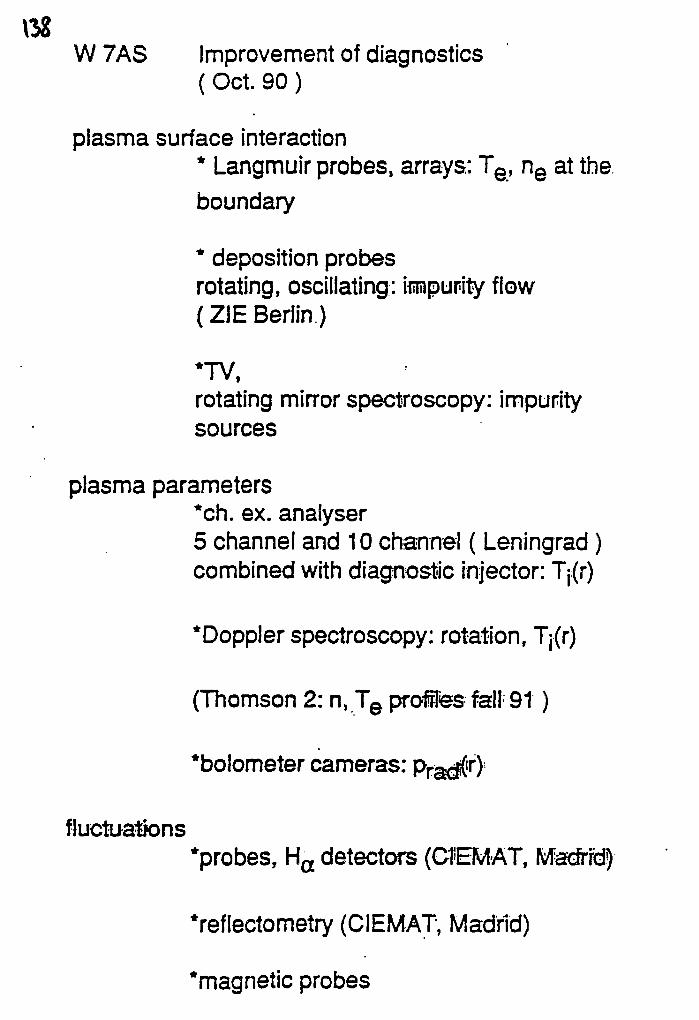
W 7AS Improvement of diagnostics(Oct. 90)
plasma surface interaction* Langmuir probes, arrays: Te, ne at the
boundary
* deposition probesrotating, oscillating: impunity flow(Z1E Berlin)
•TV,rotating mirror spectroscopy: impuritysources
plasma parameters*ch. ex. analyser5 channel and 10 channel ( Leningrad)
combined with diagnostic injector: Tj(r)
*Doppler spectroscopy: rotation, Tj(r)
(Thomson 2: n, T e praffes fall 91 )
•bolometer cameras:
fluctuations•probes, H a detectors (OIEMAT, Madrid!)
•reflectometry (CIEMAT, Madrid)
•magnetic probes
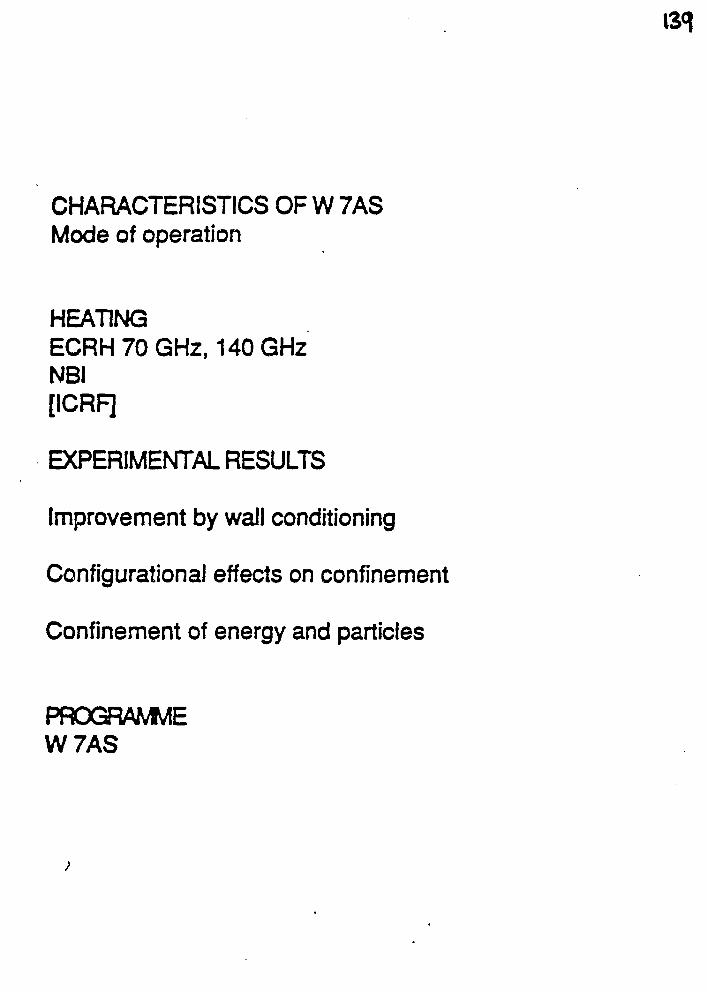
CHARACTERISTICS OF W 7ASMode of operation
HEATINGECRH70GHz,14QGHzNBI
[ICRF]
EXPERIMENTAL RESULTS
Improvement by wall conditioning
Configurational effects on confinement
Confinement of energy and particles
PROGRAMMEW7AS
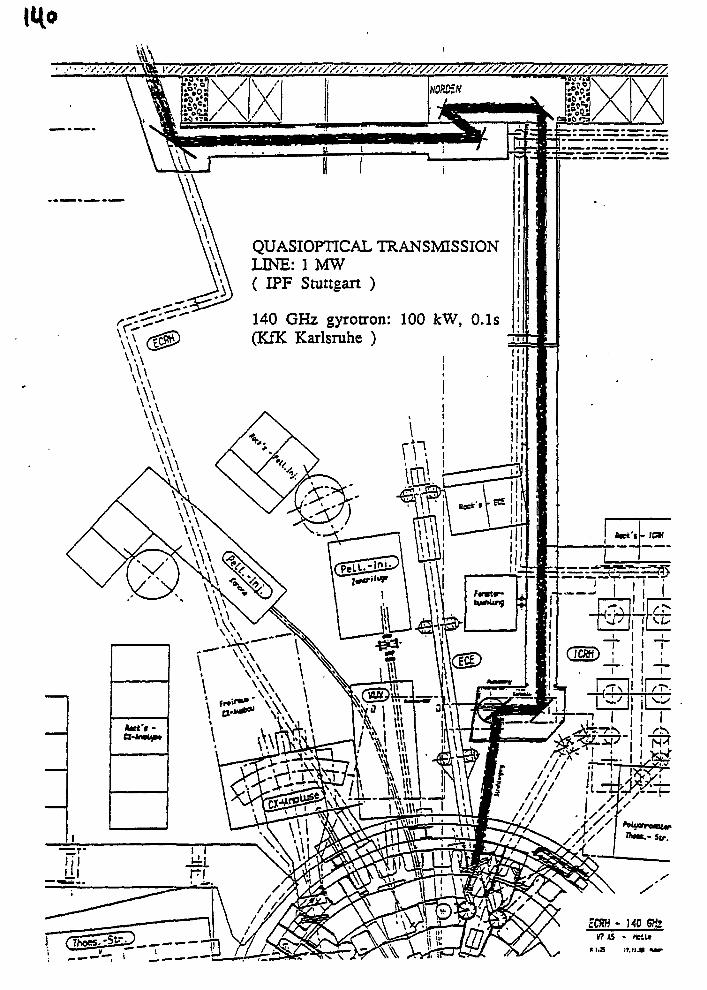
— T
LLI
QUASIOPTICAL TRANSMISSIONLINE: 1MW( IPF Stuttgart )
140 GHz gyrotron: 100 kW, 0.1s(KfK Karlsruhe )
1
tei'f -
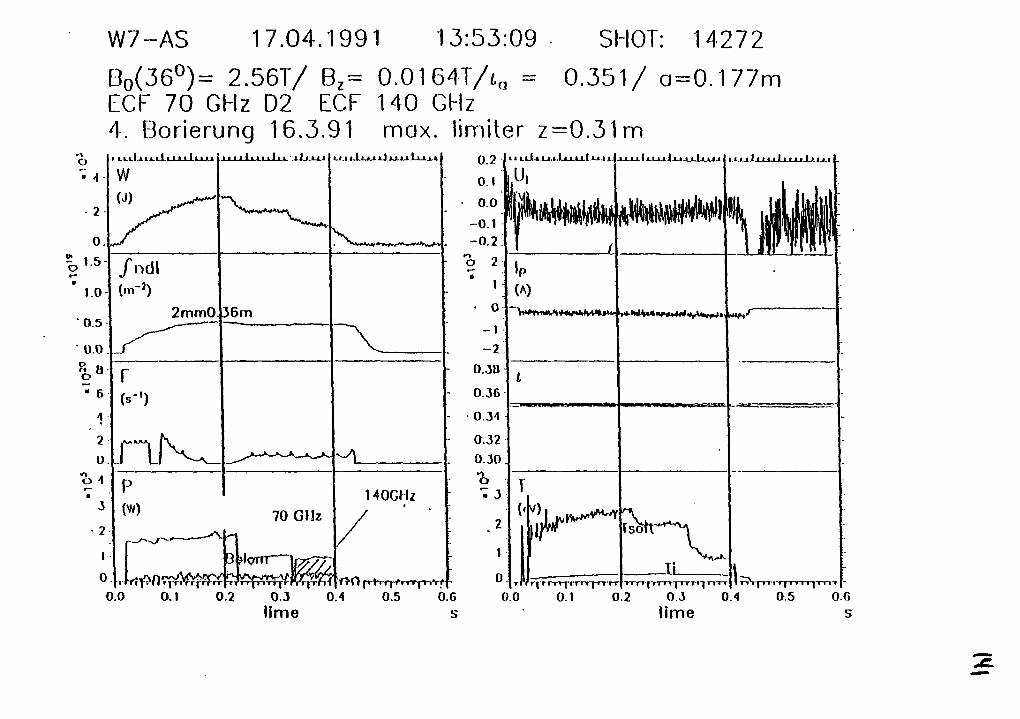
W7-AS 17.04.1991 13:53:09 SHOT: 14272
Bo(36°)= 2.56T/ Bz= 0.0164T/to - 0 .351/ a=0.177mECF 70 GHz D2 ECF 140 GHz4. Borierung 16.3.91 max. limiter z=0.31m
o
• 2
0.
JO
0.5
0.0
"" 6
4
20
m
3
2
I0
W
/ndl
2mm0 36m
r(••')
• 1 . . . . I . , , 1 . . , .
0
P(W)
0 0.1 0.2
70 GHz
I.II.I.Ii li.ii tli ixt-
HOGHz
0.2O.I0.0
-0.1-0.2b 2•
• 0
- I
-20.30
0.36
0.34
0.320.30*o
. 2
1
0.0 0.11111 il l»| I i rr|
0.2 0.3lime
l^rp0.4 0.5 0.0
s
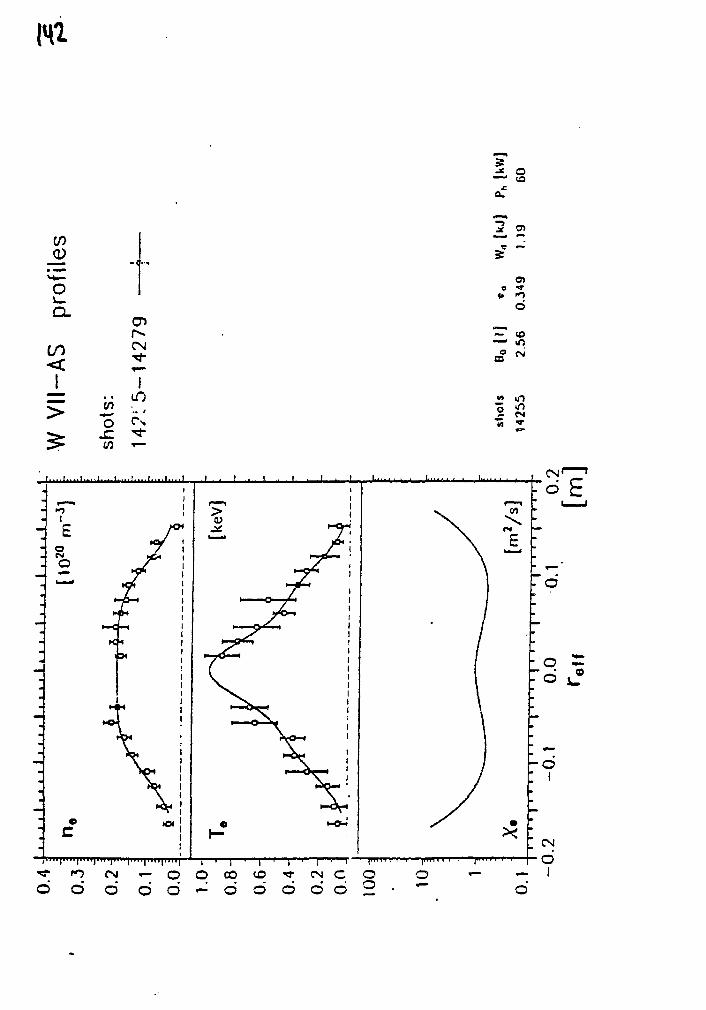
oID
oCL
CD
CN
o
zr to
CO •^~
1 . I I .
3o
0
I I . j . . - [ . l " - ' l " " l " " l I ' I ' I I I
- o
. o
-o =
-oI
CN
O O O O O ' - O O O O O ^^ o . —o — —
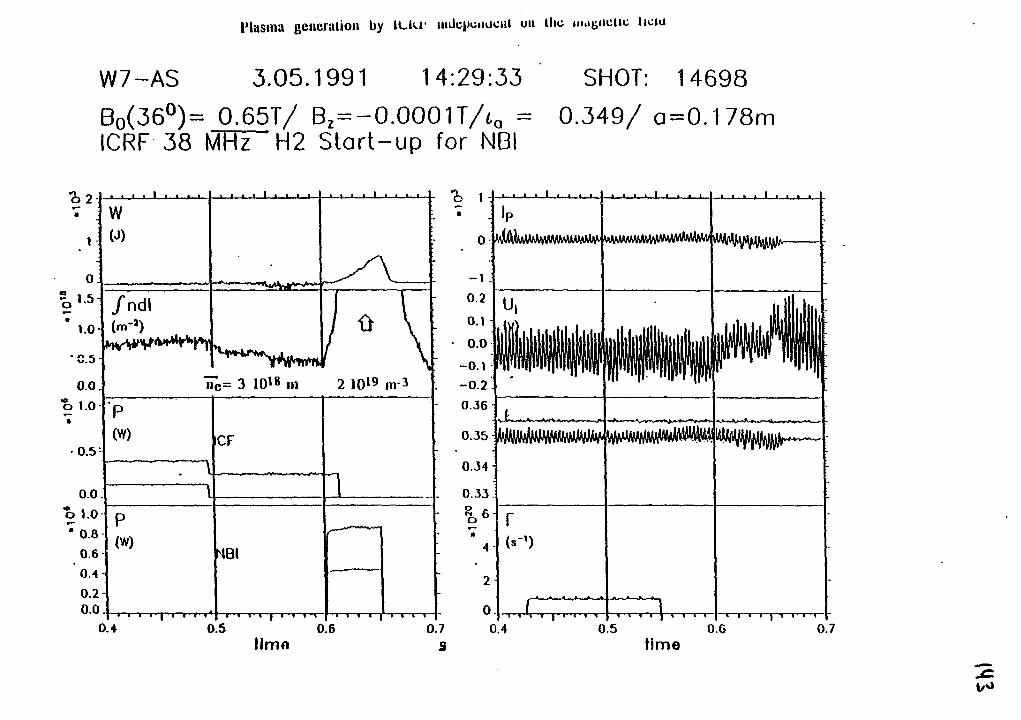
1'lasma generation by It-kr iiulqmuuciil on llic ma&iiciu; liciu
W7-AS 3.05.1991 14:29:33 SHOT: 14698
Bo(36°)= O65T/ B2=-O.OOO1T/6a = 0.349/ a=0.178mICRF 38 MHT~H2 Start-up for NB!
I
0 .
1.0
.5
0.0
"o).0
0.5
0.0
o 1.0# 0.8
0.6
OH
0.20.0
W(J)
/ndl
P(W)
(W)
0.4
^ ^ V r t ^ y
1 I I
5= 3 1018 in 2 10"9 in-3
CF
1BI
0.5
o 1-
0
-1
0 2
• • • • • f i t r
IP
u,
, . . . 1 . . . . 1 1 f 1 1 • 1 • •
II III.III.0.1
0.0
-0.1
llmo0.6 0.7
S0.4 0.5
time0.6 0.7
IHH
Parameter range
*ECF 70 GHz Te< 3 keV, Tj< 0.45 keV
v* ~ 10"3 ne< 51019 m'3 < n c u t .o f f
40ms
*NBi
Te - Tj ^ 0.5 keV
at 2.5 T: nR/B < 20 m'2 T'1, po< 1.6%,
30ms
*< B > exceeds 1 % at 1.25 T:limited by available power PJ J and radiative losses
*No major instabilities: soft X, ECE and magneticmeasurements indicate coherent MHD-modeswithout significant influence on the confinement
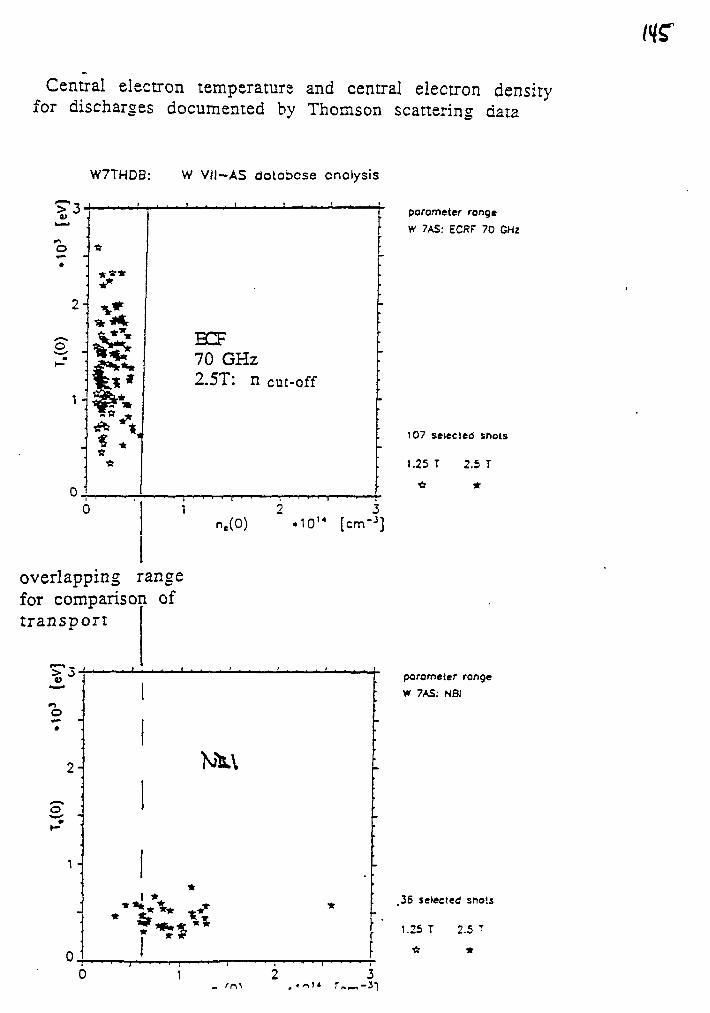
Central electron temperature and central electron densityfor discharges documented by Thomson scattering data
W7THDB: W VII-AS dotobose analysis
2 -
1 -
* * *
* * *BCF70 GHz2.5T: n cut-off
overlapping rangefor comparison oftransport
parameter range
W 7AS: ECRf 70 GHz
107 selected shots
t.25 T 2.5 T
•ft *
1 2 3ne(0) .10'4 [cm'3 ]
porometer range
W 7AS: NBI
.26 selected shots
5.25 T 2.5 T
•ft «
,. rr\\
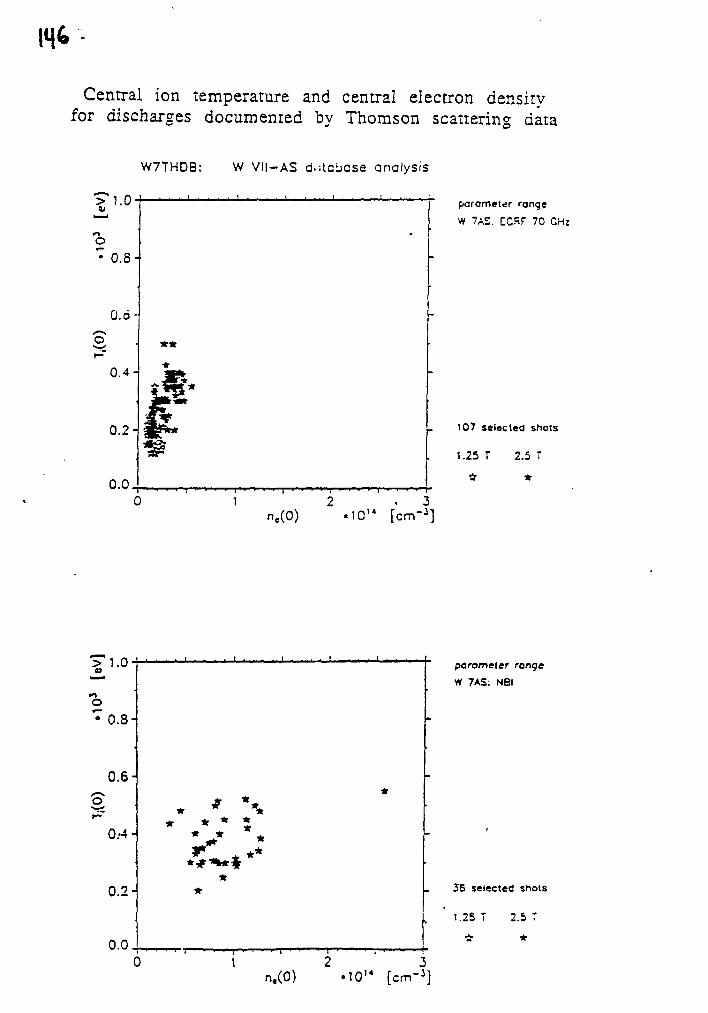
Central ion temperature and central electron densityfor discharges documented by Thomson scattering data
W7THDB: W VII-AS d-itabase analysis
porometer rongeW 7AS. ECfir 70 CH:
107 selected shots
1.25 2.5 T
0.0
parameter ronge
W 7AS: NBl
56 selected snots
1.25 T 2.5 T
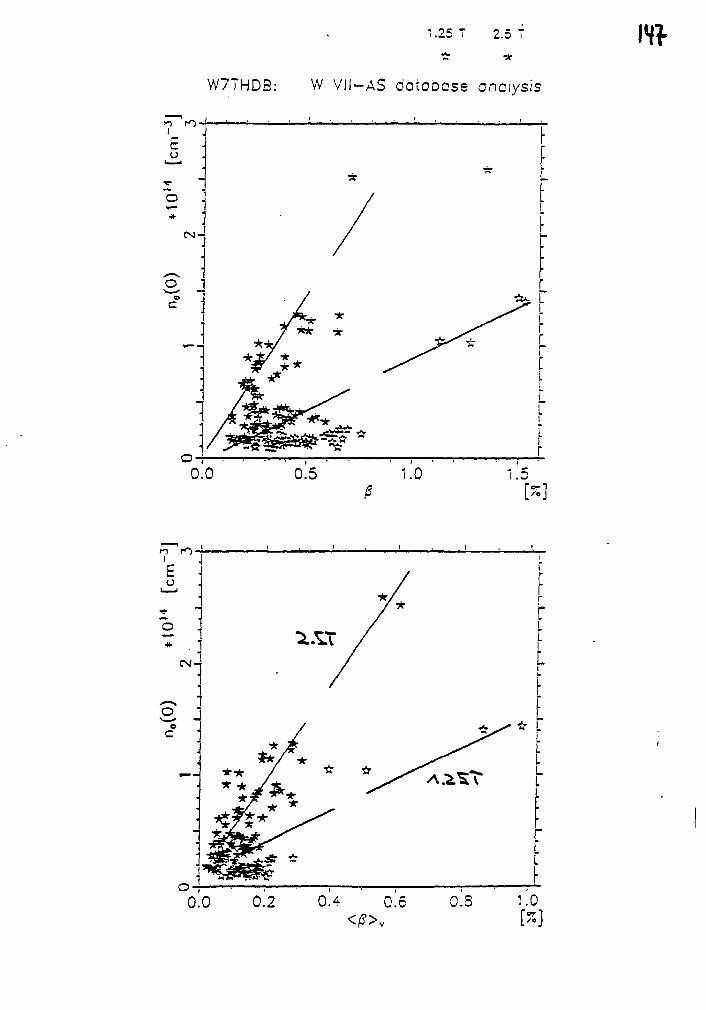
'..25 7 2.5 T
-a *
W7THDB: W VII—AS database analysis
O-j r
0.0 0.5 1.0 i .o
o*
cv r -
o
o -0.0 0.2 0.4 0.5
r
rr
1.0[55]
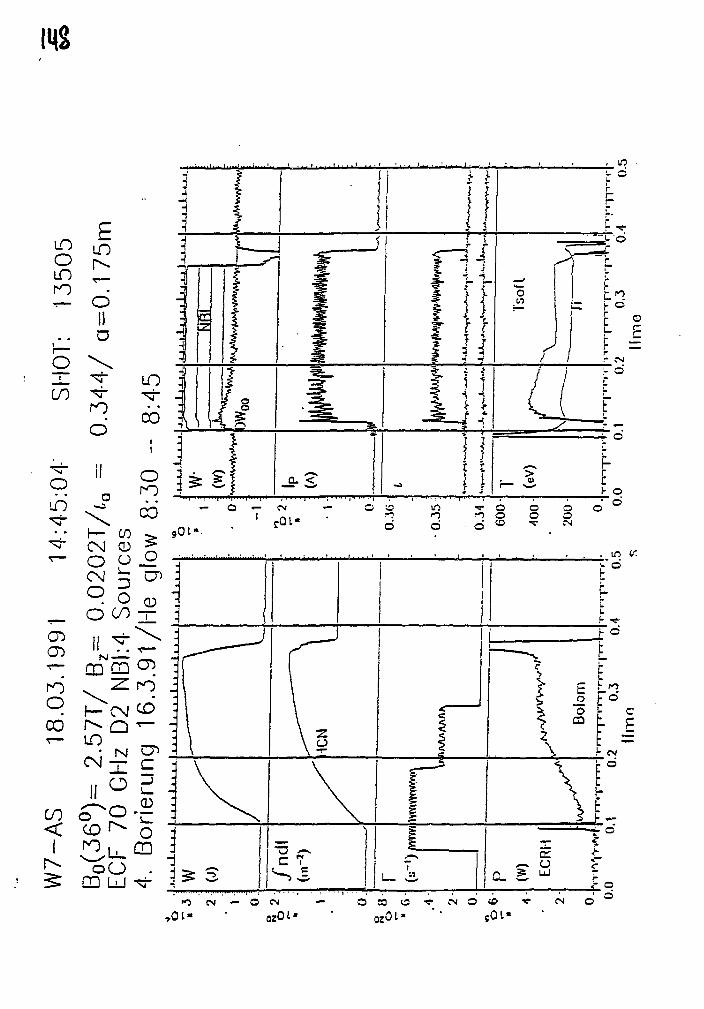
mom
£LO
dIIo
Oi
CO
O
OlO
f
t \
0. <
— O — CM
h- CO >CN CD >
o p _2CM =; cnO CO T
© a
6Li
do o © °a ©
, m
II TCD
o00
C M ^
LO
CO. ^ CD
co
oU .CD LJ " r
O :3 i
L
-
ro
• dc
0.E u
CN — O o a "C CN © °
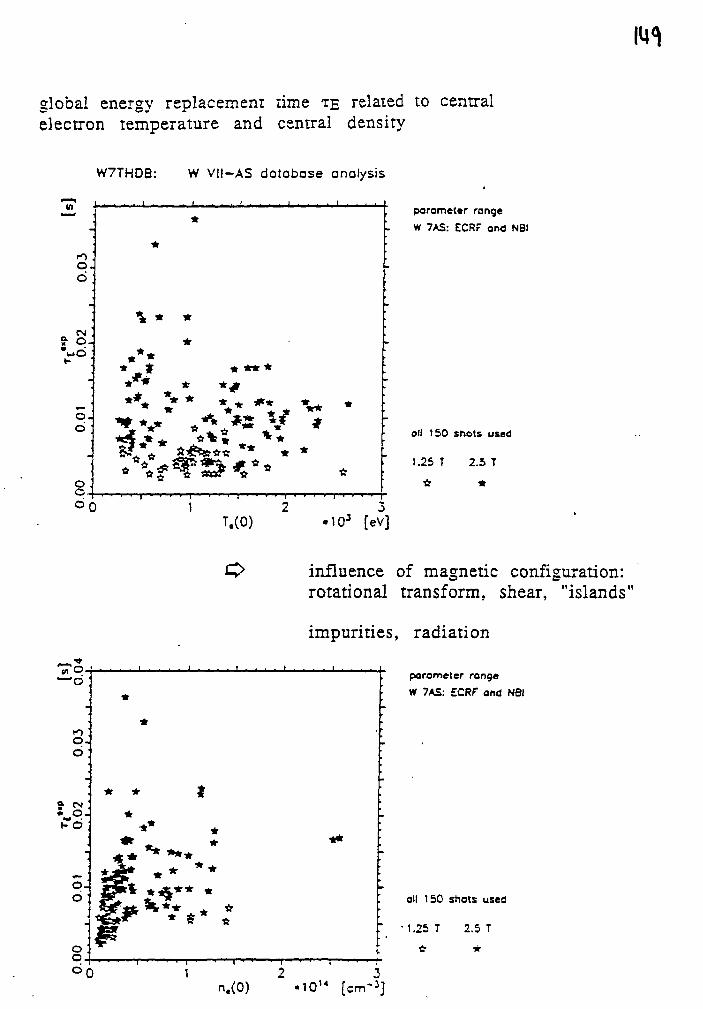
global energy replacement time TE related to centralelectron temperature and central density
W7THDB: W Vil-AS dotobose analysis
porameter range
W 7AS: ECRF and NBI
oil 150 shots used
1.25 T 2.5 T
* *
2 3T.(0) «103 [eV]
influence of magnetic configuration:rotational transform, shear, "islands"
impurities, radiation
porometer rongeW 7AS: ECRF and NBI
all 150 shots used
•1 .25T 2.5 T
n.(0)2 3
•1OM [cm"3]
Wall conditioning
After wall conditioning by carbonization andboronization:*significant and permanent reduction of O and C
"remaining very high Z at moderate densities:Zeff = 4-6, mainly due toTI and Fe.Limiter with TiC as source: Consequently reduced
impurity fluxes at lower edge temperature forhigher densities and reduced load to the limiter:external gas flow for control.
*at high density and low power Zeff ca be reducedto 1.5.
Recycling after boronization with p < 1,after carbonization conditioning by He glownecessary for density control
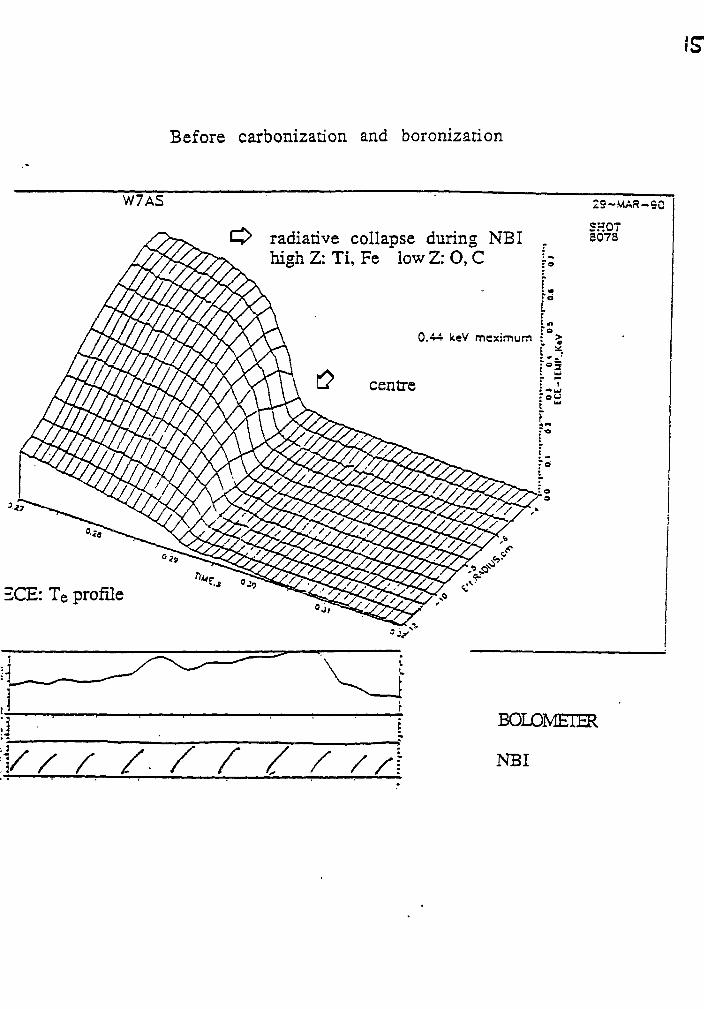
IS"
Before carbonization and boronizarion
W7AS
mm.
2CE: Te profile
o
Hmi77VY
m
radiativehigh Z: Ti
mm
collapse during NBI, Fe low 2: O, C
-
0.44 keV mcximum
centre
whft
tI _"a
29-MAR-SO
SHOT8078
BOLOMETER
NBI
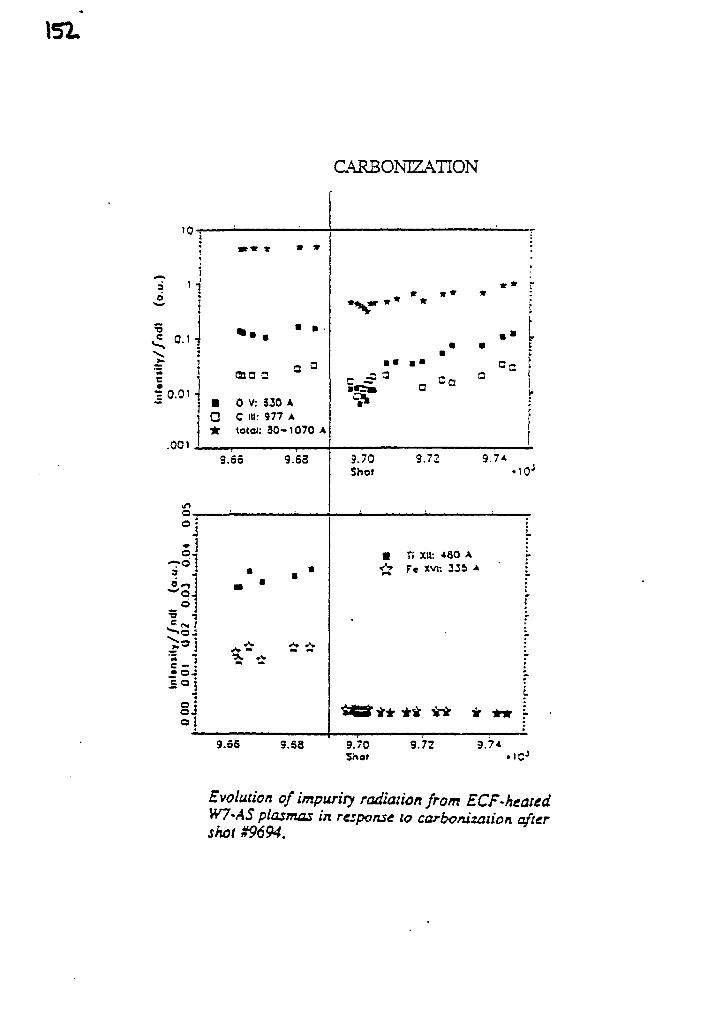
152.
CARBONIZATION
t o r
^ i
= '1
*r» * » *
, , j - .eI 0.01 ,
.001
QO 3
• 0 V: 530 AO C HI: 977 A• toccc 30-1070 A
9.55 9.S3
ina.
Q.TO3 ,O 1
hi
cioj
9.56 9.S8
*» »
• •
* » r
.4i
a
9.70 9.72 9.74.Shot
• T5 XII: *80 A<V Fe XVl: 3J5 A
* V * *
9.70Shot
9.72 9.7*
Evolution of impuriry radiation from ECF-healedW7-AS plasmas in response to carbonizaiion aftershot #9694.
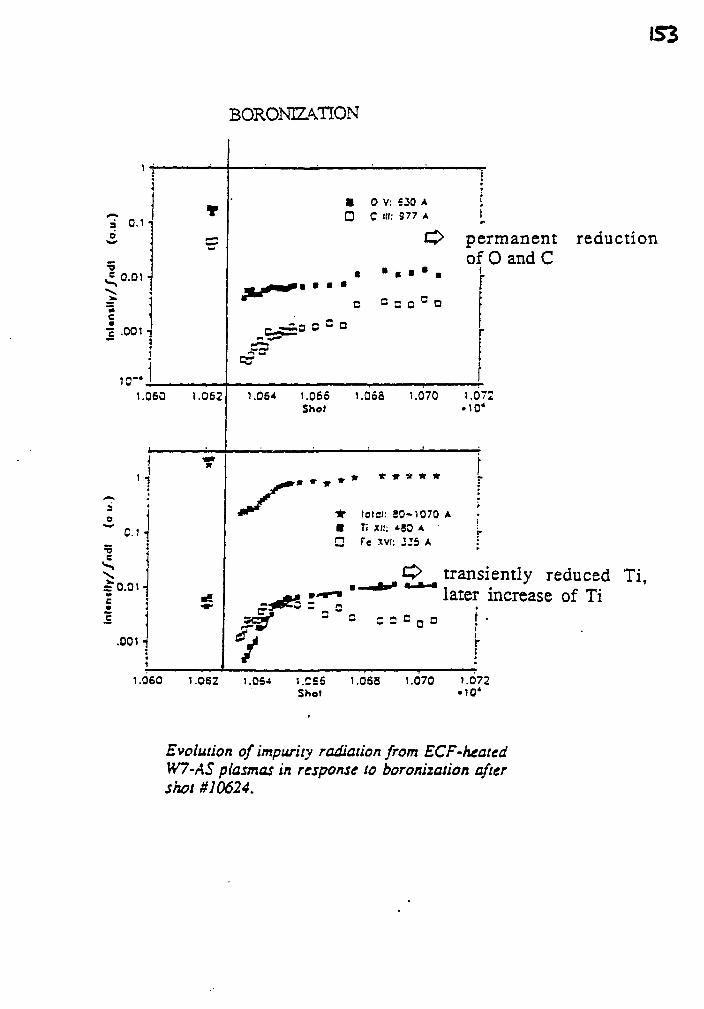
IS3
e"5 -001 •;
1
JD~*
3o
w C.J19
Si
s 0.01-•*c
.001-
1
1.060
BGRONEA3TON
l.OSO 1.062
• 0 V: £30 AD C HI: 377 A
permanent reductionof O and C
c c s c ° o-S.B O
1.064 1.066 1.055 1.070 1.07:Shof .10*
« * * * * * * * *
* lotcl: 80-1070 A• Ti Xll: *50 AD fe XVI: 225 A
transiently reduced Ti,later increase of Ti
3 = C 3
1.0S2 LOS* l.CSSShot
LOSS 1.070 1.072«10*
Evolution of impurity radiation from ECF-heatedW7-AS plasmas in response to boronization aftershot #10624.
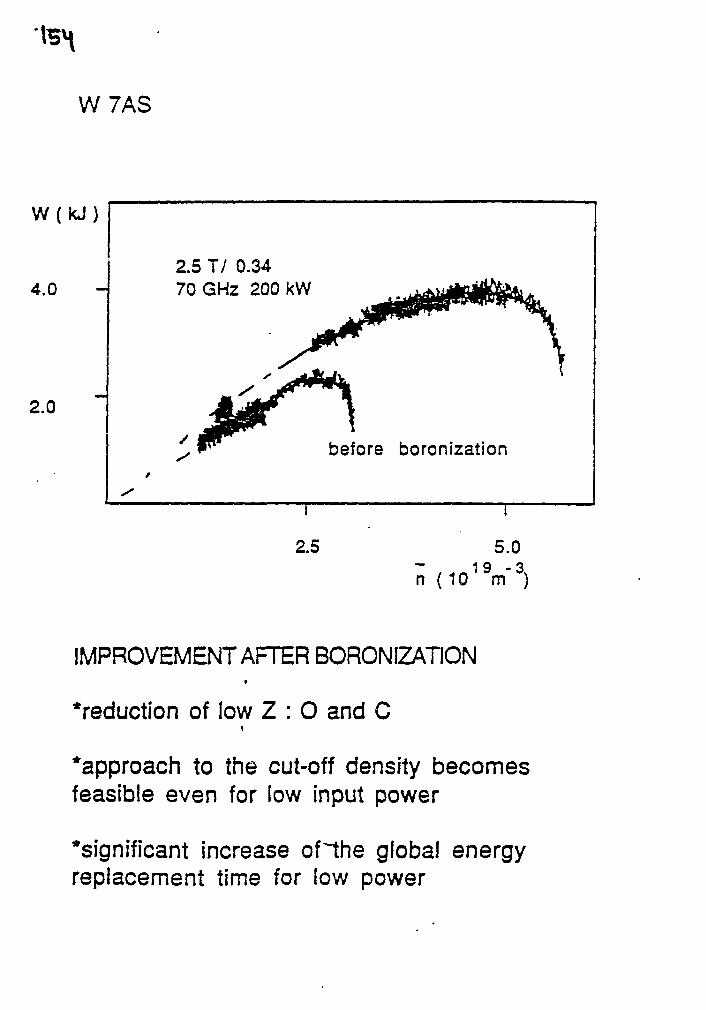
W7AS
W( kJ)
4.0
2.0
2.570
11 0GHz
&
.34200
w
kW
" \ !before
>
boronization
i
2.5 5.0
n ( 1019m"3)
IMPROVEMENT AFTER BORONIZATION»
•reduction of low 2 : O and C
*approach to the cut-off density becomesfeasible even for low input power
*significant increase of^the global energyreplacement time for low power
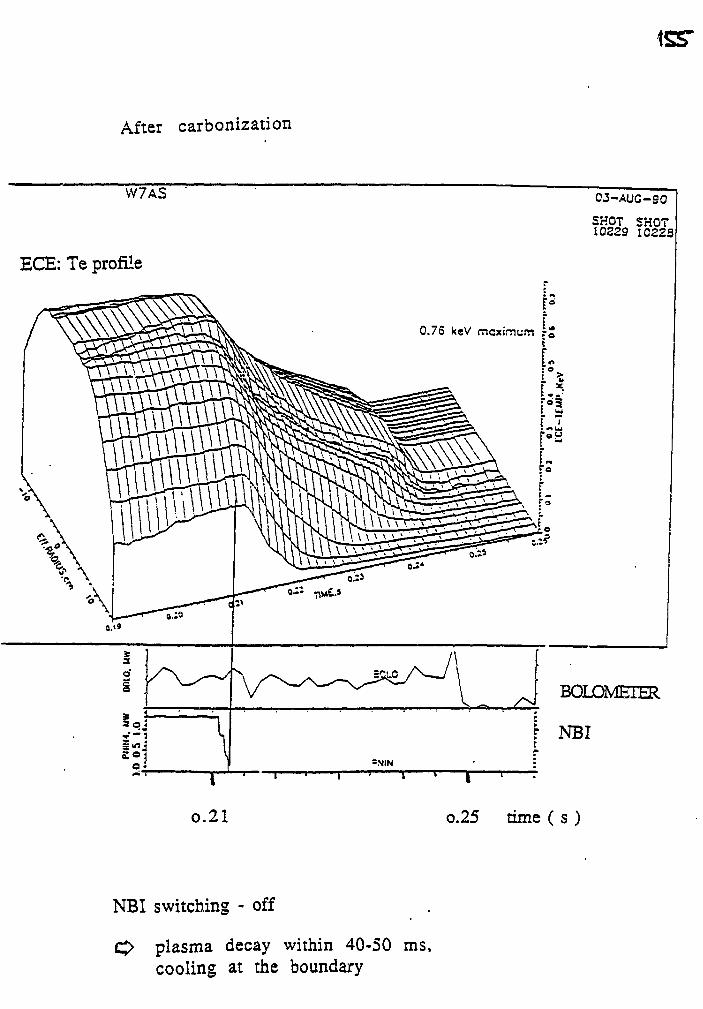
After carbonization
SHOT SHOT10229 1022
0.76 keV mcximum ?S
BOLOMETER
f NBI
I
o.21 o.25 time ( s )
NBI switching - off
plasma decay within 40-50 ms,cooling at the boundary
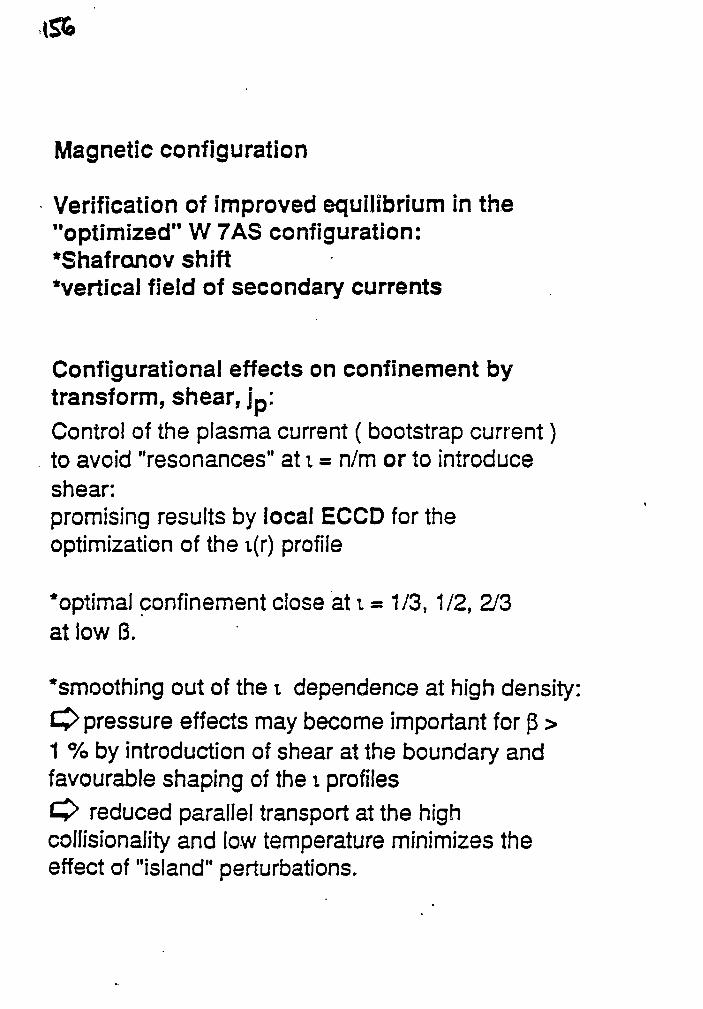
Magnetic configuration
Verification of improved equilibrium in the"optimized" W 7AS configuration:*Shafronov shift'vertical field of secondary currents
Configurational effects on confinement bytransform, shear, j p :Control of the plasma current ( bootstrap current)to avoid "resonances" at i = n/m or to introduceshear:promising results by local ECCD for theoptimization of the i(r) profile
*optimal confinement close at i = 1/3,1/2, 2/3at low B.
*smoothing out of the i dependence at high density:0 pressure effects may become important for p >1 % by introduction of shear at the boundary andfavourable shaping of the i profilesO reduced parallel transport at the highcollisionality and low temperature minimizes theeffect of "island" perturbations.
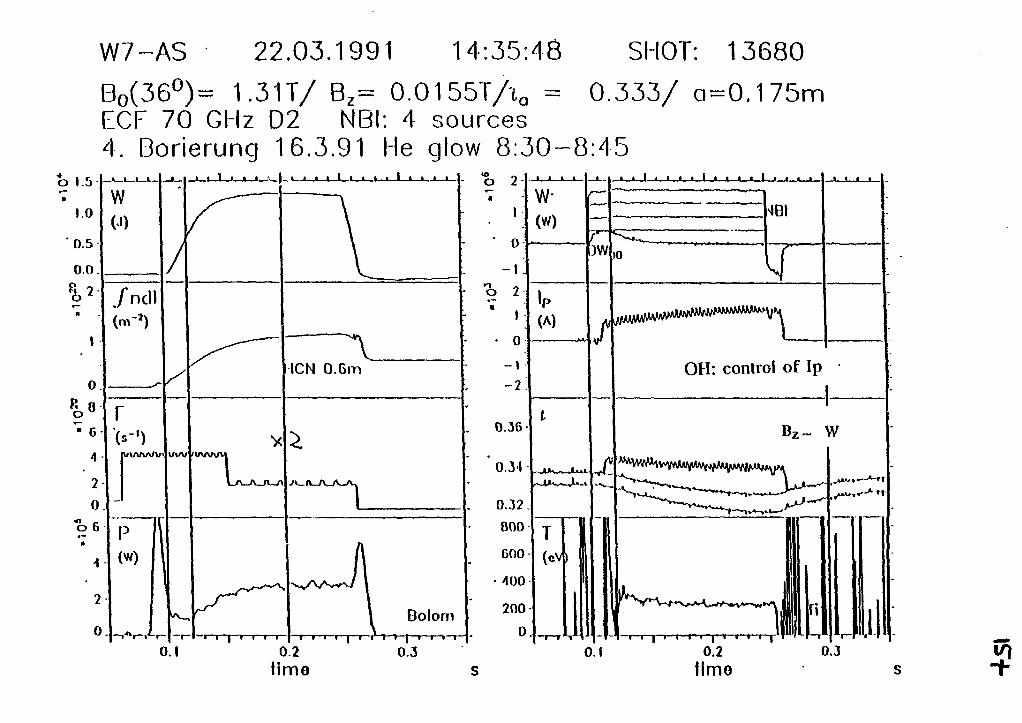
W7-AS 22.03.1991 14:35:48
BO(36°)= 1.31T/ B2= 0.0155T/ta =ECF 70 GHz D2 NBI: 4 sources4. Borierung 16.3.91 He glow 8:30-
o 1.5
1.0
0.5
0.0
0
V*" 6
A
2
0
o 6
w(J)
/ndl
ruxnnrJ'
P(W)
wnw«
ICN 0.6m
, f t _ ^ _ / V ^
0.1 0.2
lime
Bolom
0.3
1
• o
1
• 0
- I
-2
0.36
0.34
0.32
000
600
• 400
200
0
w-(W)
(A)
SHOT: 13680
0.333/ a=0.175m
i:45
)0
OH: control of Ip
B z~ W
0.1
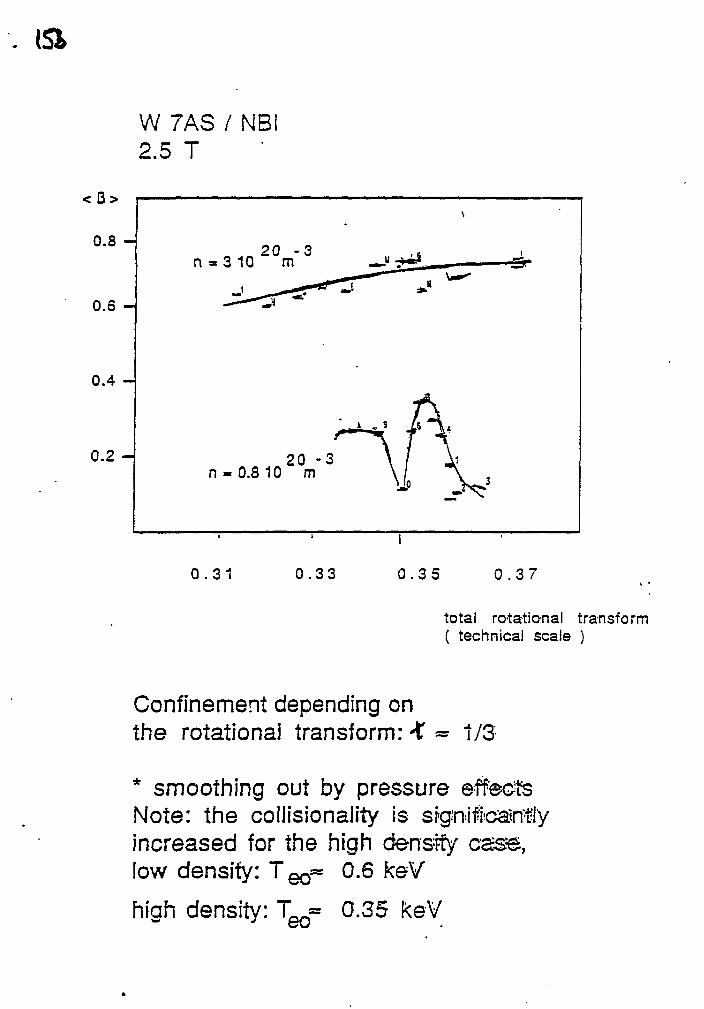
(SI
W 7AS / NBI2.5 T
0.8 -
0.6 -
0.4 -
0.2 -
_ „ - 20 -3n * 3 10 m
20 -3n-0.8 10 m
0.31 0.33 0.35 0 .37
total rotational transform( technical scale )
Confinement depending onthe rotational transform: K « 1/3
* smoothing out by pressure effectsNote: the collisionality is sigrafcarftlyincreased for the high density case,low density: T Q^ 0.6 keV
high density: T_ » 0.35 keV
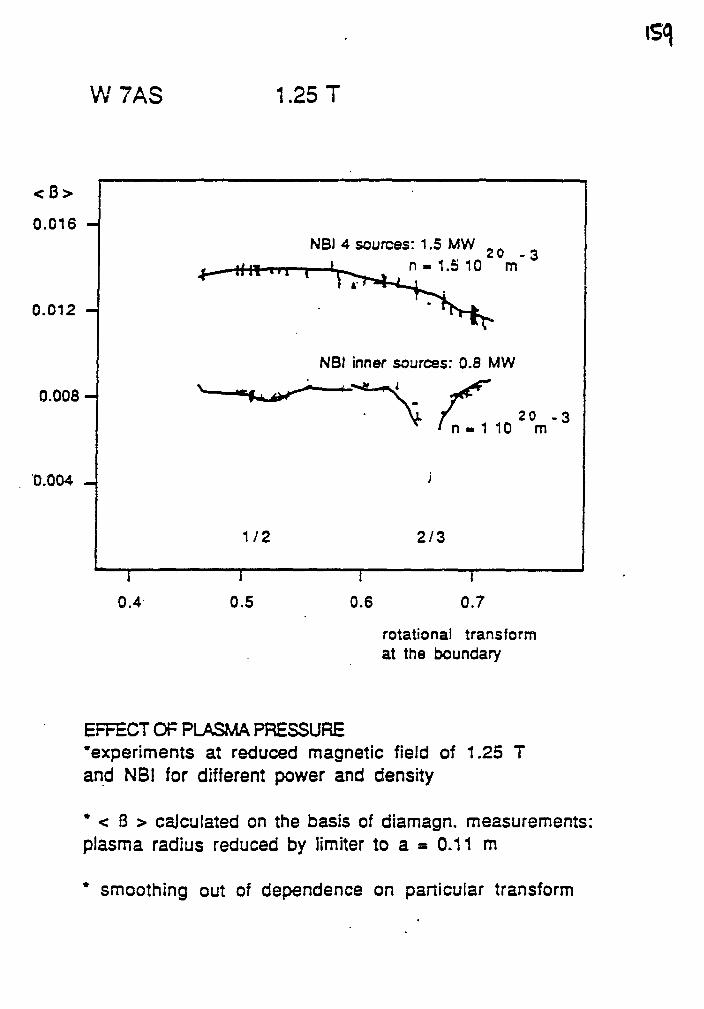
W7AS 1.25 T
I
0.4
0.016 -
0.012 -
0.008 -
0.004 _
1/2
NBI 4
NBI
sources: 1.5 MWn - 1.5 10
~ - ^
inner sources: 0.8
i
2/3
20 -m
>
MW
2I 10
3
0 . 3m
i
0.5 0.6 0.7
rotational transformat the boundary
EFFECT OF PLASMA PRESSURE•experiments at reduced magnetic field of 1.25 Tand NBI for different power and density
* < S > cajculated on the basis of diamagn. measurements:plasma radius reduced by limiter to a • 0.11 m
* smoothing out of dependence on particular transform
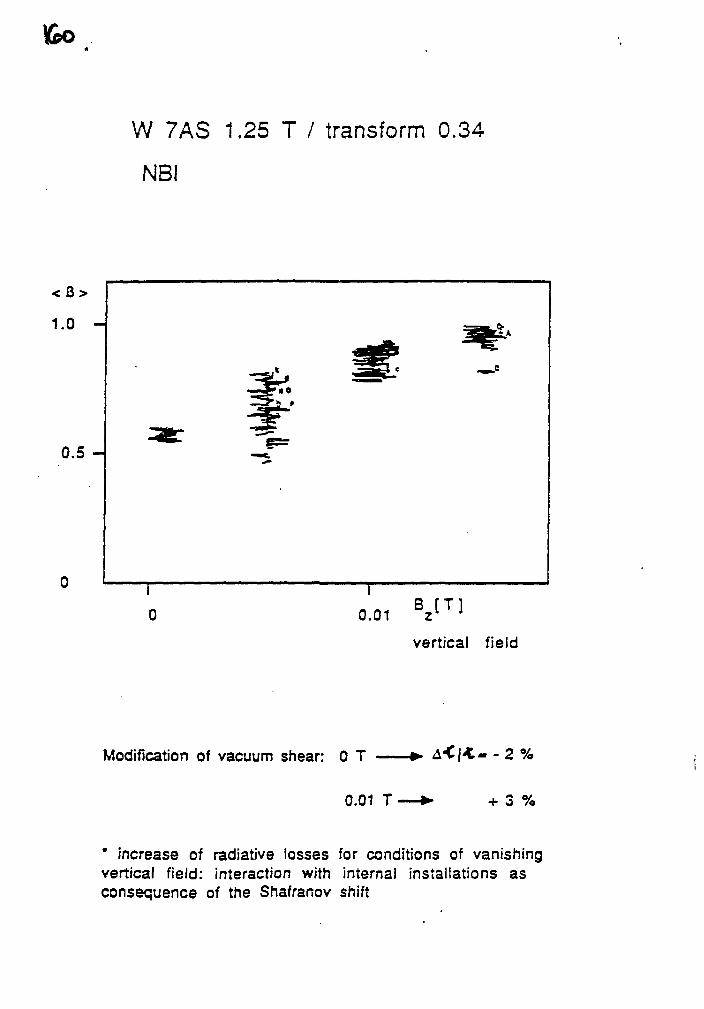
W 7AS 1.25 T / transform 0.34
NB!
1.0 -
0.5 -
vertical field
Modification of vacuum shear: 0 T %
0.01 T 3 %
* increase of radiative losses for conditions of vanishingvertical field: interaction with internal installations asconsequence of the Shafranov shift
Transport analysis
Local analysis of electron and ion heat conductionbased on density and temperature profiles, includingactive ch.exch. data and Doppler measurements ofimpurity lines:
ElectronsFor ECF discharges electron heat conduction is thedominant loss channel.*The.experimental values for %e exceed the
neoclassical predictions ( DKES ). Only athigh temperatures on agreement is being found,indications for anomaly at the boundary.
IonsAt high density discharges the ion heat conductionbecomes the dominant loss channel.*For agreement of %\ with neoclassical values
ambipolar radial electric fields must be taken inaccount: the corresponding fields are much lessthan in W 7A.
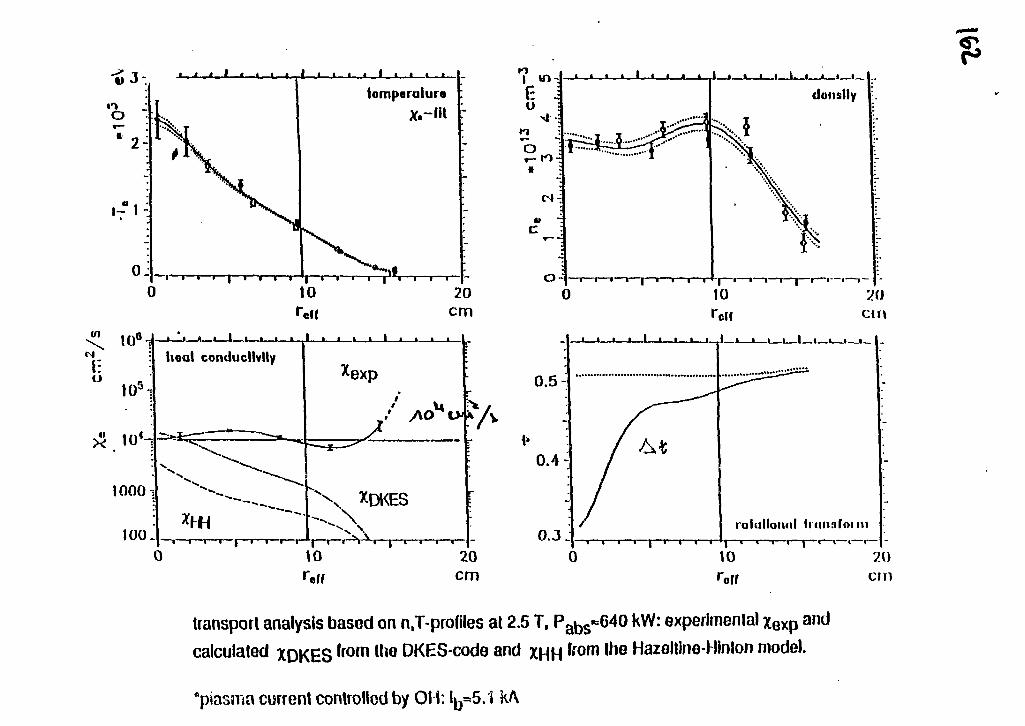
V
10<~
1OOO
100.
iioal conducllvlly
0 10 20cm
rolalionol fioimfoini0.3
transport analysis based on n.T-profiles at 2.5 T, Pabs*640 kW: experimental xeXp a n d
calculated XDKESfromlh8DKES-codeand XHHfromlheHazelllneHinlonmodel.
"plasma current controlled by OH: 1 =5.1 kA
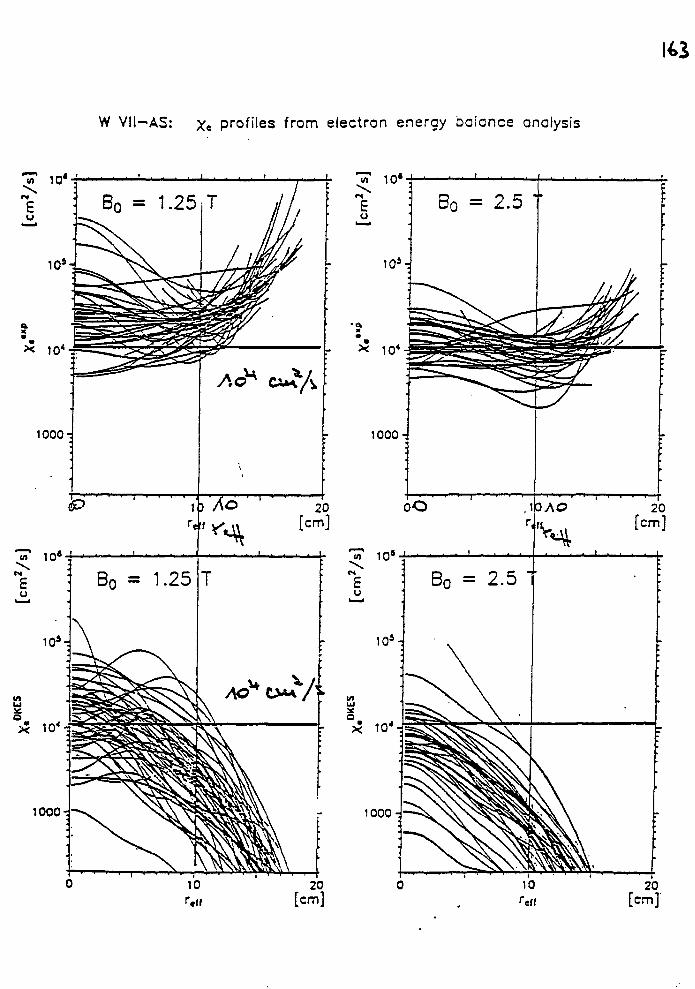
W VII-AS: Xe profiles from electron energy balance analysis
143
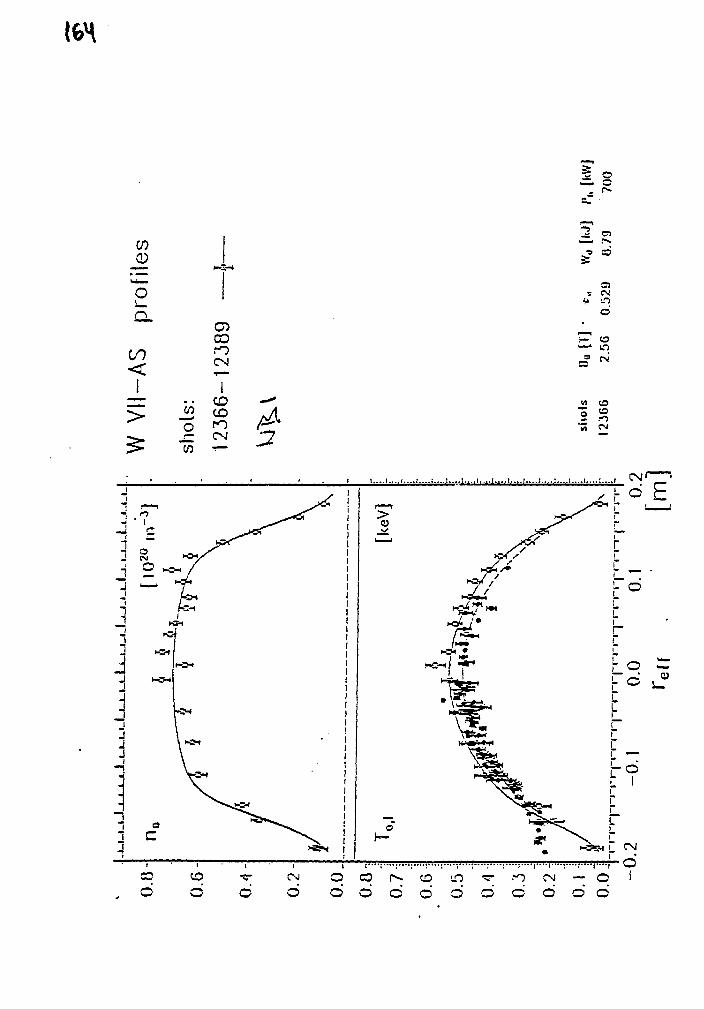
5. S
CO
<
>
i—Z—*
enCOfOCN
. . CDJ2 CDO £5
"W -r-
S5S CS!
i i . . . . i . . . . i . . . . : . . . . : • . . , i . . . . I . . . . 1 . . . . i . . . . I . . . . I . . . . ) . . . . : . . . . ; . . . . i . . . . : . . . . !
d d d d o o c o o o
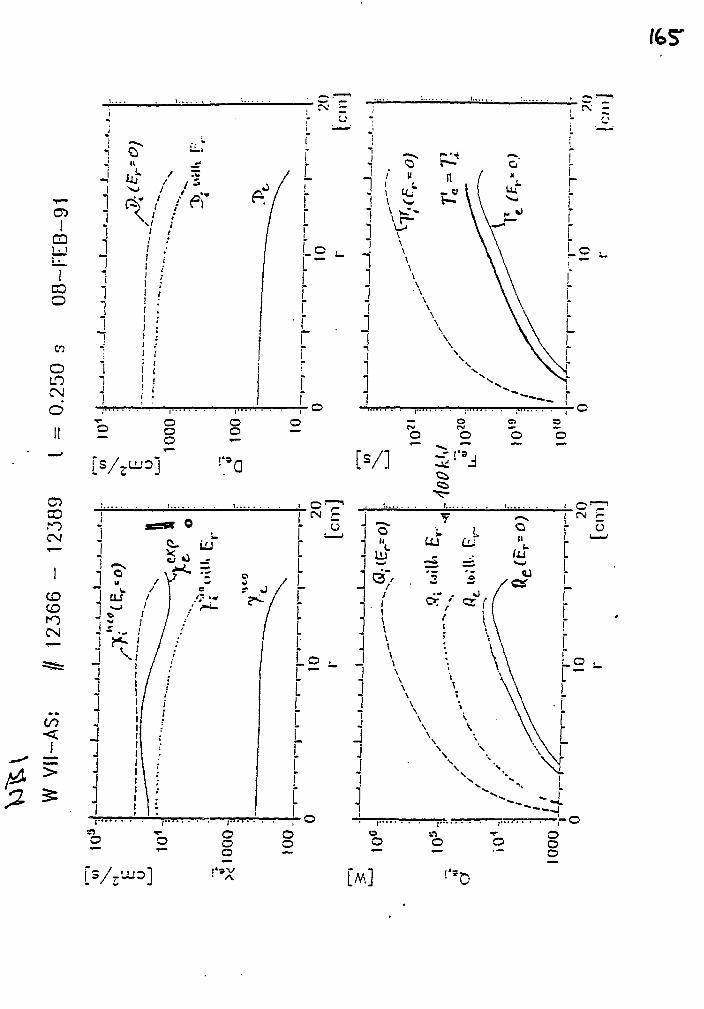
5LJ J
COO
d
CO
CM
CDCDfOCM
<JL>
§o
00
/ • • •
o ooo
t© u J
r o(V
o
M
o
o "o
^ c iu
Lo ^ _
oo
[M] ! 'SD
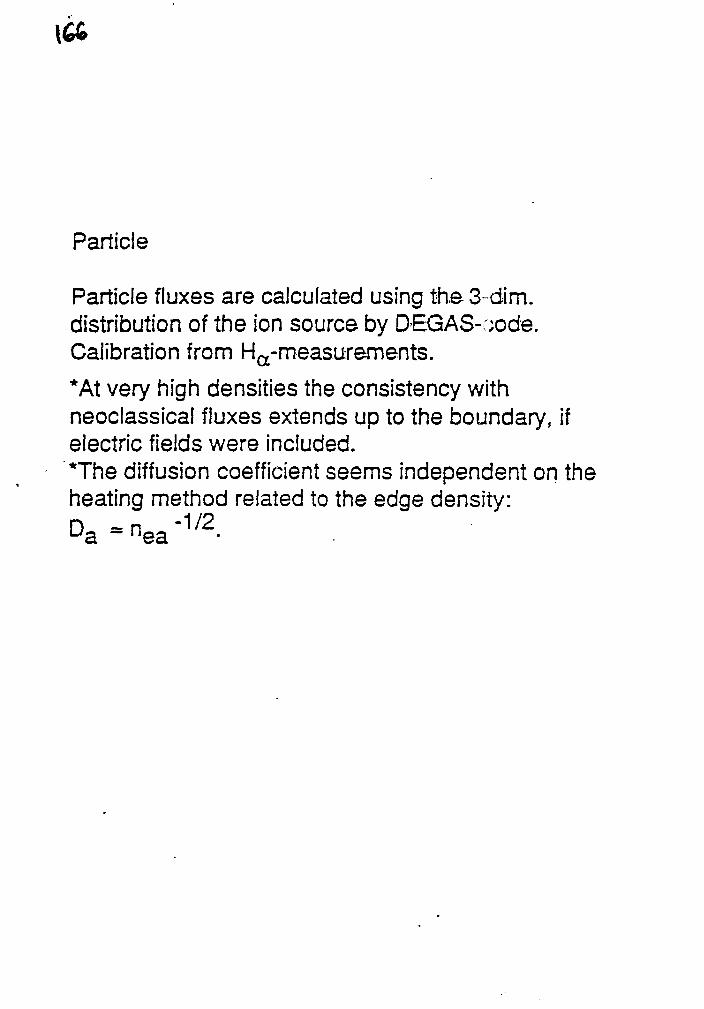
164
Particle
Particle fluxes are calculated using the 3-dim.distribution of the ion source by DEGAS-oode.Calibration from Ha-measurements.
*At very high densities the consistency withneoclassical fluxes extends up to the boundary, ifelectric fields were included.*The diffusion coefficient seems independent on theheating method related to the edge density:D - n " 1 / 2
ua ~ nea
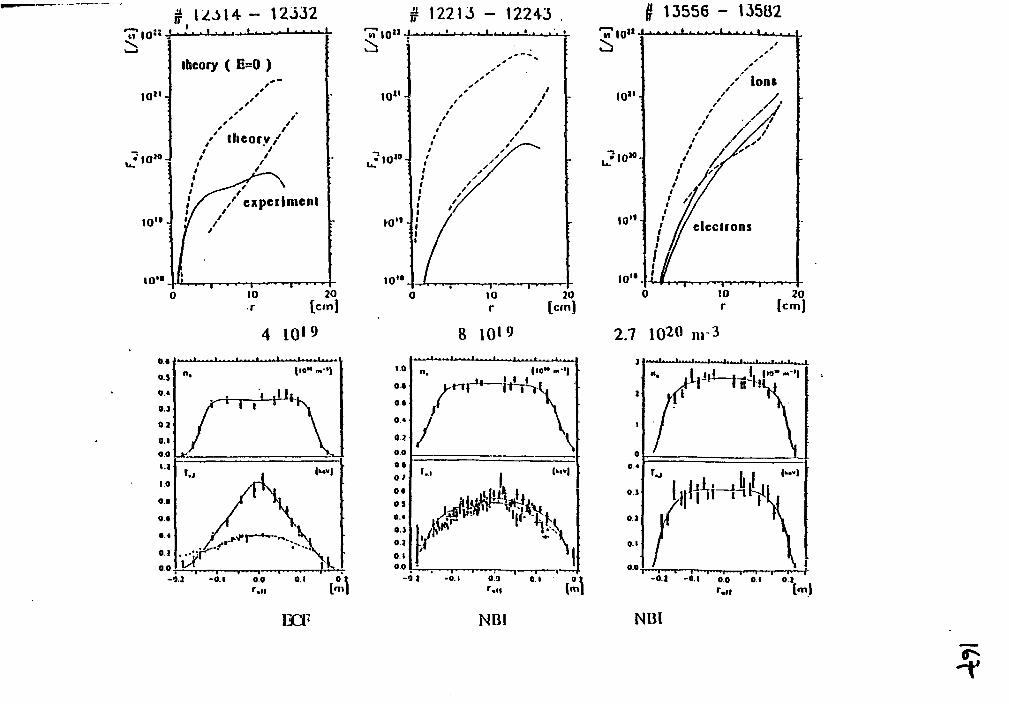
§ IZ.it 4 - 12J32 # 122U - 12243 .
theory ( E=0 )
/ iheorv/
/ experiment
20(cm)
to1*
8 1019
n» i
o"-
10 -
10"
lo'V
J
/
/
13556 -
////
U5U2• • * • • r - . i
/
y'/ ions
/ ./J
/ / /
1 //if/'electrons
/• ' 1 • • * "" 1
10r
20[cm)
2.7 1020 m-3
-0.1 -O.I 0.0 O.I 0 1
BCF NB1 NBl
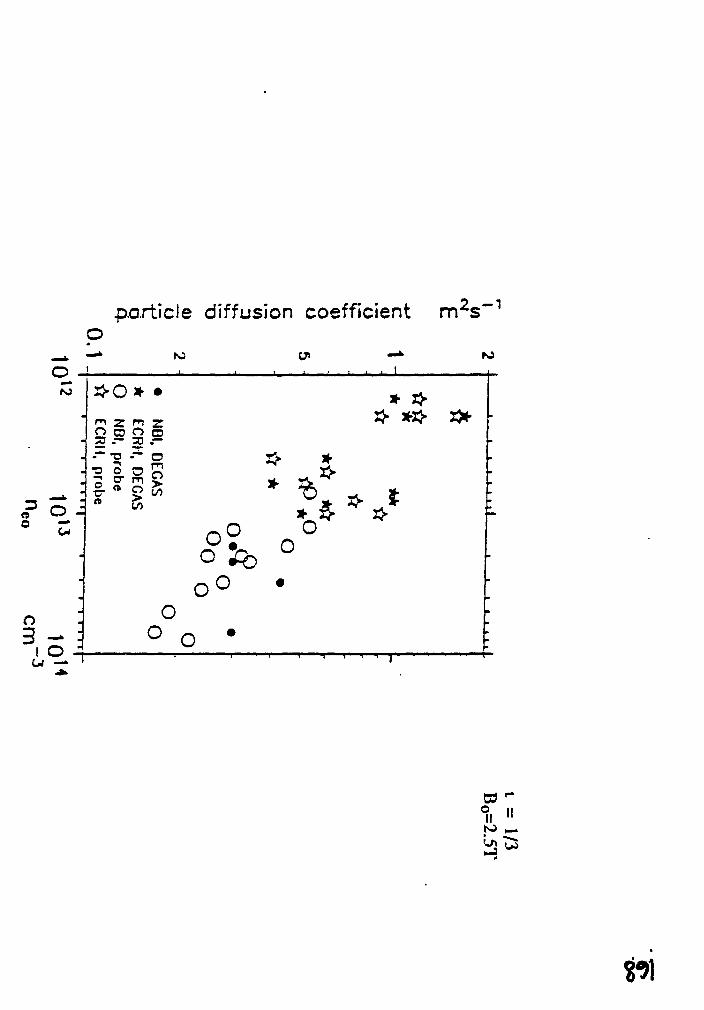
particle diffusion coefficient m2s~1
ro
NJ
O II
II "
164
Impurities
Modelling based on SITAR, STRAHL-code.Data from VUV , X-ray spectrometerand soft Xcamera system.
Derived from Al-ablation experimental data ofimpurity transport agree reasonable well withneoclassical predictions:Confinement times are typically a factor of 10larger than the energy confinement times.•Accumulation has been not yet observed, althoughthe impurity profiles are more peaked comparedwith the hydrogen profiles.*At very low densities the ambipolar positiveelectric field may explain the reduced confinementtime.
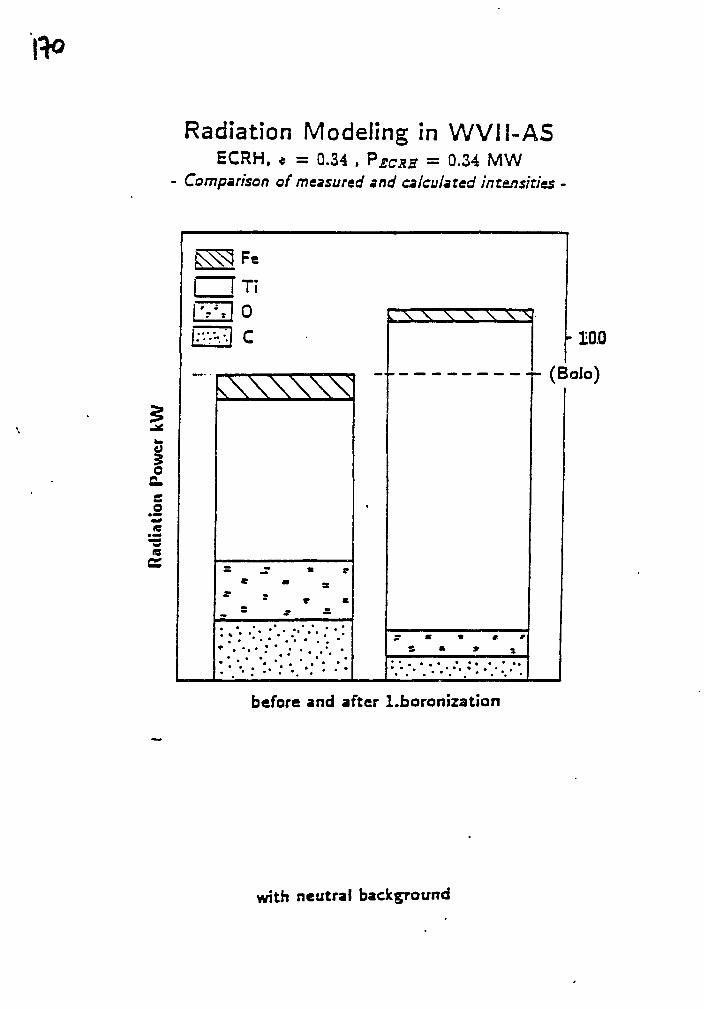
Radiation Modeling in WVII-ASECRH, * = 0.34 , PECRH = 0.34 MW
- Comparison of measured and calculated intensities -
Ioc
IB
Ti
V\vv\\\
3
T a
•10.0
-- (Bolo)
m r
« • • .
before and after l.boronization
with neutral background
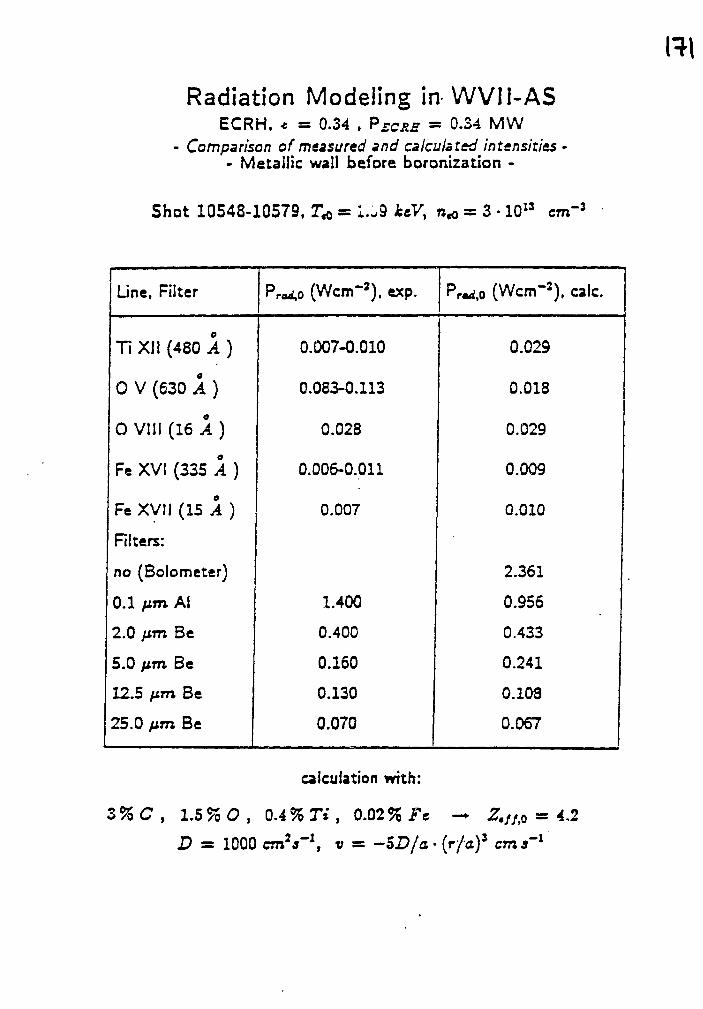
Radiation Modeling in-WVII-ASECRH, * a 0.34 , PECRS = 0.34 MW
- Comparison of measured and calculated intensities -- Metallic wall before boronization -
Shot 10548-10579, T* = 1.-9 JfceV, n* = 3 • 10" cm~3
Line, Filter
Ti XI! (480 A )
0 V (630 A )
O Vlll (16 A )
Fe XVI (335 A )
Fe XVII (15 A )
Filters:
no (Bolometer)
0.1 pm Al
2.0 /mi Be
5.0 pm. Be
12.5 fim Be
25.0 /im Be
Prcd,o (Wcm-*), exp.
0.007-0.010
0.083-0.113
0.028
0.006-0.011
0.007
1.400
0.400
0.160
0.130
0.070
Prmdt0 (Wcm-2). ale.
0.029
0.018
0.029
0.009
0.010
2.361
0.956
0.433
0.241
0.108
0.067
calculation with:
3% C , 1.5% O , 0.4 96 T* , 0.02SS Fe -> J2T.//.0
D = 1000 cm2*"1, v = -ID I a • (r/a)3
= 4.2
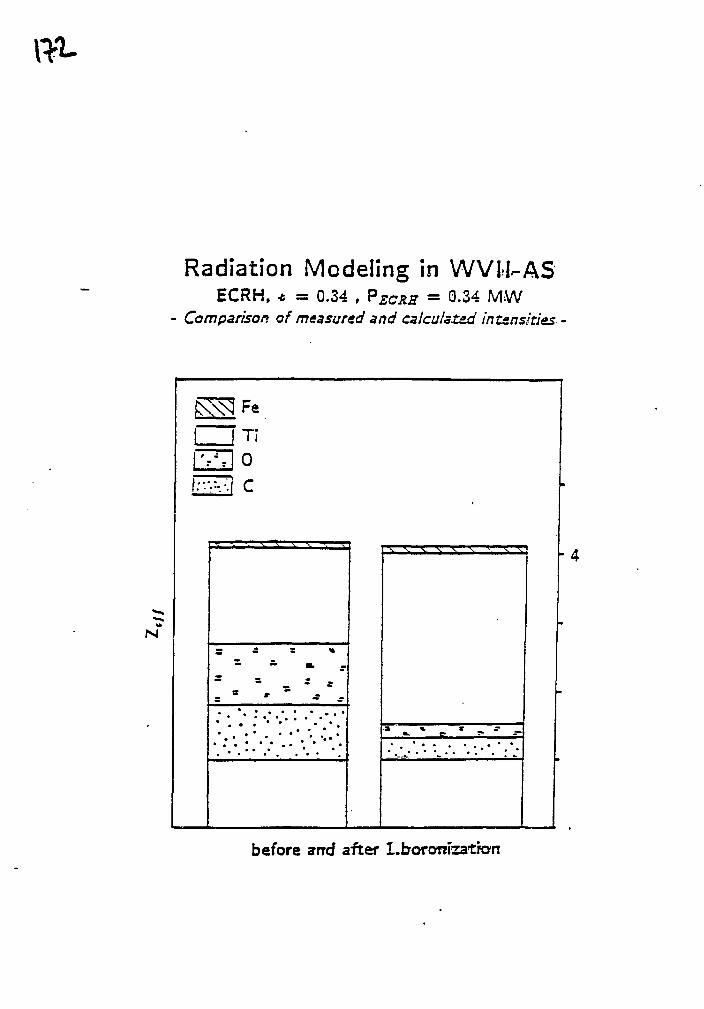
Radiation Modeling in WVM-ASECRH, * = 0.34 , PECRS = 0-34 MW
Comparison of measured and calculated intensities--
before ami after LboroTHzatrorc
ft*
SUMMARY
W 7AS is being operated with ful! field of 2.5T andfull available power:
ECF 70 GHz: 4 gyrotrons/ 800 kW140 GHz: gyrotron/ quasioptical transmissionline/100 kW/ 0.1s ( KfK Karlsruhe, IPF
Stuttgart)
NBI: 4 sources/ balanced tang, injection/1.5 MW
ICRF: 38, 76 MHz/ 500 kWstart-up for magnetic field down to 0.6 T
Extended parameter range accessible in"net-currentfree" operation.
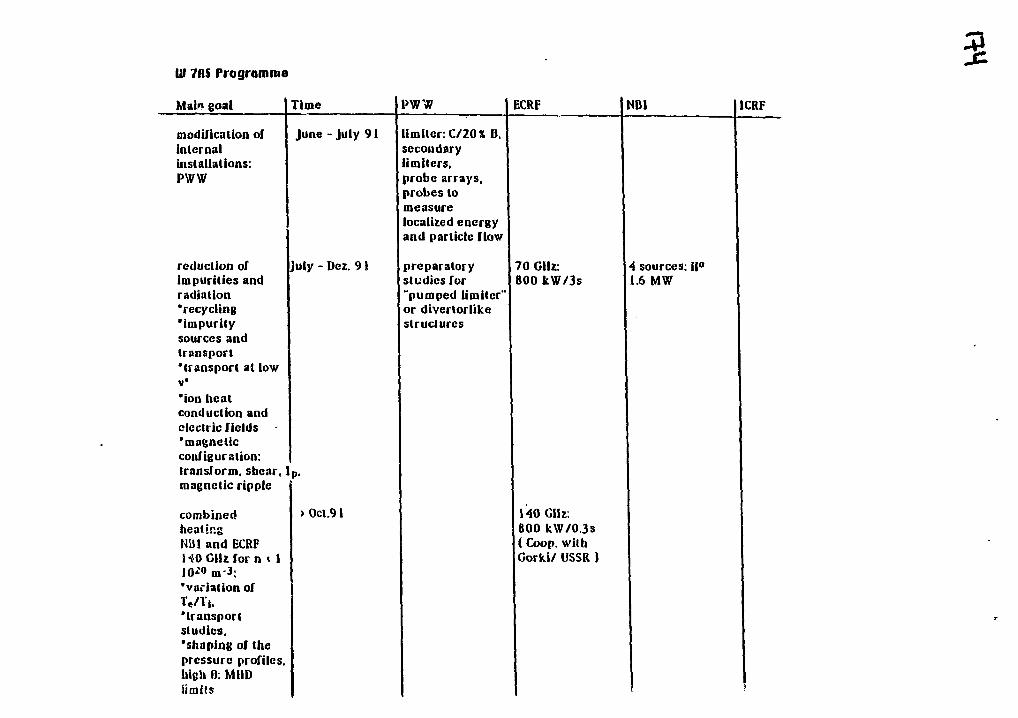
Uf 7HS Programme
Main goat Time PWW ECRF CRF
modification ofinternalinstallations:PWW
June - July 91
July - Dez. 91reduction ofimpurities andradiation'recycling'impuritysources andtransport'transport at lowV'ion heatconduction andelectric fields'magneticconfiguration:transform, shear, lp .magnetic ripple
combined > Ocl.91heatingNM1 and BCRFMO GHz for n < 1
'variation of
'transportstudies,'shaping of thepressure profiles,high 0: MUDiimiis
imiter:C/20%B.secondaryli miters,probe arrays,probes tomeasurelocalized energyand particle flow
preparatorystudies forpumped limiter"
or divertorlikestructures
7 0 GHz:800 kW/3s
4 sources: |(°.6 MW
140 GHz:800 kW/0.3s(Coop, withGorki/ USSR )
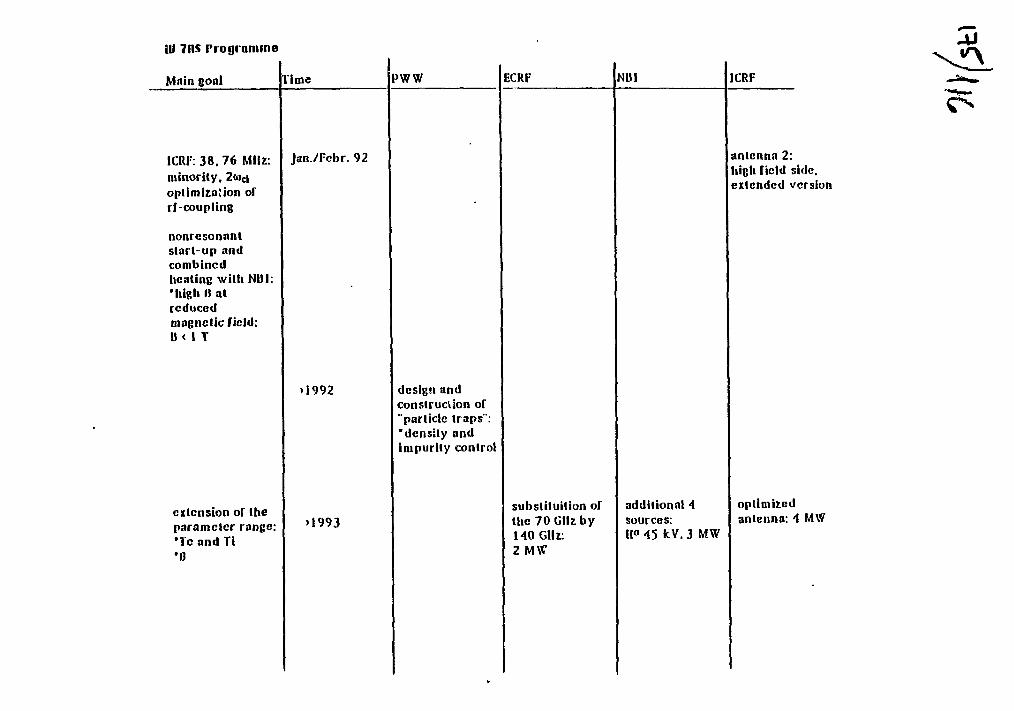
ill 7ns rrogiomine
Main goal
ICRF: 38. 76 MHz:minority, 2wc|optimization ofrf-coupling
nonrcsonantstart-up andcombinedheating with NUI:'high 0 atreducedmaenclic field:l)< 1 T
extension of theparameter range:•Tc and Ti•D
line
Jan./Fcbr. 92
>1992
>1993
I'WW
design andconstruction of"particle traps":'dens i ty andimpurity control
ECRF NUI
subst i tut ion ofthe 7 0 GHz by140 Gil z:2 M W
additional 4sources:11° 45 kV. 3 MW
ICRF
antenna 2:high field side,extended version
optimisedantenna: 4 MW
Recent Results of Heliotron E ExperimentsT. Obiki H. Zushi, S. Sudo, F. Sano, K. Kondo
T. Mizuuchi, S. Besshou, H. Okada, K. NagasakiM. Nakasuga, K. Hanatani, Y. Nakamura, and M. Wakatani
Plasma Physics Laboratory, Kyoto University, Uji, Kyoto, Japan
AbstractThe magnetic configuration effect on transport improvement has been intensively stud-
ied. Even in limiter plasmas ((a) ~ 15cm), transport improvement is realized in the axisshift experiments and the Av effects are almost the same as those in the case of a magneticdiverter configuration ((a) ~ 20cm). This fact suggests that improvement occurs in thecore region rather than in the edge region. The impurity and bulk particle transport areinvestigated by Si and D2 pellet injection . The plasma current is measured in the variousconfigurations and is studied with respect to the Bootstrap current, RF driven currentand Ohkawa current. The toroidal and poloidal measurements of plasma parameters ondiverter stripes are done.
1. IntroductionThe effects of the magnetic configuration on transport and stability have been investi-
gated by using additional vertical coils (1988 ~) [1, 2] and additional toroidal coils (1989~) [3, 4]. Energy transport in both ECRH and NBI plasmas is improved by shifting themagnetic axis inwardly, however, this configuration is not desirable with respect to MHDstability because of the magnetic hill. This disadvantage can be partially overcome byadding a small toroidal field (< 10% of Bh)- The effect of the axis shift is considered tobe due to (a) recovering the helical symmetry resulting in confinement improvement ofdeeply trapped particles and (b) increase in magnetic shear. The toroidal field effect maybe attributed to mainly (c) broadening the density profile and partially (d) creation ofshallow well.
The main purposes of the present configuration study are as follows: to clarify themost important magnetic properties with respect to transport improvement and to findout whether energy transport improvement occurs in the core region or in the edge region.In order to investigate these points a material limiter is inserted deeply inside the magneticseparatrix. Under this situation, we can study the axis shift effect on energy transportwith a fixed minor radius and fixed edge rotation transform, and also neglect the changein plasma-wall interaction due to variation of the magnetic separatrix. The configurationeffects on bulk particles and impurity transport are also studied by Dz pellet and S,injection. With respect to the confinement- of deeply trapped particles plasma currentmeasurement is performed with high resolution less than 0.1 kA.
In order to understand the role of the ergodic region surrounding the core plasma, theperturbation error fields are added and the toroidal / poloidal distributions of the plasmaparameters in the edge region and on the diverter stripe are investigated.
2. Magnetic configuration study2—1 Magnetic axis shift in the limiter configuration [5]
As reported previously [4], it is one of interesting subjects which region is dominantlyimproved by shifting magnetic axis inward. Therefore, the experiment is carried out inthe material limiter configuration with a reduced minor radius by a carbon limiter, whichis inserted by 93 mm from bottom of a vertically elongated plasma cross section. Thedependence of electron temperature and density on Av is shown in Fig.l. The ECRH
power is about 250 kW (2 tubes) and B — 1.9 T. Although gas puffing is kept constant,the density for Av < 0 is slightly higher than that for A« > 0. This point will be discussedlater. As seen in the figure, the optimum shift is also around Av = —2 cm, as is the casewithout limiter. Thus it is clear that the plasma minor radius does not play a dominantrole in the energy transport improvement. It is concluded that improvement occurs inthe core region ( r < 2/3 a and without limiter) rather than in the boundary region (2/3 a < r < a). Confinement improvement of trapped particles and an increase in globalshear inside the limiter radius are still candidates to explain transport improvement byinward shift.2—2 Particle transport
Ha measurement has been performed to study the shift dependence of particle transport[6] . In this series, small D-i pellet injection and S\ laser blow-off technique are used tostudy bulk particle and impurity transport. The decay time of the increment of line densityor soft X-ray (if«-like stage of /?,•) signal is measured as a measure of particle confinementtime of bulk electrons or impurity ions, respectively. :
The decay time if1 of Anl is the longest along the chord passing near the magneticaxis, and is the shortest along the chord passing the plasma periphery. The former dependson the shift of magnetic axis, but the latter is less sensitive to the shift. It is observed thatTjf1 is the longest for the inward shift case of Aw = —2 ~ —4 cm and high density plasmasnear a cut-off density can be sustained in almost steady condition, as shown in Fig. 2.
Although a pellet does not penetrate the magnetic axis, this decay measurement sug-gests that the particle confinement is better for the inward shift case than fcr the outwardshift case, and the confinement in the core is mainly improved. The /.vv dependence ofelectron temperature at 15 ms after injection is consistent with that obtained in limiterplasmas without pellet injection. [7]
The decay time r<JIBJ> of soft X-ray signal is studied in the range of n,. from 0.6 to
1.4 x 1013cm~3. It is found that r™p in standard configuration is 11.8 ± 3.4ma andincreases to 16.1 ± 3.3 ms by shifting Av of —2 cm. Even in the limiter configuration,rPP enhances from 11.0 db 1.0 ms (Aw = 0 cm) to 17.1 ± 1.0 ms (AV = - 2 cm) . The onedimensional transport code is used to simulate the observed temporal behaviour of thesoft X-ray signal. In this code, the uniform diffusion coefficient D is assumed and pinchvelocity v,-B is given by const, x r/a. Results are shown jn Fig.3. The diffusion coefficientreduces from 3500cm2/s for Av = 0 cm to 2800 cm2/s for Av = —2 em. The temporalevolution can be simulated without u;n.
From both measurements it is confirmed that particle transport of bulk electrons andimpurity ions in the core region are improved by the inward axis shift.
2-3 Transport analysis in the optimum configuration [5, 6]( B t / B h = 5% and Av = -2cm)
It has been reported in ref [4] that the density clamping in ECRH has been successfullysuppressed in the configuration with Av = —2 cm and Bt/Bh ~ 5%. The temperatureand density profiles are shown in Figure 4 in both plasmas without and with limiter. Atransport analysis is done assuming a broad ion temperature profile and a parabolic powerdeposition profile. The result shows that Xe for the case with the limiter is comparablewith that for the case without limiter around of r/a = 0.5.
Since line averaged densities in both cases are the same by adjusting gas puffing, theminor radius effect on TS can be analyzed. The ratio of rg obtained experimentally tore from the stellarator/heliotron scaling [8,9] in case with the limiter ((a) ~ 16cm) isabout 1.5 and is much higher than in case without limiter. This means confinement isimproved in case with the limiter compared with the expectation based on the (a ) 3 size
scaling. Since Ha emission, charge exchange flux, radiation and bolometric loss are muchreduced by a factor of 2 to 5 by limiter insertion, reduced charge exchange, convective andradiative losses may be attributed to this improvement.
3. Transport study with m = 1 / n = 1 magnetic perturbationAs described in the previous session, transport improvement based on the axis shift
seems to occur in the core region rather than in the edge region. From the beam resistancemethod the magnetic surfaces near the peripheral region are found to be destroyed in somedegrees [10]. In order to understand the role of this region on transport, an error fieldwith a dominant m = 1 / n = 1 mode is applied. In the standard configuration islandsand ergodic region appear in the region of r/a £ 0.7. In fact small change in temperature,density profiles and small reduction of the stored energy are observed in this situation.The electron temperature decay time just after RF power turned off is measured. Thedecay time near the center gradually decreases with increasing perturbation field. Thesefacts suggest that energy transport is not affected significantly even if the outer regionbecomes ergodic.
However, when the error field is applied in the case with Av =s +5 cm, in which thecentral rotational transform is close to 1 and global shear is reduced, a dramatic change isobserved in temperature profile, as shown in Fig. 5. This indicates that the properties ofthe magnetic surfaces in the core region play a relatively important role of global energytransport.
On the contrary, the impurity confinement time T<Jmj> is also unchanged in the former
case. This may reflect that the region where the ife-like impurity exists is not deterioratedby this error field. Furthermore the density decay time T^ along the peripheral region is,almost the same as that without the error field. The result suggests that particle transportis less sensitive to edge ergodicity.
4. Plasma current measurement [11]A new in-vessel Rogowski coil has been installed inside the chamber and used to study
the toroidal current with resolution less than 0.1 kA. Typical values in ECRH are < 1.5 kAat 1.9 T (fundamental heating) and < 1.0 £.4 at 0.94 T (second harmonic heating). It isfound that the toroidal current varies by shifting the magnetic axis, as shown in Fig.6.For the inward shift case, the current flows in the same direction as that of the magneticfield line and reverses its direction for the outward shift case. When the additional verticalfield is applied, the variation of the loop voltage at Bh — 0.94 T is less than ±0.04 V,which can drive a toroidal current 0.5 kA. This tendency is compared with neoclassicalpredictions. The measured toroical plasma current (0.3 kA) in ECRH experiment at 0.94 Tstandard configuration is much smaller than the recent theory of neoclassical current. InNBI plasmas the toroidal current (< 2 kA) is studied with respect to Ohkawa currentunder the following condition: B = 1.9 T, Co-injection, H° -*• D+, PB < 1.7 MW. It isfound that the current in 28' injection flows in the same direction of beam injection.
5. E d g e p l a s m a s t u d y [12]In addition to the edge density and temperature measurement [10], the distribution of
heat flux J,{z) is measured with a movable calorimeter probe of Cu-ball. The observedprofile well agrees with the density profile in the separatrix region. When the limiter isinserted into a plasma, it is found that both J,{z) and ne (R) decrease by about one orderof magnitude, which suggests that a plasma is limited by this material limiter, as shownin Fig. 7.
In order to understand the three-dimensional diverter structure, eight poloidal calorime-ter arrays are installed on the diverter region (low field side) at four toroidal cross sections
|So
[<p = 0*, 45*/«, 90*/rc, 135O/K, and K = 9.5) and are used to measure distributions of heatflux 7W, ion saturation current I, and floating potential V}.
Although the localization of Jv and /, are observed and agrees well with the rield linecalculation for diverter trace, the total amount for each section is not the same as eachother. It is also found that the magnitude and sign of Vj are varied on diverter stripes,as shown in Fig. 8. When the field direction is reversed, it is observed that Vj on mostdetector plates changes its sign, which may be consistent with the direction of VB drift.From considering connection of the field lines the positive V} region seems to be connectedto the negative one. These facts suggest that plasma current along the diverter bundlesexists and VB drift plays an important role in this flow.6. Development of a 106 GHz gyrotron system and preliminary
heating results [13,14]A 106 GHz half megawatt ECRH system has been installed. Main purpose of this
system is to produce the high density (ne ~ 7 x 1013cm~3) target plasma for NBI andto study the heating efficiency of second harmonic X-mode resonance heating. The out-put TEi2,2 mode of the gyrotron is converted into the HEu Gaussian-like beam by theimproved quasi-optical corvertor and this mode is transmitted by the tubular corrugatedwaveguides. Cold test showed that the main lobe radiated from the antenna with a visorhad a 95% of the total power. [15]
The mode profile and polarity of the HEn beam through the waveguide were measuredby the thermal image camera and the directional coupler/mode analyzer. It was confirmedthat the Gaussian-like mode with 1/e diameter of 30 mm was transmitted and had adesirable polarity. The 106GHz power was injected for short pulse (~ 20 msec) after theplasma has been produced by 53.2 GHz fundamental harmonic heating as shown in Fig. 9.The plasma (ne ~ 0.5 x 10a3cm"3, Te(0) ~ 820 eV at P& < 150 AW) was maintainedonly by the 106 GHz ECRH system.
SummaryThe magnetic configuration effects on energy, particle transport, plasma current and
diverter structure are studied in ECRH plasmas. Main results are:(1) Even in the limiter configuration with (a} ~ 15 cm transport improvement is realized
by the inward axis shift. This means that improvement occurs in core region (r < 2/3 o, where a is the minor radius without limiter) rather than in the boundaryregion (2/3 a < r < a).
(2) Transport of bulk electrons and impurity is studied by D2 pellet and Si injectiontechniques. The result shows that both transport of electron and impurity in coreregion is dominantly improved for inward shift case of Av = — 2 ~ —4 cm.
(3) Best performance of ECRH plasmas can be obtained in the configuration of Av =—2 cm and Bt / B^ = 5 % and in different plasma conditions such as magnetic sepa-ratrix, material limiter and pellet fueling.
(4) In order to clarify the role of the boundary region, which is considered intrinsicallyergodic, on energy and particle transport, a n m = l / n = 1 error field is applied.Both energy and particle transport seems to be less sensitive to the more ergodizationof this boundary region, but at least global energy transport is dramatically enhancedwhen the core region is ergodized.
(5) It is observed that plasma current in ECRH at B = 0.94T varies its magnitude(< 1 kA) and sign depending on the axis shift. The tendency seems to be consistentwith Au variation of Bootstrap current. However the measured toroidal currentabout 0.3 kA ECH at, 0.94 T standard configuration seems to be smaller than Shaing-Ohkawa theory. In NBI it is observed that the current flows in the direction of beaminjection.
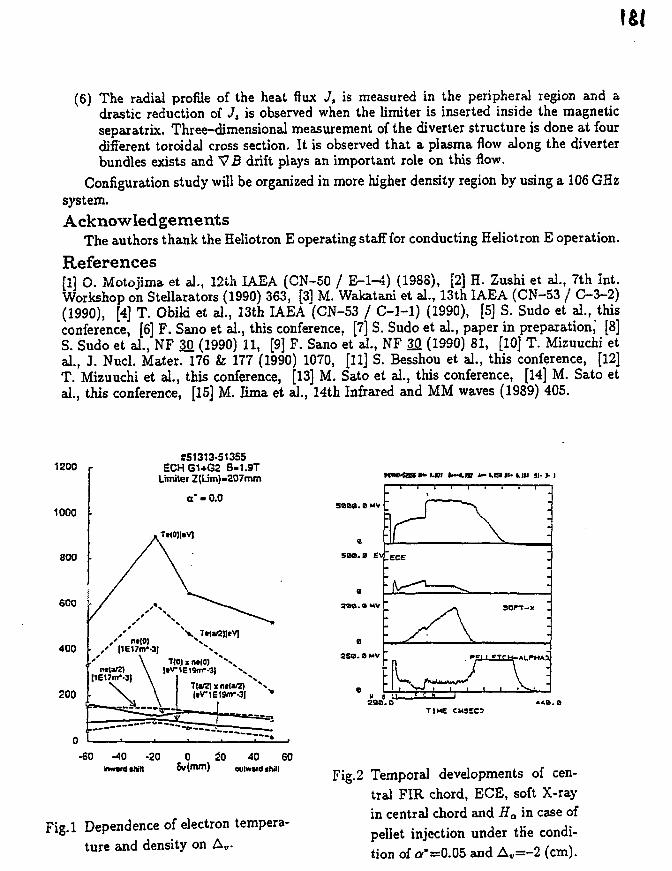
(6) The radial profile of the heat flux J, is measured in the peripheral region and adrastic reduction of J, is observed when the limiter is inserted inside the magneticseparatrix. Three-dimensional measurement of the diverter structure is done at fourdifferent toroidal cross section. It is observed that a plasma flow along the diverterbundles exists and VB drift plays an important role on this flow.
Configuration study will be organized in more higher density region by using a 106 GHzsystem.Acknowledgements
The authors thank the Heliotron E operating staff for conducting Heliotron E operation.
References[1] O. Motojima et al., 12th IAEA (CN-50 / E-l-4) (1988), [2] H. Zushi et al., 7th Int.Workshop on Stellarators (1990) 363, [3] M. Wakatani et al., 13th IAEA (CN-53 / C-3-2)(1990), [4] T. Obiki et al., 13th IAEA (CN-53 / C-l-1) (1990), [5] S. Sudo et al., thisconference, [6] F. Sano et al., this conference, [7] S. Sudo et al., paper in preparation,' [8]S. Sudo et al., NF M (1990) 11, [9] F. Sano et al., NF 2S (1990) 81, [10] T. Mizuuchi etal., J. Nucl. Mater. 176 & 177 (1990) 1070, [11] S. Besshou et al., this conference, [12]T. Mizuuchi et al., this conference, [13] M. Sato et al., this conference, [14] M. Sato etal., this conference, [15] M. lima et al., 14th Infrared and MM waves (1989) 405.
1200
1000
800
SS1313-51355ECHG1+G2 B-1.9T
Limiter Z(lim)-207mm
o - - 0.0
MM042SW.I.OI fc-LIS l-t.13ll-l.Jll Jl-J- I
600
400
2001
0
/
/ y''
• , ' |1E17m"-3|
\
%»%
T|0) x nt|0) * ^ N .
|tV1E19m--3| *^^
T(aQ)xntla^) * V N|fVlE1Sm"'3| '
e
2SS.SMV
SOFT-X .
TIME CMSEC?
-60 -40 -20 0 20 40 60Inward shin 8v(mm) oulwudshill
Fig.l Dependence of electron tempera-ture and density on Av.
Fig. 2 Temporal developments of cen-tral FIR chord, ECE, soft X-rayin central chord and Ha in case ofpellet injection under tKe condi-tion of o-"=0.05 and Aw=-2 (cm).
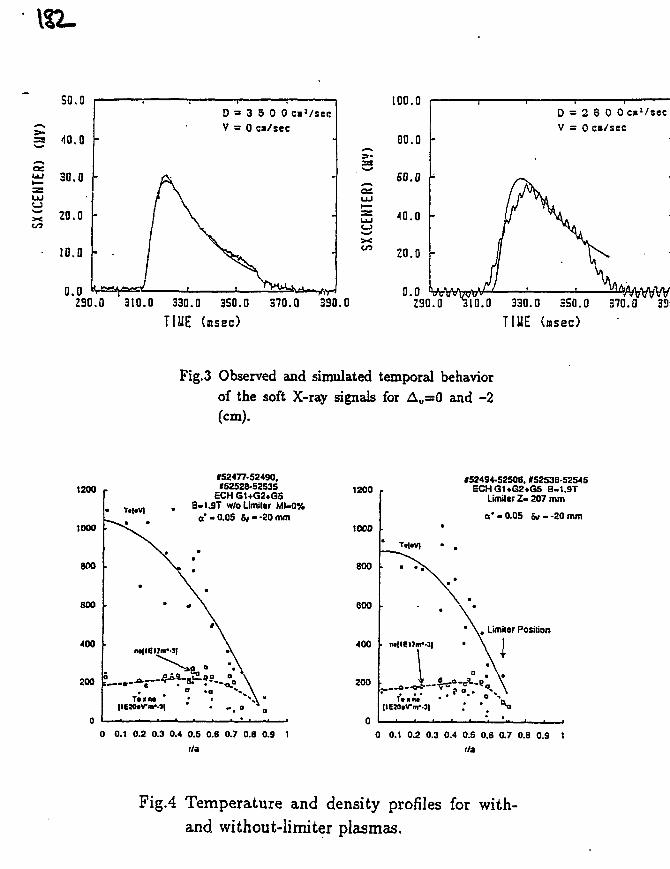
IS-
SO. 0
§j 40.0
2 30.0ssUJ(_3
^ 20.0 -
10.0 •0.0
D s 3 g o 0 c»3/secV = 0 ca/sec
xen
230.0 310.0 330.0 350.0 370.0 3SO.0
TIME (nsec)
100.0
00.0
SO.O
40.0
20.0
0.0
D = 2 3 0 0 c*2/secV = 0 c»/sec
u tf v u v w\jv * y v y y y vV'
220.0 310.0 330.0 3S0.O 370.0 321
TIME (msec)
Fig.3 Observed and simulated temporal behaviorof the soft X-ray signals for A«=0 and -2(cm).
1200 r
1000 •
800 •
Tt(.v)
#52477-52490,(52528-52535
ECH GWG2+G5- U T w/oUmiltr MI-0%o" -0.05 &r--20nun
0 0.1 0.2 0.3 0.4 0.5 0.6 0.7 0.8 0.9 1
r/a
1200 r
1000
800
I52494-5250S, #52538-52545ECHG1+G2+G5 B.1.9T
Umiler Z- 207 mm
a* - 0.05 5/ - -20 mm
• \ . Limiler Posilion
0 0.1 0.2 0.3 0.4 0.5 0.6 0.7 0.8 0.9 1
r/a
Fig.4 Temperature and density profiles for with-and without-limiter plasmas.
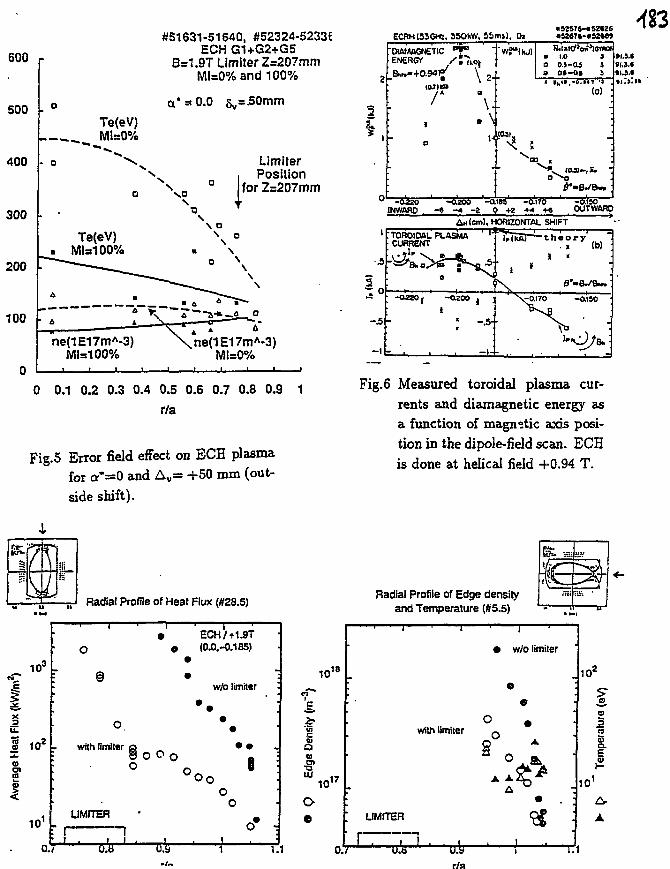
600
500
400
300
200
100
Te(eV), M!=0%
#51631-51640, #52324-5233EECH G1+G2+G5
B=1.9T Limiter Z=207mmMI=0%and100%
a* = 0.0
Limiler> PositionforZ=207mm
ITe(eV)
MI=100%
ne(1E17mA-3)Mi=100%
__a_ o6*
ne(1E17mA-3)Ml=O%
0 0.1 0.2 0.3 0.4 0.5 0.6 0.7 0.8 0.9 1
r/a
Fig.5 Error field effect on ECH plasmafor a"=0 and Av= +50 mm (out-side shift).
ECRHI53GHI, 35OKW, 55m»), O>«S2576-«S2M6
2 -
'DIWMGNETIC " f 0
ENERGY /•;"?,,
_&«»+o.9tfi;lama
1
o
a
• \
•0a
1.0as-aj
t53
(0)
»I.S.»91.3.4»l.5.»
-0^20 -azoo -ai»a -ai70 -0.150INWARD -6 -« -a 9 +2 -MI +6 OUTWARD
A M (em), HOWZOWAL SHIFT
-I =.
Fig.6 Measured toroidal plasma cur-rents and diamagnetic energy asa function of magnetic axis posi-tion in the dipole-field scan. ECHis done at helical field +0.94 T.
:—J Radial Profile of Heat Flux (#28.5)
£
Flu
SX<o0 1ID
10 3
102
10
' 1 ' 1
O •
F §
0 .
withtimiter a• S O 0 0
UMITEfl
! . ! 10./ U.U U.9
ECH/+1.9T(0.0.-0.185)
*
w/o limiter
* 0
•
:B •
O 0 <0
0
0 -1 . '1 1 .
1018
7"*
&0)
•ff10 17
O9
Radial Profile of Edge densityand Temperature (#5.5)
with limiter
LIMITER
r~—r I ••tdr
r/a
w/o limiter
8 „ *
10*
f
10'
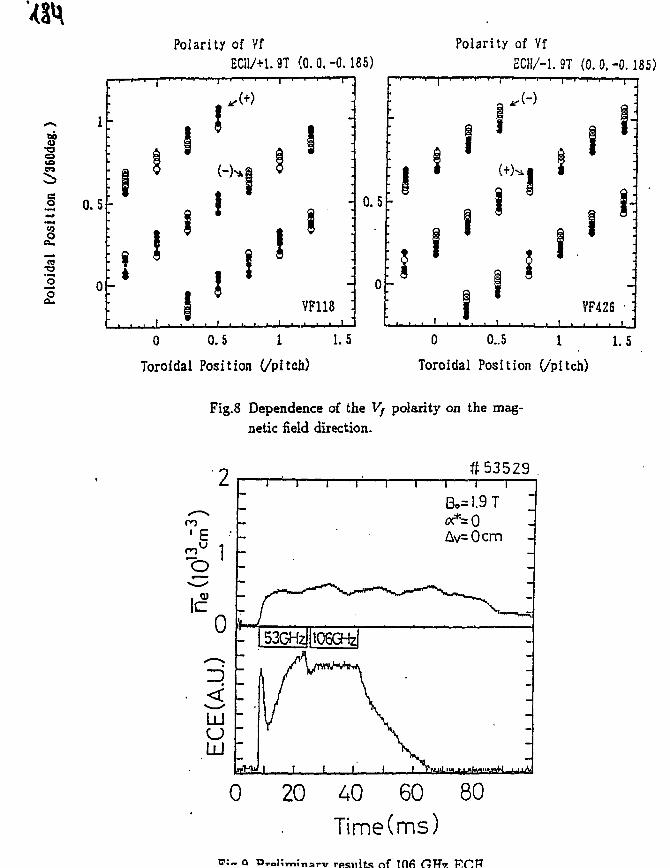
BO
•a
s
CO
•3
Polarity of VfEC11/+1. 9T (0. 0. -0.185)
T
Polarity of Yf
ECH/-1.9T (0.0,-0.185)
0 0.5 1 1.5
Toroidal Position (/pitch)
0 0..5 1 1.5
Toroidal Position (/pitch)
Fig.8 Dependence of the Vj polarity on the mag-netic field diiection.
2
•E ••
"O
0
i i i i
- 153GHzf|lO6GHzf
#53529
B0=1.9T<x*=0Av=0cm
0 20 40 60 80Time(ms)
:™ Q Dralimfnarv results nf Iflfi fiTT-JL R
MAGNETIC FLUCTUATION MEASUREMENTS IN HELIOTRON E
H.Zushi, M.Harada", T.Osaki and Heliotron E Group
Plasma Physics Laboratory, Kyoto University,
Gokasho, Uji, 611 JAPAN•NTT LSI Laboratory, Atsugi, 243-01 JAPAN
AbstractCharacteristics of Be are studied in both NBI (0.4 < £(0) < 3%) and ECRH (/?(0) <
0.5%) plasmas. It is found that unstable Be with an m = 1/n = 1 mode can be partiallystabilized by a small Bt ( £ 5% of Bh). Near the beta limit of 0(0) ~ 2 - 3%, Be(m =1/n = 1) strongly correlate with n£(m = 1/n = 1). Even in W- f ECRH plasmascoherent Bg with m=5 or 6 are observed around 55 ± 10 kHz. The amplitude increaseswith increasing RF power and beta. Strong burst of Be up to 1G is observed during thepellet ablation phase.
1. IntroductionStabilization of pressure driven interchange instabilities is a key issue to obtain a high
beta and good confinement plasma, because in tne heliotron/torsatron configuration thealmost entire minor region is in the magnetic hill, and therefore these instabilities areeasily driven. Both theoretical and experimental studies have been performed on HeliotronE with regard to broadening pressure profile, deepening magnetic well and increasingmagnetic shear [1]. In this configuration study it is recognized that the way to improvetransport is not always the way to increase MHD stability. In fact the obtained conditionwith respect to improved transport is the magnetic hill configuration [2]. Although theresistive interchange instabilities are also considered to be a candidate for the anomaloustransport in the heliotron/torsatron configuration, it is difficult to explain by interchangeinstabilities the reason why transport is improved in the hill configuration.
In this paper we study the characteristics of magnetic fluctuations which are consid-ered to be associated with ideal/resistive interchange modes. Especially, in addition tolow m modes, which are important in high 0 plasmas, the behavior of high m modesis investigated in low 0 ECRH plasmas. Configuration effect, correlation with transportimprovement, and effects of abrupt change in the pressure profile due to pellet injectionwill be described.
2. Stabilization for low frequency(< 20kHz ) MHD modesSince the t —I surface exists at r/a ~ 0.7 and there is the magnetic hill, stabilization
for the m = 1/n = 1 mode is considered to be most important. It has been observedthat Be(m = 1/n = 1) appears even in a quiet plasma when the pressure (density) profile
tends to be peaked [3]. If the magnetic axis is shifted inwardly by the additional verticalfield, internal disruptions associated with rational surfaces near the axis are caused bydestabilizing effects of the magnetic hill. In this phase Bg(m = 1/n = 1) are still observed.In this case no burst of raw signal of Be is observed at internal disruption. Plasma betavalue can be increased up to the ideal limit by pellet or strong gas puffing, because thesedisruptions does not reduce the stored energy so much and modes can be self-stabilizedby Shafranov shift. However, with increasing 0 ,the m = l / n = l mode becomes stronglyunstable and tends to limit the 0 value, because disruptions at around r/a ~ 0.7 due tothis mode affect the stored energy significantly .
The toroidal field stabilization effect has been observed on Bg(m = 1/n = 1) for inwardshifted low 0 plasmas. In the stability window ( 0.03 < a" < 0.08), where a" = Bto/Bho,no coherent low m/n Bg oscillations are observed in the low frequency range. Outsidethis window the amplitude of Bg(m = 1/n = 1) grows as | a' | increases, as shown inFig.l. The a' stabilization effect on the m = l / n = l mode is not clearly understood yet,because the pressure gradient at the t = I surface, which is monitored by the soft X rayprofile, is the largest in the stability window and the magnetic shear in vacuum, which isexpected to stabilize interchange modes, continues to gradually increase with a". For high0(O)(> 1%), this stability window disappears. The correlation with other fluctuations suchas soft X ray and line density is studied as a function of 0. For 0(0) < 1%, large amplitudefluctuations of soft X ray and line density are dominated by m=2/n=l or m=3/n=2 modesnear the axis. There are no visible m = l / n = l oscillations on both signals, but by usingFFT analysis of nl signal a consistent mode (at least m is odd) is identified under someconditions. With increasing 0(0) > 1%, fluctuations are dominated by the m = l / n = lmode. Rational surfaces near the axis are considered to be stabilized by the finite 0effects. In this case, both Bg and ni are well correlated with each other and have the samemode number at the same frequency[4].
3. High frequency ( 40 < / < 70kHz ) coherent oscillationsBesides above mentioned low frequency MHD modes, characteristics of coherent high
frequency oscillations B^F were studied in ECRH plasmas. Total 120 coils are installedinside the chamber at the five toroidal positions. From cross-correlation analysis thepoloidal mode number of BHF y}^s estimated 5 or 6, as shown in Fig.2. It was found thatthe amplitude of BHF increased with increasing RF power and decreasing Bno (that is,increasing 0). These features suggest that BHF is related to power degradation of rg andis caused by pressure driven instabilities depending on 0 value. Thus the configurationeffects on BHF are studied with respect to transport improvement by the axis shift.
First, the poloidal distribution of BHF at f = 60 kHz was studied at the verticallyelongated cross section. The plasma parameters are as follows ; ne = 1.3 xl013cm~3 ,Te(0) £ 1000 eV and Bh= 1.9 T. BHF at 9 = ±ir (inboard side) is about 50 mG and at9=0 (outboard side) is about 20 mG in the standard configuration. Distances between the
A&+
pick-up coils at 0=0 and x , and the plasma edge are about 7.8 cm and 2.5 cm, respectively.Both BHF at 8 = ± ^ / 2 are less than 2 mG. Although the distribution of heat and particleflow corresponds well to the divertor position [5], we could not observe the enhancementof BHF n e a i the divertor stripe, as seen in DIII-D[6j.
Second, the magnetic axis is varied from Aw = —8cm to Av = +6.5cm, where Av =Raxis — Ro- BHF at four ploidal positions are plotted as a function of AV1 as shown inFig.3a» When the axis is shifted inwardly, BHF{8 = =fc?0 increase up to 120 mG andBBF{8 — 0) decrease to 3.6 mG. On the contrary, when the axis is shifted outwardly,BHF{8 — i"") drop rapidly to 3 mG and BHF{8 — 0) increase gradually up to 20 mG.BHF at top and bottom are of almost constant. Av variation of total sum of BHF seemsnot to correlate with A* variation of rE. Since magnetic surfaces can move by the verticalfield, the above results suggest that BHF relates to the distance between coil position r^iand rational surfaces which axe expected to be an origin of BHF- BHF at four positionsare plotted as a function of the distance between TOM and the outermost magnetic surfaceav, as shown in Fig.3b. If the m=5 or 6 mode exists at every Aw position, this figure seemsto be contradict to a radial dependence of the simple m=5 or 6 multi-pole field. Thepoloidal distribution of coherence 7 between the coil at 8 = 0 and other coils drasticallychanges. For A,. = 0, 7 in the top plane (TT > 6 > 0)is almost l,but in the bottom plane(—TT < 6 < 0)7 decreases, which means fluctuations at 9 = 0 and 8 = —TT/2 tend to beincoherent. When the magnetic axis is shifted, 7(0 >0) decreases gradually and j{B <0)reduces rapidly, as shown in Fig.3c. Although the strong peak in power spectrum of Bis observed at every Av position in the high frequency range ( 4 0 - 6 0 kHz ), the modestructure or poloidal correlation length may be changed by Av.
Third, in order to find out the origin of BHF (m=5 or 6). a carbon limiter is inserteddeeply into a plasma. The enhancement of BHF at 8 = 0 is usually observed and othersdoes not reduce so much. Coherent mode still exists and m=5-7 is identified again. Thisresults indicates that the origin exists at least inside the limiter radius (r < 15 cm and« < 1.1). Without adjusting gas puffing, the density increases by insertion. Since thecentral pressure is almost unchanged, the pressure profile becomes rather steep in a globalsense[7j. This may cause the enhancement of BHF-
4. Burst of Be at pellet injection
The burst of Be was observed during the pellet ablation phase ( < 1 msec), at whichthe ablated particles relax toroidally and poloidally along the field lines[8j. The amplitudeof Be reaches up to about 1 G. The ion saturation current on the divertor stripe andbulk density are measured by ~ TT/3 and ir from the pellet injection port. The delay timebetween them with respect to the Ha emission from the ablating cloud are — 100 and 200jzsec.respectively. The burst of Be is already observed in the initial phase that the pelletis traveling toward the magnetic axis, as shown in Fig. 4. Within signal to noise ratio,however, it is difficult to find the time delay between Be at various toroidal positions.
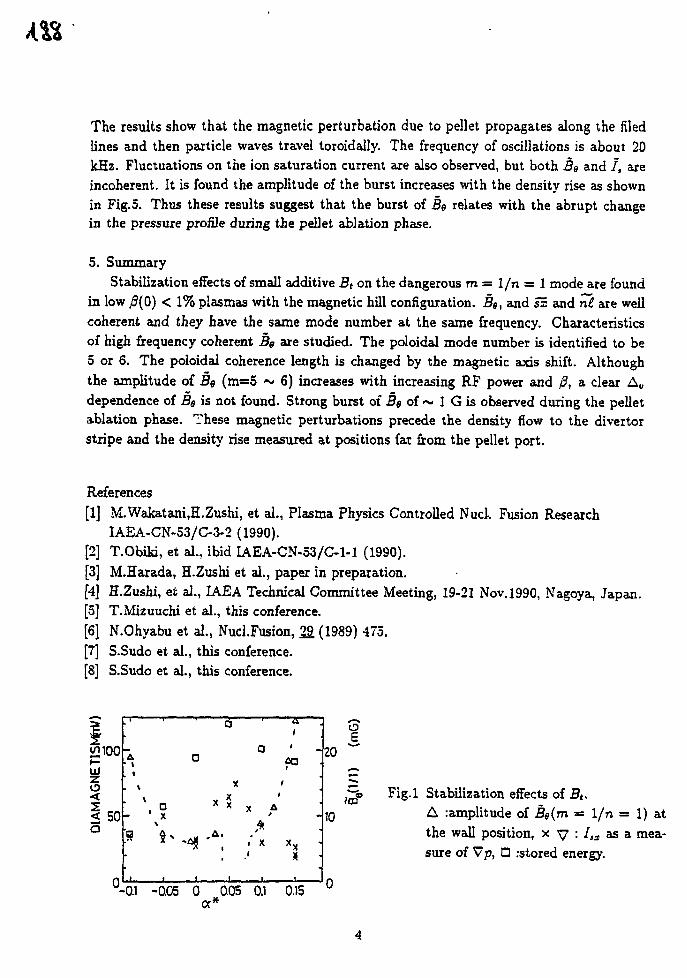
m
The results show that the magnetic perturbation due to pellet propagates along the filedlines and then particle waves travel toroidally. The frequency of oscillations is about 20kHz. Fluctuations on the ion saturation current are also observed, but both 3g and / , areincoherent. It is found the amplitude of the burst increases with the density rise as shownin Fig.5. Thus these results suggest that the burst of Bg relates with the abrupt changein the pressure profile during the pellet ablation phase.
5. SummaryStabilization effects of small additive Bt on the dangerous m = 1/n = 1 mode are found
in low £(0) < 1% plasmas with the magnetic hill configuration. Bg, and s i and rd are wellcoherent and they have the same mode number at the same frequency. Characteristicsof high frequency coherent Bg are studied. The poloidal mode number is identified to be5 or 6. The poloidal coherence length is changed by the magnetic axis shift. Althoughthe amplitude of Bg (m=5 ~ 6) increases with increasing RF power and /?, a clear Av
dependence of Bg is not found. Strong burst of Bg of ~ 1 G is observed during the pelletablation phase. These magnetic perturbations precede the density flow to the divertorstripe and the density rise measured at positions fat from the pellet port.
References
[1] M.Wakatani,H.Zushi, et al., Plasma Physics Controlled NucL Fusion ResearchIAEA-CN-53/C-3-2 (1990).
[2] T.Obiki, et al., ibid IAEA-CN-53/C-1-1 (1990).[3] M.Harada, H.Zushi et al., paper in preparation.[4] H.Zushi, et al., IAEA Technical Committee Meeting, 19-21 Nov. 1990, Nagoya, Japan.[5] T.Mizuuchi et al., this conference.[6] N.Ohyabu et al., Nucl.Fusion, 22. (1989) 475.[7] S.Sudo et al., this conference.[8] S.Sudo et al., this conference.
Fig.l Stabilization effects of Bt.A :amplitude of Bg(m = 1/n = 1) atthe wall position, x v : / „ as a mea-sure of Vp, D .-stored energy.
-0.1 -0.05 0 0.05 0.1 0.15
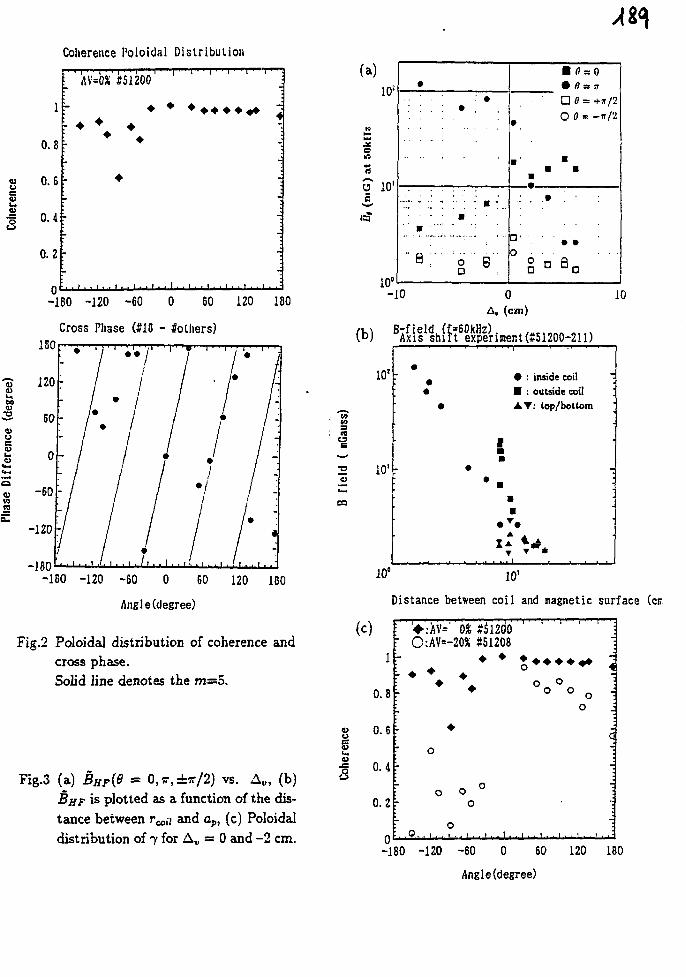
Al<\Coherence Poloidal Distribution
u§
1
0.8
0.6
0.4 •
0 . 2 -
t •
AV-OX #51200
• * •••••«*•
, ( , _ . i . . I . . I . > I • . I , i t • . 1 . . -
0-180 -120 -60 0 60 120 180
Cross Phase (#18 - Jolliers)
-180 -120 -60 0 60 120 180
Angle (degree)
Fig.2 Poloidal distribution of coherence andcross phase.Solid line denotes the m=5.
Fig.3 (a) BHF(B = 0,ff,±7r/2) vs. Av, (b)BHF is plotted as a function of the dis-tance between r^u and ap, (c) Poloidaldistribution of 7 for A,, = 0 and -2 cm.
(a)
O 10'
10°
•. . • . • : • •
; ; . ; • ;
- • • -
. . . . m - •
m • ' " ' • :
... Q . . . . Q .
D
• /? = -D8 = +i/2
# O0 = -ir/2
• •• •
° - • • • • • • •
-10 0(cm)
10
(b) BAfxllldsh[?t8egiriIner.t(*51200-211)
10J
2 10'
• : inside coilM : outside coilA T : top/bottom
10°
Distance between coil and magnetic surface (or
ice
s
Cohe
(c)
0.
0.
0.
0.
1
8
6
4
2
• '+- o
---•
r
-
: 0.
:AV=' 0%:AV=-20%
o
o
o
•
oo
1 ' 1
S51208• •
o
. i . . i .
o
1
• • • •
o °o o
. 1 . . 1 . .
1 '
oo
4
-
-.
-1
-., , ' •
-180 -120 -60 0 60 120 180
Angle (degree)
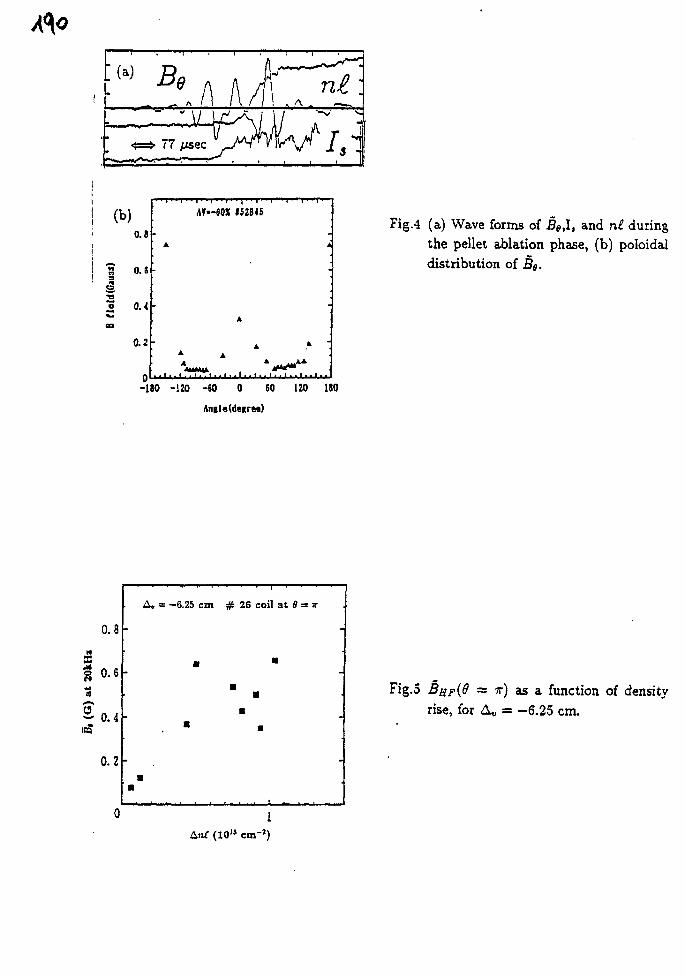
Fig.4 (a) Wave forms of Be,l, and n£ duringthe pellet ablation phase, (b) poloidaldistribution of Be-
-ISO -!20 -60 0 SO 120 110
Angle(degrea)
0.8
t 0-6
2-0.4
0.2-
&, = -6.25 cm # 26 coil at S = JT
iAnf (10" cm'2)
Fig.5 3HF(9 = TT) as a function of densityrise, for A* = -6.25 cm.
Tht «omittad manutetipt hat bt«n aumorad by acontractor of(ha U. S. Covammani und« -contract0E-AC05-WORJ1*00. AccordmQly, Iha U. S.Govcmmant » a » m a nonticlufva. royalty )taakcan»a to pual«l> or raorodue* ttw puNiihad termof t ru contribution, or allow omars to do ao, lorU 3. fiovammant purpowv
FLUCTUATIONS AND TRANSPORT IN LOW-COLLISIONALITY PLASMASIN THE ATF TORSATRON'
J. H. Harris, M. Murakami, B. A. Can-eras, S. Aceto1, B. Braiias2, L. R. Baylor3,J. D. Bell4, T. S. Bigelow, R. A. Dory, J. L. Dunlap, N. Dominguez, G. R. Dyer.A. C England, J. C. Glowienka, G. R. Hanson5, C. Hidalgo2, R. C. Isler, T. C. Jemigan.J. N. Leboeuf, D.K. Lee4, K. M. Liking J. F.Lyon, C. H. Ma, M. Meier7, M. A.Ochanco:,S. F. Paul8, D. A. Rasmussen, Ch. P. Ritz7, J. Sanchez2, A. V. Sapozhnikov6, K. A. Sarksyan6,M. G. Shats* C. E. Thomas*, J. B. Wilgen, W. R. Wing, A. J. Wootton7, J. Zielinski1
Oak Ridge National Laboratory, Oak Ridge, Tennessee, USA
In low-collisionaiity plasmas confined in tokamaks and stellarators, instabilities driven by particle?trapped in homogeneities of the magnetic field could be important in increasing plasma transportcoefficients. In the Advanced Toroidal Facility (ATF), an £ = 2, M =12 field-period stellarator-typedevice with major radius R = 2.1 m, plasma minor radius a = 0.3 m, central and edge rotationaltransforms t 0 = 0.3, <, -1, the effects of electron trapping in the helical stellarator field are expec-ted to be important in plasmas with He = 5 x 1012 cm"3, T^ « 1 keV. Such plasmas have alreadybeen sustained for long-pulses (20 s) using 150-400 kW of 53.2 GHz ECH power at B = 0.95 T.
Transport analysis shows that for r/a £ V3> the electron anomalous transport is < 10 times the neo-classical value, while at r/a = 2/3 it is 10-100 times neoclassical; this is compatible with expectationsfor transport enhancement due to dissipative trapped electron modes. Furthermore, when an exter-nally programmable quadrupole field is used to vary the elongation of the flux surfaces during asingle shot so as to change the confined traction of helically-trapped panicles from 90% to 10%, theexperimental anomalous transport at Va =2/3 decreases by a factor >10, suggesting that trapped elec-tron effects could be responsible.
An array of diagnostics is being used to measure plasma turbulence throughout the plasma. Aheavy-ion beam probe, microwave reflectometcr, and reciprocating Langmuir probe are alreadyoperational, and a 2 mm microwave scattering system is in preparation. Initial measurements showthat nVn rises from <1% at r/a s 0.3 to *10% at r/a = 1, and that at the edge, the fluctuation-inducedparticle transport is comparable to that inferred from global measurements. Detailed studies corre-lating turbulence with local transport and trapped particle populations are in progress.
"Research sponsored by the Office of Fusion Energy, U. S. Department of Energy under contract DE-AC05-84OR21400 with Martin Marietta Energy Systems, Inc.
'Renssclaer Polytechnic Institute, Troy, New York2Asociacion Euraiom/CIEMAT, Madrid, Spain^Engineering Division, Martin Marietta Energy Systems, Inc., Oak Ridge, Tennessee^Computing and Telecommunications Division, Martin Marietta Energy Systems. Inc. Oak Ridge.Tennessee^Georgia Institute of Technology, Atlanta, Georgia^General Physics Institute, Moscow, USSR^Fusion Research Center, University of Texas at Austin, Austin, Texas8Princcton Plasma Physics Laboratory, Princeton, New Jersey
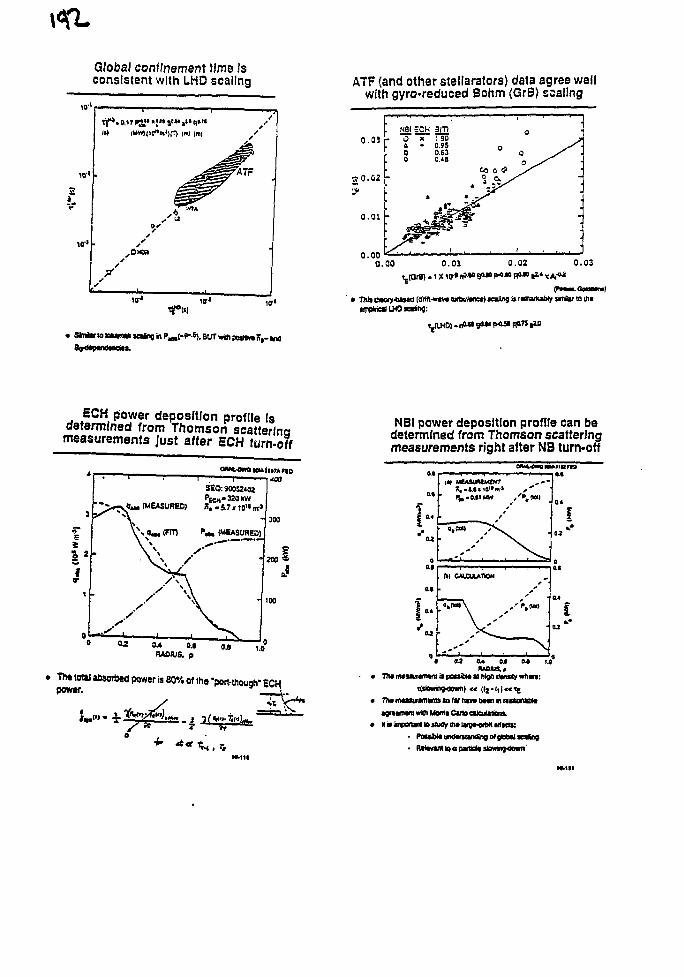
\<KL
Global confinement lime Isconsistent with LHD scaling
10'1
3
i-
Xf** 0,17 P j» • « • S"1 »« **•lit iuw)|ic"m')(T) I'M I")
A7F (and other stellarators) data agree wellwith gyro-reduced Bohm (GrB) scaling
° - a 3t MBIfC
2 '
•*>
0.000.00 0.03
' * ThlJ B»ory-bisMWrm.«i«v»lartiul«net) soling »rtnurtubly siriir ra miimMealLHOicaling:
ECH power deposition profile Isdetermined from Thomson scatterlnameasurements Just after ECH turn-off
I -SEO:900S2402
V s 9 a , (FIT) P* , (MEASURED)
400
300
"nit total absorbed power is 80% of the "port-though- ECU
NBI power deposition profile can bedetermined from Thomson scatteringmeasurements right after NB turn-off
O O2 04 a l M W"
TJw Rwuwnmtnt il peaibM ai high otnsty whm:
77w (iwaiurifflMia la far H I M bwn in nuenaM*agntniwi witfi Montt Cans calculation*.»il impenstt IS uutf/ 0» Urst-oM uf MK
• PmM«uid«sanaV«o< global icalng• Ri<«vwtioaMnicl«sle*ing4B«n
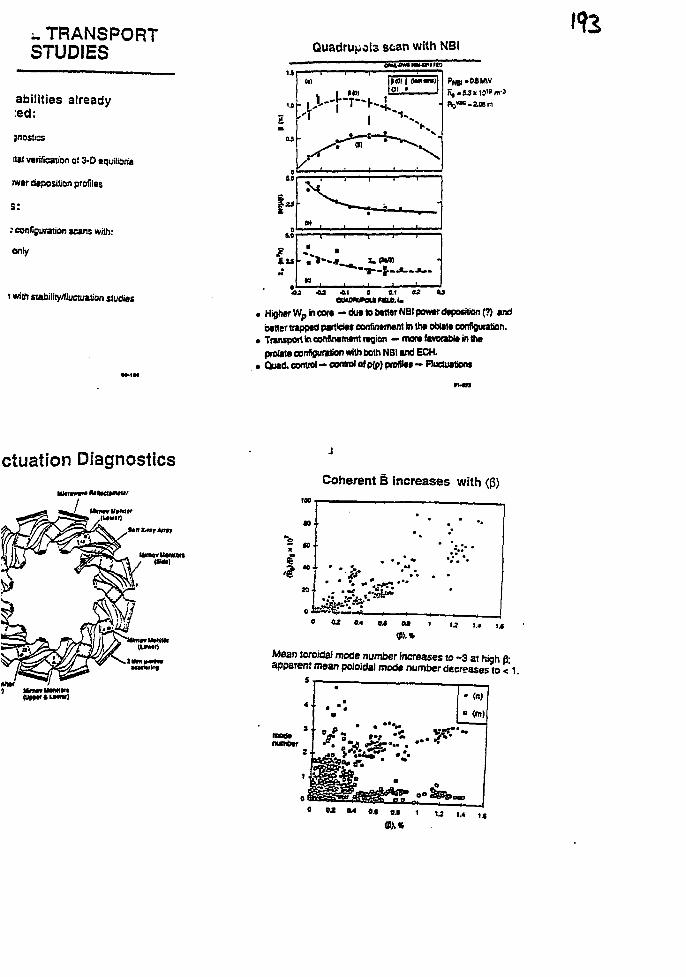
i. TRANSPORTSTUDIES
abilities already:ed:
jnostics
I U I verification of 3-0 equilibria
>w»r deposition profiles
s:
: configuration scans with:
only
t with stability/fluctuation studies
Quadrupots stan with NBI
• Higher W p in core - d u e to better NBI power deposition (?) andbetter trapped particles confinement in the oblate configuration.
• Transport in confinement region —more favorable in theprolate configuration with both NBI and ECH.
• Quad, control - control of p(p) profiles —Fluctuations
ctuation DiagnosticsCoherent B increases with (j3)
Mean toroidal mode number increases to - 3 at high frapparent mean poloidal mode number decreases to < 1
s
»•» l « t.«
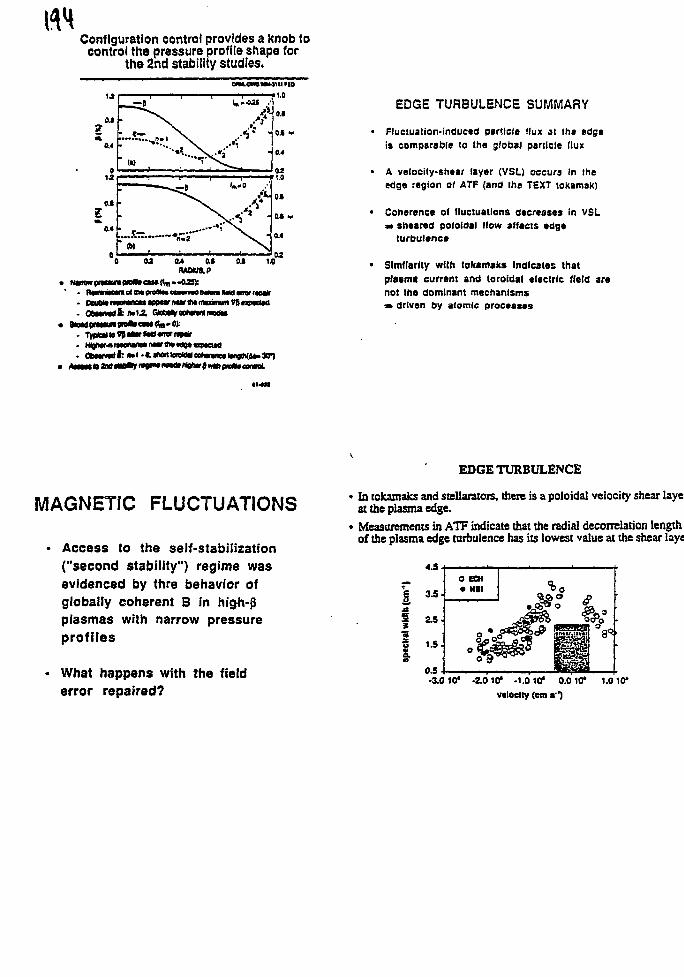
Configuration control provides a knob tocontrol the pressure profile shape for
the 2nd stability studies.
ObnmtfS: rwiz GUM*atom*mo**
EDGE TURBULENCE SUMMARY
• Flucluation-induced particle (lux at the edgeis comparable to the global particle flux
• A velocity-shear layer (VSL) occurs in theedge region of ATP (and the TEXT tokamak)
• Coherence Of fluctuations decreases in VSLm sheared poloidal flow affects edge
turbulence
• Similarity with tokamaks Indicates thatplasma current and toroidal electric field arenot the dominant mechanisms=» driven by atomic processes
g gObMMd i : iwl • #. Wort kmttt cd * 301
MAGNETIC FLUCTUATIONS
• Access to the seif-stabilization("second stability") regime wasevidenced by thre behavior ofglobally coherent B in hig+i-j3plasmas with narrow pressureprofiles
• What happens with the fielderror repaired?
EDGE TURBULENCE
• In tofcamaks and stellarators, there is a poloidal velocity shear layeiat the plasma edge.
• Measurements in ATF indicate that the radial decorrelation lengthof the plasma edge turbulence has its lowest value at the shear laye
4.5-
3.5-
2.5 •
1.5.
0.5-
O ECH• Nil
•
HI-3.0 10* -Z0 10* -1.0 10* 0.0 10* 1.0 10*vtleclty (em •"*)
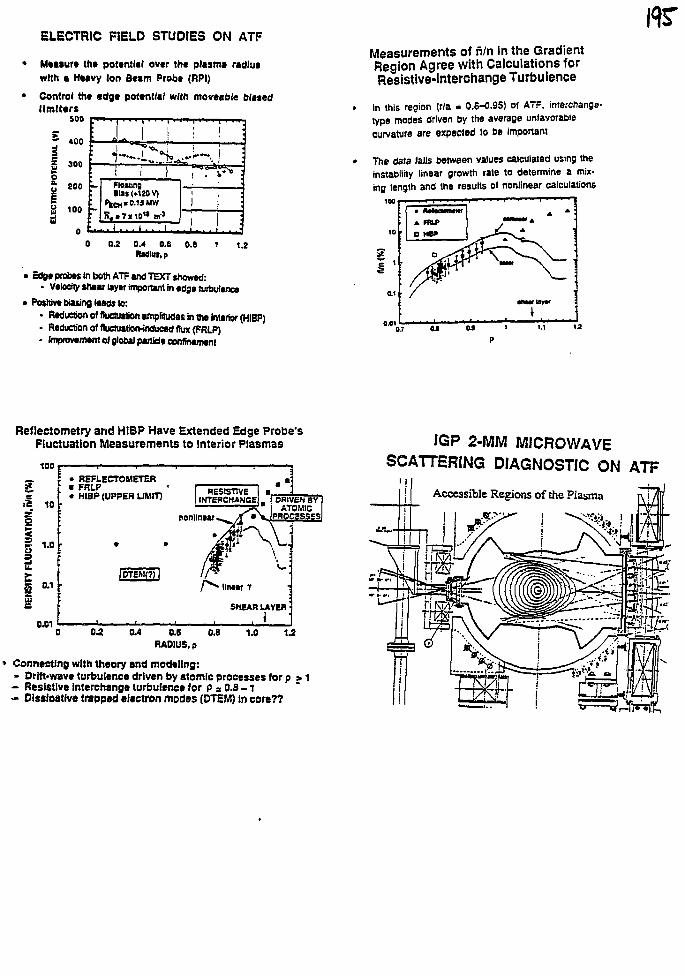
ELECTRIC FIELD STUDIES ON ATF
Measure the potential over the plasma radiuswith a Heavy ion Beam Probe (RPI)
Control the edge potential nitty moveabfe biasedllmlters
500
400
300
200
100
1 I i i i
! i 1Floating•111 (.120 V)
P ICH.0.UMW
. 1 i . . . I . . . I . .
i i i
0.2 0.4 0.6(USIUI.p
0.8 1.2
£ o > probes in both ATF and TEXT showed:
- Velocity shear laytr important in edge turbulence
Positive biasing leads to:
• Reduction of fluctuation amplitudes in the interior (HIBP)- Reduction of fluctuation-induced flux (FRLP)- Improvement oi global particle confinement
Measurements of n/n in the GradientRegion Agree with Calculations forResistive-Interchange Turbulence
In this region (r/a • 0.6-0.95) of ATF. interchange-type modes driven by the average unlavorablecurvature are expected to be important
The data tails between values calculated using theinstability linear growth rate to determine a mix-ing length and the results ol nonlinear calculations
1001
0.7 M 1.1 1.2
Refleetometry and HIBP Have Extended Edge Probe'sFluctuation Measurements to Interior Plasmas
too
II
10
I0.1
0X1
• REFLECTOMETER• FRLP• HIBP (UPPER LIMIT) RESISTIVE
INTERCHANGE
nonllmar
DRIVEN BY
02 0.4 0.S 0.8RADIUS, p
1.0 1.2
Connecting with theory and modeling:- Drift-wave turbulence driven by atomic processes for p > 1- Resistive interchange turbulence for p = 0 .8-1- Olssioattve trapped electron modes (OTEM) in core??
JGP 2-MM MICROWAVESCATTERING DIAGNOSTIC ON ATF
Accessible Regions of the Plasma
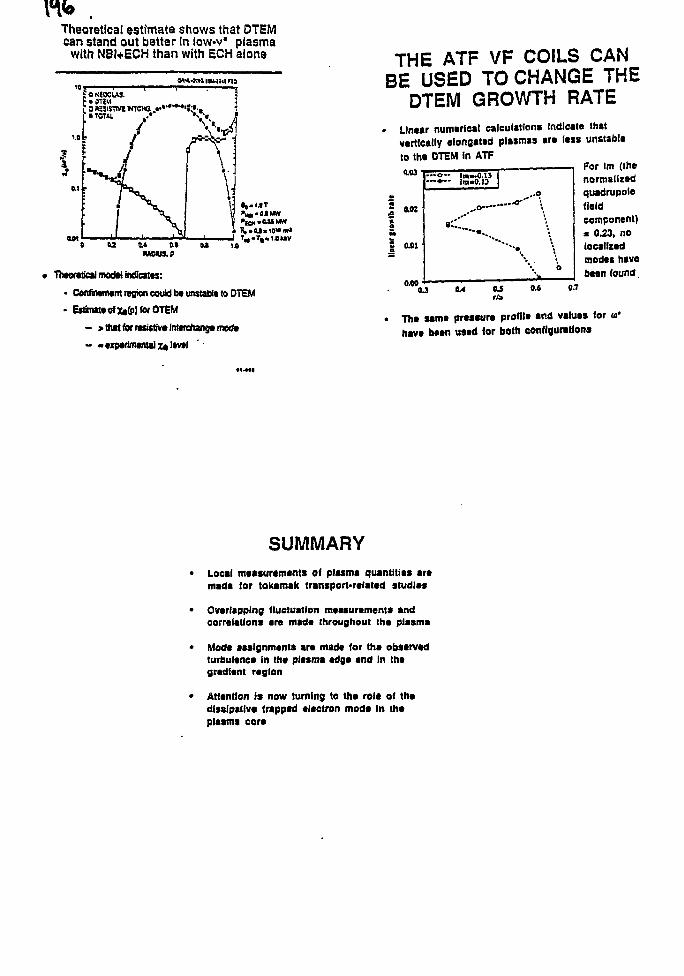
Theoretical estimate shows that DTEMcan stand out better En (ow-v* plasma
with NBI+ECH than with ECH alone
M l J TM-Ta«1«UV1.0
Theoretical model indlcatest
• Confinement region could be unstable to DTEM
• Estimate of Xe(P)fofOTEM
** > tnat for fvslstive interchange mode
- •experimental go1*"* ' '
THE ATF VF COILS CANBE USED TO CHANGE THE
DTEM GROWTH RATELinear numerieal calculations Indicate thatvertically elongated plasmas are less unstable
to the DTEM in ATFFor Im (thenormalizedquadrupotefieldcomponent)z 0.23, nolocalizedmodes havebeen found.
0.03
no:
0.01
0.00
The same pressure profile and values for u '
have been used for both configurations
SUMMARYLocal measurements of plasma quantities aremade for tokamak transport-related studies
Overlapping fluctuation measurements andcorrelations are made throughout the plasma
Mode assignments are made for the observedturbulence in the plasma edge and in thegradient region
Attention is now turning to the role of thedlsslpatlvs trapped electron mode In theplasma core
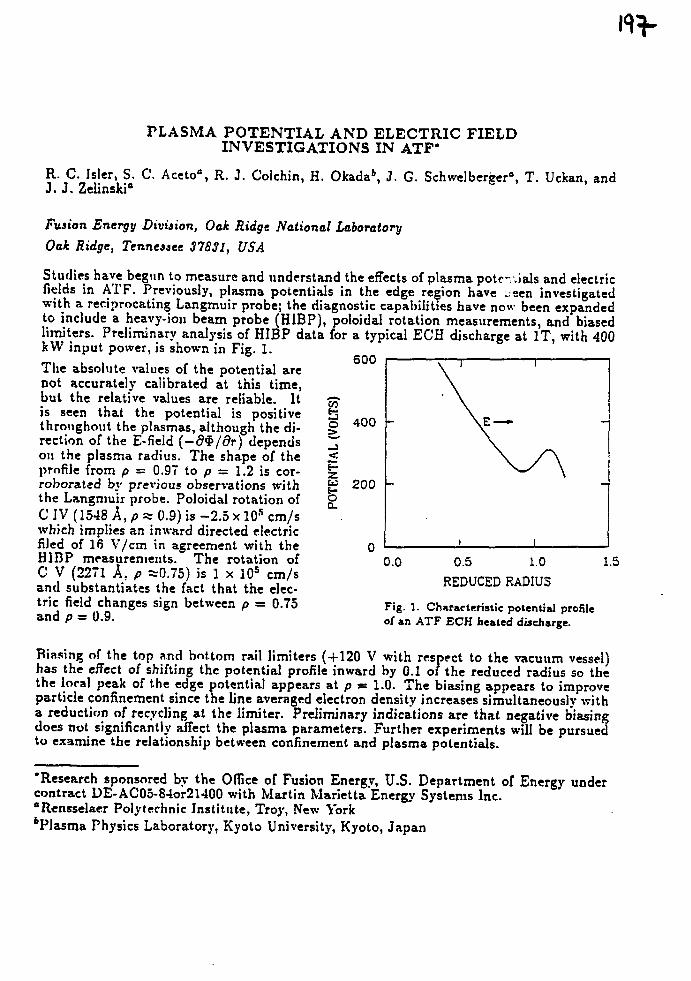
PLASMA POTENTIAL A N D ELECTRIC FIELDINVESTIGATIONS IN ATF'
R. C. Isler, S. C. Aceto0, R. J. Colchin, H. Okada*, J. G. Schwelbereer0, T. Uckan, andJ. J. Zelinski0
Fusion Energy Division, Oak Ridge National Laboratory
Oak Ridge, Tennessee 31831, USA
Studies have begun to measure and understand the effects of plasma pote-r.ials and electricfields in ATF. Previously, plasma potentials in the edge region have ween investigatedwith a reciprocating Langmuir probe; the diagnostic capabilities have now been expandedto include a heavy-ion beam probe (HIBP), poloidal rotation measurements, and biasedlimJters. Preliminary analysis of HIBP data for a typical ECH discharge at IT, with 400kW input power, is shown in Fig. 1.The absolute values of the potential arenot accurately calibrated at this time,but the relative values are reliable. Itis seen that the potential is positivethroughout the plasmas, although the di-rection of the E-field (—d$/dr) dependsOJI the plasma radius. The shape of theprofile from p = 0.97 to p = 1.2 is cor-roborated by previous observations withthe Langmuir probe. Poloidal rotation ofC JV (1548 A, p =s 0.9) is -2.5 x 10s cra/swhich implies an inward directed electricfiled of 16 V/cm in agreement with theHIBP measurements. The rotation ofC V (2271 A, p =0.75) is 1 x 10s cm/sand substantiates the fact that the elec-
400 -
200 -
0.0 0.5 1.0REDUCED RADIUS
trie field changes sign between p = 0.75and p = 0.9.
Fig. 1. Characteristic potential profileof an ATF ECH heated discharge.
Biasing of the top and bottom rail limiters (+120 V with respect to the vacuum vessel)has the effect of shifting the potential profile inward by 0.1 of the reduced radius so thethe local peak of the edge potential appears at p = 1.0. The biasing appears to improveparticle confinement since the line averaged electron density increases simultaneously witha reduction of recycling at the limiter. Preliminary indications are that negative biasingdoes not significantly affect the plasma parameters. Further experiments will be pursuedto examine the relationship between confinement and plasma potentials.
•Research sponsored by the Office of Fusion Energy, U.S. Department of Energy undercontract DE-AC05-84or21400 with Martin Marietta Energy Systems Inc."Rensselaer Polytechnic Institute, Troy, New York'Plasma Physics Laboratory, Kyoto University, Kyoto, Japan
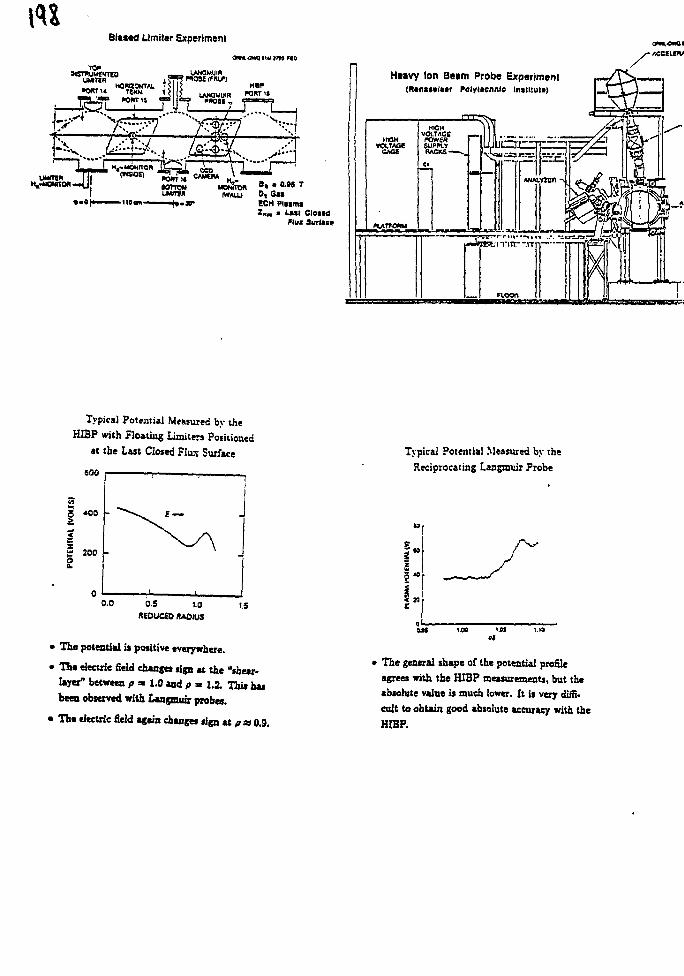
Btastd Umiter Experiment
UMITM- i 10an • ••)+.»• ECH Piumi
2Hm * Uti CloudFlux Surface
Heavy Ion Beam Probe Experiment(Htnif«((tr Polyltcnnlc Intiltult)
Typical Potential Measured by the
HIBP with Floating Limilers Positioned
at the Last Closed Flux Surface
0.5 1.0
REDUCED MOIUS
• The potential is positive everywhere.
• The electric field changes sign at the "shear-layer" between p a 1.0 and p a 1.2. This hasbeen observed with Langmuir probes.
• The electric field again changes sign tips 0.9.
Typical Potential Measured by the
Reciprocating Langauir Probe
'i• The general shape of the potential profile
agrees with the HIBP measurements, but theabsolute value is much lower. It is very diffi-cult to obtain good absolute accuracy with theH1BP.
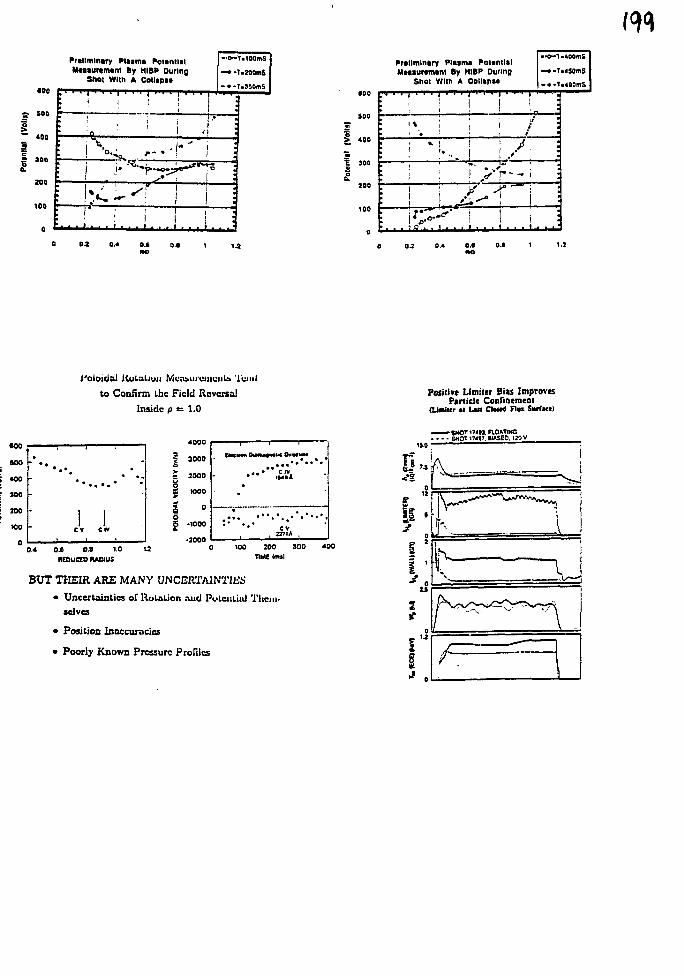
«90
400
200
Pr«llmln»ry Plaami PotentialM«isur*m«nt ay HIBP During
Shot Wllh A CollipM
: i i : !
- o ~ T . looms
—•-T.MOmS
-• -T .JSOmS
r !! L = •• i r i
*' ! I
% -: i
:|
1
400
300
100
Prtllmlniry PIMtni PonntmMHiunmint By HIBP Ourmp
Shoi Wllh A Colltpu
1
!% 11 • '
' ** [
! ' • . .' • ' »
!
= ! ! . - r «
! !
'. i
i ! /
i
-<^1-«00mS
— • -T.«S0mS
• **T«4S0mS
1 :
/ :/ •
i :
• i
ji :
i'oloidai itolaLiun Muiu>uri:iiiuiil!> iuml
to Confirm the Field Reversal
Inside p = 1.0
04 at oe i.o uMDUCTO RADIUS
100 200 300 400
TIMEfeltsI
BUT THEIR ARE MANY UNCEHTAlNTliiiJ
• Uncertainties of Rotation nud Pulciilki) Them-selves
• Position Inaccuracies
• Poorly Known Pressure Profiles
Positive Limiter Bias ImprovesPanicle Connnement
(Uailtr al Un Clurt Flui Surficf)
- SHOT 17JI3. FLOATING• SHOT 1MW. »I«SEO. I » V
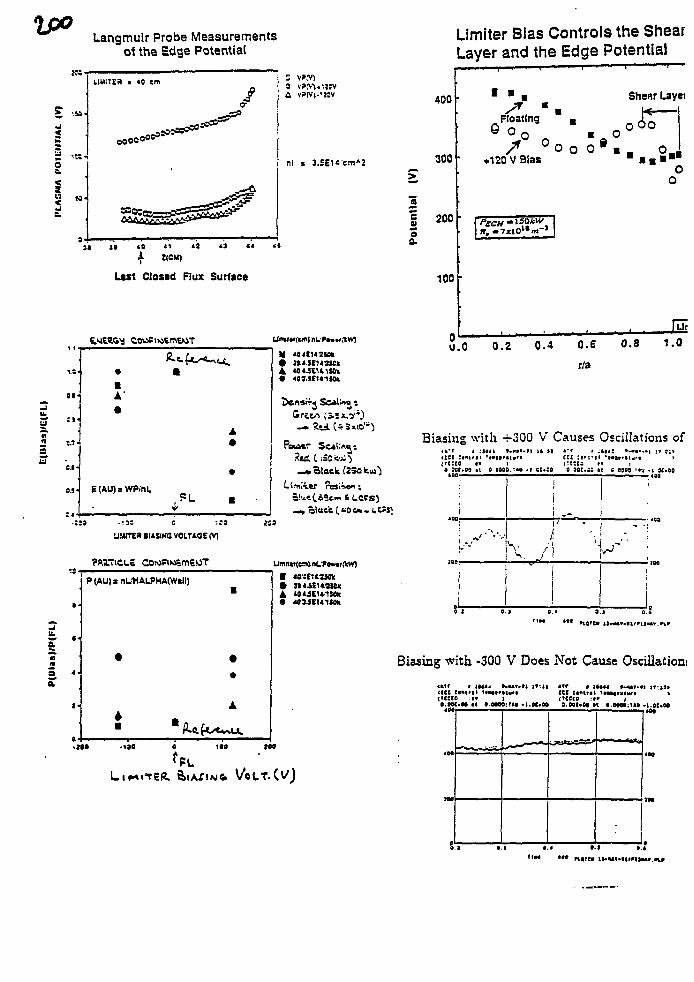
Langmuir Probe Measurementsof the Edge Potential
I - Jnl * 3.SE1«era'2
Last Closed Flux Surface
au
I t -
0 1 "
: »
C.T-
S I -
o.s-
•
•A'
E (AU) = WP.nl.
t«\EkJT
a
(i.->
A•
•
A »0«.S£UlS0k
Denair^ Soalino i
uurrja (USING VOLTAGE M
3a
Limiter Bias Controls the ShearLayer and the Edge Potential
400
300
1 200oa.
100
1 "
Floating0 oo
+12Q V BiasO o O
Shear Layei
• • • • • •
- 1 . • L .
0.2 0.4 0.6 0.8 1.0
r/a
Biasing with -f 300 V Causes Oscillations of
I"t:i3 f* )CE*OS 0 OOC.flS »t C 0 a S 3 . H U - I St>Q0
; • «3O
'K
O.J D.«TIM
Biasing with -300 V Does Not Cause Oscillation!
<1CC EIHtrll 1«a«*r»twri CCt CanUfl Ttwtrsttirc(tlCCO :tv ) ('CCro :»r f0.0M.H It •0OM:H> -t.OI.M O.IOI.M It l . m l i i u -1.0
2 •
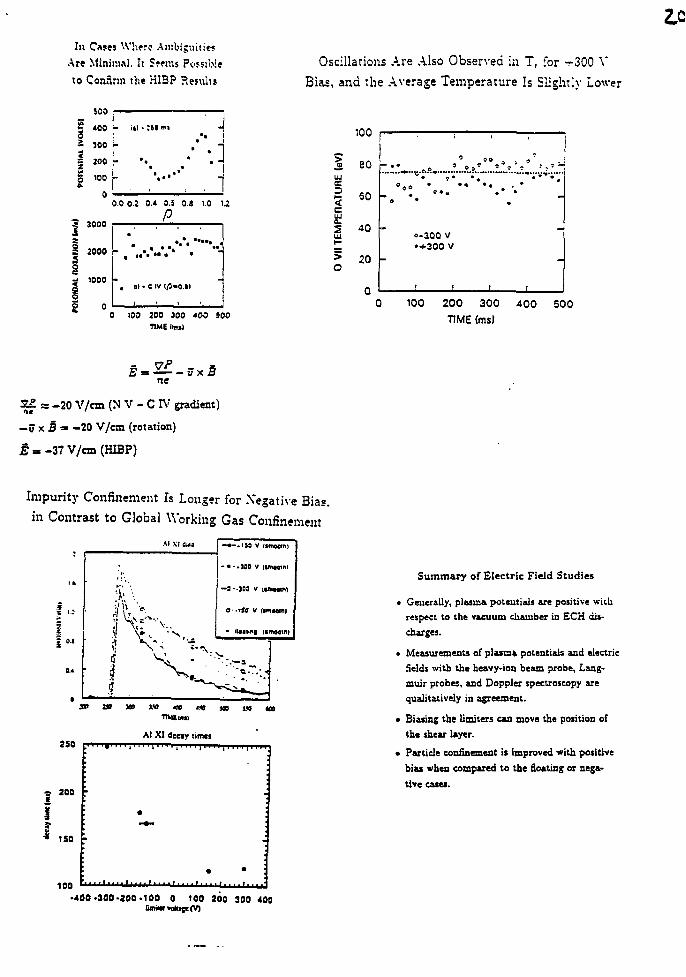
hi Cases Where Ambiguities
Are Minimal. It S«ms Possible
to ConSrai the HI3? Results
500 .-
1iin
I
400
300
200
100
I—
u1—
i l l - :
* • ••••.]
0.0 0.2 0.4 0.5 0 a 1.0 U
p
0 100 200 300 400 500TIME lm»)
Oscillations Are Also Observed in T, for -r300 V
Bias, and the Average Temperature Is Slightly Lower
1UJ
AT
UH
cUJQ.
XI
—
O
1UU
80
60
40
20
ou
c
1
0
o-300 V•+300 V
_
1 1
100 200
TIME
00 . - '
•
1 I
300 400 500
(ms)
ne
2 f ss -20 V/cm (N V - C R? gradient)
- « x 3 = -20 V/cm (rotation)
iU-37V/cm(HIBP)
Impurity Confinement Is Longer for Negative Bias,
in Contrast to Global Working Gas Confinement
Summary of Electric Field Studies
• Generally, plasma potentials are positive withrespect to the vacuum chamber in ECH dis-charges.
• Measurements of plasm* potentials and electricfields with the heavy-ion beam probe, Lang-muir probes, and Doppler spectroscopy arequalitatively in agreement.
• Biasing the Iimiters can move the position of
the shear layer.
• Particle confinement is improved with positive
bias when compared to the Seating or nega-
tive cases.
100•400 •300-200-100 0 100 200 300 400
lot
Summary of Biasing with ±120 V
Define E = W/nl
• S changes little with -120 V bias compared toliiniter floating.
• B decreases as much as a factor of 2 with+120 V bias.
Define P • fit/In.
• P changes little with -120 V bias compared tolimiter floating.
• P increase* by factors of 2-9 with -f-120 V bias.
Limiter Biasing Experiments
• Most limiter biasing experiments have beenperformed using ±120 V.
• We are just starting test biasing with ±300 V.
• Parameters that have been varied include elec-tron density, ECH power, and limiter location.
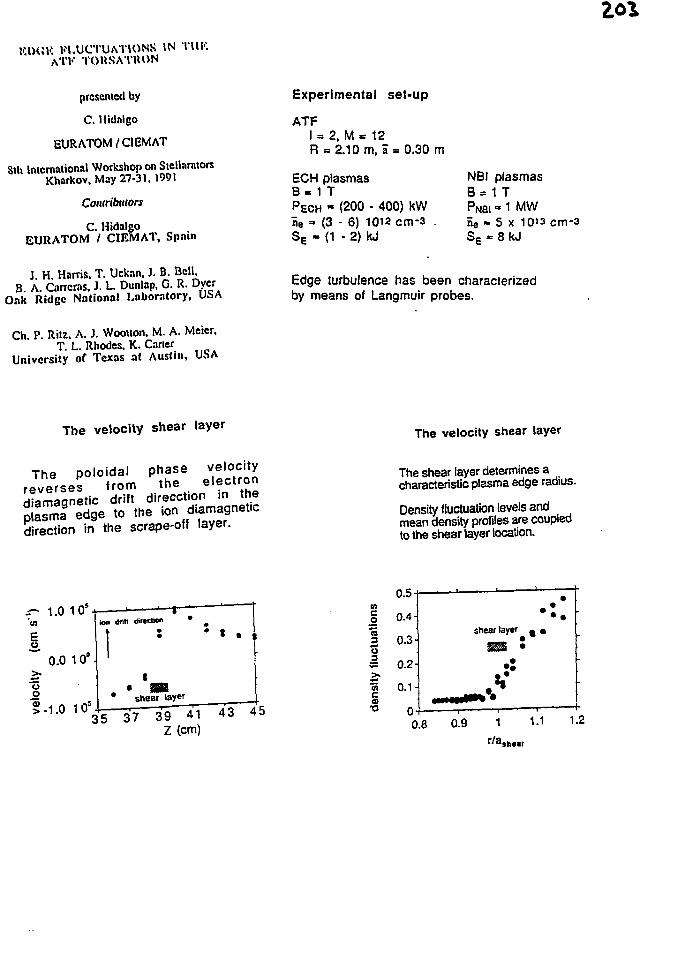
;K FLUCTUATIONS IN TIII1.,\TK TORSATIION
presented by
C. Hidalgo
EURATOM/CIEMAT
8th International Workshop on StellaratorsKharkov, May 27-31. 1991
Contributors
C. HidalgoEURATOM / CIEMAT, Spain
Experimental set-up
ATFI - 2, M - 12R = 2.10 m, a » 0.30 m
ECH plasmasB . 1 TPECH - (200 - 400) kWHe =» (3 - 6) 1012 cm-3 .SE - (1 • 2) kJ
NBI plasmasB - 1 TPNai - 1 MWne • 5 x 10'3 cm-3Sc » 8 kJ
J. H. Harris. T. Uckan. J. B. Bell.B. A. Carrcras. J. L. Dunlap, G. R. Dyer
Oak Ridge National Laboratory, USA
Edge turbulence has been characterizedby means of Langmuir probes.
Ch. P. Ritz. A. 3. Wootton. M. A. Meier.T. L. Rhodes. K. Carier
University of Texas at Austin, USA
The velocity shear layer The velocity shear layer
The poloidal phase velocityreverses from the electrondiamagnetic drift direcction in theplasma edge to the ion diamagneticdirection in the scrape-off layer.
The shear layer determines acharacteristic plasma edge radius.
Density fluctuation levels andmean density profiles are coupledto the shear layer location.
^ - 1.0 10s
E
0.0 1 0"
oo§-1.0 101
ion drill iliriction
* shear layer
3+5 37 39 41 ' 43" 45
Z(cm)
(AC
o3
<n
•o0.8
»hor
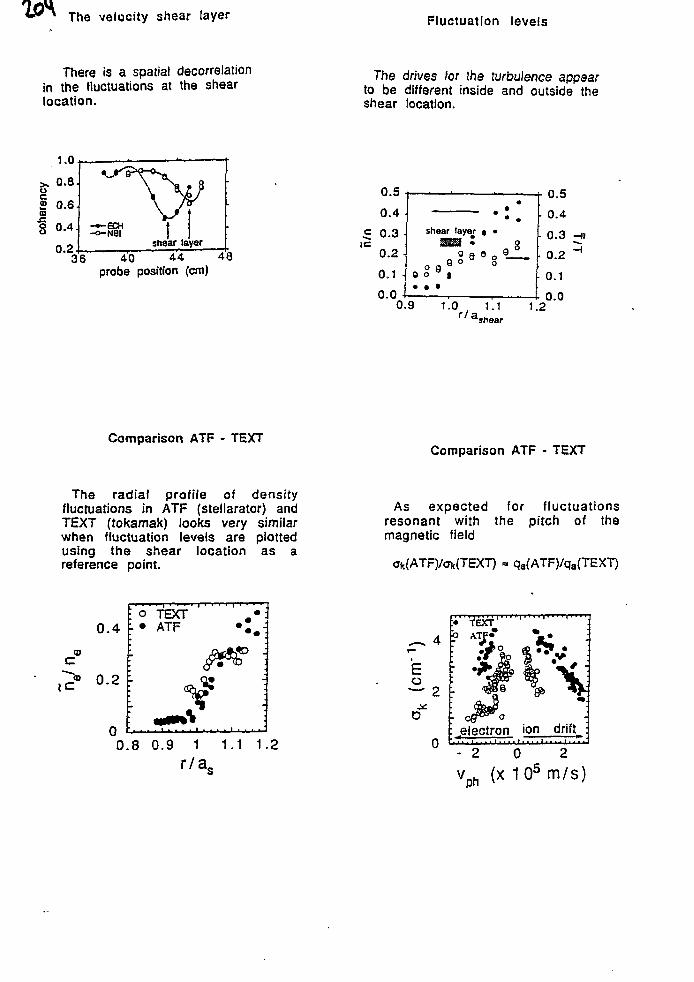
The velocity shear layer Fluctuation levels
There is a spatial decorrelationin the fluctuations at the shearlocation.
The drives for the turbulence appearto be different inside and outside theshear location.
1.0
8 0.4. ~
0.236 40 44 48
probe position (cm)
0.01.2
shear
Comparison ATF - TEXTComparison ATF - TEXT
The radial profile of densityfluctuations in ATF (stellarator) andTEXT (tokamak) looks very similarwhen fluctuation levels are plottedusing the shear location as areference point.
As expected for fluctuationsresonant with the pitch of themagnetic field
<Jh(ATF)/<jk(TEXT) =» qa(ATF)/qa(TEXT)
CD
0.4 -
-<° 0.2 -
0.8 0.9 1 1.1 1.2
l7£L
o
4 5
2 •
electron ion drift :
- 2 0 2
vph (x 105 m/s)
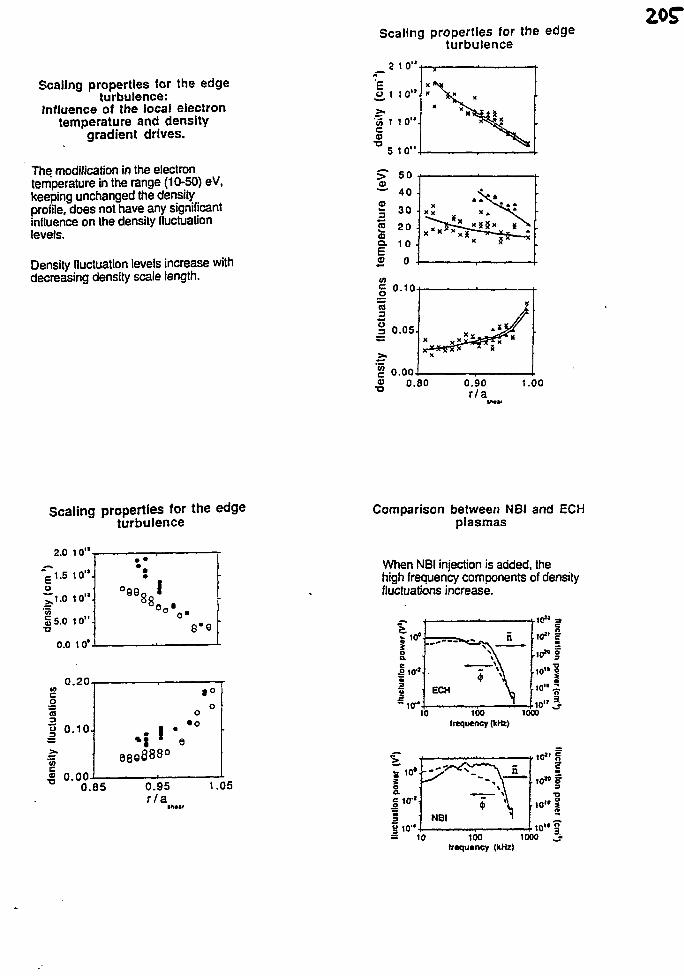
Scaling properties for the edgeturbulence:
Influence of the local electrontemperature and density
gradient drives.
The modification in the electrontemperature in the range (10-50) eV,Keeping unchanged the densityprofile, does not have any significantinfluence on the density fluctuationlevels.
Density fluctuation levels increase withdecreasing density scale length.
Scaling properties for the edgeturbulence
2 10'
1.00
Scaling properties for the edgeturbulence
Comparison between NBI and ECHplasmas
2.0 1 0"
o.o io*
0.20
1.05
When NBI injection is added, thehigh frequency components of densityfluctuations increase.
100 1000Irequency (kHz)
frequency (kHz)
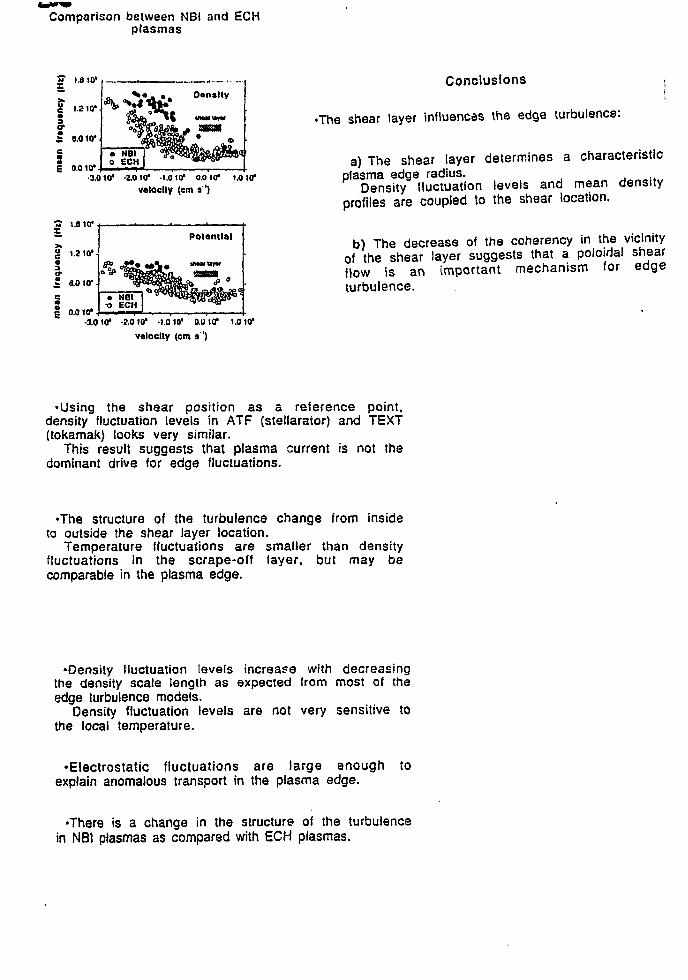
Comparison between NBl and ECHplasmas
g 0.010*•3.010" -1010* -1.010* 0.010* 1.010*
velocity (em a')
1.810*
g 1.2 10'•«a
2 s.010".
I 0.010*•3.0 10* -2.010* -1.010* 0.010* 1.010*
velocity (cm a ')
Conclusions ti
•The shear layer influences the edge turbulence:
a) The shear layer determines a characteristicplasma edge radius.
Density fluctuation levels and mean densityprofiles are coupled to the shear location.
b) The decrease of the coherency in the vicinityof the shear layer suggests that a poloidal shearflow is an important mechanism for edgeturbulence.
•Using the shear position as a reference point,density fluctuation levels in ATF (stellarator) and TEXT(tokamak) looks very similar.
This result suggests that plasma current is not thedominant drive for edge fluctuations.
•The structure of the turbulence change from insideto outside the shear layer location.
Temperature fluctuations are smaller than densityfluctuations in the scrape-off layer, but may becomparable in the plasma edge.
•Density fluctuation levels increase with decreasingthe density scale length as expected from most of theedge turbulence models.
Density fluctuation levels are not very sensitive tothe local temperature.
•Electrostatic fluctuations are large enoughexplain anomalous transport in the plasma edge.
to
•There is a change in the structure of the turbulencein NBl plasmas as compared with ECH plasmas.
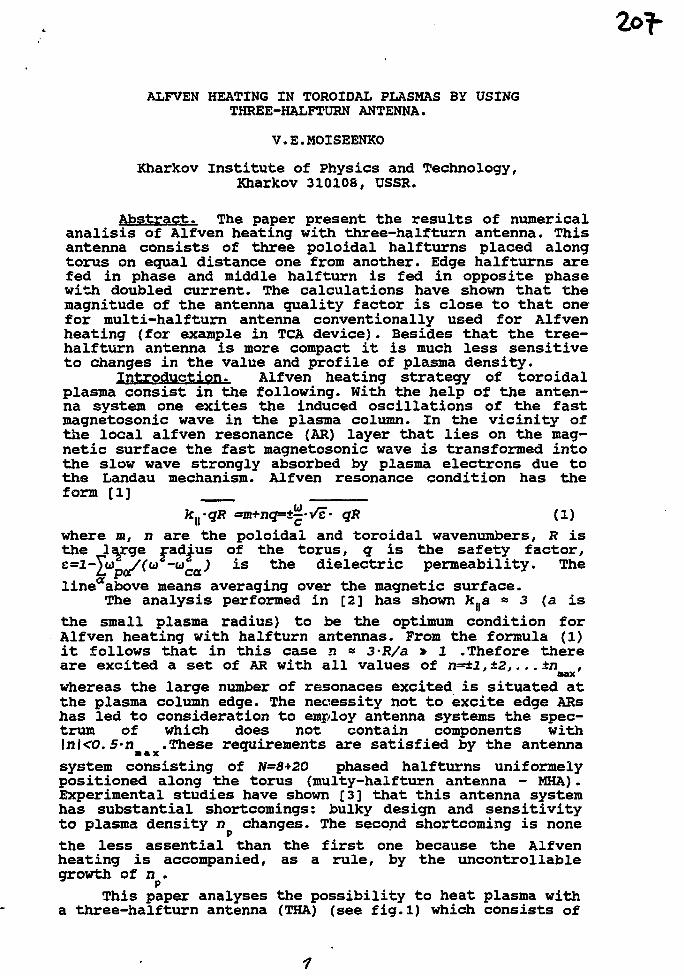
ALFVEN HEATING IN TOROIDAL PLASMAS BY USINGTHREE-HALFTURN ANTENNA.
V.E.MOISEENKO
Kharkov Institute of Physics and Technology,Kharkov 310108, USSR.
Abstract. The paper present the results of numericalanalisis of Alfven heating with three-halfturn antenna. Thisantenna consists of three poloidal halfturns placed alongtorus on equal distance one from another. Edge halfturns arefed in phase and middle half turn is fed in opposite phasewith doubled current. The calculations have shown that themagnitude of the antenna quality factor is close to that onefor multi-halfturn antenna conventionally used for Alfvenheating (for example in TCA device) . Besides that the tree-halfturn antenna is more compact it is much less sensitiveto changes in the value and profile of plasma density.
Introduction. Alfven heating strategy of toroidalplasma consist in the following. With the help of the anten-na system one exites the induced oscillations of the fastmagnetosonic wave in the plasma column. In the vicinity ofthe local alfven resonance (AR) layer that lies on the mag-netic surface the fast magnetosonic wave is transformed intothe slow wave strongly absorbed by plasma electrons due tothe Landau mechanism. Alfven resonance condition has theform [l]
(£-Vc- qR (1)
where m, n are the poloidal and toroidal wavenumbers, R isthe large radius of the torus, q is the safety factor,e=2][u/ew u ^ is t h e dielectric permeability. Thelineaabove means averaging over the magnetic surface.
The analysis performed in [2] has shown k(|a « 3 (a isthe small plasma radius) to be the optimum condition forAlfven heating with halfturn antennas. From the formula (1)it follows that in this case n ~ 3-R/a > 2 .Thefore thereare excited a set of AR with all values of n=±l, ±2,. .. ±n ,
whereas the large number of resonaces excited is situated atthe plasma column edge. The necessity not to excite edge ARshas led to consideration to employ antenna systems the spec-trum of which does not contain components with\n\<0.5-n .These requirements are satisfied by the antenna
system consisting of N-8*20 phased halfturns uniformelypositioned along the torus (multy-halfturn antenna - MHA) .Experimental studies have shown [3] that this antenna systemhas substantial shortcomings: bulky design and sensitivityto plasma density n changes. The second shortcoming is none
the less assential than the first one because the Alfvenheating is accompanied, as a rule, by the uncontrollablegrowth of n .
This paper analyses the possibility to heat plasma witha three-halfturn antenna (THA) (see fig.l) which consists of
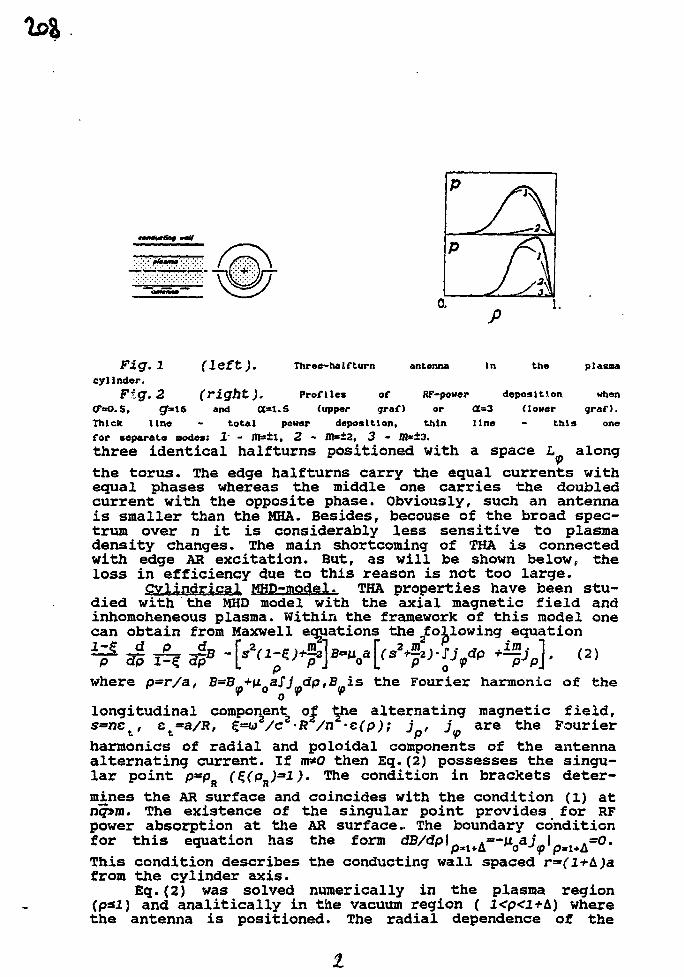
Fig. 1 (left). Three-half turn antenna In the plasnacylinder.
Fig. 2 (right). Profiles of RF-power deposition whenO"=*O. 5, gr=16 and (X=1.S (tipper graf) or 0t=3 (lower graf).Thick line - total power deposition, thin line - this onefor separate nodes: 2" - m»±l, 2 - fll=±2, 3 - Itt*±3.
three identical haIfturns positioned with a space L alongthe torus. The edge halfturns carry the equal currents withequal phases whereas the middle one carries the doubledcurrent with the opposite phase. Obviously, such an antennais smaller than the MHA. Besides, becouse of the broad spec-trum over n it is considerably less sensitive to plasmadensity changes. The main shortcoming of THA is connectedwith edge AR excitation. But, as will be shown below, theloss in efficiency due to this reason is not too large.
Cylindrical MHD-model. THA properties have been stu-died with the MHD model with the axial magnetic field andinhomoheneous plasma. Within the framework of this model onecan obtain from Maxwell equations the following equation
^4k4B ^(^^[(^ysj^ if/] (^ if/p]. (2)where p=r/a, B=B +u aSj dp,B is the Fourier harmonic of the
longitudinal component of the alternating magnetic field,s=nct, et=*a/R, £=(d /c -R /n -z(p); j , j are the Fourier
harmonics of radial and poloidal components of the antennaalternating current. If m*O then Eq.(2) possesses the singu-
i i i ig
lar point p*=pq g
)• The condition in brackets deter-mines the AR surface and coincides with the condition (1) atnq»m. The existence of the singular point provides for RFpower absorption at the AR surface.. The boundary conditionfor this equation has the form dB/dp I .=-uoaj I D B 1 + A ~ ° *
This condition describes the conducting wall spaced r=(l+&)afrom the cylinder axis.
Eq.(2) was solved numerically in the plasma region(pssl) and analitically in the vacuum region ( 2<p<l+A) wherethe antenna is positioned. The radial dependence of the
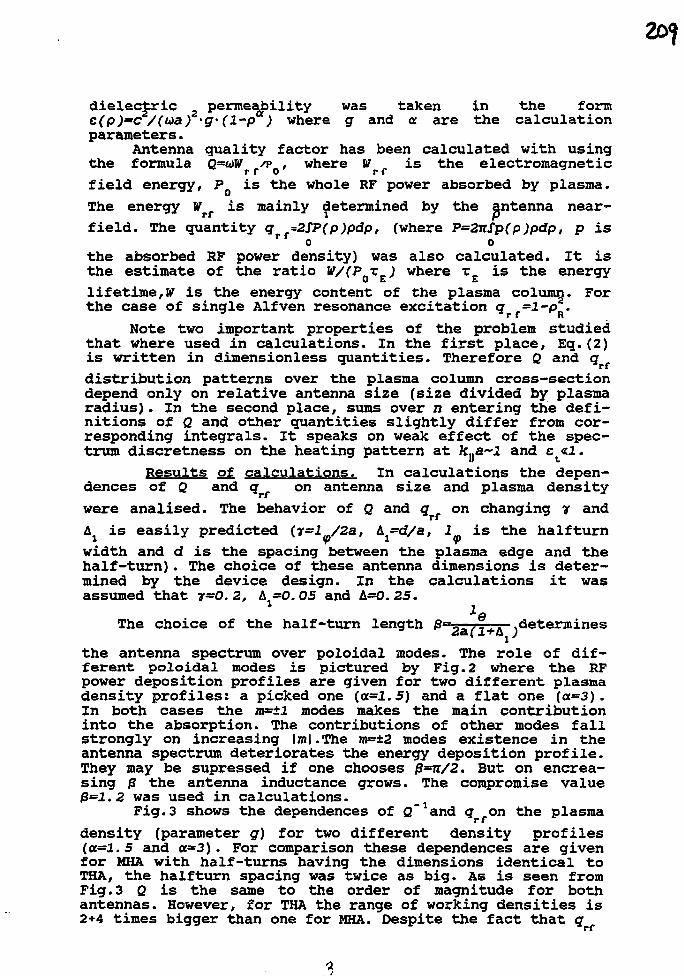
dielectric permeability was taken in the forme(p)**c /(u>a) 'g'(l-p ) where g and a are the calculationparameters.
Antenna quality factor has been calculated with usingthe formula Q=o>Wr f /PQ , where Vr{ is the electromagnetic
field energy, PQ is the whole RF power absorbed by plasma.
The energy Vrf is mainly determined by the antenna near-
field. The quantity qr{=2SP(p)pdp, (where P=2nfp(p)pdp, p iso o
the absorbed RF power density) was also calculated. It isthe estimate of the ratio W/(Pz^) where x is the energy
0 E Elifetime,W is the energy content of the plasma column. Forthe case of single Alfven resonance excitation <?rf=-
z~PR-Note two important properties of the problem studied
that where used in calculations. In the first place, Eq.(2)is written in dimensionless quantities. Therefore Q and gdistribution patterns over the plasma column cross-sectiondepend only on relative antenna size (size divided by plasmaradius). In the second place, sums over n entering the defi-nitions of Q and other quantities slightly differ from cor-responding integrals. It speaks on weak effect of the spec-trum discretness on the heating pattern at kna~2 and et«2.
Results of calculations. In calculations the depen-dences of Q and q on antenna size and plasma density
were analised. The behavior of Q and q on changing y and
At is easily predicted (7=1 /2a, L^d/a, 1 is the half turn
width and d is the spacing between the plasma edge and thehalf-turn). The choice of these antenna dimensions is deter-mined by the device design. In the calculations it wasassumed that Tf=0.2, A-0.05 and A=0.25.
1 1eThe choice of the half-turn length £--,,,,.. .determines
the antenna spectrum over poloidal modes. The role of dif-ferent poloidal modes is pictured by Fig.2 where the RFpower deposition profiles are given for two different plasmadensity profiles: a picked one (a-1.5) and a flat one (oc-3) .In both cases the m=±2 modes makes the main contributioninto the absorption. The contributions of other modes fallstrongly on increasing I mi .The m=±2 modes existence in theantenna spectrum deteriorates the energy deposition profile.They may be supressed if one chooses /S=rr/2. But on encrea-sing (3 the antenna inductance grows. The compromise value&=1.2 was used in calculations.
Fig.3 shows the dependences of Q-1and q on the plasma
density (parameter g) for two different density profiles(a-1.5 and <x=3) . For comparison these dependences are givenfor MHA with half-turns having the dimensions identical toTHA, the half turn spacing was twice as big. As is seen fromFig.3 Q is the same to the order of magnitude for bothantennas. However, for THA the range of working densities is2+4 times bigger than one for MHA. Despite the fact that q
'X
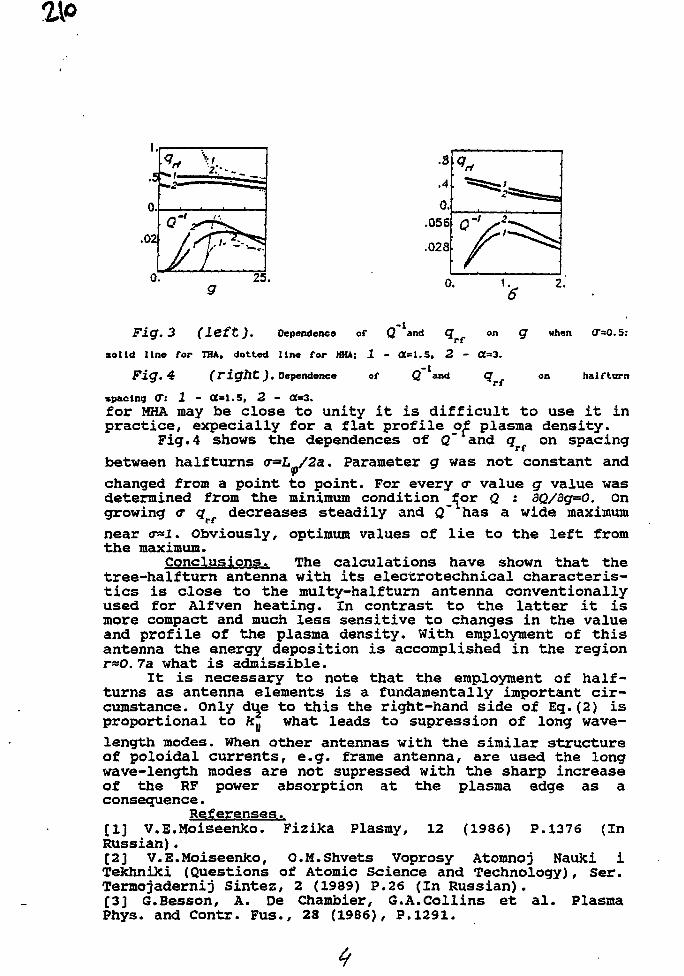
0.
.056
.028
0.
Fig. 3 (left). Dependence of Q" and q on g
solid line for THA, dotted line for MU; 1 - <X=1.5, 2 - Ct=3.
Fig. 4 ("right ^. Dependence of Q~1and q
when (T=0.5:
haIfturn
spacing <T: 1 - <X=1.5, 2 - <X=3.for MHA may be close to unity it is difficult to use it inpractice, expecially for a flat profile of plasma density.
Fig. 4 shows the dependences of Q~ and grf on spacing
between half turns <r=L /2a. Parameter g was not constant and
changed from a point to point. For every o* value g value wasdetermined from the minimum condition for Q : 3Q/8g=o. Ongrowing a* q decreases steadily and Q~ has a wide maximum
near cr«2. Obviously, optimum values of lie to the left fromthe maximum.
Conclusions. The calculations have shown that thetree-halfturn antenna with its electrotechnical characteris-tics is close to the multy-halfturn antenna conventionallyused for Alfven heating. In contrast to the latter it ismore compact and much less sensitive to changes in the valueand profile of the plasma density. With employment of thisantenna the energy deposition is accomplished in the regionr»O. 7a what is admissible.
It is necessary to note that the empiloyment of half-turns as antenna elements is a fundamentally important cir-cumstance. Only due to this the right-hand side of Eq.(2) isproportional to k.. what leads to supression of long wave-length modes. When other antennas with the similar structureof poloidal currents, e.g. frame antenna, are used the longwave-length modes are not supressed with the sharp increaseof the RF power absorption at the plasma edge as aconsequence.
Referenses.[1] V.E.Moiseenko. Fizika Plasmy, 12 (1986) P.1376 (InRussian).[2] V.E.Moiseenko, O.M.Shvets Voprosy Atomnoj Nauki iTekhniki (Questions of Atomic Science and Technology), Ser.Termojadernij Sintez, 2 (1989) P.26 (In Russian).[3] G.Besson, A. De Chambier, G.A.Collins et al. PlasmaPhys. and Contr. Fus., 23 (1986), P.1291.
zsi
GLOBAL ALFVEN MODE EXCITATION IN A STELLARATOR
A.G.Kirov , L.F.Rucako, D.A.Voytenko, A.V.Sukachev
I.N.Vekua Institute of Physics and Technology. Sukhumi, USSR
Experimental and theoretical studies on Alfven plasmaheating in tokamaks led to revealing regimes with high energyinput efficiency due to the excitation of high-Q resonancesof "global" Alfven modes [1,23. Frequencies of such resonancesare close to the lower boundary of the Alfven continuum and' alongitudinal current flow in the plasma is decisive for theirexistence. In the present paper, the excitation of Alfvenmodes and the effect of spatial speotra of generated fieldsupon the absorption zona localization are studied. Anopportunity to generate high-Q resonanoe of the "global"Alfven mode in 1=3 stellarator is found.
1. COMPUTATION OP ALFYEN ANTENNA IMPEDANCES POR A STELLARATOR
A two-fluid MHD model of a cylindrical plasma columnhaving an inhomogeneous density, iv=no(1-r*/(?)t is used in thecomputations. The field B = (0, 2L, B ) simulates a 7 = 3stellarator field. A poloidal magnetic field, Be=B +Bj iscomposed of a vacuum magnetic field of a stellaratorEp=BQ(r/R)i(r), where \.=\.Q(r/af - is the rotational transformangle, and a field Bj of the plasma current J=Jo(1-r
2/cff. Anapproach depicted in Ref.[33 was used.
The system of equations is:
r B ^ ' R* "x rAs distinguished from the tokamak of Ref. [33, a term
describing the vacuum magnetic field shear is included in G.The condition A=0 corresponds to the Alfven resonanoe. As a
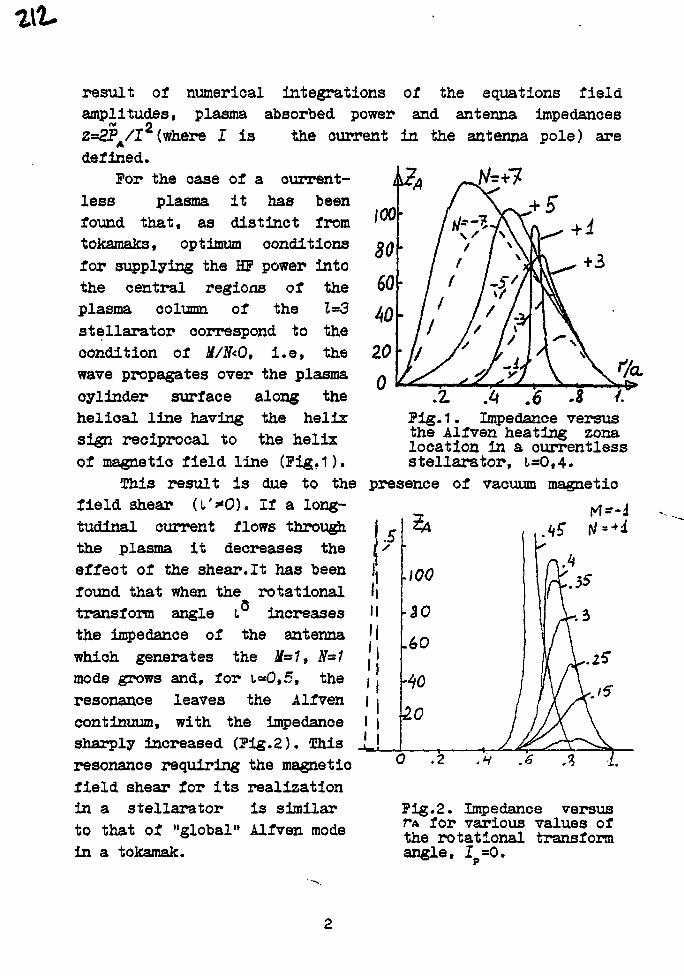
1XL
result of numerical integrations of the equations fieldamplitudes, plasma absorbed power and antenna impedances
*" 22=2PA/I (where I is the current in the antenna pole) aredefined.
Por the case of a current-less plasma it has beenfound that, as distinct fromtokamaks, optimum conditionsfor supplying the HP power intothe central regions of theplasma column of the 1=3stellarator correspond to thecondition of M/N<0, i.e, thewave propagates over the plasmacylinder surface along thehelical line having the helixsign reciprocal to the helix
.8 I
of magnetic field line (Pig, 1).This result is due to the
field shear U'*0). If a long-tudinal current flows throughthe plasma it decreases theeffect of the shear. It has beenfound that when the rotationaltransform angle i increasesthe impedance of the antennawhich generates the M=1, N=1mode grows and, for 1*0,5, theresonance leaves the Alfvencontinuum, with the impedancesharply increased (Pig.2). Thisresonance requiring the magneticfield shear for its realizationin a stellarator is similarto that of "global" Alfven modein a tokamak.
A .6Pig. 1. Impedance versusthe Alfven heating zonalocation in a currentlessstellarator, 1=0,4.
presence of vacuum magnetic
!
ti
i |
i!M'Ii i! I
.\00
•BO
.60
20
A L
Pig.2. Impedance versusTA for various values ofthe rotational transformangle, I =0.
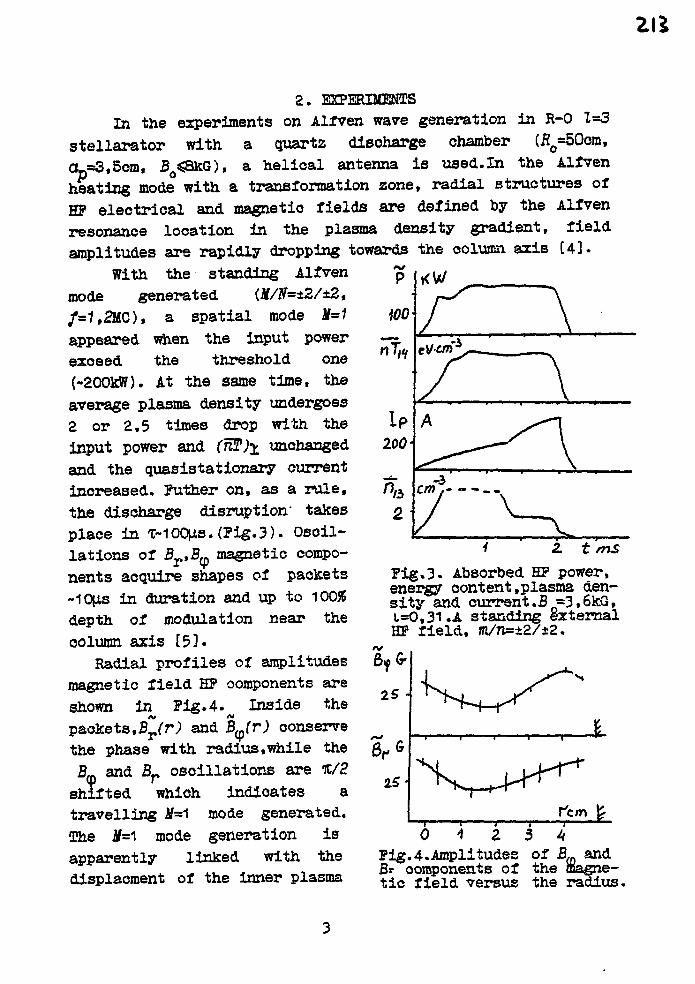
2. EXPERIMENTSIn the experiments on Alfven ware generation in R-0 1=3
stellarator with a quartz discharge chamber (f?o=50cm,a-j=3,5cm, B «S8kG), a helical antenna is used.In the Alfven
p
WO
Ip200 i
eV-cni
heating mode with a transformation zone, radial structures ofHP electrical and magnetic fields are defined by the Alfvenresonance location in the plasma density gradient, fieldamplitudes are rapidly dropping towards the column axis [4].
With the standing Alfvenmode generated (Jf/]7=±2/±2,/=7,2MC), a spatial mode U-1appeared when the input powerexceed the threshold one(~2OOkW). At the same time, theaverage plasma density undergoes2 or 2,5 times drop with theinput power and (n$)x unchangedand the quasistationary currentincreased. Puther on, as a rule,the discharge disruption" takesplace in T~iOO|is. (Pig.3). Oscil-lations of BvtBq. magnetic compo-nents acquire shapes of paokets~1Op.s in duration and up to 10056depth of modulation near thecolumn axis [53.
Radial profiles of amplitudesmagnetic field HP components areshown in Pig. 4. Inside thepackets,Bv(r) and B^tr) conservethe phase with radius,while
4 2. tmsPig.3. Absorbed HP power,energy content,plasma den-sity and current.B =3,6kG,1=0,31.A standing externalHP field, m/n=±2/±2.
2S 4
theand B r osoillations are %/2
shifted which indicates atravelling Jf=1 mode generated.The J M mode generation isapparently linked with thedisplacment of the inner plasma
&
Pig.4.Amplitudes of Bffl andBr components of the magne-tic field versus the radius.
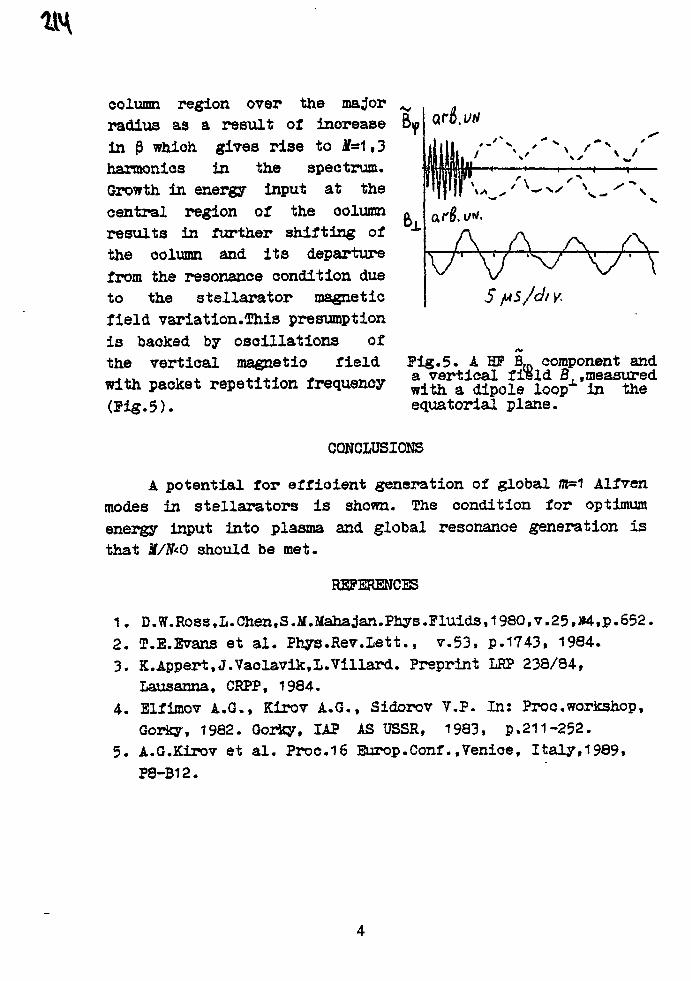
column region over the ma^orradius as a result of increasein p which gives rise to Jf=1,3harmonics in the spectrum.Growth in energy input at thecentral region of the columnresults in further shifting ofthe column and its departurefrom the resonance condition dueto the stellarator magneticfield variation.This presumptionis backed by oscillations ofthe vertical magnetic fieldbuo voiun/cu. iua&u.<s»j.yj J.J.CJ.VI. Pig.5. A HP B~. component and
with packet repetition frequency i l F i ^ i r i ^ ' S ^ *(Pig.5).
with a dipole loopequatorial plane
CONCLUSIONS
A potential for affioient generation of global fli=1 Alfvenmodes in stellarators is shown. The condition for optimumenergy input Into plasma and global resonance generation isthat Jf/iV<0 should be met.
1. D.W.Ross,L.Chen.S.M.Mahajan.Phys.Fluids, 1980,v.25,J*4,p.652.2. T.E.Evans et al. Phys.Rev.Lett., v.53, p.1743, 1984.3. K.Appert.J.Vaolavik.L.Villard. Preprint LRP 238/84,
Lausanna, CRPP, 1984.4. Elfimov A.G., Kirov A.G., Sidorov Y.P. In: Proc.workshop,
Gorky, 1982. Gorky, IAP AS USSR, 1983, p.211-252.5. A.G.Kirov et al. Proc.16 Europ.Conf..Venice, Italy,1989,
P8-B12.
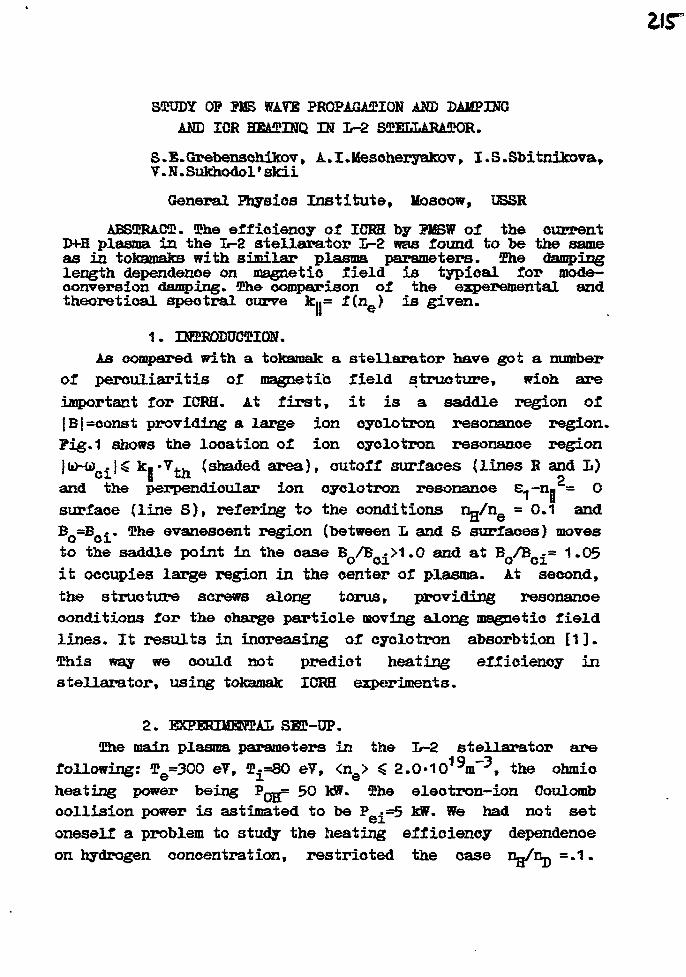
STUDY OP ?M5 HAVE PROPAGATION AND DAMPING
AND ICR HBAiPINQ IS L-2 SIELLARAJPOR.
S.B.Grebenschikov, A.I.Mesoheryakov, I.S.Sbitnikova,V.N.Sukhodol'skii
General Physios Institute, Moscow, USSR
ABSTRACT. The efficiency of ICRH by PMSW of the currentXH-H plasma in the L-2 stellarator L-2 was found to be the sameas is tokamaks with similar plasma parameters. The dampinglength dependence on magnetic field is typical for mode-conversion damping. Th& comparison of the ezperemental andtheoretical spectral curve k«= f (ne) is given.
1. INTRODUCTION.
As compared with a tokamak a stellarator have got a number
of perouliaritis of magnetic field structure, wioh are
important for ICRH. At first, it is a saddle region of
|B|=oonst providing a large ion cyclotron resonance region.
?ig.1 shows the location of ion cyclotron resonance region
i!$ Jc«'vtn (shaded area), cutoff surfaces (lines R and L)
and the perpendicular ion cyclotron resonance e -nii = 0
surface (line S), refering to the conditions ng/ne = 0.1 and
BQ=Boi. The evanescent region (between L and S surfaces) moves
to the saddle point in the case Bo/Boi>1.0 and at BQ/Bci= 1.05
it occupies large region in the center of plasma. At second,
the structure screws along torus, providing resonance
conditions for the charge particle moving along magnetic field
lines. It results in increasing of cyclotron absorbtion [1].
This way we could not predict heating efficiency in
stellarator, using tokamak ICRH experiments.
2. EXPERUJHWAL SED-UP.
The main plasma parameters in the L-2 stellarator are
following: 3?e=3OO eY, 3^=80 eV, <nQ> $ 2.0«1019nT3, the ohmio
heating power being P Q ^ ° * ®*e el®°tron-ion Coulomb
collision power is astimated to be P_J=5 kff. We had not set
oneself a problem to study the heating efficiency dependence
on hydrogen concentration, restricted the case Ug/n-j =.1.
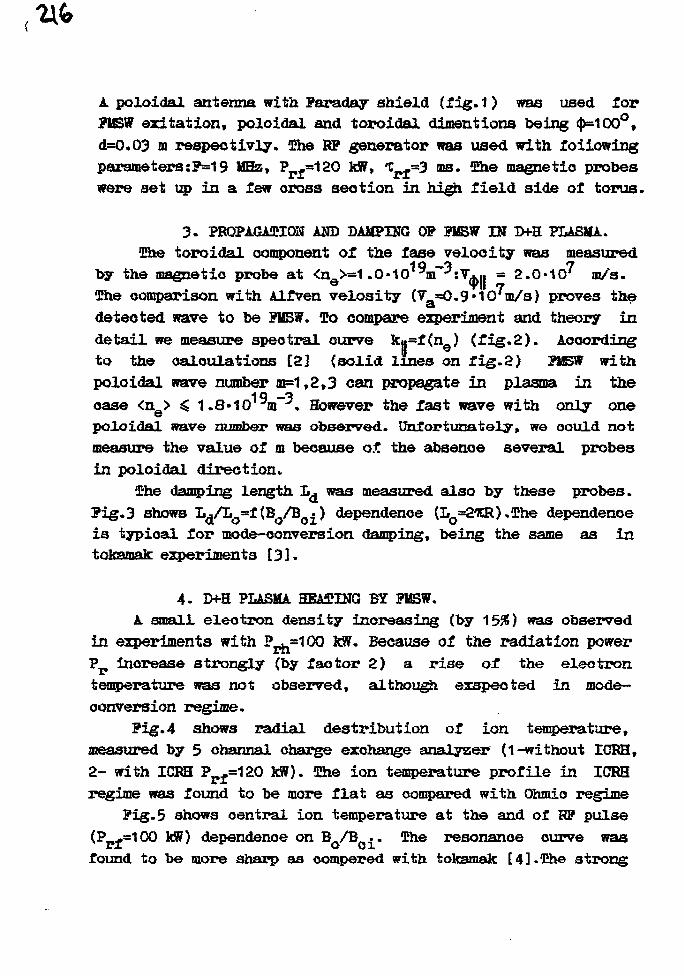
A poloidal antenna with Paraday shield (fig. 1) was used forPMSW exitation, poloidal and toroidal dimentions being $=100°,d=0.03 m respect ivly. The RP generator was used with foiiowingparameters:?=19 MHz, Ppf=120 kW, 1^=3 ms. The magnetio probeswere set up in a few cross section in high field side of torus.
3. PROPAGATION AND DAMPING OP PMSW IN D+H PLASMA.The toroidal component of the fase velocity was measured
19 —*? 7by the magnetio probe at <nQ>=1.0*10
?m -VAII = 2.0*10' m/s.The comparison with Alfven velosity (V =0.9* 10'm/s) proves the
at
detected wave to be PMSW. To compare experiment and theory indetail we measure spectral curve ku=f(ne) (fig.2). Accordingto the calculations [2] (solid lines on fig.2) PUSW withpoloidal nave number m=1,2,3 can propagate in plasma in thecase <ne> ^ 1.8»10
Jm . However the fast wave with only onepoloidal wave number was observed. Unfortunately, we could notmeasure the value of m because of the absence several probesin poloidal direction.
The damping length Lg was measured also by these probes.Pig.3 shows L^/L^f (BO/BQ£) dependence (Lo=2iCR) .The dependenceis typical for mode-conversion damping, being the same as intokamak experiments [33.
4. D4-H PLASMA HEATING BY FMSW.A small electron density increasing (by 15$) was observed
in experiments with Pph^OO KW- Because of the radiation powerP increase strongly (by factor 2) a rise of the electrontemperature was not observed, although exspeoted in mode-conversion regime.
Pig.4 shows radial destribution of ion temperature,measured by 5 channal charge exchange analyzer (1-without ICRH,2- with ICRH Prf=120 kW). The ion temperature profile in ICRHregime was found to be more flat as compared with Ohmio regime
Pig. 5 shows central ion temperature at the and of RP pulse(P £=100 kW) dependence on B /B .. The resonance curve wasfound to be more sharp as compered with tokamak [43.The strong
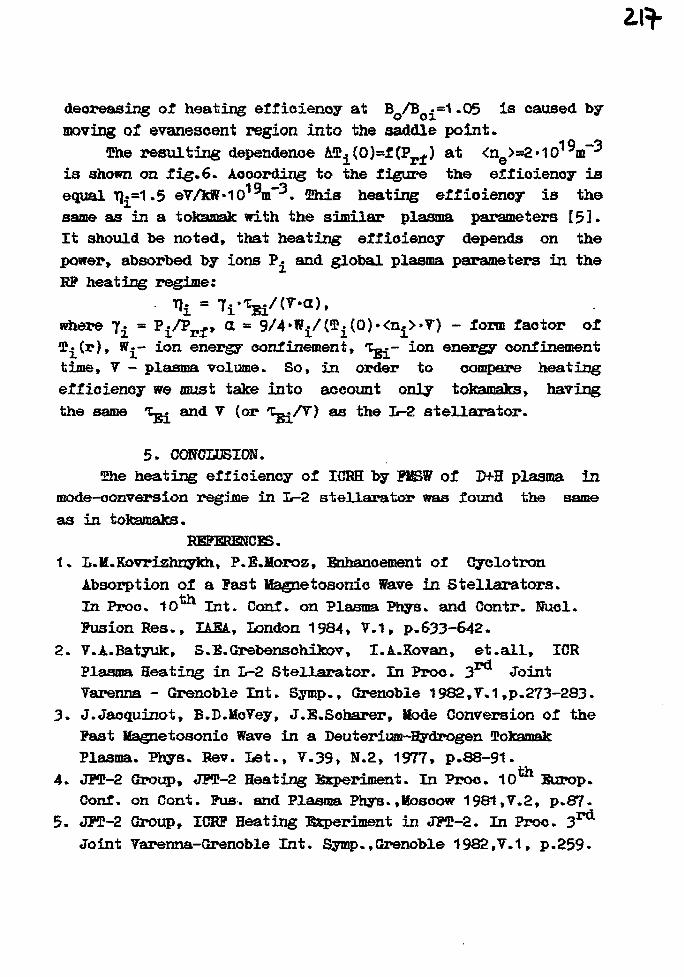
decreasing of heating efficiency at B /B .=1.05 is caused by
moving of evanescent region into the saddle point.
The resulting dependence i5?i(0)=f (Prl) at <ne>=2 • 101 *m~^
is shown on fig.6. Aooording to the figure the efficiency is
equalT].=1.5 e7/kff«101Hn . 39iis heating efficiency is the
same as in a tokamak with the similar plasma parameters [53 •
It should be noted, that heating efficiency depends on the
power, absorbed by ions F^ and global plasma parameters in the
RP heating regime:
where 7 i = P-j/Pp. & = 9/4'ffi/(5?i(O)«<nj>»7") - form factor of
^^(r), W^- ion energy confinement, *Cgj- ion energy confinement
time, 7 - plasma volume. So, in order to compare heating
efficiency we must take into account only tokamaks, having
the same 1^ and V (or / ^ / T ) as the L-2 stellarator.
5. CONCLUSION.
!She heating efficiency of ICRH by FISSW of I>fH plasma in
mode-conversion regime in L-2 stellarator was found the same
as in tokamaks.
REFERENCES.
1. L.lf.Kovrizhnykh, P.S.Horoz, Enhancement of Cyclotron
Absorption of a Fast Magnetosonic Wave in Stellarators.
In Proo. 10 Int. Conf. on Plasma Phys. and Contr. Nuol.
Fusion Res., IAEA., London 1984, V.1, p.633-642.
2. V.A.Batyuk, S.S.Grebensohikov, I.A.Kovan, et.all, ICR
Plasma Heating in L-2 Stellarator. In Proo. 3 Joint
Varenna - Grenoble Int. Symp., Grenoble 1982,7.1,p.273-283.
3. J.Jaoquinot, B.D.lSoTey, J.S.Soharer, Uode Conversion of the
Fast ttagnetosonic Wave in a Deuterium-Hydrogen Tokamak
Plasma. Phys. Rev. Let., 7.39, N.2, 1977, p.88-91.
4. JFT-2 Group, JPT-2 Heating Kxperiment. In Proc. 10 Europ.
Conf. on Cont. Pus. and Plasma Phys. ,liosoov? 1981,7.2, p. 87-
JFT-2 Group, ICRF Heating Experiment in J?0*-2. In Proc. 3rc
Joint 7arenna-Grenoble Int. Symp.,Grenoble 1982,7.1, p.259-
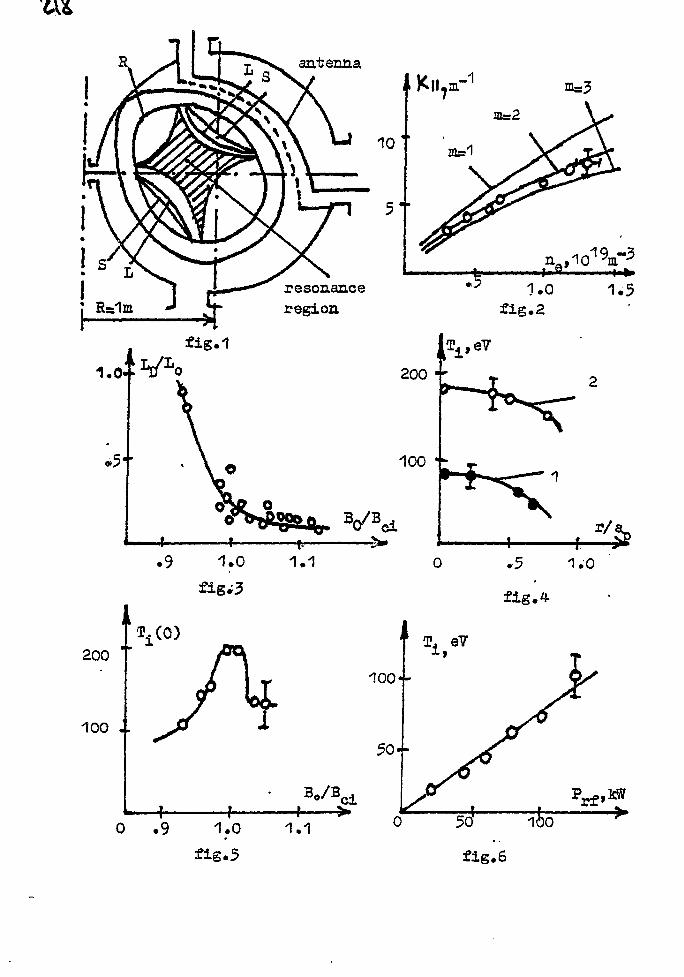
'6V*
H.
resonanceregion
200
100 . .
fig. 6
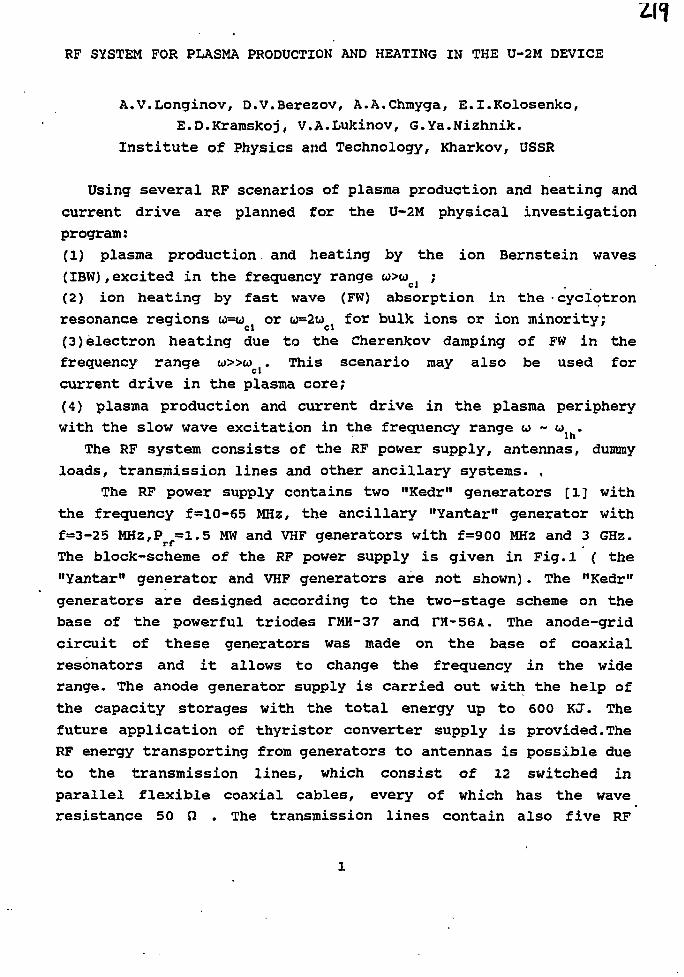
illRF SYSTEM FOR PLASMA PRODUCTION AND HEATING IN THE U-2M DEVICE
A.V.Longinov, D.V.Berezov, A.A.Chmyga, E.I.Kolosenko,
E.D.Kraraskoj, V.A.Lukinov, G.Ya.Nizhnik.
Institute of Physics and Technology, Kharkov, USSR
Using several RF scenarios of plasma production and heating and
current drive are planned for the U-2M physical investigation
program:
(1) plasma production. and heating by the ion Bernstein waves
(IBW), excited in the frequency range w>(Jci ;
(2) ion heating by fast wave (FW) absorption in the -cyclotron
resonance regions u=u or u=2w for bulk ions or ion minority;
(3) electron heating due to the Cherenkov damping of FW in the
frequency range (j»w . This scenario may also be used for
current drive in the plasma core;
(4) plasma production and current drive in the plasma periphery
with the slow wave excitation in the frequency range u - u .In
The RF system consists of the RF power supply, antennas, dummy
loads, transmission lines and other ancillary systems. ,
The RF power supply contains two "Kedr" generators [1] with
the frequency f=10-65 MHz, the ancillary "Yantar" generator with
f=3-25 MHz,Prf=1.5 MW and VHF generators with f=900 MHz and 3 GHz.
The block-scheme of the RF power supply is given in Fig.l ( the
"Yantar11 generator and VHF generators are not shown). The "Kedr"
generators are designed according to the two-stage scheme on the
base of the powerful triodes TMH-37 and TH-56A. The anode-grid
circuit of these generators was made on the base of coaxial
resonators and it allows to change the frequency in the wide
range. The anode generator supply is carried out with the help of
the capacity storages with the total energy up to 600 KJ. The
future application of thyristor converter supply is provided.The
RF energy transporting from generators to antennas is possible due
to the transmission lines, which consist of 12 switched in
parallel flexible coaxial cables, every of which has the wave
resistance 50 n . The transmission lines contain also five RF
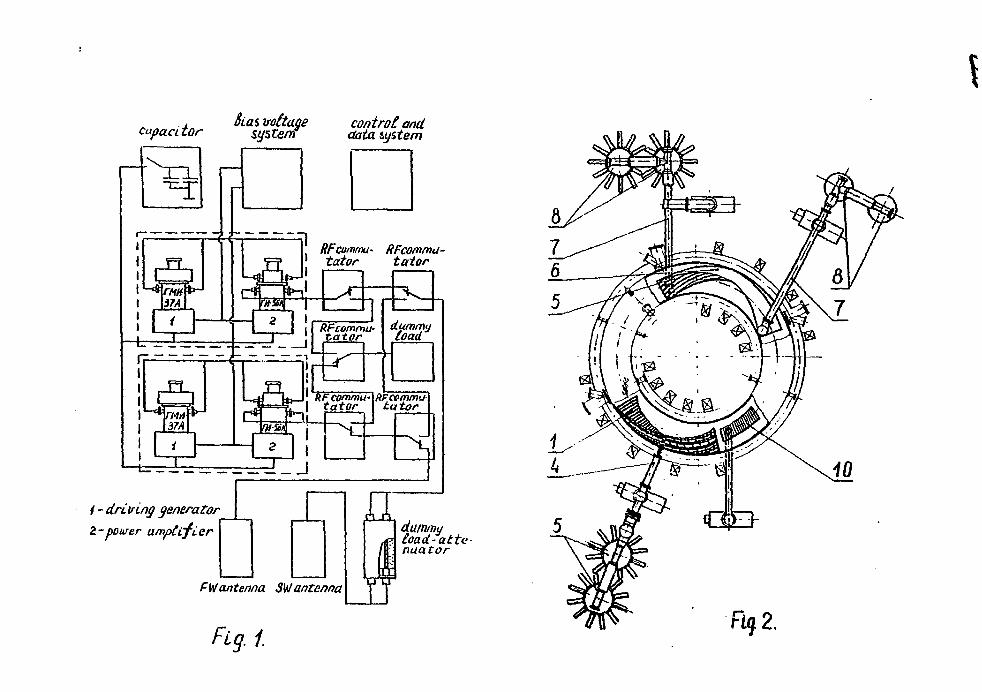
CapacitorSias voltage
systemcontrotanddata system
RFcomma- RFcomma-tator tator
L _i =-=- -
/ - driving generator2-poorer a/npCcfier dummy
Eoad-atte-nuator
FW antenna SWantenna
Fig. 1.
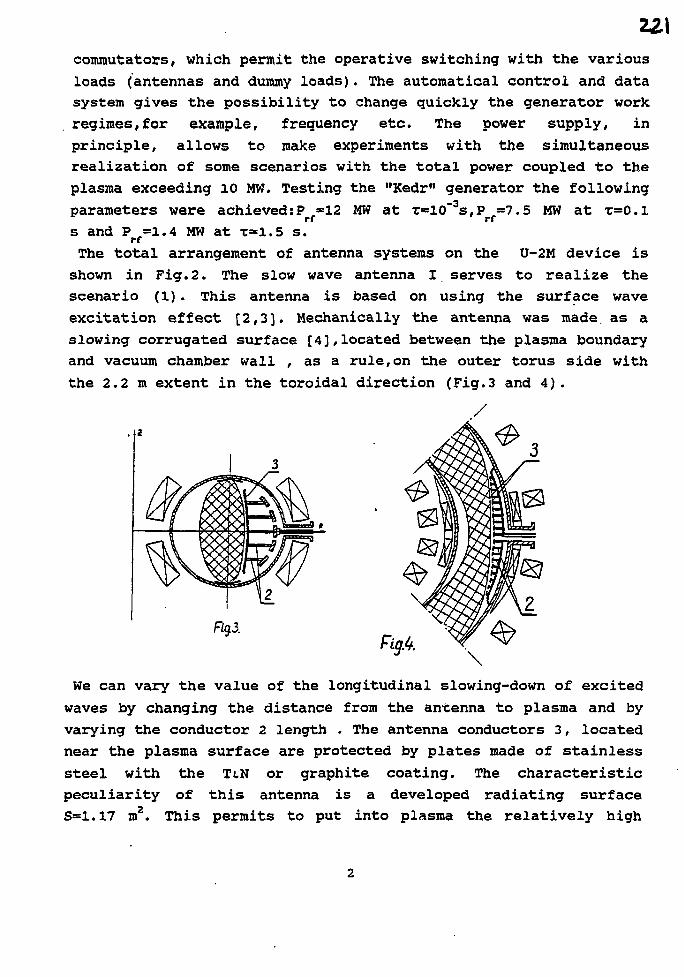
commutators, which permit the operative switching with the various
loads (antennas and dummy loads). The automatical control and data
system gives the possibility to change quickly the generator work
regimes,for example, frequency etc. The power supply, in
principle, allows to make experiments with the simultaneous
realization of some scenarios with the total power coupled to the
plasma exceeding 10 MW. Testing the "Kedr" generator the following
parameters were achieved:P «12 MW at T=10~3s,Prf=7.5 MW at T=0.1
s and P =1.4 MW at T=I.5 S.
The total arrangement of antenna systems on the U-2M device is
shown in Fig. 2. The slow wave antenna I serves to realize the
scenario (1) . This antenna is based on using the surface wave
excitation effect [2,3]. Mechanically the antenna was made, as a
slowing corrugated surface [4],located between the plasma boundary
and vacuum chamber wall , as a rule,on the outer torus side with
the 2.2 m extent in the toroidal direction (Fig.3 and 4).
We can vary the value of the longitudinal slowing-down of excited
waves by changing the distance from the antenna to plasma and by
varying the conductor 2 length . The antenna conductors 3, located
near the plasma surface are protected by plates made of stainless
steel with the TtN or graphite coating. The characteristic
peculiarity of this antenna is a developed radiating surface
S=1.17 m2. This permits to put into plasma the relatively high
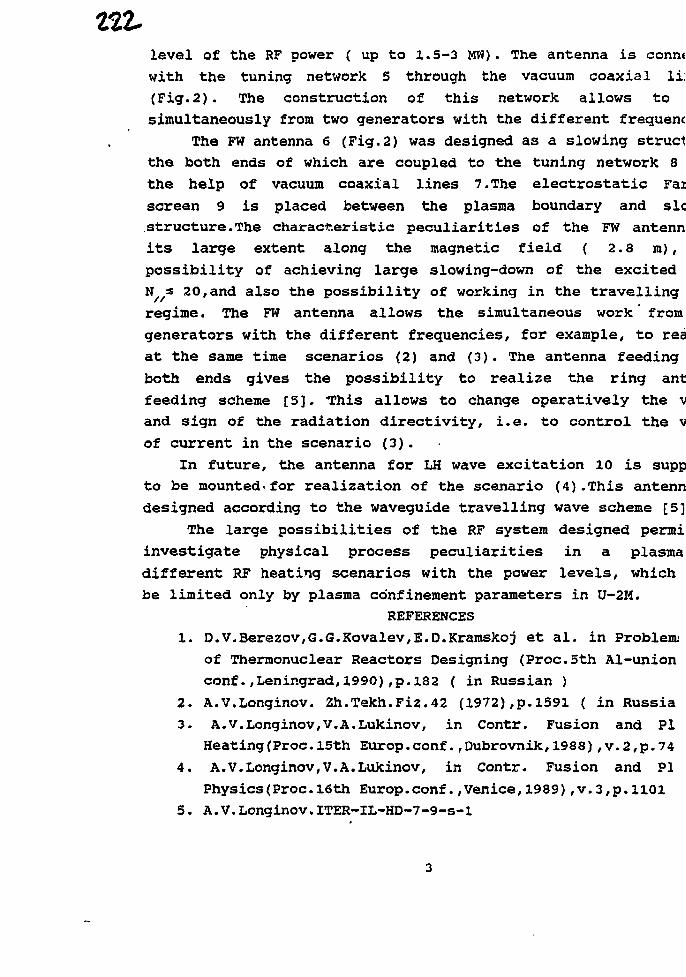
ttLlevel of the RF power ( up to 1.5-3 MW) . The antenna is conn*
with the tuning network 5 through the vacuum coaxial li:
(Fig.2). The construction of this network allows to
simultaneously from two generators with the different frequenc
The FW antenna 6 (Fig.2) was designed as a slowing struct
the both ends of which are coupled to the tuning network 8
the help of vacuum coaxial lines 7.The electrostatic Fax
screen 9 is placed between the plasma boundary and sic
structure.The characteristic peculiarities of the FW antenn
its large extent along the magnetic field ( 2.3 m),
possibility of achieving large slowing-down of the excited
N^s 20,and also the possibility of working in the travelling
regime. The FW antenna allows the simultaneous work from
generators with the different frequencies, for example, to rea
at the same time scenarios (2) and (3). The antenna feeding
both ends gives the possibility to realize the ring ant
feeding scheme [5]. This allows to change operatively the v
and sign of the radiation directivity, i.e. to control the v
of current in the scenario (3).
In future, the antenna for LH wave excitation 10 is supp
to be mounted< for realization of the scenario (4).This antenn
designed according to the waveguide travelling wave scheme [5]
The large possibilities of the RF system designed permi
investigate physical process peculiarities in a plasma
different RF heating scenarios with the power levels, which
be limited only by plasma confinement parameters in U-2M.
REFERENCES
1. D.V.Berezov,G.G.Kovalev,E.D.Kramskoj et al. in Problem!
of Thermonuclear Reactors Designing (Proc.5th Al-union
conf.,Leningrad,1990),p.132 ( in Russian )
2. A.V.Longinov. Zh.Tekh.Fiz.42 (1972),p.1591 ( in Russia
3. A.V.Longinov,V.A.Lukinov, in Contr. Fusion and PI
Heating(Proc.15th Europ.conf.,Dubrovnik,l98S),v.2,p.74
4. A.V.Longinov,V.A.Lukinov, in Contr. Fusion and PI
Physics (Proc. 16th Europ.conf., Venice, 1989) ,v.3,p.H01
5. A.V.Longinov.ITER-IL-HD-7-9-S-1
223Electron Plasma Component Heating in U-2M Torsatron
Using FMSW in the w » wcl Frequency Range
Dyakov V.E., Longinov A.V., Pavlov S.S.
Kharkov Institute of Physics and Technology ,USSR
FMS waves excited in the frequency range u » to are suppos-
ed to be used in one of possible scenarii of electron plasma
component heating in the U-2M device. Theoretical studies of such
a regime require to solve the full wave equations what is diffic-
ult to do because of the stellarator configuration peculiarities,
namely, the necessity to take into account the 3-D plasma inhomo-
geneity. However many questions may be studied on the ground of
simple models. This paper performs studies on the ground of two
models mutually complementing each on the: a model (1-D model) in
which the full wave equation is solved with the 1-0 inhomogeneity
account and a model (3-D model) accounting for the 3-D inhomogen-
eity on the ground of the WKB solutions of the wave equation by
ray tracing technique.In the 1-D model the calculations were
performed in the cylindrical geometry with the center at the real
plasma torus- axis. This model describes the excitation, propagat-
ion and absorption of waves in the plasma in the approximation of
the plasma cylinder infinitely extended along the torus axis in
which all plasma parameters (densities n , T . magnetic
field B) depend only on the distance to the torus axis R. The
wave equation was solved for a separate azimuthal mode
E=E(R)•exp(imp-iwt), whereas in the dielectric permeability tens-
or the thermal corrections in the first approximation over k p
were taken into account (k± is the transverse wave number ,p is
the Larmor radius of electrons and ions ).
Figs. 1-3 picture the dependence of the fast mode (FW) main
component modulus (E^field ,Ea± B Q), energy absorption due to
electron Landau damping D (R) and due to magnetic pumping D (R)
and the E field component modulus (E i BQ) in the plasma column
cross-section for three values of the longitudinal slowing-down
N =5,10,20 (N..=mc/Rw ) at the exciting surface. The positions of
the vacuum chamber walls and the current layer correspond to the
antenna located at the outer part of the torus and the cross-
section corresponds to the minor diameter of the plasma column
with k -0.22 [1]. The calculations were performed for the plasma
parameters: ne(0)=5-1013 cm"3 ^^IKeVjT^lOOeVjB^l.ST. As is
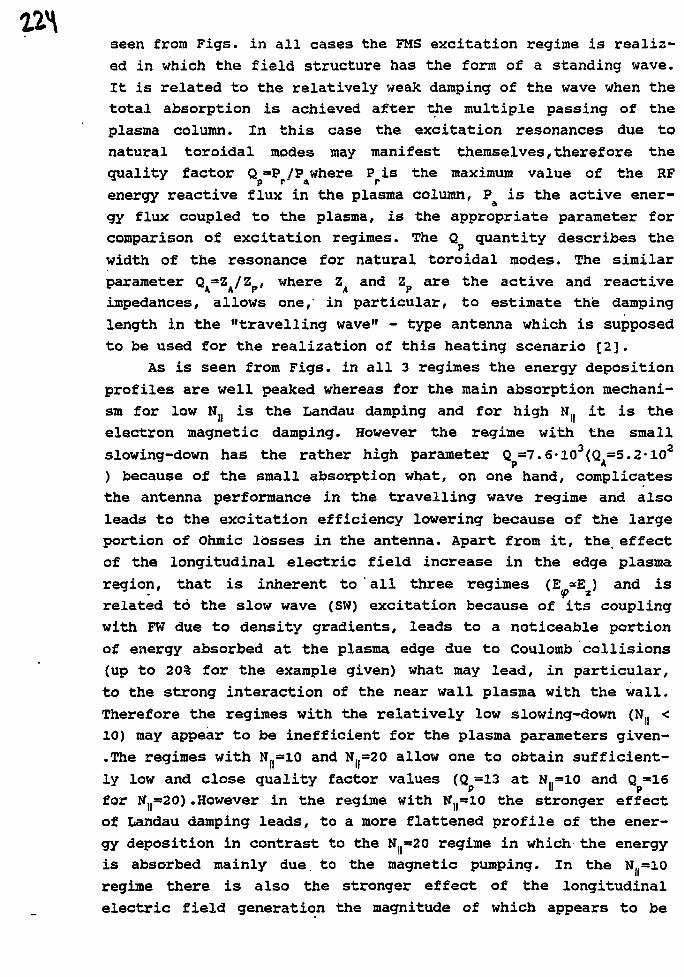
seen from Figs, in all cases the FMS excitation regime is realiz-
ed in which the field structure has the form of a standing wave.
It is related to the relatively weak damping of the wave when the
total absorption is achieved after the multiple passing of the
plasma column. In this case the excitation resonances due to
natural toroidal modes may manifest themselves,therefore the
quality factor Q =P /P where P is the maximum value of the RF
energy reactive flux in the plasma column, P is the active ener-
gy flux coupled to the plasma, is the appropriate parameter for
comparison of excitation regimes. The Q quantity describes the
width of the resonance for natural toroidal modes. The similar
parameter QA=Z
A/ZP# where 2A and Zp are the active and reactive
impedances, allows one, in particular, to estimate the damping
length in the "travelling wave" - type antenna which is supposed
to be used for the realization of this heating scenario [2].
As is seen from Figs, in all 3 regimes the energy deposition
profiles are well peaked whereas for the main absorption mechani-
sm for low N.. is the Landau damping and for high N.. it is the
electron magnetic damping. However the regime with the small
slowing-down has the rather high parameter Q =7.6-lO3(Q =5.2-102
P A
) because of the small absorption what, on one hand, complicates
the antenna performance in the travelling wave regime and also
leads to the excitation efficiency lowering because of the large
portion of Ohmic losses in the antenna. Apart from it, the effect
of the longitudinal electric field increase in the edge plasma
region, that is inherent to ' all three regimes (E *Ez) and is
related to the slow wave (SW) excitation because of its coupling
with FW due to density gradients, leads to a noticeable portion
of energy absorbed at the plasma edge due to Coulomb collisions
(up to 20% for the example given) what may lead, in particular,
to the strong interaction of the near wall plasma with the wall.
Therefore the regimes with the relatively low slowing-down (N <
10) may appear to be inefficient for the plasma parameters given-
.The regimes with N()=10 and N(|=20 allow one to obtain sufficient-
ly low and close quality factor values (Q =13 at N..=10 and Q =16P ii P
for N,,=»20) .However in the regime with N](=ao the stronger effect
of Landau damping leads, to a more flattened profile of the ener-
gy deposition in contrast to the Mj|=20 regime in which the energy
is absorbed mainly due to the magnetic pumping. In the N(|=10
regime there is also the stronger effect of the longitudinal
electric field generation the magnitude of which appears to be
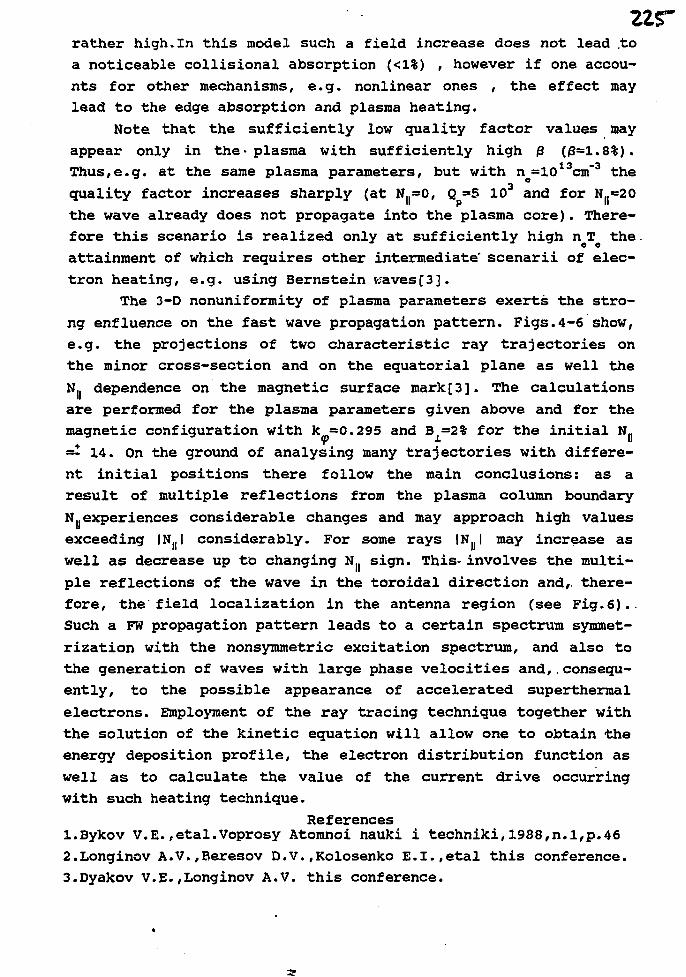
zzsrrather high.In this model such a field increase does not lead .to
a noticeable collisional absorption (<1%) , however if one accou-
nts for other mechanisms, e.g. nonlinear ones , the effect may
lead to the edge absorption and plasma heating.
Note that the sufficiently low quality factor values may
appear only in the-plasma with sufficiently high 0 (/3=1.8%).
Thus,e.g. at the same plasma parameters, but with n =1013cm~3 the
quality factor increases sharply (at N^O, Q =5 103 and for N,.=20
the wave already does not propagate into the plasma core). There-
fore this scenario is realized only at sufficiently high n T the.
attainment of which requires other intermediate' scenarii of elec-
tron heating, e.g. using Bernstein waves[3].
The 3-D nonuniformity of plasma parameters exerts the stro-
ng enfluence on the fast wave propagation pattern. Figs.4-6 show,
e.g. the projections of two characteristic ray trajectories on
the minor cross-section and on the equatorial plane as well the
N|( dependence on the magnetic surface mark[3]. The calculations
are performed for the plasma parameters given above and for the
magnetic configuration with k =0.295 and B =2% for the initial Nn
=^14. On the ground of analysing many trajectories with differe-
nt initial positions there follow the main conclusions: as a
result of multiple reflections from the plasma column boundary
N(j experiences considerable changes and may approach high values
exceeding |Nj(l considerably. For some rays |NJ(| may increase as
well as decrease up to changing N.. sign. This- involves the multi-
ple reflections of the wave in the toroidal direction and, there-
fore, the'field localization in the antenna region (see Fig.6}..
Such a FW propagation pattern leads to a certain spectrum symmet-
rization with the nonsymmetric excitation spectrum, and also to
the generation of waves with large phase velocities and,.consequ-
ently, to the possible appearance of accelerated superthermal
electrons. Employment of the ray tracing technique together with
the solution of the kinetic equation will allow one to obtain the
energy deposition profile, the electron distribution function as
well as to calculate the value of the current drive occurring
with such heating technique.
Referencesl.Bykov v.E.,etal.Voprosy Atomnoi nauki i techniki,1988,n.l,p.46
2.Longinov A.v.,Beresov D.V.,Kolosenko £.I.,etal this conference.
3.Dyakov V.E.,Longinov A.V. this conference.
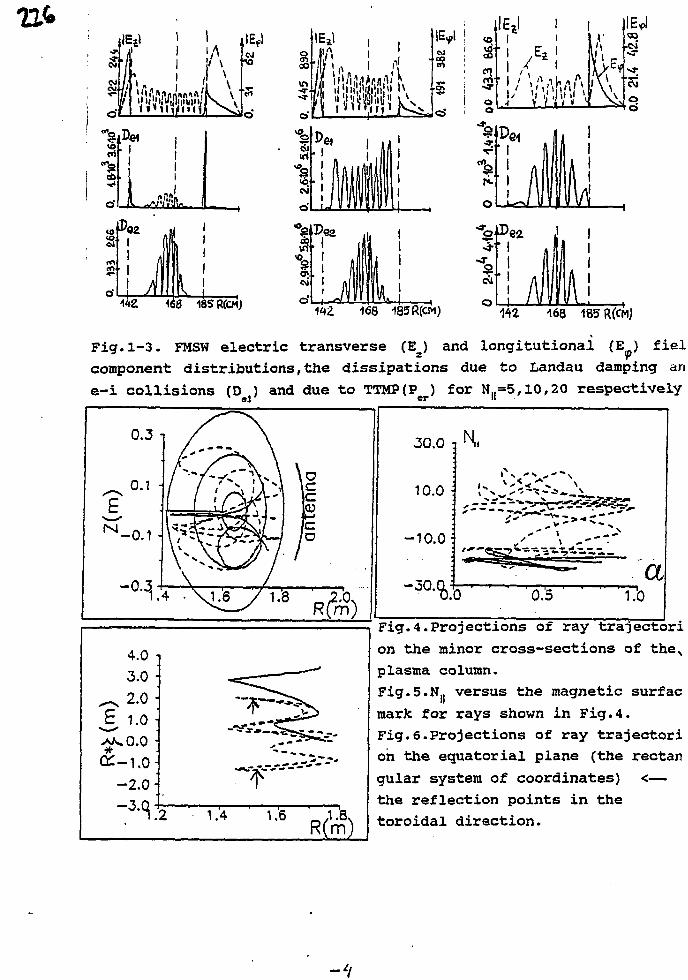
18SR(CM) Wl 168 185R(CM) 168 185 RfCMj
Fig. 1-3. FMSW electric transverse (EJ and longitutional (Ep) fiel
component distributions, the dissipations due to Landau damping an
e-i collisions (DoJ) and due to TTMP(Per) for N|(=5,10,20 respectively
4.0 -J3.0 -
^ 2.0 -
-AA.0.0 •
- 2 . 0 ;
.3'S.2 • 1.'4 1.'6
*
£>
R(m)
Fig.4.Projections of ray trajectori
on the minor cross-sections of thev
plasma column.
Fig.5.N.. versus the magnetic surfac
mark for rays shown in Fig.4.
Fig.6.Projections of ray trajectori
oh the equatorial plane (the rectan
gular system of coordinates) < —
the reflection points in the
toroidal direction.
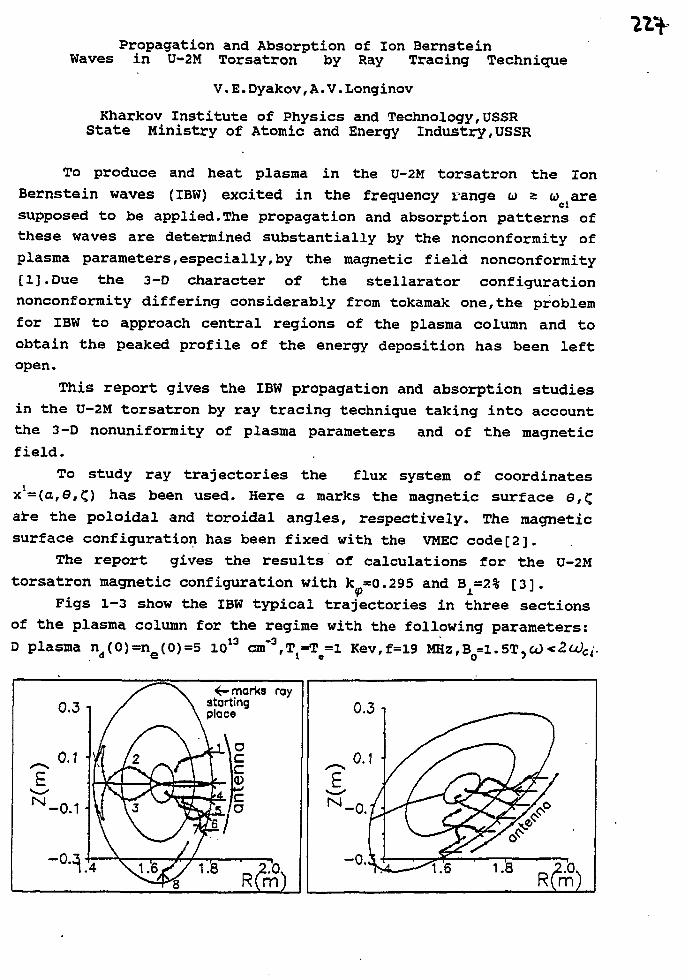
Propagation and Absorption of Ion BernsteinWaves in U-2M Torsatron by Ray Tracing Technique
V.E.Dyakov,A.V.Longinov
Kharkov Institute of Physics and Technology,USSRState Ministry of Atomic and Energy Industry,USSR
To produce and heat plasma in the U-2M torsatron the Ion
Bernstein waves (IBW) excited in the frequency range w a w are
supposed to be applied.The propagation and absorption patterns of
these waves are determined substantially by the nonconformity of
plasma parameters,especially,by the magnetic field nonconformity
[l].Due the 3-D character of the stellarator configuration
nonconformity differing considerably from tokamak one,the problem
for IBW to approach central regions of the plasma column and to
obtain the peaked profile of the energy deposition has been left
open.
This report gives the IBW propagation and absorption studies
in the U-2M torsatron by ray tracing technique taking into account
the 3-D nonuniformity of plasma parameters and of the magnetic
field.
To study ray trajectories the flux system of coordinates
x^iatOfZ) has been used. Here a marks the magnetic surface e,C
are the poloidal and toroidal angles, respectively. The magnetic
surface configuration has been fixed with the VMEC code[2].
The report gives the results of calculations for the U-2M
torsatron magnetic configuration with k =0.295 and B =2% [3].
Figs 1-3 show the IBW typical trajectories in three sections
of the plasma column for the regime with the following parameters:3 , ^ - ^ ! Kev,f=19 mz,BQ=1.5T)Ct)<2u)Cj.D plasma nd(0)=ne(0)=5 1013
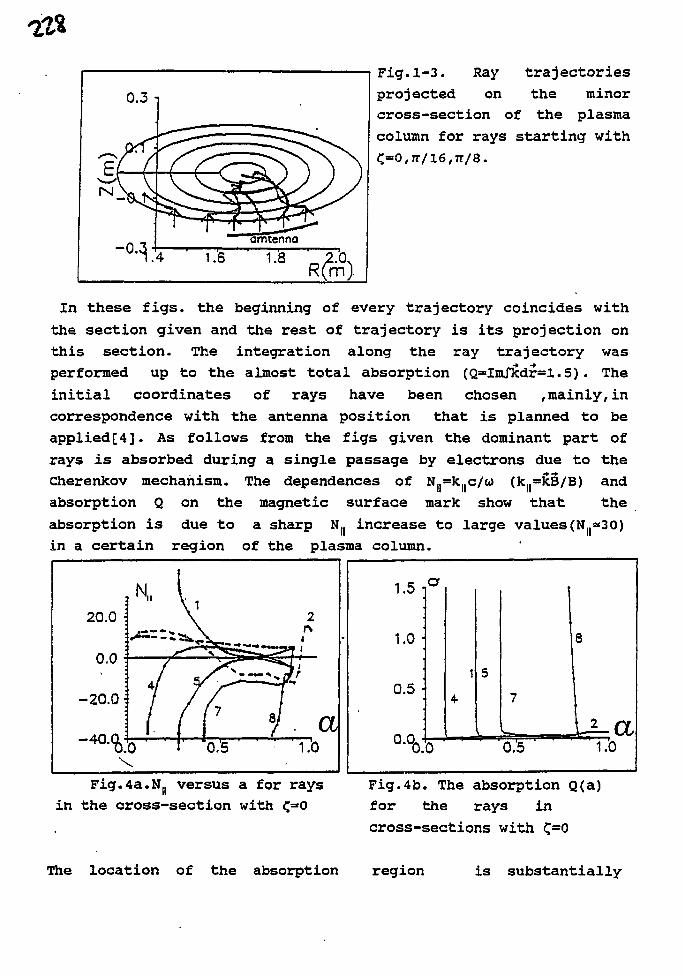
Fig.1-3. Ray trajectories
projected on the minor
cross-section of the plasma
column for rays starting with
C=O,ir/16,7T/8.
In these figs, the beginning of every trajectory coincides with
the section given and the rest of trajectory is its projection on
this section. The integration along the ray trajectory was
performed up to the almost total absorption (Q=ImJs}cdr=:L.5). The
initial coordinates of rays have been chosen ,mainly,in
correspondence with the antenna position that is planned to be
applied[4]. As follows from the figs given the dominant part of
rays is absorbed during a single passage by electrons due to the
Cherenkov mechanism. The dependences of N. k.-c/w (k..=kB/B) and
absorption Q on the magnetic surface mark show that the
absorption is due to a sharp N.. increase to large values (N..*30)
in a certain region of the plasma column.
Fig.4a.N(| versus a for rays
in the cross-section with <=0
Fig.4b. The absorption Q(a)
for the rays in
cross-sections with C=0
The location of the absorption region is substantially
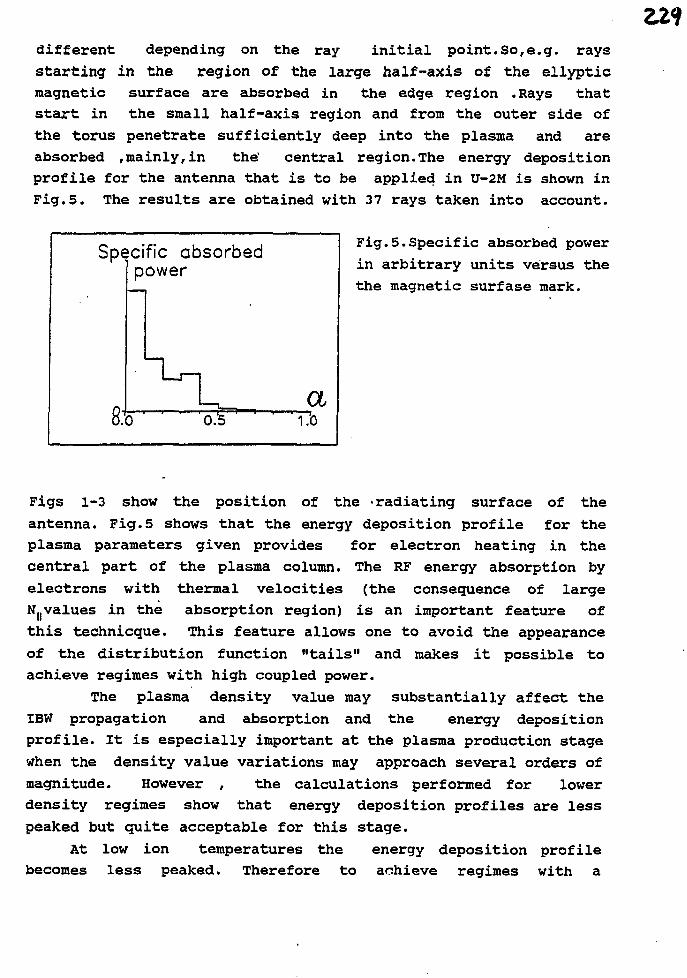
different depending on the ray initial point.So,e.g. rays
starting in the region of the large half-axis of the ellyptic
magnetic surface are absorbed in the edge region .Rays that
start in the small half-axis region and from the outer side of
the torus penetrate sufficiently deep into the plasma and are
absorbed ,mainly,in the' central region.The energy deposition
profile for the antenna that is to be applied in U-2M is shown in
Fig.5. The results are obtained with 37 rays taken into account.
Fig.5.Specific absorbed power
in arbitrary units versus the
the magnetic surfase mark.
Specific absorbed
Figs 1-3 show the position of the -radiating surface of the
antenna. Fig.5 shows that the energy deposition profile for the
plasma parameters given provides for electron heating in the
central part of the plasma column. The RF energy absorption by
electrons with thermal velocities (the consequence of large
N(| values in the absorption region) is an important feature of
this technicque. This feature allows one to avoid the appearance
of the distribution function "tails" and makes it possible to
achieve regimes with high coupled power.
The plasma density value may substantially affect the
IBW propagation and absorption and the energy deposition
profile. It is especially important at the plasma production stage
when the density value variations may approach several orders of
magnitude. However , the calculations performed for lower
density regimes show that energy deposition profiles are less
peaked but quite acceptable for this stage.
At low ion temperatures the energy deposition profile
becomes less peaked. Therefore to achieve regimes with a
sharp-peaked energy deposition profile it is necessary to keep a
sufficiently high ion temperature.
Conclusions
1. A scenario using IBW excitation in the U-2M device allows one
to achieve regimes of electron component heating with sharply
peaked energy deposition profiles' at the sufficiently large n ^
value (£2:1%) .
2. Peaked energy deposition profile may be achieved if the
exciting surface of the antenna is located near the minor half
axis of the ellyptic magnetic surface preferentially from the
outer side of the torus.
3. In low density regimes the energy deposition profile
becomes less peaked but quite acceptable.
4. The peaked energy deposition profile may be achieved at
the sufficiently large ion temperature (T^lKev).
References
l.Ono M.,Stix T.H.,Wong K.L.,Horton R. //Proc.2nd
Grenouble-Varenna symp. 1980,v.l,p.593.
2. Hirshman S.P.,Rij W.I.,Merkel P. Comp.Phys.Commun.
43,1986,p.143.
3. Bykov V.E., Georgievsky A.V. ,Demchenko V.V Voprosy atomnoj
Nauki i Techniki (Questions of Atomic Science and Technology)
n.1,1988,p.46.
4.Longinov A.V. ,Berezov D.V. ,Kolosenko E.I. ,Kramskoj E.D.,
Lukinov V.A.,Nizhnik G.Ya.,Chmyga A.A. this conference.
231
ION PLASMA COMPONENT RF HEATING SCENARII IN U2-M DEVICEUSING ION CYCLOTRON RESONANCE
A. V. Longinov, S . S . P a v l o v
Kharkov I n s t i t u t e of P h y s i c s and Technology, USSR
To choose t h e optimum s c e n a r i i of i o n plasma component hea t ingi n t h e U-2M d e v i c e t h e r e has been performed t h e a n a l y s i s of var iousRF plasma h e a t i n g regimes us ing i o n c y c l o t r o n absorpt ion of FMSwaves when t h e f a s t mode CFVO of t h e FMS wave i s e x c i t e d . Thisreport gives some results of the analysis of the advantageousregimes of bulk ion heating under U-SM conditions. This analysis i sperformed on the ground of 1-D model describing the excitation ,propagation and absorption of waves in the plasma til and of thesolution of 1-D kinetic equation with the RF diffusion quasilinearoperator C23. The analysis performed shows that the 4 regimesfollowing below are of the most interest for the U-2M device. Somefeatures of these regimes are pictured on the ground of numericalcalculations for the U—2M torsatron magnetic configuration wi_thk =0. 22 and the following plasma parameters: n C 03 =5 • 1019cm 9 ,
TCOD=TCO3=1 keV . H =1.5 T.i « o
1. The o>=co . regime for the bulk gas heating may be obtained
with sufficiently high efficiency only in high ft plasma when FW'sexcitation with the sufficiently large longitudinal si owing-downCNU>1OD are used. Fig. 1 shows the E and E field component moduli
dependences as well as the total energy flux P for the mode withN =20 excited in the hydrogen plasma from the outer side of the
torus. As i s seen from the energy flux PCRD dependence the energyabsorption occurring at the plasma edge C" 105S of the total power!)i s due to the Alfven resonance from the inner side of the torus. TheT . and N. decrease in the «=<•> . regime sharply diminishes the
absorption and enhances this negative effect.In the example given due to a large N,( the relatively small
quality factor Q =P /P i s achieved C P i s the maximum value ofpi r a r
the reactive energy flux into the plasma , P i s the active energyflux into plasma.} what allows one to provide good antenna-plasmacoupling in this regime.
2. The w=2« . regime for the bulk gas heating may be obtained
with the sufficiently high intensity in the plasma with therelatively high (3 C/3 150. Fig. 2 shows the modulus dependences for theE component being the basic one for FW,the E component as well as
the dissipations on ions D. and electrons D for the N|i=20 mode in
the D-plasma.A certain small scale modulation of the E field at the
plasma edge from the inner side of the torus points to the SWexcitation, the SW occurring in the FW-SW conversion region at theplasma boundary. This,in particular,leads to the heating of edgeelectrons due to the SW Cherenkov absorption. This effect for themodes with Nffl=2O i s not very significant C IOJO but i t may be
considerably enhanced on decreasing N... Therefore, to obtain such a
regime it. i s also necessary to use the excitation of FW with thesufficiently large N.. .The antenna-plasma coupling may also be good
because the value Q =7.5 appears even lower in this regime than forpi
the w=to . one.Gl.
3. In contrast to the regimes considered above the w=w , regimeCL
for He3 minority ions may be used at high as well as low values ofnT parameter. To attain regimes with high specific coupled power, itis necessary to use relatively high He concentrations C~10>O. Inthis case the relatively rigid conditions on the N.. of excited wavesare one of the features of this regime. As an example, the resultsof numerical calculations are given for the plasma parametersmentioned above when FW with M =1O is excited in O-plasma withn,, /n =O. 08 and T =3KeV from the outer side of the torus. As is seenHo d H«
from Fig. 3 where there are given the dependences of the exciting E
field and the transverse E field , of the total flux P and the
kinetic flux P , the strong FW-SW conversion takes place Csee the
appearance of the flux P. and the E field patterTO. The excited SW isabsorbed in the edge region in part due to the Cherenkov absorptionand , in part, due to collisions near the plasma boundary. Thereforethe portion of the power absorbed in the ICR zone C at the columncenter3 at N..=10 will comprise ca. 4054 from the total power .At the
same time for N.. =2O the conversion effects are practically absent
and the energy is totally absorbed in the central part of the columnby He ions.
22 134. Heating regime with the heavy minority C Ne , C etc.D.The most efficient scenario i s one using the FW excitation from
the inner side of the torus with the addition of a small quantity ofhydrogen to enhance the FW-SW conversion. As an example Fig. 4 givesthe E and E electric field moduli , the kinetic energy flux P and
energy dissipations by ions D.for the mode with N =10. As i s seen
from the kinetic flux and E field behaviour due to the presence of
hydrogen C n /n =7.5JO the FW-SW efficient conversion occurs withn ci
subsequent SW absorption by Ne22 isotope. The effect of cutting-offthe tai ls of resonant particle distribution function i s realizedthat sharply decreases the appearance of fast particles , and ,consequently , their escape into the loss cone. As i t follows fromthe field pattern of the E field the important issue i s therealization of the one-pass regime of RF energy absorption. Thatleads to the high excitation efficiency and to the field amplitudelowering at the plasma edge what strongly decreases the opportunityfor edge plasma heating. For the antenna planned to excite FW [23 inU-2M device such a regime will be realised in the antenna area atthe start and end sections though with a less peaked energydeposition profile . Note that the FW-SW conversion regime i s verysensitive to the hydrogen concentration.
Perform the analysis of these 4 heating regimes from the point ofview view of achieving • powerful heating regime of bulk ions on theground of 1-D kinetic equation C4). The quasilinear diffusioncoefficient was taken in the analysis in the formDpf = C n 2
where n i s the resonance number, p-iE /E i s the wave polarization.
This model accounts for energy losses by particles only due toCoulomb collisions. Though under real conditions other effects, in
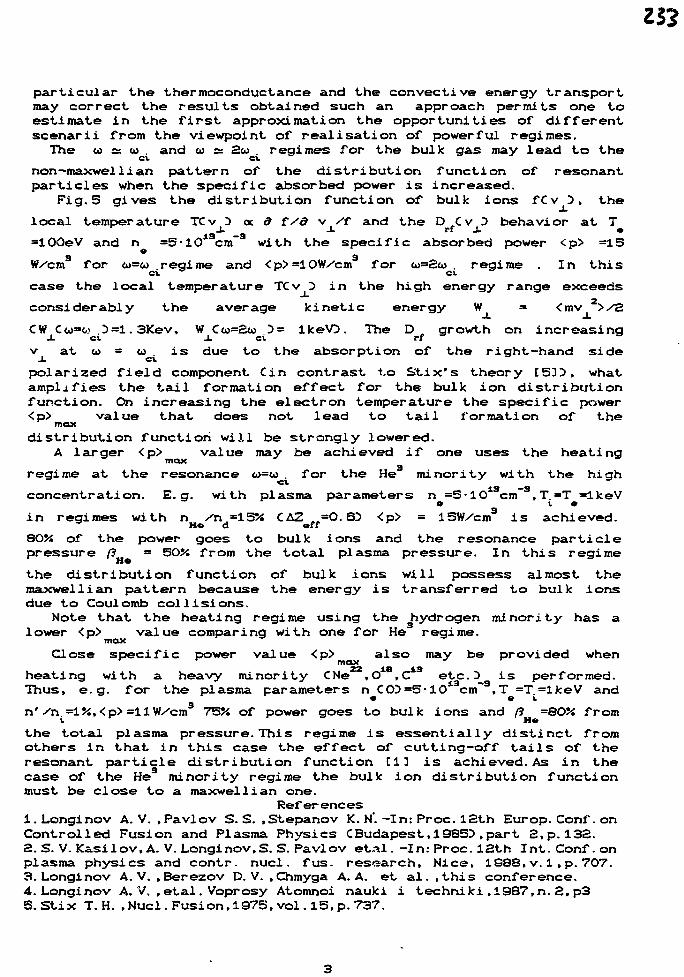
Ill
particular the thermoconductance and the convective energy transportmay correct the results obtained such an approach permits one toestimate in the first approximation the opportunities of differentscenarii from the viewpoint of realisation of powerful regimes.The to a w . and eo as 2a> . regimes for the bulk gas may lead to the
non—maxwellian pattern of the distribution function of resonantparticles when the specific absorbed power is increased.
Fig. 5 gives the distribution function of bulk ions fCv D, the
local temperature TCv D <x d f/d v /f and the D Cv 2 behavior at T
=100eV and n =5-10*3cnf3 with the specific absorbed power <p> =159 3
W/cm for o=o> regime and <p>=10W/cm for <o=2oo . regime . In th i sci. ' ci
case the local temperature TCv D in the high energy range exceeds
considerably the average kinetic energy W = <mv >/2
CW Cu=w }=1.3Kev, W Cto=2co D= lkeVD. The D growth on increasing
v at o> = to . i s due to the absorption of the right-hand sidepolarized f ie ld component Cin contrast to Stix's theory [53D, whatamplifies the tai l formation effect for the bulk ion distributionfunction. On increasing the electron temperature the specific power<p> value that does not lead to t a i l formation of the
maxdis tr ibut ion function wil l be strongly lowered.
A larger <p> value may be achieved i f one uses the heatingmax
regime at the resonance 6>=eo . for the He minority with the high
concentration. E.g. with plasma parameters n =5 • 1O13cm~3, T. =T =lkeV
in regimes with n /n =15>S CA2 =O. 6D <p> = 15W/cm3 i s achieved.of the power goes to bulk ions and the resonance particlepressure ft = 50J4 from the total plasma pressure. In this regime
H4)the distribution function of bulk ions will possess almost themaxwellian pattern because the energy is transferred to bulk ionsdue to Coulomb collisions.
Note that the heating regime using the hydrogen minority has alower <p> value comparing with one for He regime,
maxClose specific power value <p> also may be provided when
maxheating with a heavy minority CNe22,018,C13 e tc . 3 i s performed.Thus, e .g. for the plasma parameters n CO3 =5• 1013cm~3,T =T.=lkeV andn'/n. =lJi,<p>=HW/cm3 75>4 of power goes to bulk ions and ft =SOJ< from
v Hothe total plasma pressure. This regime i s essentially distinct fromothers in that in this case the effect of cut ting-off t a i l s of theresonant particle distribution function Cl] i s achieved. As in thecase of the He minority regime the bulk ion distribution functionmust be close to a maxwellian one.
References1. Longinov A. V. .Pavlov S. S. .Stepanov K. N'. -In: Proc. 12th Europ. Conf. onControlled Fusion and Plasma Physics CBudapest,1985^.part 2,p. 132.2. S. V. tCasilov, A. V. Longinov,S. S. Pavlov etal. -In: Proc. 12th Int. Conf. onplasma physics and contr. nucl. fus. research, Nice. 19S8,v. 1,p.7O7.3. Longinov A. V. .Berezov D. V. .Chmyga A. A. et al. . this conference.4. Longinov A. V. ,etal . Voprosy Atomnoi nauki i techniki,1987,n. 2,p3S.Stix T. H. .Nucl. Fusion.1975,vol. 15,p. 737.
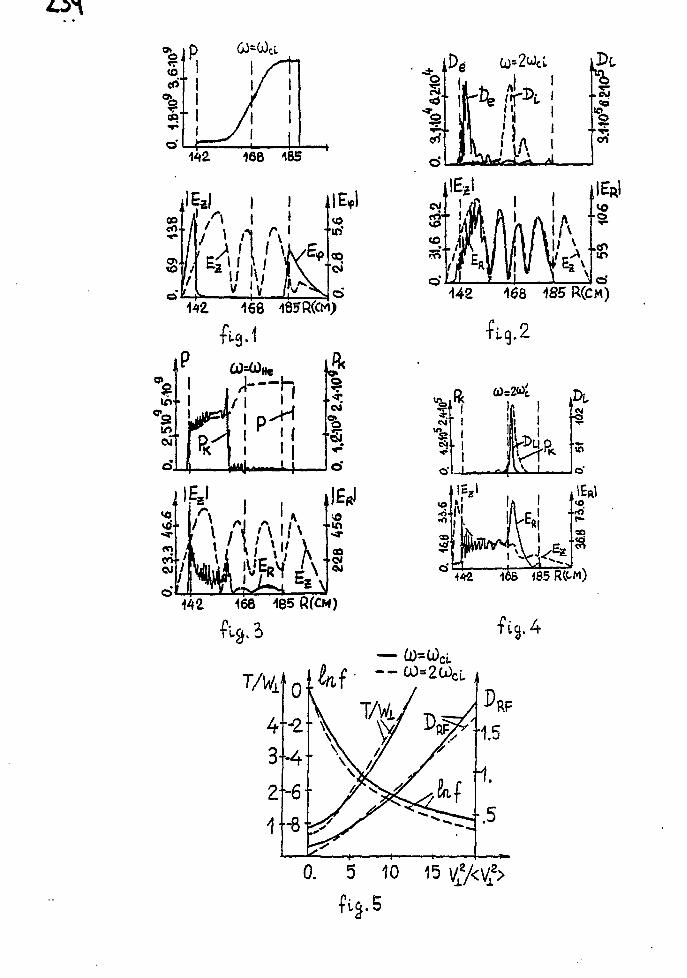
63=0)
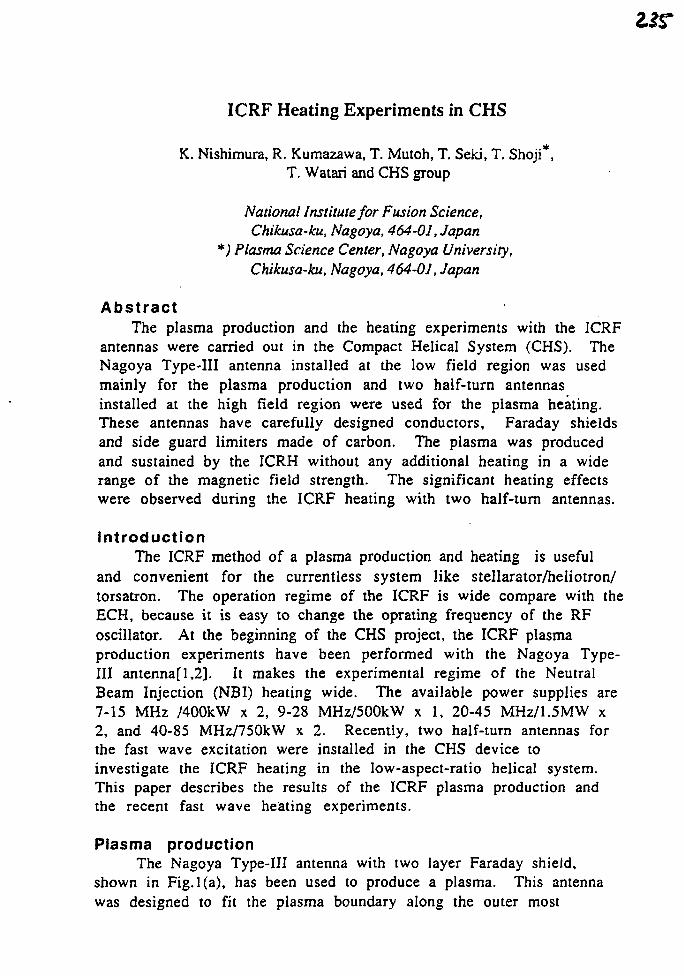
ICRF Heating Experiments in CHS
..*K. Nishimura, R. Kumazawa, T. Mutoh, T. Seki, T. Shoji ,T. Watari and CHS group
National Institute for Fusion Science,Chikusa-ku, Nagoya, 464-01, Japan
*) Plasma Science Center, Nagoya University,Chikusa-ku, Nagoya, 464-01, Japan
AbstractThe plasma production and the heating experiments with the ICRF
antennas were carried out in the Compact Helical System (CHS). TheNagoya Type-Ill antenna installed at the low field region was usedmainly for the plasma production and two half-turn antennasinstalled at the high field region were used for the plasma heating.These antennas have carefully designed conductors, Faraday shieldsand side guard limiters made of carbon. The plasma was producedand sustained by the ICRH without any additional heating in a widerange of the magnetic field strength. The significant heating effectswere observed during the ICRF heating with two half-turn antennas.
Introduct ionThe ICRF method of a plasma production and heating is useful
and convenient for the currentless system like stellarator/heliotron/torsatron. The operation regime of the ICRF is wide compare with theECH, because it is easy to change the oprating frequency of the RFoscillator. At the beginning of the CHS project, the ICRF plasmaproduction experiments have been performed with the Nagoya Type-Ill antenna[l,2]. It makes the experimental regime of the NeutralBeam Injection (NBI) heating wide. The available power supplies are7-15 MHz /400kW x 2, 9-28 MHz/500kW x 1, 20-45 MHz/1.5MW x2, and 40-85 MHz/750kW x 2. Recently, two half-turn antennas forthe fast wave excitation were installed in the CHS device toinvestigate the ICRF heating in the low-aspect-ratio helical system.This paper describes the results of the ICRF plasma production andthe recent fast wave heating experiments.
Plasma productionThe Nagoya Type-Ill antenna with two layer Faraday shield,
shown in Fig.l(a), has been used to produce a plasma. This antennawas designed to fit the plasma boundary along the outer most
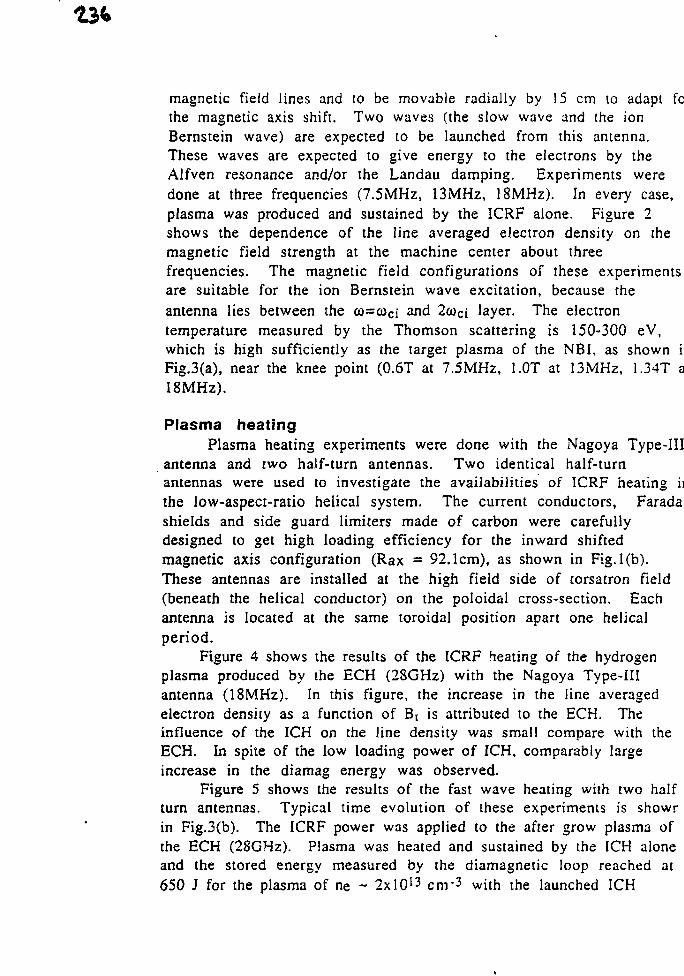
magnetic field lines and to be movable radially by 15 cm to adapi fothe magnetic axis shift. Two waves (the slow wave and the ionBernstein wave) are expected to be launched from this antenna.These waves are expected to give energy to the electrons by theAlfven resonance and/or the Landau damping. Experiments weredone at three frequencies (7.5MHz, 13MHz, 18MHz). In every case,plasma was produced and sustained by the ICRF alone. Figure 2shows the dependence of the line averaged electron density on themagnetic field strength at the machine center about threefrequencies. The magnetic field configurations of these experimentsare suitable for the ion Bernstein wave excitation, because theantenna lies between the w=coci and 2cocj layer. The electrontemperature measured by the Thomson scattering is 150-300 eV,which is high sufficiently as the target plasma of the NBI, as shown iiFig.3(a), near the knee point (0.6T at 7.5MHz, LOT at 13MHz, 1.34T aI8MHz).
Plasma heatingPlasma heating experiments were done with the Nagoya Type-Ill
antenna and two half-turn antennas. Two identical half-turnantennas were used to investigate the availabilities of ICRF heating iithe low-aspect-ratio helical system. The current conductors, Farada;shields and side guard limiters made of carbon were carefullydesigned to get high loading efficiency for the inward shiftedmagnetic axis configuration (Rax = 92.1cm), as shown in Fig.l(b).These antennas are installed at the high field side of torsatron field(beneath the helical conductor) on the poloidal cross-section. Eachantenna is located at the same toroidal position apart one helicalperiod.
Figure 4 shows the results of the ICRF heating of the hydrogenplasma produced by the ECH (28GHz) with the Nagoya Type-Illantenna (18MHz). In this figure, the increase in the line averagedelectron density as a function of Bt is attributed to the ECH. Theinfluence of the ICH on the line density was small compare with theECH. In spite of the low loading power of ICH, comparably largeincrease in the diamag energy was observed.
Figure 5 shows the results of the fast wave heating with two halfturn antennas. Typical time evolution of these experiments is showrin Fig.3(b). The ICRF power was applied to the after grow plasma ofthe ECH (28GHz). Plasma was heated and sustained by the ICH aloneand the stored energy measured by the diamagnetic loop reached at650 J for the plasma of ne - 2xl01 3 c n r 3 with the launched ICH
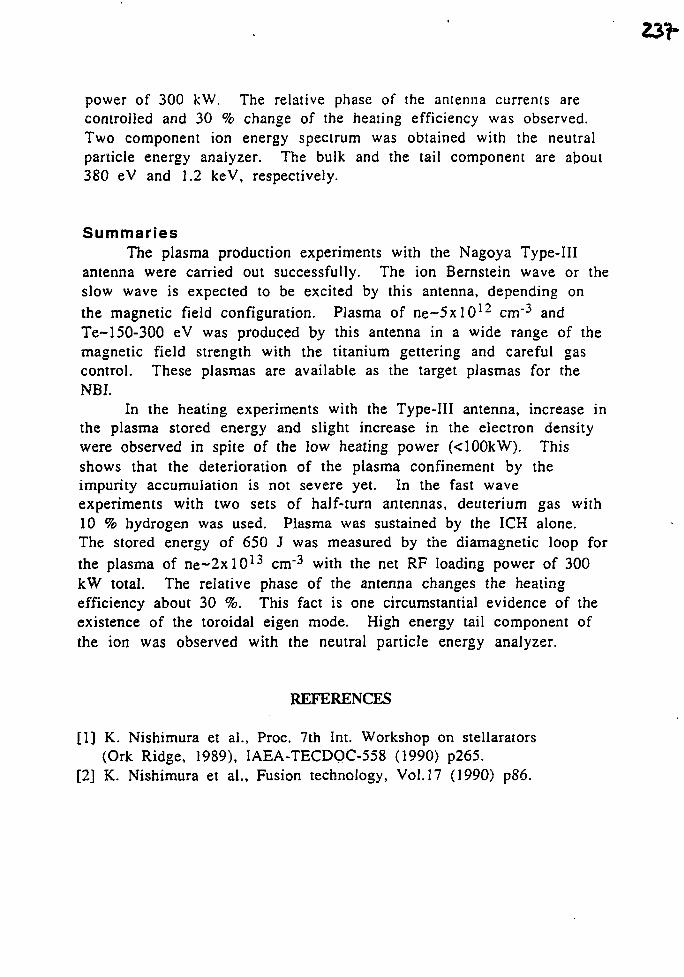
power of 300 kW. The relative phase of the antenna currents arecontrolled and 30 % change of the heating efficiency was observed.Two component ion energy spectrum was obtained with the neutralparticle energy analyzer. The bulk and the tail component are about380 eV and 1.2 keV, respectively.
SummariesThe plasma production experiments with the Nagoya Type-Ill
antenna were carried out successfully. The ion Bernstein wave or theslow wave is expected to be excited by this antenna, depending onthe magnetic field configuration. Plasma of ne~5x 101 2 cm'^ andTe~ 150-300 eV was produced by this antenna in a wide range of themagnetic field strength with the titanium gettering and careful gascontrol. These plasmas are available as the target plasmas for theNBI.
In the heating experiments with the Type-Ill antenna, increase inthe plasma stored energy and slight increase in the electron densitywere observed in spite of the low heating power (<100kW). Thisshows that the deterioration of the plasma confinement by theimpurity accumulation is not severe yet. In the fast waveexperiments with two sets of half-turn antennas, deuterium gas with10 % hydrogen was used. Plasma was sustained by the ICH alone.The stored energy of 650 J was measured by the diamagnetic loop forthe plasma of ne~2x l0 1 3 cm"3 with the net RF loading power of 300kW total. The relative phase of the antenna changes the heatingefficiency about 30 %. This fact is one circumstantial evidence of theexistence of the toroidal eigen mode. High energy tail component ofthe ion was observed with the neutral particle energy analyzer.
REFERENCES
[1] K. Nishimura et al., Proc. 7th Int. Workshop on stellarators(Ork Ridge, 1989), IAEA-TECDOC-558 (1990) p265.
[2] K. Nishimura et al., Fusion technology, Vol.17 (1990) p86.
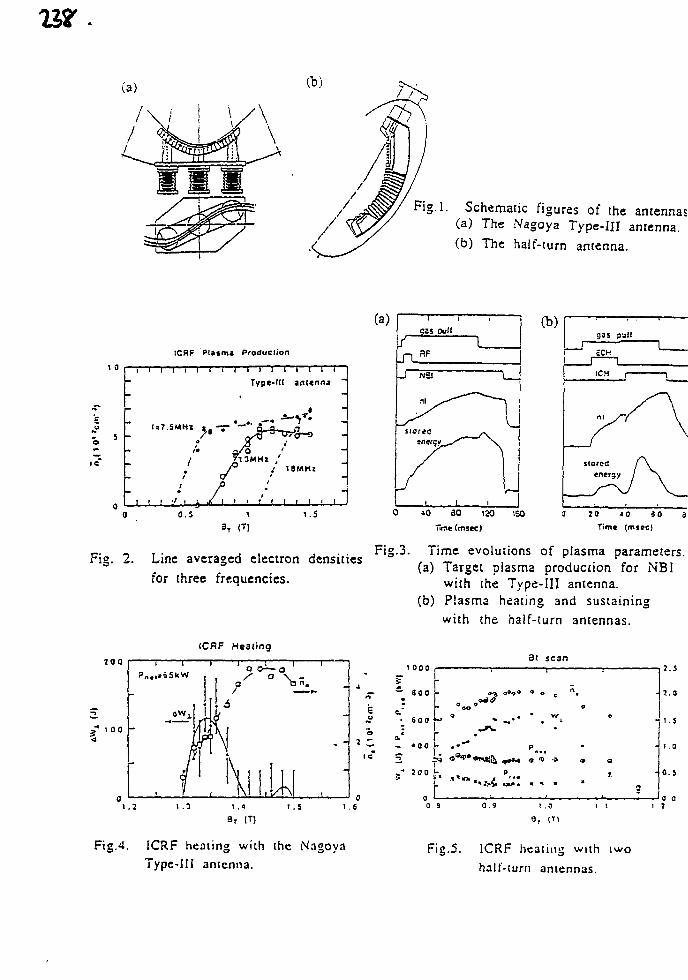
(a)
Fig.l. Schematic figures of the antennas(a) The Nagoya Type-Ill antenna.(b) The half-turn antenna.
(a)
ICRF Plasma Production
\ 0
5 -
-
-
1
1 1
1*7
i i
i i t i
,5MHz | g
o
t
I 1 1 t 1
Typ«-
a/57T3MHI
I I • r f
i i i t
III inttnm
4 ^18MH2
i i i i
I
-
-
;
n
_SIC
J
gai oull
RF
NSI \
•tH v
/
1 1 1 |
0.5 1.S 40 ao ijo iso
Time (msec)
Fig. 2. t . . , , . . Fig.j. Time evolutions of plasma parameters.Line averaged electron densities . , _ . ^ . K. . . „ ,
(a) Target plasma production for NBIfor three frequencies. w i t h [ h e T y p e . i n a n I enna.
(b) Plasma heating and sustainingwith the half-turn antennas.
ICHF Heating
2 0 0
1 0 0 -
31 scan
f" »«m .^.^ ^ * ^
1.3
Fig.4. ICRF heating with the NagoyaType-Ill antenna.
Fig.5. ICRF heating wiih twohalf-turn antennas.
PLASMA RF-PRODUCT1ON EXPERIMENTS USING THE ANTENNAINTEGRATED INTO THE U-3M TORSATRON HELICAL WINDING
A. P. LJTV1NOV. A. l.LYSOJVAN. YU. K.M JRONOV, N. 1. NAZAROV.V.V. PLYUSNIN, T.YU.RANYUK, O.M.SHVETS, A.S.SLAVNY,
M.P.VASIL'EV, E.D.VOLKOV.
Kharkov institute of Physics and Technology.Kharkov, 310108, USSR
ABSTRACT With the help of the frame-type antenna integratedinto the helical winding of the U-3M torsatron the studies ofthe RF power coupling efficiency and of plasma production inthe /CRF (u> < c^) have been performed. Dense hydrogen plasma(rie > I0'3 cm'3*) has been produced in the broad range of tor-satron magnetic field changes BQ = 0.35 - 0.8 T when RF powerof ~ WO kW level was radiated from the new antenna at thefixed frequency IQ = 5.6 MHz. The antenna coupling to a pro-duced plasma increased on grpwine the plasma density (R^ max= 0.5 Ohm at n* = 1.4 x t0TJcm~J). TIN coating of the at max
e = 1.4 x tOcmT). TIN coating of the antennacurrent earring surfaces lowered the impurity influx into thedischarge and enhanced the temperature of the plasma produced.
INTRODUCTION Electromagnetic shielded antennas of variousdesign have gained broad applications in coupl ing RF power offusion devices in the ion cyclotron range of frequecy (JCRF)for plasma production and heating. The enhanced levei of RFpower t ransmit ted to the plasma requires the efficientcoupling between the antennas and the plasma and.consiquetly.their location near the plasma boudary.But the antenna loca-tion close to the plasma inevitably tends to the interactionof the periphery plasma with the antenna surf ace. enhancementof impuri ty fluxes into the plasma and degradation of itsparameters.
The plasma RF production and heat ing in the U-3 torsatronusing of frame-type unshielded antennas [1-3] and TiN-coat ingof antenna surfaces has allowed to obtain plasma with highion temperature without i ts degradation in quasi steadydischarges [41. Nevertheless, the antenna remained, as before,the most strained uni t of the RF power coupling system.However.the excellent feature of the U-3M torsatron device,the "chamberless" location of helical winding in vacuum tankprovides to use the sections of the torsatron helical windingas a frame-type antenna. In th i s case the antenna couplingefficiency must not be strongly decreased with respect to thesimilar frame-type antenna placed into the plasma confinementvolume, because the spacing between the radiat ing surface ofantenna and plasma boudary would grow only by 2 cm.On the o ther hand. the negative influence of image currents innearby conductive surface on coupling efficiency will be re-moved. Besides.a number of elements in teract ing with the peri-phery plasma is also decreased.
This paper gives the first results on RF plasma productionand heat ing in the ICRF ( u < wc j ) when RF power is coupledwith the frame-type antenna integrated into the helical win-
ding of the U-3M torsatron.EXPERIMENTAL RESULTS AND THEIR DISCUSSION The U-3M torsa-tron parameters:/;? = 1 m. a a 0.1 m, / = 3. m = 9. -c(O) =0.20.-c(3)= 0.28.The confining magnetic field changed in the limitsBQ = 0.35 - 0.8 T. The curren t-carnne surface of antenna wasformed by two sections of the inner surfaces of SS casings ofhelical winding connected in parallel with capacities in aunified RF-circuit (Fig. 1). Variation of the toroidal lengthof the RF-circuit and location of the RF power feeding alowedone to loMii ihe antenna near-field structure and kii-spektrumrequired to produce dense plasmas by RF-technique developedin the earlier studies [1.5-7], The azimuthal wave numberspectrum has been determined by the helical winding design(| m | = 1.3VThe antenna RF circuit parameters: f0 = 5.6 MHz.wave resistance p = 15 Ohm.quality factors without load Qo =lOO.ohmic losses in the circuit rohm = 0.2 Ohm.
Two series of experiments have been performed by using twodifferent antenna materials: the 1st series with stainlesssteel antenna (SS-antenna): the 2nd one with the same antennacoated with titanium nitride (TiN-antenna).
During the experiments there have been measured the RF po-wer P^ coupled to the plasma.plasma loading into the RF cir-cuit Rp( determing coupling properties of the antenna, averageplasma density TT . electron temperature Te (2&>ce - emission),ion temperature Tt (charge-exchange measurements). The plasmaenergy contamement signal and bolometric signal have beenalso registered. Experiments have been performed with hydrogenfilling in the broad range of gas pressure variation pH =( 1 - 5 ) x 10~5 Torr.
The new antenna produced efficiently dense plasma( 7Te ~ 1013 cm"3) in the broad range of torsatron magneticfield changes Bo = 0.35 - 0.8 T ( Q = B
c i / B p = ° 4 5 ~ n d u e
to broad kn - spectrum of the antenna with excitation ofAlfven (AW) ta < wci) and ion cyclotron (ICW) (w s co.) waves.The value of plasma density has been determine*! by vacuumconditions (neutral gas pressure.conditions of the vacuumsurfaces of the tank walls and torsatron helical winding ca-sings) as well as by RF conditions (RF power input level.waveexcitation and absorbtion intencity in the plasma) The plasmawith density ne = 1.5 x 1013cm~3 has been produced at Q = 0.8when RF power of « 120 kW level was coupled |8|.As wasexpected.the plasma loading R t had almost the same value asR_j for the conventional frame-type antenna. Plasma loadingincreased with the plasma, density grows approximately identi-cally for SS- and TiN-antennas ( R^ max = 0.5 Ohm at n~e =1.4 • 1013cm~3) (Fig. 3). Similar behaviour of R^ versus theplasma density has been observed on the / = 2 CHS torsatronin experiments on plasma RF production in the ICRF by usingthe close analogy of the frame-type antenna - the Nagoya typeIII antenna [9|. Plasma loading dependence versus Bo in theU-3M experiments had a more pronounced resonance behaviourfor the case of TiN-antenna(Fig.2).The resonance R^ vs Bobehaviour mav be determined by the multimode regimes over theplasma column cross-section excitation of the AWdCW) of des-
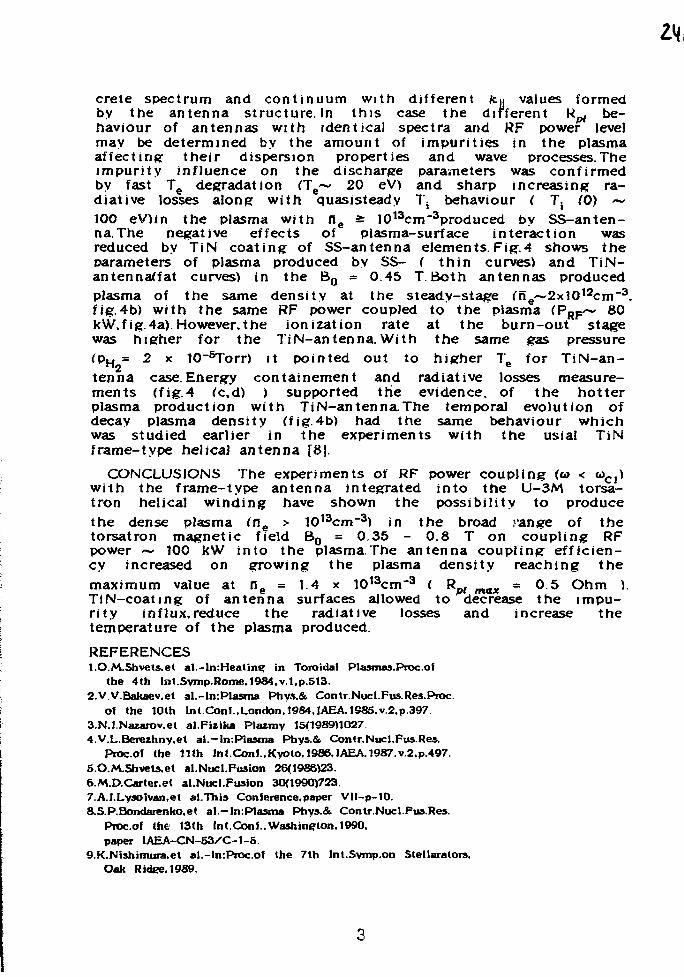
crele spectrum and continuum with different fcy values formedby the antenna structure. In this case the different Rp, be-haviour of antennas with identical spectra and RF power levelmay be determined by the amount of impurities in the plasmaaffecting their dispersion properties and wave processes. Theimpurity influence on the discharge parameters was confirmedby fast Te degradation (Te~ 20 eV) and sharp increasing ra-diative losses along with quasisteady 1\ behaviour ( T. {0) ~100 eV)in the plasma with ne 2: 1013cm~3produced by SS-anten-na. The negative effects of plasma-surface interaction wasreduced by TiN coating of SS-antenna elements.Fig.4 shows theparameters of plasma produced by SS- ( thin curves) and TiN-an ten naff at curves) in the Bo = 0.45 T. Both antennas producedplasma of the same density at the steady-stage (ne~2xl012crn~3.fig.4b) with the same RF power coupled to the plasma (P R F ~ 80kW.fig. 4a). However, the ionization rate at the burn-out stagewas higher for the TiN-antenna. With the same gas pressure(PH = 2 x IQ-^Torr) rt pointed out to higher Te for TiN-an-tenna case. Energy containement and radiative losses measure-ments (fig. 4 (c,d) ) supported the evidence, of the hotterplasma production with TiN-antenna.The temporal evolution ofdecay plasma density (fig. 4b) had the same behaviour whichwas studied earlier in the experiments with the usial TiNframe-type helical antenna [8|.
CONCLUSIONS The experiments of RF power coupling <w < o>CJ)with the frame-type antenna integrated into the U-3M torsa-tron helical winding have shown the possibility to producethe dense plasma (fle > 1013cm~3) in the broad range of thetorsatron magnetic field Bo = 0.35 - 0.8 T on coupling RFpower ~ 100 kW into the plasma.The antenna coupling efficien-cy increased on growing the plasma density reaching themaximum value at ne = 1.4 x 1013cm"3 ( R^ max = 0.5 Ohm ).TiN-coating of antenna surfaces allowed to decrease the impu-rity influx, reduce the radiative losses and increase thetemperature of the plasma produced.
REFERENCESl.O.M.Shvets.et al.-In:Heatiru? in Toroidal Plasmas.Pioc.of
the 4th bit.Symp.Rome.1984.v.l,p.5132.V V Bakaev.et al.-In:Plasma Phys.& Contr.Nucl.Pus.Res.Proc.
of the 10th IntConl.London. 1984,IAEA.lS85.v.2.p.3973.N.I Nazarov.el al.Fizika Plazmy 15(1989)1027.4 V.L.Berezhny.et al-InrPlasma Phys.& Conlr.Nucl.Fus.Res.
Proc.ol the 11th lnt.ConJ..Kyoto.l986.IAEA.1987.v.2.p.497.5.O.M.Shvet5.et al.Nucl.Fusion 26(1986)23.6M.DCarter.et al.Nucl.Fusion 30(1990)723.7.A.I.Lysoivan,et al.This Conlerence.paper VlI-p-10.8.S.P.Bondarenko.et al.-In:Plasma Phys.&. Contr.Nucl.Fus.Res.
Proc.of the 13th Int.Conf.Washington. 1990.paper IAEA-CN-53/C-1-5.
9.K.Nishimura.et al.-In:Proc.of the 7th Inl.Svmp.on Steliarators.Oak R idee. 1989.
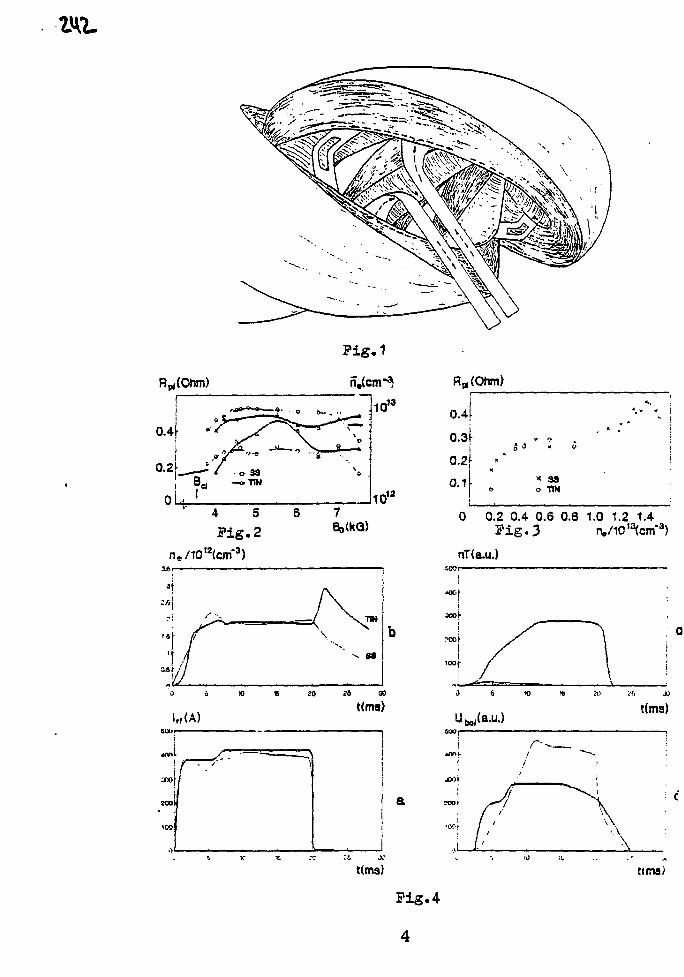
VKL
0 0.2 0.4 0.6 0.8 1.0 1.2 1.4F i g . 3 rv/iO13(cm-3)
nT(a.u.)
8»
xoj-i
?ooi-
lOOf
io e JO
Irf(A)
76 00
tOns)
/ - • -
t(ma) tina)
Pig. 4
4
ICKl—(VlfclHOU hOK MLAJ>MAi> PKODUCIIUN IM LAKGh S> I bLLAKA I ORi
A. l.l.Y.SOJVAN. V t . MO I . ^ t t N KU . O.MMlVtT-S, K.N SlbPANOV
Kharkov Institute o\ t'hystcs and Technology.KharKou. 3)0108.
> IkACI 'I his paper considers the possibiiitu to use Ht plas-ma production technuiue in the JCfcr iu> < w .) to obtain thedense plasma (ne > lO1^ cm~^j in larpe scale stellarators.l hecriteria /or optimum development, of the Rf- discharge stapesdunnp plasma production are found and anali/sed.t he calcula-tion on plasma production in next veneration stellarators aremade with the U-U transport model. Jt is shown.tn particular,that in the U-2M steliarator the tarpet piasma may lie produ-ced with parameters: ne~ iiy-U)1^ cm~**.le- 2UO eV when Kh powerot frt - ,-yoo KVC leuei is coupiea at the ) --• 6 MHz ireauencu.
i!\ l KOLJUCi ION lo obtain tne steadv regimes ot stellaraior pertormance it is necessarv 10 aevelope non-Ohm ic techniques otplasma production in this tvpe or lusion devices. This paperstudies the possibility to produce the dense plasma (ne> lO13
cm"3) in large scale stellarators bv the l<F technique in theion cyclotron ranee ot irequencies dCKf-i (w < wcj). The en-hanced interest to this irequencv ranee (I -- 60 Mi-lz) is explained bv trie existence oi operatme powerful quasisteadv HFsources (Hr| ~J0 MW. TrJ ~20 s) that are relatively cheap | l |and bv the experimental prool oi the possibility to prooucethe dense plasma (rTp 2 IO13crn"3) in the U 2 |2l.U-3 i3 i .u 3MI4|and CHb I6istellaraiors in a broad ranee or conf in ing matr-iiet ic tield changes without retunine 01 the Kf greneratorl requencv
MEGHAN IbM^ OH ICKh PLASMA PKODUCllUN Kh power con pi 1 ne isaccomplished with antennas ot electromagnetic tvpe generating
f+* f*%S ^**e /-»w
the a l te rna t ing kh t ield w i t h components ot E n. t x . B M , tsx . Onemav separate the fo l low ing kr- discharge stages in the processot plasma product ion in toroidal ' devices in the KlkF: KFbreakdown ot trie neutral gas in trie v i e f n i t v 01 trie antenna(n e «n a ) . wave stages ot preion izat ion <ne<na)and burn-ou t 01the neutral gas <n e ~ na) in the whole volume 01 plasma torusKr- breakdown ot tne gas is accomplished bv trie electrons
g a i n i n g trie energv necessary tor ioni / .at ion in tne E (| 1 lelddirected alone the steliarator magnetic i leld lines In theabsence oi tne pi as ma tne kh I leld is localized near the an
lenna and i ts t ..-componen 1 is not shielded bv charged part ic-les under trie act ion oi KI - t ield 1 he electrons mov ing alongmagnetic 1 ield lines oscil late w i t n the trequency o> and trie
velocity c |j - et. ^/mja .Electrons also perform slow mot ions un
der trie act ion ot trie Ht- potent ia l * r , - t» 2 E 2 / Am s 61 Whi leat the kr- breaKdown stage trie waves cannot propagate in thetorus (wnoc w) the kh potent ia l is nonvan i sh ing onlv near theantenna svstern. Kor a double -hump UF potent ia l d i s l n o u t ionthe Hf t ield constant ly acts on electrons trapped in the potent ia l well near trie an lenna I he rale 01 gas l o n i / a i i o n ap
'—' r>p r o a c h e s i t s m a x i m u m v a l u e w h e n t r i e c o n d i t i o n mev*/ 2™ eci i ssa t i s t c d . w h e r e S j i s t h e l o n i z a t i o n p o t e n t i a l o t t h e n e u t r a l
gas molecule I he Kr- potential is dest rue ted n t fit.- electronosci l lat ion amplitude in me KJ- Meld x u •> / u> becomes comparable to the si/x* oi the antenna near i leld localizationregion L,,. I he cond i t ion of the maximum lonizat ion rate by anelectron impact and the cond i t ion lor the double hump KF po-tent ial to exist allow one to wr i te the IvF breakdown cond i -t ion in the fo l lowing lorm lb|:wV zmje/e < E™ < uPm^,, / 2eWi th u - 3 /7x lo ' s^ .L . . -=100 crn one has 5v /cm < "En < 40v/cm,i>ucn low values of the fc. |,--1 letd amplitude are easv to at ta inin the expenmen t.
On erowme the plasma aensnv <CJ > a» there are achievedtne condi t ions tor the slow wave <. w> propagation the disper-sion ot wnicn is determined bv the expression:/v^ - e.j3f/'V? £ [ 1 ; / c , l n or^, > CJ2 the sw polarization is such
that fc. | , /E1 | .<< I because ol th is circumstance one shouldexpect trie lonizat ion rate to be lower than one for the nonwave stage I he dependence ot the ionozation rate on E N ISmore pronounced tnan on the non-wave stage. Due to th is depen-dece, the seli-consisten t proti le oi plasma densitv is formed
in which the E y -field ampli tude is the same at everv pointot the proti le | / | . in spite of the lowered lomzat ion ratew i t h respect to the non-wave stage the densitv ot the plasmaproduced grows cont inuously due to small losses ot chargedparticles. On increasing the plasma densitv fur ther the con -d i t i ons tor global resonance exci tat ions are lormed.i i rs t . torthe Alfven wave (AW) and then lor the last magnetosonic wave
(FMi>W). E ||-cornponen t ol the Kf field is verv small tor thesewaves arid tne direct interact ion between waves and electronsis accomplished onlv in the AW-bW conversion regions in tneAltven resonance lavenAK):«Fl1-<V||2.On increasing oi the plasma densitv trie AK surfaces lor a given value oi me longi tudinai wavenuniber K,, move to the plasma column edge and at thecenter the AK condi t ions are formed lor waves w i t h larger K^.I he newlv-born resonances behave simnarv Consequen t lv, theantennas fo rming the broad over K* spectrum oi the KK powerradiated rnav provide the dvnamic process or tne "relav race"of resonances and tne growtn the plasma densitv these requirements are met bv tow impedance antennas oi i rame tvpe andslot - tvpc l^.rtl lorrnes whicn mav be used in next generationstellarators lo achieve i he wave stage oi plasma productionan eiMcieru mechanism lor energy absorbtioii oi excited wavesmust exist .W propagating along i he radius and along me torusoirciimierence is absorbed DV electrons and n heats mem I fieabsorption mechanism is the i loulomb col l is ions oi electronsw i t h heavv part icles .*>W damping length along the radius ta> <<(j>ry.K],c/tjL> •> w > t x w r i ) is: A [/Irn KL& V mg/ mf a> / ((j>r/K^v^)
I l ie est imates show tha i lo r n c ~ i o ' ° I0 1 3 cm 3. I (>~ i> 100 eV
the .SW absorp t ion is s t r o n g ( A<<<7 ) lo r /c(. — 10 2 10 ' cm 'I he stage or neutral yas burn out ( n ( , ~ n.() is m e most irn
por tan t because i t is character ized bv considerable energylosses connected w i t h e x c i t a t i o n and ion i /at ion ol neutra latoms n.( At (tie staec ol h e a t i n g to ia l l v ion ized plasma theenergv losses associated w i t h con I ir iemen t are d o m i n a n t I fie
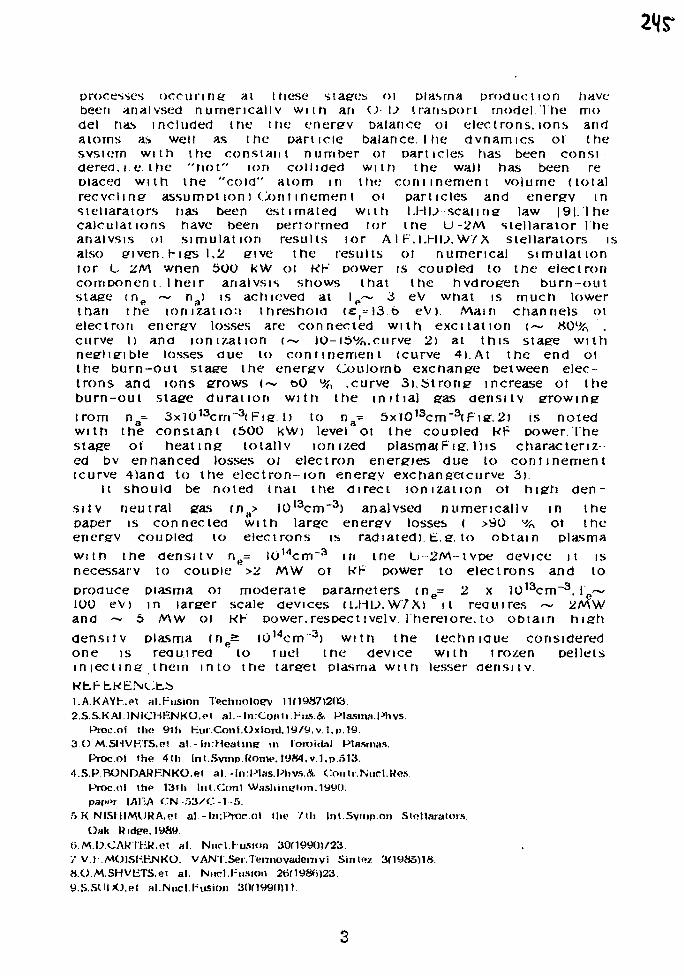
processes ocourme: ai these stages 01 plasma production have-been analysed numerically w i i h an O \J transport model.The model has included the tfie energy balance 01 electrons, ions andatoms as well as trie particle balance I he dvnamics ol thesvstern w i th trie constant number ot particles has been considered. i.e. the " h o t " ion collided wi th the wall has been replaced w i th the "co ld" atom in trie corn inemen t volume (totalrecycling assumpt ion) Cent inemen t 01 particles and energv insteliarators has been estimated w i th I.HU scaling law |9 | . lhecalculations have been pertormed tor the u -2M siellarator 1 hear.alvsis oi s imulat ion results lor AIF. I .HD.W/X stellarators isalso given. F igs 1.2 give the results oi numerical simulat iontor L 2M wnen 500 kW ot Kt-' power is coupled to tne electroncomponent. Ihei r analvsis shows that the hydrogen burn-outstage <ne ~ na) is achieved at l e ~ 3 eV what is much lowerthan the ionizat io: i threshold (£'--13 t> eV) Main channels oielectron energv losses are connected w i th excitat ion <~ H0% .curve I) and lonizat ion (— 10-15%.curve 2) at this stage w i thnegligible losses due to cont inemeri t (curve 4). At the end olthe burn-out stage the energv Coulomb exchange between elec-trons and ions grows <~ bO % .curve 3). Strong increase ot theburn-out stage duration w i th the in i t i a l gas density growing
trom n a - 3xl013crn~3< Fig. I) to na= 5x 1013cm~3(Fig.2) is notedw i th the constant (500 kW) level ot the coupled KF power I hestage ot heating totallv ionized plasmatFig. Ins charactersed bv enhanced losses oi electron energies due to com inemen t(curve 4)and to the electron- ion energv exc han get curve 3).
it should be noted that the direct tonization ot high den-
s i tv neutral gas <na> IO13cm"3) analysed numerically in thepaper is connected w i th large energv losses ( >90 % ot theenergv coupled to electrons is radiated). E.g. to obtain plasma
wi th the density ne= lO^cm"3 in tne U 2M--tvpe device it isnecessary to couple >2 MW ot kF power to electrons and to
produce plasma oi moderate parameters tne= 2 x l013cm~3. l e ~100 eV) in larger scale devices (Ui lJ . W7X) it reauires ~ 2MWand ~ 5 MW ot KF power, respect lvelv. Thereto re. to obtain high
density plasma (n e ^ i0 I4cm"3) w i th the technique consideredone is required to ruel the device w i th t rozen pelletsin iec t ing them into the target plasma w i th lesser density.
l.A.KAYh.Pt al.Fusion Technoloev 11(19871203
2.S.S.KAJ.INICHRNKO.pt al.-ln:Contt.hus.& Plasma.I^hvs.
t>ioc.ol th<> 9th KurCont.OxloixJ. 19/9,v l,p.19.
3 I ) M.SHVHTS.o( al - InHoadner in lomidal Plasmas.
Procol the 4(h ini.Sviiip Knme. iyS4.v.1.p.r>t3.
4.S.P RONDAKBNKO.et al. -ln:Plas.Plivs.&. Contr.Nucl.Me.s.
Pmcoi the 13»h liit.Omt Washmt.'ion. 1990.
parwi IABA CN-.53/C-1-5.
.r>.K.NISMIMUKA.(M al.-ln:Pmc.ol Ilic /Ui hit Svmp on St<;llarator.s
Oak H idee. 1989
ti M.DCAKIt-.K.«M al. Nurl.Fusion 30ri99())/23
/ V J MOKSI-.KNKO. VANI.Sei.Tennovadenivi Sintpz 3(19S6118
8.O M.SHVtiTS.et al. Niwi.Fusion 2BM98f>)23.
9S.SDIXJ.el al.Nucl.Fusion 300990)11
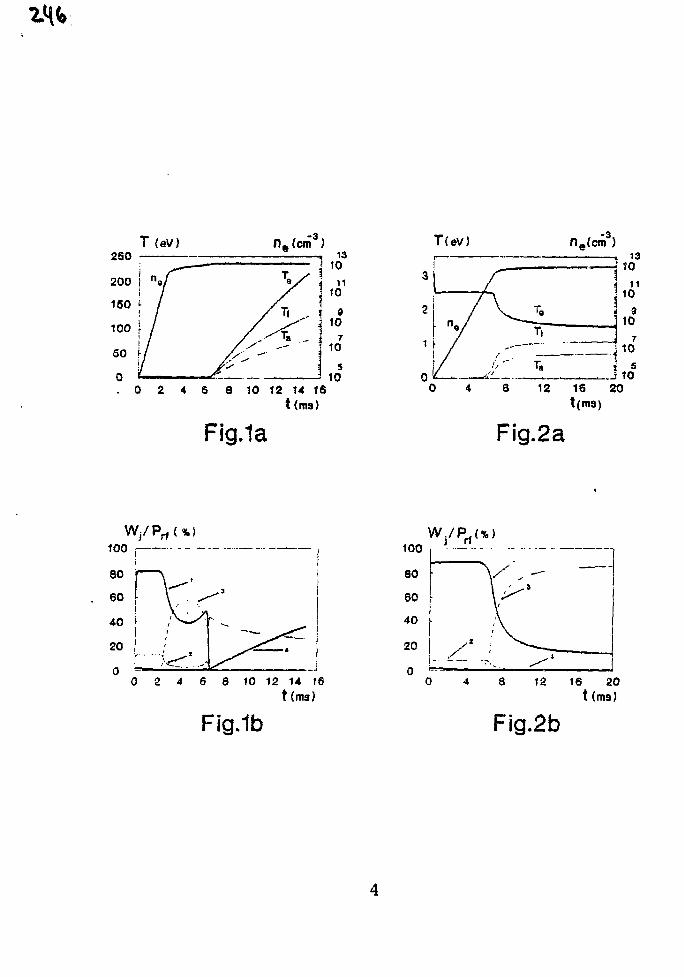
2 4 S a 10 12 14 16t(ms)
Fig.ia
T(eV) ne(cm3)
t(m3)
Fig.2a
100 i
0 2 4 6 8 10 12 14 16t(ma)
Fig.ib
W./Prf(%)
t(n»)
Fig.2b
PLASMA PRODUCTION IN A STELLARATOR BY USINGALTERNATING TOROIDAL CURRENT.
V.E.MOISEENKO
Kharkov Institute of Physics and Technology,Kharkov 310108, USSR.
Abstract. The possibility of currentless plasmaproduction by using alternating toroidal current has beentheoretically analised. The characteristic feature of thistechnique of plasma production are continious weak gaspuffing, low electron temperature and low current frequency(to avoid skin-effect), rather large plasma production time.The estimates for URAGAN-2M and LHD devices are presented.
Introduction. The Ohmic technique of plasma produc-tion applied successfully in the first generation stellara-tors is now substituted with more complicated and lessflexible radio frequency and microwave techniques. It isconnected with that the toroidal current necessary to produ-ce the Ohmic discharge effects essentially the hot plasmaconfinement in a stellarator. Meanwhile radio frequency andmicrowave techniques produce plasma without the toroidalcurrent.
One may produce the currentless plasma with the Ohmictechnique if one excites the alternating toroidal currentinstead the constant one. A stellarator gives such a pos-sibility because it possesses the vacuum confining magneticconfiguration, in contrast to a tokamak.
If the alternating current flows in the toroidal direc-tion then the skin-effect plays a considerable role. Toavoid its manifestations it is necessary for the period ofcurrent oscillations to exceed or be order of the skin time.The plasma production time (some periods of oscillation) israther large what distinguishes this means from other plasmaproduction techniques. Its engeneering simplicity, non-sensibility to the perculiarities of the magnetic configura-tion of the device and uniform filling by plasma of theoverall confinement volume speak to its advantage.
Plasma build-up model. Note that physical processestaking place in stellarator plasma under the action of cons-tant or alternating Ohmic current are similar in number ofaspects. This allows one to enploy the technique developedin paper [1].
Consider the plasma production stage that follows theinitial plasma one when the plasma density n exceeds or isequal to the neutral fill gas density n . Consider the plas-ma to be produced during the continious gas puffing into theout-of-plasma volume. In contrast to initial puffing beforebreakdown, the continious puffing enables one to extend theplasma production process in time and to lower power levelcoupled to the discharge.
The dense plasma producton process in a stellarator hasa number of features:
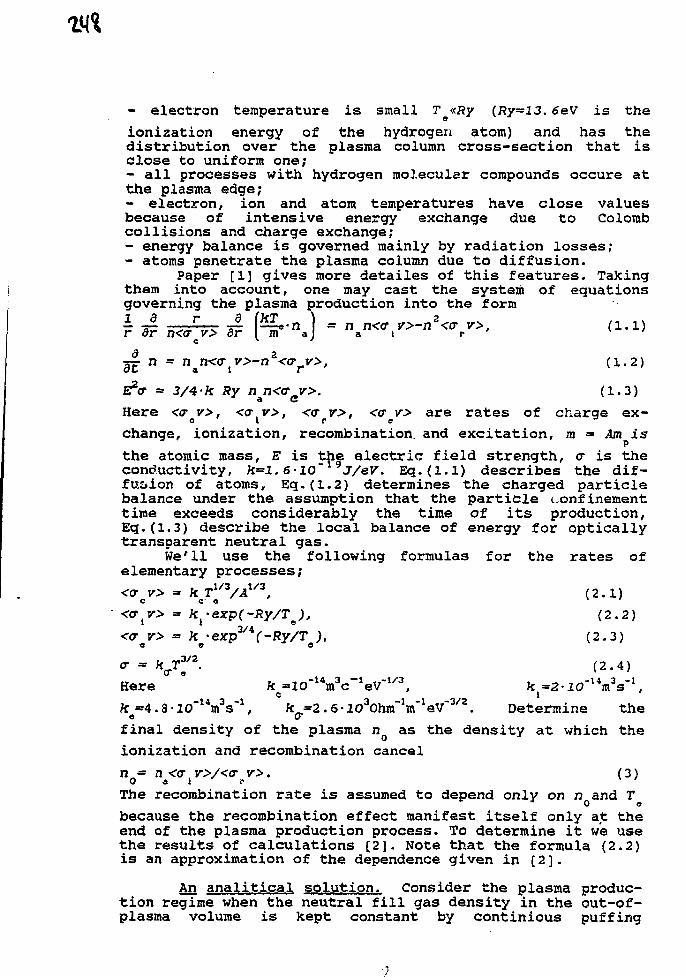
- electron temperature is small T «Ry (Ry=l3. 6eV is the
ionization energy of the hydrogen atom) and has thedistribution over the plasma column cross-section that isclose to uniform one;- all processes with hydrogen molecular compounds occure atthe plasma edge;- electron, ion and atom temperatures have close valuesbecause of intensive energy exchange due to Colombcollisions and charge exchange;- energy balance is governed mainly by radiation losses;- atoms penetrate the plasma column due to diffusion.
Paper [1] gives more detailes of this features. Takingthem into account, one may cast the system of equationsgoverning the plasma production into the formI _£ r a (kT^ ) „ n<<r r>.n2<0. (1#1)
r dr n«r v> dr I m a J a 1 r ' v '
~ n = n^n«Tiv>-nz<crry>, (1.2)
= 3/4-k Ry nji<(rev>. (1.3)
Here «rev>, «r^v>, «TpV>, «?ev> are rates of charge ex-
change, ionization, recombination, and excitation, m = Am isp
the atomic mass, E is the electric field strength, cr is theconductivity, k=l. 6-l0'19J/eV. Eq.(l.l) describes the dif-fusion of atoms, Eq.(l.2) determines the charged particlebalance under the assumption that the particle confinementtime exceeds considerably the time of its production,Eq.(l.3) describe the local balance of energy for opticallytransparent neutral gas.
We'll use the following formulas for the rates ofelementary processes;<crcv> = fccT*
/3/41/3, (2.1)
«TJ> » ki-exp(-Ry/Te), (2.2)
«r v> = k -exp3/4C-Ry/r j, (2.3)A 6 6
Here k =20*14mV1eV1/3, k =2-20~ IVs'\C t
ftj-4.8-2O"1W1, /c(J,=2.6-2O
3Ohm"V1eV~3/2. Determine the
final density of the plasma n as the density at which the
ionization and recombination cancel
nQ= n^«r iv>/«rv>. (3)
The recombination rate is assumed to depend only on n and Tbecause the recombination effect manifest itself only at theend of the plasma production process. To determine it we usethe results of calculations [2]. Note that the formula (2.2)is an approximation of the dependence given in [2].
An analitical solution. Consider the plasma produc-tion regime when the neutral fill gas density in the out-of-plasma volume is kept constant by continious puffing
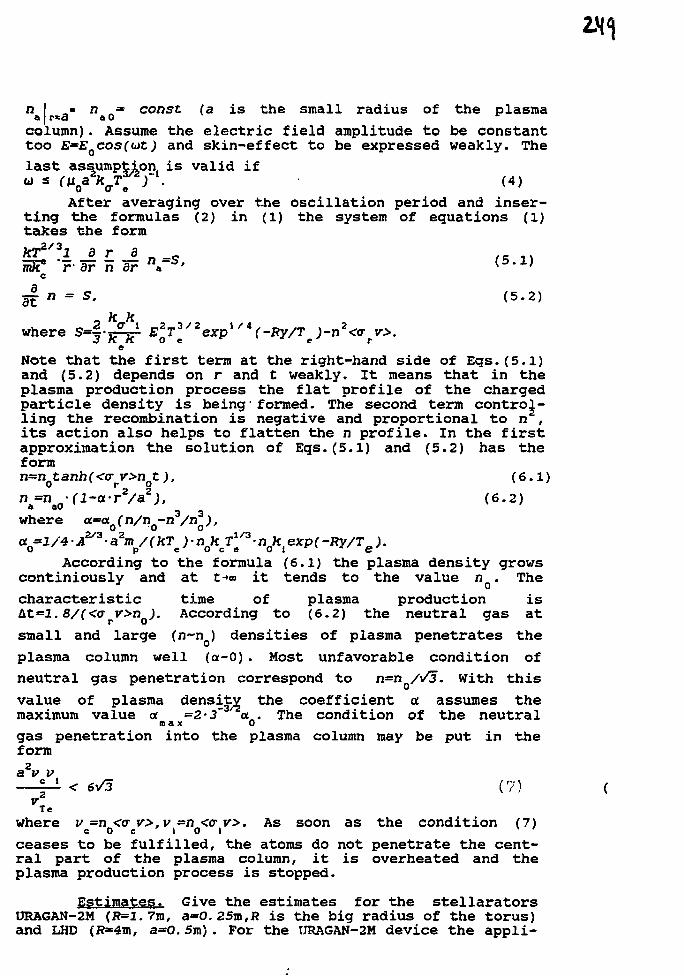
n I =.= n „* const (a is the small radius of the plasma
column). Assume the electric field amplitude to be constanttoo E*E cos(ut) and skin-effect to be expressed weakly. The
last assumption is valid ifw s (uoa\T^)~
l. (4)After averaging over the oscillation period and inser-
ting the formulas (2) in (1) the system of equations (1)takes the form
W 2 / 32 8 r d ....
mR° 'rdr nar V s ' (5-1}
g| n - S, (5.2)
where s-f-JL-i E*T*'2exp1 /4(-Ry/T )-nz<cr v>.e
Note that the first term at the right-hand side of Egs.(5.l)and (5.2) depends on r and t weakly. It means that in theplasma production process the flat profile of the chargedparticle density is being*formed. The second term control-ling the recombination is negative and proportional to n ,its action also helps to flatten the n profile. In the firstapproximation the solution of Egs.(5.1) and (5.2) has theformn=n Qt anh( <o-rv>nQt ), (6.1)
where o=a fn/n -n3/n3j,2"3 z
(6.2)
• njt/f3 • nQki exp(-Ry/Te ).
According to the formula (6.1) the plasma density growscontiniously and at t-»» it tends to the value n . The
characteristic time of plasma production isAt=2.8/(«r v>n ). According to (6.2) the neutral gas at
small and large (n~nQ) densities of plasma penetrates the
plasma column well (a-0). Most unfavorable condition of
neutral gas penetration correspond to n=n /V5. With this
value of plasma density the coefficient a assumes themaximum value a =2'3' a . The condition of the neutral
max 0gas penetration into the plasma column may be put in theform
(7)
where vc=n «r v>, v =n «r v>. As soon as the condition (7)
ceases to be fulfilled, the atoms do not penetrate the cent-ral part of the plasma column, it is overheated and theplasma production process is stopped.
Estimates. Give the estimates for the stellarators0RAGAN-2M (R=2. 7m, a-0.25m,R is the big radius of the torus)and LHD (J?«4m, a=0.5m) . For the URAGAN-2M device the appli-
V5°
cation of the loop voltage U o=°77V with the frequency
uy*l800s~l and keeping constant the neutral gas concentrationin the out-of-the-plasina volume 11^=4.2-10 m allows one
to produce plasma with the density n0=l020m"3 during the
time At=30ms. The alternating current with the amplitudeI -2OkA flows in the plasma and the plasma temperature is
-1 ,7-3
For the LHD device U =43V, uv=440s , n =7-20 m ,
nQ=3'1019m"3, IQ-10kA, T*2eV, b.t=100ms.
The necessary inductor magnetic flux accumulated is- notlarge for both device (0,0S8Vb and 0. 2Vb).
References.[1] V.E.MoiseenJco. Ukr. Phys. Journ. 35 (1990), P.214 (InRussian).[2] L.C.Johnson, E.Hinnov.J.Quant. Spectrose, and Radiat.Transfer 13 (1973) P.333.
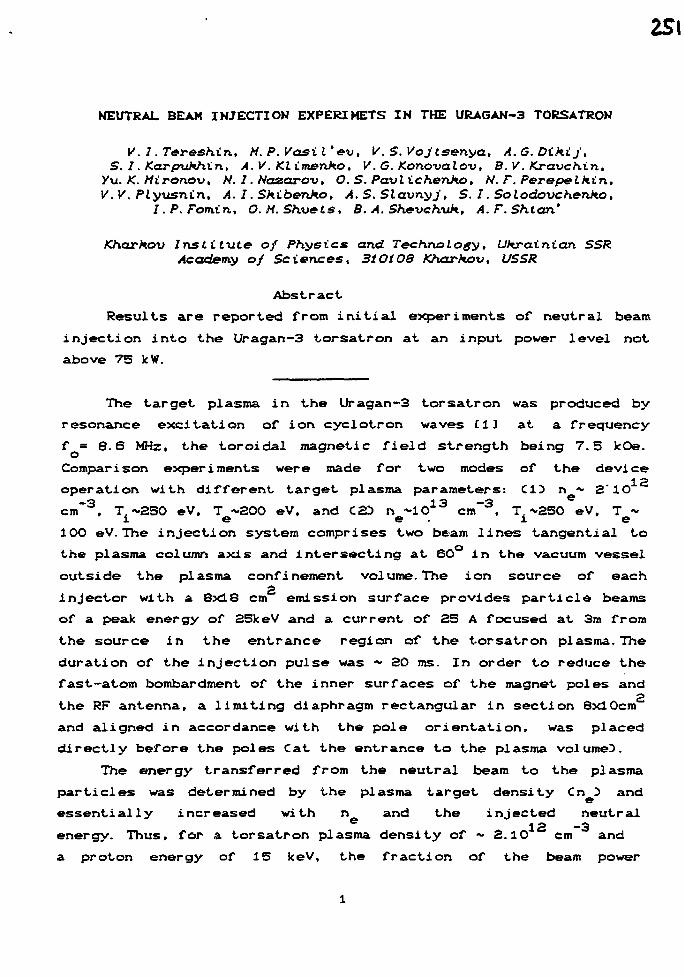
2S\
NEUTRAL BEAM INJECTION EXPERIMETS IN THE URAGAN-3 TORSATRON
V. 1. Tereshin, M. P.Vasil* ev, V. S. Vojtsenya, A.G.Dihij,S. 1. Karpukhin, A. V. Klimenko, V. G. Konovalov, B.V. Kravchin.Yu. K. Mironov. N.l.Nazarov, O. S. Pavlichenko, N. F. Perepelkin,V.V. Plyxtsnin, A.I.Skibenko, A. S, Slavnyj, S. I. Solodovchenko,
I. P. Fomin, 0. M. Shvets, B. A. Sfievch-uh, A. F. Shtan'
Kharkov Institute of Physics and Technology, Ukrainian SSRAcademy of Sciences, 3iOlO8 Kharkov, USSR
Abstract
Results are reported from initial experiments of neutral beam
injection into the Uragan-3 torsatron at an input power level not
above 75 kW.
The target plasma in the Uragan-3 torsatron was produced by
resonance excitation of ion cyclotron waves CiJ at a frequency
f = 8.6 MHz, the toroidal magnetic field strength being 7.5 kOe.
Comparison experiments were made for two modes of the device12operation with different target plasma parameters: C13 n - £'1O
cm"3, ^ 3 5 0 eV, Te~a00 eV, and C3^ n e~101 3 cm"3, ^ 3 5 0 eV, Te~
100 eV. The injection system comprises two beam lines tangential to
the plasma column axis and intersecting at 60° in the vacuum vessel
outside the plasma confinement volume. The ion source of each
Injector with a 8x13 cm emission surface provides particle beams
of a peak: energy of 25keV and a current of 25 A focused at 3m from
the source in the entrance region of the torsatron plasma. The
duration of the injection pulse was ^ 20 ms. In order to reduce the
fast-atom bombardment of the inner surfaces of the magnet poles and
the RF antenna, a limiting diaphragm rectangular in section 8x10cm
and aligned in accordance with the pole orientation, was placed
directly before the poles Cat the entrance to the plasma volume^.
The energy transferred from the neutral beam to the plasma
particles was determined by the plasma target density Cn D and
essentially increased with n and the injected neutrale 1 2 - 3
energy. Thus, for a torsatron plasma density of - 2.10 cm anda proton energy of 15 keV, the fraction of the beam power
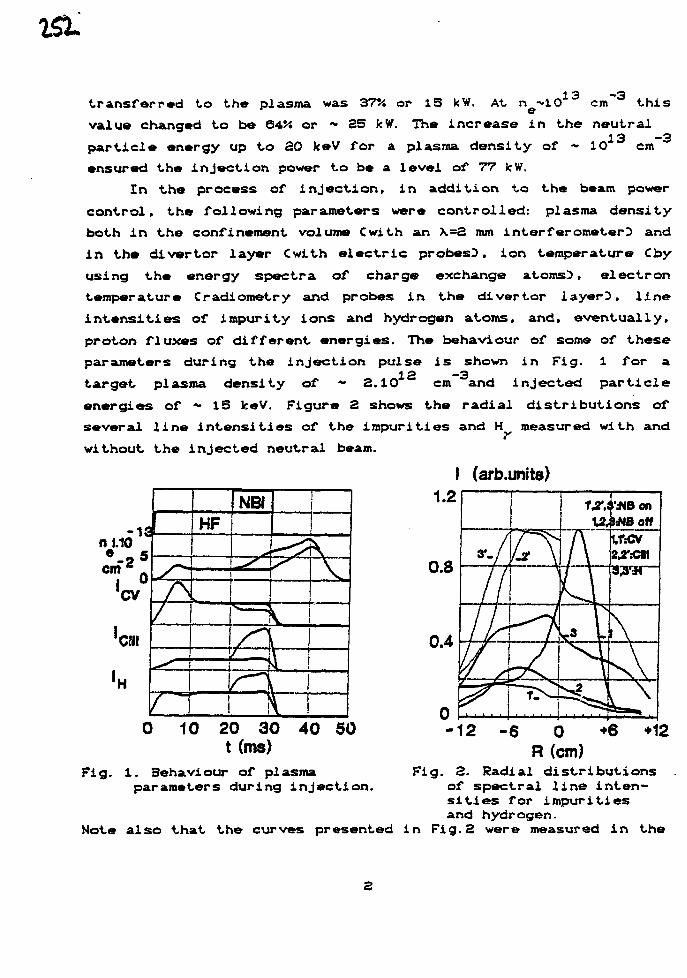
251
transferred to the plasma was 37V. or IS kW. At n^tO13 cm"3 this
value changed to be 64>S or - 25 kW. The increase in the neutral13 ~3
particle energy up to 20 keV for a plasma density of ~ 10 cm
ensured the injection power to be a level of 77 kW.
In the process of injection, in addition to the beam power
control, the following parameters were controlled: plasma density
both in the confinement volume Cwith an \=2 mm interferometerD and
in the divertor layer Cwith electric probesD, ion temperature Cby
using the energy spectra of charge exchange atoms}, electron
temperature Cradiometry and probes in the divertor layerD, line
intensities of impurity ions and hydrogen atoms, and, eventually,
proton fluxes of different energies. The behaviour of some of these
parameters during the injection pulse i s shown in Fig. 1 for a12 ~3
target plasma density of *• 2.10 cm and injected particle
energies of - IS keV. Figure 2 shows the radial distributions of
several line intensities of the im
without the injected neutral beam.
several line intensities of the impurities and H measured with and
I (arb.units)
-13nl.1O
'cv
'c!ll
•H
/
/
HF
i
NBI
\
t
II
1.2
10 20 30 40 50t (ms)
ff.l'MBonISAMBott
-12 -6 0 +6 +12R (cm)
Fig. 2. Radial distributionsof spectral line inten-sities for impuritiesand hydr ogen.
Note also that the curves presented in Fig. 2 were measured in the
Fig. 1. Behaviour of plasmaparameters during injection.
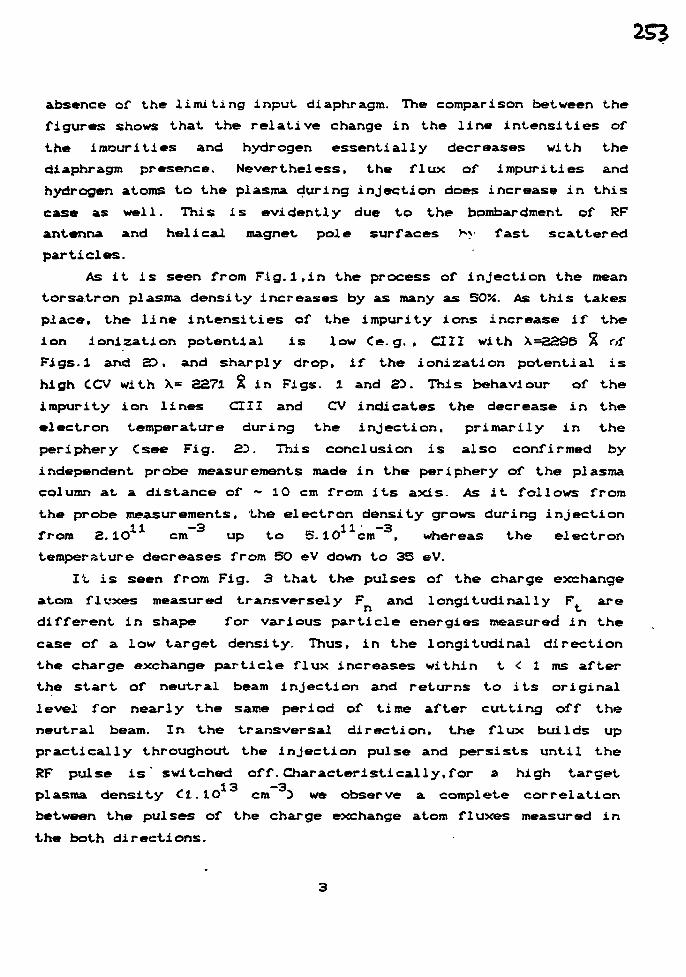
absence of the limiting input diaphragm. The comparison between the
figures shows that the relative change in the line intensities of
the imourities and hydrogen essentially decreases with the
diaphragm presence. Nevertheless, the flux of impurities and
hydrogen atoms to the plasma during injection does increase in this
case as well. This is evidently due to the bombardment of RF
antenna and helical magnet pole surfaces by fast scattered
particles.
As i t i s seen from Flg.l.in the process of injection the mean
torsatron plasma density increases by as many as 5OJ4. As this takes
place, the line intensities of the impurity ions increase if the
ion lonization potential i s low Ce. g. , CIII with X=2296 2 of
Figs.l and SD» and sharply drop, if the ioniration potential i s
high CCV with X= 2371 8 in Figs. 1 and 23. This behaviour of the
impurity ion lines CIII and CV indicates the decrease in the
electron temperature during the injection, primarily in the
periphery Csee Fig. 3D. This conclusion i s also confirmed by
independent probe measurements made in the periphery of the plasma
column at a distance of - 10 cm from i t s axis. As i t follows from
the probe measurements, the electron density grows during injection
from 2.1O cm up t o 5 .10 cm , whereas the e l e c t r o n
temperature decreases from 5O eV down t o 35 eV.
I t i s seen from Fig. 3 that the pulses of the charge exchange
atom f luxes measured t ransverse ly F and l o n g i t u d i n a l l y F are
d i f f e r e n t i n shape for various p a r t i c l e energ ie s measured* i n the
case of a low target dens i ty . Thus, in the longi tudinal d i r e c t i o n
the charge exchange p a r t i c l e f l u x increases within t < 1 ms af ter
the start of neutral beam injection and returns to i t s original
level for nearly the same period of time after cutting off the
neutral beam. In the transversal direction, the flux builds up
practically throughout the injection pulse and persists until the
RF pulse i s ' switched off. Characteristically,for a high target
plasma density £1.10 cm 3 we observe a complete correlation
between the pulses of the charge exchange atom fluxes measured in
the both directions.
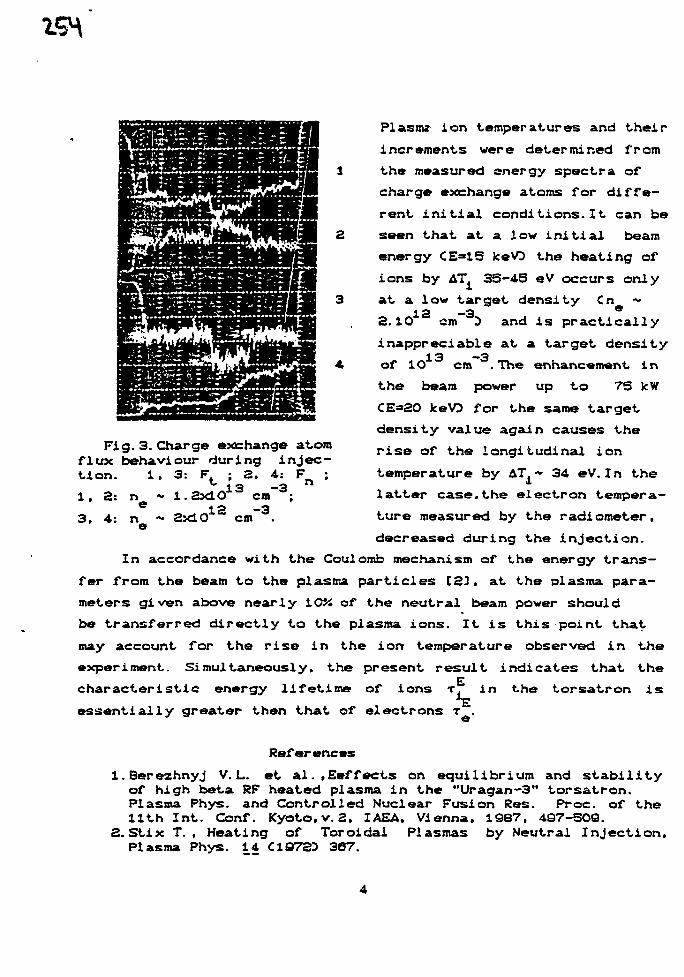
Plasms- ion temperatures and their
increments were determined from
the measured energy spectra of
charge exchange atoms for d i f fe -
rent in i t i a l conditions. lt can be
seen that at a low in i t i a l beam
energy CE=15 keVO the heating of
ions by AT. 35-45 eV occurs only
at a low target density Cn ~
2.10 1 2 em"3D and i s practically
inappreciable at a target density13 —3of 10 em . The enhancement i n
the beam power up to 75 kW
CE=20 ke\O for the same target
density value again causes the
r ise of the longitudinal ion
temperature by AT* 34 eV. In the3.
latter case.the electron tempera-
ture measured by the radiometer,
decreased during the injection.
In accordance with the Coulomb mechanism of the energy trans-
fer from the beam to the plasma particles [23, at the alasma para-
meters given above nearly 10?i of the neutral beam power should
be transferred directly to the plasma ions. It is this point that
may account for the rise in the ion temperature observed in the
experiment. Simultaneously, the present result indicates that the
characteristic energy lifetime of ions T in the torsatron is
essentially greater then that of electrons r .
Fig.3. Charge exchange atomflux behaviour during injec-tion. 1, 3: F. ; 2. 4: F_
i . 2: n 1.2xlO13 cm"3;n
3, 4: n - 2xlO1 2cm" 3
References
i.Berezhnyj V. L. et a l . ,Eeffects on equilibrium and s t a b i l i t yof high beta RF heated plasma in the "Uragan-3" torsatron.Plasma Phys. and Controlled Nuclear Fusion Res. Proc. of the11th Int. Conf. Kyoto, v. 2. IAEA, Vienna, 1987, 497-509.
2. Stix T. , Heating of Toroidal Plasmas by Neutral Injection,Plasma Phys. 14 C19733 367.
EFFICIENCY OF NEUTRAL BEAM INJECTION IN THE URAGAN-2M
AND URAGAN-3M TORSATRONS
V.Ya.Goloborod'ko. V.P.Nagornyi. V.A.Yavorskij
Insti Lute for hhiclear Research, Ukrainian SSR Academy
of Sci&nces, Ki&v, USSR
S.I.Karpukhin. A.V.Klimenko. V.I.Tereshin. B.A.ShevchukKhar'ko\> Insti txxte of Physics and Tecnology, Ukrainian SSR
Academy of Sciences, Khar'kov, USSR
1.Introduction. The neutral beam injection usually applied for
plasma heating in toroidal traps, is assumed to use in URAGAN-2M'
torsatron [1] and is already used in URAGAN-3M [2]. The purpose of this
report is to carry out the numerical simulation of NBI in torsatrons
pointed out. The beam modeling that takes into account the effects of
beam divergence, profile and focusing has been done dividing real
beam into great number of pencil ones.
2. Model used. Since the plasma parameters are function of the flux
surface radius it is convenient to describe the beam power absorption in
flux coordinates. We use here the Boozer flux coordinates y, &, <p with
co- and contravariant representations of the magnetic field given by
B" - R E ^ V (1)
§ - 7y x V$ + e (y/JVp x V (2)
where JC is the rotational transform. R is the major radius and B o is the
magnetic field value at the magnetic axis. On the other hand it is
convenient to follow the beam particle trajectories in the Cartesian
coordinates x. y. z with z being the optical axis of the beam. In the
chosen coordinates density of particles in the pencil beam (n. ) is
defined by following equationda
(3)
with <r-the particle energy. s-zv/v_ the variable along the beam path,
cr(e) the ionization cross section of the beam particles and n(v) the
plasma density. Tnen the number of particles absorbed in plasma or
striking the wall in the case of the real beam can be obtained as a
result of summing the corresponding numbers of each pencil beam.
As the injectors are placed sufficiently far from the plasma (3.5m
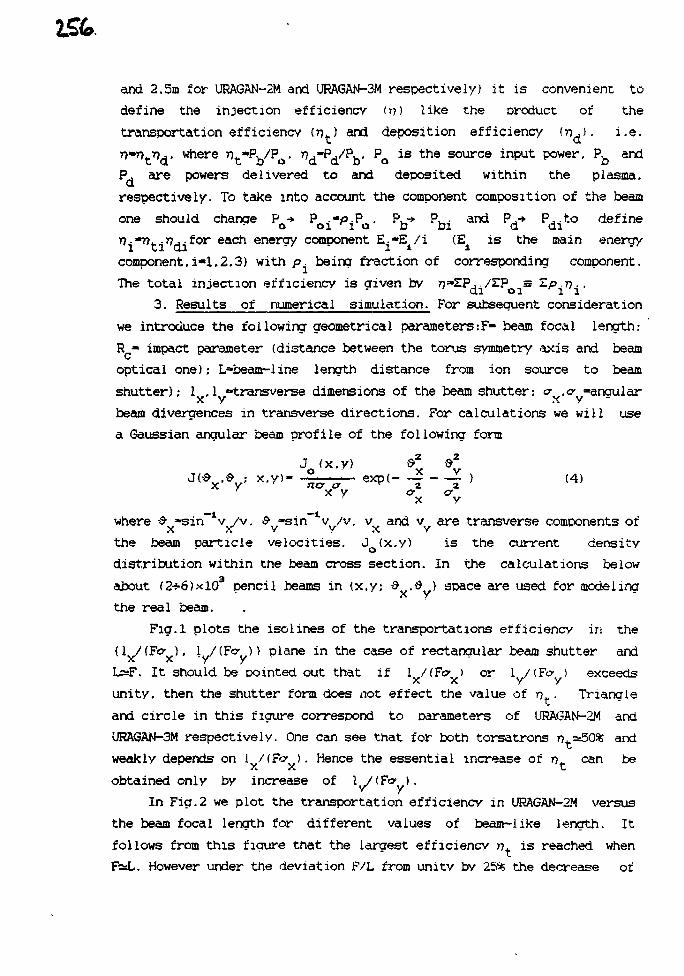
and 2.5m for URAGAN-2M and URAGAN-3M respectively) it is convenient to
define the injection efficiency (»>) like the product of the
transportation efficiency Co.) and deposition efficiency (nd) • i.e.
"""t^d' w h e r e nt*Pb/Po' ^"^V^b' Po i s t h e s o u r c e i nP u t power, P^ andP. are powers delivered to and deposited within the plasma,
respectively. To take into account the component composition of the beam
one should change P •* POi"**iPo# ^H"* ^i anc* PH"* ^di*"0 define
17.-77. -r? ..for each energy component E.-E^/i (E4 is the main energy
component,i«l.2.3) with p. being fraction of corresponding component.
The total injection efficiency is given by n-ZP./ZP s Zp .T)..
3. Results of numerical simulation. For subsequent consideration
we introduce the following geometrical parameters:F- beam focal length:
R - impact parameter (distance between the torus symmetry axis and beam
optical one); L=beam-line length distance from ion source to beam
shutter); 1 ,1 -transverse dimensions of the beam shutter: a.a -angular
beam divergences in transverse directions. For calculations we will use
a Gaussian angular beam profile of the following form
Jo(x"y) K. KY XV
where & -sin^v /v. & -sin 1v /v, v and v are transverse components of
the beam particle velocities, J (x.y) is the current density
distribution within the beam cross section. In the calculations below
about (2-r-6)xlO3 pencil beams in {x.y; $ .£ > space are used for modelingx y
the real beam.Fig.l plots the isolines of the transportations efficiency in the
{1 /(Fey ), L/tFc )> plane in the case of rectangular beam shutter andx x y y
L=sF. It should be pointed out that if 1 /(To ) or 1 /(For ) exceeds
unity, then the shutter form does not effect the value of r> . Triangle
and circle in this figure correspond to Darameters of URAGAN-2M and
URAGAN-3M respectively. One can see that for both torsatrons nt=»50% and
weakly depends on 1 /(Fa ). Hence the essential increase of r). can be
obtained only by increase of 1 /(Fee ).
In Fig.2 we plot the transportation efficiency in URAGAN-2M versus
the beam focal length for different values of beam-like length. It
follows from this figure that the largest efficiency r>. is reached when
Fai.. However under the deviation F/L from unity by 25* the decrease of
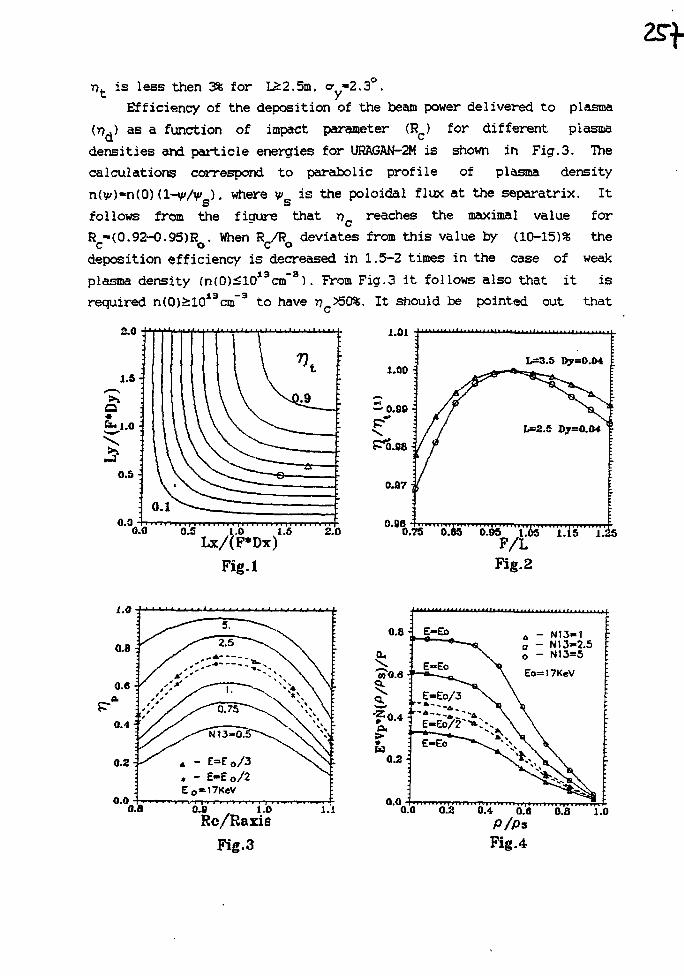
r>t is less then 3% for L£2.5m, a -2.3".
Efficiency of the deposition of the beam power delivered to plasma
(T>.) as a function of impact parameter (R ) for different plasma
densities arri particle energies for URAGAN-2H is shown in Fig.3. The
calculations correspond to parabolic profile of plasma density
n(v)-n(0)(l-v/v ). where v is the poloidal flux at the separatrix. It
follows from the figure that reaches the maximal value for
Rc-(0.92-0.95)Ro. When R_/Ro deviates from this value by (10-15)% the
deposition efficiency is decreased in 1.5-2 times in the case of weak
plasma density (n(0)il013cm~3). From Fig.3 it follows also that it is
required n(Q)>1013cnf 3 to have rtn>50%. It should be pointed out that
2 . 0 •.••i"|M.ii|i li...i....i,,...)..in.1.
0.00.0 0.5 1.0 1.5 2.0
Lx/(P*Dx)
Fig.l
0.880.75 6.i5 6.05 ' T f e 1.15
F/LFig.2
0.00.8 0.S 1.0
Rc/Raxifi
Fig.3
o.a - N13-1a - N 13-2.5
- N13=5
0.00.0
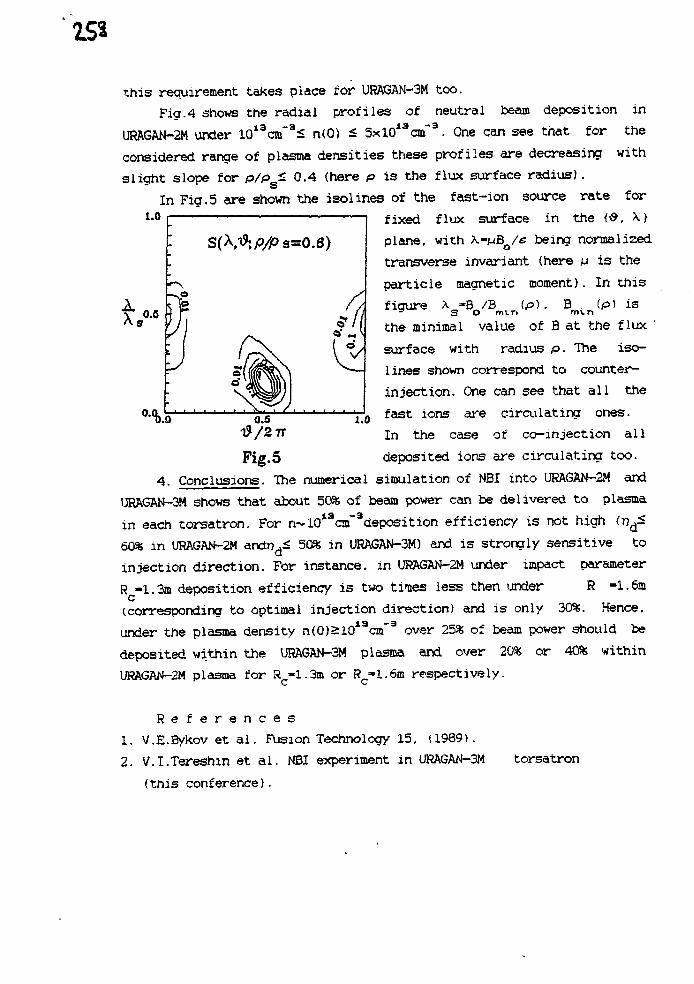
r.his requirement takes place for URAGAN-3M too.
Fig.4 shows the radial profiles of neutral beam deposition in
URAGAN-2M under 10i3cm"3^ n(0) 5 5xl013cm"3. One can see that for the
considered range of plasma densities these profiles are decreasing with
slight slope for p/p < QA (here p is the flux surface radius).
In Fig.5 are shown the isolines of the fast-ion source rate for
fixed flux surface in the {•&. \}
plane, with X-/uB /e being normalised
transverse invariant (here M is the
particle magnetic moment). In this
figure X "B /B (p). B . (p) is
the minimal value of B at the flux '
surface with radius p. The iso-
lines shown correspond to counter-
injection. One can see that all the
fast ions are circulating ones.
In the case of co-mjection all
deposited ions are circulating too.
4. Conclusions. The numerical simulation of NBI into URAGAN-2M and
URAGAN-3M shows that about 50% of beam power can be delivered to plasma
in each torsatron. For n~10i3csf3deposition efficiency is not high iv^S
60% in URAGAN-2M andr> < 50% in URAGAN-3M) and is strongly sensitive to
injection direction. For instance, in U8AGAN-2M under impact parameter
R -1.3m deposition efficiency is two tinies less then under R =1.6a
(corresponding to optimal injection direction) and is only 30%. Hence,
under the plasma density n(0)£1013czn"3 over 25% of beam power should be
deposited within the URAGAN-3M plasma and over 20% or 40% within
URAGAN-2M plasma for H -1.3m or R -1.6m respectively.c c
R e f e r e n c e s1. V.E.Bykov at a l . Fusion Technology 15, (1989).2. V.I.Tereshm et a l . MBI experiment in URAGAN-3M torsatron
(this conference).
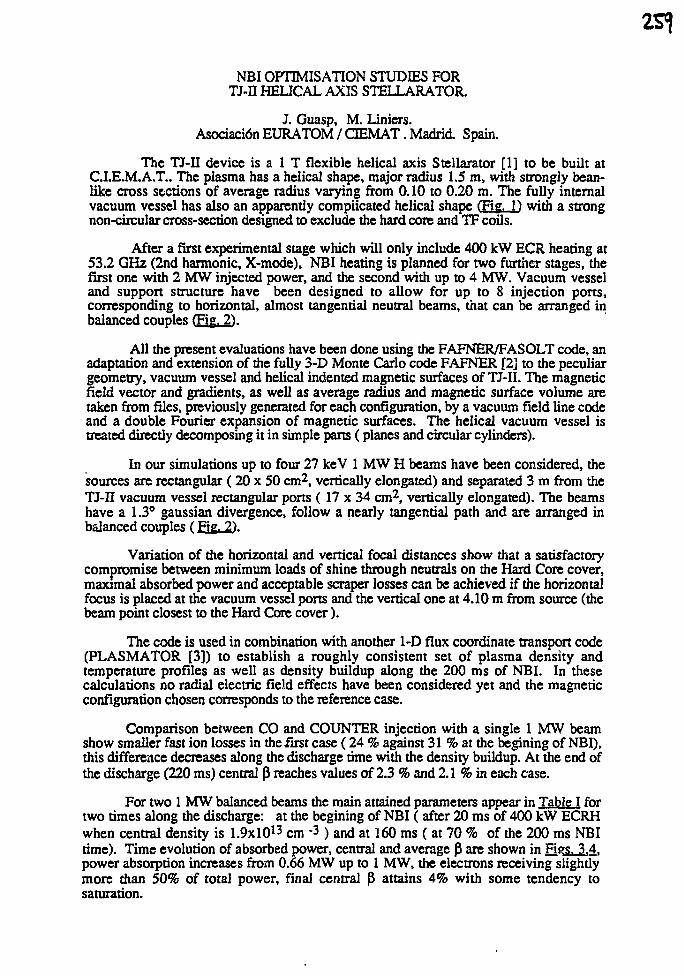
NBI OPTIMISATION STUDIES FORTJ-n HELICAL AXIS STELLARATOR.
J. Guasp, M. Liniers.Asociaci6n EURATOM / CTEMAT. Madrid Spain.
The TJ-II device is a 1 T flexible helical axis Stellarator [1] to be built atC.I.E.M.A.T.. The plasma has a helical shape, major radius 1.5 m, with strongly bean-like cross sections of average radius varying from 0.10 to 0.20 m. The fully internalvacuum vessel has also an apparently complicated helical shape (Fig. 1) with a strongnon-circular cross-section designed to exclude the hard core and TF coils.
After a first experimental stage which will only include 400 kW ECR heating at53.2 GHz (2nd harmonic, X-mode), NBI heating is planned for two further stages, thefirst one with 2 MW injected power, and the second with up to 4 MW, Vacuum vesseland support structure have been designed to allow for up to 8 injection ports,corresponding to horizontal, almost tangential neutral beams, that can be arranged inbalanced couples (Fig. 2).
AH the present evaluations have been done using the FAFNER/FASOLT code, anadaptation and extension of the fully 3-D Monte Carlo code FAFNER [2] to the peculiargeometry, vacuum vessel and helical indented magnetic surfaces of TJ-II. The magneticfield vector and gradients, as well as average radius and magnetic surface volume aretaken from files, previously generated for each configuration, by a vacuum field line codeand a double Fourier expansion of magnetic surfaces. The helical vacuum vessel istreated directly decomposing it in simple pans (planes and circular cylinders).
In our simulations up to four 27 keV 1 MW H beams have been considered, thesources are rectangular ( 20 x 50 cm2, vertically elongated) and separated 3 m from theTJ-II vacuum vessel rectangular ports ( 17 x 34 cm2, vertically elongated). The beamshave a 1.3° gaussian divergence, follow a nearly tangential path and are arranged inbalanced couples (Fig. 21.
Variation of the horizontal and vertical focal distances show that a satisfactorycompromise between minimum loads of shine through neutrals on the Hard Core cover,maximal absorbed power and acceptable scraper losses can be achieved if the horizontalfocus is placed at the vacuum vessel ports and the vertical one at 4.10 m from source (thebeam point closest to the Hard Core cover).
The code is used in combination with another 1-D flux coordinate transport code(PLASMATOR [3]) to establish a roughly consistent set of plasma density andtemperature profiles as well as density buildup along the 200 ms of NBI. In thesecalculations no radial electric field effects have been considered yet and the magneticconfiguration chosen corresponds to the reference case.
Comparison between CO and COUNTER injection with a single 1 MW beamshow smaller fast ion losses in the first case (24 % against 31 % at the begining of NBI),this difference decreases along the discharge time with the density buildup. At the end ofthe discharge (220 ms) central (3 reaches values of 2.3 % and 2.1% in each case.
For two 1 MW balanced beams the main attained parameters appear in Table I fortwo times along the discharge: at the begining of NBI ( after 20 ms of 400 kW ECRHwhen central density is 1.9xlO13 cm "3 ) and at 160 ms ( at 70 % of the 200 ms NBItime). Time evolution of absorbed power, central and average ji are shown in Figs. 3.4.power absorption increases from 0.66 MW up to 1 MW, the electrons receiving slightlymore than 50% of total power, final central P attains 4% with some tendency tosaturation.
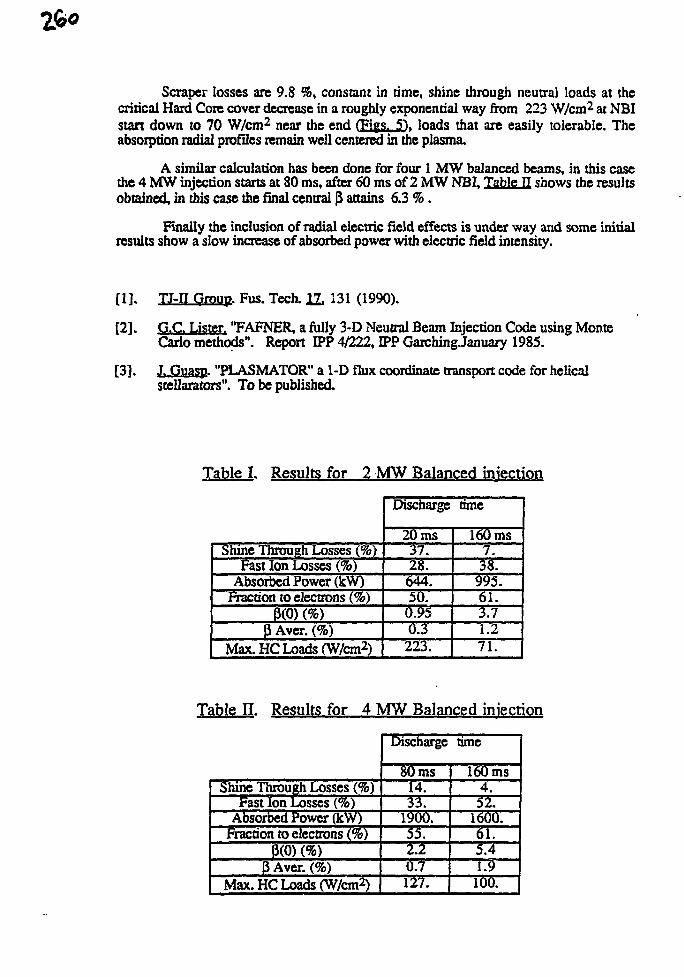
Scraper losses are 9.8 %, constant in time, shine through neutral loads at thecritical Hard Core cover decrease in a roughly exponential way from 223 W/cm2 at NBIstart down to 70 W/cm2 near the end fFigs. 51. loads that are easily tolerable. Theabsorption radial profiles remain well centered in the plasma.
A similar calculation has been done for four 1 MW balanced beams, in this casethe 4 MW injection starts at 80 ms, after 60 ms of 2 MW NBI, Table IT shows the resultsobtained, in this case the final central P attains 6.3 %.
Finally the inclusion of radial electric field effects is under way and some initialresults show a slow increase of absorbed power with electric field intensity.
[1]. TJ-n Group. Fus. Tech. 12, 131 (1990).
[2], G.C. Lister. "FAFNER, a fully 3-D Neutral Beam Injection Code using MonteCarlo methods". Report IPP 4/222, IPP GarchingJanuary 1985.
[3]. J. Guasp. "PLASMATOR" a 1-D flux coordinate transport code for helicalstellarators". To be published.
Table I. Results for 2 MW Balanced injection
Shine Through Losses (%)Fast Ion Losses (%)
Absorbed Power (kW)Fraction to electrons (%)
3(0) (%)P Aver. (%)
Max. HC Loads (W/cm2)
Discharge time
26 ms37.28.644.50.0.950.3223.
160 ms7.
38.995.61.3.71.271.
Table H Results for 4 MW Balanced injection
Shine Through Losses (%)Fast Ion Losses (%)
Absorbed Power (kW)Fraction to electrons (%)
0(0) (%)3 Aver. (%)
Max. HC Loads (W/cm2)
Discharge time
80 ms14.33.
1900.5i.2.20.7127.
160 ms4.
52.1600.61.5.41.9100.
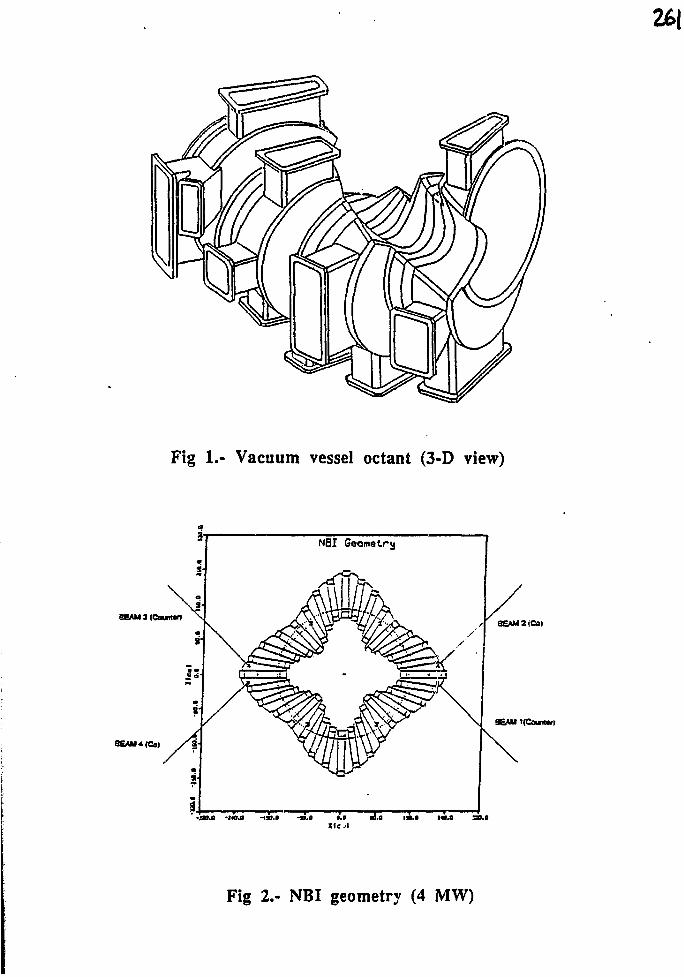
Fig 1.- Vacuum vessel octant (3-D view)
3EAM3(Cauiw>8EAM2(Ca>
SEAM t(Caumr>
Xle. l
Fig 2.- NBI geometry (4 MW)
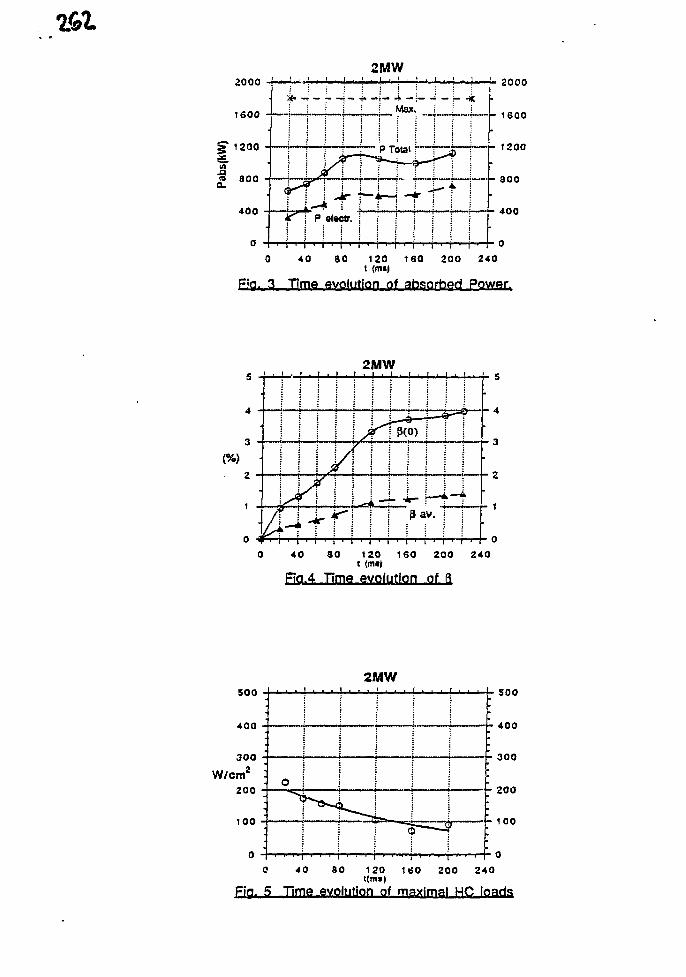
2000
40 90 120 160 200 240I (mi)
Fin. 3 Time evolution of absorbed Power.
3
(%)
2
2MWi , i . i . i . i . i . i . i . i . i
P(0)
3 av.
- 4
- 3
- 2
40 30 120 160 200 240t (mtj
FTo.4 Time evolution of B
500
4 0 0
W/cm
300a
200
100
2MW500
400
300
- 200
- 100
0 40 30 120 160 200 240t(mi)
F?o. 5 Time evolution of maximal HC loads
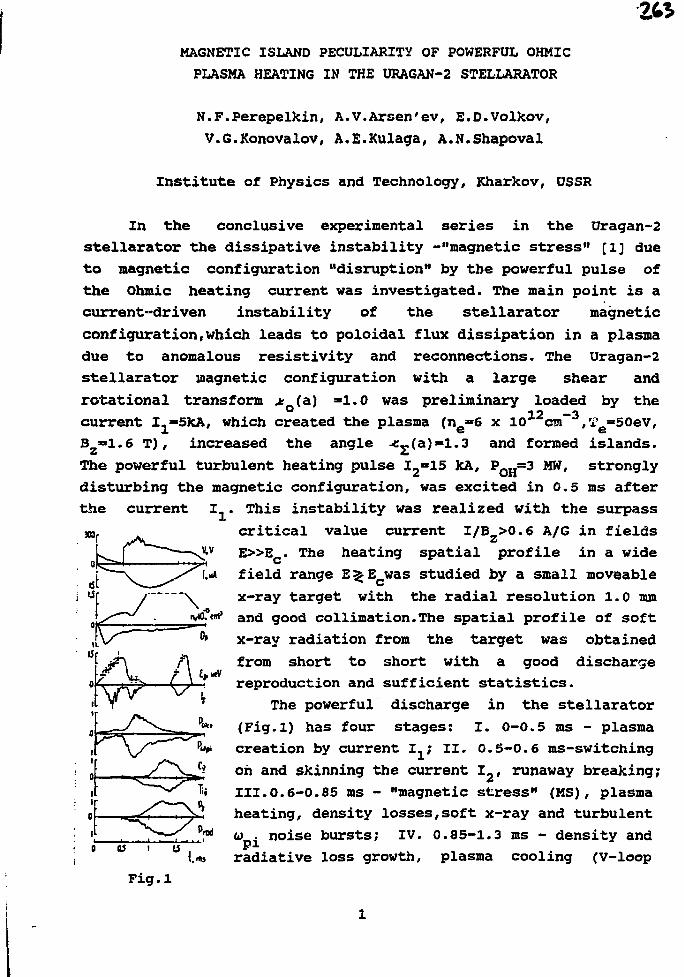
MAGNETIC ISLAND PECULIARITY OF POWERFUL OHMIC
PLASMA HEATING IN THE URAGAN-2 STELLARATOR
N.F.Perepelkin, A.V.Arsen'ev, E.D.Volkov,
V.G.Konovalov, A.E.Xulaga, A.N.Shapoval
Institute of Physics and Technology, Kharkov, USSR
In the conclusive experimental series in the Uragan-2
stellarator the dissipative instability -"magnetic stress" [1] due
to magnetic configuration "disruption" by the powerful pulse of
the Ohmic heating current was investigated. The main point is a
current-driven instability of the stellarator magnetic
configuration,which leads to poloidal flux dissipation in a plasma
due to anomalous resistivity and reconnections. The Uragan-2
stellarator magnetic configuration with a large shear and
transform -fc_(a) =1.0 was preliminary loaded by the12 —3
which created the plasma (ne»6 x 10 cm fri?e=50eV,
rotational
current I.»
B »1.6 T), increased the angle -c_(a)»1.3 and formed islands.
The powerful turbulent heating pulse I2=15 JcA/ POH~3 M W / strongly
disturbing the magnetic configuration, was excited in 0.5 ms after
the current Ij.
critical value current
.. This instability was realized with the surpass
I/Bz>0.6 A/G in fields
E » E . The heating spatial profile in a wide
[A. /U-
"15
field range E^Ecwas studied by a small moveable
x-ray target with the radial resolution 1.0 mm
and good collimation.The spatial profile of soft
x-ray radiation from the target was obtained
from short to short with a good discharge
reproduction and sufficient statistics.
The powerful discharge in the stellarator
(Fig.i) has four stages: I. 0-0.5 ms - plasma
creation by current I1; II. 0.5-0.6 ms-switching
oh and skinning the current I2, runaway breaking;
III.0.6-0.85 ms - "magnetic stress" (MS), plasma
heating, density losses,soft x-ray and turbulent
a; . noise bursts; IV. 0.85-1.3 ms - density and
radiative loss growth, plasma cooling (V-loop
Fig.l
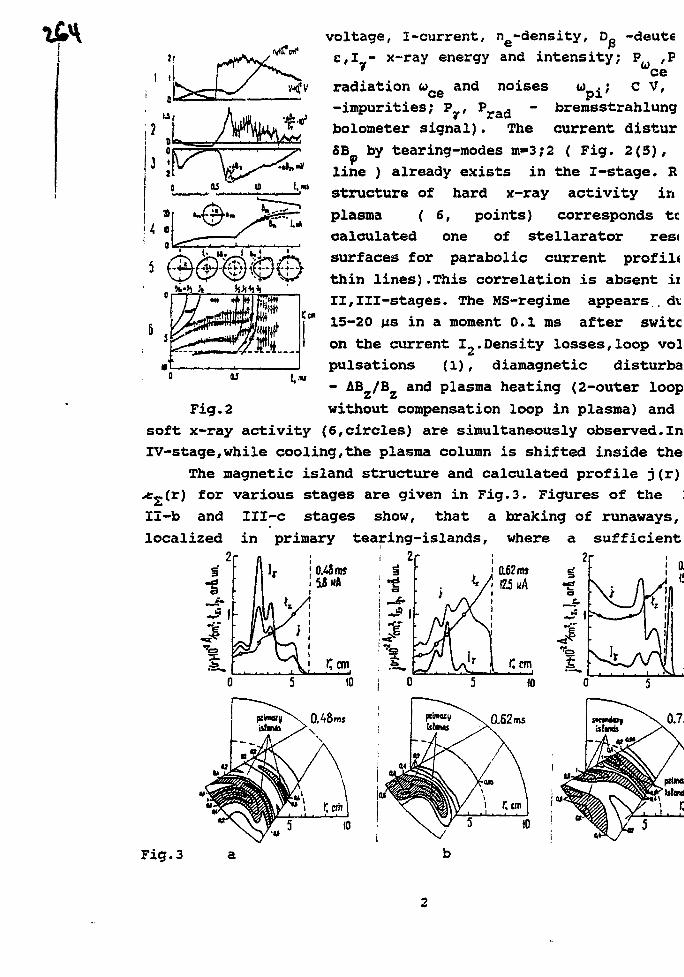
voltage, I-current, ne-density, -deute
- x-ray energy and intensity; P ,P
radiation o>ce and
-impurities; P , P
bolometer signal).
cenoises w
D i ' c V /
- bremsstrahlung
The current disturSB by tearing-modes m«3;2 ( Fig. 2(5),
line ) already exists in the I-stage. R
structure of hard x-ray activity in
plasma ( 6, points) corresponds tc
calculated one of stellarator rest
surfaces for parabolic current profile
thin lines).This correlation is absent ii
II,Ill-stages. The MS-regime appears, dt
15-20 us in a moment 0.1 ms after switc
on the current I-.Density losses,loop vol
pulsations (1), diamagnetic disturba
- AB_/B and plasma heating (2-outer loop
Fig.2 without compensation loop in plasma) and
soft x-ray activity (6,circles) are simultaneously observed.In
IV-stage,while cooling,the plasma column is shifted inside the
The magnetic island structure and calculated profile j(r)
-t2(r) for various stages are given in Fig.3. Figures of the :
Il-b and III-c stages show, that a braking of runaways,
localized in primary tearing-islands, where a sufficient
Fig.3 a
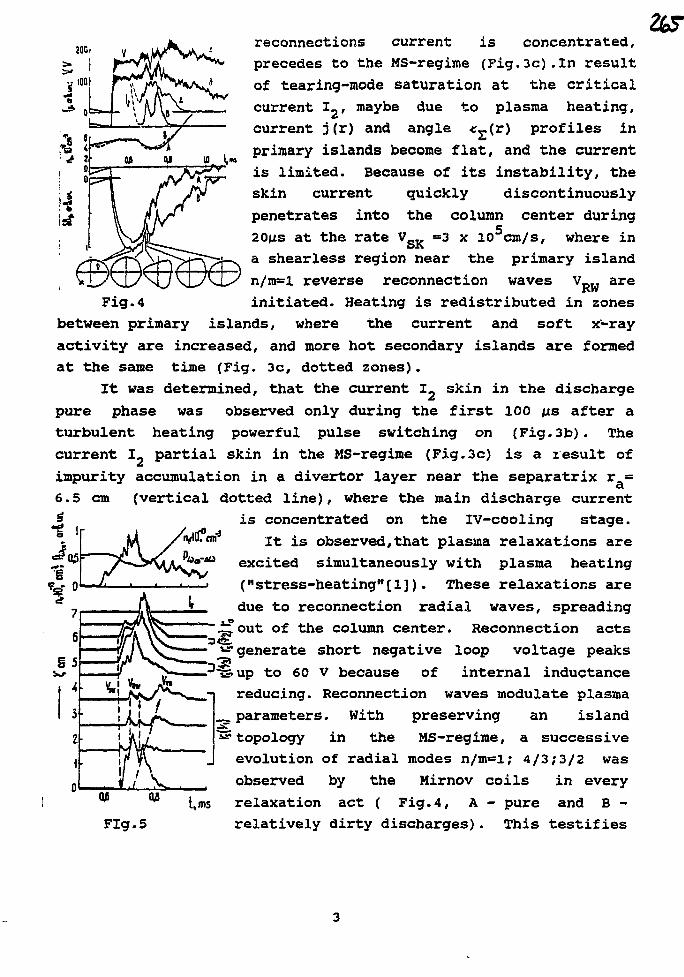
200,reconnections current is concentrated,
precedes to the MS-regime (Fig.3c).In result
of tearing-mode saturation at the critical
current I_, maybe due to plasma heating,
current j (r) and angle «r>(r) profiles in
primary islands become flat, and the current
is limited. Because of its instability, the
skin current quickly discontinuously
penetrates into the column center during
20JJS at the rate V g K =3 x 10 cm/s, where in
primary island
waves Vn,, are
a shearless region near the
n/m=l reverse reconnection nu.«» »_„
initiated. Heating is redistributed in zones
islands, where the current and soft x-ray
Fig. 4
between primary
activity are increased, and more hot secondary islands are formed
at the same time (Fig. 3c, dotted zones).
It was determined, that the current I. skin in the discharge
pure phase was observed only during the first 100 us after a
turbulent heating powerful pulse switching on (Fig.3b). The
current I, partial skin in the MS-regime (Fig.3c) is a result of
impurity accumulation in a divertor layer near the separatrix r =a
6.5 cm (vertical dotted line), where the main discharge current
is concentrated on the IV-cooling stage.
It is observed, that plasma relaxations are
excited simultaneously with plasma heating
("stress-heating"[1]). These relaxations are
due to reconnection radial waves, spreading
iut of the column center. Reconnection acts21 generate short negative loop voltage peaks
s. up to 60 V because of internal inductance
reducing. Reconnection waves modulate plasma
_ parameters. With preserving an island
^topology in the MS-regime, a successive
evolution of radial modes n/m=l; 4/3;3/2 was
observed by the Mir no v coils in every
relaxation act ( Fig.4, A - pure and B -
Fig.5 relatively dirty discharges). This testifies
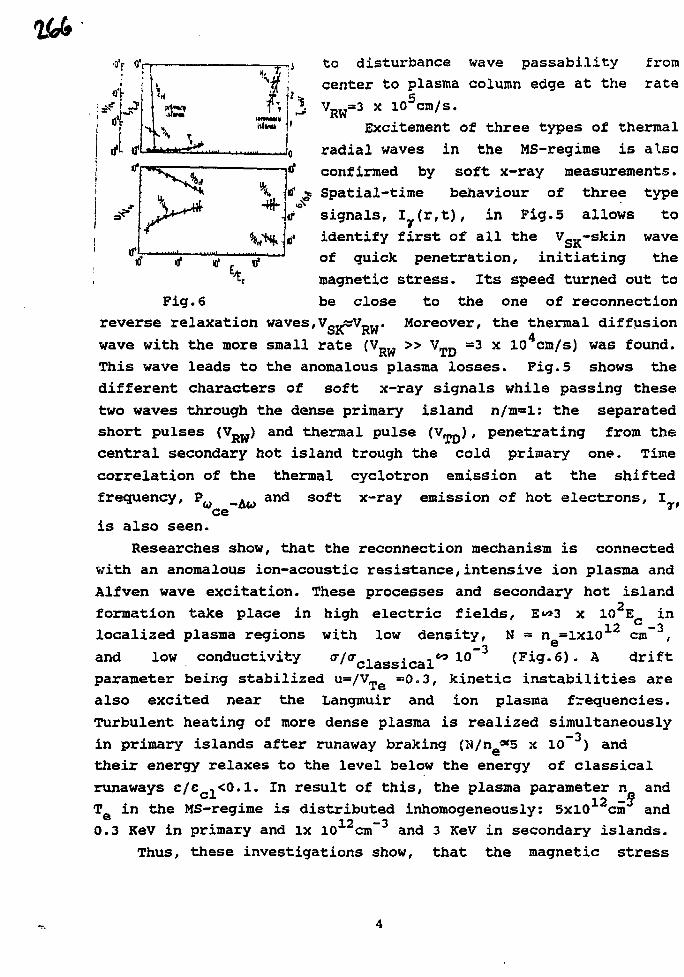
•a1.
Fig. 6
to disturbance wave passability from
center to plasma column edge at the rate5
VRW=3 x 10 cm/s.
Excitement of three types of thermal
radial waves in the MS-regirae is also
confirmed by soft x-ray measurements.
Spatial-time behaviour of three type
signals, I (r,t), in Fig.5 allows to
identify first of all the V_K-skin wave
of quick penetration, initiating the
magnetic stress. Its speed turned out to
be close to the one of reconnection
reverse relaxation waves, VSK«V_W. Moreover, the thermal diffusion
wave with the more small rate (VRW » V__ =3 x 10 cm/s) was found.
This wave leads to the anomalous plasma losses. Fig.5 shows the
different characters of soft x-ray signals while passing these
two waves through the dense primary island n/m=l: the separated
short pulses (VRW) and thermal pulse (V,_D), penetrating from the
central secondary hot island trough the cold primary one. Time
correlation of the thermal cyclotron emission at the shifted
frequency,- A w
and soft x-ray emission of hot electrons, I
is also seen.
Researches show, that the reconnection mechanism is connected
with an anomalous ion-acoustic resistance,intensive ion plasma and
Alfven wave excitation. These processes and secondary hot island
formation take place in high electric fields, E"»3 x 10 E in12 C -3
localized plasma regions with low density, N = n =1x10 cm ,_3 e
and low conductivity ""/""classical*0 1 0 (Fig. 6). A drift
parameter being stabilized u=/vTe =0.3, kinetic instabilities are
also excited near the Langmuir and ion plasma frequencies.
Turbulent heating of more dense plasma is realized simultaneously
in primary islands after runaway braking (N/n «5 x 1O~ )their energy relaxes to the level below the energy
and
of classical
runaways e/e ,<0.1. In result of this, the plasma parameter n and
T in the MS-regime is distributed inhomogeneously: 5x10 cm and*"" 12 —30.3 KeV in primary and lx 10 cm
and 3 KeV in secondary islands.
Thus, these investigations show, that the magnetic stress
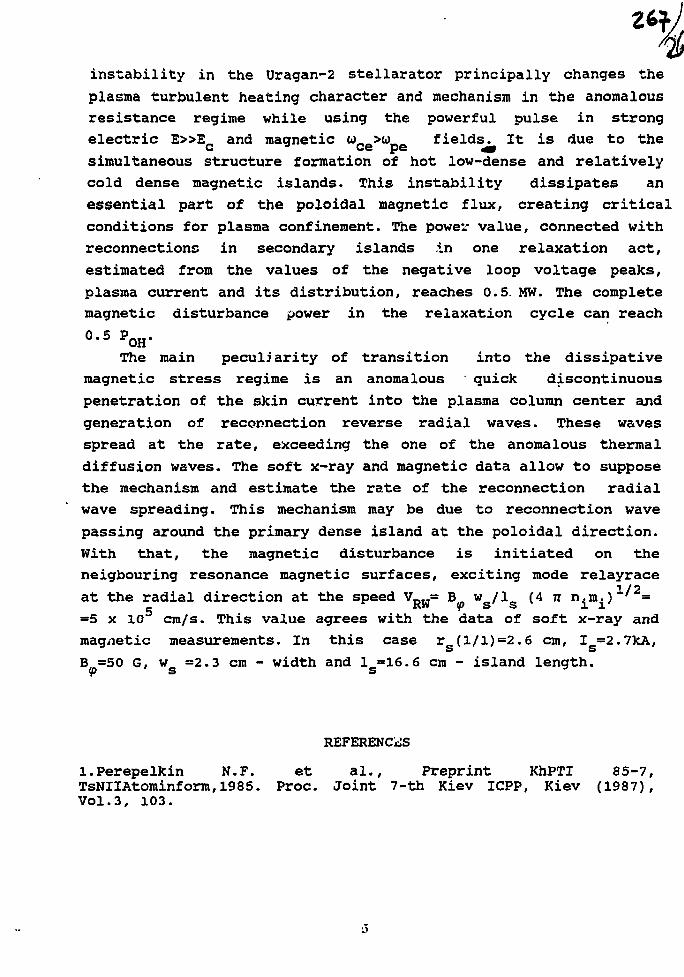
instability in the Uragan-2 stellarator principally changes the
plasma turbulent heating character and mechanism in the anomalous
resistance regime while using the powerful pulse in strong
electric E » E and magnetic wc e
> uD e fields. It is due to the
simultaneous structure formation of hot low-dense and relatively
cold dense magnetic islands. This instability dissipates an
essential part of the poloidal magnetic flux, creating critical
conditions for plasma confinement. The power value, connected with
reconnections in secondary islands .in one relaxation act,
estimated from the values of the negative loop voltage peaks,
plasma current and its distribution, reaches 0.5. MW. The complete
magnetic disturbance power in the relaxation cycle can reach
The main peculiarity of transition into the dissipative
magnetic stress regime is an anomalous quick discontinuous
penetration of the skin current into the plasma column center and
generation of reconnection reverse radial waves. These waves
spread at the rate, exceeding the one of the anomalous thermal
diffusion waves. The soft x-ray and magnetic data allow to suppose
the mechanism and estimate the rate of the reconnection radial
wave spreading. This mechanism may be due to reconnection wave
passing around the primary dense island at the poloidal direction.
With that, the magnetic disturbance is initiated on the
neigbouring resonance magnetic surfaces, exciting mode relayrace1/2
at the radial direction at the speed V_ = :B w /I (4 n n.m.) ' =_ £vW ip S S 1 1
=5 x 10 cm/s. This value agrees with the data of soft x-ray andmagnetic measurements. In this case r (1/1)=2.6 cm, I =2.7kA,
s sB =50 G, w =2.3 cm - width and 1 =16.6 cm - island length.
REFERENCES
l.Perepelkin N.F. et al., Preprint KhPTI 85-7,TsNIIAtominform,1985. Proc. Joint 7-th Kiev ICPP, Kiev (1987),Vol.3, 103.
U-3M PERIPHERAL PLASMA BEHAVIORAFTER SWITCHING OFF RF HEATING PULSE
V.S.Vojtsenya, E.D.Volkov, L.I.Grigor'eva, V.G.Konovalov,N.I.Nazarov, V.V.Plyusnin, A.I.Skibenko, V.V.Chechkin,
A.N.Shapoval
Kharkov Institute of Physics & Technology310108 Kharkov, USSR
1. The study of peripheral plasma dynamics has been made in
the URAGAN-3M (U-3M) torsatron after RF heating pulse
termination. The behavior of the plasma at different stages of
the discharge has some peculiarities caused by the specific
features of the machine construction. The most important
difference of U-3M from other stellarator-type devices lies in
a large vacuum chamber enclosing the whole magnetic system, the
volume of this chamber being -250 times larger than the
confined plasma volume.
A hydrogen plasma was ICR-produced and heated, with the RF
power being supplied by two non-shielded frame-like antennae.
The plasma characteristics depended essentially upon the
discharge regime, which in turn was defined by the working gas
pressure, the magnetic field strength (its resonant value B
=0.45 T), and the RF power value injected by the antenna. All
the results discussed below were obtained in a quasi-steady-
state discharge regime with the following bulk plasma
parameters: n «2xlO12 cm"3, T.(0)=200-300 eV, T (0)«100 eV. Ine x ethese conditions it was found that a substantial fraction of
the RF power was spent to maintain the plasma outside the last
closed magnetic surface (LCMS), behind the toroidal volume
occupied by the helical windings. As experimental results show,
the existence of this specific plasma "mantle" has a large
influence on plasma characteristics in the confinement volume
and near its boundary during all stages of the discharge. The
results of the study of plasma dynamics after RF power being
switched off give a possibility to evaluate the role of the
mantle at the active stage of the discharge.
The existence of the mantle can be ascertained both visually
(visual radiation) and by microwave interferometers (Figl)
which measure the line-averaged plasma densities in the region
of the divertor magnetic flux (n^iv, X±=8 mm) ana in the space
-i-
where no divertor flux rounds the helical winding (nma , X1 «3
cm).
The mantle density decreases with the distance from the
powered antenna. This follows from the space distribution of
the mantle visual radiation and from the comparison of X_
interferometer signals obtained with different antennae in
operation (see n ^ v and n Q2V traces in Fig.2). Such a character
of the mantle density space distribution is an evidence that
the plasma mantle is produced by the antenna near field which
arises due to the absence of the electrostatic shield.
2. After RF power termination a fast decay of the mantle
plasma occurs (Fig.2). The X.interferometer registers a mono-
tonous n™a n t decrease with a decay time of -0.5 ms, whereas the
density in the divertor flux region n 1 V decays to some minimum
value and then starts to grow again. The decay of the mantle
density is accompanied by an increase in the average plasma
density nfi
1V in the confinement volume (2-3 times along
different chords). Even higher increase in the plasma density
is registered with the Langmuir probe located near the LCMS
(n?ro e ) . The fast increase in n? r o e is accompanied by a fast
electron temperature decay in this region, going ahead of the
T_(0) decay.
The n rise during the mantle plasma decay results in a
diverted plasma density n @l v rise, recurring for the account of
the plasma diffusing across the' magnetic field from the
confinement volume and then streaming along the divertor field
lines. The maximum value of the density in the divertor flux is
attained -9 ms after the n maximum is achieved (see Fig.2b).
This time interval is a characteristic of a low T plasma
confinement in the Pfirsch-Schliiter diffusion regime. At this
stage the mantle disappears almost completely, so the A.
interferometer records a true diverted plasma. In contrast to
the active phase of the discharge, the diverted plasma dynamics
(ne^v and nj^*) is the same for both antennae after the RF
power is switched off.
3. Because of a big difference in the confined plasma and
vacuum chamber volumes, the density of hydrogen molecules at
any time of the discharge can not differ significantly from the
initial one, usually corresponding to the pressure p.=l.5xlQ~5
• / -
Torr. If it were no mantle, an average neutral flux per unit
volume of the confined plasma rH2~1.5xl0 cm s would be
several times higher than the averaged diffusion flow of the
neutrals across the magnetic field as estimated from the
measured Ho intensity. Such a difference indicates a highp
efficiency of screening properties of the mantle which extends
far away from the confinement volume.
Because of a small particle and energy confinement time in
the volume occupied by the mantle, a considerable part of the
input RF power is spent to maintain the mantle (a50% [2]).
After the RF pulse is switched off, the mantle stops to protect
the confined plasma against the neutral influx (mainly, H_
molecules), and this results in a n increase. As one could see
in Fig.2, the rate of this increase dn./dt*(i.5-2.0)xlO15—3 — i
cm s is in a good agreement with the r\,2 value cited above.The power expense necessary for H2 molecules to be ionized, to
provide the observed n increase during 2 ms after RF pulse
termination, is rather small and amounts only sio% of the
plasma energy content at the steady-state stage of the
discharge. The H, ions occuring in this process dissociate into
H° and H + for the time xaio"5 s.
The picture discribing plasma dynamics after the RF power is
switched off can explain some other experimental observations.
For example, a much lower increment of H_ line intensity
compared to that for n_ (AIo/Io*0.2An /n_ ) may be associatede P P e e
with much lower efficiency of H_ radiation during the e+H_-»+ " +
H2+2e process in comparison with the e+H-»H +2e process [3,4].
At the same time, the increment of the Fulcher-a molecular band
intensity (in our measurements, X=612.1 nm) , A.T/l=2.5-3, well
agrees quantitatively with the n increment. The higher value
of the Langmuir probe ion saturation current increment as
compared to An may be explained by the location of the pr >JO<?.
at the plasma periphery and by rather small (in comparison with
LCMS radius) mean free path of H_ molecules before their
ionization.
The increase of the H2 molecule flow into the confinement
volume results in a fast growth of some impurity line
intensities (0111,011,0111). In fact, it follows from
estimations, that the recombination of higher ionization states
-s-
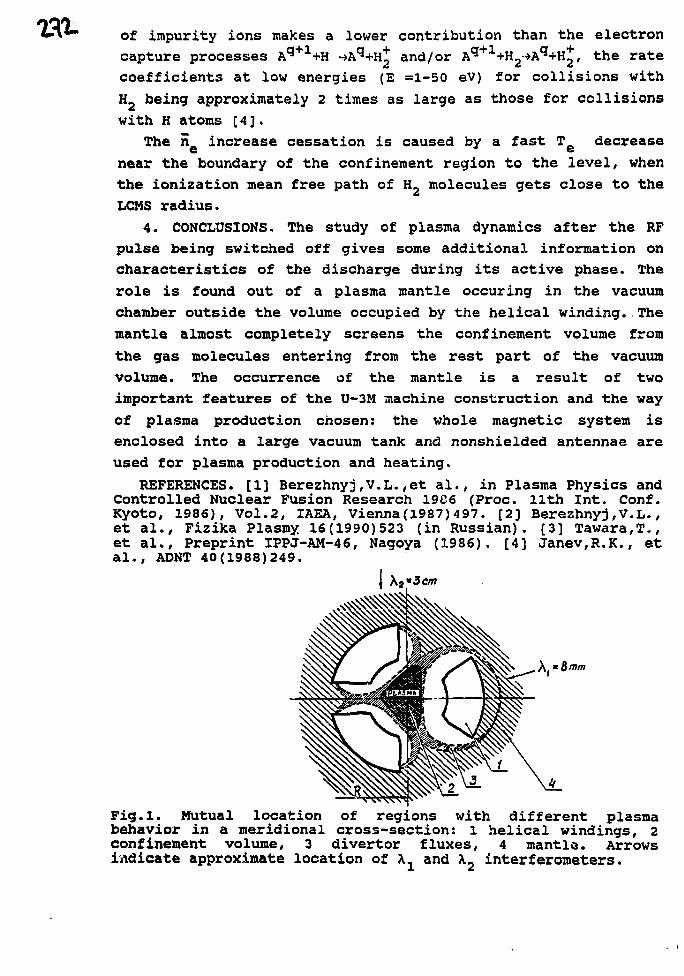
of impurity ions makes a lower contribution than the electron
capture processes Aq+1+H - ^ H - H * and/or A^^+H^A^+H*, the rate
coefficients at low energies (E =1-50 eV) for collisions with
H2 being approximately 2 times as large as those for collisions
with H atoms [4].
The n\ increase cessation is caused by a fast T decrease
near the boundary of the confinement region to the level, when
the ionization mean free path of H2 molecules gets close to the
LCMS radius.
4. CONCLUSIONS. The study of plasma dynamics after the RF
pulse being switched off gives some additional information on
characteristics of the discharge during its active phase. The
role is found out of a plasma mantle occuring in the vacuum
chamber outside the volume occupied by the helical winding. The
mantle almost completely screens the confinement volume from
the gas molecules entering from the rest part of the vacuum
volume. The occurrence of the mantle is a result of two
important features of the U-3M machine construction and the way
of plasma production chosen: the whole magnetic system is
enclosed into a large vacuum tank and nonshielded antennae are
used for plasma production and heating.
REFERENCES. [1] Berezhnyj,V.L.,et al., in Plasma Physics andControlled Nuclear Fusion Research 19C6 (Proc. 11th Int. Conf.Kyoto, 1986), Vol.2, IAEA, Vienna(1987)497. [2] Berezhnyj,V.L.,et al., Fizika Plasmy 16(1990)523 (in Russian). [3] Tawara,T.,et al., Preprint IPPJ-AM-46, Nagoya (1986). [4] Janev,R.K., etal., ADNT 40(1988)249.
\a*3cm
8 mm
Fig.l. Mutual location of regions with different plasmabehavior in a meridional cross-section: 1 helical windings, 2confinement volume, 3 divertor fluxes, 4 mantle. Arrowsi i,indicate approximate location of and \2 interferometers.
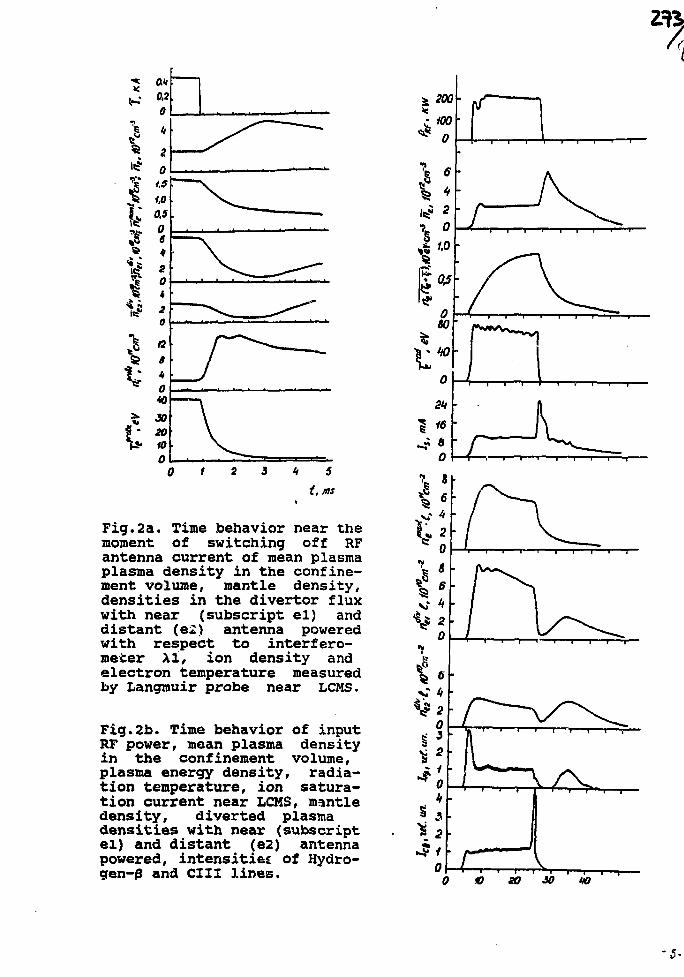
5
t.ms
Fig.2a. Time behavior near themoment of switching off RFantenna current of mean plasmaplasma density in the confine-ment volume, mantle density,densities in the divertor fluxwith near (subscript el) anddistant (e2) antenna poweredwith respect to interfero-meter Al, ion density andelectron temperature measuredby Langmuir probe near LCMS.
Fig.2b. Time behavior of inputRF power, mean plasma densityin the confinement volume,plasma energy density, radia-tion temperature, ion satura-tion current near LCMS, mantledensity, diverted plasmadensities with near (subscriptel) and distant (e2) antennapowered, intensities of Hydro-gen-0 and CIII lines.
Ofi
080
0
2k
U-\%
0 10 20 M HO
•5-
" • • " " a sICRF Heating System on Large Helical Device(Impedance Matching System for Feed-back Control)
R. Kumazawa, T. flfatari, T. Mutoh, F. ShinboK.Ohkubo, S. Kubo, T. KurodaNational Institute for Fusion Science, Nagoya, 464-01 Japan
The heating of an ion cyclotron frequency ranges (ICRF) is oneof the attractive additional heating methods to achieve theobjective plasma parameters for Large Helical Device/1,2,3/, whosefirst plasma is scheduled in 1997. The RF technologies of thesefrequency ranges have been established in several Mff for a longduration pulse. The ICRF heating has various heating scenarios suchas two ion-hybrid resonance heating, minority heating, ion Bernsteinwave heating and higher harmonic heating, which can heat electrons,bulk ions or produce high energy tail ions.
ffe have designed the RF oscillator in the wide frequency range,i.e. 25 to 95 MHz, to accommodate the above-mentioned ICRF heatingscenarios and the plasma properties such as hydrogen, deuteron andhelium(3He). ffe have determined the specifications of RF oscillator,which include the output power at the final stages and pulse length/duration time in two frequency ranges such as 25 to 60 MHz and 60 to95 MHz as shown in the tablel, accounting for the achieved resultsof RF tube so far. RF power of 2 or 1.5 Mff from two final amplifierstages is combined by the RF power combiner to be doubled.
Impedance matching system is required between ICRF antenna andRF oscillator, because the plasma loading resistance will be 3 to 5Q . In the ICRF heating experiment with a duration of 30 min., theplasma loading resistance may change with a change in the plasmaparameters near the antenna resulting in the RF power reflection tooccur. A feed-back control system to maitain the impedance match-ing is indispensable for the long pusle heating operation.
ffe propose the three different feed-back control systems asfollow: (l)the feed-back control by changing frequency; (2)by changingthe RF wave length by the feed-back control of magnetic field of theferrite installed in the stub-tuner; (3)the reflected RF power isconsumed at a dummy load through an RF circulator and within a fewsecond, the stub-tuner is moved mechanicaly to get impedancematching again(as shown in Fig.1).
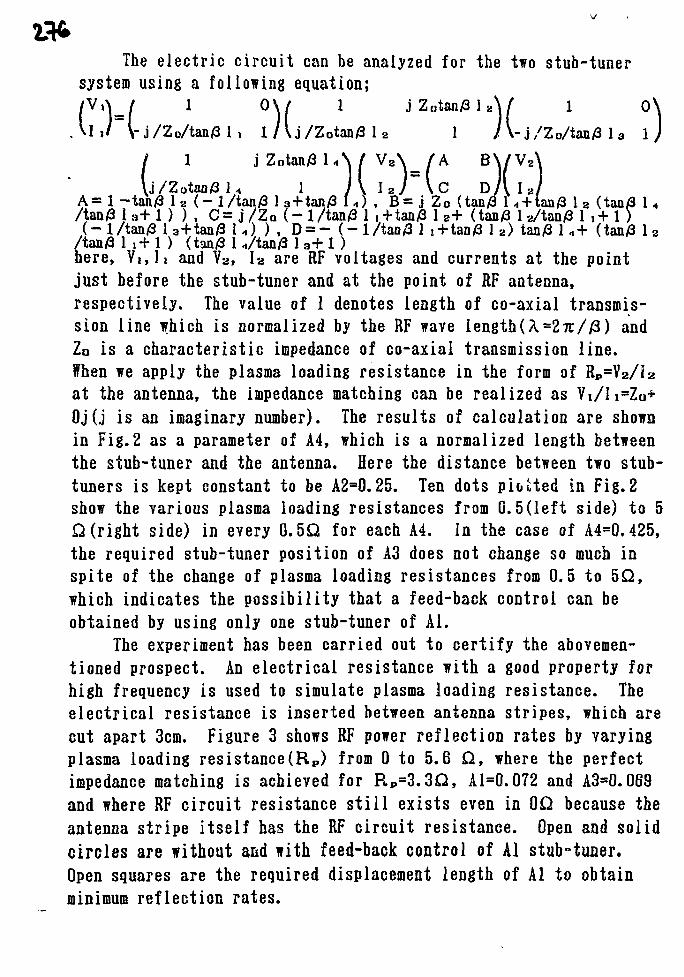
The electric circuit can be analyzed for the two stub-tunersystem using a following equation;
l /Vj/Zotaij/Zo/tan/3 1, l /Vj/Zotan/3 1 2
[i1 j Zotan/8 1 A / Vs
A= 1 -tan/8 1 2 ( - 1/tan/8 1 3+tan/8 1 5 , B'= j Zo (tan/8' l\"+lan/3 1 2 (tan/3 1 4/Zotan/3 1, 13 1 ( / 1A 1 tan/3 1 8 (l/tan/3 1 3+tan/3 I.,) , B j Zo (tan/8 I ,, + tan/3 1 8 (tan/3
/tan/8 1 3 + 1 ) ) , C = J / Z Q (-l/tan/3 1 ,+tan/818+ (tan/3 1 2/tan/3 1 ,+ 1)(-l/tan/3 la+tan/3 U ) ) , D = - (-l/tan,3 1 ,-Han/3 1 2) tan/3 ]„+ (tan/3 l a
/tan/8 1 ,+ 1 ) (tan/8 1 ./tan/3 1 3 + 1 )here, VI,II and VB, la are RF voltages and currents at the pointjust before the stub-tuner and at the point of RF antenna,respectively. The value of 1 denotes length of co-axial transmis-sion line which is normalized by the RF wave length(il=27c//3) andZQ is a characteristic impedance of co-axial transmission line.When we apply the plasma loading resistance in the form of Rp-V2/l2at the antenna, the impedance matching can be realized as Vt/li=Zo
+
Oj(j is an imaginary number). The results of calculation are shownin Fig.2 as a parameter of A4, which is a normalized length betweenthe stub-tuner and the antenna. Here the distance between two stub-tuners is kept constant to be A2=0.25. Ten dots plotted in Fig.2show the various plasma loading resistances from 0.5(left side) to 5Q (right side) in every 0.5Q for each A4. In the case of A4=0,425,the required stub-tuner position of A3 does not change so much inspite of the change of plasma loading resistances from 0.5 to 5Q,which indicates the possibility that a feed-back control can beobtained by using only one stub-tuner of Al.
The experiment has been carried out to certify the abovemen-tioned prospect. An electrical resistance with a good property forhigh frequency is used to simulate plasma loading resistance. Theelectrical resistance is inserted between antenna stripes, which arecut apart 3cm. Figure 3 shows RF power reflection rates by varyingplasma loading resistance(RP) from 0 to 5.6 Q , where the perfectimpedance matching is achieved for R P=3.3Q, Al=0.072 and A3=0.069and where RF circuit resistance still exists even in 0 Q because theantenna stripe itself has the RF circuit resistance. Open and solidcircles are without and with feed-back control of Al stub-tuner.Open squares are the required displacement length of Al to obtainminimum reflection rates.
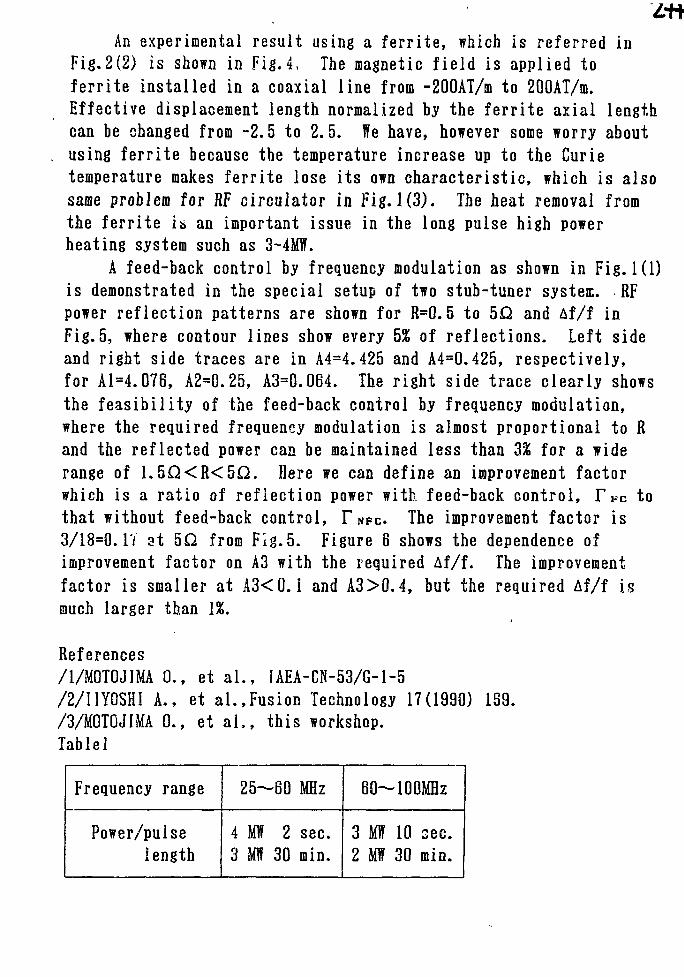
An experimental result using a ferrite, which is referred inFig.2(2) is shown in Fig.4, The magnetic field is applied toferrite installed in a coaxial line from -200AT/m to 200AT/m.Effective displacement length normalized by the ferrite axial lengthcan be changed from -2.5 to 2.5. We have, however some worry aboutusing ferrite because the temperature increase up to the Curietemperature makes ferrite lose its own characteristic, which is alsosame problem for RF circulator in Fig.1(3). The heat removal fromthe ferrite is an important issue in the long pulse high powerheating system such as 3-4MW.
A feed-back control by frequency modulation as shown in Fig.1(1)is demonstrated in the special setup of two stub-tuner systeic. RFpower reflection patterns are shown for R=0.5 to 5 Q and Af/f inFig.5, where contour lines show every 5% of reflections. Left sideand right side traces are in A4=4.425 and A4=0.425, respectively,for Al=4.076, A2=0.25, A3=0.064. The right side trace clearly showsthe feasibility of the feed-back control by frequency modulation,where the required frequency modulation is almost proportional to Rand the reflected power can be maintained less than 3% for a widerange of 1 . 5 Q < R < 5 Q . Here we can define an improvement factorwhich is a ratio of reflection power with, feed-back control, r * c tothat without feed-back control, F N F C . The improvement factor is3/18=0.17 at 5 Q from Fig.5. Figure 8 shows the dependence ofimprovement factor on A3 with the required Af/f. The improvementfactor is smaller at A3<0. i and A3>0.4, but the required Af/f ismuch larger than 1%.
References/1/M0T0JIMA 0., et al., IAEA-GN-53/G-1-5/2/I1Y0SH1 A., et al.,Fusion Technology 17(1990) 169./3/M0T0JIMA 0., et al., this workshop.Tablel
Frequency range
Power/pulselength
2 5 - 6 0 MHz
4 Mff 2 s e c .3 Ml? 30 min.
60~100MHz
3 Mff 10 s e c .2 Mff 30 min.
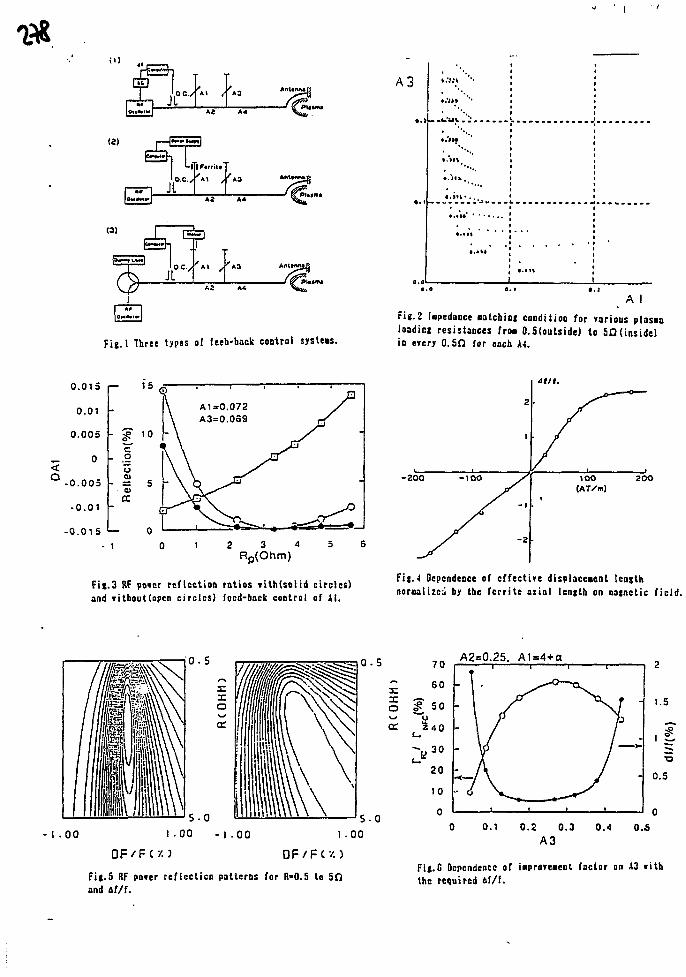
' OC.y
JL i-
A3
Fig. 1 "three types of feeb-hack control systems.
A I
Fig.2 Ispcdaoce Midlist conditioo for various plasaaloading resistances fro* 0.5(oulside) to SO (inside)in eyea O.Sfl for each ki.
0.015
0.01
0.005
0
-0.005
-0.01
-0.015
-
- g"_ o
o<u
a:
i
1 5 C
10<
s
00
\ A 1
\ A 3
\ \
1
=0.072 /=0.059 p /
2 3 4 5 5Rp(Ohm)
Fit.3 RF poter reflection ratios itthtsolid circles)and without(open circles) feed-back control of At.
-200 -100
- 2
I0O(ATVm)
2 0 0
Fil.4 Dependence of effectire dtsplaccaent lengthnoraalizca by the fcrrite axial length on namctic field.
0 . 5
S.O
- 1.00 1-00 - i . 0 0
OF/FCV. )
Fig.S RF po»cr reflccticn patterns for R"0.5 to SOand of/f.
0 . 5 A2=0.25. A1=4+a
5-00.1 0.2 0.3 O.'l 0.5
Fig.0 Dependence of inprovGicnt factor on A3 i i lhthe required af/f.
A CRITERION OP BALLOONING FLUTE MODE STABILITY IN A STELLARATOR
0. K. Cheremnykh
Institute for Nuclear Research
of the Ukrainian Academy of Sciences, Kiev, 252028, USSR
Analytical criterion of plasma stability relative to 'balloon-
ing flute modes (BFM) in a stellarator with flat circular axis
and circular "in average" magnetic surfaces is obtained. This
criterion takes into account new physical effect: BFM generation
by vacuum configuration of the machine.
According to modern theoretical ideas BFM in a stellarator
with flat circular axis do not restrict essentially confined
plasma pressure. It is considered that in the case of finite
plasma pressure (& £ 1, where & is a ratio of plasma pressure
to poloidal magnetic field pressure) these modes may be unstable
only in a stellarator with a current and in currentless regime
instability occurs only if plasma pressure is large (^^ 1). It
is shown in the present report that BFM in "ordinary" stellarator
may be more dangerous from the point of view of plasma stability
then it is supposed earlier.
The problem of stellarator stability relative to BFM is reduc-
ed to the equation of small oscillations for small-scale ideal
MHD modes obtained in Connor-Hastie-Taylor transformation [1]. In
a limit case ""-t >" 1 (where n is poloidal wavenumber and q is
safety factor) and ^ e > 1 this equation for amplitude ^ of radi-
al displacement of plasma element takes a form (compare with [2])
where y is ballooning variable,
The other notations are generally accepted (see [2J).
In order to analyse plasma stability, let us construct from
Eq.(1) potential energy functional,
Using asymptotic variational method [3]> we shall find test func-
tion for Sq.(2). For this purpose we consider Eq.Ci) in the limit
of small shear S - Q-f'/f 1» when this equation is characterized
"by two spatial scales y and z=sy. This fact allows us to repre-
sent the function ^ as a sum of slowly and rapidly varied parts,
By means of averaging method one can express | as a function of
" , moreover, the latter one is chosen as in [3] in the form,
Here ^ > 0 is a variational parameter. In obtaining of J , one
has to take into account the following fact. Usually it is sup-
posed (see, for example, [4]) that h (the average of h) is of
order of o/2 , where <J--£Q.f /i-' . However, for the stellarators
with multiple field periods, such as Uragan-3 and ATF, the situa-
tion takes place when li ~ oil> <~ a , since for these stellarators
the estimation
A if
is valid. The change of order of h leads to a substantial modifi-
cation of the function ? .
Substitution of the function (3) into functional (2) gives us
highly complicated expression, where a shear may be considered as
a finite value. However, this expression is simplified substan-
tially in the case of parabolic plasma pressure and large aspect
ratio, when the functional (2) takes a form:
Here2
s
3 ^
(7)
1/2
Prom the condition ^B > 0 we find plasma parameters satisfying
the criterion (6),
- So- id2' < S < -So _ £ ^ (8)
where4. i _ 4 r i+ ^ r + 3^ b
Here we take into account the fact that the value of stellarator
shear may be both positive and negative. If the inequality (8) is
violated, then the criterion
M>0 (9)
will be more rigid then (6).
It follows from (6) (see Fig. 1) that in the case ^ ~ 6 ^ 1
BFM instability occurs only for negative shear (s<0), i.e. either
in the regime with a current or for large plasma pressure in cur-
rentless regime due to rotational transformation profile deforma-
tion [5] . If S> ~ 1, the HPM may be unstable for both positive and
negative shear, moreover, as one can easy check, in this case the
criterion (6) predicts second zone stability absence (see Fig.2).
In conclusion let us consider a stability of central part of
plasma column, where the inequalities (6) and (9) lead to the
following restriction on plasma pressure,
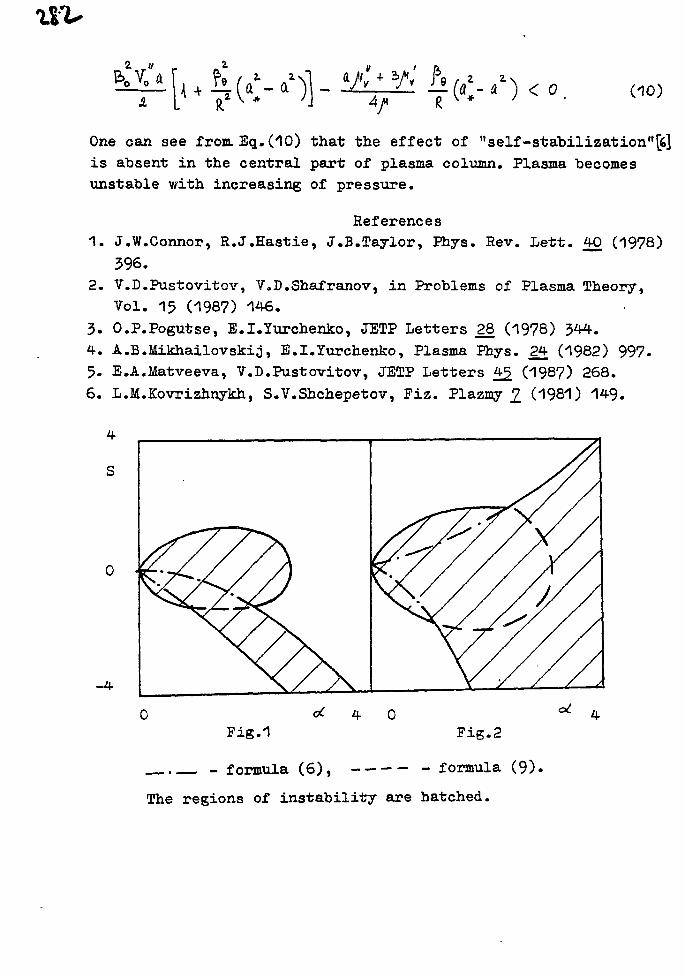
(10)
One can see from. Eq. (10) that the effect of "self-stabilization"[fe]
is absent in the central part of plasma column. Plasma becomes
unstable with increasing of pressure.
References1. J.W.Connor, R.J.Hastie, J.B.Taylor, Phys. Sev. Lett. 40 (1978)
396.2- V.D.Pustovitov, V.D.Shafranov, in Problems of Plasma Theory,
Vol. 15 (1987) 146.
3. O.P.Pogutse, B.I.Yurchenko, JETP Letters .28 (1978) 344.
4. A.B.Mikhailovskia, E.I.Yurchenko, Plasma Phys. 24 (1982) 997.
5. E.A.Matveeva, V.D.Pustovitov, JETP Letters 4^ (1987) 268.
6. L.M.Kovrizhnykh, S.V.Shchepetov, Fiz. Plazmy 2 (1981) 149.
4
S
Fig.1 Fig.2
- formula (6), formula (9).
The regions of instability are hatched.
INTERNAL KINK MODE m = 1 IN A STELLARATOR
O.K.Cheremnykh and A.V.Podnebesnyo
Institute for Nuclear Research of the Ukrainian
Academy of Sciences, Kiev, 252028, USSR
A problem of internal kink mode m = 1 stability in a ste-
llarator becomes urgent issue, when longitudinal current flows
on plasma column. An investigetion of this problem is an aim
of present report.
It is known that a necessary condition of internal kink mo-
de excitation in a magnetic trap consists in an existence of the
point inside plasma column, where rotational transform M equals
unity [1] . Then the equality
is a condition of existence of resonant surface a = a whereoH. (fl., = 1 , inside plasma column of stellarator. Here Ji
are current and vacuum rotational transforms, respectively. If
. / j and y<v take such values that condition (1) is violated,
then the problem of internal kink mode stability is senseless
due to lack of conditions of these modes generation. A presence
of the resonant surface does not mean instability excitation,
since it is necessary to study equilibrium state stability re-
lative to the perturbation m = 1.
The problem of stellarator stability relative to internal
kink mode is reduced in general to an investigation of system
of equations for Fourier - harmonics 2L of radial plasma dis-
placement \2] i
(2)
Here S », T , and U , are the coefficients depending on metric
tensor components g in "quasi-tokamak" flux coordinate sys-
tem straightening magnetic force lines [5] and some equilibri-
um parameters of plasma column ]4] .
Below we shall restrict ourselves by the consideration of
stellarator with planar circular axis , circular "in average"
magnetic surfaces and large aspect ratio (A = €." » 1). In this
case the system of equations (2) is reduced to one equation
for the harmonic X m
(3)
where
(5)
and
0 —2
Jl&f
Here <2 is radius of magnetic surface, d is large radius of
torus, £ = Q-/R , B>0 is toroidal magnetic' field, P is plasma
pressure, livi5 vacuum ratational transform, A is displacement
of magnetic surface center relative to geometric axis, the func-
tion "V characterizes vacuum magnetic hill, and the prime
means the derivative with respect to <X .
In obtaining of equation (3) it has "been supposed ^ >-> £
and terms of order of €. have been omitted .
The potential energy functional for Eq.(3) appearing
in energetic method is
The inequality W >0 corresponds to plasma stability.
We note that the functional (6) describes a stability of
arbitrary ideal kink perturbations over all cross-section of
plasma column. This functional is simplified substantially
for the perturbation localized near the resonant magnetic sur-
face /*»£O = y m and satisfied the condition^X /"U » »»X & .
In this case the condition of stability give us Mercier cri-
terion (for arbitrary m and n),
One can obtain this result representing the function f in the
form | •= i'C^t) Ca~ a»^ a n d using the following estimate of
integral}
Taking an interest in the case of the internal kink mode
with m = n = 1, we see, that the first term on the right hand
side in Bq .(5) vanishes, and g is reduced to terms of order £
To order 6 , W is minimized by the singular function
a>
The minimum value of functional (6) is
where
g « a**/*, do)
Since the test function (8) is close to eigenfunction,
then the inequality
is close to necessary and sufficient criterion of stability.
In conclusion we take notice of the following circum-
stances, (i) For the finit plasma pressure (<?i >1) Eq.(3) has
not already the solutions of the form of step function (7)»
therefore, it is necessary to investigate a stability of MHU
perturbations of another type, (ii) If the condition /*(a«)='l
is satisfied, then the mode m = 1 maybe realized in the current-
less regime.
References
1. V.D.Shafranov, J.Tech.Phys. 40 (1970) 241.
2. A.B.Mikhailovskio, in Problems of Plasma Theory,
V.9 (1979) 3.
3. V.D.Pustovitov, V.D.Shafranov, in Problems of Plasma
Theory, V.15 (1987) 146.
4. G.D.Aburdzhanija, O.K.Cheremnykh, Fizika Flasmy 2 (1981)64.
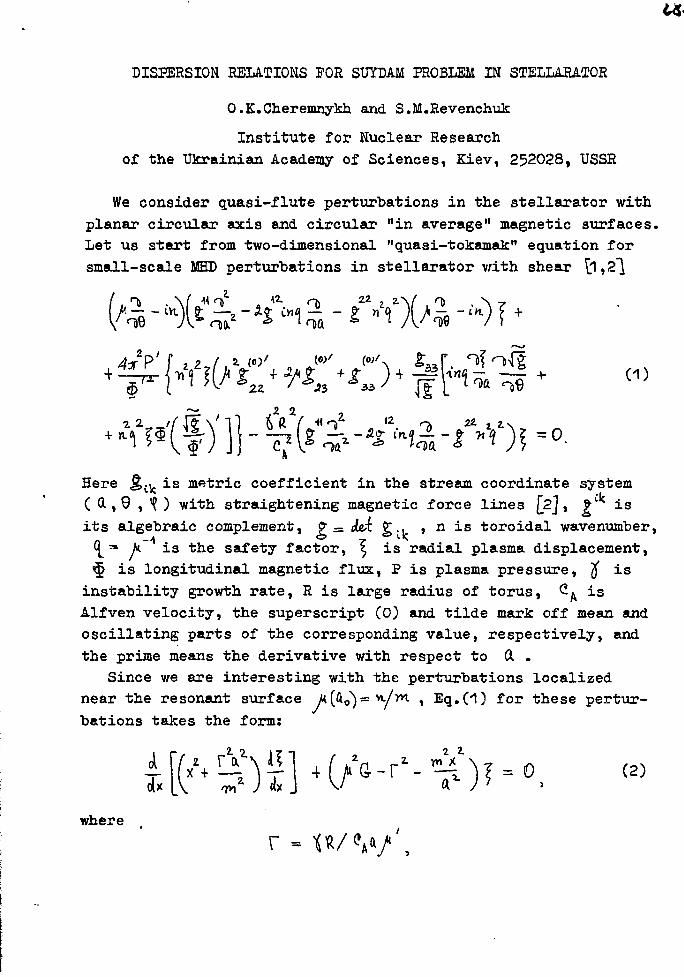
t*.
DISPERSION RELATIONS FOR SUYDAM PROBLEM IN STELLARATOR
O.K.Cheremnykh and S.M.Revenchuk
Institute for Nuclear Research
of the Ukrainian Academy of Sciences, Kiev, 252028, USSR
We consider quasi-flute perturbations in the stellarator with
planar circular axis and circular "in average" magnetic surfaces.
Let us start from two-dimensional "quasi-tokamak" equation for
small-scale MHD perturbations in stellarator with shear tl,2"][
l + (1)
Here .y. is metric coefficient in the stream coordinate system
(I,?,1? ) with straightening magnetic force lines [2], 9 is
its algebraic complement, g = c(ei £., , n is toroidal wavenumber,
^ - A is the safety factor, ^ is radial plasma displacement,
$ is longitudinal magnetic flux, P is plasma pressure, $ is
instability growth rate, R is large radius of torus, Cft is
Alfven velocity, the superscript (0) and tilde mark off mean and
oscillating parts of the corresponding value, respectively, and
the prime means the derivative with respect to d .
Since we are interesting with the perturbations localized
near the resonant surface M(&0^= YL/TYI , Eq. (1) for these pertur-
bations takes the form:
-r1- - O f = 0where
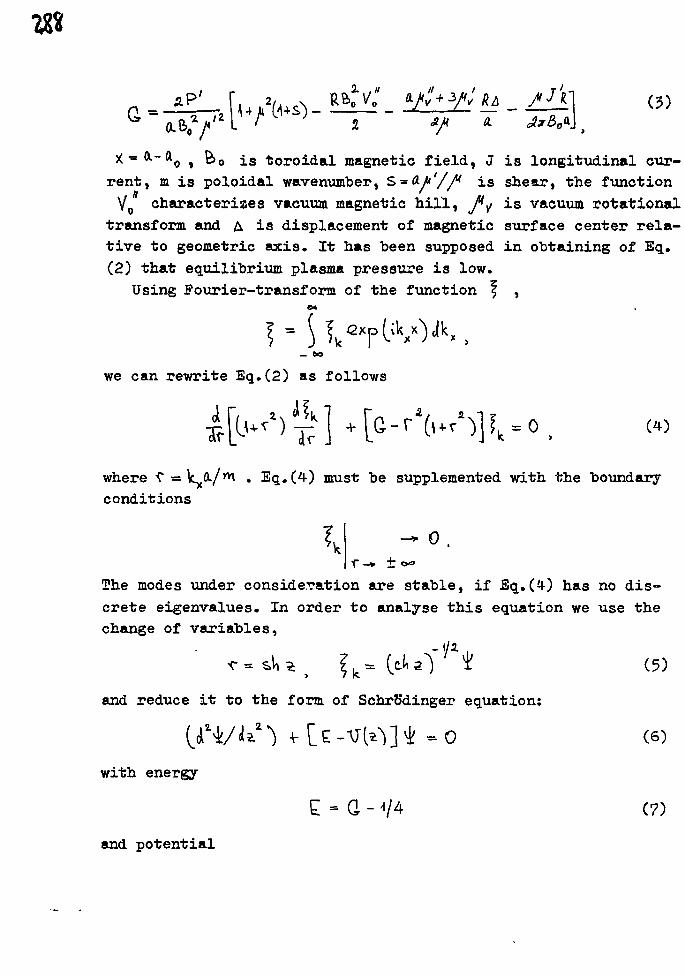
•ffl
X = °-~ *0 , fi>o is toroidal magnetic field, J is longitudinal cur-
rent, m is poloidal wavenumber, S = &f'//* is shear, the function
Vo characterizes vacuum magnetic hill, J*y is vacuum rotational
transform and A is displacement of magnetic surface center rela-
tive to geometric axis. It has been supposed in obtaining of Eq.
(2) that equilibrium plasma pressure is low.
Using Fourier-transform of the function £ ,
we can rewrite Eq.(2) as follows
where "C = Icfl-/™ . Eq.(4) must be supplemented with the boundary
conditions
- 0.
3?he modes under consideration are stable, if Eq.(4) has no dis-
crete eigenvalues. In order to analyse this equation we use the
change of variables,
(5)
and reduce it to the form of SchrSdinger equation:
^ [to] =0 (6)with energy
E - G - V4 (7)and potential
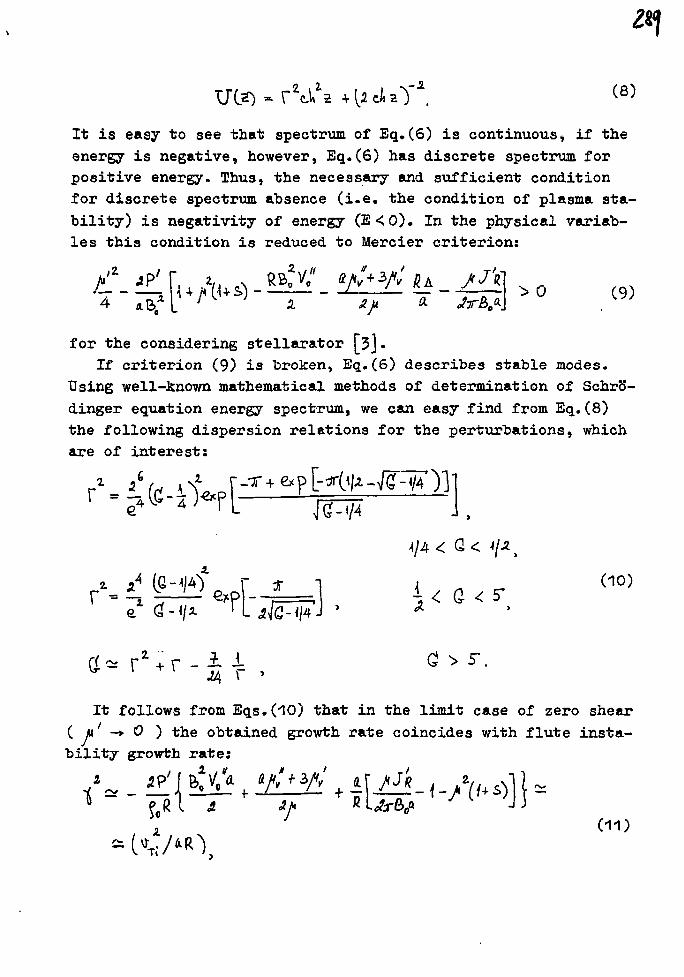
-2
It is easy to see that spectrum of Eq.(6) is continuous, if the
energy is negative, however, Bq.(6) has discrete spectrum for
positive energy. Thus, the necessary and sufficient condition
for discrete spectrum absence (i.e. the condition of plasma sta-
bility) is negativity of energy (E<0). In the physical variab-
les this condition is reduced to Mercier criterion:
, 0 C9)
for the considering stellarator [3].
If criterion (9) is broken, Eq.(6) describes stable modes.
Using well-known mathematical methods of determination of Schro
dinger equation energy spectrum, we can easy find from Eq.(8)
the following dispersion relations for the perturbations, which
are of interest:
G<
It follows from Bqs.(10) that in the limit case of zero shear
( u' -> 0 ) the obtained growth rate coincides with flute insta-
bility growth rate;
(11)
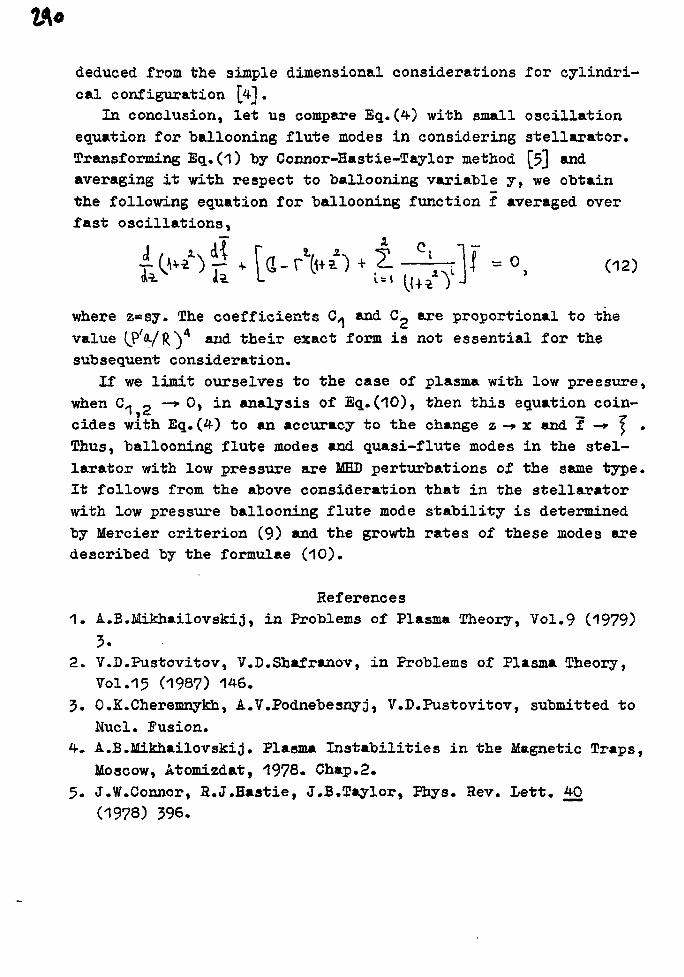
deduced from the simple dimensional considerations for cylindri-
cal configuration [4] .
In conclusion, let us compare Eq.(4) with small oscillation
equation for ballooning flute modes in considering stellarator.
Transforming Eq. (1) by Connor-Hastie-Taylor method [5] and
averaging it with respect to ballooning variable y, we obtain
the following equation for ballooning function f averaged over
fast oscillations}
where z=sy. The coefficients C^ and C2 are proportional to the
value (JP'VftV ^ ^ 'fckeir exact form is not essential for the
subsequent consideration.
If we limit ourselves to the case of plasma with low pressure,
when C.« o —* 0, in analysis of Eq.(10), then this equation coin-
cides with Eq.(4) to an accuracy to the change z -» x and f -* T .
Thus, ballooning flute modes and quasi-flute modes in the stel-
larator with low pressure are MED perturbations of the same type.
It follows from the above consideration that in the stellarator
with low pressure ballooning flute mode stability is determined
by Mercier criterion (9) and the growth rates of these modes are
described by the formulae (10).
References
1. A.B.MiMiailovskiJ, in Problems of Plasma Theory, Vol.9 (1979)
3.
2. V.D.Pustovitov, V.D.Shafraaov, in Problems of Plasma Theory,
Vol.15 (1987) 146.
3. O.K.Cheremnykh, A.V.Podnebesnyj, V.D.Pustovitov, submitted to
Nucl. Fusion.
4. A.B.Mikhailovskij. Plasma Instabilities in the Magnetic Traps,
Moscow, Atomizdat, 1978. Chap.2.
5. J.W.Connor, H.J.Hastie, J.B.Taylor, Phys. Rev. Lett. 40
(1978) 396.
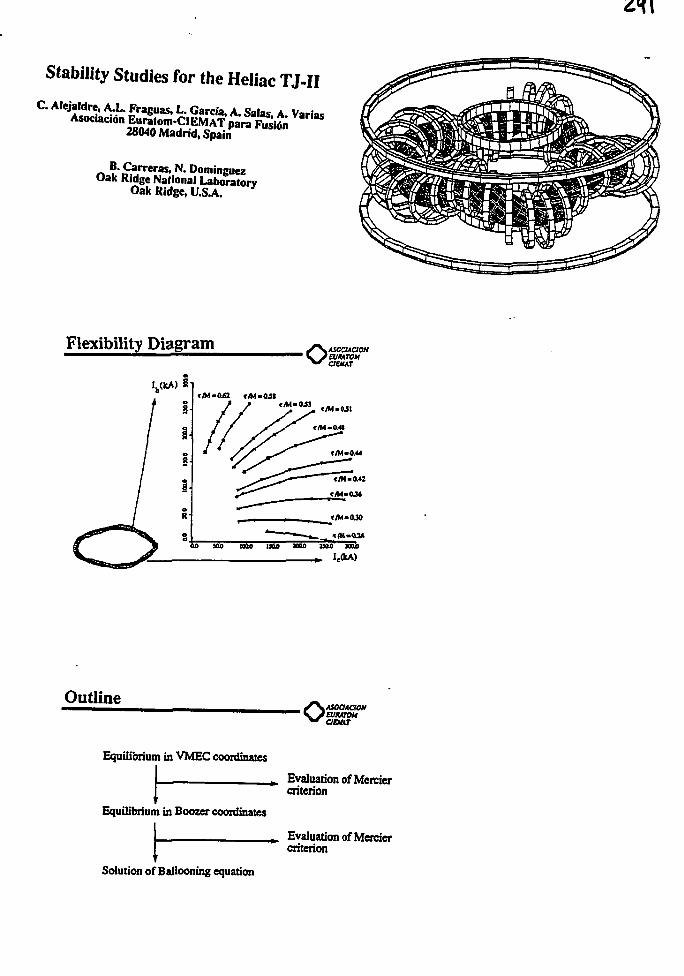
Stability Studies for the Heliac TJ-II
28040 Madrid, Spain
_ B. Carreras, N. DominguezOak Ridge National Laboratory
Oak Ridge, U.S.A. *
Flexibility Diagram oEUHATOH
aaurIh(kA)
c/M-042 f/M-OJSC/M-CM3
Outline . S \ A o'\JiVMrouVMrou
C1EUAT
Equilibrium in VMEC coordinates
Equilibrium in Boozer coordinates
Evaluation of Merciercriterion
Evaluation of Merciercriterion
Solution of Ballooning equation
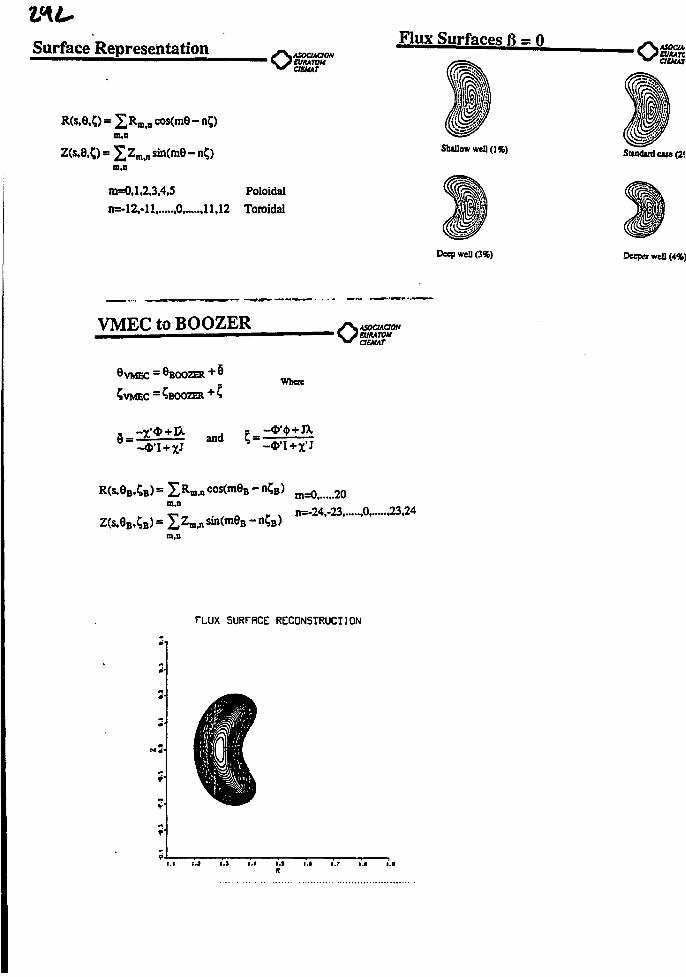
Surface Representation Flux Surfaces ft = 0EVKATOM
m.n
m,n
m=0,l,2,3,4,5 Poloidal
n=-12,-l l......,0,.....,l 1,12 Toroidal
Deep well (3%)
VMEC to BOOZER O uoanawOIKATOU
Where
-Vl+X*and
Z(s,8B,;B)
m = 0 i . . . . . 2 0
n=-24,-23 ,0 ,23,24
FLUX SURFRCE RECONSTRUCTION
l.s 1.1 i.r I.I i.t
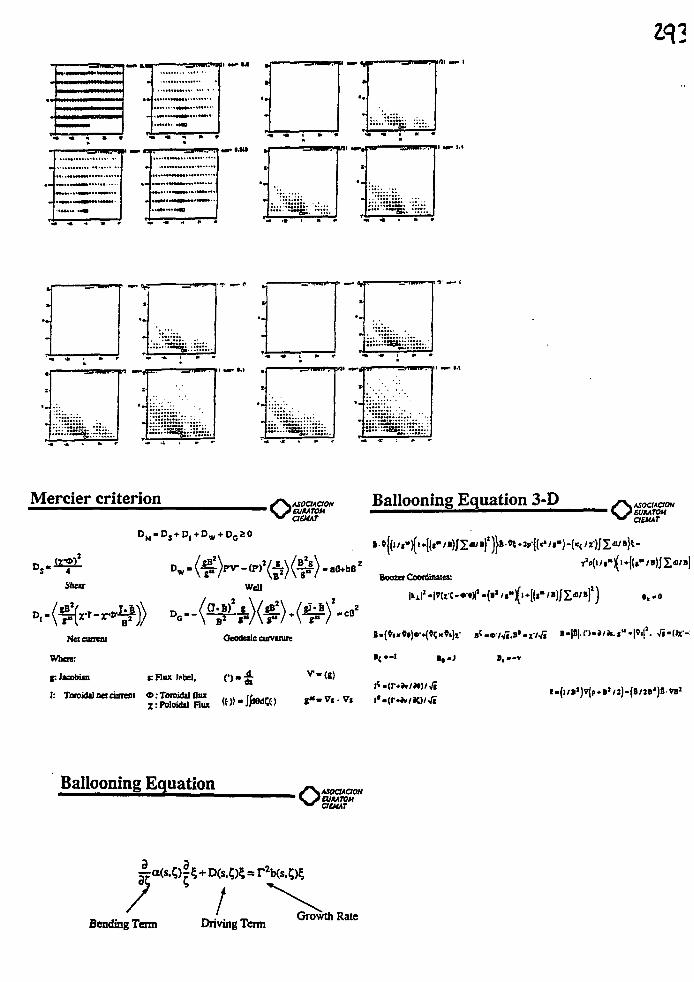
IV.
: : ; . . : ; ; ! £ i : : • ; . .
Mercier criterion OEMATOMC1EMAT
Ds + D, + Dw + Do a 0
Shear
D,-
Nctcwcai
Where:
g:Jacobiin
I: Taoidilaetcunaii
Geodesic euivuun
«:Flux label, O-&
Ballooning Equation 3-D
Boozer Cooidinues:
•{•-I B,—v
1 S^euMOMaaur
i!1. •Ji-W-
Ballooning EquationEUKATOH
auua
Bending Tenn Driving TennGrowth Rate
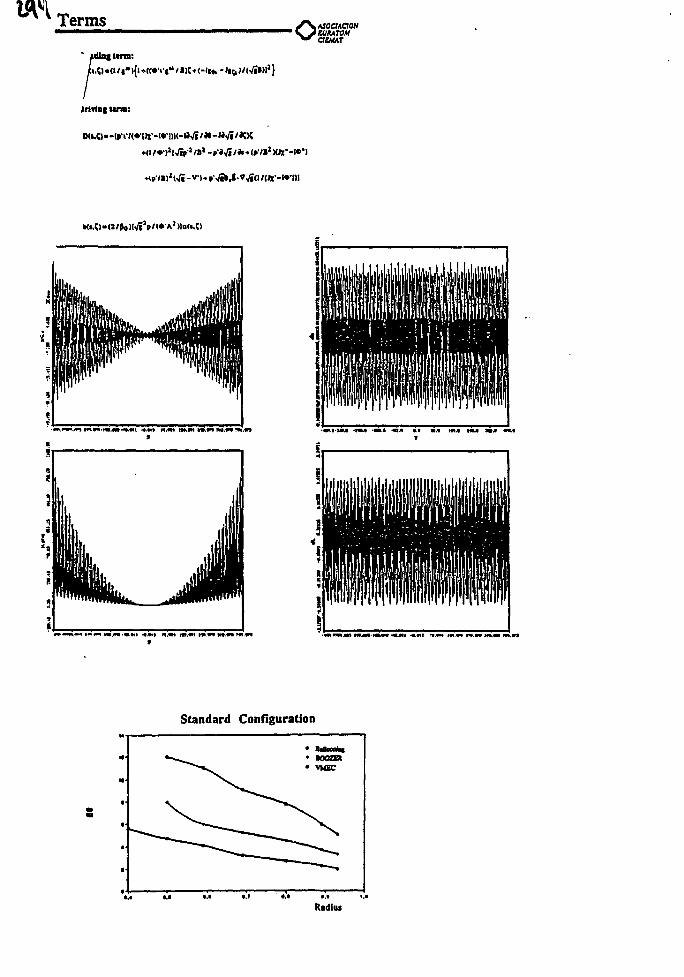
Terms" idiatltnn;
Mvlag ttm:
oASOCMIOH
CllMAT
Standard Configuration
S
Rtdfus
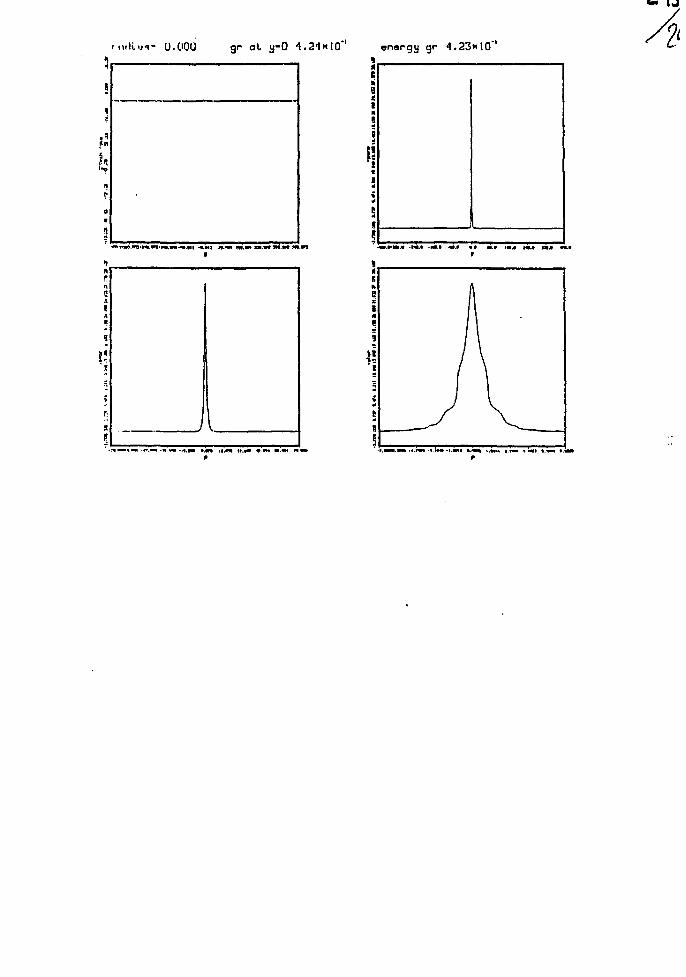
I J
4.23x10''
QUASI-SYMMETRIC STELLARATOR IN PARAXIAL APPROXIMATION.
M. Yu. Isaev
I.V.Kurchatov Institute of Atomic Energy, Moscow, USSR
Introducing.
Optimization of quasi-symmetric stellar a tors by numerical
methods has the growing importance. In a number of articles
authors wrote about the results obtained with help of the
different 3D MHO equilibrium codes exploiting the assumption
of nested toroidal surfaces [1-4]. Such codes usually absorb
large computers power. In this articles as in [5] we'll try to
develop some analytical and numerical methods which may be
lightly for the purposes of examination of quasi-symmetric
stellarators using paraxial expanding.
First we'll show the way for the calculation of Boozer
coordinates [6] as function of so called work coordinates and
rows of magnetic surface parameters. Previously [5] Boozer
Jacobian JQ has been received in the first order of paraxial
expanding, here we'll get it in the second order. Then we'll
consider the condition of quasi-symmetry that has given us [5]
relations between four parameters of system: k, JC, C, 5 (k(s),
K(S) - curvature and torsion of magnetic axis, e(s), 5(s) -
ellipticity and angle between the normal and small semiaxis of
ellipse) and now gives the new equations connecting Shafranov
shifts ^ ( s ) , $2(s) with triangularities a1(s), «2(s), £=2p/B2
and other parameters of system.
1. Boozer coordinates.
Here we describe the procedure of finding of Boozer
coordinates [5]. There are two equations for Boozer angles ea,
C B (in the case of 1=0, where I- net current):
B)=o and ift. (eB-/u<B) ]=o, (l)
where differential operator L is [7]
A a/aec^s/as-zs^a/asj+a/ss^^a/as-^a/ae],^- <£i| (2)
|S.. =g.k/(g1:L g1'2)-metric coefficients of the work coordinate
system (a,0,s), /u - rotational transform. We determine the
shape of magnetic surface a=const and angle © so (see [8], the
field on the axes B=const):
x=a e" 1^ 2 [cos ©+a(S1+4a1sin2e)+a2r1(©,s)] (3)
y=a e 7^ 2 [sin ©+a(?2-4a2cos2©)+a23r2(8,s) ] (4)
where e(s)=th TJ(S) , s-the angle length of magnetic axes, axis
x,y lay on small and large semiaxis of a=const rotating
ellipse, a/R-the small parameter of paraxial expanding,
L=27rR-full length of magnetic axes, y (s) , r2(s)- some
coefficients in the third order of a. The solution of
equations (1) we'll find in the form:
(0,s)a2/R2 (5)
B 3 (6)
To get X. we should have the expression for g.j. and the
expression right up to the third order of a for work system
Jacobian g1' . The analysis of harmonical form for surfaces
a=const [9] leads to the fact that functions y.(e,s) must
include 5 parameters C.(s) and odd harmonics of ©:
r1=c1(s) cos e+c2(s) cos 3e+c3(s) sin 3©, (7)
y_=C.(s) cos 3©+C5(s) sin 3©, (8)
In such form only (^(s) will stay in our solution. The
periodicy conditions and expressions for (3^k gives us the
opportunity to find A.. For illustration we show only two
examples, more full formulas will be published:
A0'(s)= <,»'/ch 7)>s-tf'/ch TI, (9)
c COS 29+0.5 T}' ch TJ sin 29, (10)
To turn into the Boozer Jacobian Jfi:
^^S^/did.s)]'1 (11)
2. Relationships between quasi-symmetric parameters.
The angle dependence for J_ is equal to the angle
dependence for quasi-symmetric magnetic field's square B
[6]:
JB(a,9B,CB)=JB(a,9B-n<B), (12)
from (5), (6), in the work coordinates to the third order of a:
[v'+(ax1/as)a/R]ajB/ae=[i+(ax1/a©)a/R]aJB/as/ (13).
V (s)=A0'-n. The condition (13) gives equations for parameters
of quasi-symmetric magnetic configuration. Two equations for
the terms of the second order of a (for this order in (13)
X =0): k, K, c, 5 are in [5]. The third order of a contains
three equations. Two formers connect shifts £., £_ with
triangularities a., a_ in the ordinary differential equations
which are easy to solve. The solution has the form:
51=P1+a2 sin 2v-2a1 cos v (14)
S2=P2~al sin 2v+2a2 sin
2 v (15)
where P. enclose known functions: P-(s)=Re(P), P2(s)=Im(P),
P=-i[d0e~iv+(t1+it2)e
iv/A0], A^R
do=i?1(O)-?2(O)+2ia1(O)-(t1(O)+it2(O))/Ao,
2 sin 2&-0'T\'-d{c$'))fds,
= (kR)2[shTj-ch7} cos 25]/2+[(TI'/2) 2+I> / 2] sh
5Tj' ch 7}))/as.
The last equation gives C.(s):
C1(s)=d1+t3(s)+2A0(C2 sin v-^ cos v) (16)
where t3 (s) = [ (n'/2) 2+tf/2+(kR)2] ch 7j-i>'2/ch T\ and constant dx
is found from the periodicy condition. Now we can insert
expressions (14), (15) to the equilibrium equations (3.7) from
[10] and obtain following:
."«i'(s)=Pi(a1, a2,0,v,e,ji)/ i-1,2. (17)
FJ are also known functions which we can't write out here
because of a snail paper volume. The equations (17) can be
solved numerically and we receive the quasy-symmetric magnetic
surface parameters depending from /3 for the third order of a.
Conclusions.
Using conditions of the quasi-symmetry and paraxial
expansion, we've got the equations, connecting magnetic
configuration parameters. This equations make possible to
conduct the successive numerical equilibrium and stability
optimization, this optimization isn't in need of 30 codes and
can explain the correlation between the form and properties of
magnetic surfaces. The expression obtained may be used for
transport analyses in quasi-symmetric stellarator.
References.
1. Nuhrenberg J., Zille R.// Phys.Let.A. 1988. V. 129. P.113.
2. Proceedings of the Workshop on Wendelstein VTI-X.FRG.1987,
3. Proceedings of the 2nd Workshop on Wendelstein
VII-X.FRG.1988.
4. Wendelstein VII-X. Application for Preferential Support. //
IPP-Euratom Association. 1990
5. Isaev M. Yu. , Shafranov V. D. //Fiz. Plasiay. 1990. V. 6. P. 723.
6. Boozer A.H. // Phys. Fluids. 1981. V. 24. P. 1999.
7. Degtyarev L.M., Drozdov V.V.//1984. Preprint Keldysch IPM.
8. Shafranov V.O., Yurchenko E.I.//Nucl. Fus. 1968.V.8.P.329.
9. Shafranov V.D., Solov'ev L.S.//Vopr. Theor.Plasmy.l967.V.5.
10. Dobryakov A.V. et all. // Nucl.Fus. 1985. V.25. Pn891.
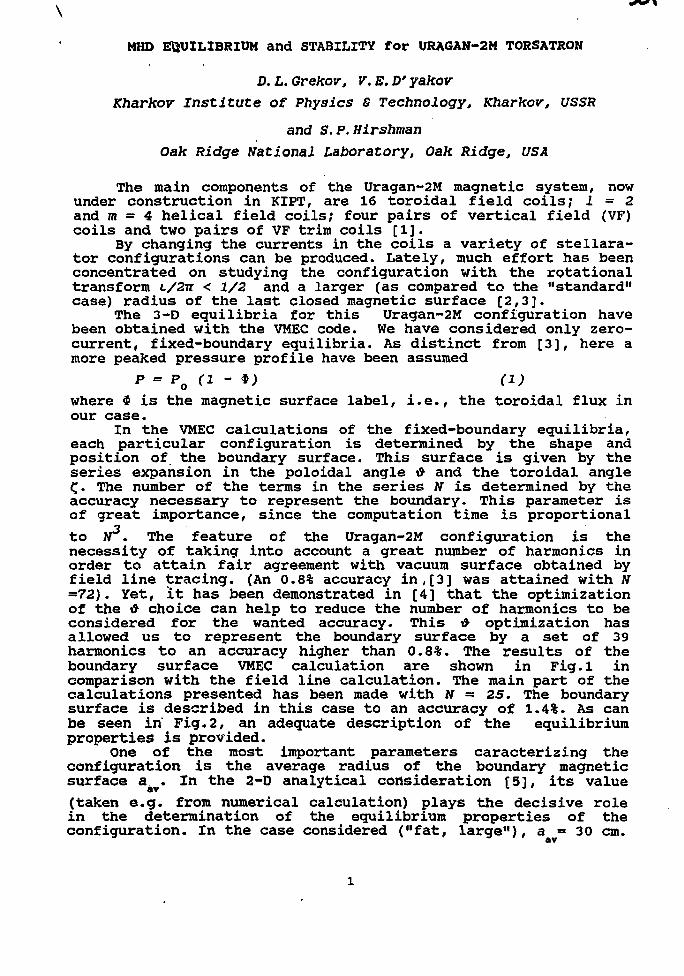
MHD EQUILIBRIUM and STABILITY for URAGAN-2M TORSATRON
D. I. Grekov, V. E. D' yakov
Kharkov Institute of Physics S Technology, Kharkov, USSR
and S.P. Hirshman
Oak Ridge National Laboratory, Oak Ridge, USA
The main components of the Uragan-2M magnetic system, nowunder construction in KIPT, are 16 toroidal field coils; 1=2and m = 4 helical field coils; four pairs of vertical field (VF)coils and two pairs of VF trim coils [1].
By changing the currents in the coils a variety of stellara-tor configurations can be produced. Lately, much effort has beenconcentrated on studying the configuration with the rotationaltransform L/2n < 1/2 and a larger (as compared to the "standard"case) radius of the last closed magnetic surface [2,3].
The 3-D equilibria for this Uragan-2M configuration havebeen obtained with the VMEC code. We have considered only zero-current, fixed-boundary equilibria. As distinct from [3], here amore peaked pressure profile have been assumed
P = Po (1 - 4>) (1)
where $ is the magnetic surface label, i.e., the toroidal flux inour case.
In the VMEC calculations of the fixed-boundary equilibria,each particular configuration is determined by the shape andposition of the boundary surface. This surface is given by theseries expansion in the poloidal angle tf and the toroidal angleC- The number of the terms in the series N is determined by theaccuracy necessary to represent the boundary. This parameter isof great importance, since the computation time is proportional
to N . The feature of the Uragan-2M configuration is thenecessity of taking into account a great number of harmonics inorder to attain fair agreement with vacuum surface obtained byfield line tracing. (An 0.8% accuracy in,[3] was attained with N=72). Yet, It has been demonstrated in [4] that the optimizationof the t? choice can help to reduce the number of harmonics to beconsidered for the wanted accuracy. This t> optimization hasallowed us to represent the boundary surface by a set of 39harmonics to an accuracy higher than 0.8%. The results of theboundary surface VMEC calculation are shown in Fig.l incomparison with the field line calculation. The main part of thecalculations presented has been made with N = 25. The boundarysurface is described in this case to an accuracy of 1.4%. As canbe seen in Fig.2, an adequate description of the equilibriumproperties is provided.
One of the most important parameters caracterizing theconfiguration is the average radius of the boundary magneticsurface a . In the 2-D analytical consideration [5], its value
(taken e.g. from numerical calculation} plays the decisive rolein the determination of the equilibrium properties of theconfiguration. In the case considered ("fat, large"), a = 30 cm.
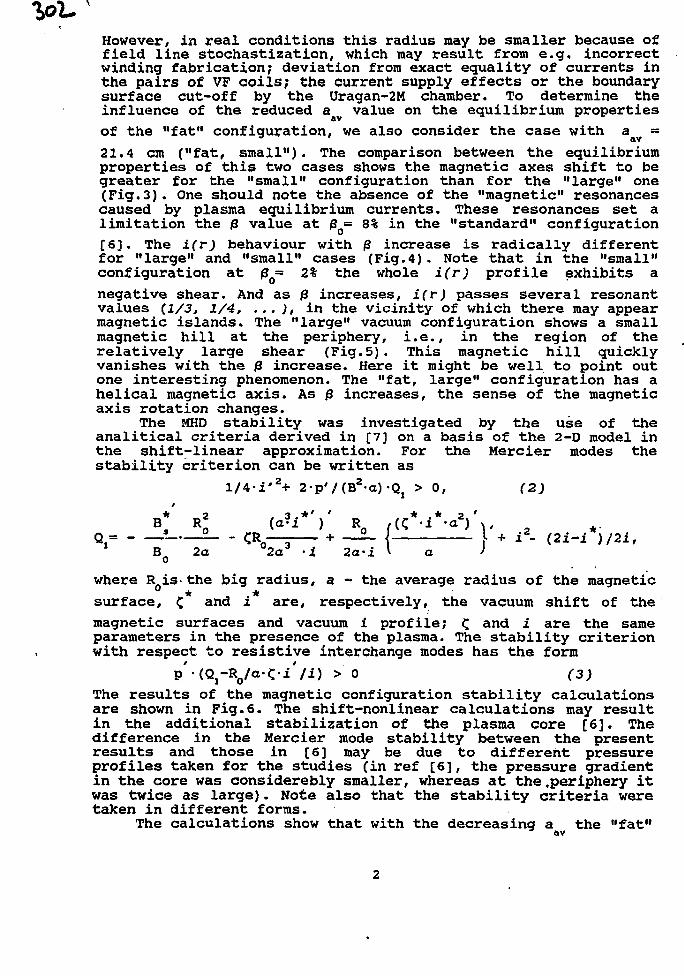
However, in real conditions this radius may be smaller because offield line stochastization, which may result from e.g. incorrectwinding fabrication; deviation from exact equality of currents inthe pairs of VF coils; the current supply effects or the boundarysurface cut-off by the Uragan-2M chamber. To determine theinfluence of the reduced a value on the equilibrium properties
of the "fat" configuration, we also consider the case with a =
21.4 cm ("fat, small"). The comparison between the equilibriumproperties of this two cases shows the magnetic axes shift to begreater for the "small" configuration than for the "large" one(Fig.3). One should note the absence of the "magnetic" resonancescaused by plasma equilibrium currents. These resonances set alimitation the |3 value at (3 = 8% in the "standard" configuration
[6], The i(r) behaviour with |3 increase is radically differentfor "large" and "small" cases (Fig.4). Note that in the "small"configuration at £o= 2% the whole i(r) profile exhibits a
negative shear. And as £ increases, i(r) passes several resonantvalues (1/3, 1/4, ...), in the vicinity of which there may appearmagnetic islands. The "large" vacuum configuration shows a smallmagnetic hill at the periphery, i.e., in the region of therelatively large shear (Fig.5). This magnetic hill quicklyvanishes with the ft increase. Here it might be well to point outone interesting phenomenon. The "fat, large" configuration has ahelical magnetic axis. As /3 increases, the sense of the magneticaxis rotation changes.
The MHD stability was investigated by the use of theanalitical criteria derived in [7] on a basis of the 2-D model inthe shift-linear approximation. For the Mercier modes thestability criterion can be written as
'2+ 2-p'/(B2-a)-Qi > 0, (2)
(a?i*Y R+
°2a -i 2a
._ . 2,(C -l 'a ) x,
2- I I + i2- (2i-i*)/2i,•i y a i
where R is- the big radius, a - the average radius of the magnetic* *
surface, C an<* i are, respectively, the vacuum shift of the
magnetic surfaces and vacuum i profile; C and i are the sameparameters in the presence of the plasma. The stability criterionwith respect to resistive interchange modes has the form
P'^-^o/a-Z-i/i) > 0 (3)The results of the magnetic configuration stability calculationsare shown in Fig. 6. The shift-nonlinear calculations may resultin the additional stabilization of the plasma core [6]. Thedifference in the Mercier mode stability between the presentresults and those in [6] may be due to different pressureprofiles taken for the studies (in ref [6], the pressure gradientin the core was considerebly smaller, whereas at the.periphery itwas twice as large). Note also that the stability criteria weretaken in different forms.
The calculations show that with the decreasing a the "fat"
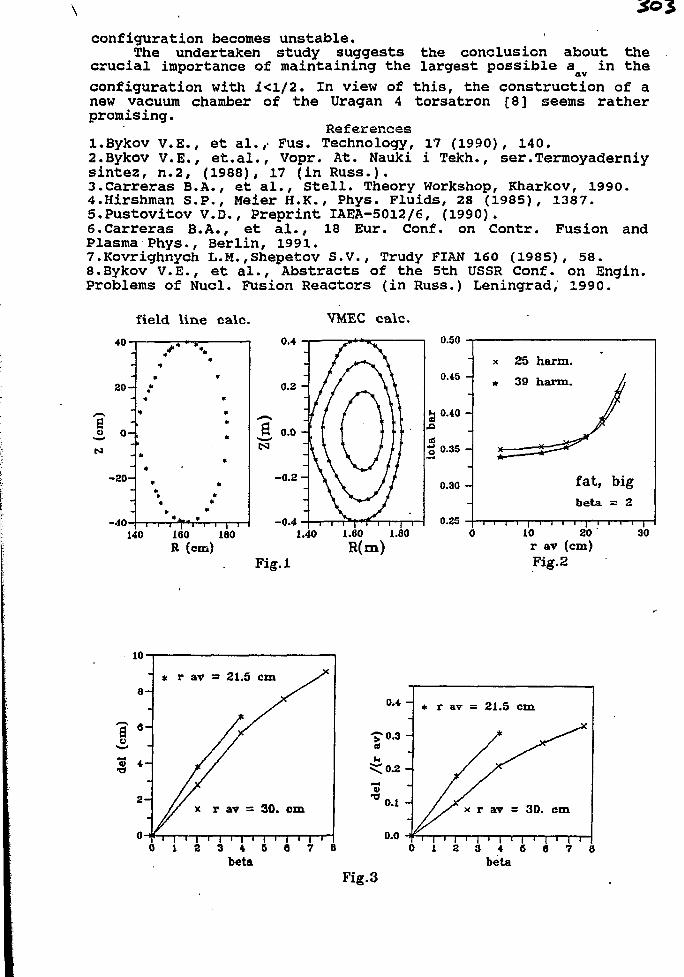
configuration becomes unstable.The undertaken study suggests the conclusion about the
crucial importance of maintaining the largest possible a in theconfiguration with i<l/2. In view of this, the construction of anew vacuum chamber of the Uragan 4 torsatron [8] seems ratherpromising.
Referencesl.Bykov V.E., et al.,- Fus. Technology, 17 (1990), 140.2.Bykov V.E., et.al., Vopr. At. Nauki i Tekh., ser.Termoyaderniysintez, n.2, (1988), 17 (in Russ.).3.Carreras B.A., et al., Stell. Theory Workshop, Kharkov, 1990.4.Hirshman S.P., Meier H.K., Phys. Fluids, 28 (1985), 1387.S.Pustovitov V.D., Preprint IAEA-5012/6, (1990).6.Carreras B.A., et al., 18 Eur. Conf. on Contr. Fusion andPlasma Phys., Berlin, 1991.7.Kovrighnych L.M.,Shepetov S.V., Trudy FIAN 160 (1985), 58.S.Bykov V.E., et al., Abstracts of the 5th USSR Conf. on Engin.Problems of Nucl. Fusion Reactors (in Russ.) Leningrad, 1990.
field line calc. VMEC calc.40-
2 0 -
ao o -
- 2 0 -
-40- 1 i i T ' ' i I i
0.4 0.50
x 25 harm.
-0.4
fat, bigbeta = 2
140 100 ISO 1.40 1.60 1.80
R (cm) R(m)Fig.l
r av (cm)Fig.2
30
10-
8 -* r av = 21.5 cm
0 1 2 3 4 5 0 7 B
0.4 -
'0.3 -
* r av- = 21.5 cm
betaFig.3
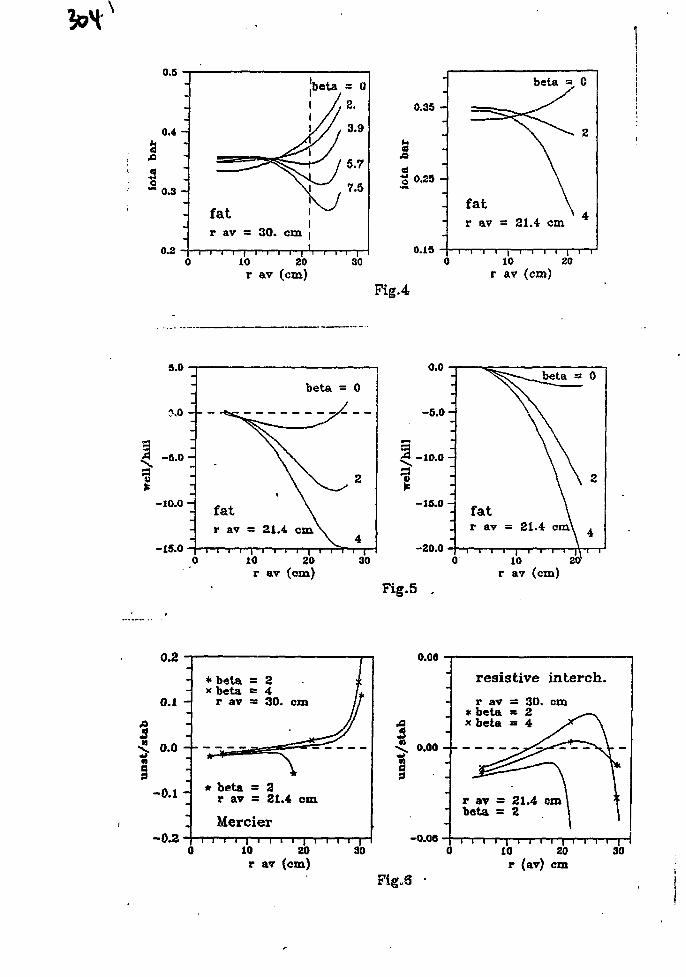
0.310r av (cm)
30
bar
iota
-
0.35 -
-
0.25 -
-
0.15 -C
fatr av = 21
i >10
beta =
* /
\
\A cm
i i i i
20
0
2
4
Fig.4r av (cm)
1
a.u —
0,0 -
-8.0 -
-
-10.0 -
-
<
fatr av
I
\
= 21.4
10
beta =
y
\
\cm\
20
0
2
30r av (cm)
1
MM —
-5 .0 -
-10.0 -
-
-16.0 -
-
-20.0 -<
fatr av
•
\
\
= 21.4 cm\\
10 20l
0
2
4
Fig.5 .r ay (cm)
0.2
I
-o . i -
-0J3
*beta = 2beta = 4
O.I -
O . O - : - - • = •
* beta = 2r av = 21.4 cm
Mercier» I | * I I I I I I I I I
10 20 30r av (cm)
0.00
.ann
0.00 - -
-o.oa
resistive interch.r av = 30. cmbeta = 2beta = 4
r av = 21.4 cmbeta = 2
10I p T ' ' ' 120 30
Fig.6 •r (av) cm
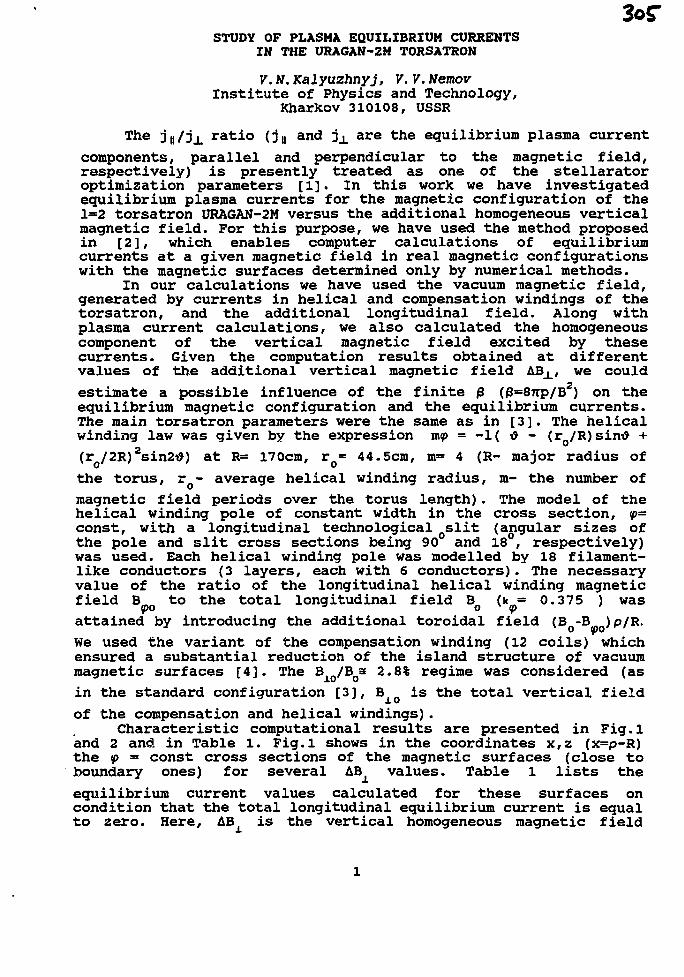
STUDY OF PLASMA EQUILIBRIUM CURRENTSIN THE URAGAN-2M TORSATRON
7. N. Kalyuzhnyj, V. V. NemovInstitute of Physics and Technology,
Kharkov 310108, USSR
The Jn/Jx ratio (j,, and j x are the equilibrium plasma current
components, parallel and perpendicular to the magnetic field,respectively) is presently treated as one of the stellaratoroptimization parameters [1]. In this work we have investigatedequilibrium plasma currents for the magnetic configuration of the1=2 torsatron URAGAN-2M versus the additional homogeneous verticalmagnetic field. For this purpose, we have used the method proposedin [2], which enables computer calculations of equilibriumcurrents at a given magnetic field in real magnetic configurationswith the magnetic surfaces determined only by numerical methods.
In our calculations we have used the vacuum magnetic field,generated by currents in helical and compensation windings of thetorsatron, and the additional longitudinal field. Along withplasma current calculations, we also calculated the homogeneouscomponent of the vertical magnetic field excited by thesecurrents. Given the computation results obtained at differentvalues of the additional vertical magnetic field ABj_, we could
estimate a possible influence of the finite 0 (£=87ip/B2) on theequilibrium magnetic configuration and the equilibrium currents.The main torsatron parameters were the same as in [3]. The helicalwinding law was given by the expression mtp = -1( •& - (r /R)sintf +
(r /2R)2sin2tf) at R= 170cm, rQ= 44.5cm, m= 4 (R- major radius of
the torus, rQ- average helical winding radius, m- the number of
magnetic field periods over the torus length). The model of thehelical winding pole of constant width in the cross section, <p=const, with a longitudinal technological .slit (angular sizes ofthe pole and slit cross sections being 90 and 18 , respectively)was used. Each helical winding pole was modelled by 18 filament-like conductors (3 layers, each with 6 conductors). The necessaryvalue of the ratio of the longitudinal helical winding magneticfield B o to the total longitudinal field BQ (k = 0.375 ) was
attained by introducing the additional toroidal field (B -B )p/R.
We used the variant of the compensation winding (12 coils) whichensured a substantial reduction of the island structure of vacuummagnetic surfaces [4]. The B /BQ3 2.8% regime was considered (as
in the standard configuration [3], B is the total vertical field
of the compensation and helical windings).Characteristic computational results are presented in Fig.l
and 2 and in Table 1. Fig.l shows in the coordinates x,z (x=p-R)the ip = const cross sections of the magnetic surfaces (close toboundary ones) for several AB± values. Table 1 lists the
equilibrium current values calculated for these surfaces oncondition that the total longitudinal equilibrium current is equalto zero. Here, AB is the vertical homogeneous magnetic field
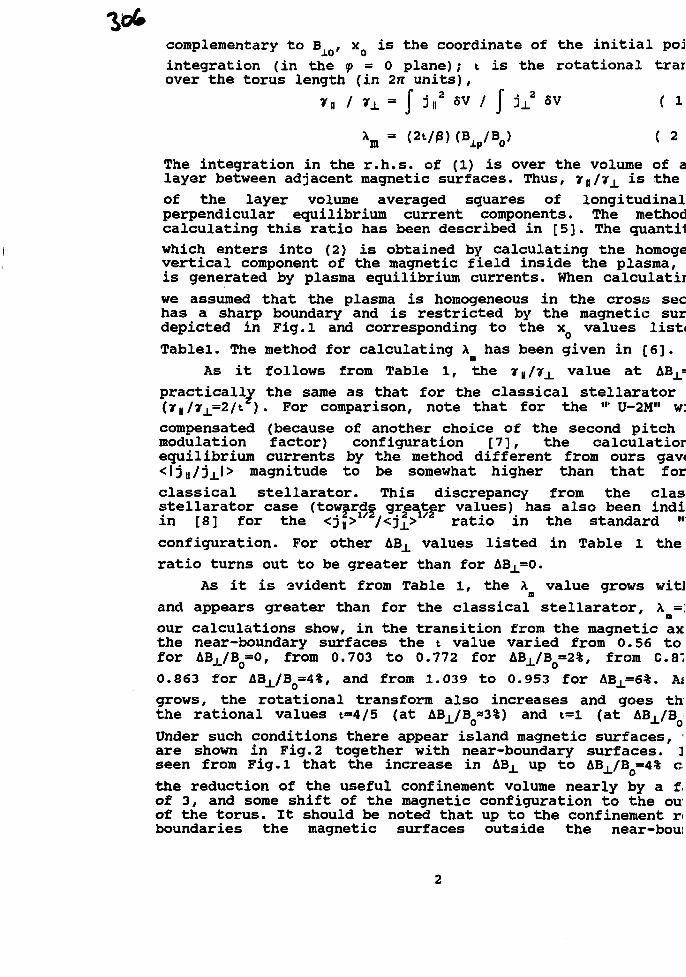
complementary to B , x is the coordinate of the initial poi
integration (in the ip = 0 plane); t is the rotational trarover the torus length (in 2rr units),
*a / r± - J Jn2 «v / J j ±2 SV ( l
\ = (2t/p)(Bxp/Bo) ( 2
The integration in the r.h.s. of (1) is over the volume of alayer between adjacent magnetic surfaces. Thus, 7ra/7± is the
of the layer volume averaged squares of longitudinalperpendicular equilibrium current components. The methodcalculating this ratio has been described in [5]. The quantii
which enters into (2) is obtained by calculating the homogevertical component of the magnetic field inside the plasma,is generated by plasma equilibrium currents. When calculatii
we assumed that the plasma is homogeneous in the cross, sechas a sharp boundary and is restricted by the magnetic surdepicted in Fig.l and corresponding to the xQ values list*
Tablel. The method for calculating A. has been given in [6].II
As it follows from Table 1, the 7|/7j_ value at ABX=practically the same as that for the classical stellarator(rM/7j_=2/t ) • For comparison, note that for the "" U-2M" w:compensated (because of another choice of the second pitchmodulation factor) configuration [7], the calculatiorequilibrium currents by the method different from ours gav<<|jH/jjJ> magnitude to be somewhat higher than that for
classical stellarator. This discrepancy from the classtellarator case (towards greater values) has also been indiin [8] for the <jj> /<j£> ratio in the standard ••
configuration. For other LB± values listed in Table 1 the
ratio turns out to be greater than for ABX=O.
As it is evident from Table 1, the A value grows wit!D
and appears greater than for the classical stellarator, X =our calculations show, in the transition from the magnetic axthe near-boundary surfaces the t value varied from 0.56 tofor ABj_/Bo=0, from 0.703 to 0.772 for AB±/BQ=2%, from C.8"
0.863 for ABJL/B0=4%, and from 1.039 to 0.953 for ABX=6%. As
grows, the rotational transform also increases and goes ththe rational values t=4/5 (at AB^/B »3%) and t=l (at ABX/B
Under such conditions there appear island magnetic surfaces,are shown in Fig.2 together with near-boundary surfaces. ]seen from Fig.l that the increase in ABj_ up to ABX/B =4% c
the reduction of the useful confinement volume nearly by a fof 3, and some shift of the magnetic configuration to the ouof the torus. It should be noted that up to the confinement r<boundaries the magnetic surfaces outside the near-bou:
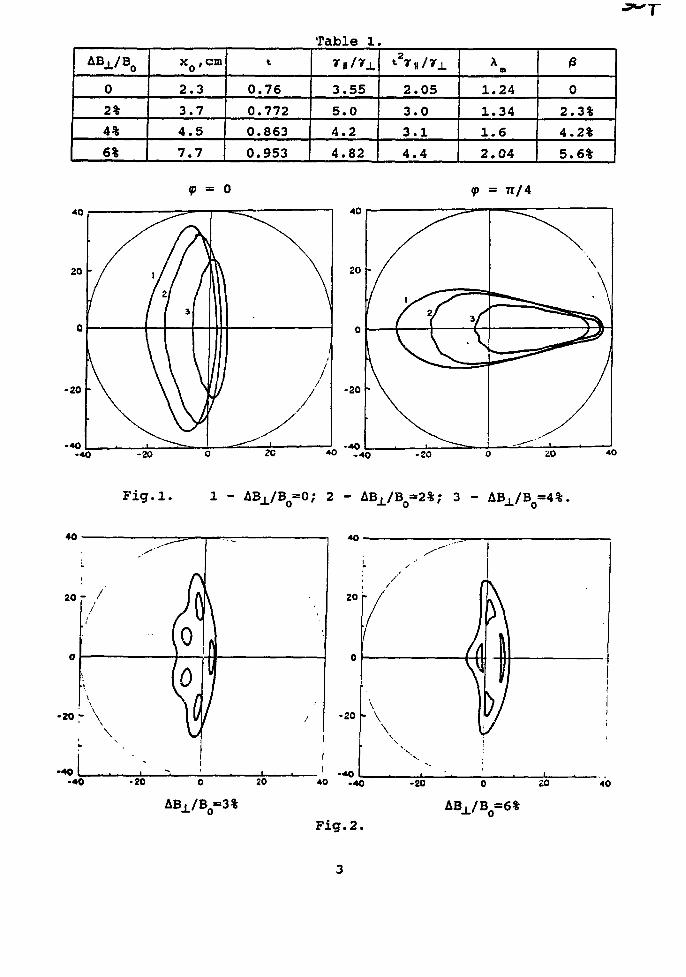
ABX/B0
0
2%
4%
6%
2
3
4
7
o ' c m
. 3
. 7
. 5
.7
0
0
0
0
t
. 7 6
.772
.863
.953
Table 1
3.555 . 0
4 . 2
4.82
9
2
3
3
4
. 0 5
. 0
. 1
. 4
1
1
1
2
An
. 2 4
. 3 4
. 6
. 0 4
/S
0
2 . 3 %
4 . 2 %
5.6%
<p = 0 7T/4
-40 -20
F i g . l . 1 - ABj_/B =0; 2 - ABX /B-2%; 3 - ABj_/B =4%.
4 0
20
0
•20
-40
/ 1kV
- \\ I
I7y
40 .40 -20 0 £0 40
ABX/BO=6%
F i g . 2 .
surfaces (Table 1, Figs.l and 2) were either the island surfaceswith a great number of small islands or had a stronglyinhomogeneous Vp distribution along the magnetic surface.
So far, the magnetic field AB_L has been treated as an
external field. Since in the magnetic field generated byequilibrium currents inside the plasma a significant role belongsits homogeneous vertical component, it is ot interest to estimateby the use of this component, the influence of the plasma pressureon the vacuum magnetic configuration. Taking the B± value listed
in Table 1 as ABj_, we can then treat the magnetic configurations
presented in Figs. 1 and 2 and Table l at ABX*O as configurations
without the ABj_ addition (i.e., at AB±=O) but in the presence of
the plasma with 0 generating B^ , the latter being equal to the
ABj_ value used in our calculations. Putting B± =ABX, we obtain
from (2) /S = (2t/A ) (ABi/BJ. The jS values, calculated in thisED ^^ 0
manner, are listed in the last column of Table 1. In view of theseestimates, the reduction of the vacuum magnetic configuration sizeunder the action of ABJL can be considered as a result of the
finite £ effect at ABX=O. From the estimate given it follows that
the presence of the homogeneous plasma with a free boundary andwith /3 - 4% to 6% leads to: (i) nearly a 3-fold reduction of theuseful confinement volume as compared with the initial vacuummagnetic configuration , (ii) a shift of the magneticconfiguration to the outside of the torus (Shafranov shift), and(iii) the appearance of island magnetic surfaces with t growing tot=4/5 or t=l. Note, that the reduction of the confinement volumein the presence of the free-boundary plasma in the "U-2M" isconfirmed by the calculations of [9]. From the estimates presentedit also follows that the mentioned effects due to the finite /3(magnetic configuration size reduction and island formation) canbe lessened to a certain extent by adding the external field ABj_
with such a direction that the field B would be compensated and
the configuration would shift inside the torus (i.e., by the useof Blo/Bo < 2.8%).
REFERENCES
[1] Chodura R.,et al.,IEEE Trans. Plasma Sci. Ps-9 (1981) 221.[2] Nemov V.V., Nucl. Fusion 28 (1988) 1727.[3] Bykov V.E., et al., Problems of Atomic Science and Technology,
Series: Thermonuclear Fusion, 2 (1988) 17 (in Russian)[4] Bykov V.E., Kuznetsov Yu.K,Pavlichenko O.S., et al, 13th Int.
Conf.on Plasma Phys.and Cont. Nucl. Fus.Res. Washington (1990)IAEA CN-53, Extended Synopses, p.p. 128-129.
[5] Nemov V.V. Preprint KhFTI 90-8, Kharkov, 1990 (in Russian).[6] Kalyuzhnuj V.N., Nemov V.V. 17th European Conf.on Cont.Fus. and
Plasma Heating, Amsterdam (1990),Part II p. 525.[7] Bykov V.E., et al., Rep. IPP2/301, Max-Plank-Institut fur
Plasmaphysik, Garching (1990).[8] Dominguez N., et al.,Rep.ORNL/TM-ll701,Oak Ridge Nat.Lab.(1990)[9] Shishkin A.A., et al., 15th Europ. Conf. on Cont. Fus. and
Plasma Heating, Dubrovnic (1988), Part II, p.p.478-481.
CI1PABKA OB
cnpaBKa ynocTOBepaeT, w o pyccKMfl H
T6KCTU AoiuaAa aBTopoB B.H.KajnoxHoro, B.B.HeuoBa "
nia3M6HHHx TOKOB paBHOsecHfl B TopcaTpoHe "yparaH-2M
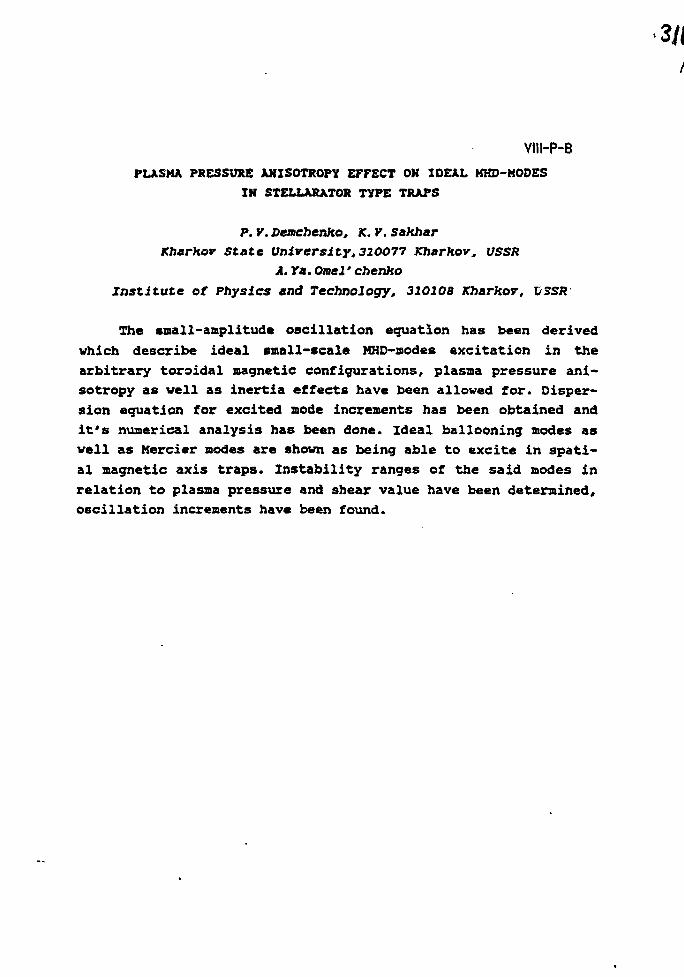
3/1
YIII-P-8PLASMA PRESSURE AXISOTROPY EFFECT OK IDEAL KHD-HODES
IH STELLAKATOR TYPE TRAPS
P.V.Demchenko, K.V.SakharKharkov State University, 320077 Kharkov, USSR
A.Ya.Omel' chenko
Institute of Physics and Technology* 310108 Kharkov, VSSR
The small-amplitude oscillation equation has been derived
which describe ideal snail-scale MHD-sodes excitation in the
arbitrary toroidal magnetic configurations, plasma pressure ani-
sotropy as well as inertia effects have been allowed for. Disper-
sion equation for excited aode increments has been obtained and
it's numerical analysis has been done. Ideal ballooning modes as
well as Hercier modes are shown as being able to excite in spati-
al magnetic axis traps. Instability ranges of the said modes in
relation to plasma pressure and shear value have been determined,
oscillation increments have been found.
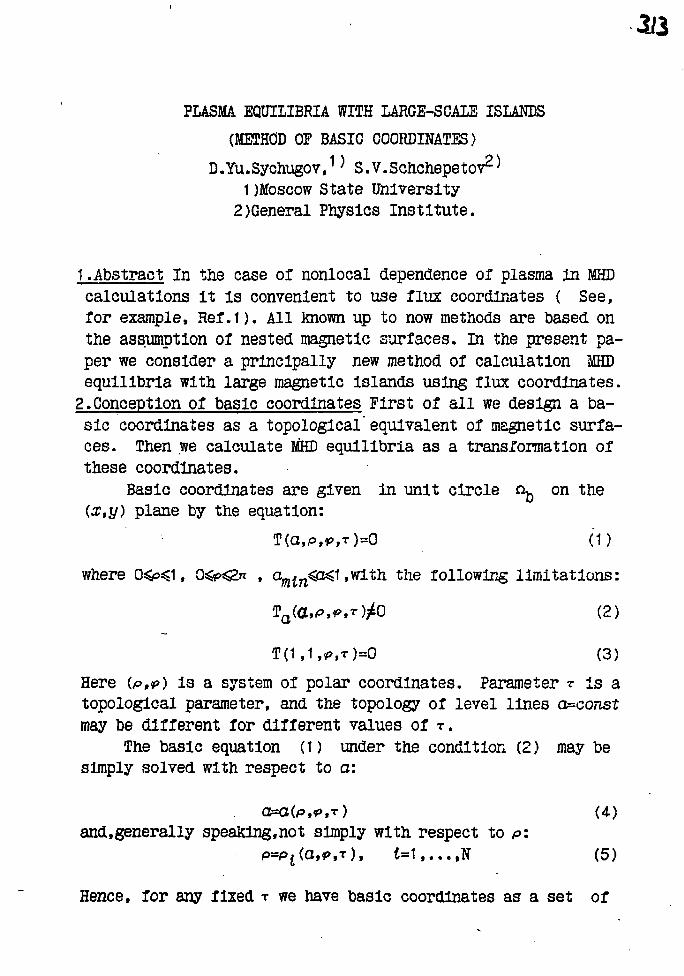
PLASMA EQUILIBRIA WITH LARGE-SCALE ISLANDS
(METHOD OP BASIC COORDINATES)
D. Yu. Sychugov, S. V. Schchepe tov2 1 )Moscow State University
2)General Physics Institute.
1 .Abstract In the case of nonlocal dependence of plasma In MHDcalculations It Is convenient to use flux coordinates ( See,for example, Ref.1). All known up to now methods are based onthe assumption of nested magnetic surfaces. In the present pa-per we consider a principally new method of calculation MHDequilibria with large magnetic Islands using flux coordinates.
2.Conception of basic coordinates First of all we design a ba-sic coordinates as a topologlcal'equivalent of magnetic surfa-ces. Then we calculate MHD equilibria as a transformation ofthese coordinates.
Basic coordinates are given in unit circle n^ on the(x,y) plane by the equation:
T(O,P,*>,T)=0 (1)
where 0<P^1 , 04s>^.n , amin<&&1 ,wlth the following limitations:
(2)
(3)
Here (P,*>) is a system of polar coordinates. Parameter T is atopological parameter, and the topology of level lines a^constmay be different for different values of T.
The basic equation (1) under the condition (2) may besimply solved with respect to a:
(4)and.generally speaking.no t simply with respect to P:
, t=t , . . . ,N (5)
Hence, for any fixed T we have basic coordinates as a set of
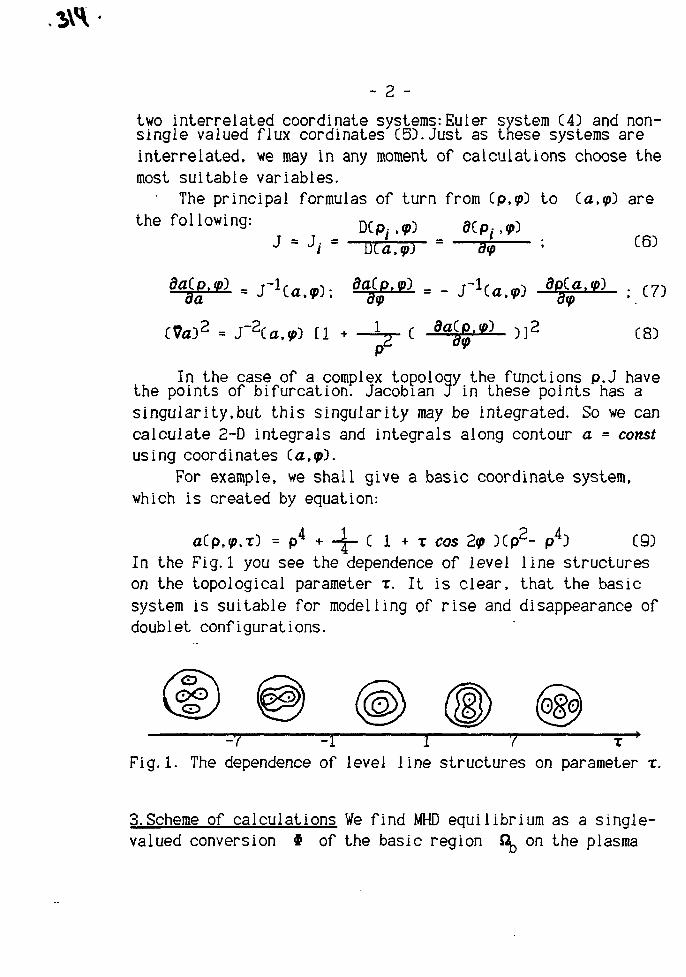
- 2 -
two interrelated coordinate systems: Euler system (4) and non-single valued flux cordinates (5D.Just as these systems areinterrelated, we may in any moment of calculations choose themost suitable variables.
• The principal formulas of turn from Cp.gO to Ca.gO arethe following: DCp,.»3 flCp,.»)
~ Ji Dia.tp) Wp
_1
In the case of a complex topology the functions p,J havethe points of bifurcation. Jacobian J in these points has asingularity.but this singularity may be integrated. So we cancalculate 2-D integrals and integrals along contour a = constusing coordinates (.a.qti.
For example, we shall give a basic coordinate system,which is created by equation:
aCp.y.xD = p 4 + -jp C 1 + x cos 2<p X p 2 - p43 (9}In the Fig.1 you see the dependence of level line structureson the topological parameter T. It is clear, that the basicsystem is suitable for modelling of rise and disappearance ofdoublet configurations.
=7 =1 I 7 T ^
Fig.1. The dependence of level line structures on parameter T.
3.Scheme of calculations We find MHD equilibrium as a single-valued conversion # of the basic region Q^ on the plasma
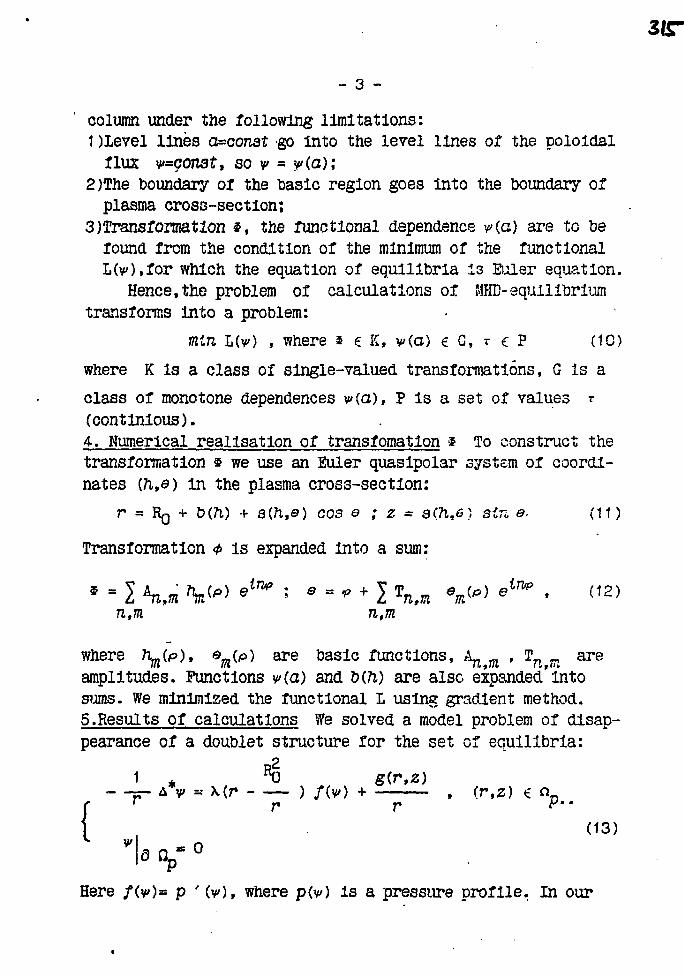
— 3 —
column under the following limitations:1)level lines a=conat go Into the level lines of the poloidalflux v=co7i3t, so v = y(o);
2)The boundary of the basic region goes Into the boundary ofplasma cross-section;
3)Transformation s, the functional dependence v(a) are to befound from the condition of the minimum of the functionalL(y),for which the equation of equilibria is Euler equation.
Hence,the problem of calculations of MHD-equilibriumtransforms into a problem:
min L(y) , where a c K, v(a) € G, T C P (10)
where K is a class of single-valued transformations, G is a
class of monotone dependences y(a), P is a set of values r(contlnious).4. Numerical realisation of transfomatlon $ To construct thetransformation s we use an Euler quasipolar system of coordi-nates (7i,0) in the plasma cross-section:
r = Rg + b(7i) + s{h,&) cos o ; z = a(h,6) sir,, e. (U)
Transformation 4> is expanded into a sum:
n,m n, M
where \(P)* %^^ are basic functions, k^ m , Tn m areamplitudes. Functions y(a) and b(ft) are also expanded'intosums. We minimised the functional L using gradient method.5.Results of calculations We solved a model problem of disap-pearance of a doublet structure for the set of equilibria:
1 * R0 gir,z)- -=- * v - Mr ) /(v) + , (r,z) a a
, T r r p..( (13)
Is v °Here /(v)= p ' (v), where p(v) is a pressiu e profile. In our
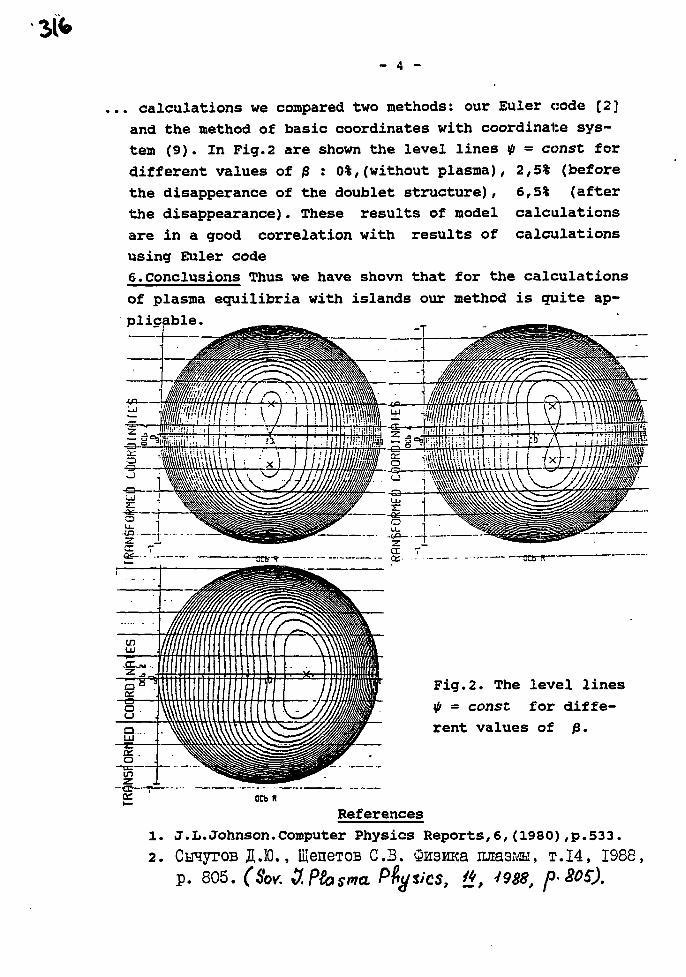
- 4 -
. calculations we compared two methods: our Euler code [2]
and the method of basic coordinates with coordinate sys-
tem (9). In Fig.2 are shown the level lines t(i = const for
different values of 0 : 0%,(without plasma), 2,5% (before
the disapperance of the doublet structure),
the disappearance). These results of model
are in a good correlation with results of
using Euler code
6.Conclusions Thus we have shovn that for the calculations
of plasma equilibria with islands our method is quite ap-
plicable.
6,5% (after
calculations
calculations
O 'iill W Mi : |
Fig.2. The level lines
= const for diffe-
rent values of /3.
OCb R
References
1. J.L.Johnson.Computer Physics Reports,6,(1980),p.533.
2. CwiyroB £.10., UleneTOB C.3. 3z3HKa njia3MH, T . I 4 , 1988,p. 805. (Sov. ttPtasma Pfysics, # , V9^ p-80S).
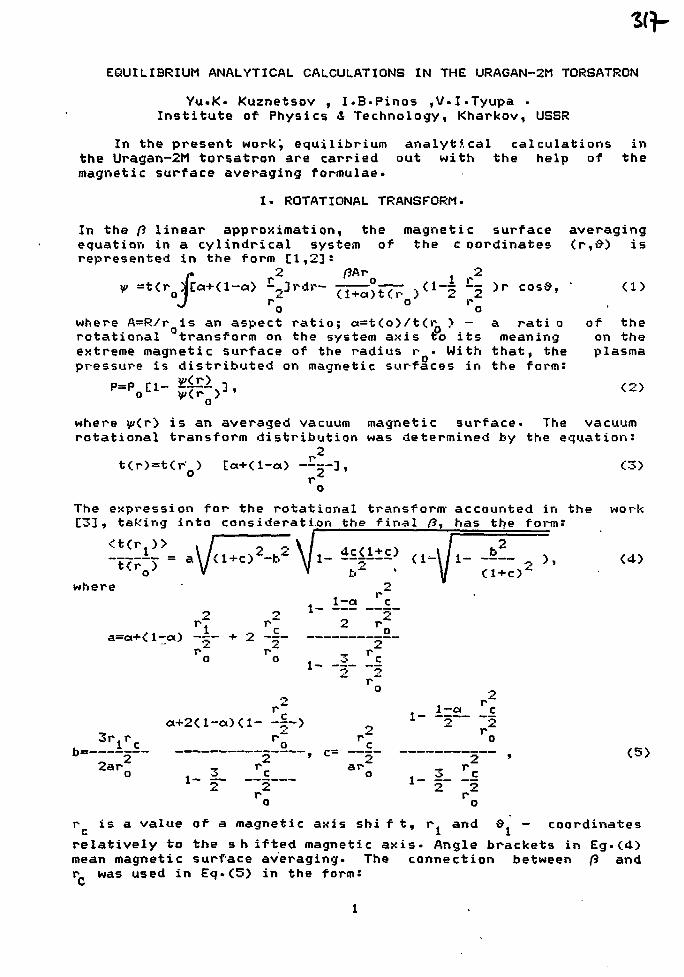
EQUILIBRIUM ANALYTICAL CALCULATIONS IN THE URAGAN-2M TORSATRON
Yu.K« Kuznetsov , I.B-Pinos ,V.I.Tyupa .Institute of Physics & Technology, Kharkov, USSR
In the present workj equilibrium analytical calculations inthe Uragan-2M torsatron are carried out with the help of themagnetic surface averaging formulae*
I- ROTATIONAL TRANSFORM-
In the ft linear approximation, the magnetic surface averagingequation in a cylindrical system of the c oordinates <r,$) isrepresented in the form [1,2]:
f 2 ftbr JZW = t ( r JlCo+d-a) -«Drdr- — ?IT~ v^1"^ ~o > r cosd, " <1>
oj 2 (I +c» ) t C r } 2 2J r or" o o
where A=R/r is an aspect ratio; a=t<o)/t<^ > — a rati o of therotational transform on the system axis to its meaning on theextreme magnetic surface of the radius r • With that, the plasmapressure is distributed on magnetic surfaces in the form:
where v<^> is an averaged vacuum magnetic surface- The vacuumrotational transform distribution was determined by the equation:
Ur> tO o> a-Kl-a> j ],
o
The expression for the rotational transform" accounted in the workC33, taking into consideration the final ft, has the form:
where " 2. r
i_ ±12 _£_
r2 % 2 ";~ ; 2 "O O _3_ _£
2 2r
-cXl- -|-> 2 x 2 r2
b !,£_ _._o._? c= __c „
u t 3 £ O O_ _ C2~ 2 J 2 2
ro ro
r is a value of a magnetic axis shi f t, r and & - coordinates
relatively to the sh ifted magnetic axis- Angle brackets in Eg-<4)mean magnetic surface averaging. The connection between ft andr was used in Eq-<5) in the form:c
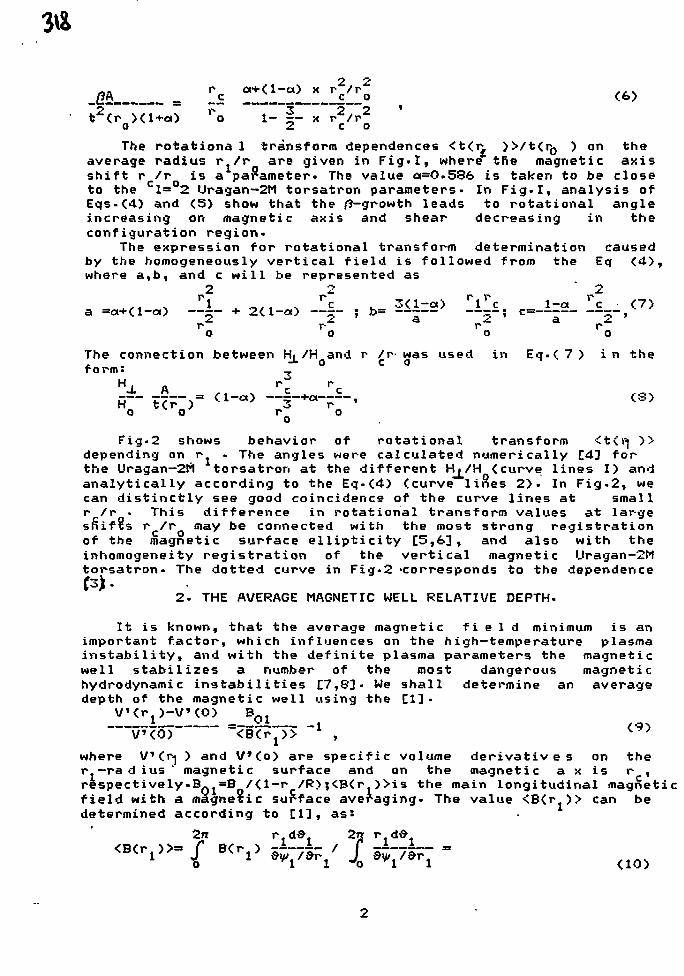
_^__r , 3 2,2 'o 1- r- x r /ra 2 c o
The rotational transform dependences <t(r. >>/t(r0 ) on theaverage radius r./\- are given in Fig. I, where tne magnetic axisshift r /r- is a parameter. The value ot=O-536 is taken to be closeto the cl-°2 Uragan—2M torsatron parameters. In Fig.I, analysis ofEqs.(4) and (5) show that the /3-growth leads to rotational angleincreasing on magnetic axis and shear decreasing in theconfiguration region-
The expression for rotational transform determination causedby the homogeneously vertical field is followed from the Eq (4>,where a,b, and c will be represented as
r2 r2 r r ' r2
1 «,« v c . 3(l-ct> 1 c l-a c (7)a =a+(l-cO — — + 2(1-«> —-- ; b= —x-; c= — " »r2 r2 a r^ a r2
o o o oThe connection between Hi /H and r /r - was used in Eq-< 7 > i n the. •— o c oform: _
H t ? >o o r oo
Fig.2 shows behavior of rotational transform <t<F| )>depending on r . The angles were calculated numerically r4D forthe Uragan—2rt torsatron at the different Hi/H (curve lines I) andanalytically according to the Eq.<4> (curve lines 2). In Fig.2, wecan distinctly see good coincidence of the curve lines at smallr /r . This difference in rotational transform values at largesfiif s r /r may be connected with the most strong registrationof the magnetic surface ellipticity [5,63, and also with theinhomogeneity registration of the vertical magnetic Uragan-2Mtorsatron. The dotted curve in Fig-2 'Corresponds to the dependence
C3) •2- THE AVERAGE MAGNETIC WELL RELATIVE DEPTH.
It is known, that the average magnetic fi e1 d minimum is animportant factor, which influences on the high—temperature plasmainstability, and with the definite plasma parameters the magneticwell stabilizes a number of the most dangerous magnetichydrodynamic instabilities 17,81- We shall determine an averagedepth of the magnetic well using the Cll•
V'(O) <B(r1)> , ^ "
where V*(r-j > and V*(o) are specific volume derivatives on ther.-radius ' magnetic surface and on the magnetic a x is r ,respectively.B- =B /(1-r /R>;<B(r1>>is the main longitudinal magneticfield with a magnetic surface averaging. The value <B(rt)> can bedetermined according to £1], as:
2n
*V*rl (10)
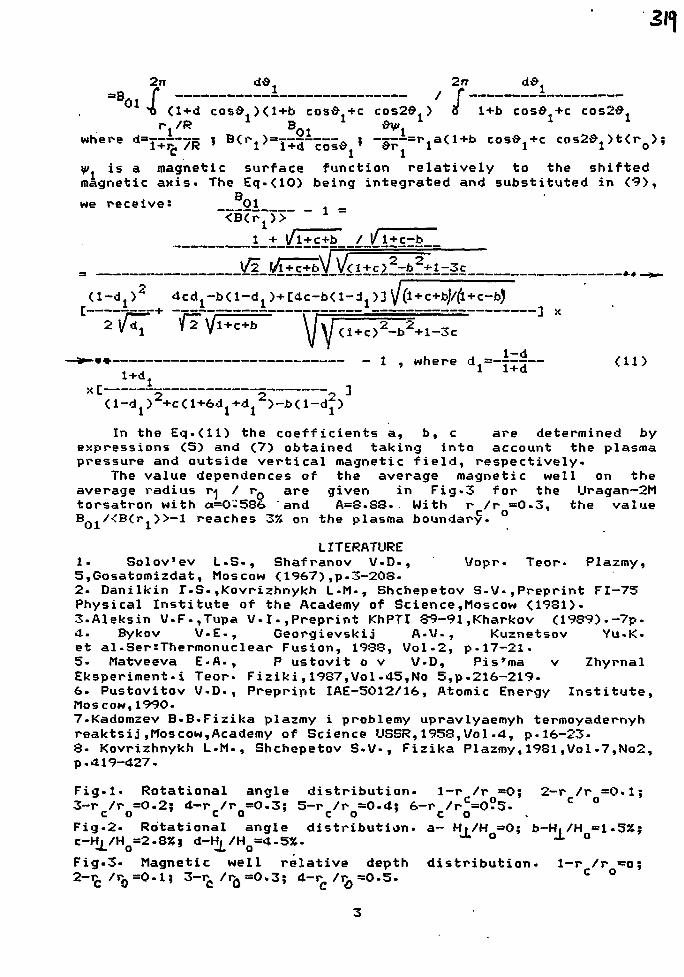
2n " i ^ * " *^i
_B r / fT> <l+d cosS.Xl+b cosdj + c C0S2&.) o 1+b cosSj+c
r,/R B. v*. *where ^"Y^fTg 5 ®^ri ^=T+d~cosd ' ~ 5 ~ = r l a ^ 1 + b COS:&i+c cos2^1>t<rQ);
C 1 1\f1 is a magnetic surface function relatively to the shiftedmagnetic axis. The Eq.(lO) being integrated and substituted in <9),
Bwe receives 01 _ _ _~<B<r >>
1 + l/l+c+b / |/l+c-b
*-#.
<l+c)2-b2+l-3c
In the Eq-Cll) the coefficients a, b, c are determined byexpressions <5> and <7> obtained taking into account the plasmapressure and outside vertical magnetic field, respectively*
The value dependences of the average magnetic well on theaverage radius r-j / r_ are given in Fig.3 for the Uragan—2Mtorsatron with a=0'-'S8b and A=8-83. With r /r =0.3, the valueB /<B<r1>>-l reaches 3% on the plasma boundary. °
LITERATURE1. Solov'ev L.S-, Shafranov V-D-, V/opr. Teor- Plazmy,5,Gosatomizdat, Moscow <1967),p.3-20S-2- Danilkin T-S-,Kovrizhnykh L-M-, Shchepetov S-V-,Preprint FI—75Physical Institute of the Academy of Science,Moscow (1981)•3-Aleksin V-F-,Tupa V-I.,Preprint KhPTI 89-91.Kharkov <1989>.-7p.4. Bykov V-E-, Georgievskij A-V., Kuznetsov Yu.K.et al-SersThermonuclear Fusion, 1988, Vol.2, p.17-21.5. Matveeva E-A., P ustovit o v V.D, Pis'ma v ZhyrnalEksperiment.i Teor- Fiziki,1987,Vol.45,No 5,p.216-219-€>. Pustovitov V-D-, Preprint IAE-5012/16, Atomic Energy Institute,Moscow,1990-7-Kadomzev B.B.Fizika plazmy i problemy upravlyaemyh termoyadernyhreaktsij,Moscow,Academy of Science USSR,1958,Vol.4, p.16-23-8- Kovrizhnykh L-M-, Shchepetov S-V/. , Fizika Plazmy, 1981,Vol-7,No2,p.419-427.
Fig.l. Rotational angle distribution- 1-r /r =0; 2-r /r =0.1;3-r /r =0-2; 4-r /r =0.3: 5-r /r =0-4; 6-r /rc=0?5- c °
C O C O C O C OFig.2- Rotational angle distribution- a- Hi/H =0; b-Hi/H =1-5JJ;c-Hi /H =2.8%; d-H, /H =4-5»- ° -t- o
-*- o J. oFig.3- Magnetic well relative depth distribution. 1-r /r =o;2-r, /r0 =0.1; 3-r,/rfl=0.3; 4-^/^=0-5-
C °
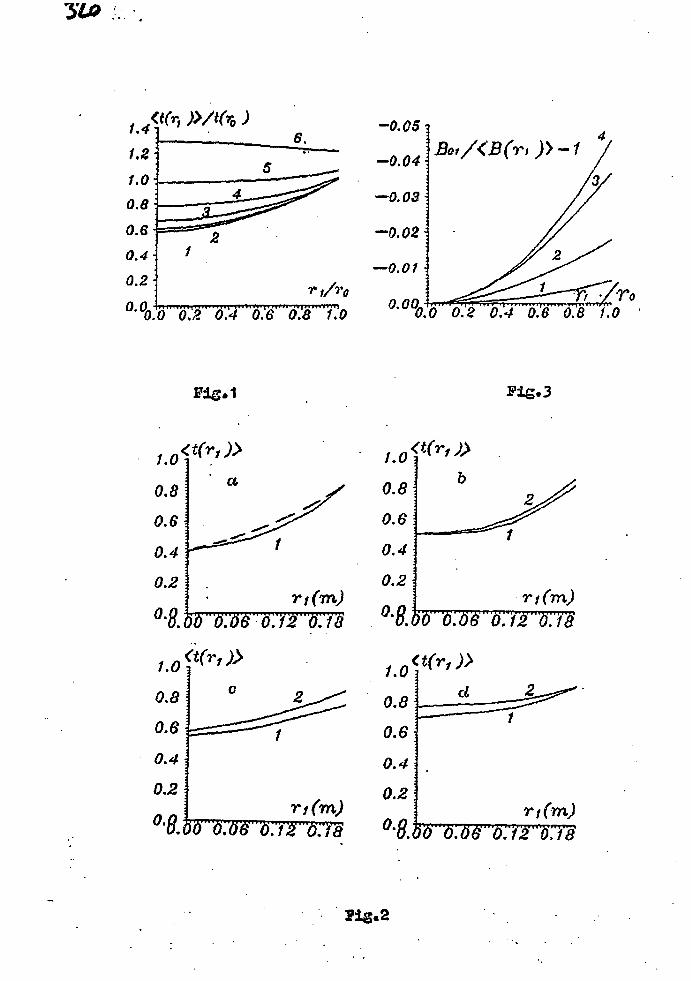
r t/r0
'• uo:o ' " W 0 . 4 • 0 : 6 ""d'.'6""i'.'o0.0,
-0.Q5
-0.04
°'00ot
Bot/<B(r, )>-
'0.0 0.2 0.'4 O.'B 0.8 f.O
°-8.bo 0.06 0.12 OJS
DYNAMIC OF LONGITUDINAL CURRENT IN THE URAGAN-3 TORSATRON
Yu.V.Gutarev, V.K.Pashnev
Institute of Physics and Technology,Kharkov
V.D.Pustovitov
Institute of Atomic Energy, Moscov.
Abstract. The analysis of dynamic of longitudinal current inthe Uragan-3 is presented. It was found,that in the dynami-cal stage of discharge,additionally to known currents, thecurrent,which is proportionalto poloidal magnetic flux,isexcited. This effect requires oftheoretical explanation.
A longitudinal unidirectional current (up to 2 kA) have
been observed [1,2] in the Uragan-3 torsatron [3] during RF
plasma heating alone without any externally applied electromot-
ive forces. Functional dependences of this current from plasma
and magnetic field parameters have been carefully investigated
It was earlier shown,that in stationary part of discharge
in the collisionless regime the observed current can be ident-
ified as a bootstrap one [4]. The RF-current drive mechanism
is expected to be vanished in our experimental conditions.
In order to describe the dynamic of bootstrap current we
used the electrotechnical equation
e=L x dI/dt+R*I (1)
e=I_ x R* B
where L and R -plasma inductance and resistance, respectivel-
ly, IQ -bootstrap current, calculated in accordance with theory
results [5],
1/2 f {neTe + niTi> 1/2In - -47TCR
1'2 A(r) - e - e — - f - 1 - r1'2 dr , (3)
0B_=* confined magnetic field, t - rotational transform angle,
the coefficient A(r) depends upon characteristics of magnetic
field. Typical time behavior of main plasma parameters are
shown in Fig.l.
The time behavior of longitudinal plasma current,I, and
poloidal magnetic flux,$,measured by dipole saddle-type ^-coil
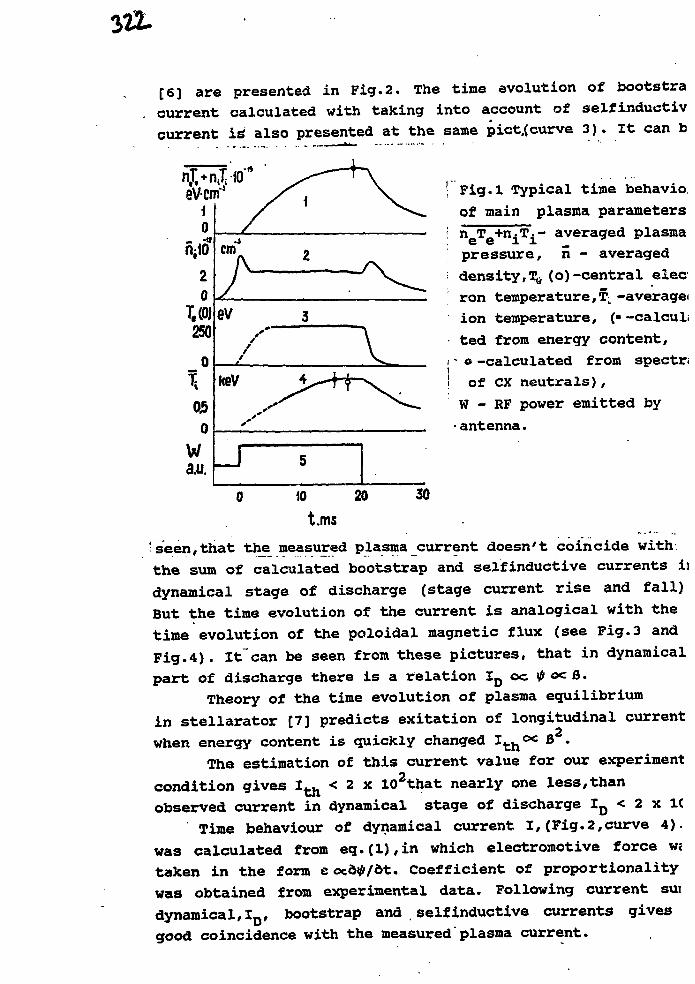
322-
[6] are presented in Fig.2. The time evolution of bootstra
current calculated with taking into account of selfinductiv
current is also presented at the same pict.(curve 3). It can b
Fig.l Typical time behavio:
of main plasma parameters
n T +n.T.- averaged plasma6 6 11 M
pressure, n - averaged
density,^ (o)-central elec
ron temperature,Tt -averagei
ion temperature, (• -calculi
ted from energy content,
- ©-calculated from spectr;
of CX neutrals),
W - RF power emitted by
• antenna.
; seen,that the measured plasma current doesn't coincide with
the sum of calculated bootstrap and selfinductive currents ii
dynamical stage of discharge (stage current rise and fall)
But the time evolution of the current is analogical with the
time evolution of the poloidal magnetic flux (see Fig.3 and
Fig.4). Itcan be seen from these pictures, that in dynamical
part of discharge there is a relation I D oc tf oc a.
Theory of the time evolution of plasma equilibrium
in stellarator [7] predicts exitation of longitudinal current
when energy content is quickly changed ^tiloc 6 •
The estimation of this current value for our experiment
condition gives I t h < 2 x 10²that nearly one less,than
observed current in dynamical stage of discharge I D < 2 x 1C
Time behaviour of dynamical current I,(Fig.2,curve 4).
was calculated from eq.(l),in which electromotive force wi
taken in the form c ocd^/dt. Coefficient of proportionality
was obtained from experimental data. Following current sui
dynamical,ID, bootstrap and selfinductive currents gives
good coincidence with the measured plasma current.
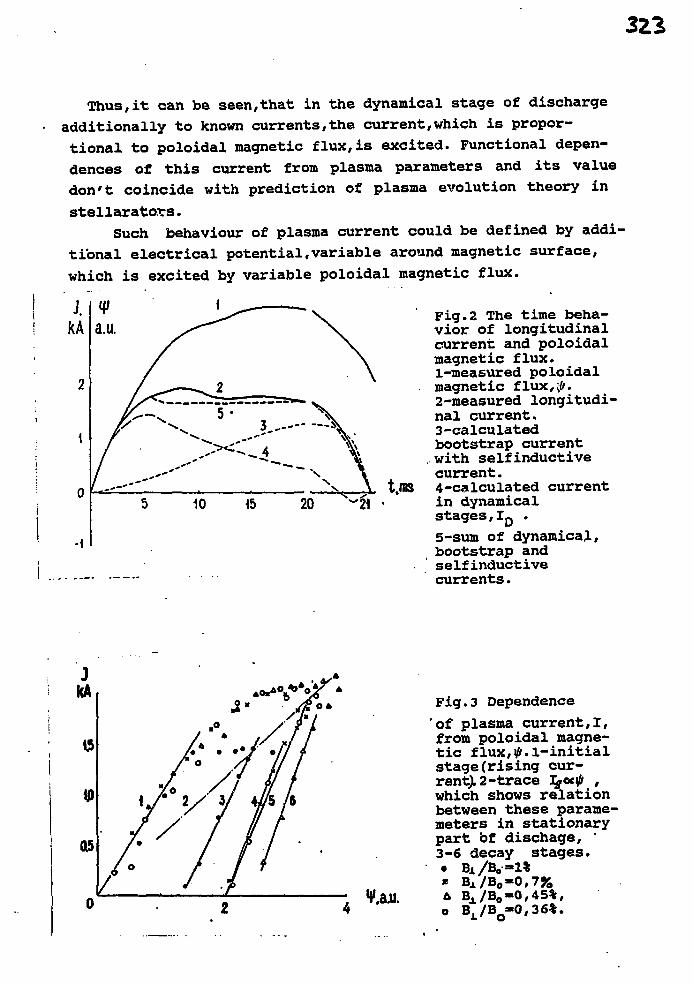
322
Thus,it can be seen,that in the dynamical stage of discharge
additionally to known currents,the current,which is propor-
tional to poloidal magnetic flux,is excited. Functional depen-
dences of this current from plasma parameters and its value
don't coincide with prediction of plasma evolution theory in
stellarators.
Such behaviour of plasma current could be defined by addi-
tional electrical potential,variable around magnetic surface,
which is excited by variable poloidal magnetic flux.
J.kA
-1
a*
/
5
/
10
\
2—5-
* *~
^-
^^
15
\
A3. X
^ ~ \ \20 ^i\
t.ms
Fig.2 The time beha-vior of longitudinalcurrent and poloidalmagnetic flux.1-measured poloidalmagnetic flux,j&-2-measured longitudi-nal current.3-calculatedbootstrap currentwith selfinductivecurrent.4-calculated currentin dynamicalstages,ID .
5-sum of dynamical,bootstrap andselfinductivecurrents.
JkA Fig.3 Dependence
'of plasma current,I,from poloidal magne-t ic flux,0.1-initialstage(rising cur-rent). 2 -trace JgOClfl ,which shows relationbetween these parame-meters in stationarypart of dischage, '3-6 decay stages.
/ %« B x /B 0 0 ,7%A Bj.ZBo-0,45%,o B /B »0,36%.
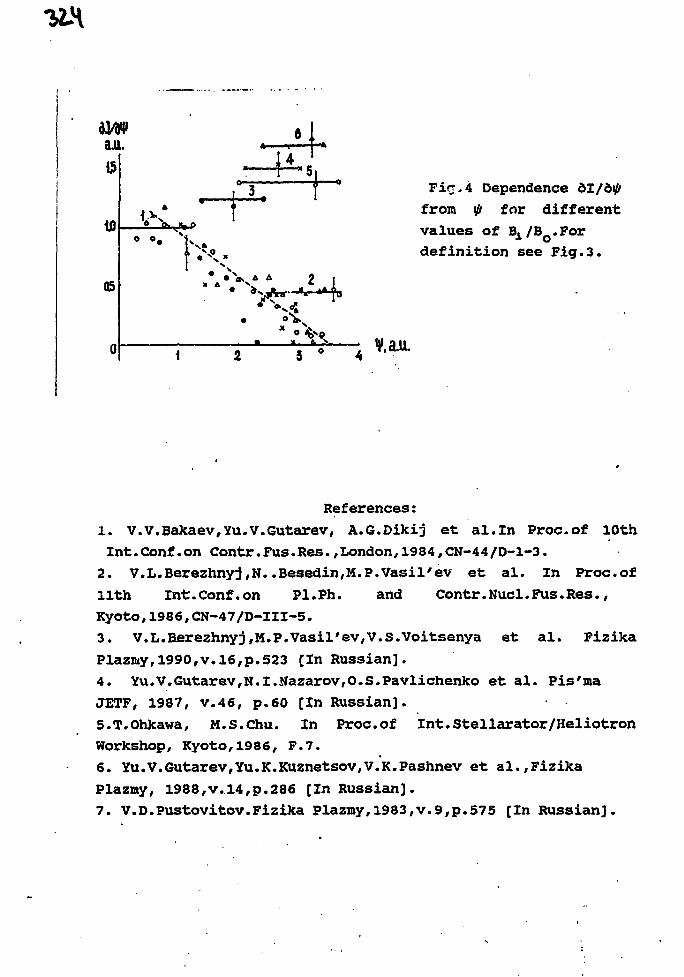
a.u.
^afinc
"JL
\ ' *• 2 i
Fir,4 Dependencefrom \& for differentvalues of BA/B .Fordefinit ion see Fig.3 .
¥.a.u.
References:
1. V.V.BakaevrYu.V.Gutarev, A.G.Dikij et al.ln Proc-of 10th
Int.Conf.on Contr.Fus.Res.,London,1984,CN-44/D-1-3.
2. V.L.Berezhnyj,N..Besedin,M.P.Vasil'ev et al. In Proc.of
1 lth Int.Conf.on PI.Ph. and Contr.Nucl.Fus.Res.,
Kyoto,1986,CN-47/D-III-5.
3. V.L.Berezhnyj,M.P.Vasil'ev,V.S.Voitsenya et al. Fizika
Plazmy,1990,v.l6,p.523 [In Russian].
4. Yu.V.Gutarev,N. I. Nazarov,O.S. Pavlichenko et al. Pis'ma
JETF, 1987, v.46, p.60 [In Russian].
S.T.Ohkawa, M.S.Chu. In Proc.of Int.Stellarator/Heliotron
Workshop, Kyoto,1986, F.7.
6. Yu.V.Gutarev,Yu.K.Kuznetsov,V.K.Pashnev et al.,Fizika
Plazmy, 1988,v.l4,p.286 [In Russian].
7. V.D.Pustovitov.Fizika Plazmy,1983,v.9,p.575 [In Russian].
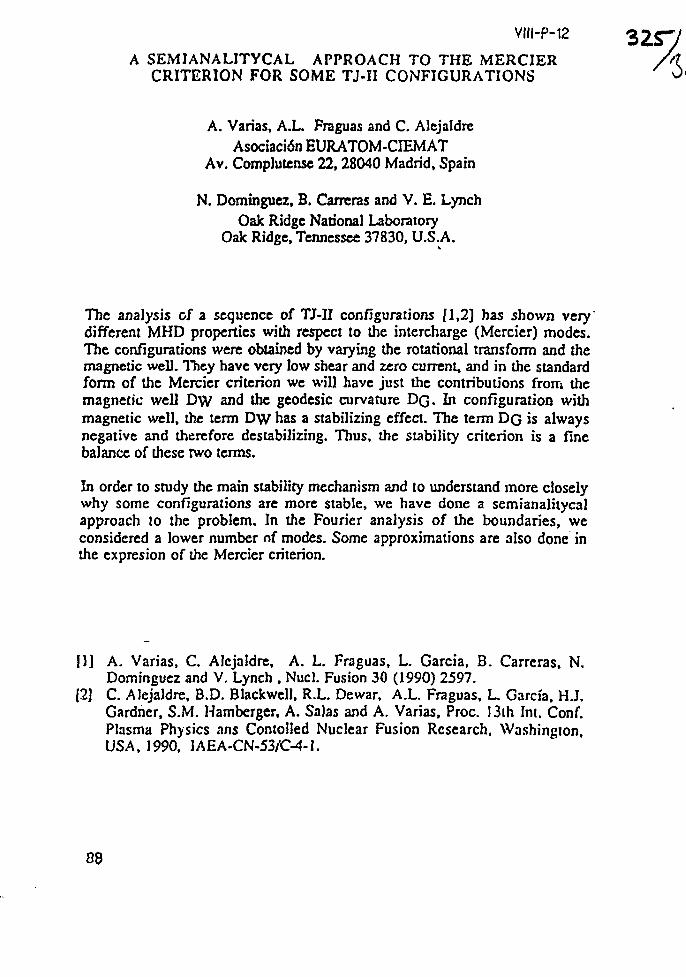
VIII-P-12
A SEMIANALITYCAL APPROACH TO THE MERCIERCRITERION FOR SOME TJ-II CONFIGURATIONS
A. Varias, A.L. Fraguas and C. AJejaldrcAsociacidn EURATOM-CIEMAT
Av. CompJutensc 22,28040 Madrid, Spain
N. Domingucz, B. Cameras and V. E. LynchOak Ridge National Laboratory
Oak Ridge, Tennessee 37830, U.S.A.
The analysis of a sequence of TJ-II configurations [1,2] has shown verydifferent MHD properties with respect to the intercharge (Mercier) modes.The configurations were obtained by varying the rotational transform and themagnetic well. They have very low shear and zero current, and in the standardform of the Mcrcier criterion we will have just the contributions from themagnetic well Dw and the geodesic curvature DG- In configuration withmagnetic well, the term D\V has a stabilizing effect. The term DG is alwaysnegative and therefore destabilizing. Thus, the stability criterion is a finebalance of these two terms.
In order to study the main stability mechanism and to understand more closelywhy some configurations are more stable, we have done a semianalitycalapproach to the problem. In the Fourier analysis of the boundaries, weconsidered a lower number of modes. Some approximations are also done inthe expresion of the Mercier criterion.
II] A. Varias, C. Alcjaldrc, A. L. Fraguas, L. Garcia, B. Carreras, N.Dominguez and V. Lynch , Nucl. Fusion 30 (1990) 2597.
(2] C. Alejaldre, B.D. Blackwell, R.L. Dewar, A.L. Fraguas, L. Garcia, H.J.Gardner, S.M. Hamberger, A. Salas and A. Varias, Proc. 13ih Int. Conf.Plasma Physics ans Contolled Nuclear Fusion Research, Washington,USA, 1990, 1AEA-CN-53/C-4-1.
88
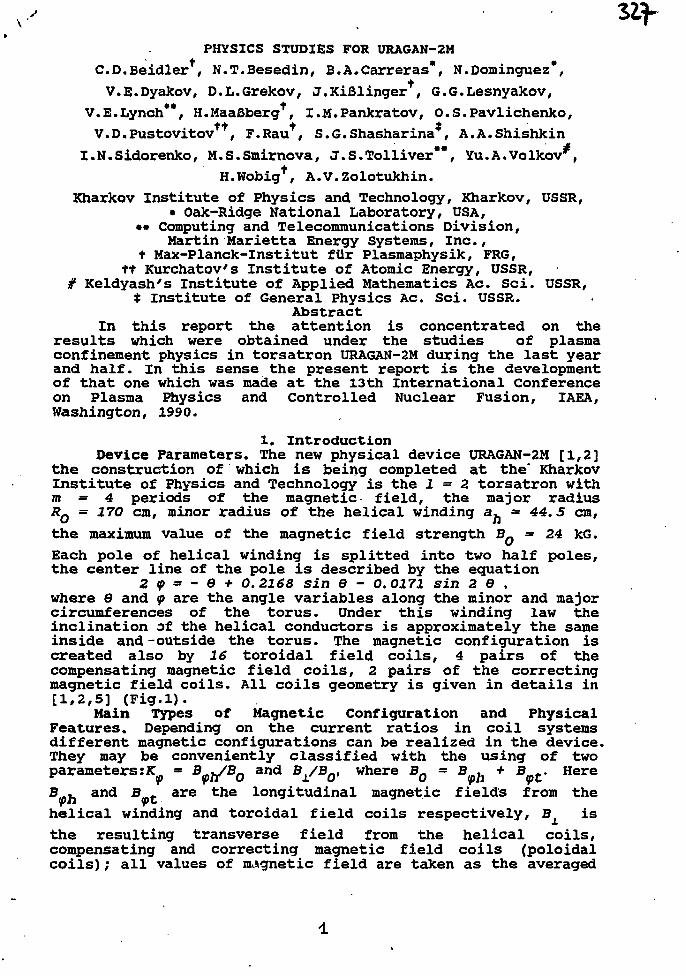
\'
PHYSICS STUDIES FOR URAGAN-2M
C.D.Beidler , N.T.Besedin, B.A.Carreras*, N.Dominguez*,
V.E.Dyakov, D.L.Grekov, J.KiBlinger , G.G.Lesnyakov,
V.E.Lynch**, H.MaaBberg+, I.M.Pankratov, O.S.Pavlichenko,
V.D.Pustovitov , F.Rau , S.G.Shasharina , A.A.Shishkin
I.N.Sidorenko, M.S.Smirnova, J.S.Tolliver**, Yu.A.Volkov ,
H.Wobig*, A.V.Zolotukhin.Kharkov Institute of Physics and Technology, Kharkov, USSR,
• Oak-Ridge National Laboratory, USA,•• Computing and Telecommunications Division,
Martin Marietta Energy Systems, Inc.,t Max-Planck-Institut fur Plasmaphysik, FRG,
tt Kurchatov's Institute of Atomic Energy, USSR,# Keldyash's Institute of Applied Mathematics Ac. Sci. USSR,
t Institute of General Physics Ac. Sci. USSR.Abstract
In this report the attention is concentrated on theresults which were obtained under the studies of plasmaconfinement physics in torsatron URAGAN-2M during the last yearand half. In this sense the present report is the developmentof that one which was made at the 13th International Conferenceon Plasma Physics and Controlled Nuclear Fusion, IAEA,Washington, 1990.
1. IntroductionDevice Parameters. The new physical device URAGAN-2M [1,2]
the construction of which is being completed at the' KharkovInstitute of Physics and Technology is the 1=2 torsatron withm = 4 periods of the magnetic field, the major radiusRQ = 170 cm, minor radius of the helical winding a^ - 44.5 cm,
the maximum value of the magnetic field strength BQ = 24 kG.
Each pole of helical winding is splitted into two half poles,the center line of the pole is described by the equation
2 <p => - 9 + 0.2168 sin 9 - 0.0171 sin 2 9 ,where 9 and <f> are the angle variables along the minor and majorcircumferences of the torus. Under this winding law theinclination of the helical conductors is approximately the sameinside and-outside the torus. The magnetic configuration iscreated also by 16 toroidal field coils, 4 pairs of thecompensating magnetic field coils, 2 pairs of the correctingmagnetic field coils. All coils geometry is given in details in[1,2,5] (Fig.l).
Main Types of Magnetic Configuration and PhysicalFeatures. Depending on the current ratios in coil systemsdifferent magnetic configurations can be realized in the device.They may be conveniently classified with the using of twoparameters:^ - ^ 0 and BL/BQ, where BQ = B^ + B^. Here
B . and B £ are the longitudinal magnetic fields from the
helical winding and toroidal field coils respectively, B is
the resulting transverse field from the helical coils,compensating and correcting magnetic field coils (poloidalcoils); all values of magnetic field are taken as the averaged
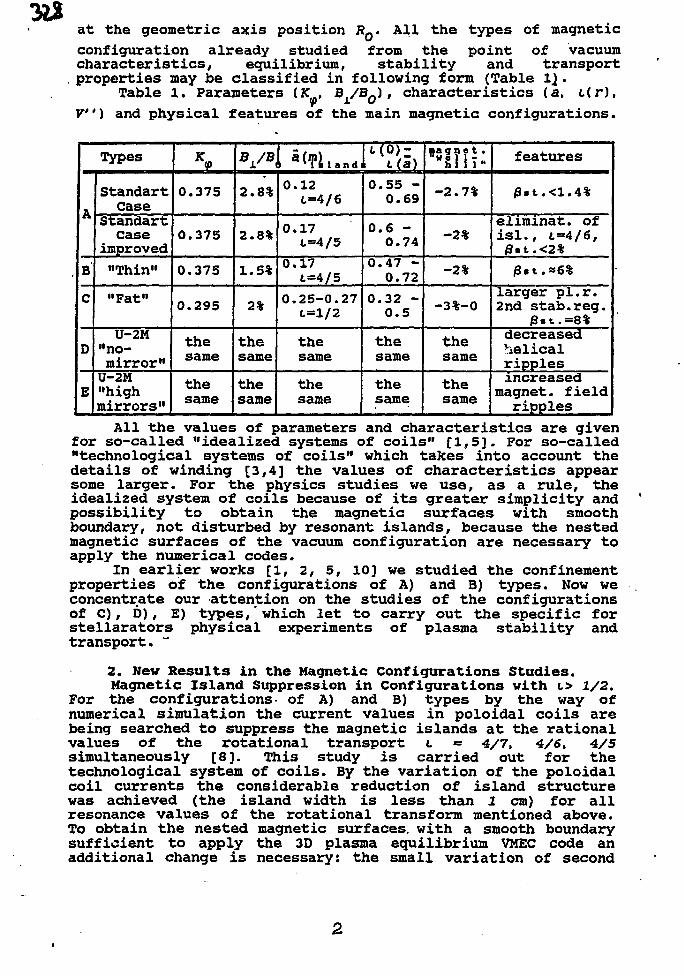
at the geometric axis position RQ. All the types of magnetic
configuration already studied from the point of vacuumcharacteristics, equilibrium, stability and transport
. properties may be classified in following form (Table lj.Table 1. Parameters (K. BX/BQ), characteristics (a, c(r),
V") and physical features of the main magnetic configurations.
Types
A
B
c
D
E
StandartCase
StandartCase
improved
"Thin"
"Fat"
U-2M••no-mirror"U-2M"highmirrors"
0.375
0.375
0.375
0.295
thesame
thesame
BL/B
2.8%
2.8%
1.5%
2%
thesame
thesame
0.12t=4/6
0.17t=4/5
0.17t=4/5
0.25-0.27L=l/2
thesame
thesame
Ha)0.55 -
0.69
0.6 -0.74
0.47 -0.72
0.32 -0.5
thesame
thesame
-2.7%
-2%
-2%
-3%-0
thesame
thesame
features
/3.t.<1.4%
eliminat. ofisl., c=4/6,£«t.<2%
j3«t.»6%
larger pl.r.2nd stab.reg.
£.t.=8%decreasedhelicalripplesincreased
magnet, fieldripples
All the values of parameters and characteristics are givenfor so-called "idealized systems of coils" [1,5]. For so-called"technological systems of coils" which takes into account thedetails of winding [3,4] the values of characteristics appearsome larger. For the physics studies we use, as a rule, theidealized system of coils because of its greater simplicity andpossibility to obtain the magnetic surfaces with smoothboundary, not disturbed by resonant islands, because the nestedmagnetic surfaces of the vacuum configuration are necessary toapply the numerical codes.
In earlier works [1, 2, 5, 10] we studied the confinementproperties of the configurations of A) and B) types. Now weconcentrate our attention on the studies of the configurationsof C), D) , E) types, which let to carry out the specific forstellarators physical experiments of plasma stability andtransport. "
2. New Results in the Magnetic Configurations Studies.Magnetic Island Suppression in Configurations with o 2/2.
For the configurations- of A) and B) types by the way ofnumerical simulation the current values in poloidal coils arebeing searched to suppress the magnetic islands at the rationalvalues of the rotational transport L = 4/7, 4/6, 4/5simultaneously [8]. This study is carried out for thetechnological system of coils. By the variation of the poloidalcoil currents the considerable reduction of island structurewas achieved (the island width is less than 1 cm) for allresonance values of the rotational transform mentioned above.To obtain the nested magnetic surfaces, with a smooth boundarysufficient to apply the 3D plasma equilibrium VMEC code anadditional change is necessary: the small variation of second
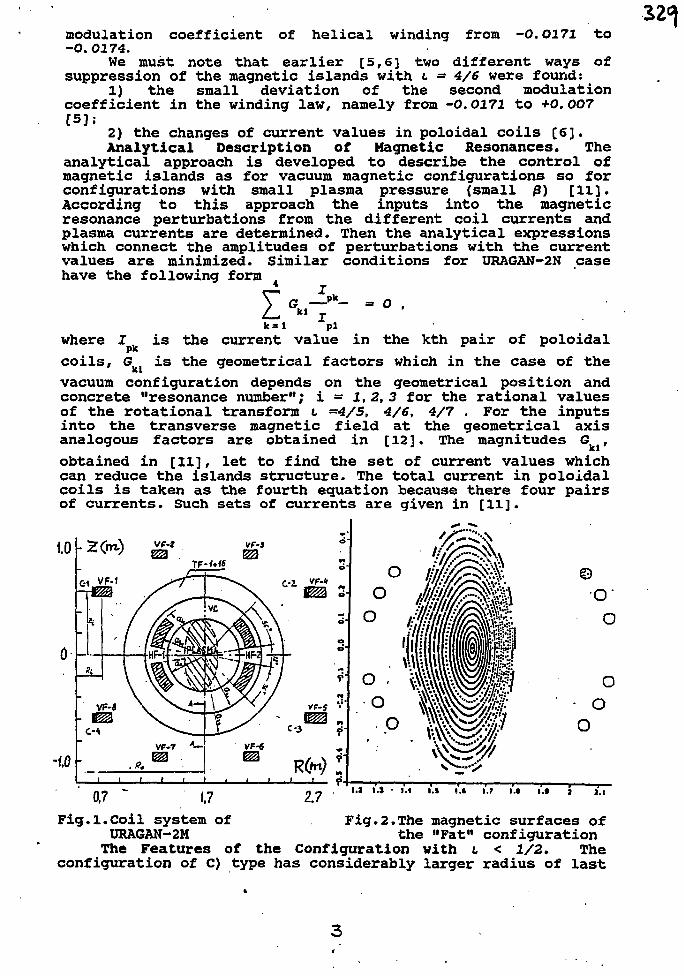
modulation coefficient of helical winding from -0.0171 to-0.0174.
We must note that earlier [5,6] two different ways ofsuppression of the magnetic islands with L = 4/6 were found:
1) the small deviation of the second modulationcoefficient in the winding law, namely from -0.0171 to +0.007[5];
2} the changes of current values in poloidal coils [6].Analytical Description of Magnetic Resonances. The
analytical approach is developed to describe the control ofmagnetic islands as for vacuum magnetic configurations so forconfigurations with small plasma pressure (small P) [11].According to this approach the inputs into the magneticresonance perturbations from the different coil currents andplasma currents are determined. Then the analytical expressionswhich connect the amplitudes of perturbations with the currentvalues are minimized. Similar conditions for URAGAN-2N casehave the following form
G — p k - - "
where IPk
kl Ik - 1 pi
is the current value in the kth pair of poloidalcoils, G is the geometrical factors which in the case of the
vacuum configuration depends on the geometrical position andconcrete "resonance number"; i = 1,2,3 for the rational valuesof the rotational transform c =4/5, 4/6, 4/7 . For the inputsinto the transverse magnetic field at the geometrical axisanalogous factors are obtained in [12]. The magnitudes G ,
obtained in [11], let to find the set of current values whichcan reduce the islands structure. The total current in poloidalcoils is taken as the fourth equation because there four pairsof currents. Such sets of currents are given in [11].
•O-
o
o .
° 1
2.7i.a i.i • i.t i.» i.t t.t i.» i.« > i^\
Fig.1.Coil system of Fig.2.The magnetic surfaces ofURAGAN-2M the "Fat" configuration
The Features of the Configuration with L < 1/2. Theconfiguration of C) type has considerably larger radius of last
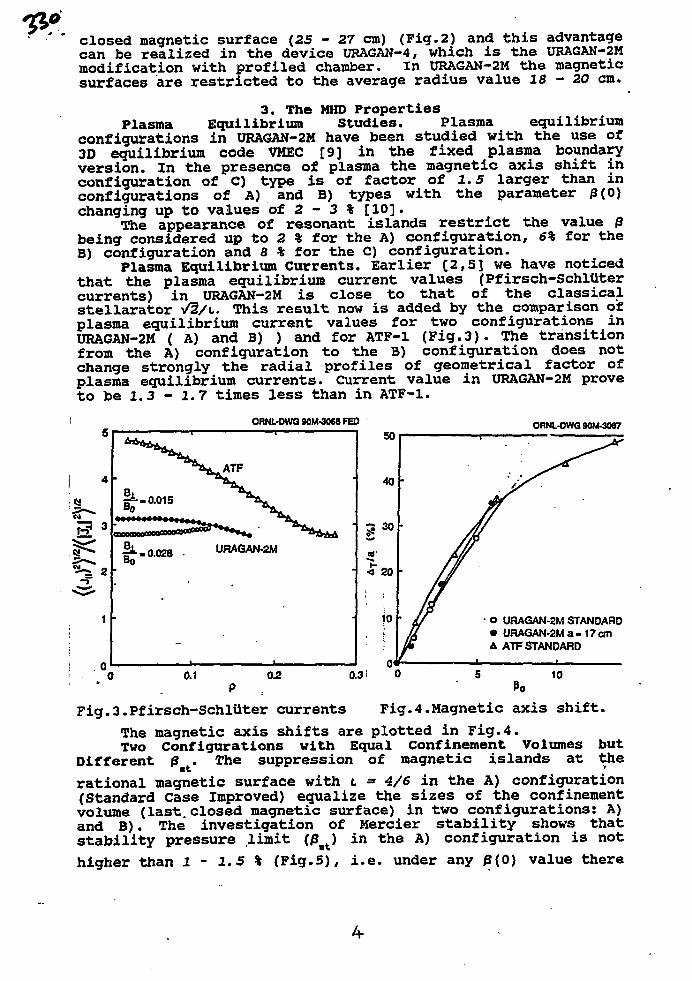
closed magnetic surface (25 - 27 cm) (Fig.2) and this advantagecan be realized in the device URAGAN-4, which is the URAGAN-2Mmodification with profiled chamber. In URAGAN-2M the magneticsurfaces are restricted to the average radius value 18 - 20 cm.
3. The MHD PropertiesPlasma Equilibrium Studies. Plasma equilibrium
configurations in URAGAN-2M have been studied with the use of3D equilibrium code VMEC [9] in the fixed plasma boundaryversion. In the presence of plasma the magnetic axis shift inconfiguration of C) type is of factor of 1.5 larger than inconfigurations of A) and B) types with the parameter 0(0)changing up to values of 2 - 3 % [10].
The appearance of resonant islands restrict the value 0being considered up to 2 % for the A) configuration, 6% for theB) configuration and 8 % for the C) configuration.
Plasma Equilibrium Currents. Earlier [2,5] we have noticedthat the plasma equilibrium current values (Pfirsch-Schltttercurrents) in URAGAN-2M is close to that of the classicalstellarator V2/L. This result now is added by the comparison ofplasma equilibrium current values for two configurations inURA6AN-2M ( A) and B) ) and for ATF-1 (Fig.3). The transitionfrom the A) configuration to the B) configuration does notchange strongly the radial profiles of geometrical factor ofplasma equilibrium currents. Current value in URAGAN-2M proveto be 1.3 - 1.7 times less than in ATF-1.
ORNL-DWQ 90M-3068 FED ORNL-DWG90M-3087
- O (JRAGAN-2M STANDARDURAGAN-2Ma-17cm
A ATFSTANDARD
Fig.3.Pfirsch-SchlUter currents Fig.4.Magnetic axis shift.
The magnetic axis shifts are plotted in Fig.4.Two Configurations with Equal Confinement Volumes but
Different fl . The suppression of magnetic islands at the
rational magnetic surface with t =* 4/6 in the A) configuration(Standard Case Improved) equalize the sizes of the confinementvolume (last closed magnetic surface) in two configurations: A)and B). The investigation of Mercier stability shows thatstability pressure limit (/3>t) in the A) configuration is not
higher than 1 - 1.5 % (Fig.5), i.e. under any /3(0) value there
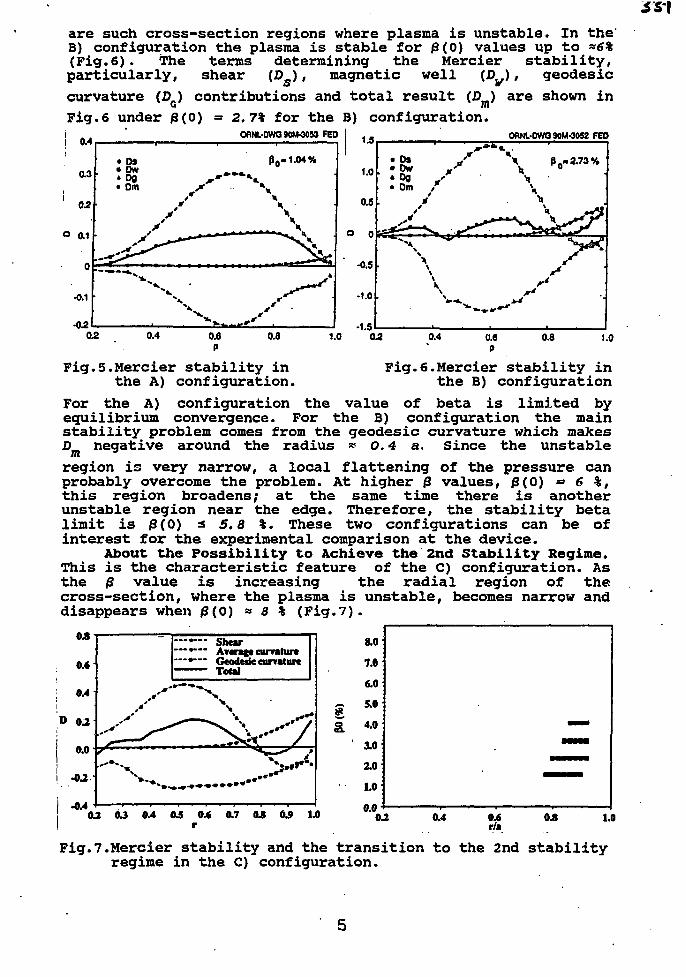
are such cross-section regions where plasma is unstable. In the'B) configuration the plasma is stable for (3(0) values up to «6%(Fig.6). The terms determining the Mercier stability,particularly, shear (D ), magnetic well (D ), geodesic
curvature (D_) contributions and total result (D_) are shown inG IIIFig.6 under /3(0) 2.7% for the B) configuration.
OAM.-OWG90M-3033 FED OWrt.-DWG90M.3052 FED
0.6 0.8 1.0
Fig.5.Mercier stability inthe A) configuration.
Fig.6.Mercier stability inthe B) configuration
For the A) configuration the value of beta is limited byequilibrium convergence. For the B) configuration the mainstability problem comes from the geodesic curvature which makesD negative around the radius ~ O.4 a. Since the unstable
region is very narrow, a local flattening of the pressure canprobably overcome the problem. At higher |3 values, (3(0) = 6 %,this region broadens; at the same time there is anotherunstable region near the edge. Therefore, the stability betalimit is |3(0) s 5.8 %• These two configurations can be ofinterest for the experimental comparison at the device.
About the Possibility to Achieve the 2nd Stability Regime.This is the characteristic feature of the C) configuration. Asthe /3 value is increasing the radial region of thecross-section, where the plasma is unstable, becomes narrow anddisappears when 0(0) * 8 % (Fig.7).
03
o.«
D 02
0.0
I
ShewAveng* curvatureGeodesic curvatureTotal
- ^ • • - • 7
0,7 U U 1.0
Fig.7.Mercier stability and the transition to the 2nd stabilityregime in the C) configuration.
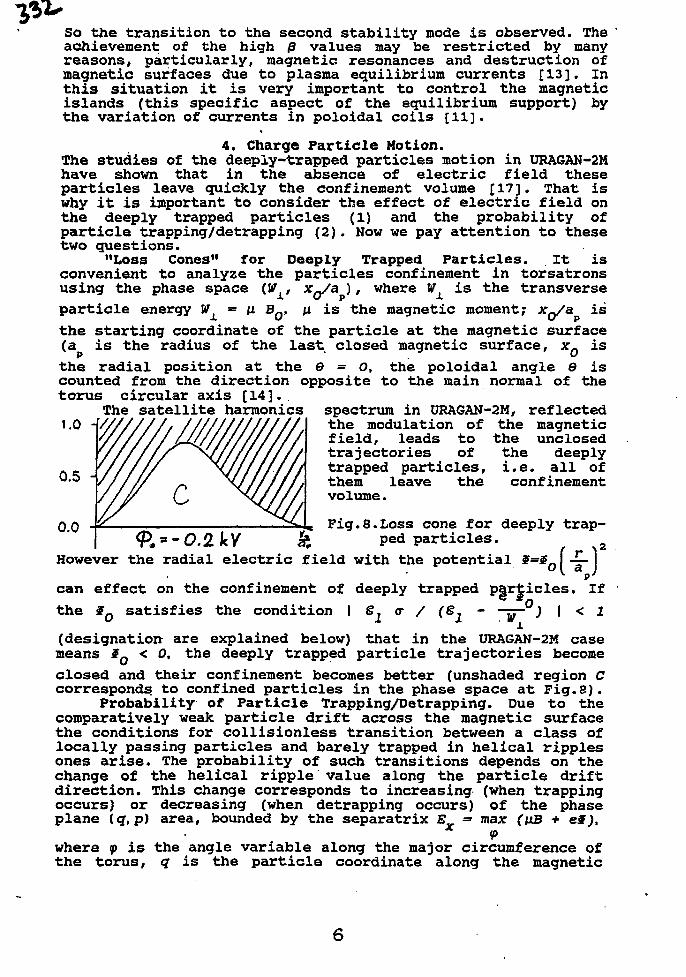
So the transition to the second stability mode is observed. Theachievement of the high j3 values may be restricted by manyreasons, particularly, magnetic resonances and destruction ofmagnetic surfaces due to plasma equilibrium currents [13]. Inthis situation it is very important to control the magneticislands (this specific aspect of the equilibrium support) bythe variation of currents in poloidal coils [11].
4. Charge Particle Motion.The studies of the deeply-trapped particles motion in URAGAN-2Mhave shown that in the absence of electric field theseparticles leave quickly the confinement volume [17]. That iswhy it is important to consider the effect of electric field onthe deeply trapped particles (1) and the probability ofparticle trapping/detrapping (2). Now we pay attention to thesetwo questions.
"Loss Cones" for Deeply Trapped Particles. It isconvenient to analyze the particles confinement in torsatronsusing the phase space (W , xQ/a ), where W is the transverse
particle energy W = n BQ, u is the magnetic moment; xQ/a is
the starting coordinate of the particle at the magnetic surface(a is the radius of the last closed magnetic surface, xn is
p • . o
the radial position at the 9 = 0, the poloidal angle 9 iscounted from the direction opposite to the main normal of thetorus circular axis [14].
spectrum in URAGAN-2M, reflectedthe modulation of the magneticfield, leads to the unclosedtrajectories of the deeplytrapped particles, i.e. all ofthem leave the confinementvolume.
The satellite harmonics1.0 -f
0.5 -
0 0 , Fig.8.Loss cone for deeply trap-ped particles.
However the radial electric field with the potentialf=5Q [ ~- 1
can effect on the confinement of deeply trapped particles. If
the §Q satisfies the condition I <r / (Sx - ) I < 1
(designation are explained below) that in the URAGAN-2M casemeans §Q < 0, the deeply trapped particle trajectories become
closed and their confinement becomes better (unshaded region Ccorresponds to confined particles in the phase space at Fig.8).
Probability of Particle Trapping/Detrapping. Due to thecomparatively weak particle drift across the magnetic surfacethe conditions for collisionless transition between a class oflocally passing particles and barely trapped in helical ripplesones arise. The probability of such transitions depends on thechange of the helical ripple value along the particle driftdirection. This change corresponds to increasing (when trappingoccurs) or decreasing (when detrapping occurs) of the phaseplane {q, p) area, bounded by the separatrix E = max (\iB + e§),
<Pwhere p is the angle variable along the major circumference ofthe torus, q is the particle coordinate along the magnetic
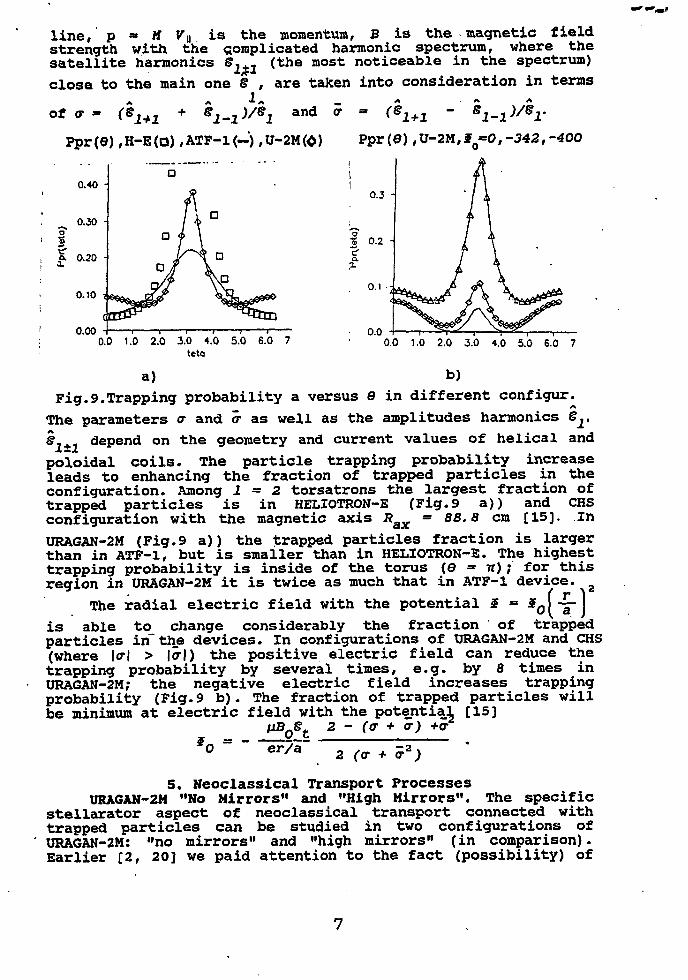
line,' p " M Vt is the momentum, B is the magnetic fieldstrength with the complicated harmonic spectrum, where thesatellite harmonics &1+1 (the most noticeable in the spectrum)
close to the main one § , are taken into consideration in terms
and (? • (Sj .. - S,
-I(-) ,U-2M(0)
>1-1)/srPpr(e) ,U-2M,*Q=0, -342, -400
0.0 1.0 2.0 3.0 4.0 5.0 6.0 7teto
a)
0.0 1.0 2.0 3.0 4.0 5.0 6.0
b)
Fig.9.Trapping probability a versus 8 in different configur.
The parameters <r and ar as well as the amplitudes harmonics £,,
g depend on the geometry and current values of helical and
poloidal coils. The particle trapping probability increaseleads to enhancing the fraction of trapped particles in theconfiguration. Among 1 = 2 torsatrons the largest fraction oftrapped particles is in HELIOTRON-E (Fig. 9 a)) and CHSconfiguration with the magnetic axis Rax = 88.8 cm [15]. In
URAGAN-2M (Fig.9 a)) the trapped particles fraction is largerthan in ATF-1, but is smailer than in HELIOTRON-E. The highesttrapping probability is inside of the torus (8 = TT) ; for thisregion in URAGAN-2M it is twice as much that in ATF-1 device.
• ( r iThe radial electric field with the potential $ = iQ\ -5-I
is able to change considerably the fraction of trappedparticles in" the devices. In configurations of URAGAN-2M and CHS(where |cr| > |<r|) the positive electric field can reduce thetrapping probability by several times, e.g. by 8 times inURAGAN-2M; the negative electric field increases trappingprobability (Fig. 9 b). The fraction of trapped particles willbe minimum at electric field with the potential [15]
- "* 2 (<r + <r) +<r2 -
*om " er/a
5. Neoclassical Transport ProcessesURAGAN-2M "No Mirrors" and "High Mirrors". The specific
stellarator aspect of neoclassical transport connected withtrapped particles can be studied in two configurations ofURAGAN-2M: "no mirrors" and "high mirrors" (in comparison).Earlier [2, 20] we paid attention to the fact (possibility) of
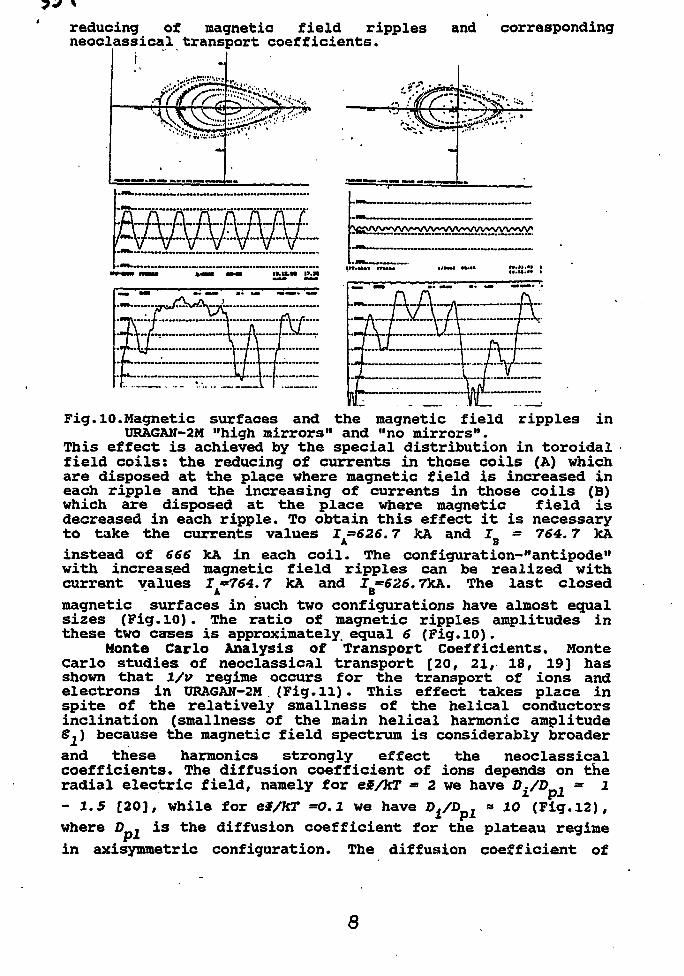
reducing of magnetic field ripples and correspondingneoclassical transport coefficients.
- 'it
IS.1I.M !>••llt'MM V»M
Fig.10.Magnetic surfaces and the magnetic field ripples inURAGAN-2M "high mirrors11 and "no mirrors11.
This effect is achieved by the special distribution in toroidalfield coils: the reducing of currents in those coils (A) whichare disposed at the place where magnetic field is increased ineach ripple and the increasing of currents in those coils (B)which are disposed at the place where magnetic field isdecreased in each ripple. To obtain this effect it is necessaryto take the currents values 1=626.7 kA and I
A o
764.7 kA
instead of 666 kA in each coil. The configuration-"antipode"with increased magnetic field ripples can be realized withcurrent values I =764.7 kA and I =626.7kA. The last closed
magnetic surfaces in such two configurations have almost equalsizes (Fig.10). The ratio of magnetic ripples amplitudes inthese two cases is approximately, equal 6 (Fig.10).
Monte Carlo Analysis of Transport Coefficients. MonteCarlo studies of neoclassical transport [20, 21, 18, 19] hasshown that 1/v regime occurs for the transport of ions andelectrons in URAGAN-2M (Fig.ll). This effect takes place inspite of the relatively smallness of the helical conductorsinclination (smallness of the main helical harmonic amplitudeSj) because the magnetic field spectrum is considerably broader
and these harmonics strongly effect the neoclassicalcoefficients. The diffusion coefficient of ions depends on theradial electric field, namely for e§/kT - 2 we have O./D , =• l
-1.5 [20], while for ef/OT =0.1 we have ^/D . « 10 (Fig. 12),
where D , is the diffusion coefficient for the plateau regime
in axisymmetric configuration. The diffusion coefficient of
8
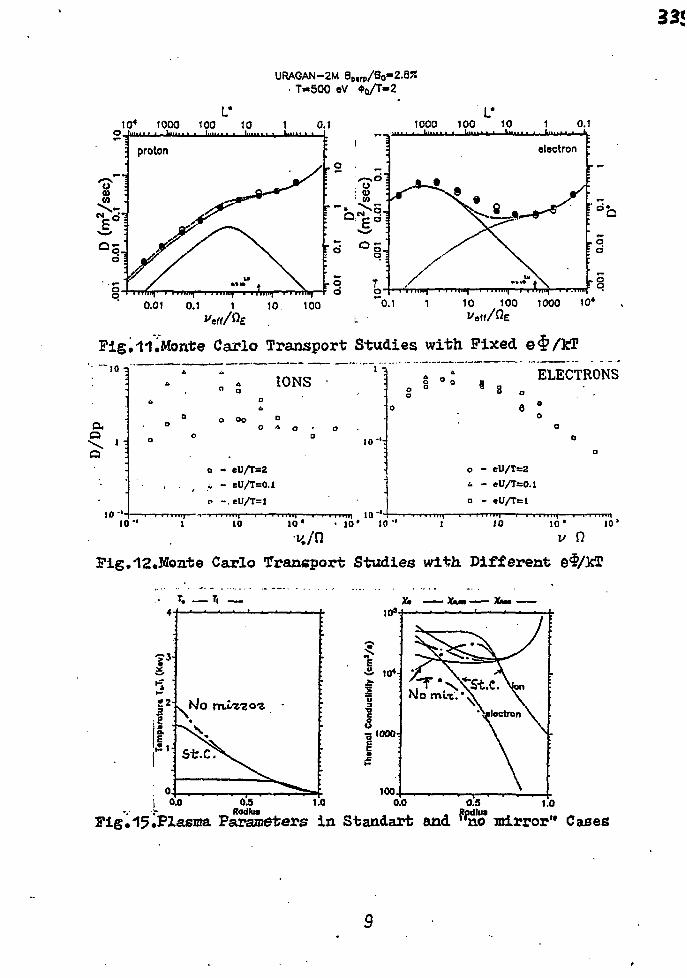
URAGAN-2M Qptrf/B0"2.BT.T-500 eV <t>oA"2
OJiu
100 1000 104
Carlo Transport Studies with Fixed'JO ?
a
Q
10
1 -A
IONS
O A o . „o
10 -
o -i. - eUA=0.1f -.eU/T=l
10™i 10'
ELECTRONS
o
0 - eU/T=2
1 - eU/Ts0.1a - eUA=«
to 10' 10 ' 10 10' 10'
1/ Q
Fig.12,Mozrfce Carlo Transport Studies with Different
T. T,
Fig• 15.Plasma Parajneters in Standart and "no mirror" Cases
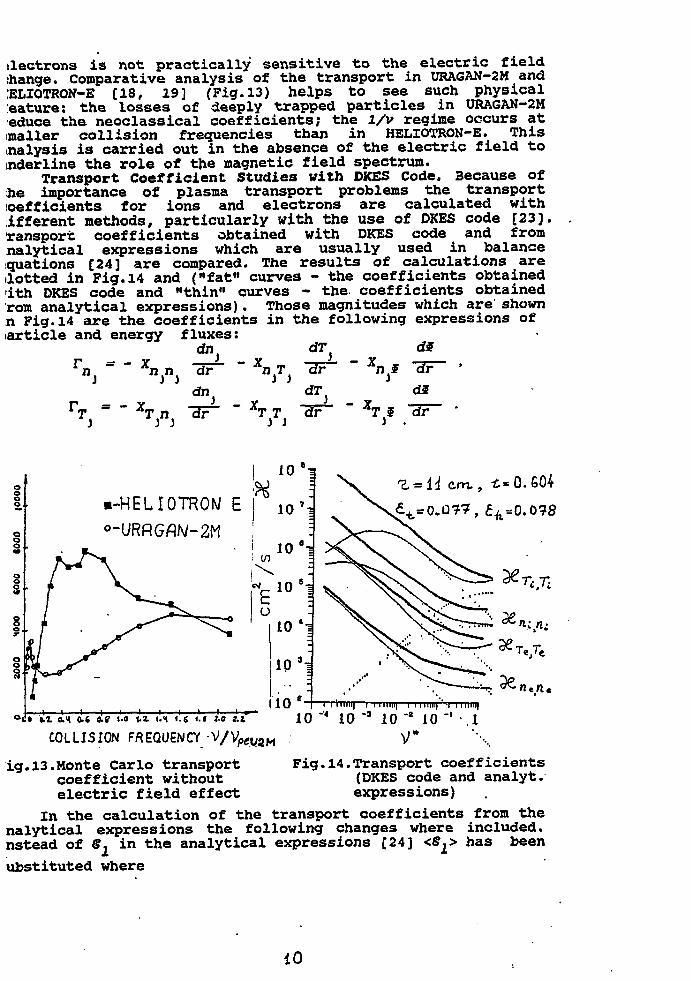
slectrons is not practically sensitive to the electric fieldihange. Comparative analysis of the transport in URAGAN-2M and[ELIOTRON-B [18, 19] (Pig. 13) helps to see such physicaleature: the losses of deeply trapped particles in URAGAN-2M•educe the neoclassical coefficients; the 1/v regime occurs atmailer collision frequencies than in HELIOTRON-E. Thisnalysis is carried out in the absence of the electric field tomderline the role of the magnetic field spectrum.
Transport Coefficient Studies with DKES Code. Because ofhe importance of plasma transport problems the transportcoefficients for ions and electrons are calculated withlifferent methods, particularly with the use of DKES code [23],ransport coefficients obtained with DKES code and fromnalytical expressions which are usually used in balancequations [24] are compared. The results of calculations arelotted in Fig.14 and ("fat" curves - the coefficients obtained1th DKES code and "thin" curves - the coefficients obtainedram analytical expressions). Those magnitudes which are shownn Fig.14 are the coefficients in the following expressions of•article and energy fluxes:
dn.
-HELI0TR0W E
COLLISION FREQUENCY V/Vp (rV a M
10 J4 10 -3 10 " 10
V*
i
.1
ig.13.Monte Carlo transportcoefficient withoutelectric field effect
Fig.14.Transport coefficients(DKES code and analyt.expressions)
In the calculation of the transport coefficients from thenalytical expressions the following changes where included,nstead of 8^ in the analytical expressions [24] <§2> has been
ubstituted where
10
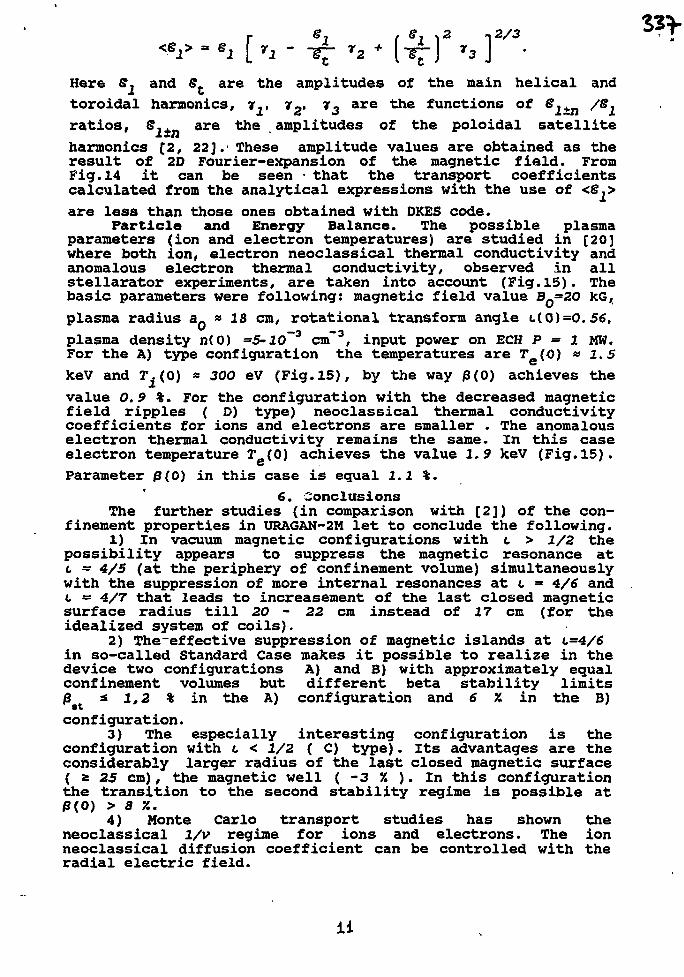
-*1 - -f£•&¥
Here S^ and &c are the amplitudes of the main helical and
toroidal harmonics, v,, 72> ?3 a r e t n e functions of ^i+n / ^
ratios, $.,_ are the amplitudes of the poloidal satellite
harmonics [2, 22].' These amplitude values are obtained as theresult of 2D Fourier-expansion of the magnetic field. FromFig. 14 it can be seen - that the transport coefficientscalculated from the analytical expressions with the use of <&.>
are less than those ones obtained with DKES code.Particle and Energy Balance. The possible plasma
parameters (ion and electron temperatures) are studied in [20]where both ion, electron neoclassical thermal conductivity andanomalous electron thermal conductivity, observed in allstellarator experiments, are taken into account (Fig.15). Thebasic parameters were following: magnetic field value BQ=2O kG,
plasma radius a_ * 18 cm, rotational transform angle i(Q)=0.56,
plasma density n(0) =5-l6~3 cm"3, input power on ECH P = 1 MW.For the A) type configuration the temperatures are T (O) « 1.5
keV and 2V. (0) * 300 eV (Fig. 15), by the way /3(0) achieves the
value 0.9 %. For the configuration with the decreased magneticfield ripples ( D) type) neoclassical thermal conductivitycoefficients for ions and electrons are smaller . The anomalouselectron thermal conductivity remains the same. In this caseelectron temperature T (0) achieves the value 1.9 keV (Fig.15).
Parameter 0(0) in this case is equal 2.2 %.6. Conclusions
The further studies (in comparison with [2]) of the con-finement properties in URAGAN-2M let to conclude the following.
1) In vacuum magnetic configurations with c > 1/2 thepossibility appears to suppress the magnetic resonance atL => 4/5 (at the periphery of confinement volume) simultaneouslywith the suppression of more internal resonances at L - 4/6 andL = 4/7 that leads to increasement of the last closed magneticsurface radius till 20 - 22 cm instead of 27 cm (for theidealized system of coils).
2) The-effective suppression of magnetic islands at i=4/6in so-called Standard Case makes it possible to realize in thedevice two configurations A) and B) with approximately equalconfinement volumes but different beta stability limitsa * 1,2 % in the A) configuration and 6 7, in the B)
configuration.3) The especially interesting configuration is the
configuration with 1 < 1/2 ( C) type). Its advantages are theconsiderably larger radius of the last closed magnetic surface( a 25 cm), the magnetic well ( -3 V. ). In this configurationthe transition to the second stability regime is possible at0(0) > 3 %.
4) Monte Carlo transport studies has shown theneoclassical 1/v regime for ions and electrons. The ionneoclassical diffusion coefficient can be controlled with theradial electric field.
li
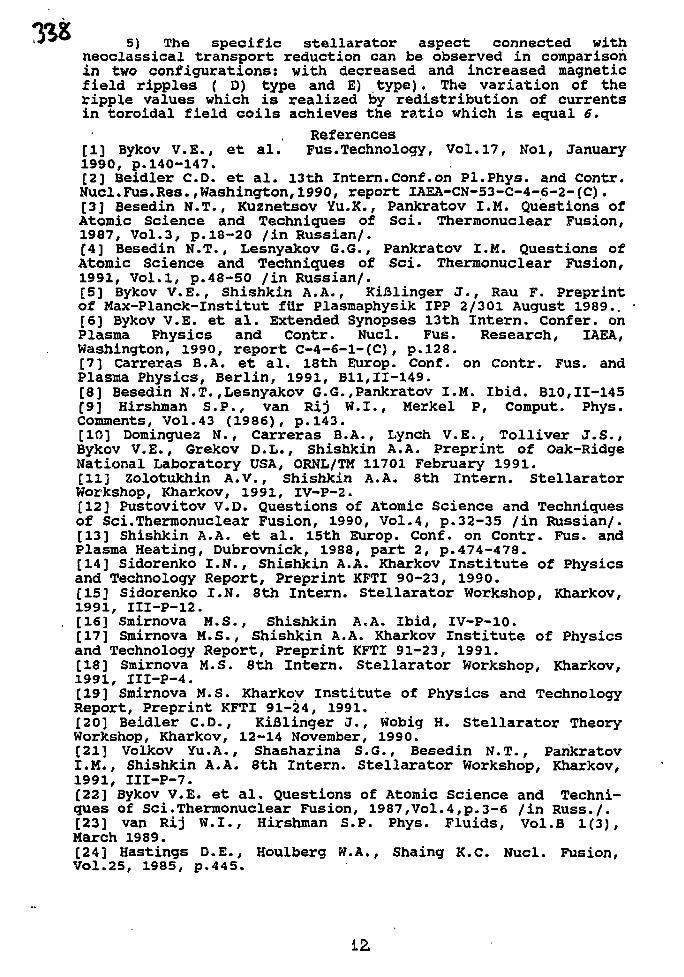
5) The specific stellarator aspect connected withneoclassical transport reduction can be observed in comparisonin two configurations: with decreased and increased magneticfield ripples ( D) type and E) type). The variation of theripple values which is realized by redistribution of currentsin toroidal field coils achieves the ratio which is equal 6.
References[1] Bykov V.E., et al. Fus.Technology, Vol.17, Nol, January1990, p.140-147.[2] Beidler C O . et al. 13 th Intern. Conf .on PI. Phys. and Contr.Nucl.Fus.Res.,Washington,1990, report IAEA-CN-53-C-4-6-2-(C).[3] Besedin N.T., Kuznetsov Yu.K., Pankratov I.M. Questions ofAtomic Science and Techniques of Sci. Thermonuclear Fusion,1987, Vol.3, p.18-20 /in Russian/.[4] Besedin N.T., Lesnyakov G.G., Pankratov I.M. Questions ofAtomic Science and Techniques of Sci. Thermonuclear Fusion,1991, Vol.1, p.48-50 /in Russian/.[5] Bykov V.E., Shishkin A.A., KiJJlinger J., Rau F. Preprintof Max-Planck-lnstitut fiir Plasmaphysik IPP 2/301 August 1989..[6] Bykov V.E. et al. Extended Synopses 13th Intern. Confer, onPlasma Physics and Contr. Nucl. Fus. Research, IAEA,Washington, 1990, report C-4-6-l-(C), p.128.[7] Carreras B.A. et al. 18th Europ. Conf. on Contr. Fus. andPlasma Physics, Berlin, 1991, Bll,11-149.[8] Besedin N.T.,Lesnyakov G.G.,Pankratov I.M. Ibid. B10,11-145[9] Hirshman S.P., van Rij W.I., Merkel P, comput. Phys.Comments, Vol.43 (1986), p.143.[10] Dominguez N., Carreras B.A., Lynch V.E., Tolliver J.S.,Bykov V.E., Grekov D.L., Shishkin A.A. Preprint of Oak-RidgeNational Laboratory USA, ORNL/TM 11701 February 1991.[11] Zolotukhin A.V., Shishkin A.A. 8th Intern. StellaratorWorkshop, Kharkov, 1991, IV-P-2.[12] Pustovitov V.D. Questions of Atomic Science and Techniquesof Sci.Thermonuclear Fusion, 1990, Vol.4, p.32-35 /in Russian/.[13] Shishkin A.A. et al. 15th Europ. Conf. on Contr. Fus. andPlasma Heating, Dubrovnick, 1988, part 2, p.474-478.[14] Sidorenko I.N., Shishkin A.A. Kharkov Institute of Physicsand Technology Report, Preprint KFTI 90-23, 1990.[15] Sidorenko I.N. 8th Intern. Stellarator Workshop, Kharkov,1991, III-P-12.[16] Smirnova M.S., Shishkin A.A. Ibid, IV-P-10.[17] Smirnova M.S., Shishkin A.A. Kharkov Institute of Physicsand Technology Report, Preprint KFTI 91-23, 1991.[18] Smirnova M.S. 8th Intern. Stellarator Workshop, Kharkov,1991, III-P-4.[19] Smirnova M.S. Kharkov Institute of Physics and TechnologyReport, Preprint KFTI 91-24, 1991. .[20] Beidler CD., Kifilinger J., Wobig H. Stellarator TheoryWorkshop, Kharkov, 12-14 November, 1990.[21] Volkov Yu.A., Shasharina S.G., Besedin N.T., PankratovI.M., Shishkin A.A. 8th Intern. Stellarator Workshop, Kharkov,1991, III-P-7.[22] Bykov V.E. et al. Questions of Atomic Science and Techni-ques of Sci.Thermonuclear Fusion, 1987,Vol.4,p.3-6 /in Russ./.[23] van Rij W.I., Hirshman S.P. Phys. Fluids, Vol.B 1(3),March 1989.[24] Hastings D.E., Houlberg W.A., Shaing K.C. Nucl. Fusion,Vol.25, 1985, p.445.
12,
CICMAT
REVIEW OF THE TJ-II FLEXIBLEHELIAC PROJECT
A. P. NAVARROAsociaci6n EURATOM / CIEMAT
28040 Madrid, SPAINTJ.II ItKLUC MVIEW
Contributions O ASOCIACIONEUHATOMCIEMAT
TheoryC. Alejaldre, F. Castej6n, J. Guasp, A. L. Fraguas,L. Garcia w, V. Krivcnski, A. Rodriguez-Yunta, A. Salas,V. Tribaldos, A. Varias.
F.nginceriny and HeatingL. Almoguera, J. Alonso Gozalo, J. Alonso Cadcnas,M. Blaumoser <», J. Botija, J.R. Cepcro, A. Garcia,M. Liniers, A. Martinez, R. Martin, M. Medrano.
I U«i>. CwluKRK, M«*i*$p«l«1 If f C»r<lil«t. F.R. C<f tiunf
TJ.UHCLIACHVICW
Index oASOCIACIOSEUKATOHC1EMAT
' Introduction• Configuration studies
• Coil configuration
• Operational space
> Physics studies• Equilibrium• Stability• Transport
> Heating studies
• E C H
• N B I
> Engineering design• Summary
Introduction oASOCIACIOHEUKATOUCICMAT
TI-UHEUACUVICW
• TJ-II has been defined as the focal point of Spain programmein Fusion research in the frame of the European Programme.
• Study of the physics of helical magnetic axis stellaratorsprovide an adequate answer to this goal:
• complement the Euratom programme
• it is related to a high p* configuration, withreactor potential
• allows for a moderate budget device
• can involve efforts from Spain universities andindustries.
TMIIIEUACUCVIEW
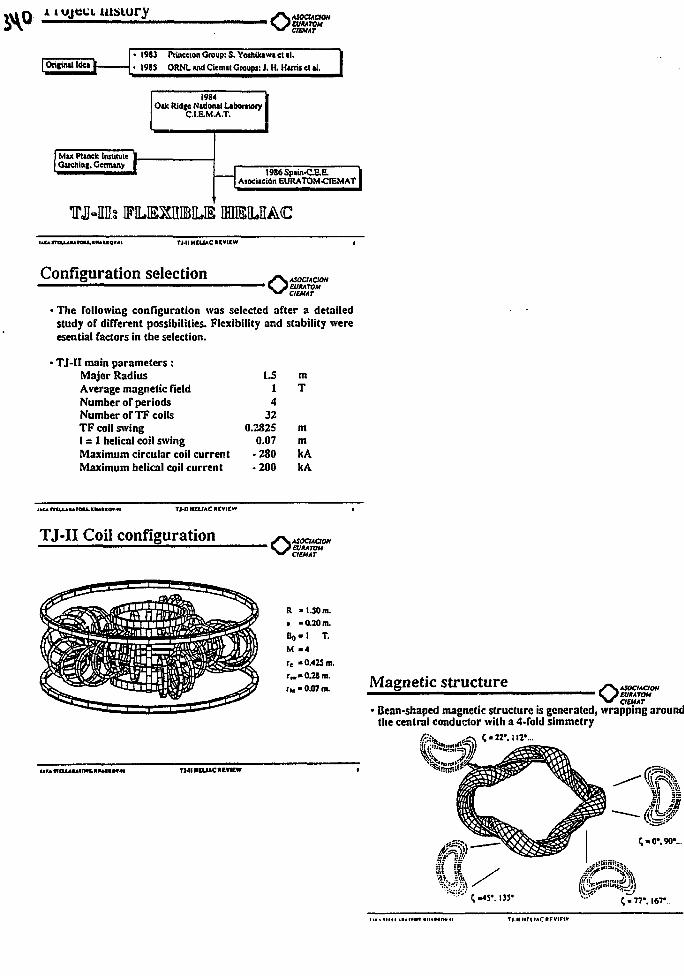
t ujeci msiory oMoanaoC/CMAT
1983 Princeton Group: S. Yoshiluwt cl tl .
1915 ORNL «nd Ciem>i Groups: J, H. Hunt a tl.
1984Oik Ridfe Nidoml Ltbonwiy
C.I.E.M.A.T.
I Mu PUnck liuliniic | _Garehim. Gcnniny |
!98SSp«in-C.EE.A>ociaci6n EURATOMCIEMAT
IFLIXHIBILIE DQEILIIACTMIIICLUOCVICW
Configuration selection\s EUKATOU
aCMAT
• The following configuration was selected after a detailedstudy of different possibilities. Flexibility and stability wereesential factors in the selection.
• TJ-II main parameters :Major RadiusAverage magnetic fieldNumber of periodsNumber of TF coilsTF coil swingI = 1 helical coil swingMaximum circular coil currentMaximum helical coil current
1.514
320.2825
0.07•280
mT
mmkA
• 200 kA
* CfKLUtUf OU.KIUM0V.tl Tj-n IIEUAC REVIEW
TJ-II Coil configuration
TMIIIUUCMVIEW
R - 1.50 m.• - 0.20 m.Bo-I T.M ««
rc '0.425 m.^ • 0 . 2 8 01.rx" 0.07 in. Magnetic structure oASOCIACION
CVItATOHCICMAT
• Bean-shaped magnetic structure is generated, wrapping aroundthe central conductor with a 4-fold simmetry
. 167*
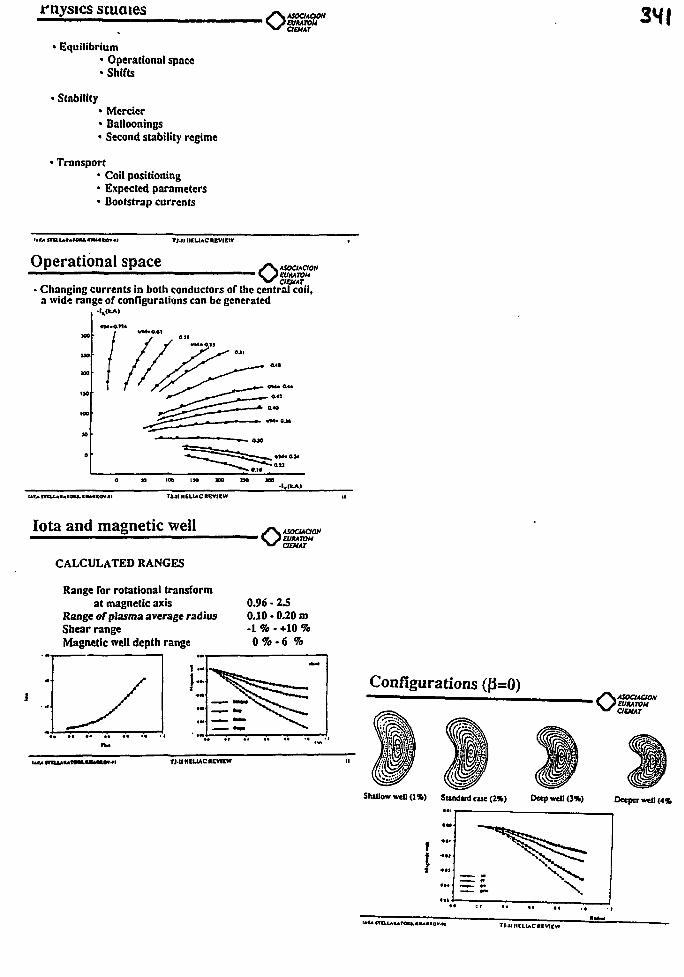
rnysics studies
> Equilibrium< Operational space* Shifts
> StabilityMercier
' Balioonings1 Second stability regime
1 Transport1 Coil positioning1 Expected parameters1 Bootstrap currents
TJ.Il IIEUAC REVIEW
Operational space •oaeuAT• Changing currents in both conductors of the central coil,
a wide range of configurations can be generated
o jo too i» m uo
TJ.IIHELUCKCVICW
Iota and magnetic well
CALCULATED RANGES
OASOCIAdONOJKAT0M
Range for rotational transformat magnetic axis 0.96 - 2S
Range of plasma average radius 0.10 - 0.20 mShear range -1 % - +10 %Magnetic well depth range 0 % - 6 %
TMIHtUACMVIfW
Configurations ((3=0)O ASOC1ACIOH
EVKATOHCIEMAT
Shallow well (1%) Slindinj cue (2%) Deep well (J*) Deeper well W*
TJ-IIMCLlACKCVTtW
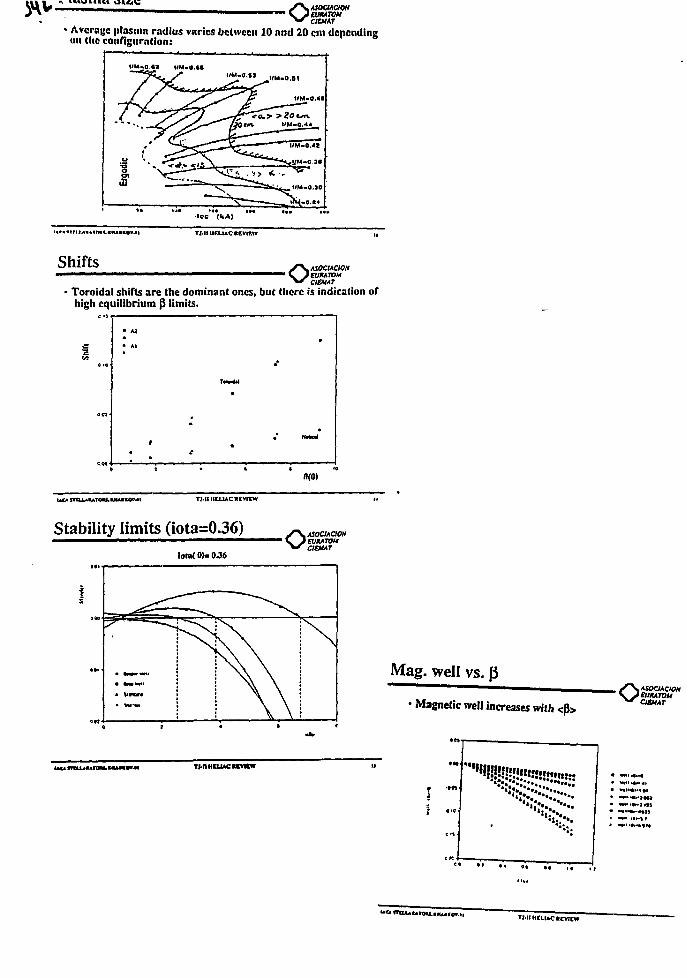
tUKATOM
• Average plasma radius varies between 10 and 20 cm dependingon Cite configuration:
»"•«.« M.1.III/M.fl.fj UM.o.51
•ICC IkA)
Shifts S \
• Toroidal shifts are the dominant ones, but there is indication ofhigh equilibrium (5 limits.
UXA XRLLAKATOU. TMIIICLUOCVItW
Stability limits (iota=0.36)Iou(0).0J6
TJ-nHCU*CUVItw
otsocuaoHEUttATOMCISMAT
Mag. well vs. J3
• Magnetic well increases with <p>O *SOCUC10N
ZUKATOUCJEMAT
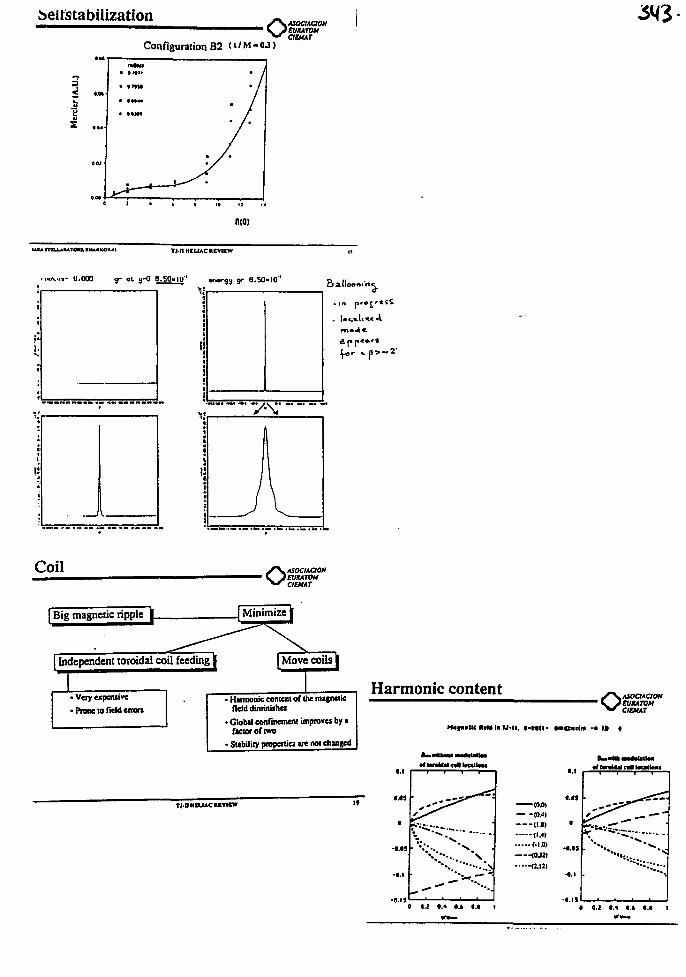
beltstabilization
Configuration B2 (i / M - oJ )
RHMOMCIEMAT
n HCLUC REVIEW
* - 0.000 go at 3 - 0 O.SOHU' . f * r g a gr S . Snt'rtc,
«!t
Coil oASOCUCIONEUKATOMCIBUT
| Independent toroidal coil feeding \ \ Move coils |
• Vayexpeiuive
•Prom to field e n o n• Harmonic comenl or the mafneiic
field diminishes
• Global confinement impnvei by afactor of iwo
• Stability propcniM are not changed
Harmonic content
T)DH(UACK«ICW
oASOCIACIONCVIUTOMCIEMAT
Mifnallc nal< In M-li. •-•0(1 • laCnlin -• I t
a a.i • < «.» • • i 0 0.2 0.4 l.t 0.0 1
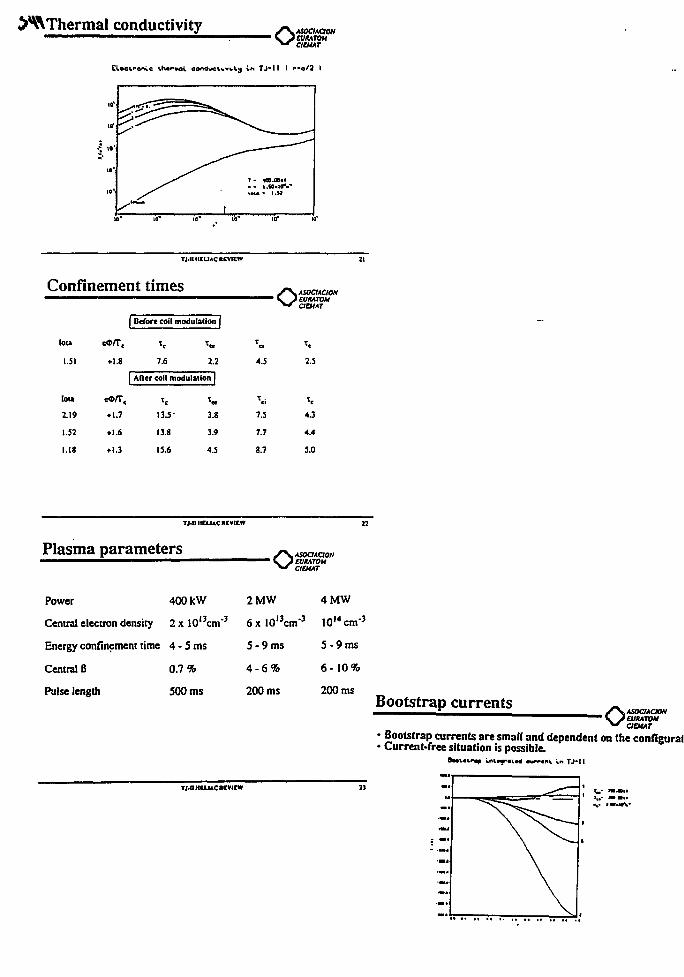
conductivity oASOCiACItWCVKATOKCIEMAT
Claebronvc iharatoL aondwclivbly In TJ-II I r-o
TJ.IHICIMC REVIEW
Confinement times
Ion
1.51
lou
2.19
1.52
1.18
| Before coll modulation |
eO/T, xe tM
•1.8 7.6 2.2
After coll modulation |
• 1.7 13.5- 3.8
• 1.6 13.8 3.9
• 1.3 15.6 4.5
I
4.S
7.5
7.7
8.7
21
. JEUKATOM^* CIEHAT
2.5
te
4.3
4.4
5.0
TJ.IIIICLUCHEVIEW
Plasma parametersEUXATOMCICMAT
Power 400 kW 2MW 4MW
Central electron density 2xlO l3cm'3 6xl0 l 3cm'3 I0l4cm"3
Energy confinement time 4 - 5 ms
Central B 0.7%
Pulse length 500 ms
5 - 9 ms
4 - 6 %
200 ms
5-9ms
6 -10 %
200 ms
TinHUUCHIVIIW
Bootstrap currents
• Bootstrap currents are small and dependent on the configurat• Current-free situation is possible.
Sastalxap Ulrarmd •arrant in IJ- i l
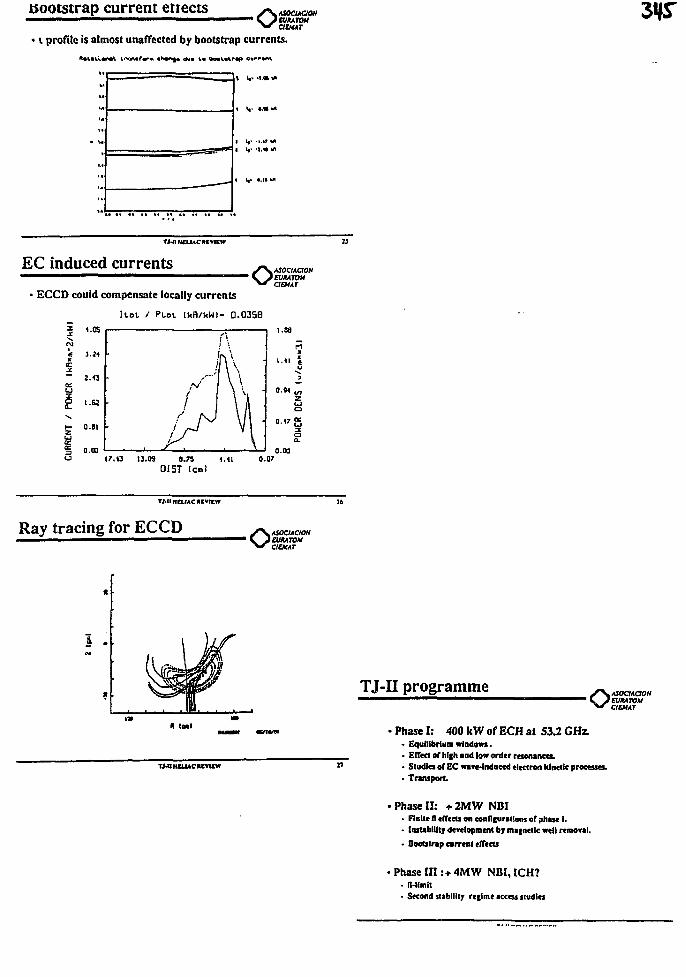
bootstrap current etrects oASaCIAClON
> i profile is almost unaffected by bootstrap currents.
TJ-n IICLUCMVIEW
EC induced currents oEVRATOUCIIMAT
ECCD could compensate locally currents
Rot / Pt-ot IkH/ViW)- Q.O3SB
1.05
eX~s3
0.B1 • <>•<'£
17.13 13.09 8.75 1.110I5T (OnI
TMI HCUAC REVIEW
Ray tracing for ECCD oASOCIACtONCUKATOMOCMAT
1 .
T/OHtU*CM»ltW
TJ-II programme • V A
- Phase I: 400 kW of ECH at S3J GHz.
• Equilibrium windows.
- Effect of hlfhind low order resonances.• Studies of EC m*e-induccd electron kinetic processes.• Transport.
• Phase II: + 2MW NBI
• Finite A effecu on conflf urallons of phase I.• Instability development by ma(nellc well removal.
• Bootstrap current effects
• Phase III:+ 4MW NBI, ICH?
• It-limit• Second stability retime access studies
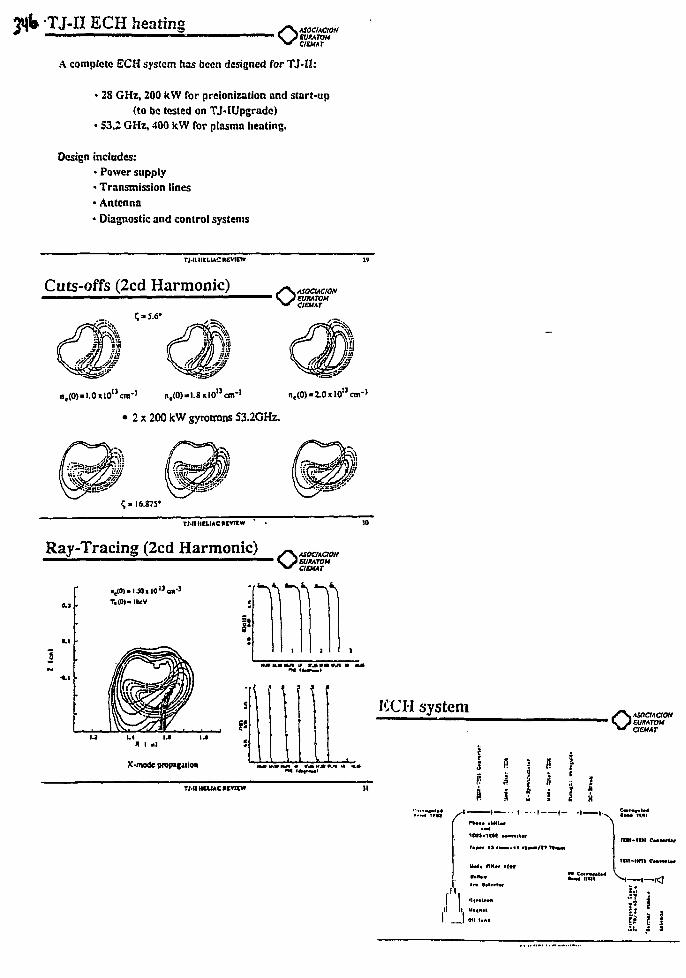
ECH heating oAsacuaotiH/fttTOM
A complete ECH system has been designed for TJ-H:
• 28 GHz, 200 kW for preionization and start-up(to be tested on TJ-IUpgrade)
• 53.2 GHz, 400 kW for plasma heating.
Design includes:• Power supply• Transmission lines• Antenna• Diagnostic and control systems
TMlIICUAC REVIEW
Cuts-offs (2cd Harmonic)
n«(O)»I.O*IOucnr> ne(0}«1.8*l0 l)enra
• 2 x 200 kW gyrotrons 53.2GHZ.
ne(0)-2.0xl0"cm-}
16.875'
TMl HKLIAC REVItW
Ray-Tracing (2cd Harmonic) oEUIUTOMCICMAT
ICCH systemO euitAwu
CICMAT
X-modc propijjuon
TJ.IIHCLUCHVHW
i fi i fi \
ft I f 1 I) _ . . , — , _ TOII
rt*t*TCll
TUI-tmi
It IIMM
I
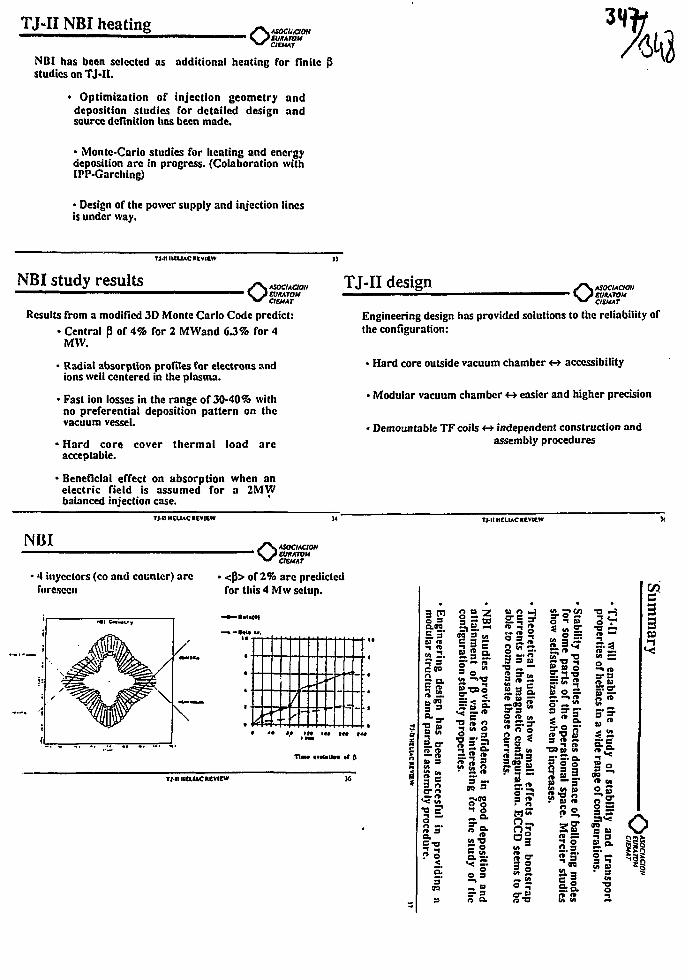
TJ-IINBI heatingfta,eUHATOCIEMAT
NBI has been selected as additional heating for finite p"studies on TJ-II.
• Optimization of injection geometry anddeposition studies for detailed design andsource definition has been made.
• Monte-Carlo studies for heating and energydeposition arc in progress. (Colaboration withIPP-Garching)
• Design of the power supply and injection linesis under way.
TJ.I1IIELIAC REVIEW
NBI study results S\ASOCIACION• lEVIUTOM
CICMAT
Results from a modified 3D Monte Carlo Code predict:• Central P of 4% for 2 MWand 6.3% for 4
MVV.
• Radial absorption profiles for electrons andtons well centered in the plasma.
• Fast ion losses in the range of 30-40% withno preferential deposition pattern on thevacuum vessel.
• Hard core cover thermal load arcacceptable.
TJ-II design O ASOCIAC1OHEUKATOMCIEMAT
Engineering design has provided solutions to the reliability ofthe configuration:
• Hard core outside vacuum chamber <-» accessibility
• Modular vacuum chamber <-» easier and higher precision
• Demountable TF coils <-» independent construction andassembly procedures
• Beneficial effect on absorption when anelectric field is assumed for a 2MWbalanced injection case.
TJ-n HCUAC REVIEW TJ.IIHELUC REVIEW
NBI oASOCIACIONEVIMTOMCIBMT
• 4 inycclors (co and counter) arc • <P> of 2% are predictedforeseen for this 4 Mw setup.
«
/
-
-
• *• fl.« i » <««
TJ.IIIIEUAC KVItW
3 PI§.<ro
™ *t
ft 52."
—• n
O 3
O M
B n
11m
"588O _ 3
l a g
O o-< o_ a.
> 2«o
o a
n a.
S s a
5 ~ w
2-1I I I3 si.llWill
I?II
i s
Sn2.=
S 3
|M•ao
2 =• 5 3 n">j
IMPURITY ANALYSIS IN THE W7-ASSTELLARATOR AFTER WALL CONDITIONINGBY CARBONIZATION AND BORONIZATION
R. Brakel, R. Burhenn, A. Eisner, P. Grigull, H. Hacker,
D. Hildebrandt+), K. Kondo++), H. Renner, F.Sardei, U. Schneider,
A. Weller, H, Wolff1-), W7-AS Team, ECRH G r o u p + + + \ Nl Group
Max-Planck-lnstitut fur Plasmaphysik
Association EURATOM-IPP, D-8046 Garching, FRG
+ ) Zentralinstitut fur Etektronenphysik Berlin, FRG
++' Plasma Phys. Lab., Kyoto University, Japan
+ + + ) Institut fur Pfasmaforschung, Universita't Stuttgart, FRG
Outline:
1. Coating procedure
2. Machine specific aspects with respect to the boundary mag-netic field topology and limiter action
3. Impurity radiation and deposition probe analysis
4. Impurity transport study
5. Summary and conclusions
1. Coating procedure
• DC glow discharges in:
- 70%He + 30%CH± or 4
- 90%He + 10%B2H6
- room temperature
- typical pressure 10~2mbar
- three anodes (« 120° apart)
- discharge current ~ 3A
carbonization
boronization
growing rate ~
coating thickness 500 - 800A
composition of the boron layer:
60% boron, 30% hydrogen, 10% carbon
i m p o r t a n t : coating life-time due to physical sputtering
from strongly loaded components (limiters and
other in-vessel components) is of the order of
seconds only!
=$>• • long-term reduction of impurities originating
from wall and other low-loaded components, but
==£" • only transiently supressed impurity inflow
from limiters and other erosion-dominated
areas (for a few ten shots or (essl)
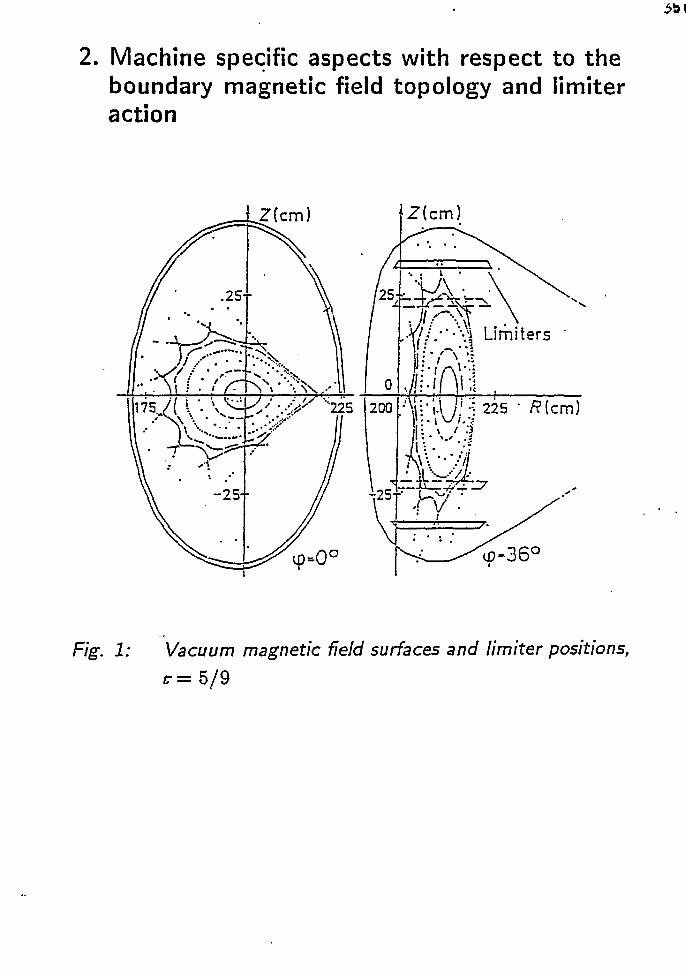
2. Machine specific aspects with respect to theboundary magnetic field topology and limiteraction
Z(cm)
•¥//.-*• vi Limiters
F/g. 1 ; Vacuum magnetic field surfaces and limiter positions,
r=5/9
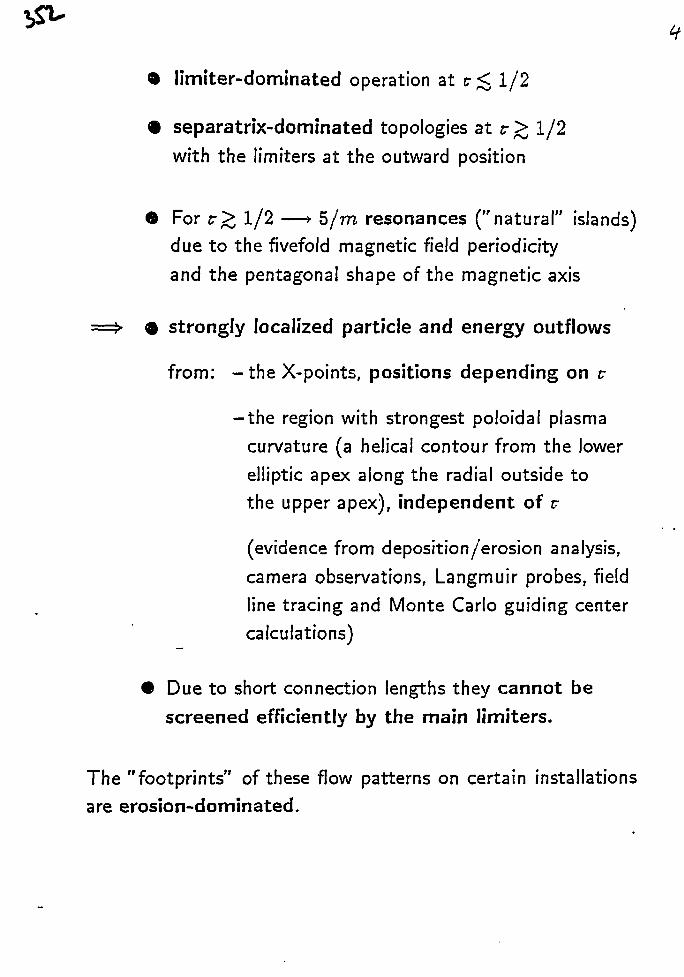
• limiter-dominated operation at r < 1/2
• separatrix-dominated topologies at r > 1/2
with the limiters at the outward position
• For c > 1/2 — • 5/m resonances ("natural" islands)
due to the fivefold magnetic field periodicity
and the pentagonal shape of the magnetic axis
==> e strongly localized particle and energy outflows
from: - the X-points, positions depending on c
- the region with strongest poloidal plasma
curvature (a helical contour from the lower
elliptic apex along the radial outside to
the upper apex), independent of r
(evidence from deposition/erosion analysis,
camera observations, Langmuir probes, field
line tracing and Monte Carlo guiding center
calculations)
• Due to short connection lengths they cannot be
screened efficiently by the main limiters.
The "footprints" of these flow patterns on certain installations
are erosion-dominated.
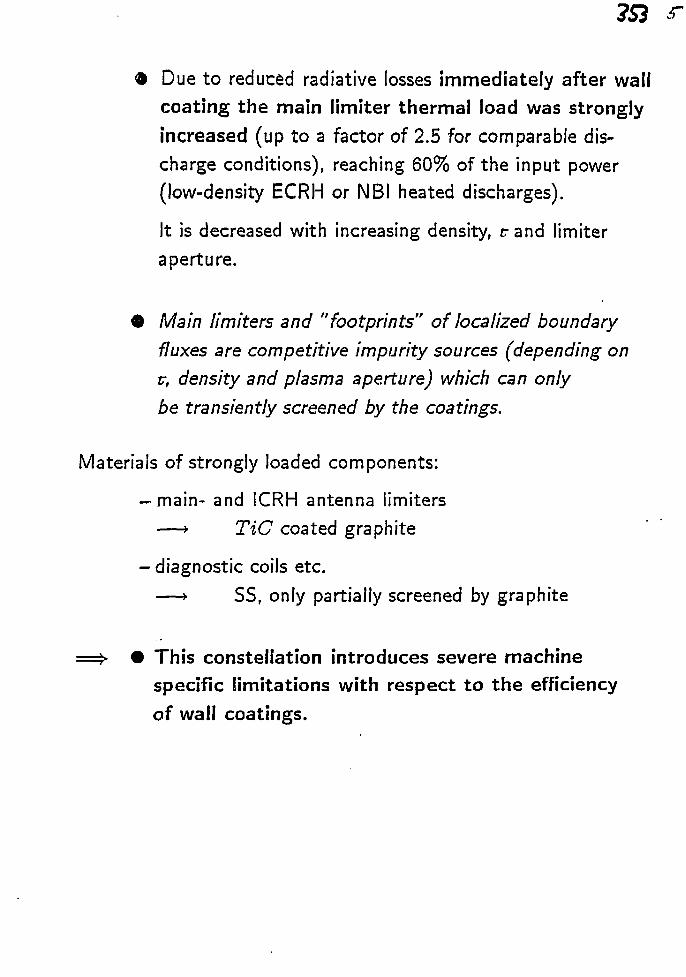
• Due to reduced radiative losses immediately after wall
coating the main limiter thermal load was strongly
increased (up to a factor of 2.5 for comparable dis-
charge conditions), reaching 60% of the input power
(low-density ECRH or NBI heated discharges).
It is decreased with increasing density, r and limiter
aperture.
• Main limiters and "footprints" of localized boundary
fluxes are competitive impurity sources (depending on
v, density and plasma aperture) which can only
be transiently screened by the coatings.
Materials of strongly loaded components:
-ma in - and ICRH antenna limiters
— • TiC coated graphite
- diagnostic coils etc.
— • SS, only partially screened by graphite
This constellation introduces severe machine
specific limitations with respect to the efficiency
of wall coatings.
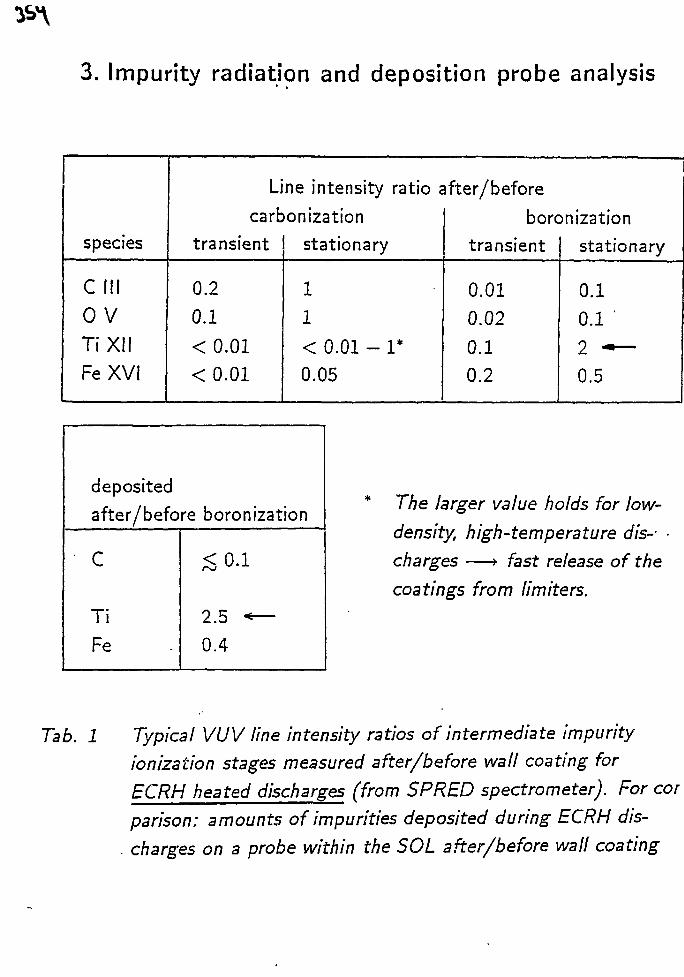
3. Impurity radiation and deposition probe analysis
species
C III0 VTi XIIFeXVI
Line intensity ratio i
carbonizationtransient
0.20.1<0.01<0.01
stationary
11
< 0.01 - 1*0.05
jfter/before1
boronization
transient
0.01
0.02
0.1
0.2
stationary
0.1
0.1 '
0.5
deposited
after/before boronization
C
TiFe
2.5 * —
0.4
The larger value holds for low-
density, high-temperature dis-
charges —*• fast release of the
coatings from Umiters.
Tab. 1 Typical VUV line intensity ratios of intermediate impurity
ionization stages measured after/before wall coating for
ECRH heated discharges (from SPRED spectrometer). For cor
parison: amounts of impurities deposited during ECRH dis-
. charges on a probe within the SOL after/before wall coating
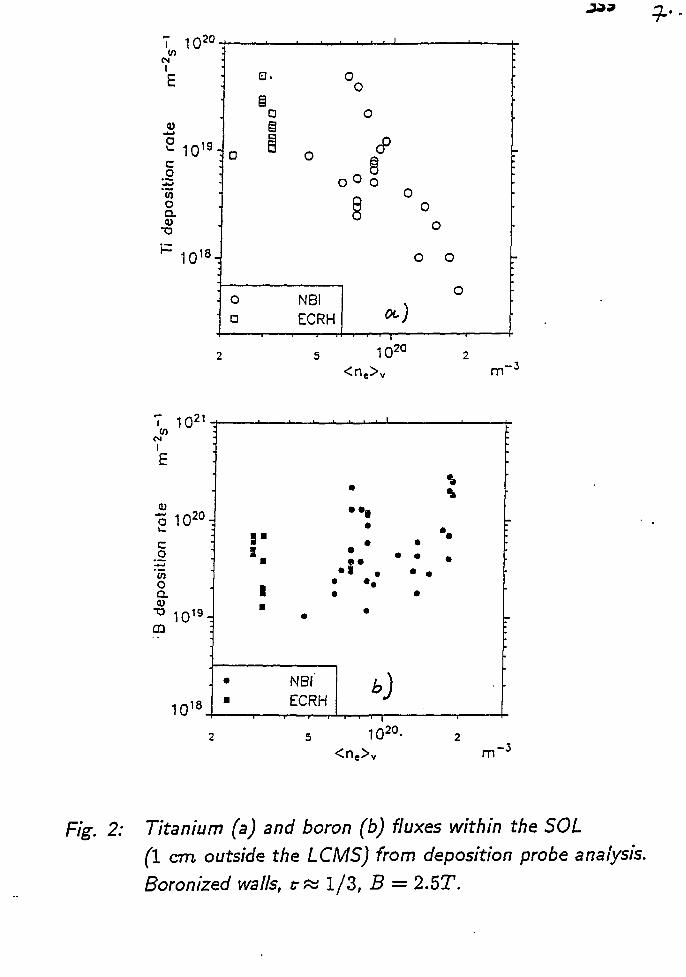
T 10 2 0
(NI
<0
1019 .C
'55oa
1018 .
ia§
o
o o
m
7 1021
o 10 2 0
oa.
ca
10 1 8 .
5 1020-<ne>v m
2: Titanium (a) and boron (b) fluxes within the SOL(I cm outside the LCMS) from deposition probe analysis.Boronized walls, r « 1/3, B = 2.57.
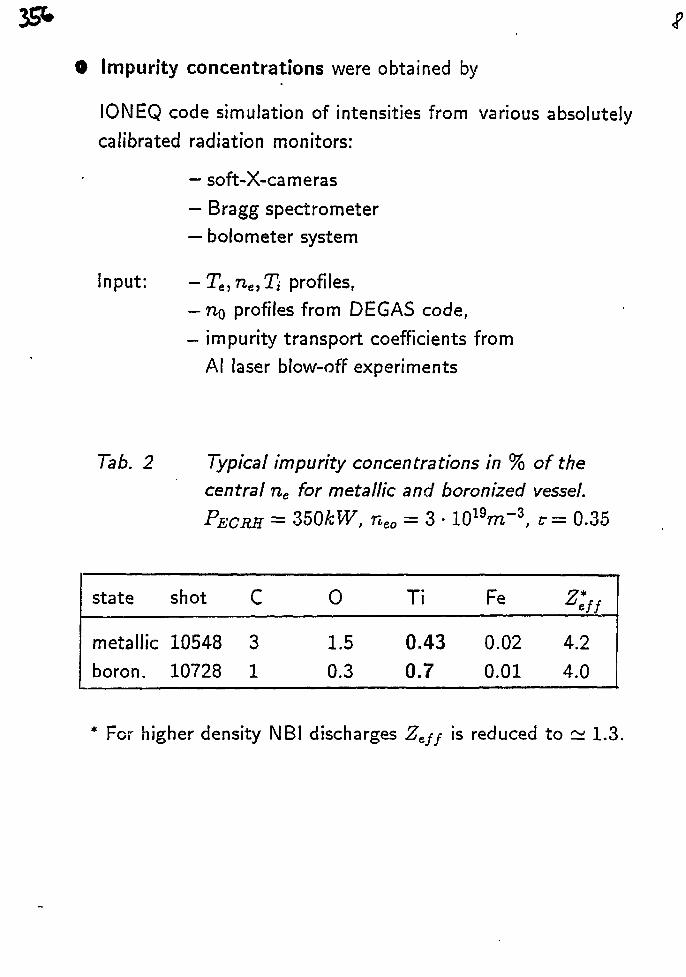
• Impurity concentrations were obtained by
IONEQ code simulation of intensities from various absolutely
calibrated radiation monitors:
— soft-X-cameras
— Bragg spectrometer
— bolometer system
Input: - Te ,ne ,Ti profiles,
— no profiles from DEGAS code,
— impurity transport coefficients from
Al laser blow-off experiments
Tab. 2 Typical impurity concentrations in % of the
central ne for metallic and boronized vessel.
PECRH = SBOkW, nt0 = 3 • 1019m"3, t= 0.35
state
metallic
boron.
shot
10548
10728
C
3
1
0
1.5
0.3
Ti
0.430.7
Fe
0.02
0.01
i
4
4
.2
.0
* For higher density NBI discharges Zefj is reduced to ~ 1.3.
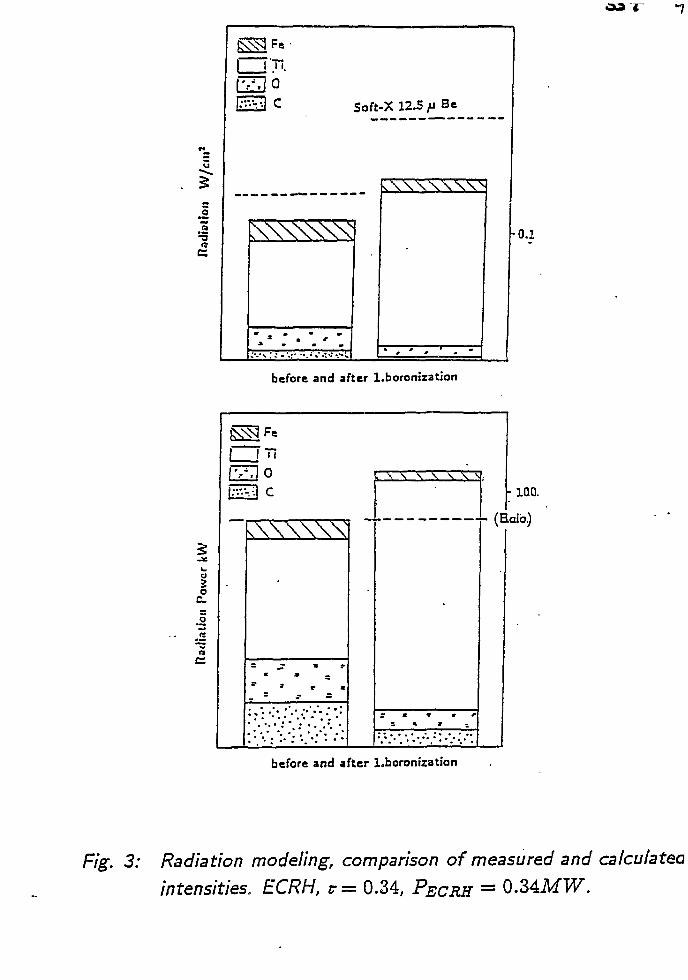
IIOI
dia
l
C
" . - : • *. - :
Soft-X 12^ /J Be
v\\\\\\\N
0.1
before and after l.boromzation
oc
13
A\\\V\
\ \ \ \ \ \ \
1Q0.
before and after l.boronization
Fig. 3: Radiation modeling, comparison of measured and calculatedintensities, ECRH, r = 0.34, PECRH = 0.34MTF.
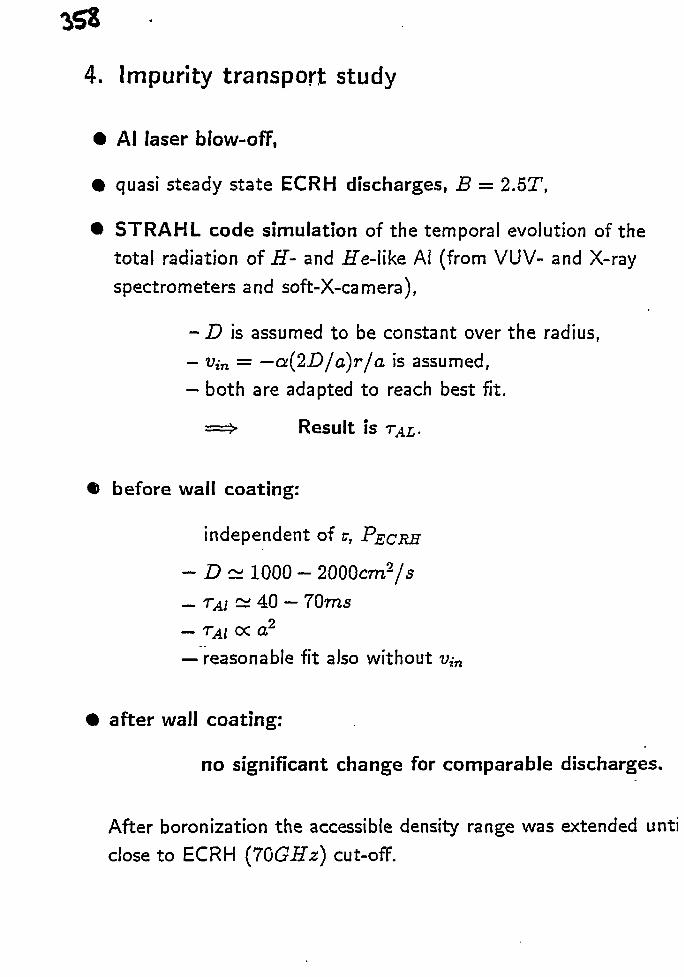
4. Impurity transport study
• Al laser blow-off,
• quasi steady state ECRH discharges, B = 2.5T,
• STRAHL code simulation of the temporal evolution of thetotal radiation of H- and ile-like Ai (from VUV- and X-rayspectrometers and soft-X-camera),
- D is assumed to be constant over the radius,- Vin = —a(2D/a)r/a is assumed,- both are adapted to reach best fit.
Result is
before wall coating:
independent of c, PECRH
- D ~ 1000 - 2000cm21s- TAJ ~ 40 - 70ms- TAJ CC a2
- reasonable fit also without
after wall coating:
no significant change for comparable discharges.
After boronization the accessible density range was extended unticlose to ECRH (70GHz) cut-off.
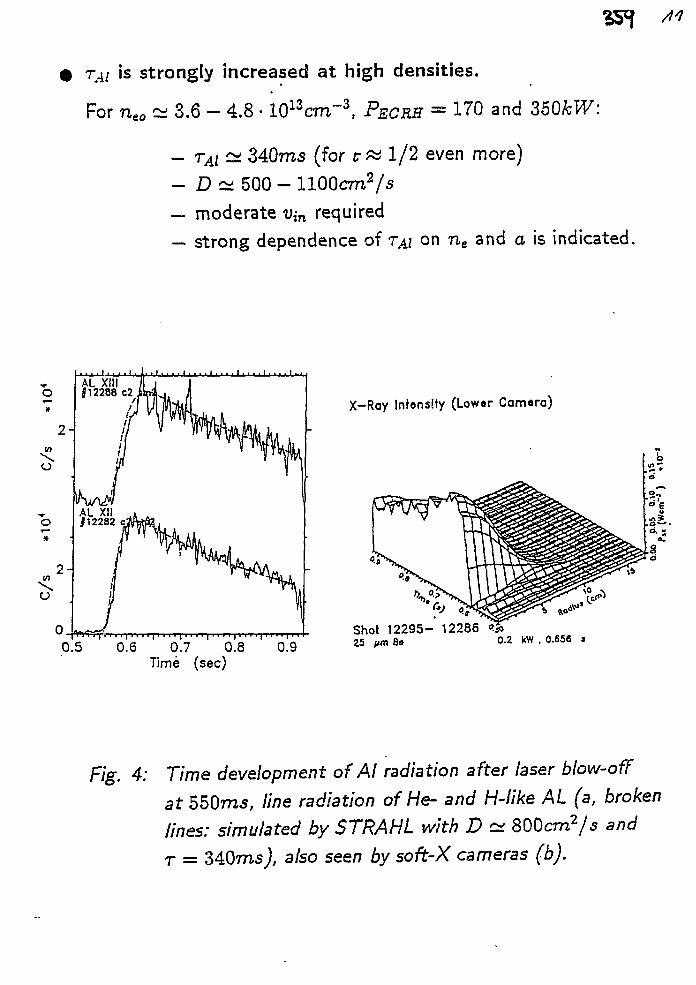
JA is strongly increased at high densities.
For neo ~ 3.6 - 4.8 • 1013cm"3, PECRH = 170 and 350kW:
- rAi ~ 340ms (for v « 1/2 even more)- D ~ 500 - 1100cm2/s— moderate V{n required— strong dependence of TAI on ne and a is indicated.
0.5 0.6 0.7 0.8 0.9Time (sec)
X-Ray Infonsity (Lower Camera)
Shot 12295- 1228625 /-m 8» 0.2 kW . 0.656 3
Fig. 4: Time development of Al radiation after laser blow-offat 550ros, line radiation of He- and H-like AL (a, brokenlines: simulated by STRAHL with D ~ 800cm2/s andr — ZAQms), also seen by soft-X cameras (b).
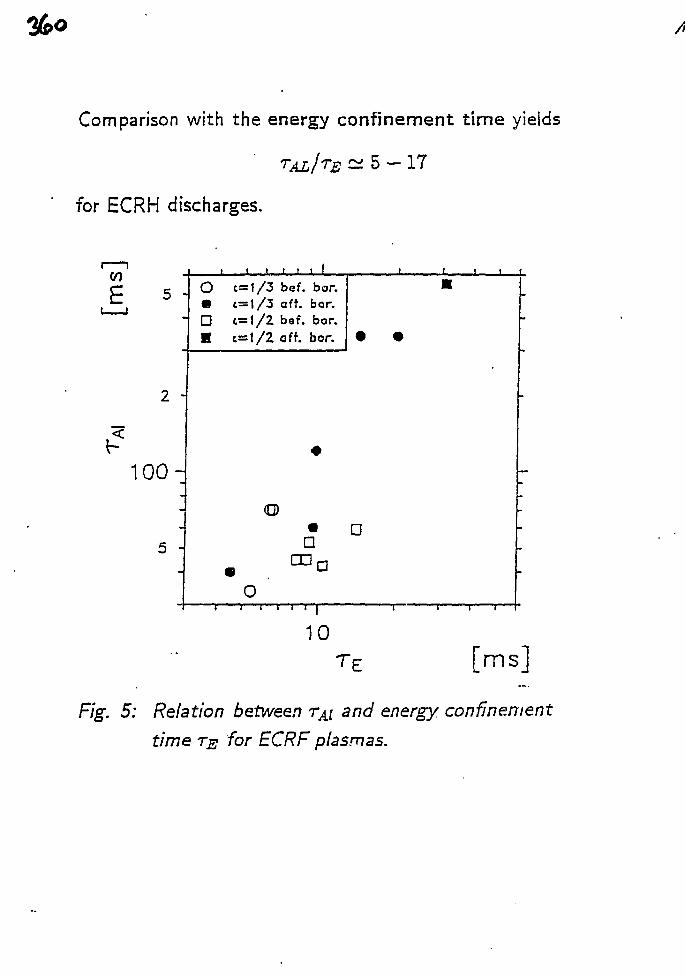
Comparison with the energy confinement time yields
TALJTE si 5 - 17
for ECRH discharges.
V)
£
2 -
100-
5 -
I I l i l t IO c=i/3 bef. bor.m i=i/3 aft. bor.D 1=1/2 bef. bor.• t=l/2 off. bor.
©D
* i i i i i r
10
I t 1 I
\ I 1
[ms]
Fig. 5: Relation between TAJ and energy confinement
time TJS for ECRF plasmas.
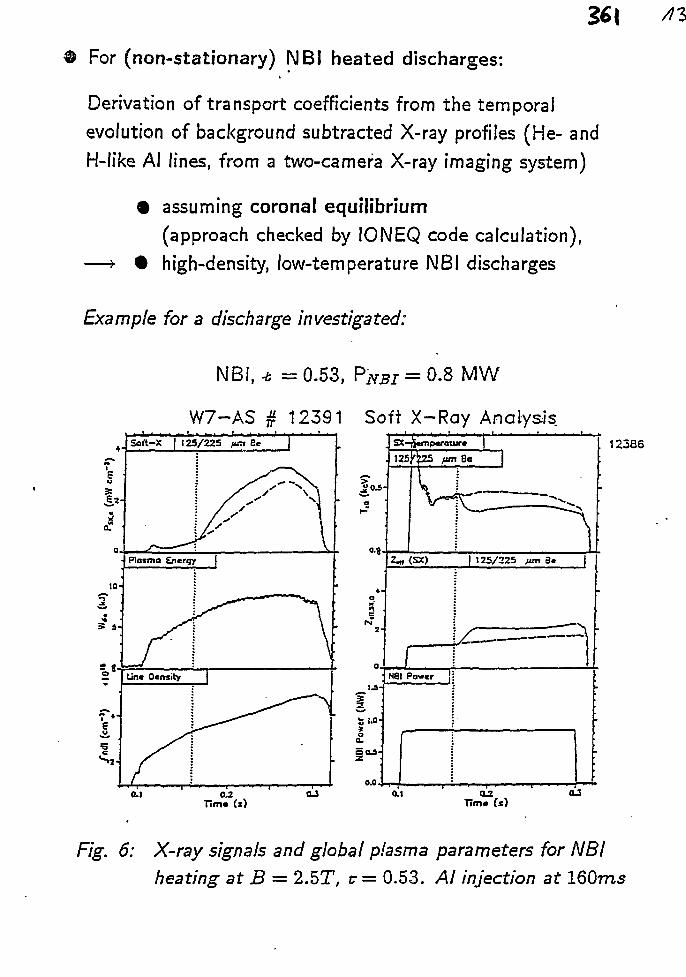
2*1
For (non-stationary) NBI heated discharges:
Derivation of transport coefficients from the temporalevolution of background subtracted X-ray profiles (He- andH-like A\ lines, from a two-camera X-ray imaging system)
• assuming coronal equilibrium(approach checked by IONEQ code calculation),
—»• • high-density, low-temperature NBI discharges
Example for a discharge investigated:
NBI, -t = 0.53, PNBi = 0.8 MW
W7-AS # 12391 Soft X-Ray Analysis
fa.
o.g
i
O U -
0.0,
Z-t <sx)
NSl Power
J 25/225 Mm 3*
. 12386
0.2TTm« (s)
0.1 O2Tim* (s)
Fig. 6: X-ray signals and global plasma parameters for NBIheating at B ~ 2.5T, r = 0.53. Al injection at 160ms
Assuming corona equilibrium:
Determine PJf ' fat) from Al Laser'blow off experiment (X-ray cameras, background subtraction method).
Determine n.4?(r,t) (^11+>12+>13+) using measured Profiles ofTe, ne and calculated radiation coefficient for Al (e) neglect-ing transport (check this approach by calculations, IOMEQcode).
, *) = nAi(r, t) • ne(r, t) • e(T&(r, t))
• Calculate Al transport fluxes TAI neglecting external sourceand sink terms from:
dnAl Id__- . — __
at r or
Get diffusion coefficent D(r) and convection velocity v(r)from
— vOr
by plotting
T 1 ®UAX IJ- Al/nAl vs. —?—/nAi
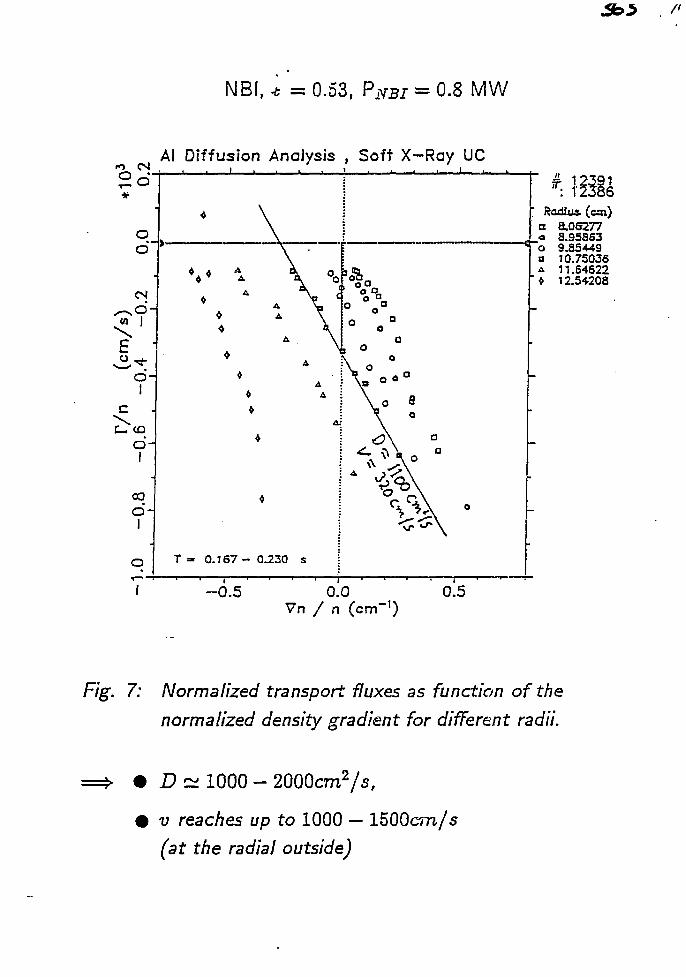
NBI, -t = 0.53, PNBI = 0.8 MW
Al Diffusion Analysis , Soft X-Ray UC
Radius, (cm)a 8.06277o 3.95863o 9.85449a 10.75036A 11.64622* 12.54208
F/g\ 7: Normalized transport fluxes as function of thenormalized density gradient for different radii.
D ~ 1000 - 2000cm21s,
v reaches up to 1000 — 1500cm/s
(at the radial outside)
5. Summary and conclusions
• Carbon, oxygen, iron and titanium (the latter originating
from TiC coated limiters) are dominant impurities in W7-AS.
• Carbonization of the vessel reduces the light impurities only
transiently (for a few ten shots), whereas Fe is more per-
sistently su pressed.
• Boronization durably supresses C and O influx due to active
oxygen gettering and break of the CO desorption cycle.
Fe and Ti are transiently reduced ("optimum conditions"),
but the long-term reduction of Fe is only marginal whereas
the Ti influx is even significantly increased. For that
reason the central Ze/f value is not decreased significantly.
• Large Ti and Fe fluxes after vessel coating are due to
enhanced sputtering from limiters and "footprints" of loca-
lized boundary plasma fluxes after fast release of coatings
from the respective areas.
• As a consequence of these machine specific restrictions the
TiC coated limiter tiles are replaced now by bulk boronized
graphite tiles (20% boron). Beside the elimination of the
Ti sources an in-situ boronization at least of parts of the
vessel wall is expected.
• Impurity confinement times deduced from Al laser blow-off
into ECRH discharges are typically by a factor of ~ 10
larger than the respective energy confinement times.
Characteristics of Plasma Edge in the Heiiotron-E Device
T.Mizuuchi, H.Matsuura' and Heliotmn-E Group
Plasma Physics Laboratory, Kyoto University,Gokasho, Uji, 611JAPAN
'College of Engineering, University of Osaka Prefecture,Mozuumemachi, Sakai, 591 JAPAN
1. INTRODUCTIONIn the Heliotron-E device, plasma flows to the wall in distinct flux bun-
dles[1,2,3]. This situation is similar to an open divertor in tokamaks. In contrast totokamak divertor, however, the field line in the edge region moves stochastically. Thegoal of our experiments is to understand this complicated three-dimensional plasmaedge. In this paper, plasma distributions in-two edge regions, ( in the core plasmaedge and near the wall), are described based on the recent experiments.
2. CORE PLASMA EDGE2.1 Plasma distribution
The profiles of plasma density and temperature near the core plasma edge arereported in [1,2]. The radial distribution of heat flux, Js, for ECH plasma (JPECH « 250kW) was measured with a movable calorimeter of Co-ball (6xlO~3 m+). As shown inFig.1, the obtained profile well agrees with the electron density profile in the separa-trix region measured with a electrical probe at different cross section. The gradient ofJs changes just inside of the outermost flux surface estimated from field tracing calcu-lations. The results of vacuum field measurements indicate the existence of low n-mode magnetic islands in the edge region[4,5]. In order to study the effects of the de-formed flux surfaces on the plasma confinement, a material limiter was inserted at z »-0.21 m (r/a m 0.7)[6]. In this case, Js decreased more than one order in the outerregion and this is also consistent with the decrease of the edge density (a materiallimiter configuration). As in Fig.1, a plateau region in /s-profile was clearly observedat 0.84 < r/a < 0.93 for the limiter case. Taking account the results of field measure-ments, it is considered that this plateau should be attributed to n=2 island around1/231-2 surface. In the limiter shadow, the characteristic decay length of the heat fluxis shorter (about 8xlO~3 m) than that for the original separatrix region (about 3.4xlO~2
m), possibly due to the shorter connection length.
2.2 Distribution of neutral particlesBecause of open-divertor-like configuration, it is expected that the hydrogen
recycling is localized at the "divertor trace" on the wall and this would cause non-uniform distribution of plasma source along the poloidal direction.
The behavior of atomic hydrogen near the core plasma boundary has beenextensively studied under collaboration with a group of Kyushu university [7] throughspectroscopic measurements combined with laser aided techniques and the numeri-cal simulation with DEGAS code. The observed density profile of atomic hydrogen iswell explained by the penetration of Franck-Condon atom with localized recyclingsource at the divertor trace[6]. The numerical simulation shows clear difference in theatomic hydrogen density along the poloidal direction. This localized neutral densitymay affect the plasma behavior. It is expected to expand the plasma parameter
region by using the gas fueling from the high field side (see section 4).
3. "DIVERTOR PLASMA" NEAR THE WALLIn order to construct a divertor system by using the flux bundle, uniformity of
particle flux and heat load on the wall is important issue. On the other hand, since the"divertor* flux bundles are terminated at the metal wall, it is not necessary to keep theequality in the electrcn and the ion currents to the surface in the local small area. Theedge plasma transport might be affected by the electric field due to this non-ambipoler flow. In order to study these issues, the ion saturation current and the float-ing potential to the wail have been measured by using eight poloidal calorimeterarrays of electrically insulated plates located at four different cross sections in onepitch of the helical field(Fig.2).
The localization of the ion saturation current, Is, and the heat flux on the divertortrace, Jw, was confirmed for different four toroidal positions. The observed peak valueof Jw are not the same along the divertor trace (Fig.3a). The "non-uniform" factor ofheat flux along the divertor trace is about 6 -10. Since the field structure is not ideallyergodic, the field lines to each plate keeps local information of the up-stream. Theobserved non-uniformity in ./^-distributions might be attributed to this field structureand tiie effect of trapped particle. The effect of obstacles in the chamber also shouldbe considered because of short distance (0.015 m) between the wall and the plate.
As for the floating potential, not only the absolute value but also its polarity isvaried in poloidal and toroidal directions (Fig.3b). This suggests that the chargeequality of the plasma flow is broken in a local area. Owing to the imperfect ergodicnature of the edge field, we can find correlations between sensor plate positionsassuming the periodic change, of the field structure. From this point of view, the posi-tive potential region seems to be connected to the negative ones by the field lines.This means the existence of current in the edge region. Since it was observed thatthe polarity of the floating potential for most of sensor plates was consistent with thedirection of gradB drift and was reversed by the change of the helical field direction,it is considered that grad B drift has an important part in this flow.
4. Density Clamping in ECH plasmaThe "density clamping" is usually observed in Heliotron-E ECH-plasma and
this prevents controlling the plasma density[8]. This phenomenon is characterized bythe burst of edge plasma during RF pulse, i.e. abrupt increase in the intensity of ionsaturation current (and also the density) at the core plasma edge and the divertortrace, and Ha-emission. At almost the same time, the line averaged density starts todecrease. The uncontrollable density decay itself can be reduced by superimposingtoroidal field. However, the burst of edge plasma and increase of Ha-emission arestill observed there, i.e. the loss rate is not reduced. In this case, the outer plasmaedge might contact with bumper limiters or other materials at the high field side. Thissuggests that not the gas fueling from the low field side but that from the high fieldside due to change of recycling or fueling efficiency caused by contact with materialsimproves the situation.
The way of change in the floating potential of the calorimeter plate at the densityclamping is not the same for each one. The most interesting observation is a spike-like change in the potential at some positions. Both of negative and positive spikeswere observed depending on the positions, but the largest one is negative. On theother hand, the potential at the core plasma edge (r-rseparainx = 0.01 m) showed a
positive spike (this possibly depends on the position.). The electron temperatureestimated with the triple probe method increased at this phase, but after that, thetemperature decreased to the previous level or lower. These observations suggestthat there are, at ieast, two confinement modes in ECH phase and that the transitionfrom one mode to another causes the spike-like change in edge potential andtemperature.
Recently, a new clamping-free mode was observed even in the standard con-figuration. In this mode, not only the density was kept high but also no rapid increaseof Ha-emission and the ion saturation current was observed. The large negativespike in the floating potential also disappeared. Since the electron temperature of thecore plasma was almost the same as that in the low density case with clamping, theinternal energy of the confined plasma increased in this mode. Up to now, this modeis out of our control but it seems that the key parameter is a little change of the fillingpressure (or the recycling condition) just before RF pulse or the pre-ionization condi-tion relating to the existence of non-thermal electron.
5. CONCLUSIONS- The radial profile of the heat flux in the edge region was measured and the resultsare consistent with the density and temperature profile. The effect of the deformedflux surface which is indicated from the field measurements was observed.- The observed density profile of atomic hydrogen is well explained by penetration ofFranck-Condon atom with localized recycling source on the divertor trace.- The localization of particle and heat flux on the divertor trace was confirmed fordifferent toroidal positions in one helical pitch. It is shown that these values are notconstant along the divertor trace with a "non-uniform" factor of 6-10.~ The positive or negative (floating) potential near the wall was observed. The polari-ty seems to consistent with the direction of the gradBior ECH plasma. This suggeststhe existence of plasma current in the edge region and that the grad B drift has animportant part in this flow.- A spike-like change in the edge potential was observed at density clamping inECH plasma. This suggests some transient process in the edge region is caused bythe abrupt change of the core plasma profile or confinement.- A new clamping-free mode was observed in the standard configuration where theinternal energy of the confined plasma increased.
ACKNOWLEDGEMENTWe are grateful to all collaborators for their excellent experiments and. useful
discussions.
REFERENCES[1] T. Mizuuchi, et al., J. Nucl. Mater., 121 (1984) 3.[2] T. Obiki, et al., Plasma Phys. Controlled Nucl. Fusion Research 1988,
Vol.2 (IAEA, Vienna, 1989) 337.[3] T. Mizuuchi and the Heliotron-E Group, J. Nucl. Mater., 162 & 164 (1989) 105.[4] R. Takahashi.et al., Jpn. J. A. P., 28 (1989) 2604.[5] T. Mizuuchi, et al., J. Nucl. Mater., 176 & 177 (1990) 1070.[6] T. Obiki, et al., in this workshop.[7] K. Muraoka, et al., J.Nucl.Mater., 176 & 177 (1990) 231.[8] H. Zushi, et al., PPLK-R-27.
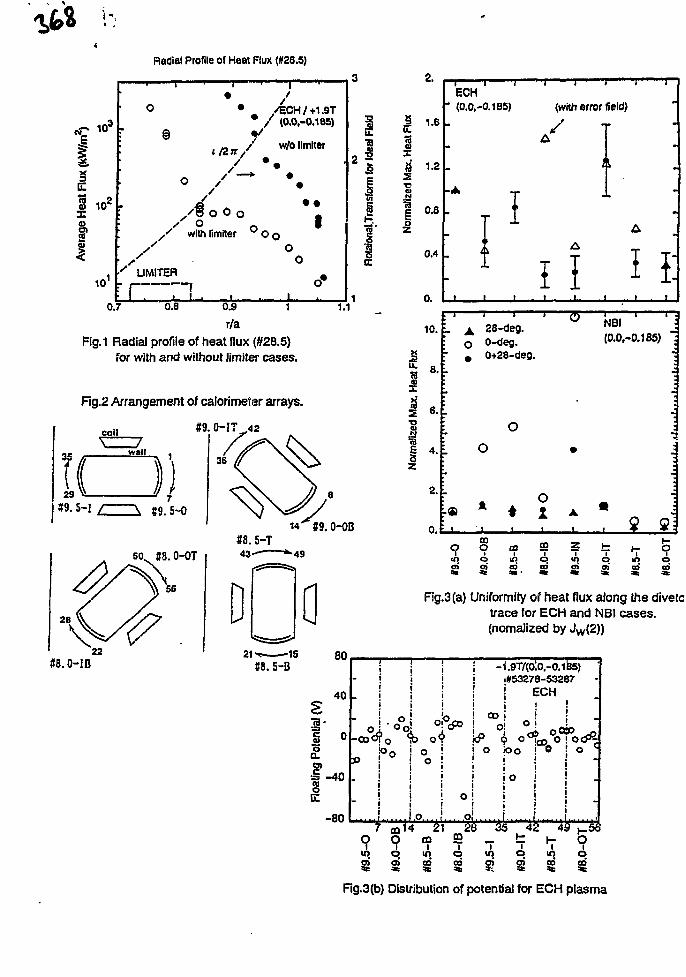
3-,
Radial Profile ol Heat Flux (#26.5)
II
§
10
o
i @
' UMITER
T7""7
o /
/fooc' o
with limiter
1. ,
' 1
' . /ECH/+1.9T* / (0.0.-0.165)
Y/ w/o limiter
— • •
oo
o*
.13
0.7 0.8 0.9
r/a1.1
Fig.1 Radial profile of heat flux (#28.5)for with and without limiter cases.
Fig.2 Arrangement of calorimeter arrays.
29#9.5-1
7*9. 5-0
36
M #9.0-OB« . 5-T43 ' *-49
a#8.0-IB
21 'v 15#8. 5-B
80
40
1-40
-80
o-CO
2.
1.6
1.2
0.8
0.4
0.
10.
1 (
ECH(0.0,-0.185) (with error field)
i\ n_i I I i_
|
6.
4.
2.
0.
28-deg.
0+28-deg.
O NBI(0.0,-0.185)
[• • X$ g;
9*>.O)
a*
COOo
co £9 5 fcin c> u> p O
CO
Fig.3(a) Uniformity of heat flux along the divetotrace for ECH and NBI cases,(nomalized by Jw(2))
o,oo]
^o \ o*to,
Oi'
oo
9 9
'tf»
i9T/(0.0.-0.1B5)i#53278-53287
ECH
icPO! o
oc
ioo
28 35 42 49
qoi « q
GOin
9qr
in q00 CO
Fig.3(b) Distribution of potential for ECH plasma
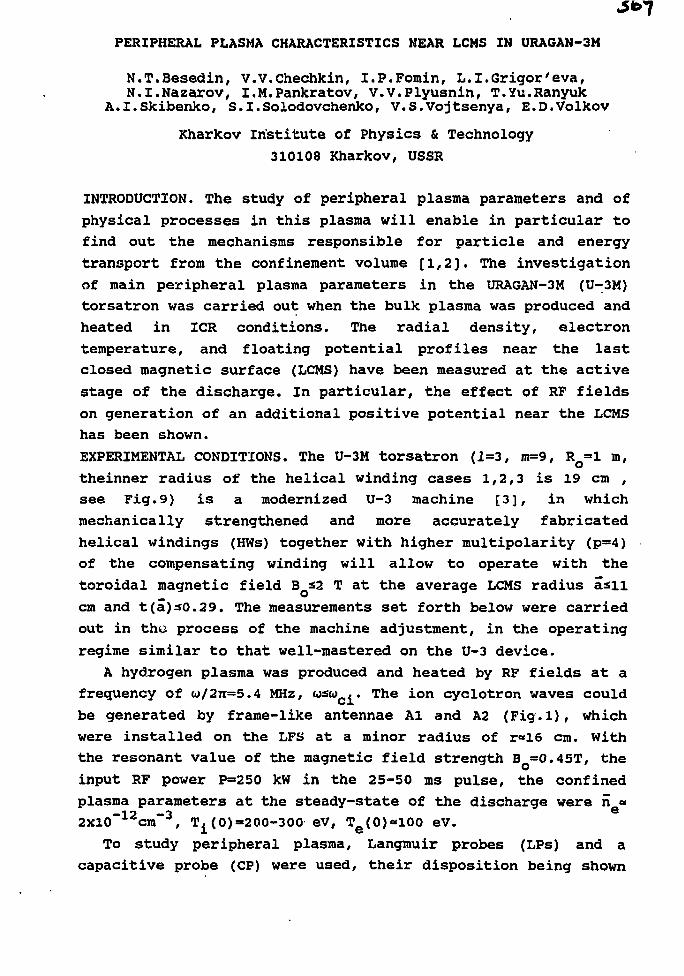
PERIPHERAL PLASMA CHARACTERISTICS HEAR LCMS IN URAGAN-3M
N.T.Besedin, V.V.Chechkin, I.P.Fomin, L.I.Grigor'eva,N.I.Nazarov, l.M.Pankratov, V.V.Plyusnin, T.Yu.Ranyuk
A.I.Skibenko, S.I.Solodovchenko, V.S.vojtsenya, E.D.Volkov
Kharkov Institute of Physics & Technology
310108 Kharkov, USSR
INTRODUCTION. The study of peripheral plasma parameters and of
physical processes in this plasma will enable in particular to
find out the mechanisms responsible for particle and energy
transport from the confinement volume [1,2]. The investigation
of main peripheral plasma parameters in the URAGAN-3M (U-3M)
torsatron was carried out when the bulk plasma was produced and
heated in ICR conditions. The radial density, electron
temperature, and floating potential profiles near the last
closed magnetic surface (LCMS) have been measured at the active
stage of the discharge. In particular, the effect of RF fields
on generation of an additional positive potential near the LCMS
has been shown.
EXPERIMENTAL CONDITIONS. The U-3M torsatron (1=3, m=9, RQ=1 m,
theinner radius of the helical winding cases 1,2,3 is 19 cm ,
see Fig. 9) is a modernized U-3 machine [3], in which
mechanically strengthened and more accurately fabricated
helical windings (HWs) together with higher multipolarity (p=4)
of the compensating winding will allow to operate with the
toroidal magnetic field B *2 T at the average LCMS radius asil
cm and t(a)50.29. The measurements set forth below were carried
out in the process of the machine adjustment, in the operating
regime similar to that well-mastered on the U-3 device.
A hydrogen plasma was produced and heated by RF fields at a
frequency of CJ/2TI=5.4 MHZ, wsu .. The ion cyclotron waves could
be generated by frame-like antennae Al and A2 (Fig.l), which
were installed on the LFS at a minor radius of r«16 cm. With
the resonant value of the magnetic field strength B =0.45T, the
input RF power P=250 kW in the 25-50 ms pulse, the confined
plasma parameters at the steady-state of the discharge were n «
2xl0"12cm~3, T^O) =200-300 eV, Te(0)«100 eV.
To study peripheral plasma, Langmuir probes (LPs) and a
capacitive probe (CP) were used, their disposition being shown
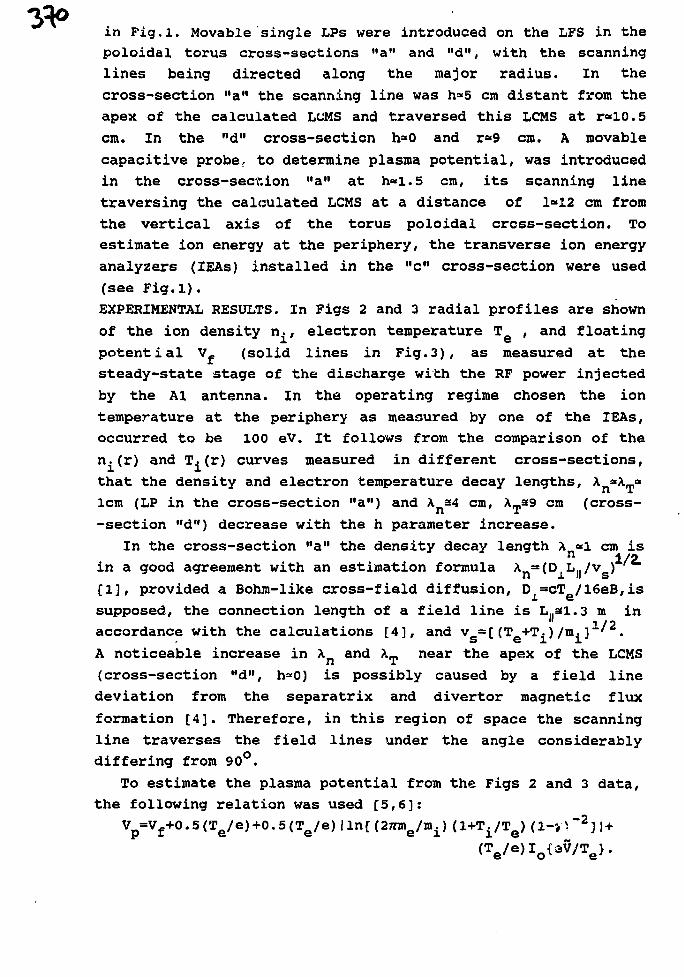
in Fig.l. Movable single LPs were introduced on the LFS in the
poloidal torus cross-sections "a" and "dM, with the scanning
lines being directed along the major radius. In the
cross-section "a" the scanning line was h<*5 cm distant from the
apex of the calculated LCMS and traversed this LCMS at r«10.5
cm. In the "d" cross-section h*0 and r*9 cm. A movable
capacitive probe, to determine plasma potential, was introduced
in the cross-section "a" at h«l.5 cm, its scanning line
traversing the calculated LCMS at a distance of 1«12 cm from
the vertical axis of the torus poloidal cross-section. To
estimate ion energy at the periphery, the transverse ion energy
analyzers (IEAs) installed in the "c" cross-section were used
(see Fig.l}.
EXPERIMENTAL RESULTS. In Figs 2 and 3 radial profiles are shown
of the ion density n., electron temperature T , and floatingl e
potential V- (solid lines in Fig. 3), as measured at the
steady-state stage of the discharge with the RF power injected
by the Al antenna. In the operating regime chosen the ion
temperature at the periphery as measured by one of the IEAs,
occurred to be 100 eV. It follows from the comparison of the
n.(r) and T. (r) curves measured in different cross-sections,
that the density and electron temperature decay lengths, ^-^m*
lcm (LP in the cross-section "a") and A =4 cm, X_a9 cm (cross-
-section "d") decrease with the h parameter increase.
In the cross-section "a" the density decay length A * ! cm is
in a good agreement with an estimation formula An~^
D1Lii/v
s)
[1], provided a Bohm-like cross-field diffusion, D =cT /16eB,is
supposed, the connection length of a field line is L..31.3 m in
accordance with the calculations [4], and v =[(T +T.)/m.]"' .
A noticeable increase in X and X_ near the apex of the LCMS
(cross-section "d", h«0) is possibly caused by a field line
deviation from the separatrix and divertor magnetic flux
formation [4]. Therefore, in this region of space the scanning
line traverses the field lines under the angle considerably
differing from 90°.
To estimate the plasma potential from the Figs 2 and 3 data,
the following relation was used [5,6]:Vp = Vf + O- 5 ( Te / e ) + O* 5 ( Te / e ) | l n [ ( 2 7 n ne / i ni ) ( 1 + Ti / I re ) ( 1~*'~ 2 3 l +
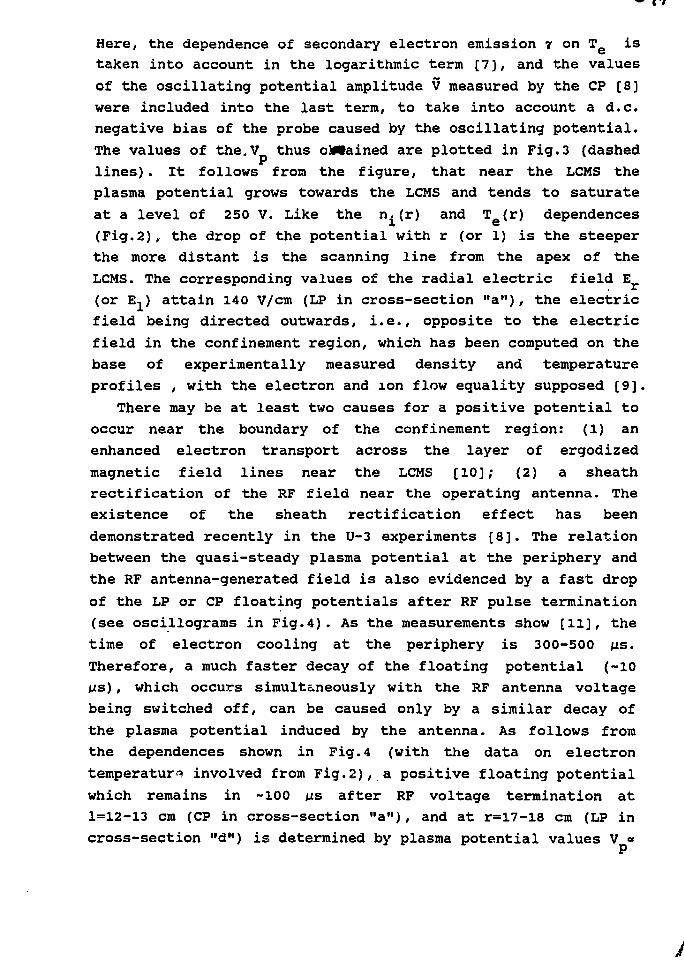
Here, the dependence of secondary electron emission r on T @ is
taken into account in the logarithmic term [7], and the values
of the oscillating potential amplitude V measured by the CP [8]
were included into the last term, to take into account a d.c.
negative bias of the probe caused by the oscillating potential.
The values of the.V thus oMIained are plotted in Fig.3 (dashed
lines) . It follows from the figure, that near the LCMS the
plasma potential grows towards the LCMS and tends to saturate
at a level of 250 V. Like the n^(r) and Te(r) dependences
(Fig.2), the drop of the potential with r (or 1) is the steeper
the more distant is the scanning line from the apex of the
LCMS. The corresponding values of the radial electric field E
(or E,) attain 140 V/cm (LP in cross-section "a"), the electric
field being directed outwards, i.e., opposite to the electric
field in the confinement region, which has been computed on the
base of experimentally measured density and temperature
profiles , with the electron and ion flow equality supposed [9].
There may be at least two causes for a positive potential to
occur near the boundary of the confinement region: (1) an
enhanced electron transport across the layer of ergodized
magnetic field lines near the LCMS [10]; (2) a sheath
rectification of the RF field near the operating antenna. The
existence of the sheath rectification effect has been
demonstrated recently in the U-3 experiments [8]. The relation
between the quasi-steady plasma potential at the periphery and
the RF antenna-generated field is also evidenced by a fast drop
of the LP or CP floating potentials after RF pulse termination
(see oscillograms in Fig.4). As the measurements show [11], the
time of electron cooling at the periphery is 300-500 us.
Therefore, a much faster decay of the floating potential (-10
us) , which occurs simultaneously with the RF antenna voltage
being switched off, can be caused only by a similar decay of
the plasma potential induced by the antenna. As follows from
the dependences shown in Fig.4 (with the data on electron
temperature involved from Fig.2), a positive floating potential
which remains in -100 us after RF voltage termination at
1=12-13 cm (CP in cross-section "a"), and at r=17-18 cm (LP in
cross-section Md") is determined by plasma potential values V «
70 V and V =«14O V, respectively, and possibly is associated
with an enhanced electron transport through the ergodic layer.
Note, that because of a small connection length of a field
line after it crosses the separatrix (L^l.3 m on the LFS [4])
a potential induced near the operating antenna can be
transferred to the "a" and "d" cross-sections due to the
electron re-distribution along the field lines only through a
thin layer near the LCMS, where according to the calculations,
a field line makes about one or more turns around the torus
until it crosses the separatrix. Also, in this region the above
mentioned ergodic layer could be localized, in which a fast
electron re-distribution along the torus should take place.
Therefore, in any case, the potential far from the antenna
should have a maximum value near the LCMS and drop with
radius, just what is observed in Fig.3.
The radial electric field near the boundary of the
confinement region may have a serious effect on the
low-frequency turbulence in the peripheral plasma, and thereby
influence the particle and energy transport through the LCMS
[2].
CONCLUSIONS
1. In the U-3M torsatron the steepness of the density,
electron temperature and potential profiles near the LCMS
increases with the distance of the scanning line from the apex
of the LCMS; at a distance from the apex of the LCMS the
density decay length agrees with the Bohm value of the cross-
field diffusion coefficient.
2. Near the LCMS the peripheral plasma acquires a positive
potential up to 250 V at the active stage of the discharge;
partly, this potential is associated with the way chosen for
plasma production and heating, namely, with the RF sheath
rectification near the operating antenna; the other part of the
potential is presumably caused by an enhanced electron
transport from the ergodic layer;
3. The radial electric field in the peripheral plasma near
the LCMS exceeds 100 V/cra and is directed outwards, opposite to
ths calculated ambipolar electric field in the confinement
volume.
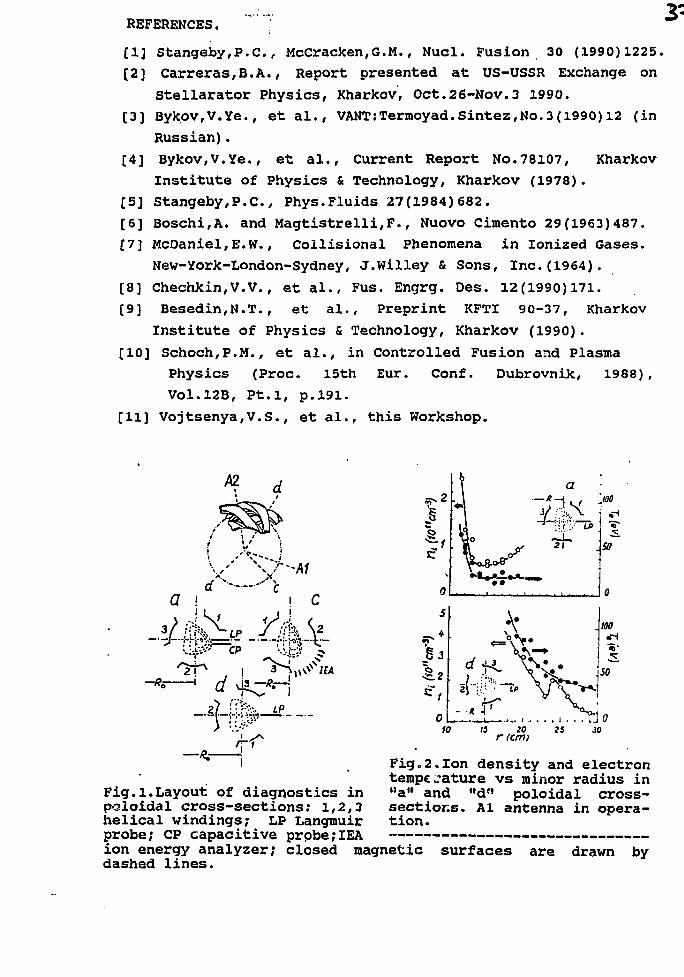
REFERENCES.
[1] Stangeby,P.C, McCracken,G.M., Nucl. Fusion 30 (1990)1225.
[2] Carreras,B,A., Report presented at US-USSR Exchange on
Stellarator Physics, Kharkov, Oct.26-Nov.3 1990.
[3] Byk,ov,V.Ye., et al., VANT:Termoyad.Sintez,No.3(1990) 12 (in
Russian).
[4] Bykov,V.Ye., et al., Current Report No.78107, Kharkov
Institute of Physics & Technology, Kharkov (1978).
[5] Stangeby,P.C, Phys.Fluids 27(1984)682.
[6] Boschi,A. and Magtistrelli,F., Nuovo Cimento 29(1963)487.
[7] McDaniel,E.W., Collisional Phenomena in Ionized Gases.
New-York-London-Sydney, J.Willey & Sons, Inc.(1964).
[8] Chechkin,V.V., et al., Fus. Engrg. Des. 12(1990)171.
[9] Besedin,N.T., et al., Preprint KFTI 90-37, Kharkov
Institute of Physics & Technology, Kharkov (1990).
[10] Schoch,P.M., et al., in Controlled Fusion and Plasma
Physics (Proc. 15th Eur. Conf. Dubrovnik, 1988),
Vol.l2B, Pt.l, p.191.
[11] Vojtsenya,V.S., et al., this Workshop.
-R
to 30
Fig.1.Layout of diagnostics inpoloidal cross-sections: 1,2,3helical windings; LP Langmuirprobe; CP capacitive probe;IEAion energy analyzer; closed magneticdashed lines.
Fig.2.Ion density and electrontemperature vs minor radius in"a" and "d» poloidal cross-sections. Al antenna in opera-tion.
surfaces are drawn by
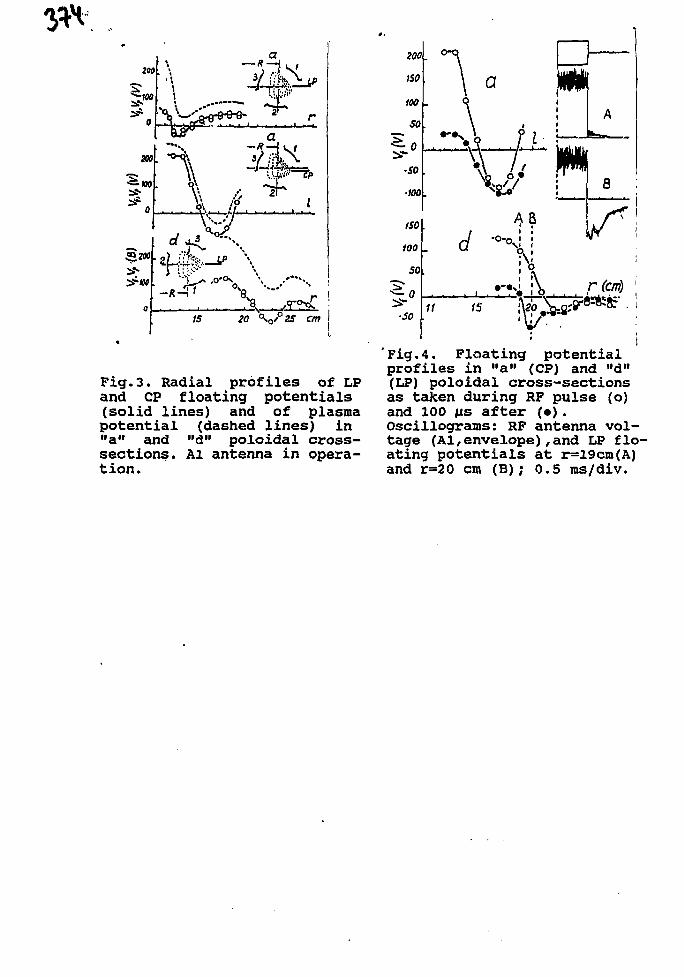
...V. i l
0
cm
Fig.3. Radial profiles of LPand CP floating potentials(solid lines) and of plasmapotential (dashed lines) in"a" and "d" poloidal cross-sections. Al antenna in opera-tion.
'Fig.4. Floating potentialprofiles in "a" (CP) and »d"(LP) poloidal cross-sectionsas taken during RF pulse (o)and 100 MS after (•).Oscillograros: RF antenna vol-tage (Al,envelope),and LP flo-ating potentials at r=l9cm(A)and r=20 cm (B); 0.5 ms/div.
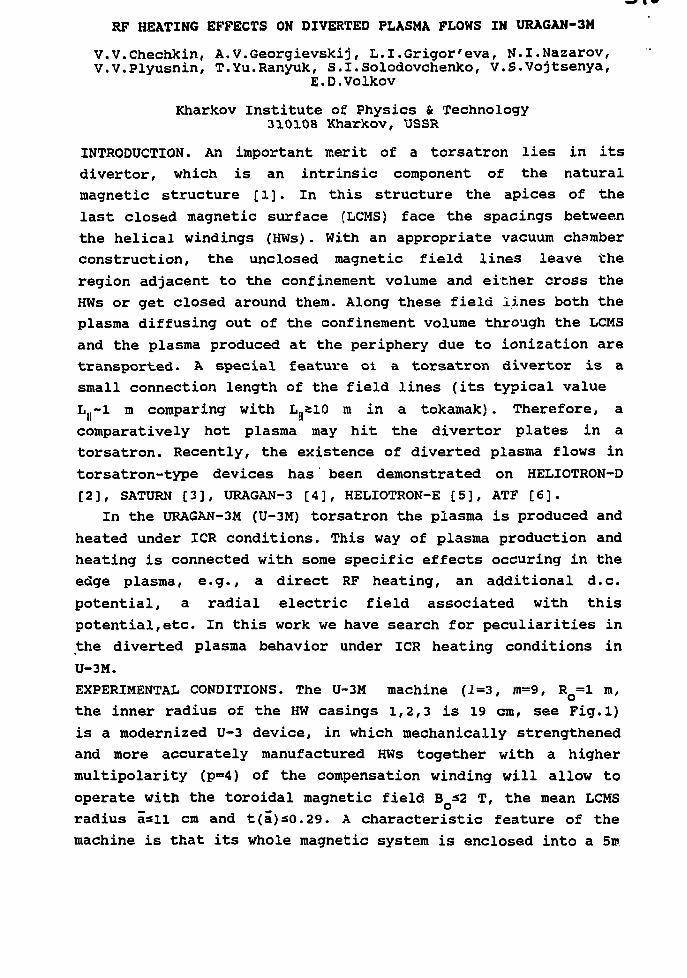
RF HEATING EFFECTS ON DIVERTED PLASMA FLOWS IN URAGAN-3M
V.V.Chechkin, A.V.Georgievskij, L.I.Grigor'eva, N.I.Nazarov,V.V.Plyusnin, T.Yu.Ranyuk, S.I.Solodovchenko, V.S.Vojtsenya,
E.D.Volkov
Kharkov Institute of Physics & Technology310108 Kharkov, USSR
INTRODUCTION. An important merit of a torsatron lies in its
divertor, which is an intrinsic component of the natural
magnetic structure [l]. In this structure the apices of the
last closed magnetic surface (LCMS) face the spacings between
the helical windings (HWs). With an appropriate vacuum chamber
construction, the unclosed magnetic field lines leave the
region adjacent to the confinement volume and either cross the
HWs or get closed around them. Along these field lines both the
plasma diffusing out of the confinement volume through the LCMS
and the plasma produced at the periphery due to ionization are
transported. A special feature ol a torsatron divertor is a
small connection length of the field lines (its typical value
L..-1 m comparing with L..£lO m in a tokamak) . Therefore, a
comparatively hot plasma may hit the divertor plates in a
torsatron. Recently, the existence of diverted plasma flows in
torsatron-type devices has been demonstrated on HELIOTRON-D
[ 2 ] , SATURN [3], URAGAN-3 [4], HELIOTRON-E [5], ATF [6].
In the URAGAN-3M (U-3M) torsatron the plasma is produced and
heated under ICR conditions. This way of plasma production and
heating is connected with some specific effects occuring in the
edge plasma, e.g., a direct RF heating, an additional d.c.
potential, a radial electric field associated with this
potential,etc. In this work we have search for peculiarities in
the diverted plasma behavior under ICR heating conditions in
U-3M.
EXPERIMENTAL CONDITIONS. The U-3M machine (1=3, m=9, RQ=1 m,
the inner radius of the HW casings 1,2,3 is 19 cm, see Fig.l)
is a modernized U-3 device, in which mechanically strengthened
and more accurately manufactured HWs together with a higher
multipolarity (p=4) of the compensation winding will allow to
operate with the toroidal magnetic field B *2 T, the mean LCMS
radius asil cm and t(a)so.29. A characteristic feature of the
machine is that its whole magnetic system is enclosed into a 5n»
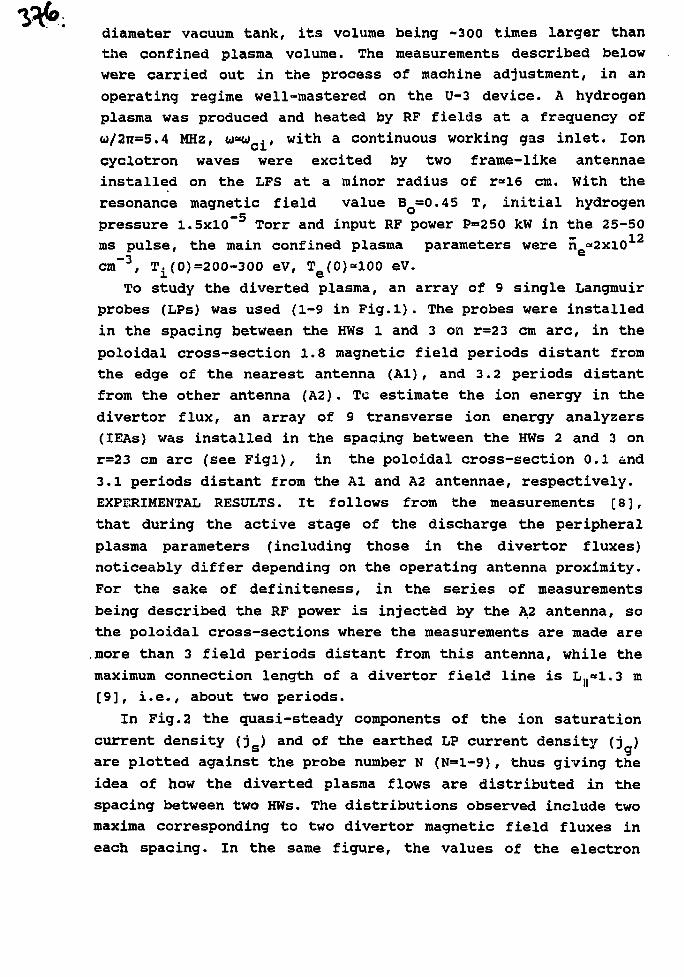
diameter vacuum tank, its volume being -300 times larger than
the confined plasma volume. The measurements described below
were carried out in the process of machine adjustment, in an
operating regime well-mastered on the U-3 device. A hydrogen
plasma was produced and heated by RF fields at a frequency of
<J/2TT=5.4 MHZ, w*w ., with a continuous working gas inlet. Ion
cyclotron waves were excited by two frame-like antennae
installed on the LFS at a minor radius of r<*16 cm. With the
resonance magnetic field value B =0.45 T, initial hydrogen-5
pressure 1.5x10 Torr and input RF power P=250 kW in the 25-50
ms pulse, the main confined plasma parameters were ne«2xl01
cm"3, Ti(0)=200-300 eV, Te(0)«100 eV.
To study the diverted plasma, an array of 9 single Langmuir
probes (LPs) was used (1-9 in Fig.l). The probes were installed
in the spacing between the HWs 1 and 3 on r=23 cm arc, in the
poloidal cross-section 1.8 magnetic field periods distant from
the edge of the nearest antenna (Al), and 3.2 periods distant
from the other antenna (A2). Tc estimate the ion energy in the
divertor flux, an array of 9 transverse ion energy analyzers
(IEAs) was installed in the spacing between the HWs 2 and 3 on
r=23 cm arc (see Figl), in the poloidal cross-section 0.1 and
3.1 periods distant from the Al and A2 antennae, respectively.
EXPERIMENTAL RESULTS. It follows from the measurements [8],
that during the active stage of the discharge the peripheral
plasma parameters (including those in the divertor fluxes)
noticeably differ depending on the operating antenna proximity.
For the sake of definiteness, in the series of measurements
being described the RF power is injected by the A2 antenna, so
the poloidal cross-sections where the measurements are made are
more than 3 field periods distant from this antenna, while the
maximum connection length of a divertor field line is L.«1.3 m
[9], i.e., about two periods.
In Fig.2 the quasi-steady components of the ion saturation
current density (jg) and of the earthed LP current density (j )
are plotted against the probe number N (N=l-9), thus giving the
idea of how the diverted plasma flows are distributed in the
spacing between two HWs. The distributions observed include two
maxima corresponding to two divertor magnetic field fluxes in
each spacing. In the same figure, the values of the electron
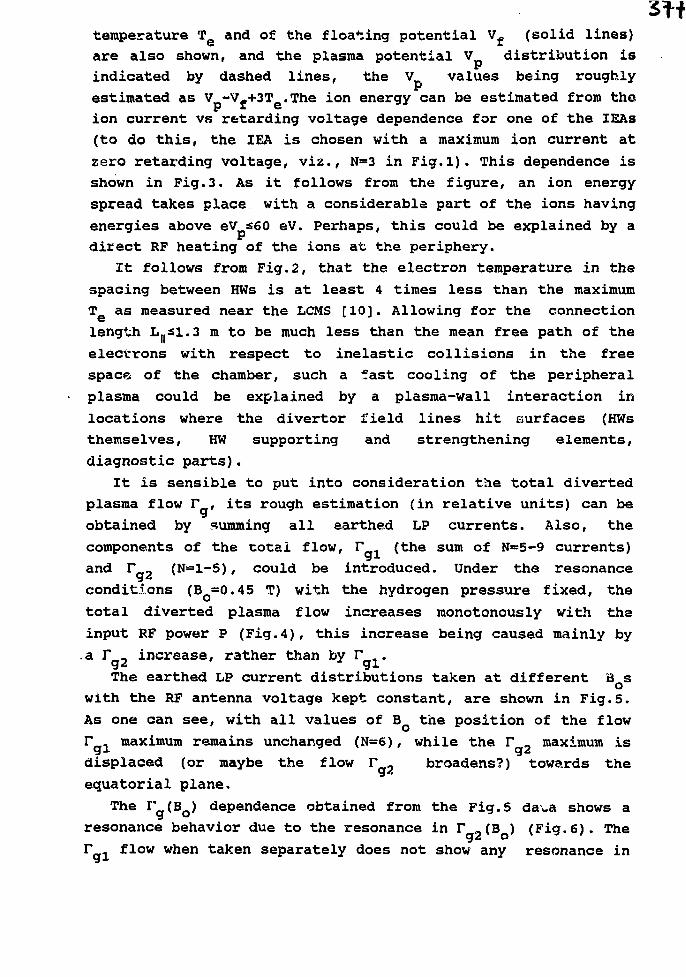
temperature T e and of the floating potential Vf (solid lines)
are also shown, and the plasma potential V distribution is
indicated by dashed lines, the V values being roughly
estimated as V -Vf+3Te.The ion energy can be estimated from the
ion current vs retarding voltage dependence for one of the IEAs
(to do this, the IEA is chosen with a maximum ion current at
zero retarding voltage, viz., N=3 in Pig.l). This dependence is
shown in Fig. 3. As it follows from the figure, an ion energy
spread takes place with a considerable part of the ions having
energies above eV £60 eV. Perhaps, this could be explained by a
direct RF heating of the ions at the periphery.
It follows from Fig.2, that the electron temperature in the
spacing between HWs is at least 4 times less than the maximum
T as measured near the LCMS [10]. Allowing for the connection
length L..31.3 m to be much less than the mean free path of the
electrons with respect to inelastic collisions in the free
space of the chamber, such a fast cooling of the peripheral
plasma could be explained by a plasma-wall interaction in
locations where the divertor field lines hit surfaces (HWs
themselves, HW supporting and strengthening elements,
diagnostic parts).
It is sensible to put into consideration the total diverted
plasma flow r , its rough estimation (in relative units) can be
obtained by summing all earthed LP currents. Also, the
components of the total flow, r . (the sum of N=5-9 currents)
and r _ (N=l-5), could be introduced. Under the resonance
conditions (BQ=0.45 T) with the hydrogen pressure fixed, the
total diverted plasma flow increases monotonously with the
input RF power P (Fig.4), this increase being caused mainly by
a T 2 increase, rather than by T .
The earthed LP current distributions taken at different B so
with the RF antenna voltage kept constant, are shown in Fig.5.
As one can see, with all values of B the position of the flow
r ^ maximum remains unchanged (N=6), while the r maximum is
displaced (or maybe the flow I* broadens?) towards the
equatorial plane.
The r (BQ) dependence obtained from the Fig. 5 da\.a shows a
resonance behavior due to the resonance in r ,(B ) (Fig.6). The
F - flow when taken separately does not show any resonance in
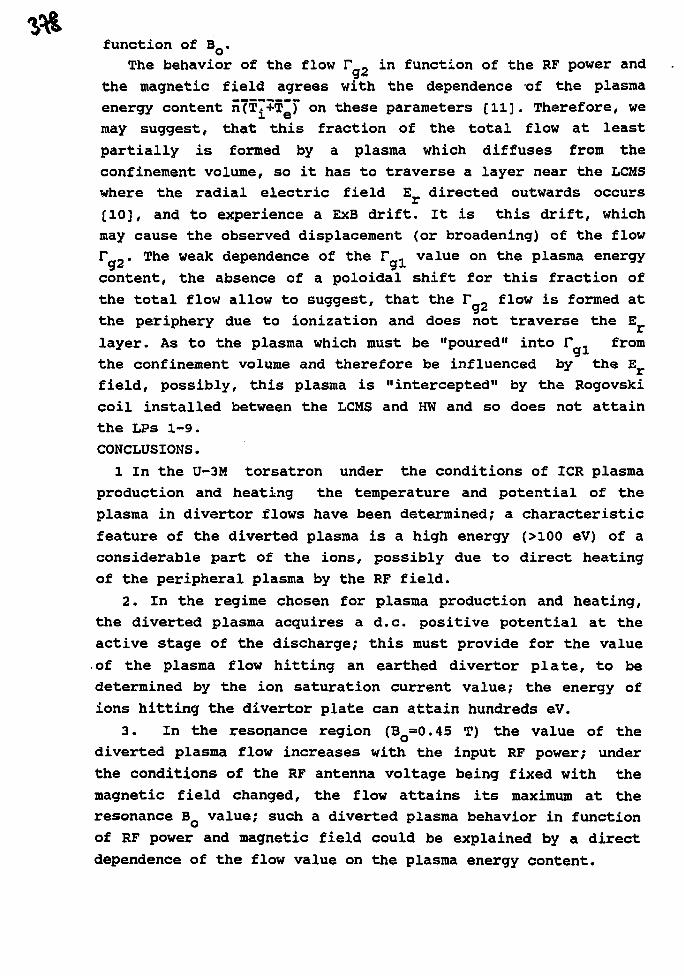
function of B .
The behavior of the flow r , in function of the RF power and
the magnetic field agrees with the dependence of the plasma
energy content n7T^+T~7 on these parameters [11]. Therefore, we
may suggest, that this fraction of the total flow at least
partially is formed by a plasma which diffuses from the
confinement volume, so it has to traverse a layer near the LCMS
where the radial electric field E directed outwards occurs
[10], and to experience a ExB drift. It is this drift, which
may cause the observed displacement (or broadening) of the flow
F „. The weak dependence of the r 1 value on the plasma energy
content, the absence of a poloidal shift for this fraction of
the total flow allow to suggest, that the r flow is formed at
the periphery due to ionization and does not traverse the E
layer. As to the plasma which must be "poured" into r from
the confinement volume and therefore be influenced by the E
field, possibly, this plasma is "intercepted" by the Rogovski
coil installed between the LCMS and HW and so does not attain
the LPs 1-9.
CONCLUSIONS.
1 In the U-3M torsatron under the conditions of ICR plasma
production and heating the temperature and potential of the
plasma in divertor flows have been determined; a characteristic
feature of the diverted plasma is a high energy (>100 eV) of a
considerable part of the ions, possibly due to direct heating
of the peripheral plasma by the RF field.
2. In the regime chosen for plasma production and heating,
the diverted plasma acquires a d.c. positive potential at the
active stage of the discharge; this must provide for the value
of the plasma flow hitting an earthed divertor plate, to be
determined by the ion saturation current value; the energy of
ions hitting the divertor plate can attain hundreds eV.
3. In the resonance region (BQ=0.45 T) the value of the
diverted plasma flow increases with the input RF power; under
the conditions of the RF antenna voltage being fixed with the
magnetic field changed, the flow attains its maximum at the
resonance B Q value; such a diverted plasma behavior in function
of RF power and magnetic field could be explained by a direct
dependence of the flow value on the plasma energy content.
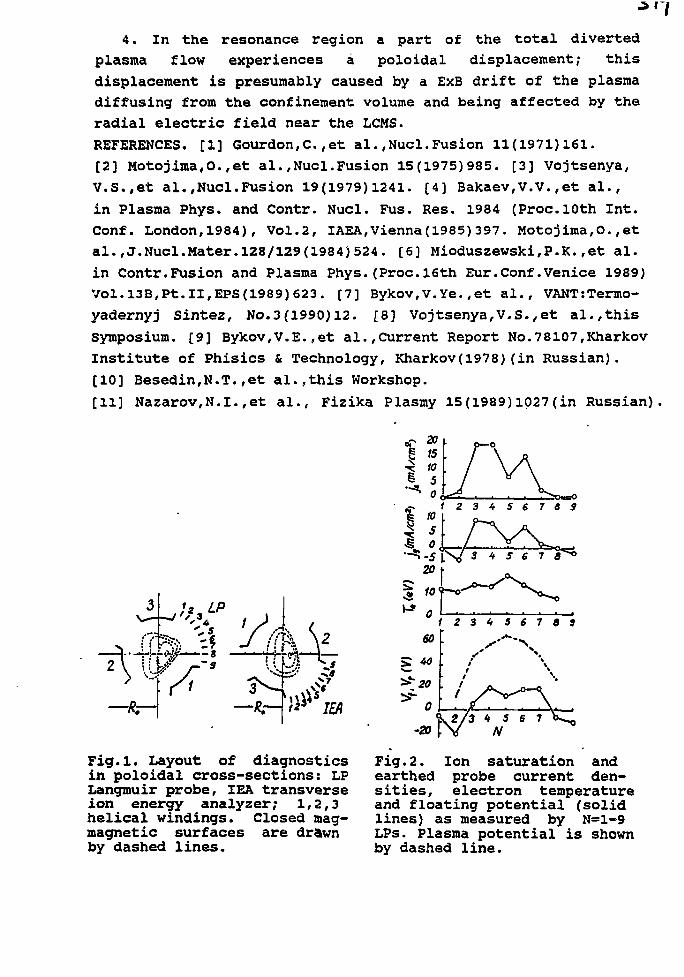
I4. In the resonance region a part of the total diverted
plasma flow experiences a poloidal displacement; this
displacement is presumably caused by a ExB drift of the plasma
diffusing from the confinement volume and being affected by the
radial electric field near the LCMS.
REFERENCES. [1] Gourdon,C.,et al.,Nucl.Fusion 11(1971)161.
[2] Motojima,0.,et al.,Nucl.Fusion 15(1975)985. [3] Vojtsenya,
V.S.,et al.,Nucl.Fusion 19(1979)1241. [4] Bakaev,V.V.,et al.,
in Plasma Phys. and Contr. Nucl. Fus. Res. 1984 (Proc.lOth Int.
Conf. London,1984), Vol.2, lAEA,vienna(1985)397. Motojima,O.,et
al.,J.Nucl.Mater.128/129(1984)524. [6] Mioduszewski,P.K.,et al.
in Contr.Fusion and Plasma Phys.(Proc.l6th Eur.Conf.Venice 1989)
Vol.l3B,Pt.II,EPS(1989)623. [7] Bykov,V.Ye.,et al., VANT:Termo-
yadernyj Sintez, No.3(1990)12. [8] Vojtsenya,V.S.,et al.,this
Symposium. [9] Bykov,V.E.,et al.,Current Report No.78107,Kharkov
Institute of Phisics & Technology, Kharkov(1978)(in Russian).
[10] Besedin,N.T.,et al.,this Workshop.
[11] Nazarov,N.I.,et al., Fizika Plasmy 15(1989)1027(in Russian).
Fig.l. Layout of diagnosticsin poloidal cross-sections: LPLangmuir probe, IEA transverseion energy analyzer; 1,2,3helical windings. Closed mag-magnetic surfaces are drawnby dashed lines.
208
1 2 3 4 5 6 7 0 9
-»W3Fig.2. Ion saturation andearthed probe current den-sities, electron temperatureand floating potential (solidlines) as measured by N=l-9LPs. Plasma potential is shownby dashed line.
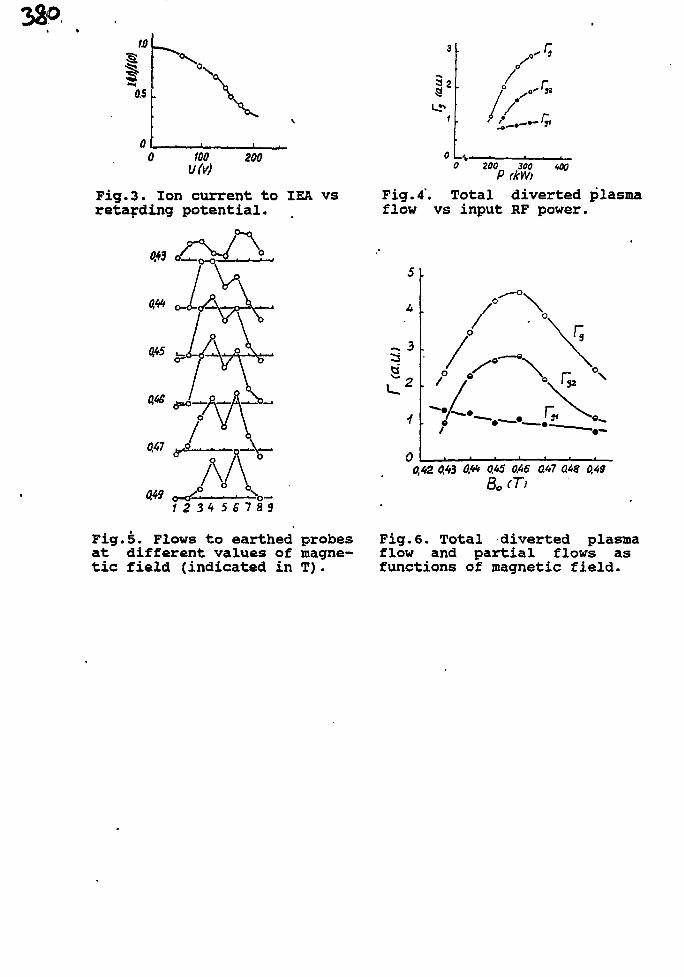
23Pto
I0.5
100U(V)
200
Pig.3. Ion current to IEA vsretarding potential.
345678$
Fig.5. Flows to earthed probesat different values of magne-tic field (indicated in T).
ur/ ,1-1
U0 200 300 1,00
P (kW)Fig. 4'. Total diverted plasmaflow vs input RF power.
0,42 443 Of* 0.45 0.46 0A7 OAS 0.49
Bo (T)
Fig.6. Total diverted plasmaflow and partial flows asfunctions of magnetic field.
Profile Measurements and Transport Analysisof ECH Plasmas in Heliotron E
S. S U D O , H. Z U S H I , K. K O N D O , F. S A N O , T. M I Z U U C H I ,S. B E S S H O U , H . O K A D A , T. B A B A , T. F U R U K A W A ,
K. H A N A T A N I , M. W A K A T A N I , and T. OBIKI
Plasma Phys ics Laboratory, Kyoto University, Uji, Kyoto , Japan
A B S T R A C T . Electron temperature and density profiles of ECH plasmas are measured by amultiple Thomson scattering system under several conditions. Some results are presented in this paper. Theoptimum condition for a plasma reduced to 2/3 of the original minor radius limited by a carbon Iimiter is 20mminward shift, as it was for the case without limiter. Profiles of ECH plasmas with previously reported optimumconfiguration are measured and analyzed.1. I N T R O D U C T I O N
Recently, active control of magnetic configuration of Heliotron E has been intensively studied forconfinement optimization and for investigation of transport property [1,2]. As for helical systems, similar studyis being carried out in ATF [3] and CHS [4]. It is one key issue for designing a new large experimental devicehow and how much the confinement can be improved compared to the empirical confinement scaling forstcllarator/heliotron [5]. Changs of the edge plasma property is also interested from the viewpoint of panicle andheat flux control in addition to global transport property. For these purposes, the electron temperature anddensity profiles of ECH plasmas of Heliotron E are measured mainly by a multiple Thomson scatteringsystem under several conditions like auxiliary toroidal field control ( a ^ ^ / B j j , where B t and Bjj are themagnetic field strength produced by toroidal field coils and that by a helical coil, respectively.), magnetic axisshift (p^By/Bjj , where B v is the magnetic field strength produced by vertical field coils.), material limiterinsertion.2 . E X P E R I M E N T A L R E S U L T S2.1. Magnetic axis shift
For concrete image, a quantity of magnetic axis shift from the standard configuration, 5^ is used hereafter
instead of p*. As for the definition of sign of 6\,, + and - indicate outward and inward shift of the magnetic
axis, respectively. The absolute value of 6\, is the distance of the magnetic axis from that of the standard
configuration, and the unit is mm. (b\,=0 for fl*=-0.185) As for magnetic axis shift as already reported [2,6],
the condition around 6\, =-20 mm can be considered as optimum.It is one of interesting subjects which region is dominantly improved by shifting magnetic axis 20mm
inward. Therefore, the magnetic axis shift experiment is carried out with cutting a plasma radius by a carbonlimiter. The position of the limiter is set at Z(Lim)=207mm; this corresponds to about 93mm cut of the plasmaof the standard configuration in the vertical direction, which causes decrease of the plasma radius to 2/3 of thatwithout limiter. More merit of this limiter insertion is that the average plasma radius can be kept almost constant(a=0.15m). This experiment is carried out at B=1.9T. The dependence of plasma parameters on 8y is shownin Fig-1. The ECH power is about 250kW (Gl and G2) and cc*=O.O. The gas-puff condition is kept
1
322-
constant. As seen in the figure, the optimum shift is also around Sv=-20mm, as is the case without limner.In order to see change of plasma property, dependence of calculated square of minor radius normalized at
6^=0, shear 0 and B ^ contour on magnetic axis shift Sy is shown in Fig.2. The square of plasma minorradius with Iimiter is kept rather constant compared to that without limiter. The shear at 1/2 and 2/3 of a (undercondition without limiter) are denoted with 0(a/2) and 6(2a/3), respectively. The value, S C B ^ ) , is defined asA J J ^ / AQ, where A ^ is the area enclosed by the largest B ^ contour, and AQ is the area of the last closedflux surface. This is one measure of particle confinement [7]. The change of S C B ^ ) in. case with the limiter isessentially the same as that without the limiter. By comparing these with experimental results, first, it is clear thatthe plasma minor radius does not play a dominant role in the improvement. This is more confirmed than in theprevious experiments. Second, there was possibility that the shear at the edge region, 9(2a/3), might bedominant for the improvement because of similar change of the electron temperature or pressure. However,this possibility is almost eliminated because the parameter dependence on the axis shift is unchanged in spite ofcutting the plasma outside of ija> 2/3. The change of 9(a/2) is somewhat similar to that of the plasmaparameters. The shear at tja> 1/2, however, becomes very low, rapidly. Therefore, it seems that shearcontribution is less important in the improvement by axis shift Thus, the effect of panicle orbit is considered tobe most dominant in magnetic axis shift, although quantitative comparison with experimental results is furthernecessary.2 . 1 Optimum configuration (oc*=O.O5, Sv=-20mm)
For low beta NBI plasmas, the optimum configuration is reported to be a*=0.05 and S y ^ O m m [2].This is also the case for EOT plasmas. The density control is relatively easier than the case of the standardconfiguration. The electron temperature, density and pressure profiles in case of a*=0.05, 5v=-20mm are
shown in Fig.3 for the ECH plasma without limiter. A somewhat large scattering of the temperature and thus,the pressure is seen, although the radial scan data show smooth profile. This means that complete equality ofparameters on the calculated same magnetic surface may be not achieved (especially, the data on R>2220mmat fixed Z=0mm is lower than expected; this is in the direction of the small minor radius on the equatorial plane),which suggests some asymmetry in poloidal cross section. This point is not yet clarified, and further detailinvestigation will be necessary.
The electron temperature, density and pressure profiles in case of the same configuration with limiterinsertion (Z= 207 mm) are shown in Fig.4. The limiter position is indicated with an arrow. Although it seemsthe warm plasma exists a link bit outside of the limiter at the toroidal location of the Thomson scattering system,the effective plasma radius is obviously shrinked from the case of Fig3. The electron density in the core regionis kept to be almost the same as the case without limiter, by decreasing gas-puff.
A transport analysis is made for the results obtained for <x*=0.05 and 5y= -20mm. The best fined curves
for Tc and ne are already shown in H g 3 and Fig.4. Although the detail measurement of the ion temperature
was not available, from some chord data and experience acquired so far, the ion temperature profile is assumed
a s Tj (x)= 250 (1 - x*), which represents a very flat profile and unit is [eV]. The ECH power deposition
profile is assumed as: P ^ x ) * PECH T\ (1 - x 2 ) , where Pab$ , PECH and T\ denote the ECH power
density absorbed in the plasma, the input ECH power density, and the heating efficiency, respectively. From
these, the values of the electron thermal conductivity j ^ (including convection term) arc shown in Fig i and 6,
for the cases with and without limiter. In the figures, two vaiues for T| (Case A: 0.6 and Case B: 0.8) are
assumed based on the data obtained previously by an ECE decay method [8]. It is remarkable that the value of
XQ for the case with the limiter is comparable with that for the case without limiter around the region of *=0.5.
The confinement times are tabulated in Table I. When the plasma is clearly cut by the limiter, the plasma minor
radius should be 0.16m as shown in Table I. If this value is used, the ratio of the confinement time xE obtained
experimentally to that obtained from the stellarator/heliotron scaling [5] in case with the limiter is much higher
than in case without limiter. This means confinement is improved in case with the limiter. The change of
recycling may be attributed to this improvement. As one of the other possibilities, however, the effective
plasma radius may be larger than the above value, of which tendency is seen as described in the previous
section. If the effective plasma radius is assumed to be 0.184m (80% of the plasma radius), the ratio for xE
with the limiter is comparable with the case without limiter.
3 . C O N C L U S I O N S
Electron temperature and density profiles of ECH plasmas are measured by a multiple Thomson scatteringsystem under several conditions.Main results are: (1} Rom experiments of magnetic axis shift variation, the optimum condition for a plasma
reduced to 2/3 of the original minor radius limited by a limiter is 20mm inward shift, as it was for the casewithout limiter. This means that improvement of confinement by magnetic axis shift occurs in core region(K2/3a, where a is the minor radius without limiter), and that the improvement is not dominated by theoriginal boundary region (2/3<K/<a). (2) Profiles of ECH plasmas with previously reported optimumconfiguration (a*=0.05 and J3*=-0.192; magnetic axis shift of 20mm inward) are measured in detail. Theelectron pressure in case of the optimum configuration is definitely higher than that for the standardconfiguration.A C K N O W L E D G E M E N T S
The authors thank the Heliotron E operating staff for conducting Heliotron E operation.
R E F E R E N C E S[1] OBOCI, T.. a aL, Fusion TechnoL 170990)101. [2] OBKI, T., in Plasma Physics and Controlled Nuclear Fusion Research 1990(Proa 13th InLCatf. Washington, DC, 1990)IAEA-CN-53/C-l-l. [3J MURAKAMI, M.,etal., in Plasma Physics and ConuolledNuclear Fusion Research 1990 (Proc. 13th Int. Conf. Washington, DC, 1990) IAEA-CN-53/C-1-3. [4] KANEKO, O., a aL. inPlasma Physics and Controlled Nuclear Fusion Research 1990 (Prcc. 13th Ira. Conf. Washington, DC, 1990) IAEA-CN-53/C-1-4.15] SUDO, S . ,« aL, NucL Fusion 30<1990)l 1. [6] MOTOJIMA, O. ,« al., in Plasma Physics and Controlled Nuclear FusionResearch 1990 (Free 12ih Ira. Conf. Nice, 1988), VoL 1, IAEA, Vienna(1989)551. [71HANATANI, K.. in Plasma Physics andControlled Nuclear Fusion 1989 (Proc. 1st Ira. Conf. Told, 1989) NIFS-PROC-3(I990)45. [8] ZUSHI. H., et al., NucL Fusion28(1988)1801.
Table I Confinement t imes in
cases with and without limiter for
a*=0.05 and 8y=-20mm.
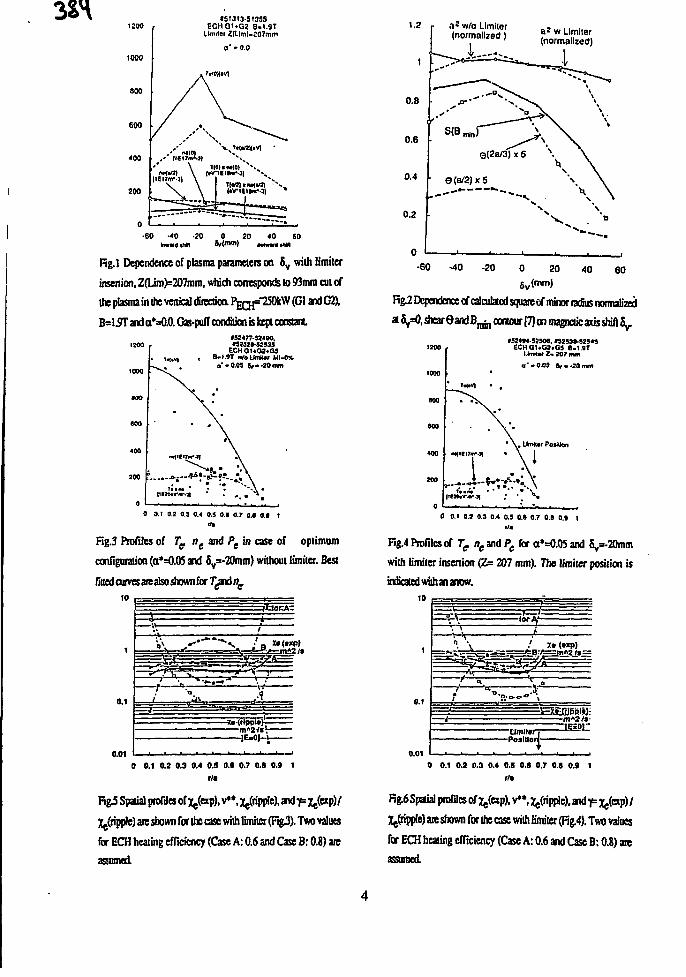
3SH1300
(000
800
600
400
200
0
»SI3t3-5l355r ECHQUGJ 8-1.9T
timiter Z(Um)-2a7mm
a'»0.0
AT
-60 -40 -20 0 SO 40 60
Rg.l Dependence of plasma parameters on 5V with limiter
insenion, Z(Lim)=207mm. which corresponds to 93mm cut of
the plasma in the vertical directioaPEQ[="250kW(Gl andG2),
B=15T and a*=0.0. Gas-puff condiiion is kepi constart
«»32*52939ECH GKQ24O5
8-I.9T nAUMIW Ul.0%
0 O.I O.I 0.3 0.4 0.5 O.I 0.7 O.« O.f t
Fig.3 Profiles of Tff ng and ?t in case of optimum
configuration (a*=O.05 and 5v=-20mm) without limiter. Best
fitted curves are also shown for TpAn,.
0.010 0.1 0.2 0.3 0.4 0.S O.S 0.7 0.8 0.9 1
fit
R g i Spatial profiles of Xg(exp), v**, (rippte), and y= y^iap)/
^(ripple) are shown for ihc case with limitcr (HgJ). Two values
for ECH heating efficiency (Case A: 0.6 and Case B: 0.8) are
assumed.
-60 -40 -20 0 20 40 60
fig.2 Dependence of calculated square of minor radius normalized
at 6^=0, shear 9 and B , , ^ contour |7J on magnetic axis shift 5, .
<3 0.1 0.2 0.3 0.4 0.5 O.ft 0.7 O.B 0.9 1
fig.4 Profiles of Tff ae and Pe for o*=0.05 and 5v=-20mmwith limiter insertion (Z= 207 mm). The limiter position isindkaed with an arrow.
0.01
J*f O" O ° ^
- t lmli t i-Poalll
wrr-HoiJ—
0 0.1 0.Z 0.3 0.4 0.5 0.6 0.7 0.8 0.8 1
fig.6Sjaia! profiles of (eap). v**, Xefripple), and T= ^ ( n p ) /
XgCnpple) ate shown for ine case with limiter (Fig.4). Two values
for ECH healing efficiency (Case A: 0.6 and Case B: 0.8) are
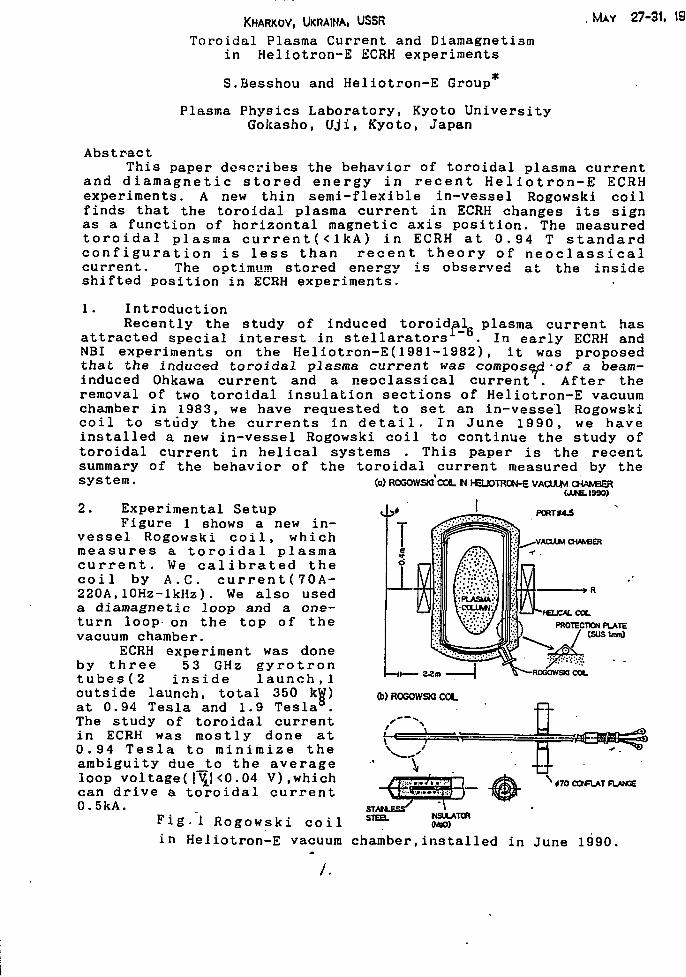
. MAY 27-31. 19KHARKOV, UKRAINA, USSR
Toroidal Plasma Current and Diamagnetismin Heliotron-E ECRH experiments
S.Besshou and Heliotron-E Group*
Plasma Physics Laboratory, Kyoto UniversityGokasho, Uji, Kyoto, Japan
AbstractThis paper describes the behavior of toroidal plasma current
and diamagnetic stored energy in recent Heliotron-E ECRHexperiments. A new thin semi-flexible in-vessel Rogowski coilfinds that the toroidal plasma current in ECRH changes i t s signas a function of horizontal magnetic axis position. The measuredtoroidal plasma current(<1kA) in ECRH at 0.94 T standardconfiguration is less than recent theory of neoc lass ica lcurrent. The optimum stored energy is observed at the insideshifted position in ECRH experiments.
1. IntroductionRecently the study of induced toroidal plasma current has
attracted special interest in stellarators . In early ECRH andNBI experiments on the Heliotron-E(1981-1982), it was proposedthat the induced toroidal plasma current was composed-of a beam-induced Ohkawa current and a neoclassical current . After theremoval of two toroidal insulation sections of Heliotron-E vacuumchamber in 1983, we have requested to set an in-vessel Rogowskicoil to study the currents in detail. In June 1990, we haveinstalled a new in-vessel Rogowski coil to continue the study oftoroidal current in helical systems . This paper is the recentsummary of the behavior of the toroidal current measured by thesystem.
2. Experimental SetupFigure 1 shows a new in-
vessel Rogowski c o i l , whichmeasures a t o r o i d a l plasmac u r r e n t . We c a l i b r a t e d thec o i l by A.C. cur ren t (70A-220A,10Hz-lkHz) . We also useda diamagnetic loop and a one-turn loop on the top of thevacuum chamber.
ECRH experiment was doneby t h r e e 53 GHz gyro t rontubes (2 i n s i d e l aunch ,1outside launch, total 350 kW)at 0.94 Tesla and 1.9 Tesla .The study of toroidal currentin ECRH was mostly done at0.94 Tesla to minimize theambiguity due_to the averageloop voltage(|^|<0.04 V),whichcan drive a to ro ida l current0.5kA.
F ig .1 Rogowski c o i l
(o) ROGOWSKI COL N HELJOTRON-E VACULM CHAMBER(jure. 1990)
P0RT*4£
PROTECTION PLATE/ CSUStimO
COL
(b) ROGOWSKI C0C
SJANLESSTSTEEL
v 470 COFLAT FLANGE
MSULATORWoo)
in Heliotron-E vacuum chamber,installed in June 1990.
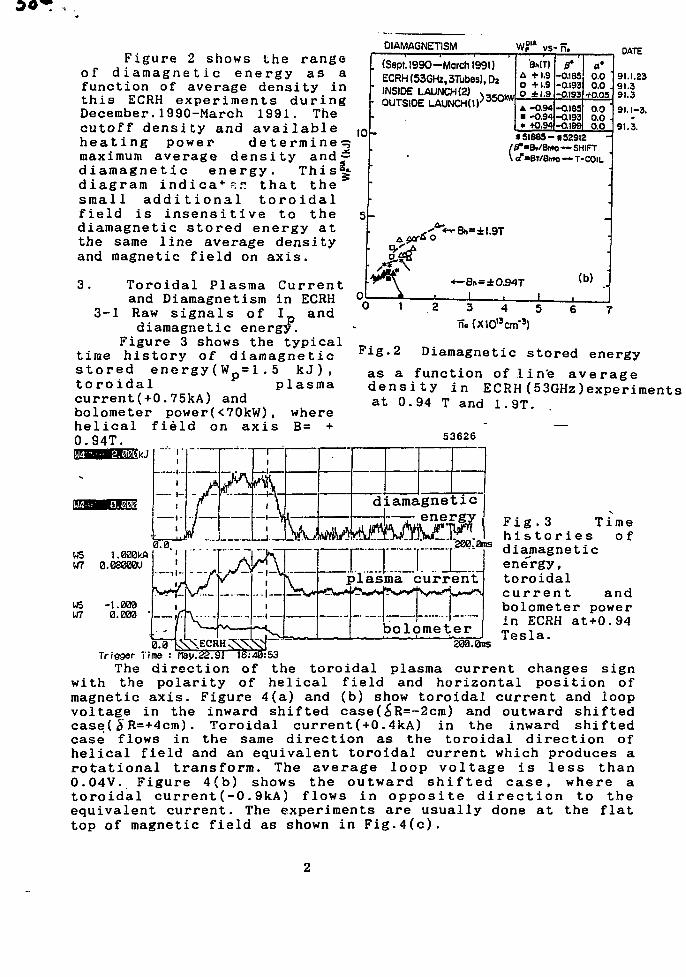
Figure 2 shows the rangeof diamagnetic energy as afunction of average density inthis ECRH experiments duringDecember.1990-March 1991. Thecutoff density and availableheating power determine?maximum average density and~diamagnetic energy. This^-diagram indica*^s that thesmall addi t ional to ro ida lfield is insensitive to thediamagnetic stored energy atthe same line average densityand magnetic field on axis.
3. Toroidal Plasma Currentand Diamagnetism in ECRH
3-1 Raw signals of I p anddiamagnetic energy.
Figure 3 shows the typicaltime history of diamagneticstored energy(W =1.5 kJ ) ,to ro ida l plasmacurrent(+0.75kA) andbolometer power(<70kW), wherehelical field on axis B= +0.94T.
DIAMAGNETISM
(Sept. 1990-March 1991)ECRH(53GHz,3Tubes),D*INSIDE LAUNCH(2) v , ,
• OUTSIDE LAUNCH(IK0DO
10
vs-n.
A +1.9• +1.9O ±1.9
A -o.94 -aies• -O.94 -0.193» +0.94 -0.199
-0.185-0.193-0.193
a'0.00.0
40.050.00.00.0
#51685-#52912/^•B. /BMO—SHIFT\ a""BT/Bnto — T-COIL
y*T
"<-»-Bh=±l.9T
-Bi.=±0.94T (b)
1 2
DATE
91.1.2391.3
91.3
91.1-3.
91.3.
n. (X10l3OTf3)
Fig.2 Diamagnetic stored energy
as a function of l ine averagedensi ty in ECRH (53GHz)experimentsat 0.94 T and 1.9T.
53626
0.0Trigger Tims : nay.22.91
The directionwith the polaritymagnetic axisvoltage in
Fig.3 Timeh i s to r i e s ofdiamagneticene"rgy,toroidalcurrent andbolometer powerin ECRH at+0.94Tesla.
16:40:53of the toroidal plasma current changes signof helical field and horizontal position of
Figure 4(a) and (b) show toroidal current and loopthe inward shifted case(£R=-2cm) and outward shifted
case( SR=+4cm). Toroidal current(+0.4kA) in the inward shiftedcase flows in the same direction as the toroidal direction ofhelical field and an equivalent toroidal current which produces arotational transform. The average loop voltage is less than0.04V. Figure 4(b) shows the outward shifted case, where atoroidal current(-0.9kA) flows in opposite direction to theequivalent current. The experiments are usually done at the flattop of magnetic field as shown in Fig.4(c).
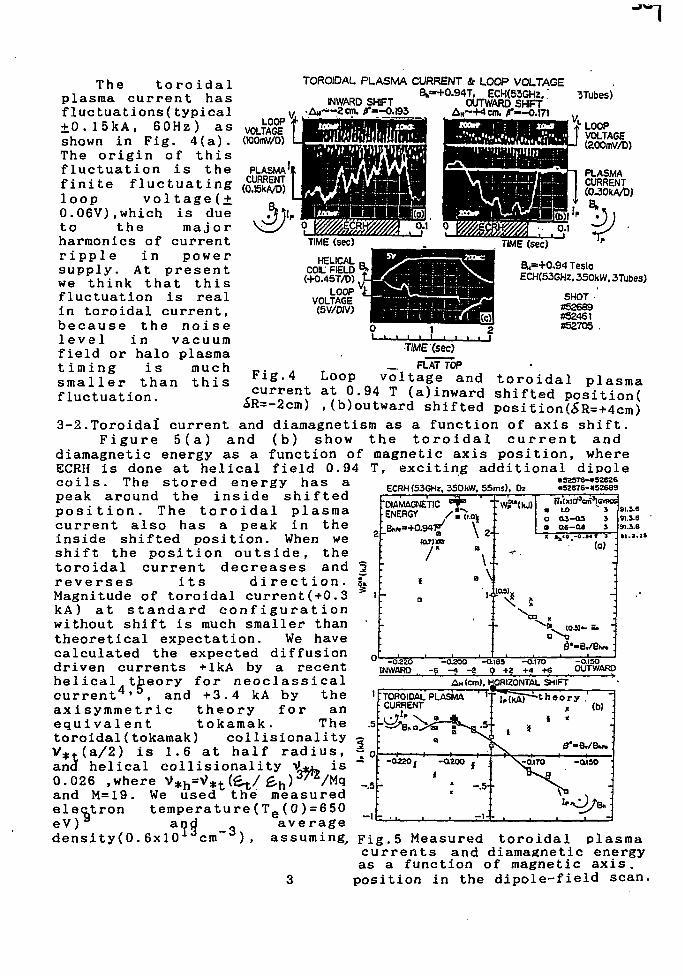
The toroidalplasma current hasfluctuations(typical+0.15kA, 60Hz) asshown in Fig. 4(a).The origin of thisfluctuation is thefinite fluctuatingloop voltage(+0.06V),which is dueto the ma j orharmonics of currentr ipple in powersupply. At presentwe think that thisfluctuation is realin toroidal current,because the noiselevel in vacuumfield or halo plasmat imi ng i s muchsmaller than t h i sfluctuation.
TOROIDAL PLASMA CURRENT & LOOP VOLTAGEB.-+O.94T. ECH(53GHz.'
OUTWARD SHIFT"--0 .171
INWARD SHIFT
LOOPVOLTAGEOOOmV/D)
PLASMACURRENT
(O.BkA/D)
STubes)
LOOPVOLTAGE(200mV/D)
PLASMACURRENT(OJOkA/D)
TIME (sec)
HELICALCOIL FIELD(+0.45T/D)
LOOPVOLTAGE(5V/DIV)
TIME (sec)
B M = + 0 . 9 4 Tesla
ECH(53GHZ, 350kW. 3Tubes)
SHOT •#52689#52461#52705 .
Fig.4current
<5R=-2cm)
Loopat 0
TIME (sec)
_ FLAT TOP
voltage and94 T (a)inward
3-2.Toroidal current and diamagnetism asF i g u r e 5 ( a ) and (b) show t h e
diamagnetic energy as a function ofECRH i s done a t h e l i c a l f i e ld 0.94coils. The stored energy has apeak around the inside shiftedposit ion. The toroidal plasmacurrent also has a peak in theinside shifted position. When weshift the position outside, thetoroidal current decreases andreverses i t s direct ion.Magnitude of toroidal current(+0.3kA) at standard configurationwithout shift is much smaller thantheoretical expectation. We havecalculated the expected diffusiondriven currents +lkA by a recenthelical theory for neoclassicalcurrent ' , and +3.4 kA by theaxisymmetric theory for anequivalent tokamak. Thetoroidal(tokamak) collisionalityV#t(a/2) is 1.6 at half radius,and helical collisionality ^ ^ is0.026 ,where V*h=v-*1.(et/£n)
J7VMq
toroidal plasma. . . shifted position((b)outward shifted position(<5R=+4cm)
a function of axis shift,toroidal current and
magnetic axis position, whereexciting additional dipole
ECRH (536HI, 350KW, 55ms), Di•SZ576-K52626«32676-»5Z689
-0.150OUTWAFffl
i -i
.5 -i
and M=19electroneV)9
density(O,
We used the measuredtemperature(Te(0)=650
and average6X101 Jcm"vl) , assuming.
: TOROIDALCURRENT
- O 2 2 0 ,
_
PLASMA ' '"
a ^
-0.200 |
" - .5-
- 1 -
pRIZONTAL SHIFT
'u(kAT :" th8ory •' . , "x 1°)I *
Nr0.l7O -ftWO
- % , --.5-
-lb
Fig.5 Measured toroidal plasmacurrents and diamagnetic energyas a function of magnetic axis,position in the dipole-field scan.
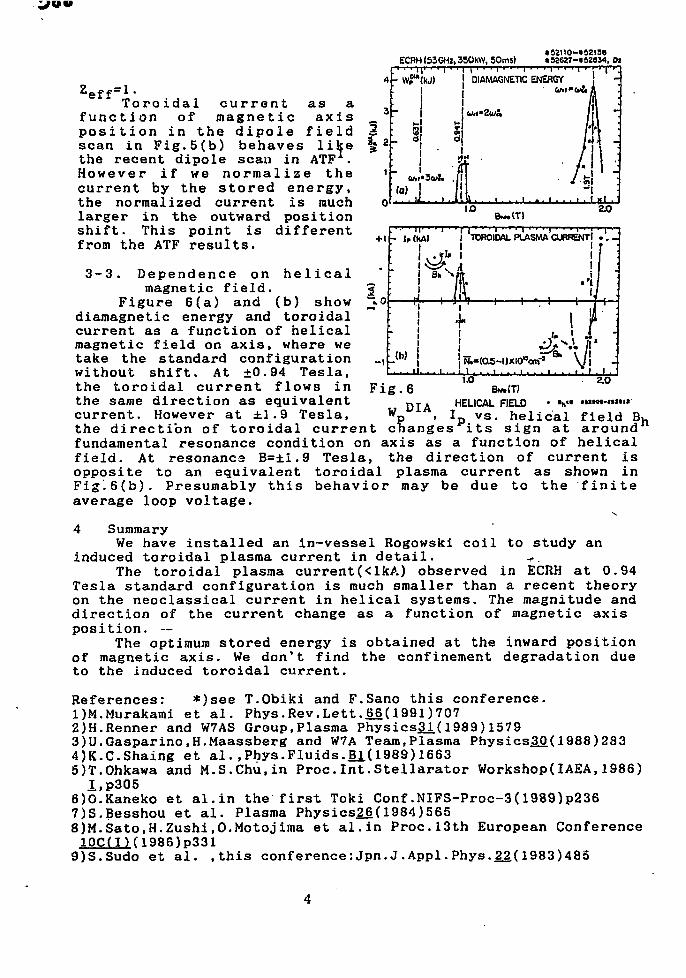
i/uv
ECRH(53GHl,350KW, 50ms)«5211O-«S2I3B• S26Z7-«9Z634, 02
ze f f=i.Toroidal current as a
function of magnetic axisposi t ion in the dipole fieldscan in Fig.5(b) behaves likethe recent dipole scan in ATF .However if we normalize thecurrent by the stored energy,the normalized current is muchlarger in the outward positionshift. This point is differentfrom the ATF results.
3-3. Dependence on he l ica lmagnetic field.
Figure 6(a) and (b) showdiamagnetic energy and toroidalcurrent as a function of helicalmagnetic field on axis, where wetake the standard configurationwithout shift. At +0.94 Tesla,the toroidal current flows inthe same direction as equivalentcurrent. However at ±1.9 Tesla,
DIAMAGNETIC ENERGY
(a)
- Ir(fcA) I TOROIDAL PLASMA CURRENTi . „ . -
- 1 -(W
UtfZuit,
IWT)
J ffc»(0l5-l)XI01'em-s
F i g . 6w DIA
1.0 2.OBM.(T)
HELICAL FIELDIp vs. helical field Bh
min-nnit
•p l field Bthe direction of toroidal current changes its sign at aroundfundamental resonance condition on axis as a function of helicalfield. At resonance B=±1.9 Tesla, the direction of current isopposite to an equivalent toroidal plasma current as shown inFig.6(b). Presumably this behavior may be due to the finiteaverage loop voltage.
*4 Summary
We have installed an in-vessel Rogowski coil to study aninduced toroidal plasma current in detail. -..
The toroidal plasma current(<lkA) observed in ECRH at 0.94Tesla standard configuration is much smaller than a recent theoryon the neoclassical current in helical systems. The magnitude anddirection of the current change as a function of magnetic axisposition. —
The optimum stored energy is obtained at the inward positionof magnetic axis. We don't find the confinement degradation dueto the induced toroidal current.
References: *)see T.Obiki and F.Sano this conference.1)M.Murakami et al. Phys.Rev.Lett.66(1991)7072)H.Renner and W7AS Group,Plasma Physics3_i( 1989) 15793)U.Gasparino,H.Maassberg and W7A Team,Plasma Physics.30( 1988)2834)K.C.Shaing et al.,Phys.Fluids.11(1989)16635)T.0hkawa and M.S.Chu.in Proc.Int.Stellarator Workshop(IAEA,1986)I,p305
6)0.Kaneko et al.in the first Toki Conf.NIFS-Proc-3(1989)p2367)S.Besshou et al. Plasma Physics2j>( 1984)5658)M.Sato,H.Zushi,0.Motojima et al.in Proc.13th European Conference10Cm(1986)p331
9)S.Sudo et al. ,this conference:Jpn.J.Appl.Phys.2j£(1983)485
ELECTRON TEMPERATURE MEASUREMENTS BYTHOMSON SCATTERING ON THE CURRENT-FREEECRH PLASMAS IN THE L-2 STELLARATOR
N.P. Larionova.Yu.A.Orlov
Institute of General Physics, Moscow,USSR
Abstract. A plasma in the L-2 stellarator is produced andheated by a cyclotron resonance wave only. Experimentalresults obtained with Thomson scattering system duringoperation with a currentless plasma are presented. For bothfundamental and second-harmonic resonances, optimum heatingis observed, providing the rise in the central electrontemperature upto 1 keV. On the other hand, the saturationof the central temperature (0.6-0.7) keV and profilebroadening take? place,depending on heating conditions.Underlow-density plasma conditions ( ne< 10 cm ) non-thermalelectrons may be detected.
Diagnostics. A spatial multipoint Thomson scattering system[ 11 has been successfully used under low-density plasmaconditions (ne<10
13 cm"3).The system measures the electrontemperature at 3 vertical locations over the region (0-8 cm)in a wide range of T e (0.15-1 keV),providing profile byshot-to-shot scanning In the vertical direction . The lasersource —Is neodymlum-glass oscillator/2 amplifier system(SHG, wavelenght of 5300 A, pulse energy of 2 J, pulse widthof 50 ns). The two-stage spectrometer (type SEEK?) operateswith f/4 optics, the height of the entrance and eiitslits being 50 mm. The spectrometer output is coupled to 16photomultipliers (6+5+5). To measure the photomultlpllercurrents the digital current integrators (type QD 808) areused on-line connected to the computer.Fundamental Heating with an Ordinary Wave. Plasma heatingbehaviour was studied In detail In previous experiments onplasma production and heating by fundamental ordinary waves[11. A single gyrotron was used with a frequency of 37.5 GHz
capable to generate 200 kW of rf for a pulse length of 7-8ras.The wave was launched from the low - field side through thehorisontal mid-plane port.The beam dimension was about 6 cm,providing resonance close to the plasma centre. . Efficientelectron heating was observed with a linear rlae^he centraltemperature up to IkeV by the end of pulse,P^ being 100 kW.At the same time the electron temperature was saturatedoutside the centre (r=a/2)as shown In Pig. 1.line density waskept 7.5*1012cm""3. The internal energy W e was found toincrease approximately linearly as well as the diamagneticsignal in the best heating discharges. On the other hand twotypes of T e profiles were observed eventually,I.e. a peakedprofile and a broad one. Apparently, a peaked profile showsup the power deposition at the plasma centre. Anothertype of profile was noted to be rather flat with a slightgradient in the region r=a/2. The electron temperature wasfound to range 0.5-0.7 keV and be saturated by the end of thepulse. The enhanced power Pin=170 kW and pulse duration 8 msdid not take effect of increasing of the value of the centraltemperature IkeV up, the stored plasma energy being 180 J.Under the same conditions the saturation of the centraltemperature on the level of 0.6-0.7 keV and the displacementof the gradient zone towards the periphery were also observed.
This discrepancy was an objective of a series ofexperiments [23, the operating conditions being (P^IOO kW,t=8 ms, helium).The electron tneperature in the core wasmeasured by Thomson scatterlng.To avoid the instrumentlimitation of laser diagnostics of the plasma periphery thedata of spectroscopy were taken into account. The HCN -Interferometer was used to measure n g profile evolution.Two power deposition profiles were obtained (I-II In Pig.2).A broad profile (II) ljnplies displacement of the absorptionzone out of the centre, providing "flat" profiles of theelectron temperature.A similar effect is predicted by the raytracing under the conditions deviated of the centre resonance.These conditions are: i)possible variations of 0.555 of themagnetic field value, ii) 3°-inclination of the incidentbeam axis to the major radius, ill) refraction of the beam.
2nd Harmonic Heating with an Extraordinary Wave. The recentexperiments were carried out on plasma heating by anextraordinary wave, gyrotron parameters being ( f=75 GHz,Pr£=280 kW, t=8-9 ms). The experiments were performed onseries, the Input power ranging to 100, 180, 280 kW.The line- averaged density was kept constant during thepulse at one of three levels, beeing of 0.9, 1.35,i.88"io'°cra .respectively.The time of plasma production wasfound to be of 1-2.5 ms , depending on the initial gaspressure as well as rf power. The stationary phase of thedischarge was observed by the end of the pulse. The timeevolution of the electron temperature in the core of plasmacolumn is shown in Pig.3, refei-tng to the series (180 kW,1.35*1O13 cm"3). The electron temperature Increases rapidlyupto the level of 0.5 ke7.lt seems to be saturated during thepulse and decrease by the end.Both the temperature anddensity profiles broaden. As a rule, Thomson scattering dataIndicates the absence of a visible gradient of T e profile inthe inner part of the plasma at t> 4- ms.This effect might beattributed to the viewing conditions changing because ofthe plasma shifting outwards by the end of the heating pulse.Referlng to the series ( 100 fcW,0.9-1013cnf3 ) themaximum value of 0.5 keV was obtained. ( Compared to theordinary wave heating the efficiency ratio Te(0)/Pr;C=5 eV/kffseems to decrease. ) The central temperature does not varystrongly with the input power increase, being no more than0.8keV In series (28OkW,1.35'i013cm~3).Non-thermal electronsmay be detected when the plasma centre Is viewed. A typicalspectrum is shown in Pig.4, refering to the series (180 kW,0.9'1013cnf3). The physical picture of anomallty is not yetclarified.References
1. Andryukhina E.D.,Akullna D.K.,Batanov G.M. et al.Electroncyclotron heating (ECH) of the ^urrentless and "target1*current plasmas by an ordinary waves in the L-2stellarator.//15-th Eur. conf. on contr. fus. and pi. phys.Dubrovnlk.1988.v. 12B,part 2,p.447-450.2. Donskaya N.P.,Iarionova N.P.,Roshchin V.I. et al.Optical
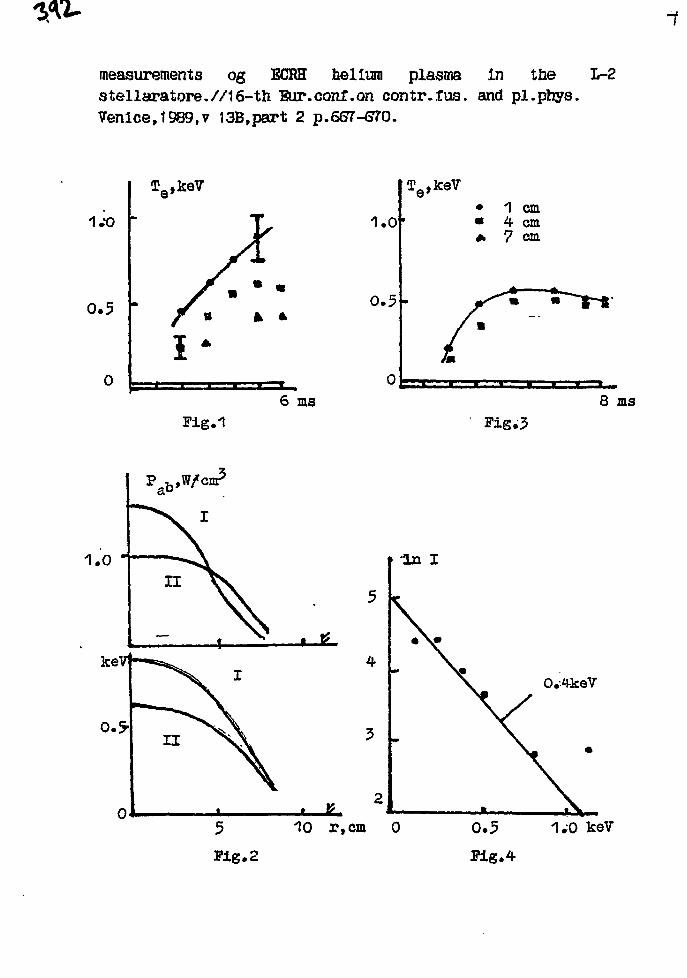
1
measurements og ECHK helium plasma In the L-2stellaratore.//16-th Eur.conf.on contr.fag. and pl.phys.7enlce,1989,v 13B,part 2
0.5
TQ,lceV
Plg.16 ms
1.0
0.5
TQ,keV1 cm4 cm7 cm
Fig.38 ms
1.0 -la I
1.0 keV
ION $EXFBtt£UKB IN L-2 S3MELABA.TOR WISH HP-HEAIIBGFROM DOPPIER BROADENING.
Donskaya N.P., Voronov G.S.GENERAL PHYSICS INSTITUTE, MOSCOW, USSR.
ABSTRACT Ion temperature measurements by means of various ionlines are described. Typioal results for ICR and EGR beatingexperiments are presented.
The line profiles were measured by means of 60cm Ebert-Fastietype monoohromator (BKC-1) equipped with a sistem of mirrors and alens. The entrance slit was projected into plasma with enlarging1:3. The high quality 1200 line/aam grating was used: i) in the 2ndorder for > 227.1na. and J> 278.1 ran lines; ii) in the third orderfor / 227.1nm; and iii) 1st order forwA464.7nm,>468.6nm ets. Thedetectors were photomultlpliers. The Instrumental profile obtainedin the 1st order with Hgl y\ 577nm line from a low pressuremercury lamp was sufficiently close to Gaussian. In most measure-ments the instrumental width was small compared to the measuredone(|4p.1-.3). The Zeeman splitting and Stark broadening were smallcompared to the Doppler width. The entrance and exit slits wereplaced horizontally so we could scan the plasma in direction tothe transverse magnetic field with resolution^.5cm with help ofrotating mirror placed near the stellarator window.The mirror wasrotated between discharges through small angles thus about 15discharges were required to determine the spatial distribution ofline radiation. A. triangular prism with aluminium covered surfaseswas put in a position near the Inner part of the stellarator port.It gives the opportunity of simultaneous measurements in bothtangential directions. The light reflected from this prism come torotating mirror and then to the entrance slit. The opaque mask wasplaced on the stellarator window to cut off the radiation fromwrong directions.
The intensity distribution of Doppler broaden line Is:2 ? ?The brightness obtained by viewing along any chord of discharge is
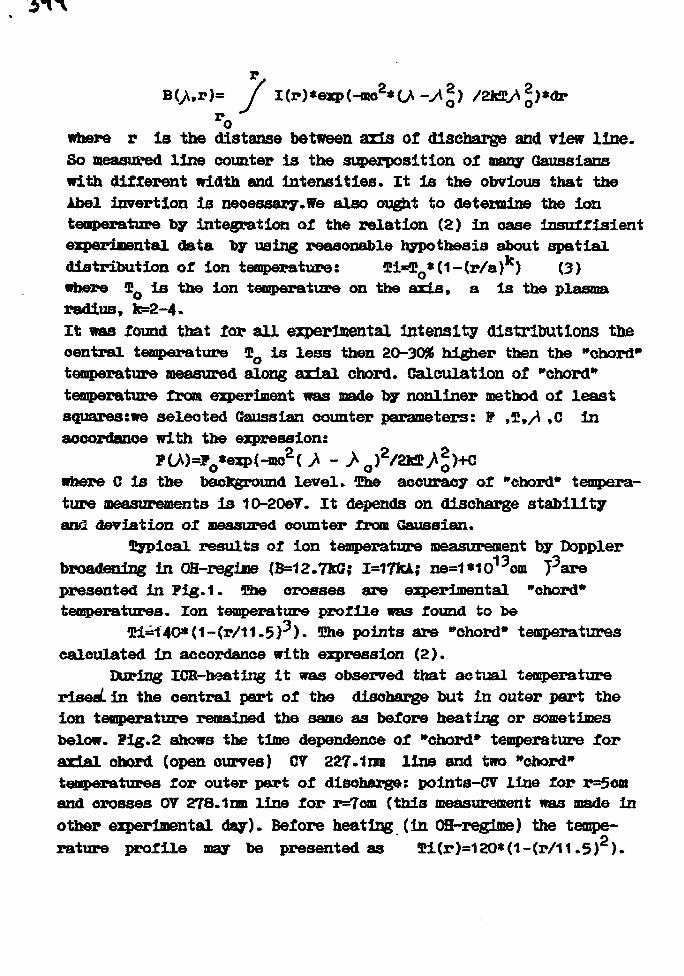
/
owhere r Is the distanse between axis of discharge and view line.So measured line counter is the superposition of many Gausslanswith different width and intensities. It is the obvious that theAbel insertion is necessary.We also ought to determine the iontemperature by integration of the relation (2) in case lnsufflsientexperimental data by using reasonable hypothesis about spatialdistribution of ion temperature: Ii=3Jo*(1-(r/a)
lc) (3)where I is the ion temperature on the axis, a is the plasmaradius, fc=2-4.It was found that for all experimental Intensity distributions thecentral temperature 3»o is less then 20-30% higher then the "chord*temperature measured along axial chord. Calculation of "chord*temperature from experiment was made by nonliner method of leastsquares:we selected Gaussian counter parameters: 9 ,£»/! ,C inaccordance with the expression:
PtA)=yo*exp(-mo2( * - > O)
2/2KM*)+Cwhere C is the background level. The accuracy of "chord* tempera-ture measurements is 10-20eY. It depends on discharge stabilityand deviation of measured counter from Gaussian.
Typical results of ion temperature measurement by Dopplerbroadening in OS-regime (B=12-7kG; I=17fcA; ne=1*10 om T^arepresented in Pig.1. She crosses are experimental "chord"temperatures. Ion temperature profile was found to be
(Di=14O*(1-(r/11.5)3). 3Jhe points are "chord* temperaturescalculated in accordance with expression (2).
During ICR-heating it was observed that actual temperaturerisest in the central part of the discharge but in outer part theion temperature remained the same as before heating or sometimesbelow. ?ig.2 shows the time dependence of "chord* temperature foraxial chord (open curves) CY 227.1m line and two "chord"temperatures for outer part of discharge: points-CV line for r=5cmand crosses 07 278.1nm line for r=7cm (this measurement was made inother experimental day). Before heating (in OH-reglme) the tempe-rature profile may be presented as Ti(r)=120*(1-(r/11.5) ).
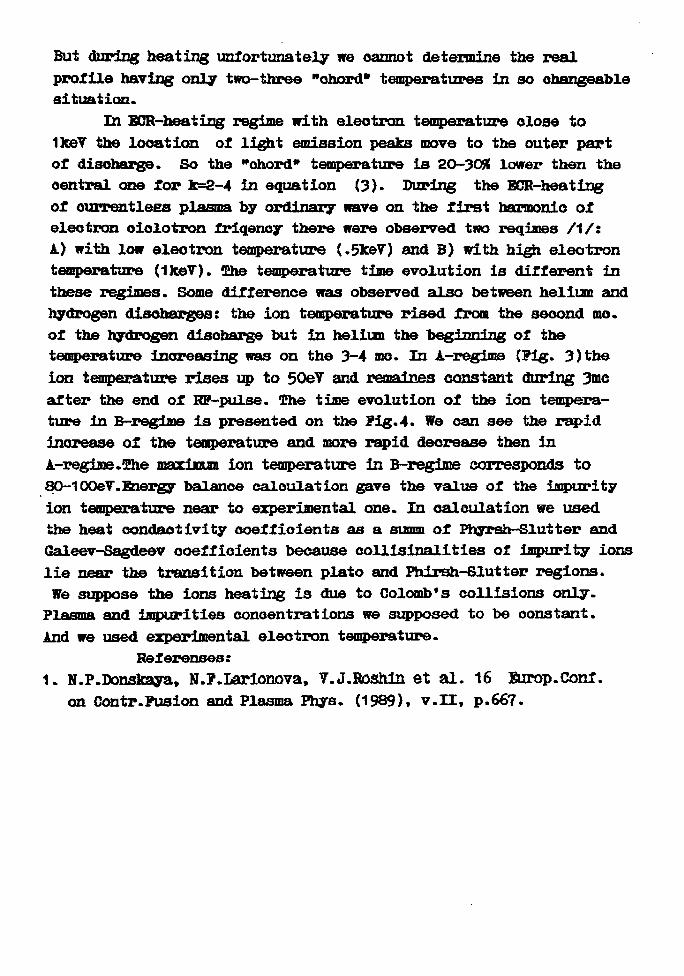
But during heating unfortunately we oannot determine the real
profile having only two-three "chord* temperatures in so changeable
situation.
In ECR-heating regime with electron temperature olose to
1keV the location of light emission peaks move to the outer part
of discharge. So the "chord* temperature is 2O-30jt lower then the
central one for fc=2-4 in equation (3). During the ECR-heating
of ourrentlees plasma by ordinary wave on the first harmonic of
electron oiolotron friqenoy there were observed two reqimes /1/:
A.) with low electron temperature (,5keV) and B) with high electron
temperature (1keV). She temperature time evolution is different in
these regimes. Some difference was observed also between helium and
hydrogen discharges: the ion temperature rised from the second mo.
of the hydrogen discharge but in helium the beginning of the
temperature increasing was on the 3-4 mo. In A-regime (Pig. 3)the
ion temperature rises up to 50eY and remaines constant during 3mc
after the end of HF-pulse. The time evolution of the ion tempera-
ture in B-regime is presented on the Fig.4. We can see the rapid
increase of the temperature and more rapid decrease then in
A.-regime.2he maximum ion temperature in B-reginoe corresponds to
80-1 OOeV.Energy balance calculation gave the value of the impurity
ion temperature near to experimental one. In calculation we used
the heat oondaotivity coefficients as a summ of Phyrsh-Slutter and
Galeev-Sagdeev coefficients because collisinalities of impurity ions
lie near the transition between plato and Phirsh-Slutter regions.
We suppose the ions heating is due to Colomb's collisions only.
Plasma and impurities concentrations we supposed to be oonstant.
And we used experimental electron temperature.
Beferenses:
1. N.P.Donskaya, N.?.Iarionova, V.J.Roshln et al. 16 Europ.Conl.on Contr.?usion and Plasma Phys. (1989), v.H, p.667.
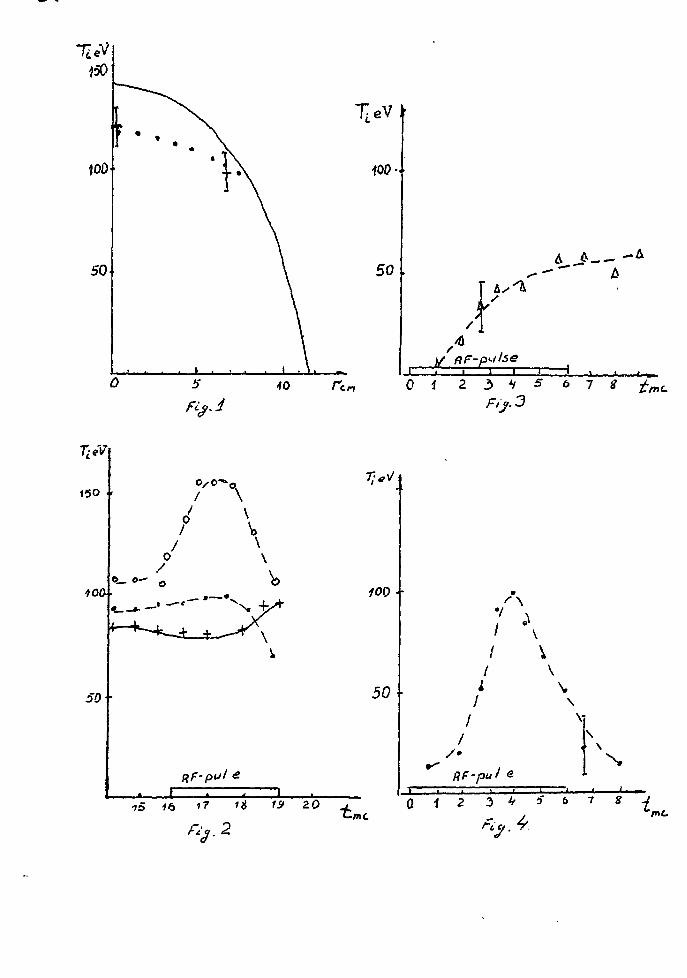
50
0
72.V
150 \
/
100
50
I . \ .
A * — *
-pulse
2 3 VFij.3
100
50
I \I \
\I \-
I
* * *19 20-me
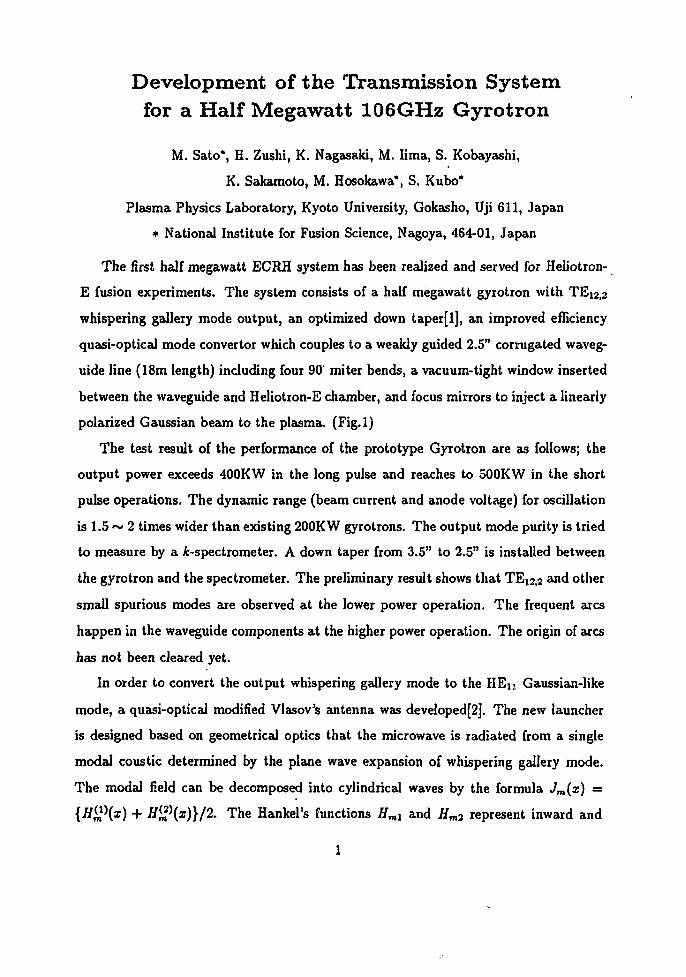
Development of the Transmission Systemfor a Half Megawatt 10 6 GHz Gyrotron
M. Sato", H. Zushi, K. Nagasaki, M. lima, S. Kobayashi,
K. Sakamoto, M. Hosokawa', S. Kubo*
Plasma Physics Laboratory, Kyoto University, Gokasho, Uji 611, Japan
* National Institute for Fusion Science, Nagoya, 464-01, Japan
The first half megawatt ECRH system has been realized and served for Heliotron-
E fusion experiments. The system consists of a half megawatt gyrotron with TEi2)2
whispering gallery mode output, an optimized down taper[l], an improved efficiency
quasi-optical mode converter which couples to a weakly guided 2.5" corrugated waveg-
uide line (18m length) including four 90' miter bends, a vacuum-tight window inserted
between the waveguide and Heliotron-E chamber, and focus mirrors to inject a linearly
polarized Gaussian beam to the plasma. (Fig.l)
The test result of the performance of the prototype Gyrotron are as follows; the
output power exceeds 400KW in the long pulse and reaches to 500KW in the short
pulse operations. The dynamic range (beam current and anode voltage) for oscillation
is 1.5 ~ 2 times wider than existing 200KW gyrotrons. The output mode purity is tried
to measure by a ^-spectrometer. A down taper from 3.5" to 2.5" is installed between
the gyrotron and the spectrometer. The preliminary result shows that TEi2,2 a°d other
small spurious modes are observed at the lower power operation. The frequent arcs
happen in the waveguide components at the higher power operation. The origin of arcs
has not been cleared yet.
In order to convert the output whispering gallery mode to the HEn Gaussian-like
mode, a quasi-optical modified Vlasov's antenna was developed[2]. The new launcher
is designed based on geometrical optics that the microwave is radiated from a single
modal coustic determined by the plane wave expansion of whispering gallery mode.
The modal field can be decomposed into cylindrical waves by the formula Jm(x) =
+ H™{x)}/2. The Hankel's functions Hml and Hm2 represent inward and
1
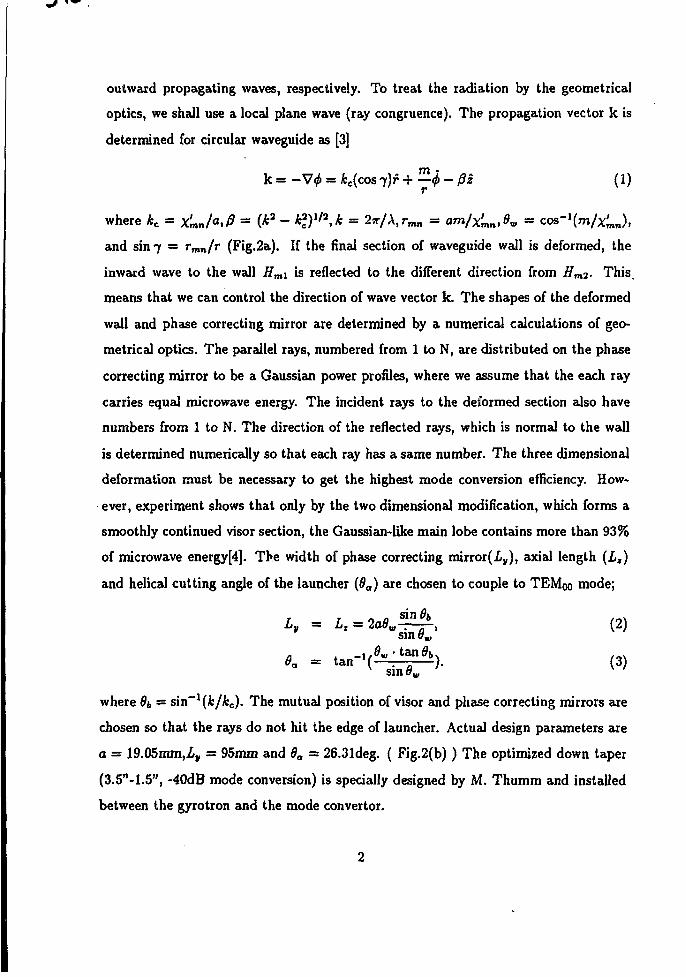
outward propagating waves, respectively. To treat the radiation by the geometrical
optics, we shall use a local plane wave (ray congruence). The propagation vector k is
determined for circular waveguide as [3]
m *k=-V^ = M«>S7)r+-<0-£i (1)
r
where kc = x'mJ«,P = (*3 - k^,k = 2wf\rmn = am/X'mn,Om = cos-\m/X'mn),
and sin 7 = rmn/r (Fig.2a). If the final section of waveguide wall is deformed, the
inward wave to the wall Hm\ is reflected to the different direction from # m 2 . This,
means that we can control the direction of wave vector k. The shapes of the deformed
wall and phase correcting mirror are determined by a numerical calculations of geo-
metrical optics. The parallel rays, numbered from 1 to N, are distributed on the phase
correcting mirror to be a Gaussian power profiles, where we assume that the each ray
carries equal microwave energy. The incident rays to the deformed section also have
numbers from 1 to N. The direction of the reflected rays, which is normal to the wall
is determined numerically so that each ray has a same number. The three dimensional
deformation must be necessary to get the highest mode conversion efficiency. How-
ever, experiment shows that only by the two dimensional modification, which forms a
smoothly continued visor section, the Gaussian-like main lobe contains more than 93%
of microwave energy[4]. The width of phase correcting mirror(£y), axial length (Lx)
and helical cutting angle of the launcher (da) are chosen to couple to TEMoo mode;
Lv = Lt = 2aau . , (2)SHI Pa,
' • = t a n ~ 1 (
where 9b ~ sin"1 (k/kc). The mutual position of visor and phase correcting mirrors are
chosen so that the rays do not hit the edge of launcher. Actual design parameters are
a = 19.05wm,Ly = 95mm and 0a = 26.31deg. ( Fig.2(b) ) The optimized down taper
(3.5"-1.5", -40dB mode conversion) is specially designed by M. Thumm and installed
between the gyrotron and the mode convertor.
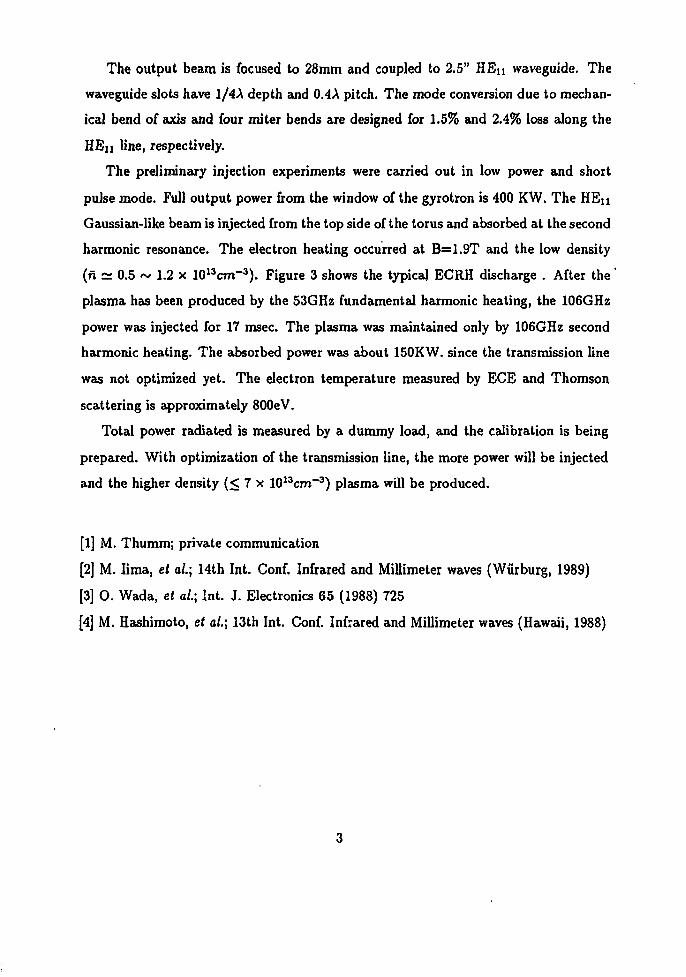
The output beam is focused to 28mm and coupled to 2.5" HEn waveguide. The
waveguide slots have 1/4A depth and 0.4A pitch. The mode conversion due to mechan-
ical bend of axis and four miter bends are designed for 1.5% and 2.4% loss along the
HEn Une, respectively.
The preliminary injection experiments were carried out in low power and short
pulse mode. Full output power from the window of the gyrotron is 400 KW. The HEn
Gaussian-like beam is injected from the top side of the torus and absorbed at the second
harmonic resonance. The electron heating occurred at B=1.9T and the low density
(n =; 0.5 ~ 1.2 x 1013cm-3). Figure 3 shows the typical ECRH discharge . After the'
plasma has been produced by the 53GHz fundamental harmonic heating, the 106GHz
power was injected for 17 msec. The plasma was maintained only by 106GHz second
harmonic heating. The absorbed power was about 150KW. since the transmission line
was not optimized yet. The electron temperature measured by ECE and Thomson
scattering is approximately 800eV.
Total power radiated is measured by a dummy load, and the calibration is being
prepared. With optimization of the transmission line, the more power will be injected
and the higher density (< 7 x 1013cm~3) plasma will be produced.
[l] M. Thumm; private communication
[2] M. lima, et a/.; 14th Int. Conf. Infrared and Millimeter waves (Wiirburg, 1989)
[3] O. Wada, et ai; Int. J. Electronics 65 (1988) 725
[4] M. Hashimoto, et a/.; 13th Int. Conf. Infrared and Millimeter waves (Hawaii, 1988)
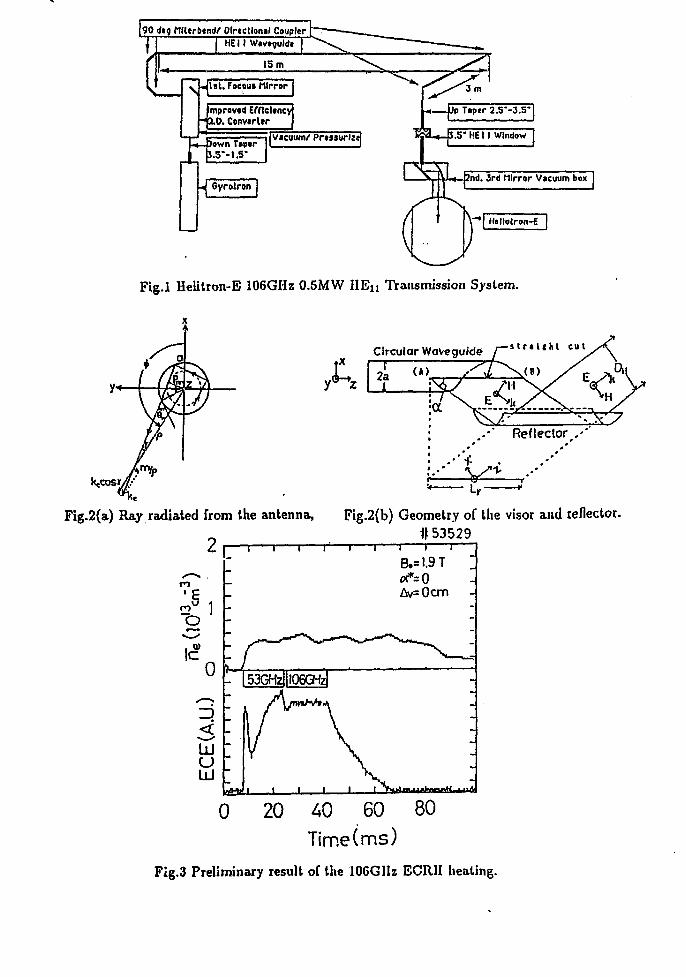
|90 d«o fWerbendr Direction*) Coupler |T T | HE 11 Wivtyuld*
(b ISrn
Jlst. Foceus Mirror I
mprovcd ECftcltncy" 3.0. Convtrltr
L«_ )own Tij p.5'-1.1
T«ptP.5'
IVtcuum/ Prissurlza
3 m
* |JpT»per2.5'-3.S-[
•J&U-JJ.5" HE 11 Window I
^ Gyrolron Id. 3rd Mirror Vacuum box
V~*| Hellotron-E |
Fig.l Helitron-E 106GHz 0.5MW HEn TVansmissioji System.
Circular Waveguide f~ i t r • 1 c h t c u t
2a (A)
Fig.2(a) Ray radiated from the antenna, Fig.2(b) Geometry of the visor and reflector._ n53529
1 r—i—i 1 1
i I i i Tnlmiiirilnrri'l
0 20 40 60 80Time(nns)
Fig.3 Preliminary result of the lOGGIIz ECRII heating.
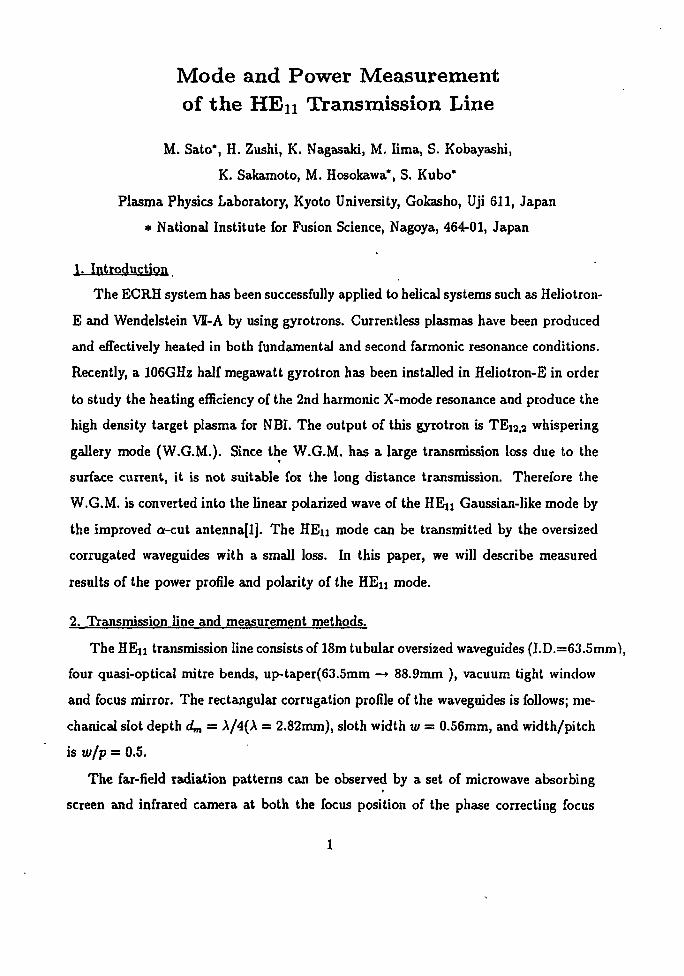
Mode and Power Measurementof the HE n Transmission Line
M. Sato", H. Zushi, K. Nagasaki, M. lima, S. Kobayashi,
K. Sakamoto, M. Hosokawa*, S. Kubo*
Plasma Physics Laboratory, Kyoto University, Gokasho, Uji 611, Japan
* National Institute for Fusion Science, Nagoya, 464-01, Japan
1. Introduction
The ECRH system has been successfully applied to helical systems such as Heliotron-
E and Wendelstein VH-A by using gyrotrons. Currentless plasmas have been produced
and effectively heated in both fundamental and second farmonic resonance conditions.
Recently, a 106GHz half megawatt gyrotron has been installed in Heliotron-E in order
to study the heating efficiency of the 2nd harmonic X-mode resonance and produce the
high density target plasma for NBI. The output of this gyrotron is TEi2|2 whispering
gallery mode (W.G.M.). Since the W.G.M. has a large transmission loss due to the
surface current, it is not suitable for the long distance transmission. Therefore the
W.G.M. is converted into the linear polarized wave of the HEn Gaussian-like mode by
the improved a-cut antenna[l]. The HEn mode can be transmitted by the oversized
corrugated waveguides with a small loss. In this paper, we will describe measured
results of the power profile and polarity of the HEn mode.
2. Transmission line and measurement methods.
The HEn transmission line consists of 18m tubular oversized waveguides (I.D.=63.5mm),
four quasi-optical mitre bends, up-taper(63.5mm —• 88.9mm ), vacuum tight window
and focus mirror. The rectangular corrugation profile of the waveguides is follows; me-
chanical slot depth dm = A/4(A = 2.82mm), sloth width w — 0.56mm, and width/pitch
is w/p = 0.5.
The far-field radiation patterns can be observed by a set of microwave absorbing
screen and infrared camera at both the focus position of the phase correcting focus
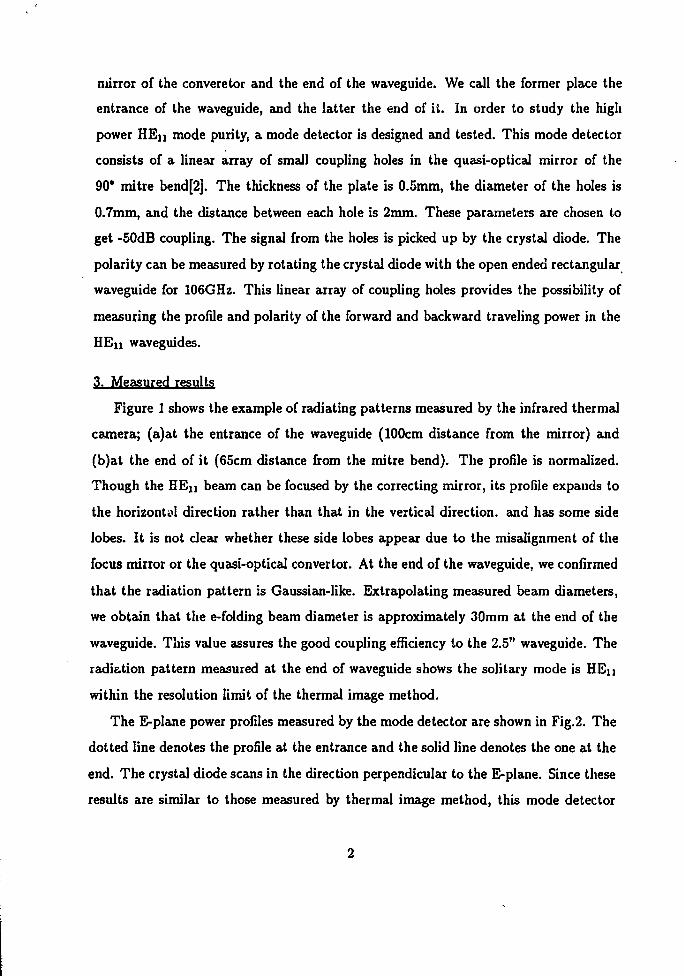
mirror of the converetor and the end of the waveguide. We call the former place the
entrance of the waveguide, and the latter the end of it. In order to study the high
power HEn mode purity, a mode detector is designed and tested. This mode detector
consists of a linear array of small coupling holes in the quasi-optical mirror of the
90* mitre bend[2]. The thickness of the plate is 0.5mm, the diameter of the holes is
0.7mm, and the distance between each hole is 2mm. These parameters are chosen to
get -50dB coupling. The signal from the holes is picked up by the crystal diode. The
polarity can be measured by rotating the crystal diode with the open ended rectangular
waveguide for 106GHz. This linear array of coupling holes provides the possibility of
measuring the profile and polarity of the forward and backward traveling power in the
n waveguides.
3. Measured results
Figure 1 shows the example of radiating patterns measured by the infrared thermal
camera; (a)at the entrance of the waveguide (100cm distance from the mirror) and
(b)at the end of it (65cm distance from the mitre bend). The profile is normalized.
Though the HEn beam can be focused by the correcting mirror, its profile expands to
the horizontal direction rather than that in the vertical direction, and has some side
lobes. It is not clear whether these side lobes appear due to the misalignment of the
focus mirror or the quasi-optical convertor. At the end of the waveguide, we confirmed
that the radiation pattern is Gaussian-like. Extrapolating measured beam diameters,
we obtain that the e-folding beam diameter is approximately 30mm at the end of the
waveguide. This value assures the good coupling efficiency to the 2.5" waveguide. The
radiation pattern measured at the end of waveguide shows the solitary mode is HEn
within the resolution limit of the thermal image method.
The E-plane power profiles measured by the mode detector are shown in Fig.2. The
dotted line denotes the profile at the entrance and the solid line denotes the one at the
end. The crystal diode scans in the direction perpendicular to the E-plane. Since these
results are similar to those measured by thermal image method, this mode detector
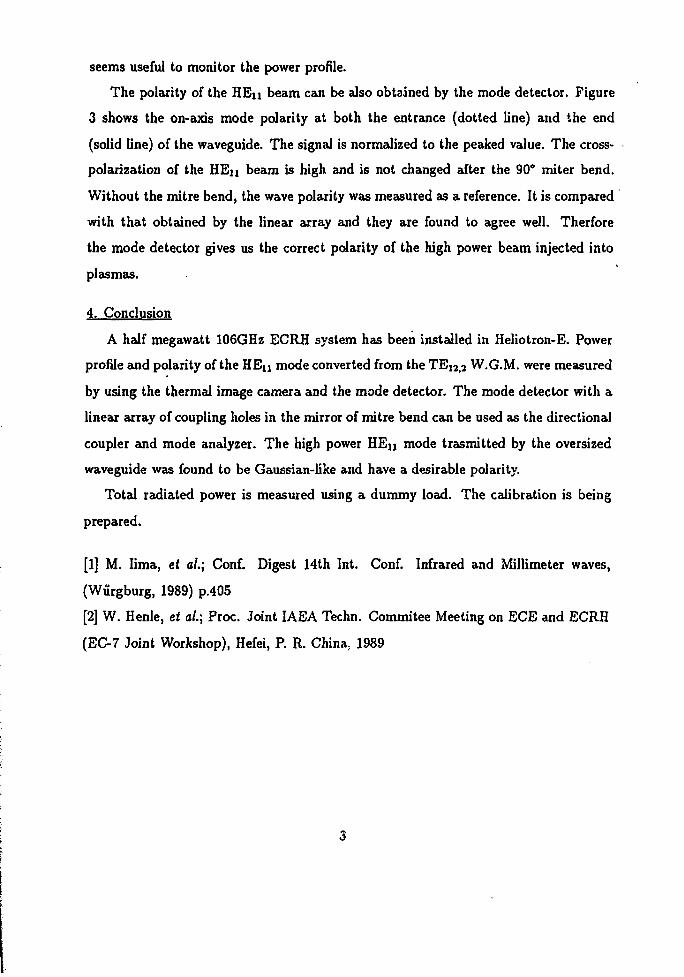
seems useful to monitor the power profile.
The polarity of the HEn beam can be also obtained by the mode detector. Figure
3 shows the on-axis mode polarity at both the entrance (dotted line) and the end
(solid line) of the waveguide. The signal is normalized to the peaked value. The cross-
polarization of the HEn beam is high and is not changed after the 90° miter bend.
Without the mitre bend, the wave polarity was measured as a reference. It is compared
with that obtained by the linear array and they are found to agree well. Therfore
the mode detector gives us the correct polarity of the high power beam injected into
plasmas.
4. Conclusion
A half megawatt 106GHz ECRH system has been installed in Heliotron-E. Power
profile and polarity of the HEu mode converted from the TE12(2 W.G.M. were measured
by using the thermal image camera and the mode detector. The mode detector with a
linear array of coupling holes in the mirror of mitre bend can be used as the directional
coupler and mode analyzer. The high power HEn mode trasmitted by the oversized
waveguide was found to be Gaussian-like and have a desirable polarity.
Total radiated power is measured using a dummy load. The calibration is being
prepared.
[1] M. lima, et a/.; Conf. Digest 14th Int. Conf. Infrared and Millimeter waves,
(Wiirgburg, 1989) p.405
[2] W. Henle, et al.\ Proc. Joint IAEA Techn. Commitee Meeting on ECE and ECRH
(EC-7 Joint Workshop), Hefei, P. R. China, 1989
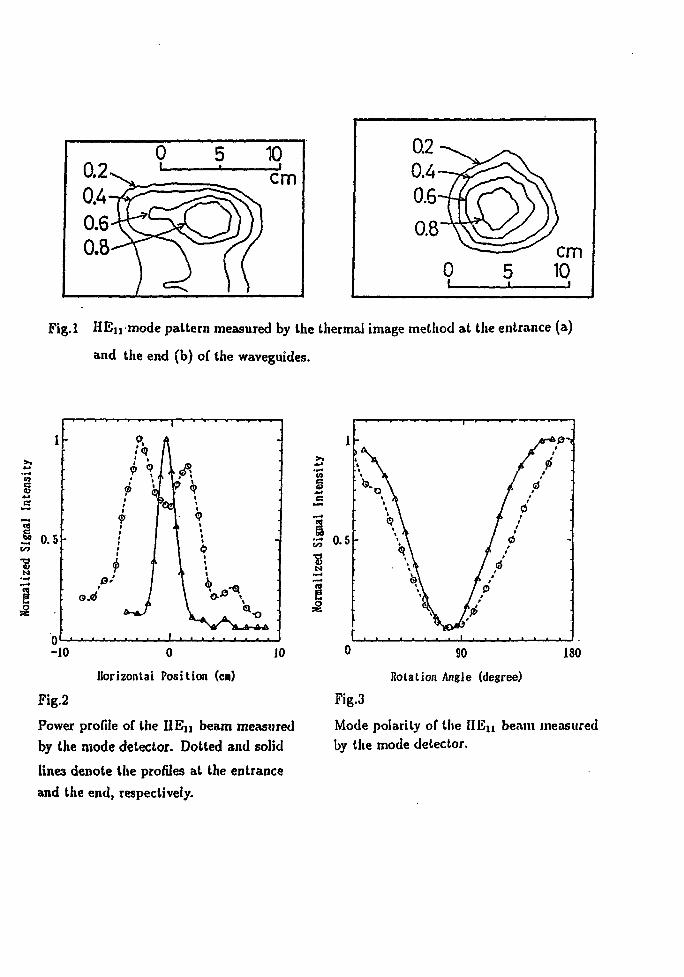
Fig.l HE]] mode pattern measured by the thermal image method at the entrance (a)
and tiie end (b) of the waveguides.
5
Horizontal Position (CM)
Fig.2
Power profile of the IIEn beam measuredby the mode detector. Dotted and solid
lines denote the profiles at the entrance
and the end, respectively.
Inte
nsit
.—*5xn
"8
1
0.5
: \
: "°\\nA
\
• *
/TI 0
/ / :
1 *'If :
90
Rotalion Angle (degree)
180
Fig.3
Mode polarity of the HEn beam measuredby the mode detector.
IONS BEHAVIOUR DURING ECRH IN THE STELLAHATOR L-2
I.S.Sbitnikova,V.N.Sukhodolfskii
General Physics Institute ,Moscow, USSR
Attract.. The ordinary wave heating experiments aredescribed. The data of charge-exchange neutral fluxes andthe the ions behaviour are presented. The ion temperatureprofiles were measured. The central ion temperature wasfound to range (60-90) eVf a flat profile being registrated.The anallsis was done for tbe colllslonless Ions heatingconnected with the super high frequency wave decayprocesses.The ECR production and heating of plasma Is a promisingmethod of the stellarator research. It's known that the purestellarator magnetic field configuration may effect on tbetransport as well as the ion energy confinement andbehaviour.To measure the Ion component characteristics the 5-channel
neutral particle analazer [1 ] was used to be 70 cm distancefrom the HFP launching crossed;ion. The N.P.A. was able toscann plasma in the meridional plane.A. lot of experiments were carried out under various heatingconditions. Within the report narrow framework we considera beating regime with following parameters: 0-mode (E||B),Pj^lOO kW, f=37.5 GHz, B-B^gsi.32 I.The main plasma parameters temporal evolution is shown in?lg.1a,b,c. The intensity of the plasma Irradiation noisespectrum at t^gOA MHz and f-^400 MHz Is shown In Pig-Id.The typical charge-exchange spectra measured along thecentral chord are shown in Flg.2, (a) - for the beginningand (b) for the end of the heating ECRH pulse. The spectrum(a) seems to be slightly nonmaxwelllan. The ion energydistribution function was found to become maxwellian (b)(T^TeV) at the heating pulse. Such spectrum evolutiondoesn't contrudlct to tbe time behaviour of the oscillations
Intensity at the "Ion frequencies" (Fig.id) which wereobserved only during the first three ECRH millseconds.The ion temperature profile was found to be wide and flatat t>3 QDS (Plg.3). The central ion temperature Increasesmonotonously, as shown In Plg.ic up to 77 eV and doesn'tdecrease for a long time ("3 ma) after toe ECRH pulse end.It should be noted that the charge-exchange spectra
measured along the other chords are also mazwelllans at t>3ms, the temporal evolution being similar to the Plg.2.This set of facts argues for absence of the direct ionsheating due to parametric decay In the whole plasma, whenthe Initial stage is finished (t>3 ma).The ion energy balance was simulated [2], taking Intoaccount therms: pei»pcondfPdif»pcx" B * code uses
experimental data (referlng to the final heating stage) i.e.Te(r),ne(r) and charge-exchange fluxes. The resultant ionlosses channel was found to be thermoconductlvlty; Ionenergy contents being " 15 J.Ion spectrum tall formation was also investigated Inthl3 experimental series. There is notlcable correlationbetween the existence, shape, and duration of the regist-rated oscillations (f=fcl=24.4 MHz) and the charge exchangeflux Intensity at the energy B=950eV (oder of i2Ti(0)).The results confirm the connection between the parametricdecay and the ions direct heating.Resume: The study of the ions behaviour shows up a flat T^profile with a central value about 60-90 eV. The ion energycontents Is about 10-20 J - less than 10% of the full plasmaenergy contents. Superthennal tails were registered In theexperiment.Ion tails and plasma oscillations In the IH and IC frequency
ranges were observed only during the Initial stageof the ECRH pulse. The possible explanation: at the pulsebeginning a rather big nonabsorbed HP power is reflected bythe vacuum chamber walls and converts into X-mode, which candecay in the upper hybrlde resonance layer.
The sharp oscillations desruption could be explained l?l bythe parametric decay threshold Increasing due to theelectrontemperature arising, which leads to the Ion tailsdisappearance. Anyway the estimations show that HP powertaken by the Ions directly ba3 a value less then 5% of totalIncident power.
Refrences:1 . A$pOCHMOB B.B. , Eep93OBCKHft E.JI., rJiaflKOBCKHft H.II. H flp.
MHoroKaHajn.HHft aHajmsaTop SHepreTawecKoro H uaccoBorocneKTpoB arroMHHX ^ a c n m / /XT*. 1 9 7 5 . T . 4 5 , Bun.I , CTp.56
2 . rpeCfeHIUHKOB C.E. , M3BO3TOKOB A . B . , CdHTHHKOBa M.C. H ^ p .FacneT aBBprodajiaHca HOHOB B iuia3M8 cTeJuiapaTopa 1 -2OpenpHHT W&AH X 56 M.I984
3 . BaTaaoB r.M.,Kojnnc JI.B. tRsnnm JI.M. a ^ . CneKTpu njia3-MeBBHI KOJiedaHHft UpH aJieKTpOHHDM HHKJIOTpOHHOM HSFpeBa
B crajmapaTope J - 2 / / ® I . I 9 8 9 . T . I 5 . B H n . 2 . c . I 5 I
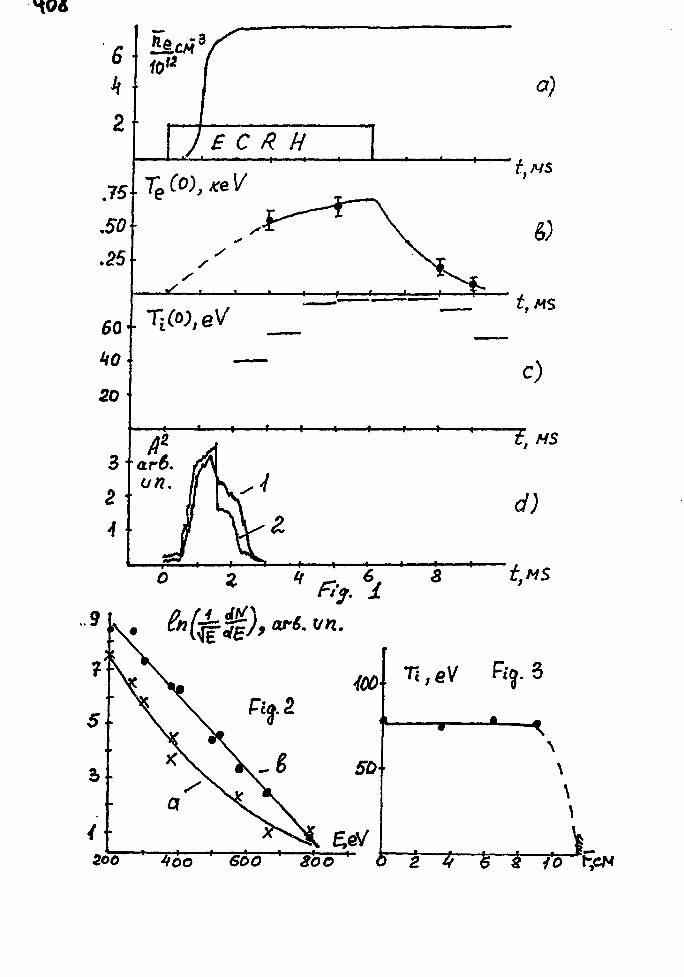
HO*
6kZ
.75
.50
.25
60
kO
20
f C R H
c)
3
Z
I I * » •
d)
*t,MS
i, eV fij. 3
Zoo
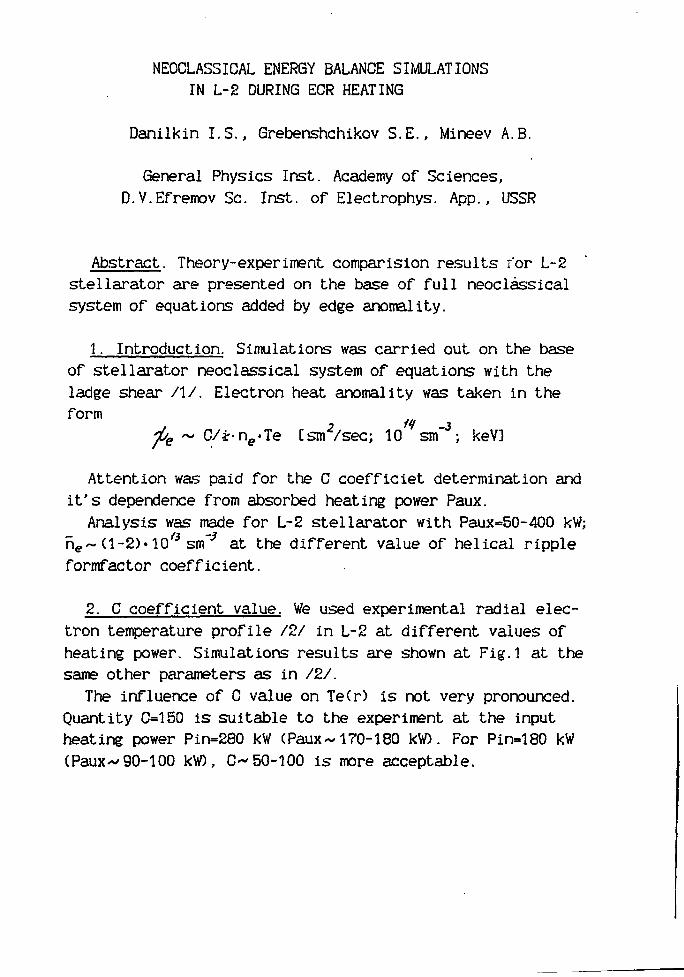
NEOCLASSICAL ENERGY BALANCE SIMULATIONSIN L-2 DURING ECR HEATING
Danilkin I.S., Grebenshchikov S.E., Mineev A.B.
General Physics Inst. Academy of Sciences,D.V.Efremov Sc. Inst. of Electrophys. App., USSR
Abstract. Theory-experiment comparision results for L-2stellarator are presented on the base of full neoclassicalsystem of equations added by edge anomality.
1. Introduction. Simulations was carried out on the baseof stellarator neoclassical system of equations with theladge shear /I/. Electron heat anomality was taken in theform
~ G/i-ne'le Csm2/sec; 10 snf3; keV]
Attention was paid for the C coefficiet determination andit's dependence from absorbed heating power Paux.
Analysis was made for L-2 stellarator with Paux=50-400 kW;n e ~ (l-2)«10
/i srrf* at the different value of helical rippleformfactor coefficient.
2. C coefficient value. We used experimental radial elec-tron temperature profile /2/ in L-2 at different values ofheating power. Simulations results are shown at Fig.l at thesame other parameters as in /2/.
The influence of C value on Te(r) is not very pronounced.Quantity C=150 is suitable to the experiment at the inputheating power Pin=280 kW (Paux ~170-180 kV). For Pin-180 kW(Paux^90-100 kW), C-50-100 is more acceptable.
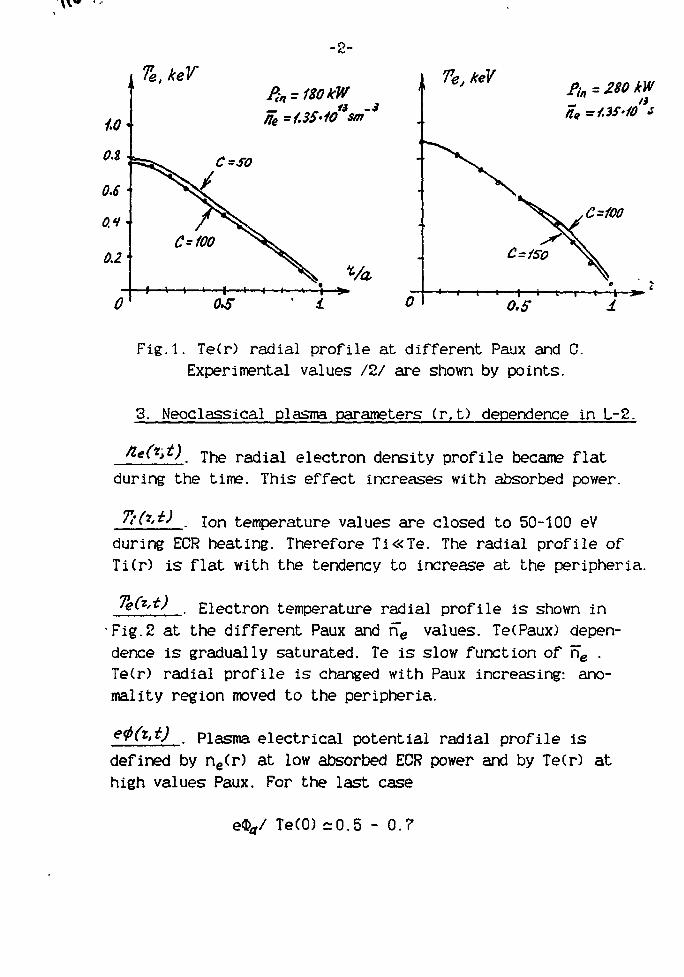
~ A
Te.keVPin-1$0kW
={.35'10 sm"
Te, keV
Fig.l. Te(r) radial profile at different Paux and C.Experimental values /2/ are shown by points.
3. Neoclassical plasma parameters (r, t) dependence in L-2.
tle(**t) The racjiax electron density profile became flatduring the time. This effect increases with absorbed power.
tl_. Ion temperature values are closed to 50-100 eVduring ECR heating. Therefore Ti«Te. The radial profile ofTi(r) is flat with the tendency to increase at the peripheria.
i_. Electron temperature radial profile is shown inFig.2 at the different Paux and n~e values. Te(Paux) depen-dence is gradually saturated. Te is slow function of ne .Te(r) radial profile is changed with Paux increasing: ano-mality region moved to the peripheria.
•J . Plasma electrical potential radial profile isdefined by ne(r) at low absorbed ECR power and by Te(r) athigh values Paux. For the last case
e<V Te(O) -0.5 - 0.7
-3-TeJeV
i.Z (a) (6)
Fig.2. Te(r) at the different Paux values.^ " 3(a) - ne -1.7-lO^sm" (b) - ne =1.
4. Energy time L-2 neoclassical scaling at the base valueof the helical ripple coefficient. Best fit of calculatedneoclassical value for L-2 may be written in the form
0.68 Q.53, /3 .3
T:e cr 28.2-ne / Paux Cms; 10 sm ;
n -2)* 10 3 sm~3e . ; Paux €(50-400) kVIt is useful to compare with the experimental energy
time scaling for the different types of heating /3/. In thesame units
The agreement is quite closed.
5. Neoclassical results for the different ripple form-factor values. There is the technical possibility of strongripple formfactor decreasing in L-2.
Calculations were made for the lower antisymmetrical(ripple) terms formfactor values fa in the neoclassical equa-tions. At the same time the symmetrical terms formfactor va-lues fs were increased. The results vas carried out forfs -1/ f<w =1 (base) ; and fs =1.1, fas =0.3 (lower ripple).
-4-
For the last case the improvement degree of electron tem-perature and plasma energy wp is about 10-15 Z at Paux~50-100 kW and ~ 25-30 % at Paux * 300-400 kW.
6. Conclusions,- Plasma anomalous transport was analysed for L-2 stellara-tor ECR heating. It's functional form corresponds to
The tendency was noted of the C coefficient increasing withthe absorbed power.
- Simulations was obtained in wide region of the absorbedpower Paux and the plasma density ne with the full neo-classical system of equations added by anomality.This statistics may be described by "teoretical" energytime scaling "Z^ cr 28.2-rig68/ Paux0"53 which is close toexperimental scaling /3/ obtained from the lot of stella-rator experiments.This conformity allow us to hope the parameters extrapola-tion under the installation perspective regimes search.
- The estimations of the plasma parameters improvement degree-during the helical ripple formfactor decreasing were made.This effect is about 25-30 % at the Pauxa 300-400 kW andne~1.35'10 sm" .
References:/I/ L.M.Kovrizhnykh Nuclear Fusion 1984,v.24,no.7,p.851./2/ L.M.Kovrizhnykh Plasma Phys. & Contr. Fus. 1989, v.31,
no.10, p.1705./3/ S.Sudo et al. Nuclear Fusion 1990.v.30,no.1,p.11.
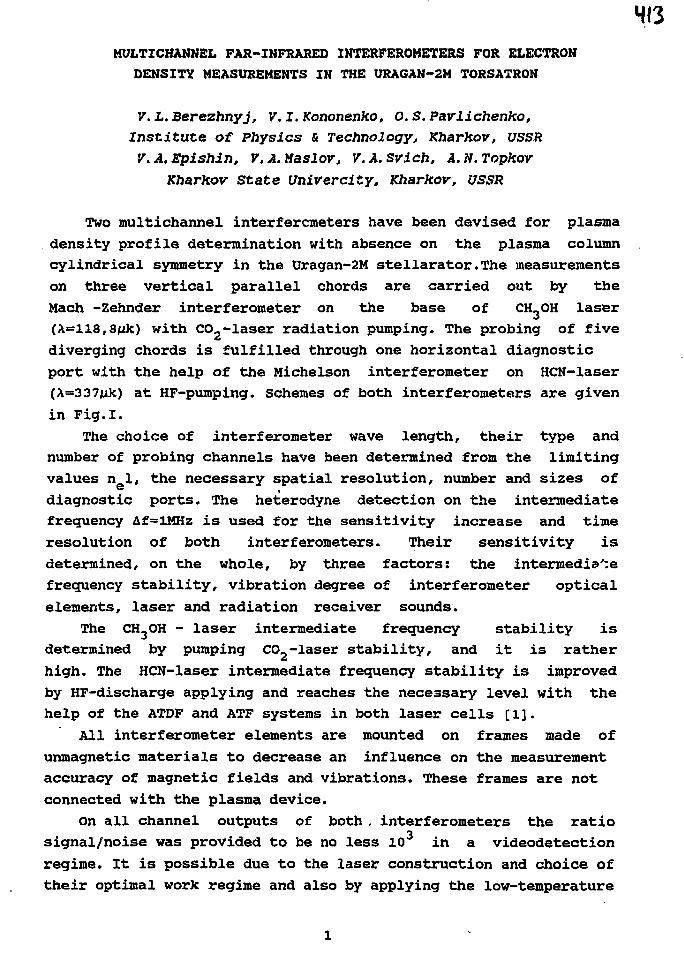
MULTICHANNEL FAR-INFRARED INTERFEROMETERS FOR ELECTRON
DENSITY MEASUREMENTS IN THE URAGAN-2M TORSATRON
V. L. Berezhnyj, V. I. Kononenko, 0. S. Pavlichenko,Institute of Physics & Technology, Kharkov, USSR
V.A.Epishin, V.A.Maslov, V.A.Svich, A.N.Topkov
Kharkov State Univercity, Kharkov, USSR
Two multichannel interferometers have been devised for plasma
density profile determination with absence on the plasma column
cylindrical symmetry in the Uragan-2M stellarator.The measurements
on three vertical parallel chords are carried out by the
Mach -Zehnder interferometer on the base of CH,OH laser
(X=ll8,8/i]c) with C02-laser radiation pumping. The probing of five
diverging chords is fulfilled through one horizontal diagnostic
port with the help of the Michelson interferometer on HCN-laser
(A=337juk) at HF-puroping. Schemes of both interferometers are given
in Fig.I.
The choice of interferometer wave length, their type and
number of probing channels have been determined from the limiting
values n 1, the necessary spatial resolution/ number and sizes of
diagnostic ports. The heterodyne detection on the intermediate
frequency Af=lMHz is used for the sensitivity increase and time
resolution of both interferometers. Their sensitivity is
determined, on the whole, by three factors: the intermediate
frequency stability, vibration degree of interferometer optical
elements, laser and radiation receiver sounds.
The CH-OH - laser intermediate frequency stability is
determined by pumping C02-laser stability, and it is rather
high. The HCN-laser intermediate frequency stability is improved
by HF-discharge applying and reaches the necessary level with the
help of the ATDF and ATF systems in both laser cells [1].
All interferometer elements are mounted on frames made of
unmagnetic materials to decrease an influence on the measurement
accuracy of magnetic fields and vibrations. These frames are not
connected with the plasma device.
on all channel outputs of both . interferometers the ratio
signal/noise was provided to be no less 10 in a videodetection
regime. It is possible due to the laser construction and choice of
their optimal work regime and also by applying the low-temperature
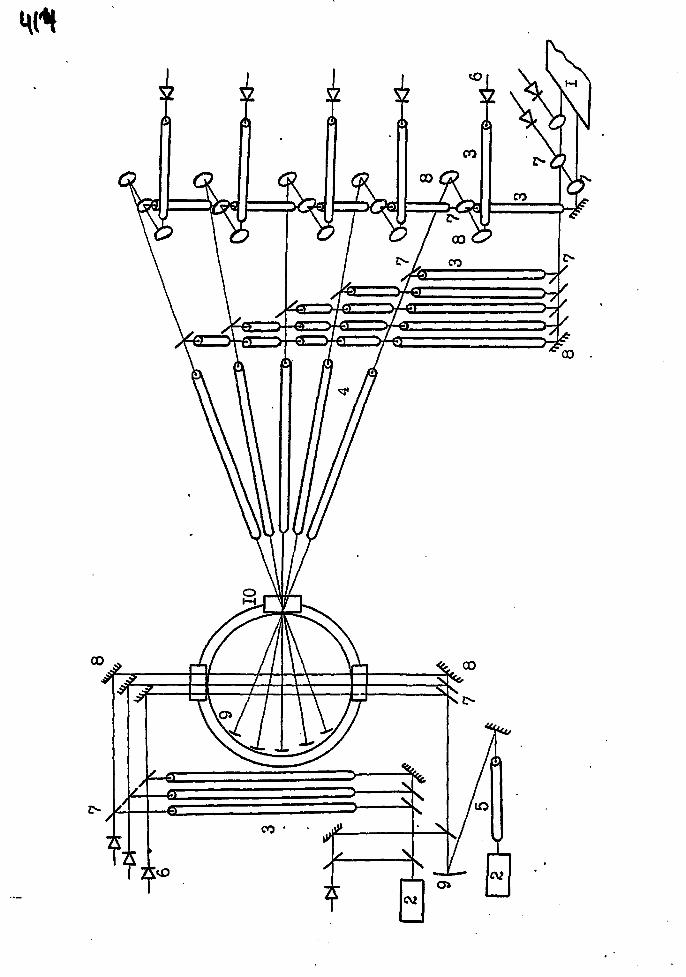
HCH
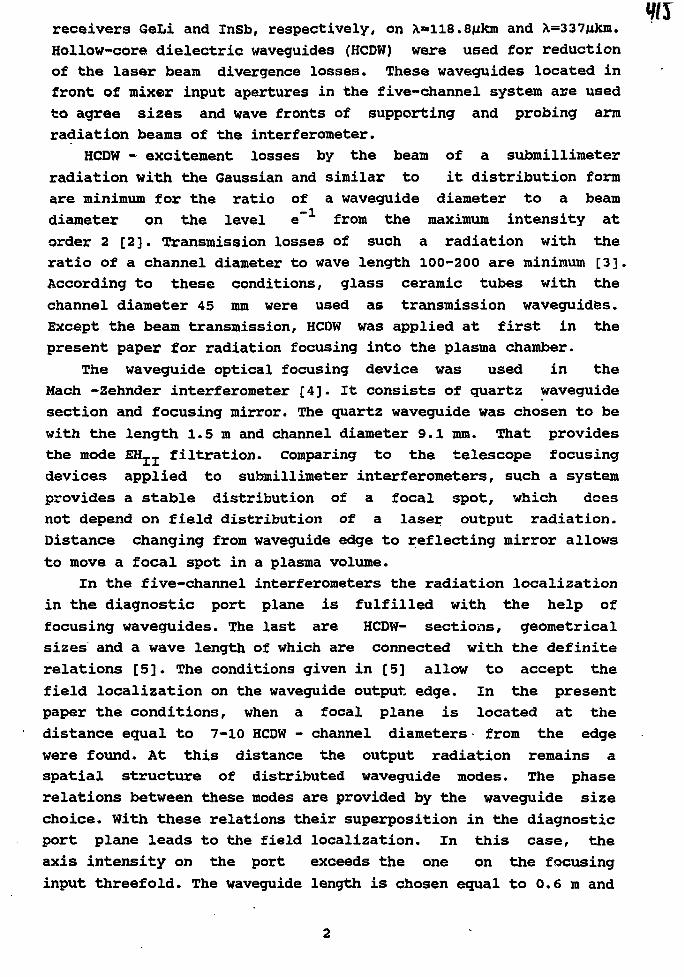
receivers GeLi and InSb, respectively, on X»118.8ukm and \=337n)cm.
Hollow-core dielectric waveguides (HCDW) were used for reduction
of the laser beam divergence losses. These waveguides located in
front of mixer input apertures in the five-channel system are used
to agree sizes and wave fronts of supporting and probing arm
radiation beams of the interferometer.
HCDW - excitement losses by the beam of a submillimeter
radiation with the Gaussian and similar to it distribution form
are minimum for the ratio of a waveguide diameter to a beam
diameter on the level e~ from the maximum intensity at
order 2 [2]. Transmission losses of such a radiation with the
ratio of a channel diameter to wave length 100-200 are minimum [3].
According to these conditions, glass ceramic tubes with the
channel diameter 45 mm were used as transmission waveguides.
Except the beam transmission, HCDW was applied at first in the
present paper for radiation focusing into the plasma chamber.
The waveguide optical focusing device was used in the
Mach -Zehnder interferometer [ 4 ]. It consists of quartz waveguide
section and focusing mirror. The quartz waveguide was chosen to be
with the length 1.5 m and channel diameter 9.1 mm. That provides
the mode EH__ filtration. Comparing to the telescope focusing
devices applied to submillimeter interferometers, such a system
provides a stable distribution of a focal spot, which does
not depend on field distribution of a laser output radiation.
Distance changing from waveguide edge to reflecting mirror allows
to move a focal spot in a plasma volume.
In the five-channel interferometers the radiation localization
in the diagnostic port plane is fulfilled with the help of
focusing waveguides. The last are HCDW- sections, geometrical
sizes and a wave length of which are connected with the definite
relations [5]. The conditions given in [5] allow to accept the
field localization on the waveguide output edge. In the present
paper the conditions, when a focal plane is located at the
distance equal to 7-10 HCDW - channel diameters from the edge
were found. At this distance the output radiation remains a
spatial structure of distributed waveguide modes. The phase
relations between these modes are provided by the waveguide size
choice. With these relations their superposition in the diagnostic
port plane leads to the field localization. In this case, the
axis intensity on the port exceeds the one on the focusing
input threefold. The waveguide length is chosen equal to 0.6 m and
the channel diameter is 3 sm.
The focal spot structure for the focusing waveguide differs
front the input beam Fourier transformation characteristic to
positive lenses and mirrors. As a rule, it has no interference
side lobes, and its distribution form is more homogeneously than
the Fourier-transformation of the input radiation. One of the
advantages of a focusing waveguide using is also a vibration
resistance increasing, reducing the refractive- distortion
influence, absence of thin positioning joints and high
reliability.
Mirror sizes inside the discharge chamber were chosen
according to production conditions of a focusing waveguide optimal
excitement at reversal passing of probing beams. The one-type
"phase-code" modules are used in the registration system. They are
applied in the data-recording system of the CAMAK datum collection
and working up.
The interferometer sensitivity is not worse than 10 strip,
the spatial resolution <4 sm, time resolution - ljuks.
The devised interferometers can be used successfully for
researches in different possible working regimes in the Uragan-2M
stellarator at the Ohmic, HF and ECR- heating, neutral atom and
hydrogen pellet injections.
LITERATURE
1. Berezhnyj V.L., Kononenko V.I., Pavlichenko O.S. et al.,Pribory i teknika eksperimenta, 1990, No 5, pl78-182.2. Epishin V.A., Maslov V.A., Ryabykh V.N. et al., KvantovayaElektron., 1990, Vol.17, No 4, p480-484.3. Berezhnyj V.L., Kononenko V.I., Epishin V.A. et al., Preprint88-18 Physicotechnical Academy of Sciences of the Ukrainian SSR,Kharkov, 1988, 36 p.4. Epishin V.A.,Maslov V.A.,Ryabykh et al, Optica i spectroskopya,1989, Vol.66, No 3, p.688-691.5. Epishin V.A., Maslov V.A., Ryabykh V.N. et al.,Pis'ma Zh. Tekn.Fiz.,1988, Vol.14, No 14, p.1335-1338.
Fig.i Multichannel interferometer optical scheme for the U-2Mstellarator. l-HCN-laser;2-CH 0H-lasers?3-transmitting waveguides;4-focusing waveguides;5-waveguide filter;6-mixers;7-beam dividers;8-mirrors;9-focusing mirrors; 10-diagnostic ports.
HEAVY ION BEAM PROBING OPTIMIZATION IN STELLARATORS
Melnikov A.V.
l.V. Kvrchatov Atomic Energy Institute, Moscow, USSR,
Krupnlk L . I . , Nedzelskij I . S . , samokhvalov N.V.
Kharkov Physical-Technical Institute, Kheurhov, USSR,
Xharchev N.X.
Institute of General Physics, Moscow, USSR.
Heavy Ion Beam Probe Diagnostics allows to make direct tine-spatial
measurements of electric field, density and electron temperature. Before
the measurements it demands to determine their coordinates in plasma and to
optimize probing pattern, that realized by calculations only. Such a work
from the calculations to measurements was complete in TM-4 and T-10
tokamaks in USSR. This paper describes the possibility to realize measure-
ments in Uragan-2M and Liven-2 facilities.
Diagnostics with heavy ion beans is based on the interaction of probing
beam particles with an electromagnetic field and with plasma particles
within the region of beam secondary ionization in the plasma (observation
region). The secondary heavy ions, created in this region registered by the
detector, lies outside the plasma. They carry out the information about the
plasma parameters in observation region. At fixed position of an injector
and a detector for a given magnetic field in facility and for a given
species of probing ions, the position of the observation region in the
midplane determined by the beam energy and by the beam injection angle .
Let's discuss firstly this plane case. Varying these parameters, one
can translate observation region across the plasma column. The variation in
one of these parameters qives an opportunity to register secondary ions
coming from some spatial line (detector line). A family of the lines of
equal angles together with the lines of equal enerqies cover the plasma
cross-section by the "detector grid". The position and the size of the
observation region as well as the detector lines and grids, can be found by
calculation only. This is a peculiar feature of the method. In order to
obtain a spatial distribution of any plasma parameter, the values of a
given parameter are obtained by experimental data processing; the correspo-
nding coordinates are obtained as a result of calculations. Therefore the
diagnostics set for probing the plasma by heavy ion beam has a number of
computer codes realizing the algorithms for data processing as well as the
orbit calculations and those of detector lines and grids, along with the
instrumentation and with an accelerating equipment.
Before the experiment, a problem of it's optimization is solved. The
position of the observation region in the midplane depends on a large
number of parameters. The geometric parameters are: coordinates of the
points of injection x_, y and detection x_,ys, injection angle a.The
physical parameters are: toroidal magnetic field H , energy E, mass M and
charge Q of probing particles. Probing particle move along the Larmoure1/2
circle in the magnetic field of the facility with R = c(2MB) ' /QH. This isii
the single independent physical parameter affecting the trajectories arid
observation region position. It is necessary to determine not the R, value
but the values of it's arguments that are affected by independent limita-
tions. The equality R.(Q,M,B,H) = const decrease the number of physical
parameters from 4 to 3. So there are 8 parameters for optimization in
midplane: x;, y_, x_,y., «» H, E, Q. The necessity of locating the particle
orbit within the vacuum vessel ports and taking into account the dispositi-
on of structural units imposes severe restrictions to these parameters.
These restrictions are interconnected to each other, because the available
limits for every parameter depends on others. This connections haven't
analytical description because of the complexity of the trajectories
behavior. The vacuum vessel configuration in the midplane give preliminary
limits for them.
The problem of experimental condition optimization includes the choice
of optimal parameters values in sense of following efficiency functions:.
- To give an opportunity to carry out the beams through the vacuum vessel
ports of the facility;
- To find a detector line connecting the center and the edge of the plasma
(see Fig. 1);
- To find a detector grid covering the maximal plasma cross-section (see
Pig. 2);
- To choose the probing pattern in order to optimize the beam energy range.
In stellarator conditions the magnetic field has a significant poloidal
components. Its effect results in escape of probing particle orbits from
midplane and in their conversion into spatial curves. In this case additio-
nal parameters affecting the observation region. They are: z_, z_ - toroi-
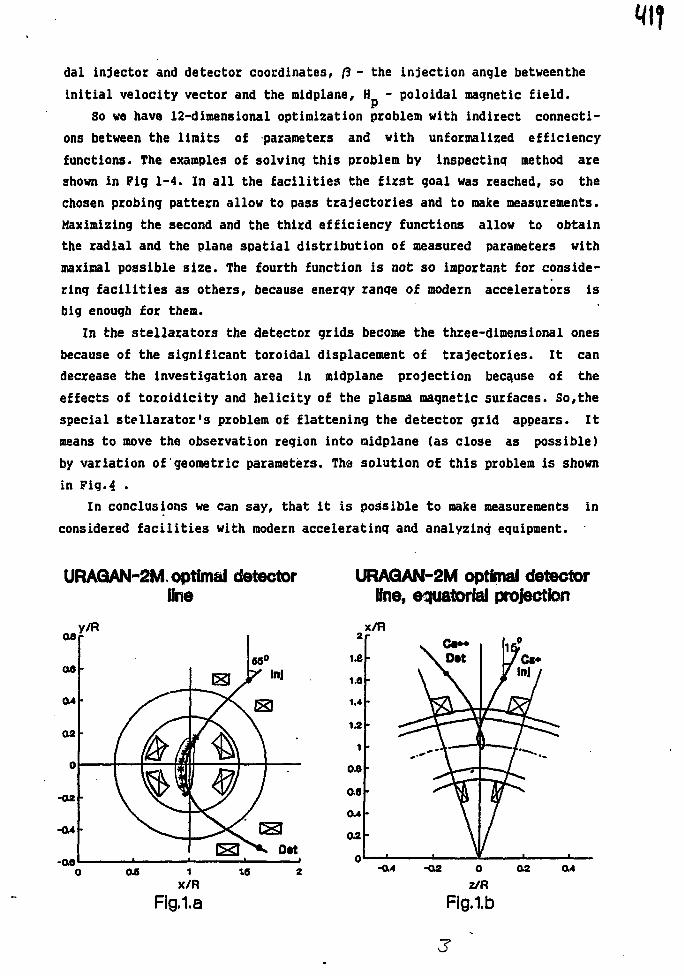
dal injector and detector coordinates, ft - the injection angle betweenthe
initial velocity vector and the midplane, H - poloidal magnetic field.
So we have 12-dimensional optimization problem with indirect connecti-
ons between the Units of parameters and with unformalized efficiency
functions. The examples of solvinq this problem by inspecting method are
shown in Pig 1-4. In all the facilities the first goal was reached, so the
chosen probing pattern allow to pass trajectories and to make measurements.
Maximizing the second and the third efficiency functions allow to obtain
the radial and the plane spatial distribution of measured parameters with
maximal possible size. The fourth function is not so important for conside-
ring facilities as others, because energy range of modern accelerators is
big enough for then.
In the stellarators the detector grids become the three-dimensional ones
because of the significant toroidal displacement of trajectories. It can
decrease the investigation area in midplane projection because of the
effects of toroidicity and helicity of the plasma magnetic surfaces. So,the
special stellarator's problem of flattening the detector grid appears. It
means to move the observation region into aidplane (as close as possible)
by variation of geometric parameters. The solution of this problem is shown
in Fig.4 .
In conclusions we can say, that it is possible to make measurements in
considered facilities with modern accelerating and analyzing equipment. '
URAQAN-2M optimal detectorline
-OS
Fig.1.a
URAGAN-2M optimal detector(hie, equatorial projection
x/Rz
1.0
1.4
1.2
1
03
a«
O4
O2
\ D»t
)
16?JCt*
7ln'/
rh11
-oa 0
z/R
Rg.1.b
O4
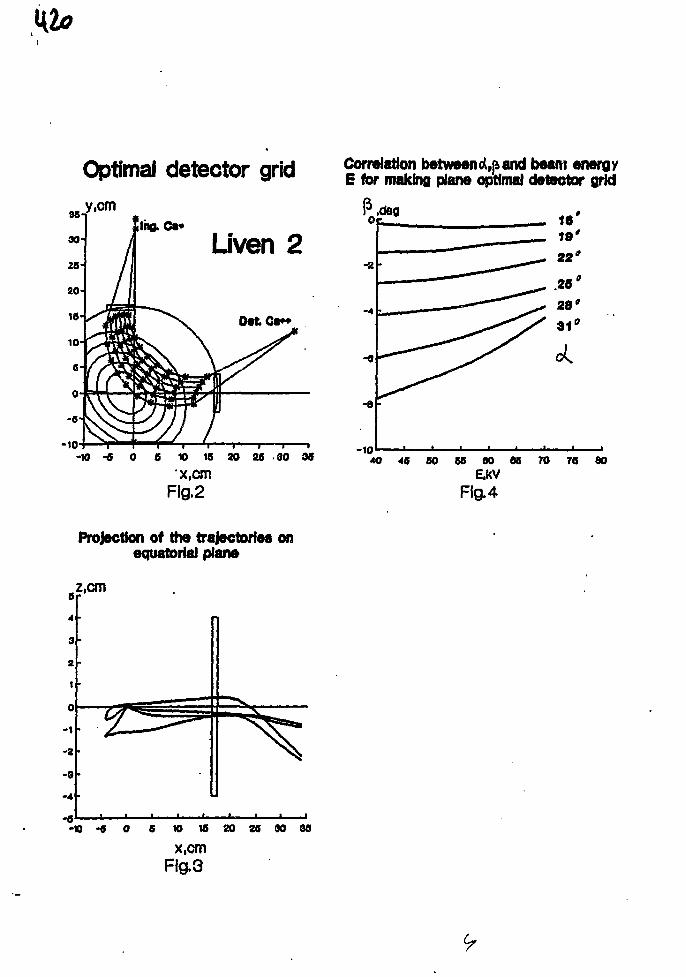
Optimal detector grid
v.cmClhg. <*••
Liven 2
-10
Correlation between riband beam energyE for making plane optimal detector grid
- » -6 0 6 10 15 20 26 30 35
x.cmFig.2
-1040 45 50 65 00 65 70 78 60
E.kVFig.4
6
4
3
z
1
0
-1
-2
-9
-4
Projection of the trajectories onequatorial plane
z.cm
10 16 20 25 90 38
x.cmFlg.3
* ON THE PROBLEM OF MAGNETIC MEASUREMENTS
IN STELLARATORS
Yu.K.Kuznetsov
Institute of Physics and Technology, Kharkov
S.V.Shchepetov
General Physics Institute , Moscow
1. Abstract. In this paper the possibility of the expe-
rimental identification of stellarator equilibria from the
external magnetic measurements is analyzed. Also we discuss
the problem of reconstruction of the plasma boundary. The
analytical expressions for three-dimensional magnetic fields
produced by currents flowing in the plasma are derived, which
can be used for interpretation of the experimental data. Also
these expressions make it possible to calculate the influence
of finite pressure effects and plasma currents on the ripples
of longitudinal magnetic field. This may be useful for
investigation of transport properties of finite /3 plasmas
confined in stellarators with planar circular axis and
tokamaks with ripple.
2. Introduction. Since now detailed investigations
devoted to the problem of experimental identification of
tokamak equilibria from the external magnetic measurements are
well known ( See, for example, review [ 1 ]). The gradual
development of methods of analysis of experimental data brings
forward to the fact that now the problem of reconstruction of
pressure and current density is being solved quite accurately.
In contemporary experiments on stellarators the simplest
variant of magnetic diagnostics is used based on the measurem-
ents of the total toroidal current I , averaged toroidal -
A* and poloidal - A* magnetic fluxes [ 2-4 ]. For interpr-
etation of experimental data simplified two-dimensional theo-
retical models ( based on averaging over coordinate <p )are
usually utilized . Taking into account real three-dimensional
structure of magnetic field in a stellarator makes it possible
(as it will be shown below ) to extract additional information
about pressure and current density profiles.
3. Calculation of three-dimensional magnetic fields. In
the frame of the formalism of averaged equations [ 5 ] it is
natural to assume that all quantities characterizing the
plasma can be written as a sum of two parts , e.g., X = <X> +
X , where X is an arbitrary quantity to be determined from
the magnetohydrodynamic ( MHD ) equations, and <X> = 0, and
the angle brackets mean an average over the toroidal variable
ip , along which the system is periodic. Making this changing
of variables we have the following expression for oscillating -
current density [ 5 ] (for convenience, we are omitting the
symbols denoting averages for averaged quantities):
J = 5BTep + at* + [ e^ x Vp ]/2?T - J {8*/dip) / {RB J , ( 1 )
a = - R(Voc V$)f Br + (J 7*)/B*, ( 2 )
p = - J?(Vp 7* )/BT, (...)= J (...) d<p, ( 3 )
a = (J B)/B2, ( 4 )
where J, B, and p are the current density, magnetic field,and
pressure; $ is the scalar potential of vacuum helical magnetic
field; B_ is the axially symmetric part of longitudinal vacuum
magnetic field, ( R,<p,Z ) is the cylindrical co-ordinate
system. The averaged quantities are to be found from the
system of averaged MHD equations [ 6 ].
After straight-forward algebra we find equations for
magnetic fields created by these currents:
5 n "= V * V + [ R 5x% }t ( 5 >where 7 = V - e d/d<p , subscript 1 denotes corrections to
helical fields created by plasma currents. For the
longitudinal component of the magnetic field we have the
following equation ( here we neglect small terms of order of
U/N with respect to unity, where n is the rotational
transform and N is the total number of periods of the helical
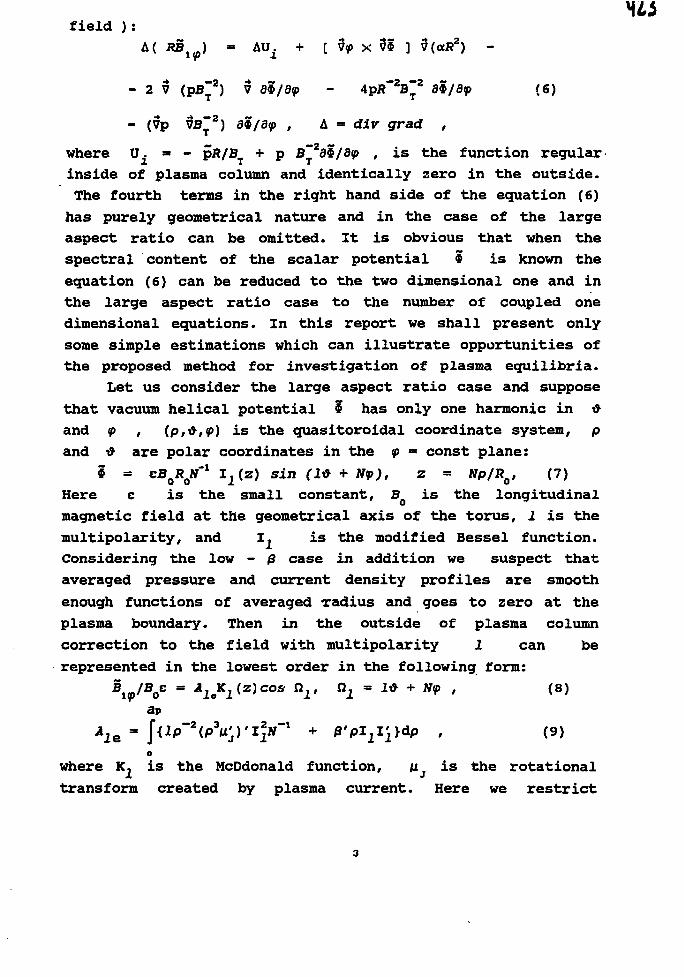
field ):
A( a§ip) - A ^ + [ Vip x 7* ] 7(«J?2) -
- 2 v (pB~2) 7 at/a?) - 4pjT2B~2 d9/a<p (6)
- (Vp VB~2) a*/ay , A = dir grad ,
where IT. • - pR/BT + p B~2d$/dt(> , is the function regular
inside of plasma column and identically zero in the outside.
The fourth terms in the right hand side of the equation (6)
has purely geometrical nature and in the case of the large
aspect ratio can be omitted. It is obvious that when the
spectral content of the scalar potential * is known the
equation (6) can be reduced to the two dimensional one and in
the large aspect ratio case to the number of coupled one
dimensional equations. In this report we shall present only
some simple estimations which can illustrate opportunities of
the proposed method for investigation of plasma equilibria.
Let us consider the large aspect ratio case and suppose
that vacuum helical potential $ has only one harmonic in *
and <p , (p,&,<p) is the quasitoroidal coordinate system, p
and i> are polar coordinates in the <p - const plane:
* = cB^W"1 I2(z) sin (1* + Nip), z = Np/RQ, (7)
Here c is the small constant, B is the longitudinal
magnetic field at the geometrical axis of the torus, I is the
multipolarity, and I. is the modified Bessel function.
Considering the low - 0 case in addition we suspect that
averaged pressure and current density profiles are smooth
enough functions of averaged -radius and goes to zero at the
plasma boundary. Then in the outside of plasma column
correction to the field with multipolarity 1 can be
represented in the lowest order in the following form:Si<p/Boe = *laK2 («)«>» n1# n2 = 2* + Nip , (8)
owhere K. is the HcDdonald function, u is the rotational
transform created by plasma current. Here we restrict
ourselves to the usual case Np/IR s 1. For the nearest
satellite harmonics in the lowest nonvanising order we have:
zl±i{ « 2 < * ' / 2 M ) ' * i^'/2u}dp, (10)
In these expressions prime means differentiation with respect
to p. It can be easily seen from expression (8) that the input
of current terms is important up to the values of the parameter
fi _ fx /N ( the averaged displacement of plasma boundary in the
presence of unidirectional current in the case of practical
interest, i.e., /3 > nuj (a_/i?Q) 2is a weak function of plasma
profile).
4. Conclusions. Thus we have shown that measurements of
helical magnetic fields created by plasma currents can suffic-
iently simplify the problem of reconstructing of current dens-
ity profiles (for instance bootstrap current) and give additi-
onal information about pressure profile. Information about
both averaged and helical magnetic fields created by plasma
gives an opportunity to reconstruct the last undestroyed magn-
etic surface by the method of tracing of the field lines of
magnetic field. A simple semianalytical procedure is proposed
for theoretical studying three-dimensional magnetic fields
created by finite (3 effects and plasma currents. For magnetic
measurements of three -dimensional magnetic fields magnetic
probes located in £ and <p directions can be used.
REFERENCES
l.Braams B.J. Preprint IPF 5/2,Charching,1985.
2.Kuznetsov Yu.K.,Pashnev V.K.,Tonkopryad V.M. In: Problems of
the Atomic Science and Technology,Thermonuclear Fusion ,2(4)
1975 ,p.52 (in Russian).
3.Andryukhina E.D.,Fedyuanin O.I. Sov.J. Plasma Phys.,
V.3,1977,p.792
4.Pustovitov V.D. Nuclear Fusion ,v.30,1990,p.1523.
S.Kovrizhnykh L.M.,Shchepetov S.V. Sov.J. Plasma Phys.,
V.7,1981,p.527.
6.Kovrizhnykh L.M.,Shchepetov S.V. Advances in Sov.
Phys.,V.29,1986,p.343.
HIS
Unconventional method in magnetic diagnostics forstationary toroidal magnetic confinement system
Eh. D. Andryukhina, K. S. Dyabilin, 0.1. Pedyanin
General Physios Institute,Moscow,USSR
One of the principle stellarator advantages is the pos-sibility to create dosed toroidal traps with the'fixed' structure of a confining stationary magnetic field. Anymodern heating techniques may be used for plasma heating:ECHH,ICRH, neutral beam injection.Stationary magnetic fields and plasma parameters in new gene-ration of devices imply particular features and restrictionsfor diagnostic methods and, in particular, for electromagneticplasma diagnostics (HID).While at the present stage of researchthe experiments are carried out on quasistationary plasmaconfinement in the ATP torsatron (20seo) and few sec.on to-kamaks,in future devices the confinement time is to be someorders of magnitude higher (e.g. for the second HER phase it is10 sec). The use of conventional ESED methods with such characte-ristic times ia problematic and it becomes enevitable findingand approval of new principles.There exists a physical phenomenon which has played an impor-
tant role at the very begining of thermonuclear research,that isthe effect of conservation of the magnetic flux in a conductingshell. Equilibrium and stability of current formations inpinches and tokamaks, the systems of superstrong magneticfields, exploading liners, that is a brief list of physicalexperiments based on the phenomenon of conservation of themagnetic flux.
It is of interest to continue the analysis of some other pos-sibilities the phenomenon of conservation of the magnetic flux.A simple conducting circuit may be deformed into geometric con-figuration of separate not connected by magnetic flux circuits(more than two) with the properties of the total magnetic flux Pconservation.
The condition lor P conservation is, naturally,determined by
the Xlux dissipation time in the conducting circuit T=L/R,where
L is a inductance, R is a resistance.Por the modern stage of su-
per conductance technique it's actually achievable to get t=1year.
That allows us to consider the effect of conservation in the
scale of constant (quasy-stationary) magnetic fields : at t«z
i.e. in the case of fast changes the effect really exists.
A multy-oirouit system (for simplicity two circuits with
1=1^+1^) has the following properties: when a single (active)
circuit L,, is excited by the external flux 3?0, the flux
?2=-I^/(Ii1+I^)*P0 is initiated in the circuit 1^, which is not
connected with P_ ('passive' oirouit). It 1 B possible magnetio
flux transport in space from one circuit to another, transfer
coefficient KO=-PO/?Q=T|/(1+TJ); TJ^LQ/IU .The presence of the flux
?,, leads naturally to the perturbation of the external flux FQ,
which is characterized by the magnitude K 1=-? 1/?Q=1/(1+T|) .Hence,
a complete external flux transformation in space results in
natural decay of perturbation in the region ?Q.
The next property is associated with the effect of
magnetic field conversion. She value of the magnetic field in
the active (Lj ,W1=1 ,S1) and passive multiturn (N2) oirouit
N2,S2) is equal to
-B1-B0/(1+N22*S2/S1); -B2-B0*
S1 ,Sg are the squares of the circuits ILJ , Iv> respectively.The condition of TnaT-iTpmn increase is
g 2 0 2
Let us consider the possible application of the constant
flux 'transformer'.
In the conditions of stationary plasma confinement, theconventional methods, based on the inductive coupling between
the magnetic detectors stop to work, and the methods based onmeasuring constant magnetic fields should be applied.
Namely under tiieBe conditions the properties of ahortoiroui-
ting superconducting circuit (5CC) may be used. The active cir-
ouit, which functions as a detector is placed in the region
of varying magnetic field or magnetic flux due to the presence
of the plasma(e.g.the flux due to the plasma diamagnetism or
plasma-current paramagnetism, the magnetic field produced by
Pfirsh-Shlutter currents, the poloidal magnetic field due to the
plasma current, the toroidal magnetio field varying in the pre-
sence of the plasma,etc.).Varying or constant flux in a passive
circuit may be determined by the conventional classic techniques
applied for measuring constant or quasioonstant magnetio fields
(Hall effect, NMR method, etc.)
To improve the measurement accuracy, 5GG should be made
superconducting in the steady external magnetio field without
a plasma (i.e. the initial state of 5GC is a current-free
circuit). To decrease perturbations in the measured fields
(fluxes) it is necessary to satisfy the condition Tf»1.
While in fusion devices there are alternative
diagnostics of stationary magnetic fields (e.g. oscillating
magnetio coils), to measure both the toroidal magnetic flux,
and the structure of the poloidal magnetio flux , SCO
method is now the only possible diagnostics (to determine
the plasma energy it is necessary to measure simultaneously
both plasma current and toroidal magnetio field).
It is also of interest to make use of other SCC properties:
possible enhancement of a steady magnetic field in small
volumes;transport and production of constant reduced field in
a volumes which exceed essentially that of a source PQ (or B Q);
screening the objects out of slowly varying magnetio field
(magnetio storms).
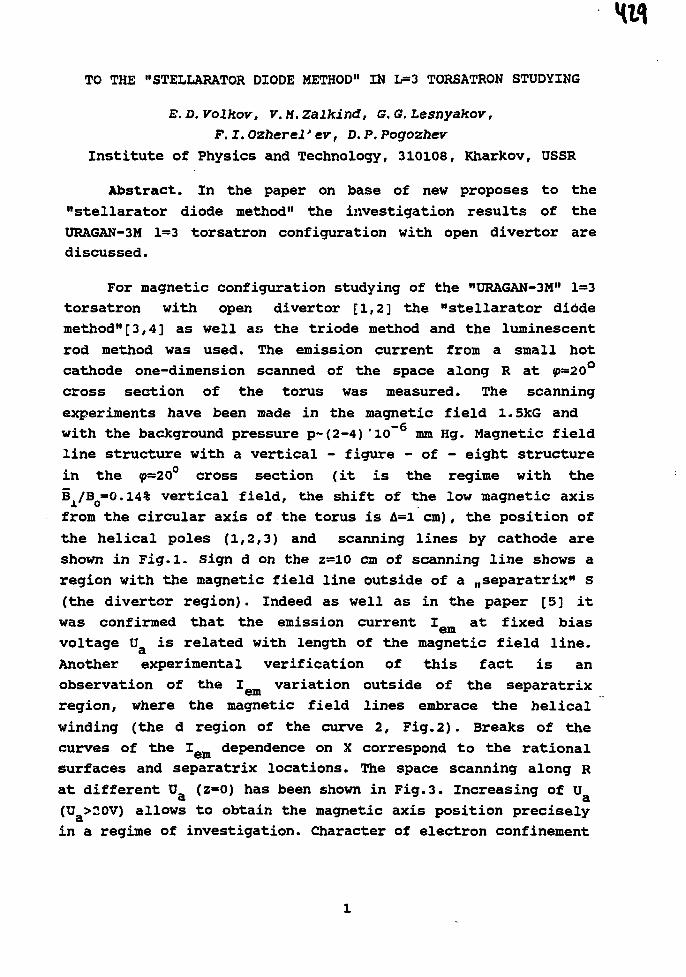
TO THE "STELLARATOR DIODE METHOD11 IN L=3 TORSATRON STUDYING
E. D. volkov, V.M.Zalhind, G. G. Lesnyakov,
F. I. Ozherel' er, D. P. Pogozhev
Institute of Physics and Technology, 310108, Kharkov, USSR
Abstract. In the paper on base of new proposes to the
"stellarator diode method" the investigation results of the
URAGAN-3M 1=3 torsatron configuration with open divertor are
discussed.
For magnetic configuration studying of the "URAGAN-3M11 1=3
torsatron with open divertor [1,2] the "stellarator diode
method"[3,4] as well as the triode method and the luminescent
rod method was used. The emission current from a small hot
cathode one-dimension scanned of the space along R at <p—20°
cross section of the torus was measured. The scanning
experiments have been made in the magnetic field 1.5kG and
with the background pressure p~(2-4)"io~ mm Hg. Magnetic field
line structure with a vertical - figure - of - eight structure
in the ip-20° cross section (it is the regime with the
B /B=0.14% vertical field, the shift of the low magnetic axis
from the circular axis of the torus is A=l cm), the position of
the helical poles (1,2,3) and scanning lines by cathode are
shown in Fig.l. Sign d on the z=10 cm of scanning line shows a
region with the magnetic field line outside of a Mseparatrix" S
(the divertor region). Indeed as well as in the paper [5] it
was confirmed that the emission current I at fixed biasem
voltage U is related with length of the magnetic field line.
Another experimental verification of this fact is an
observation of the I variation outside of the separatrix
region, where the magnetic field lines embrace the helical
winding (the d region of the curve 2, Fig.2). Breaks of the
curves of the I dependence on X correspond to the rational
surfaces and separatrix locations. The space scanning along Rat different U (z=0) has been shown in Fig. 3. Increasing of ua a(U >20V) allows to obtain the magnetic axis position precisely
in a regime of investigation. Character of electron confinement
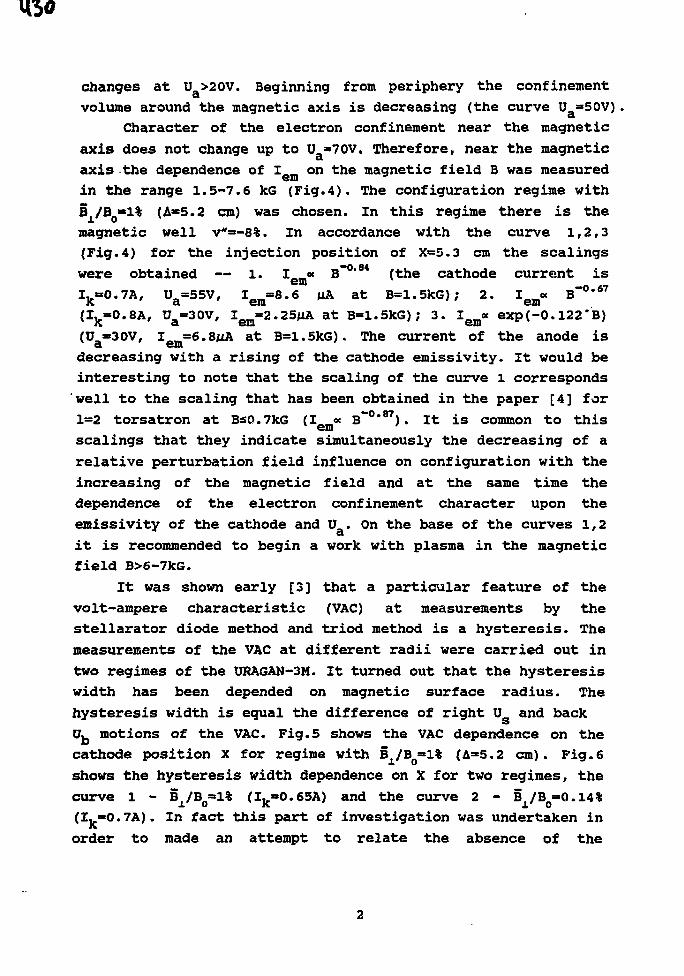
changes at U >20V. Beginning from periphery the confinement
volume around the magnetic axis is decreasing (the curve U =50V)d
Character of the electron confinement near the magnetic
axis does not change up to Ua»70V. Therefore, near the magnetic
axis the dependence of I on the magnetic field B was measured
in the range 1.5-7.6 kG (Fig.4). The configuration regime with
B /B »1% (A*5.2 cm) was chosen. In this regime there is the
magnetic well v*=-8%. In accordance with the curve 1,2,3
(Fig.4) for the injection position of X=5.3 cm the scalings
were obtained — 1. I « B~0"8* (the cathode current is
Iv=0.7A, U=55V, I =8.6 uA at B=1.5kG); 2. I « B~0*67
(Iv=0.8A, U =30V, I =2.25jUA at B=1.5kG); 3. I « exp(-O.122'B)(U =30V, I =6.8JIA at B=1.5kG). The current of the anode isa emdecreasing with a rising of the cathode emissivity. It would be
interesting to note that the scaling of the curve l corresponds
well to the scaling that has been obtained in the paper [4] for
1=2 torsatron at BsO.7kG (Iem« B"0"87) . It is common to this
scalings that they indicate simultaneously the decreasing of a
relative perturbation field influence on configuration with the
increasing of the magnetic field and at the same time the
dependence of the electron confinement character upon the
emissivity of the cathode and U . On the base of the curves 1,2
it is recommended to begin a work with plasma in the magnetic
field B>6-7kG.
It was shown early [3] that a particular feature of the
volt-ampere characteristic (VAC) at measurements by the
stellarator diode method and triod method is a hysteresis. The
measurements of the VAC at different radii were carried out in
two regimes of the URAGAN-3M. It turned out that the hysteresis
width has been depended on magnetic surface radius. The
hysteresis width is equal the difference of right U and back
Uu motions of the VAC. Fig.5 shows the VAC dependence on the
cathode position X for regime with BJL/BQ»1% (A=5.2 cm). Fig.6
shows the hysteresis width dependence on X for two regimes, the
curve 1 - B /B0=»l% (Ij»0.65A) and the curve 2 - § /B«O.14%
(Ij=*0.7A). In fact this part of investigation was undertaken in
order to made an attempt to relate the absence of the
hysteresis of the VAC with injection of the electron beam at
the magnetic field lines leaving the confinement volume to the
wall and to obtain the answer where the last closed magnetic
surface (LCMS) is located. Analysis of the obtained data showed
that in the regime with Bx/Bo=l% the hysteresis is absent on
the VAC for the magnetic field line behind the LCMS. The
numerical calculations for the regime with § /B0=»l% (A=5 cm)
give us the average radii of the magnetic surfaces - r=*5cm at
X=9cm, f=10.3 cm - X=l3cm, r=12.5cm - X=15cm [1,2]. The
estimations by the triode method measurements [1/2] give us
r=8.3cm (N>100) at X=9cm, f=10.5-11 cm (9.3 cm < r < 12.3 cm,
N=20+5) - X=13 cm, ?£12.3 cm (N=1O) - X=15 cm. Thus,the region
r>ll cm is considered as a region without the nested magnetic
surfaces. However, such the estimations for the regime with
B /B=0.14% give us r considerably low, it demands the further
investigation.
References
[1]. V.E.Bykov, E.D.Volkov, V.S.Voitsenya, et al. Stellarator
Physics (Proc. 7-oh Intern. Workshop on Stellarator, IAEA and
ORNL, Tennessee, 10-14 Apr. 1989) IAEA-TECDOC-558, IAEA, Vienna
(1990) 363.
[2]. V.E.Bykov, E.D.Volkov, V.S.Voitsenya, et al. Voprosy
atomnoj nauki i tehniki, series Termojadernyi Sintez, Moskva, 3
(1990) 12 (in Russian).
[3]. A.G.Dikij, V.M.Zalkind, G.G.Lesnyakov, et al., Sov. J.
Plasma Phys. 14 (1988) 160.
[4]. R.F.Gandy, M.A.Henderson, J.D.Hanson, et al. Rev. Sci.
Instrum. 58 (1987) 509.
[5]. R.Takahashi, O.Motojima, T.Obiki, et al., Jpn. J. Applied
Phys. 28 (1989) 2604.
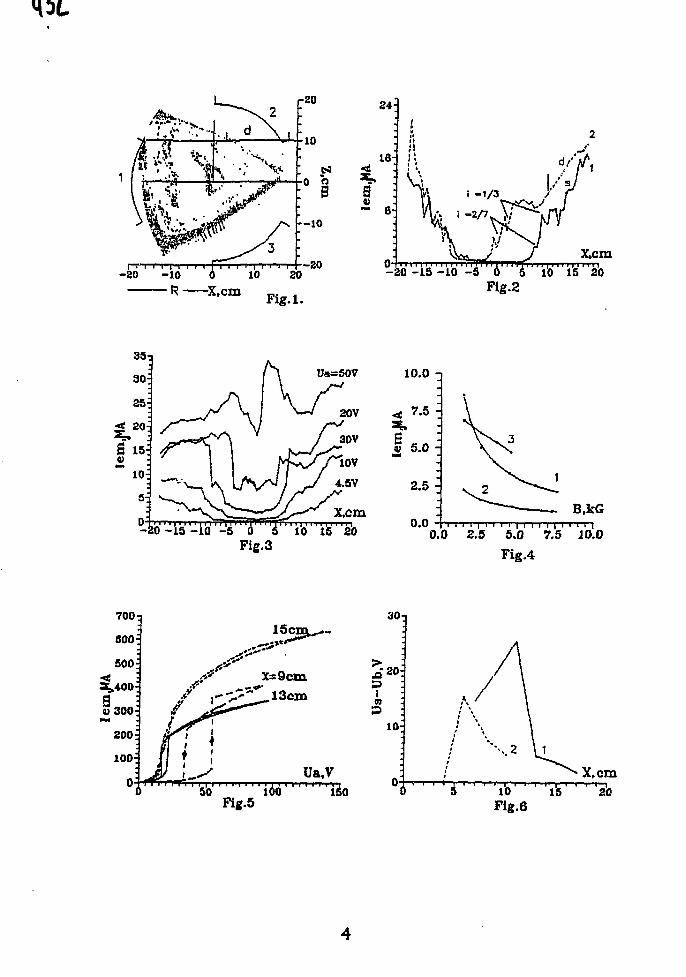
r2D
-80 -10
-X,cm10 20
Fig.l.
-20
34-
-80 -15 -10 -5
Fig.2
X,cmi'o" i'5"2'o
U«=50V
-20 -15 -10 -iFig.3
10.0 -i
7-5 -I
5.0 -
2.5 -
0.0B,kG
0.0 2.5 5.0 7.5 10.0
Fig.4
30-i
50 100Fig.5
150
9I
10-
10Fig.f
X,cm15 20
A THEORY OP "A STELLARATOR DIODE"
DIM;) A.G.. Zalldnfl Y.M., LesnyaKov G.G., Pavllchenfco o.s.fPashchenko A.V.. Pashnev V.K., Pogozhev D.P.
Kharkov Institute of Physics and Technology,310108, Kharkov, USSR.
nA stellarator dlodew [1] Is a stellarator with an electronsource, placed In Its magnetic field. The conducting vacuum cham-ber serves as an anode, and the electron source as a cathode. Astudy of the stellarator as a nstellarator diode" provides a newmethod for Investigating stellarator vacuum magnetic configurati-ons [11. This method Is based on measurements of the current flo-wing from the electron source, movable inside the stellarator, tothe vacuum chamber wall or to an additional transparent conductinggrid that cuts off the magnetic confinement region. Behind the me-thod is the statement that the value of the current carryled thro-ugh the diode depends on the magnetic field value and geometry.More partlculary, the concept of the method Is based on the hypo-thesis that the surfaces of the constant emission current coincidewith the magnetic (more exactly, with drift) surfaces, providedthat the free path of electrons Is sufficiently longe, so that forthe time between two succeslve collisions the electron can travelfar ahead along the drift surface. By the present time, this me-thod of studying magnetic configurations has gained recognitionand needs C1 ] a strong theory, wlch would take Into account thenearcathode events, drifts, collisions and the spatial charge.
This report proposes a scheme of constructing such a theory.Let us suppose that electrons stay for some time in the trap-
ping region of the stellarator field. This allows us to considera slow colllslonal balance of a rarefied electron gas (ne ~ 10
6
cm" 3), at wlch collisions with neutrals (n^ ~(1010+1011)cm"3) playthe main role. This circumstance permits the use of the approach,which was developed on considering a slightly Ionized gas (see 121and references In It) for electron diffusion In the given externalthree-component magnetic field.
In the zero approzlmatlon In the (v/wBe )-parameter, we get
the solution of the kinetic equation
to the form erf the Maxwell distribution function fo, then take thecolllslonal term In the BGK lorn:
S t = - v (f - fo) (2)and find the diffusion flow In the first approximation
= D ± C? - T) CP hJ + T)2 (F,h) h) , (3)
where D. = T ^ ; T Is the electron gas temperature; TJ = -1^ ;B U5h = B / B : P * - ^ j r E - v j r .o T
The set of equations (1)-(3) must be considered together withthe equations for fields and diffusion flows:
-» »div E = - 4 i c e n , n = / f d < u f (4)dlv B = 0 , rot B = 0 , (5)dl-u 3 = 0 . (6)When applying eqs. (3)-(6) to the magnetic fields of diffe-
rent symmetries, which contain the regions with closed magneticsurfaces, we use the known result that slow colllslonal electronstravel along the drift surfaces, which deflect from magnetic onesby - p e [33 (pe Is the Larmour radius of electrons).
We shall consider the magnetic fields for which this conclu-sion remains correct even with the consideration of the banana-effects C4].
The above given considerations lead to conclusion that theelectrons emitted by source of small but finite dimensions, havethe time between two succeslve collisions to spread the magneticsurfaces, which cut across the source. This allows us to believethat a certain average surface Is a really existing cathode.
Under the above-mentioned conditions, the electric potentialand the electron density are the functions of the magnetic surfa-ce, and E , TO 11 dS ( dS ls the d l r e c t l n 5 vector of the magneticsurfase); £ £ , . 0-
Equations (3)-(6) were considered for straight fields witha helical symmetry and, in particular, for stellarators with cir-cular and nonclrcular cross sections.
The consideration of the cases with nonclrcular cross secti-ons requires the averaging over Q = 8 - a z, (r, 6, z are thecylindrical coordinates), a =29C/L , L is the lenth of the magneticfield period.
Por the hr= 0 case, the cross sections of the magnetic surfa-ces are circles. So, there is no necessity of averaging over Qand the simultaneous equations for the calculations may be written
as: ^ n E + ^ = Q(r) (7)T r dri ^ ( r E ) = - 4 % e n , (8)r dr r ,,
, r < r < rwhere Q(r) 2 f V T r ' s
0 , 0 < r < r_
I is current through the unit lenth of the bounding surface,rs is co-ordinate of the current source,rQ is co-ordinate of the chamber.
Por the region rs < r < ro , from equations (7)-(8) we have
_ _ 2T S S+1 rtj.- gp / -y- dr.J3L 1
where S(r) is found from the equation
r dS + S2 = 1 + 2EL- J g2 Q(g) d| . (9)
dr T ra
The last equation is also valid for the region 0 < r < rs .If r = rs then it is necessary to Join solutions for the two re-gions, satysfylng the boundary conditions for the potential. Thisresults in seven equations with six constants. Prom the seventhequation we obtain the current-voltage characteristic (CVC)
uQ = §2 ; -HIM dg . do)
The analysis of the G7C (10) shows, that it has the regionwith hysteresis, which has been predicted theoretically and foundexperimentally In [13.
Compared to the above given solution talcing account of thenonclrcular cross section of the magnetic surfaces led to a cor-
2 * B r _rection of » ( £_° ) 2 .
The present solution allows us to answer all the questions
correctly formulated within our statement of the problem.
REFERENCES
t. DUciJ A.C., et al., Plz. Plazmy 14(1988), p. 279.2. Gurln A.A., Pasechnik L.I., Popovicn A.S. Plasma diffusion Ina magnetic field (In Russian), "NauKova Dumka" publ., Kiev, 1979,p. 42.3. Morozov A.I., SoloTyov L.S., Vopr. Teorli Plazmy. Ed. byM.A.Leontovlch, Gosatomlzdat publ., Moscow, 1963, p. 200.4. Kadomtsev B.B., Pogutse O.P. Vopr. Teorll Plazmy. Ed. by •M.A.Ieontovlch, Atomlzdat publ., Moscow, 1967, p. 220.
EXPERIMENTAL URAGAN-6 INSTALLATION CONCEPTION
V.Z.Amelin, E.D.Volkov, A.V.Georgievskij,V.I.Koryavko,
K.s.Rubtsov, V.A.Rudakov, Yu.F.Sergeev.
Institute of Physics and Technology, Kharkov, USSR
Parameter choice results of the next generation experimental
installation are given. It is supposed, that the main aim of the
installation is a plasma investigation at the temperature 3KeV
and reaching the confinement parameter nx =10 s/cm . The modular
1=2 torsatron with the large radius R=2 and helical winding radius
a. =0.75 m was proposed as a suitable variant. It was shown, that
in the case of the installation magnetic system made of
hyperconducting aluminium our aim is achievable.
The following plasma investigations on the controlled fusion
problem require the successive approximation of plasma parameters
to the reactor ones. The present investigation level on the Louson12 3
parameter nr_ approximately corresponds to the valu<=> 10 s/cm.13 3It seems naturally to reach the level nzE~10 s/cm as an aim of a
next generation mounting . It is also necessary to increase a
plasma temperature up to some KeV.
Reactor technological problem decision should accompany the
thermonuclear installation creation. In particular, we have to
solve such tasks as construction modularity, divertor creation,
superconducting or hyperconducting material using for the high
magnetic field production etc.
Some times ago the works on the experimental installation
parameter choice began in KhPTI. This installation has to
change Uragan-2M and was titled "Uragan-6". Uragan-6 should13 3
provide the value nr^io s/cm at the plasma temperature equal tosome KeV. Moreover, we hope to realize the modular divertor and
modular magnetic system. The possibility of the magnetic system
made of the hyperconductor is also being studied now.
Some various variants of modular systems was investigated
while choosing the installation construction.The W-7AS modular
system has some advantages. It is characterized by low levels of
magnetic field helical inhomogeneity and small values of
equilibrium currents. However, the shear is not high in the
system and does not allow to suppress effectively a plasma
instability. Another disadvantage is using a number of coil
different forms. That complicates the installation construction
and creates some obstacles for divertor realization.
The construction which consists of identical moduli is more
attractive. The magnetic configuration study of the proposed to
the UWTOR-M reactor modular systems [1] showed the relatively
small useful value of flux surfaces with a small
rotational transform . One of the modulus peculiarities is the
current compensative part location on the same radius with
helical conductors. Magnetic fields of these parts destroy
flux magnetic surfaces. The low quality of the magnetic
configuration in Uragan-5 may be explained by the close location
relatively to the confinement volume of compensative parts [2].
That is why, the modulus using proposed in KhPTI was studied
in detail [3]. The main idea of this using is following. The
torsatron continuous helical winding is divided into m - parts,
number of which is equal to the field period one. Ends of the
helical parts are connected with the compensative conductor
parts by current cross-pieces. In this case, the compensative
conductor number and their location are chosen to compensate
in the best way the vertical field of helical currents at the
total current equal to the one in helical windings. The
calculation scheme of the torsatron 1=2 modulus with four
compensative conductors is given in Fig.l.
Calculations of the torsatron which consists of such moduli
showed a good quality of the magnetic configuration. In Fig.2, we
can'see torsatron magnetic surfaces with the parameters given in
Table 2. It is shown, that when the torus is steep enough
(a.=0.75m, R=2m) and the magnetic field period number is rather
small (m=8), the maximum radius of closed magnetic surfaces is
equal to 0.5m, and rotational transform is 0.8. These parameters
are achievable when the tilted angle of the helical conductors to
the torus generator was chosen in such a way, that ends of
the neighbouring modulus helical conductors had the same angle
8 in the small torus section. In this case,, the disturbing
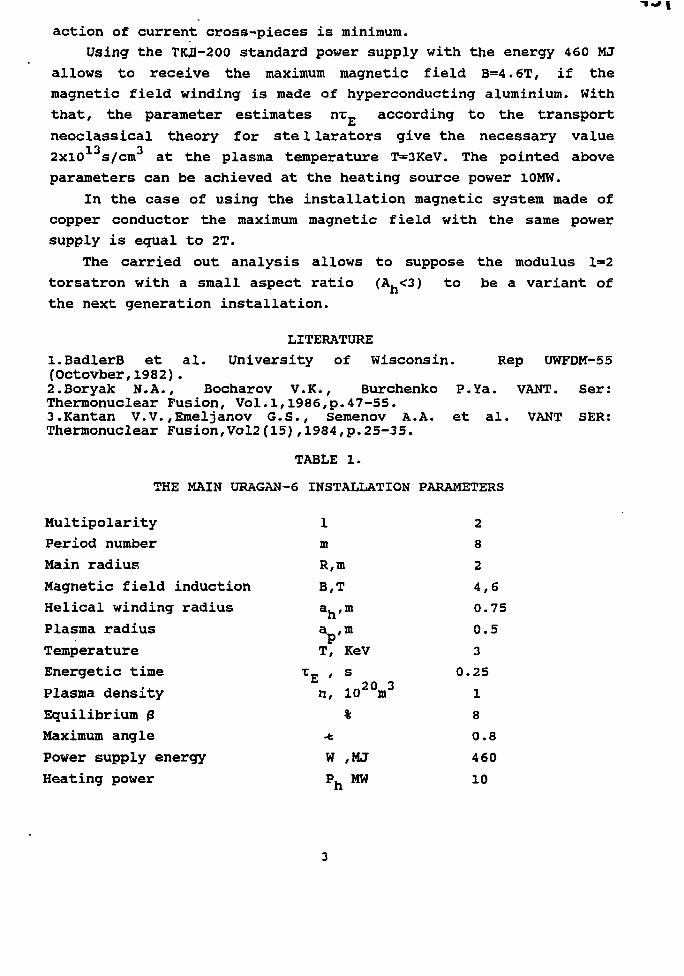
action of current cross-pieces is minimum.
Using the TKJQ-200 standard power supply with the energy 460 MJ
allows to receive the maximum magnetic field B=4.6T, if the
magnetic field winding is made of hyperconducting aluminium. With
that, the parameter estimates nr_, according to the transport
neoclassical theory for ste 1larators give the necessary value
2x10 s/cm at the plasma temperature T=3KeV. The pointed above
parameters can be achieved at the heating source power 10MW.
In the case of using the installation magnetic system made of
copper conductor the maximum magnetic field with the same power
supply is equal to 2T.
The carried out analysis allows to suppose the modulus 1=2
torsatron with a small aspect ratio (A. <3) to be a variant of
the next generation installation.
LITERATURE
l.BadlerB et al. University of Wisconsin. Rep UWFDM-55(Octovber,1982).2.BoryaJc N.A., Bocharov V.K., Burchenko P.Ya. VANT. Ser:Thermonuclear Fusion, Vol.1,1986,p.47-55.3.Kantan V.V.,Emeljanov G.S., Semenov A.A. et al. VANT SER:Thermonuclear Fusion,Vol2(15),1984,p.25-35.
TABLE 1.
THE MAIN URAGAN-6 INSTALLATION PARAMETERS
Multipolarity
Period number
Main radius
Magnetic field induction
Helical winding radius
Plasma radius
Temperature
Energetic time
Plasma density
Equilibrium |3
Maximum angle
Power supply energy
Heating power
1
m
R,m
B,Tah,m
ap,m
T, KeVTE ' s
n, 102V%
-t
W ,MJ
P. MWn
2
8
2
4,6
0.75
0.5
3
0.25
1
8
0.8
460
10
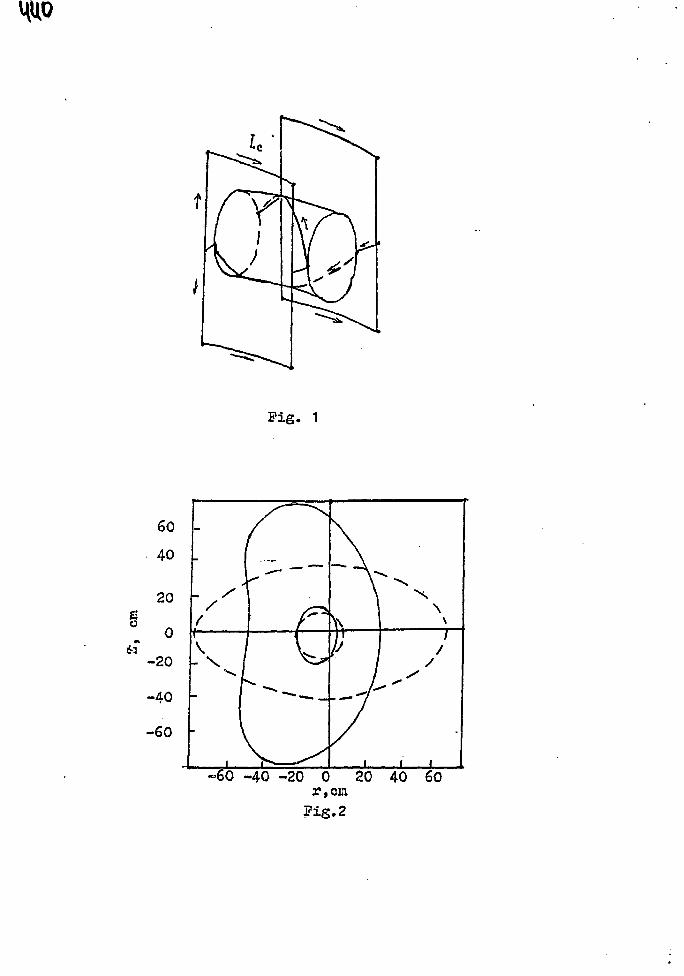
Pig. 1
o
60
40
20
0
-20
-40
-60
- AxA
jj
\\
//
/
/i i i
-60 -40 -20 0 20 40 60r,ciaig . 2
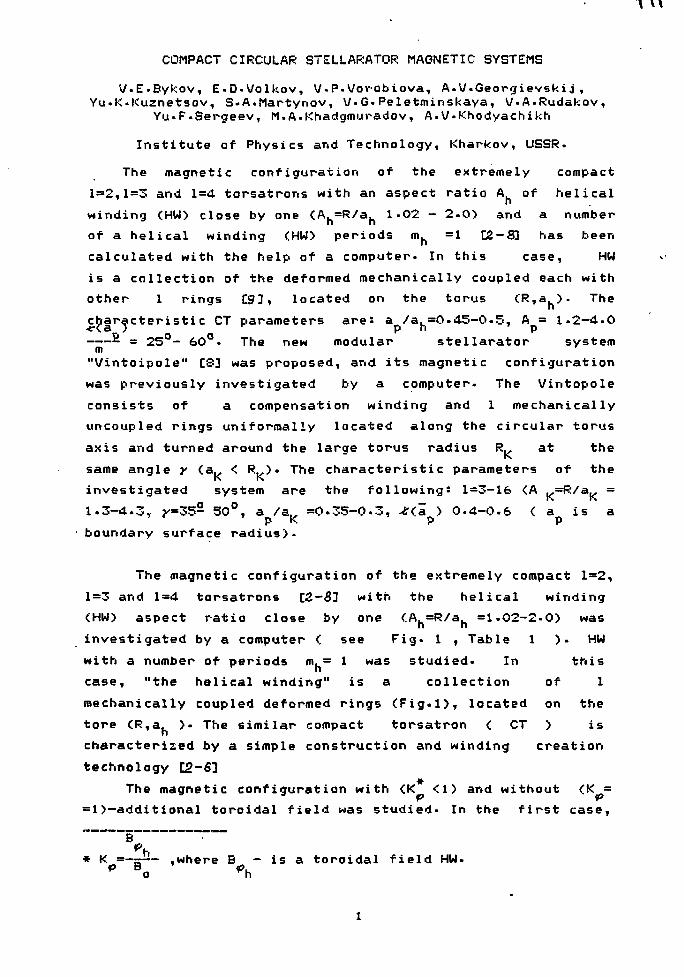
COMPACT CIRCULAR STELLARATOR MAGNETIC SYSTEMS
V-E.Bykov, E-D-V/olkov, V-P-Vovabiova, A-V-Georgievskij,Yu.K.Kuznetsov, S.A.Martynov, V-G-Peletminskaya, V-A-Rudakov,
Yu.F-Sergeev, M-A-Khadgmuradov, A.V-Khodyachikh
Institute of Physics and Technology, Kharkov, USSR.
The magnetic configuration of the extremely compact
1=2,1=3 and 1=4 torsatrons with an aspect ratio A. of helical
winding <HW> close by one <A =R/a. 1-02 - 2-0> and a number
of a helical winding <HW> periods m. =1 C2-83 has been
calculated with the help of a computer. In this case, HW
is a collection of the deformed mechanically coupled each with
other 1 rings Z31, located on the torus (R,a. >. The
characteristic CT parameters are: a /a =0.45-0.5, A = 1-2-4.0
^ = 25°- 60°. The new modular stellarator systemID
"Vintoipole" [83 was proposed, and its magnetic configuration
was previously investigated by a computer. The Vintopole
consists of a compensation winding and 1 mechanically
uncoupled rings uniformally located along the circular torus
axis and turned around the larcre torus radius R,, at the
same angle y (a,. < R. >. The characteristic parameters of the
investigated system are the following: 1=3—16 <A =E:/a.- =
1.3-4.3, j-=35°- 50°, a /a,,p K
boundary surface radius)-
1.3-4.3, j-=35s 50°, a /a,, =0.35-0-3, -*<a > 0-4-0-6 < a isP K p p
The magnetic configuration of the extremely compact 1=2,
1=3 and 1=4 torsatrons 02-3] with the helical winding
<HW) aspect ratio close by one <!A =R/a. =1-02-2-0) was
investigated by a computer < see Fig. 1 , Table 1 )• HW
with a number of periods m.= 1 was studied- In this
case, "the helical winding" is a collection of 1
mechanically coupled deformed rings (Fig-1), located on the
tore <R,a. >• The similar compact torsatron < CT ) isn
characterised by a simple construction and winding creation
technology Z2-S]
The magnetic configuration with <K <1> and without <K =
=1>-additional toroidal field was studied- In the first case,_
* K =-5-- ,where B - is a toroidal field HW.p Bo "h
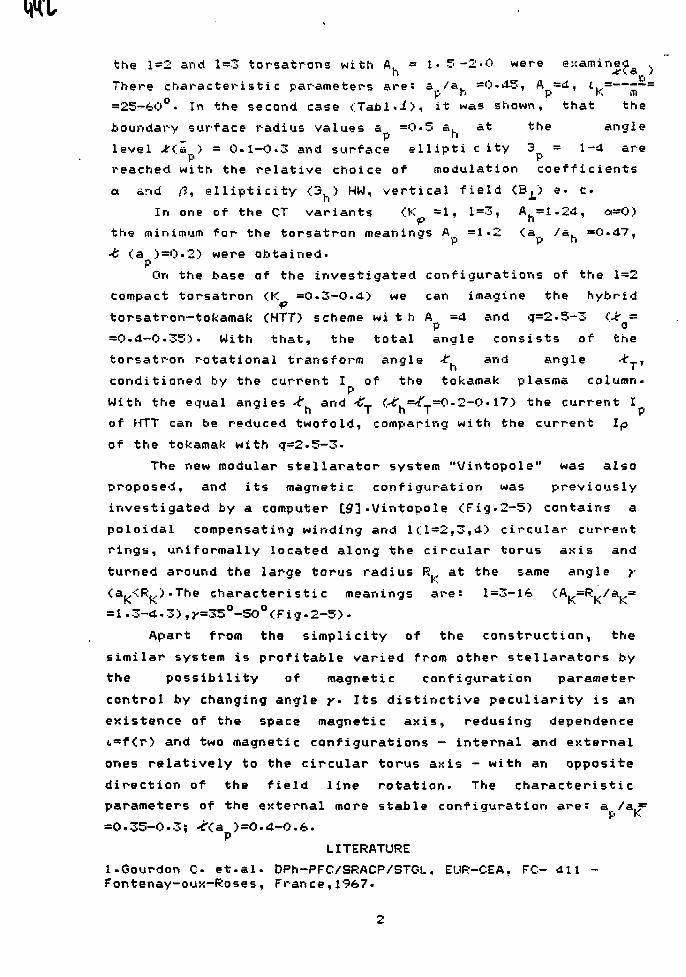
the 1=2 and 1=3 torsatrons with A. - 1 . 5 - 2 - 0 were examine a .h c<
There characteristic parameters ares am/&. =0.4-5, A =il, <-^=—~""
=25-60°. In the second case <Tabl.i), it was shown, that the
boundary surface radius values a =0-5 a. at the angleP "
level Jr<!a.) = 0-1-0.3 and surface ellipti c ity 3 = 1-4 are
reached with the relative choice of modulation coefficients
a and f3, ellipticity O,.) HW, vertical field CBj_) e. c-
In one of the CT variants <K =1, 1=3, A. =1-24, ot-0.)p n
the minimum for the torsatron meanings A. =1-2 <a /a. =0-47,•6 <a )=0-2> were obtained.
POn the base of the investigated configurations of the 1=2
compact torsatron <K =0-3-0.4) we can imaorine the hybrid<P
torsatron-tokamak <HTT> scheme w i t h A =4 and cj=2-5-3 (Jr -P o
=0-4-0-35). With that, the total angle consists of the
torsatron rotational transform angle <f and angle -t,
conditioned by the current I of the tokamak plasma column-
With the equal anales *t. and -£_ (.•£. =£- =0-2-0• 17> the current Ih T h T p
of HTT can be reduced twofold, comparing with the current Ip
of the tokamak with q=2-5-3-
The new modular stellarator system "Vintopole" was also
proposed, and its magnetic configuration was previously
investigated by a computer 19]-Uintopole <Fig-2-5) contains a
poloidal compensating winding and 1(1=2,3,4) circular current
rings, uniformally located along the circular torus axis and
turned around the large torus radius R at the same angle y
<aK<R^.) -The characteristic meanings ares 1=3-16 <A^=R_/a =
=1.3-4-3),^=35°-50°<Fig.2-5>-
Apart from the simplicity of the construction, the
similar system is profitable varied from other stellarators by
the possibility of magnetic configuration parameter
control by changing angle y* Its distinctive peculiarity is an
existence of the space magnetic axis, redusing dependence
t=f<r) and two magnetic configurations - internal and external
ones relatively to the circular torus axis - with an apposite
direction of the field line rotation- The characteristic
parameters of the external more stable configuration ares a./a..r
=0.35-0-3; -iXa )=0-4-0.6.
LITERATURE1-Gourdon C- et-al- DPh-PFC/SRACP/BTGL, EUR-CEA, FC- 411 -Fontenay-oux-Roses, France,1967-

2-Bykov V.E., Volkov E-D-, Georgievskij A-V. et al. In. Procof 12-th Int. Conf. on Plasma Physics and Controlled NuclearFusion Research <1938>, Nica, France, Report:C, 1-S-o.3-Amelin V.Z., Bykov V.E., Volkov E-D-, Georgievskij A.V.,In:Proc of 15-th Europ- Conf. on Controlled Fusion and PlasmaHeating, Dubrovnic, 1988, V-12B, Part 2,_p-482.4-, Amelin V-Z-, Volkov E-D-, Georgievsku A-V- et al.Proc of 4-th P'.l Union Conf. on Engineering ProblemsThermonuclear Reactors- EPTR>, Leningrad, 1988, P-*2.5- Amelin V-Z-, Bykov V-E-, Volkov f-.D-, Georgievskij A.V-
Insof
eton EPTR- - Moscow:al. In: Reports of 3-th All-Union Conf.
CHIIatominform., 1984, V.I, P-103-111- _ . nr6. Georgievskij A.V. et al. In: Proc of 4-th All-Union Conf or,EPTR-- Leningrad, Nil EFA, 1988, p-41-7- Bykov V-E. Volkov E-D-, Georgievskij A-V- et al. In.Voprosy Atomnoi Nauki i Techniki, Ser: Termoyadernij Sintez ,
"J?P^ "Georgievskij A-V- et al , Ibid, 1988 V-2f
9! Georgievskij A-V- et al., Ibid ,1989, V-4, p-28-35-
Tabl.1Magnetic surface parameters CT (Afrl.03-1.6;mn=i)
AA MHIA/AM
rarawBlarS
E
BJ/BQ, X
JLjjsBp/ip
& i/&h
AV/Vo'
I3
1.0311+6>0.4i3.5+0.2-
120.1
0.13-
U2
1.0311+70.581.6-0.1-180.1
0.1
7 AM3
1241
0.8+60.54
2.5+0.1—
200.1702-0.1
R I AJT3
1241.30.8+40.57230-20
0.1702-0.1
H 1r3
1241
000.471.5-0.51.9120.10-
J73
1241.30
-40.47
12-0.722240200
M3
1.4210-4
0.531.4-0.712320270
+0.4
m3
1.61
-0.400.4
20-0.81330.3
02+0.3
K3
12410-40.38127-0.83.512
0.10
X4
1.3610
-50.381.6-0.63.5120.130
+0.3
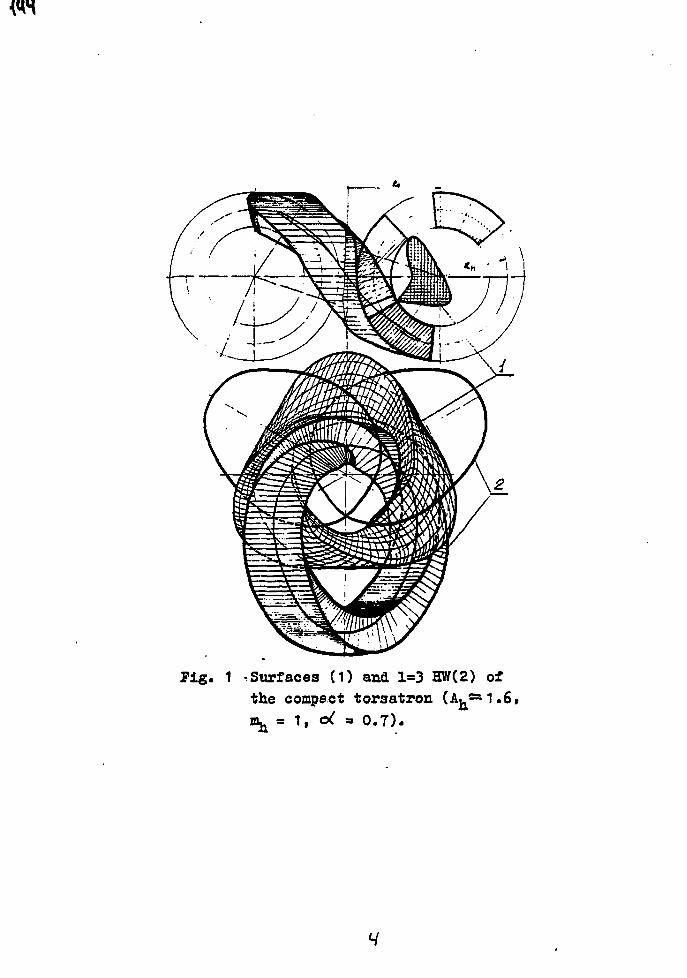
P i g . 1 -.Surfaces (1) and 1=3 HW(2) ofthe compact toraatron (Ay.—1.6,
i f o( = 0 . 7 ) .
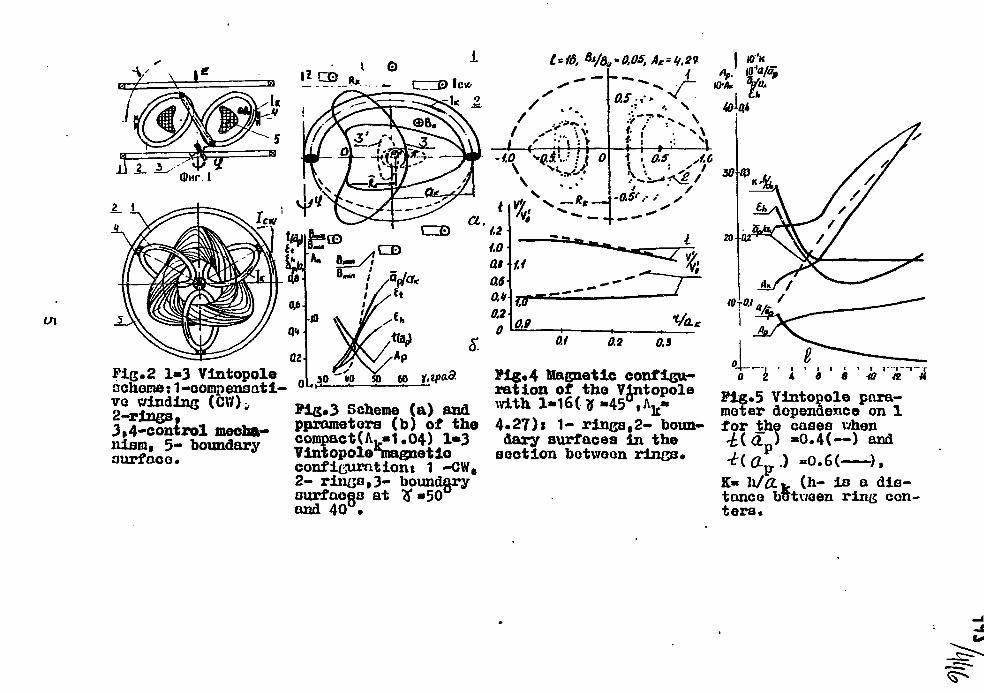
U\
Fig.2 1-3 Vintopoleochocte: 1-oorapenaati-
9ig«4 Magnetic configu-ration of
2 ' i a
Sohem.mecba-
j- boundarysurface.
andPig«5 Vlntopole pora-
. - meter dependence on 1««m«D«*,« , « . , . . , 4;2''* 1~ rings,2- boun- for the cases v/honcon^actUj-i.04) 1-3 dary surfaces in the 4(a ) -0.4(—) andVintopolo'Snagnetio section botwoon rings. V, „* . r, ,confit,xirntion» 1 -CWe *-^o«. <( fl-p..) -0.6( ),
K« h/tf.k (h- is a dis-tance between ring con-ters«
o£, -CWe
2 - r l i iGo t 3- boundarysurfaces at y»50and 40°.
URAGAN-4 PROJECT
V.E.Bykov, A,V,Georgievsky, A.V.Khodyachikh, Yu.K.Kuznetsov,
Yu.A.Litvinenko, O.S.Pavlichenko, V.G.Peletminskaya,
Yu.F.Sergeev,A.A.Shishkin, V.G.Smirnov, F.A.Tkhoryak
Institute of Physics and Technology,Kharkov,USSR
Abstract. The U-4 torsatron is upgrading of the. U -2M torsa-
tron[l]. The main aim of this upgradingis is a plasma radius
enlargement by using a non-circular vacuum chamber.
The circular vacuum chamber was accepted in U-2M as technol-
ogically more simple. At the same time it is well known that
non-circular vacuum chamber ( He-E,ATF-1 ) or external vacuum
chamber (U-3M) allows to increase essentially the plasma minor
radius at other similar conditions.
The U-2M helical winding (HW) can not be used in U-4. The
new HW is changed ; the bolted joints and current feeds are modi-
fied to decrease the magnetic field perturbations.
Fig.l shows vacuum chamber contours and the magnetic confi-
gurations of the U-4 and U-2M. In the regime K =0.375
(K=Bnt/BQ,where B n t is a toroidal field produced by the HW,
B =B_t+B t is.a total toroidal field ) the magnetic configurati-
on boundary (the last closed toroidal magnetic surface) is loca-
ted inside the circular vacuum chamber U-2M. In this' case the
non-circular chamber U-4 provides the magnetic configuration
control by the vertical field in a wider range.
The non-circular chamber advantage increases with reducing
K . For K = 0.35 in the U-2H plasma radius a - 0.19. m and
rotational transform -6(a) =0.61 are determined by a chamber
size, as it is shown in Fig.l where the last magnetic surface
and last internal magnetic surface (plasma boundary) for K =0.35
are pointed by solid lines. In the case of the non-circular
chamber magnetic configuration boundary remains inside the
chamber up to K =0.35 ( a = 0.25 m,-t(a) = 0.74 )*
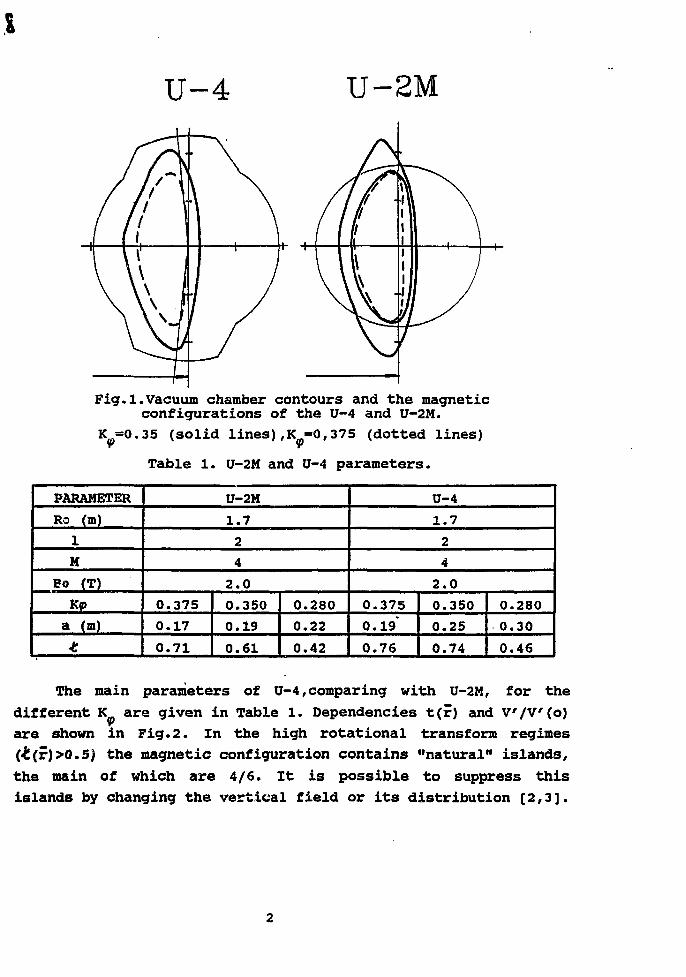
.1
U-4 U-2M
Fig.1.Vacuum chamber contours and the magneticconfigurations of the U-4 and U-2M.
K =0.35 (solid lines),K =0,375 (dotted lines)
Table 1. U-2M and U-4 parameters.
PARAMETER
Ro (m)
1M
Eo (T)
K<p
a (m)
U-2M
1 . 7
2
4
2 . 0
0.3750.17
0.71
0.350
0.19
0.61
0.2800.22
0.42
U-4
1 . 7
2
4
2 . 0
0.3750.19*
0.76
0.3500.25
0.74
0.280
0.30
0.46
The main parameters of U-4, comparing with U-2M, for the
different K are given in Table 1. Dependencies t(f) and V'/V'(o)
are shown in Fig.2. In the high rotational transform regimes
(£(r)>0.5) the magnetic configuration contains "natural" islands,
the main of which are 4/6. It is possible to suppress this
islands by changing the vertical field or its distribution [2,3].
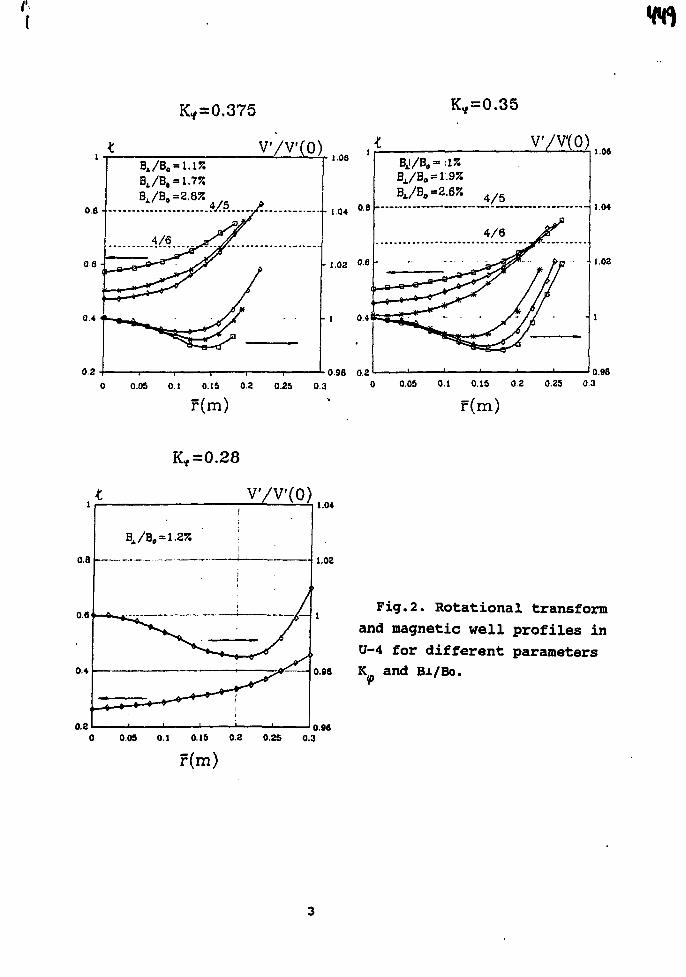
v'/v'(Q) v/vto), , o a
1.06
0.2
- 1.04
- 1.02 0.6 -
1 0.4
0 98 0.2
- 1.04
• 1.02
0 0.05 0.1 0.15 0.2 0.25 0.3 0 o o s 0 1 0 I S ° 2 o z 5 0 3
r(m) ' r(m)
V7v(0)
0.8
0.8
0.4
0.2
\/29 = 1.2%j
!
1.04
- 1.02
Fig.2. Rotational transform
and magnetic well profiles in
U-4 for different parameters
o.ea K and BJL/BO.
0.980 0.05 0.1 0.1S 0.2 0.25 0.3
r(m)
f-'HSQ
Thus, the non-circular chamber allows to increase
essentially a plasma minor radius and provides better
possibilities of vacuum magnetic configuration control by the
vertical field.
The non-circular chamber,made of stainless steel, has the
thickness 1.6 cm.The maximum sizes of ports are 0.35 x 0.40 mz.
The Uragan-4 was designed in 1990, the experiments is
planed to be started in 1993.
REFERENCES
l.Bykov V.E, Georgievsky A.V.,Demchenko V.V. et. al. Fusion
Technology,1990,17,p.140.
2.Beidler C.O.,Besedin N.T.,Bykov V.E. et al. In:Proc. 13-th IEAE
Conf.,Washington,1990, Rep.C-4-6-1.
3.Bykov V.E.,Kuznetsov Yu.K.,Pavlichenko O.S.et. al. In: 8-th
Intern. Stellarator Workshop,Kharkov, 1991, IV-P-3.
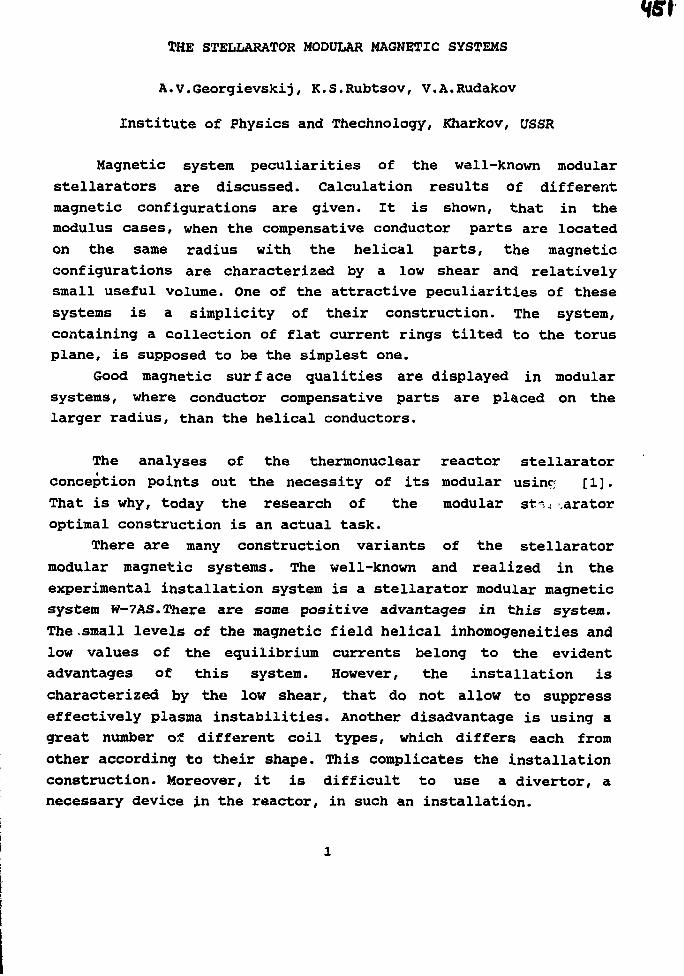
THE STELLARATOR MODULAR MAGNETIC SYSTEMS
A.v.Georgievskij, K.S.Rubtsov, V.A.Rudakov
Institute of Physics and Thechnology, Kharkov, USSR
Magnetic system peculiarities of the well-known modular
stellarators are discussed. Calculation results of different
magnetic configurations are given. It is shown, that in the
modulus cases, when the compensative conductor parts are located
on the same radius with the helical parts, the magnetic
configurations are characterized by a low shear and relatively
small useful volume. One of the attractive peculiarities of these
systems is a simplicity of their construction. The system,
containing a collection of flat current rings tilted to the torus
plane, is supposed to be the simplest one.
Good magnetic surface qualities are displayed in modular
systems, where conductor compensative parts are placed on the
larger radius, than the helical conductors.
The analyses of the thermonuclear reactor stellarator
conception points out the necessity of its modular usino [1].
That is why, today the research of the modular st-.- .arator
optimal construction is an actual task.
There are many construction variants of the stellarator
modular magnetic systems. The well-known and realized in the
experimental installation system is a stellarator modular magnetic
system W-7AS.There are some positive advantages in this system.
The .small levels of the magnetic field helical inhomogeneities and
low values of the equilibrium currents belong to the evident
advantages of this system. However, the installation is
characterized by the low shear, that do not allow to suppress
effectively plasma instabilities. Another disadvantage is using a
great number of different coil types, which differs each from
other according to their shape. This complicates the installation
construction. Moreover, it is difficult to use a divertor, a
necessary device in the reactor, in such an installation.
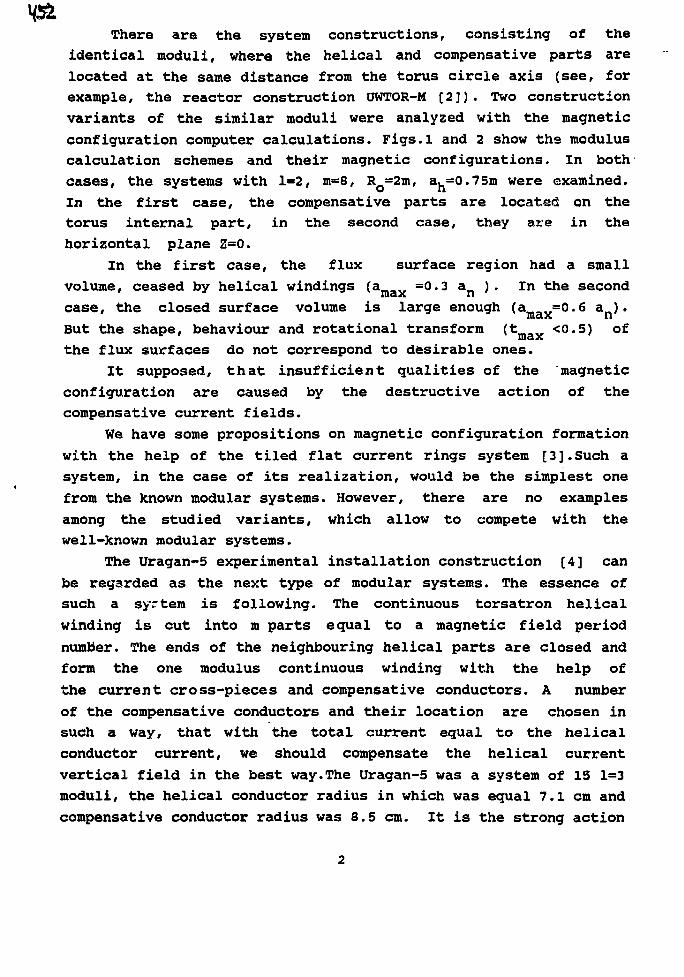
There are the system constructions, consisting of the
identical moduli, where the helical and compensative parts are
located at the same distance from the torus circle axis (see, for
example, the reactor construction UWTOR-M [2]). Two construction
variants of the similar moduli were analyzed with the magnetic
configuration computer calculations. Figs.l and 2 show the modulus
calculation schemes and their magnetic configurations. In both
cases, the systems with 1=2, m-8, RQ=2m, a^=0.75m were examined.
In the first case, the compensative parts are located on the
torus internal part, in the second case, they are in the
horizontal plane Z=0.
In the first case, the flux surface region had a small
volume, ceased by helical windings (araax =0.3 an ). In the second
case, the closed surface volume is large enough (a^, =0.6 a ) .IllcLX ri
But the shape, behaviour and rotational transform (tm=v <0.5) of
the flux surfaces do not correspond to desirable ones.
It supposed, that insufficient qualities of the magnetic
configuration are caused by the destructive action of the
compensative current fields.
We have some propositions on magnetic configuration formation
with the help of the tiled flat current rings system [3].Such a
system, in the case of its realization, would be the simplest one
from the known modular systems. However, there are no examples
among the studied variants, which allow to compete with the
well-known modular systems.
The Uragan-5 experimental installation construction [4] can
be regarded as the next type of modular systems. The essence of
such a syrtera is following. The continuous torsatron helical
winding is cut into m parts equal to a magnetic field period
number. The ends of the neighbouring helical parts are closed and
form the one modulus continuous winding with the help of
the current cross-pieces and compensative conductors. A number
of the compensative conductors and their location are chosen in
such a way, that with the total current equal to the helical
conductor current, we should compensate the helical current
vertical field in the best way.The Uragan-5 was a system of 15 1=3
moduli, the helical conductor radius in which was equal 7.1 cm and
compensative conductor radius was 8.5 cm. It is the strong action
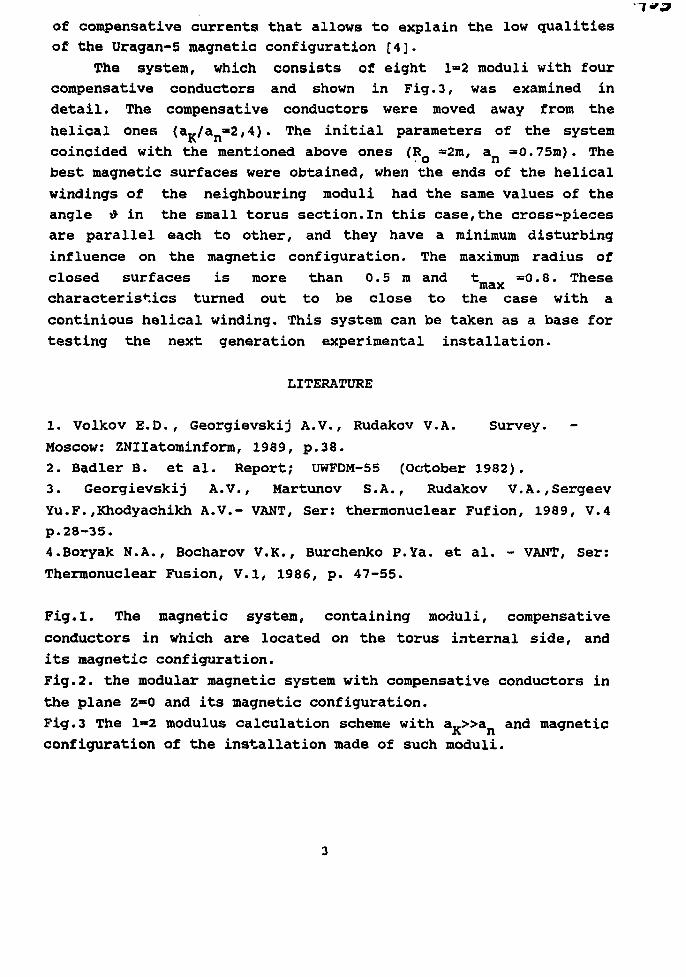
of compensative currents that allows to explain the low qualities
of the Uragan-5 magnetic configuration [4].
The system, which consists of eight 1=2 moduli with four
compensative conductors and shown in Fig.3, was examined in
detail. The compensative conductors were moved away from the
helical ones (aK/a =2,4). The initial parameters of the system
coincided with the mentioned above ones (R =2m, a =0.75ro). The
best magnetic surfaces were obtained, when the ends of the helical
windings of the neighbouring moduli had the same values of the
angle tf in the small torus section.In this case,the cross-pieces
are parallel each to other, and they have a minimum disturbing
influence on the magnetic configuration. The maximum radius of
closed surfaces is more than 0.5 m and t =0.8. Thesemax
characteristics turned out to be close to the case with a
continious helical winding. This system can be taken as a base for
testing the next generation experimental installation.
LITERATURE
1. Volkov E.D., Georgievskij A.V., Rudakov V.A. Survey.
Moscow: ZNIIatominform, 1989, p.38.
2. Badler B. et al. Report; UWFDM-55 (October 1982).
3. Georgievskij A.V., Martunov S.A., Rudakov V.A.,Sergeev
Yu.F.,Khodyachikh A.V.- VANT, Ser: thermonuclear Fufion, 1989, V.4
p.28-35.
4.Boryak N.A., Bocharov V.K., Burchenko P.Ya. et al. - VANT, Ser:
Thermonuclear Fusion, V.I, 1986, p. 47-55.
Fig.l. The magnetic system, containing moduli, compensative
conductors in which are located on the torus internal side, and
its magnetic configuration.
Fig.2. the modular magnetic system with compensative conductors in
the plane Z=0 and its magnetic configuration.
Fig.3 The 1=2 modulus calculation scheme with av»& and magnetic
configuration of the installation made of such moduli.
Pig.1
i I t I I
-60 -40 ->'b "0 2o 40 BO
r . cm
TJ-1 UJTUKAJLHi: A IS11UK3A1RWFOR STABILITY STUDIES.
THEORETICAL PREDICTIONS ANDSTATUS OF THE PROJECT
E. Ascasibar, J. Alonso, C. Alejaldre, F. Castejon,J. Guasp, V. Krivenski, A. Lopez Fraguas, R.
Martin, A. Martinez, A.P. Navarro, M.A. Ochando,I. Pastor, A. Rodriguez Yunta, J. Sanchez, F.
Tabares,V.Tribaldos
Asociadon EURATOM-CIEMAT para FusidnE-28040 Madrid. SPAIN
Introduction o ASOCUCIOHuaunuCtMtiAT
TJ-I U is a low aspect ratio torsatron underconstruction at CIEMAT and to be completed by the endof this year. It will share power supplies, control systemand site with TJ-I tokamak.
Besides the fundamental interest of plasma stabilitystudies in this type of machine, TJ-I U will allow ourplasma group to get expertise in areas related with thenext CIEMAT de< " —diagnosis)
device: TJ-II heliac (ECH and stellarator
This poster summarizes some predictions on plasmastability and transport in this device as well as studies ofbootstrap currents. Details of the construction and thecurrent status of the device are also presented
T-IU reference configuration
Major radiusPlasma average radiusCoil minor radiusNumber of periodsRotational transform at axisShearMagnetic well depthMagnetic ripple on axisHelical axis elongationMagnetic field on axis, $ =30 *Heating (ECRH, 2nd harmonic)
O aoeuaoKluunwaour
0.6 m0.10 m0.24 m60.30almost null63%7.6%0.025 m
0.5 T
200 kW, 28 GHz
T.T-I U coils
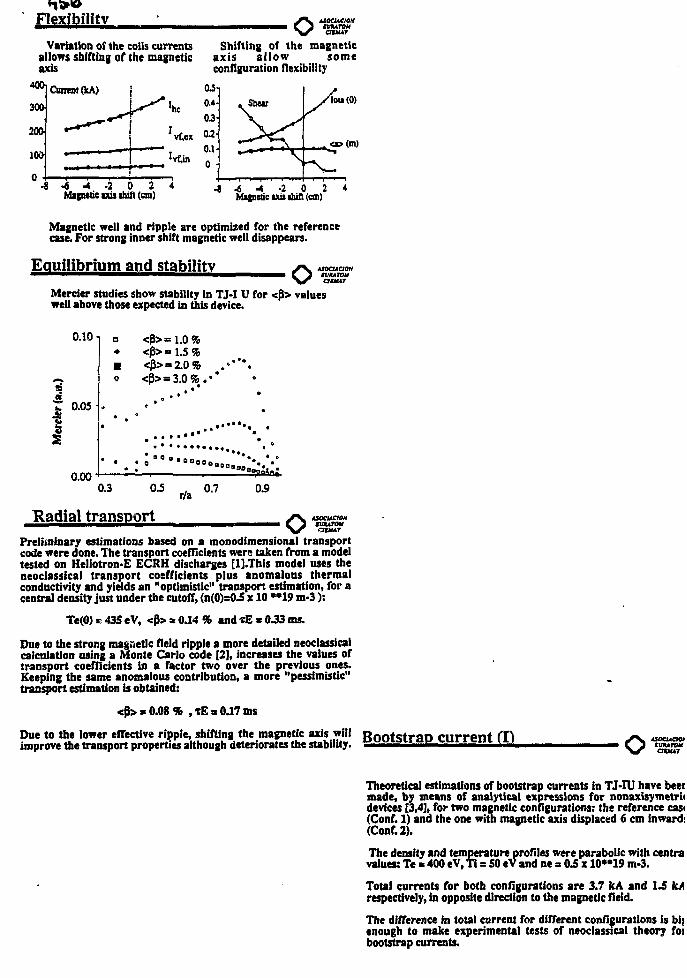
FlexibilityVariation of the coils currents
allows shining of the magneticaxis
Shifting of the magneticaxis allow someconfiguration flexibility
•8 • 6 4 - 2 0 2Ma jnetic axis shin (em)
4 - 4 - 2 0 2Magnetic axis sbift (cm)
Magnetic well and ripple are optimized for the referencecase. For strong inner shift magnetic well disappears.
Equilibrium and stability tsocuaoHtuvmuQMUAT
Merrier studies show stability in TJ-I U for <p> valueswell above those expected in this device.
s
0.10-
0.05-
0.00
o <p>== 1.0%• <P>=1.5%• <P> =o <p>s
I
0.3 0.5
Radial transport
»2.0% ^.** *.3.0 % . ' *
.• • • * * *
r/a °"7 ° ' 9
^V uoeuaoHJ MUHATOM
\S atHATPreliminary estimations based on a monodimensional transportcode were done. The transport coefficients were taken from a modeltested on Heliotron-E ECRH discharges [l].This model uses theneoclassical transport coefficients plus anomalous thermalconductivity and yields an "optimistic" transport estimation, for acentral density just under the cutoff, (n(0)=0.5 x 10 **19 m-3):
Te(0) * 435 eV, <p> * 0.14 % and *E • 033 ms.
Due to the strong magnetic field ripple a more detailed neoclassicalcalculation using a Monte Carlo code [2], increases the values oftransport coefficients in a factor two over the previous ones.Keeping the same anomalous contribution, a more "pessimistic"transport estimation is obtained:
<P> * 0.08 % , *E a 0.17 ms
Due to the lower effective ripple, shifting the magnetic axis willimprove the transport propertied although deteriorates the stability.
RontstraD currentPOQtSirap current ASOCMCIWtuumrcruu;
Theoretical estimations of bootstrap currents in TJ-IU have beeimade, by means of analytical expressions for nonaxisymetri<devices [3,4], for two magnetic configurations: the reference cast(Conf. 1) and the one with magnetic axis displaced 6 cm inward!(Conf.2).
The density and temperature profiles were parabolic with centravalues: Te * 400 eV, Ti = 50 eV and ne = OS x 10**19 m-3.
Total currents for both configurations are 3.7 kA and 1.5 k/respectively, in opposite direction to the magnetic field.
The difference in total current for different configurations is bijenough to make experimental tests of neoclassical theory foibootstrap currents.
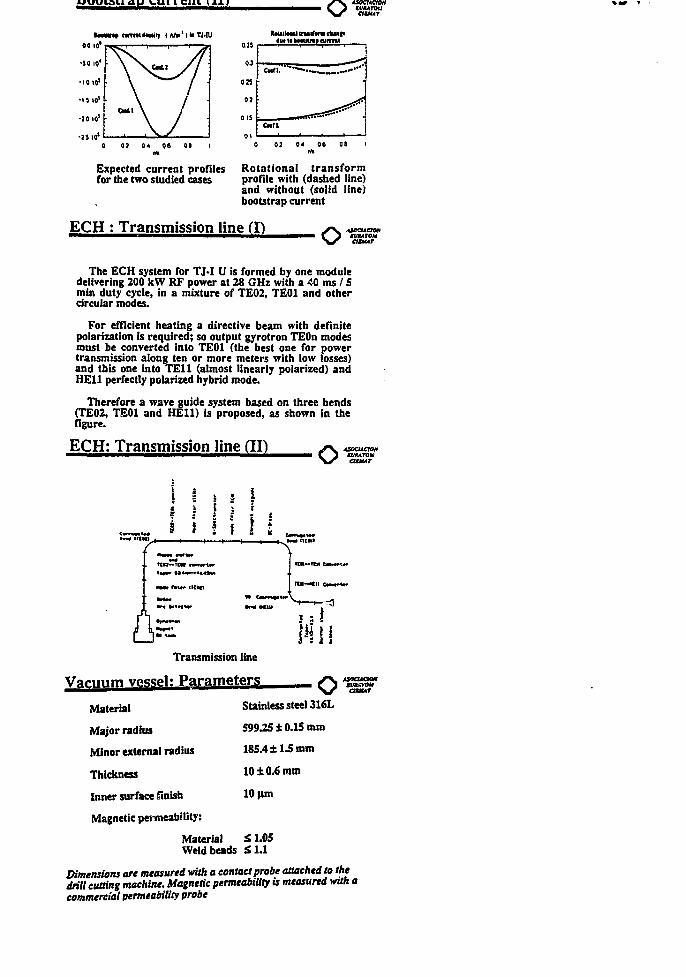
onuisirau uuneui UJU o JSOCMCWNfl/MTOUCIIMAT
l inni> amnimitj (Mm'Ife TJ.IU
00 10*
04 06 01
Expected current profiles Rotational transformfor the two studied cases profile with (dashed line)
and without (solid line)bootstrap current
ECH : Transmission line CD oThe ECH system for TJ-I U is formed by one module
delivering 200 kW RF power at 28 GHz with a 40 ms / 5min duty cycle, in a mixture of TE02, TE01 and othercircular modes.
For efficient heating a directive beam with definitepolarization is required; so output gyrotron TEOn modesmust be converted into TE01 (the best one for powertransmission along ten or more meters with low losses)and this one into TEH (almost linearly polarized) andHE11 perfectly polarized hybrid mode.
Therefore a wave guide system based on three bends(TE02, TE01 and HE11) is proposed, as shown in thefigure.
ECH: Transmission line o ASKUCIOKttlKATQM
aour
CM • it*—
Transmission line
vessel: Parameters oMaterial
Major radius
Minor external radius
Thickness
Inner surface finish
Magnetic permeability:
Stainless steel 316L
599.25 ±0.15 mm
185.4 ±1.5 mm
10 ±0.6 mm
10 um
aaataoKMUiWauur
Material £ 1.05Weld beads 51.1
Dimensions are measured with a contact probe attached to thedrill cutting machine. Magnetic permeability is measured with acommercial permeability probe
Vacuum vessel: Construction status
i. Support of the helical coil (HC) on the vacuum vessel (V V)
Consists of 24 warping plates welded together and to the VV,forming two parallel guides, nominally 200 mm apart, runninghelically around the torus.
It serves as a support structure and also helps in winding thecoil on the exact position.
First the guides have been positioned and tack-weldedfollowing the points previously marked on the torus surface.
The final welding process has been finished by mid May withno apparent deformations of the VV.
Vacuum vessel; Construction statusBBaBBBBB^BBBBBBBBBBBBBaBBBBBBBBBBBBBHBKaBBBBBBBBBBBBBBBBBBflBBBB^aBBBBBBBBBI
2. Ports
• Very good access: 24 circular windows with 70 and 261 mminner diameter. Viton seals.
• Six up/down ports providing overlap through the plasma
- Already machined and prepared to weld.
3. Support structure
According to calculations of the mechanical stresses associatedwith the electromagnetic loads appearing on the helical coil, asupport system for all the sets of coils and the vacuum vessel hasbeen designed . It is based on six columns supported on the floorand permits very good access to the diagnostic ports as well as fineadjustment of the coils positions to minimize field asymmetries.
Helical coil: Winding procedure O• The most favorable location for the feeds is at the lowest positionof the helical winding (toroidal angle $ = 18.8°) or its equivalentpositions in any period. Increasing the number of feeds lowers thecurrent flowing trough each one and then lowers the dipole fieldproduced by them.
• The error field produced by only one feed noticeably distorts themagnetic surfaces shape and decreases the plasma average radius.
• Six identical feeds, one per period, will be installedsymmetrically, at the lowest positions of the helical coil
• Six double spools. Each one has 110 m copper cable, enough for20 turns without connections
• Beginning of winding from the middle point of each doublespool: Both extremes of the conductor appear outside allowingeasy connections and minimizing the area of the magnetic dipolesassociated with current feeds
References ~•suss?
1. H.Zushi et al. Nucl. Fusion 24, (1984), 305.
3. E.R.Solano and K.CShaing. Phys. Fluids 30, (1987), 462.
2. W.Lotz et al. J.Comput.Phys 73, (1987), 73.
4. K.CShaing et al. Phys.Fluids Bl, (1989), 1663.
XJl-P-6STELUUtATOR REACTOR orriMIZATXOM*
J.F.Lyon and S. L. Painter1
Oak ftitige National Laboratory. Oak Ridge. Tennessee, US A
Stellarator reactor optimization was studied by integrating a
1-0 stallarator transport cod* Into a raactor systems optimization
coda with self-consistent assumptions for th« physics,engineering,
reactor-component,and cost constraints. In the 1-D steady-state
transport coda, the n(r) and t(r) profiles were held fixed and the
electron and ion heat flow equations were solved for T#(r) and
T,(r). A 0-D LHD scaling relation was aiso used for comparison. The
engineering constraints,reactor-conponent properties,and costing
assumptions were taken from detailed tokamak reactor studies.
Although most of the analysis holds for stellarators in general.the
Compact Torsatron family of devices was used for calculations of
coil-geooetry-dependent quantities such as the maximum field and
force on the superconducting windings,distance between
windings,etc. The sensitivity of the cost of the nuclear island
(reactor core),the optimization criterion,to various assumptions was
examined.
For neoclassical ripple-induced losses, two operating modes with
different signs of the assumed radial electric field were
identified. The operating mode with a positive radial electric
field is characterized by high temperatures (<T>-3SkeV) and
moderate densities (<n>-7xio19n ) whereas the mode with a negative
radial electric field has lower temperature (<T>-8 keV) and higher
densities (<n>- 2x10 m~ . Both modes lead to possible reactors
that could tolerate a large alpha-particle energy loss(<S0»).The
values of electric potential required to reach ignition are near
the range expected neoclassically for electron-root operation but
outside that range for ion-root operation. Operation with 0- He is
also feasible,but more denanding. The O-D code results indicate
that a confinement improvement factor of <2 is needed for an
attractive reactor,similar to the H-node inprovenent factor needed
in tokamaks. For a range of options and assumptions,the cost of the
nuclear island and the cost of electricity were found to be
essentially the same as that for tokanak reactors.
*R«««arch i f « w « M by th« Office «r r « l M CfMrfy.U.S.Dep»rt»«nl «fClwrgy CjMrfy wider ctntrKl DC**COS-*40H21«0O vtlft Hartln ItarlaU*CMrgy Syalasa.lnc.
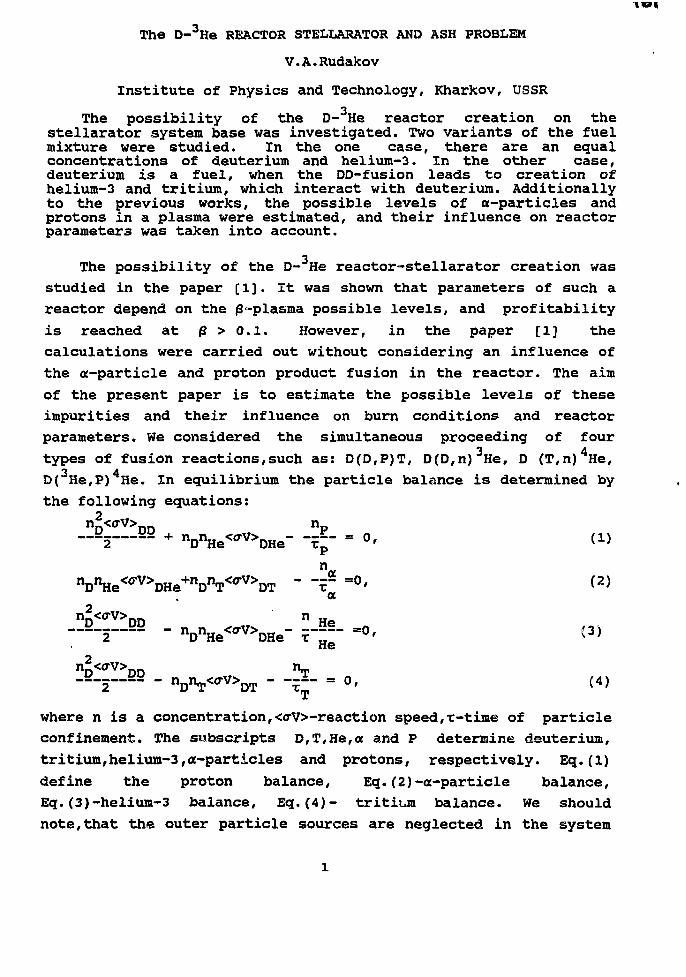
The D-3He REACTOR STELLARATOR AND ASH PROBLEM
V.A.Rudakov
Institute of Physics and Technology, Kharkov, USSR
The possibility of the D-3He reactor creation on thestellarator system base was investigated. Two variants of the fuelmixture were studied. In the one case, there are an equalconcentrations of deuterium and helium-3. In the other case,deuterium is a fuel, when the DD-fusion leads to creation ofhelium-3 and tritium, which interact with deuterium. Additionallyto the previous works, the possible levels of a-particles andprotons in a plasma were estimated, and their influence on reactorparameters was taken into account.
The possibility of the D- He reactor-stellarator creation was
studied in the paper [1]. It was shown that parameters of such a
reactor depend on the /3-plasma possible levels, and profitability
is reached at & > 0.1. However, in the paper [1] the
calculations were carried out without considering an influence of
the a-particle and proton product fusion in the reactor. The aim
of the present paper is to estimate the possible levels of these
impurities and their influence on burn conditions and reactor
parameters. We considered the simultaneous proceeding of four1 A
types of fusion reactions,such as: D(D,P)T, D(D,n) He, D (T,n) He,
D(3He,P)4He. In equilibrium the particle balance is determined by
the following equations:< < r V > n P
n D n H e « r V > D H e - - - £ - = 0 , (1)
' " ^ = 0 '
nj?<o-V>_n n „
nD<0>V>DD "T
- B _ S B - nDnT<o-v>DT - --^ = o, (4)where n is a concentration,<ffV>-reaction speed,r-time of particle
confinement. The subscripts D,T,He,<x and P determine deuterium,
tritium,helium-3,a-particles and protons, respectively. Eq.(1)
define the proton balance, Eq.(2)-a-particle balance,
Eq.(3)-helium-3 balance, Eq.(4)- tritium balance. We should
note,that the outer particle sources are neglected in the system
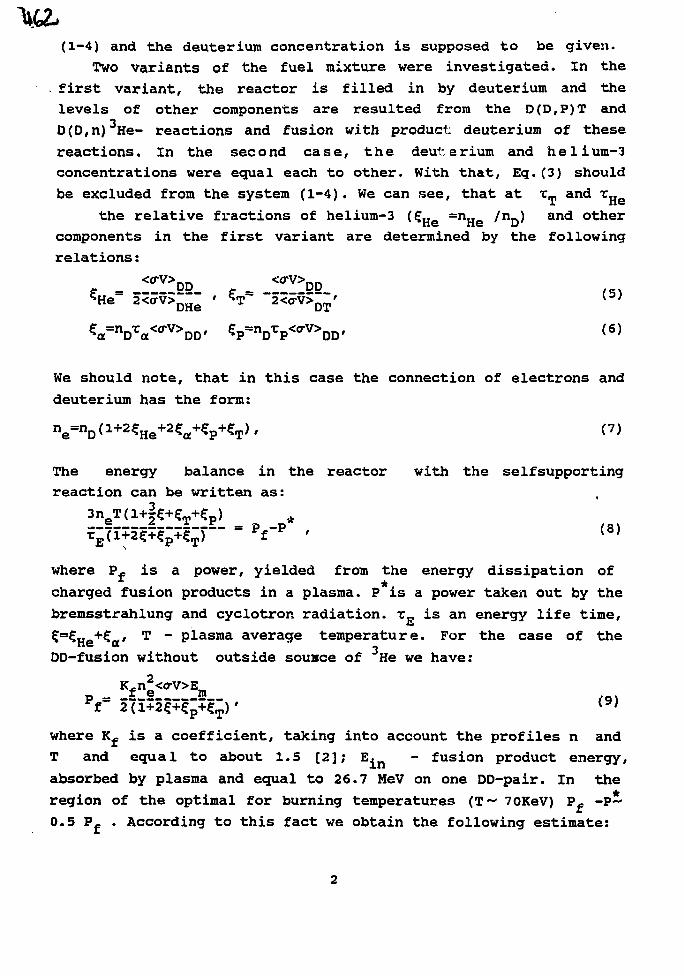
(1-4) and the deuterium concentration is supposed to be given.
Two variants of the fuel mixture were investigated. In the
. first variant, the reactor is filled in by deuterium and the
levels of other components are resulted from the D(D,P)T and
D(D,n) He- reactions and fusion with product deuterium of these
reactions. In the second case, the deuterium and helium-3
concentrations were equal each to other. With that, Eq.(3) should
be excluded from the system (1-4). We can see, that at T™ and T H
the relative fractions of helium-3 (£„„ =nrj /n_.) and othertie rie u
components in the first variant are determined by the following
relations:
2<o-V>DT'
We should note, that in this case the connection of electrons and
deuterium has the form:
, (7)
The energy balance in the reactor with the selfsupporting
reaction can be written as:
3n f
where P. is a power, yielded from the energy dissipation of*
charged fusion products in a plasma. P is a power taken out by the
bremsstrahlung and cyclotron radiation. T_, is an energy life time,
£=£11^+?^/ T - plasma average temperature. For the case of thetie oc A
DD-fusion without outside sousce of He we have:
K_n2«rv>E_p - _£_S 2Ff
where K~ is a coefficient, taking into account the profiles n and
T and equal to about 1.5 [2]; E. - fusion product energy,
absorbed by plasma and equal to 26.7 MeV on one DD-pair. In the
region of the optimal for burning temperatures (T~ 70KeV) P. -P~
0.5 Pf . According to this fact we obtain the following estimate:
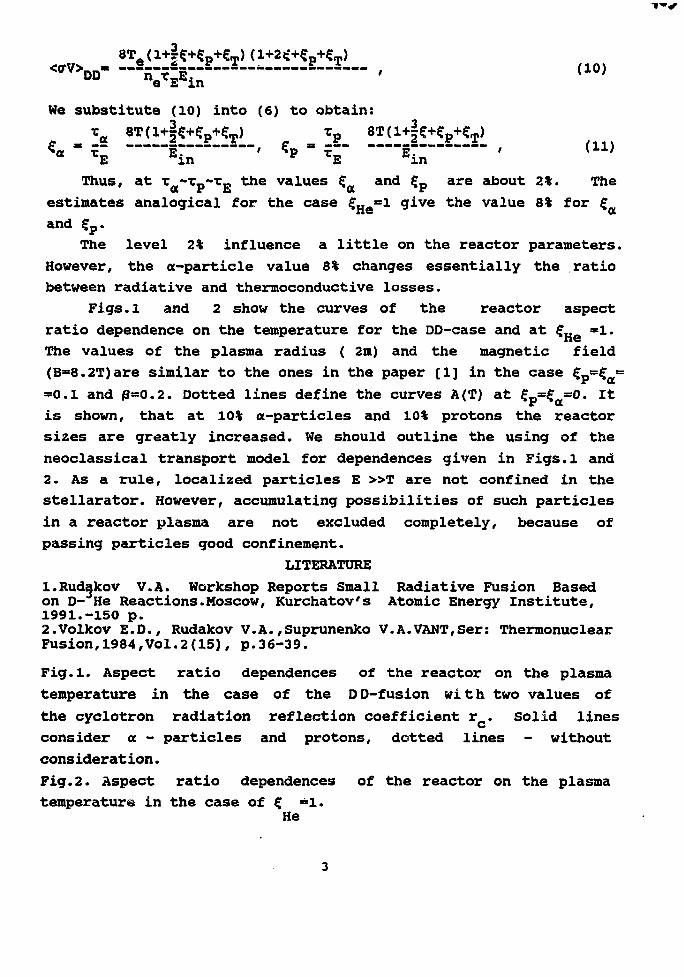
8T
We substitute (10) into (6) to obtain:
p
«« Tj E ~ ' «F " xj fi~Thus, at T ~T_~T., the values £ and £_, are about 2%. The
estimates analogical for the case £He=l give the value 8% for £
and £p.
The level 2% influence a little on the reactor parameters.
However, the a-particle value 8% changes essentially the ratio
between radiative and thermoconductive losses.
Figs.l and 2 show the curves of the reactor aspect
ratio dependence on the temperature for the DD-case and at £ H e *1.
The values of the plasma radius ( 2m) and the magnetic field
(B=8.2T)are similar to the ones in the paper [1] in the case ?p=Ca=
=0.1 and (3=0.2. Dotted lines define the curves A(T) at £p=£a=0« Ifc
is shown, that at 10% ct-particles and 10% protons the reactor
sizes are greatly increased. We should outline the using of the
neoclassical transport model for dependences given in Figs.l and
2. As a rule, localized particles E » T are not confined in the
stellarator. However, accumulating possibilities of such particles
in a reactor plasma are not excluded completely, because of
passing particles good confinement.
LITERATURE
l.Rudakov V.A. Workshop Reports Small Radiative Fusion Basedon 0- He Reactions.Moscow, Kurchatov's Atomic Energy Institute,1991.-150 p.2.Volkov E.D., Rudakov V.A.,Suprunenko V.A.VANT,Ser: ThermonuclearFusion,1984,Vol.2(15), p.36-39.
Fig.l. Aspect ratio dependences of the reactor on the plasma
temperature in the case of the DD-fusion with two values of
the cyclotron radiation reflection coefficient r . Solid lines
consider a - particles and protons, dotted lines - without
consideration.
Fig.2. Aspect ratio dependences of the reactor on the plasma
temperature in the case of £ =1»He
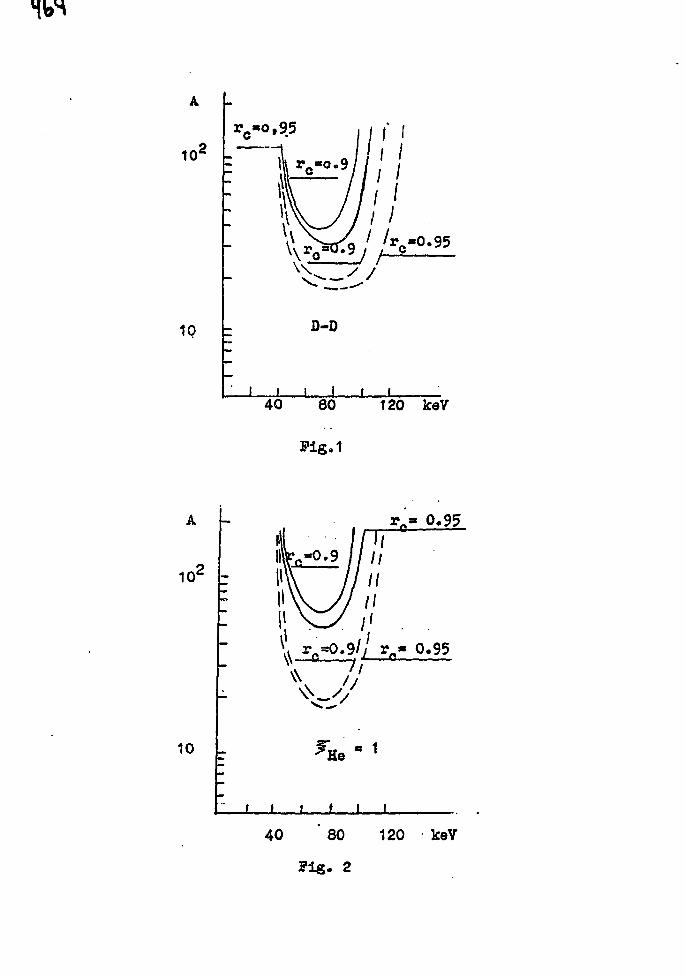
10'
10 D-D
I I I ! i i
40 80
Pig.1
120 keV
10*
10
0.95
r i t i i
40 80 120 keV
Fig. 2
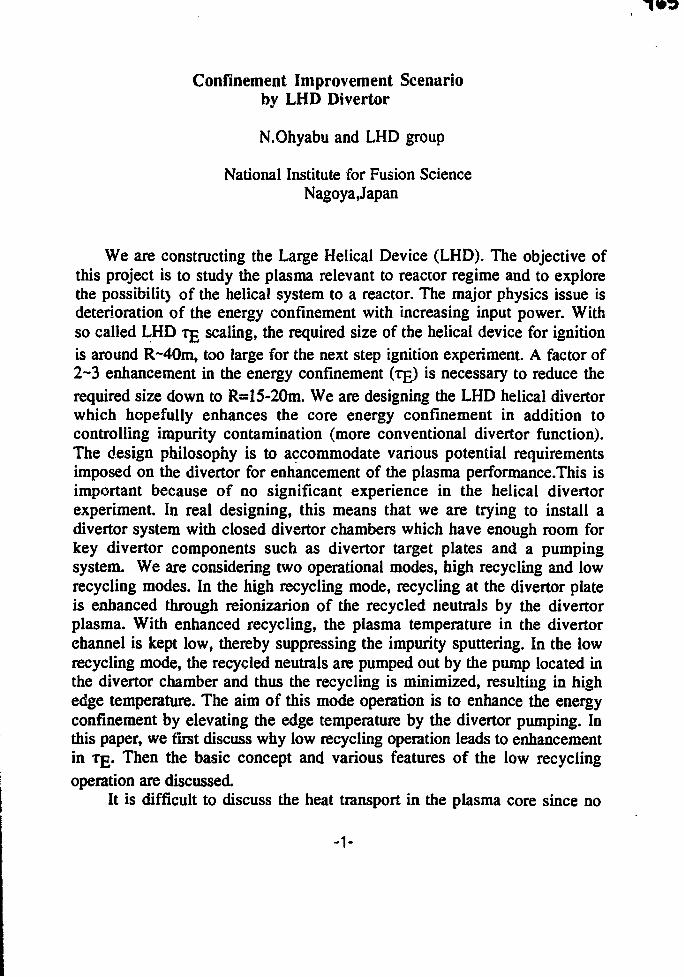
Confinement Improvement Scenarioby LHD Divertor
N.Ohyabu and LHD group
National Institute for Fusion ScienceNagoyajapan
We are constructing the Large Helical Device (LHD). The objective ofthis project is to study the plasma relevant to reactor regime and to explorethe possibility of the helical system to a reactor. The major physics issue isdeterioration of the energy confinement with increasing input power. Withso called LHD T£ scaling, the required size of the helical device for ignitionis around R~40m, too large for the next step ignition experiment. A factor of2-3 enhancement in the energy confinement (T£) is necessary to reduce therequired size down to R=15-20m. We are designing the LHD helical divertorwhich hopefully enhances the core energy confinement in addition tocontrolling impurity contamination (more conventional divertor function).The design philosophy is to accommodate various potential requirementsimposed on the divertor for enhancement of the plasma performance.This isimportant because of no significant experience in the helical divertorexperiment. In real designing, this means that we are trying to install adivertor system with closed divertor chambers which have enough room forkey divertor components such as divertor target plates and a pumpingsystem. We are considering two operational modes, high recycling and lowrecycling modes. In the high recycling mode, recycling at the divertor plateis enhanced through reionizarion of the recycled neutrals by the divertorplasma. With enhanced recycling, the plasma temperature in the divertorchannel is kept low, thereby suppressing the impurity sputtering. In the lowrecycling mode, the recycled neutrals are pumped out by the pump located inthe divertor chamber and thus the recycling is minimized, resulting in highedge temperature. The aim of this mode operation is to enhance the energyconfinement by elevating the edge temperature by the divertor pumping. Inthis paper, we first discuss why low recycling operation leads to enhancementin T£. Then the basic concept and various features of the low recycling
operation are discussed.It is difficult to discuss the heat transport in the plasma core since no
-1-
X
reliable transport theory is available. It tends to be inevitably speculative.Our argument on how the energy confinement improves by the low recyclingoperation is based upon the tokamak experimental results. We first assumethat the transport mechanism in the helical system is essentially the same as inthe tokamaks since the global rg scaling in the tokamak is very similar to theLHD T£ scaling. In tokamak L-mode limiter discharges, the temperatureappears to saturate at high power, a severe deterioration of the energyconfinement. We consider a H-mode divertor discharge which has the samebasic plasma parameters such as magnetic field, the average density as a L-mode discharge. When we compare these L and H mode discharges(the maindifference between them is the edge configuration), the K-mode temperatureprofile at the power level just above the H-mode threshold power appears tobe above that of the L-mode discharge even at high power. This is consistentwith a local transport model (a very natural assumption) in which the localtransport coeffifients are determined by the local plasma parameters. If theL-mode profile at high power overlaps with that of the H-mode at lowpower, then the transport coefficient with the nearly same plasma parametershas two quite different values, contradictory to the local transport model.This argument suggest that there exist an improved confinement regime inthe higher temperature parameter space. The question is how to get access tothe regime. It is imposible to enter the high temperature good confinementregime locally because the local transport becomes very large in the regionexceeding the L-mode saturation temperature. But when the very edgetemperature is raised by the external mean such as divertor pumping, thenthe discharge could enter the good confinement regime smoothly. For the H-mode discharge, it is not external mean, but formation of the temperaturepedestal at the very edge of the main plasma by so called L-H transition. Ifthis argument is correct, then the edge temperature needed for rgimprovement is in the order of the H-mode pedestal temperature(300~400eV for ASDEX and DIIID, -lkev for JET).
In addtion to the H-mode type enhancement of the confinement, theenergy confinement can be improved even without reduction of the transportcoefficients. In the low recycling divertor operation mode, the edgetemperature is kept high by the pumping and the peaked density profile ismaintained by a combination of deep fuelling such as pellet or neutral beaminjection and the pumping. In such a case, diffusion coefficient (D) and henceparticle confinement determines the energy confinement rather than thethermal diffusivity (x). Even though D has been observed to increase withincreasing input power similarly as x . the observed values of D are
-2-
generally much lower than those of x and thus deterioration of T£ can beminimized in the low recycling operation. In torsatron/Heliotron devicessuch as LHD, the neoclassical loss due to helical ripple is also a concern. Theexpected parameter space for a helical reactor plasma is that the ions are inthe v regime where the poloidal rotation due to the radial electric fieldreduces the ripple loss significantly and the electrons are in the l/v(rippleloss dominant) regime. Thus the electron neoclassical thermal diffusivity (x)is high, limiting achievable temperature. However, the diffusion process isambiplolar and thus determined by the diffusion of slower species(in thiscase, the ions) and hence the effective D is substantially low. Thus the energyconfinement improves by changing mode of the operation even withoutreduction of the transport coefficients.
The power and particle balances in the low recycling divertor operationare as follows:The temperature is given by the power balance at the divertor plate.
Q = Y . r . T T - Q / ( v . r )
= Q T p / ( Y . n . V )
where Q and T are the total heat flux and particle flux on the divertor plate,respectively, T is the temperature in the divertor channel, v is the heattransfer coefficient at the sheath boundary, n and V are die average densityand the volume of the main plasma respectively and tp is defined as rp= n .V/ F .The energy confinement ( Tg ) for a extreme case where VT=0 is givenas
T E = 3 n ,T .V / Q = 3 Tp / Y
From these simple expressions, Tp determines the energy confinement andhence D(r) and S(r) (the spacial distribution of the particle source) are thekey parameters for the energy confinement. The neutral particles recycled atthe divertor plate are needed to be pumped and be fuelled by deep particlepenetration methods such as pellet or neutral beam injection to enhance Tp
and hence Tg.As a simple example, we consider a steady-state discharge which is heatedand fuelled by neutral beam alone. We assumed that the pumping efficiency
-3-
of the divertor is r\ , i.,eM a fraction (n) of the particles reaching the divertorplates are pumped and the same amount of the particles are fuelled by theneutral beam injection. The rest of them are ionized in the very edge regionso that we assume that they do not contribute to fuelling of the core plasma.The temperature for this case is T = W. n / Y .where W is the beam energy.The energy confinement is 3 Tpcore.r| / y where Tpc o r e is the particle
confinement which takes into account the beam feulling ( Tp = r|TpCore ).For a parameter set ( W ~ lOOkev, y ~ 10 , n ~ 0.3 ), T becomes as high as3 keV, significantly higher than those observed at the pedestal of the H-modedischarges.
The major uncertainties of this scheme is wall plasma interaction at highplasma temperature and its associated impurity contamination. Physicalsputtering yield of D ion to carbon tile has a peak value of 0.02 at theincident energy of ~200 eV. Beyond this temperature , it gradually decreases.The sputtering yield at 1 kev plasma is very similar to that at 15 ev, a typicaldivertor temperature in the existing experiments. Thus physical sputtering isnot a problem. The issue may be unipolar arking ,which used to beconsidered as a major impurity source in the tokamak devices. It mightoccurs at high divertor plasma temperature and definitely need anexperimental test for it. At high temperature, the secondary electrons areemitted from the divertor plate and become a source of the cold particles,which lower the divertor plasma temperature. This effect can be included iny and y is 7.8 without the secondary electron emission and is -10 when thesecondary emssion rate is 0.7. But when it exceeds 0.7, y increases rapidlyand then saturates at -23 because of the space charge limit. At high incidention energy, the secondary electron emission by the ion becomes high andinfluences the sheath boundary condition. It is typically ~ 1.0 at the incidention energy of 10 keV. For this case, the emission rate by the electron mustbe below 0.4 for y to be below 10. Selection of the divertor plate materialcould be important.
In the LHD experiment, we plan to install a cryopump system withpumping efficiency of -30% in the divertor chamber. For a reactor,installation of the cryopump in the divertor region is unrealistic. We aretrying to find divertor configurations which guide the heat and particlefluxes to a remote region, away from the main coil system, thereby makingpumping of the particles and handling of the heat achievable even in a reactorsystem.
.4.
XIM-0-1STATUS Or STELLAIATOX EESEMtCI IM THE CEMEKAL rUMICS INSTITUTE
Aaeanor O.K.. Orebcnsttchikor S.E. .Korrizhnykh.Fedyanin O.I.
General physics Institute.USSR Academy of Science*. Hoscov
Recent experiments carried out on the creation and heating of •
current-free plasm in the ECKK regiae in the L-2 stellarator are
reported. A plasms is obtained with an electron teapereture 0.1-1 keV
and average density up to 2.io13ca"3. Heating radiation power is
100-270 kH and energy deposition density reaches 20-4- W/ca3. The vave
absorption at the second haraonlc of the gyrofrequency is ithown tc fit
the theoretical predictions. It is established that dlaaagnetic
measureaents yield lower (1.5 or 2 tiaes) absorption coefficients than
microwave measurements, that is due to the fast energy' losser *roa the
plasaa during ECRK. Theoretically predicted localization of the energy
deposition region during ECRU acconpanied by the radiation power
growth is qualitatively confined. The Halt in the teaperatura growth
at the center of the column and detonation of the density and
tcBpcrature profiles arc recorded. The liait in the plasaa energy
growth with the radiation power, accoapanlad by the plasma density
growth)is not recorded. A qualitative agreement between the results of
plasaa energy measurements and calculations in terms of neoclassical
theory is established. At the saae time a correlation is observed
between plasaa parameter* and intensity of drift turbulent noise. Data
on aodification of the 1-2 stellarator is presented: change of the
vacuum chamber, prolongation of the magnetic field pulse,power
Increase and prolongation .of the radiation pulse for ECRH. The project
of a new 1 2/4 stellarator carried out in collaboration with
O.v.Efreaov Institute (Leningrad) is presented, it is ba.sed on the
topologically stable magnetic configuration having decreased level of
neoclassical losses (reduced helical ripple and sufficient aagnetic
shear)*
* See the papers by S.E.Grcbenshchlkov et al. (General PhysicsInstitute), E.N.Bondarchuk et al.(Efrcaov Institute) Design of theL2/« stellarator presented at this conference.
Ill
Review of CHS Experiments
K.Matauoka and CHS Group*5
National Institute for Fusion Science
Nagoya 464-01, Japan
Abstract
Review of recent experimental efforts is presented on CHS plasma with the
low aspect ratio. MHD characteristics is discussed from viewpoint of Shafranov
shift, where NBI beam pressure plays an important role in the equilibrium
pressure at the low density of < 2xl0I3cm~3. Compensation of large Shafranov
shift by the pre-programmed vertical field control is shown to be effective to
obtain high 0 plasma in the low Ap configuration. Local transport analysis has
been extensively done for NBI and EEH plasmas. Effect of the radial electric
field and the magnetic well on the transport is discussed. Dependence of the
NBI deposited power on the magnetic axis position is also discussed. Recent
experiments include perturbation field effect on the transport, and damping
mechanism of the toroidal plasma rotation, which are interesting from helical
plasma physics. Preliminary ICRF heating experiment gives a promising result.
1. Introduction
CHS experiments have been done to understand helical plasma characteristics
with the low aspect ratio and to produce database for LHD as its supporting
experiment. Major experimental efforts are put on elucidation of MHD
characteristics, local transport analysis of electron and ion, realization of
high 0 plasma, analysis of toroidal and poloidal plasma rotation and ICRF
heating since last summer when IEA Stellarator Workshop(June) at Garching and
IAEA Conference(October) in Washington were held.
In the experiment, the magnetic field configuration is controlled primarily
through the magnetic axis shift. Plasmas are heated with ECH(28GHz and 53.2GHz,
200kWeach), NBI(40kV, 1. 1MW, lsec) and ICRF(7-15MHz/800kW/30ms,
9-28MHz/500kW/10ms and 40MHz/l,5MW/100ms).
On BCH plasmas the transport in the low collisionality regime has been the
major concern, besides the density clamping resulting in the hollow density
profile. On NBI plasmas the relation between the poloidal plasma rotation and
the transport coefficient, dependence of the toroidal rotation on the magnetic
configuration and the electron density, comparison of confinement
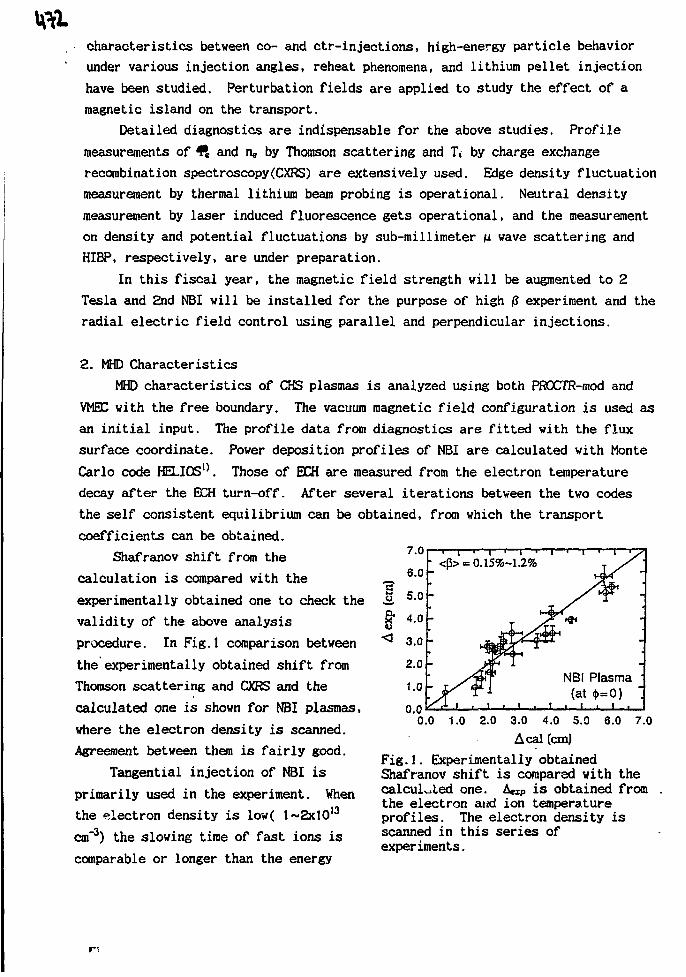
tfflcharacteristics between co- and ctr-injections, high-energy particle behavior
under various injection angles, reheat phenomena, and lithium pellet injection
have been studied. Perturbation fields are applied to study the effect of a
magnetic island on the transport.
Detailed diagnostics are indispensable for the above studies. Profile
measurements of and rie by Thomson scattering and Ti by charge exchange
recombination spectroscopy(CXRS) are extensively used. Edge density fluctuation
measurement by thermal lithium beam probing is operational. Neutral density
measurement by laser induced fluorescence gets operational, and the measurement
on density and potential fluctuations by sub-millimeter u wave scattering and
HIBP, respectively, are under preparation.
In this fiscal year, the magnetic field strength will be augmented to 2
Tesla and 2nd NBI will be installed for the purpose of high # experiment and the
radial electric field control using parallel and perpendicular injections.
2. MHD Characteristics
MHD characteristics of CHS plasmas is analyzed using both PROCTR-mod and
VMBC with the free boundary. The vacuum magnetic field configuration is used as
an initial input. The profile data from diagnostics are fitted with the flux
surface coordinate. Power deposition profiles of NBI are calculated with Monte
Carlo code HELIOS^. Those of BCH are measured from the electron temperature
decay after the EEH turn-off. After several iterations between the two codes
the self consistent equilibrium can be obtained, from which the transport
coefficients can be obtained.
Shafranov shift from the
calculation is compared with the
experimentally obtained one to check the
validity of the above analysis
procedure. In Fig.1 comparison between
the experimentally obtained shift from
Thomson scattering and CXRS and the
calculated one is shown for NBI plasmas,
where the electron density is scanned.
Agreement between them is fairly good.
Tangential injection of NBI is
primarily used in the experiment. When
the electron density is low( l~2xlO13
cm"3) the slowing time of fast ions is
comparable or longer than the energy
NBI Plasma(at <(>=0)
1.0 2.0 3.0 4.0 5.0
Acal (cm)6.0 7.0
Fig.1. Experimentally obtainedShafranov shift is compared with thecalculated one. A«zP is obtained fromthe electron and ion temperatureprofiles. The electron density isscanned in this series ofexperiments.
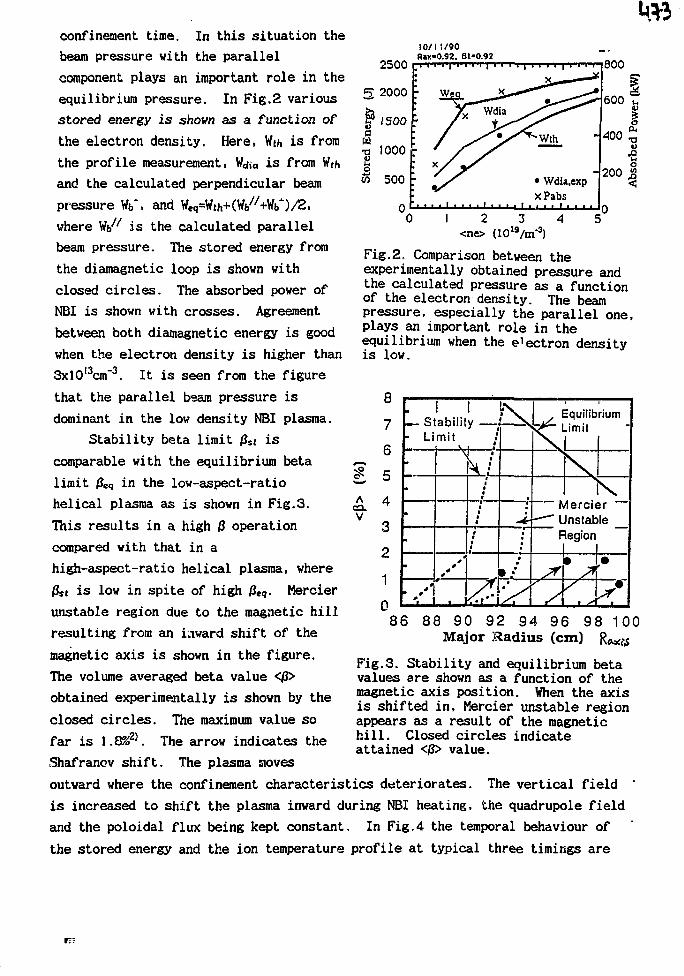
2500 r
10/11/90Rax-0.92. Bt-0.92
800
confinement time. In this situation the
beam pressure with the parallel
component plays an important role in the
equilibrium pressure. In Fig.2 various
stored energy is shown as a function of
the electron density. Here, Weh is from
the profile measurement, Vdia is from Wth
and the calculated perpendicular beam
pressure Wt*, and Weq=Wth+(W(//+WO/2.
where Wb^ is the calculated parallel
beam pressure. The stored energy from
the diamagnetic loop is shown with
closed circles. The absorbed power of
NBI is shown with crosses. Agreement
between both diamagnetic energy is good
when the electron density is higher than
3xl0l3cm"3. It is seen from the figure
that the parallel beam pressure is
dominant in the low density NBI plasma.
Stability beta limit /5st is
comparable with the equilibrium beta
limit /3eq in the low-aspect-ratio
helical plasma as is shown in Fig.3.
This results in a high /? operation
compared with that in a
high-aspect-ratio helical plasma, where
Pst is low in spite of high 0eq. Mercier
unstable region due to the magnetic hill
resulting from an inward shift of the
magnetic axis is shown in the figure.
The volume averaged beta value </S>
obtained experimentally is shown by the
closed circles. The maximum value so
far is 1.8%2). The arrow indicates the
Shafranov shift. The plasma aoves
outward where the confinement characteristics deteriorates. The vertical field
is increased to shift the plasma inward during NBI heating, the quadrupole field
and the poloidal flux being kept constant. In Fig.4 the temporal behaviour of
the stored energy and the ion temperature profile at typical three timings are
0 1 2 3 4<ne> (10 l9/m-3)
Fig.2. Comparison between theexperimentally obtained pressure andthe calculated pressure as a functionof the electron density. The beampressure, especially the parallel one,plays an important role in theequilibrium when the e ^ t r o n densityis low.
8
7
6
5
4
3
2
1
0
AexV
. I 1— Stability — i
• Limit •'\ M
•
•
•
4
00
00
•
1••$
t
•1
*
A
;•
•
••
EquilibriumX$f~ Limit\lX
1 XMercier
r-~ UnstableRegion|
S\ , A*
88 90 92 94 96 98Major Radius (cm)
10086
Fig.3. Stability and equilibrium betavalues are shown as a function of themagnetic axis position. When the axisis shifted in, Mercier unstable regionappears as a result of the magnetichill. Closed circles indicateattained <(i> value.
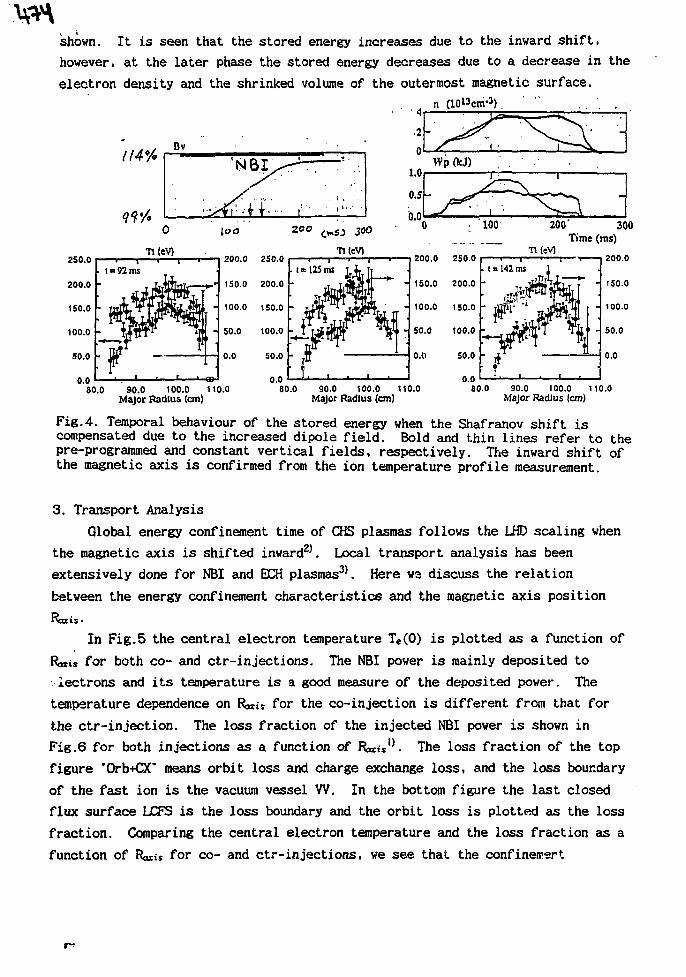
shown. It is seen that the stored energy increases due to the inward shift,
howeveri at the later phase the stored energy decreases due to a decrease in the
electron density and the shrinked volume of the outermost magnetic surface.n (1013cm-3). " . . . ,
30.0 90.0 100.0 110.0Major Radius (cm)
80.0 90.0 100.0 110.0Major Radius (cm)
80.0 90.0 100.0 110.0Major Radius (cm)
Fig.4. Temporal behaviour of the stored energy when the Shafranov shift iscompensated due to the increased dipole field. Bold and thin lines refer to thepre-programmed and constant vertical fields, respectively. The inward shift ofthe magnetic axis is confirmed from the ion temperature profile measurement.
3. Transport Analysis
Global energy confinement time of CHS plasmas follows the LHD scaling when
the magnetic axis is shifted inward2'. Local transport analysis has been
extensively done for NBI and BCH plasmas3*. Here we discuss the relation
between the energy confinement characteristics and the magnetic axis position
Raris.
In Fig.5 the central electron temperature Te(0) is plotted as a function of
F xis for both co- and ctr-injections. The NBI power is mainly deposited to
' iectrons and its temperature is a good measure of the deposited power. The
temperature dependence on Raxis for the co-injection is different from that for
the ctr-injection. The loss fraction of the injected NBI power is shown in
Fig.6 for both injections as a function of Rjrts'5. The loss fraction of the top
figure 'Orb+CX* means orbit loss and charge exchange loss, and the loss boundary
of the fast ion is the vacuum vessel W . In the bottom figure the last closed
flux surface LCFS is the loss boundary and the orbit loss is plotted as the loss
fraction. Comparing the central electron temperature and the loss fraction as a
function of RoxiS for co- and ctr-injections, we see that the confinement
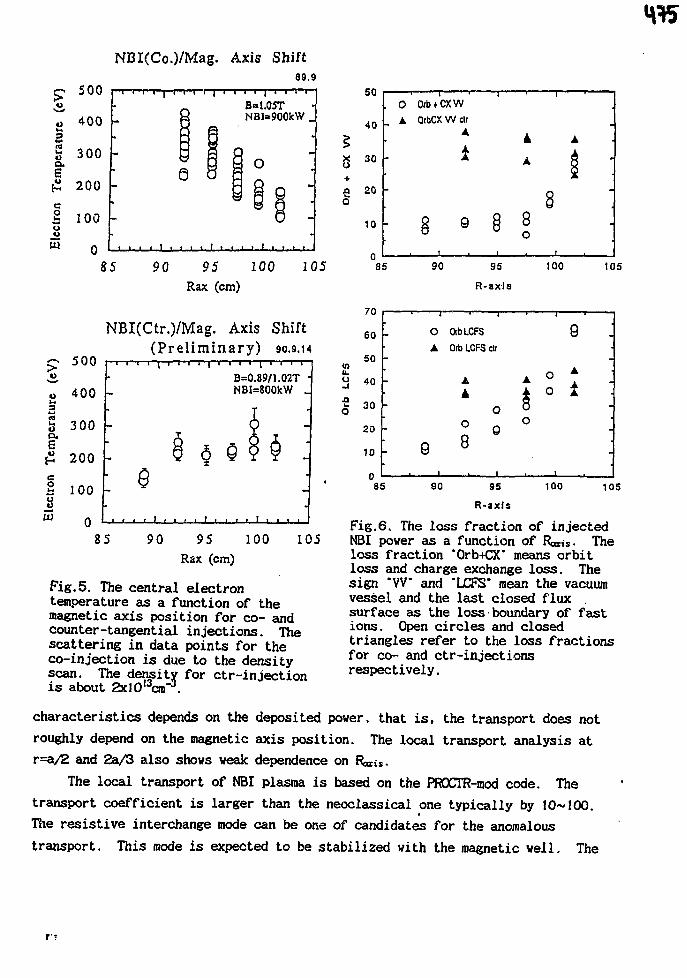
NBI(Co.)/Mag. Axis Shift89.9
o
3
Sa.
IW
500
400
300
200
100
0
B=t.0STNBI=>900kW _
= O
85 90 95Rax (cm)
100 105
oa.
eo
500
400
300
200
100
NBI(Ctr.)/Mag. Axis Shift(Pre l iminary) 90.9.14
B=0.89/1.02TNBI=800kW _
§ §
85 90 95 100Rax (cm)
105
Fig.5. The central electrontemperature as a function of themagnetic axis position for co- andcounter-tangential injections. Thescattering in data points for theco-injection is due to the densityscan. The density for ctr-injectioni s about 2xl0l3cm .
50
40
8 30
a 20O
10 -
85
0
. A
-
0/btCXW
OtbCX W clrA
1
§ e {t
A A
A A
8 :i 8j 0
90 95
R-axIs
100 105
70
60
50«u.0 40
1 30
20
10
'. 0A
-
-
1 8
OtbLCFS
Otb LCFS ctr
A
A
o
8
o0
1
A
0o
oo
1
8 :
A
-
-
85 90 95
R-axIs
100 105
Fig.6. The loss fraction of injectedNBI power as a function of Raxxs- Theloss fraction *0rb+CX" means orbitloss and charge exchange loss. Thesign *W" and "LCFS* mean the vacuumvessel and the last closed fluxsurface as the loss boundary of fastions. Open circles and closedtriangles refer to the loss fractionsfor co- and ctr-injectionsrespectively.
characteristics depends on the deposited power, that is, the transport does notroughly depend on the magnetic axis position. The local transport analysis atr=a/2 and 2a/3 also shows weak dependence on Roiis,
The local transport of NBI plasma is based on the PROCTR-mod code. The
transport coefficient is larger than the neoclassical one typically by 10~!00.
The resistive interchange mode can be one of candidates for the anomalous
transport. This mode is expected to be stabilized with the magnetic well. The
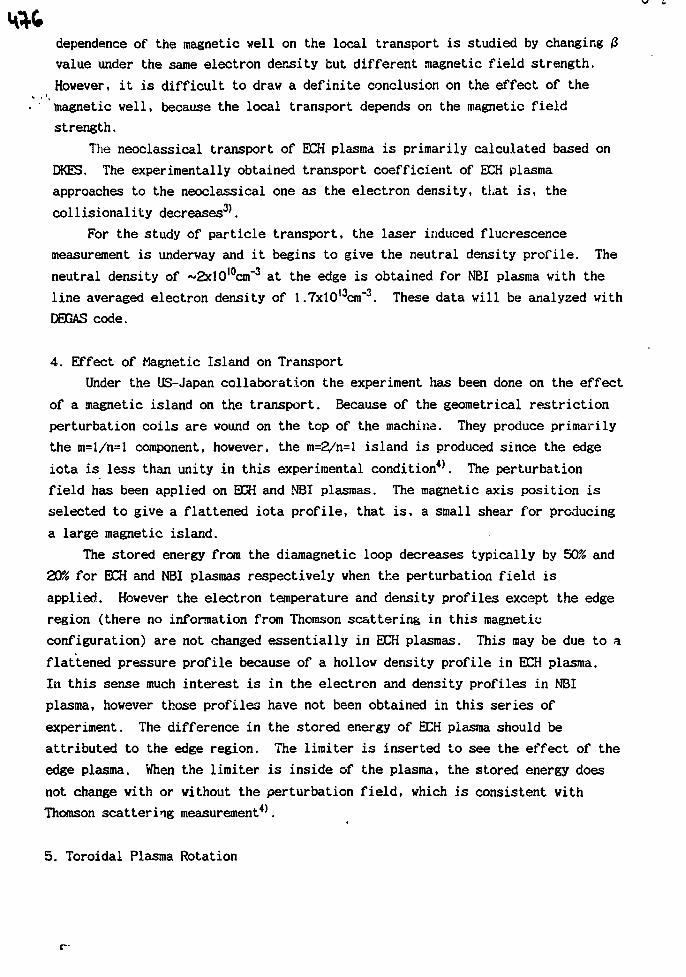
dependence of the magnetic veil on the local transport is studied by changing /3
value under the same electron density but different magnetic field strength.
However, it is difficult to draw a definite conclusion on the effect of the
magnetic well, because the local transport depends on the magnetic field
strength.
The neoclassical transport of ECH plasma is primarily calculated based on
DKES. The experimentally obtained transport coefficient of ECH plasma
approaches to the neoclassical one as the electron density, that is, the
collisionality decreases3*.
For the study of particle transport, the laser induced flucrescence
measurement is underway and it begins to give the neutral density profile. The
neutral density of ~2xl0l0cnf3 at the edge is obtained for NBI plasma with the
line averaged electron density of 1.7xl0l3cnf3. These data will be analyzed with
DBGAS code.
4. Effect of Magnetic Island on Transport
Under the US-Japan collaboration the experiment has been done on the effect
of a magnetic island on the transport. Because of the geometrical restriction
perturbation coils are wound on the top of the machine. They produce primarily
the m=l/n-l component, however, the m=2/n=l island is produced since the edge
iota is less than unity in this experimental condition**. The perturbation
field has been applied on BGH and NBI plasmas. The magnetic axis position is
selected to give a flattened iota profile, that is, a small shear for producing
a large magnetic island.
The stored energy from the diamagnetic loop decreases typically by 50% and
20% for ECH and NBI plasmas respectively when the perturbation field is
applied.. However the electron temperature and density profiles except the edge
region (there no information from Thomson scattering in this magnetic
configuration) are not changed essentially in ECH plasmas. This may be due to a
flattened pressure profile because of a hollow density profile in ECH plasma.
In this sense much interest is in the electron and density profiles in NBI
plasma, however those profiles have not been obtained in this series of
experiment. The difference in the stored energy of ECH plasma should be
attributed to the edge region. The limiter is inserted to see the effect of the
edge plasma. When the limiter is inside of the plasma, the stored energy does
not change with or without the perturbation field, which is consistent with
Thomson scattering measurement*5.
5. Toroidal Plasma Rotation
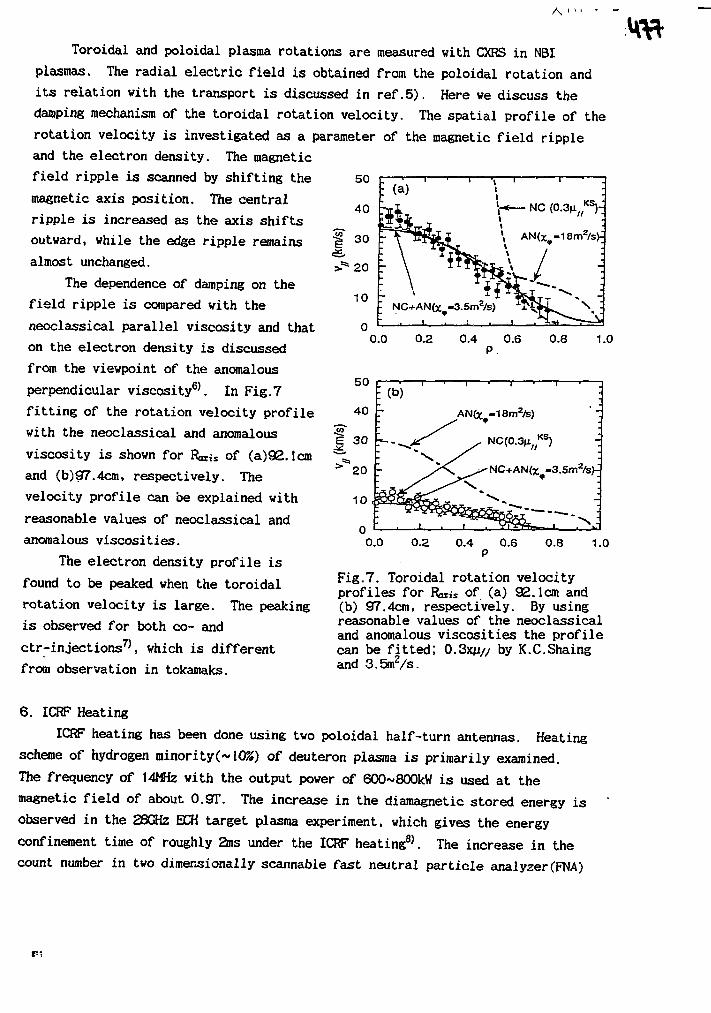
! (a)
'T \
\ NC+ANfe1
1 'I
I
1
-3.5ma/s)
i
<—
tt
- NC (0.3n K S ) -
AN(x? -18m2 /s^
Toroidal and poloidal plasma rotations are measured with CXRS in NBI
plasmas. The radial electric field is obtained from the poloidal rotation and
its relation with the transport is discussed in ref.5). Here we discuss the
damping mechanism of the toroidal rotation velocity. The spatial profile of the
rotation velocity is investigated as a parameter of the magnetic field ripple
and the electron density. The magnetic
field ripple is scanned by shifting the
magnetic axis position. The central
ripple is increased as the axis shifts
outward, while the edge ripple remains
almost unchanged.
The dependence of damping on the
field ripple is compared with the
neoclassical parallel viscosity and that
on the electron density is discussed
from the viewpoint of the anomalous
perpendicular viscosity6'. In Fig.7
fitting of the rotation velocity profile
with the neoclassical and anomalous
viscosity is shown for Razis of (a)92. lcm
and (b)97.4cm, respectively. The
velocity profile can be explained with
reasonable values of neoclassical and
anomalous viscosities.
The electron density profile is
found to be peaked when the toroidal
rotation velocity is large. The peaking
is observed for both co- and
ctr-injections7), which is different
from observation in tokamaks.
50 p
40
30 r
20 r
10
00.0 0.2 0.4 0.6
P.0.8 1.0
50
40
1 30
20 -
10
0.0
AN(xr-18mz/s)
'NC+AN(x -3.5mz
0.2 0.6 0.8 1.0
Fig.7. Toroidal rotation velocityprofiles for Roris of (a) 92.1cm and(b) 97.4cm, respectively. By usingreasonable values of the neoclassicaland anomalous viscosities the profilecan be fitted; 0.3xy// by K.C.Shaingand 3.5m2/s.
6. ICRF Heating
ICRF heating has been done using two poloidal half-turn antennas. Heating
scheme of hydrogen minority(~ 10%) of deuteron plasma is primarily examined.
The frequency of 14MHz with the output power of 600~800kW is used at the
magnetic field of about 0.9T. The increase in the diamagnetic stored energy is
observed in the 28GHz BCH target plasma experiment, which gives the energy
confinement time of roughly 2ms under the ICRF heating8). The increase in the
count number in two dimensionally scannable fast neutral particle analyzer(FNA)
is observed when ICRF is applied and the bulk ion temperature of 300~400 eV is
obtained. ICRF heating at high density with NBI plasma as a target will be done
and FNA spectra corresponding to various pitch angles will be measured soon.
Summary
1. MHD characteristics of CHS plasma, i.e., Shafranov shift can be well
described with MHD theory. For plasmas up to <|3> of 1.8%, compatibility
between the vacuum magnetic hill and the good confinement characteristics in
the inward shifted configuration is still maintained.
2. Global characteristics of energy confinement is good when the magnetic axis
is shifted in. This may be due to the power deposition. Gross energy
confinement time follows LHD (gyro reduced Bohm) scaling.
3. Transport analysis of NBI plasma has been performed based on finite /3
equilibrium and on Monte Carlo calculation for the power deposition.
Transport of electrons is anomalous in NBI plasma, however, that in BCH
plasma is close to the neoclassical value.
4. Magnetic island in the core plasma seems to have no deleterious effect on the
transport of ECH plasma with a flattened pressure profile. Further study is
needed on the edge plasma behaviour.
5. Dependence of the toroidal plasma rotation on the magnetic field ripple and
the electron density shows that the rotation damping can be explained by the
neoclassical theory and the anomalous viscosity.
6. Preliminary result on ICRF heating is promising. High power heating will be
made in the near future.
Reference
1) K.Hanatani: private communication.
2) O.Kaneko et al. : "Confinement Characteristics of High Power Heated Plasma in
CHS" Plasma Physics and Controlled Nuclear Fusion Research(Proc. 13th
Int. Conf. Washington,1990) IAEA-CN-53/C-1-4.
3) H.Yamada et al. : "Local Thermal Transport in The Low-Aspect-Ratio
Heliotron/Torsatron CHS" this workshop,
H.Yaraada et al. : "Local Thermal Transport in The Low-Aspect-Ratio
Heliotron/Torsatron CHS" 18th EPS Conf. (Berlin, 1991).
4) S.Okamura et al. : "Perturbation Field Experiments in CHS" this workshop,
S.Okamura et al. : "Effect of Externally-Applied Perturbation on the
Confinement of CHS" 18th EPS Conf. (Berlin, 1991).
5) K.Ida et al. : "Electric field profile of a Compact Helical System
Heliotron/Torsatron with tangential neutral beam injection" Phys. of Fluids
B3(199t) 515.
6) K.Ida et al. : "Observation of Damping of Toroidal Rotation due to
Neoclassical Parallel Viscosity in Heliotron/Torsatron CHS" this workshop,
K.Ida et al. : "Observation of Damping of Toroidal Rotation due to
Neoclassical Parallel Viscosity in Heliotron/Torsatron CHS" 18th EPS
Conf. (Berlin, 1991).
7) H.Iguchi et al. : "Peaked Density Profile and Its Correlation with Toroidal
Rotation in the Heliotron/Torsatron CHS" this workshop.
8) K.Nishimura et al. : "ICRF Heating Experiments in CHS" this workshop.
*) CHS group: H.Arimoto, A.Fujisawa, M.Hosokawa, K.Ida, H.Idei, H.Iguchi,
O.Kaneko, S.Kubo, R.Kumazawa, K.Matsuoka, S.Morita, T.Mutoh, K.Nishimura,
N.Noda, S.Okamura, T.Ozaki, A.Sagara, S.Sakakibara, H.Sanuki, C.Takahashi,
Y.Takeiri, Y.Takita, M.Ueda+), H.Yamada, T.Watari
+) on leave from Instituto Nacional de Pesquisas Espaciais-INPE,
Sao Jose dos Campos, Sao Paulo, BRAZIL
m
XIV-O-1RECENT STATUS OF LARGE HELICAL DEVICE PROJECT
Q. Motojima,M. Fujivara and LHD Design Group.
National Institute for Fusion Science,Nagoya 464-01,Japan.
P R O J E C T OP THE L - 2 / 4 S T E I L A R A T O R
S .E.Grebenshchikov, I . S .D anilkin, L. M .Kovrizhnykh, 0.1 .PedyaninS.V.Shchepetov,I.S.Shpigel',V.A.Tsygankov,O.E.Khadin
las t , of General Phys. of the USSR Academy of Sciences, Moscow
E.N.Bondarchuk,M.M.Golovanov,V,V.Ivanov,V.A.Karnaukh,I.V.Kir-'.pichev, B.A.Kitaev, V.S .Kuligin, V. V.Makarov, I .V.Markov, S. I .Mash-
kovtsev,A.B.Mineev,A.V.PetrovD.V.Efremov Sci-Res.Inst. of El ectrophys. Apparatus, Leningrad
Abstract
A short description of the L-2/4- stellarator project per-formed by IGP in collaboration with Efremov Institute.Main pa-rameters of the L-2/4- are: Ro=3 m, a_=:0.25-0.27 m, Bo=3 l s , . s=0.03-0.05, 0.54^X60.90-0.92, lo=2+ paddit .f ield harmonics ^toproduce a shear stabilization of the L-2/4- magnetic configura-tion topology, 11=8, magnetic well<«0.005»Main objects of the •L-2/4 are: scalings of the plasma parameters in the region T «-.-3-5 KeV, n~1020m i nTg10'l7m-3sec, the tes t of different con^'1cepts used by optimiza tion of the next-step devices.
1. INTRODUCTION
I t seems that a demonstration experiment with Qeq=1 by2000-2005 i s the main object of the present strategy of the CTS.stellarator program which will be aimed further to work out thephysical base and technological suggestions of a thermonuclearstellarator-reactor realization (excluding ITER-stage).
The logic of the stellarator program development i s deter-mined by a practical possibility to extrapolate reliantly thebasic experimental scalings found in the each new generation ofinstalations. I t i s not more than an order of magnitude in the"confinement parameter" nT ,, and/or 3-4- times in the plasma tem-perature only.
The present level attained in stellarators (USSR) isi nigs-lO^^cm^sec, Tg i=0.5-1.0 KeV. Consequently, two intermediatesteps for the "demo" experiment (n.tj-10 ci^sec, TQ i«10 KeV)are necessary: (1) nTE-fio crn^sec, TQ ^s1-3 KeV, (T-4- - scale),(2) n1^,sio'l^cm5sec, Tg ^3-5 KeV,(T-10,PLT - scale).
The L-2/4—stellarator i s aimed to investigate the secondstep of the program, i . e . the parameter region of nHj-jiO ^cm^secT A s 3-5 KeV. As for supports of the common problems of theITER-program, the L-2/4-Device could be used for plasma-boundary
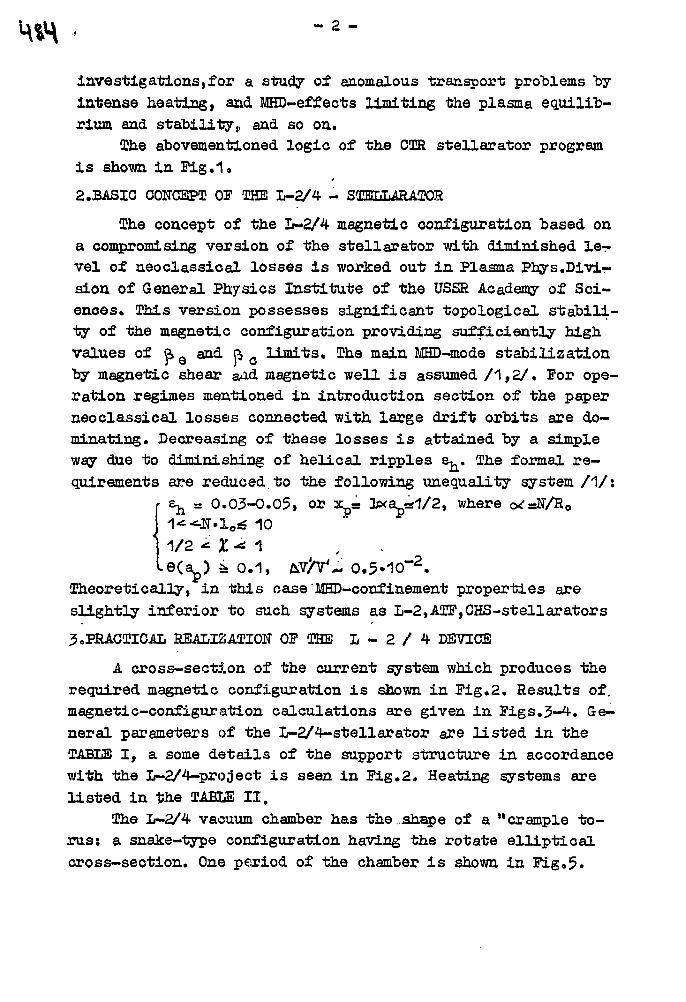
HiH - 2 -
investigations,for a study of anomalous transport problems "byintense heating, and MHD-effects limiting the plasma equilib-rium and stability,, and so on.
The abovementioned logic of the CXR stellarator programi s shown in Fig.1.
2.BASIC CONCEPT OF THE L-2/4 - STELMRATOR
The concept of the L-2/4 magnetic configuration based ona compromising version of the stellarator with diminished l e -vel of neoclassical losses i s worked out in Plasma Phys.Divi-sion of General Physics Institute of the USSR Academy of Sci-ences. This version possesses significant topological s tabi l i -ty of the magnetic configuration providing sufficiently highvalues of <$> Q and P, C l imits. The main MHD-mode stabilizationby magnetic shear aad magnetic well i s assumed / 1 , 2 / . For ope-ration regimes mentioned in introduction section of the paperneoclassical losses connected with large drift orbits are do-minating. Decreasing of these losses i s attained by a simpleway due to diminishing of helical ripples o*. The formal r e -quirements are reduced to the following unequal!ty system / 1 / :
e^ = 0.03-0.05, or :x = ljxa^ai/2, where*««.jsr.iojs 10
p ss 0.1, ttf/v** 0.5-1CT2.Theoretically, in this oase'MHD-confinement properties areslightly inferior to such systems as L-2,ATF,CHS-stellarators
3 .PRACTICAL REALIZATION OF THE L - 2 / 4 DEVICE
A cross-section of the current system which produces therequired magnetic configuration i s shown in Fig.2. fiesults of.magnetic-configuration calculations are given in Figs.3-4. Ge-neral parameters of the L-2/4-stellarator are l is ted in theTABLE I , a some details of the support structure in accordancewith the L-2/4-project i s seen in Fig.2. Heating systems arelisted in the TAHCE I I .
The L-2/4 vacuum chamber has the ..shape of a "crample to-rus: a snake-type configuration having the rotate el l ipt icalcross-section. One period of the chamber i s shown in Fig»5.
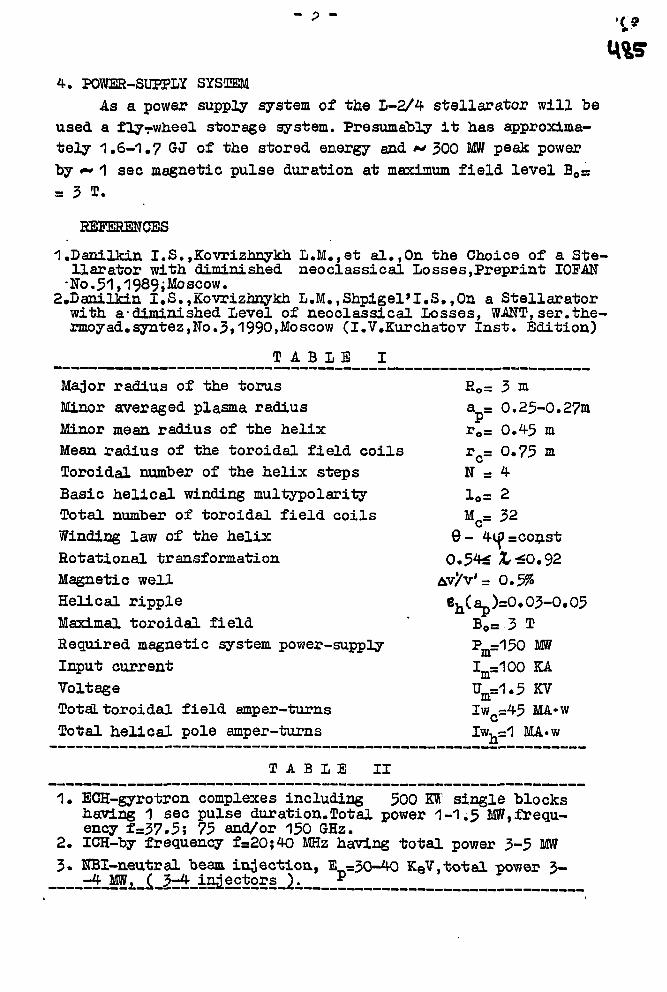
4. POWER-SUPPLY SYSTEMAs a power supply system of the L-2/4 s t a l l arator wi l l "be
used a flyrwheel storage system. Presumably i t has approxima-te ly 1.6-1.7 GJ of the stored energy and ** 300 MW peak powerby «•* 1 sec magnetic pulse duration at maximum f ie ld level BoS!
= 3 1.
REFERENCES
LDanilkin I.S.,Kovrizhnykh L.M.,et al.,0n the Choice of a Ste-l lar ator with diminished neoclassical Losses,Preprint IOFAFN 5 M5 » 9 9 i
2.Danilkin I.S.,Kovrizhnykh L.M.,Shpigel'I.S.,On a S te l la ra torwith a-diminished Level of neoclassical Losses, WAUT,ser.the-rmoyad.syntez,lTo.3»1990,Moscow (I.V.Kurchatov I n s t . Edition)
T A B L E I
Major radius of the torus Eo= 3 mMinor averaged plasma radius a = 0.25-0.27mMinor mean radius of the helix r0 = 0.45 mMean radius of the toroidal field coils r = 0.75 m
cToroidal number of the helix steps N s 4Basic helical winding multypolarity l o = 2Total number of toroidal field coils Mc= 32Winding law of the hel ix ©-Rotational transformation 0.54s? £--£0.92Magnetic well &v/v' = 0.5%Helical r ipp le eh(a_)=O.O3-O.O5Maximal to ro ida l f ie ld ' B o =3 TRequired magnetic system power-supply Pm=150 MWInput current I =100 KAVoltage u
m=t»5 KVTotal toroidal f ie ld amper-turns Iw s45 MA*w
cTotal he l i ca l pole amper-turns ^whs^ MA*W
T A B L E I I
1. ECH-gyrotron complexes including 500 ffi single blockshaving 1 sec pulse duration.Total power 1-1.5 Mff,frequ-ency f=37.5; 75 and/or 150 GHz.
2. ICH-by frequency f=20;40 MHz having total power 3-5 Ml/7
3. NBI-neutral beam injection, E=30-4Q KeV,total pov»©r 3-
fUSLL5fLi3ilSS*2£5L^E
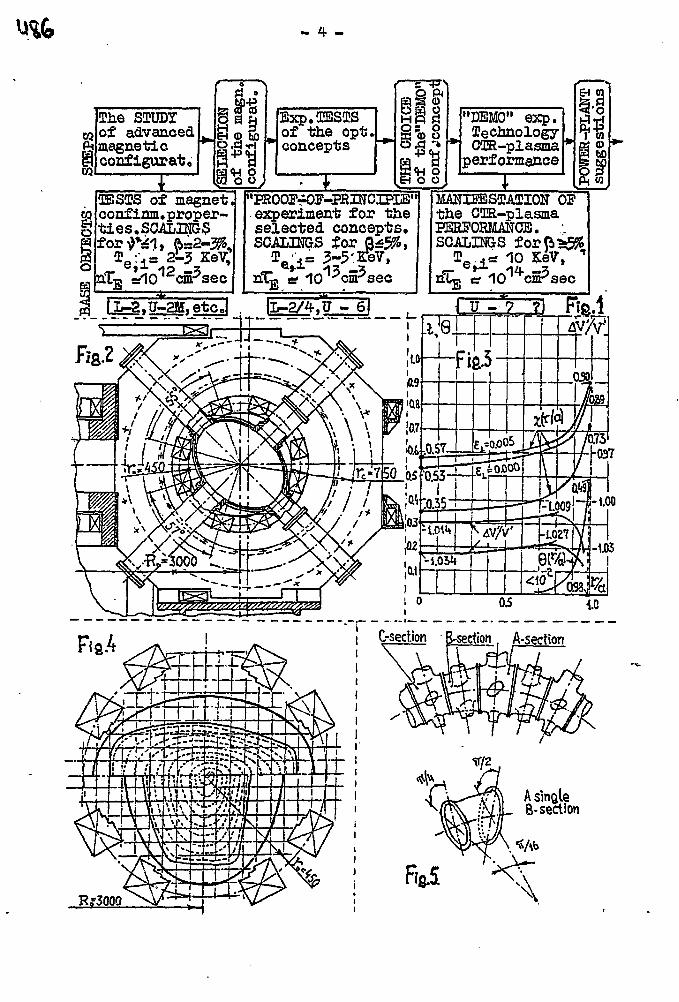
8£1CQ
•The STUDYof advancedmagneticconfigur&t9
R*3
^8
Bxp.lEBSTSof the opt,concepts
•P<H
<H ooo
"DEMO" pTechnologyCIR-plasma
performance
ito
so
OESTS of magnet,confinm.proper-ties.SOALIHGiS
experiment for theselected concepts.SCALJMGS for fl^r"
MANIEBS!DAIION OPt h e CGE-plasmaPERFORMANCE.SCALINGS ^
10 KeV,10 cSrsec
tion A-section
HW-
FREE-BOUNDARY PLASMA EQUILIBRIUM IN STELLARATORS
V.D.Pustov itov
I.V.Kurchatov Institute of Atomic Energy, Moscow, USSR
ABSTRACT. A review of theoretical results on free-boundary
plasma equilibrium in stellarators is presented.
Free-boundary plasma equilibrium is a problem which arises
naturally in tokamak theory in connection with the problem of
plasma column equilibrium along the major radius (which is
impossible in tokamaks without an external vertical field
[1]). This problem becomes actual for stellarators due to the
progress in experiments to high £'s when plasma current fields
can strongly distort the magnetic configuration. The
distortion may be accompanied by the loss of stability or by a
considerable outward displacement of the plasma. To avoid
these undesirable effects (and to make it possible to obtain jS
close to £__) it is necessary to "repair" properly theeqstellarator magnetic configuration during the discharge with
the growth of /3. The solution of this problem includes:
a) finding out the external (control) magnetic fields
necessary for the plasma column maintenance in a given
equilibrium state and for its shape control;
b) prediction of plasma behavior in the external fields
(plasma shift, change of its shape with (9-rise etc.);
c) determination of plasma parameters by the external
magnetic measurements (magnetic diagnostics), which is
necessary for closing the loop of a plasma feedback control.
We are going to discuss these issues for the case of a
conventional stellarator with planar axis. We shall support
the main results by simple analytical dependencies obtained in
the framework of a standard stellarator approximation.
It is known, that the determination of the external
confining field and the field of plasma currents can be
reduced to the calculation of the self field of the current
i - [ B n J (1)"flowing" over the plasma surface (see, e.g., [1]). Here B is
the magnetic field at plasma boundary, iv is the normal to the
surface. This method is called the virtual casing principle
(v.c.p.) when (1) is used explicitly, or Green's function or
surface potential methods when the same result is obtained
with the help of Green's theorem. Good examples of its appli-
cation in numerical calculations one can find in well-known
publications by P.Merkel. For the direct numerical calculati-
ons of plasma fields in stellarators it was used in [2].
The presence of small parameters in stellarator problems
allows one to solve them by the expansion methods. In early
80-ies Hitchon and Fielding were the first trying to adapt the
v.c.p. to their fully analytical technique, see [3], Later [4]
the v.c.p. was adjusted to the more universal classical
stellarator approximation [5]. The obtained in [4] general
formulation of the reduced 2-D v.c.p. for stellarator turned
out to be very useful means for solving the free boundary
plasma equilibrium tasks. With its help the axisymmetrical
component of the self plasma field or of the external
confining field
B = I" 7(rA) 7C ] (2)
can be calculated via contour integrals over the boundary r
of the plasma column cross-section averaged along C:
r A , in vacuum
(3)-» -» i r <PV o G ,
G B dl - A — dl2 7T I r' d n' - rA . + const in plasma
Here G(r*,r') is the Green's function for Grad-Shafranov A
(2TTG - is the poloidal flux of a unit ring current) . Some
results obtained with the help of (3) are discussed below.
When analyzing finite-/5 plasma behavior in the external
fields it is natural to consider first the question of its
reaction on the external homogeneous transverse field B . The
physical aspects of this question was discussed in a profound
paper [6]. The analytics!, calculations for finite-^ plasma
with the circular averaged cross-section in stellarator with a
shear were done in [7], the numerical ones - in [2,8]. As the
final result, the plasma column position was determined. To
illustrate the results let us give the formula for the plasma
column outward shift A, (shift of the plasma boundary)
obtained in [7] for a shearless stellarator:
Ab/b = Bx/B* - 0.5 A' » Bx/B* + 0.5 (3//3°q (4)
Here j8° = M? b/R. Mb is the rotational transform at the
plasma boundary, b and R are the plasma minor and major radii,
B - BQ ub b/R. A is the derivative of the shift at the
plasma boundary. Similar relationship for the 1 = 3
stellarator (another limiting case) has the form, see [7]:
Ab/b = B^yB* - 0.25 A' (5)
The main conclusion which follows from the solution of
this simplest problem of free-boundary currentless plasma
equilibrium is as follows: is stellarators with j3-rise the
plasma column can be greatly shifted outwards (it is also true
for current-carrying plasma). The higher £, the stronger this
effect is. In stellarators with a larger shear it should be
weaker according to (4), (5). To suppress the undesirable
plasma shift, the external vertical field B is necessary.
This follows from analytics and is confirmed by reliable
numerical calculations [2,8]. However, it does not agree with
the conclusions of Ref.[3]. It is so, probably, due to the
low-/3 approximation used in [3].
Another effective means of the stellarator configuration
control is the quadrupole field. Attention to this issue was
attracted by ORNL theoreticians whose studies have laid the
basis of the ATF torsatron concept [9]. With quadrupole field
it is possible to change the rotational transform profile, to
increase j3 by 2-2.5-times, to produce three-axial doublet
configurations. Torsatron ATF is the first stellarator
facility which permits to study these effects systematically.
There is no doubt that in the future stellarators with a
quadrupole field (with elongated "in average" magnetic
surfaces), as similar tokamaks, will prove their advantages.
As a qualitative estimate of quadrupole field effect on S we
can offer a formula obtained for a shearless stellarator:
Here K is the magnetic surfaces elongation.
Some words about magnetic diagnostics. Poloidal field
o£ plasma currents is asymmetric, see [2, 10j:
rApl ' f0 + fl C 0 S U
The reason is the Shafranov shift. To find fQ and f- and their
derivatives one needs only simple magnetic measurements. The
main problem to be solved here is the separation of plasma
self magnetic fields and fluxes from the measured values. It
can be done with the help of v.c.p. (3) which gives a similar
to (7) expression for rAej£t (in particular cases it reduces to
(4) or (5)). Analytics allows to express measurable values
through the device parameters and integral plasma characteris-
tics such as total current J, A. and A . Finally, plasma shift
A, can be experimentally found without solving full equilibri-
um problem and not knowing current and pressure profiles [10].
Summing up, one can say that the "strength margin" of
stellarator "initial" vacuum magnetic configuration is not
sufficient to confine high-/3 plasma properly. There arises a
need of configuration control by means of external poloidal
fields following ^-changes. So, equilibrium control systems
similar to the tokamak ones with magnetic diagnostics in the
feedback loop are necessary. The present state of the theory
permits to pass to the practical solution of this problem.
REFERENCES
[1] Zakharov, L.E., Shafranov, V.D., Reviews of Plasma
Physics (Leontovich, M.A., Ed.), Consultants Bureau, New
York 1986, Vol.11, p.153.
[2] Morris, R.N., et al., Nuclear Fusion 29 (1989) 2115.
[3] Hitchon, W.N.G, Fielding, P.J., Nucl. Fus. 21 (1981) 775.
[4] Pustovitov, V.D., Contr. Fus. and Plasma Heating (Proc.
15th Europ. Conf. Dubrovnik, 1988), V. 12B, Part II, 502.
[5] Greene, J.M., Johnson, J.L., Phys. Fluids 4 (1961) 875.
[6] Friedberg, J.P., Politzer, P.A., Rosenau, Ph., Phys.
Fluids 27 (1984) 2093.
[7] Pustovitov, V.D., Sov. J. Plasma Phys. 14 (1988) 840.
[8] Hirshman, S.P., van Rij, W.I., Merkel, P. Comp. Phys.
Comm. 43 (1986) 143.
[9] Lyon, J.F., Carreras, B.A., Chipley, K.K., et al., Fusion
Technol. 10 (1986) 179.
[10] Pustovitov, V.D., Nuclear Fusion 30 (1990) 1523.
GLOBAL INTERNAL MHD MODE ANALYSISOF STELLARATORS AND W7-X APPLICATION
C. SCHWAB
IPP-Euratom Association,Max-Planck-Institut fur Plasmaphysik,Garching, Federal Republic of Germany
A b s t r a c t
GLOBAL INTERNAL MHD MODE ANALYSIS OF STELLARATORS AND W7-X APPLICATION.
The global MHD stability of 3D toroidal plasmas, here being investigated by the ideal MHD energyprinciple formulated in magnetic coordinates, is studied by the Finite-Element Fourier code CAS3D.A first survey of the stability properties of W7-X representative configurations enlightens structuralcharacteristics of global MHD modes in optimized stellarators such as the existence of independent modefamilies and the internal nature of these modes. As to the proposed W7-X stellarator experiment, theenvisaged configurational class - providing tha intended experimental flexibility - appears to have a safestability margin against all potentially dangerous non-local MHD modes.
1. INTRODUCTION
'A flexible experimental device requires a suffiently broad range of the magneticfield parameters' (W7-X Proposal, [1]). Leaving out of account details of specific real-izations by modular and auxiliary coil sets this paper will discuss the ideal MHD stabil-ity properties of a variety of optimized W7-X representative configurations that differin MHD-relevant aspects such as rotational transform profile, shear profile, strength ofthe mirror-field component and aspect ratio. The Finite-Element Fourier code packageCAS3D (Code for the Analysis of the MHD Stability of 3D Equilibria) [2], which is basedon a formulation of the ideal MHD energy principle in magnetic coordinates [3, 4], pro-vides the computational tool that is necessary to study the global MHD stability of 3Dtoroidal plasmas. Previous work [2, 5] showed that there is a close correlation betweenthe results given by the local ideal stability theory and by the global calculation. Fur-ther results (see below) confirm this observation. Therefore, the present paper views theglobal stability analysis as the main facet of ideal MHD and uses Mercier- and ballooningcriteria evaluations by way of comparison and supplementary explanation. In this wayMHD aspects may be used among other critical issues to define the meaningful range offlexibility in the configurational space.
2. CAS3D GLOBAL STABILITY CODE AND LOCAL CRITERIA
During the various stages of code development which started from a formulationof the energy principle that employs two scalar components of the displacement vectorthe critical aspects of global MHD stability that emerged from the calculations havebeen embedded into CAS3D [2], so that now the code may be used for a variety of 3Dconfigurations including small-positive-shear stellarator and high-negative-shear toka-mak equilibria. In the incompressible case it has been demonstrated with CAS3D2
1
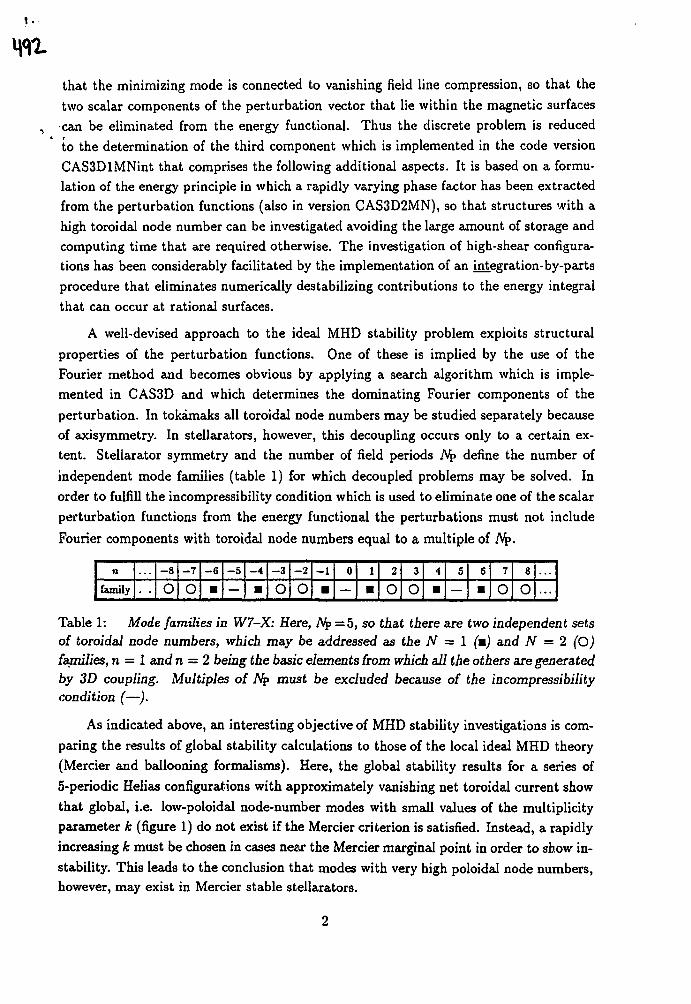
!.
that the minimizing mode is connected to vanishing field line compression, so that thetwo scalar components of the perturbation vector that lie within the magnetic surfacescan be eliminated from the energy functional. Thus the discrete problem is reducedto the determination of the third component which is implemented in the code versionCAS3DlMNint that comprises the following additional aspects. It is based on a formu-lation of the energy principle in which a rapidly varying phase factor has been extractedfrom the perturbation functions (also in version CAS3D2MN), so that structures with ahigh toroidal node number can be investigated avoiding the large amount of storage andcomputing time that are required otherwise. The investigation of high-shear configura-tions has been considerably facilitated by the implementation of an integration-by-partsprocedure that eliminates numerically destabilizing contributions to the energy integralthat can occur at rational surfaces.
A well-devised approach to the ideal MHD stability problem exploits structural
properties of the perturbation functions. One of these is implied by the use of the
Fourier method and becomes obvious by applying a search algorithm which is imple-
mented in CAS3D and which determines the dominating Fourier components of the
perturbation. In tokamaks all toroidal node numbers may be studied separately because
of axisymmetry. In stellarators, however, this decoupling occurs only to a certain ex-
tent. Stellarator symmetry and the number of field periods Np define the number of
independent mode families (table 1) for which decoupled problems may be solved. In
order to fulfill the incompressibility condition which is used to eliminate one of the scalar
perturbation functions from the energy functional the perturbations must not include
Fourier components with toroidal node numbers equal to a multiple of Np.
n
family
. . .
• •
- 8
O- 7
o- 6
•- 5
—
- 4
•- 3
O- 2
0- 1
•0
—
1
•2
O3
O4
•5
—
6
•7
O8
O ...
Table 1: Mode families in W7-X: Here, Afr=5, so that there are two independent setsof toroidal node numbers, which may be addressed as the N = I (m) and N = 2 (Ojfamilies, n = 1 and n = 2 being the basic elements from which all the others are generatedby 3D coupling. Multiples of Np must be excluded because of the incompressibilitycondition (—).
As indicated above, an interesting objective of MHD stability investigations is com-paring the results of global stability calculations to those of the local ideal MHD theory(Mercier and ballooning formalisms). Here, the global stability results for a series of5-periodic Helias configurations with approximately vanishing net toroidal current showthat global, i.e. low-poloidal node-number modes with small values of the multiplicityparameter k (figure 1) do not exist if the Mercier criterion is satisfied. Instead, a rapidlyincreasing k must be chosen in cases near the Mercier marginal point in order to show in-stability. This leads to the conclusion that modes with very high poloidal node numbers,however, may exist in Mercier stable stellarators.
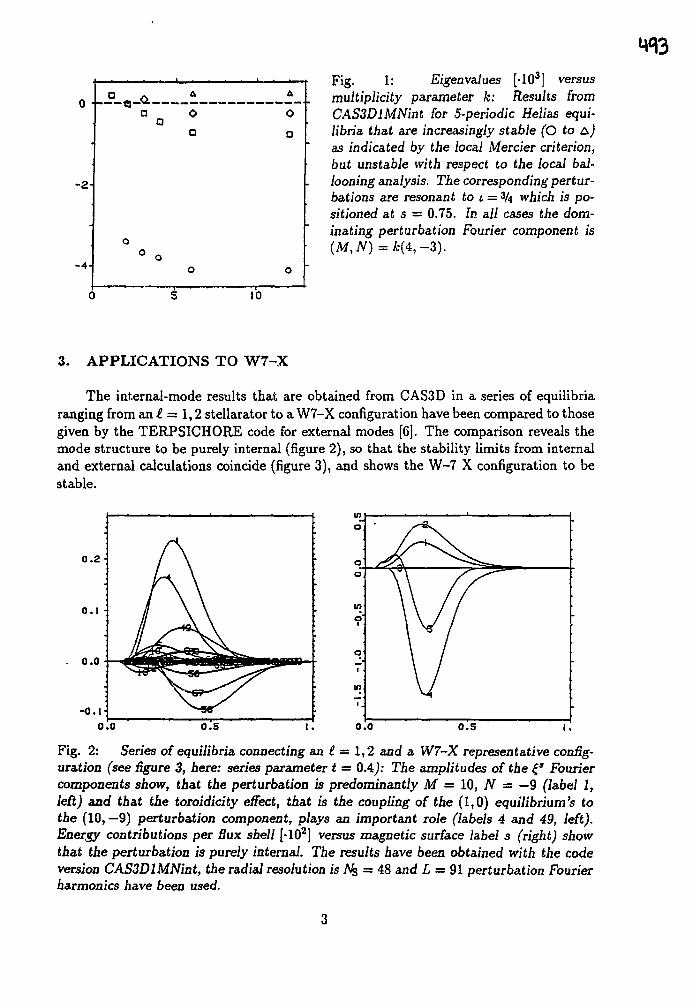
- 2 -
Fig. 1: Eigenvaiues [-103] versusmultiplicity parameter k: Results fromCAS3DlMNint for 5-periodic Helias equi-libria that are increasingly stable (O to AJas indicated by the local Mercier criterion,but unstable with respect to the local bal-looning analysis. The corresponding pertur-bations are resonant to c = 3k which is po-sitioned at s = 0.75. In all cases the dom-inating perturbation Fourier component is
10
3. APPLICATIONS TO W7-X
The internal-mode results that are obtained from CAS3D in a series of equilibriaranging from an I = 1,2 stellarator to a W7-X configuration have been compared to thosegiven by the TERPSICHORE code for external modes [6]. The comparison reveals themode structure to be purely internal (figure 2), so that the stability limits from internaland external calculations coincide (figure 3), and shows the W-7 X configuration to bestable.
0 . 2
o. i
o.o
-o.i-
o.s i .
Fig. 2: Series of equilibria connecting an £ = 1,2 and a W7-X representative config-uration (see figure 3, here: series parameter t = OA): The amplitudes of the £* Fouriercomponents show, that the perturbation is predominantly M — 10, N = — 9 (label 1,left) and that the toroidicity effect, that is the coupling of the (1,0) equilibrium's tothe (10, —9) perturbation component, plays an important role (labels 4 and 49, left).Energy contributions per flux shell [-102] versus magnetic surface label s (right) showthat the perturbation is purely internal. The results have been obtained with the codeversion CAS3DlMNint, the radial resolution is J\fc = 48 and L = 91 perturbation Fourierharmonics have been used.
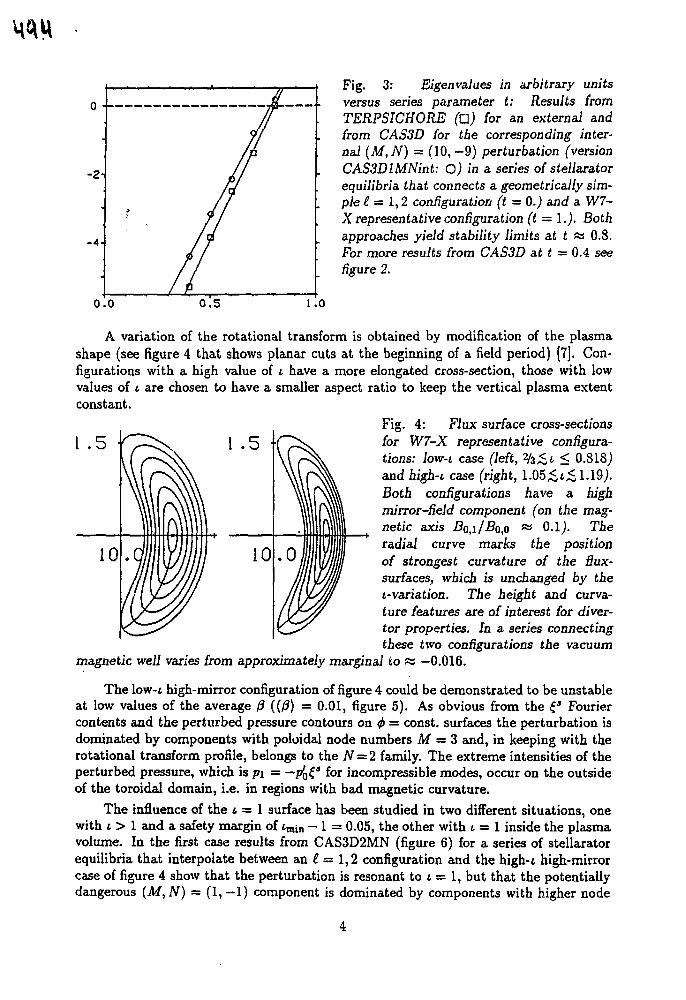
-2-
- 4 -
Fig. 3: Eigenvalues in arbitrary unitsversus series parameter t: Results fromTERPSICHORE (a) for an external andfrom CAS3D for the corresponding inter-nal (M,N) = (10, -9) perturbation (versionCAS3DlMNint: O) in a series of stellaratorequilibria that connects a geometrically sim-ple 1 = 1,2 configuration (t = 0.) and a W7-X representative configuration (t = 1.). Bothapproaches yield stability limits at t « 0.8.For more results from CAS3D at t = 0.4 seefigure 2.
0.5 1.0
A variation of the rotational transform is obtained by modification of the plasmashape (see figure 4 that shows planar cuts at the beginning of a field period) [7]. Con-figurations with a high value of i have a more elongated cross-section, those with lowvalues of i are chosen to have a smaller aspect ratio to keep the vertical plasma extentconstant.
Fig. 4: Flux surface cross-sectionsfor W7-X representative configura-tions: low-i case (left, ^h<i < 0.818)and high-L case (right, 1.05;$*;$ 1.19).Both configurations have a highmirror-field component (on the mag-netic axis Bo^/Bofl ~ 0.1). Theradial curve marks the positionof strongest curvature of the dux-surfaces, which is unchanged by thei-variation. The height and curva-ture features are of interest for diver-tor properties. In a series connectingthese two configurations the vacuum
magnetic well varies from approximately marginal to ss —0.016.
The low-t high-mirror configuration of figure 4 could be demonstrated to be unstableat low values of the average 0 ((/?) = 0.01, figure 5). As obvious from the £* Fouriercontents and the perturbed pressure contours on <j> = const, surfaces the perturbation isdominated by components with poloidal node numbers M = 3 and, in keeping with therotational transform profile, belongs to the N = 2 family. The extreme intensities of theperturbed pressure, which is pi = — p'0£
a for incompressible modes, occur on the outsideof the toroidal domain, i.e. in regions with bad magnetic curvature.
The influence of the t — 1 surface has been studied in two different situations, onewith t > 1 and a safety margin of 4m,n — 1 = 0.05, the other with i = 1 inside the plasmavolume. In the first case results from CAS3D2MN (figure 6) for a series of stellaratorequilibria that interpolate between an t = 1,2 configuration and the high-i high-mirrorcase of figure 4 show that the perturbation is resonant to i = 1, but that the potentiallydangerous (M,N) — (1,-1) component is dominated by components with higher node
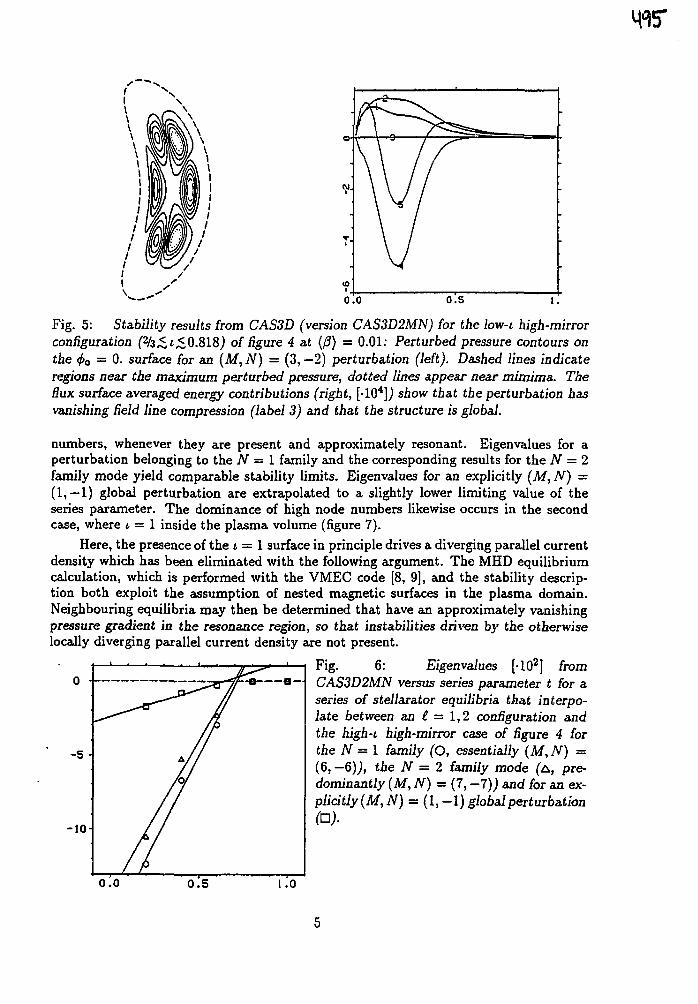
0.0 0.5
Fig. 5: Stability results from CAS3D (version CAS3D2MN) for the low-i high-mirrorconfiguration (%,$i,< 0.818,) of figure 4 at {/?) = 0.01: Perturbed pressure contours onthe (f>o = 0. surface for an (M, N) = (3, —2) perturbation (left). Dashed lines indicateregions near the maximum perturbed pressure, dotted lines appear near mimima. Theflux surface averaged energy contributions (right, [-104],) show that the perturbation hasvanishing Reid line compression (label 3) and that the structure is global.
numbers, whenever they are present and approximately resonant. Eigenvalues for aperturbation belonging to the N = 1 family and the corresponding results for the N = 2family mode yield comparable stability limits. Eigenvalues for an explicitly (Af, N) =(1,-1) global perturbation are extrapolated to a slightly lower limiting value of theseries parameter. The dominance of high node numbers likewise occurs in the secondcase, where 4 = 1 inside the plasma volume (figure 7).
Here, the presence of the i = 1 surface in principle drives a diverging parallel currentdensity which has been eliminated with the following argument. The MHD equilibriumcalculation, which is performed with the VMEC code [8, 9], and the stability descrip-tion both exploit the assumption of nested magnetic surfaces in the plasma domain.Neighbouring equilibria may then be determined that have an approximately vanishingpressure gradient in the resonance region, so that instabilities driven by the otherwiselocally diverging parallel current density are not present.
Fig. 6: Eigenvalues [-102] fromCAS3D2MN versus series parameter t for aseries of stellarator equilibria that interpo-late between an I — 1,2 configuration andthe high-c high-mirror case of figure 4 forthe N = 1 family (O, essentially (Af, N) =(6, — 6)), the N = 2 family mode (&, pre-dominantly (Af,iV) = (7, -7) ) and for an ex-plicitly(M,N) = (1,-1) giobai perturbation
//-10-
0.5 1.0
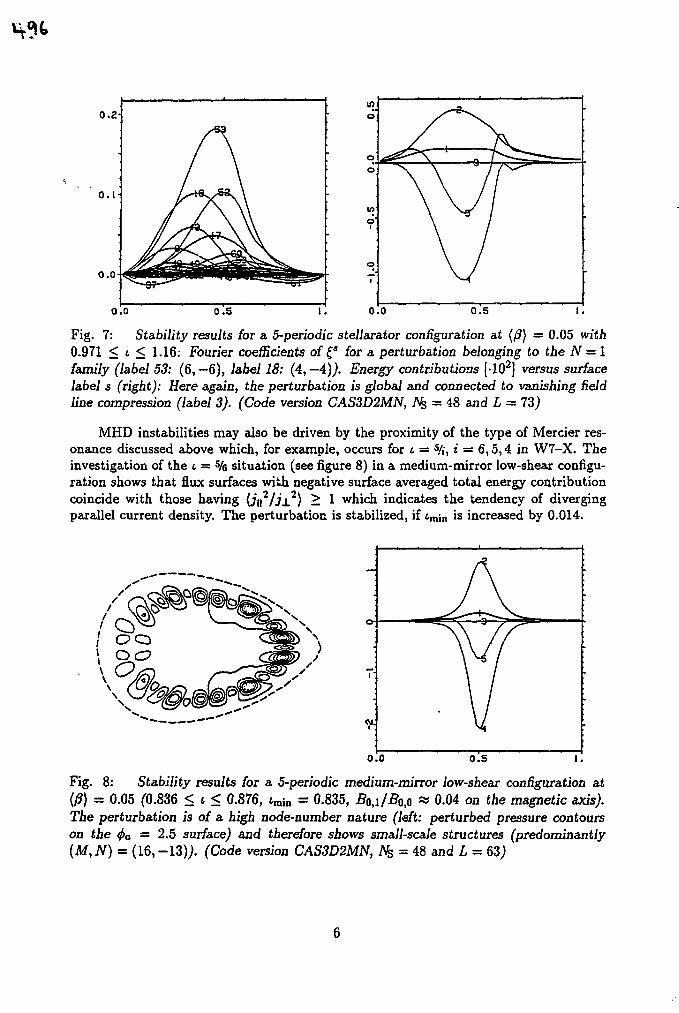
o.a
O. I
o.o
o.o 0 . 5 o.o o.s
Fig. 7: Stability results for a 5-periodic stellarator configuration at (/?} = 0.05 with0.971 < i < 1.16: Fourier coefficients of £* for a perturbation belonging to the N = 1family (label 53: (6, —6), label 18: (4, — 4)). Energy contributions [-102] versus surfacelabel s (right): Here again, the perturbation is global and connected to vanishing fieldline compression (label 3). (Code version CAS3D2MN, i\fc = 48 and L = 73 J
MHD instabilities may also be driven by the proximity of the type of Mercier res-onance discussed above which, for example, occurs for i = s/;, i = 6,5,4 in W7-X. Theinvestigation of the i — % situation (see figure 8) in a medium-mirror low-shear configu-ration shows that flux surfaces with negative surface averaged total energy contributioncoincide with those having (j[\2/j±2) > 1 which indicates the tendency of divergingparallel current density. The perturbation is stabilized, if tmin is increased by 0.014.
o o
Fig. 8: Stability results for a 5-periodic medium-mirror low-shear configuration at(0) = 0.05 (0.836 < i < 0.876, tmin = 0.835, Bo,i/Bofi « 0.04 on the magnetic axis).The perturbation is of a high node-number nature (left: perturbed pressure contourson the 4>o — 2.5 surface) and therefore shows small-scale structures (predominantly(M, N) = (16, -13)J. (Code version CAS3D2MN, Ns - 48 and L = 63J
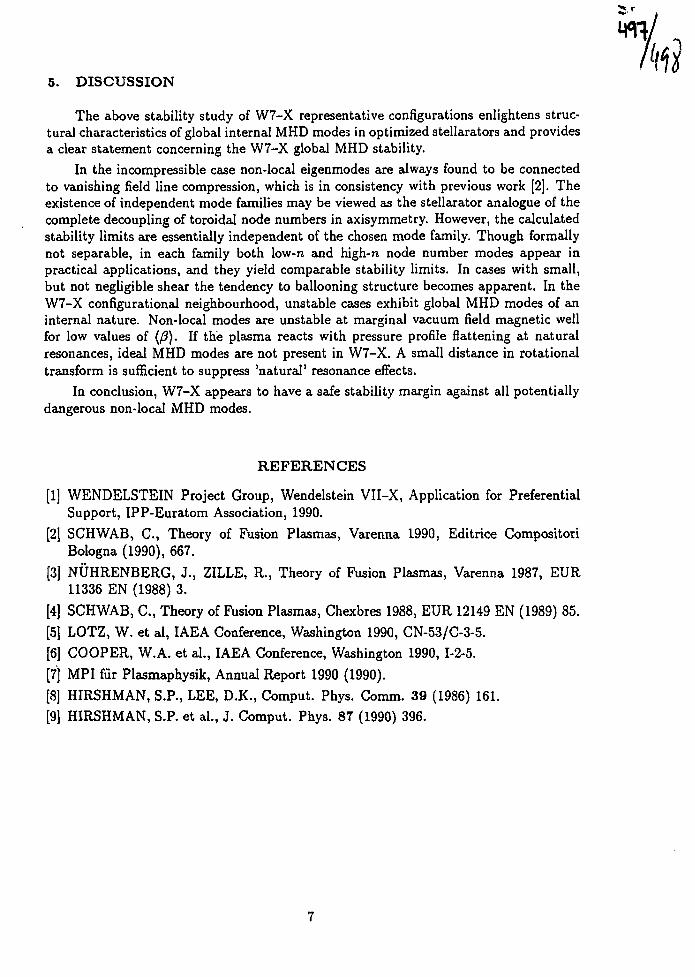
5. DISCUSSION
The above stability study of W7-X representative configurations enlightens struc-tural characteristics of global internal MHD modes in optimized stellarators and providesa clear statement concerning the W7-X global MHD stability.
In the incompressible case non-local eigenmodes are always found to be connectedto vanishing field line compression, which is in consistency with previous work [2]. Theexistence of independent mode families may be viewed as the stellarator analogue of thecomplete decoupling of toroidal node numbers in axisymmetry. However, the calculatedstability limits are essentially independent of the chosen mode family. Though formallynot separable, in each family both low-n and high-n node number modes appear inpractical applications, and they yield comparable stability limits. In cases with small,but not negligible shear the tendency to ballooning structure becomes apparent. In theW7-X configurational neighbourhood, unstable cases exhibit global MHD modes of aninternal nature. Non-local modes are unstable at marginal vacuum field magnetic wellfor low values of (/?). If the plasma reacts with pressure profile flattening at naturalresonances, ideal MHD modes are not present in W7-X. A small distance in rotationaltransform is sufficient to suppress 'natural' resonance effects.
In conclusion, W7-X appears to have a safe stability margin against all potentiallydangerous non-local MHD modes.
REFERENCES
[1] WENDELSTEIN Project Group, Wendelstein VII-X, Application for PreferentialSupport, IPP-Euratom Association, 1990.
[2] SCHWAB, C , Theory of Fusion Plasmas, Varenna 1990, Editrice CompositoriBologna (1990), 667.
[3] NUHRENBERG, J., ZILLE, R., Theory of Fusion Plasmas, Varenna 1987, EUR11336 EN (1988) 3.
[4] SCHWAB, C , Theory of Fusion Plasmas, Chexbres 1988, EUR 12149 EN (1989) 85.
[5] LOTZ, W. et al, IAEA Conference, Washington 1990, CN-53/C-3-5.
[6] COOPER, W.A. et al., IAEA Conference, Washington 1990, 1-2-5.
[7] MPI fur Plasmaphysik, Annual Report 1990 (1990).
[8] HIRSHMAN, S.P., LEE, D.K., Comput. Phys. Comm. 39 (1986) 161.
[9] HIRSHMAN, S.P. et al., J. Comput. Phys. 87 (1990) 396.
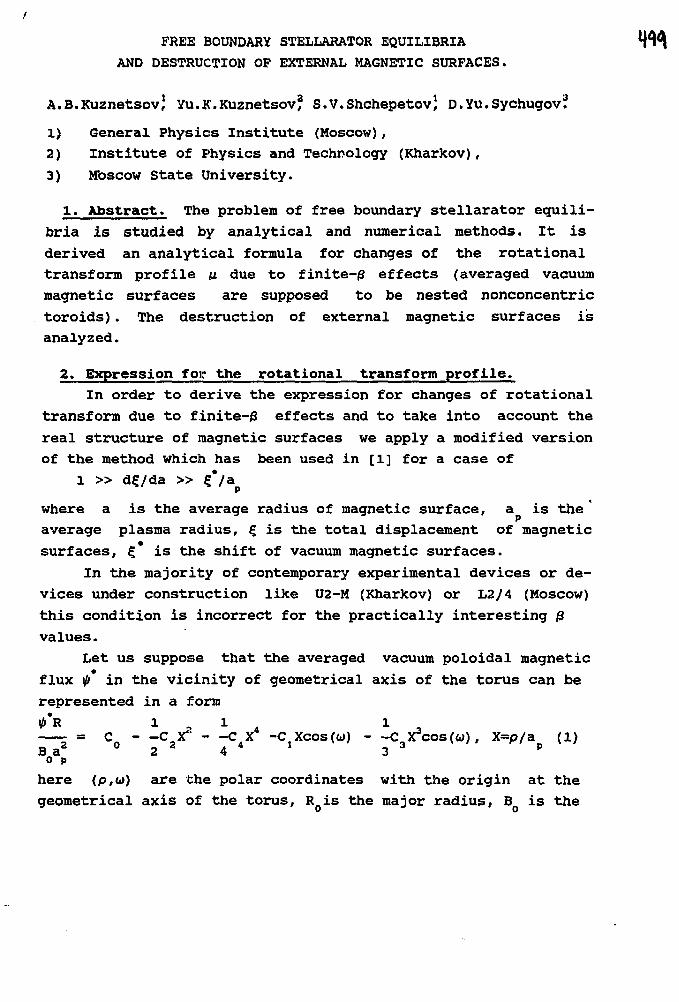
FREE BOUNDARY STELLARATOR EQUILIBRIAAND DESTRUCTION OP EXTERNAL MAGNETIC SURFACES.
A.B.Xuznetsov} Yu.K.Kuznetsov? S.V.Shchepetov) D.Yu.Sychugov?
1) General Physics Institute (Moscow),2) Institute of Physics and Technology (Kharkov),
3) Moscow State University.
1. Abstract. The problem of free boundary stellarator equili-
bria is studied by analytical and numerical methods. It is
derived an analytical formula for changes of the rotational
transform profile u due to finite-(3 effects (averaged vacuum
magnetic surfaces are supposed to be nested nonconcentric
toroids). The destruction of external magnetic surfaces is
analyzed.
2. Expression for the rotational transform profile.
In order to derive the expression for changes of rotational
transform due to finite-jS effects and to take into account the
real structure of magnetic surfaces we apply a modified version
of the method which has been used in [1] for a case of
1 » d£/da » £*/ap
where a is the average radius of magnetic surface, a is the 'p
average plasma radius, £ is the total displacement of magnetic
surfaces, £* is the shift of vacuum magnetic surfaces.
In the majority of contemporary experimental devices or de-
vices under construction like U2-M (Kharkov) or L2/4 (Moscow)
this condition is incorrect for the practically interesting |3
values.
Let us suppose that the averaged vacuum poloidal magnetic
flux $ in the vicinity of geometrical axis of the torus can be
represented in a form
= C C X* C X -CXcos(w) C X3cos(u), X=p/a (1)B a 2 O 2 2 4 4 1 3 3 p
o p
here (p,w) are the polar coordinates with the origin at the
geometrical axis of the torus, RQis the major radius, BQ is the
5 w longitudinal magnetic field at the torus geometric axis (p=0),
C( are constants. The term Cg describes the average effect of
helical field with multipolarity lo=2 and satellite harmonics
with multipolarities equal 1Q+1 or lo-l. It is necessary to
note that the Eq. (l) takes into account the average effect of
helical vacuum magnetic field and vertical axisymmetric field.
In the case of zero-net current we obtain the following
expression for the rotational transform at the shifted magnetic
surfaces:
" = (C2+C4 (a/ap)2)(l-^2/2) + 2C4€
2/a2 + 4C3€/3a2 (2)
In the case of C =0 the expression (2) goes into formula
which was derived in [1]. The vacuum rotational transform JLX can
be obtained from the Eq.(2) if we put
€ = € * - - (Ci+C3(a/ap)2/3) / (C2+C4(a/ap)
2) (3)
One can note that in the case of small values of <£/a } morep
rigid dependence of u on ? (linear) follows from the Eq.(2)
in presence of C component.
The term C characterizes the effect of shift of plasma
in inhomogeneous quasi-vertical field which increases or
decreases the effective poloidal field in various plasma
regions.
3. Destruction of magnetic surfaces.
This problem may be important, in particular, when we ana-
lyze the high-/3 equilibrium or the possibility of existence of
natural divertor.
The destruction of the external magnetic surfaces is the
result of the plasma field and helical vacuum field interaction
and of the plasma boundary shift towards the coils region.
The following procedure is utilized to investigate the ef-
fect of destruction. We solve numerically the two-dimensional
equilibrium equation [2,3] assuming that the current flowing
through each surface cross section is equal to zero.
To eliminate the "artificial stochastization11 of the
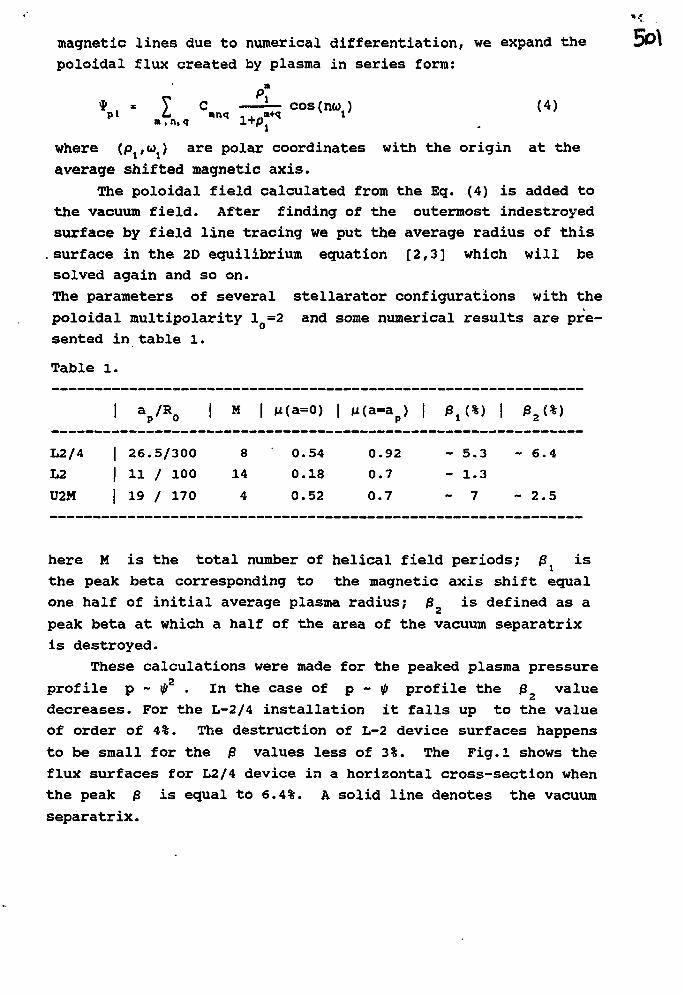
magnetic lines due to numerical differentiation, we expand the 0O\
poloidal flux created by plasma in series form:
* , - 7 C — cos(na> ) (4)m n <j 1 + P
where (p^o^) are polar coordinates with the origin at the
average shifted magnetic axis.
The poloidal field calculated from the Eq. (4) is added to
the vacuum field. After finding of the outermost indestroyed
surface by field line tracing we put the average radius of this
surface in the 2D equilibrium equation [2,3] which will be
solved again and so on.
The parameters of several stellarator configurations with the
poloidal multipolarity 1=2 and some numerical results are pre-
sented in table 1.
Table 1.
L2/4
L2
U2M
| 26.
1 111 19
5/300
/ 100
/ 170
M |
8
14
4
0.
0.
0.
=0) |
54
18
52
0.
0.
0.
V 192
7
7
»,(*> 1
- 5.3
- 1.3
- 7
».<
- 6.
**• 2
%)
4
5
here M is the total number of helical field periods; jSi is
the peak beta corresponding to the magnetic axis shift equal
one half of initial average plasma radius; 0 is defined as a
peak beta at which a half of the area of the vacuum separatrix
is destroyed.
These calculations were made for the peaked plasma pressure
profile p - ill2 . In the case of p - if) profile the 0 value
decreases. For the L-2/4 installation it falls up to the value
of order of 4%. The destruction of L-2 device surfaces happens
to be small for the 0 values less of 3%. The Fig.l shows the
flux surfaces for L2/4 device in a horizontal cross-section when
the peak /3 is equal to 6.4%. A solid line denotes the vacuum
separatrix.
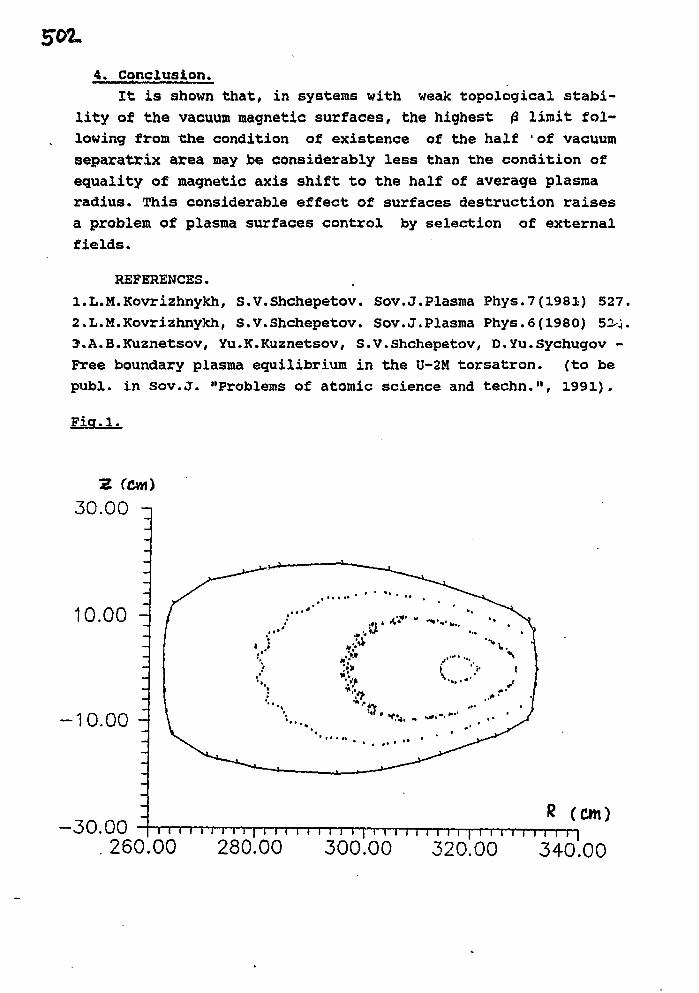
502.
4. Conclusion.
It is shown that, in systems with weak topological stabi-
lity of the vacuum magnetic surfaces, the highest 0 limit fol-
lowing from the condition of existence of the half ' of vacuum
separatrix area may be considerably less than the condition of
equality of magnetic axis shift to the half of average plasma
radius. This considerable effect of surfaces destruction raises
a problem of plasma surfaces control by selection of external
fields.
REFERENCES.
l.L.M.Kovrizhnykh, S.v.Shchepetov. Sov.J.Plasma Phys.7(l98l) 527.
2.L.M.Kovrizhnykh, S.v.Shchepetov. Sov.J.Plasma Phys.6(1980) 52^.
3\A.B.Kuznetsov, Yu.K.Kuznetsov, S.v.Shchepetov, D.Yu.Sychugov -
Free boundary plasma equilibrium in the U-2M torsatron. (to be
publ. in Sov.J. "Problems of atomic science and techn.", 1991).
Fiq.l.
H (cm)30.00 n
10.00 -
-10.00 -
-30.00 (cm)m i i i i i i | i i i i i i i i i i i i i i i i i i y i i i i i t i i r i
. 260.00 280.00 300.00 320.00 340.00
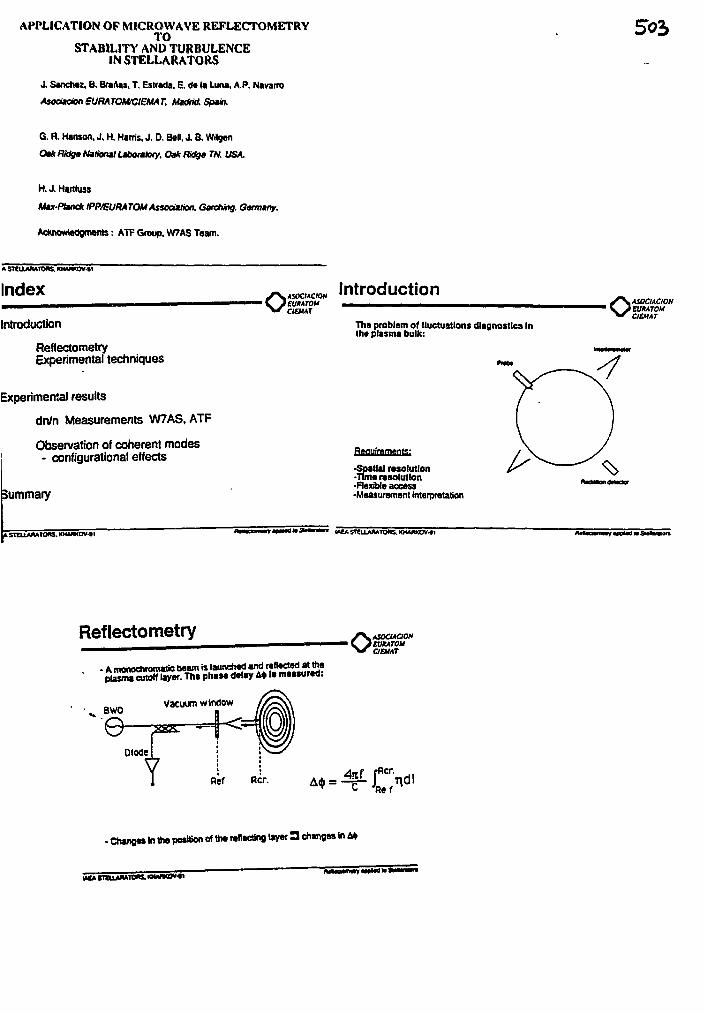
APPLICATION OF MICROWAVE REFLECTOMETRYTO
STABILITY AND TURBULENCEINSTELLARATORS
J. Sanchez, B. Brartas. T. Estrada, E. de la Luna, A.P. Navarro
Asodaaon eURATCUVCISMAT. Madrid. Spain.
G. R. Hanson. J. H. Harris. J. 0. B«ll, J. B. Wilgen
Otk Ridge National Laboratory. Oak Ridge TN. USA.
H.J.H«rttuss
Max-Planck IPP/SURATOM Association. Garching. Germany.
Acknowledgments: ATF Group, W7AS Team.
* 5TEUARMORS, KHMW0V4I
Index OASOCMCIONeUKATOMCICMAT
Introduction
Introduction
ReflectometryExperimental techniques
Experimental results
dn/n Measurements W7AS, ATF
Observation of coherent modes- configurational effects
Summary
The problem of fluctuations diagnostics Inth* plasma bulk:
OASOCMCIONEVMTOMCltMAT
Requirements:
-Spatial resolution•Tim* resolution•Flexible access-Measurement interpretation
> SIBUUUTOHS. KHMKOV4I . KHAM(0V-41
Reflectometry
• BWO
romatic beam is launched and reflected at thet f f l ^ r . The phase delay A* la measured:
Vacuum window
Otoae
Ref
O ASOCUCI0NEUKATOUOEH/LT
- Changes In the posifion of the reflecting layer 3 changes In 6*
MCA STOlAIUTORS. OIMK0V4I
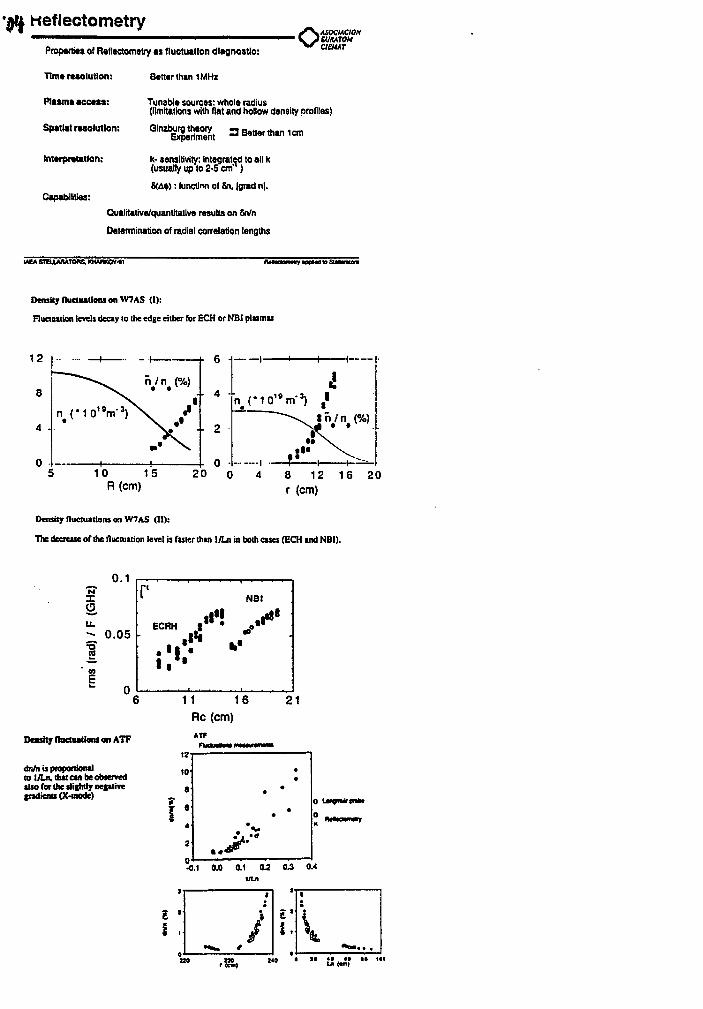
neflectometry
Properties of Reflectometry as fluctuatlgn diagnostic:
Tim* rtsolutlon: Bctt«r than 1 MHz
oASOCIACIONEUKATOHCIEMAT
Plasma access: Tunable sources: whole radius(limitations with flat and hollow density profiles)
Spatial resolution: Ginzbur^heon^ 3 Better than 1 cm
Interpretation:
Capabifities:
k- sensitivity: integrated to all k(usually up to 2-5 cm )
8(A«: function of £n. Igrad n|.
Qualitative/quantitative results on Sn/n
Determination of radial correlation lengths
IAEA STOXARATORS. KHMKOV<tl
Density lUicliiatloiis on W7 AS (I):
Fluctuation levels decay to the edge either for ECH or NBI plasmas
12
8
4 •
0
6 H , i
_ _ |I
10 15 20 0 4 8 12 16 20R (cm) r (cm)
Density nuctuailoiu on W7AS (II):
The decrease of the flucniaiion level is faster than 1/Ln in both cases (ECH and NBI).
2.u.
0.05
DensHjr IbcuiaUons on ATF
dn/n ts proportionalto IAJI* thai can be observedalso for the slightly negativegradients (X-mode)
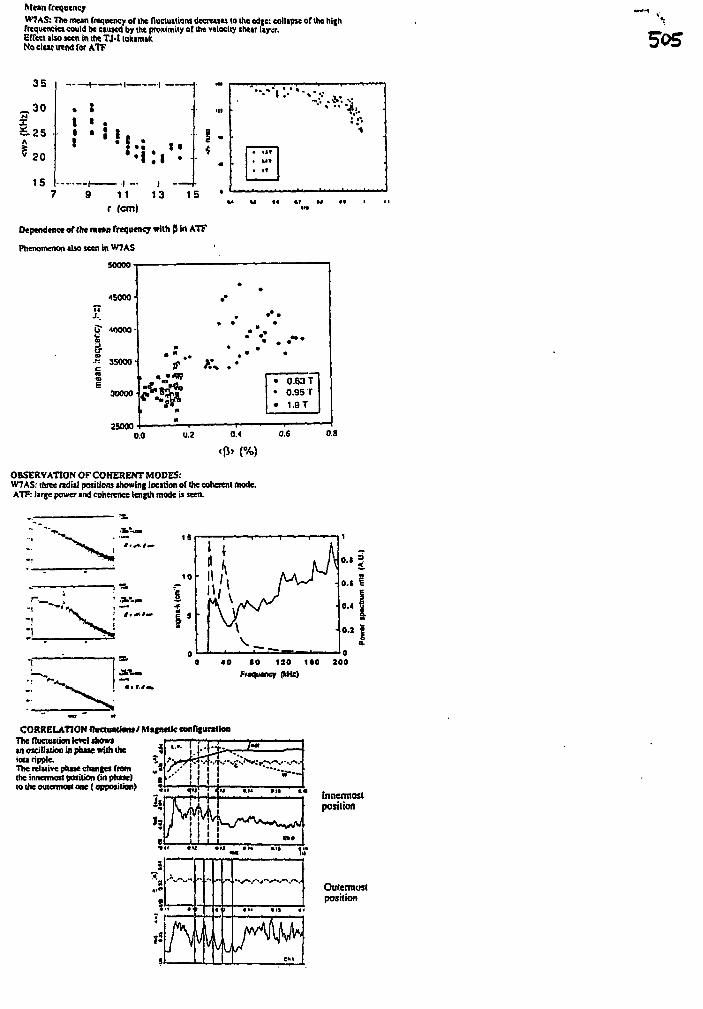
M«*n frequency
W7AS: The mean frequency of Ihe fluctuation! decrease! to die ed|c: collapse of the highfrequencies could be caused by the proximity of the velocity their laysr.Errcct i lw seen in the TJ-t tokamikNo clear trend for A I T
3 5
~30
1.25A
* 20
15
• I 1 —
; : ; >
7 9 1 1 1 3 1 5
r (cm)
Dependence of Hi* rann frequency with 0 In ATF
Phenomenon also seen in W7AS
50000
• UT
* M l
• If
• * • i t
25000
OBSERVATION OF COHERENT MODES:W7 AS: three ndial positions ihowing location of the coheitnt mode.ATP: large power and coherence length mode U seen.
rs.
CORRELATION flirctowtanj/ Magnetic cmnguntloaThe fluctuation level thowtan oscillaikm in phase with the *iota ripple.The relative phase changes fromthe innermost position (in phase)to the outermost one (opposition) *
I.
11* tf«
lnnennastposition
A - . - - - .
5»
* • <
/ \
•• -
V
...
«V
> • •• «•» •
Oulermoslposition
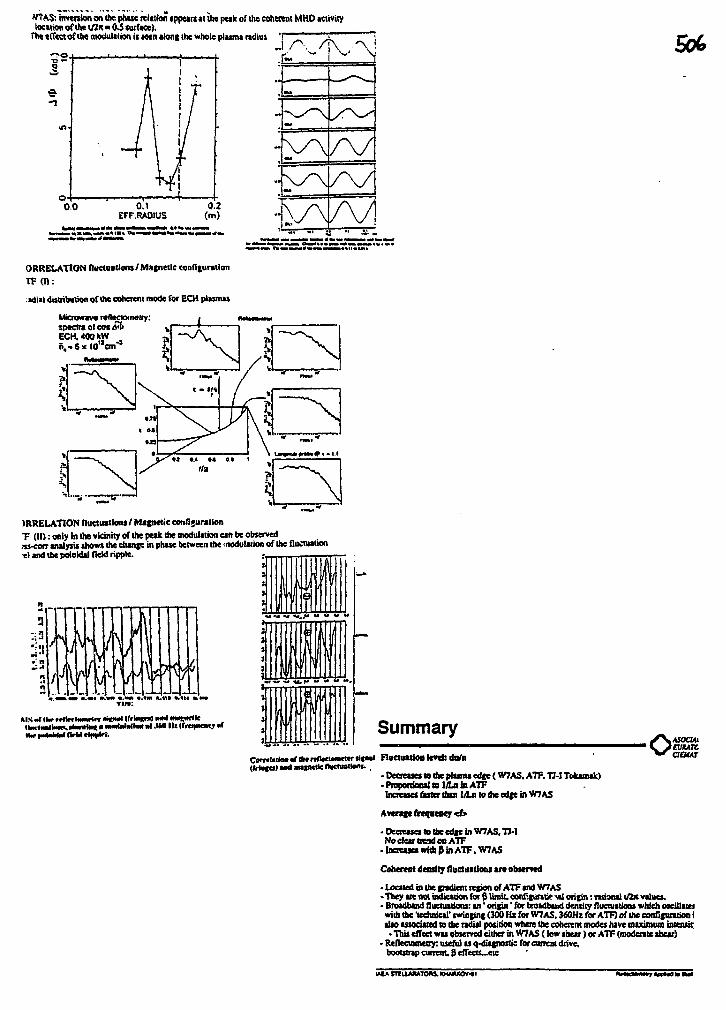
•V? AS; inversion on the phase relation appear* at tire peak of the coherent MHD activitylocation of the U ? K « 0 4 surface).
Che effect of the modulation it seen alone the whole plasma tadiu* T - .
ORRELATtON fluctuation!/Magnetic configuration
TF(H:
JdUl disuibulion of Ihe coherent mode for ECH plasmas
Microwave- rcflsclonMtry: ,
ECH. 400 kWB,«6iet0'lem">
)RRELAT1ON tluctiurtlons / Magnetic cond juratkmT (II): only in the vicinity of Ihe peak the modulation can be observedss-coiT analysis shows the change in phase between the snodulation of Ihe fluctuationel and the poloMal field ripple.
\ itIi3 f \1
1J ' /3 JJ1 . . . . . . . .
JAf."IT ,
i i
Summary oASQCUtBIIUK
OFluctuation Icrti: do/n
- Decreases to * e plasma edge { W7AS. ATF. TI-I Tokamak)-Proponiooalttl/LainATFIncreuet faster than I/In w the edp in W7AS
AVCI mt RVtt^KflCf *Ct>
• Decreases to the edie in W7AS, TI-INo clear tread on A77
• Increases with p in ATF. W7AS
Cobenat dtnsitj fluctuatioM are observed
- Located in me gradient rejion of ATF and W7AS- They ate not indication for p limit, confituriw- «1 origin: radooal i/2« values.• Broadband fluctuations: an' origin' for broadbaud density fluctuations which "twith the 'technical' swinging (300 Hz for W7AS. 360Hz for AIT) of Ihe configuration ialto aasociited to the radial position whew the coherent modes have maximum inicntir- This effect was observed either in W7AS (low inear ) or ATF (moderate shear)
• Rtflectometry: useful as q-diagnostic forcuntat drive,booistnp cunent, p eflects.-eu
IUA STIUAMTOKS. KHAIW0V41
COIL SYSTEMS FOR OPTIMAL FLEXIBILITY IN W7-X
P. MERKEL
IPP-Euratom Association,Max-Planck-Institut fur Plasmaphysik,Garching, Federal Republic of Germany
Abstract
COIL SYSTEMS FOR OPTIMAL FLEXIBILITY IN W7-X.
A method to determine coil systems for a set of optimized W7-X configurations is described. Asystem consisting of a main modular coil set and an auxiliary modular coil set is obtained which, inparticular, allows variation of the rotational transform and mirror ratio.
To study the flexibility for W7-X [1], a set of variants additional to a basic config-uration was computed by optimizing Helias configurations [2]. These variants cover arange of the rotational transform at the boundary of | < i < f and high as well as lowmirror ratios of the magnetic field.
At the boundary these configurations form a "helical edge" given by the half-helix-like line along the locus of strongest boundary curvature connecting the bottom of theindented cross-section via the triangular cross-section to the top of the indented cross-section one period apart. This region appears to be suitable for divertor action. Detailedstudies of the vacuum field outside the last closed surface show that the field diversionoccurs essentially along the helical edge close to which x-points between islands appear[3]. The set of optimized configurations was selected with the additional intention ofgiving the helical edge an approximately constant location in space, necessary for theinstallation of a fixed divertor structure.
To generate the vacuum fields of this optimized set of variants, a coil system consist-ing of two sets of modular coils is studied where the standard configuration is producedby the main modular coil set and the variants are approximated by adding the currentsof a supplementary set of coils surrounding the main coil system and/or by controllingthe coil currents individually. Variation of the iota profile is achieved by means of thecurrents of the auxiliary coils, while the mirror ratio can be adjusted by varying thecurrents of the main (and auxiliary) coils individually.
In order to find such an appropriately optimized coil system, an extended versionof the NESCOIL code is applied. A detailed description of the procedure is given in [4,5]: On an outer boundary a surface current is determined such that the vacuum field ofthe W7-X configuration is closely approximated.
This is achieved by approximate solution of the Neumann problem of making thenormal component of the field produced by the surface current on the prescribed plasmaboundary vanish:
F= j{B- n)2df = min!
Modular coils are then obtained by discretizing the surface current into a finite numberof poloidally closed, infinitely thin filaments which represent the centre of the finite-sizecoils.
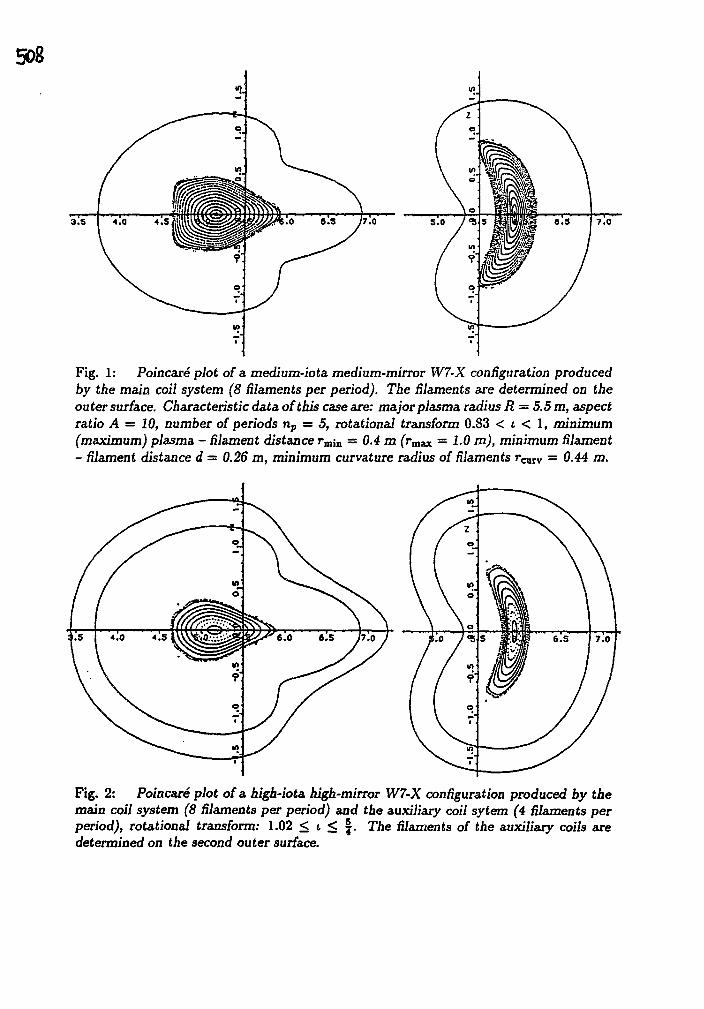
508
Fig. 1: Poincare plot of a medium-iota medium-mirror W7-X configuration producedby the main coil system (8 filaments per period). The filaments are determined on theouter surface. Characteristic data of this case are: major plasma radius R = 5.5 m, aspectratio A = 10, number of periods np = 5, rotational transform 0.83 < i < 1, minimum(maximum) plasma - filament distance rm j n — 0.4 m (rmax =1.0 m), minimum filament- filament distance d = 0.26 m, minimum curvature radius of filaments rcurv = 0.44 m.
Fig. 2: Poincare plot of a higb-iota high-mirror W7-X configuration produced by themain coil system (8 filaments per period) and the auxiliary coil sytem (4 filaments perperiod), rotational transform: 1.02 < t < | . The filaments of the auxiliary coils aredetermined on the second outer surface.
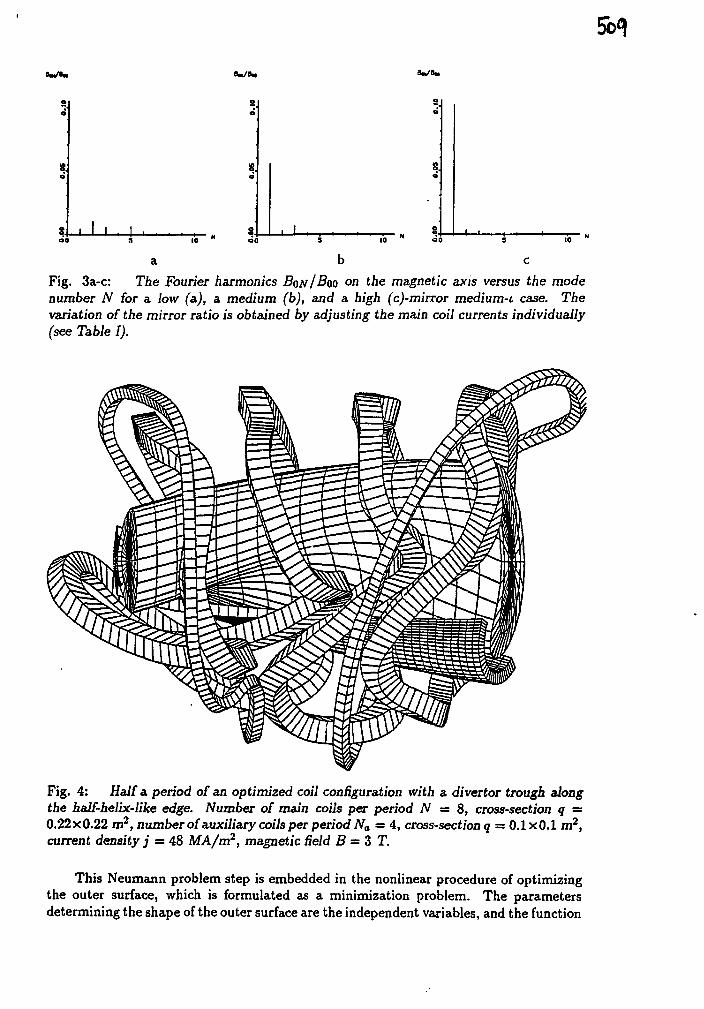
8.
IWh
2
8.
Fig. 3a-c: TAe Fourier harmonics BQN/BOO on the magnetic axis versus the modenumber N for a low (a), a medium (b), and a high (c)-mirror medium-t case. Thevariation of the mirror ratio is obtained by adjusting the main coil currents individually(see Table I).
Fig. 4: Half a period of an optimized coil configuration with a divertor trough alongthe half-helix-like edge. Number of main coils per period N = 8, cross-section q —0.22x0.22 m2, number of auxiliary coils per period Na = 4, cross-section q = 0.1x0.1 m2,current density j = 48 MA/m2, magnetic field B = 3 T.
This Neumann problem step is embedded in the nonlinear procedure of optimizingthe outer surface, which is formulated as a minimization problem. The parametersdetermining the shape of the outer surface are the independent variables, and the function
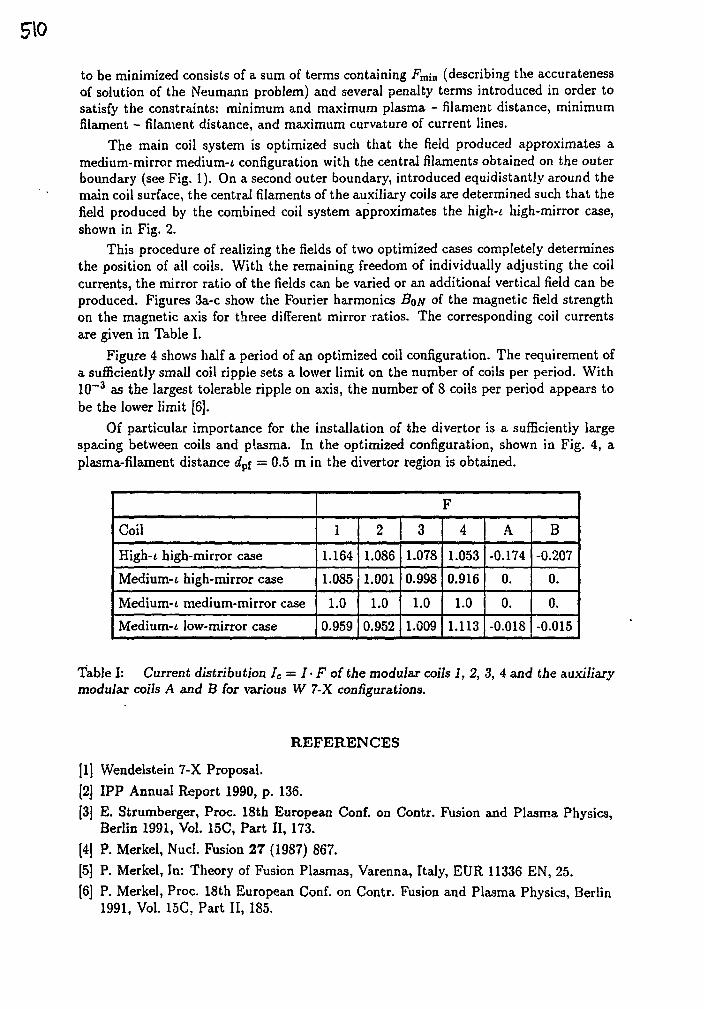
510
to be minimized consists of a sum of terms containing Fmin (describing the accuratenessof solution of the Neumann problem) and several penalty terms introduced in order tosatisfy the constraints: minimum and maximum plasma - filament distance, minimumfilament - filament distance, and maximum curvature of current lines.
The main coil system is optimized such that the field produced approximates amedium-mirror medium-t configuration with the central filaments obtained on the outerboundary (see Fig. 1). On a second outer boundary, introduced equidistantly around themain coil surface, the central filaments of the auxiliary coils are determined such that thefield produced by the combined coil system approximates the high-6 high-mirror case,shown in Fig. 2.
This procedure of realizing the fields of two optimized cases completely determinesthe position of all coils. With the remaining freedom of individually adjusting the coilcurrents, the mirror ratio of the fields can be varied or an additional vertical field can beproduced. Figures 3a-c show the Fourier harmonics BoJV of the magnetic field strengthon the magnetic axis for three different mirror ratios. The corresponding coil currentsare given in Table I.
Figure 4 shows half a period of an optimized coil configuration. The requirement ofa sufficiently small coil ripple sets a lower limit on the number of coils per period. With10~3 as the largest tolerable ripple on axis, the number of 8 coils per period appears tobe the lower limit [6].
Of particular importance for the installation of the divertor is a sufficiently largespacing between coils and plasma. In the optimized configuration, shown in Fig. 4, aplasma-filament distance dpf = 0.5 m in the divertor region is obtained.
Coil
High-i high-mirror case
Medium-1 high-mirror case
Medium-i medium-mirror case
Medium-* low-mirror case
F
1
1.164
1.085
1.0
0.959
2
1.086
1.001
1.0
0.952
3
1.078
0.998
1.0
1.009
4
1.053
0.916
1.0
1.113
A
-0.174
0.
0.
-0.018
B
-0.207
0.
0.
-0.015
Table I: Current distribution Ic = I • F of the modular coils 1, 2, 3, 4 and the auxiliarymodular coils A and B for various W 7-X configurations.
REFERENCES
[1] Wendelstein 7-X Proposal.
[2] IPP Annual Report 1990, p. 136.
[3] E. Strumberger, Proc. 18th European Conf. on Contr. Fusion and Plasma Physics,Berlin 1991, Vol. 15C, Part II, 173.
[4] P. Merkel, Nud. Fusion 27 (1987) 867.
[5] P. Merkel, In: Theory of Fusion Plasmas, Varenna, Italy, EUR 11336 EN, 25.
[6] P. Merkel, Proc. 18th European Conf. on Contr. Fusion and Plasma Physics, Berlin1991, Vol. 15C, Part II, 185.
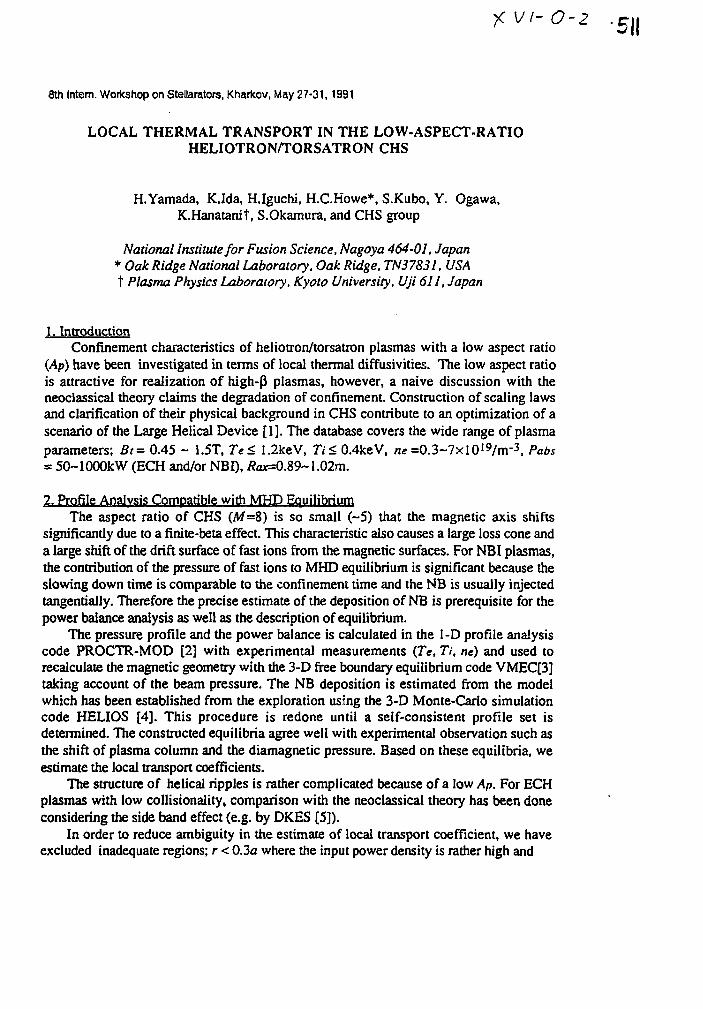
)CVI-O-2 . eII
8th Intern. Workshop on Stellarators, Kharkov, May 27-31,1991
LOCAL THERMAL TRANSPORT IN THE LOW-ASPECT-RATIOHELIOTRON/TORSATRON CHS
H.Yamada, K.Ida, H.Iguchi, H.C.Howe*, S.Kubo, Y. Ogawa,K.Hanatanit, S.Okamura, and CHS group
National Institute for Fusion Science, Nagoya 464-01, Japan* Oak Ridge National Laboratory, Oak Ridge, TN37831, USAt Plasma Physics Laboratory, Kyoto University, Uji 611, Japan
1. IntroductionConfinement characteristics of heliotron/torsatron plasmas with a low aspect ratio
(Ap) have been investigated in terms of local thermal diffusivities. The low aspect ratiois attractive for realization of high-(3 plasmas, however, a naive discussion with theneoclassical theory claims the degradation of confinement. Construction of scaling lawsand clarification of their physical background in CHS contribute to an optimization of ascenario of the Large Helical Device [1]. The database covers the wide range of plasmaparameters; Bt = 0.45 ~ 1.5T, Te< 1.2keV, Ti< 0.4keV, /ie=0.3~7xl0 I9/nr3 , Pabs= 50-1000kW (ECH and/or NBI), tfo*=0.89~ 1.02m.
2. Profile Analysis Compatible with MHD EquilibriumThe aspect ratio of CHS (Af=8) is so small (~5) that the magnetic axis shifts
significantly due to a finite-beta effect. This characteristic also causes a large loss cone anda large shift of the drift surface of fast ions from the magnetic surfaces. For NBI plasmas,the contribution of the pressure of fast ions to MHD equilibrium is significant because theslowing down time is comparable to the confinement time and the NB is usually injectedtangentially. Therefore the precise estimate of the deposition of NB is prerequisite for thepower balance analysis as well as the description of equilibrium.
The pressure profile and the power balance is calculated in the 1-D profile analysiscode PROCTR-MOD [2] with experimental measurements (Te, Ti, ne) and used torecalculate the magnetic geometry with the 3-D free boundary equilibrium code VMEC[3]taking account of the beam pressure. The NB deposition is estimated from the modelwhich has been established from the exploration using the 3-D Monte-Carlo simulationcode HELIOS [4]. This procedure is redone until a self-consistent profile set isdetermined. The constructed equilibria agree well with experimental observation such asthe shift of plasma column and the diamagnetic pressure. Based on these equilibria, weestimate the local transport coefficients.
The structure of helical ripples is rather complicated because of a low Ap. For ECHplasmas with low collisionality, comparison with the neoclassical theory has been doneconsidering the side band effect (e.g. by DKES [5]).
In order to reduce ambiguity in the estimate of local transport coefficient, we haveexcluded inadequate regions; r < 0.3a where the input power density is rather high and
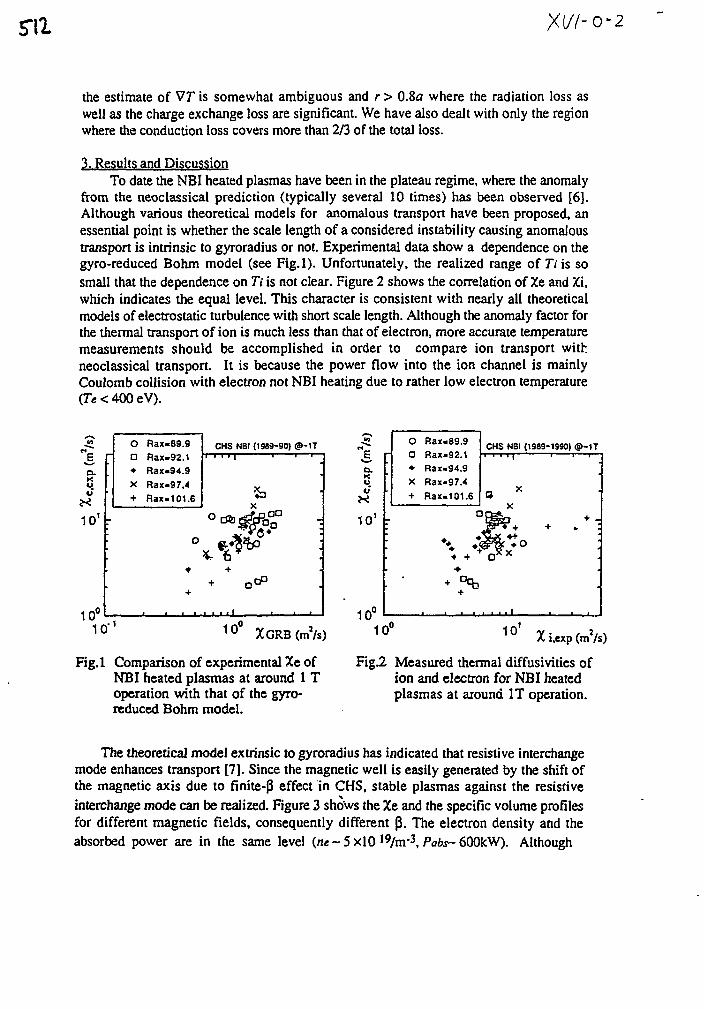
su Xt//-o-2
the estimate of VT is somewhat ambiguous and r > 0.8a where the radiation loss aswell as the charge exchange loss are significant. We have also dealt with only the regionwhere the conduction loss covers more than 2/3 of the total loss.
3. Results and DiscussionTo date the NBI heated plasmas have been in the plateau regime, where the anomaly
from the neoclassical prediction (typically several 10 times) has been observed [6].Although various theoretical models for anomalous transport have been proposed, anessential point is whether the scale length of a considered instability causing anomaloustransport is intrinsic to gyroradius or not. Experimental data show a dependence on thegyro-reduced Bohm model (see Fig.l). Unfortunately, the realized range of 7"; is sosmall that the dependence on Ti is not clear. Figure 2 shows the correlation of Xe and Xi,which indicates the equal level. This character is consistent with nearly all theoreticalmodels of electrostatic turbulence with short scale length. Although the anomaly factor forthe thermal transport of ion is much less than that of electron, more accurate temperaturemeasurements should be accomplished in order to compare ion transport withneoclassical transport. It is because the power flow into the ion channel is mainlyCoulomb collision with electron not NBI heating due to rather low electron temperature(Te < 400 eV).
E rD.K•iO
10'fr
O Rax-89.9O Rax-92.1• Rax-94.9x Rax-97.4+ Rax-101.6
O
•
CHS NBI (1989-90) @-1T
10 1 ° XGRB (m'/s)
Fig.l Comparison of experimental Xe ofNBI heated plasmas at around 1 Toperation with that of the gyro-reduced Bohm model.
E ra.K
101 r
10°
;
O
a•
X
+
RaxRax
-89.9-92.1
Rax-94.9Rax
Rax
-97.4
.101.6
C
\ • ;• +
+
CHS NBI (1989-1990) <3>-1T
O
)Q=J
• • i • ' •
X
b * -• + + :«+_ :
;x
. i • .
10° % i.exp (m /s)
Fig.2 Measured thermal diffusivities ofion and electron for NBI heatedplasmas at around IT operation.
The theoretical model extrinsic to gyroradius has indicated that resistive interchangemode enhances transport [7]. Since the magnetic well is easily generated by the shift ofthe magnetic axis due to finite-P effect in CHS, stable plasmas against the resistiveinterchange mode can be realized. Figure 3 shows the Xe and the specific volume profilesfor different magnetic fields, consequently different p. The electron density and theabsorbed power are in the same level (ne~5xl0 19/nr3, Pate-600kW). Although
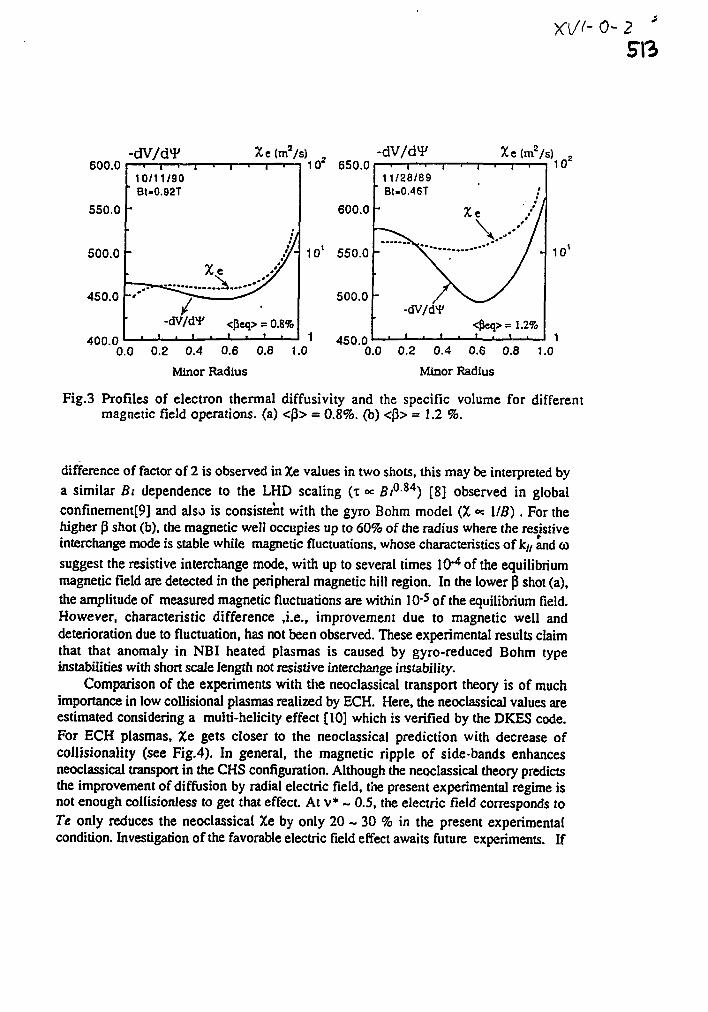
600.0
550.0
500.0
450.0
Ann n
-dV/d^
10/11/90' BI-0.92T
• i * 1 • i •
Xc (m2/*
/
> = 0.8%1 .
- 0- 2
102 650.0
600.0
- 10' 550.0
500.0
Xe(m2/s)
11/28/89Bt-0.46T
<&eq> = 1.2%
) 2
101
0 1 450.0' • I • I • I • I • I 10.0 0.2 0.4 0.6 0.8 1.0 0.0 0.2 0.4 0.6 0.8 1.0
Minor Radius Minor Radius
Fig.3 Profiles of electron thermal diffusivity and the specific volume for differentmagnetic field operations, (a) <p> = 0.8%. (b) <P> = 1.2 %.
difference of factor of 2 is observed in Xe values in two shots, this may be interpreted bya similar Bt dependence to the LHD scaling (x <* Bt0M) [8] observed in globalconfinement^] and also is consistent with the gyro Bohm model (X « MB). For thehigher p shot (b), the magnetic well occupies up to 60% of the radius where the resistiveinterchange mode is stable while magnetic fluctuations, whose characteristics of ktl and (O
suggest the resistive interchange mode, with up to several times \QA of the equilibriummagnetic field are detected in the peripheral magnetic hill region. In the lower p shot (a),the amplitude of measured magnetic fluctuations are within 10*5 of the equilibrium field.However, characteristic difference ,i.e., improvement due to magnetic well anddeterioration due to fluctuation, has not been observed. These experimental results claimthat that anomaly in NBI heated plasmas is caused by gyro-reduced Bohm typeinstabilities with short scale length not resistive interchange instability.
Comparison of the experiments with the neoclassical transport theory is of muchimportance in low collisional plasmas realized by ECH. Here, the neoclassical values areestimated considering a multi-helicity effect [10] which is verified by the DKES code.For ECH plasmas, Xe gets closer to the neoclassical prediction with decrease ofcollisionality (see Fig.4). In general, the magnetic ripple of side-bands enhancesneoclassical transport in the CHS configuration. Although the neoclassical theory predictsthe improvement of diffusion by radial electric field, the present experimental regime isnot enough collisionless to get that effect. At v* - 0.5, the electric field corresponds toTe only reduces the neoclassical Xe by only 20 ~ 30 % in the present experimentalcondition. Investigation of the favorable electric field effect awaits future experiments. If
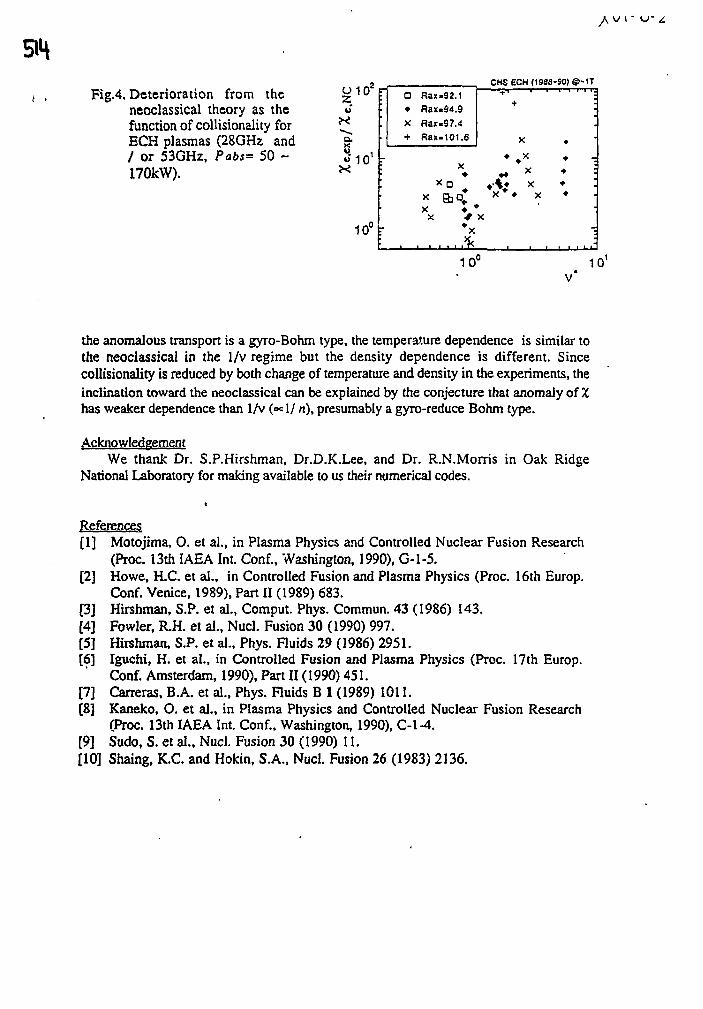
yvv/»
Fig.4. Deterioration from theneoclassical theory as thefunction of collisionality forECH plasmas (28GHz and/ or 53GHz, Pabs= 50 -170kW).
o io*
o.
J10'
10" r
a•
X
+
r
Rax.Rax.
Rax-
Rax.
X
XX
X
92.194.9
97.4
101.6
X
V•x
CHS
X *•
X
ECH (19M-90) ©-1T
+
X
• *XX
• X
• -• :• \*
-.
10° 101
V
the anomalous transport is a gyro-Bohm type, the temperature dependence is similar tothe neoclassical in the 1/v regime but the density dependence is different. Sincecollisionality is reduced by both change of temperature and density in the experiments, theinclination toward the neoclassical can be explained by the conjecture that anomaly of Xhas weaker dependence than 1/v («= 1/ n), presumably a gyro-reduce Bohm type.
AcknowledgementWe thank Dr. S.P.Hirshman, Dr.D.K.Lee, and Dr. R.N.Morris in Oak Ridge
National Laboratory for making available to us their numerical codes.
References[1] Motojima, O. et al., in Plasma Physics and Controlled Nuclear Fusion Research
(Proc. 13th IAEA Int. Conf., Washington, 1990), G-l-5.[2] Howe, H.C. et al., in Controlled Fusion and Plasma Physics (Proc. 16th Europ.
Conf. Venice, 1989), Part II (1989) 683.[3] Hirshman, S.P. et al., Comput. Phys. Commun. 43 (1986) 143.[4] Fowler, R.H. et al., Nucl. Fusion 30 (1990) 997.[5] Hirshman, S.P. et al., Phys. Fluids 29 (1986) 2951.[6] Iguchi, H. et al., in Controlled Fusion and Plasma Physics (Proc. 17th Europ.
Conf. Amsterdam, 1990), Part II (1990) 451.[7] Carreras, B.A. et al., Phys. Fluids B 1 (1989) 1011.[8] Kaneko, O. et al., in Plasma Physics and Controlled Nuclear Fusion Research
(Proc. 13th IAEA Int. Conf., Washington, 1990), C-l-4.[9] Sudo, S. et al., Nucl. Fusion 30 (1990) 11.[10] Shaing, K.C. and Hokin, S.A., Nucl. Fusion 26 (1983) 2136.
515
Efficiency of EOR wave absorption in the L-2 stellarator.Eh. D. Andryukhina , K.S. Dyabilin , O.X. Fedyanin
General Physics Institute , Moscow , USSR
Introduction.The study of ECR heating of a ourrentless plasma in the 1-2
stellarator has shown that this method allows us to produce
plasma with the following parameters : Te(0)=1keV, n <2*10'-'om -1
,Ti(0)=0.1KeV [13. The energy confinement time of plasma in thisregime is Tg= 3 as.
Aooordinary to theoretical calculations the absorption coef-ficient of a microwave in plasma with such parameters should beabout 90 % , but actually this value , measured from the jump ofthe energy derivative at the moment when the heating power isswithed off , does not exceed 50-60 %.
In the present paper a 3tudy is made of some peculiar featu-res of the method of measuring the absorption power from theplasma diamagnetism. The measurements of both longitudinalmagnetic flux and transverse flux due to the equilibrium plasmacurrents were used.
The method of determining the absorbed power P a b is basedon tiie plasma energy balance equation :
d w/ dt = pab - P 3 - P V d)
where W is the total plasma energy , P s and Pv are the powers of
energy losses through the plasma boundary (thermal conductivity )and the volume losses , respectively (radiation, charge-exchange)at the moment o£ termination being invariable constant , the chan-ge in the plasma energy derivative is equal to F . . In our case,
the invariability of the volume losses follows from the "direct"measurements , while the constancy of the heat flux through theboundary follows from the direct measurements o£ the plasmaparameters at the periphery.
To measure correctly the change in the magnetic flux it isnecessary to incorporate the influence of the conducting vacuumchamber. In our case it is easy to sake corrections for theinfluence of the chamber using the expression :
d ' dt)*(d
where (d * /d*)true *B * h o r e a l o h a n S e o£ the magnetic flux ,
(d $/ dt) rrnAd ^B ^lx° m e a s u p e d value, obtained from the
diamagnetio loop voltage measurements , >loimnib9r is the time
constant of the chamber. (Che value of t . amounts 110 Uschamber
in the measurements of the longitudinal flux and 150 (is in the
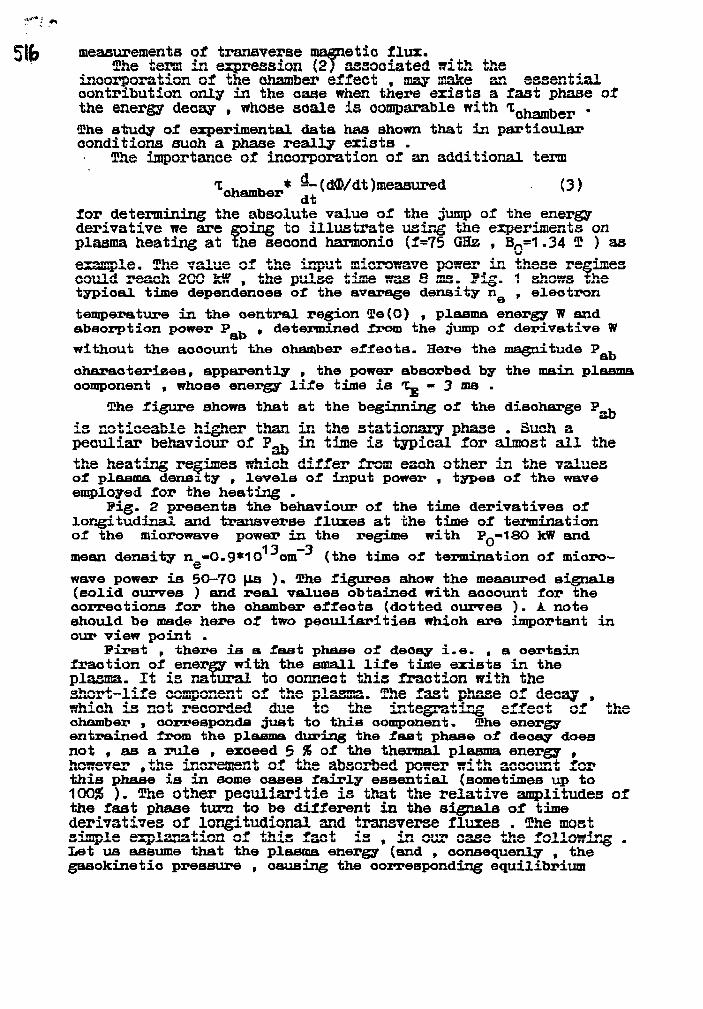
measurements of transverse magnetic flux.The term in expression (2) associated with the
incorporation of the chamber effect , may make an essentialcontribution only in the oase when there exists a fast phase ofthe energy decay , whose scale is comparable with ~She atudy of experimental data has shown that in particularconditions such a phase really exists .
The importance of incorporation of an additional term
Chamber* ?7 W d t Jmeasured (3)at
for determining the absolute value of the jump of the energyderivative we are going to illustrate using the experiments onplasma heating at the second harmonic (f=75 GHz , Bn=1.34 T ) asexample. The value of the input microwave power in these regimescould reach 200 kii? , the pulse time was S ms. Pig. 1 shows thetypical time dependences of the average density n , electron
temperature in the central region Te(0) , plasma energy W andabsorption power P . , determined from the jump of derivative W
without the account the chamber effects. Here the magnitude P .
characterises, apparently , the power absorbed by the main plasmacomponent , whose energy life time ia t_ • 3 ma .
The figure shows that at the beginning of the discharge P .
is noticeable higher than in the stationary phase . Such apeculiar behaviour of P a b in time is typical for almost all theUA1W -AtWC* U ' 1 * ^ J. 1 r^| I 1111 r'lmt I U i J . W i t \JtA^. J»WJ. J.O. W*U WCJkWA* W UA1WA -LA* UA4W V ** - * UWfcJ1
of plasma density , levels of input power , types of the waveemployed for the heating .
Fig. 2 presentB the behaviour of the time derivatives oflongitudinal and transverse fluxes at the time of terminationof the microwave power in the regime with Pn-»18O kW and
13 —3mean density n -0.9*10 cm (the time of termination of micro-wave power is 50-70 [is ). She figures show the measured signals(solid curves ) and real values obtained with account for thecorrections for the chamber effects (dotted curves ). A noteshould be made here of two peculiarities which are important inour view point .
First , there is a fast phase of decay i.e. , a certainfraction of energy with the small life time exists in theplasma. It is natural to connect this fraction with theshort-life component of the plasma. The fast phase of decay ,which is not recorded due to tire integrating effect of thechamber , corresponds just to this component. She energyentrained from the plasma during the fast phase of decay doesnot , as a rule , exceed 5 % of the thermal plasma energy ,however ,tiie increment of the absorbed power with account forthis phase is in some oases fairly essential (sometimes up to100J5 ). The other peculiaritie is that the relative amplitudes ofthe fast phase turn to be different in the signals of timederivatives of longitudional and transverse fluxes . The mostsimple explanation of this fact is , in our case the following .Let us assume that the plasma energy (and , oonsequenly , thegasokinetio pressure , causing the corresponding equilibrium
currents and the change in the magnetic fluxes associated withthem ) , in the case of short-life plasma component , may bedistributed nonuniformly along the torus . For example themaximum of the plasma pressure may exist near the port ofthe microwave power input. In this oaae , alao the valuesof magnetic fluxea (both transverse and longitudinal) shouldbe correspondingly distributed. The change in the longitudinalmagnetio flux is recorded by the loops covering the vacuumchamber (diamagnetio winding). She turns lie in separate sectionsalong the torus perimeter , while near the microwave power inputport there are no recording windings. On the other hand , in ourexperiments the changes in the transverse flux are recorded by aloop covering all the torus including the region of the increasedpressure. Hence , the larger relative amplitude of the phase ,in the oase of measuring the transverse flux , may be explainedby the peculiarities of recording, if the assumption of nonuni-form distribution of the short-life component pressure is true.
ACT «a TVIY 1 a +\*<a f n o + T\H<ioa * - \ ^ Hon«iTr •n a trwo-4-1 TT mon-i *^A04°A/4
in the quasistationary phase of the. discharge. Jig. 3 shows thetime evolution of the magnitudes Pab» P^ and P . during the hea-ting pulse. The value ^oK^ah+^f i3 * n e total absorbed power
obtained with the corrections of the signal incorporating thechamber effect. P . and P_ are the powera abBOi>bed by the main
and short-life components , respectively. The dependences are
13 —3obtained in the regime with n -10 cm , Pn-180 kW. It is seen
that the microwave power absorbed by a short-life component canreach 2O-5O kW at the end of the heating pulae. Jt is ofinterest to note that the total absorbed power P . remains
practically constant during all the heating pulse, i.e. theprocesses of power absorption by a thermal component and ashort-life one are competing processes. The fraction of the fastphase in the total energy balance is the higher, the higher isthe value of the introduced microwave power and Jhe lower is theplasma density. Fig. 4 showB the dependence of P . , P . and P. on
P Q at n -10 cm , and Pig. 5 shows their dependence on the
density at Pn-180 kW. As it is seen the dependence of full
absorbed power on the density is rather weakft Alao ,the valueof absorption coefficient , defined as 7J - P . / P Q very slowly
depends on input power P Q .
Conclusion.
The analysis of the results of diamagnetio measurementsduring UH7 plasma heating in the L-2 stellarator allowed us todiscover the existence of a short-life plasma component which mayabsorb a significant fraction of the power introduced in theplasma , the energy stored in this component being very low . Thequestion what are the particles in the short-life componentremains open. These particles may supposed to be trapped in thestellarator field ripples , localized in the region of themicrowave power input .
References.[1] D.K. Akulina et al., IAEA-CW-/C-I-3,IAEA. Conference (Nice), 1988.
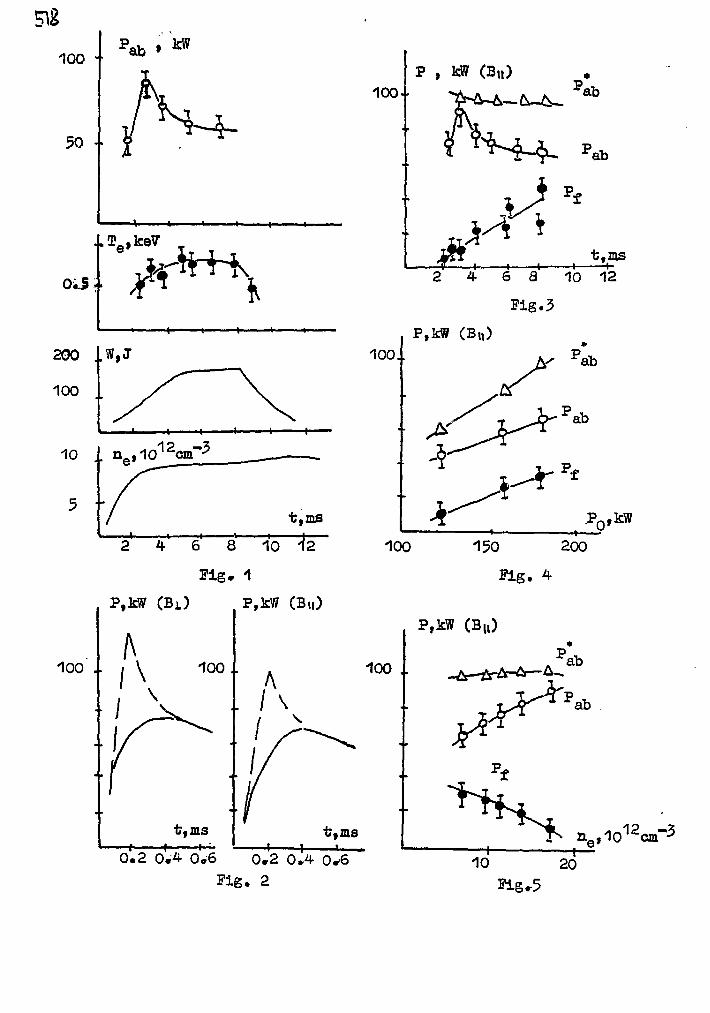
100
..O?e,keV
0.3 r
10
5 +•
100 J.
• • /
P,kW
\
t,ms•+-
1004
1001
100
2 4 6 8 10 12
P0,kW
100
(BU)
0.2 0.4 0.6 0.2 0^4 0*6Fig. 2
I10 20
Fig.5
COLLISIONLESS a-PARTICLE CONFINEMENTIN STELLARATORS
W. LOTZ, P. MERKEL, J. NUIIRENBERG
IPP-Euratom Association,Max-Planck-Institut fur Plasmaphysik,Garching, Federal Republic of Germany
Abstract
COLLISIONLESS a-PARTICLE CONFINEMENT IN STELLARATORS.In many stellarators - envisaged as fusion devices - any a-particle which ever gets reflected («n = 0)
is collisionlessly lost in a time which is by orders of magnitude smaller than the typical slowing-downtime of w 10~1s. Two classes of stellarators are described for which this general picture does not apply:quasi-helically symmetric stellarators and a class of stellarators with vanishing bootstrap current inwhich the collisionless a-particle confinement sufficiently improves at finite j3.
1. Introduction
Collisionless a-particle confinement is an important aspect of toroidal confinementschemes. In this respect stellarators behave quite differently from tokamaks. Whiletokamaks - in their axisymmetric idealization - completely confine collisionless orbitsexcept for finite-thickness-banana effects (incomplete confinement due to the toroidalfield coil ripple effect can be reduced by increasing the number of these coils), stellaratorsgenerally are truly three-dimensional and suffer from severe collisionless a-particle loss:in many stellarators any particle which ever gets reflected (vi{ = 0) is collisionlessly lostin a time which is by orders of magnitude smaller than the typical slowing-down time of« 10-xs.
There are several exceptions from this general picture. One ideal solution to thecollisionless-confinement problem would be isodynamic stellarators [1], i.e configurationswithout net toroidal current in which B = B(s, <j>) with B the strength of the magneticfield, s the flux label, and <j> the toroidal magnetic coordinate constant orthogonal to themagnetic field lines; these configurations do not exist because of the required toroidalconnection which requires curvature of the plasma column and, therefore, ^-variation ofB> with 9 the poloidal magnetic coordinate. An actual solution - comparable in natureto the axisymmetric one - is given by quasi-helically symmetric stellarators [2] which arecharacterized by B = B(s, 9—<j>) and in which the helical symmetry of B leads to completeconfinement. These stellarators show that the geometrical appearance of a configurationin real space does not give a reliable insight into the nature of its particle orbits; at finite/? this solution exhibits a finite (rotational transform decreasing) bootstrap current. Athird option which has been selected for the proposed W7-X device combines vanishingbootstrap current and sufficiently good collisionless a-particle confinement by creationof poloidally closed ,7-contours at finite /?, with J the second adiabatic invariant.
The remainder of this paper is organized as follows. In Sec. 2, the numerical pro-cedure is briefly described; in Sec. 3, examples are given for stellarators which are notoptimized with respect to collisionless a-particle confinement. In Sec. 4, the optimizedstellarator selected for W7-X is discussed. In Sec. 5, the influence of the modular rippleis investigated.
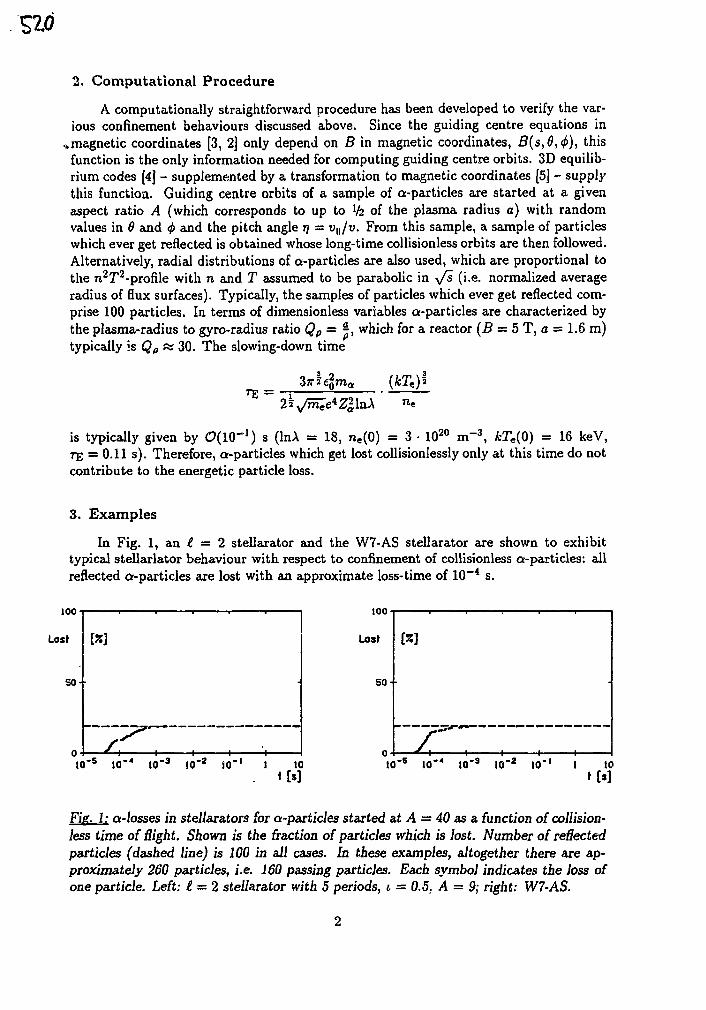
2. Computational Procedure
A computationally straightforward procedure has been developed to verify the var-ious confinement behaviours discussed above. Since the guiding centre equations in
^magnetic coordinates [3, 2] only depend on B in magnetic coordinates, B(s,0,(f>), thisfunction is the only information needed for computing guiding centre orbits. 3D equilib-rium codes [4] - supplemented by a transformation to magnetic coordinates [5] - supplythis function. Guiding centre orbits of a sample of a-particles are started at a givenaspect ratio A (which corresponds to up to l£ of the plasma radius a) with randomvalues in 6 and 4> and the pitch angle TJ = vtt/v. From this sample, a sample of particleswhich ever get reflected is obtained whose long-time collisionless orbits are then followed.Alternatively, radial distributions of a-particles are also used, which are proportional tothe n2T>2-profile with n and T assumed to be parabolic in \/s (J-e- normalized averageradius of flux surfaces). Typically, the samples of particles which ever get reflected com-prise 100 particles. In terms of dimensionless variables a-particles are characterized bythe plasma-radius to gyro-radius ratio Qp = •*, which for a reactor (B = 5 T, a = 1.6 m)typically is Qp ss 30. The slowing-down time
is typically given by C^IO'1) s (lnA = 18, ne(0) = 3 • 1020 m"3, fcTe(0) = 16 keV,T£ = 0.11 s). Therefore, a-particles which get lost collisionlessly only at this time do notcontribute to the energetic particle loss.
3. Examples
In Fig. 1, an I = 2 stellarator and the W7-AS stellarator are shown to exhibittypical stellarlator behaviour with respect to confinement of collisionless a-particles: allreflected a-particles are lost with an approximate loss-time of 10~4 s.
Fig. 1: a-losses in stellarators for a-particles started at A = 40 as a. function of collision-less time of Sight. Shown is the fraction of particles which is lost. Number of reflectedparticles (dashed line) is 100 in all cases. In these examples, altogether there are ap-proximately 260 particles, i.e. 160 passing particles. Each symbol indicates the loss ofone particle. Left: 1 — 2 stellarator with 5 periods, i = 0.5. A = 9; right: W7-AS.
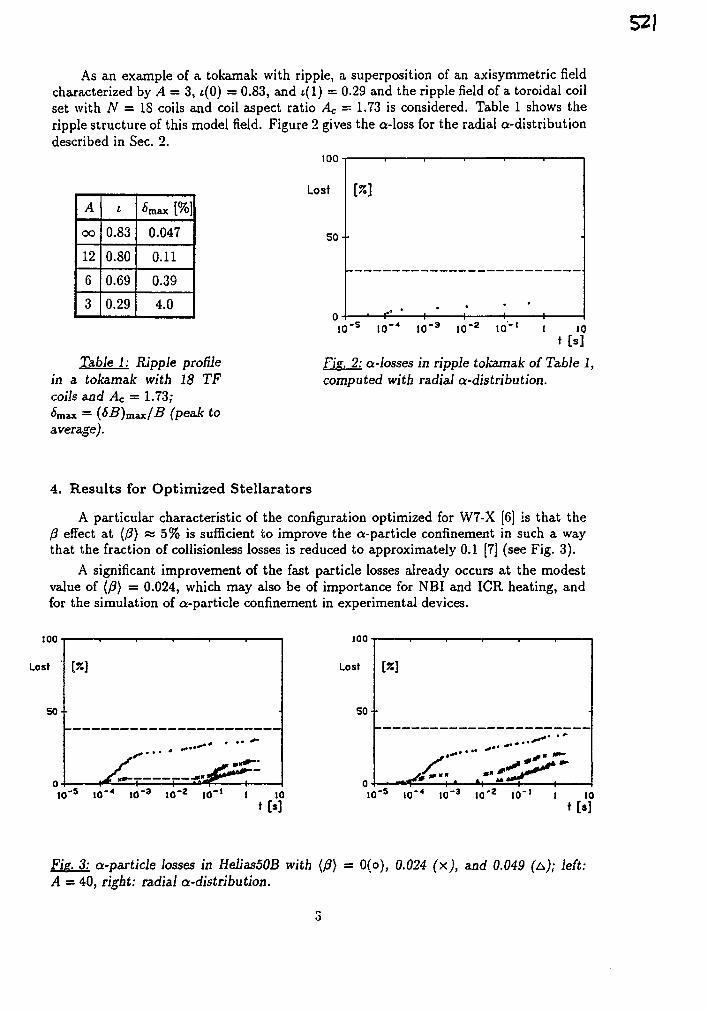
521
As an example of a tokamak with ripple, a superposition of an axisymmetric fieldcharacterized by A = 3, i(0) = 0.83, and t(l) = 0.29 and the ripple field of a toroidal coilset with N = IS coils and coil aspect ratio Ac = 1.73 is considered. Table 1 shows theripple structure of this model field. Figure 2 gives the a-loss for the radial a-distributiondescribed in Sec. 2.
too
A
CO
12
6
3
i
0.83
0.80
0.69
0.29
0.047
0.11
0.39
4.0
Lost
Table 1: Ripple profilein a tokamak with 18 TFcoils and Ac = 1.73;<Smax = (££)max/£ (peak toaverage).
S O - -
Fie. 2: ct-losses in ripple tokamak of Table 1,computed with radial a-distribution.
4. Results for Optimized Stellarators
A particular characteristic of the configuration optimized for W7-X [6] is that theft effect at (ft) ss 5% is sufficient to improve the a-partide confinement in such a waythat the fraction of collisionless losses is reduced to approximately 0.1 [7] (see Fig. 3).
A significant improvement of the fast particle losses already occurs at the modestvalue of {ft) = 0.024, which may also be of importance for NBI and ICR heating, andfor the simulation of a-particle confinement in experimental devices.
10
Fie. 3: a-particle losses in HeliasSOB with (ft) = 0(o), 0.024 (x), and 0.049 (&); left:A — 40, right: radial a-distribution.
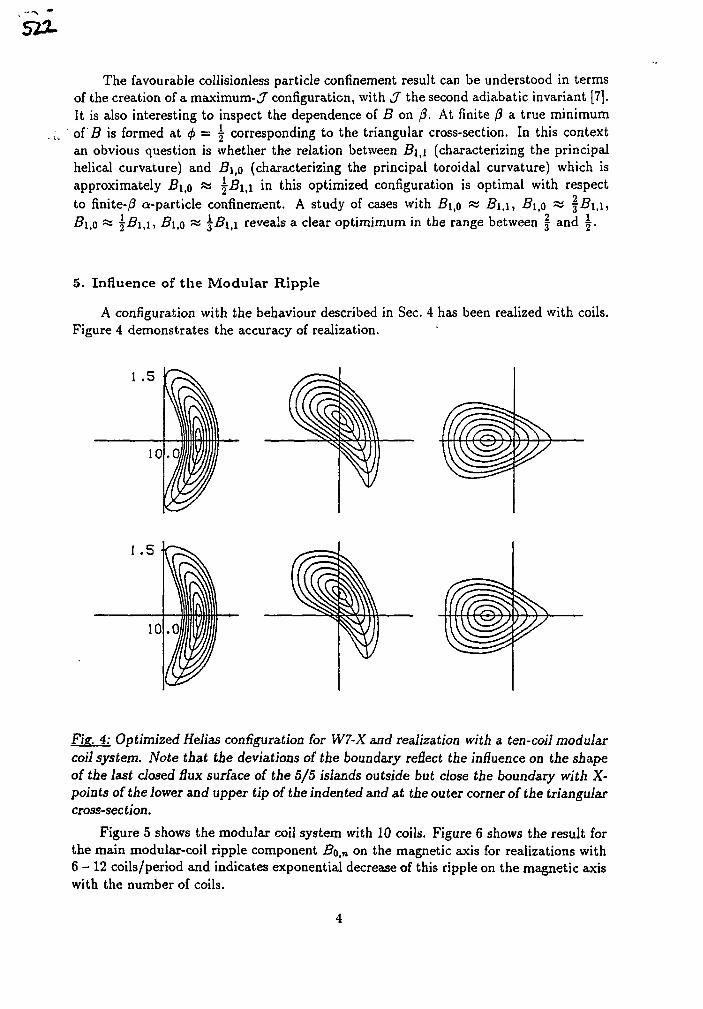
522.
The favourable collisionless particle confinement result can be understood in termsof the creation of a maximum- J configuration, with J the second adiabatic invariant [7].It is also interesting to inspect the dependence of B on /?. At finite /? a true minimumof B is formed at cf> = j corresponding to the triangular cross-section. In this contextan obvious question is whether the relation between B\ti (characterizing the principalhelical curvature) and B\$ (characterizing the principal toroidal curvature) which isapproximately B\$ « \B\,\ in this optimized configuration is optimal with respectto finite-/? a-particle confinement. A study of cases with Bito « B\ti, B\fi w j5 i , i ,#1,0 «s j ^ i , ! , B\fi as 3^1,1 reveals a clear optimimum in the range between \ and | .
5. Influence of the Modular Ripple
A configuration with the behaviour described in Sec. 4 has been realized with coils.Figure 4 demonstrates the accuracy of realization.
1 .5
Fig. 4: Optimized Helias configuration for W7-X and realization with a ten-coil modularcoil system. Note that the deviations of the boundary reflect the influence on the shapeof the last closed flux surface of the 5/5 islands outside but close the boundary with X-points of the lower and upper tip of the indented and at the outer corner of the triangularcross-section.
Figure 5 shows the modular coil system with 10 coils. Figure 6 shows the result forthe main modular-coil ripple component 2?o,n °n the magnetic axis for realizations with6 -12 coils/period and indicates exponential decrease of this ripple on the magnetic axiswith the number of coils.
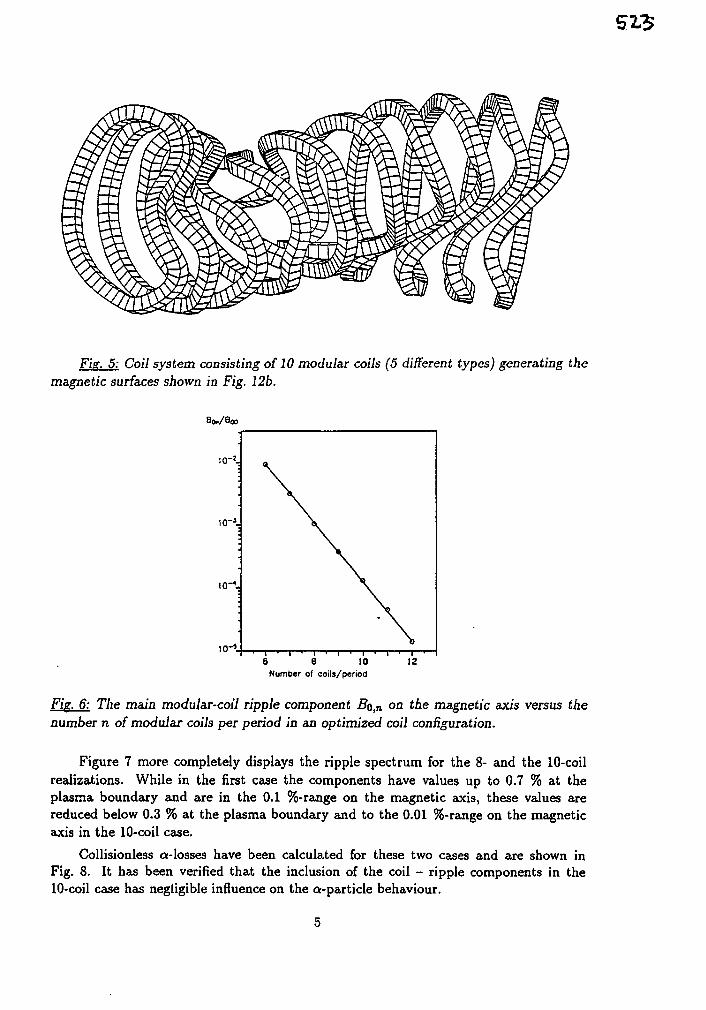
523
Fis. 5: Coil system consisting of 10 modular coils (5 different types) generating themagnetic surfaces shown in Fig. 12b.
Son/Boo
io-s.6 6 10
Number of coils/period
Fig. 6: The main modular-coil ripple component 5o,n on the magnetic axis versus thenumber n of modular coils per period in an optimized coil configuration.
Figure 7 more completely displays the ripple spectrum for the 8- and the 10-coilrealizations. While in the first case the components have values up to 0.7 % at theplasma boundary and are in the 0.1 %-range on the magnetic axis, these values arereduced below 0.3 % at the plasma boundary and to the 0.01 %-range on the magneticaxis in the 10-coil case.
Collisionless a-losses have been calculated for these two cases and are shown inFig. 8. It has been verified that the inclusion of the coil - ripple components in the10-coil case has negligible influence on the a-particle behaviour.
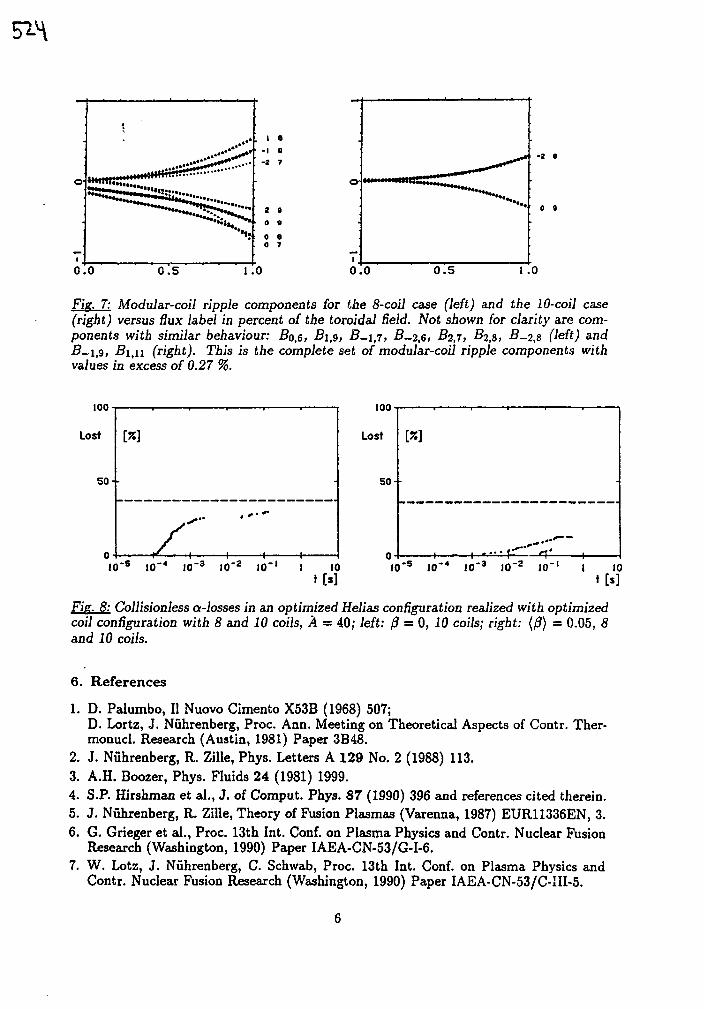
0 . 5 1.0
o o
0 0 0 . 5 1.0
Fie. 7: Modular-coil ripple components for the 8-coil case (left) and the 10-coil case(right) versus dux label in percent of the toroidal Reid. Not shown for clarity are com-ponents with similar behaviour: Bofi, Bitg, B-\j, B-2fi, BI,T, i?2,8> #-2,8 (left) andi?-i,9, B\tu (right). This is the complete set of modular-coil ripple components withvalues in excess of 0.27 %.
Fis. 8: Collisionless a-losses in an optimized Helias configuration realized with optimizedcoil configuration with 8 and 10 coils, A = 40; left: 0 — 0, 10 coils; right: {/?) = 0.05, 8and 10 coils.
6. References
1. D. Palumbo, II Nuovo Cimento X53B (1968) 507;D. Lortz, J. Nuhrenberg, Proc. Ann. Meeting on Theoretical Aspects of Contr. Ther-monucl. Research (Austin, 1981) Paper 3B48.
2. J. Nuhrenberg, R. Zille, Phys. Letters A 129 No. 2 (1988) 113.3. A.H. Boozer, Phys. Fluids 24 (1981) 1999.4. S.P. Hirshman et al., J. of Comput. Phys. 87 (1990) 396 and references cited therein.5. J. Nuhrenberg, R. Zille, Theory of Fusion Plasmas (Varenna, 1987) EUR11336EN, 3.6. G. Grieger et al., Proc. 13th Int. Conf. on Plasma Physics and Contr. Nuclear Fusion
Research (Washington, 1990) Paper IAEA-CN-53/G-I-6.7. W. Lotz, J. Nuhrenberg, C. Schwab, Proc. 13th Int. Conf. on Plasma Physics and
Contr. Nuclear Fusion Research (Washington, 1990) Paper IAEA-CN-53/C-III-5.
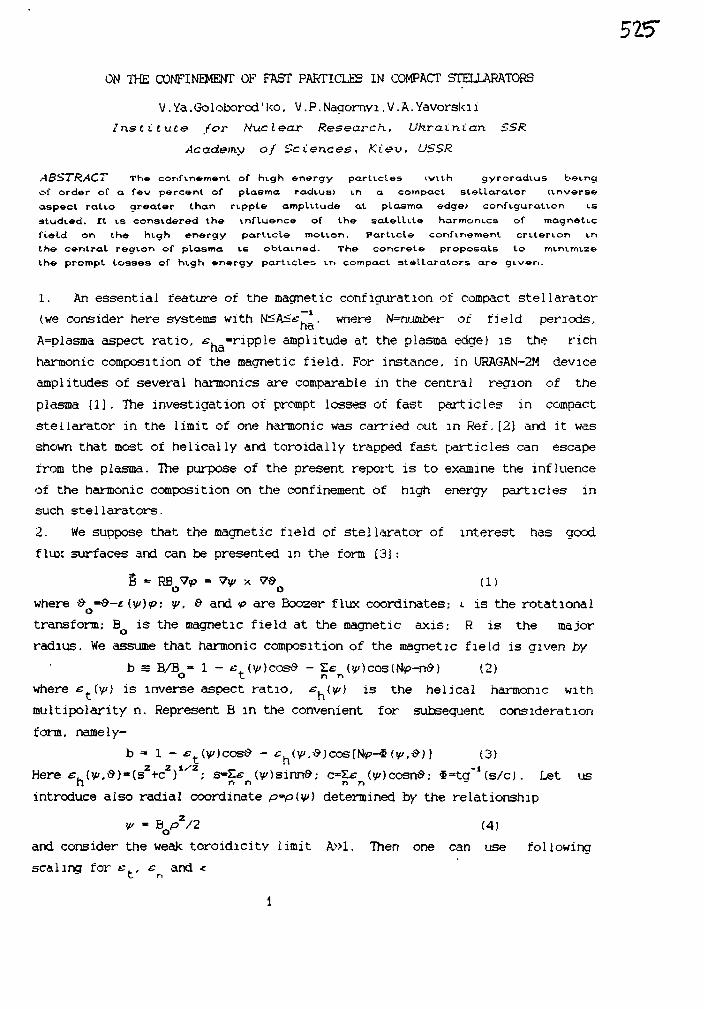
515"
ON THE CONFINEMENT OF FAST PARTICLES IN COMPACT STELLARATORS
V.Ya.Goloborod'ko. V.P.Nagornvi.V.A.Yavorskn
Institute /or Nuclear Research., Ukrainian SSR
Acad&my of Sciences, Ki&v, USSR
ABSTRACT The confinement of high energy particles ivith gyroradius being
cf order of a few percent of plasma radius) in a compact stellaralor (inverse
aspect ratio greater than ripple amplitude at plasma edge> configuration is
studied. It is considered the influence of the satellite harmonics of magnetic
field on the high energy particle motion. Particle confinement criterion m
the central region of plasma is obtained. The concrete proposals to minimize
the prompt losses of high energy particles ir> compact stellarators are given.
1. An essential feature of the magnetic configuration of compact stellarator
twe consider here systems with M^k^£ . where N=number of field periods,
A=plasma aspect ratio, e. -ripple amplitude at the plasma edge) is the rich
harmonic composition of the magnetic field. For instance, in URAGAN-2M device
amplitudes of several harmonics are comparable in the central region of the
plasma flj. The investigation of prompt losses of fast particles in compact
stellarator in the limit of one harmonic was carried out in Ref.[2] and it was
shown that most of helically and toroidally trapped fast particles can escape
from the plasma. The purpose of the present report is to examine the influence
of the harmonic composition on the confinement of high energy particles in
such stellarators.
2. We suppose that the magnetic field of stellarator of interest has good
flux surfaces and can be presented in the form [3J:
§ « RE ?<p " Vy x 7$ (1)
where $ =&—e [y)<p; w, 9 and <p are Boozer flux coordinates; <. is the rotational
transform; BQ is the magnetic field at the magnetic axis.- R is the major
radius. We assume that harmonic composition of the magnetic field is given by
b = B/B - 1 - £. (y)cos$ - Ze (y)cos(lV-nS) (2)O c n rt
where eAy>) is inverse aspect ratio, £Av) is the helical harmonic with
multipolarity n. Represent B in the convenient for subsequent consideration
form, namely-
b =• 1 - £Av)cos& - cAV.S)cosfN«?-$ (y ,#)} (3)
Here s. (v,^)*(s2+c2)1''2; s-Ze (v)sinn»; c=Sfi (v)cosnd; *=ta~*(s/c). Let usn n n n n
introduce also radial coordinate p=p(y) determined by the relationship
V - Bop2/2 (4)
and consider the weak toroidicity limit A»l. Then one can use following
scaling for e s and -et n
1
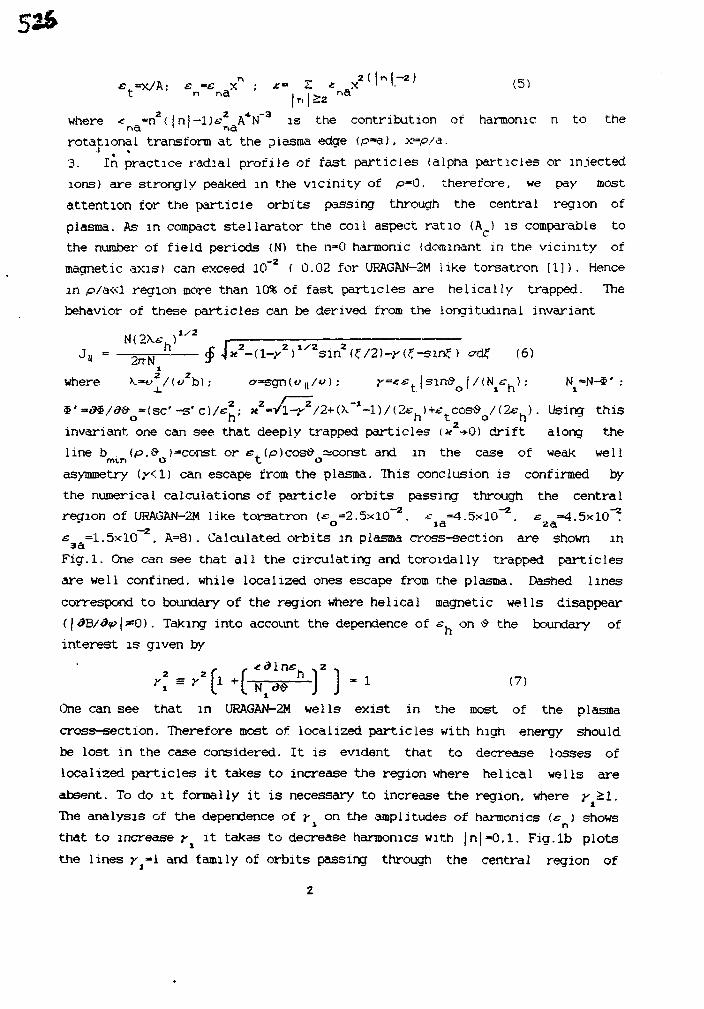
n „ 2(InI—2) , _ .
t n na |r, |>2 n a
where -e »n2< I n l -Di- 2 A4N~3 i s the contribution of harmonic n to ther>a ' ' r>arotational transform at the plasma edge (p»a), x=p/a.
3. In practice radial profile of fast particles (alpha particles or injected
ions) are strongly peaked in the vicinity of p-0. therefore, we pay most
attention for the particle orbits passing through the central region of
plasma. As in compact stellarator the coil aspect ratio (A ) is comparable to
the number of field periods (N) the n-0 harmonic (dominant in the vicinity of
magnetic axis) can exceed 10~2 (0.02 for URAGAN-2M like torsatron [1]). Hence
in p/a«l region more than 10% of fast particles are helically trapped. The
behavior of these particles can be derived from the longitudinal invariant
§ U2-(l-y2)iyzsinz^/2)-r(^si^) <?<£. (6)
/' (where K=t> /' (u b ) : c=sgn(t> n/v); ?=*.£ | s i n £ j / fN^r , ) ; N -N-S* :
=(sc'-s'c)/c2; K2-yi-yz/2+(X."*-l)/(2e. »+*v cosS /(2e.). Using thiso h h t o h
invariant one can see that deeply trapped particles <* -+0) drift along the
line b <p.# )=const or e. ip)cos& asconst and in the case of weak wellrnvn O t o
asymmetry (^l) can escape from the plasma. This conclusion is confirmed by
the numerical calculations of particle orbits passing through the central
region of URAGAN-2M like torsatron (s =2.5:<10~2. &- =4.5x10^. e ^.Sxio"2
o ia 2as .=1.5x10 . A=8). Calculated orbits in plasma cross-section are shown in3a
Fig.l. One can see that all the circulating and toroidally trapped particles
are well confined, while localized ones escape from the plasma. Dashed lines
correspond to boundary of the region where helical magnetic wells disappear
(\dB/d<p\*Q). Taking into account the dependence of s on # the boundary of
interest is given byd\ 2
]One can see that in URAGAN-2M wells exist in the most of the plasma
cross-section. Therefore most of localized particles with high energy should
be lost in the case considered. It is evident that to decrease losses of
localized particles it takes to increase the region where helical wells are
absent. To do it formally it is necessary to increase the region, where y £1.
The analysis of the dependence of r on the amplitudes of harmonics (s ) shows
that to increase y it takas to decrease harmonics with |n|-0,l. Fig.lb plots
the lines j^-1 and family of orbits passing through the central region of
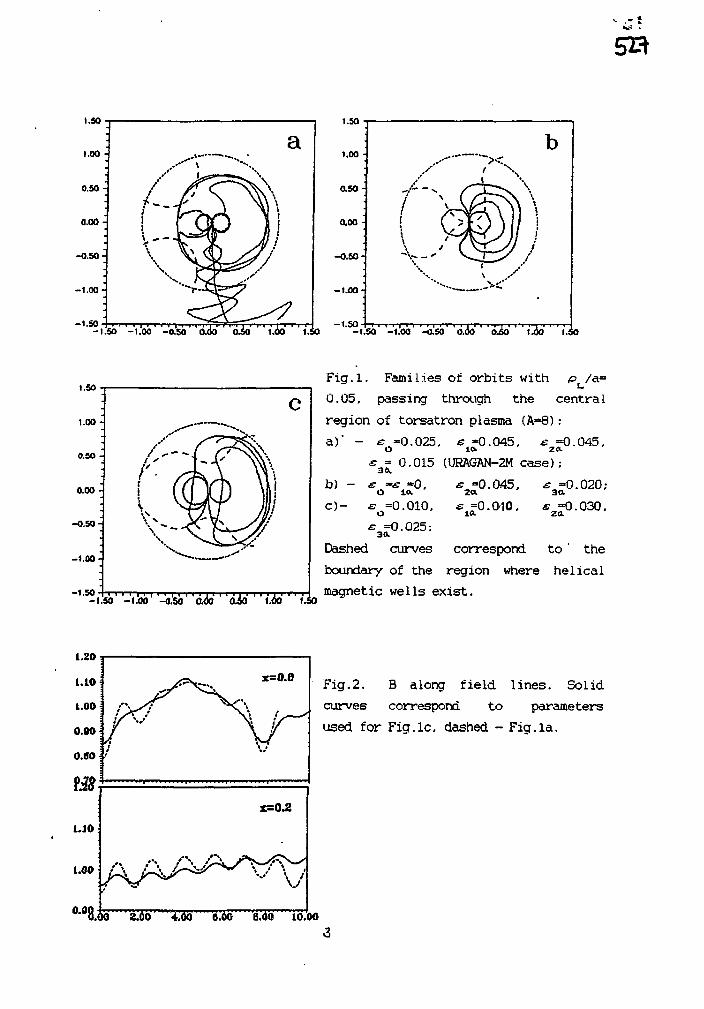
i.so
1.00
0.50 -
0.00-
-0.50-
-1.00-
a/
t
1
^7-1.50- . . . . . . . • , rr^-, . . . , ,
-1.50 -1.00 -0.50 0.00 Oio 1.00 1.50
1.50
1.00 •
0.50 -
0.00 -
-0.50-
-1.00-
-1.50-t.so -i.oo -aso ado aio'' ' ido ' ' i.so
1.50
1.0O-
0.90 -
0.0O-
-0.50-
-1.00-
-1.50
Fig.l. Families of orbits with p /a=
0.05, passing through the central
region of torsatron plasma (A=8):
a)' - £ =0.025. e =0.045, £ =0.045,
s = 0.015 (URAGAN-2M case);
b) - e =0,^=0.010.
^=0.020;
^=0.030.
-t.5O -1.00 -0.50' '6.6o O50 1.00 1.50
O - c =0.010,
£ =0.025:30.
Dashed curves correspond to' the
boundary of the region where helical
magnetic wells exist.
.00 8.0O 4.00i 0.00
Fig.2. B along field lines. Solid
curves correspond to parameters
used for Fig.lc, dashed - Fig.la.
10.00
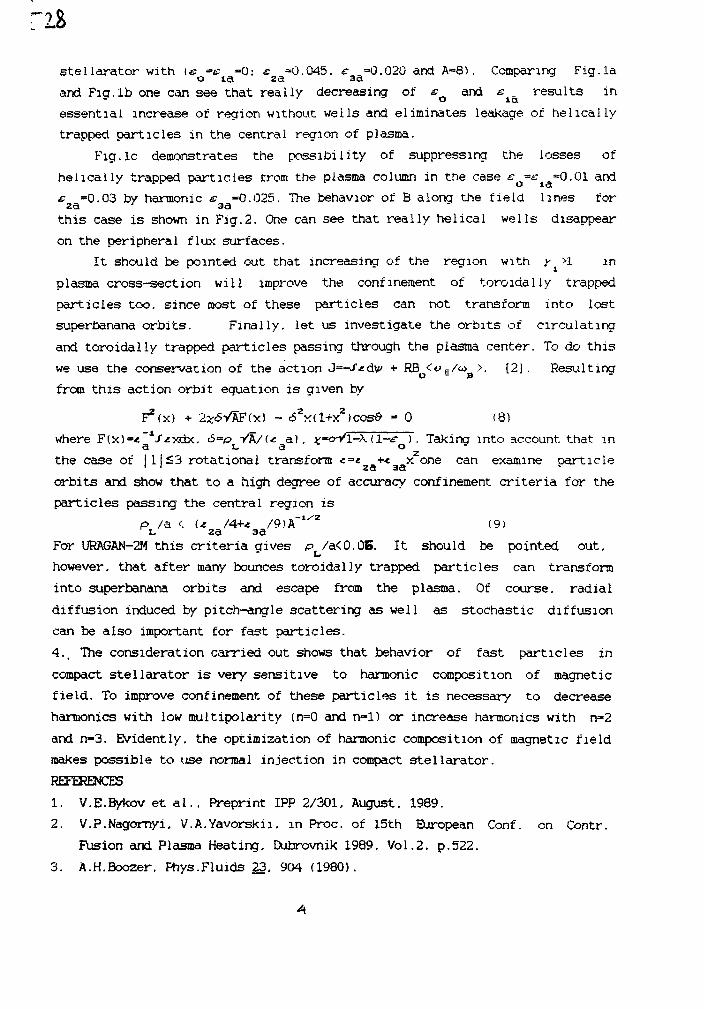
"IS
stellarator with is =e =0: £ =0.045. e =0.020 and A=8). Comparing Fig.laO let 2cl 3d
and Fig.lb one can see that really decreasing of SQ and s^ results in
essential increase of region without wells and eliminates leakage of helically
trapped particles in the central region of plasma.
Fig.lc demonstrates the possibility of suppressing the losses of
helically trapped particles from the plasma column in the case c =e =0.01 andO let
s =0.03 by harmonic s =0.025. The behavior of B alona the field lines for2a sa
this case is shown in Fig.2. One can see that really helical wells disappear
on the peripheral flux surfaces.
It should be pointed out that increasing of the region with y >1 in
plasma cross-section will improve the confinement of toroidally trapped
particles too. since most of these particles can not transform into lost
superbanana orbits. Finally, let us investigate the orbits of circulating
and toroidally trapped particles passing through the plasma center. To do this
we use the conservation of the action J=-/^dv + RB <v,|/« >. {2] . Resulting
from this action orbit equation is given byF2(x) + 2*<5VSF(x) - 62yAl+y?)cos& = 0 (8)
where F(x)=* -fzxdx. S=p VA/O a). -o-Vl-A. (1-e ) . Takincr into account that ina L a o •
the case of |1|£3 rotational transform <:=« +< x one can examine particle
orbits and show that to a high degree of accuracy confinement criteria for the
particles passing the central region isP /a <. U /4+* /9)A"^Z (9)i/ 2a aa
For URAGAN-2M this criteria gives pL/a<0.0B. It should be pointed out.
however, that after many bounces toroidally trapped particles can transform
into superbanana orbits and escape from the plasma. Of course, radial
diffusion induced by pitch-angle scattering as well as stochastic diffusion
can be also important for fast particles.
4., The consideration carried out shows that behavior of fast particles in
compact stellarator is very sensitive to harmonic composition of magnetic
field. To improve confinement of these particles it is necessary to decrease
harmonics with low multipolarity (n=0 and n=l) or increase harmonics with n=2
and n-3. Evidently, the optimisation of harmonic composition of magnetic field
makes possible to use normal injection in compact stellarator.
REFERENCES
1. V.E.Bykov et al.. Preprint IPP 2/301. August. 1989.
2. V.P.Nagomyi. V.A.Yavorskii, in Proc. of 15th European Conf. en Contr.
Fusion and Plasma Heating. Dubrovnik 1989. Vol.2, p.522.
3. A.H.Boozer. Phys.Fluids 23, 904 (1980).
529
Pellet Injection Experiments of ECH Plasmasin Heliotron E
S. SUDO, T. BABA, H. ZUSHI, K. KONDO, F. SANO,T. MIZUUCHI, S. BESSHOU, H.OKADA,
M. WAKATANI, and T. OBIKI
Plasma Physics Laboratory, Kyoto University, Uji, Kyoto, Japan
ABSTRACT.Deuterium pellet injection is used for investigation of transport through dynamic
process. It is carried out under several conditions like auxiliary toroidal field control,magnetic axis shift, and externally added magnetic field perturbation.1. INTRODUCTION
Recently, pellet injection is used well both for refuelling and transport study intokamaks and stellarators/heliotrons. In addition, active control of magneticconfiguration of Heliotron E-has been intensively studied for confinement optimizationand for investigation of transport property [1,2]. Deuterium pellet injection is here usedfor investigation of transport through dynamic process. For these purposes, theelectron temperature and density profiles of ECH plasmas of Heliotron E are measuredmainly by a multiple Thomson scattering system under several conditions like auxiliarytoroidal field control (cc*=Bt/Bh , where Bt and Bh are the magnetic field strengthproduced by toroidal field coils and that by a helical coil, respectively.), magnetic axisshift (p*=Bv/Bh , where Bv is the magnetic field strength produced by vertical fieldcoils.), and externally added magnetic field perturbation (magnetic island: MI). Here,a* changes mainly plasma minor radius and the profile of rotational transform, whilep* changes the position of the magnetic axis. The values of a* and P* are able to beindependently controlled
2. PELLET INJECTORA six-pellet injector for Heliotron E [3] is pneumatic type, and both deuterium and
hydrogen pellets are available. The pellet velocity is monitored by a time-of-flightmethod each shot. Typical pellet velocity is around 1 km/s, while it can be changedfrom 400 m/s to 1.4 km/s for some purpose. The size of pellet used in this series ofexperiments is 1 mml x 0.7-0.8 mm<j>. The pellet is injected into a plasma in thedirection of long minor radius (of the elliptical poloidal cross section) on the equatorialplane.
3. EXPERIMENTAL RESULTSHere, the behavior of plasmas after pellet injection is primary subject. The ablation
property of a pellet in ECH plasmas will be described in the separate paper. Thepenetration depth of the pellet into a plasma ranges from 150mm to 200mm in thedirection of the long minor radius of the elliptical plasma cross section in this series of
530
experiments.3.1 The case of oc*=O.O5 and Sv=-20mm
As shown in Fig.l, the density of the central chord of FIR is kept constant afterpellet injection. The decay time of the FIR central chord cannot be defined. The linedensity in the chords passing through the edge region is observed to decay in time scaleof 100ms (time taken to the half value for chord 6) and 45ms (for chord 1). In contrastwith the chorda! density, it is remarkable that the soft X-ray array signal intensity ofchords passing through the plasma core region is linearly increasing with time. The Hasignal is increased after pellet injection, and it remains at the same level during the ECHpulse. The outer FIR chord is also increased after pellet injection, and the density levelis kept higher than that of pre-pellet injection, although the slow density decay isobserved. Thus, the recycling of the particle might be kept at higher level than that ofpre-pellet injection.
The Te and ne profiles for the pellet injected case and the case without pelletinjection are shown in Fig.2. The density for the pellet injected case is obviously higherat least in the core region (r/a< 1/2) than that for the case without pellet. The pressurefor the former case is almost the same as the latter case, while the electron temperaturefor the former case is lower than the latter case. Although the confinement time shouldbe improved with increasing the density according to the empirical scaling [4], nodistinctive gain of pressure or confinement time by increasing line-averaged densityfrom 1.7xlO19m-3 to 2.5xlO19m-3 is observed as shown in Table I. The reason forthe degradation of confinement (from the viewpoint of the positive density dependence)may be attributed to the fact that the local density in the core region is adjacent to thecut-off density (3.5xl019m-3) of 53.2 GHz ECH. This may be supported with the factthat the plasma with higher density than the above case is cooled down (radiationcollapse), although the density limit given with a scaling [4] should be 5xl019m-3 incase neglecting cut-off This status may be definitely distinguished by using 106 GHzsecond harmonic heating, since the cut-off density becomes doubled.3.2 The case of magnetic axis shift
At fixed a* of 0.0, a pellet is injected into a plasma under various magnetic axispositions from 5v=-60mm to 8v=+35mm. In case of inward shift, the decay of theline-density of the FIR central chord is faster for 5v=-60mm than for 5v=-20mm justafter pellet injection, but at the timing about 10ms later after pellet injection the decaytime is almost the same for both cases. Thus, in cases of inward shift, the relatedphenomena may be different between the phase just after pellet injection and the latephase. In case of outward shift, the decay is faster for 8v=35mm than for 5v=20mm atthe timing 5-20ms after pellet injection. These may indicate that the large outward shiftcauses markedly degradation of panicle confinement. This is consistent with thebehavior of profiles obtained in cases without pellet injection reported in the separatepaper.
A little decay of the density change in case of a*=0.0 and 8v=-20mm after pelletinjection is observed in contrast with the case of cc*=0.05 and 8v= -20mm. Thus, a*
531has some effect on particle confinement and/or recycling.
The general behavior of the parameter change is consistent with the results obtainedwithout pellet injection (in quasi-steady state). The Te- ne diagrams for a) 5v= -60mm,b) 5v= -40mm, and c) 8v= +35mm (taken after about 15ms after pellet injection) areshown in Fig.3. Each value is local one, and there is a case that the density around halfradius is lower in spite of increase of central density (this is usually the transient phaseto the plasma collapse due to too high density). It is remarkable in the diagram that theperformance of 8v= -40mm is much higher than that of 8v= +35mm.
3.3 The case of magnetic field disturbanceIn case of existence of magnetic field disturbance (MI coil current = 100% of our
system, and dominant mode of m/n= 1/1) for the standard configuration (a*=0.0 and5v=0mm), plasma response is studied. Significant change of plasma parameters isexpected, since there is rather large ergodic region. However, experimental resultsshows that the decay property for both the cases of MI=0% and 100% is similar afterthe above timing. And, Ha signals arc essentially the same level for both cases. Theseare consistent with the results of only small difference in profiles between MI=0% andMI=100% for the standard configuration without pellet injection as will be presented inthe separate paper. Such a small difference should be resolved with both the detailedprofile measurements and the magnetic surface mapping (in vacuum). In a high densityregion, more larger difference (degradation in case of MI=100%) is observed.4.CONCLUSIONS
A deuterium pellet is injected into an ECH plasma, and the plasma behavior afterpellet injection is studied. Main results obtained by pellet injection are:(1) In case of oc*=O.O5 and 5v=-20mm (previously reported as the optimumconfiguration), the line-averaged density in the central chord after pellet injection is keptconstant in contrast with cases of a*=0.0. The Te and ne profiles for the pellet injectedcase and the case without pellet injection are compared.
(2) At fixed a* of 0.0, a pellet is injected into a plasma under various magnetic axispositions from 5v=-60mm to 8v=+35mm. The relatively slow decay is observedaround 8v=-20mm, which is consistent with the results obtained in case without pelletinjection (in quasi-steady state).
(3) In experiments of magnetic field disturbance, only small difference between MI=0%and MI=100% under the standard configuration is observed, which is consistent withthe case without pellet injection (in quasi-steady state).ACKNOWLEDGEMENTS
The authors thank the Heliotron E operating staff for conducting Heliotron £ operation. They alsoacknowledge M. Nakasuga for computing magnetic surfaces under several conditions.REFERENCES
[1] OBIKI, T., et al., Fusion Technol. 17(1990)101. [2] OBIKI, T., et al., in Plasma Physics and ControlledNuclear Fusion Research 1990 (Proc. 13th Int. Conf. Washington, DC, 1990) IAEA-CN-53/C-1-I. [31SUDO, S., ct al. in Proc. of a Technical Committee Meeting, IAEA, (Gut Ising, Federal Republic ofGermany, 1988), IAEA-TECDOC-534, p.73. [4] SUDO, S., et aJ., Nud. Fusion 30(1990)11.
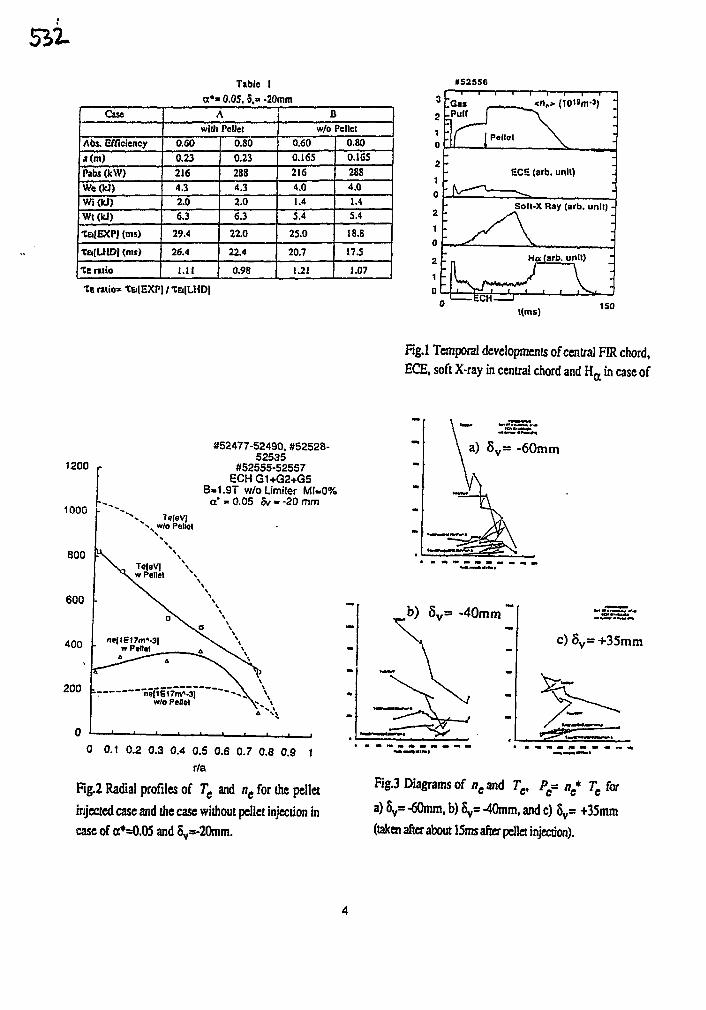
Sbt-
Table I
a*" 0.05.5,=» -20mm
#52556
Caw
Ate. Efficiencya Cm)Pab$ (kW)We(fcJ)WiflcJ)Wt(kJ)
TafEXP] (ms)
Ta(UlD) (ms)
1E ratio
Awi(ii Pellet
0.600.232164.32.06.3
29.4
26.4
1.11
0.800.232884.32.06.3
22.0
22.4
0.98
Bw/o Pellet
0.600.1652164.01.45.4
25.0
20.7
1.21
0.800.1652884.01.45.4
18.8
17.5
1.07
Te ratio* TEI(EXP) / TEI(LHD|
t(ms)150
Fig.l Temporal developments of central FIR chord,ECE, soft X-ray in central chord and H a in case of
1200
1000
800
600
400
200
#52477-52490, #52528-52535
#52555-52557ECH G1+G2+G5
8-1.9T w/oLimiler MI-0%a" » 0.05 5v • -20 mm
V Te[eV|* W 'O Piallet
0 0.1 0.2 0.3 0.4 0.5 0.6 0.7 0.8 0.9 1
r/a
Fig.2 Radial profiles of Te and ne for the pelletinjected case and the case without pellet injection incase of oc*=O.O5 and 8v=-20nun.
a) 5 V = - 6 0 m m
5V= -40mm
N\c) 5 V = + 3 5 m m
Fig.3 Diagrams of fleand Tv P= n* Te for
a) 8V= -60mm, b) 8y= -40mm, and c) 8V= +35mm
(taken after about 15ms after pellet injection).
533
NEOCLASSICAL TRANSPORT IN STELLARATORS —A COMPARISON OF CONVENTIONALSTELL^RATOR/TORSATRONS WITHTHE ADVANCED STELLARATOR, WENDELSTEIN 7X
CD. BEIDLERMax-Planck-Institut fur Plasmapbysik,W-8046 Garching bei Munchen,Federal Republic of Germany
A general expression for the magnitude of a stellarator's magnetic field, in termsof the Fourier decomposition
B/Bo = ^2 Cm,t(r) cos mp<t> cos £9 + 21W(r)sin m^ s i n ^> (l)
is too complicated to lend itself easily to analytic transport calculations. (In theabove equation, r is the radial flux-coordinate variable related to the toroidal fluxby %l> — BQV2/2, 9 and <f> are the poloidal and toroidal flux-coordiante variables,respectively, and p is the stellarator's field-period number.) The great majority ofstellarator-type devices, however, may be accurately described if one retains onlythose harmonics with m = 0 and m = 1. This simplification makes it possible toconstruct the model magnetic field
B/Bo = 1 - |CQ,I I cos 9 + C0r2 cos 29 - eH(r, 6) cos(x - p<£), (2)where the m = 1 harmonics are identified with the stellarator's helical ripple
eu(r,9) as e/i(r)(l - <ri(r)cos9-<r2(r)cos29),the phase angle x is determined from cosx = —C/CH, sinx = S/CH, and wherethe geometric quantities are given by
C = Ci.o + Chl cos9 + -• + Ciltcoa£9 S = S M sin0
2TT 2 *
eh = i - fd9(C2 + S2)1'2 , <rn = - — [<19(C2 +2TT J nek J
o
Two special cases are of note. For |CQ,II = e< = r/iZo, and Co,2 = <J\ = <r-i = 0, themodel magnetic field of Equation (2) reduces to that of the usual idealized stellarator.By allowing for non-zero <7x, one obtains the simplest of the so-called "transport-optimized" stellarator fields (Mynick, Chu and Boozer, Phys. Rev. Lett., 48,(1982) 322) which exhibit reduced neoclassical transport rates relative to the ideal-ized case for a range of positive values of <j\.
The identification of |Co,il with the inverse aspect ratio, et, is a good approx-imation for conventional stellarator/torsatrons. This is not the case, however, fordevices of the Helical-Axis Advanced Stellarator (Helias) type (Niihrenberg and Zille,Phys. Lett. A, 114, (1986) 129) for which |C0,i| is considerably smaller than et.This has important consequences on the neoclassical transport in such devices, as
53H
will be seen below. Whether of the Helias or conventional stellarator type, however,the model magnetic field of Equation (2) provides an accurate approximation to theactual B of the device, as can be seen in Figure 1. This model field will be used inall calculations whica follow.
Solution of the Bounce-Averaged Kinetic EquationIn the long-mean-free-path (Imfp) regime, where J = $v\\dl is an adiabatic in-
variant of a ripple-trapped particle's motion, the guiding-center drift-kinetic equationmay be simplified to yield the bounce-averaged kinetic equation
+ mil - gfc y«// d
with i/,// = v/2eht A(k2) = 8(£(&) - (1 - k2)K(k))} A'(k2) = 4ff(Jfc), where K{k)and E{k) are the complete elliptic integrals of the first and second kinds, respectively.The pitch-angle variable k2 is given by
k2 = (it/fiBo - 1 + |Co,i | cos 9 - CQ<2 COS 29 + tn)/2eH ,where n = mv2/2 and p = mvj£/2B, Localized particles satisfy 0 < k2 < 1, withthe limits corresponding to particles trapped at the bottom of a helical-ripple welland to those marginally trapped, respectively. The solution of Equation (3) is soughtfor the perturbed distribution function / , with the usual transport ordering / < Fm.
The constraint that particle transport in a stellarator plasma be ambipolar gen-erally requires the formation of a large radial potential, $(r). Given this assumptionand the model magnetic field, the bounce-averaged drift velocities are given by
(f) = ^
where v* = fi/qRo is the VJ3 drift velocity, T] = \—P<t> and (COSJJ) = 2E(k)/K(k) —To obtain a general solution of Equation (3), begin with the ansatz
/ = ^2- (Z{k2) + Y(k2) sin 6 + X(k2) cos B + W(k2) sin 29 + V(k2) cos 29J.
The resulting 5 coupled differential equations are solved by power-series expansionwith the approximations A(Jb2)/A'(Jfe2) = k2 - (fc2)2/4 and {cos rj) = 1 - Jfc2 - (A2)2/4and boundary conditions which fully account for coliisionless trapping and detrap-ping of particles in the helical ripple wells when vefj <C &E- Due to the complexityof the recursion relationships which result and also because a large number of termsis often required for convergence, the solution is implemented numerically.
Using this solution, it is possible to calculate the particle and heat fluxes dueto helical-ripple transport in stellarators throughout the entire Imfp regime
, ,dFm
where the moncenergetic diffusion coefficient is given by2ir
D = - ^ jdO (2eH)1/2 f dk2 (r) (Y(k2) sm9 + W{k2)sin2*) K(Jk).
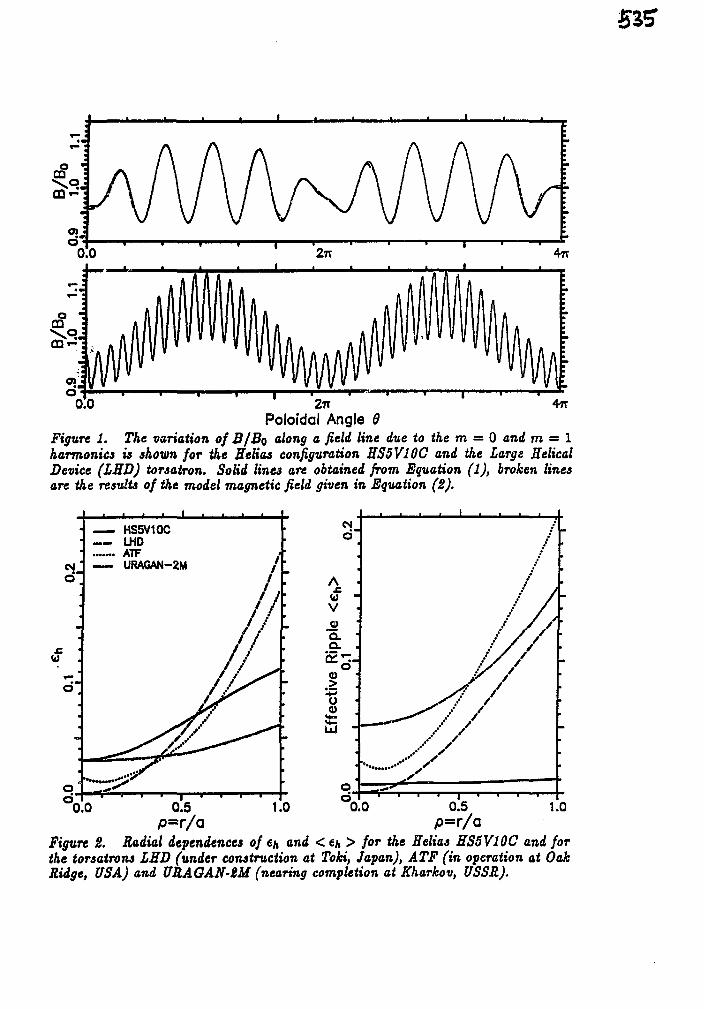
Poloidal Angle 9Figure 1. The variation of B/BQ along a field line due to the m = 0 and m = 1harmonica is shown for the Helios configuration HS5V10C and the Largs HelicalDevice (LHD) torsatron. Solid Une3 are obtained from Equation (1), broken linesare the results of the model magnetic field given in Equation (2).
3-
HS5V10CLHD
i l l URAGAN-2M
0.0 1.00.5
P-r/a P=r/aFigure 2. Radial dependences of €K and < e/, > for the Helias HS5V10C and forthe torsatrons LHD (under construction at Tola, Japan), ATF (in operation at OakRidge, USA) and URAGAN-2M (nearing completion at Kharkov, USSR).
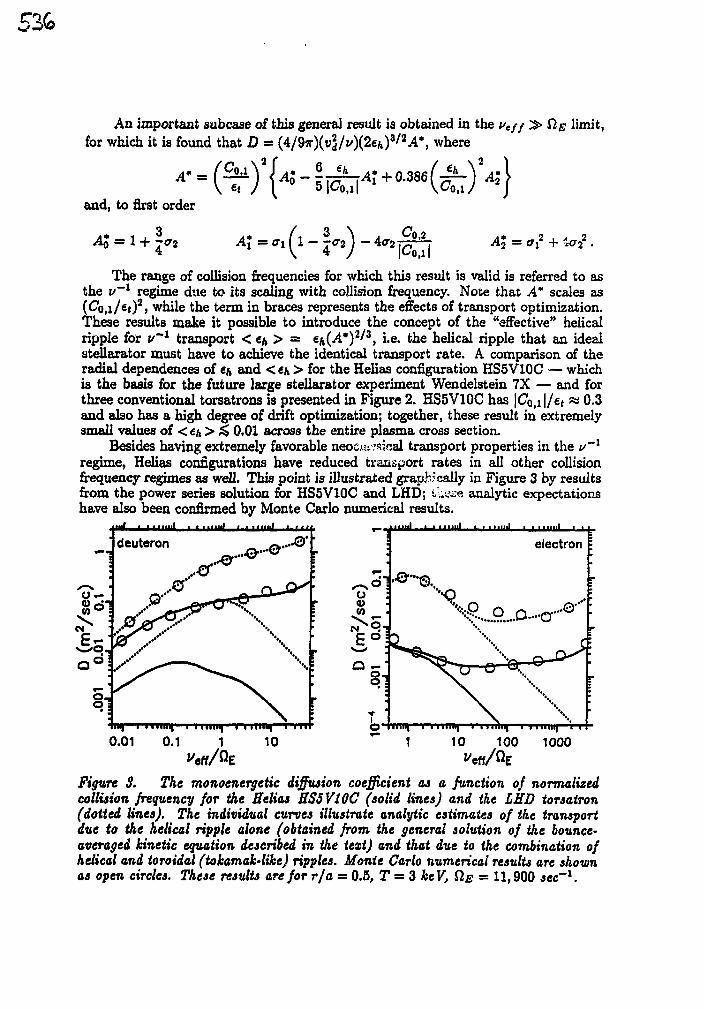
53G
Aa important subcase oi this general result is obtained in the utfffor which it is found that 23 = (4/97r)(t>2/i/)(2cfc)3''2A*, where
A*
fig limit,
and, to first order
A% =
The range of collision frequencies for which this result is valid is referred to asthe i/"1 regime due to its scaling with collision frequency. Note that A* scales as(Co,i/e*)2> while the term in braces represents the effects of transport optimization.These results make it possible to introduce the concept of the "effective" helicalripple for W1 transport < «& > = e^-A*)2/3, i.e. the helical ripple that an idealstellarator must have to achieve the identical transport rate. A comparison of theradial dependences of «A and < e/> > for the Helias configuration HS5V10C — whichis the basis for the future large stellarator experiment Wendelstein 7X — and forthree conventional torsatrons is presented in Figure 2. HS5V10C has |Co,i|/et « 0.3and also has a high degree of drift optimization; together, these result in extremelysmall values of <e/j > ;$ 0.01 across the entire plasma cross section.
Besides having extremely favorable neocj&^kal transport properties in the v~l
regime, Helias configurations have reduced transport rates in all other collisionfrequency regimes as well. This point is illustrated graph; cally in Figure 3 by resultsfrom the power series solution for HS5V10C and LHD; tLese analytic expectationshave also been confirmed by Monte Carlo numerical results.
>e>lo(0
electron
"••©.,•'••<?
"^.S.....o.-a-'Q"'
1 10 100 1000
Figure 3. The monoenergetic diffusion coefficient as a function of normalizedcollision frequency for the Helias HS5V10C (solid lines) and the LHD torsatron(dotted lines). The individual curves illustrate analytic estimates of the transportdue to the helical ripple alone (obtained from the general solution of ike bounce-averaged kinetic equation described in the text) and that due to the combination ofhelical and toroidal (tokamak-like) ripples. Monte Carlo numerical results are shownas open circles. These results are for r/a = 0.5, T = 3 keV, SIE — 11,900 sec~x.
- lo
DIAGNOSTICS DEVELOPMENT FOR THE LARGE HELICAL DEVICE
H. Iguchifor
Diagnostic Division and Research & Development DivisionNational Institute for Fusion Science
Nagoya 464-01, Japan
The Large Helical Device is a superconducting heliotron/torsatrondevice, which will be constructed for the world largest stellaratorresearch project. Its major radius is 3.9 m and average plasma radius of0.6- 0.65 m depending on the magnetic field configuration. One of themain purpose of the LHD project is physics understanding of toroidallyconfined plasmas with reactor relevant plasma parameters. Some physicsissues are common between tokamak and stellarator and the others arestellarator's own. Preparation of reliable plasma diagnostic instrumentswith high space and time resolution is essential to achieve this purpose.Three dimensional measurements are also required because of non-axisymmetry of the helical field.
Several severe conditions have been pointed out in thedevelopment of diagnostics for LHD. The LHD is a superconductingdevice, in which heat shielding for the superconducting coils is severeand the size of the diagnostic port are restricted. Operational conditionshave a variety with standard 10 second operation and low power (3 MW)but steady state operation. Plasma parameters are ranging from a lowdensity high temperature regime ( <nc > = 1- 3 x 10*3 cm-3, Te(0) = 8 -10 keV) to a high density regime (<ne> = 1 - 2 x 1014 cm-3) . Another
difficulty is the heavy neutron radiation environment, which is mainlyproduced by D-D beam plasma interaction in the 2nd phase of theresearch program.
Basic principles for the diagnostic development is as follows;1) Cooperation with universities in Japan.2) Based on Heliotron-E, JIPPTII-U and CHS diagnostics.3) Cross-check plasma parameters using different diagnostics.
1
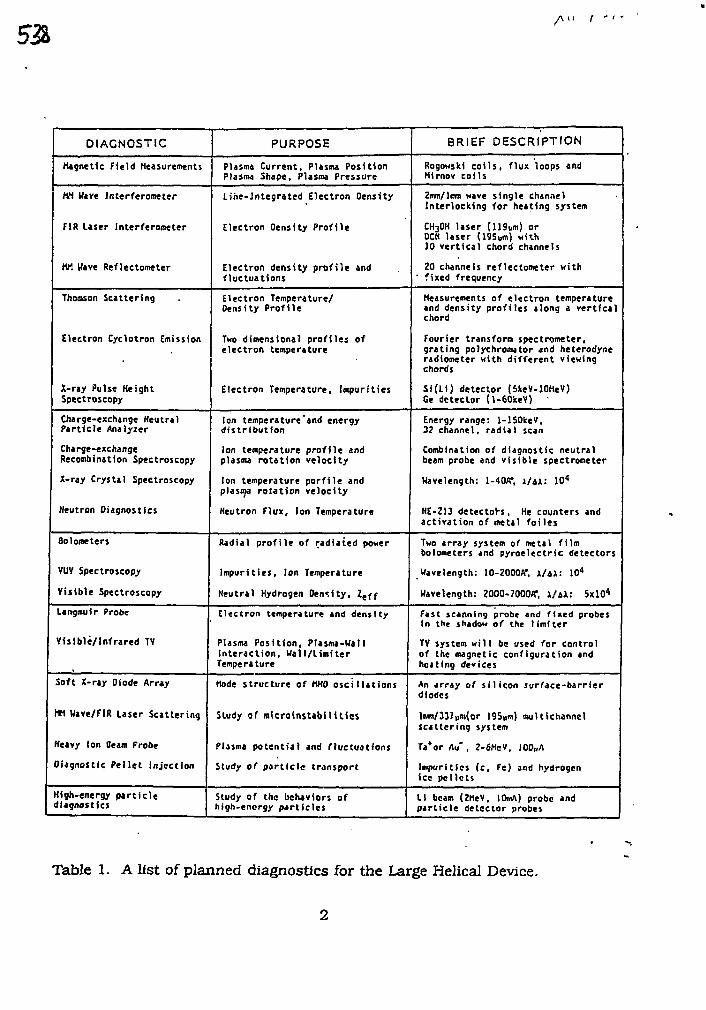
DIAGNOSTIC
Magnetic Field Measurements
m Wave Interferometer
FIR Laser Interferometer
m Have Reflectometer
Thomson Scattering
Electron Cyclotron Emission
X-ray Pulse HeightSpectroscopy
Charge-exchange NeutralParticle Analyser
Charge-exchangeRecombination Spectroscopy
X-ray Crystal Spectroscopy
Neutron Diagnostics
Bolometers
VUV Spectroscopy
Visible Spectroscopy
Langmutr Probe
Visible/ Infrared TV
Soft X-ray Diode Array
Hrl Wave/FIR Laser Scattering
Heavy (on Beam Probe
Diagnostic Pel let Injection
High-energy part ic lediagnostics
PURPOSE
Plasma Current, Plasma PositionPlasma Shape, Plasma Pressure
Line-Integrated Electron Density
Electron Density Profile
Electron density profile andfluctuations
Electron Temperature/Density Profile
Two dimensional profiles ofelectron temperature
Electron Temperature, Impurities
Ion temperature'and energydistribution
Ion temperature profile andplasma rotation velocity
Ion temperature porfile andplasma rotation velocity
Neutron Flux, Ion Temperature
Radial profile of radiated power
Impurities, Ion Temperature
Neutral Hydrogen Density, 2eff
Electron temperature and density
Plasma Position, Plasma-WallInteraction, Wall/LimiterTemperature
Mode structure of MHO oscillations
Study of mfcroinjtabilitics
Plasma potential and flue toot ions
Study of particle transport
Study of the behaviors ofhigh-energy particles
BRIEF DESCRIPTION
Rogowski co i ls , flux loops andMirnov coils
2tnm/]mm wave single channelInterlocking for heating system
CH3OH laser (I19um) orDCH laser (19Sum) with10 vert ical chord channels
20 channels reflectometer with' fixed frequency
Measurements of electron temperatureand density profi les along a vert icalchord
Fourier transform spectrometer,grating polychromator and heterodyneradiometer with different viewingchords
Si (L i ) detector (SkeV-lOHeV)Ge detector (l-60keV) '
Energy range: 1-lSOkeV,32 channel, radial scan
Combination of diagnostic neutralbeam probe and visible spectrometer
Wavelength: 1-4CW, i / 4 1 : i C
ME-213 detectors, He counters andactivation of metal fo i les
Two array system of metal f i lmbolometers and pyroelectrfc detectors
Wavelength: 10-Z000A*. x/tx: 104
Wavelength: 2OOO-70OCW, X/&X: 5xl04
Fast scanning probe and fixed probes(n the shadow of the l imi ter
TV system w i l l be used for controlof the magnetic configuration andheating devices
An tmy of si l icon lurface-barr ierdiodes
lrnn/]37um(or 19Sum) multichannelscattering system
Ta*or rtu", ?-6McV, JOOWA
Impurities (c , Fc) and hydrogenice pel lets
LI beam (2MeV, 10mA) probe andpart icle detector probes
Table 1. A list of planned diagnostics for the Large Helical Device.
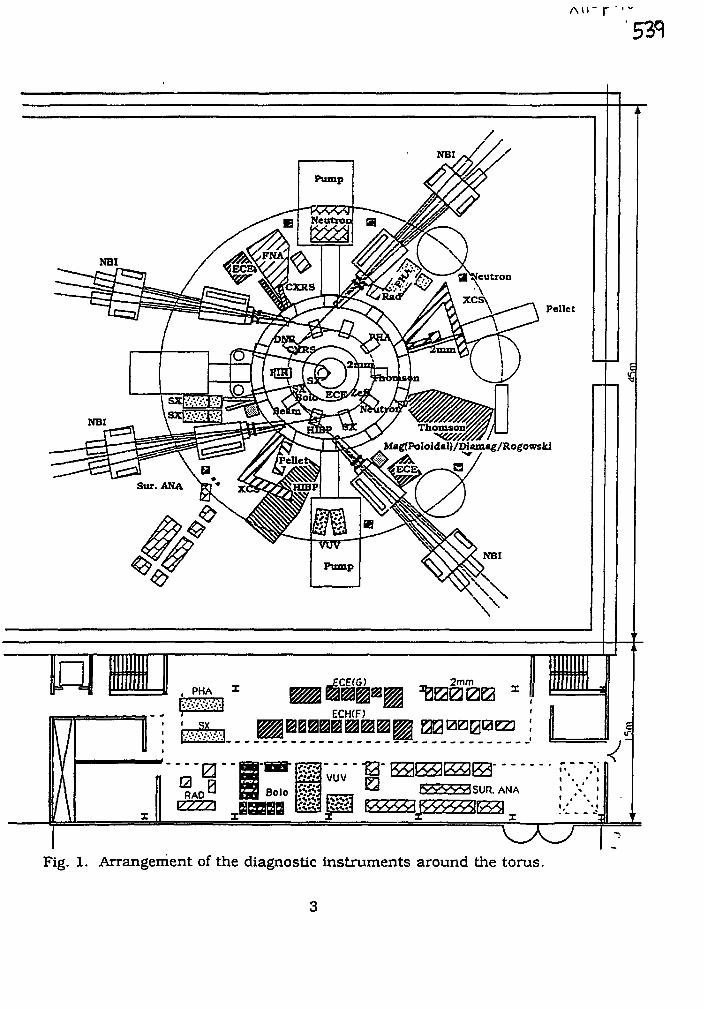
Pellet
Mag(Po2oidaI}/Diamag/Rogowski
, PHAECE(G)
ECH(F)
2mm
RAOU BoloVUV
r w v w i « ; i i R ANA
I
T:Fig. 1. Arrangement of the diagnostic instruments around the torus.
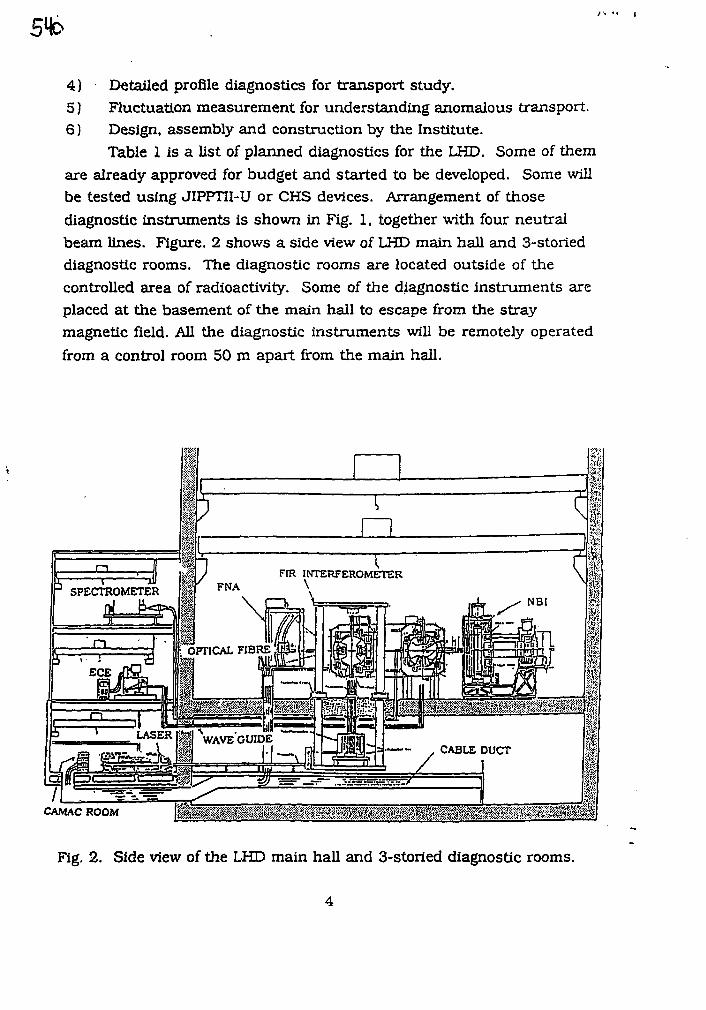
4) Detailed profile diagnostics for transport study.5) Fluctuation measurement for understanding anomalous transport.6) Design, assembly and construction by the Institute.
Table 1 is a list of planned diagnostics for the LHD. Some of themare already approved for budget and started to be developed. Some willbe tested using JIPPTH-U or CHS devices. Arrangement of thosediagnostic instruments is shown in Fig. 1, together with four neutralbeam lines. Figure. 2 shows a side view of LHD main hall and 3-storieddiagnostic rooms. The diagnostic rooms are located outside of thecontrolled area of radioactivity. Some of the diagnostic instruments areplaced at the basement of the main hall to escape from the straymagnetic field. All the diagnostic instruments will be remotely operatedfrom a control room 50 m apart from the main hall.
CAMAC ROOM
Fig. 2. Side view of the LHD main hall and 3-storied diagnostic rooms.


