Embed Size (px)
Citation preview
University of Nigeria Virtual Library
Serial No
ISBN 978-32226-2-7
Author 1
ONAH, F. E.
Author 2
Author 3
Title
Employment Prospects and Training Needs for Self-Employment in Nigeria
Keywords
Description
Employment Prospects and Training Needs for
Self-Employment in Nigeria
Category
Social Sciences
Publisher
National Manpower Board
Publication Date
1994
Signature

Diagnostic Studies Series 3
I
L rraining: Self-Employment in Nigeria .
NATIONAL MANPOWER BOARD
Employment Prospects and Training Needs for Self-Em ployment in Nigeria
Ebebe A. Uk~one: Series Editor
Other Publications in the Diagnostic Studies Series (DSS)
Absorption of Educated Manpower into Nigeria's Informal Sector by S.I. Oladeji. DSS 1.
A Macro-economic Model for Simulating Employment and Manpower Implications of Macro-economic Policies in Nigeria by Olu Ajakaiye. DSS2

Employment prospects and Training needs for Self-Employment in Nigeria
F. E. Onah University of Nigeria
National Manpower Board, Lagos

@ Copyright National Manpower Board, 1994
Published by, National Manpower Board 1-5 Omo Osagie Street, S.W. Ikoyi, P. M. B. 12680, Lagos, Nigeria.
- - - - - - - -
Sections of this publication may be reproduced provided credit is given to National Manpower Board. The views expressed are those of the author and do not necessarily represent those of National Manpower Board, its staff or Series Editor.
Printed by Nolbil (Nig.) Limited 34/36, Ojuelegba Road, Surulere, Lagos, Nigeria.
ISBN 978 - 32226-2-7
Contents
List of Tables
Preface
Editorial Summary
1. 1.1 1.2 1.3 1.4 1.5
II. 11.1 11.2
IV. 1 IV.2
Introduction Nature of Research Problem Objectives Policy Relevance The Scope Methods of Research
The Nature of Self-Employment Definition Scope and Coverage
Characteristics of Self-Employment Size Composition Employment Density Female Participation Income
The Extent, Forms and Determinants of Labour Absorptlon into the Rural - Urban Informal Sector Formal and Informal Sectors Distinguished The ~xteht of Labour Absorption
Contents contd.
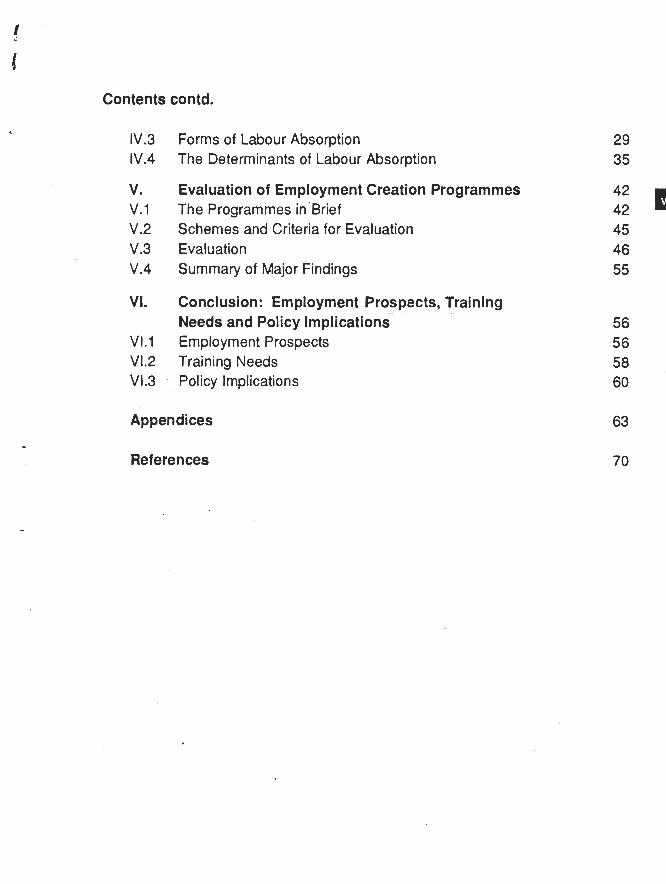
IV.3 Forms of Labour Absorption 1V.4 The Determinants of Labour Absorption
V. Evaluation of Employment Creation Programmes V.l The Programmes in Brief V.2 Schemes and Criteria for Evaluation V.3 Evaluation V.4 Summary of Major Findings
VI. Conclusion: Employment Prospects, Training Needs and Policy implications
VI.l Employment Prospects V1.2 Training Needs V1.3 Policy Implications
Appendices
References
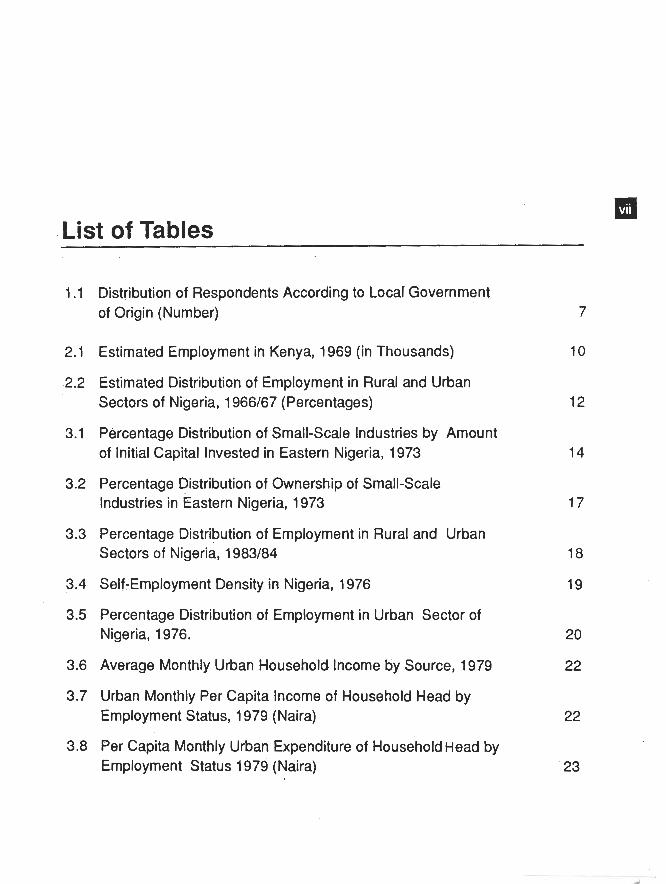
List of Tables
1.1 Distribution of Respondents According to Local Government of Origin (Number)
2.1 Estimated Employment in Kenya, 1969 (in Thousands)
2.2 Estimated Distribution of Employment in Rural and Urban Sectors of Nigeria, 1966/67 (Percentages)
3.1 Percentage Distribution of Small-Scale Industries by Amount of initial Capital Invested in Eastern Nigeria, 1973
3.2 Percentage Distribution of Ownership of Small-Scale Industries in Eastern Nigeria, 1973
3.3 Percentage Distribution of Employment in Rural and Urban Sectors of Nigeria. 1983/84
3.4 Self-Employment Density in Nigeria, 1976
3.5 Percentage Distribution of Employment in Urban Sector of Nigeria, 1976.
3.6 Average Monthly Urban Household Income by Source, 1979
3.7 Urban Monthly Per Capita lncome of Household Head by Employment Status, 1979 (Naira)
3.8 Per Capita Monthly Urban Expenditure of Household Head by Employment Status 1979 (Naira)
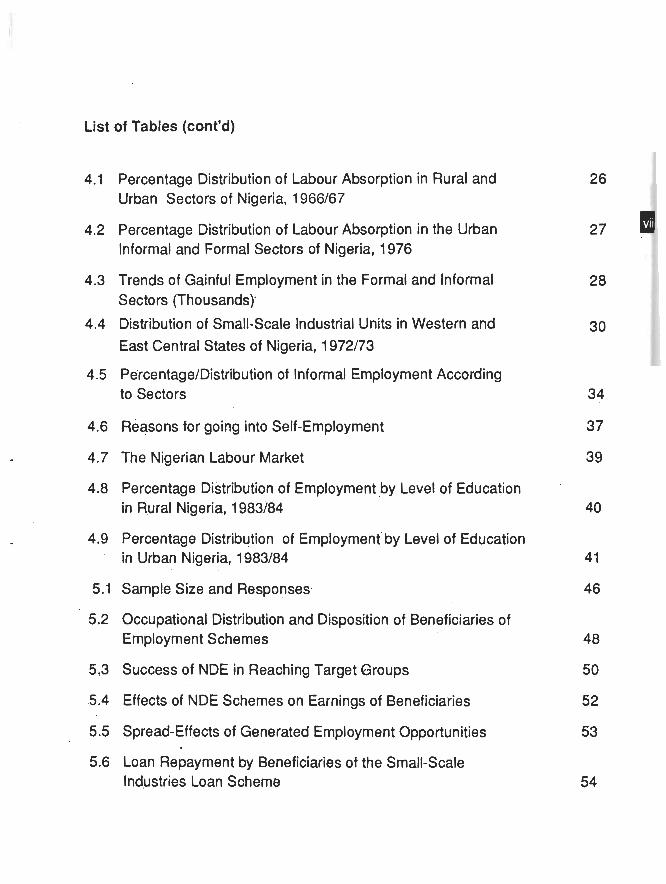
List of Tables (cont'd)
4.1 Percentage Distribution of Labour Absorption in Rural and Urban Sectors of Nigeria, 1966167
4.2 Percentage Distribution of Labour Absorption in the Urban Informal and Formal Sectors of Nigeria, 1976
4.3 Trends of Gainful Employment in the Formal and Informal Sectors (Thousands)'
4.4 Distribution of Small-Scale Industrial Units in Western and East Central States of Nigeria, 1972173
4.5 Pe'rcentagelDistribution of Informal Employment According to Sectors
4.6 Reasons for going into Self-Employment
4.7 The Nigerian Labour Market
4.8 Percentage Distribution of Employment by Level of Education in Rural Nigeria, 1983184
4.9 Percentage Distribution of Employment'by Level of Education in Urban Nigeria, 1983184
5.1 Sample Size and Responses.
5.2 Occupational Distribution and Disposition of Beneficiaries of Employment Schemes
5.3 Success of NDE in Reaching Target Groups
.5.4 Effects of NDE Schemes on Earnings of Beneficiaries
5.5 Spread-Effects of Generated Employment Opportunities
5.6 Loan Repayment by Beneficiaries of the Small-Scale Industries Loan Scheme
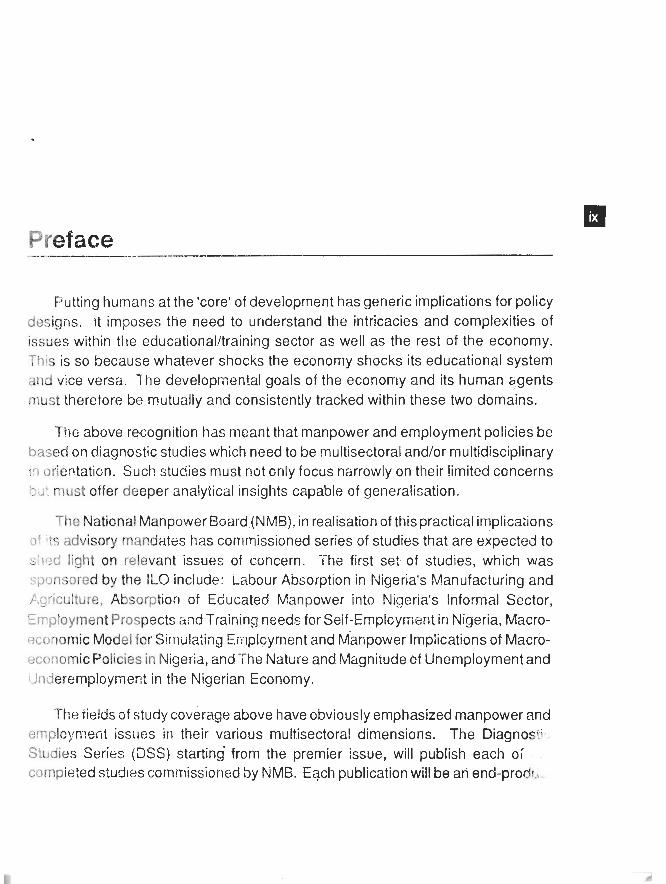
Preface
Putting humans at the 'core' of development has generic implications for policy designs. It imposes the need to understand the intricacies and complexities of issues within the educationalltraining sector as well as the rest of the economy. Thls is so because whatever shocks the economy shocks its educational system and vice versa. The developri.;ent.al goals of the economy and its human bgents must therefore be mutually and consistently tracked within these two domains.
The above recognition has meant that manpower and employment policies be based on diagnostic studies which need to be multisectoral and/or multidisciplinary i r 1 orie~tation. Such studies must not only focus narrowly on their !imited concerns '5i' must offer deeper analyl~cal insights capable of generalisation.
The National Manpower Board (NMB), in realisation of this practical implications n' ,ts advisory rnamhtes has commissioned series of studies that are expected to
-7
5 ' ~ d light on relevant issues of concern. I he first set of studies, which was L-pmsorcd by the It0 include: Labour Absorption in Nigeria's Manufacturing and ~ . ~ ~ i c u l t u r e , Absorption of Educated Manpower into Nigeria's Informal Sector, f rrployrnent Prospects and Training neecis for Self-Ernplcyment in Nigeria, Macro- wnnomic Model for Siniiilating Emplcyrrient and anpo power Implications of Macro- eccnomic Policies in Nigeria, and The Natwe and Magnitude cf Unemployment and ~Jncleremploymen: in the Nigerian Economy.
The iields of study coverage above have obviously emphasized manpower and ~mployn?ent issues in their various multisectorat dimensions. The Diagnos!; S!ttdies Series (3SS) starting from the premier issue, will publish each o; cornpieted studies commissioned by NME. Each publication will be an end-prod!.,

of astudy process which had gone through the standard crucible of peer assessment in order to improve on its technical quality. It is hoped that the analytical insights unveiled by each study will not only be of interest to policy advisors but would motivate further scholastic inquiries by interested audience.
We want to use this opportunity to thank the ILO for sponsoring the first set of our Diagnostic Studies Series. The author of each of the published paper is also E l congratulated for hisfher contribution. The opinions of the authors are however, regarded as personal to them and do not reflect the official position of National Manpower Board. Readers are encouraged to,send their comments, if any, to National Manpower Board.
.Professor Joe U Umo Executive Secretary
October, 1994

Editorial Summary
Based on the primary data from the National Directorate of Employment (NDE), the report presents an analysis of the efficacy of self-employment in solving Nigeria's unemployment problems. Attention is paid to engendering the understanding of the concept and features of self-employment, evaluation of employment prospects and requisite training ne.eds and determinants of labour absorption in rural and urban sectors.
On the basis of the detailed evaluation of the four employment programmes of NDE, the following findings are recorded: there is a tendency towards exaggerating the successes claimed by the NDE for its Open Apprenticeship and Small-Scale lndustries Schemes; the Entrepreneurship Development Scheme has inherent dislocation given the low access rate of its beneficiaries to bank loans; the Small- Scale lndustries Scheme alm& achieved total reliance on self-employment for its beneficiaries who are in employment; and the credit-worthiness of the beneficiaries is vouched for by the act of almost all the recipients of the Small-Scale lndustries Scheme starting to pay back loans granted them.
Specific policy actionsfor the enhancement of the self-employment programmes of NDE are suggested. What is not raised in the report and hence not clear, is the extent these suggestions can be applied elsewhere. However, what is worthy of note is the report'sattempt to broaden the understanding of policy-makers and other actors in Nigeria's development scene on the processual interaction between policy measures and unemployment alleviation. The historical context of the study itself may therefore turn out to be illuminative.

I. Introduction
1.1 Nature of Research Problem
Unemployment has over the years constituted a serious problem in the Nigerian economy. During the development plan periods of 1962 - 68 and 1970 - 74 the level of unemployment, particularly in the modern sector among 'literate but unskilled
r school leavers, reached apoint where development planners began arethinkon the data and strategies for estimating the growth of employment. Accordingly, reliance i on the growth of the Grofs Domestic Product (GDP) either as a basis for calculating the future manpower needs of the economy or as a necessary and sufficient condition for generating adequate employment opportunities came to be consid- ered inappropriate (Aderinto,l984, P. 14.). Consequently, the Third National Development Plan, 1975 - 80, not only specified 'reduction in the level of unemploy- ment' and 'increase in skilled manpower' as two of its seven specific objectives but alsocontained the following strategies for achieving them:
(i) Expansion of employment opportunities through the implementation of 1 I
employment-oriented programmes;
(ii) Provision of industrial attachment programmes, occupational guidance and similar schemes; and
(iii) Strengthening of existing educationaland training facilities and establish- ment of additional ohes in identified areas of need.
Unfortunately, however, neither did the plan provide for the establishment of any agencies for providing employment opportunities nor were any industries established in pursuit of the first strategy. With regard to the second and third

strategies government intensified training efforts through the activities of the following agencies:
(i)
(ii)
(iii)
the Industrial Training Fund (ITF) whoseobjective was and is to generate the necessary funds and encourage private firms to train and retrain low level and intermediate manpower;
the Centre for Management Development (CMD) established fordeveloping and updating management skills among senior managers in the private sector; and
the Administrative Staff College of Nigeria (ASCON) established to improve management skills within the public sector (Aderinto, 1984,
p.15 -16).
The Plan, among other things, envisaged the generation of additional employment opportunities to reduce the projected unemployment rate of 4.5 per . cent for 1975 to 3 per cent in 1980. However, by 1980 the unemployment rate was estimated at between 8 and 15 per cent for most of the urban centres and about 4.4 per cent for the entire country. A further evidence of the seriousness of the unemployment situation is revealed by a survey of the 1981 first degre,e graduates of a certain University and the Nigerian National Diploma graddates of one University of Science and Technology conducted in 1983 . The survey recorded unemployment rates of 5.6 per cent and 12 per cent for the two categories of graduates respectively, 12 months after completing their National Youth Service. (Angaye, 1984, p. 13 - 14).
The Fourth National Development Plan, 1981 ~ 8 5 , identified the increasing rate of unemployment as resulting from h e :
(i) failure of the various development plans to generate anticipated employment opportunities; and
(ii) lack of labour market information.
A change of policy direction was, therefore, necessary. This change came with the adoption of 'the Structural Adjustment Programme (SAP) in June 1986.

Emphasis shifted from public wage employment to self-employment generation. This gave rise to the establishment of the National Directorate of Empl6ylment (NDE), a body charged with the responsibility of generating employment ppportv- nities with emphasis on self - employment. The agency has since 1987 been operating, and claiming huge successes for, four core programmes geared towards achieving these objectives.
The questions which aAse from the foregoing discussion are:
What is the nature (definition, range, and characteristics) of self - employment?
What are the extent, forms and determinants of self-employment in rufiaV urban Nigeria?
How successful have the employment generation progra,mmds been in creating employment opportunities?
What are the prospects and training needs of self-employment?
These questions constitNe the problems which this study addresses.
,I. 2 Objectives
t h e objectives of the study i r e as follows:
(1) To examine the nature of self - employment with a view to determining its efficiency in solving Nigeria's unemployment problems;
(2) Td increase the understanding of policy makers, academics and external agencies of the interaction between policy measures and unemployment alleviation; and
(3) To enhance the efficacy of the agencies and institutions charged with the design and management of employment creation programmes.
1. 3 Policy .Relevance _ ..
Policy makers choose combination of social security policies that reflect their
perceptions of need and vulnerability. The relevant policy depends on identifying the vulnerable groups as well as administrative, financial and political constrains.
In the case of our proposed study, the vulnerable group is identified as the unemployed school leavers (so as to prevent destitution), but the issues of administrative and financial constraints are of no less importance. In addition to budget constraint, the difficulties of administering programmes of social security, particularly in the informalsector, cannot be over-emphasized. Agricultural and self- employed workers are hard to trace. It is difficult to keep track of people who move back and forth and whose work histories are not recorded. Similarly, targeting transfers (benefits) to such groups is a challenge, and so are questions of efficiency and incentive.
Considered in the above light, the findings of the study will- be useful in informing policies both at home and at the international level. On the domestic front, they will enable government :
(1) determine the appropriateness of policy interventions designed to stimulate self-employment as a strategy for combating unemployment and hence, poverty;
(2) assess the administrative efficiency of targeting the transfer (benefits); and
(3) assess the effects of the interventions on economic growth.
On the external front, it is expected that the findings would influence the generosity of donor agencies. Altruistic donors who know ,!hat their money is appropriately being utilized for alleviating poverty wou(d'6e more forthcoming with funds. Similarly, donors whqse,financiql and ~olitic&f support is not altruistic but. depends on benefits they would derive are more likely to feel better di~posed to assist in programmes that have bette; chances of,succtks in achieving the intended objectives (Ravallion,l991, p. 157).
-1. 4 The Scope
The empirical component of the study has been limited in geographical
coverage to the former Anambra State. There are two main reasons for this. One is that the number of beneficiaries of the chosen employment generation scheme is very large and the number of states too many to cover in a single study of this size. The second is that the required period of study is too short for more than one state.
1.5 Methods of Research
Data Collection
The Data used in the study were gathered from primary and secondary sources. The secondarysources include reports of small-scale industries surveys, distribution surveys, household surveys, and other publications such as those of the Central Bank of Nigeria and the Federal Office of Statistics (FOS). Primary data came from a survey mounted for the purpose of assessing the effectiveness of the Open Apprenticeship and Small-Scale Industries Schemes of the National Directorate of Employment, (NDE).
The sample for the survey was designed as follows. As at the close of 1991 about 1 1,095 job seekers in the former AnambraState had benefited from the Open Apprenticeship ~cheme.0f this number about 5,219 had graduated from training while 5,876 werestill undergoing training. The number that had benefited from the Small-Scale Industries Scheme was estimated at 1666. A two-stage sampling procedure was initially planned. The first stage was to involve taking a 35 per cent random sample of the 29 Local Government Areas in the State. This would result in a sample of the 10 Local Government Areas. The second stage was to take a 35 per cent random sample of the beneficiaries of each of the two schemes in the selected Local Governments (that is, on assumption of equality of Local Governments, of 180 and 58 beneficiaries respectively in each of the 10 Local Governments). This wo,uld yield total sample sizes of 630 and 203 for the two schemes.
However, a pre-survey visit to the NDE Secretariat at Enugu revealed the need for revising the sample design. Following the recent creation of two new states (Enugu and Anambya) out of the former Anambra State, some staff of the NDE at Enugu were moved'to Awka, the capital of the new AnambraState. Records relating
to the new state were also moved. As a result of the confusion that attended the movement, it became impossible to get information about the beneficiaries of the schemes in the new Anambra State. Secondly, it was discovered that the selection of beneficiaries in Enugu State (our new study location) was made according to zones rather than Local Governments. The zones were Enugu, Nsukka and Abakaliki. Moreover, equality of zones was not considered as a factor in the selection exercise.
We therefore had to abandon our initial sampling procedure. Instead, we took all the names available for Enugu and Nsukka zones, numbering 1795 for the Open Apprenticeship and 87 for Small-Scale Industries. These represented 34.4 and 5.2 per cent of the totals for the former Anambra State respectively. The beneficiaries were interviewed through contact persons selected and trained in advance.
The distribution of actual respondents according to Local Government of origin is presented in Table 1 .I. It is shown that the respondents came from 17 of the 29 Local Government Areas of the former Anambra State. Some of them came from Awka, Aguata, Anaocha, Idemili,.lhiala and Njikoka in new Anambra State, and from Abakaliki, Ezza, lshielu and lzzi in Abakaliki zone. However, the bulk of them concentrated in 8 Local Government Areas of Enugu and Nsukka zones of Enugu State.
Data Analysis
Statistical methods have been used to analyse the data collected. First, the raw data were coded, collated and tabulated. Where applicable ratios were computed and tabulated. Thereafter, analysis was conducted using the descriptive and analytical methods.
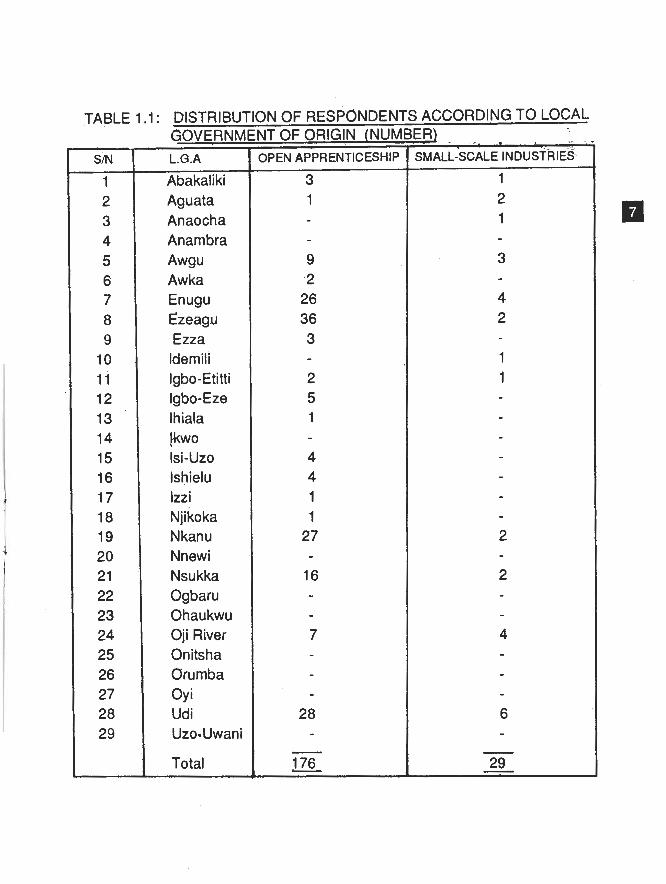
TABLE 1.1 : DISTRIBU' GOVERNM
-
L.0.A
Abakaliki Aguata Anaocha Anarnbra Awgu Awka Enugu Czeagu Ezza ldernili Igbo-Etitti Igbo-Eze lhiala lkwo Isi-Uzo Ishielu lzzi ~jikoka .N kanu Nnewi Nsukka Ogbaru Ohaukwu Oji River Onitsha Orurnba oy i Udi Uzo-Uwani
Total
I N OF RESPONDEN1 qT OF ORIGIN (NUM 3PEN APPRENTICESHIP
3 1
i ACCORDING TO LOCAL ER) - .-. . . , .- -
SMALL~CALE INDUSTRIES:

II. The Nature of Self-Employment
II. 1 Definition
Self-employment is one of such concepts that are more easily recognised in practice than defined. One attempt is to define it as expenditure of one's resources for income in activities other than wage or salaried employment. This definition is, however, too imprecise. On the one hand, it admits of investments, sale of assets, and expenditure of labour resource for income purposes. On the other hand, it apparently precludes work done by the immediate family members of the self- employed. Similarly, it may not account forthe work of artisans who contract out their sewicesfor short periods of time in return forcash payments. They take up jobsfrom a variety of sources but at the same time exhibit some elements of independence. They cannot, therefore, be appropriately classified either as self-employed or employees; they are in part-time or non-wage employment or at best in informal "casual self-Employment" (Steel, 1977, p. 64 & 76).
Perhaps a more precise criterion is achieved by adapting the definition of a self- employed household. It is defined as one whose head earns income by working for himself (FOS ,1985, p. 135). The essential ingredient of self-employed is, therefore, that, whether investments are involved or not, the people concerned work for themselves. They work under their own management for the purpose of earning a living and acquiring wealth, without legal obligations of accountability to any other person or persons.
In other words, the concept may be defined as own-account employment. Whether the self-employed are assisted by their relatives and immediate families or not is immaterial. Similarly, whether the business is well established (in terms of fixed public place of business and assets) or the people work in their own homes
or market stalls does no violence to the definition. These are merely forms (well established and casual) of self-employment (Steel, 1977, p. 64 & 76).
11.2 Scope and Coverage
There is abundant and yet growing literature on three sectoral division of an economy for purposes of analysing employment, income and output. (See for instance, Child, 1977; Guade, 1972; Steel and Takagi; 1976; and Steel, 1977). These are the traditional (sometimes referred to as the informal), intermediate, and modern sectors.
The traditional sector is predominantly rural and consists of small farmerswho employ traditional methods in mainly subsistence agriculture. Non-agricultural activities include traditional crafts fsuch as basket and mat making, pottery, calabash carving, etc.) cottage industries (such as palm produce pro,wssing, spinning and cloth weaving on hand-looms, and food processing), petty trade, and small-scale construction ,(Child, 1977, p.1).
The intermediate sector is a half way house between the traditional and modern sectors. It consists of small-scale enterprices in repair services, food services, very small-scale manufacturing, and trade. These enterprises are found most obviously in rural market centres and on the fringes of cities. Their products include such items as furniture, kitchenware, clothing materials, processed foods, simple agricultural implements, and a variety of services (Child,1977, p. 4). Although these products may be of low quality, they are derivative of the modern sector.
The modern sector consists of large-scale farms and small-scale farms that substantially produce for the market. Non-agricultural establishments include large- scale private firms that use relativelycapital intensive methods and the public sector. Both farm and non-farm establishments are found in urban as well as rural settings.
The range of activities amenable to self-employment is limited to the traditional and intermediate sectors. This is borne out by data in Table 2.1 which relates to employment in Kenya. The data show the existence of self-employment in rural (traditional) agriculture, crafts, and services. The intermediate sector contains information for both rural and urban sector. Thus, the analysis of self-employment
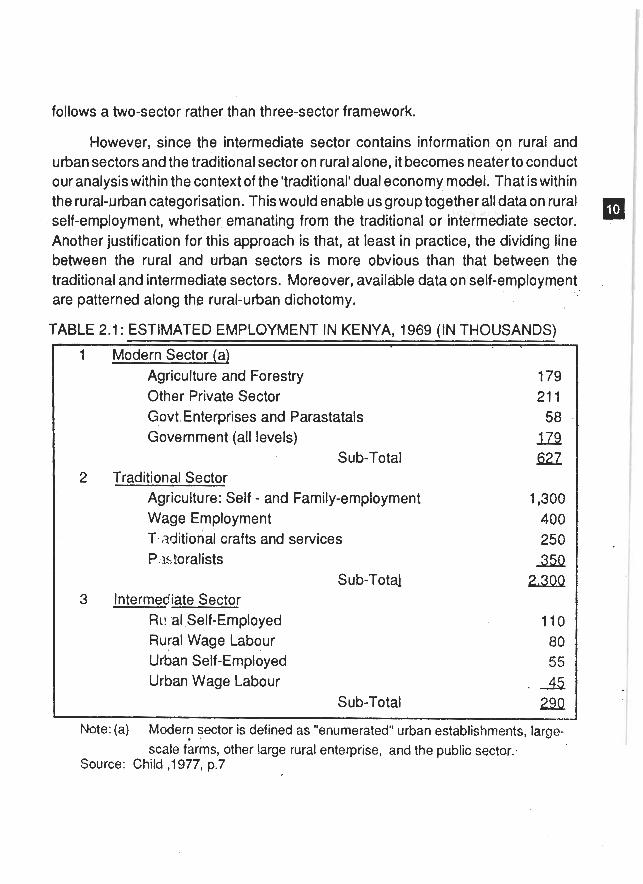
follows a two-sector rather than three-sector framework.
However, since the intermediate sector contains information on rural and urban sectors and the traditional sector on rural alone, it becomes neater to conduct our analysis within the context of the 'traditional' dual economy model. That is within the rural-urban categorisation. This would enable us group together all data on rural self-employment, whether emanating from the traditional or intermediate sector. Another justification for this approach is that, at least in practice, the dividing line between the rural and urban sectors is more obvious than that between the traditional and intermediate sectors. Moreover, available data on self-employment are patterned along the rural-urban dichotomy.
TABLE 2.1: ESTIMATED EMPLOYMENT IN KENYA. 1969 (IN THOUSANDS)
Modern Sector (a) Agriculture and Forestry Other Private Sector Govt Enterprises and Parastatals Government (all levels)
Sub-Total Traditional Sector
Agriculture: Self - and Family-employment Wage Employment T aditional crafts and services P.K toralists
Sub-Total Intermediate Sector
Ru ,al Self-Employed Rural Wage Labour Urban Self-Employed Urban Wage Labour
Sub-Total
Note: (a) Modern sector is defined as "enumerated" urban establishments, large- scale firms, other large rural enterprise, and the public sector:
Source: Child ,1977, p.7
Table 2.2 contains information on the distribution of employment in Nigeria according to the type of activity, namely, agricultural and non-agricultural activities. Small-holder farmers constitute the self-employed in both rural and urban agricultural sector, that is in crop and livestock production. The self-employed in non- agricultural activities include those in all economic. activities other than crop and livestock production, encompassing crafts, services, construction, mining, commerce, and manufacturing. They also include those in agro -industrial activities which store, process and market agricultural commodities (Haggblade et al., 1988, p. 3).
The table shows that as of 1966167, 64 per cent of all gainfully employed persons in Nigeria were in self-employment, with 42.3 and 21.7 per cent in agricultural and non-agricultural activities respectively. A breakdown between rural and urban sectors shows t6at 63.3 and 67.8 per cent rural and urban employment respectively were accounted for by self-employment. A further disaggregation shows that 46.3 and 17.0 per cent of all rural employment were in agricultural and non-agricultural activities respectively, while the corresponding percentages for the urban sector were 20.3 and 47.5. Thus, while self-employment dominates employment in rural agriculture, it predominates in non-agricultural activities in the urban sector.
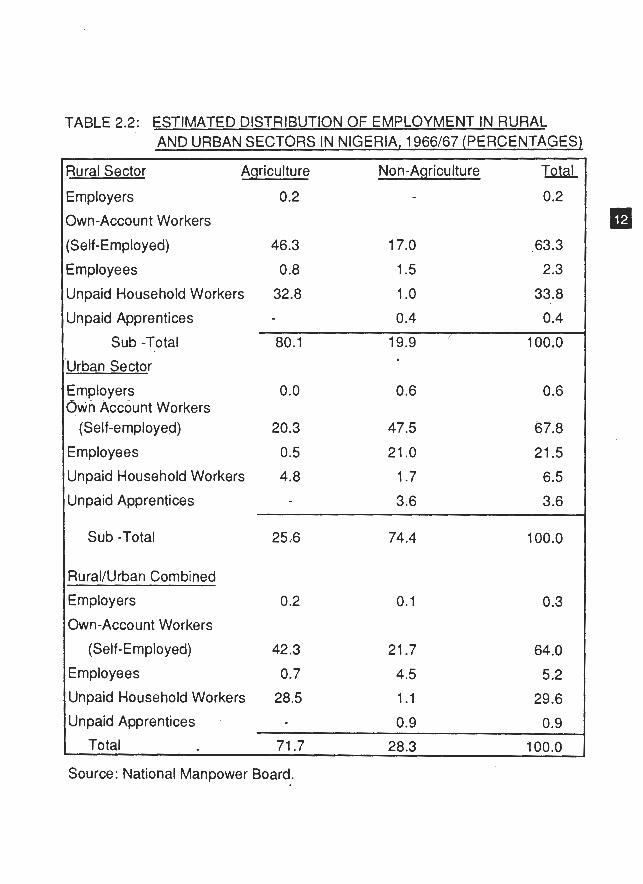
TABLE 2.2: ESTIMATED DISTRIBUTION OF EMP,LOYMENT IN RURAL AND URBAN SECTORS IN NIGERIA, 1966167 (PERCENTAGES1
3ural Sector Agriculture Non-Agriculture T&kd.
Employers 0.2 0.2
3wn-Account Workers
Self-Employed) 46.3 17.0 63.3
Employees 0.8 1.5 2.3
Jnpaid Household Workers 32.8 1 .O 33.8
Jnpaid Apprentices 0.4 0.4
Sub -Total 80.1 19.9 / 100.0
Jrban Sector
Employers 0.0 0.6 0.6 3wn Account -- Workers
(Self-employed) 20.3 47.5 67.8
Employees 0.5 21 .O 21.5
Unpaid Household Workers 4.8 1.7 6.5
Unpaid Apprentices 3.6 3.6
Sub -Total 25,6 74.4 100.0
RurallUrban Combined
Employers 0.2 0.1 0.3
Own-Account Workers
(Self-Employed) 42.3 21.7 64.0
Employees 0.7 4.5 5 -2
Unpaid Household Workers 28.5 1.1 29.6
Unpaid Apprentices 0.9 0.9
Total 71.7 28.3 100.0
Source: National Manpower Board.
Il l . Characteristics of Self - Employment
111.1 Size
Self-employment in the urban economy is a phenomenon of the informal and intermediate sectors. Enterprises in the latter sector are smalland use more labour- intensive methods of production relative to the modern sector. The scale of operation in the former sector is very small. Little or no fixedcapital is used and operation is highly labour intensive.
In the rural economy there ar.e two classes of self-employed labour. One group consists of those that produce essentially for subsistence in small farms and make use of traditional methods of agriculture and raising of livestock. The second class is engaged in non-farm activities such as crafts, small-scale construction and petty commerce. Whether in farm or non-farm activities, rural enterprises are characterised by a paucity of capital and hence small-scale operation.
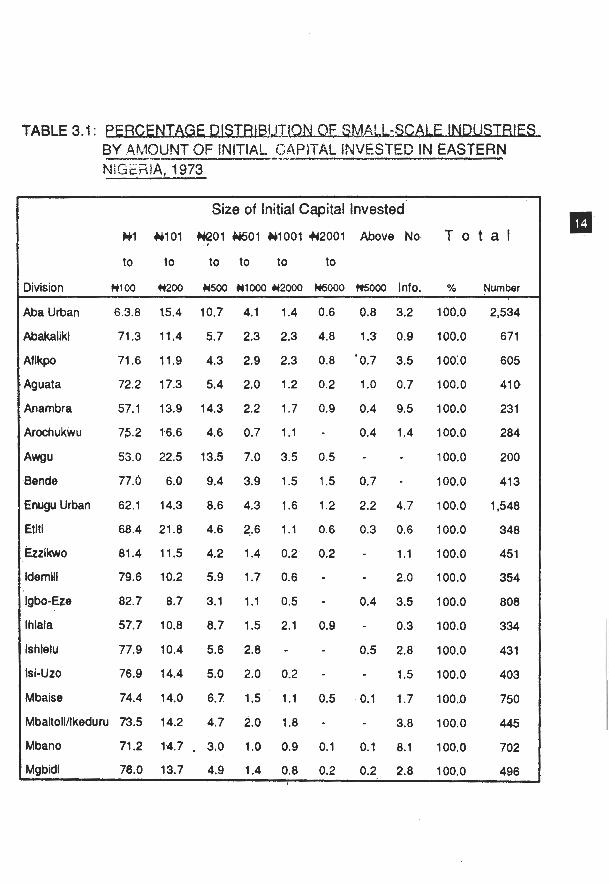
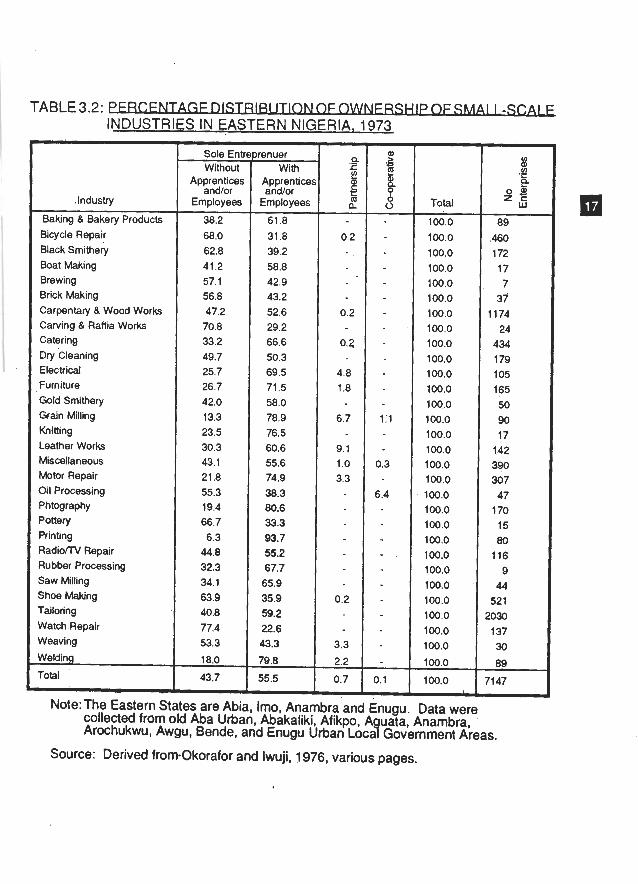
Thus, when capital investment is used as a measure of size, self-employment occurs-in business that are characterised as being small in scale. Table 3.1 gives
' information on the size of initial capital investment of small-scale enterprises in Nigeria. These are typical small scale non-farm enterprises in both the intermediate and informal sectors of the economy. The table shows that, on the aggregate, 70.3 per cent of the 21,614 thousand enterprises covered in the survey had initial capital investment of N1 - kn 000. Some 83.9 per cent had initial investment of MI-WOO and only 1.2 per cent invested more than M000.I
it may be argued that not all the enterprises in the table might be operated by self~employed labour. However, as shown in Table 3.2 a large proportion of them is owned and operated by own-account workers. The table contains data on the
BY -.- AMQUNT OF INITIAL -...-- CAPlTki INVESTED IN EASTERN NiGEGiA, 1973
Size of Initial Capital Invested
livision #loo ++no0 t i 5 ~ ti1000 ti2000 C1600o MOW Info. % Number
4ba Urban
Wakaliki
4fikpo
Aguata
Anambra
Arochukwu
Awsu
Bende
Enugu Urban
Etiti
Gzikwo
ldemill
Igbo-Ez~
lhiala
lshlelu
Isi-Uzo
Mbaise
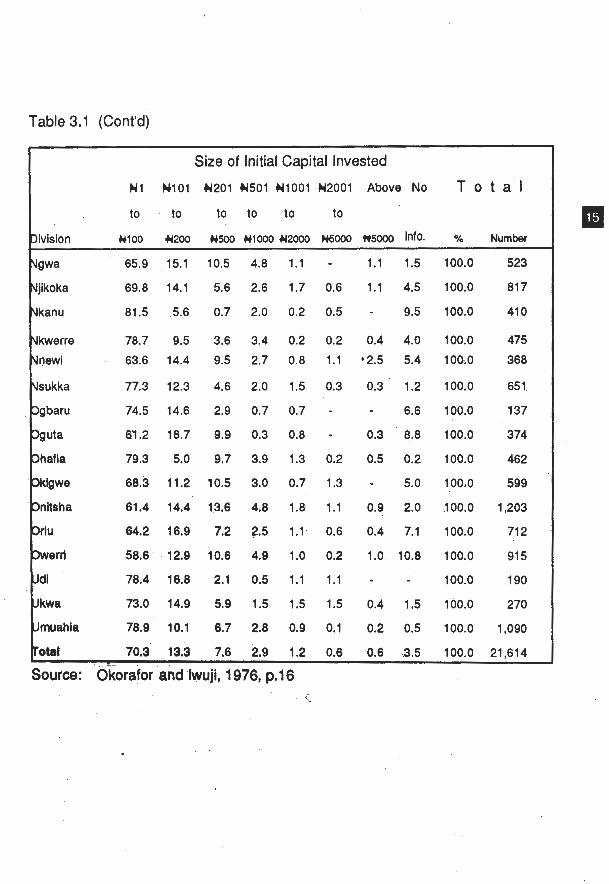
Table 3.1 (Cont'd)
Size of Initial Capital Invested
~1i WIOI u201 u5oi uiooi ~12001 ~ b o v e NO T o t a I
to . to to to ,to to
3ivision NIOO ~ 2 0 0 ~ s o o NIOOO uzooo ~ o o o nsooo Info. % umber
jikoka
kwerre
sukka
gbaru
hafia 79.3
kigwe 68.3.
nltsha h 61.4 64.2
otel 70.3 13.3 7.6 2.9
Source: Okorafor and lwuji, 1976, p.16
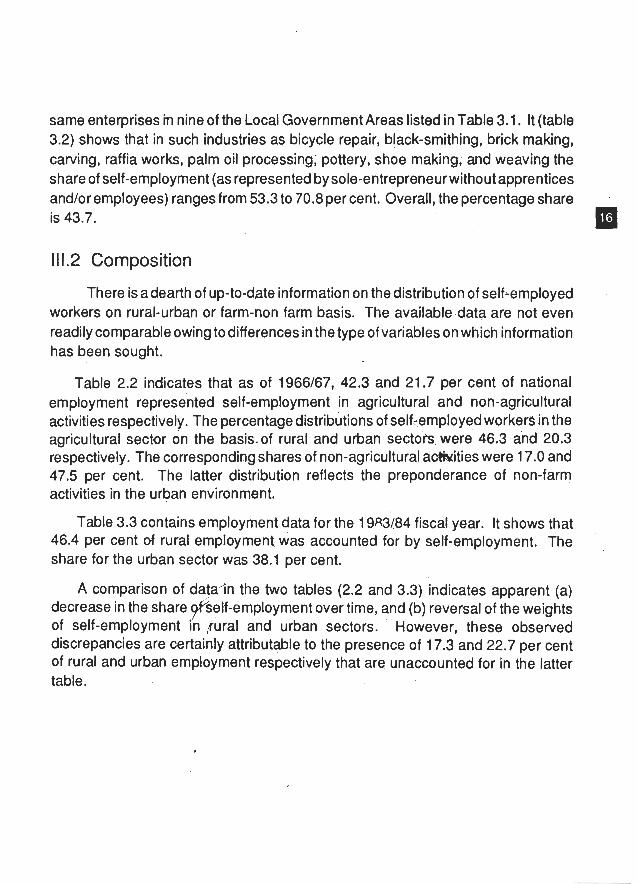
same enterprises m nine of the Local Government Areas listed in Table 3.1. It (table 3.2) shows that in such industries as bicycle repair, black-smithing, brick making, carving, raffia works, palm oil processing; pottery, shoe making; and weaving the share of self-employment (as represented by sole-entrepreneur without apprentices andlor employees) ranges from 53.3 to 70.8per cent. Overall, the percentage share is 43.7.
111.2 Composition
There is adearth of up-to-date information on the distribution of self-employed workers on rural-urban or farm-non farm basis. The available data are' not even readily comparable owing to differences in the type of variables on which information has been sought. . ~
Table 2.2 indicates that as of 1966167, 42.3 and 21.7 per cent of national employment represe'nted self-employment in agricultural and non-agricultural activities respectively. The percentage distributions of self-employed workers in the agricultural sector on the basis.of rural and urban sect&. were' 46.3 and 20.3 respectively. The corresponding shares of non-agricultural aWt ies were 1 7.0 and 47.5 per cent. The latter distribution reflects the preponderance of non-farm activities in the urban environment.
Table 3.3 contains employment data for the 1983184 fiscal year. It shows that 46.4 per cent d rural employment was accounted for by self-employment. The share for the urban sector was 38.1 per cent.
A comparison of data'in the two tables (2.2 and 3.3) indicates apparent (a) decrease in the share yself-employment over time, and (b) reversal of the weights of self-employment in ,rural and urban sectors. However, these observed discrepancies are certainly attributable to the presence of 17.3 and 22.7 per cent of rural and urban employment respectively that are unaccounted for in the latter table.
INDUSTRIES IN EASTERN NIGERIA, 1973
Sole Entre renuer l 7 z Z - h G - I Apprentices I Apprentices
andlor andlor .Industry I Employees 1 Employees
Baking & Bakery Products Bicycle Repair Black Smithery Boat Making Brewing Brick Making Carpentary & Wood Works Carving & Raffia Works Catering Dry cleaning Electrical Furniture Gold Smithery Grain Milling Knitting Leather Works Miscellaneous Motor Repair Oil Processing Phtography Pottery Printing Radio/TV Repair Rubber Processing Saw Milling Shoe Making Tailoring Watch.Repair Weaving
Total
100.0
100.0 100.0 100.0 100.0 100.0 100.0 100.0 100.0 100.0 100.0 100.0 100.0 100.0 100.0 100.0 100.0 100.0 100.0 100.0 100.0 100.0 100.0 100.0 100.0 100.0 100.0
100.0 100.0
100.0
100.0 I
Welding
Total
Note: The Eastern States are Abia, Imo, Anambra and Enugu. Data were collected from old Aba Urban, Abakaliki, Afikpo, A uata, Anambra, Arochukwu, Awgu, Bende, and Enugu Urban Loca 9 Government Areas.
Source: Derived from-Okorafor and Iwuji, 1976, various pages.
18.0
43.7
79.8
55.5
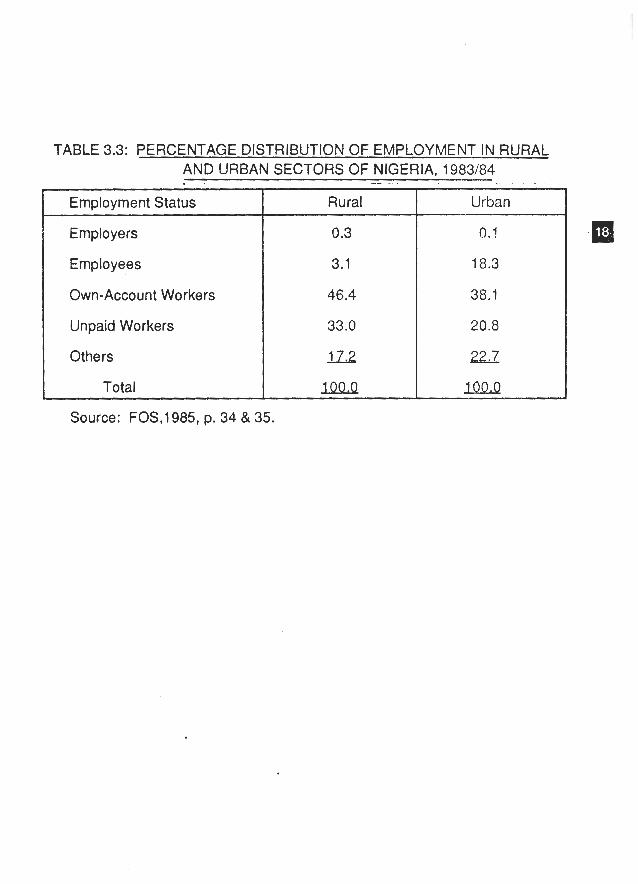
TABLE 3.3: PERCENTAGE DISTRIBUTION OF EMPLOYMENT IN RURAL AND URBAN SECTORS OF NIGERIA, 1983184
--
Employers
Employees
-
Employment Status
I Own-Account Workers I 46.4
Rural
Unpaid Workers
Others
Total
Source: FOS,l985, p. 34 & 35.
Urban I
111.3 Employment Density
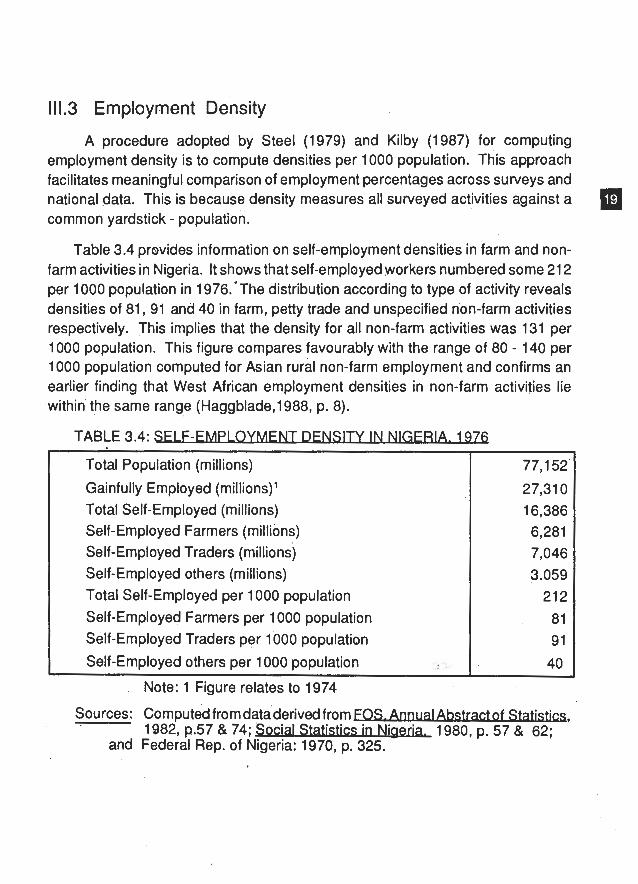
A procedure adopted by Steel (1979) and Kilby (1987) for computing employment density is to compute densities per 1000 population. This approach facilitates meaningful comparison of employment percentages across surveys and national data. This is because density measures all sutveyed activities against a common yardstick - population.
Table 3.4 provides information on self-employment densities in farm and non- farm activities in Nigeria. It shows that self-employed workers numbered some 21 2 per 1000 population in 1976,'The distribution according to type of activity reveals densities of 81, 91 and 40 in farm, petty trade and unspecified non-farm activities respectively. This implies that the density for all non-farm activities was 131 per 1000 population. This figure compares favourably with the range of 80 - 140 per 1000 population computed for Asian rural non-farm employment and confirms an earlier finding that West African employment densities in non-farm activities lie .within' the same range (Haggblade,1988, p. 8).
TABLE 3.4: SF1 F-FMPI QYMENT DFNSlTY IN NIGFRIA. 1976
Total Population (millions)
Gainfully Employed (millions)' Total Self-Employed (millions) Self-Employed Farmers (millions) Self-Employed Traders (millions) Self-Employed others (millions) Total Self-Employed per 1000 population Self-Employed Farmers per 1000 population Self-Employed Traders per 1000 population
Self-Employed others per 1000 population
Note: 1 Figure relates to 1974
Sources.: computed fromdataderived f r o m F 0 ~ A m of St-, 6 .
. . . . . 1982, p.57 & 74; %cia1 S- In N I ~ 1980, p. 57 & 62; and Federal Rep. of Nigeria: 1970, p. 325.
111.4 Female Participation
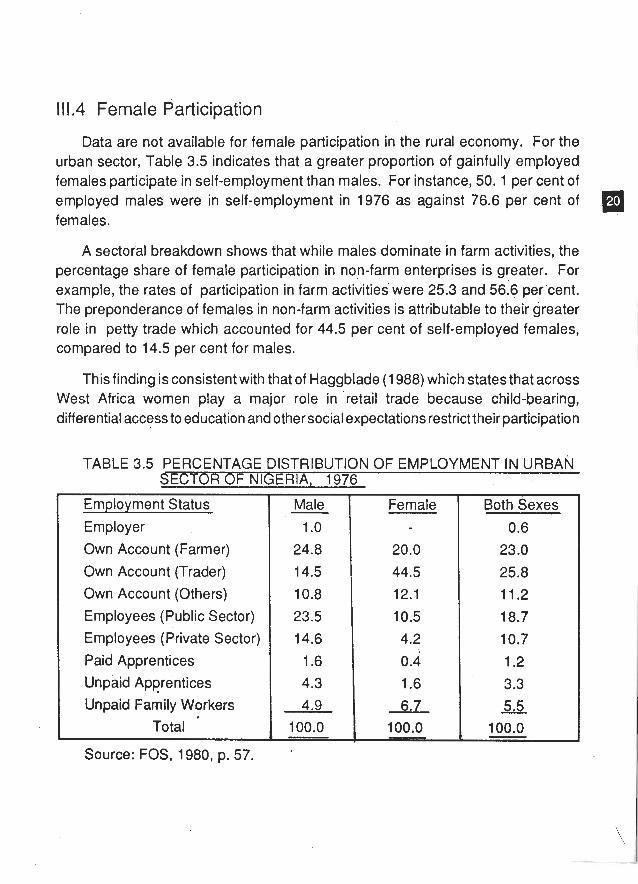
Data are not available for female participation in the rural economy. For the urban sector, Table 3.5 indicates that a greater proportion of gainfully employed females participate in self-employment than males. For instance, 50. 1 per cent of employed males were in self-employment in 1976 as against 76.6 per cent of females.
A sectot'al breakdown shows that while males dominate in farm activities, the percentage share of female participation in non-farm enterprises is greater. For example, the rates of participation in farm activities were 25.3 and 56.6 per cent. The preponderance of females in non-farm activities is attributable to their greater role in petty trade which accounted for 44.5 per cent of self-employed females, compared to 14.5 per cent for males.
This finding is consistent with that of Haggb[ade (1 988) which states that across West Africa women play a major role in retail trade because child-bearing, differential access to education and other social expectations restrict their participation
TABLE 3.5 PERCENTAGE DISTRIBUTION OF EMPLOYMENT IN URBAN SECTOR OF NIGERIA, 1976
Employment Status
Employer
Own Account (Farmer) Own Account (Trader)
Own Account (Others)
Employees (Public Sector) Employees (Private Sector)
Paid Apprentices
Unpaid Apprentices Unpaid Family Workers
Total
Source: FOS, 1980, p. 57.
Male - 1 .o
24.8 14.5 10.8
23.5 14.6
1.6 4.3 4.9
100.0
Female
20.0
44.5 12.1
10.5 4.2
Both Sexes
0.6
23.0 25.8 11.2 18.7 10.7 1.2 3.3
.EL 100.0 -
rates in formal sector employment (which in 1976 stood at 10.5 per cent as against 23.5 for males in Nigeria). They consequently participate more actively in informal activities. It is also consistent with the findings of Steel (1 979) and ILO (1 982) which indicate rates of 10 and 54 per cent female participation in Ghana's formal sector employment and informal small enterprises respectively (Haggblade, p.9).
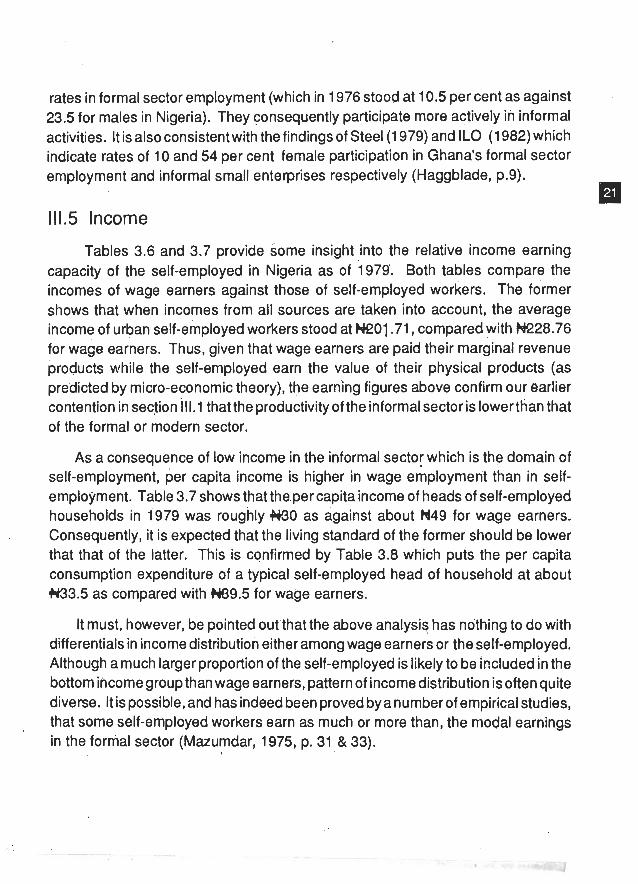
111.5 Income
Tables 3.6 and 3.7 provide some insight into the relative income earning capacity of the self-employed in Nigeria as of 1979. Both tables comparethe incomes of wage earners against those of self-employed workers; The former shows that when incomes from all sources are .taken into account, the average income of urban self-employed workers stood at W01.71, compared with W28.76 for wabe earners. Thus, given that wage earners are paid their marginal revenue products while the self-employed earn the value of their physical products (as predicted by micro-economic theory), the earning figures above confirm our earlier contentlon in section I lLl that the productivity of the informal sector islower than that of the formal or modern sector.
As a consequence of low income in the informal sector which is the domain of self-employment, per capita income is higher in wage employment than in self- employment. Table 3.7 shows that the.per capita income of heads of self-employed households in 1979 was roughly N O as against about H49 for wage earners. Consequently, it is expected that the living standard of the former should be lower that that of the latter. This is confirmed by Table 3.8 which puts the per capita consumption expenditure of a typical self-employed head of household at about N33.5 as compared with H89.5 for wage earners.
It must, however, be pointed outthat the above analysis has nothing to do with differentials in income distribution either among wage earners or the self-employed. Although a much larger proportion of the self-employed is likely to be it?cluded in the bottom income group than wage earners, pattern of income distribution is often quite diverse. lt is possible, and has indeed been proved by a number of empirical studies, that some self-employed workers earn as much or more than, the modal earnings in the fornial sector (Mazumdar, 1 975, p. 31 & 33).
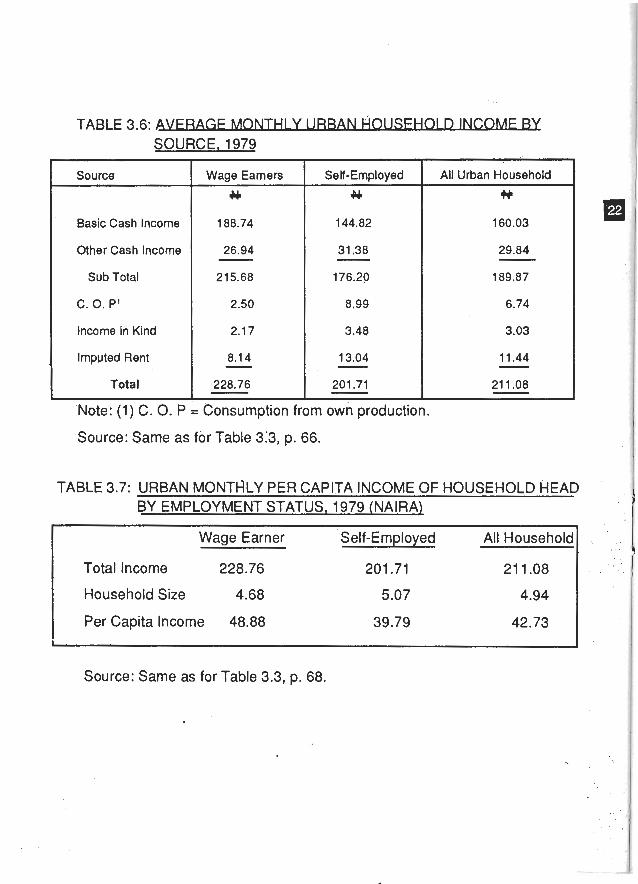
TABLE 3.6: AVFRAGF MONTH1 Y l JRRAN HOI JSFHOI n INCOMF BY /
SOURCE, 1979
Source
Basic Cash lncome
Other Cash lncome
Sub Total
C. 0. P'
lncome in Kind
Imputed Rent
Total
Wage Earners
9C
Self-Employed
9C
L Note: (1) C. 0. P = Consumption from own production.
All Urban Household
Source: Same as for Table 3:3, p. 66.
TABLE 3.7: URBAN MONTHLY PER CAPITA INCOME OF HOUSEHOLD HEAD BY EMPLOYMENT STATUS, 1979 (NAIRA)
Wage Earner Self-Employed All Household
Total Income 228.76 201.71 21 1.08
Household Size 4.68 5.07 4.94
Per Capita Income 48.88 39.79 42.73 1 - --
Source: Same as for Table 3.3, p. 68.
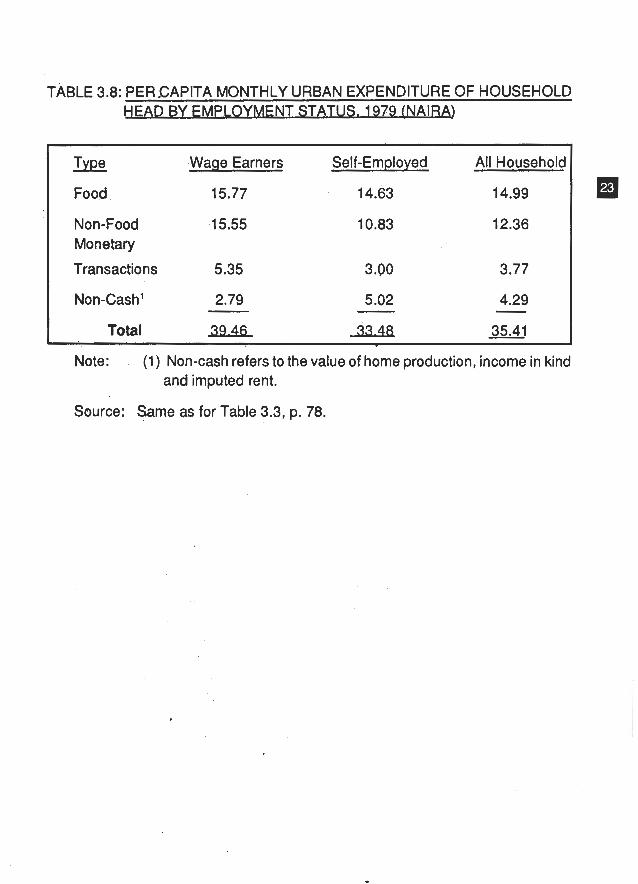
TABLE 3.8: PERCAPITA MONTHLY URBAN EXPENDITURE OF HOUSEHOLD HEAO BY FMPLOYMFNT STATUS. 1979 (NAIRA)
Type W a ~ e Earners Self-Employed All Household
Food 15.77 14.63 14.99
Non-Food 15.55 Monetary
Transactions 5.35
Total 39.46 33.48 35.41
Note: (1) Non-cash refers to the value of home production, income in kind and imputed rent.
Source: Same.as for Table 3.3, p. 78.
IV. The Extent, Forms and Determinants of Labour Absorption into the Rural - Urban Informal Sector
IV. 1 Formal and Informal Sectors Distinguished Many analysts of urban poverty and employment in developing countries have
adopted the formal - informal nomenclature and technique of analysis (Oyeneye,l980, p. 69). It is not clear, and indeed not necessary to bother about, who initiated this type of analysis Suffice it to say that in the seventies Hart (1 973) used it in his study of income and embloyment opportunities in Ghana. About the same time, Dasgupta (1 973) used it in his study of the urban poor in Calcutta. The mode of analysis was refined by the International Labour Office (1 972) in its report on Kenya, following which several writers have been emphasizing different aspects of the informal sector, such as ease of entry, use of indigenous resources, labour intensiveness, low. productivity, etc. (Nelson,l979, p. 284). Some have sought to rationalise its existence with reference to a form of capitalist exploitation, while others point to the survival syndrome whereby the informal sector acts as the "urban labour sponge or last resort for people without other work" (Westlake, 1990, p. 13).
At this point it has become necessary to distinguish between the two concepts "formal" and "informal" sectors. The basic distinction between them lies in the
protected nature of the formal sector. Apart from regulations governing registration and property rights, employment in the sector is protected in the sense that the wage level and conditions of work are regulated, and, in general, are not available to job- seekers in the market unless they somehow manage to cross the barrier of entry (Mazumdar,l975, p. i). Protection may emanate from the actions of trade unions, or government, or both acting to@ther. The sectors is sometimes referred to as the
"organized" sector and includes the public sector and large private-sector enterprises that recruit labour on a permanent and regular basis for fixed rewards. In Nigeria the principal components of the "organized private sector" include firms that make up the following bodies: the National Association of Chambers of Commerce & Industry, Mines and Agriculture (NACCIMA), the Manufacturers Association of Nigeria (MAN), and the Nigeria Employers' Consultative Association (NECA).
The informal sector, on the other hand, may be said to consist of economic activities outside the mainstream economy (that is, outside the formal sector) where the regulations governing trading permits, minimum wages, property titles, and tax payments have little relevance and are largely ignored (Westlake, 1990, p.12). Some of the jobs are performed outside the framework of law, while others require no more than formal registration with the authorities (Dasgupta,1973, p. 56).
IV.2 The Extent of Labour Absorption
The informalactivities encompass a wide-ranging scale, from marginal operations to large-scale enterprises, and account for a large proportion of gainful employment in developing countries. Mazumdar (1975) observes that measurement of the extent of labour absorption into the informal sector presupposes a statistical criterion by which the sector can be identified. This criterion does not exist and as a result, he suggests that since the formal sector is identified with the 'enumerated' sector (that is, one covered in business surveys), employment in the informal sector can be obtained by deducting employment in the enumerated sector from total working population derived from the population census.
If however, data on employment in the formal sector ,come from household surveys rather than statistics reported by establishments, Mazumdar continues, there may not be adequate information about the type of enterprise in which the respondent worked. In such cases, he suggest that the only possible solution is probably to include all employees and employers above a certain size of establishment in the formal'sector, arid all the self-employed (except in the liberal professions) in the informal sector.
The criterion used by Merrick (1973) on Belo Horizonte was payment of contributions to social security, which is shared by employers and employees, and which indicates that the work arrangement k protected by law. He supplemented the data obtained in this way by adding the number employed in establishment employing more than five workers (Merrick, p. 14-1 5). This approach is nevertheless not appropriate in the Nigerian situation because of inadequate information of employment in the publicsectorand complete absence of it in the liberal professions.
In our study, the two strategies suggested by Mazumdar will be adopted with some modification in the second. For the economy-wide analysis, we shall regard the difference between employment data in the enumerated sector and total gainful employment in the economy as representing the size of labour absorption in the informal sector. This is despite the fact that there is inadequate information on the public sector employment, especially at the State and Local Government levels. Moreover, the census data currently being used in the country are those of the 1963 census. Consequently, much of labour statistics in the country is based on estimates
For sectoral analysis with respect to rural - urban sectors and gender, a modified version of the second strategy will be used. This is because data relating to these issues are derived from household surveys in which enterprises are not classified
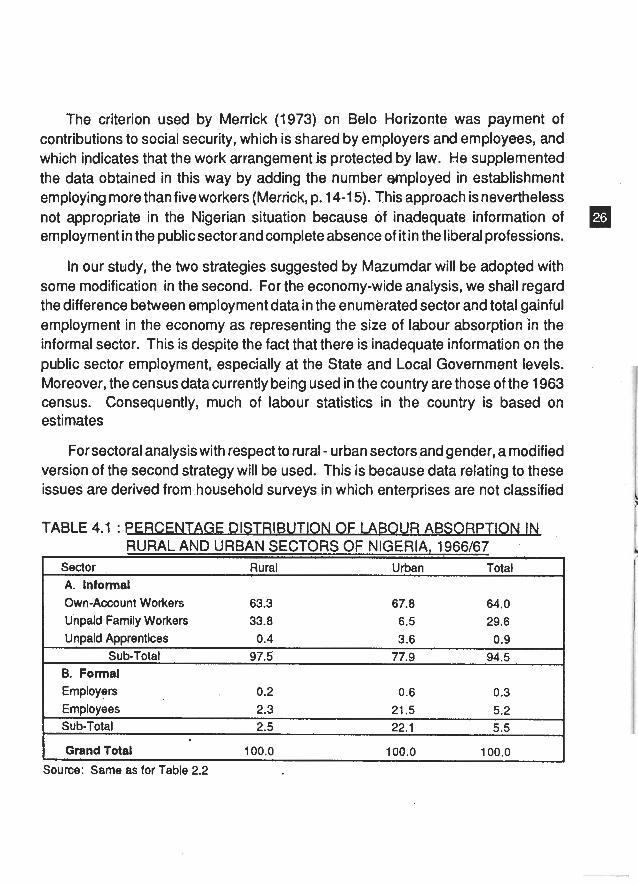
TABLE 4.1 : PFRCENTAGE DISTRIBUTION OF I ABOUR ABSORPTION IN RURAL AND URBAN SECTORS OF NIGERIA, 1966167
Sector Rural Urban Total A. Informal Own-Account Workers 63.3 67.8 64.0 Unpaid Family Workers 33.8 6.5 29.6 Unpaid Apprentices 0.4 3.6 0.9
Sub-Total 97.5 77.9 94.5 B. Formal Employers 0.2 0.6 0.3 Employees 2.3 21.5 5.2 Sub-Total 2.5 22.1 5.5
[ Grand Total 100.0 100.0 100.0 I Source: Same as for Table 2.2
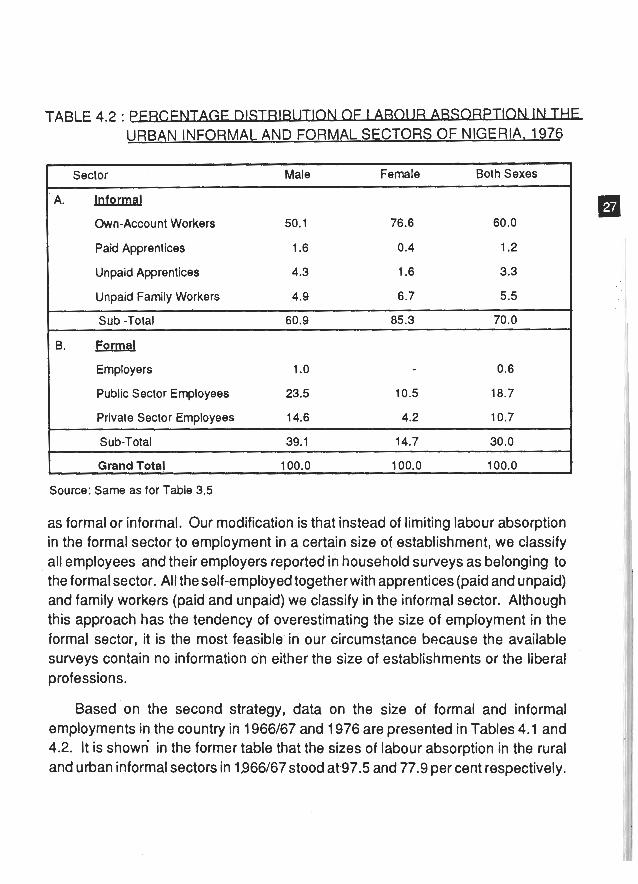
URBAN INFORMAL AND FORMAL SECTORS OF NIGERIA. 1976
sector Male Female Both Sexes
A. lnformal Own-Account Workers 50.1 76.6 60.0
Paid Apprentices 1.6 0.4 1.2
Unpaid Apprentices 4.3 1.6 3.3
Unpaid Family Workers 4.9 6.7 5.5
Sub -Total 60.9 85.3 70.0 - - - - -- -
B. Formal Employers 1 .O
Public Sector Employees 23.5
Private Sector Employees 14.6 - - -
Sub-Total
Grand Total 100.0 100.0 100.0
Source: Same as for Table 3.5
as formal or informal. Our modification is that instead of limiting labour absorption in the formal sector to employment in a certain size of establishment, we classify all employees and their employers reported in household surveys as belonging to the formal sector. All the self-emplbyed together with apprentices (paid and unpaid) and family workers (paid and unpaid) we classify in the informal sector. Although this approach has the tendency of overestimating the size of employment in the formal sector, it is the most feasible in our circumstance because the available surveys contain no information on either the size of establishments or the liberal professions.
Based 'on the second strategy, data on the size of formal and informal employments in the country in 1966167 and 1976 are presented in Tables 4.1 and 4.2. It is shown in the former table that the sizes of labour absorption in the rural and urban informal sectors in 1966167stood at 97.5 and 77.9 per cent respectively.
For the total economy the percentage was 94.5. The estimate of about 78 per cent for the urban sector exceeds Merrick's 69 per cent for Belo Horizonte in 1972 (Mazumdar, 1975, p. 10).
Table 4.2 presents data for 1976 according to sex. It shows that the informal sector accounted for80.9 per cent of male employment and 85.3 per cent of female employment. The figure for total employment (70 per cent) suggests a tendency of labour absorption in the sector to decline over time when compared with a figure of 94.5 per cent given in Table 4.1 for 1966/67.
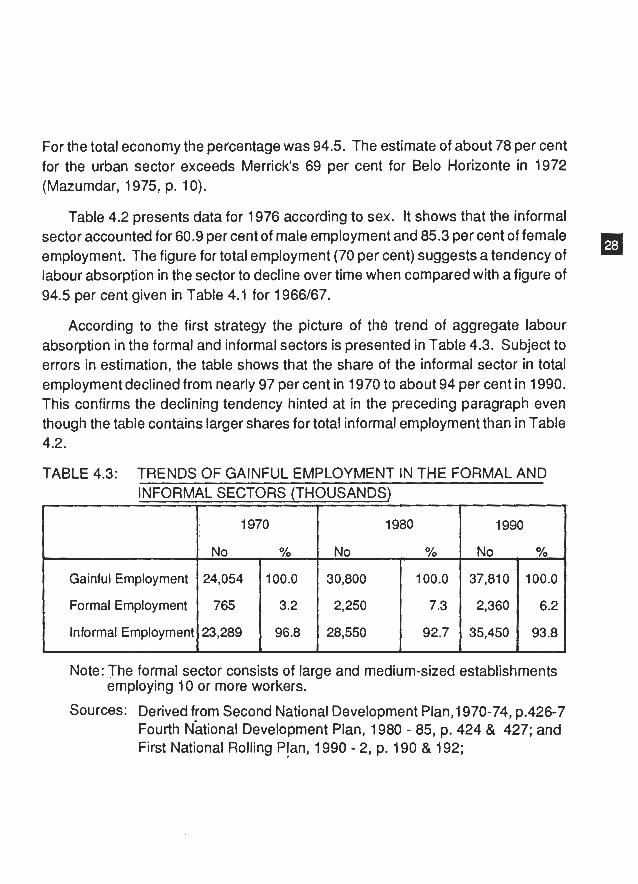
According to the first strategy the picture of the trend of aggregate labour absorption in the formal and informal sectors is presented in Table 4.3. Subject to errors in estimation, the table shows that the share of the informal sector in total employment declined from nearly 97 per cent in 1970 to about 94 per cent in 1990. This confirms the declining tendency hinted at in the preceding paragraph even though the table contains larger shares for total informal employment than in Table 4.2.
TABLE 4.3: TRENDS OF GAINFUL EMPLOYMENT IN THE FORMAL AND -
INFORMAL SECTORS (THOUSANDS) I I I 1 1
Note: The formal sector consists of large and medium-sized establishments employing 10 or more workers.
Sources: Derived from Second National Development Plan,1970-74, p.426-7 Fourth ~ational Development Plan, 1980 - 85, p. 424 & 427; and First National Rolling Plan, 1990 - 2, p. 190 & 192;
Gainful Employment
Formal Employment
Informal Employment
1970
No O/o
24,054
765
23,289
100.0
3.2
96.8 i
1980
No %
30,800
2,250
28,550
1990
No % .
100.0
7.3
92.7
37,810
2,360
35,450
100.0
6.2
93.8
IV.3 Forms of Labour Absorption
The informal labour market covers a wide spectrum of economic activities, ranging from the very poorest people that scratch a meagre living by cleaning shoes or selling cigarettes to productive enterprises that employ several workers.
Theoccupational forms are so diverse that they include legitimate and illegitimate B! activities. Hart (1 978, p. 70 - 73) categorises the legitimate activities into four, viz; primary and secondary activities, tertiary activities, small-scale distribution, and other services.
IV.3. 1 Primary and Secondary Activities
The primary activities include farming (crop and livestock), fishing, market gardening, mining and quarrying. Workers in the secondary enterprises include building contractors, self-employed artisans, craftsmen, shoemakers, tailors, electricians, spirit distillers, etc. They are engaged in what are sometimes referred to as "micro-enterprises" characterised by small capital but considerable amount of learned expertise acquired through apprenticeship. While some of the enterprises may have fixed +laces (structures) of business others may be carried on in the open air, on the verandah or partitions of living quarters.
Table 4.4 gives information on the types and relative numerical strength of secondary informal enterprises (with data oh few repair services) in theEastern and Western parts of the country. Column 6 shows that as of 1973 tailoring accounted for the largest share of total establishments, followed by carpentry, bicycle repair service and shoe-making.
IV.3. 2 Tertiary Enterprises
Within this category are entrepreneurial activities in the service sector. These include real estate development, transport operation, bulk-purchasing and sales, cassava and grain milling. These enterprises constitute the apex of the informal activities and are ofJen characterised by part-time roles, entrepreneurs who had accumulated savings by other means, and have reinvested part of their income under their own management. Success in business is not so much determined by
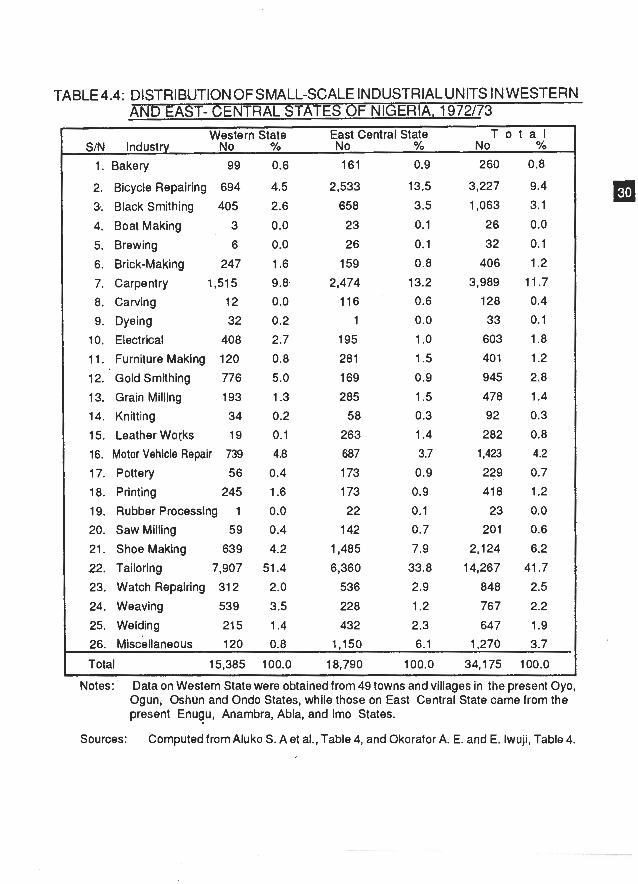
TABLE4.4: DISTRIBUTION OFSMALL-SCALE INDUSTRIAL UNITS IN WESTERN AND tAST- CENTRAL STATES OF NIGERIA, 1972173
Western State East Central State T o t a l SIN lndustrv No YO N o YO N o YO
1. Bakery 99
2. Bicycle Repairing 694
3.. Black Smithlng 405
4. Boat Making 3
5. Brewing 6
6. Brick-Making 247
7. Carpentry 1,515
8. Carving 12
9. Dyeing 32
10. Electrical 408
11. Furniture Making 120
12. Gold Smithlng 776
13. Grain Milling 193
14. Knitting 34
15. Leather WoCks 19
16. Motor Vehicle Repair 739
17. Pottery 56
18. Printing 245
19. Rubber Processing 1
20. Saw Milling 59
21. Shoe Making 63 9
22. Tailoring 7,907
23. Watch Repairing 31 2
24. Weaving 539
25. Welding 21 5
26. ~iscellaneous 120 0.8 1,150 6.1 1,270 3.7
Total 15,385 100.0 18,790 100.0 34,175 100.0
Notes: Data on Western State were obtained from 49 towns and villages in the present Oyo, Ogun, Oshun and Ondo States, while those on East Central State came from the present Enugu, Anambra, Abia, and Imo States.
Sources: Computed from Aluko S. A et al., Table 4, and Okorafor A. E. and E. Iwuji, Table 4.
the size of capital and bureaucratic knowledge as by specialised know how, diversification of investments, and delegation of tasks. For example, the Ekene Dili Chukwu (Nig). Ltd., operates a large fleet of luxury buses, a fleet of taxi cabs, and cafeterias at all its stations. Similarly, D N Umeano, the proprietor of Umeano ahd Sons (Nig) Ltd., accumulated savings from acting as palm kernel buying agent for an expatriate firm. He invested in long-distance haulage of palm kernel and other commodities, later branched into beer, cement, truck, car and vehicle spare parts distribution,vehicle repairservices, wholesale and retail trade in general merchandise, etc. In each of the two cases, the initial investment took place under the personal management of the proprietor but as the business expanded certain tasks came to be delegated to other people.
IV.3 .3 Other Services
Some of the services in this category require skills while othersdo not. Asecond characteristic is that some of them are carried out on full-time basis while others are performed in order to supplement income from the main occupation. They include barbing, photography, laundry services, data processing and tabulating services, photocopying, motion picture production, radio and television broadcasting, theatrical production and entertainment services, repair of footwears and other leathergoods, electrical repair services, repair of motor-vehicles and motor-cycles, watch, clock and jewellery repairs and other services (FOS, 1978, p.4).
IV.3.4 Small -Scale Distribution
For the purpose of our analysis, distribution establishment are classified into four. These are large-scale, medium-scale, small-scale and petty trading establish- ments2. Although informal enterprises may be found in the medium-scale category, their domains are the last two categories.
The first group consists of multiple shop organigations including chain stores, and departmental stores. The second category is made up of chain stores of limited geographical coverage, departmental stores, supermarkets, and cooperative stores. Although in terrnsof shareholding these two categories are dominated by Nigerians, it is in the first that are'found..expatriate companies 'such as the United Africa
Company (U. A. C), Paterson Zochonis (PZ) and John Holt, some of which have now diversified into manufacturing activities. In the second category are found establishments of Lebanese, Indian and Syrian origin as well as indigenous enterprises. These two classes belong to the formal sector.
The third and fourth categories are entirely owned and operated by NiQerians in keeping with the indigenisation policy of the country. The organisation of establishments in them primarily takes the form of sole-proprietorship and co- operative societies. Unit shops located in urban centres, " mammy marketsMdealing in textiles and general goods, and market stalls in capital and large urban centres come under the third categorisation (Oiakanpo, 1966, p. 12). The fourth category consists of itinerant retailers, peddlers, street hawkers, kiosk operators, caterers in food and drink, bar attendants, middlemen, roadside sellers, and operators of market stall and single branch shops in rural towns, sub-urban and urban areas.
Unlike in othercategories, the majority of enterprises in the last category do not pay economic rent for their business premises. Some operate from the living premises of their proprietors in which case no rent is paid. Alternatively, nominal fees are paid for markets stalls or rented shops Thus, major characteristics of this class of distributive trade are ease of entry, competition, and proliferation of operatives.
IV.3. 5 Illegitimate Activities
Some analysts do not include illegal activities in informal income opportunities. They hold that while informal enterprises usually have quasi-legal status because they fail to comply with all regulations, they are distinct from criminal activities (Westlake, 1990, p. 13). On the other hand, it is contended that'in certain societies it is difficult to find people who have not, at one time or another, -transgressed the law, sometimes with profitable results. For this reason income opportunities outside the formal sector ought to include certain kinds of crime (Hart, 1978, p. 68). In this regard, a distincti0n.i~ made between illegal and illegitimate activities, the latter referring to those activities that are not consistentwith the morality of the "respectable" segment of the society even though they are not enshrined in the nation's-code of laws (.lbid,P.74)
We prefer to organise our analysis along different lines. We recognise that there are certain means of livelihood which are both prohibited by law and frowned upon as immoral by the society. There are also those which, even though the law is silent on them, are not consistent with social norms. Finally, there are certain activities which are prohibited by law but are tolerated by certain sub-culture of the society. Indeed, violation of such activities may be regarded as heroic as long as the perpetrator escapespunishment by law. We shall regard the three classesof activity as illegitimate.
A typical activity in the first category is drug pushing - a trade in which pioneer perpetrators made fortunes without detection. Men and women alike are involved in this illegal trade and some of them are now serving prison sentences in and out of the country. One peculiarity of this "business" is that it is often sponsored by well- placed men and women in society, some of whom may belong to the formal sector. Other shady business in this class include theft of all kinds, ranging from pick- pocketing in market places and busy urban streets to armed robbery which has become rife since the end of the civil war in 1970. Also included are "fakery" and adulteration of drugs which have become serious in the eighties.
An example of activities in the second category is the sharp but dishonest practice which is now becoming widespread in the Lagos area of the country. At traffic hold-ups a sly member of a gang of unemployed young men would creep under the car of an unsuspecting driver, disconnect the fuel supply hose and seal it tightly with the cap of a ball-point pen. Thereafter, the car soon grinds to a halt once the fuel in the carburettor is exhausted. As the driver opens the car bonnet and fiddles for what might have gone wrong with his car some members of the gang emerge and offer to repair the vehicle. They charge exhorbitant fees and in the process may cqndemn some good parts which they now replace at huge costs. When the driver may not be watching one of them reconnects the. fuel hose. The car is now in order more to the happiness of its owner and the fake repairers who now get away with a handsome sum of money for no genuine service.
In the third-category is a long list of illegitimate activities. These include defrauding public institutions, embezzlement of money belonging to public institutions, trading in contraband goods, touting at motor parks and airports, and prostitution.
Although these activities are contrary to the laws of the land, they do not attract public opprobrium.
The above lists are by no means exhaustive. They only serve to indicate the type of illegitimate ways of making a living in the informal sector of the economy.
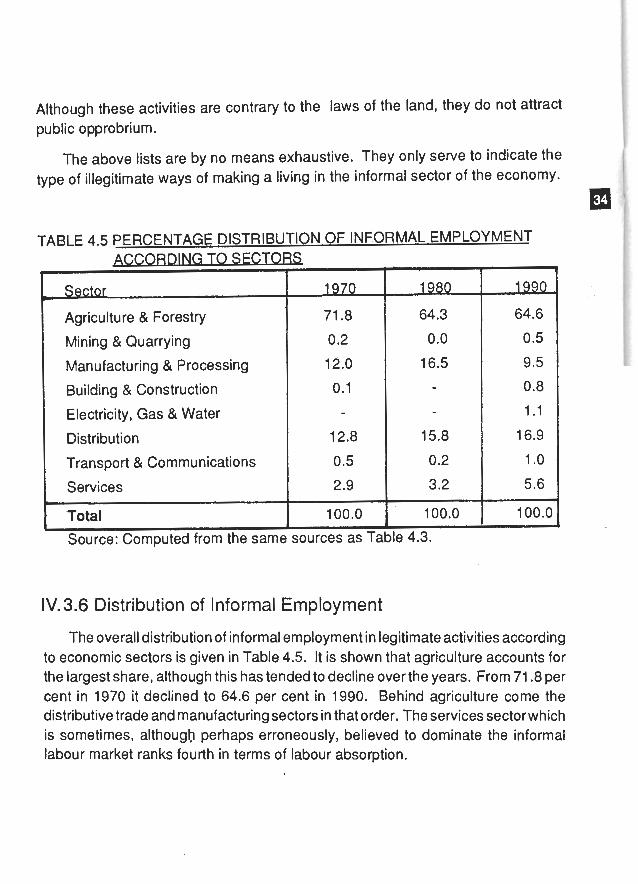
TABLE 4.5 PERCENTAGE DISTRIBUTION OF INFORMAL EMPLOYMENT
Sector
Agriculture & Forestry
Mining & Quarrying
Manufacturing & Processing
Building & Construction
Electricity, Gas & Water
Distribution
Transport & Communications
Services
IV.3.6 Distribution of Informal Employment
The overall distribution of informal employment in legitimate activities according to economic sectors is given in Table 4.5. It is shown that agriculture accounts for the largest share, although this has tended to decline over the years. From 71.8 per cent in 1970 it declined to 64.6 per cent in 1990. Behind agriculture come the distributive trade and manufacturing sectors in that order. The services sectorwhich is sometimes, although perhaps erroneously, believed to dominate the informal labour market ranks fourth in terms of labour absorption.
IV.4 The Determinants of Labour Absorption
Some conjectural analysis of the determinants of labour absorption in the informal sector do,exist. For instance, such factors as government policy, labour- saving techniques of production, and the general problems of economic developmbnt have been put forward as some of the factors that affect the size of the informal sector employment .
It is contended that increases in the size of the sector may be attributed to the suffocating bureaucracy and regulations that oostruct legal entrepreneurial activity among the poorer urban classes. Such constraints include discriminatory import restrictions, formal registration requirements, etc., in favour of large-scale enterprises. They not only restrict the development of small-scale enterprises and their eventual entry into the formal sector, but may also push some people into illegitimate activities and, thus, help swell the relative size of informal employment.
The extent of capitalist penetration with its labour-savings techniques and irrepairable products may negatively influence the labour absorption capacity of the informal sector (Streefland,l977, p. 293 - 305). As the economy becomes modernised the need for the informal sector diminishes as labour saving devices displace many people from the sector. Modernisation is also connected with changes in both urban and rural environments, such as improvement in transportation which reduces the need for hawkers and middlemen. In these ways the process of modernisation results in the reduction of thedemand for the services of labour in the informal sector. . . . . .
However, this line of argument begs a fundamental question as to what becomes of the labour so displaced in the process of modernisation. Obviously, such labour would quickly be directed to other lines of informal activity as their owners must have to earn their living. They may, of course, remain unemployed for some time but in the long-run must return to informal employment.
Lastly, thegeneral problems of economicdevelopment which include unbalanced growth, income inequality, and in recent times, the debt induced recession which has put economic development in developing countries into reverse, contribute to
the expansion of the informal sector. The formal sector is unable to absorb the rising numbers that join the labour force. At the same time, more and more pe'ople have lost their job owing to the slashing of the public sector workforce in attempts to reduce publicsector expenditure. These two forces'combine to increase the relative size of employment in the informal sector.
However, the above analysis are not supported by empirical evidence. We have, therefore, generated some empirical data to provide not only a backup but also the lead for our analysis. The data have been generated by means of a sample survey conducted in Enugu (the capital of the former Anambra State and now the capital of Enugu State), Udi and Ezeagu Local Government Areas. The respondents at Enugu were beneficiaries of the Open Apprenticeship Scheme of the NDE and hailed from 15 Local Government Areas of the former Anambra State. They numbered 106. Those at Udi and Ezeagu (Rural Local Government Areas) numbered 33 and were beneficiaries of the schemes. A total of 115 useful responses (Table 4.6) were obtained from the respondents to the question on what determined their decisions to go into self-employment.
To borrow from HO (1 986, p.14), the determining forces can be classified as "push" and "pull" factors. In a dual economy consisting of the formal and informal sector, the "push" factors act to increase or reduce the share of available labour resource to the latter sector. On the other hand, the "pull" factors are related to the availability of attractive income opportunities in the informal sector. The relative importance of the two sets of factors depends partly on the state of economic development and partly on the intensity of population pressure on the formal sector.
The most push factor, as shown in Table 4.6, is the limited capacity of the formal sector to absorb the available labour force. Working under this factor are the process of modernisation, introduction of labour-saving techniques of production, availability of irrepairable products, the problems of economic development, and external debt-induced recession, all of which combine to limit or expand the amount of labour that the formal sector could absorb. For example, as the size of the labour force grows without suJficient capacity of the formal sector to absorb the available labour, the unemployed come under increase pressure to find ways of earning a living in the informal sector. The ways these forces affect the availability of labour
Reasons
To be Own Boss
InBility to Secure Wage Employmenl
Prospects for Higher Income
Inadequate Formal Education
Loss of Wage Employment
To Supplement Wage Income
Others
Frequency
34
55'
15
2
4
2
3 -
Relative
Frequency(%]
for the informal sector have already been discussed above and, therefore, require no further repetition.
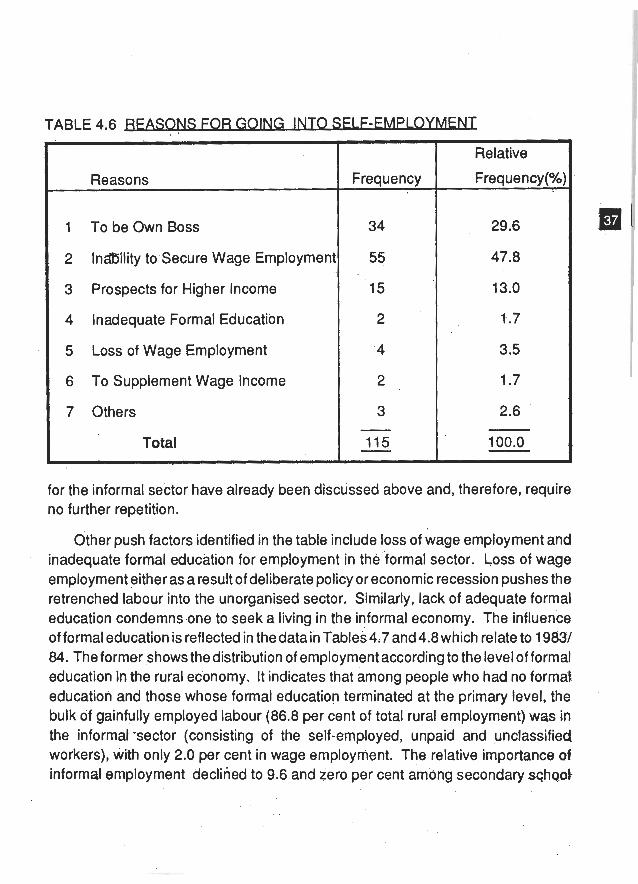
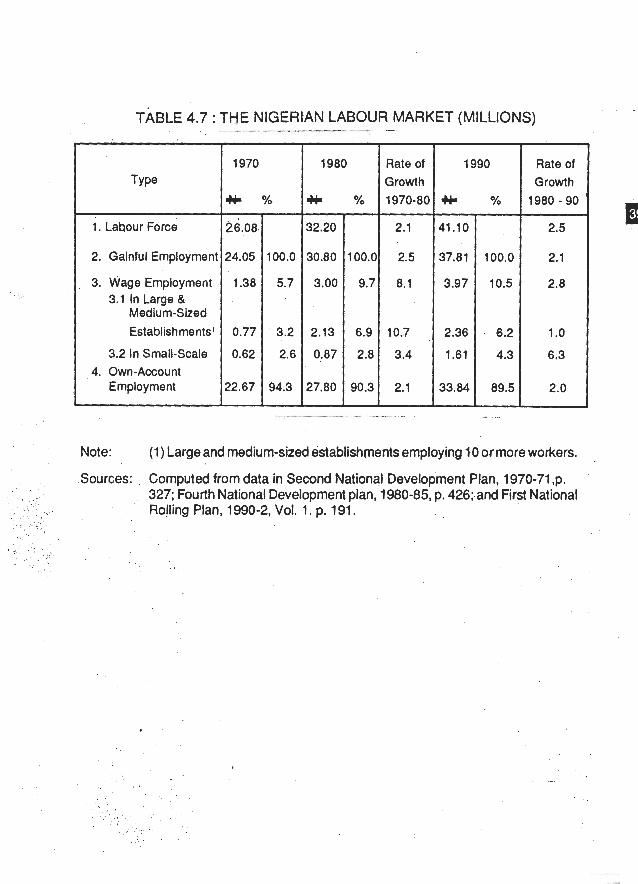
Other push factors identified in the table include loss of wage employment and inadequate formal education for employment in the formal sector. Loss of wage employment either as a result of deliberate policy or economic recession pushes the retrenched labour into the unorganised sector. Similarly, lack of adequate formal education condemns.one to seek a living in the informal economy. The influence of formal education is reflected in thedatain Tables4'7 and4.8 which relate to 19831 84. The former shows the distribution of employment according to the level of formal education in the rural economy. It indicates that among people who had no formal education and those whose formal education terminated at the primary level, the bulk of gainfully employed labour (86.8 per cent of total rural employment) was in the informal -sector (consisting of the self-employed, unpaid and unclassified workers), with only 2.0 per cent in wage employment. The relative importance of informal employment declined to 9.6 and zero per cent among secondary sqhgo).
and University graduatq,respectively. Table 4.8 shows that in the urban sector the relative importance of wage employment tended to increase with the level of formal education. Its share in total employment increasedfrom 2.3 per cent among people with no formal education to 5.8 per cent and 7.0 per cent among primary ?nd secondary school products. Although the share of University graduates was only 3.2 per cent, this is greater than the 2.1 per cent employed in the informal sector.
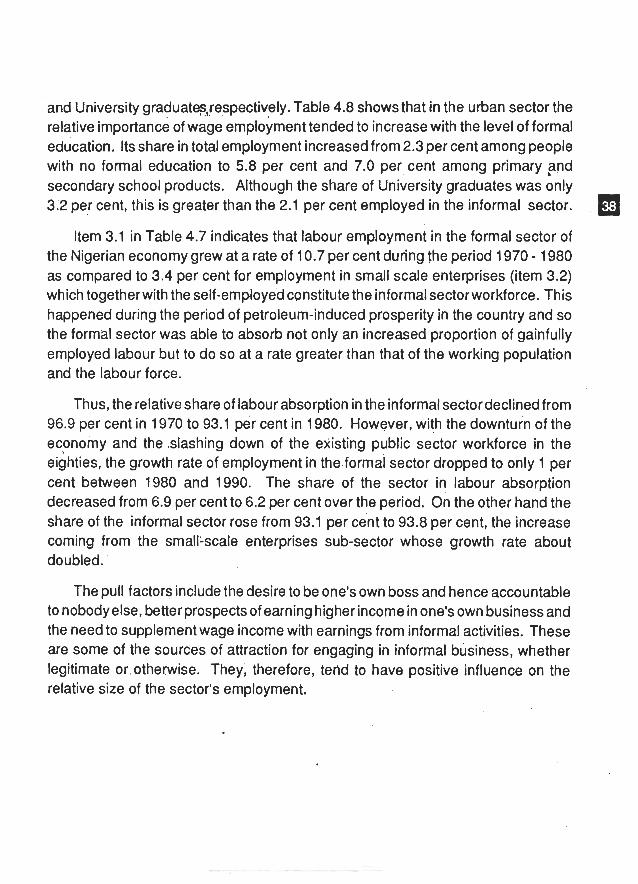
Item 3.1 in Table 4.7 indicates that labour employment in the formal sector of the Nigerian economy grew at a rate of 10.7 per cent during the period 1970 - 1980 as compared to 3.4 per cent for employment in small scale enterprises (item 3.2) which togetherwith the self-employed constitute the informal sectorworkforce. This happened during the period of petroleum-induced prosperity in the country and so the formal sector was able to absorb not only an increased proportion of gainfully employed labour but to do so at a rate greater than that of the working population and the labour force.
Thus, the relative share of labour absorption in the informal sector declinedfrom 96.9 per cent in 1970 to 93.1 per cent in 1980. However, with the downturn of the economy and the .slashing down of the existing public sector workforce in the eighties, the growth rate of employment in theformal sector dropped to only 1 per cent between 1980 and 1990. The share of the sector in labour absorption decreased from 6.9 per cent to 6.2 per cent over the period. on the other hand the share of the informal sector rose from 93.1 per cent to 93.8 per cent, the increase coming from the small-scale enterprises sub-sector whose growth rate about doubled.
The pull factors include the desire to be one's own boss and hence accountable to nobody else, better prospects of earning higher income in one's own business and the need to supplement wage income with earnings from informal activities. These are some of the sources of attraction for engaging in informal business, whether legitimate or. otherwise. They, therefore, tend to have positive influence on the relative size of the sector's employment.
1. Labour Force
2. Gainful Employmenl
3. Wage Employment 3.1 In Large &
Medium-Sized Establishments1
3.2 In Small-Scale 4. Own-Account
Employment
Growth % 1970-80
2.1
100.0 2.5
9.7 8.1
6.9 10.7
2.8 3.4
90.3 2.1
Rate of Growth
Note: (1) Large and medium-sized establishments employing 10 or more workers.
Sources: . Computed from data in Second National Development Plan, 1970-71 ,p. 327; Fourth National Development plan, 1980-85, p. 426;.and First National Rolling Plan, 1990-2, Vol. 1. p. 191.
TABLE 4.8: PERCENTAGE DISTRIBUTION OF EMPLOYMENT BY LEVEL OF EDUCATION IN RURAL NIGERIA, 1983184
Never ~t tended School Employers Employees Own-Account Workers Unpaid Workers Others
Sub-Total
Primary School EmpJoyers Employees Own-Account Workers Unpaid Workers Others
Sub-Total
Secondary School Employers Employees Own-Account Workers Unpaid Workers Others
Sub-Total
Post-Secondary School Employers Employees Own-Account Workers Unpaid Workers Others
Sub-Total Grand Total 100.0
Source: F. 0. S, 1985, 'p. 34 & 35. .
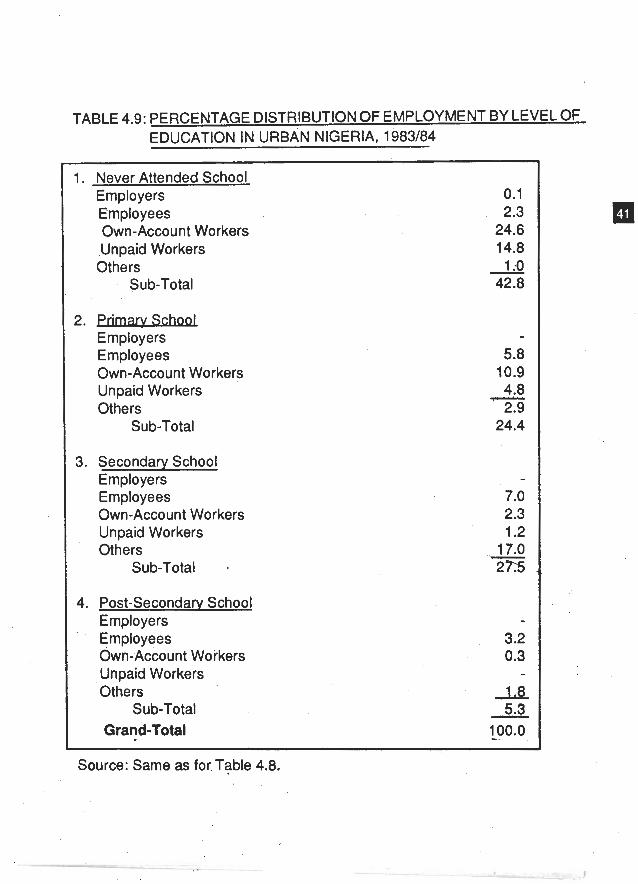
TABLE 4.9: PERCENTAGE DISTRIBUTION OF EMPLOYMENT BY LEVEL OF EDUCATION IN URBAN NIGERIA, 1983184
1. Never Attended School Employers €mployees Own-Account Workers Unpaid Workers Others
Sub-Total
SctlQQl Employers Employees Own-Account Workers Unpaid Workers Others
Sub-Total
Secondary School Employers Employees Own-Account Workers Unpaid Workers Others
Sub-Total .
Post-Secondarv School Employers Employees Own-Account Workers Unpaid Workers Others
Sub-Total Grand-Total
Source: Same as for. Table 4.8.

V. Evaluation of Employment Creation Programmes
.V.1 The Programmes in Brief
The National Directorate of Employment (NDE). wa$ established on 22nd November, 1986 to seek out ways of reducing the scourge of unemployment that had afflicted the nation for years. Specifically, it was established with the objective of creating employmentwith emphasis on self-reliance and entreprenehrship. In the 1987 budget speech the President of ~ i g e h a directed the NDE t efforts on the reactivation of public works, promotion of direct lab self-employment, organisation of artisans into co-operatives, and of a culture of maintenance and repairs" (NDE,1990, p.3). The initial core programmes of the body, launched on 30 January 1987'included the following:
(1) ' The National Youth Employment and Vocatidnal ~ k i k ~ e v e l o ~ m e n t Programme;
(2) The Small-Scale Industries and Graduate Employment Programme;
(3) The Agricultural Sector Employment Programme; and
(4) The Special Public Works Programme.
These programmes were backed by the necessary administrative, monitoring, and support personnel for successful implementation. In what follows, we outline the various schemes that come under the programmes.

V.1. 1 The National Youth Employment and Vocational Skills Development Programme
This programme was designed in the realisation that the majority of the unemployed persons in the economywere youth without productive and marketable skills. It consists of four schemes concerned with skills acquisition. These are:
(a) The Open Apprenticeship Scheme.
This is aimed at providing unemployed youths with skills that are needed in the economy. The youths are attached, as apprentices for periods ranging from two to three years, to companies, ministries, parastatals, and professional craftsmen and women all over the country. It is expected that on the successful completion of training the participants would possess the necessary skills that are considered valuable by potential employers or would enable those with entrepreneural skills to go into self-employment. With effect from4 December, 1991, when the Resettlement Loan Scheme was launched in Lagos, it became possible for beneciaries of the Open Apprenticeship to obtain loans, on application, for self-ernploymentpurposes.
(b) The Waste to Wealth Scheme.
This was designed to encourage the conversion of hitherto discarded raw materials into useful marketable products. Apart from creating employment opportunities, the scheme would encourage self-reliance in resource use and in developing a culture of inventiveness.
(c) The School on Wheels Scheme.
This is a rural.counterpart of the Open Apprenticeship Scheme which is essentially urban oriented. It was introduced in April 1990 to make available in rural areas fully equipped mobile vocational training facilities for the training of rural youths who would become the "cornerstone" of rural employment and development (NDE, 1990, p.5).
(d) The Disabled Work Scheme.
This scheme is aimed at integrating the disabled into the mainstream of the gainfully employed class. It is meant to enable them acquire appropriate skills and traini'ng for self-employment.

V.1. 2 The Small-Scale lndustries and Graduate Employment Programme
This programme contain two schemes. In addition to satisfylhg conditisns specific to each scheme, selected participants in the programme are expected to undergo atwo-weekintensive orientation under the Entrepreneurship Development Programme (EDP). The orientation covers self-evaluation, business identification, market research and feasibility studies, marshalling of resources to start a business, obtaining a bank loan, managing a business, record keeping and accounting, marketing management, legal aspects of business, etc. The course prepares participants with the necessary ingredients for self-employment.
The component schemes are as follows:
(a) The Job Creation Loan Guarantee Scheme.
This ic particularly directed at graduates of tertiary education. Under it, a bank loan is guaranteed by the NDE for the beneficiary. The applicant first
a feasibility study of his proposed business and, on approval, is granted s u b T a a loan nging from#5,000 to *35,000 at 13 per cent interest rate. The loan is repayable over five years at variuos periods of moratorium. The only collateral required is the certificate. However, if a loan between#3,000 an'd#50,000 is required a personal guarantor is required.
(b) The Mature People's Scheme.
The intended beneficiaries of this scheme are retired people who are willing and able to.maintain economically productive life. The amount of loan available to selected participants who must have presented bankable projects may be up to#150,000. On the deposit of a security of 50 per cent of the total loan package, a beneficiary is granted the loan at 9 per cent interest rate and is required to employ two graduates of tertiary educational institutions for every W25.000.
V.1. 3. The Agricultijral Sector Employment Programme
This programme has been designed to provide self-employment in agriculture for school'leavers and gradoates of Universities and Polytechnics. The beneficiaries

are given the necessary training and orientation,and loans for farming ventures. Theprogramme is implemented by the NDE in collaboration with state governments.
5.1.4 The Special Public Works Programme
Under this programme unemployed yau#s from various local government a areas are deployed to execute labour-intensive projects such as tree planting,
-
environmental sanitation, land clearing, and the construction and maintenance of toads and public buildings. The objective is to provide relief to a large number of the unemployed by providing them with immediate but temporary employment. However, this programme had since be'en abolished.
V.2 Schemes and Criteria for Evaluation
The Special Public Works Programme provides only temporary employment to beneficiaries. It is, therefore, precluded in the assessment of the effectiveness of the programmes in generating enduring employment. We are now left with three programmes from which to select schemes forthe exercise. The Open Apprenticeship Scheme (of the National Youth mploymen! and Vocational Skills Development Programme) and the Small-S&le lndustries Scheme (that is, the Job Creation Loan Guarantee Scheme andthe Mature People's Scheme combined into one) have been chosen.
Our choice has been influenced by two main considerations. First, of the four schemes tha'b.constitute the National Youth Employment Programme, the Open Apprenticeship Sch,eme is the one for which greatest achievement has been claimed by the NDE. As at the end of 1990, it was claimed that since inception a total of 5,000 youths had been trained under the Waste-to-Wealth Scheme, 441 youths benefited from the School on Wheels Scheme, while 209,735 job-seekers had enlisted for training (1 04,370 had graduated while 105,365 were still undergoing training) under the Open Apprenticeship Scheme (CBN, 1990, p.94). There is no record of the number of beneficiaries of the Disabled Work Scheme. Second, time constraint and geographical location of agricultural zones at remote and less accessible areas of the State disqualified the Agricultural Sector Programme in favour of €he Small-Scale lndustries Scheme.
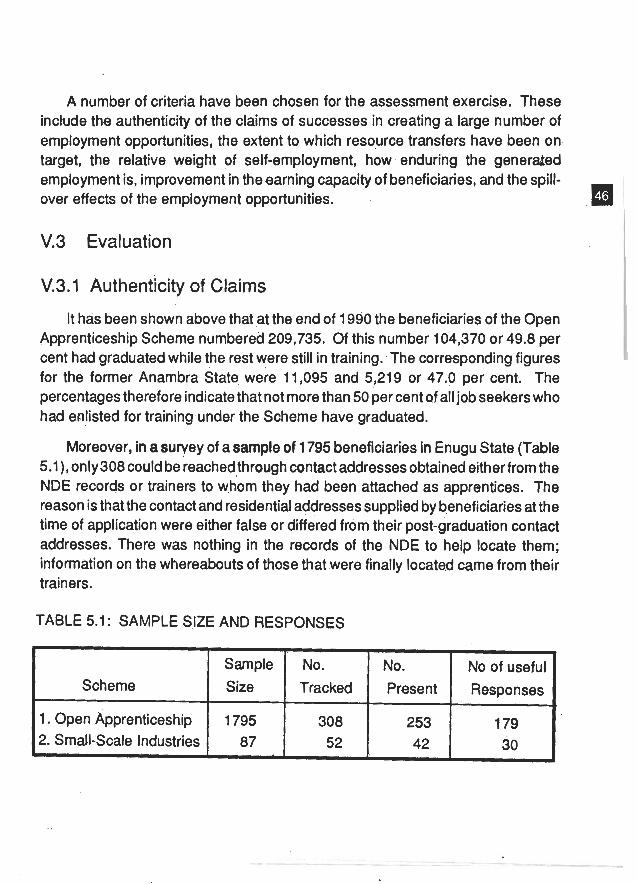
A number of criteria have been chosen for the assessment exercise. These inctude the authenticity of the claims of successes in creating a large number of employment opportunities, the extent to which resource transfers have been on target, the relative weight of self-employment, how enduring the generded employment is, improvement in the earning capacity of beneficiaries, and the spill- over effects of the employment opportunities. .a V.3 Evaluation
V.3.1 ~uthentkity of Claims
It has been shown above that at the end of 1990 the beneficiaries of the Open Apprenticeship Scheme numbered 209,735. Of this number 104,370 or 49.8 per cent had graduated while the rest were still in training. The corresponding figures for the former Anambra State were 11,095 and 5,219 or 47.0 per cent. The percentages therefore indicate that not more than 50 per cent af all job seekers who had enlisted for training under the Scheme have graduated.
Moreover, in a suryey of a sample of 1795 beneficiaries in Enugu State (Table 5.1), only308 could be reached through contact addresses obtained either from the NDE records or trainers to whom they had been attached as apprentices. The reason is that the contact and residential addresses supplied by beneficiaries at the time of application were either false or differed from their post-graduation contact addresses. There was nothing in the records of the NDE to help locate them; information on the whereabouts of those that were finally located came from their trainers.
TABLE 5.1 : SAMPLE SIZE AND RESPONSES
Scheme
1. Open Apprenticeship 2. Small-Scale Industries
L
Sample
Size
1795 87
No.
Tracked
308 52
No.
Present
253 42
No of useful
Responses
1 79 30
Futhermore, our investigation revealed that some of the apprentices did not, for one reason or another, complete their course of training. Reasons frequently given wore that the NDE either failed to pay training fees or failed to pay the agreed stipend to trainees for their maintenance.
Of the number of beneficiaries that supplied information in our enquiry (see Table 5.2), 75.4 per cent were gainfully employed as of January 1992, with 39.1 and 36.3 per cent in wage and self-employment respectively! Another revelation was that 20.0 per cent of those In employment weredoing work other than that they had trained for. From these figures, therefore, the rate of success that the NDE could justifiably claim is 55.4 per cent (that is, 75.4 per cent less 20 percent for those in jobs other than those trained for).
The import of the foregoing ana1yses.k that it is safer for the NDE to claim huge successes for the number of applicants enlisted for training rather than the number of employment or employment opportunitiescreated under the Open Apprenticeship Scheme. A score of 55 per cent is a pass mark but it is 55 per cent of !hose apprentices who completed their course of training ratherthan of those who enlisted for it.
With respect to the Small-Scale Industries Scheme the picture is not very different. It is contained in the NDE record that 35,000 applicants had, by the end of 1990, benefited from the Entrepreneurship Development training which is a prerequisite for attracting aloan under the scheme. The complete absence from the information booklet of the agency of the number of applicants who had benefited from loans suggests low performance in thisdirection. This inference is corroborated by a tale of disappointment told by a would-be beneficiary of the loan scheme who was interviewed during our survey.
According to our source, a set of 100 participants was selected out of over 500 applicants in the former Anambra State to undergo the Entrepreneurship training in Lagos in 1988. Each participant was responsible for his transport and upkeep in Lagos throughout the 2-week training programme. At the end of training, only 50 participants out of-the 100 got loans the same year. The next set of 50 (which included the informant) filed and submitted application forms for loan only in 1990 and up to February 1992 had no't gotten the loan. Meanwhile, other batches of
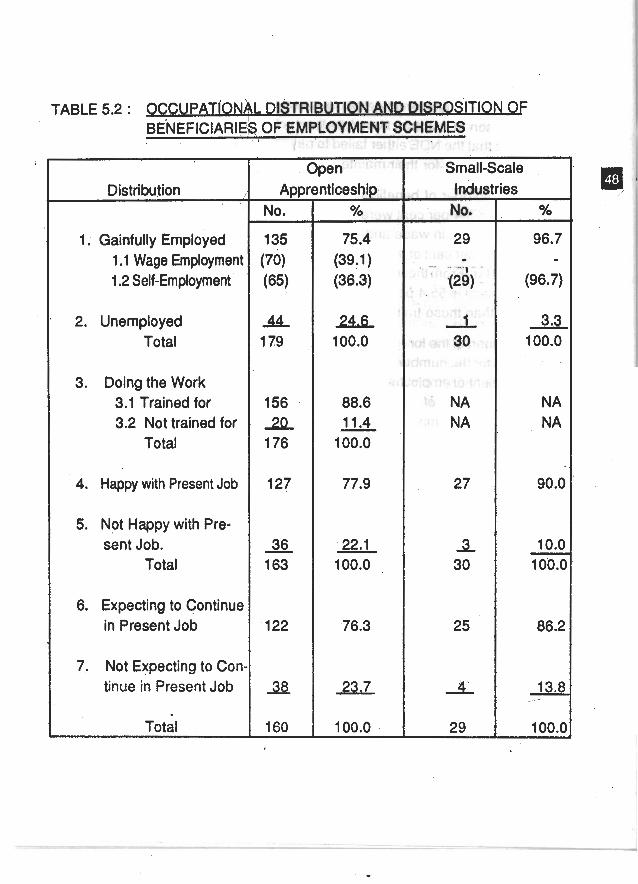
TABLE 5.2 : OCCUPATION~L DISTRIBUTION AND DISPOSITION OF BENEFICIARI&, OF EMPLOYMENT SCHEMES
I
Distribution I . ,
1. Gainfully Employed 1 .I Wage Employmenl 1.2 Self-Employment
2. Unemployed Total
3. Doing the Work 3.1 Trained for 3.2 Not trained for
Total
4. Happy with Present Job
5. Not Happy with Pre- sent Job.
Total
6. Expecting to Continue in Present Job
7. Not Expecting to Con tinue in Present Job
Total
Open Small-Scale Industries
--
No.
applicants had been sent for training every year since 1988 and had also ended up getting no loans. Our efforts to get this story confirmed'or denied by NDE officials yielded no useful results.
Nevertheless, loans are guaranteed by the NDE but granted by banks at rates of interest ranging from 9 to 13 per cent. In an era of deregulated interest rates such as has existed in the economy since 1987, and in a situation where the market rate of interest has stayed at 21 per cent or above, it is not rational to expect commercial banks to be forthcoming in granting loans to applicants under the Scheme. Thus, the NDE can speak justifiably of the large number of beneficiaries of its training programme rather than those it has enabled settle in self-employment.
For our survey, 87 names and contact addresses of loan beneficiaries were collected from the NDE records. It was not, however, possible to locate a good number of them with the addresses. However, of the number that supplied information, nearly 97per cent (Table 5.2) were in self-employment and only 3.3 per cent-remained without employment. Thus, in respect of beneficiaries of loans under the Scheme, the NDE has scored remarkable successes.
V. 3.2 Success in Reaching Targets
A policy measure is said to be on target if it directly affects or gets to the intended group in the society, otherwise, it is said to be off target. Table 5.3 contains information in respect of the two schemes being evaluated.
The target group in the case of the Open Apprenticeship Scheme are the unemployed youths in the economy. Our enquiry revealed thabvirtually all the beneficiaries of the Scheme who supplied information left school between 1980 and 1991, even though their levels of education varied from primary to post-secondary. Thus, all of them belonged to the class referred to as youth. About 81.2 per cent of them remained unemployed at the time of enlisting for the ,- scheme while 18.8 per cent already had something doing. The administration of the scheme can therefore be said to have been effective as far as being on target is concerned.
For the Small-Scale Industries Scheme, the target group were unemployed graduates of tertiary educational institutions and persons retired from wage
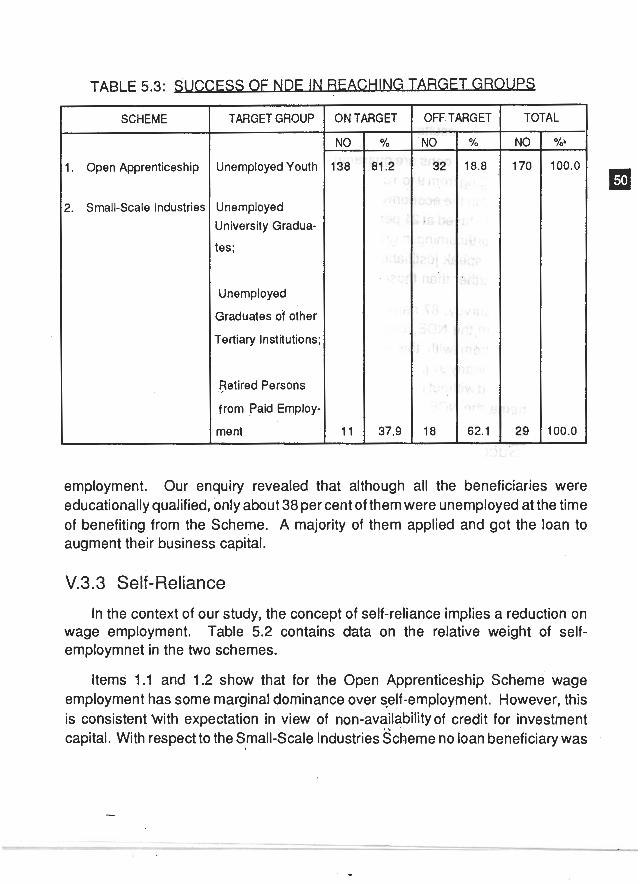
SCHEME ~ -~
. Open Apprenticeship
!. Small-Scale Industries
TARGET GROUP
Unemployed Youth
Unemployed University Gradua-
tes;
Unemployed
Graduates o'f other
Tertiary Institutions
Retired Persons
from Paid Employ
ment
ON TARGET OFF TARGET TOTAL
employment. Our enquiry revealed that although all the beneficiaries were educationally qualified, only about 38 per cent of them were unemployed at the time of benefiting from the Scheme. A majority of them applied and got the loan to augment their business capital.
V.3.3 Self-Reliance
In the context of our study, the concept of self-reliance implies a reduction on wage employment. Table 5.2 contains data on the relative weight of self- employmnet in the two schemes.
Items 1.1 and 1.2 show that for the Open Apprenticeship Scheme wage employment has some marginal dominance over self-employment. However, this is consistent With expectation in view of non-availabilityof credit for investment capital. With respect to the Small-Scale Industries scheme no loan beneficiary was

found to be in wage employment. Except for about 3 per cent that had nothing to do, all of them were self-employed.
In conclusion, it can be said that 96.7 per cent self-reliance has been achieved in the casepf Small-Scale lndustries Scheme (Table 5.2). With respect to theopen Apprenticeship Scheme only 36.3 per cent self-reliance has been recorded. ow ever, it has to be pointed out that the latter has been designed to equip its la beneficiaries for self-employment as well as wage employment.
V.3.4 Permanency of Employment
Our concern here is about how enduring the jobs,created under the Schemes are. Information in this regard is also contained in Table'5.2.
Our assumption is that the happier one feels with his job the longer he is likely to remain in it. In answer to a question on this issue, about 78 per cent of our respondents under the Open Apprenticeship stated that they felt happy with their present work. In answer to a follow-up question 76 per cent indicated intention to continue in their present employment. For the Small-Scale lndustries Scheme the corresponding percentages were 90 and 86.2. One may, therefore, conclude that the employment opportunities generated under the schemes are likely to be enduring.
V.3.5 Improvement in Earning Capacity
Table 5.4 provides information on the earning capacity of the beneficiaries of the two schemes. Their average income immediately prior to enlisting for training under the relevant schemes is given under item A. Under item 8 is contained the nominal value of their weighted average current income in January 1992. The discounted value of the income under 8 is given under item C. The essence of discounting is to make incomes under A and C comparable.
For the Open Apprenticeship Scheme the ratio of C to A is 150.4 per cent. This implies that the earning capacity of tne beneficiaries has, on the average, increased by over 50 per cent. For the Small-Scale Industries Scheme the ratio is 165.4, implying an enhancement of the.average earning capacity by 65.4 per cent. Thus,
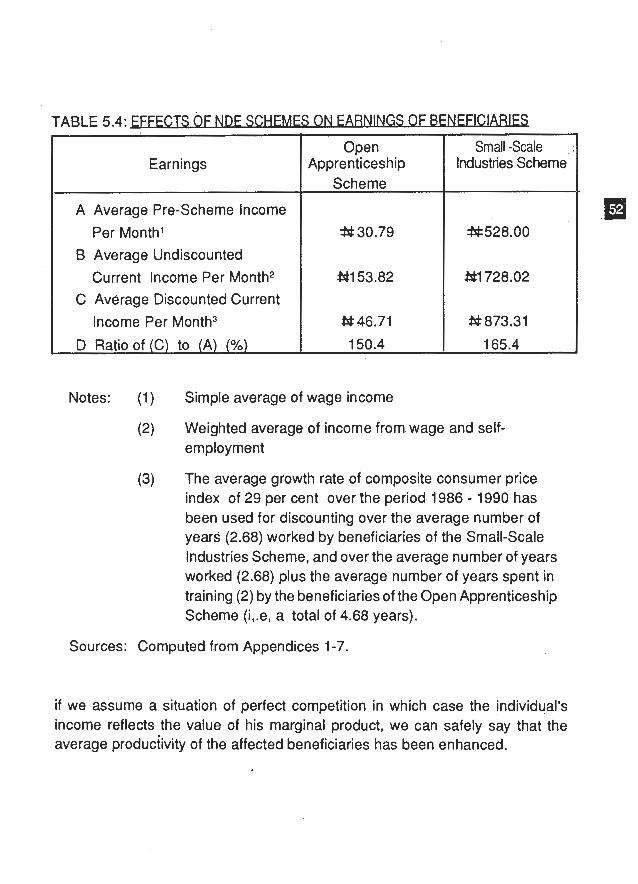
TABLE 5.4: EFFFCTS OF NnF S C H E M E S O N E A R N l N G S F F l C l A ~
Earnings
A Average Pre-Scheme lncome
Per Month1
B Average Undiscounted
Current lncome Per Month2 C Average Discounted Current
lncome Per Month3
D Ratio of (C) to (A) (%)
Open Apprenticeship
Scheme
Small -Scale lndustries Scheme
Notes: (1) Simple average of wage income
(2) Weighted average of income from wage and self- employment
(3) The average growth rate of composite consumer price index of 29 per cent over the period 1986 - 1990 has been used for discounting over the average number of years (2.68) worked by beneficiaries of the Small-Scale Industries Scheme, and over the average number of years worked (2.68) plus the average number of years spent in training (2) by the beneficiaries of the Open Apprenticeship Scheme (i,.e, a total of 4.68 years).
Sources: Computed from Appendices 1-7.
if we assume a situation of perfect competition in which case the individual's income reflects the value of his marginal product, we can safely say that the average produciivity of the affected beneficiaries has been enhanced.
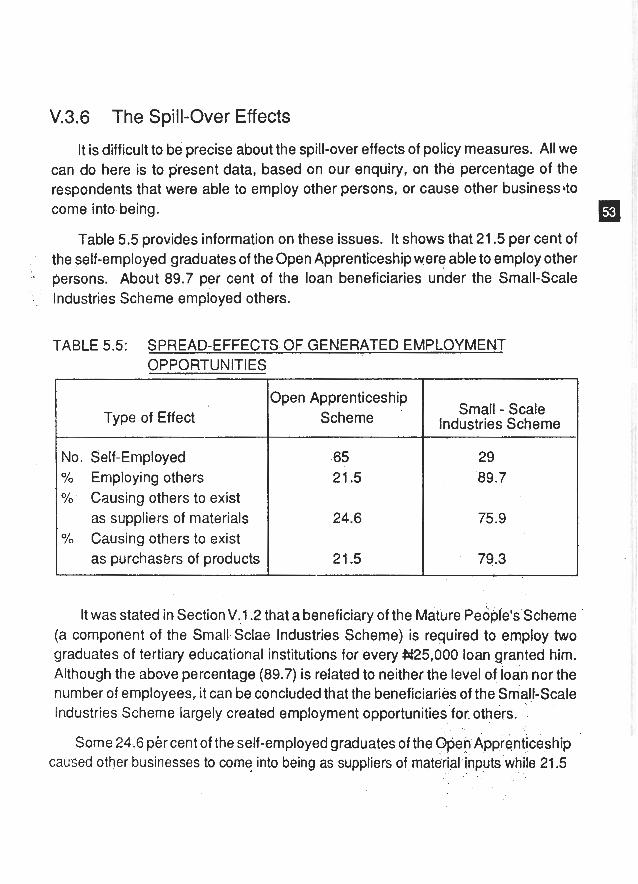
V.3.6 The Spill-Over Effects
It is difficult to be precise about the spill-over effects of policy measures. All we can do here is to present data, based on our enqliiry, on the percentage of the respondents that were able to employ other persons, or cause other business40 come into being. la
Table 5.5 provides information on these issues. It shows that 21.5 per cent of the self-employed graduates of the Open Apprenticeship were able to employ other
- persons. About 89.7 per cent of the loan beneficiaries under the Small-Scale ; . lndustries Scheme employed others.
TABLE 5.5: SPREAD-EFFECTS. OF GENERATED EMPLOYMENT
Small - Scale lndustries Scheme
OPPORTUNITIES
It was stated in Section V,1.2 that a beneficiary of the Mature ~eople's'~cheme
Type of Effect
No. Self-Employed % Employing others %' Causing others to exist
as suppliers of materials O/O Causing others to exist
as purchasers of products
(a component of the Small Sclae lndustries Scheme) is required to employ two graduates of tertiary educational institutions for every 825,000 loan granted him.
Open Apprentices hip Scheme
.65 21.5
24.6
21.5
Although the above percentage (89.7) is related to neither the level of loan nor the number of employees, it can be concluded that the beneficiaries of the Smal,t-Scale lndustries Scheme largely created employment opportunities for. others.
Some 24.6 pkr cent of the self-employed graduates of the Open Apprenticeship caused other businesses to come into being as suppliers of material inputs while 21.5
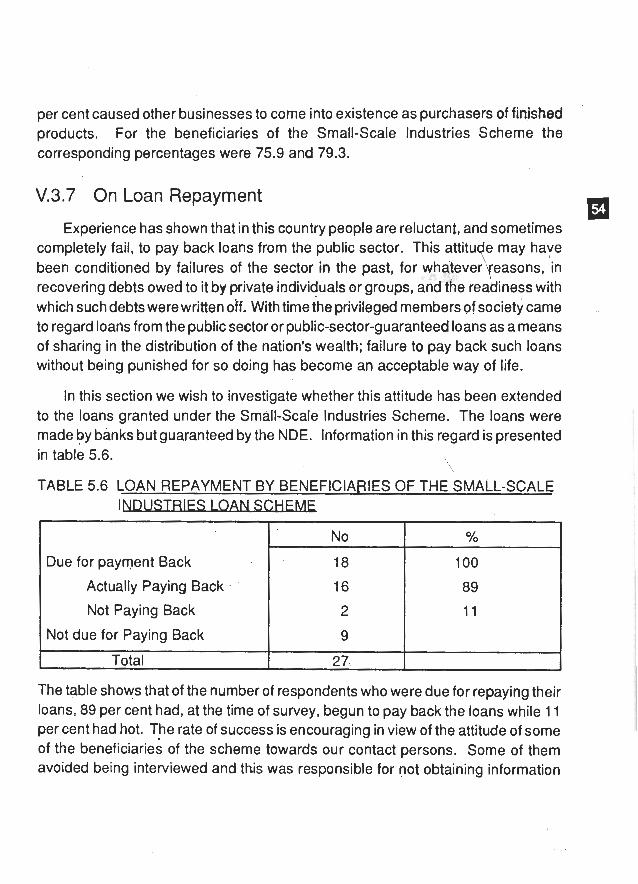
per cent caused other businesses to come into existence as purchasers of finished products. For the beneficiaries of the Small-Scale Industries Scheme the corresponding percentages were 75.9 and 79.3.
V.3.7 On Loan Repayment
Experience has shown that in this country people are reluctant, and sometimes bl
completely fail, to pay back loans from the public sector. This attitu e may have d, been conditioned by failures of the sector in the past, for whatever~easons, in recovering debts owed to it by private individuals or groups, and the reakiiness with which such debts were written off. with time the privileged members of society came to regard loans from the public sector or public-sector-guaranteed loans as a means of sharing in the distribution of the nation's wealth; failure to pay back such loans without being punished for so doing has become an acceptable way of life.
In this section we wish to investigate whether this attitude has been extended to the loans granted under the Small-Scale Industries Scheme. The loans were made by banks but guaranteed by the NDE. Information in this regard is presented in table 5.6. \ TABLE 5.6 LOAN REPAYMENT BY BENEFICIARIES OF THE SMALL-SCALE
l C
The table shows that of the number of respondents who were due for repaying their loans, 89 per cent had, at the time of survey, begun to pay back the loans while 11 per cent had hot. The rate of success is encouraging in view of the attitude of some of the beneficiarie; of the scheme towards our contact persons. Some of them avoided being interviewed and this was responsible for not obtaining information
Due for payment Back
Actually Paying Back .
Not Paying Back
Not due for Paying Back
Total
No
18
16
2
9
27..
O h
100
89
11

from 25.3 per cent of our sample. Moreover, our inability to locate some of them (35 per cent) could hardly be completely divorced from attempts to conceal their whereabouts in order to-evade loan repayment, albeit temporarily.
V.4 Summary of Major Findings
Major findings in this section may be summarized as follows:
Successes claimed by the NDE for its Open Apprenticeship and Small- Scale lndustries Schemes have been exaggerated. The claims relate more to the number of applicants enlisted under the schemes than the number of applicants that have either successfully completed their course of training or are gainfully employed.
Performance rating of the NDE in securing bankloans for applicants after completing their Entrepreneurship Development Training is very low.
Recipients of resources meant for alleviating the problems of unemployment and poverty under the Open Apprenticeship and Small- .Scale lndustries Schemes have been the intended beneficiaries.
A large majority of the beneficiaries of the Open Apprenticeship scheme who are in employment are gainfully employed on the type of job they had trained for.
The SmdI-Scale. lndustries Scheme has almost achieved total reliance on self-employment for its beneficiaries who are in employment.
For the majority of respondents in our study, employment opportunities generated by the NDE under its Open Apprenticeship and Small-Scale lndustries Schemes are not temporary.
The two schemes (Open Apprenticeship and Small-Scale Industries) have enhanced both the productivity and earning capacity of their beneficiaries.
The two schemes, particularly the Small-Scale lndustries Scheme, have positive spill-over ef.fect on employment.
~ o s i of the recipients of Small-Scale lndustries Scheme have begun to Ray back the loan granted them.
VI. Conclusion: Employment Prospects, Training Needs and Policy Implications
VI. 1 Employment Prospects
There has, in recent years been a debate about the role of the informal sector (of which self-employment constitutes the bulk) in economicgrowth and employment. On the one side are those who believe that it plays a positive role. Their views may be summarised in the expression of Gabriela Romanow that "it is one of the few sectors that hold scale growth potential and often (it) represents the only fountain of employment" (We~tlake,l990, p.167). Producers in the sector are seen as strengthening the internal market by increasing both demand and supply. Unlike formal operators, they use local inputs and do not engage in capital flight.
On the other side are those who express astrongdoubt as to whether the sector can be converted into a vehicle for economic growth. They contend that it is unproductive and serves only to provide stop-gap employment for people who are unable to get work in the formal sector. It is felt that i f its expansion is driven by an endless supply of job-seekers, they would find progressively less work to do and meagre incomes would be squeezed further.
To enable analysis of whether the sector merely plays a complementary role or provides more than just a residual function, we conduct our analysis within the framework of the following propositions:
(1) he formal and informal sectors have a synchronised cycle of growth and reEession. However, the relationship is such that informal producers are locked Into the formal sector by buying basic inputs from it and selling
finished products back to it. Consequently, government policies ought to be directed towards encouraging growth in the formal sector only since that of the informal sector is thereby guaranteed.
(2) The informal sector is autonomous and caters for separate markets. 4ntI-j~ case, it can grow when the formal market is depressed. This implies- potential for independent growth and employment generation. a
(3) The informal sector is partly dependent on the formal market and partly autonomous. This situation enables i t to benefit from both boom and slump in the formal market.. When things are bad, partial autonomy enables it benefit from increased demand. Its growth is, therefore, a response to rising demand for what it can produce. In this case it has good prospects for growth and employment.
With respect to the Nigerian economy, the of self-employment can be inferred from data in Tables 4.4 and 4.7. The latter table indicates that self- employment accounted for 89.5 - 94.3 per cent of total gainful employment in the country. Moreover, its growth rate has tended to be more stable than that of the formal sector, While the growth rate of formal employment declined from 10.7 per cent during the period 1970 - 1990 to t ,O per cent during 1980 -1 990, that of self- employment beclined only by 0.1 per cent. T+is indicates a good measure of autonomy for the latter.
This conclusion Is corroborated by data in Table 4.4 which contains the relative distribution of informal employment among typical small-mile Industries. The table shows that while service industries such as bicycle and automobile repairs that are partly dependent on the growth of the economy accounted for 13.6 per cent of total employment, the share of industries (tailoring, shoe-making and capentry) that do well even during recession is 59.6 per cent. The autonomy of self-employment in the country is even more apparent when it is remembered that most of it in the rural environment is attributable to subsistence agriculture.
In conclusion, it may be said that in terms of relative importance, stability and autonomy'6f growJh, self-employment hasgood prospects in Nigeria. However, its relative share of total employment has tended to decline over time.

V1.2 Training Needs
The need for technical andvocational education was recognised as early as the Ten Years Plan of Development and welfare, 1946-55. The plan document states that:
the shortage of properly trained artisans and technicians is at the present time one of the limiting factors in any real and rapid development. Unless quick action is taken to provide facilities for training of such men, there must be a serious I'ag in the work of development (Fed. of Nigeria, p. 3 - 4).
This need was reiterated in subsequent plans and as a result numerous polytechnics, colleges of technology, trade and technical schools were established throughout the country for the production of artisans, technicians and skilled middle- level manpower. In addition, introductory technology was introduced into the Junior Secondary School curriculum in the eighties to impart vocational skills at that level. The objective was to equip Junior Secondary School graduates who could not proceed to Senior Secondary Schools with the necessary skills for employment in various trades.
However, the good intentions of government in providing the above institutions 'have not been realised owing to a number of factors. One is lack of the necessary machinery, equipment and materials for pra'ctical training. Another is lack of competent personnel to teach the skills. Even where both the equipment and teaching staff are therd, installation, repair and maintenance of. machinery and equipment constitute another factor that renders effective utilisation of these resources impossible. The result is that students learn theories without the necessary practical work.
To help bridge the gap between theory and practice, the Federal Government established in 1971 the lndustrial Training Fund (ITF) with the responsibility of :
(a) bearing a proportion of the direct costs of on-the-job and off-the-job training of Nigerian employees undergoing tiaining courses approved by the ~ u n d ;
(b) assisting andlor strengthening training capability and facilities throughout the country;

encouraging greater involvement of employers irrdhe organisation and direction of training schemes and centres in certain critical areas of economic activity;
working out a co-operative machinery with industry and commerce whereby students in institutions of higher learning undertake,mid-career work- experience attachments in industry on projects which are compatible with their areas of study;
building of industry-oriented training facilities of its own;
organising research and studies into training as support to other activities of the Fund; and
seeking to harmonise all its training efforts and support with the activities of formal training institutions, as well as, utilising their facilities for clearly defined job-oriented training programmes.
To complement the efforts of the ITF and to provide special ingredients in the area of.training for self-employment, the NDE introduced the Open Apprenticeship and the Entrepreneurship Development Programmes already discussed in Section Vu Other organisations in the country have also joined in the national effort to create employment opportunities. These include the following:
(a) The Nigerian Bank for Commerce and Industry runs entrepreneurship development programme. In addition to the course in entrepreneurship programme, it provides loans and other supports to beneficiaries to enable them establish their own businesses.
(b) The Societe Generale Bank (Nigeria) Limited has a self-employment programme for University and Polytechnic graduates who have innovative ideas that could be commercialised. In addition to the course programme, it advances loans to qualified participants.
lnspite of the foregoing efforts, there still exist unfu!filled needs for the training of the unemployed for self-employment. Such needs are categorised as follows:

(1) There is a dearth of personnel with the necessary expertise for handling introductory technology machinery and equipment in the Secondary school system. For this reason, these machinery and gadgets purchased at great cost in foreign exchange lie either uninstalledor unutillised in most Secondary Schbols throughout the country. There is therefore the need to train and supply this category of manpower; m
(2) A large number of Secondary Schools has not been supplied with introductory technology equipment and materials needed for practical work. As a consequence, only theoretical knowledge is taught in such schools that have the required teaching staff. It is therefore necessary to supply these schools with the required equipment;
(3) There is the need to further decentralise entrepreneurship training. Training facilities should be provided at the state and local government levels to reduce costs to participants; and
(4) There is the need for the establishment of well-equipped integrated workshops in --A each - state and possibly each local government area to carry out the assembling, repair and maintenance of machinery and equipment for use in agriculture and industry. This would equip workers in such workshops for the establishment of their own repair and maintenance workshops.
V1.3 Policy Implications
In order to exploit the full potentials of self-employment, we suggest the following policy actions:
(1) The NDE should ensure proper implementation of its programmes. For instance, a situation where its officials, for whatever reasons, fait to pay elther the agreed professional fees to the handlers of apprentices, or the maintenance allowance to trainees, is detrimental to the realisation of

programme objectives. Although the implementation processes are said to be monitored, our field work did not reveal any evidence of that. It is, therefore, suggested that a monitoring unit be created by the NDE or government to ensure proper programme implementation.
(2) It is not enough to give training in entrepreneurship; it is necessary to accompany the training with a loan to ensure that beneficiaries are enabled 'to establish their own business. It is therefore, suggested that the granting of loans should be automaticand immediate upon successful completion of entrepreneurship training for applicants who have submitted acceptable feasibility studiesof their proposed projects. It is further suggested that interest payment on loans should be subsidized to the tune of the difference between the 9 - 13 percent payable by beneficiaries and the market rate. This would make commercial banks to be more forthcoming with loans;
(3) The NDE should emphasize more intermediate industries that do not depend on the formal market for expansion. Such industries have greater growth potential and are more likely to' generate lasting employment opportunities;
(4) In order to keep trackof programme beneficiaries, they should be required to undertake to furnish the NDE secretariat with their work addresses annually for five years, starting from the date of their benefit;
(5) For a fair distribution of beneficiaries, selection should be based on local government area rather than zones. This will also facilitate effective monitoring of the activities of beneficiaries; and
(6) Registration of business premises or workplaces is good at least for statistical purposes. Nevertheless, to impose heavy annual registration1 renewal fees, sometimes by both state and local governments, is distinc- tive and detrimental to the development of small-scale businesses.
1 As of 1973 to which data relate #I = $1.54
2 The annual turn-over of t he first.two categories must be above W2 million while for the last two categories it is below W2 million (WEPB, Schedules
1 & 2).
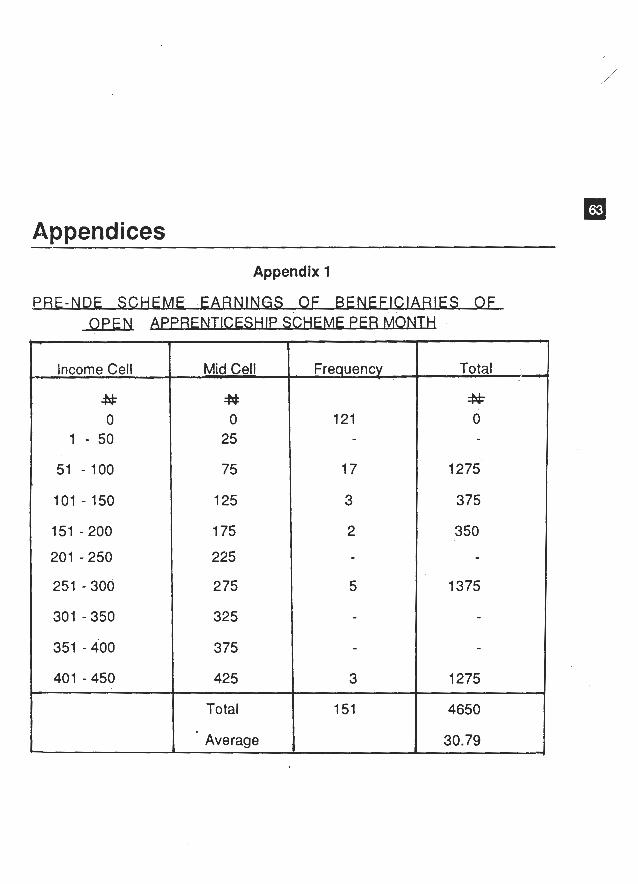
Appendices
Appendix 1
Income Cell
# 0
1 - 50 51 - 100
101 - 150
151 - 200
201 - 250
251 - 306
301 - 350
351 - 400
401 - 450
Mid Cell
# 0 25
75
125
1 75
225
275
325
375
425
Total
Average
, Frequency
121 -
17
3
2
5
3
Total 7
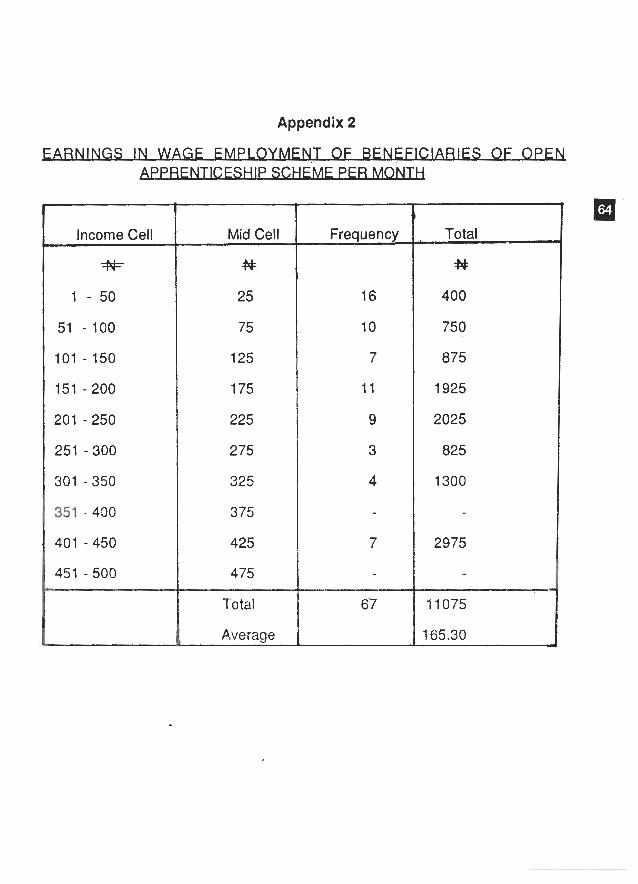
Appendix 2
Mid Cell
#
T'otal
Average
Frequency Total
#
400
750
875
1925
2025
825
1300
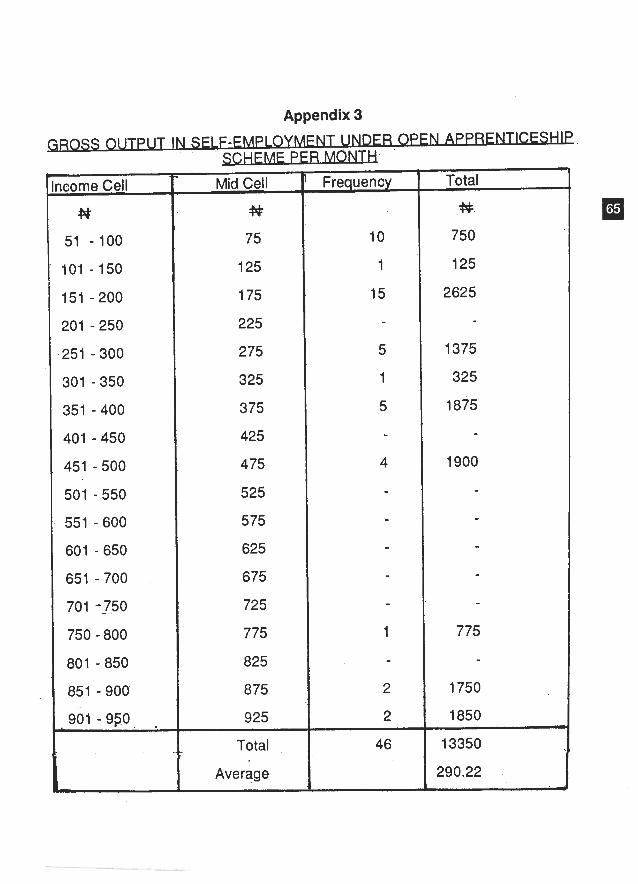
Appendix 3
ieome Cell Mid Cell
#
75
125
1 75
225
275
325
375
425
475
525
575
625
675
725
775
825
8 75
925
Total
Average
Frequency
10
1
15
-
5
1
5
4
- - - 1
2
2
Total
#
750
125
2625
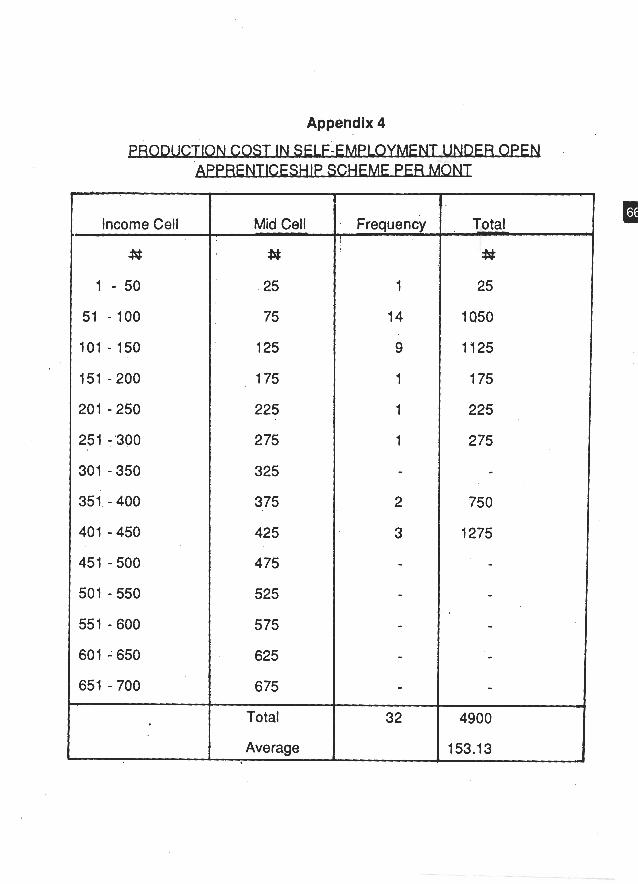
Appendix 4
ODUCTION COST IN SF1 F-FMPI OYMFNT UNDFR OPFN MF PFR MON1:
Income Cell Mid Cell
#
Total
Average
Frequency
1
14
9
1
1
1
- 2
3
- - -
Total
#
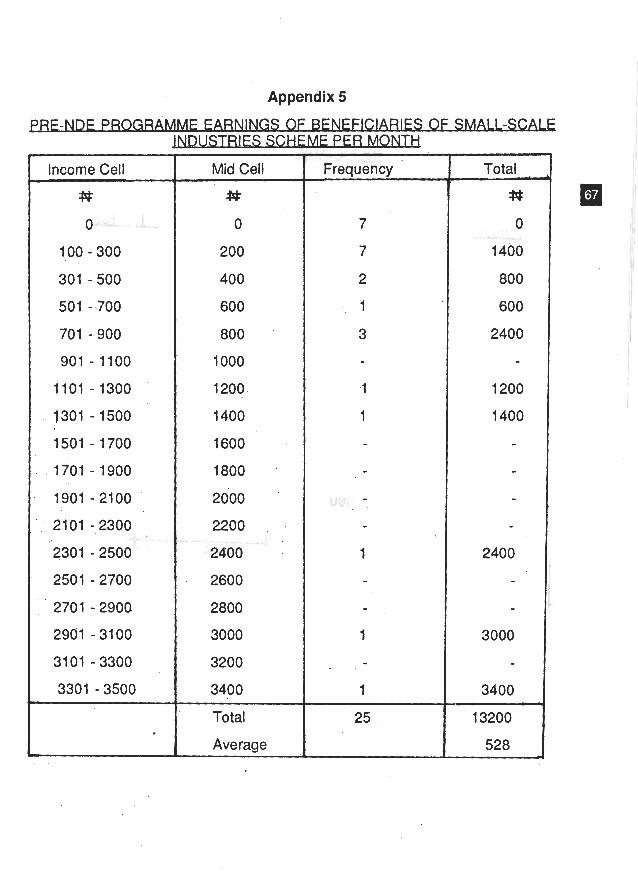
Appendix 5
Income Cell Mid Cell
#
0
200
400
600
800
.I 000
1200.
1400
1600
1800 .
2000
2200 , .
2400
2600
2800
3000
3200
3400
Total
Average
Frequency Total ,
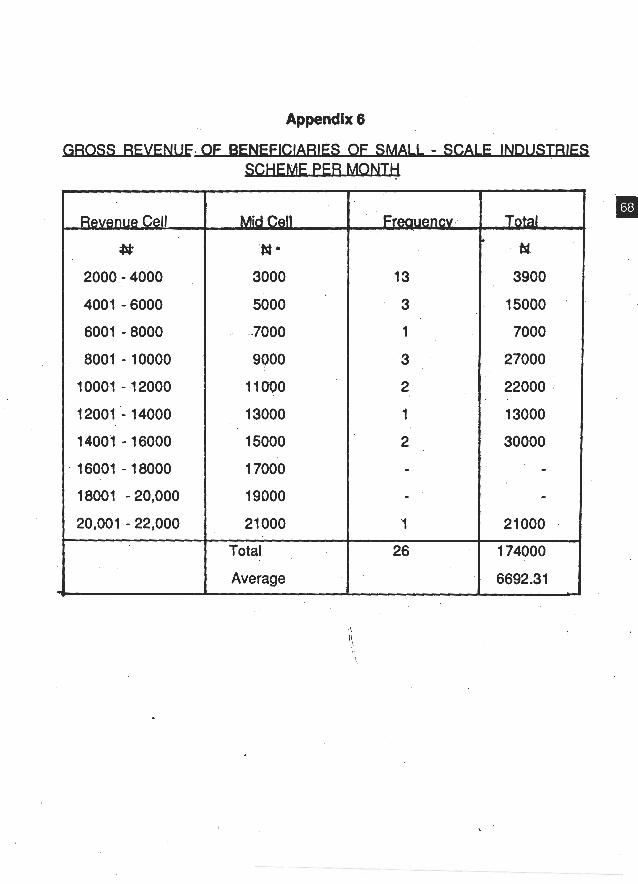
Revenue Cell
#
2000 - 4000
4001 - 6000
6001 - 8000
8001 - 10000
10001 - 12000
12001 - 14000
1400'1 - 16000
16001 - 18000
18001 - 20,000
20,001 - 22,000
Mid (&lJ
W.
3000
5000
7000
9900
11mo
13000
15000
17000
l9OOO
21 000
Total
Average
Total fl.
3900
15000
7000
27000
22000 , . .
13000
30000
- -
21 000
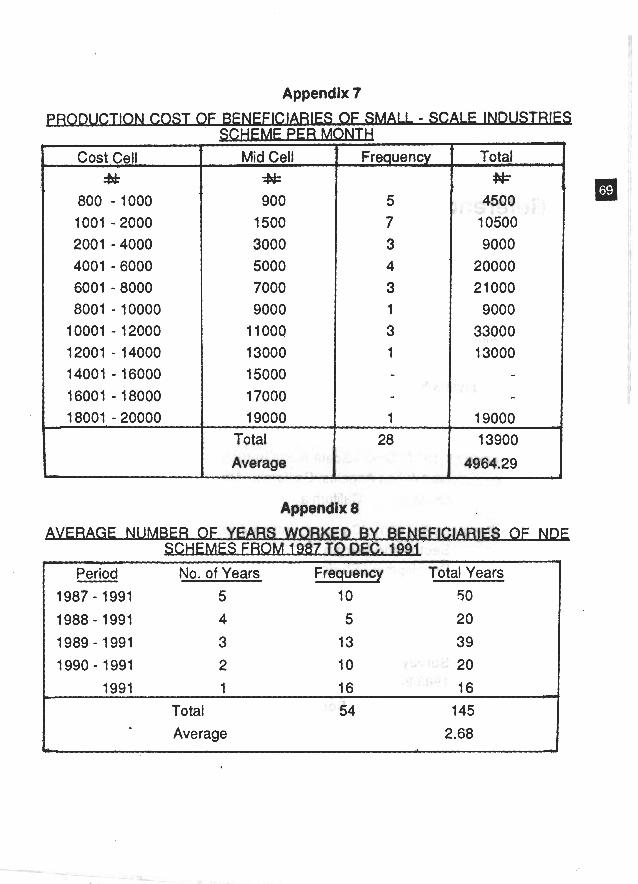
Appendix 7
Appendix 8
-
AVERAGE NUMBER OF YEARS W O R K E D B Y F S OF NDE MFS FROM 1987 TO DFC. 1991
Period No. of Years Frequency Total Years
1987 - 1991 5 10 50
4
lB
1990 - 1991 2 10 20
1991 1 16 16
Total 54 145
Average 2.68 L
r Cost Cell t Mid Cell
Ebt # Frequency f Total
800 - 1000 1001 - 2000 2001 - 4000 4001 - 6000 6001 - 8000 8001 - 10000
10001 - 12000 12001 - 14000 14001 - 16000 16001 - 18000 18001. - 20000
5 7 3 4 3 1 3 1 - - 1
28
900 1500 3000 5000 7000 9000
1 1000 13000 15000 17000 19000
Total
Average
* 4500 10500 9000
20000 2 1000 9000
33000 13000
- -
19000 . 13900
4964.29
References
Aderinto A (1 984), "Manpower Planning for Self-Reliant National ~ e & l o ~ - ment: The Nigerian Experience" (Paper presented at the 1984 NES Annual Conference.) Port Harcourt, Nigeria.
Aluko S A et. al. (1 972), Small-Scale Industries, Western State of Nigeria. lle - Ife, The Industrial Research Unit, University of Ife.
Angaye G S (1 984), "Self-Reliant Education and Development Strategy in Nigeria" (Paper presented at the 1984 NES Annual Conference) Port Harcourt, Nigeria.
Child F (1 977), Small-Scale Rural Industry in Kenya (Occasional Paper No.17) Los Angeles, California, African Studies Center, University of California.
Dasgupta B (1 973), "Calcutta's Informal Sector, Bulletin: The Informal Sector and Marginal Groups. Vol. 5, No. 213, Sussex, Institute of Development Studies.
Federation of Nigeria (1955), A Ten Years Plan of Development and Welfare for Nigeria, 1946-55, Lagos, Govt. Printer.
Federal Office of Statistics (FOS) (1 985 A), Nigeria National Integrated Survey of Households: Report of General Household Survey, 1983184, Lagos.
(1985 B), Social Statistics in Nigeria, Lagos.
(1982), Annual Abstract of Statistics, Lagos.
(1 98O), Social Statistics in Nigeria, Lagos.
(1 978), -Distribution Survey of Nigeria, Lagos.
Federal Republic of Nigeria (1 970), Second National Development Plan 1970-74, Lagos, Fed. Ministry of Information.
(1 980), Fourth National Development Plan, 1980-85, Lagos, Fed. Ministry of Information.
(1 990). First National Rolling Plan, 1990-2, Vol. 1, Lagos, Planning Office, Fed. Min. of Budget and Planning.
Guade J (1972), "Agricultural Employment and Rural Migration in a Dual Economy", 'International Labour Review, Vol. 106, No. 5.
Haggblade S et. at. (1988), Farm-Non-farm Linkages In Rurai Sub- Saharan Africa World Bank, Agricultural and Rural Development Department, April.
Hart K (1978), "Informal Income Opportunities and Urban Employment in Ghana". The Journal of Modern African Studies, Vol. 11, No. 1.
HO S P S (1 986), The Asian Experience In Rural Non-agrlcuiturai Development and Its Relevance for China (World Bank Staff Working Papers No.757), Washington D. C., The World Bank.
I L 0 (198211, Rural-Urban Gap and income Distrlbutlon (A Comparative Sub-Regional Study): The Case of Ghana, Addis Ababa, 110 Job and Skills Programme for Africa.
Kilby P (1 987), "Small-Scale Manufacturing in KenyaV(Mimeo), Washington D. C., Smithsonian Institution, The Wilson Center.
Mazumdar D (1 975), The Urban Informal Sector (World Bank-Staff Working Paper No. 21 I ) , Washington D. C., The World Bank.
Merrick T'W (1 973), The informal Sector in Beio Horizonte: A Case Study, cited in Mazumdar, Op. cit.
National Directorate of Employment (1990), Creating More Job Opportunities, Lagos.
Nelson Nici (1 979), "How Women and Men get by: The Sexual Division of Labour in the Informal Sector of a Nairobi Squatter Settlementn, Casual Work and Poverty in Third World Cities, ed., R Bromlley & C Gerry, Chichester, John Wiley & Sons.
8 ' Nigerian Enterprises Promotion Board (1 977), Nigerian Enterprises
Promotion Decree, 1977: Promotion of Nlg. Enterpriseq Lagos.
Okorafor A E and E C lwuji (1976), Smali-Scaie Industries 1n.the East Central State of Nigeria, Nsukka, Dept of Eoon~, Industrial Research Unit, U. N. N.
Olakanpo 0 (1 966), A Preliminary Report on the Indigenous Enterprise in Distributive Trades in Nigeria, Ibadan, NISER.
Oysneye 0 Y (1 980), "Apprentices in the Informal Sector of Nigerian, Labour, Capital and Soclety, No. 2.
Ravallion M (1 991), "Reaching the Rural Poor through Public Employment: Arguments, Evidence, and Lessons from South Asian, The World Bank Research Observer, Vol. 6, No. 2.
Streefland P (1 977), "The Absorptive Capacity of the Urban Tertiary Sector in the Third World Countriesn, Development and Change Vol. 8.
Steel W F (1977), Small-Scale Employment and Production in Developing Countries: Evidence from Ghana, New York, Praeger Publishers, lnc..
Steel W F &Takagi (1 975), "The Intermediate Sector, Unemployment and the Employment-Output Conflict: A Multi-Sector Modeln, (mimeo), N ,shville,Tenn; Vanderbilt University, Dept of Econs, cited in Steel d ~ . , Op. cit.
Westlake M. et al, (1 990), "Out of the Shadows", South Magazine, No. 1 15.


