Embed Size (px)
Citation preview
laboratory communications
Acta Cryst. (2013). F69, 195–200 doi:10.1107/S1744309112044387 195
Acta Crystallographica Section F
Structural Biologyand CrystallizationCommunications
ISSN 1744-3091
Visualizing ligand molecules in twilight electrondensity
Christian X. Weichenberger,a*
Edwin Pozharskib* and Bernhard
Ruppc
aCenter for Biomedicine, European Academy of
Bozen/Bolzano (EURAC), Viale Druso 1,
I-39100 Bozen/Bolzano, Italy, bUniversity of
Maryland, Baltimore, Maryland, USA, andck.-k. Hofkristallamt, 991 Audrey Place, Vista,
CA 92084, USA
Correspondence e-mail:
Received 22 August 2012
Accepted 25 October 2012
Three-dimensional models of protein structures determined by X-ray crystallo-
graphy are based on the interpretation of experimentally derived electron-
density maps. The real-space correlation coefficient (RSCC) provides an easily
comprehensible, objective measure of the residue-based fit of atom coordinates
to electron density. Among protein structure models, protein–ligand complexes
are of special interest, given their contribution to understanding the molecular
underpinnings of biological activity and to drug design. For consumers of such
models, it is not trivial to determine the degree to which ligand-structure
modelling is biased by subjective electron-density interpretation. A standalone
script, Twilight, is presented for the analysis, visualization and annotation of a
pre-filtered set of 2815 protein–ligand complexes deposited with the PDB as of
15 January 2012 with ligand RSCC values that are below a threshold of 0.6.
It also provides simplified access to the visualization of any protein–ligand
complex available from the PDB and annotated by the Uppsala Electron
Density Server. The script runs on various platforms and is available for
download at http://www.ruppweb.org/twilight/.
1. Introduction
The Protein Data Bank (PDB; Berman et al., 2000) contains almost
105 protein-structure models. Among these, one class of models
determined by means of X-ray crystallography is of particular
interest, namely those of protein–ligand complexes. While extensive
validation performed for the protein component of each crystal
structure almost assures that gross inaccuracies are avoided, valida-
tion of the small-molecular-weight ligands is more challenging. An
attempt to address this issue through geometry validation, for
example, is provided by the ValLigURL server (Kleywegt & Harris,
2007) for comparing the conformation of a ligand across PDB entries
containing the same ligand, highlighting instances of ligands with
deviating geometries.
In practical terms, however, the primary evidence in support of
both the presence and the specific pose (position and conformation)
of a ligand molecule is the corresponding electron density. User-
friendly molecular-visualization programs such as Chimera (Pettersen
et al., 2004) or PyMOL (http://www.pymol.org) provide direct access
to the structure models deposited in the PDB. However, outside of
the context of experimental data in the form of electron density, one
has to accept the deposited atomic coordinates of protein–ligand
complex structure models without qualification.
In reality, crystal structure models are to a large extent inter-
pretations of experimental evidence (that is, electron density) by
their originators. Given the lack of universally accepted guidelines for
ligand validation, a broad range of interpretations exist in which
authors may push the boundaries of justification despite sparse
evidence. The average ‘consumer’ of the structural information is
often not an expert crystallographer and may be unfamiliar with the
procedures of obtaining electron-density maps or may even be
unaware of this essential presentation of the experimental electron-# 2013 International Union of Crystallography
All rights reserved
density evidence in support of protein–ligand complexes. The
program we describe, Twilight, is designed to fill this gap and provide
easy access to the visualization of protein–ligand complexes based on
experimental data in form of electron-density maps. Twilight is linked
to the ligand structures deposited in the PDB, which are filtered to
include only entries which are in low agreement with electron density
as indicated by low real-space correlation coefficients (RSCCs;
Branden & Jones, 1990) provided by the Uppsala Electron Density
Server (EDS; Kleywegt et al., 2004). The applications of the tool
extend beyond the inspection of the pre-compiled list of potentially
problematic PDB entries. It also allows the interested researcher to
easily access the corresponding information for any PDB entry with
available density maps at the EDS for the purposes of analysis,
verification, review and education.
2. Design and implementation
2.1. Ligand database
The PDB online Advanced Search Interface was used to retrieve
37 419 database entries with protein chains determined by X-ray
crystallography as of 15 January 2012 which were cocrystallized with a
ligand (including covalently bound sugars from glycosylations) and
which were also listed in the EDS database, excluding entries
containing additional chains of either DNA or RNA. For each entry,
the corresponding real-space fit MAPMAN (Kleywegt & Jones, 1996)
output file was downloaded with permission from the EDS. All values
displayed in the final table were retrieved from the PDB, except for
the residue number, the RSCC value and the occupancy-weighted
average B factor (OWAB) of the atoms of the residue, which were
parsed from the real-space fit files from EDS. The OWAB factor is
computed as the sum of the B factors of the atoms of the residue
multiplied by their occupancy, divided by the sum of the occupancies
of the affected atoms. The ligand charge and the total number of
atoms per residue, split into the number of H and non-H atoms, were
derived from the chemical formula as provided by the PDB. We
included only PDB heterogens which met the following criteria: (i)
the RSCC is between zero and 0.6, (ii) the ligand consists of at least
six non-H atoms, (iii) the ligand is not a glycerol molecule and (iv) the
ligand does not include a peptide bond, as is frequently encountered
in modified residues contained in protein chains. The list of peptide-
bond-containing residues is provided as Supplementary Table 11.
Furthermore, the choice of RSCC threshold (0.6) reflects our attempt
to balance the length of the resulting list and the detection of cases
with ligands in high disagreement with electron density: higher RSCC
threshold values will result in a notably broader selection, while a
lower real-space correlation threshold excludes interesting cases. The
entries were ordered by a score S, which provides an intuitive ranking
for the degree of misfit of the ligand in the electron density depen-
dent on the resolution of the protein structure,
S ¼2
ðRSCC=0:6Þ þ ðRESOL=1:3Þ; ð1Þ
where RSCC is the real-space correlation coefficient and RESOL is
the resolution of the crystal structure. This score becomes S = 1.0
for RSCC = 0.6 and RESOL = 1.3, and penalizes residues in crystal
structures with a resolution better than 1.3 A by assigning values
greater than one. By the definition of this score, ligands in high-
resolution structures with low correlation to electron density are
ranked high. However, the score S is solely used to provide an
ordering of the list of ligands in the graphical user interface and is not
used as a threshold in the identification and annotation of problem-
atic ligands. The program also allows sorting of the entries based on
RSCC only. We have collected a list of 63 commonly encountered
buffer molecules (Supplementary Table 2) and any ligand encoun-
tered in this list is assigned classification code ‘B’, which is displayed
in the Class column in the tabular view (Table 1) for convenient
elimination of ligands of limited interest.
While the primary use of Twilight is to identify and review
problematic ligands in protein crystal structures, we also provide an
option for inspecting a ‘daylight’ list of entries, which are character-
ized by an RSCC of�0.95. This option may be used as an educational
laboratory communications
196 Weichenberger et al. � Twilight Acta Cryst. (2013). F69, 195–200
Table 1Description of column names in the Twilight script.
This table contains a reference sheet for all columns shown in the Twilight main table,supplying remarks on their origin. If a datum is unavailable for a particular PDB entry,the description mentions its default value for the corresponding column.
Column name Description
Rank† Initial sort order upon loading, which is a combination of descendingscore S and grouping by PDB four-character code.
PDBID‡ RCSB Protein Data Bank (PDB) four-character accession code.LigNm‡ Three-letter PDB ligand name.ResNr‡ Unique residue identifier. This has the general format CNNNNI,
where C is the chain name, NNNN is the four-digit residue numberand I is the insertion code. The residue number NNNN is right-justified and the insertion code I is mostly the space character.Residue number 66 of chain A is therefore represented as ‘A 66 ’.Notice that the RSCC values are not reported by the EDSseparately when alternate conformers are present and therefore thealternate conformation indicators are not included.
RSCC§ Real-space correlation coefficient for the ligand retrieved from EDS.Used in the computation of the score S.
OWAB§ Occupancy-weighted average B factor of the ligand, also retrievedfrom EDS.
MolWt‡ Molecular weight of the ligand in units of Da.Charge} Ligand charge, computed from its chemical formula.#Heavy} Number of non-H atoms that the ligand is composed of.#Hydrog} Number of H atoms for the ligand.#Atoms} The overall number of atoms; that is, #Heavy + #Hydrog.DepDate‡ Protein structure deposition date according to the HEADER record
from the PDB.Resol‡ Experimental resolution of the crystal structure in units of A. Used in
the calculation of the score S.Rwork‡ Working-set R value. A negative number indicates its absence.Rfree‡ Test-set R value (Rfree). A negative number indicates its absence.Robs‡ Observed-set (working set and test set taken together) R value. A
negative number indicates its absence.Softwre† Software used for crystallographic refinement as stated in REMARK
3 of the PDB entry. In the case that multiple refinement programsare stated, this becomes a comma-separated list of program names.
Jrnl‡ Abbreviated journal name if an article describing the structure hasbeen published. Contains ‘To be Published’ if no publication isassociated with the PDB entry.
PMID‡ NCBI PubMed identifier of the primary citation, if the structure hasbeen published; otherwise, the cell is empty.
Class† Ligand type. Frequently encountered crystallization buffer moleculesare conveniently flagged with the letter ‘B’, otherwise the hyphencharacter ‘-’ is printed.
Valid† This column contains the letter ‘Y’ (RSCC � 0.6) or ‘G’ (RSCC �0.95) to indicate that the ligand has passed all of the filter criteriadescribed in x2. The letter ‘A’ is used for heterogroups from amanually imported structure.
Score† Combination of the real-space correlation coefficient and theexperimental resolution into a single score S, which is used forranking the list of ligands.
Comment Author comment if the particular ligand has been analyzed; otherwise,it is empty. We have blanked all our in-house-generated annotationsexcept for false positives. However, users are especially encouragedto add their own annotations in this column.
† Value resulting from the filtering procedure mentioned in x2. ‡ Value directly takenfrom the result list returned by the PDB Advanced Search Interface query described inx2. § Value retrieved from the EDS server. } Value derived from the chemicalformula returned by the PDB Advanced Search Interface query described in x2.
1 Supplementary material has been deposited in the IUCr electronic archive(Reference: WD5192).
tool to highlight cases of very clear electron density confirming the
presence of a ligand.
2.2. Graphical user-interface components of the Twilight script
The Twilight script aims to simplify electron-density-map-based
visualization, analysis, validation, annotation and correction of ligand
molecules found in protein structures determined by X-ray crystallo-
graphy. The GUI as shown in Fig. 1 is composed of a File menu for
loading and saving pre-calculated data files containing ligand data,
with the possibility of directly importing structure data from the PDB
and EDS, a large main table for displaying these data and a second,
smaller table for providing detailed ligand information from a
particular protein structure.
2.2.1. Table elements. The main table, with its 23 sortable columns,
represents the most dominant part of the application window
presented in Fig. 1. The following paragraph explains each column in
detail and Table 1 provides a brief and compact summary for fast
lookup.
The initial sorting order (that is, the highest combined score S at
the top), grouped by PDB entry, is given in the Rank column. (If the
Twilight script is invoked with the --sort-rscc command-line
option, initial sorting will be based on RSCC only.) The PDB four-
character accession code is displayed in the column termed PDBID,
and the ligand three-letter code is shown in the LigNm column. In the
ResNr column, a unique ligand identifier is displayed as a concate-
nation of chain identifier, residue integer number and, if present,
insertion code. The column labelled RSCC shows the real-space
correlation coefficient which, together with the experimental reso-
lution displayed in the Resol column, forms the basis for the
combined score S (1) given in the Score column. The occupancy-
weighted average B factor of the ligand is shown as OWAB, and the
molecular weight (in Da) is presented in the MolWt column. The
overall charge of the ligand, its number of non-H and H atoms, and
the sum of the latter two are given in the columns Charge, #Heavy,
#Hydrog and #Atoms, respectively. The DepDate column stores the
deposition date of the protein structures as provided by the PDB
HEADER record. The R values for the working, test and observed
(i.e. both the working and test) sets are shown in the corresponding
columns Rwork, Rfree and Robs. The software used for refinement
presented in the PDB REMARK 3 record is shown in the Softwre
column. We found that 82% of the analysed structures were asso-
ciated with a peer-reviewed publication, and abbreviated journal
names as well as NCBI PubMed identifiers are shown in the Jrnl and
PMID columns. The Class column contains the letter ‘B’ for ligands
defined as buffer molecules, as explained in x2. The Valid column
discriminates between manually imported ligand data (letter ‘A’) and
our set of ligands that have passed the filter criteria described in x2
(letters ‘Y’ and ‘G’, respectively). The last column, Comments, is
reserved for user-defined annotations. These can either be entered as
free text or can conveniently be assigned from a set of predefined
strings which cover all frequently observed cases. When the PDB
entries did not contain data for one or more of the above-described
parameters, unrealistic default values that do not interfere with the
sorting scheme of the affected column were assigned (e.g. �66.0 for a
missing R value). A pop-up explanation of the content of the column
is given when placing the mouse pointer on the respective column
header text. Sorting is achieved by clicking on the header; a second
click reverses the sort order.
A table can be loaded with the File menu and the initially provided
table is contained in a file called ligands-2012-01-15.tsv. This
menu also offers the import of ligand data from an arbitrary PDB
entry, provided that a corresponding entry exists at the EDS. Newly
imported ligands are added on top of the pre-calculated table or into
an empty table and are highlighted in light blue. For unrestricted
investigation of these ligands, no filtering is applied to these data.
laboratory communications
Acta Cryst. (2013). F69, 195–200 Weichenberger et al. � Twilight 197
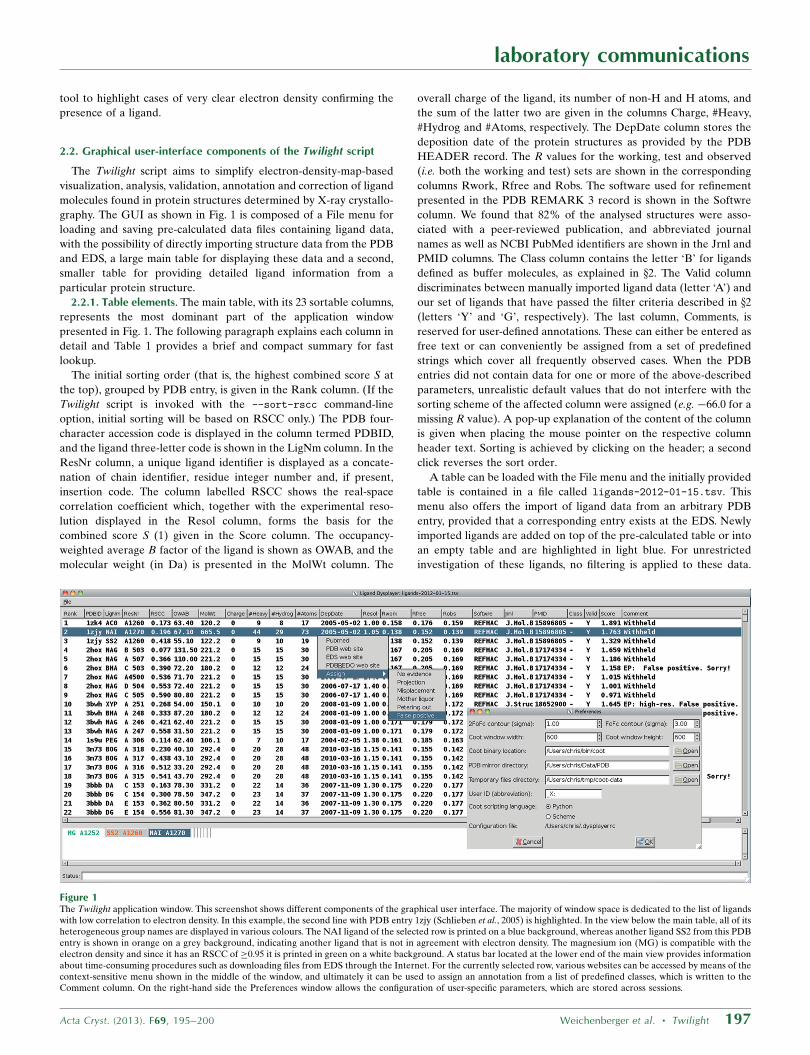
Figure 1The Twilight application window. This screenshot shows different components of the graphical user interface. The majority of window space is dedicated to the list of ligandswith low correlation to electron density. In this example, the second line with PDB entry 1zjy (Schlieben et al., 2005) is highlighted. In the view below the main table, all of itsheterogeneous group names are displayed in various colours. The NAI ligand of the selected row is printed on a blue background, whereas another ligand SS2 from this PDBentry is shown in orange on a grey background, indicating another ligand that is not in agreement with electron density. The magnesium ion (MG) is compatible with theelectron density and since it has an RSCC of �0.95 it is printed in green on a white background. A status bar located at the lower end of the main view provides informationabout time-consuming procedures such as downloading files from EDS through the Internet. For the currently selected row, various websites can be accessed by means of thecontext-sensitive menu shown in the middle of the window, and ultimately it can be used to assign an annotation from a list of predefined classes, which is written to theComment column. On the right-hand side the Preferences window allows the configuration of user-specific parameters, which are stored across sessions.
After adding or amending comments in the corresponding column, it
is possible to save the file under the same or a different name, with
distinct and increasing version numbers automatically appended to
the name in the former case.
2.2.2. Customization. The Preferences menu allows customization
of the application. We utilize the macromolecular model-building
tool Coot (Emsley et al., 2010) for displaying protein structures and
their associated electron-density maps, so that the Coot window size
on startup, the initial contouring of the 2mFo � DFc and mFo � DFc
electron-density maps and the location of the Coot binary can be
specified in the Preferences menu. A local PDB-file mirror may be
entered, which will be used to load coordinate data prior to accessing
the remote EDS server. Any three-dimensional coordinate file or
electron-density file loaded from the web server is stored locally in a
configurable location for faster access in the future. It is possible to
choose an identification code for the currently active annotator which
will automatically be used as a prefix for any annotation text entered
in the Comment column. Input fields in the Preferences window are
furnished with help texts that appear on mouse-over. Coot instruc-
tions are sent either as Scheme or as Python scripts and our script
supports them both, which is especially helpful for some Coot
versions which lack either interpreter. Finally, a system-dependent
configuration file is used to store preferences between sessions. This
file can be edited to alter or extend the set of predefined annotation
texts, electron-density levels or Coot window sizes according to
individual needs.
The Twilight tabular viewer is written in the programming
language Python and utilizes the Python wrapper PyGTK to the
GIMP Toolkit for the graphical user interface. Both Python and
PyGTK are highly portable software packages and the tabular viewer
has been tested in combination with Coot on Mac OS X, Windows
XP and several commonly used Linux distributions. The software
package can be downloaded from http://www.ruppweb.org/twilight/
and the distribution package contains further instructions for invo-
cation and platform-dependent installation of additional packages
required by Twilight.
2.3. Twilight for review
The overarching objective of our work is to raise the awareness
that electron density is the primary evidence to support the assess-
ment of local model quality. In an accompanying publication
(Pozharski et al., 2013), we provide technical details of why electron-
density inspection is decisively important for ligand validation.
Twilight therefore allows the coordinates and electron density of any
given PDB code to be fetched, provided that an EDS entry exists.
Specifically, an entry can be added to the existing database or to
an empty database generated by the user. If for some reason the
electron-density maps are not available from the EDS, the program
issues a warning. It also reports if a specific entry does not have any
ligands, if the EDS server is inaccessible or if the PDB code does not
exist at all.
We envision that the following process would be extremely simple
and easy to use for review, requiring almost no additional effort on
the parts of the PDB, journal editors and reviewers. Following nearly
universally required submission of model coordinates and structure
factors and the issue of a corresponding PDB code, the PDB creates
the electron density via the EDS or other appropriate means, which
can be password-protected if desired by the deposition authors. The
password is revealed to the corresponding editor of the associated
primary publication and provided through the editor to appropriate
reviewers. Reviewers can then utilize the Twilight review script,
which automatically displays electron density and model, beginning
at the first heterogen that complies with our (or any agreed-upon)
definition of bona fide ligands. Identification of the appropriate
ligand and inspection of its electron density and environment should
be intuitive even for non-expert users.
While many variants of the above scheme are conceivable, we
believe that the inspection of electron density in a simple and
accessible way for non-expert reviewers and editors will greatly
enhance the quality of ligand structures in the PDB. We show in the
accompanying publication (Pozharski et al., 2013) that this is indeed
a pressing need and a serious matter for the credibility of protein
crystallography.
3. Results and discussion
The standalone Python script Twilight implements a tool for high-
lighting ligands which are insufficiently supported by the electron
density reconstructed from the data and model, and is tightly
connected to the three-dimensional macromolecular-graphics model-
building program Coot. The program visualizes its central data
element, a table of flagged ligands enriched with additional data and
manual annotations by users, and offers a variety of utilities for
sorting, searching, editing and viewing three-dimensional structures,
and provides links to the most important web resources. As of 15
January 2012, the PDB includes 2850 entries with 5154 heterogens
assigned an RSCC value of 0.6 or less according to EDS, encom-
passing the full range of possible ligands, which are subject to further
filtering as described below. This represents 7.6% of the 37 419 PDB
entries investigated; that is, entries with protein chains but no DNA
or RNA chains, including a free ligand and determined by X-ray
crystallography with a corresponding entry available at the EDS.
The choice of the RSCC cutoff of �0.6 was simply driven by the
desire to arrive at a list of PDB entries that would not be over-
whelmingly long, while at the same time assuring that a significant
mismatch exists between the electron density and ligand model.
However, it should be noted that the real-space correlation coeffi-
cient is sensitive to the B factors of the ligand atoms, the ligand size
and the resolution of the experimental data used to calculate the
laboratory communications
198 Weichenberger et al. � Twilight Acta Cryst. (2013). F69, 195–200
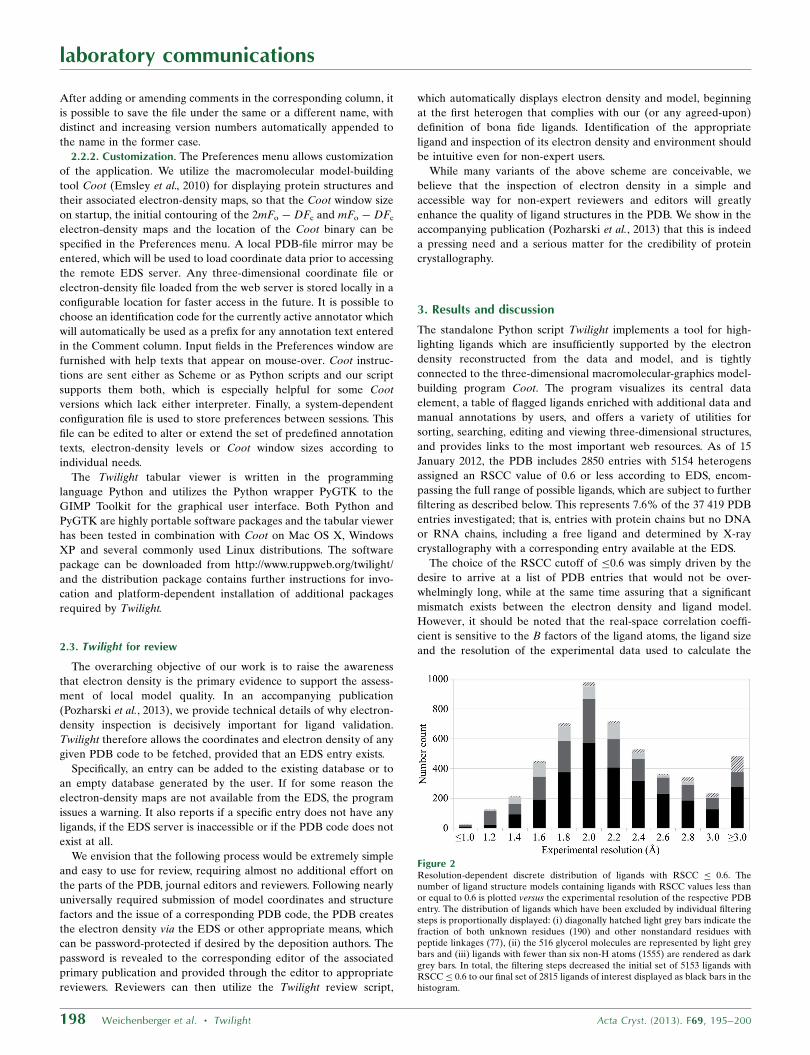
Figure 2Resolution-dependent discrete distribution of ligands with RSCC � 0.6. Thenumber of ligand structure models containing ligands with RSCC values less thanor equal to 0.6 is plotted versus the experimental resolution of the respective PDBentry. The distribution of ligands which have been excluded by individual filteringsteps is proportionally displayed: (i) diagonally hatched light grey bars indicate thefraction of both unknown residues (190) and other nonstandard residues withpeptide linkages (77), (ii) the 516 glycerol molecules are represented by light greybars and (iii) ligands with fewer than six non-H atoms (1555) are rendered as darkgrey bars. In total, the filtering steps decreased the initial set of 5153 ligands withRSCC � 0.6 to our final set of 2815 ligands of interest displayed as black bars in thehistogram.
laboratory communications
Acta Cryst. (2013). F69, 195–200 Weichenberger et al. � Twilight 199
electron-density maps (Kleywegt et al., 2004) and also depends on
both the precision of the data and the accuracy of the model (Tickle,
2012). Consequently, we designed the Twilight tool specifically to
facilitate the important actual inspection of the electron-density maps.
A certain number of the flagged entries are related to molecules
from the solvent and therefore these are of only secondary interest.
This was addressed by excluding 1555 ligands with fewer than six non-
H atoms. Of the remaining 3599 ligands, we removed 516 glycerol
molecules (PDB ligand name GOL), an abundant cryoprotectant
molecule with six non-H atoms. Another 267 ligands were eliminated
since they contained a peptide-bond linkage; the majority of these
were unknown residues (listed with residue name UNK in the PDB
entries). Whether the remaining 77 heterogeneous groups are true
unbound ligands or appear as a linked residue in a polypeptide chain
cannot be determined using the PDB web interface and requires the
analysis of the surrounding atoms in three-dimensional space or the
inspection of individual LINK/CONECT records, a task that we have
omitted owing to the relatively small number of expected ligands.
After the application of the described filtering steps, the final list
contained 2815 ligands distributed across 1464 PDB entries. Fig. 2
presents a graphical overview of the filtering steps divided into
experimental resolutions, which range from 0.85 to 4.3 A, with a
median resolution of 2.1 A computed over all 2815 ligands. In this
figure, a large portion of filtered and eliminated nonstandard peptide
residues is found in the resolution range of 3 A or higher, and manual
inspection has shown that almost all are unknown peptides covalently
bound to a polypeptide chain, which could not be assigned an amino
acid owing to weak, or a complete lack of, electron density.
3.1. Program use
After launching the tabular viewer program Twilight, a file
containing a list of ligands incompatible with experimental electron
density can be opened. Initially, this is a precompiled and partially
annotated list (Pozharski et al., 2013) packaged with the software.
Upon loading, the ligands are grouped by PDB code and sorted by
the combined score S, which links experimental resolution and ligand
RSCC value (1), with higher values indicating a worse fit to electron
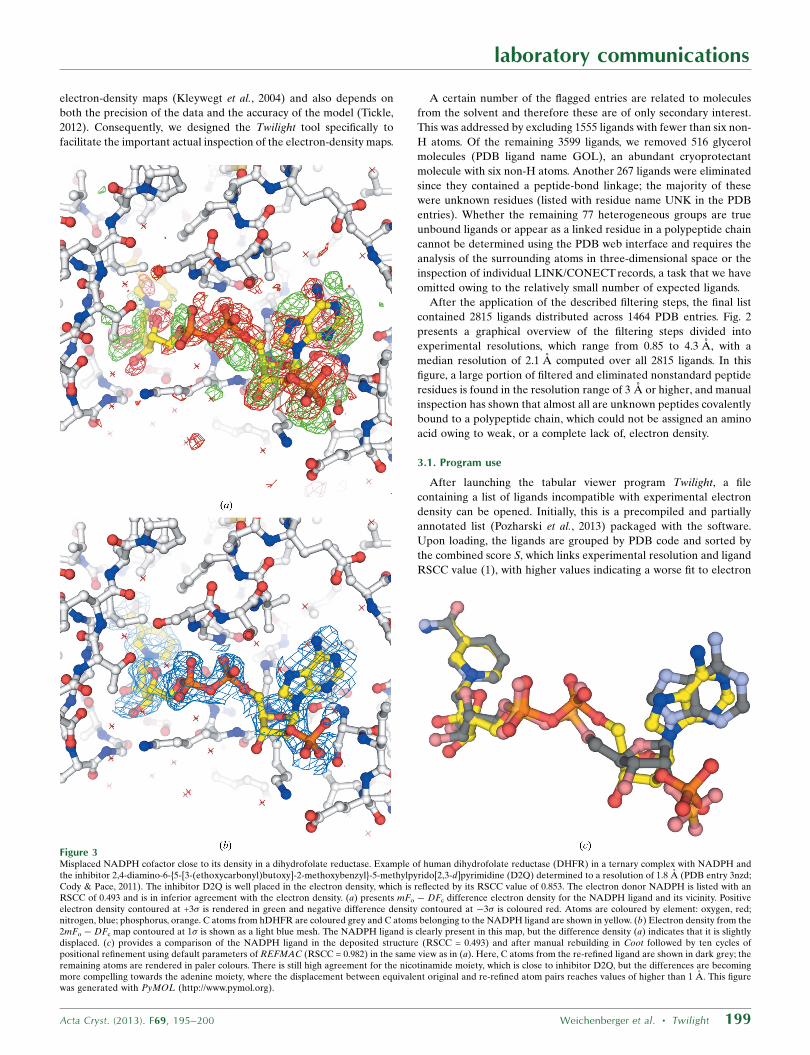
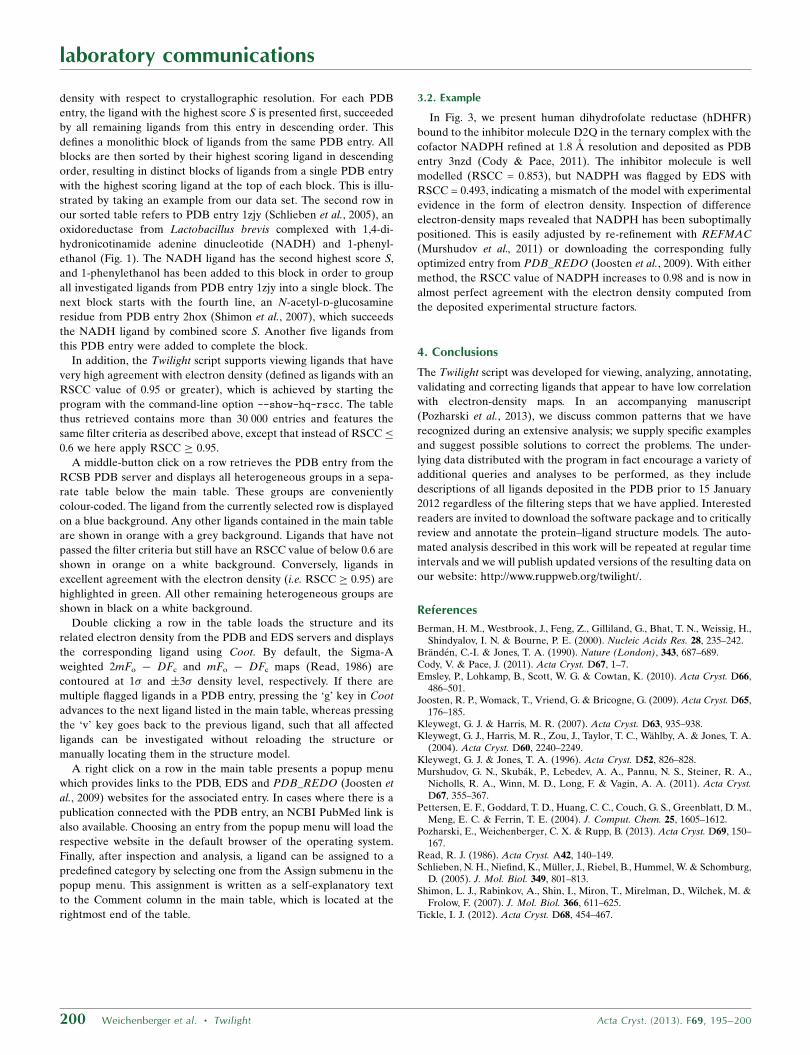
Figure 3Misplaced NADPH cofactor close to its density in a dihydrofolate reductase. Example of human dihydrofolate reductase (DHFR) in a ternary complex with NADPH andthe inhibitor 2,4-diamino-6-{5-[3-(ethoxycarbonyl)butoxy]-2-methoxybenzyl}-5-methylpyrido[2,3-d]pyrimidine (D2Q) determined to a resolution of 1.8 A (PDB entry 3nzd;Cody & Pace, 2011). The inhibitor D2Q is well placed in the electron density, which is reflected by its RSCC value of 0.853. The electron donor NADPH is listed with anRSCC of 0.493 and is in inferior agreement with the electron density. (a) presents mFo � DFc difference electron density for the NADPH ligand and its vicinity. Positiveelectron density contoured at +3� is rendered in green and negative difference density contoured at �3� is coloured red. Atoms are coloured by element: oxygen, red;nitrogen, blue; phosphorus, orange. C atoms from hDHFR are coloured grey and C atoms belonging to the NADPH ligand are shown in yellow. (b) Electron density from the2mFo � DFc map contoured at 1� is shown as a light blue mesh. The NADPH ligand is clearly present in this map, but the difference density (a) indicates that it is slightlydisplaced. (c) provides a comparison of the NADPH ligand in the deposited structure (RSCC = 0.493) and after manual rebuilding in Coot followed by ten cycles ofpositional refinement using default parameters of REFMAC (RSCC = 0.982) in the same view as in (a). Here, C atoms from the re-refined ligand are shown in dark grey; theremaining atoms are rendered in paler colours. There is still high agreement for the nicotinamide moiety, which is close to inhibitor D2Q, but the differences are becomingmore compelling towards the adenine moiety, where the displacement between equivalent original and re-refined atom pairs reaches values of higher than 1 A. This figurewas generated with PyMOL (http://www.pymol.org).
density with respect to crystallographic resolution. For each PDB
entry, the ligand with the highest score S is presented first, succeeded
by all remaining ligands from this entry in descending order. This
defines a monolithic block of ligands from the same PDB entry. All
blocks are then sorted by their highest scoring ligand in descending
order, resulting in distinct blocks of ligands from a single PDB entry
with the highest scoring ligand at the top of each block. This is illu-
strated by taking an example from our data set. The second row in
our sorted table refers to PDB entry 1zjy (Schlieben et al., 2005), an
oxidoreductase from Lactobacillus brevis complexed with 1,4-di-
hydronicotinamide adenine dinucleotide (NADH) and 1-phenyl-
ethanol (Fig. 1). The NADH ligand has the second highest score S,
and 1-phenylethanol has been added to this block in order to group
all investigated ligands from PDB entry 1zjy into a single block. The
next block starts with the fourth line, an N-acetyl-d-glucosamine
residue from PDB entry 2hox (Shimon et al., 2007), which succeeds
the NADH ligand by combined score S. Another five ligands from
this PDB entry were added to complete the block.
In addition, the Twilight script supports viewing ligands that have
very high agreement with electron density (defined as ligands with an
RSCC value of 0.95 or greater), which is achieved by starting the
program with the command-line option --show-hq-rscc. The table
thus retrieved contains more than 30 000 entries and features the
same filter criteria as described above, except that instead of RSCC�
0.6 we here apply RSCC � 0.95.
A middle-button click on a row retrieves the PDB entry from the
RCSB PDB server and displays all heterogeneous groups in a sepa-
rate table below the main table. These groups are conveniently
colour-coded. The ligand from the currently selected row is displayed
on a blue background. Any other ligands contained in the main table
are shown in orange with a grey background. Ligands that have not
passed the filter criteria but still have an RSCC value of below 0.6 are
shown in orange on a white background. Conversely, ligands in
excellent agreement with the electron density (i.e. RSCC � 0.95) are
highlighted in green. All other remaining heterogeneous groups are
shown in black on a white background.
Double clicking a row in the table loads the structure and its
related electron density from the PDB and EDS servers and displays
the corresponding ligand using Coot. By default, the Sigma-A
weighted 2mFo � DFc and mFo � DFc maps (Read, 1986) are
contoured at 1� and �3� density level, respectively. If there are
multiple flagged ligands in a PDB entry, pressing the ‘g’ key in Coot
advances to the next ligand listed in the main table, whereas pressing
the ‘v’ key goes back to the previous ligand, such that all affected
ligands can be investigated without reloading the structure or
manually locating them in the structure model.
A right click on a row in the main table presents a popup menu
which provides links to the PDB, EDS and PDB_REDO (Joosten et
al., 2009) websites for the associated entry. In cases where there is a
publication connected with the PDB entry, an NCBI PubMed link is
also available. Choosing an entry from the popup menu will load the
respective website in the default browser of the operating system.
Finally, after inspection and analysis, a ligand can be assigned to a
predefined category by selecting one from the Assign submenu in the
popup menu. This assignment is written as a self-explanatory text
to the Comment column in the main table, which is located at the
rightmost end of the table.
3.2. Example
In Fig. 3, we present human dihydrofolate reductase (hDHFR)
bound to the inhibitor molecule D2Q in the ternary complex with the
cofactor NADPH refined at 1.8 A resolution and deposited as PDB
entry 3nzd (Cody & Pace, 2011). The inhibitor molecule is well
modelled (RSCC = 0.853), but NADPH was flagged by EDS with
RSCC = 0.493, indicating a mismatch of the model with experimental
evidence in the form of electron density. Inspection of difference
electron-density maps revealed that NADPH has been suboptimally
positioned. This is easily adjusted by re-refinement with REFMAC
(Murshudov et al., 2011) or downloading the corresponding fully
optimized entry from PDB_REDO (Joosten et al., 2009). With either
method, the RSCC value of NADPH increases to 0.98 and is now in
almost perfect agreement with the electron density computed from
the deposited experimental structure factors.
4. Conclusions
The Twilight script was developed for viewing, analyzing, annotating,
validating and correcting ligands that appear to have low correlation
with electron-density maps. In an accompanying manuscript
(Pozharski et al., 2013), we discuss common patterns that we have
recognized during an extensive analysis; we supply specific examples
and suggest possible solutions to correct the problems. The under-
lying data distributed with the program in fact encourage a variety of
additional queries and analyses to be performed, as they include
descriptions of all ligands deposited in the PDB prior to 15 January
2012 regardless of the filtering steps that we have applied. Interested
readers are invited to download the software package and to critically
review and annotate the protein–ligand structure models. The auto-
mated analysis described in this work will be repeated at regular time
intervals and we will publish updated versions of the resulting data on
our website: http://www.ruppweb.org/twilight/.
References
Berman, H. M., Westbrook, J., Feng, Z., Gilliland, G., Bhat, T. N., Weissig, H.,Shindyalov, I. N. & Bourne, P. E. (2000). Nucleic Acids Res. 28, 235–242.
Branden, C.-I. & Jones, T. A. (1990). Nature (London), 343, 687–689.Cody, V. & Pace, J. (2011). Acta Cryst. D67, 1–7.Emsley, P., Lohkamp, B., Scott, W. G. & Cowtan, K. (2010). Acta Cryst. D66,
486–501.Joosten, R. P., Womack, T., Vriend, G. & Bricogne, G. (2009). Acta Cryst. D65,
176–185.Kleywegt, G. J. & Harris, M. R. (2007). Acta Cryst. D63, 935–938.Kleywegt, G. J., Harris, M. R., Zou, J., Taylor, T. C., Wahlby, A. & Jones, T. A.
(2004). Acta Cryst. D60, 2240–2249.Kleywegt, G. J. & Jones, T. A. (1996). Acta Cryst. D52, 826–828.Murshudov, G. N., Skubak, P., Lebedev, A. A., Pannu, N. S., Steiner, R. A.,
Nicholls, R. A., Winn, M. D., Long, F. & Vagin, A. A. (2011). Acta Cryst.D67, 355–367.
Pettersen, E. F., Goddard, T. D., Huang, C. C., Couch, G. S., Greenblatt, D. M.,Meng, E. C. & Ferrin, T. E. (2004). J. Comput. Chem. 25, 1605–1612.
Pozharski, E., Weichenberger, C. X. & Rupp, B. (2013). Acta Cryst. D69, 150–167.
Read, R. J. (1986). Acta Cryst. A42, 140–149.Schlieben, N. H., Niefind, K., Muller, J., Riebel, B., Hummel, W. & Schomburg,
D. (2005). J. Mol. Biol. 349, 801–813.Shimon, L. J., Rabinkov, A., Shin, I., Miron, T., Mirelman, D., Wilchek, M. &
Frolow, F. (2007). J. Mol. Biol. 366, 611–625.Tickle, I. J. (2012). Acta Cryst. D68, 454–467.
laboratory communications
200 Weichenberger et al. � Twilight Acta Cryst. (2013). F69, 195–200