Embed Size (px)
Citation preview
Vodafone Group Plc
Annual ReportFor the year ended 31 March 2008
Registered OfficeVodafone HouseThe ConnectionNewburyBerkshire RG14 2FNEnglandRegistered in England No. 1833679
Tel: +44 (0) 1635 33251Fax: +44 (0) 1635 45713
www.vodafone.com
Vodafone Group Plc
Vodafone Group Plc Annual Report for the year ended 31 M
arch 2008
This constitutes the Annual Report of Vodafone Group Plc (the “Company”) for the year ended 31 March 2008 and is dated 27 May 2008. This document includes information that is required by the United States (“US”) Securities and Exchange Commission (the “SEC”) for the Company’s US filing of its Annual Report on Form 20-F. The information in this document may be updated or supplemented at the time of filing with the SEC or later amended if necessary. The content of the Group’s website (www.vodafone.com) should not be considered to form part of this Annual Report or the Company’s Annual Report on Form 20-F.
In the discussion of the Group’s reported financial position, operating results and cash flows for the year ended 31 March 2008, information is presented to provide readers with additional financial information that is regularly reviewed by management. However, this additional information presented is not uniformly defined by all companies, including those in the Group’s industry. Accordingly, it may not be comparable with similarly titled measures and disclosures by other companies. Additionally, certain information presented is derived from amounts calculated in accordance with IFRS but is not itself an expressly permitted GAAP measure. Such non-GAAP measures should not be viewed in isolation or as an alternative to the equivalent GAAP measure. For further information see “Non-GAAP Information” on pages 150 to 151 and “Definition of Terms” on page 155.
The terms “Vodafone”, the “Group”, “we”, “our” and “us” refer to the Company and, as applicable, its subsidiary undertakings and/or its interests in joint ventures and associated undertakings.
This Annual Report contains forward-looking statements within the meaning of the US Private Securities Litigation Reform Act of 1995 with respect to the Group’s financial condition, results of operations and business management and strategy, plans and objectives for the Group. For further details, please see “Cautionary Statement Regarding Forward-Looking Statements” on page 154 and “Principal Risk Factors and Uncertainties” on pages 52 and 53 for a discussion of the risks associated with these statements.
Vodafone, the Vodafone logo, Vodafone live!, Vodafone Mobile Connect, Vodafone Office, Vodafone Wireless Office, Vodafone Passport, Vodafone At Home, Vodafone Zuhause, Vodafone Applications Service, Vodafone Email Plus, Vodafone M-PESA, Vodafone Money Transfer, Vodafone Betavine and Vodacom are trademarks of the Vodafone Group. The RIM® and BlackBerry® families of trademarks, images and symbols are the exclusive properties and trademarks of Research in Motion Limited, used by permission. RIM and BlackBerry are registered with the US Patent and Trademark Office and may be pending or registered in other countries. Windows Mobile is either a registered trademark or trademark of Microsoft Corporation in the United States and/or other countries. Palm and Treo are among trademarks or registered trademarks owned by or licensed to Palm, Inc™. SAP is a registered trademark of SAP AG in Germany and in several other countries. Other product and company names mentioned herein may be the trademarks of their respective owners.
14 Business Overview16 Technology and Resources20 People22 Brand and Distribution24 Products and Services
1 Highlights2 Chairman’s Statement4 Chief Executive’s Review8 Performance at a Glance10 Operating Environment and Strategy12 Group at a Glance
30 Key Performance Indicators32 Operating Results51 Outlook52 Principal Risk Factors and Uncertainties54 Financial Position and Resources59 Corporate Responsibility
82 Contents83 Directors’ Statement of Responsibility*
84 Audit Report on Internal Controls85 Critical Accounting Estimates88 Consolidated Financial Statements132 Audit Report on the Consolidated
Financial Statements133 Audit Report on the Company
Financial Statements134 Company Financial Statements
140 Shareholder Information*
146 History and Development*
147 Regulation*
150 Non-GAAP Information*
152 Form 20-F Cross Reference Guide154 Cautionary Statement Regarding
Forward-Looking Statements*
155 Definition of Terms156 Financial Highlights
62 Board of Directors and Group Management65 Corporate Governance71 Directors’ Remuneration
* These sections make up the Directors’ Report.
Executive Summary* Business* Performance*
Governance* Financials Additional information
Our goal is to be the communications leader in an increasingly connected world
Investor RelationsTelephone: +44 (0) 1635 664447
Media RelationsTelephone: +44 (0) 1635 664444
Corporate Responsibility Fax: +44 (0) 1635 674478E-mail: [email protected]: www.vodafone.com/responsibility
We want to keep the environmental impact of the documents in our Annual Report package to a minimum. We have therefore given careful consideration to the production process. This document is printed on Revive 75 Silk, manufactured in the EU at mills with ISO 14001 accreditation and comprising 50% de-inked post consumer waste, 25% pre-consumer waste and 25% virgin fibre. The FSC logo identifies products which contain wood from well-managed forests certified in accordance with the rules of the Forest Stewardship Council. Printed by St Ives in accordance with the ISO 14001 environmental management system using vegetable-based inks. The printer holds FSC Chain of Custody (certificate number SGS-COC-1732). All the steps we have taken demonstrate our commitment to making sustainable choices.
Printed in the United Kingdom
Designed and produced by Addison Corporate Marketing
Contact Details
Highlights
Final dividend per share of 5.02 pence, giving total dividends per share of 7.51 pence
Dividend pay out ratio of 60%, in line with policy, and a total payout of £4.0 billion for the financial year
1st in UK and 11th globally in the BrandZ most powerful brands ranking
•
•
•
Adjusted earnings per share up 11.0% to 12.50 pence. Basic earnings per share of 12.56 pence
Free cash flow of £5.5 billion. Net cash flow from operating activities of £10.5 billion
•
•
Key financials
Other highlights
Progress towards strategic objectives
Europe: 2.0% revenue growth with outgoing usage up 20.1% and data revenue up 35.7%, all on an organic basis
9.9% mobile capital intensity for Europe and common functions
EMAPA: revenue growth of 45.1%, reflecting acquisitions in India and Turkey. Organic growth of 14.5%
Group data revenue up 52.7% to £2.2 billion, with organic growth of 40.6%
•
•
•
•
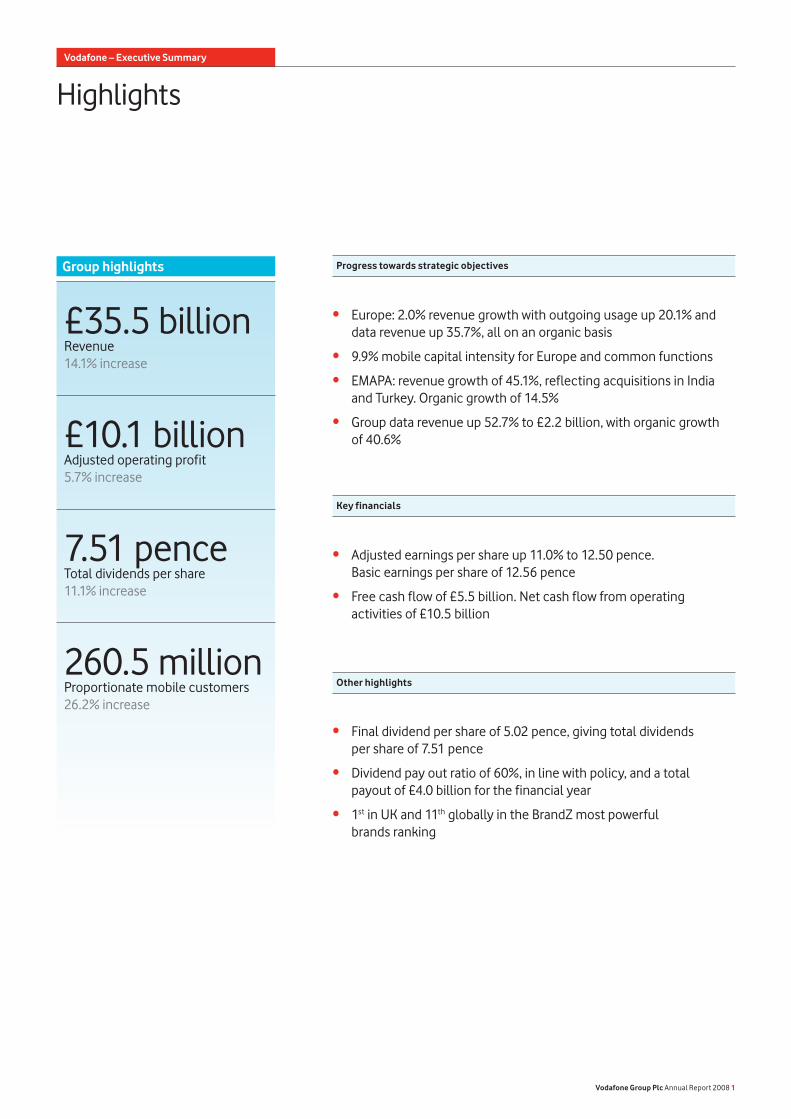
£35.5 billionRevenue14.1% increase
£10.1 billionAdjusted operating profit5.7% increase
7.51 penceTotal dividends per share11.1% increase
260.5 millionProportionate mobile customers26.2% increase
Group highlights
Vodafone – Executive Summary
Vodafone Group Plc Annual Report 2008 1
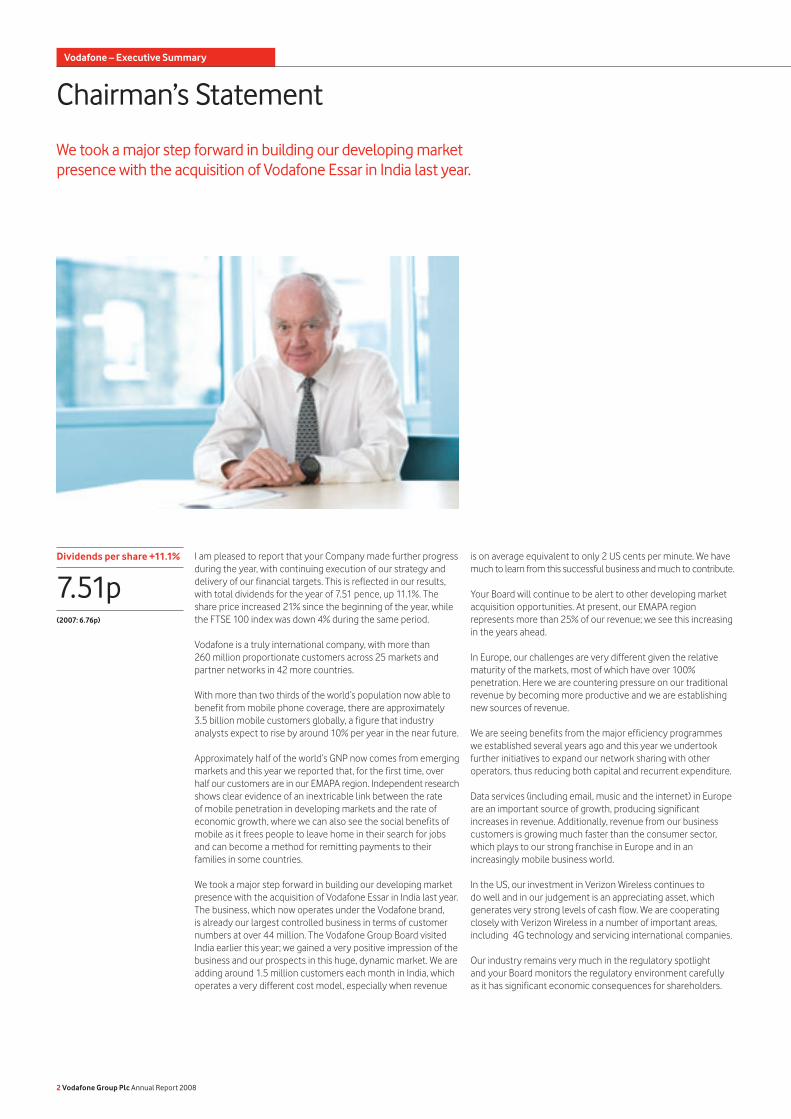
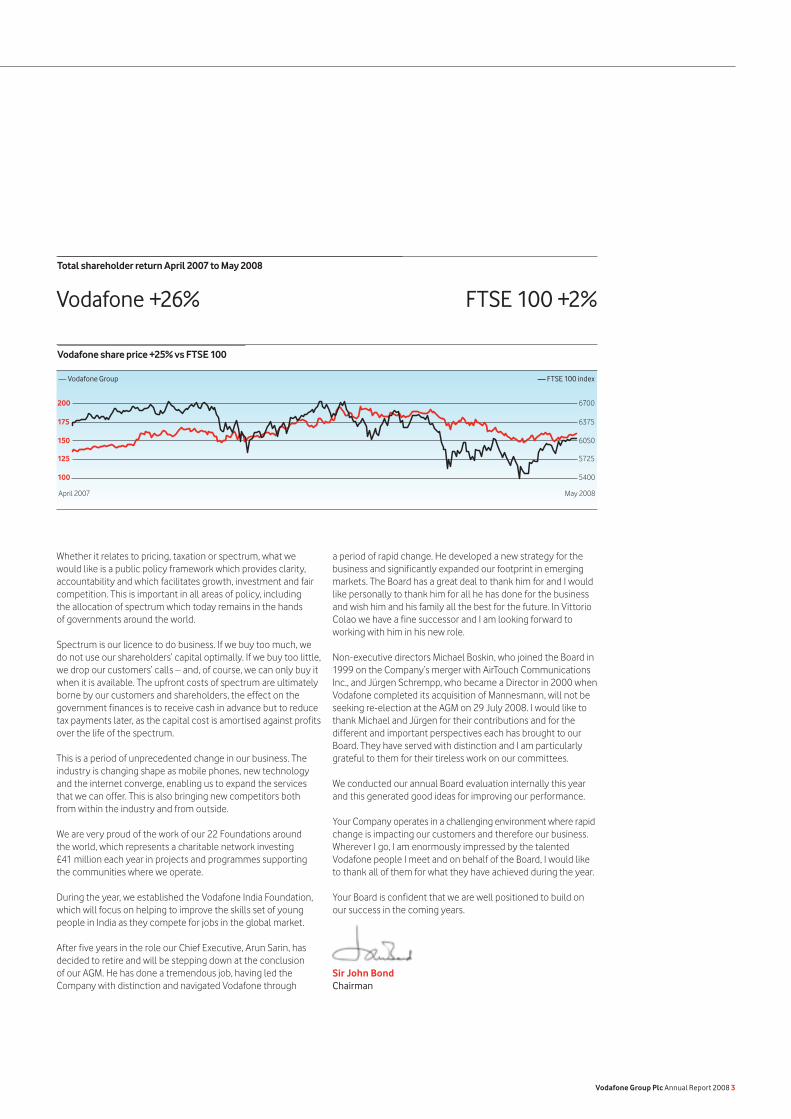
I am pleased to report that your Company made further progress during the year, with continuing execution of our strategy and delivery of our financial targets. This is reflected in our results, with total dividends for the year of 7.51 pence, up 11.1%. The share price increased 21% since the beginning of the year, while the FTSE 100 index was down 4% during the same period.
Vodafone is a truly international company, with more than 260 million proportionate customers across 25 markets and partner networks in 42 more countries.
With more than two thirds of the world’s population now able to benefit from mobile phone coverage, there are approximately 3.5 billion mobile customers globally, a figure that industry analysts expect to rise by around 10% per year in the near future.
Approximately half of the world’s GNP now comes from emerging markets and this year we reported that, for the first time, over half our customers are in our EMAPA region. Independent research shows clear evidence of an inextricable link between the rate of mobile penetration in developing markets and the rate of economic growth, where we can also see the social benefits of mobile as it frees people to leave home in their search for jobs and can become a method for remitting payments to their families in some countries.
We took a major step forward in building our developing market presence with the acquisition of Vodafone Essar in India last year. The business, which now operates under the Vodafone brand, is already our largest controlled business in terms of customer numbers at over 44 million. The Vodafone Group Board visited India earlier this year; we gained a very positive impression of the business and our prospects in this huge, dynamic market. We are adding around 1.5 million customers each month in India, which operates a very different cost model, especially when revenue
We took a major step forward in building our developing market presence with the acquisition of Vodafone Essar in India last year.
Chairman’s Statement
is on average equivalent to only 2 US cents per minute. We have much to learn from this successful business and much to contribute.
Your Board will continue to be alert to other developing market acquisition opportunities. At present, our EMAPA region represents more than 25% of our revenue; we see this increasing in the years ahead.
In Europe, our challenges are very different given the relative maturity of the markets, most of which have over 100% penetration. Here we are countering pressure on our traditional revenue by becoming more productive and we are establishing new sources of revenue.
We are seeing benefits from the major efficiency programmes we established several years ago and this year we undertook further initiatives to expand our network sharing with other operators, thus reducing both capital and recurrent expenditure.
Data services (including email, music and the internet) in Europe are an important source of growth, producing significant increases in revenue. Additionally, revenue from our business customers is growing much faster than the consumer sector, which plays to our strong franchise in Europe and in an increasingly mobile business world.
In the US, our investment in Verizon Wireless continues to do well and in our judgement is an appreciating asset, which generates very strong levels of cash flow. We are cooperating closely with Verizon Wireless in a number of important areas, including 4G technology and servicing international companies.
Our industry remains very much in the regulatory spotlight and your Board monitors the regulatory environment carefully as it has significant economic consequences for shareholders.
7.51pDividends per share +11.1%
(2007: 6.76p)
2 Vodafone Group Plc Annual Report 2008
Vodafone – Executive Summary
a period of rapid change. He developed a new strategy for the business and significantly expanded our footprint in emerging markets. The Board has a great deal to thank him for and I would like personally to thank him for all he has done for the business and wish him and his family all the best for the future. In Vittorio Colao we have a fine successor and I am looking forward to working with him in his new role.
Non-executive directors Michael Boskin, who joined the Board in 1999 on the Company’s merger with AirTouch Communications Inc., and Jürgen Schrempp, who became a Director in 2000 when Vodafone completed its acquisition of Mannesmann, will not be seeking re-election at the AGM on 29 July 2008. I would like to thank Michael and Jürgen for their contributions and for the different and important perspectives each has brought to our Board. They have served with distinction and I am particularly grateful to them for their tireless work on our committees.
We conducted our annual Board evaluation internally this year and this generated good ideas for improving our performance.
Your Company operates in a challenging environment where rapid change is impacting our customers and therefore our business. Wherever I go, I am enormously impressed by the talented Vodafone people I meet and on behalf of the Board, I would like to thank all of them for what they have achieved during the year.
Your Board is confident that we are well positioned to build on our success in the coming years.
Sir John BondChairman
Whether it relates to pricing, taxation or spectrum, what we would like is a public policy framework which provides clarity, accountability and which facilitates growth, investment and fair competition. This is important in all areas of policy, including the allocation of spectrum which today remains in the hands of governments around the world.
Spectrum is our licence to do business. If we buy too much, we do not use our shareholders’ capital optimally. If we buy too little, we drop our customers’ calls – and, of course, we can only buy it when it is available. The upfront costs of spectrum are ultimately borne by our customers and shareholders, the effect on the government finances is to receive cash in advance but to reduce tax payments later, as the capital cost is amortised against profits over the life of the spectrum.
This is a period of unprecedented change in our business. The industry is changing shape as mobile phones, new technology and the internet converge, enabling us to expand the services that we can offer. This is also bringing new competitors both from within the industry and from outside.
We are very proud of the work of our 22 Foundations around the world, which represents a charitable network investing £41 million each year in projects and programmes supporting the communities where we operate.
During the year, we established the Vodafone India Foundation, which will focus on helping to improve the skills set of young people in India as they compete for jobs in the global market.
After five years in the role our Chief Executive, Arun Sarin, has decided to retire and will be stepping down at the conclusion of our AGM. He has done a tremendous job, having led the Company with distinction and navigated Vodafone through
Vodafone +26% FTSE 100 +2%
Total shareholder return April 2007 to May 2008
Vodafone share price +25% vs FTSE 100
May 2008April 2007
100
125
150
175
200
5400
5725
6050
6375
6700
― Vodafone Group ― FTSE 100 index
Vodafone Group Plc Annual Report 2008 3
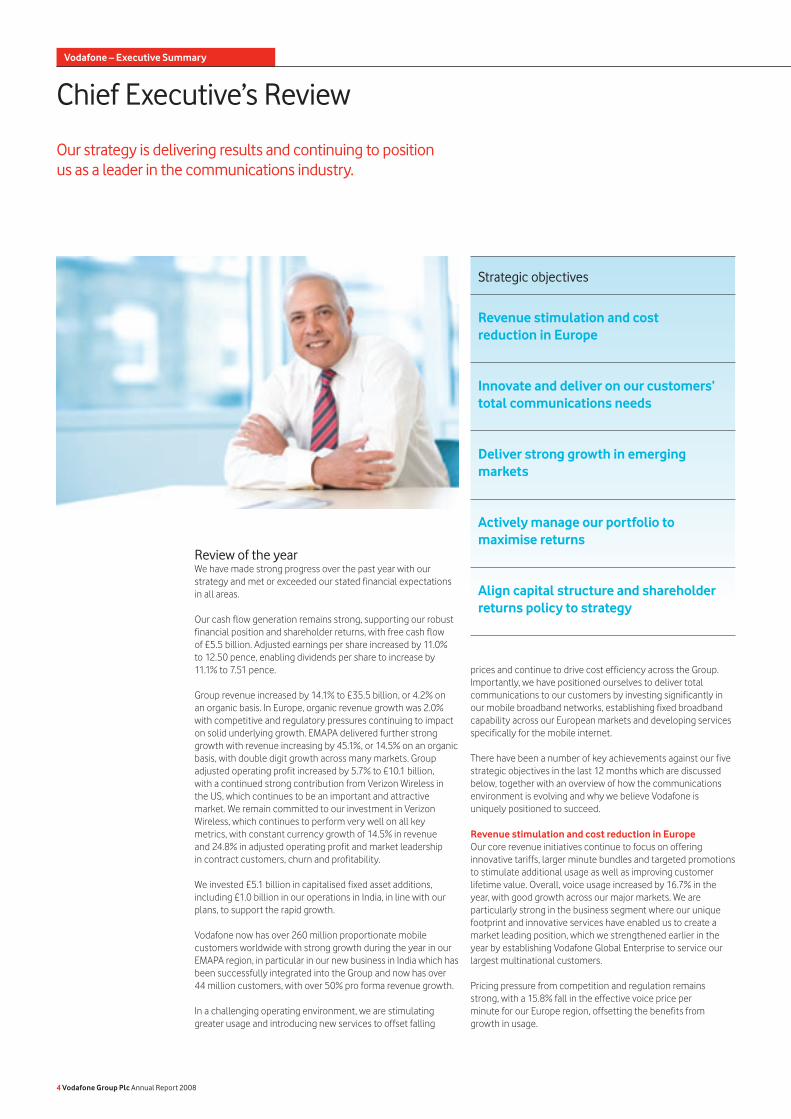
Chief Executive’s Review
Our strategy is delivering results and continuing to position us as a leader in the communications industry.
Review of the yearWe have made strong progress over the past year with our strategy and met or exceeded our stated financial expectations in all areas.
Our cash flow generation remains strong, supporting our robust financial position and shareholder returns, with free cash flow of £5.5 billion. Adjusted earnings per share increased by 11.0% to 12.50 pence, enabling dividends per share to increase by 11.1% to 7.51 pence.
Group revenue increased by 14.1% to £35.5 billion, or 4.2% on an organic basis. In Europe, organic revenue growth was 2.0% with competitive and regulatory pressures continuing to impact on solid underlying growth. EMAPA delivered further strong growth with revenue increasing by 45.1%, or 14.5% on an organic basis, with double digit growth across many markets. Group adjusted operating profit increased by 5.7% to £10.1 billion, with a continued strong contribution from Verizon Wireless in the US, which continues to be an important and attractive market. We remain committed to our investment in Verizon Wireless, which continues to perform very well on all key metrics, with constant currency growth of 14.5% in revenue and 24.8% in adjusted operating profit and market leadership in contract customers, churn and profitability.
We invested £5.1 billion in capitalised fixed asset additions, including £1.0 billion in our operations in India, in line with our plans, to support the rapid growth.
Vodafone now has over 260 million proportionate mobile customers worldwide with strong growth during the year in our EMAPA region, in particular in our new business in India which has been successfully integrated into the Group and now has over 44 million customers, with over 50% pro forma revenue growth.
In a challenging operating environment, we are stimulating greater usage and introducing new services to offset falling
prices and continue to drive cost efficiency across the Group. Importantly, we have positioned ourselves to deliver total communications to our customers by investing significantly in our mobile broadband networks, establishing fixed broadband capability across our European markets and developing services specifically for the mobile internet.
There have been a number of key achievements against our five strategic objectives in the last 12 months which are discussed below, together with an overview of how the communications environment is evolving and why we believe Vodafone is uniquely positioned to succeed.
Revenue stimulation and cost reduction in EuropeOur core revenue initiatives continue to focus on offering innovative tariffs, larger minute bundles and targeted promotions to stimulate additional usage as well as improving customer lifetime value. Overall, voice usage increased by 16.7% in the year, with good growth across our major markets. We are particularly strong in the business segment where our unique footprint and innovative services have enabled us to create a market leading position, which we strengthened earlier in the year by establishing Vodafone Global Enterprise to service our largest multinational customers.
Pricing pressure from competition and regulation remains strong, with a 15.8% fall in the effective voice price per minute for our Europe region, offsetting the benefits from growth in usage.
Strategic objectives
Revenue stimulation and cost reduction in Europe
Innovate and deliver on our customers’ total communications needs
Deliver strong growth in emerging markets
Actively manage our portfolio to maximise returns
Align capital structure and shareholder returns policy to strategy
4 Vodafone Group Plc Annual Report 2008
Vodafone – Executive Summary
Messaging revenue increased by 8.1% on an organic basis, with a 28.1% increase in the total number of text and picture messages sent. This reflects strong performances in the year in Italy and the UK, primarily through targeted promotions and tariffs.
In 2006, we set out a number of core cost reduction programmes that are now delivering results and have contributed to the key cost targets we met this year, with savings of around £300 million during the year, bringing the cumulative savings to date to around £550 million. We have achieved mobile capital expenditure at 10% of mobile revenue for 2008, with important contributions from centralising key purchasing activities and consolidating our data centres, while having enhanced the speed and data capability of our mobile networks. These programmes, together with the outsourcing of certain IT operations, have also contributed to maintaining broadly stable operating expenses for 2008 compared to 2006. This has been achieved in a period when customers have increased on an organic basis by 19%, voice minutes by 36% and data volumes by over tenfold.
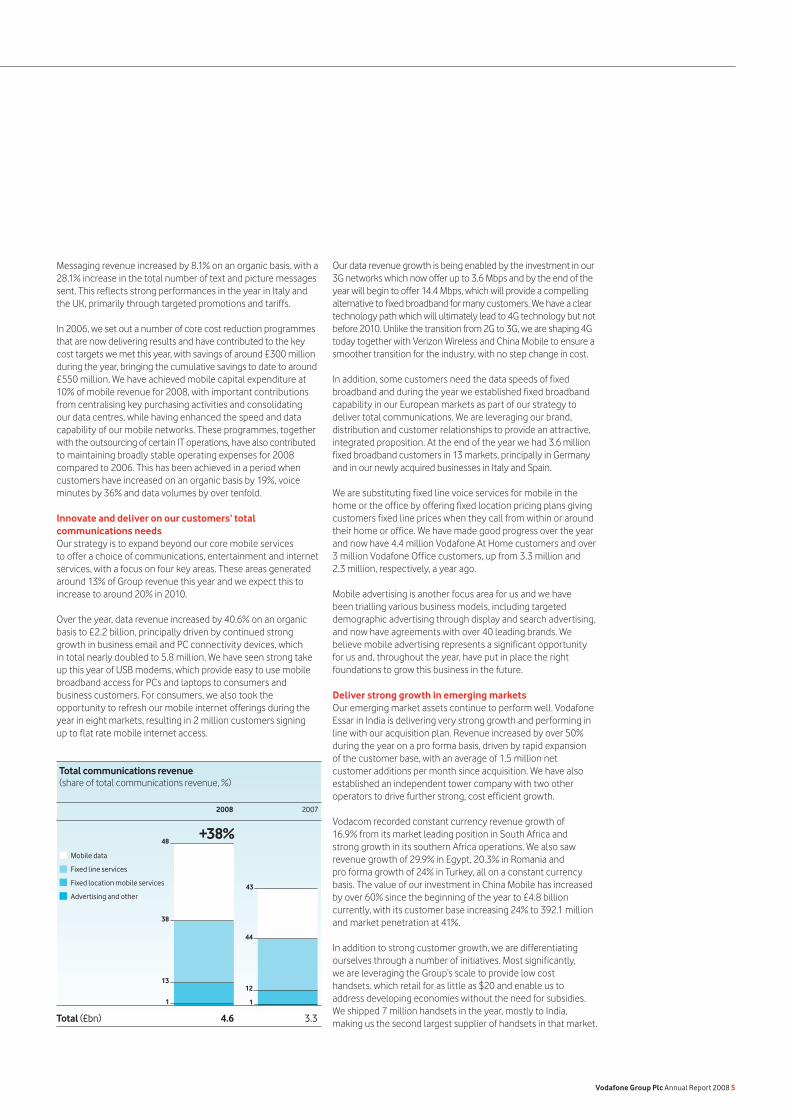
Innovate and deliver on our customers’ total communications needsOur strategy is to expand beyond our core mobile services to offer a choice of communications, entertainment and internet services, with a focus on four key areas. These areas generated around 13% of Group revenue this year and we expect this to increase to around 20% in 2010.
Over the year, data revenue increased by 40.6% on an organic basis to £2.2 billion, principally driven by continued strong growth in business email and PC connectivity devices, which in total nearly doubled to 5.8 million. We have seen strong take up this year of USB modems, which provide easy to use mobile broadband access for PCs and laptops to consumers and business customers. For consumers, we also took the opportunity to refresh our mobile internet offerings during the year in eight markets, resulting in 2 million customers signing up to flat rate mobile internet access.
Our data revenue growth is being enabled by the investment in our 3G networks which now offer up to 3.6 Mbps and by the end of the year will begin to offer 14.4 Mbps, which will provide a compelling alternative to fixed broadband for many customers. We have a clear technology path which will ultimately lead to 4G technology but not before 2010. Unlike the transition from 2G to 3G, we are shaping 4G today together with Verizon Wireless and China Mobile to ensure a smoother transition for the industry, with no step change in cost.
In addition, some customers need the data speeds of fixed broadband and during the year we established fixed broadband capability in our European markets as part of our strategy to deliver total communications. We are leveraging our brand, distribution and customer relationships to provide an attractive, integrated proposition. At the end of the year we had 3.6 million fixed broadband customers in 13 markets, principally in Germany and in our newly acquired businesses in Italy and Spain.
We are substituting fixed line voice services for mobile in the home or the office by offering fixed location pricing plans giving customers fixed line prices when they call from within or around their home or office. We have made good progress over the year and now have 4.4 million Vodafone At Home customers and over 3 million Vodafone Office customers, up from 3.3 million and 2.3 million, respectively, a year ago.
Mobile advertising is another focus area for us and we have been trialling various business models, including targeted demographic advertising through display and search advertising, and now have agreements with over 40 leading brands. We believe mobile advertising represents a significant opportunity for us and, throughout the year, have put in place the right foundations to grow this business in the future.
Deliver strong growth in emerging marketsOur emerging market assets continue to perform well. Vodafone Essar in India is delivering very strong growth and performing in line with our acquisition plan. Revenue increased by over 50% during the year on a pro forma basis, driven by rapid expansion of the customer base, with an average of 1.5 million net customer additions per month since acquisition. We have also established an independent tower company with two other operators to drive further strong, cost efficient growth.
Vodacom recorded constant currency revenue growth of 16.9% from its market leading position in South Africa and strong growth in its southern Africa operations. We also saw revenue growth of 29.9% in Egypt, 20.3% in Romania and pro forma growth of 24% in Turkey, all on a constant currency basis. The value of our investment in China Mobile has increased by over 60% since the beginning of the year to £4.8 billion currently, with its customer base increasing 24% to 392.1 million and market penetration at 41%.
In addition to strong customer growth, we are differentiating ourselves through a number of initiatives. Most significantly, we are leveraging the Group’s scale to provide low cost handsets, which retail for as little as $20 and enable us to address developing economies without the need for subsidies. We shipped 7 million handsets in the year, mostly to India, making us the second largest supplier of handsets in that market.
48
38
13
1
43
44
12
1
Total communications revenue (share of total communications revenue, %)
2008 2007
Total (£bn)
Mobile data
Fixed line services
Fixed location mobile services
Advertising and other
4.6 3.3
+38%
Vodafone Group Plc Annual Report 2008 5
Chief Executive’s Review continued
Actively manage our portfolio to maximise returnsWe completed the acquisition of Vodafone Essar in India in May 2007. We also strengthened our total communications offerings in Italy and Spain through the purchase of Tele2’s assets in those countries in December 2007 and in May 2008 acquired the minority interests in Arcor. In December 2007, we won the auction for the second mobile licence in Qatar through a consortium with the Qatar Foundation, in which we are the controlling partner. All our transactions are subject to strict financial criteria so as to deliver superior returns to our shareholders.
We now have 42 partner market agreements. These arrangements enable us to increase the presence of our brand and services without the need for direct equity investment, either because the investment opportunity does not exist or the returns are unattractive.
Align capital structure and shareholder returns policy to strategyThe Board remains committed to its policy of distributing 60% of adjusted earnings per share by way of dividend. Our robust financial and operating performance, together with a positive impact from foreign currency exchange rates, offset the dilution arising from the India acquisition and delivered 11% growth in adjusted earnings per share and therefore in dividends per share. Notwithstanding the increase in net debt to £25.1 billion, our long term credit ratings currently remain at low single A on average, in line with our Group policy.
Evolving environmentTwo years ago we updated our strategy to reflect developments in our industry and have made strong progress executing against our objectives since then. The communications industry continues to evolve and our five strategic objectives continue to position us well in this environment.
Firstly, customer needs and preferences in particular continue to evolve. We are transitioning from being a provider of core mobile voice and messaging services to offering a wide range of communications and one of the key advancements in the past year has been the mobile internet. Customers are taking content and applications from their PC to their mobile and this needs a compelling mobile internet experience.
We are, therefore, developing a range of internet services and content specifically for mobile by enhancing our successful Vodafone live! offering to include email, instant messaging and social networking while leveraging the power of mobile through location based services. We are also ensuring that devices are developed with innovative functionality and intuitive user interfaces that are suitable for the mobile internet, with features such as touch screen technology. Our investment in high speed data networks provides the platform to deliver these services to customers, as does the ongoing development
of our customer information and support systems. However, these developments in our industry also challenge our traditional business model as partners such as software providers, internet companies and handset manufacturers also become competitors.
The industry is changing and, although the majority of our revenue will continue to be from our core mobile business, we are positioning ourselves for this change through our total communications strategy to deliver broadband and internet offerings.
Secondly, competitive and regulatory pressures continue to reduce prices in the industry and therefore we continue to stimulate additional revenue and reduce costs. On revenue, there is still significant opportunity for growth in mobile usage. Average mobile usage levels per customer in Europe remain well below markets such as the US and India and significant volumes of minutes continue to be carried by fixed networks.
Our established major cost reduction programmes are now delivering results and we are continuing to look at ways of managing our costs to maintain our market competitiveness. During the year, we have recently centralised our handset design and procurement to not only drive cost savings but also to facilitate the development of devices for the mobile internet. We also continue to standardise our network design and deployment, particularly in the core network to take advantage of an all IP infrastructure. One of the more important developments during the year has been the extension of network sharing across our markets, with agreements reached in Italy and the UK, resulting in site sharing in nine out of our ten Europe region markets. This is a key area of focus for us and we aim to build on the current level of around one third of sites shared and explore opportunities to extend the scope of network sharing. We have made good progress on our cost saving initiatives over the past year.
Finally, while penetration is very high in Europe, across emerging markets it is on average still much lower which, together with higher GDP growth prospects, provides a significant revenue growth opportunity. Over time, we expect these markets will also show the same demand for entertainment and internet based services that we are seeing in more developed markets and we are well placed to meet such demand.
Our money transfer solution, Vodafone M-Pesa/Vodafone Money Transfer, was launched earlier in the year and is proving to be a significant point of differentiation in Kenya as we provide some banking capability through mobile phones to a largely cash based country. This is an evolving area which we expect to bring to more countries and also has the potential to expand beyond the current focus on money transfers and micro payments.
6 Vodafone Group Plc Annual Report 2008
Vodafone – Executive Summary
As well as driving growth in our existing emerging market assets, we will continue to explore further opportunities to expand our emerging market footprint through selective investments, with a particular focus on Africa and Asia.
Uniquely positioned to deliver growthWe believe that Vodafone is uniquely positioned to capitalise on the evolving communications environment. Our portfolio of assets provides the advantages of scale and exposure to attractive growth, and leverages our strong customer franchise in both consumer and business segments supported by a leading global brand.
We have a market leading position in mature, high cash flow generating markets in Europe combined with an increasing exposure to higher growth emerging markets in Eastern Europe, Middle East, Africa and Asia, in particular in India. We also have a material position in the attractive US market through our stake in Verizon Wireless.
By expanding beyond our historic core mobile offerings to deliver data and fixed broadband services through our total communications strategy, this enables us to continue to be a leader in the increasingly integrated communications industry and therefore supports continued strong cash generation and returns to shareholders.
Prospects for the year aheadOperating conditions are expected to continue to be challenging in Europe given the current economic environment and ongoing pricing and regulatory pressures but with continued positive trends in messaging and data revenue and voice usage growth. We expect increasing market penetration to continue to result in overall strong growth for the EMAPA region. Our geographically diverse portfolio should provide some resilience in the current economic environment. We also anticipate significant benefit from recent changes in foreign exchange rates compared to 2008, particularly in respect of the euro, which we have assumed to be on average at 1.30 to sterling for the year.
Our revenue expectations for the year ahead reflect our drive for growth, particularly in respect of our total communications strategy for data and fixed broadband services and in emerging markets. Adjusted operating profit is therefore anticipated to reflect a greater proportion of lower margin fixed broadband services together with continued strong performance from Verizon Wireless in the US.
Capital expenditure on fixed assets includes an increase in investment in India to drive further strong growth. Capital intensity is expected to be maintained at around 10% of revenue for the total of our Europe region and common functions, with continued investment in growth. Free cash flow excludes spectrum and licence payments and is after taking into account £0.3 billion from payments for capital expenditure deferred from 2008.
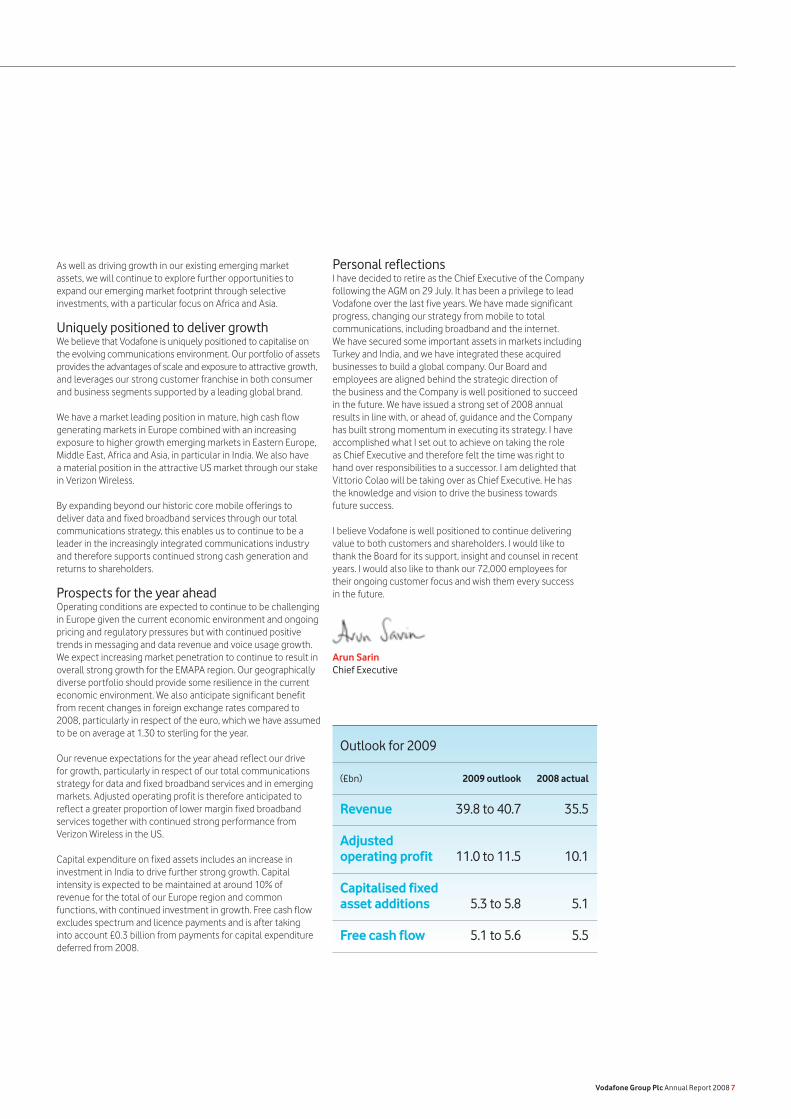
Personal reflectionsI have decided to retire as the Chief Executive of the Company following the AGM on 29 July. It has been a privilege to lead Vodafone over the last five years. We have made significant progress, changing our strategy from mobile to total communications, including broadband and the internet. We have secured some important assets in markets including Turkey and India, and we have integrated these acquired businesses to build a global company. Our Board and employees are aligned behind the strategic direction of the business and the Company is well positioned to succeed in the future. We have issued a strong set of 2008 annual results in line with, or ahead of, guidance and the Company has built strong momentum in executing its strategy. I have accomplished what I set out to achieve on taking the role as Chief Executive and therefore felt the time was right to hand over responsibilities to a successor. I am delighted that Vittorio Colao will be taking over as Chief Executive. He has the knowledge and vision to drive the business towards future success.
I believe Vodafone is well positioned to continue delivering value to both customers and shareholders. I would like to thank the Board for its support, insight and counsel in recent years. I would also like to thank our 72,000 employees for their ongoing customer focus and wish them every success in the future.
Arun SarinChief Executive
Outlook for 2009
(£bn) 2009 outlook 2008 actual
Revenue 39.8 to 40.7 35.5
Adjusted operating profit 11.0 to 11.5 10.1
Capitalised fixed asset additions 5.3 to 5.8 5.1
Free cash flow 5.1 to 5.6 5.5
Vodafone Group Plc Annual Report 2008 7
Performance at a Glance
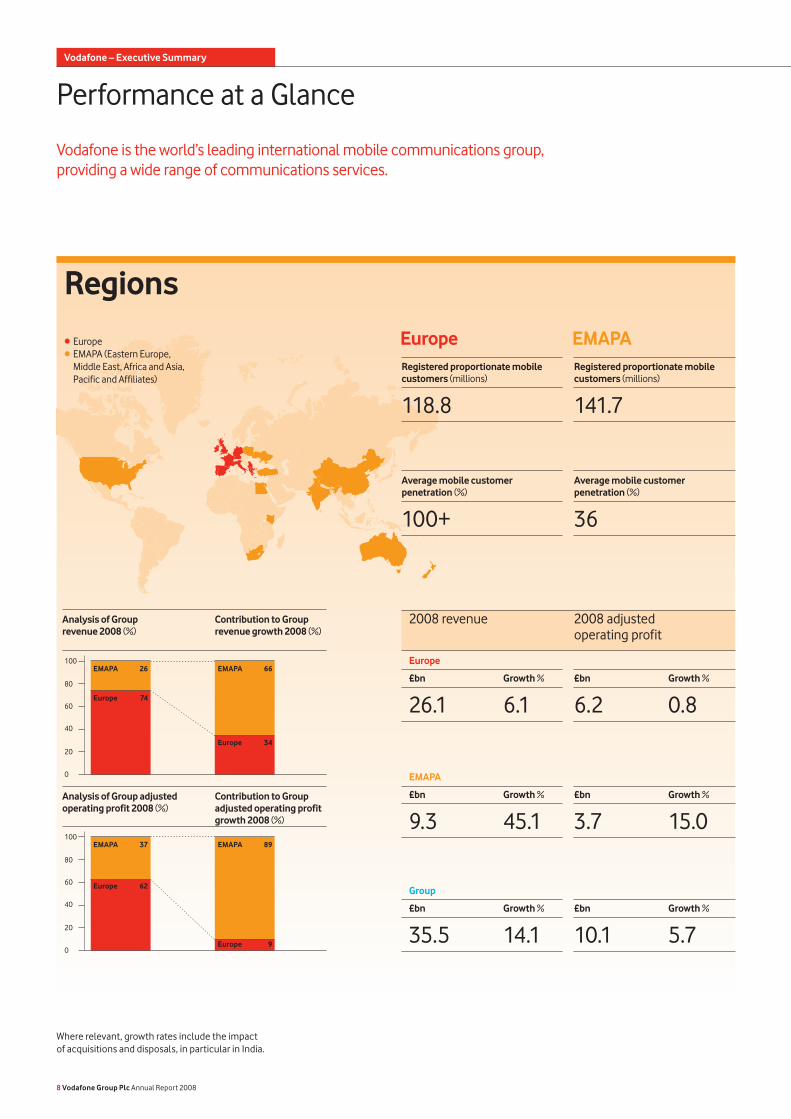
Vodafone is the world’s leading international mobile communications group, providing a wide range of communications services.
Where relevant, growth rates include the impact of acquisitions and disposals, in particular in India.
8 Vodafone Group Plc Annual Report 2008
Vodafone – Executive Summary
Regions
100
80
60
40
20
0
100
80
60
40
20
0
Analysis of Group revenue 2008 (%)
Contribution to Group revenue growth 2008 (%)
Analysis of Group adjusted operating profit 2008 (%)
Contribution to Group adjusted operating profit growth 2008 (%)
EMAPA 26
Europe 74
EMAPA 37
Europe 62
EMAPA 66
Europe 34
EMAPA 89
Europe 9
Europe EMAPA
2008 revenue 2008 adjusted operating profit
• Europe • EMAPA (Eastern Europe,
Middle East, Africa and Asia, Pacific and Affiliates)
Registered proportionate mobile customers (millions)
118.8
Average mobile customer penetration (%)
100+
Registered proportionate mobile customers (millions)
141.7
Average mobile customer penetration (%)
36
Europe
£bn Growth %
26.1 6.1£bn Growth %
6.2 0.8
EMAPA
£bn Growth %
9.3 45.1£bn Growth %
3.7 15.0
Group
£bn Growth %
35.5 14.1£bn Growth %
10.1 5.7
Vodafone Group Plc Annual Report 2008 9
Services
100
80
60
40
20
0
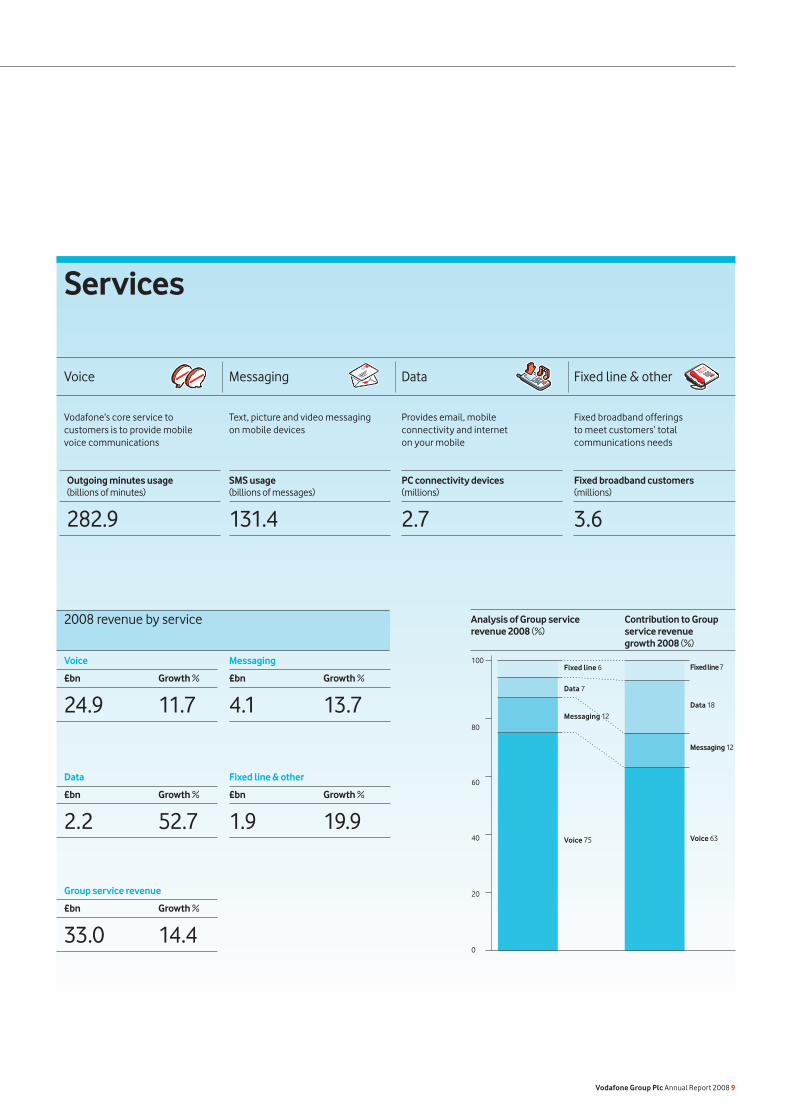
Vodafone’s core service to customers is to provide mobile voice communications
Text, picture and video messaging on mobile devices
Provides email, mobile connectivity and internet on your mobile
Fixed broadband offerings to meet customers’ total communications needs
Analysis of Group service revenue 2008 (%)
Contribution to Group service revenue growth 2008 (%)
Voice 75 Voice 63
Messaging 12
Messaging 12
Data 18
Fixed line 7
Data 7
Fixed line 6
2008 revenue by service
Voice Messaging Data Fixed line & other
SMS usage(billions of messages)
131.4
PC connectivity devices(millions)
2.7
Fixed broadband customers(millions)
3.6
Outgoing minutes usage(billions of minutes)
282.9
Voice
£bn Growth %
24.9 11.7
Messaging
£bn Growth %
4.1 13.7
Data
£bn Growth %
2.2 52.7
Fixed line & other
£bn Growth %
1.9 19.9
Group service revenue
£bn Growth %
33.0 14.4
1
2
3
4
5
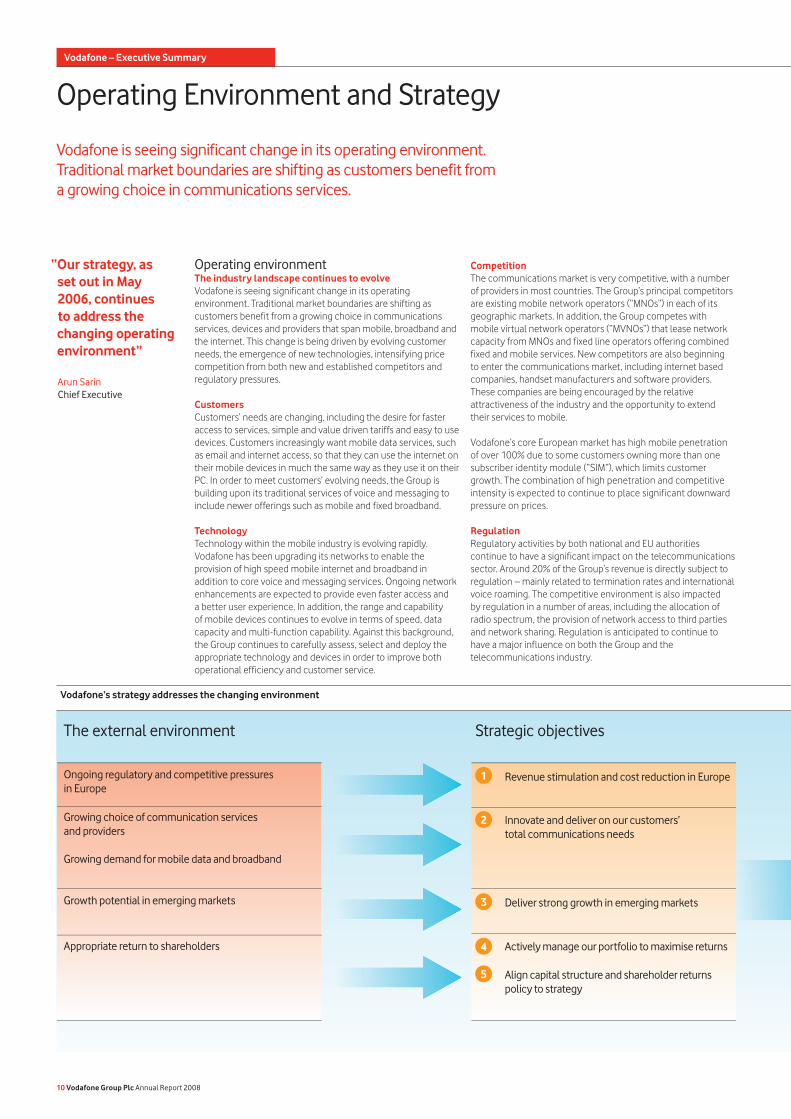
Operating environmentThe industry landscape continues to evolveVodafone is seeing significant change in its operating environment. Traditional market boundaries are shifting as customers benefit from a growing choice in communications services, devices and providers that span mobile, broadband and the internet. This change is being driven by evolving customer needs, the emergence of new technologies, intensifying price competition from both new and established competitors and regulatory pressures.
CustomersCustomers’ needs are changing, including the desire for faster access to services, simple and value driven tariffs and easy to use devices. Customers increasingly want mobile data services, such as email and internet access, so that they can use the internet on their mobile devices in much the same way as they use it on their PC. In order to meet customers’ evolving needs, the Group is building upon its traditional services of voice and messaging to include newer offerings such as mobile and fixed broadband.
TechnologyTechnology within the mobile industry is evolving rapidly. Vodafone has been upgrading its networks to enable the provision of high speed mobile internet and broadband in addition to core voice and messaging services. Ongoing network enhancements are expected to provide even faster access and a better user experience. In addition, the range and capability of mobile devices continues to evolve in terms of speed, data capacity and multi-function capability. Against this background, the Group continues to carefully assess, select and deploy the appropriate technology and devices in order to improve both operational efficiency and customer service.
Vodafone is seeing significant change in its operating environment. Traditional market boundaries are shifting as customers benefit from a growing choice in communications services.
Operating Environment and Strategy
Vodafone’s strategy addresses the changing environment
“Our strategy, as set out in May 2006, continues to address the changing operating environment”
Arun SarinChief Executive
Competition The communications market is very competitive, with a number of providers in most countries. The Group’s principal competitors are existing mobile network operators (“MNOs”) in each of its geographic markets. In addition, the Group competes with mobile virtual network operators (“MVNOs”) that lease network capacity from MNOs and fixed line operators offering combined fixed and mobile services. New competitors are also beginning to enter the communications market, including internet based companies, handset manufacturers and software providers. These companies are being encouraged by the relative attractiveness of the industry and the opportunity to extend their services to mobile.
Vodafone’s core European market has high mobile penetration of over 100% due to some customers owning more than one subscriber identity module (“SIM”), which limits customer growth. The combination of high penetration and competitive intensity is expected to continue to place significant downward pressure on prices.
RegulationRegulatory activities by both national and EU authorities continue to have a significant impact on the telecommunications sector. Around 20% of the Group’s revenue is directly subject to regulation – mainly related to termination rates and international voice roaming. The competitive environment is also impacted by regulation in a number of areas, including the allocation of radio spectrum, the provision of network access to third parties and network sharing. Regulation is anticipated to continue to have a major influence on both the Group and the telecommunications industry.
Strategic objectivesThe external environment
Revenue stimulation and cost reduction in Europe
Innovate and deliver on our customers’ total communications needs
Deliver strong growth in emerging markets
Actively manage our portfolio to maximise returns
Align capital structure and shareholder returns policy to strategy
Ongoing regulatory and competitive pressures in Europe
Growing choice of communication services and providers
Growing demand for mobile data and broadband
Growth potential in emerging markets
Appropriate return to shareholders
10 Vodafone Group Plc Annual Report 2008
Vodafone – Executive Summary
Key focusRevenue stimulation and cost reduction
Europe
Business units aligned to strategy
Key focusDeliver strong growthin emerging markets
EMAPA
StrategyVodafone’s five key strategic objectives were set out in May 2006 to address the mobile industry’s changing environment and to draw upon the Group’s strengths.
Revenue stimulation and cost reduction in EuropeCompetition and regulation in Europe are placing significant pressure on pricing. In order to offset these pressures, the Group’s strategy is to drive additional revenue and reduce costs.
Revenue stimulation is focused on ways to encourage additional usage and revenue from core voice and messaging services in Europe, where only around 40% of voice traffic is carried over mobile networks and customers use their mobiles for around 170 minutes per month, around a quarter of comparable US levels. The strategy is based on a market by market approach of targeted propositions for key customer segments. Consumer offers include a range of attractive tariffs, which are designed to offer both simplicity and value. Business propositions are focused on leveraging Vodafone’s market leading presence among European business customers. For roaming customers, Vodafone’s wide European footprint enables it to offer competitive and transparent price tariffs.
Cost reduction is being driven by leveraging the Group’s local and regional scale. Key initiatives are focused on centralising, sharing and outsourcing certain activities.
The Group has centralised bulk purchasing of networks, IT and services to drive cost efficiencies. Parts of the networks have been shared with other operators to reduce the costs, as well as the environmental impact, of network expansion and maintenance. In addition, certain functions have been outsourced in markets where industry leading partners are able to realise greater scale and cost efficiencies.
Innovate and deliver on our customers’ total communications needsThe communications environment is constantly evolving and customers increasingly want solutions to meet all their communications needs from one provider. In this environment, Vodafone has broadened its offerings beyond core voice and messaging to include total communications solutions, which is comprised of data, fixed location services, fixed broadband and advertising.
Vodafone continues to benefit from strong data revenue growth, particularly due to mobile devices and services that connect business and consumer users to their email and the internet. In addition, through partnerships with leading internet companies, the Group provides products and services that integrate the mobile and PC environments. This enables consumers to use their mobiles to replicate fixed line internet activities.
Fixed location services have been developed to encourage customers to substitute fixed line usage for mobile within their home and office environments. This includes services that allow customers to make mobile calls from designated locations at prices similar to fixed line providers.
Vodafone offers fixed broadband services as a complement to its mobile broadband products. This combination enables customers to have alternative means to access their internet applications either at home, in the office or on the move. Fixed broadband is provided through a mixture of owned assets and wholesale relationships with leading partners.
Mobile advertising is still in its infancy, but offers a potentially significant future revenue stream. By using mobile devices, both advertisers and consumers have the opportunity to create and receive adverts that are more targeted to users’ interests and preferences than traditional media. The Group’s current focus is on building the appropriate distribution channels and content.
Total communications services contributed 13% of Group revenue during the year and are expected to represent around 20% by the 2010 financial year.
Deliver strong growth in emerging marketsEmerging markets are expected to represent an increasing proportion of the Group in the next few years due to organic growth and new investments.
Existing markets continue to benefit from strong customer growth due to low mobile penetration rates of 36% on average. Additional value is being driven by measures to reduce costs and stimulate revenue by leveraging the Group’s global scale and best practice from within its more established European operations.
The Group continues to pursue selective opportunities to invest in new markets as well as taking opportunities to increase its stakes in existing markets. The focus is on attractive growth regions such as the Middle East, Africa and Asia.
Actively managing our portfolio to maximise returnsThe Group seeks to optimise its portfolio of assets by either disposing of assets when a superior return cannot be earned or acquiring assets when substantial additional value for shareholders can be achieved. Potential acquisitions are subject to strict criteria including appropriate financial returns, a strong local position and an identifiable path to control.
Align capital structure and shareholder policy to strategyThe Group’s capital structure and returns policy has been aligned to its operational strategy. The key targets are low single A long term credit ratings and 60% of adjusted earnings per share distributed as dividends.
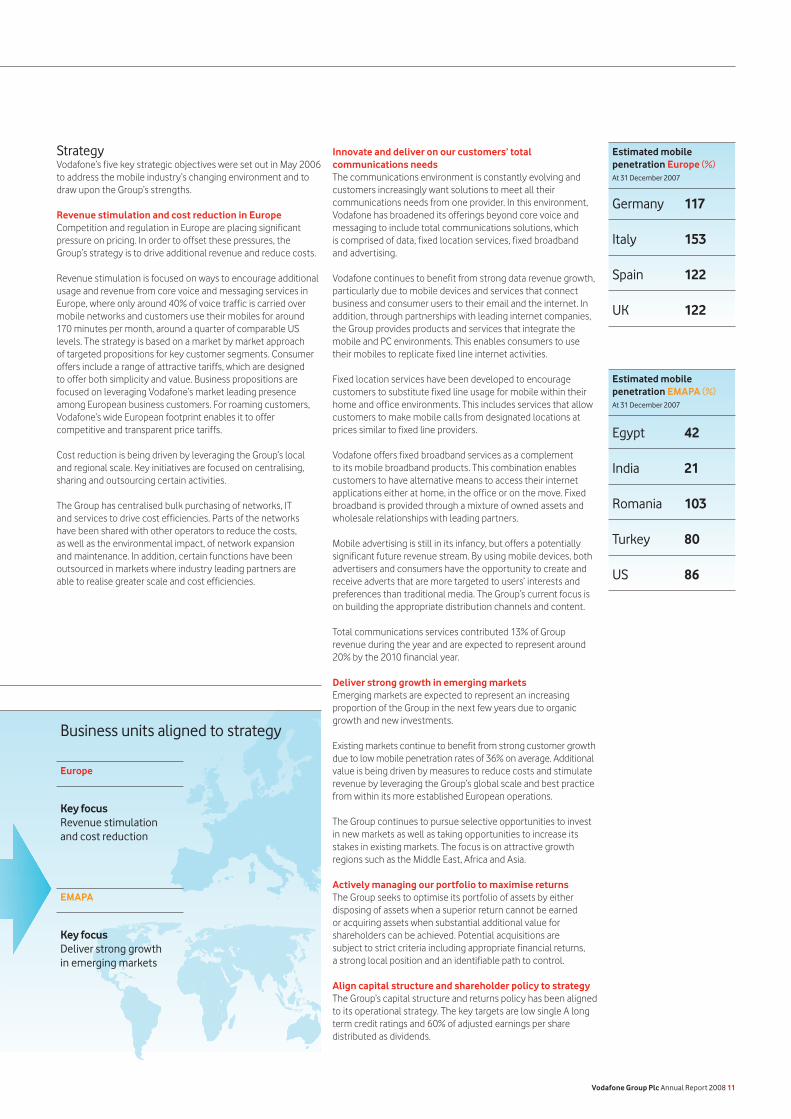
Est imated mobile penetration EMAPA (%)At 31 December 2007
Egypt 42
India 21
Romania 103
Turkey 80
US 86
Est imated mobile penetration Europe (%)At 31 December 2007
Germany 117
Italy 153
Spain 122
UK 122
Vodafone Group Plc Annual Report 2008 11
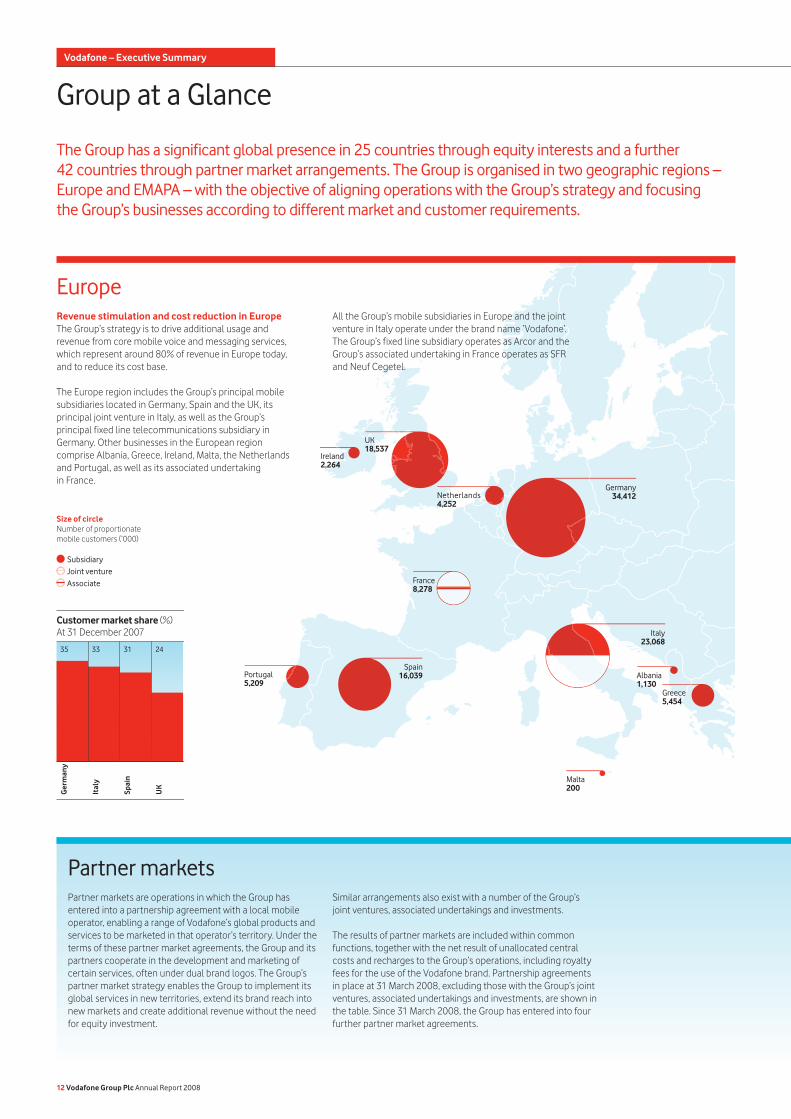
The Group has a significant global presence in 25 countries through equity interests and a further 42 countries through partner market arrangements. The Group is organised in two geographic regions – Europe and EMAPA – with the objective of aligning operations with the Group’s strategy and focusing the Group’s businesses according to different market and customer requirements.
Group at a Glance
EuropeRevenue stimulation and cost reduction in EuropeThe Group’s strategy is to drive additional usage and revenue from core mobile voice and messaging services, which represent around 80% of revenue in Europe today, and to reduce its cost base.
The Europe region includes the Group’s principal mobile subsidiaries located in Germany, Spain and the UK, its principal joint venture in Italy, as well as the Group’s principal fixed line telecommunications subsidiary in Germany. Other businesses in the European region comprise Albania, Greece, Ireland, Malta, the Netherlands and Portugal, as well as its associated undertaking in France.
Partner marketsPartner markets are operations in which the Group has entered into a partnership agreement with a local mobile operator, enabling a range of Vodafone’s global products and services to be marketed in that operator’s territory. Under the terms of these partner market agreements, the Group and its partners cooperate in the development and marketing of certain services, often under dual brand logos. The Group’s partner market strategy enables the Group to implement its global services in new territories, extend its brand reach into new markets and create additional revenue without the need for equity investment.
Customer market share (%)At 31 December 2007
35 33 31 24
Ger
man
y
Ital
y
Spai
n
UK
All the Group’s mobile subsidiaries in Europe and the joint venture in Italy operate under the brand name ‘Vodafone’. The Group’s fixed line subsidiary operates as Arcor and the Group’s associated undertaking in France operates as SFR and Neuf Cegetel.
Similar arrangements also exist with a number of the Group’s joint ventures, associated undertakings and investments.
The results of partner markets are included within common functions, together with the net result of unallocated central costs and recharges to the Group’s operations, including royalty fees for the use of the Vodafone brand. Partnership agreements in place at 31 March 2008, excluding those with the Group’s joint ventures, associated undertakings and investments, are shown in the table. Since 31 March 2008, the Group has entered into four further partner market agreements.
Size of circle Number of proportionate mobile customers (’000)
Subsidiary Joint venture Associate
Greece5,454
UK18,537
Germany34,412
Italy23,068
Portugal5,209
Albania1,130
Spain16,039
Ireland2,264
Malta200
France8,278
Netherlands4,252
12 Vodafone Group Plc Annual Report 2008
Vodafone – Executive Summary
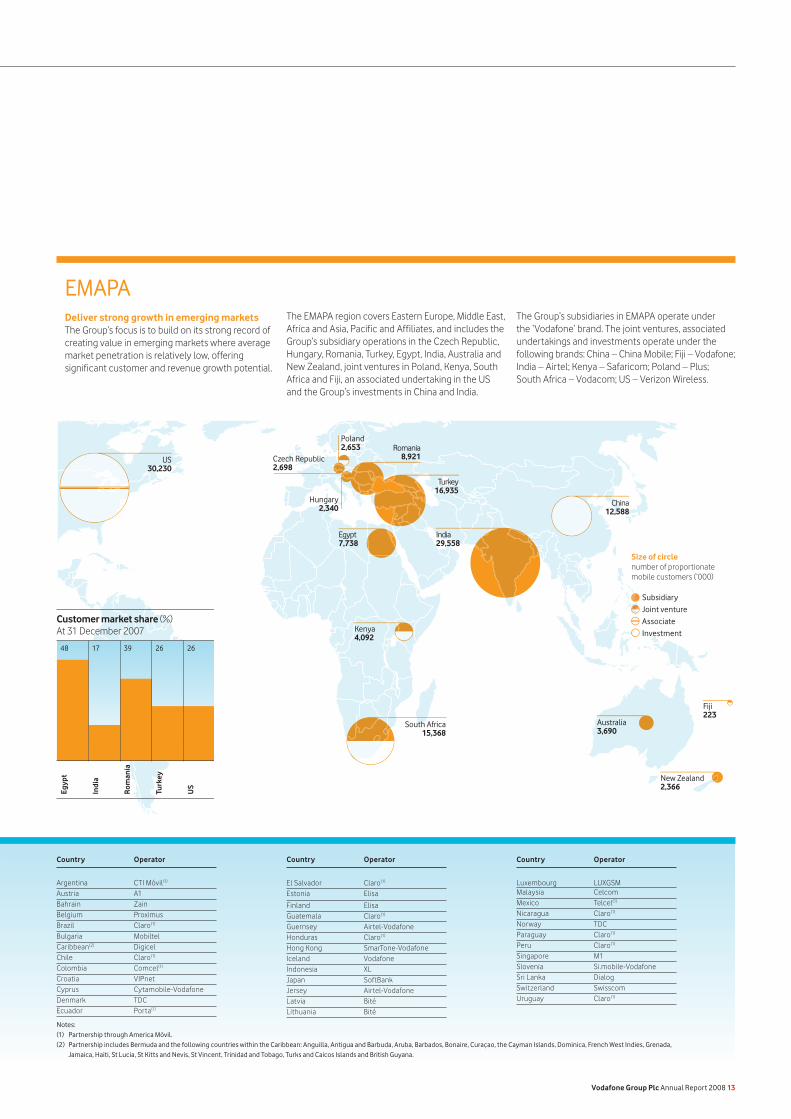
EMAPADeliver strong growth in emerging marketsThe Group’s focus is to build on its strong record of creating value in emerging markets where average market penetration is relatively low, offering significant customer and revenue growth potential.
Notes:(1) Partnership through America Móvil.(2) Partnership includes Bermuda and the following countries within the Caribbean: Anguilla, Antigua and Barbuda, Aruba, Barbados, Bonaire, Curaçao, the Cayman Islands, Dominica, French West Indies, Grenada,
Jamaica, Haiti, St Lucia, St Kitts and Nevis, St Vincent, Trinidad and Tobago, Turks and Caicos Islands and British Guyana.
The EMAPA region covers Eastern Europe, Middle East, Africa and Asia, Pacific and Affiliates, and includes the Group’s subsidiary operations in the Czech Republic, Hungary, Romania, Turkey, Egypt, India, Australia and New Zealand, joint ventures in Poland, Kenya, South Africa and Fiji, an associated undertaking in the US and the Group’s investments in China and India.
The Group’s subsidiaries in EMAPA operate under the ‘Vodafone’ brand. The joint ventures, associated undertakings and investments operate under the following brands: China – China Mobile; Fiji – Vodafone; India – Airtel; Kenya – Safaricom; Poland – Plus; South Africa – Vodacom; US – Verizon Wireless.
Customer market share (%)At 31 December 2007
48 17 39 26
Egyp
t
Indi
a
Rom
ania
Turk
ey
26
US
Egypt7,738
Kenya4,092
South Africa15,368
Fiji223
New Zealand2,366
Poland2,653
Czech Republic2,698
Australia3,690
India29,558
Romania8,921
Hungary2,340
Size of circle number of proportionate mobile customers (’000)
Subsidiary Joint venture Associate Investment
China12,588
US30,230
Turkey16,935
Country Operator
Argentina CTI Móvil(1) Austria A1Bahrain ZainBelgium ProximusBrazil Claro(1)
Bulgaria MobiltelCaribbean(2) DigicelChile Claro(1) Colombia Comcel(1) Croatia VIPnetCyprus Cytamobile-VodafoneDenmark TDCEcuador Porta(1)
Country Operator
Luxembourg LUXGSMMalaysia CelcomMexico Telcel(1) Nicaragua Claro(1) Norway TDCParaguay Claro(1) Peru Claro(1)
Singapore M1Slovenia Si.mobile-VodafoneSri Lanka DialogSwitzerland SwisscomUruguay Claro(1)
Country Operator
El Salvador Claro(1) Estonia Elisa
Finland ElisaGuatemala Claro(1)
Guernsey Airtel-VodafoneHonduras Claro(1) Hong Kong SmarTone-VodafoneIceland VodafoneIndonesia XL Japan SoftBankJersey Airtel-VodafoneLatvia BitéLithuania Bité
Vodafone Group Plc Annual Report 2008 13
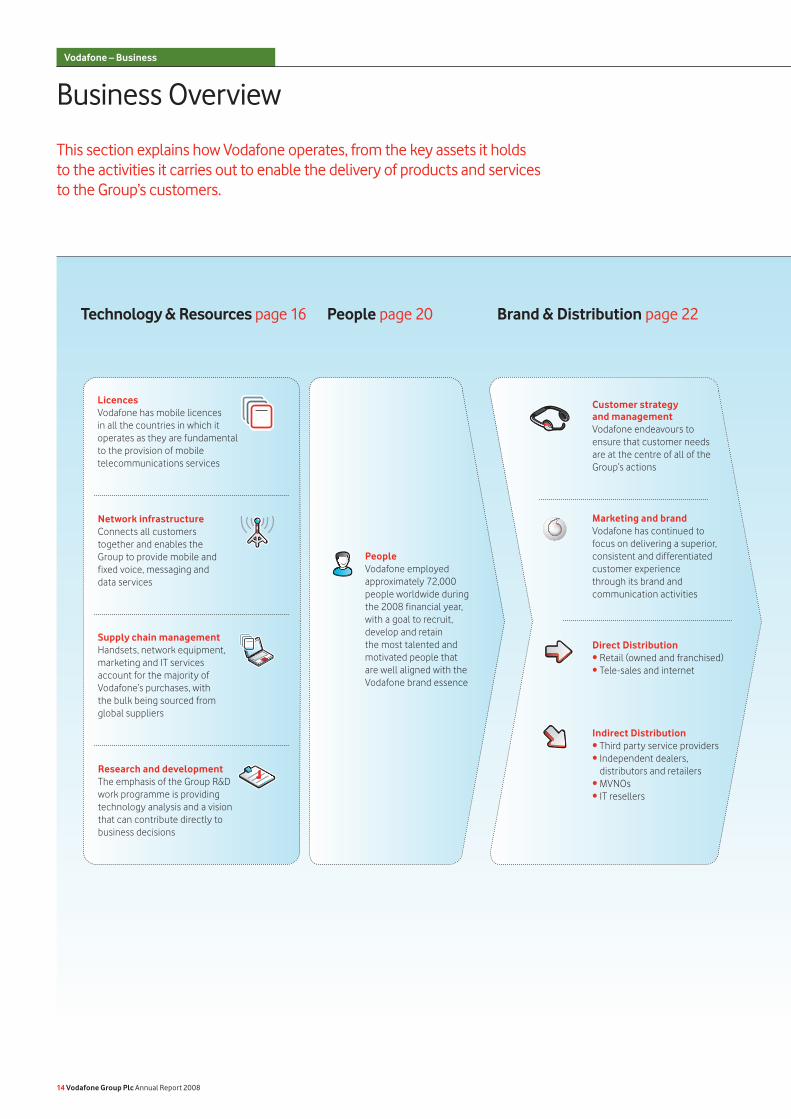
This section explains how Vodafone operates, from the key assets it holds to the activities it carries out to enable the delivery of products and services to the Group’s customers.
Business OverviewVodafone – Business
14 Vodafone Group Plc Annual Report 2008
Technology & Resources page 16 People page 20 Brand & Distribution page 22
Research and developmentThe emphasis of the Group R&D work programme is providing technology analysis and a vision that can contribute directly to business decisions
PeopleVodafone employed approximately 72,000 people worldwide during the 2008 financial year, with a goal to recruit, develop and retain the most talented and motivated people that are well aligned with the Vodafone brand essence
LicencesVodafone has mobile licences in all the countries in which it operates as they are fundamental to the provision of mobile telecommunications services
Network infrastructureConnects all customers together and enables the Group to provide mobile and fixed voice, messaging and data services
Supply chain management Handsets, network equipment, marketing and IT services account for the majority of Vodafone’s purchases, with the bulk being sourced from global suppliers
Customer strategy and managementVodafone endeavours to ensure that customer needs are at the centre of all of the Group’s actions
Marketing and brandVodafone has continued to focus on delivering a superior, consistent and differentiated customer experience through its brand and communication activities
Direct Distribution• Retail (owned and franchised)• Tele-sales and internet
Indirect Distribution• Third party service providers• Independent dealers,
distributors and retailers• MVNOs• IT resellers
Customers
Vodafone Group Plc Annual Report 2008 15
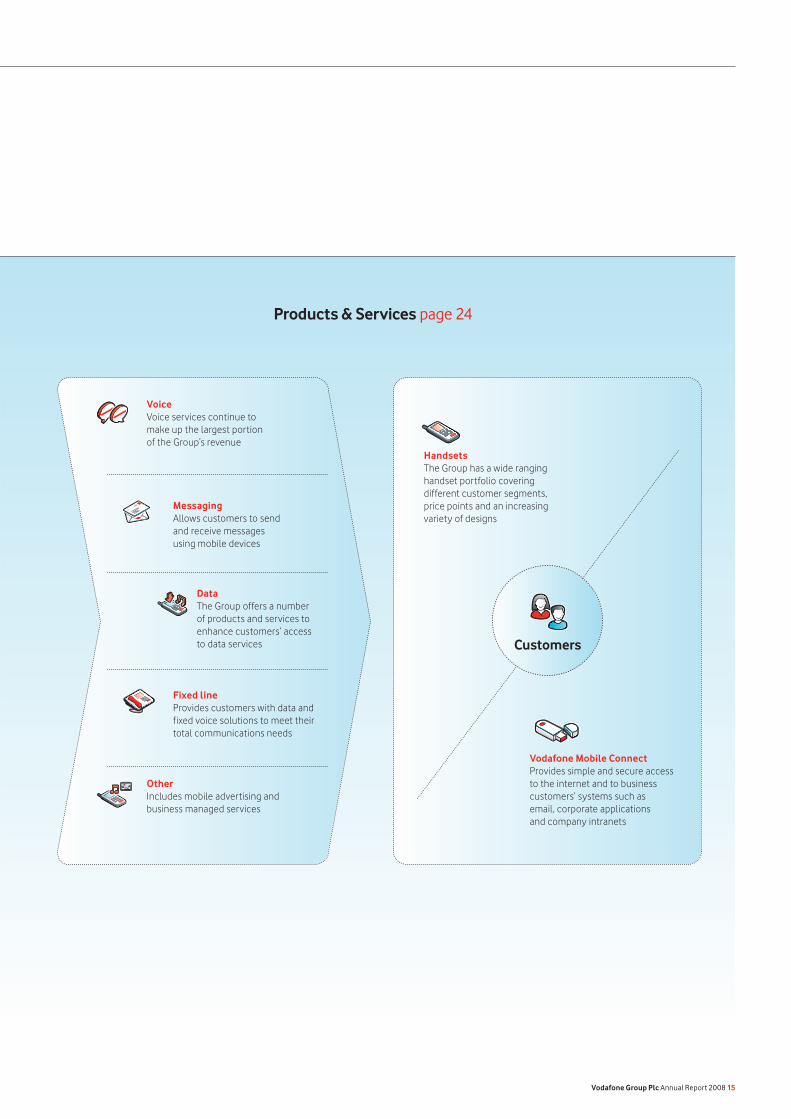
Products & Services page 24
MessagingAllows customers to send and receive messages using mobile devices
DataThe Group offers a number of products and services to enhance customers’ access to data services
Fixed lineProvides customers with data and fixed voice solutions to meet their total communications needs
OtherIncludes mobile advertising and business managed services
HandsetsThe Group has a wide ranging handset portfolio covering different customer segments, price points and an increasing variety of designs
Vodafone Mobile ConnectProvides simple and secure access to the internet and to business customers’ systems such as email, corporate applications and company intranets
VoiceVoice services continue to make up the largest portion of the Group’s revenue
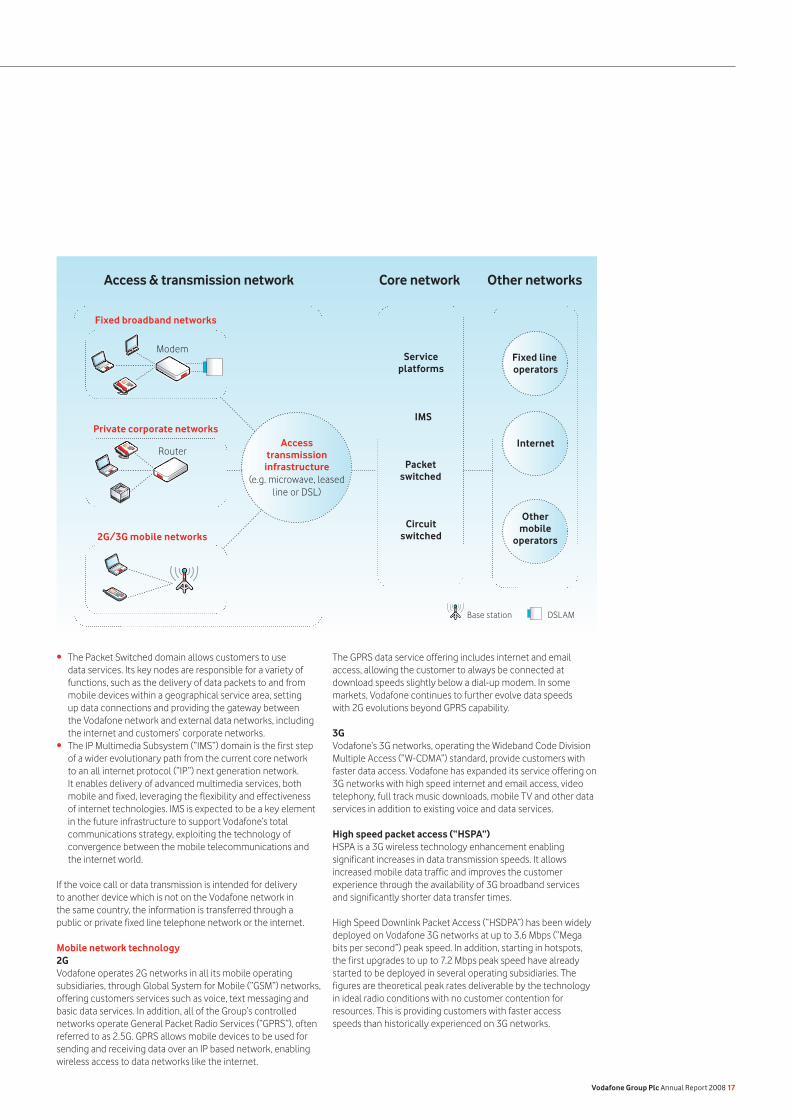
Network infrastructureHow Vodafone’s network infrastructure worksVodafone’s network infrastructure is fundamental to the Group being able to provide mobile and fixed voice, messaging and data services. The Group’s customers are linked to the access part of the network, which links to the core network that manages the set-up of calls, transfer of messages and data connections and allows the Group to provide a wide variety of other services.
2G/3G mobile access networkWhen a voice call or data transmission is made on a mobile device, voice or data is sent from the device and transmitted by low powered radio signals to the nearest base station, which in turn is connected to the Group’s core network via the access transmission infrastructure. Each base station provides coverage over a given geographic area, often referred to as a cell. Cells can be as small as an individual building or as large as 20 miles across and each is equipped with its own radio transmitter and receiver antenna. This network of cells provides, within certain limitations, coverage over the service area. When a customer using a mobile device approaches the boundary of one cell, the mobile network senses that the signal is becoming weak and automatically hands over the call to the transmission unit in the next cell into which the device is moving.
Fixed broadband access networkWhen communication takes place over fixed line networks, the traffic flows over a traditional wired infrastructure until the point it reaches the Vodafone access device (a “DSLAM”), where it connects to the access transmission infrastructure. Additionally, corporate customers can connect their local network to Vodafone’s access transmission infrastructure directly using a dedicated link.
In the UK market, Vodafone delivers fixed broadband services through a reseller agreement with the local incumbent.
Access transmission infrastructureThe access transmission network is the connection between a base station, a DSLAM, or a corporate customer’s dedicated line, and the core network. This consists of mainly leased lines or Vodafone’s own transmission lines, such as microwave links.
Core networkThe core network is responsible for setting up and controlling connections between mobile or fixed line customers attached to access networks by locating the called party and routing voice calls towards it. Additionally, the core network handles data traffic by allowing customers to access service platforms offering services such as Vodafone live!, web browsing, email, mobile TV and other data related services.
The core network comprises three domains, with each domain containing nodes with specific functionality interconnected by transmission links:
The Circuit Switched domain enables voice and video calls. Its key nodes are switches (which manage the set-up of connections) and user databases, storing the information needed to provide services to each customer, such as location in the network, list of subscribed services and home/visited network.
•
Technology and Resources
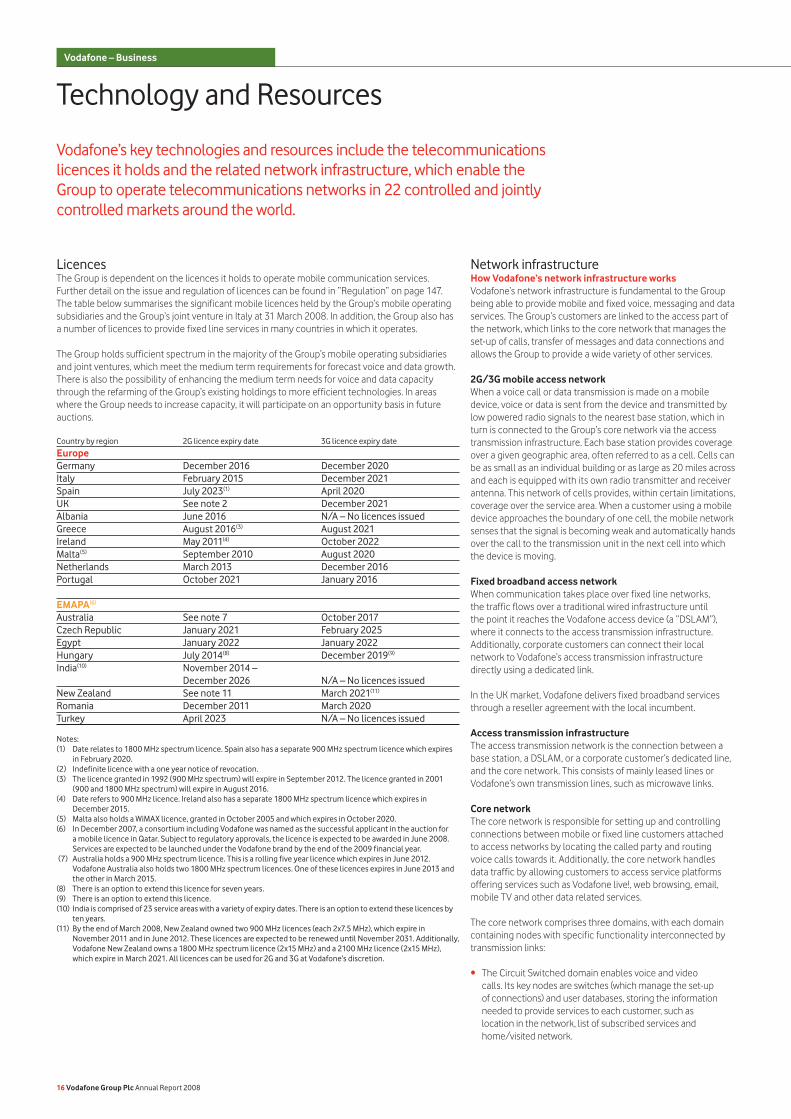
LicencesThe Group is dependent on the licences it holds to operate mobile communication services. Further detail on the issue and regulation of licences can be found in “Regulation” on page 147. The table below summarises the significant mobile licences held by the Group’s mobile operating subsidiaries and the Group’s joint venture in Italy at 31 March 2008. In addition, the Group also has a number of licences to provide fixed line services in many countries in which it operates.
The Group holds sufficient spectrum in the majority of the Group’s mobile operating subsidiaries and joint ventures, which meet the medium term requirements for forecast voice and data growth. There is also the possibility of enhancing the medium term needs for voice and data capacity through the refarming of the Group’s existing holdings to more efficient technologies. In areas where the Group needs to increase capacity, it will participate on an opportunity basis in future auctions.
Country by region 2G licence expiry date 3G licence expiry date
Europe Germany December 2016 December 2020 Italy February 2015 December 2021 Spain July 2023(1) April 2020 UK See note 2 December 2021 Albania June 2016 N/A – No licences issuedGreece August 2016(3) August 2021 Ireland May 2011(4) October 2022 Malta(5) September 2010 August 2020 Netherlands March 2013 December 2016 Portugal October 2021 January 2016 EMAPA(6) Australia See note 7 October 2017 Czech Republic January 2021 February 2025 Egypt January 2022 January 2022 Hungary July 2014(8) December 2019(9) India(10) November 2014 – December 2026 N/A – No licences issuedNew Zealand See note 11 March 2021(11) Romania December 2011 March 2020 Turkey April 2023 N/A – No licences issued
Notes:(1) Date relates to 1800 MHz spectrum licence. Spain also has a separate 900 MHz spectrum licence which expires
in February 2020.(2) Indefinite licence with a one year notice of revocation.(3) The licence granted in 1992 (900 MHz spectrum) will expire in September 2012. The licence granted in 2001
(900 and 1800 MHz spectrum) will expire in August 2016.(4) Date refers to 900 MHz licence. Ireland also has a separate 1800 MHz spectrum licence which expires in
December 2015.(5) Malta also holds a WiMAX licence, granted in October 2005 and which expires in October 2020.(6) In December 2007, a consortium including Vodafone was named as the successful applicant in the auction for
a mobile licence in Qatar. Subject to regulatory approvals, the licence is expected to be awarded in June 2008. Services are expected to be launched under the Vodafone brand by the end of the 2009 financial year.
(7) Australia holds a 900 MHz spectrum licence. This is a rolling five year licence which expires in June 2012. Vodafone Australia also holds two 1800 MHz spectrum licences. One of these licences expires in June 2013 and the other in March 2015.
(8) There is an option to extend this licence for seven years.(9) There is an option to extend this licence.(10) India is comprised of 23 service areas with a variety of expiry dates. There is an option to extend these licences by
ten years.(11) By the end of March 2008, New Zealand owned two 900 MHz licences (each 2x7.5 MHz), which expire in
November 2011 and in June 2012. These licences are expected to be renewed until November 2031. Additionally, Vodafone New Zealand owns a 1800 MHz spectrum licence (2x15 MHz) and a 2100 MHz licence (2x15 MHz), which expire in March 2021. All licences can be used for 2G and 3G at Vodafone’s discretion.
Vodafone’s key technologies and resources include the telecommunications licences it holds and the related network infrastructure, which enable the Group to operate telecommunications networks in 22 controlled and jointly controlled markets around the world.
Vodafone – Business
16 Vodafone Group Plc Annual Report 2008
The Packet Switched domain allows customers to use data services. Its key nodes are responsible for a variety of functions, such as the delivery of data packets to and from mobile devices within a geographical service area, setting up data connections and providing the gateway between the Vodafone network and external data networks, including the internet and customers’ corporate networks.The IP Multimedia Subsystem (“IMS”) domain is the first step of a wider evolutionary path from the current core network to an all internet protocol (“IP”) next generation network. It enables delivery of advanced multimedia services, both mobile and fixed, leveraging the flexibility and effectiveness of internet technologies. IMS is expected to be a key element in the future infrastructure to support Vodafone’s total communications strategy, exploiting the technology of convergence between the mobile telecommunications and the internet world.
If the voice call or data transmission is intended for delivery to another device which is not on the Vodafone network in the same country, the information is transferred through a public or private fixed line telephone network or the internet.
Mobile network technology2GVodafone operates 2G networks in all its mobile operating subsidiaries, through Global System for Mobile (“GSM”) networks, offering customers services such as voice, text messaging and basic data services. In addition, all of the Group’s controlled networks operate General Packet Radio Services (“GPRS”), often referred to as 2.5G. GPRS allows mobile devices to be used for sending and receiving data over an IP based network, enabling wireless access to data networks like the internet.
•
•
The GPRS data service offering includes internet and email access, allowing the customer to always be connected at download speeds slightly below a dial-up modem. In some markets, Vodafone continues to further evolve data speeds with 2G evolutions beyond GPRS capability.
3GVodafone’s 3G networks, operating the Wideband Code Division Multiple Access (“W-CDMA”) standard, provide customers with faster data access. Vodafone has expanded its service offering on 3G networks with high speed internet and email access, video telephony, full track music downloads, mobile TV and other data services in addition to existing voice and data services.
High speed packet access (“HSPA”)HSPA is a 3G wireless technology enhancement enabling significant increases in data transmission speeds. It allows increased mobile data traffic and improves the customer experience through the availability of 3G broadband services and significantly shorter data transfer times.
High Speed Downlink Packet Access (“HSDPA”) has been widely deployed on Vodafone 3G networks at up to 3.6 Mbps (“Mega bits per second”) peak speed. In addition, starting in hotspots, the first upgrades to up to 7.2 Mbps peak speed have already started to be deployed in several operating subsidiaries. The figures are theoretical peak rates deliverable by the technology in ideal radio conditions with no customer contention for resources. This is providing customers with faster access speeds than historically experienced on 3G networks.
Vodafone Group Plc Annual Report 2008 17
Access & transmission network
Fixed broadband networks
Core network Other networks
Private corporate networks
2G/3G mobile networks
Accesstransmission
infrastructure(e.g. microwave, leased
line or DSL)
Router
ModemService
platforms
IMS
Packet switched
Circuit switched
Fixed line operators
Internet
Other mobile
operators
Base station DSLAM
Technology and Resources continued
While HSDPA focuses on the downlink (network to mobile), Vodafone is also improving the data speeds on the uplink (mobile to network) with HSUPA (“High Speed Uplink Packet Access”). Operating subsidiaries have already started deployments to achieve peak speeds of up to 1.4 Mbps on the uplink.
Vodafone is actively driving additional 3G data technology enhancements to further improve the customer’s experience, including evolutions of HSPA technology to upgrade both the downlink and uplink speeds.
Current developments in the infrastructureAs growth in data traffic accelerates with the proliferation in, and adoption of, web services, Vodafone is evolving its infrastructure through a range of initiatives.
Access transmission infrastructure evolutionVodafone is upgrading its access transmission infrastructure from the base stations to the core switching network as part of a transition to a scaleable and cost effective solution able to deal with the increasing bandwidth demands and data dominated traffic mix driven by HSDPA and fixed broadband.
Core network evolutionVodafone has transformed its national transport networks in all subsidiaries, converging the infrastructure to support all services using IP as the strategic technology. During the 2009 financial year, the Group expects that the transformation to IP services will start to be extended to a European level, consolidating Vodafone’s ten national IP networks into a single IP backbone, centralising IP operations, avoiding duplication and achieving simplicity and flexibility to deploy new services to serve multiple markets.
Cost reductionWhile evolving the Group’s infrastructure, it is also important that the Group continues to have a tight control over its cost base. This has been achieved through various measures.
Infrastructure sharingSignificant effort has been placed in reducing the costs to deploy mobile network infrastructure. Important developments during the 2008 financial year included the extension of a tower sharing agreement in Italy as well as the formation of a company for the purposes of network sharing with other operators in India. Agreements have also been made on network sharing in Spain and the UK. Vodafone continues to investigate opportunities to share network infrastructure where it makes commercial sense based on local market conditions.
InnovationIn 3G network deployments, Vodafone is driving the use of new technology enhancements such as “Remote Radio Heads” that are a new type of lower cost base station equipment, which improve coverage and enable improvements to the customer experience. In addition, all aspects of wireless access point site design are being targeted to reduce energy consumption.
Another type of innovation being considered by Vodafone is the potential for 3G femtocells to address capacity and coverage needs in certain network deployments. Femtocells are a new way to deliver 3G wireless coverage to a small area at low cost compared to traditional macro network technologies. Effectively, a femtocell would give a customer a small 3G base station connected to the Vodafone network via a fixed broadband line.
ITThe scope of the Group’s outsourcing of IT application development and maintenance operations is expanding. Service commencement is now complete in all 12 selected markets of the first phase. The second phase of the project, principally outsourcing to India, is now in progress.
Vodafone has successfully completed outsourcing of its Indian IT estate to a specialist organisation with capability to match the Group’s scale and growth requirements.
In addition to the above initiatives, there are a number of IT cost saving initiatives that have been accelerated, which include the consolidation of European data centres and the outsourcing of internal help desks.
Supply chain managementHandsets, network equipment, marketing and IT services account for the majority of Vodafone’s purchases, with the bulk of these purchases from global suppliers. The Group’s Supply Chain Management (“SCM”) team is responsible for managing the Group’s relationships with all suppliers, except for handsets.
The transformation of the supply chain organisation into a single community under one leadership and the application of global material category strategies, in conjunction with local market expertise, have enabled savings across all operating companies. This is supported by a uniform savings methodology applied across all operating companies and the alignment of objectives across all material categories, operations and enabling functions. Innovative sourcing methods such as eAuctions and seamless business to business applications form a vital part in utilising the Group’s scale. The Vodafone Procurement Company S.a.r.l. was founded in Luxembourg in the 2008 financial year and is expected to enable additional leverage of scale and scope through a leaner procurement model.
SCM is a major contributor to the European cost reduction programme. The publicly announced goal to save 8% of the external networks spend over two years has been overachieved.
SCM won two major industry awards in 2007: the European Leaders in Procurement Award for Corporate Responsibility and the European Supply Chain Excellence Award in Sourcing and Procurement.
The major suppliers to Vodafone are required to comply with the Group’s Code of Ethical Purchasing. Further detail on this can be found in “Corporate Responsibility” on page 61.
The China Sourcing Centre based in Beijing, founded in March 2007, has enabled Vodafone to introduce new suppliers from emerging markets to further enhance competitive advantage.
It is the Group’s policy to agree terms of transactions, including payment terms, with suppliers and it is the Group’s normal practice that payment is made accordingly. The number of days outstanding between receipt of invoices and date of payment, calculated by reference to the amount owed to suppliers at the year end as a proportion of the amounts invoiced by suppliers during the year, was 37 days (2007: 34 days) in aggregate for the Group.
18 Vodafone Group Plc Annual Report 2008
Vodafone – Business
Research and development (“R&D”)The Group R&D function comprises an international team for applied research in mobile and internet communications and their related applications. Group R&D teams are located in Newbury, Maastricht, Munich, California and Madrid, and there is an affiliated team in Paris belonging to Vodafone’s associated undertaking in France, SFR. A small team was set up at the end of 2007 in the Vodafone Beijing office to work in close collaboration with China Mobile and a number of Chinese vendors.
Function of Group R&DGroup R&D works beyond the traditional established markets of Vodafone in search of technology based business opportunities by:
delivering a systematic programme of demand inspired research and development in wireless and internet communications that is positioned between basic research and commercial product development;leading Vodafone’s work with technical standards bodies and its intellectual property activities; andproviding a route for start-up companies to engage with Vodafone. Group R&D is also in the process of establishing a laboratory in Newbury to evaluate start-up technologies.
Typically, Group R&D starts working on developments that are expected to be introduced into the business in three to five years, and leads them until a year or so before full commercialisation. Currently the horizon covers some significant business developments that can already be anticipated. For example, Group R&D leads the introduction of wireless technology beyond 3G and is researching the next phase of the emergence of the internet as a personal communications platform– including radio technologies for accessing the internet in emerging markets.
Governance is provided by the Group R&D Board, which is chaired by the Group R&D Director and consists of the chief technology officers from six of the operating subsidiaries in Europe, the heads of Business Strategy and Global Terminals and a representative from EMAPA.
Group R&D work programmeThe emphasis of the Group R&D work programme is on providing technology analysis and a vision that contributes directly to business decisions, enabling new applications of mobile communications, technology for new services and research for improving operational efficiency and quality of the Group’s networks. This is done by:
pioneering the adoption of new technologies, business opportunities and innovations through technology analysis, trials, invention and prototypes;making the Group aware of market opportunities or threats posed by new technologies and business models and helping the Company to exploit or resist them;providing technology leadership by working with the industry to define and standardise the technology Vodafone uses; and securing intellectual property and technology ownership for the Group.
•
•
•
•
•
•
•
The work of Group R&D is delivered through a portfolio of programmes and cross industry activities with a substantial number of trials, demonstrations and prototypes. All work is set in a business and social context, and must lead to intellectual property rights or to Vodafone having significant influence on the technology it will deploy in the future. Group R&D also provides leadership for funding research into health and safety aspects of mobile communications and technical leadership for the Group’s spectrum strategy.
The main themes currently being researched are as follows:
the next generation of mobile technologies;consumable software for mobile phones;electronic newsmedia; andnew GSM based services.
There have been several significant advances during the 2008 financial year including:
next generation technology field trials have been announced with Verizon Wireless and China Mobile and are expected to begin in summer 2008;a system has been designed and standardised to enable the SIM in GSM phones to control nearfield communications for transport ticketing and other applications, with commercial trials planned for late 2008;demonstration of mobile software, social networks and the open source innovation platform called Vodafone Betavine at the Mobile World Congress and at Cebit; andresearch into the application of mobile communications to health and well being and to energy use.
The R&D programme provides the Group with long term technical policy, strategy and leadership, as well as providing technical underpinning for the Group’s public policies and government relations. It is shared with all Group functions and Vodafone operating companies. Commercialisation of Group R&D results is through submissions to international standards bodies, intellectual property filings and directly with Vodafone operating companies.
Collaborative workMuch of the work of Group R&D is done in collaboration with others, both within the Group and externally, with the Group’s traditional suppliers and increasingly with other companies in the communications, media and internet industries. During the 2008 financial year the following has been achieved:
a research collaboration was started with IBM which has led to the development of a mobile private social network called BuddyCom;a research agreement was also established with Huawei;a continuing programme of work with academic institutions, which includes student placements in Vodafone laboratories during summer vacations;the continued development of Vodafone Betavine, a web based research and innovation platform;the hosting of an academic conference where academic partners were brought together to launch a new programme – 3D internet; andacademic collaborations in India have started.
••••
•
•
•
•
•
••
•
•
•
Vodafone Group Plc Annual Report 2008 19
Vodafone’s global people strategy was embedded during the 2008 financial year and aims to increase employee engagement by setting out a framework that enables Vodafone to be clear about the employee experience the Group wants to create. This enables Vodafone to engage employees to deliver to customers and to increase business performance.
Additionally, during the 2008 financial year, the Group further embedded the Vodafone brand essence, “Red, Rock Solid, Restless”, which communicates a common way of behaving that is designed to enhance business performance and customer orientation. This has been reinforced at the local level through workshops that encourage teams to apply the Vodafone values to their specific work concentrating on improving the experience of their customers. In addition, human resources (“HR”) processes such as induction and training have been developed to explicitly provide people with a deeper understanding of how to demonstrate the behaviours in their daily work.
Training and developmentTraining and development programmes help employees to develop their skills and experience and to reach their full potential, benefiting themselves and the Company.
During the 2008 financial year, the Group delivered a training programme to build total communications awareness and capabilities within the Group’s employees. The training was designed to equip employees to understand the Group’s new total communications strategy, the competitive landscape, key technologies and resources and Vodafone’s products and services. Over 4,500 managers across the Group (more than 99% of the managerial population) completed 36,000 hours of dedicated total communications training. Feedback on the programme has been overwhelmingly positive. During the coming financial year, the Group will ensure all employees receive the same training via an online learning tool and that awareness is maintained through monthly webinars (web seminars), a daily blog and a wiki site (a collaborative website where content can be edited by anyone who has access to it).
Vodafone operates a global Performance Dialogue process for every employee. The process ensures that employees can make a clear connection between their goals and the business objectives. Each individual’s performance is discussed with their manager and career development goals are set. 93% of managers completed the Performance Dialogue process in the 2007 calendar year and 83% of employees approved development goals with their manager.
People SurveyIn October 2007, Vodafone carried out its third global People Survey and had an 83% response rate globally, with 50,548 people giving their views on 68 questions. Vodafone India was not included in the survey as it had only been acquired in May 2007. For the first time, the Manager Index was also introduced to the People Survey, a subset of questions focused on the experience a manager creates for their team. A strong set of results were achieved with a number of key strengths and improvements:
Employee engagement was high at a steady 71 out of 100 in the 2007 People Survey, compared to 73 out of 100 in the 2005 People Survey and 70 out of 100 in the April 2007 Pulse Survey (Pulse surveys are smaller surveys carried out in between People Surveys).The first Manager Index scored 69 out of 100 globally, with individual questions showing that managers are growing stronger in coaching, (which scored 8 points higher when compared to the 2005 People Survey), feedback, (which scored 10 points higher when compared to the 2005 People Survey) and recognition, (which scored 7 points higher when compared to the April 2007 Pulse Survey).Leadership continued its strong trend upwards, with confidence in the strategy strengthening further. Confidence in operating company senior management increased by 8 points, and trust and confidence in the function/business/department increased by 8 points in the six months since the April 2007 Pulse Survey.Employees are feeling more cared for, with wellbeing questions showing considerable improvement. 57% of employees rated their operating company favourably on taking a genuine interest in the wellbeing of its people (+15 points on 2005 People Survey and +5 points on April 2007 Pulse Survey). 70% of employees rated their manager favourably on supporting them to achieve a work-life balance, which is +13 points on the high performing norm (externally benchmarked best in class companies who have excellent engagement coupled with strong financial performance).
Vodafone is focused on continual improvement and values the feedback that the People Survey provides. Specifically in response to employee feedback from last year, the Global Change Framework was developed, a practical set of guidelines with training to help employees effectively manage change within the business.
The Group plans to carry out another full global survey in November 2008. Targets have been set by each operating company and Group functions to ensure that Vodafone continues to drive engagement across the business.
Communications and involvementEmployee engagement remains a key driver for Vodafone. Effective employee communication and the need to create dialogue with its people is championed at Board level. Vodafone continues to use its own products and services to reach out to staff – the use of mobile technologies such as SMS, video clips and mobile intranet sites is commonplace, all assisting in sharing knowledge amongst employees, creating a sense of global community and demonstrating the flexibility of Vodafone’s products, allowing employees to become advocates of the brand.
Visibility and access to the Executive Committee helps create Vodafone’s open and honest communication culture. The Chief Executive and other members of the Executive Committee continue to host the Talkabout programme, which puts executives on tour to visit the Group’s operating companies. The Executive Committee use these sessions to discuss the Group’s strategic goals, listen to employee views and provide an opportunity to discuss the issues that most matter to employees.
•
•
•
•
People
Vodafone employed approximately 72,000 people worldwide during the 2008 financial year, with a goal to recruit, develop and retain the most talented, motivated people that are well aligned with the Vodafone brand essence. The Group aims to do this by providing a productive and safe working environment, treating people with respect and offering attractive performance based incentives and opportunities.
99%+ of managers globally received training in the total communications strategy, products and marketplace
RedBeing passionate and energetic
Rock SolidBeing reliable and following through on promises
RestlessContinually striving for improvement and challenging the status quo
Vodafone – Business
20 Vodafone Group Plc Annual Report 2008
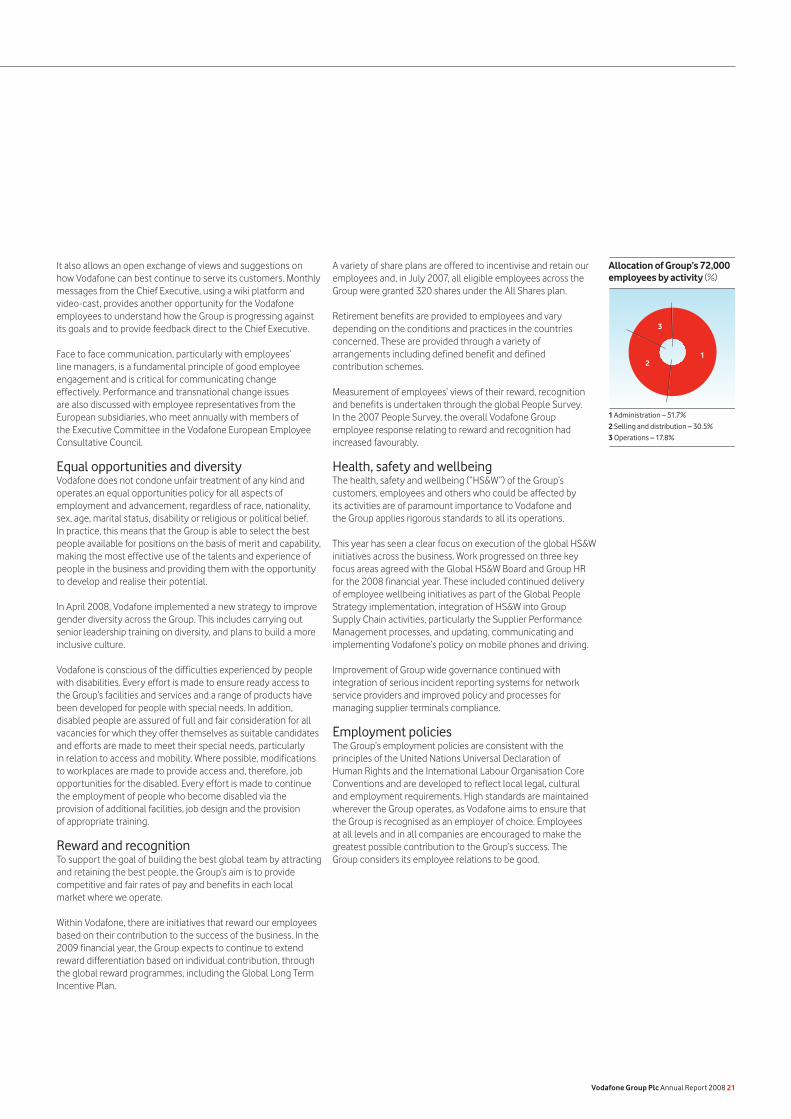
It also allows an open exchange of views and suggestions on how Vodafone can best continue to serve its customers. Monthly messages from the Chief Executive, using a wiki platform and video-cast, provides another opportunity for the Vodafone employees to understand how the Group is progressing against its goals and to provide feedback direct to the Chief Executive.
Face to face communication, particularly with employees’ line managers, is a fundamental principle of good employee engagement and is critical for communicating change effectively. Performance and transnational change issues are also discussed with employee representatives from the European subsidiaries, who meet annually with members of the Executive Committee in the Vodafone European Employee Consultative Council.
Equal opportunities and diversityVodafone does not condone unfair treatment of any kind and operates an equal opportunities policy for all aspects of employment and advancement, regardless of race, nationality, sex, age, marital status, disability or religious or political belief. In practice, this means that the Group is able to select the best people available for positions on the basis of merit and capability, making the most effective use of the talents and experience of people in the business and providing them with the opportunity to develop and realise their potential.
In April 2008, Vodafone implemented a new strategy to improve gender diversity across the Group. This includes carrying out senior leadership training on diversity, and plans to build a more inclusive culture.
Vodafone is conscious of the difficulties experienced by people with disabilities. Every effort is made to ensure ready access to the Group’s facilities and services and a range of products have been developed for people with special needs. In addition, disabled people are assured of full and fair consideration for all vacancies for which they offer themselves as suitable candidates and efforts are made to meet their special needs, particularly in relation to access and mobility. Where possible, modifications to workplaces are made to provide access and, therefore, job opportunities for the disabled. Every effort is made to continue the employment of people who become disabled via the provision of additional facilities, job design and the provision of appropriate training.
Reward and recognitionTo support the goal of building the best global team by attracting and retaining the best people, the Group’s aim is to provide competitive and fair rates of pay and benefits in each local market where we operate.
Within Vodafone, there are initiatives that reward our employees based on their contribution to the success of the business. In the 2009 financial year, the Group expects to continue to extend reward differentiation based on individual contribution, through the global reward programmes, including the Global Long Term Incentive Plan.
A variety of share plans are offered to incentivise and retain our employees and, in July 2007, all eligible employees across the Group were granted 320 shares under the All Shares plan.
Retirement benefits are provided to employees and vary depending on the conditions and practices in the countries concerned. These are provided through a variety of arrangements including defined benefit and defined contribution schemes.
Measurement of employees’ views of their reward, recognition and benefits is undertaken through the global People Survey. In the 2007 People Survey, the overall Vodafone Group employee response relating to reward and recognition had increased favourably.
Health, safety and wellbeingThe health, safety and wellbeing (“HS&W”) of the Group’s customers, employees and others who could be affected by its activities are of paramount importance to Vodafone and the Group applies rigorous standards to all its operations.
This year has seen a clear focus on execution of the global HS&W initiatives across the business. Work progressed on three key focus areas agreed with the Global HS&W Board and Group HR for the 2008 financial year. These included continued delivery of employee wellbeing initiatives as part of the Global People Strategy implementation, integration of HS&W into Group Supply Chain activities, particularly the Supplier Performance Management processes, and updating, communicating and implementing Vodafone’s policy on mobile phones and driving.
Improvement of Group wide governance continued with integration of serious incident reporting systems for network service providers and improved policy and processes for managing supplier terminals compliance.
Employment policiesThe Group’s employment policies are consistent with the principles of the United Nations Universal Declaration of Human Rights and the International Labour Organisation Core Conventions and are developed to reflect local legal, cultural and employment requirements. High standards are maintained wherever the Group operates, as Vodafone aims to ensure that the Group is recognised as an employer of choice. Employees at all levels and in all companies are encouraged to make the greatest possible contribution to the Group’s success. The Group considers its employee relations to be good.
Allocation of Group’s 72,000 employees by activity (%)
1 Administration – 51.7%
2 Selling and distribution – 30.5%
3 Operations – 17.8%
1
3
2
Vodafone Group Plc Annual Report 2008 21
Brand and Distribution
73.1Customer Delight Index
(2007: 70.6, 2006: 69.9)
Vodafone’s products and services are available directly, via Vodafone stores and country specific Vodafone websites, and indirectly via third party service providers, independent dealers, distributors and retailers, to both consumer and business customers in the majority of markets under the Vodafone brand.
Customer strategy and managementVodafone endeavours to ensure that customer needs are at the centre of all of the Group’s actions. The Group seeks to use its understanding to deliver relevance and value to each customer and communicate to them on an individual, household, community or business level, with the ultimate aim of encouraging customers to stay with Vodafone for longer and use and promote the Group’s services more.
For this reason, the Group has created a Global Customer Value Management team to support operating companies with their aim to engage with customers directly through a data driven approach, linking all the elements of customer interactions to deliver exceptional service and consistency in the Group’s approach while financially optimising decisions made via a branded customer experience across all touchpoints. Recent examples of this include: rollout of a consistent and innovative store design to eight countries, successful trial of an innovative handset based self service solution and creation of a global training academy for customer facing staff.
Vodafone’s customer knowledge driven organisation aims to make the most of its deep customer understanding by approaching customers with the most appropriate product through a channel they enjoy at a time that is best for them. This approach firmly places Vodafone as an organisation that listens to customers, delivers value and enhances their experience.
Vodafone continues to use a customer measurement system called “customer delight” to monitor and drive customer satisfaction in the Group’s controlled markets at a local and global level. This is a proprietary diagnostic system, which tracks customer satisfaction across all points of interaction with Vodafone and identifies the drivers of customer delight and their relative impact. This information is used to identify any areas for improvement and focus.
During the 2008 financial year, further econometric tools were developed and employed to better quantify the commercial impact of improved customer experience by linking customer feedback directly to business performance. Results from the study are used to generate the Customer Delight Index (“CDI”), which is one element of Vodafone’s short term incentive plan (“GSTIP”), thereby directly linking employee remuneration with customer satisfaction performance. The CDI result for the 2008 financial year was 73.1 points on a 100 point scale, which was 2.0 percentage points ahead of the average competitor.
Marketing and brandBrand and customer communicationsVodafone has continued to focus on delivering a superior, consistent and differentiated customer experience through its brand and communications activities. A new Marketing Framework has been developed and implemented across the business, which includes a new vision of expanding the Group’s category from mobile only to total communications “to be the communications leader in an increasingly connected world”. Brand and customer experience continues to implement Vodafone’s promise of “helping customers make the most of their time”. The brand function has also developed a methodology to develop competitive local market brand positioning, with local brand positioning projects now implemented in 12 markets.
To enable the consistent use of the Vodafone brand, a set of guidelines has been developed in areas such as advertising, retail, online and merchandising, all including detail on how to make the brand work across every touchpoint. Since June 2006, eight markets have implemented the global retail design.
In September 2007, Vodafone welcomed India with the “Hutch is now Vodafone” campaign. The migration from Hutch to Vodafone was one of the fastest and most comprehensive brand transitions in the history of the Group, with 400,000 multi brand outlets, over 350 Vodafone stores, over 1,000 mini stores, over 35 mobile stores and over 3,000 touchpoints rebranded in two months, with 60% completed within 48 hours of the launch.
Vodafone regularly conducts Brand Health Tracking, which is designed to measure the brand performance against a number of key metrics and generate insights to assist the management of the Vodafone brand across all Vodafone branded operating companies. This tracking has been in place since 2002 and provides continuous historical data against key metrics in all 19 Vodafone branded operating markets. Each operating company manages a study that complies with the standards and methodology set by Vodafone Group Insights. An external accredited and independent market research organisation provides global coordination of the methodology, reporting and analysis. As a result of these activities the Vodafone brand is now ranked number 11 in the BrandZ Top 100 global brands list, recently published in The Financial Times, with an estimated value attributable to the brand of £18.7 billion.
For the 2008 financial year, Vodafone brand preference among its own users reached 81.9%, up 2.0 percentage points on the previous financial year, and a performance level that is 1.0 percentage point higher than its closest competitors. In addition, the brand consideration among non-users of the brand has increased in the 2008 financial year to 33.5%, 1.8 percentage points above its market share.
1st
BrandZ UK ranking
In the BrandZ most powerful brands ranking. Ranked 11th globally.
Vodafone – Business
22 Vodafone Group Plc Annual Report 2008
1,150
Number of directly owned stores
6,500Number of branded stores
SponsorshipsVodafone’s global sponsorship strategy has delivered a strong set of results across all Vodafone markets. Central sponsorship agreements, including the UEFA Champions League and the title sponsorship of the Vodafone McLaren Mercedes F1 team, have supported multiple business objectives and enabled Vodafone to provide customers with differentiating brand and product experiences.
The strong performance of the Vodafone McLaren Mercedes F1 team during the 2007 season enabled Vodafone to maintain a dominant presence in one of the world’s most popular annual sporting events. Vodafone successfully integrated the sponsorship into a wide variety of business activities including communications, events, content and the launch of three bespoke handsets.
In Vodafone’s first year as a sponsor of the UEFA Champions League, Vodafone became recognised as a leading sponsor of the competition (Source: TNS Soccerscope, May 2007) and used this association to showcase a variety of products and services in a manner designed to build greater affinity with football fans across all relevant territories.
In January 2008, Vodafone became a global partner of the Laureus Foundation, which tackles various social challenges worldwide through a programme of sports related community development initiatives. This agreement complements Vodafone’s long standing relationship with sport and aims to help Laureus to use sport as a catalyst for inspiring positive social change.
To maintain a relevant and strategic role for global sponsorship investments, Vodafone is continually reviewing the portfolio to maintain pace with business and customer needs. On this basis, Vodafone has decided to discontinue the UEFA Champions League sponsorship at the end of the 2008/9 competition and increase emphasis in global music opportunities. Music’s broad appeal and product relevance provides a host of new and exciting opportunities for the business and the Group’s customers.
DistributionDirect distributionVodafone directly owns and manages over 1,150 stores. These stores sell services to new customers, renew or upgrade services for existing customers, and in many cases also provide customer support. A standard store format, which was tested in 2006, was rolled out in 11 markets during the 2008 financial year. The store footprint is constantly reviewed in response to market conditions which resulted in, for example, Vodafone opening a further 90 stores in Spain and 21 stores in Romania during the year. Additionally, all stores in India were rebranded as Vodafone and over 40 stores were refurbished to the Group’s standard format.
The Group also has 6,500 Vodafone branded stores, which sell Vodafone products and services exclusively, by way of franchise and exclusive dealer arrangements.
The internet is a key channel to promote and sell Vodafone’s products and services and to provide customers with an easy, user friendly and accessible way to manage their Vodafone services and access support. As a result, a specific Group wide programme is currently being rolled out across all controlled markets, in order to ensure Vodafone websites have state of the art online capabilities and provide the customer with an excellent and consistent online experience.
Additionally, in most operating companies, sales forces are in place to sell directly to business customers and some consumer segments.
Indirect distributionThe extent of indirect distribution varies between markets but may include using third party service providers, independent dealers, distributors and retailers.
The Group hosts MVNOs in a number of markets. These are operators who buy access to existing networks and resell that access to customers under a different brand name and proposition. Where appropriate, Vodafone seeks to enter mutually profitable relationships with MVNO partners as an additional route to market. During the past year new relationships established include Asda in the UK, Euskaltel in Spain and Carrefour in Italy.
Vodafone Group Plc Annual Report 2008 23
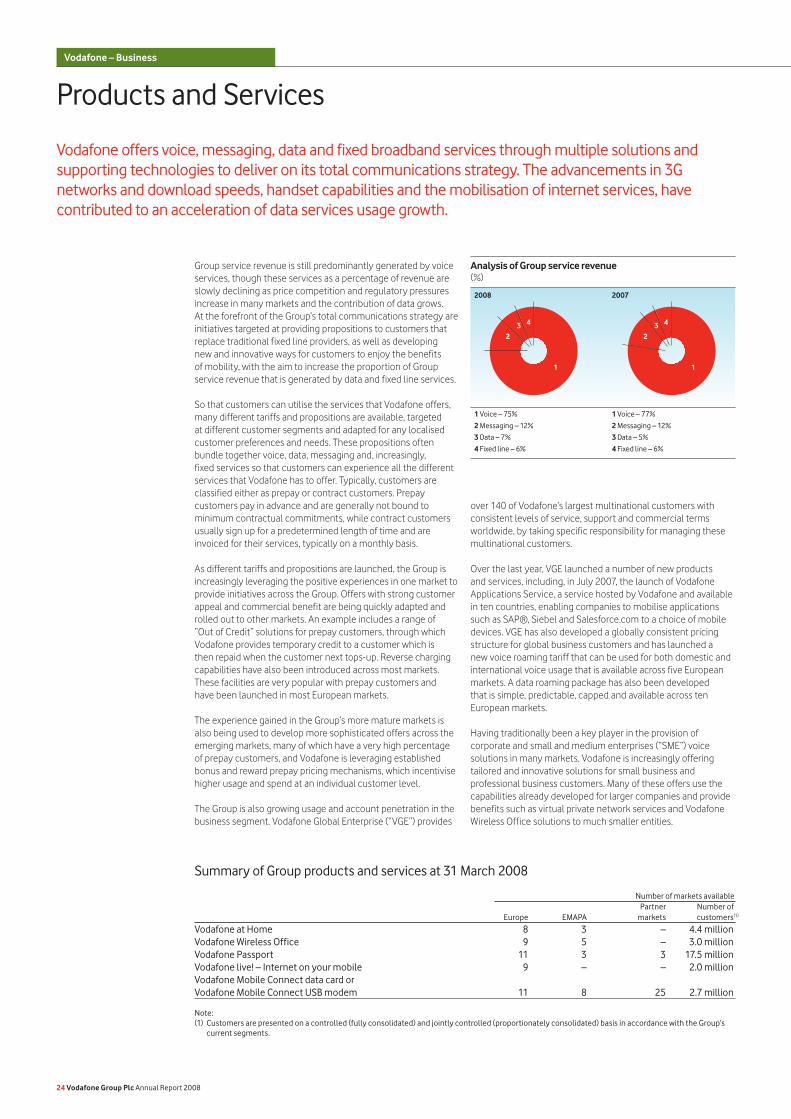
Vodafone offers voice, messaging, data and fixed broadband services through multiple solutions and supporting technologies to deliver on its total communications strategy. The advancements in 3G networks and download speeds, handset capabilities and the mobilisation of internet services, have contributed to an acceleration of data services usage growth.
Products and Services
Group service revenue is still predominantly generated by voice services, though these services as a percentage of revenue are slowly declining as price competition and regulatory pressures increase in many markets and the contribution of data grows. At the forefront of the Group’s total communications strategy are initiatives targeted at providing propositions to customers that replace traditional fixed line providers, as well as developing new and innovative ways for customers to enjoy the benefits of mobility, with the aim to increase the proportion of Group service revenue that is generated by data and fixed line services.
So that customers can utilise the services that Vodafone offers, many different tariffs and propositions are available, targeted at different customer segments and adapted for any localised customer preferences and needs. These propositions often bundle together voice, data, messaging and, increasingly, fixed services so that customers can experience all the different services that Vodafone has to offer. Typically, customers are classified either as prepay or contract customers. Prepay customers pay in advance and are generally not bound to minimum contractual commitments, while contract customers usually sign up for a predetermined length of time and are invoiced for their services, typically on a monthly basis.
As different tariffs and propositions are launched, the Group is increasingly leveraging the positive experiences in one market to provide initiatives across the Group. Offers with strong customer appeal and commercial benefit are being quickly adapted and rolled out to other markets. An example includes a range of “Out of Credit” solutions for prepay customers, through which Vodafone provides temporary credit to a customer which is then repaid when the customer next tops-up. Reverse charging capabilities have also been introduced across most markets. These facilities are very popular with prepay customers and have been launched in most European markets.
The experience gained in the Group’s more mature markets is also being used to develop more sophisticated offers across the emerging markets, many of which have a very high percentage of prepay customers, and Vodafone is leveraging established bonus and reward prepay pricing mechanisms, which incentivise higher usage and spend at an individual customer level.
The Group is also growing usage and account penetration in the business segment. Vodafone Global Enterprise (“VGE”) provides
over 140 of Vodafone’s largest multinational customers with consistent levels of service, support and commercial terms worldwide, by taking specific responsibility for managing these multinational customers.
Over the last year, VGE launched a number of new products and services, including, in July 2007, the launch of Vodafone Applications Service, a service hosted by Vodafone and available in ten countries, enabling companies to mobilise applications such as SAP®, Siebel and Salesforce.com to a choice of mobile devices. VGE has also developed a globally consistent pricing structure for global business customers and has launched a new voice roaming tariff that can be used for both domestic and international voice usage that is available across five European markets. A data roaming package has also been developed that is simple, predictable, capped and available across ten European markets.
Having traditionally been a key player in the provision of corporate and small and medium enterprises (“SME”) voice solutions in many markets, Vodafone is increasingly offering tailored and innovative solutions for small business and professional business customers. Many of these offers use the capabilities already developed for larger companies and provide benefits such as virtual private network services and Vodafone Wireless Office solutions to much smaller entities.
Summary of Group products and services at 31 March 2008
Number of markets available Partner Number of Europe EMAPA markets customers(1)
Vodafone at Home 8 3 – 4.4 millionVodafone Wireless Office 9 5 – 3.0 millionVodafone Passport 11 3 3 17.5 millionVodafone live! – Internet on your mobile 9 – – 2.0 millionVodafone Mobile Connect data card or Vodafone Mobile Connect USB modem 11 8 25 2.7 million
Note:(1) Customers are presented on a controlled (fully consolidated) and jointly controlled (proportionately consolidated) basis in accordance with the Group’s
current segments.
24 Vodafone Group Plc Annual Report 2008
Vodafone – BusinessVodafone – Business
Analysis of Group service revenue(%)
20072008
1
23 4
1
23 4
1 Voice – 77%
2 Messaging – 12%
3 Data – 5%
4 Fixed line – 6%
1 Voice – 75%
2 Messaging – 12%
3 Data – 7%
4 Fixed line – 6%
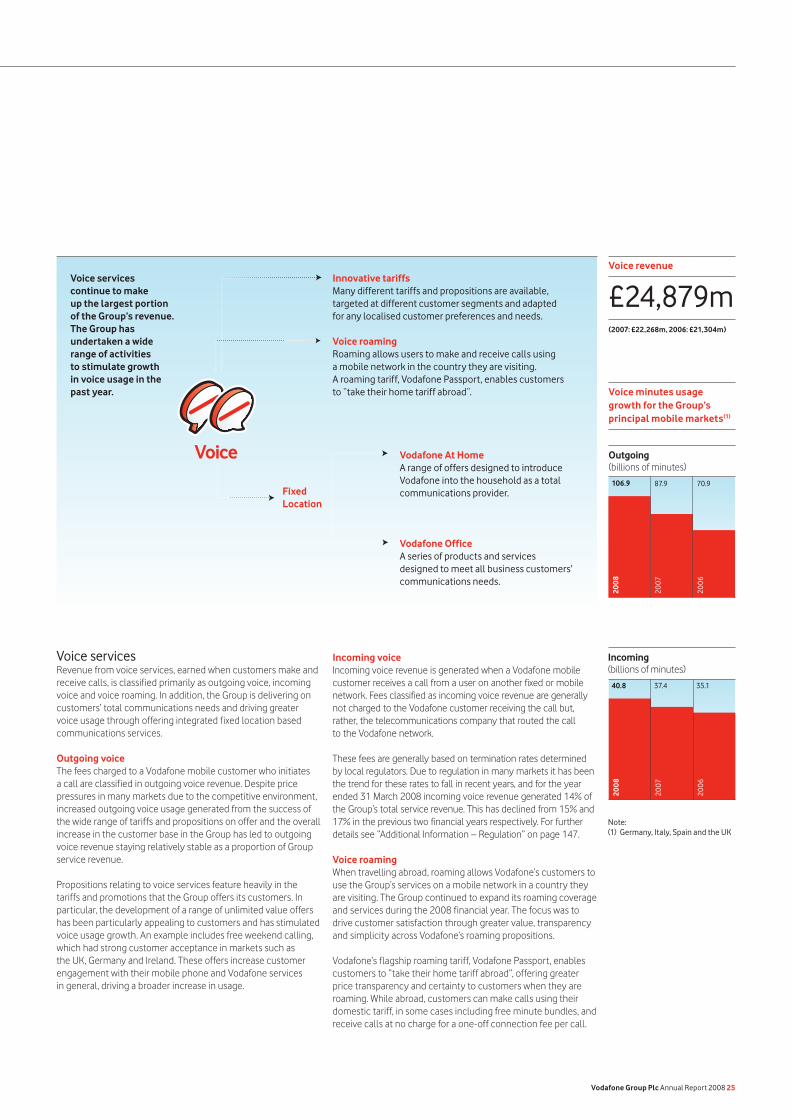
Voice services continue to make up the largest portion of the Group’s revenue. The Group has undertaken a wide range of activities to stimulate growth in voice usage in the past year.
Voice servicesRevenue from voice services, earned when customers make and receive calls, is classified primarily as outgoing voice, incoming voice and voice roaming. In addition, the Group is delivering on customers’ total communications needs and driving greater voice usage through offering integrated fixed location based communications services.
Outgoing voice The fees charged to a Vodafone mobile customer who initiates a call are classified in outgoing voice revenue. Despite price pressures in many markets due to the competitive environment, increased outgoing voice usage generated from the success of the wide range of tariffs and propositions on offer and the overall increase in the customer base in the Group has led to outgoing voice revenue staying relatively stable as a proportion of Group service revenue.
Propositions relating to voice services feature heavily in the tariffs and promotions that the Group offers its customers. In particular, the development of a range of unlimited value offers has been particularly appealing to customers and has stimulated voice usage growth. An example includes free weekend calling, which had strong customer acceptance in markets such as the UK, Germany and Ireland. These offers increase customer engagement with their mobile phone and Vodafone services in general, driving a broader increase in usage.
£24,879mVoice revenue
(2007: £22,268m, 2006: £21,304m)
Incoming voice Incoming voice revenue is generated when a Vodafone mobile customer receives a call from a user on another fixed or mobile network. Fees classified as incoming voice revenue are generally not charged to the Vodafone customer receiving the call but, rather, the telecommunications company that routed the call to the Vodafone network.
These fees are generally based on termination rates determined by local regulators. Due to regulation in many markets it has been the trend for these rates to fall in recent years, and for the year ended 31 March 2008 incoming voice revenue generated 14% of the Group’s total service revenue. This has declined from 15% and 17% in the previous two financial years respectively. For further details see “Additional Information – Regulation” on page 147.
Voice roamingWhen travelling abroad, roaming allows Vodafone’s customers to use the Group’s services on a mobile network in a country they are visiting. The Group continued to expand its roaming coverage and services during the 2008 financial year. The focus was to drive customer satisfaction through greater value, transparency and simplicity across Vodafone’s roaming propositions.
Vodafone’s flagship roaming tariff, Vodafone Passport, enables customers to “take their home tariff abroad”, offering greater price transparency and certainty to customers when they are roaming. While abroad, customers can make calls using their domestic tariff, in some cases including free minute bundles, and receive calls at no charge for a one-off connection fee per call.
Vodafone Group Plc Annual Report 2008 25
Vodafone At HomeA range of offers designed to introduce Vodafone into the household as a total communications provider.
Voice
Vodafone OfficeA series of products and services designed to meet all business customers’ communications needs.
Innovative tariffsMany different tariffs and propositions are available, targeted at different customer segments and adapted for any localised customer preferences and needs.
Voice roamingRoaming allows users to make and receive calls using a mobile network in the country they are visiting. A roaming tariff, Vodafone Passport, enables customers to “take their home tariff abroad”.
2008
2007
2006
Note:(1) Germany, Italy, Spain and the UK
2008
2007
2006
Voice minutes usage growth for the Group’s principal mobile markets(1)
Outgoing(billions of minutes)
70.987.9106.9
Incoming(billions of minutes)
35.137.440.8
Fixed Location
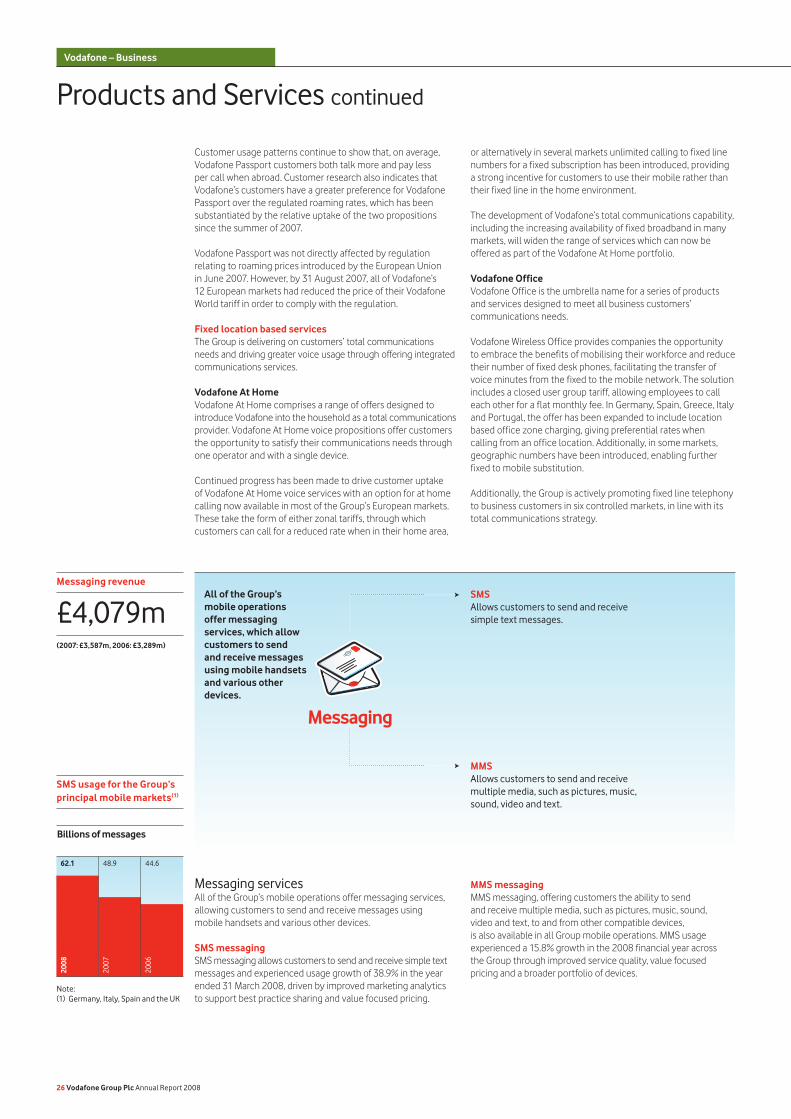
Customer usage patterns continue to show that, on average, Vodafone Passport customers both talk more and pay less per call when abroad. Customer research also indicates that Vodafone’s customers have a greater preference for Vodafone Passport over the regulated roaming rates, which has been substantiated by the relative uptake of the two propositions since the summer of 2007.
Vodafone Passport was not directly affected by regulation relating to roaming prices introduced by the European Union in June 2007. However, by 31 August 2007, all of Vodafone’s 12 European markets had reduced the price of their Vodafone World tariff in order to comply with the regulation.
Fixed location based servicesThe Group is delivering on customers’ total communications needs and driving greater voice usage through offering integrated communications services.
Vodafone At HomeVodafone At Home comprises a range of offers designed to introduce Vodafone into the household as a total communications provider. Vodafone At Home voice propositions offer customers the opportunity to satisfy their communications needs through one operator and with a single device.
Continued progress has been made to drive customer uptake of Vodafone At Home voice services with an option for at home calling now available in most of the Group’s European markets. These take the form of either zonal tariffs, through which customers can call for a reduced rate when in their home area,
All of the Group’s mobile operations offer messaging services, which allow customers to send and receive messages using mobile handsets and various other devices.
Products and Services continued
£4,079mMessaging revenue
(2007: £3,587m, 2006: £3,289m)
or alternatively in several markets unlimited calling to fixed line numbers for a fixed subscription has been introduced, providing a strong incentive for customers to use their mobile rather than their fixed line in the home environment.
The development of Vodafone’s total communications capability, including the increasing availability of fixed broadband in many markets, will widen the range of services which can now be offered as part of the Vodafone At Home portfolio.
Vodafone Office Vodafone Office is the umbrella name for a series of products and services designed to meet all business customers’ communications needs.
Vodafone Wireless Office provides companies the opportunity to embrace the benefits of mobilising their workforce and reduce their number of fixed desk phones, facilitating the transfer of voice minutes from the fixed to the mobile network. The solution includes a closed user group tariff, allowing employees to call each other for a flat monthly fee. In Germany, Spain, Greece, Italy and Portugal, the offer has been expanded to include location based office zone charging, giving preferential rates when calling from an office location. Additionally, in some markets, geographic numbers have been introduced, enabling further fixed to mobile substitution.
Additionally, the Group is actively promoting fixed line telephony to business customers in six controlled markets, in line with its total communications strategy.
Messaging servicesAll of the Group’s mobile operations offer messaging services, allowing customers to send and receive messages using mobile handsets and various other devices.
SMS messagingSMS messaging allows customers to send and receive simple text messages and experienced usage growth of 38.9% in the year ended 31 March 2008, driven by improved marketing analytics to support best practice sharing and value focused pricing.
MMS messagingMMS messaging, offering customers the ability to send and receive multiple media, such as pictures, music, sound, video and text, to and from other compatible devices, is also available in all Group mobile operations. MMS usage experienced a 15.8% growth in the 2008 financial year across the Group through improved service quality, value focused pricing and a broader portfolio of devices.
26 Vodafone Group Plc Annual Report 2008
Vodafone – BusinessVodafone – Business
SMSAllows customers to send and receive simple text messages.
MMSAllows customers to send and receive multiple media, such as pictures, music, sound, video and text.
Messaging
2008
2007
2006
SMS usage for the Group’s principal mobile markets(1)
Billions of messages
44.648.962.1
Note:(1) Germany, Italy, Spain and the UK
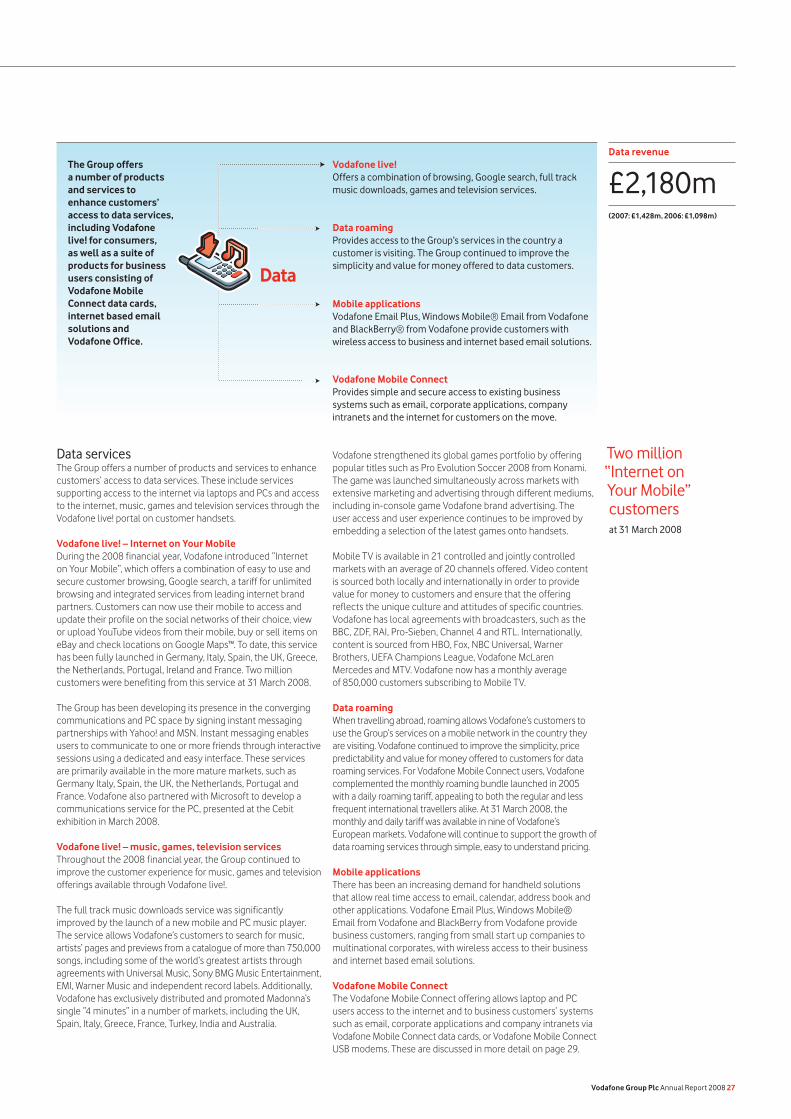
Data servicesThe Group offers a number of products and services to enhance customers’ access to data services. These include services supporting access to the internet via laptops and PCs and access to the internet, music, games and television services through the Vodafone live! portal on customer handsets.
Vodafone live! – Internet on Your MobileDuring the 2008 financial year, Vodafone introduced “Internet on Your Mobile”, which offers a combination of easy to use and secure customer browsing, Google search, a tariff for unlimited browsing and integrated services from leading internet brand partners. Customers can now use their mobile to access and update their profile on the social networks of their choice, view or upload YouTube videos from their mobile, buy or sell items on eBay and check locations on Google Maps™. To date, this service has been fully launched in Germany, Italy, Spain, the UK, Greece, the Netherlands, Portugal, Ireland and France. Two million customers were benefiting from this service at 31 March 2008.
The Group has been developing its presence in the converging communications and PC space by signing instant messaging partnerships with Yahoo! and MSN. Instant messaging enables users to communicate to one or more friends through interactive sessions using a dedicated and easy interface. These services are primarily available in the more mature markets, such as Germany Italy, Spain, the UK, the Netherlands, Portugal and France. Vodafone also partnered with Microsoft to develop a communications service for the PC, presented at the Cebit exhibition in March 2008.
Vodafone live! – music, games, television servicesThroughout the 2008 financial year, the Group continued to improve the customer experience for music, games and television offerings available through Vodafone live!.
The full track music downloads service was significantly improved by the launch of a new mobile and PC music player. The service allows Vodafone’s customers to search for music, artists’ pages and previews from a catalogue of more than 750,000 songs, including some of the world’s greatest artists through agreements with Universal Music, Sony BMG Music Entertainment, EMI, Warner Music and independent record labels. Additionally, Vodafone has exclusively distributed and promoted Madonna’s single “4 minutes” in a number of markets, including the UK, Spain, Italy, Greece, France, Turkey, India and Australia.
The Group offers a number of products and services to enhance customers’ access to data services, including Vodafone live! for consumers, as well as a suite of products for business users consisting of Vodafone Mobile Connect data cards, internet based email solutions and Vodafone Office.
£2,180mData revenue
(2007: £1,428m, 2006: £1,098m)
Vodafone strengthened its global games portfolio by offering popular titles such as Pro Evolution Soccer 2008 from Konami. The game was launched simultaneously across markets with extensive marketing and advertising through different mediums, including in-console game Vodafone brand advertising. The user access and user experience continues to be improved by embedding a selection of the latest games onto handsets.
Mobile TV is available in 21 controlled and jointly controlled markets with an average of 20 channels offered. Video content is sourced both locally and internationally in order to provide value for money to customers and ensure that the offering reflects the unique culture and attitudes of specific countries. Vodafone has local agreements with broadcasters, such as the BBC, ZDF, RAI, Pro-Sieben, Channel 4 and RTL. Internationally, content is sourced from HBO, Fox, NBC Universal, Warner Brothers, UEFA Champions League, Vodafone McLaren Mercedes and MTV. Vodafone now has a monthly average of 850,000 customers subscribing to Mobile TV.
Data roaming When travelling abroad, roaming allows Vodafone’s customers to use the Group’s services on a mobile network in the country they are visiting. Vodafone continued to improve the simplicity, price predictability and value for money offered to customers for data roaming services. For Vodafone Mobile Connect users, Vodafone complemented the monthly roaming bundle launched in 2005 with a daily roaming tariff, appealing to both the regular and less frequent international travellers alike. At 31 March 2008, the monthly and daily tariff was available in nine of Vodafone’s European markets. Vodafone will continue to support the growth of data roaming services through simple, easy to understand pricing.
Mobile applications There has been an increasing demand for handheld solutions that allow real time access to email, calendar, address book and other applications. Vodafone Email Plus, Windows Mobile® Email from Vodafone and BlackBerry from Vodafone provide business customers, ranging from small start up companies to multinational corporates, with wireless access to their business and internet based email solutions.
Vodafone Mobile ConnectThe Vodafone Mobile Connect offering allows laptop and PC users access to the internet and to business customers’ systems such as email, corporate applications and company intranets via Vodafone Mobile Connect data cards, or Vodafone Mobile Connect USB modems. These are discussed in more detail on page 29.
Two million “Internet on Your Mobile”customersat 31 March 2008
Vodafone Group Plc Annual Report 2008 27
Vodafone live!Offers a combination of browsing, Google search, full track music downloads, games and television services.
Mobile applicationsVodafone Email Plus, Windows Mobile® Email from Vodafone and BlackBerry® from Vodafone provide customers with wireless access to business and internet based email solutions.
Vodafone Mobile ConnectProvides simple and secure access to existing business systems such as email, corporate applications, company intranets and the internet for customers on the move.
Data roamingProvides access to the Group’s services in the country a customer is visiting. The Group continued to improve the simplicity and value for money offered to data customers.
Data
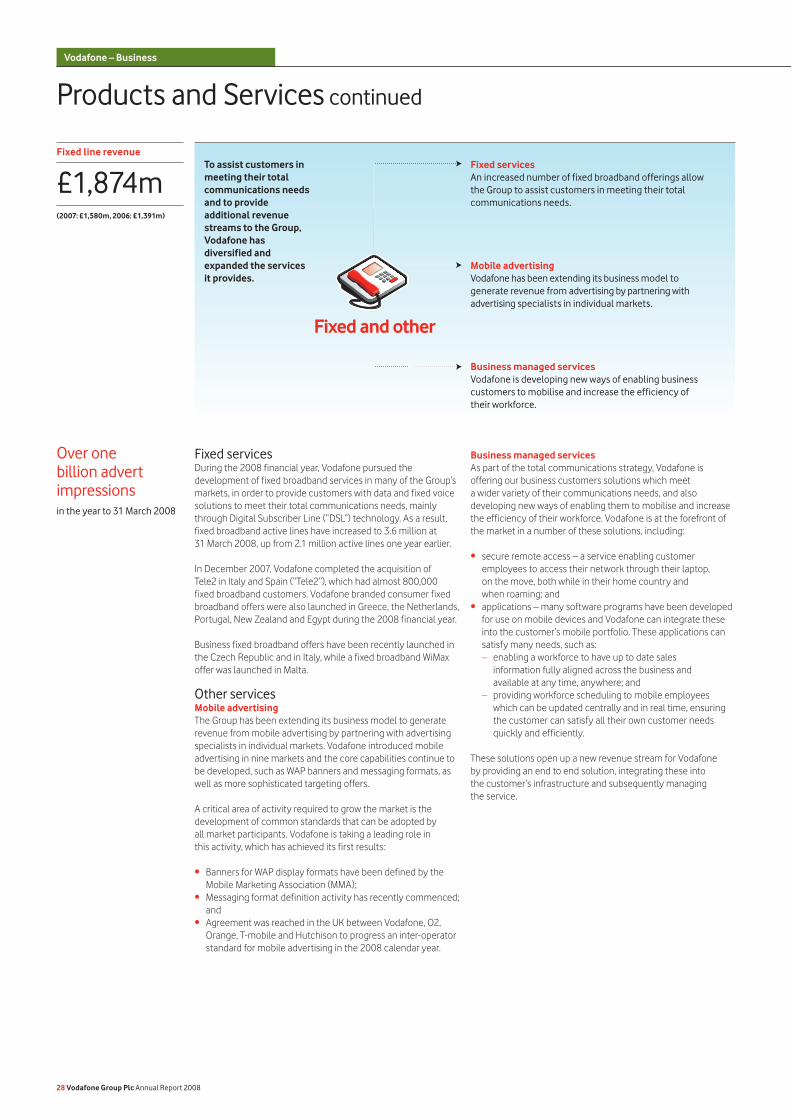
Fixed servicesDuring the 2008 financial year, Vodafone pursued the development of fixed broadband services in many of the Group’s markets, in order to provide customers with data and fixed voice solutions to meet their total communications needs, mainly through Digital Subscriber Line (“DSL”) technology. As a result, fixed broadband active lines have increased to 3.6 million at 31 March 2008, up from 2.1 million active lines one year earlier.
In December 2007, Vodafone completed the acquisition of Tele2 in Italy and Spain (“Tele2”), which had almost 800,000 fixed broadband customers. Vodafone branded consumer fixed broadband offers were also launched in Greece, the Netherlands, Portugal, New Zealand and Egypt during the 2008 financial year.
Business fixed broadband offers have been recently launched in the Czech Republic and in Italy, while a fixed broadband WiMax offer was launched in Malta.
Other servicesMobile advertisingThe Group has been extending its business model to generate revenue from mobile advertising by partnering with advertising specialists in individual markets. Vodafone introduced mobile advertising in nine markets and the core capabilities continue to be developed, such as WAP banners and messaging formats, as well as more sophisticated targeting offers.
A critical area of activity required to grow the market is the development of common standards that can be adopted by all market participants. Vodafone is taking a leading role in this activity, which has achieved its first results:
Banners for WAP display formats have been defined by the Mobile Marketing Association (MMA); Messaging format definition activity has recently commenced; and Agreement was reached in the UK between Vodafone, O2, Orange, T-mobile and Hutchison to progress an inter-operator standard for mobile advertising in the 2008 calendar year.
•
•
•
Products and Services continued
Business managed servicesAs part of the total communications strategy, Vodafone is offering our business customers solutions which meet a wider variety of their communications needs, and also developing new ways of enabling them to mobilise and increase the efficiency of their workforce. Vodafone is at the forefront of the market in a number of these solutions, including:
secure remote access – a service enabling customer employees to access their network through their laptop, on the move, both while in their home country and when roaming; andapplications – many software programs have been developed for use on mobile devices and Vodafone can integrate these into the customer’s mobile portfolio. These applications can satisfy many needs, such as:
enabling a workforce to have up to date salesinformation fully aligned across the business andavailable at any time, anywhere; and providing workforce scheduling to mobile employees which can be updated centrally and in real time, ensuring the customer can satisfy all their own customer needs quickly and efficiently.
These solutions open up a new revenue stream for Vodafone by providing an end to end solution, integrating these into the customer’s infrastructure and subsequently managing the service.
•
•
–
–
To assist customers in meeting their total communications needs and to provide additional revenue streams to the Group, Vodafone has diversified and expanded the services it provides.
Fixed line revenue
£1,874m(2007: £1,580m, 2006: £1,391m)
Over one billion advert impressionsin the year to 31 March 2008
28 Vodafone Group Plc Annual Report 2008
Vodafone – BusinessVodafone – Business
Fixed servicesAn increased number of fixed broadband offerings allow the Group to assist customers in meeting their total communications needs.
Business managed servicesVodafone is developing new ways of enabling business customers to mobilise and increase the efficiency of their workforce.
Fixed and other
Mobile advertisingVodafone has been extending its business model to generate revenue from advertising by partnering with advertising specialists in individual markets.
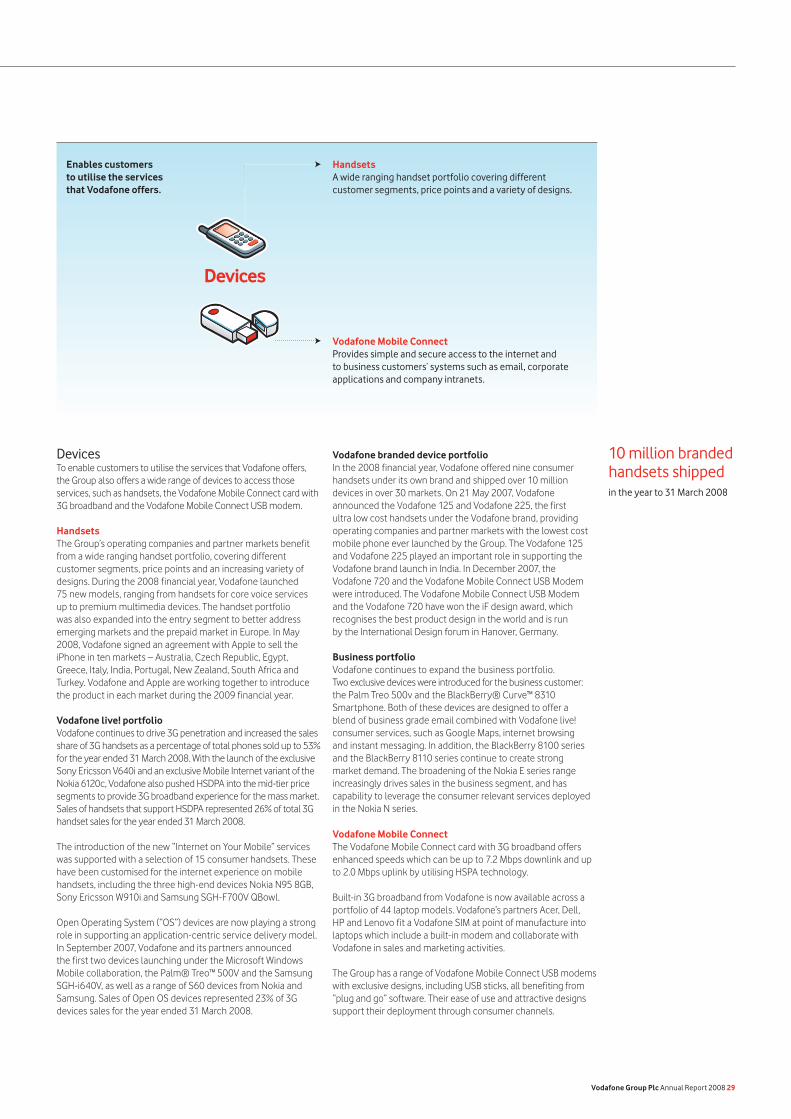
DevicesTo enable customers to utilise the services that Vodafone offers, the Group also offers a wide range of devices to access those services, such as handsets, the Vodafone Mobile Connect card with 3G broadband and the Vodafone Mobile Connect USB modem.
HandsetsThe Group’s operating companies and partner markets benefit from a wide ranging handset portfolio, covering different customer segments, price points and an increasing variety of designs. During the 2008 financial year, Vodafone launched 75 new models, ranging from handsets for core voice services up to premium multimedia devices. The handset portfolio was also expanded into the entry segment to better address emerging markets and the prepaid market in Europe. In May 2008, Vodafone signed an agreement with Apple to sell the iPhone in ten markets – Australia, Czech Republic, Egypt, Greece, Italy, India, Portugal, New Zealand, South Africa and Turkey. Vodafone and Apple are working together to introduce the product in each market during the 2009 financial year.
Vodafone live! portfolio Vodafone continues to drive 3G penetration and increased the sales share of 3G handsets as a percentage of total phones sold up to 53% for the year ended 31 March 2008. With the launch of the exclusive Sony Ericsson V640i and an exclusive Mobile Internet variant of the Nokia 6120c, Vodafone also pushed HSDPA into the mid-tier price segments to provide 3G broadband experience for the mass market. Sales of handsets that support HSDPA represented 26% of total 3G handset sales for the year ended 31 March 2008.
The introduction of the new “Internet on Your Mobile” services was supported with a selection of 15 consumer handsets. These have been customised for the internet experience on mobile handsets, including the three high-end devices Nokia N95 8GB, Sony Ericsson W910i and Samsung SGH-F700V QBowl.
Open Operating System (“OS”) devices are now playing a strong role in supporting an application-centric service delivery model. In September 2007, Vodafone and its partners announced the first two devices launching under the Microsoft Windows Mobile collaboration, the Palm® Treo™ 500V and the Samsung SGH-i640V, as well as a range of S60 devices from Nokia and Samsung. Sales of Open OS devices represented 23% of 3G devices sales for the year ended 31 March 2008.
Vodafone branded device portfolio In the 2008 financial year, Vodafone offered nine consumer handsets under its own brand and shipped over 10 million devices in over 30 markets. On 21 May 2007, Vodafone announced the Vodafone 125 and Vodafone 225, the first ultra low cost handsets under the Vodafone brand, providing operating companies and partner markets with the lowest cost mobile phone ever launched by the Group. The Vodafone 125 and Vodafone 225 played an important role in supporting the Vodafone brand launch in India. In December 2007, the Vodafone 720 and the Vodafone Mobile Connect USB Modem were introduced. The Vodafone Mobile Connect USB Modem and the Vodafone 720 have won the iF design award, which recognises the best product design in the world and is run by the International Design forum in Hanover, Germany.
Business portfolioVodafone continues to expand the business portfolio. Two exclusive devices were introduced for the business customer: the Palm Treo 500v and the BlackBerry® Curve™ 8310 Smartphone. Both of these devices are designed to offer a blend of business grade email combined with Vodafone live! consumer services, such as Google Maps, internet browsing and instant messaging. In addition, the BlackBerry 8100 series and the BlackBerry 8110 series continue to create strong market demand. The broadening of the Nokia E series range increasingly drives sales in the business segment, and has capability to leverage the consumer relevant services deployed in the Nokia N series.
Vodafone Mobile ConnectThe Vodafone Mobile Connect card with 3G broadband offers enhanced speeds which can be up to 7.2 Mbps downlink and up to 2.0 Mbps uplink by utilising HSPA technology.
Built-in 3G broadband from Vodafone is now available across a portfolio of 44 laptop models. Vodafone’s partners Acer, Dell, HP and Lenovo fit a Vodafone SIM at point of manufacture into laptops which include a built-in modem and collaborate with Vodafone in sales and marketing activities.
The Group has a range of Vodafone Mobile Connect USB modems with exclusive designs, including USB sticks, all benefiting from “plug and go” software. Their ease of use and attractive designs support their deployment through consumer channels.
Enables customers to utilise the services that Vodafone offers.
10 million branded handsets shippedin the year to 31 March 2008
Vodafone Group Plc Annual Report 2008 29
HandsetsA wide ranging handset portfolio covering different customer segments, price points and a variety of designs.
Vodafone Mobile ConnectProvides simple and secure access to the internet and to business customers’ systems such as email, corporate applications and company intranets.
Devices
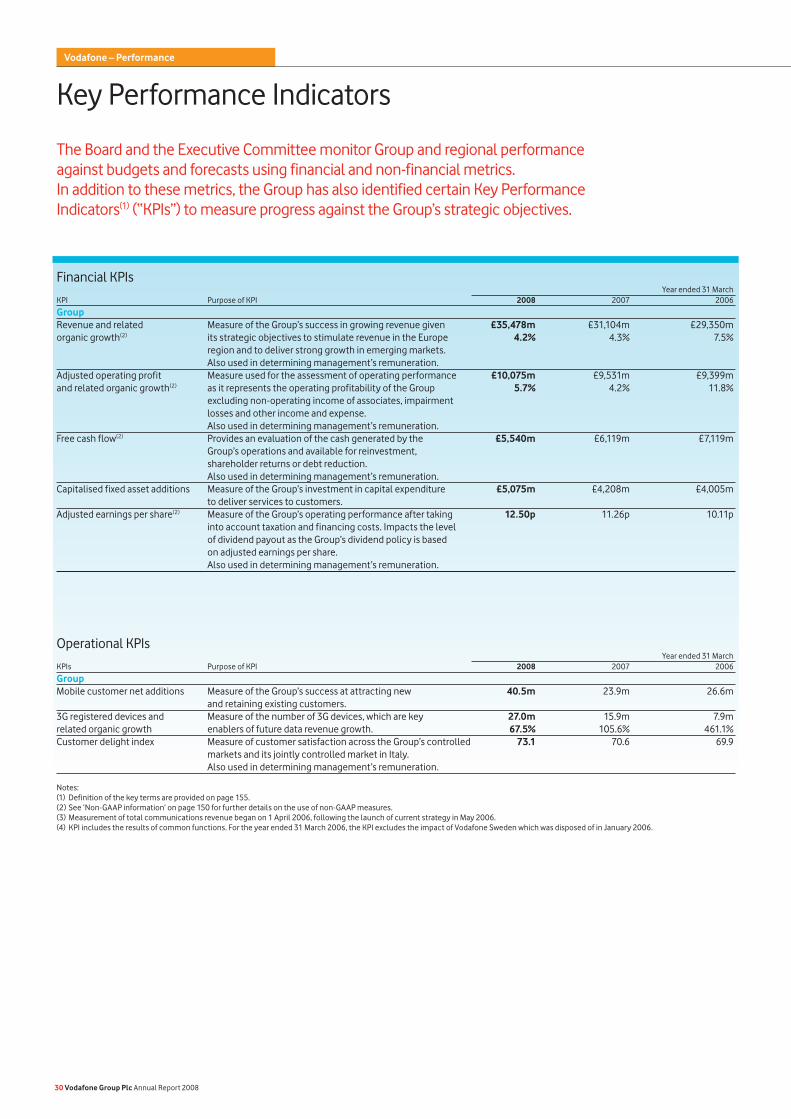
Key Performance Indicators
Financial KPIs Year ended 31 MarchKPI Purpose of KPI 2008 2007 2006
Group Revenue and related Measure of the Group’s success in growing revenue given £35,478m £31,104m £29,350morganic growth(2) its strategic objectives to stimulate revenue in the Europe 4.2% 4.3% 7.5%
region and to deliver strong growth in emerging markets.Also used in determining management’s remuneration.
Adjusted operating profit Measure used for the assessment of operating performance £10,075m £9,531m £9,399mand related organic growth(2) as it represents the operating profitability of the Group 5.7% 4.2% 11.8%
excluding non-operating income of associates, impairment losses and other income and expense.Also used in determining management’s remuneration.
Free cash flow(2) Provides an evaluation of the cash generated by the £5,540m £6,119m £7,119mGroup’s operations and available for reinvestment, shareholder returns or debt reduction. Also used in determining management’s remuneration.
Capitalised fixed asset additions Measure of the Group’s investment in capital expenditure £5,075m £4,208m £4,005mto deliver services to customers.
Adjusted earnings per share(2) Measure of the Group’s operating performance after taking 12.50p 11.26p 10.11pinto account taxation and financing costs. Impacts the level of dividend payout as the Group’s dividend policy is based on adjusted earnings per share.Also used in determining management’s remuneration.
Operational KPIs Year ended 31 MarchKPIs Purpose of KPI 2008 2007 2006
Group Mobile customer net additions Measure of the Group’s success at attracting new 40.5m 23.9m 26.6m and retaining existing customers.3G registered devices and Measure of the number of 3G devices, which are key 27.0m 15.9m 7.9mrelated organic growth enablers of future data revenue growth. 67.5% 105.6% 461.1%Customer delight index Measure of customer satisfaction across the Group’s controlled 73.1 70.6 69.9
markets and its jointly controlled market in Italy.Also used in determining management’s remuneration.
Notes:(1) Definition of the key terms are provided on page 155.(2) See ‘Non-GAAP information’ on page 150 for further details on the use of non-GAAP measures.(3) Measurement of total communications revenue began on 1 April 2006, following the launch of current strategy in May 2006.(4) KPI includes the results of common functions. For the year ended 31 March 2006, the KPI excludes the impact of Vodafone Sweden which was disposed of in January 2006.
The Board and the Executive Committee monitor Group and regional performance against budgets and forecasts using financial and non-financial metrics. In addition to these metrics, the Group has also identified certain Key Performance Indicators(1) (“KPIs”) to measure progress against the Group’s strategic objectives.
30 Vodafone Group Plc Annual Report 2008
Vodafone – Performance
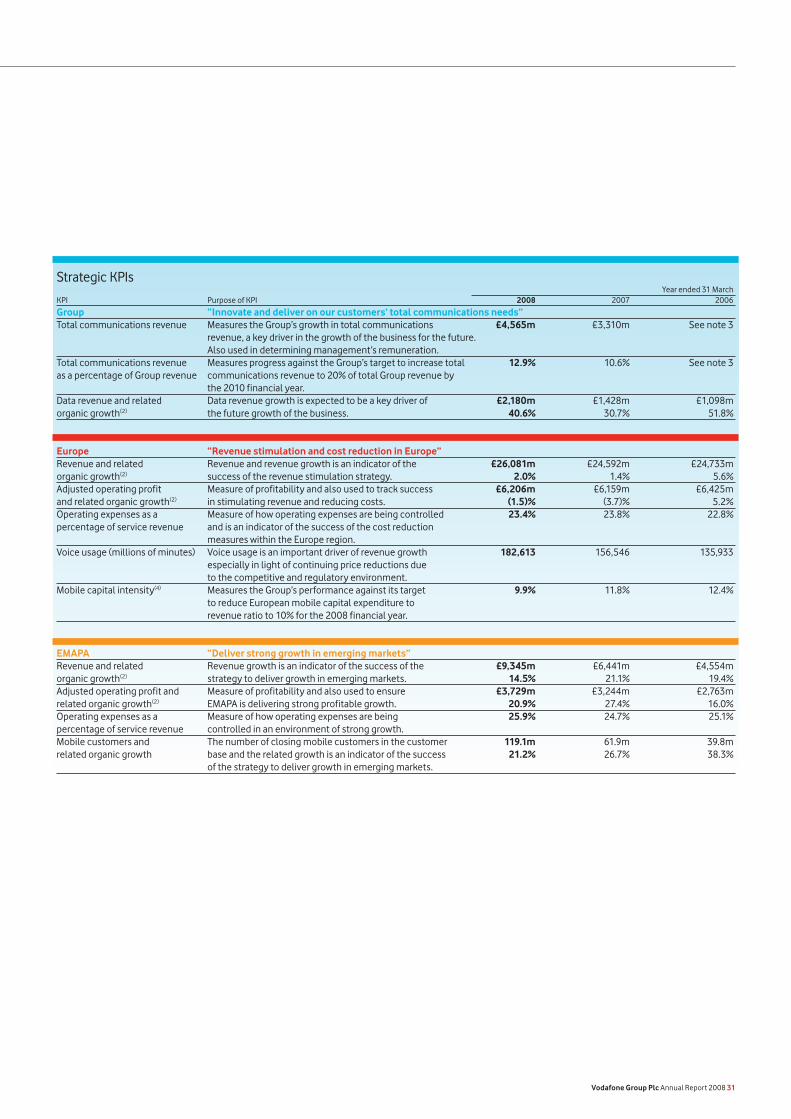
Strategic KPIs Year ended 31 MarchKPI Purpose of KPI 2008 2007 2006
Group “Innovate and deliver on our customers’ total communications needs” Total communications revenue Measures the Group’s growth in total communications £4,565m £3,310m See note 3
revenue, a key driver in the growth of the business for the future.Also used in determining management’s remuneration.
Total communications revenue Measures progress against the Group’s target to increase total 12.9% 10.6% See note 3as a percentage of Group revenue communications revenue to 20% of total Group revenue by the 2010 financial year. Data revenue and related Data revenue growth is expected to be a key driver of £2,180m £1,428m £1,098morganic growth(2) the future growth of the business. 40.6% 30.7% 51.8%
Europe “Revenue stimulation and cost reduction in Europe” Revenue and related Revenue and revenue growth is an indicator of the £26,081m £24,592m £24,733morganic growth(2) success of the revenue stimulation strategy. 2.0% 1.4% 5.6%Adjusted operating profit Measure of profitability and also used to track success £6,206m £6,159m £6,425m and related organic growth(2) in stimulating revenue and reducing costs. (1.5)% (3.7)% 5.2%Operating expenses as a Measure of how operating expenses are being controlled 23.4% 23.8% 22.8%percentage of service revenue and is an indicator of the success of the cost reduction
measures within the Europe region.Voice usage (millions of minutes) Voice usage is an important driver of revenue growth 182,613 156,546 135,933
especially in light of continuing price reductions due to the competitive and regulatory environment.
Mobile capital intensity(4) Measures the Group’s performance against its target 9.9% 11.8% 12.4%to reduce European mobile capital expenditure torevenue ratio to 10% for the 2008 financial year.
EMAPA “Deliver strong growth in emerging markets” Revenue and related Revenue growth is an indicator of the success of the £9,345m £6,441m £4,554morganic growth(2) strategy to deliver growth in emerging markets. 14.5% 21.1% 19.4%Adjusted operating profit and Measure of profitability and also used to ensure £3,729m £3,244m £2,763m related organic growth(2) EMAPA is delivering strong profitable growth. 20.9% 27.4% 16.0%Operating expenses as a Measure of how operating expenses are being 25.9% 24.7% 25.1%percentage of service revenue controlled in an environment of strong growth.Mobile customers and The number of closing mobile customers in the customer 119.1m 61.9m 39.8mrelated organic growth base and the related growth is an indicator of the success 21.2% 26.7% 38.3%
of the strategy to deliver growth in emerging markets.
Vodafone Group Plc Annual Report 2008 31
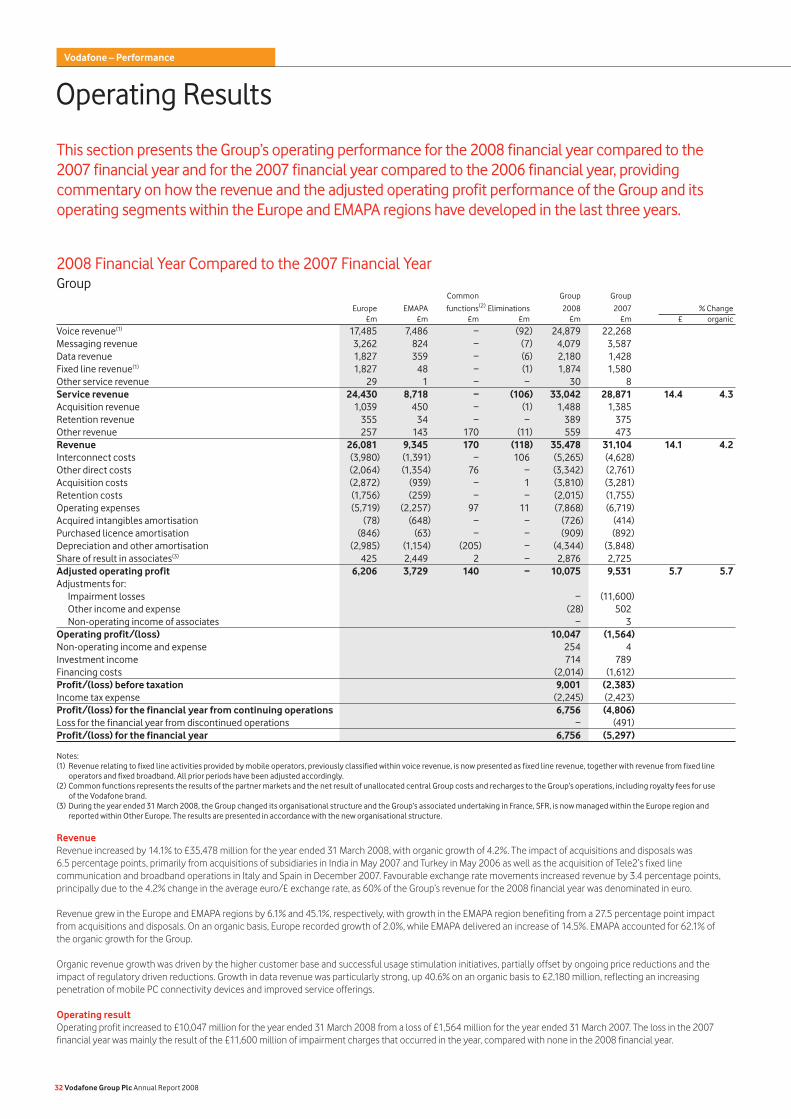
Operating Results
2008 Financial Year Compared to the 2007 Financial YearGroup Common Group Group
Europe EMAPA functions(2) Eliminations 2008 2007 % Change £m £m £m £m £m £m £ organic
Voice revenue(1) 17,485 7,486 − (92) 24,879 22,268Messaging revenue 3,262 824 − (7) 4,079 3,587Data revenue 1,827 359 − (6) 2,180 1,428Fixed line revenue(1) 1,827 48 − (1) 1,874 1,580Other service revenue 29 1 − − 30 8Service revenue 24,430 8,718 − (106) 33,042 28,871 14.4 4.3Acquisition revenue 1,039 450 − (1) 1,488 1,385Retention revenue 355 34 − − 389 375Other revenue 257 143 170 (11) 559 473Revenue 26,081 9,345 170 (118) 35,478 31,104 14.1 4.2Interconnect costs (3,980) (1,391) − 106 (5,265) (4,628)Other direct costs (2,064) (1,354) 76 − (3,342) (2,761)Acquisition costs (2,872) (939) − 1 (3,810) (3,281)Retention costs (1,756) (259) − − (2,015) (1,755)Operating expenses (5,719) (2,257) 97 11 (7,868) (6,719)Acquired intangibles amortisation (78) (648) − − (726) (414)Purchased licence amortisation (846) (63) − − (909) (892)Depreciation and other amortisation (2,985) (1,154) (205) − (4,344) (3,848)Share of result in associates(3) 425 2,449 2 − 2,876 2,725Adjusted operating profit 6,206 3,729 140 − 10,075 9,531 5.7 5.7Adjustments for: Impairment losses − (11,600) Other income and expense (28) 502 Non-operating income of associates − 3Operating profit/(loss) 10,047 (1,564)Non-operating income and expense 254 4Investment income 714 789Financing costs (2,014) (1,612)Profit/(loss) before taxation 9,001 (2,383)Income tax expense (2,245) (2,423)Profit/(loss) for the financial year from continuing operations 6,756 (4,806)Loss for the financial year from discontinued operations − (491)Profit/(loss) for the financial year 6,756 (5,297)
Notes:(1) Revenue relating to fixed line activities provided by mobile operators, previously classified within voice revenue, is now presented as fixed line revenue, together with revenue from fixed line
operators and fixed broadband. All prior periods have been adjusted accordingly. (2) Common functions represents the results of the partner markets and the net result of unallocated central Group costs and recharges to the Group’s operations, including royalty fees for use
of the Vodafone brand. (3) During the year ended 31 March 2008, the Group changed its organisational structure and the Group’s associated undertaking in France, SFR, is now managed within the Europe region and
reported within Other Europe. The results are presented in accordance with the new organisational structure.
RevenueRevenue increased by 14.1% to £35,478 million for the year ended 31 March 2008, with organic growth of 4.2%. The impact of acquisitions and disposals was 6.5 percentage points, primarily from acquisitions of subsidiaries in India in May 2007 and Turkey in May 2006 as well as the acquisition of Tele2’s fixed line communication and broadband operations in Italy and Spain in December 2007. Favourable exchange rate movements increased revenue by 3.4 percentage points, principally due to the 4.2% change in the average euro/£ exchange rate, as 60% of the Group’s revenue for the 2008 financial year was denominated in euro.
Revenue grew in the Europe and EMAPA regions by 6.1% and 45.1%, respectively, with growth in the EMAPA region benefiting from a 27.5 percentage point impact from acquisitions and disposals. On an organic basis, Europe recorded growth of 2.0%, while EMAPA delivered an increase of 14.5%. EMAPA accounted for 62.1% of the organic growth for the Group.
Organic revenue growth was driven by the higher customer base and successful usage stimulation initiatives, partially offset by ongoing price reductions and the impact of regulatory driven reductions. Growth in data revenue was particularly strong, up 40.6% on an organic basis to £2,180 million, reflecting an increasing penetration of mobile PC connectivity devices and improved service offerings.
Operating resultOperating profit increased to £10,047 million for the year ended 31 March 2008 from a loss of £1,564 million for the year ended 31 March 2007. The loss in the 2007 financial year was mainly the result of the £11,600 million of impairment charges that occurred in the year, compared with none in the 2008 financial year.
This section presents the Group’s operating performance for the 2008 financial year compared to the 2007 financial year and for the 2007 financial year compared to the 2006 financial year, providing commentary on how the revenue and the adjusted operating profit performance of the Group and its operating segments within the Europe and EMAPA regions have developed in the last three years.
32 Vodafone Group Plc Annual Report 2008
Vodafone – Performance
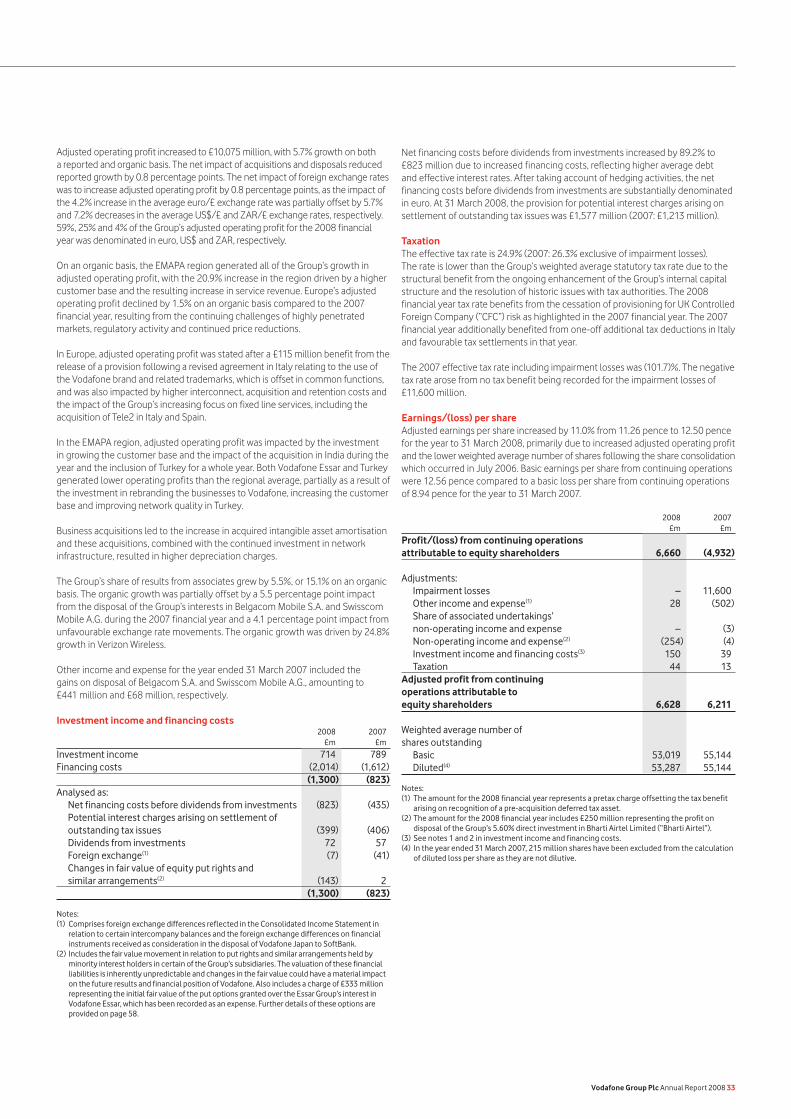
Adjusted operating profit increased to £10,075 million, with 5.7% growth on both a reported and organic basis. The net impact of acquisitions and disposals reduced reported growth by 0.8 percentage points. The net impact of foreign exchange rates was to increase adjusted operating profit by 0.8 percentage points, as the impact of the 4.2% increase in the average euro/£ exchange rate was partially offset by 5.7% and 7.2% decreases in the average US$/£ and ZAR/£ exchange rates, respectively. 59%, 25% and 4% of the Group’s adjusted operating profit for the 2008 financial year was denominated in euro, US$ and ZAR, respectively.
On an organic basis, the EMAPA region generated all of the Group’s growth in adjusted operating profit, with the 20.9% increase in the region driven by a higher customer base and the resulting increase in service revenue. Europe’s adjusted operating profit declined by 1.5% on an organic basis compared to the 2007 financial year, resulting from the continuing challenges of highly penetrated markets, regulatory activity and continued price reductions.
In Europe, adjusted operating profit was stated after a £115 million benefit from the release of a provision following a revised agreement in Italy relating to the use of the Vodafone brand and related trademarks, which is offset in common functions, and was also impacted by higher interconnect, acquisition and retention costs and the impact of the Group’s increasing focus on fixed line services, including the acquisition of Tele2 in Italy and Spain.
In the EMAPA region, adjusted operating profit was impacted by the investment in growing the customer base and the impact of the acquisition in India during the year and the inclusion of Turkey for a whole year. Both Vodafone Essar and Turkey generated lower operating profits than the regional average, partially as a result of the investment in rebranding the businesses to Vodafone, increasing the customer base and improving network quality in Turkey.
Business acquisitions led to the increase in acquired intangible asset amortisation and these acquisitions, combined with the continued investment in network infrastructure, resulted in higher depreciation charges.
The Group’s share of results from associates grew by 5.5%, or 15.1% on an organic basis. The organic growth was partially offset by a 5.5 percentage point impact from the disposal of the Group’s interests in Belgacom Mobile S.A. and Swisscom Mobile A.G. during the 2007 financial year and a 4.1 percentage point impact from unfavourable exchange rate movements. The organic growth was driven by 24.8% growth in Verizon Wireless.
Other income and expense for the year ended 31 March 2007 included the gains on disposal of Belgacom S.A. and Swisscom Mobile A.G., amounting to £441 million and £68 million, respectively.
Investment income and financing costs 2008 2007 £m £m
Investment income 714 789Financing costs (2,014) (1,612) (1,300) (823)Analysed as: Net financing costs before dividends from investments (823) (435) Potential interest charges arising on settlement of outstanding tax issues (399) (406) Dividends from investments 72 57 Foreign exchange(1) (7) (41) Changes in fair value of equity put rights and similar arrangements(2) (143) 2 (1,300) (823)
Notes:(1) Comprises foreign exchange differences reflected in the Consolidated Income Statement in
relation to certain intercompany balances and the foreign exchange differences on financial instruments received as consideration in the disposal of Vodafone Japan to SoftBank.
(2) Includes the fair value movement in relation to put rights and similar arrangements held by minority interest holders in certain of the Group’s subsidiaries. The valuation of these financial liabilities is inherently unpredictable and changes in the fair value could have a material impact on the future results and financial position of Vodafone. Also includes a charge of £333 million representing the initial fair value of the put options granted over the Essar Group’s interest in Vodafone Essar, which has been recorded as an expense. Further details of these options are provided on page 58.
Net financing costs before dividends from investments increased by 89.2% to £823 million due to increased financing costs, reflecting higher average debt and effective interest rates. After taking account of hedging activities, the net financing costs before dividends from investments are substantially denominated in euro. At 31 March 2008, the provision for potential interest charges arising on settlement of outstanding tax issues was £1,577 million (2007: £1,213 million).
TaxationThe effective tax rate is 24.9% (2007: 26.3% exclusive of impairment losses). The rate is lower than the Group’s weighted average statutory tax rate due to the structural benefit from the ongoing enhancement of the Group’s internal capital structure and the resolution of historic issues with tax authorities. The 2008 financial year tax rate benefits from the cessation of provisioning for UK Controlled Foreign Company (“CFC”) risk as highlighted in the 2007 financial year. The 2007 financial year additionally benefited from one-off additional tax deductions in Italy and favourable tax settlements in that year.
The 2007 effective tax rate including impairment losses was (101.7)%. The negative tax rate arose from no tax benefit being recorded for the impairment losses of £11,600 million.
Earnings/(loss) per shareAdjusted earnings per share increased by 11.0% from 11.26 pence to 12.50 pence for the year to 31 March 2008, primarily due to increased adjusted operating profit and the lower weighted average number of shares following the share consolidation which occurred in July 2006. Basic earnings per share from continuing operations were 12.56 pence compared to a basic loss per share from continuing operations of 8.94 pence for the year to 31 March 2007.
2008 2007 £m £m
Profit/(loss) from continuing operations attributable to equity shareholders 6,660 (4,932) Adjustments: Impairment losses – 11,600 Other income and expense(1) 28 (502) Share of associated undertakings’ non-operating income and expense – (3) Non-operating income and expense(2) (254) (4) Investment income and financing costs(3) 150 39 Taxation 44 13Adjusted profit from continuing operations attributable to equity shareholders 6,628 6,211 Weighted average number of shares outstanding Basic 53,019 55,144 Diluted(4) 53,287 55,144
Notes:(1) The amount for the 2008 financial year represents a pretax charge offsetting the tax benefit
arising on recognition of a pre-acquisition deferred tax asset. (2) The amount for the 2008 financial year includes £250 million representing the profit on
disposal of the Group’s 5.60% direct investment in Bharti Airtel Limited (“Bharti Airtel”).(3) See notes 1 and 2 in investment income and financing costs.(4) In the year ended 31 March 2007, 215 million shares have been excluded from the calculation
of diluted loss per share as they are not dilutive.
Vodafone Group Plc Annual Report 2008 33
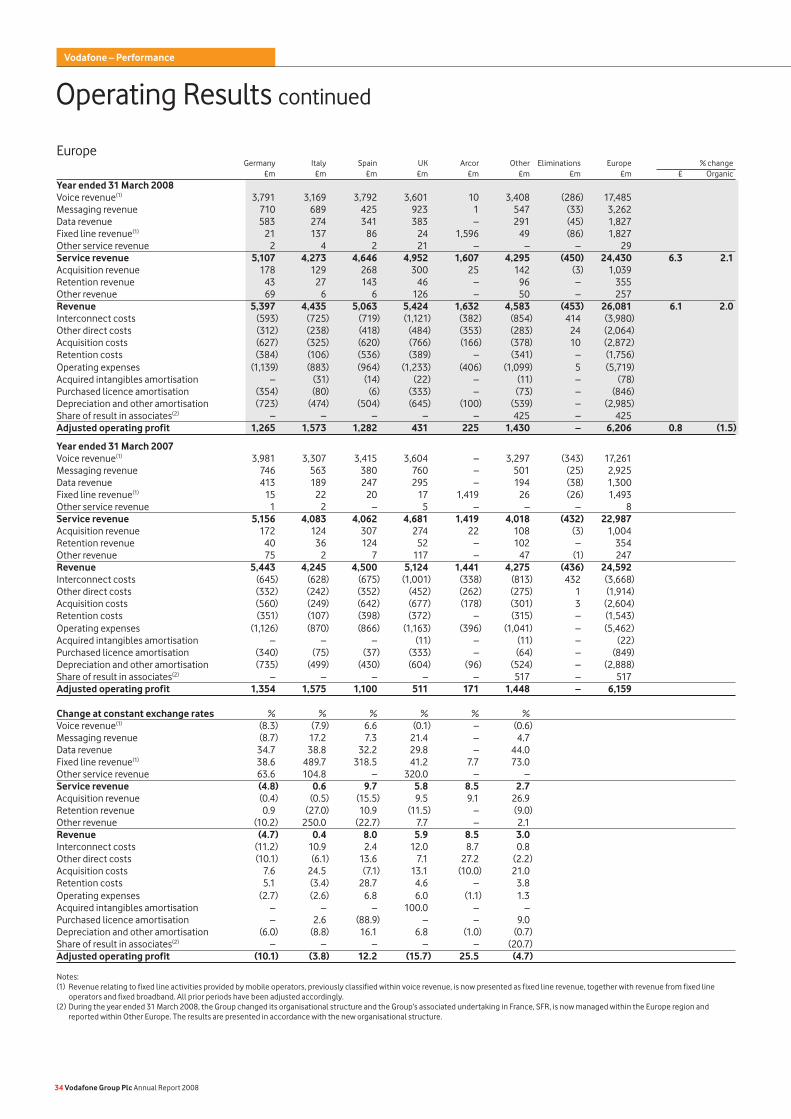
Operating Results continued
Europe Germany Italy Spain UK Arcor Other Eliminations Europe % change £m £m £m £m £m £m £m £m £ Organic
Year ended 31 March 2008 Voice revenue(1) 3,791 3,169 3,792 3,601 10 3,408 (286) 17,485 Messaging revenue 710 689 425 923 1 547 (33) 3,262 Data revenue 583 274 341 383 – 291 (45) 1,827 Fixed line revenue(1) 21 137 86 24 1,596 49 (86) 1,827 Other service revenue 2 4 2 21 – – – 29 Service revenue 5,107 4,273 4,646 4,952 1,607 4,295 (450) 24,430 6.3 2.1Acquisition revenue 178 129 268 300 25 142 (3) 1,039 Retention revenue 43 27 143 46 – 96 – 355 Other revenue 69 6 6 126 – 50 – 257 Revenue 5,397 4,435 5,063 5,424 1,632 4,583 (453) 26,081 6.1 2.0Interconnect costs (593) (725) (719) (1,121) (382) (854) 414 (3,980) Other direct costs (312) (238) (418) (484) (353) (283) 24 (2,064) Acquisition costs (627) (325) (620) (766) (166) (378) 10 (2,872) Retention costs (384) (106) (536) (389) – (341) – (1,756) Operating expenses (1,139) (883) (964) (1,233) (406) (1,099) 5 (5,719) Acquired intangibles amortisation – (31) (14) (22) – (11) – (78) Purchased licence amortisation (354) (80) (6) (333) – (73) – (846) Depreciation and other amortisation (723) (474) (504) (645) (100) (539) – (2,985) Share of result in associates(2) – – – – – 425 – 425 Adjusted operating profit 1,265 1,573 1,282 431 225 1,430 – 6,206 0.8 (1.5)
Year ended 31 March 2007 Voice revenue(1) 3,981 3,307 3,415 3,604 – 3,297 (343) 17,261 Messaging revenue 746 563 380 760 – 501 (25) 2,925 Data revenue 413 189 247 295 – 194 (38) 1,300 Fixed line revenue(1) 15 22 20 17 1,419 26 (26) 1,493 Other service revenue 1 2 – 5 – – – 8 Service revenue 5,156 4,083 4,062 4,681 1,419 4,018 (432) 22,987 Acquisition revenue 172 124 307 274 22 108 (3) 1,004 Retention revenue 40 36 124 52 – 102 – 354 Other revenue 75 2 7 117 – 47 (1) 247 Revenue 5,443 4,245 4,500 5,124 1,441 4,275 (436) 24,592 Interconnect costs (645) (628) (675) (1,001) (338) (813) 432 (3,668) Other direct costs (332) (242) (352) (452) (262) (275) 1 (1,914) Acquisition costs (560) (249) (642) (677) (178) (301) 3 (2,604) Retention costs (351) (107) (398) (372) – (315) – (1,543) Operating expenses (1,126) (870) (866) (1,163) (396) (1,041) – (5,462) Acquired intangibles amortisation – – – (11) – (11) – (22) Purchased licence amortisation (340) (75) (37) (333) – (64) – (849) Depreciation and other amortisation (735) (499) (430) (604) (96) (524) – (2,888) Share of result in associates(2) – – – – – 517 – 517 Adjusted operating profit 1,354 1,575 1,100 511 171 1,448 – 6,159 Change at constant exchange rates % % % % % % Voice revenue(1) (8.3) (7.9) 6.6 (0.1) – (0.6) Messaging revenue (8.7) 17.2 7.3 21.4 – 4.7 Data revenue 34.7 38.8 32.2 29.8 – 44.0 Fixed line revenue(1) 38.6 489.7 318.5 41.2 7.7 73.0 Other service revenue 63.6 104.8 – 320.0 – – Service revenue (4.8) 0.6 9.7 5.8 8.5 2.7 Acquisition revenue (0.4) (0.5) (15.5) 9.5 9.1 26.9 Retention revenue 0.9 (27.0) 10.9 (11.5) – (9.0) Other revenue (10.2) 250.0 (22.7) 7.7 – 2.1 Revenue (4.7) 0.4 8.0 5.9 8.5 3.0 Interconnect costs (11.2) 10.9 2.4 12.0 8.7 0.8 Other direct costs (10.1) (6.1) 13.6 7.1 27.2 (2.2) Acquisition costs 7.6 24.5 (7.1) 13.1 (10.0) 21.0 Retention costs 5.1 (3.4) 28.7 4.6 – 3.8 Operating expenses (2.7) (2.6) 6.8 6.0 (1.1) 1.3 Acquired intangibles amortisation – – – 100.0 – – Purchased licence amortisation – 2.6 (88.9) – – 9.0 Depreciation and other amortisation (6.0) (8.8) 16.1 6.8 (1.0) (0.7) Share of result in associates(2) – – – – – (20.7) Adjusted operating profit (10.1) (3.8) 12.2 (15.7) 25.5 (4.7)
Notes:(1) Revenue relating to fixed line activities provided by mobile operators, previously classified within voice revenue, is now presented as fixed line revenue, together with revenue from fixed line
operators and fixed broadband. All prior periods have been adjusted accordingly. (2) During the year ended 31 March 2008, the Group changed its organisational structure and the Group’s associated undertaking in France, SFR, is now managed within the Europe region and
reported within Other Europe. The results are presented in accordance with the new organisational structure.
34 Vodafone Group Plc Annual Report 2008
Vodafone – Performance
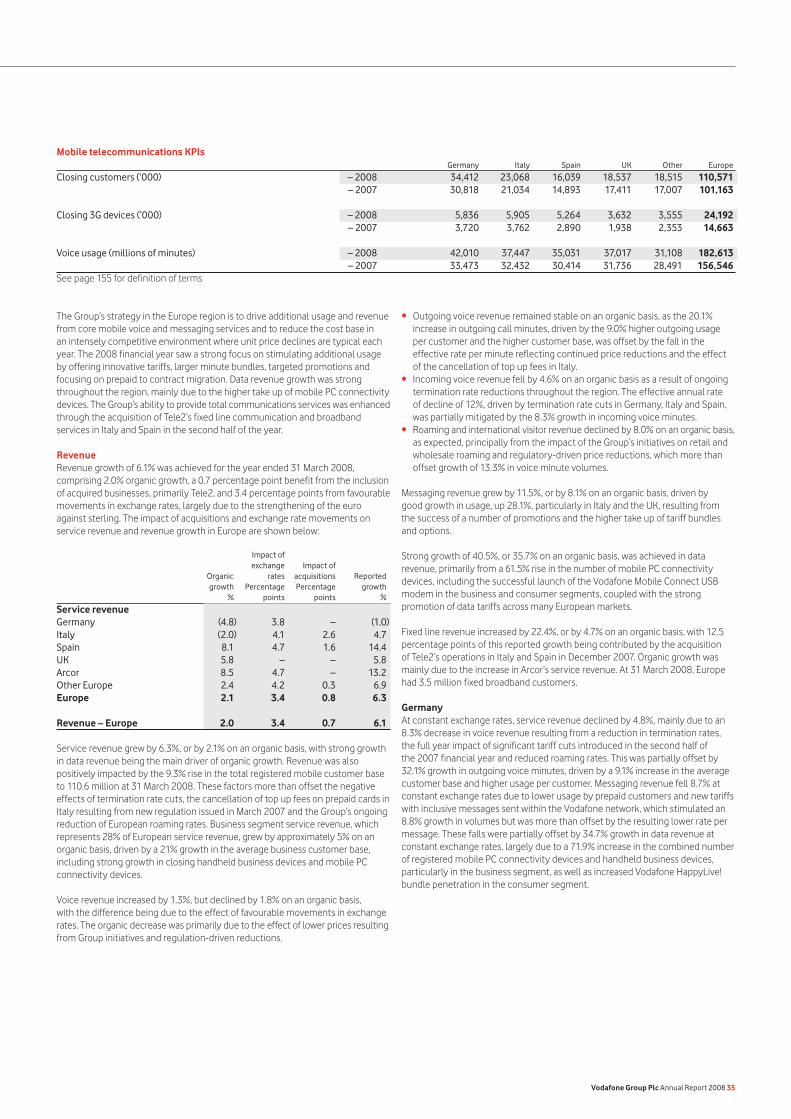
Mobile telecommunications KPIs Germany Italy Spain UK Other Europe
Closing customers (’000) – 2008 34,412 23,068 16,039 18,537 18,515 110,571 – 2007 30,818 21,034 14,893 17,411 17,007 101,163 Closing 3G devices (’000) – 2008 5,836 5,905 5,264 3,632 3,555 24,192 – 2007 3,720 3,762 2,890 1,938 2,353 14,663 Voice usage (millions of minutes) – 2008 42,010 37,447 35,031 37,017 31,108 182,613 – 2007 33,473 32,432 30,414 31,736 28,491 156,546See page 155 for definition of terms
The Group’s strategy in the Europe region is to drive additional usage and revenue from core mobile voice and messaging services and to reduce the cost base in an intensely competitive environment where unit price declines are typical each year. The 2008 financial year saw a strong focus on stimulating additional usage by offering innovative tariffs, larger minute bundles, targeted promotions and focusing on prepaid to contract migration. Data revenue growth was strong throughout the region, mainly due to the higher take up of mobile PC connectivity devices. The Group’s ability to provide total communications services was enhanced through the acquisition of Tele2’s fixed line communication and broadband services in Italy and Spain in the second half of the year.
RevenueRevenue growth of 6.1% was achieved for the year ended 31 March 2008, comprising 2.0% organic growth, a 0.7 percentage point benefit from the inclusion of acquired businesses, primarily Tele2, and 3.4 percentage points from favourable movements in exchange rates, largely due to the strengthening of the euro against sterling. The impact of acquisitions and exchange rate movements on service revenue and revenue growth in Europe are shown below:
Impact of exchange Impact of Organic rates acquisitions Reported growth Percentage Percentage growth % points points %
Service revenue Germany (4.8) 3.8 – (1.0)Italy (2.0) 4.1 2.6 4.7Spain 8.1 4.7 1.6 14.4UK 5.8 – – 5.8Arcor 8.5 4.7 – 13.2Other Europe 2.4 4.2 0.3 6.9Europe 2.1 3.4 0.8 6.3 Revenue – Europe 2.0 3.4 0.7 6.1
Service revenue grew by 6.3%, or by 2.1% on an organic basis, with strong growth in data revenue being the main driver of organic growth. Revenue was also positively impacted by the 9.3% rise in the total registered mobile customer base to 110.6 million at 31 March 2008. These factors more than offset the negative effects of termination rate cuts, the cancellation of top up fees on prepaid cards in Italy resulting from new regulation issued in March 2007 and the Group’s ongoing reduction of European roaming rates. Business segment service revenue, which represents 28% of European service revenue, grew by approximately 5% on an organic basis, driven by a 21% growth in the average business customer base, including strong growth in closing handheld business devices and mobile PC connectivity devices.
Voice revenue increased by 1.3%, but declined by 1.8% on an organic basis, with the difference being due to the effect of favourable movements in exchange rates. The organic decrease was primarily due to the effect of lower prices resulting from Group initiatives and regulation-driven reductions.
Outgoing voice revenue remained stable on an organic basis, as the 20.1% increase in outgoing call minutes, driven by the 9.0% higher outgoing usage per customer and the higher customer base, was offset by the fall in the effective rate per minute reflecting continued price reductions and the effect of the cancellation of top up fees in Italy. Incoming voice revenue fell by 4.6% on an organic basis as a result of ongoing termination rate reductions throughout the region. The effective annual rate of decline of 12%, driven by termination rate cuts in Germany, Italy and Spain, was partially mitigated by the 8.3% growth in incoming voice minutes. Roaming and international visitor revenue declined by 8.0% on an organic basis, as expected, principally from the impact of the Group’s initiatives on retail and wholesale roaming and regulatory-driven price reductions, which more than offset growth of 13.3% in voice minute volumes.
Messaging revenue grew by 11.5%, or by 8.1% on an organic basis, driven by good growth in usage, up 28.1%, particularly in Italy and the UK, resulting from the success of a number of promotions and the higher take up of tariff bundles and options.
Strong growth of 40.5%, or 35.7% on an organic basis, was achieved in data revenue, primarily from a 61.5% rise in the number of mobile PC connectivity devices, including the successful launch of the Vodafone Mobile Connect USB modem in the business and consumer segments, coupled with the strong promotion of data tariffs across many European markets.
Fixed line revenue increased by 22.4%, or by 4.7% on an organic basis, with 12.5 percentage points of this reported growth being contributed by the acquisition of Tele2’s operations in Italy and Spain in December 2007. Organic growth was mainly due to the increase in Arcor’s service revenue. At 31 March 2008, Europe had 3.5 million fixed broadband customers.
GermanyAt constant exchange rates, service revenue declined by 4.8%, mainly due to an 8.3% decrease in voice revenue resulting from a reduction in termination rates, the full year impact of significant tariff cuts introduced in the second half of the 2007 financial year and reduced roaming rates. This was partially offset by 32.1% growth in outgoing voice minutes, driven by a 9.1% increase in the average customer base and higher usage per customer. Messaging revenue fell 8.7% at constant exchange rates due to lower usage by prepaid customers and new tariffs with inclusive messages sent within the Vodafone network, which stimulated an 8.8% growth in volumes but was more than offset by the resulting lower rate per message. These falls were partially offset by 34.7% growth in data revenue at constant exchange rates, largely due to a 71.9% increase in the combined number of registered mobile PC connectivity devices and handheld business devices, particularly in the business segment, as well as increased Vodafone HappyLive! bundle penetration in the consumer segment.
•
•
•
Vodafone Group Plc Annual Report 2008 35
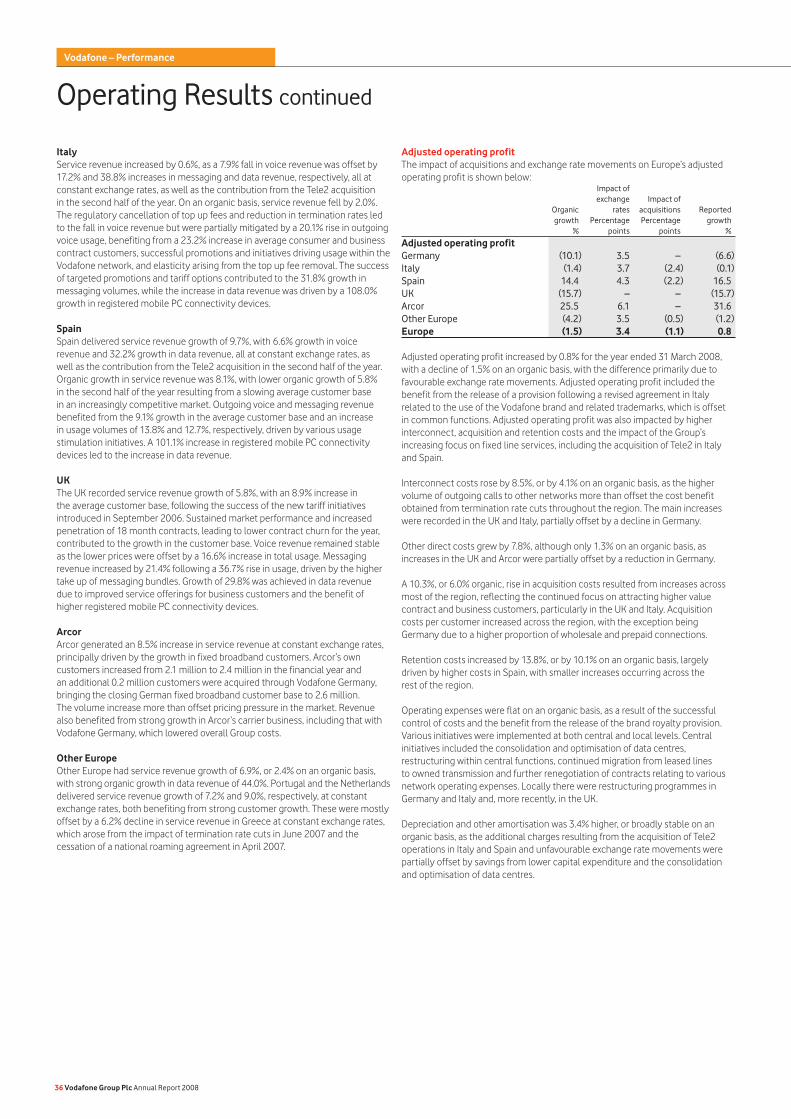
ItalyService revenue increased by 0.6%, as a 7.9% fall in voice revenue was offset by 17.2% and 38.8% increases in messaging and data revenue, respectively, all at constant exchange rates, as well as the contribution from the Tele2 acquisition in the second half of the year. On an organic basis, service revenue fell by 2.0%. The regulatory cancellation of top up fees and reduction in termination rates led to the fall in voice revenue but were partially mitigated by a 20.1% rise in outgoing voice usage, benefiting from a 23.2% increase in average consumer and business contract customers, successful promotions and initiatives driving usage within the Vodafone network, and elasticity arising from the top up fee removal. The success of targeted promotions and tariff options contributed to the 31.8% growth in messaging volumes, while the increase in data revenue was driven by a 108.0% growth in registered mobile PC connectivity devices.
SpainSpain delivered service revenue growth of 9.7%, with 6.6% growth in voice revenue and 32.2% growth in data revenue, all at constant exchange rates, as well as the contribution from the Tele2 acquisition in the second half of the year. Organic growth in service revenue was 8.1%, with lower organic growth of 5.8% in the second half of the year resulting from a slowing average customer base in an increasingly competitive market. Outgoing voice and messaging revenue benefited from the 9.1% growth in the average customer base and an increase in usage volumes of 13.8% and 12.7%, respectively, driven by various usage stimulation initiatives. A 101.1% increase in registered mobile PC connectivity devices led to the increase in data revenue.
UKThe UK recorded service revenue growth of 5.8%, with an 8.9% increase in the average customer base, following the success of the new tariff initiatives introduced in September 2006. Sustained market performance and increased penetration of 18 month contracts, leading to lower contract churn for the year, contributed to the growth in the customer base. Voice revenue remained stable as the lower prices were offset by a 16.6% increase in total usage. Messaging revenue increased by 21.4% following a 36.7% rise in usage, driven by the higher take up of messaging bundles. Growth of 29.8% was achieved in data revenue due to improved service offerings for business customers and the benefit of higher registered mobile PC connectivity devices.
ArcorArcor generated an 8.5% increase in service revenue at constant exchange rates, principally driven by the growth in fixed broadband customers. Arcor’s own customers increased from 2.1 million to 2.4 million in the financial year and an additional 0.2 million customers were acquired through Vodafone Germany, bringing the closing German fixed broadband customer base to 2.6 million. The volume increase more than offset pricing pressure in the market. Revenue also benefited from strong growth in Arcor’s carrier business, including that with Vodafone Germany, which lowered overall Group costs.
Other EuropeOther Europe had service revenue growth of 6.9%, or 2.4% on an organic basis, with strong organic growth in data revenue of 44.0%. Portugal and the Netherlands delivered service revenue growth of 7.2% and 9.0%, respectively, at constant exchange rates, both benefiting from strong customer growth. These were mostly offset by a 6.2% decline in service revenue in Greece at constant exchange rates, which arose from the impact of termination rate cuts in June 2007 and the cessation of a national roaming agreement in April 2007.
Adjusted operating profitThe impact of acquisitions and exchange rate movements on Europe’s adjusted operating profit is shown below: Impact of exchange Impact of Organic rates acquisitions Reported growth Percentage Percentage growth % points points %
Adjusted operating profit Germany (10.1) 3.5 – (6.6)Italy (1.4) 3.7 (2.4) (0.1)Spain 14.4 4.3 (2.2) 16.5UK (15.7) – – (15.7)Arcor 25.5 6.1 – 31.6Other Europe (4.2) 3.5 (0.5) (1.2)Europe (1.5) 3.4 (1.1) 0.8
Adjusted operating profit increased by 0.8% for the year ended 31 March 2008, with a decline of 1.5% on an organic basis, with the difference primarily due to favourable exchange rate movements. Adjusted operating profit included the benefit from the release of a provision following a revised agreement in Italy related to the use of the Vodafone brand and related trademarks, which is offset in common functions. Adjusted operating profit was also impacted by higher interconnect, acquisition and retention costs and the impact of the Group’s increasing focus on fixed line services, including the acquisition of Tele2 in Italy and Spain.
Interconnect costs rose by 8.5%, or by 4.1% on an organic basis, as the higher volume of outgoing calls to other networks more than offset the cost benefit obtained from termination rate cuts throughout the region. The main increases were recorded in the UK and Italy, partially offset by a decline in Germany.
Other direct costs grew by 7.8%, although only 1.3% on an organic basis, as increases in the UK and Arcor were partially offset by a reduction in Germany.
A 10.3%, or 6.0% organic, rise in acquisition costs resulted from increases across most of the region, reflecting the continued focus on attracting higher value contract and business customers, particularly in the UK and Italy. Acquisition costs per customer increased across the region, with the exception being Germany due to a higher proportion of wholesale and prepaid connections.
Retention costs increased by 13.8%, or by 10.1% on an organic basis, largely driven by higher costs in Spain, with smaller increases occurring across the rest of the region.
Operating expenses were flat on an organic basis, as a result of the successful control of costs and the benefit from the release of the brand royalty provision. Various initiatives were implemented at both central and local levels. Central initiatives included the consolidation and optimisation of data centres, restructuring within central functions, continued migration from leased lines to owned transmission and further renegotiation of contracts relating to various network operating expenses. Locally there were restructuring programmes in Germany and Italy and, more recently, in the UK.
Depreciation and other amortisation was 3.4% higher, or broadly stable on an organic basis, as the additional charges resulting from the acquisition of Tele2 operations in Italy and Spain and unfavourable exchange rate movements were partially offset by savings from lower capital expenditure and the consolidation and optimisation of data centres.
36 Vodafone Group Plc Annual Report 2008
Vodafone – Performance
Operating Results continued
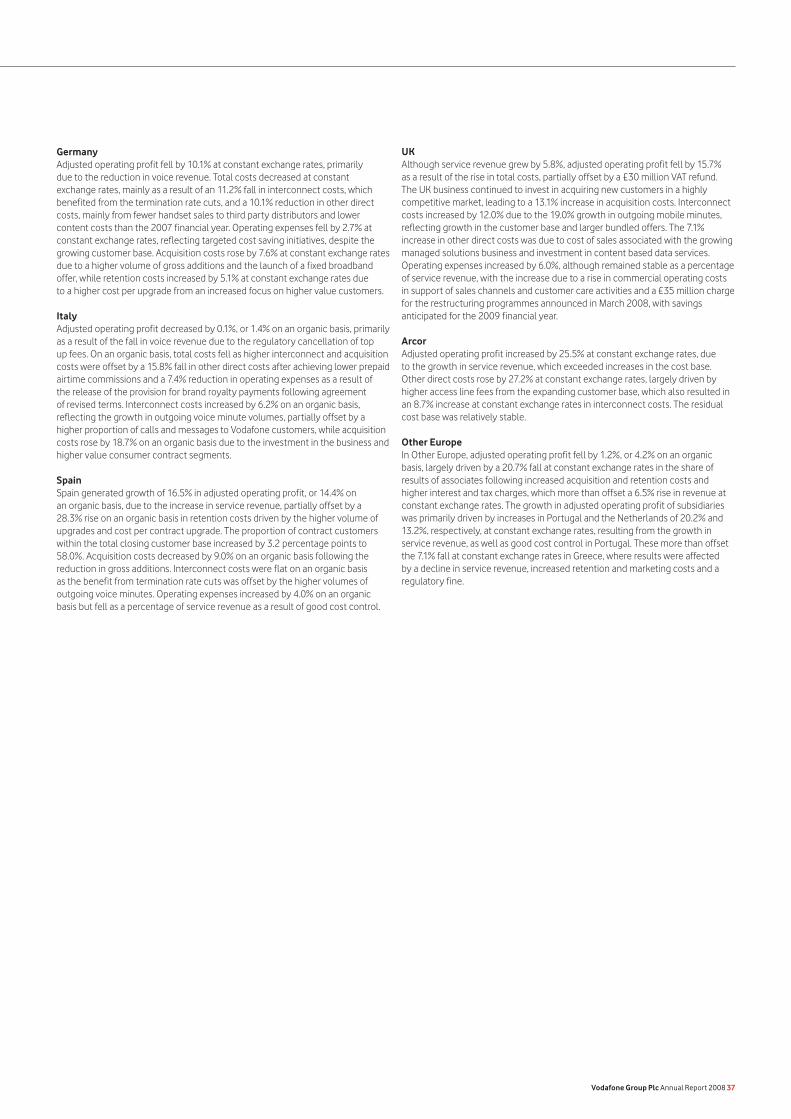
GermanyAdjusted operating profit fell by 10.1% at constant exchange rates, primarily due to the reduction in voice revenue. Total costs decreased at constant exchange rates, mainly as a result of an 11.2% fall in interconnect costs, which benefited from the termination rate cuts, and a 10.1% reduction in other direct costs, mainly from fewer handset sales to third party distributors and lower content costs than the 2007 financial year. Operating expenses fell by 2.7% at constant exchange rates, reflecting targeted cost saving initiatives, despite the growing customer base. Acquisition costs rose by 7.6% at constant exchange rates due to a higher volume of gross additions and the launch of a fixed broadband offer, while retention costs increased by 5.1% at constant exchange rates due to a higher cost per upgrade from an increased focus on higher value customers.
Italy Adjusted operating profit decreased by 0.1%, or 1.4% on an organic basis, primarily as a result of the fall in voice revenue due to the regulatory cancellation of top up fees. On an organic basis, total costs fell as higher interconnect and acquisition costs were offset by a 15.8% fall in other direct costs after achieving lower prepaid airtime commissions and a 7.4% reduction in operating expenses as a result of the release of the provision for brand royalty payments following agreement of revised terms. Interconnect costs increased by 6.2% on an organic basis, reflecting the growth in outgoing voice minute volumes, partially offset by a higher proportion of calls and messages to Vodafone customers, while acquisition costs rose by 18.7% on an organic basis due to the investment in the business and higher value consumer contract segments.
SpainSpain generated growth of 16.5% in adjusted operating profit, or 14.4% on an organic basis, due to the increase in service revenue, partially offset by a 28.3% rise on an organic basis in retention costs driven by the higher volume of upgrades and cost per contract upgrade. The proportion of contract customers within the total closing customer base increased by 3.2 percentage points to 58.0%. Acquisition costs decreased by 9.0% on an organic basis following the reduction in gross additions. Interconnect costs were flat on an organic basis as the benefit from termination rate cuts was offset by the higher volumes of outgoing voice minutes. Operating expenses increased by 4.0% on an organic basis but fell as a percentage of service revenue as a result of good cost control.
UK Although service revenue grew by 5.8%, adjusted operating profit fell by 15.7% as a result of the rise in total costs, partially offset by a £30 million VAT refund. The UK business continued to invest in acquiring new customers in a highly competitive market, leading to a 13.1% increase in acquisition costs. Interconnect costs increased by 12.0% due to the 19.0% growth in outgoing mobile minutes, reflecting growth in the customer base and larger bundled offers. The 7.1% increase in other direct costs was due to cost of sales associated with the growing managed solutions business and investment in content based data services. Operating expenses increased by 6.0%, although remained stable as a percentage of service revenue, with the increase due to a rise in commercial operating costs in support of sales channels and customer care activities and a £35 million charge for the restructuring programmes announced in March 2008, with savings anticipated for the 2009 financial year.
ArcorAdjusted operating profit increased by 25.5% at constant exchange rates, due to the growth in service revenue, which exceeded increases in the cost base. Other direct costs rose by 27.2% at constant exchange rates, largely driven by higher access line fees from the expanding customer base, which also resulted in an 8.7% increase at constant exchange rates in interconnect costs. The residual cost base was relatively stable.
Other EuropeIn Other Europe, adjusted operating profit fell by 1.2%, or 4.2% on an organic basis, largely driven by a 20.7% fall at constant exchange rates in the share of results of associates following increased acquisition and retention costs and higher interest and tax charges, which more than offset a 6.5% rise in revenue at constant exchange rates. The growth in adjusted operating profit of subsidiaries was primarily driven by increases in Portugal and the Netherlands of 20.2% and 13.2%, respectively, at constant exchange rates, resulting from the growth in service revenue, as well as good cost control in Portugal. These more than offset the 7.1% fall at constant exchange rates in Greece, where results were affected by a decline in service revenue, increased retention and marketing costs and a regulatory fine.
Vodafone Group Plc Annual Report 2008 37
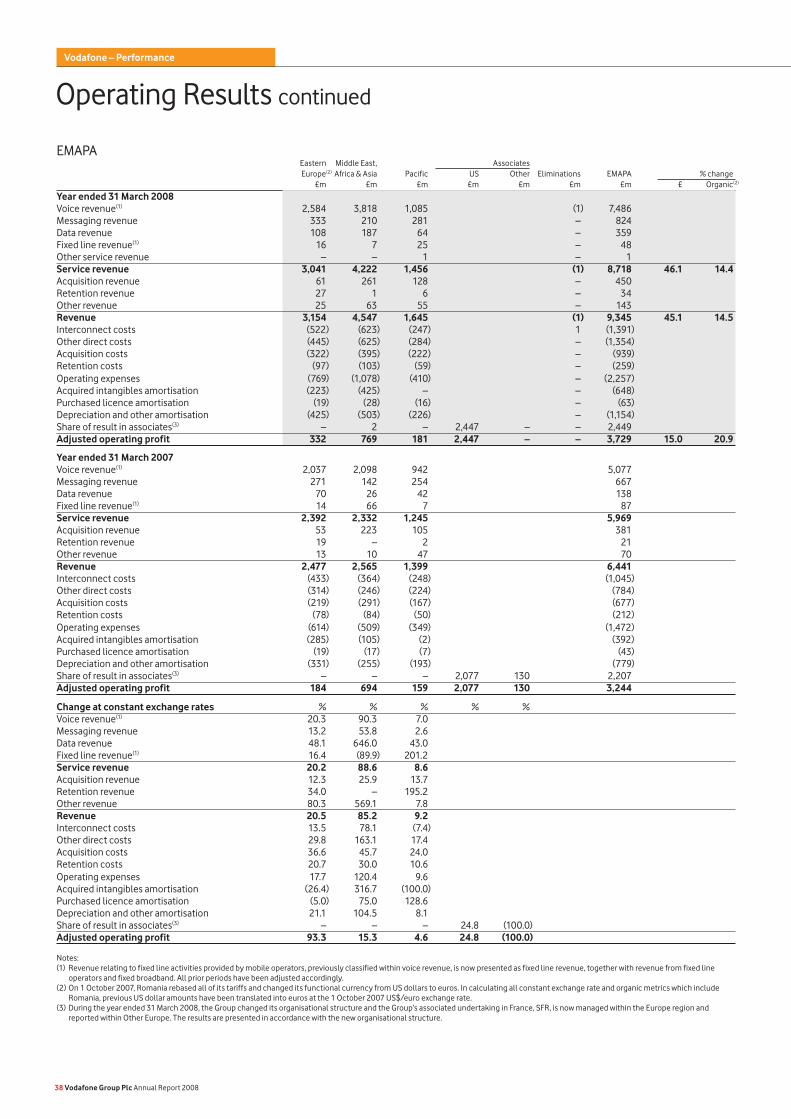
EMAPA Eastern Middle East, Associates Europe(2) Africa & Asia Pacific US Other Eliminations EMAPA % change £m £m £m £m £m £m £m £ Organic(2)
Year ended 31 March 2008 Voice revenue(1) 2,584 3,818 1,085 (1) 7,486 Messaging revenue 333 210 281 – 824 Data revenue 108 187 64 – 359 Fixed line revenue(1) 16 7 25 – 48 Other service revenue – – 1 – 1 Service revenue 3,041 4,222 1,456 (1) 8,718 46.1 14.4Acquisition revenue 61 261 128 – 450 Retention revenue 27 1 6 – 34 Other revenue 25 63 55 – 143 Revenue 3,154 4,547 1,645 (1) 9,345 45.1 14.5Interconnect costs (522) (623) (247) 1 (1,391) Other direct costs (445) (625) (284) – (1,354) Acquisition costs (322) (395) (222) – (939) Retention costs (97) (103) (59) – (259) Operating expenses (769) (1,078) (410) – (2,257) Acquired intangibles amortisation (223) (425) – – (648) Purchased licence amortisation (19) (28) (16) – (63) Depreciation and other amortisation (425) (503) (226) – (1,154) Share of result in associates(3) – 2 – 2,447 – – 2,449 Adjusted operating profit 332 769 181 2,447 – – 3,729 15.0 20.9 Year ended 31 March 2007 Voice revenue(1) 2,037 2,098 942 5,077 Messaging revenue 271 142 254 667 Data revenue 70 26 42 138 Fixed line revenue(1) 14 66 7 87 Service revenue 2,392 2,332 1,245 5,969 Acquisition revenue 53 223 105 381 Retention revenue 19 – 2 21 Other revenue 13 10 47 70 Revenue 2,477 2,565 1,399 6,441 Interconnect costs (433) (364) (248) (1,045) Other direct costs (314) (246) (224) (784) Acquisition costs (219) (291) (167) (677) Retention costs (78) (84) (50) (212) Operating expenses (614) (509) (349) (1,472) Acquired intangibles amortisation (285) (105) (2) (392) Purchased licence amortisation (19) (17) (7) (43) Depreciation and other amortisation (331) (255) (193) (779) Share of result in associates(3) – – – 2,077 130 2,207 Adjusted operating profit 184 694 159 2,077 130 3,244 Change at constant exchange rates % % % % % Voice revenue(1) 20.3 90.3 7.0 Messaging revenue 13.2 53.8 2.6 Data revenue 48.1 646.0 43.0 Fixed line revenue(1) 16.4 (89.9) 201.2 Service revenue 20.2 88.6 8.6 Acquisition revenue 12.3 25.9 13.7 Retention revenue 34.0 – 195.2 Other revenue 80.3 569.1 7.8 Revenue 20.5 85.2 9.2 Interconnect costs 13.5 78.1 (7.4) Other direct costs 29.8 163.1 17.4 Acquisition costs 36.6 45.7 24.0 Retention costs 20.7 30.0 10.6 Operating expenses 17.7 120.4 9.6 Acquired intangibles amortisation (26.4) 316.7 (100.0) Purchased licence amortisation (5.0) 75.0 128.6 Depreciation and other amortisation 21.1 104.5 8.1 Share of result in associates(3) – – – 24.8 (100.0) Adjusted operating profit 93.3 15.3 4.6 24.8 (100.0)
Notes:(1) Revenue relating to fixed line activities provided by mobile operators, previously classified within voice revenue, is now presented as fixed line revenue, together with revenue from fixed line
operators and fixed broadband. All prior periods have been adjusted accordingly. (2) On 1 October 2007, Romania rebased all of its tariffs and changed its functional currency from US dollars to euros. In calculating all constant exchange rate and organic metrics which include
Romania, previous US dollar amounts have been translated into euros at the 1 October 2007 US$/euro exchange rate.(3) During the year ended 31 March 2008, the Group changed its organisational structure and the Group’s associated undertaking in France, SFR, is now managed within the Europe region and
reported within Other Europe. The results are presented in accordance with the new organisational structure.
Operating Results continued
38 Vodafone Group Plc Annual Report 2008
Vodafone – PerformanceVodafone – Performance
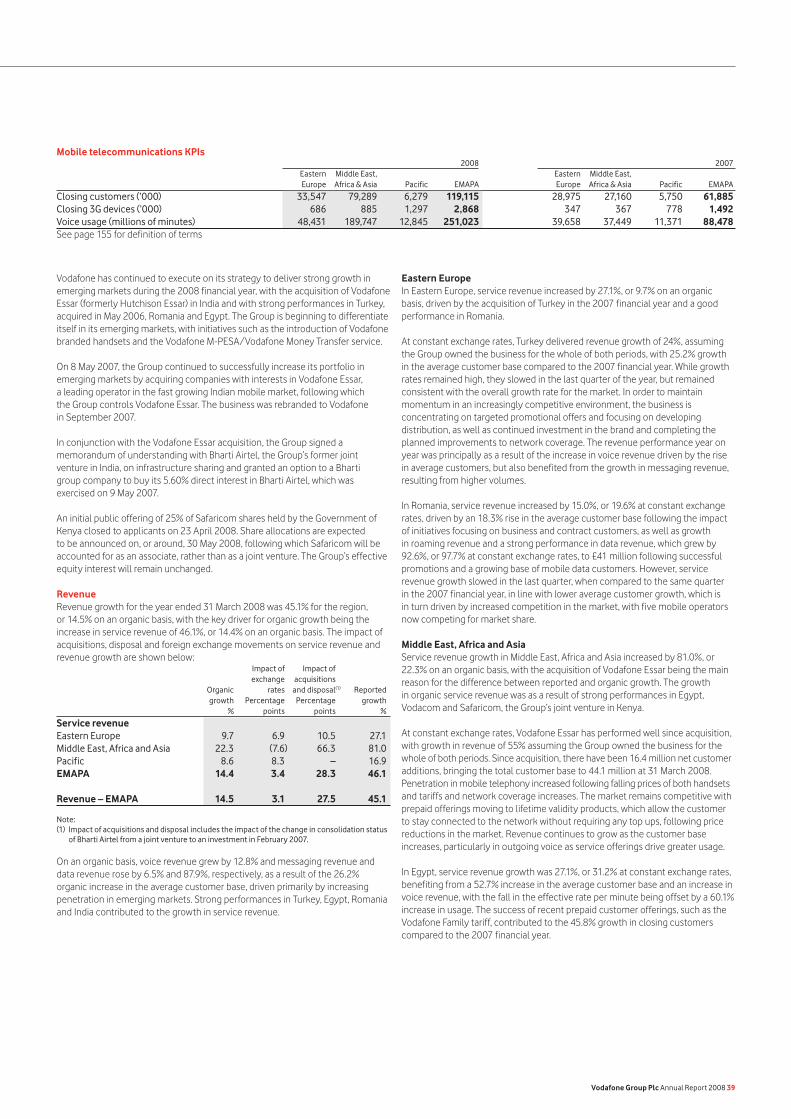
Mobile telecommunications KPIs 2008 2007 Eastern Middle East, Eastern Middle East, Europe Africa & Asia Pacific EMAPA Europe Africa & Asia Pacific EMAPA
Closing customers (’000) 33,547 79,289 6,279 119,115 28,975 27,160 5,750 61,885Closing 3G devices (’000) 686 885 1,297 2,868 347 367 778 1,492Voice usage (millions of minutes) 48,431 189,747 12,845 251,023 39,658 37,449 11,371 88,478See page 155 for definition of terms
Vodafone has continued to execute on its strategy to deliver strong growth in emerging markets during the 2008 financial year, with the acquisition of Vodafone Essar (formerly Hutchison Essar) in India and with strong performances in Turkey, acquired in May 2006, Romania and Egypt. The Group is beginning to differentiate itself in its emerging markets, with initiatives such as the introduction of Vodafone branded handsets and the Vodafone M-PESA/Vodafone Money Transfer service.
On 8 May 2007, the Group continued to successfully increase its portfolio in emerging markets by acquiring companies with interests in Vodafone Essar, a leading operator in the fast growing Indian mobile market, following which the Group controls Vodafone Essar. The business was rebranded to Vodafone in September 2007.
In conjunction with the Vodafone Essar acquisition, the Group signed a memorandum of understanding with Bharti Airtel, the Group’s former joint venture in India, on infrastructure sharing and granted an option to a Bharti group company to buy its 5.60% direct interest in Bharti Airtel, which was exercised on 9 May 2007.
An initial public offering of 25% of Safaricom shares held by the Government of Kenya closed to applicants on 23 April 2008. Share allocations are expected to be announced on, or around, 30 May 2008, following which Safaricom will be accounted for as an associate, rather than as a joint venture. The Group’s effective equity interest will remain unchanged.
RevenueRevenue growth for the year ended 31 March 2008 was 45.1% for the region, or 14.5% on an organic basis, with the key driver for organic growth being the increase in service revenue of 46.1%, or 14.4% on an organic basis. The impact of acquisitions, disposal and foreign exchange movements on service revenue and revenue growth are shown below: Impact of Impact of exchange acquisitions Organic rates and disposal(1) Reported growth Percentage Percentage growth % points points %
Service revenue Eastern Europe 9.7 6.9 10.5 27.1Middle East, Africa and Asia 22.3 (7.6) 66.3 81.0Pacific 8.6 8.3 – 16.9EMAPA 14.4 3.4 28.3 46.1 Revenue – EMAPA 14.5 3.1 27.5 45.1
Note:(1) Impact of acquisitions and disposal includes the impact of the change in consolidation status
of Bharti Airtel from a joint venture to an investment in February 2007.
On an organic basis, voice revenue grew by 12.8% and messaging revenue and data revenue rose by 6.5% and 87.9%, respectively, as a result of the 26.2% organic increase in the average customer base, driven primarily by increasing penetration in emerging markets. Strong performances in Turkey, Egypt, Romania and India contributed to the growth in service revenue.
Eastern EuropeIn Eastern Europe, service revenue increased by 27.1%, or 9.7% on an organic basis, driven by the acquisition of Turkey in the 2007 financial year and a good performance in Romania.
At constant exchange rates, Turkey delivered revenue growth of 24%, assuming the Group owned the business for the whole of both periods, with 25.2% growth in the average customer base compared to the 2007 financial year. While growth rates remained high, they slowed in the last quarter of the year, but remained consistent with the overall growth rate for the market. In order to maintain momentum in an increasingly competitive environment, the business is concentrating on targeted promotional offers and focusing on developing distribution, as well as continued investment in the brand and completing the planned improvements to network coverage. The revenue performance year on year was principally as a result of the increase in voice revenue driven by the rise in average customers, but also benefited from the growth in messaging revenue, resulting from higher volumes.
In Romania, service revenue increased by 15.0%, or 19.6% at constant exchange rates, driven by an 18.3% rise in the average customer base following the impact of initiatives focusing on business and contract customers, as well as growth in roaming revenue and a strong performance in data revenue, which grew by 92.6%, or 97.7% at constant exchange rates, to £41 million following successful promotions and a growing base of mobile data customers. However, service revenue growth slowed in the last quarter, when compared to the same quarter in the 2007 financial year, in line with lower average customer growth, which is in turn driven by increased competition in the market, with five mobile operators now competing for market share.
Middle East, Africa and AsiaService revenue growth in Middle East, Africa and Asia increased by 81.0%, or 22.3% on an organic basis, with the acquisition of Vodafone Essar being the main reason for the difference between reported and organic growth. The growth in organic service revenue was as a result of strong performances in Egypt, Vodacom and Safaricom, the Group’s joint venture in Kenya.
At constant exchange rates, Vodafone Essar has performed well since acquisition, with growth in revenue of 55% assuming the Group owned the business for the whole of both periods. Since acquisition, there have been 16.4 million net customer additions, bringing the total customer base to 44.1 million at 31 March 2008. Penetration in mobile telephony increased following falling prices of both handsets and tariffs and network coverage increases. The market remains competitive with prepaid offerings moving to lifetime validity products, which allow the customer to stay connected to the network without requiring any top ups, following price reductions in the market. Revenue continues to grow as the customer base increases, particularly in outgoing voice as service offerings drive greater usage.
In Egypt, service revenue growth was 27.1%, or 31.2% at constant exchange rates, benefiting from a 52.7% increase in the average customer base and an increase in voice revenue, with the fall in the effective rate per minute being offset by a 60.1% increase in usage. The success of recent prepaid customer offerings, such as the Vodafone Family tariff, contributed to the 45.8% growth in closing customers compared to the 2007 financial year.
Vodafone Group Plc Annual Report 2008 39
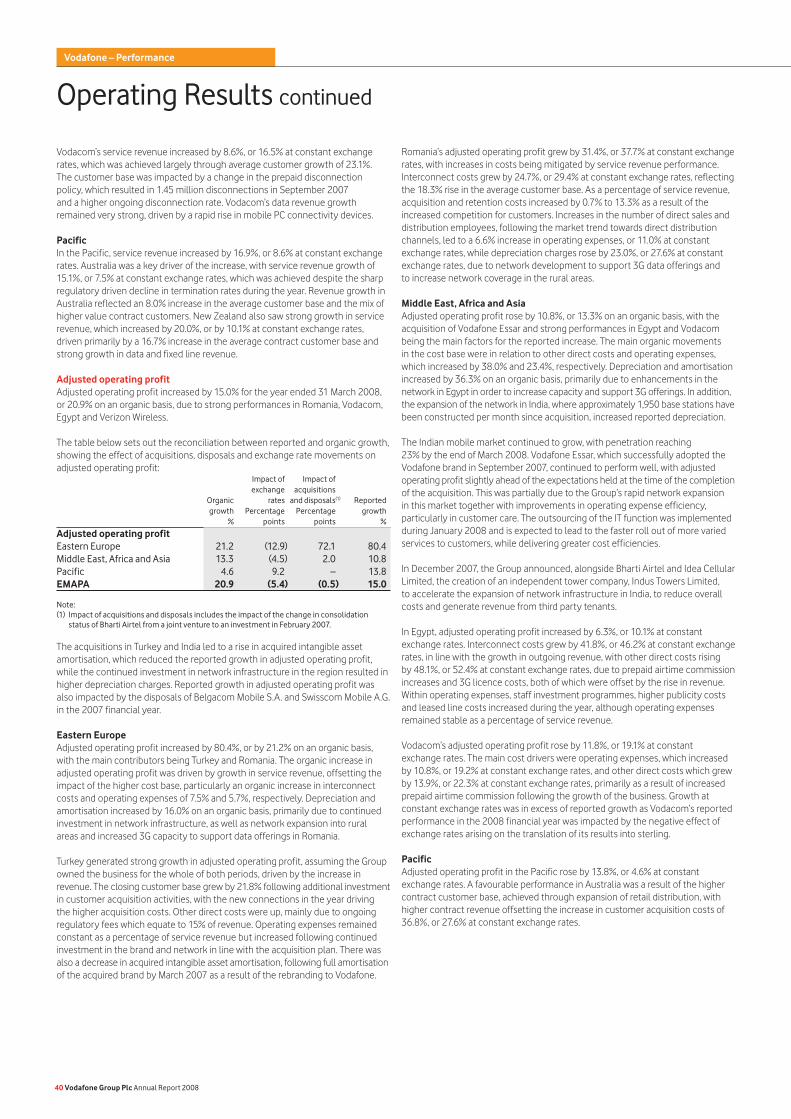
Vodacom’s service revenue increased by 8.6%, or 16.5% at constant exchange rates, which was achieved largely through average customer growth of 23.1%. The customer base was impacted by a change in the prepaid disconnection policy, which resulted in 1.45 million disconnections in September 2007 and a higher ongoing disconnection rate. Vodacom’s data revenue growth remained very strong, driven by a rapid rise in mobile PC connectivity devices.
PacificIn the Pacific, service revenue increased by 16.9%, or 8.6% at constant exchange rates. Australia was a key driver of the increase, with service revenue growth of 15.1%, or 7.5% at constant exchange rates, which was achieved despite the sharp regulatory driven decline in termination rates during the year. Revenue growth in Australia reflected an 8.0% increase in the average customer base and the mix of higher value contract customers. New Zealand also saw strong growth in service revenue, which increased by 20.0%, or by 10.1% at constant exchange rates, driven primarily by a 16.7% increase in the average contract customer base and strong growth in data and fixed line revenue.
Adjusted operating profitAdjusted operating profit increased by 15.0% for the year ended 31 March 2008, or 20.9% on an organic basis, due to strong performances in Romania, Vodacom, Egypt and Verizon Wireless.
The table below sets out the reconciliation between reported and organic growth, showing the effect of acquisitions, disposals and exchange rate movements on adjusted operating profit: Impact of Impact of exchange acquisitions Organic rates and disposals(1) Reported growth Percentage Percentage growth % points points %
Adjusted operating profit Eastern Europe 21.2 (12.9) 72.1 80.4Middle East, Africa and Asia 13.3 (4.5) 2.0 10.8Pacific 4.6 9.2 – 13.8EMAPA 20.9 (5.4) (0.5) 15.0
Note:(1) Impact of acquisitions and disposals includes the impact of the change in consolidation
status of Bharti Airtel from a joint venture to an investment in February 2007.
The acquisitions in Turkey and India led to a rise in acquired intangible asset amortisation, which reduced the reported growth in adjusted operating profit, while the continued investment in network infrastructure in the region resulted in higher depreciation charges. Reported growth in adjusted operating profit was also impacted by the disposals of Belgacom Mobile S.A. and Swisscom Mobile A.G. in the 2007 financial year.
Eastern EuropeAdjusted operating profit increased by 80.4%, or by 21.2% on an organic basis, with the main contributors being Turkey and Romania. The organic increase in adjusted operating profit was driven by growth in service revenue, offsetting the impact of the higher cost base, particularly an organic increase in interconnect costs and operating expenses of 7.5% and 5.7%, respectively. Depreciation and amortisation increased by 16.0% on an organic basis, primarily due to continued investment in network infrastructure, as well as network expansion into rural areas and increased 3G capacity to support data offerings in Romania.
Turkey generated strong growth in adjusted operating profit, assuming the Group owned the business for the whole of both periods, driven by the increase in revenue. The closing customer base grew by 21.8% following additional investment in customer acquisition activities, with the new connections in the year driving the higher acquisition costs. Other direct costs were up, mainly due to ongoing regulatory fees which equate to 15% of revenue. Operating expenses remained constant as a percentage of service revenue but increased following continued investment in the brand and network in line with the acquisition plan. There was also a decrease in acquired intangible asset amortisation, following full amortisation of the acquired brand by March 2007 as a result of the rebranding to Vodafone.
Romania’s adjusted operating profit grew by 31.4%, or 37.7% at constant exchange rates, with increases in costs being mitigated by service revenue performance. Interconnect costs grew by 24.7%, or 29.4% at constant exchange rates, reflecting the 18.3% rise in the average customer base. As a percentage of service revenue, acquisition and retention costs increased by 0.7% to 13.3% as a result of the increased competition for customers. Increases in the number of direct sales and distribution employees, following the market trend towards direct distribution channels, led to a 6.6% increase in operating expenses, or 11.0% at constant exchange rates, while depreciation charges rose by 23.0%, or 27.6% at constant exchange rates, due to network development to support 3G data offerings and to increase network coverage in the rural areas.
Middle East, Africa and AsiaAdjusted operating profit rose by 10.8%, or 13.3% on an organic basis, with the acquisition of Vodafone Essar and strong performances in Egypt and Vodacom being the main factors for the reported increase. The main organic movements in the cost base were in relation to other direct costs and operating expenses, which increased by 38.0% and 23.4%, respectively. Depreciation and amortisation increased by 36.3% on an organic basis, primarily due to enhancements in the network in Egypt in order to increase capacity and support 3G offerings. In addition, the expansion of the network in India, where approximately 1,950 base stations have been constructed per month since acquisition, increased reported depreciation.
The Indian mobile market continued to grow, with penetration reaching 23% by the end of March 2008. Vodafone Essar, which successfully adopted the Vodafone brand in September 2007, continued to perform well, with adjusted operating profit slightly ahead of the expectations held at the time of the completion of the acquisition. This was partially due to the Group’s rapid network expansion in this market together with improvements in operating expense efficiency, particularly in customer care. The outsourcing of the IT function was implemented during January 2008 and is expected to lead to the faster roll out of more varied services to customers, while delivering greater cost efficiencies.
In December 2007, the Group announced, alongside Bharti Airtel and Idea Cellular Limited, the creation of an independent tower company, Indus Towers Limited, to accelerate the expansion of network infrastructure in India, to reduce overall costs and generate revenue from third party tenants.
In Egypt, adjusted operating profit increased by 6.3%, or 10.1% at constant exchange rates. Interconnect costs grew by 41.8%, or 46.2% at constant exchange rates, in line with the growth in outgoing revenue, with other direct costs rising by 48.1%, or 52.4% at constant exchange rates, due to prepaid airtime commission increases and 3G licence costs, both of which were offset by the rise in revenue. Within operating expenses, staff investment programmes, higher publicity costs and leased line costs increased during the year, although operating expenses remained stable as a percentage of service revenue.
Vodacom’s adjusted operating profit rose by 11.8%, or 19.1% at constant exchange rates. The main cost drivers were operating expenses, which increased by 10.8%, or 19.2% at constant exchange rates, and other direct costs which grew by 13.9%, or 22.3% at constant exchange rates, primarily as a result of increased prepaid airtime commission following the growth of the business. Growth at constant exchange rates was in excess of reported growth as Vodacom’s reported performance in the 2008 financial year was impacted by the negative effect of exchange rates arising on the translation of its results into sterling.
PacificAdjusted operating profit in the Pacific rose by 13.8%, or 4.6% at constant exchange rates. A favourable performance in Australia was a result of the higher contract customer base, achieved through expansion of retail distribution, with higher contract revenue offsetting the increase in customer acquisition costs of 36.8%, or 27.6% at constant exchange rates.
40 Vodafone Group Plc Annual Report 2008
Vodafone – Performance
Operating Results continued
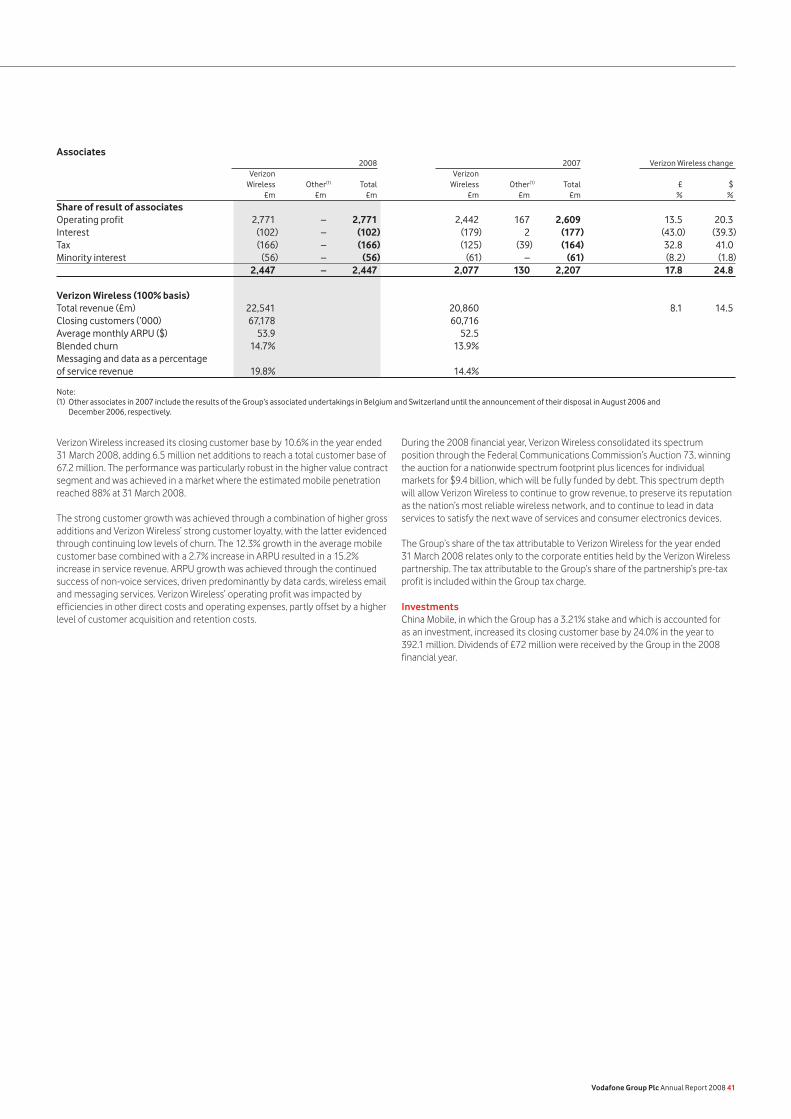
Verizon Wireless increased its closing customer base by 10.6% in the year ended 31 March 2008, adding 6.5 million net additions to reach a total customer base of 67.2 million. The performance was particularly robust in the higher value contract segment and was achieved in a market where the estimated mobile penetration reached 88% at 31 March 2008.
The strong customer growth was achieved through a combination of higher gross additions and Verizon Wireless’ strong customer loyalty, with the latter evidenced through continuing low levels of churn. The 12.3% growth in the average mobile customer base combined with a 2.7% increase in ARPU resulted in a 15.2% increase in service revenue. ARPU growth was achieved through the continued success of non-voice services, driven predominantly by data cards, wireless email and messaging services. Verizon Wireless’ operating profit was impacted by efficiencies in other direct costs and operating expenses, partly offset by a higher level of customer acquisition and retention costs.
During the 2008 financial year, Verizon Wireless consolidated its spectrum position through the Federal Communications Commission’s Auction 73, winning the auction for a nationwide spectrum footprint plus licences for individual markets for $9.4 billion, which will be fully funded by debt. This spectrum depth will allow Verizon Wireless to continue to grow revenue, to preserve its reputation as the nation’s most reliable wireless network, and to continue to lead in data services to satisfy the next wave of services and consumer electronics devices.
The Group’s share of the tax attributable to Verizon Wireless for the year ended 31 March 2008 relates only to the corporate entities held by the Verizon Wireless partnership. The tax attributable to the Group’s share of the partnership’s pre-tax profit is included within the Group tax charge.
InvestmentsChina Mobile, in which the Group has a 3.21% stake and which is accounted for as an investment, increased its closing customer base by 24.0% in the year to 392.1 million. Dividends of £72 million were received by the Group in the 2008 financial year.
Associates 2008 2007 Verizon Wireless change Verizon Verizon Wireless Other(1) Total Wireless Other(1) Total £ $ £m £m £m £m £m £m % %
Share of result of associatesOperating profit 2,771 – 2,771 2,442 167 2,609 13.5 20.3Interest (102) – (102) (179) 2 (177) (43.0) (39.3)Tax (166) – (166) (125) (39) (164) 32.8 41.0Minority interest (56) – (56) (61) – (61) (8.2) (1.8) 2,447 – 2,447 2,077 130 2,207 17.8 24.8 Verizon Wireless (100% basis)Total revenue (£m) 22,541 20,860 8.1 14.5Closing customers (’000) 67,178 60,716 Average monthly ARPU ($) 53.9 52.5 Blended churn 14.7% 13.9% Messaging and data as a percentage of service revenue 19.8% 14.4%
Note:(1) Other associates in 2007 include the results of the Group’s associated undertakings in Belgium and Switzerland until the announcement of their disposal in August 2006 and
December 2006, respectively.
Vodafone Group Plc Annual Report 2008 41
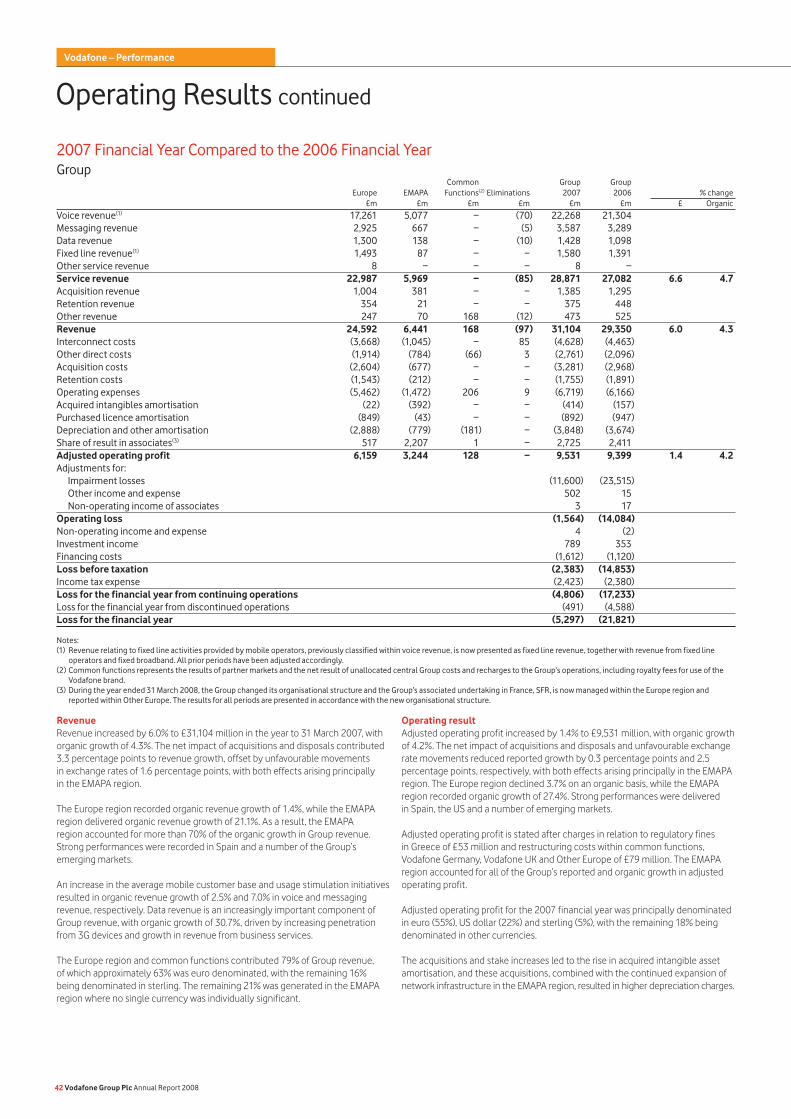
Operating Results continued
2007 Financial Year Compared to the 2006 Financial YearGroup Common Group Group Europe EMAPA Functions(2) Eliminations 2007 2006 % change £m £m £m £m £m £m £ Organic
Voice revenue(1) 17,261 5,077 − (70) 22,268 21,304 Messaging revenue 2,925 667 − (5) 3,587 3,289 Data revenue 1,300 138 − (10) 1,428 1,098 Fixed line revenue(1) 1,493 87 − − 1,580 1,391 Other service revenue 8 − − − 8 − Service revenue 22,987 5,969 − (85) 28,871 27,082 6.6 4.7Acquisition revenue 1,004 381 − − 1,385 1,295 Retention revenue 354 21 − − 375 448 Other revenue 247 70 168 (12) 473 525 Revenue 24,592 6,441 168 (97) 31,104 29,350 6.0 4.3Interconnect costs (3,668) (1,045) − 85 (4,628) (4,463) Other direct costs (1,914) (784) (66) 3 (2,761) (2,096) Acquisition costs (2,604) (677) − − (3,281) (2,968) Retention costs (1,543) (212) − − (1,755) (1,891) Operating expenses (5,462) (1,472) 206 9 (6,719) (6,166) Acquired intangibles amortisation (22) (392) − − (414) (157) Purchased licence amortisation (849) (43) − − (892) (947) Depreciation and other amortisation (2,888) (779) (181) − (3,848) (3,674) Share of result in associates(3) 517 2,207 1 − 2,725 2,411 Adjusted operating profit 6,159 3,244 128 − 9,531 9,399 1.4 4.2Adjustments for: Impairment losses (11,600) (23,515) Other income and expense 502 15 Non-operating income of associates 3 17 Operating loss (1,564) (14,084) Non-operating income and expense 4 (2) Investment income 789 353 Financing costs (1,612) (1,120) Loss before taxation (2,383) (14,853) Income tax expense (2,423) (2,380) Loss for the financial year from continuing operations (4,806) (17,233) Loss for the financial year from discontinued operations (491) (4,588) Loss for the financial year (5,297) (21,821) Notes:(1) Revenue relating to fixed line activities provided by mobile operators, previously classified within voice revenue, is now presented as fixed line revenue, together with revenue from fixed line
operators and fixed broadband. All prior periods have been adjusted accordingly.(2) Common functions represents the results of partner markets and the net result of unallocated central Group costs and recharges to the Group’s operations, including royalty fees for use of the
Vodafone brand.(3) During the year ended 31 March 2008, the Group changed its organisational structure and the Group’s associated undertaking in France, SFR, is now managed within the Europe region and
reported within Other Europe. The results for all periods are presented in accordance with the new organisational structure.
RevenueRevenue increased by 6.0% to £31,104 million in the year to 31 March 2007, with organic growth of 4.3%. The net impact of acquisitions and disposals contributed 3.3 percentage points to revenue growth, offset by unfavourable movements in exchange rates of 1.6 percentage points, with both effects arising principally in the EMAPA region.
The Europe region recorded organic revenue growth of 1.4%, while the EMAPA region delivered organic revenue growth of 21.1%. As a result, the EMAPA region accounted for more than 70% of the organic growth in Group revenue. Strong performances were recorded in Spain and a number of the Group’s emerging markets.
An increase in the average mobile customer base and usage stimulation initiatives resulted in organic revenue growth of 2.5% and 7.0% in voice and messaging revenue, respectively. Data revenue is an increasingly important component of Group revenue, with organic growth of 30.7%, driven by increasing penetration from 3G devices and growth in revenue from business services.
The Europe region and common functions contributed 79% of Group revenue, of which approximately 63% was euro denominated, with the remaining 16% being denominated in sterling. The remaining 21% was generated in the EMAPA region where no single currency was individually significant.
Operating resultAdjusted operating profit increased by 1.4% to £9,531 million, with organic growth of 4.2%. The net impact of acquisitions and disposals and unfavourable exchange rate movements reduced reported growth by 0.3 percentage points and 2.5 percentage points, respectively, with both effects arising principally in the EMAPA region. The Europe region declined 3.7% on an organic basis, while the EMAPA region recorded organic growth of 27.4%. Strong performances were delivered in Spain, the US and a number of emerging markets.
Adjusted operating profit is stated after charges in relation to regulatory fines in Greece of £53 million and restructuring costs within common functions, Vodafone Germany, Vodafone UK and Other Europe of £79 million. The EMAPA region accounted for all of the Group’s reported and organic growth in adjusted operating profit.
Adjusted operating profit for the 2007 financial year was principally denominated in euro (55%), US dollar (22%) and sterling (5%), with the remaining 18% being denominated in other currencies.
The acquisitions and stake increases led to the rise in acquired intangible asset amortisation, and these acquisitions, combined with the continued expansion of network infrastructure in the EMAPA region, resulted in higher depreciation charges.
42 Vodafone Group Plc Annual Report 2008
Vodafone – Performance
The Group’s share of results from associates increased by 13.0%, mainly due to Verizon Wireless which reported record growth in net additions and increased ARPU. The growth in Verizon Wireless was offset by a reduction in the Group’s share of results from its other associated undertakings, which fell due to the disposals of Belgacom Mobile S.A. and Swisscom Mobile A.G. as well as the impact of reductions in termination rates and intense competition experienced by SFR in France.
Operating loss was £1,564 million compared with a loss of £14,084 million in the 2006 financial year following lower impairment charges. In the year ended 31 March 2007, the Group recorded an impairment charge of £11,600 million (2006: £23,515 million) in relation to the carrying value of goodwill in the Group’s operations in Germany (£6,700 million) and Italy (£4,900 million). The impairment in Germany resulted from an increase in long term interest rates, which led to higher discount rates, along with increased price competition and continued regulatory pressures in the German market. The impairment in Italy resulted from an increase in long term interest rates and the estimated impact of legislation cancelling the fixed fees for the top up of prepaid cards and the related competitive response in the Italian market. The increase in interest rates accounted for £3,700 million of the reduction in value during the 2007 financial year.
Certain of the Group’s cost reduction and revenue stimulation initiatives are managed centrally within common functions. Consequently, operating and capital expenses are incurred centrally and recharged to the relevant countries, primarily in Europe. This typically results in higher operating expenses with a corresponding reduction in depreciation for the countries concerned.
Other income and expense for the year ended 31 March 2007 included the gains on disposal of Belgacom Mobile S.A. and Swisscom Mobile A.G., amounting to £441 million and £68 million, respectively.
Investment income and financing costs 2007 2006 £m £m
Investment income 789 353Financing costs (1,612) (1,120) (823) (767)
Analysed as: Net financing costs before dividends from investments(1) (435) (318) Potential interest charges arising on settlement of outstanding tax issues (406) (329) Dividends from investments 57 41 Foreign exchange(2) (41) – Changes in the fair value of equity put rights and similar arrangements(3) 2 (161)Net financing costs (823) (767)
Notes:(1) Includes a one off gain of £86 million related to the Group renegotiating its investments in
SoftBank.(2) Comprises foreign exchange differences reflected in the Consolidated Income Statement in
relation to certain intercompany balances and the foreign exchange differences on financial instruments received as consideration in the disposal of Vodafone Japan to SoftBank, which completed in April 2006.
(3) Includes the fair value movement in relation to the put rights and similar arrangements held by minority interest holders in certain of the Group’s subsidiaries. The valuation of these financial liabilities is inherently unpredictable and changes in the fair value could have a material impact on the future results and financial position of Vodafone. Details of these options can be found on page 58.
Net financing costs before dividends from investments increased by 36.8% to £435 million as increased financing costs, reflecting higher average debt and interest rates, and losses on mark to market adjustments on financial instruments more than offset higher investment income resulting from new investments in SoftBank, which arose on the sale of Vodafone Japan during the 2007 financial year, including an £86 million gain related to the renegotiation of these investments. At 31 March 2007, the provision for potential interest charges arising on settlement of outstanding tax issues was £1,213 million.
TaxationThe effective tax rate, exclusive of impairment losses, was 26.3% (2006: 27.5%), which was lower than the Group’s weighted average tax rate due to the resolution of a number of historic tax issues with tax authorities and additional tax deductions in Italy. The 2006 financial year benefited from the tax treatment of a share repurchase in Vodafone Italy and favourable tax settlements.
A significant event in the 2007 financial year was a European Court decision in respect of the UK CFC legislation, following which Vodafone has not accrued any additional provision in respect of the application of UK CFC legislation to the Group.
The effective tax rate including impairment losses was (101.7)% compared to (16.0)% for the 2006 financial year. The negative tax rates arose from no tax benefit being recorded for the impairment losses of £11,600 million (2006: £23,515 million).
Loss per shareAdjusted earnings per share increased by 11.4% from 10.11 pence to 11.26 pence for the year to 31 March 2007. Basic loss per share from continuing operations decreased from 27.66 pence to 8.94 pence for the year ended 31 March 2007.
2007 2006 £m £m
Loss from continuing operations attributable to equity shareholders (4,932) (17,318) Adjustments: Impairment losses(1) 11,600 23,515 Other income and expense (502) (15) Share of associated undertakings’ non-operating income (3) (17) Non-operating income and expense (4) 2 Investment income and financing costs(2) 39 161 Tax on the above items 13 –Adjusted profit from continuing operations attributable to equity shareholders 6,211 6,328 Weighted average number of shares outstanding Basic and diluted(3) 55,144 62,607
Notes:(1) See note 10 to the Consolidated Financial Statements.(2) See note 2 and 3 in investment income and financing costs.(3) In the year ended 31 March 2007, 215 million (2006: 183 million) shares have been excluded
from the calculation of diluted loss per share as they are not dilutive.
Vodafone Group Plc Annual Report 2008 43
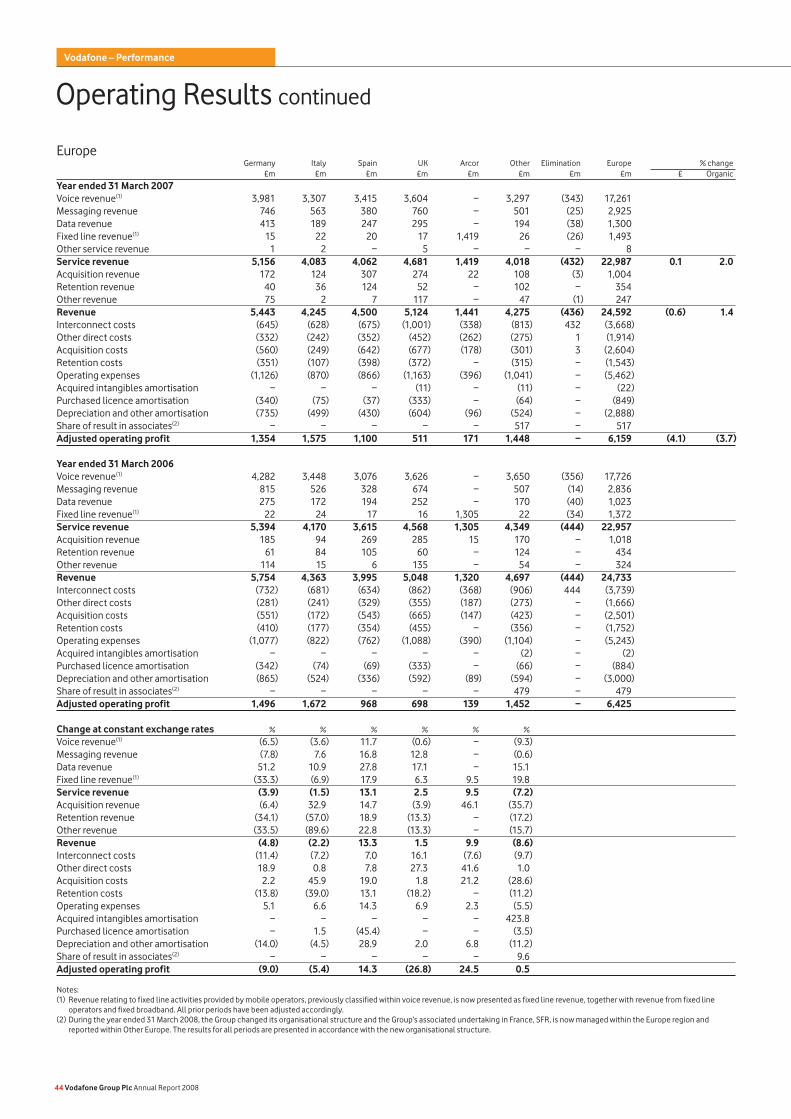
Operating Results continued
Europe Germany Italy Spain UK Arcor Other Elimination Europe % change £m £m £m £m £m £m £m £m £ Organic
Year ended 31 March 2007Voice revenue(1) 3,981 3,307 3,415 3,604 − 3,297 (343) 17,261 Messaging revenue 746 563 380 760 − 501 (25) 2,925 Data revenue 413 189 247 295 − 194 (38) 1,300 Fixed line revenue(1) 15 22 20 17 1,419 26 (26) 1,493 Other service revenue 1 2 − 5 − − − 8 Service revenue 5,156 4,083 4,062 4,681 1,419 4,018 (432) 22,987 0.1 2.0Acquisition revenue 172 124 307 274 22 108 (3) 1,004 Retention revenue 40 36 124 52 − 102 − 354 Other revenue 75 2 7 117 − 47 (1) 247 Revenue 5,443 4,245 4,500 5,124 1,441 4,275 (436) 24,592 (0.6) 1.4Interconnect costs (645) (628) (675) (1,001) (338) (813) 432 (3,668) Other direct costs (332) (242) (352) (452) (262) (275) 1 (1,914) Acquisition costs (560) (249) (642) (677) (178) (301) 3 (2,604) Retention costs (351) (107) (398) (372) − (315) − (1,543) Operating expenses (1,126) (870) (866) (1,163) (396) (1,041) − (5,462) Acquired intangibles amortisation − − − (11) − (11) − (22) Purchased licence amortisation (340) (75) (37) (333) − (64) − (849) Depreciation and other amortisation (735) (499) (430) (604) (96) (524) − (2,888) Share of result in associates(2) − − − − − 517 − 517 Adjusted operating profit 1,354 1,575 1,100 511 171 1,448 − 6,159 (4.1) (3.7)
Year ended 31 March 2006 Voice revenue(1) 4,282 3,448 3,076 3,626 − 3,650 (356) 17,726 Messaging revenue 815 526 328 674 − 507 (14) 2,836 Data revenue 275 172 194 252 − 170 (40) 1,023 Fixed line revenue(1) 22 24 17 16 1,305 22 (34) 1,372 Service revenue 5,394 4,170 3,615 4,568 1,305 4,349 (444) 22,957 Acquisition revenue 185 94 269 285 15 170 − 1,018 Retention revenue 61 84 105 60 − 124 − 434 Other revenue 114 15 6 135 − 54 − 324 Revenue 5,754 4,363 3,995 5,048 1,320 4,697 (444) 24,733 Interconnect costs (732) (681) (634) (862) (368) (906) 444 (3,739) Other direct costs (281) (241) (329) (355) (187) (273) − (1,666) Acquisition costs (551) (172) (543) (665) (147) (423) − (2,501) Retention costs (410) (177) (354) (455) − (356) − (1,752) Operating expenses (1,077) (822) (762) (1,088) (390) (1,104) − (5,243) Acquired intangibles amortisation − − − − − (2) − (2) Purchased licence amortisation (342) (74) (69) (333) − (66) − (884) Depreciation and other amortisation (865) (524) (336) (592) (89) (594) − (3,000) Share of result in associates(2) − − − − − 479 − 479 Adjusted operating profit 1,496 1,672 968 698 139 1,452 − 6,425
Change at constant exchange rates % % % % % %
Voice revenue(1) (6.5) (3.6) 11.7 (0.6) − (9.3)Messaging revenue (7.8) 7.6 16.8 12.8 − (0.6)Data revenue 51.2 10.9 27.8 17.1 − 15.1Fixed line revenue(1) (33.3) (6.9) 17.9 6.3 9.5 19.8Service revenue (3.9) (1.5) 13.1 2.5 9.5 (7.2)Acquisition revenue (6.4) 32.9 14.7 (3.9) 46.1 (35.7)Retention revenue (34.1) (57.0) 18.9 (13.3) − (17.2)Other revenue (33.5) (89.6) 22.8 (13.3) − (15.7)Revenue (4.8) (2.2) 13.3 1.5 9.9 (8.6)Interconnect costs (11.4) (7.2) 7.0 16.1 (7.6) (9.7)Other direct costs 18.9 0.8 7.8 27.3 41.6 1.0Acquisition costs 2.2 45.9 19.0 1.8 21.2 (28.6)Retention costs (13.8) (39.0) 13.1 (18.2) − (11.2)Operating expenses 5.1 6.6 14.3 6.9 2.3 (5.5)Acquired intangibles amortisation − − − − − 423.8Purchased licence amortisation − 1.5 (45.4) − − (3.5)Depreciation and other amortisation (14.0) (4.5) 28.9 2.0 6.8 (11.2)Share of result in associates(2) − − − − − 9.6Adjusted operating profit (9.0) (5.4) 14.3 (26.8) 24.5 0.5
Notes:(1) Revenue relating to fixed line activities provided by mobile operators, previously classified within voice revenue, is now presented as fixed line revenue, together with revenue from fixed line
operators and fixed broadband. All prior periods have been adjusted accordingly.(2) During the year ended 31 March 2008, the Group changed its organisational structure and the Group’s associated undertaking in France, SFR, is now managed within the Europe region and
reported within Other Europe. The results for all periods are presented in accordance with the new organisational structure.
44 Vodafone Group Plc Annual Report 2008
Vodafone – Performance
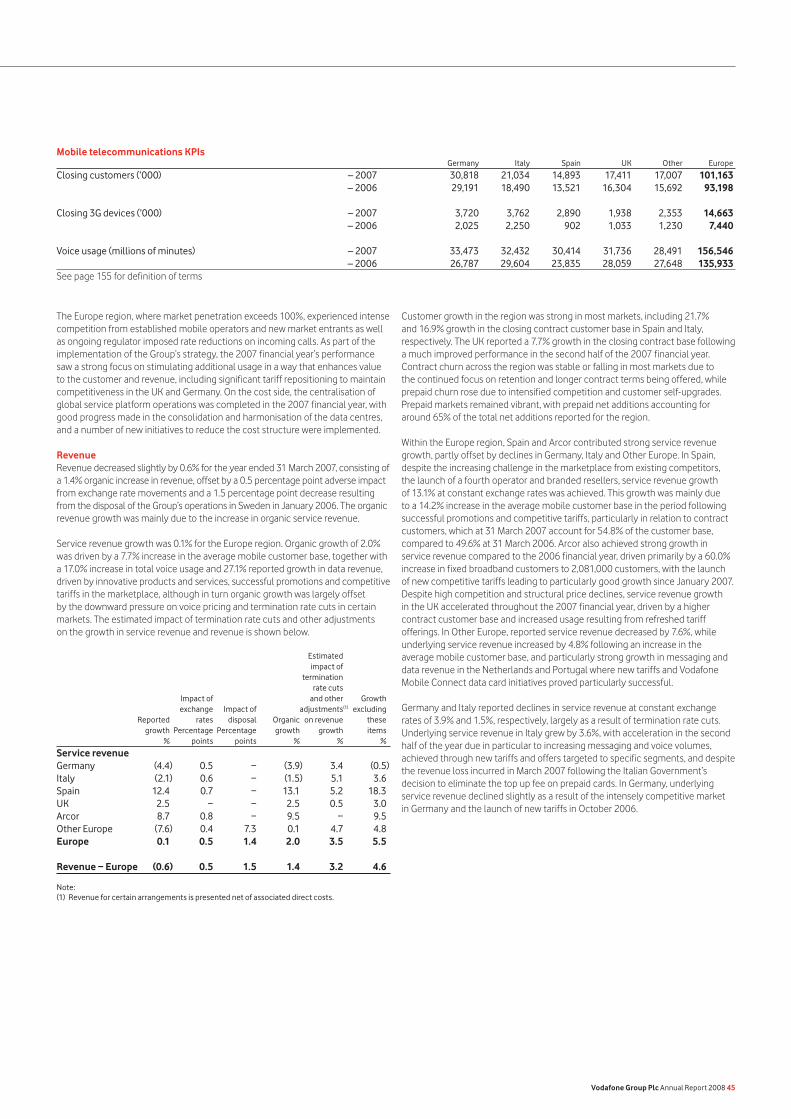
Mobile telecommunications KPIs Germany Italy Spain UK Other Europe
Closing customers (’000) – 2007 30,818 21,034 14,893 17,411 17,007 101,163 – 2006 29,191 18,490 13,521 16,304 15,692 93,198 Closing 3G devices (’000) – 2007 3,720 3,762 2,890 1,938 2,353 14,663 – 2006 2,025 2,250 902 1,033 1,230 7,440 Voice usage (millions of minutes) – 2007 33,473 32,432 30,414 31,736 28,491 156,546 – 2006 26,787 29,604 23,835 28,059 27,648 135,933See page 155 for definition of terms
The Europe region, where market penetration exceeds 100%, experienced intense competition from established mobile operators and new market entrants as well as ongoing regulator imposed rate reductions on incoming calls. As part of the implementation of the Group’s strategy, the 2007 financial year’s performance saw a strong focus on stimulating additional usage in a way that enhances value to the customer and revenue, including significant tariff repositioning to maintain competitiveness in the UK and Germany. On the cost side, the centralisation of global service platform operations was completed in the 2007 financial year, with good progress made in the consolidation and harmonisation of the data centres, and a number of new initiatives to reduce the cost structure were implemented.
RevenueRevenue decreased slightly by 0.6% for the year ended 31 March 2007, consisting of a 1.4% organic increase in revenue, offset by a 0.5 percentage point adverse impact from exchange rate movements and a 1.5 percentage point decrease resulting from the disposal of the Group’s operations in Sweden in January 2006. The organic revenue growth was mainly due to the increase in organic service revenue.
Service revenue growth was 0.1% for the Europe region. Organic growth of 2.0% was driven by a 7.7% increase in the average mobile customer base, together with a 17.0% increase in total voice usage and 27.1% reported growth in data revenue, driven by innovative products and services, successful promotions and competitive tariffs in the marketplace, although in turn organic growth was largely offset by the downward pressure on voice pricing and termination rate cuts in certain markets. The estimated impact of termination rate cuts and other adjustments on the growth in service revenue and revenue is shown below.
Estimated impact of termination rate cuts Impact of and other Growth exchange Impact of adjustments(1) excluding Reported rates disposal Organic on revenue these growth Percentage Percentage growth growth items % points points % % %
Service revenueGermany (4.4) 0.5 − (3.9) 3.4 (0.5)Italy (2.1) 0.6 − (1.5) 5.1 3.6Spain 12.4 0.7 − 13.1 5.2 18.3UK 2.5 − − 2.5 0.5 3.0Arcor 8.7 0.8 − 9.5 − 9.5Other Europe (7.6) 0.4 7.3 0.1 4.7 4.8Europe 0.1 0.5 1.4 2.0 3.5 5.5 Revenue − Europe (0.6) 0.5 1.5 1.4 3.2 4.6
Note:(1) Revenue for certain arrangements is presented net of associated direct costs.
Customer growth in the region was strong in most markets, including 21.7% and 16.9% growth in the closing contract customer base in Spain and Italy, respectively. The UK reported a 7.7% growth in the closing contract base following a much improved performance in the second half of the 2007 financial year. Contract churn across the region was stable or falling in most markets due to the continued focus on retention and longer contract terms being offered, while prepaid churn rose due to intensified competition and customer self-upgrades. Prepaid markets remained vibrant, with prepaid net additions accounting for around 65% of the total net additions reported for the region.
Within the Europe region, Spain and Arcor contributed strong service revenue growth, partly offset by declines in Germany, Italy and Other Europe. In Spain, despite the increasing challenge in the marketplace from existing competitors, the launch of a fourth operator and branded resellers, service revenue growth of 13.1% at constant exchange rates was achieved. This growth was mainly due to a 14.2% increase in the average mobile customer base in the period following successful promotions and competitive tariffs, particularly in relation to contract customers, which at 31 March 2007 account for 54.8% of the customer base, compared to 49.6% at 31 March 2006. Arcor also achieved strong growth in service revenue compared to the 2006 financial year, driven primarily by a 60.0% increase in fixed broadband customers to 2,081,000 customers, with the launch of new competitive tariffs leading to particularly good growth since January 2007. Despite high competition and structural price declines, service revenue growth in the UK accelerated throughout the 2007 financial year, driven by a higher contract customer base and increased usage resulting from refreshed tariff offerings. In Other Europe, reported service revenue decreased by 7.6%, while underlying service revenue increased by 4.8% following an increase in the average mobile customer base, and particularly strong growth in messaging and data revenue in the Netherlands and Portugal where new tariffs and Vodafone Mobile Connect data card initiatives proved particularly successful.
Germany and Italy reported declines in service revenue at constant exchange rates of 3.9% and 1.5%, respectively, largely as a result of termination rate cuts. Underlying service revenue in Italy grew by 3.6%, with acceleration in the second half of the year due in particular to increasing messaging and voice volumes, achieved through new tariffs and offers targeted to specific segments, and despite the revenue loss incurred in March 2007 following the Italian Government’s decision to eliminate the top up fee on prepaid cards. In Germany, underlying service revenue declined slightly as a result of the intensely competitive market in Germany and the launch of new tariffs in October 2006.
Vodafone Group Plc Annual Report 2008 45
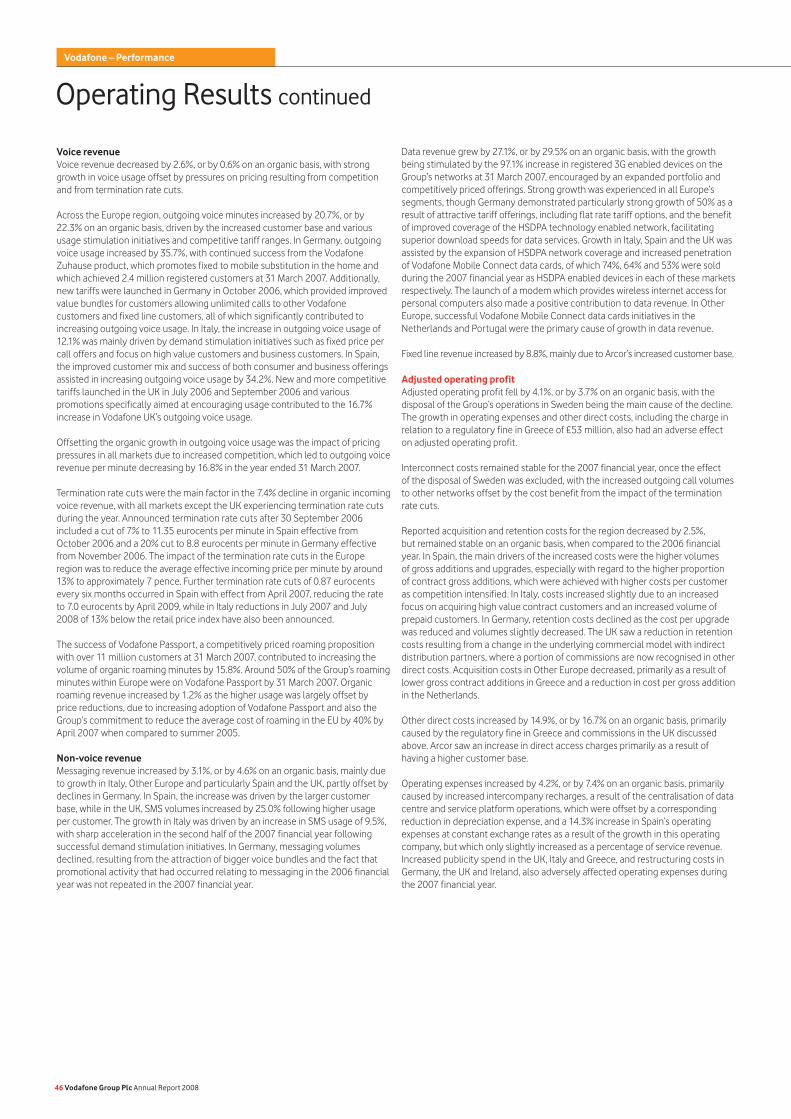
Operating Results continued
Voice revenueVoice revenue decreased by 2.6%, or by 0.6% on an organic basis, with strong growth in voice usage offset by pressures on pricing resulting from competition and from termination rate cuts.
Across the Europe region, outgoing voice minutes increased by 20.7%, or by 22.3% on an organic basis, driven by the increased customer base and various usage stimulation initiatives and competitive tariff ranges. In Germany, outgoing voice usage increased by 35.7%, with continued success from the Vodafone Zuhause product, which promotes fixed to mobile substitution in the home and which achieved 2.4 million registered customers at 31 March 2007. Additionally, new tariffs were launched in Germany in October 2006, which provided improved value bundles for customers allowing unlimited calls to other Vodafone customers and fixed line customers, all of which significantly contributed to increasing outgoing voice usage. In Italy, the increase in outgoing voice usage of 12.1% was mainly driven by demand stimulation initiatives such as fixed price per call offers and focus on high value customers and business customers. In Spain, the improved customer mix and success of both consumer and business offerings assisted in increasing outgoing voice usage by 34.2%. New and more competitive tariffs launched in the UK in July 2006 and September 2006 and various promotions specifically aimed at encouraging usage contributed to the 16.7% increase in Vodafone UK’s outgoing voice usage.
Offsetting the organic growth in outgoing voice usage was the impact of pricing pressures in all markets due to increased competition, which led to outgoing voice revenue per minute decreasing by 16.8% in the year ended 31 March 2007.
Termination rate cuts were the main factor in the 7.4% decline in organic incoming voice revenue, with all markets except the UK experiencing termination rate cuts during the year. Announced termination rate cuts after 30 September 2006 included a cut of 7% to 11.35 eurocents per minute in Spain effective from October 2006 and a 20% cut to 8.8 eurocents per minute in Germany effective from November 2006. The impact of the termination rate cuts in the Europe region was to reduce the average effective incoming price per minute by around 13% to approximately 7 pence. Further termination rate cuts of 0.87 eurocents every six months occurred in Spain with effect from April 2007, reducing the rate to 7.0 eurocents by April 2009, while in Italy reductions in July 2007 and July 2008 of 13% below the retail price index have also been announced.
The success of Vodafone Passport, a competitively priced roaming proposition with over 11 million customers at 31 March 2007, contributed to increasing the volume of organic roaming minutes by 15.8%. Around 50% of the Group’s roaming minutes within Europe were on Vodafone Passport by 31 March 2007. Organic roaming revenue increased by 1.2% as the higher usage was largely offset by price reductions, due to increasing adoption of Vodafone Passport and also the Group’s commitment to reduce the average cost of roaming in the EU by 40% by April 2007 when compared to summer 2005.
Non-voice revenueMessaging revenue increased by 3.1%, or by 4.6% on an organic basis, mainly due to growth in Italy, Other Europe and particularly Spain and the UK, partly offset by declines in Germany. In Spain, the increase was driven by the larger customer base, while in the UK, SMS volumes increased by 25.0% following higher usage per customer. The growth in Italy was driven by an increase in SMS usage of 9.5%, with sharp acceleration in the second half of the 2007 financial year following successful demand stimulation initiatives. In Germany, messaging volumes declined, resulting from the attraction of bigger voice bundles and the fact that promotional activity that had occurred relating to messaging in the 2006 financial year was not repeated in the 2007 financial year.
Data revenue grew by 27.1%, or by 29.5% on an organic basis, with the growth being stimulated by the 97.1% increase in registered 3G enabled devices on the Group’s networks at 31 March 2007, encouraged by an expanded portfolio and competitively priced offerings. Strong growth was experienced in all Europe’s segments, though Germany demonstrated particularly strong growth of 50% as a result of attractive tariff offerings, including flat rate tariff options, and the benefit of improved coverage of the HSDPA technology enabled network, facilitating superior download speeds for data services. Growth in Italy, Spain and the UK was assisted by the expansion of HSDPA network coverage and increased penetration of Vodafone Mobile Connect data cards, of which 74%, 64% and 53% were sold during the 2007 financial year as HSDPA enabled devices in each of these markets respectively. The launch of a modem which provides wireless internet access for personal computers also made a positive contribution to data revenue. In Other Europe, successful Vodafone Mobile Connect data cards initiatives in the Netherlands and Portugal were the primary cause of growth in data revenue.
Fixed line revenue increased by 8.8%, mainly due to Arcor’s increased customer base.
Adjusted operating profitAdjusted operating profit fell by 4.1%, or by 3.7% on an organic basis, with the disposal of the Group’s operations in Sweden being the main cause of the decline. The growth in operating expenses and other direct costs, including the charge in relation to a regulatory fine in Greece of £53 million, also had an adverse effect on adjusted operating profit.
Interconnect costs remained stable for the 2007 financial year, once the effect of the disposal of Sweden was excluded, with the increased outgoing call volumes to other networks offset by the cost benefit from the impact of the termination rate cuts.
Reported acquisition and retention costs for the region decreased by 2.5%, but remained stable on an organic basis, when compared to the 2006 financial year. In Spain, the main drivers of the increased costs were the higher volumes of gross additions and upgrades, especially with regard to the higher proportion of contract gross additions, which were achieved with higher costs per customer as competition intensified. In Italy, costs increased slightly due to an increased focus on acquiring high value contract customers and an increased volume of prepaid customers. In Germany, retention costs declined as the cost per upgrade was reduced and volumes slightly decreased. The UK saw a reduction in retention costs resulting from a change in the underlying commercial model with indirect distribution partners, where a portion of commissions are now recognised in other direct costs. Acquisition costs in Other Europe decreased, primarily as a result of lower gross contract additions in Greece and a reduction in cost per gross addition in the Netherlands.
Other direct costs increased by 14.9%, or by 16.7% on an organic basis, primarily caused by the regulatory fine in Greece and commissions in the UK discussed above. Arcor saw an increase in direct access charges primarily as a result of having a higher customer base.
Operating expenses increased by 4.2%, or by 7.4% on an organic basis, primarily caused by increased intercompany recharges, a result of the centralisation of data centre and service platform operations, which were offset by a corresponding reduction in depreciation expense, and a 14.3% increase in Spain’s operating expenses at constant exchange rates as a result of the growth in this operating company, but which only slightly increased as a percentage of service revenue. Increased publicity spend in the UK, Italy and Greece, and restructuring costs in Germany, the UK and Ireland, also adversely affected operating expenses during the 2007 financial year.
46 Vodafone Group Plc Annual Report 2008
Vodafone – Performance
As many of the cost reduction initiatives are centralised in common functions, as described earlier, the Group’s target in respect of operating expenses for the total of the Europe region (excluding Arcor) includes common functions but excludes the developing and delivering of new services and business restructuring costs. On this basis, these costs grew by 3.5% in the 2007 financial year for the reasons outlined in the preceding paragraph.
AssociatesSFR, the Group’s associated undertaking in France, achieved an increase of 3.5% in its customer base, higher voice usage and strong growth in data services. However, service revenue was stable at constant exchange rates as the impact of these items was offset by a 5.7% decline in ARPU due to the increase in competition and significant termination rate cuts imposed by the regulator. The voice termination rate was cut by 24% to 9.5 eurocents per minute with effect from 1 January 2006 and by a further 21% to 7.5 eurocents per minute with effect from 1 January 2007. France is the first European Union country to impose regulation on SMS termination rates, which were cut by 19% with effect from 1 January 2006 and a further 30% with effect from mid September 2006 to 3 eurocents per SMS.
Cost reduction initiativesThe Group has set targets in respect of operating expenses and capitalised fixed asset additions. The operating expense and capitalised fixed asset additions targets relate to the Europe region (excluding Arcor) and common functions in aggregate. During the 2007 financial year, the implementation of a range of Group wide initiatives and cost saving programmes commenced, designed to deliver savings in the 2008 financial year and beyond. The key initiatives were as follows:
The application development and maintenance initiative focused on driving cost and productivity efficiencies through outsourcing the application development and maintenance for key IT systems. In October 2006, the Group announced that EDS and IBM had been selected to provide application development and maintenance services to separate groupings of operating companies within the Group. The initiative was in the execution phase in the 2007 financial year and was progressing ahead of plan, with a number of operating companies having commenced service with their respective vendors.
•
The supply chain management initiative focused on centralising supply chain management activities and leveraging Vodafone’s scale in purchasing activities. Through the standardisation of designs and driving scale strategies in material categories, the Group aimed to increase the proportion of purchasing performed globally. The alignment of all objectives and targets across the entire supply chain management was completed during the 2007 financial year. The IT operations initiative created a shared service organisation to support the business with innovative and customer focused IT services. This organisation consolidated localised data centres into regionalised northern and southern European centres and consolidated hardware, software, maintenance and system integration suppliers to provide high quality IT infrastructure, services and solutions. The Group commenced a three year business transformation programme to implement a single integrated operating model, supported by a single enterprise resource planning (“ERP”) system covering human resources, finance and supply chain functions. The network team focused on network sharing deals in a number of operating companies, with the principal objectives of cost saving and faster network rollout. Many of the Group’s operating companies participated in external cost benchmarking studies and used the results to target local cost reductions. Initiatives implemented in the 2007 financial year included reductions to planned network rollout, outsourcing and off-shoring of customer services operations, property rationalisation, replacing leased lines with owned transmission, network site sharing and renegotiation of supplier contracts and service agreements.
•
•
•
•
•
Vodafone Group Plc Annual Report 2008 47
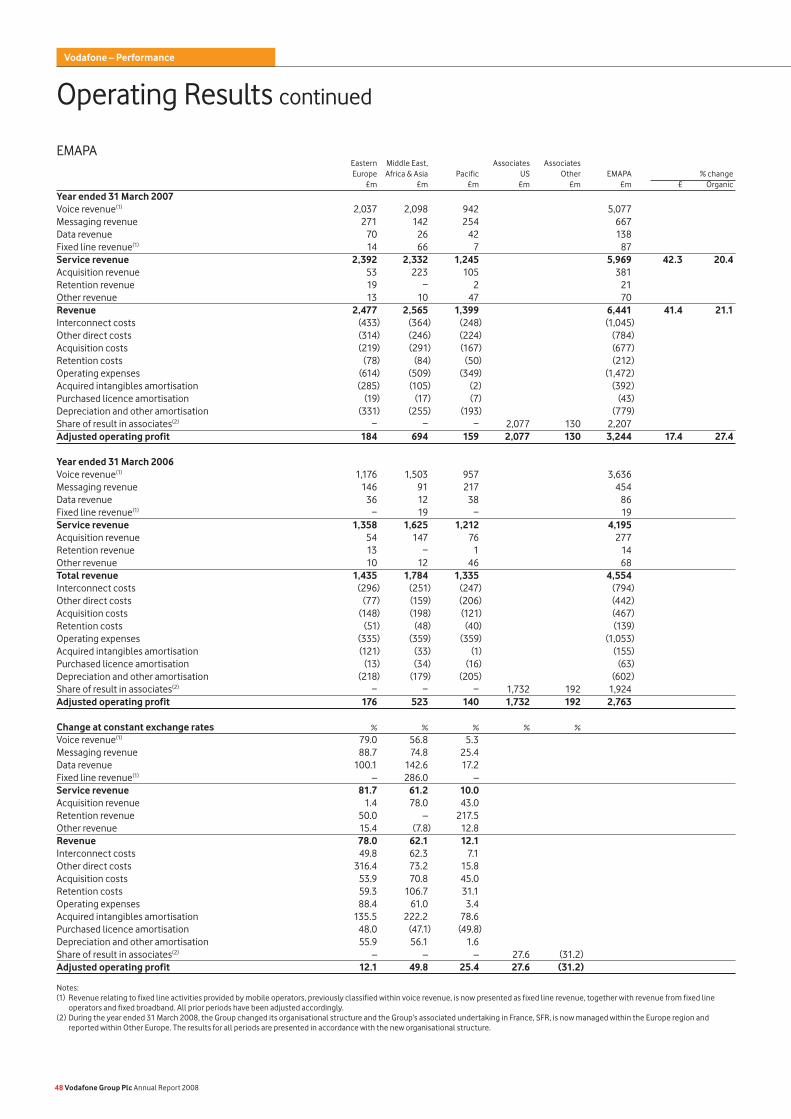
Operating Results continued
EMAPA Eastern Middle East, Associates Associates Europe Africa & Asia Pacific US Other EMAPA % change £m £m £m £m £m £m £ Organic
Year ended 31 March 2007Voice revenue(1) 2,037 2,098 942 5,077 Messaging revenue 271 142 254 667 Data revenue 70 26 42 138 Fixed line revenue(1) 14 66 7 87 Service revenue 2,392 2,332 1,245 5,969 42.3 20.4Acquisition revenue 53 223 105 381 Retention revenue 19 − 2 21 Other revenue 13 10 47 70 Revenue 2,477 2,565 1,399 6,441 41.4 21.1Interconnect costs (433) (364) (248) (1,045) Other direct costs (314) (246) (224) (784) Acquisition costs (219) (291) (167) (677) Retention costs (78) (84) (50) (212) Operating expenses (614) (509) (349) (1,472) Acquired intangibles amortisation (285) (105) (2) (392) Purchased licence amortisation (19) (17) (7) (43) Depreciation and other amortisation (331) (255) (193) (779) Share of result in associates(2) − − − 2,077 130 2,207 Adjusted operating profit 184 694 159 2,077 130 3,244 17.4 27.4
Year ended 31 March 2006 Voice revenue(1) 1,176 1,503 957 3,636 Messaging revenue 146 91 217 454 Data revenue 36 12 38 86 Fixed line revenue(1) − 19 − 19 Service revenue 1,358 1,625 1,212 4,195 Acquisition revenue 54 147 76 277 Retention revenue 13 − 1 14 Other revenue 10 12 46 68 Total revenue 1,435 1,784 1,335 4,554 Interconnect costs (296) (251) (247) (794) Other direct costs (77) (159) (206) (442) Acquisition costs (148) (198) (121) (467) Retention costs (51) (48) (40) (139) Operating expenses (335) (359) (359) (1,053) Acquired intangibles amortisation (121) (33) (1) (155) Purchased licence amortisation (13) (34) (16) (63) Depreciation and other amortisation (218) (179) (205) (602) Share of result in associates(2) − − − 1,732 192 1,924 Adjusted operating profit 176 523 140 1,732 192 2,763
Change at constant exchange rates % % % % %
Voice revenue(1) 79.0 56.8 5.3 Messaging revenue 88.7 74.8 25.4 Data revenue 100.1 142.6 17.2 Fixed line revenue(1) – 286.0 – Service revenue 81.7 61.2 10.0 Acquisition revenue 1.4 78.0 43.0 Retention revenue 50.0 – 217.5 Other revenue 15.4 (7.8) 12.8 Revenue 78.0 62.1 12.1 Interconnect costs 49.8 62.3 7.1 Other direct costs 316.4 73.2 15.8 Acquisition costs 53.9 70.8 45.0 Retention costs 59.3 106.7 31.1 Operating expenses 88.4 61.0 3.4 Acquired intangibles amortisation 135.5 222.2 78.6 Purchased licence amortisation 48.0 (47.1) (49.8) Depreciation and other amortisation 55.9 56.1 1.6 Share of result in associates(2) – – – 27.6 (31.2)Adjusted operating profit 12.1 49.8 25.4 27.6 (31.2)
Notes:(1) Revenue relating to fixed line activities provided by mobile operators, previously classified within voice revenue, is now presented as fixed line revenue, together with revenue from fixed line
operators and fixed broadband. All prior periods have been adjusted accordingly.(2) During the year ended 31 March 2008, the Group changed its organisational structure and the Group’s associated undertaking in France, SFR, is now managed within the Europe region and
reported within Other Europe. The results for all periods are presented in accordance with the new organisational structure.
48 Vodafone Group Plc Annual Report 2008
Vodafone – Performance
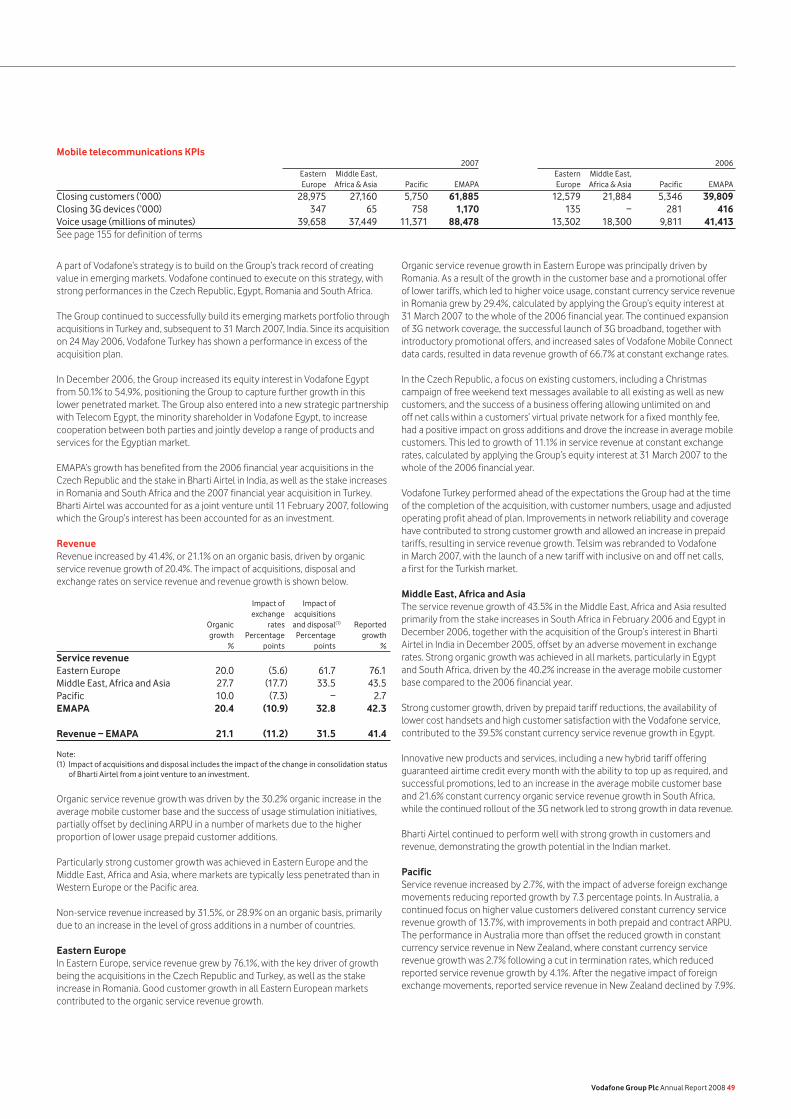
Mobile telecommunications KPIs 2007 2006 Eastern Middle East, Eastern Middle East, Europe Africa & Asia Pacific EMAPA Europe Africa & Asia Pacific EMAPA
Closing customers (’000) 28,975 27,160 5,750 61,885 12,579 21,884 5,346 39,809Closing 3G devices (’000) 347 65 758 1,170 135 − 281 416Voice usage (millions of minutes) 39,658 37,449 11,371 88,478 13,302 18,300 9,811 41,413See page 155 for definition of terms
A part of Vodafone’s strategy is to build on the Group’s track record of creating value in emerging markets. Vodafone continued to execute on this strategy, with strong performances in the Czech Republic, Egypt, Romania and South Africa.
The Group continued to successfully build its emerging markets portfolio through acquisitions in Turkey and, subsequent to 31 March 2007, India. Since its acquisition on 24 May 2006, Vodafone Turkey has shown a performance in excess of the acquisition plan.
In December 2006, the Group increased its equity interest in Vodafone Egypt from 50.1% to 54.9%, positioning the Group to capture further growth in this lower penetrated market. The Group also entered into a new strategic partnership with Telecom Egypt, the minority shareholder in Vodafone Egypt, to increase cooperation between both parties and jointly develop a range of products and services for the Egyptian market.
EMAPA’s growth has benefited from the 2006 financial year acquisitions in the Czech Republic and the stake in Bharti Airtel in India, as well as the stake increases in Romania and South Africa and the 2007 financial year acquisition in Turkey. Bharti Airtel was accounted for as a joint venture until 11 February 2007, following which the Group’s interest has been accounted for as an investment.
RevenueRevenue increased by 41.4%, or 21.1% on an organic basis, driven by organic service revenue growth of 20.4%. The impact of acquisitions, disposal and exchange rates on service revenue and revenue growth is shown below. Impact of Impact of exchange acquisitions Organic rates and disposal(1) Reported growth Percentage Percentage growth % points points %
Service revenue Eastern Europe 20.0 (5.6) 61.7 76.1Middle East, Africa and Asia 27.7 (17.7) 33.5 43.5Pacific 10.0 (7.3) − 2.7EMAPA 20.4 (10.9) 32.8 42.3 Revenue − EMAPA 21.1 (11.2) 31.5 41.4
Note:(1) Impact of acquisitions and disposal includes the impact of the change in consolidation status
of Bharti Airtel from a joint venture to an investment.
Organic service revenue growth was driven by the 30.2% organic increase in the average mobile customer base and the success of usage stimulation initiatives, partially offset by declining ARPU in a number of markets due to the higher proportion of lower usage prepaid customer additions.
Particularly strong customer growth was achieved in Eastern Europe and the Middle East, Africa and Asia, where markets are typically less penetrated than in Western Europe or the Pacific area.
Non-service revenue increased by 31.5%, or 28.9% on an organic basis, primarily due to an increase in the level of gross additions in a number of countries.
Eastern EuropeIn Eastern Europe, service revenue grew by 76.1%, with the key driver of growth being the acquisitions in the Czech Republic and Turkey, as well as the stake increase in Romania. Good customer growth in all Eastern European markets contributed to the organic service revenue growth.
Organic service revenue growth in Eastern Europe was principally driven by Romania. As a result of the growth in the customer base and a promotional offer of lower tariffs, which led to higher voice usage, constant currency service revenue in Romania grew by 29.4%, calculated by applying the Group’s equity interest at 31 March 2007 to the whole of the 2006 financial year. The continued expansion of 3G network coverage, the successful launch of 3G broadband, together with introductory promotional offers, and increased sales of Vodafone Mobile Connect data cards, resulted in data revenue growth of 66.7% at constant exchange rates.
In the Czech Republic, a focus on existing customers, including a Christmas campaign of free weekend text messages available to all existing as well as new customers, and the success of a business offering allowing unlimited on and off net calls within a customers’ virtual private network for a fixed monthly fee, had a positive impact on gross additions and drove the increase in average mobile customers. This led to growth of 11.1% in service revenue at constant exchange rates, calculated by applying the Group’s equity interest at 31 March 2007 to the whole of the 2006 financial year.
Vodafone Turkey performed ahead of the expectations the Group had at the time of the completion of the acquisition, with customer numbers, usage and adjusted operating profit ahead of plan. Improvements in network reliability and coverage have contributed to strong customer growth and allowed an increase in prepaid tariffs, resulting in service revenue growth. Telsim was rebranded to Vodafone in March 2007, with the launch of a new tariff with inclusive on and off net calls, a first for the Turkish market.
Middle East, Africa and AsiaThe service revenue growth of 43.5% in the Middle East, Africa and Asia resulted primarily from the stake increases in South Africa in February 2006 and Egypt in December 2006, together with the acquisition of the Group’s interest in Bharti Airtel in India in December 2005, offset by an adverse movement in exchange rates. Strong organic growth was achieved in all markets, particularly in Egypt and South Africa, driven by the 40.2% increase in the average mobile customer base compared to the 2006 financial year.
Strong customer growth, driven by prepaid tariff reductions, the availability of lower cost handsets and high customer satisfaction with the Vodafone service, contributed to the 39.5% constant currency service revenue growth in Egypt.
Innovative new products and services, including a new hybrid tariff offering guaranteed airtime credit every month with the ability to top up as required, and successful promotions, led to an increase in the average mobile customer base and 21.6% constant currency organic service revenue growth in South Africa, while the continued rollout of the 3G network led to strong growth in data revenue.
Bharti Airtel continued to perform well with strong growth in customers and revenue, demonstrating the growth potential in the Indian market.
PacificService revenue increased by 2.7%, with the impact of adverse foreign exchange movements reducing reported growth by 7.3 percentage points. In Australia, a continued focus on higher value customers delivered constant currency service revenue growth of 13.7%, with improvements in both prepaid and contract ARPU. The performance in Australia more than offset the reduced growth in constant currency service revenue in New Zealand, where constant currency service revenue growth was 2.7% following a cut in termination rates, which reduced reported service revenue growth by 4.1%. After the negative impact of foreign exchange movements, reported service revenue in New Zealand declined by 7.9%.
Vodafone Group Plc Annual Report 2008 49
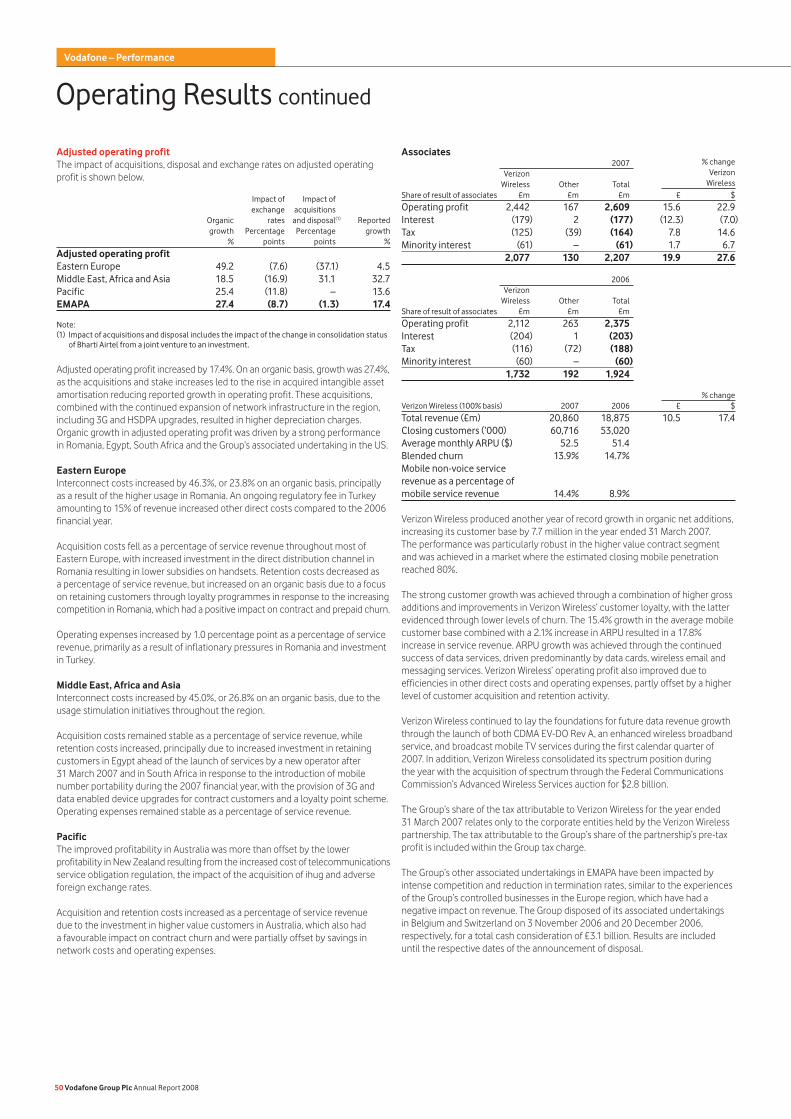
Operating Results continued
Adjusted operating profitThe impact of acquisitions, disposal and exchange rates on adjusted operating profit is shown below. Impact of Impact of exchange acquisitions Organic rates and disposal(1) Reported growth Percentage Percentage growth % points points %
Adjusted operating profit Eastern Europe 49.2 (7.6) (37.1) 4.5Middle East, Africa and Asia 18.5 (16.9) 31.1 32.7Pacific 25.4 (11.8) – 13.6EMAPA 27.4 (8.7) (1.3) 17.4
Note:(1) Impact of acquisitions and disposal includes the impact of the change in consolidation status
of Bharti Airtel from a joint venture to an investment.
Adjusted operating profit increased by 17.4%. On an organic basis, growth was 27.4%, as the acquisitions and stake increases led to the rise in acquired intangible asset amortisation reducing reported growth in operating profit. These acquisitions, combined with the continued expansion of network infrastructure in the region, including 3G and HSDPA upgrades, resulted in higher depreciation charges. Organic growth in adjusted operating profit was driven by a strong performance in Romania, Egypt, South Africa and the Group’s associated undertaking in the US.
Eastern EuropeInterconnect costs increased by 46.3%, or 23.8% on an organic basis, principally as a result of the higher usage in Romania. An ongoing regulatory fee in Turkey amounting to 15% of revenue increased other direct costs compared to the 2006 financial year.
Acquisition costs fell as a percentage of service revenue throughout most of Eastern Europe, with increased investment in the direct distribution channel in Romania resulting in lower subsidies on handsets. Retention costs decreased as a percentage of service revenue, but increased on an organic basis due to a focus on retaining customers through loyalty programmes in response to the increasing competition in Romania, which had a positive impact on contract and prepaid churn.
Operating expenses increased by 1.0 percentage point as a percentage of service revenue, primarily as a result of inflationary pressures in Romania and investment in Turkey.
Middle East, Africa and AsiaInterconnect costs increased by 45.0%, or 26.8% on an organic basis, due to the usage stimulation initiatives throughout the region.
Acquisition costs remained stable as a percentage of service revenue, while retention costs increased, principally due to increased investment in retaining customers in Egypt ahead of the launch of services by a new operator after 31 March 2007 and in South Africa in response to the introduction of mobile number portability during the 2007 financial year, with the provision of 3G and data enabled device upgrades for contract customers and a loyalty point scheme. Operating expenses remained stable as a percentage of service revenue.
PacificThe improved profitability in Australia was more than offset by the lower profitability in New Zealand resulting from the increased cost of telecommunications service obligation regulation, the impact of the acquisition of ihug and adverse foreign exchange rates.
Acquisition and retention costs increased as a percentage of service revenue due to the investment in higher value customers in Australia, which also had a favourable impact on contract churn and were partially offset by savings in network costs and operating expenses.
Associates 2007 % change Verizon Verizon Wireless Other Total WirelessShare of result of associates £m £m £m £ $
Operating profit 2,442 167 2,609 15.6 22.9Interest (179) 2 (177) (12.3) (7.0)Tax (125) (39) (164) 7.8 14.6Minority interest (61) – (61) 1.7 6.7 2,077 130 2,207 19.9 27.6
2006 Verizon Wireless Other TotalShare of result of associates £m £m £m
Operating profit 2,112 263 2,375Interest (204) 1 (203)Tax (116) (72) (188)Minority interest (60) – (60) 1,732 192 1,924
% changeVerizon Wireless (100% basis) 2007 2006 £ $
Total revenue (£m) 20,860 18,875 10.5 17.4Closing customers (’000) 60,716 53,020Average monthly ARPU ($) 52.5 51.4Blended churn 13.9% 14.7%Mobile non-voice service revenue as a percentage of mobile service revenue 14.4% 8.9%
Verizon Wireless produced another year of record growth in organic net additions, increasing its customer base by 7.7 million in the year ended 31 March 2007. The performance was particularly robust in the higher value contract segment and was achieved in a market where the estimated closing mobile penetration reached 80%.
The strong customer growth was achieved through a combination of higher gross additions and improvements in Verizon Wireless’ customer loyalty, with the latter evidenced through lower levels of churn. The 15.4% growth in the average mobile customer base combined with a 2.1% increase in ARPU resulted in a 17.8% increase in service revenue. ARPU growth was achieved through the continued success of data services, driven predominantly by data cards, wireless email and messaging services. Verizon Wireless’ operating profit also improved due to efficiencies in other direct costs and operating expenses, partly offset by a higher level of customer acquisition and retention activity.
Verizon Wireless continued to lay the foundations for future data revenue growth through the launch of both CDMA EV-DO Rev A, an enhanced wireless broadband service, and broadcast mobile TV services during the first calendar quarter of 2007. In addition, Verizon Wireless consolidated its spectrum position during the year with the acquisition of spectrum through the Federal Communications Commission’s Advanced Wireless Services auction for $2.8 billion.
The Group’s share of the tax attributable to Verizon Wireless for the year ended 31 March 2007 relates only to the corporate entities held by the Verizon Wireless partnership. The tax attributable to the Group’s share of the partnership’s pre-tax profit is included within the Group tax charge.
The Group’s other associated undertakings in EMAPA have been impacted by intense competition and reduction in termination rates, similar to the experiences of the Group’s controlled businesses in the Europe region, which have had a negative impact on revenue. The Group disposed of its associated undertakings in Belgium and Switzerland on 3 November 2006 and 20 December 2006, respectively, for a total cash consideration of £3.1 billion. Results are included until the respective dates of the announcement of disposal.
50 Vodafone Group Plc Annual Report 2008
Vodafone – Performance
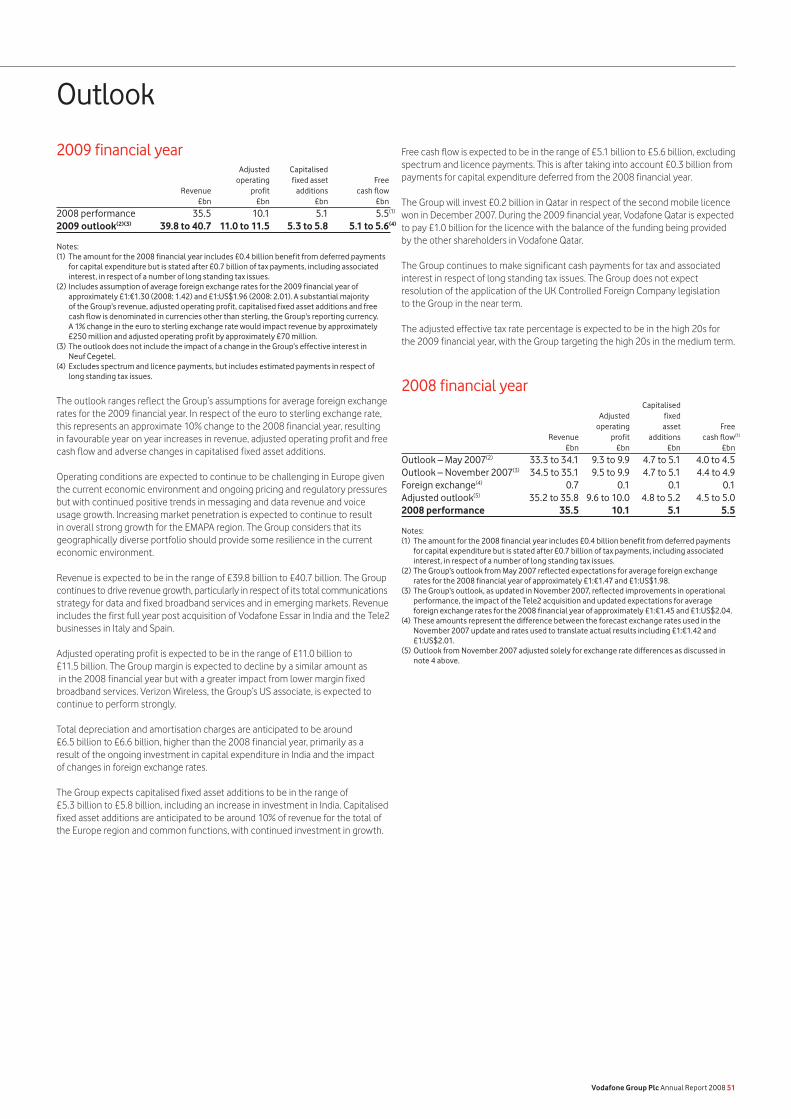
Outlook
2009 financial year Adjusted Capitalised operating fixed asset Free Revenue profit additions cash flow £bn £bn £bn £bn
2008 performance 35.5 10.1 5.1 5.5(1)
2009 outlook(2)(3) 39.8 to 40.7 11.0 to 11.5 5.3 to 5.8 5.1 to 5.6(4)
Notes:(1) The amount for the 2008 financial year includes £0.4 billion benefit from deferred payments
for capital expenditure but is stated after £0.7 billion of tax payments, including associated interest, in respect of a number of long standing tax issues.
(2) Includes assumption of average foreign exchange rates for the 2009 financial year of approximately £1:€1.30 (2008: 1.42) and £1:US$1.96 (2008: 2.01). A substantial majority of the Group’s revenue, adjusted operating profit, capitalised fixed asset additions and free cash flow is denominated in currencies other than sterling, the Group’s reporting currency. A 1% change in the euro to sterling exchange rate would impact revenue by approximately £250 million and adjusted operating profit by approximately £70 million.
(3) The outlook does not include the impact of a change in the Group’s effective interest in Neuf Cegetel.
(4) Excludes spectrum and licence payments, but includes estimated payments in respect of long standing tax issues.
The outlook ranges reflect the Group’s assumptions for average foreign exchange rates for the 2009 financial year. In respect of the euro to sterling exchange rate, this represents an approximate 10% change to the 2008 financial year, resulting in favourable year on year increases in revenue, adjusted operating profit and free cash flow and adverse changes in capitalised fixed asset additions.
Operating conditions are expected to continue to be challenging in Europe given the current economic environment and ongoing pricing and regulatory pressures but with continued positive trends in messaging and data revenue and voice usage growth. Increasing market penetration is expected to continue to result in overall strong growth for the EMAPA region. The Group considers that its geographically diverse portfolio should provide some resilience in the current economic environment.
Revenue is expected to be in the range of £39.8 billion to £40.7 billion. The Group continues to drive revenue growth, particularly in respect of its total communications strategy for data and fixed broadband services and in emerging markets. Revenue includes the first full year post acquisition of Vodafone Essar in India and the Tele2 businesses in Italy and Spain.
Adjusted operating profit is expected to be in the range of £11.0 billion to £11.5 billion. The Group margin is expected to decline by a similar amount as in the 2008 financial year but with a greater impact from lower margin fixed broadband services. Verizon Wireless, the Group’s US associate, is expected to continue to perform strongly.
Total depreciation and amortisation charges are anticipated to be around £6.5 billion to £6.6 billion, higher than the 2008 financial year, primarily as a result of the ongoing investment in capital expenditure in India and the impact of changes in foreign exchange rates.
The Group expects capitalised fixed asset additions to be in the range of £5.3 billion to £5.8 billion, including an increase in investment in India. Capitalised fixed asset additions are anticipated to be around 10% of revenue for the total of the Europe region and common functions, with continued investment in growth.
Free cash flow is expected to be in the range of £5.1 billion to £5.6 billion, excluding spectrum and licence payments. This is after taking into account £0.3 billion from payments for capital expenditure deferred from the 2008 financial year.
The Group will invest £0.2 billion in Qatar in respect of the second mobile licence won in December 2007. During the 2009 financial year, Vodafone Qatar is expected to pay £1.0 billion for the licence with the balance of the funding being provided by the other shareholders in Vodafone Qatar.
The Group continues to make significant cash payments for tax and associated interest in respect of long standing tax issues. The Group does not expect resolution of the application of the UK Controlled Foreign Company legislation to the Group in the near term.
The adjusted effective tax rate percentage is expected to be in the high 20s for the 2009 financial year, with the Group targeting the high 20s in the medium term.
2008 financial year Capitalised Adjusted fixed operating asset Free Revenue profit additions cash flow(1)
£bn £bn £bn £bn
Outlook – May 2007(2) 33.3 to 34.1 9.3 to 9.9 4.7 to 5.1 4.0 to 4.5Outlook – November 2007(3) 34.5 to 35.1 9.5 to 9.9 4.7 to 5.1 4.4 to 4.9Foreign exchange(4) 0.7 0.1 0.1 0.1Adjusted outlook(5) 35.2 to 35.8 9.6 to 10.0 4.8 to 5.2 4.5 to 5.02008 performance 35.5 10.1 5.1 5.5
Notes:(1) The amount for the 2008 financial year includes £0.4 billion benefit from deferred payments
for capital expenditure but is stated after £0.7 billion of tax payments, including associated interest, in respect of a number of long standing tax issues.
(2) The Group’s outlook from May 2007 reflected expectations for average foreign exchange rates for the 2008 financial year of approximately £1:€1.47 and £1:US$1.98.
(3) The Group’s outlook, as updated in November 2007, reflected improvements in operational performance, the impact of the Tele2 acquisition and updated expectations for average foreign exchange rates for the 2008 financial year of approximately £1:€1.45 and £1:US$2.04.
(4) These amounts represent the difference between the forecast exchange rates used in the November 2007 update and rates used to translate actual results including £1:€1.42 and £1:US$2.01.
(5) Outlook from November 2007 adjusted solely for exchange rate differences as discussed in note 4 above.
Vodafone Group Plc Annual Report 2008 51
Regulatory decisions and changes in the regulatory environment could adversely affect the Group’s business. Because the Group has ventures in a large number of geographic areas, it must comply with an extensive range of requirements that regulate and supervise the licensing, construction and operation of its telecommunications networks and services. In particular, there are agencies which regulate and supervise the allocation of frequency spectrum and which monitor and enforce regulation and competition laws which apply to the mobile telecommunications industry. Decisions by regulators regarding the granting, amendment or renewal of licences, to the Group or to third parties, could adversely affect the Group’s future operations in these geographic areas. The Group cannot provide any assurances that governments in the countries in which it operates will not issue telecommunications licences to new operators whose services will compete with it. In addition, other changes in the regulatory environment concerning the use of mobile phones may lead to a reduction in the usage of mobile phones or otherwise adversely affect the Group. Additionally, decisions by regulators and new legislation, such as those relating to international roaming charges and call termination rates, could affect the pricing for, or adversely affect the revenue from, the services the Group offers. Further details on the regulatory framework in certain countries and regions in which the Group operates, and on regulatory proceedings can be found in “Regulation” on page 147.
Increased competition may reduce market share or revenue.The Group faces intensifying competition. Competition could lead to a reduction in the rate at which the Group adds new customers and to a decrease in the size of the Group’s market share as customers choose to receive telecommunications services, or other competing services, from other providers. Examples include, but are not limited to, competition from internet based services and MVNOs.
The focus of competition in many of the Group’s markets continues to shift from customer acquisition to customer retention as the market for mobile telecommunications has become increasingly penetrated. Customer deactivations are measured by the Group’s churn rate. There can be no assurance that the Group will not experience increases in churn rates, particularly as competition intensifies. An increase in churn rates could adversely affect profitability because the Group would experience lower revenue and additional selling costs to replace customers.
Increased competition has also led to declines in the prices the Group charges for its mobile services and is expected to lead to further price declines in the future. Competition could also lead to an increase in the level at which the Group must provide subsidies for handsets. Additionally, the Group could face increased competition should there be an award of additional licences in jurisdictions in which a member of the Group already has a licence.
Delays in the development of handsets and network compatibility and components may hinder the deployment of new technologies.The Group’s operations depend in part upon the successful deployment of continuously evolving telecommunications technologies. The Group uses technologies from a number of vendors and makes significant capital expenditures in connection with the deployment of such technologies. There can be no assurance that common standards and specifications will be achieved, that there will be inter-operability across Group and other networks, that technologies will be developed according to anticipated schedules, that they will perform according to expectations or that they will achieve commercial acceptance. The introduction of software and other network components may also be delayed. The failure of vendor performance or technology performance to meet the Group’s expectations or the failure of a technology to achieve commercial acceptance could result in additional capital expenditures by the Group or a reduction in profitability.
Expected benefits from cost reduction initiatives may not be realised.The Group has entered into several cost reduction initiatives principally relating to the outsourcing of IT application development and maintenance, data centre consolidation, supply chain management and a business transformation programme to implement a single, integrated operating model using one ERP system. However, there is no assurance that the full extent of the anticipated benefits will be realised.
Changes in assumptions underlying the carrying value of certain Group assets could result in impairment.Vodafone completes a review of the carrying value of its assets annually, or more frequently where the circumstances require, to assess whether those carrying values can be supported by the net present value of future cash flows derived from such assets. This review examines the continued appropriateness of the assumptions in respect of highly uncertain matters upon which the carrying values of certain of the Group’s assets are based. This includes an assessment of discount rates and long term growth rates, future technological developments and timing and quantum of future capital expenditure, as well as several factors which may affect revenue and profitability identified within other risk factors in this section such as intensifying competition, pricing pressures, regulatory changes and the timing for introducing new products or services. Due to the Group’s substantial carrying value of goodwill under IFRS, the revision of any of these assumptions to reflect current or anticipated changes in operations or the financial condition of the Group could lead to an impairment in the carrying value of certain assets in the Group. While impairment does not impact reported cash flows, it does result in a non-cash charge in the Consolidated Income Statement and thus no assurance can be given that any future impairments would not affect the Company’s reported distributable reserves and therefore its ability to make distributions to its shareholders or repurchase its shares. See “Critical Accounting Estimates” on page 85.
The Group’s geographic expansion may increase exposure to unpredictable economic, political and legal risks.Political, economic and legal systems in emerging markets historically are less predictable than in countries with more developed institutional structures. As the Group increasingly enters into emerging markets, the value of the Group’s investments may be adversely affected by political, economic and legal developments which are beyond the Group’s control.
Expected benefits from acquisitions may not be realised.The Group has made significant acquisitions, which are expected to deliver benefits resulting from the anticipated growth potential of the relevant markets. However, there is no assurance as to the successful integration of companies acquired by the Group or the extent to which the anticipated benefits resulting from the acquisitions will be achieved.
The Company’s strategic objectives may be impeded by the fact that it does not have a controlling interest in some of its ventures.Some of the Group’s interests in mobile licences are held through entities in which it is a significant but not controlling owner. Under the governing documents for some of these partnerships and corporations, certain key matters such as the approval of business plans and decisions as to the timing and amount of cash distributions require the consent of the partners. In others, these matters may be approved without the Company’s consent. The Company may enter into similar arrangements as it participates in ventures formed to pursue additional opportunities. Although the Group has not been materially constrained by the nature of its mobile ownership interests, no assurance can be given that its partners will not exercise their power of veto or their controlling influence in any of the Group’s ventures in a way that will hinder the Group’s corporate objectives and reduce any anticipated cost savings or revenue enhancement resulting from these ventures.
Principal Risk Factors and Uncertainties
52 Vodafone Group Plc Annual Report 2008
Vodafone – Performance
Expected benefits from investment in networks, licences and new technology may not be realised.The Group has made substantial investments in the acquisition of licences and in its mobile networks, including the roll out of 3G networks. The Group expects to continue to make significant investments in its mobile networks due to increased usage and the need to offer new services and greater functionality afforded by new or evolving telecommunications technologies. Accordingly, the rate of the Group’s capital expenditures in future years could remain high or exceed that which it has experienced to date.
There can be no assurance that the introduction of new services will proceed according to anticipated schedules or that the level of demand for new services will justify the cost of setting up and providing new services. Failure or a delay in the completion of networks and the launch of new services, or increases in the associated costs, could have a material adverse effect on the Group’s operations.
The Group may experience a decline in revenue or profitability notwithstanding its efforts to increase revenue from the introduction of new services.As part of its strategy, the Group will continue to offer new services to its existing customers and seek to increase non-voice service revenue as a percentage of total service revenue. However, the Group may not be able to introduce these new services commercially, or may experience significant delays due to problems such as the availability of new mobile handsets, higher than anticipated prices of new handsets or availability of new content services. In addition, even if these services are introduced in accordance with expected time schedules, there is no assurance that revenue from such services will increase ARPU or maintain profit margins.
The Group’s business and its ability to retain customers and attract new customers may be impaired by actual or perceived health risks associated with the transmission of radio waves from mobile telephones, transmitters and associated equipment.Concerns have been expressed in some countries where the Group operates that the electromagnetic signals emitted by mobile telephone handsets and base stations may pose health risks at exposure levels below existing guideline levels and may interfere with the operation of electronic equipment. In addition, as described under the heading “Legal proceedings” in note 32 to the Consolidated Financial Statements, several mobile industry participants, including the Company and Verizon Wireless, have had lawsuits filed against them alleging various health consequences as a result of mobile phone usage, including brain cancer. While the Company is not aware that such health risks have been substantiated, there can be no assurance that the actual, or perceived, risks associated with radio wave transmission will not impair its ability to retain customers and attract new customers, reduce mobile telecommunications usage or result in further litigation. In such event, because of the Group’s strategic focus on mobile telecommunications, its business and results of operations may be more adversely affected than those of other companies in the telecommunications sector.
The Group’s business would be adversely affected by the non-supply of equipment and support services by a major supplier.Companies within the Group source network infrastructure and other equipment, as well as network-related and other significant support services, from third party suppliers. The withdrawal or removal from the market of one or more of these major third party suppliers would adversely affect the Group’s operations and could result in additional capital or operational expenditures by the Group.
Vodafone Group Plc Annual Report 2008 53
Financial Position and Resources
Consolidated Balance Sheet
2008 2007 £m £m
Non-current assetsIntangible assets 70,331 56,272Property, plant and equipment 16,735 13,444Investments in associated undertakings 22,545 20,227Other non-current assets 8,935 6,861 118,546 96,804Current assets 8,724 12,813Total assets 127,270 109,617
Total equity shareholders funds 78,043 67,067Total minority interests (1,572) 226Total equity 76,471 67,293
LiabilitiesBorrowings Long term 22,662 17,798 Short term 4,532 4,817Taxation liabilities Deferred tax liabilities 5,109 4,626 Current taxation liabilities 5,123 5,088Other non-current liabilities 1,055 954Other current liabilities(2) 12,318 9,041 50,799 42,324Total equity and liabilities 127,270 109,617
Non-current assetsIntangible assetsAt 31 March 2008, the Group’s intangible assets were £70.3 billion, with goodwill comprising the largest element at £51.3 billion (2007: £40.6 billion). The increase in intangible assets was primarily as a result of £7.9 billion of favourable exchange rate movements and £7.6 billion arising on the acquisitions of Vodafone Essar and Tele2, partially offset by amortisation of £2.5 billion. Refer to note 28 to the Consolidated Financial Statements for further information on the business acquisitions.
Property, plant and equipmentProperty, plant and equipment increased from £13.4 billion at 31 March 2007 to £16.7 billion at 31 March 2008, predominantly as a result of £4.1 billion of additions, a £1.2 billion increase due to acquisitions during the year and £1.6 billion of favourable foreign exchange movements, which more than offset the £3.4 billion of depreciation charges and £0.1 billion reduction due to disposals.
Investments in associated undertakingsThe Group’s investments in associated undertakings increased from £20.2 billion at 31 March 2007 to £22.5 billion at 31 March 2008, as a result of a £2.9 billion increase from the Group’s share of the results of its associates, after the deductions of interest, tax and minority interest, mainly arising from the Group’s investment in Verizon Wireless and favourable foreign exchange movements of £0.3 billion, partially offset by £0.9 billion of dividends received.
Other non-current assetsOther non-current assets mainly relates to other investments held by the Group, which totalled £7.4 billion at 31 March 2008 compared to £5.9 billion at 31 March 2007. The movement primarily represents an increase of £1.8 billion in the investment in China Mobile as a result of the increase in the listed share price, partially offset by the disposal of the Group’s 5.60% stake in Bharti Airtel.
Current assetsCurrent assets decreased to £8.7 billion at 31 March 2008 from £12.8 billion at 31 March 2007, mainly as a result of decreased cash holdings following the completion of the Vodafone Essar acquisition.
Total equity shareholders’ fundsTotal equity shareholders’ funds increased from £67.1 billion at 31 March 2007 to £78.0 billion at 31 March 2008. The increase comprises primarily of the profit for the year of £6.8 billion less equity dividends of £3.7 billion, a £5.8 billion benefit from the impact of favourable exchange rate movements and the unrealised holding gains on other investments discussed above.
BorrowingsLong term borrowings and short term borrowings increased to £27.2 billion at 31 March 2008 from £22.6 billion at 31 March 2007, mainly as a result of foreign exchange movements and written put option liabilities assumed on the completion of the Vodafone Essar acquisition.
Taxation liabilitiesThe deferred tax liability increased from £4.6 billion at 31 March 2007 to £5.1 billion at 31 March 2008, which arose mainly from £0.5 billion in relation to the acquisition of Vodafone Essar.
Other current liabilitiesThe increase in other current liabilities from £9.0 billion to £12.3 billion is primarily to due foreign exchange differences arising on translation and other current liabilities in the newly acquired Vodafone Essar.
Contractual obligations A summary of the Group’s principal contractual financial obligations is shown below. Further details on the items included can be found in the notes to the Consolidated Financial Statements. Payments due by period £m 1-3 3-5Contractual obligations(1) Total <1year years years >5 years
Borrowings(2) 34,537 5,492 10,150 4,728 14,167Operating lease commitments(3) 4,441 837 1,081 771 1,752Capital commitments(3)(4) 1,620 1,262 213 84 61Purchase commitments 2,347 1,548 439 283 77Total contractual cash obligations(1) 42,945 9,139 11,883 5,866 16,057
Notes:(1) The above table of contractual obligations excludes commitments in respect of options over
interests in Group businesses held by minority shareholders (see “Option agreements and similar arrangements”) and obligations to pay dividends to minority shareholders (see “Dividends from associated undertakings and to minority shareholders”). The table excludes current and deferred tax liabilities and obligations under post employment benefit schemes, details of which are provided in notes 6 and 25 to the Consolidated Financial Statements, respectively.
(2) See note 24 to the Consolidated Financial Statements.(3) See note 31 to the Consolidated Financial Statements.(4) Primarily related to network infrastructure.
ContingenciesDetails of the Group’s contingent liabilities are included in note 32 to the Consolidated Financial Statements.
54 Vodafone Group Plc Annual Report 2008
Vodafone – Performance
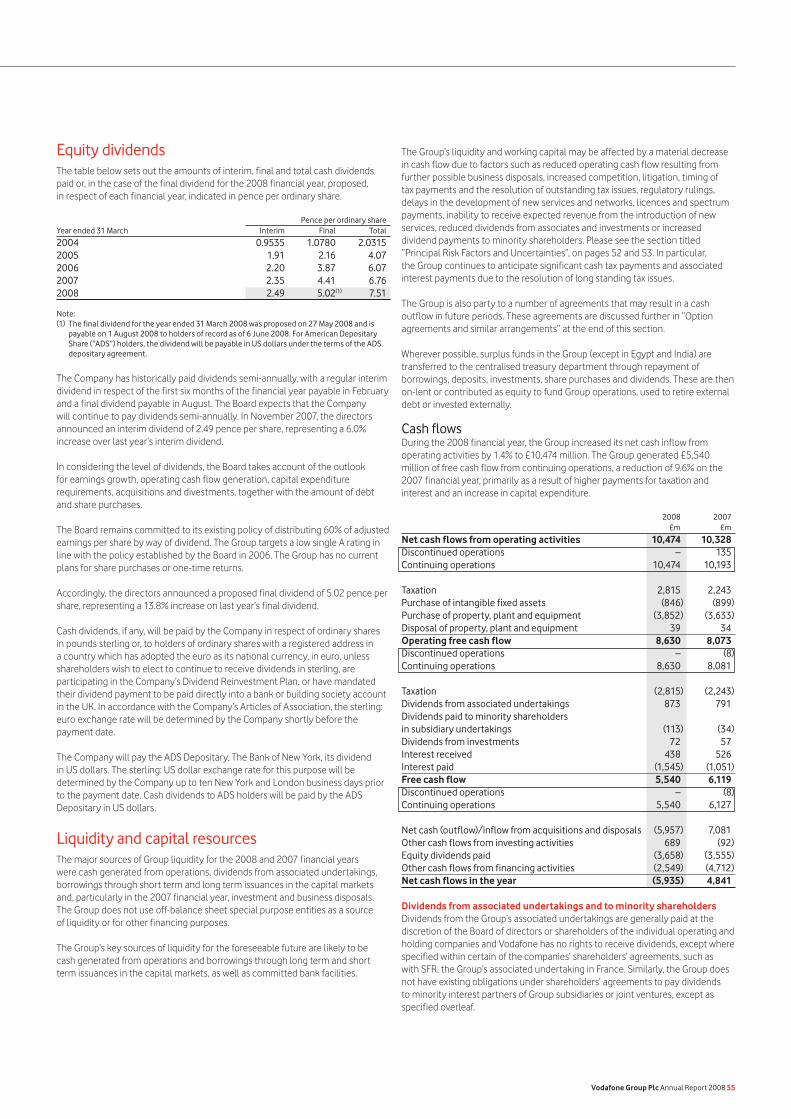
Equity dividendsThe table below sets out the amounts of interim, final and total cash dividends paid or, in the case of the final dividend for the 2008 financial year, proposed, in respect of each financial year, indicated in pence per ordinary share.
Pence per ordinary shareYear ended 31 March Interim Final Total
2004 0.9535 1.0780 2.03152005 1.91 2.16 4.072006 2.20 3.87 6.072007 2.35 4.41 6.76 2008 2.49 5.02(1) 7.51
Note:(1) The final dividend for the year ended 31 March 2008 was proposed on 27 May 2008 and is
payable on 1 August 2008 to holders of record as of 6 June 2008. For American Depositary Share (“ADS”) holders, the dividend will be payable in US dollars under the terms of the ADS depositary agreement.
The Company has historically paid dividends semi-annually, with a regular interim dividend in respect of the first six months of the financial year payable in February and a final dividend payable in August. The Board expects that the Company will continue to pay dividends semi-annually. In November 2007, the directors announced an interim dividend of 2.49 pence per share, representing a 6.0% increase over last year’s interim dividend.
In considering the level of dividends, the Board takes account of the outlook for earnings growth, operating cash flow generation, capital expenditure requirements, acquisitions and divestments, together with the amount of debt and share purchases.
The Board remains committed to its existing policy of distributing 60% of adjusted earnings per share by way of dividend. The Group targets a low single A rating in line with the policy established by the Board in 2006. The Group has no current plans for share purchases or one-time returns.
Accordingly, the directors announced a proposed final dividend of 5.02 pence per share, representing a 13.8% increase on last year’s final dividend.
Cash dividends, if any, will be paid by the Company in respect of ordinary shares in pounds sterling or, to holders of ordinary shares with a registered address in a country which has adopted the euro as its national currency, in euro, unless shareholders wish to elect to continue to receive dividends in sterling, are participating in the Company’s Dividend Reinvestment Plan, or have mandated their dividend payment to be paid directly into a bank or building society account in the UK. In accordance with the Company’s Articles of Association, the sterling: euro exchange rate will be determined by the Company shortly before the payment date.
The Company will pay the ADS Depositary, The Bank of New York, its dividend in US dollars. The sterling: US dollar exchange rate for this purpose will be determined by the Company up to ten New York and London business days prior to the payment date. Cash dividends to ADS holders will be paid by the ADS Depositary in US dollars.
Liquidity and capital resourcesThe major sources of Group liquidity for the 2008 and 2007 financial years were cash generated from operations, dividends from associated undertakings, borrowings through short term and long term issuances in the capital markets and, particularly in the 2007 financial year, investment and business disposals. The Group does not use off-balance sheet special purpose entities as a source of liquidity or for other financing purposes.
The Group’s key sources of liquidity for the foreseeable future are likely to be cash generated from operations and borrowings through long term and short term issuances in the capital markets, as well as committed bank facilities.
The Group’s liquidity and working capital may be affected by a material decrease in cash flow due to factors such as reduced operating cash flow resulting from further possible business disposals, increased competition, litigation, timing of tax payments and the resolution of outstanding tax issues, regulatory rulings, delays in the development of new services and networks, licences and spectrum payments, inability to receive expected revenue from the introduction of new services, reduced dividends from associates and investments or increased dividend payments to minority shareholders. Please see the section titled “Principal Risk Factors and Uncertainties”, on pages 52 and 53. In particular, the Group continues to anticipate significant cash tax payments and associated interest payments due to the resolution of long standing tax issues.
The Group is also party to a number of agreements that may result in a cash outflow in future periods. These agreements are discussed further in “Option agreements and similar arrangements” at the end of this section.
Wherever possible, surplus funds in the Group (except in Egypt and India) are transferred to the centralised treasury department through repayment of borrowings, deposits, investments, share purchases and dividends. These are then on-lent or contributed as equity to fund Group operations, used to retire external debt or invested externally.
Cash flowsDuring the 2008 financial year, the Group increased its net cash inflow from operating activities by 1.4% to £10,474 million. The Group generated £5,540 million of free cash flow from continuing operations, a reduction of 9.6% on the 2007 financial year, primarily as a result of higher payments for taxation and interest and an increase in capital expenditure.
2008 2007 £m £m
Net cash flows from operating activities 10,474 10,328Discontinued operations – 135Continuing operations 10,474 10,193 Taxation 2,815 2,243Purchase of intangible fixed assets (846) (899)Purchase of property, plant and equipment (3,852) (3,633)Disposal of property, plant and equipment 39 34Operating free cash flow 8,630 8,073Discontinued operations – (8)Continuing operations 8,630 8,081
Taxation (2,815) (2,243)Dividends from associated undertakings 873 791Dividends paid to minority shareholders in subsidiary undertakings (113) (34)Dividends from investments 72 57Interest received 438 526Interest paid (1,545) (1,051)Free cash flow 5,540 6,119Discontinued operations – (8)Continuing operations 5,540 6,127 Net cash (outflow)/inflow from acquisitions and disposals (5,957) 7,081Other cash flows from investing activities 689 (92)Equity dividends paid (3,658) (3,555)Other cash flows from financing activities (2,549) (4,712)Net cash flows in the year (5,935) 4,841
Dividends from associated undertakings and to minority shareholdersDividends from the Group’s associated undertakings are generally paid at the discretion of the Board of directors or shareholders of the individual operating and holding companies and Vodafone has no rights to receive dividends, except where specified within certain of the companies’ shareholders’ agreements, such as with SFR, the Group’s associated undertaking in France. Similarly, the Group does not have existing obligations under shareholders’ agreements to pay dividends to minority interest partners of Group subsidiaries or joint ventures, except as specified overleaf.
Vodafone Group Plc Annual Report 2008 55
Financial Position and Resources continued
Included in the dividends received from associated undertakings and investments is an amount of £414 million (2007: £328 million) received from Verizon Wireless. Until April 2005, Verizon Wireless’ distributions were determined by the terms of the partnership agreement distribution policy and comprised income distributions and tax distributions. Since April 2005, tax distributions have continued. Current projections forecast that tax distributions will not be sufficient to cover the US tax liabilities arising from the Group’s partnership interest in Verizon Wireless until 2015 and, in the absence of additional distributions above the level of tax distributions during this period, will result in a net cash outflow for the Group. Under the terms of the partnership agreement, the Board has no obligation to provide for additional distributions above the level of the tax distributions. It is the current expectation that Verizon Wireless will continue to re-invest free cash flow in the business and reduce indebtedness.
During the year ended 31 March 2008, cash dividends totalling £450 million (2007: £450 million) were received from SFR in accordance with the shareholders’ agreement. It is currently expected that future dividends from SFR will reduce, but by no more than 50%, between 2009 and 2011 inclusive, should SFR increase debt levels following completion of the purchase of an additional stake in Neuf Cegetel.
Verizon Communications Inc. (“Verizon”) has an indirect 23.1% shareholding in Vodafone Italy and, under the shareholders’ agreement, the shareholders have agreed to take steps to cause Vodafone Italy to pay dividends at least annually, provided that such dividends will not impair the financial condition or prospects of Vodafone Italy including, without limitation, its credit rating. During the 2008 financial year, Vodafone Italy declared and paid a gross dividend of €8.9 billion, of which €2.1 billion was received by Verizon net of withholding tax.
The Vodafone Essar shareholders’ agreement provides for the payment of dividends to minority partners under certain circumstances but not before May 2011.
Acquisitions and disposals The Group paid a net £5,268 million cash and cash equivalents from acquisition and disposal activities, including investments, in the year to 31 March 2008. An analysis of the main transactions in the 2008 financial year, including the changes in the Group’s effective shareholding, are shown in the table below. Further details of the acquisitions are provided in note 28 to the Consolidated Financial Statements.
£m
Acquisitions(1): Acquisition of 100% of CGP Investments (Holdings) Limited (“CGP”), a company with indirect interests in Vodafone EssarLimited (formerly Hutchison Essar Limited) (5,429)Tele2 Spain and Italy (from nil to 100%) (451)
Disposals: Partial disposal of Bharti Airtel (from 9.99% to 5.00%)(1) 654Other net acquisitions and disposals, including investments (1) (42)Total (5,268)
Note:(1) Amounts are shown net of cash and cash equivalents acquired or disposed.
On 8 May 2007, the Group completed the acquisition of 100% of CGP Investments (Holdings) Limited (“CGP”), a company with indirect interests in Vodafone Essar, from Hutchison Telecommunications International Limited for cash consideration of £5,438 million, net of £51 million cash and cash equivalents acquired, of which £5,429 million was paid during the 2008 financial year. Following this transaction, the Group has a controlling financial interest in Vodafone Essar. As part of this transaction, the Group also assumed gross debt of £1,483 million, including £217 million related to written put options over minority interests, and issued a written put to the Essar group for which the present value of the redemption price at the date of grant was £2,154 million. See page 58 for further details on these options. The Group also entered into a shareholders’ agreement with the Essar Group in relation to Vodafone Essar.
On 9 May 2007, in conjunction with the acquisition of Vodafone Essar, the Group entered into a share sale and purchase agreement in which a Bharti group company irrevocably agreed to purchase the Group’s 5.60% direct shareholding in Bharti Airtel. During the year ended 31 March 2008, the Group received £654 million in cash consideration for 4.99% of such shareholding. The Group’s remaining 0.61% direct shareholding was transferred in April 2008 for cash consideration of £87 million. The Group retains a 4.36% indirect stake in Bharti Airtel.
On 3 December 2007, the Group completed the acquisition of Tele2 Italia SpA (“Tele2 Italy”) and Tele2 Telecommunication Services SLU (“Tele2 Spain”) from Tele2 AB Group for a cash consideration of £452 million, of which £451 million was paid during the 2008 financial year.
Other returnsThe Board will periodically review the free cash flow, anticipated cash requirements, dividends, credit profile and gearing of the Group and consider additional shareholder returns.
Treasury sharesThe Companies Act 1985 permits companies to purchase their own shares out of distributable reserves and to hold shares with a nominal value not to exceed 10% of the nominal value of their issued share capital in treasury. If shares in excess of this limit are purchased they must be cancelled. While held in treasury, no voting rights or pre-emption rights accrue and no dividends are paid in respect of treasury shares. Treasury shares may be sold for cash, transferred (in certain circumstances) for the purposes of an employee share scheme, or cancelled. If treasury shares are sold, such sales are deemed to be a new issue of shares and will accordingly count towards the 5% of share capital which the Company is permitted to issue on a non pre-emptive basis in any one year as approved by its shareholders at the AGM. The proceeds of any sale of treasury shares up to the amount of the original purchase price, calculated on a weighted average price method, is attributed to distributable profits which would not occur in the case of the sale of non-treasury shares. Any excess above the original purchase price must be transferred to the share premium account. The Company did not repurchase any of its own shares between 1 April 2007 and 31 March 2008.
Shares purchased are held in treasury in accordance with section 162 of the Companies Act 1985. The movement in treasury shares during the financial year is shown below: Number Million £m
1 April 2007 5,251 8,047Re-issue of shares (118) (191) 31 March 2008 5,133 7,856
56 Vodafone Group Plc Annual Report 2008
Vodafone – Performance
Funding The Group’s consolidated net debt position at 31 March was as follows:
2008 2007 £m £m
Cash and cash equivalents (as presented in the Consolidated Balance Sheet) 1,699 7,481 Trade and other receivables(1) 892 304Trade and other payables(1) (544) (219)Short term borrowings (4,532) (4,817)Long term borrowings (22,662) (17,798) (26,846) (22,530)Net debt shown in the Consolidated Balance Sheet (25,147) (15,049)
Note:(1) Trade and other receivables and payables included in net debt represent certain derivative
financial instruments (see notes 17 and 27 to the Consolidated Financial Statements).(2) The amount for the 2008 financial year includes £2,625 million related to put options over
minority interests, including those in Vodafone Essar and Acror, which are reported as financial liabilities.
At 31 March 2008, the Group had £1,699 million of cash and cash equivalents, with the decrease since 31 March 2007 being due to the holding of funds at 31 March 2007 prior to the completion of the Vodafone Essar transaction, which occurred on 8 May 2007. Cash and cash equivalents are held in accordance with the Group treasury policy.
The Group holds its cash and liquid investments in accordance with the counterparty and settlement risk limits of the Board approved treasury policy. The main forms of liquid investments at 31 March 2008 were money market funds, commercial paper and bank deposits.
Net debt increased to £25,147 million, from £15,049 million at 31 March 2007, as the impact of business acquisitions and disposals, movements in the liability related to written put options and equity dividend payments were partially offset by free cash flow. The impact of foreign exchange rates increased net debt by £3,238 million, primarily as approximately 80% of net debt is denominated in euro and the euro/£ exchange rate increased by 17.2% during the 2008 financial year. Net debt represented approximately 31% of the Group’s market capitalisation at 31 March 2008 compared with 16% at 31 March 2007. Average net debt at month end accounting dates over the 12 month period ended 31 March 2008 was £22,194 million and ranged between £14,876 million and £25,147 million during the year.
Consistent with the development of its strategy, the Group targets low single A long term credit ratings, with its current credit ratings being P-2/F2/A-2 short term and Baa1 stable/A- stable/A- stable long term from Moody’s, Fitch Ratings and Standard & Poor’s, respectively. Credit ratings are not a recommendation to purchase, hold or sell securities, in as much as ratings do not comment on market price or suitability for a particular investor, and are subject to revision or withdrawal at any time by the assigning rating organisation. Each rating should be evaluated independently.
The Group’s credit ratings enable it to have access to a wide range of debt finance, including commercial paper, bonds and committed bank facilities.
Commercial paper programmesThe Group currently has US and euro commercial paper programmes of $15 billion and £5 billion, respectively, which are available to be used to meet short term liquidity requirements. At 31 March 2008, €1,686 million (£1,342 million), £81 million and £33 million equivalent of other currencies were drawn under the euro commercial paper programme, with such funds being provided by counterparties external to the Group. There were no drawings under the US commercial paper programme. At 31 March 2007, $26 million (£13 million) was drawn under the US commercial paper programme and €1,531 million (£1,040 million) and £50 million were drawn under the euro commercial paper programme. The commercial paper facilities were supported by $11.3 billion (£5.7 billion) of committed bank facilities (see “Committed facilities” below), comprised of a $6.1 billion Revolving Credit Facility that matures on 24 June 2009 and a $5.2 billion Revolving Credit Facility that matures on 22 June 2012. At 31 March 2008 and 31 March 2007, no amounts had been drawn under either bank facility. On 8 May 2007, these facilities were increased from $5.9 billion and $5.0 billion, respectively.
BondsThe Group has a €25 billion Euro Medium Term Note programme and a US shelf programme, which are used to meet medium to long term funding requirements. At 31 March 2008, the total amounts in issue under these programmes split by currency were $13.0 billion, £1.5 billion, €10.3 billion and AUD$ 0.3 billion.
In the year to 31 March 2008, bonds with a nominal value of £1.6 billion were issued under the US shelf and the Euro Medium Term Note programme. The bonds issued during the year were: US shelf/ Euro Medium Term Note Amount (“EMTN”)Date of bond issue Maturity of bond Currency Million programme
6 June 2007 6 June 2014 EUR 1,250 EMTN 6 June 2007 6 June 2022 EUR 500 EMTN24 October 2007 27 February 2037 USD 500 US shelf
At 31 March 2008, the Group had bonds outstanding with a nominal value of £17,143 million. On 13 May 2008, the Group issued €250 million of 3.625% bonds maturing on 29 November 2012.
Committed facilitiesThe following table summarises the committed bank facilities available to the Group at 31 March 2008.
Committed bank facilities Amounts drawn
24 June 2004$6.1 billion Revolving Credit No drawings have been made against thisFacility, maturing 24 June 2009. facility. The facility supports the Group’s
commercial paper programmes and may be used for general corporate purposes, including acquisitions.
24 June 2005 $5.2 billion Revolving Credit No drawings have been made against thisFacility, maturing 22 June 2012. facility. The facility supports the Group’s
commercial paper programmes and may be used for general corporate purposes, including acquisitions.
21 December 2005 ¥258.5 billion Term Credit The facility was drawn down in full onFacility, maturing 16 March 2011, 21 December 2005. The facility is available entered into by Vodafone for general corporate purposes, althoughFinance K.K. and guaranteed amounts drawn must be on-lent to theby the Company. Company.
16 November 2006€0.4 billion Loan Facility, The facility was drawn down in full onmaturing 14 February 2014 14 February 2007. The facility is available
for financing capital expenditure in the Group’s Turkish operating company.
Under the terms and conditions of the $11.3 billion committed bank facilities, lenders have the right, but not the obligation, to cancel their commitments and have outstanding advances repaid no sooner than 30 days after notification of a change of control of the Company. This is in addition to the rights of lenders to cancel their commitment if the Company has committed an event of default.
The facility agreements provide for certain structural changes that do not affect the obligations of the Company to be specifically excluded from the definition of a change of control.
Substantially the same terms and conditions apply in the case of Vodafone Finance K.K.’s ¥258.5 billion term credit facility, although the change of control provision is applicable to any guarantor of borrowings under the term credit facility. Additionally, the facility agreement requires Vodafone Finance K.K. to maintain a positive tangible net worth at the end of each financial year. As of 31 March 2008, the Company was the sole guarantor.
Vodafone Group Plc Annual Report 2008 57
Financial Position and Resources continued
The terms and conditions of the €0.4 billion loan facility are similar to those of the $11.3 billion committed bank facilities, with the addition that, should the Group’s Turkish operating company spend less than the equivalent of $0.8 billion on capital expenditure, the Group will be required to repay the drawn amount of the facility that exceeds 50% of the capital expenditure.
Furthermore, two of the Group’s subsidiary undertakings are funded by external facilities which are non-recourse to any member of the Group other than the borrower, due to the level of country risk involved. These facilities may only be used to fund their operations. At 31 March 2008, Vodafone India had facilities of INR 138 billion (£1.7 billion), of which INR 118 billion (£1.5 billion) is drawn. Since 31 March 2008, Vodafone India has entered into additional facilities amounting to INR 71.5 billion (£898 million). Vodafone Egypt has a partly drawn EGP 1.7 billion (£156 million) syndicated bank facility of EGP 4.0 billion (£369 million) that matures in March 2014.
In aggregate, the Group has committed facilities of approximately £9,870 million, of which £6,174 million was undrawn and £3,696 million was drawn at 31 March 2008.
The Group believes that it has sufficient funding for its expected working capital requirements. Further details regarding the maturity, currency and interest rates of the Group’s gross borrowings at 31 March 2008 are included in note 24 to the Consolidated Financial Statements.
Financial assets and liabilitiesAnalyses of financial assets and liabilities, including the maturity profile of debt, currency and interest rate structure, are included in notes 18 and 24 to the Consolidated Financial Statements. Details of the Group’s treasury management and policies are included within note 24 to the Consolidated Financial Statements.
Option agreements and similar arrangementsPotential cash inflowsOn 8 August 2007, the Group announced that it had decided not to exercise its rights under its agreement with Verizon Communications (“Verizon”) to sell to Verizon up to $10 billion of the Group’s interest in Verizon Wireless. There are no other agreements, which allow Vodafone to put its interest in Verizon Wireless to Verizon.
Potential cash outflowsIn respect of the Group’s interest in the Verizon Wireless partnership, an option granted to Price Communications, Inc. by Verizon Communications Inc. was exercised on 15 August 2006. Under the option agreement, Price Communications, Inc. exchanged its preferred limited partnership interest in Verizon Wireless of the East LP for 29.5 million shares of common stock in Verizon Communications Inc. Verizon Communications Inc. has the right, but not the obligation, to contribute the preferred interest to the Verizon Wireless partnership, diluting the Group’s interest. However, the Group also has the right to contribute further capital to the Verizon Wireless partnership in order to maintain its percentage partnership interest. Such amount, if contributed, would be $0.9 billion.
In respect of Arcor, the Group’s non-mobile operation in Germany, the capital structure provides all partners, including the Group, the right to withdraw capital from 31 December 2026 onwards and this right in relation to the minority partners has been recognised as a financial liability. The Group acquired the outstanding minority interests on 19 May 2008.
As part of the Vodafone Essar acquisition, the Group acquired less than 50% equity interests in Telecom Investments India Private Limited (“TII”) and in Omega Telecom Holdings Private Limited (‘Omega’), which in turn have a 19.54% and 5.11% indirect shareholding in Vodafone Essar. The Group was granted call options to acquire 100% of the shares in two companies which together indirectly own the remaining shares of TII for, if the market equity of Vodafone Essar at the time of exercise is less than US$25 billion, an aggregate price of US$431 million plus interest or, if the market equity value of Vodafone Essar at the time of exercise is greater than US$25 billion, the fair market value of the shares as agreed between the parties. The Group also has an option to acquire 100% of the shares in a third company which owns the remaining shares in Omega. In conjunction with the receipt of these options, the Group also granted a put option to each of the shareholders of these companies with identical pricing which, if exercised, would require Vodafone to purchase 100% of the equity in the respective company. These options can only be exercised in accordance with Indian law prevailing at the time of exercise.
The Group granted put options exercisable between 8 May 2010 and 8 May 2011 to members of the Essar group of companies that, if exercised, would allow the Essar group to sell its 33% shareholding in Vodafone Essar to the Group for US$5 billion or to sell between US$1 billion and US$5 billion worth of Vodafone Essar shares to the Group at an independently appraised fair market value.
Off-balance sheet arrangementsThe Group does not have any material off-balance sheet arrangements, as defined in item 5.E.2. of the SEC’s Form 20-F. Please refer to notes 31 and 32 to the Consolidated Financial Statements for a discussion of the Group’s commitments and contingent liabilities.
Quantitative and qualitative disclosures about market riskA discussion of the Group’s financial risk management objectives and policies and the exposure of the Group to liquidity, market and credit risk is included within note 24 to the Consolidated Financial Statements.
58 Vodafone Group Plc Annual Report 2008
Vodafone – Performance
Corporate Responsibility
Business impactCR issues present both risks and opportunities for Vodafone and a broad range of stakeholders are increasingly interested in how Vodafone manages these issues. For example, the Group’s licences to operate are granted by governments that frequently seek evidence of responsible business practices and in many markets consumers are becoming more concerned about CR issues, such as climate change, content standards and mobile phones, masts and health.
The range of stakeholders and the breadth of the issues involved indicate that CR is relevant across all aspects of Vodafone’s activities and therefore the Group seeks to integrate its CR approach into all key business processes.
StrategyThe CR strategy, which addresses CR issues material to the Group, has the following main strands:
to capture the potential of mobile to bring socio-economic value in both emerging economies and developed markets, through broadening access to communications to all sections of society;to deliver against stakeholder expectations on the key areas of climate change, a safe and responsible internet experience and sustainable products and services; andto ensure Vodafone’s operating standards are of a consistent and appropriate level across the Group.
•
•
•
CR governanceVodafone’s approach to CR is underpinned by its business principles which cover, amongst other things, the environment, employees, individual conduct and community and society. The business principles are available on www.vodafone.com/responsibility/businessprinciples and are communicated to employees in a number of ways, including induction processes, websites and face to face meetings.
The Executive Committee receives regular information on CR and, for the last five years, the Board has had an annual presentation on CR. A CR management structure is established in each local operating company, with each one having a representative on its management board with responsibility for CR. For the purposes of this section of the Annual Report, “operating companies” refers to the Group’s operating subsidiaries and the Group’s joint venture in Italy. It includes information for the first time for Turkey and Arcor, Vodafone’s fixed-line business in Germany, but excludes the newly acquired operations in India and Tele2 in Spain and Italy. These newly acquired operations will be included in the 2009 financial year.
CR performance is closely monitored and reported at most local operating company boards on a regular basis. CR is also integrated into Vodafone’s risk management processes such as the formal annual confirmation provided by each local operating company detailing the operation of their controls system.
These processes are supported by stakeholder engagement, which helps to ensure Vodafone is aware of the issues relevant to the business and to provide a clear understanding of expectations of performance. Stakeholder consultations take place with customers, investors, employees, suppliers, the communities where the Group operates and where networks are based, governments and regulators and non-governmental organisations. In addition, the Group has continued the Vodafone CR Dialogues programme of in-depth discussions on specific, emerging issues. CR Dialogues this year focused on privacy, climate change, safe internet and emerging markets. More information on this can be found at www.vodafone.com/responsibility.
Vodafone’s CR programme and performance as reported on the Group’s online CR report has been independently assured using the AccountAbility 1000 Assurance Standard (AA1000 AS) by the Group’s auditors, Deloitte & Touche LLP. The AA1000 AS requires Vodafone to report its responses and performance on material issues. Deloitte’s assurance statement outlining the specific assurance scope, procedures and “reasonable assurance” opinion is published in the Group’s online CR report.
The Group’s CR reporting comprises an online report and a printed CR summary focusing on strategy and trends, while 12 operating companies also produce their own CR reports.
During the year, Vodafone’s 2007 CR report won the main accolade of the Corporate Register Reporting Awards for the best report and was commended by the Association of Chartered Certified Accountants (“ACCA”) for the best disclosure in Tax and Public Policy. Vodafone is included in the FTSE4Good and Dow Jones Sustainability Index and rated fifth in the Global AccountAbility Rating, published by Fortune.
The Board regards responsible behaviour in all Vodafone’s operations as underpinning the value of the brand and has established ‘being a responsible business’ as one of the Group’s long term goals.
The Group’s approach to corporate responsibility (“CR”) enables it to understand the expectations of stakeholders, forecast trends in social, environmental and ethical requirements and to manage the Group’s performance in an appropriate manner.
More detail will be available in the online CR report with the full CR performance for the year ended 31 March 2008 at www.vodafone.com/responsibility.
Key CR strategic objectives
Core initiative: Access to communications
Safe and responsible internet experience
Climate change Sustainableproducts and services
Supported by responsible business practices
Underpinned by values, principles and behaviours
Vodafone Group Plc Annual Report 2008 59
Performance in the 2008 financial yearAccess to communications Access to communications offers the single greatest opportunity for Vodafone to make a strong contribution to society, with a considerable body of research showing that telecommunications – and mobile communications in particular – has the potential to change people’s lives for the better, by promoting economic and social development. During the 2008 financial year, Vodafone continued its focus on mobile payment services and own brand handsets for emerging markets as follows:
Vodafone has continued with the ambition of extending access to communications in emerging markets by increasing the portfolio of own branded handsets that introduce higher levels of technological development and affordability so that more people are able to use more services. The Group has shipped more than 10 million of these new handsets to more than 30 markets during the 2008 financial year.Over two million people in Kenya have used the Vodafone M-PESA/Vodafone Money Transfer mobile transaction service since its launch in February 2007, with an average of 200,000 more signing up each month. Customers can pay in and withdraw cash at local agents, transfer money to other mobile users via SMS and buy prepaid airtime credit. Vodafone M-PESA/Vodafone Money Transfer is being used by customers for a wide range of money transfer transactions, with the majority of transaction values being below €20. Partnering with local mobile operator Roshan, Vodafone is piloting a similar scheme in Afghanistan and plans further launches in India and in other African countries.
The Group is also finding ways to make mobile phones easier to use, particularly for customers who are elderly, deaf, hard of hearing, blind, visually impaired or have other disabilities. Examples include a speaking phone for the visually impaired and special data tariffs for deaf customers. The Group is currently conducting a strategic review of how best to address those issues and will announce the development of a centre of excellence during the 2009 financial year.
Safe and trusted internet experienceVodafone’s reputation depends on earning and maintaining the trust of its customers. The way the Group deals with certain key consumer issues directly impacts trust in Vodafone. These include responsible marketing, clear pricing, protecting customers’ privacy and developing a mobile advertising proposition that customers find acceptable. During the year, Vodafone has re-drafted its responsible marketing guidelines to ensure that customers can continue to trust the Group’s services in new areas such as mobile advertising, social networking and digital marketing.
Age-restricted contentDuring the 2008 financial year, the Group’s research has shown that parents are increasingly concerned about what their children see on the internet and it is anticipated that those concerns will be transferred to children’s use of mobile devices as parents become more aware of mobile internet.
Vodafone’s initiatives in these areas include:
All mobile operating companies that offer age-restricted content have implemented parental controls. These block access to age-restricted content on the Vodafone live! domain to those under 18 years of age. Internet filters are offered by eight operating companies, which also enable parents to prevent their children accessing inappropriate age-restricted content on the internet via their mobile phones. The mobile operating companies that have not implemented the filter will remove individual access to the internet completely on request.Vodafone is leading a pan-European ICT Education Initiative in partnership with other ICT companies and European Schoolnet, to develop online education resources. These will help teachers understand new mobile and internet technology and encourage their students to use it responsibly.Vodafone is a founding member of the Mobile Alliance against Child Sexual Abuse Content, launched by the GSMA in February 2008 to prevent users from accessing websites identified as hosting child sexual abuse content. A representative from Vodafone chaired the UK Home Office taskforce to develop industry guidelines on social networking. Vodafone will develop its own social networking guidelines for operating companies based on the industry guidelines to inform the way access is offered to services like Bebo, Facebook, Flickr, MySpace and YouTube.
•
•
•
•
•
•
Privacy and freedom of expressionIn response to concerns raised about privacy and freedom of expression on the internet, Vodafone continued to participate in a multi-stakeholder engagement initiative to agree principles for companies on these issues. More than 20 academics, investors, companies and non-governmental organisations are now involved in this process.
The Group launched mobile advertising activities in 11 markets, adopting a conservative approach to content and privacy issues. Vodafone has begun to monitor conformance with the Group’s global guidance on advertising and is reviewing feedback on areas where the guidance should be clarified, adapted or modified.
Climate changeVodafone recognises that climate change is likely to result in profound consequences for the environment, society and the economy. Limiting the Group’s contribution is a priority and during the year the Group announced that by 2020 it will reduce its CO2 emissions by 50% against the 2007 financial year baseline of 1.23 million tonnes. The Group is currently gathering data about the carbon footprint of its newly acquired businesses in India and Turkey, and climate change targets for these businesses will be announced in due course.
The Group reviewed the options for achieving this target, including carbon off-setting as a last resort, and concluded that the most effective strategy is to cut CO
2 emissions directly. The target is expected to be achieved principally through
operational changes and technological innovation to improve energy efficiency in the networks. Renewable energy will be used when and where possible.
In addition, as part of the climate strategy, the Group announced that it will also be focusing on developing products and services which will help customers limit their own emissions. This is expected to include exploring consumer related solutions such as solar-powered or universal chargers as well as improving understanding of how mobile technology can enable lower emissions through more efficient traffic management, logistic planning and scheduling and the remote monitoring of utility meters.
Energy use associated with the operation of the network accounts for around 80% of the Group’s carbon dioxide emissions. In 2006, the Group set a target to reduce CO
2 emissions per unit of data transmitted by 40% by 2011. This target
has been achieved in 2008, three years in advance, with network carbon dioxide emissions per unit of data transmitted decreasing by 50% from 0.034 Kg/Mb to 0.17 Kg/Mb. In the 2008 financial year, Vodafone’s energy use was 2,996 GWh, equating to 1.45 million tonnes of carbon dioxide.
Sustainable products and servicesVodafone is developing programmes aimed at making delivery of its products and services more sustainable. The key focus during the 2008 financial year was on the reuse and recycling of handsets and accessories, and network equipment.
Mobile phones, accessories and the networks on which they operate require upgrading, replacement and decommissioning. The Group complies with the EU’s Waste Electronic and Electrical Equipment directive through its handset recycling programmes in all operating companies where it applies. The Group has also worked with suppliers to ensure substances prohibited by the ‘Restriction of the use of certain Hazardous Substances’ directive are phased out. During the 2008 financial year, 1.33 million phones were collected for reuse and recycling through collection programmes in 16 mobile operating companies, achieving the Group’s target. 11,849 tonnes of network equipment waste was generated, with 96% of this sent for reuse or recycling, exceeding the target of 95%.
Mobile phones, masts and health Vodafone recognises that there is public concern about the safety of Radio Frequency (“RF”) fields from mobile phones and base stations. The Group contributes to funding of independent scientific research to resolve scientific uncertainty in areas identified by the World Health Organisation (“WHO”). The WHO established an International EMF Project in 1996, which records global research into mobile phones, masts and health and prioritises research needs. In 2006, they identified the following three main areas for additional research: long term (more than 10 years) exposure to low-level RF fields, possible health effects of mobile use in children and dosimetry (the way levels of RF absorbed are calculated).
Corporate Responsibility continued
60 Vodafone Group Plc Annual Report 2008
Vodafone – Performance
Vodafone requires manufacturers of the mobile devices it sells to test for Specific Absorption Rate compliance when used both against the ear and against, or near, the body, using the US FCC Test procedure. Vodafone is actively engaged with the IEC Standards Organisation in developing a new global protocol for body worn phones and expects a new standard, which better reflects customers’ use of mobile devices, to be adopted later this year. The Group’s long term programme of engagement, with a range of stakeholders, aims to reduce levels of concern amongst the public and to demonstrate that Vodafone is acting responsibly.
Responsible network deploymentVodafone’s mobile services rely on a network of radio base stations that transmit and receive calls. The Group recognises that network deployment can cause concern to communities, usually about the visual impact of base stations or health issues concerning RF fields. During the year, the Group reviewed and updated its policy on responsible network deployment. In addition, nine mobile operating companies have signed up to national industry codes of best practice on network deployment.
By cooperating with other mobile operators to share sites, the Group is reducing the total number of base stations required. This lowers costs, enables faster network deployment and reduces the environmental footprint of the network without loss of quality or coverage. Vodafone has active or passive network sharing agreements in 17 countries. In India, in partnership with Bharti Airtel and Idea Cellular Limited, the Group announced the creation of Indus Towers, an independent mobile infrastructure company that will provide infrastructure services to all telecommunications operators on a non-discriminatory basis.
The Group has conducted audits of network deployment contractors in all its local operating companies to verify adherence to the global responsible network deployment policy. As an example, more than 1,000 site audits took place in Turkey, one of the newest operating companies and the focus of significant network deployment during the year.
Vodafone aims to comply with local planning regulations but is sometimes found to be in breach. This is normally related to conflicting local, regional or national planning regulations. During the 2008 financial year, Vodafone was found in breach of planning regulations relating to 423 mast sitings. Fines levied by regulatory bodies or courts in relation to offences under environmental law or regulations were approximately £61,000.
Supply chainThe Group continues to implement Vodafone’s Code of Ethical Purchasing, which sets out environmental and labour standards for suppliers.
The Group increased its CR capability in China by training all supply chain employees, establishing two CR qualified auditors within the Group’s offices in Beijing and Hong Kong and embedding CR in supplier selection and management using the Group’s global qualification process. A project with two strategic Chinese suppliers was implemented to manage CR risk within sub-tier suppliers.
A total of 488 suppliers, including 63 strategic global suppliers, have been assessed using the Group’s supplier evaluation scorecard in which CR accounts for 10% of the total. The scorecard evaluates the supplier’s CR management systems, public reporting and approach to managing their suppliers. Seven site evaluations of high risk suppliers have been completed.
The duty to report programme provides suppliers with a means to report any ethical concerns. Twelve incidents were reported in relation to managing the global supply chain in the 2008 financial year. All have been investigated and resolved satisfactorily.
Social investment The Vodafone Group Foundation and its network of 21 local operating company and associate foundations have continued to implement a global social investment programme.
During the 2008 financial year, the Company made a charitable grant of £24.0 million to the Vodafone Group Foundation. The majority of foundation funds are distributed in grants through operating company foundations to a variety of local charitable organisations meeting the needs of the communities in which they operate.
The Vodafone Group Foundation made additional grants to charitable partners engaged in a variety of global projects. Its areas of focus are: sport and music as a means of benefiting some of the most disadvantaged young people and their communities, and disaster relief and preparedness.
In addition, operating companies donated a further £12.9 million to their foundations and a further £4.2 million directly to a variety of causes. Total donations for the year ended 31 March 2008 were £44.9 million and included donations of £3.8 million towards foundation operating costs.
Key performance indicators(1) KPI 2008(2) 2007(3) 2006(4)
Number of mobile operating subsidiaries undertakingindependent RF field monitoring 15 15 15Total energy use (GWh) (direct and indirect)(5) 2,996 2,690 2,900Total carbon dioxide emissions (millions of tonnes)(5) 1.45 1.23 1.31Percentage of energy sourced from renewables 18 17 12Number of phones collected for reuse and recycling (millions) 1.33 1.03 1.37Network equipment waste generated (tonnes) 12,096 9,960 2,950Percentage of network equipment waste sent for reuse or recycling 96 97 97
Notes:(1) These performance indicators were calculated using actual or estimated data collected by the Group’s mobile operating companies. The data is sourced from invoices, purchasing requisitions,
direct data measurement and estimations where required. The carbon dioxide emissions figure is calculated using the kWh/CO2 conversion factor for the electricity provided by the national grid and for other energy sources in each operating company. The Group’s joint venture in Italy is included in all years.
(2) The data for the 2008 financial year excludes the newly acquired Vodafone Essar in India and Tele2 in Italy and Spain. (3) The data for the 2007 financial year excludes the newly acquired operations in Turkey and the operations in Japan that were sold during the 2007 financial year. (4) The data for the 2006 financial year excludes the acquired businesses in Czech Republic and Romania and the business in Sweden that was sold during the 2006 financial year, but does include
the business in Japan that was disposed of during the 2007 financial year. (5) The 2007 figure includes Arcor.
Vodafone Group Plc Annual Report 2008 61

4. Andy Halford, Chief Financial Officer, aged 49, joined the Board in July 2005. Andy joined Vodafone in 1999 as Financial Director for Vodafone Limited, the UK operating company, and in 2001 he became Financial Director for Vodafone’s Northern Europe, Middle East and Africa region. In 2002, he was appointed Chief Financial Officer of Verizon Wireless in the US and is currently a member of the Board of Representatives of the Verizon Wireless partnership. Prior to joining Vodafone, he was Group Finance Director at East Midlands Electricity Plc. Andy holds a bachelors degree in Industrial Economics from Nottingham University and is a Fellow of the Institute of Chartered Accountants in England and Wales.
Deputy Chairman and senior independent director5. John Buchanan§†, aged 64, became Deputy Chairman and senior independent director in July 2006 and has been a member of the Board since April 2003. He retired from the board of directors of BP Plc in 2002 after six years as Group Chief Financial Officer and executive director, following a wide-ranging career with the company. He was a member of the United Kingdom Accounting Standards Board from 1997 to 2001. He is Chairman of Smith & Nephew plc, a non-executive director of AstraZeneca PLC and senior independent director of BHP Billiton Plc.
Non-executive directors6. Dr Michael Boskin§, aged 62, became a member of the Board in June 1999 on completion of the merger with AirTouch Communications, Inc. and is Chairman of the Audit Committee. He was a director of AirTouch from August 1996 to June 1999. He has been a Professor of Economics at Stanford University since 1971 and was Chairman of the President’s Council of Economic Advisers from February 1989 until January 1993. Michael is President and Chief Executive Officer of Boskin & Co., an economic consulting company, and is also a director of Exxon Mobil Corporation, Shinsei Bank Limited and Oracle Corporation. He will retire from the Board at the conclusion of the Company’s AGM on 29 July 2008.
7. Alan Jebson§, aged 58, joined the Board in December 2006. He retired in May 2006 from his role as Group Chief Operating Officer of HSBC Holdings Plc, a position which included responsibility for IT and Global Resourcing. During a long career with HSBC, Alan held various positions in IT, including the position of Group Chief Information Officer. His roles included responsibility for the Group’s international systems, including the consolidation of HSBC and Midland systems following the acquisition of Midland Bank in 1993. He originally joined HSBC as Head of IT Audit in 1978 where, building upon his qualification as a chartered accountant, he built an international audit team and implemented controls in the Group’s application systems. He is also a non-executive director of Experian Group plc and McDonald Dettwiler in Canada.
§ Audit Committee† Nominations and Governance Committee‡ Remuneration Committee
Directors and senior managementThe business of the Company is managed by its board of directors (“the Board”). Biographical details of the directors and senior management at the date of this report are as follows:
Board of directorsChairman1. Sir John Bond†, aged 66, became Chairman of Vodafone Group Plc in July 2006, having previously served as a non-executive director of the Board, and is Chairman of the Nominations and Governance Committee. Sir John is a non-executive director of Ford Motor Company, USA, and A.P. Møller – Mærsk A/S and is a director of Shui On Land Limited (Hong Kong SAR). He retired from the position of Group Chairman of HSBC Holdings plc in May 2006, after 45 years of service. Other previous roles include Chairman of HSBC Bank plc and director of The Hong Kong and Shanghai Banking Corporation and HSBC North America Holdings Inc. Previous non-executive directorships include the London Stock Exchange, Orange plc, British Steel plc and the Court of the Bank of England.
Executive directors2. Arun Sarin†, Chief Executive, aged 53, became a member of the Board in June 1999. He was appointed Chief Executive in July 2003. Arun joined Pacific Telesis Group in San Francisco in 1984 and has served in many executive positions in his career in telecommunications, which spans more than 20 years. He was a director of AirTouch Communications, Inc. from July 1995 and was President and Chief Operating Officer from February 1997 to June 1999. He was Chief Executive Officer for the Vodafone United States and Asia Pacific region until 15 April 2000, when he became a non-executive director. He has served as a director of The Gap, Inc., The Charles Schwab Corporation and Cisco Systems, Inc., and is a non-executive director of the Court of the Bank of England. He will retire as Chief Executive at the conclusion of the Company’s AGM on 29 July 2008.
3. Vittorio Colao, Deputy Chief Executive and CEO of the Group’s Europe region, aged 46, joined the Board in October 2006. He spent the early part of his career as a partner in the Milan office of McKinsey & Co working on media, telecommunications and industrial goods and was responsible for recruitment. In 1996, he joined Omnitel Pronto Italia, which subsequently became Vodafone Italy, and he was appointed Chief Executive in 1999. He was then appointed Regional Chief Executive Officer, Southern Europe for Vodafone Group Plc in 2001, became a member of the Board in 2002 and was appointed to the role of Regional Chief Executive Officer for Southern Europe, Middle East and Africa for Vodafone in 2003. In 2004, he left Vodafone to join RCS MediaGroup, the leading Italian publishing company, where he was Chief Executive until he rejoined Vodafone. He will become Chief Executive at the conclusion of the Company’s AGM on 29 July 2008.
62 Vodafone Group Plc Annual Report 2008
Vodafone – Governance
1 2 3 4
5 6 7
Board of Directors and Group Management
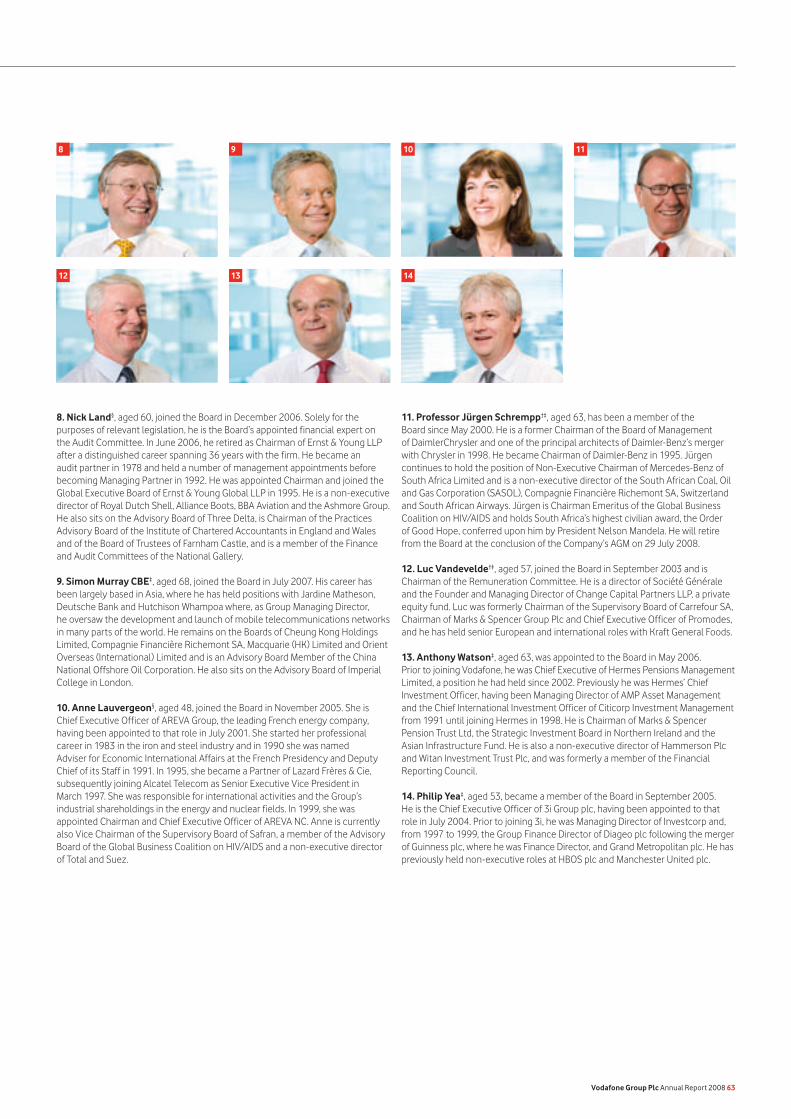
8. Nick Land§, aged 60, joined the Board in December 2006. Solely for the purposes of relevant legislation, he is the Board’s appointed financial expert on the Audit Committee. In June 2006, he retired as Chairman of Ernst & Young LLP after a distinguished career spanning 36 years with the firm. He became an audit partner in 1978 and held a number of management appointments before becoming Managing Partner in 1992. He was appointed Chairman and joined the Global Executive Board of Ernst & Young Global LLP in 1995. He is a non-executive director of Royal Dutch Shell, Alliance Boots, BBA Aviation and the Ashmore Group. He also sits on the Advisory Board of Three Delta, is Chairman of the Practices Advisory Board of the Institute of Chartered Accountants in England and Wales and of the Board of Trustees of Farnham Castle, and is a member of the Finance and Audit Committees of the National Gallery.
9. Simon Murray CBE‡, aged 68, joined the Board in July 2007. His career has been largely based in Asia, where he has held positions with Jardine Matheson, Deutsche Bank and Hutchison Whampoa where, as Group Managing Director, he oversaw the development and launch of mobile telecommunications networks in many parts of the world. He remains on the Boards of Cheung Kong Holdings Limited, Compagnie Financière Richemont SA, Macquarie (HK) Limited and Orient Overseas (International) Limited and is an Advisory Board Member of the China National Offshore Oil Corporation. He also sits on the Advisory Board of Imperial College in London.
10. Anne Lauvergeon§, aged 48, joined the Board in November 2005. She is Chief Executive Officer of AREVA Group, the leading French energy company, having been appointed to that role in July 2001. She started her professional career in 1983 in the iron and steel industry and in 1990 she was named Adviser for Economic International Affairs at the French Presidency and Deputy Chief of its Staff in 1991. In 1995, she became a Partner of Lazard Frères & Cie, subsequently joining Alcatel Telecom as Senior Executive Vice President in March 1997. She was responsible for international activities and the Group’s industrial shareholdings in the energy and nuclear fields. In 1999, she was appointed Chairman and Chief Executive Officer of AREVA NC. Anne is currently also Vice Chairman of the Supervisory Board of Safran, a member of the Advisory Board of the Global Business Coalition on HIV/AIDS and a non-executive director of Total and Suez.
11. Professor Jürgen Schrempp†‡, aged 63, has been a member of the Board since May 2000. He is a former Chairman of the Board of Management of DaimlerChrysler and one of the principal architects of Daimler-Benz’s merger with Chrysler in 1998. He became Chairman of Daimler-Benz in 1995. Jürgen continues to hold the position of Non-Executive Chairman of Mercedes-Benz of South Africa Limited and is a non-executive director of the South African Coal, Oil and Gas Corporation (SASOL), Compagnie Financière Richemont SA, Switzerland and South African Airways. Jürgen is Chairman Emeritus of the Global Business Coalition on HIV/AIDS and holds South Africa’s highest civilian award, the Order of Good Hope, conferred upon him by President Nelson Mandela. He will retire from the Board at the conclusion of the Company’s AGM on 29 July 2008.
12. Luc Vandevelde†‡, aged 57, joined the Board in September 2003 and is Chairman of the Remuneration Committee. He is a director of Société Générale and the Founder and Managing Director of Change Capital Partners LLP, a private equity fund. Luc was formerly Chairman of the Supervisory Board of Carrefour SA, Chairman of Marks & Spencer Group Plc and Chief Executive Officer of Promodes, and he has held senior European and international roles with Kraft General Foods.
13. Anthony Watson‡, aged 63, was appointed to the Board in May 2006. Prior to joining Vodafone, he was Chief Executive of Hermes Pensions Management Limited, a position he had held since 2002. Previously he was Hermes’ Chief Investment Officer, having been Managing Director of AMP Asset Management and the Chief International Investment Officer of Citicorp Investment Management from 1991 until joining Hermes in 1998. He is Chairman of Marks & Spencer Pension Trust Ltd, the Strategic Investment Board in Northern Ireland and the Asian Infrastructure Fund. He is also a non-executive director of Hammerson Plc and Witan Investment Trust Plc, and was formerly a member of the Financial Reporting Council.
14. Philip Yea‡, aged 53, became a member of the Board in September 2005. He is the Chief Executive Officer of 3i Group plc, having been appointed to that role in July 2004. Prior to joining 3i, he was Managing Director of Investcorp and, from 1997 to 1999, the Group Finance Director of Diageo plc following the merger of Guinness plc, where he was Finance Director, and Grand Metropolitan plc. He has previously held non-executive roles at HBOS plc and Manchester United plc.
Vodafone Group Plc Annual Report 2008 63
8 9 10 11
12 13 14
Steve Pusey, Chief Technology Officer, aged 46, joined Vodafone in September 2006 and is responsible for all aspects of Vodafone’s networks, IT capability, research and development and supply chain management. Prior to joining Vodafone, he held the positions of Executive Vice President and President, Nortel EMEA, having joined Nortel in 1982, gaining a wealth of international experience across both the wireline and wireless industries and in business applications and solutions. Prior to Nortel, he spent several years with British Telecom.
Frank Rovekamp, Group Chief Marketing Officer, aged 53, was appointed to this position and joined the Executive Committee in May 2006. He joined Vodafone in 2002 as Marketing Director and a member of the Management Board of Vodafone Netherlands and later moved to Vodafone Germany as Chief Marketing Officer and a member of the Management Board. Before joining Vodafone, he held roles as President and Chief Executive Officer of Beyoo and Chief Marketing Officer with KLM Royal Dutch Airlines. He is a trustee of The Vodafone Group Foundation.
Stephen Scott, Group General Counsel and Company Secretary, aged 54, was appointed to this position in 1991, prior to which he was employed in the Racal Group legal department, which he joined in 1980 from private law practice in London. He is a director of the Company’s UK pension trustee company and of ShareGift (the Orr Mackintosh Foundation Limited) and is a director and trustee of LawWorks (the Solicitors Pro Bono Group).
Strategy Board The Strategy Board meets three times each year to discuss strategy. This is attended by Executive Committee members and the Chief Executive Officers of the major operating companies and other selected individuals based on Strategy Board topics.
Other Board and Executive Committee membersThe following members also served on the Board or the Executive Committee during the 2008 financial year:
Lord Broers was a member of the Board, the Audit Committee and the Nominations and Governance Committee until the conclusion of the AGM on 24 July 2007.
Alan Harper was Group Strategy and New Business Director and was a member of the Executive Committee until 1 September 2007.
Executive CommitteeChaired by Arun Sarin, this committee focuses on the Group’s strategy, financial structure and planning, succession planning, organisational development and Group-wide policies. The Executive Committee membership comprises the executive directors, details of whom are shown on page 62, and the senior managers who are listed below.
Senior management Members of the Executive Committee who are not also executive directors are regarded as senior managers of the Company.
Paul Donovan, Chief Executive Officer, EMAPA, aged 49, was appointed to this position in May 2006. He joined Vodafone UK in 1999 as Managing Director – Commercial and became Chief Executive Officer of Vodafone Ireland in 2001. In January 2005, he became Chief Executive Officer, Other Vodafone Subsidiaries, managing 15 markets in which Vodafone operated. Paul has over 16 years’ experience in the telecommunications and IT industries, gained at Apple Computer, BT and Cable and Wireless, as well as Vodafone. He began his career in sales and marketing at the Mars Group before becoming Marketing Director at Coca-Cola and Schweppes Beverages.
Warren Finegold, Chief Executive Officer, Global Business Development, aged 51, was appointed to this position and joined the Executive Committee in April 2006. He was previously a Managing Director of UBS Investment Bank and head of its technology team in Europe. He is responsible for business development, mergers and acquisitions and partner networks.
Terry Kramer, Group Strategy and Human Resources Director and Chief of Staff, aged 48, joined Vodafone in January 2005 as Chief of Staff and was appointed Group Human Resources Director in December 2006. Terry’s role was recently expanded to include Vodafone Group Strategy. Prior to his appointment, he was Chief Executive Officer of Q Comm International, a publicly traded provider of transaction processing services for the telecommunications industry. He also worked for 12 years at PacTel/AirTouch Communications in a variety of roles including President AirTouch Paging, Vice President Human Resources-AirTouch Communications, Vice President Business Development-AirTouch Europe and Vice President & General Manager-AirTouch Cellular Southwest Market. Prior to that, he was an Associate with Booz Allen & Hamilton, a management consulting firm. Terry is a trustee of The Vodafone Group Foundation.
Simon Lewis, Group Corporate Affairs Director, aged 49, joined Vodafone in November 2004. He previously held senior roles at Centrica Plc including Managing Director, Europe, and Group Director of Communications and Public Policy. Prior to that, he was Director of Corporate Affairs at NatWest Group and the Head of Public Relations at S.G. Warburg plc. He was President of the Institute of Public Relations in 1997 and is a Visiting Professor at the Cardiff School of Journalism. In 1998, he was seconded to Buckingham Palace for two years as the first Communications Secretary to The Queen. He is Chairman of the UK Fulbright Commission and a trustee of The Vodafone Group Foundation.
64 Vodafone Group Plc Annual Report 2008
Vodafone – Governance
Board of Directors and Group Management continued
1
Board meetingsThe Board meets at least eight times a year and the meetings are structured to allow open discussion. All directors participate in discussing the strategy, trading and financial performance and risk management of the Company. All substantive agenda items have comprehensive briefing papers, which are circulated one week before the meeting.
The following table shows the number of years directors have been on the Board at 31 March 2008 and their attendance at scheduled Board meetings they were eligible to attend during the 2008 financial year:
Years Meetings on Board attended
Sir John Bond 3 8/8John Buchanan 5 8/8Arun Sarin 8 8/8Vittorio Colao 1 8/8Andy Halford 2 8/8Dr Michael Boskin 8 8/8Alan Jebson 1 8/8Nick Land 1 8/8Anne Lauvergeon 2 7/8Simon Murray (from 1 July 2007) <1 6/7Professor Jürgen Schrempp 7 7/8Luc Vandevelde 4 8/8Anthony Watson 2 8/8Philip Yea 2 8/8Lord Broers (until 24 July 2007) n/a 2/2
In addition to regular Board meetings, there are a number of other meetings to deal with specific matters. Directors unable to attend a Board meeting because of another engagement are nevertheless provided with all the papers and information relevant for such meetings and are able to discuss issues arising in the meeting with the Chairman or the Chief Executive.
Division of responsibilitiesThe roles of the Chairman and Chief Executive are separate and there is a division of responsibilities that is clearly established, set out in writing and agreed by the Board to ensure that no one person has unfettered powers of decision. The Chairman is responsible for the operation, leadership and governance of the Board, ensuring its effectiveness and setting its agenda. The Chief Executive is responsible for the management of the Group’s business and the implementation of Board strategy and policy.
Board balance and independenceThe Company’s Board consists of 14 directors, 13 of whom served throughout the 2008 financial year. At 31 March 2008, in addition to the Chairman, Sir John Bond, there were three executive directors and ten non-executive directors.
The Deputy Chairman, John Buchanan, is the nominated senior independent director and his role includes being available for approach or representation by directors or significant shareholders who may feel inhibited from raising issues with the Chairman. He is also responsible for conducting an annual review of the performance of the Chairman and, in the event it should be necessary, convening a meeting of the non-executive directors.
The Company considers all of its present non-executive directors to be fully independent. The Board is aware of the other commitments of its directors and is satisfied that these do not conflict with their duties as directors of the Company. The names and biographical details of the current directors are given on pages 62 and 63. Changes to the commitments of the directors are reported to the Board.
For each of the annual reports issued since 2004, Governance Metrics International, a global corporate governance ratings agency, ranked the Company amongst the top UK companies, with an overall global corporate governance rating of eight and a half and above out of ten.
In the Company’s profile report by Institutional Shareholder Services Inc. (“ISS”), dated 1 May 2008, the Company’s governance practices outperformed 95.9% of the companies in the ISS developed (excluding US) universe, 88.1% of companies in the telecommunications sector group and 96.5% of the companies in the UK.
Compliance with the Combined CodeThe Company’s ordinary shares are listed in the UK on the London Stock Exchange. In accordance with the Listing Rules of the UK Listing Authority, the Company confirms that throughout the year ended 31 March 2008 and at the date of this Annual Report, it was compliant with the provisions of, and applied the principles of, Section 1 of the 2006 FRC Combined Code on Corporate Governance (the “Combined Code”). The following section, together with the “Directors’ Remuneration” section on pages 71 to 81, provides details of how the Company applies the principles and complies with the provisions of the Combined Code.
Board organisation and structureThe role of the BoardThe Board is responsible for the overall conduct of the Group’s business and has the powers, authorities and duties vested in it by and pursuant to the relevant laws of England and Wales and the Articles of Association. The Board:
has final responsibility for the management, direction and performance of the Group and its businesses;is required to exercise objective judgement on all corporate matters independent from executive management;is accountable to shareholders for the proper conduct of the business; andis responsible for ensuring the effectiveness of and reporting on the Group’s system of corporate governance.
The Board has a formal schedule of matters reserved to it for its decision and these include:
Group strategy;major capital projects, acquisitions or divestments;annual budget and operating plan;Group financial structure, including tax and treasury;annual and half-yearly financial results and shareholder communications;system of internal control and risk management; andsenior management structure, responsibilities and succession plans.
The schedule is reviewed periodically. It was last formally reviewed by the Nominations and Governance Committee in September 2005, at which time it was determined that no amendments were required. Its continued validity was assessed as part of the performance evaluations conducted in the 2008 financial year.
Other specific responsibilities are delegated to Board committees which operate within clearly defined terms of reference. Details of the responsibilities delegated to the Board committees are given on pages 67 to 68.
•
•
••
•••••••
The Board of the Company is committed to high standards of corporate governance, which it considers are critical to business integrity and to maintaining investors’ trust in the Company. The Group expects all its directors and employees to act with honesty, integrity and fairness. The Group will strive to act in accordance with the laws and customs of the countries in which it operates; adopt proper standards of business practice and procedure; operate with integrity; and observe and respect the culture of every country in which it does business.
Vodafone Group Plc Annual Report 2008 65
Corporate Governance
Under the laws of England and Wales, the executive and non-executive directors are equal members of the Board and have overall collective responsibility for the direction of the Company. In particular, non-executive directors are responsible for:
bringing a wide range of skills and experience to the Group, including independent judgement on issues of strategy, performance, financial controls and systems of risk management;constructively challenging the strategy proposed by the Chief Executive and executive directors;scrutinising and challenging performance across the Group’s business;assessing risk and the integrity of the financial information and controls of the Group; andensuring appropriate remuneration and succession planning arrangements are in place in relation to executive directors and other senior executive roles.
Board effectivenessAppointments to the BoardThere is a formal, rigorous and transparent procedure, which is based on merit and against objective criteria, for the appointment of new directors to the Board. This is described in the section on the Nominations and Governance Committee set out on page 67. Individual non-executive directors are generally expected to serve two three-year terms. At the end of the second three-year term, a rigorous and detailed analysis is undertaken and only then would a non-executive director be invited to serve a third term. The non-executive directors are generally not expected to serve for a period exceeding nine years. The terms and conditions of appointment of the non-executive directors are available for inspection at the Company’s registered office and will be available for inspection at the AGM from 15 minutes before the meeting until it ends. Information and professional developmentEach member of the Board has immediate access to a dedicated online team room and can access monthly information including actual financial results, reports from the executive directors in respect of their areas of responsibility and the Chief Executive’s report which deals, amongst other things, with investor relations, giving Board members an opportunity to develop an understanding of the views of major investors. These matters are discussed at each Board meeting. From time to time, the Board receives detailed presentations from non-Board members on matters of significance or on new opportunities for the Group. Financial plans, including budgets and forecasts, are regularly discussed at Board meetings. The non-executive directors periodically visit different parts of the Group and are provided with briefings and information to assist them in performing their duties.
The Chairman is responsible for ensuring that induction and training programmes are provided and the Company Secretary organises the programmes. Individual directors are also expected to take responsibility for identifying their training needs and to take steps to ensure that they are adequately informed about the Company and their responsibilities as a director. The Board is confident that all its members have the knowledge, ability and experience to perform the functions required of a director of a listed company.
On appointment, individual directors undergo an induction programme covering, amongst other things:
the business of the Group;their legal and regulatory responsibilities as directors of the Company;briefings and presentations from relevant executives; and opportunities to visit business operations.
If appropriate, the induction will also include briefings on the scope of the Internal Audit function and the role of the Audit Committee, meetings with the external auditor and other areas the Company Secretary deems fit, considering the director’s area of responsibility.
•
•
••
•
••••
The Company Secretary provides a programme of ongoing training for the directors, which covers a number of sector specific and business issues, as well as legal, accounting and regulatory changes and developments relevant to individual director’s areas of responsibility. Throughout their period in office, the directors are continually updated on the Group’s businesses and the regulatory and industry specific environments in which it operates. These updates are by way of written briefings and meetings with senior executives and, where appropriate, external sources.
The Company Secretary ensures that the programme to familiarise the non-executive directors with the business is maintained over time and kept relevant to the needs of the individuals involved. The Company Secretary confers with the Chairman and senior independent director to ensure that this is the case.
Performance evaluationPerformance evaluation of the Board, its committees and individual directors takes place on an annual basis and is conducted within the terms of reference of the Nominations and Governance Committee with the aim of improving individual contributions, the effectiveness of the Board and its Committees and the Group’s performance. Prior to the 2007 financial year, the evaluation was internally facilitated.
Following on from the externally facilitated evaluation of the Board’s performance during the 2007 financial year, the Board has undertaken a formal self-evaluation of its own performance. The process involved the Chairman:
sending a template questionnaire to each Board member which was completed and returned;undertaking individual meetings with each Board member on Board performance;producing a report on Board performance, with the assistance of an external agency, using the completed questionnaire and notes from the individual meetings; andpreparing a summary which was sent with the report to Board members for discussion at the following Board meeting.
The evaluation was designed to determine whether the Board continues to be capable of providing the high level judgement required and whether, as a Board, the directors were informed and up to date with the business and its goals and understood the context within which it operates. The evaluation also included a review of the administration of the Board covering the operation of the Board, its agenda and the reports produced for the Board’s consideration. The Board will continue to review its procedures, its effectiveness and development in the financial year ahead.
The Chairman leads the assessment of the Chief Executive and the non-executive directors, the Chief Executive undertakes the performance reviews for the executive directors and the senior independent director conducts the review of the performance of the Chairman by having a meeting with all the non-executive directors together and individual meetings with the executive directors and the Company Secretary. Following this process, the senior independent director produces a written report which is discussed with the Chairman.
The evaluation of each of the Board committees was undertaken using an online questionnaire that each member of the committees and others who attend committee meetings or interact with committee members are required to complete. The results of the questionnaires were discussed with the Chairman of the Board and the members of the committees.
The evaluations found the performance of each director to be effective and concluded that the Board provides the effective leadership and control required for a listed company. The Nominations and Governance Committee confirmed to the Board that the contributions made by the directors offering themselves for re-election at the AGM in July 2008 continue to be effective and that the Company should support their re-election.
•
•
•
•
66 Vodafone Group Plc Annual Report 2008
Vodafone – Governance
Corporate Governance continued
The Audit Committee’s responsibilities include the following:
overseeing the relationship with the external auditors; reviewing the Company’s preliminary results announcement, half-yearly results and annual financial statements; monitoring compliance with statutory and listing requirements for any exchange on which the Company’s shares and debt instruments are quoted; reviewing the scope, extent and effectiveness of the activity of the Group Internal Audit Department; engaging independent advisers as it determines is necessary and to perform investigations; reporting to the Board on the quality and acceptability of the Company’s accounting policies and practices including, without limitation, critical accounting policies and practices; andplaying an active role in monitoring the Company’s compliance efforts for Section 404 of the Sarbanes-Oxley Act and receiving progress updates at each of its meetings.
At least twice a year, the Audit Committee meets separately with the external auditors and the Group Audit Director without management being present. Further details on the work of the Audit Committee and its oversight of the relationships with the external auditors can be found under “Auditors” and the “Report from the Audit Committee” which are set out on pages 69 and 70.
Nominations and Governance CommitteeThe members of the Nominations and Governance Committee during the year, together with a record of their attendance at scheduled meetings which they were eligible to attend, are set out below:
Meetings attended
Sir John Bond, Chairman 6/6Lord Broers (until 23 July 2007) 2/2John Buchanan 5/6Arun Sarin 6/6Professor Jürgen Schrempp 4/6Luc Vandevelde 6/6
The Nominations and Governance Committee’s key objective is to ensure that the Board comprises individuals with the requisite skills, knowledge and experience to ensure that it is effective in discharging its responsibilities. The Nominations and Governance Committee:
leads the process for identifying and making recommendations to the Board of candidates for appointment as directors of the Company, giving full consideration to succession planning and the leadership needs of the Group; makes recommendations to the Board on the composition of the Nominations and Governance Committee and the composition and chairmanship of the Audit and Remuneration Committees; regularly reviews the structure, size and composition of the Board, including the balance of skills, knowledge and experience and the independence of the non-executive directors, and makes recommendations to the Board with regard to any change; and is responsible for the oversight of all matters relating to corporate governance, bringing any issues to the attention of the Board.
The Nominations and Governance Committee meets periodically when required. No one other than a member of the Nominations and Governance Committee is entitled to be present at its meetings. Other non-executive directors and external advisers may be invited to attend. The Nominations and Governance Committee usually meets two or three times each year but this year, in order to address the matter of the Chief Executive’s succession, it met six times as a body. Committee members were also additionally involved in the assessment and interview of potential successors to the Chief Executive, a process in which they were supported by MWM Consulting.
••
•
•
•
•
•
•
•
•
•
Re-election of directorsAlthough not required by the Articles, in the interests of good corporate governance, the directors have resolved that they will all submit themselves for annual re-election at each AGM of the Company. Accordingly, at the AGM to be held on 29 July 2008, all the directors will be retiring and, with the exception of Arun Sarin, Michael Boskin and Jürgen Schrempp who will not offer themselves for re-election, being eligible and on the recommendation of the Nominations and Governance Committee, will offer themselves for re-election.
Independent adviceThe Board recognises that there may be occasions when one or more of the directors feel it is necessary to take independent legal and/or financial advice at the Company’s expense. There is an agreed procedure to enable them to do so.
Indemnification of directorsIn accordance with the Company’s Articles of Association and to the extent permitted by the laws of England and Wales, directors are granted an indemnity from the Company in respect of liabilities incurred as a result of their office. In respect of those matters for which the directors may not be indemnified, the Company maintained a directors’ and officers’ liability insurance policy throughout the financial year. This policy has been renewed for the next financial year. Neither the Company’s indemnity nor the insurance provides cover in the event that the director is proven to have acted dishonestly or fraudulently.
Board committeesThe Board has established an Audit Committee, a Nominations and Governance Committee and a Remuneration Committee, each of which has formal terms of reference approved by the Board. The Board is satisfied that the terms of reference for each of these committees satisfy the requirements of the Combined Code and are reviewed internally on an ongoing basis by the Board. The terms of reference for all Board committees can be found on the Company’s website at www.vodafone.com or a copy can be obtained by application to the Company Secretary at the Company’s registered office.
The committees are provided with all necessary resources to enable them to undertake their duties in an effective manner. The Company Secretary or his delegate acts as secretary to the committees. The minutes of committee meetings are circulated to all directors.
Each committee has access to such information and advice, both from within the Group and externally, at the cost of the Company as it deems necessary. This may include the appointment of external consultants where appropriate. Each committee undertakes an annual review of the effectiveness of its terms of reference and makes recommendations to the Board for changes where appropriate.
Audit CommitteeThe members of the Audit Committee during the year, together with a record of their attendance at scheduled meetings which they were eligible to attend, are set out below:
Meetings attended
Dr Michael Boskin, Chairman 4/4John Buchanan 4/4Alan Jebson (from 23 July 2007) 3/3Nick Land 4/4Anne Lauvergeon 3/4Lord Broers (until 23 July 2007) 1/1
The Audit Committee is comprised of financially literate members having the necessary ability and experience to understand financial statements. Solely for the purpose of fulfilling the requirements of the Sarbanes-Oxley Act and the Combined Code, the Board has designated Nick Land, who is an independent non-executive director satisfying the independence requirements of Rule 10A-3 of the US Securities Exchange Act 1934, as its financial expert on the Audit Committee. Further details on Nick Land can be found in “Board of Directors and Group Management” on page 63.
Vodafone Group Plc Annual Report 2008 67
Remuneration CommitteeThe members of the Remuneration Committee during the year, together with a record of their attendance at scheduled meetings which they were eligible to attend, are set out below:
Meetings attended
Luc Vandevelde, Chairman 5/5Simon Murray (from 23 July 2007) 3/4Professor Jürgen Schrempp 4/5Anthony Watson 5/5Philip Yea 5/5Dr Michael Boskin (until 23 July 2007) 2/2
The responsibilities of the Remuneration Committee include the following:
determining, on behalf of the Board, the Company’s policy on the remuneration of the Chairman, the executive directors and the senior management team of the Company;determining the total remuneration packages for these individuals, including any compensation on termination of office; and appointing any consultants in respect of executive directors’ remuneration.
The Chairman and Chief Executive may attend the Remuneration Committee’s meetings by invitation. They do not attend when their individual remuneration is discussed and no director is involved in deciding his own remuneration.
Further information on the Remuneration Committee’s activities is contained in “Directors’ Remuneration” on pages 71 to 81.
Executive CommitteeThe executive directors, together with certain other Group functional heads and regional chief executives, meet 12 times a year as the Executive Committee under the chairmanship of the Chief Executive. The Executive Committee is responsible for the day-to-day management of the Group’s businesses, the overall financial performance of the Group in fulfilment of strategy, plans and budgets and Group capital structure and funding. It also reviews major acquisitions and disposals. The members of the Executive Committee and their biographical details are set out on pages 62 and 64.
Company SecretaryThe Company Secretary acts as Secretary to the Board and to the committees of the Board and, with the consent of the Board, may delegate responsibility for the administration of the Committees to other suitably qualified staff. He:
assists the Chairman in ensuring that all directors have full and timely access to all relevant information;is responsible for ensuring that the correct Board procedures are followed and advises the Board on corporate governance matters; andadministers the procedure under which directors can, where appropriate, obtain independent professional advice at the Company’s expense.
The appointment or removal of the Company Secretary is a matter for the Board as a whole.
Relations with shareholdersThe Company is committed to communicating its strategy and activities clearly to its shareholders and, to that end, maintains an active dialogue with investors through a planned programme of investor relations activities. The investor relations programme includes:
formal presentations of full year and half-yearly results and interim management statements;briefing meetings with major institutional shareholders in the UK, the US and in Continental Europe after the half-yearly results and preliminary announcement, to ensure that the investor community receives a balanced and complete view of the Group’s performance and the issues faced by the Group;regular meetings with institutional investors and analysts by the Chief Executive and the Chief Financial Officer to discuss business performance;
•
•
•
•
•
•
•
•
•
hosting investors and analysts sessions at which senior management from relevant operating companies deliver presentations which provide an overview of each of the individual businesses and operations; attendance by senior executives across the business at relevant meetings and conferences throughout the year; responding to enquiries from shareholders and analysts through the Company’s Investor Relations team; anda section dedicated to shareholders on the Company’s corporate website, www.vodafone.com.
Overall responsibility for ensuring that there is effective communication with investors and that the Board understands the views of major shareholders on matters such as governance and strategy rests with the Chairman, who makes himself available to meet shareholders for this purpose.
The senior independent director and other members of the Board are also available to meet major investors on request. The senior independent director has a specific responsibility to be available to shareholders who have concerns, for whom contact with the Chairman, Chief Executive or Chief Financial Officer has either failed to resolve their concerns, or for whom such contact is inappropriate.
At the 2007 AGM, the shareholders approved amendments to the Articles which enabled the Company to take advantage of the provision in the Companies Act 2006 (effective from 20 January 2007) to communicate with its shareholders electronically. Following that approval, unless a shareholder has specifically asked to receive a hard copy, they will receive notification of the availability of the Annual Report on the Company’s website www.vodafone.com. For the 2008 financial year, shareholders will receive the Notice of Meeting and form of proxy in paper through the post unless they have previously opted to receive email communications. Shareholders continue to have the option to appoint proxies and give voting instructions electronically.
The principal communication with private investors is via the Annual Report and through the AGM, an occasion which is attended by all the Company’s directors and at which all shareholders present are given the opportunity to question the Chairman and the Board as well as the Chairmen of the Audit, Remuneration and Nominations and Governance Committees. After the AGM, shareholders can meet informally with directors.
A summary presentation of results and development plans is also given at the AGM before the Chairman deals with the formal business of the meeting. The AGM is broadcast live on the Group’s website, www.vodafone.com, and a recording of the webcast can subsequently be viewed on the website. All substantive resolutions at the Company’s AGMs are decided on a poll. The poll is conducted by the Company’s Registrars and scrutinised by Electoral Reform Services. The proxy votes cast in relation to all resolutions, including details of votes withheld, are disclosed to those in attendance at the meeting and the results of the poll are published on the Company’s website and announced via the regulatory news service. Financial and other information is made available on the Company’s website, www.vodafone.com, which is regularly updated.
Political donationsAt the 2006 AGM, the directors sought and received a renewal of shareholders’ approval for a period of three years (until the AGM in 2009) to enable the Group to make donations to EU Political Organisations or EU Political Expenditure, under the relevant provisions of the Political Parties, Elections and Referendums Act 2000. The approval given restricts such expenditure for each year until the AGM in 2009 to an aggregate amount of £100,000 (£50,000 in respect of donations to EU Political Organisations and £50,000 in respect of EU Political Expenditure).
Neither the Company nor any if its subsidiaries have made any political donations during the year.
With effect from 1 October 2007, the relevant provisions governing political donations in the Companies Act 1985 have been replaced by similar provisions in Part 14 of the Companies Act 2006. Although the existing shareholder approval in respect of political donations does not expire until the Company’s AGM in 2009, Part 14 of the Companies Act 2006 is technically different to the relevant
•
•
•
•
68 Vodafone Group Plc Annual Report 2008
Vodafone – Governance
Corporate Governance continued
Disclosure controls and proceduresThe Company maintains “disclosure controls and procedures”, as such term is defined in Exchange Act Rule 13a-15(e), that are designed to ensure that information required to be disclosed in reports the Company files or submits under the Exchange Act is recorded, processed, summarised and reported within the time periods specified in the Securities and Exchange Commission rules and forms, and that such information is accumulated and communicated to management, including the Company’s Group Chief Executive and Chief Financial Officer, as appropriate, to allow timely decisions regarding required disclosure.
The directors, the Chief Executive and the Chief Financial Officer have evaluated the effectiveness of the disclosure controls and procedures and, based on that evaluation, have concluded that the disclosure controls and procedures are effective at the end of the period covered by this Annual Report.
AuditorsFollowing a recommendation by the Audit Committee and, in accordance with Section 384 of the Companies Act 1985, a resolution proposing the reappointment of Deloitte & Touche LLP as auditors to the Company will be put to the 2008 AGM.
In its assessment of the independence of the auditors and in accordance with the US Independence Standards Board Standard No. 1, “Independence Discussions with Audit Committees”, the Audit Committee receives in writing details of relationships between Deloitte & Touche LLP and the Company that may have a bearing on their independence and receives confirmation that they are independent of the Company within the meaning of the securities laws administered by the SEC.
In addition, the Audit Committee pre-approves the audit fee after a review of both the level of the audit fee against other comparable companies, including those in the telecommunications industry, and the level and nature of non-audit fees, as part of its review of the adequacy and objectivity of the audit process.
In a further measure to ensure auditor independence is not compromised, policies provide for the pre-approval by the Audit Committee of permitted non-audit services by Deloitte & Touche LLP. For certain specific permitted services, the Audit Committee has pre-approved that Deloitte & Touche LLP can be engaged by Group management subject to specified fee limits for individual engagements and fee limits for each type of specific service permitted. For all other services, or those permitted services that exceed the specified fee limits, the Chairman of the Audit Committee, or in his absence another member, can pre-approve services which have not been pre-approved by the Audit Committee.
In addition to their statutory duties, Deloitte & Touche LLP are also employed where, as a result of their position as auditors, they either must, or are best placed to, perform the work in question. This is primarily work in relation to matters such as shareholder circulars, Group borrowings, regulatory filings and certain business acquisitions and disposals. Other work is awarded on the basis of competitive tender.
During the year, Deloitte & Touche LLP and its affiliates charged the Group £7 million (2007: £7 million, 2006: £4 million) for audit and audit-related services and a further £2 million (2007: £3 million, 2006: £4 million) for non-audit assignments. An analysis of these fees can be found in note 4 to the Consolidated Financial Statements.
provisions of the Companies Act 1985 and, consequently, to avoid any confusion, the directors, on a precautionary basis, are bringing this matter again to shareholders and the terms of this year’s resolution have been adjusted to reflect the different technical requirements of Part 14 of the Companies Act 2006.
It remains the policy of the Company not to make political donations or incur political expenditure as those expressions are normally understood. However, the directors consider that it is in the best interests of shareholders for the Company to participate in public debate and opinion-forming on matters which affect its business. To avoid inadvertent infringement of the Companies Act 2006, the directors are seeking shareholders’ authority for the Company and its subsidiaries to make political donations and to incur political expenditure during the period from the date of the AGM to the conclusion of the AGM in 2012 or 29 July 2012, whichever is the earlier, up to a maximum aggregate amount of £100,000 per year.
Internal controlThe Board has overall responsibility for the system of internal control. A sound system of internal control is designed to manage rather than eliminate the risk of failure to achieve business objectives and can only provide reasonable and not absolute assurance against material misstatement or loss. The process of managing the risks associated with social, environmental and ethical impacts is also discussed under “Performance – Corporate Responsibility” on pages 59 to 61.
The Board has established procedures that implement in full the Turnbull Guidance “Internal Control: Revised Guidance for Directors on the Combined Code” for the year under review and to the date of approval of the Annual Report. These procedures, which are subject to regular review, provide an ongoing process for identifying, evaluating and managing the significant risks faced by the Group. See page 83 for management’s report on internal control over financial reporting.
Monitoring and review activitiesThere are clear processes for monitoring the system of internal control and reporting any significant control failings or weaknesses together with details of corrective action. These include:
a formal annual confirmation provided by the Chief Executive Officer and Chief Financial Officer of each Group company certifying the operation of their control systems and highlighting any weaknesses, the results of which are reviewed by regional management, the Audit Committee and the Board;a review of the quality and timeliness of disclosures undertaken by the Chief Executive and the Chief Financial Officer which includes formal annual meetings with the operating company or regional chief executives and chief financial officers and the Disclosure Committee;periodic examination of business processes on a risk basis including reports on controls throughout the Group undertaken by the Group Internal Audit Department who report directly to the Audit Committee; andreports from the external auditors, Deloitte & Touche LLP, on certain internal controls and relevant financial reporting matters, presented to the Audit Committee and management.
Any controls and procedures, no matter how well designed and operated, can provide only reasonable and not absolute assurance of achieving the desired control objectives. Management is required to apply judgement in evaluating the risks facing the Group in achieving its objectives, in determining the risks that are considered acceptable to bear, in assessing the likelihood of the risks concerned materialising, in identifying the Company’s ability to reduce the incidence and impact on the business of risks that do materialise and in ensuring that the costs of operating particular controls are proportionate to the benefit.
Review of effectivenessThe Board and the Audit Committee have reviewed the effectiveness of the internal control system, including financial, operational and compliance controls and risk management, in accordance with the Code for the period from 1 April 2007 to the date of approval of this Annual Report. No significant failings or weaknesses were identified during this review. However, had there been any such failings or weaknesses, the Board confirms that necessary actions would have been taken to remedy them.
•
•
•
•
Vodafone Group Plc Annual Report 2008 69
US listing requirementsThe Company’s ADSs are listed on the NYSE and the Company is, therefore, subject to the rules of the NYSE as well as US securities laws and the rules of the SEC. The NYSE requires US companies listed on the exchange to comply with the NYSE’s corporate governance rules but foreign private issuers, such as the Company, are exempt from most of those rules. However, pursuant to NYSE Rule 303A.11, the Company is required to disclose a summary of any significant ways in which the corporate governance practices it follows differ from those required by the NYSE for US companies. The differences are as follows:
Independence
NYSE rules require that a majority of the Board must be comprised of independent directors and the rules include detailed tests that US companies must use for determining independence.The Combined Code requires a company’s board of directors to assess and make a determination as to the independence of its directors.
While the Board does not explicitly take into consideration the NYSE’s detailed tests, it has carried out an assessment based on the requirements of the Combined Code and has determined in its judgement that all of the non-executive directors are independent within those requirements. At the date of this Annual Report, the Board comprised the Chairman, three executive directors and ten non-executive directors.
Committees
NYSE rules require US companies to have a nominating and corporate governance committee and a compensation committee, each composed entirely of independent directors with a written charter that addresses the Committees’ purpose and responsibilities.
•
•
•
The Company’s Nominations and Governance Committee and Remuneration Committee have terms of reference and composition that comply with the Combined Code requirements.The Nominations and Governance Committee is chaired by the Chairman of the Board, and its other members are non-executive directors of the Company and the Chief Executive.The Audit Committee is composed entirely of non-executive directors whom the Board has determined to be independent and who meet the requirements of Rule 10A-3 of the Securities Exchange Act.
The Company considers that the terms of reference of these committees, which are available on its website at www.vodafone.com, are generally responsive to the relevant NYSE rules but may not address all aspects of these rules.
Corporate governance guidelines
Under NYSE rules, US companies must adopt and disclose corporate governance guidelines. Vodafone has posted its statement of compliance with the Combined Code on its website at www.vodafone.com. The Company has also adopted a Group Governance and Policy Manual which provides the first level of the framework within which its businesses operate. The Manual applies to all directors and employees.
The Company considers that its corporate governance guidelines are generally responsive to, but may not address all aspects of, the relevant NYSE rules.
The Company has also adopted a corporate Code of Ethics for senior executives, financial and accounting officers, separate from and additional to its Business Principles. A copy of this code is available on the Group’s website at www.vodafone.com.
•
•
•
•
•
Report from the Audit CommitteeThe composition of the Audit Committee is shown in the table on page 67 and its terms of reference are discussed under “Board committees – Audit Committee”.
During the year ended 31 March 2008, the principal activities of the Committee were as follows:
Financial statementsThe Committee considered reports from the Chief Financial Officer and the Director of Financial Reporting on the half-year and annual financial statements. It also considered reports from the external auditors, Deloitte & Touche LLP, on the scope and outcome of the half-year review and annual audit.
The financial statements were reviewed in the light of these reports and the results of that review reported to the Board.
Risk management and internal controlThe Committee reviewed the process by which the Group evaluated its control environment, its risk assessment process and the way in which significant business risks were managed. It also considered the Group Audit Department’s reports on the effectiveness of internal controls, significant frauds and any fraud that involved management or employees with a significant role in internal controls. The Committee was also responsible for oversight of the Group’s compliance activities in relation to section 404 of the Sarbanes-Oxley Act.
The Committee also reviewed arrangements by which staff could, in confidence, raise concerns about possible improprieties in matters of financial reporting or other matters. This was achieved through using existing reporting procedures and a website with a dedicated anonymous email feature.
External auditorsThe Committee reviewed the letter from Deloitte & Touche LLP confirming their independence and objectivity. It also reviewed and approved the scope of non-audit services provided by Deloitte & Touche LLP to ensure that there was no impairment of independence.
The Committee approved the scope and fees for audit services provided by Deloitte & Touche LLP and confirmed the wording of the recommendations put by the Board to the shareholders on the appointment and retention of the external auditors.
Private meetings were held with Deloitte & Touche LLP to ensure that there were no restrictions on the scope of their audit and to discuss any items the auditors did not wish to raise with management present.
Internal auditThe Committee engaged in discussion and review of the Group Audit Department’s audit plan for the year, together with its resource requirements. Private meetings were held with the Group Audit Director.
Audit Committee effectivenessThe Audit Committee conducts a formal review of its effectiveness annually and concluded this year that it was effective and able to fulfil its terms of reference.
Dr Michael Boskin On behalf of the Audit Committee
70 Vodafone Group Plc Annual Report 2008
Vodafone – Governance
Corporate Governance continued
Dear Shareholder
The Vodafone Remuneration Committee commissioned a review of the reward package for the executive directors during the 2008 financial year. The objective was to consider the effectiveness of the reward arrangements in aligning with our strategy and shareholder interests. As a result, the Remuneration Committee has updated the remuneration policy, reward structure and market positioning for the coming years.
The key principles adopted for the updated Vodafone remuneration policy are as follows:
ensure a competitive total remuneration package as benchmarked against relevant companies and markets;provide the opportunity for significant reward upside only if:
truly exceptional performance is delivered; andparticipants invest their own money;
deliver a high proportion of total remuneration through performance related equity payments; anddrive alignment to our strategy, to create shareholder value, and reinforce shareholder alignment.
In order to fulfil this policy, the following key changes are being made to the components of directors’ remuneration:
the long term incentive structure is being simplified – awards will be made in performance shares only;the vesting of performance shares will be based upon a combination of operational and equity performance measures; andparticipants will be invited to invest their own money in order to maximise their long term award.
The Remuneration Committee continues to monitor how well incentive awards made in previous years align with the Company’s performance. We are confident that forecast rewards are commensurate with performance. This financial year we have taken the opportunity to further align the Vodafone reward package to the strategy and shareholder interests. In particular, this Remuneration Report outlines the detailed changes to the Global Long Term Incentive Plan (“GLTI”) for the 2009 financial year. This plan operates under the existing plan rules which were approved in 2006. As a result there will be no separate resolution for the amendments. However, the Remuneration Committee always takes an active interest in shareholder views and the voting on the Remuneration Report. As such, it hopes to receive your support at the AGM on 29 July 2008.
Luc VandeveldeChairman of the Remuneration Committee27 May 2008
•
•––
•
•
•
•
•
Remuneration CommitteeThe Remuneration Committee is comprised to exercise independent judgement and consists only of independent non-executive directors. The Remuneration Committee had five scheduled and a number of other ad hoc meetings during the year. For further details, the terms of reference can be found on page 68.
Remuneration CommitteeChairman Luc VandeveldeCommittee members Dr Michael Boskin (left on 23 July 2007) Simon Murray (joined on 25 July 2007) Professor Jürgen Schrempp Anthony Watson Philip Yea
Management attendeesChief Executive Arun SarinGroup HR Director Terry KramerGroup Reward & Recognition Director Tristram Roberts
External advisersDuring the year, Towers Perrin supplied market data and advice on market practice and governance. PricewaterhouseCoopers LLP and Kepler Associates provided performance analysis and advice on plan design and performance measures.
The advisers also provided advice to the Company on general human resource and compensation related matters. In addition, PricewaterhouseCoopers LLP also provided a broad range of tax, share scheme and advisory services to the Group during 2008.
ContentsThe detail of this Remuneration Report is set out over the following pages, as follows:
Review of the executive directors’ remuneration How the executive directors were paid in the 2008 financial yearChanges to how the executive directors will be paid in the 2009 financial year Grants made and payouts received in the 2008 financial yearOther elements of directors’ packagesNon-executive directors’ remunerationOther considerationsAudited information.
••••••••
Vodafone Group Plc Annual Report 2008 71
Directors’ Remuneration
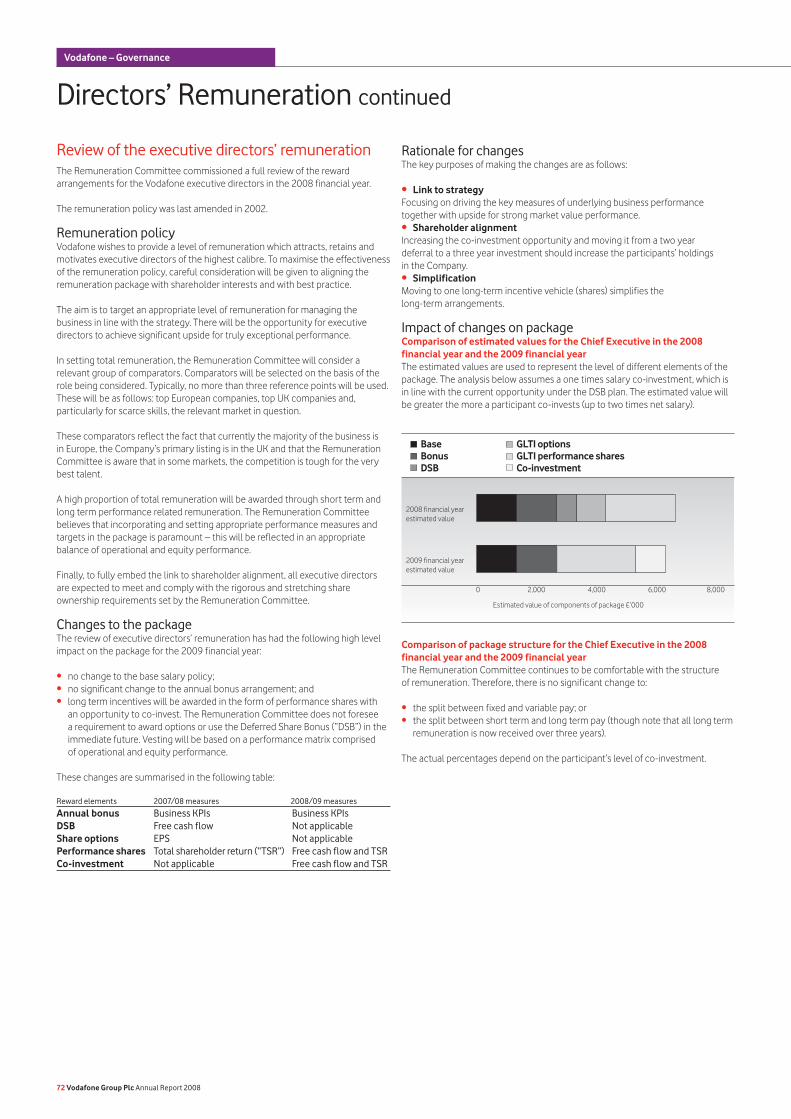
Review of the executive directors’ remuneration The Remuneration Committee commissioned a full review of the reward arrangements for the Vodafone executive directors in the 2008 financial year.
The remuneration policy was last amended in 2002.
Remuneration policyVodafone wishes to provide a level of remuneration which attracts, retains and motivates executive directors of the highest calibre. To maximise the effectiveness of the remuneration policy, careful consideration will be given to aligning the remuneration package with shareholder interests and with best practice.
The aim is to target an appropriate level of remuneration for managing the business in line with the strategy. There will be the opportunity for executive directors to achieve significant upside for truly exceptional performance.
In setting total remuneration, the Remuneration Committee will consider a relevant group of comparators. Comparators will be selected on the basis of the role being considered. Typically, no more than three reference points will be used. These will be as follows: top European companies, top UK companies and, particularly for scarce skills, the relevant market in question.
These comparators reflect the fact that currently the majority of the business is in Europe, the Company’s primary listing is in the UK and that the Remuneration Committee is aware that in some markets, the competition is tough for the very best talent.
A high proportion of total remuneration will be awarded through short term and long term performance related remuneration. The Remuneration Committee believes that incorporating and setting appropriate performance measures and targets in the package is paramount – this will be reflected in an appropriate balance of operational and equity performance.
Finally, to fully embed the link to shareholder alignment, all executive directors are expected to meet and comply with the rigorous and stretching share ownership requirements set by the Remuneration Committee.
Changes to the packageThe review of executive directors’ remuneration has had the following high level impact on the package for the 2009 financial year:
no change to the base salary policy;no significant change to the annual bonus arrangement; andlong term incentives will be awarded in the form of performance shares with an opportunity to co-invest. The Remuneration Committee does not foresee a requirement to award options or use the Deferred Share Bonus (“DSB”) in the immediate future. Vesting will be based on a performance matrix comprised of operational and equity performance.
These changes are summarised in the following table:
Reward elements 2007/08 measures 2008/09 measures
Annual bonus Business KPIs Business KPIsDSB Free cash flow Not applicableShare options EPS Not applicablePerformance shares Total shareholder return (“TSR”) Free cash flow and TSRCo-investment Not applicable Free cash flow and TSR
•••
Rationale for changesThe key purposes of making the changes are as follows:
Link to strategyFocusing on driving the key measures of underlying business performance together with upside for strong market value performance.
Shareholder alignmentIncreasing the co-investment opportunity and moving it from a two year deferral to a three year investment should increase the participants’ holdings in the Company.
SimplificationMoving to one long-term incentive vehicle (shares) simplifies the long-term arrangements.
Impact of changes on packageComparison of estimated values for the Chief Executive in the 2008 financial year and the 2009 financial yearThe estimated values are used to represent the level of different elements of the package. The analysis below assumes a one times salary co-investment, which is in line with the current opportunity under the DSB plan. The estimated value will be greater the more a participant co-invests (up to two times net salary).
Comparison of package structure for the Chief Executive in the 2008 financial year and the 2009 financial yearThe Remuneration Committee continues to be comfortable with the structure of remuneration. Therefore, there is no significant change to:
the split between fixed and variable pay; or the split between short term and long term pay (though note that all long term remuneration is now received over three years).
The actual percentages depend on the participant’s level of co-investment.
•
•
•
••
0 2,000 4,000 6,000 8,000
2009 financial year estimated value
2008 financial year estimated value
Estimated value of components of package £’000
72 Vodafone Group Plc Annual Report 2008
Vodafone – Governance
Directors’ Remuneration continued
Base GLTI optionsBonus GLTI performance sharesDSB Co-investment
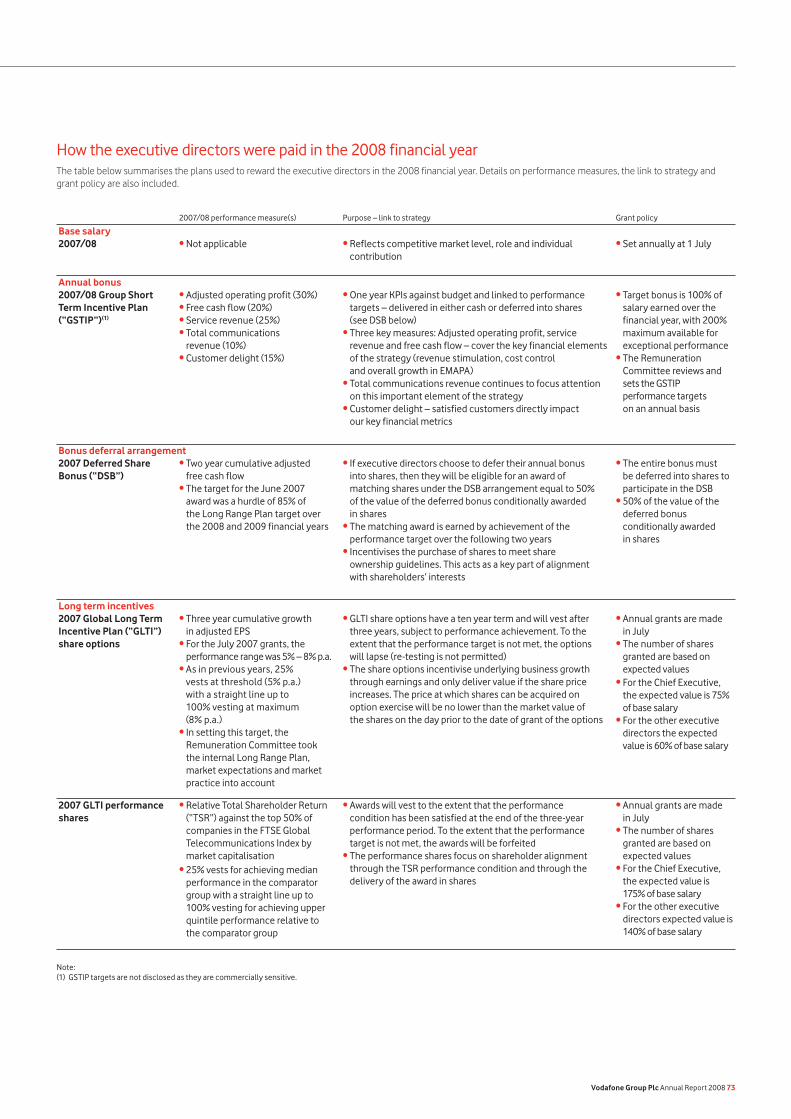
How the executive directors were paid in the 2008 financial year The table below summarises the plans used to reward the executive directors in the 2008 financial year. Details on performance measures, the link to strategy and grant policy are also included.
2007/08 performance measure(s) Purpose – link to strategy Grant policy
Base salary2007/08 • Not applicable • Reflects competitive market level, role and individual
contribution• Set annually at 1 July
Annual bonus2007/08 Group Short Term Incentive Plan (“GSTIP”)(1)
• Adjusted operating profit (30%)• Free cash flow (20%)• Service revenue (25%)
• One year KPIs against budget and linked to performance targets – delivered in either cash or deferred into shares (see DSB below)
• Target bonus is 100% of salary earned over the financial year, with 200% maximum available for exceptional performance
• The Remuneration Committee reviews and sets the GSTIP performance targets on an annual basis
• Total communications revenue (10%)
• Customer delight (15%)
• Three key measures: Adjusted operating profit, service revenue and free cash flow – cover the key financial elements of the strategy (revenue stimulation, cost control and overall growth in EMAPA)
• Total communications revenue continues to focus attention on this important element of the strategy
• Customer delight – satisfied customers directly impact our key financial metrics
Bonus deferral arrangement2007 Deferred Share Bonus (“DSB”)
• Two year cumulative adjusted free cash flow
• If executive directors choose to defer their annual bonus into shares, then they will be eligible for an award of matching shares under the DSB arrangement equal to 50% of the value of the deferred bonus conditionally awarded in shares
• The matching award is earned by achievement of the performance target over the following two years
• Incentivises the purchase of shares to meet share ownership guidelines. This acts as a key part of alignment with shareholders’ interests
• The entire bonus must be deferred into shares to participate in the DSB
• 50% of the value of the deferred bonus conditionally awarded in shares
• The target for the June 2007 award was a hurdle of 85% of the Long Range Plan target over the 2008 and 2009 financial years
Long term incentives2007 Global Long Term Incentive Plan (“GLTI”) share options
• Three year cumulative growth in adjusted EPS
• For the July 2007 grants, the performance range was 5% – 8% p.a.
• As in previous years, 25% vests at threshold (5% p.a.) with a straight line up to 100% vesting at maximum (8% p.a.)
• In setting this target, the Remuneration Committee took the internal Long Range Plan, market expectations and market practice into account
• GLTI share options have a ten year term and will vest after three years, subject to performance achievement. To the extent that the performance target is not met, the options will lapse (re-testing is not permitted)
• The share options incentivise underlying business growth through earnings and only deliver value if the share price increases. The price at which shares can be acquired on option exercise will be no lower than the market value of the shares on the day prior to the date of grant of the options
• Annual grants are made in July
• The number of shares granted are based on expected values
• For the Chief Executive, the expected value is 75% of base salary
• For the other executive directors the expected value is 60% of base salary
2007 GLTI performance shares
• Relative Total Shareholder Return (“TSR”) against the top 50% of companies in the FTSE Global Telecommunications Index by market capitalisation
• Awards will vest to the extent that the performance condition has been satisfied at the end of the three-year performance period. To the extent that the performance target is not met, the awards will be forfeited
• The performance shares focus on shareholder alignment through the TSR performance condition and through the delivery of the award in shares
• Annual grants are made in July
• The number of shares granted are based on expected values
• For the Chief Executive, the expected value is 175% of base salary
• For the other executive directors expected value is 140% of base salary
• 25% vests for achieving median performance in the comparator group with a straight line up to 100% vesting for achieving upper quintile performance relative to the comparator group
Note:(1) GSTIP targets are not disclosed as they are commercially sensitive.
Vodafone Group Plc Annual Report 2008 73
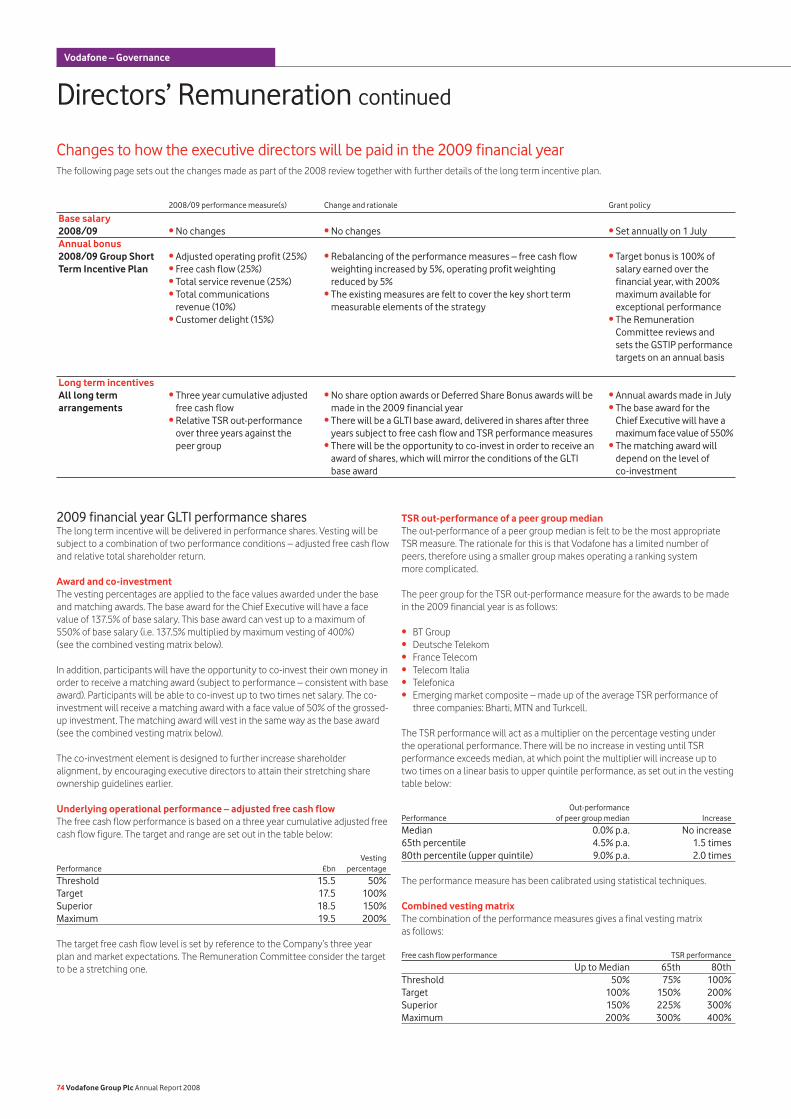
Changes to how the executive directors will be paid in the 2009 financial yearThe following page sets out the changes made as part of the 2008 review together with further details of the long term incentive plan.
2008/09 performance measure(s) Change and rationale Grant policy
Base salary2008/09 • No changes • No changes • Set annually on 1 JulyAnnual bonus2008/09 Group Short Term Incentive Plan
• Adjusted operating profit (25%)• Free cash flow (25%)• Total service revenue (25%)• Total communications
revenue (10%)• Customer delight (15%)
• Rebalancing of the performance measures – free cash flow weighting increased by 5%, operating profit weighting reduced by 5%
• The existing measures are felt to cover the key short term measurable elements of the strategy
• Target bonus is 100% of salary earned over the financial year, with 200% maximum available for exceptional performance
• The Remuneration Committee reviews and sets the GSTIP performance targets on an annual basis
Long term incentivesAll long term arrangements
• Three year cumulative adjusted free cash flow
• No share option awards or Deferred Share Bonus awards will be made in the 2009 financial year
• There will be a GLTI base award, delivered in shares after three years subject to free cash flow and TSR performance measures
• Annual awards made in July• The base award for the
Chief Executive will have a maximum face value of 550%
• Relative TSR out-performance over three years against the peer group • There will be the opportunity to co-invest in order to receive an
award of shares, which will mirror the conditions of the GLTI base award
• The matching award will depend on the level of co-investment
2009 financial year GLTI performance sharesThe long term incentive will be delivered in performance shares. Vesting will be subject to a combination of two performance conditions – adjusted free cash flow and relative total shareholder return.
Award and co-investmentThe vesting percentages are applied to the face values awarded under the base and matching awards. The base award for the Chief Executive will have a face value of 137.5% of base salary. This base award can vest up to a maximum of 550% of base salary (i.e. 137.5% multiplied by maximum vesting of 400%) (see the combined vesting matrix below).
In addition, participants will have the opportunity to co-invest their own money in order to receive a matching award (subject to performance – consistent with base award). Participants will be able to co-invest up to two times net salary. The co-investment will receive a matching award with a face value of 50% of the grossed-up investment. The matching award will vest in the same way as the base award (see the combined vesting matrix below).
The co-investment element is designed to further increase shareholder alignment, by encouraging executive directors to attain their stretching share ownership guidelines earlier.
Underlying operational performance – adjusted free cash flowThe free cash flow performance is based on a three year cumulative adjusted free cash flow figure. The target and range are set out in the table below:
Vesting Performance £bn percentage
Threshold 15.5 50%Target 17.5 100%Superior 18.5 150%Maximum 19.5 200%
The target free cash flow level is set by reference to the Company’s three year plan and market expectations. The Remuneration Committee consider the target to be a stretching one.
TSR out-performance of a peer group medianThe out-performance of a peer group median is felt to be the most appropriate TSR measure. The rationale for this is that Vodafone has a limited number of peers, therefore using a smaller group makes operating a ranking system more complicated.
The peer group for the TSR out-performance measure for the awards to be made in the 2009 financial year is as follows:
BT GroupDeutsche TelekomFrance TelecomTelecom ItaliaTelefonicaEmerging market composite – made up of the average TSR performance of three companies: Bharti, MTN and Turkcell.
The TSR performance will act as a multiplier on the percentage vesting under the operational performance. There will be no increase in vesting until TSR performance exceeds median, at which point the multiplier will increase up to two times on a linear basis to upper quintile performance, as set out in the vesting table below:
Out-performance Performance of peer group median Increase
Median 0.0% p.a. No increase65th percentile 4.5% p.a. 1.5 times80th percentile (upper quintile) 9.0% p.a. 2.0 times
The performance measure has been calibrated using statistical techniques.
Combined vesting matrixThe combination of the performance measures gives a final vesting matrix as follows:
Free cash flow performance TSR performance
Up to Median 65th 80thThreshold 50% 75% 100%Target 100% 150% 200%Superior 150% 225% 300%Maximum 200% 300% 400%
••••••
74 Vodafone Group Plc Annual Report 2008
Vodafone – Governance
Directors’ Remuneration continued
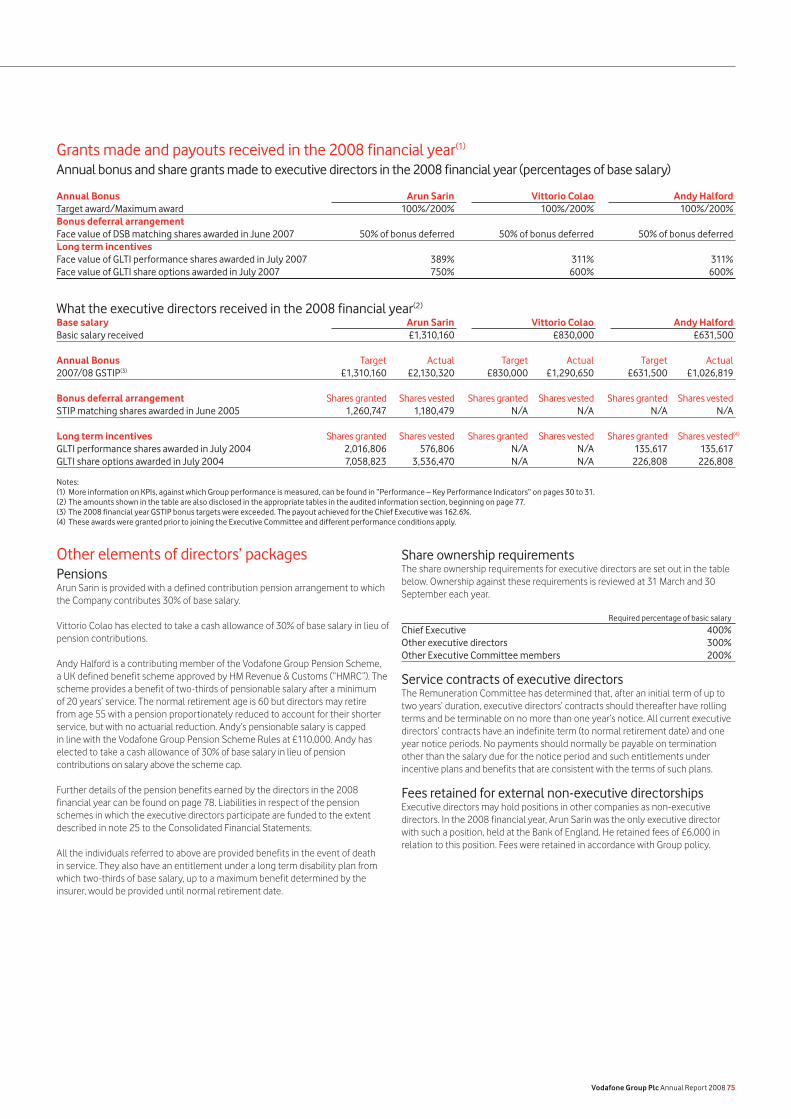
Other elements of directors’ packagesPensionsArun Sarin is provided with a defined contribution pension arrangement to which the Company contributes 30% of base salary.
Vittorio Colao has elected to take a cash allowance of 30% of base salary in lieu of pension contributions.
Andy Halford is a contributing member of the Vodafone Group Pension Scheme, a UK defined benefit scheme approved by HM Revenue & Customs (“HMRC”). The scheme provides a benefit of two-thirds of pensionable salary after a minimum of 20 years’ service. The normal retirement age is 60 but directors may retire from age 55 with a pension proportionately reduced to account for their shorter service, but with no actuarial reduction. Andy’s pensionable salary is capped in line with the Vodafone Group Pension Scheme Rules at £110,000. Andy has elected to take a cash allowance of 30% of base salary in lieu of pension contributions on salary above the scheme cap.
Further details of the pension benefits earned by the directors in the 2008 financial year can be found on page 78. Liabilities in respect of the pension schemes in which the executive directors participate are funded to the extent described in note 25 to the Consolidated Financial Statements.
All the individuals referred to above are provided benefits in the event of death in service. They also have an entitlement under a long term disability plan from which two-thirds of base salary, up to a maximum benefit determined by the insurer, would be provided until normal retirement date.
Share ownership requirementsThe share ownership requirements for executive directors are set out in the table below. Ownership against these requirements is reviewed at 31 March and 30 September each year.
Required percentage of basic salary
Chief Executive 400%Other executive directors 300%Other Executive Committee members 200%
Service contracts of executive directorsThe Remuneration Committee has determined that, after an initial term of up to two years’ duration, executive directors’ contracts should thereafter have rolling terms and be terminable on no more than one year’s notice. All current executive directors’ contracts have an indefinite term (to normal retirement date) and one year notice periods. No payments should normally be payable on termination other than the salary due for the notice period and such entitlements under incentive plans and benefits that are consistent with the terms of such plans. Fees retained for external non-executive directorshipsExecutive directors may hold positions in other companies as non-executive directors. In the 2008 financial year, Arun Sarin was the only executive director with such a position, held at the Bank of England. He retained fees of £6,000 in relation to this position. Fees were retained in accordance with Group policy.
Grants made and payouts received in the 2008 financial year(1)
Annual bonus and share grants made to executive directors in the 2008 financial year (percentages of base salary)
Annual Bonus Arun Sarin Vittorio Colao Andy HalfordTarget award/Maximum award 100%/200% 100%/200% 100%/200%Bonus deferral arrangement Face value of DSB matching shares awarded in June 2007 50% of bonus deferred 50% of bonus deferred 50% of bonus deferredLong term incentives Face value of GLTI performance shares awarded in July 2007 389% 311% 311%Face value of GLTI share options awarded in July 2007 750% 600% 600%
What the executive directors received in the 2008 financial year(2)
Base salary Arun Sarin Vittorio Colao Andy HalfordBasic salary received £1,310,160 £830,000 £631,500
Annual Bonus Target Actual Target Actual Target Actual2007/08 GSTIP(3) £1,310,160 £2,130,320 £830,000 £1,290,650 £631,500 £1,026,819
Bonus deferral arrangement Shares granted Shares vested Shares granted Shares vested Shares granted Shares vestedSTIP matching shares awarded in June 2005 1,260,747 1,180,479 N/A N/A N/A N/A
Long term incentives Shares granted Shares vested Shares granted Shares vested Shares granted Shares vested(4)
GLTI performance shares awarded in July 2004 2,016,806 576,806 N/A N/A 135,617 135,617GLTI share options awarded in July 2004 7,058,823 3,536,470 N/A N/A 226,808 226,808
Notes: (1) More information on KPIs, against which Group performance is measured, can be found in “Performance – Key Performance Indicators” on pages 30 to 31.(2) The amounts shown in the table are also disclosed in the appropriate tables in the audited information section, beginning on page 77.(3) The 2008 financial year GSTIP bonus targets were exceeded. The payout achieved for the Chief Executive was 162.6%.(4) These awards were granted prior to joining the Executive Committee and different performance conditions apply.
Vodafone Group Plc Annual Report 2008 75
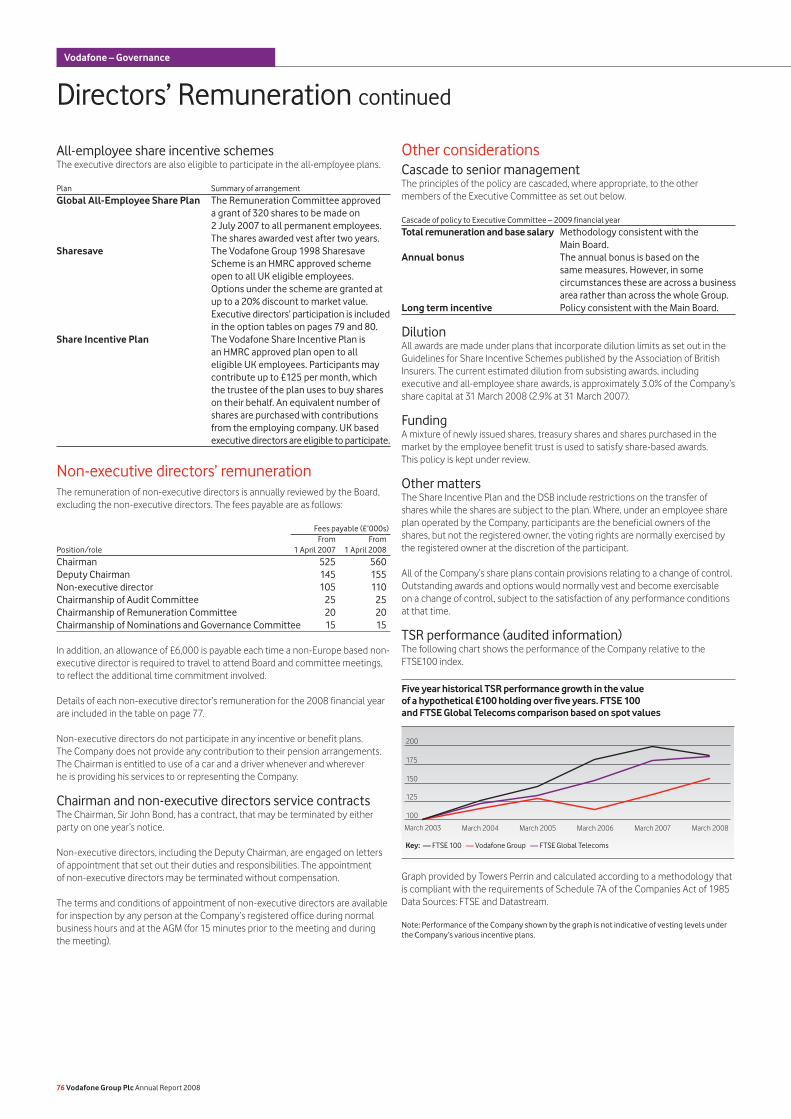
All-employee share incentive schemesThe executive directors are also eligible to participate in the all-employee plans.
Plan Summary of arrangement
Global All-Employee Share Plan The Remuneration Committee approved a grant of 320 shares to be made on 2 July 2007 to all permanent employees. The shares awarded vest after two years.
Sharesave The Vodafone Group 1998 Sharesave Scheme is an HMRC approved scheme open to all UK eligible employees. Options under the scheme are granted at up to a 20% discount to market value. Executive directors’ participation is included in the option tables on pages 79 and 80.
Share Incentive Plan The Vodafone Share Incentive Plan is an HMRC approved plan open to all eligible UK employees. Participants may contribute up to £125 per month, which the trustee of the plan uses to buy shares on their behalf. An equivalent number of shares are purchased with contributions from the employing company. UK based executive directors are eligible to participate.
Non-executive directors’ remunerationThe remuneration of non-executive directors is annually reviewed by the Board, excluding the non-executive directors. The fees payable are as follows:
Fees payable (£’000s) From FromPosition/role 1 April 2007 1 April 2008
Chairman 525 560Deputy Chairman 145 155Non-executive director 105 110Chairmanship of Audit Committee 25 25Chairmanship of Remuneration Committee 20 20Chairmanship of Nominations and Governance Committee 15 15
In addition, an allowance of £6,000 is payable each time a non-Europe based non-executive director is required to travel to attend Board and committee meetings, to reflect the additional time commitment involved.
Details of each non-executive director’s remuneration for the 2008 financial year are included in the table on page 77.
Non-executive directors do not participate in any incentive or benefit plans. The Company does not provide any contribution to their pension arrangements. The Chairman is entitled to use of a car and a driver whenever and wherever he is providing his services to or representing the Company.
Chairman and non-executive directors service contractsThe Chairman, Sir John Bond, has a contract, that may be terminated by either party on one year’s notice.
Non-executive directors, including the Deputy Chairman, are engaged on letters of appointment that set out their duties and responsibilities. The appointment of non-executive directors may be terminated without compensation.
The terms and conditions of appointment of non-executive directors are available for inspection by any person at the Company’s registered office during normal business hours and at the AGM (for 15 minutes prior to the meeting and during the meeting).
Other considerationsCascade to senior management The principles of the policy are cascaded, where appropriate, to the other members of the Executive Committee as set out below.
Cascade of policy to Executive Committee – 2009 financial year
Total remuneration and base salary Methodology consistent with the Main Board.
Annual bonus The annual bonus is based on the same measures. However, in some circumstances these are across a business area rather than across the whole Group.
Long term incentive Policy consistent with the Main Board.
DilutionAll awards are made under plans that incorporate dilution limits as set out in the Guidelines for Share Incentive Schemes published by the Association of British Insurers. The current estimated dilution from subsisting awards, including executive and all-employee share awards, is approximately 3.0% of the Company’s share capital at 31 March 2008 (2.9% at 31 March 2007).
FundingA mixture of newly issued shares, treasury shares and shares purchased in the market by the employee benefit trust is used to satisfy share-based awards. This policy is kept under review.
Other mattersThe Share Incentive Plan and the DSB include restrictions on the transfer of shares while the shares are subject to the plan. Where, under an employee share plan operated by the Company, participants are the beneficial owners of the shares, but not the registered owner, the voting rights are normally exercised by the registered owner at the discretion of the participant.
All of the Company’s share plans contain provisions relating to a change of control. Outstanding awards and options would normally vest and become exercisable on a change of control, subject to the satisfaction of any performance conditions at that time.
TSR performance (audited information)The following chart shows the performance of the Company relative to the FTSE100 index.
Graph provided by Towers Perrin and calculated according to a methodology that is compliant with the requirements of Schedule 7A of the Companies Act of 1985Data Sources: FTSE and Datastream.
Note: Performance of the Company shown by the graph is not indicative of vesting levels under the Company’s various incentive plans.
Key: ― FTSE 100 ― Vodafone Group ― FTSE Global Telecoms
March 2008March 2003
100
125
March 2004 March 2005 March 2006 March 2007
150
175
200
76 Vodafone Group Plc Annual Report 2008
Vodafone – Governance
Directors’ Remuneration continued
Five year historical TSR performance growth in the value of a hypothetical £100 holding over five years. FTSE 100and FTSE Global Telecoms comparison based on spot values
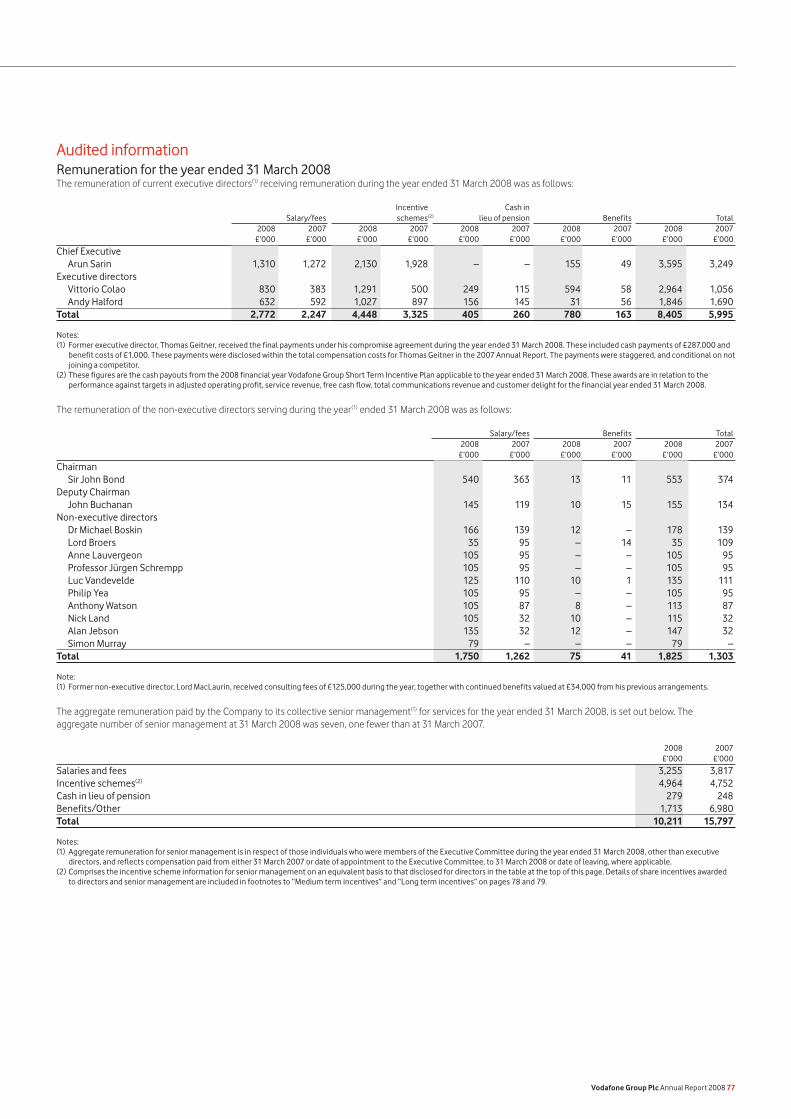
Audited information Remuneration for the year ended 31 March 2008The remuneration of current executive directors(1) receiving remuneration during the year ended 31 March 2008 was as follows:
Incentive Cash in Salary/fees schemes(2) lieu of pension Benefits Total 2008 2007 2008 2007 2008 2007 2008 2007 2008 2007 £’000 £’000 £’000 £’000 £’000 £’000 £’000 £’000 £’000 £’000
Chief Executive Arun Sarin 1,310 1,272 2,130 1,928 – – 155 49 3,595 3,249Executive directors Vittorio Colao 830 383 1,291 500 249 115 594 58 2,964 1,056 Andy Halford 632 592 1,027 897 156 145 31 56 1,846 1,690Total 2,772 2,247 4,448 3,325 405 260 780 163 8,405 5,995
Notes:(1) Former executive director, Thomas Geitner, received the final payments under his compromise agreement during the year ended 31 March 2008. These included cash payments of £287,000 and
benefit costs of £1,000. These payments were disclosed within the total compensation costs for Thomas Geitner in the 2007 Annual Report. The payments were staggered, and conditional on not joining a competitor.
(2) These figures are the cash payouts from the 2008 financial year Vodafone Group Short Term Incentive Plan applicable to the year ended 31 March 2008. These awards are in relation to the performance against targets in adjusted operating profit, service revenue, free cash flow, total communications revenue and customer delight for the financial year ended 31 March 2008.
The remuneration of the non-executive directors serving during the year(1) ended 31 March 2008 was as follows:
Salary/fees Benefits Total 2008 2007 2008 2007 2008 2007 £’000 £’000 £’000 £’000 £’000 £’000
Chairman Sir John Bond 540 363 13 11 553 374Deputy Chairman John Buchanan 145 119 10 15 155 134Non-executive directors Dr Michael Boskin 166 139 12 – 178 139 Lord Broers 35 95 – 14 35 109 Anne Lauvergeon 105 95 – – 105 95 Professor Jürgen Schrempp 105 95 – – 105 95 Luc Vandevelde 125 110 10 1 135 111 Philip Yea 105 95 – – 105 95 Anthony Watson 105 87 8 – 113 87 Nick Land 105 32 10 – 115 32 Alan Jebson 135 32 12 – 147 32 Simon Murray 79 – – – 79 –Total 1,750 1,262 75 41 1,825 1,303 Note:(1) Former non-executive director, Lord MacLaurin, received consulting fees of £125,000 during the year, together with continued benefits valued at £34,000 from his previous arrangements.
The aggregate remuneration paid by the Company to its collective senior management(1) for services for the year ended 31 March 2008, is set out below. The aggregate number of senior management at 31 March 2008 was seven, one fewer than at 31 March 2007.
2008 2007 £’000 £’000
Salaries and fees 3,255 3,817Incentive schemes(2) 4,964 4,752Cash in lieu of pension 279 248Benefits/Other 1,713 6,980Total 10,211 15,797
Notes:(1) Aggregate remuneration for senior management is in respect of those individuals who were members of the Executive Committee during the year ended 31 March 2008, other than executive
directors, and reflects compensation paid from either 31 March 2007 or date of appointment to the Executive Committee, to 31 March 2008 or date of leaving, where applicable.(2) Comprises the incentive scheme information for senior management on an equivalent basis to that disclosed for directors in the table at the top of this page. Details of share incentives awarded
to directors and senior management are included in footnotes to “Medium term incentives” and “Long term incentives” on pages 78 and 79.
Vodafone Group Plc Annual Report 2008 77
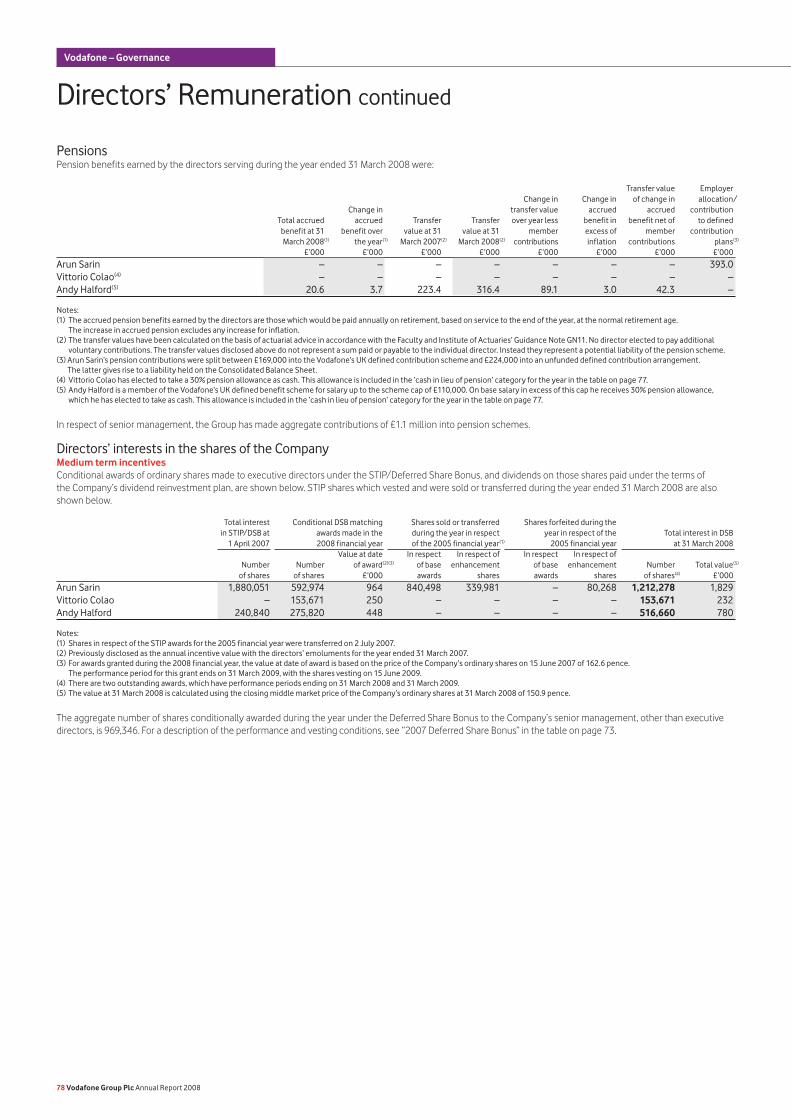
PensionsPension benefits earned by the directors serving during the year ended 31 March 2008 were:
Transfer value Employer Change in Change in of change in allocation/ Change in transfer value accrued accrued contribution Total accrued accrued Transfer Transfer over year less benefit in benefit net of to defined benefit at 31 benefit over value at 31 value at 31 member excess of member contribution March 2008(1) the year(1) March 2007(2) March 2008(2) contributions inflation contributions plans(3) £’000 £’000 £’000 £’000 £’000 £’000 £’000 £’000
Arun Sarin – – – – – – – 393.0Vittorio Colao(4) – – – – – – – –Andy Halford(5) 20.6 3.7 223.4 316.4 89.1 3.0 42.3 –
Notes:(1) The accrued pension benefits earned by the directors are those which would be paid annually on retirement, based on service to the end of the year, at the normal retirement age.
The increase in accrued pension excludes any increase for inflation.(2) The transfer values have been calculated on the basis of actuarial advice in accordance with the Faculty and Institute of Actuaries’ Guidance Note GN11. No director elected to pay additional
voluntary contributions. The transfer values disclosed above do not represent a sum paid or payable to the individual director. Instead they represent a potential liability of the pension scheme.(3) Arun Sarin’s pension contributions were split between £169,000 into the Vodafone’s UK defined contribution scheme and £224,000 into an unfunded defined contribution arrangement.
The latter gives rise to a liability held on the Consolidated Balance Sheet.(4) Vittorio Colao has elected to take a 30% pension allowance as cash. This allowance is included in the ‘cash in lieu of pension’ category for the year in the table on page 77.(5) Andy Halford is a member of the Vodafone’s UK defined benefit scheme for salary up to the scheme cap of £110,000. On base salary in excess of this cap he receives 30% pension allowance,
which he has elected to take as cash. This allowance is included in the ‘cash in lieu of pension’ category for the year in the table on page 77.
In respect of senior management, the Group has made aggregate contributions of £1.1 million into pension schemes.
Directors’ interests in the shares of the CompanyMedium term incentivesConditional awards of ordinary shares made to executive directors under the STIP/Deferred Share Bonus, and dividends on those shares paid under the terms of the Company’s dividend reinvestment plan, are shown below. STIP shares which vested and were sold or transferred during the year ended 31 March 2008 are also shown below. Total interest Conditional DSB matching Shares sold or transferred Shares forfeited during the in STIP/DSB at awards made in the during the year in respect year in respect of the Total interest in DSB 1 April 2007 2008 financial year of the 2005 financial year(1) 2005 financial year at 31 March 2008 Value at date In respect In respect of In respect In respect of Number Number of award(2)(3) of base enhancement of base enhancement Number Total value(5)
of shares of shares £’000 awards shares awards shares of shares(4) £’000
Arun Sarin 1,880,051 592,974 964 840,498 339,981 – 80,268 1,212,278 1,829Vittorio Colao – 153,671 250 – – – – 153,671 232Andy Halford 240,840 275,820 448 – – – – 516,660 780
Notes:(1) Shares in respect of the STIP awards for the 2005 financial year were transferred on 2 July 2007.(2) Previously disclosed as the annual incentive value with the directors’ emoluments for the year ended 31 March 2007.(3) For awards granted during the 2008 financial year, the value at date of award is based on the price of the Company’s ordinary shares on 15 June 2007 of 162.6 pence.
The performance period for this grant ends on 31 March 2009, with the shares vesting on 15 June 2009.(4) There are two outstanding awards, which have performance periods ending on 31 March 2008 and 31 March 2009.(5) The value at 31 March 2008 is calculated using the closing middle market price of the Company’s ordinary shares at 31 March 2008 of 150.9 pence.
The aggregate number of shares conditionally awarded during the year under the Deferred Share Bonus to the Company‘s senior management, other than executive directors, is 969,346. For a description of the performance and vesting conditions, see “2007 Deferred Share Bonus” in the table on page 73.
78 Vodafone Group Plc Annual Report 2008
Vodafone – Governance
Directors’ Remuneration continued
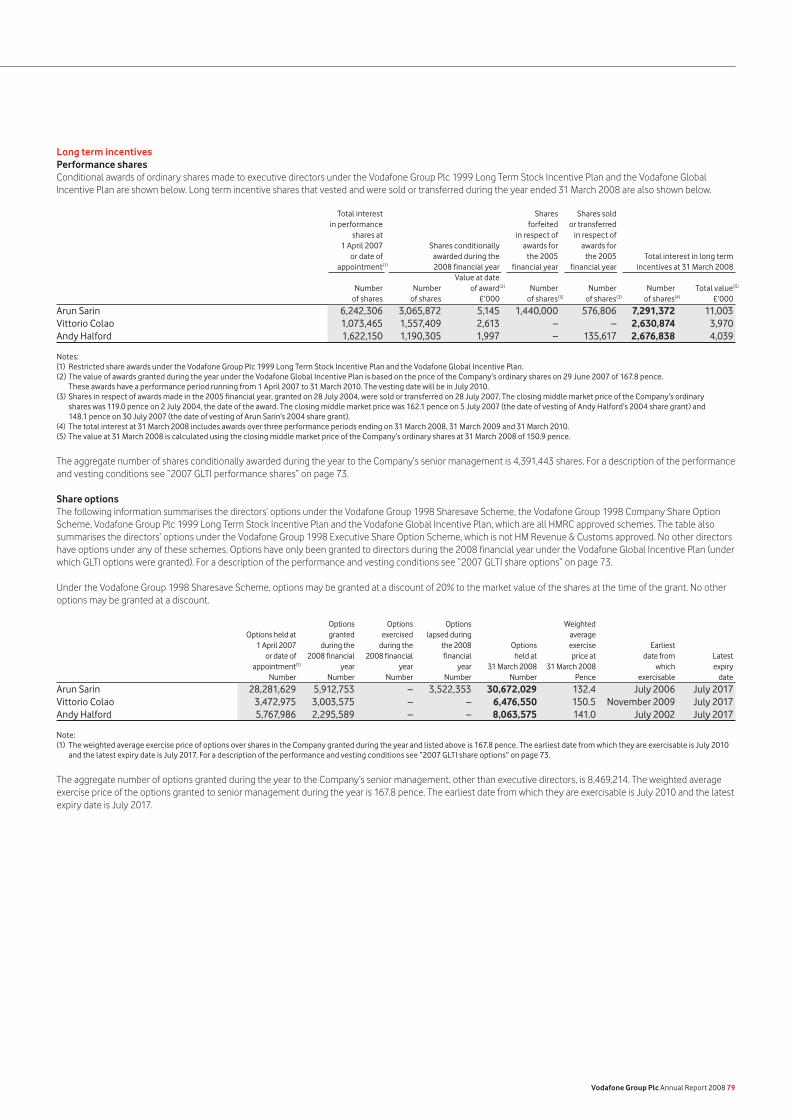
Long term incentivesPerformance sharesConditional awards of ordinary shares made to executive directors under the Vodafone Group Plc 1999 Long Term Stock Incentive Plan and the Vodafone Global Incentive Plan are shown below. Long term incentive shares that vested and were sold or transferred during the year ended 31 March 2008 are also shown below.
Total interest Shares Shares sold in performance forfeited or transferred shares at in respect of in respect of 1 April 2007 Shares conditionally awards for awards for or date of awarded during the the 2005 the 2005 Total interest in long term appointment(1) 2008 financial year financial year financial year incentives at 31 March 2008 Value at date Number Number of award(2) Number Number Number Total value(5)
of shares of shares £’000 of shares(3) of shares(3) of shares(4) £’000
Arun Sarin 6,242,306 3,065,872 5,145 1,440,000 576,806 7,291,372 11,003Vittorio Colao 1,073,465 1,557,409 2,613 – – 2,630,874 3,970Andy Halford 1,622,150 1,190,305 1,997 – 135,617 2,676,838 4,039
Notes:(1) Restricted share awards under the Vodafone Group Plc 1999 Long Term Stock Incentive Plan and the Vodafone Global Incentive Plan.(2) The value of awards granted during the year under the Vodafone Global Incentive Plan is based on the price of the Company’s ordinary shares on 29 June 2007 of 167.8 pence.
These awards have a performance period running from 1 April 2007 to 31 March 2010. The vesting date will be in July 2010.(3) Shares in respect of awards made in the 2005 financial year, granted on 28 July 2004, were sold or transferred on 28 July 2007. The closing middle market price of the Company’s ordinary
shares was 119.0 pence on 2 July 2004, the date of the award. The closing middle market price was 162.1 pence on 5 July 2007 (the date of vesting of Andy Halford’s 2004 share grant) and 148.1 pence on 30 July 2007 (the date of vesting of Arun Sarin’s 2004 share grant).
(4) The total interest at 31 March 2008 includes awards over three performance periods ending on 31 March 2008, 31 March 2009 and 31 March 2010.(5) The value at 31 March 2008 is calculated using the closing middle market price of the Company’s ordinary shares at 31 March 2008 of 150.9 pence.
The aggregate number of shares conditionally awarded during the year to the Company‘s senior management is 4,391,443 shares. For a description of the performance and vesting conditions see “2007 GLTI performance shares” on page 73.
Share optionsThe following information summarises the directors’ options under the Vodafone Group 1998 Sharesave Scheme, the Vodafone Group 1998 Company Share Option Scheme, Vodafone Group Plc 1999 Long Term Stock Incentive Plan and the Vodafone Global Incentive Plan, which are all HMRC approved schemes. The table also summarises the directors’ options under the Vodafone Group 1998 Executive Share Option Scheme, which is not HM Revenue & Customs approved. No other directors have options under any of these schemes. Options have only been granted to directors during the 2008 financial year under the Vodafone Global Incentive Plan (under which GLTI options were granted). For a description of the performance and vesting conditions see “2007 GLTI share options” on page 73.
Under the Vodafone Group 1998 Sharesave Scheme, options may be granted at a discount of 20% to the market value of the shares at the time of the grant. No other options may be granted at a discount.
Options Options Options Weighted Options held at granted exercised lapsed during average 1 April 2007 during the during the the 2008 Options exercise Earliest or date of 2008 financial 2008 financial financial held at price at date from Latest appointment(1) year year year 31 March 2008 31 March 2008 which expiry Number Number Number Number Number Pence exercisable date
Arun Sarin 28,281,629 5,912,753 – 3,522,353 30,672,029 132.4 July 2006 July 2017Vittorio Colao 3,472,975 3,003,575 – – 6,476,550 150.5 November 2009 July 2017Andy Halford 5,767,986 2,295,589 – – 8,063,575 141.0 July 2002 July 2017 Note:(1) The weighted average exercise price of options over shares in the Company granted during the year and listed above is 167.8 pence. The earliest date from which they are exercisable is July 2010
and the latest expiry date is July 2017. For a description of the performance and vesting conditions see “2007 GLTI share options” on page 73.
The aggregate number of options granted during the year to the Company’s senior management, other than executive directors, is 8,469,214. The weighted average exercise price of the options granted to senior management during the year is 167.8 pence. The earliest date from which they are exercisable is July 2010 and the latest expiry date is July 2017.
Vodafone Group Plc Annual Report 2008 79
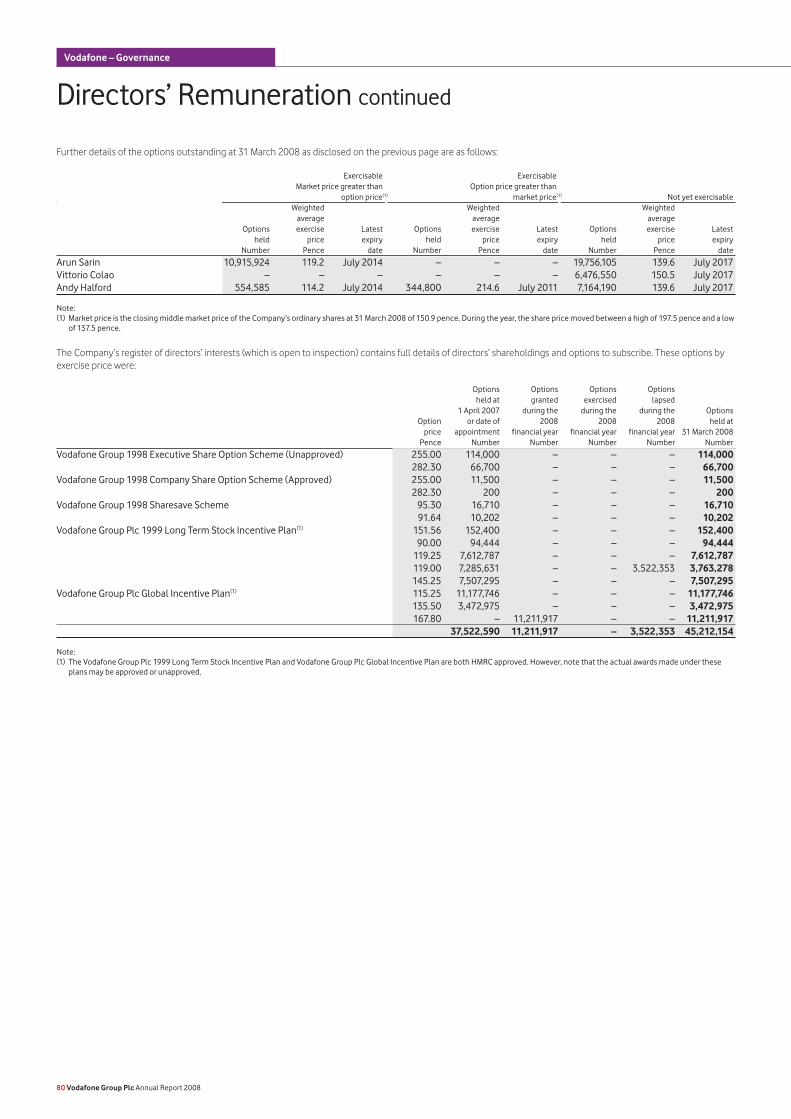
Further details of the options outstanding at 31 March 2008 as disclosed on the previous page are as follows:
Exercisable Exercisable Market price greater than Option price greater than option price(1) market price(1) Not yet exercisable Weighted Weighted Weighted average average average Options exercise Latest Options exercise Latest Options exercise Latest held price expiry held price expiry held price expiry Number Pence date Number Pence date Number Pence date
Arun Sarin 10,915,924 119.2 July 2014 – – – 19,756,105 139.6 July 2017Vittorio Colao – – – – – – 6,476,550 150.5 July 2017Andy Halford 554,585 114.2 July 2014 344,800 214.6 July 2011 7,164,190 139.6 July 2017
Note:(1) Market price is the closing middle market price of the Company’s ordinary shares at 31 March 2008 of 150.9 pence. During the year, the share price moved between a high of 197.5 pence and a low of 137.5 pence.
The Company’s register of directors’ interests (which is open to inspection) contains full details of directors’ shareholdings and options to subscribe. These options by exercise price were:
Options Options Options Options held at granted exercised lapsed 1 April 2007 during the during the during the Options Option or date of 2008 2008 2008 held at price appointment financial year financial year financial year 31 March 2008 Pence Number Number Number Number Number
Vodafone Group 1998 Executive Share Option Scheme (Unapproved) 255.00 114,000 – – – 114,000 282.30 66,700 – – – 66,700Vodafone Group 1998 Company Share Option Scheme (Approved) 255.00 11,500 – – – 11,500 282.30 200 – – – 200Vodafone Group 1998 Sharesave Scheme 95.30 16,710 – – – 16,710 91.64 10,202 – – – 10,202Vodafone Group Plc 1999 Long Term Stock Incentive Plan(1) 151.56 152,400 – – – 152,400 90.00 94,444 – – – 94,444 119.25 7,612,787 – – – 7,612,787 119.00 7,285,631 – – 3,522,353 3,763,278 145.25 7,507,295 – – – 7,507,295Vodafone Group Plc Global Incentive Plan(1) 115.25 11,177,746 – – – 11,177,746 135.50 3,472,975 – – – 3,472,975 167.80 – 11,211,917 – – 11,211,917 37,522,590 11,211,917 – 3,522,353 45,212,154
Note:(1) The Vodafone Group Plc 1999 Long Term Stock Incentive Plan and Vodafone Group Plc Global Incentive Plan are both HMRC approved. However, note that the actual awards made under these plans may be approved or unapproved.
80 Vodafone Group Plc Annual Report 2008
Vodafone – Governance
Directors’ Remuneration continued
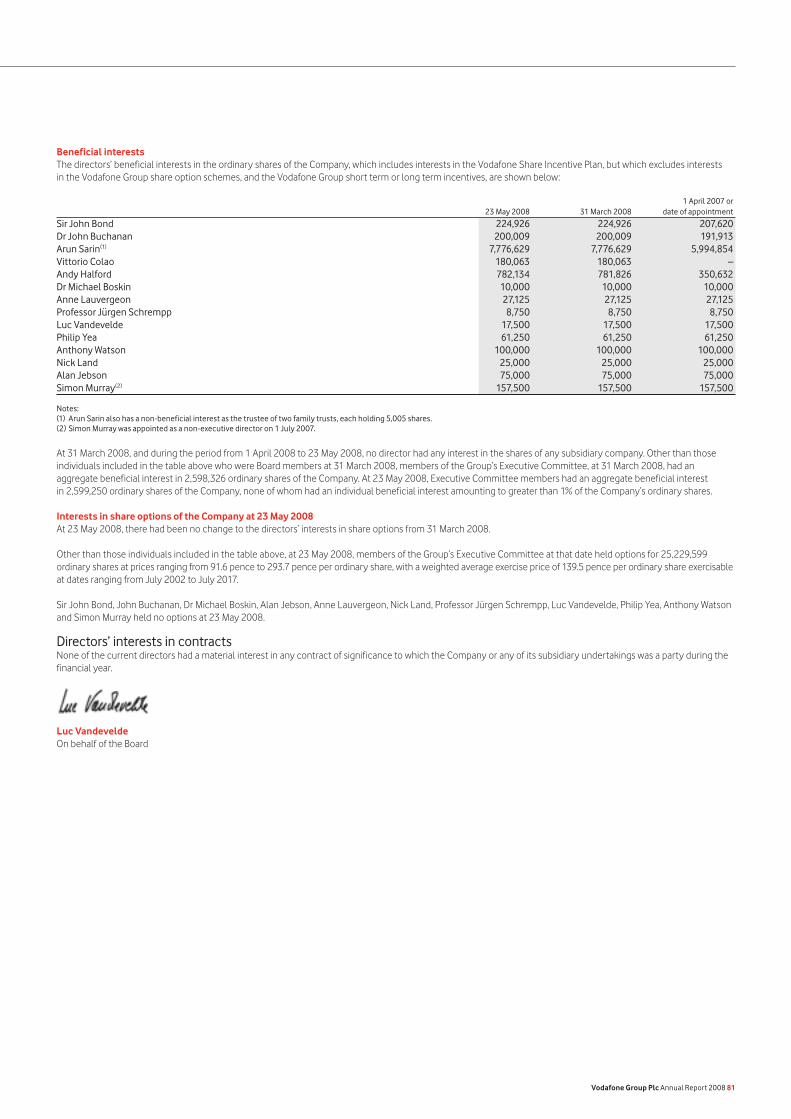
Beneficial interestsThe directors’ beneficial interests in the ordinary shares of the Company, which includes interests in the Vodafone Share Incentive Plan, but which excludes interests in the Vodafone Group share option schemes, and the Vodafone Group short term or long term incentives, are shown below:
1 April 2007 or 23 May 2008 31 March 2008 date of appointment
Sir John Bond 224,926 224,926 207,620Dr John Buchanan 200,009 200,009 191,913Arun Sarin(1) 7,776,629 7,776,629 5,994,854Vittorio Colao 180,063 180,063 –Andy Halford 782,134 781,826 350,632Dr Michael Boskin 10,000 10,000 10,000Anne Lauvergeon 27,125 27,125 27,125Professor Jürgen Schrempp 8,750 8,750 8,750Luc Vandevelde 17,500 17,500 17,500Philip Yea 61,250 61,250 61,250Anthony Watson 100,000 100,000 100,000Nick Land 25,000 25,000 25,000Alan Jebson 75,000 75,000 75,000Simon Murray(2) 157,500 157,500 157,500
Notes:(1) Arun Sarin also has a non-beneficial interest as the trustee of two family trusts, each holding 5,005 shares.(2) Simon Murray was appointed as a non-executive director on 1 July 2007.
At 31 March 2008, and during the period from 1 April 2008 to 23 May 2008, no director had any interest in the shares of any subsidiary company. Other than those individuals included in the table above who were Board members at 31 March 2008, members of the Group’s Executive Committee, at 31 March 2008, had an aggregate beneficial interest in 2,598,326 ordinary shares of the Company. At 23 May 2008, Executive Committee members had an aggregate beneficial interest in 2,599,250 ordinary shares of the Company, none of whom had an individual beneficial interest amounting to greater than 1% of the Company’s ordinary shares.
Interests in share options of the Company at 23 May 2008At 23 May 2008, there had been no change to the directors’ interests in share options from 31 March 2008.
Other than those individuals included in the table above, at 23 May 2008, members of the Group’s Executive Committee at that date held options for 25,229,599 ordinary shares at prices ranging from 91.6 pence to 293.7 pence per ordinary share, with a weighted average exercise price of 139.5 pence per ordinary share exercisable at dates ranging from July 2002 to July 2017.
Sir John Bond, John Buchanan, Dr Michael Boskin, Alan Jebson, Anne Lauvergeon, Nick Land, Professor Jürgen Schrempp, Luc Vandevelde, Philip Yea, Anthony Watson and Simon Murray held no options at 23 May 2008.
Directors’ interests in contractsNone of the current directors had a material interest in any contract of significance to which the Company or any of its subsidiary undertakings was a party during the financial year.
Luc VandeveldeOn behalf of the Board
Vodafone Group Plc Annual Report 2008 81
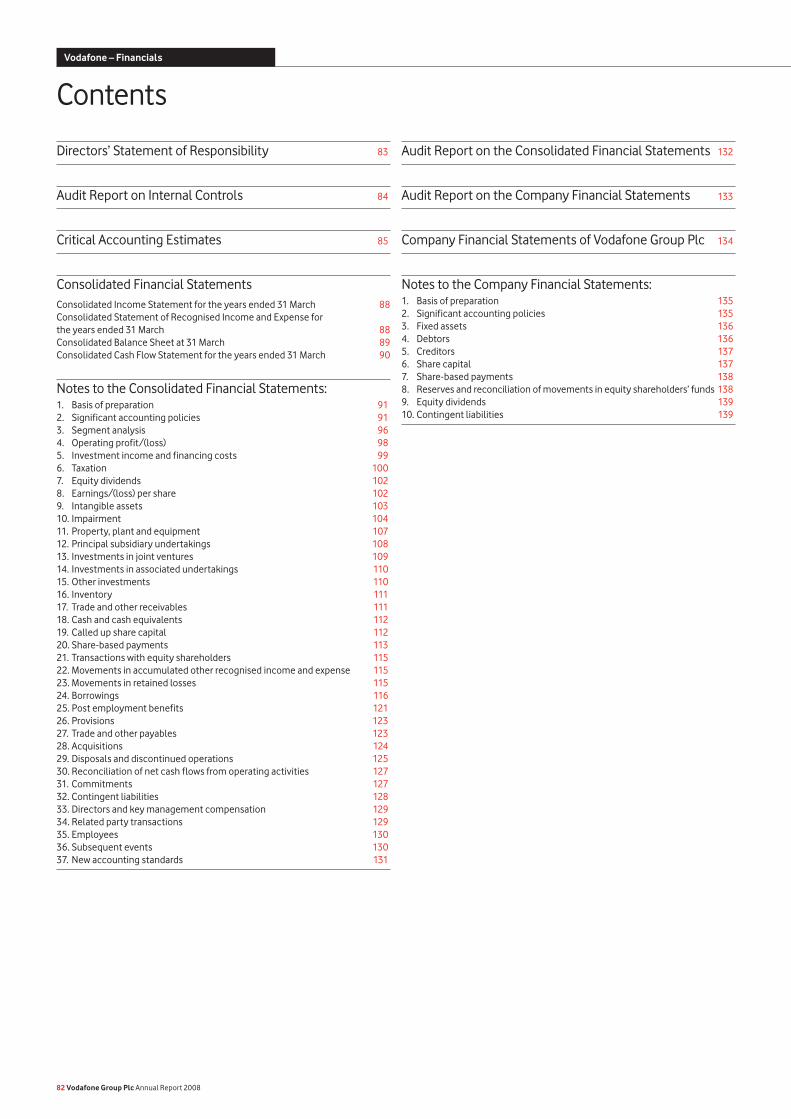
Directors’ Statement of Responsibility 83
Audit Report on Internal Controls 84
Critical Accounting Estimates 85
Consolidated Financial StatementsConsolidated Income Statement for the years ended 31 March 88Consolidated Statement of Recognised Income and Expense for the years ended 31 March 88Consolidated Balance Sheet at 31 March 89Consolidated Cash Flow Statement for the years ended 31 March 90
Notes to the Consolidated Financial Statements:1. Basis of preparation 912. Significant accounting policies 913. Segment analysis 964. Operating profit/(loss) 985. Investment income and financing costs 996. Taxation 1007. Equity dividends 1028. Earnings/(loss) per share 1029. Intangible assets 10310. Impairment 10411. Property, plant and equipment 10712. Principal subsidiary undertakings 10813. Investments in joint ventures 10914. Investments in associated undertakings 11015. Other investments 11016. Inventory 11117. Trade and other receivables 11118. Cash and cash equivalents 11219. Called up share capital 11220. Share-based payments 11321. Transactions with equity shareholders 11522. Movements in accumulated other recognised income and expense 11523. Movements in retained losses 11524. Borrowings 11625. Post employment benefits 12126. Provisions 12327. Trade and other payables 12328. Acquisitions 12429. Disposals and discontinued operations 12530. Reconciliation of net cash flows from operating activities 12731. Commitments 12732. Contingent liabilities 12833. Directors and key management compensation 12934. Related party transactions 12935. Employees 13036. Subsequent events 13037. New accounting standards 131
Audit Report on the Consolidated Financial Statements 132
Audit Report on the Company Financial Statements 133
Company Financial Statements of Vodafone Group Plc 134
Notes to the Company Financial Statements:1. Basis of preparation 1352. Significant accounting policies 1353. Fixed assets 1364. Debtors 1365. Creditors 1376. Share capital 1377. Share-based payments 1388. Reserves and reconciliation of movements in equity shareholders’ funds 1389. Equity dividends 13910. Contingent liabilities 139
82 Vodafone Group Plc Annual Report 2008
Contents Vodafone – Financials
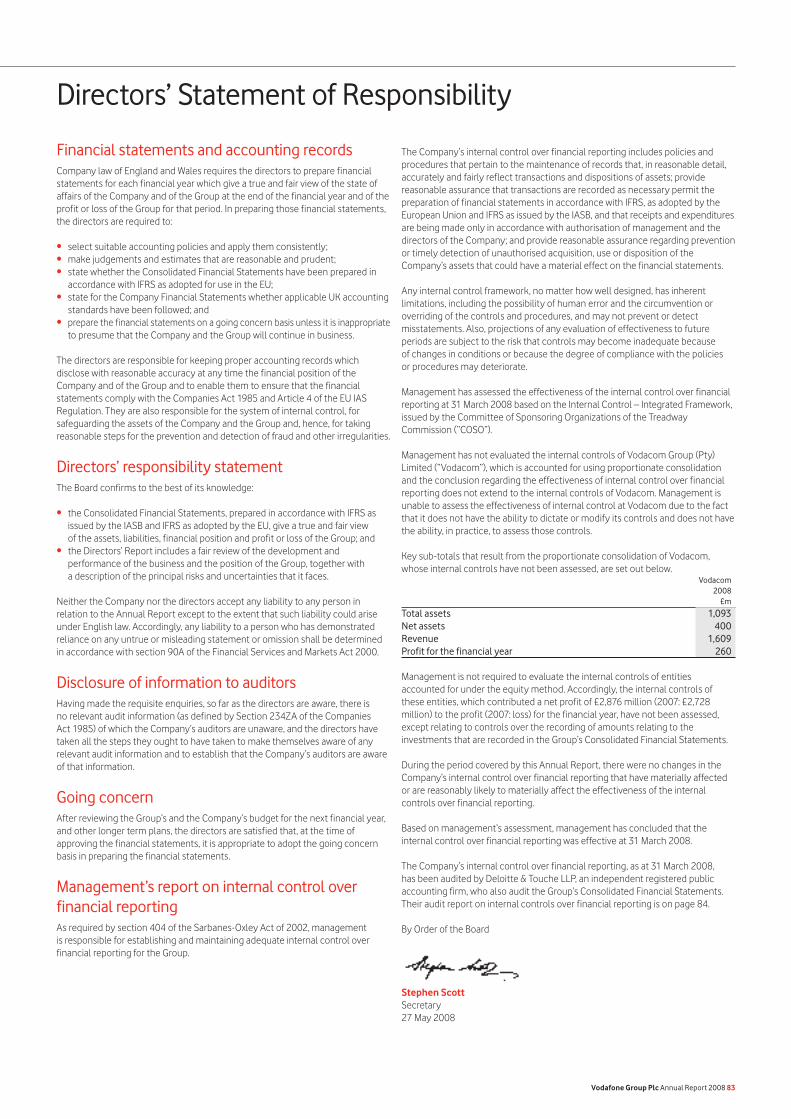
Financial statements and accounting recordsCompany law of England and Wales requires the directors to prepare financial statements for each financial year which give a true and fair view of the state of affairs of the Company and of the Group at the end of the financial year and of the profit or loss of the Group for that period. In preparing those financial statements, the directors are required to:
select suitable accounting policies and apply them consistently;make judgements and estimates that are reasonable and prudent;state whether the Consolidated Financial Statements have been prepared in accordance with IFRS as adopted for use in the EU; state for the Company Financial Statements whether applicable UK accounting standards have been followed; andprepare the financial statements on a going concern basis unless it is inappropriate to presume that the Company and the Group will continue in business.
The directors are responsible for keeping proper accounting records which disclose with reasonable accuracy at any time the financial position of the Company and of the Group and to enable them to ensure that the financial statements comply with the Companies Act 1985 and Article 4 of the EU IAS Regulation. They are also responsible for the system of internal control, for safeguarding the assets of the Company and the Group and, hence, for taking reasonable steps for the prevention and detection of fraud and other irregularities.
Directors’ responsibility statementThe Board confirms to the best of its knowledge:
the Consolidated Financial Statements, prepared in accordance with IFRS as issued by the IASB and IFRS as adopted by the EU, give a true and fair view of the assets, liabilities, financial position and profit or loss of the Group; and the Directors’ Report includes a fair review of the development and performance of the business and the position of the Group, together with a description of the principal risks and uncertainties that it faces.
Neither the Company nor the directors accept any liability to any person in relation to the Annual Report except to the extent that such liability could arise under English law. Accordingly, any liability to a person who has demonstrated reliance on any untrue or misleading statement or omission shall be determined in accordance with section 90A of the Financial Services and Markets Act 2000.
Disclosure of information to auditorsHaving made the requisite enquiries, so far as the directors are aware, there is no relevant audit information (as defined by Section 234ZA of the Companies Act 1985) of which the Company’s auditors are unaware, and the directors have taken all the steps they ought to have taken to make themselves aware of any relevant audit information and to establish that the Company’s auditors are aware of that information.
Going concernAfter reviewing the Group’s and the Company’s budget for the next financial year, and other longer term plans, the directors are satisfied that, at the time of approving the financial statements, it is appropriate to adopt the going concern basis in preparing the financial statements.
Management’s report on internal control over financial reportingAs required by section 404 of the Sarbanes-Oxley Act of 2002, management is responsible for establishing and maintaining adequate internal control over financial reporting for the Group.
•••
•
•
•
•
The Company’s internal control over financial reporting includes policies and procedures that pertain to the maintenance of records that, in reasonable detail, accurately and fairly reflect transactions and dispositions of assets; provide reasonable assurance that transactions are recorded as necessary permit the preparation of financial statements in accordance with IFRS, as adopted by the European Union and IFRS as issued by the IASB, and that receipts and expenditures are being made only in accordance with authorisation of management and the directors of the Company; and provide reasonable assurance regarding prevention or timely detection of unauthorised acquisition, use or disposition of the Company’s assets that could have a material effect on the financial statements.
Any internal control framework, no matter how well designed, has inherent limitations, including the possibility of human error and the circumvention or overriding of the controls and procedures, and may not prevent or detect misstatements. Also, projections of any evaluation of effectiveness to future periods are subject to the risk that controls may become inadequate because of changes in conditions or because the degree of compliance with the policies or procedures may deteriorate.
Management has assessed the effectiveness of the internal control over financial reporting at 31 March 2008 based on the Internal Control – Integrated Framework, issued by the Committee of Sponsoring Organizations of the Treadway Commission (“COSO”).
Management has not evaluated the internal controls of Vodacom Group (Pty) Limited (“Vodacom”), which is accounted for using proportionate consolidation and the conclusion regarding the effectiveness of internal control over financial reporting does not extend to the internal controls of Vodacom. Management is unable to assess the effectiveness of internal control at Vodacom due to the fact that it does not have the ability to dictate or modify its controls and does not have the ability, in practice, to assess those controls.
Key sub-totals that result from the proportionate consolidation of Vodacom, whose internal controls have not been assessed, are set out below. Vodacom 2008 £m
Total assets 1,093Net assets 400Revenue 1,609Profit for the financial year 260
Management is not required to evaluate the internal controls of entities accounted for under the equity method. Accordingly, the internal controls of these entities, which contributed a net profit of £2,876 million (2007: £2,728 million) to the profit (2007: loss) for the financial year, have not been assessed, except relating to controls over the recording of amounts relating to the investments that are recorded in the Group’s Consolidated Financial Statements.
During the period covered by this Annual Report, there were no changes in the Company’s internal control over financial reporting that have materially affected or are reasonably likely to materially affect the effectiveness of the internal controls over financial reporting.
Based on management’s assessment, management has concluded that the internal control over financial reporting was effective at 31 March 2008.
The Company’s internal control over financial reporting, as at 31 March 2008, has been audited by Deloitte & Touche LLP, an independent registered public accounting firm, who also audit the Group’s Consolidated Financial Statements. Their audit report on internal controls over financial reporting is on page 84.
By Order of the Board
Stephen ScottSecretary27 May 2008
Vodafone Group Plc Annual Report 2008 83
Directors’ Statement of Responsibility
Report of Independent Registered Public Accounting Firm to the Members of Vodafone Group Plc We have audited the internal control over financial reporting of Vodafone Group Plc and subsidiaries and applicable joint ventures (the “Group”) as of 31 March 2008 based on criteria established in Internal Control – Integrated Framework issued by the Committee of Sponsoring Organizations of the Treadway Commission.
As described in Management’s Report on Internal Control over Financial Reporting, management excluded from its assessment the internal control over financial reporting at Vodacom Group (Pty) Limited (“Vodacom”), as the Group does not have the ability to dictate, modify or assess the controls. Vodacom constitutes 0.5 percent and 0.9 percent of net assets and total assets, respectively, 4.5 percent of revenue, and 3.9 percent of net income of the consolidated financial statement amounts as of and for the year ended 31 March 2008. Accordingly, our audit did not include the internal control over financial reporting at Vodacom. The Group’s management is responsible for maintaining effective internal control over financial reporting and for its assessment of the effectiveness of internal control over financial reporting, included in the accompanying Management’s report on internal control over financial reporting. Our responsibility is to express an opinion on the Group’s internal control over financial reporting based on our audit.
We conducted our audit in accordance with the standards of the Public Company Accounting Oversight Board (United States). Those standards require that we plan and perform the audit to obtain reasonable assurance about whether effective internal control over financial reporting was maintained in all material respects. Our audit included obtaining an understanding of internal control over financial reporting, assessing the risk that a material weakness exists, testing and evaluating the design and operating effectiveness of internal control based on the assessed risk, and performing such other procedures as we considered necessary in the circumstances. We believe that our audit provides a reasonable basis for our opinion.
A company’s internal control over financial reporting is a process designed by, or under the supervision of, the company’s principal executive and principal financial officers, or persons performing similar functions, and effected by the company’s board of directors, management, and other personnel to provide reasonable assurance regarding the reliability of financial reporting and the preparation of financial statements for external purposes in accordance with generally accepted accounting principles. A company’s internal control over financial reporting includes those policies and procedures that (1) pertain to the maintenance of records that, in reasonable detail, accurately and fairly reflect the transactions and dispositions of the assets of the company; (2) provide reasonable assurance that transactions are recorded as necessary to permit preparation of financial statements in accordance with generally accepted accounting principles, and that receipts and expenditures of the company are being made only in accordance with authorisations of management and directors of the company; and (3) provide reasonable assurance regarding prevention or timely detection of unauthorised acquisition, use, or disposition of the company’s assets that could have a material effect on the financial statements.
Because of the inherent limitations of internal control over financial reporting, including the possibility of collusion or improper management override of controls, material misstatements due to error or fraud may not be prevented or detected on a timely basis. Also, projections of any evaluation of the effectiveness of the internal control over financial reporting to future periods are subject to the risk that the controls may become inadequate because of changes in conditions, or that the degree of compliance with the policies or procedures may deteriorate.
In our opinion, the Group maintained, in all material respects, effective internal control over financial reporting as of 31 March 2008, based on the criteria established in Internal Control – Integrated Framework issued by the Committee of Sponsoring Organizations of the Treadway Commission.
We have also audited, in accordance with the standards of the Public Company Accounting Oversight Board (United States), the Consolidated Financial Statements of the Group as of and for the year ended 31 March 2008, prepared in conformity with International Financial Reporting Standards (“IFRS”), as adopted by the European Union and IFRS as issued by the International Accounting Standards Board (“IASB”). Our report dated 27 May 2008 expressed an unqualified opinion on those financial statements.
Deloitte & Touche LLPChartered Accountants and Registered AuditorsLondonUnited Kingdom27 May 2008
84 Vodafone Group Plc Annual Report 2008
Audit Report on Internal ControlsVodafone – Financials
For mobile businesses where the first five years of the ten year management plan are used for the Group’s value in use calculations, a long term growth rate into perpetuity has been determined as the lower of:
the nominal GDP rates for the country of operation; andthe long term compound annual growth rate in EBITDA in years six to ten of the management plan.
For mobile businesses where the full ten year management plans are used for the Group’s value in use calculations, a long term growth rate into perpetuity has been determined as the lower of:
the nominal GDP rates for the country of operation; andthe compound annual growth rate in EBITDA in years nine to ten of the management plan.
For non-mobile businesses, no growth is expected beyond management’s plans for the initial five year period.
Changing the assumptions selected by management, in particular the discount rate and growth rate assumptions used in the cash flow projections, could significantly affect the Group’s impairment evaluation and, hence, results.
The Group’s review includes the key assumptions related to sensitivity in the cash flow projections.
The following changes to the assumptions used in the impairment review would have led to an impairment loss being recognised in the year ended 31 March 2008:
Increase Decrease by 2% by 2% £bn £bn
Discount rate 0.3 –Budgeted EBITDA(1) – 0.2Capital expenditure(2) – –Long term growth rate – –
Notes:(1) Represents the compound annual growth rate for the initial five years of the Group’s approved
financial plans.(2) Represents capital expenditure as a percentage of revenue in the initial five years of the
Group’s approved plans.
Business combinationsGoodwill only arises in business combinations. The amount of goodwill initially recognised is dependent on the allocation of the purchase price to the fair value of the identifiable assets acquired and the liabilities assumed. The determination of the fair value of the assets and liabilities is based, to a considerable extent, on management’s judgement.
Allocation of the purchase price affects the results of the Group as finite lived intangible assets are amortised, whereas indefinite lived intangible assets, including goodwill, are not amortised and could result in differing amortisation charges based on the allocation to indefinite lived and finite lived intangible assets.
On the acquisition of mobile network operators, the identifiable intangible assets may include licences, customer bases and brands. The fair value of these assets is determined by discounting estimated future net cash flows generated by the asset, assuming no active market for the assets exist. The use of different assumptions for the expectations of future cash flows and the discount rate would change the valuation of the intangible assets.
••
••
The Group prepares its Consolidated Financial Statements in accordance with IFRS as issued by the International Accounting Standards Board and IFRS as adopted by the European Union, the application of which often requires judgements to be made by management when formulating the Group’s financial position and results. Under IFRS, the directors are required to adopt those accounting policies most appropriate to the Group’s circumstances for the purpose of presenting fairly the Group’s financial position, financial performance and cash flows.
In determining and applying accounting policies, judgement is often required in respect of items where the choice of specific policy, accounting estimate or assumption to be followed could materially affect the reported results or net asset position of the Group should it later be determined that a different choice would be more appropriate.
Management considers the accounting estimates and assumptions discussed below to be its critical accounting estimates and, accordingly, provides an explanation of each below.
The discussion below should also be read in conjunction with the Group’s disclosure of significant IFRS accounting policies, which is provided in note 2 to the Consolidated Financial Statements, “Significant accounting policies”.
Management has discussed its critical accounting estimates and associated disclosures with the Company’s Audit Committee.
Impairment reviewsAsset recoverability is an area involving management judgement, requiring assessment as to whether the carrying value of assets can be supported by the net present value of future cash flows derived from such assets using cash flow projections which have been discounted at an appropriate rate. In calculating the net present value of the future cash flows, certain assumptions are required to be made in respect of highly uncertain matters, as noted below.
IFRS requires management to undertake an annual test for impairment of indefinite lived assets and, for finite lived assets, to test for impairment if events or changes in circumstances indicate that the carrying amount of an asset may not be recoverable. Group management currently undertakes an annual impairment test covering goodwill and other indefinite lived assets and also reviews finite lived assets and investments in associated undertakings at least annually to consider whether a full impairment review is required.
AssumptionsThere are a number of assumptions and estimates involved in calculating the net present value of future cash flows from the Group’s businesses, including management’s expectations of:
growth in EBITDA, calculated as adjusted operating profit before depreciation and amortisation;timing and quantum of future capital expenditure;uncertainty of future technological developments; long term growth rates; andthe selection of discount rates to reflect the risks involved.
The Group prepares and internally approves formal ten year plans for its businesses and uses these as the basis for its impairment reviews. Management uses the initial five years of the plans, except in markets which are forecast to grow ahead of the long term growth rate for the market. In such cases, further years will be used until the forecast growth rate trends towards the long term growth rate, up to a maximum of ten years.
•
••••
Vodafone Group Plc Annual Report 2008 85
Critical Accounting Estimates
On transition to IFRS, the Group elected not to apply IFRS 3, “Business Combinations”, retrospectively as the difficulty in applying these requirements to the large number of business combinations completed by the Group from incorporation through to 1 April 2004 exceeded any potential benefits. Goodwill arising before the date of transition to IFRS, after adjusting for items including the impact of proportionate consolidation of joint ventures, amounted to £78,753 million.
If the Group had elected to apply the accounting for business combinations retrospectively, it may have led to an increase or decrease in goodwill and increase in licences, customer bases, brands and related deferred tax liabilities recognised on acquisition.
Intangible assets, excluding goodwillOther intangible assets include the Group’s aggregate amounts spent on the acquisition of 2G and 3G licences, computer software, customer bases, brands and development costs. These assets arise from both separate purchases and from acquisition as part of business combinations.
The relative size of the Group’s intangible assets, excluding goodwill, makes the judgements surrounding the estimated useful lives critical to the Group’s financial position and performance.
At 31 March 2008, intangible assets, excluding goodwill, amounted to £18,995 million (2007: £15,705 million) and represented 14.9% (2007: 14.3%) of the Group’s total assets.
Estimation of useful lifeThe useful life used to amortise intangible assets relates to the future performance of the assets acquired and management’s judgement of the period over which economic benefit will be derived from the asset. The basis for determining the useful life for the most significant categories of intangible assets is as follows:
Licences and spectrum feesThe estimated useful life is, generally, the term of the licence, unless there is a presumption of renewal at negligible cost. Using the licence term reflects the period over which the Group will receive economic benefit. For technology specific licences with a presumption of renewal at negligible cost, the estimated useful economic life reflects the Group’s expectation of the period over which the Group will continue to receive economic benefit from the licence. The economic lives are periodically reviewed, taking into consideration such factors as changes in technology. Historically, any changes to economic lives have not been material following these reviews.
Customer basesThe estimated useful life principally reflects management’s view of the average economic life of the customer base and is assessed by reference to customer churn rates. An increase in churn rates may lead to a reduction in the estimated useful life and an increase in the amortisation charge. Historically, changes to the estimated useful lives have not had a significant impact on the Group’s results and financial position.
Capitalised softwareThe useful life is determined by management at the time the software is acquired and brought into use and is regularly reviewed for appropriateness. For computer software licences, the useful life represents management’s view of expected benefits over which the Group will receive benefits from the software, but not exceeding the licence term. For unique software products controlled by the Group, the life is based on historical experience with similar products as well as anticipation of future events, which may impact their life, such as changes in technology.
Historically, changes in useful lives have not resulted in material changes to the Group’s amortisation charge.
Property, plant and equipmentProperty, plant and equipment also represent a significant proportion of the asset base of the Group, being 13.1% (2007: 12.3%) of the Group’s total assets. Therefore, the estimates and assumptions made to determine their carrying value and related depreciation are critical to the Group’s financial position and performance.
Estimation of useful lifeThe charge in respect of periodic depreciation is derived after determining an estimate of an asset’s expected useful life and the expected residual value at the end of its life. Increasing an asset’s expected life or its residual value would result in a reduced depreciation charge in the Consolidated Income Statement.
The useful lives of Group assets are determined by management at the time the asset is acquired and reviewed annually for appropriateness. The lives are based on historical experience with similar assets as well as anticipation of future events, which may impact their life, such as changes in technology. Furthermore, network infrastructure is only depreciated over a period that extends beyond the expiry of the associated licence under which the operator provides telecommunications services, if there is a reasonable expectation of renewal or an alternative future use for the asset.
Historically, changes in useful lives have not resulted in material changes to the Group’s depreciation charge.
Cost capitalisationCost includes the total purchase price and labour costs associated with the Group’s own employees to the extent that they are directly attributable to construction costs, or where they comprise a proportion of a department directly engaged in the purchase or installation of a fixed asset. Management judgement is involved in determining the appropriate internal costs to capitalise and the amounts involved. For the year ended 31 March 2008, internal costs capitalised were £245 million (2007: £244 million) and represented approximately 5% (2007: 6%) of expenditure on property, plant and equipment and computer software.
86 Vodafone Group Plc Annual Report 2008
Critical Accounting Estimates continued
Vodafone – Financials
Arrangements with multiple deliverablesIn revenue arrangements including more than one deliverable, the arrangement consideration is allocated to each deliverable based on the fair value of the individual element. The Group generally determines the fair value of individual elements based on prices at which the deliverable is regularly sold on a standalone basis, after considering volume discounts where appropriate.
Deferral periodCustomer connection fees, when combined with related equipment revenue, in excess of the fair value of the equipment are deferred and recognised over the expected life of the customer relationship. The life is determined by reference to historical customer churn rates. An increase in churn rates would reduce the expected customer relationship life and accelerate revenue recognition. Historically, changes to the expected customer relationship lives have not had a significant impact on the Group’s results and financial position.
Any excess upgrade or tariff migration fees over the fair value of equipment provided are deferred over the average upgrade or tariff migration period as appropriate. This time period is calculated based on historical activity of customers who upgrade or change tariffs. An increase in the time period would extend the period over which revenue is recognised.
PresentationWhen deciding the most appropriate basis for presenting revenue or costs of revenue, both the legal form and substance of the agreement between the Group and its business partners are reviewed to determine each party’s respective role in the transaction.
Where the Group’s role in a transaction is that of principal, revenue is recognised on a gross basis. This requires revenue to comprise the gross value of the transaction billed to the customer, after trade discounts, with any related expenditure charged as an operating cost.
Where the Group’s role in a transaction is that of an agent, revenue is recognised on a net basis, with revenue representing the margin earned.
TaxationThe Group’s tax charge on ordinary activities is the sum of the total current and deferred tax charges. The calculation of the Group’s total tax charge necessarily involves a degree of estimation and judgement in respect of certain items whose tax treatment cannot be finally determined until resolution has been reached with the relevant tax authority or, as appropriate, through a formal legal process. The final resolution of some of these items may give rise to material profit and loss and/or cash flow variances. See “Financial Position and Resources” on page 54.
The complexity of the Group’s structure following its geographic expansion makes the degree of estimation and judgement more challenging. The resolution of issues is not always within the control of the Group and it is often dependent on the efficiency of the legal processes in the relevant taxing jurisdictions in which the Group operates. Issues can, and often do, take many years to resolve. Payments in respect of tax liabilities for an accounting period result from payments on account and on the final resolution of open items. As a result, there can be substantial differences between the tax charge in the Consolidated Income Statement and tax payments.
Significant items on which the Group has exercised accounting judgement include a provision in respect of an enquiry from UK HMRC with regard to the CFC tax legislation (see note 32 to the Consolidated Financial Statements), potential tax losses in respect of a write down in the value of investments in Germany (see note 6 to the Consolidated Financial Statements) and litigation with the Indian tax authorities in relation to the acquisition of Vodafone Essar (see note 32 to the Consolidated Financial Statements). The amounts recognised in the Consolidated Financial Statements in respect of each matter are derived from the Group’s best estimation and judgement, as described above. However, the inherent uncertainty regarding the outcome of these items means eventual resolution could differ from the accounting estimates and therefore impact the Group’s results and cash flows.
Recognition of deferred tax assetsThe recognition of deferred tax assets is based upon whether it is more likely than not that sufficient and suitable taxable profits will be available in the future, against which the reversal of temporary differences can be deducted. Recognition, therefore, involves judgement regarding the future financial performance of the particular legal entity or tax group in which the deferred tax asset has been recognised.
Historical differences between forecast and actual taxable profits have not resulted in material adjustments to the recognition of deferred tax assets.
Revenue recognition and presentation Revenue from mobile telecommunications comprises amounts charged to customers in respect of monthly access charges, airtime charges, messaging, the provision of other mobile telecommunications services, including data services and information provision, fees for connecting users of other fixed line and mobile networks to the Group’s network, revenue from the sale of equipment, including handsets, and revenue arising from the Group’s partner network agreements.
Vodafone Group Plc Annual Report 2008 87
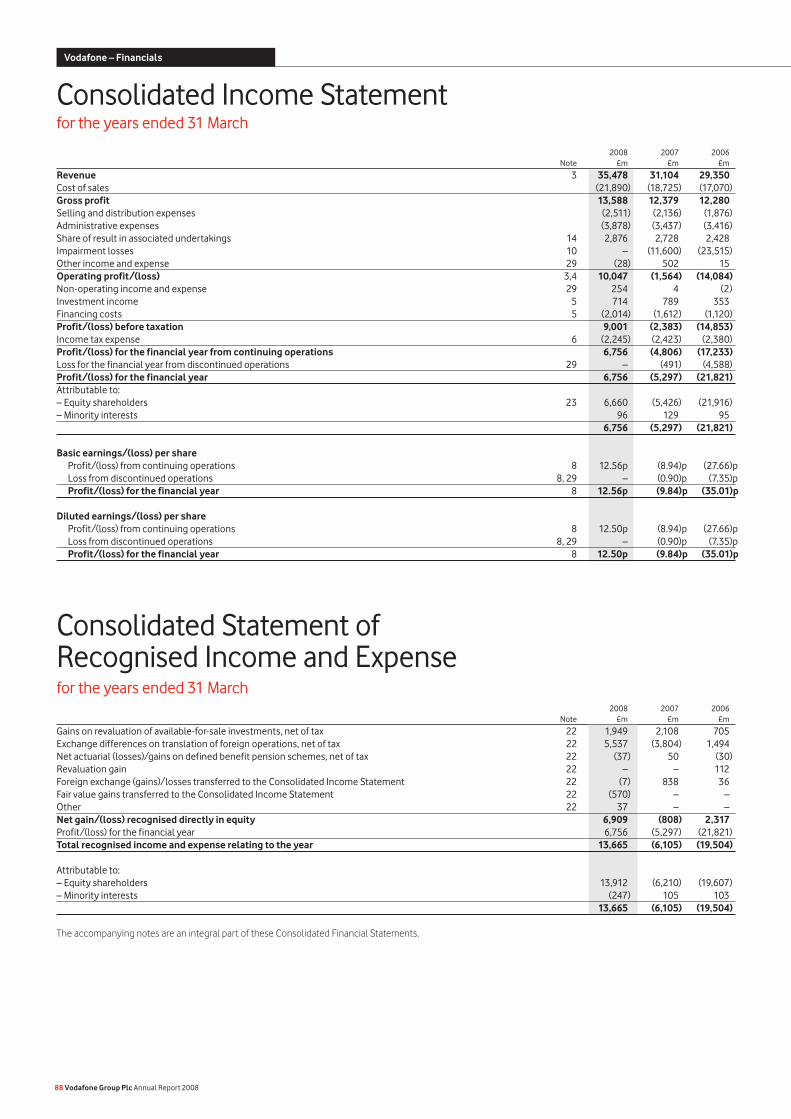
2008 2007 2006 Note £m £m £m
Revenue 3 35,478 31,104 29,350Cost of sales (21,890) (18,725) (17,070)Gross profit 13,588 12,379 12,280Selling and distribution expenses (2,511) (2,136) (1,876)Administrative expenses (3,878) (3,437) (3,416)Share of result in associated undertakings 14 2,876 2,728 2,428Impairment losses 10 – (11,600) (23,515)Other income and expense 29 (28) 502 15Operating profit/(loss) 3,4 10,047 (1,564) (14,084)Non-operating income and expense 29 254 4 (2)Investment income 5 714 789 353Financing costs 5 (2,014) (1,612) (1,120)Profit/(loss) before taxation 9,001 (2,383) (14,853)Income tax expense 6 (2,245) (2,423) (2,380)Profit/(loss) for the financial year from continuing operations 6,756 (4,806) (17,233)Loss for the financial year from discontinued operations 29 – (491) (4,588)Profit/(loss) for the financial year 6,756 (5,297) (21,821)Attributable to: – Equity shareholders 23 6,660 (5,426) (21,916)– Minority interests 96 129 95 6,756 (5,297) (21,821)
Basic earnings/(loss) per share Profit/(loss) from continuing operations 8 12.56p (8.94)p (27.66)p Loss from discontinued operations 8, 29 – (0.90)p (7.35)p Profit/(loss) for the financial year 8 12.56p (9.84)p (35.01)p Diluted earnings/(loss) per share Profit/(loss) from continuing operations 8 12.50p (8.94)p (27.66)p Loss from discontinued operations 8, 29 – (0.90)p (7.35)p Profit/(loss) for the financial year 8 12.50p (9.84)p (35.01)p
2008 2007 2006 Note £m £m £m
Gains on revaluation of available-for-sale investments, net of tax 22 1,949 2,108 705Exchange differences on translation of foreign operations, net of tax 22 5,537 (3,804) 1,494Net actuarial (losses)/gains on defined benefit pension schemes, net of tax 22 (37) 50 (30)Revaluation gain 22 – – 112Foreign exchange (gains)/losses transferred to the Consolidated Income Statement 22 (7) 838 36Fair value gains transferred to the Consolidated Income Statement 22 (570) – –Other 22 37 – –Net gain/(loss) recognised directly in equity 6,909 (808) 2,317Profit/(loss) for the financial year 6,756 (5,297) (21,821)Total recognised income and expense relating to the year 13,665 (6,105) (19,504)
Attributable to:– Equity shareholders 13,912 (6,210) (19,607)– Minority interests (247) 105 103 13,665 (6,105) (19,504)
The accompanying notes are an integral part of these Consolidated Financial Statements.
88 Vodafone Group Plc Annual Report 2008
Vodafone – Financials
Consolidated Statement ofRecognised Income and Expensefor the years ended 31 March
Consolidated Income Statementfor the years ended 31 March
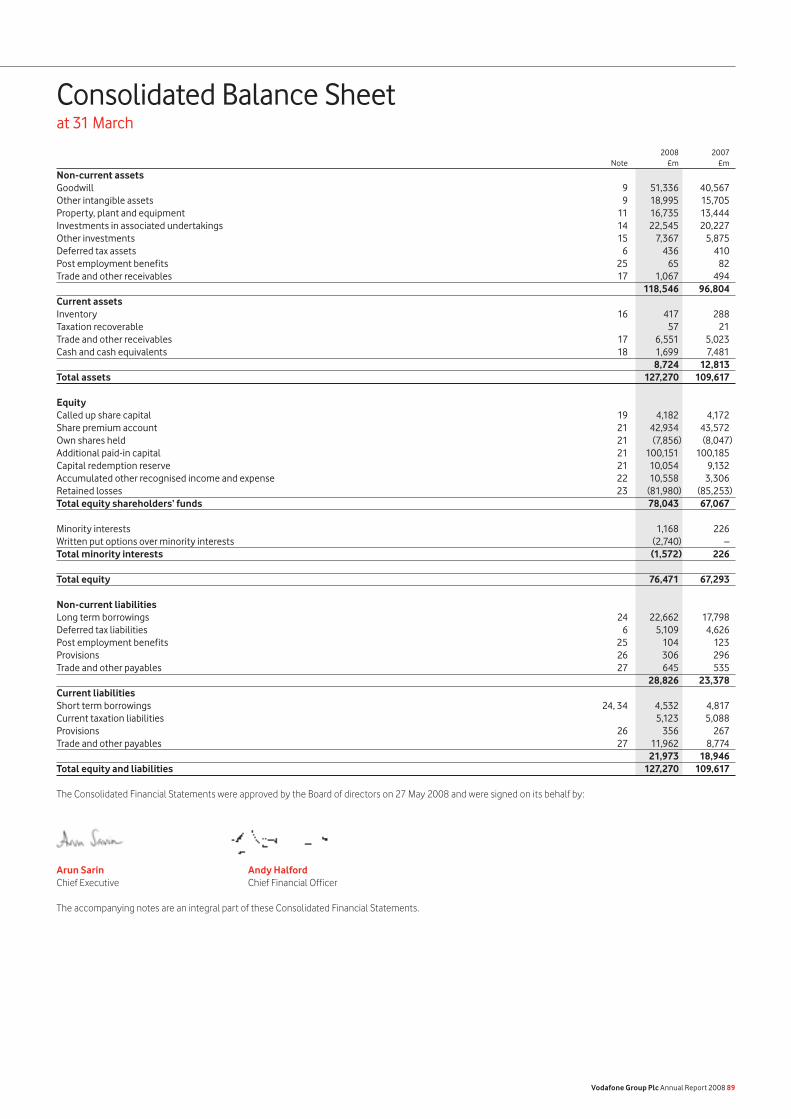
2008 2007 Note £m £m
Non-current assets Goodwill 9 51,336 40,567Other intangible assets 9 18,995 15,705Property, plant and equipment 11 16,735 13,444Investments in associated undertakings 14 22,545 20,227Other investments 15 7,367 5,875Deferred tax assets 6 436 410Post employment benefits 25 65 82Trade and other receivables 17 1,067 494 118,546 96,804Current assets Inventory 16 417 288Taxation recoverable 57 21Trade and other receivables 17 6,551 5,023Cash and cash equivalents 18 1,699 7,481 8,724 12,813Total assets 127,270 109,617 Equity Called up share capital 19 4,182 4,172Share premium account 21 42,934 43,572Own shares held 21 (7,856) (8,047)Additional paid-in capital 21 100,151 100,185Capital redemption reserve 21 10,054 9,132Accumulated other recognised income and expense 22 10,558 3,306Retained losses 23 (81,980) (85,253)Total equity shareholders’ funds 78,043 67,067
Minority interests 1,168 226Written put options over minority interests (2,740) –Total minority interests (1,572) 226
Total equity 76,471 67,293
Non-current liabilities Long term borrowings 24 22,662 17,798Deferred tax liabilities 6 5,109 4,626Post employment benefits 25 104 123Provisions 26 306 296Trade and other payables 27 645 535 28,826 23,378Current liabilities Short term borrowings 24, 34 4,532 4,817Current taxation liabilities 5,123 5,088Provisions 26 356 267Trade and other payables 27 11,962 8,774 21,973 18,946Total equity and liabilities 127,270 109,617
The Consolidated Financial Statements were approved by the Board of directors on 27 May 2008 and were signed on its behalf by:
Arun Sarin Andy HalfordChief Executive Chief Financial Officer
The accompanying notes are an integral part of these Consolidated Financial Statements.
Vodafone Group Plc Annual Report 2008 89
Consolidated Balance Sheetat 31 March
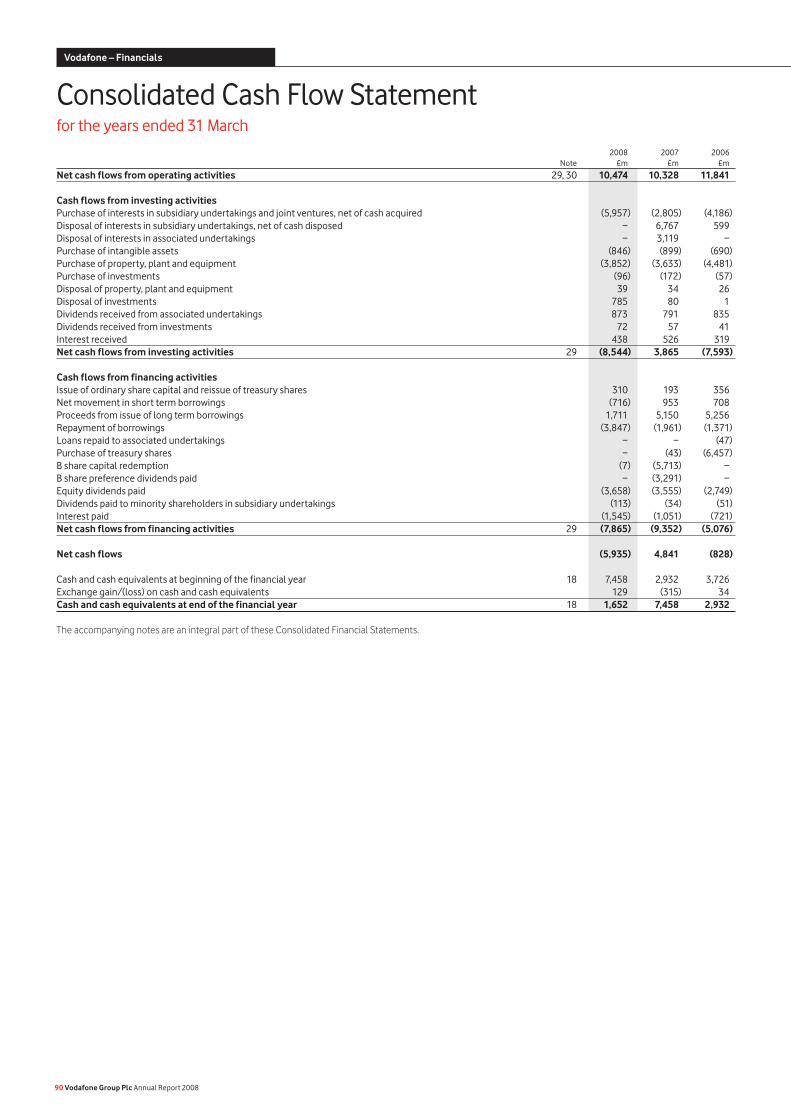
2008 2007 2006 Note £m £m £m
Net cash flows from operating activities 29, 30 10,474 10,328 11,841
Cash flows from investing activities Purchase of interests in subsidiary undertakings and joint ventures, net of cash acquired (5,957) (2,805) (4,186)Disposal of interests in subsidiary undertakings, net of cash disposed − 6,767 599Disposal of interests in associated undertakings − 3,119 −Purchase of intangible assets (846) (899) (690)Purchase of property, plant and equipment (3,852) (3,633) (4,481)Purchase of investments (96) (172) (57)Disposal of property, plant and equipment 39 34 26Disposal of investments 785 80 1Dividends received from associated undertakings 873 791 835Dividends received from investments 72 57 41Interest received 438 526 319Net cash flows from investing activities 29 (8,544) 3,865 (7,593)
Cash flows from financing activities Issue of ordinary share capital and reissue of treasury shares 310 193 356Net movement in short term borrowings (716) 953 708Proceeds from issue of long term borrowings 1,711 5,150 5,256Repayment of borrowings (3,847) (1,961) (1,371)Loans repaid to associated undertakings − − (47)Purchase of treasury shares − (43) (6,457)B share capital redemption (7) (5,713) −B share preference dividends paid − (3,291) −Equity dividends paid (3,658) (3,555) (2,749)Dividends paid to minority shareholders in subsidiary undertakings (113) (34) (51)Interest paid (1,545) (1,051) (721)Net cash flows from financing activities 29 (7,865) (9,352) (5,076)
Net cash flows (5,935) 4,841 (828)
Cash and cash equivalents at beginning of the financial year 18 7,458 2,932 3,726Exchange gain/(loss) on cash and cash equivalents 129 (315) 34Cash and cash equivalents at end of the financial year 18 1,652 7,458 2,932
The accompanying notes are an integral part of these Consolidated Financial Statements.
90 Vodafone Group Plc Annual Report 2008
Vodafone – Financials
Consolidated Cash Flow Statementfor the years ended 31 March
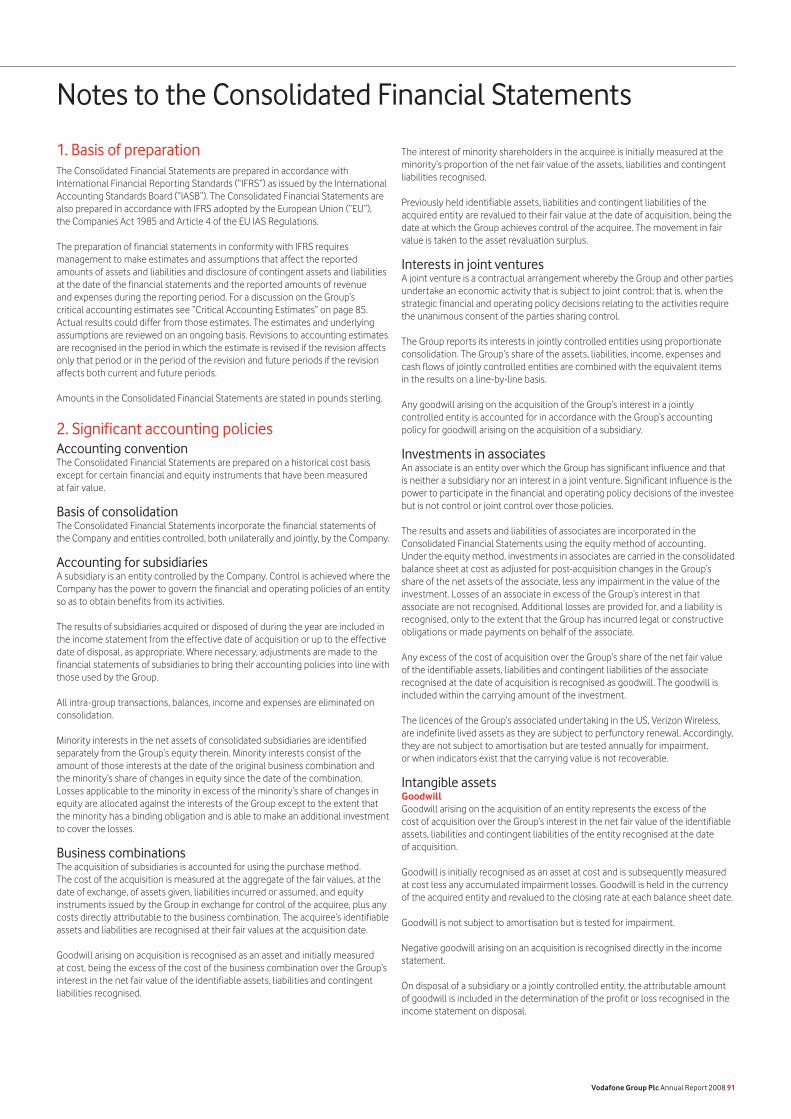
1. Basis of preparation The Consolidated Financial Statements are prepared in accordance with International Financial Reporting Standards (“IFRS”) as issued by the International Accounting Standards Board (“IASB”). The Consolidated Financial Statements are also prepared in accordance with IFRS adopted by the European Union (“EU”), the Companies Act 1985 and Article 4 of the EU IAS Regulations.
The preparation of financial statements in conformity with IFRS requires management to make estimates and assumptions that affect the reported amounts of assets and liabilities and disclosure of contingent assets and liabilities at the date of the financial statements and the reported amounts of revenue and expenses during the reporting period. For a discussion on the Group’s critical accounting estimates see “Critical Accounting Estimates” on page 85. Actual results could differ from those estimates. The estimates and underlying assumptions are reviewed on an ongoing basis. Revisions to accounting estimates are recognised in the period in which the estimate is revised if the revision affects only that period or in the period of the revision and future periods if the revision affects both current and future periods.
Amounts in the Consolidated Financial Statements are stated in pounds sterling.
2. Significant accounting policiesAccounting conventionThe Consolidated Financial Statements are prepared on a historical cost basis except for certain financial and equity instruments that have been measured at fair value.
Basis of consolidationThe Consolidated Financial Statements incorporate the financial statements of the Company and entities controlled, both unilaterally and jointly, by the Company.
Accounting for subsidiariesA subsidiary is an entity controlled by the Company. Control is achieved where the Company has the power to govern the financial and operating policies of an entity so as to obtain benefits from its activities.
The results of subsidiaries acquired or disposed of during the year are included in the income statement from the effective date of acquisition or up to the effective date of disposal, as appropriate. Where necessary, adjustments are made to the financial statements of subsidiaries to bring their accounting policies into line with those used by the Group.
All intra-group transactions, balances, income and expenses are eliminated on consolidation.
Minority interests in the net assets of consolidated subsidiaries are identified separately from the Group’s equity therein. Minority interests consist of the amount of those interests at the date of the original business combination and the minority’s share of changes in equity since the date of the combination. Losses applicable to the minority in excess of the minority’s share of changes in equity are allocated against the interests of the Group except to the extent that the minority has a binding obligation and is able to make an additional investment to cover the losses.
Business combinationsThe acquisition of subsidiaries is accounted for using the purchase method. The cost of the acquisition is measured at the aggregate of the fair values, at the date of exchange, of assets given, liabilities incurred or assumed, and equity instruments issued by the Group in exchange for control of the acquiree, plus any costs directly attributable to the business combination. The acquiree’s identifiable assets and liabilities are recognised at their fair values at the acquisition date.
Goodwill arising on acquisition is recognised as an asset and initially measured at cost, being the excess of the cost of the business combination over the Group’s interest in the net fair value of the identifiable assets, liabilities and contingent liabilities recognised.
The interest of minority shareholders in the acquiree is initially measured at the minority’s proportion of the net fair value of the assets, liabilities and contingent liabilities recognised.
Previously held identifiable assets, liabilities and contingent liabilities of the acquired entity are revalued to their fair value at the date of acquisition, being the date at which the Group achieves control of the acquiree. The movement in fair value is taken to the asset revaluation surplus.
Interests in joint venturesA joint venture is a contractual arrangement whereby the Group and other parties undertake an economic activity that is subject to joint control; that is, when the strategic financial and operating policy decisions relating to the activities require the unanimous consent of the parties sharing control.
The Group reports its interests in jointly controlled entities using proportionate consolidation. The Group’s share of the assets, liabilities, income, expenses and cash flows of jointly controlled entities are combined with the equivalent items in the results on a line-by-line basis.
Any goodwill arising on the acquisition of the Group’s interest in a jointly controlled entity is accounted for in accordance with the Group’s accounting policy for goodwill arising on the acquisition of a subsidiary.
Investments in associatesAn associate is an entity over which the Group has significant influence and that is neither a subsidiary nor an interest in a joint venture. Significant influence is the power to participate in the financial and operating policy decisions of the investee but is not control or joint control over those policies.
The results and assets and liabilities of associates are incorporated in the Consolidated Financial Statements using the equity method of accounting. Under the equity method, investments in associates are carried in the consolidated balance sheet at cost as adjusted for post-acquisition changes in the Group’s share of the net assets of the associate, less any impairment in the value of the investment. Losses of an associate in excess of the Group’s interest in that associate are not recognised. Additional losses are provided for, and a liability is recognised, only to the extent that the Group has incurred legal or constructive obligations or made payments on behalf of the associate.
Any excess of the cost of acquisition over the Group’s share of the net fair value of the identifiable assets, liabilities and contingent liabilities of the associate recognised at the date of acquisition is recognised as goodwill. The goodwill is included within the carrying amount of the investment.
The licences of the Group’s associated undertaking in the US, Verizon Wireless, are indefinite lived assets as they are subject to perfunctory renewal. Accordingly, they are not subject to amortisation but are tested annually for impairment, or when indicators exist that the carrying value is not recoverable.
Intangible assetsGoodwillGoodwill arising on the acquisition of an entity represents the excess of the cost of acquisition over the Group’s interest in the net fair value of the identifiable assets, liabilities and contingent liabilities of the entity recognised at the date of acquisition.
Goodwill is initially recognised as an asset at cost and is subsequently measured at cost less any accumulated impairment losses. Goodwill is held in the currency of the acquired entity and revalued to the closing rate at each balance sheet date.
Goodwill is not subject to amortisation but is tested for impairment.
Negative goodwill arising on an acquisition is recognised directly in the income statement.
On disposal of a subsidiary or a jointly controlled entity, the attributable amount of goodwill is included in the determination of the profit or loss recognised in the income statement on disposal.
Vodafone Group Plc Annual Report 2008 91
Notes to the Consolidated Financial Statements
2. Significant accounting policies continued Goodwill arising before the date of transition to IFRS, on 1 April 2004, has been retained at the previous UK GAAP amounts, subject to being tested for impairment at that date. Goodwill written off to reserves under UK GAAP prior to 1998 has not been reinstated and is not included in determining any subsequent profit or loss on disposal.
Licence and spectrum feesLicence and spectrum fees are stated at cost less accumulated amortisation. The amortisation periods range from 3 to 25 years and are determined primarily by reference to the unexpired licence period, the conditions for licence renewal and whether licences are dependent on specific technologies. Amortisation is charged to the income statement on a straight-line basis over the estimated useful lives from the commencement of service of the network.
Computer softwareComputer software licences are capitalised on the basis of the costs incurred to acquire and bring into use the specific software. These costs are amortised over their estimated useful lives, being 3 to 5 years.
Costs that are directly associated with the production of identifiable and unique software products controlled by the Group, and that are expected to generate economic benefits exceeding costs beyond one year, are recognised as intangible assets. Direct costs include software development employee costs and directly attributable overheads.
Software integral to a related item of hardware equipment is accounted for as property, plant and equipment.
Costs associated with maintaining computer software programs are recognised as an expense when they are incurred.
Research and development expenditureExpenditure on research activities is recognised as an expense in the period in which it is incurred.
An internally-generated intangible asset arising from the Group’s development activity is recognised only if all of the following conditions are met:
an asset is created that can be separately identified;it is probable that the asset created will generate future economic benefits; andthe development cost of the asset can be measured reliably.
Internally-generated intangible assets are amortised on a straight-line basis over their estimated useful lives. Where no internally-generated intangible asset can be recognised, development expenditure is charged to the income statement in the period in which it is incurred.
Other intangible assetsOther intangible assets with finite lives are stated at cost less accumulated amortisation and impairment losses. Amortisation is charged to the income statement on a straight-line basis over the estimated useful lives of intangible assets from the date they are available for use. The estimated useful lives are as follows:
Brands 1 – 10 yearsCustomer bases 2 – 5 years
Property, plant and equipmentLand and buildings held for use are stated in the balance sheet at their cost, less any subsequent accumulated depreciation and subsequent accumulated impairment losses.
Equipment, fixtures and fittings are stated at cost less accumulated depreciation and any accumulated impairment losses.
Assets in the course of construction are carried at cost, less any recognised impairment loss. Depreciation of these assets commences when the assets are ready for their intended use.
•••
The cost of property, plant and equipment includes directly attributable incremental costs incurred in their acquisition and installation.
Depreciation is charged so as to write off the cost or valuation of assets, other than land and properties under construction, using the straight-line method, over their estimated useful lives, as follows:
Freehold buildings 25 – 50 yearsLeasehold premises the term of the lease
Equipment, fixtures and fittings:
Network infrastructure 3 – 25 yearsOther 3 – 10 years
Depreciation is not provided on freehold land.
Assets held under finance leases are depreciated over their expected useful lives on the same basis as owned assets or, where shorter, the term of the relevant lease.
The gain or loss arising on the disposal or retirement of an item of property, plant and equipment is determined as the difference between the sales proceeds and the carrying amount of the asset and is recognised in the income statement.
Impairment of assetsGoodwillGoodwill is not subject to amortisation but is tested for impairment annually or whenever there is an indication that the asset may be impaired.
For the purpose of impairment testing, assets are grouped at the lowest levels for which there are separately identifiable cash flows, known as cash-generating units. If the recoverable amount of the cash-generating unit is less than the carrying amount of the unit, the impairment loss is allocated first to reduce the carrying amount of any goodwill allocated to the unit and then to the other assets of the unit pro-rata on the basis of the carrying amount of each asset in the unit. Impairment losses recognised for goodwill are not reversed in a subsequent period.
Recoverable amount is the higher of fair value less costs to sell and value in use. In assessing value in use, the estimated future cash flows are discounted to their present value using a pre-tax discount rate that reflects current market assessments of the time value of money and the risks specific to the asset for which the estimates of future cash flows have not been adjusted.
The Group prepares and internally approves formal ten year management plans for its businesses. The first five years of these plans are used for the value in use calculations, except in markets which are forecast to grow ahead of the long term growth rate. In such cases, the ten year plan is used until the forecast growth rate trends towards the long term growth rate, up to a maximum of ten years. Long range growth rates are used for cash flows into perpetuity beyond the relevant five or ten year period.
Property, plant and equipment and finite lived intangible assets At each balance sheet date, the Group reviews the carrying amounts of its property, plant and equipment and finite lived intangible assets to determine whether there is any indication that those assets have suffered an impairment loss. If any such indication exists, the recoverable amount of the asset is estimated in order to determine the extent, if any, of the impairment loss. Where it is not possible to estimate the recoverable amount of an individual asset, the Group estimates the recoverable amount of the cash-generating unit to which the asset belongs.
If the recoverable amount of an asset or cash-generating unit is estimated to be less than its carrying amount, the carrying amount of the asset or cash-generating unit is reduced to its recoverable amount. An impairment loss is recognised immediately in the income statement.
Where an impairment loss subsequently reverses, the carrying amount of the asset or cash-generating unit is increased to the revised estimate of its recoverable amount, not to exceed the carrying amount that would have been
••
92 Vodafone Group Plc Annual Report 2008
Notes to the Consolidated Financial Statements continued
Vodafone – Financials
determined had no impairment loss been recognised for the asset or cash-generating unit in prior years. A reversal of an impairment loss is recognised immediately in the income statement.
Disposal groups held for saleDisposal groups held for sale are stated at the lower of carrying value and fair value less costs to sell.
Revenue Group revenue comprises revenue of the Company and its subsidiary undertakings plus the Group’s share of the revenue of its joint ventures and excludes sales taxes and discounts.
Revenue from mobile telecommunications comprises amounts charged to customers in respect of monthly access charges, airtime usage, messaging, the provision of other mobile telecommunications services, including data services and information provision, fees for connecting users of other fixed line and mobile networks to the Group’s network, revenue from the sale of equipment, including handsets, and revenue arising from partner market agreements.
Access charges and airtime used by contract customers are invoiced and recorded as part of a periodic billing cycle and recognised as revenue over the related access period, with unbilled revenue resulting from services already provided from the billing cycle date to the end of each period accrued and unearned revenue from services provided in periods after each accounting period deferred. Revenue from the sale of prepaid credit is deferred until such time as the customer uses the airtime, or the credit expires.
Other revenue from mobile telecommunications primarily comprises equipment sales, which are recognised upon delivery to customers, and customer connection revenue. Customer connection revenue is recognised together with the related equipment revenue to the extent that the aggregate equipment and connection revenue does not exceed the fair value of the equipment delivered to the customer. Any customer connection revenue not recognised together with related equipment revenue is deferred and recognised over the period in which services are expected to be provided to the customer.
Revenue from data services and information provision is recognised when the Group has performed the related service and, depending on the nature of the service, is recognised either at the gross amount billed to the customer or the amount receivable by the Group as commission for facilitating the service.
Incentives are provided to customers in various forms and are usually offered on signing a new contract or as part of a promotional offering. Where such incentives are provided on connection of a new customer or the upgrade of an existing customer, revenue representing the fair value of the incentive, relative to other deliverables provided to the customer as part of the same arrangement, is deferred and recognised in line with the Group’s performance of its obligations relating to the incentive.
For equipment sales made to intermediaries, revenue is recognised if the significant risks associated with the equipment are transferred to the intermediary and the intermediary has no general right of return. If the significant risks are not transferred, revenue recognition is deferred until sale of the handset to an end customer by the intermediary or the expiry of the right of return.
Intermediaries are incentivised by the Group to connect new customers and upgrade existing customers. Where such incentives are separable from the initial sale of equipment to an intermediary, the incentive is accounted for as an expense upon connection, or upgrade, of the customer.
Revenue from other businesses primarily comprises amounts charged to customers of the Group’s fixed line businesses, mainly in respect of access charges and line usage, invoiced and recorded as part of a periodic billing cycle.
In revenue arrangements including more than one deliverable, the arrangement consideration is allocated to each deliverable based on the fair value of the individual element. The Group generally determines the fair value of individual elements based on prices at which the deliverable is regularly sold on a standalone basis, after considering volume discounts where appropriate.
InventoryInventory is stated at the lower of cost and net realisable value. Cost is determined on the basis of weighted average costs and comprises direct materials and, where applicable, direct labour costs and those overheads that have been incurred in bringing the inventories to their present location and condition.
LeasingLeases are classified as finance leases whenever the terms of the lease transfer substantially all the risks and rewards of ownership of the asset to the lessee. All other leases are classified as operating leases.
Assets held under finance leases are recognised as assets of the Group at their fair value at the inception of the lease or, if lower, at the present value of the minimum lease payments as determined at the inception of the lease. The corresponding liability to the lessor is included in the balance sheet as a finance lease obligation. Lease payments are apportioned between finance charges and reduction of the lease obligation so as to achieve a constant rate of interest on the remaining balance of the liability. Finance charges are recognised in the income statement.
Rentals payable under operating leases are charged to the income statement on a straight line basis over the term of the relevant lease. Benefits received and receivable as an incentive to enter into an operating lease are also spread on a straight line basis over the lease term.
Foreign currencies In preparing the financial statements of the individual entities within the Group, transactions in currencies other than the entity’s functional currency are recorded at the rates of exchange prevailing on the dates of the transactions. At each balance sheet date, monetary items denominated in foreign currencies are retranslated at the rates prevailing on the balance sheet date. Non-monetary items carried at fair value that are denominated in foreign currencies are retranslated at the rate prevailing on the date when fair value was determined. Non-monetary items that are measured in terms of historical cost in a foreign currency are not retranslated.
Changes in the fair value of monetary securities denominated in foreign currency classified as available for sale are analysed between translation differences and other changes in the carrying amount of the security. Translation differences are recognised in the income statement and other changes in carrying amount are recognised in equity.
Translation differences on non-monetary financial assets and liabilities are reported as part of the fair value gain or loss. Translation differences on non-monetary financial assets, such as investments in equity securities classified as available for sale, are included in equity.
For the purpose of presenting Consolidated Financial Statements, the assets and liabilities of entities with a functional currency other than sterling are expressed in sterling using exchange rates prevailing on the balance sheet date. Income and expense items and cash flows are translated at the average exchange rates for the period and exchange differences arising are recognised directly in equity. Such translation differences are recognised in the income statement in the period in which a foreign operation is disposed of.
Goodwill and fair value adjustments arising on the acquisition of a foreign operation are treated as assets and liabilities of the foreign operation and translated accordingly.
In respect of all foreign operations, any exchange differences that have arisen before 1 April 2004, the date of transition to IFRS, are deemed to be nil and will be excluded from the determination of any subsequent profit or loss on disposal.
The net foreign exchange gains recognised in the Consolidated Income Statement for continuing operations is £373 million (2007: £92 million loss, 2006: £36 million loss). A loss of £794 million was recognised in the 2007 financial year for discontinued operations.
Vodafone Group Plc Annual Report 2008 93
2. Significant accounting policies continued Borrowing costsAll borrowing costs are recognised in the income statement in the period in which they are incurred.
Post employment benefits For defined benefit retirement plans, the difference between the fair value of the plan assets and the present value of the plan liabilities is recognised as an asset or liability on the balance sheet. Scheme liabilities are assessed using the projected unit funding method and applying the principal actuarial assumptions as at the balance sheet date. Assets are valued at market value.
During the year ended 31 March 2006, the Group early adopted the amendment to IAS 19, “Employee Benefits”, and applied it from 1 April 2004. Accordingly, actuarial gains and losses are taken to the statement of recognised income and expense as incurred. For this purpose, actuarial gains and losses comprise both the effects of changes in actuarial assumptions and experience adjustments arising because of differences between the previous actuarial assumptions and what has actually occurred.
Other movements in the net surplus or deficit are recognised in the income statement, including the current service cost, any past service cost and the effect of any curtailment or settlements. The interest cost less the expected return on assets is also charged to the income statement. The amount charged to the income statement in respect of these plans is included within operating costs or in the Group’s share of the results of equity accounted operations as appropriate.
The Group’s contributions to defined contribution pension plans are charged to the income statement as they fall due.
Cumulative actuarial gains and losses as at 1 April 2004, the date of transition to IFRS, have been recognised in the balance sheet.
TaxationIncome tax expense represents the sum of the current tax payable and deferred tax.
Current tax payable or recoverable is based on taxable profit for the year. Taxable profit differs from profit as reported in the income statement because some items of income or expense are taxable or deductible in different years or may never be taxable or deductible. The Group’s liability for current tax is calculated using UK and foreign tax rates and laws that have been enacted or substantively enacted by the balance sheet date.
Deferred tax is the tax expected to be payable or recoverable in the future arising from temporary differences between the carrying amounts of assets and liabilities in the financial statements and the corresponding tax bases used in the computation of taxable profit. It is accounted for using the balance sheet liability method. Deferred tax liabilities are generally recognised for all taxable temporary differences and deferred tax assets are recognised to the extent that it is probable that taxable profits will be available against which deductible temporary differences can be utilised. Such assets and liabilities are not recognised if the temporary difference arises from the initial recognition (other than in a business combination) of assets and liabilities in a transaction that affects neither the taxable profit nor the accounting profit. Deferred tax liabilities are not recognised to the extent they arise from the initial recognition of goodwill.
Deferred tax liabilities are recognised for taxable temporary differences arising on investments in subsidiaries and associates, and interests in joint ventures, except where the Group is able to control the reversal of the temporary difference and it is probable that the temporary difference will not reverse in the foreseeable future.
The carrying amount of deferred tax assets is reviewed at each balance sheet date and adjusted to reflect changes in probability that sufficient taxable profits will be available to allow all or part of the asset to be recovered.
Deferred tax is calculated at the tax rates that are expected to apply in the period when the liability is settled or the asset realised, based on tax rates that have been enacted or substantively enacted by the balance sheet date.
Tax assets and liabilities are offset when there is a legally enforceable right to set off current tax assets against current tax liabilities and when they either relate to income taxes levied by the same taxation authority on either the same taxable entity or on different taxable entities which intend to settle the current tax assets and liabilities on a net basis.
Tax is charged or credited to the income statement, except when it relates to items charged or credited directly to equity, in which case the tax is also recognised directly in equity.
Financial instrumentsFinancial assets and financial liabilities, in respect of financial instruments, are recognised on the Group’s balance sheet when the Group becomes a party to the contractual provisions of the instrument.
The Group has applied the requirements of IFRS to financial instruments for all periods presented and has not taken advantage of any exemptions available to first time adopters of IFRS in this respect. During the year ended 31 March 2006, the Group early adopted IFRS 7, “Financial Instruments: Disclosures”, amendments to IAS 39, “Financial Instruments: Recognition and Measurement” and IFRS 4, “Insurance Contracts”, regarding “Financial Guarantee Contracts” and amendments to IAS 39 regarding “The Fair Value Option” and “Cash Flow Hedge Accounting of Forecast Intragroup Transactions” and applied them from 1 April 2004.
Trade receivablesTrade receivables do not carry any interest and are stated at their nominal value as reduced by appropriate allowances for estimated irrecoverable amounts. Estimated irrecoverable amounts are based on the ageing of the receivable balances and historical experience. Individual trade receivables are written off when management deems them not to be collectible.
Other investmentsOther investments are recognised and derecognised on a trade date where a purchase or sale of an investment is under a contract whose terms require delivery of the investment within the timeframe established by the market concerned, and are initially measured at cost, including transaction costs.
Other investments classified held for trading and available-for-sale are stated at fair value. Where securities are held for trading purposes, gains and losses arising from changes in fair value are included in net profit or loss for the period. For available-for-sale investments, gains and losses arising from changes in fair value are recognised directly in equity, until the security is disposed of or is determined to be impaired, at which time the cumulative gain or loss previously recognised in equity, determined using the weighted average costs method, is included in the net profit or loss for the period.
Other investments classified as loans and receivables are stated at amortised cost using the effective interest method, less any impairment.
Cash and cash equivalentsCash and cash equivalents comprise cash on hand and call deposits, and other short term highly liquid investments that are readily convertible to a known amount of cash and are subject to an insignificant risk of changes in value.
Trade payablesTrade payables are not interest bearing and are stated at their nominal value.
Financial liabilities and equity instrumentsFinancial liabilities and equity instruments issued by the Group are classified according to the substance of the contractual arrangements entered into and the definitions of a financial liability and an equity instrument. An equity instrument is any contract that evidences a residual interest in the assets of the Group after deducting all of its liabilities and includes no obligation to deliver cash or other financial assets. The accounting policies adopted for specific financial liabilities and equity instruments are set out below.
94 Vodafone Group Plc Annual Report 2008
Notes to the Consolidated Financial Statements continued
Vodafone – Financials
Capital market and bank borrowingsInterest bearing loans and overdrafts are initially measured at fair value (which is equal to cost at inception), and are subsequently measured at amortised cost, using the effective interest rate method, except where they are identified as a hedged item in a fair value hedge. Any difference between the proceeds net of transaction costs and the settlement or redemption of borrowings is recognised over the term of the borrowing.
Equity instrumentsEquity instruments issued by the Group are recorded at the proceeds received, net of direct issue costs.
Derivative financial instruments and hedge accountingThe Group’s activities expose it to the financial risks of changes in foreign exchange rates and interest rates.
The use of financial derivatives is governed by the Group’s policies approved by the Board of directors, which provide written principles on the use of financial derivatives consistent with the Group’s risk management strategy. Changes in values of all derivatives of a financing nature are included within investment income and financing costs in the income statement. The Group does not use derivative financial instruments for speculative purposes.
Derivative financial instruments are initially measured at fair value on the contract date and are subsequently re-measured to fair value at each reporting date. The Group designates certain derivatives as either:
hedges of the change of fair value of recognised assets and liabilities (“fair value hedges”); orhedges of net investments in foreign operations.
Hedge accounting is discontinued when the hedging instrument expires or is sold, terminated, or exercised, or no longer qualifies for hedge accounting.
Fair value hedgesThe Group’s policy is to use derivative instruments (primarily interest rate swaps) to convert a proportion of its fixed rate debt to floating rates in order to hedge the interest rate risk arising, principally, from capital market borrowings. The Group designates these as fair value hedges of interest rate risk with changes in fair value of the hedging instrument recognised in the income statement for the period together with the changes in the fair value of the hedged item due to the hedged risk, to the extent the hedge is effective. The ineffective portion is recognised immediately in the income statement.
Net investment hedgesExchange differences arising from the translation of the net investment in foreign operations are recognised directly in equity. Gains and losses on those hedging instruments (which include bonds, commercial paper and foreign exchange contracts) designated as hedges of the net investments in foreign operations are recognised in equity to the extent that the hedging relationship is effective. These amounts are included in exchange differences on translation of foreign operations as stated in the statement of recognised income and expense. Gains and losses relating to hedge ineffectiveness are recognised immediately in the income statement for the period. Gains and losses accumulated in the translation reserve are included in the income statement when the foreign operation is disposed of. During the year ended 31 March 2006, the Group adopted the Amendments to IAS 21, “The Effect of Changes in Foreign Exchange Rates”, with effect from 1 April 2004, being the date of transition to IFRS for the Group.
Put option arrangementsThe potential cash payments related to put options issued by the Group over the equity of subsidiary companies are accounted for as financial liabilities when such options may only be settled other than by exchange of a fixed amount of cash or another financial asset for a fixed number of shares in the subsidiary.
•
•
The amount that may become payable under the option on exercise is initially recognised at fair value within borrowings with a corresponding charge directly to equity. The charge to equity is recognised separately as written put options over minority interests, adjacent to minority interests in the net assets of consolidated subsidiaries. The Group recognises the cost of writing such put options, determined as the excess of the fair value of the option over any consideration received, as a financing cost.
Such options are subsequently measured at amortised cost, using the effective interest rate method, in order to accrete the liability up to the amount payable under the option at the date at which it first becomes exercisable. The charge arising is recorded as a financing cost. In the event that the option expires unexercised, the liability is derecognised with a corresponding adjustment to equity.
ProvisionsProvisions are recognised when the Group has a present obligation as a result of a past event and it is probable that the Group will be required to settle that obligation. Provisions are measured at the directors’ best estimate of the expenditure required to settle the obligation at the balance sheet date and are discounted to present value where the effect is material.
Share-based paymentsThe Group issues equity-settled share-based payments to certain employees. Equity-settled share-based payments are measured at fair value (excluding the effect of non market-based vesting conditions) at the date of grant. The fair value determined at the grant date of the equity-settled share-based payments is expensed on a straight-line basis over the vesting period, based on the Group’s estimate of the shares that will eventually vest and adjusted for the effect of non market-based vesting conditions.
Fair value is measured using a binomial pricing model, being a lattice-based option valuation model, which is calibrated using a Black-Scholes framework. The expected life used in the model has been adjusted, based on management’s best estimate, for the effects of non-transferability, exercise restrictions and behavioural considerations.
The Group uses historical data to estimate option exercise and employee termination within the valuation model; separate groups of employees that have similar historical exercise behaviour are considered separately for valuation purposes. The expected life of options granted is derived from the output of the option valuation model and represents the period of time that options are expected to be outstanding. Expected volatilities are based on implied volatilities as determined by a simple average of no less than three international banks, excluding the highest and lowest numbers. The risk-free rates for periods within the contractual life of the option are based on the UK gilt yield curve in effect at the time of grant.
Some share awards have an attached market condition, based on Total Shareholder Return (“TSR”), which is taken into account when calculating the fair value of the share awards. The valuation for the TSR is based on Vodafone’s ranking within the same group of companies, where possible, over the past five years. The volatility of the ranking over a three year period is used to determine the probable weighted percentage number of shares that could be expected to vest and hence affect fair value.
The fair value of awards of non-vested shares to the Board of directors and Executive Committee is equal to the closing price of the Vodafone’s shares on the date of grant, as these awards are entitled to dividend equivalents during the vesting period. Awards of non-vested shares to other employees are not entitled to dividends during the vesting period and the fair value reflects a discount to the closing share price of Vodafone’s shares on the date of grant equal to the present value of expected dividends to be received over the vesting period.
Vodafone Group Plc Annual Report 2008 95
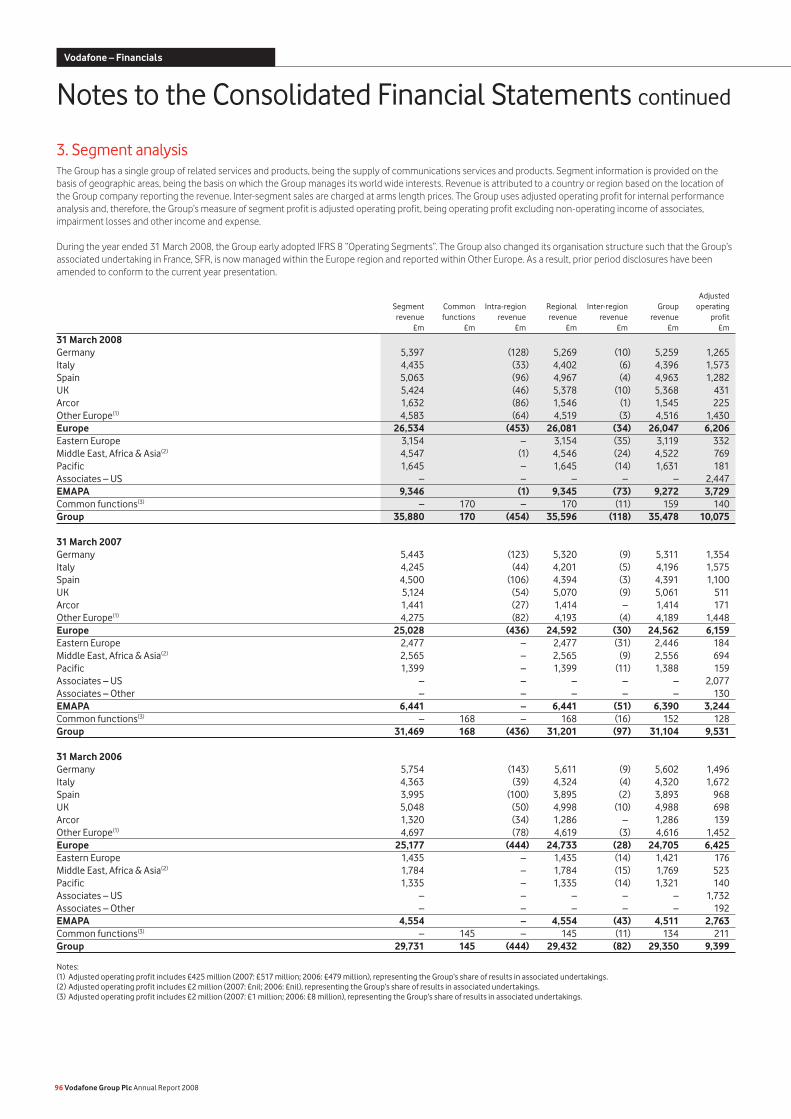
3. Segment analysisThe Group has a single group of related services and products, being the supply of communications services and products. Segment information is provided on the basis of geographic areas, being the basis on which the Group manages its world wide interests. Revenue is attributed to a country or region based on the location of the Group company reporting the revenue. Inter-segment sales are charged at arms length prices. The Group uses adjusted operating profit for internal performance analysis and, therefore, the Group’s measure of segment profit is adjusted operating profit, being operating profit excluding non-operating income of associates, impairment losses and other income and expense.
During the year ended 31 March 2008, the Group early adopted IFRS 8 “Operating Segments”. The Group also changed its organisation structure such that the Group’s associated undertaking in France, SFR, is now managed within the Europe region and reported within Other Europe. As a result, prior period disclosures have been amended to conform to the current year presentation.
Adjusted Segment Common Intra-region Regional Inter-region Group operating revenue functions revenue revenue revenue revenue profit £m £m £m £m £m £m £m
31 March 2008 Germany 5,397 (128) 5,269 (10) 5,259 1,265Italy 4,435 (33) 4,402 (6) 4,396 1,573Spain 5,063 (96) 4,967 (4) 4,963 1,282UK 5,424 (46) 5,378 (10) 5,368 431Arcor 1,632 (86) 1,546 (1) 1,545 225Other Europe(1) 4,583 (64) 4,519 (3) 4,516 1,430Europe 26,534 (453) 26,081 (34) 26,047 6,206Eastern Europe 3,154 – 3,154 (35) 3,119 332Middle East, Africa & Asia(2) 4,547 (1) 4,546 (24) 4,522 769Pacific 1,645 – 1,645 (14) 1,631 181Associates – US – – – – – 2,447EMAPA 9,346 (1) 9,345 (73) 9,272 3,729Common functions(3) – 170 – 170 (11) 159 140Group 35,880 170 (454) 35,596 (118) 35,478 10,075 31 March 2007 Germany 5,443 (123) 5,320 (9) 5,311 1,354Italy 4,245 (44) 4,201 (5) 4,196 1,575Spain 4,500 (106) 4,394 (3) 4,391 1,100UK 5,124 (54) 5,070 (9) 5,061 511Arcor 1,441 (27) 1,414 – 1,414 171Other Europe(1) 4,275 (82) 4,193 (4) 4,189 1,448Europe 25,028 (436) 24,592 (30) 24,562 6,159Eastern Europe 2,477 – 2,477 (31) 2,446 184Middle East, Africa & Asia(2) 2,565 – 2,565 (9) 2,556 694Pacific 1,399 – 1,399 (11) 1,388 159Associates – US – – – – – 2,077Associates – Other – – – – – 130EMAPA 6,441 – 6,441 (51) 6,390 3,244Common functions(3) – 168 – 168 (16) 152 128Group 31,469 168 (436) 31,201 (97) 31,104 9,531 31 March 2006 Germany 5,754 (143) 5,611 (9) 5,602 1,496Italy 4,363 (39) 4,324 (4) 4,320 1,672Spain 3,995 (100) 3,895 (2) 3,893 968UK 5,048 (50) 4,998 (10) 4,988 698Arcor 1,320 (34) 1,286 – 1,286 139Other Europe(1) 4,697 (78) 4,619 (3) 4,616 1,452Europe 25,177 (444) 24,733 (28) 24,705 6,425Eastern Europe 1,435 – 1,435 (14) 1,421 176Middle East, Africa & Asia(2) 1,784 – 1,784 (15) 1,769 523Pacific 1,335 – 1,335 (14) 1,321 140Associates – US – – – – – 1,732Associates – Other – – – – – 192EMAPA 4,554 – 4,554 (43) 4,511 2,763Common functions(3) – 145 – 145 (11) 134 211Group 29,731 145 (444) 29,432 (82) 29,350 9,399
Notes:(1) Adjusted operating profit includes £425 million (2007: £517 million; 2006: £479 million), representing the Group’s share of results in associated undertakings.(2) Adjusted operating profit includes £2 million (2007: £nil; 2006: £nil), representing the Group’s share of results in associated undertakings.(3) Adjusted operating profit includes £2 million (2007: £1 million; 2006: £8 million), representing the Group’s share of results in associated undertakings.
96 Vodafone Group Plc Annual Report 2008
Notes to the Consolidated Financial Statements continued
Vodafone – Financials

A reconciliation of adjusted operating profit to operating profit/(loss) is shown below. For a reconciliation of operating profit/(loss) to profit/(loss) before taxation, see the Consolidated Income Statement on page 88.
2008 2007 2006 £m £m £m
Adjusted operating profit 10,075 9,531 9,399Impairment losses – (11,600) (23,515)Other items (28) 505 32Operating profit/(loss) 10,047 (1,564) (14,084)
Other Capitalised expenditure Depreciation Non-current fixed asset on intangible and Impairment assets(1) additions(2) assets amortisation of goodwill £m £m £m £m £m
31 March 2008 Germany 18,267 392 14 1,067 –Italy 16,215 411 1 582 –Spain 14,589 533 – 500 –UK 7,930 465 – 973 –Arcor 862 221 – 100 –Other Europe 8,303 469 11 616 –Europe 66,166 2,491 26 3,838 –Eastern Europe 6,879 633 – 665 –Middle East, Africa & Asia 11,958 1,554 7 954 –Pacific 1,346 212 – 245 –EMAPA 20,183 2,399 7 1,864 –Common functions 717 185 8 207 –Group 87,066 5,075 41 5,909 – 31 March 2007 Germany 16,233 425 – 1,063 6,700Italy 13,722 421 26 556 4,900Spain 12,289 547 – 449 –UK 8,483 661 – 930 –Arcor 627 189 – 144 –Other Europe 7,187 489 6 586 –Europe 58,541 2,732 32 3,728 11,600Eastern Europe 6,235 435 – 349 –Middle East, Africa & Asia 3,079 574 276 272 –Pacific 1,249 251 – 194 –EMAPA 10,563 1,260 276 815 –Common functions 612 216 – 568 –Group 69,716 4,208 308 5,111 11,600 31 March 2006 Germany 592 – 1,167 19,400Italy 541 1 588 3,600Spain 502 – 395 –UK 665 11 924 –Arcor 129 – 140 –Other Europe 511 4 645 515Europe 2,940 16 3,859 23,515Eastern Europe 280 – 231 –Middle East, Africa & Asia 426 – 216 –Pacific 247 – 209 –EMAPA 953 – 656 –Common functions 112 – 189 –Group 4,005 16 4,704 23,515
Notes:(1) Includes goodwill, other intangible assets and property, plant and equipment.(2) Includes additions to property, plant and equipment and computer software, reported within intangible assets.
Vodafone Group Plc Annual Report 2008 97

4. Operating profit/(loss)Operating profit/(loss) has been arrived at after charging/(crediting): 2008 2007 2006 £m £m £m
Net foreign exchange (gains)/losses (27) 6 –Depreciation of property, plant and equipment (note 11): Owned assets 3,400 2,994 3,069 Leased assets 27 17 10Amortisation of intangible assets (note 9) 2,482 2,100 1,625Impairment of goodwill (note 10) – 11,600 23,515Research and development expenditure 234 222 206Staff costs (note 35) 2,698 2,466 2,310Operating lease rentals payable: Plant and machinery 43 35 35 Other assets including fixed line rentals 1,117 984 933Loss on disposal of property, plant and equipment 70 43 69Own costs capitalised attributable to the construction or acquisition of property, plant and equipment (245) (244) (256)
The total remuneration of the Group’s auditor, Deloitte & Touche LLP, and its affiliates for services provided to the Group is analysed below:
2008 2007 2006 £m £m £m
Audit fees: Parent company 1 1 1Subsidiary undertakings 5 4 3 6 5 4Fees for statutory and regulatory filings(1) 1 2 –Audit and audit-related fees 7 7 4 Other fees: Taxation 1 1 1Corporate finance transactions – – 1Other(2) 1 2 2 2 3 4Total fees 9 10 8
Notes:(1) Amounts for 2008 and 2007 include mainly audit fees in relation to Section 404 of the US Sarbanes-Oxley Act of 2002. (2) Amounts for 2007 and 2006 include fees mainly relating to the preparatory work required in advance of the implementation of Section 404 of the US Sarbanes-Oxley Act of 2002 and general
accounting advice.
The total remuneration includes £nil (2007: £nil, 2006: £1 million) in respect of the Group’s discontinued operations in Japan. In addition to the above, the Group’s joint ventures and associated undertakings paid fees totalling £2 million (2007: £2 million, 2006: £2 million) and £3 million (2007: £4 million, 2006: £4 million), respectively, to Deloitte & Touche LLP and its affiliates during the year. Deloitte & Touche LLP and its affiliates have also received amounts totalling less than £1 million in each of the last three years in respect of services provided to pension schemes and charitable foundations associated to the Group.
A description of the work performed by the Audit Committee in order to safeguard auditor independence when non-audit services are provided is set out in “Corporate Governance” on page 69.
98 Vodafone Group Plc Annual Report 2008
Notes to the Consolidated Financial Statements continued
Vodafone – Financials
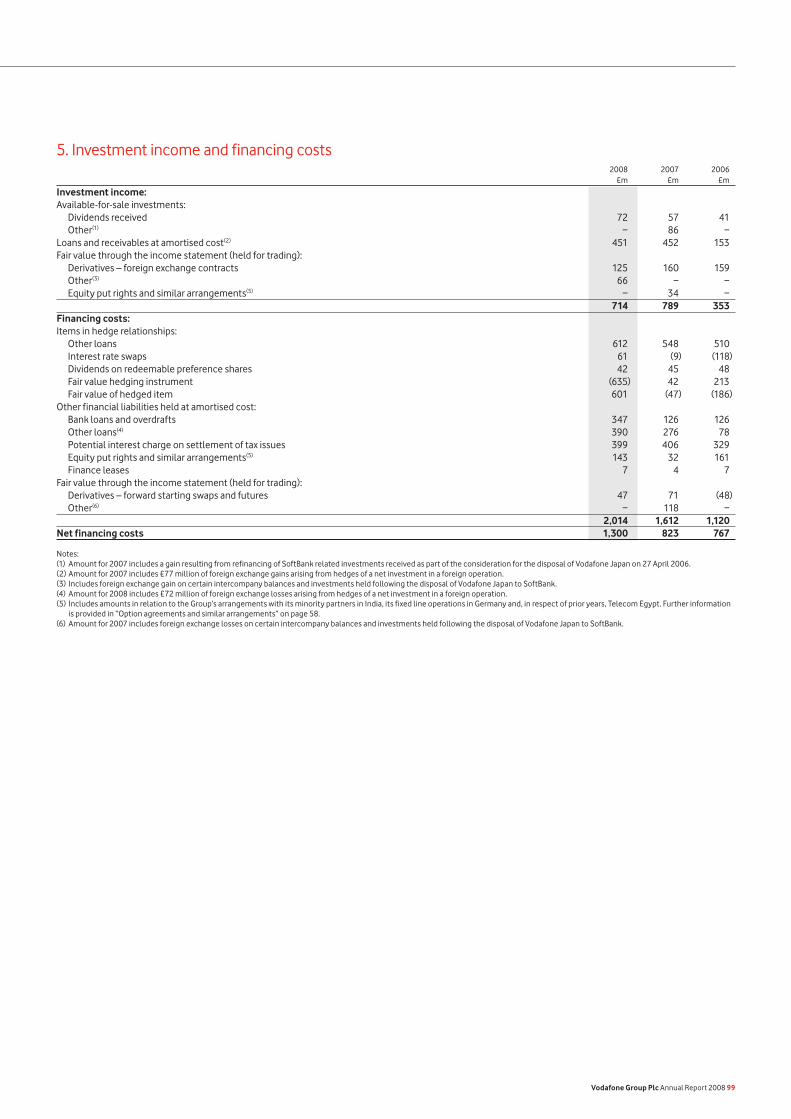
5. Investment income and financing costs 2008 2007 2006 £m £m £m
Investment income:Available-for-sale investments: Dividends received 72 57 41 Other(1) − 86 −Loans and receivables at amortised cost(2) 451 452 153Fair value through the income statement (held for trading): Derivatives – foreign exchange contracts 125 160 159 Other(3) 66 − − Equity put rights and similar arrangements(5) − 34 − 714 789 353Financing costs: Items in hedge relationships: Other loans 612 548 510 Interest rate swaps 61 (9) (118) Dividends on redeemable preference shares 42 45 48 Fair value hedging instrument (635) 42 213 Fair value of hedged item 601 (47) (186)Other financial liabilities held at amortised cost: Bank loans and overdrafts 347 126 126 Other loans(4) 390 276 78 Potential interest charge on settlement of tax issues 399 406 329 Equity put rights and similar arrangements(5) 143 32 161 Finance leases 7 4 7Fair value through the income statement (held for trading): Derivatives – forward starting swaps and futures 47 71 (48) Other(6) − 118 − 2,014 1,612 1,120Net financing costs 1,300 823 767
Notes:(1) Amount for 2007 includes a gain resulting from refinancing of SoftBank related investments received as part of the consideration for the disposal of Vodafone Japan on 27 April 2006. (2) Amount for 2007 includes £77 million of foreign exchange gains arising from hedges of a net investment in a foreign operation.(3) Includes foreign exchange gain on certain intercompany balances and investments held following the disposal of Vodafone Japan to SoftBank.(4) Amount for 2008 includes £72 million of foreign exchange losses arising from hedges of a net investment in a foreign operation.(5) Includes amounts in relation to the Group’s arrangements with its minority partners in India, its fixed line operations in Germany and, in respect of prior years, Telecom Egypt. Further information
is provided in “Option agreements and similar arrangements” on page 58. (6) Amount for 2007 includes foreign exchange losses on certain intercompany balances and investments held following the disposal of Vodafone Japan to SoftBank.
Vodafone Group Plc Annual Report 2008 99
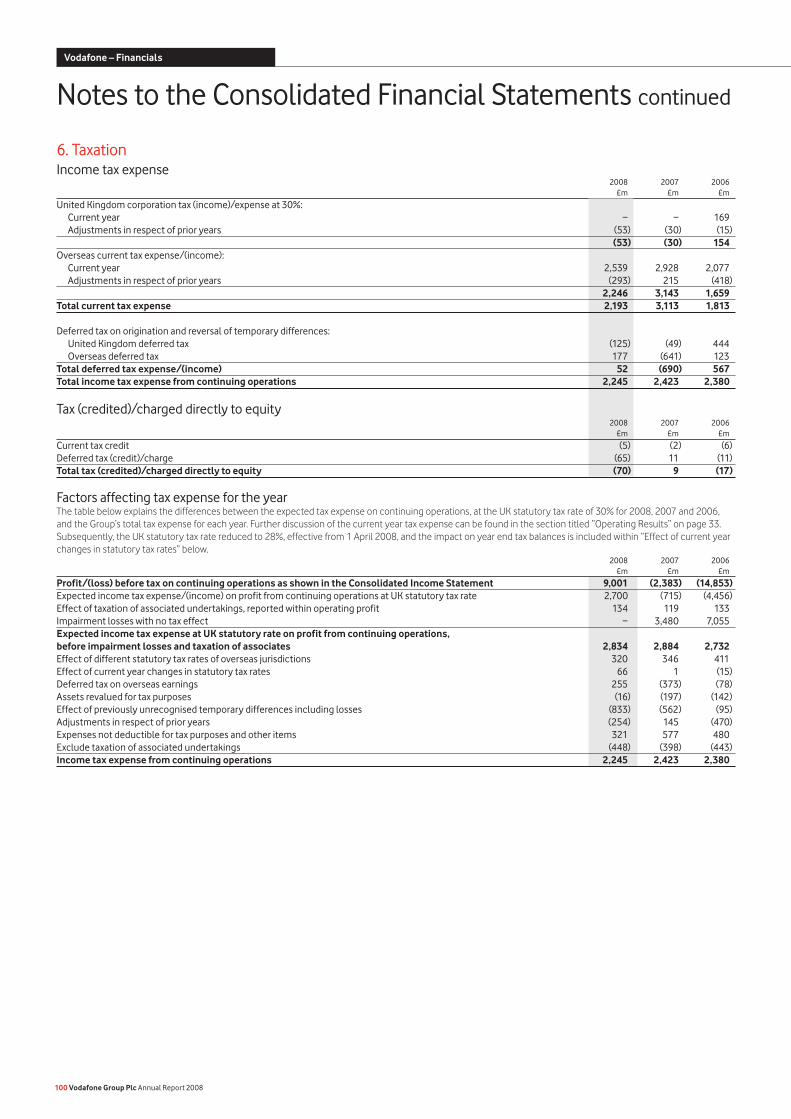
6. TaxationIncome tax expense 2008 2007 2006 £m £m £m
United Kingdom corporation tax (income)/expense at 30%: Current year − − 169 Adjustments in respect of prior years (53) (30) (15) (53) (30) 154Overseas current tax expense/(income): Current year 2,539 2,928 2,077 Adjustments in respect of prior years (293) 215 (418) 2,246 3,143 1,659Total current tax expense 2,193 3,113 1,813 Deferred tax on origination and reversal of temporary differences: United Kingdom deferred tax (125) (49) 444 Overseas deferred tax 177 (641) 123Total deferred tax expense/(income) 52 (690) 567Total income tax expense from continuing operations 2,245 2,423 2,380
Tax (credited)/charged directly to equity 2008 2007 2006 £m £m £m
Current tax credit (5) (2) (6)Deferred tax (credit)/charge (65) 11 (11)Total tax (credited)/charged directly to equity (70) 9 (17)
Factors affecting tax expense for the year The table below explains the differences between the expected tax expense on continuing operations, at the UK statutory tax rate of 30% for 2008, 2007 and 2006, and the Group’s total tax expense for each year. Further discussion of the current year tax expense can be found in the section titled “Operating Results” on page 33. Subsequently, the UK statutory tax rate reduced to 28%, effective from 1 April 2008, and the impact on year end tax balances is included within “Effect of current year changes in statutory tax rates” below. 2008 2007 2006 £m £m £m
Profit/(loss) before tax on continuing operations as shown in the Consolidated Income Statement 9,001 (2,383) (14,853)Expected income tax expense/(income) on profit from continuing operations at UK statutory tax rate 2,700 (715) (4,456)Effect of taxation of associated undertakings, reported within operating profit 134 119 133Impairment losses with no tax effect − 3,480 7,055Expected income tax expense at UK statutory rate on profit from continuing operations, before impairment losses and taxation of associates 2,834 2,884 2,732Effect of different statutory tax rates of overseas jurisdictions 320 346 411Effect of current year changes in statutory tax rates 66 1 (15)Deferred tax on overseas earnings 255 (373) (78)Assets revalued for tax purposes (16) (197) (142)Effect of previously unrecognised temporary differences including losses (833) (562) (95)Adjustments in respect of prior years (254) 145 (470)Expenses not deductible for tax purposes and other items 321 577 480Exclude taxation of associated undertakings (448) (398) (443)Income tax expense from continuing operations 2,245 2,423 2,380
100 Vodafone Group Plc Annual Report 2008
Notes to the Consolidated Financial Statements continued
Vodafone – Financials
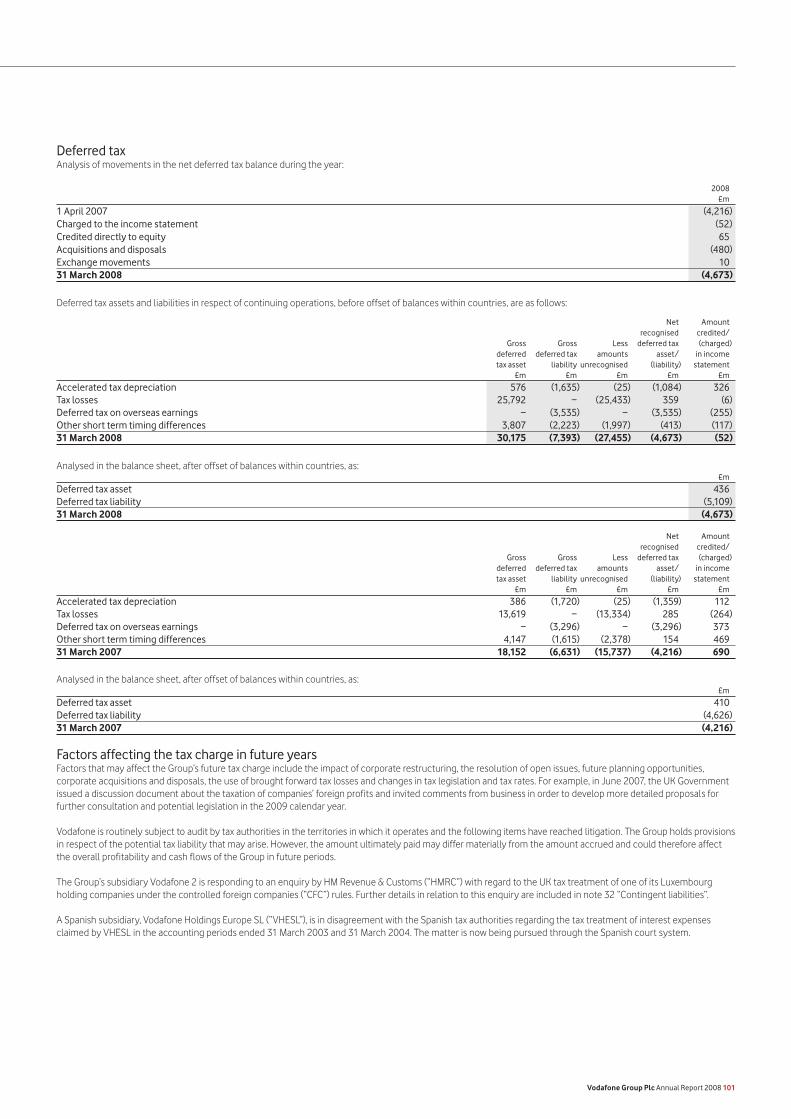
Deferred taxAnalysis of movements in the net deferred tax balance during the year:
2008 £m
1 April 2007 (4,216)Charged to the income statement (52)Credited directly to equity 65Acquisitions and disposals (480)Exchange movements 1031 March 2008 (4,673)
Deferred tax assets and liabilities in respect of continuing operations, before offset of balances within countries, are as follows:
Net Amount recognised credited/ Gross Gross Less deferred tax (charged) deferred deferred tax amounts asset/ in income tax asset liability unrecognised (liability) statement £m £m £m £m £m
Accelerated tax depreciation 576 (1,635) (25) (1,084) 326Tax losses 25,792 − (25,433) 359 (6)Deferred tax on overseas earnings − (3,535) − (3,535) (255)Other short term timing differences 3,807 (2,223) (1,997) (413) (117)31 March 2008 30,175 (7,393) (27,455) (4,673) (52)
Analysed in the balance sheet, after offset of balances within countries, as: £m
Deferred tax asset 436Deferred tax liability (5,109)31 March 2008 (4,673)
Net Amount recognised credited/ Gross Gross Less deferred tax (charged) deferred deferred tax amounts asset/ in income tax asset liability unrecognised (liability) statement £m £m £m £m £m
Accelerated tax depreciation 386 (1,720) (25) (1,359) 112Tax losses 13,619 − (13,334) 285 (264)Deferred tax on overseas earnings − (3,296) − (3,296) 373Other short term timing differences 4,147 (1,615) (2,378) 154 46931 March 2007 18,152 (6,631) (15,737) (4,216) 690 Analysed in the balance sheet, after offset of balances within countries, as: £m
Deferred tax asset 410Deferred tax liability (4,626)31 March 2007 (4,216)
Factors affecting the tax charge in future yearsFactors that may affect the Group’s future tax charge include the impact of corporate restructuring, the resolution of open issues, future planning opportunities, corporate acquisitions and disposals, the use of brought forward tax losses and changes in tax legislation and tax rates. For example, in June 2007, the UK Government issued a discussion document about the taxation of companies’ foreign profits and invited comments from business in order to develop more detailed proposals for further consultation and potential legislation in the 2009 calendar year.
Vodafone is routinely subject to audit by tax authorities in the territories in which it operates and the following items have reached litigation. The Group holds provisions in respect of the potential tax liability that may arise. However, the amount ultimately paid may differ materially from the amount accrued and could therefore affect the overall profitability and cash flows of the Group in future periods.
The Group’s subsidiary Vodafone 2 is responding to an enquiry by HM Revenue & Customs (“HMRC”) with regard to the UK tax treatment of one of its Luxembourg holding companies under the controlled foreign companies (“CFC”) rules. Further details in relation to this enquiry are included in note 32 “Contingent liabilities”.
A Spanish subsidiary, Vodafone Holdings Europe SL (“VHESL”), is in disagreement with the Spanish tax authorities regarding the tax treatment of interest expenses claimed by VHESL in the accounting periods ended 31 March 2003 and 31 March 2004. The matter is now being pursued through the Spanish court system.
Vodafone Group Plc Annual Report 2008 101
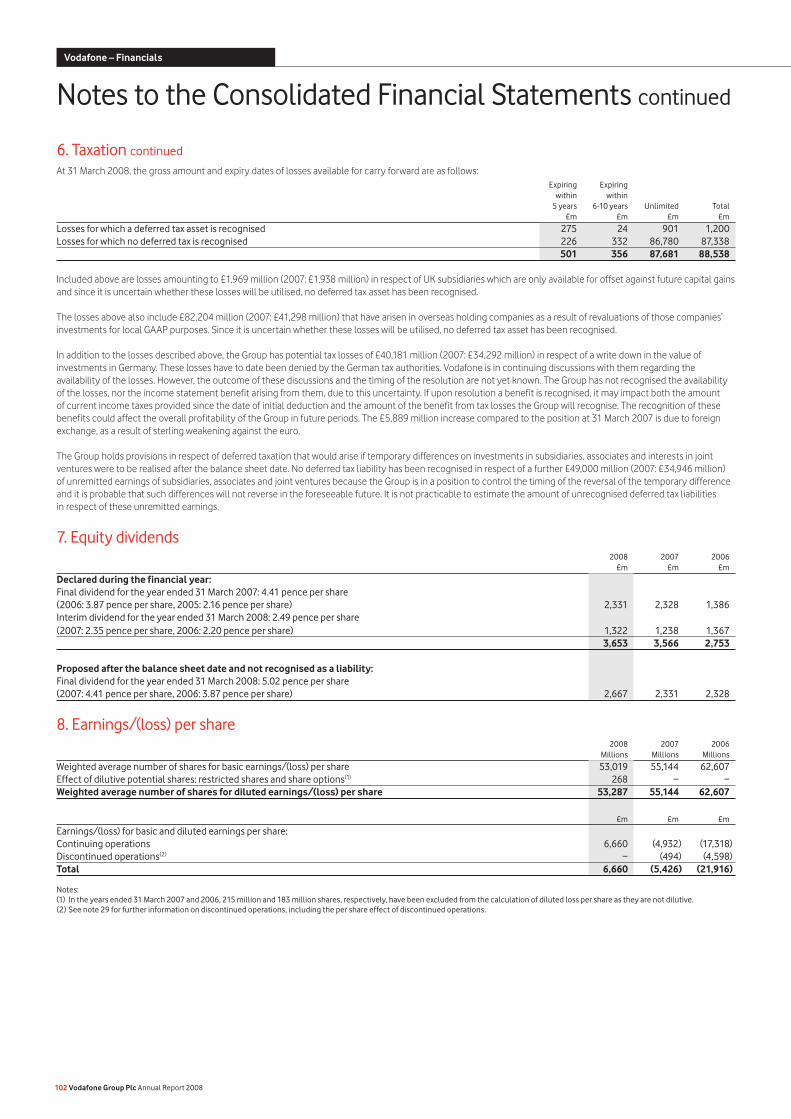
6. Taxation continued At 31 March 2008, the gross amount and expiry dates of losses available for carry forward are as follows: Expiring Expiring within within 5 years 6-10 years Unlimited Total £m £m £m £m
Losses for which a deferred tax asset is recognised 275 24 901 1,200Losses for which no deferred tax is recognised 226 332 86,780 87,338 501 356 87,681 88,538
Included above are losses amounting to £1,969 million (2007: £1,938 million) in respect of UK subsidiaries which are only available for offset against future capital gains and since it is uncertain whether these losses will be utilised, no deferred tax asset has been recognised.
The losses above also include £82,204 million (2007: £41,298 million) that have arisen in overseas holding companies as a result of revaluations of those companies’ investments for local GAAP purposes. Since it is uncertain whether these losses will be utilised, no deferred tax asset has been recognised.
In addition to the losses described above, the Group has potential tax losses of £40,181 million (2007: £34,292 million) in respect of a write down in the value of investments in Germany. These losses have to date been denied by the German tax authorities. Vodafone is in continuing discussions with them regarding the availability of the losses. However, the outcome of these discussions and the timing of the resolution are not yet known. The Group has not recognised the availability of the losses, nor the income statement benefit arising from them, due to this uncertainty. If upon resolution a benefit is recognised, it may impact both the amount of current income taxes provided since the date of initial deduction and the amount of the benefit from tax losses the Group will recognise. The recognition of these benefits could affect the overall profitability of the Group in future periods. The £5,889 million increase compared to the position at 31 March 2007 is due to foreign exchange, as a result of sterling weakening against the euro.
The Group holds provisions in respect of deferred taxation that would arise if temporary differences on investments in subsidiaries, associates and interests in joint ventures were to be realised after the balance sheet date. No deferred tax liability has been recognised in respect of a further £49,000 million (2007: £34,946 million) of unremitted earnings of subsidiaries, associates and joint ventures because the Group is in a position to control the timing of the reversal of the temporary difference and it is probable that such differences will not reverse in the foreseeable future. It is not practicable to estimate the amount of unrecognised deferred tax liabilities in respect of these unremitted earnings.
7. Equity dividends 2008 2007 2006 £m £m £m
Declared during the financial year: Final dividend for the year ended 31 March 2007: 4.41 pence per share (2006: 3.87 pence per share, 2005: 2.16 pence per share) 2,331 2,328 1,386Interim dividend for the year ended 31 March 2008: 2.49 pence per share (2007: 2.35 pence per share, 2006: 2.20 pence per share) 1,322 1,238 1,367 3,653 3,566 2,753 Proposed after the balance sheet date and not recognised as a liability: Final dividend for the year ended 31 March 2008: 5.02 pence per share (2007: 4.41 pence per share, 2006: 3.87 pence per share) 2,667 2,331 2,328
8. Earnings/(loss) per share 2008 2007 2006 Millions Millions Millions
Weighted average number of shares for basic earnings/(loss) per share 53,019 55,144 62,607Effect of dilutive potential shares: restricted shares and share options(1) 268 − −Weighted average number of shares for diluted earnings/(loss) per share 53,287 55,144 62,607
£m £m £m
Earnings/(loss) for basic and diluted earnings per share: Continuing operations 6,660 (4,932) (17,318)Discontinued operations(2) − (494) (4,598)Total 6,660 (5,426) (21,916)
Notes:(1) In the years ended 31 March 2007 and 2006, 215 million and 183 million shares, respectively, have been excluded from the calculation of diluted loss per share as they are not dilutive. (2) See note 29 for further information on discontinued operations, including the per share effect of discontinued operations.
102 Vodafone Group Plc Annual Report 2008
Notes to the Consolidated Financial Statements continued
Vodafone – Financials
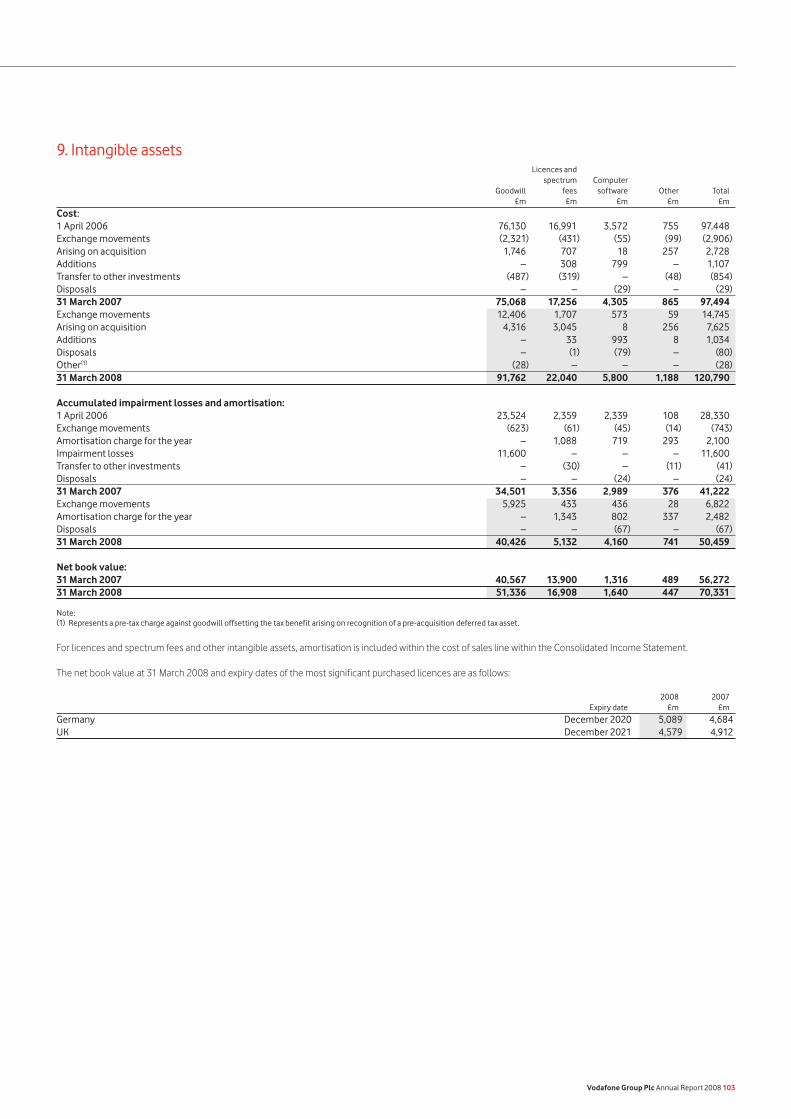
9. Intangible assets Licences and spectrum Computer Goodwill fees software Other Total £m £m £m £m £m
Cost: 1 April 2006 76,130 16,991 3,572 755 97,448Exchange movements (2,321) (431) (55) (99) (2,906)Arising on acquisition 1,746 707 18 257 2,728Additions – 308 799 – 1,107Transfer to other investments (487) (319) – (48) (854)Disposals – – (29) – (29)31 March 2007 75,068 17,256 4,305 865 97,494Exchange movements 12,406 1,707 573 59 14,745Arising on acquisition 4,316 3,045 8 256 7,625Additions – 33 993 8 1,034Disposals – (1) (79) – (80)Other(1) (28) – – – (28)31 March 2008 91,762 22,040 5,800 1,188 120,790 Accumulated impairment losses and amortisation: 1 April 2006 23,524 2,359 2,339 108 28,330Exchange movements (623) (61) (45) (14) (743)Amortisation charge for the year – 1,088 719 293 2,100Impairment losses 11,600 – – – 11,600Transfer to other investments – (30) – (11) (41)Disposals – – (24) – (24)31 March 2007 34,501 3,356 2,989 376 41,222Exchange movements 5,925 433 436 28 6,822Amortisation charge for the year – 1,343 802 337 2,482Disposals – – (67) – (67)31 March 2008 40,426 5,132 4,160 741 50,459 Net book value: 31 March 2007 40,567 13,900 1,316 489 56,27231 March 2008 51,336 16,908 1,640 447 70,331
Note:(1) Represents a pre-tax charge against goodwill offsetting the tax benefit arising on recognition of a pre-acquisition deferred tax asset.
For licences and spectrum fees and other intangible assets, amortisation is included within the cost of sales line within the Consolidated Income Statement.
The net book value at 31 March 2008 and expiry dates of the most significant purchased licences are as follows:
2008 2007 Expiry date £m £m
Germany December 2020 5,089 4,684UK December 2021 4,579 4,912
Vodafone Group Plc Annual Report 2008 103
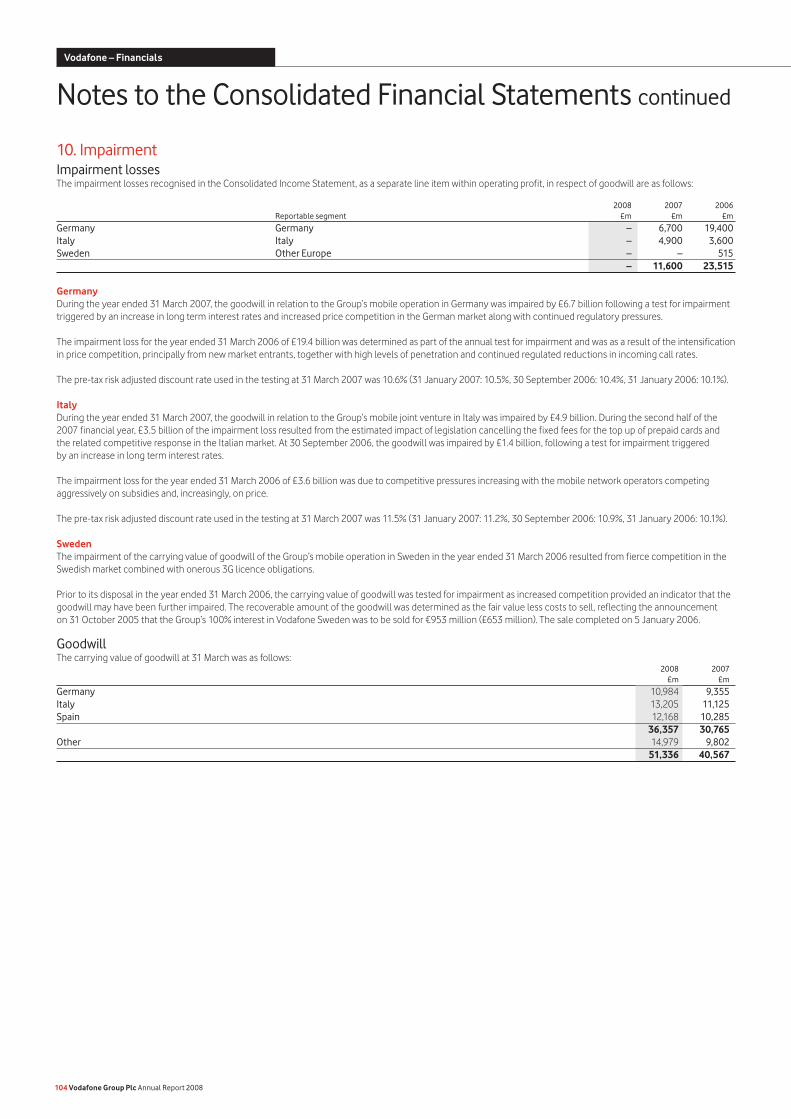
10. ImpairmentImpairment lossesThe impairment losses recognised in the Consolidated Income Statement, as a separate line item within operating profit, in respect of goodwill are as follows:
2008 2007 2006 Reportable segment £m £m £m
Germany Germany – 6,700 19,400Italy Italy – 4,900 3,600Sweden Other Europe – – 515 – 11,600 23,515
Germany During the year ended 31 March 2007, the goodwill in relation to the Group’s mobile operation in Germany was impaired by £6.7 billion following a test for impairment triggered by an increase in long term interest rates and increased price competition in the German market along with continued regulatory pressures.
The impairment loss for the year ended 31 March 2006 of £19.4 billion was determined as part of the annual test for impairment and was as a result of the intensification in price competition, principally from new market entrants, together with high levels of penetration and continued regulated reductions in incoming call rates.
The pre-tax risk adjusted discount rate used in the testing at 31 March 2007 was 10.6% (31 January 2007: 10.5%, 30 September 2006: 10.4%, 31 January 2006: 10.1%).
ItalyDuring the year ended 31 March 2007, the goodwill in relation to the Group’s mobile joint venture in Italy was impaired by £4.9 billion. During the second half of the 2007 financial year, £3.5 billion of the impairment loss resulted from the estimated impact of legislation cancelling the fixed fees for the top up of prepaid cards and the related competitive response in the Italian market. At 30 September 2006, the goodwill was impaired by £1.4 billion, following a test for impairment triggered by an increase in long term interest rates.
The impairment loss for the year ended 31 March 2006 of £3.6 billion was due to competitive pressures increasing with the mobile network operators competing aggressively on subsidies and, increasingly, on price.
The pre-tax risk adjusted discount rate used in the testing at 31 March 2007 was 11.5% (31 January 2007: 11.2%, 30 September 2006: 10.9%, 31 January 2006: 10.1%).
SwedenThe impairment of the carrying value of goodwill of the Group’s mobile operation in Sweden in the year ended 31 March 2006 resulted from fierce competition in the Swedish market combined with onerous 3G licence obligations.
Prior to its disposal in the year ended 31 March 2006, the carrying value of goodwill was tested for impairment as increased competition provided an indicator that the goodwill may have been further impaired. The recoverable amount of the goodwill was determined as the fair value less costs to sell, reflecting the announcement on 31 October 2005 that the Group’s 100% interest in Vodafone Sweden was to be sold for €953 million (£653 million). The sale completed on 5 January 2006.
GoodwillThe carrying value of goodwill at 31 March was as follows: 2008 2007 £m £m
Germany 10,984 9,355Italy 13,205 11,125Spain 12,168 10,285 36,357 30,765Other 14,979 9,802 51,336 40,567
104 Vodafone Group Plc Annual Report 2008
Notes to the Consolidated Financial Statements continued
Vodafone – Financials
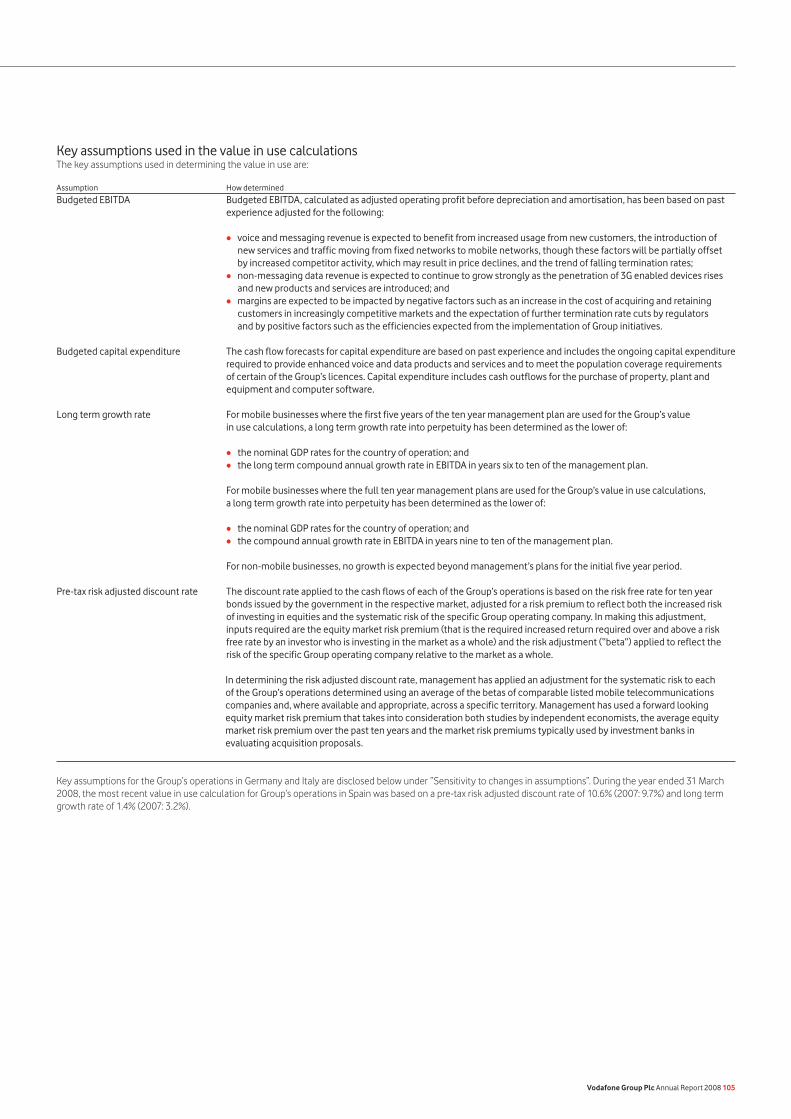
Key assumptions used in the value in use calculationsThe key assumptions used in determining the value in use are:
Assumption How determined
Budgeted EBITDA Budgeted EBITDA, calculated as adjusted operating profit before depreciation and amortisation, has been based on past experience adjusted for the following:
• voice and messaging revenue is expected to benefit from increased usage from new customers, the introduction of new services and traffic moving from fixed networks to mobile networks, though these factors will be partially offset by increased competitor activity, which may result in price declines, and the trend of falling termination rates;
• non-messaging data revenue is expected to continue to grow strongly as the penetration of 3G enabled devices rises and new products and services are introduced; and
• margins are expected to be impacted by negative factors such as an increase in the cost of acquiring and retaining customers in increasingly competitive markets and the expectation of further termination rate cuts by regulators and by positive factors such as the efficiencies expected from the implementation of Group initiatives.
Budgeted capital expenditure The cash flow forecasts for capital expenditure are based on past experience and includes the ongoing capital expenditure required to provide enhanced voice and data products and services and to meet the population coverage requirements of certain of the Group’s licences. Capital expenditure includes cash outflows for the purchase of property, plant and equipment and computer software.
Long term growth rate For mobile businesses where the first five years of the ten year management plan are used for the Group’s value in use calculations, a long term growth rate into perpetuity has been determined as the lower of:
• the nominal GDP rates for the country of operation; and • the long term compound annual growth rate in EBITDA in years six to ten of the management plan.
For mobile businesses where the full ten year management plans are used for the Group’s value in use calculations, a long term growth rate into perpetuity has been determined as the lower of:
• the nominal GDP rates for the country of operation; and • the compound annual growth rate in EBITDA in years nine to ten of the management plan.
For non-mobile businesses, no growth is expected beyond management’s plans for the initial five year period.
Pre-tax risk adjusted discount rate The discount rate applied to the cash flows of each of the Group’s operations is based on the risk free rate for ten year bonds issued by the government in the respective market, adjusted for a risk premium to reflect both the increased risk of investing in equities and the systematic risk of the specific Group operating company. In making this adjustment, inputs required are the equity market risk premium (that is the required increased return required over and above a risk free rate by an investor who is investing in the market as a whole) and the risk adjustment (“beta”) applied to reflect the risk of the specific Group operating company relative to the market as a whole.
In determining the risk adjusted discount rate, management has applied an adjustment for the systematic risk to each of the Group’s operations determined using an average of the betas of comparable listed mobile telecommunications companies and, where available and appropriate, across a specific territory. Management has used a forward looking equity market risk premium that takes into consideration both studies by independent economists, the average equity market risk premium over the past ten years and the market risk premiums typically used by investment banks in evaluating acquisition proposals.
Key assumptions for the Group’s operations in Germany and Italy are disclosed below under “Sensitivity to changes in assumptions”. During the year ended 31 March 2008, the most recent value in use calculation for Group’s operations in Spain was based on a pre-tax risk adjusted discount rate of 10.6% (2007: 9.7%) and long term growth rate of 1.4% (2007: 3.2%).
Vodafone Group Plc Annual Report 2008 105
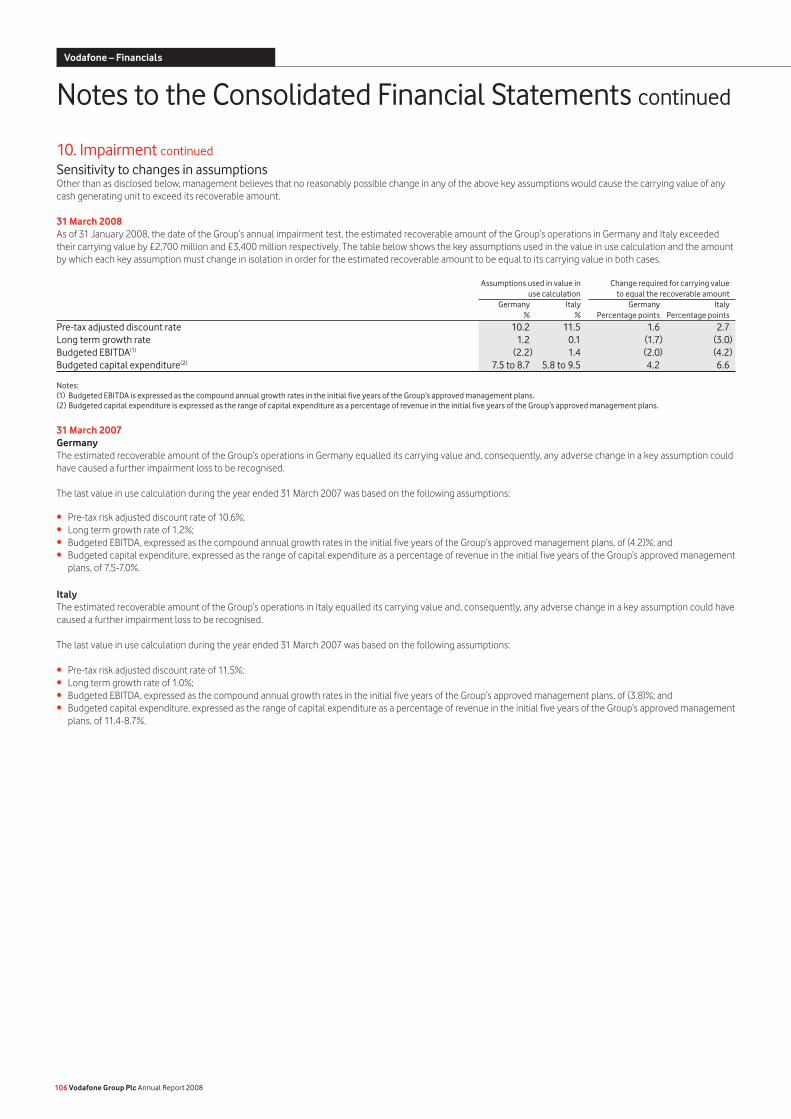
10. Impairment continued
Sensitivity to changes in assumptionsOther than as disclosed below, management believes that no reasonably possible change in any of the above key assumptions would cause the carrying value of any cash generating unit to exceed its recoverable amount.
31 March 2008As of 31 January 2008, the date of the Group’s annual impairment test, the estimated recoverable amount of the Group’s operations in Germany and Italy exceeded their carrying value by £2,700 million and £3,400 million respectively. The table below shows the key assumptions used in the value in use calculation and the amount by which each key assumption must change in isolation in order for the estimated recoverable amount to be equal to its carrying value in both cases.
Assumptions used in value in Change required for carrying value use calculation to equal the recoverable amount Germany Italy Germany Italy % % Percentage points Percentage points
Pre-tax adjusted discount rate 10.2 11.5 1.6 2.7Long term growth rate 1.2 0.1 (1.7) (3.0)Budgeted EBITDA(1) (2.2) 1.4 (2.0) (4.2)Budgeted capital expenditure(2) 7.5 to 8.7 5.8 to 9.5 4.2 6.6
Notes:(1) Budgeted EBITDA is expressed as the compound annual growth rates in the initial five years of the Group’s approved management plans.(2) Budgeted capital expenditure is expressed as the range of capital expenditure as a percentage of revenue in the initial five years of the Group’s approved management plans.
31 March 2007Germany The estimated recoverable amount of the Group’s operations in Germany equalled its carrying value and, consequently, any adverse change in a key assumption could have caused a further impairment loss to be recognised.
The last value in use calculation during the year ended 31 March 2007 was based on the following assumptions:
Pre-tax risk adjusted discount rate of 10.6%;Long term growth rate of 1.2%;Budgeted EBITDA, expressed as the compound annual growth rates in the initial five years of the Group’s approved management plans, of (4.2)%; andBudgeted capital expenditure, expressed as the range of capital expenditure as a percentage of revenue in the initial five years of the Group’s approved management plans, of 7.5-7.0%.
ItalyThe estimated recoverable amount of the Group’s operations in Italy equalled its carrying value and, consequently, any adverse change in a key assumption could have caused a further impairment loss to be recognised.
The last value in use calculation during the year ended 31 March 2007 was based on the following assumptions:
Pre-tax risk adjusted discount rate of 11.5%;Long term growth rate of 1.0%;Budgeted EBITDA, expressed as the compound annual growth rates in the initial five years of the Group’s approved management plans, of (3.8)%; andBudgeted capital expenditure, expressed as the range of capital expenditure as a percentage of revenue in the initial five years of the Group’s approved management plans, of 11.4-8.7%.
••••
••••
106 Vodafone Group Plc Annual Report 2008
Notes to the Consolidated Financial Statements continued
Vodafone – Financials
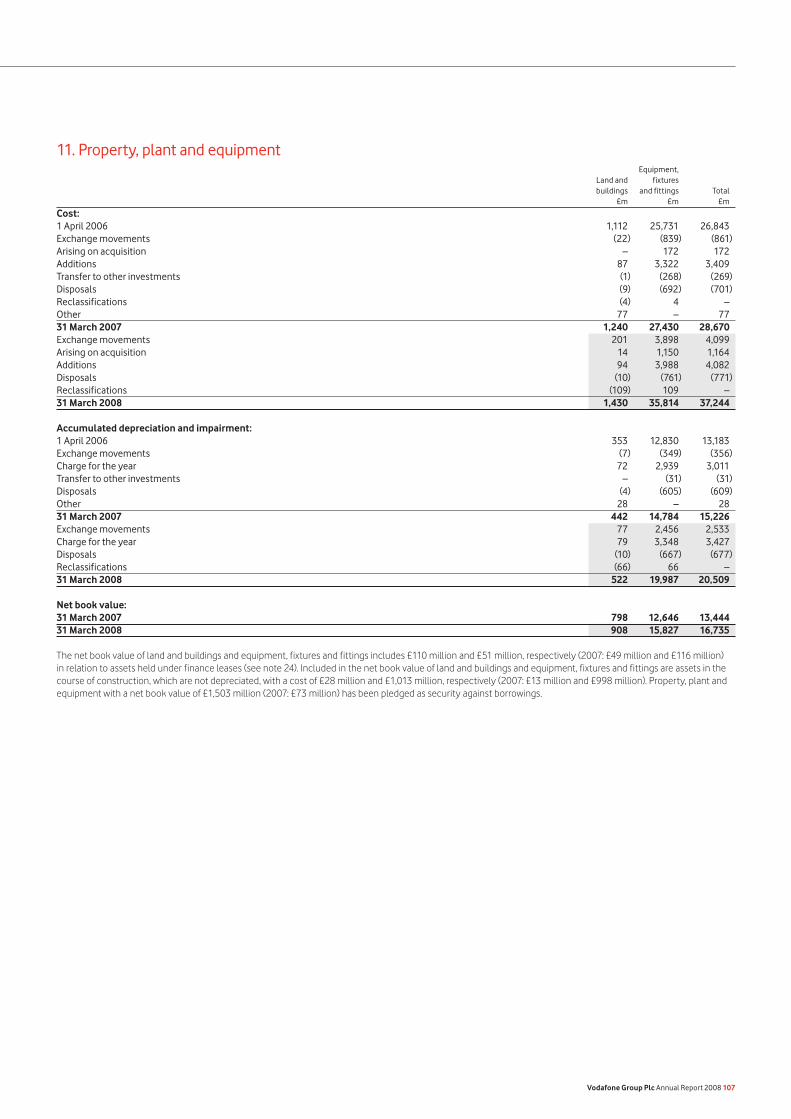
11. Property, plant and equipment Equipment, Land and fixtures buildings and fittings Total £m £m £m
Cost: 1 April 2006 1,112 25,731 26,843Exchange movements (22) (839) (861)Arising on acquisition – 172 172Additions 87 3,322 3,409Transfer to other investments (1) (268) (269)Disposals (9) (692) (701)Reclassifications (4) 4 –Other 77 – 7731 March 2007 1,240 27,430 28,670Exchange movements 201 3,898 4,099Arising on acquisition 14 1,150 1,164Additions 94 3,988 4,082Disposals (10) (761) (771)Reclassifications (109) 109 –31 March 2008 1,430 35,814 37,244 Accumulated depreciation and impairment: 1 April 2006 353 12,830 13,183Exchange movements (7) (349) (356)Charge for the year 72 2,939 3,011Transfer to other investments – (31) (31)Disposals (4) (605) (609)Other 28 – 2831 March 2007 442 14,784 15,226Exchange movements 77 2,456 2,533Charge for the year 79 3,348 3,427Disposals (10) (667) (677)Reclassifications (66) 66 –31 March 2008 522 19,987 20,509 Net book value: 31 March 2007 798 12,646 13,44431 March 2008 908 15,827 16,735
The net book value of land and buildings and equipment, fixtures and fittings includes £110 million and £51 million, respectively (2007: £49 million and £116 million) in relation to assets held under finance leases (see note 24). Included in the net book value of land and buildings and equipment, fixtures and fittings are assets in the course of construction, which are not depreciated, with a cost of £28 million and £1,013 million, respectively (2007: £13 million and £998 million). Property, plant and equipment with a net book value of £1,503 million (2007: £73 million) has been pledged as security against borrowings.
Vodafone Group Plc Annual Report 2008 107
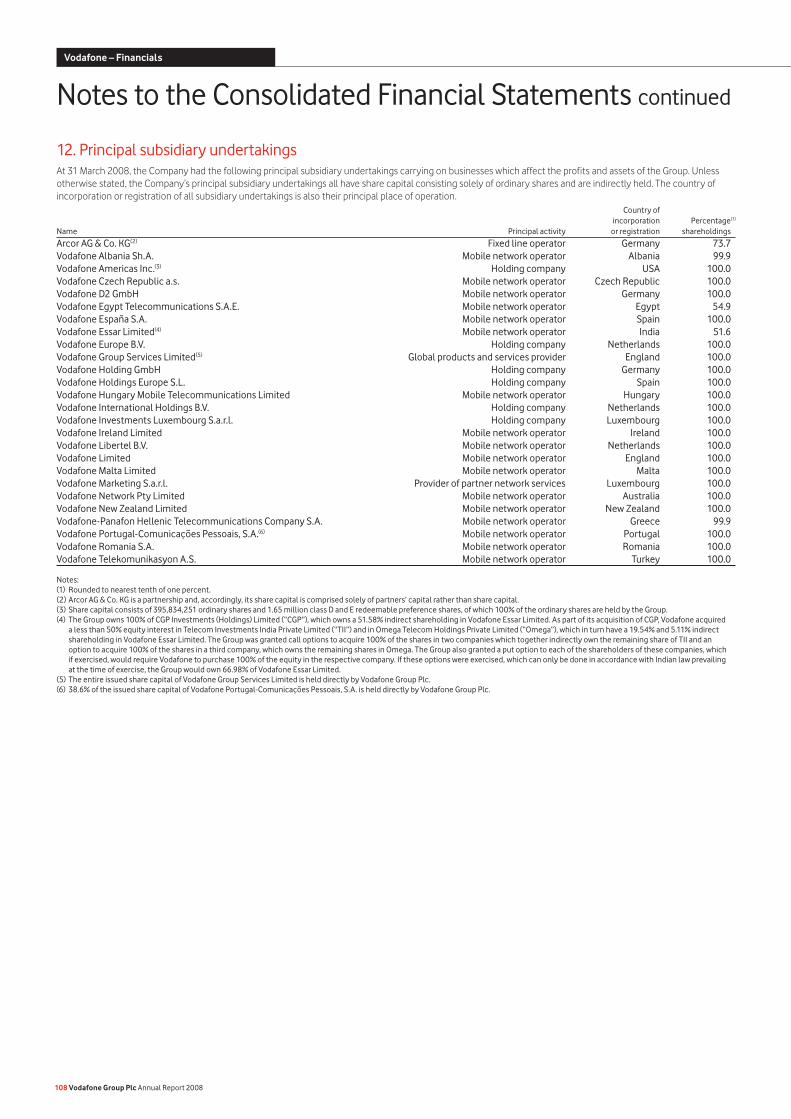
12. Principal subsidiary undertakingsAt 31 March 2008, the Company had the following principal subsidiary undertakings carrying on businesses which affect the profits and assets of the Group. Unless otherwise stated, the Company’s principal subsidiary undertakings all have share capital consisting solely of ordinary shares and are indirectly held. The country of incorporation or registration of all subsidiary undertakings is also their principal place of operation. Country of incorporation Percentage(1) Name Principal activity or registration shareholdings
Arcor AG & Co. KG(2) Fixed line operator Germany 73.7Vodafone Albania Sh.A. Mobile network operator Albania 99.9Vodafone Americas Inc.(3) Holding company USA 100.0Vodafone Czech Republic a.s. Mobile network operator Czech Republic 100.0Vodafone D2 GmbH Mobile network operator Germany 100.0Vodafone Egypt Telecommunications S.A.E. Mobile network operator Egypt 54.9Vodafone España S.A. Mobile network operator Spain 100.0Vodafone Essar Limited(4) Mobile network operator India 51.6Vodafone Europe B.V. Holding company Netherlands 100.0Vodafone Group Services Limited(5) Global products and services provider England 100.0Vodafone Holding GmbH Holding company Germany 100.0Vodafone Holdings Europe S.L. Holding company Spain 100.0Vodafone Hungary Mobile Telecommunications Limited Mobile network operator Hungary 100.0Vodafone International Holdings B.V. Holding company Netherlands 100.0Vodafone Investments Luxembourg S.a.r.l. Holding company Luxembourg 100.0Vodafone Ireland Limited Mobile network operator Ireland 100.0Vodafone Libertel B.V. Mobile network operator Netherlands 100.0Vodafone Limited Mobile network operator England 100.0Vodafone Malta Limited Mobile network operator Malta 100.0Vodafone Marketing S.a.r.l. Provider of partner network services Luxembourg 100.0Vodafone Network Pty Limited Mobile network operator Australia 100.0Vodafone New Zealand Limited Mobile network operator New Zealand 100.0Vodafone-Panafon Hellenic Telecommunications Company S.A. Mobile network operator Greece 99.9Vodafone Portugal-Comunicações Pessoais, S.A.(6) Mobile network operator Portugal 100.0Vodafone Romania S.A. Mobile network operator Romania 100.0Vodafone Telekomunikasyon A.S. Mobile network operator Turkey 100.0
Notes:(1) Rounded to nearest tenth of one percent.(2) Arcor AG & Co. KG is a partnership and, accordingly, its share capital is comprised solely of partners’ capital rather than share capital.(3) Share capital consists of 395,834,251 ordinary shares and 1.65 million class D and E redeemable preference shares, of which 100% of the ordinary shares are held by the Group.(4) The Group owns 100% of CGP Investments (Holdings) Limited (“CGP”), which owns a 51.58% indirect shareholding in Vodafone Essar Limited. As part of its acquisition of CGP, Vodafone acquired
a less than 50% equity interest in Telecom Investments India Private Limited (“TII”) and in Omega Telecom Holdings Private Limited (“Omega”), which in turn have a 19.54% and 5.11% indirect shareholding in Vodafone Essar Limited. The Group was granted call options to acquire 100% of the shares in two companies which together indirectly own the remaining share of TII and an option to acquire 100% of the shares in a third company, which owns the remaining shares in Omega. The Group also granted a put option to each of the shareholders of these companies, which if exercised, would require Vodafone to purchase 100% of the equity in the respective company. If these options were exercised, which can only be done in accordance with Indian law prevailing at the time of exercise, the Group would own 66.98% of Vodafone Essar Limited.
(5) The entire issued share capital of Vodafone Group Services Limited is held directly by Vodafone Group Plc.(6) 38.6% of the issued share capital of Vodafone Portugal-Comunicações Pessoais, S.A. is held directly by Vodafone Group Plc.
108 Vodafone Group Plc Annual Report 2008
Notes to the Consolidated Financial Statements continued
Vodafone – Financials
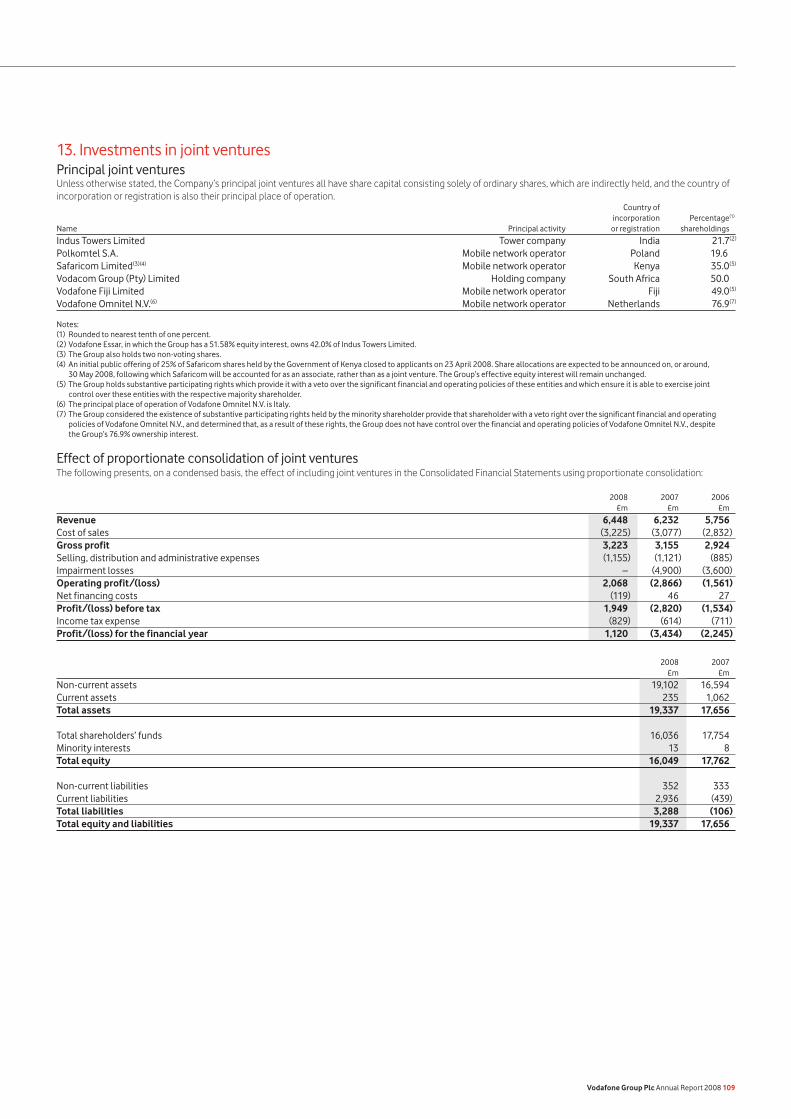
13. Investments in joint venturesPrincipal joint venturesUnless otherwise stated, the Company’s principal joint ventures all have share capital consisting solely of ordinary shares, which are indirectly held, and the country of incorporation or registration is also their principal place of operation. Country of incorporation Percentage(1)
Name Principal activity or registration shareholdings
Indus Towers Limited Tower company India 21.7(2)
Polkomtel S.A. Mobile network operator Poland 19.6Safaricom Limited(3)(4) Mobile network operator Kenya 35.0(5)
Vodacom Group (Pty) Limited Holding company South Africa 50.0Vodafone Fiji Limited Mobile network operator Fiji 49.0(5)
Vodafone Omnitel N.V.(6) Mobile network operator Netherlands 76.9(7)
Notes:(1) Rounded to nearest tenth of one percent.(2) Vodafone Essar, in which the Group has a 51.58% equity interest, owns 42.0% of Indus Towers Limited.(3) The Group also holds two non-voting shares.(4) An initial public offering of 25% of Safaricom shares held by the Government of Kenya closed to applicants on 23 April 2008. Share allocations are expected to be announced on, or around,
30 May 2008, following which Safaricom will be accounted for as an associate, rather than as a joint venture. The Group’s effective equity interest will remain unchanged. (5) The Group holds substantive participating rights which provide it with a veto over the significant financial and operating policies of these entities and which ensure it is able to exercise joint
control over these entities with the respective majority shareholder.(6) The principal place of operation of Vodafone Omnitel N.V. is Italy.(7) The Group considered the existence of substantive participating rights held by the minority shareholder provide that shareholder with a veto right over the significant financial and operating
policies of Vodafone Omnitel N.V., and determined that, as a result of these rights, the Group does not have control over the financial and operating policies of Vodafone Omnitel N.V., despite the Group’s 76.9% ownership interest.
Effect of proportionate consolidation of joint venturesThe following presents, on a condensed basis, the effect of including joint ventures in the Consolidated Financial Statements using proportionate consolidation:
2008 2007 2006 £m £m £m
Revenue 6,448 6,232 5,756Cost of sales (3,225) (3,077) (2,832)Gross profit 3,223 3,155 2,924Selling, distribution and administrative expenses (1,155) (1,121) (885)Impairment losses – (4,900) (3,600)Operating profit/(loss) 2,068 (2,866) (1,561)Net financing costs (119) 46 27Profit/(loss) before tax 1,949 (2,820) (1,534)Income tax expense (829) (614) (711)Profit/(loss) for the financial year 1,120 (3,434) (2,245)
2008 2007 £m £m
Non-current assets 19,102 16,594Current assets 235 1,062Total assets 19,337 17,656
Total shareholders’ funds 16,036 17,754Minority interests 13 8Total equity 16,049 17,762
Non-current liabilities 352 333Current liabilities 2,936 (439)Total liabilities 3,288 (106)Total equity and liabilities 19,337 17,656
Vodafone Group Plc Annual Report 2008 109
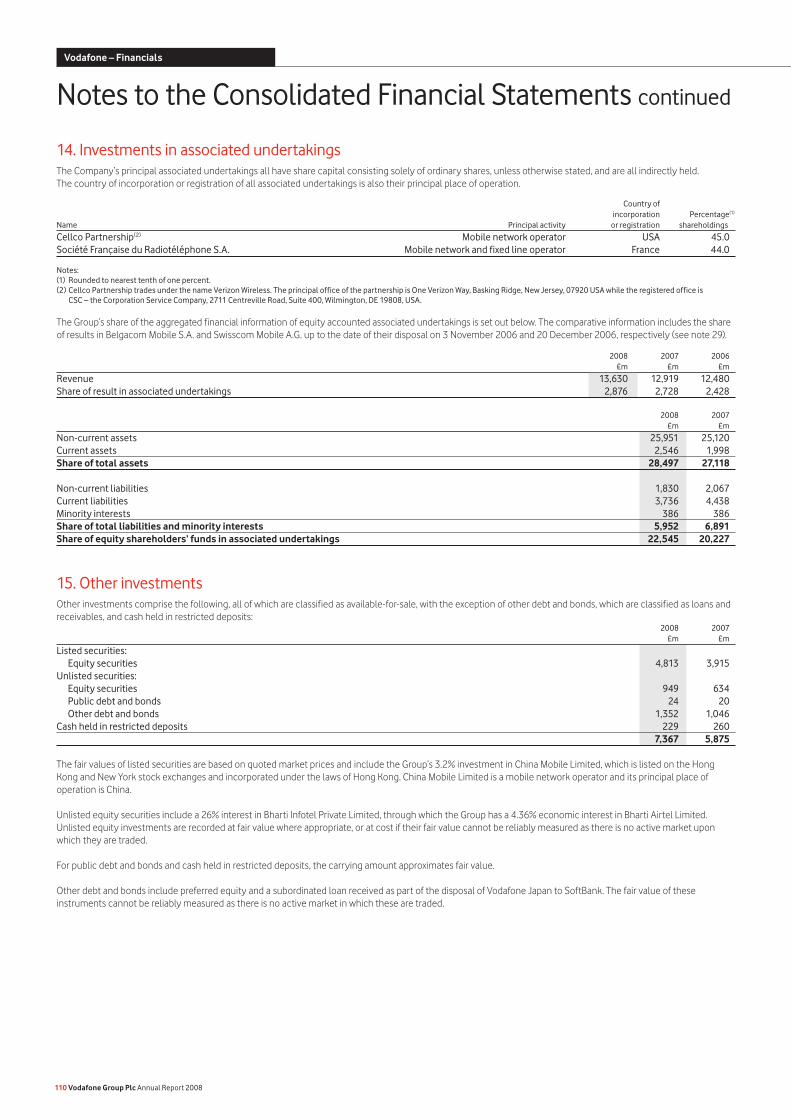
14. Investments in associated undertakingsThe Company’s principal associated undertakings all have share capital consisting solely of ordinary shares, unless otherwise stated, and are all indirectly held. The country of incorporation or registration of all associated undertakings is also their principal place of operation.
Country of incorporation Percentage(1)
Name Principal activity or registration shareholdings
Cellco Partnership(2) Mobile network operator USA 45.0Société Française du Radiotéléphone S.A. Mobile network and fixed line operator France 44.0
Notes:(1) Rounded to nearest tenth of one percent.(2) Cellco Partnership trades under the name Verizon Wireless. The principal office of the partnership is One Verizon Way, Basking Ridge, New Jersey, 07920 USA while the registered office is
CSC – the Corporation Service Company, 2711 Centreville Road, Suite 400, Wilmington, DE 19808, USA.
The Group’s share of the aggregated financial information of equity accounted associated undertakings is set out below. The comparative information includes the share of results in Belgacom Mobile S.A. and Swisscom Mobile A.G. up to the date of their disposal on 3 November 2006 and 20 December 2006, respectively (see note 29).
2008 2007 2006 £m £m £m
Revenue 13,630 12,919 12,480Share of result in associated undertakings 2,876 2,728 2,428
2008 2007 £m £m
Non-current assets 25,951 25,120Current assets 2,546 1,998Share of total assets 28,497 27,118
Non-current liabilities 1,830 2,067Current liabilities 3,736 4,438Minority interests 386 386Share of total liabilities and minority interests 5,952 6,891Share of equity shareholders’ funds in associated undertakings 22,545 20,227
15. Other investmentsOther investments comprise the following, all of which are classified as available-for-sale, with the exception of other debt and bonds, which are classified as loans and receivables, and cash held in restricted deposits: 2008 2007 £m £m
Listed securities: Equity securities 4,813 3,915Unlisted securities: Equity securities 949 634 Public debt and bonds 24 20 Other debt and bonds 1,352 1,046Cash held in restricted deposits 229 260 7,367 5,875
The fair values of listed securities are based on quoted market prices and include the Group’s 3.2% investment in China Mobile Limited, which is listed on the Hong Kong and New York stock exchanges and incorporated under the laws of Hong Kong. China Mobile Limited is a mobile network operator and its principal place of operation is China.
Unlisted equity securities include a 26% interest in Bharti Infotel Private Limited, through which the Group has a 4.36% economic interest in Bharti Airtel Limited. Unlisted equity investments are recorded at fair value where appropriate, or at cost if their fair value cannot be reliably measured as there is no active market upon which they are traded.
For public debt and bonds and cash held in restricted deposits, the carrying amount approximates fair value.
Other debt and bonds include preferred equity and a subordinated loan received as part of the disposal of Vodafone Japan to SoftBank. The fair value of these instruments cannot be reliably measured as there is no active market in which these are traded.
110 Vodafone Group Plc Annual Report 2008
Notes to the Consolidated Financial Statements continued
Vodafone – Financials
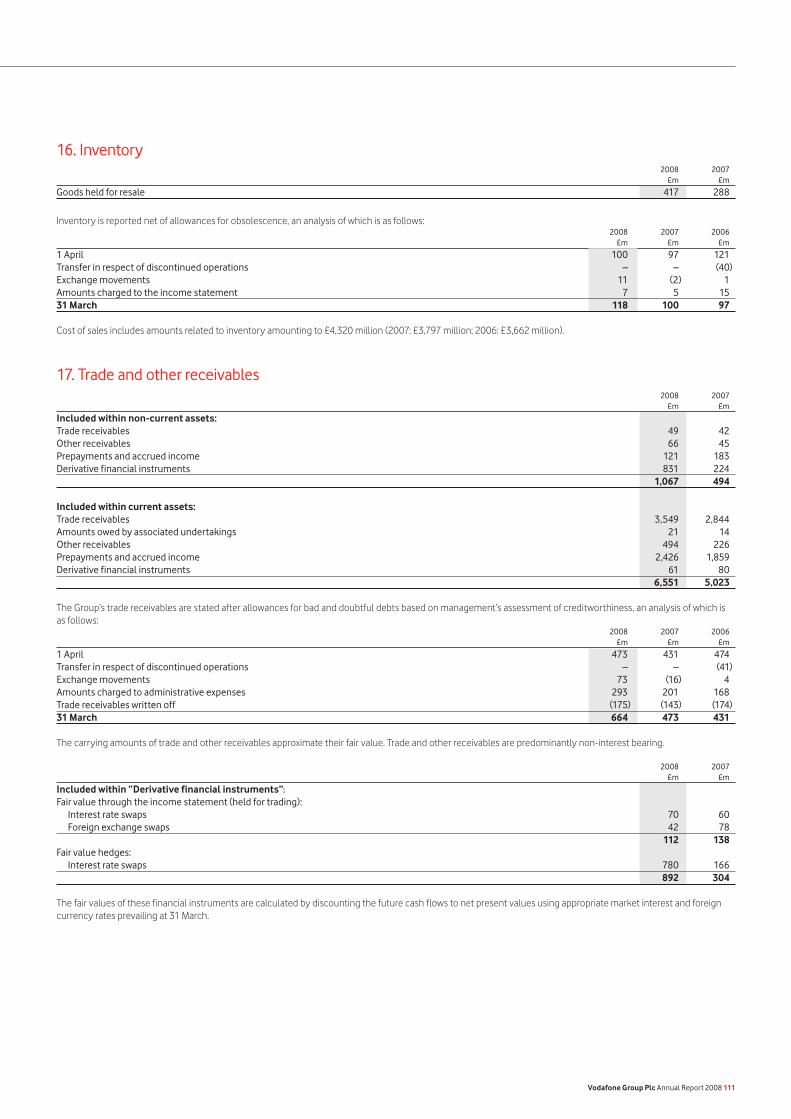
16. Inventory 2008 2007 £m £m
Goods held for resale 417 288
Inventory is reported net of allowances for obsolescence, an analysis of which is as follows: 2008 2007 2006 £m £m £m
1 April 100 97 121Transfer in respect of discontinued operations – – (40)Exchange movements 11 (2) 1Amounts charged to the income statement 7 5 1531 March 118 100 97
Cost of sales includes amounts related to inventory amounting to £4,320 million (2007: £3,797 million; 2006: £3,662 million).
17. Trade and other receivables 2008 2007 £m £m
Included within non-current assets: Trade receivables 49 42Other receivables 66 45Prepayments and accrued income 121 183Derivative financial instruments 831 224 1,067 494
Included within current assets: Trade receivables 3,549 2,844Amounts owed by associated undertakings 21 14Other receivables 494 226Prepayments and accrued income 2,426 1,859Derivative financial instruments 61 80 6,551 5,023
The Group’s trade receivables are stated after allowances for bad and doubtful debts based on management’s assessment of creditworthiness, an analysis of which is as follows: 2008 2007 2006 £m £m £m
1 April 473 431 474Transfer in respect of discontinued operations – – (41)Exchange movements 73 (16) 4Amounts charged to administrative expenses 293 201 168Trade receivables written off (175) (143) (174)31 March 664 473 431
The carrying amounts of trade and other receivables approximate their fair value. Trade and other receivables are predominantly non-interest bearing.
2008 2007 £m £m
Included within “Derivative financial instruments”:
Fair value through the income statement (held for trading): Interest rate swaps 70 60 Foreign exchange swaps 42 78 112 138Fair value hedges: Interest rate swaps 780 166 892 304
The fair values of these financial instruments are calculated by discounting the future cash flows to net present values using appropriate market interest and foreign currency rates prevailing at 31 March.
Vodafone Group Plc Annual Report 2008 111
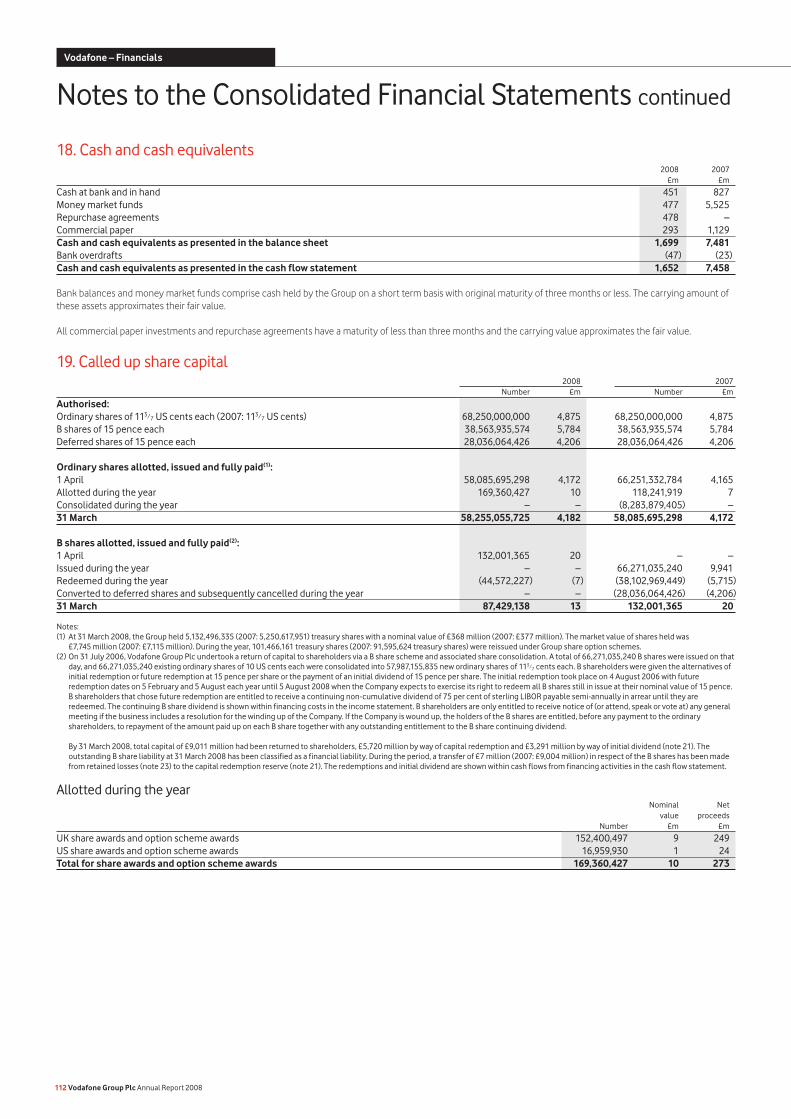
18. Cash and cash equivalents 2008 2007 £m £m
Cash at bank and in hand 451 827Money market funds 477 5,525Repurchase agreements 478 –Commercial paper 293 1,129Cash and cash equivalents as presented in the balance sheet 1,699 7,481Bank overdrafts (47) (23)Cash and cash equivalents as presented in the cash flow statement 1,652 7,458
Bank balances and money market funds comprise cash held by the Group on a short term basis with original maturity of three months or less. The carrying amount of these assets approximates their fair value.
All commercial paper investments and repurchase agreements have a maturity of less than three months and the carrying value approximates the fair value.
19. Called up share capital 2008 2007 Number £m Number £m
Authorised: Ordinary shares of 113/7 US cents each (2007: 113/7 US cents) 68,250,000,000 4,875 68,250,000,000 4,875B shares of 15 pence each 38,563,935,574 5,784 38,563,935,574 5,784Deferred shares of 15 pence each 28,036,064,426 4,206 28,036,064,426 4,206
Ordinary shares allotted, issued and fully paid(1): 1 April 58,085,695,298 4,172 66,251,332,784 4,165Allotted during the year 169,360,427 10 118,241,919 7Consolidated during the year – – (8,283,879,405) –31 March 58,255,055,725 4,182 58,085,695,298 4,172
B shares allotted, issued and fully paid(2): 1 April 132,001,365 20 – –Issued during the year – – 66,271,035,240 9,941Redeemed during the year (44,572,227) (7) (38,102,969,449) (5,715)Converted to deferred shares and subsequently cancelled during the year – – (28,036,064,426) (4,206)31 March 87,429,138 13 132,001,365 20
Notes:(1) At 31 March 2008, the Group held 5,132,496,335 (2007: 5,250,617,951) treasury shares with a nominal value of £368 million (2007: £377 million). The market value of shares held was
£7,745 million (2007: £7,115 million). During the year, 101,466,161 treasury shares (2007: 91,595,624 treasury shares) were reissued under Group share option schemes.(2) On 31 July 2006, Vodafone Group Plc undertook a return of capital to shareholders via a B share scheme and associated share consolidation. A total of 66,271,035,240 B shares were issued on that
day, and 66,271,035,240 existing ordinary shares of 10 US cents each were consolidated into 57,987,155,835 new ordinary shares of 113/7 cents each. B shareholders were given the alternatives of initial redemption or future redemption at 15 pence per share or the payment of an initial dividend of 15 pence per share. The initial redemption took place on 4 August 2006 with future redemption dates on 5 February and 5 August each year until 5 August 2008 when the Company expects to exercise its right to redeem all B shares still in issue at their nominal value of 15 pence. B shareholders that chose future redemption are entitled to receive a continuing non-cumulative dividend of 75 per cent of sterling LIBOR payable semi-annually in arrear until they are redeemed. The continuing B share dividend is shown within financing costs in the income statement. B shareholders are only entitled to receive notice of (or attend, speak or vote at) any general meeting if the business includes a resolution for the winding up of the Company. If the Company is wound up, the holders of the B shares are entitled, before any payment to the ordinary shareholders, to repayment of the amount paid up on each B share together with any outstanding entitlement to the B share continuing dividend.
By 31 March 2008, total capital of £9,011 million had been returned to shareholders, £5,720 million by way of capital redemption and £3,291 million by way of initial dividend (note 21). The outstanding B share liability at 31 March 2008 has been classified as a financial liability. During the period, a transfer of £7 million (2007: £9,004 million) in respect of the B shares has been made from retained losses (note 23) to the capital redemption reserve (note 21). The redemptions and initial dividend are shown within cash flows from financing activities in the cash flow statement.
Allotted during the year Nominal Net value proceeds Number £m £m
UK share awards and option scheme awards 152,400,497 9 249US share awards and option scheme awards 16,959,930 1 24Total for share awards and option scheme awards 169,360,427 10 273
112 Vodafone Group Plc Annual Report 2008
Notes to the Consolidated Financial Statements continued
Vodafone – Financials
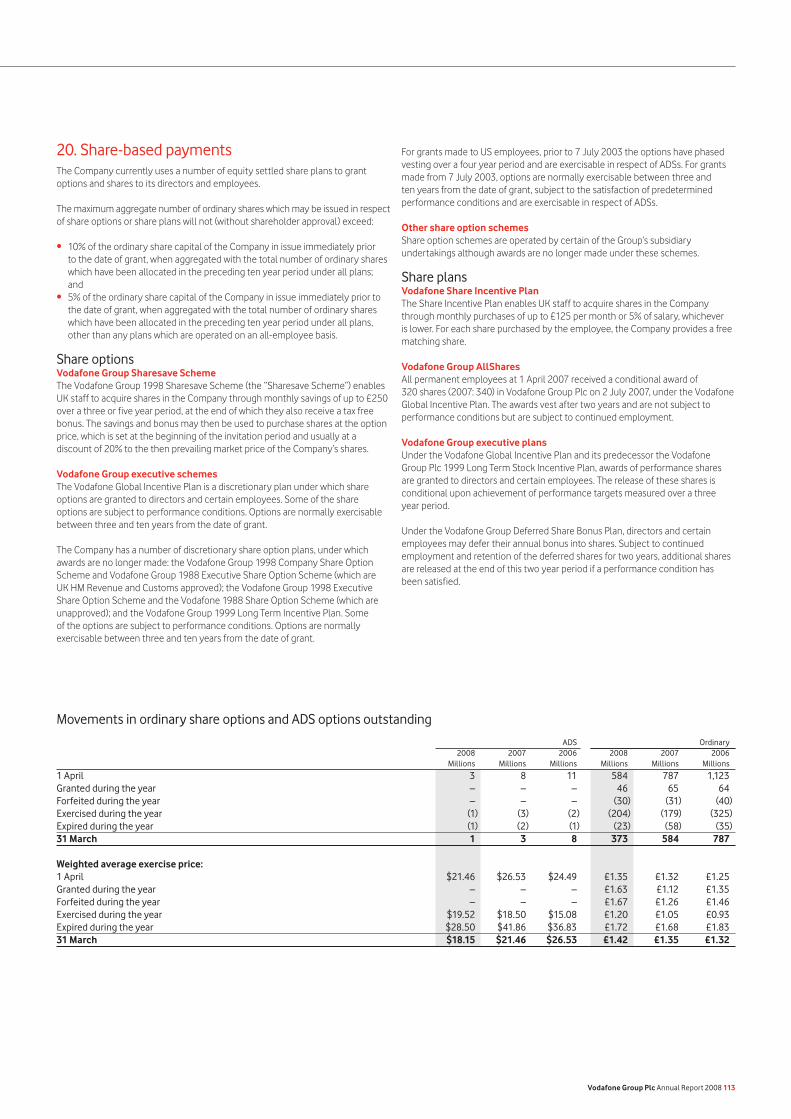
20. Share-based payments The Company currently uses a number of equity settled share plans to grant options and shares to its directors and employees.
The maximum aggregate number of ordinary shares which may be issued in respect of share options or share plans will not (without shareholder approval) exceed:
10% of the ordinary share capital of the Company in issue immediately prior to the date of grant, when aggregated with the total number of ordinary shares which have been allocated in the preceding ten year period under all plans; and5% of the ordinary share capital of the Company in issue immediately prior to the date of grant, when aggregated with the total number of ordinary shares which have been allocated in the preceding ten year period under all plans, other than any plans which are operated on an all-employee basis.
Share optionsVodafone Group Sharesave SchemeThe Vodafone Group 1998 Sharesave Scheme (the “Sharesave Scheme”) enables UK staff to acquire shares in the Company through monthly savings of up to £250 over a three or five year period, at the end of which they also receive a tax free bonus. The savings and bonus may then be used to purchase shares at the option price, which is set at the beginning of the invitation period and usually at a discount of 20% to the then prevailing market price of the Company’s shares.
Vodafone Group executive schemesThe Vodafone Global Incentive Plan is a discretionary plan under which share options are granted to directors and certain employees. Some of the share options are subject to performance conditions. Options are normally exercisable between three and ten years from the date of grant.
The Company has a number of discretionary share option plans, under which awards are no longer made: the Vodafone Group 1998 Company Share Option Scheme and Vodafone Group 1988 Executive Share Option Scheme (which are UK HM Revenue and Customs approved); the Vodafone Group 1998 Executive Share Option Scheme and the Vodafone 1988 Share Option Scheme (which are unapproved); and the Vodafone Group 1999 Long Term Incentive Plan. Some of the options are subject to performance conditions. Options are normally exercisable between three and ten years from the date of grant.
•
•
For grants made to US employees, prior to 7 July 2003 the options have phased vesting over a four year period and are exercisable in respect of ADSs. For grants made from 7 July 2003, options are normally exercisable between three and ten years from the date of grant, subject to the satisfaction of predetermined performance conditions and are exercisable in respect of ADSs.
Other share option schemesShare option schemes are operated by certain of the Group’s subsidiary undertakings although awards are no longer made under these schemes.
Share plansVodafone Share Incentive PlanThe Share Incentive Plan enables UK staff to acquire shares in the Company through monthly purchases of up to £125 per month or 5% of salary, whichever is lower. For each share purchased by the employee, the Company provides a free matching share.
Vodafone Group AllShares All permanent employees at 1 April 2007 received a conditional award of 320 shares (2007: 340) in Vodafone Group Plc on 2 July 2007, under the Vodafone Global Incentive Plan. The awards vest after two years and are not subject to performance conditions but are subject to continued employment.
Vodafone Group executive plansUnder the Vodafone Global Incentive Plan and its predecessor the Vodafone Group Plc 1999 Long Term Stock Incentive Plan, awards of performance shares are granted to directors and certain employees. The release of these shares is conditional upon achievement of performance targets measured over a three year period.
Under the Vodafone Group Deferred Share Bonus Plan, directors and certain employees may defer their annual bonus into shares. Subject to continued employment and retention of the deferred shares for two years, additional shares are released at the end of this two year period if a performance condition has been satisfied.
Movements in ordinary share options and ADS options outstanding
ADS Ordinary 2008 2007 2006 2008 2007 2006 Millions Millions Millions Millions Millions Millions
1 April 3 8 11 584 787 1,123Granted during the year – – – 46 65 64Forfeited during the year – – – (30) (31) (40)Exercised during the year (1) (3) (2) (204) (179) (325)Expired during the year (1) (2) (1) (23) (58) (35)31 March 1 3 8 373 584 787 Weighted average exercise price: 1 April $21.46 $26.53 $24.49 £1.35 £1.32 £1.25Granted during the year – – – £1.63 £1.12 £1.35Forfeited during the year – – – £1.67 £1.26 £1.46Exercised during the year $19.52 $18.50 $15.08 £1.20 £1.05 £0.93Expired during the year $28.50 $41.86 $36.83 £1.72 £1.68 £1.8331 March $18.15 $21.46 $26.53 £1.42 £1.35 £1.32
Vodafone Group Plc Annual Report 2008 113
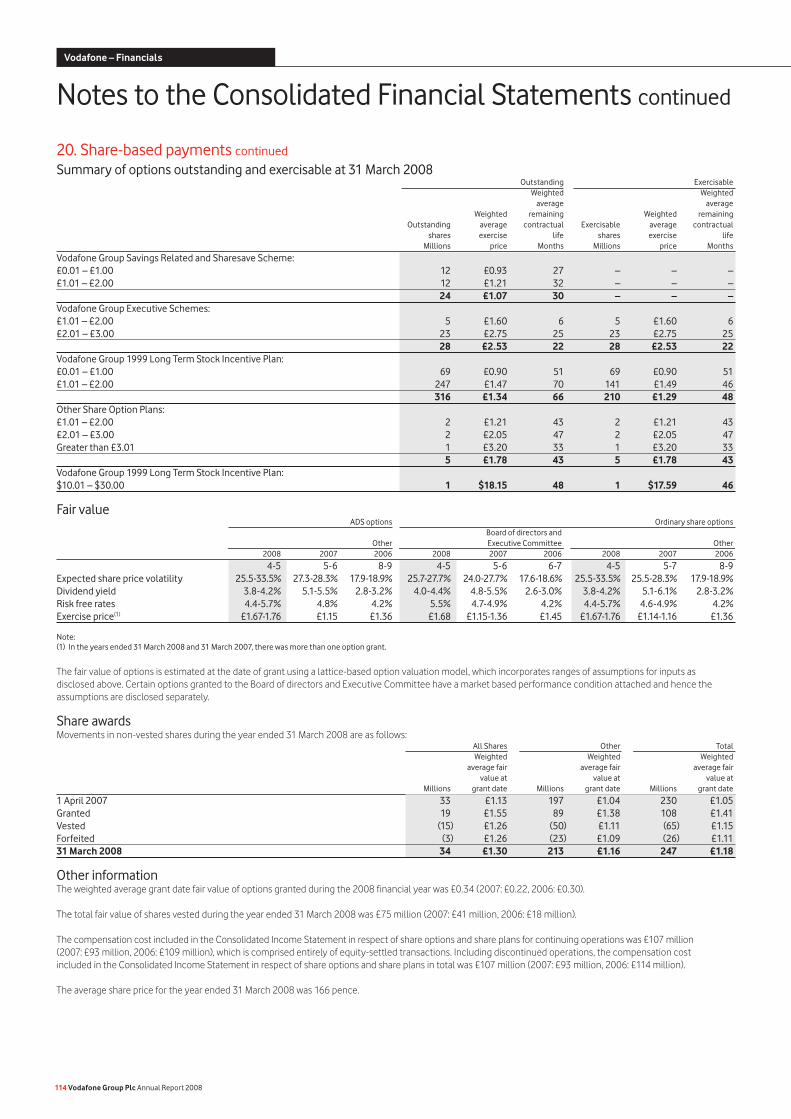
20. Share-based payments continued
Summary of options outstanding and exercisable at 31 March 2008 Outstanding Exercisable Weighted Weighted average average Weighted remaining Weighted remaining Outstanding average contractual Exercisable average contractual shares exercise life shares exercise life Millions price Months Millions price Months
Vodafone Group Savings Related and Sharesave Scheme:£0.01 – £1.00 12 £0.93 27 – – –£1.01 – £2.00 12 £1.21 32 – – – 24 £1.07 30 – – –Vodafone Group Executive Schemes:£1.01 – £2.00 5 £1.60 6 5 £1.60 6£2.01 – £3.00 23 £2.75 25 23 £2.75 25 28 £2.53 22 28 £2.53 22Vodafone Group 1999 Long Term Stock Incentive Plan:£0.01 – £1.00 69 £0.90 51 69 £0.90 51£1.01 – £2.00 247 £1.47 70 141 £1.49 46 316 £1.34 66 210 £1.29 48Other Share Option Plans:£1.01 – £2.00 2 £1.21 43 2 £1.21 43£2.01 – £3.00 2 £2.05 47 2 £2.05 47Greater than £3.01 1 £3.20 33 1 £3.20 33 5 £1.78 43 5 £1.78 43Vodafone Group 1999 Long Term Stock Incentive Plan:$10.01 – $30.00 1 $18.15 48 1 $17.59 46
Fair value ADS options Ordinary share options Board of directors and Other Executive Committee Other 2008 2007 2006 2008 2007 2006 2008 2007 2006
4-5 5-6 8-9 4-5 5-6 6-7 4-5 5-7 8-9Expected share price volatility 25.5-33.5% 27.3-28.3% 17.9-18.9% 25.7-27.7% 24.0-27.7% 17.6-18.6% 25.5-33.5% 25.5-28.3% 17.9-18.9%Dividend yield 3.8-4.2% 5.1-5.5% 2.8-3.2% 4.0-4.4% 4.8-5.5% 2.6-3.0% 3.8-4.2% 5.1-6.1% 2.8-3.2%Risk free rates 4.4-5.7% 4.8% 4.2% 5.5% 4.7-4.9% 4.2% 4.4-5.7% 4.6-4.9% 4.2%Exercise price(1) £1.67-1.76 £1.15 £1.36 £1.68 £1.15-1.36 £1.45 £1.67-1.76 £1.14-1.16 £1.36
Note:(1) In the years ended 31 March 2008 and 31 March 2007, there was more than one option grant.
The fair value of options is estimated at the date of grant using a lattice-based option valuation model, which incorporates ranges of assumptions for inputs as disclosed above. Certain options granted to the Board of directors and Executive Committee have a market based performance condition attached and hence the assumptions are disclosed separately.
Share awardsMovements in non-vested shares during the year ended 31 March 2008 are as follows: All Shares Other Total Weighted Weighted Weighted average fair average fair average fair value at value at value at Millions grant date Millions grant date Millions grant date
1 April 2007 33 £1.13 197 £1.04 230 £1.05Granted 19 £1.55 89 £1.38 108 £1.41Vested (15) £1.26 (50) £1.11 (65) £1.15Forfeited (3) £1.26 (23) £1.09 (26) £1.1131 March 2008 34 £1.30 213 £1.16 247 £1.18
Other informationThe weighted average grant date fair value of options granted during the 2008 financial year was £0.34 (2007: £0.22, 2006: £0.30).
The total fair value of shares vested during the year ended 31 March 2008 was £75 million (2007: £41 million, 2006: £18 million).
The compensation cost included in the Consolidated Income Statement in respect of share options and share plans for continuing operations was £107 million (2007: £93 million, 2006: £109 million), which is comprised entirely of equity-settled transactions. Including discontinued operations, the compensation cost included in the Consolidated Income Statement in respect of share options and share plans in total was £107 million (2007: £93 million, 2006: £114 million).
The average share price for the year ended 31 March 2008 was 166 pence.
114 Vodafone Group Plc Annual Report 2008
Vodafone – Financials
Notes to the Consolidated Financial Statements continued
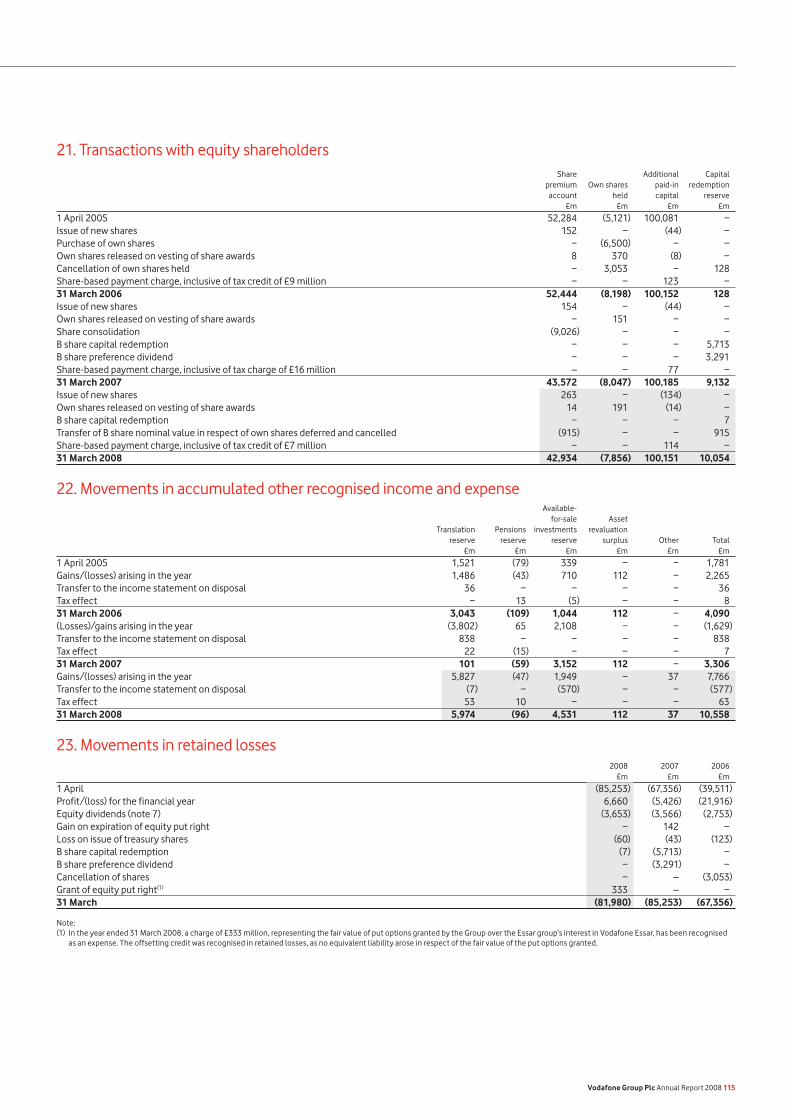
21. Transactions with equity shareholders Share Additional Capital premium Own shares paid-in redemption account held capital reserve £m £m £m £m
1 April 2005 52,284 (5,121) 100,081 −Issue of new shares 152 − (44) −Purchase of own shares − (6,500) − −Own shares released on vesting of share awards 8 370 (8) −Cancellation of own shares held − 3,053 − 128Share-based payment charge, inclusive of tax credit of £9 million − − 123 −31 March 2006 52,444 (8,198) 100,152 128Issue of new shares 154 − (44) −Own shares released on vesting of share awards − 151 − −Share consolidation (9,026) − − −B share capital redemption − − − 5,713B share preference dividend − − − 3,291Share-based payment charge, inclusive of tax charge of £16 million – − 77 −31 March 2007 43,572 (8,047) 100,185 9,132Issue of new shares 263 − (134) −Own shares released on vesting of share awards 14 191 (14) −B share capital redemption − − − 7Transfer of B share nominal value in respect of own shares deferred and cancelled (915) − − 915Share-based payment charge, inclusive of tax credit of £7 million − − 114 −31 March 2008 42,934 (7,856) 100,151 10,054
22. Movements in accumulated other recognised income and expense Available- for-sale Asset Translation Pensions investments revaluation reserve reserve reserve surplus Other Total £m £m £m £m £m £m
1 April 2005 1,521 (79) 339 − − 1,781Gains/(losses) arising in the year 1,486 (43) 710 112 − 2,265Transfer to the income statement on disposal 36 − − − − 36Tax effect − 13 (5) − − 831 March 2006 3,043 (109) 1,044 112 − 4,090(Losses)/gains arising in the year (3,802) 65 2,108 − − (1,629)Transfer to the income statement on disposal 838 − − − − 838Tax effect 22 (15) − − − 731 March 2007 101 (59) 3,152 112 − 3,306Gains/(losses) arising in the year 5,827 (47) 1,949 − 37 7,766Transfer to the income statement on disposal (7) − (570) − − (577)Tax effect 53 10 − − − 6331 March 2008 5,974 (96) 4,531 112 37 10,558
23. Movements in retained losses 2008 2007 2006 £m £m £m
1 April (85,253) (67,356) (39,511)Profit/(loss) for the financial year 6,660 (5,426) (21,916)Equity dividends (note 7) (3,653) (3,566) (2,753)Gain on expiration of equity put right − 142 −Loss on issue of treasury shares (60) (43) (123)B share capital redemption (7) (5,713) −B share preference dividend − (3,291) −Cancellation of shares − – (3,053)Grant of equity put right(1) 333 – −31 March (81,980) (85,253) (67,356)
Note:(1) In the year ended 31 March 2008, a charge of £333 million, representing the fair value of put options granted by the Group over the Essar group’s interest in Vodafone Essar, has been recognised
as an expense. The offsetting credit was recognised in retained losses, as no equivalent liability arose in respect of the fair value of the put options granted.
Vodafone Group Plc Annual Report 2008 115
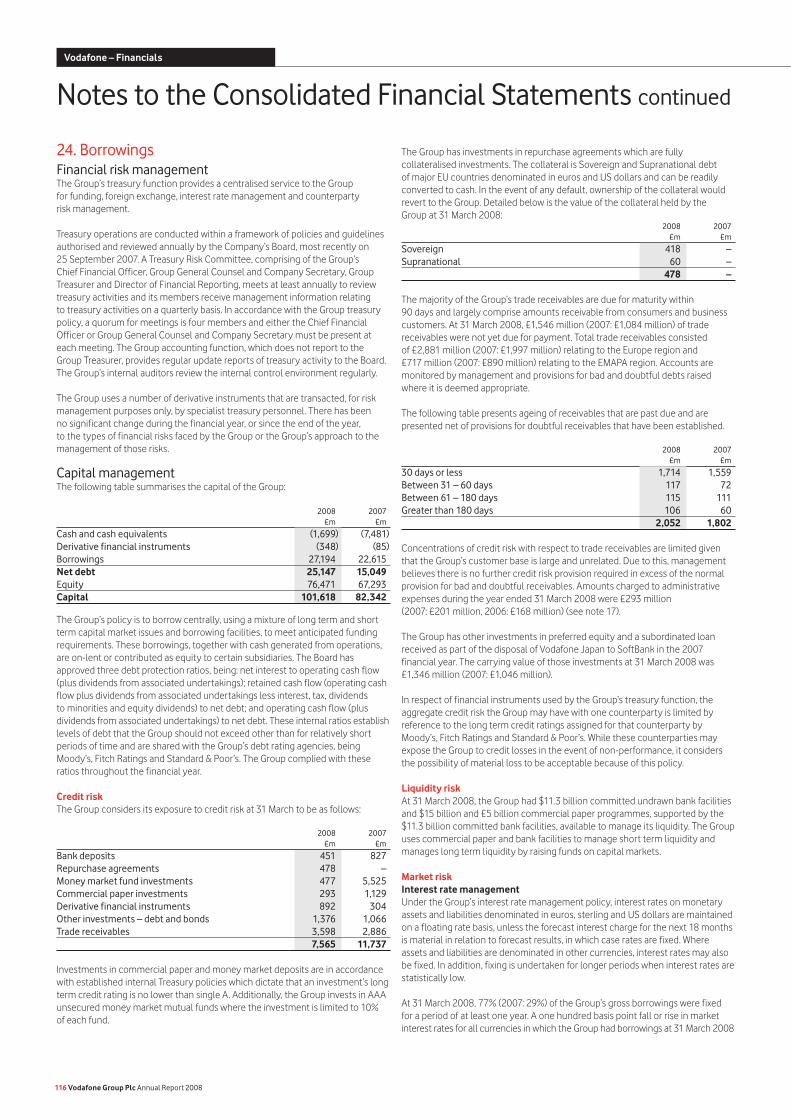
24. BorrowingsFinancial risk managementThe Group’s treasury function provides a centralised service to the Group for funding, foreign exchange, interest rate management and counterparty risk management.
Treasury operations are conducted within a framework of policies and guidelines authorised and reviewed annually by the Company’s Board, most recently on 25 September 2007. A Treasury Risk Committee, comprising of the Group’s Chief Financial Officer, Group General Counsel and Company Secretary, Group Treasurer and Director of Financial Reporting, meets at least annually to review treasury activities and its members receive management information relating to treasury activities on a quarterly basis. In accordance with the Group treasury policy, a quorum for meetings is four members and either the Chief Financial Officer or Group General Counsel and Company Secretary must be present at each meeting. The Group accounting function, which does not report to the Group Treasurer, provides regular update reports of treasury activity to the Board. The Group’s internal auditors review the internal control environment regularly.
The Group uses a number of derivative instruments that are transacted, for risk management purposes only, by specialist treasury personnel. There has been no significant change during the financial year, or since the end of the year, to the types of financial risks faced by the Group or the Group’s approach to the management of those risks.
Capital managementThe following table summarises the capital of the Group:
2008 2007 £m £m
Cash and cash equivalents (1,699) (7,481)Derivative financial instruments (348) (85)Borrowings 27,194 22,615Net debt 25,147 15,049Equity 76,471 67,293Capital 101,618 82,342
The Group’s policy is to borrow centrally, using a mixture of long term and short term capital market issues and borrowing facilities, to meet anticipated funding requirements. These borrowings, together with cash generated from operations, are on-lent or contributed as equity to certain subsidiaries. The Board has approved three debt protection ratios, being: net interest to operating cash flow (plus dividends from associated undertakings); retained cash flow (operating cash flow plus dividends from associated undertakings less interest, tax, dividends to minorities and equity dividends) to net debt; and operating cash flow (plus dividends from associated undertakings) to net debt. These internal ratios establish levels of debt that the Group should not exceed other than for relatively short periods of time and are shared with the Group’s debt rating agencies, being Moody’s, Fitch Ratings and Standard & Poor’s. The Group complied with these ratios throughout the financial year.
Credit riskThe Group considers its exposure to credit risk at 31 March to be as follows:
2008 2007 £m £m
Bank deposits 451 827Repurchase agreements 478 –Money market fund investments 477 5,525Commercial paper investments 293 1,129Derivative financial instruments 892 304Other investments – debt and bonds 1,376 1,066Trade receivables 3,598 2,886 7,565 11,737
Investments in commercial paper and money market deposits are in accordance with established internal Treasury policies which dictate that an investment’s long term credit rating is no lower than single A. Additionally, the Group invests in AAA unsecured money market mutual funds where the investment is limited to 10% of each fund.
The Group has investments in repurchase agreements which are fully collateralised investments. The collateral is Sovereign and Supranational debt of major EU countries denominated in euros and US dollars and can be readily converted to cash. In the event of any default, ownership of the collateral would revert to the Group. Detailed below is the value of the collateral held by the Group at 31 March 2008: 2008 2007 £m £m
Sovereign 418 –Supranational 60 – 478 –
The majority of the Group’s trade receivables are due for maturity within 90 days and largely comprise amounts receivable from consumers and business customers. At 31 March 2008, £1,546 million (2007: £1,084 million) of trade receivables were not yet due for payment. Total trade receivables consisted of £2,881 million (2007: £1,997 million) relating to the Europe region and £717 million (2007: £890 million) relating to the EMAPA region. Accounts are monitored by management and provisions for bad and doubtful debts raised where it is deemed appropriate.
The following table presents ageing of receivables that are past due and are presented net of provisions for doubtful receivables that have been established.
2008 2007 £m £m
30 days or less 1,714 1,559Between 31 – 60 days 117 72Between 61 – 180 days 115 111Greater than 180 days 106 60 2,052 1,802
Concentrations of credit risk with respect to trade receivables are limited given that the Group’s customer base is large and unrelated. Due to this, management believes there is no further credit risk provision required in excess of the normal provision for bad and doubtful receivables. Amounts charged to administrative expenses during the year ended 31 March 2008 were £293 million (2007: £201 million, 2006: £168 million) (see note 17).
The Group has other investments in preferred equity and a subordinated loan received as part of the disposal of Vodafone Japan to SoftBank in the 2007 financial year. The carrying value of those investments at 31 March 2008 was £1,346 million (2007: £1,046 million).
In respect of financial instruments used by the Group’s treasury function, the aggregate credit risk the Group may have with one counterparty is limited by reference to the long term credit ratings assigned for that counterparty by Moody’s, Fitch Ratings and Standard & Poor’s. While these counterparties may expose the Group to credit losses in the event of non-performance, it considers the possibility of material loss to be acceptable because of this policy.
Liquidity riskAt 31 March 2008, the Group had $11.3 billion committed undrawn bank facilities and $15 billion and £5 billion commercial paper programmes, supported by the $11.3 billion committed bank facilities, available to manage its liquidity. The Group uses commercial paper and bank facilities to manage short term liquidity and manages long term liquidity by raising funds on capital markets.
Market riskInterest rate managementUnder the Group’s interest rate management policy, interest rates on monetary assets and liabilities denominated in euros, sterling and US dollars are maintained on a floating rate basis, unless the forecast interest charge for the next 18 months is material in relation to forecast results, in which case rates are fixed. Where assets and liabilities are denominated in other currencies, interest rates may also be fixed. In addition, fixing is undertaken for longer periods when interest rates are statistically low.
At 31 March 2008, 77% (2007: 29%) of the Group’s gross borrowings were fixed for a period of at least one year. A one hundred basis point fall or rise in market interest rates for all currencies in which the Group had borrowings at 31 March 2008
116 Vodafone Group Plc Annual Report 2008
Notes to the Consolidated Financial Statements continued
Vodafone – Financials
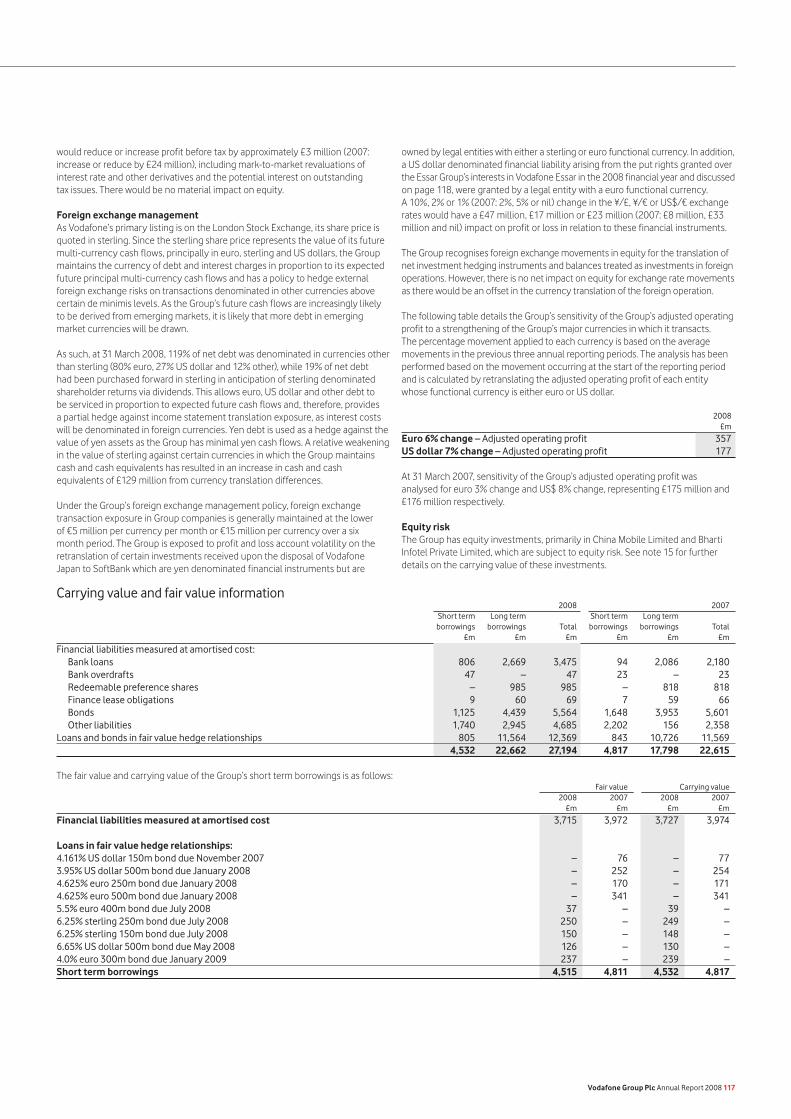
would reduce or increase profit before tax by approximately £3 million (2007: increase or reduce by £24 million), including mark-to-market revaluations of interest rate and other derivatives and the potential interest on outstanding tax issues. There would be no material impact on equity.
Foreign exchange managementAs Vodafone’s primary listing is on the London Stock Exchange, its share price is quoted in sterling. Since the sterling share price represents the value of its future multi-currency cash flows, principally in euro, sterling and US dollars, the Group maintains the currency of debt and interest charges in proportion to its expected future principal multi-currency cash flows and has a policy to hedge external foreign exchange risks on transactions denominated in other currencies above certain de minimis levels. As the Group’s future cash flows are increasingly likely to be derived from emerging markets, it is likely that more debt in emerging market currencies will be drawn.
As such, at 31 March 2008, 119% of net debt was denominated in currencies other than sterling (80% euro, 27% US dollar and 12% other), while 19% of net debt had been purchased forward in sterling in anticipation of sterling denominated shareholder returns via dividends. This allows euro, US dollar and other debt to be serviced in proportion to expected future cash flows and, therefore, provides a partial hedge against income statement translation exposure, as interest costs will be denominated in foreign currencies. Yen debt is used as a hedge against the value of yen assets as the Group has minimal yen cash flows. A relative weakening in the value of sterling against certain currencies in which the Group maintains cash and cash equivalents has resulted in an increase in cash and cash equivalents of £129 million from currency translation differences.
Under the Group’s foreign exchange management policy, foreign exchange transaction exposure in Group companies is generally maintained at the lower of €5 million per currency per month or €15 million per currency over a six month period. The Group is exposed to profit and loss account volatility on the retranslation of certain investments received upon the disposal of Vodafone Japan to SoftBank which are yen denominated financial instruments but are
owned by legal entities with either a sterling or euro functional currency. In addition, a US dollar denominated financial liability arising from the put rights granted over the Essar Group’s interests in Vodafone Essar in the 2008 financial year and discussed on page 118, were granted by a legal entity with a euro functional currency. A 10%, 2% or 1% (2007: 2%, 5% or nil) change in the ¥/£, ¥/€ or US$/€ exchange rates would have a £47 million, £17 million or £23 million (2007: £8 million, £33 million and nil) impact on profit or loss in relation to these financial instruments.
The Group recognises foreign exchange movements in equity for the translation of net investment hedging instruments and balances treated as investments in foreign operations. However, there is no net impact on equity for exchange rate movements as there would be an offset in the currency translation of the foreign operation.
The following table details the Group’s sensitivity of the Group’s adjusted operating profit to a strengthening of the Group’s major currencies in which it transacts. The percentage movement applied to each currency is based on the average movements in the previous three annual reporting periods. The analysis has been performed based on the movement occurring at the start of the reporting period and is calculated by retranslating the adjusted operating profit of each entity whose functional currency is either euro or US dollar.
2008 £m
Euro 6% change – Adjusted operating profit 357US dollar 7% change – Adjusted operating profit 177
At 31 March 2007, sensitivity of the Group’s adjusted operating profit was analysed for euro 3% change and US$ 8% change, representing £175 million and £176 million respectively.
Equity riskThe Group has equity investments, primarily in China Mobile Limited and Bharti Infotel Private Limited, which are subject to equity risk. See note 15 for further details on the carrying value of these investments.
Carrying value and fair value information 2008 2007 Short term Long term Short term Long term borrowings borrowings Total borrowings borrowings Total £m £m £m £m £m £m
Financial liabilities measured at amortised cost: Bank loans 806 2,669 3,475 94 2,086 2,180 Bank overdrafts 47 – 47 23 – 23 Redeemable preference shares – 985 985 – 818 818 Finance lease obligations 9 60 69 7 59 66 Bonds 1,125 4,439 5,564 1,648 3,953 5,601 Other liabilities 1,740 2,945 4,685 2,202 156 2,358Loans and bonds in fair value hedge relationships 805 11,564 12,369 843 10,726 11,569 4,532 22,662 27,194 4,817 17,798 22,615
The fair value and carrying value of the Group’s short term borrowings is as follows: Fair value Carrying value 2008 2007 2008 2007 £m £m £m £m
Financial liabilities measured at amortised cost 3,715 3,972 3,727 3,974
Loans in fair value hedge relationships: 4.161% US dollar 150m bond due November 2007 – 76 – 773.95% US dollar 500m bond due January 2008 – 252 – 2544.625% euro 250m bond due January 2008 – 170 – 1714.625% euro 500m bond due January 2008 – 341 – 3415.5% euro 400m bond due July 2008 37 – 39 –6.25% sterling 250m bond due July 2008 250 – 249 –6.25% sterling 150m bond due July 2008 150 – 148 –6.65% US dollar 500m bond due May 2008 126 – 130 –4.0% euro 300m bond due January 2009 237 – 239 –Short term borrowings 4,515 4,811 4,532 4,817
Vodafone Group Plc Annual Report 2008 117
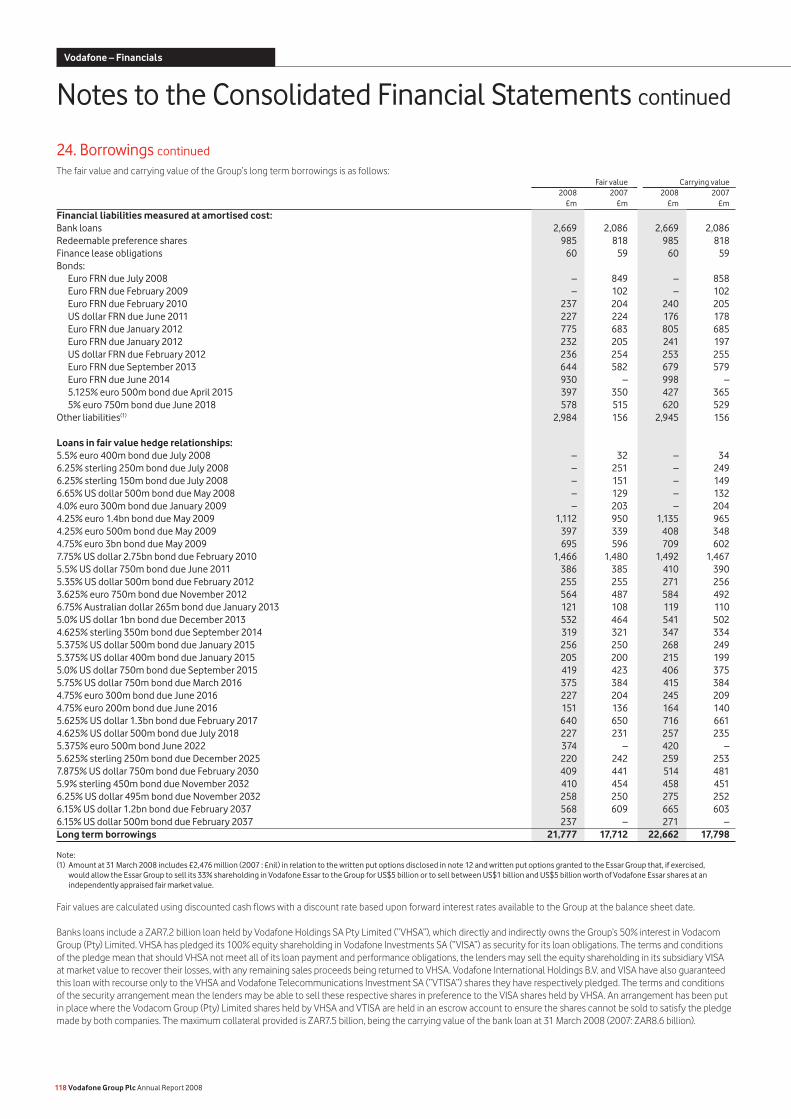
24. Borrowings continued The fair value and carrying value of the Group’s long term borrowings is as follows: Fair value Carrying value 2008 2007 2008 2007 £m £m £m £m
Financial liabilities measured at amortised cost: Bank loans 2,669 2,086 2,669 2,086Redeemable preference shares 985 818 985 818Finance lease obligations 60 59 60 59Bonds: Euro FRN due July 2008 – 849 – 858 Euro FRN due February 2009 – 102 – 102 Euro FRN due February 2010 237 204 240 205 US dollar FRN due June 2011 227 224 176 178 Euro FRN due January 2012 775 683 805 685 Euro FRN due January 2012 232 205 241 197 US dollar FRN due February 2012 236 254 253 255 Euro FRN due September 2013 644 582 679 579 Euro FRN due June 2014 930 – 998 – 5.125% euro 500m bond due April 2015 397 350 427 365 5% euro 750m bond due June 2018 578 515 620 529Other liabilities(1) 2,984 156 2,945 156
Loans in fair value hedge relationships: 5.5% euro 400m bond due July 2008 – 32 – 346.25% sterling 250m bond due July 2008 – 251 – 2496.25% sterling 150m bond due July 2008 – 151 – 1496.65% US dollar 500m bond due May 2008 – 129 – 1324.0% euro 300m bond due January 2009 – 203 – 2044.25% euro 1.4bn bond due May 2009 1,112 950 1,135 9654.25% euro 500m bond due May 2009 397 339 408 3484.75% euro 3bn bond due May 2009 695 596 709 6027.75% US dollar 2.75bn bond due February 2010 1,466 1,480 1,492 1,4675.5% US dollar 750m bond due June 2011 386 385 410 3905.35% US dollar 500m bond due February 2012 255 255 271 2563.625% euro 750m bond due November 2012 564 487 584 4926.75% Australian dollar 265m bond due January 2013 121 108 119 1105.0% US dollar 1bn bond due December 2013 532 464 541 5024.625% sterling 350m bond due September 2014 319 321 347 3345.375% US dollar 500m bond due January 2015 256 250 268 2495.375% US dollar 400m bond due January 2015 205 200 215 1995.0% US dollar 750m bond due September 2015 419 423 406 3755.75% US dollar 750m bond due March 2016 375 384 415 3844.75% euro 300m bond due June 2016 227 204 245 2094.75% euro 200m bond due June 2016 151 136 164 1405.625% US dollar 1.3bn bond due February 2017 640 650 716 6614.625% US dollar 500m bond due July 2018 227 231 257 2355.375% euro 500m bond June 2022 374 – 420 –5.625% sterling 250m bond due December 2025 220 242 259 2537.875% US dollar 750m bond due February 2030 409 441 514 4815.9% sterling 450m bond due November 2032 410 454 458 4516.25% US dollar 495m bond due November 2032 258 250 275 2526.15% US dollar 1.2bn bond due February 2037 568 609 665 6036.15% US dollar 500m bond due February 2037 237 – 271 –Long term borrowings 21,777 17,712 22,662 17,798
Note:(1) Amount at 31 March 2008 includes £2,476 million (2007 : £nil) in relation to the written put options disclosed in note 12 and written put options granted to the Essar Group that, if exercised,
would allow the Essar Group to sell its 33% shareholding in Vodafone Essar to the Group for US$5 billion or to sell between US$1 billion and US$5 billion worth of Vodafone Essar shares at an independently appraised fair market value.
Fair values are calculated using discounted cash flows with a discount rate based upon forward interest rates available to the Group at the balance sheet date.
Banks loans include a ZAR7.2 billion loan held by Vodafone Holdings SA Pty Limited (“VHSA”), which directly and indirectly owns the Group’s 50% interest in Vodacom Group (Pty) Limited. VHSA has pledged its 100% equity shareholding in Vodafone Investments SA (“VISA”) as security for its loan obligations. The terms and conditions of the pledge mean that should VHSA not meet all of its loan payment and performance obligations, the lenders may sell the equity shareholding in its subsidiary VISA at market value to recover their losses, with any remaining sales proceeds being returned to VHSA. Vodafone International Holdings B.V. and VISA have also guaranteed this loan with recourse only to the VHSA and Vodafone Telecommunications Investment SA (“VTISA”) shares they have respectively pledged. The terms and conditions of the security arrangement mean the lenders may be able to sell these respective shares in preference to the VISA shares held by VHSA. An arrangement has been put in place where the Vodacom Group (Pty) Limited shares held by VHSA and VTISA are held in an escrow account to ensure the shares cannot be sold to satisfy the pledge made by both companies. The maximum collateral provided is ZAR7.5 billion, being the carrying value of the bank loan at 31 March 2008 (2007: ZAR8.6 billion).
118 Vodafone Group Plc Annual Report 2008
Notes to the Consolidated Financial Statements continued
Vodafone – Financials
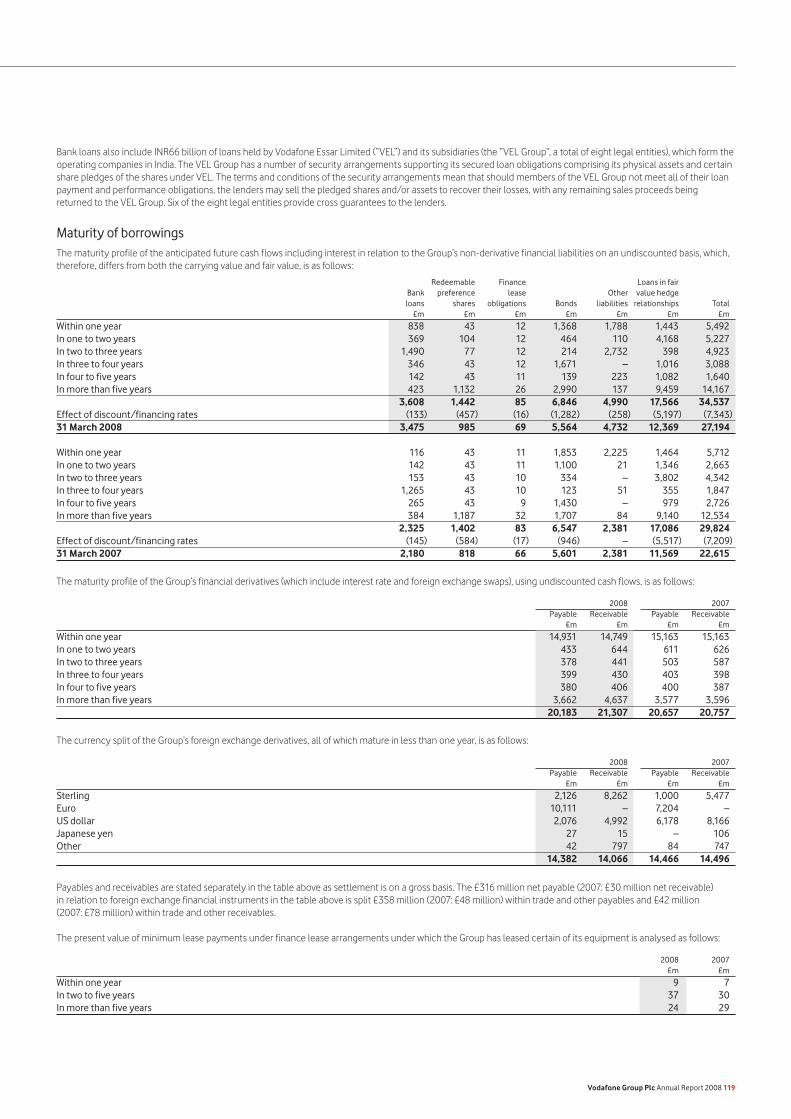
Bank loans also include INR66 billion of loans held by Vodafone Essar Limited (“VEL”) and its subsidiaries (the “VEL Group”, a total of eight legal entities), which form the operating companies in India. The VEL Group has a number of security arrangements supporting its secured loan obligations comprising its physical assets and certain share pledges of the shares under VEL. The terms and conditions of the security arrangements mean that should members of the VEL Group not meet all of their loan payment and performance obligations, the lenders may sell the pledged shares and/or assets to recover their losses, with any remaining sales proceeds being returned to the VEL Group. Six of the eight legal entities provide cross guarantees to the lenders.
Maturity of borrowingsThe maturity profile of the anticipated future cash flows including interest in relation to the Group’s non-derivative financial liabilities on an undiscounted basis, which, therefore, differs from both the carrying value and fair value, is as follows:
Redeemable Finance Loans in fair Bank preference lease Other value hedge loans shares obligations Bonds liabilities relationships Total £m £m £m £m £m £m £m
Within one year 838 43 12 1,368 1,788 1,443 5,492In one to two years 369 104 12 464 110 4,168 5,227In two to three years 1,490 77 12 214 2,732 398 4,923In three to four years 346 43 12 1,671 – 1,016 3,088In four to five years 142 43 11 139 223 1,082 1,640In more than five years 423 1,132 26 2,990 137 9,459 14,167 3,608 1,442 85 6,846 4,990 17,566 34,537Effect of discount/financing rates (133) (457) (16) (1,282) (258) (5,197) (7,343)31 March 2008 3,475 985 69 5,564 4,732 12,369 27,194 Within one year 116 43 11 1,853 2,225 1,464 5,712In one to two years 142 43 11 1,100 21 1,346 2,663In two to three years 153 43 10 334 – 3,802 4,342In three to four years 1,265 43 10 123 51 355 1,847In four to five years 265 43 9 1,430 – 979 2,726In more than five years 384 1,187 32 1,707 84 9,140 12,534 2,325 1,402 83 6,547 2,381 17,086 29,824Effect of discount/financing rates (145) (584) (17) (946) – (5,517) (7,209)31 March 2007 2,180 818 66 5,601 2,381 11,569 22,615
The maturity profile of the Group’s financial derivatives (which include interest rate and foreign exchange swaps), using undiscounted cash flows, is as follows:
2008 2007 Payable Receivable Payable Receivable £m £m £m £m
Within one year 14,931 14,749 15,163 15,163In one to two years 433 644 611 626In two to three years 378 441 503 587In three to four years 399 430 403 398In four to five years 380 406 400 387In more than five years 3,662 4,637 3,577 3,596 20,183 21,307 20,657 20,757
The currency split of the Group’s foreign exchange derivatives, all of which mature in less than one year, is as follows:
2008 2007 Payable Receivable Payable Receivable £m £m £m £m
Sterling 2,126 8,262 1,000 5,477Euro 10,111 – 7,204 –US dollar 2,076 4,992 6,178 8,166Japanese yen 27 15 – 106Other 42 797 84 747 14,382 14,066 14,466 14,496
Payables and receivables are stated separately in the table above as settlement is on a gross basis. The £316 million net payable (2007: £30 million net receivable) in relation to foreign exchange financial instruments in the table above is split £358 million (2007: £48 million) within trade and other payables and £42 million (2007: £78 million) within trade and other receivables.
The present value of minimum lease payments under finance lease arrangements under which the Group has leased certain of its equipment is analysed as follows:
2008 2007 £m £m
Within one year 9 7In two to five years 37 30In more than five years 24 29
Vodafone Group Plc Annual Report 2008 119
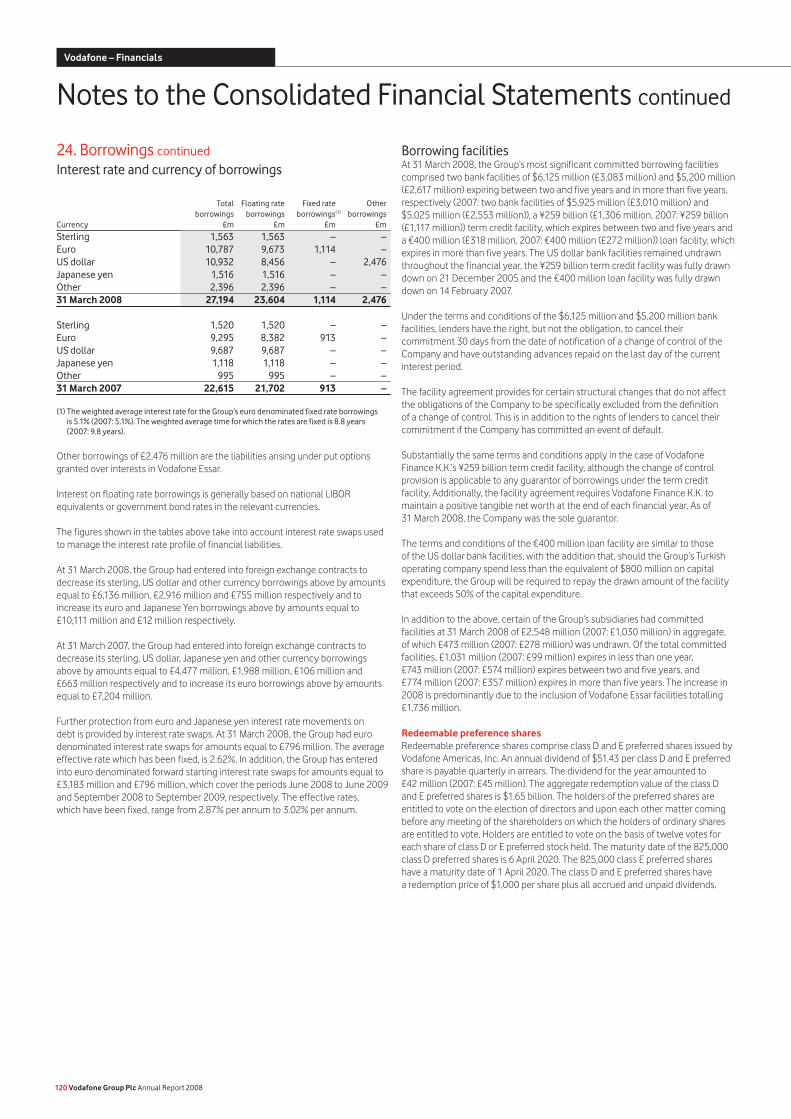
24. Borrowings continued
Interest rate and currency of borrowings Total Floating rate Fixed rate Other borrowings borrowings borrowings(1) borrowingsCurrency £m £m £m £m
Sterling 1,563 1,563 – –Euro 10,787 9,673 1,114 –US dollar 10,932 8,456 – 2,476Japanese yen 1,516 1,516 – –Other 2,396 2,396 – –31 March 2008 27,194 23,604 1,114 2,476
Sterling 1,520 1,520 – –Euro 9,295 8,382 913 –US dollar 9,687 9,687 – –Japanese yen 1,118 1,118 – –Other 995 995 – –31 March 2007 22,615 21,702 913 –
(1) The weighted average interest rate for the Group’s euro denominated fixed rate borrowings is 5.1% (2007: 5.1%). The weighted average time for which the rates are fixed is 8.8 years (2007: 9.8 years).
Other borrowings of £2,476 million are the liabilities arising under put options granted over interests in Vodafone Essar.
Interest on floating rate borrowings is generally based on national LIBOR equivalents or government bond rates in the relevant currencies.
The figures shown in the tables above take into account interest rate swaps used to manage the interest rate profile of financial liabilities.
At 31 March 2008, the Group had entered into foreign exchange contracts to decrease its sterling, US dollar and other currency borrowings above by amounts equal to £6,136 million, £2,916 million and £755 million respectively and to increase its euro and Japanese Yen borrowings above by amounts equal to £10,111 million and £12 million respectively.
At 31 March 2007, the Group had entered into foreign exchange contracts to decrease its sterling, US dollar, Japanese yen and other currency borrowings above by amounts equal to £4,477 million, £1,988 million, £106 million and £663 million respectively and to increase its euro borrowings above by amounts equal to £7,204 million.
Further protection from euro and Japanese yen interest rate movements on debt is provided by interest rate swaps. At 31 March 2008, the Group had euro denominated interest rate swaps for amounts equal to £796 million. The average effective rate which has been fixed, is 2.62%. In addition, the Group has entered into euro denominated forward starting interest rate swaps for amounts equal to £3,183 million and £796 million, which cover the periods June 2008 to June 2009 and September 2008 to September 2009, respectively. The effective rates, which have been fixed, range from 2.87% per annum to 3.02% per annum.
Borrowing facilities At 31 March 2008, the Group’s most significant committed borrowing facilities comprised two bank facilities of $6,125 million (£3,083 million) and $5,200 million (£2,617 million) expiring between two and five years and in more than five years, respectively (2007: two bank facilities of $5,925 million (£3,010 million) and $5,025 million (£2,553 million)), a ¥259 billion (£1,306 million, 2007: ¥259 billion (£1,117 million)) term credit facility, which expires between two and five years and a €400 million (£318 million, 2007: €400 million (£272 million)) loan facility, which expires in more than five years. The US dollar bank facilities remained undrawn throughout the financial year, the ¥259 billion term credit facility was fully drawn down on 21 December 2005 and the €400 million loan facility was fully drawn down on 14 February 2007.
Under the terms and conditions of the $6,125 million and $5,200 million bank facilities, lenders have the right, but not the obligation, to cancel their commitment 30 days from the date of notification of a change of control of the Company and have outstanding advances repaid on the last day of the current interest period.
The facility agreement provides for certain structural changes that do not affect the obligations of the Company to be specifically excluded from the definition of a change of control. This is in addition to the rights of lenders to cancel their commitment if the Company has committed an event of default.
Substantially the same terms and conditions apply in the case of Vodafone Finance K.K.’s ¥259 billion term credit facility, although the change of control provision is applicable to any guarantor of borrowings under the term credit facility. Additionally, the facility agreement requires Vodafone Finance K.K. to maintain a positive tangible net worth at the end of each financial year. As of 31 March 2008, the Company was the sole guarantor.
The terms and conditions of the €400 million loan facility are similar to those of the US dollar bank facilities, with the addition that, should the Group’s Turkish operating company spend less than the equivalent of $800 million on capital expenditure, the Group will be required to repay the drawn amount of the facility that exceeds 50% of the capital expenditure.
In addition to the above, certain of the Group’s subsidiaries had committed facilities at 31 March 2008 of £2,548 million (2007: £1,030 million) in aggregate, of which £473 million (2007: £278 million) was undrawn. Of the total committed facilities, £1,031 million (2007: £99 million) expires in less than one year, £743 million (2007: £574 million) expires between two and five years, and £774 million (2007: £357 million) expires in more than five years. The increase in 2008 is predominantly due to the inclusion of Vodafone Essar facilities totalling £1,736 million.
Redeemable preference sharesRedeemable preference shares comprise class D and E preferred shares issued by Vodafone Americas, Inc. An annual dividend of $51.43 per class D and E preferred share is payable quarterly in arrears. The dividend for the year amounted to £42 million (2007: £45 million). The aggregate redemption value of the class D and E preferred shares is $1.65 billion. The holders of the preferred shares are entitled to vote on the election of directors and upon each other matter coming before any meeting of the shareholders on which the holders of ordinary shares are entitled to vote. Holders are entitled to vote on the basis of twelve votes for each share of class D or E preferred stock held. The maturity date of the 825,000 class D preferred shares is 6 April 2020. The 825,000 class E preferred shares have a maturity date of 1 April 2020. The class D and E preferred shares have a redemption price of $1,000 per share plus all accrued and unpaid dividends.
120 Vodafone Group Plc Annual Report 2008
Notes to the Consolidated Financial Statements continued
Vodafone – Financials
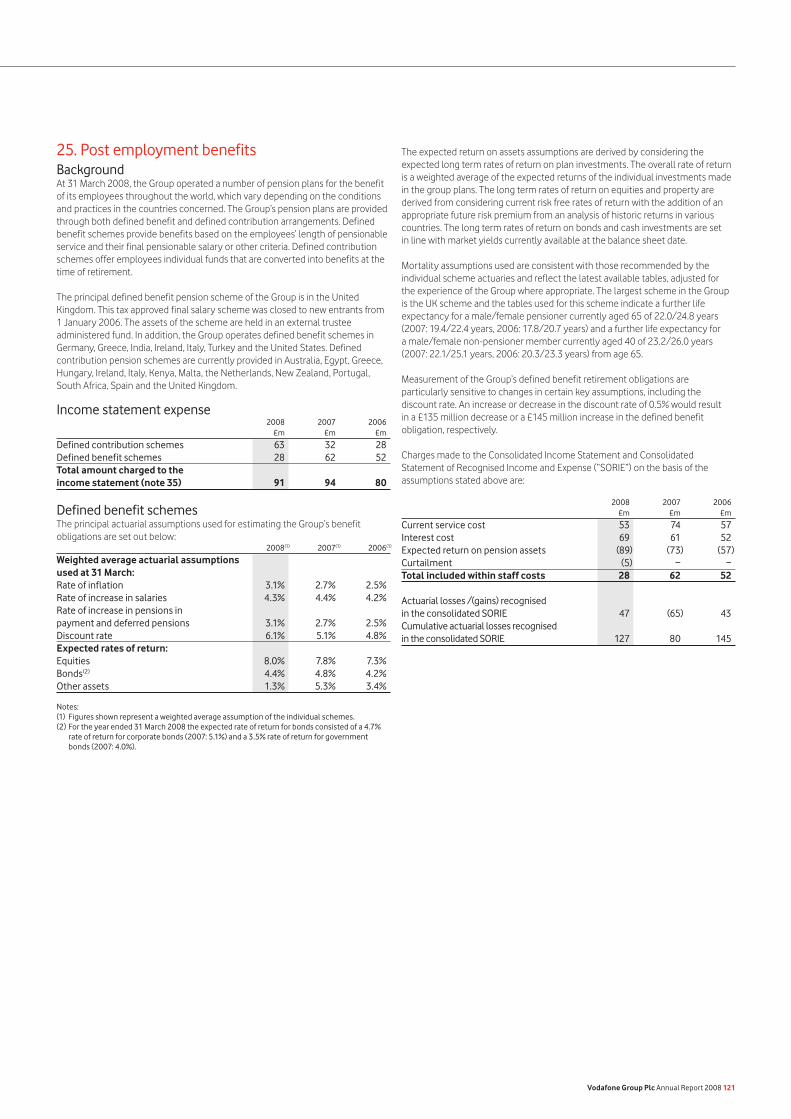
25. Post employment benefitsBackgroundAt 31 March 2008, the Group operated a number of pension plans for the benefit of its employees throughout the world, which vary depending on the conditions and practices in the countries concerned. The Group’s pension plans are provided through both defined benefit and defined contribution arrangements. Defined benefit schemes provide benefits based on the employees’ length of pensionable service and their final pensionable salary or other criteria. Defined contribution schemes offer employees individual funds that are converted into benefits at the time of retirement.
The principal defined benefit pension scheme of the Group is in the United Kingdom. This tax approved final salary scheme was closed to new entrants from 1 January 2006. The assets of the scheme are held in an external trustee administered fund. In addition, the Group operates defined benefit schemes in Germany, Greece, India, Ireland, Italy, Turkey and the United States. Defined contribution pension schemes are currently provided in Australia, Egypt, Greece, Hungary, Ireland, Italy, Kenya, Malta, the Netherlands, New Zealand, Portugal, South Africa, Spain and the United Kingdom.
Income statement expense 2008 2007 2006 £m £m £m
Defined contribution schemes 63 32 28Defined benefit schemes 28 62 52Total amount charged to the income statement (note 35) 91 94 80
Defined benefit schemesThe principal actuarial assumptions used for estimating the Group’s benefit obligations are set out below: 2008(1) 2007(1) 2006(1)
Weighted average actuarial assumptionsused at 31 March:Rate of inflation 3.1% 2.7% 2.5%Rate of increase in salaries 4.3% 4.4% 4.2%Rate of increase in pensions in payment and deferred pensions 3.1% 2.7% 2.5%Discount rate 6.1% 5.1% 4.8%Expected rates of return: Equities 8.0% 7.8% 7.3%Bonds(2) 4.4% 4.8% 4.2%Other assets 1.3% 5.3% 3.4%
Notes:(1) Figures shown represent a weighted average assumption of the individual schemes.(2) For the year ended 31 March 2008 the expected rate of return for bonds consisted of a 4.7%
rate of return for corporate bonds (2007: 5.1%) and a 3.5% rate of return for government bonds (2007: 4.0%).
The expected return on assets assumptions are derived by considering the expected long term rates of return on plan investments. The overall rate of return is a weighted average of the expected returns of the individual investments made in the group plans. The long term rates of return on equities and property are derived from considering current risk free rates of return with the addition of an appropriate future risk premium from an analysis of historic returns in various countries. The long term rates of return on bonds and cash investments are set in line with market yields currently available at the balance sheet date.
Mortality assumptions used are consistent with those recommended by the individual scheme actuaries and reflect the latest available tables, adjusted for the experience of the Group where appropriate. The largest scheme in the Group is the UK scheme and the tables used for this scheme indicate a further life expectancy for a male/female pensioner currently aged 65 of 22.0/24.8 years (2007: 19.4/22.4 years, 2006: 17.8/20.7 years) and a further life expectancy for a male/female non-pensioner member currently aged 40 of 23.2/26.0 years (2007: 22.1/25.1 years, 2006: 20.3/23.3 years) from age 65.
Measurement of the Group’s defined benefit retirement obligations are particularly sensitive to changes in certain key assumptions, including the discount rate. An increase or decrease in the discount rate of 0.5% would result in a £135 million decrease or a £145 million increase in the defined benefit obligation, respectively.
Charges made to the Consolidated Income Statement and Consolidated Statement of Recognised Income and Expense (“SORIE”) on the basis of the assumptions stated above are:
2008 2007 2006 £m £m £m
Current service cost 53 74 57Interest cost 69 61 52Expected return on pension assets (89) (73) (57)Curtailment (5) − −Total included within staff costs 28 62 52
Actuarial losses /(gains) recognised in the consolidated SORIE 47 (65) 43Cumulative actuarial losses recognised in the consolidated SORIE 127 80 145
Vodafone Group Plc Annual Report 2008 121
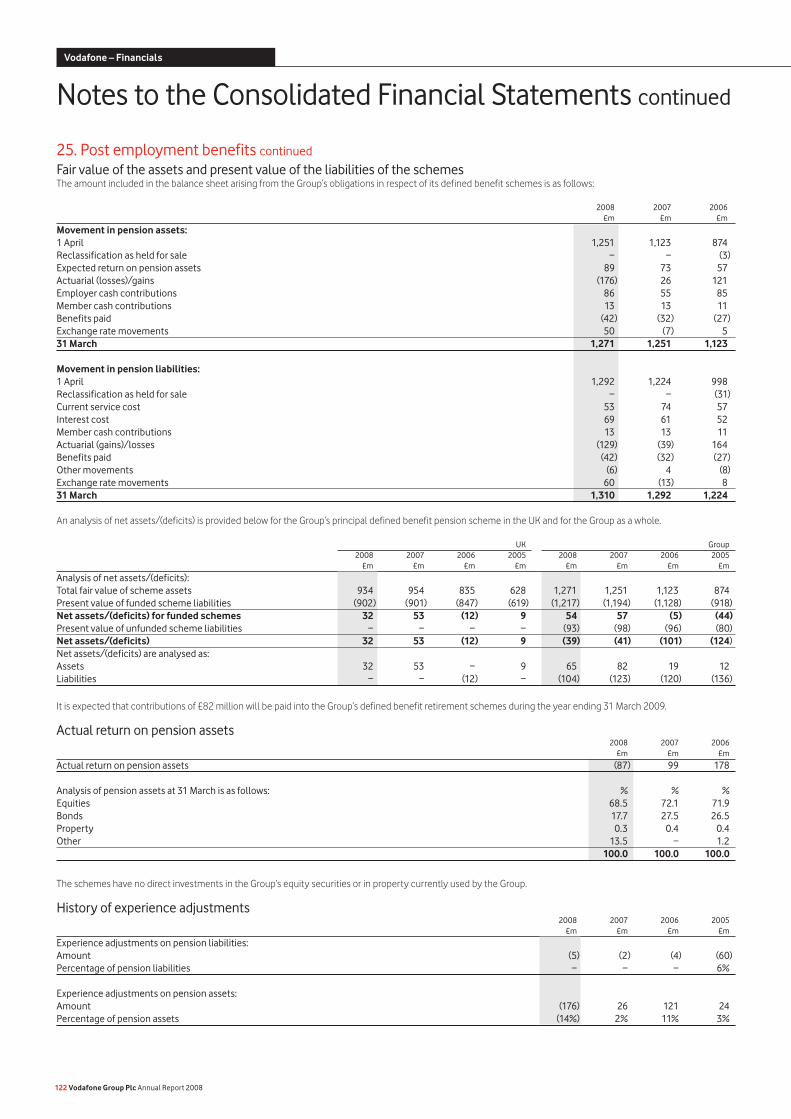
25. Post employment benefits continued
Fair value of the assets and present value of the liabilities of the schemesThe amount included in the balance sheet arising from the Group’s obligations in respect of its defined benefit schemes is as follows:
2008 2007 2006 £m £m £m
Movement in pension assets:1 April 1,251 1,123 874Reclassification as held for sale − − (3)Expected return on pension assets 89 73 57Actuarial (losses)/gains (176) 26 121Employer cash contributions 86 55 85Member cash contributions 13 13 11 Benefits paid (42) (32) (27)Exchange rate movements 50 (7) 531 March 1,271 1,251 1,123
Movement in pension liabilities:1 April 1,292 1,224 998Reclassification as held for sale − − (31)Current service cost 53 74 57Interest cost 69 61 52Member cash contributions 13 13 11Actuarial (gains)/losses (129) (39) 164Benefits paid (42) (32) (27)Other movements (6) 4 (8)Exchange rate movements 60 (13) 831 March 1,310 1,292 1,224
An analysis of net assets/(deficits) is provided below for the Group’s principal defined benefit pension scheme in the UK and for the Group as a whole.
UK Group 2008 2007 2006 2005 2008 2007 2006 2005 £m £m £m £m £m £m £m £m
Analysis of net assets/(deficits): Total fair value of scheme assets 934 954 835 628 1,271 1,251 1,123 874Present value of funded scheme liabilities (902) (901) (847) (619) (1,217) (1,194) (1,128) (918)Net assets/(deficits) for funded schemes 32 53 (12) 9 54 57 (5) (44)Present value of unfunded scheme liabilities − − − − (93) (98) (96) (80)Net assets/(deficits) 32 53 (12) 9 (39) (41) (101) (124)Net assets/(deficits) are analysed as: Assets 32 53 − 9 65 82 19 12Liabilities − − (12) − (104) (123) (120) (136)
It is expected that contributions of £82 million will be paid into the Group’s defined benefit retirement schemes during the year ending 31 March 2009.
Actual return on pension assets 2008 2007 2006 £m £m £m
Actual return on pension assets (87) 99 178 Analysis of pension assets at 31 March is as follows: % % % Equities 68.5 72.1 71.9Bonds 17.7 27.5 26.5Property 0.3 0.4 0.4Other 13.5 − 1.2 100.0 100.0 100.0
The schemes have no direct investments in the Group’s equity securities or in property currently used by the Group.
History of experience adjustments 2008 2007 2006 2005 £m £m £m £m
Experience adjustments on pension liabilities: Amount (5) (2) (4) (60)Percentage of pension liabilities − − − 6%
Experience adjustments on pension assets: Amount (176) 26 121 24Percentage of pension assets (14%) 2% 11% 3%
122 Vodafone Group Plc Annual Report 2008
Notes to the Consolidated Financial Statements continued
Vodafone – Financials
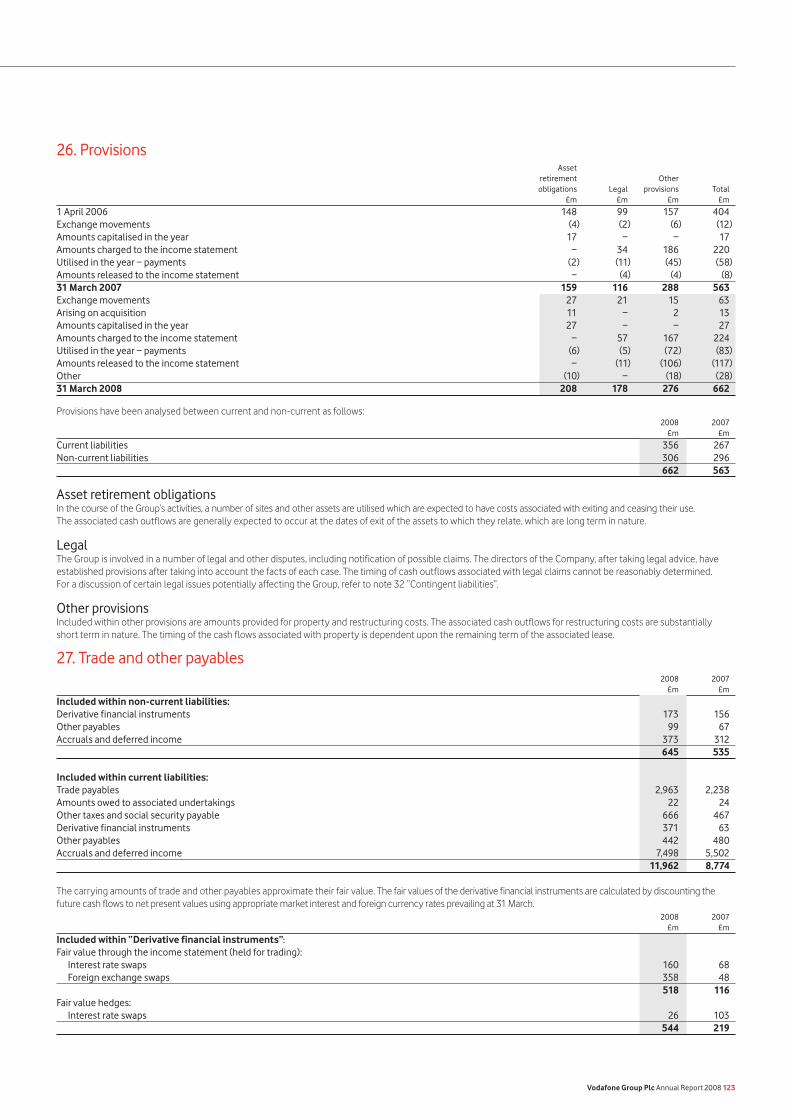
26. Provisions Asset retirement Other obligations Legal provisions Total £m £m £m £m
1 April 2006 148 99 157 404Exchange movements (4) (2) (6) (12)Amounts capitalised in the year 17 − − 17Amounts charged to the income statement − 34 186 220Utilised in the year − payments (2) (11) (45) (58)Amounts released to the income statement − (4) (4) (8)31 March 2007 159 116 288 563Exchange movements 27 21 15 63Arising on acquisition 11 − 2 13Amounts capitalised in the year 27 − − 27Amounts charged to the income statement − 57 167 224Utilised in the year − payments (6) (5) (72) (83)Amounts released to the income statement − (11) (106) (117)Other (10) − (18) (28)31 March 2008 208 178 276 662
Provisions have been analysed between current and non-current as follows: 2008 2007 £m £m
Current liabilities 356 267Non-current liabilities 306 296 662 563
Asset retirement obligationsIn the course of the Group’s activities, a number of sites and other assets are utilised which are expected to have costs associated with exiting and ceasing their use. The associated cash outflows are generally expected to occur at the dates of exit of the assets to which they relate, which are long term in nature.
Legal The Group is involved in a number of legal and other disputes, including notification of possible claims. The directors of the Company, after taking legal advice, have established provisions after taking into account the facts of each case. The timing of cash outflows associated with legal claims cannot be reasonably determined. For a discussion of certain legal issues potentially affecting the Group, refer to note 32 “Contingent liabilities”.
Other provisionsIncluded within other provisions are amounts provided for property and restructuring costs. The associated cash outflows for restructuring costs are substantially short term in nature. The timing of the cash flows associated with property is dependent upon the remaining term of the associated lease.
27. Trade and other payables 2008 2007 £m £m
Included within non-current liabilities: Derivative financial instruments 173 156Other payables 99 67Accruals and deferred income 373 312 645 535
Included within current liabilities: Trade payables 2,963 2,238Amounts owed to associated undertakings 22 24Other taxes and social security payable 666 467Derivative financial instruments 371 63Other payables 442 480Accruals and deferred income 7,498 5,502 11,962 8,774
The carrying amounts of trade and other payables approximate their fair value. The fair values of the derivative financial instruments are calculated by discounting the future cash flows to net present values using appropriate market interest and foreign currency rates prevailing at 31 March. 2008 2007 £m £m
Included within “Derivative financial instruments”:
Fair value through the income statement (held for trading): Interest rate swaps 160 68 Foreign exchange swaps 358 48 518 116Fair value hedges: Interest rate swaps 26 103 544 219
Vodafone Group Plc Annual Report 2008 123
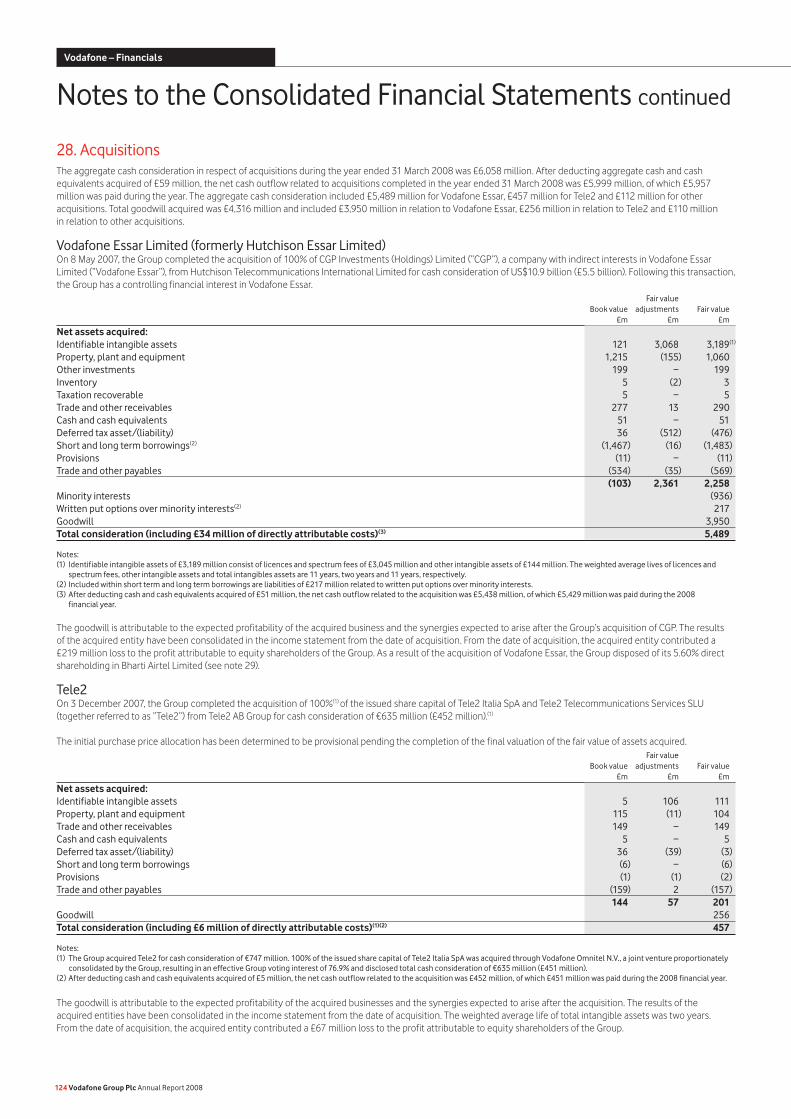
28. AcquisitionsThe aggregate cash consideration in respect of acquisitions during the year ended 31 March 2008 was £6,058 million. After deducting aggregate cash and cash equivalents acquired of £59 million, the net cash outflow related to acquisitions completed in the year ended 31 March 2008 was £5,999 million, of which £5,957 million was paid during the year. The aggregate cash consideration included £5,489 million for Vodafone Essar, £457 million for Tele2 and £112 million for other acquisitions. Total goodwill acquired was £4,316 million and included £3,950 million in relation to Vodafone Essar, £256 million in relation to Tele2 and £110 million in relation to other acquisitions.
Vodafone Essar Limited (formerly Hutchison Essar Limited)On 8 May 2007, the Group completed the acquisition of 100% of CGP Investments (Holdings) Limited (“CGP”), a company with indirect interests in Vodafone Essar Limited (“Vodafone Essar”), from Hutchison Telecommunications International Limited for cash consideration of US$10.9 billion (£5.5 billion). Following this transaction, the Group has a controlling financial interest in Vodafone Essar. Fair value Book value adjustments Fair value £m £m £m
Net assets acquired: Identifiable intangible assets 121 3,068 3,189(1)
Property, plant and equipment 1,215 (155) 1,060Other investments 199 − 199Inventory 5 (2) 3Taxation recoverable 5 − 5Trade and other receivables 277 13 290Cash and cash equivalents 51 − 51Deferred tax asset/(liability) 36 (512) (476)Short and long term borrowings(2) (1,467) (16) (1,483)Provisions (11) − (11)Trade and other payables (534) (35) (569) (103) 2,361 2,258Minority interests (936)Written put options over minority interests(2) 217Goodwill 3,950Total consideration (including £34 million of directly attributable costs)(3) 5,489
Notes:(1) Identifiable intangible assets of £3,189 million consist of licences and spectrum fees of £3,045 million and other intangible assets of £144 million. The weighted average lives of licences and
spectrum fees, other intangible assets and total intangibles assets are 11 years, two years and 11 years, respectively.(2) Included within short term and long term borrowings are liabilities of £217 million related to written put options over minority interests.(3) After deducting cash and cash equivalents acquired of £51 million, the net cash outflow related to the acquisition was £5,438 million, of which £5,429 million was paid during the 2008
financial year.
The goodwill is attributable to the expected profitability of the acquired business and the synergies expected to arise after the Group’s acquisition of CGP. The results of the acquired entity have been consolidated in the income statement from the date of acquisition. From the date of acquisition, the acquired entity contributed a £219 million loss to the profit attributable to equity shareholders of the Group. As a result of the acquisition of Vodafone Essar, the Group disposed of its 5.60% direct shareholding in Bharti Airtel Limited (see note 29).
Tele2On 3 December 2007, the Group completed the acquisition of 100%(1) of the issued share capital of Tele2 Italia SpA and Tele2 Telecommunications Services SLU (together referred to as “Tele2”) from Tele2 AB Group for cash consideration of €635 million (£452 million).(1)
The initial purchase price allocation has been determined to be provisional pending the completion of the final valuation of the fair value of assets acquired. Fair value Book value adjustments Fair value £m £m £m
Net assets acquired: Identifiable intangible assets 5 106 111 Property, plant and equipment 115 (11) 104Trade and other receivables 149 − 149Cash and cash equivalents 5 − 5Deferred tax asset/(liability) 36 (39) (3)Short and long term borrowings (6) − (6)Provisions (1) (1) (2)Trade and other payables (159) 2 (157) 144 57 201Goodwill 256Total consideration (including £6 million of directly attributable costs)(1)(2) 457
Notes:(1) The Group acquired Tele2 for cash consideration of €747 million. 100% of the issued share capital of Tele2 Italia SpA was acquired through Vodafone Omnitel N.V., a joint venture proportionately
consolidated by the Group, resulting in an effective Group voting interest of 76.9% and disclosed total cash consideration of €635 million (£451 million).(2) After deducting cash and cash equivalents acquired of £5 million, the net cash outflow related to the acquisition was £452 million, of which £451 million was paid during the 2008 financial year.
The goodwill is attributable to the expected profitability of the acquired businesses and the synergies expected to arise after the acquisition. The results of the acquired entities have been consolidated in the income statement from the date of acquisition. The weighted average life of total intangible assets was two years. From the date of acquisition, the acquired entity contributed a £67 million loss to the profit attributable to equity shareholders of the Group.
124 Vodafone Group Plc Annual Report 2008
Notes to the Consolidated Financial Statements continued
Vodafone – Financials
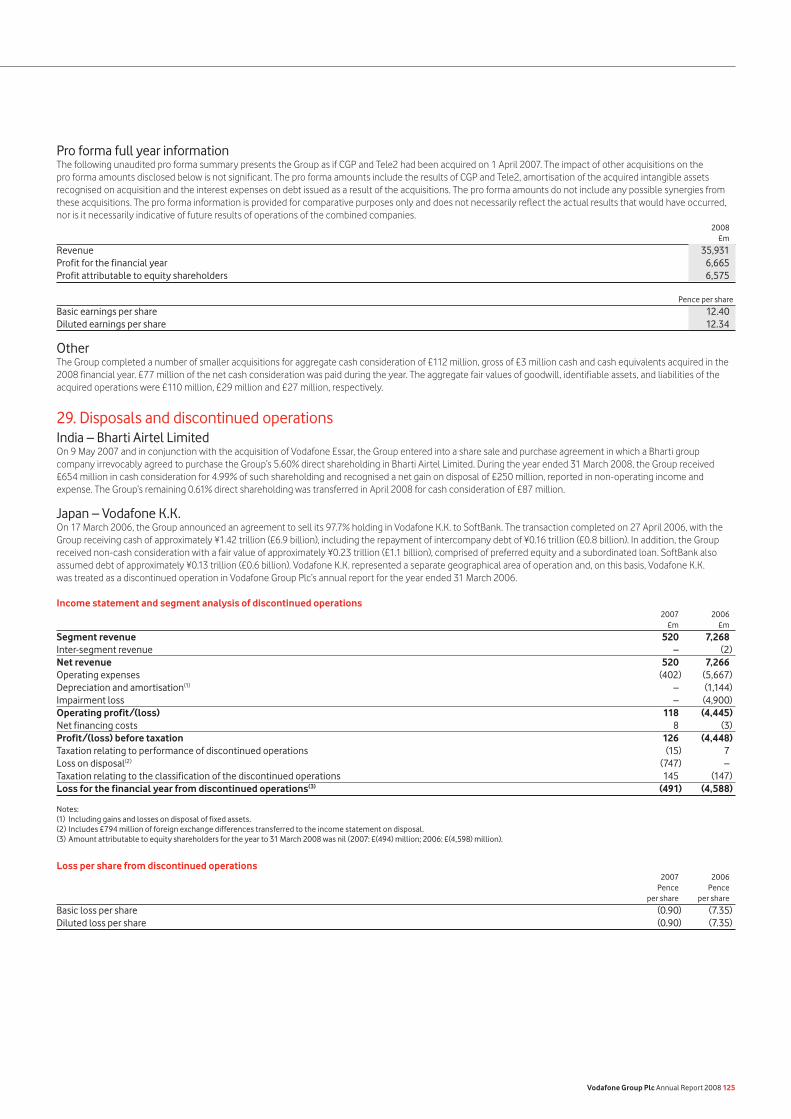
Pro forma full year informationThe following unaudited pro forma summary presents the Group as if CGP and Tele2 had been acquired on 1 April 2007. The impact of other acquisitions on the pro forma amounts disclosed below is not significant. The pro forma amounts include the results of CGP and Tele2, amortisation of the acquired intangible assets recognised on acquisition and the interest expenses on debt issued as a result of the acquisitions. The pro forma amounts do not include any possible synergies from these acquisitions. The pro forma information is provided for comparative purposes only and does not necessarily reflect the actual results that would have occurred, nor is it necessarily indicative of future results of operations of the combined companies. 2008 £m
Revenue 35,931Profit for the financial year 6,665Profit attributable to equity shareholders 6,575 Pence per share
Basic earnings per share 12.40Diluted earnings per share 12.34
OtherThe Group completed a number of smaller acquisitions for aggregate cash consideration of £112 million, gross of £3 million cash and cash equivalents acquired in the 2008 financial year. £77 million of the net cash consideration was paid during the year. The aggregate fair values of goodwill, identifiable assets, and liabilities of the acquired operations were £110 million, £29 million and £27 million, respectively.
29. Disposals and discontinued operationsIndia – Bharti Airtel LimitedOn 9 May 2007 and in conjunction with the acquisition of Vodafone Essar, the Group entered into a share sale and purchase agreement in which a Bharti group company irrevocably agreed to purchase the Group’s 5.60% direct shareholding in Bharti Airtel Limited. During the year ended 31 March 2008, the Group received £654 million in cash consideration for 4.99% of such shareholding and recognised a net gain on disposal of £250 million, reported in non-operating income and expense. The Group’s remaining 0.61% direct shareholding was transferred in April 2008 for cash consideration of £87 million.
Japan – Vodafone K.K.On 17 March 2006, the Group announced an agreement to sell its 97.7% holding in Vodafone K.K. to SoftBank. The transaction completed on 27 April 2006, with the Group receiving cash of approximately ¥1.42 trillion (£6.9 billion), including the repayment of intercompany debt of ¥0.16 trillion (£0.8 billion). In addition, the Group received non-cash consideration with a fair value of approximately ¥0.23 trillion (£1.1 billion), comprised of preferred equity and a subordinated loan. SoftBank also assumed debt of approximately ¥0.13 trillion (£0.6 billion). Vodafone K.K. represented a separate geographical area of operation and, on this basis, Vodafone K.K. was treated as a discontinued operation in Vodafone Group Plc’s annual report for the year ended 31 March 2006.
Income statement and segment analysis of discontinued operations 2007 2006 £m £m
Segment revenue 520 7,268Inter-segment revenue – (2)Net revenue 520 7,266Operating expenses (402) (5,667)Depreciation and amortisation(1) – (1,144)Impairment loss – (4,900)Operating profit/(loss) 118 (4,445)Net financing costs 8 (3)Profit/(loss) before taxation 126 (4,448)Taxation relating to performance of discontinued operations (15) 7Loss on disposal(2) (747) –Taxation relating to the classification of the discontinued operations 145 (147)Loss for the financial year from discontinued operations(3) (491) (4,588)
Notes:(1) Including gains and losses on disposal of fixed assets.(2) Includes £794 million of foreign exchange differences transferred to the income statement on disposal.(3) Amount attributable to equity shareholders for the year to 31 March 2008 was nil (2007: £(494) million; 2006: £(4,598) million).
Loss per share from discontinued operations 2007 2006 Pence Pence per share per share
Basic loss per share (0.90) (7.35)Diluted loss per share (0.90) (7.35)
Vodafone Group Plc Annual Report 2008 125
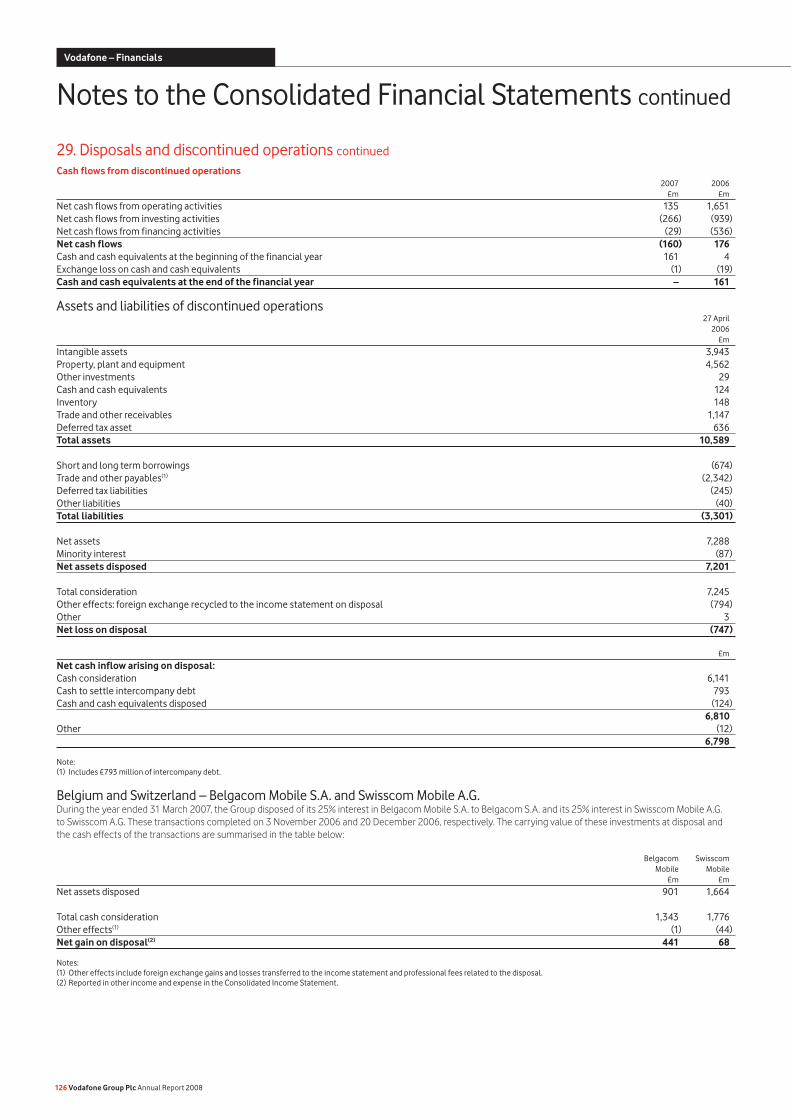
29. Disposals and discontinued operations continued
Cash flows from discontinued operations 2007 2006 £m £m
Net cash flows from operating activities 135 1,651Net cash flows from investing activities (266) (939)Net cash flows from financing activities (29) (536)Net cash flows (160) 176Cash and cash equivalents at the beginning of the financial year 161 4Exchange loss on cash and cash equivalents (1) (19)Cash and cash equivalents at the end of the financial year – 161
Assets and liabilities of discontinued operations 27 April 2006 £m
Intangible assets 3,943Property, plant and equipment 4,562Other investments 29Cash and cash equivalents 124Inventory 148Trade and other receivables 1,147Deferred tax asset 636Total assets 10,589 Short and long term borrowings (674)Trade and other payables(1) (2,342)Deferred tax liabilities (245)Other liabilities (40)Total liabilities (3,301) Net assets 7,288Minority interest (87)Net assets disposed 7,201
Total consideration 7,245Other effects: foreign exchange recycled to the income statement on disposal (794)Other 3Net loss on disposal (747) £m
Net cash inflow arising on disposal: Cash consideration 6,141Cash to settle intercompany debt 793Cash and cash equivalents disposed (124) 6,810Other (12) 6,798
Note:(1) Includes £793 million of intercompany debt.
Belgium and Switzerland – Belgacom Mobile S.A. and Swisscom Mobile A.G.During the year ended 31 March 2007, the Group disposed of its 25% interest in Belgacom Mobile S.A. to Belgacom S.A. and its 25% interest in Swisscom Mobile A.G. to Swisscom A.G. These transactions completed on 3 November 2006 and 20 December 2006, respectively. The carrying value of these investments at disposal and the cash effects of the transactions are summarised in the table below:
Belgacom Swisscom Mobile Mobile £m £m
Net assets disposed 901 1,664
Total cash consideration 1,343 1,776Other effects(1) (1) (44)Net gain on disposal(2) 441 68
Notes:(1) Other effects include foreign exchange gains and losses transferred to the income statement and professional fees related to the disposal.(2) Reported in other income and expense in the Consolidated Income Statement.
126 Vodafone Group Plc Annual Report 2008
Notes to the Consolidated Financial Statements continued
Vodafone – Financials
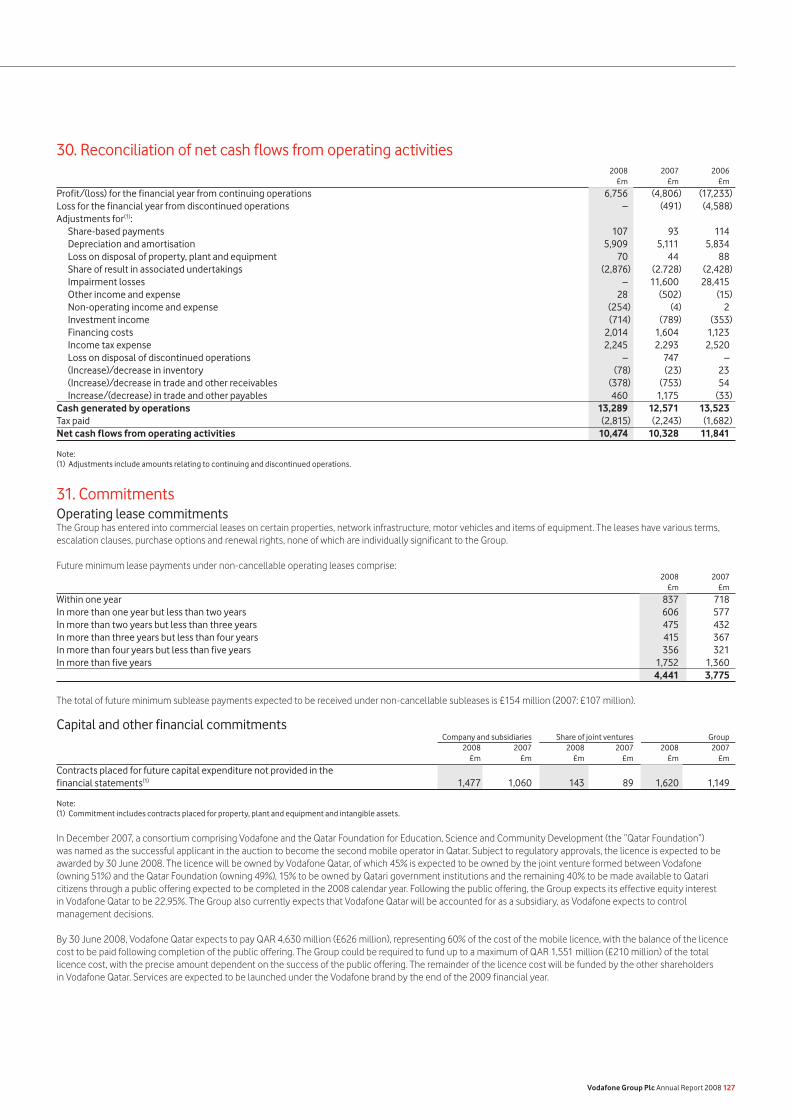
30. Reconciliation of net cash flows from operating activities 2008 2007 2006 £m £m £m
Profit/(loss) for the financial year from continuing operations 6,756 (4,806) (17,233)Loss for the financial year from discontinued operations – (491) (4,588)Adjustments for(1): Share-based payments 107 93 114 Depreciation and amortisation 5,909 5,111 5,834 Loss on disposal of property, plant and equipment 70 44 88 Share of result in associated undertakings (2,876) (2.728) (2,428) Impairment losses – 11,600 28,415 Other income and expense 28 (502) (15) Non-operating income and expense (254) (4) 2 Investment income (714) (789) (353) Financing costs 2,014 1,604 1,123 Income tax expense 2,245 2,293 2,520 Loss on disposal of discontinued operations – 747 – (Increase)/decrease in inventory (78) (23) 23 (Increase)/decrease in trade and other receivables (378) (753) 54 Increase/(decrease) in trade and other payables 460 1,175 (33)Cash generated by operations 13,289 12,571 13,523Tax paid (2,815) (2,243) (1,682)Net cash flows from operating activities 10,474 10,328 11,841
Note: (1) Adjustments include amounts relating to continuing and discontinued operations.
31. CommitmentsOperating lease commitmentsThe Group has entered into commercial leases on certain properties, network infrastructure, motor vehicles and items of equipment. The leases have various terms, escalation clauses, purchase options and renewal rights, none of which are individually significant to the Group.
Future minimum lease payments under non-cancellable operating leases comprise: 2008 2007 £m £m
Within one year 837 718In more than one year but less than two years 606 577In more than two years but less than three years 475 432In more than three years but less than four years 415 367In more than four years but less than five years 356 321In more than five years 1,752 1,360 4,441 3,775
The total of future minimum sublease payments expected to be received under non-cancellable subleases is £154 million (2007: £107 million).
Capital and other financial commitments Company and subsidiaries Share of joint ventures Group 2008 2007 2008 2007 2008 2007 £m £m £m £m £m £m
Contracts placed for future capital expenditure not provided in the financial statements(1) 1,477 1,060 143 89 1,620 1,149
Note:(1) Commitment includes contracts placed for property, plant and equipment and intangible assets.
In December 2007, a consortium comprising Vodafone and the Qatar Foundation for Education, Science and Community Development (the “Qatar Foundation”) was named as the successful applicant in the auction to become the second mobile operator in Qatar. Subject to regulatory approvals, the licence is expected to be awarded by 30 June 2008. The licence will be owned by Vodafone Qatar, of which 45% is expected to be owned by the joint venture formed between Vodafone (owning 51%) and the Qatar Foundation (owning 49%), 15% to be owned by Qatari government institutions and the remaining 40% to be made available to Qatari citizens through a public offering expected to be completed in the 2008 calendar year. Following the public offering, the Group expects its effective equity interest in Vodafone Qatar to be 22.95%. The Group also currently expects that Vodafone Qatar will be accounted for as a subsidiary, as Vodafone expects to control management decisions.
By 30 June 2008, Vodafone Qatar expects to pay QAR 4,630 million (£626 million), representing 60% of the cost of the mobile licence, with the balance of the licence cost to be paid following completion of the public offering. The Group could be required to fund up to a maximum of QAR 1,551 million (£210 million) of the total licence cost, with the precise amount dependent on the success of the public offering. The remainder of the licence cost will be funded by the other shareholders in Vodafone Qatar. Services are expected to be launched under the Vodafone brand by the end of the 2009 financial year.
Vodafone Group Plc Annual Report 2008 127
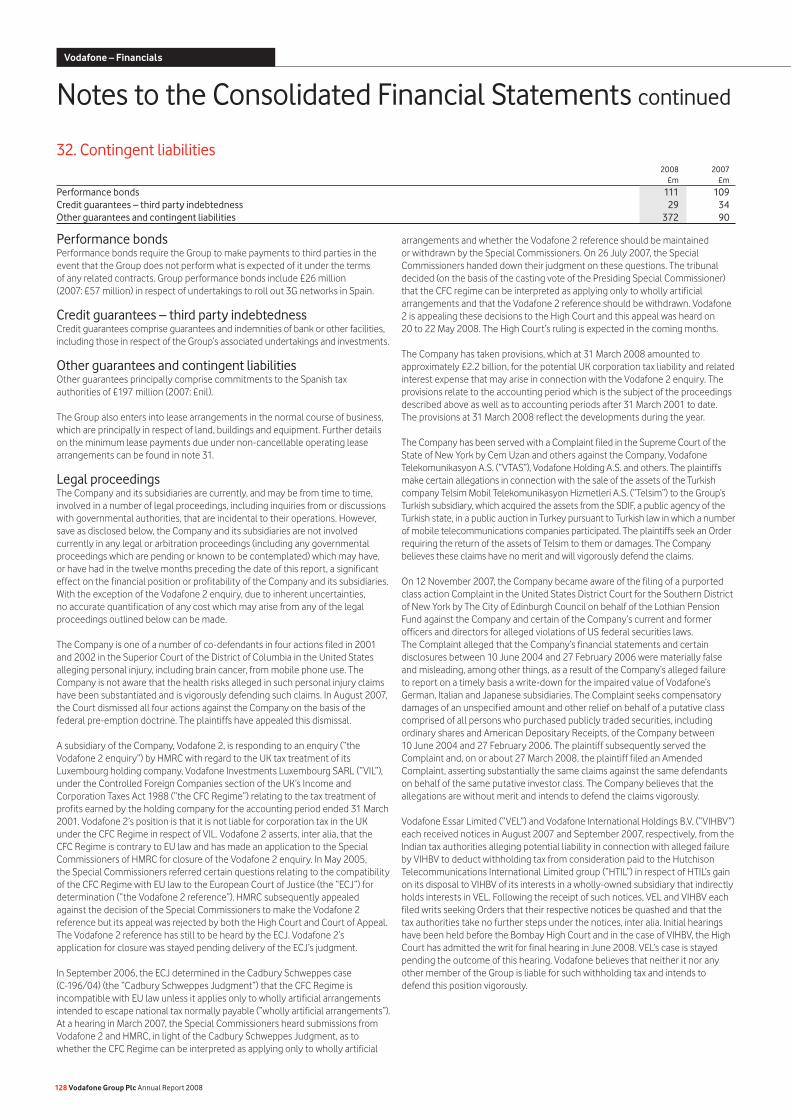
Performance bondsPerformance bonds require the Group to make payments to third parties in the event that the Group does not perform what is expected of it under the terms of any related contracts. Group performance bonds include £26 million (2007: £57 million) in respect of undertakings to roll out 3G networks in Spain.
Credit guarantees – third party indebtednessCredit guarantees comprise guarantees and indemnities of bank or other facilities, including those in respect of the Group’s associated undertakings and investments.
Other guarantees and contingent liabilitiesOther guarantees principally comprise commitments to the Spanish tax authorities of £197 million (2007: £nil).
The Group also enters into lease arrangements in the normal course of business, which are principally in respect of land, buildings and equipment. Further details on the minimum lease payments due under non-cancellable operating lease arrangements can be found in note 31.
Legal proceedingsThe Company and its subsidiaries are currently, and may be from time to time, involved in a number of legal proceedings, including inquiries from or discussions with governmental authorities, that are incidental to their operations. However, save as disclosed below, the Company and its subsidiaries are not involved currently in any legal or arbitration proceedings (including any governmental proceedings which are pending or known to be contemplated) which may have, or have had in the twelve months preceding the date of this report, a significant effect on the financial position or profitability of the Company and its subsidiaries. With the exception of the Vodafone 2 enquiry, due to inherent uncertainties, no accurate quantification of any cost which may arise from any of the legal proceedings outlined below can be made.
The Company is one of a number of co-defendants in four actions filed in 2001 and 2002 in the Superior Court of the District of Columbia in the United States alleging personal injury, including brain cancer, from mobile phone use. The Company is not aware that the health risks alleged in such personal injury claims have been substantiated and is vigorously defending such claims. In August 2007, the Court dismissed all four actions against the Company on the basis of the federal pre-emption doctrine. The plaintiffs have appealed this dismissal.
A subsidiary of the Company, Vodafone 2, is responding to an enquiry (“the Vodafone 2 enquiry”) by HMRC with regard to the UK tax treatment of its Luxembourg holding company, Vodafone Investments Luxembourg SARL (“VIL”), under the Controlled Foreign Companies section of the UK’s Income and Corporation Taxes Act 1988 (“the CFC Regime”) relating to the tax treatment of profits earned by the holding company for the accounting period ended 31 March 2001. Vodafone 2’s position is that it is not liable for corporation tax in the UK under the CFC Regime in respect of VIL. Vodafone 2 asserts, inter alia, that the CFC Regime is contrary to EU law and has made an application to the Special Commissioners of HMRC for closure of the Vodafone 2 enquiry. In May 2005, the Special Commissioners referred certain questions relating to the compatibility of the CFC Regime with EU law to the European Court of Justice (the “ECJ”) for determination (“the Vodafone 2 reference”). HMRC subsequently appealed against the decision of the Special Commissioners to make the Vodafone 2 reference but its appeal was rejected by both the High Court and Court of Appeal. The Vodafone 2 reference has still to be heard by the ECJ. Vodafone 2’s application for closure was stayed pending delivery of the ECJ’s judgment.
In September 2006, the ECJ determined in the Cadbury Schweppes case (C-196/04) (the “Cadbury Schweppes Judgment”) that the CFC Regime is incompatible with EU law unless it applies only to wholly artificial arrangements intended to escape national tax normally payable (“wholly artificial arrangements”). At a hearing in March 2007, the Special Commissioners heard submissions from Vodafone 2 and HMRC, in light of the Cadbury Schweppes Judgment, as to whether the CFC Regime can be interpreted as applying only to wholly artificial
arrangements and whether the Vodafone 2 reference should be maintained or withdrawn by the Special Commissioners. On 26 July 2007, the Special Commissioners handed down their judgment on these questions. The tribunal decided (on the basis of the casting vote of the Presiding Special Commissioner) that the CFC regime can be interpreted as applying only to wholly artificial arrangements and that the Vodafone 2 reference should be withdrawn. Vodafone 2 is appealing these decisions to the High Court and this appeal was heard on 20 to 22 May 2008. The High Court’s ruling is expected in the coming months.
The Company has taken provisions, which at 31 March 2008 amounted to approximately £2.2 billion, for the potential UK corporation tax liability and related interest expense that may arise in connection with the Vodafone 2 enquiry. The provisions relate to the accounting period which is the subject of the proceedings described above as well as to accounting periods after 31 March 2001 to date. The provisions at 31 March 2008 reflect the developments during the year.
The Company has been served with a Complaint filed in the Supreme Court of the State of New York by Cem Uzan and others against the Company, Vodafone Telekomunikasyon A.S. (“VTAS”), Vodafone Holding A.S. and others. The plaintiffs make certain allegations in connection with the sale of the assets of the Turkish company Telsim Mobil Telekomunikasyon Hizmetleri A.S. (“Telsim”) to the Group’s Turkish subsidiary, which acquired the assets from the SDIF, a public agency of the Turkish state, in a public auction in Turkey pursuant to Turkish law in which a number of mobile telecommunications companies participated. The plaintiffs seek an Order requiring the return of the assets of Telsim to them or damages. The Company believes these claims have no merit and will vigorously defend the claims.
On 12 November 2007, the Company became aware of the filing of a purported class action Complaint in the United States District Court for the Southern District of New York by The City of Edinburgh Council on behalf of the Lothian Pension Fund against the Company and certain of the Company’s current and former officers and directors for alleged violations of US federal securities laws. The Complaint alleged that the Company’s financial statements and certain disclosures between 10 June 2004 and 27 February 2006 were materially false and misleading, among other things, as a result of the Company’s alleged failure to report on a timely basis a write-down for the impaired value of Vodafone’s German, Italian and Japanese subsidiaries. The Complaint seeks compensatory damages of an unspecified amount and other relief on behalf of a putative class comprised of all persons who purchased publicly traded securities, including ordinary shares and American Depositary Receipts, of the Company between 10 June 2004 and 27 February 2006. The plaintiff subsequently served the Complaint and, on or about 27 March 2008, the plaintiff filed an Amended Complaint, asserting substantially the same claims against the same defendants on behalf of the same putative investor class. The Company believes that the allegations are without merit and intends to defend the claims vigorously.
Vodafone Essar Limited (“VEL”) and Vodafone International Holdings B.V. (“VIHBV”) each received notices in August 2007 and September 2007, respectively, from the Indian tax authorities alleging potential liability in connection with alleged failure by VIHBV to deduct withholding tax from consideration paid to the Hutchison Telecommunications International Limited group (“HTIL”) in respect of HTIL’s gain on its disposal to VIHBV of its interests in a wholly-owned subsidiary that indirectly holds interests in VEL. Following the receipt of such notices, VEL and VIHBV each filed writs seeking Orders that their respective notices be quashed and that the tax authorities take no further steps under the notices, inter alia. Initial hearings have been held before the Bombay High Court and in the case of VIHBV, the High Court has admitted the writ for final hearing in June 2008. VEL’s case is stayed pending the outcome of this hearing. Vodafone believes that neither it nor any other member of the Group is liable for such withholding tax and intends to defend this position vigorously.
32. Contingent liabilities 2008 2007 £m £m
Performance bonds 111 109Credit guarantees – third party indebtedness 29 34Other guarantees and contingent liabilities 372 90
128 Vodafone Group Plc Annual Report 2008
Notes to the Consolidated Financial Statements continued
Vodafone – Financials
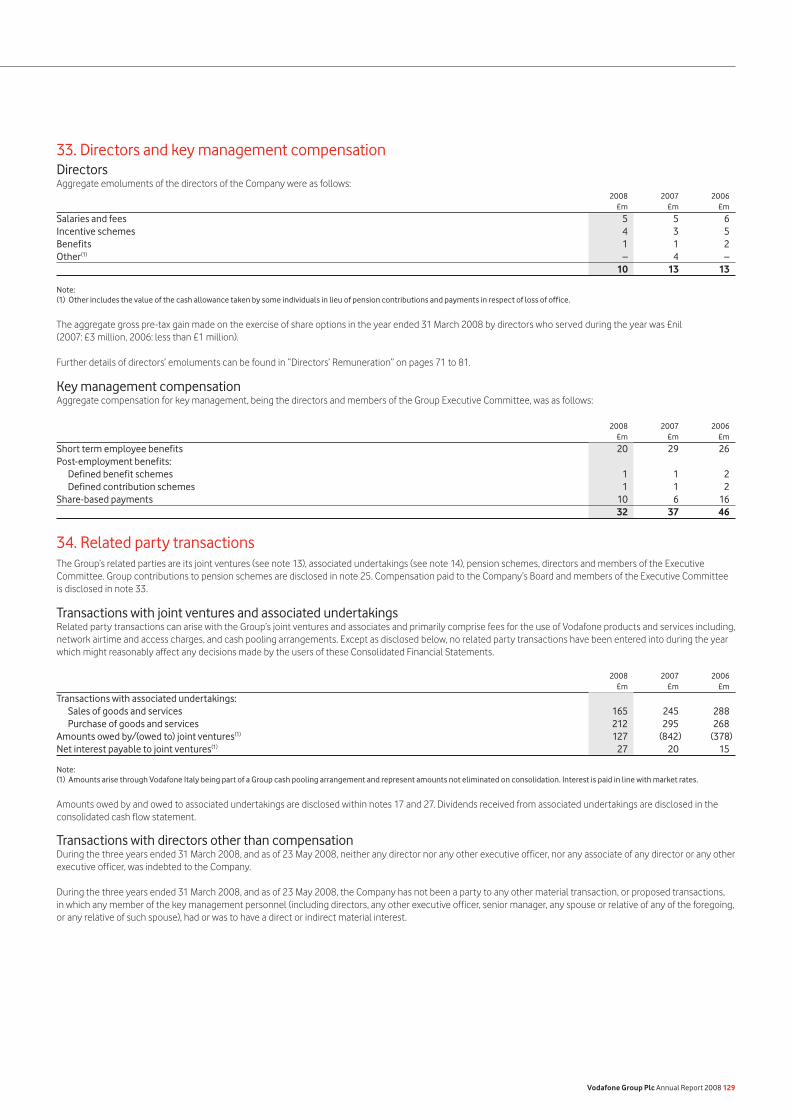
33. Directors and key management compensationDirectorsAggregate emoluments of the directors of the Company were as follows: 2008 2007 2006 £m £m £m
Salaries and fees 5 5 6Incentive schemes 4 3 5Benefits 1 1 2Other(1) – 4 – 10 13 13
Note: (1) Other includes the value of the cash allowance taken by some individuals in lieu of pension contributions and payments in respect of loss of office.
The aggregate gross pre-tax gain made on the exercise of share options in the year ended 31 March 2008 by directors who served during the year was £nil (2007: £3 million, 2006: less than £1 million).
Further details of directors’ emoluments can be found in “Directors’ Remuneration” on pages 71 to 81.
Key management compensationAggregate compensation for key management, being the directors and members of the Group Executive Committee, was as follows:
2008 2007 2006 £m £m £m
Short term employee benefits 20 29 26Post-employment benefits: Defined benefit schemes 1 1 2 Defined contribution schemes 1 1 2Share-based payments 10 6 16 32 37 46
34. Related party transactionsThe Group’s related parties are its joint ventures (see note 13), associated undertakings (see note 14), pension schemes, directors and members of the Executive Committee. Group contributions to pension schemes are disclosed in note 25. Compensation paid to the Company’s Board and members of the Executive Committee is disclosed in note 33.
Transactions with joint ventures and associated undertakingsRelated party transactions can arise with the Group’s joint ventures and associates and primarily comprise fees for the use of Vodafone products and services including, network airtime and access charges, and cash pooling arrangements. Except as disclosed below, no related party transactions have been entered into during the year which might reasonably affect any decisions made by the users of these Consolidated Financial Statements.
2008 2007 2006 £m £m £m
Transactions with associated undertakings: Sales of goods and services 165 245 288 Purchase of goods and services 212 295 268Amounts owed by/(owed to) joint ventures(1) 127 (842) (378)Net interest payable to joint ventures(1) 27 20 15
Note:(1) Amounts arise through Vodafone Italy being part of a Group cash pooling arrangement and represent amounts not eliminated on consolidation. Interest is paid in line with market rates.
Amounts owed by and owed to associated undertakings are disclosed within notes 17 and 27. Dividends received from associated undertakings are disclosed in the consolidated cash flow statement.
Transactions with directors other than compensationDuring the three years ended 31 March 2008, and as of 23 May 2008, neither any director nor any other executive officer, nor any associate of any director or any other executive officer, was indebted to the Company.
During the three years ended 31 March 2008, and as of 23 May 2008, the Company has not been a party to any other material transaction, or proposed transactions, in which any member of the key management personnel (including directors, any other executive officer, senior manager, any spouse or relative of any of the foregoing, or any relative of such spouse), had or was to have a direct or indirect material interest.
Vodafone Group Plc Annual Report 2008 129
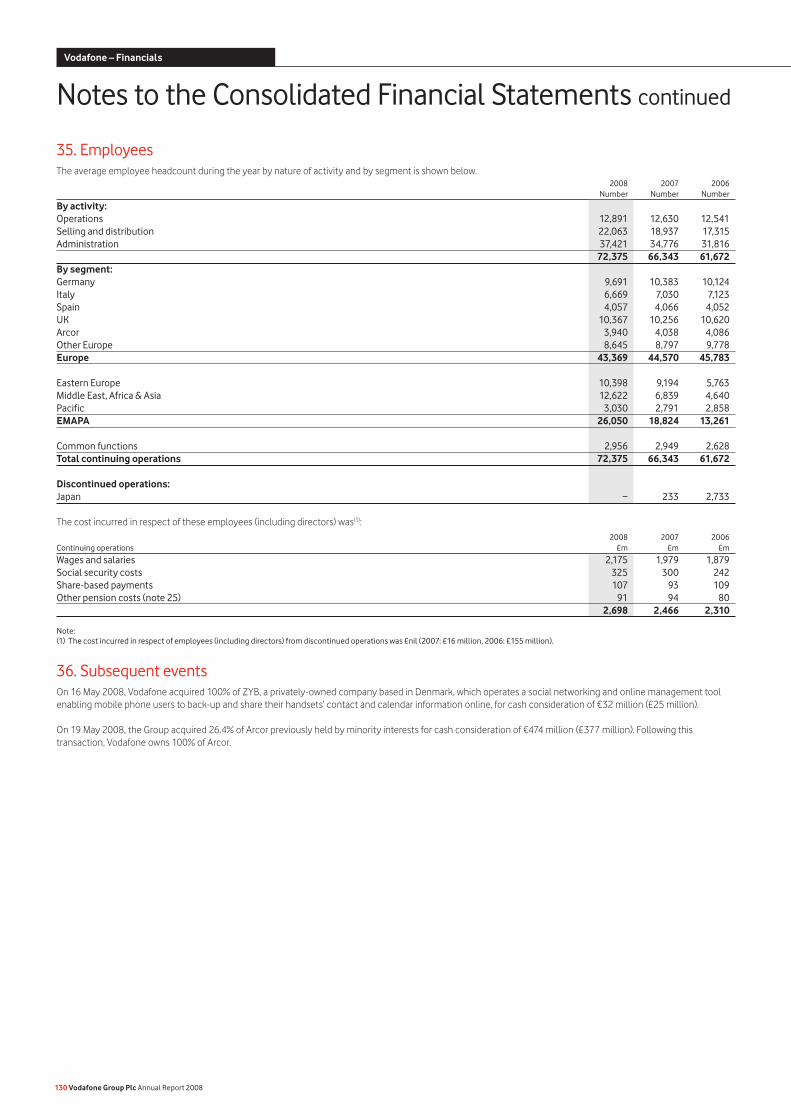
35. EmployeesThe average employee headcount during the year by nature of activity and by segment is shown below. 2008 2007 2006 Number Number Number
By activity: Operations 12,891 12,630 12,541Selling and distribution 22,063 18,937 17,315Administration 37,421 34,776 31,816 72,375 66,343 61,672By segment: Germany 9,691 10,383 10,124Italy 6,669 7,030 7,123Spain 4,057 4,066 4,052UK 10,367 10,256 10,620Arcor 3,940 4,038 4,086Other Europe 8,645 8,797 9,778Europe 43,369 44,570 45,783
Eastern Europe 10,398 9,194 5,763Middle East, Africa & Asia 12,622 6,839 4,640Pacific 3,030 2,791 2,858EMAPA 26,050 18,824 13,261
Common functions 2,956 2,949 2,628Total continuing operations 72,375 66,343 61,672
Discontinued operations:Japan − 233 2,733
The cost incurred in respect of these employees (including directors) was(1): 2008 2007 2006Continuing operations £m £m £m
Wages and salaries 2,175 1,979 1,879Social security costs 325 300 242Share-based payments 107 93 109Other pension costs (note 25) 91 94 80 2,698 2,466 2,310
Note:(1) The cost incurred in respect of employees (including directors) from discontinued operations was £nil (2007: £16 million, 2006: £155 million).
36. Subsequent eventsOn 16 May 2008, Vodafone acquired 100% of ZYB, a privately-owned company based in Denmark, which operates a social networking and online management tool enabling mobile phone users to back-up and share their handsets’ contact and calendar information online, for cash consideration of €32 million (£25 million).
On 19 May 2008, the Group acquired 26.4% of Arcor previously held by minority interests for cash consideration of €474 million (£377 million). Following this transaction, Vodafone owns 100% of Arcor.
130 Vodafone Group Plc Annual Report 2008
Notes to the Consolidated Financial Statements continued
Vodafone – Financials
37. New accounting standardsThe Group has not adopted and does not intend to early adopt the following pronouncements, which have been issued by the IASB or the International Financial Reporting Interpretations Committee (“IFRIC”), but have not yet been endorsed for use in the EU.
An amendment to IFRS 2 “Share-based Payment: Vesting Conditions and Cancellations” was issued in January 2008 and will be effective retrospectively for annual periods beginning on or after 1 January 2009. This amendment clarifies that vesting conditions are service conditions and performance conditions only, and as such, any other features of a share-based payment are not vesting conditions. It also specifies that all cancellations, whether by the entity or by other parties, should receive the same accounting treatment. The Group is currently assessing the impact and expected timing of adoption of this amendment on the Group’s results and financial position.
IFRS 3 (Revised) “Business Combinations” was issued in January 2008 and will apply to business combinations occurring on or after 1 April 2010. The revised standard introduces a number of changes in the accounting for business combinations that will impact the amount of goodwill recognised, the reported results in the period that a business acquisition occurs and future reported results. Assets and liabilities arising from business combinations before 1 April 2010 will not be restated and thus there will be no effect on the Group’s results or financial position on adoption. However, this standard is likely to have a significant impact on the accounting for business acquisitions post adoption.
IAS 1 (Revised) “Presentation of Financial Statements” was issued in September 2007 and will be effective for annual periods beginning on or after 1 January 2009. The revised standard introduces the concept of a statement of comprehensive income, which enables users of the financial statements to analyse changes in a company’s equity resulting from transactions with owners separately from non-owner changes. The revised standard provides the option of presenting items of income and expense and components of other comprehensive income either as a single statement of comprehensive income or in two separate statements. The Group does not currently believe the adoption of this revised standard will have a material impact on the consolidated results or financial position of the Group.
IAS 23 (Revised) “Borrowing Costs” was issued in March 2007 and will be effective for annual periods beginning on or after 1 January 2009. It requires the capitalisation of borrowing costs, to the extent they are directly attributable to the acquisition, production or construction of a qualifying asset. The existing option of immediate recognition of those borrowing costs as an expense has been removed. The Group is currently assessing the impact and expected timing of adoption of this standard on the Group’s results and financial position.
An amendment to IAS 27 “Consolidated and Separate Financial Statements” was issued in January 2008 and is effective for annual periods beginning on or after 1 July 2009. The amendment requires that when a transaction occurs with non-controlling interests in Group entities that do not result in a change in control, the difference between the consideration paid or received and the recorded non-controlling interest should be recognised in equity. In cases where control is lost, any retained interest should be remeasured to fair value with the difference between fair value and the previous carrying value being recognised immediately in the income statement. Transactions occurring before 1 April 2010 will not be restated and thus there will be no effect on the Group’s results or financial position on adoption. However, the Group has historically entered into transactions that are within the scope of this standard and may do so in the future.
“Amendments to IAS 32 Financial Instruments: Presentation and IAS 1 Presentation of Financial Statements – Puttable Financial Instruments and Obligations Arising on Liquidation” was issued in February 2008 and is effective for annual periods beginning on or after 1 January 2009. The amendments require entities to classify certain financial instruments as equity if certain specific criteria are met. The Group is currently assessing the impact and expected timing of adoption of this amendment on the Group’s results and financial position.
IFRIC 12 “Service Concession Arrangements” was issued in November 2006 and is effective for annual periods beginning on or after 1 January 2008. The interpretation addresses how service concession operators should apply existing IFRSs to account for the obligations they undertake and rights they receive in service concession arrangements. The Group does not currently believe the adoption of these pronouncements will have a material impact on the consolidated results or financial position of the Group.
IFRIC 13 “Customer Loyalty Programmes” was issued in June 2007 and will be effective for annual periods beginning on or after 1 July 2008. The interpretation addresses how companies that grant their customers loyalty award credits when buying goods or services should account for their obligation to provide free or discounted goods and services if and when the customers redeem the credits. It requires that consideration received be allocated between the award credits and the other components of the sale. The Group is currently assessing the impact and expected timing of adoption of this standard on the Group’s results and financial position.
IFRIC 14 “IAS 19 – The Limit on a Defined Benefit Asset, Minimum Funding Requirements and their Interaction” was issued in July 2007 and is effective for annual periods beginning on or after 1 January 2008. The interpretation provides guidance on determining the amount of any post employment benefit surplus that could be recognised as an asset on the balance sheet, how a minimum funding requirement affects that measurement, and when a minimum funding requirement can create an onerous obligation that should be recognised as a liability in addition to that otherwise recognised under IAS 19. The Group will adopt this interpretation with effect from 1 April 2008 and is currently assessing the impact of adoption of this interpretation on the consolidated results and financial position of the Group.
“Improvements to IFRSs” was issued in May 2008 and its requirements are effective over a range of dates, with the earliest effective date being for annual periods beginning on or after 1 January 2009. This comprises a number of amendments to IFRSs, which resulted from the IASB’s annual improvements project. The Group is currently assessing the impact and expected timing of adoption of these amendments on the Group’s results and financial position.
Vodafone Group Plc Annual Report 2008 131
Report of Independent Registered Public Accounting Firm to the Members of Vodafone Group Plc We have audited the Consolidated Financial Statements of Vodafone Group Plc which comprise the consolidated balance sheet at 31 March 2008 and 2007, the consolidated income statement, the consolidated cash flow statement, the consolidated statement of recognised income and expense for each of the three years in the period ended 31 March 2008 and the related notes numbered 1 to 37. These Consolidated Financial Statements have been prepared under the accounting policies set out therein. We have also audited the information in the directors’ remuneration report that is described as having been audited.
We have reported separately on the parent Company Financial Statements of Vodafone Group Plc for the year ended 31 March 2008.
Respective responsibilities of directors and auditorsThe directors’ responsibilities for preparing the annual report, the directors’ remuneration report and the Consolidated Financial Statements in accordance with applicable law and International Financial Reporting Standards (“IFRS”) as adopted by the European Union are set out in the statement of directors’ responsibilities.
Our responsibility is to audit the Consolidated Financial Statements in accordance with relevant legal and regulatory requirements and International Standards on Auditing (UK and Ireland).
We report to you our opinion as to whether the Consolidated Financial Statements give a true and fair view, whether the Consolidated Financial Statements have been properly prepared in accordance with the Companies Act 1985 and Article 4 of the IAS Regulation and whether the part of the directors remuneration report described as having been audited has been properly prepared in accordance with the Companies Act 1985. We also report to you whether, in our opinion, the information given in the directors’ report is consistent with the Consolidated Financial Statements.
In addition, we report to you if we have not received all the information and explanations we require for our audit, or if information specified by law regarding directors’ transactions with the Company and other members of the Group is not disclosed.
We review whether the corporate governance statement reflects the Company’s compliance with the nine provisions of the 2006 Combined Code specified for our review by the Listing Rules of the Financial Services Authority, and we report if it does not. We are not required to consider whether the board’s statement on internal control covers all risks and controls, or form an opinion on the effectiveness of the Group’s corporate governance procedures or its risk and control procedures.
We read the other information contained in the annual report as described in the contents section and consider whether it is consistent with the audited Consolidated Financial Statements. We consider the implications for our report if we become aware of any apparent misstatements or material inconsistencies with the Consolidated Financial Statements. Our responsibilities do not extend to any further information outside the annual report.
Basis of audit opinionWe conducted our audit in accordance with International Standards on Auditing (UK and Ireland) issued by the Auditing Practices Board and with the standards of the Public Company Accounting Oversight Board (United States). An audit includes examination, on a test basis, of evidence relevant to the amounts and disclosures in the Consolidated Financial Statements and the part of the directors’ remuneration report to be audited. It also includes an assessment of the significant estimates and judgements made by the directors in the preparation of the Consolidated Financial Statements, and of whether the accounting policies are appropriate to the Group’s circumstances, consistently applied and adequately disclosed.
We planned and performed our audit so as to obtain all the information and explanations which we considered necessary in order to provide us with sufficient evidence to give reasonable assurance that the Consolidated Financial Statements and the part of the directors’ remuneration report to be audited are free from material misstatement, whether caused by fraud or other irregularity or error. In forming our opinion we also evaluated the overall adequacy of the presentation of information in the Consolidated Financial Statements and the part of the directors’ remuneration report to be audited.
OpinionsUK opinionIn our opinion:
the Consolidated Financial Statements give a true and fair view, in accordance with IFRS as adopted by the European Union, of the state of the Group’s affairs as at 31 March 2008 and of its profit for the year then ended; the Consolidated Financial Statements have been properly prepared in accordance with the Companies Act 1985 and Article 4 of the IAS Regulation; the part of the directors’ remuneration report described as having been audited has been properly prepared in accordance with the Companies Act 1985; and the information given in the Directors’ Report is consistent with the Consolidated Financial Statements.
As explained in note 1 to the Consolidated Financial Statements, the Group, in addition to complying with its legal obligation to comply with IFRS as adopted by the European Union, has also complied with IFRS as issued by the International Accounting Standards Board.
In our opinion the Consolidated Financial Statements give a true and fair view, in accordance with IFRS, of the state of the Group’s affairs as at 31 March 2008 and of its profit for the year then ended.
US opinionIn our opinion, the Consolidated Financial Statements present fairly, in all material respects, the consolidated financial position of the Group at 31 March 2008 and 2007 and the consolidated results of its operations and cash flows for each of the three years in the period ended 31 March 2008 in conformity with IFRS as adopted by the European Union and as issued by the International Accounting Standards Board.
We have also audited, in accordance with the standards of the Public Company Accounting Oversight Board (United States), the effectiveness of the Group’s internal control over financial reporting as at 31 March 2008, based on the criteria established in the Internal Control-Integrated Framework issued by the Committee of Sponsoring Organizations of the Treadway Commission. Our report including our opinions on the effectiveness of the Group’s internal control over financial reporting is set out on page 84.
Deloitte & Touche LLPChartered Accountants and Registered AuditorsLondonUnited Kingdom27 May 2008
•
•
•
•
132 Vodafone Group Plc Annual Report 2008
Audit Report on the Consolidated Financial StatementsVodafone – Financials
Independent Auditor’s Report to the Members of Vodafone Group Plc We have audited the parent Company Financial Statements of Vodafone Group Plc for the year ended 31 March 2008 which comprise the balance sheet and the related notes 1 to 10. These parent Company Financial Statements have been prepared under the accounting policies set out therein.
We have reported separately on the Consolidated Financial Statements of Vodafone Group Plc for the year ended 31 March 2008 and on the information in the directors’ remuneration report that is described as having been audited.
Respective responsibilities of directors and auditorsThe directors’ responsibilities for preparing the Annual Report and the parent Company Financial Statements in accordance with applicable law and United Kingdom Accounting Standards (United Kingdom Generally Accepted Accounting Practice) are set out in the Statement of Directors’ Responsibilities.
Our responsibility is to audit the parent Company Financial Statements in accordance with relevant legal and regulatory requirements and International Standards on Auditing (UK and Ireland).
We report to you our opinion as to whether the parent Company Financial Statements give a true and fair view and whether the parent Company Financial Statements have been properly prepared in accordance with the Companies Act 1985. We also report to you whether in our opinion the Directors’ Report is consistent with the parent Company Financial Statements.
In addition we report to you if, in our opinion, the Company has not kept proper accounting records, if we have not received all the information and explanations we require for our audit, or if information specified by law regarding directors’ remuneration and other transactions is not disclosed.
We read the information contained in the Annual Report for the above year as described in the contents section and consider whether it is consistent with the audited parent Company Financial Statements. We consider the implications for our report if we become aware of any apparent misstatements or material inconsistencies with the parent Company Financial Statements. Our responsibility does not extend to any further information outside the annual report.
Basis of audit opinionWe conducted our audit in accordance with International Standards on Auditing (UK and Ireland) issued by the Auditing Practices Board. An audit includes examination, on a test basis, of evidence relevant to the amounts and disclosures in the parent Company Financial Statements. It also includes an assessment of the significant estimates and judgments made by the directors in the preparation of the parent Company Financial Statements, and of whether the accounting policies are appropriate to the Company’s circumstances, consistently applied and adequately disclosed.
We planned and performed our audit so as to obtain all the information and explanations which we considered necessary in order to provide us with sufficient evidence to give reasonable assurance that the parent Company Financial Statements are free from material misstatement, whether caused by fraud or other irregularity or error. In forming our opinion we also evaluated the overall adequacy of the presentation of information in the parent Company Financial Statements.
OpinionIn our opinion:
the parent Company Financial Statements give a true and fair view, in accordance with United Kingdom Generally Accepted Accounting Practice, of the state of the Company’s affairs as at 31 March 2008; the parent Company Financial Statements have been properly prepared in accordance with the Companies Act 1985; and the information given in the Directors’ Report is consistent with the parent Company Financial Statements.
Deloitte & Touche LLPChartered Accountants and Registered AuditorsLondonUnited Kingdom27 May 2008
•
•
•
Vodafone Group Plc Annual Report 2008 133
Audit Report on the Company Financial Statements
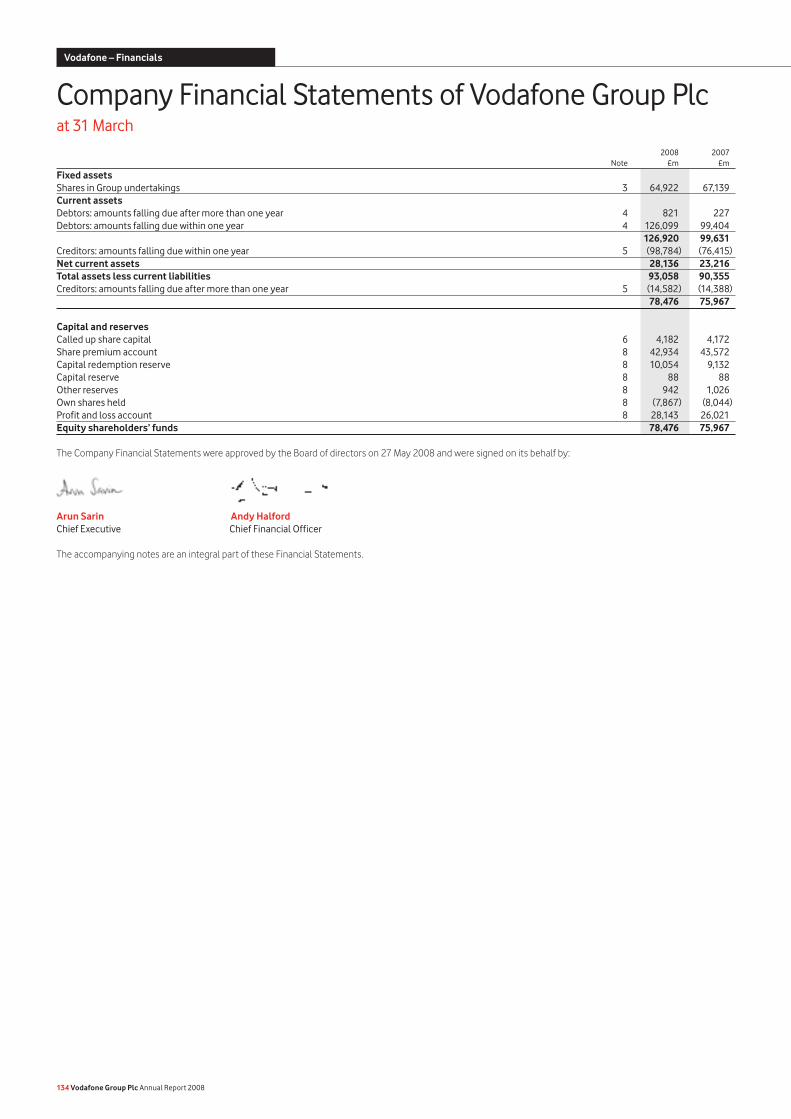
2008 2007 Note £m £m
Fixed assetsShares in Group undertakings 3 64,922 67,139Current assets Debtors: amounts falling due after more than one year 4 821 227Debtors: amounts falling due within one year 4 126,099 99,404 126,920 99,631Creditors: amounts falling due within one year 5 (98,784) (76,415)Net current assets 28,136 23,216Total assets less current liabilities 93,058 90,355Creditors: amounts falling due after more than one year 5 (14,582) (14,388) 78,476 75,967
Capital and reserves Called up share capital 6 4,182 4,172Share premium account 8 42,934 43,572Capital redemption reserve 8 10,054 9,132Capital reserve 8 88 88Other reserves 8 942 1,026Own shares held 8 (7,867) (8,044)Profit and loss account 8 28,143 26,021Equity shareholders’ funds 78,476 75,967 The Company Financial Statements were approved by the Board of directors on 27 May 2008 and were signed on its behalf by:
Arun Sarin Andy Halford Chief Executive Chief Financial Officer
The accompanying notes are an integral part of these Financial Statements.
134 Vodafone Group Plc Annual Report 2008
Company Financial Statements of Vodafone Group Plc at 31 March
Vodafone – Financials
1. Basis of preparation The separate financial statements of the Company are drawn up in accordance with the Companies Act 1985 and UK generally accepted accounting principles (“UK GAAP”).
The preparation of Company Financial Statements in conformity with generally accepted accounting principles requires management to make estimates and assumptions that affect the reported amounts of assets and liabilities and disclosure of contingent assets and liabilities at the date of the Company Financial Statements and the reported amounts of revenue and expenses during the reporting period. Actual results could differ from those estimates. The estimates and underlying assumptions are reviewed on an ongoing basis. Revisions to accounting estimates are recognised in the period in which the estimate is revised if the revision affects only that period or in the period of the revision and future periods if the revision affects both current and future periods.
As permitted by Section 230 of the Companies Act 1985, the profit and loss account of the Company is not presented in this Annual Report. These separate financial statements are not intended to give a true and fair view of the profit or loss or cash flows of the Company. The Company has not published its individual cash flow statement as its liquidity, solvency and financial adaptability are dependent on the Group rather than its own cash flows.
The Company has taken advantage of the exemption contained in FRS 8 “Related party disclosures” and has not reported transactions with fellow Group undertakings.
The Company has taken advantage of the exemption contained in FRS 29 “Financial Instruments: Disclosures” and has not produced any disclosures required by that standard, as disclosures that comply with FRS 29 are available in the Vodafone Group Plc Annual Report for the year ended 31 March 2008.
2. Significant accounting policiesThe Company’s significant accounting policies are described below.
Accounting conventionThe Company Financial Statements are prepared under the historical cost convention and in accordance with applicable accounting standards of the UK Accounting Standards Board and pronouncements of the Urgent Issues Task Force.
Investments Shares in Group undertakings are stated at cost less any provision for impairment.
The Company assesses investments for impairment whenever events or changes in circumstances indicate that the carrying value of an investment may not be recoverable. If any such indication of impairment exists, the Company makes an estimate of the recoverable amount. If the recoverable amount of the cash-generating unit is less than the value of the investment, the investment is considered to be impaired and is written down to its recoverable amount. An impairment loss is recognised immediately in the profit and loss account.
For available-for-sale investments, gains and losses arising from changes in fair value are recognised directly in equity, until the investment is disposed of or is determined to be impaired, at which time the cumulative gain or loss previously recognised in equity, determined using the weighted average cost method, is included in the net profit or loss for the period.
Foreign currencies In preparing the Company Financial Statements, transactions in currencies other than the Company’s functional currency are recorded at the rates of exchange prevailing on the dates of the transactions. At each balance sheet date, monetary items denominated in foreign currencies are retranslated at the rates prevailing on the balance sheet date. Non-monetary items carried at fair value that are denominated in foreign currencies are retranslated at the rate prevailing on the date when fair value was determined. Non-monetary items that are measured in terms of historical cost in a foreign currency are not retranslated.
Exchange differences arising on the settlement of monetary items, and on the retranslation of monetary items, are included in the profit and loss account for the period. Exchange differences arising on the retranslation of non-monetary items carried at fair value are included in the profit and loss account for the period.
Borrowing costsAll borrowing costs are recognised in the profit and loss account in the period in which they are incurred.
TaxationCurrent tax, including UK corporation tax and foreign tax, is provided at amounts expected to be paid (or recovered) using the tax rates and laws that have been enacted or substantively enacted by the balance sheet date.
Deferred tax is provided in full on timing differences that exist at the balance sheet date and that result in an obligation to pay more tax, or a right to pay less tax in the future. The deferred tax is measured at the rate expected to apply in the periods in which the timing differences are expected to reverse, based on the tax rates and laws that are enacted or substantively enacted at the balance sheet date. Timing differences arise from the inclusion of items of income and expenditure in taxation computations in periods different from those in which they are included in the Company Financial Statements. Deferred tax assets are recognised to the extent that it is regarded as more likely than not that they will be recovered. Deferred tax assets and liabilities are not discounted.
Financial instrumentsFinancial assets and financial liabilities in respect of financial instruments are recognised on the Company Balance Sheet when the Company becomes a party to the contractual provisions of the instrument.
Financial liabilities and equity instruments Financial liabilities and equity instruments issued by the Company are classified according to the substance of the contractual arrangements entered into and the definitions of a financial liability and an equity instrument. An equity instrument is any contract that evidences a residual interest in the assets of the Company after deducting all of its liabilities and includes no obligation to deliver cash or other financial assets. The accounting policies adopted for specific financial liabilities and equity instruments are set out below.
Capital market and bank borrowingsInterest-bearing loans and overdrafts are initially measured at fair value (which is equal to cost at inception) and are subsequently measured at amortised cost using the effective interest rate method, except where they are identified as a hedged item in a fair value hedge. Any difference between the proceeds net of transaction costs and the settlement or redemption of borrowings is recognised over the term of the borrowing.
Equity instrumentsEquity instruments issued by the Company are recorded at the proceeds received, net of direct issue costs.
Derivative financial instruments and hedge accounting The Company’s activities expose it to the financial risks of changes in foreign exchange rates and interest rates.
The use of financial derivatives is governed by the Group’s policies approved by the Board of directors, which provide written principles on the use of financial derivatives consistent with the Group’s risk management strategy.
Derivative financial instruments are initially measured at fair value on the contract date and are subsequently re-measured to fair value at each reporting date. The Company designates certain derivatives as hedges of the change of fair value of recognised assets and liabilities (“fair value hedges”). Hedge accounting is discontinued when the hedging instrument expires or is sold, terminated or exercised, or no longer qualifies for hedge accounting.
Vodafone Group Plc Annual Report 2008 135
Notes to the Company Financial Statements
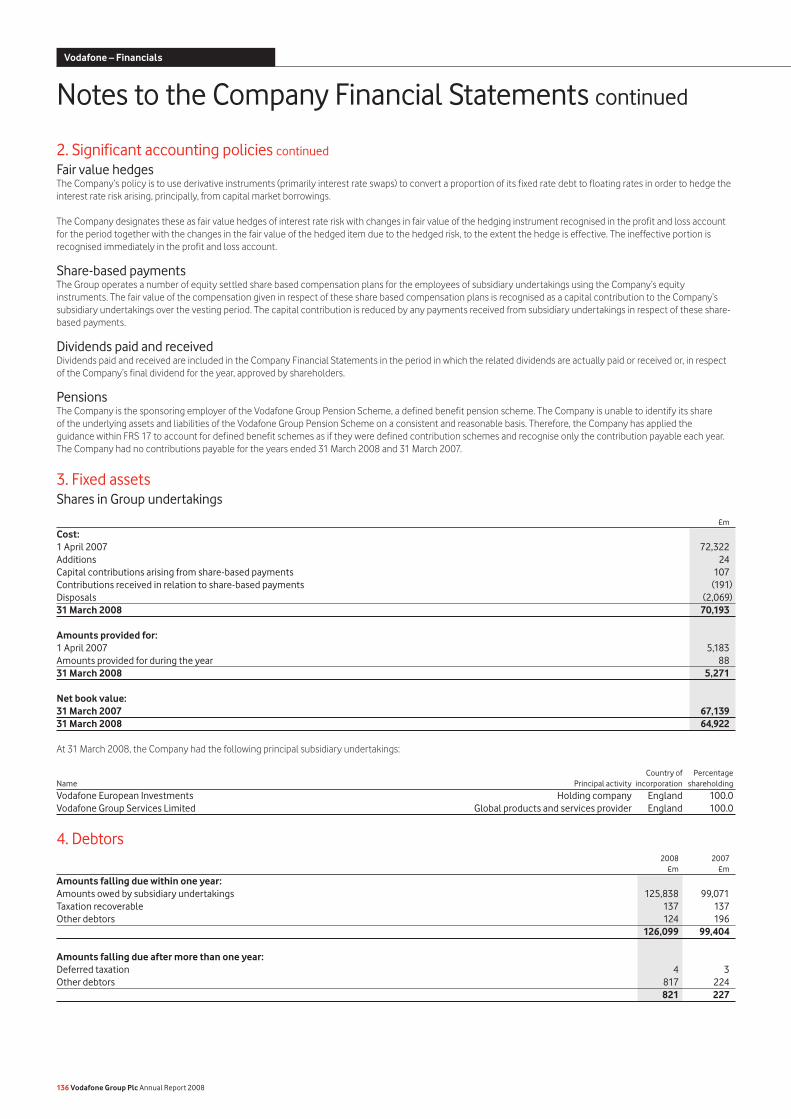
2. Significant accounting policies continued
Fair value hedges The Company’s policy is to use derivative instruments (primarily interest rate swaps) to convert a proportion of its fixed rate debt to floating rates in order to hedge the interest rate risk arising, principally, from capital market borrowings.
The Company designates these as fair value hedges of interest rate risk with changes in fair value of the hedging instrument recognised in the profit and loss account for the period together with the changes in the fair value of the hedged item due to the hedged risk, to the extent the hedge is effective. The ineffective portion is recognised immediately in the profit and loss account.
Share-based paymentsThe Group operates a number of equity settled share based compensation plans for the employees of subsidiary undertakings using the Company’s equity instruments. The fair value of the compensation given in respect of these share based compensation plans is recognised as a capital contribution to the Company’s subsidiary undertakings over the vesting period. The capital contribution is reduced by any payments received from subsidiary undertakings in respect of these share-based payments.
Dividends paid and receivedDividends paid and received are included in the Company Financial Statements in the period in which the related dividends are actually paid or received or, in respect of the Company’s final dividend for the year, approved by shareholders.
PensionsThe Company is the sponsoring employer of the Vodafone Group Pension Scheme, a defined benefit pension scheme. The Company is unable to identify its share of the underlying assets and liabilities of the Vodafone Group Pension Scheme on a consistent and reasonable basis. Therefore, the Company has applied the guidance within FRS 17 to account for defined benefit schemes as if they were defined contribution schemes and recognise only the contribution payable each year. The Company had no contributions payable for the years ended 31 March 2008 and 31 March 2007.
3. Fixed assetsShares in Group undertakings
£m
Cost:1 April 2007 72,322Additions 24Capital contributions arising from share-based payments 107Contributions received in relation to share-based payments (191)Disposals (2,069)31 March 2008 70,193
Amounts provided for:1 April 2007 5,183Amounts provided for during the year 8831 March 2008 5,271
Net book value: 31 March 2007 67,13931 March 2008 64,922
At 31 March 2008, the Company had the following principal subsidiary undertakings:
Country of PercentageName Principal activity incorporation shareholding
Vodafone European Investments Holding company England 100.0Vodafone Group Services Limited Global products and services provider England 100.0
4. Debtors 2008 2007 £m £m
Amounts falling due within one year:Amounts owed by subsidiary undertakings 125,838 99,071Taxation recoverable 137 137Other debtors 124 196 126,099 99,404
Amounts falling due after more than one year:Deferred taxation 4 3Other debtors 817 224 821 227
136 Vodafone Group Plc Annual Report 2008
Notes to the Company Financial Statements continued
Vodafone – Financials
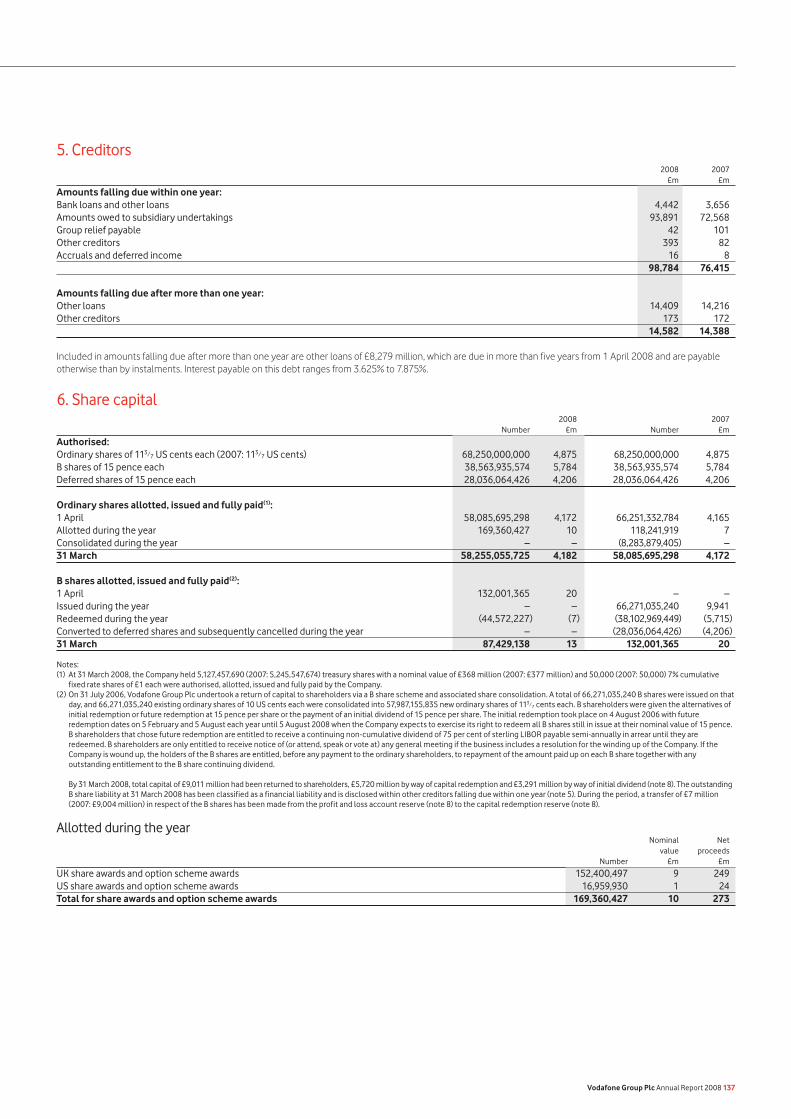
5. Creditors 2008 2007 £m £m
Amounts falling due within one year:Bank loans and other loans 4,442 3,656Amounts owed to subsidiary undertakings 93,891 72,568Group relief payable 42 101Other creditors 393 82Accruals and deferred income 16 8 98,784 76,415
Amounts falling due after more than one year: Other loans 14,409 14,216Other creditors 173 172 14,582 14,388
Included in amounts falling due after more than one year are other loans of £8,279 million, which are due in more than five years from 1 April 2008 and are payable otherwise than by instalments. Interest payable on this debt ranges from 3.625% to 7.875%.
6. Share capital 2008 2007 Number £m Number £m
Authorised:Ordinary shares of 113/7 US cents each (2007: 113/7 US cents) 68,250,000,000 4,875 68,250,000,000 4,875B shares of 15 pence each 38,563,935,574 5,784 38,563,935,574 5,784Deferred shares of 15 pence each 28,036,064,426 4,206 28,036,064,426 4,206 Ordinary shares allotted, issued and fully paid(1): 1 April 58,085,695,298 4,172 66,251,332,784 4,165Allotted during the year 169,360,427 10 118,241,919 7Consolidated during the year – – (8,283,879,405) –31 March 58,255,055,725 4,182 58,085,695,298 4,172 B shares allotted, issued and fully paid(2): 1 April 132,001,365 20 – –Issued during the year – – 66,271,035,240 9,941Redeemed during the year (44,572,227) (7) (38,102,969,449) (5,715)Converted to deferred shares and subsequently cancelled during the year – – (28,036,064,426) (4,206)31 March 87,429,138 13 132,001,365 20
Notes:(1) At 31 March 2008, the Company held 5,127,457,690 (2007: 5,245,547,674) treasury shares with a nominal value of £368 million (2007: £377 million) and 50,000 (2007: 50,000) 7% cumulative
fixed rate shares of £1 each were authorised, allotted, issued and fully paid by the Company.(2) On 31 July 2006, Vodafone Group Plc undertook a return of capital to shareholders via a B share scheme and associated share consolidation. A total of 66,271,035,240 B shares were issued on that
day, and 66,271,035,240 existing ordinary shares of 10 US cents each were consolidated into 57,987,155,835 new ordinary shares of 113/7 cents each. B shareholders were given the alternatives of initial redemption or future redemption at 15 pence per share or the payment of an initial dividend of 15 pence per share. The initial redemption took place on 4 August 2006 with future redemption dates on 5 February and 5 August each year until 5 August 2008 when the Company expects to exercise its right to redeem all B shares still in issue at their nominal value of 15 pence. B shareholders that chose future redemption are entitled to receive a continuing non-cumulative dividend of 75 per cent of sterling LIBOR payable semi-annually in arrear until they are redeemed. B shareholders are only entitled to receive notice of (or attend, speak or vote at) any general meeting if the business includes a resolution for the winding up of the Company. If the Company is wound up, the holders of the B shares are entitled, before any payment to the ordinary shareholders, to repayment of the amount paid up on each B share together with any outstanding entitlement to the B share continuing dividend.
By 31 March 2008, total capital of £9,011 million had been returned to shareholders, £5,720 million by way of capital redemption and £3,291 million by way of initial dividend (note 8). The outstanding B share liability at 31 March 2008 has been classified as a financial liability and is disclosed within other creditors falling due within one year (note 5). During the period, a transfer of £7 million (2007: £9,004 million) in respect of the B shares has been made from the profit and loss account reserve (note 8) to the capital redemption reserve (note 8).
Allotted during the year Nominal Net value proceeds Number £m £m
UK share awards and option scheme awards 152,400,497 9 249US share awards and option scheme awards 16,959,930 1 24Total for share awards and option scheme awards 169,360,427 10 273
Vodafone Group Plc Annual Report 2008 137
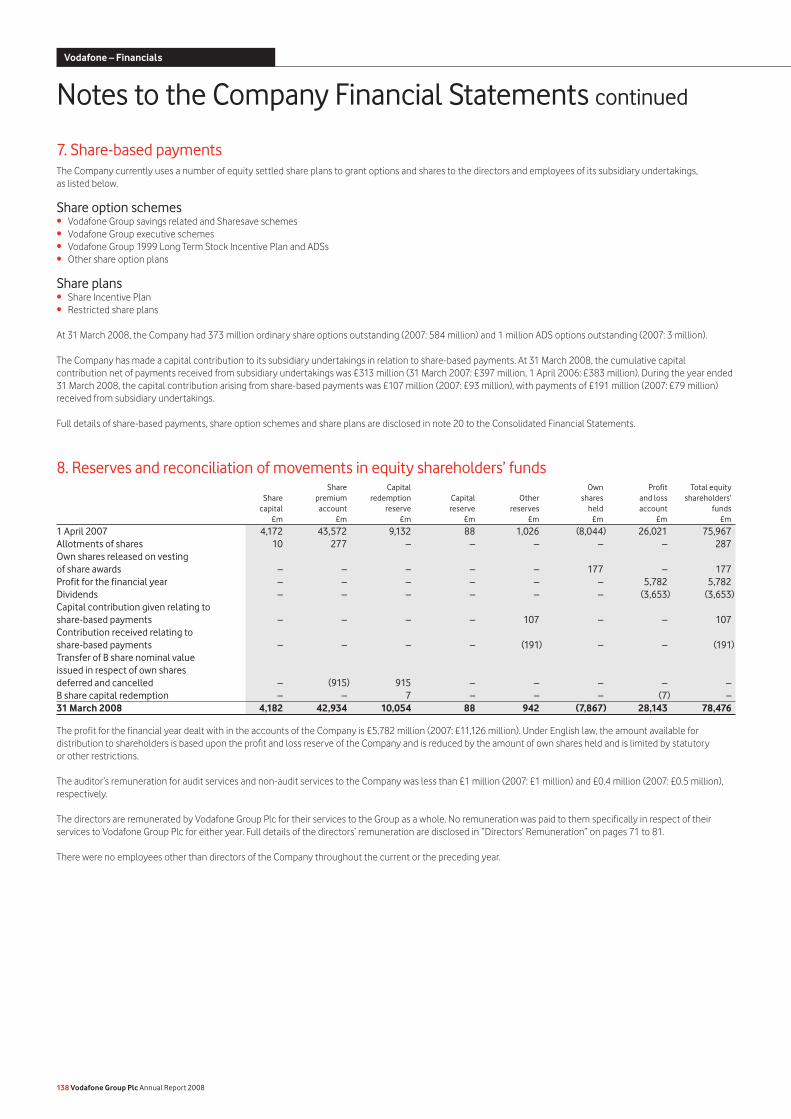
7. Share-based paymentsThe Company currently uses a number of equity settled share plans to grant options and shares to the directors and employees of its subsidiary undertakings, as listed below.
Share option schemesVodafone Group savings related and Sharesave schemesVodafone Group executive schemesVodafone Group 1999 Long Term Stock Incentive Plan and ADSsOther share option plans
Share plansShare Incentive PlanRestricted share plans
At 31 March 2008, the Company had 373 million ordinary share options outstanding (2007: 584 million) and 1 million ADS options outstanding (2007: 3 million).
The Company has made a capital contribution to its subsidiary undertakings in relation to share-based payments. At 31 March 2008, the cumulative capital contribution net of payments received from subsidiary undertakings was £313 million (31 March 2007: £397 million, 1 April 2006: £383 million). During the year ended 31 March 2008, the capital contribution arising from share-based payments was £107 million (2007: £93 million), with payments of £191 million (2007: £79 million) received from subsidiary undertakings.
Full details of share-based payments, share option schemes and share plans are disclosed in note 20 to the Consolidated Financial Statements.
8. Reserves and reconciliation of movements in equity shareholders’ funds Share Capital Own Profit Total equity Share premium redemption Capital Other shares and loss shareholders’ capital account reserve reserve reserves held account funds £m £m £m £m £m £m £m £m
1 April 2007 4,172 43,572 9,132 88 1,026 (8,044) 26,021 75,967Allotments of shares 10 277 – – – – – 287Own shares released on vesting of share awards – – – – – 177 – 177Profit for the financial year – – – – – – 5,782 5,782Dividends – – – – – – (3,653) (3,653)Capital contribution given relating to share-based payments – – – – 107 – – 107Contribution received relating to share-based payments – – – – (191) – – (191)Transfer of B share nominal valueissued in respect of own shares deferred and cancelled – (915) 915 – – – – –B share capital redemption – – 7 – – – (7) –31 March 2008 4,182 42,934 10,054 88 942 (7,867) 28,143 78,476
The profit for the financial year dealt with in the accounts of the Company is £5,782 million (2007: £11,126 million). Under English law, the amount available for distribution to shareholders is based upon the profit and loss reserve of the Company and is reduced by the amount of own shares held and is limited by statutory or other restrictions.
The auditor’s remuneration for audit services and non-audit services to the Company was less than £1 million (2007: £1 million) and £0.4 million (2007: £0.5 million), respectively.
The directors are remunerated by Vodafone Group Plc for their services to the Group as a whole. No remuneration was paid to them specifically in respect of their services to Vodafone Group Plc for either year. Full details of the directors’ remuneration are disclosed in “Directors’ Remuneration” on pages 71 to 81.
There were no employees other than directors of the Company throughout the current or the preceding year.
••••
••
138 Vodafone Group Plc Annual Report 2008
Notes to the Company Financial Statements continued
Vodafone – Financials
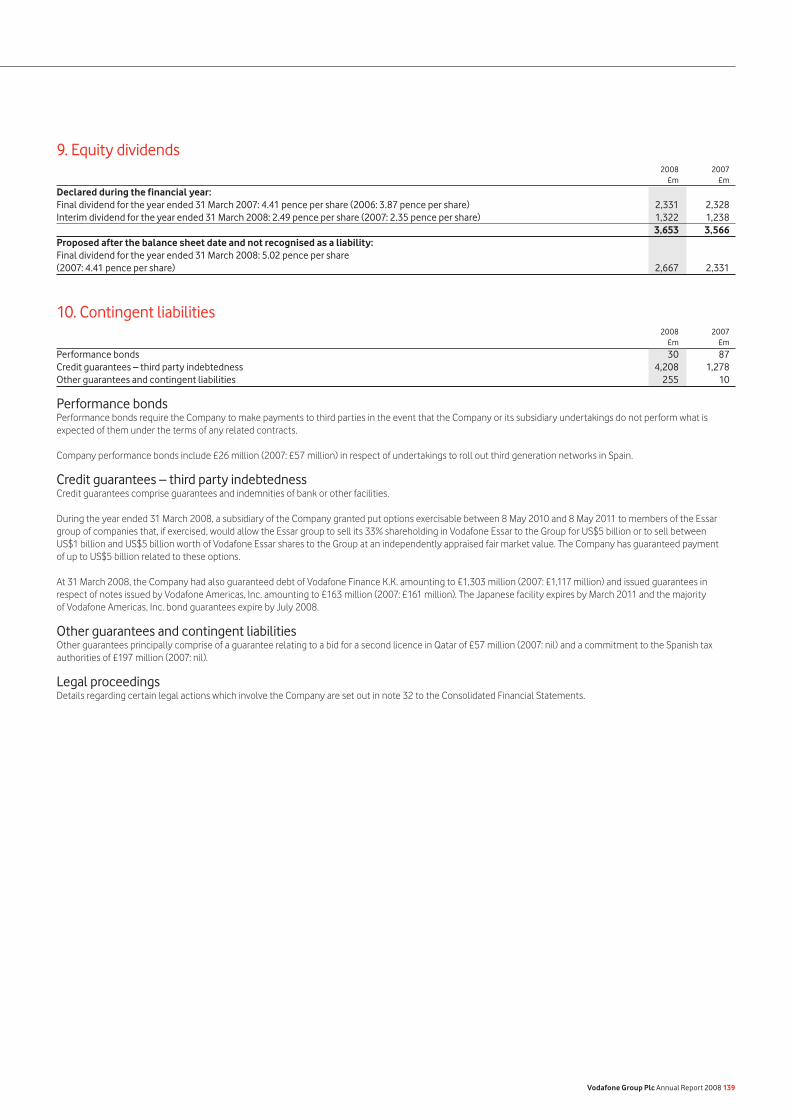
9. Equity dividends 2008 2007 £m £m
Declared during the financial year:Final dividend for the year ended 31 March 2007: 4.41 pence per share (2006: 3.87 pence per share) 2,331 2,328Interim dividend for the year ended 31 March 2008: 2.49 pence per share (2007: 2.35 pence per share) 1,322 1,238 3,653 3,566Proposed after the balance sheet date and not recognised as a liability:Final dividend for the year ended 31 March 2008: 5.02 pence per share (2007: 4.41 pence per share) 2,667 2,331
10. Contingent liabilities 2008 2007 £m £m
Performance bonds 30 87Credit guarantees – third party indebtedness 4,208 1,278Other guarantees and contingent liabilities 255 10
Performance bondsPerformance bonds require the Company to make payments to third parties in the event that the Company or its subsidiary undertakings do not perform what is expected of them under the terms of any related contracts.
Company performance bonds include £26 million (2007: £57 million) in respect of undertakings to roll out third generation networks in Spain.
Credit guarantees – third party indebtednessCredit guarantees comprise guarantees and indemnities of bank or other facilities.
During the year ended 31 March 2008, a subsidiary of the Company granted put options exercisable between 8 May 2010 and 8 May 2011 to members of the Essar group of companies that, if exercised, would allow the Essar group to sell its 33% shareholding in Vodafone Essar to the Group for US$5 billion or to sell between US$1 billion and US$5 billion worth of Vodafone Essar shares to the Group at an independently appraised fair market value. The Company has guaranteed payment of up to US$5 billion related to these options.
At 31 March 2008, the Company had also guaranteed debt of Vodafone Finance K.K. amounting to £1,303 million (2007: £1,117 million) and issued guarantees in respect of notes issued by Vodafone Americas, Inc. amounting to £163 million (2007: £161 million). The Japanese facility expires by March 2011 and the majority of Vodafone Americas, Inc. bond guarantees expire by July 2008.
Other guarantees and contingent liabilitiesOther guarantees principally comprise of a guarantee relating to a bid for a second licence in Qatar of £57 million (2007: nil) and a commitment to the Spanish tax authorities of £197 million (2007: nil).
Legal proceedingsDetails regarding certain legal actions which involve the Company are set out in note 32 to the Consolidated Financial Statements.
Vodafone Group Plc Annual Report 2008 139
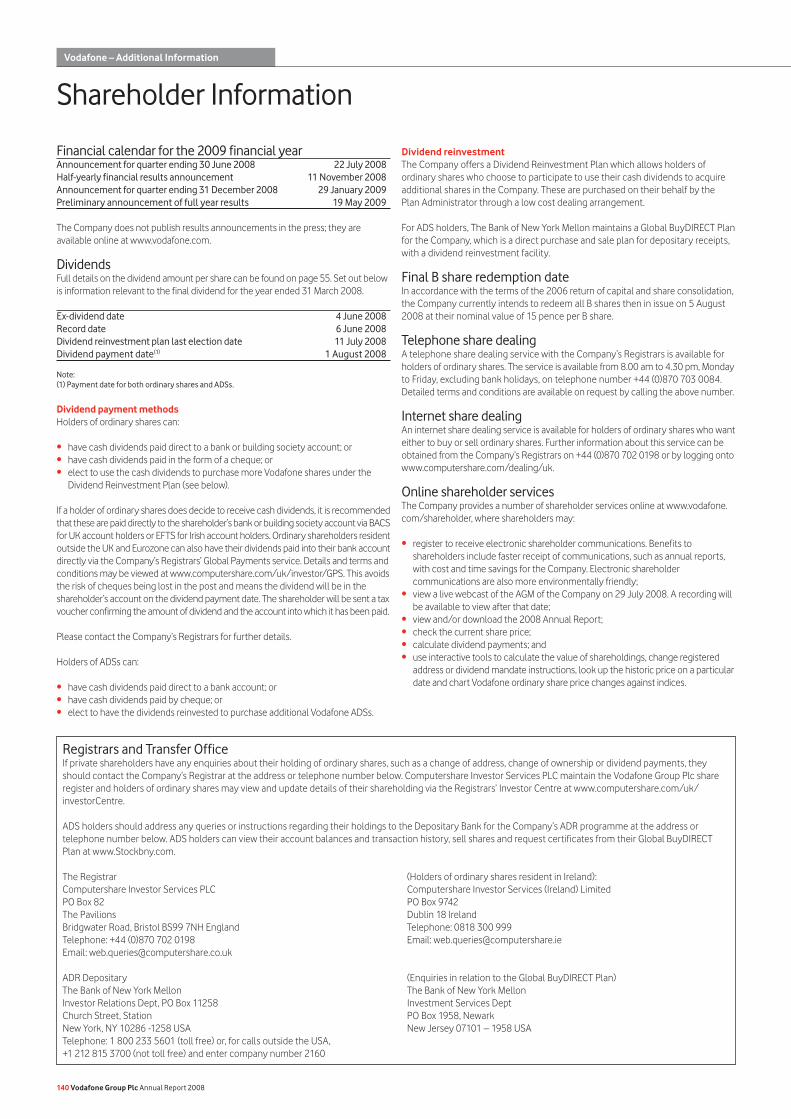
Financial calendar for the 2009 financial yearAnnouncement for quarter ending 30 June 2008 22 July 2008Half-yearly financial results announcement 11 November 2008Announcement for quarter ending 31 December 2008 29 January 2009Preliminary announcement of full year results 19 May 2009
The Company does not publish results announcements in the press; they are available online at www.vodafone.com.
DividendsFull details on the dividend amount per share can be found on page 55. Set out below is information relevant to the final dividend for the year ended 31 March 2008.
Ex-dividend date 4 June 2008Record date 6 June 2008Dividend reinvestment plan last election date 11 July 2008Dividend payment date(1) 1 August 2008
Note:(1) Payment date for both ordinary shares and ADSs.
Dividend payment methodsHolders of ordinary shares can:
have cash dividends paid direct to a bank or building society account; orhave cash dividends paid in the form of a cheque; orelect to use the cash dividends to purchase more Vodafone shares under the Dividend Reinvestment Plan (see below).
If a holder of ordinary shares does decide to receive cash dividends, it is recommended that these are paid directly to the shareholder’s bank or building society account via BACS for UK account holders or EFTS for Irish account holders. Ordinary shareholders resident outside the UK and Eurozone can also have their dividends paid into their bank account directly via the Company’s Registrars’ Global Payments service. Details and terms and conditions may be viewed at www.computershare.com/uk/investor/GPS. This avoids the risk of cheques being lost in the post and means the dividend will be in the shareholder’s account on the dividend payment date. The shareholder will be sent a tax voucher confirming the amount of dividend and the account into which it has been paid.
Please contact the Company’s Registrars for further details.
Holders of ADSs can:
have cash dividends paid direct to a bank account; or have cash dividends paid by cheque; orelect to have the dividends reinvested to purchase additional Vodafone ADSs.
•••
•••
Dividend reinvestmentThe Company offers a Dividend Reinvestment Plan which allows holders of ordinary shares who choose to participate to use their cash dividends to acquire additional shares in the Company. These are purchased on their behalf by the Plan Administrator through a low cost dealing arrangement.
For ADS holders, The Bank of New York Mellon maintains a Global BuyDIRECT Plan for the Company, which is a direct purchase and sale plan for depositary receipts, with a dividend reinvestment facility.
Final B share redemption dateIn accordance with the terms of the 2006 return of capital and share consolidation, the Company currently intends to redeem all B shares then in issue on 5 August 2008 at their nominal value of 15 pence per B share.
Telephone share dealingA telephone share dealing service with the Company’s Registrars is available for holders of ordinary shares. The service is available from 8.00 am to 4.30 pm, Monday to Friday, excluding bank holidays, on telephone number +44 (0)870 703 0084. Detailed terms and conditions are available on request by calling the above number.
Internet share dealingAn internet share dealing service is available for holders of ordinary shares who want either to buy or sell ordinary shares. Further information about this service can be obtained from the Company’s Registrars on +44 (0)870 702 0198 or by logging onto www.computershare.com/dealing/uk.
Online shareholder servicesThe Company provides a number of shareholder services online at www.vodafone.com/shareholder, where shareholders may:
register to receive electronic shareholder communications. Benefits to shareholders include faster receipt of communications, such as annual reports, with cost and time savings for the Company. Electronic shareholder communications are also more environmentally friendly;view a live webcast of the AGM of the Company on 29 July 2008. A recording will be available to view after that date;view and/or download the 2008 Annual Report;check the current share price;calculate dividend payments; anduse interactive tools to calculate the value of shareholdings, change registered address or dividend mandate instructions, look up the historic price on a particular date and chart Vodafone ordinary share price changes against indices.
•
•
••••
Registrars and Transfer OfficeIf private shareholders have any enquiries about their holding of ordinary shares, such as a change of address, change of ownership or dividend payments, they should contact the Company’s Registrar at the address or telephone number below. Computershare Investor Services PLC maintain the Vodafone Group Plc share register and holders of ordinary shares may view and update details of their shareholding via the Registrars’ Investor Centre at www.computershare.com/uk/investorCentre.
ADS holders should address any queries or instructions regarding their holdings to the Depositary Bank for the Company’s ADR programme at the address or telephone number below. ADS holders can view their account balances and transaction history, sell shares and request certificates from their Global BuyDIRECT Plan at www.Stockbny.com.
The Registrar (Holders of ordinary shares resident in Ireland):Computershare Investor Services PLC Computershare Investor Services (Ireland) LimitedPO Box 82 PO Box 9742The Pavilions Dublin 18 IrelandBridgwater Road, Bristol BS99 7NH England Telephone: 0818 300 999Telephone: +44 (0)870 702 0198 Email: [email protected]: [email protected]
ADR Depositary (Enquiries in relation to the Global BuyDIRECT Plan)The Bank of New York Mellon The Bank of New York MellonInvestor Relations Dept, PO Box 11258 Investment Services DeptChurch Street, Station PO Box 1958, NewarkNew York, NY 10286 -1258 USA New Jersey 07101 – 1958 USATelephone: 1 800 233 5601 (toll free) or, for calls outside the USA,+1 212 815 3700 (not toll free) and enter company number 2160
140 Vodafone Group Plc Annual Report 2008
Vodafone – Additional Information
Shareholder Information
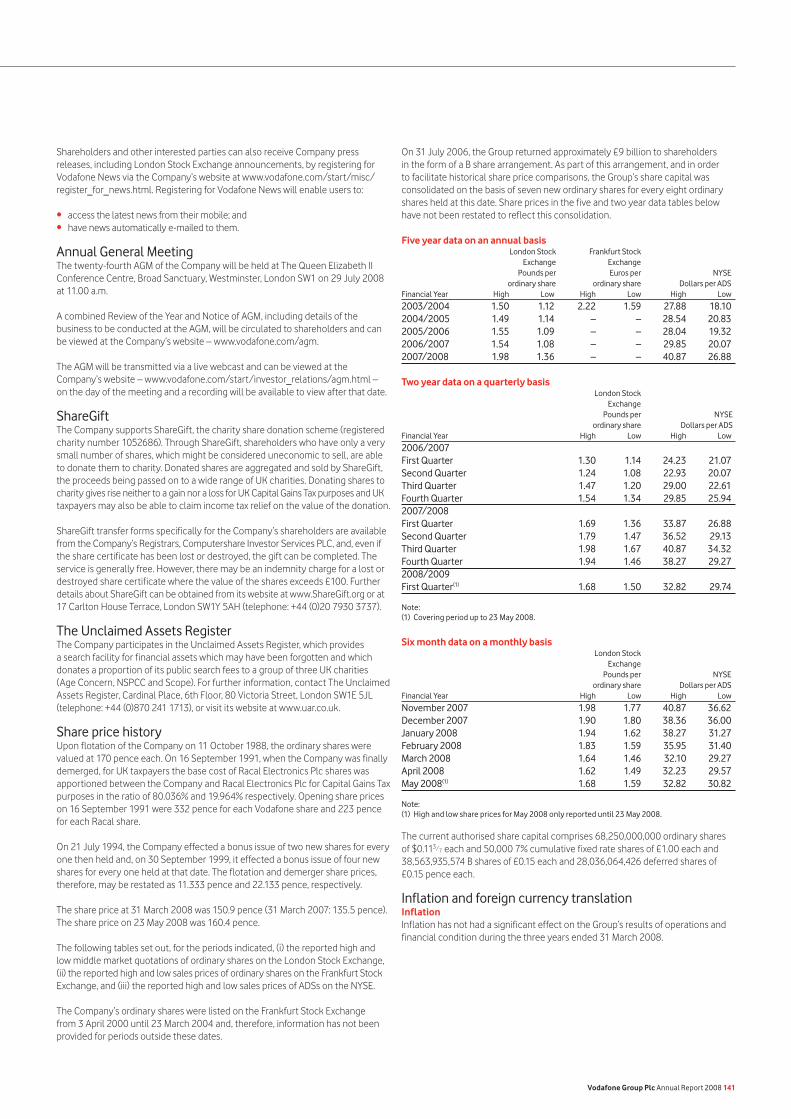
Shareholders and other interested parties can also receive Company press releases, including London Stock Exchange announcements, by registering for Vodafone News via the Company’s website at www.vodafone.com/start/misc/register_for_news.html. Registering for Vodafone News will enable users to:
access the latest news from their mobile; andhave news automatically e-mailed to them.
Annual General MeetingThe twenty-fourth AGM of the Company will be held at The Queen Elizabeth II Conference Centre, Broad Sanctuary, Westminster, London SW1 on 29 July 2008 at 11.00 a.m.
A combined Review of the Year and Notice of AGM, including details of the business to be conducted at the AGM, will be circulated to shareholders and can be viewed at the Company’s website – www.vodafone.com/agm.
The AGM will be transmitted via a live webcast and can be viewed at the Company’s website – www.vodafone.com/start/investor_relations/agm.html – on the day of the meeting and a recording will be available to view after that date.
ShareGiftThe Company supports ShareGift, the charity share donation scheme (registered charity number 1052686). Through ShareGift, shareholders who have only a very small number of shares, which might be considered uneconomic to sell, are able to donate them to charity. Donated shares are aggregated and sold by ShareGift, the proceeds being passed on to a wide range of UK charities. Donating shares to charity gives rise neither to a gain nor a loss for UK Capital Gains Tax purposes and UK taxpayers may also be able to claim income tax relief on the value of the donation.
ShareGift transfer forms specifically for the Company’s shareholders are available from the Company’s Registrars, Computershare Investor Services PLC, and, even if the share certificate has been lost or destroyed, the gift can be completed. The service is generally free. However, there may be an indemnity charge for a lost or destroyed share certificate where the value of the shares exceeds £100. Further details about ShareGift can be obtained from its website at www.ShareGift.org or at 17 Carlton House Terrace, London SW1Y 5AH (telephone: +44 (0)20 7930 3737).
The Unclaimed Assets RegisterThe Company participates in the Unclaimed Assets Register, which provides a search facility for financial assets which may have been forgotten and which donates a proportion of its public search fees to a group of three UK charities (Age Concern, NSPCC and Scope). For further information, contact The Unclaimed Assets Register, Cardinal Place, 6th Floor, 80 Victoria Street, London SW1E 5JL (telephone: +44 (0)870 241 1713), or visit its website at www.uar.co.uk.
Share price historyUpon flotation of the Company on 11 October 1988, the ordinary shares were valued at 170 pence each. On 16 September 1991, when the Company was finally demerged, for UK taxpayers the base cost of Racal Electronics Plc shares was apportioned between the Company and Racal Electronics Plc for Capital Gains Tax purposes in the ratio of 80.036% and 19.964% respectively. Opening share prices on 16 September 1991 were 332 pence for each Vodafone share and 223 pence for each Racal share.
On 21 July 1994, the Company effected a bonus issue of two new shares for every one then held and, on 30 September 1999, it effected a bonus issue of four new shares for every one held at that date. The flotation and demerger share prices, therefore, may be restated as 11.333 pence and 22.133 pence, respectively.
The share price at 31 March 2008 was 150.9 pence (31 March 2007: 135.5 pence). The share price on 23 May 2008 was 160.4 pence.
The following tables set out, for the periods indicated, (i) the reported high and low middle market quotations of ordinary shares on the London Stock Exchange, (ii) the reported high and low sales prices of ordinary shares on the Frankfurt Stock Exchange, and (iii) the reported high and low sales prices of ADSs on the NYSE.
The Company’s ordinary shares were listed on the Frankfurt Stock Exchange from 3 April 2000 until 23 March 2004 and, therefore, information has not been provided for periods outside these dates.
••
On 31 July 2006, the Group returned approximately £9 billion to shareholders in the form of a B share arrangement. As part of this arrangement, and in order to facilitate historical share price comparisons, the Group’s share capital was consolidated on the basis of seven new ordinary shares for every eight ordinary shares held at this date. Share prices in the five and two year data tables below have not been restated to reflect this consolidation.
Five year data on an annual basis London Stock Frankfurt Stock Exchange Exchange Pounds per Euros per NYSE ordinary share ordinary share Dollars per ADSFinancial Year High Low High Low High Low
2003/2004 1.50 1.12 2.22 1.59 27.88 18.102004/2005 1.49 1.14 – – 28.54 20.832005/2006 1.55 1.09 – – 28.04 19.322006/2007 1.54 1.08 – – 29.85 20.072007/2008 1.98 1.36 – – 40.87 26.88
Two year data on a quarterly basis London Stock Exchange Pounds per NYSE ordinary share Dollars per ADSFinancial Year High Low High Low
2006/2007 First Quarter 1.30 1.14 24.23 21.07Second Quarter 1.24 1.08 22.93 20.07Third Quarter 1.47 1.20 29.00 22.61Fourth Quarter 1.54 1.34 29.85 25.942007/2008 First Quarter 1.69 1.36 33.87 26.88Second Quarter 1.79 1.47 36.52 29.13Third Quarter 1.98 1.67 40.87 34.32Fourth Quarter 1.94 1.46 38.27 29.272008/2009 First Quarter(1) 1.68 1.50 32.82 29.74
Note:(1) Covering period up to 23 May 2008.
Six month data on a monthly basis London Stock Exchange Pounds per NYSE ordinary share Dollars per ADSFinancial Year High Low High Low
November 2007 1.98 1.77 40.87 36.62December 2007 1.90 1.80 38.36 36.00January 2008 1.94 1.62 38.27 31.27February 2008 1.83 1.59 35.95 31.40March 2008 1.64 1.46 32.10 29.27April 2008 1.62 1.49 32.23 29.57May 2008(1) 1.68 1.59 32.82 30.82
Note:(1) High and low share prices for May 2008 only reported until 23 May 2008.
The current authorised share capital comprises 68,250,000,000 ordinary shares of $0.113/7 each and 50,000 7% cumulative fixed rate shares of £1.00 each and 38,563,935,574 B shares of £0.15 each and 28,036,064,426 deferred shares of £0.15 pence each.
Inflation and foreign currency translationInflationInflation has not had a significant effect on the Group’s results of operations and financial condition during the three years ended 31 March 2008.
Vodafone Group Plc Annual Report 2008 141
Foreign currency translationThe following table sets out the pounds sterling exchange rates of the other principal currencies of the Group, being: “euros”, “€” or “eurocents”, the currency of the EU Member States which have adopted the euro as their currency, and “US dollars”, “$”, “cents” or “¢”, the currency of the United States.
At year ended ChangeCurrency (=£1) 2008 2007 %
Average: Euro 1.42 1.48 (4.1)US dollar 2.01 1.89 6.3At 31 March:Euro 1.26 1.47 (14.3)US dollar 1.99 1.97 1.0
The following table sets out, for the periods and dates indicated, the period end, average, high and low exchanges rates for pounds sterling expressed in US dollars per £1.00.
Year ended 31 March Period end Average High Low
2004 1.84 1.69 1.90 1.552005 1.89 1.85 1.96 1.752006 1.74 1.79 1.92 1.712007 1.97 1.89 1.98 1.742008 1.99 2.01 2.11 1.94
Month High Low
November 2007 2.11 2.05 December 2007 2.07 1.98January 2008 1.99 1.95February 2008 1.99 1.94March 2008 2.03 1.98April 2008 2.00 1.96
MarketsOrdinary shares of Vodafone Group Plc are traded on the London Stock Exchange and, in the form of ADSs, on the NYSE. The Company had a total market capitalisation of approximately £86.8 billion at 23 May 2008, making it the third largest listing in The Financial Times Stock Exchange 100 index and the 24th largest company in the world based on market capitalisation at that date.
ADSs, each representing ten ordinary shares, are traded on the NYSE under the symbol ‘VOD’. The ADSs are evidenced by ADRs issued by The Bank of New York Mellon, as Depositary, under a Deposit Agreement, dated as of 12 October 1988, as amended and restated as of 26 December 1989, as further amended and restated as of 16 September 1991, as further amended and restated as of 30 June 1999, and as further amended and restated as of 31 July 2006 between the Company, the Depositary and the holders from time to time of ADRs issued thereunder.
ADS holders are not members of the Company but may instruct The Bank of New York Mellon on the exercise of voting rights relative to the number of ordinary shares represented by their ADSs. See “Memorandum and Articles of Association and applicable English law – Rights attaching to the Company’s shares – Voting rights” on page 143.
Shareholders at 31 March 2008 Number of % of totalNumber of ordinary shares held accounts issued shares
1 – 1,000 443,176 0.211,001 – 5,000 81,173 0.305,001– 50,000 25,087 0.5550,001 – 100,000 1,158 0.14100,001– 500,000 1,142 0.45More than 500,000 1,757 98.35 553,493 100.00
Geographical analysis of shareholdersAt 31 March 2008, approximately 51.58% of the Company’s shares were held in the UK, 33.64% in North America, 11.73% in Europe (excluding the UK) and 3.05% in the rest of the world.
Major shareholdersThe Bank of New York Mellon, as custodian of the Company’s ADR programme, held approximately 12.6% of the Company’s ordinary shares of $0.113/7 each at 23 May 2008 as nominee. The total number of ADRs outstanding at 23 May 2008 was 670,777,009. At this date, 1,182 holders of record of ordinary shares had registered addresses in the United States and in total held approximately 0.006% of the ordinary shares of the Company. At 23 May 2008, the following percentage interests in the ordinary share capital of the Company, disclosable under the Disclosure and Transparency Rules, (DTR 5), have been notified to the directors:
Shareholder Shareholding
AXA S.A. 5.81%Legal & General Group Plc 4.53%
The rights attaching to the ordinary shares of the Company held by this shareholder are identical in all respects to the rights attaching to all the ordinary shares of the Company. The directors are not aware, at 23 May 2008, of any other interest of 3% or more in the ordinary share capital of the Company. The Company is not directly or indirectly owned or controlled by any foreign government or any other legal entity. There are no arrangements known to the Company that could result in a change of control of the Company.
Memorandum and Articles of Association and applicable English lawThe following description summarises certain provisions of the Company’s Memorandum and Articles of Association and applicable English law. This summary is qualified in its entirety by reference to the Companies Act 1985 of England and Wales, as amended and the Companies Act 2006 of England and Wales (the “Companies Acts”), and the Company’s Memorandum and Articles of Association. Information on where shareholders can obtain copies of the Memorandum and Articles of Association is provided under “Documents on display” on page 144.
All of the Company’s ordinary shares are fully paid. Accordingly, no further contribution of capital may be required by the Company from the holders of such shares.
English law specifies that any alteration to the Articles of Association must be approved by a special resolution of the shareholders.
A resolution to change the Articles of Association in order to comply with the Companies Act 2006 will be put to shareholders at the 2008 AGM.
The Company’s objectsThe Company is a public limited company under the laws of England and Wales. The Company is registered in England and Wales under the name Vodafone Group Public Limited Company, with the registration number 1833679. The Company’s objects are set out in the fourth clause of its Memorandum of Association and cover a wide range of activities, including to carry on the business of a holding company, to carry on business as dealers in, operators, manufacturers, repairers, designers, developers, importers and exporters of electronic, electrical, mechanical and aeronautical equipment of all types as well as to carry on all other businesses necessary to attain the Company’s objectives. The Memorandum of Association grants the Company a broad range of powers to affect its objects.
DirectorsThe Company’s Articles of Association provide for a Board of directors, consisting of not fewer than three directors, who shall manage the business and affairs of the Company.
The directors are empowered to exercise all the powers of the Company subject to any restrictions in the Articles of Association.
Under the Company’s Articles of Association, a director cannot vote in respect of any proposal in which the director, or any person connected with the director, has a material interest other than by virtue of the director’s interest in the Company’s shares or other securities. However, this restriction on voting does not apply to resolutions (a) giving the director or a third party any guarantee, security or indemnity in respect of obligations or liabilities incurred at the request of or for the benefit of the Company, (b) giving any guarantee, security or indemnity to the director or a third party in respect of obligations of the Company for which the director has assumed responsibility under an indemnity or guarantee, (c) relating to an offer of securities of the Company in which the director participates as a holder of shares or other securities or in the underwriting of such shares or securities, (d) concerning any other company in which the director (together with
142 Vodafone Group Plc Annual Report 2008
Vodafone – Additional Information
Shareholder Information continued
any connected person) is a shareholder or an officer or is otherwise interested, provided that the director (together with any connected person) is not interested in 1% or more of any class of the company’s equity share capital or the voting rights available to its shareholders, (e) relating to the arrangement of any employee benefit in which the director will share equally with other employees and (f) relating to any insurance that the Company purchases or renews for its directors or any group of people, including directors.
The directors are empowered to exercise all the powers of the Company to borrow money, subject to the limitation that the aggregate amount of all liabilities and obligations of the Group outstanding at any time shall not exceed an amount equal to 1.5 times the aggregate of the Group’s share capital and reserves calculated in the manner prescribed in the Articles of Association, unless sanctioned by an ordinary resolution of the Company’s shareholders.
The Company can make market purchases of its own shares or agree to do so in the future, provided it is duly authorised by its members in a general meeting and subject to and in accordance with Section 166 of the Companies Act 1985.
In accordance with the Company’s Articles of Association, directors retiring at each AGM are those last elected or re-elected at or before the AGM held in the third calendar year before the current year. In 2005, the Company reviewed its policy regarding the retirement and re-election of directors and, although it is not intended to amend the Company’s Articles in this regard, the Board has decided, in the interests of good corporate governance, that all of the directors should offer themselves for re-election annually. Accordingly, all the directors not retiring will submit themselves for re-election at the 2008 AGM.
No person is disqualified from being a director or is required to vacate that office by reason of age.
Directors are not required, under the Company’s Articles of Association, to hold any shares of the Company as a qualification to act as a director, although executive directors participating in long term incentive plans must comply with the Company’s share ownership guidelines. In accordance with best practice in the UK for corporate governance, compensation awarded to executive directors is decided by a remuneration committee consisting exclusively of non-executive directors.
In addition, as required by The Directors’ Remuneration Report Regulations, the Board has, since 2003, prepared a report to shareholders on the directors’ remuneration which complies with the Regulations (see pages 71 to 81). The report is also subject to a shareholder vote.
Rights attaching to the Company’s sharesAt 31 March 2008, the issued share capital of the Company was comprised of 50,000 7% cumulative fixed rate shares of £1.00 each, 53,127,598,035 ordinary shares (excluding treasury shares) of US$0.113/7 each and 87,429,138 B shares of 15 pence each.
Dividend rightsHolders of 7% cumulative fixed rate shares are entitled to be paid in respect of each financial year, or other accounting period of the Company, a fixed cumulative preferential dividend of 7% per annum on the nominal value of the fixed rate shares. A preferential dividend may only be paid out of available distributable profits which the directors have resolved should be distributed. The fixed rate shares do not have any other right to share in the Company’s profits.
Holders of the Company’s ordinary shares may, by ordinary resolution, declare dividends but may not declare dividends in excess of the amount recommended by the directors. The Board of directors may also pay interim dividends. No dividend may be paid other than out of profits available for distribution. Dividends on ordinary shares will be announced in pounds sterling. Holders of ordinary shares with a registered address in a euro zone country (defined, for this purpose, as a country that has adopted the euro as its national currency) will receive their dividends in euros, exchanged from pounds sterling at a rate fixed by the Board of directors in accordance with the Articles of Association. Dividends for ADS holders represented by ordinary shares held by the Depositary will be paid to the Depositary in US dollars, exchanged from pounds sterling at a rate fixed by the directors in accordance with the Articles of Association, and the Depositary will distribute them to the ADS holders.
If a dividend has not been claimed for one year after the date of the resolution passed at a general meeting declaring that dividend or the resolution of the
directors providing for payment of that dividend, the directors may invest the dividend or use it in some other way for the benefit of the Company until the dividend is claimed. If the dividend remains unclaimed for 12 years after the relevant resolution either declaring that dividend or providing for payment of that dividend, it will be forfeited and belong to the Company.
Holders of outstanding B shares in issue are entitled to accrue a continuing dividend at the rate of 75% of sterling LIBOR, payable semi-annually in arrears, on all future redemption dates until final redemption on 5 August 2008. The B shares do not have any other right to share in the profits of the Company.
Special distribution At an Extraordinary General Meeting of the Company on 25 July 2006, shareholders approved a distribution of capital of approximately £9 billion by way of a B share scheme, equating to 15 pence per B share for every ordinary share in issue at 28 July 2006. The Company has made payments against B shares redeemed in August 2006, February 2007, August 2007 and February 2008. The Company intends to redeem all outstanding B shares in issue, on 5 August 2008.
Voting rightsThe Company’s Articles of Association provide that voting on Substantive Resolutions (i.e. any resolution which is not a Procedural Resolution) at a general meeting shall be decided on a poll. On a poll, each shareholder who is entitled to vote and is present in person or by proxy has one vote for every share held. Procedural Resolutions (such as a resolution to adjourn a General Meeting or a resolution on the choice of Chairman of a General Meeting) shall be decided on a show of hands, where each shareholder who is present at the meeting has one vote regardless of the number of shares held, unless a poll is demanded. In addition, the Articles of Association allow persons appointed as proxies of shareholders entitled to vote at general meetings to vote on a show of hands, as well as to vote on a poll and attend and speak at general meetings. Holders of the Company’s ordinary shares do not have cumulative voting rights.
Under English law, two shareholders present in person constitute a quorum for purposes of a general meeting, unless a company’s articles of association specify otherwise. The Company’s Articles of Association do not specify otherwise, except that the shareholders do not need to be present in person, and may instead be present by proxy, to constitute a quorum.
Under English law, shareholders of a public company such as the Company are not permitted to pass resolutions by written consent.
Record holders of the Company’s ADSs are entitled to attend, speak and vote on a poll or a show of hands at any general meeting of the Company’s shareholders by the Depositary’s appointment of them as corporate representatives with respect to the underlying ordinary shares represented by their ADSs. Alternatively, holders of ADSs are entitled to vote by supplying their voting instructions to the Depositary or its nominee, who will vote the ordinary shares underlying their ADSs in accordance with their instructions.
Employees are able to vote any shares held under the Vodafone Group Share Incentive Plan and “My ShareBank” (a vested share account) through the respective plan’s trustees.
Holders of the Company’s 7% cumulative fixed rate shares are only entitled to vote on any resolution to vary or abrogate the rights attached to the fixed rate shares. Holders have one vote for every fully paid 7% cumulative fixed rate share.
Holders of B shares are only entitled to vote on a proposal to wind up the Company and have one vote for every fully paid B share held.
Liquidation rightsIn the event of the liquidation of the Company, after payment of all liabilities and deductions in accordance with English law, the holders of the Company’s 7% cumulative fixed rate shares would be entitled to a sum equal to the capital paid up on such shares, together with certain dividend payments, in priority to holders of the Company’s ordinary shares. The holders of the fixed rate shares do not have any other right to share in the Company’s surplus assets.
The holders of B shares will be entitled, before any payment to holders of the Company’s ordinary shares but after any payment to holders of the Company’s 7% cumulative fixed rate shares, to repayment of the amount paid up or treated to be paid up on the nominal value of each B share, together with any outstanding
Vodafone Group Plc Annual Report 2008 143
entitlement to the B share continuing dividend up to the future redemption date immediately before the liquidation. The holders of B shares do not have any other right to share in the Company’s surplus assets.
Pre-emptive rights and new issues of sharesUnder Section 80 of the Companies Act 1985, directors are, with certain exceptions, unable to allot relevant securities without the authority of the shareholders in a general meeting. Relevant securities as defined in the Companies Act include the Company’s ordinary shares or securities convertible into the Company’s ordinary shares. In addition, Section 89 of the Companies Act 1985 imposes further restrictions on the issue of equity securities (as defined in the Companies Act, which include the Company’s ordinary shares and securities convertible into ordinary shares) which are, or are to be, paid up wholly in cash and not first offered to existing shareholders. The Company’s Articles of Association allow shareholders to authorise directors for a period up to five years to allot (a) relevant securities generally up to an amount fixed by the shareholders and (b) equity securities for cash other than in connection with a rights issue up to an amount specified by the shareholders and free of the restriction in Section 89. In accordance with institutional investor guidelines, the amount of relevant securities to be fixed by shareholders is normally restricted to one third of the existing issued ordinary share capital, and the amount of equity securities to be issued for cash other than in connection with a rights issue is restricted to 5% of the existing issued ordinary share capital.
Disclosure of interests in the Company’s sharesThere are no provisions in the Articles of Association whereby persons acquiring, holding or disposing of a certain percentage of the Company’s shares are required to make disclosure of their ownership percentage, although such requirements exist under rules derived by the Disclosure and Transparency Rules (“DTRs”).
The basic disclosure requirement upon a person acquiring or disposing of shares carrying voting rights is an obligation to provide written notification to the Company, including certain details as set out in DTR 5, where the percentage of the person’s voting rights which he holds as shareholder or through his direct or indirect holding of financial instruments (falling within DTR 5.3.1R) reaches or exceeds 3% and reaches, exceeds or falls below each 1% threshold thereafter.
Under Section 793 of the Companies Act 2006, the Company may, by notice in writing, require a person that the Company knows or has reasonable cause to believe is, or was during the preceding three years, interested in the Company’s shares to indicate whether or not that is correct and, if that person does or did hold an interest in the Company’s shares, to provide certain information as set out in the Companies Act 2006. DTR 3 deals with the disclosure by persons “discharging managerial responsibility” and their connected persons of the occurrence of all transactions conducted on their account in the shares in the Company. Part 28 of The Companies Act 2006 sets out the statutory functions of the Panel on Takeovers & Mergers (the “Panel”). The Panel is responsible for issuing and administering the Code on Takeovers & Mergers and governs disclosure requirements on all parties to a takeover with regard to dealings in the securities of an offeror or offeree company and also on their respective associates during the course of an offer period.
General meetings and noticesAnnual general meetings are held at such times and place as determined by the directors of the Company. The directors may also, when they think fit, convene an extraordinary general meeting of the Company. General meetings may also be convened on requisition as provided by the Companies Acts.
An annual general meeting and an extraordinary general meeting called for the passing of a special resolution needs to be called by not less than twenty-one days’ notice in writing and all other extraordinary general meetings by not less than fourteen days’ notice in writing. The directors may determine that persons entitled to receive notices of meetings are those persons entered on the register at the close of business on a day determined by the directors but not later than twenty-one days before the date the relevant notice is sent. The notice may also specify the record date, which shall not be more than forty-eight hours before the time fixed for the meeting.
Shareholders must provide the Company with an address or (so far as the Companies Acts allow) an electronic address or fax number in the United Kingdom in order to be entitled to receive notices of shareholders’ meetings and other notices and documents. In certain circumstances, the Company may give notices to shareholders by advertisement in newspapers in the United Kingdom. Holders
of the Company’s ADSs are entitled to receive notices under the terms of the Deposit Agreement relating to the ADSs.
Under Section 336 of the Companies Act 2006, the annual general meeting of shareholders must be held each calendar year and within six months of the Company’s year end.
Electronic communicationsThe Company may, subject to and in accordance with the Companies Act 2006, communicate all shareholder information by electronic means, including by making such information available on a website, with notification that such information shall be available on the website.
Variation of rightsIf, at any time, the Company’s share capital is divided into different classes of shares, the rights attached to any class may be varied, subject to the provisions of the Companies Acts, either with the consent in writing of the holders of three fourths in nominal value of the shares of that class or upon the adoption of an extraordinary resolution passed at a separate meeting of the holders of the shares of that class.
At every such separate meeting, all of the provisions of the Articles of Association relating to proceedings at a general meeting apply, except that (a) the quorum is to be the number of persons (which must be at least two) who hold or represent by proxy not less than one-third in nominal value of the issued shares of the class or, if such quorum is not present on an adjourned meeting, one person who holds shares of the class regardless of the number of shares he holds, (b) any person present in person or by proxy may demand a poll, and (c) each shareholder will have one vote per share held in that particular class in the event a poll is taken. Class rights are deemed not to have been varied by the creation or issue of new shares ranking equally with or subsequent to that class of shares in sharing in profits or assets of the Company or by a redemption or repurchase of the shares by the Company.
Limitations on voting and shareholdingAs far as the Company is aware, there are no limitations imposed on the transfer, holding or voting of the Company’s shares other than those limitations that would generally apply to all of the shareholders. No shareholder has any securities carrying special rights with regard to control of the Company.
Documents on displayThe Company is subject to the information requirements of the US Securities and Exchange Act of 1934 applicable to foreign private issuers. In accordance with these requirements, the Company files its Annual Report on Form 20-F and other related documents with the SEC. These documents may be inspected at the SEC’s public reference rooms located at 100 F Street, NE Washington, DC 20549. Information on the operation of the public reference room can be obtained in the US by calling the SEC on +1-800-SEC-0330. In addition, some of the Company’s SEC filings, including all those filed on or after 4 November 2002, are available on the SEC’s website at www.sec.gov. Shareholders can also obtain copies of the Company’s Memorandum and Articles of Association from the Vodafone website at www.vodafone.com or from the Company’s registered office.
Debt securitiesPursuant to an Agreement of Resignation, Appointment and Acceptance, dated as of 24 July 2007, by and among the Company, The Bank of New York Mellon and Citibank N.A, The Bank of New York Mellon has become the successor trustee to Citibank N.A. under the Company’s Indenture dated as of 10 February 2000.
Material contracts At the date of this Annual Report, the Group is not party to any contracts that are considered material to the Group’s results or operations, except for its $11.3 billion credit facilities which are discussed under “Financial Position and Resources” on page 57.
Exchange controlsThere are no UK government laws, decrees or regulations that restrict or affect the export or import of capital, including but not limited to, foreign exchange controls on remittance of dividends on the ordinary shares or on the conduct of the Group’s operations, except as otherwise set out under “Taxation” below.
TaxationAs this is a complex area, investors should consult their own tax adviser regarding the US federal, state and local, the UK and other tax consequences of owning and disposing of shares and ADSs in their particular circumstances.
144 Vodafone Group Plc Annual Report 2008
Vodafone – Additional Information
Shareholder Information continued
This section describes, primarily for a US holder (as defined below), in general terms, the principal US federal income tax and UK tax consequences of owning or disposing of shares or ADSs in the Company held as capital assets (for US and UK tax purposes). This section does not, however, cover the tax consequences for members of certain classes of holders subject to special rules including officers of the Company, employees and holders that, directly or indirectly, hold 10% or more of the Company’s voting stock. The tax consequences of the return of capital and the share consolidation undertaken during the 2007 financial year pursuant to a B share scheme are also not covered in this section. Guidance for holders of B shares in certain specific circumstances was included in the Circular for the issue of B shares, a copy of which is available on the Company’s website at www.vodafone.com.
A US holder is a beneficial owner of shares or ADSs that is for US federal income tax purposes:
a citizen or resident of the United States; a US domestic corporation; an estate, the income of which is subject to US federal income tax regardless of its source; or a trust, if a US court can exercise primary supervision over the trust’s administration and one or more US persons are authorised to control all substantial decisions of the trust.
If a partnership holds the shares or ADSs, the US federal income tax treatment of a partner will generally depend on the status of the partner and the tax treatment of the partnership. A partner in a partnership holding the shares or ADSs should consult its tax advisor with regard to the US federal income tax treatment of an investment in the shares or ADSs.
This section is based on the Internal Revenue Code of 1986, as amended, its legislative history, existing and proposed regulations thereunder, published rulings and court decisions, and on the tax laws of the United Kingdom and the Double Taxation Convention between the United States and the United Kingdom (the “Treaty”), all as currently in effect. These laws are subject to change, possibly on a retroactive basis.
This section is further based in part upon the representations of the Depositary and assumes that each obligation in the Deposit Agreement and any related agreement will be performed in accordance with its terms.
Based on this assumption, for purposes of the Treaty and the US-UK double taxation convention relating to estate and gift taxes (the “Estate Tax Convention”), and for US federal income tax and UK tax purposes, a holder of ADRs evidencing ADSs will be treated as the owner of the shares in the Company represented by those ADSs. Generally, exchanges of shares for ADRs, and ADRs for shares, will not be subject to US federal income tax or to UK tax, other than stamp duty or stamp duty reserve tax (see the section on these taxes below).
Taxation of dividendsUK Taxation Under current UK tax law, no withholding tax will be deducted from dividends paid by the Company. A shareholder that is a company resident for UK tax purposes in the United Kingdom will not be taxable on a dividend it receives from the Company. A shareholder in the Company who is an individual resident for UK tax purposes in the United Kingdom is entitled, in calculating their liability to UK income tax, to a tax credit on cash dividends paid on shares in the Company or ADSs, and the tax credit is equal to one-ninth of the cash dividend.
US Federal Income TaxationSubject to the PFIC rules described below, a US holder is subject to US federal income taxation on the gross amount of any dividend paid by the Company out of its current or accumulated earnings and profits (as determined for US federal income tax purposes). Dividends paid to a non-corporate US holder in tax years beginning before 1 January 2011 that constitute qualified dividend income will be taxable to the holder at a maximum tax rate of 15%, provided that the ordinary shares or ADSs are held for more than 60 days during the 121 day period beginning 60 days before the ex-dividend date and the holder meets other holding period requirements. Dividends paid by the Company with respect to the shares or ADSs will generally be qualified dividend income.
•••
•
A US holder is not subject to a UK withholding tax. The US holder includes in gross income for US federal income tax purposes only the amount of the dividend actually received from the Company, and the receipt of a dividend does not entitle the US holder to a foreign tax credit.
Dividends must be included in income when the US holder, in the case of shares, or the Depositary, in the case of ADSs, actually or constructively receives the dividend and will not be eligible for the dividends-received deduction generally allowed to US corporations in respect of dividends received from other US corporations. Dividends will be income from sources outside the United States. Dividends paid in taxable years beginning before 1 January 2007 generally will be “passive” or “financial services” income, and dividends paid in taxable years beginning after 31 December 2006 generally will be “passive” or “general” income, which in either case is treated separately from other types of income for the purposes of computing any allowable foreign tax credit.
In the case of shares, the amount of the dividend distribution to be included in income will be the US dollar value of the pound sterling payments made, determined at the spot pound sterling/US dollar rate on the date of the dividend distribution, regardless of whether the payment is in fact converted into US dollars. Generally, any gain or loss resulting from currency exchange fluctuations during the period from the date the dividend payment is to be included in income to the date the payment is converted into US dollars will be treated as ordinary income or loss. Generally, the gain or loss will be income or loss from sources within the United States for foreign tax credit limitation purposes.
Taxation of capital gainsUK taxationA US holder may be liable for both UK and US tax in respect of a gain on the disposal of the Company’s shares or ADSs if the US holder is:
a citizen of the United States resident or ordinarily resident for UK tax purposes in the United Kingdom; a citizen of the United States who has been resident or ordinarily resident for UK tax purposes in the United Kingdom, ceased to be so resident or ordinarily resident for a period of less than five years of assessment and who disposed of the shares or ADSs during that period (a “Temporary Non-Resident”), unless the shares or ADSs were also acquired during that period, such liability arising on that individual’s return to the UK;a US domestic corporation resident in the United Kingdom by reason of being centrally managed and controlled in the United Kingdom; or a citizen of the United States or a US domestic corporation that carries on a trade, profession or vocation in the United Kingdom through a branch or agency or, in the case of US domestic companies, through a permanent establishment and that has used the shares or ADSs for the purposes of such trade, profession or vocation or has used, held or acquired the shares or ADSs for the purposes of such branch or agency or permanent establishment.
Under the Treaty, capital gains on dispositions of the shares or ADSs are generally subject to tax only in the country of residence of the relevant holder as determined under both the laws of the United Kingdom and the United States and as required by the terms of the Treaty. However, individuals who are residents of either the United Kingdom or the United States and who have been residents of the other jurisdiction (the US or the UK, as the case may be) at any time during the six years immediately preceding the relevant disposal of shares or ADSs may be subject to tax with respect to capital gains arising from the dispositions of the shares or ADSs not only in the country of which the holder is resident at the time of the disposition, but also in that other country (although, in respect of UK taxation, generally only to the extent that such an individual comprises a Temporary Non-Resident).
US federal income taxationSubject to the PFIC rules described below, a US holder that sells or otherwise disposes of the Company’s shares or ADSs will recognise a capital gain or loss for US federal income tax purposes equal to the difference between the US dollar value of the amount realised and the holder’s tax basis, determined in US dollars, in the shares or ADSs. Generally, a capital gain of a non-corporate US holder that is recognised in tax years beginning before 1 January 2011 is taxed at a maximum rate of 15%, provided the holder has a holding period of more than one year. The gain or loss will generally be income or loss from sources within the United States for foreign tax credit limitation purposes. The deductibility of losses is subject to limitations.
•
•
•
•
Vodafone Group Plc Annual Report 2008 145
Additional tax considerationsUK inheritance taxAn individual who is domiciled in the United States (for the purposes of the Estate Tax Convention) and is not a UK national will not be subject to UK inheritance tax in respect of the Company’s shares or ADSs on the individual’s death or on a transfer of the shares or ADSs during the individual’s lifetime, provided that any applicable US federal gift or estate tax is paid, unless the shares or ADSs are part of the business property of a UK permanent establishment or pertain to a UK fixed base used for the performance of independent personal services. Where the shares or ADSs have been placed in trust by a settlor, they may be subject to UK inheritance tax unless, when the trust was created, the settlor was domiciled in the United States and was not a UK national. Where the shares or ADSs are subject to both UK inheritance tax and to US federal gift or estate tax, the Estate Tax Convention generally provides a credit against US federal tax liabilities for UK inheritance tax paid.
UK stamp duty and stamp duty reserve taxStamp duty will, subject to certain exceptions, be payable on any instrument transferring shares in the Company to the Custodian of the Depositary at the rate of 1.5% on the amount or value of the consideration if on sale or on the value of such shares if not on sale. Stamp duty reserve tax (“SDRT”), at the rate of 1.5% of the price or value of the shares, could also be payable in these circumstances and on issue to such a person, but no SDRT will be payable if stamp duty equal to such SDRT liability is paid. In accordance with the terms of the Deposit Agreement, any tax or duty payable on deposits of shares by the Depositary or the Custodian of the Depositary will be charged to the party to whom ADSs are delivered against such deposits.
No stamp duty will be payable on any transfer of ADSs of the Company, provided that the ADSs and any separate instrument of transfer are executed and retained at all times outside the United Kingdom. A transfer of shares in the Company in registered form will attract ad valorem stamp duty generally at the rate of 0.5% of the purchase price of the shares. There is no charge to ad valorem stamp duty on gifts.
SDRT is generally payable on an unconditional agreement to transfer shares in the Company in registered form at 0.5% of the amount or value of the consideration for the transfer, but is repayable if, within six years of the date of the agreement, an instrument transferring the shares is executed or, if the SDRT has not been paid, the liability to pay the tax (but not necessarily interest and penalties) would be cancelled. However, an agreement to transfer the ADSs of the Company will not give rise to SDRT.
PFIC RulesThe Company does not believe that the shares or ADSs will be treated as stock of a passive foreign investment company, or PFIC, for US federal income tax purposes. This conclusion is a factual determination that is made annually and thus is subject to change. If the Company is treated as a PFIC, any gain realised on the sale or other disposition of the shares or ADSs would in general not be treated as capital gain, unless a US holder elects to be taxed annually on a mark to market basis with respect to the shares or ADSs. Otherwise a US holder would be treated as if he or she has realised such gain and certain “excess distributions” rateably over the holding period for the shares or ADSs and would be taxed at the highest tax rate in effect for each such year to which the gain was allocated. An interest charge in respect of the tax attributable to each such year would also apply. Dividends received from Vodafone would not be eligible for the preferential tax rate applicable to qualified dividend income for certain non-corporate holders.
The Company was incorporated under English law in 1984 as Racal Strategic Radio Limited (registered number 1833679). After various name changes, 20% of Racal Telecom Plc capital was offered to the public in October 1988. The Company was fully demerged from Racal Electronics Plc and became an independent company in September 1991, at which time it changed its name to Vodafone Group Plc.
Since then, the Group entered into various transactions, which consolidated the Group’s position in the United Kingdom and enhanced its international presence. The most significant of these transactions were as follows:
The merger with AirTouch Communications, Inc., which completed on 30 June 1999. The Company changed its name to Vodafone AirTouch Plc in June 1999, but then reverted to its former name, Vodafone Group Plc, on 28 July 2000.The acquisition of Mannesmann AG, which completed on 12 April 2000. Through this transaction the Group acquired subsidiaries in Germany and Italy, and increased the Group’s indirect holding in SFR.Through a series of business transactions between 1999 and 2004, the Group acquired a 97.7% stake in Vodafone Japan. This was then disposed of on 27 April 2006.On 8 May 2007, the Group acquired companies with interests in Vodafone Essar for $10.9 billion (£5.5 billion), following which the Group controls Vodafone Essar (see note 28 to the Consolidated Financial Statements).
Other transactions that have occurred since 31 March 2005 are as follows:
11 May 2005 – France: Following a transaction completed by the Group’s associated undertaking, SFR, the Group’s effective shareholding in Neuf Cegetel became 12.4%.
31 May 2005 – Czech Republic and Romania: 79.0% of the share capital of MobiFon S.A. (“MobiFon”) in Romania and 99.9% of the share capital of Oskar Mobil a.s. (“Oskar”) in the Czech Republic were acquired for $3.5 billion (£1.9 billion). In addition, the Group assumed approximately $1.0 billion (£0.6 billion) of net debt.
18 November 2005 – India: Acquired a 5.60% interest in Bharti Airtel and on 22 December 2005 acquired a further 4.39% interest in Bharti Airtel. Total consideration for the combined 10.0% stake was Rs. 67 billion (£858 million).
•
•
•
•
5 January 2006 – Sweden: Sold Vodafone Sweden for €970 million (£660 million).
20 April 2006 – South Africa: Increased stake in Vodacom Group (Pty) Limited (“Vodacom”) by 15.0% to 50.0% for a consideration of ZAR15.8 billion (£1.5 billion).
24 May 2006 – Turkey: The assets of Telsim Mobil Telekomunikasyon (“Telsim”) were acquired for $4.67 billion (£2.6 billion).
29 June 2006 – Greece: The Group’s interest in Vodafone Greece reached 99.9% following a public offer for all outstanding shares.
3 November 2006 – Belgium: Disposed of 25% interest in Belgacom Mobile SA for €2.0 billion (£1.3 billion).
25 November 2006 – The Netherlands: Group’s shareholdings increased to 100.0% following a compulsory acquisition of outstanding shares.
3 December 2006 – Egypt: Acquired an additional 4.8% stake in Vodafone Egypt bringing the Group’s interest to 54.9%.
20 December 2006 – Switzerland: Disposed of 25% interest in Swisscom Mobile AG for CHF4.25 billion (£1.8 billion).
9 May 2007 – India: A Bharti group company irrevocably agreed to purchase the Group’s 5.60% direct shareholding in Bharti Airtel (see note 29 to the Consolidated Financial Statements).
3 December 2007 – Italy and Spain: Acquired Tele2 Italia SpA and Tele2 Telecommunications Services SLU from Tele2 AB Group for €775 million (£537 million).
11 December 2007 – Qatar: A consortium comprising Vodafone and The Qatar Foundation was named as the successful applicant in the auction to become the second mobile operator in Qatar.
19 May 2008 – Arcor: The Group increased its stake in Arcor for €474 million (£377 million) and now owns 100% of Arcor.
146 Vodafone Group Plc Annual Report 2008
Vodafone – Additional Information
Shareholder Information continued
History and Development
The Group’s operating companies are generally subject to regulation governing the operation of their business activities. Such regulation typically takes the form of industry-specific law and regulation covering telecommunications services and general competition (anti-trust) law applicable to all activities. Some regulation implements commitments made by governments under the Basic Telecommunications Accord of the World Trade Organisation to facilitate market entry and establish regulatory frameworks.
The following section describes the regulatory framework and the key regulatory developments at the global and regional level and in selected countries in which the Group has significant interests. Many of the regulatory developments reported in the following section involve ongoing proceedings or consideration of potential proceedings that have not reached a conclusion. Accordingly, the Group is unable to attach a specific level of financial risk to the Group’s performance from such matters.
World Radiocommunication ConferenceDuring October and November 2007, the World Radiocommunication Conference of the International Telecommunications Union met in Geneva to consider changes to the Radio Regulations. The next such Conference will be held in 2011. The Conference establishes, by means of international treaty, the basis upon which radio frequency bands may be used in the signatory countries (which include all markets in which Vodafone has interests). Such agreements are required to prevent interference between users in different countries and to facilitate the development of scalable technologies such as GSM or UMTS. The most important outcome of the 2007 conference for Vodafone was the identification of additional spectrum in the UHF band for mobile services and, in particular, the identification of spectrum in the 790-862 MHz range for mobile services in Europe.
European UnionThe EU Regulatory Framework for the communications sector (“the EU Framework”) was adopted in 2002 and has been implemented by all EU Member States although there remain both ongoing and new infringement proceedings against a number of Member States for late or inadequate implementation.
The EU Framework consists of four principal Directives outlining matters such as:
the objectives to be pursued by national regulatory authorities (“NRAs”);the way in which telecommunications operators are to be licensed;measures to be taken to protect consumers; andensuring universal provision of certain telecommunications services and the terms and basis upon which operators interconnect and provide access to each other.
The EU Framework seeks to align the techniques for defining where sector specific regulation may be applied, and the threshold for when such regulation can be applied, with those already employed in EU competition law. It is also intended to ensure consistency of approach amongst NRAs within the Member States. All NRAs are required to take utmost account of a list of markets which are specified by the European Commission (the “Commission”) in a Recommendation when deciding which markets to investigate. The second such Recommendation was published by the Commission in November 2007 and for the mobile industry includes only the market at a wholesale level for ‘voice call termination on individual mobile networks’. Two markets included the first Recommendation, one for the ‘wholesale national market for international roaming’ and the market for ‘access and call origination’ on public mobile networks, have been removed. NRAs may still review other markets subject to satisfying certain tests.
Under the EU Framework, regulation can only be applied to undertakings with significant market power (“SMP”), either individually or collectively, in the relevant markets, subject to the Commission’s consent. SMP under the EU Framework accords with the concept of “dominance” under existing EU competition law. For individual dominance, this generally implies a market share of at least 40%, although other factors may also be taken into consideration.
In November 2007, the Commission published proposals to amend the EU Framework (“the review”). Any changes to the EU Framework would become effective following their transposition into national law from around 2010. Not all of these affect Vodafone directly. The proposals that may directly affect Vodafone include:
the proposed creation of a new European regulatory authority;the extension of the Commission’s powers so as to allow it, rather than national regulators, to determine remedies where SMP is found;
••••
••
the addition of functional separation as a remedy subject to certain conditions being fulfilled;fundamental changes to the licensing of spectrum, introducing more flexibility, trading and market-based approaches;some ‘net neutrality’ provisions to address the concerns that the services of some internet service providers (“ISPs”) will be blocked or otherwise discriminated against by network operators;proposals that number portability be completed in one day on all networks in the EU;various measures to address concerns about network security; andvarious measures to address the provision of services for the disabled.
The proposed changes are now being debated in the European Parliament and the Council of Member States and this process is expected to continue for most, if not all, of 2008. The impact of the review on Vodafone will depend on the changes actually adopted by the EU, the manner in which revised directives are subsequently implemented in Member States and how the revised regulatory framework is then applied by the respective NRAs and the Commission.
SpectrumIn February 2007, the Commission published a communication on its plans to introduce greater flexibility in the use of spectrum in selected bands, including 2G and 3G bands, through the use of Decisions agreed with the Radio Spectrum Committee (an EU level committee comprising the Commission and Member States). These reforms are expected to take place in advance of the review. The first proposed measure is a replacement of the GSM Directive by a decision to allow the deployment of UMTS services using 900 MHz and 1800 MHz spectrum (“refarming”). The Commission submitted formal proposals for such a decision to the European Parliament in July 2007.
In November 2007, the European Commission made a policy announcement on the 800 MHz ‘digital dividend’ spectrum (to be released following the transition from analogue to digital TV). It urged Europe, and the Member States in particular, to create new harmonised bands of spectrum for mobile broadband services and mobile TV. The need for action on the digital dividend has been supported by leading European Parliamentarians, and the Member States are expected to respond with a statement at the EU Telecoms Council in June 2008.
International roamingIn June 2007, a regulation (the “roaming regulation”) under Article 95 of the EU Treaty came into force requiring mobile operators to offer a ‘euro-tariff’ under which the cost of making calls within the EU is capped at 49 eurocents per minute and the cost of receiving calls within the EU is capped at 24 eurocents per minute. Customers who had not otherwise already opted for another roaming tariff, such as Vodafone Passport, were automatically opted onto the euro-tariff. The roaming regulation also requires that wholesale roaming charges within the EU are capped at an initial average rate of 30 eurocents per minute and that operators provide certain tariff transparency services to customers when they roam. The level of the retail and wholesale caps will fall in a further 12 and 24 months following the application of the regulation, which will terminate after three years.
The Commission is required by the roaming regulation to consider whether voice roaming should continue to be regulated beyond the expiry of the current regulation and, if so, what form such regulation might take. In addition, the Commission is required to review SMS and data roaming and to consider whether regulation is required, and if so, what form this might take. The Commission is consulting on these matters, with a view to publishing conclusions in late summer or early autumn of 2008. The Commission indicated in February 2008 that it would consider regulation in the event that SMS retail roaming prices did not approach justified levels, which it considered to be not more than 12 eurocents per SMS. The Commission urged the industry to adopt more predictable and transparent tariffs for data roaming services, and suggested that wholesale data roaming pricing should fall to around 35 eurocents per megabyte.
Call terminationAt 31 March 2008, the termination rates effective for the Group’s subsidiaries and joint ventures within the European Union, which differs from the Group’s Europe region, ranged from 6.40 eurocents (5.09 pence) to 11.84 eurocents (9.42 pence), at the relevant 31 March 2008 exchange rate.
The Commission is studying the regulation of call termination and is expected to consult upon and then issue a Recommendation in the autumn of 2008. The Commission has indicated that it is concerned by what it considers to be the unjustifiably wide range of regulated rates set by NRA’s in the EU and by their level relative to its view of cost. The NRAs are required to take utmost account of the Commission’s recommendations, but may depart from them in justified circumstances.
•
•
•
•••
Vodafone Group Plc Annual Report 2008 147
Vodafone – Additional Information
Regulation
EuropeGermanyVodafone’s 900 MHz licence was extended to 2016. In April 2008, the NRA published the rules for auctioning further 2.0 GHz, 2.6 GHz and 1800 MHz spectrum, with auctions expected in 2009.
In April 2008, the German Supreme Administration Court rejected lawsuits filed by the four mobile network operators against the NRA’s decision to regulate mobile termination rates on an ex ante basis. The German Competition Authority has commenced an investigation into the use by Vodafone Germany and T-Mobile Germany of on-net pricing.
During the year, the NRA reduced Vodafone’s termination rate by 9.8% to 7.92 eurocents, valid until March 2009.
ItalyThe NRA launched a public consultation for the assignment of 900 MHz, 1800 MHz and 2.1 GHz spectrum and on the implementation of 900 MHz refarming. The Italian Ministry of Communications assigned 5 MHz of 900 MHz spectrum to Wind on a temporary basis in 16 main cities. The NRA published proposals to licence DVB-H services.
The Italian National Competition Authority (“NCA”) closed its investigation into alleged anti-competitive practices by mobile network operators, including Vodafone Italy, in relation to network access for MVNOs and other matters. Undertakings in relation to network access were submitted by Vodafone Italy and accepted by the NCA, and the case has been closed without sanction for Vodafone. A new law was enacted prohibiting fees or other charges in addition to airtime for prepaid services and introducing measures to enable consumers to terminate contracts without penalty. The Italian NRA published guidelines requiring operators to reimburse or transfer any remaining prepaid airtime of customers switching networks.
The Italian NRA and Government commenced discussions with Telecom Italia about proposed voluntary separation of the Telecom Italia fixed network. Vodafone currently purchases certain services from Telecom Italia in order to provide fixed broadband services in the Italian market and it is possible that both existing and future arrangements between Vodafone and Telecom Italia would be affected if such proposals were to be implemented.
During the year, the NRA reduced Vodafone’s termination rate by 11.0% to 9.97 eurocents, with the NRA foreseeing further reductions to 8.85 eurocents in July 2008, 7.70 eurocents in July 2009, 6.60 eurocents in July 2010 and 5.90 eurocents in July 2011.
SpainThe NRA commenced a review of the wholesale market for SMS termination. The Spanish Competition Authority commenced an investigation against the three largest mobile operators in Spain, including Vodafone, alleging that the firms colluded when setting call set-up charges. A new law was passed requiring telecommunications operators to retain certain data for a 12 month period and requiring operators to register the identity of new prepay customers and to register the identity of existing prepay customers within a two year period. The NRA commenced a review to determine the operators obliged to contribute to the national universal service fund and the criteria for distribution of the fund.
During the year, the NRA reduced Vodafone’s termination rate by 15.3% to 9.61 eurocents. In April 2008, the NRA reduced the rate to 8.74 eurocents, with reductions to 7.87 eurocents in October 2008 and 7.00 eurocents in April 2009.
United KingdomAn auction of 2.6 GHz spectrum is expected to commence in September 2008 and the NRA also proposes to auction 112 MHz of digital dividend spectrum in the 550-860 MHz range during 2009. The NRA published proposals to allow refarming of 900 MHz spectrum, but proposed that Vodafone, and O2, first release 2 x 7.5 MHz each for reallocation to other parties. Following consultation, the NRA has decided to reconsider these proposals.
The appeal by certain stakeholders against the NRA’s decision on setting call termination rates until 2011 is being considered by the UK Competition Commission and Competition Appeal Tribunal. Vodafone UK filed an appeal against the proposals of the NRA to reform the number portability processes and reduce porting times to two hours.
The NRA announced that it will withdraw certain regulatory obligations from BT in relation to the provision of wholesale broadband services in certain parts of the UK market where it considers that BT no longer has SMP, a result of competition from other fixed unbundlers and cable operators. Vodafone purchases certain fixed wholesale services from BT.
Vodafone’s average termination rate for the 2008 financial year was 5.70 pence. Rates declined by 3.2% below the retail price index in April 2008 and will decline by 2.5% below the retail price index in the April 2009 and April 2010.
Other EuropeGreeceIn January 2007, Vodafone Greece was fined €76 million as software foreign to the network and capable of intercepting calls had been installed without Vodafone’s knowledge in the network software. Vodafone Greece has paid the fine but is appealing the decision before the Council of State and a hearing is set for October 2008. In March 2008, Vodafone Greece was fined €19 million by the NRA for violations of telecommunications legislation and provisions of licences in connection with the interception incident. Vodafone has appealed the decision. Vodafone Greece appealed a finding that the three largest mobile network operators colluded in setting retail SMS prices and won. The NRA then appealed this decision before the Council of State.
During the year, the termination rate reduced by 15.6% to 9.91 eurocents.
IrelandVodafone Ireland has obtained a trial licence to deploy UMTS in 900 MHz spectrum. In March 2007, a 3G licence was awarded to eircom.
The NetherlandsIn March 2007, Vodafone Netherlands’ 900 MHz licence was extended for three years to 2013. The NRA is expected to consult upon compliance with 3G coverage obligations in 2008. Auctions of 2.6 GHz spectrum are also expected in 2008.
An appeal by one stakeholder against the NRA’s decision setting call termination rates was heard and a decision is expected in the coming months. During the year, the termination rate reduced by 9.1% to 10.00 eurocents. The NRA proposes to reduce termination rates to 9.00 eurocents in July 2008 and to 7.00 eurocents in July 2009.
PortugalThe NRA decided to implement technology neutrality for 900 MHz spectrum, paving the way for refarming. The NRA proposed to allocate, through a public tender, 450 MHz spectrum for mobile services.
A new law concerning unfair commercial practices was enacted in April 2008 that prohibits the rounding up of charges and introduced a series of associated tariff transparency measures.
During the year, the NRA published a proposal for future termination rates. This proposal is yet to be finalised and the termination rate applied in Portugal remained unchanged at 11.00 eurocents during the year.
FranceThe NRA issued a call for tenders for a fourth 3G licence by July 2007. No licence has been awarded to date. The NRA authorised refarming of the 900 MHz and 1800 MHz bands.
The French Competition Council has issued a Statement of Objection to SFR concerning on-net pricing in certain tariffs.
148 Vodafone Group Plc Annual Report 2008
Vodafone – Additional Information
Regulation continued
EMAPAEastern EuropePolandThe NRA concluded an analysis of the market for access and call origination on mobile public networks, concluding that no operator had SMP.
RomaniaThe Government commenced a process to issue a sixth mobile licence in the 410-415 MHz band. Mobile number portability is expected to be implemented in October 2008.
TurkeyThe Government undertook an auction of 2.1 GHz licences in August 2007. The auction was subsequently revoked and no licences were issued. The NRA may recommence the award of 3G licences in late 2008 or 2009.
The NRA has applied certain restrictions on the on-net retail pricing practices of Turkcell, which are subject to appeal by Turkcell. Mobile number portability is expected to be implemented in the autumn of 2008.
Middle East, Africa and AsiaEgyptThe NRA extended Vodafone Egypt’s 2G licence until 2013 and its 3G licence until 2022.
The third entrant, ETISALAT, launched GSM services in the Egyptian market in May 2007. ETISALAT was awarded an International Gateway Licence in October 2007. Mobile number portability was introduced in Egypt in April 2008.
IndiaThe NRA has issued recommendations to the Department of Telecommunications (“DoT”) on the licence terms and capping the number of licensees. The DoT has permitted CDMA operators to apply for GSM spectrum to enable them to provide GSM services alongside their CDMA operations. It has revised the customer number threshold at which licensees become eligible for incremental spectrum allocation, with the threshold being made significantly more stringent. The DoT has also issued new licences for up to seven new licences in each licence area. It has commenced the process of allocating GSM spectrum to these new licensees, with Vodafone Essar being awarded initial GSM spectrum in seven service areas in the 2008 financial year.
The DoT issued guidelines to permit active infrastructure sharing between licensees. It has issued guidelines on mobile number portability, which is to be launched in four Metro cities by the fourth quarter of the 2008 calendar year, before being extended nationwide. The DoT has also issued broad guidelines on 3G mobile services and broadband wireless access.
The NRA has recommended the abolition of the Access Deficit Contribution, a 0.75% charge levied on adjusted gross revenue of operators.
KenyaThe Kenya Communications Amendment Bill 2007 was withdrawn by the Government.
The NRA has granted Telkom Kenya a licence for the provision of Mobile Cellular Services. It is expected that Telkom Kenya will roll out GSM services during 2008 under the Orange East Africa brand. The third Kenyan mobile licence has been awarded to Econet Wireless, which plans to roll out its GSM services during 2008.
South AfricaThe NRA is proceeding with the implementation of the Electronic Communications Act (“ECA”) of 2006 and the associated licence conversion process. The NRA plans to issue service licences by July 2008 and complete regulations before the end of 2008.
Vodacom has announced its commitment to a transaction in 2008 under the South Africa Government’s programme of Broad-Based Black Economic Empowerment (“BBBEE”). The Information Communications Technologies BBBEE Sector Code (“Code”) was submitted to the Minister of Trade and Industry in March 2008 for approval. To date, the Minister has not published the Code for the 60 day public comment process required before the Minister may give his approval. Vodacom remains subject to the generic Department of Trade and Industry Codes of Good Practice until the Code is approved. As part of the implementation of the ECA, the NRA is consulting on the process of determining wholesale and retail regulations (i.e. interconnection, facilities leasing and essential facilities). The NRA is expected to conclude this by the end of June 2008.
Call termination remains under investigation by the NRA. In January 2007, the NRA issued proposals to declare Vodacom, MTN and Cell C as having SMP mobile call termination on individual networks.
QatarIn December 2007, a consortium comprising Vodafone and the Qatar Foundation for Education, Science and Community Development was named as the successful applicant in the auction to become the second mobile operator in Qatar. The licence is expected to be granted by 30 June 2008 and will be owned by Vodafone Qatar, which is required to complete a public offering of 40% of its shareholding on the Doha Securities Market for Qatari nationals. The public offering is expected to complete in the 2008 calendar year.
The NRA is currently consulting on Qtel’s status and whether to impose dominant service provider obligations.
PacificNew ZealandVodafone sold 2x 5.8 MHZ of 900 MHz spectrum to the third mobile entrant in March 2008. Vodafone retains 2x 15 MHz until 2031, subject to payment of a renewal fee. Vodafone has entered into a national roaming agreement with the third entrant, as a result of which the NRA has concluded an enquiry without taking further action.
Vodafone Group Plc Annual Report 2008 149
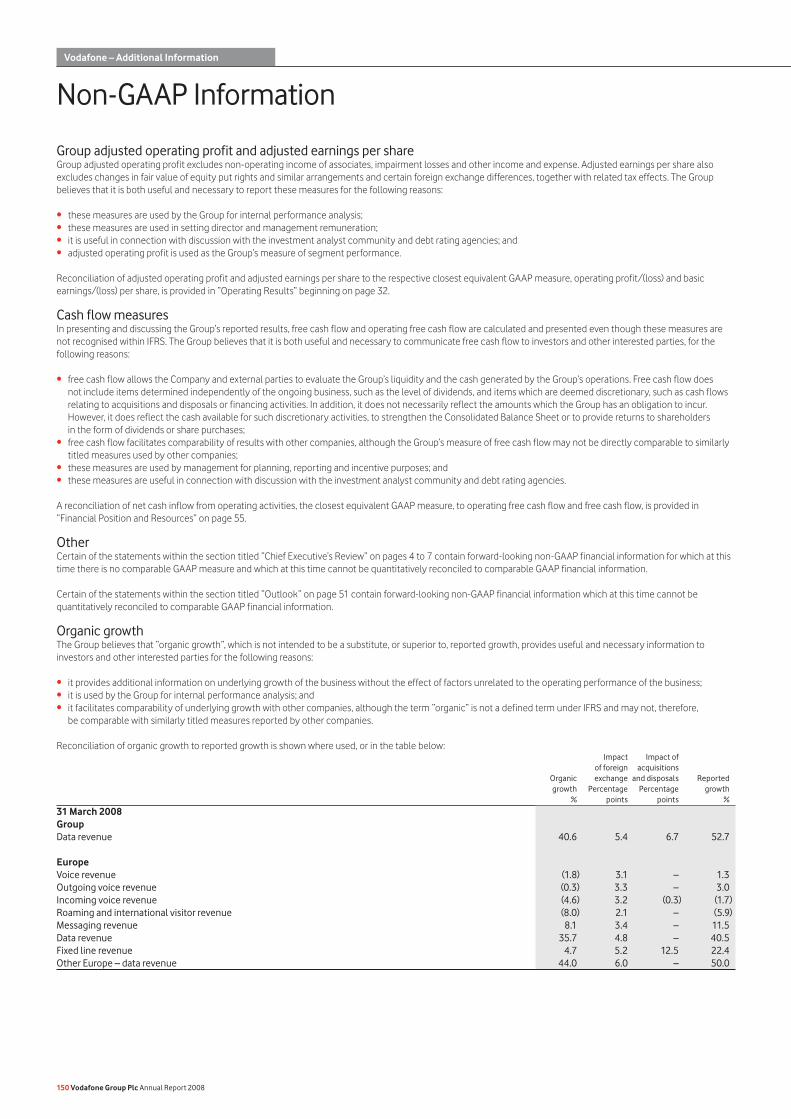
Non-GAAP Information
Group adjusted operating profit and adjusted earnings per shareGroup adjusted operating profit excludes non-operating income of associates, impairment losses and other income and expense. Adjusted earnings per share also excludes changes in fair value of equity put rights and similar arrangements and certain foreign exchange differences, together with related tax effects. The Group believes that it is both useful and necessary to report these measures for the following reasons:
these measures are used by the Group for internal performance analysis; these measures are used in setting director and management remuneration; it is useful in connection with discussion with the investment analyst community and debt rating agencies; andadjusted operating profit is used as the Group’s measure of segment performance.
Reconciliation of adjusted operating profit and adjusted earnings per share to the respective closest equivalent GAAP measure, operating profit/(loss) and basic earnings/(loss) per share, is provided in “Operating Results” beginning on page 32.
Cash flow measuresIn presenting and discussing the Group’s reported results, free cash flow and operating free cash flow are calculated and presented even though these measures are not recognised within IFRS. The Group believes that it is both useful and necessary to communicate free cash flow to investors and other interested parties, for the following reasons:
free cash flow allows the Company and external parties to evaluate the Group’s liquidity and the cash generated by the Group’s operations. Free cash flow does not include items determined independently of the ongoing business, such as the level of dividends, and items which are deemed discretionary, such as cash flows relating to acquisitions and disposals or financing activities. In addition, it does not necessarily reflect the amounts which the Group has an obligation to incur. However, it does reflect the cash available for such discretionary activities, to strengthen the Consolidated Balance Sheet or to provide returns to shareholders in the form of dividends or share purchases;free cash flow facilitates comparability of results with other companies, although the Group’s measure of free cash flow may not be directly comparable to similarly titled measures used by other companies;these measures are used by management for planning, reporting and incentive purposes; andthese measures are useful in connection with discussion with the investment analyst community and debt rating agencies.
A reconciliation of net cash inflow from operating activities, the closest equivalent GAAP measure, to operating free cash flow and free cash flow, is provided in “Financial Position and Resources” on page 55.
OtherCertain of the statements within the section titled “Chief Executive’s Review” on pages 4 to 7 contain forward-looking non-GAAP financial information for which at this time there is no comparable GAAP measure and which at this time cannot be quantitatively reconciled to comparable GAAP financial information.
Certain of the statements within the section titled “Outlook” on page 51 contain forward-looking non-GAAP financial information which at this time cannot be quantitatively reconciled to comparable GAAP financial information.
Organic growthThe Group believes that “organic growth”, which is not intended to be a substitute, or superior to, reported growth, provides useful and necessary information to investors and other interested parties for the following reasons:
it provides additional information on underlying growth of the business without the effect of factors unrelated to the operating performance of the business;it is used by the Group for internal performance analysis; andit facilitates comparability of underlying growth with other companies, although the term “organic” is not a defined term under IFRS and may not, therefore, be comparable with similarly titled measures reported by other companies.
Reconciliation of organic growth to reported growth is shown where used, or in the table below: Impact Impact of of foreign acquisitions Organic exchange and disposals Reported growth Percentage Percentage growth % points points %
31 March 2008GroupData revenue 40.6 5.4 6.7 52.7
EuropeVoice revenue (1.8) 3.1 – 1.3Outgoing voice revenue (0.3) 3.3 – 3.0Incoming voice revenue (4.6) 3.2 (0.3) (1.7)Roaming and international visitor revenue (8.0) 2.1 – (5.9)Messaging revenue 8.1 3.4 – 11.5Data revenue 35.7 4.8 – 40.5Fixed line revenue 4.7 5.2 12.5 22.4Other Europe – data revenue 44.0 6.0 – 50.0
••••
•
•
••
•••
150 Vodafone Group Plc Annual Report 2008
Vodafone – Additional Information
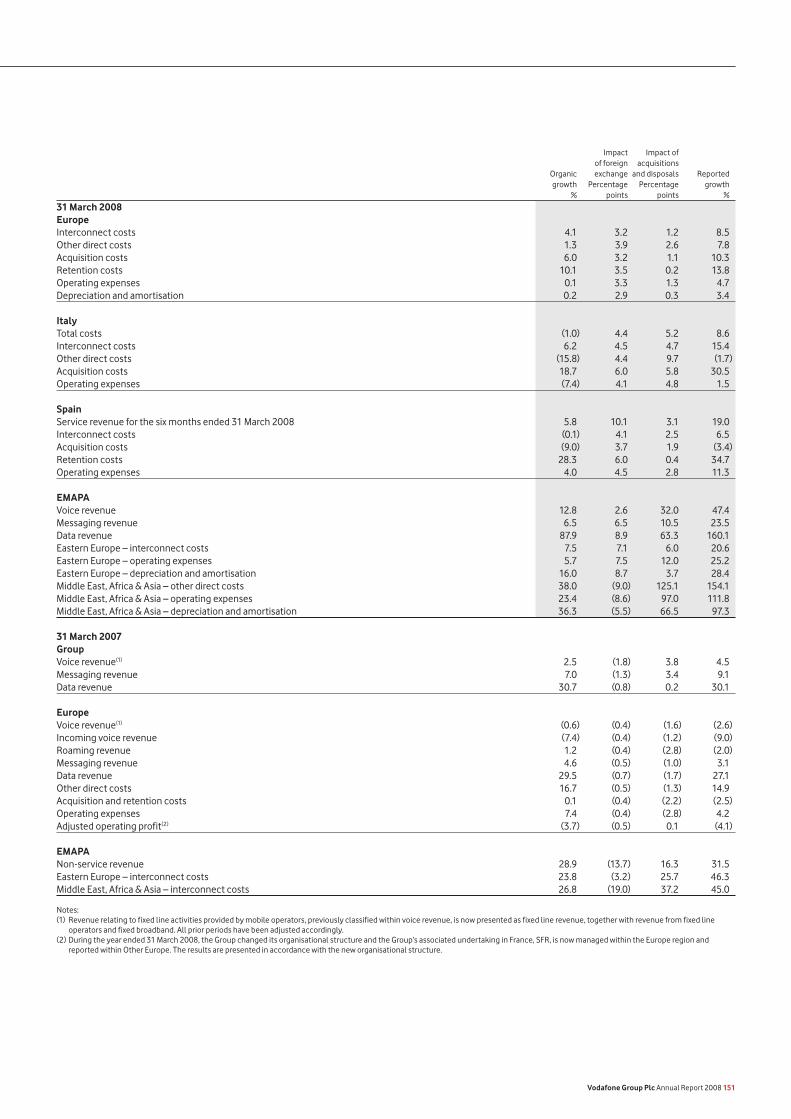
Impact Impact of of foreign acquisitions Organic exchange and disposals Reported growth Percentage Percentage growth % points points %
31 March 2008EuropeInterconnect costs 4.1 3.2 1.2 8.5Other direct costs 1.3 3.9 2.6 7.8Acquisition costs 6.0 3.2 1.1 10.3Retention costs 10.1 3.5 0.2 13.8Operating expenses 0.1 3.3 1.3 4.7Depreciation and amortisation 0.2 2.9 0.3 3.4
ItalyTotal costs (1.0) 4.4 5.2 8.6Interconnect costs 6.2 4.5 4.7 15.4Other direct costs (15.8) 4.4 9.7 (1.7)Acquisition costs 18.7 6.0 5.8 30.5Operating expenses (7.4) 4.1 4.8 1.5
SpainService revenue for the six months ended 31 March 2008 5.8 10.1 3.1 19.0Interconnect costs (0.1) 4.1 2.5 6.5Acquisition costs (9.0) 3.7 1.9 (3.4)Retention costs 28.3 6.0 0.4 34.7Operating expenses 4.0 4.5 2.8 11.3
EMAPAVoice revenue 12.8 2.6 32.0 47.4Messaging revenue 6.5 6.5 10.5 23.5Data revenue 87.9 8.9 63.3 160.1Eastern Europe – interconnect costs 7.5 7.1 6.0 20.6Eastern Europe – operating expenses 5.7 7.5 12.0 25.2Eastern Europe – depreciation and amortisation 16.0 8.7 3.7 28.4Middle East, Africa & Asia – other direct costs 38.0 (9.0) 125.1 154.1Middle East, Africa & Asia – operating expenses 23.4 (8.6) 97.0 111.8Middle East, Africa & Asia – depreciation and amortisation 36.3 (5.5) 66.5 97.3
31 March 2007GroupVoice revenue(1) 2.5 (1.8) 3.8 4.5Messaging revenue 7.0 (1.3) 3.4 9.1Data revenue 30.7 (0.8) 0.2 30.1
EuropeVoice revenue(1) (0.6) (0.4) (1.6) (2.6)Incoming voice revenue (7.4) (0.4) (1.2) (9.0)Roaming revenue 1.2 (0.4) (2.8) (2.0)Messaging revenue 4.6 (0.5) (1.0) 3.1Data revenue 29.5 (0.7) (1.7) 27.1Other direct costs 16.7 (0.5) (1.3) 14.9Acquisition and retention costs 0.1 (0.4) (2.2) (2.5)Operating expenses 7.4 (0.4) (2.8) 4.2Adjusted operating profit(2) (3.7) (0.5) 0.1 (4.1)
EMAPANon-service revenue 28.9 (13.7) 16.3 31.5Eastern Europe – interconnect costs 23.8 (3.2) 25.7 46.3Middle East, Africa & Asia – interconnect costs 26.8 (19.0) 37.2 45.0
Notes:(1) Revenue relating to fixed line activities provided by mobile operators, previously classified within voice revenue, is now presented as fixed line revenue, together with revenue from fixed line
operators and fixed broadband. All prior periods have been adjusted accordingly.(2) During the year ended 31 March 2008, the Group changed its organisational structure and the Group’s associated undertaking in France, SFR, is now managed within the Europe region and
reported within Other Europe. The results are presented in accordance with the new organisational structure.
Vodafone Group Plc Annual Report 2008 151
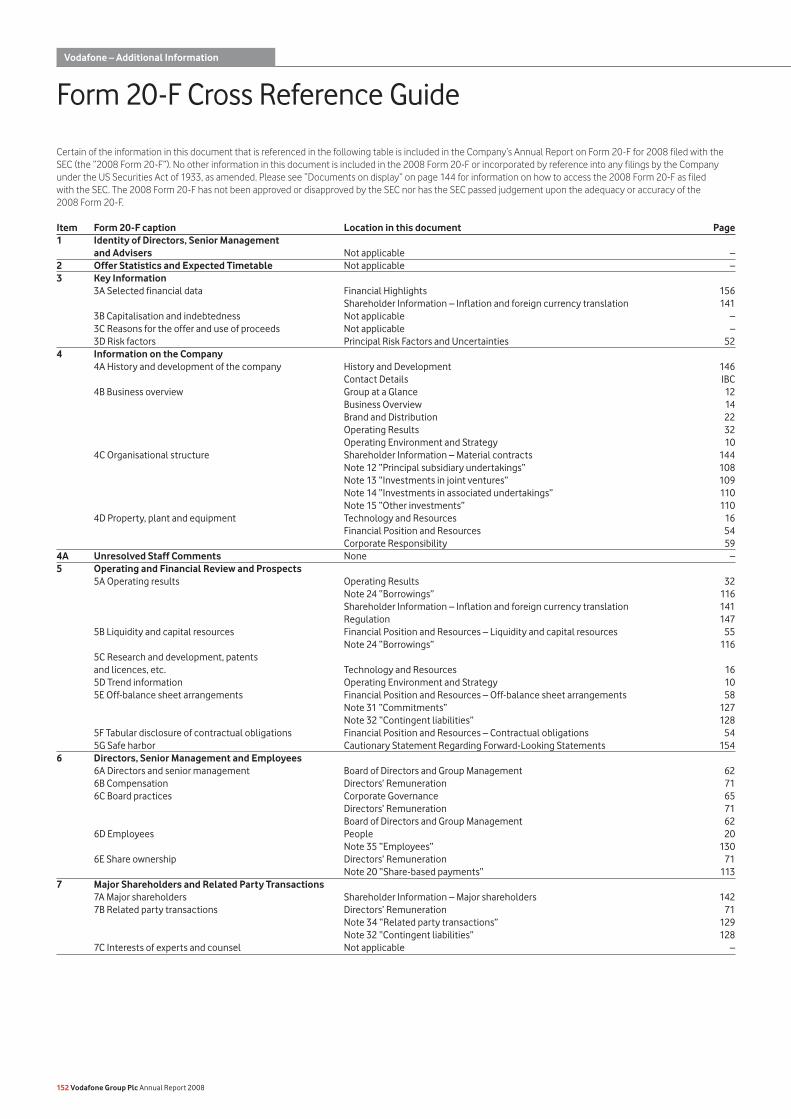
Certain of the information in this document that is referenced in the following table is included in the Company’s Annual Report on Form 20-F for 2008 filed with the SEC (the “2008 Form 20-F”). No other information in this document is included in the 2008 Form 20-F or incorporated by reference into any filings by the Company under the US Securities Act of 1933, as amended. Please see “Documents on display” on page 144 for information on how to access the 2008 Form 20-F as filed with the SEC. The 2008 Form 20-F has not been approved or disapproved by the SEC nor has the SEC passed judgement upon the adequacy or accuracy of the 2008 Form 20-F.
Item Form 20-F caption Location in this document Page1 Identity of Directors, Senior Management and Advisers Not applicable –2 Offer Statistics and Expected Timetable Not applicable –3 Key Information 3A Selected financial data Financial Highlights 156 Shareholder Information – Inflation and foreign currency translation 141 3B Capitalisation and indebtedness Not applicable – 3C Reasons for the offer and use of proceeds Not applicable – 3D Risk factors Principal Risk Factors and Uncertainties 524 Information on the Company 4A History and development of the company History and Development 146 Contact Details IBC 4B Business overview Group at a Glance 12 Business Overview 14 Brand and Distribution 22 Operating Results 32 Operating Environment and Strategy 10 4C Organisational structure Shareholder Information – Material contracts 144 Note 12 “Principal subsidiary undertakings” 108 Note 13 “Investments in joint ventures” 109 Note 14 “Investments in associated undertakings” 110 Note 15 “Other investments” 110 4D Property, plant and equipment Technology and Resources 16 Financial Position and Resources 54 Corporate Responsibility 594A Unresolved Staff Comments None –5 Operating and Financial Review and Prospects 5A Operating results Operating Results 32 Note 24 “Borrowings” 116 Shareholder Information – Inflation and foreign currency translation 141 Regulation 147 5B Liquidity and capital resources Financial Position and Resources – Liquidity and capital resources 55 Note 24 “Borrowings” 116 5C Research and development, patents and licences, etc. Technology and Resources 16 5D Trend information Operating Environment and Strategy 10 5E Off-balance sheet arrangements Financial Position and Resources – Off-balance sheet arrangements 58 Note 31 “Commitments” 127 Note 32 “Contingent liabilities” 128 5F Tabular disclosure of contractual obligations Financial Position and Resources – Contractual obligations 54 5G Safe harbor Cautionary Statement Regarding Forward-Looking Statements 1546 Directors, Senior Management and Employees 6A Directors and senior management Board of Directors and Group Management 62 6B Compensation Directors’ Remuneration 71 6C Board practices Corporate Governance 65 Directors’ Remuneration 71 Board of Directors and Group Management 62 6D Employees People 20 Note 35 “Employees” 130 6E Share ownership Directors’ Remuneration 71 Note 20 “Share-based payments” 1137 Major Shareholders and Related Party Transactions 7A Major shareholders Shareholder Information – Major shareholders 142 7B Related party transactions Directors’ Remuneration 71 Note 34 “Related party transactions” 129 Note 32 “Contingent liabilities” 128 7C Interests of experts and counsel Not applicable –
152 Vodafone Group Plc Annual Report 2008
Vodafone – Additional Information
Form 20-F Cross Reference Guide
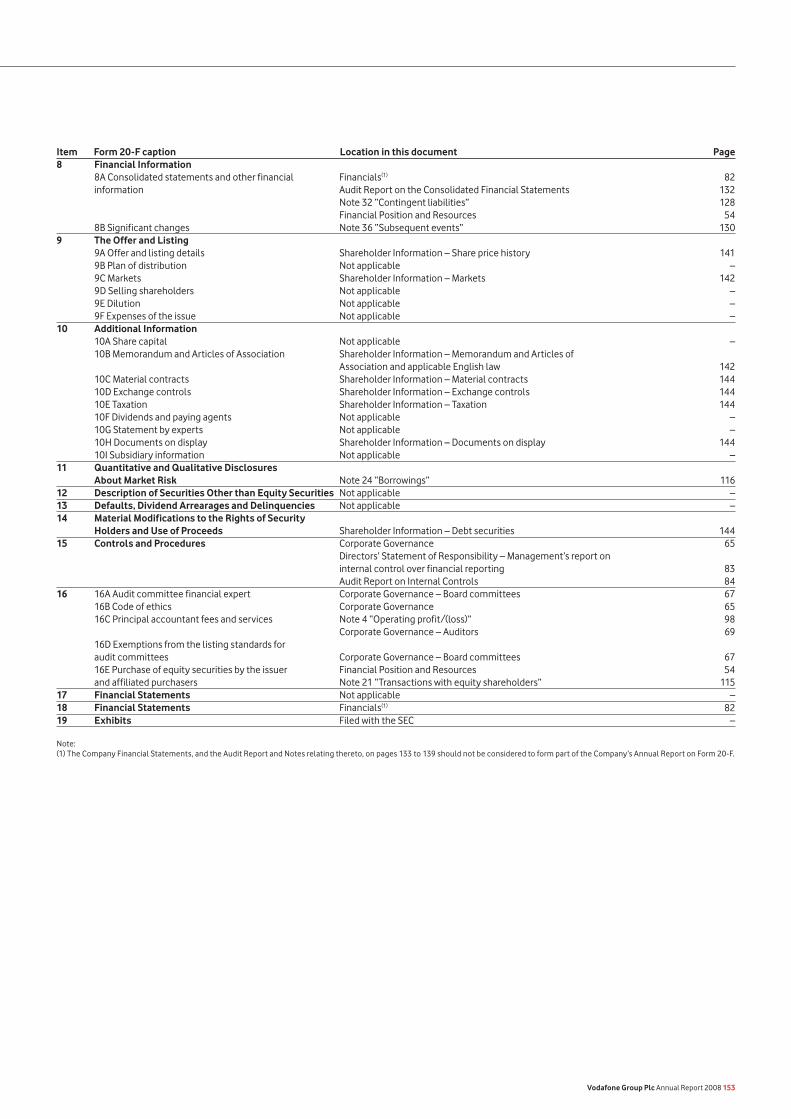
Item Form 20-F caption Location in this document Page8 Financial Information 8A Consolidated statements and other financial Financials(1) 82 information Audit Report on the Consolidated Financial Statements 132 Note 32 “Contingent liabilities” 128 Financial Position and Resources 54 8B Significant changes Note 36 “Subsequent events” 1309 The Offer and Listing 9A Offer and listing details Shareholder Information – Share price history 141 9B Plan of distribution Not applicable – 9C Markets Shareholder Information – Markets 142 9D Selling shareholders Not applicable – 9E Dilution Not applicable – 9F Expenses of the issue Not applicable –10 Additional Information 10A Share capital Not applicable – 10B Memorandum and Articles of Association Shareholder Information – Memorandum and Articles of Association and applicable English law 142 10C Material contracts Shareholder Information – Material contracts 144 10D Exchange controls Shareholder Information – Exchange controls 144 10E Taxation Shareholder Information – Taxation 144 10F Dividends and paying agents Not applicable – 10G Statement by experts Not applicable – 10H Documents on display Shareholder Information – Documents on display 144 10I Subsidiary information Not applicable –11 Quantitative and Qualitative Disclosures About Market Risk Note 24 “Borrowings” 11612 Description of Securities Other than Equity Securities Not applicable –13 Defaults, Dividend Arrearages and Delinquencies Not applicable –14 Material Modifications to the Rights of Security Holders and Use of Proceeds Shareholder Information – Debt securities 14415 Controls and Procedures Corporate Governance 65 Directors’ Statement of Responsibility – Management’s report on internal control over financial reporting 83 Audit Report on Internal Controls 8416 16A Audit committee financial expert Corporate Governance – Board committees 67 16B Code of ethics Corporate Governance 65 16C Principal accountant fees and services Note 4 “Operating profit/(loss)” 98 Corporate Governance – Auditors 69 16D Exemptions from the listing standards for audit committees Corporate Governance – Board committees 67 16E Purchase of equity securities by the issuer Financial Position and Resources 54 and affiliated purchasers Note 21 “Transactions with equity shareholders” 11517 Financial Statements Not applicable –18 Financial Statements Financials(1) 8219 Exhibits Filed with the SEC –
Note:(1) The Company Financial Statements, and the Audit Report and Notes relating thereto, on pages 133 to 139 should not be considered to form part of the Company’s Annual Report on Form 20-F.
Vodafone Group Plc Annual Report 2008 153
This document contains “forward-looking statements” within the meaning of the US Private Securities Litigation Reform Act of 1995 with respect to the Group’s financial condition, results of operations and businesses and certain of the Group’s plans and objectives.
In particular, such forward-looking statements include statements with respect to
Vodafone’s expectations as to launch and roll out dates for products, services or technologies offered by Vodafone;expectations regarding the operating environment and market conditions;intentions regarding the development of products, services and initiatives introduced by Vodafone or by Vodafone in conjunction with third parties; revenue and growth expected from our total communications strategy;the development and impact of new mobile technology including the development of 4G technology and the launch of faster data speeds;anticipated benefits to the Group from cost efficiency programmes,including outsourcing of IT functions and network sharing agreements;growth in customers and usage; expected growth prospects in Europe and the EMAPA region;expectations regarding the performance of investments, associates, joint ventures and newly acquired businesses, including the expected performance of Verizon Wireless;the Group’s expectations for revenue, adjusted operating profit, average foreign exchange rates, depreciation and amortisation charges, capitalised fixed asset additions, capital intensity, free cash flow, cash payments for tax and associated interest, payments of deferred capital expenditures, adjusted effective tax rates and foreign exchange rate changes contained within the Chief Executives Review on pages 4 to 7 and the Outlook statement on page 51 of this document, and expectations for the Group’s future performance generally, including average revenue per user, costs, capital expenditures, operating expenditures and margins; the expected contribution to the Group’s revenue of voice services, messaging services, data services, broadband services, fixed location pricing, internet services and mobile advertising; the rate of dividend growth by the Group or its existing investments; the expected contributions to the Group’s revenue from our business segment;expectations regarding the Group’s access to adequate funding for its working capital requirements; possible future acquisitions, including increases in ownership in existing investments, the timely completion of pending acquisition transactions and pending offers for investments, including licence acquisitions, and the expected funding required to complete such acquisitions or investments; mobile penetration and coverage rates and the Group’s ability to acquire spectrum; the impact of regulatory and legal proceedings involving Vodafone and of scheduled or potential regulatory changes; expectations with respect to long term shareholder value growth; andoverall market trends and other trend projections.
Forward-looking statements are sometimes, but not always, identified by their use of a date in the future or such words as “anticipates”, “aims”, “could”, “may”, “should”, “expects”, “believes”, “intends”, “plans” or “targets”. By their nature, forward-looking statements are inherently predictive, speculative and involve risk and uncertainty because they relate to events and depend on circumstances that will occur in the future. There are a number of factors that could cause actual results and developments to differ materially from those expressed or implied by these forward-looking statements. These factors include, but are not limited to, the following:
changes in economic or political conditions in markets served by operations of the Group that would adversely affect the level of demand for mobile services; greater than anticipated competitive activity, from both existing competitors and new market entrants, including Mobile Virtual Network Operators, which could require changes to the Group’s pricing models, lead to customer churn and make it more difficult to acquire new customers, and reduce profitability; the impact of investment in network capacity and the deployment of new technologies, or the rapid obsolescence of existing technology; slower than expected customer growth and reduced customer retention; changes in the spending patterns of new and existing customers; the possibility that new products and services will not be commercially
•
••
••
•
•••
•
•
•••
•
•
•
••
•
•
•
•
•
accepted or perform according to expectations or that vendors’ performance in marketing these technologies will not meet the Group’s requirements; the Group’s ability to win 3G licence allocations; the Group’s ability to realise expected synergies and benefits associated with 3G technologies; the Group’s ability to expand its spectrum position; a lower than expected impact of new or existing products, services or technologies on the Group’s future revenue, cost structure and capital expenditure outlays; the ability of the Group to harmonise mobile platforms and delays, impediments or other problems associated with the roll out and scope of and other new or existing products, services or technologies in new markets; the ability of the Group to offer new services and secure the timely delivery of high quality, reliable handsets, network equipment and other key products from suppliers; the Group’s ability to develop competitive data content and services that will attract new customers and increase average usage; future revenue contributions of both voice and non-voice services; greater than anticipated prices of new mobile handsets; changes in the costs to the Group of or the rates the Group may charge for terminations and roaming minutes; the Group’s ability to achieve meaningful cost savings and revenue improvements as a result of its cost reduction programmes; the ability to realise benefits from entering into partnerships for developing data and internet services and entering into service franchising and brand licensing; the possibility that the pursuit of new, unexpected strategic opportunities may have a negative impact on the Group’s financial performance; developments in the Group’s financial condition, earnings and distributable funds and other factors that the Board of Directors takes into account in determining the level of dividends; any unfavourable conditions, regulatory or otherwise, imposed in connection with pending or future acquisitions or dispositions and the integration of acquired companies in the Group’s existing operations; the risk that, upon obtaining control of certain investments, the Group discovers additional information relating to the businesses of that investment leading to restructuring charges or write-offs or with other negative implications; changes in the regulatory framework in which the Group operates, including possible action by regulators in markets in which the Group operates or by the EU regulating rates the Group is permitted to charge; the impact of legal or other proceedings against the Group or other companies in the mobile communications industry; the possibility that new marketing or usage stimulation campaigns or efforts and customer retention schemes are not an effective expenditure; the possibility that the Group’s integration efforts do not reduce the time to market for new products or improve the Group’s cost position; loss of suppliers or disruption of supply chains; the Group’s ability to satisfy working capital requirements through borrowing in capital markets, bank facilities and operations; changes in exchange rates, including particularly the exchange rate of pounds sterling to the euro and the US dollar; changes in statutory tax rates and profit mix which would impact the weighted average tax rate; changes in tax legislation in the jurisdictions in which the Group operates; final resolution of open issues which might impact the effective tax rate; andtiming of tax payments relating to the resolution of open issues.
Furthermore, a review of the reasons why actual results and developments may differ materially from the expectations disclosed or implied within forward-looking statements can be found under “Principal Risk Factors and Uncertainties” on pages 52 and 53 of this document. All subsequent written or oral forward-looking statements attributable to the Company or any member of the Group or any persons acting on their behalf are expressly qualified in their entirety by the factors referred to above. No assurances can be given that the forward-looking statements in this document will be realised. Neither Vodafone nor any of its affiliates intends to update these forward-looking statements.
••
••
•
•
•
•••
•
•
•
•
•
•
•
•
•
••
•
•
•••
154 Vodafone Group Plc Annual Report 2008
Vodafone – Additional Information
Cautionary Statement Regarding Forward-Looking Statements
3G broadband 3G services enabled with High Speed Downlink Packet Access (“HSDPA”) technology which enables data transmission at speeds of up to 7.2 megabits per second.
3G device A handset or device capable of accessing 3G data services.
Acquired intangibles Amortisation relating to intangible assets identified and recognised separately in respect of a business combination in excess of the amortisation intangible assets recognised by the acquiree prior to acquisition.
Acquisition costs The total of connection fees, trade commissions and equipment costs relating to new customer connections.
Capitalised fixed asset additions This measure includes the aggregate of capitalised property, plant and equipment additions and capitalised software costs.
Change at constant exchange Growth or change calculated by restating the prior period’s results as if they had been generated at the current period’s exchange rates rates. Also referred to as “constant currency”.
Churn Total gross customer disconnections in the period divided by the average total customers in the period.
Controlled and jointly controlled Controlled and jointly controlled measures include 100% for the Group’s mobile operating subsidiaries and the Group’s proportionate share for joint ventures.
Customer delight The Group uses a proprietary ‘customer delight’ system to track customer satisfaction across its controlled markets and jointly controlled market in Italy. Customer delight is measured by an index based on the results of surveys performed by an external research company which cover all aspects of service provided by Vodafone and incorporates the results of the relative satisfaction of the competitors’ customers. An overall index for the Group is calculated by weighting the results for each of the Group’s operations based on service revenue.
Data revenue Data revenue includes all non-voice service revenue excluding messaging revenue and fixed line revenue.
Depreciation and other This measure includes the profit or loss on disposal of property, plant and equipment and computer software. amortisation
DSL A Digital Subscriber Line which is a fixed line enabling data to be transmitted at high speeds.
Handheld business device A wireless connection device which allows access to business applications and push and pull email.
HSDPA High Speed Downlink Packet Access is a wireless technology enabling network to mobile data transmission speeds of up to 7.2 megabits per second.
HSUPA High Speed Uplink Packet Access is a wireless technology enabling mobile to network data transmission speeds of up to 1.4 megabits per second.
Interconnect costs A charge paid by Vodafone to other fixed line or mobile operators when a Vodafone customer calls a customer connected to a different network.
Messaging revenue Messaging revenue includes all SMS and MMS revenue including wholesale messaging revenue, revenue from the use of messaging services by Vodafone customers roaming away from their home network and customers visiting the local network.
Mobile customer A mobile customer is defined as a Subscriber Identity Module (“SIM”), or in territories where SIMs do not exist, a unique mobile telephone number, which has access to the network for any purpose, including data only usage, except telemetric applications. Telemetric applications include, but are not limited to, asset and equipment tracking, mobile payment and billing functionality, e.g. vending machines and meter readings, and include voice enabled customers whose usage is limited to a central service operation, e.g. emergency response applications in vehicles.
Mobile PC connectivity A connection device which provides access to 3G services to users with an active PC or laptop connection. This includes Vodafone device Mobile Connect Cards with 3G broadband, Vodafone Mobile Connect 3G/GPRS data cards and Vodafone Mobile Connect USB modems.
Net debt Long term borrowings, short term borrowings and mark to market adjustments on financing instruments less cash and cash equivalents.
Organic growth The percentage movements in organic growth are presented to reflect operating performance on a comparable basis. Where an entity, being a subsidiary, joint venture or associated undertaking, was newly acquired or disposed of in the current or prior period, the Group adjusts, under organic growth calculations, the results for the current and prior period to remove the amount the Group earned in both periods as a result of the acquisition or disposal of subsidiary or associated undertakings. Where the Group increases, or decreases, its ownership interest in a joint venture or associated undertaking in the current or prior period, the Group’s results for the prior period are restated at the current period’s ownership level. Further adjustments in organic calculations exclude the effect of exchange rate movements by restating the prior period’s results as if they had been generated at the current period’s exchange rates and excludes the amortisation of acquired intangible assets.
Partner markets Markets in which the Group has entered into a Partner Agreement with a local mobile operator enabling a range of Vodafone’s global products and services to be marketed in that operator’s territory and extending Vodafone’s brand reach into such new markets.
Penetration Number of customers in a country as a percentage of the country’s population. Penetration can be in excess of 100% due to customers’ owning more than one SIM.
Proportionate customers The proportionate customer number represents the number of mobile customers in ventures which the Group either controls or in which it invests, based on the Group’s ownership in such ventures.
Purchased licence amortisation Amortisation relating to capitalised licence and spectrum fees purchased directly by the Group or existing on recognition through business combination accounting, and such fees recognised by an acquiree prior to acquisition.
Retention costs The total of trade commissions, loyalty scheme and equipment costs relating to customer retention and upgrade.
Service revenue Service revenue comprises all revenue related to the provision of ongoing services including, but not limited to, monthly access charges, airtime usage, roaming, incoming and outgoing network usage by non-Vodafone customers and interconnect charges for incoming calls.
Termination rate A per minute charge paid by a telecommunications network operator when a customer makes a call to another mobile or fixed line network operator.
Total communications revenue Comprises all fixed location services revenue, data revenue, fixed line revenue and other service revenue.
Vodafone Group Plc Annual Report 2008 155
Definition of Terms
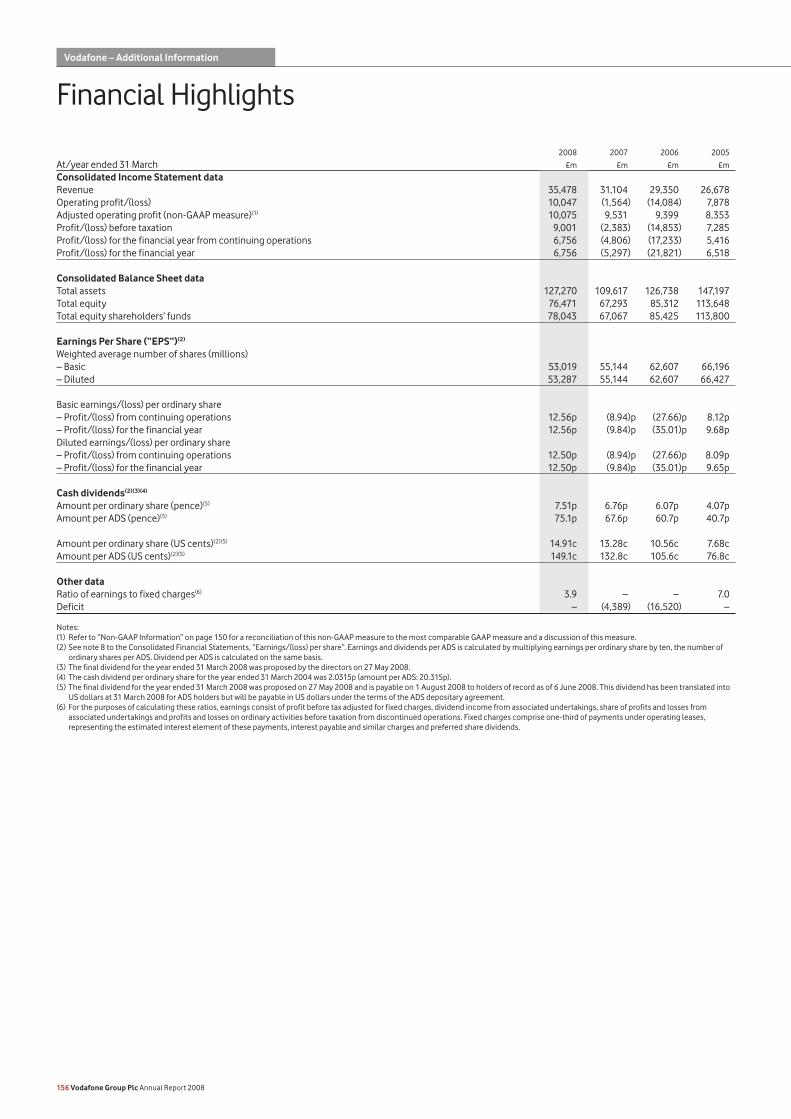
2008 2007 2006 2005
At/year ended 31 March £m £m £m £m
Consolidated Income Statement dataRevenue 35,478 31,104 29,350 26,678Operating profit/(loss) 10,047 (1,564) (14,084) 7,878Adjusted operating profit (non-GAAP measure)(1) 10,075 9,531 9,399 8,353Profit/(loss) before taxation 9,001 (2,383) (14,853) 7,285Profit/(loss) for the financial year from continuing operations 6,756 (4,806) (17,233) 5,416Profit/(loss) for the financial year 6,756 (5,297) (21,821) 6,518
Consolidated Balance Sheet dataTotal assets 127,270 109,617 126,738 147,197Total equity 76,471 67,293 85,312 113,648Total equity shareholders’ funds 78,043 67,067 85,425 113,800
Earnings Per Share (“EPS”)(2) Weighted average number of shares (millions) – Basic 53,019 55,144 62,607 66,196– Diluted 53,287 55,144 62,607 66,427
Basic earnings/(loss) per ordinary share – Profit/(loss) from continuing operations 12.56p (8.94)p (27.66)p 8.12p– Profit/(loss) for the financial year 12.56p (9.84)p (35.01)p 9.68pDiluted earnings/(loss) per ordinary share – Profit/(loss) from continuing operations 12.50p (8.94)p (27.66)p 8.09p– Profit/(loss) for the financial year 12.50p (9.84)p (35.01)p 9.65p
Cash dividends(2)(3)(4)
Amount per ordinary share (pence)(5) 7.51p 6.76p 6.07p 4.07pAmount per ADS (pence)(5) 75.1p 67.6p 60.7p 40.7p
Amount per ordinary share (US cents)(2)(5) 14.91c 13.28c 10.56c 7.68cAmount per ADS (US cents)(2)(5) 149.1c 132.8c 105.6c 76.8c
Other dataRatio of earnings to fixed charges(6) 3.9 – – 7.0Deficit – (4,389) (16,520) –
Notes: (1) Refer to “Non-GAAP Information” on page 150 for a reconciliation of this non-GAAP measure to the most comparable GAAP measure and a discussion of this measure.(2) See note 8 to the Consolidated Financial Statements, “Earnings/(loss) per share”. Earnings and dividends per ADS is calculated by multiplying earnings per ordinary share by ten, the number of
ordinary shares per ADS. Dividend per ADS is calculated on the same basis.(3) The final dividend for the year ended 31 March 2008 was proposed by the directors on 27 May 2008.(4) The cash dividend per ordinary share for the year ended 31 March 2004 was 2.0315p (amount per ADS: 20.315p).(5) The final dividend for the year ended 31 March 2008 was proposed on 27 May 2008 and is payable on 1 August 2008 to holders of record as of 6 June 2008. This dividend has been translated into
US dollars at 31 March 2008 for ADS holders but will be payable in US dollars under the terms of the ADS depositary agreement.(6) For the purposes of calculating these ratios, earnings consist of profit before tax adjusted for fixed charges, dividend income from associated undertakings, share of profits and losses from
associated undertakings and profits and losses on ordinary activities before taxation from discontinued operations. Fixed charges comprise one-third of payments under operating leases, representing the estimated interest element of these payments, interest payable and similar charges and preferred share dividends.
156 Vodafone Group Plc Annual Report 2008
Vodafone – Additional Information
Financial Highlights
This constitutes the Annual Report of Vodafone Group Plc (the “Company”) for the year ended 31 March 2008 and is dated 27 May 2008. This document includes information that is required by the United States (“US”) Securities and Exchange Commission (the “SEC”) for the Company’s US filing of its Annual Report on Form 20-F. The information in this document may be updated or supplemented at the time of filing with the SEC or later amended if necessary. The content of the Group’s website (www.vodafone.com) should not be considered to form part of this Annual Report or the Company’s Annual Report on Form 20-F.
In the discussion of the Group’s reported financial position, operating results and cash flows for the year ended 31 March 2008, information is presented to provide readers with additional financial information that is regularly reviewed by management. However, this additional information presented is not uniformly defined by all companies, including those in the Group’s industry. Accordingly, it may not be comparable with similarly titled measures and disclosures by other companies. Additionally, certain information presented is derived from amounts calculated in accordance with IFRS but is not itself an expressly permitted GAAP measure. Such non-GAAP measures should not be viewed in isolation or as an alternative to the equivalent GAAP measure. For further information see “Non-GAAP Information” on pages 150 to 151 and “Definition of Terms” on page 155.
The terms “Vodafone”, the “Group”, “we”, “our” and “us” refer to the Company and, as applicable, its subsidiary undertakings and/or its interests in joint ventures and associated undertakings.
This Annual Report contains forward-looking statements within the meaning of the US Private Securities Litigation Reform Act of 1995 with respect to the Group’s financial condition, results of operations and business management and strategy, plans and objectives for the Group. For further details, please see “Cautionary Statement Regarding Forward-Looking Statements” on page 154 and “Principal Risk Factors and Uncertainties” on pages 52 and 53 for a discussion of the risks associated with these statements.
Vodafone, the Vodafone logo, Vodafone live!, Vodafone Mobile Connect, Vodafone Office, Vodafone Wireless Office, Vodafone Passport, Vodafone At Home, Vodafone Zuhause, Vodafone Applications Service, Vodafone Email Plus, Vodafone M-PESA, Vodafone Money Transfer, Vodafone Betavine and Vodacom are trademarks of the Vodafone Group. The RIM® and BlackBerry® families of trademarks, images and symbols are the exclusive properties and trademarks of Research in Motion Limited, used by permission. RIM and BlackBerry are registered with the US Patent and Trademark Office and may be pending or registered in other countries. Windows Mobile is either a registered trademark or trademark of Microsoft Corporation in the United States and/or other countries. Palm and Treo are among trademarks or registered trademarks owned by or licensed to Palm, Inc™. SAP is a registered trademark of SAP AG in Germany and in several other countries. Other product and company names mentioned herein may be the trademarks of their respective owners.
14 Business Overview16 Technology and Resources20 People22 Brand and Distribution24 Products and Services
1 Highlights2 Chairman’s Statement4 Chief Executive’s Review8 Performance at a Glance10 Operating Environment and Strategy12 Group at a Glance
30 Key Performance Indicators32 Operating Results51 Outlook52 Principal Risk Factors and Uncertainties54 Financial Position and Resources59 Corporate Responsibility
82 Contents83 Directors’ Statement of Responsibility*
84 Audit Report on Internal Controls85 Critical Accounting Estimates88 Consolidated Financial Statements132 Audit Report on the Consolidated
Financial Statements133 Audit Report on the Company
Financial Statements134 Company Financial Statements
140 Shareholder Information*
146 History and Development*
147 Regulation*
150 Non-GAAP Information*
152 Form 20-F Cross Reference Guide154 Cautionary Statement Regarding
Forward-Looking Statements*
155 Definition of Terms156 Financial Highlights
62 Board of Directors and Group Management65 Corporate Governance71 Directors’ Remuneration
* These sections make up the Directors’ Report.
Executive Summary* Business* Performance*
Governance* Financials Additional information
Our goal is to be the communications leader in an increasingly connected world
Investor RelationsTelephone: +44 (0) 1635 664447
Media RelationsTelephone: +44 (0) 1635 664444
Corporate Responsibility Fax: +44 (0) 1635 674478E-mail: [email protected]: www.vodafone.com/responsibility
We want to keep the environmental impact of the documents in our Annual Report package to a minimum. We have therefore given careful consideration to the production process. This document is printed on Revive 75 Silk, manufactured in the EU at mills with ISO 14001 accreditation and comprising 50% de-inked post consumer waste, 25% pre-consumer waste and 25% virgin fibre. The FSC logo identifies products which contain wood from well-managed forests certified in accordance with the rules of the Forest Stewardship Council. Printed by St Ives in accordance with the ISO 14001 environmental management system using vegetable-based inks. The printer holds FSC Chain of Custody (certificate number SGS-COC-1732). All the steps we have taken demonstrate our commitment to making sustainable choices.
Printed in the United Kingdom
Designed and produced by Addison Corporate Marketing
Contact Details
Vodafone Group Plc
Annual ReportFor the year ended 31 March 2008
Registered OfficeVodafone HouseThe ConnectionNewburyBerkshire RG14 2FNEnglandRegistered in England No. 1833679
Tel: +44 (0) 1635 33251Fax: +44 (0) 1635 45713
www.vodafone.com
Vodafone Group Plc
Vodafone Group Plc Annual Report for the year ended 31 M
arch 2008


