Embed Size (px)
Citation preview
VOL. 21 (4) DEC. 2013
Vol. 21 (4) Dec. 2013
Pertanika Journal of Social Sciences & HumanitiesVol. 21 (4) Dec. 2013
Contents
ISSN 0128-7702
Pertanika Editorial O�ce, Journal DivisionO�ce of the Deputy Vice Chancellor (R&I) 1st Floor, IDEA Tower II UPM-MTDC Technology CentreUniversiti Putra Malaysia43400 UPM SerdangSelangor Darul EhsanMalaysia
http://www.pertanika.upm.edu.my/E-mail: [email protected]: +603 8947 1622 / 1619
Foreword
i
iNayan Deep S. Kanwal
EditorialNorms, Values and Innovation iii
Roel Rutten
Regular ArticlesPortfolio as an Assessment Tool and Its Implementation in Malaysian ESL Classrooms: A Study in Two Secondary Schools
1255
Charanjit Kaur Swaran Singh and Arshad Abdul Samad
The Exploration of Social Capital and Its Relation with Economic Empowerment of Orang Kuala in Johor, Malaysia
1275
W. A. Amir Zal, Ma’Rof Redzuan, Asnarukhadi Abu Samah and Hanina H. Hamsan
1297Mina Abbasiyannejad and Rosli Talif
Comprehension1309
Khazriyati Salehuddin, Heather Winskel and Imran Ho Abdullah
The Behavioural Based Safety (BBS) and Culture Change Approach for Managing Workplace Safety
1327
Faridah Ismail, Norizan Ahmad, Ahmad Ezanee Hashim and Razidah Ismail
Sepang, Malaysia1341
Zurina Mahadi and Hukil Sino
Pre-Service Science Teachers’ Mental Images of Science Teaching 1361Lay, Y. F. and Khoo, C. H.
A Case Study on Friendship, Loneliness and Social Dissatisfaction among Preschool Children
1379
Suresh Kumar N. Vellymalay
Journal of Social Sciences & Humanities
About the JournalPertanika is an international peer-reviewed journal devoted to the publication of original papers, and it serves as a forum for practical approaches to improving quality in issues pertaining to tropical agriculture and its related fields. Pertanika began publication in 1978 as the Journal of Tropical Agricultural Science. In 1992, a decision was made to streamline Pertanika into three journals to meet the need for specialised journals in areas of study aligned with the interdisciplinary strengths of the university.
The revamped Journal of Social Sciences & Humanities (JSSH) aims to develop as a pioneer journal for the Social Sciences with a focus on emerging issues pertaining to the social and behavioural sciences as well as the humanities, particularly in the Asia Pacific region. Other Pertanika series include Pertanika Journal of Tropical Agricultural Science (JTAS); and Pertanika Journal of Science and Technology (JST).
JSSH is published in English and it is open to authors around the world regardless of the nationality. It is currently published four times a year i.e. in March, June, September and December.
Goal of PertanikaOur goal is to bring the highest quality research to the widest possible audience.
Quality We aim for excellence, sustained by a responsible and professional approach to journal publishing. Submissions are guaranteed to receive a decision within 12 weeks. The elapsed time from submission to publication for the articles averages 5-6 months.
Indexing of PertanikaPertanika is now over 33 years old; this accumulated knowledge has resulted Pertanika JSSH being indexed in SCOPUS (Elsevier), EBSCO, Thomson (ISI) Web of Knowledge [CAB Abstracts], DOAJ, Google Scholar, ISC, Citefactor, Rubriq and MyAIS.
Future visionWe are continuously improving access to our journal archives, content, and research services. We have the drive to realise exciting new horizons that will benefit not only the academic community, but society itself.
We also have views on the future of our journals. The emergence of the online medium as the predominant vehicle for the ‘consumption’ and distribution of much academic research will be the ultimate instrument in the dissemination of research news to our scientists and readers.
Aims and ScopePertanika Journal of Social Sciences & Humanities aims to provide a forum for high quality research related to social sciences and humanities research. Areas relevant to the scope of the journal include: Accounting, Agricultural & resource economics, Anthropology, Communication, Community and peace studies, Design and architecture, Disaster and crisis management, Economics, Education, Extension education, Finance, Gerontology, Hospitality and tourism, Human ecology, Human resource development, Language studies (education, applied linguistics, acquisition, pedagogy), Language literature (literary & cultural studies), Management, Marketing, Psychology, Safety and environment, Social and behavioural sciences, Sociology, Sustainable development, and Ethnic relations.
Editorial StatementPertanika is the official journal of Universiti Putra Malaysia. The abbreviation for Pertanika Journal of Social Sciences & Humanities is Pertanika J. Soc. Sci. Hum.
Journ
al o
f S
oci
al S
cience
s &
Hum
aniti
es
Jo
urn
al o
f S
oci
al S
cience
s &
Hum
aniti
es
Journ
al o
f S
oci
al S
cience
s &
Hum
aniti
es

Editorial Board2013-2015
Editor-in-ChiefMohd. Shahwahid Haji Othman, Malaysia
Economics, Natural Resource & Enviromental Economics, Economics Valuation
Chief Executive EditorNayan D.S. KANWAL, Malaysia
Environmental issues- landscape plant modelling applications
Editorial Board Members
Abdul Mansur M. Masih (Professor Dr), Economics, Econometrics, Finance, King Fahd University of Petroleum and Minerals, Saudi Arabia.
Alan MALEY (Professor Dr), English Language Studies, Teaching of English Language and Literatures, Leeds Metropolitan University, UK.Ali Reza KALDI (Professor Dr), Medical Sociology, Sociology of Developement, Ageing, Gerontology, University of Social Welfare and Rehabilitation, Tehran, IRAN.
Aminah Ahmad (Professor Dr), Sociology, Gender and Development, Universiti Putra Malaysia, Malaysia.Bee-Hoon TAN (Associate Professor Dr), English Language Studies and Applied Linguistics, with Special Research Interest in e-learning and Learning Support, Universiti Putra Malaysia, Malaysia.Brian TOMLINSON (Professor Dr), English Language Studies, The Evaluation, Adaptation and Development of Materials for Language Learning, Language through Literature, Teaching Methodology and Second Language Acquisition, Leeds Metropolitan University, UK.
Deanna L. SHARPE (Associate Professor Dr), Economics, Consumer and Family Economics, Personal Finance, The University of Missouri, Columbia, USA.
Dessy IRAWATI (Assistant Professor Dr), International Business Management, Strategic Management, Economic Geography, Globalization and Development Studies, Industrial Dynamics and Knowledge Transfer, International School at Sondervick College, the Netherlands.
Elias @Ilias SALLEH (Professor Ar. Dr), Architectural Science, Sustainable Tropical Design, Thermal Comfort, Universiti Kebangsaan Malaysia, Malaysia.
Gong-Soog HONG (Professor Dr), Economics, Consumer and Family Sciences, The Ohio State University, USA.
Jacqueline Pugh-Kitingan (Associate Professor Dr), Music, Ethnomusicology, Borneo and Papua New Guinea Studies, Universiti Malaysia Sabah, Malaysia.
James R. STOCK (Professor Dr), Management Studies, Marketing, Logistics and Supply Chain Management, Quantitative Method, University of South Florida, USA. Jayakaran MUKUNDAN (Professor Dr), English Language Studies, Teaching English as a Second Language (TESL), English Language Studies, Universiti Putra Malaysia, Malaysia.Jayum A. JAWAN (Professor Dr), Sociology, Politics and Government, Civilization Studies, Universiti Putra Malaysia, Malaysia.Jonathan NEWTON (Dr), Classroom-based second language acquisition, language teaching methodology (and especially the design and implementation of task-based language learning and teaching), the interface of culture and language in language teaching and learning, and language/communication training and materials design for the multicultural workplace, Victoria University of Wellington, New Zealand.Mary Susan PHILIP (Associate Professor Dr), English Language Theatre in Malaysia and Singapore; Postcolonial Theatre, Universiti Malaya, Malaysia.Muzafar Shah HABIBULLAH (Professor Dr), Economics, Monetary Economics, Banking, Macroeconomics, Universiti Putra Malaysia, Malaysia.Patricia MATUSKY (Professor Dr), Music, Ethnomusicology, Malay and Indonesian language, Literature and Culture, Grand Valley State University, USA.
Samsinar Md. Sidin (Professor Dr), Management Studies, Marketing, Consumer Behaviour, Universiti Putra Malaysia, Malaysia.
Shameem Rafik-Galea (Associate Professor Dr), English Language Studies, Linguistics, Applied Linguistics, Language and Communication, Universiti Putra Malaysia, Malaysia.Shamsher Mohamad Ramadili Mohd. (Professor Dr), Finance, Corporate Governance, The Global University of Islamic Finance (INCEIF), Malaysia.Stephen J. HALL (Associate Professor Dr), English Language Studies, Linguist, Teacher Educator, TESOL, Sunway University College, Malaysia.
Stephen J. THOMA (Professor Dr), Psychology, Educational Psychology, The University of Alabama, USA.
Su-Kim LEE (Associate Professor Dr), English Language Studies, Language and Culture, World Englishes and Materials Design, Universiti Kebangsaan Malaysia, Malaysia.
Swee-Heng CHAN (Professor Dr), English Language Studies, Universiti Putra Malaysia, Malaysia.
Turiman Suandi (Professor Dr), Psychology, Youth Development and Volunteerism, Universiti Putra Malaysia, Malaysia.
Victor T. KING (Emeritus Professor Dr), Anthropology /Southeast Asian Studies, White Rose East Asia Centre, University of Leeds, UK.

International Advisory Board
Carolyn GRAHAM, Music, Jazz Chants, Harvard University, USA.David NUNAN (Emeritus Professor Dr), Vice-President: Academic, Anaheim University, California, English Language Studies, Linguist, TESOL, University of Hong Kong, Hong Kong.Faith TRENT AM FACE (Emeritus Professor), Education: Curriculum development, Flinders University, Adelaide, Australia.Gary N. MCLEAN (Senior Professor Dr), Executive Director, International Human Resource Development Programs, EAHR, Human Resource Development for National, Community and Social Development, International Human Resource Development, Organizational Development, Texas A&M University, USA.Graham THURGOOD (Professor Dr), English Language Studies, General Linguistics, Discourse and Syntax, California State University, Chico., USA.
Handoyo Puji Widodo, English Language Studies, ESP, Language Curriculum-Materials Design and Development, and Language Methodology, Politeknik Negeri Jember, East Java-Indonesia.John R. SCHERMERHORN Jr. (Emeritus Professor Dr), Management Studies, Management and Organizational Behaviour, International Business, Ohio University, USA.Kent MATTHEWS (Professor Dr), Economics, Banking and Finance, Modelling and Forecasting the Macro Economy, Cardiff Business School, U.K.Lehman B. FLETCHER (Emeritus Professor Dr), Economics, Agricultural Development, Policy Analysis and Planning, Iowa State University, USA.
Mark P. ORBE (Professor Dr), Communication, Interpersonal Communication, Communication and Diversity, Intercultural Communication, Western Michigan University, USA.
Mohamed Abdel-Ghany (Emeritus Professor Dr), Economics, Family and Consumer Economics, The University of Alabama, USA.
Mohamed ARIFF, CMA (Professor Dr), Economics, Finance, Capital Market, Islamic Finance, Fiscal Policy, Bond University, Australia.Pal AHLUWALIA (Professor Dr), Pro Vice Chancellor & Vice-President, UNESCO Chair in Transnational Diasporas and Reconciliation Studies, African Studies, Social and Cultural Theory, Post-colonial Theory, Division of Education, Arts & Social Sciences, University of South Australia, Australia.Phillip JONES (Professor Dr), Architectural Science, Sustainability in the Built Environment, Welsh School of Architecture, Cardiff University, UK.Rance P. L. LEE (Emeritus Professor Dr), Sociology, The Chinese University of Hong Kong.Royal D. COLLE (Emeritus Professor Dr), Communication, Cornell University, USA.Vijay K. BHATIA (Professor), Education: Genre Analysis and Professional Communication, City University of Hong Kong.
Pertanika Editorial OfficeOffice of the Deputy Vice Chancellor (R&I), 1st Floor, IDEA Tower II, UPM-MTDC Technology Centre
Universiti Putra Malaysia, 43400 Serdang, Selangor, Malaysia
Tel: +603 8947 1622
E-mail: [email protected]; [email protected]
URL: http://www.pertanika.upm.edu.my/editorial_board.htm
PublisherThe UPM Press
Universiti Putra Malaysia43400 UPM, Serdang, Selangor, Malaysia
Tel: +603 8946 8855, 8946 8854 • Fax: +603 8941 [email protected]
URL : http://penerbit.upm.edu.my
The publisher of Pertanika will not be responsible for the statements made by the authors in any articles published in the journal. Under no circumstances will the publisher of this publication be liable for any loss or damage caused by your reliance on the advice, opinion or information obtained either explicitly or implied through the contents of this publication.
All rights of reproduction are reserved in respect of all papers, articles, illustrations, etc., published in Pertanika. Pertanika provides free access to the full text of research articles for anyone, web-wide. It does not charge either its authors or author-institution for refereeing/ publishing outgoing articles or user-institution for accessing incoming articles.
No material published in Pertanika may be reproduced or stored on microfilm or in electronic, optical or magnetic form without the written authorization of the Publisher.
Copyright © 2013 Universiti Putra Malaysia Press. All Rights Reserved.
Pertanika Journal of Social Sciences & Humanities Vol. 21 (4) Dec. 2013
Contents
Foreword iNayan Deep S. Kanwal
EditorialNorms, Values and Innovation iii
Roel Rutten
Regular ArticlesPortfolio as an Assessment Tool and Its Implementation in Malaysian ESL Classrooms: A Study in Two Secondary Schools
1255
Charanjit Kaur Swaran Singh and Arshad Abdul Samad
The Exploration of Social Capital and Its Relation with Economic Empowerment of Orang Kuala in Johor, Malaysia
1275
W. A. Amir Zal, Ma’Rof Redzuan, Asnarukhadi Abu Samah and Hanina H. Hamsan
Cultural Conflict in Ian McEwan’s On Chesil Beach through Semiotics 1297Mina Abbasiyannejad and Rosli Talif
Developmental Patterns in Malay Shape-Based Numeral Classifier Comprehension
1309
Khazriyati Salehuddin, Heather Winskel and Imran Ho Abdullah
The Behavioural Based Safety (BBS) and Culture Change Approach for Managing Workplace Safety
1327
Faridah Ismail, Norizan Ahmad, Ahmad Ezanee Hashim and Razidah Ismail
Defining Public Needs in Sustainable Development: A Case Study of Sepang, Malaysia
1341
Zurina Mahadi and Hukil Sino
Pre-Service Science Teachers’ Mental Images of Science Teaching 1361Lay, Y. F. and Khoo, C. H.
A Case Study on Friendship, Loneliness and Social Dissatisfaction among Preschool Children
1379
Suresh Kumar N. Vellymalay
Factors Influencing Preferences of Garden Iconographies 1395Mina Kaboudarahangi, Osman Mohd Tahir, Mustafa Kamal M. S. and Suhardi Maulan
Politeness in Spoken Review Genre: Viva Voce Context 1411Izadi, A.
Parenting Behaviour of Mothers, Adolescents’ Social Emotional Adjustments and their Correlates in Intact and Non-intact Malay Families in Kuala Lumpur
1431
Chiah, W. Y. and Baharudin, R.
Productive Work as Pedagogical Tool in School Education 1447Asfa M. Yasin
How Real is Real: Attitudes towards Realism in Selected Post-war British Fiction
1457
Nahid Shahbazi Moghadam and Arbaayah Ali Termizi
Islamic Work Ethics and Organizational Commitment: Evidence from Employees of Banking Institutions in Malaysia
1471
Manan, S. K., Kamaluddin, N. and Puteh Salin, A. S. A.
Thermal Comfort Investigation in Traditional and Modern Urban Canyons in Bandar Abbas, Iran
1491
Masoud Dalman, Elias Salleh, Abdul Razak Sapian and Omidreza Saadatian
Turning a Social Character Trait Phenomenon into a Diagnostic Web-Based Measuring Instrument Using a Grounded Theory Research Method
1517
Normahdiah S. Said, Hashim, M., Rozita, C. R. and Siti Sarah, A. K.
Analysing Hardy’s Portrayal of Tess Through Christian Feminism 1525Faezeh Sivandipour
Attitude of Teachers towards Adolescence Education 1533Gyanendra Kumar Rout
The Implementation of Picture Exchange Communication System: A Mother’s Perspective of a Young Child with Pervasive Developmental Disorder
1543
Phoon Hooi San and Anna Christina Abdullah
Selected Articles from the International Conference of English Language Teaching (ICELT 2011)Guest Editors: Jayakaran Mukundan and Vahid Nimehchisalem
Comparison of Free-writing and Word-matching Activities as EFL Pre-reading Tasks
1555
Mohammad Reza Masrour and Mehdi Hoseini
Wordlists Analysis: Specialised Language Categories 1563Noorli Khamis and Imran Ho Abdullah
One Semester of Speaking Tasks – An Experimental Approach with Low Proficiency Students
1583
Andrew N. Williams and Yah Awg Nik
Common Patterns of Learner Characteristics Displayed by More Proficient EFL Learners
1595
Maosheng Hung and Ying Shing Hung
EFL Teacher Education: Where Do Trainers’ and Trainees’ Criteria Match? 1609Natasha Pourdana and Sayyed Mohammad Karimi Behbahani
Teaching as Transformative Performance: Performance as Kinesis in an Argumentative Writing Class
1621
Gene Segarra Navera
The Effect of Type of Cooperative Learning Grouping on ESL Learners’ Reading Comprehension Performance
1633
Nooreiny Maarof and Tan Shir Ley

Foreword
Welcome to the Third Issue 2013 of the Journal of Social Sciences and Humanities (JSSH)!
JSSH is an open-access journal for the Social Sciences and Humanities that is published by Universiti Putra Malaysia Press. It is independently owned and managed by the university and run on a non-profit basis for the benefit of the world-wide social science community.
In this issue, there are 26 articles published, of which 19 are regular articles and seven are from an international conference. There are seven articles arising from the International Conference on English Language Teaching, “Teaching English as Performing Art” ICELT 2011. The authors of these articles come from different countries, namely, Malaysia, Iran, Taiwan, India and the Philippines.
The regular articles cover a wide range of topics: workplace safety based on the behavioural and cultural change (Faridah Ismail, Norizan Ahmad, Ahmad Ezanee Hashim and Razidah Ismail); Islamic Work Ethics (IWE) practices among employees of banking institutions in Malaysia with specific focus given to the possible relationship between IWE variables and organisational commitment (OC) (Manan, S. K., Kamaluddin, N. and Puteh Salin, A. S. A.); factors influencing preferences of garden iconographies (Mina Kaboudarahangi, Osman Mohd Tahir, Mustafa Kamal M. S. and Suhardi Maulan); Thermal Comfort Investigation in Traditional and Modern Urban Canyons in Bandar Abbas, Iran (Masoud Dalman, Elias Salleh, Abdul Razak Sapian and Omidreza Saadatian); social capital and its relation with economic empowerment of Orang Kuala in Johor (W. A. Amir Zal, Ma’Rof Redzuan, Asnarukhadi Abu Samah and Hanina H. Hamsan); use of developmental psychology to determine the relationship between parenting behaviour of mothers and social emotional adjustments of adolescents in intact and non-intact Malay families in Kuala Lumpur (Chiah, W. Y. and Baharudin, R.).
The research studies, on topics related to linguistics, literature, education and sociology, include a study of linguistic politeness in 10 viva voce sessions occurring in two universities in Iran (Izadi, A.), a study of the developmental patterns observed in the comprehension of Malay shape-based numeral classifiers (Khazriyati Salehuddin, Heather Winskel and Imran Ho Abdullah); research into a mother’s perception about the efficacy of Picture Exchange Communication System (PECS) and issues related to PECS intervention (Phoon Hooi San and Anna Christina Abdullah); a study on the implication and tenets of realism and its progress and changes in selected works of post-war British fiction (Nahid Shahbazi Moghadam and Arbaayah Ali Termizi); a study on cultural conflict in Ian McEwan’s on Chesil Beach through semiotics (Mina Abbasiyannejad and Rosli Talif); a study on analysing Hardy’s portrayal of Tess based on Christian feminism (Faezeh Sivandipour), a study of pre-service science teachers’ mental images of science teaching (Lay, Y.F. and Khoo, C.H. ); research to examine productive work as a pedagogical tool in school education (Asfa M. Yasin); a study conducted to explore the attitude of teachers towards adolescent education (Gyanendra Kumar Rout); a study related to the portfolio as an assessment tool and its implementation by English as Second Language (ESL) teachers in
two secondary schools (Charanjit Kaur Swaran Singh and Arshad Abdul Samad); a study on the exploration of the sustainable development needs of the public and governors to provide greater understanding of the discrepancies between both parties’ needs and to propose a mechanism to define important sustainable development needs in Sepang, Selangor, Malaysia (Zurina Mahadi and Hukil Sino); a study of the relationship between the number of best friends and feelings of loneliness and social dissatisfaction among children in preschool (Suresh Kumar N. Vellymalay); and a paper on how the basic components of social character traits were transformed into a measuring instrument through grounded theory research (Normahdiah S. Said, Hashim, M., Rozita, C. R. and Siti Sarah, A. K.).
This issue concludes with seven articles arising from the ICELT 2011 conference: a comparison study of free-writing and word-matching activities as EFL pre-reading tasks (Mohammad Reza Masrour and Mehdi Hoseini); a paper demonstrating different yet useful information about a specialised language that can be discerned from the analysis of three types of wordlist, namely, frequency wordlist, keyword list and key-keyword list (Noorli Khamis and Imran Ho Abdullah); a study testing the hypothesis postulating that Malaysian undergraduate students with low proficiency would make the most rapid progress in English if all guided learning time (tutorials and lectures) in the first semester was used entirely for speaking tasks (Andrew N. Williams and Yah Awg Nik); a qualitative research work exploring the common patterns of three learner characteristics (i.e. motivation, learning styles and learning strategies) shown by more proficient Taiwanese EFL learners based on their language learning experiences (Maosheng Hung and Ying Shing Hung); a descriptive study of the current state of affairs in how evaluation takes places in EFL teacher education programmes in Iran (Natasha Pourdana and Sayyed Mohammad Karimi Behbahani); a paper demonstrating how the notion of ‘performance as kinesis’ or ‘activist performance’ (Navera 2007) can be applied to the teaching of argumentative writing (Gene Segarra Navera); and a study on the effect of the type of cooperative learning grouping on ESL learners’ reading comprehension performance of polytechnic students (Nooreiny Maarof and Tan Shir Ley).
I anticipate that you will find the evidence presented in this issue to be intriguing, thought provoking, and useful in reaching new milestones. Please recommend the journal to your colleagues and students to make this endeavour meaningful.
I would also like to express my gratitude to all the contributors who have made this issue possible, the authors, reviewers and editors for their professional contribution. Last but not least, the editorial assistance of the journal division staff is also fully appreciated.
JSSH is currently accepting manuscripts for upcoming issues based on original qualitative or quantitative research that opens new areas of inquiry and investigation..
Chief Executive EditorNayan Deep S. KANWAL, FRSA, ABIM, AMIS, Ph.D.
Editoriali
Norms, Values And Innovation
Too often innovation is simply thought of as a
matter of technology. Of course, this is true to
some extent in that technology is at the core of
most, if not all innovations. But innovation goes
way beyond that. Contemporary innovation
literature conceptualizes innovation as a process
of knowledge creation, which invites us to look at
the role of individuals in the innovation process
more closely as knowledge creation is an act of
individuals rather than companies. Ultimately,
knowledge creation comes down to communication, and since the seminal work on the
management of innovation by Burns and Stalker (1961) from half a century ago, we
already know how complicated communication can be between different departments
of the same organization. That is because the individuals within these departments hold
different norms and values, different belief systems about how to do things. The problem
magnifies as we move from the organizational to the network level. It is important that
companies increasingly work together on innovation in networks, as no single firm has
all the knowledge necessary for innovation.
There is a substantial literature on the role of norms and values in relation to innovation.
Generally speaking, this literature strongly suggests that openness for and tolerance
to new ideas, new views, and new behaviours facilitates innovation, while traditional
norms and values tend to produce the opposite effect (Inglehart & Baker, 2000). It is
not surprisingly, therefore, that the cosmopolitan cities of this world, where people
from all walks of life meet and thrive, are also the innovation hotspots of the knowledge
economy of the 21st Century (Florida, 2002).
This raises some compelling questions about the nature of innovation that mainstream
innovation literature has thus far barely touched upon. With its focus on companies and
networks of companies, mainstream innovation literature is poorly equipped to look
at norms and values, as they are enacted on the level of individuals and networks of
individuals. Taking an individual perspective allows us to see the effect of norms and
values on innovation more clearly, but it also complicates matters. Norms and values can
make communication, and thus knowledge creation, among individuals either easier or
more difficult, depending on the kind of norms and values that dominate. The problem
is that the norms and values that individuals bring to work are not only those of the
company in which they work. Individuals have their own often deep-felt norms and
values that are in turn affected by the society in which they live.
It is therefore not enough to promote innovation-related norms and values at work.
Of course it is necessary for companies to encourage openness and tolerance for
experimentation and the inevitable failures that this will bring. In such an environment,
individuals are motivated to be creative, share and create knowledge and thus contribute
to innovation. However, it is also important to understand how their personal norms and
values and the norms and values of the society in which they live shape their behaviour.
This goes beyond the traditional scope of innovation studies but to me, it seems to be a
necessary effort to understand how innovation in modern societies can benefit from the
social and cultural diversity that they harbour.
This is the aim of a new research network that I have started in Europe; to understand
how norms and values contribute to innovation by the effects they have on how
individuals share and create knowledge. Thus, I am looking forward to an opportunity to
studying this in the developing economies of South-East Asia. Today, South-East Asia is a
fascinating region to study the relations between norms, values, and innovation. On the
one hand, South-East Asia is rapidly catching up with the developed economies of Europe
and North America and modern cosmopolitan (though not necessarily Western) norms
and values are proliferating into South-East Asia in the wake of this process. The effect
of social network technologies on how young people communicate with each other, for
example, will also affect relations at work. The work environment of the future will be
much less hierarchical than it is today; which is a good thing for innovation. On the other
hand, the nations of South-East Asia are keenly aware of their traditions and cultural
heritage. The norms and values flowing from them will continue to shape economic
life in these nations to a substantial degree. The meeting of modern, cosmopolitan and
traditional norms and values in South-East Asia brings with it opportunities and threats
for innovation in this region. The outcome of that process depends very much on the
degree in which individual people in the nations of South-East Asia succeed in marrying
the two sets of norms and values. This is all the more reason to adopt an individual
perspective to the study of innovation.
References
Burns, T., & Stalker, G. (1961). The management of innovation. Oxford: Oxford University Press.
Florida, R. (2002). The rise of the creative class. New York: Basic Books.
Ingelhart, R., & Baker, W. (2000). Modernization, cultural change and the persistence of traditional values. American Sociological Review, 65(1), 19-51.
ROEL RUTTEN, PhDTilburg UniversitySchool of Social and Behavioral SciencesTilburg, the [email protected]
December, 2013
Roel Rutten is assistant professor in the Tilburg School of Social and Behavioral Sciences (the Netherlands) and a visiting
fellow in the Newcastle University Business School (United Kingdom). His main research interests centre on learning
organizations, networks and innovation and on innovation and regional development. He is also a co-founder of a
new European research network on the Social Dynamics of Innovation Networks (SDIN) and a co-organizer of a range
of international research co. From 1994 to 2001, he worked as a consultant in the field of innovation and regional
development.
i DISCLAIMERThe views expressed in this article are those of the author and do not necessarily represent the views of, and should not be attributed to, the Pertanika Journal or the Pertanika Editorial Board.

Pertanika J. Soc. Sci. & Hum. 21 (4): 1255 - 1273 (2013)
ISSN: 0128-7702 © Universiti Putra Malaysia Press
SOCIAL SCIENCES & HUMANITIESJournal homepage: http://www.pertanika.upm.edu.my/
Article history:Received: 2 July 2012Accepted: 1 December 2012
ARTICLE INFO
E-mail addresses: [email protected] (Charanjit Kaur Swaran Singh), [email protected] (Arshad Abdul Samad) * Corresponding author
Portfolio as an Assessment Tool and Its Implementation in Malaysian ESL Classrooms: A Study in Two Secondary Schools
Charanjit Kaur Swaran Singh* and Arshad Abdul SamadFaculty of Educational Studies, Universiti Putra Malaysia, 43400 Serdang, Selangor, Malaysia
ABSTRACT
This research presents the findings of a study relating to portfolio as an assessment tool and its implementation by English as Second Language (ESL) teachers in two secondary schools. Participants included nine lower and upper secondary school classroom ESL teachers. The research design was qualitative in nature as there was a need to immerse in the classroom to witness and observe the portfolio assessment process carried out by the ESL teachers. The interviewing technique was used for triangulating data obtained during classroom observations. Data collected through both techniques were transcribed and analyzed manually. The nine ESL teachers involved felt that the current assessment methods were insufficient for measuring student learning as students focused on memorization and studied merely for examination rather than the acquisition of knowledge. Significantly, the teachers divulged that when students are engaged in portfolio assessment, they become less examination oriented and are able to take charge of their learning. The teachers reported that although the implementation of portfolio as an assessment tool involved major investment in time, they proved to be valuable and conducive tools for individualizing the learning process and in documenting student progress and achievement over time. Findings from this study recommend that portfolios drive instruction by assisting teachers to identify student needs by matching instruction to needs and assessment to instruction. The results have clear implications for assessment, and the teaching and learning of second language learning.
Keywords: Portfolio, ESL instruction and assessment, alternative assessment
INTRODUCTION
Opponents of t radi t ional forms of assessment, specifically standardized multiple-choice tests have expressed a need for alternative forms of assessment.
Charanjit Kaur Swaran Singh and Arshad Abdul Samad
1256 Pertanika J. Soc. Sci. & Hum. 21 (4): 1255 - 1273 (2013)
Traditional assessments involving one-shot and indirect tests with no feedback provided to students, and decontextualized test tasks, cannot test the whole spectrum of knowledge, skills, and cognitive operations learned by the students (Abdul Samad, 2004, p.100). These traditional tests have neglected to evaluate the kinds of competence expressed in “real-life” milieu beyond school such as those experienced by writers, scientists, community people, businesspeople and craftspeople (Archbald & Newman, 1988; Shepard, 1989; Wiggins, 1989). In other words, traditional assessments are inaccurate and not fair enough to improve student learning as they provide no feedback. According to Tunku Mohani Tunku Mohtar (2010), traditional assessments are not always favored because the type of examination implemented examines students’ performance at one point within a given time frame, encourages guess work and the results cannot reflect the students’ actual language competence. Furthermore, ranking according to the performance of others in the class is not a good enough indicator of individual performance.
In response, the portfolio is selected as an alternative form of assessment in view of the shortcomings of traditional forms of assessment. The wide literature on use of portfolios confirms the great potential of portfolio to be utilized as an assessment tool and a learning tool. Coombe (2004) supports the use of portfolio assessment as a leading alternative assessment approach. The use of portfolio as an assessment tool
benefits teachers as they are able to improve their teaching practices, allow them to see new developments and directions in teaching and learning and as a result they can better facilitate their students’ learning (Tunku Mohani Tunku Mohani, 2010 & Knight, 1992). Azam & Iqbal (2006), in their study, reported the dual role played by a portfolio: tool for assessment and tool for learning ito help teachers to better understand their teaching practices, and as a result, better monitor their student’s learning. It is believed that portfolios enable students to think critically, become active, self-regulated and independent learners (Bergman, 1994). This reflects authentic student learning (Klenowski, 1998). Berry and Lewkowicz (2000) found that portfolios also encourage students to revise and improve their work and at the same time they are judged on their best performances. They propose that portfolios require reflection on student’s individual performance and their improvement, encouraging continued efforts throughout their studies and reflect authentic contexts both within and outside the classrooms.
REVIEW OF LITERATURE
It is interesting to note that in Malaysia, much emphasis is given to the centralised public summative examination which focuses on students studying only for examination purposes rather than learning for the sake of exploring and gaining knowledge. The current assessment system for Malaysian schools, however, will soon change from centralised examinations, to
Portfolio as an Assessment Tool and Its Implementation in Malaysian ESL Classrooms: A Study in Two Secondary Schools
1257Pertanika J. Soc. Sci. & Hum. 21 (4): 1255 - 1273 (2013)
a combination of centralised examination, and school-based assessment as a move to improve the quality of education and also to provide greater opportunities for students in terms of assessment for learning.
Assessment is an integral aspect of teaching and learning and has always been part of the education curriculum in Malaysia. At present, centralised public examinations are still practiced in Malaysia. Such standardized examinations as UPSR (Primary School Evaluation Test), PMR (Lower Secondary Assessment), SPM (Malaysian School Certificate) and STPM (Malaysian School Higher Certificate) reveal that assessment in the Malaysian context is very much examination oriented and can result in students being passive recipients in the classroom. The centralized examinations influence teachers to narrow the curriculum by giving students previous tests and focus on examinations which naturally motivates students to prepare solely for the examinations. It should be noted, however, that the Malaysian National Philosophy of Education emphasizes “developing the potential of individuals in a holistic and integrated manner, so as to produce individuals who are intellectually, spiritually, emotionally and physically balanced and harmonious”. Greater emphasis, therefore, must be placed on the role of assessment to promote learning. Stiggins (2005), for example, suggests that one strategy teachers can explore in assessment for learning is to provide students with a clear vision of the learning target from the beginning of the learning. It is crucial for teachers to
provide students with continuous access to descriptive feedback which can give students an idea on how to improve the quality of their work. As a result, students will learn to generate their own descriptive feedback in their learning and take the responsibility in monitoring their own success (Stiggins, 2005). Thus, some researchers suggest that the use of portfolios will benefit and assist ESL/EFL students to monitor their own learning (Delett et al., 2001; Hamp-Lyons, 1995; Hamp-Lyons & Condon, 2000; Song & August, 2002).
Today, teachers no longer advocate the traditional paper and pencil approach. Instead they have started to modify and use alternative assessment to improve the teaching and learning process (Tunku Mohani Tunku Mohtar, 2010). Assessment has always been an issue in all educational institutions where one form of assessment or another is used. The question of administering the right assessment strategy to the students is of great concern. The role of assessment has been to ascertain the extent of student learning. Black and William (1998, p.7) refer to assessment as activities used by teachers and their students to assess themselves. These activities provide information to be used as feedback to modify the teaching and learning activities in which they are engaged.
The impact of constructivism has revolutionized teachers’ and experts’ opinions and has brought about in depth changes in assessments (Hashemian & Azadi, 2011). In constructivist classrooms, students are given a chance to learn from
Charanjit Kaur Swaran Singh and Arshad Abdul Samad
1258 Pertanika J. Soc. Sci. & Hum. 21 (4): 1255 - 1273 (2013)
active participation and have opportunities to discover their own ideas via discussion, debate, discourse and inquiry (Anderson and Piazza, 1996; Bufkin & Bryde, 1996; Davydov, 1995; Duckworth, 1987; Kroll & LaBoskey, 1996; Gruender, 1996). Teachers play the role of a facilitator and students assume responsibility for their learning (Fosnot, 1996). In short, behaviors and skills are not the main aims of instruction; instead, the focus is on concept development, deep understanding, and construction of active learner reorganization (Brooks, 1990).
Unfortunately, traditional assessment does not evaluate this form of instruction (Anderson, 1996). In contrast, several researchers and theorists (Johnston 1989; Short & Burke, 1991; Wolf, 1990) argue that the purpose of alternative assessment is to enhance students’ learning through the development of learning skills. When students receive feedback about their learning, they gain new direction and are able to progress in their learning (Anderson, 1998). Therefore, it is understood that the purpose of assessment is not to classify or rank the students. Both the teacher and student are able to share the power to make decisions about what they learn and to determine how well they are learning. Heron (1988) asserts that alternative assessment embraces a democratic decision-making process.
PORTFOLIO USE IN GENERAL
A portfolio is actually a collection of documents kept for specific purposes. It is a purposeful collection of work sample
made by students over a period of time. In education, students keep a collection of their work in a folder or a file. Each piece of work is then checked and marked by the teacher. At the end of the semester or term the teacher will add up the marks obtained by each student from selected samples of work. The role of the teacher is to identify students’ weaknesses, discuss their problems with them, and provide sufficient exercises for them to do to improve their performance. Portfolio assessment entails the procedure used to plan, collect, and analyse the various types of products kept in the portfolio (Tunku Mohani Tunku Mohtar, 2010).
PORTFOLIO USED SPECIFICALLY FOR ESL/EFL PURPOSES
A study conducted by Ghorrchaei et al. (2010), revealed that portfolio assessment empowers students’ learning of English writing and emphasized the formative potential of portfolio assessment in EFL classes. The study showed that portfolio assessment a ffec ted the s tudents ’ achievement in their overall writing as well as their achievement in terms of focus, elaboration, organization and vocabulary. Their findings were consistent with Elahinia’s (2004) and Yurdabakan and Erdogan’s (2009) findings that portfolio assessment significantly improves students’ overall writing ability. The researchers also made an attempt to generate the ‘portfolio culture’ so that students can be engaged in process-based reflection which would allow them to perceive the value of writing portfolios in assessment. Another interesting
Portfolio as an Assessment Tool and Its Implementation in Malaysian ESL Classrooms: A Study in Two Secondary Schools
1259Pertanika J. Soc. Sci. & Hum. 21 (4): 1255 - 1273 (2013)
theme that emerged from their study was the awareness of writing. Students were able to identify their weaknesses in writing and seemed to be determined to solve their writing problems.
Chen (2006) investigated and evaluated the implementation of portfolio system at secondary English classrooms in Taiwan. The study found that students favored the portfolio system because the learning tasks were beneficial to their learning as it allowed them to examine their own learning process and thus improved learning. Furthermore, teachers’ observations also revealed that students benefited from the portfolio system in terms of the development of English use and confidence, learning ownership, versatile talents, and critical thinking. This is in line with Belanoff (1994) as cited in Hassaskhah & Sharifi (2011), that portfolio assessment promotes participation and autonomy by allowing students to select the work on which they will be evaluated, to reflect on their work, to take control of revisions and have the opportunity to produce substantive revisions. According to Genesee & Upshur (1996), portfolios can boost students’ involvement in and ownership of their own learning. Portfolios have positive effects on student learning as it allows students to take charge of their own learning and become active learners.
Interestingly, a study conducted by Nezakatgoo (2011) specifically addressing the development of EFL students’ mechanics of writing in portfolio-based assessment revealed students whose work was evaluated
by a portfolio system (portfolio-based assessment) had a significant reduction in their errors in mechanics compared to those students work evaluated using the more traditional evaluation system (non portfolio-based assessment).
METHOD
Since the main objective of this study was to investigate ESL teachers’ implementation of portfolio as an assessment tool in ESL classrooms, the use of a qualitative research method offers greater opportunities for conducting exploratory and descriptive research as it uses the context and setting to search for a deeper understanding of what is being studied (Troudi, 1994, Maykut & Morehouse, 1994; Maxwell, 1996; Silverman, 2000; Radnor, 2001). In this study, the learning context is the Malaysian secondary school ESL classroom. The study embarks on a case study which is descriptive in nature and the focus is on a natural setting which is the classroom. It is interested in meanings, perspectives and understanding by investigating the implementation of portfolio as an assessment tool by the ESL teachers in Malaysian classrooms. The primary data for this study are interviews and classroom observations which are used to complement the interviews. The major research question addressed in this study was:
1. How has portfolio assessment been implemented in the teaching and learning of ESL in Malaysian classrooms?
Charanjit Kaur Swaran Singh and Arshad Abdul Samad
1260 Pertanika J. Soc. Sci. & Hum. 21 (4): 1255 - 1273 (2013)
In this study, nine ESL teachers who are familiar with portfolio assessment and were using portfolio assessment in their classrooms on a voluntary basis were the main respondents. Their unique experiences will contribute to the understanding of the essence of the phenomenon as it will reveal how teachers implement and carry out the portfolio assessment process in the classroom when conducted out of their own volition. Participants were purposefully selected through “snowball” or “chain” sampling (Patton, 1990). This approach “identifies cases of interest from people who know, that cases are information rich, that is, good examples for study, good interview subjects” (Patton, 1990, p. 182). For this study, a snowball sampling technique was employed to choose a sample. This technique was seen most suitable because the researcher could not determine which teachers had carried out portfolio assessment as at the time of the study, portfolio assessment was not a compulsory form of assessment in Malaysian secondary school ESL classrooms. The snowball sampling technique involves asking a participant to refer the researcher to other potential participants (Merriam, 1998).
OBSERVATION
Observation seems to be one of the most appropriate techniques for getting at ‘real life’ in the real world. It provide an opportunity to the researchers to record, describe, analyse, interpret and investigate an ESL teacher’s implementation of portfolio as an assessment tool in the classrooms.
According to Robson (2002), observation permits the researchers to watch and listen to the interaction between the teacher and the students.
Permission from all the nine teachers was sought before the researchers entered the classroom. The teachers were observed four times due to the tight schedule of the teachers and school activities. All the teachers were also made to understand that the observation was done to discover the implementation of portfolio as an assessment tool. The teachers’ teaching in the classroom was deemed crucial as it would enable the researchers to discover the implementation of portfolio as an assessment tool. By doing so, the researchers would be able to identify the processes involved in implementing portfolio as an assessment tool. The teachers’ instructions and explanations to the students were made without any intervention by the researchers. The researchers did not provide any comments about their lessons as had been promised to them. The main intention of the study was to observe the implementation portfolio as an assessment tool by the nine ESL teachers.
Students in the classes were of mixed abilities. There were some average students who could write very well but unable to speak confidently. There were also some students who were really weak at English in spite of the teachers’ attempts at conducting a variety of activities to make them speak and write in English. The teachers attributed the problem to the students’ negative attitude towards learning in general
Portfolio as an Assessment Tool and Its Implementation in Malaysian ESL Classrooms: A Study in Two Secondary Schools
1261Pertanika J. Soc. Sci. & Hum. 21 (4): 1255 - 1273 (2013)
SEMI-STRUCTURED INTERVIEWS
The interview sessions was carried out with all the nine ESL teachers. The interview was carried out in the school staffroom and consisted of questions and answers pertaining to the teachers’ experience in implementing portfolio as an assessment tool in their respective classrooms. The interviews with the ESL teachers were carried out twice in a month for a period of two months. The duration of the interviews was between fifteen to thirty minutes due to the teacher’s workload and other commitments in the school. The aim of the interview sessions was to obtain the overall picture and experiences of teachers on the implementation of portfolio as an assessment tool. As stated by many researchers, the advantage of having semi-structured interviews is that it will help the researcher to stay alert to the focus of the study and at the same time be open minded to encounter spontaneous and new ideas that will emerge during the interview sessions (Kvale, 1996; Gillham, 2000; Radnor, 2001; Silverman, 2006). Basically, the interviews in this study focused on one main area which was the implementation of portfolio as an assessment tool.
FINDINGS
Responses were obtained from nine ESL teachers from two secondary schools in Perak and Selangor. The findings presented below are divided into (i) the teachers’ understanding on the use of portfolio and portfolio as an assessment tool, (ii) how portfolio assessment was implemented
in the classroom, and (iii) the portfolio assessment process.
i. Teachers’ understanding on the use of portfolio and portfolio as an assessment tool
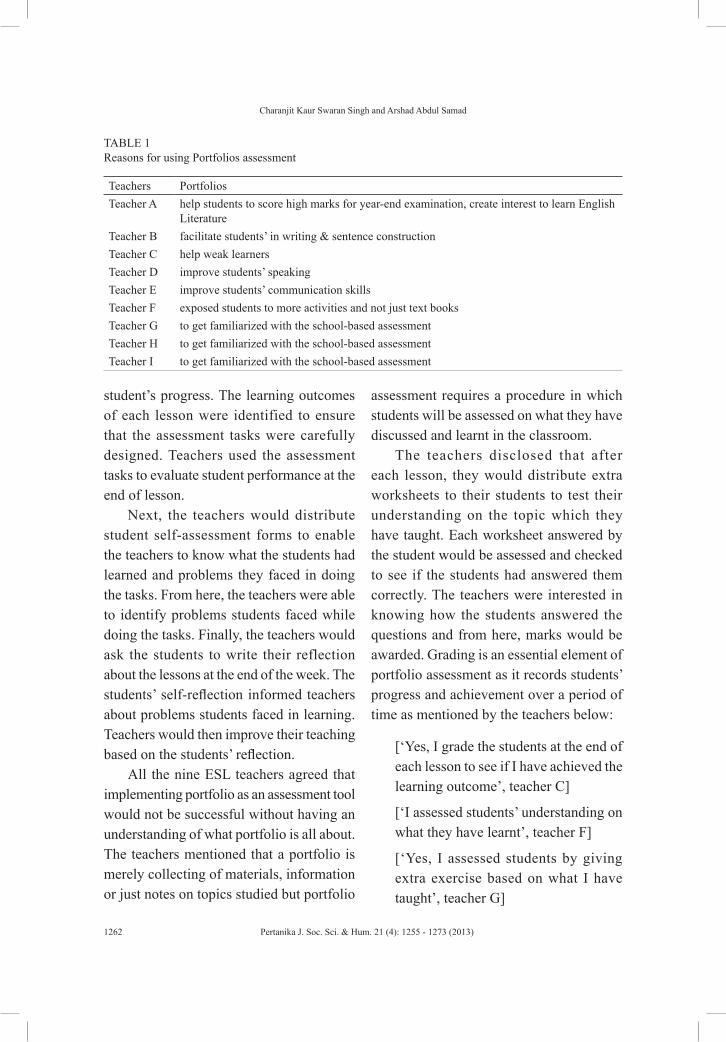
The teachers mentioned that they carry out the portfolio assessment once in a week in the classroom. The teachers set and prepare the assessment tasks based on the learning outcomes to be achieved. Data obtained from the teachers’ interviews revealed that they started using portfolio assessment for several reasons as shown in Table 1.
Teachers disclosed that one way of attracting students to learn English was via portfolio assessment because it involved marks. So, students were determined to take part in the classroom activities as they knew marks would be awarded for each activity they answered and submitted. Each student’s portfolio carries 20% based on the following: (personal, 2%), (academic, 2%), (assessment/worksheets, 14%) and (appendix, 2%).
Each teacher teaches five periods of English language which consists of 40 minutes each. Each week the teachers would distribute 2-3 assessment tasks to the students. The assessment task with the highest marks will be compiled into the student’s portfolio for grading purposes while the assessment tasks with fewer marks will be compiled in the assessment section in the student’s portfolio. The students’ portfolios are kept by the teachers in the staffroom and are evaluated by the teachers at the end of the week to record each
Charanjit Kaur Swaran Singh and Arshad Abdul Samad
1262 Pertanika J. Soc. Sci. & Hum. 21 (4): 1255 - 1273 (2013)
student’s progress. The learning outcomes of each lesson were identified to ensure that the assessment tasks were carefully designed. Teachers used the assessment tasks to evaluate student performance at the end of lesson.
Next, the teachers would distribute student self-assessment forms to enable the teachers to know what the students had learned and problems they faced in doing the tasks. From here, the teachers were able to identify problems students faced while doing the tasks. Finally, the teachers would ask the students to write their reflection about the lessons at the end of the week. The students’ self-reflection informed teachers about problems students faced in learning. Teachers would then improve their teaching based on the students’ reflection.
All the nine ESL teachers agreed that implementing portfolio as an assessment tool would not be successful without having an understanding of what portfolio is all about. The teachers mentioned that a portfolio is merely collecting of materials, information or just notes on topics studied but portfolio
assessment requires a procedure in which students will be assessed on what they have discussed and learnt in the classroom.
The teachers disclosed that after each lesson, they would distribute extra worksheets to their students to test their understanding on the topic which they have taught. Each worksheet answered by the student would be assessed and checked to see if the students had answered them correctly. The teachers were interested in knowing how the students answered the questions and from here, marks would be awarded. Grading is an essential element of portfolio assessment as it records students’ progress and achievement over a period of time as mentioned by the teachers below:
[‘Yes, I grade the students at the end of each lesson to see if I have achieved the learning outcome’, teacher C]
[‘I assessed students’ understanding on what they have learnt’, teacher F]
[‘Yes, I assessed students by giving extra exercise based on what I have taught’, teacher G]
TABLE 1 Reasons for using Portfolios assessment
Teachers PortfoliosTeacher A help students to score high marks for year-end examination, create interest to learn English
LiteratureTeacher B facilitate students’ in writing & sentence constructionTeacher C help weak learnersTeacher D improve students’ speakingTeacher E improve students’ communication skillsTeacher F exposed students to more activities and not just text booksTeacher G to get familiarized with the school-based assessmentTeacher H to get familiarized with the school-based assessmentTeacher I to get familiarized with the school-based assessment
Portfolio as an Assessment Tool and Its Implementation in Malaysian ESL Classrooms: A Study in Two Secondary Schools
1263Pertanika J. Soc. Sci. & Hum. 21 (4): 1255 - 1273 (2013)
With grading the teachers were able to track students’ development in learning. The teachers felt that they could understand the students’ strengths and weaknesses in learning a particular topic or lesson of the day.
Apart from this, the teachers pointed out that it was crucial to explain to students specifically about the contents of a portfolio before they could proceed to the specific segments of the portfolio. At the beginning, all the teachers faced some difficulties in explaining about portfolio to their students. The teachers solved this problem by giving the students some examples of portfolios and also some guidance. It was found that a clear set of instructions given by the teachers to the students facilitated students’ understanding of portfolios.
Another key element of portfolio assessment the teachers shared was about collecting evidence of their learning. The teachers explained to students that there was a need to collect evidence of learning in their files which would indicate and support their understanding and mastery of a topic. Some students are very apprehensive, nervous and afraid to approach the teachers to share about the problems they encounter in learning or even understanding a topic in the class.
In order to solve this problem, the teachers prepared a self-evaluation form for each student to fill in to indicate what they have learnt, whether they understood what they have learnt and how they have learnt it. Teacher A, C and E shared that by using portfolio as an assessment tool for
their students; they could improve their own teaching to bring about effective results in student’s learning in the classroom as shown in the examples :
[‘to do something different for students & to motivate students to have more interest to learn English’, teacher A]
[‘My students are very weak. I want to help them. So portfolio assessment will enable me to see progress students make in English’, teacher C]
[‘to improve my own teaching’, teacher E]
As Slavin (2003), reiterates, “learners must individually discover and transform complex information if they are to make it their own, a more active role for students in their own learning than typical in many classrooms” (Slavin, 2003, p. 257-258). The function of teachers in this view is to construct a learning environment that provides opportunities for an analysis of learning. They are now known as facilitators rather than teachers who serve as a mediator to facilitate learning, as well as group and peer discussion among students.
Fundamentally, the teachers concurred that purpose is another key ingredient in developing a portfolio for assessment. In other words, the portfolio as an assessment tool is developed for the student to demonstrate and provide evidence that he or she has mastered a given set of learning objectives. The assessment purpose for the portfolio is developed via the learning outcomes based on the syllabus. In other
Charanjit Kaur Swaran Singh and Arshad Abdul Samad
1264 Pertanika J. Soc. Sci. & Hum. 21 (4): 1255 - 1273 (2013)
words, the learning outcomes of each lesson were identified to ensure that assessment purposes were appropriately constructed.
Another essential aspect that the teachers shared with the students was the self-reflection which contained statements accompanying how students feel about the lesson which took place in the classroom. The teachers conceded that the self-reflection produced by the students was another dominant evidence demonstrating student mastery of learning in the classroom. Through self-reflection, all the teachers were able to improve their approach to instruction to cater to student needs in the classroom. The teachers were able to make some changes to their teaching approach based on information from the self-reflection. The teachers admitted that they had to make their teaching interesting from time to time to attract students’ attention in the classroom. The teachers would also decide how to help students who have problems in learning once they received feedback from students’ self-evaluation and self-reflection.
ii. How por t fo l io assessment was implemented in the classroom.
The classroom observation allowed the researchers to record the portfolio assessment process and its implementation in the class. Basically we have summarized what the teachers did in the classroom during the portfolio assessment process. First, the teachers provided constructive feedback to students after reading their self-reflection in the following class. They spent some time with students explaining
thoroughly on ways students can improve learning based on the topics the teachers had taught.
Students were given many opportunities to speak and share their ideas about the assessment activities the teachers gave them in the classroom. The teachers returned the portfolios to the students and asked the students to check the documents compiled and insert their self-reflection into the portfolio. Students started discussing with their friends and showing their portfolios to one another.
The teachers began their lesson by teaching and after teaching, the teachers distributed the assessment activities to the students. All the students knew that they have to answer the activities independently without having a discussion with their friends. The teachers collected the assessment activities from the students and kept them on the table. The teachers distributed self-assessment forms to students after completing the assessment activities. The students filled in the forms meticulously to inform their teachers about the learning outcomes they have understood. Some students raised their hands and asked the teachers’ for assistance. The students submitted the self-assessment forms to their teachers. Then, the teachers reminded the students about the next lesson and the materials they were supposed to bring in class for discussion and compilation in the portfolios. The students returned the portfolios to their teachers.
A pattern that emerged among all the nine teachers when they started teaching in
Portfolio as an Assessment Tool and Its Implementation in Malaysian ESL Classrooms: A Study in Two Secondary Schools
1265Pertanika J. Soc. Sci. & Hum. 21 (4): 1255 - 1273 (2013)
the classroom refers to the distribution of worksheets by the teachers to their students after teaching the lesson. All the teachers distributed worksheets after they finished teaching and instructed students to answer them in order to test their mastery of the topics taught. The teachers brought their portfolios together when they stepped into the class. The portfolios were then given to the students and collected by the teachers after the lesson to evaluate and record each student’s progress.
Before the teachers started the lesson, they provided feedback to students based on the self-reflection which they had read. There were so many questions posed by the students for example, some students were absent and they could not do the worksheets and some students did not compile materials required by the teachers. These students were asked to collect the worksheets from the teachers after the lesson and were reminded to compile materials to get marks.
After answering the worksheets, the students filled in the self-assessment form to enable the teachers to know if students understood the lesson taught. Then, the teachers reminded students to submit their self-reflection the following week. The teachers evaluated the worksheets completed by the students and provided feedback to help students improve their work. The students’ work was then returned and kept by the students in their files. Table 2 is a summary of how the nine teachers conducted their lessons based on the researchers’ observations.
Despite the generally similar manner in implementing portfolio assessment, the classroom observation data revealed that all the nine teachers conducted their lessons in a different manner as they used their own creativity to start and end the lesson. This may imply that the teachers were actively evaluating how best to implement portfolio assessment in their classrooms.
Overall, the researchers were able to observe how teachers implemented portfolio as an assessment tool via worksheets given to the students, student’s self-assessment and self-reflection. The portfolio assessment is an on-going assessment which the teachers use to track progress students make in learning. From the observations made, it was found that teachers awarded marks based on what students have scored in their record books. The teachers identified 14 worksheets for students to complete. For each task a student completed, the teacher awarded one mark and for students who did not accomplish the assessment activity, a reminder was given for them to complete the task. The teachers distributed a lot of worksheets to the students to help them master the topic/skill taught for the specific week. Students were involved in group discussions, role-plays, and dramatizing act in the classrooms. Students showed interest in learning English as they participated enthusiastically in all the classroom activities. This was the teachers’ strategy to make students involved in group discussions and provide opportunities to speak and answer the assessment activities as the students were aware marks would be awarded if they participate.

Charanjit Kaur Swaran Singh and Arshad Abdul Samad
1266 Pertanika J. Soc. Sci. & Hum. 21 (4): 1255 - 1273 (2013)
iii. Portfolio Assessment Process and its Implementation
Based on the observation and interview data, five major stages in implementing portfolio assessment in the classroom can be identified as follows:
1. Assessment purpose
2. Collection of evidence
3. Evaluation of evidence
4. Reflection on learning
5. Assessment decision
Assessment purpose- All the nine teachers agreed that they were involved in deciding the assessment purpose before they could start implementing portfolio assessment for their students. The assessment purpose is developed based on the learning outcomes in the syllabus as shared by the teachers below:
[‘Yes, I follow the syllabus and learning outcomes’, teacher C.]
[‘Must be based on the syllabus and learning outcomes’, teacher E]
TABLE 2 Summary of how the nine teachers conducted their lessons based on the researchers’ observations Teacher LessonsTeacher A Did some explanation about the topic & had two-way communication with her students.
After teaching she distributed worksheets to her students. Did not do self-assessment with her students. She reminded the students to write self-reflection.
Teacher B Used questioning technique, mind-mapping & power-point slides to conduct her lesson.She distributed worksheets to the students. Students filled in self-assessment form. She asked her students to submit self-reflection. Students did peer-assessment and were guided by the teacher.
Teacher C She read the text aloud followed by the students. The teacher did the activity together with the students. Teacher gave self-assessment form to students.
Teacher D She drew some pictures before she started teaching.Teacher E The students put up an acting and the whole class guessed what the lesson was all about.
Then, the teacher started with her explanation about the lesson. The teacher asked students to present. The students worked in groups of four. The teacher distributed worksheets to the students. The teacher distributed self-assessment form to students. She reminded the students to write self-reflection.
Teacher F Did not do any explanation. She distributed some notes to the students. The students read. The students were asked to get into groups of four. They discussed and the teacher gave out the self-assessment form to the students. She reminded students to write self-reflection.
Teacher G She taught her class by giving some explanation. Then, worksheets were distributed. Students copied learning outcomes from the board and the teacher asked students if they had understood what she taught.
Teacher H She taught her class by giving some explanation. Then, worksheets were distributed. Students copied learning outcomes from the board and the teacher asked students if they had understood what she taught.
Teacher I She taught her class by giving some explanation. Then, worksheets were distributed. Students copied learning outcomes from the board and the teacher asked students if they had understood what she taught. Did not do self-reflection with the students.
Portfolio as an Assessment Tool and Its Implementation in Malaysian ESL Classrooms: A Study in Two Secondary Schools
1267Pertanika J. Soc. Sci. & Hum. 21 (4): 1255 - 1273 (2013)
The teachers discovered that there were many weak students and to improve their learning in English, the teachers prepared worksheets to monitor students’ progress in learning. The teachers scrutinized student’s learning in English by recording marks obtained in each worksheet. Furthermore, the teachers noticed that good students who were good at writing were not able to speak confidently because they were too dependent on their teachers for translation and lacked the confidence to share their thoughts in the classroom. All the nine teachers prepared the types of assessment task or activity based on the learning outcomes to be achieved and the scoring criteria as shown in the samples below:
[‘I designed the assessment purpose based on the syllabus and learning outcomes. Next, I prepare worksheets based on the lesson that I’m teaching’, Teacher A]
[‘The syllabus and the learning outcomes and from here I can come out with the assessment purpose’, Teacher I]
In short, the teachers designed the activities or tests that would be used to evaluate student learning based on the assessment purpose and syllabus learning outcomes.
Collection of evidence- The teachers reported that there was a need to collect evidence to monitor students’ progress and achievement in learning. Teachers allowed students to contribute some materials and through this manner they get to hear students exchange ideas verbally with one another
and identify students’ needs and problems in learning so that they can modify their teaching styles to make learning more meaningful and interesting.
In a similar vein, portfolios orient the students to produce various types of more authentic work and urge them to be more creative; also portfolio assessment gives the learners more freedom and contributes to development and improvement of their higher order thinking skills and meta-cognitive strategies Erdogan (2011).
The teachers distributed extra activities to the students which they have to compile in their portfolios. The students were allowed to choose the best work with the highest marks which display their ability in a certain topic. Next, the activities had to be evaluated by the students and students had to write in their self-reflection to indicate how much learning has taken place and the problems they encountered while doing the activity. Students were required to collect and compile other activities which reported on their development in learning from time to time.
At the same time, the teachers permitted students to compile notes or other related information for the specific lesson of the day. This revealed that the students were also given an opportunity to be involved in the decision making specifically in collecting materials from the internet, magazines and other sources to make learning more meaningful. Homework was also considered as a part of collecting evidence for the portfolio as one of the teachers had taught writing found that her students took longer time to write.
Charanjit Kaur Swaran Singh and Arshad Abdul Samad
1268 Pertanika J. Soc. Sci. & Hum. 21 (4): 1255 - 1273 (2013)
So, the students were allowed to take the writing back as homework and they had to submit their work the following day. As a result, the teacher started giving personal attention and more feedback to students who had difficulties in grammar, constructing sentences and writing the introduction of an essay to improve their marks. The positive results obtained in this study agree with the results of many researchers (Alabdelwahab, 2002; Hall & Hewitt-Gervais, 1999; Spencer, 1999; Tiwari, 2003; Slater et al., 1997; Liu, 2003; Barootchi & Keshavarz, 2002; Calfee & Perfumo, 1993; Korkmaz & Kaptan, 2002; Morgil et al, 2004; Deveci et al., 2006; Birgin, 2008; Bekir et al., 2009) who reported that portfolio assessment improves students’ motivation in learning, self-respect and responsibility towards learning. Based on the teachers’ feedback and interviews, the researchers were able to come up with the contents of portfolio for collection of evidence. There were four main sections in a student’s portfolio: personal, academic, assessment/worksheets and appendix. Students were allowed to put in their personal information, photos and learning goals in the personal section. As for the academic, students included samples of best worksheets with the highest marks collected to show their progress in learning. In the assessment/worksheets section, students compiled the self-assessment and self-reflection forms. For the appendix, students brought together their homework, notes, internet resources, newspaper cuttings and additional collection of materials.
Evaluation of evidence- The portfolio provides criteria for the identification of student achievement in learning which will improve the teaching and assessment process for the teachers. The teachers will interpret each student’s ability based on the marks given for each activity in the portfolio, students’ individual performance, and also their personal contribution in terms of delivering and sharing of ideas during discussion in the classroom. The evaluation form provides some valuable information in terms of how students learn in the classroom.
Teachers revealed that students’ involvement in self-assessment provided an opportunity for students to evaluate their own learning process, identify their own weaknesses and strengths and inform teachers so that they could design their teaching based on students’ needs and then match instruction to needs and assessment to instruction. This is in line with Karababa and Suzer (2010) who believe that the portfolio is to illustrate and report student personal language learning strategies, which enables the development of the student’s of self-control and self-actualization in the whole learning process.
Reflection on learning- All the teachers did self-reflection with their students except for [teacher I] who did not carry out the self-reflection with her students due to time constraint and students’ inability to write well in English.
Student’s self-reflection help teachers understand and observe their problems
Portfolio as an Assessment Tool and Its Implementation in Malaysian ESL Classrooms: A Study in Two Secondary Schools
1269Pertanika J. Soc. Sci. & Hum. 21 (4): 1255 - 1273 (2013)
in learning. The teachers concurred that the majority of their students were able to express their difficulties in learning English and agreed that portfolio assessment had motivated them, made them more responsible and had made them more confident. The teachers, however shared that students reflected that they still needed teacher’s assistance in explaining and giving more information about topics that they have learnt in the classroom.
The teachers admitted that they realized that the examination-oriented system had placed great emphasis on students being so dependent on teachers and students focus purely on how to answer exam questions and pay less attention on daily lessons. Therefore, teachers felt there is need for students to reflect on the lesson taught and also the activities given so that teachers can identify student strengths and weaknesses and provide some necessary feedback to overcome their problems in learning. This sentiment is displayed in the comments below:
[‘They do the reflection and peer-evaluation to see their strengths and weaknesses’, teacher D]
[‘Students share what they know and what they don’t know while learning English’, teacher H]
Reflection is reckoned as an important element in the use of portfolio, ‘with reflection, the portfolio can become an episode of learning; without reflection, the portfolio may be little more than an exercise in amassing papers’ (Wolf & Dietz,
1998, p. 14). Portfolios must exhibit some features to be considered as a good example of alternative assessment (Khodadady & Khodabakshzade, 2012). Students’ reflection is one of those features which have been highlighted (Lynch & Shaw, 2005). Moreover, teachers felt that they have to provide constructive feedback to students based on their reflection so that students can be engaged in the assessment process. Khodadady & Khodabakshzade (2012) assert that making students conscious and reflective about their learning is a complicated task which should be made more practicable by means of a criterion-referenced and a pre-determined organized self-assessment plan.
Assessment decision- Teachers disclosed that they were able to make decisions about students’ learning based on the self-evaluation, self-reflection and feedback obtained from the students. The teachers reported that students have to participate actively during the portfolio assessment process in order to assess student performance but the teacher is the key to the successful use of such a strategy.
Portfolio assessment transforms the role of teacher away from generating comparative rankings of achievement and toward improving student achievement via evaluation, self-evaluation and feedback (Tabatabaei, 2012). Teachers were able to make decisions not only about the assessment of their students but they were able to improve their teaching. The assessment assists teachers to evaluate their own teaching and help them with
Charanjit Kaur Swaran Singh and Arshad Abdul Samad
1270 Pertanika J. Soc. Sci. & Hum. 21 (4): 1255 - 1273 (2013)
instructional decisions. Similarly, the assessment activities provided by the teachers for students allow them to be engaged in evaluating their own learning, and help them reflect on and understand their own strengths and needs. These benefits are mentioned by the teachers:
[‘Students want to improve their wri t ing, sentence construct ion, vocabulary, grammar. I am able to see the improvement now, with portfolio I have created interest in students to write’, teacher B]
[‘Students are able to give feedback about what they prefer to learn and I do this by giving them extra activities, students are free to express their opinions and ican improve my own teaching’. Teacher F]
[‘I give activities to students and they are assessed based on the bands, this is the latest assessment, school-based assessment’, teacher G]
CONCLUSION
Based on the findings of the current study, portfolio as an assessment tool and its implementation in ESL classrooms assisted and offered ESL teachers some invigorating experiences in assessing their students’ learning. The teachers in the study are able to utilize portfolio assessment to scrutinize student progress in learning and use the information for decision making regarding future instruction. The portfolio assessment technique enabled the teachers to identify
students’ weaknesses, discuss their learning problems with them, and provide adequate exercises and activities exercise for them to improve their performance. The teachers also demonstrated a generally common procedure in implementing portfolio assessment which consisted of several major stages as described earlier.
In sum, the findings of this study suggest that portfolio assessment has the potential to help students to improve their learning in English, develop their ability to self-evaluate and understand their strengths and weaknesses. More importantly, it shows that teachers can adapt sufficiently well to new assessment techniques in order to implement portfolio assessment successfully through appropriate planning and preparation. Additionally, the study indicates that the portfolio has the potential to increase teacher professionalism through continuous and meaningful collaboration in student assessment.
REFERENCESAbdul Samad, A. (2004). Essential language testing
for Malaysian teachers. Serdang: Universiti Putra Malaysia Press.
Alabdelwahab, S. Q. (2002). Portfolio assessment: A qualitative investigation of portfolio self-assessment practices in an Intermediate EFL Classrooms, Saudi Arabia. (UMI No:3081894).
Anderson, D. S., and Piazza, J. A. (1996) Changing Beliefs: Teaching and Learning Mathematics in Constructivist Pre-service Classroom. Action in Teacher Education, 18(2), 51-62.
Portfolio as an Assessment Tool and Its Implementation in Malaysian ESL Classrooms: A Study in Two Secondary Schools
1271Pertanika J. Soc. Sci. & Hum. 21 (4): 1255 - 1273 (2013)
Archbald, D, A., & Newman, F. M. (1988). Beyond Standardized testing: Authentic academic achievement in the secondary school. Reston, VA: NASSP Publications.
Azam, S., & Iqbal H. (2006). Use of Portfolios for Assessing Practice Teaching of Prospective Science Teachers. Retrieved from http://www.aare.edu.au/publications-database.php/296/use-of-portfolios-for-assessing-practice-teaching-of-prospective-science-teachers.
Barootchi, N., & Keshavarz, M. H. (2002). Assessment of achievement through portfolios and teacher-made tests. Educational Research, 44(3), 279-288.
Belanoff, P. & M. Dickson (eds) (1991) Portfolios: Process and Product. Portmouth, NH: Boyton/Cook.
Bekir, A., Polat, M. & Sakaci, T. (2009). Performance application of the 7 th grade. Science and technology course, 5(1), 45-58.
Berry, V., & Lewkowicz, J. (2000). Special Issue: Assessment in Chinese Contexts: Hong Kong Journal of Applied Linguistics.
Bergman, T. (1994). Feasible electronic portfolios: Global networking for the self-directed learner in the digital age.
Birgin, O. (2008). Students’ views on portfolio application as an alternative assessment method, 6(1), 1-24.
Bufkin, L. J., and Bryde, S. (1996). Implementing a Constructivist Approach in Higher Education with Early Childhood Educators. Journal of Early Childhood Instructor Education, 17(2), 58-65.
Black, P., & William, D. (1998). Assessment and classroom learning. Assessment in Education: Principles, Policy & Practice, 5(1), 7-74.
Brooks, J. G. (1996). Instructors and students: Constructivist Forming new Connections. Educational Leadership, 47(5), 68-71.
Calfee, R., & Perfumo, P. (1993). Student portfolios: Opportunities for a revolution in assessment. Journal of Reading, 36(7), 532-537.
Coombe, C. (2004). The reflective portfolio: Two case studies from the United Arab Emirates. English Language Forum.
Chen, Y. M. (2006). EFL instruction and assessment with portfolios: A case study in Taiwan. Asian EFL Journal, 8(1), 69-96.
Chan. Y. M. (2010). Portfolio Assessment: A Frontier Educational Method in ESL Classroom . International Conference on Science and Social Science (CSSR 2010), December 5 – 7, Kuala Lumpur, Malaysia.
Davydov, V. V. (1995). The Influence of L.S. Vygotsky on Education Theory, Research and Practice. Education Researcher, 24(3), 12-21.
Delett, J. S., Barnhardt, S., & Kevorkian, J. A. (2001). A framework for portfolio assessment in the foreign language classroom. Foreign Language Annal, 34(6), 559-568.
Deveci, H., Ersoy, A. F., & Ersoy, A. (2006). The views of prospective elementary school teachers on the use of portfolio assessment in teacher education. Educational Science: Theory & Practice, 6(1), 193-199.
Duckworth, E. (1987). The Having of Wonderful Ideas. New York: Instructors College Press, 1987.
Elahinia, H. (2004). Assessment of writing through portfolios and achievement tests. (Unpublished M.A thesis). Teacher Training University, Iran.
Erdogan, T. (2009). The effects of portfolio assessment on reading, listening and writing skills of
Charanjit Kaur Swaran Singh and Arshad Abdul Samad
1272 Pertanika J. Soc. Sci. & Hum. 21 (4): 1255 - 1273 (2013)
secondary school prep class students. The Journal of International Social Research, 2(9), 526-538.
Erdogan, T. (2011). Secondary School Students’ Opinions on Portfolio Assessment in EFL. International Journal on New Trends in Educations and Their Implications, 2(3).
Fosnot, C. W. (1996). Constructivism: A Psychological Theory of Learning. In C. W. Fosnot (Ed.), Constructivism: Theory, Perspectives, and Practices. New York: Teachers College Press, 1996.
Genesee, F., & Upshur, J. A. (1996). Classroom-based evaluation in second language education. Cambridge: Cambridge University Press.
Ghoorchaei, B. Tavakoli, M., & Nejad Ansari, D. (2010). The impact of Portfolio Assessment on Iranian EFLStudents’s Essay Writing: A Process-Oriented Approach. GEMA Online Journal of Language Studies, 10(3), 35-51.
Gruencher, C. D. (1996). Constructivism and Learning. A Philosophical Appraisal. Educational Technology, 36(3), 21-29.
Hamp-Lyons, L. (1995). Portfolios with ESL writers: What the research shows. Paper presented at The annual convention of Teachers of English as a Second Language, Long Beach, CA.
Hamp-Lyons, L., & Condon, W. (2000). Assessing the portfolio: Principles for Practice, Theory, and Research. New Jersey: Hampton Press.
Hashemian, M., & Azadi, G. (2011). Arguing for the Use of Portfolio in L2 Classrooms. Theory and Practice in Language Studies, 1(5), 501-506, May 2011.
Hassaskhah, J., & Sharifi. (2011). The role of portfolio assessment and reflection on process writing. Asian EFL Journal, 3(1).
Hall, B. W., & Hewitt-Gervais, C.M. (1999). The application of student portfolios in primary/intermediate and self-contained multi-age team classroom environments: Implications for instructions, learning and assessment. (ERIC-Document Reproduction, No.EDR32598)
Johnston, P. H. (1989). Constructive Evaluation and the Improvement of Teaching and Learning.Instructors College Record, 1989, 90(4), 509-528.
Karababa, C., & Suzer, S. S. (2010). Practitioners’’ Evaluation on The Procedural Aspects of An English Language Portfolio. Journal of College Teaching and Learning, 7(3).
K o r k m a z , H . , & K a p t a n , F. ( 2 0 0 2 ) . A n investigation on using portfolio for assessing students’development in Science Education. 23, 167-176.
Klenowski, V. (2002). Developing portfolios for learning and assessment. Process and product.London: Routledge Falner.
Khodadady, E., & Khodabakshzade, H. (2012). The Effect of Portfolio and Self Assessment on Writing Ability and Autonomy. Journal of Language Teaching and Research, 3(3). 518-524.
Knight, P. (2002). How I use portfolios in Mathematics. Educational Leadership, 49(8), 71-72.
Kroll, L. R., & LaBosky, V. K. (1996). Practicing what we Preach: Constructivism in a Teacher Education Program. Action in Teacher Education, 18(2), 63-72.
Kvale, S. (1996). Interviews: An Introduction to qualitative research interviewing. Thousand Oaks: Sage Publications.
Liu, Y. (2003). A case study of selected ESL students’ experiences with using portfolios in college composition classes. (No:3115767).
Portfolio as an Assessment Tool and Its Implementation in Malaysian ESL Classrooms: A Study in Two Secondary Schools
1273Pertanika J. Soc. Sci. & Hum. 21 (4): 1255 - 1273 (2013)
Lynch, B., & Shaw, P. (2005). Portfolio, power and ethics. Tesol Quarterly, 39(2), 263-297.
Maxwell, J. A. (1996). Qualitative Research Design: An Interactive Approach. London: Sage Publications.
Maykut, P., & Morehouse, R. (1994). Beginning Qualitative Research. London: Routledge Falmer.
Merriam, S. B. (1998). Qualitative research and case study applications in education. San Francisco: Jossey-Bass.
Morgil, I., Cingor, N., Erokten, S., Yavuz, S. & Ozyalacin, Oskay, O. (2004). Portfolio studies in computer assisted chemistry education. The Turkish Online Journal of Educational Technology, 3(2), 103-118.
Nezakatgoo, B. (2011). Portfolio as a Viable Aternative in Writing Assessment. Journal of Language Teaching and Research, 2(4), 747-756.
Patton, M. Q. (1990). Qualitative evaluation and research methods ( 2nd ed.). Newbury Park, CA: Sage.
Radnor, H. (2001). Researching Your Professional Practice: Buckingham: Open University Press.
Robson, C. (2002). Read-World Research. (2nd ed.). Oxford: Blackwells.
Silverman, D. (2000). Interpreting qualitative data: Methods for analyzing talk, text and Interaction: London: Sage Publication.
Silverman, D. (2000). Doing Qualitative Research. London: Sage Publications.
Shepard, L. A. (1989). Why we need better assessments. Educational Leadership. pp. 46-49.
Slater, T. F., Ryan, J. M., & Samson, S. L. (1997). The impact and dynamics of portfolio assessment and traditional assessment in a college physic course. Retrieved from http://solar.physics.montana.edu.edu/tslater/publications/#jrst1
Spencer, D. M. (1991). An Exploration of Portfolio assessment and its influence on Childrens’ writing: (Unpublished Master’s thesis). Regina University - Canada.
Song, B., & August, B. (2002). Using portfolios to assess the writing of ESL students: A powerful alternative? Journal of Second Language Writing, 11(1), 49-72.
Short. K. G., & Burke, C. (1991). Creating Curriculum: Instructors and students as a Community of Learners, Portsmouth, N. H. Heinemann.
Stiggins, R. J. (2005). Student involved assessment for learning. Columbus: Merrill Prentice Hall.
Tabatabaei. (2012). The Effect of Portfolio Assessment Technique on Writing Performance of EFL Learners. English Language Teaching, 5(5).
Tiwari, A. (2003). From process to outcome: The effect of portfolio assessment on student learning. Nurse Education Today, 23(24), 269-277.
Tunku Mohani Tunku Mohani, (2010). The use of alternative assessment to sustain Teaching and learning. Penerbit Universiti Pendidikan Sultan Idris.
Troudi, S. (1994). The Nature of Speaking Opportunities in An English As a Second Language Speaking Class. (Unpublished PhD Thesis). University of Florida
Wiggins, G. (1989). A true test: Toward more authentic and equitable assessment. Phi Delta Kappan. pp.703—713.
Wolf, D. P. (1990). Assessment as an Episode of Learning. Paper presented at the Conference of Constructive Response, Princeton, N. J., November 1990.
Wolf, K., & Dietz, M. (1998). Teaching Portfolios: Purposes and Possibilities. Teacher Education Quarterly, pp. 9-22.


Pertanika J. Soc. Sci. & Hum. 21 (4): 1275 - 1295 (2013)
ISSN: 0128-7702 © Universiti Putra Malaysia Press
SOCIAL SCIENCES & HUMANITIESJournal homepage: http://www.pertanika.upm.edu.my/
Article history:Received: 11 November 2011Accepted: 19 April 2012
ARTICLE INFO
E-mail addresses: [email protected] (W. A. Amir Zal), [email protected] (Ma’Rof Redzuan), [email protected] (Asnarukhadi Abu Samah), [email protected] (Hanina H. Hamsan), * Corresponding author
The Exploration of Social Capital and Its Relation with Economic Empowerment of Orang Kuala in Johor, Malaysia
W. A. Amir Zal1*, Ma’Rof Redzuan2, Asnarukhadi Abu Samah2 and Hanina H. Hamsan2
1School of Social and Economic Development, Universiti Malaysia Terengganu,21030 Kuala Terengganu, Terengganu, Malaysia2Department of Social and Development Sciences, Faculty of Human Ecology, Universiti Putra Malaysia, 43400 Serdang, Selangor, Malaysia
ABSTRACT
Trust economic empowerment is an issue that is rarely debated in discussing the reality of Orang Asli’s economy. Instead, other issues such as lagging behind, poverty, and marginalization of Orang Asli often become the hot topics for discussion. History, however, has shown that Orang Asli have been conducting economic activities with other communities for ages, even though the returns of the aforementioned activities are not encouraging for them. Orang Asli also have shown, through their history, their ability to fulfil other communities’ needs. Such a relationship directly indicates the relation of social capitals and economic empowerment among Orang Asli. In order to examine this issue, a study was carried out. The study was conducted on seven interviewees, who are the Orang Kuala villagers, residing at Bumiputera Dalam, Batu Pahat, Johor, Malaysia. Data were gathered by using in-depth interview method and semi-structured interview protocol technique. Data gathered were then analysed by using QSR NVivo software. The findings of this study showed that Orang Kuala have social capitals but the relationship differs according to the types of social capital, the bonding social and the bridging social capital. In particular, Orang Kuala have weak bonding social capital but possess a strong bridging social capital. They also show the ability to empower their economy through self-reliant,
participation in businesses, increase in revenues and ability to control their income. As a conclusion, this study concluded that the economic empowerment of Orang Kuala is a result of bridging social capital.
W. A. Amir Zal, Ma’Rof Redzuan, Asnarukhadi Abu Samah and Hanina H. Hamsan
1276 Pertanika J. Soc. Sci. & Hum. 21 (4): 1275 - 1295 (2013)
Keywords: Bonding social capital, bridging social
capital, economic empowerment, self-reliance,
participation and revenue control
INTRODUCTION
Economic empowerment is one of the important aspects for community development. Even so, the process or the goal of economic empowerment is not per se in nature; instead, it requires other elements to uphold it, which is the social capital. In general, social capital owned by a community could revitalise the economy of a community (Payne, 2006). This is because the principle of empowerment depends on the ability of resource-based communities to make changes (Kapitsa, 2008). Since the process of community development involves relationship with other communities (Obibuaku, 1983, cited in Ajayi & Otuya, 2006), social capitals are often defined as a social relation that is important in empowering the economy of a community.
Such a community relat ionship has managed to attract attention from Callaghan and Colton (2008) who state that the stability, flexibility, resiliency and sustainability of a development, especially in the economy aspect can be maintained through it. According to Emery and Flora (2006), the relationship will ultimately create a strong momentum that gives people opportunities to serve others better through capital appreciation. For example, the increasing community mental health depends on strong social networks (Coker, 2008).
STATEMENT OF THE PROBLEM
Orang Asli are the indigenous groups in Peninsular Malaysia (Ramle, 2007). The communication between their communities and the ‘outside’ communities is low, yet they exercise good relationships with other communities of Orang Asli from other places. The various forms of social relation between Orang Asli and other communities and within their communities are what often called as social capital (Monkman, Ronald, & Théramène, 2005). Social capital is important as it generates beneficial outcomes to the relationship. Social capital can be viewed from two angles; the bonding social capital and the bridging social capital (Payne, 2006). In this article, the bonding social capital refers to the relationship among the Orang Asli, while the bridging social capital is defined as the relationship between Orang Asli with the other communities. Researchers such as Ramle (1993), Gomes (2004), and Toshiro (2009) have found that Orang Asli have a close bond with each other. This is highlighted through their daily activities which are performed together (Wazir-Jehan, 1981). However, as the time passes and as they are being exposed to development, the bond between them has also changed. Itam Wali Nawan (1993) discovered that the exposure to development has caused the young people of Orang Asli to transfer and migrate to other places, making the social ties between Orang Asli .
At the same time, the rapport between Orang Asli and outsiders has long existed, i.e., since the 15th century (Gianno & Bayr,
The Exploration of Social Capital and Its Relation with Economic Empowerment
1277Pertanika J. Soc. Sci. & Hum. 21 (4): 1275 - 1295 (2013)
2009) through economic-commercial activities (Dunn, 1975; Carey, 1977; Nicholas, Chopil & Sabak, 2003; Gianno & Bayr, 2009). The economic activities at that time involved the sale of forest products consisting of resin and other forest produce and such activities are still happening until today (Rambo, 1979; Sarjit & Amir Zal, 2009; Amir Zal & Ma’Rof, 2010). The impacts of economic activities create economic interaction and have opened up a space for Orang Asli to build networks with outsiders, either to market their products or for other purposes. Such interactions may indicate the existence of social capital in the form of bridging social capital between Orang Asli and other communities, although in certain situation, the benefits gained by Orang Asli are of minimum returns (Gomes, 2007; Toshihiro, 2009; Amir Zal & Ma’Rof, 2010). The opportunities for Orang Asli to build the bridging social capital are getting bigger if these are considered from the perspective of their placement. Data from JHEOA (2008) showed a total of 62.4 per cent and 0.7 per cent of Orang Asli villages are now located in the sub-urban or city. This indicates the opportunities for Orang Asli to interact with other people and build networks with them are getting higher. However, a question arises: Has bridging social capital between the Orang Asli and outsiders occurred holistically? This is because a study conducted by Amir Zal and Ma’Rof (2010) revealed that bridging social capital is very low because of the ‘middlemen’, namely, those who become negotiators in buying and selling the products of Orang Asli.
F u r t h e r m o r e , f r o m e c o n o m i c empowerment of Orang Asli point of view, scholars such as Gomes (2007), Tuck-Po (2005), Gianno and Bayr (2009), Toshihiro (2009) and Amir Zal and Ma’Rof (2010) often see activities conducted by Orang Asli as ones that could not be separated from the acquisition of their economic resources. However, this is only seen from the perspective of routine activities and economic exploitation by outsiders. The discussion from the aspects of Orang Asli’s economic empowerment is still an uncommon practice among researchers.
To discuss this issue, the history of Orang Asli’s economic empowerment must first be viewed. During the Malay feudalism in the 18th and 19th centuries, Orang Asli were abused and enslaved (Mansor, Abdul Rahman & Mohamad Ainuddin, 2007); however, the situation changed after Malaysia gained independence. Various plans have been designed by the government to help them. The effort could be seen from the Seventh to the Tenth Malaysia Plan, involving more than RM400 million (JHEOA, 2008). However, the development has been carried out through a paternalistic, dominated and controlled approach by the government (Asnarulkhadi & Hanina, 2008). This means Orang Asli are not brought to participate in planning their own development. Thus, Orang Asli are not exposed to determine their lives independently.
Despite the fact that they are not participating in the planning of their own development, the findings by Gianno and Bayr (2009) showed the economic
W. A. Amir Zal, Ma’Rof Redzuan, Asnarukhadi Abu Samah and Hanina H. Hamsan
1278 Pertanika J. Soc. Sci. & Hum. 21 (4): 1275 - 1295 (2013)
empowerment seemed to have occurred among the Orang Asli of the Semelai tribe. They are less dependent on the outsiders even after the introduction of agricultural crops. Similarly, the findings by Amir Zal and Ma’Rof (2010) reported the earnest of Orang Asli in searching products from forests and their resistance towards repression and exploitation by outsiders. In regard to the relationship between social capital and economic empowerment, Verhoef (2008) stresses that the interrelation between them, especially in the context of the impacts and benefits of social capitals on economic growth, does exist. Similarly, Bridger and Alter (2006) also stated that there is a relation between social capitals and economic changes. In reality, Orang Asli have shown almost the same thing although indirectly to the economic empowerment per se. For example, the finding by Tosihiro (2009) directly relates the Orang Asli and outsiders (bridging social capital) with an impact on Orang Asli’s economy. Similarly, Gomes (2007) reflects on the same aspect. His view is on the economic growth, although it has no direct impact towards Orang Asli. Amir Zal and Ma’Rof (2010) agreed with this to a certain extent, but looking at how to leverage the relationship between Orang Asli and middlemen to produce better economic benefits to them. Based on this discussion, the current study drew a number of specific issues such as:
1. What are the social capitals of Orang Kuala?
2. Is there economic empowerment among Orang Kuala?
3. Is there any relationship between social capital and economic empowerment among Orang Kuala?
SOCIAL CAPITAL IN COMMUNITIES
The term social capital was first used in 1961 by Jane Jacobs, but according to Kay (2006), the term has actually been used since the 19th century. The term ‘capital’ in this study does not refer to the term used by the economists in describing property, stocks, bonds and cash (Phillips & Pittman, 2009). Instead, capital in this study is seen as the talent, skills and capacities of an individual, unions and institutions (Kretzmann & McKnight, 1993). For Kretzmann and McKnight, capital is an asset. Therefore, one could consider that an individual, a nation, an organization and community that have capital can make decisions for their future in a better way (Diacon & Guimarães, 2003). Scholars categorise social capital into two; the bonding social capital (Agnitsch, Flora & Ryan, 2006) and the bridging social capital (Campbell et al., 2010).
The bonding social capital is known as an entity that allows people to interact with others and to build trust within their own community (Payne, 2006). For Putnam (2000), this capital is referred as the social relations of a homogeneous group and represents the internal view that tends to reinforce their identity. This also runs in tandem with Larsen et al. (2004), Leonard (2004), and Bottrell (2009) who believe that social model (social capital) can help to strengthen the social tie in a local homogenous group.

The Exploration of Social Capital and Its Relation with Economic Empowerment
1279Pertanika J. Soc. Sci. & Hum. 21 (4): 1275 - 1295 (2013)
The bonding social capital becomes an important source in establishing a viable rural community (Wilkinson, 1991, as cited in Bottrell, 2009; George, 2008). The bonding social capital creates solidarity among members of local groups (Bottrell, 2009). The establishment of solidarity creates a strong social interdependence of each other (Bridger & Alter, 2006, George, 2008). This shows that social capital is critical in creating a strong social bond within the neighbourhood (Payne, 2006), and it provides the opportunities to develop mutual trust and cooperation between the people such as on how to deal with problems in the community, social problems, poverty and crimes.
The bridging social capital, on the other hand, is associated with heterogeneous communities (Agnitsch et al., 2006), which goes beyond than the internal community affair (Coffé, Geys & Geys, 2008). For Payne (2006) and Dale and Newman (2010), bridging social capital is the ability of a community to communicate with other communities outside their own circle. This relationship includes the purpose of expanding contacts (Agnitsch et al., 2006), gaining support or information (Larsen et al., 2004) that goes beyond members of the circle. This also means that the bridging social capital can be referred to as the development between communities (Campbell et al., 2010). Besides, the associated organizations also come from different backgrounds (Putnam, 2000). Although the individuals or organizations are outside of the local community and do
not know each other, they share the same interest or are willing to share the same opportunities; namely, the opportunities in economy (UN-HABITAT, 2008).
The bridging social capital is important for the community. It brings them closer to the external network of communities that can give positive impacts for them (Coffé & Geys, 2007). Bridger and Alter (2006) mentioned that social capital provides community members with ample opportunity to access external resources and at the same time, promotes dissemination of information through the creation of a network. Such characteristics of bridging social capital have made it known to be the bright side of social capital (Coffé & Geys, 2008), that is, members of the community gain benefits that are difficult to be found before (Bottrell, 2009).
ECONOMIC EMPOWERMENT IN THE COMMUNITY
Economic empowerment is an important aspect for empowerment (Basargekar, 2009). As a matter of fact, economic empowerment leads to a balance development (Laverack & Thangphet, 2009). For example, the empowerment of women is measured in terms of economic empowerment (Moyle, Dollard, & Biswas, 2006; Hollifield, Donnermeyer, Wolford, & Agunga, 2007; Vyas & Watts, 2009). More specifically, economic empowerment leads to poverty reduction (Basargekar, 2009; Vyas & Watts, 2009), which encourages a community to be self-reliance from the economic aspect. It also increases resources that can be used
W. A. Amir Zal, Ma’Rof Redzuan, Asnarukhadi Abu Samah and Hanina H. Hamsan
1280 Pertanika J. Soc. Sci. & Hum. 21 (4): 1275 - 1295 (2013)
and reduces problems in order to achieve a higher income (Basargekar, 2009).
According to Kantor (2005), economic empowerment includes revenues, earnings, value added and turnover, which allow women to compensate for market control and gain control over their corporate profit. The parameters used by Kantor (2005) are the control of company, profitability and numbers of individual to be contacted such as suppliers, contractors and customers. Control over income is measured by the question of who makes decision on the use of revenue gained. This also shows that participation in economic development will increase the empowerment of an individual (Wilson, 1996).
Economic empowerment is also seen from the context of revenue and its relation to the quality of life (Moyle, Dollard & Biswas, 2006); with a strong economy, a community will be able to generate employment and income (Phillips & Pittman, 2009). This is achieved by creating new jobs as the key to wealth and to improved standard of living, improving the standard of living through higher income per capita, as well as the quality of work and employment (Phillips & Pittman, 2009).
SOCIAL CAPITAL AND ECONOMIC EMPOWERMENT
Many research findings have proven that social capital and economic empowerment are linked with one another (Green & Dougherty, 2008). They further explained that being independent is an indicator of economic empowerment, which happens
when a community takes advantage on the existing network based on their strengths. This is to enable them to be independent from external parties that try to gain economic benefits from them. Apart from that, they can also help other people in their community. Costa (2005) found that women empowerment happens when they get new job, their income increases and their ability to meet their won needs and those of their families.
Such a fact , however, is due to the beliefs that exist within each individual; one that is related to the community network (Wilson, 1996). The beliefs shape specific behaviours among community members (Boyd et al., 2008; Qingwen et al., 2010). Meanwhile, participation in the network clearly shows the existence of a mutual relationship between social capital and economic empowerment. This is disclosed by Bowen (2008) as the link between economic reform and social change. Cameron and Gibson (2005) stated that social capital helps the economy and generates positive socio-economic development and the opposite will happen if a community has a weak network. As a conclusion, it was found that economic activities among rural households give the minimum impact on the empowerment of women because of the low network with outside parties (Bose, Alia Ahmad, & Mahabub Hossain, 2009).
Du Toit, Kruger and Ponte (2008) further reinforce the argument on the link between participation and empowerment. According to them, economic empowerment happens when one relates himself with
The Exploration of Social Capital and Its Relation with Economic Empowerment
1281Pertanika J. Soc. Sci. & Hum. 21 (4): 1275 - 1295 (2013)
external networks. The Black Economic Empowerment, as stated by Ponte, Roberts and Sittert (2007), is a good example to explain the relation of the aforementioned issue; that economic empowerment occurs when people in the community have access to outside network.
RESEARCH METHODOLOGY
This study was conducted among the Orang Asli tribe of Kuala or Duano who are residing at Bumiputera Dalam, Rengit, located in Batu Pahat, Johor, Malaysia. The researchers chose this particular location/area because of its uniqueness and differences from other villages of Orang Asli. These include their success in improving their local economic activities. The reason why the economy of Orang Kuala at the village is empowered is because it centres on businesses. In fact, they have also opened economic opportunities to other communities such as to the Malays who are working with them.
Data were collected through in-depth interview method based on the interview protocol. This protocol is more flexible and responsive in obtaining data. This technique is needed to explore the issues raised in this research thoroughly. The interview was conducted on seven informers or individuals who served as references and have authority in the community such as Tok Batin, JKKK chairman, and businessmen at the aforementioned village.
When the in terview was being conducted, in-depth questions were asked to the informers by using probing technique
(Walliman, 2006). The use of the language and questions in the interview protocol questions were based on Walliman’s (2006) and Majumdar’s (2008) proposal; an interview needs to be conducted in an easy language so it can be understood by interviewees. This can be done by understanding their culture and way of life (Goulding, 2002). The formation of the in-depth interview protocol in this study was done by taking into account the procedure outlined by Gray et al. (2007), i.e. researchers must understand and familiarize themselves with the objectives of the study in advance. Therefore, data from the interview protocol are believed to be valid and reliable to answer the objectives of this study.
After interviewing the informers, the researchers transcribed the conversations. The completed and transcribed texts were then analysed by using a computer software known as QSR NVivo. The researchers built open codes derived from the raw data, and then the code was classified into the same category. In this process, the open codes are filtered to avoid duplication. In the next step, the researchers categorized the groups formed from the previous process into specific themes based on the objectives of the study. This process was done through the functions of Tree Nodes and Free Nodes QSR NVivo. Each developed theme guided researchers to describe the reality of the research informants.
W. A. Amir Zal, Ma’Rof Redzuan, Asnarukhadi Abu Samah and Hanina H. Hamsan
1282 Pertanika J. Soc. Sci. & Hum. 21 (4): 1275 - 1295 (2013)
RESEARCH FINDINGS
The Background of Orang Kuala
The village of Bumiputera Dalam at Rengit is occupied by the Orang Kuala, a tribe in the Orang Asli community. However, Orang Kuala do not favor the term ‘Orang Kuala’ as they think it is used to underrate them. Hence, they are more comfortable with the names Orang Laut (Sea people), Orang Asli, Malay Asli or Orang Duanu (or also spelled as Duano). Orang Kuala are the sub-ethnic of the Malay Proto. They are known as Orang Kuala for several reasons: 1) they reside along river or sea; and 2) they work as a fisherman or any activities related to water.
Since their work is very much related to river or ocean, they are also often referred to as Orang Laut, while other Orang Asli tribes living on lands are referred to as Orang Asli Darat (Land People) or Orang Sakai. In the bigger group of Orang Asli, apart from Orang Kuala, Orang Laut is also referred as Orang Seletar and Mah Meri. Mah Meri is also known as Ma’ Betisek or Besese. From religion point of view, all Orang Kuala are Muslims. Unlike other Orang Asli tribes, who need to be converted, Orang Kuala have been practicing Islam since their ancestors’ days. They also allege, based on the stories which have been passed down from one generation to another, that they are connected to Orang Asli in Riau, Indonesia. From a different view, Chou (2003) and Andaya (2008) stated that the Orang Asli tribe in Riau is not called Orang Kuala but rather Orang Laut or Suku Sampan.
Most of the villagers in this study involved in selling second-hand products from Singapore or things that are taken without any middlemen’s interference. However, this does not mean that all the villagers are involved in the same business. Among them, there are a few who are still focusing on the traditional way of earning money such as by fishing. Second-hand products include furniture, electrical appliances, toys and decorative items. The history of businesses among Orang Kuala can be traced back as early as 1990s. In the beginning, their businesses were conducted in small scale and located in their home area; some even renovated their home into second-hand goods store. Now, however, they are many convenience stores to facilitate their businesses. Their stores are visited by many visitors and tourists, including middlemen from Kelantan and Terengganu.
Ownership of the Social Capitals
1. Bonding Social Capital
Based on the observation done in this study, there is a huge difference between the lives of Orang Kuala at Bumiputera Dalam and other Orang Asli tribes, specifically from the physical aspect. This village has received major development, just like those living in the urban and sub-urban areas, and they have accepted the development positively. Most of them have houses made of concrete, equipped with basic amenities such as 24-hour electricity, piped water, paved roads
The Exploration of Social Capital and Its Relation with Economic Empowerment
1283Pertanika J. Soc. Sci. & Hum. 21 (4): 1275 - 1295 (2013)
and other facilities. In fact, most of the villagers have shops or stores to display their products for sale.
Despite the positive development, the relationship among Orang Kuala is tenuous even when the villagers are of the same family members or living in the same neighbourhood. The tenuous relationship is manifested through their negative perceptions and behaviours towards one another. Among the negative perceptions that they hold are the belief that others will not help them if they have problem in their business and they also think that other people will feel happy if their businesses are closed down.
“Taking care of the others? Emm, it does not happen here sir. Everyone is more into taking care of their own business. My business ruined years ago and nobody ever bothered to help me or maybe they like it better.
(Mr. F)
Such a reality happens due to the intense competition in their businesses, which leads to the poor relationship among them. The main thing that is being considered in their social relation is the profit or loss in their businesses.
“That’s right, I do not like him. He is my husband’s brother. But he never comes to my house, though our home is close to one another. Due to business reasons… He said I took his business. But he has forgotten that it was me who
open the business first. Since then our relationship remains in bad condition”.
(Mrs. A)
The tenuous relationship was detected because of their prejudice and lack of proper communication with one another. However, they did admit that they used to have good relationships, and that such a situation only started once they involved in business. This also happened because they were focusing on selling the same product(s). Thus, it raises the competition in terms of building, maintaining, expending and sustaining their businesses. Kinship is no longer a force to establish cooperation among them, and the relationship is no longer significant, especially when it is about gaining profit.
The situation will become worst if their effort in gaining profit is being deprived. For example, the efforts of the villagers and the intervention of former Senator of Orang Asli managed to get a building specifically designed for the villagers to run their businesses. However, the number of the stores is not sufficient to all the residents who are involved in the businesses. The problem has caused dissatisfactions among the Orang Kuala. They associate it with cronyism, i.e. the failure to get the shop is described as an effort to sustain and maintain family’s businesses.
“I asked for a shop, but was rejected! The shop must be for their families only. Like this person, he has three children who are doing
W. A. Amir Zal, Ma’Rof Redzuan, Asnarukhadi Abu Samah and Hanina H. Hamsan
1284 Pertanika J. Soc. Sci. & Hum. 21 (4): 1275 - 1295 (2013)
business … same business and everyone in his family got the store. And me? I do not get the store. How can I make a living here (in house). People no longer go from house to house to buy goods”.
(Mr. B)
The problem has caused distrust and unhappiness among them. It has developed a negative environment and tenuous relationship between the local people. The inadequacy of the stores was because there are many new middlemen who want to take advantage of the business. Their existence is not taken into account at the planning stage. This is due to the new traders who start to do business only after realizing the advantages and benefits that they would get from it.
2. Bridging Social Capital
Orang Kuala have good relationships with outsiders (people who are not of their community). The outsiders are divided into three categories; namely the customers, the people living nearby who are not Orang Kuala and the middlemen. However, the relationships or the way the outsiders are treated differs based on the category. They would treat the customers better and try to fulfil their requests by providing better services and supplying the desired goods, quantity, quality, price, and delivery service at reasonable prices. Orang Kuala only provide products that are considered as needs by their customers only.
“I buy all sorts of goods in Singapore, but I have to choose very well. If it is good for our customers, we will take it. But, we are not taking everything. Of course, we have to consider our customers’ tastes and needs. If not, we will not get the profit too, right?”.
(Mr. C)
The quality of the goods will then be improved; this includes repainting the furniture, and repairing electrical appliances that are purchased from Singapore, etc. By doing these, they hope to satisfy their customers’ requirements/ needs even though they are well aware the goods are of second-hand items. Prices are also placed reasonably and they also allow their customers to negotiate the price, depending on the profitability that they want to make. In fact, mutual trust exists between the Orang Kuala and their customers when they allow them to buy their products through debt. However, this applies only to customers whom they trust, or their regular customers. This shows a good rapport between Orang Kuala and their customers, although the relationship only involves business activities or buy-and-sell activities.
O r a n g K u a l a a l s o h a v e g o o d relationships with the non-Orang Kuala who are living nearby. The relationship is not only in the type of middleman-or-customer relationship but also in the social relation. Social relation means a relation seeks to add contacts and gain cooperation. This is to further assist their businesses. Through
The Exploration of Social Capital and Its Relation with Economic Empowerment
1285Pertanika J. Soc. Sci. & Hum. 21 (4): 1275 - 1295 (2013)
this study, it was also found that outsiders have been assisting Orang Kuala in their businesses. Assisting in their businesses such as business capitals are injected from people outside of the community to them. In fact, this support is easily obtained from the outsiders compared to Orang Kuala, their own community.
“Like I told before, I have closed down my shop four times (in business). Have I received any help from them? No! This person, (while point the finger at someone next to him), he helped me. Give me financial aid and support to build back my business. Others? No way, they just want to see me fail in my business”.
(Mr. F)
Orang Kuala made two types of network among the middlemen. First, the middlemen in Singapore and second the local middlemen. Through their middlemen in Singapore, Orang Kuala get second-hand goods. The local middlemen, on the other hand, buy goods from Orang Kuala and sell them in their shops. Orang Kuala have very good relations with both networks. Singapore middlemen are Bangladeshi who collect goods that are no longer needed by Singaporeans. They usually gather items in one place and then contact Orang Kuala to collect them.
The middlemen, however, are still new among Orang Kuala. Previously, Orang Kuala had to collect goods on their own.
They travelled to Singapore and went from house to house to collect any usable goods. One of the advantages of doing this is that they can obtain second-hand goods for free. Now, by using the services of the middlemen, Orang Kuala do not need to trouble themselves to collect second-hand goods. Instead, they just have to wait for phone calls from the middlemen to get the items that are already collected. However, Orang Kuala have to buy the items from the middlemen.
The transaction however only involves certain middlemen. This often depends on the prices offered by the middlemen and the quality of the products. If the goods are not of their liking, they will make deals with other middlemen. The middlemen will also do likewise; the transaction will only happen if the prices offered by Orang Kuala are appropriate. The middlemen will only contact that particular Orang Kuala and not other individuals of the tribe. Such a reality reflects good relationships between Orang Kuala and their middlemen. This is to ensure that their businesses are sustained and developed at the same time.
“Emm, they are very important. If we do not keep these people, we will face a lot of problems in business”.
(Mr. A)
Their relationships with the local middlemen who buy goods from them are similar with the one mentioned above. Local middlemen are not only of the local residents but also from Kelantan, Terengganu and
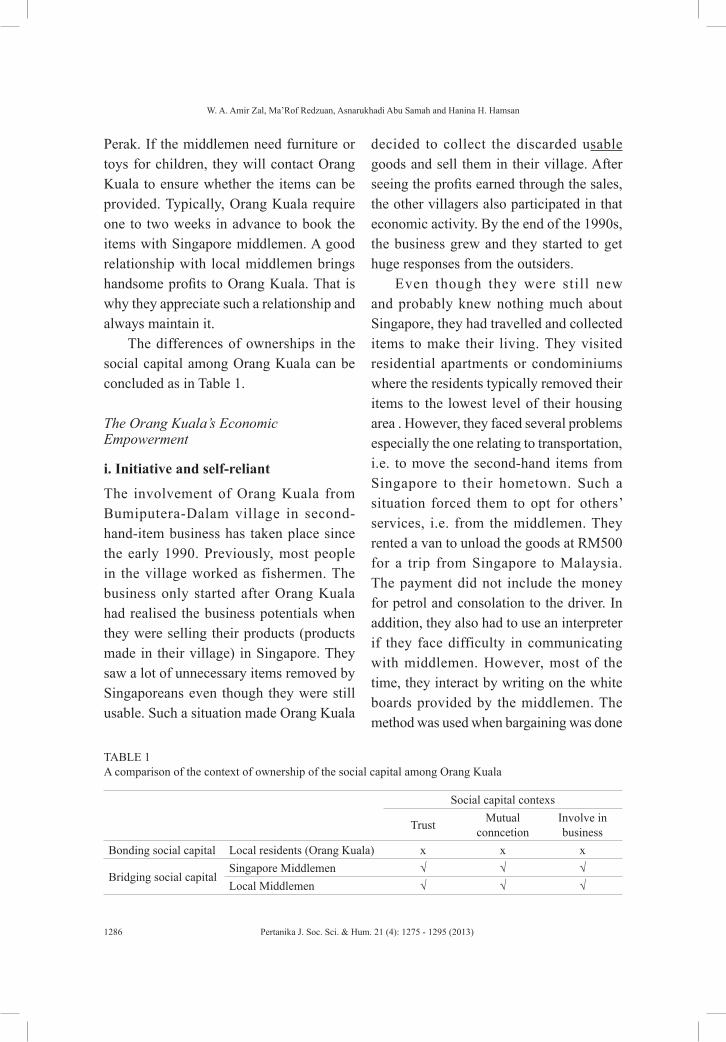
W. A. Amir Zal, Ma’Rof Redzuan, Asnarukhadi Abu Samah and Hanina H. Hamsan
1286 Pertanika J. Soc. Sci. & Hum. 21 (4): 1275 - 1295 (2013)
Perak. If the middlemen need furniture or toys for children, they will contact Orang Kuala to ensure whether the items can be provided. Typically, Orang Kuala require one to two weeks in advance to book the items with Singapore middlemen. A good relationship with local middlemen brings handsome profits to Orang Kuala. That is why they appreciate such a relationship and always maintain it.
The differences of ownerships in the social capital among Orang Kuala can be concluded as in Table 1.
The Orang Kuala’s Economic Empowerment
i. Initiative and self-reliant
The involvement of Orang Kuala from Bumiputera-Dalam village in second-hand-item business has taken place since the early 1990. Previously, most people in the village worked as fishermen. The business only started after Orang Kuala had realised the business potentials when they were selling their products (products made in their village) in Singapore. They saw a lot of unnecessary items removed by Singaporeans even though they were still usable. Such a situation made Orang Kuala
decided to collect the discarded usable goods and sell them in their village. After seeing the profits earned through the sales, the other villagers also participated in that economic activity. By the end of the 1990s, the business grew and they started to get huge responses from the outsiders.
Even though they were still new and probably knew nothing much about Singapore, they had travelled and collected items to make their living. They visited residential apartments or condominiums where the residents typically removed their items to the lowest level of their housing area . However, they faced several problems especially the one relating to transportation, i.e. to move the second-hand items from Singapore to their hometown. Such a situation forced them to opt for others’ services, i.e. from the middlemen. They rented a van to unload the goods at RM500 for a trip from Singapore to Malaysia. The payment did not include the money for petrol and consolation to the driver. In addition, they also had to use an interpreter if they face difficulty in communicating with middlemen. However, most of the time, they interact by writing on the white boards provided by the middlemen. The method was used when bargaining was done
TABLE 1 A comparison of the context of ownership of the social capital among Orang Kuala
Social capital contexs
Trust Mutual conncetion
Involve in business
Bonding social capital Local residents (Orang Kuala) x x x
Bridging social capitalSingapore Middlemen √ √ √Local Middlemen √ √ √
The Exploration of Social Capital and Its Relation with Economic Empowerment
1287Pertanika J. Soc. Sci. & Hum. 21 (4): 1275 - 1295 (2013)
between Orang Kuala and the Singaporean middlemen.
Despite of the huge cost involved and problems in communication, they are willing to do so because the profits gained will be much greater than the costs they need to pay. These show they have the initiatives to improve their life.
The efforts made by the Orang Kuala reflect the characteristics of their economic empowerment which is self-reliant. More importantly, they realize the opportunity to improve their economy and subsequently use own capabilities even though they do not have basic business skills such as reading and writing skills, which are crucial for the aforementioned activity.
“I was the first person to start the business. At that time I knew nothing about business what more how to read and write. But I know how to calculate money. Hehehe. Yes, I also do not know how to begin my business. I only observed others, so I tried too. Everything was on my own.
(Mr. B)
ii. Decision Making and Economic Consideration Skills
Orang Kuala also have the skills to estimate the prices of goods to be purchased from the middlemen without depending on others. They do this by estimating the prices that will probably be offered by the customers and the profits that they will make. Such a logical thought helps them to gain profits.
“That’s easy, first I wilI estimate the number of customers that would buy the item, then I will add the basic price with the profit that I want and other costs; transportation and others. That is how my business is being conducted”.
(Mrs. A)
Their involvement in businesses also requires them to learn about foreign exchange currency rates. Purchasing goods from Singapore requires them to use Singapore dollar. Therefore, they need to know the amount of money to use since the goods are sold in Singapore dollar. The skill enables them to reap greater benefits if they know about currency exchange.
From another aspect, the ability to empower their economy is also due to the freedom in making decisions; they have the power to decide on what to do with their income. This power also includes determining the goods to be bought with their money. Their decisions are not influenced by other people but rather based on their own considerations. Similarly, they have freedom to inject capital into their businesses and to purchase new assets for their businesses.
“No, no one has forced me on how to utilize my money. My money is my money; I know what I can do with my money. I use it to buy new stuff. Ha, this house, my husband and I used our savings to build it”.
(Mrs. A)
W. A. Amir Zal, Ma’Rof Redzuan, Asnarukhadi Abu Samah and Hanina H. Hamsan
1288 Pertanika J. Soc. Sci. & Hum. 21 (4): 1275 - 1295 (2013)
iii. Worthwhile Returns
Finally, they stated that the income they earn from their businesses is worthwhile. They even claimed that their lives are different now compared to the previous days, where their main economic activities only focused on works related to the sea. To date, they have been able to build their own houses with the aforementioned income. Moreover, they can afford to buy other things such as cars and motorcycles. When asked about being independent in businesses, they agreed that they would be able to maintain their businesses without having to depend on other people, particularly on outsiders. However, they do not deny the fact that certain roles still need to be played by outsiders, and these are important to help their businesses to grow.
“I have never been helped by other people. People of Department (officers of Jabatan Kemajuan Orang Asli) never ask us about our business. Nope, do these people (the JAKOA) know how to do their work? But for me, I still want help from the outsiders. Like bankers. We need funds to do this business”.
(Mr. A)
These findings show that the economy of Orang Kuala in the village of Bumiputera Dalam is very much empowered. It can be seen through the ownership of the attitudes of independent and initiative, ownership of fixed income and assets, and changes in life, especially in the economy.
The Relationship between Social Capitals and Economy Empowerment
This study also found that the bonding social capital of Orang Kuala is negative. This is because the relationship between Orang Kuala is depressing and tenuous. The situation does not contribute to the economic empowerment of Orang Kuala. In particular, it is a rare practice among Orang Kuala to help each other in advancing or expanding their businesses. Instead, they compete negatively and this leads to conflicts with each other. Being suspicious with others creates negative reactions among them and this does not help their economy empowerment in the long run.
“I do not know. But so far I have never asked help from other people. I must be flexible in order to live. If it is difficult to get even a customer, I will do something to attract them to my shop. But to date, for whatever reason, these people never help me”.
(Mr. C)
In contrast, the bridging social capital among the Orang Kuala helps to empower their economy. The increase in revenues, and the ability to enhance and grow businesses stand out among them. This Orang Asli group even think that by having good relations with the outsiders will bring their businesses to another higher level. Success is measured through acquisition and increases in their income.
The Exploration of Social Capital and Its Relation with Economic Empowerment
1289Pertanika J. Soc. Sci. & Hum. 21 (4): 1275 - 1295 (2013)
“Em, if you want to compare between the folks and outsiders, from my point of view, the outsiders are better. The reason ... I think, the villagers will never buy our goods, because these people have their own shop as well (selling the same item). But with outsiders, our profits are multiplied. I remember, the first time I started doing this business outsiders rushed to my shop to buy things from me. I definitely earn more money from the outsiders”.
(Mr. A)
A good relation between Orang Kuala and Singapore middlemen is meaningful. If they have good quality items, the Singapore middlemen will contact Orang Kuala. The middlemen will not sell the items to other Orang Kuala except to the one who has good relation with them. Thus, for the Orang Kuala, relationship with Singapore middlemen should be treated with care.
The relationship between Orang Kuala and local middlemen is also good. Apart from collecting items that have been booked in advance, they also buy goods which are available at Orang Kuala’s shops. Such an action allows Orang Kuala to clear their stocks immediately and purchase other
goods for sale. In this way, Orang Kuala can earn benefits faster. The relationship between Orang Kuala and outsiders also helps their economic empowerment. Financial supports, received from banks or loans, have enabled Orang Kuala to start their businesses. It also allows Orang Kuala to continue their businesses even though they have failed before. The relationship between social capital and economic empowerment has been concluded in Table 2.
CONCLUSION
In this study, we found that Orang Kuala have both types of social capital, known as the bonding social capital and the bridging social capital. The bonding social capital is represented by the relationship that exists between Orang Kuala or the relationship within the people in their community. The bonding social capital, from this study however, was found to be rather weak and it is manifested through negative behaviours such as ignorance and prejudice; they believe that everyone in their community is trying to destroy each other’s business.
This finding indicates a different reality from the studies done by some previous researchers. For example, Larsen et al. (2004) elucidated the bonding social capital could generate collective actions, especially
TABLE 2 The Correlation between Social Capitals and Economic Empowerment
Type of economic empowermentMutual in business Income increase Self-reliance
Bonding social capital X X XBridging social capital √ √ √
W. A. Amir Zal, Ma’Rof Redzuan, Asnarukhadi Abu Samah and Hanina H. Hamsan
1290 Pertanika J. Soc. Sci. & Hum. 21 (4): 1275 - 1295 (2013)
in poor communities. Similarly, views made by George (2008) and De Silva et al. (2007) stress on the importance of bonding social capital for the community in dealing with a variety of problems. In contrast, this study also found that bonding social capital does not generate collective actions among the people of Orang Kuala, especially in increasing their business revenues. Instead, Orang Kuala consider others in their community as a threat to the continuity of their businesses.
The bridging social capital, on the other hand, indicates the opposite; Orang Kuala’s bridging social capital is particularly strong with the middlemen, the nearby outsiders and their customers. It is manifested in the sense of trust, proper communication and participation in economy activities and such actions have increased their revenues. The findings run in tandem with Coffé and Geys (2007) who conclude that the bridging social capital is essential to any community. This is also agreed by Bridger and Alter (2006) who state bridging social capital allows community members to have access to external resources and promote the dissemination of information through the creation of network.
In reality, the economy of Orang Kuala is now empowered. They manage to use second-hand products as a means to provide them income. The initiatives and their efforts to maintain and sustain their businesses are fundamental indicators of their economic empowerment. Apart from that, the skills to determine the price of items, quantity that need to be supplied and other considerations
to ensure a good income also indicate that they are economically empowered. These findings show similar characteristics to the economic empowerment found by some previous researchers. The characteristics are independent (Wilson, 1996, Moyle et al., 2006; Kapitsa, 2008), the acquisition and increasing of income (Costa, 2005; Moyle et al., 2006; Kapitsa, 2008), the ability to control their income (Kantor, 2005; Basargekar, 2009) and fulfil needs (Costa, 2005), and the ability to decide on how to use the income (Kantor, 2005).
This study, therefore, differs in the fact that bonding social capital does not help the economic empowerment of Orang Kuala. On the other side of the coin, bridging social capital leads to their economic empowerment. This finding reinforces the findings made by Costa (2005) that the outside network will increase the income and the ability to meet their own needs themselves and their families. The study also supports the conclusion disclosed by Coffé and Geys (2008) and Rusch (2010) that the bridging social capital is known as the bright side of social capital, while the bonding social capital is the dark side of the community (Kay, 2006; Coffé & Geys, 2008; Bottrell, 2009).
REFERENCESAgnitsch, K., Flora, J., & Ryan, V. (2006). Bonding
and Bridging Social Capital: The Interactive Effects on Community Action. Journal of the Community Development, 37(1), 36-51.
Ajayi, R. & Otuya, N. (2006). Women’s participation in self-help community development projects in Ndokwa agricultural zone of Delta State,
The Exploration of Social Capital and Its Relation with Economic Empowerment
1291Pertanika J. Soc. Sci. & Hum. 21 (4): 1275 - 1295 (2013)
Nigeria. Community Development Journal, 41(2), 189–209.
Amir Zal, W. A. & Ma’Rof Redzuan. (2010). Komuniti Orang Asli Temiar Hubungannya dengan Peraih Hasil Hutan. Seri Kembangan: Citrus Printing & Silkscreen.
Andaya, L. A. (2008). Leaves of the same tree - Trade and ethnicity in the Straits of Malaka. Honolulu: University of Hawaii Press.
Asnarulkhadi, A. S., & Hanina H. H. (2008). Pendekatan dan Model Pembangunan Komuniti Orang Asli: Satu Ulasan. Dalam Ma’Rof Redzuan dan Sarjit S. (Eds.), Orang Asli Isu, Tranformasi dan Cabaran (hlm. 25-43). Serdang: Penerbit Universiti Putra Malaysia.
Basargekar, P. (2009). Economic Empowerment Through Microfinance. Journal of Business Insights & Transformation, 2(1), 64-74.
Bose, M. L., Alia Ahmad ., & Mahabub Hossain. (2009). The Role of Gender in Economic Activities with Special Reference to Women’s Participation and Empowerment in Rural Bangladesh . Gender, Technology and Development, 13(1), 69–102.
Bottrell, D. (2009). Dealing with Disadvantage Resilience and the Social Capital of Young People’s Networks. Youth and Society, 40(4), 476-501.
Boyd, C. P., Hayes, L., Wilson, R. L., & Bearsley-Smith, C. (2008). Harnessing the social capital of rural communities for youth mental health: An asset-based community development framework. Aust. J. Rural Health, 16, 189–193.
Bridger, J. C., & Alter, T. R. (2006). Place, Community Development, and Social Capital. Journal of the Community Development Society, 37(1), 5-18.
Callaghan, E. G., & Colton, J. (2008). Building sustainable & resilient communities: a balancing of community capital. Environment, Development and Sustainability, 10 (6), 931–942.
Cameron, J., & Gibson, K. (2008). ABCD Meets DEF: Using Asset Based Community Development to Build Economic Diversity. Paper presented at the Asset Based Community Development Conference, The University of Newcastle, 3 – 5 December 2008.
Campbell, A., Hughes, J., Hewstone, M., & Cairns, E. (2010). Social capital as a mechanism for building a sustainable society in Northern Ireland. Community Development Journal, 45(1), 22–38.
Carey, I. (1977). The Resettlement of the Orang Asli from a Historical Perspective. Federation Musuems Journal, 24, 158-176.
Chou, C. (2003). Indonesian Sea Nomads Money, Magic, and fear of the Orang Suku Laut. British: Taylor & Francis Group.
Coffé, H., & Geys, B. (2008). Measuring the Bridging Nature of Voluntary Organizations The Importance of Association Size. Sociology, 42(2), 357–369.
Coker, E. M. (2008). Religion, ethnicity, and community mental health: service provision and identity politics in an unplanned Egyptian community. Community Development Journal, 43(1), 79–92.
Costa, J. A. (2005). Empowerment and Exploitation: Gendered Production and Consumption in Rural Greece. Consumption, Markets and Culture, 8(3), 313–323.
Dale, A., & Newman, L. (2010). Social capital: a necessary and sufficient condition for sustainable communi ty deve lopment? Communi ty Development Journal, 45(1), 5–21.
Du Toit, A., Kruger, S., & Ponte, S. (2008). Deracializing Exploitation? Black Economic Empowerment in the South African Wine Industry. Journal of Agrarian Change, 8(1), 6–32.
W. A. Amir Zal, Ma’Rof Redzuan, Asnarukhadi Abu Samah and Hanina H. Hamsan
1292 Pertanika J. Soc. Sci. & Hum. 21 (4): 1275 - 1295 (2013)
Dunn, F. L. (1976). Rain-forest Collectors and Middlemen: A Study of Resource Utilization in Modern and Ancient Malaya. Monographs of the Malaysian Branch of the Royal Asiatic Society (5). Kuala Lumpur: MBRAS.
Emery, M., & Flora, C. (2006). Spiraling-Up: Mapping Community Transformation with Community Capitals Framework. Journal of the Community Development, 37(1), 19-35.
George, B. P. (2008). Local community’s support for post-tsunami recovery efforts in an agrarian village and a tourist destination: a comparative analysis. Community Development Journal, 43(4), 444–458.
Gianno, R., & Bayr, K. J. (2009). Semelai Agricultural Patterns: Toward an Understanding of Variation Among Indigenous Cultures in Southern Peninsular Malaysia. Journal of Southeast Asian Studies, 40(1), 153–185.
Gomes, A. G. (2004). Looking for Money - Capitalism and Modernity in an Orang Asli Village. Subang Jaya: Center Orang Asli Concern.
Gomes, A. G. (2007). Modernity and Malaysia Settling the Menraq forest Nomads. Britain: Routledge.
Goulding, C. (2002). Grounded Theory A Practical Guide for Management, Business and Market Researchers. British: SAGE Publications Ltd.
Gray, P. S., Williamson, J. B., Karp, D. A., & Dalphin, J.R. (2007). The Research Imagination: An Introduction to Qualitative and Quantitative Methods. USA: Cambridge University Press.
Green, G. P., & Dougherty, M. L. (2008). Localizing Linkages for Food and Tourism: Culinary Tourism as a Community Development Strategy. Community Development, 39(3), 148-158.
Hollifield, C. A., Donnermeyer, J. F., Wolford, G., & Agunga, R. (2007). Leading Community Innovation: Organizing Successful Rural Telecommunications Self-Development Projects. Community Development, 38(2), 52-67.
Itam Wali Nawan. (1993). Rancangan Pengumpulan Semula (RPS) Orang Jahai; Kajian Kes Mengenai Perubahan Sosial di RPS Air Banun. Bangi: Penerbit UKM.
JHEOA (2008). Data Maklumat Asas. Kuala Lumpur: Percetakan Nasional Malaysia Berhad.
Kantor, P. (2005). Determinants of Women’s Microenterprise Success In Ahmedabad, India: Empowerment And Economics. Feminist Economics, 11(3), 63 – 83.
Kapitsa, L. M. (2008). Women’s Economic Empowerment. United Nations Division for the Advancement of Women Expert Consultation on the 2009 World Survey on the Role of Women in Development: Women’s control over economic resources and access to financial resources, including microfinance. Bangkok, Thailand: 12-14 November.
Kay, A. (2006). Social capital, the social economy and community development. Community Development Journal, 41(2), 160–173.
Kretzmann, J. P., & McKnight, J.L. (1993). Building Communities from the Inside Out: A Path Toward Finding and Mobilizing a Community’s Assets. Chicago: ACTA Publications.
Larsen, L., Harlan, S. L., Bolin, B., Hackett, E. J., Hope, D., Kirby, A., Nelson, A., Rex, T. R., & Wolf, S. (2004). Bonding and Bridging Understanding the Relationship between Social Capital and Civic Action. Journal of Planning Education and Research, 24, 64-77.
Laverack, G., & Thangphet, S. (2009). Building community capacity for locally managed ecotourism in Northern Thailand. Community Development Journal, 44(2), 72–185.
Leonard, M. (2004). Bonding and Bridging Social Capital: Reflections from Belfast. Sociology, 38(5), 927–944.
Majumdar, S. R. (2008). Using the Survey as an Instrument of Inquiry in Research. In G.J. Miller, and K. Yang (Eds.), Handbook of Research
The Exploration of Social Capital and Its Relation with Economic Empowerment
1293Pertanika J. Soc. Sci. & Hum. 21 (4): 1275 - 1295 (2013)
Methods in Public Administration (pp. 241-254). USA: Taylor & Francis Group.
Mansor Mohd Noor, Abdul Rahman Abdul Aziz, & Mohamad Ainuddin Iskandar Lee. (2007). Hubungan etnik di Malaysia. Petaling Jaya Pearson: Prentice Hall.
Monkman, K., Ronald, M., & Théramène, F. D. (2005). Social and Cultural Capital in an Urban Latino School Community. Urban Education, 40(4), 4-33.
Moyle, T. L., Dollard, M., & Biswas, S. N. (2006). A Self-help Group Approach Personal and Economic Empowerment in Rural Indian Women: A Self-help Group Approach. International Journal of Rural Management, 2, 245-266.
Nicholas C., Chopil T. Y., & Sabak T. (2003). Orang Asli Women and the Forest. Subang Jaya: Center for Orang Asli Concern.
Payne, P. R. (2006). Youth Violence Prevention through Asset-Based Community Development. New York: LFB Scholarly Publishing LLC.
Phillips, R., & Pittman, R. H. (2009). An Introduction to Community Development. USA: Routledge.
Ponte, S., Roberts, S., & Sittert, L. V. (2007). Black Economic Empowerment, Business and the State in South Africa. Development and Change, 38(5), 933–955.
Putnam, R. D. (2000). Bowling Alone: The Collapse and Revival Of American Community. New York: Simon & Schuster.
Qingwen, X., Perkins, D. D., & Chun, J. C. C. (2010). Sense of Community, Neighboring, and Social Capital as Predictors of Local Political Participation in China. American Journal of Community Psychology, 45(3-4), 259–271.
Rambo, A. T. (1979). Human Ecology of the Orang Asli: A Review of Research on the Enviroment Relation of the Aborigines of Peninsular Malaysia. Federal Museums Journal, 24, 41-74.
Ramle Abdullah. (2007). Orang Asli Dalam Arus Pembangunan Nasional: Analisis Persepsi dan Penerimaan Terhadap Pembangunan di Kalangan Orang Asli di Terengganu. In Arshad Abd. Samad, Asmawati Suhid, Bahaman Abu Samah, Jamilah Othman, Jegak Uli, Mazanah Muhamad, Nobaya Ahmad, & Samsilah Roslan. (Eds), Seminar Kebangsaan Sains Sosial: Sains Sosial Teras Pembangunan Modal Insan Jilid 1 (pp. 105-119). Serdang: Institut Pengajian Sains Sosial (IPSAS) UPM.
Ramle, A. (1993). Semaq Beri Komuniti Orang Asli di Terengganu. Terengganu: Percetakan Yayasan Islam Terengganu Sdn. Bhd.
Robbins, D. (2008). Questionnaire Construction. In G.J. Miller and K. Yang (Eds.), Handbook of Research Methods in Public Administration (hlm. 255-268). USA: Taylor & Francis Group.
Rusch, L. (2010). Rethinking Bridging: Risk and Trust in Multiracial Community Organizing. Urban Affairs Review, 45(4), 483–506.
Sarjit S. G., & Amir Zal W.A. (2009). Penerimaan Belia Orang Asli terhadap Teknologi Maklumat Komunikasi ICT di Selangor. Dalam Abdul Razaaq Ahmad dan Zalizan Mohd Jelas (Pyt) (hlm: 119-132). Masyarakat Orang Asli: Perspektif Pendidikan dan Sosiobudaya. Bangi: Penerbit UKM.
Toshihiro, N. (2009). Living on the Periphery Development and Islamization among the Orang Asli in Malaysia. Subang Jaya: Center for Orang Asli Concerns.
Tuck-Po, L. (2005). Changing Pathways Forest Degration and The Batek pf Pahang, Malaysia. Petaling Jaya: Strategic Information Research Development.
UN-HABITAT (2008). An Asset-based Approach to Community Development and Capacity-Building; the Human Settlements Financing Tools and Best Practices Series. Nairobi: United Nations Human Settlements Programme.

W. A. Amir Zal, Ma’Rof Redzuan, Asnarukhadi Abu Samah and Hanina H. Hamsan
1294 Pertanika J. Soc. Sci. & Hum. 21 (4): 1275 - 1295 (2013)
Verhoef, G. (2008). Nationalism, social capital and economic empowerment: SANLAM and the economic upliftment of the Afrikaner people, 1918–1960. Business History. 50(6), 695–713.
Vyas, S., & Watts, C. (2009). How Does Economic Empowerment Affect Women’s Risk of Intimate Partner Violence in Lowand Middle Income Countries? A Systematic Review of Published Evidence. Journal Of International Development, 21, 577–602.
Vyas, S., & Watts, C. (2009). How Does Economic Empowerment Affect Women’s Risk of Intimate Partner Violence in Lowand Middle Income Countries? A Systematic Review of Published Evidence. Journal Of International Development, 21, 577–602.
Walliman, N. (2006). Social Research Methods. London: SAGE Publications Ltd.
Wazir-Jahan Begum Karim (1981). Ma’ Betisek Concepts of Living Things. New Jersey: The Athlone Press.
Wilson, P. A. (1996). Empowerment: Community Economic Development from the Inside Out. Urban Studies, 33, 617-630.
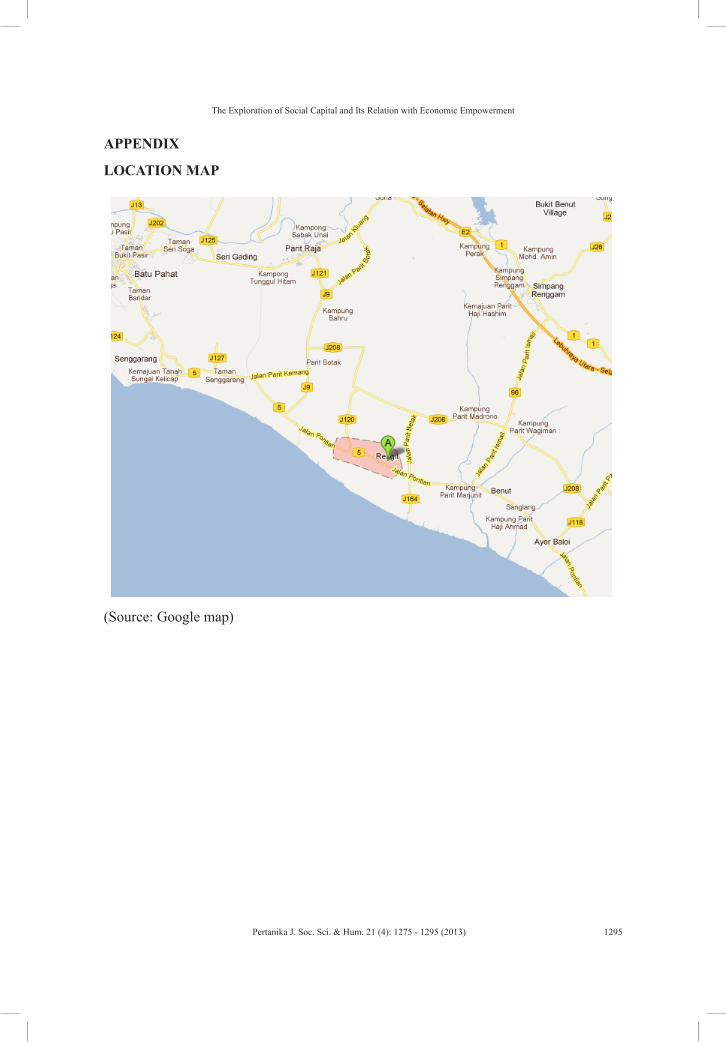
The Exploration of Social Capital and Its Relation with Economic Empowerment
1295Pertanika J. Soc. Sci. & Hum. 21 (4): 1275 - 1295 (2013)
APPENDIX
LOCATION MAP
(Source: Google map)

Pertanika J. Soc. Sci. & Hum. 21 (4): 1297 - 1308 (2013)
ISSN: 0128-7702 © Universiti Putra Malaysia Press
SOCIAL SCIENCES & HUMANITIESJournal homepage: http://www.pertanika.upm.edu.my/
Article history:Received: 18 August 2011Accepted: 2 August 2012
ARTICLE INFO
E-mail address: [email protected] (Rosli Talif)
Cultural Conflict in Ian McEwan’s On Chesil Beach through Semiotics
Mina Abbasiyannejad and Rosli Talif*Department of English, Faculty of Modern Languages and Communication, Universiti Putra Malaysia, 43400 UPM Serdang, Selangor, Malaysia
ABSTRACT
Contemporary British writer Ian McEwan explored various themes as he progressed from his early fiction to his later work, focusing more on personal relationships in the later years and how such relationships were affected by cultural and other issues of the time. He also shows how the macrocosm, which is society, affects the microcosm (human relationships) directly or indirectly. His meticulous writing style is obvious in all of his works. McEwan’s careful choice of words and use of similes, metaphors and symbols creates diverse moods and touches the very emotional and psychological core of the reader. On Chesil Beach is an excellent example of his craft, as he presents the reader with conflicts at various levels. The protagonists, Edward and Florence, suffer the burden of belonging to different social classes; challenged by the constraints of Victorian-era sexual boundaries while facing the consequences of a lack of proper communication and miscommunication. Edward and Florence, like most of the major characters of McEwan’s later novels, are victims of their time and this paper strives to understand, and interpret the signs by using semiotics as a tool to unravel the meaning behind the words.
Keywords: On Chesil Beach, Ian McEwan, sexual boundaries, conflicts, semiotics, Victorian-era
closely at his themes and the nature of his literary style. His particular interest in relationships is obvious in most of his works. In an interview with Ryan Roberts, he admits that “we are social creatures, and relationships are where we live, unless our lives are spent tragically alone” (2008, p. 188). He pictures various types of relationships in his works, between
INTRODUCTION
McEwan’s fiction has attracted much attention from critics and scholars alike and there is ample literature that has looked
Mina Abbasiyannejad and Rosli Talif
1298 Pertanika J. Soc. Sci. & Hum. 21 (4): 1297 - 1308 (2013)
lovers, between parents and children, and among individuals. The portrayals of the relationships are overwhelmed with conflicts that offer a rich source of critical comment and study. This paper focuses particularly on the relationship between Edward and his new bride, Florence and explores the complex nature of the failure of their relationship by looking at the various semiotic signposts that pepper the story.McEwan shifted from “macabre” subjects of murder, incest, paedophilia, and homosexuality, in his early works to more general and social issues such as family matters in his later works. He focused on familial disagreement and dispute, which would almost always end disastrously. He also focused on political and historical issues that directly or indirectly affected people’s lives. Zalewski in the New Yorker said “McEwan’s empirical temperament distinguishes him from his contemporaries such as Martin Amis, Salman Rushdie and Julian Barnes.” It has also been commented that McEwan has the ability to narrate the story in slow motion at the moments of highest intensity, a kind of suffering that readers enjoy, but the characters struggle with personal anguish (2009, p. 2).
McEwan’s fascination with taboo subjects runs through his fiction. In his book, Sex and Sexuality in Ian McEwan’s Works, Byrnes (2004) mentions, “McEwan’s portrayal of sexuality is to highlight various aspects of relationship, interpersonal communication, closeness, and distance, status and the acting out of erotic fantasy” (p. 5). Cultural conflicts arise as a result
of class distinction, among others, and they affect his characters’ lives and lead to sexual incompatibility, unhappiness and relationship failures.
On Chesil Beach is a story of failure and incompatible relationship. A young couple gets married in 1962, but despite their deep love for each other, their marriage lasts no more than eight long, confused and unhappy hours. Their relationship is burdened by their class difference, and in the end, it is a social, emotional and psychological chasm that proves too wide to bridge. Florence belongs to upper class society and enjoys a luxurious life style, while Edward hails from the lower middle class. McEwan, through his writing technique creates a picture in the mind’s eye and establishes a scene that the reader sees and feels.
Semiotics, as a tool, aids the reader in exploring the effectiveness of McEwan’s writing style in On Chesil Beach and shows how he succeeds in touching the sensibilities and feelings of the reader. This paper aims to firstly, shed light on the relation between semiotics and literature, and how semiotics enhances our understanding in reading literature. Secondly, it identifies the various conflicts that exist; and thirdly, this paper analyses the various signs, symbols and icons, images, and metaphors that indicate these conflicts and explain their implications.
SEMIOTICS AND LITERATURE
Studying semiotics enables us to become more aware of the role of signs and their importance in our lives. Semiotics is not
Cultural Conflict in Ian McEwan’s On Chesil Beach through Semiotics
1299Pertanika J. Soc. Sci. & Hum. 21 (4): 1297 - 1308 (2013)
only helpful for people who study language, literature and cultural studies, but also generally helps the understanding of all types of signs used and that exist in human culture . Signs surround us in our everyday life and we continually make meaning by interpreting these signals (Johansen, 2002, p. 6). A range of theories and methodological tools are employed in the field of study called semiotics. Umberto Eco (1976), in his book, A Theory of Semiotics, states that “semiotics is concerned with everything that can be taken as a sign” (p. 7).
The study of semiotics encompasses both signs in everyday speech and also anything, which denotes something else. It looks at how meaning is constructed and how reality is represented, so that signs take the form of words, images, sounds, gestures and objects (Chandler, 2007, p. 2). The difference between semiotics and other literary criticism is that semiotics is concerned with how “language and literature convey meanings” while other literary criticism, “asks what texts mean” (Atkins & Morrow, 1989, p. 61).
Umberto Eco developed his theories in the twentieth century. In his article, “Theory of Signs and the Role of the Reader,” he argues that literary texts are fields of meaning and they contain meaning more than one can imagine. We can always get new meaning from them “precisely because signs are the starting point of process of interpretation which leads to an infinite series of progressive consequences. Signs are open devices, not stiff armors prescribing a bi-conditional identity” (1981,
p. 44). He also believed that words are “in their dictionary form” when they are outside the text, they convey different meanings therefore context makes the meanings. It shows that text plays a vital role in creating meanings. He asserts, “texts are loci where sense is produced...when signs are isolated and removed from the living texture of a text, they do become spectral and lifeless conventions” (p. 37). Ronald Barthes states, “Semiotics shows how meaning is possible” (as cited in Davis, 1989, p. 253).
Recently, Charles Sanders Peirce’s theory of signs has attracted much research and many scholars. Peirce states, “We think only in signs” (1998, p. 10). Misak, in The Cambridge Companion to Peirce (2004), explains that,
Thought, for Peirce, is always conceptual, hence, general in content. And he developed this idea in a distinctly contemporary (though also Platonic) way, by identifying thought as internalized discourse. Thought is a species of semiotic behavior, generally but not exclusively verbal, on a par with speech and writing; our capacity to think is dependent on our having learned a language. To conceive of thought as a sign thus presupposes that words and sentences are signs
(p. 216).
Contexts play a crucial role in semiotics, since words have different meanings in different contexts. The book, Contemporary
Mina Abbasiyannejad and Rosli Talif
1300 Pertanika J. Soc. Sci. & Hum. 21 (4): 1297 - 1308 (2013)
Literary Theory, explains the relationship of meaning in semiotics and restores literature to its many contexts. Consequently, semiotics explores the inner structures, questioning meaning as expressed, within specific categories and how they have been organized (1989, p. 61). In semiotics, connotations play a crucial rule. Beyond their literal meaning, words have various other meanings, within society and culture. Thomas Sebeok (2001) maintains that depending on usage and situation, most human signs have the capacity to encode two primary kinds of referents—denotative and connotative (p. 6).
Jonathan D. Culler (2001) in The Pursuit of Signs: Semiotics, Literature, Deconstruction says that semiotics introduces a methodology that is lucid and clear that was often disregarded when studying literature and culture (p. xiv & xv). The association between semiotics and culture reveals that signs are meaningful within a particular culture whether the signs are produced by that culture or attributes meaning to signs. In the same trend, Robert Scholes (1977) in Toward the Semiotics of Literature explains the relationship between semiotics and the study of literature in the way that generally studying literature must involve semiotics and in particular in production and interpretation of the most important kinds of literature that are ruled by codes of semiotics (p. 15). McEwan’s obsession with language is rooted in his family background. He always attempts to write in a “secure and complete” way, employing imagery and visualizing
everything. In Mother Tongue (2001), McEwan explains that after he writes he questions himself, “Did it really say what I mean? Did it contain an error or an ambiguity that I could not see?” (para. 12, p...). He has the ability to visualize the brutality of war and its consequences to the reader. McEwan in Ian McEwan, The Essential Guide states “You have got to make your reader see and when people accuse me of being too graphic in my depiction of violence, my response is, well… you’ve got to show it in all its horror” (Reynolds & Noakes, p. 22 - 23). In addition, the preface of the same book emphasizes McEwan’s concern with language “… a separate concern is McEwan’s interest in language. It’s his vehicle certainly. But he also knows that it is one that can be abused, used to deceive, to cheat, to deprave” (p. 8).
Reading On Chesil Beach through semiotics
McEwan’s portrayal of character conflict is not so much explicit as implicit. His careful and meticulous choice of words, use of adjectives, metaphors and gestures evoke mental pictures and suggest in the reader’s mind, emotional vistas that are the result of his “showing” rather than “telling” of his story. He paints pictures in the mind of the reader through his story-telling technique. This section identifies the semiotic tools that McEwan employs in his story telling to enrich his writing style. The title itself, On Chesil Beach is symbolic. McEwan in an audio conversation with Charlie Rose (2007) explains that Chesil Beach is a
Cultural Conflict in Ian McEwan’s On Chesil Beach through Semiotics
1301Pertanika J. Soc. Sci. & Hum. 21 (4): 1297 - 1308 (2013)
place confined between two places, one side is the English Channel and on the other side there is a lagoon. He said his aim for choosing such a location is to create a sort of trap. The narrow place symbolizes the English cultural restrictions of the time. He rationalizes that such a physical location is representative of the two people caught in a societal bind, unable to escape the boundaries that enclose them. The characters’ final argument takes place on Chesil Beach, a place that foreshadows being trapped in a disastrous circumstance, from which they cannot be freed.
The story begins on the wedding day of Edward and Florence. The bride and groom seem to be happy and spend a lovely time in their luxurious hotel surroundings. “Superficially they were in fine spirits. Their wedding at St Mary’s, Oxford, had gone well; the service was decorous, the reception jolly, the send-off from school and college friends raucous and uplifting” (Italics are mine, p. 3). The signposts are there: “superficially” hints at the hypocrisy of putting on the correct public face befitting the occasion, in the presence of guests, both acquainted and strangers. The propriety and formal correctness that a high society wedding demands is implied by the way the service is “decorous.” The “jolly” reception perhaps is the most sincere, and we immediately imagine the couple relaxing and at ease in the company of their respective social peers, while the “raucous” and “uplifting” mood of the send off paints a picture of high-spirited young people, male and female, friends of both
Edward and Florence, having a good time but in retrospect, we will come to realize the word superficially, could be cleverly foreshadowing the deep-set incompatibility of the bride and groom, which eventually leads to their breakup.
Edward and Florence are spending their honeymoon. They have their supper in the “tiny” sitting room. While there is “a four-poster bed, rather narrow, whose bedcover was pure white and stretched startlingly smooth, as though by no human hand...” (“Italics,” p. 3). The “tiny” sitting room is indicative of the many social, cultural restrictions that hem them in; the four-poster bed, covered with curtains is intimidating, the whole physical atmosphere of the room appears to reflect the deep-set and private feelings of both Edward and Florence that may never be exorcised and must forever be kept secret and hidden.They had so many plans, giddy plans, heaped up before them in the misty future” (p. 5). Their plans are “giddy”, lightheaded, and indefinite; their future is at best, “misty”, vague, uncertain, and unpredictable.
Cultural restriction towards sexuality in the 1960s
“This was still the era—it would end later in that famous decade—when to be young was a social encumbrance, a mark of irrelevance, a faintly embarrassing condition for which marriage was the beginning of a cure” (p. 6). In one sentence like the above, McEwan paints a picture of an era merely with the clever choice of words: it is a time when the young have to be tolerated because they
Mina Abbasiyannejad and Rosli Talif
1302 Pertanika J. Soc. Sci. & Hum. 21 (4): 1297 - 1308 (2013)
are a ‘social encumbrance’ and irrelevant in an era when adults reign supreme and to be young is be an embarrassment that can begin to be eliminated on marriage. The socio-cultural message for the era is that acceptance in the society of this era can only come with age and that marriage is the key to social respect and acceptance . Marriage itself is an unknown world for the young, a mysterious frightening puzzle.
The time is 1962 and discussing sexual matters publicly is taboo. To discuss or even think of what the bride and groom are going to do is out of the question. It is just not done. Edward is acutely aware of this and McEwan puts it thus:
“[Edward was] proud and protective, the young man watched closely for any gesture or expression that might have seemed critical. He could not have tolerated any sniggering”
(p . 4).
Deep down he has the feeling of someone who is going to do something shameful; he feels so vulnerable and defensive, before any attack. “The lads” are aware of this and try to be as emotionless as possible. “The lads with bowed backs and closed faces, and their manner were tentative” (“Italics,” p. 4). Obviously, “the lads” are uncomfortable and are afraid of making mistakes to reveal their awareness of the upcoming sex between the newlywed bride and groom. Here, McEwan employs symbolic gestures, which are meaningful taken in the context of the
socio-cultural atmosphere of 1960s Britain when matters pertaining to sex, explicit or implicit, made people uncomfortable.
McEwan shows the cultural attitude of the time that considered marriage as the beginning of adulthood. He describes how it affects the characters and prevents them from doing what actually they like to do even when they are behind closed doors, as shown below:
It was, in theory, open to them to abandon their plates, seize the wine bottle by the neck and run down to the shore and kick their shoes off and exult in their liberty… They were adults at last, on holiday, free to do as they chose. In just a few years’ time, that would be the kind of thing quite ordinary young people would do. But for now the times held them. Even when Edward and Florence were alone, a thousand unacknowledged rules still applied”
(“Italics,” p. 18).
T h e y a r e s u r r o u n d e d b y t h e “unacknowledged rules” of their time that are the social do’s and don’ts that both of them are aware of, and which control them.
Edward suffers the anguish and troubled feelings in anticipation of his first sexual experience and the reader can literally feel his tension and anxiety as “His trousers or underwear seemed to have shrunk” (p. 19). Edward and Florence are husband and wife but they are described as “strangers”
Cultural Conflict in Ian McEwan’s On Chesil Beach through Semiotics
1303Pertanika J. Soc. Sci. & Hum. 21 (4): 1297 - 1308 (2013)
since they are unable to express their feelings for each other, mostly because of “unacknowledged rules” or familial restriction. “Almost strangers, they stood, strangely together, on a new pinnacle of existence, gleeful that their new status promised to promote them out of their endless youth—Edward and Florence free at last!” (p. 6). Yet, they are and will never be free, inescapably restrained by invisible thoughts and the “unacknowledged” rules of their time; thus, they remain “strangers” even in the apparent privacy of their freedom.
The circumstances being such, Edward and Florence both suffer as they approach their first sexual experience. “Where he merely suffered conventional first-night nerves, she experienced a visceral dread, a helpless disgust as palpable as sea sickness” (“Italics,” p. 7). Edward’s suffering is predictably that of a virgin facing his first sexual encounter; Florence’s situation is even worse; her fears make her helpless to overcome her nightmarish feelings of her first sexual encounter. Florence is alone with her anxiety and abhors any sexual relationship. She feels alone, with her problem. “Her mother was too intellectual, too brittle, an old fashioned blue stocking” (“Italics,” p. 10). Blue stocking refers to the intellectual woman who is interested in books and ideas, and is not able or unwilling to discuss personal intimacies. “Whenever confronted by an intimate problem, she tended to adopt the public manner of the lecture hall, and use longer and longer words, and make references to books she thought everyone should have read” (p. 10).
Not surprisingly, Florence abhors having sex primarily because of the social and religious attitudes of her time compounded by her total ignorance of anything sexual. However, “She did not fear pregnancy; if she could, like the mother of Jesus, arrive at the swollen state by magic” (p. 8). She accepts pregnancy, but prefers to have it “like the mother of Jesus” through an “Immaculate Conception,” without having sex, by magic.
There are of course several other examples of McEwan’s clever use of words in On Chesil Beach which go on to enhance his reputation as a writer who is a master of the (English) language: “This endless wheedling” in reference to Edward’s persistent persuasion to Florence to make love. Then there is the talk of reefers as McEwan describes: “There was even talk of reefers. Edward sometimes took an experimental stroll from the History to the English department, hoping to find evidence of paradise on earth, but the corridors, the notice boards, and even the women looked no different” (“Italics,” p. 40). Reefers are an indexical sign; an implication of the ideal world achievable in a drug-induced state when there can be “a paradise on earth.” It is a desired and fantastical state and an avenue of escape from the realities of life—but it is unreal, temporary and soon one is brought back to the reality of the mundane world. McEwan illustrates how powerful the clever association of thought and mental images through the use of language can be.
In the case of Edward, a wild woman would have terrified him (“Italics,” p. 21).
Mina Abbasiyannejad and Rosli Talif
1304 Pertanika J. Soc. Sci. & Hum. 21 (4): 1297 - 1308 (2013)
In the 1960s, women were expected to be ignorant about sexual activity, and it was not usual for them to show their sexual interest or they would be considered wild. Edward admits that he prefers a coy and reserved woman who conceals her feelings. He believes that he must have such tolerance to make Florence ready for sex. Florence states,
“...He had come to respect it, even revere it, mistaking it for a form of coyness, a conventional veil for a richly sexual nature...”
(p. 21)
Conventional veil is a symbolic representation of the cultural attitude that makes women represent themselves as disinterested in sex, and seemingly tolerating it as part of fulfilling their marital duties. “They were alone then, and theoretically free to do whatever they wanted, but they went on eating the dinner they had no appetite for” (“Italics,” p. 23). Again the word theoretically shows that they are still under the pressure of cultural restriction even in their private domain and there is indeed no real freedom for them.
When McEwan sees the need, he injects action, passion and aggression in one fell swoop, wasting no time and the reader receives a punch right in the face without warning as in this instance when Edward displays a rare outburst:
“… Edward came out swinging. He started and said “You don’t have the faintest idea how to be with a
man. You carry on as if it’s eighteen sixty-two. You don’t even know how to kiss.”
(“Italics,” p. 144).
He refers to the sexual boundaries of eighteen sixty-two and the reader can literally translate the outburst into: You are old fashioned and out of touch.
There are quite a few gestured signs in the story for example, when he said, “There you go indeed; there was exasperation in his voice” (“Italics,” p. 143). The exasperation shows an annoyance or anger in Edward’s voice. In another place “she surprised herself with the hardness in her voice” (“Italics,” p. 143). The “hardness” signifies the lack of emotion and diminishing friendliness. She could feel how he shifted his weight, “When he shifted his weight, the stones tinkled under his feet” (p. 143). The burden of his affliction on his chest is compared to the punch in his chest with a rough noise of unhappiness. “She imagined she heard him grunt, as though punched in the chest” (p. 144). She could hear the sound of his footfalls on the pebbles, which meant that he would hear hers (p. 142). McEwan provides the auditory and visual senses to enhance the effect of a scene.
“Edward loosened his tie and firmly set down his knife and fork in parallel on his plate” (“Italics,” p. 26). Putting his knife and fork “firmly” is a sign of controlled anger or annoyance and placing them “in parallel” indicates a certain determination and a prelude to an impending action. Such fairly simple gestures described with meticulously
Cultural Conflict in Ian McEwan’s On Chesil Beach through Semiotics
1305Pertanika J. Soc. Sci. & Hum. 21 (4): 1297 - 1308 (2013)
planned vocabulary heighten the intensity of the moment and show again McEwan’s mastery of his language skills. When this is followed by Edward saying “… we could go downstairs and listen properly” (p. 26) and the description that “He hoped he was being humorous, directing his sarcasm against them both, but his words emerged with surprising ferocity, and Florence blushed” (“Italics,” p. 26), the mental picture that the author paints is complete and the reader senses, like the characters, the discomfort of the moment. Edward tries to be humorous, appears less serious and to be less offensive. Also, Florence blushing is an indexical sign of her embarrassment. This is a cause and effect sign, which one relates to the other. “Or we could go and lie on the bed, and nervously swiped an invisible hair from her forehead” (p. 27). Going to bed is a dread and nightmarish idea that she had proposed. Swiping an invisible hair is the indexical sign of her personal anguish and mental anxiety. Whenever she is trapped in an intolerable situation, she acts out of her subconscious. In another instance, McEwan’s clever use of imagery is remarkably effective: “Rising from his plate, mingling with the sea breeze, was a clammy odour, like the breath of the family dog (p. 19). It is merely the smell of food emanating from a plate but that simple smell is in one sense unpleasant as it feels “clammy” and made more unpleasant by being compared to the freshness of a sea breeze and then equated with the warm, heated feel of a dog’s breath. The combination of images creates a sense of discomfort and irritation.
Character conflicts are described or shown by behavioural changes. For example: “…in her nervousness she began to speak faster, though her words were crisply enunciated. Like a skater on thinning ice, she accelerated to save herself from drowning” (“Italics,” p. 154). The word crisply shows how she speaks precisely and formally, a deliberate show of formality that indicates the emotional distance between them. McEwan compares Florence’s situation to the skater who skates, not on “thin” ice but on “thinning” ice, a deliberate modification of a popular idiom to enhance the critical status of the potential danger; a small, almost unnoticeable linguistic difference but a significant difference in meaning. In building up the “dangerous” situation, McEwan wishes his reader to sense the inevitability of eventual disaster.
“Her back was still turned. She sensed he had drawn closer, she imagined him right behind her, his hands hanging loosely at his side, softly clenching and unclenching as he considered the possibility of touching her shoulder” (“Italics,” p.150). The intensity of the situation is so great that Florence does not need to look to know how Edward is feeling and to anticipate how he behaves. It is this intensity that allows her the ability to know without seeing, to feel with her whole being and then to see through such feeling. Clenching and unclenching indicates the emotional confusion and tension that has overwhelmed Edward which he directly and indirectly passes on to Florence. In this particular situation, Edward does not just move towards Florence but is drawn
Mina Abbasiyannejad and Rosli Talif
1306 Pertanika J. Soc. Sci. & Hum. 21 (4): 1297 - 1308 (2013)
towards her and that attraction is so strong that Florence seems to sense it without needing to see it.
On the other hand, McEwan does expect his readers to be well read and well informed to fully grasp the various images, metaphors and symbols that he employs. “She heard herself say smoothly, ‘I know failure when I see it.’ This was merely the second violin answering the first; a rhetorical parry provoked by the suddenness, the precision of his attack, the sneer she heard in all his repeated “you’s” (p. 145). “[…] the second violin answering the first” refers to Florence’s admission of her failure and it is merely a mandatory answer to a question, asked or unasked but importantly, it is a response to a question, without the passion and energy of the question, just as the second violin in a musical conversation merely answers the musical query of the first violin, the aggressor who must be answered.
It is to McEwan’s credit that he does not require lengthy, wordy passages to convey the deepest of meanings and to conjure images in the reader’s mind. All he does is to employ a specific, carefully thought out word or phrase. He indicates social class difference of the characters in several ways.
The familial encounter in the wedding is described. Florence’s parents “had not condescended to his, as they had feared” (“Italics,” p. 3). Edward and his family, aware of their social class, had expected to be patronized by Florence’s parents and peers but surprisingly they were not, which begs the question, “Why?” The use of the word “condescended” shows that a class
distinction exists between Edward’s parents and Florence’s parents, and the reason why the latter did not behave the way they were expected to is a comment on the sensitivity and consideration that Florence’s parents have for their daughter’s new in-laws, and by implication, a confirmation of true class that considers the feelings of others—even those in the lower classes.
In the following sentence, for example, just the “woody quality” of Edward’s scent and the accompanying “reassuring” feeling say more than just three individual words: She liked his scent, “which had a woody quality and was reassuring” (“Italics,” p. 28). Woody quality implies something rural, laid back, cosy, and perhaps a little peasant-like. It implies a consciousness of class difference that is nevertheless “reassuring” to Florence. More than just that, it is also a semiotic indicator of the love that she has for him despite the social disparity. In another instance, the very use of the word “convent” in referring to Florence’s accommodation says it all: “It was as though the young women had entered a convent” (p. 43). There is a sense of restriction, implications of single gender (female) living environment with its implied social inherences. McEwan represents the symbolic representation of social restriction, with the word convent.
In the uncomfortable and incompatible relationship of Edward and Florence, the extent of their differences is insurmountable and McEwan drives this home dramatically and by using the solid massiveness of geography. Their differences are “as solid as a geographical feature, a mountain, a
Cultural Conflict in Ian McEwan’s On Chesil Beach through Semiotics
1307Pertanika J. Soc. Sci. & Hum. 21 (4): 1297 - 1308 (2013)
headland” (“Italics,” p. 139-140). Again, a simple use of physical distance, “a good room’s length away” paints a vivid mental picture. Their physical distance is a symbolic representation of their emotional distance, how they break off from each other, and it is visible. His staying away is to be out of reach “He stopped a good room’s length away […]” (“Italics,” p. 143).
CONCLUSION
When reading On Chesil Beach, one is amazed at how meticulous McEwan is in the way he has crafted his writing. There is a wealth of linguistic, emotional and psychological mysteries waiting to be discovered and semiotics is the appropriate tool to unravel these many mysteries. Semiotics is not only helpful for people who study language, literature and cultural studies, but generally helps the understanding of all types of signs used and that exist in human culture. The world is painted by different types of signs, such as verbal, gestural, nonverbal, textual, natural, and artificial. Signs stand for something more than they represent. They tell what is behind their apparent feature. People are surrounded by signs and deal with them in their everyday life, consciously or subconsciously. But to understand all of these signs one needs to decode the meanings and interpret them. The implied or situational context in which these signs take place plays a crucial role in their meaning.
Peirce’s category of signs along with Eco’s contribution to semiotics provides
the opportunity to study the signs of cultural stress. Peirce classifies the signs into three different levels which are iconic, symbolic, and indexical. His classification is according to the relation of the signs to their referents. Signs are idiomatic in the way they stand for something more than what the signs themselves depict.
On Chesil Beach bounds to a certain period of time that is the 1960s, with pictures of how environmental societal issues such as cultural restrictions towards sexuality influence society particularly the young. Semiotics as an interpretative tool facilitates our understanding and dives to the depth of the words and unravels the implications within.
REFERENCESAtkins, G. D., & Morrow, L. (1989). Contemporary
Literary Theory. Amherst, MA: University of Massachusetts Press.
Byrnes, C. (2004). Sex and Sexuality in Ian McEwan’s Work. Nottingham: Paupers’ Press.
Chandler, D. (2007). Semiotics: The Basics. London: Routledge.
Culler, J. (2001). The Pursuit of Signs: Semiotics, Literature, Deconstruction. London: Routledge.
Davis, R. C., & Schleifer, R. (1989). Contemporary Literary Criticism: Literary and Cultural Studies. New York: Longman.
Eco, U. (1979). A Theory of Semiotics. Bloomington, IN: Indiana University Press.
Eco, U. (1981). The Theory of Signs and the Role of the Reader. The Bulletin of the Midwest Modern Language Association, 14(1), 35-45.
Mina Abbasiyannejad and Rosli Talif
1308 Pertanika J. Soc. Sci. & Hum. 21 (4): 1297 - 1308 (2013)
Hamilton, I. (1978). Points of Departure. In R. Roberts (Eds.), Conversations With Ian McEwan (pp.9-21). Jackson, MS: University Press of Mississippi.
Johansen, J. D., & Larsen, S. E. (2002). Signs in Use: An Introduction to Semiotics (D. L. G. a. J. Irons, Trans.). New York: Psychology Press.
McEwan, I. (2001). Mother Tongue. Retrieved from http://www. ianmcewan.com/bib/articles/mother-tongue.
McEwan, I. (2007). On Chesil Beach. London: Anchor.
Misak, C. (2004). The Cambridge Companion to Peirce. Cambridge: Cambridge University Press.
Peirce, C. (1998). The Essential Peirce: Selected Philosophical Writings, 1893-1913. (Vol.2). The Peirce Edition Project, (Ed.). Bloomington, IN: Indiana University Press.
Reynolds, M., & Noakes, J. (2002). Ian McEwan: The Essential Guide. London: Vintage Books.
Roberts , R. (2008). “A Thing One Does.” Conversations with Ian McEwan. In R. Roberts (Eds.), Conversations With Ian McEwan (pp.188-201). Jackson, MS: University Press of Mississippi.
Rose, C. (2007). Conversations with Ian McEwan. [Video file]. Retrieved from http://www.charlierose.com/view/interview/8533.
Scholes, R. (1977). Toward a semiotics of literature. Critical Inquiry, 4(1), 105-120.
Sebeok, T. A. (2001). Signs: An Introduction to Semiotics. Toronto: University of Toronto Press.
Zalewski, D. (2009). The Background Hum. The New Yorker, 23, 46-61.
Pertanika J. Soc. Sci. & Hum. 21 (4): 1309 - 1326 (2013)
ISSN: 0128-7702 © Universiti Putra Malaysia Press
SOCIAL SCIENCES & HUMANITIESJournal homepage: http://www.pertanika.upm.edu.my/
Article history:Received: 11 July 2011Accepted: 20 September 2012
ARTICLE INFO
E-mail addresses: [email protected] (Khazriyati Salehuddin), * Corresponding author
Developmental Patterns in Malay Shape-Based Numeral Classifier Comprehension
Khazriyati Salehuddin1*, Heather Winskel2 and Imran Ho Abdullah1
1School of Language Studies and Linguistics, Faculty of Social Sciences and Humanities, Universiti Kebangsaan Malaysia, 43600 Bangi, Selangor, Malaysia2School of Health and Human Sciences, Southern Cross University, Australia
ABSTRACT
Numeral classifier system is an instance of linguistic device for categorisation, a cognitive process that is indispensable in human cognition and language development. The current study investigated the acquisition of eight Malay shape-based numeral classifiers through a matching comprehension task in 140 6 to 9 year old children. The aim is to examine the developmental patterns observed in the comprehension of Malay shape-based numeral classifiers. Specifically, the study focused at examining if the complexity of the semantic features of individual numeral classifiers plays a role in numeral classifier comprehension order, and if the degree of typicality of numeral classifier exemplars has an effect on the comprehension order. Results indicated that semantic complexity and exemplar typicality play a significant role in Malay numeral classifier comprehension.This suggests that multiple factors interact with each other and contribute to the developmental pattern of numeral classifier.
Keywords: Acquisition order, categorisation, children, cognition, comprehension language development,
Malay, numeral classifier
Categorisation is a complex task (Yuan et al., 2010) as information can only be categorised, retrieved, labelled and evaluated when there is a satisfactory resemblance between new and stored information before an object is accepted into a respective category (Barsalou et al., 1998). Objects that are perceived as belonging to the same category are then assigned to
INTRODUCTION
Categorising and labelling is a fundamental process in human cognition and language development (Croft & Cruse, 2004).
Khazriyati Salehuddin, Heather Winskel and Imran Ho Abdullah
1310 Pertanika J. Soc. Sci. & Hum. 21 (4): 1309 - 1326 (2013)
the same label (Mervis & Rosch, 1981).The current study is aimed at examining the developmental patterns observed in the comprehension of Malay shape-based numeral classifiers.
‘Numeral classifiers’ is a commonly recognised type of noun classifier system. They are used usually in counting objects and they occur contiguously to numerals and expressions of quantity in a noun phrase. Being a manifestation of a linguistic device of categorisation (Craig, 1986)(cf. “language-inherent classification”, Zhang & Schmitt, 1998, p. 376), numeral classifiers classify nouns explicitly by signifying “some salient perceived or inputted characteristic” of the entity in question (Allan, 1977, p. 285). Syntactically, numeral classifiers form part of a noun phrase together with a noun and a numeral (Richards et al., 1985).Semantically, they provide information about the physical, conceptual, functional and cognitive properties of objects in a particular culture (Zhang & Schmitt, 1998). Due to the fact that speakers of numeral classifier languages need to learn how to categorise objects in their environment and pair them with the appropriate numeral classifier using the language-specific classification system, numeral classifier systems offer researchers an ideal opportunity to examine how children learn to categorise and label objects in their environment using a constrained system.
The assignment of numeral classifiers in counting activities is primarily dependent upon semantic properties of the noun
they categorise, usually based on “the parameters of animateness, shape, or function which are attributed to the head noun” (Adams & Conklin, 1973, p. 1). Allan’s (1977) description of shape-based numeral classifiers illustrates how numeral classifier categorisation is, in general, a systematic, yet complex categorisation process. Typically, the categorisation of shape-based numeral classifiers is based on saliently one-dimensional (henceforth 1D to indicate ‘long’), saliently two-dimensional (2D to indicate ‘flat’), and saliently three-dimensional (3D to indicate ‘round’ or ‘polyhedral’) parameters. In addition, secondary parameters such as the rigidity and the size of the objects are also taken into consideration in determining which shape-based numeral classifier is to be assigned to the noun in question.
MALAY NUMERAL CLASSIFIERS
Malay, an Austronesian language spoken by 20 to 30 million native speakers, is said to be one of the languages that has an extensive numeral classifier system (Richards et al., 1985). The Malay numeral classifiers are described as ‘coefficients’ and ‘numeral coefficients’ because of their rigid collocation between nouns and numeral classifier names (Omar & Subbiah, 1995). In some cases, its absence in numeral phrases makes the structure of any formal Malay sentence ungrammatical (Omar & Subbiah, 1995).
Malay numeral c lass i f iers may sometimes be homonymous to some Malay nouns (Salehuddin et al., 2011). However,
Developmental Patterns in Malay Shape-Based Classifiers
1311Pertanika J. Soc. Sci. & Hum. 21 (4): 1309 - 1326 (2013)
despite being homonymous, they do not, unlike Thai repeaters (Haas, 1942), collocate with each other. Thus, the noun phrase *tiga buah buah and *tiga biji biji never exist in Malay. The classification of Malay numeral classifiers is systematic, yet complex as it involves mixed semantic criteria between various inherent semantic features of the objects in question (Salehuddin & Winskel, 2008).
CROSS-LINGUISTIC STUDIES ON NUMERAL CLASSIFIER ACQUISITION
Quite a large number of cross-linguistic studies on numeral classifier acquisition have been conducted. Among the East and Southeast Asian numeral classifier languages, Japanese, Chinese and Thai are the most comprehensively investigated. In general, researchers agree that numeral classifier acquisition takes place at a later stage in language development in comparison with noun and verb acquisition (e.g., Carpenter, 1991; Gandour et al., 1984; Mak, 1991; Ng, 1989; Uchida & Imai, 1999; Yamamoto, 2005). For example, Uchida and Imai (1999) found that 5-year-old Mandarin Chinese children gave only 45% of correct responses in a counting task, and in correcting errors. Even by the age of 12, Chinese children’s numeral classifier repertoire is still not equivalent to an adults’ (Ng, 1989).
Among the different types of numeral classifiers, shape-based numeral classifiers are considered as one of the most difficult types for children to acquire (Gandour et al., 1984). This is due to the fact that for some
languages, the classification of objects into the various shape-based numeral classifiers involves a combination of dimensionality and rigidity, or dimensionality and size of the objects in question.
Cross-linguistic studies conducted on the comprehension of numeral classifiers showed different results. For example, in a study conducted on the comprehension of Mandarin and Cantonese shape-based numeral classifiers on 34 4- to 6-year-olds, the majority of the 4-year-olds were not able to comprehend the numeral classifiers tested (Fang, 1985). Only by 6 years old could Mandarin and Cantonese speakers comprehend the inherent features of the Chinese shape-based numeral classifiers.
In a comprehension task on 12 Mandarin numeral classifiers with 24 Mandarin speaking children from the Greater Boston area, Hu (1993) found that the order of comprehension of Mandarin numeral classifiers is as follows: zhang(2D)>tiao(1D)>ke/li (0D)> and pian(3D). Chien et al. (2003) conducted another study on Mandarin numeral classifier comprehension on 80 3- to 8-year-olds. They found that by 7 years old, children showed an adult-like comprehension of the numeral classifiers tested.
S tud i e s on numera l c l a s s i f i e r comprehension have also been conducted on Japanese children. For example, 157 3- to 6-year-old Japanese children interpreted the 1D -hon and 2D -mai substantially more correctly than 3D –ko (Yamamoto, 2005).
Cross-linguistic studies reviewed above showed that children begin to comprehend shape-based numeral classifiers at different
Khazriyati Salehuddin, Heather Winskel and Imran Ho Abdullah
1312 Pertanika J. Soc. Sci. & Hum. 21 (4): 1309 - 1326 (2013)
ages, and the order of numeral classifiers they comprehend differ between languages. Among the factors identified as playing a role in comprehension order are semantic complexity (e.g., Matsumoto, 1987; Yamamoto, 2005) and exemplar typicality (e.g., Carpenter, 1991; Matsumoto, 1985).
Semantic complexity or cognitive complexity refers to the cumulative number of semantic features in a particular semantic category. From the cognitive perspective, the degree of complexity is usually determined by “the number of criteria to be applied in order to arrive at the correct form” (Hulstijn & de Graff, 1994, p.103). According to the semantic complexity theory, the cumulative number of semantic features in a particular semantic category plays a role in children’s categorisation patterns (Clark, 1973; Matsumoto, 1987). It has been argued that children first learn to categorise objects requiring less semantic features and then proceed to categories involving more complex categorisation processes (Clark, 1973). This also suggests that multiple-dimension categorisation rules are harder to acquire than single-dimension categorisation rules (Maddox, 1992). Such a complexity also affects the acquisition order of shape-based numeral classifiers (Yamamoto, 2005). With regard to Chinese and Japanese numeral classifiers, it has been found that Japanese numeral classifiers are acquired earlier than Chinese numeral classifiers because Japanese numeral classifiers have less semantic features attached to the category than the Chinese numeral classifiers (Uchida & Imai, 1999).
Similarly, Thai khûuuis acquired earlier than Thai phy᷇yn as the latter is said to be more semantically heavy than the former (Gandour et al. 1994).
According to prototype theory (Rosch & Mervis, 1975), a member with more attributes in common with other members of the category, and with more dissimilarities with members of contrasting categories, is graded as a more prototypical or typical member (the best exemplar) of a particular category. Conversely, any members on the borderline (i.e., those having less features in common with other members within the same category, especially with the most typical member) are graded as atypical members of a category (Matsumoto, 1985). Initially, children appear to learn categorisation rules through typical exemplars and then gradually proceed to learning the rules associated with more atypical members of the particular category (Markman, 1989; Mervis & Pani, 1980; Rosch & Mervis, 1975). Cross-linguistic studies on numeral classifier acquisition also reveal that the acquisition of a numeral classifier begins with the prototype of the category and later proceeds to the less prototypical exemplars (e.g., Carpenter, 1991; Matsumoto, 1985; Uchida & Imai, 1999). For example, in a series of error-detection experiments on 4 to 7 year-olds acquiring Japanese and Mandarin, it was found that prototypical referents are learned earlier than less familiar items (Uchida & Imai, 1999).
T h i s p a p e r f o c u s e s o n t h e comprehension of eight Malay shape-based numeral classifiers through a matching
Developmental Patterns in Malay Shape-Based Classifiers
1313Pertanika J. Soc. Sci. & Hum. 21 (4): 1309 - 1326 (2013)
comprehension task. The aim was to explore the developmental patterns observed in the comprehension of Malay shape-based numeral classifiers. Specifically, it aimed at examining if the complexity of the semantic features of individual numeral classifiers plays a role in numeral classifier comprehension order. This experiment also aimed at investigating if the degree of typicality of numeral classifier exemplars has an effect on the comprehension order. This paper is written based on the following predictions:
1. Based on semantic complexity theory i t was predicted that children’s comprehension order of Malay shape-based numeral classifiers would begin with the two-form 1D and 2D numeral classifiers and progress to the four-form 3D numeral classifiers (1D, 2D > 3D).
2. Based on the prototype theory, it was predicted that more typical exemplars of a particular Malay shape-based numeral classifier would be comprehended earlier and classified with fewer errors than more marginal or peripheral (atypical) exemplars of the same Malay shape-based numeral classifier (Very Typical > Very Atypical).
METHOD
The objects used in this experiment were pictures of very typical, typical,moderate, atypical, and very atypical exemplars of the Malay shape-based numeral classifiers, which were the same exemplars used in Salehuddin & Winskel (2009, 2011). A
picture of an exemplar of all Malay shape-based numeral classifiers from the same typicality type (e.g., pictures of very typical exemplar of batang, very typical exemplar of utas, very typical exemplar of keping, helai, buah, ketul, biji, and butir) were all printed on the same piece of A4 paper and were later simultaneously shown to the children. Children were asked to match the numeral classifier names, which were read to them, to the correct pictures. This task was chosen as matching labels to particular referents is a common activity in class for children in this age group (c.f. Scrimshaw, 1988).
Participants
One hundred and forty children attending a preschool and a primary school participated in the study. The children were 6 to 9-year-old native speakers of Malay and spoke Malay as their first language. 20 adults also participated in the experiment as a comparison group. The adults lived in the vicinity of the school and were from a mixed educational background. All participants were from middle SES. A description of the participants is given in Table 1.
Typicality ratings
Prior to the experiment, a survey of the typicality ratings of numeral classifier exemplars was conducted. Thirty adults were asked to rate pictures of familiar, everyday objects from most typical to most atypical exemplars for each of the eight numeral classifier categories. An object rated as very typical was given a score of
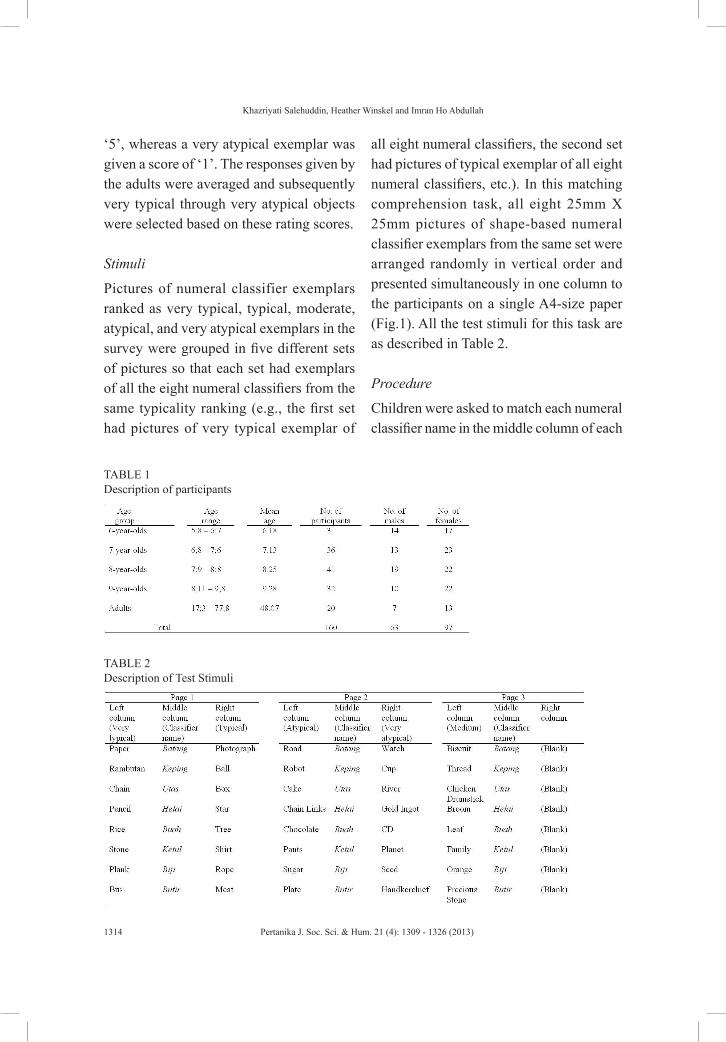
Khazriyati Salehuddin, Heather Winskel and Imran Ho Abdullah
1314 Pertanika J. Soc. Sci. & Hum. 21 (4): 1309 - 1326 (2013)
‘5’, whereas a very atypical exemplar was given a score of ‘1’. The responses given by the adults were averaged and subsequently very typical through very atypical objects were selected based on these rating scores.
Stimuli
Pictures of numeral classifier exemplars ranked as very typical, typical, moderate, atypical, and very atypical exemplars in the survey were grouped in five different sets of pictures so that each set had exemplars of all the eight numeral classifiers from the same typicality ranking (e.g., the first set had pictures of very typical exemplar of
all eight numeral classifiers, the second set had pictures of typical exemplar of all eight numeral classifiers, etc.). In this matching comprehension task, all eight 25mm X 25mm pictures of shape-based numeral classifier exemplars from the same set were arranged randomly in vertical order and presented simultaneously in one column to the participants on a single A4-size paper (Fig.1). All the test stimuli for this task are as described in Table 2.
Procedure
Children were asked to match each numeral classifier name in the middle column of each
TABLE 1 Description of participants
TABLE 2 Description of Test Stimuli
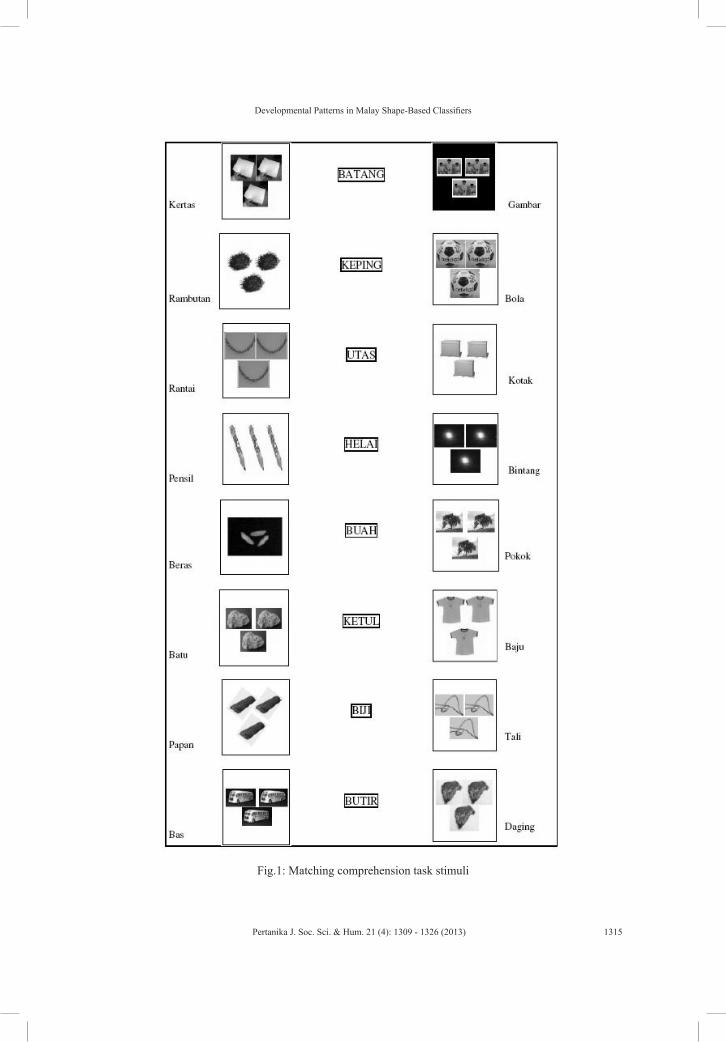
Developmental Patterns in Malay Shape-Based Classifiers
1315Pertanika J. Soc. Sci. & Hum. 21 (4): 1309 - 1326 (2013)
Fig.1: Matching comprehension task stimuli
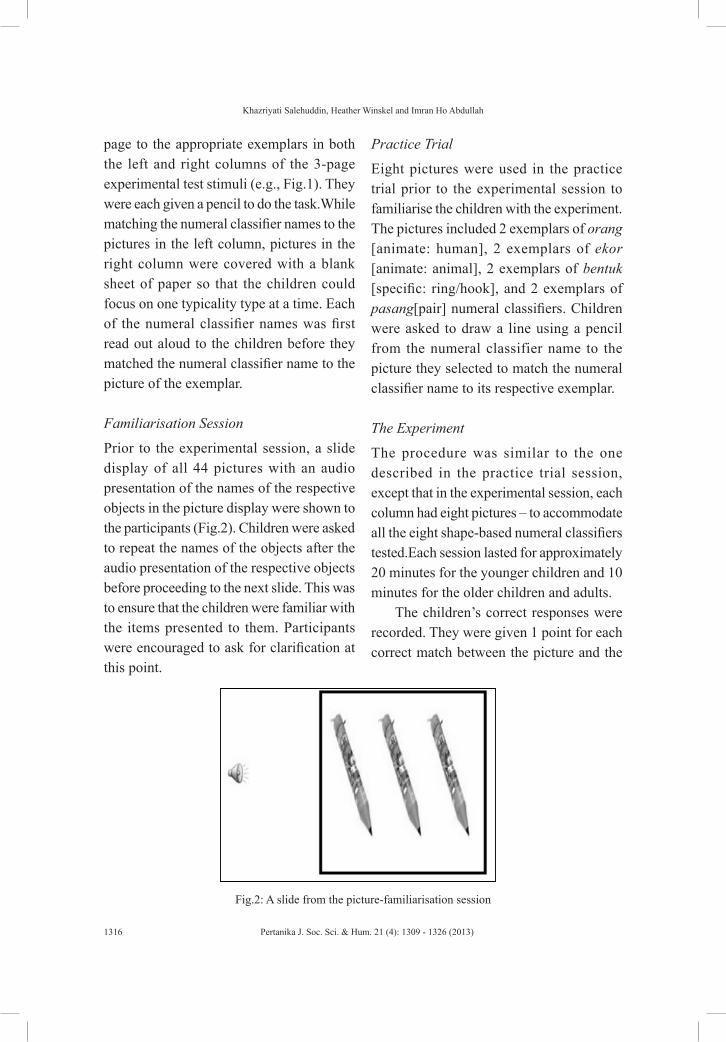
Khazriyati Salehuddin, Heather Winskel and Imran Ho Abdullah
1316 Pertanika J. Soc. Sci. & Hum. 21 (4): 1309 - 1326 (2013)
page to the appropriate exemplars in both the left and right columns of the 3-page experimental test stimuli (e.g., Fig.1). They were each given a pencil to do the task.While matching the numeral classifier names to the pictures in the left column, pictures in the right column were covered with a blank sheet of paper so that the children could focus on one typicality type at a time. Each of the numeral classifier names was first read out aloud to the children before they matched the numeral classifier name to the picture of the exemplar.
Familiarisation Session
Prior to the experimental session, a slide display of all 44 pictures with an audio presentation of the names of the respective objects in the picture display were shown to the participants (Fig.2). Children were asked to repeat the names of the objects after the audio presentation of the respective objects before proceeding to the next slide. This was to ensure that the children were familiar with the items presented to them. Participants were encouraged to ask for clarification at this point.
Practice Trial
Eight pictures were used in the practice trial prior to the experimental session to familiarise the children with the experiment. The pictures included 2 exemplars of orang [animate: human], 2 exemplars of ekor [animate: animal], 2 exemplars of bentuk [specific: ring/hook], and 2 exemplars of pasang[pair] numeral classifiers. Children were asked to draw a line using a pencil from the numeral classifier name to the picture they selected to match the numeral classifier name to its respective exemplar.
The Experiment
The procedure was similar to the one described in the practice trial session, except that in the experimental session, each column had eight pictures – to accommodate all the eight shape-based numeral classifiers tested.Each session lasted for approximately 20 minutes for the younger children and 10 minutes for the older children and adults.
The children’s correct responses were recorded. They were given 1 point for each correct match between the picture and the
Fig.2: A slide from the picture-familiarisation session
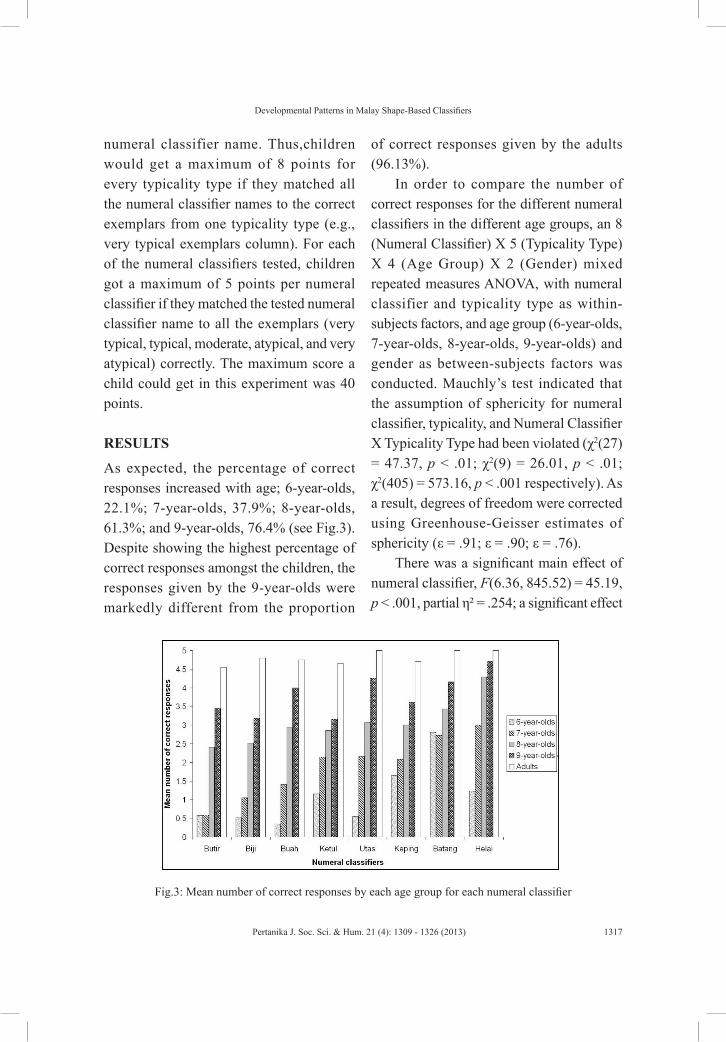
Developmental Patterns in Malay Shape-Based Classifiers
1317Pertanika J. Soc. Sci. & Hum. 21 (4): 1309 - 1326 (2013)
numeral classifier name. Thus,children would get a maximum of 8 points for every typicality type if they matched all the numeral classifier names to the correct exemplars from one typicality type (e.g., very typical exemplars column). For each of the numeral classifiers tested, children got a maximum of 5 points per numeral classifier if they matched the tested numeral classifier name to all the exemplars (very typical, typical, moderate, atypical, and very atypical) correctly. The maximum score a child could get in this experiment was 40 points.
RESULTS
As expected, the percentage of correct responses increased with age; 6-year-olds, 22.1%; 7-year-olds, 37.9%; 8-year-olds, 61.3%; and 9-year-olds, 76.4% (see Fig.3). Despite showing the highest percentage of correct responses amongst the children, the responses given by the 9-year-olds were markedly different from the proportion
of correct responses given by the adults (96.13%).
In order to compare the number of correct responses for the different numeral classifiers in the different age groups, an 8 (Numeral Classifier) X 5 (Typicality Type) X 4 (Age Group) X 2 (Gender) mixed repeated measures ANOVA, with numeral classifier and typicality type as within-subjects factors, and age group (6-year-olds, 7-year-olds, 8-year-olds, 9-year-olds) and gender as between-subjects factors was conducted. Mauchly’s test indicated that the assumption of sphericity for numeral classifier, typicality, and Numeral Classifier X Typicality Type had been violated (χ2(27) = 47.37, p < .01; χ2(9) = 26.01, p < .01; χ2(405) = 573.16, p < .001 respectively). As a result, degrees of freedom were corrected using Greenhouse-Geisser estimates of sphericity (ε = .91; ε = .90; ε = .76).
There was a significant main effect of numeral classifier, F(6.36, 845.52) = 45.19, p < .001, partial η² = .254; a significant effect
Fig.3: Mean number of correct responses by each age group for each numeral classifier
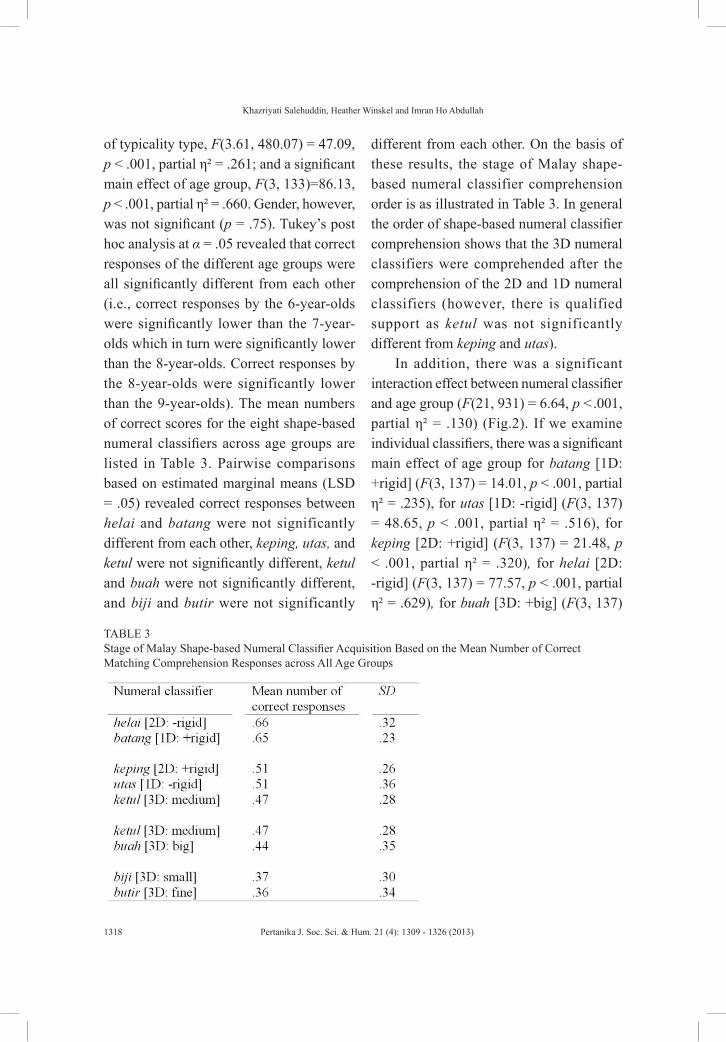
Khazriyati Salehuddin, Heather Winskel and Imran Ho Abdullah
1318 Pertanika J. Soc. Sci. & Hum. 21 (4): 1309 - 1326 (2013)
of typicality type, F(3.61, 480.07) = 47.09, p < .001, partial η² = .261; and a significant main effect of age group, F(3, 133)=86.13, p < .001, partial η² = .660. Gender, however, was not significant (p = .75). Tukey’s post hoc analysis at α = .05 revealed that correct responses of the different age groups were all significantly different from each other (i.e., correct responses by the 6-year-olds were significantly lower than the 7-year-olds which in turn were significantly lower than the 8-year-olds. Correct responses by the 8-year-olds were significantly lower than the 9-year-olds). The mean numbers of correct scores for the eight shape-based numeral classifiers across age groups are listed in Table 3. Pairwise comparisons based on estimated marginal means (LSD = .05) revealed correct responses between helai and batang were not significantly different from each other, keping, utas, and ketul were not significantly different, ketul and buah were not significantly different, and biji and butir were not significantly
different from each other. On the basis of these results, the stage of Malay shape-based numeral classifier comprehension order is as illustrated in Table 3. In general the order of shape-based numeral classifier comprehension shows that the 3D numeral classifiers were comprehended after the comprehension of the 2D and 1D numeral classifiers (however, there is qualified support as ketul was not significantly different from keping and utas).
In addition, there was a significant interaction effect between numeral classifier and age group (F(21, 931) = 6.64, p <.001, partial η² = .130) (Fig.2). If we examine individual classifiers, there was a significant main effect of age group for batang [1D: +rigid] (F(3, 137) = 14.01, p < .001, partial η² = .235), for utas [1D: -rigid] (F(3, 137) = 48.65, p < .001, partial η² = .516), for keping [2D: +rigid] (F(3, 137) = 21.48, p < .001, partial η² = .320), for helai [2D: -rigid] (F(3, 137) = 77.57, p < .001, partial η² = .629), for buah [3D: +big] (F(3, 137)
TABLE 3 Stage of Malay Shape-based Numeral Classifier Acquisition Based on the Mean Number of Correct Matching Comprehension Responses across All Age Groups
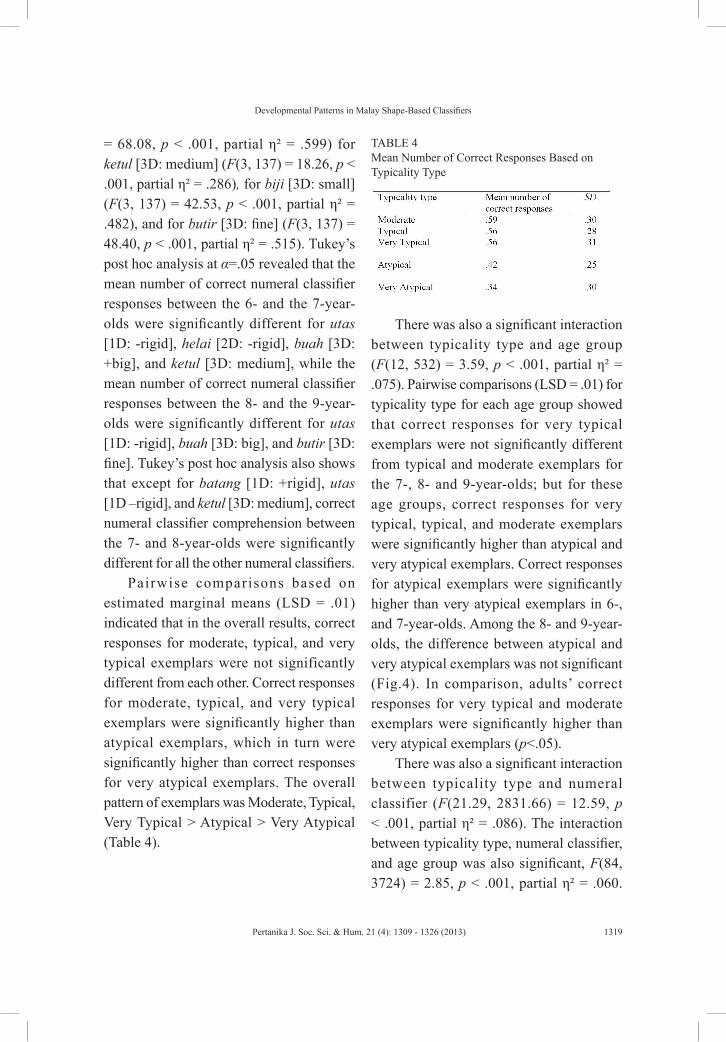
Developmental Patterns in Malay Shape-Based Classifiers
1319Pertanika J. Soc. Sci. & Hum. 21 (4): 1309 - 1326 (2013)
= 68.08, p < .001, partial η² = .599) for ketul [3D: medium] (F(3, 137) = 18.26, p < .001, partial η² = .286), for biji [3D: small] (F(3, 137) = 42.53, p < .001, partial η² = .482), and for butir [3D: fine] (F(3, 137) = 48.40, p < .001, partial η² = .515). Tukey’s post hoc analysis at α=.05 revealed that the mean number of correct numeral classifier responses between the 6- and the 7-year-olds were significantly different for utas [1D: -rigid], helai [2D: -rigid], buah [3D: +big], and ketul [3D: medium], while the mean number of correct numeral classifier responses between the 8- and the 9-year-olds were significantly different for utas [1D: -rigid], buah [3D: big], and butir [3D: fine]. Tukey’s post hoc analysis also shows that except for batang [1D: +rigid], utas [1D –rigid], and ketul [3D: medium], correct numeral classifier comprehension between the 7- and 8-year-olds were significantly different for all the other numeral classifiers.
Pairwise comparisons based on estimated marginal means (LSD = .01) indicated that in the overall results, correct responses for moderate, typical, and very typical exemplars were not significantly different from each other. Correct responses for moderate, typical, and very typical exemplars were significantly higher than atypical exemplars, which in turn were significantly higher than correct responses for very atypical exemplars. The overall pattern of exemplars was Moderate, Typical, Very Typical > Atypical > Very Atypical (Table 4).
TABLE 4 Mean Number of Correct Responses Based on Typicality Type
There was also a significant interaction between typicality type and age group (F(12, 532) = 3.59, p < .001, partial η² = .075). Pairwise comparisons (LSD = .01) for typicality type for each age group showed that correct responses for very typical exemplars were not significantly different from typical and moderate exemplars for the 7-, 8- and 9-year-olds; but for these age groups, correct responses for very typical, typical, and moderate exemplars were significantly higher than atypical and very atypical exemplars. Correct responses for atypical exemplars were significantly higher than very atypical exemplars in 6-, and 7-year-olds. Among the 8- and 9-year-olds, the difference between atypical and very atypical exemplars was not significant (Fig.4). In comparison, adults’ correct responses for very typical and moderate exemplars were significantly higher than very atypical exemplars (p<.05).
There was also a significant interaction between typicality type and numeral classifier (F(21.29, 2831.66) = 12.59, p < .001, partial η² = .086). The interaction between typicality type, numeral classifier, and age group was also significant, F(84, 3724) = 2.85, p < .001, partial η² = .060.
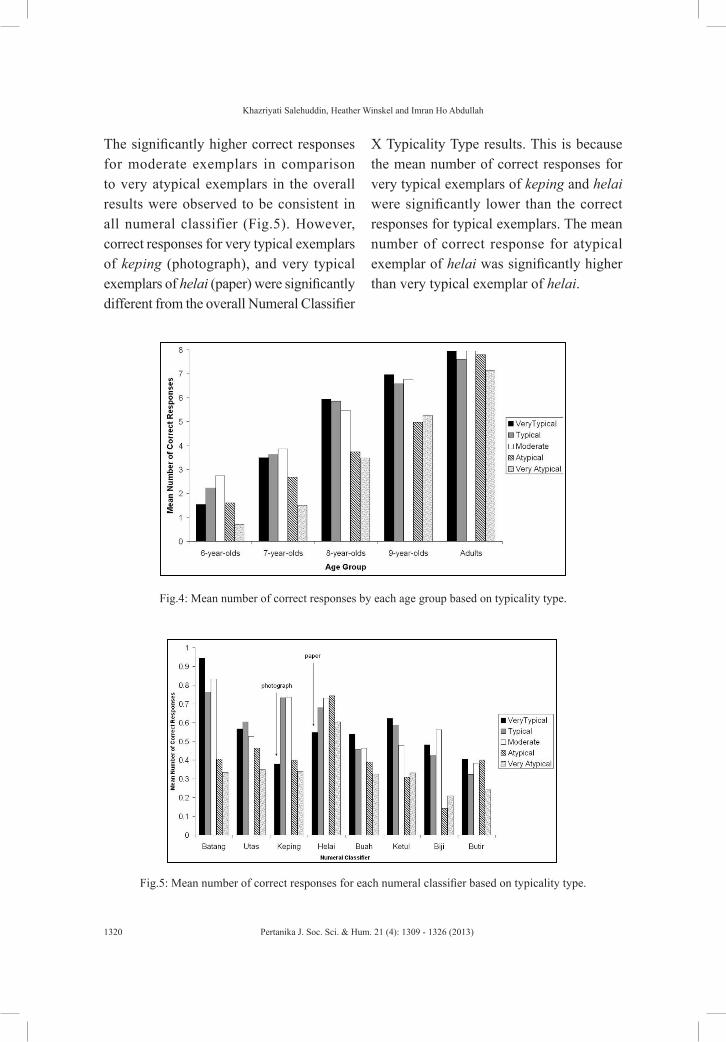
Khazriyati Salehuddin, Heather Winskel and Imran Ho Abdullah
1320 Pertanika J. Soc. Sci. & Hum. 21 (4): 1309 - 1326 (2013)
The significantly higher correct responses for moderate exemplars in comparison to very atypical exemplars in the overall results were observed to be consistent in all numeral classifier (Fig.5). However, correct responses for very typical exemplars of keping (photograph), and very typical exemplars of helai (paper) were significantly different from the overall Numeral Classifier
X Typicality Type results. This is because the mean number of correct responses for very typical exemplars of keping and helai were significantly lower than the correct responses for typical exemplars. The mean number of correct response for atypical exemplar of helai was significantly higher than very typical exemplar of helai.
Fig.4: Mean number of correct responses by each age group based on typicality type.
Fig.5: Mean number of correct responses for each numeral classifier based on typicality type.
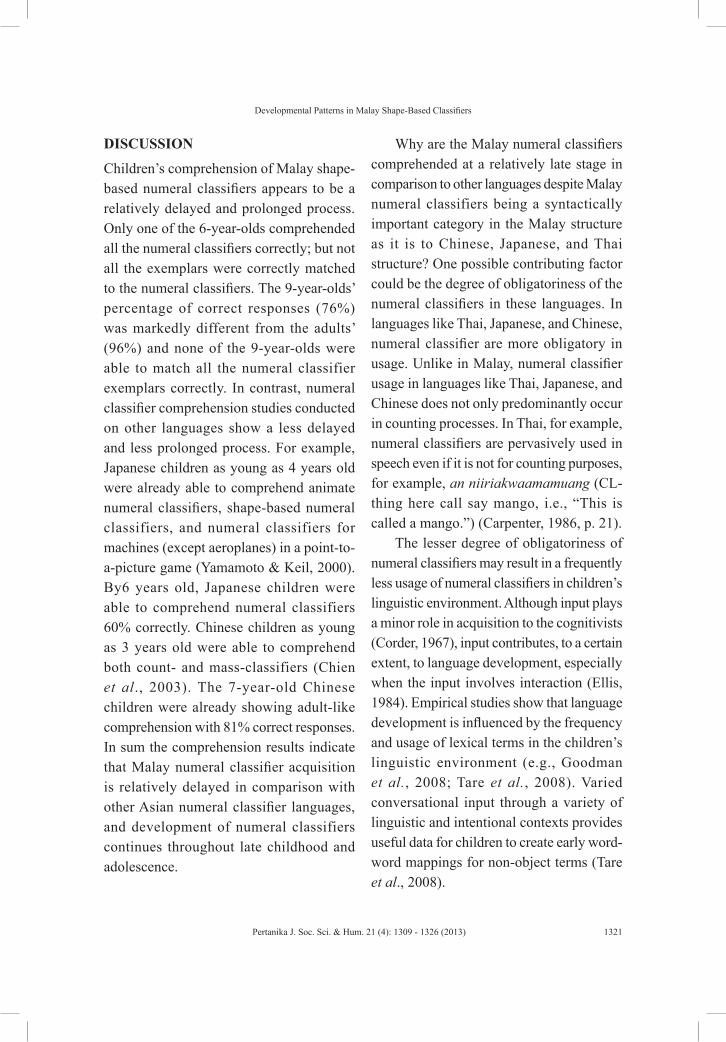
Developmental Patterns in Malay Shape-Based Classifiers
1321Pertanika J. Soc. Sci. & Hum. 21 (4): 1309 - 1326 (2013)
DISCUSSION
Children’s comprehension of Malay shape-based numeral classifiers appears to be a relatively delayed and prolonged process. Only one of the 6-year-olds comprehended all the numeral classifiers correctly; but not all the exemplars were correctly matched to the numeral classifiers. The 9-year-olds’ percentage of correct responses (76%) was markedly different from the adults’ (96%) and none of the 9-year-olds were able to match all the numeral classifier exemplars correctly. In contrast, numeral classifier comprehension studies conducted on other languages show a less delayed and less prolonged process. For example, Japanese children as young as 4 years old were already able to comprehend animate numeral classifiers, shape-based numeral classifiers, and numeral classifiers for machines (except aeroplanes) in a point-to-a-picture game (Yamamoto & Keil, 2000). By6 years old, Japanese children were able to comprehend numeral classifiers 60% correctly. Chinese children as young as 3 years old were able to comprehend both count- and mass-classifiers (Chien et al., 2003). The 7-year-old Chinese children were already showing adult-like comprehension with 81% correct responses. In sum the comprehension results indicate that Malay numeral classifier acquisition is relatively delayed in comparison with other Asian numeral classifier languages, and development of numeral classifiers continues throughout late childhood and adolescence.
Why are the Malay numeral classifiers comprehended at a relatively late stage in comparison to other languages despite Malay numeral classifiers being a syntactically important category in the Malay structure as it is to Chinese, Japanese, and Thai structure? One possible contributing factor could be the degree of obligatoriness of the numeral classifiers in these languages. In languages like Thai, Japanese, and Chinese, numeral classifier are more obligatory in usage. Unlike in Malay, numeral classifier usage in languages like Thai, Japanese, and Chinese does not only predominantly occur in counting processes. In Thai, for example, numeral classifiers are pervasively used in speech even if it is not for counting purposes, for example, an niiriakwaamamuang (CL-thing here call say mango, i.e., “This is called a mango.”) (Carpenter, 1986, p. 21).
The lesser degree of obligatoriness of numeral classifiers may result in a frequently less usage of numeral classifiers in children’s linguistic environment. Although input plays a minor role in acquisition to the cognitivists (Corder, 1967), input contributes, to a certain extent, to language development, especially when the input involves interaction (Ellis, 1984). Empirical studies show that language development is influenced by the frequency and usage of lexical terms in the children’s linguistic environment (e.g., Goodman et al., 2008; Tare et al., 2008). Varied conversational input through a variety of linguistic and intentional contexts provides useful data for children to create early word-word mappings for non-object terms (Tare et al., 2008).
Khazriyati Salehuddin, Heather Winskel and Imran Ho Abdullah
1322 Pertanika J. Soc. Sci. & Hum. 21 (4): 1309 - 1326 (2013)
In later language development, both spoken and written forms of communication are significant sources of language stimulation as school children learn language both in informal settings (through indirect modelling and reinforcement) and formal instruction (Nippold, 1988). Thus, the numeral classifier comprehension pattern among children could depend on how much the children are exposed to usage of the numeral classifier in their environment.
Input frequency has been cited to be another important factor in the acquisition of Japanese numeral classifiers (Matsumoto, 1985; Yamamoto, 2005). Yamamoto (2005, p. 119), for example, found that higher frequency numeral classifiers in both speech and written texts such as -tsu, -ko, -ri, -hiki, and -dai “emerged maturationally” earlier than lower frequency numeral classifiers.
As numeral classifier acquisition takes place at a later stage in language development (e.g., Carpenter, 1991; Gandour et al., 1984; Mak, 1991; Ng, 1989; Yamamoto, 2005), input from various forms of discourse and not limited to only those concerning caretaker-child interactions is also more likely to play a role in the acquisition of Malay numeral classifiers in children. The Malay numeral classifiers usage is not pervasive in Malay caretaker-child interaction. In a total of 192-minute semi-structured elicitation procedure to stimulate caretaker-child interactions, only 44 numeral classifiers were observed, with helai as the frequently used numeral classifiers (12 times) (Salehuddin & Winskel, 2012).The lesser degree of obligatoriness of numeral
classifier in Malay in comparison to other numeral classifier languages is probably a contributing factor to why the frequency of Malay numeral classifiers in interaction is low.
The relatively high frequency of helai (12) and batang (8) in the caretaker-child interactions in comparison to other numeral classifier could also explain why these two numeral classifiers are comprehended relatively earlier than other numeral classifiers. However, biji is comprehended at a much later stage even when its frequency in the caretaker-child interactions is the relatively high (11) (Salehuddin & Winskel, 2012).The relatively high frequency of biji now does not support our earlier proposition that high frequency may result in earlier comprehension. Clearly, input alone does not determine the acquisition of semantically complex item, like the Malay shape-based numeral classifiers.
We have so far explained why certain individual numeral classifiers are acquired earlier. We can clearly see that children comprehended 1D and 2D numeral classifiers earlier than they comprehended 3D numeral classifiers (Table 3). Malay 3D numeral classifiers (four forms) are semantically relatively more complex than the 1D and 2D numeral classifiers (two forms). According to semantic complexity theory, the cumulative number of semantic features in a particular semantic category plays a role in the development of children’s categorisation ability (Matsumoto, 1987). Lexical categories which involve using less semantic features to categorise objects are
Developmental Patterns in Malay Shape-Based Classifiers
1323Pertanika J. Soc. Sci. & Hum. 21 (4): 1309 - 1326 (2013)
acquired earlier than those which involve more semantic features. Our prediction that Malay numeral classifier acquisition order would follow the order that the two-form 1D and 2D numeral classifiers would be comprehended earlier than those with more complex features, (the four-form 3D numeral classifiers)is supported. When matching 1D or 2D exemplars, categorisation is based on whether objects are ‘rigid’ or ‘flexible’, whereas matching 3D objects is more complex as it involves deciding whether objects are ‘big’, ‘medium’, ‘small’, or ‘fine’.
However, as shown in Fig.5, not all 1D and 2D exemplars are matched correctly more than 3D exemplars. In the current study, children matched objects more accurately when the exemplars were typical exemplars of the particular numeral classifier category. This concurs with previous research on numeral classifier acquisition (e.g., Carpenter, 1991; Matsumoto, 1985; Uchida & Imai, 1996, 1999) and previous categorisation studies (Gelman & Coley, 1990; Hampton, 1998).
According to Mervis and Rosch (1981), children tend to initially restrict category labels to only typical members. This results in “immature” categorisation, where atypical exemplars that do not share properties relative to adult category prototypes get excluded from the category whereas out-of-category instances that do share these properties are inappropriately included (Rogers & McClelland, 2004).
Objects that are least frequently encountered by children are poorly
recognised (Lederman et al., 1990, p. 58), and are categorised less accurately by younger children (Matsumoto, 1985; Uchida & Imai, 1999). Since the “redundancy structure of the category as a whole” (Rosch & Mervis, 1975, p. 602) is often not reflected in atypical members, atypical exemplars are more likely to be matched with greater difficulty by children than typical members. For example, younger children tended to match atypical exemplar of buah [3D: big] (planet) with the numeral classifier biji [3D: small]. This could be due to children basing their decision predominantly on perceptual features. A planet, although spherical and big, can be perceived as more like a small, spherical object, like a ball, when presented on paper. Children tend to match a planet with the numeral classifier biji probably due to the similarity between a planet and a ball (a typical example of biji) when the former is presented on paper. Children between 6 and 9 years old might also not have a true grasp of what planets are and how big they can be.Although in the familiarisation session children indicated that they knew what planets are, their limited knowledge with regard to the physical properties of planets may affect their judgement when the picture of a planet is presented on paper.
CONCLUSION
The categorisation of some objects into a particular numeral classifier category is not always clear-cut as there is a degree of flexibility or choice in how some objects are classified. Items can be paired with different numeral classifiers depending on
Khazriyati Salehuddin, Heather Winskel and Imran Ho Abdullah
1324 Pertanika J. Soc. Sci. & Hum. 21 (4): 1309 - 1326 (2013)
their shape, appearance, or presentation, as categorisation is dependent on how the item is perceived by the speaker. Hence, it can be seen that there can be quite a high degree of variation between how some items are sorted into different categories by speakers. In sum, the developmental pattern in the Malay shape-based numeral classifier comprehension is not influenced by a single factor. Multiple factors namely semantic complexity, exemplar typicality, and numeral classifier frequency, all interact with each other and contribute to the developmental pattern observed in this study.
REFERENCESAdams, K. L., & Conklin, N. F. (1973). Towards a
theory of natural classification. In C. Corum, T. C. Smith-Clark & A. Weiser (Eds.), Paper from the Ninth Regional Meeting of the Chicago Linguistic Society (pp. 1-10). Chicago: U of Chicago: Chicago Linguistic Society.
Allan, K. (1977). Classifiers. Language, 53, 285-311.
Barsalou, L. W., Huttenlocher, J., & Lamberts, K. (1998). Basing categorization on individuals and events. Cognitive Psychology, 36, 203-272.
Carpenter, K. (1986). Productivity and pragmatics of Thai classifiers. Paper presented at the 12th meeting of Berkeley Linguistics Society.
Carpenter, K. (1991). Later rather than sooner: Extralinguistic categories in the acquisition of Thai classifiers. Journal of Child Language, 18, 93-113.
Chien, Y.-C., Lust, B., & Chiang, C.-P. (2003). Chinese children’s comprehension of count-classifiers and mass-classifiers. Journal of East Asian Linguistics, 12, 91-120.
Clark, E. V. (1973). Nonlinguistic strategies and the acquisition of word meanings. Cognition, 2, 161-182.
Corder, S. P. (1967). The significance of learner’s errors. International Review of Applied Linguistics, 5, 161-170.
Craig, C. G. (Ed.). (1986). Noun classes and categorization. Amsterdam/Philadelphia: John Benjamins Publishing Company.
Croft, W., & Cruse, D. A. (2004). Cognitive linguistics. Cambridge: Cambridge University Press.
Ellis, R. (1984). Classroom second language development: A study of classroom interaction and language acquisition. Oxford, UK: Pergamon
Fang, F. (1985). An experiment on the use of classifiers by 4- to 6-year-olds. Acta Psychologica Sinica, 17, 384-392.
Gandour, J., Petty, S. H., Dardarananda, R., Dechongkit, S., & Mukngoen, S. (1984). The acquisition of numeral classifiers in Thai. Linguistics, 22, 455-479.
Gelman, S. A., & Coley, J. D. (1990). The importance of knowing a dodo is a bird: Categories and inferences in 2-year-old children. Developmental Psychology, 26(5), 796-804.
Goodman, J. C., Dale, P. S., & Li, P. (2008). Does frequency count? Parental input and the acquisition of vocabulary. Journal of Child Language, 35, 515-531.
Haas, M. R. (1942). The use of numeral classifiers in Thai. Language, 18, 201-206.
Hampton, J. A. (1998). Similarity-based categorization and fuzziness of natural categories. Cognition, 65, 137-165.
Hu, Q. (1993). The acquisition of Chinese classifiers by young Mandarin speaking children. (Unpublished PhD Dissertation). Boston University, Boston.
Developmental Patterns in Malay Shape-Based Classifiers
1325Pertanika J. Soc. Sci. & Hum. 21 (4): 1309 - 1326 (2013)
Hulstijn, J.H. & de Graaf, R. (1994). Under what conditions does explicit knowledge of a second language facilitate the acquisition of implicit knowledge? A research proposal. AILA Review, 11(97-112)
Lederman, S. J., Klatzky, R. L., Chataway, C., & Summers, C. D. (1990). Visual mediation and the haptic recognition of two-dimensional pictures of common objects. Perception & Psychophysics, 47(1), 54-64.
Maddox, W. T. (1992). Perceptual and decisional s e p a r a b i l i t y. I n F. G . A s h b y ( E d . ) , Multidimensional models of perception and cognition (pp. 147-180). Hillsdale, N.J.: L Erlbaum.
Mak, D.-L.-W. (1991). The acquisition of classifiers in Cantonese. University of Reading, Reading.
Markman, E. M. (1989). Categorization and naming in children: Problems of induction. Cambridge, Massachusetts: MIT Press.
Matsumoto, Y. (1985). Acquisition of some Japanese numeral classifiers. The search for convention. Papers and Reports on Child Language Development, 24, 79-86.
Matsumoto, Y. (1987). Order of acquisition in the lexicon: Implications from Japanese numeral classifiers. In K. E. Nelson & A. v. Kleek (Eds.), Children’s language (Vol. 6, pp. 229-260). Hillsdale: Lawrence Erlbaum Associates.
Mervis, C. B., & Pani, J. R. (1980). Acquisition of basic object categories. Cognitive Psychology, 12(4), 496-522.
Mervis, C. B., & Rosch, E. (1981). Categorization of natural objects. Annual Review of Psychology, 32, 89-115.
Ng, B. C. (1989). The acquisition of numeral classifiers in Hokkien, a Southern Min Language. Unpublished PhD Thesis, La Trobe University, Victoria.
Nippold, M. A. (1988). Later language development: The school-age and adolescent years. Austin, Texas: Pro-Ed.
Omar, A. H., & Subbiah, R. (1995). An introduction to Malay grammar. Kuala Lumpur: Dewan Bahasa dan Pustaka.
Richards, J., Platt, J., & Weber, H. (1985). Longman dictionary of applied linguistics. Essex: Longman Group Limited.
Rogers, T. T., & McClelland, J. L. (2004). Semantic cognition: A parallel distributed processing approach. Cambridge, Massachusetts: The MIT Press.
Rosch, E., & Mervis, C. B. (1975). Family resemblances: Studies in the internal structure of categories. Cognitive Psychology, 7, 573-605.
Salehuddin, K., & Winskel, H. (2008). Malay numeral classifiers: Sketching its conceptual representation from a native speaker ’s perspective [Electronic Version]. SEALSXVI: 16th Meeting of the Southeast Asian Linguistics Society (2006), E6, 65-74, from http://www.pacling.com/catalogue/SEALSXVI_Final.pdf
Salehuddin, K. & Winskel, H. (2009). An investigation into Malay numeral classifier acquisition through an elicited production task. First Language, 29(3): 291-313.
Salehuddin, K., & Winskel, H. (2011). Object categorisation using Malay shape-based numeral classifier categories.GEMA Online Journal of Language Studies, 11(3), 53-68. http://www.ukm.my/ppbl/Gema/GEMA%20vol%2011%20(3)%202011/pp53-68.pdf
Salehuddin, K., & Winskel, H. (2012).Malay numeral classifier usage in caretaker-child talk.GEMA Online Journal of Language Studies, 12(1), Special Section, 89-104. http://www.ukm.my/ppbl/Gema/GEMA%20vol%2012%20(1)%20Special%20section%202012/pp_89_104.pdf
Khazriyati Salehuddin, Heather Winskel and Imran Ho Abdullah
1326 Pertanika J. Soc. Sci. & Hum. 21 (4): 1309 - 1326 (2013)
Salehuddin, K., Winskel, H., & Maros, M. (2011).The pragmatic functions of numeral classifiers in modern Malay written corpus.GEMA Online Journal of Language Studies, 11(2), 137-153.http://www.ukm.my/ppbl/GEMA%20vol%2011%20(2)%202011/137-153.pdf
Scrimshaw, P. (1988). Matching task to children: Can computers help? Journal of Computer Assisted Learning, 4(2), 71-78.
Tare, M., Shatz, M., & Gilbertson, L. (2008). Maternal uses of non-object terms in child-directed speech: Color, number and time. First Language, 28(1), 87-100.
Uchida, N., & Imai, M. (1996). A study on the acquisition of numeral classifiers among young children: The development of human-animal categories and generation of the role of classifiers applying. Japanese Journal of Educational Psychology, 44(2), 126-135
Uchida, N., & Imai, M. (1999). Heuristics in learning classifiers: The acquisition of the classifier system and its implications for the nature of lexical acquisition. Japanese Psychological Research, 41(1), 50-69.
Yamamoto, K. (2005). The acquisition of numeral classifiers: The case of Japanese children (Vol. 27). Berlin: Mouton de Gruyter.
Yamamoto, K., & Keil, F. C. (2000). The acquisition of Japanese numeral classifiers: Linkage between grammatical forms and conceptual categories. Journal of East Asian Linguistics, 9, 379-409.
Yuan, Y., Woltz, D., & Zheng, R. (2010). Cross-language priming of word measuring during second language sentence comprehension. Language Learning, 60(2), 446-469.
Zhang, S., & Schmitt, B. (1998). Language-dependent classification: The mental representation of classifiers in cognition, memory, and ad evaluations. Journal of Experimental Psychology: Applied, 4(4), 375-385.
Pertanika J. Soc. Sci. & Hum. 21 (4): 1327 - 1339 (2013)
ISSN: 0128-7702 © Universiti Putra Malaysia Press
SOCIAL SCIENCES & HUMANITIESJournal homepage: http://www.pertanika.upm.edu.my/
Article history:Received: 25 April 2011Accepted: 27 February 2012
ARTICLE INFO
E-mail addresses: [email protected] (Faridah Ismail), [email protected] (Norizan Ahmad), [email protected] (Ahmad Ezanee Hashim), [email protected] (Razidah Ismail) * Corresponding author
The Behavioural Based Safety (BBS) and Culture Change Approach for Managing Workplace Safety
Faridah Ismail1*, Norizan Ahmad1, Ahmad Ezanee Hashim1 and Razidah Ismail2
1Faculty of Architecture, Planning and Surveying, Universiti Teknologi MARA, 40450 Shah Alam, Selangor, Malaysia2Faculty of Computer and Mathematical Sciences, Universiti Teknologi MARA, 40450 Shah Alam, Selangor, Malaysia
ABSTRACT
This paper attempts to investigate the current literature on behavioural based and culture change approach on workplace safety. It draws on current publications and the findings of a two recent research study; Safety Culture and Behavioural Based Study Approach. A semi-structured interview and questionnaire survey approach methods was adopted for both studies. The interrelationship, the comparison in terms of concept, characteristics, and application and implementation steps is analysed. The findings revealed that culture formation can be thought of as a series of behaviours and consequences. Behavioural Based approach to safety focuses on workers’ behaviour as the cause of most work-related injuries and illness. In contrast, the culture change approaches to safety are “top-down”, focus on changing the values and beliefs of the organisation, and involve working with the leadership of the enterprise. Hence, both approaches are complementary and a combination of the two will enhance workplace safety.
Keywords: Framework, safety culture, Malaysian construction companies
INTRODUCTION
The main focus over the past 150 years has been on improving the technical aspect of engineering systems to improve safety, and these efforts have been successful. As the frequency in technological failure in industry has diminished, the role of human behaviour has become more apparent, and safety experts now estimate that 80-90%
Faridah Ismail, Norizan Ahmad, Ahmad Ezanee Hashim and Razidah Ismail
1328 Pertanika J. Soc. Sci. & Hum. 21 (4): 1327 - 1339 (2013)
of all industrial accidents are attributed to human factors. According to Fleming and Larder (1999), it is now widely accepted that the most effective way to further reduce accident rates is to address the social and organisational factors that influence the safety performance. Management has come to realize that the general likelihood of an accident occurring in their plant depends not just on the actions of the individual employees but on the safety culture of the organisation (Flemming et al., 1999).
The Behavioural Based Safety (BBS) approach and the Safety Culture Change approach has attracted debate and gained attention for managing workplace safety (Dejoy, 2005). A preliminary exploration on the Malaysian Society of Occupational Safety and Health (MSOSH) revealed that, unlike safety culture change approach, BBS is only practiced in the oil and gas industries in Malaysia. Further, training for BBS is offered by a small number of training providers.
The present paper attempts to investigate the current literature on behavioural based and culture change approaches on workplace safety. It draws on the current publications and the findings of two recent research studies; namely, the BBS approach (Faridah et al., 2010b) and safety culture (Faridah et al., 2010a).
MANAGING WORKPLACE SAFETY
The organisational benefits of an effective safety programme have been found to increase in profits, improve reputation and image, and reduce insurance premiums.
Most importantly, the benefits will decrease accidents at job sites (Koehn et al., 1995). The increase in the awareness of safety among construction companies, according to Wilson et al. (2000), is attributed to many factors. The construction industry has come to recognise the relationship between risk management and return on investment (Davis, 1998, as cited in Wilson et al., 2000). The ever increasing cost of medical treatment, convalescent care, and the potential for lawsuits all add-up to higher insurance premiums, which in turn tend to have a negative impact on a company’s profit (Heinz et al., 1998). In addition, the significant of safety programme is further highlighted when the International Labour Office (ILO) considers safety culture and management system approach to be essential elements for the improvement of performance (Mandorf, 2000).
CULTURE AND BEHAVIOUR RELATIONSHIP
According to Schneider (990), translating culture formation into behavioural terms helps people understand how the process works. People learn more from behaviour than from printed statements and company policies. Behaviour is the function of its consequences and these make behaviours strongly associated with learning (Schneider, 1990). Research from social learning theory noted that individuals in social settings may learn which behaviours and opinions are rewarded and punished by observing others. Hence, there seems to be an acknowledged connection between behaviours and the
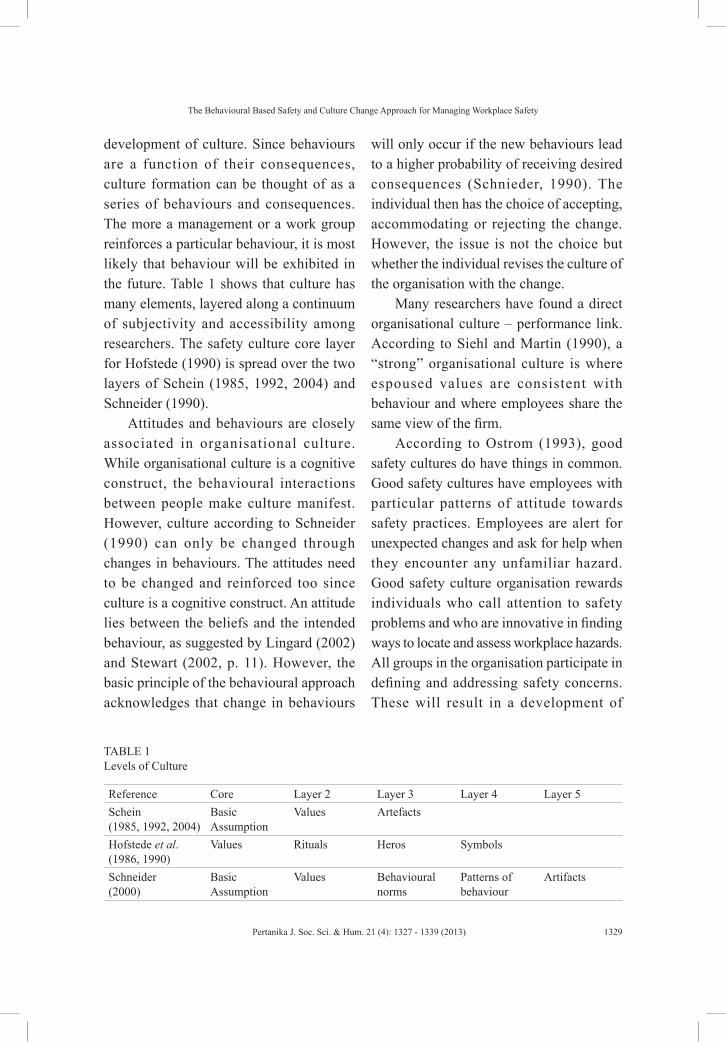
The Behavioural Based Safety and Culture Change Approach for Managing Workplace Safety
1329Pertanika J. Soc. Sci. & Hum. 21 (4): 1327 - 1339 (2013)
development of culture. Since behaviours are a function of their consequences, culture formation can be thought of as a series of behaviours and consequences. The more a management or a work group reinforces a particular behaviour, it is most likely that behaviour will be exhibited in the future. Table 1 shows that culture has many elements, layered along a continuum of subjectivity and accessibility among researchers. The safety culture core layer for Hofstede (1990) is spread over the two layers of Schein (1985, 1992, 2004) and Schneider (1990).
Attitudes and behaviours are closely associated in organisational culture. While organisational culture is a cognitive construct, the behavioural interactions between people make culture manifest. However, culture according to Schneider (1990) can only be changed through changes in behaviours. The attitudes need to be changed and reinforced too since culture is a cognitive construct. An attitude lies between the beliefs and the intended behaviour, as suggested by Lingard (2002) and Stewart (2002, p. 11). However, the basic principle of the behavioural approach acknowledges that change in behaviours
will only occur if the new behaviours lead to a higher probability of receiving desired consequences (Schnieder, 1990). The individual then has the choice of accepting, accommodating or rejecting the change. However, the issue is not the choice but whether the individual revises the culture of the organisation with the change.
Many researchers have found a direct organisational culture – performance link. According to Siehl and Martin (1990), a “strong” organisational culture is where espoused values are consistent with behaviour and where employees share the same view of the firm.
According to Ostrom (1993), good safety cultures do have things in common. Good safety cultures have employees with particular patterns of attitude towards safety practices. Employees are alert for unexpected changes and ask for help when they encounter any unfamiliar hazard. Good safety culture organisation rewards individuals who call attention to safety problems and who are innovative in finding ways to locate and assess workplace hazards. All groups in the organisation participate in defining and addressing safety concerns. These will result in a development of
TABLE 1 Levels of Culture
Reference Core Layer 2 Layer 3 Layer 4 Layer 5Schein (1985, 1992, 2004)
Basic Assumption
Values Artefacts
Hofstede et al. (1986, 1990)
Values Rituals Heros Symbols
Schneider (2000)
Basic Assumption
Values Behavioural norms
Patterns of behaviour
Artifacts
Faridah Ismail, Norizan Ahmad, Ahmad Ezanee Hashim and Razidah Ismail
1330 Pertanika J. Soc. Sci. & Hum. 21 (4): 1327 - 1339 (2013)
positive attitudes towards safety. According to Ostrom (1993), organisations with a good safety culture are also reflective on safety practices. They have mechanisms in place to gather safety related information, measure safety performance, and bring people together to learn how to work more safely. They use the mechanism not only to support solving immediate problems but learn how to better identify and address those problems on a daily basis.
A corporate culture that values safety can be created if they define and practice what has been accepted by a company. Ideally, the employees should know all the risks associated with their jobs, what is required for safety and take responsibility for them. These will develop the norm in which the employees are all aware of all the risks in their workplace and continually be on the lookout for risks. Weigmann (2002) reports suggestions that there are at least five global categories or indicators of safety culture. These include organisational commitment, management involvement, employee empowerment, reward systems and reporting systems.
While several management practices have been cited as important components of safety programmes, none of it shows how much each incrementally contributes to injury reduction. Vredenburgh (2002) has compiled factors found across several reports concerning safety culture based on the works of Cohen and Cleveland (1983); Pidgeon (1991), and Turner (1991). He found that there are six management practices that have been discussed consistently concerning
safety culture: (a) rewards, (b) training, (c) hiring, (d) communication/ feedback, (e) participation, and (f) management support. On the other hand, a study conducted among grade G7 contractors’ companies in Malaysia on the management practices by Faridah and Torrance (2006) revealed five factors, which include leadership, management commitment, organisational commitment, resource allocation, and training.
This is shown through consistent findings by researchers such as Cooper (1998), Ostrom (1993), Mohamed (2002), Weigmann (2002), Vredenburg (2002), and Schein (2004), as tabulated in Table 2. There seems to be a general agreement that management commitment is the driving force towards the achievement of safety culture. This commitment is then translated into actions and reflected through the behavioural practices that will embed and transmit safety culture into the organisational culture.
THE BEHAVIOURAL BASED VERSUS CULTURE CHANGE APPROACH
One of the strengths which the Total Quality Management (TQM) approach has over a behavioural approach to safety is in the realisation that TQM focuses on “systematic” changes in attitude, which in turn, results in changes in behaviour. The TQM approach to safety offers more long-lasting results as it addresses the core layer of culture; however, the behaviour modification gives quicker impact, especially
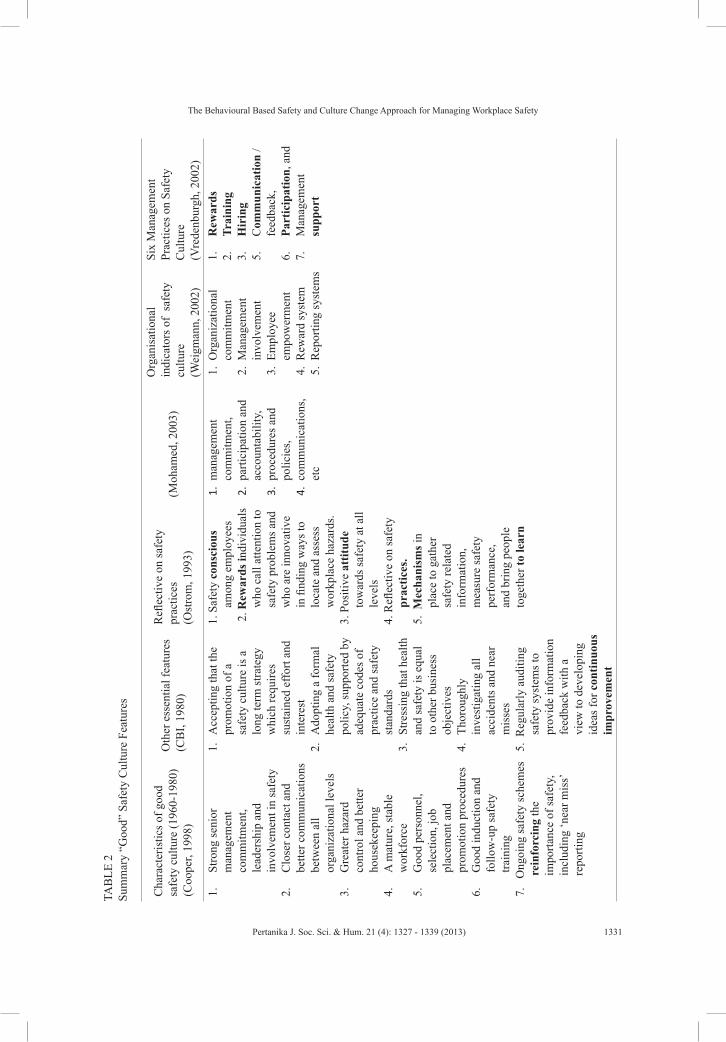
The Behavioural Based Safety and Culture Change Approach for Managing Workplace Safety
1331Pertanika J. Soc. Sci. & Hum. 21 (4): 1327 - 1339 (2013)
TAB
LE 2
Su
mm
ary
“Goo
d” S
afet
y C
ultu
re F
eatu
res
Cha
ract
eris
tics o
f goo
d sa
fety
cul
ture
(196
0-19
80)
(Coo
per,
1998
)
Oth
er e
ssen
tial f
eatu
res
(CB
I, 19
80)
Refl
ectiv
e on
safe
ty
prac
tices
(Ost
rom
, 199
3)(M
oham
ed, 2
003)
Org
anis
atio
nal
indi
cato
rs o
f sa
fety
cu
lture
(W
eigm
ann,
200
2)
Six
Man
agem
ent
Prac
tices
on
Safe
ty
Cul
ture
(V
rede
nbur
gh, 2
002)
1.
Stro
ng se
nior
m
anag
emen
t co
mm
itmen
t, le
ader
ship
and
in
volv
emen
t in
safe
ty2.
C
lose
r con
tact
and
be
tter c
omm
unic
atio
ns
betw
een
all
orga
niza
tiona
l lev
els
3.
Gre
ater
haz
ard
cont
rol a
nd b
ette
r ho
usek
eepi
ng4.
A
mat
ure,
stab
le
wor
kfor
ce5.
G
ood
pers
onne
l, se
lect
ion,
job
plac
emen
t and
pr
omot
ion
proc
edur
es6.
G
ood
indu
ctio
n an
d fo
llow
-up
safe
ty
train
ing
7.
Ong
oing
safe
ty sc
hem
es
rein
forc
ing
the
impo
rtanc
e of
safe
ty,
incl
udin
g ‘n
ear m
iss’
repo
rting
1. A
ccep
ting
that
the
prom
otio
n of
a
safe
ty c
ultu
re is
a
long
term
stra
tegy
w
hich
requ
ires
sust
aine
d ef
fort
and
inte
rest
2. A
dopt
ing
a fo
rmal
he
alth
and
safe
ty
polic
y, su
ppor
ted
by
adeq
uate
cod
es o
f pr
actic
e an
d sa
fety
st
anda
rds
3. S
tress
ing
that
hea
lth
and
safe
ty is
equ
al
to o
ther
bus
ines
s ob
ject
ives
4. T
horo
ughl
y in
vest
igat
ing
all
acci
dent
s and
nea
r m
isse
s5.
Reg
ular
ly a
uditi
ng
safe
ty sy
stem
s to
prov
ide
info
rmat
ion
feed
back
with
a
view
to d
evel
opin
g id
eas f
or c
ontin
uous
im
prov
emen
t
1. S
afet
y co
nsci
ous
amon
g em
ploy
ees
2. R
ewar
ds in
divi
dual
s w
ho c
all a
ttent
ion
to
safe
ty p
robl
ems a
nd
who
are
inno
vativ
e in
find
ing
way
s to
loca
te a
nd a
sses
s w
orkp
lace
haz
ards
. 3.
Pos
itive
att
itude
to
war
ds sa
fety
at a
ll le
vels
4. R
eflec
tive
on sa
fety
pr
actic
es.
5. M
echa
nism
s in
plac
e to
gat
her
safe
ty re
late
d in
form
atio
n,
mea
sure
safe
ty
perf
orm
ance
, an
d br
ing
peop
le
toge
ther
to le
arn
1. m
anag
emen
t co
mm
itmen
t, 2.
par
ticip
atio
n an
d ac
coun
tabi
lity,
3.
pro
cedu
res a
nd
polic
ies,
4. c
omm
unic
atio
ns,
etc
1. O
rgan
izat
iona
l co
mm
itmen
t2.
Man
agem
ent
invo
lvem
ent
3. E
mpl
oyee
em
pow
erm
ent
4. R
ewar
d sy
stem
5. R
epor
ting
syst
ems
1.
Rew
ards
2.
Trai
ning
3.
Hir
ing
5.
Com
mun
icat
ion
/ fe
edba
ck,
6.
Part
icip
atio
n, a
nd7.
M
anag
emen
t su
ppor
t
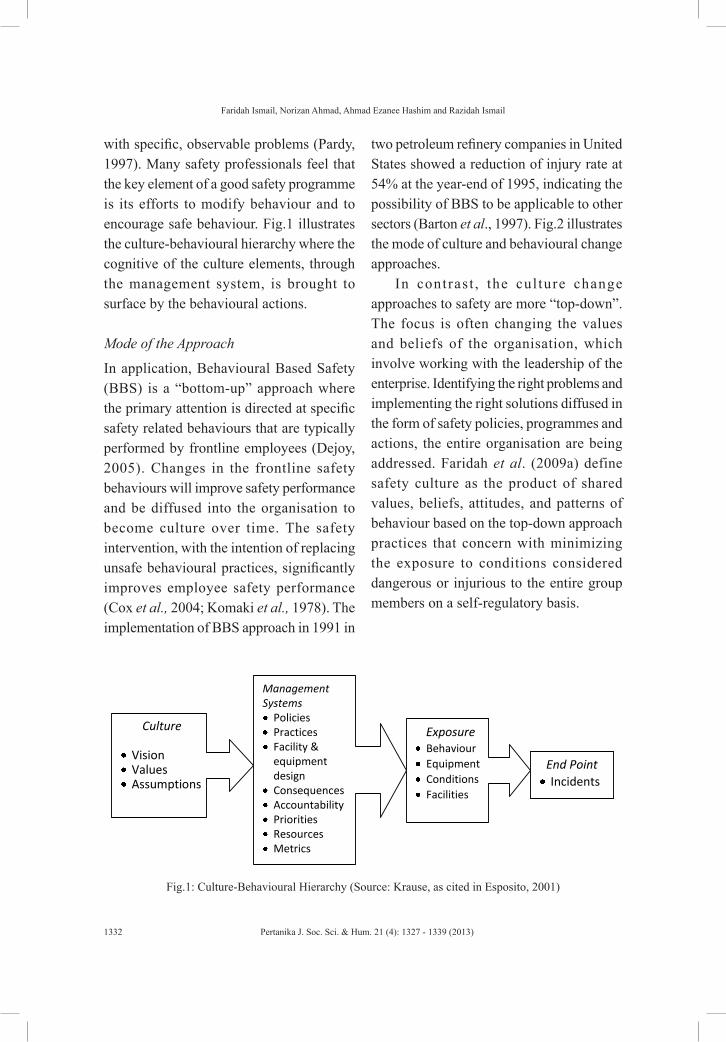
Faridah Ismail, Norizan Ahmad, Ahmad Ezanee Hashim and Razidah Ismail
1332 Pertanika J. Soc. Sci. & Hum. 21 (4): 1327 - 1339 (2013)
with specific, observable problems (Pardy, 1997). Many safety professionals feel that the key element of a good safety programme is its efforts to modify behaviour and to encourage safe behaviour. Fig.1 illustrates the culture-behavioural hierarchy where the cognitive of the culture elements, through the management system, is brought to surface by the behavioural actions.
Mode of the Approach
In application, Behavioural Based Safety (BBS) is a “bottom-up” approach where the primary attention is directed at specific safety related behaviours that are typically performed by frontline employees (Dejoy, 2005). Changes in the frontline safety behaviours will improve safety performance and be diffused into the organisation to become culture over time. The safety intervention, with the intention of replacing unsafe behavioural practices, significantly improves employee safety performance (Cox et al., 2004; Komaki et al., 1978). The implementation of BBS approach in 1991 in
two petroleum refinery companies in United States showed a reduction of injury rate at 54% at the year-end of 1995, indicating the possibility of BBS to be applicable to other sectors (Barton et al., 1997). Fig.2 illustrates the mode of culture and behavioural change approaches.
In contrast , the cul ture change approaches to safety are more “top-down”. The focus is often changing the values and beliefs of the organisation, which involve working with the leadership of the enterprise. Identifying the right problems and implementing the right solutions diffused in the form of safety policies, programmes and actions, the entire organisation are being addressed. Faridah et al. (2009a) define safety culture as the product of shared values, beliefs, attitudes, and patterns of behaviour based on the top-down approach practices that concern with minimizing the exposure to conditions considered dangerous or injurious to the entire group members on a self-regulatory basis.
Culture
Vision Values Assumptions
Management Systems Policies Practices Facility & equipment design
Consequences Accountability Priorities Resources Metrics
Exposure Behaviour Equipment Conditions Facilities
End Point Incidents
Fig.1: Culture-Behavioural Hierarchy (Source: Krause, as cited in Esposito, 2001)
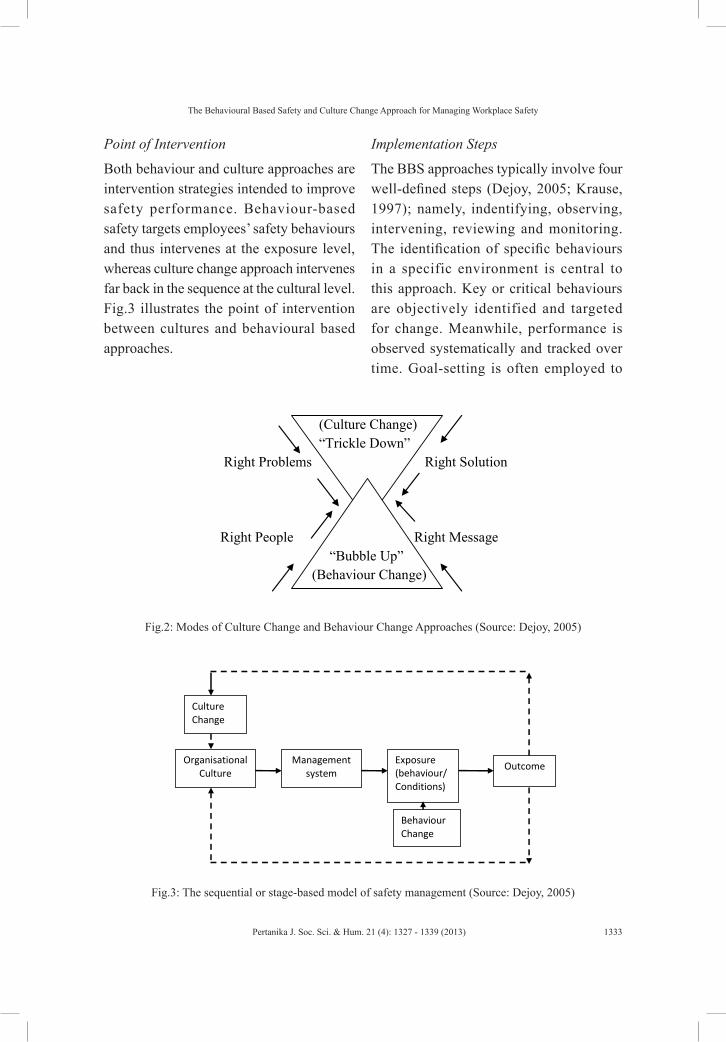
The Behavioural Based Safety and Culture Change Approach for Managing Workplace Safety
1333Pertanika J. Soc. Sci. & Hum. 21 (4): 1327 - 1339 (2013)
Point of Intervention
Both behaviour and culture approaches are intervention strategies intended to improve safety performance. Behaviour-based safety targets employees’ safety behaviours and thus intervenes at the exposure level, whereas culture change approach intervenes far back in the sequence at the cultural level. Fig.3 illustrates the point of intervention between cultures and behavioural based approaches.
Implementation Steps
The BBS approaches typically involve four well-defined steps (Dejoy, 2005; Krause, 1997); namely, indentifying, observing, intervening, reviewing and monitoring. The identification of specific behaviours in a specific environment is central to this approach. Key or critical behaviours are objectively identified and targeted for change. Meanwhile, performance is observed systematically and tracked over time. Goal-setting is often employed to
(Culture Change) “Trickle Down”
Right Problems Right Solution
Right People Right Message “Bubble Up”
(Behaviour Change)
Organisational Culture
Management system
Exposure (behaviour/ Conditions)
Outcome
Behaviour Change
Culture Change
Fig.2: Modes of Culture Change and Behaviour Change Approaches (Source: Dejoy, 2005)
Fig.3: The sequential or stage-based model of safety management (Source: Dejoy, 2005)
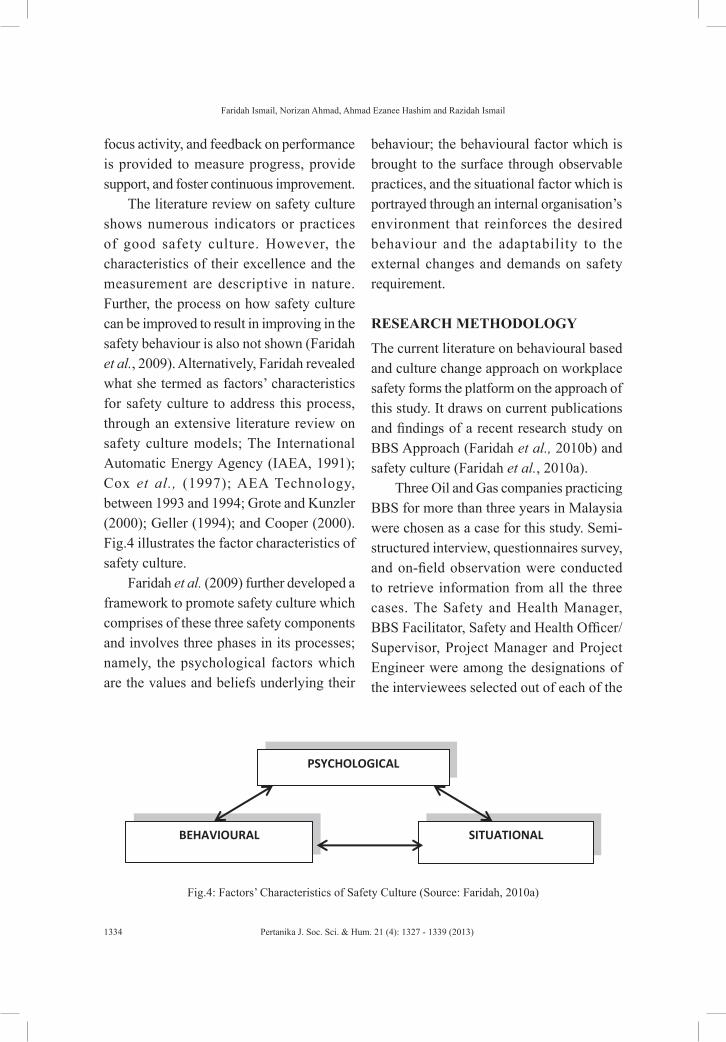
Faridah Ismail, Norizan Ahmad, Ahmad Ezanee Hashim and Razidah Ismail
1334 Pertanika J. Soc. Sci. & Hum. 21 (4): 1327 - 1339 (2013)
focus activity, and feedback on performance is provided to measure progress, provide support, and foster continuous improvement.
The literature review on safety culture shows numerous indicators or practices of good safety culture. However, the characteristics of their excellence and the measurement are descriptive in nature. Further, the process on how safety culture can be improved to result in improving in the safety behaviour is also not shown (Faridah et al., 2009). Alternatively, Faridah revealed what she termed as factors’ characteristics for safety culture to address this process, through an extensive literature review on safety culture models; The International Automatic Energy Agency (IAEA, 1991); Cox et al., (1997); AEA Technology, between 1993 and 1994; Grote and Kunzler (2000); Geller (1994); and Cooper (2000). Fig.4 illustrates the factor characteristics of safety culture.
Faridah et al. (2009) further developed a framework to promote safety culture which comprises of these three safety components and involves three phases in its processes; namely, the psychological factors which are the values and beliefs underlying their
behaviour; the behavioural factor which is brought to the surface through observable practices, and the situational factor which is portrayed through an internal organisation’s environment that reinforces the desired behaviour and the adaptability to the external changes and demands on safety requirement.
RESEARCH METHODOLOGY
The current literature on behavioural based and culture change approach on workplace safety forms the platform on the approach of this study. It draws on current publications and findings of a recent research study on BBS Approach (Faridah et al., 2010b) and safety culture (Faridah et al., 2010a).
Three Oil and Gas companies practicing BBS for more than three years in Malaysia were chosen as a case for this study. Semi-structured interview, questionnaires survey, and on-field observation were conducted to retrieve information from all the three cases. The Safety and Health Manager, BBS Facilitator, Safety and Health Officer/ Supervisor, Project Manager and Project Engineer were among the designations of the interviewees selected out of each of the
BEHAVIOURAL SITUATIONAL
PSYCHOLOGICAL
Fig.4: Factors’ Characteristics of Safety Culture (Source: Faridah, 2010a)
The Behavioural Based Safety and Culture Change Approach for Managing Workplace Safety
1335Pertanika J. Soc. Sci. & Hum. 21 (4): 1327 - 1339 (2013)
case studies. The interview solicited the organisations’ background, establishment and the implementation steps involved in the BBS practice.
In addition, forty (40) questionnaires were distributed for each case study to seek the current implementation of BBS from the safety officers, safety supervisors, project managers, project engineers, supervisors and other managerial staff and technical staff. The survey questions consist of three parts; Part A solicits data on personal information and organisation’s background; Part B focuses on its implementation, and Part C assesses on the management’s support towards safety improvement. Management practice towards safety improvement has been divided into two; Safety and Health Policy statements and Behaviour Based Safety (BBS) approach.
The methodological approach to derive the measurement of the concept of safety culture involves the choice of sequencing three research methods. A preliminary survey was carried out to identify the practices that embed safety culture into the organisational culture. The characteristics of good safety culture practices (Faridah, 2004) form the basis for development of the questionnaire. The identified factors, which are behavioural in nature, were expanded further to include the aspects of psychological and situational factors formulated into the Main Survey, which formed the measurement scale for safety culture. The questions were designed to capture these three aspects of safety culture adapted, from Cooper (2000), Stringer (2002), Stewart (2002), and Schein (2004).
The methodological development of the framework of the safety culture was earlier discussed in detail by Faridah et al. (2010a).
Unlike the BBS approach, the safety culture change approach uses construction organisations as the unit of analysis. The scope of the study was derived from the whole total population of 866 (overall total of 1,171) numbers of a Grade 7 contractors listed under the Construction Industry Development Board (CIDB) Directory who undertakes Building Works within the Klang Valley.
FINDINGS AND DISCUSSION
The behavioural factors are one out of the three components in measuring safety culture. While safety culture is associated with the psychological aspect, behaviours are layers of the culture being manifested. On the other hand, the situational factors reinforce the behaviours and lead to the formation of safety culture. The review of the literature and current findings revealed that both BBS and culture change approach are interrelated and do have things in common in managing workplace safety. Culture formation can be thought of as a series of behaviours and consequences. Both are intervention strategies intended to improve safety performance. Further, the characteristics that each possesses complement one another, as well as provide two modes, intervention point and implementation steps for achieving the common goal of workplace safety. The strength of BBS substitutes the weaknesses of safety change approach vice versa.
Faridah Ismail, Norizan Ahmad, Ahmad Ezanee Hashim and Razidah Ismail
1336 Pertanika J. Soc. Sci. & Hum. 21 (4): 1327 - 1339 (2013)
BBS focuses on seen unsafe related behaviours and demands immediate corrective action, lesson learnt shared, accepted as norm so as to ensure that no repetition will occur. This complements the culture change approach that addresses the values and beliefs which are cognitive in nature and only seen when they appear in behavioural actions.
Unlike BBS which is limited in its approaches for empirical analysis of critical safety-related behaviours, the culture change working with leadership offers a comprehensive and systematic approach that addresses the entire organisational in managing safety. Hence, BBS offers a short-term approach as compared to the long-term approach of safety culture.
Out of 40 questionnaires distributed, the number of responses received from each of companies A, B, and C, was 22 (55%), 15 (37.5%) and 19 (47.5%), respectively. The findings revealed that the basic implementation steps of BBS approach under the case study comprised of identifying, observing, intervention, feedback, and report. Company B introduced an innovation into the new term as Positive Intervention Walkabout (PIW) in 2007, after first implementing BBS in 2003. PIW is a combination of behaviour based safety and process safety, where they
believe that this combination forms a comprehensive approach to improve safety performance. This includes coaching, cross-section visit, intervene and action, cover all area, emphasizing personal and process safety, self follow-up, safety is
everybody’s responsibilities, web link and appreciating the employees were identified. Further, Company C innovated BBS into the LPO process accommodated within 8 steps, as follows: Identification of target areas, selection of observers and scheduling observations, preparation for observation, conduct observation, feedback discussion session, quality review and approval by Area/ Department/ Operation Manager, communication and implementation of solution and recommendation and verification and validation of solutions.
A separate safety culture study involved a preliminary survey, where the questionnaires were distributed to 866, grade G7 contractors’ companies undertaking building works in the Klang Valley. The response rate of the preliminary survey was 16.67%. The principal components for the extraction method with varimax rotation were used, where six factors were extracted as detailed in Faridah et al. (2009). Detail surveys measuring all these six factors were further distributed to the contractors who responded to the preliminary survey. The mean score was used to deduce from the detail survey with a respond rate of 48%. The semi-structured interview conducted among 11 contractors’ organisation involving three key controlling safety related personnel each; the Chief Executive Officer/Safety Manager; the Safety Officer and; the Site Supervisor revealed the following results.
The culture approach requires the senior management to built strong safety values and beliefs that are translated into observable behavioural practices, and
The Behavioural Based Safety and Culture Change Approach for Managing Workplace Safety
1337Pertanika J. Soc. Sci. & Hum. 21 (4): 1327 - 1339 (2013)
characterised by leadership, organisational commitment, management commitment, safety training and resource allocation. Further, an internal environment that reinforces the desired behaviour, adapting and aligning to the external environmental factors makes safety culture enhanced. The desired safety culture is then clearly communicated, portrayed through the behavioural actions, implemented via mutual trust and commitment to the Safety Officers and Site Supervisors.
Though safety culture measures behavioural factors, it is at the leadership level (with the hope) that it will filter down within the organisation. Thus, BBS which focuses on safety-related behaviours does not duplicate in its approach but complement instead. The BBS in the context of safety culture can be considered as the internal environmental factor that reinforces the desired behaviours. This suggests that an integration of both the approaches will provide a holistic platform to enhance workplace safety within organisations.
CONCLUSION
This paper has set out the elements involved in the BBS and safety culture approaches towards workplace safety. Based on the study by Flemming et al. (1999), unsafe behaviours both directly and indirectly contribute to 80%-90% of workplace accidents and incidents. Culture formation can be thought of as a series of behaviours and consequences. Behavioural Based approach to safety focuses on workers’
behaviour as the cause of most work-related injuries and illness.
This study draws on the current publications and the findings of a recent research study on both safety culture and Behavioural Based Study Approach. A semi-structured interview and the questionnaire survey approach were adopted. The interrelationship, i.e. a comparison in terms of concept, characteristics, and application and implementation steps, was analysed.
In contrast , the cul ture change approaches to safety are “top-down”, focus on changing the values and beliefs of the organisation, and involve working with the leadership of the enterprise.
The review has revealed that both approaches are complementary and the integration of both, regardless of sectors, will provide a holistic platform to enhance workplace safety within organisations.
ACKNOWLEDGEMENTS
The authors wish to thank the reviewers for their invaluable comments on this paper.
REFERENCESBarton, J., Caldwell, T. C., & Hodson, S. (1997).
Behavior-Based Safety in Action. Occupational Health & Safety, 80.
Cohen, H. H., & Cleveland, R.J. (1983). Safety program practices in record- holding plants. In A. G. Vredenburgh (Ed.).
Cooper, M.D. (1998). Improving Safety Culture. John Wiley & Sons.
Cooper, M. D. (2000). Towards a Model of Safety Culture. Safety Science, 36, 111-136.
Faridah Ismail, Norizan Ahmad, Ahmad Ezanee Hashim and Razidah Ismail
1338 Pertanika J. Soc. Sci. & Hum. 21 (4): 1327 - 1339 (2013)
Cox, S., Chyne, A., & Alexander, A. (1997). Safety culture in offshore environments: developing the safety climate measurement tool. In HSE (Ed.) Development of a Business Excellence Model of Safety Culture. London.
Davis, S. G. (1998). Reducing insurance costs in today’s marketplace. In J.M. Wilson (Ed.), Roads and Bridges (pp. 54-75).
Dejoy, D. M. (2005). Behaviour change versus culture change: Divergent approaches to managing workplace safety. Safety Science, 105-129.
Faridah, I. & Torrance, J.V. (2004). Literature review on defining safety culture. The Malaysian Surveyor, 39(2), 33-37.
Faridah, I. & Torrance, J.V. (2006). The Organisational Factors that Influence the Safety Culture of the Malaysian Construction Organisations. Selangor Institute of Research Development and Commercialisation, Universiti Teknologi MARA.
Faridah, I., Hashim, A. E., Ismail, R., & Abdul Majid, M. Z (2009). The Operationalisation of Safety Culture for the Malaysian Construction Organisations. International Journal of Business and Management, 4(9), 226-237.
Faridah, I., Harun, H., Hashim, A.E, & Ismail, R. (2010a). A Framework of Safety Culture for the Malaysian Construction Companies: A Methodological Development. Journal of Social Science & Humanities, 18(1), 45-54.
Faridah, I., Mahmood, A., Hashim, A.E., & Salimin, R. (2010b). Behaviour Base Safety Approach: A Mechanism for Workplace Safety Improvement. Proceedings of International Conference of Construction Project Management (ICCPM), Chengdu, China: IEEE.
Fleming, M., & Larder, R (1999). Safety culture - the way forward. The Chemical Cngineer (March), 16-18.
Komaki, J., Kenneth, D., Barwick, & Lawrence, R.S. (1978). A Behavioral Approach to Occupational Safety: Pinpointing and Reinforcing Safe Performance in a Food Manufacturing Plant. Journal of Applied Psychology, 434-445.
Geller, S. E. (1994). Ten principles for achieving a total safety culture. Professional Safety (September), 18-24.
Grote, G., & Kunzler, C. (2000). Diagnosis of safety culture in safety management audits. Safety Science, 34, 131-150.
Heinz, J., & Pedersen, C. (1998). “Identifying root causes of construction injuries. Journal of Construction Engineering and Management, 124(1), 67-71.
Hofstede, G., Neuijen, B., Daval, O.D., & Sanders, G. (1990). “Measuring Organisational Cultures: A Qualitative and Quantitative Study across Twenty Cases. Administrative Science Quarterly, 35, 286-316.
IAEA (1991). Safety Culture: A report by the International Nuclear Safety Advisory Group. Safety Series No.75-INSAG-4. Vienna.
ILO (2005). Promotional framework for occupational safety and health. Geneva, International Labour Office.
Koehn, E. E., Kothari, R.P., & Pan C.-S. (1995). Safety in Developing Countries: Professional and Bureaucratic Problems. Journal of Construction Engineering and Management, 121(3), 261-265.
Krause, T. R. (2004). Influencing the behavior of senior leadership: what makes a great safety leader. Professional Safety, 29-33.
Lingard, H. (2002). The effect of first aid training on Australian construction workers’ occupational health and safety knowledge and motivation to avoid work-related injury or illness. Construction Management and Economics, 20, 263-273.
The Behavioural Based Safety and Culture Change Approach for Managing Workplace Safety
1339Pertanika J. Soc. Sci. & Hum. 21 (4): 1327 - 1339 (2013)
Mansdorf, Z. (2000). Will ILO take the lead on OSH management systems? Occupational Hazards, 62(9), 71-75.
Mohamed, S. (2003). Scorecard approach to benchmarking organizational safety culture in construction. Construction Engineering and Management (January/February), 80-88.
Molenaar, K., Brown, H., Caile, S., & Smith, R. (2002). Corporate Culture: A study of firms with outstanding construction safety. Professional Safety.
Ostrom, L., Wilheimsen, C., & Kaplan, B. (1993). Assessing Safety Culture. Nuclear Safety, 34(2), 163-172.
Pardy, W. G. (1997). Safety Incentive, Recognition and Awareness Programs: One Company’s Experience & Industry Perspective. Safety Incentive, Recognition & Awareness.
Pidgeon, N. (1991). Safety culture and risk management in organisations. Journal of Cross-Cultural Psychology, 22, 129-140.
Schneider, B. (1990). Organizational Climate and Culture. California: Jossey- Bass.
Schein, E. H. (1985). Organizational Culture and Leadership. San Fransisco: Jossey-Bass.
Schein, E. H. (2004). Organizational Culture and Leadership. United States of America, Jossey-Bass. Sekaran, U. (2003). Research Methods for Business. United States of America: John Wiley & Sons, Inc.
Siehl, C., & Martin, J (1990). Organizational culture: a key to financial performance? In B.
Suraji, A., & Duff. (2001). Development of casual model of construction accident causation. Journal of Construction Engineering and Management, 127(4), 337-344.
Stewart, J. M. (2002). Managing for World Class Safety. Canada: John Wiley & Sons.
Stringer, R. (2002). Leadership and Organizational Climate, Prentice Hall
Turner, B. A. (1991). The development of safety culture. Chemical Industries, 1, 241-243.
Vredenburgh, A.G. (2002). Organizational safety: Which management practices are most effective in reducing employee injury rates? Journal of Safety Research, 33, 259-276.
Weigmann, D. A., Zhang, H., & Thaden T. v. (2002). A synthesis of Safety Culture and Safety Climate Research. Aviation Research Labrotary, 11-12.
Wilson, J. M., & E (2000). Safety Management: problems encountered and recommended solution. Journal of Construction Engineering and Management, 126(1), 77-79.

Pertanika J. Soc. Sci. & Hum. 21 (4): 1341 - 1360 (2013)
ISSN: 0128-7702 © Universiti Putra Malaysia Press
SOCIAL SCIENCES & HUMANITIESJournal homepage: http://www.pertanika.upm.edu.my/
Article history:Received: 20 May 2011Accepted: 7 August 2012
ARTICLE INFO
E-mail addresses: [email protected] (Zurina Mahadi), [email protected] (Hukil Sino), * Corresponding author
Defining Public Needs in Sustainable Development: A Case Study of Sepang, Malaysia
Zurina Mahadi1* and Hukil Sino2
1Centre for General Studies, Universiti Kebangsaan Malaysia, 43600 Bangi, Selangor, Malaysia2Faculty of Health Sciences, Universiti Kebangsaan Malaysia, 50300 Kuala Lumpur, Malaysia
ABSTRACT
Defining public needs is hugely important to the concept of sustainable development and it has been at the core of the concept from the very beginning. This study was undertaken in order to explore the sustainable development needs of the public and governors, to provide greater understanding of the discrepancies within both parties’ needs and to propose a mechanism to define important sustainable development needs in Sepang, Selangor,Malaysia. A qualitative investigation was conducted through the use of , in-depth interviews and group discussions were held with the public and the governors to represent their personal and that of the community views they represented. Both parties exhibited five common values, namely identity, safety, freedom, environment and development. Both parties also highlighted six fundamental needs according to the Max-Neef list, i.e. subsistence, protection, participation, creation, identity and freedom. Only the public participants highlighted the need of affection. Despite similarities in terms of needs, the findings revealed discrepancies in values and perspectives. This study implies that it is important for the governors to comprehend and acknowledge local public values because these needs conform to values and normativity. This study suggests governors should evaluate the relevancy of development plans towards present being and tailor the needs of the development to local traditions, local nature and existing structures. In conclusion, the governors should decide on needs that resemble the aspirations of the local people within the existing systems they are living in and supported by.
Keywords: Sustainable development, needs, values,
governor, public
INTRODUCTION
Sustainable development is a concept that addresses societal development, judging it
Zurina Mahadi and Hukil Sino
1342 Pertanika J. Soc. Sci. & Hum. 21 (4): 1341 - 1360 (2013)
on its capacity to meet present individual needs and that of the future. Defined as development that meets the needs of the present without compromising the ability of future generations to meet their own needs, it contains within it two key concepts: the concept of ‘needs’, in particular essential needs; and the concept of limitations imposed by the state of technology and social organisation on the environment’s ability to meet present and future needs (World Commission on Environment and Development, 1987). The concept of limitations in sustainable development is related to the carrying capacity of the environment (Niu et al., 1993). Carrying capacity is the operational dimension of the life-support system which refers to the size of population the environment can support. In sustainable development, carrying capacity refers to the quantity and quality of available natural resources, and the assimilative capacity of the environment to absorb the effects of human activities (Kates et al., 2005). Many agree that the concepts of both needs and limitations refer to intergenerational equity which is the main pillar of sustainability (Kates et al., 2005).
Right from the onset, , sustainable development is defined by its capacity to meet human needs. But the concept of needs remained quite unclear as the report does not give a valid definition of needs. Examples of such definitions (Chapter 2, section 1),“The essential needs of vast numbers of people in developing countries for food, clothing, shelter, jobs are not being met…”; and that in Chapter 2, section 3: “Critical objectives
for environment and development policies that follow from the concept of sustainable development include…meeting essential needs for jobs, food, energy, water and sanitation…” (World Commission on Environment and Development, 1987) provided mere definitions of the needs. Departing from this elaboration, we will begin our investigation with local public needs as it has not been fully appraised in the local context thus far.
Gasper (1996) provides three generic meanings of the term needs, which are positive entities related to some form of want and desire (descriptive analyses); requisites for meeting a given end (instrumental analyses); and justified or priority requisites (normative analyses). Many studies, in an effort to be pragmatic, are drawn to the tangible analysis i.e. the instrumental analysis which permeates into the objective criteria of needs. Rauschmayer and his colleagues (2008) have given a compelling definition of needs as the most fundamental dimensions of human flourishing and such reasons for action that need no further reasoning. Rauschmayer et al. (2008) have also linked needs to well-being, which they defined as the emotional state and reflection of meaning in life, based on the subjective experience of one’s fulfilment of needs. In this context, as securing the well-being of humans and their supporting subsystem is the final aim of sustainable development, the study will investigate both concepts simultaneously.
Previous studies propose that needs and well-being could be systematically
Defining Sustainable Development Needs
1343Pertanika J. Soc. Sci. & Hum. 21 (4): 1341 - 1360 (2013)
categorised into physical (biology and physiology) and psychological dimensions (Doyal & Gough 1991; Ramsay 1992; Max-Neef 1993; Narayan, Chambers et al., 2000; Cummins 2000b). The component of subsistence described by Max-Neef covered most of the physical needs that were also proposed by other researchers. Max-Neef has listed food, shelter and work as the requisites of subsistence needs which is similar to Doyal and Gough’s (1991) intermediate needs as well as Narayan et al. (1993) and Cummins’ (2000b) material needs. These studies also listed psychological needs including autonomy (Doyal & Gough 1991; Max-Neef 1993), freedom (Max-Neef, 1993; Narayan et al., 2000) and harmony (Narayan et al., 2000; Cummins 2000b), security (Doyal & Gough 1991; Ramsay 1992; Max-Neef 1993; Narayan et al., 2000) and esteem (Ramsay 1992; Max-Neef 1993; Narayan et al., 2000) among many other needs. It is also evident that one need may comprise both physical and psychological needs, for example, the need of safety which is realised through the presence of protection (physical) and the sense of security (psychology). One informative approach formulated by Edward Deci and Richard Ryan (2000) is different from other approaches because they have excluded physiological needs from their needs concept (Andresen & Albus, 2010). This is because they believe these needs are existential givens that have to be satisfied in order to ensure survival. Their conceptual work instead focuses on three needs that are relevant for human well-being: autonomy,
competence and membership, which they consider non interchangeable and have to be satisfied to promote mental health. Deci and Ryan (2000) also pronounce that the non-satisfaction of the three needs can have social consequences, because such need deprivation may express itself in illness and social disintegration.
In human development, there are many different needs which Alkire (2002) discussed as part of the basic dimensions of human well-being, coming from moral philosophy, psychology, economics and development studies. She found little difference between the results. From the exhaustive list, we specifically adopt the Max-Neef fundamental human needs theory because it thoroughly defines the qualities, things, actions and settings in the pursuit of each needs fulfilment. Max-Neef (1993) identified nine fundamental needs which could be traced back to different reasons for action, which he developed into a matrix of needs (Table 1) and four categories of strategies (satisfiers, as Max-Neef calls them), to meet these needs (Rauschmayer et al., 2008). The column of ‘Being’ registers personal or collective attributes (expressed as nouns). The column of ‘Having’ registers institutions, norms, mechanisms, tools, laws etc. the column of Doing registers personal or collective actions (expressed as verbs). The ‘Interacting’ column registers locations and milieus (as times and spaces) (Rauschmayer et al., 2008).
Along with Max-Neef’s fundamental needs theory, it is also worth capturing the capability perspective before analysis.
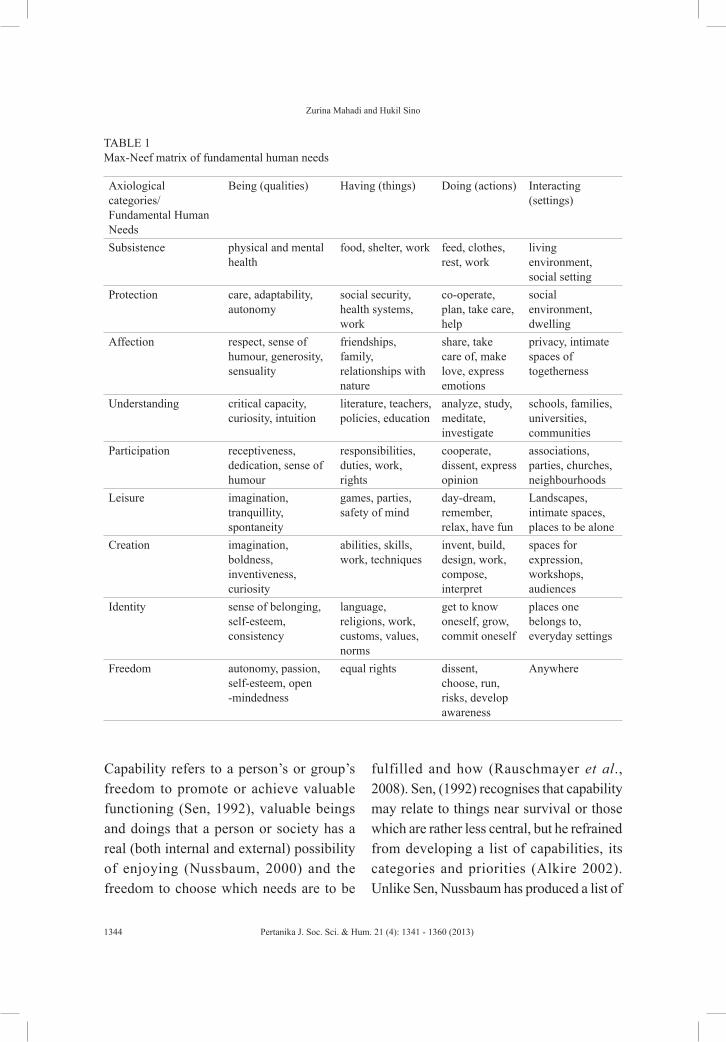
Zurina Mahadi and Hukil Sino
1344 Pertanika J. Soc. Sci. & Hum. 21 (4): 1341 - 1360 (2013)
TABLE 1 Max-Neef matrix of fundamental human needs
Axiological categories/Fundamental Human Needs
Being (qualities) Having (things) Doing (actions) Interacting (settings)
Subsistence physical and mental health
food, shelter, work feed, clothes, rest, work
living environment, social setting
Protection care, adaptability, autonomy
social security, health systems, work
co-operate, plan, take care, help
social environment, dwelling
Affection respect, sense of humour, generosity, sensuality
friendships, family, relationships with nature
share, take care of, make love, express emotions
privacy, intimate spaces of togetherness
Understanding critical capacity, curiosity, intuition
literature, teachers, policies, education
analyze, study, meditate, investigate
schools, families, universities, communities
Participation receptiveness, dedication, sense of humour
responsibilities, duties, work, rights
cooperate, dissent, express opinion
associations, parties, churches, neighbourhoods
Leisure imagination, tranquillity, spontaneity
games, parties, safety of mind
day-dream, remember, relax, have fun
Landscapes, intimate spaces, places to be alone
Creation imagination, boldness, inventiveness, curiosity
abilities, skills, work, techniques
invent, build, design, work, compose, interpret
spaces for expression, workshops, audiences
Identity sense of belonging, self-esteem, consistency
language, religions, work, customs, values, norms
get to know oneself, grow, commit oneself
places one belongs to, everyday settings
Freedom autonomy, passion, self-esteem, open -mindedness
equal rights dissent, choose, run, risks, develop awareness
Anywhere
Capability refers to a person’s or group’s freedom to promote or achieve valuable functioning (Sen, 1992), valuable beings and doings that a person or society has a real (both internal and external) possibility of enjoying (Nussbaum, 2000) and the freedom to choose which needs are to be
fulfilled and how (Rauschmayer et al., 2008). Sen, (1992) recognises that capability may relate to things near survival or those which are rather less central, but he refrained from developing a list of capabilities, its categories and priorities (Alkire 2002). Unlike Sen, Nussbaum has produced a list of
Defining Sustainable Development Needs
1345Pertanika J. Soc. Sci. & Hum. 21 (4): 1341 - 1360 (2013)
central human functional capabilities which she calls the ‘Capabilities Approach’ (Albus et al., 2009).
Whether all these aspects of human lifestyle are perceived as needs by all individuals in an identical way is of only secondary importance, according to the capabilities perspective (Andresen & Albus, 2010). What is far more important is the provision of real freedom to shape one’s life according to one’s own conception of the good (Sen, 2001). Real freedom is more than just the distribution of resources and less than the need satisfaction that actually occurs; they refer to the possibilities that the individual can realise through the available structural resources, individual abilities and social rights should he or she wish to (Otto & Ziegler, 2006).
This study will not only identify public basic needs but also involve promoting a mechanism to define the actual needs in accordance with sustainable development in the future. Within both physical and psychological discourses, we will define local public needs to allow a meaningful mechanism to be initiated to realise needs as inspired by the sustainable development concept.
MATERIALS AND METHODS
Conceptual framework
Inco rpo ra t i ng Max-Nee f ’s (yea r ) fundamental needs theory into Brundtland’s definition, we define sustainable development needs as “...the needs in development to be satiated to secure the well-being of a human and its supporting systems”. We will identify
the needs and well-being component by looking into the participants’ expressions of dissatisfaction and expectations towards current development, and their aspirations for future development.
Research area
Sepang, Malaysia was selected as the research area due to the rapid development process which has transformed it from an agricultural-based, rural area into a semi-urban and urban area as a result of the development of Kuala Lumpur International Airport (KLIA) and Wilayah Persekutuan, Putrajaya. The population of Sepang has increased from 121,100 in 2002 to 138,100 in 2006. The manufacturing sector has the largest manpower, which is 32.0% in comparison to other sectors (Table 2). Sepang was previously an agriculture-based area where rubber and palm plantations were the major commodities. In 2005, approximately 470.76 hectares of land were designated for agriculture activities in comparison to 1, 3677.1 hectares in 2002. The reduction in agriculture area is partly a result of the increment of mega projects in Sepang (Table 3). As the number of mega projects increases, the number of foreigners who work in the projects increases as well. In the year 2008 alone, 640 illegal foreign workers were arrested in this area for multiple crimes.
Sampling method and approach
A qualitative methodology was used to collect the data through a series of in-depth interviews and discussion groups
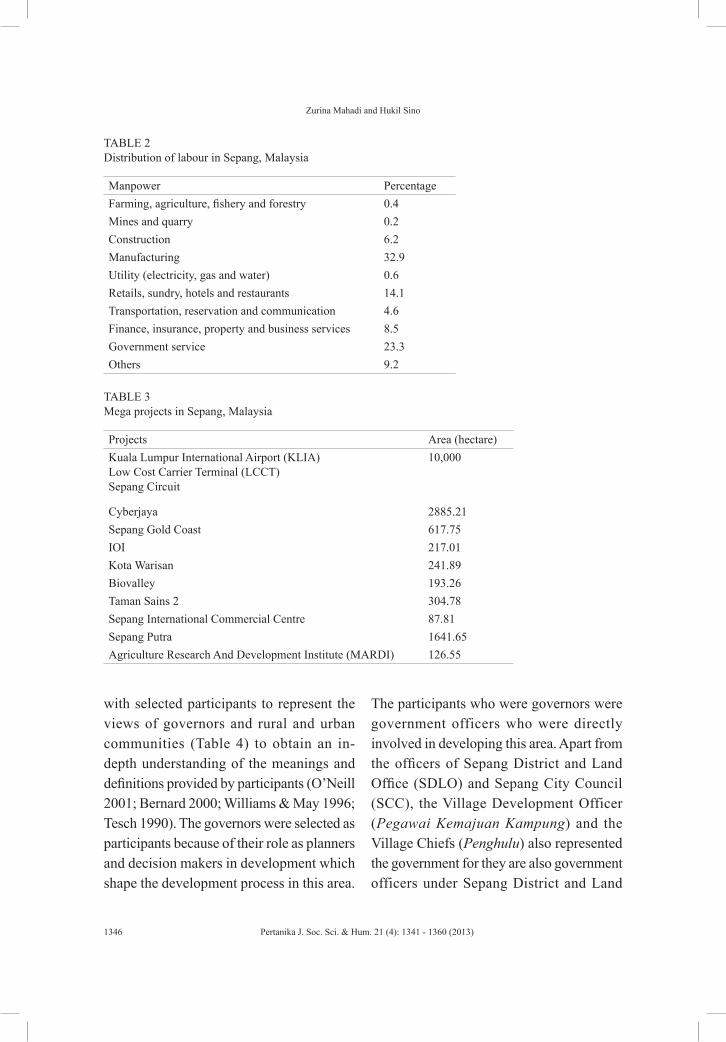
Zurina Mahadi and Hukil Sino
1346 Pertanika J. Soc. Sci. & Hum. 21 (4): 1341 - 1360 (2013)
with selected participants to represent the views of governors and rural and urban communities (Table 4) to obtain an in-depth understanding of the meanings and definitions provided by participants (O’Neill 2001; Bernard 2000; Williams & May 1996; Tesch 1990). The governors were selected as participants because of their role as planners and decision makers in development which shape the development process in this area.
The participants who were governors were government officers who were directly involved in developing this area. Apart from the officers of Sepang District and Land Office (SDLO) and Sepang City Council (SCC), the Village Development Officer (Pegawai Kemajuan Kampung) and the Village Chiefs (Penghulu) also represented the government for they are also government officers under Sepang District and Land
TABLE 2 Distribution of labour in Sepang, Malaysia
Manpower PercentageFarming, agriculture, fishery and forestry 0.4Mines and quarry 0.2Construction 6.2Manufacturing 32.9Utility (electricity, gas and water) 0.6Retails, sundry, hotels and restaurants 14.1Transportation, reservation and communication 4.6Finance, insurance, property and business services 8.5Government service 23.3Others 9.2
TABLE 3 Mega projects in Sepang, Malaysia
Projects Area (hectare)Kuala Lumpur International Airport (KLIA)Low Cost Carrier Terminal (LCCT)Sepang Circuit
10,000
Cyberjaya 2885.21Sepang Gold Coast 617.75IOI 217.01Kota Warisan 241.89Biovalley 193.26Taman Sains 2 304.78Sepang International Commercial Centre 87.81Sepang Putra 1641.65Agriculture Research And Development Institute (MARDI) 126.55
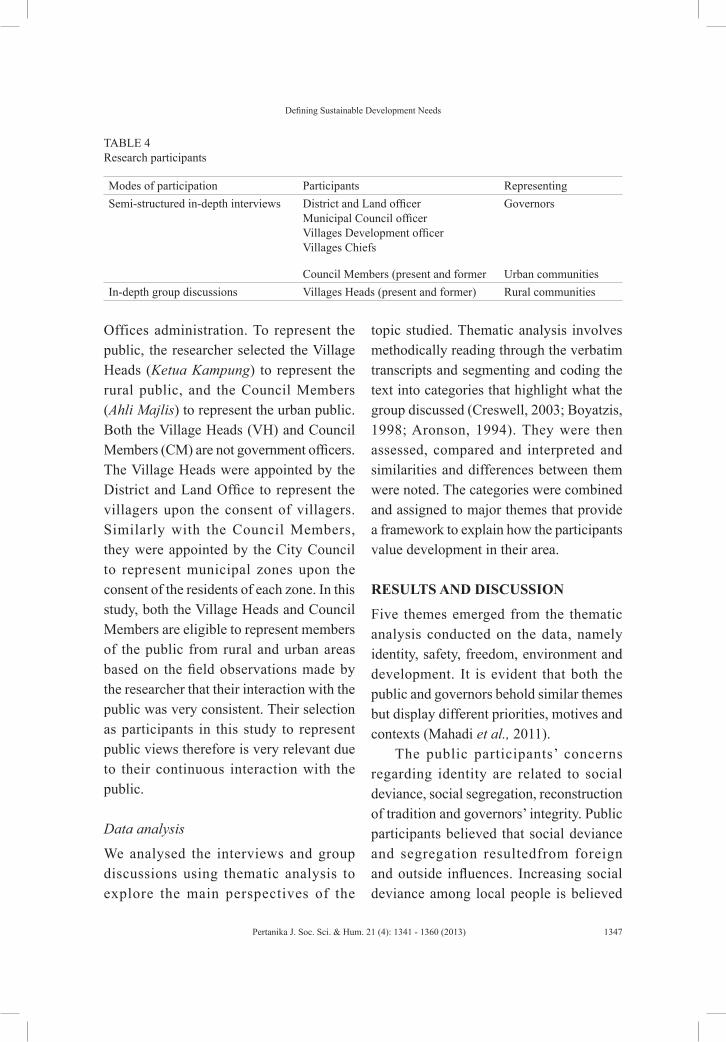
Defining Sustainable Development Needs
1347Pertanika J. Soc. Sci. & Hum. 21 (4): 1341 - 1360 (2013)
Offices administration. To represent the public, the researcher selected the Village Heads (Ketua Kampung) to represent the rural public, and the Council Members (Ahli Majlis) to represent the urban public. Both the Village Heads (VH) and Council Members (CM) are not government officers. The Village Heads were appointed by the District and Land Office to represent the villagers upon the consent of villagers. Similarly with the Council Members, they were appointed by the City Council to represent municipal zones upon the consent of the residents of each zone. In this study, both the Village Heads and Council Members are eligible to represent members of the public from rural and urban areas based on the field observations made by the researcher that their interaction with the public was very consistent. Their selection as participants in this study to represent public views therefore is very relevant due to their continuous interaction with the public.
Data analysis
We analysed the interviews and group discussions using thematic analysis to explore the main perspectives of the
topic studied. Thematic analysis involves methodically reading through the verbatim transcripts and segmenting and coding the text into categories that highlight what the group discussed (Creswell, 2003; Boyatzis, 1998; Aronson, 1994). They were then assessed, compared and interpreted and similarities and differences between them were noted. The categories were combined and assigned to major themes that provide a framework to explain how the participants value development in their area.
RESULTS AND DISCUSSION
Five themes emerged from the thematic analysis conducted on the data, namely identity, safety, freedom, environment and development. It is evident that both the public and governors behold similar themes but display different priorities, motives and contexts (Mahadi et al., 2011).
The public participants’ concerns regarding identity are related to social deviance, social segregation, reconstruction of tradition and governors’ integrity. Public participants believed that social deviance and segregation resultedfrom foreign and outside influences. Increasing social deviance among local people is believed
TABLE 4 Research participants
Modes of participation Participants Representing Semi-structured in-depth interviews District and Land officer
Municipal Council officerVillages Development officerVillages Chiefs
Council Members (present and former
Governors
Urban communities In-depth group discussions Villages Heads (present and former) Rural communities
Zurina Mahadi and Hukil Sino
1348 Pertanika J. Soc. Sci. & Hum. 21 (4): 1341 - 1360 (2013)
to be influenced by foreigners’ indecent behaviour, suggesting increasing social segregation is partly due to outsiders’ (Malaysian citizens who were not born in the area or had not previously resided in it) refusal to mingle with local communities.
“...regarding the major influx of foreigners, most of them display improper behaviour...we witness that local people are adapting these behaviours...” [VH]
“…there is now segregation between the villagers and the owners of the bungalows recently developed in this area…these people do not mix with local villagers…” [VH]
The other concern is the re-construction of traditional villages which they believed should be safeguarded along with its history and identity.
“…the traditional villages should be protected…they are the heritages left by our ancestors…if these villages need to be developed, it should be done without damaging the original structures…” [VH]
The final concern is the integrity of the governors with regardto their inappropriate actions when dealing with corruption and malpractice. To them, the integrity of governors is vital in safeguarding development as well as ones’ identity.
“…a leader should be trustworthy…to the followers, to the environment, to the culture, to the nation and top of all, to oneself…or else this nation will be in trouble…” [CM]
The governors’ participants agreed with conserving the identity of traditional villages during development but their statement is inconsistent with practices.
Under the theme of safety, the main concern of both parties is safety. Both parties highlighted the issues of violence related to foreign students while only the public participants highlighted the issue of criminality related to foreign workers. Both parties were equally worried for their safety due to the above scenarios.
“…these foreign students, they are involved with drugs, alcohol, reckless driving…fights with local people…they are very dangerous…” [VH]
“…now that the foreign workers are many in this area, crimes like robbery frequently occur, unlike before…” [CM]
Two issues related to the development freedoms highlighted by both parties were right and privilege and participation. The public participants also highlighted another component of freedom, i.e. politics, whereby the governors highlighted governance. The public participants claimed that present development denies their rights and
Defining Sustainable Development Needs
1349Pertanika J. Soc. Sci. & Hum. 21 (4): 1341 - 1360 (2013)
privileges (Mahadi et al., 2011) as their land is inappropriately reclaimed, rewarded and substituted (right). The land that was previously the privilege of the natives can now be occupied by the non-native, outsiders and foreigners (privilege).
“…even though this area needs to be developed, local people’s land should not be taken without consent…underpaid…” [VH]
“…the land here should benefit bumiputera, local people…not non-bumiputera, not foreigners…” [VH]
The area has also been commercially developed into more sophisticated and costly facilities to accommodate the surrounding developments. The public participants claimed that local people can’t afford to get involved in the costly operations and survive the rising cost of living.
“…this time around, expensive shops are built…the old shops are torn down…we can afford to do business any longer due to high rental…” [VH]
The governors’ issues of rights and privileges are related to the privileges of land provision for aborigines in this area which they believed should be developed rather being wasted inadvertently.
“…the provision of zon rayau should be revised…rather than the
land being wasted, it should be developed for common good…” [SCC]
Regarding the issue of participation, both parties were seen to hold opposite views. The public participants claimed that they are not welcome to voice their views and opinions towards the development while the governors claimed that the public refuses to participate due to their ignorance, even though they are given platforms and opportunities to do so.
“…we have a lot to suggest but then the government never seeks our opinion…” [VH]
“…the public only react after the project has begun…nobody came forward when we announced the development plan in mass media…nobody came when we call for meeting…” [SCC]
The public participants also had great concerns regarding another branch of freedom - politics. They claimed that major political transition during the recent general election was not embraced by the people in charge by practicing discrimination due to political disparity. These people should hence be more ethical in fulfilling their responsibilities towards serving the public, regardless of their different political stands.
“…the government servants should not treat us badly just because
Zurina Mahadi and Hukil Sino
1350 Pertanika J. Soc. Sci. & Hum. 21 (4): 1341 - 1360 (2013)
of different political views…they should treat everyone equally regard less o f our po l i t i ca l background…” [VH]
As for the governors, the concern was the governance of individual lots. At the moment, the development of individual lots is not bound by any development act, and therefore the district development plan has become complicated in such a way that it has become unsystematic and imbalanced. They proposed that individual lot development regulation should be legislated and enforced in order to be governed properly.
“…we need to enforce individual lot development regulation or else major problems will occur…” [SCC]
Under the theme of environment, issues highlighted by the public participants in this study were water and atmospheric pollution and environmental disaster. Water pollution in this area is a result of construction activities and pig farming. The participants claimed that the waste is not properly managed, with most of it being dumped into surrounding waters.
“…the seaside development posed many environmental problems…the waste was dumped into the water…the water is now terribly polluted…” [VH]
“…the most troubling project in this area is pig farming…it pollutes the water…produces bad smell…very disturbing…” [VH]
This irresponsible action not only will pollute the water but it could also be life threatening to living organisms as well. Indirectly, this condition affected communities who depend on this ecosystem for living such as the fishing communities.
Atmospheric pollution, on the other hand, is a result of intensified quarry operations due to rising demand from the construction sectors. Together with the increasing amount of suspended particulate matter from growing construction areas, the atmospheric pollution in this area is getting worse.
“…the dust produced by the quarries is very disturbing…it pollutes the air terribly…” [VH]
Apart from pollution, the participants have also highlighted two forms of environmental disasters, namely flash flood and landslides. They believed that flash floods were a result of the area becoming increasing built up and the river becoming shallower while the land-slides resulted from the development of individual lots which disturbed sediment stability.
“…an increasingly bui l t up environment resulted in less natural environment…the rainwater cannot be absorbed, [which]…resulted in the flash flood…” [VH]
Defining Sustainable Development Needs
1351Pertanika J. Soc. Sci. & Hum. 21 (4): 1341 - 1360 (2013)
“…when the hilly area is being developed, it becomes unstable…heavy rain could wash up the lands easily…resulting in the landslides…” [CM]
Overall, the public participants regard environment as an important part of their well-being.
The participants representing the governors did not mention environmental pollution in particular but they did bring up the issue of environmental degradation as a result of individual lot development. They claimed that this kind of development degraded the environment more than large projects due to improper methods and management.
“…this kind of project creates more problems than mega projects because they are not bound by development regulations…” [SCC]
Apart from that, the participants were optimistic that present development has taken adequate measures to safeguard the environment. They also believed that the natural resources in this area are abundant and will be able to cater to the needs of development in years to come.
“…our natural resources are abundant in quantity…we are optimistic that they are sufficient to cater for development in years to come…” [SDLO]
Under the theme of development, the majority of the public participants perceived that present development disregarded the human development of local people. In reference to the moved communities, the participants claimed that the moved communities were ignored and unable to survive in the new environment. They expected the government to help the communities to embrace new ways of generating income.
“…some people have to move from their land because the government wants to develop the land…this practice made them lose their house, their job…the government should do something about it…” [CM]
One of the participants suggested small medium industries (SMIs) as one effective approach to tackle this problem since they required only minimal skills and knowledge to operate.
“…SMI is a very practical way to overcome unemployment…it needs minimal skill and knowledge…” [CM]
They said that the major flaws of development were a resu l t o f the development of mega projects which benefited a few but degraded many. They are worried about increases in development and the subsequent loss of public areas. The participants argue that the large scale development left too little public area to
Zurina Mahadi and Hukil Sino
1352 Pertanika J. Soc. Sci. & Hum. 21 (4): 1341 - 1360 (2013)
accommodate public facilities like schools, playgrounds, a building of worship and a cemetery.
“…from what I see, development degrades public welfare…the schools are crowded…recreation areas are reduced…the worship facilities and cemetery remain small despite the increment of population…” [CM]
The governors’ participants’ view on development was limited towards only economic development. Although they mentioned human development sparingly, their major focus obviously is the economy, which they believed to vital to promote public well-being.
“…economic development is of prime importance to realise every other development plan…” [VH]
They also regard the extraction and exploitation of natural resources as efficient means by which to facilitate economic development. At present, the main sources of income for this area are annual housing and building tax, land status conversion premiums (especially the conversion of agricultural to industrial land), quarries and agricultural products. Therefore the government encourages the expansion of these sectors to reinforce the continuity of contribution.
“…our main income is building tax…therefore we support physical
development because it is our source of income…” [SCC]
“…the premiums from land title conversion contribute a large income to our office…” [SDLO]
To conclude all themes, the public participants in general felt that present development focussed only on the material benefits and disregards human and environmental well-being. They urged that a thorough impact assessment is conducted prior to any development, and at all times and during all circumstances, the physical, moral and ethical aspects of development should be observed.
“…al though we unders tand the importance of economic development, we believe that human development should be given priority…the government should also take the environment into consideration…” [VH]
“…it is very important for every project to be evaluated…to reduce negative consequences…” [VH]
As for governors’ participants, they believed that the present development wason the right track. They believed that the government has taken adequate measures to curb possible environmental and social problems which may or have occurred due to the development. They also believed that the area in Sepang, Malaysia has a lot
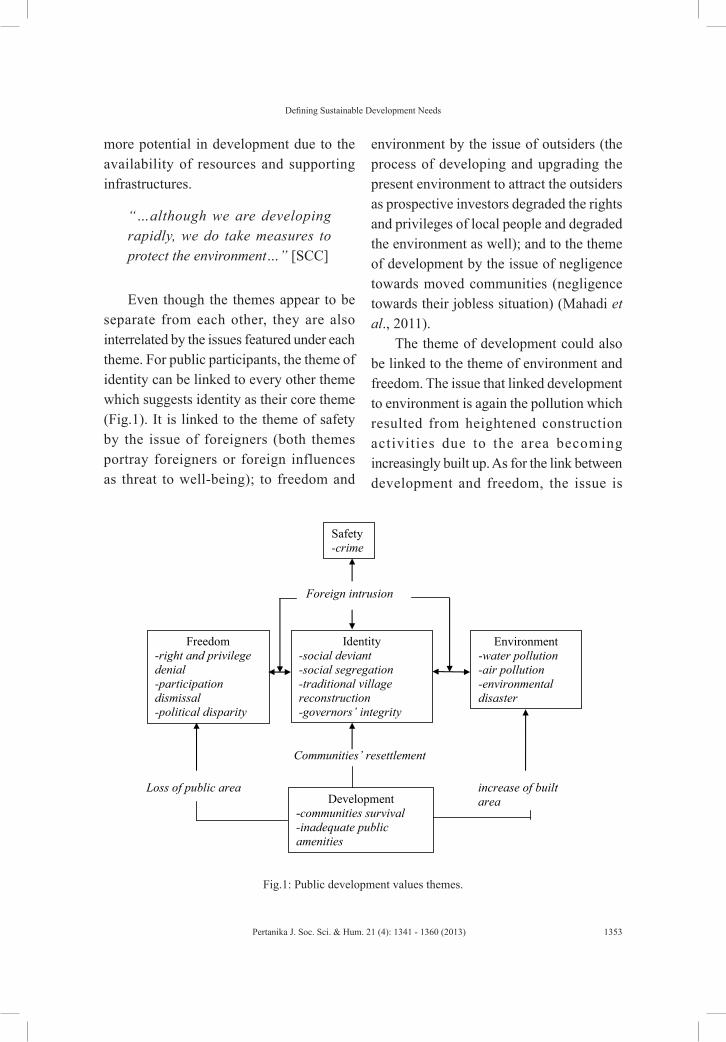
Defining Sustainable Development Needs
1353Pertanika J. Soc. Sci. & Hum. 21 (4): 1341 - 1360 (2013)
more potential in development due to the availability of resources and supporting infrastructures.
“…although we are developing rapidly, we do take measures to protect the environment…” [SCC]
Even though the themes appear to be separate from each other, they are also interrelated by the issues featured under each theme. For public participants, the theme of identity can be linked to every other theme which suggests identity as their core theme (Fig.1). It is linked to the theme of safety by the issue of foreigners (both themes portray foreigners or foreign influences as threat to well-being); to freedom and
environment by the issue of outsiders (the process of developing and upgrading the present environment to attract the outsiders as prospective investors degraded the rights and privileges of local people and degraded the environment as well); and to the theme of development by the issue of negligence towards moved communities (negligence towards their jobless situation) (Mahadi et al., 2011).
The theme of development could also be linked to the theme of environment and freedom. The issue that linked development to environment is again the pollution which resulted from heightened construction activities due to the area becoming increasingly built up. As for the link between development and freedom, the issue is
Foreign intrusion
Communities’ resettlement
Loss of public area increase of built area
Safety -crime
Identity -social deviant -social segregation -traditional village reconstruction -governors’ integrity
Freedom -right and privilege denial -participation dismissal -political disparity
Environment -water pollution -air pollution -environmental disaster
Development -communities survival -inadequate public amenities
Fig.1: Public development values themes.
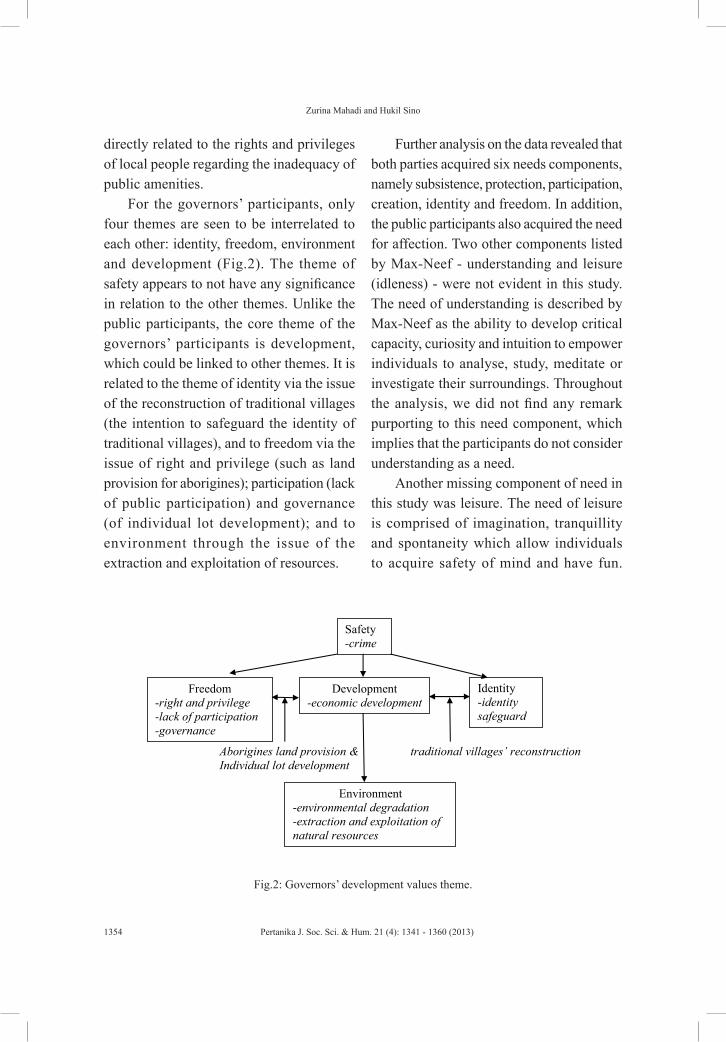
Zurina Mahadi and Hukil Sino
1354 Pertanika J. Soc. Sci. & Hum. 21 (4): 1341 - 1360 (2013)
directly related to the rights and privileges of local people regarding the inadequacy of public amenities.
For the governors’ participants, only four themes are seen to be interrelated to each other: identity, freedom, environment and development (Fig.2). The theme of safety appears to not have any significance in relation to the other themes. Unlike the public participants, the core theme of the governors’ participants is development, which could be linked to other themes. It is related to the theme of identity via the issue of the reconstruction of traditional villages (the intention to safeguard the identity of traditional villages), and to freedom via the issue of right and privilege (such as land provision for aborigines); participation (lack of public participation) and governance (of individual lot development); and to environment through the issue of the extraction and exploitation of resources.
Further analysis on the data revealed that both parties acquired six needs components, namely subsistence, protection, participation, creation, identity and freedom. In addition, the public participants also acquired the need for affection. Two other components listed by Max-Neef - understanding and leisure (idleness) - were not evident in this study. The need of understanding is described by Max-Neef as the ability to develop critical capacity, curiosity and intuition to empower individuals to analyse, study, meditate or investigate their surroundings. Throughout the analysis, we did not find any remark purporting to this need component, which implies that the participants do not consider understanding as a need.
Another missing component of need in this study was leisure. The need of leisure is comprised of imagination, tranquillity and spontaneity which allow individuals to acquire safety of mind and have fun.
Aborigines land provision & traditional villages’ reconstruction Individual lot development
Development -economic development
Safety -crime
Identity -identity safeguard
Freedom -right and privilege -lack of participation -governance
Environment -environmental degradation -extraction and exploitation of natural resources
Fig.2: Governors’ development values theme.
Defining Sustainable Development Needs
1355Pertanika J. Soc. Sci. & Hum. 21 (4): 1341 - 1360 (2013)
Similar to the need of understanding, the need of leisure did not occur throughout the discussions. None of the participants indicated that le isure is valued in development process. We assume this is due to the abundance of green area in this district. Apparently, even though Sepang is developing rapidly, the green area of this district is still abundant because most of the mega projects develop beautiful landscapes. This could be the reason why leisure was not perceived as being under threat by the participants and not considered a need.
Six needs components present in this study can either be explicitly connected to the development theme, i.e. the need of identity to the identity theme values, the need of protection to the safety theme values, and the need of subsistence to the development theme values, or implicitly under a specific theme, i.e. the needs of affection and creativity to the development theme values, and the need of participation to the freedom theme values.
For the public participants, the need of protection was evident under each theme. This indicates the public feels insecure about the present development process. According to the Max-Neef matrix of needs, protection is associated with care, adaptability and autonomy towards social components such as safety, health and work. In this study, public participants have shown that care, adaptability and autonomy are required to achieve well-being, specifically care towards identity, safety and environment; being able to adapt to development and having the autonomy to exercise their
freedom. Therefore, it can be concluded that the need of protection is the most important need to be satisfied to achieve well-being.
The governors’ participants also indicated the need of protection under each key value except the key value of development. None of the issues highlighted by them indicated their need for protection with regards to the development. As for the other themes, the need for protection was particularly evident with regards to autonomy. Under the themes of freedom and environment, protection relates to regulations and authority, while for the theme of safety, protection is defined by security.
The needs of subsistence and creation were evident under the key value of development. According to Max-Neef, subsistence is the prerequisite of mental and physical health. Food, shelter and work are among the basic necessities covered by subsistence. The definition of subsistence given by Max-Neef is similar to the basic needs definition by Maslow (1970). Many researchers agree that both compromise the needs proposed by Brundtland (Rauschmayer et al., 2008). The need of subsistence in this study was specifically related to the issue of the sources of income.
The public in Sepang felt that the current development process jeopardised their sources of income in several ways and this had a negative effect on their well-being. This perception has led the public to see subsistence as one of the vital needs in development. As for the governors’
Zurina Mahadi and Hukil Sino
1356 Pertanika J. Soc. Sci. & Hum. 21 (4): 1341 - 1360 (2013)
participants, the need of subsistence was related to the means to generate income. They believed that the exploitation and extraction of natural resources is the best way to secure the governors’ expenses in development. Apparently, the public’s concerns about subsistence were not addressed by the governors. This leads us to the question of capabilities which will be discussed later in this paper.
The need of creation in this study was also linked to the key values within development. Among the elements listed by Max-Neef under this need are imagination, boldness, inventiveness and curiosity. As these elements are the pre-requisites to invent, build, design, work and compose, creativity is clearly related to career and job development. In this study, the element of creation that was mentioned by both parties was related to job creation and career enhancement. Both parties seek the need of creation to promote human development. Along with the need of subsistence, creation is seen by both the public and governors as a vital need for survival and well-being.
The need of identity in this study is depicted by the issues of culture and norms, and integrity. This need is linked to the theme values of identity. The harmful intrusion of foreigners and outsiders evident by the public encouraged the public participants to consider identity as one of the needs in development. Apart from outside intervention, the issue of integrity and the need to be protected from malpractice and abuses of power by the developers is also seen as a flaw to identity. The public
blamed the practices of corrupt developers in their knowledge for most of the negative consequences of the current development and they believed that a reinforcement of identity is needed to steer the development back on the right track. For the participants representing the governors, their need of identity was reflected in their support of the motion to recognise the value of traditional villages.
The need of participation was also evident in both parties’ statements. Participation is referred to as the act of cooperation, dissention or opinion expression in response to the receptiveness and dedication of the individual. In this study, the public recognised the importance of enduring participation in order to promote effective development. This was evident through their frustration at not being able to participate. The governors’ participants also highlighted the importance of public participation in form of response and feedback over development plans. The frustration over the public’s lack of participation indicated their belief that participation is one of the needs in development.
The need of freedom is defined by Max-Neef as the ability to realise autonomy, passion, self-esteem and open-mindedness. Public participants perceived that their freedom to express their rights, views and consent have been denied by the developers. They claimed that their rights were denied, their views dismissed and their consent waived. These perceptions have directed the public to see freedom as a development need. The need of freedom is reflected
Defining Sustainable Development Needs
1357Pertanika J. Soc. Sci. & Hum. 21 (4): 1341 - 1360 (2013)
in the governors through their pursuit of autonomy in regards to the management of the development process.
As mentioned earlier, one needs component that is required only by the public participants is affection. The need of affection, as elaborated by Max-Neef, is related to respect, sense of humour, generosity and sensuality demonstrated in the relationship among family, friends and neighbours. In this study, the need of affection was seen as very significant to public participants in order to overcome the problems related to development of individual lots. Public participants believed that if these individuals were more affectionate to the wellbeing of their neighbours, problems that may arise due to the inadvertent development of individual lots could be avoided.
Overall, the majority of the statements made by public participants highlighted the problems with development. They perceived that the development decreased their well-being as its goals and mechanisms destroyed their identity, safety, freedom and environment, and defeated the presupposed purpose of development. These perceptions encouraged the public participants to convey the needs of subsistence, protection, affection, participation, freedom, creation and identity as being necessary to overcome the threat and enable them to achieve well-being throughout the development process. The governors’ participants, on the other hand, embraced similar needs but differed in their perspective. These opposite points of view will be discussed below.
The discrepancies within development needs in this study may result from different values in development. To the public, any development initiatives that release destructive forces on their already stable and comfortable lives are unacceptable. In this study, it is noted that the public values identity highly but the practices in current development seem to eradicate their precious identity. The transformation of Sepang from a traditional, agricultural setting into a modern, commercial area is perceived by the public to deprive their actual needs more than improving them. Apparently, the transformation is not fully embraced by the majority of the public who preferred the previous social setting. This would likely create tension between the new values imposed by the governors and the values that the public wanted to keep. Such conflicts have been described by Schwartz (1992) through an integrated structure of values. According to Schwartz, the integrated structure of values can be summarised into two orthogonal dimensions: the openness to change dimension opposing the conservative dimension and the self-transcendence dimension opposing the self-enhancement dimension. In this study, public values can be categorised into the conservation dimension which prioritised values like identity. In contrast, the governors promote values that support advancement and improvisation which fit the criteria of the openness to change dimension. This will likely result in conflict between the needs and values of the public and that purported by the governors.
Zurina Mahadi and Hukil Sino
1358 Pertanika J. Soc. Sci. & Hum. 21 (4): 1341 - 1360 (2013)
The inconsistency within values between both parties also may be due to their different perspectives. Two examples of this idea are the themes of environment and development. Under the theme of environment, the governors perceived individual lot development as the major contributor to environmental degradation while the public viewed mega development as the main culprit in environmental problems. Throughout the discussion, the governors also exhibited profound anthropogenic attitudes in their interest in the exploitation of natural resources. However, the public never mentioned exploitation at all. These scenarios showed that even though both parties regard environment as important in development, their concerns were underpinned by different views. The same scenario is evident in the theme of development. Both parties recognise the significance of development but in different ways. The governors prioritised the economic aspect of development over any other whereas the public believed that human development should be entertained most. The governors also viewed economic development as development goals while the public addressed economic development only as a mechanism to develop and not as a goal itself.
The purpose of this study is to define public needs in development. It is important to define public needs because needs are the core element of sustainable development. Only after needs are defined can an appropriate development framework be created to determine the needs and how
to address them. In this study, needs are identified by applying the Max-Neef matrix of needs towards the themes found in this study. The Max-Neef matrix was adopted in this study because it addresses social needs and not individual needs. The findings indicated that public needs in development are constructed in response to the changes in environment which are induced by development process. These constructions are underlined by values. The mechanism to define needs, therefore, should take these into account. Our proposed mechanism will be now be discussed further.
Our proposed mechanism with which to define needs is divided into three stages. First, we propose the governors should comprehend and acknowledge public values because needs are value-laden. Values are usually related to the predominant culture and rarely change. By defining needs as the most basic dimensions of human flourishing, it is clear that needs are valuable per se (Rauschmayer et al., 2008). As values are normative, needs conform to normativity as well. The governors should acknowledge the needs that are valuable to public and recognise them as vital needs in development.
However, discrepancies in development values may occur between the public and the governors. As this study indicated, the discrepancies most likely resulted from the different perspectives and priorities of each party. Therefore, upon acknowledgement of public values, we propose the governors evaluate the compatibility of the needs they decided in their development plan with the
Defining Sustainable Development Needs
1359Pertanika J. Soc. Sci. & Hum. 21 (4): 1341 - 1360 (2013)
values of the public. If any of the aspired needs could jeopardise public values then the needs should not be recognised as sustainable development needs. In terms of capabilities, the governors should eliminate needs that could reduce the public’s ability to pursue their well-being. Sustainable development needs should be able to increase the public’s capabilities and not the other way round.
However, there are circumstances where some needs are critical in development despite them contradicting the values of the public. Under such circumstances, we propose the governors promote the importance of the needs to the public in order to increase understanding and agreement towards the needs. Consensus among stakeholders, including the public, over development needs is vitally important in order to recognise those needs as sustainable needs.
CONCLUSION
In order to establish the needs that conform to the concept of sustainable development, the governors should comprehend and acknowledge public values. Presently, the public believes that development deprives their needs and suppresses their well-being, which causes feelings of insecurity. The governors do not seem to realise this and present development plans are driven in such a way that they ignore or damage the essential needs of the public, and these needs are crucial in sustainable development. The findings suggest that if the governors
can tap back into local values and existing structures, they may recognise the needs of the public which need to be satisfied in their journey towards sustainable development.
ACKNOWLEDGEMENTS
This research is funded by Fundamental Research Grant Scheme (UKM-11JC-04-FRGS 0003-2006), Department of Higher Education, Ministry of Higher Education, Malaysia.
REFERENCESAlbus, S., Andresen, S., Fegter, S., & Richter, M.
(2009). Wohlergehen und das “guteLeben” in der Perspektive von Kindern. Das Potenzial das Capability Approach fur die Kindheitsforschung. Zeitschrift fur Soziologie der Erziehung und Sozialisation, 29(4), 346-358.
Alkire, S. (2002).Dimensions of Human Development. World Development, 30(2), 181-205.
Andresen, S., & Albus, S. (2010). Children and Their Needs. In S. Andersen et al. (Eds), Children and the Good Life, Children’s Well-Being: Indicators and Research4, DOI 10.1007/978-90-481-9219-9_5, Springer Science+Business Media B.V.)
Bernard, H. R. (2000). Social Research Method: Qualitative and Quantitative Approach. Sage Publication Inc, London.
Cummins, R. A. (2000b). Objective and subjective quality of life: An interactive model. Social Indicators Research, 52, 55-72.
Deci, E. L., & Ryan, R. M. (2000). The “what” and “why” of goal pursuits: Human needs and the self-determination of behavior. Psychological Inquiry, 11(4), 27-268.
Doyal, L., & Gough, I. (1991). A theory of human need. Basingstoke: Macmillan.
Zurina Mahadi and Hukil Sino
1360 Pertanika J. Soc. Sci. & Hum. 21 (4): 1341 - 1360 (2013)
Mahadi, Z., Abdul Hadi, A. S., & Sino, H. (2011). Public sustainable development values: A case study in Sepang, Malaysia. Journal of Sustainable Development, 4(2), 154-166. Retrieved from: http://www.ccsenet.org/journal/index.php/jsd/issue/view/337.
Max-Neef, M. (1993).Human scale development: Conception, application, and further reflections. London: Apex Press.
Narayan, D., Chambers, R., Shah, M. K., & Petesch, P. (2000). Voices of the poor: Crying out for change. New York: Oxford University Press for the World Bank.
Nussbaum, M. C. (2000). Women and human development: The capabilities approach. Cambridge: Cambridge University Press.
O’Neill, J. (2001). Representing people, representing nature, representing the world. Environ. Planning C: Government Policy, 19: 483-500.
Otto, H. U., & Ziegler, H. (2006).Capabilities and education. Social Work and Society, 4(2), 269-287.
Ramsay, M. (1992).Human needs and the market.Aldershot:Avebury.
Rauschmayer, F., Omann, I. , Fruhmann, J., &Bohunovsky, L. (2008). What about needs? Re-conceptualising sustainable development. Sustainable Europe Research Institute (SERI) Working Papers.
Schwartz, S. H. (1992). Universals in the content and structure of values: Theoretical advances and empirical tests in 20 countries. In M.P. Zanna (Ed.), Advances in experimental social psychology (vol 25, pp.1-65). San Diego, CA: Academic Press.
Sen, A. K. (2001). Development as freedom. New York: Oxford University Press.
Sen, A. K. (1992). Inequality reexamined. Cambridge: Harvard University Press.
Tesch, R. (1990). Qualitative Research: Analysis, Types and Software tools. Hampshire: The Falmer Press.
Williams, M., & May, T. (1996). Introduction to the Philosophy of Social Research. London: UCL Press.
World Commission on Environment and Development (WCED).(1987). Our Common Future.New York: OxfordUniversity Press.
Pertanika J. Soc. Sci. & Hum. 21 (4): 1361 - 1377 (2013)
ISSN: 0128-7702 © Universiti Putra Malaysia Press
SOCIAL SCIENCES & HUMANITIESJournal homepage: http://www.pertanika.upm.edu.my/
Article history:Received: 24 May 2011Accepted: 24 September 2012
ARTICLE INFO
E-mail addresses: [email protected] (Lay, Y. F.), [email protected] (Khoo, C. H.) * Corresponding author
Pre-Service Science Teachers’ Mental Images of Science Teaching
Lay, Y. F.1* and Khoo, C. H.2
1School of Education and Social Development, Universiti Malaysia Sabah, Jalan UMS, 88400 Kota Kinabalu, Sabah, Malaysia2Teacher Education Institute - Kent Campus, P.O. Box No.2, 89207 Tuaran, Sabah, Malaysia
ABSTRACT
The purpose of this study is to investigate pre-service science teachers’ mental images of science teaching. This study also aimed to ascertain if there is any significant difference in pre-service science teachers’ mental images of science teaching based on gender and levels of schooling. This study was both quantitative and qualitative in its design. In this study, the ‘Draw-A-Science-Teacher-Test-Checklist’ (DASTT-C) was used as the primary data collection instrument. Pre-service science teachers were instructed to draw pictures of themselves as science teachers at work and write a brief explanation describing their drawings. They were also asked to specifically answer two questions namely, “What is the teacher doing?” and “What are the students doing?” regarding their drawings. This study revealed that pre-service science teachers had three different teaching styles which were categorized as, i) ‘neither student-centred nor teacher-centred (no decision)’, ii) ‘teacher-centred’ and iii), ‘student-centred’. Independent sample t-test results showed that there was no significant difference in pre-service science teachers’ mental images of science teaching based on gender. However, there was a significant difference in pre-service science teachers’ mental images of science teaching based on levels of schooling
Keywords: Pre-Service science teachers, mental images of science teaching, DASTT-C
INTRODUCTION
One of the fundamental goals of the National Science Education Standards (National Research Council, 1996) is to instill science learning as an active, inquiry-based activity that students do rather than something that is done for them. Following the explicit goal of the standards to establish scientific literacy for all, students are expected to participate in
Lay, Y. F. and Khoo, C. H.
1362 Pertanika J. Soc. Sci. & Hum. 21 (4): 1361 - 1377 (2013)
hands-on and minds-on learning experiences that reflect the intellectual traditions of the contemporary science. In relation to this, standards-based lessons involve children in inquiry-oriented investigations, help them to establish connections, encourage questions, promote problem solving, and support group discussions. In the words of the Standards, “Emphasizing active science learning means shifting away from teachers presenting information and covering science topics. The perceived needs to include all the topics, vocabulary, and information in the textbooks are in direct conflict with the central goal of having students learn scientific knowledge with understanding” (National Research Council, 1996, p.20).
In accordance with the National Science Education Philosophy, science curriculum in Malaysia gives clear and conscious emphasis on the acquisition of scientific skills and thinking skills, the fostering of scientific attitudes and noble values besides the acquisition of scientific and technological knowledge and its application to the natural phenomena and students’ day-to-day experiences (Curriculum Development Centre, 2001). Teaching and learning strategies recommended in the science curriculum emphasise thoughtful learning, a process that helps students acquire knowledge and master the skills that will help them develop their minds to the optimum level. In relation to this, thoughtful learning can occur through various learning approaches such as inquiry, constructivism, contextual learning, and mastery learning (Curriculum Development Centre, 2001).
Many studies showed that using inquiry and constructivist perspective is the most effective way to teach science as students experience the learning of science as a process of doing something or looking at something, and then learning what it means by processing their observations with their classmates. In constructivist perspective, students are encouraged to ask their own questions, carry out their own experiments, make their own analogies, and come to their own conclusions by themselves (Caprio, 1994; Staver, 1998; Yilmaz & Huyuguzel Cavas, 2006). These research findings indicate that “students are likely to begin to understand the natural world, if they work directly with natural phenomena, using their senses to observe, and using instruments to extend the power of their senses (National Science Board, 1991, p.27), while these approaches generally improve students’ attitudes toward science in a positive way (Glasson, 1989). It is of no surprise that contemporary philosophers and educators suggest that it is time to replant student-centred instruction in the field of science learning (Taylor et al., 1995; Turkmen, 2006; Turkmen & Pedersen, 2005; Yilmaz & Huyuguzel Cavas, 2006).
PROBLEM STATEMENT
Today’s pre-service science teachers experience yesterday’s science learning in the form of text-based, didactic lessons presenting science as an inert body of knowledge (Tobin et al., 1990). Pre-service science teachers usually experience traditional science learning at primary
Pre-Service Science Teachers’ Mental Images of Science Teaching
1363Pertanika J. Soc. Sci. & Hum. 21 (4): 1361 - 1377 (2013)
and secondary levels where teachers are considered as the main source of knowledge that should be transmitted to students. Such learning experiences will undoubtedly have a powerful impact on the way in which pre-service science teachers understand the nature of science and the way in which science should be taught. Consequently, pre-service science teachers’ mental models about science teaching are usually incompatible with science teaching as a hands-on and minds-on activity (Thomas et al., 2001). As highlighted by Goodman (1988), pre-service teachers are guided by past events that create intuitive screens through which new information is filtered and transformed, and that their beliefs predict, to a certain extent, their teaching behaviour, and are much more influential than knowledge in determining their future teaching practices and approaches. Hence, this study is crucial due to the inadequate understanding of pre-service science teachers’ mental images of themselves as science teachers at work especially in the state of Sabah, Malaysia.
PURPOSE OF THE STUDY
The purpose of this study is to investigate pre-service science teachers’ mental images and teaching styles of science teaching and to ascertain the significant difference in pre-service science teachers’ mental images of science teaching based on gender and levels of schooling.
RESEARCH QUESTIONS
Four research questions have been formulated in this study, namely,
1. What mental images do pre-service science teachers have of themselves as science teachers at work?
2. What teaching styles do pre-service science teachers have of themselves as science teachers at work?
3. Is there a significant difference in pre-service science teachers’ mental images of science teaching based on gender?
4. Is there a significant difference in pre-service science teachers’ mental images of science teaching based on levels of schooling?
RESEARCH DESIGN
This study was both quantitative and qualitative in its design. The ‘Draw-A-Science-Teacher-Test-Checkl is t ’ (DASTT-C) (Thomas & Pedersen, 1998a, 1998b; Thomas et al., 2001) was used to investigate pre-service science teachers’ mental images of themselves as science teachers at work. The DASTT-C was selected as it lends itself to this type of data collection and can assist in evaluating how pre-service science teachers perceived their self-image as science teachers. The DASTT-C is one of the essential instruments that can be used to develop techniques and procedures for promoting reflection and analysis of pre-service science teachers’ thinking.
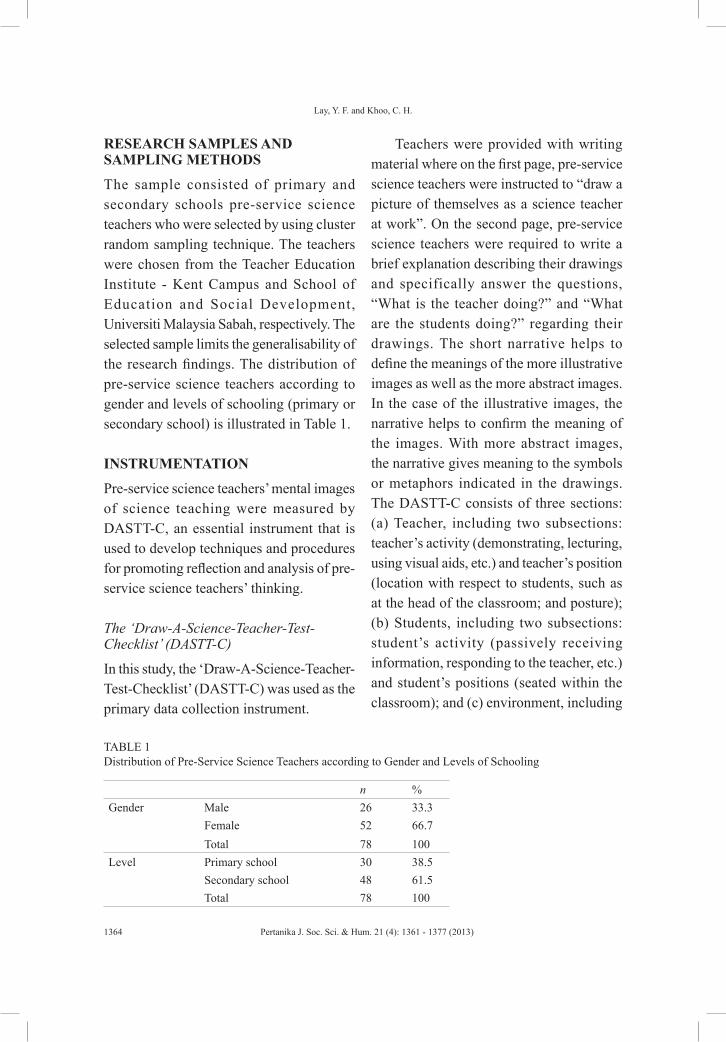
Lay, Y. F. and Khoo, C. H.
1364 Pertanika J. Soc. Sci. & Hum. 21 (4): 1361 - 1377 (2013)
RESEARCH SAMPLES AND SAMPLING METHODS
The sample consisted of primary and secondary schools pre-service science teachers who were selected by using cluster random sampling technique. The teachers were chosen from the Teacher Education Institute - Kent Campus and School of Education and Social Development, Universiti Malaysia Sabah, respectively. The selected sample limits the generalisability of the research findings. The distribution of pre-service science teachers according to gender and levels of schooling (primary or secondary school) is illustrated in Table 1.
INSTRUMENTATION
Pre-service science teachers’ mental images of science teaching were measured by DASTT-C, an essential instrument that is used to develop techniques and procedures for promoting reflection and analysis of pre-service science teachers’ thinking.
The ‘Draw-A-Science-Teacher-Test-Checklist’ (DASTT-C)
In this study, the ‘Draw-A-Science-Teacher-Test-Checklist’ (DASTT-C) was used as the primary data collection instrument.
Teachers were provided with writing material where on the first page, pre-service science teachers were instructed to “draw a picture of themselves as a science teacher at work”. On the second page, pre-service science teachers were required to write a brief explanation describing their drawings and specifically answer the questions, “What is the teacher doing?” and “What are the students doing?” regarding their drawings. The short narrative helps to define the meanings of the more illustrative images as well as the more abstract images. In the case of the illustrative images, the narrative helps to confirm the meaning of the images. With more abstract images, the narrative gives meaning to the symbols or metaphors indicated in the drawings. The DASTT-C consists of three sections: (a) Teacher, including two subsections: teacher’s activity (demonstrating, lecturing, using visual aids, etc.) and teacher’s position (location with respect to students, such as at the head of the classroom; and posture); (b) Students, including two subsections: student’s activity (passively receiving information, responding to the teacher, etc.) and student’s positions (seated within the classroom); and (c) environment, including
TABLE 1 Distribution of Pre-Service Science Teachers according to Gender and Levels of Schooling
n %Gender Male 26 33.3
Female 52 66.7Total 78 100
Level Primary school 30 38.5Secondary school 48 61.5Total 78 100
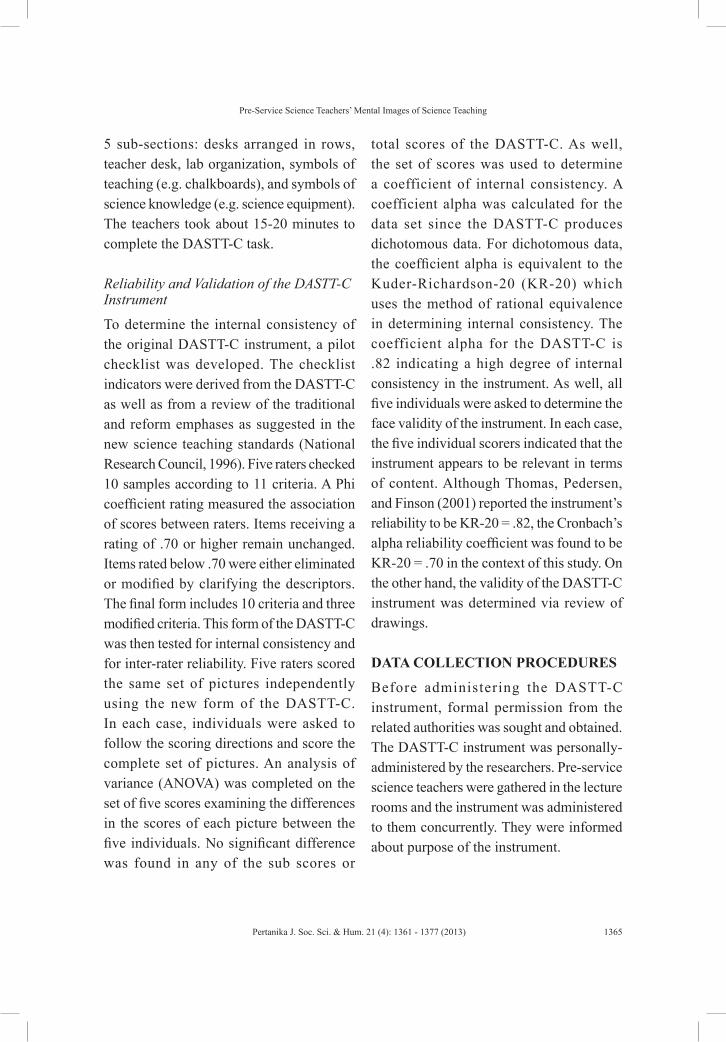
Pre-Service Science Teachers’ Mental Images of Science Teaching
1365Pertanika J. Soc. Sci. & Hum. 21 (4): 1361 - 1377 (2013)
5 sub-sections: desks arranged in rows, teacher desk, lab organization, symbols of teaching (e.g. chalkboards), and symbols of science knowledge (e.g. science equipment). The teachers took about 15-20 minutes to complete the DASTT-C task.
Reliability and Validation of the DASTT-C Instrument
To determine the internal consistency of the original DASTT-C instrument, a pilot checklist was developed. The checklist indicators were derived from the DASTT-C as well as from a review of the traditional and reform emphases as suggested in the new science teaching standards (National Research Council, 1996). Five raters checked 10 samples according to 11 criteria. A Phi coefficient rating measured the association of scores between raters. Items receiving a rating of .70 or higher remain unchanged. Items rated below .70 were either eliminated or modified by clarifying the descriptors. The final form includes 10 criteria and three modified criteria. This form of the DASTT-C was then tested for internal consistency and for inter-rater reliability. Five raters scored the same set of pictures independently using the new form of the DASTT-C. In each case, individuals were asked to follow the scoring directions and score the complete set of pictures. An analysis of variance (ANOVA) was completed on the set of five scores examining the differences in the scores of each picture between the five individuals. No significant difference was found in any of the sub scores or
total scores of the DASTT-C. As well, the set of scores was used to determine a coefficient of internal consistency. A coefficient alpha was calculated for the data set since the DASTT-C produces dichotomous data. For dichotomous data, the coefficient alpha is equivalent to the Kuder-Richardson-20 (KR-20) which uses the method of rational equivalence in determining internal consistency. The coefficient alpha for the DASTT-C is .82 indicating a high degree of internal consistency in the instrument. As well, all five individuals were asked to determine the face validity of the instrument. In each case, the five individual scorers indicated that the instrument appears to be relevant in terms of content. Although Thomas, Pedersen, and Finson (2001) reported the instrument’s reliability to be KR-20 = .82, the Cronbach’s alpha reliability coefficient was found to be KR-20 = .70 in the context of this study. On the other hand, the validity of the DASTT-C instrument was determined via review of drawings.
DATA COLLECTION PROCEDURES
Before administering the DASTT-C instrument, formal permission from the related authorities was sought and obtained. The DASTT-C instrument was personally-administered by the researchers. Pre-service science teachers were gathered in the lecture rooms and the instrument was administered to them concurrently. They were informed about purpose of the instrument.
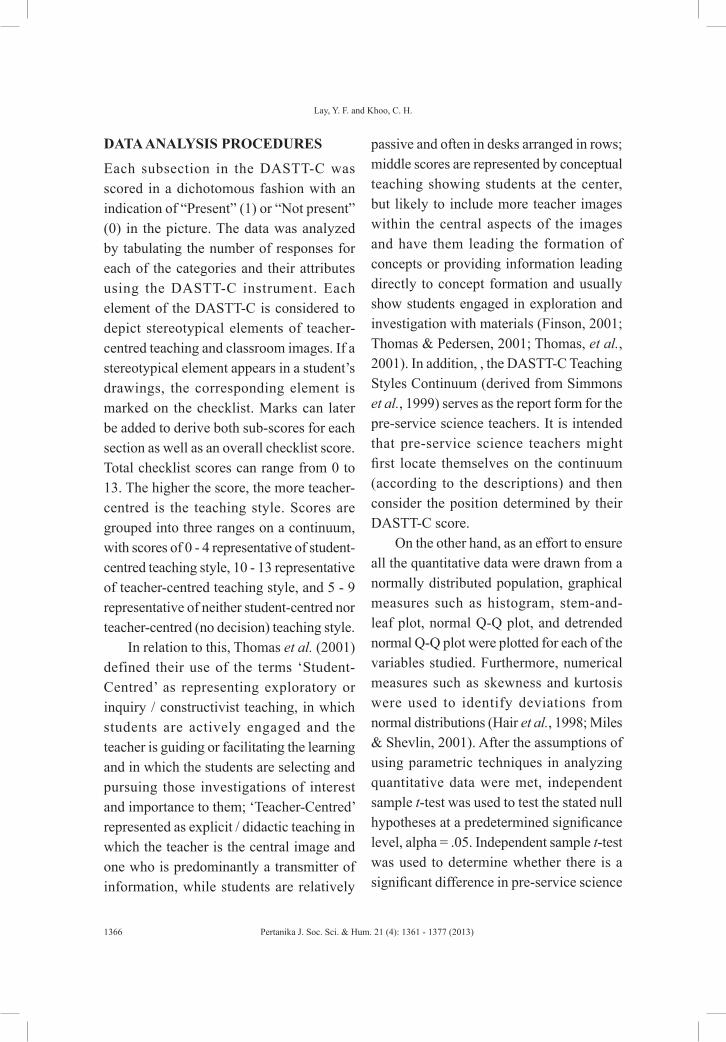
Lay, Y. F. and Khoo, C. H.
1366 Pertanika J. Soc. Sci. & Hum. 21 (4): 1361 - 1377 (2013)
DATA ANALYSIS PROCEDURES
Each subsection in the DASTT-C was scored in a dichotomous fashion with an indication of “Present” (1) or “Not present” (0) in the picture. The data was analyzed by tabulating the number of responses for each of the categories and their attributes using the DASTT-C instrument. Each element of the DASTT-C is considered to depict stereotypical elements of teacher-centred teaching and classroom images. If a stereotypical element appears in a student’s drawings, the corresponding element is marked on the checklist. Marks can later be added to derive both sub-scores for each section as well as an overall checklist score. Total checklist scores can range from 0 to 13. The higher the score, the more teacher-centred is the teaching style. Scores are grouped into three ranges on a continuum, with scores of 0 - 4 representative of student-centred teaching style, 10 - 13 representative of teacher-centred teaching style, and 5 - 9 representative of neither student-centred nor teacher-centred (no decision) teaching style.
In relation to this, Thomas et al. (2001) defined their use of the terms ‘Student-Centred’ as representing exploratory or inquiry / constructivist teaching, in which students are actively engaged and the teacher is guiding or facilitating the learning and in which the students are selecting and pursuing those investigations of interest and importance to them; ‘Teacher-Centred’ represented as explicit / didactic teaching in which the teacher is the central image and one who is predominantly a transmitter of information, while students are relatively
passive and often in desks arranged in rows; middle scores are represented by conceptual teaching showing students at the center, but likely to include more teacher images within the central aspects of the images and have them leading the formation of concepts or providing information leading directly to concept formation and usually show students engaged in exploration and investigation with materials (Finson, 2001; Thomas & Pedersen, 2001; Thomas, et al., 2001). In addition, , the DASTT-C Teaching Styles Continuum (derived from Simmons et al., 1999) serves as the report form for the pre-service science teachers. It is intended that pre-service science teachers might first locate themselves on the continuum (according to the descriptions) and then consider the position determined by their DASTT-C score.
On the other hand, as an effort to ensure all the quantitative data were drawn from a normally distributed population, graphical measures such as histogram, stem-and-leaf plot, normal Q-Q plot, and detrended normal Q-Q plot were plotted for each of the variables studied. Furthermore, numerical measures such as skewness and kurtosis were used to identify deviations from normal distributions (Hair et al., 1998; Miles & Shevlin, 2001). After the assumptions of using parametric techniques in analyzing quantitative data were met, independent sample t-test was used to test the stated null hypotheses at a predetermined significance level, alpha = .05. Independent sample t-test was used to determine whether there is a significant difference in pre-service science
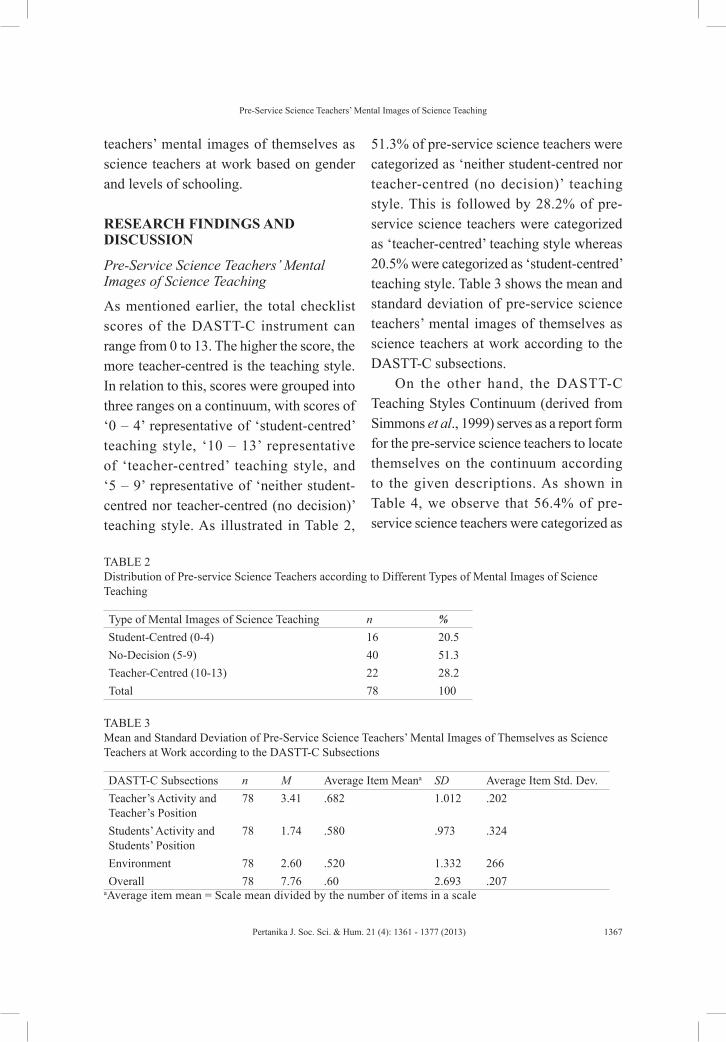
Pre-Service Science Teachers’ Mental Images of Science Teaching
1367Pertanika J. Soc. Sci. & Hum. 21 (4): 1361 - 1377 (2013)
teachers’ mental images of themselves as science teachers at work based on gender and levels of schooling.
RESEARCH FINDINGS AND DISCUSSION
Pre-Service Science Teachers’ Mental Images of Science Teaching
As mentioned earlier, the total checklist scores of the DASTT-C instrument can range from 0 to 13. The higher the score, the more teacher-centred is the teaching style. In relation to this, scores were grouped into three ranges on a continuum, with scores of ‘0 – 4’ representative of ‘student-centred’ teaching style, ‘10 – 13’ representative of ‘teacher-centred’ teaching style, and ‘5 – 9’ representative of ‘neither student-centred nor teacher-centred (no decision)’ teaching style. As illustrated in Table 2,
51.3% of pre-service science teachers were categorized as ‘neither student-centred nor teacher-centred (no decision)’ teaching style. This is followed by 28.2% of pre-service science teachers were categorized as ‘teacher-centred’ teaching style whereas 20.5% were categorized as ‘student-centred’ teaching style. Table 3 shows the mean and standard deviation of pre-service science teachers’ mental images of themselves as science teachers at work according to the DASTT-C subsections.
On the other hand, the DASTT-C Teaching Styles Continuum (derived from Simmons et al., 1999) serves as a report form for the pre-service science teachers to locate themselves on the continuum according to the given descriptions. As shown in Table 4, we observe that 56.4% of pre-service science teachers were categorized as
TABLE 2 Distribution of Pre-service Science Teachers according to Different Types of Mental Images of Science Teaching
Type of Mental Images of Science Teaching n %Student-Centred (0-4) 16 20.5No-Decision (5-9) 40 51.3Teacher-Centred (10-13) 22 28.2Total 78 100
TABLE 3 Mean and Standard Deviation of Pre-Service Science Teachers’ Mental Images of Themselves as Science Teachers at Work according to the DASTT-C Subsections
DASTT-C Subsections n M Average Item Meana SD Average Item Std. Dev.Teacher’s Activity and Teacher’s Position
78 3.41 .682 1.012 .202
Students’ Activity and Students’ Position
78 1.74 .580 .973 .324
Environment 78 2.60 .520 1.332 266Overall 78 7.76 .60 2.693 .207
aAverage item mean = Scale mean divided by the number of items in a scale
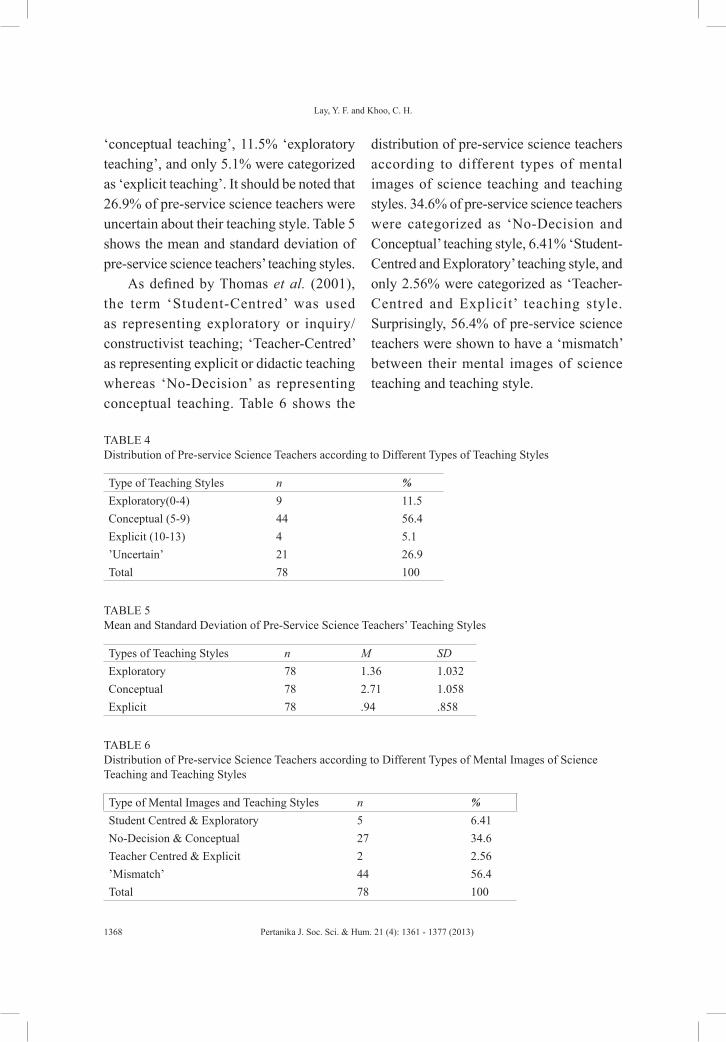
Lay, Y. F. and Khoo, C. H.
1368 Pertanika J. Soc. Sci. & Hum. 21 (4): 1361 - 1377 (2013)
‘conceptual teaching’, 11.5% ‘exploratory teaching’, and only 5.1% were categorized as ‘explicit teaching’. It should be noted that 26.9% of pre-service science teachers were uncertain about their teaching style. Table 5 shows the mean and standard deviation of pre-service science teachers’ teaching styles.
As defined by Thomas et al. (2001), the term ‘Student-Centred’ was used as representing exploratory or inquiry/ constructivist teaching; ‘Teacher-Centred’ as representing explicit or didactic teaching whereas ‘No-Decision’ as representing conceptual teaching. Table 6 shows the
distribution of pre-service science teachers according to different types of mental images of science teaching and teaching styles. 34.6% of pre-service science teachers were categorized as ‘No-Decision and Conceptual’ teaching style, 6.41% ‘Student-Centred and Exploratory’ teaching style, and only 2.56% were categorized as ‘Teacher-Centred and Explicit’ teaching style. Surprisingly, 56.4% of pre-service science teachers were shown to have a ‘mismatch’ between their mental images of science teaching and teaching style.
TABLE 4 Distribution of Pre-service Science Teachers according to Different Types of Teaching Styles
Type of Teaching Styles n %Exploratory(0-4) 9 11.5Conceptual (5-9) 44 56.4Explicit (10-13) 4 5.1’Uncertain’ 21 26.9Total 78 100
TABLE 5 Mean and Standard Deviation of Pre-Service Science Teachers’ Teaching Styles
Types of Teaching Styles n M SDExploratory 78 1.36 1.032Conceptual 78 2.71 1.058Explicit 78 .94 .858
TABLE 6 Distribution of Pre-service Science Teachers according to Different Types of Mental Images of Science Teaching and Teaching Styles
Type of Mental Images and Teaching Styles n %Student Centred & Exploratory 5 6.41No-Decision & Conceptual 27 34.6Teacher Centred & Explicit 2 2.56’Mismatch’ 44 56.4Total 78 100
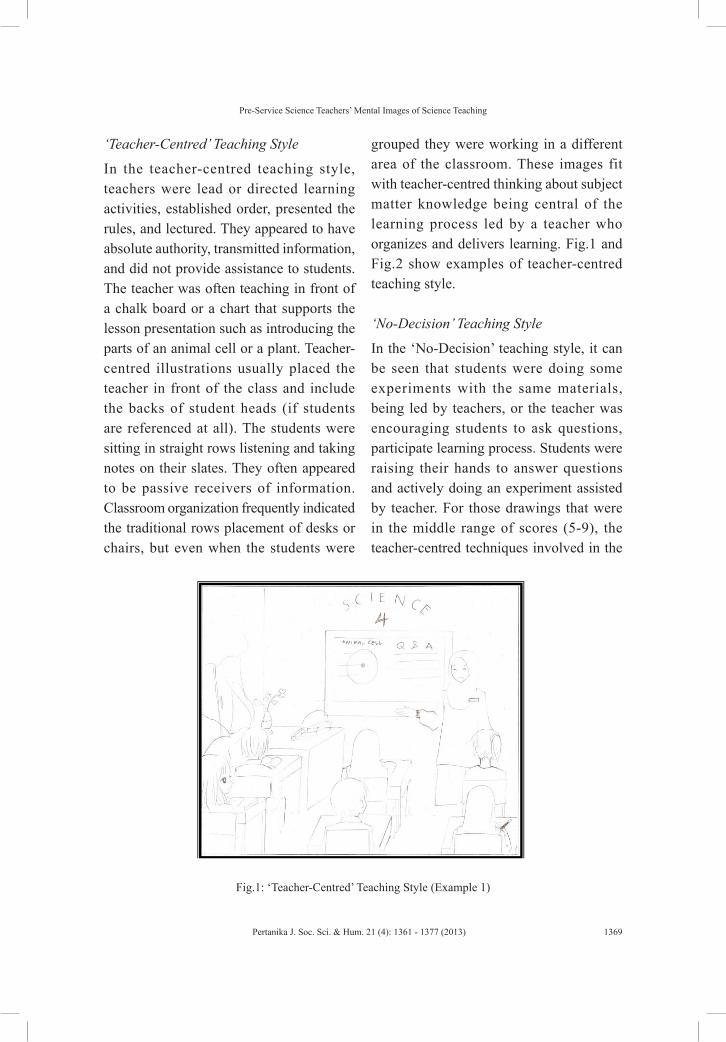
Pre-Service Science Teachers’ Mental Images of Science Teaching
1369Pertanika J. Soc. Sci. & Hum. 21 (4): 1361 - 1377 (2013)
‘Teacher-Centred’ Teaching Style
In the teacher-centred teaching style, teachers were lead or directed learning activities, established order, presented the rules, and lectured. They appeared to have absolute authority, transmitted information, and did not provide assistance to students. The teacher was often teaching in front of a chalk board or a chart that supports the lesson presentation such as introducing the parts of an animal cell or a plant. Teacher-centred illustrations usually placed the teacher in front of the class and include the backs of student heads (if students are referenced at all). The students were sitting in straight rows listening and taking notes on their slates. They often appeared to be passive receivers of information. Classroom organization frequently indicated the traditional rows placement of desks or chairs, but even when the students were
grouped they were working in a different area of the classroom. These images fit with teacher-centred thinking about subject matter knowledge being central of the learning process led by a teacher who organizes and delivers learning. Fig.1 and Fig.2 show examples of teacher-centred teaching style.
‘No-Decision’ Teaching Style
In the ‘No-Decision’ teaching style, it can be seen that students were doing some experiments with the same materials, being led by teachers, or the teacher was encouraging students to ask questions, participate learning process. Students were raising their hands to answer questions and actively doing an experiment assisted by teacher. For those drawings that were in the middle range of scores (5-9), the teacher-centred techniques involved in the
Fig.1: ‘Teacher-Centred’ Teaching Style (Example 1)
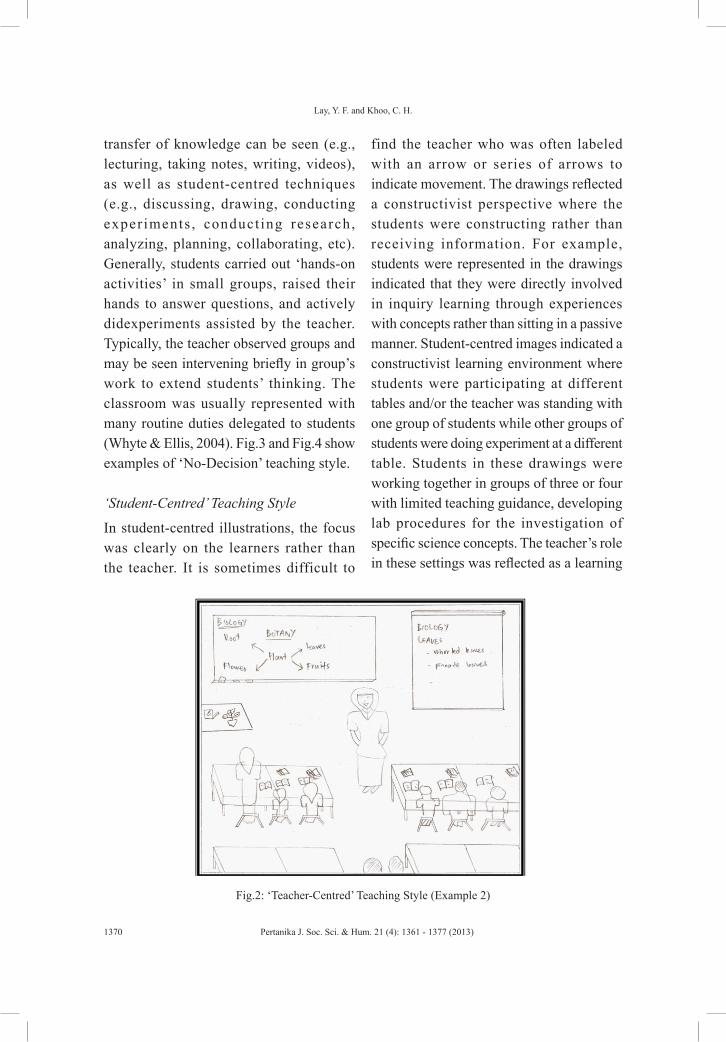
Lay, Y. F. and Khoo, C. H.
1370 Pertanika J. Soc. Sci. & Hum. 21 (4): 1361 - 1377 (2013)
transfer of knowledge can be seen (e.g., lecturing, taking notes, writing, videos), as well as student-centred techniques (e.g., discussing, drawing, conducting exper iments , conduct ing research, analyzing, planning, collaborating, etc). Generally, students carried out ‘hands-on activities’ in small groups, raised their hands to answer questions, and actively didexperiments assisted by the teacher. Typically, the teacher observed groups and may be seen intervening briefly in group’s work to extend students’ thinking. The classroom was usually represented with many routine duties delegated to students (Whyte & Ellis, 2004). Fig.3 and Fig.4 show examples of ‘No-Decision’ teaching style.
‘Student-Centred’ Teaching Style
In student-centred illustrations, the focus was clearly on the learners rather than the teacher. It is sometimes difficult to
find the teacher who was often labeled with an arrow or series of arrows to indicate movement. The drawings reflected a constructivist perspective where the students were constructing rather than receiving information. For example, students were represented in the drawings indicated that they were directly involved in inquiry learning through experiences with concepts rather than sitting in a passive manner. Student-centred images indicated a constructivist learning environment where students were participating at different tables and/or the teacher was standing with one group of students while other groups of students were doing experiment at a different table. Students in these drawings were working together in groups of three or four with limited teaching guidance, developing lab procedures for the investigation of specific science concepts. The teacher’s role in these settings was reflected as a learning
Fig.2: ‘Teacher-Centred’ Teaching Style (Example 2)
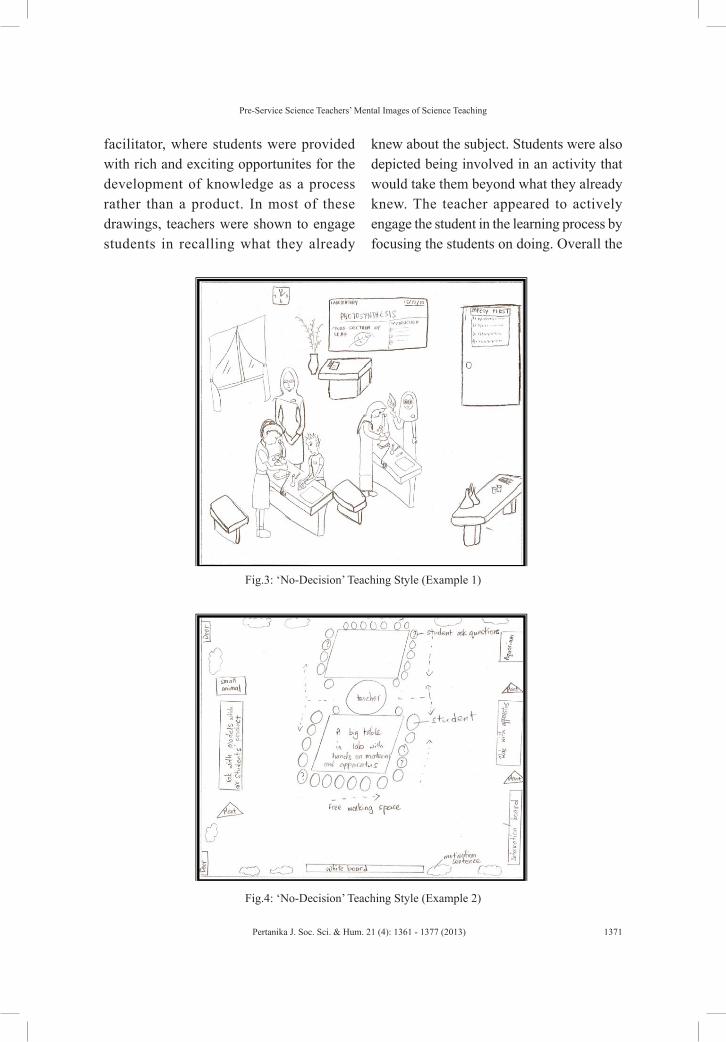
Pre-Service Science Teachers’ Mental Images of Science Teaching
1371Pertanika J. Soc. Sci. & Hum. 21 (4): 1361 - 1377 (2013)
Fig.3: ‘No-Decision’ Teaching Style (Example 1)
Fig.4: ‘No-Decision’ Teaching Style (Example 2)
facilitator, where students were provided with rich and exciting opportunites for the development of knowledge as a process rather than a product. In most of these drawings, teachers were shown to engage students in recalling what they already
knew about the subject. Students were also depicted being involved in an activity that would take them beyond what they already knew. The teacher appeared to actively engage the student in the learning process by focusing the students on doing. Overall the
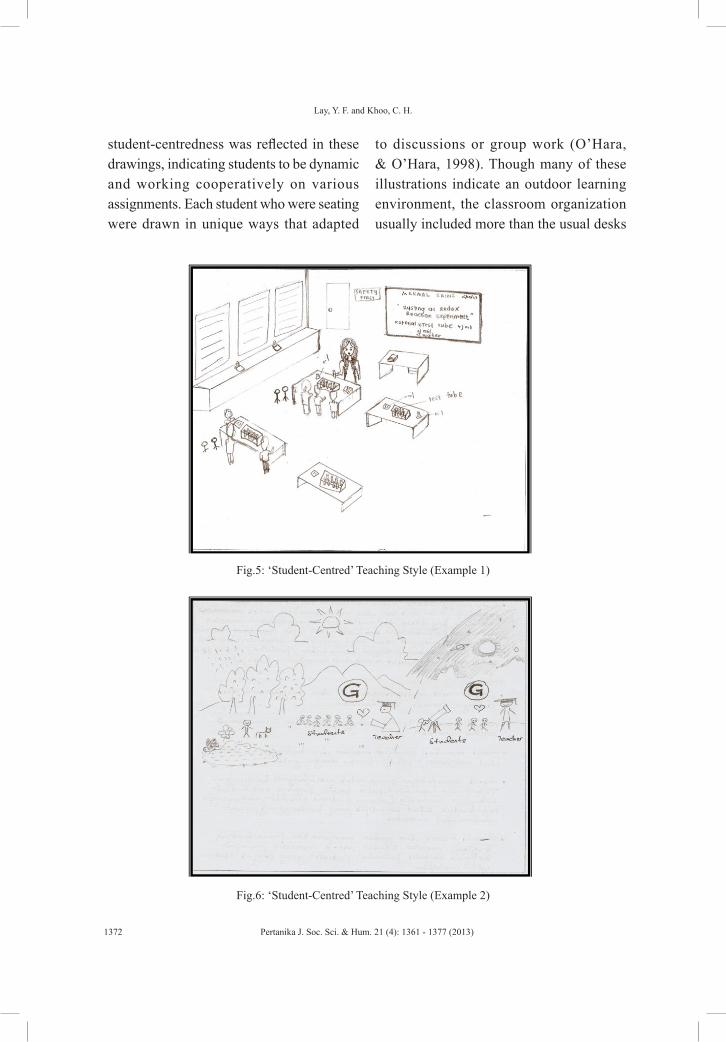
Lay, Y. F. and Khoo, C. H.
1372 Pertanika J. Soc. Sci. & Hum. 21 (4): 1361 - 1377 (2013)
student-centredness was reflected in these drawings, indicating students to be dynamic and working cooperatively on various assignments. Each student who were seating were drawn in unique ways that adapted
to discussions or group work (O’Hara, & O’Hara, 1998). Though many of these illustrations indicate an outdoor learning environment, the classroom organization usually included more than the usual desks
Fig.5: ‘Student-Centred’ Teaching Style (Example 1)
Fig.6: ‘Student-Centred’ Teaching Style (Example 2)
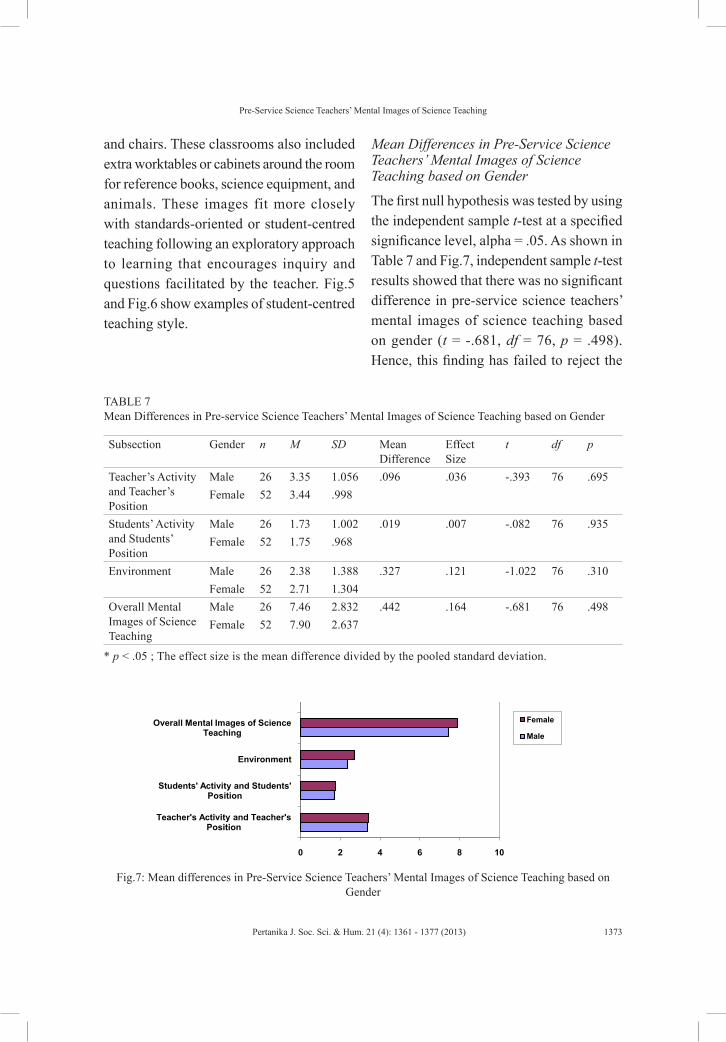
Pre-Service Science Teachers’ Mental Images of Science Teaching
1373Pertanika J. Soc. Sci. & Hum. 21 (4): 1361 - 1377 (2013)
and chairs. These classrooms also included extra worktables or cabinets around the room for reference books, science equipment, and animals. These images fit more closely with standards-oriented or student-centred teaching following an exploratory approach to learning that encourages inquiry and questions facilitated by the teacher. Fig.5 and Fig.6 show examples of student-centred teaching style.
Mean Differences in Pre-Service Science Teachers’ Mental Images of Science Teaching based on Gender
The first null hypothesis was tested by using the independent sample t-test at a specified significance level, alpha = .05. As shown in Table 7 and Fig.7, independent sample t-test results showed that there was no significant difference in pre-service science teachers’ mental images of science teaching based on gender (t = -.681, df = 76, p = .498). Hence, this finding has failed to reject the
TABLE 7 Mean Differences in Pre-service Science Teachers’ Mental Images of Science Teaching based on Gender
Subsection Gender n M SD Mean Difference
Effect Size
t df p
Teacher’s Activity and Teacher’s Position
Male 26 3.35 1.056 .096 .036 -.393 76 .695Female 52 3.44 .998
Students’ Activity and Students’ Position
Male 26 1.73 1.002 .019 .007 -.082 76 .935Female 52 1.75 .968
Environment Male 26 2.38 1.388 .327 .121 -1.022 76 .310Female 52 2.71 1.304
Overall Mental Images of Science Teaching
Male 26 7.46 2.832 .442 .164 -.681 76 .498Female 52 7.90 2.637
* p < .05 ; The effect size is the mean difference divided by the pooled standard deviation.
0 2 4 6 8 10
Teacher's Activity and Teacher's Position
Students' Activity and Students' Position
Environment
Overall Mental Images of Science Teaching
Female
Male
Fig.7: Mean differences in Pre-Service Science Teachers’ Mental Images of Science Teaching based on Gender
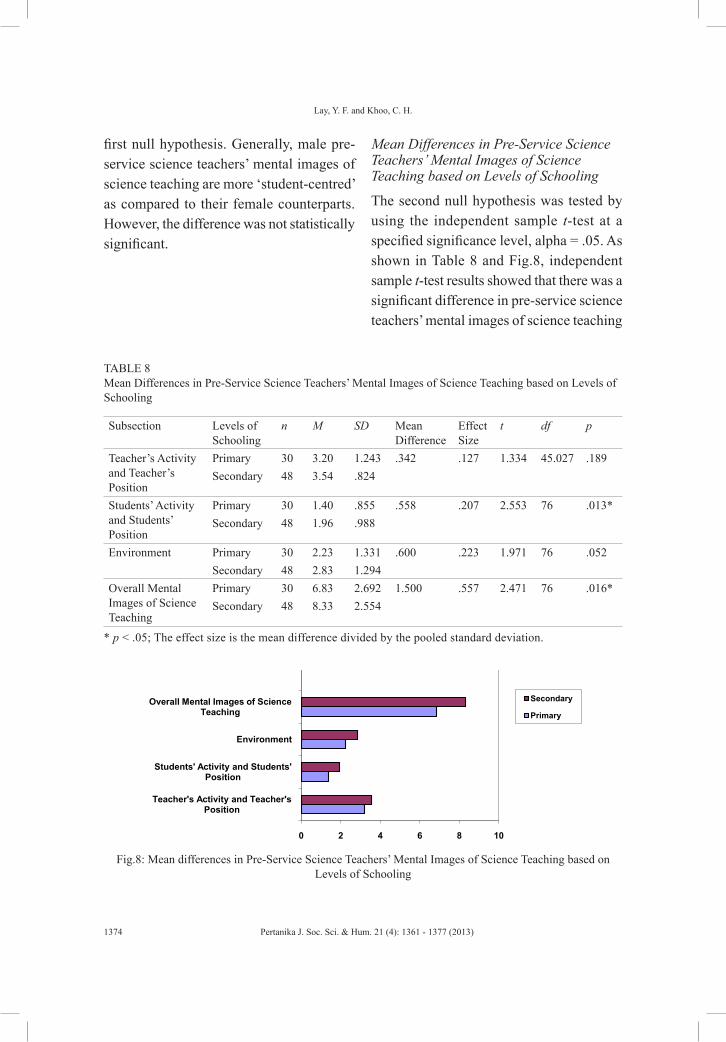
Lay, Y. F. and Khoo, C. H.
1374 Pertanika J. Soc. Sci. & Hum. 21 (4): 1361 - 1377 (2013)
first null hypothesis. Generally, male pre-service science teachers’ mental images of science teaching are more ‘student-centred’ as compared to their female counterparts. However, the difference was not statistically significant.
Mean Differences in Pre-Service Science Teachers’ Mental Images of Science Teaching based on Levels of Schooling
The second null hypothesis was tested by using the independent sample t-test at a specified significance level, alpha = .05. As shown in Table 8 and Fig.8, independent sample t-test results showed that there was a significant difference in pre-service science teachers’ mental images of science teaching
TABLE 8 Mean Differences in Pre-Service Science Teachers’ Mental Images of Science Teaching based on Levels of Schooling
Subsection Levels of Schooling
n M SD Mean Difference
Effect Size
t df p
Teacher’s Activity and Teacher’s Position
Primary 30 3.20 1.243 .342 .127 1.334 45.027 .189Secondary 48 3.54 .824
Students’ Activity and Students’ Position
Primary 30 1.40 .855 .558 .207 2.553 76 .013*Secondary 48 1.96 .988
Environment Primary 30 2.23 1.331 .600 .223 1.971 76 .052Secondary 48 2.83 1.294
Overall Mental Images of Science Teaching
Primary 30 6.83 2.692 1.500 .557 2.471 76 .016*Secondary 48 8.33 2.554
* p < .05; The effect size is the mean difference divided by the pooled standard deviation.
0 2 4 6 8 10
Teacher's Activity and Teacher's Position
Students' Activity and Students' Position
Environment
Overall Mental Images of Science Teaching
Secondary
Primary
Fig.8: Mean differences in Pre-Service Science Teachers’ Mental Images of Science Teaching based on Levels of Schooling
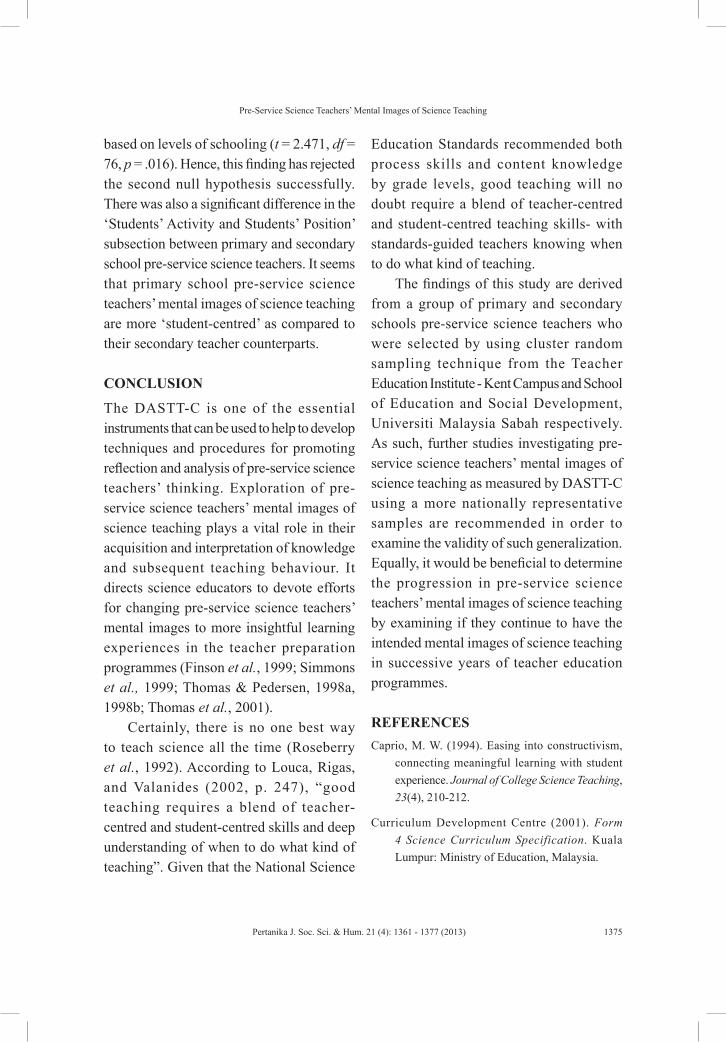
Pre-Service Science Teachers’ Mental Images of Science Teaching
1375Pertanika J. Soc. Sci. & Hum. 21 (4): 1361 - 1377 (2013)
based on levels of schooling (t = 2.471, df = 76, p = .016). Hence, this finding has rejected the second null hypothesis successfully. There was also a significant difference in the ‘Students’ Activity and Students’ Position’ subsection between primary and secondary school pre-service science teachers. It seems that primary school pre-service science teachers’ mental images of science teaching are more ‘student-centred’ as compared to their secondary teacher counterparts.
CONCLUSION
The DASTT-C is one of the essential instruments that can be used to help to develop techniques and procedures for promoting reflection and analysis of pre-service science teachers’ thinking. Exploration of pre-service science teachers’ mental images of science teaching plays a vital role in their acquisition and interpretation of knowledge and subsequent teaching behaviour. It directs science educators to devote efforts for changing pre-service science teachers’ mental images to more insightful learning experiences in the teacher preparation programmes (Finson et al., 1999; Simmons et al., 1999; Thomas & Pedersen, 1998a, 1998b; Thomas et al., 2001).
Certainly, there is no one best way to teach science all the time (Roseberry et al., 1992). According to Louca, Rigas, and Valanides (2002, p. 247), “good teaching requires a blend of teacher-centred and student-centred skills and deep understanding of when to do what kind of teaching”. Given that the National Science
Education Standards recommended both process skills and content knowledge by grade levels, good teaching will no doubt require a blend of teacher-centred and student-centred teaching skills- with standards-guided teachers knowing when to do what kind of teaching.
The findings of this study are derived from a group of primary and secondary schools pre-service science teachers who were selected by using cluster random sampling technique from the Teacher Education Institute - Kent Campus and School of Education and Social Development, Universiti Malaysia Sabah respectively. As such, further studies investigating pre-service science teachers’ mental images of science teaching as measured by DASTT-C using a more nationally representative samples are recommended in order to examine the validity of such generalization. Equally, it would be beneficial to determine the progression in pre-service science teachers’ mental images of science teaching by examining if they continue to have the intended mental images of science teaching in successive years of teacher education programmes.
REFERENCESCaprio, M. W. (1994). Easing into constructivism,
connecting meaningful learning with student experience. Journal of College Science Teaching, 23(4), 210-212.
Curriculum Development Centre (2001). Form 4 Science Curriculum Specification. Kuala Lumpur: Ministry of Education, Malaysia.
Lay, Y. F. and Khoo, C. H.
1376 Pertanika J. Soc. Sci. & Hum. 21 (4): 1361 - 1377 (2013)
Finson, K. D. (2001). Investigating pre-service elementary teachers’ self-efficacy relative to self-image as a science teacher. Journal of Elementary Science Education, 13(1), 31-42.
Finson, K., Riggs, I. M., & Jesunathadas, J. (1999). The relationship of science teaching self-efficacy and outcome expectancy to the Draw-A-Science-Teacher-Teaching Checklist. In P. Rubba, J. Rye, & P.Keg (Ed.). In the Proceedings of the 1999 Annual International Conference of the Association for the Education of Teachers in Science (pp. 123-133). Greenville, NC: Association for the Education of Teachers in Science. (ERIC Document Reproduction Service No. ED 431 626).
Glasson, G. E. (1989). The effects of hands-on and teacher demonstration laboratory methods on science achievement in relation to reasoning ability and prior knowledge. Journal of Research in Science Teaching, 26(2), 121—131.
Goodman, J. (1988). Constructing a practical philosophy of teaching: A study of preservice teachers’ professional perspectives. Teaching and Teacher Education, 4, 121-137.
Hair, J. F., Anderson, R. E., Tatham, R. L., & Black, W.C. (1998). Multivariate data analysis, 5th Ed. New Jersey: Prentice Hall Inc.
Louca, P., Rigas, P., & Valanides, N. (2002). Primary student teachers’ conceptions of science teaching. In A. Papastylianou (Ed.), Proceedings of the 2nd International Conference on Science Education. (pp. 242-248). Nicosia, Cyprus: ARLO, Ltd.
Miles, J., & Shevlin, M. (2001). Applying regression and correlation. A guide for students and researchers. London: Sage Publications.
National Science Board. (1991). Science & engineering indicators-1991. Washington, DC: U.S. Government Printing Office.
National Research Council (1996). National science education standards. Washington, DC: National Academy Press.
O’Hara, M. T., & O’Hara, J. A. (1998). Corporating learning: A paradigm for learning in the 21st century. American Secondary Education, 27, 9-17.
Roseberry, A. S., & Warren, B., & Conant, F. R. (1992). Appropriating scientific discourse: Findings from language minority classrooms. The Journal of Learning Sciences, 21, 61-94.
Simmons, P. E., Emory, A., Carter, T., Coker, T., Finnegan, B., Crockett, D., Richardson, L., Yager, R., Craven, J., Tillotson, J., Brunkhorst, H., Twiest, M., Hossain, K., Gallagher, J., Duggan-Haas, D., Parker, J., Cajas, F., Alshannag, Q., McGlamery, S., Krockover, J., Adams, P., Spector, B., LaPorta, T., James, B., Rearden, K., & Lubuda, K. (1999). Beginning teachers: Beliefs and classroom actions. Journal of Research in Science Teaching, 36(8), 930-954.
Staver, J. R. (1998). Constructivism: Sound theory of explicating the practice of science and science teaching. Journal of Research in Science Teaching, 35, 501-520.
Taylor, P., Dawson, V., & Fraser, B. (1995). Classroom learning environments under transformation: A constructivist perpective. Paper presented at the American Educational Research Association, San Francisco, CA.
Thomas, J., & Pedersen, J. E. (1998a). Draw-A-Science-Teacher: A visualization of beliefs and self-efficacy. Paper presented at the annual meeting of the Association for the Education of Teachers in Science, Minneapolis, MN.
Thomas, J., & Pedersen, J. E. (1998b). Draw-A-Science-Teacher-Test: Pre-service elementary teachers perceptions of classroom experiences. Paper presented at the National Association of Researchers in Science Teaching international meeting, San Diego: California.
Thomas, J., & Pedersen, J. E. (2001). When do science teachers learn to teach? A comparison of school children’s and pre-service teachers’ science

Pre-Service Science Teachers’ Mental Images of Science Teaching
1377Pertanika J. Soc. Sci. & Hum. 21 (4): 1361 - 1377 (2013)
teacher illustrations. A paper presented at the Association for the Education of Teachers of Science annual meeting, Costa Mesa.
Thomas, J. A., Pedersen, J. E., & Finson, K. (2001). Validating the Draw-A-Science-Teacher-Test-Checklist (DASTT-C): Exploring mental models and teacher beliefs. Journal of Science Teacher Education, 12(4), 295-310.
Tobin, K., Briscoe, C., & Holman, J.R. (1990). Overcoming constraints to effective elementary science teaching. Science Education, 74(4), 409-412.
Turkmen, H. (2006). How should be taught science by using learning cycle approach in our elementary schools? Elementary Education Online, 5(2), 1-15.
Turkmen, H., & Pedersen, J. E. (2005). Examining the technological history of Turkey impacts on teaching science. Science Education International, 17(2), 115-123.
Whyte, A., & Ellis, N. (2004). The power of a network organization: A model for school-university collaboration. Contemporary Issues in Technology and Teacher Education, 4(2), 137-151.
Yilmaz, H., & Huyuguzel Cavas, P. (2006). The effect of the 4-E learning cycle method on students’ understanding of electricity. Journal of Turkish Science Education, 3(1), 2-5.

Pertanika J. Soc. Sci. & Hum. 21 (4): 1379 - 1393 (2013)
ISSN: 0128-7702 © Universiti Putra Malaysia Press
SOCIAL SCIENCES & HUMANITIESJournal homepage: http://www.pertanika.upm.edu.my/
Article history:Received: 30 May 2011Accepted: 29 September 2012
ARTICLE INFO
E-mail address: [email protected] (Suresh Kumar N. Vellymalay), * Corresponding author
A Case Study on Friendship, Loneliness and Social Dissatisfaction among Preschool Children
Suresh Kumar N. VellymalaySchool of Distance Education, Universiti Sains Malaysia, 11800 Penang, Malaysia
ABSTRACT
This study was designed to identify the relationship between number of best friends and the feelings of loneliness and social dissatisfaction among the children in preschool. Thirty-six children of a private preschool were interviewed based on structured interview using interview schedule to gather information regarding their self reported feelings on loneliness and social dissatisfaction at their preschool. In-depth interviews was also conducted to elicit information from the children and the teachers regarding the children’s best friends, socialization at school and the feelings of loneliness. Findings suggest that a considerable number of children experience feelings of loneliness and social dissatisfaction at preschool. However, the study did not find any significant relationship between children’s number of best friends and the self reported feelings of loneliness and social dissatisfaction.
Keywords: Friendship, loneliness, preschool, social dissatisfaction
Friendship encourages social interactions and counteracts the feelings of loneliness for many children; but it is totally reverse in the case of friendless children (Page & Scanlan, 1994). A child’s ability to form a satisfactory relationship with his peer group at school heightens the level of social satisfaction he has; and vice versa.
However, many students are lonely and they have difficulty in developing peer relationships (Asher et al., 1984). Children who are unable to develop peer relationship often feel isolated and they fail to initiate interaction with other children in their
INTRODUCTION
Friendship creates a platform of socialization and social interaction among individuals. For children, apart from the early socialization either within one’s family, relatives or a small community around them where they live, the development of social interactions among peers is much stronger in school.
Suresh Kumar N. Vellymalay
1380 Pertanika J. Soc. Sci. & Hum. 21 (4): 1379 - 1393 (2013)
classroom. Lack of social skills and the confidence in developing social interactions is one of the main factors of loneliness and social dissatisfaction. Children who have fewer or no friends at all experience loneliness and social dissatisfaction in relations with their peers at school.
In earlier years, research on loneliness was not seen as an area of inquiry since it was embedded by the belief that children do not experience feelings of loneliness (Bullock, 1993). Only in the 80’s did researchers show an increased interest in the phenomenon of loneliness in children (Asher et al., 1984; Asher & Wheeler, 1985; Moore & Schultz, 1983) and this interest continued to develop more in 90’s (Cassidy & Asher, 1992; Galanaki & Kalantzi-Azizi, 1999; Margalit, 1998; Margalit & Efrati, 1996; Page et al., 1992; Parker & Asher, 1993; Parkhurst & Asher, 1992; Quay, 1992; Sanderson & Seagal, 1995) To date, more studies have focused on this area of research (Bakkaloglu, 2010; Han & Choi, 2006; Jobe & White, 2007; Yu et al., 2005). These researchers attempt to explain loneliness and social dissatisfaction from various scopes i.e. social relationship which focuses on friendship, peer interaction and peer rejection (Asher et al., 1984; Asher & Wheeler, 1985; Bullock, 1993; Cassidy & Asher, 1992; Galanaki & Kalantzi-Azizi, 1999; Han & Choi, 2006; Parkhurst & Asher, 1992; Sanderson & Seagal, 1995) besides the importance given to education achievement (Bakkaloglu, 2010), physical fitness (Page et al., 1992) and learning
disabilities (Jobe & White, 2007; Yu et al., 2005; Margalit, 1998; Margalit & Efrati, 1996; Pavri & Monda-Amaya, 2000), family effects (Quay, 1992) and the emotional characteristic in siblings of children with cancer (Hamama, et al., 2000).
In accordance to the description above, several studies have attempted to explain further on the relationship between friendship and the feelings of loneliness. For example, Page et al. (1992) in their study on 601 grade one to grade six children of two elementary schools found children who are lonely unable to interact and function effectively in groups due to their lacking in social skills. Another study by Cheng & Furnham (2002) on ninety adolescence aged sixteen to eighteen years in three schools in UK found that lack of self-esteem and self-concept in the form of confidence among the adolescence was the main source of intimate aspect of loneliness. Furthermore, their study also indicated that lack of the confidence among the adolescence in social interactions was the main source of intimate and social aspect of loneliness. Chen et al. (2004) examine loneliness and social adaptation among 2263 children from grade three to grade six, aged nine to twelve years in Brazil, Canada, China and Italy found that sociability was positively associated with peer relationships due to their social participation. Asher et al. (1984) examined the relationship between number of best friends and loneliness for third through sixth grade (9-12 years) children. They found that as the number of best friends decreased,
Friendship, Loneliness and Social Dissatisfaction
1381Pertanika J. Soc. Sci. & Hum. 21 (4): 1379 - 1393 (2013)
the feelings of loneliness increased. A study by Moore & Schultz (1983) on high school children ranging in age from 14-19 years indicated that those children who were identified as lonely were less willing to take risks in interaction. They seem to have difficulty in initiating communication with others. It is important to note here that children who have fewer friends at school have reported more feelings of loneliness and social dissatisfaction.
Research on loneliness among children has also focused on the issue of peer acceptance and peer rejection (Asher & Paquette, 2003). Qualter & Munn (2002) examine the relationship between social isolation and emotional loneliness on 640 children aged four to nine years. The results showed that 60 children who were socially isolated but not lonely, 145 children who felt lonely but not socially isolated, 61 children who were rejected and lonely, and another 374 children were neither lonely nor rejected. They found that loneliness has a direct influence over the withdrawn behavior among children rather than peer rejection. Sanderson & Seagal (1995) in their study on 4-5 year old children who were either attending preschool or day care also found that children who were rejected by their peers are lonelier than neglected children. Cassidy & Asher (1992) in their study on kindergarten and first grade classroom (5-7 years) pointed out that children who were rejected by their peers are lonelier than the average children, neglected children and the popular ones. Besides the studies discussed
above, Asher et al. (1984) also found that the unpopular children in third through sixth grade classrooms (9-12 years) are likely to have more feelings of loneliness and social dissatisfaction than the popular ones.
Similar to Sanderson & Seagal (1995), Cassidy & Asher (1992) and Asher’s et al. (1984), Asher & Wheeler’s (1985) study on third through sixth grade children (9-12 years) in elementary school also indicated that rejected children reported extreme feelings of loneliness than the matched groups in the study. In another major study, Parkhurst & Asher (1992) had examined the relationship between children’s sociometric status and their feelings of loneliness and social dissatisfaction among seventh and eighth-grade middle school children aged 13-14 years. Their study showed that the subgroup of rejected children reported more loneliness and social dissatisfaction than the matched groups. Therefore, it is clear that children who were rejected by their peers reported greater feelings of loneliness (Asher et al., 1984; Asher & Wheeler, 1985; Cassidy & Asher, 1992; Parkhurst & Asher, 1992; Sanderson & Seagal, 1995). In addition, Coplan et al. (2007), in their study of 139 kindergarten children in fourteen public schools indicated that loneliness was positively correlated to anxiety, aggression and peer exclusion. The study also suggests gender differences in behavioral associates of loneliness among the children. Kirova (2003) in her study of seventy-five children from kindergarten to grade six in a school examined children’s
Suresh Kumar N. Vellymalay
1382 Pertanika J. Soc. Sci. & Hum. 21 (4): 1379 - 1393 (2013)
experiences of loneliness by initiating conversation with them. She indicated that loneliness in children separates the children from their lived space, body, others and also their lived time.
H o w e v e r , i n s h o r t , p r e v i o u s studies found that loneliness and social dissatisfaction among children at school is associated with the number of friends that the children have at school. Lack of social skills and confidence in children affects the children’s ability to initiate friendships and form social interactions among them. Furthermore, various other factors such as anxiety, aggression, peer exclusion, limited social participation and withdrawn behavior at school also lead to the feelings of loneliness and social dissatisfaction among children.
In recent times, studies have noted an increased interest in the phenomenon of loneliness and social dissatisfaction among children. Although extensive research has been carried out on loneliness and social dissatisfaction, the number of research which focused on children at preschools remains unsatisfactory. In the context of Malaysia, ample research has been done on preschool and children’s education. However, the academic interest and research based studies on children’s loneliness and social dissatisfaction is still new and it is insufficient to explain the impact of loneliness and social dissatisfaction on a child’s educational success. Therefore, the current study adds to the present corpus of knowledge of loneliness and social
dissatisfaction among the preschoolers in the context of Malaysian studies.
The study on loneliness and social dissatisfaction among preschool children is very important due to several reasons. First, children’s loneliness and social dissatisfaction in the early years of childhood could lead to serious problems later in life in terms of interaction, socialization, adjustment and adaptation. Second, research on loneliness and social dissatisfaction is needed to understand its cause and effect in order to develop various classroom practices to encourage social interaction towards forming sustainable peer relationships. Finally, it is also important to study loneliness and dissatisfaction among preschool children since little is known about this phenomenon. Thus, this research will serve as a base for future studies in analyzing loneliness and social dissatisfaction in children.
PURPOSE OF THE STUDY
In accordance with the description above, the objective of this research is to explain the existence of loneliness and social dissatisfaction among children in preschool. There are two main questions addressed in this research. First, what is the level of loneliness and social dissatisfaction among the children in preschool; and second, to what extent does the number of best friends at preschool affect loneliness and social dissatisfaction among these children?
Friendship, Loneliness and Social Dissatisfaction
1383Pertanika J. Soc. Sci. & Hum. 21 (4): 1379 - 1393 (2013)
RESEARCH METHODS
The current study adopted the deductive strategy which is in nature to test on previous research findings. Using this strategy, data were gathered from the sample of the study and necessary analysis was conducted from the gathered data. In reference to the previous research findings, conclusion was made and it is tested and compared to those previous research findings in order to identify the logical reasoning and the relationship that exist between them.
Sample
The sample of this study was drawn from a private preschool in Taiping located in the state of Perak Darul Ridzuan, Malaysia. There are forty-two children in the preschool. However, only thirty-six children participated in this study due to repeated school absences. As such six of the forty-two children could not participate in the study. The total of thirty-six children comprised children from lower kindergarten which usually caters to children aged 3-5 years and also the upper kindergarten which caters to children aged 6 years. Of these thirty-six children, 20 children were 4-5 years old. The other 16 children were 6 years old. The preschool consists of children from two main ethnic groups, the Indians and the Malays.
Procedure
The study was conducted in July 2009. The teachers were informed of the study prior the research. . The researcher visited the preschool several times in the morning
before the classroom activities resumed. The researcher formed friendly interaction with the children during their recess. The role of a researcher as a friend is highly important to the development of trust and the relationship between the children and the researcher (Fine & Sandstorm, 1988). It needs to be emphasized that this is a crucial role because without establishing trust, it would be extremely difficult to conduct interviews with younger children. First, the children may not be familiar with the form of interaction and second, they may not have experience conversing with others besides their teachers at school (Grave & Walsh, 1998).
In the middle of July, written consent was obtained from the parents through the class teachers. All the parents had permitted their children to participate in this study. At the end of July, structured interviews were conducted where the children were interviewed individually in a classroom set for the purpose of the interview. Before the interview the children were asked if they were willing to participate. They were told that they need not participate if they did not want to. All thirty six children who were present during this study agreed to participate. Children were assured of the confidentiality of the interview. The children were interviewed by the researcher himself. Each structured interview took about 20 minutes.
There were two different ethnic groups in the sample. They were the Indians and the Malays. The researcher had to translate the questions in the questionnaire verbally
Suresh Kumar N. Vellymalay
1384 Pertanika J. Soc. Sci. & Hum. 21 (4): 1379 - 1393 (2013)
according to their spoken language at home. For the Indian children, the medium of instruction used was Tamil language as English was not their native language. The Malay language was used with the Malay children. This helped the children to understand the questions in the instrument used for the interview. However, as the researcher was fluent in both languages, it was relatively easy for the researcher to enhance the children’s understanding of the questions being asked during the interview sessions.
Besides the structured interviews, in-depth interviews were scheduled in order to elicit information from the children and the teachers regarding the children’s best friends, socialization at school and their feelings of loneliness. During the structured interviews, all the children were asked about the number of best friends they have, based on six categories of best friends (no best friend, one friend, two friends, three friends, four friends, five friends and above). The children were asked to name their best friends according to how much they liked to play with them at school. The numbers of best friends were calculated based on the information received from each child. From the total of 36 children who participated in this study, twelve children were chosen randomly which comprised of two children from each category of best friends who were then interviewed. Moreover, an interview was also conducted with two teachers at the preschool to gather information from them regarding their observations of the
children’s friendship, interactions and feelings of loneliness at school.
Measures
As for the structured interview, questions in an interview form were developed to assess loneliness and social dissatisfaction among children in preschool. The questionnaire was formatted into two different sections. The first section of the questionnaire contained six items on the children’s background. This section required information on the children’s gender, religion, age, educational status, parent’s background, and the number of best friends they have at their preschool. The first five questions on gender, religion, age, educational status, parent’s background were taken from the teacher’s records. The information on the number of best friends was gathered from the sample. However, since the purpose of this paper is to explain the level of loneliness and social dissatisfaction; and the relationship between friendship and loneliness and social dissatisfaction among the children in preschool, this paper only focuses on the number of best friends as the only variable being tested in the line of few independent variables stated above.
The second section of the questionnaire was an adapted version of Loneliness and Social Dissatisfaction Questionnaire. The original 24-item Loneliness and Social Dissatisfaction Questionnaire designed by Asher et al. (1984), as modified by Cassidy & Asher (1992) was used in the present study. Of the 24 items of Asher et al. (1984)
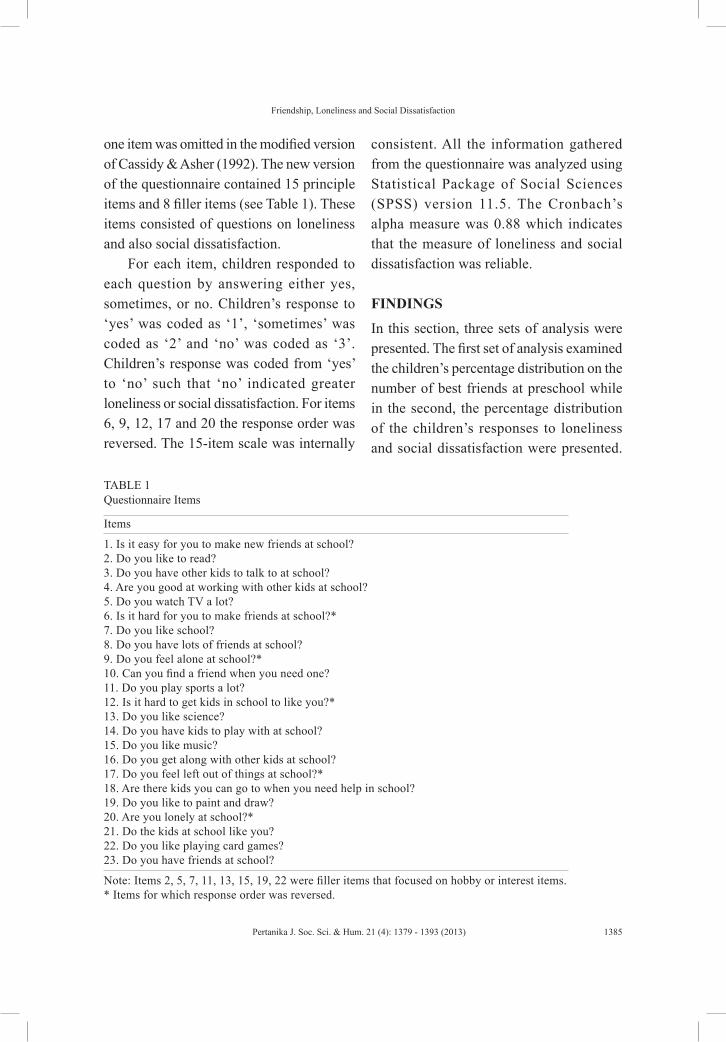
Friendship, Loneliness and Social Dissatisfaction
1385Pertanika J. Soc. Sci. & Hum. 21 (4): 1379 - 1393 (2013)
one item was omitted in the modified version of Cassidy & Asher (1992). The new version of the questionnaire contained 15 principle items and 8 filler items (see Table 1). These items consisted of questions on loneliness and also social dissatisfaction.
For each item, children responded to each question by answering either yes, sometimes, or no. Children’s response to ‘yes’ was coded as ‘1’, ‘sometimes’ was coded as ‘2’ and ‘no’ was coded as ‘3’. Children’s response was coded from ‘yes’ to ‘no’ such that ‘no’ indicated greater loneliness or social dissatisfaction. For items 6, 9, 12, 17 and 20 the response order was reversed. The 15-item scale was internally
consistent. All the information gathered from the questionnaire was analyzed using Statistical Package of Social Sciences (SPSS) version 11.5. The Cronbach’s alpha measure was 0.88 which indicates that the measure of loneliness and social dissatisfaction was reliable.
FINDINGS
In this section, three sets of analysis were presented. The first set of analysis examined the children’s percentage distribution on the number of best friends at preschool while in the second, the percentage distribution of the children’s responses to loneliness and social dissatisfaction were presented.
TABLE 1 Questionnaire Items
Items
1. Is it easy for you to make new friends at school? 2. Do you like to read?3. Do you have other kids to talk to at school? 4. Are you good at working with other kids at school? 5. Do you watch TV a lot?6. Is it hard for you to make friends at school?*7. Do you like school?8. Do you have lots of friends at school? 9. Do you feel alone at school?*10. Can you find a friend when you need one? 11. Do you play sports a lot?12. Is it hard to get kids in school to like you?*13. Do you like science?14. Do you have kids to play with at school? 15. Do you like music?16. Do you get along with other kids at school? 17. Do you feel left out of things at school?*18. Are there kids you can go to when you need help in school? 19. Do you like to paint and draw?20. Are you lonely at school?*21. Do the kids at school like you? 22. Do you like playing card games?23. Do you have friends at school?
Note: Items 2, 5, 7, 11, 13, 15, 19, 22 were filler items that focused on hobby or interest items. * Items for which response order was reversed.
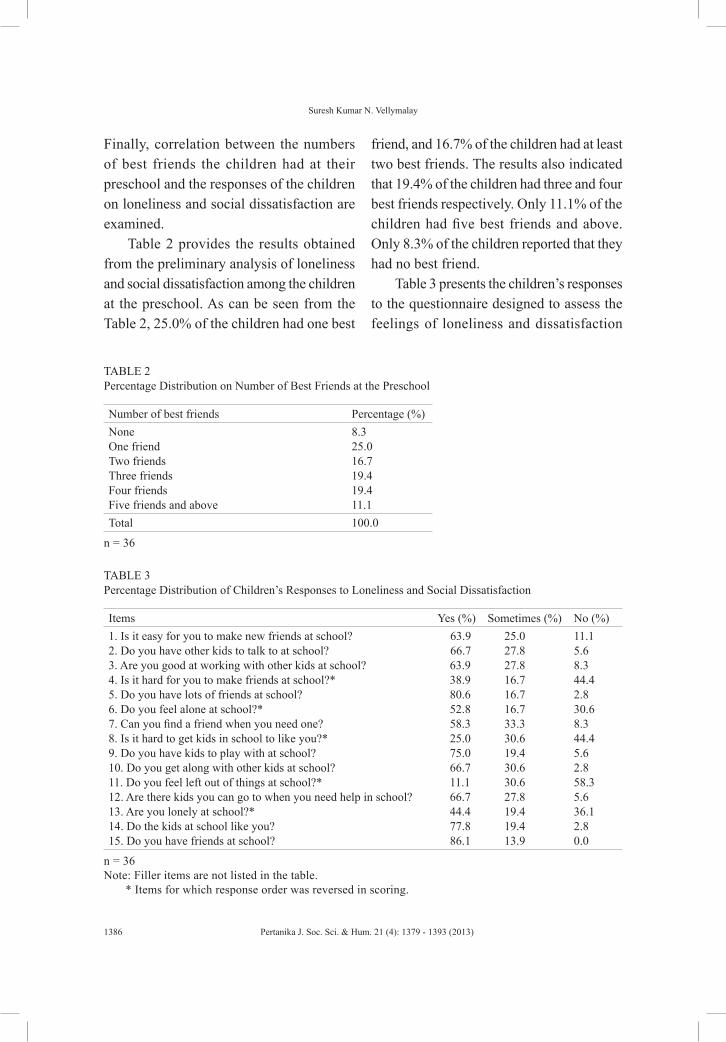
Suresh Kumar N. Vellymalay
1386 Pertanika J. Soc. Sci. & Hum. 21 (4): 1379 - 1393 (2013)
Finally, correlation between the numbers of best friends the children had at their preschool and the responses of the children on loneliness and social dissatisfaction are examined.
Table 2 provides the results obtained from the preliminary analysis of loneliness and social dissatisfaction among the children at the preschool. As can be seen from the Table 2, 25.0% of the children had one best
friend, and 16.7% of the children had at least two best friends. The results also indicated that 19.4% of the children had three and four best friends respectively. Only 11.1% of the children had five best friends and above. Only 8.3% of the children reported that they had no best friend.
Table 3 presents the children’s responses to the questionnaire designed to assess the feelings of loneliness and dissatisfaction
TABLE 2 Percentage Distribution on Number of Best Friends at the Preschool
Number of best friends Percentage (%)NoneOne friendTwo friendsThree friendsFour friendsFive friends and above
8.325.016.719.419.411.1
Total 100.0
n = 36
TABLE 3 Percentage Distribution of Children’s Responses to Loneliness and Social Dissatisfaction
Items Yes (%) Sometimes (%) No (%)1. Is it easy for you to make new friends at school? 2. Do you have other kids to talk to at school? 3. Are you good at working with other kids at school? 4. Is it hard for you to make friends at school?*5. Do you have lots of friends at school? 6. Do you feel alone at school?*7. Can you find a friend when you need one? 8. Is it hard to get kids in school to like you?*9. Do you have kids to play with at school? 10. Do you get along with other kids at school? 11. Do you feel left out of things at school?*12. Are there kids you can go to when you need help in school? 13. Are you lonely at school?*14. Do the kids at school like you? 15. Do you have friends at school?
63.966.763.938.980.652.858.325.075.066.711.166.744.477.8
86.1
25.027.827.816.716.716.733.330.619.430.630.627.819.419.413.9
11.15.68.344.42.830.68.344.45.62.858.35.636.12.80.0
n = 36Note: Filler items are not listed in the table. * Items for which response order was reversed in scoring.
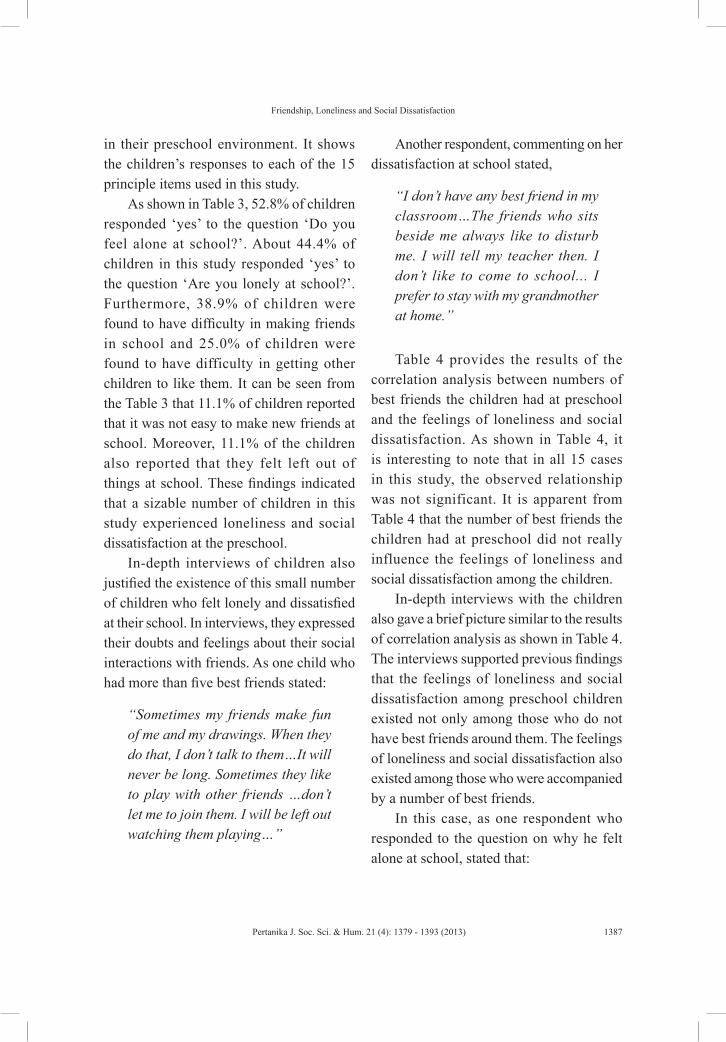
Friendship, Loneliness and Social Dissatisfaction
1387Pertanika J. Soc. Sci. & Hum. 21 (4): 1379 - 1393 (2013)
in their preschool environment. It shows the children’s responses to each of the 15 principle items used in this study.
As shown in Table 3, 52.8% of children responded ‘yes’ to the question ‘Do you feel alone at school?’. About 44.4% of children in this study responded ‘yes’ to the question ‘Are you lonely at school?’. Furthermore, 38.9% of children were found to have difficulty in making friends in school and 25.0% of children were found to have difficulty in getting other children to like them. It can be seen from the Table 3 that 11.1% of children reported that it was not easy to make new friends at school. Moreover, 11.1% of the children also reported that they felt left out of things at school. These findings indicated that a sizable number of children in this study experienced loneliness and social dissatisfaction at the preschool.
In-depth interviews of children also justified the existence of this small number of children who felt lonely and dissatisfied at their school. In interviews, they expressed their doubts and feelings about their social interactions with friends. As one child who had more than five best friends stated:
“Sometimes my friends make fun of me and my drawings. When they do that, I don’t talk to them…It will never be long. Sometimes they like to play with other friends …don’t let me to join them. I will be left out watching them playing…”
Another respondent, commenting on her dissatisfaction at school stated,
“I don’t have any best friend in my classroom…The friends who sits beside me always like to disturb me. I will tell my teacher then. I don’t like to come to school... I prefer to stay with my grandmother at home.”
Table 4 provides the results of the correlation analysis between numbers of best friends the children had at preschool and the feelings of loneliness and social dissatisfaction. As shown in Table 4, it is interesting to note that in all 15 cases in this study, the observed relationship was not significant. It is apparent from Table 4 that the number of best friends the children had at preschool did not really influence the feelings of loneliness and social dissatisfaction among the children.
In-depth interviews with the children also gave a brief picture similar to the results of correlation analysis as shown in Table 4. The interviews supported previous findings that the feelings of loneliness and social dissatisfaction among preschool children existed not only among those who do not have best friends around them. The feelings of loneliness and social dissatisfaction also existed among those who were accompanied by a number of best friends.
In this case, as one respondent who responded to the question on why he felt alone at school, stated that:
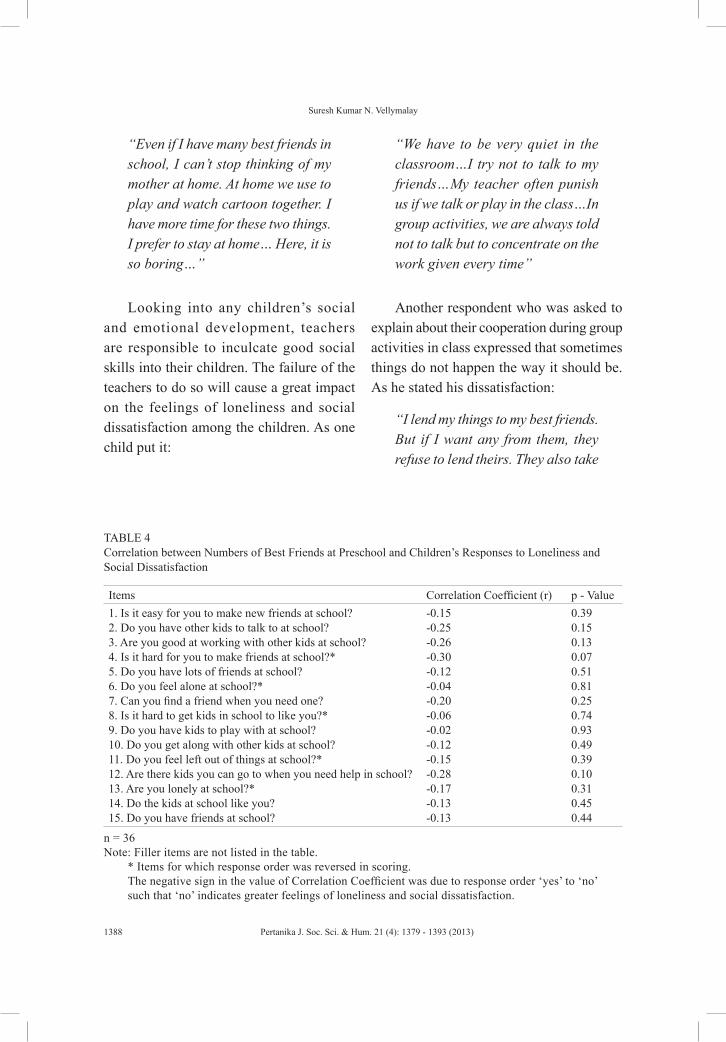
Suresh Kumar N. Vellymalay
1388 Pertanika J. Soc. Sci. & Hum. 21 (4): 1379 - 1393 (2013)
“Even if I have many best friends in school, I can’t stop thinking of my mother at home. At home we use to play and watch cartoon together. I have more time for these two things. I prefer to stay at home… Here, it is so boring…”
Looking into any children’s social and emotional development, teachers are responsible to inculcate good social skills into their children. The failure of the teachers to do so will cause a great impact on the feelings of loneliness and social dissatisfaction among the children. As one child put it:
“We have to be very quiet in the classroom…I try not to talk to my friends…My teacher often punish us if we talk or play in the class…In group activities, we are always told not to talk but to concentrate on the work given every time”
Another respondent who was asked to explain about their cooperation during group activities in class expressed that sometimes things do not happen the way it should be. As he stated his dissatisfaction:
“I lend my things to my best friends. But if I want any from them, they refuse to lend theirs. They also take
TABLE 4 Correlation between Numbers of Best Friends at Preschool and Children’s Responses to Loneliness and Social Dissatisfaction
Items Correlation Coefficient (r) p - Value1. Is it easy for you to make new friends at school? 2. Do you have other kids to talk to at school? 3. Are you good at working with other kids at school? 4. Is it hard for you to make friends at school?*5. Do you have lots of friends at school? 6. Do you feel alone at school?*7. Can you find a friend when you need one? 8. Is it hard to get kids in school to like you?*9. Do you have kids to play with at school? 10. Do you get along with other kids at school? 11. Do you feel left out of things at school?*12. Are there kids you can go to when you need help in school? 13. Are you lonely at school?*14. Do the kids at school like you? 15. Do you have friends at school?
-0.15-0.25-0.26-0.30-0.12-0.04-0.20-0.06-0.02-0.12-0.15-0.28-0.17-0.13-0.13
0.390.150.130.070.510.810.250.740.930.490.390.100.310.450.44
n = 36Note: Filler items are not listed in the table.
* Items for which response order was reversed in scoring. The negative sign in the value of Correlation Coefficient was due to response order ‘yes’ to ‘no’ such that ‘no’ indicates greater feelings of loneliness and social dissatisfaction.
Friendship, Loneliness and Social Dissatisfaction
1389Pertanika J. Soc. Sci. & Hum. 21 (4): 1379 - 1393 (2013)
my things…not telling me. If I tell this to teacher … I will be punished as well. I’m afraid… so I have to keep quiet. I don’t want to friend them!”
The results from the in-depth interview of the class teachers also supported the interview of the children described above. Interviews of teachers suggested that some children felt isolated when they were in the classroom. However, they rejected the idea that the feelings of loneliness and social dissatisfaction were influenced by the number of best friends. As one teacher stated:
“Some students are extremely quiet. They don’t have so called best friends and they don’t talk much. But they are very obedient and cooperative in learning. They participate well in activities handled in the classroom. On the other hand, there are also those who have several best friends around them yet they are not cooperative enough. They often feel dissatisfied because of peer rejection.”
DISCUSSION
The descriptive analysis of this study showed that in four negatively stated items, the percentage of loneliness and social dissatisfaction reported by the children was between 25.0% and 53.0%. The two most interesting findings of these four items were ‘Do you feel alone at school?’ and
‘Are you lonely at school?’ These two items were rated 52.8% and 44.4% respectively on self reported feelings of loneliness and social dissatisfaction. The other two items (e.g., ‘Is it hard for you to make friends at school?’ and ‘Is it hard to get kids in school to like you?’) were rated 38.9% and 25.0% respectively on self reported feelings of loneliness and social dissatisfaction. The percentages for other items in this study were not high. It was rated at a minimum of 2.8% to a maximum of 13.9%. This result indicated that even though the percentages of children who experienced loneliness and social dissatisfaction were not high but it justified the existence of loneliness and social dissatisfaction among children at the preschool to a certain extent. This study produced results which corroborate the findings of Asher et al. (1984) and Cassidy & Asher (1992) that a considerable number of children expressed their feelings of loneliness and social dissatisfaction at school in most of the questions that had been asked to them during the interview session. The percentages for loneliness and social dissatisfaction for the four negatively stated items were unexpected. These items have shown a high percentage of loneliness and social dissatisfaction than those reported by Asher et al. (1984) and Cassidy & Asher (1992). A possible explanation for this might be that the study was focused on a private preschool where the teachers in private school may not be well trained in various aspects of education such as the pedagogy, classroom teaching and children’s learning outcomes as those teachers in
Suresh Kumar N. Vellymalay
1390 Pertanika J. Soc. Sci. & Hum. 21 (4): 1379 - 1393 (2013)
public preschools. Thus, the teachers in the current study may not have a polished skill in handling the classroom as those teachers in the public preschools who attend more trainings and courses.
In contrast, the current study did not find any significant relationship between number of best friends that the children have at preschool and the responses of the children on loneliness and social dissatisfaction. Surprisingly, the findings showed that loneliness and social dissatisfaction among children in the preschool was not influenced by the number of best friends that the children have at their preschool. Thus, the findings of the current study do not support the previous research of Asher et al. (1984) and Pavri & Monda-Amaya (2000) who found that loneliness and social dissatisfaction somewhat greater among the children with fewer friends.
The reason as to why loneliness and social dissatisfaction among children in this study was not influenced by the number of best friends that the children have at their preschool is not clear. However, a possible explanation for this might be that having best friends to a child doesn’t mean that the child had been accepted by the friends in their classroom on all occasions. In accordance to that, children’s emotional development needs to be considered especially when it comes to classroom activities in which they are involved in. During these activities, children could face criticism raised by their own best friends. The competition that exists among children during their activities (such as reading, writing, coloring, and painting)
could cause a child to criticize another. These criticisms affect a child emotionally and cause dissatisfaction towards their best friends, and this could lead to peer rejection. Hence, it is not surprising that the feelings of loneliness and social dissatisfaction are often accompanied by peer rejection (Asher et al., 1990 as cited in Cassidy & Asher, 1992).
Another possible explanation for this is that the teacher’s application of teaching and learning in the classroom and the co-curriculum activities held outside the classroom does not provide the children enough skills to enhance a good cooperation and social interaction among them especially with their best friends. From the interview conducted with the class teachers it is noted that the class teachers were quite strict with the children in order to control their class, and to discipline them. In accordance to that, the children’s involvement in various activities such as reading, writing, coloring, and painting and even during their physical education could produce a negative impact in forming a reliable social interaction among them due to the strictness of their teachers. The strictness shown by the teachers especially during their lessons in order to control and to discipline their children does not provide a healthy environment for the children either to interact well or to help each other in the classroom. In fact, it teaches them to be more individual rather than to be cooperative in groups. Thus, the curriculum and co-curriculum which focuses on group activities should be seen as a platform for the children to interact
Friendship, Loneliness and Social Dissatisfaction
1391Pertanika J. Soc. Sci. & Hum. 21 (4): 1379 - 1393 (2013)
and adapt well with each other. It may encourage greater social interaction among them and if this is the case, then there is a high probability that feelings of loneliness and social dissatisfaction can be alleviated among children at the preschool.
The findings in this study are subject to at least three limitations. First, the number of children studied was relatively small. With a small sample size, caution must be applied, as the findings might not represent the feelings of loneliness and social dissatisfaction among all the preschoolers in the country. Second, the current study has only examined loneliness and social dissatisfaction among children in a private preschool. The public preschools were not taken into consideration in this study. Third, the present study only evaluated the children’s self reported feelings of loneliness and social dissatisfaction. The attitude and behavior of children who experience feelings of loneliness and social dissatisfaction were not observed by the researcher.
CONCLUSION
The study examined the relation of loneliness and social dissatisfaction in preschool with number of best friends that the children have. However, the findings showed that the relationship was not significant. The current study justifies that there are some other factors that influence the feelings of loneliness and social dissatisfaction among the preschoolers. More information on these factors would help us to establish a better understanding on this matter.
IMPLICATIONS
The findings of this study have several implications. The evidence of this study suggests that teachers play an important role as a source of dependency of their child at school. As such, they should identify interesting ways of participation to help their children to socialize with other children in class room activities. They should provide more attachment to their child concerning educational activities. This helps the child to gain the trust of their teachers without any fear of being punished. Furthermore, teachers also need to identify their strength and weaknesses in their teaching and learning strategies at classroom so that it could develop more sense on peer interaction and socialization among the children. It also enables the teachers to provide more assistance to their children whenever it is needed. In addition, school also needs to develop a program on social skills to help the children who are lonely. These children need to be identified, encouraged and motivated to engage in many forms of participation in class room activities in order for their social skills to be sharpened.
RECOMMENDATIONS
The issue of loneliness and social dissatisfaction among preschool children is interesting and can be usefully explored in further research. The present study focuses only on the number of best friends and its relationship with loneliness and social dissatisfaction. Considerably more work will need to be done to explore how the
Suresh Kumar N. Vellymalay
1392 Pertanika J. Soc. Sci. & Hum. 21 (4): 1379 - 1393 (2013)
friendship is formed among the popular children than the neglected ones and it would be interesting to assess the effects of friendship on these children by looking into its influence on loneliness and social dissatisfaction. Further research might also explore the children’s self-concept and self-esteem; and its relationship with loneliness and social dissatisfaction among preschool children. Research is also needed to determine the extent to which the activities that the preschool children are involved in help them to cope with the feelings of loneliness and social dissatisfaction. A further study also needs to be done to identify other factors that influence the feelings of loneliness and social dissatisfaction among the preschoolers.
REFERENCESAsher, S., Hymel, S., & Renshaw, P. (1984). Loneliness
in Children. Child Development, 55, 1456-1464.
Asher, S., & Wheeler, V. (1985). Children’s loneliness: A comparison of rejected and neglected peer status. Journal of Consulting and Clinical Psychology, 53, 500-505.
Asher, S. R., & Paquette, J.A. (2003). Loneliness and peer relations in childhood. Current Directions in Psychological Science, 12(3), 75-78.
Bakkaloglu, H. (2010). A comparison of the loneliness levels of mainstreamed primary students according to their sociometric status. Procedia - Social and Behavioral Sciences, 2(2), 330-336.
Bullock, J. (1993). Children’s loneliness and their peer relationships with family and peers. Family Relations, 42(1), 46-49.
Cassidy, J., & Asher, S. (1992). Loneliness and peer relations in young children. Child Development, 63, 350-365.
Chen, X., He, Y., De Olivera, A. M., Coco, A.L., Zappulla, C., Kasper, V., Schneider, B., Valdivia, I. A., Tse, H. C., & DeSouza, A. (2004). Loneliness and social adaptation in Brazilian, Canadian, Chinese, and Italian children: a multi-national comparative study. Journal of Child Psychology and Psychiatry, 45(8), 1373-1384.
Cheng, H., & Furnham, A. (2002). Personality, peer relations and self-confidence as predictors of happiness and loneliness. Journal of Adolescence, 25(3), 327-339.
Coplan, R. J., Closson, L. M., & Arbeau, K. A. (2007). Gender differences in the behavioral associates of loneliness and social dissatisfaction in kindergarten. Journal of Child Psychology and Psychiatry, 48(10), 988-995.
Galanaki, E., & Kalantzi-Azizi, A. (1999). Loneliness and social dissatisfaction: Its relation with children’s self-efficacy for peer interaction. Child Study Journal, 29(1), 1-28.
Hamama, R., Ronnen, T., & Feigin, R. (2000). Self-control, anxiety and loneliness in siblings of children with cancer. Social Work in Health Care, 31(1), 63-83.
Han, E., & Choi, N. (2006). Korean institutionalized adolescents’ attributions of success and failure in interpersonal relations and perceived loneliness. Children and Youth Services Review, 28 (5), 535-547.
Jobe, L., & White, S. (2007). Loneliness, social relationships, and a broader autism phenotype in college students. Personality and Individual Differences, 42(8), 1479–1489.
Kirova, A. (2003). Assessing children’s experiences of loneliness through conversations. Field Methods, 15(1), 3-24.
Margalit, M. (1998). Loneliness and coherence among preschool children with learning disabilities. Journal of Learning Disabilities, 31(2), 173-180.
Friendship, Loneliness and Social Dissatisfaction
1393Pertanika J. Soc. Sci. & Hum. 21 (4): 1379 - 1393 (2013)
Margalit, M., & Efrati, M. (1996). Loneliness, coherence and companionship among children with learning disorders. Educational Psychology, 16(1), 69-79.
Moore, D., & Schultz, N. (1983). Loneliness at adolescence: Correlates, attributions, and coping. Journal of Youth and Adolescence, 12(2), 95-100.
Page, R., Frey, J., Talbert, R., & Falk, C. (1992). Children’s feelings of loneliness and social dissatisfaction: Relationship to measures of physical fitness and activity. Journal of Teaching in Physical Education, 11, 211-219.
Page, R., & Scanlan, A., (1994). Childhood loneliness and isolation: Implications and strategies for childhood educators. Child Study Journal, 24(2), 107. Retrieved from EBSCOhost.
Parker, J., & Asher, S. (1993). Friendship and friendship quality in middle school: Links with peer group acceptance and feelings of loneliness and social dissatisfaction. Developmental Psychology, 29, 611-621.
Parkhurst, J., & Asher, S. (1992) Peer rejection in middle school: Subgroup differences in behaviour, loneliness, and interpersonal concerns. Developmental Psychology, 28, 231-241.
Pavri, S., & Monda-Amaya, L. (2000). Loneliness and students with learning disabilities in inclusive classroom: Self-perception, coping strategies, and preferred interventions. Learning Disabilities Research & Practice, 15(1), 22-33.
Qualter, P., & Munn, P. (2002). The separateness of social and emotional loneliness in childhood. Journal of Child Psychology and Psychiatry, 43(2), 233-244.
Quay, L. (1992). Personal and family effects on loneliness. Journal of Applied Developmental Psychology, 13 (1), 97-110.
Sanderson, J., & Siegal, M. (1995). Loneliness and stable friendship in rejected and nonrejected preschoolers. Journal of Applied Developmental Psychology, 16(4), 555-567.
Yu, G., Zhang, Y., & Yan, R. (2005). Loneliness, peer acceptance, and family functioning of Chinese children with learning disabilities: Characteristics and relationships. Psychology in the Schools, 42(3), 325-331.

Pertanika J. Soc. Sci. & Hum. 21 (4): 1395 - 1409 (2013)
ISSN: 0128-7702 © Universiti Putra Malaysia Press
SOCIAL SCIENCES & HUMANITIESJournal homepage: http://www.pertanika.upm.edu.my/
Article history:Received: 13 June 2011Accepted: 30 April 2012
ARTICLE INFO
E-mail addresses: [email protected] (Mina Kaboudarahangi), [email protected] (Osman Mohd Tahir), [email protected] (Mustafa Kamal M. S.), [email protected] (Suhardi Maulan), * Corresponding author
Factors Influencing Preferences of Garden Iconographies
Mina Kaboudarahangi*, Osman Mohd Tahir, Mustafa Kamal M. S. and Suhardi MaulanLandscape Architecture Department, Faculty of Design and Architecture, Universiti Putra Malaysia, 43400 Serdang, Selangor, Malaysia
ABSTRACT
Gardens are natural and cultural artifacts presenting both natural and man-made beauty through their natural images. The collection of these representative images or iconography forms the particular identity of a garden. Hence, different gardens present a variety of iconographies, which could affect people preferences for them. For the purpose of this study, four well-established gardens in the world were selected as case studiesand their images were used to represent their iconographies. A photo-questionnaire survey was employed to elicit preferences for garden iconographies and to determine factors influencing their preferences. Factor analysis was used to reveal preference dimensions and stimuli in each category or groups of garden scenes based on preference ratings. Dimensions were qualitatively analyzed and were discussed in terms of their contents and spatial organizations. The study found that garden elements, axes, direction, focal points, and their particular arrangements influence preferences of garden iconographies. The findings from this study will help to inform Landscape Architects the choice of iconographies in the development of new garden identities.
Keywords: Garden iconography, garden identity, landscape preferences
INTRODUCTION
Well-established gardens are different from each other and display different images that people can identify with. These images are known as garden iconographies. These visual differences are contributed to the people who created these gardens since people create gardens based on their tastes and preferences. Furthermore, they are
Mina Kaboudarahangi, Osman Mohd Tahir, Mustafa Kamal M. S. and Suhardi Maulan
1396 Pertanika J. Soc. Sci. & Hum. 21 (4): 1395 - 1409 (2013)
also active users of gardens. Nevertheless, no studies to date have sought to identify preferred iconographies of new gardens. This knowledge gap has led to this study on new garden iconography. Previous studies by Kaplan (1985), Kaplan and Kaplan (1989), Van den Berg and Koole (2006), Rogge, Nevens, and Gulinck, (2007), Ode et al. (2009), have reported people preferences and factors affecting preferences of landscapes in general but not on garden iconographies. Therefore, this study is aimed to elicit people preferences for iconographies of selected established gardens (Persian, English, Japanese and Chinese) and factors that affect their preferences in suggesting guidelines for designers to develop new gardens acceptable by local population. It is expected that the findings from this study assist in developing new garden iconographies acceptable by the public. The findings could also benefit existing gardens by highlighting images that are preferred by the public and this could contribute to improving tourism marketing.
LITERATURE REVIEW
Gardens incorporated nature and human artifacts into artworks. They are artistic-natural phenomenon to bring aesthetic beauty to people’s living environment (Connell, 2005; Turner, 2005; McIntosh, 2005; Clayton, 2007; Gross & Lane, 2007). This has led Albers (1991), Ross (1998) and Waymark (2003) to suggest that gardens should be studied as a work of art like painting and sculpture.
Iconography is an art historical approach for studying artistic works. As stated above, gardens are artistic works with specific and unique cultural values. On this, Daniels and Cosgrove (2007) considered gardens as cultural images and pictorial way of representing, structuring or symbolizing the environment. Therefore, iconography as a method can be employed in studying gardens (Kaboudarahangi et al., 2011).
Defining Garden Iconography
An iconography expresses particular idea in images and could be defined as a visual expression of an idea (Wages, 1999). Princeton University (2006) defines iconography as images and symbolic representations that are traditionally associated with a person or a subject. In fact, iconography is seeking to understand the underlying meaning of a work of art by studying its historical context (Daniels & Cosgrove, 2007). Straten (1994) argued that the concept of iconography or “image reading,” is a practice and a creative method of historical analysis of a work of art. He defined three stages for an iconographic practice. The first stage looks at artistic work as a whole, then identifies the components of the work and finally interprets the artistic work in terms of history and philosophy. According to Wages (1999), iconographies expressed the variety of ideas associated with gardens in historical paintings or images.
Factors Influencing Preferences of Garden Iconographies
1397Pertanika J. Soc. Sci. & Hum. 21 (4): 1395 - 1409 (2013)
Garden Preferences and Factors Affecting Preferences
According to Carroll (2003), gardens shaped through the history by people based on their needs and preferences. Gardens have been designed based on people preferences, needs, purposes and activities (King, 1979; Hunt, 2000; Hobhouse, 2002; McIntosh, 2005; Clayton, 2007). For newly developing gardens, they have to be accepted, valued and appreciated by people who are active users of the gardens. (Kaboudarahangi et al., 2011). Kaplan (1985) identified the landform, color patterns, vegetation and water as factors that affect landscape preferences. Then, Moreover, Rogge, Nevens, and Gulinck (2007) explained that aesthetics, pleasure, uniqueness and harmony of landscapes are highly preferred and cultural modifications have negative effects on landscape preferences. Based on findings from literatures, factors affecting preferences of landscapes (including gardens) can be categorize in five main elements as follows:
Natural features
Degree of naturalness seems to be one of the most important positive predictors for landscape preference (Kaplan, 1985; Kaplan & Kaplan, 1982; Herzog &; Bosley, 1992; Rogge, Nevens, & Gulinck, 2007; Ivarssona & Hagerhall, 2008 ). According to Yang and Kaplan (1990), the landscapes with more natural forms are more preferred than those with formal or linear forms. Moreover, people prefer natural scenes higher in comparison to urban scenes (Kaplan &
Talbot, 1988; Kaplan & Kaplan, 1989; Strumse, 1996; Kaplan, Kaplan, & Ryan, 1998; Suhardi, 2006) . Thus, the degree of “naturalness” is one of the most important positive predictors for landscape preferences (Rogge, Nevens, & Gulinck, 2007).
Natural features are also found to be significantly affecting people preferences for landscape even though in a time when people have negative feelings (Regan & Horn, 2005). It is because natural landscapes are perceived to be more identifiable, impressive, soothing and scenic. Several researchers have argued that naturalness contributes to landscape preference in a positive way (Herbert, Kaplan, & Crooks, 2000; Austin & Kaplan, 2004; Van den Berg & Koole, 2006; Ivarssona & Hagerhall, 2008; Hanely, Ready, Colombo, Watson, Stewart, & Bergmann, 2009).
Landscape Elements and their Visual Qualities
Other studies on landscape preferences have generally focused on landscape elements in the scene. For instance, Austin and Kaplan (2004) pointed out that certain features in natural environments engage the sense of belonging to a place. According to Zube (1981), man-made structures are associated with variability in perceived scenic quality. They have a strong affect on landscape preference, because of providing visual values. Nevertheless, natural landscape and wilderness are found to be more preferred than landscape with man-made structures (Zube, 1981; Kaplan, 1985; Yu, 1995). On the other hand, Kohsaka and Flitner
Mina Kaboudarahangi, Osman Mohd Tahir, Mustafa Kamal M. S. and Suhardi Maulan
1398 Pertanika J. Soc. Sci. & Hum. 21 (4): 1395 - 1409 (2013)
(2004) found that scenes with artistic icons, recreation, and leisure are highly preferred. Recreation and aesthetic values are strong predictors of landscape, which recognized by Browna and Raymond (2007).
Presence of Water
Yu (1995) found water is an effective factor in increasing landscape preference level. The positive effect of water on preference has been proven in many studies. Accordingly, Dramstad, Tveit, & Fjellstad (2006) in their study reported that images with water are considerably more preferred than the images without water. Moreover, Kaplan and Kaplan (1989) have pointed to the positive affect of water and water bodies such as lakes in people preferences of landscapes. According to the Information-processing Theory (Kaplan and Kaplan, 1989), people “read the landscape and interpret cues of the presence of water”.
Content and Spatial Organizations of the Scenes
The visual concept of naturalness is linked to other visual concepts such as disturbance, stewardship and coherence (Ode et al., 2009). Consequently, the content of the scenes, including water, rock and vegetation strongly affect environmental experiences (Kaplan & Kaplan, 1989; Yang & Kaplan, 1990). According to Dramstad et al., (2006), there is a positive correlation between landscape preferences and landscape spatial qualities. If one of the spatial qualities is present in a scene then viewers will
highly prefer the said scene over another. The spatial quality of the landscape, with regard to nature, has a stronger influence on people’s preference than their backgrounds (Kaplan, Kaplan, & Ryan, 1998; Ode .et al., 2009). Spatial qualities could be simplified as coherence, complexity, mystery and legibility (Kaplan & Kaplan, 1989).
Influence of People’s Background on Preference
Yu (1995) pointed to the strong influence of living environment (urban vs. rural) on people’s preferences. A study by Zube (1981) has shown that people prefer the landscapes that are most similar to their living environments. In addition, education in environmental subjects can be an effective predictor for landscape preferences (Dramstad, Tveit, & Fjellstad, 2006). Kaplan and Herbert (1986) have found that greater knowledge and concern for the types of plants species is clear in the preference differences (Kaplan & Herbert, 1986). The effects of people’s education levels in terms of their landscape preferences have been proven by researchers (Hanely, Ready, Colombo, Watson, Stewart, & Bergmann, 2009). Indeed, people with different experiences may have different environmental preferences (Kaplan & Kaplan, 1989).
According to the literature, it is concluded that content, spatial organizations of the scenes in addition to people’s backgrounds affect preferences. The content is including landform, vegetation, color patterns, aesthetic qualities, garden elements
Factors Influencing Preferences of Garden Iconographies
1399Pertanika J. Soc. Sci. & Hum. 21 (4): 1395 - 1409 (2013)
and their harmony. Furthermore, natural forms, man-made features, structures, water and waterways were recognized as affecting factors that could be classified in terms of content. Accordingly, spatial organizations of a scene including mystery, legibility, complexity and coherence in addition to people’s background and culture affect preferences.
As discussed, garden iconographies should present garden images with uniqueness and specific identity. On the other hand, the review of preference studies revealed that content and spatial organizations of the scenes affect people preferences of landscapes, hence gardens. In addition, the effect of natural features, landscape elements and water were reported by previous studies. Therefore, garden iconographies, which were employed in this study, displayed both garden contents and their spatial organizations. They were included unique and distinctive water features, plants, architectural features, pathways, rocks, stones, sand and decorative features of each garden, which can be commonly called as garden elements.
METHODOLOGY
A preference photo survey was selected as a method to seek preferences for garden iconographies. This method was frequently utilized to obtain information about preference of landscapes including built landscapes. For example, Kaplan and Herbert (1986), Kaplan and Talbot (1988), Yang and Kaplan (1990), Yu (1995) and Rogge et al., (2007), employed preference
photo surveys in their studies. The method has generally been used because images are surrogates of actual scenes to the respondents. In this method, respondents were asked to rate scenes of gardens presented and respond to questions related to their preferences. The data was then analyzed to reveal people preferences for gardens and factors that affect the preferences. The following outlines the procedure:
Preference Photo Survey Procedure
Content Identifying Method (CIM) developed by Kaplan et al. (1972), and further improved by Kaplan and Kaplan (1989). The method is based on preference ratings for scenes. In this study, the scenes were selected of Persian, English, Japanese and Chinese gardens. The method elicits both quantitative and qualitative visual responses and judgments of the preferred environment (Kaplan & Kaplan, 1989). Photographs were used because they act as surrogates of real environments (Kaplan & Kaplan, 1989; Hull & Revel, 1989). The uses of photographs have been validated in numerous preferences studies and are found to be more economical than bringing participants to the actual locations (Kaplan & Kaplan, 1989).
In this study, photographs of selected gardens were collected from websites and garden books such as Christopher Thacker’s History of Gardens. The selected photographs normally represent popular images (iconographies) of the gardens.The selection of garden images to represent
Mina Kaboudarahangi, Osman Mohd Tahir, Mustafa Kamal M. S. and Suhardi Maulan
1400 Pertanika J. Soc. Sci. & Hum. 21 (4): 1395 - 1409 (2013)
garden iconographies was conducted in several stages. First, a pool of 360 images of Persian, English, Japanese, and Chinese gardens were shown to the 20 volunteers from various fields of study such as landscape architecture, architecture, horticulture, etc. These volunteers were selected randomly among students in Universiti Putra Malaysia. The volunteers were asked to categorize the photographs according to four gardens types – Persian, English, Japanese and Chinese landscape/images/gardens. This was done by employing13 cm x 18 cm colored photographs of the scenes mounted on 15 cm x 20 cm boards.
120 images were selected by the volunteers according to the four categories. These were then shown to three landscape architecture academicians in the Faculty of Design and Architecture, Universiti Putra Malaysia. They were asked to select 10 images that represented each category of gardens based on their specific elements and spatial organizations.
In next stage, five images from each garden category were randomly selected to represent their iconographies. Therefore 20 images represent the four types of gardens. An additional 8 scenes were added as fillers to allow respondents to be familiar with the procedure before the actual stimuli. These images were not analyzed. According to Rogge et al., (2007), the first few images could affect preferences when respondents are not yet familiar with the procedure. Respondents were asked to rate the images based on the question “How much do you prefer the presented scene?” on a 5 point
Likert-like scale where 1was denoted as “least preferred” to 5 which was ranked as the “ most preferred”.
Sampling
This study involved 400 undergraduate students enrolled in landscape architecture, architecture, industrial design, forestry, agriculture, and environmental studies programs. The selection of respondents was based on Kaplan and Herbert (1986) that identified level and field of study, familiarity with nature, age and influence of living environment as affecting factors on preferences. Consequently, 12 sessions were conducted to collect preferences for garden iconographies. They were performed under similar conditions and using the same procedure.
RESULTS
The following sections discusses the results of the participants’ feedback to the images concerned.
Preference Dimension Analysis
Factor analysis grouped the scenes based on preference ratings. These groupings are based on the pattern of reaction to the stimuli inside the scenes (Suhardi, 2006). According to Kaplan and Kaplan (1989), this is not related to the extent of preferences but can reveal the underlying factors affecting preferences . Add a sentence to relate to table 1.
A factor analysis of preference ratings resulted in 4 dimensions. These were labeled Plant and Water, Plant and Architecture,

Factors Influencing Preferences of Garden Iconographies
1401Pertanika J. Soc. Sci. & Hum. 21 (4): 1395 - 1409 (2013)
Dimension (factors)
Plan
t & W
ater
M
ean=
4.0
Std.
Dev
.=1.
01
5 7 11
Plan
t & A
rchi
tect
ure
Mea
n=3.
9 St
d. D
ev.=
1.0
6 8 9
Gat
eway
& A
xes
Mea
n=3.
7 St
d. D
ev.=
1.14
17 21 20
27 19 22
14
Fear
ful &
unc
lear
M
ean=
3.4
Std.
Dev
.=1.
14
16 15 12
TABLE 1 Preference Dimensions of Garden Scenes
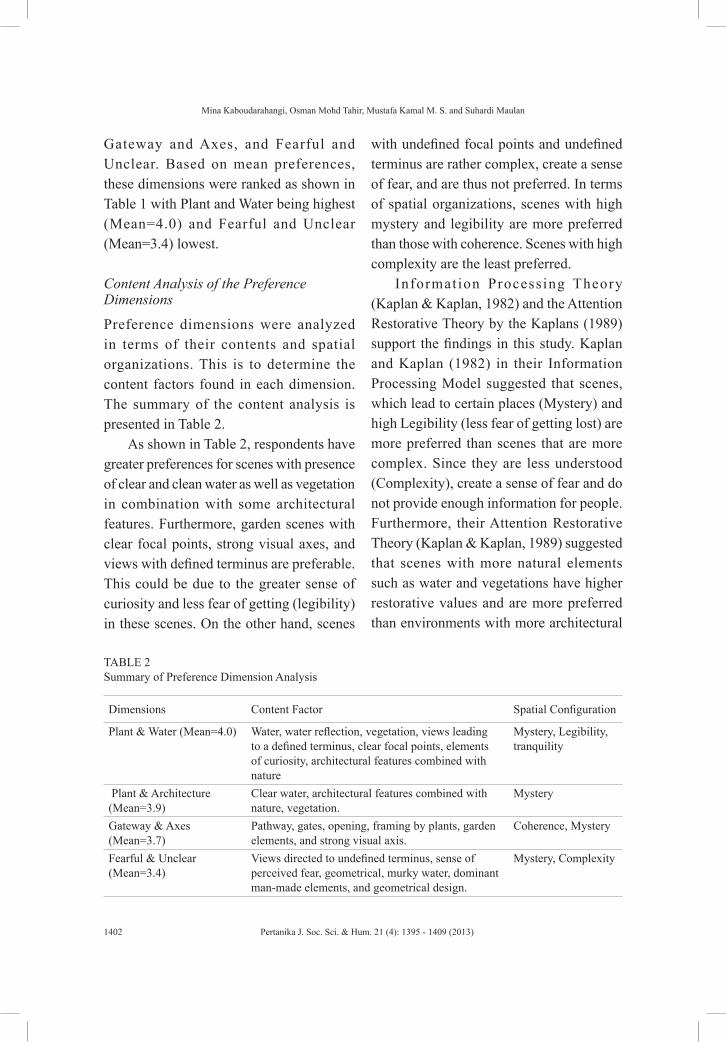
Mina Kaboudarahangi, Osman Mohd Tahir, Mustafa Kamal M. S. and Suhardi Maulan
1402 Pertanika J. Soc. Sci. & Hum. 21 (4): 1395 - 1409 (2013)
Gateway and Axes, and Fearful and Unclear. Based on mean preferences, these dimensions were ranked as shown in Table 1 with Plant and Water being highest (Mean=4.0) and Fearful and Unclear (Mean=3.4) lowest.
Content Analysis of the Preference Dimensions
Preference dimensions were analyzed in terms of their contents and spatial organizations. This is to determine the content factors found in each dimension. The summary of the content analysis is presented in Table 2.
As shown in Table 2, respondents have greater preferences for scenes with presence of clear and clean water as well as vegetation in combination with some architectural features. Furthermore, garden scenes with clear focal points, strong visual axes, and views with defined terminus are preferable. This could be due to the greater sense of curiosity and less fear of getting (legibility) in these scenes. On the other hand, scenes
with undefined focal points and undefined terminus are rather complex, create a sense of fear, and are thus not preferred. In terms of spatial organizations, scenes with high mystery and legibility are more preferred than those with coherence. Scenes with high complexity are the least preferred.
Information Processing Theory (Kaplan & Kaplan, 1982) and the Attention Restorative Theory by the Kaplans (1989) support the findings in this study. Kaplan and Kaplan (1982) in their Information Processing Model suggested that scenes, which lead to certain places (Mystery) and high Legibility (less fear of getting lost) are more preferred than scenes that are more complex. Since they are less understood (Complexity), create a sense of fear and do not provide enough information for people. Furthermore, their Attention Restorative Theory (Kaplan & Kaplan, 1989) suggested that scenes with more natural elements such as water and vegetations have higher restorative values and are more preferred than environments with more architectural
TABLE 2 Summary of Preference Dimension Analysis
Dimensions Content Factor Spatial Configuration
Plant & Water (Mean=4.0) Water, water reflection, vegetation, views leading to a defined terminus, clear focal points, elements of curiosity, architectural features combined with nature
Mystery, Legibility, tranquility
Plant & Architecture (Mean=3.9)
Clear water, architectural features combined with nature, vegetation.
Mystery
Gateway & Axes (Mean=3.7)
Pathway, gates, opening, framing by plants, garden elements, and strong visual axis.
Coherence, Mystery
Fearful & Unclear (Mean=3.4)
Views directed to undefined terminus, sense of perceived fear, geometrical, murky water, dominant man-made elements, and geometrical design.
Mystery, Complexity
Factors Influencing Preferences of Garden Iconographies
1403Pertanika J. Soc. Sci. & Hum. 21 (4): 1395 - 1409 (2013)
features. Ivarsson and Hagerhall (2008) have studied the relationship between preferences and restorative value of gardens. They have considered gardens as settings with strong feeling of being away but they should be close to work and living places.
DISCUSSION
The results of this study found four garden elements and 4 spatial layouts to influence garden image preferences. It seems that garden elements (water, plants and architectural features), and spatial layout (axes, direction, focal points, and the arrangements of the garden features), influence preferences for the images of the selected gardens. However, the mean preference scores for each garden elements and their spatial layout have positive and negative contribution to preference. These are further discussed as follows:
Influence of Garden Elements
Garden elements are recognized as the one of the most influential factors affecting environmental preferences. The effects of elements such as water, plants, as well as natural and man-made structures on preference were already confirmed through the literatures (Kaplan, 1985; Kaplan and Kaplan, 1989; Yu, 1995; Dramstad et al., 2006; Ode et al., 2009). This study found that water features positively influence preferences for garden iconographies. In addition, clean and clear water, soft and irregular water edges, and water in reflective geometrical basins were highly preferred.
These findings were supported by previous studies such as by Yu (1995) who found water to be a positive element in increasing landscape preference level. In addition, Suhardi (2006) in his study on preferences of wetlands also found the positive affect of clear and clean water on preferences.
Vegetation was also found to influence preferences of garden images. Plants in combination with few architectural features seem to be the preferred images. It seems that nurtured nature in combination with water features and light green color are preferred, whereas messy plants with dark colors or in shadows are not much preferred. This finding is similar to Regan & Horn (2005) who found that trees and other plants were among the most preferred items. Similarly, Hanely et al., (2009) also demonstrated vegetation is the most preferred elements in the landscape scenes.
Garden architectural features such as pathways and gates have received lower scores in preference ratings. On the other hand, other architectural features have both positive and negative effects on the preferences of garden iconographies. Architectural features such as basins and gates in combination with plants and water have positive effects. However, architectural features alone or combined with hard elements such as rocks and stones negatively influence preference. The importance of man-made structures and their effects on preferences has already confirmed by Zube (1981) and Yu (1995).
Mina Kaboudarahangi, Osman Mohd Tahir, Mustafa Kamal M. S. and Suhardi Maulan
1404 Pertanika J. Soc. Sci. & Hum. 21 (4): 1395 - 1409 (2013)
Influence of Axes, Direction and Focal Points
The presence of strong axes seems to contribute to a positive influence on preferences of garden iconographies. This is perhaps due to their contributions towards locating the observer in space, place orientation, a sense of orderliness and less fear of getting lost. Connectors such as footpaths and tracks that provide a sense of direction seem to convey both positive and negative effects on preference. Garden scenes that provide clear direction leading to some definite destination appear to be preferred. This could be due to them creating a sense of mystery and curiosity but with less fear of getting lost. On the other hand, scenes with connectivity elements leading to uncertain location seems less preferred. Perhaps these induce a sense of fear more than curiosity and thus lower preferences. Focal points that are clear and provide depth and vista are preferred but indistinguishable focal points seem to affect preferences negatively. This could be explained by clear vista and focal points that create prospects where the observer has the opportunity to see without being seen (Appleton 1975 as cited in Kylea et al., 2004).
Influence of Spatial Configurations
Kaplan and Kaplan (1982) Information Processing Theory described Coherence and Legibility as representing understanding of an environment and Complexity and Mystery representing exploration. Results from this study seem to agree that Mystery ( the promise of more information if one is
to explore further) has the greatest effect on preferences of garden iconographies. However, this effect appears in both positive and negative. When mystery is combined with a clear direction leading to some definite destination, they appear to contribute positively to preference. However, mystery with unclear destination has a negative contribution on preference. This could be due to the role of fear of uncertainty when destinations are vague. This notion is further supported as legibility (the ability to find one’s way in the environment) seems to have positive effects on preferences of garden iconographies. Likewise, coherence (the organization and structure of the scene, in terms of their harmony and connection) scenes are better preferred. Coherence provides the mind with more manageable information to be understood and thus contribute to a sense of at ease, tranquility, and relaxation. This is on contrary to complexity (the amount of diversity in the scene when it contains different elements). Garden scenes where there are too many varieties of different elements and no clear order of spatial arrangement are less preferred.
CONCLUSION
This paper focused on the preferences for selected images or iconographies of Persian, English, Japanese and Chinese gardens. These gardens were selected as they are well established gardens but no studies have been done to explore their preferred iconographies. The study employed preference photo survey to
Factors Influencing Preferences of Garden Iconographies
1405Pertanika J. Soc. Sci. & Hum. 21 (4): 1395 - 1409 (2013)
test factors affecting preferences for the garden iconographies and the results were analyzed for mean preference and preference dimensional categories. The study concluded that garden elements, axes, direction, focal points, and their particular arrangements affect preferences of garden iconographies. Among garden elements, water, plant and architectural features have the most influence on preferences. They are more preferred when they are combined providing a setting that contribute to tranquility and relaxation. Moreover, directions, axes and focal points positively affect preference for garden iconographies when directing to a certain place and have negative effect when leading to an unclear destinations. In terms of spatial organization, mystery, legibility, coherence, and complexity affect preferences of garden iconographies. Legibility affects positively, mystery has both positive and negative effects and complexity has negative effect on preference. These findings have implications in the development of new garden where garden iconographies play important roles in their identities. Selected iconographies to be introduced in these new gardens should be those that are preferred by the general public.
REFERENCES Albers, L. H. (1991). The Perception of Gardening as
Art. Garden History, 19 (2), 163-174.
Austin, M. E., & Kaplan, R. (2004). Out in the country: sprawl and the quest for nature nearby. Landscape and Urban Planning, 69, 235–243.
Brace, C. (1999). Gardenesque imagery in the representation of regional and national identity: the Cotswold garden of stone. Journal of Rural Studies, 15(4), 365-376.
Brown, G., & Raymond, C. (2007). The relationship between place attachment and landscape values: Toward mapping place attachment. Applied Geography, 27, 89–111.
Clayton, S. (2007). Domesticated nature: Motivations for gardening and perceptions of environmental impact. Journal of Environmental Psychology, 27, 215–224.
Connell, J. (2005). Managing gardens for visitors in Great Britain: a story of continuity and change. Tourism Management, 26, 185–201.
Daniels, S., & Cosgrove, D. (2007). Iconography and landscape. In D. Cosgrove, & S. Daniels, The iconography of landscape (pp. 1-10). Cambridge: Cambridge University Press.
Dramstad, W. E., Tveit, S. M., & Fjellstad, W. J. (2006). Relationships between visual landscape preferences and map-based indicators of landscape structure. Landscape and Urban Planning, 78, 465–474.
Gross, H., & Lane, N. (2007). Landscapes of the lifespan: Exploring accounts of own gardens and gardening. Journal of Environmental Psychology, 27, 225–241.
Hanely, N., Ready, R., Colombo, S., Watson, F., Stewart, M., & Bergmann, E. A. (2009). The impacts of knowledge of the past on preferences for future landscape change. Journal of Environmental Management, 90, 1404–1412.
Helmreich, A. (2002). English garden and national identity:the competing styles of garden design. Cambridge: Cambridge University press.
Herzog, T. R., & Bosley, P. J. (1992). Tranquility and preference as affective qualities of natural environments. Journal of Environmental Psychology, 12 (2), 115-127.
Mina Kaboudarahangi, Osman Mohd Tahir, Mustafa Kamal M. S. and Suhardi Maulan
1406 Pertanika J. Soc. Sci. & Hum. 21 (4): 1395 - 1409 (2013)
Herzog, T. R., Herbert, E. J., Kaplan, R., & Crooks, C. L. (2000). Cultural and developmental comparison of landscape perceptions and preferences. Environmental Behaviour, 32 (3), 323–346.
Dictionary.com. (n.d.). Iconography. Retrieved on March, 2008from Dictionary.com http://dictionary.reference.com/browse/iconography
Hobhouse, P. (2002). Garden Style. London, United Kingdom: Frances Lincoln.
Hull, R. B., & Revel, G. R. (1989). Issues in Sampling Landscapes for Visual Quality Assessments. Landscapeand C’rhan Planning, 17, 323-330.
Hunt, J. D. (2000). Greater perfections:the practice of garden theory. Philadelphia, Pennsylvania: University of Pennsylvania Press.
Ivarssona, C. T., & Hagerhall, C. M. (2008). The perceived restorativeness of gardens – Assessing the restorativeness of mixed built and natural scene type. Urban Forestry & Urban Greening, 7, 107–118.
Kaboudarahangi, M., Mohd Tahir, O., and Mohd Sharif, M. K. (2011). The Potential of Iconography as A Method in the Development of A New Garden Identity. Australian Journal of Basic and Applied Sciences, 5 (12), 2239-2245.
Kaltenborn, B. P., & Bjerke, T. (2002). Associations between environmental value orientations and landscape preferences. Landscape and Urban Planning, 59, 1-11.
Kaplan, R. (1985). The analysis of perception via preference: a strategy for studying how the environment is experienced. Landscape Planning, 12, 161--176.
Kaplan, R., & Herbert, E. J. (1986). Cultural and sub-cultural comparisons in preferences for natural settings. Landscapeand Urban Planning, 14, 281-293.
Kaplan, R., & Kaplan, S. (1982). Cognition and environment: Functioning in an uncertain world. New York: Praeger Publisher.
Kaplan, R., & Kaplan, S. (1989). The Experience Of Nature: A psychological perspective. New York: Cambridge University Press.
Kaplan, R., & Talbot, J. F. (1988). Ethnicity and Preference for Natural Settings: A Review and Recent Findings. Landscape and Urban Planning, 15, 107-l I7.
Kaplan, R., Kaplan, S., & Ryan, R. L. (1998). With people in mind: Design and management of everyday nature. Washington, D.C.: Island Press.
Kaplan, S., Kaplan, R., & Wendt, E. (1972). Related Preferences and complexity for natural and urban visual material. Perception and Psychophysics, 12, 354-355.
King, R. (1979). The Quest for Paradise; a history of the world gardens. New York: Mayflower Books.
Kohsaka, R., & Flitner, M. (2004). Exploring forest aesthetics using forestry photo contests: case studies examining Japanese and German public preferences. Forest Policy and Economics, 6(3-4), 289– 299.
Kyle, G. T., Mowenb, A. J., & Tarrant, M. (2004). Linking place preferences with place meaning: An examination of the relationship between place motivation and place attachment. Journal of Environmental Psychology, 24, 439–454.
Lekagul, A. (2002). A preference study of the traditional Thai Market Place: A management and preservat ion tool for vernacular environments. (Unpublished PhD Dissertation). Virginia Polytechnic Institute and State University,Blacksburg.
McIntosh, C. (2005). Gardens of the Gods: Myth, Magic and Meaning. London: I.B. Tauris & Co Ltd.
Factors Influencing Preferences of Garden Iconographies
1407Pertanika J. Soc. Sci. & Hum. 21 (4): 1395 - 1409 (2013)
Miller, M. (1993). The Garden as an Art. Albany: State of University of new york press.
Mustafa Kamal, M. S. (1994). A cross cultural comparison of visual landscape preferences for the natural environment. Unpublished PhD dissertation). Colorado, Colorado, United States of America.
Nakagawara, C. (2004). The Japanese Garden for the Mind:The ‘Bliss’ of Paradise Transcended. SJEAA, 4(2), 83-102.
Nassauer, J. (1995). Culture and changing landscape structure. Landscape Ecology, 10(4), 229–237.
Nassauer, J. I. (2004). Monitoring the success of metropolitan wetlands restoration:cultural sustainability and ecological function. Wetlands, 24(4), 756-765.
Ode, A., Fry, G., Tveit, M. S., Messager, P., & Miller, D. (2009). Indicators of perceived naturalness as drivers of landscape preference. Journal of Environmental Management, 90, 375-383.
Pavlikakis, G. E., & Tsihrintzis, V. A. (2006). Perceptions and preferences of the local population in Eastern Macedonia and Thrace National Park in Greece. Landscape and Urban Planning, 77, 1–16.
Rayan, R. L. (1998). Local perceptions and values for Midwestern river corridor. Landscape and Urban Planning, 42, 225-237.
Regan, C. L., & Horn, S. A. (2005). To nature or not to nature: Associations between environmental preferences, mood states and demographic factors. Journal of Environmental Psychology, 25, 57–66.
Rogge, E., Nevens, F., & Gulinck, H. (2007). Perception of rural landscapes in Flanders: Looking beyond aesthetics. Landscape and Urban Planning, 89, 159–174.
Ross, S. (1998). What Gardens Mean. University of Chicago Press.
Sommer, B., & Sommer, R. (1997). A practical guide to behavioral research: Tools and techniques (4 ed.). New York: Oxford University Press.
Staatsa, H., Kievieta, A., & Hartig, T. (2003). Where to recover from attentional fatigue: An expectancy-value analysis of environmental preference. Journal of Environmental Psychology , 23, 147–157.
Stamps, A. E., & Nasar, J. L. (1997). Design Review and Public Preferences: Effects of Geographical Location, Puplic Consensus, Sensation seeking, and Architectural Styles. Journal of Environmental Psychology, 17(1), 11-32.
Straten, R. V. (1994). An Introduction to Iconography. (P. d. Man, Trans.) Yverdon, Switzerland: Gordon and Breach Science Publishers.
Strumse, E. (1996). Demographic Differences in the Visual Preferences for Agrarian Landscapes in Western Norway. Journal of Environmental Psychology, 16, 17-31.
Suhardi, M. (2006, March 16). A Perceptual Study of Wetlands: Implications for Wetland Restoration in the Urban Areas in Malaysia. (Unpublished PhD dissertation). Virginia.
Thacker, C. (1979). The history of gardens. London: Croom Helm.
Tips, W. E., & Savasdisara, T. (1986). The influence of the environmental Background of subjects on their landscape Preference evaluation. Landscape and urban Planning, 13, 125 - 133.
Turner, T. (2005). Garden history. New York: Spon Press.
Van den Berg, A. E., & Koole, S. L. (2006). New wilderness in the Netherlands:an investigation of visual preferences for nature development landscapes. Landscape Urban Planning , 78(4), 362–372.
Wages, S. M. (1999). changing views: the origins and iconology of garden images in seventeenth

Mina Kaboudarahangi, Osman Mohd Tahir, Mustafa Kamal M. S. and Suhardi Maulan
1408 Pertanika J. Soc. Sci. & Hum. 21 (4): 1395 - 1409 (2013)
Century .Waymark, J. (2003). modern garden design, innovaton since 1900. London: Thames & Hudson Ltd.
Yang, B. E., & Kaplan, R. (1990). The Perception of Landscape Style: a Cross-cultural Comparison. Landscape and Urban Planning, 19, 25l-262.
Yu, K. (1995). Cultural variations in landscape preference: comparisons among Chinese sub-groups and Western design experts. Landscape and Urban Planning, 32, 107-126.
Zube, E. H. (1981). Cross-cultural perceptions of scenic and heritage landscapes. Landscape Planning, 8, 69-87.
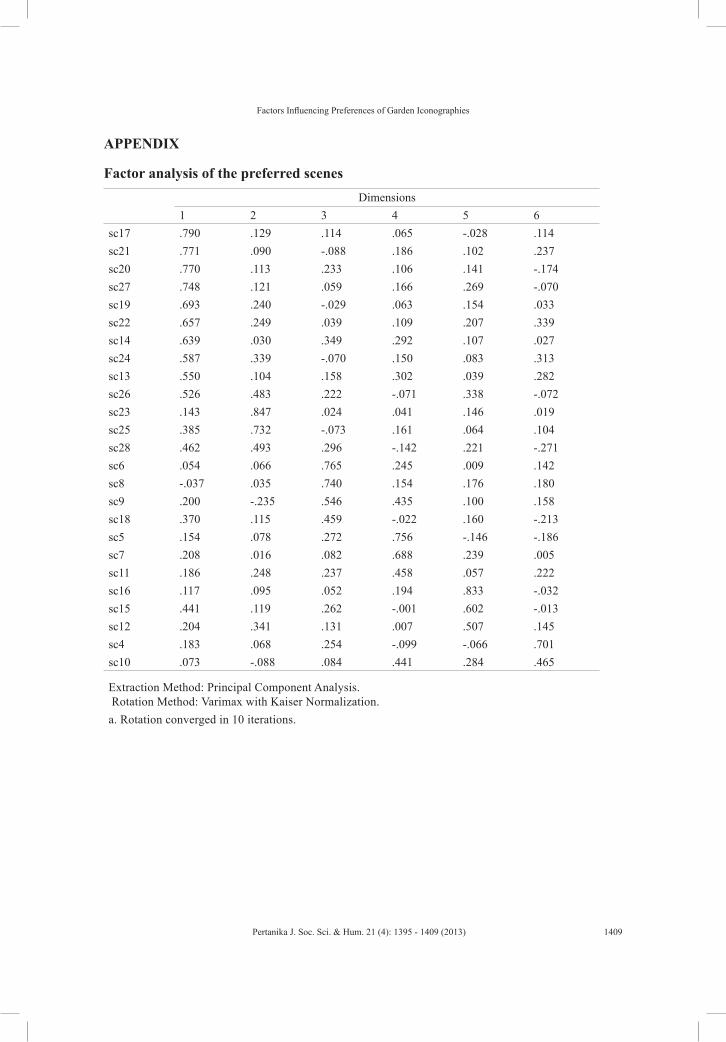
Factors Influencing Preferences of Garden Iconographies
1409Pertanika J. Soc. Sci. & Hum. 21 (4): 1395 - 1409 (2013)
APPENDIX
Factor analysis of the preferred scenesDimensions
1 2 3 4 5 6sc17 .790 .129 .114 .065 -.028 .114sc21 .771 .090 -.088 .186 .102 .237sc20 .770 .113 .233 .106 .141 -.174sc27 .748 .121 .059 .166 .269 -.070sc19 .693 .240 -.029 .063 .154 .033sc22 .657 .249 .039 .109 .207 .339sc14 .639 .030 .349 .292 .107 .027sc24 .587 .339 -.070 .150 .083 .313sc13 .550 .104 .158 .302 .039 .282sc26 .526 .483 .222 -.071 .338 -.072sc23 .143 .847 .024 .041 .146 .019sc25 .385 .732 -.073 .161 .064 .104sc28 .462 .493 .296 -.142 .221 -.271sc6 .054 .066 .765 .245 .009 .142sc8 -.037 .035 .740 .154 .176 .180sc9 .200 -.235 .546 .435 .100 .158sc18 .370 .115 .459 -.022 .160 -.213sc5 .154 .078 .272 .756 -.146 -.186sc7 .208 .016 .082 .688 .239 .005sc11 .186 .248 .237 .458 .057 .222sc16 .117 .095 .052 .194 .833 -.032sc15 .441 .119 .262 -.001 .602 -.013sc12 .204 .341 .131 .007 .507 .145sc4 .183 .068 .254 -.099 -.066 .701sc10 .073 -.088 .084 .441 .284 .465
Extraction Method: Principal Component Analysis. Rotation Method: Varimax with Kaiser Normalization.a. Rotation converged in 10 iterations.

Pertanika J. Soc. Sci. & Hum. 21 (4): 1411 - 1429 (2013)
ISSN: 0128-7702 © Universiti Putra Malaysia Press
SOCIAL SCIENCES & HUMANITIESJournal homepage: http://www.pertanika.upm.edu.my/
Article history:Received: 13 June 2011Accepted: 23 July 2012
ARTICLE INFO
E-mail address: [email protected] (Izadi, A.)
Politeness in Spoken Review Genre: Viva Voce Context
Izadi, A.Department of English, Abadan Branch, Islamic Azad University, Abadan, Iran
ABSTRACT
The study investigated linguistic politeness in ten viva voce sessions occurring in two universities in Iran. The model of politeness which was proposed by Brown and Levinson (1987) was drawn upon in the study to analyze academic talk in the review context of viva sessions. Particularly, the study focused on negative politeness strategies, which are used to attend the ‘negative face’ of the speaker and the hearer, due to the formality of the context. Of the negative politeness strategies which were used, ‘give deference’, ‘hedging’ and ‘impersonalization’ were found to be the most frequent strategies. Type of genre and the institutionality of discourse had a robust impact on almost every instance of talk, including politeness strategy choice. While raising our awareness of academic discourse in Persian, the results of the study could help foster interpersonal communication between the peers and academic members to enjoy a more pleasant social world.
Keywords: Linguistic politeness, viva voce, Persian language, negative politeness, review genre, academic
discourse
in the daily life of human beings. As such, politeness is used as a means to avoid conflict and establish harmonious interpersonal relationships between social interactants. However, in some speech events in academia, like viva voce sessions, which comprise a great deal of negative speech acts of criticisms, disagreements and face threatening questions, interpersonal relationship might be downplayed due to the more important goal of the discourse. Politeness, therefore, plays even a more important role in such contexts.
INTRODUCTION
Politeness research has been in the core of attention for three decades, producing a great deal of literature in Pragmatics, Social Psychology and Sociolinguistics (Haugh, 2007). Establishing and maintaining a solemn interpersonal relationship is crucial
Izadi, A.
1412 Pertanika J. Soc. Sci. & Hum. 21 (4): 1411 - 1429 (2013)
The goal of the interactions in such discourses is not primarily to establish interpersonal relationships between individuals but issues like the business to be done, scholarship to be defended, or meeting a future institutional goal (Locher, 2004; Drew & Heritage, 1992). Mechanisms of politeness are conceptualized variably not only in different cultures but also subjected to different stipulations of discourse.
Since the seminal work of Brown and Levinson on politeness (1978, 1987), the phenomenon has received a great deal of attention. Although a number of politeness studies have challenged the notion of ‘face’ as a cornerstone of Brown and Levinson’s theory in that it is Anglo centric, individualistic and insufficient to be applicable to many non-western societies (Werkhofer, 1992; Matsumoto, 1988; Koutlaki, 2002; Watts, 2003; Mills, 2003; Bravo, 2008), it still provides a comprehensive set of strategies which make it eligible to work as a viable theoretical framework of politeness studies.
Drawing upon Brown and Levinson’s (1987) theory of politeness, the present study aims at tracing linguistic politeness strategies in stretches of talk beyond the sentence level in academic discussions and arguments in Persian. In particular, the study attempts to answer the following research question: What politeness strategies are used by Iranian Persian speakers in academic talk in viva voce context?
The term ‘strategy’ which is used here is a technical term in Brown and Levinson’s model of politeness and refers to the rational
choices speakers make while confronted with face threatening acts. By politeness strategies, we refer only to the negative politeness strategies proposed by Brown and Levinson (1987). The reason for excluding positive politeness strategies is that they are ‘approach-based’ and are usually employed to claim solidarity (Scollon & Scollon, 2001). Therefore, their frequent occurrences are not expected in formal evaluative discourse. On the other hand, negative politeness strategies are ‘avoidance-based’ and are present in formal contexts when the relationship between the participants is not close. The formality of the dissertation defense sessions (DDs) speech events is expected to be more amenable to negative politeness strategies.
This study is significant in that it focuses on politeness in contexts which are argumentative in nature and might negatively influence interpersonal relationships. There are a myriad of studies which have been conducted on written aspects of academic discourse, such as research articles and dissertations (Hyland, 1994; 1998). However, the oral aspect of academic discourse, despite the importance it carries in the academia, has not yet received enough attention in discourse studies with a few exceptions (Grimshaw, 1989; Swales, 2004; Recsky, 2005; Flowerdew, 1994; He, 1997). In addition, studies conducted on politeness in oral academic discourse are even fewer.
More importantly, research conducted in academic discourse focuses on the use of English language. While there is no question about the importance of English for academic
Politeness in Spoken Review Genre
1413Pertanika J. Soc. Sci. & Hum. 21 (4): 1411 - 1429 (2013)
purposes in today’s academic world, the role of other languages for academic purposes should not be underestimated. Persian language is an official language and a means of instruction in almost all academic institutions in Iran. Despite its wide use in academia, research in the oral aspect of Persian for Academic Purposes (PAP) is tremendously low. The results of the present study can clear the ground for comparison of academic discourses in different linguistic and cultural contexts.
SPEECH ACT, POLITENESS AND THE NOTION OF FACE
Indirect speech act has been associated with politeness in many early studies in Pragmatics. Brown and Levinson (1978, 1987), Leech (1983), and Searle (1976) postulated indirectness as a feature of politeness. Searle (1976) concluded that people tend to be indirect and use indirect speech acts such as disagreement to be polite in their conversation. Similarly, in explaining the violations of Grice’s (1975) maxims of quality, quantity, relevance and manner, Leech (1983) linked indirectness with politeness.
However, it was in the politeness theory of Brown and Levinson( 1978) that speech act theory came to the fore as closely related to politeness. In fact Brown and Levinson’s theory of politeness, used speech act theory as its underlying notion. The second underlying notion of their theory was the notion of ‘face’.
Brown and Levinson (1987) define “face” as “the public self image that
every individual wants to claim for him/herself” (p. 67). They borrow the term from Goffman (1967) and use it in their introduction of “politeness” theory. Brown and Levinson then divide ‘face’ into two aspects: “positive” and “negative”. “Positive face” is defined as “the individual’s wants of admiration and approval” and negative face is the individual’s “wants of freedom from imposition” (p. 61).
According to Brown and Levinson (1978, 1987), some speech acts are intrinsically “face threatening”. They are called “Face Threatening Acts” and abbreviated as FTAs. They may threaten the ‘face’ of the speaker, the hearer or both. Thus production of these kinds of acts brings about more challenge for language users in different cultural settings. Many of the speech acts in viva voce context belong to such category. Criticisms, challenging questions and disagreements are all face-threatening acts since they threat the “face” of hearer and sometimes the speaker (Brown & Levinson, 1987, p. 61). Realizations of such speech acts in inappropriate ways may be taken as ‘impolite’ and damage the hearer and the speaker’s face. To avoid threat to each other’s face, therefore, people try to ‘mitigate’ their production of FTAs by using certain strategies (Brown & Levinson, 1987).
Face threatening acts are also determined by the context of talk. Based on the three social factors ‘Power’, ‘Distance’, and the ‘Rank’ of the speech act in terms of the degree of the imposition of a given act in a particular context, an individual
Izadi, A.
1414 Pertanika J. Soc. Sci. & Hum. 21 (4): 1411 - 1429 (2013)
evaluates the degree of FTA and then chooses the most appropriate strategy to produce that speech act (Brown &Levinson, 1987). In viva voce contexts, the degree of imposition incurred by the acts of criticism, disagreement and question is very high. Similarly, the ‘distance’ between the two main participants; that is examiners and the candidates, can be taken as moderate to high. Power relationship, however, is a very influential determining factor in the choice of the politeness strategies. The institutional power of the examiners allows them to sometimes ignore the face of their addressees (candidates) and impose on their freedom of action (Zuraidah &Izadi, 2011). Whereas, the candidates are obliged to be more attentive of the examiner’s face.
When the degree of the imposition of the particular act is assessed, then the individual has five choices to make in realizing the given act. Each of these choices is termed a “strategy”. These strategies are as follows 1) Don’t do the Face Threatening Act (FTA) 2) Do the FTA off-record 3) Do the FTA on record without redress (baldly) 4) Do the FTA on record with redress (positive politeness) 5) Do the FTA on record with redress (negative politeness). It is the latter that falls within the scope of the present research.
The negative politeness strategies are used to satisfy the hearer’s desire to be respected or recognized. Brown and Levinson (1987) enumerate ten strategies for negative politeness. These strategies are inclined in attending the speakers and/or hearers’ negative face, which is attending
to their freedom from imposition. According to Scollon and Scollon (2001), negative politeness strategies are ‘avoidance-based’, hence their occurrence is expected in formal talk like viva voce. The negative politeness strategies, which are proposed by Brown and Levinson (1987), are as follows:
1. Be conventionally indirect, as in “Can you please tell me the time?”,
2. Questions, hedge, as in “This may not be relevant but..”,
3. Be pessimistic, “Could you set the table?”,
4. Minimize the imposition, Rx, “I just dropped by for a minute to ask you...”,
5. Give deference, as in “Excuse me, sir, would you mind if I close the window?”,
6. Apologize, as in “I do not want to bother you, but...”,
7. Impersonalize S and H as in “Is it possible to ask a favour?”,
8. State the FTA as a general rule, as in “We do not eat with our hands, we eat with knives and forks”,
9. Nominalize, as in “Your performance was very good” instead of “You performed well”,
10. Go on record as incurring a debt, o r a s n o t i n d e b t i n g H , a s i n “I’d really appreciate it if you would…”.
Out of the 10 negative politeness strategies, 4 strategies (1, 2, 5, and 7) enjoyed the highest frequency in the present research. Therefore, a brief description of them is inevitable in the following lines.
Politeness in Spoken Review Genre
1415Pertanika J. Soc. Sci. & Hum. 21 (4): 1411 - 1429 (2013)
Be conventionally indirect
When there is a clash between the desire to be direct (on-record) and the desire to be indirect (off-record), some compromise between the two is reached in the strategy of conventional indirectness. Indirect speech acts are generally associated with politeness in Pragmatics research. The most well-known exemplar of conventional indirectness is the use of the so called “whimperatives” (Sadock, 1974) to make indirect requests as in ‘Would you please pass the salt?’.
Hedging
A hedge is a particle, word or phrase that modifies the degree of membership of a predicate or a noun phrase to a set. In the majority of cases, hedges in the data were used to downgrade the degree of threat which is incurred to the negative face of the addressee. In fact, these hedges display the low commitment of the speakers to the propositional content of their utterances (Hyland, 1998; Brown & Levinson, 1987). Brown and Levinson distinguish three kinds of hedges: hedges on illocutionary force, hedges addressed to Grice’s (1975) maxims and prosodic/kinesic hedges. The latter is not the concern of the present research. The first two, however, are a bit described:
Hedges on illocutionary force function as satisfying speaker’s want “DON’T ASSUME H IS ABLE/WILLING TO DO A”. The second subcategory of Hedges include hedges that address Grice’s (1975) maxims: Grice’s cooperative principle entails four maxims: Quality, Quantity,
Manner and Relevance. For example, as maxim of quality pledges the speaker to the truth of the proposition, quality hedges may suggest that the speaker is not taking the full responsibility for the truth of his utterances.
Apart from its function as politeness, hedging is also a feature of academic discourse. Studies on both written (Hyland, 1998) and spoken (Recsky, 2005) modes of academic discourse have characterized academic discourse with hedging. Therefore, the frequent occurrence of this strategy is expected in the present research. Moreover, the context of review, which constitutes face threatening speech acts, warrants even a higher frequency. The more face threatening an act is, the more likely it is hedged. As demonstrated in Zuraidah & Izadi (2011), the examiners in the viva sessions tended to use myriad of hedging devices in their realization of criticisms, although they were assigned a pre-established source of power as representatives of their institutions (Heritage, 2005; Drew and Heritage, 1992).
Give deference
Give deference equals giving ehteram in Persian. The strategy ‘give deference’ (ehteram) involves humbling self and raising addressee. By putting self in lower position and putting the hearer in upper position, the speaker gives the hearer positive face and conveys that the hearer is socially superior. In many languages, including Persian, ‘deference’ is linguistically realized through the use of ‘honorifics’, which renders both deferential and humiliative forms of deference into language (Jahangiri, 2000).
Izadi, A.
1416 Pertanika J. Soc. Sci. & Hum. 21 (4): 1411 - 1429 (2013)
This strategy will be more elaborated in the next section.
Impersonalize S and H
One way of indicating that S does not want to impinge on H is to phrase the Face Threatening Act (FTA) as if the agent were other than S, or at least possibly not S or not S alone, and the addressee were other than H, or only inclusive of H.
Brown and Levinson (1978, 1987) claimed that the notion of face with its two aspects of positive and negative, as well as the individual’s face wants is universal. However, the individuality which is embedded in Brown and Levinson’s model is not supported in many non-Western cultures, including Persian (Eslamirasekh, 2004; Koutlaki, 2002, 2009). Conformity to social conventions seems to be a stronger motivation for politeness than the individual desires to attend to his/her interlocutor’s face in many non-western collectivist cultures (Ide, 1989; Mao, 1994; Koutlaki, 2002, 2009).
Recent studies on politeness (Mills, 2003; Watts, 2003; Locher, 2004; Bravo, 2008) perceive politeness as a socio-cultural script and are based on the notion that politeness behavior (whether verbal or non-verbal) needs social approval and social consensus because culture determines politeness norms. Mechanisms of politeness may, therefore, vary not only across but also within cultures (Eelen, 2001; Mills, 2003; Watts, 2003). The reason is that various cultures have their own standards with respect to politeness.
Lakoff and Ide (2005) argue that politeness as well as languages in various cultures has many common elements, universally applicable although unique in their own way. The reason is that regardless of the culture, the concept of politeness involves showing the individual’s compliance to social norms and expectations. This is the reason why each culture has its own distinctive politeness system although many cultures often share similar features. Therefore, the cultural and social values or customs need to be a consideration in studying politeness in speech acts, on the grounds that, as Eelen (2001) notes, the distinction between polite and impolite is not universal but based on the dominant social norms.
The present study adopts Brown and Levinson’s (1987) theory and model of politeness. The theory introduces a comprehensive set of strategies to analyze politeness. While face attendance has been questioned to be the (at least the only) incentive for politeness in many long-standing critiques of Brown and Levinson, the association of many of the politeness strategies proposed by them to politeness norms in many cultures and languages is hardly a matter of question. Five important strategies, which are closely knitted to the concept of ædæb (politeness) in Persian, are ‘give deference’ ‘hedging’, and ‘apologize’, ‘be conventionally indirect’, and ‘impersonalize S and H’. One could think of ædæb as at least one (if not the only) motivation for these strategies.
Politeness in Spoken Review Genre
1417Pertanika J. Soc. Sci. & Hum. 21 (4): 1411 - 1429 (2013)
Furthermore, the methodological applicability of Brown and Levinson’s model makes it viable compared to more recent theories of politeness (Haugh, 2007). However, the study is circumspect about the universal generalizations inherited in the politeness model of Brown and Levinson. Socio-cultural values of Persian are meticulously attended to in this study so that the study might not be dismissed by criticisms which are leveled at the universality of Brown and Levinson’s model.
POLITENESS IN THE PERSIAN LANGUAGE
The term ædæb can be taken as the rough equivalent for ‘politeness’ ‘courtesy’ and ‘tact’. ædæb is highly valued among Iranians, since it is closely linked to their family breeding (Koutlaki, 2009, 2002). Persian language is a manifestation of the great value its speakers assign to polite verbal and nonverbal behavior. A rich variety of lexicon and syntactic forms referring to and reflecting the speakers’ respect toward the addressee is a reason for this claim. According to Jahangiri (2000: 176), “the polite form [of Persian language] reflects a part of the cultural identity of the Iranian people and the social structure in which they live.”
A person’s manifestation of ædæb is an indication of good family breeding and well-acquired socialization skills (Sharifian, 2007, Sahragard, 2003). Similar to what has been reported to be the working motivations for polite behavior in Eastern societies like Japanese (Matsumoto, 1988; Ide, 1989)
and Chinese (Mao, 1994), ædæb in Persian is also a socially oriented linguistic or nonlinguistic behavior (Terkourafi, 2005), the good effects of which return to the individual. For example, saying “hello” to a senior is considered a social duty of a younger participant in many subcultures/communities of practice, and a manifestation of ædæb.
The confo rmi ty to th i s soc ia l responsibility on the part of a younger participant who says “hello” to an older or superior person is rewarding. The least reward one could think of is that people develop positive judgmental attitude toward that person, which in turn would enhance his/her face and his/her family’s face, not to mention the face of other communities of practice that he/she belongs to. This could be taken as the least motivation for ‘strategic’ manifestation of politeness as well, provided that a person deliberately appears moæddæb (roughly polite), being aware of its good effects. The more strategic use of ædæb is, however, when in some instances sales people drag heedless passers-by to their shop and turn them into customers using ædæb as a tool, as it is evident in Koutlaki’s (2002) data.
Closely knitted to the concept of ædæb is ehteram, meaning deference, respect, honour, pride and reverence. This concept reflects Brown and Levinson’s negative politeness strategy “give deference”. Respecting others (especially seniors) is highly valued among Iranians (Beeman, 1986; Koutlaki, 2002, Sahragard, 2003). The motive for it comes from two sources:
Izadi, A.
1418 Pertanika J. Soc. Sci. & Hum. 21 (4): 1411 - 1429 (2013)
First is the teachings of religion and morality which encourage its followers to have and show respect towards others (Sahragard, 2003), hence an altruistic incentive. The second incentive for respecting others is egotistical. As a social being one needs to ‘keep his/her own respect’ by respecting others; that is, one is respected as long or as much as he/she pays respect to other members of the society.
Ehteram is a “duty” of social being towards his society (Goffman, 1967: 9; Koutlaki, 2002: 1742), which is realized through, inter alia, appropriate address terms, greeting with a senior, conformity to ‘tæarof’ (ritual politeness) and attending to one’s shæxsiæt (face). Persian language reflects a rich variety of lexicon and syntactic form referring to and reflecting the speakers’ respect toward the addressee is a reason for this claim. According to Jahangiri (2000), “the polite form reflects a part of the cultural identity of the Iranian people and the social structure in which they live” [of Persian language](p. 176). For example, in Persian the substitution of second person singular pronoun /to/ for the plural pronoun /shoma/and the word /jenab (e) ali or hazrate ali (meaning your Excellency), in a typical interaction, when irony, sarcasm and the like are not intended, reflects the humility of the speaker while respecting the addressee (Jahangiri, 2000:, pp.182-185).
The concepts of ædæb and ehteram is closely related to shaxsiat. Shaxsiat (honor, social standing) can be viewed as the relational aspect of one’s personality, which is constructed in his/her relationship
with others. People’s shaxsiat depends on their social behavior, family breeding and level of education. It is a non-metaphorical parallel term for aberu (face) in Persian (but cf. Koutlaki, 2002, for a different view). People use the two terms interchangeably in their metapragmatic talk. For example, ‘my aberu went’ is the same as ‘my shaxsiat smashed’, both can be glossed as ‘I lost my face’. Therefore, giving somebody shaxsiat means attending to his/her aberu, and vice versa. Giving ehteram to people is one way to attend to their shaxsiat and the speaker’s own shaxsiat. It also has implications for the shaxsiat (face) of both the speaker and the hearer’s family (public face) (Spencer-Oatey, 2005).
Persian language is replete with different forms of ‘honorifics’ which are manifested in grammar and lexicon to indicate giving ehteram to the addressee. Grammatical honorifics in Persian include the use of plural pronoun (plural form of T/V) to address a singular addressee and a referent, plural form of the verb to implicate a singular person to agree with plural (respected) subject, and switching the second person to the third person pronoun to refer to the addressee. One important feature of Persian language is the honorifics that involve using the deferential alternative of neutral verbs and nouns. A conspicuous way to give deference in Persian is through the employment of lexical forms of the same verb, e. g. “goftan” (say) which implicate abjecting ‘self’ and raising ‘other’. For example, ‘goftan’ (to say) is the neutral verb. The elevated form of goftan (to say) is
Politeness in Spoken Review Genre
1419Pertanika J. Soc. Sci. & Hum. 21 (4): 1411 - 1429 (2013)
farmudan (to command) and is used for high status or respected addressee, whereas the downgraded form is arz kardan (to petition) and is used for self (Beeman, 1976).
METHODOLOGY
Data and Participants
The data of the study comprise of ten audio-recorded PhD viva voce sessions in Humanities /program department in two universities, namely, the Isfahan University and Shahid Chamran University of Ahvaz, Iran (?). The participants of the study comprise 45 Iranian PhD candidates and academics of both genders participating in viva sessions acting as supervisors, readers and examiners. A viva voce in Iran is an open oral examination in the presence of an audience including the candidate’s supervisory committee, graduate studies deputy, dean/head of the department, internal and external examiners, other interested students and even the candidate’s friends and family members (cf. Swales, 2004, for US defenses). The event lasts about two hours, and is typically held in a large colloquium. The present research analyzes talk in post-presentation sections canonically known as Q-A sections.
The viva sessions were held at two Iranian universities in 2010. These universities are Isfahan University and Shahid Chamran University of Ahvaz. The whole data resulted in 25 hours and 12 minutes of talk. Out of this number, 10 hours and 25 minutes which were dedicated to the question-answer (Q-A)
section of the viva sessions were selected for analysis. The data represented four disciplines; namely, Education (3 sessions), Social Sciences (3 sessions), Geography (2 sessions) and Linguistics (2 sessions). What is referred to as the Q-A section of viva sessions is the sequences of talk after the candidates’ presentations. They mainly include questions and answers, criticisms, disagreements and academic discussions and arguments.
Data Analysis
To analyze the data, first, the audio-recorded data were transcribed. As the unit of analysis was speech act, the different speech acts were identified. Then, the linguistic utterances were close-read to find out in which strategy of negative politeness strategies they can be categorized. In other words, they were coded and classified to indicate any of the negative strategies proposed by Brown and Levinson (1987). In case an utterance coud be codified under more than one strategy, it was put under as many strategies as it realized. The negative politeness strategies, which are originally ordered from number 1 to 10 in Brown and Levinson (1987), are as follows: (P- stands for negative politeness.) In the paper, the negative politeness strategies are referred to by P- and their numbers; for example, P-1 stands for negative politeness strategy number 1.
P-1. Be conventionally indirect, as in “Can you please tell me the time?”,
P-2. Questions, hedge, as in “This may not be relevant but..”,
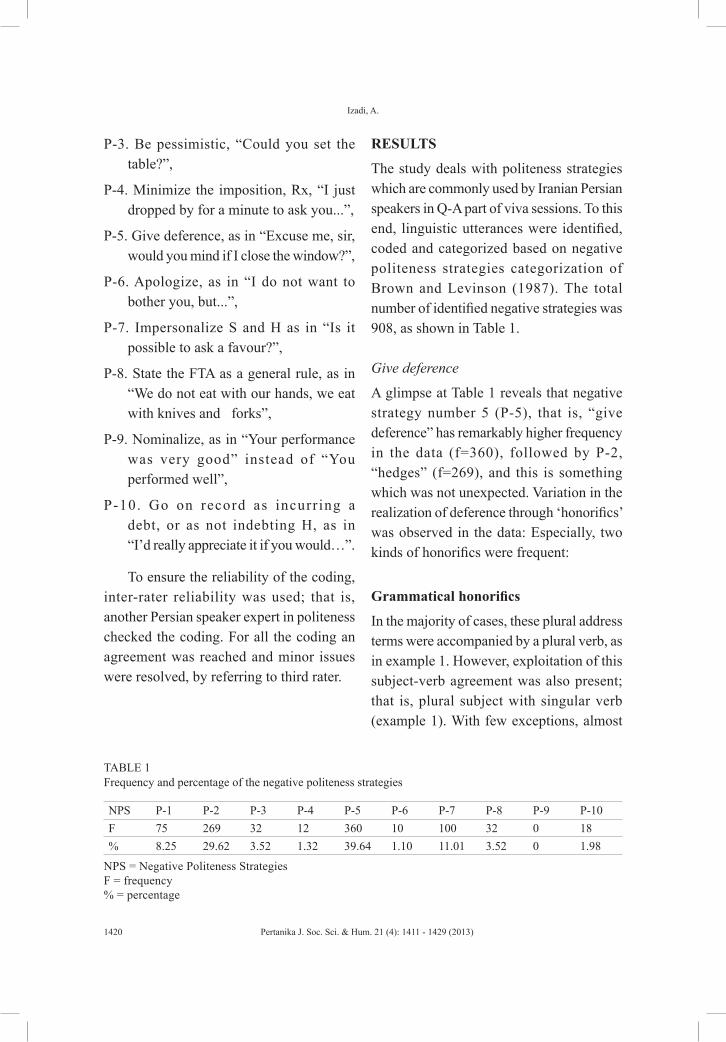
Izadi, A.
1420 Pertanika J. Soc. Sci. & Hum. 21 (4): 1411 - 1429 (2013)
P-3. Be pessimistic, “Could you set the table?”,
P-4. Minimize the imposition, Rx, “I just dropped by for a minute to ask you...”,
P-5. Give deference, as in “Excuse me, sir, would you mind if I close the window?”,
P-6. Apologize, as in “I do not want to bother you, but...”,
P-7. Impersonalize S and H as in “Is it possible to ask a favour?”,
P-8. State the FTA as a general rule, as in “We do not eat with our hands, we eat with knives and forks”,
P-9. Nominalize, as in “Your performance was very good” instead of “You performed well”,
P-10. Go on record as incurring a debt, or as not indebting H, as in “I’d really appreciate it if you would…”.
To ensure the reliability of the coding, inter-rater reliability was used; that is, another Persian speaker expert in politeness checked the coding. For all the coding an agreement was reached and minor issues were resolved, by referring to third rater.
RESULTS
The study deals with politeness strategies which are commonly used by Iranian Persian speakers in Q-A part of viva sessions. To this end, linguistic utterances were identified, coded and categorized based on negative politeness strategies categorization of Brown and Levinson (1987). The total number of identified negative strategies was 908, as shown in Table 1.
Give deference
A glimpse at Table 1 reveals that negative strategy number 5 (P-5), that is, “give deference” has remarkably higher frequency in the data (f=360), followed by P-2, “hedges” (f=269), and this is something which was not unexpected. Variation in the realization of deference through ‘honorifics’ was observed in the data: Especially, two kinds of honorifics were frequent:
Grammatical honorifics
In the majority of cases, these plural address terms were accompanied by a plural verb, as in example 1. However, exploitation of this subject-verb agreement was also present; that is, plural subject with singular verb (example 1). With few exceptions, almost
TABLE 1 Frequency and percentage of the negative politeness strategies
NPS P-1 P-2 P-3 P-4 P-5 P-6 P-7 P-8 P-9 P-10F 75 269 32 12 360 10 100 32 0 18% 8.25 29.62 3.52 1.32 39.64 1.10 11.01 3.52 0 1.98
NPS = Negative Politeness Strategies F = frequency % = percentage
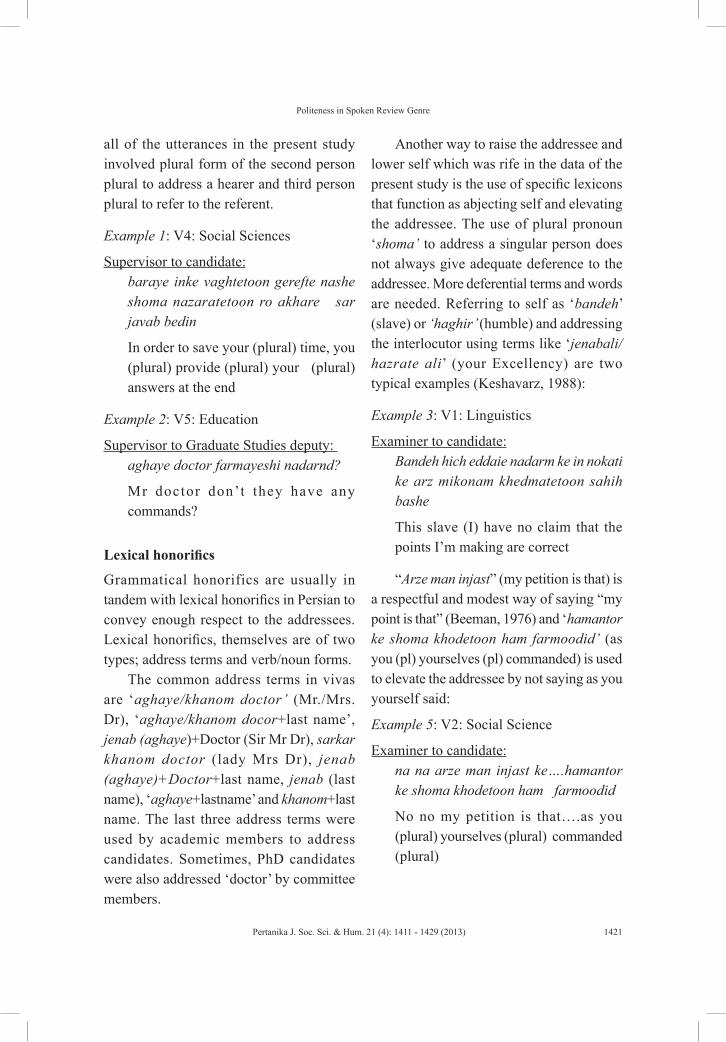
Politeness in Spoken Review Genre
1421Pertanika J. Soc. Sci. & Hum. 21 (4): 1411 - 1429 (2013)
all of the utterances in the present study involved plural form of the second person plural to address a hearer and third person plural to refer to the referent.
Example 1: V4: Social Sciences
Supervisor to candidate:baraye inke vaghtetoon gerefte nashe shoma nazaratetoon ro akhare sar javab bedin
In order to save your (plural) time, you (plural) provide (plural) your (plural) answers at the end
Example 2: V5: Education
Supervisor to Graduate Studies deputy: aghaye doctor farmayeshi nadarnd?
Mr doctor don’t they have any commands?
Lexical honorifics
Grammatical honorifics are usually in tandem with lexical honorifics in Persian to convey enough respect to the addressees. Lexical honorifics, themselves are of two types; address terms and verb/noun forms.
The common address terms in vivas are ‘aghaye/khanom doctor’ (Mr./Mrs. Dr), ‘aghaye/khanom docor+last name’, jenab (aghaye)+Doctor (Sir Mr Dr), sarkar khanom doctor (lady Mrs Dr), jenab (aghaye)+Doctor+last name, jenab (last name), ‘aghaye+lastname’ and khanom+last name. The last three address terms were used by academic members to address candidates. Sometimes, PhD candidates were also addressed ‘doctor’ by committee members.
Another way to raise the addressee and lower self which was rife in the data of the present study is the use of specific lexicons that function as abjecting self and elevating the addressee. The use of plural pronoun ‘shoma’ to address a singular person does not always give adequate deference to the addressee. More deferential terms and words are needed. Referring to self as ‘bandeh’ (slave) or ‘haghir’ (humble) and addressing the interlocutor using terms like ‘jenabali/hazrate ali’ (your Excellency) are two typical examples (Keshavarz, 1988):
Example 3: V1: Linguistics
Examiner to candidate:Bandeh hich eddaie nadarm ke in nokati ke arz mikonam khedmatetoon sahih bashe
This slave (I) have no claim that the points I’m making are correct
“Arze man injast” (my petition is that) is a respectful and modest way of saying “my point is that” (Beeman, 1976) and ‘hamantor ke shoma khodetoon ham farmoodid’ (as you (pl) yourselves (pl) commanded) is used to elevate the addressee by not saying as you yourself said:
Example 5: V2: Social Science
Examiner to candidate:na na arze man injast ke….hamantor ke shoma khodetoon ham farmoodid
No no my petition is that….as you (plural) yourselves (plural) commanded (plural)

Izadi, A.
1422 Pertanika J. Soc. Sci. & Hum. 21 (4): 1411 - 1429 (2013)
Questions, hedges
Hedges are the second most prominent feature of talk in academic discourse. In the data of the present study, 269 instances were identified. Some indirect speech acts are conventionalized to the extent that there can be no doubt about what is meant. In Persian, there are particles and words which downgrade/upgrade the propositional content of the utterances. Two examples of hedging on illocutionary force in the data are as follows:
Example 6: V1: Linguistics
Examiner to candidate:onvanetoon ba oon zironvanesh ghadri nahamahange va az do jense
Your (plural) title and its subtitle are a bit disharmonious
Example 7: V3: Social Sciences
Examiner to candidate:barkhi az gooyehatoon dar meghyasi nist ke betooneh be shoma javab bedeh har chand be shoma yek javabi mideh vali in pasokh ha be ehtemale ziad gheire vaghei khahad bud
some of your (pl) items are not able to give you (pl) proper answers, they might give you an answer, though. But the answers will most probably be unreal.
Hedges on illocutionary force of the utterances can also be encoded in adverbial clauses, especially ‘if’ clauses. Usually speakers use ‘if’ clauses to put conditions on the volitional acts predicted in the speech acts, as in example 8:
Example 8: V8: Geography
Examiner to candidate: ye seri nokati ro man inja yaddasht kardam age ghabel estefade hast anjamesh bedid
I have jotted down some points here, do them if they are useful
Example 9: V1: Linguistics
Examiner to candidate:man nazare khodam ro sarahatan migam ghesmate review za’eefeh
I’m just giving my own opinions candidly, the review section is weak
Impersonalize S and H
There were 100 instances of this strategy in the data, which can be encoded in three ways: The most salient examples of ‘impersonalization’ are ‘passivization and hypothesization’ of the sentences. The data are replete with utterances like “it would have been much better if ….”, or ‘the methodology section still required much more work” to avoid pointing the criticism directly to the addressee:
Example 9: V8: Geography
Examiner to candidate:Dar ghesmate pishineh tahghigh on tor ke bayad o shayd adabiat naghd nashode va bishtar kar ha gozaresh shodeh
In the literature review section, the literature has not been critically reviewed in the real sense of it, and it has more been reported.
Politeness in Spoken Review Genre
1423Pertanika J. Soc. Sci. & Hum. 21 (4): 1411 - 1429 (2013)
Another way to impersonalize is to replace the pronouns ‘I’ and ‘you’ with indefinites. In the following example, an examiner avoids a sentence like’ you should explain’ by replacing it with ‘the reader should understand’.
Example 10: V3: Social Sciences
Examiner to candidate:man be shoma hagh midam ke az chehel ta ghom chahar ta ro entekhab konid amma ye jaie khanande bayad befahme ke chera oon chahar ta ro entekhab kardid
You have the right to choose four ethnic groups out of forty, but the reader must somewhere understand why you have chosen these four.
Shifting point of view from ‘you’ to ‘I’ and ‘we’ is another impersonalization strategy, as in the following example. This strategy was not present in Brown and Levinson model of politeness, but its occurrence was considerable in the data.
Example 11: V9: Geography
Examiner:Shoma oomadid har chi model budeh inja avordid khob man avval bayad biam az khodam beporsam har kodom az in model ha be che dardi mikhoreh …
You have used all models here well I first should ask myself what each of these models are here for…
Be conventionally indirect
This strategy is the first strategy of negative politeness in Brown and Levinson’s (1987) model of politeness. The data of the present study favored the distribution of 75 instances of conventional indirectness which made it the fourth prominent strategy used by the participants. Examples found in the data are:
Example 12: V9: Geography
Examiner to candidate:Bakhshi az ettela’ati ke dar fasle 7 conclusion avordid natayej e tahghighe shoma hastand
Part of the information you’re providing in chapter 7 conclusion is your results
Although this sentence looks like an assertion, it indirectly conveys a criticism of a candidate that he has made a mistake in deciding in which chapter the given information should appear. Similarly in the following example, the examiner is indirectly criticizing the work as ignoring the aspectuality of the language.
Example 13: V1: Linguistics
Examiner to candidate:Man kamtar didam ke kari dar ertebat ba modality anjam beshe vali daresh aspectuality ghayeb bashe
I have not seen many cases of work that is done on modality but lacks the aspectuality.
Other negative politeness strategies were not so salient in the data, and hence are not discussed here. However, one important
Izadi, A.
1424 Pertanika J. Soc. Sci. & Hum. 21 (4): 1411 - 1429 (2013)
finding of the study is the frequency of overlaps between the strategies. In the majority of the times, the utterances could ambivalently be codified under more than one strategy (see the following example).
Example 14: V 9: Geography
Examiner to candidate:man chand nokteye moshkhas ro zekr mikonam agar ghabele estefadast anjamesh bedid’
I just mention some clear points: if they’re useful, do (pl) it)
In this example, we see that the speaker uses at least 5 strategies to realize his preface to criticism: First, he minimizes the imposition to H (P-4) by referring to his comments as ‘chand’ implying that the critical comments are not many. Second, he uses ‘hedging’ in the same utterance (chand) and (P-2) by referring to his criticisms as ‘some points’ and hence downgrades it. Also, another hedging is that he assigns his so called points an attribute ‘moshakhas’ (clear), which is a hedge addressing to Grice’s maxims. The speaker uses another hedge which is in the form of an adverbial (if) clause, by which he also expresses pessimism (P-3). Finally, by using the plural form of the verb ‘anjamesh bedid’ (do (pl) it), the examiner also uses the strategy ‘give deference’ by using the plural form of the verb, which is an indication of paying respect to addressee through elevating him.
DISCUSSION
‘Give deference’ and ‘hedges’ were the most frequent strategies in the data. The equivalent of deference, ehteram is a highly valued concept among Iranians and is strictly observed by Iranian people especially in formal contexts. Persian language is the real manifestation of a variety of honorifics which denote ehteram to addressee (Jahangiri, 2000). Ehteram has direct implication for attending to shaxsiat (face) of both the speaker and the addressee (Spencer-Oatey, 2005). Moreover, ehteram to the addressee brings back the same or even more ehteram on the part of the hearer to the speaker, and this is the mechanism that social interactions work in the Iranian society in general and in academic discourse in particular.
While ‘deference’ (ehteram) is common in many types of the interactions among Iranians, its pervasiveness in academic discourse is even more vivid. It seems safe to argue that in the formal contexts, participants claim more distance than solidarity and the ‘deference’ strategy is a favorable means to claim such a distance; that is, this prominence of negative politeness strategy can be justified by the stipulations of academic discourse. Moreover, academic society is built on mutual respect, and the social expectations of academics regarding ehteram is very high. Behaving contrary to this expectation runs the risk of damaging the professional face of all academic members (Spencer-Oatey, 2007).
As demonstrated by some examples extracted from the data, even in the context
Politeness in Spoken Review Genre
1425Pertanika J. Soc. Sci. & Hum. 21 (4): 1411 - 1429 (2013)
of thesis evaluation, much caution was used by the participants to pay as high amount of ehteram as possible through a host of honorifics which are a conspicuous feature of Persian language. Despite the fact that examiners usually favor institutional power (Heritage, 2005) over the candidates, we still see them observe the rules of ehteram. The simplest reason one could think of for giving ehteram even from a more powerful party to the less powerful is the indication of ædæb (politeness). Regardless of power differential, breaching the norms of ehteram form any party brings about evaluations of impoliteness. In fact, the collocation of ehteram with ædæb (politeness) in Persian denotes a significant interconnection between the two concepts.
One of the salient characteristics of academic discourse is hedging. It is no wonder why the data favored a high number of hedging instances. The high occurrence of this strategy is closely related to the type of discourse which influences talk. Research in both written (Hyland, 1998) and spoken (Recksy, 2005) modes of academic genre has characterized this genre as being associated with ‘hedging”. The kind of hedging which has been repeatedly reported in research in academic discourse is the ‘downgraders’ (Hyland, 1998). Downgraders function as representing the speaker/writer’s low commitment to the propositional content of his/her utterances. Although, the purpose behind this hedging has not always been ‘politeness’ and ‘face’ issues, and many a time it is the epistemic stance of the speaker/writer that urges him/
her to hedge his/her propositions, politeness has been proved to be at least one concern which triggers hedging.
Another important reason for the high occurrence of hedging in the data of the present study is the realization of face threatening speech acts. The more face-threatening an act is, the more strategies are likely to be employed to soften it. Expressing critical views on a scholarly work, disagreements, challenging and defending are among those acts which require a great deal of mitigation on the part of the speaker. Many a time these speech acts are intrinsically face threatening for the candidate and by implication for his/her supervisory team. Hedging, therefore, can be used as a remedial linguistic device to soften the harsh effect of such negative speech acts on the interpersonal relationship between members of an academic society.
Hedging the utterances by an examiner can be taken as his desire not to fully pledge to his propositions, lest there might come a defensive response from the candidate or his/her supervisors. However, as one important incentive for hedging, the desire to attend to the face of the addressee(s) and by implication to his own face can hardly be denied. Concomitant with this desire, there may be a want for conforming to not only the social norms (by giving ehteram), but also to the norms of academic community of practice, which is more universal than Iranian social norms.
Two other frequent strategies in the data were ‘impersonalization’ and ‘conventional indirectness’. Similar to what was discussed
Izadi, A.
1426 Pertanika J. Soc. Sci. & Hum. 21 (4): 1411 - 1429 (2013)
about hedging, these two strategies have close veering on the ‘institutionality’ of the discourse. Members of academic community have to be critical of each other’s work in order to survive (Tannen, 2002). Reviewers in a thesis evaluation context have to be critical, as they explicitly state a disclaimer in their introduction to their talk. As such, at times, they try to distance the work from the author, thereby criticizing the work rather than the author, to keep their fellow academic member’s face. In Persian, this strategy also works as to respect (ehteram) the addressee and hence giving him/her shaxsiat; that is, attending to his face. ‘Impersonalization’ could also convey the contention that the examiners criticize the work, regardless of the author, even if the author is themselves, although disintegrating the work from its author is not always feasible. Similarly, by employing ‘conventional indirectness’, the participants avoid directly imposing on their interlocutor’s face. This is especially the case here, as the speech acts in focus involve a great deal of imposition to the face of the addressee(s).
CONCLUSION
The study attempted to explore how politeness is expressed through language in spoken academic discourse, using the model of politeness proposed by Brown and Levinson (1987). The findings of this study can be a good contribution in understanding the politeness norms of Iranian society in general, and academic discourse in particular. The four prominent strategies
in the data can be attributed not only to the politeness features of Iranian society, but also to the culture of academic discourse. Specifically, hedging and impersonalization are supported to be the universal features of academic discourse. In the context of thesis review, which entails intrinsically face threatening acts of criticisms and disagreements, using politeness strategies are promising factors in softening the bitter effect of the given acts, hence fostering interpersonal relationship between the social members. Pedagogically, theorists, curriculum developers and practitioners in the field of Teaching Persian for Academic Purposes may benefit from the findings of this study in their research and practice.
The more important implication of the study, however, is for politeness theory. First and foremost, applying Brown and Levinson’s (1987) model to the natural data poses considerable problems in coding the utterances as realizing a strategy. As was shown in example 14 in the results section, many a time, an utterance could be codified to encode more than one strategy. Therefore, a model which explains the dynamicity of language seems required to be applicable to natural data.
While face management can be a good motivation for politeness, in Persian, there seems to be an equally robust motivation for that, which is ‘social indexing’ (Terkourafi, 2005). It is possible for an Iranian to appear polite to demonstrate his/her understanding of and abiding by the social ethics and norms of his/her society to establish his/her and his/her interlocutors status in the
Politeness in Spoken Review Genre
1427Pertanika J. Soc. Sci. & Hum. 21 (4): 1411 - 1429 (2013)
structure and hierarchy of the group (cf: Ide, 1989; Matsumoto, 1988; for similar discussion in Japanese). Generally, almost all studies on non-western languages and cultures have advocated the prominence of “social indexing” (Terkourafi, 2005) over ‘face saving’ or “conflict avoidance” (Leech, 1983; Ide, 1989; Matsomuto, 1988; Mao, 1994), although politeness might have implications for face management (Spencer-Oatey, 2005).
Poli teness may st i l l have other motives like self-display. Polite language behavior in Persian is closely linked with circumlocutionary and flowery language. Mastery over such a language requires a dexterity which is frequently associated with high education. Academics are such highly educated people who must show that dexterity in language through polished verbal behavior to self-display and hence establish their social position. As such, politeness can be viewed as a distinctive feature of academic identity.
Further research is required to touch upon different aspects of relational phenomena such as face and politeness. Future studies are suggested to draw upon more dynamic and discursive models for analyzing the issues and focus on more social variables like power, gender, age and level of education. Also, it is suggested that the oral aspect of academic discourse be compared with its written aspect to find any similarities or differences.
ACKNOWLEDGEMENTS
The author wishes to acknowledge Islamic Azad University: Abadan Branch, Iran for funding the research project and all participants who contributed to the study
REFERENCES Beeman, W. O. (1976). Status, style and strategy
in Iranian interactions. Anthropological linguistoics, 18(7), 305-322.
Beeman, W. O. (1986). Language, status and power in Iran. Indiana University Press.
Bravo, D. (2008). The implications of studying politeness in Spanish speaking context: A discussion. Pragmatics, 18(4), 577-603.
Brown, P., & Levinson, S. C., (1987) . Politeness: Some universals in language usage. Cambridge: Cambridge University Press, [Originally published as Universals in language usage: politeness phenomenon. In E. Goody, (Eds.), Questions and politeness: Strategies in social interaction, CUP, New York, 1978.
Drew, P., & Heritage, J. (1992). Analyzing talk at work: An introduction. In P. Drew & J. Heritage (Eds.), Talk at work (pp. 3-65). Cambridge: Cambridge University Press.
Eelen, G. (2001). A critique of politeness theories. Manchester: St. Jerome.
Eslamirasekh, Z. (2004). Face keeping strategies in reaction to complains: English and Persian. Journal of Asian Pacific Communication, 14(1), 181-197.
Flowerdew, J. (1994). (Eds.) Academic listening: Research perspectives. Cambridge: Cambridge University Press.
Goffman, E. (1967). Interaction ritual: Essays on face-to-face behavior. Nueva York: Anchor Books.
Izadi, A.
1428 Pertanika J. Soc. Sci. & Hum. 21 (4): 1411 - 1429 (2013)
Grice, P. H. (1975). Logic and conversation. In P. Cole, & J. L. Morgan (Eds.), Speech acts (pp. 41-58). New York: Academic Press.
Grimshaw, A. D. (1989). Collegial discourse: Professional conversation among peers. Norwood, NJ: Albex.
Haugh, M. (2007). The discursive challenge to politeness research: An interactional alternative. Journal of Politeness Research, 3, 295–317.
He, A. W. (1997). Reconstructing identities through talk: A discourse study of academic counseling encounters. (Unpublished PhD dissertation). University of California Los Angeles.
Heritage, J. (2005). Conversation analysis and institutional talk. In K. L. Fitch, & R. Sanders, Handbook of Language and Social Interaction. Routledge.
Hyland, K. (1994). Hedging in academic writing and EAP textbook. English for Specific Purposes, 13, 239-256.
Hyland, K. (1998). Boosting, hedging and negotiation of academic knowledge. Text, 18, 349-382.
Ide, S. (1989). Formal forms and discernment: two neglected aspects of universals of linguistic politeness. Multilingua, 8, 223–248.
Jahangiri, N. (2000). A sociolinguistic study of Persian in Tehran. London: Institute for the study of Languages and Cultures of Asia and Africa.
Keshavarz, M., H. (1988). Forms of address in post-revolutionary Iranian Persian. A sociolinguistic analysis. Language in Society, 17, 565-575.
Koutlaki, S. A. (2002). Offers and expressions of thanks as face enhancing acts: Tæ’arof in Persian. Journal of Pragmatics, 34, 1733-1756.
Koutlaki, S. A. (2009). Two sides of the same coin: how the notion of ‘face’ in encoded in Persian communication. In F. Bargiella-Chiappini, & M. Haugh, (Eds.), Face, communication, and social interaction (pp. 115-133). London: Equinox.
Lakoff, R., & Ide, S. (2005). Introduction: Broadening the horizon of linguistic politeness. In R. Lakoff & S. Ide (Eds.), Broadening the horizon of linguistic politeness (pp.1-20). John Benjamin.
Leech, G. (1983). Principles of pragmatics. London: Longman.
Locher, M. (2004). Power and politeness in action: Disagreements in oral communication. Berlin/New York: Mouten de Gruyter.
Mao, L. R. (1994). Beyond politeness theory: ‘Face’ revisited and renewed. Journal of Pragmatics, 21, 451–486.
Matsumoto, Y. (1988). Reexamination of the universality of face: Politeness phenomena in Japanese. Journal of Pragmatics, 12(4), 403–426.
Mills, S. (2003). Gender and politeness. Cambridge: Cambridge University Press.
Recksy, L. (2005). Interpersonal engagement in academic spoken discourse: a functional account of dissertation defenses. English for Specific Purposes, 24, 5–23.
Sadock, J. M. (1974). Toward a linguistic theory of speech acts. New York: Academic Press.
Sahragard, R. (2003). A cultural script analysis of a politeness feature in Persian. Retrieved from http://www.paaljapan.org/resources/proceedings/PAAL8/pdf/pdf034.pdf
Scollon, R., & Scollon, S. W. (2001). Intercultural communication , (2nd ed.). Malden, MA: Blackwell.
Sharifian, F. (2007). L1 cultural conceptualization in L2 learning: The case of Persian-speaking learners of English. In F. Sharifian, & G. B. Palmer (Eds.), Applied Cultural Linguistics. The Netherlands: John Benjamin B. V.
Spencer-Oatey, H. (2005). (Im)Politeness, face and perceptions of rapport: Unpackaging their bases and interrelationships. Journal of Politeness Research, 1(1), 95–119.
Politeness in Spoken Review Genre
1429Pertanika J. Soc. Sci. & Hum. 21 (4): 1411 - 1429 (2013)
Spenser-Oatey, H. (2007). Theories of identity and the analysis of face. Journal of Pragmatics, 39, 639-656.
Swales, J. M. (2004). Research genres: Explorations and applications. Cambridge: Cambridge University Press.
Swift, J. (1997). The viva voce. In D. Newbury (Eds.), The viva voce. RTI Research Guides. Birmingham: University of Central England, RTI Research Training Initiative.
Tannen, D. (2002). Agonism in academic discourse. Journal of Pragmatics, 34(10), 1651-1669.
Terkourafi, M. (2005). An argument for a frame-based approach to politeness: Evidence from the use of the imperative in Cypriot Greek. In R. Lakoff, & S. Ide, (Eds.), Broadening the Horizon of Linguistic Politeness (pp. 99-117). Amsterdam/Philadelphia: John Benjamins.
Watts, R. J. (2003). Politeness. Cambridge: Cambridge University Press.
Werkhofer, K. T. (1992). Traditional and modern views: The social constitution and the power of politeness. In R. J. Watts, S. Ide, & K. Ehlich, (Eds.), Politeness in language: studies in its history, theory and practice (pp. 155–197). Berlin: Mouton de Gruyter.
Zuraidah, M. D., & Izadi, A. (2011). Relational separation and connection in dissertation defenses in Iran. Journal of Pragmatics, 43(15), 3782-3792.

Pertanika J. Soc. Sci. & Hum. 21 (4): 1431 - 1446 (2013)
ISSN: 0128-7702 © Universiti Putra Malaysia Press
SOCIAL SCIENCES & HUMANITIESJournal homepage: http://www.pertanika.upm.edu.my/
Article history:Received: 15 June 2011Accepted: 27 February 2012
ARTICLE INFO
E-mail addresses: [email protected] (Chiah, W. Y.), [email protected] (Baharudin, R.) * Corresponding author
Parenting Behaviour of Mothers, Adolescents’ Social Emotional Adjustments and their Correlates in Intact and Non-intact Malay Families in Kuala Lumpur
Chiah, W. Y. and Baharudin, R.*Department of Human Development and Family Studies, Faculty of Human Ecology, Universiti Putra Malaysia, 43400 Serdang, Selangor, Malaysia
ABSTRACT
The main objective of the study was to determine the relationship between parenting behaviour of mothers and social emotional adjustments of adolescents in intact and non-intact Malay families. Sample comprised 213 mothers (n = 166 from intact families; 47 from non-intact families), with at least one adolescent child between the ages of 13 and 17 years, and are residing in Kuala Lumpur. The respondents were identified via a name list of the adolescents’ and e-survey. Using a self-administered questionnaire, the respondents provided information on their background characteristics, self-esteem, family functioning, parenting behaviour, and adolescents’ social emotional adjustments. Results revealed that mothers parenting quality and adolescents’ social emotional adjustments in the overall sample were generally moderate. Better parenting behaviour was shown to be positively related to adolescents’ strengths in non-intact family, and negatively related to adolescent’s difficulties in both family types. Additional analysis, however, indicated that family functioning rather than parenting behaviour is a better predictor of adolescents’ social emotional adjustments. Findings imply that parents and families in any structure are important contributors of adolescents’ social emotional adjustments.
Keywords: Adolescents, difficulties, intact family, non-intact family, parenting behaviour, social emotional
adjustments, strengths
INTRODUCTION
Sociologically, family is defined as a social group, a social system and a social institution (Eshleman, 2003). As a social institution, family plays its roles that revolve around intimate relationships, as
Chiah, W. Y. and Baharudin, R.
1432 Pertanika J. Soc. Sci. & Hum. 21 (4): 1431 - 1446 (2013)
well as reproduction and socialization of their offsprings. The studies on family have long made a distinction between “traditional family” and “non-traditional family”. The phrase, ‘traditional family’, is always used interchangeably with the term ‘intact family’, which refers to a nuclear family in which membership has remained constant in the absence of divorce or other divisive factors. Intact families have been differentiated from single parent families, step families and other family types which include cohabiting parents, gay and lesbian families (Björklund et al., 2007). Hence, the remarkable characteristic that distinguishes intact families from non-intact families are adolescents from intact families living continuously with both their biological parents without experiencing disruption of family structure. The emergence of diverse family structures has resulted in various societal changes such as the increase in single-parent, step-parent, and reconstituted families. Despite these shifts in family life, family institutions remain to be the basic units of the society.
Earlier studies look into various parenting behaviour and adolescent outcomes by types of household. One such study was by Simons et al. (2006) who delineated three perspectives regarding the association between family structure, quality of parenting and adolescent well-being. Firstly, the marriage perspective holds that adolescents raised by married parents are more likely to demonstrate better growth and development. Secondly, the two-caregiver perspective asserts that the
presence of two caregivers in facilitating adolescent development is more favourable than a single caregiver. Lastly, from the evolutionary psychology viewpoint, it is believed that biological fathers will be more invested in their own adolescents than stepfathers and that a child in intact families tends to adjust better than one in non-intact families. This theory also suggests that women have the natural instinct of being more nurturing compared to men. Hence, parenting is viewed fundamentally as the domain of the female regardless of the family conditions. These perspectives are crucial among family scholars as they have significant influence on parenting and adolescent outcomes.
A review of the literature has revealed that parents of intact families are likely to provide healthier developmental support for their adolescents compared to non-intact families (Demuth & Brown, 2004; Sweeney & Bracken, 2000; Wen, 2008). As contended by Simon et al. (2006), the factors that lead to such condition could be that intact families have greater family income, social support from spouse and two parents who could provide for emotional support for healthy adolescent outcomes. However, Simon and colleagues’ (2006) investigation on parenting practices on different types of household, specifically intact nuclear, stepparent, mother-grandmother, mother-relative and single mother households, indicated that mothers did not differ in parenting regardless of the family structure. Another study by Aquilino (2005) found that single parents reported less positive
Parenting Behaviour and Adolescents’ Social Emotional Adjustments
1433Pertanika J. Soc. Sci. & Hum. 21 (4): 1431 - 1446 (2013)
attitudes towards economic support than two-biological-parent families. The inconsistent findings thus call for the need to further investigate the impact of family structure on adolescents.
The study on the impact of family structure on adolescent outcomes is not exclusive from parenting behaviour studies. An understanding of the factors contributing to parenting behaviour without doubt will serve as a basis to improve child and adolescent’s development. In his influential paper, Belsky (1984) postulated an ecological determinant of parenting behaviour model. Belsky suggested that parent’s characteristics are the most important condition for effective parenting, followed by contextual sources of stress and support, and adolescent’s characteristics. He posited that personal maturity, psychological health, and growth-facilitating parenting are some of the factors that lead to positive parenting. The present study also took into consideration some of the parental characteristics, including age, education and self-esteem, which would contribute to parenting behaviour. Elder mothers (Moore & Florsheim, 2008), higher educational attainment mothers (Cui, Conger, Bryant, & Elder Jr, 2002; Murry et al., 2008), and positive maternal self-worth (Gronick et al., 2007) were found to promote functional parenting. Thus, maternal attributes are expected to contribute to the parenting behaviour.
In addition to parental contribution, Belsky’s model speculates that contextual sources of stress and support can also be
determinants of parenting. A few contextual factors included in the analysis of the current study were family size (number of children), family income, and family functioning. DeOliveira et al. (2006) found that large family size had negative effect on family socioeconomic and home environment, while Solantaus et al. (2004) suggested that deprivation of family resources, particularly family income, posed a risk for adolescents due to the economic pressure parents faced. Subsequently, it led to negative consequences in parental psychological health, marital, and parenting quality. Possibly better family socioeconomic status and smaller family size could reduce family stress and thus produce better quality of parenting. On the other hand, positive family functioning was associated with desirable parenting style (Drescher, 2008). More generally, these studies provide evidence that parents do better in conducive social contexts.
In his model, Belsky also noted the role of adolescent’s dispositions on parenting. In particular, the temperament of the adolescent was given emphasis; however, adolescent gender and age were also included in the present study. Difficult temperament or perceived difficulty level of the adolescent causes lesser interaction and the parents to be less responsive towards their adolescents. Adolescents who are perceived as difficult are most likely to be rejected and are particularly and likely to be rejected if the mother is highly conscientious (Neitzel & Stright, 2004). Meanwhile, parent-adolescent conflict was found to be
Chiah, W. Y. and Baharudin, R.
1434 Pertanika J. Soc. Sci. & Hum. 21 (4): 1431 - 1446 (2013)
associated with more behavioural problems for adolescents of all ages, but it is more detrimental for adolescent (Wen, 2008). With regard to adolescent’s gender, there is limited information on how gender influences parents’ behaviour. A comparative study of sons and daughters in Thailand revealed no significant difference in various parenting styles (Rhucharoenpornpanich et al., 2010). Despite the incongruent findings, adolescent’s contribution on parenting is widely recognized.
In general, positive parenting behaviour is associated with favourable social emotional adjustments of adolescents. Past research showed that parent-adolescent relations have significant impact on psychological well-being of adolescents, regardless of gender of the parent (Videon, 2005). Numerous research has also revealed that good quality parenting, such as parental support, parental warmth, and parental acceptance promote better psychological and behavioural adjustment (Finkenauer et al., 2005; Suchman et al., 2007). Furthermore, Rebecca (2006) found that perceived maternal parenting style was significant for Malay adolescents’ attitude in school, in which authoritative mothers had more positive attitudes. These past findings posited a positive correlation between good parenting behaviour and social emotional adjustments of the adolescents.
B e s i d e s e v i d e n c e o f p o s i t i v e association between quality parenting behaviour and adolescents’ outcomes, other studies revealed that poor parenting could contribute to several developmental maladjustments. For instance, Wissink et
al. (2006) found significant association between negative parent-adolescent relationship and adolescents’ aggressive behaviour, delinquency and low self worth. Furthermore, parental strictness was shown to be related to psychological discomfort, as well as low expectation of future success in adolescents (Ciairano et al., 2008). Consistent with previous findings, Vieno et al. (2009) found a similar relation on parental control and maladjustments in adolescents, particularly the anti-social behaviour in boys. In summary, positive parenting behaviour is reckoned as important for it tends to facilitate adolescents’ towards better adjustments.
Disruption of a family does have adverse effects on parents and adolescents (Cavanagh & Huston, 2006). Given the evidence that parenting behaviour will influence adolescents’ behaviour, an imperative focus for investigation on the links of these two constructs in different family structures is highlighted. Although a substantial amount of research has examined the impact of different family structures on adolescents’ well-being, the growing number of family decomposition has not been matched by an increase in our understanding of their family functioning, particularly parenting behaviour in different family forms and its impact on adolescents. Thus, the present study would add to the limited knowledge available on parenting and adolescent social emotional adjustments in intact and non-intact families.
The phenomenal increase in divorce among families of all races has led to the growth of non-intact families in Malaysia.
Parenting Behaviour and Adolescents’ Social Emotional Adjustments
1435Pertanika J. Soc. Sci. & Hum. 21 (4): 1431 - 1446 (2013)
Statistics shows that divorce cases among Malays are more in number (i.e., from 13,536 in 2000 to 27,116 cases in 2009) than other ethnic groups (i.e., from 1,613 in 2000 to 2,938 cases in 2009) (Ministry of Women Family and Community Development, 2009). This situation may be expected since the population of Malays in this country is larger compared to other groups; nonetheless, it indicates the need to understand the impacts of the structural changes on the functioning of Malay families and their adolescents. Thus, the present study was designed to examine the relationship between parenting behaviour and adolescents social emotional adjustment amongst intact and non-intact Malay families. In addition, this study determined what family (parent and adolescent) background characteristics are related to adolescent social emotional adjustments. Hence, three research questions were addressed in the present study:
1. What are the parenting behaviour and adolescents social emotional adjustments in both intact and non-intact Malay families?
2. What are the relationships among family background characteristics, parenting behaviour and adolescent social emotional adjustments?
3. What factors are predictive of the social emotional adjustments of adolescents in both family types?
MATERIALS AND METHODS
Location of the Study and Sampling Procedure
The present study selected the capital city of Malaysia, the Federal Territory of Kuala Lumpur, in its investigation involving intact and non-intact Malay families. Kuala Lumpur is well-known as the fastest growing metropolitan region in the country, and is the only state in Malaysia that has a 100% level of urbanization (Department of Statistics Malaysia, 2000). Rapid modernization and urbanization were noted to contribute to greater decomposition of family structure, and subsequent variation in family forms in this area (Al-Kazi, 2008). According to the Social Statistics Bulletin (2007), 40.7 percent of the total populations in Kuala Lumpur are Malays, followed by Chinese (39.3%), and Indians (10.17%). Furthermore, the number of registered Muslim divorces in this state has seen an increase from 499 divorces to 1,637 divorces within 10 years since 2000. Thus, theoretically, this area is considered appropriate for the present study.
The theoretical population for this study was mothers with at least one adolescent, aged 13 to 17 years, and are residing in Kuala Lumpur. Due to unexpected poor responses (i.e., 32% of 465 distributed questionnaires collected, only 24% was useable) in the data collection process and the types of respondents needed for the present study, two methods of sampling techniques were employed: (1) non-proportionate stratified random sampling
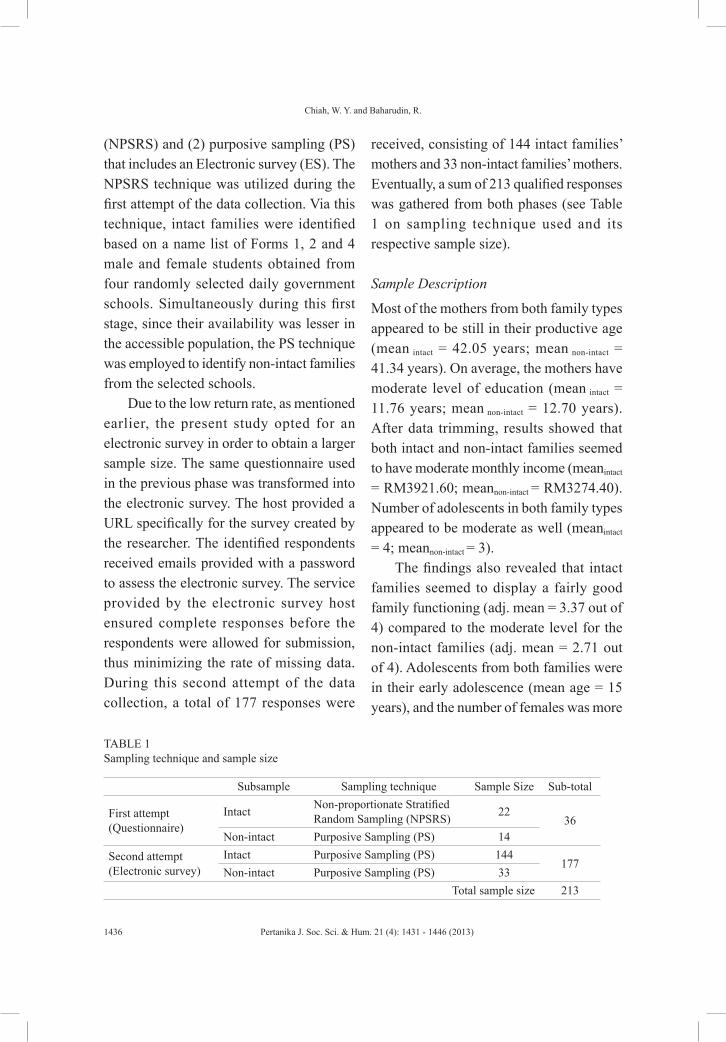
Chiah, W. Y. and Baharudin, R.
1436 Pertanika J. Soc. Sci. & Hum. 21 (4): 1431 - 1446 (2013)
(NPSRS) and (2) purposive sampling (PS) that includes an Electronic survey (ES). The NPSRS technique was utilized during the first attempt of the data collection. Via this technique, intact families were identified based on a name list of Forms 1, 2 and 4 male and female students obtained from four randomly selected daily government schools. Simultaneously during this first stage, since their availability was lesser in the accessible population, the PS technique was employed to identify non-intact families from the selected schools.
Due to the low return rate, as mentioned earlier, the present study opted for an electronic survey in order to obtain a larger sample size. The same questionnaire used in the previous phase was transformed into the electronic survey. The host provided a URL specifically for the survey created by the researcher. The identified respondents received emails provided with a password to assess the electronic survey. The service provided by the electronic survey host ensured complete responses before the respondents were allowed for submission, thus minimizing the rate of missing data. During this second attempt of the data collection, a total of 177 responses were
received, consisting of 144 intact families’ mothers and 33 non-intact families’ mothers. Eventually, a sum of 213 qualified responses was gathered from both phases (see Table 1 on sampling technique used and its respective sample size).
Sample Description
Most of the mothers from both family types appeared to be still in their productive age (mean intact = 42.05 years; mean non-intact = 41.34 years). On average, the mothers have moderate level of education (mean intact = 11.76 years; mean non-intact = 12.70 years). After data trimming, results showed that both intact and non-intact families seemed to have moderate monthly income (meanintact
= RM3921.60; meannon-intact = RM3274.40). Number of adolescents in both family types appeared to be moderate as well (meanintact = 4; meannon-intact = 3).
The findings also revealed that intact families seemed to display a fairly good family functioning (adj. mean = 3.37 out of 4) compared to the moderate level for the non-intact families (adj. mean = 2.71 out of 4). Adolescents from both families were in their early adolescence (mean age = 15 years), and the number of females was more
TABLE 1 Sampling technique and sample size
Subsample Sampling technique Sample Size Sub-total
First attempt(Questionnaire)
Intact Non-proportionate Stratified Random Sampling (NPSRS) 22
36Non-intact Purposive Sampling (PS) 14
Second attempt(Electronic survey)
Intact Purposive Sampling (PS) 144177
Non-intact Purposive Sampling (PS) 33Total sample size 213
Parenting Behaviour and Adolescents’ Social Emotional Adjustments
1437Pertanika J. Soc. Sci. & Hum. 21 (4): 1431 - 1446 (2013)
than males (intact families: male = 41.0%, female = 59.0%; non-intact families: male = 63.8%, female =36.2%). Most of the adolescents (intact = 75.9%, non-intact = 66.0%) were perceived by mothers in both families as easy to raise or in other words, have good temperament.
Measures
Self-esteemSelf-esteem of the mothers in this study was measured using Rosenberg’s (1965) Self-Esteem Scale (RSE). The 10-item scale was rated on four-point Likert scale ranging from 1 (strongly agree) to 4 (strongly disagree). Total scores were calculated by summing all 10 items after reverse coding the negatively worded items. A sample item is “on the whole, I am satisfied with myself”. The alpha coefficient yielded for the total sample was 0.83, and 0.70, and 0.84 for intact and non-intact families, respectively.
Family functioning
The Family Assessment Device (FAD) (Epstein, Baldwin & Bishop, 1983) based on the McMaster Model of Family Functioning was used to assess family functioning of the respondents. A total of 12 items adopted from General Functioning Subscale was rated on four-point Likert scale ranging from 1 (strongly agree) to 4 (strongly disagree). An example of the item in the scale is “planning family activities is difficult because we misunderstand each other”. The items describing healthy functioning were reverse coded so as higher score would indicate a better level of family
functioning. Meanwhile, a mean score below 2.00 indicated problematic family functioning. For the present study, the general functioning subscale demonstrated good reliability with alpha coefficient of 0.86 for the total sample, 0.80 for intact families and 0.77 for non-intact families.
Adolescent temperament
The ‘adolescent temperament’ construct describes how easy or difficult it is to raise an adolescent. A single item, with four-point Likert responses, was used to rate the chosen focal adolescent ranging from 1 (very easy to raise) to 4 (very difficult to raise). High score in this measure indicates that the adolescent is perceived by the mother as being difficult to raise. This construct was first used by Simons, Whitebeck, Conger and Melby (1990) in their study to identify the determinant of parenting. Using the same scale, adolescent’s temperament was found to have significant correlation with mother’s parenting behaviour in a local study (Baharudin, 1996).
Parenting behaviour
Parenting Behaviour Scale (Voydanoff & Donnelly, 1998) which encompasses four dimensions; namely, parent-adolescent discussions, parent-adolescent activities, parental involvement and parental monitoring, was used to assess mother’s parenting behaviour. The 12 items scale rated on a 5-point Likert ranging from 1 (never) to 5 (very often) measure frequency of parents practicing various parenting
Chiah, W. Y. and Baharudin, R.
1438 Pertanika J. Soc. Sci. & Hum. 21 (4): 1431 - 1446 (2013)
behaviour. Total score was derived by summing all items. An item from the scale is “Talk about a television show you watched together”. A higher total score indicates a better quality of parenting behaviour. For this study, the overall scale yielded fairly good reliability, alpha coefficient was 0.85 for total sample, 0.77 and 0.89 for intact families subsample and non-intact families, respectively.
Social emotional adjustments
The social emotional adjustments of adolescents in the present study were measured using Strength and Difficulties Questionnaires (SDQ) (Goodman, 1997). The respondents rated their chosen focal adolescent child’s social emotional adjustments on two broad aspects, i.e., strengths (5 items) and difficulties (20 items). A strength item from the scale is “Considerate of other people’s feelings” and one example of difficulties scale is “Restless, overactive, cannot stay still for long”. The scale was rated on three-point Likert scale with 0 (not true), 1 (somewhat true) and 2 (true). Adolescent’s strengths score was obtained by adding up all five items in the prosocial subscale. A higher score indicates greater adolescent’s strengths. Total score for difficulties of the adolescent was obtained by summing all 20 items after reverse coding negative items. A lower score indicates lesser difficulties of the adolescent. The scale in the present study demonstrated varied reliability value based on the subscales. For the adolescent’s strengths, total sample had a good reliability
with alpha coefficient of 0.78, while alpha for the intact family subsample and non-intact family subsample were 0.75 and 0.73, respectively. As for adolescent’s difficulties, alpha coefficient of 0.80 was yielded for both total sample and intact families subsample, and this was 0.73 for non-intact families subsample.
Data Analysis
Univariate analysis was generated through descriptive statistics to provide information about the respondents’ characteristics, parenting behaviours and adolescent’s social emotional adjustments. Descriptive results were reported using percentage, mean, median, standard deviation, minimum, maximum, adjusted mean and range. Bivariate analysis was computed in order to determine the relationships between two variables according to the specific objectives using Pearson Correlation. The Pearson correlation coefficient (r) represents the degree in which the two variables are linearly correlated in the sample. For the multivariate analysis, multiple linear regression was computed to determine the predictors for adolescent social emotional adjustments, namely, strengths and difficulties.
RESULTS
Parenting Behaviour and Adolescents’ Social Emotional Adjustments
Results from the descriptive analyses revealed that mothers from intact families seemed to demonstrate better parenting behaviours as compared to mothers from
Parenting Behaviour and Adolescents’ Social Emotional Adjustments
1439Pertanika J. Soc. Sci. & Hum. 21 (4): 1431 - 1446 (2013)
non-intact families. The mean and adjusted mean score of mothers from intact families (mean = 41.19, sd. = 5.07, adj. mean = 3.43 out of 5) (mean = 33.51, sd. = 6.95, adj. mean = 2.79 out of 5) were slightly higher. Further analysis indicated significant difference in parenting behaviour between mothers from intact and non-intact families (t = 7.06, p < 0.001).
Social emotional adjustments were determined by adolescents’ strengths and the difficulties as rated by their mothers. Adolescents from intact families were found to display more strengths, as measured based on prosocial behaviour, (mean = 7.91, sd. = 2.05, adj. mean = 1.58 out of 2) than those from non-intact families (mean = 5.81, sd. = 1.96, adj. mean = 1.16 out of 2). Nonetheless, adolescents’ strength was not found to be significantly different between these two groups (t = 1.63, p > 0.05). Apparently, mothers tended to perceive their adolescents as not having much difficulty in social emotional adjustments. Adolescents were at a lower risk of difficulty in social emotional adjustments, where majority (83.1%) was having normal level of behavioural difficulties. However, the analysis on both subsamples revealed that adolescents from non-intact families (mean = 7.25, sd. = 5.46, adj. mean = 0.42 out of 2) have more difficulties compared to those from intact families (mean = 11.96, sd. = 4.51, adj. mean = 0.63 out of 2). The discrepancy was supported by a significant t-test results (t = -5.03, p < 0.001).
Relationships between Family Background Characteristics, Parenting Behaviour and Adolescent Social Emotional Adjustments
The correlation matrix for all the study variables is presented in Table 2. The findings revealed that family size and family functioning were significantly related to both strengths and difficulties. However, adolescents’ temperament was related only to strengths, while mother’s education, and self-esteem and adolescent’s age were significantly associated to difficulties. The correlational analyses also indicated that there were fewer correlates of strengths in non-intact family, as compared to intact family. In particular, mother’s self-esteem and family size were the only two factors that were significantly related to strengths in non-intact family. Meanwhile, in the intact family, beside mother’s self-esteem, other factors (i.e., family income, family functioning, and adolescent temperament) were also found to be related significantly to strengths.
As for adolescent’s difficulties, with exception of mother’s age and family income, significant correlates for both subsamples were almost similar, and these included mother’s self-esteem, family functioning, and adolescent temperament. Parenting behaviour and adolescent social emotional adjustments correlated significantly, except for strengths in non-intact family. Good parenting behaviour was positively related to strengths in intact family, but negatively related to difficulties, regardless of the family structure.
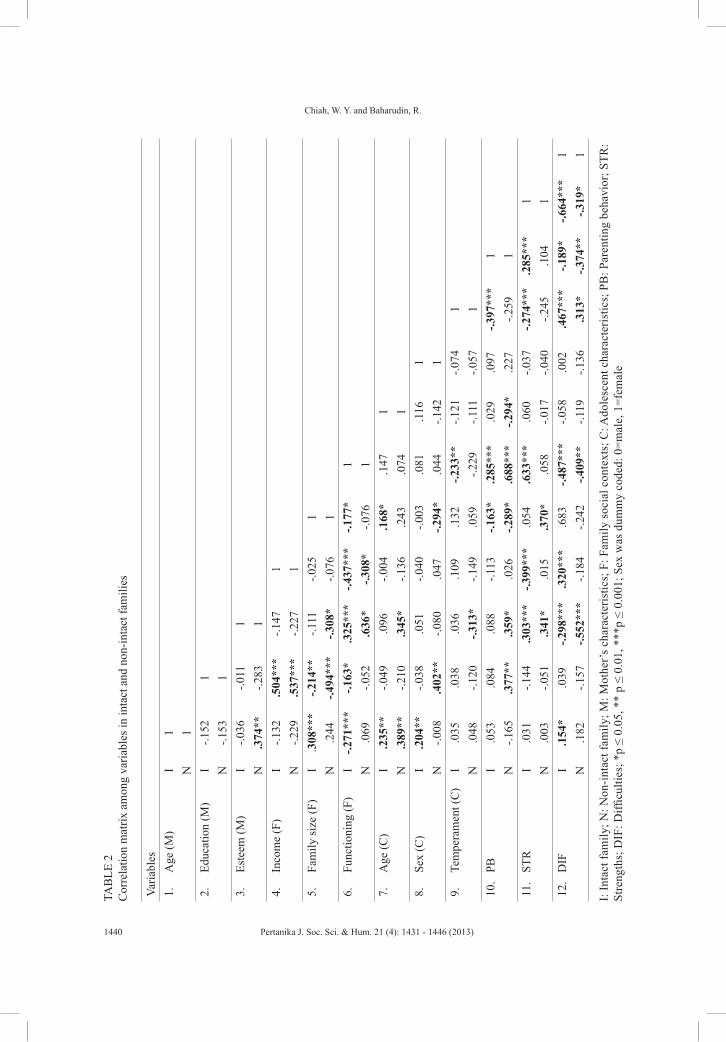
Chiah, W. Y. and Baharudin, R.
1440 Pertanika J. Soc. Sci. & Hum. 21 (4): 1431 - 1446 (2013)
TAB
LE 2
C
orre
latio
n m
atrix
am
ong
varia
bles
in in
tact
and
non
-inta
ct fa
mili
es
Varia
bles
1.
Age
(M)
I1
N1
2.
Educ
atio
n (M
)I
-.152
1N
-.153
13.
Es
teem
(M)
I-.0
36-.0
111
N.3
74**
-.283
14.
In
com
e (F
)I
-.132
.504
***
-.147
1N
-.229
.537
***
-.227
15.
Fa
mily
size
(F)
I.3
08**
*-.2
14**
-.111
-.025
1N
.244
-.494
***
-.308
*-.0
761
6.
Func
tioni
ng (F
)I
-.271
***
-.163
*.3
25**
*-.4
37**
*-.1
77*
1N
.069
-.052
.636
*-.3
08*
-.076
17.
A
ge (C
)I
.235
**-.0
49.0
96-.0
04.1
68*
.147
1N
.389
**-.2
10.3
45*
-.136
.243
.074
18.
Se
x (C
)I
.204
**-.0
38.0
51-.0
40-.0
03.0
81.1
161
N-.0
08.4
02**
-.080
.047
-.294
*.0
44-.1
421
9.
Tem
pera
men
t (C
)I
.035
.038
.036
.109
.132
-.233
**-.1
21-.0
741
N.0
48-.1
20-.3
13*
-.149
.059
-.229
-.111
-.057
110
. PB
I.0
53.0
84.0
88-.1
13-.1
63*
.285
***
.029
.097
-.397
***
1N
-.165
.377
**.3
59*
.026
-.289
*.6
88**
*-.2
94*
.227
-.259
111
. ST
RI
.031
-.144
.303
***
-.399
***
.054
.633
***
.060
-.037
-.274
***
.285
***
1N
.003
-.051
.341
*.0
15.3
70*
.058
-.017
-.040
-.245
.104
112
. D
IFI
.154
*.0
39-.2
98**
*.3
20**
*.6
83-.4
87**
*-.0
58.0
02.4
67**
*-.1
89*
-.664
***
1N
.182
-.157
-.552
***
-.184
-.242
-.409
**-.1
19-.1
36.3
13*
-.374
**-.3
19*
1
I: In
tact
fam
ily; N
: Non
-inta
ct fa
mily
; M: M
othe
r’s
char
acte
ristic
s; F
: Fam
ily s
ocia
l con
text
s; C
: Ado
lesc
ent c
hara
cter
istic
s; P
B: P
aren
ting
beha
vior
; STR
: St
reng
ths;
DIF
: Diffi
culti
es; *
p ≤
0.05
, **
p ≤
0.01
, ***
p ≤
0.00
1; S
ex w
as d
umm
y co
ded:
0=m
ale,
1=f
emal
e
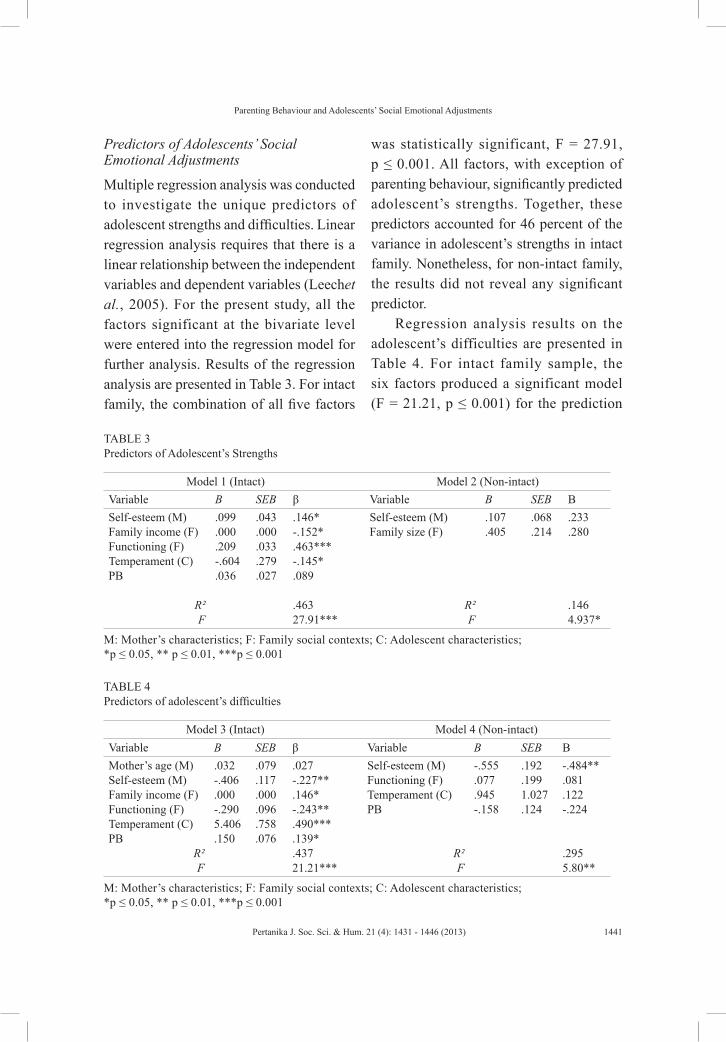
Parenting Behaviour and Adolescents’ Social Emotional Adjustments
1441Pertanika J. Soc. Sci. & Hum. 21 (4): 1431 - 1446 (2013)
Predictors of Adolescents’ Social Emotional Adjustments
Multiple regression analysis was conducted to investigate the unique predictors of adolescent strengths and difficulties. Linear regression analysis requires that there is a linear relationship between the independent variables and dependent variables (Leechet al., 2005). For the present study, all the factors significant at the bivariate level were entered into the regression model for further analysis. Results of the regression analysis are presented in Table 3. For intact family, the combination of all five factors
was statistically significant, F = 27.91, p ≤ 0.001. All factors, with exception of parenting behaviour, significantly predicted adolescent’s strengths. Together, these predictors accounted for 46 percent of the variance in adolescent’s strengths in intact family. Nonetheless, for non-intact family, the results did not reveal any significant predictor.
Regression analysis results on the adolescent’s difficulties are presented in Table 4. For intact family sample, the six factors produced a significant model (F = 21.21, p ≤ 0.001) for the prediction
TABLE 3 Predictors of Adolescent’s Strengths
Model 1 (Intact) Model 2 (Non-intact)Variable B SEB β Variable B SEB ΒSelf-esteem (M)Family income (F)Functioning (F)Temperament (C)PB
R²F
.099
.000
.209-.604.036
.043
.000
.033
.279
.027
.146*-.152*.463***-.145*.089
.46327.91***
Self-esteem (M)Family size (F)
R²F
.107
.405.068.214
.233
.280
.1464.937*
M: Mother’s characteristics; F: Family social contexts; C: Adolescent characteristics; *p ≤ 0.05, ** p ≤ 0.01, ***p ≤ 0.001
TABLE 4 Predictors of adolescent’s difficulties
Model 3 (Intact) Model 4 (Non-intact)Variable B SEB β Variable B SEB ΒMother’s age (M)Self-esteem (M)Family income (F)Functioning (F)Temperament (C)PB
R²F
.032-.406.000-.2905.406.150
.079
.117
.000
.096
.758
.076
.027-.227**.146*-.243**.490***.139*.43721.21***
Self-esteem (M)Functioning (F)Temperament (C)PB
R²F
-.555.077.945-.158
.192
.1991.027.124
-.484**.081.122-.224
.2955.80**
M: Mother’s characteristics; F: Family social contexts; C: Adolescent characteristics; *p ≤ 0.05, ** p ≤ 0.01, ***p ≤ 0.001
Chiah, W. Y. and Baharudin, R.
1442 Pertanika J. Soc. Sci. & Hum. 21 (4): 1431 - 1446 (2013)
on adolescent’s strengths. Mother’s self-esteem, family income, family functioning, temperament, and parenting behaviour were found to be significant predictors. About 44 percent of the variation in adolescent’s difficulties was explained by these predictors. In the meantime, in non-intact family, the model (F = 5.80, p ≤ 0.01) consisted of four factors, namely, mother’s self-esteem, family functioning, temperament and parenting behaviour, significantly predicted adolescent’s difficulties. However, only mother’s self-esteem was found to be significant predictor. Together, the four factors accounted for 30 percent of the variance in adolescent’s strengths in non-intact families.
DISCUSSION
As noted earlier, the primary objective of the study was to determine the relationships be tween paren t ing behav iour and adolescent’s adjustments in both intact and non-intact families. Prior to this, the level of parenting and adjustments of the adolescent were identified. In contrast to earlier evidence (Simons et al., 2006), the present study revealed that mothers from the intact families seemed to practice more favourable parenting behaviour compared to non-intact families. With regards to adolescent’s adjustments, although the study unveiled the discrepancies of adolescent’s difficulties between the two studied samples, overall, adolescents scored better in “strengths” compared to “difficulties”. These findings seem to suggest that the target adolescents in this study may not be experiencing social emotional problem.
The bivariate findings paralleled the literature where parenting behaviour and adolescents’ outcomes are closely related. The present study provides evidence on the significant impact of parenting on adolescent’s adjustments for both intact and non-intact families, with the exception of adolescent’s strengths in non-intact families. Another finding from the present study worth mentioning is on the multiple determinants of parenting behaviour, as proposed in Belsky’s model, although the order of importance was dissimilar. As expected, positive developmental outcome in adolescents is associated with responsive mothers, i.e. those with conducive parenting behaviour. The three dimensions of parenting behaviour focused in the present study were parent-adolescent relationship, parental monitoring and involvement. Based on the results, the study suggests that good quality parenting is vital for adolescent’s social emotional well-being.
Regression analyses were computed to determine the predictors of adolescent’s social emotional adjustments. In intact families, mother’s self-esteem, family income, family functioning and temperament predicted strengths in adolescents. A similar set of predictors for strengths including parenting behaviour were found in non-intact families. All of these factors were in the expected direction, with exception of family income. Interestingly, family’s wealth seemed to promote difficulties rather than strengths in adolescents. This finding contradicts with Solantaus et al. (2004) who viewed family deprivation in financial resources as a risk for adolescents. The possible reason for this
Parenting Behaviour and Adolescents’ Social Emotional Adjustments
1443Pertanika J. Soc. Sci. & Hum. 21 (4): 1431 - 1446 (2013)
sociological pendulum could have attributed to the increase of affluent parents in the society, which in turn produce “pampered adolescent”, as denoted by Mamen (2006). Wealth could to a certain extent complicate developmental process because it can “belittle achievement, distort relationship and amplifies sense of what is good enough” (Pittman, 2004).
Despite the significant correlation found at the bivariate level, findings from the study revealed that family functioning instead of parenting behaviour played a stronger role in influencing adolescent’s social emotional adjustment, particularly in intact families. This finding may be plausible as the interactive function of a family as a whole unit could bring bigger impact on adolescents compared to their experience in its sub-unit (i.e., parent-child interaction) (Cox & Brooks-Gunn, 1999; Holmbeck, 1996). Thus, the finding cast light on the crucial role of systematic, rather than dyadic functioning, in studying adolescent’s development. Nonetheless, the focus on interaction between parent and adolescent in this study may not help to refine the understanding on the impact of social interaction patterns in families on adolescent development.
Several implications could be drawn from the present study and useful for the parents, educators, policy makers and other relevant parties. The present study has provided greater insight into the studies of parenting behaviour and adolescent’s adjustments, particularly in the Malay population. From the theoretical
perspective, determinants of parenting are multidimensional and this had been shown in the primitive analysis. However, some novice findings were found regarding the factor of strengths and difficulties. One of the notable ideas is the discovering of family process in influencing adolescents’ adjustments. Such conception connotes that a system perspective may be better to understand how developmental process occur beyond the dyad. This new knowledge redefines both the processes and outcomes that emerge between parents and their adolescents. In closing, the present study furthers our understanding of the dyadic parenting process and the systemic family functioning that play unique roles on adolescents’ social emotional adjustments, for both intact and non-intact families. Some empirical support for the theoretical integration of determinant of parenting has been realized. An enhanced understanding of families helps family practitioners to better assist families to balance the dyadic and systemic processes that both can be protective factors for promoting adolescents into well-adjusted member in the society. Assistance given to a family should incorporate assessment of family contextual factors together with parental factors into practice and education.
There are some limitations within the present study. The present study included only two types of households, which were simplified to intact and non-intact families. A broader array of family structures is recommended to avoid undue generalization. Furthermore, the present
Chiah, W. Y. and Baharudin, R.
1444 Pertanika J. Soc. Sci. & Hum. 21 (4): 1431 - 1446 (2013)
study focused only on maternal parenting; in fact, paternal parenting behavior deserves further exploration. As noted earlier, mixed sampling methods were utilized when there are complications in data collection. Along with the shortcomings in data collection, difference in the sample size of the two subgroups was large; thus, limit the statistical comparison tests to be conducted. Despite the drawbacks in the study, it revealed that conducive parenting could contribute to adolescent’s positive behavioural development and subsequently buffer an adolescent from difficult disposition. Conceptually, mother’s parenting behaviour is influenced by multiple factors, those of which discussed in this study were parental characteristics, family social contexts and adolescent’s characteristics. These determinants of parenting could have influenced on the adolescent-rearing of the mothers, which in turn, have marked effects on adolescent’s adjustments.
REFERENCESAl-Kazi, L. A. (2008). Divorce: A structural problem
not just a personal crisis. Journal of Comparative Family Studies, 39(2), 241-257.
Aquilino, W. S. (2005). Impact of family structure on parental attitudes toward the economic support of adult adolescents over the transition to adulthood. Journal of Family Issues, 26(2), 143-167.
Baharudin, R. (1996). Ecological predictors of the parenting behaviour of Malay Mothers. Journal of Social Sciences & Humanities, 4(1), 29-39.
Belsky, J. (1984). The determinants of parenting: A process model. Adolescent Development, 55, 83-96.
Björklund, A., Ginther, D. K., & Sundström, M. (2007). Family structure and adolescent outcomes in the USA and Sweden. Journal Population Economic, 20(1), 183-201.
Cavanagh, S. E., & Huston, A. C. (2006). Family Instability and Childrenʼs Early Problem Behavior. Social Forces, 85(1), 551-581. doi: 10.1353/sof.2006.0120
Ciairano, S., Kliewer, W., Bonino, S., & Bosma, H. A. (2008). Parenting and adolescent well-being in two European countries. Adolescence, 43(169), 99-117.
Cox, M. J., & Brooks-Gunn, J. (1999). Conflict and cohesion in families: Causes and consequences. Mahwah, NJ: Lawrence Erlbaum.
Cox, M. J., & Paley, B. (1997). Families as systems. Annual Review of Psychology, 48, 243-267.
Cui, M., Conger, R. D., Bryant, C. M., & Elder Jr, G. H. (2002). Parental behavior and the quality of adolescent friendships: A social contextual perspective. Journal of Marriage & Family, 64(3), 676-689.
Demuth, S., & Brown, S. L. (2004). Family structure, family processes and adolescent delinquency: The significance of parental absence versus parental gender. Journal of Research in Crime and Delinquency, 41(1), 58-81.
DeOliveria, E., Barros, F., daSilve, A. L., & Piccinini, C. (2006). The quality of home environment in Brazil: An ecological model. Journal of Adolescent and Family Studies, 15(5), 631-642.
Department of Statistics Malaysia. (2000). Population and housing census. General report of the population and housing census. Putrajaya: Government Printers.
Department of Statistics Malaysia. (2007). Social statistics bulletin. Putrajaya: Government Printers.
Drescher, A. L. (2008). The relations among maternal depression, parenting behaviors, and
Parenting Behaviour and Adolescents’ Social Emotional Adjustments
1445Pertanika J. Soc. Sci. & Hum. 21 (4): 1431 - 1446 (2013)
adolescents’ perceptions of family functioning: The moderating effect of mothers’ couple relationship status. (Master Dissertation). Retrieved February 28, 2011, from ProQuest Digital Dissertations (UMI No. 1453755).
Drescher, A. L. (2008). The relations among maternal depression, parenting behaviors, and adolescents’ perceptions of family functioning: The moderating effect of mothers’ couple relationship status. North Zeeb Road: ProQuest Information and Learning Company.
Epstein, N. B., Baldwin, L. M., & Bishop, S. B. (1983). The McMaster family assessment device. Journal of Marital and Family Therapy, 9(2), 171-180.
Eshleman, J. R. (2003). The Family (10th ed.). Boston: Allyn & Bacon.
Finkenauer, C., Engels, R. C. M. E., & Baumeister, R. F. (2005). Parenting behaviour and adolescent behavioural and emotional problems: The role of self-control. International Journal of Behavioural DEvelopment, 29(1), 58-69.
Goodman, R. (1997). The strengths and difficulties questionnaire: A research note. Journal of Adolescent Psychology and Psychiatric, 38(5), 581-586.
Gronick, W. S., Price, C. E., Beiswenger, K. L., & Sauck, C. C. (2007). Evaluative pressure in mothers: Effects of situation, maternal, and adolescent characteristics on autonomy supportive versus controlling behavior. Developmental Psychology, 43(4), 991-1002.
Holmbeck, G. (1996). A model of family relational transformations during the transition to adolescence: Parent-adolescent conflict and adaptation. In J. Graber, J. Brooks-Gunn, & A. Petersen (Eds.), Transitions through adolescence: Interpersonal domains and context (pp. 167-199). Mahwah, NJ: Lawrence Erlbaum.
Leech, N. L., Barrett, M. K., & Morgan, G. A. (2005). SPSS for intermediate statistics: Use and interpretation. New Jersey: Lawrence Erlbaum Associates, Inc.
Mamen, M. (2006). The pampered adolescent syndrome.How to recognize it, how to manage it, and how to avoid it. A guide for parents and professionals. London: Jessica Kingsley Publishers.
Ministry of Women Family and Community Development. (2009). Kes Juvana mengikut Negeri, 2000-2005 Retrieved 30 Mac, 2009, from http://www.kpwkm.gov.my
Ministry of Women, Family and Community Development. (2009). Statistic. Retrieved February 28, 2011, from http://www.kpwkm.gov.my/new_index.php?page=statist ic_content&year=2009&lang=eng.
Moore, D. R., & Florsheim, P. (2008). Interpartner conflict and adolescent abuse risk among African American and Latino adolescent parenting couples. Adolescent Abuse & Neglect, 32(4), 463-475.
Murry, V. M., Brody, G. H., Simons, R. L., Cutrona, C. E., & Gibbons, F. X. (2008). Disentangling ethnicity and context as predictors of parenting within rural African American families. Applied Developmental Science, 12(4), 202-210.
Neitzel, C., & Stright, A. D. (2004). Parenting behaviours during adolescent problem solving: The roles of adolescent temperament, mother education and personality, and the problem-solving context. International Journal of Behavioural Development, 28(2), 166-179.
Pittman, F. S. (1985). Adolescents of the rich. Family Process, 24(4), 461-472.
Rebecca, P. A. (2006). Effects of parenting style on personal and social variables for Asian adolescents. American Journal of Orthopsychiatry, 76(4), 503–511.
Chiah, W. Y. and Baharudin, R.
1446 Pertanika J. Soc. Sci. & Hum. 21 (4): 1431 - 1446 (2013)
Rhucharoenpornpanich, O., Chamratrithirong, A., Fongkaew, W., Rosati, M. J., Miller, B. A., & Cupp, P. K. (2010). Parenting and adolescent problem behaviors: A comparative study of sons and daughters in Thailand. Journal of The Medical Association of Thailand, 93(3), 293-300.
Rosenberg, M. (1965). Society and the adolescent self-image. Princeton, NJ: Princeton University Press.
Simons, L. G., Chen, Y. F., Simons, R. L., Brody, G., & Carolyn, C. (2006). Parenting practices and adolescent adjustment in different types of households: A study of African American Families. Journal of Family Issues, 27(6), 803-825.
Simons, R. L., Whiteback, L. B., Conger, R. S., & Melby, J. N. (1990). Husband and wife differences in determinants of parenting: A social learning and exchange model of parental behaviour. Journal of Marriage and the Family, 52, 375-392.
Solantaus, T., Leinonen, J., & Punamaki, R. (2004). Adolescents’s mental health in times of economic recession: Replication and extension of the family economic stress model in Finland. Developmental Psychology, 40(3), 412-429.
Suchman, N. E., Rounsaville, B., DeCoste, C., & Luthar, S. (2007). Parental control, parental warmth, and psychological adjustment in a sample of substance-abusing mothers and their school-ages and adolescent adolescents. Journal of Substance Abuse Treatment, 32, 1-10.
Sweeney, R. B., & Bracken, A. B. (2000). Influence of family structure on adolescents’s self-concept development. Canadian Journal of School Psychology, 16(1), 39-52.
Videon, T. M. (2005). Parent-adolescent relations and adolescents’s psychological well-being: Do Dads matter? Journal of Family Issues, 26(1), 55-78.
Vieno, A., Nation, M., Pastore, M., & Santinello, M. (2009). Parenting and antisocial behavior: A model of the relationship between adolescent self-disclosure, parental closeness, parental control, and adolescent antisocial behavior. Developmental Psychology, 45(6), 1509-1519.
Voydanoff, P., & Donnelly, B. W. (1998). Parents’ risk and protective factors as predictors of parental well-being and behavior. Journal of Marriage and the Family, 55, 385-398.
Wen, M. (2008). Family structure and adolescents’s health and behavior. Journal of Family Issues, 29(11), 1492-1519.
Wissink, I. B., Dekovic, M., & Meijer, A. M. (2006). Parenting behavior, quality of the parent-adolescent relationship, and adolescent functioning in four ethnic groups. The Journal of Early Adolescence, 26(2), 133-159.
Pertanika J. Soc. Sci. & Hum. 21 (4): 1447 - 1455 (2013)
ISSN: 0128-7702 © Universiti Putra Malaysia Press
SOCIAL SCIENCES & HUMANITIESJournal homepage: http://www.pertanika.upm.edu.my/
Article history:Received: 23 June 2011Accepted: 6 October 2012
ARTICLE INFO
E-mail address: [email protected] (Asfa M. Yasin)
Productive Work as Pedagogical Tool in School Education
Asfa M. YasinAgriculture Division, PSS Central Institute of Vocational Education (PSSCIVE), NCERT, 131, Zone-II, M. P. Nagar, Bhopal – 462011 (MP) India
ABSTRACT
In the era of globalization, the educational needs are changing world wide. With special reference to developing countries, objectives and aim of education are more toward self-sustenance, happy and healthy living in safe and pollution-free environment. At the same time, it is without a doubt that materialism and technological advancements at some instances cause youth to be competitive among themselves which inevitably causes stress among school students. This is due to education system, curriculum load and competition for achieving excellence. With this view in mind, the National Council of Educational Research & Training (NCERT), New Delhi, an apex body for school education in the country, has suggested revolutionary changes in education as suggested in the it’s the National Curriculum Framework (2005). Amongst them, one of the important changes suggested is the integration of work with academic subjects. Work-based education as pedagogical medium in school education is based on Gandhian philosophy. Designating Work Centered Education (WCE) to this concept, it is considered that integration of work in school curriculum, replace rote learning, develop generic competencies and develop values, respect for manual work and workers besides physical development of children. This paper deals with the concept of Work Centered Education (WCE), its operationalisation and its advantages in making school education children centered.
Keywords: Pedagogical tool, work centered education, school education
INTRODUCTION
In education, ‘learning-by-doing’ is an established fact. In India, this concept was advocated by Mahatma Gandhi in his scheme ‘Basic Education ’. According to Gandhi, education should be integrated with work, which should actually be associated with
Asfa M. Yasin
1448 Pertanika J. Soc. Sci. & Hum. 21 (4): 1447 - 1455 (2013)
productive work. Every work or vocation is ingrained with certain scientific principles, social usefulness, ethics, personal, social and national values. Keeping this in mind, work is assigned as the central fundamental key position in school curriculum. Around the said concept, knowledge and concepts of science, mathematics, linguistics, management are inter-twined giving rise to the concept of work-centered education.
Mahatma Gandhi (1937) whi le addressing teachers in Wardha conference placed this powerful dimension of education by saying,
“The brain must be educated through the hand ……. Those who do not train their hands, who go through the ordinary rut of education, lack music in their life”.
All their faculties are not trained. Mere book knowledge does not interest the child so as to hold his attention fully.
As an extrapolation of the above, productive work is considered an exclusive pedagogical tool for joyful learning and an easy way of understanding difficult concepts besides value development. National Council of Educational Research and Training (NCERT) India’s apex organization for school education has proposed to use this concept in school education system in the National Curriculum Framework 2005.
Work and Education i.e. integration of work in teaching-learning process leads to the Institutionalization of Work Centered Education (WCE) concept. This concept
assigns central place to ‘work’ which entails understanding of scientific and mathematical concepts, geographical, social and environmental issues and development of generic competencies. WCE provides opportunities to students to undertake productive work which not only unfold their potential, creativity and innovation but also show the gate of ‘world of work’ that exist around them.
In the last five to six decades in education, as in all walks of life, we have moved from cooperation to competition as a model for living. Despite several attempts at humanizing education, it is pushing children in a culture of ruthless competition through means fair or foul, through cramming or cheating, private tuitions and through influence. Violence and hostility are the hallmarks of day today living. Peace, harmony, contentment and sharing are little used words or values. Dignity of labour, hard work, punctuality and honesty are causalities. To some extent these ailments of the society may be handled by the integration of work in education, which creates scope to ensure that from toddlers to teenagers, our youngsters are well equipped to handle life as it exists today and give them space for forging a desired future.
PRACTICES IN RELATION TO WORK CENTERED EDUCATION
Case 1 & 2:WCE concept used by State Boards of Madhya Pradesh and Gujarat
In India the ‘Work Centered Education (WCE)’ concept has been used in the past by Govt. State Boards in formal system
Productive Work as Pedagogical Tool in School Education
1449Pertanika J. Soc. Sci. & Hum. 21 (4): 1447 - 1455 (2013)
viz., Gujarat State Board of Secondary Examination in Buniyadi Shallas during 1960’s, Madhya Pradesh more than 1000 schools of 14 districts were covered under Hoshangabad Science Teaching Programme (HSTP) with the involvement of government system of the state from 1972 to 2000. In non-formal system, many Non-Government Organizations (NGOs), are still using work-based education programme in schools run by them specially to cater to the needs of the people of their respective localities.
Case 3: Adharshila Learning Centre
The children of the Adharshila School at Village Saakad, near Sendhwa, District Badwani, Madhya Pradesh, learn from being actively engaged in community life (cooking, cleaning, campus maintenance, etc.) at the school and, interacting with the village people. The children prepared a ‘Book of Famine’ (Akaal ki Kitaab) named ‘Rookhi-Sookhi’ in the year of famine in the area by interviewing village elders and recording the local history of famine. This enabled the children to bring out the local scientific knowledge relating to crops, water sources, flora and fauna and environment (NFG, 2007 – Position Paper on Work and Education). The school won first prize in the state in National Children Science Congress on Science project for understanding malnutrition. Children study mathematics by taking real measurements of length, area, volume, accounts, etc. during productive work undertaken by them.
Case 4 :Walmikinagar
Walmikinagar (in Patan Taluka, District Satara, Maharashtra, India) is a cluster of 10 to 12 hamlets at the top of the plateau in remote Sahyadri Hills. In 1997, it was planned to establish a school from Classes V to X. The people from the surrounding villages viz. Udhawane, Karale, Tamine, Paneri, Ruvale and others organised a meeting at a hill top. The women passed a resolution to start a school with people’s support. The local farmers and shepherds (including women) became its ‘Honorable Teachers’. As a non-literate farmer entered the school, the first time, everyone mocked at him saying, “What can this person teach us when he does not know how to write or read even his own name?” Later, he was introduced as a person who can draw parallel lines along the length of a one hectare plot with the help of his bullocks. The farmer began by talking about the bullock cart parts and their functions and then moved on to seasons, vegetation and soils. He taught 150 new words regarding farming and bullock cart and referred to 14 principles of physics. Each principle was accompanied by a practical demonstration. At the end of the session, the teachers agreed that now they understood real physics.
Case 5: Vigyan Ashram
Institutionalization of concept of WCE in school system is well undertaken by Vigyan Ashram, Pabal, Pune, Maharashtra since 1969. There is a programme of education ‘Introduction to Basic Technology’, under
Asfa M. Yasin
1450 Pertanika J. Soc. Sci. & Hum. 21 (4): 1447 - 1455 (2013)
this various productive works are used in the curricula of 8th, 9th and 10th standards. Teaching of science, mathematics, geography and environmental sciences is being undertaken in different classes using different productive work/ activities as pedagogical medium. This programme is designed as pre-vocational programme implemented by Maharashtra State Government. This programme is running in 92 schools in Maharashtra and 5 schools in Karnataka states in collaboration with Vigyan Ashram. Few productive works undertaken class-wise are mentioned below:
i. 8th Standard – Water testing, welding and making a sitting stool of iron, making wooden shoes stand, domestic wiring, and plant grafting, seed processing, animal care, etc. in agriculture
ii. 9th Standard – Water conservation (contour mapping to locate water shed area), Ferro-cement work – making soak pit for sanitation and safety tank for toilet wastes, use of biogas plant, Blood group and hemoglobin testing, and in agriculture use of drip and sprinkler irrigation implements, animal care and production (one day old chick to adult selling size), etc.
iii. 10th Standard – Repair and maintenance of electrical motors, Domestic wiring, Repair and maintenance of domestic appliances, Pest control, Handicapped people – care; innovative design of toilets and clutches.
Case 6: Shishuvan
As part of the Khadi (it is a type of cloth prepared by hand weaving using Charkha, a device used for spinning and weaving) curriculum, students at Shishuvan, Mumbai learn how to use the takli to make thread, in standard IV. They gradually learn charkha operation by standard VII. Those who become proficient, start working on the loom by standard IX. Others who were not so proficient, move from the charkha to paper recycling. They recycle all the newspapers and waste papers in the school by shredding it and making into hand-made paper which is used for invitations to the school’s annual day and other events. Some of the paper is used to make paper handbags for giving to visitors, guests or/and seminar speakers. The vision driving this is to inculcate a love of working with the hands to produce something of value. When children make something on their own, they feel a sense of creation and of having contributed to the school.
WORK CENTERED EDUCATION (WCE): THE CONCEPT
‘Education’ in a very simple meaning, is the ‘understanding of life, materials and livelihood’. In furtherance to this understanding, it may be mentioned that various subjects i.e. science, social science, languages, mathematics, geography, etc. are actually interwoven, and be taught in an integrated way around some concrete experience that a child has, and not in isolation or as abstract thing. Looked in this way, one can develop all this in relation
Productive Work as Pedagogical Tool in School Education
1451Pertanika J. Soc. Sci. & Hum. 21 (4): 1447 - 1455 (2013)
to our day-to-day life. In this approach the ‘work’ occupies central position, as every productive work has elements of science, maths, language, social aspects, geographical dimensions, etc.
In India, the education policy envisioned to introduce work in all the stages of school education. Right from primary stage to upper primary stage as Socially Useful Productive Work (SUPW)/ Work Experience, at secondary level pre-vocational education and separate vocational stream at senior secondary stage of education. In relation to ‘work experience’ at primary stage, National Policy on Education (NPE) 1986 of Govt. of India states “one of the aims of education at this stage should be to develop awareness in the child about the world of work through participation in productive work. The development of desirable attitudes, values and habits to work, such as appreciation of manual work and regard for manual workers, cooperativeness and team work, regularity, punctuality, discipline, honesty, creativity, persistence, etc. can be achieved through well organised, self-expressive service and production oriented activities”.
For upper primary stage, the NPE (1986) mentioned that “at this stage children are sufficiently mature to carry out strenuous work with higher skills which may require closer coordination of hand and brain’. They should be encouraged to participate more intensively in production processes by undertaking well-designated projects in selected areas of human need which will mark the beginning of pre-vocational orientation to the work experience programme. The children should also be
able to relate their knowledge of facts and the scientific principles involved in various types of work”.
Accordingly, systemic reforms to institutionalize ‘Work Centered Education’ remain the urgent need for today’s scenario of technology in every walk of life. With special mention of science teaching, difficult concepts can be understood by children while undertaking some kind of productive work. Activities or experiments may not and can not take the place of productive work due to limited scope for comprehension, understanding and application. On contrary to this, productive work can enable children to comprehend the scientific concepts and their applicability.
An attempt has been made to explain the concept of WCE by using ‘Nursery Raising’ as example of productive work in Fig.1.
INSTITUTIONALIZATION OF WCE: A PERSPECTIVE
These days common problem of students is that of rote learning. In the context of science teaching and understanding of difficult concepts, children need special provisions for experimentation/ demonstration, otherwise children tend to memorize principles and formulae without comprehending their meaning and hence have difficulty in interpreting them and applying them in practical situations. By undertaking productive work, wherein related scientific principles are applied in our day to day life, it will be easier for children to understand scientific principles and their applications.
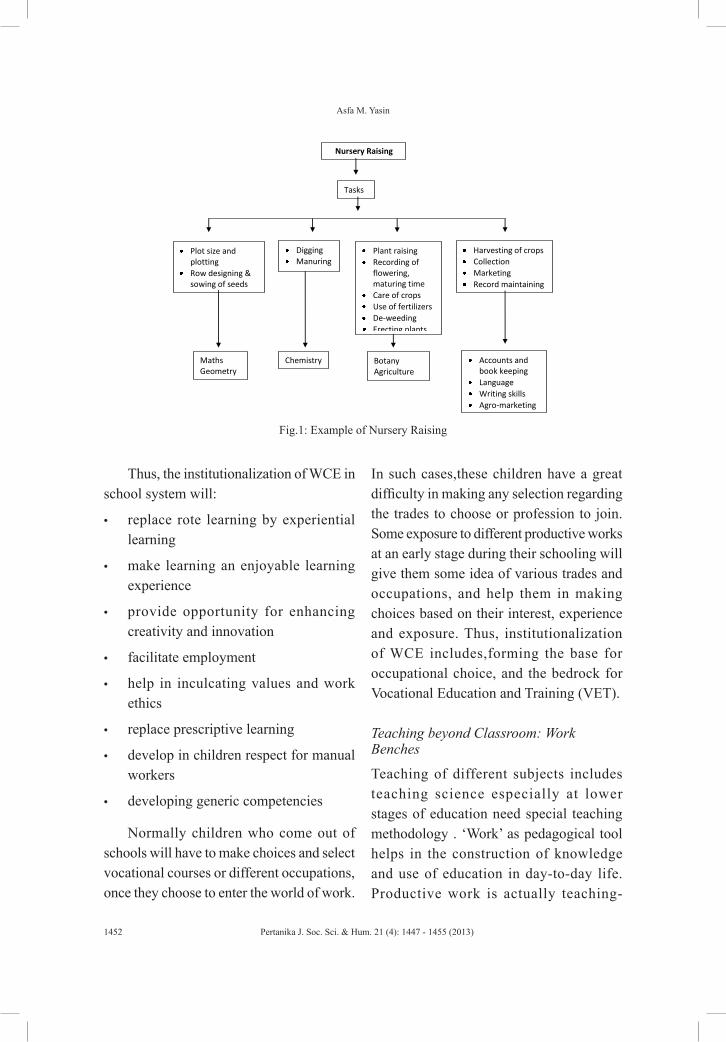
Asfa M. Yasin
1452 Pertanika J. Soc. Sci. & Hum. 21 (4): 1447 - 1455 (2013)
Thus, the institutionalization of WCE in school system will:
• replace rote learning by experiential learning
• make learning an enjoyable learning experience
• provide opportunity for enhancing creativity and innovation
• facilitate employment
• help in inculcating values and work ethics
• replace prescriptive learning
• develop in children respect for manual workers
• developing generic competencies
Normally children who come out of schools will have to make choices and select vocational courses or different occupations, once they choose to enter the world of work.
In such cases,these children have a great difficulty in making any selection regarding the trades to choose or profession to join. Some exposure to different productive works at an early stage during their schooling will give them some idea of various trades and occupations, and help them in making choices based on their interest, experience and exposure. Thus, institutionalization of WCE includes,forming the base for occupational choice, and the bedrock for Vocational Education and Training (VET).
Teaching beyond Classroom: Work Benches
Teaching of different subjects includes teaching science especially at lower stages of education need special teaching methodology . ‘Work’ as pedagogical tool helps in the construction of knowledge and use of education in day-to-day life. Productive work is actually teaching-
Nursery Raising
Plot size and plotting
Row designing & sowing of seeds
Digging Manuring
Plant raising Recording of
flowering, maturing time
Care of crops Use of fertilizers De-weeding Erecting plants
Harvesting of crops Collection Marketing Record maintaining
Maths Geometry
Chemistry Botany Agriculture
Accounts and book keeping
Language Writing skills Agro-marketing
Tasks
Fig.1: Example of Nursery Raising
Productive Work as Pedagogical Tool in School Education
1453Pertanika J. Soc. Sci. & Hum. 21 (4): 1447 - 1455 (2013)
learning in ‘beyond classroom situation’. This situation may be workshop located in school or real job situation as work benches. The school would have to be duly empowered to carve out ‘work benches’ in the neighborhood, where the students could get to learn through work at the real job/ vocation related shop/ workshop/ agriculture farm/ dairy or poultry or fish farm as the case may be. Thus, using this methodology for demonstration and teaching will be beneficial in: (a) less or no capital investment in the school; (b) exposure to work situation enabling dealing with day to day problems, latest technology and trade tips; and (c) making learning contextual, and (d) acquiring practical knowledge and skills.
Examples of productive work
The productive work may be chosen on the basis of stage of education and age of children. Following productive works are suggested which may be chosen for different classes:
Group IFood Processing – Processing of Vegetables and Fruits, Bakery
Group II Agricul ture – Hor t icu l ture , Crop Production, Nursery Raising, Agricultural and animal farm practices – dairy, poultry, fisheries, etc.
Group IIITechnology – Repair and Maintenance of Domestic Appliances, Metal Sheet Work,
Carpentry, Furniture Making and Designing, Electrical Fittings, Renewable Energy Sources (Solar and Wind Energy)
Group IVArts and Crafts/ others – Clay Work, Making of Toys, Painting, Traditional Crafts, Photography, Videography, etc. and Care of old aged people
Change in Time-table
Work Centered Education will not run in the boundaries of rigid time table. The work undertaken will have to be completed in the stipulated time ensuring skill development in children and desired learning outcome in consonance of contents/ concepts of different subjects . Time table may be prepared on weekly basis and group teaching methodology may be beneficial and result oriented.
Group Teaching
Teaching in ‘beyond class room’ situation undertaken at the workshop will require science, maths, language, geography, social science teaching by subject teachers together with field expert, depending upon the subjects and contents to be taught by the productive work undertaken .
Development of Scientific Temper
Students engaged in productive work will be exposed to different aspects of operations and processes involved in the given productive work. The ‘Do’s’ and ‘Don’t besides why, what, how? of the productive work will develop inquisitiveness leading
Asfa M. Yasin
1454 Pertanika J. Soc. Sci. & Hum. 21 (4): 1447 - 1455 (2013)
to the development of scientific temper in students which is one of the essential objectives of education in modern society.
Developing Generic Competencies and Values
Any productive work related to providing services or production of goods involves a team of workers, and their devotion for quality of products and services. Productive work thus, enable the development of values such as team work, punctuality, honesty, sincerity, workmanship and generic competencies such as critical thinking, mathematical and linguistic abilities, work ethics, social skills, communication skills, inquisitiveness, entrepreneurial skills, etc.
In the present scenario of globalization, liberalization and privatization development of generic competencies is essential. According to NFG Position Paper (2005), generic competencies can be categorized into three groups:
i. Basic; creativity, inquisitiveness, mathematical abilities, motivation and comprehension for work including systematic applications.
ii. I n t e r p e r s o n a l c o m p e t e n c i e s ; communication skills, social skills, attitude to work etc. and
iii. Systemic competencies ; taking initiative, leadership qualities, sincerity etc.
CONCLUSION
It is proposed that education system in developing countries, if restructured to
institutionalize WCE, will enable children to equip themselves with generic competencies required for the present market demand. Secondly, use of productive work will help in learning and understanding difficult concepts/principles thus, education will become enjoyable. Children coming from the families having traditional occupations will also be happily sent to schools by their parents in order to learn more about their parental occupations. Idea of work-bench to teach and train in practical aspects of a productive work will enable local community to participate in educational programmes at school level. This may also help in enhancing enrolment in schools and reducing drop-out rates, with special reference to marginalized sections of people.
In conclusion, it may also be mentioned that to implement WCE programme, and run it successfully, there will be need of a policy for systemic reforms including common school system and teacher preparation for pre-service and in-service teachers.
REFERENCESAdharshila Learning Centre. (2007). Personal
communication – Amit and Jayshree, Director, Adharshila, Sendhwa, Madhya Pradesh.
Govt. of India. (1964-66). Report of Education Commission, Ministry of Education, New Delhi.
Govt. of India. (1977). Report of the Review Committee on the Curriculum for the Ten-year School (Ishwar Bhai Patel Committee), Ministry of Education, New Delhi.
Mahatma Gandhi. (1937). Address to teachers in Wardha Conference in collected works of Mahatma Gandhi, 68, pp.372-373.

Productive Work as Pedagogical Tool in School Education
1455Pertanika J. Soc. Sci. & Hum. 21 (4): 1447 - 1455 (2013)
National Curriculum Framework (NCF). (2005). National Focus Group (NFG) Position Paper on Work and Education. NCERT, New Delhi.
S h i s h u v a n . ( 2 0 1 0 ) . K h a d i C u r r i c u l u m . Personal communication – Kavita Anand ([email protected]), Executive Director, Shishuvan, 426, Shraddhananda Red Kings Circle, Matunga, Mumbai 400 019 for details go to links www.shishuvan.com.
Vigyan Ashram. (2011). Introduction to Basic Technology. Personal communication – Dr. Yogesh Kulkarni ([email protected]), Director, Vigyan Ashram, Pabal, Pune, Maharashtra, for details go to links www.vigyanashram.com.

Pertanika J. Soc. Sci. & Hum. 21 (4): 1457 - 1470 (2013)
ISSN: 0128-7702 © Universiti Putra Malaysia Press
SOCIAL SCIENCES & HUMANITIESJournal homepage: http://www.pertanika.upm.edu.my/
Article history:Received: 28 July 2011Accepted: 20 September 2012
ARTICLE INFO
E-mail addresses: [email protected] (Nahid Shahbazi Moghadam), [email protected] (Arbaayah Ali Termizi) * Corresponding author
How Real is Real: Attitudes towards Realism in Selected Post-war British Fiction
Nahid Shahbazi Moghadam and Arbaayah Ali Termizi*Department of English Language, Faculty of Modern Languages and Communication, Universiti Putra Malaysia, 43400 Serdang, Selangor, Malaysia
ABSTRACT
Despite its apparent precision in meaning, realism as a once-held literary school of thought provokes controversies regarding its basic definition and the works attributed to it. This is particularly the case with the postmodern use of the term, most specifically in relation to fiction, with realism generally asserted as the traditional language of the genre. This paper is an attempt to discuss the implication and tenets of realism, its progress and changes, in selected works of post-war British fiction. Accordingly, Graham Greene’s The Power and the Glory, Mervyn Peake’s Gormenghast, and Ian McEwan’s Atonement are dealt with to trace realism within their respective modes of new realism, fantastic-grotesque and postmodern metafiction. Having survived the early twentieth century allure of modernism, realism has gradually evolved into a new identity capable of emerging in and mingling with new modes prevalent in postmodern fiction. Owing to the spirit of the time immediately following the Second World War and the particularities of different authors, the postmodern realism has gone beyond a mere portrayal of the objective world and is in demand of a refreshed understanding of the new outlooks contemporary realism has the potentiality to offer.
Keywords: Realism, post-war British fiction, metafiction, modernism, post-modernism, Graham Greene,
Mervyn Peake, Ian McEwan
INTRODUCTION
Socio-historical Background
Referring to the American civil war, Flannery O’Connor (1972) once made a very delicate indication as to how war could possibly affect those who were defeated:
Nahid Shahbazi Moghadam and Arbaayah Ali Termizi
1458 Pertanika J. Soc. Sci. & Hum. 21 (4): 1457 - 1470 (2013)
We have had our Fall. We have gone into the modern world with an inburnt knowledge of human limitations and with a sense of mystery which could not have developed in our first state of innocence (p. 59).
Regarding the war calamity and its effects, such a claim makes sense even in the case of the conquerors in the Second World War, perhaps with the exception of the United States as the only nation having had its land untouched by the battlefields. The United Kingdom and her European allies earned the victory at a great expense. Considering all the rationing, evacuation, and air-raids, Harry Blamires (1988) indicates that “the second world war was not just something happening overseas like the first” (p. 197).
All the aftershock effects of the war continued to haunt the minds with the threat of the ongoing development of the nuclear and atomic bombs and the arms race of superpowers. The invasion of Egypt in mid fifties rose concerns whether Britain was receding back into imperial days. Undeniably, these events had an impact on the literature of the age. The harsh reality of political and social situation of the time had a crude effect on how the new realism was portrayed in works of various literary genres particularly novel as the most life-like replica of the real world. Furthermore, the after-war pandemonium was accompanied by still another wave of change targeting the old world. The initiation of a social openness
to deal with the already assumed obscenity of sexual matters made it possible for writers to freely excavate new grounds in human relationships.
THE LITERARY SCENE
With all the turmoil in the air, one can expect the literary works of the age to be in a state of flux. Literary historians like George Watson (1991) believe that the mid-twentieth century witnessed “reviving a tradition of realism that had flourished first in the eighteenth century England” (p. 6). Recognizing the technical complexities of the literature of between the war years as an imported method, Watson favours the retreat to a British narrative style devoid of the stream of consciousness and complex points of view.1 In Flight from Realism, Marguerite Alexander (1990) also indicates that it was the realist writers, who initiated a break from Modernism as early as 1930s (p. 9). Accordingly, it can be asserted that new realism acted as a revolt against the excesses of modernist style just like the way traditional realism had gone against romanticism in early nineteenth century.
As it is generally the case, new literary movements are born or old ones are revived when the current ones are taken to extreme. However, the spirit of the age is of such a quality that the course of contemporary events and context generally spreads its effects upon the epoch it touches. As to post-war British fiction, a revival of realism had the quality of unrestricted and flexible imitation of the eighteenth-century pioneering fiction or nineteenth-century Realism, particularly
Realism in Post-war British Fiction
1459Pertanika J. Soc. Sci. & Hum. 21 (4): 1457 - 1470 (2013)
in relation to technicalities of the style. Considering the spirit of the age, the public taste immediately following the war years was too overwhelmed and exhausted to be entertained with complex, esoteric and abstract notions most favoured by Modernists. As Blamires (1988) states:
In the central decades of the century public appetite created a market not only for the pulp fiction but for well-made novels of daily life, readably undemanding, handling with simplistic conviction the limited range of moral and emotional conflicts that the modern media allot to suburban man (p. 195).
It might be unfairly inferred that the novelists who preferred to satisfy the public, mainly clung to a shallow realism, reportage of a series of events arranged in a way to be followed and rejoiced instantly. In the first place, this short-lived period can be considered as an ‘interlude’ or for the sake of its initiation more aptly a ‘prelude’ hailing and paving the way for the new realism. Furthermore, stereotypical notions conceiving a fixed framework of realism could and still can be challenged by imposing the question of to what extent the personal perception of a writer with regard to the reality surrounding him is ‘real.’ Can a piece of literary work be labelled as realistic on the ground that it sticks to a report-like account of a writer, who furnishes his fictional world setting by ‘real’ surroundings? Can it be guaranteed
that two authors of identical background and social surroundings perceive the world in the same manner? Is that the right criteria to take such works as ‘real’ on the ground that they follow what was once considered as Realism? As Bertolt Brecht (1992) asserts; “one cannot decide if a work is realist or not by finding whether it resembles existing, reputedly works which must be counted realist for their time” (p. 44).
As a recapitulation, it can be expressed that the rising individual consciousness of authors regarding their autonomy in representation of real along with the events of post-war period had its impact on the diversity which was to come. As already stated, political as well as social events of late fifties rekindled controversial issues and awakened the war-stricken and dormant public from their short term slumber. According to Blamires (1988), the “social and spiritual discomfiture,” was then “restlessly or wryly, angrily or mockingly projected” through theatre and fiction (p. 223).
Types of fiction prevalent from mid twentieth century have thus enjoyed a variety less common to previous eras. This paper choice would, then, be more tangible in dealing with realistic elements in some sample works as diverse as socio-political fiction of Graham Greene, the grotesque and fantasy-bound novels of Mervyn Peake, and the more recent psychological works of Ian McEwan. The textual analyses are here to be preceded by a brief discussion of realism in relation to modernism and postmodernism.
Nahid Shahbazi Moghadam and Arbaayah Ali Termizi
1460 Pertanika J. Soc. Sci. & Hum. 21 (4): 1457 - 1470 (2013)
REALISM, MODERNISM AND POSTMODERNISM
In an essay entitled “Modernism, Anti-modernism and Post-modernism,” David Lodge (1981) makes the distinction between modernism and postmodernism by referring to modernism as being based on obscurity whereas postmodernism centres on uncertainty, “a labyrinth without exits” (p. 13). Where does realism abide in the territory where modernism is giving place to postmodernism? Lodge takes a very illustrative standpoint by conceiving a pendulum which alternatively dangles from modernism to realism and vice versa. Accordingly, he considers 1920s as the time of modernism while 1930s is dominated by realism. To him, a half-way move toward modernism occurs in 1940s. In turn, mid 1950s is the age of new realism. Lodge exploits Roman Jakobson’s idea of metaphor and metonymy to respectively refer to modernism and realism. Then, the gradual upheaval of postmodernism from 1960s onward is what Lodge calls the “powerful emblem of contradiction, defying the most fundamental binary system of all” (p. 13). He believes in postmodernism as a follower of “the modernist critique of traditional realism” (p. 12) (italic mine). Regarding the defiance of binary opposition, which in this case refers to the dichotomy between modernism and realism, it can be deduced that postmodern fiction is not necessarily anti-realist in certain respects.
Patricia Waugh’s Metafiction seems to invoke a standpoint similar to that of
David Lodge, whom she acknowledges for his inspiration in the writing of her book. Waugh asserts that metafiction “is an elastic term which covers a wide range of fiction,” identical to a spectrum (1984, p. 19). At the centre of this imaginary spectrum resides the new realism, which “manifests the symptoms of formal and ontological insecurity but allows their deconstruction to be finally re-contextualized or ‘naturalized’ and given a total interpretation” (Waugh, 1984, p. 19). Her stipulation distinctly illuminates the strength of the new realism in pushing back traditional boundaries.
To consider postmodernism as a reconciliation of realism and modernism may sound rather too bold or hasty to be expressed directly. Nonetheless, the advent of new narrative modes since mid-twenties rendered the mingling of already existing modes more smooth. Whether termed as metafiction or postmodern fiction, the new novel has consolidated new realism by bridging the gap between modernism and realism. As Linda Hutcheon (2002) points out, postmodern fiction bears no threat to representation of reality but, the point that is of significance is a “question of what reality can mean and how we can come to know it” (p. 32). Accordingly, her standpoint appears in The Politics of Modernism as follows:
What postmodernism does is to denaturalize both realism’s transparency and modernism’s reflexive response, while retaining (in its typically complicitously critical way) the historically
Realism in Post-war British Fiction
1461Pertanika J. Soc. Sci. & Hum. 21 (4): 1457 - 1470 (2013)
attested power of both. This is the ambivalent politics of postmodern representation.
(Hutcheon, 2002, p. 32)
GRAHAM GREENE: EARLY RETREATS TO REALISM
Although Graham Greene lived well into the post war era, he is considered by some critics to be a writer of 1930s. This “inescapably 1930s writer,” as Watson (1991) puts it in his preface to British Literature since 1945 (p. xiv), is included in this discussion due to two main reasons. First, he is undeniably classified as an early new realist writer back in the thirties.2 More important are his own declarations regarding realism. In a series of correspondence with Elizabeth Bowen and V.S. Pritchett published under the title Why Do I Write, Greene (1948) asserts that telling the truth is the responsibility of the novelist. He elaborates on his standpoint as follows:
I don’t mean anything flamboyant by the phrase ‘telling the truth’: I don’t mean exposing anything. By truth I mean accuracy - it is largely a matter of style. It is my duty to society not to write: ‘I stood above a bottomless gulf ’ or ‘going downstairs, I got into a taxi,’ because these statements are untrue. My characters must not go white in the face or tremble like leaves, not because these phrases are clichés but because they are untrue (p. 30).
Considering a few main concerns of Greene, this is indeed a new realistic trend. As it is generally acknowledged, traditional Realism is more liable to verisimilitude and moral and didactic concerns in literature. From a technical point of view, the realism Greene has in mind has scarcely anything to do with verisimilitude. Furthermore, he does not advocate a moralist and didactic view of literature. He indicates that the novelist has no undertaking to ‘edify,’ which has to do with the personal essence of morality than the false assumption of amorality of literature (1948, p. 32).
In The Power and the Glory, the conceptual realism goes beyond a formal sense of closure at the end. A priest, betrayed by his drinking habits and a child out of wedlock, is on a constant flight from the government, where Church services are to be banned. After a long procession of escape and wandering, he is finally under arrest and shot to death. The whisky priest, as he is referred to recurrently throughout the narrative, faces the reality in his acceptance of what is made real to him through his various encounters with the realities in his life. He comes to admit that he feels more delighted than resentful by the fruit of his adultery. The reality is too vivid for him to blame himself for the wrong act; he is concerned with what the future may hold for his daughter. When finally arrested, he experiences the natural fear of death like any other human being. It can be assumed that reality comes to him gradually, and with every step he takes in his flight from the police.
Nahid Shahbazi Moghadam and Arbaayah Ali Termizi
1462 Pertanika J. Soc. Sci. & Hum. 21 (4): 1457 - 1470 (2013)
A very significant part of this novel is the prison scene, from which he eventually manages a narrow escape. In a dirty dungeon of a cell, the whisky priest spends the night in the company of criminals; grownups, an old man, a pious woman imprisoned for having a Bible at home, and a child. He unwillingly comes to speak about God and religion with the woman and some others, while hearing a couple making love in the darkness, and someone urinating. It is in this gloomy, impious, and grotesque scene that the priest feels at home:
… h e w a s t o u c h e d b y a n extraordinary affection. He was just one criminal among a herd of criminals… he had a sense of companionship which he had never experienced in the old days when, pious people came kissing his black cotton glove.
(G. Greene, 1962, p. 128)
How can one interpret the reality of this scene? From an objective point of view, which is more susceptible to verisimilitude than true realism, this incident is most queer and untruthful. It can, in fact, be considered as a grotesque experience expressed through a very subjective standpoint of reality. Greene’s portrayal of the whisky priest is not certainly of a typical religious man one expects to encounter very often. Thus, his treatment of the reality surrounding the social issue of the story is a reality from a fresh look, which managed to enrage religious radicals of his time.3 Nevertheless,
this could assuredly be the right way to deal with the issue of priesthood and Catholicism at the time, more to show than to judge a reality all too present to be taken for granted. Looking through the public eye, there seems to be a banal sense of reality, which fails to notice the depth of his predicaments. From phenomenological point of view, one cannot see the reality unless he gives up his position of a public spectator and walks with the priest along his path which more involves a fresh encounter with life than a mere way to escape police. This may be the case with the lieutenant, who parallels the priest’s escape with his obsession to hunt him down. This sort of reality certainly differs from a light account of daily events to entertain the average mind.
Regarding the ending of the novel from a technical view, it can be said that it does not fully display the sense of ending traditionally expected from a realistic work in which matters are generally resolved and settled down by the end of the story. As the whiskey priest is shot dead, another priest arrives at the scene, an incident which is potentially open to interpretations such as the indestructible Catholic Church or the continuation of the belief battles. The fate of Coral Fellows, the teenage girl who once helped the priest, is also left unuttered by her parents, who seem too distressed to mention her mysterious going away even in private.
Related to the point of view, technical aspect of realism can be discerned in that the third person narrative proceeds smoothly throughout the story leaving minimal confusion common to multi-
Realism in Post-war British Fiction
1463Pertanika J. Soc. Sci. & Hum. 21 (4): 1457 - 1470 (2013)
voiced modernist novels. There is no shift of narrative voice as the plot moves into different settings. Nevertheless, there is also no trace of an omnipresent narrator, whose authorial tone governs the text, directing the reader what to praise and what to abhor.
MERVYN PEAKE: MID-CENTURY REALISM IN FANTASTIC-GROTESQUE FICTION
For the sake of a fresher outlook on the realism of the post-war British fiction, this paper abandons the more commonly asserted works of realism in 1950s in favour of the fantasy-bound Gormenghast, the second novel in the trilogy of Mervyn Peake. Regarding the significance of the work, C.S. Lewis wrote to the author that it “had the hallmark of true myth ... adding to a class of literature in which the attempts are few and the successes very few indeed” (qtd. in Winnington, 2006, p. 21). Peake’s fiction is mainly recognized as works of the grotesque and the fantastic. However, this study means to consider his works in the light of its implication of realistic elements since new realism is here viewed as capable of blending with other modes beyond the conventional bonds of Realism. Among various modes, the grotesque has a well-grounded claim for mixing the unreal/surreal with reality.4
Mingling fantasy with reality has long been the debate of many critics and the practice of many writers. In a discussion of the fantastic in postmodern fiction, Gerhard Hoffman (2005) speaks of the paradoxical copresentation of the real and the fantastic as
an “interface of the actual and the possible” (p. 261) (italic mine). As the discussion goes, one certain quality of contemporary realism is its capacity to merge in with a wide range of modes such as European surrealism or the more recent magic realism first associated with the writings of Latin American authors. The line dividing these modes sometimes seems so blurry. Dealing with magic realism, Hoffman (2005) quotes Gabriel Garcia Marques speaking of Latin American realism as an “outsized reality,” which Marques refers to as their ‘reality’ (pp. 240-241). In a similar vein, Salman Rushdie echoes the notion of ‘outsizeness’ in defining certain representations of reality. In “Influence” in his collection of nonfiction Step across this Line (2002), Rushdie stipulates that Charles Dickens’ style of using realism in a liberating way influenced him in writing Midnight Children:
In Dickens, the details of place and social mores are skewered by a pitiless realism, a naturalistic exactitude that has never been bettered. Upon this realistic canvas he places his outsize characters, in whom we have no choice but to believe because we cannot fail to believe in the world they live in (p. 71).
In fact, it is a very illuminating point to detect such liberalism in a distinguished author of nineteenth-century Realism. This thorough explication on Dickensian use of realism seems most appropriate and
Nahid Shahbazi Moghadam and Arbaayah Ali Termizi
1464 Pertanika J. Soc. Sci. & Hum. 21 (4): 1457 - 1470 (2013)
applicable to Mervyn Peake’s works. If Dickens places ‘outsize’ characters upon a realistic canvas, Peake portrays both the characters and settings in a fusion of fantasy-bound reality and reality-bound fantasy. Peake’s mastery of the grotesque is an indispensible factor in creating such fusions. Interestingly enough, Peake’s realism and his use of the grotesque are likened to Dickens by Duncan Fallowell in the short entry of his profile in Makers of Modern Culture:
Peake is the most accomplished Fantastic Realist in modern English literature, having more stylistically in common with Dickens than with any of his British contemporaries. The world of Gormenghast and its inhabitants is the exaggerated one of dreams and nightmares. Where Dickens was eccentric, Peake is entirely grotesque.
(Wintle, 2001, p. 404)
The commonality can be associated with their simultaneous handling of the grotesque and fantastic in fictional worlds of a unique intense reality. The fact that reality is capable of fitting into a work of grotesque and fantastic dimension is a notion hinted at as early as 1957 by Wolfgang Kayser in his seminal book; The Grotesque in Art and Literature. With a partially rhetorical question, he engages our mind in whether the ‘new realism’ is to be “actually devoid of all fantastic elements” (1963, p. 126). Even
earlier than Kayser, Bertolt Brecht (1992) asserts that reality can be well-portrayed in a fantastic context where actors “wear grotesque mask and represent the truth” (p. 44).
Although Peake’s Gormenghast is limited to the imaginary world of Gormenghast, the Groan royal family and the school staff as the most eccentric and ‘outsize’ characters are so deliberately placed in a surrounding with all realistic details that their existence is made plausible. Accordingly, Joseph L. Sanders (1984) indicates that “Peake’s vivid description convince the reader of Gormenghast’s physical existence” (p. 78). In the world of Gormenghast, the castle certainly has a life and society of its own, made conceivable through all the vices and wishes that the characters share with mankind in general. Their world is populated in a manner much identical to our own familiar world in its endless battle of good and evil.
In this “microcosm of decaying civilization”, as Blamires (1988) terms it (p. 204), good and evil are barely of a fairytale-like nature. This implies a thematic realism in which no clear-cut absolutism between good and evil exists. Titus, the protagonist, who manages to slay the villain (Steerpike), is hardly portrayed as the hero and the saviour of his Earldom. Far from that, he even sees himself as a ‘traitor’ in his mother’s eyes; “he was her traitor” for the obvious reason of his disbelief in the vitality of retaining his family line (Peake, 1950, p. 488). He kills Steerpike out of a personal sense of revenge for Fuchsia’s death and the
Realism in Post-war British Fiction
1465Pertanika J. Soc. Sci. & Hum. 21 (4): 1457 - 1470 (2013)
robbery of his boat.5 Neither is the power-thirsty red-eyed Steerpike the epitome of a monster from the very start. He has his gradual spiritual downfall from a clever mischievous urchin to an insatiable and over-ambitiously power-infatuated youth, which finally leads him to be the heartless vampire especially after killing barquentine. His initial revolt against authority is the most realistic reaction which leads us to identify him as “one of us” (Johnson, 2004, p. 13).
Since this novel is the second in a trilogy, the sense of ending is of a rather different nature here. As mentioned above, Steerpike is killed at the end by Titus, who himself departs from Gormenghast into the wide world outside the castle walls, into the unknown. In a traditional ending, Titus could have stayed back and enjoyed ruling his territory. Even the end of the third book, which washes Titus ashore to Gormenghast after a harsh journey into the modern world, does not terminate in his being ultimately settled down. It once again ends with Titus leaving Gormenghast in a different direction. Therefore, there is no fixed sense of ending neither to Gormenghast nor to the trilogy.
Gormenghast trilogy is written from the point of view of the third person. The crucial point in the narrative style is the descriptive and poetic language, which relieves the narrative tone from a more traditionally realistic mode of omniscient third-person view. As a painter and illustrator, Peake reveals his talent by creating a pictorial text, a slide-like
procession of images woven into each other through a poetic language. Although there is no shift in the point of view, the dominance of the narrative viewpoint cannot be of much concern since any possible authorial conventionality is overshadowed by the language itself. This is what makes the storyline realistically unconventional, without the use of complexity in the point of view.
IAN MCEWAN: POSTMODERN REALISM
As a contemporary writer with a flourishing career from the last two decades of the twentieth century, Ian McEwan never fails to shock postmodern readers by his choice of revolting subject matters, “the shock value” of which “is reflective of the world” (Slay, 1996, p. 5). McEwan has earned his professional reputation not owing to the experimentation prevalent both at the outset and the closing decades of the twentieth century. In Understanding Ian McEwan, David Malcolm (2002) elaborates the point by asserting that McEwan makes no use of experimental style neither in “observing sequence in terms of time and cause and effect” nor in narrative techniques (p. 29).6
As indicated in ‘The Literary scene’ section of this article, new realism inaugurating in the mid-twentieth century has revived nineteenth-century Realism particularly in subject matters, with a concern for social issues. Due to its wide-range readership potential, realism has always been popular in dealing with social issues. The trend is also noticeable in the
Nahid Shahbazi Moghadam and Arbaayah Ali Termizi
1466 Pertanika J. Soc. Sci. & Hum. 21 (4): 1457 - 1470 (2013)
generation of British fiction writers since the seventies (Slay, 1996, p. 3). Considering British literature as “characterized by conscience,” Slay (1996) compares McEwan and his contemporaries with the Victorian authors:
British literature has come full circle, returning to the formative literature of the Victorian Age, to the societal warnings, bemoaning, and railing of such writers as Dickens, Eliot, and Carlyle. The concerns have transmogrified from the horror of slums and labour conditions to the terror of nuclear armament and unconscionable patriarchies.
(Slay, 1996, p. 4)
In line with Slay’s sound remark about the conceptual nature of realistic fiction since the seventies, the present study proceeds with the discussion focusing on a contemporary novel by an author starting his career since the seventies. Nonetheless, this article does not deal with a work by McEwan only because he can be considered as a contemporary realist. The significance of McEwan’s fiction, particularly the selected novel which has been penned with the maturity of its author in full swing, is the perfect blend of new realism with metafictional mode of narration.
As far as literary tradition is concerned, most writers start their career based on the influence they receive from already accomplished works, and finding one’s
own voice comes with the passage of time. McEwan’s early works were the two collections of short stories, most of which were later used as thematic background for his novels. Therefore, an early experimental style (see note 6) with later practice of more traditional techniques culminates in a postmodern fiction with a simultaneous claim both for realism and metafiction.
In an essay ent i t led “McEwan: Contemporary Realism and the Novel of Ideas,” Judith Seaboyer (2005) draws quick sketches of the themes of Realism reflected in McEwan’s novels. She discusses how some themes such as ethics and gender subjectivity are exploited by McEwan, addressed in a way different from traditional realism (p. 24). Dealing with issues of Victorian age, the psychological weight of his works is crucial in its depictions of postmodern attitudes toward those themes. Taking Atonement into consideration, it is noticeable how thematic realism is fused into a metafictional narrative style.
The novel is the portrayal of a typical upper-middle class suburban family with the background event of World War II, and the unsuitable love match of the Tallis older daughter and the charlady’s son. Jack Tallis is the absent father who financially supports the education of the charlady’s son in Cambridge. Nevertheless, this certainly does not help Robbie Turner to equal Cecilia. The way he is kept in a lower status is typical of the class struggles of its time in England as in many other countries. He is accused of rape by Briony and, except for Cecilia, the family consents to his accusation. Unlike
Realism in Post-war British Fiction
1467Pertanika J. Soc. Sci. & Hum. 21 (4): 1457 - 1470 (2013)
Paul Marshall, the real rapist, Robbie has neither money nor a big name to help a possible exoneration. As a matter of fact, the love between Cecilia and Robbie is typically unconventional due to class differences. The typical social class discrimination is also noticeable later in Robbie’s relation with his two comrades in the battlefield, where he leads but is not recognized in the role. The love catastrophe ends with both Cecilia and Robbie dying in the war. They are never reunited, which makes Briony suffer from guilt complex all through her life, once she learns the truth. She comes to see the folly of her judgment too late. As Lynn Wells (2006) in “The Ethical Otherworld: Ian McEwan’s Fiction” states, Briony painstakingly learns “to abandon fantasy in favour of a more adult style of psychological realism” (p. 124).
The narrative technique is itself very crucial since the storyline shifts several times, and the story is related in a metafictional manner. The narrative is divided in four sections, three of which are related from the third person point of view. The first and longest part is set in rural England of 1930s, followed by the next part with Robbie wandering about in the battlefields of the Second World War. The third part, again with no lapse of time, is London and the hospital where Briony serves as a nurse during the war. The final section which is narrated by Briony from the first person viewpoint is at the close of the century, London in 1999. The often shifting narrative account is artistically used in full measure to convey delicate psychological details.
As to the sense of ending, two different endings are amusingly offered at the end of the third and fourth part of the narration. One is the wish-fulfilment of Briony in reuniting the couple through narration. It is only at the end of this section that the reader is made aware of the fact that whole first three parts were possibly the manuscript of BT, which obviously refers to Briony Tallis. This is followed by the truth of elderly Briony, the author, confessing that in reality the couple desperately died far from each other during the war.
The ending can be doubtlessly called an unconventional one as it shocks the readers by the innovative way the novel seems to end and how it really ends. It simultaneously does and does not fulfil the existence of a closure, which is a vivid manifestation of how boundaries between realism and experimentation can be crossed. In the closing part of the final section, Briony intelligibly doubts if the sad truth has to be revealed by rhetorically asking “who would want to believe that, except in the service of the bleakest realism” (McEwan, 2001, p. 350). Though a novel and not a critical piece of writing, the issue of realism is intrinsically brought up as the above-mentioned quotation is shortly followed by the coming part, which seems to hint at how delicate the dividing lines between reality and dream can be:
I know there’s always a certain kind of reader who will be compelled to ask, But what really happened? The answer is simple: the lovers survive and flourish. As long as there is a
Nahid Shahbazi Moghadam and Arbaayah Ali Termizi
1468 Pertanika J. Soc. Sci. & Hum. 21 (4): 1457 - 1470 (2013)
single copy, a solitary typescript of my final draft, then my spontaneous, fortuitous sister and her medical prince survive to love
(McEwan, 2001, p. 350).
CONCLUSION
As debates about the presence of realism in post-war fiction continue, realistic themes and elements keep appearing in literary works. Owing to its rich thematic implication, realism has outlived a definite time span and continues to reciprocally enrich and be enriched by eclectic fusions with contemporary modes of narration. As Patricia Waugh (1984) asserts, “the ‘meta’ levels of fictional and social discourse might shift our notion of reality slightly but can never totally undermine it” (p. 52). In this regard, realism was particularly traced in this study merging with the fantastic-grotesque of Gormenghast and the metafictional mode of Atonement.
With all the talks about the anti-realism of postmodern fiction and the emergence of metafiction, there are growing numbers of articles and books depicting traces of realism in contemporary works. As observed in the discussion of the selected novels, realism in the post-war British fiction has survived in thematic dimensions rather than style. Accordingly, the typical stylistic techniques of traditional Realism such as the omniscient point of view, sense of ending and judgemental authorial attitude faded away as new realism began mixing with other modes of narration.
To conclude, as a conceptual standpoint in post-war British fiction, realism has followed a steady pace to be employed thematically rather than stylistically through different modes and in a variety of works since late 1940s. As witnessed in the sample works under study, realism proves broad enough in its thematic quintessence not to be limited to a certain era of literary history.
As Dominic Head truly (2002) encourages, it is high time for “new hybrids and fresh extensions of realism” to demonstrate “the falsity of the realism/experimentalism dichotomy” (p. 10).
ENDNOTES1Regarding the narrative point of view and the role of the narrator in the contemporary fiction, a most recent source for further study is Paul Dawson’s article, ‘The Return of Omniscience in Contemporary Fiction’, _Narrative_ 17.2 (May 2009).2It may be worth mentioning that Greene’s The Power and the Glory, included in this paper, was first published in 1940. 3The book aroused the dissatisfaction of the Catholic Church and was condemned by Cardinal Bernard Griffin of Westminster in 1953.4The basic structure of the grotesque is defined as a simultaneous copresentation of in compatibilities such as real/unreal, comic/tragic, attractive/repulsive and so on. Philip Thomson’s The grotesque (Routledge, 1972) is good source for further reference in this matter.
Realism in Post-war British Fiction
1469Pertanika J. Soc. Sci. & Hum. 21 (4): 1457 - 1470 (2013)
5Fuchsia, Titus’ sister, who is for a while courted by Steerpike, kills herself by jumping down through her room window into the flood water. The boat incident is related to the final battle scene between Titus and Steerpike. 6Of course, as Malcolm later mentions, McEwan refers to his early works as being imitations of certain experimental writers (p. 39).
REFERENCESAlexander, M. (1990). Flight from Realism: Themes
and Strategies in Postmodernist British and American Fiction. London & New York: Edward Arnold
Blamires, H. (1988). Twentieth Century English Literature. London: Macmillan Press Ltd.
Brecht, B. (1992). “The popular and the Realistic” In Pe ter Brooker (Ed. ) , Modernism / Postmodernism. London: Longman.
Greene, G. (1962). The Power and the Glory. London: Penguin Books.
Greene, G. et al. (1948). Why Do I Write? An Exchange of Views between Elizabeth Bowen, Graham Greene, V. S. Pritchett. London: Percival Marshall.
Head, H. (2002). The Cambridge Introduction to Modern British Fiction, 1950-2002. Cambridge: Cambridge University Press.
Hoffman, G. (2005) . From Modernism to Postmodernism: Concepts and Strategies of Postmodern American Fiction. Amsterdam & New York: Rodopi B. V.
Hutcheon, L. (2002). The Politics of Postmodernism. London & New York: Routledge.
Johnson, I. (2004). Despite His Evil Actions. Peake Studies 7(2), 9-18.
Kayser, W. (1963). The Grotesque in Art and Literature (Ulrich Weisstein, Trans.). Bloomington: Indiana University Press.
Lodge, D. (1981). Working with Structuralism: Essays and Review on Nineteenth and Twentieth Century Literature Mass. & London: Routledge & Kegan Paul Ltd.
Malcolm, D. (2002). Understanding Ian McEwan. Columbia University of South Carolina Press.
McEwan, I. (2001). Atonement. . New York: Random House.
O’Connor, F. (1972). Mystery and Manners, Occasional Prose London: Faber and Faber Ltd.
Peake, M. (1950). Gormenghast. Middlesex: Penguin Books Ltd.
Rushdie, S. (2002). Step Across this Line: Collected non-fiction 1992-2000. London: Vintage Books.
Sanders, L. J. (1984). “The Passion in the Clay”: Mervyn Peake’s Titus Stories. In Thomas D. Clareson (Ed.), Voices for the Future: Essays on Major Science Fiction Writers (Vol. three). Bowling Green: Bowling Green Univeristy Popular press.
Seaboyer, J. (2005). Ian McEwan: Contemporary Realism and the Novel of Ideas. In James Acheson and Sarah C.E. Ross (Ed.), The Contemporary British Fiction. Edinburgh: Edinburgh University Press.
Slay, J. ( 1996). Ian McEwan. New York: Twayne Publishers.
Watson, G. (1991). British Literature since 1945. London: Macmillan.
Waugh, P. (1984). Metafiction: The Theory and Practice of Self-conscious Fiction. London: Methuen & Co. Ltd.
Wells, L. (2006). The Ethical Otherworld: Ian McEwan’s Fiction. In Philip Tew and Rod Mengham (Ed.), British Fiction Today. London: Continuum International Publishing Group.

Nahid Shahbazi Moghadam and Arbaayah Ali Termizi
1470 Pertanika J. Soc. Sci. & Hum. 21 (4): 1457 - 1470 (2013)
Winnington, P. (2006). The Voice of the Heart: The Working of Mervyn Peake’s Imagination. Liverpool: Liverpool University Press.
Wintle, J. (Ed.). (2001). Makers of Modern Culture. (Vol. I). London: Routledge.
Pertanika J. Soc. Sci. & Hum. 21 (4): 1471 - 1489 (2013)
ISSN: 0128-7702 © Universiti Putra Malaysia Press
SOCIAL SCIENCES & HUMANITIESJournal homepage: http://www.pertanika.upm.edu.my/
Article history:Received: 15 August 2011Accepted: 20 September 2012
ARTICLE INFO
E-mail address: [email protected] (Manan, S. K.), * Corresponding author
Islamic Work Ethics and Organizational Commitment: Evidence from Employees of Banking Institutions in Malaysia
Manan, S. K.1,2*, Kamaluddin, N.1,2 and Puteh Salin, A. S. A.2,3
1Centre for Islamic Thought and Understanding (CITU), Universiti Teknologi MARA, 40450 Shah Alam, Selangor, Malaysia2Accounting Research Institute (ARI), Universiti Teknologi MARA, 40450 Shah Alam, Selangor, Malaysia3Faculty of Accounting, Universiti Teknologi MARA, 40450 Shah Alam, Selangor, Malaysia
ABSTRACT
Current literatures show that study on work ethics is gaining popularity among researchers for a very obvious reason, namely the threat of moral hazards. Cases of corporate scandals and collapses provide evidence that moral misconducts among employees have contributed to the financial disaster of many companies. It is believed that there is a possible relationship between work ethics and organizational commitment, thus performance. This study would therefore attempt to investigate the Islamic Work Ethics (IWE) practices among the employees of banking institutions in Malaysia with specific focus given to the possible relationship between IWE variables and organizational commitment (OC). The findings of this study indicate that all IWE variables are positively and significantly related to organizational commitment.
Keywords: Accountability, effort, honesty, Islamic work ethics, shari’ah, teamwork
A lot of policies and action have been implemented such as benchmarking to an international standard such as the Basel Accord, improvising the code of corporate governance, executing capital and financial market master plan, gradual liberalization, and leveraging the strength by encouraging the bank to merge with each other. These actions (just to name a few) are undeniably making the banking system in Malaysia vigilant and competitive in contributing
INTRODUCTION
Since the major financial crisis in 1997-1998 that hit the Malaysian economy, the government has taken robust actions to build strong and solid fundamentals of financial and banking institutions .
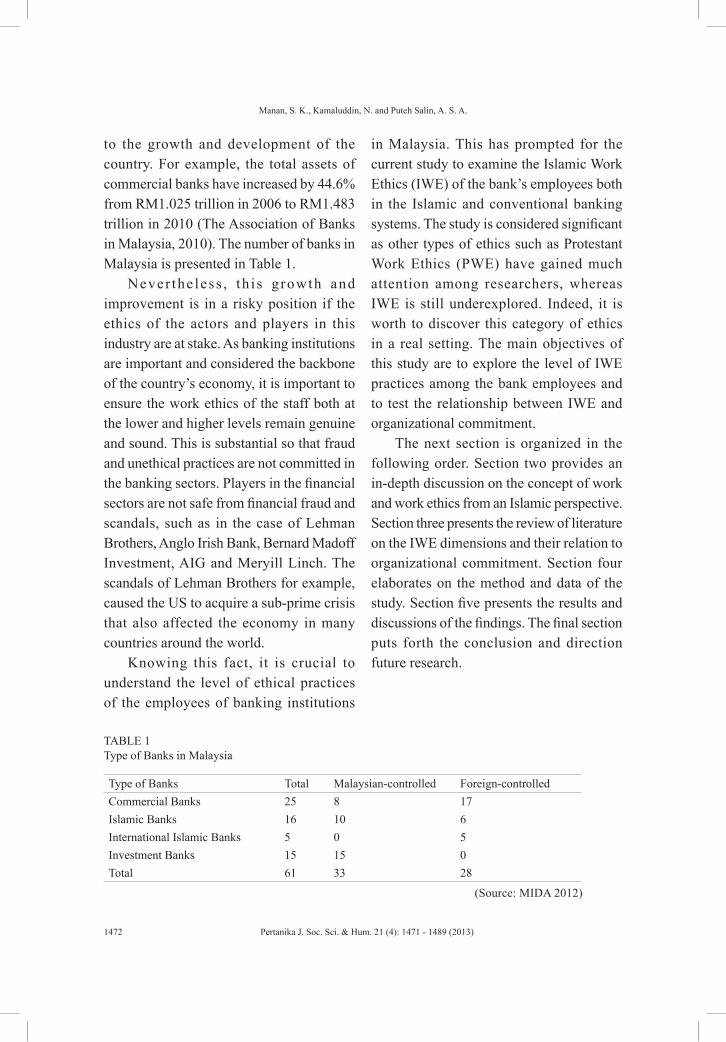
Manan, S. K., Kamaluddin, N. and Puteh Salin, A. S. A.
1472 Pertanika J. Soc. Sci. & Hum. 21 (4): 1471 - 1489 (2013)
to the growth and development of the country. For example, the total assets of commercial banks have increased by 44.6% from RM1.025 trillion in 2006 to RM1.483 trillion in 2010 (The Association of Banks in Malaysia, 2010). The number of banks in Malaysia is presented in Table 1.
Never the less , th i s g rowth and improvement is in a risky position if the ethics of the actors and players in this industry are at stake. As banking institutions are important and considered the backbone of the country’s economy, it is important to ensure the work ethics of the staff both at the lower and higher levels remain genuine and sound. This is substantial so that fraud and unethical practices are not committed in the banking sectors. Players in the financial sectors are not safe from financial fraud and scandals, such as in the case of Lehman Brothers, Anglo Irish Bank, Bernard Madoff Investment, AIG and Meryill Linch. The scandals of Lehman Brothers for example, caused the US to acquire a sub-prime crisis that also affected the economy in many countries around the world.
Knowing this fact, it is crucial to understand the level of ethical practices of the employees of banking institutions
in Malaysia. This has prompted for the current study to examine the Islamic Work Ethics (IWE) of the bank’s employees both in the Islamic and conventional banking systems. The study is considered significant as other types of ethics such as Protestant Work Ethics (PWE) have gained much attention among researchers, whereas IWE is still underexplored. Indeed, it is worth to discover this category of ethics in a real setting. The main objectives of this study are to explore the level of IWE practices among the bank employees and to test the relationship between IWE and organizational commitment.
The next section is organized in the following order. Section two provides an in-depth discussion on the concept of work and work ethics from an Islamic perspective. Section three presents the review of literature on the IWE dimensions and their relation to organizational commitment. Section four elaborates on the method and data of the study. Section five presents the results and discussions of the findings. The final section puts forth the conclusion and direction future research.
TABLE 1 Type of Banks in Malaysia
Type of Banks Total Malaysian-controlled Foreign-controlledCommercial Banks 25 8 17Islamic Banks 16 10 6International Islamic Banks 5 0 5Investment Banks 15 15 0Total 61 33 28
(Source: MIDA 2012)
Islamic Work Ethics and Organizational Commitment: Evidence from Employees of Banking Institutions in Malaysia
1473Pertanika J. Soc. Sci. & Hum. 21 (4): 1471 - 1489 (2013)
WORK AND WORK ETHICS - AN ISLAMIC PERSPECTIVE
Workers a re human cap i ta l o f an organization. Having morally and ethically behaved workers in an organization will have a favorable impact on the organization itself. There is a genuine belief that Islam emphasizes on a creative and productive effort as a source of happiness and accomplishment. This is in line with what Allah promise us in the Quran: “…Allah promised you His forgiveness and bounties” (2:268). The verse implies that forgiveness and bounties are promised to those who put a strenuous effort in fulfilling their work responsibly in accordance to Allah’s will. Instead, begging and living as a parasite on the labors of others are condemned by Islamic teaching. With this regards, the Prophet Muhammed (P.B.U.H) has preached that: “No one eats better food than that which he eats out of his own labour” (Bukhari, no. 1979). Islam perceives work as an ibadah (a religious duty) and jihad (cause of Allah). Prophet (P.B.U.H) has preached: “The honest, trustworthy merchant will be with the Prophets, siddeeqs and martyrs.” (At-Tirmidhi, no. 1209).
Work is a dedicative effort striving to further self interest economically, socially and psychologically, to sustain social prestige, to advance societal welfare and reaffirm faith. In other words, work as a mean to safeguard the five essential human needs, namely their din (faith), their nafs (human self), `aql (intellect), their nasl (posterity) and their mal (wealth). Hence, it is important for human beings to pursue
whatever work is available whenever it is available subjected to the Will of Allah SWT as Allah SWT has decreed in the Quran: “… disperse through the land and seek of the bounty of Allah” (62:10).
The concept of work as an ibadah (religious duties) and jihad (striving for something) ascertains that the involvement and participation in economic activities (work) is not merely a means to sustain a thriving and healthy society but also a divine call. According to Ali (1988), the value of work in IWE is derived from the accompanying intentions rather than from the results of work. Thus, the most essential feature of work as an ibadah and jihad is niyyah (intention). In Islam, intention (niyyah) of every man’s action must be ultimately for Allah SWT alone.
Hence, work must be conducted sincerely (ikhlas) for the sake of Allah’s pleasures. This has been explained in the Qur’an: “Say; verily I am commanded to serve Allah with sincere devotion” (39:14). Sincere intention will ensure that the work effectively and efficiently follows the revealed guidance which in turn contributes to al falah (successful in this world and hereafter). In addition, Ali (1988, p.577) has described work as :
“… an obligatory activity and a virtue in light of the needs of man and the necessity to establish equilibrium in one’s individual and social life. Work enables man to be independent and is a source of self-respect, satisfaction and fulfillment. Success and progress
Manan, S. K., Kamaluddin, N. and Puteh Salin, A. S. A.
1474 Pertanika J. Soc. Sci. & Hum. 21 (4): 1471 - 1489 (2013)
on the job depend on hard work and commitment to one’s job. Commitment to works also involves a desire to improve community and societal welfare. Society would have fewer problems if each person were committed to his work and avoided unethical methods of wealth accumulation. Creative work and cooperation are not only a source of happiness but considered noble deeds too.”
The Islamic view on work is futher explained in the concept of work ethics. Basically, the Islamic system comprises of three main fundamental teachings in which the first is aqidah or a strong belief in the Oneness of Allah; the second is ibadah or one’s submission and obedience to Allah; while the third is akhlaq. This is indeed the Islamic ethical system that work ethics fall under (Beekun, 2004).
Basically, akhlaq refers to one’s good behaviour, manner, attitude or values guided by the Qur’an and Sunnah. Hence, it is subjected to the evaluation of Allah SWT: “… verily the most honoured of you in the sight of Allah is the most righteous of you.”(49:13). Akhlaq differs from the conventional view of “do no harm” because Islam argues that this can also imply that not to harm others may be neutral in the sense that one may not do any good either. Therefore, Imam Al- Ghazali had refined the view by recommending three ways of doing good so as to imply the true meaning of akhlaq.
First and foremost, one has to show beneficence (ihsan) to others. Second, one has to refrain from harming others. Lastly, one who harms others is considered irreligious and immoral. The three attributes are in conformity to Allah’s revelation in the Qur’an: “We sent yee not, but as a mercy for all creatures.” (21:107). Islam uses several other terms to describe the concept of akhlaq such as khayr (goodness), birr (righteousness), qist (equity), ‘adl (justice), haqiqah (truth), ma’ruf (known and approved), and taqwa (piety). Pious actions are described as salihat and impious actions are described as sayyiat Abuznaid (2009). Islam also provides mankind with the most influential model to uphold akhlaq in every activity as stated in the Qur’an: “We have indeed in the Apostle of Allah a beautiful pattern of (conduct) for anyone whose hope is in Allah and the Final Day, and who engages much in the praise of Allah” (33:21).
While the term IWE refers to a set of moral principles that distinguishes what is right from what is wrong in the Islamic context (Beekun, 2004) and is originally based on the Qur’an and the Sunnah of the Prophet Muhammad (P.B.U.H) (Ali, 2005; Rizk, 2008). Hence, in this study it is suggested that IWE may be defined as a set of values and principles that guide individuals’ rights and responsibilities at work based on Islamic teachings that follow doctrines in the Qur’an and Sunnah. In other words, the teaching of Islam emphasizes that it is the Islamic values that dominate behavior (work ethics) of an individual and
Islamic Work Ethics and Organizational Commitment: Evidence from Employees of Banking Institutions in Malaysia
1475Pertanika J. Soc. Sci. & Hum. 21 (4): 1471 - 1489 (2013)
not the other way around. The following are examples of the Quranic verses and the Sunnah regarding the IWE:
a. Allah says: “O ye who believe! Fear Allah and be with those who are true (in word and deed)” (9:119).
b. Allah says: “Allah commands justice, the doing of good …”(16:90).
c. Al lah says : “Say; ver i l y I am commanded to serve Allah with sincere devotion” (39:14).
d. Prophet (P.B.U.H) has preached: “The honest, trustworthy merchant will be with the Prophets, siddeeqs and martyrs.” (At-Tirmidhi, no. 1209)
e. Prophet (P.B.U.H) advised: “Allah loves that when anyone does a job, he does it perfectly.” (Al-Bayhaqi, no. 4915)
ISLAMIC WORK ETHICS AND ORGANIZATIONAL COMMITMENT
Organizational commitment refers to an employee’s belief in the organization’s goals and values, the desire to remain a member of the organization and loyalty to the organization (Mowday et al., 1982). He will accept and see he is a member of the organization. Therefore, he will be dedicated to the organization at different degrees including the decision to stay or quit from the organization. This emotional attachment to the organization will reduce labor cost such as employee turnover, being careless, and non-commitment, and lack of interest and concern that will diminish the productivity of the worker thus, giving a severe impact to the company in the long
term (Allen & Meyer, 1990) while the pillars of IWE will be discussed based on the four primary concepts of IWE set by Ali & Falcon (1995) and Ali & al-Owaihan (2008). The four pillars/concepts are: effort, competition, transparency, and morally responsible conduct. In this study however, the pillars/concepts are refined into a broader perspectives as suggested by Norlela and Siti Khadijah (2010), namely effort, teamwork, accountability, and honesty.
EFFORT AND ORGANIZATIONAL COMMITMENT (OC)
Effort in Islam is held in the highest regard. Islam encourages humans to acquire skills and technology, and highly praises those who strive in order to earn a living as stated in the Quran: “Whoever works righteousness, man or woman and has faith verily to him will We give a new life, a life that is good and pure and We will bestow on such their reward according to the best of his action”(16:97). Islam also demands its adherents to be efficient and proficient that is to do more than what is minimally required as mentioned by Allah: “Verily Allah command that you establish justice and be efficient and proficient”(16:90). Therefore, a good individual should always feel obliged to put in extra effort, time (not over time), and interest so that he would provide more than what is minimally required.
Islam emphasizes that the exerted effort of an individual should be linked to itqan, istiqamah and tawakkal. Itqan means knowledgeable and conscientiousness in all endeavors (Syed Othman et.al., 1998).
Manan, S. K., Kamaluddin, N. and Puteh Salin, A. S. A.
1476 Pertanika J. Soc. Sci. & Hum. 21 (4): 1471 - 1489 (2013)
Islam encourages all its adherents to acquire the necessary ‘ilm (knowledge of things) before executing any action (work). The Prophet (P.B.U.H) advised: “Whoever wish for the world need to have knowledge, whoever wish for the hereafter need to have knowledge, whoever wish for both need to have knowledge” (Nik Mohamed Affandi, 2002) and narrated by Abu Hurairah, the Messenger of Allah said: “...when the power or authority comes in the hand of unfit persons, then wait for the Hour (Doomsday).” (Bukhari, no. 56)
Knowledge is not simply a case of “the what”, but is also the skill required to perform the task. Itqan also requires man’s effort to discover (tadabbur) Allah’s bounties. In this regards, the Prophet (P.B.U.H) propagated that: The Prophet Muhammad (peace be upon him) said: “Acquiring knowledge in (the) company (of others) for an hour in the night is better than spending the whole night in prayer.” (At-Tirmidhi, no.91)
Application of the acquired knowledge must be implemented with conscientiousness. Conscientiousness requires the presence of perseverance, passion and commitment in individual performance. Conscientiousness must be followed with continuous self evaluation (muhasabah) in order to correct the wrongs and to improve on the good actions as Allah has mentioned in the Quran: “You are the best of peoples, evolved for mankind enjoining what is right and forbidding what is wrong” (3:110). Istiqamah means consistency and passion for excellence. Islam admits excellence as a virtue and encourages its adherents to
excel in everything that they do. Prophet (P.B.U.H) advised: “Allah loves that when anyone does a job, he does it perfectly.” (Al-Bayhaqi, no. 4915)
Islam also demands its adherents to be efficient and proficient that is to do more than what is minimally required. Allah has decreed: “Verily Allah command that you establish justice and be efficient and proficient” (16:90). Therefore, a good Muslim will always feel obliged to put in extra effort, time (not over time), and interest so that he would provide more than what is minimally required.
Furthermore, istiqamah also requires the Muslims to be patient (sabr) while undertaking any task or job entrusted to them. Allah has decreed: “O ye who believe! Persevere in patience and constancy; vie in such perseverance; strengthen each other; and fear Allah that ye may prosper” (3:200). Patience has two aspects (Syed Othman et. al. 1998). Firstly, mental patience which resists the demands of desires and anger. Mental patience is required in controlling anger and greed for wealth. Secondly, bodily patience which is endurance of physical pain felt in performing devotional or non devotional acts. Hence, patience can be divided into three; first, patience in carrying commandments; second, patience in avoiding maksiat; and last, patience in facing difficulties and hardships. Consequently, patience is importantly required in work to face any disagreement, temptation of taking bribery and laziness.
Tawakkal means surrendering oneself to Allah the Almighty solely. This is indeed one’s ultimate effort after itqan and
Islamic Work Ethics and Organizational Commitment: Evidence from Employees of Banking Institutions in Malaysia
1477Pertanika J. Soc. Sci. & Hum. 21 (4): 1471 - 1489 (2013)
istiqamah. Allah commands us: “But on Allah put your trust if you have faith”(5:23). However, the concept of tawakkal must be incorporated with itqan and istiqamah as well as supplication (du’a). Allah has decreed:
“When My servants ask thee concerning Me, I am indeed close to them. I listen to the prayer of every suppliant when he calleth on Me. Let them also with a will listen to my call and believe in Me that they may walk in the right way” (2:186).
Therefore, tawakkal is the essential final step of an effort. Tawakkal will guide man to accept virtuous or deficient consequences positively resulted from his endeavor. Hence the concept of tawakkal infuses the spirit of perseverance in all work which in turn ensures the excellent quality of one’s effort. Furthermore Allah promises to provide adequate bounties to he who surrenders himself to Allah:
“… and if anyone puts his trust in Allah, sufficient is Allah for him. For Allah will surely accomplish His purpose. Verily for all things has Allah appointed a due portion” (65:3).
Previous studies indicate that high levels of effort are assumed to be generated in the model of the high commitment work organization (Angle & Perry, 1981; Yousef, 2000; Mc Cook, 2002, Green, 2004; Kuean et al., 2010). Mc Cook (2002) and Kuean
et al. (2010) agreed that organizational commitment theoretically should relate positively to effort because individuals who are more committed to their organization should be by nature of this commitment exert more effort. It is because employees who are committed to their organization will ensure the organization meets its goals.
Thus, more effort is required to achieve this. In addition, Kuean et al. (2010) suggested that the organization should pursue a reward strategy that links effort or productivity with pay and incentives in order to induce employees to input higher level of effort which in turn reflects the organizational commitment. Hence, the following hypothesis is derived:
Ha: Employees’ effort is positively and significantly related to organizational commitment.
TEAMWORK AND OC
Islam promotes teamwork thus employees can help each other to fulfill their needs in this world and the hereafter as stated in the Quran: “… and we raise some of them above others in ranks, so that some may command work from others …” (43:32) and “And those in whose wealth is a recognized right for the (needy) who asks and him who is prevented (for some reason)” (70:24-25).
Competition in team work must be executed fairly, justly and honestly and can be realized through the implementation of the concept of mu’awanah, ‘adl and syura. Mu’awanah refers to cooperation among individuals to promote good and forbid evil
Manan, S. K., Kamaluddin, N. and Puteh Salin, A. S. A.
1478 Pertanika J. Soc. Sci. & Hum. 21 (4): 1471 - 1489 (2013)
as Allah has stated in the Quran: “… help ye one another in righteousness and piety, but help ye one another in sin and rancor. Fear Allah for Allah is strict in punishment” (5:2).
Thus Islam encourages competition among man in preventing immoral action as well as inciting virtuous action in his work place. This task can be effectively and efficiently performed by imposing the spirit of ukhuwwah (brotherhood) as decreed by Allah in the Quran: “The believers are but a single brotherhood. So make peace and reconciliation between your two contending brothers. And fear Allah that ye may receive mercy” (49:10) and also notified by the Prophet (P.B.U.H): Narrated by Ma’rur, I saw Abu Dhar wearing a Burd (garment) and his slave too was wearing a Burd, so I said (to Abu Dhar), “If you take this (Burda of your slave) and wear it (along with yours), you will have a nice suit (costume) and you may give him another garment.” Abu Dhar said, “There was a quarrel between me and another man whose mother was a non-Arab and I called her bad names. The man mentioned (complained about) me to the Prophet. The Prophet said, “Did you abuse so-and-so?” I said, “Yes” He said, “Did you call his mother bad names?” I said, “Yes”. He said, “You still have the traits of (the Pre-lslamic period of) ignorance.” I said. “(Do I still have ignorance) even now in my old age?” He said, “Yes, they (slaves or servants) are your brothers, and Allah has put them under your command. So the one under whose hand Allah has put his brother, should feed him of what he eats,
and give him dresses of what he wears, and should not ask him to do a thing beyond his capacity. And if at all he asks him to do a hard task, he should help him therein.” (Bukhari, no.76).
Thus in Islam, competition among man is carried out without oppression and injustice and instead it employs the value of cooperation; while ‘Adl (justice) means the rendering of trust where it is due. Islam demands human beings to uphold justice in every action as decreed by Allah: “Allah commands justice and the doing of good” (16:90). In Islam justice is prevailed in promoting positive virtues like honesty, moderation and generosity as well as prohibiting evils like eliminating risywah (bribery), greed and extravagance. Thus Islam prohibits zulm that is the opposite of ‘adl. The Prophet (P.B.U.H) warned about doing zulm: “Beware of injustice for injustice will be equivalent to darkness on the Day of judgment” (Bukhari, no. 2447). ‘Adl is also significantly related to ihsan which refers to right action, goodness, charity and proficiency. Other meanings of ihsan can be extracted from the Sunnah whereby the Prophet (P.B.U.H) was asked: “… What al-Ihsan is? Upon this he (the Holy Prophet) said: (Al-Ihsan implies) that you fear Allah as if you are seeing Him, and though you see Him not, verily He is seeing you. He (the inquirer) said: You (have) told the truth.” (Muslim, no. 6).
Ihsan will educate man to voluntarily sacrifice extra effort, time, and wealth as an addition to the compulsory requirement in rendering the rights or trust. In turn it
Islamic Work Ethics and Organizational Commitment: Evidence from Employees of Banking Institutions in Malaysia
1479Pertanika J. Soc. Sci. & Hum. 21 (4): 1471 - 1489 (2013)
will enhance productivity. Syura (mutual consultation) refers to a collective mutual consultation and empowerment. Allah has mentioned in the Quran: “Those who hearken to their Lord, and establish regular prayer, who conduct their affairs by mutual consultation, who spend out of what We bestow on them for sustenance…” (42:38). Hence syura in team building refers to participative work force moulded in the spirit of oneness. For example, by sharing power such as power in decision making, people basically respect and trust one’s competency, strength and reliability.
This in turn enhances creativity, innovation and passion for improved quality and productivity (Syed Othman et. al. 2008). Furthermore it will strengthen and intensify the efforts and relationship among human beings in the team building. Allah loves the strong and the trusty as stated in the Quran: “O my dear farther! Engage him on wages. Truly the best of men for you to employ is the (man) who is strong and trusty” (28:26).
The concept of team and teamwork is increasingly important to productivity and employees’ organizational commitment in the workplace (Boon & Arumugam, 2006). Teamwork facilitates the meeting of affiliate needs within the workplace and has been directly connected to organizational commitment (Karia & Ahmad, 2000; Silos, 1999). They studied the impact of Empowerment and Teamwork (E&T) practices on 104 employees in five Malaysian public and private organizations which implemented some level of E&T practices. The results showed that an
organization which practiced some level of teamwork experienced an increase in employees’ organizational commitment. Meanwhile, Silos (1999) stated that the key to Japanese efficiency was in how the people worked together and he also suggested that teamwork would result in more commitment and involvement of employees within the organization.
Furthermore, participation in decision-making that was enhanced by teamwork is said to have had a significant positive effect on job satisfaction and commitment of employees (Sarata, 1984; Ascigil, n. d.). Kuean et al. (2010) found that teamwork had a positive relationship with organizational commitment if employees experienced a high level of participation opportunities in the job i.e. have a chance to have a say or influence on the decisions. Therefore, the following hypothesis is proposed:
Hb: Employees’ teamwork is positively and significantly related to organizational commitment.
HONESTY AND OC
Honesty could mean telling the truth even though it is difficult to do so (Norlela and Siti Khadijah , 2010). In other words, the person does not conceal anything that should be disclosed. If he is an accountant, he has to report all the transactions accurately according to the accounting steps and procedures in place (Atiyah, 1993).
The Almighty Allah had instructed us to be honest in any sort of dealings. Allah says: “O ye who believe! Fear Allah
Manan, S. K., Kamaluddin, N. and Puteh Salin, A. S. A.
1480 Pertanika J. Soc. Sci. & Hum. 21 (4): 1471 - 1489 (2013)
and be with those who are true (in word and deed)” (9:119). In the same context, the Prophet (P.B.U.H) stated: Abdullah reported, the Messenger of Allah (P.B.U.H) said: “Truthfulness leads to righteousness and righteousness leads to Paradise. A man may speak the truth until he is recorded with Allah as truthful. Lying leads to wickedness and wickedness leads to the Fire. A man may tell lies until he is recorded with Allah as a liar.” (Muslim, no. 6308)
The Prophet (P.B.U.H) strongly warned that; “It is narrated on the authority of Abu Hurairah that the Messenger of Allah (may peace be upon him) happened to pass by a heap of eatables (corn). He thrust his hand in that (heap) and his fingers were moistened. He said to the owner of that heap of eatables (corn): What is this? He replied: Messenger of Allah, these have been drenched by rainfall. He (the Holy Prophet) remarked: Why did you not place this (the drenched part of the heap) over other eatables so that the people could see it ? He who deceives is not of me (is not my follower). (Muslim, no. 183)Hence, whoever knows a defect in something is obliged to disclose it. At the same time, the Prophet (P.B.U.H) motivates the honest person by saying that; ;“The honest, trustworthy merchant will be with the Prophets, siddeeqs and martyrs.” (At-Tirmidhi, no. 1209).
Honesty and the ability to act with integrity lie not in the act of “never speaking a false word”, rather in humans choosing to “always speak words and perform acts that create safe, caring, and healthy spaces for human development” (Howatt, 2002).
Honesty also is the belief that one stands by his word as well as the belief that one is interested in the company’s welfare and will not take unexpected actions that will negatively impact the company (Wetzels, Ruyter & Birgele, 1998).
Without honesty and integrity an administrator cannot build trust. Without trust, a co-operative and collaborative relationship with the others cannot be attained (Scarnati, 1997). Trust is the catalyst that makes it possible for organizations to function. It is the bonding agent that holds personal and business relationships together. It manifests itself in the form of concrete deeds and actions. Trust breeds credibility, and credible people are believable. Previous studies have suggested that honesty has a positive influence on commitment (Anderson & Narus, 1984; Anderson & Weitz, 1989; Morgan & Hunt, 1994; Wetzels, et al., 1998). Thus, with the above explanation and findings, the following hypothesis is proposed:
Hc: Employees’ honesty is positively and significantly related to organizational commitment.
ACCOUNTABILITY AND OC
Allah wants man to know whether his work (acts and deeds) might be good or evil. He wants him to ask himself if the work is good or evil, and if it is permissible or prohibited. Man ought to know himself and learn about his points of strength and points of weakness, so as to reach a balanced view, and not become conceited, because he was
Islamic Work Ethics and Organizational Commitment: Evidence from Employees of Banking Institutions in Malaysia
1481Pertanika J. Soc. Sci. & Hum. 21 (4): 1471 - 1489 (2013)
successful in a certain domain or a certain stage, or become desperate, if he encounters a certain loss or failure. As Allah mentioned in the Holy Qur’an:
“O you who believe! Be careful of (your duty to) Allah, and let every soul consider what it has sent on for the morrow, and be careful of (your duty to) Allah; surely Allah is Aware of what you do. And be not like those who forsook Allah, so He made them forsake their own souls: these it is that are the transgressors. Not alike are the inmates of the fire and the dwellers of the garden: the dwellers of the garden are they that are the achievers” (59:18-20).
Accountability is frequently described as the means by which individuals and organizations report to a recognized authority (or authorities) and are held responsible for their actions (Ebrahim, 2005). Accountability exists when there is a relationship between one party and another. This view assumes that some individuals, small groups or organizations have certain rights to make demands over the conduct of another, as well as seek reasons for actions taken and the individual, or organization is answerable to a higher authority for the action taken and for handling the resources received (Hasan & Siti Nabiha, 2010).
This internal dimension of accountability is motivated by a “felt responsibility” as expressed through individual action and organizational mission. In other words,
accountability is trustworthiness. People are considered to be trustworthy when they behave in ways expected of them in the absence of surveillance. They do not merely comply with external forces, such as surveillance pressures, but have internalized the behaviors (Brockner, Siegel, Phyllis, Daly, Joseph, Martin, & Tyler, 1997).
A trustworthy person is a person who will keep the trust entrusted to him responsibly and faithfully. Allah says in the Qur’an:
“Allah does command you to render back your trust to those to whom they are due; and when ye judge between man and man that ye judge with justice; verily how excellent is the teaching which He gives you for Allah is He who hearth and sees all things” (4:58). In another verse, Allah says: “If any of you deposits a thing on trust with another, the trustee should (faithfully) discharge his trust, and let him fear his Lord” (2:283).
In this sense, every Muslim has an ‘account’ with Allah, in which all good and all bad actions are ‘recorded’; an account which will continue until death, for Allah shows all people their accounts on judgment day (4:62). The Messenger of Allah (P.B.U.H.) has mentioned self-accountability as: “The wise person is one who holds himself accountable and works for what comes after death. And the weak, impotent person is one whose self follows
Manan, S. K., Kamaluddin, N. and Puteh Salin, A. S. A.
1482 Pertanika J. Soc. Sci. & Hum. 21 (4): 1471 - 1489 (2013)
its vain desires and he (simply) puts his hope in Allah”. (At-Tirmidhi, no. 2459)
Fulfilling one’s trust could mean fulfilling the rights of the person who gives the trust to you (Abdurrahman, 2005). In other words, as a trustee you should render the trust that had been given to you back to the owner. As far as trustworthiness in work is concerned, an individual worker should fulfil his obligations at the workplace to his best. If he is given a task to complete, he has to perform the task responsibly and accountably. He will exert his effort to the best as he believes that laziness and absenteeism are vice. He will always try to ensure that the task given is not overdue (Rice, 1999).
In other words, he will meet the deadlines of the task given to him. He will emphasize on excellence and good quality of work as he realizes that such attitudes are promoted. The Prophet (P.B.U.H) says: “Allah likes that when someone does anything, it must be done perfectly well” (Al-Bayhaqi, no. 4915)
The explanations above not only deal with personal accountability but also apply to all organizations. This means that organizations should comply with all the applicable laws and ethical standards, adhere to their mission, be ethical and protect the rights of their members. Furthermore, studies have also shown that trust in organizational authorities influences a variety of subordinates’ work attitudes and behaviors. In general, employees are more supportive of or committed to authorities and the institutions that the authorities
represent, when trust is relatively high (Brockner et. al., 1997). With the above explanation, the following hypothesis is proposed:
H d: Employees ’ accoun tab i l i t y i s positively and significantly related to organizational commitment.
METHOD AND DATA COLLECTION
This study employs a survey method whereby primary data are collected via a distribution of questionnaires. The population of this study comprises of bank employees who work in a commercial area in Klang Valley in Malaysia. A proper sampling technique is important in order to have a precise and unbiased sample that represents the whole population. In this study, simple random sampling is used to draw a total of 500 samples.
The employees of both banking systems (Islamic and conventional) are taken as the sample of this study as it is believed that IWE is universal in nature. Hence, it is applicable to everybody irrespective of the organization an individual works in. Due to this, no discrimination is imposed in categorizing and analyzing the employees from these two different systems.
The questionnaire was distributed to each of the selected sample via a personally-administered survey. Several sets of Likert-scale statements were posed to the sample to obtain their perspectives on the IWE practices. The respondents could indicate from the scale of 1 = Strongly Disagree up to 10 = Strongly Agree on the statements
Islamic Work Ethics and Organizational Commitment: Evidence from Employees of Banking Institutions in Malaysia
1483Pertanika J. Soc. Sci. & Hum. 21 (4): 1471 - 1489 (2013)
that reflected their effort, teamwork, honesty and accountability, and the dimensions that made up IWE. The first variable (effort) is captured by asking the respondents their passion and commitment at work. The second variable (teamwork) is captured by examining the respondents’ participation in the work force while the third variable (honesty) is captured by their integrity at work. The last variable (accountability) is measured by their commitment in fulfilling their responsibility and their willingness in being responsible for their actions.
Out of the total 500 distributed questionnaires, 383 (or 76.6 percent response rate) questionnaires were returned and used for analysis of this study. This favorable response could mainly be due to the direct approach by the researchers in collecting the data. The collected data were processed and analyzed using correlation to test the possible relationship between the dependent and independent variables under study.
RESULTS AND DISCUSSION
The following sub-sections present the demographic profile of the respondents and discuss the analysis of the study’s findings which comprised the practice of IWE among employees and the relationship between IWE variables and OC.
Demographic Profile of the Respondents
Table 2 shows the main characteristics of the sample.
Many of the respondents (62 percent) are female employees and the majority of the respondents are Malay (80.7 percent).
Only a handful of them are Chinese and Indian (11.7 percent and 7.3 percent respectively). This could imply that many of the subordinates employees approached are Malays who do not involve in top management of the banks.
General ly, the respondents are considered young as 62.1 percent of them aged below 35 years old. As for the respondents’ marital status, 68.2 percent of them are married while the other 29.7 percent are still single. As far as the respondents’ religious background is concerned, most that responded are Muslims (80.7 percent) and very few are Christians (6.8 percent) and Hindus (8.9 percent).
With regards to educational level, many of the surveyed employees had either diplomas (39 percent) or bachelor’s degree (24.1 percent), quite a significant number of them (28.3 percent) had completed Secondary school and the rest of them had professional certificate (6.3 percent) or post-graduate degrees (2.4 percent).
IWE Practices among Employees
The respondents were assessed on their IWE practices by asking them to indicate their level of agreement to the statements relating to each of the IWE variables namely effort, teamwork, honesty and accountability. Table 3 displays the employees’ mean scores on the IWE variables.
The mean analysis for each of the IWE variable indicated that the employees scored the highest in accountability (mean 8.93; SD 1.18), followed by honesty (mean 8.68; SD 1.29) and teamwork (mean 8.22; SD 1.31).
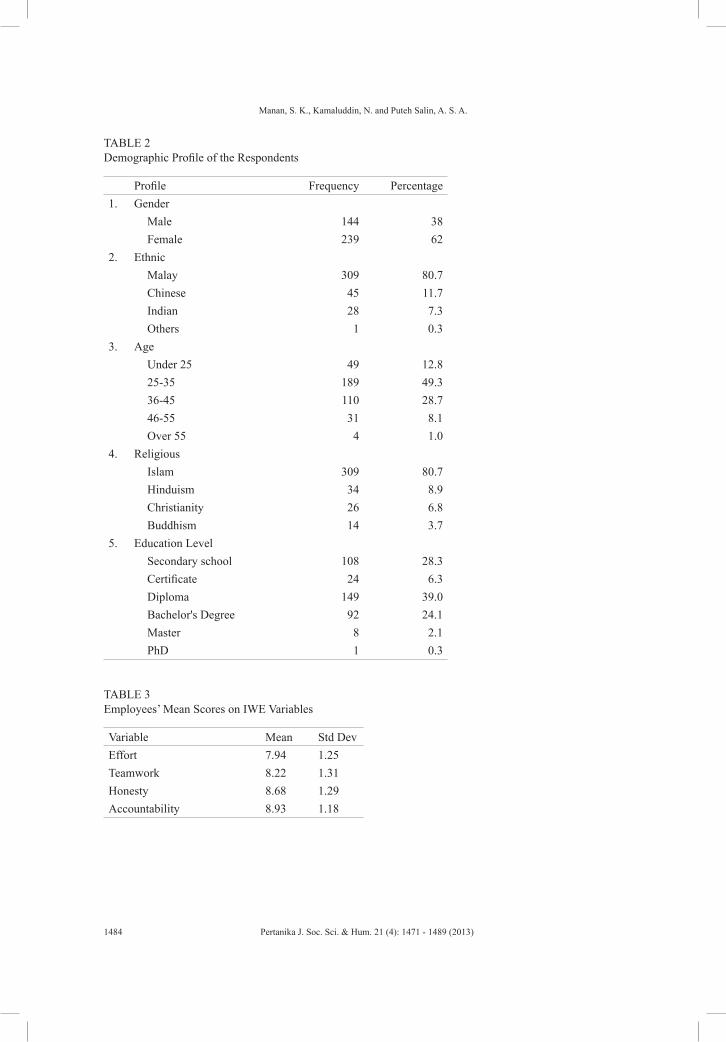
Manan, S. K., Kamaluddin, N. and Puteh Salin, A. S. A.
1484 Pertanika J. Soc. Sci. & Hum. 21 (4): 1471 - 1489 (2013)
TABLE 2 Demographic Profile of the Respondents
Profile Frequency Percentage1. Gender
Male 144 38Female 239 62
2. Ethnic Malay 309 80.7Chinese 45 11.7Indian 28 7.3Others 1 0.3
3. AgeUnder 25 49 12.825-35 189 49.336-45 110 28.746-55 31 8.1Over 55 4 1.0
4. ReligiousIslam 309 80.7Hinduism 34 8.9Christianity 26 6.8Buddhism 14 3.7
5. Education LevelSecondary school 108 28.3Certificate 24 6.3Diploma 149 39.0Bachelor's Degree 92 24.1Master 8 2.1PhD 1 0.3
TABLE 3 Employees’ Mean Scores on IWE Variables
Variable Mean Std DevEffort 7.94 1.25Teamwork 8.22 1.31Honesty 8.68 1.29Accountability 8.93 1.18
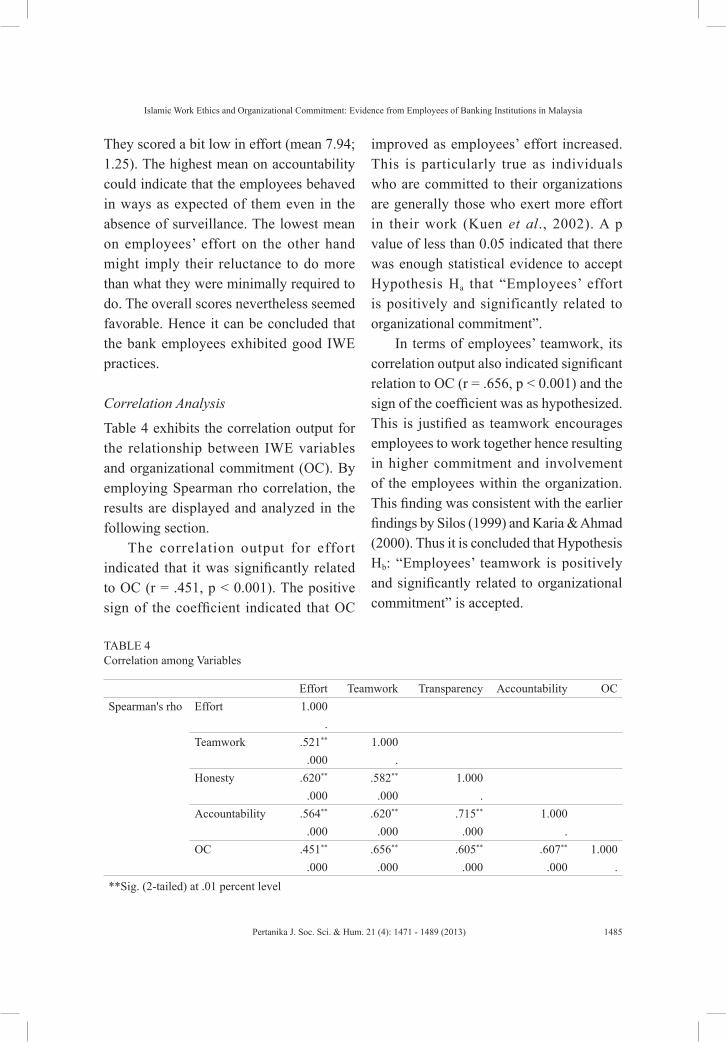
Islamic Work Ethics and Organizational Commitment: Evidence from Employees of Banking Institutions in Malaysia
1485Pertanika J. Soc. Sci. & Hum. 21 (4): 1471 - 1489 (2013)
They scored a bit low in effort (mean 7.94; 1.25). The highest mean on accountability could indicate that the employees behaved in ways as expected of them even in the absence of surveillance. The lowest mean on employees’ effort on the other hand might imply their reluctance to do more than what they were minimally required to do. The overall scores nevertheless seemed favorable. Hence it can be concluded that the bank employees exhibited good IWE practices.
Correlation Analysis
Table 4 exhibits the correlation output for the relationship between IWE variables and organizational commitment (OC). By employing Spearman rho correlation, the results are displayed and analyzed in the following section.
The correlation output for effort indicated that it was significantly related to OC (r = .451, p < 0.001). The positive sign of the coefficient indicated that OC
improved as employees’ effort increased. This is particularly true as individuals who are committed to their organizations are generally those who exert more effort in their work (Kuen et al., 2002). A p value of less than 0.05 indicated that there was enough statistical evidence to accept Hypothesis Ha that “Employees’ effort is positively and significantly related to organizational commitment”.
In terms of employees’ teamwork, its correlation output also indicated significant relation to OC (r = .656, p < 0.001) and the sign of the coefficient was as hypothesized. This is justified as teamwork encourages employees to work together hence resulting in higher commitment and involvement of the employees within the organization. This finding was consistent with the earlier findings by Silos (1999) and Karia & Ahmad (2000). Thus it is concluded that Hypothesis Hb: “Employees’ teamwork is positively and significantly related to organizational commitment” is accepted.
TABLE 4 Correlation among Variables
Effort Teamwork Transparency Accountability OCSpearman's rho Effort 1.000
.Teamwork .521** 1.000
.000 .Honesty .620** .582** 1.000
.000 .000 .Accountability .564** .620** .715** 1.000
.000 .000 .000 .OC .451** .656** .605** .607** 1.000
.000 .000 .000 .000 .**Sig. (2-tailed) at .01 percent level
Manan, S. K., Kamaluddin, N. and Puteh Salin, A. S. A.
1486 Pertanika J. Soc. Sci. & Hum. 21 (4): 1471 - 1489 (2013)
As far as employees’ honesty is concerned, its correlation output (r = .605, p < 0.001) indicated a significant relation to OC. This could imply that honest employees are committed employees of an organization. This finding is justified as earlier findings by Anderson et al. (1990) also indicated a similar result. The value of p < 0.05 indicated that there was enough statistical evidence to accept Hypothesis Hc: “Employees’ honesty is positively and significantly related to organizational commitment”.
Correlation output for accountability (r = .607, p < 0.001) showed similar findings with the other IWE variables, indicating that there was also a significant relation between accountability and OC. In fact, the value of r for accountability showed the highest as compared to the other variables. This implies that accountability of the employees is the most significant element of OC. This finding is consistent with the earlier finding of Brokner et al. (1997) which suggested that highly trustworthy employees had a high commitment to their organization. The value of p < 0.05 indicated that there was enough statistical evidence to accept Hypothesis Hd: “Employees’ accountability is positively and significantly related to organizational commitment”.
In sum, it can be concluded that all the IWE variables had a positive and significant relationship with OC. It may thus be implied that commitment of employees in their organization is associated with their effort, teamwork, honesty and accountability. Consistent with earlier findings, committed
employees are those who work efficiently and effectively which will benefit the organization both in the short and the long run. They are those who always put extra effort to complete their tasks even without surveillance. In many instances, these employees are dedicated and responsible employees who are willing to be accountable for what they are doing. More importantly, the awareness on work as ibadah could further motivate the Muslims in particular to work hard. The findings of this study have practical implications for administrators and managers who want to improve staff commitment and further increase their staff’s performance in the organization
CONCLUSION
The main purpose of this study was to investigate Islamic Work Ethics (IWE) practices among employees of banking institutions in Malaysia with specific focus being given to the possible relationship between IWE variables with organizational commitment (OC). Previous literature indicated that effort, teamwork, honesty and accountability contributed significantly to OC. These findings of the study indicated that employees of banking institutions in Malaysia exhibited a favorable practice of IWE. It was also found that all the IWE variables had a positive and significant relationship to OC. This indicated that commitment of employees in their organization was influenced by their effort, teamwork, honesty and accountability. The findings of this study could imply that the exerted effort of the employees, their spirit
Islamic Work Ethics and Organizational Commitment: Evidence from Employees of Banking Institutions in Malaysia
1487Pertanika J. Soc. Sci. & Hum. 21 (4): 1471 - 1489 (2013)
of teamwork, their truthfulness and their self-reliance in the absence of surveillance are significant elements of organizational commitment.
However, there are some limitations that can be considered for future research. This study was only limited to banks in the Klang Valley, thus a larger sample can be used with more industries (non-financial institutions) for future study. This study also did not intend to compare the level of the IWE between the employees of the Islamic and conventional banking systems.
Thus, it would be interesting to examine if the IWE of bank employees in Islamic banks is higher than those in the conventional banking sector. Apart from that, a comparative study of the IWE between Muslim and non-Muslim employees who work in the Islamic banks can be conducted to gather information on whether the environment and surrounding of working in an Islamic bank influence non-Muslims to adopt IWE. Finally, a comparison between IWE and Protestant Work Ethics (PWE) practices can also be carried out.
REFERENCESAbdurrahman, S. A. (2005), Fiqh Pekerja (translated
by Achmad Sunarto), Indonesia: Pustaka Anisah.
Abuznaid, S. A. (2009). Business ethics in Islam: The glaring gap in practice, International Journal of Islamic and Middle Eastern Finance and Management, 2(4), 278-288
Allen, N. J., & Meyer, J. P. (1990). The measurement and the antecedents of affective, continuance and normative commitment to the organization. Journal of Occupational Psychology, 63, 1-18.
Al-Imam Al-Bukhari. (1994). Sahih al-Bukhari. Translated by Muhammad Muhsin Khan 1994. Riyadh: Maktaba Dar-us-Salam
Al-Imam Muslim. (1972). Sahih Muslim. Translated by Abdul Hamid Siddique Pakistan: Sh. Muhammad Ashraf
Al-Imam al-Tirmidhi. (2007). Jami’ al-Tirmidhi. Translated by Abu Khaliyl 2007. Riyadh: Maktaba Dar us-Salam
Al-Imam Al-Bayhaqi. (n.d). Syu’b al-Iman. Bab 35. No. 4915 www.islamweb.net
Ali, A. J., & Falcone, T. (1995). Work ethic in the USA and Canada, Journal of Management Development, 14(6), 26-34.
Ali, A. J. (1992). Islamic work ethic in Arabia. Journal of Psychology, 126(5), 507-520.
Ali, A. J (1988). Scaling an Islamic work ethic. The Journal of Social Psychology, 128(5), 575-583.
Ali, A. J., & al Owaihan, A. (2008). Islamic work ethic: a critical review. Cross Cultural Management: An International Journal, 15(1), 5-19.
Anderson, J. C., & Narus, J. A. (1984). A model of the distributor’s perspective of distributor-manufacturer working relationship. Journal of Marketing, 58, 1-15.
Anderson, J. C., & Weitz, B. A. (1990). Determinants of continuity in conventional industrial channels Dyads. Marketing Science, 8, 310-323.
Angle, H. L., & Perry, J. L. (1981). An Empirical Assessment of Organizational Commitment and Organizational Effectiveness. Administrative Science Quarterly, 26(1), 1-14.
Ascigil, Semra F. (n.d.). A Tool for Enhancing Positive Work Attitudes? http://www.wku.edu/gfcb/papers/TeamsAscigil.pdf. Retrieved on 25 March 2011
Atiyah, M. K. (1993). Sistem Perakaunan Dalam Islam (terj). Kuala Lumpur: Dewan Bahasa dan Pustaka.
Manan, S. K., Kamaluddin, N. and Puteh Salin, A. S. A.
1488 Pertanika J. Soc. Sci. & Hum. 21 (4): 1471 - 1489 (2013)
Beekun, R. I. (2004). Islamic Business Ethics, Goodword Books Pvt., New Delhi.
Boon, O. K., & Arumugam, V. (2006). The influence of corporate culture on organizational commitment: case study of semiconductor organizations in Malaysia. Sunway Academic Journal, 3, 99–115.
Brockner, J., Siegel, Phyllis A., Daly, Joseph P., Martin, C., & Tyler, T. (1997). When Trust Matters: The Moderating Effect of Outcome Favorability. Administrative Science Quarterly, 42, 558-583.
Ebrahim, A. (2005). Accountability Myopia: Losing Sight of Organizational Learning. Non-Profit and Voluntary Sector Quarterly, 34(1), 56-87
Green. F. (2004). Why has work effort become more intense? Industrial Relations: A Journal of Economy and Society, 43(4), 709-741.
Hasan, B. A., & Siti-Nabiha, A.K. (2010). Towards good accountability: The role of accounting in Islamic religious organisations. World Academy of Science, Engineering and Technology, 66, 1133-1139.
Howatt, B. (2002). Quality Workplace Discussion Brief. Howatt HR Consulting Inc. www.howatthrconsulting.com. Retrieved on 25 March 2011
Karia. N., & Ahmad, Z.A. 2000. Quality practices that pay: empowerment and teamwork. Malaysian Management Review. 35(2). 66-76.
Kuean, W. L., Kaur, S., & Wong, E. S. K. (2010). The relationship between organizational commitment and intention to quit: The Malaysian companies perspectives. Journal Applied Science, 10, 2251-2260.
Malaysian Industrial Development Authority (2012), Invest in Malaysia – Banking, Finance and Exchange Administration. Retrieved from www.mida.gov.my/env3/index.php?page=banking-system. Retrieved on 8 May 2012
McCook, K. D. (2002). Organizational perceptions and their relationships to job attitudes, effort, performance and organizational citizenship behaviors. (Ph.D. Thesis dissertaion). Louisiana State University.
Morgan, R. M., & Hunt, S. D. (1994). The commitment-trust theory of relationship marketing. Journal of Marketing, 58(3), 20-38.
Mowday, R. T., Porter, L. W., & Steers, R. M. (1982). Employee-Organization Linkages: The Psychology of Commitment, Absenteeism, and Turnover. Academic Press, New York, NY.
Nik Mohamed Affandi Nik Yusoff. (2002). Islam & Business, Subang Jaya: Pelanduk Publications (M) Sdn. Bhd.
Norlela, K., & Siti Khadijah A. M. (2010). The conceptual framework of Islamic work ethic, Malaysian Accounting Review (MAR), Special Issue, 9(2), 57-70
Rice, G. (1999). Islamic ethics and the implications for business, Journal of Business Ethics, 18(4), 345-358.
Sarata, B. P. (1984). Changes in staff satisfaction after increase in pay, autonomy and participation. American Journal of Community Psychology, 12, 431-444.
Scarnati, J. T. (1997). Beyond technical competence: honesty and integrity. Career Development International. 2(1), 24–27.
Silos, I. M. (1999). Employee involvement: Acomponent of total quality management. Production and Inventory Manager Journal, 40(1), 56-66.
Syed Othman, A. H., Syed, O. S. A., Nik, M. N. H., & Aidit, G. (1998). Islamic Management For Excellence . Kuala Lumpur: Institut Perkembangan Minda
The Association of Banks in Malaysia. (2010). Annual Report 2010.

Islamic Work Ethics and Organizational Commitment: Evidence from Employees of Banking Institutions in Malaysia
1489Pertanika J. Soc. Sci. & Hum. 21 (4): 1471 - 1489 (2013)
Wetzels, M., De Ruyter, K., & Van Birgele, M. (1998). Marketing service relationships: the role of commitment. Journal of Business & Industrial Marketing. 13(4/5), 406-423
Yousef, D. A. (2000). Organizational commitment as a mediator of the relationship between IWE and attitudes towards organizational change. Human Relations, 53(4). 513-537.
Yousef, D. A. (2001). Islamic work ethic: A moderator between organizational commitment and job satisfaction in a cross-cultural context, Personnel Review, 30(2), 152-169.

Pertanika J. Soc. Sci. & Hum. 21 (4): 1491 - 1515 (2013)
ISSN: 0128-7702 © Universiti Putra Malaysia Press
SOCIAL SCIENCES & HUMANITIESJournal homepage: http://www.pertanika.upm.edu.my/
Article history:Received: 27 September 2011Accepted: 13 February 2012
ARTICLE INFO
E-mail addresses: [email protected] (Masoud Dalman), [email protected] (Elias Salleh), [email protected] (Abdul Razak Sapian), [email protected] (Omidreza Saadatian) * Corresponding author
Thermal Comfort Investigation in Traditional and Modern Urban Canyons in Bandar Abbas, Iran
Masoud Dalman1, Elias Salleh1, Abdul Razak Sapian2 and Omidreza Saadatian3*1Faculty of Design and Architecture, Universiti Putra Malaysia, 43400 Serdang, Selangor, Malaysia2Department of Architecture, Kulliyyah of Architecture and Environmental Design, International Islamic University of Malaysia, P.O. Box 10, 50728 Kuala Lumpur, Malaysia3Solar Energy Research Institute, Universiti Kebangsaan Malaysia, Perpustakaan Tun Sri Lanang, Universiti Kebangsaan Malaysia, 43600 Bangi, Selangor, Malaysia
ABSTRACT
Urban design plays an important role in a city’s daily life. Therefore, accessibility to thermal comfort spaces for citizens engaged in urban outdoor activities could be one of the main goals of urban designers. Urban forms and canyons have important roles in microclimate and thermal comfort situation in outdoor spaces. The hot humid climate of Bandar Abbas, especially in long summers, causes thermal stress for urban activities. In this study, two different urban fabrics were investigated using thermal comfort and Computational Fluid Dynamics (CFD) methods. Eight provisional measuring points in the selected prevailing canyons were used to obtain the data. The results correlated with the effects of the urban canyon orientation to variation of the microclimate factors, and consequently, the thermal comfort situation in the hottest period of the year. In addition, the results also indicated that the traditional urban fabric is more thermally comfortable than the new residential urban fabric. According to field measurements, thermal comfort calculation and wind simulations, the canyons with the north-south direction present a better orientation for air circulation benefiting from the sea breezes as compared to the other canyon orientations. Hence, this study provides insights for urban designers and policy makers residing in the hot and humid climate in the Middle East.
Keywords: Microclimate, hot-humid, urban canyon,
thermal comfort, Computational Fluid Dynamics
INTRODUCTION
Bandar Abbas is a big port in southern Iran, which has experienced a rapid growth of urban area, population, shipping, industrial,
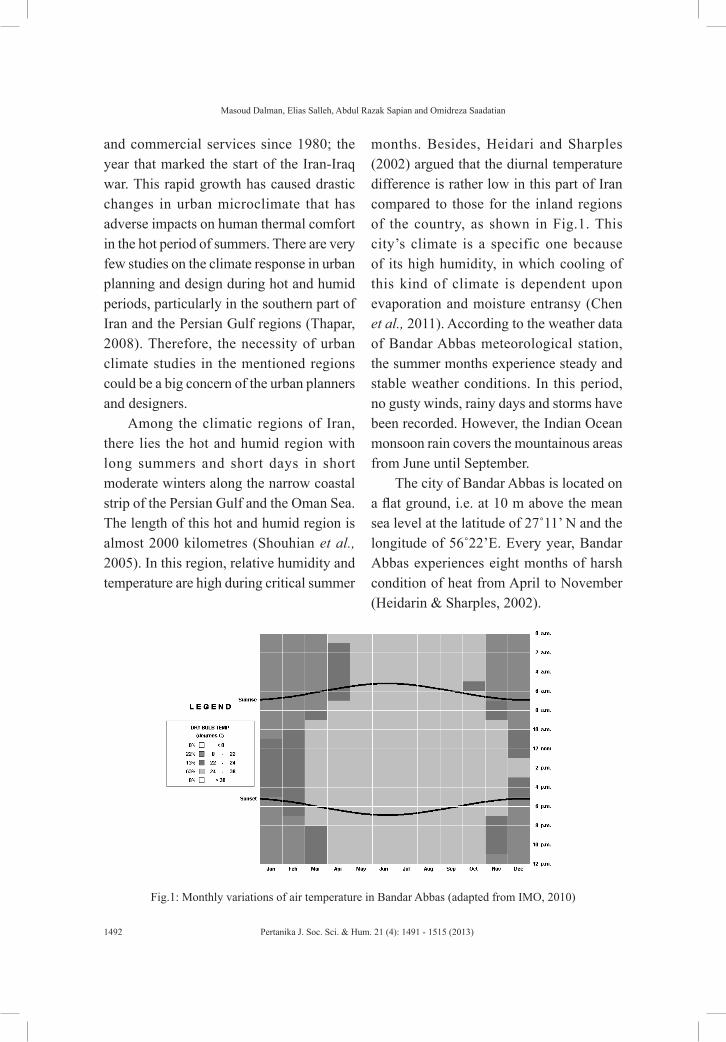
Masoud Dalman, Elias Salleh, Abdul Razak Sapian and Omidreza Saadatian
1492 Pertanika J. Soc. Sci. & Hum. 21 (4): 1491 - 1515 (2013)
Fig.1: Monthly variations of air temperature in Bandar Abbas (adapted from IMO, 2010)
and commercial services since 1980; the year that marked the start of the Iran-Iraq war. This rapid growth has caused drastic changes in urban microclimate that has adverse impacts on human thermal comfort in the hot period of summers. There are very few studies on the climate response in urban planning and design during hot and humid periods, particularly in the southern part of Iran and the Persian Gulf regions (Thapar, 2008). Therefore, the necessity of urban climate studies in the mentioned regions could be a big concern of the urban planners and designers.
Among the climatic regions of Iran, there lies the hot and humid region with long summers and short days in short moderate winters along the narrow coastal strip of the Persian Gulf and the Oman Sea. The length of this hot and humid region is almost 2000 kilometres (Shouhian et al., 2005). In this region, relative humidity and temperature are high during critical summer
months. Besides, Heidari and Sharples (2002) argued that the diurnal temperature difference is rather low in this part of Iran compared to those for the inland regions of the country, as shown in Fig.1. This city’s climate is a specific one because of its high humidity, in which cooling of this kind of climate is dependent upon evaporation and moisture entransy (Chen et al., 2011). According to the weather data of Bandar Abbas meteorological station, the summer months experience steady and stable weather conditions. In this period, no gusty winds, rainy days and storms have been recorded. However, the Indian Ocean monsoon rain covers the mountainous areas from June until September.
The city of Bandar Abbas is located on a flat ground, i.e. at 10 m above the mean sea level at the latitude of 27˚11’ N and the longitude of 56˚22’E. Every year, Bandar Abbas experiences eight months of harsh condition of heat from April to November (Heidarin & Sharples, 2002).
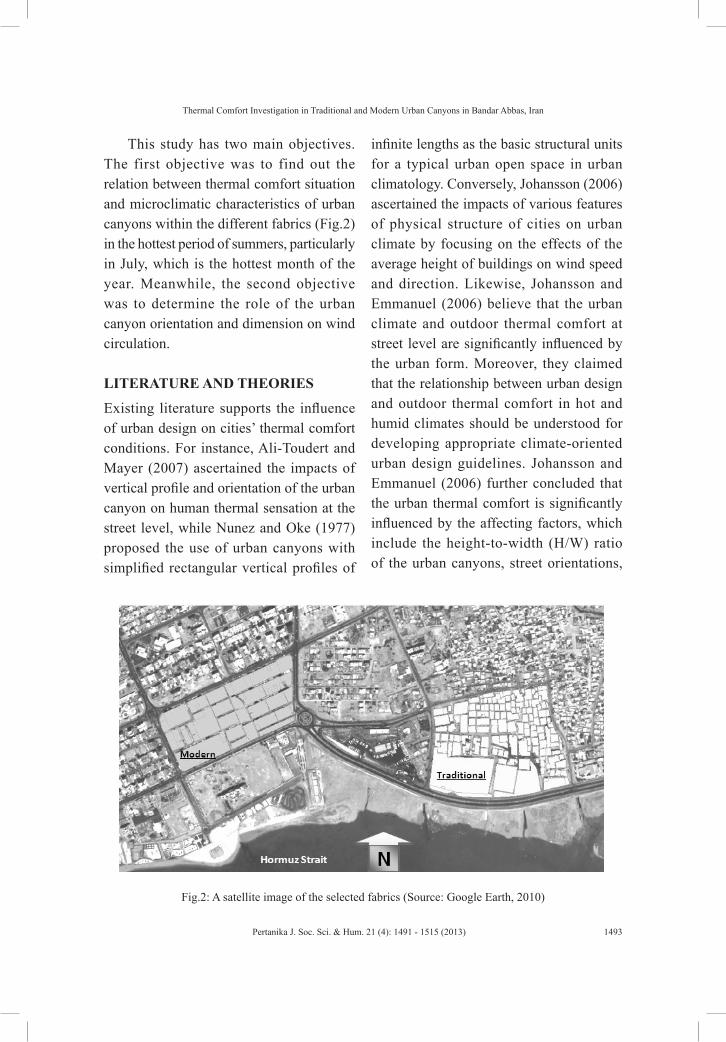
Thermal Comfort Investigation in Traditional and Modern Urban Canyons in Bandar Abbas, Iran
1493Pertanika J. Soc. Sci. & Hum. 21 (4): 1491 - 1515 (2013)
This study has two main objectives. The first objective was to find out the relation between thermal comfort situation and microclimatic characteristics of urban canyons within the different fabrics (Fig.2) in the hottest period of summers, particularly in July, which is the hottest month of the year. Meanwhile, the second objective was to determine the role of the urban canyon orientation and dimension on wind circulation.
LITERATURE AND THEORIES
Existing literature supports the influence of urban design on cities’ thermal comfort conditions. For instance, Ali-Toudert and Mayer (2007) ascertained the impacts of vertical profile and orientation of the urban canyon on human thermal sensation at the street level, while Nunez and Oke (1977) proposed the use of urban canyons with simplified rectangular vertical profiles of
infinite lengths as the basic structural units for a typical urban open space in urban climatology. Conversely, Johansson (2006) ascertained the impacts of various features of physical structure of cities on urban climate by focusing on the effects of the average height of buildings on wind speed and direction. Likewise, Johansson and Emmanuel (2006) believe that the urban climate and outdoor thermal comfort at street level are significantly influenced by the urban form. Moreover, they claimed that the relationship between urban design and outdoor thermal comfort in hot and humid climates should be understood for developing appropriate climate-oriented urban design guidelines. Johansson and Emmanuel (2006) further concluded that the urban thermal comfort is significantly influenced by the affecting factors, which include the height-to-width (H/W) ratio of the urban canyons, street orientations,
Fig.2: A satellite image of the selected fabrics (Source: Google Earth, 2010)
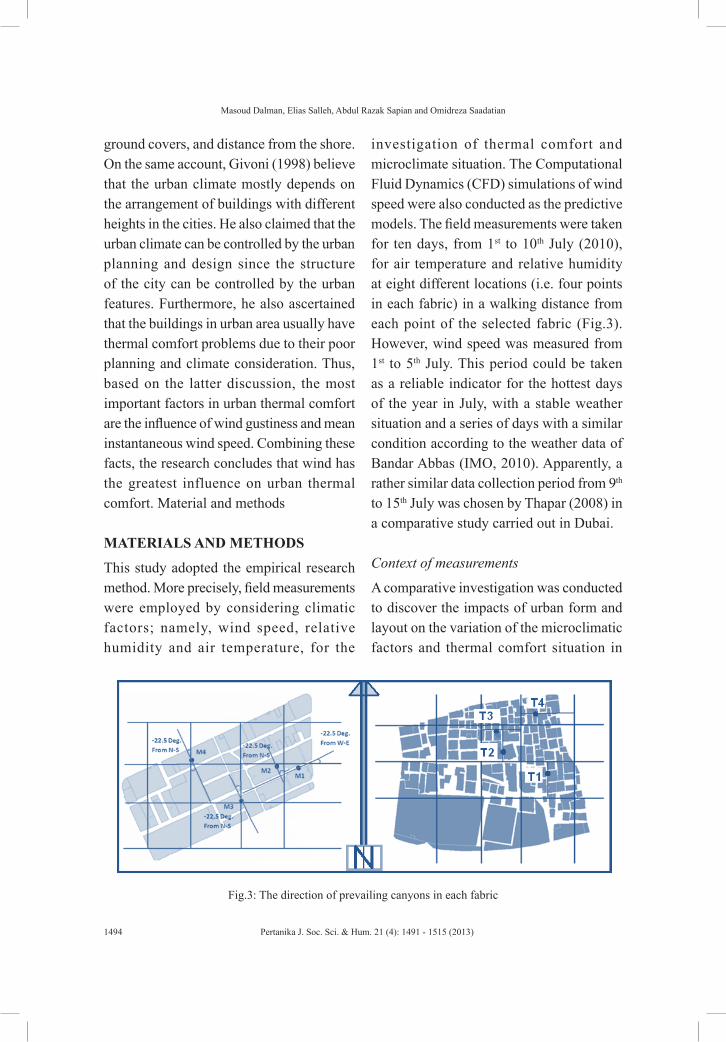
Masoud Dalman, Elias Salleh, Abdul Razak Sapian and Omidreza Saadatian
1494 Pertanika J. Soc. Sci. & Hum. 21 (4): 1491 - 1515 (2013)
ground covers, and distance from the shore. On the same account, Givoni (1998) believe that the urban climate mostly depends on the arrangement of buildings with different heights in the cities. He also claimed that the urban climate can be controlled by the urban planning and design since the structure of the city can be controlled by the urban features. Furthermore, he also ascertained that the buildings in urban area usually have thermal comfort problems due to their poor planning and climate consideration. Thus, based on the latter discussion, the most important factors in urban thermal comfort are the influence of wind gustiness and mean instantaneous wind speed. Combining these facts, the research concludes that wind has the greatest influence on urban thermal comfort. Material and methods
MATERIALS AND METHODS
This study adopted the empirical research method. More precisely, field measurements were employed by considering climatic factors; namely, wind speed, relative humidity and air temperature, for the
investigation of thermal comfort and microclimate situation. The Computational Fluid Dynamics (CFD) simulations of wind speed were also conducted as the predictive models. The field measurements were taken for ten days, from 1st to 10th July (2010), for air temperature and relative humidity at eight different locations (i.e. four points in each fabric) in a walking distance from each point of the selected fabric (Fig.3). However, wind speed was measured from 1st to 5th July. This period could be taken as a reliable indicator for the hottest days of the year in July, with a stable weather situation and a series of days with a similar condition according to the weather data of Bandar Abbas (IMO, 2010). Apparently, a rather similar data collection period from 9th to 15th July was chosen by Thapar (2008) in a comparative study carried out in Dubai.
Context of measurements
A comparative investigation was conducted to discover the impacts of urban form and layout on the variation of the microclimatic factors and thermal comfort situation in
Fig.3: The direction of prevailing canyons in each fabric
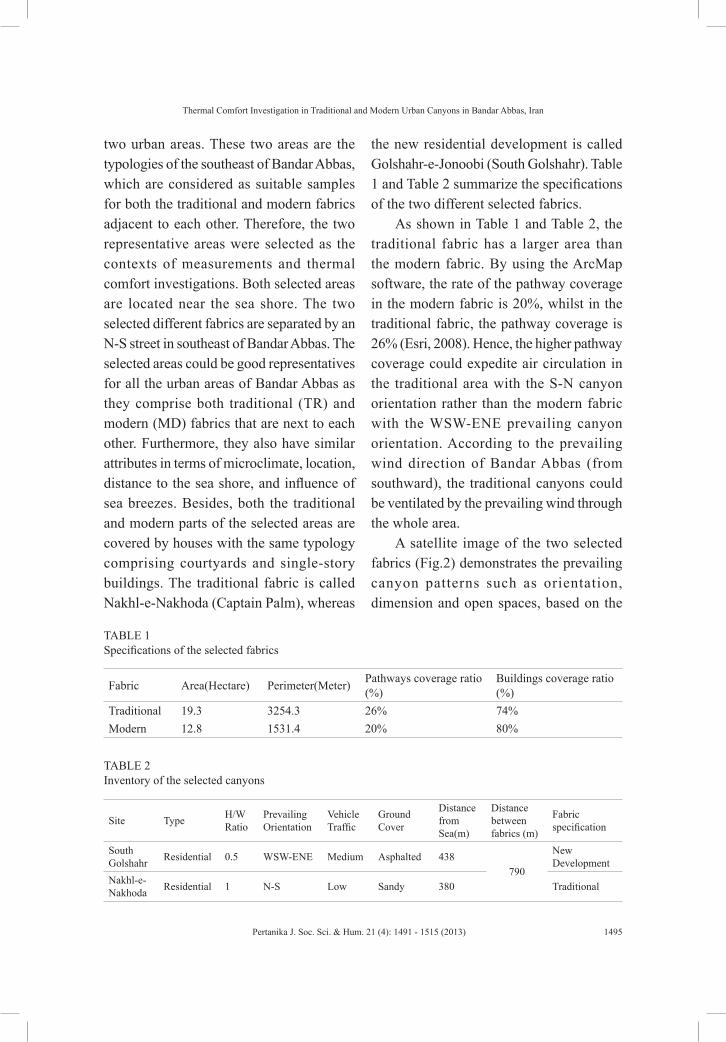
Thermal Comfort Investigation in Traditional and Modern Urban Canyons in Bandar Abbas, Iran
1495Pertanika J. Soc. Sci. & Hum. 21 (4): 1491 - 1515 (2013)
two urban areas. These two areas are the typologies of the southeast of Bandar Abbas, which are considered as suitable samples for both the traditional and modern fabrics adjacent to each other. Therefore, the two representative areas were selected as the contexts of measurements and thermal comfort investigations. Both selected areas are located near the sea shore. The two selected different fabrics are separated by an N-S street in southeast of Bandar Abbas. The selected areas could be good representatives for all the urban areas of Bandar Abbas as they comprise both traditional (TR) and modern (MD) fabrics that are next to each other. Furthermore, they also have similar attributes in terms of microclimate, location, distance to the sea shore, and influence of sea breezes. Besides, both the traditional and modern parts of the selected areas are covered by houses with the same typology comprising courtyards and single-story buildings. The traditional fabric is called Nakhl-e-Nakhoda (Captain Palm), whereas
the new residential development is called Golshahr-e-Jonoobi (South Golshahr). Table 1 and Table 2 summarize the specifications of the two different selected fabrics.
As shown in Table 1 and Table 2, the traditional fabric has a larger area than the modern fabric. By using the ArcMap software, the rate of the pathway coverage in the modern fabric is 20%, whilst in the traditional fabric, the pathway coverage is 26% (Esri, 2008). Hence, the higher pathway coverage could expedite air circulation in the traditional area with the S-N canyon orientation rather than the modern fabric with the WSW-ENE prevailing canyon orientation. According to the prevailing wind direction of Bandar Abbas (from southward), the traditional canyons could be ventilated by the prevailing wind through the whole area.
A satellite image of the two selected fabrics (Fig.2) demonstrates the prevailing canyon patterns such as orientation, dimension and open spaces, based on the
TABLE 1 Specifications of the selected fabrics
Fabric Area(Hectare) Perimeter(Meter) Pathways coverage ratio (%)
Buildings coverage ratio (%)
Traditional 19.3 3254.3 26% 74%Modern 12.8 1531.4 20% 80%
TABLE 2 Inventory of the selected canyons
Site Type H/W Ratio
Prevailing Orientation
Vehicle Traffic
Ground Cover
Distance from Sea(m)
Distance between fabrics (m)
Fabric specification
South Golshahr Residential 0.5 WSW-ENE Medium Asphalted 438
790
New Development
Nakhl-e-Nakhoda Residential 1 N-S Low Sandy 380 Traditional
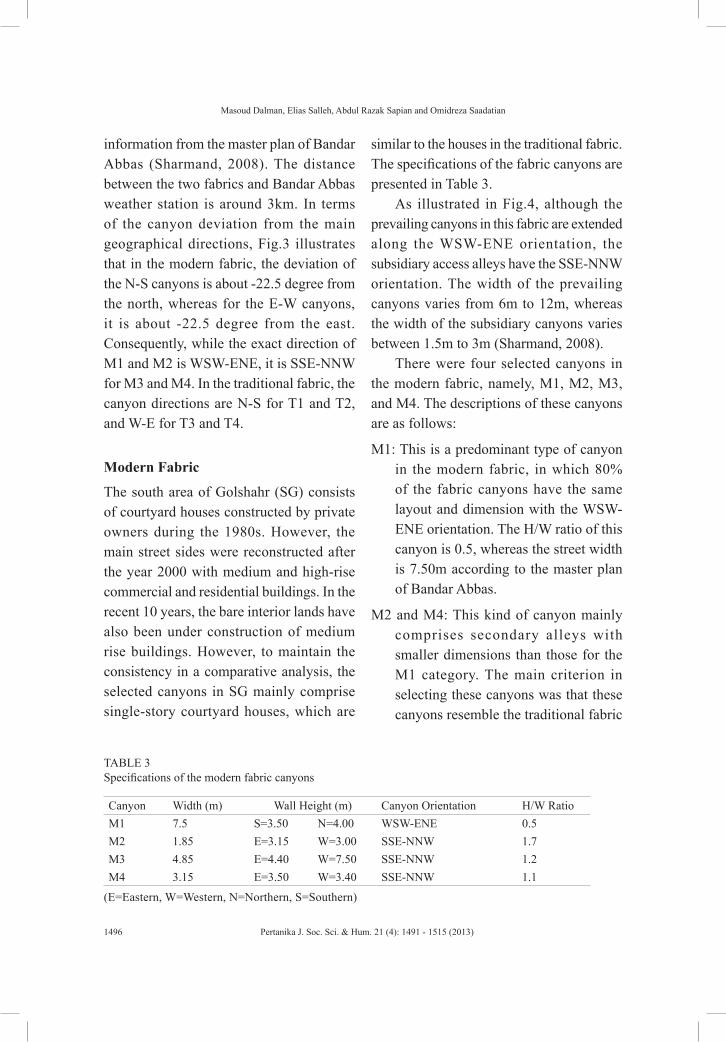
Masoud Dalman, Elias Salleh, Abdul Razak Sapian and Omidreza Saadatian
1496 Pertanika J. Soc. Sci. & Hum. 21 (4): 1491 - 1515 (2013)
information from the master plan of Bandar Abbas (Sharmand, 2008). The distance between the two fabrics and Bandar Abbas weather station is around 3km. In terms of the canyon deviation from the main geographical directions, Fig.3 illustrates that in the modern fabric, the deviation of the N-S canyons is about -22.5 degree from the north, whereas for the E-W canyons, it is about -22.5 degree from the east. Consequently, while the exact direction of M1 and M2 is WSW-ENE, it is SSE-NNW for M3 and M4. In the traditional fabric, the canyon directions are N-S for T1 and T2, and W-E for T3 and T4.
Modern Fabric
The south area of Golshahr (SG) consists of courtyard houses constructed by private owners during the 1980s. However, the main street sides were reconstructed after the year 2000 with medium and high-rise commercial and residential buildings. In the recent 10 years, the bare interior lands have also been under construction of medium rise buildings. However, to maintain the consistency in a comparative analysis, the selected canyons in SG mainly comprise single-story courtyard houses, which are
similar to the houses in the traditional fabric. The specifications of the fabric canyons are presented in Table 3.
As illustrated in Fig.4, although the prevailing canyons in this fabric are extended along the WSW-ENE orientation, the subsidiary access alleys have the SSE-NNW orientation. The width of the prevailing canyons varies from 6m to 12m, whereas the width of the subsidiary canyons varies between 1.5m to 3m (Sharmand, 2008).
There were four selected canyons in the modern fabric, namely, M1, M2, M3, and M4. The descriptions of these canyons are as follows:
M1: This is a predominant type of canyon in the modern fabric, in which 80% of the fabric canyons have the same layout and dimension with the WSW-ENE orientation. The H/W ratio of this canyon is 0.5, whereas the street width is 7.50m according to the master plan of Bandar Abbas.
M2 and M4: This kind of canyon mainly comprises secondary alleys with smaller dimensions than those for the M1 category. The main criterion in selecting these canyons was that these canyons resemble the traditional fabric
TABLE 3 Specifications of the modern fabric canyons
Canyon Width (m) Wall Height (m) Canyon Orientation H/W RatioM1 7.5 S=3.50 N=4.00 WSW-ENE 0.5M2 1.85 E=3.15 W=3.00 SSE-NNW 1.7M3 4.85 E=4.40 W=7.50 SSE-NNW 1.2M4 3.15 E=3.50 W=3.40 SSE-NNW 1.1
(E=Eastern, W=Western, N=Northern, S=Southern)
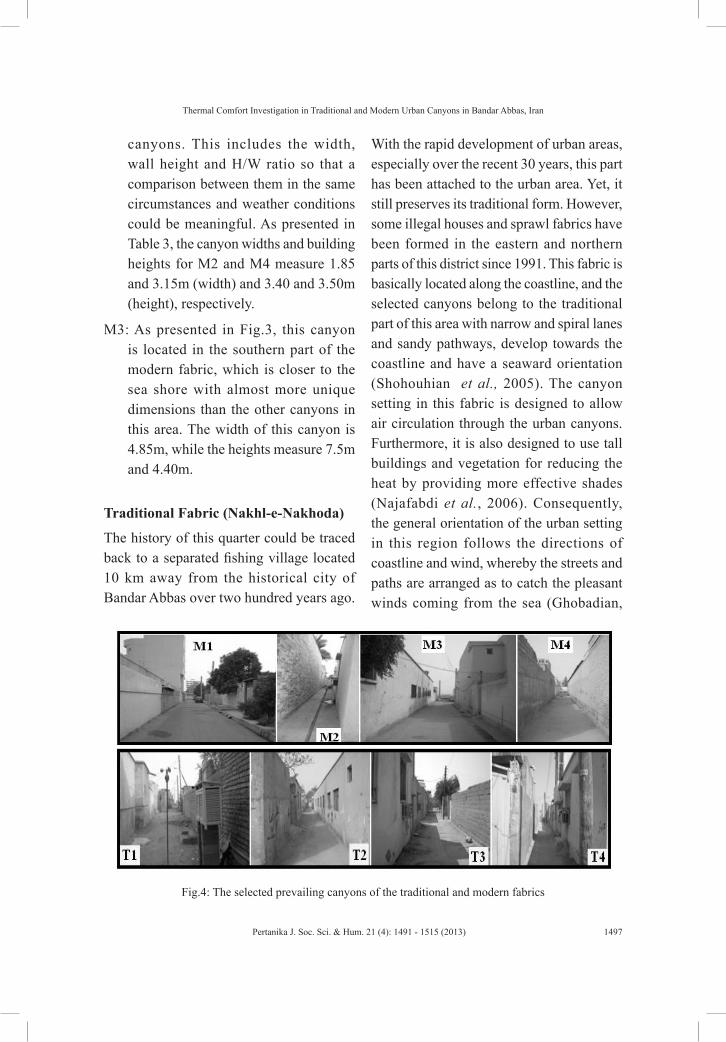
Thermal Comfort Investigation in Traditional and Modern Urban Canyons in Bandar Abbas, Iran
1497Pertanika J. Soc. Sci. & Hum. 21 (4): 1491 - 1515 (2013)
canyons. This includes the width, wall height and H/W ratio so that a comparison between them in the same circumstances and weather conditions could be meaningful. As presented in Table 3, the canyon widths and building heights for M2 and M4 measure 1.85 and 3.15m (width) and 3.40 and 3.50m (height), respectively.
M3: As presented in Fig.3, this canyon is located in the southern part of the modern fabric, which is closer to the sea shore with almost more unique dimensions than the other canyons in this area. The width of this canyon is 4.85m, while the heights measure 7.5m and 4.40m.
Traditional Fabric (Nakhl-e-Nakhoda)
The history of this quarter could be traced back to a separated fishing village located 10 km away from the historical city of Bandar Abbas over two hundred years ago.
With the rapid development of urban areas, especially over the recent 30 years, this part has been attached to the urban area. Yet, it still preserves its traditional form. However, some illegal houses and sprawl fabrics have been formed in the eastern and northern parts of this district since 1991. This fabric is basically located along the coastline, and the selected canyons belong to the traditional part of this area with narrow and spiral lanes and sandy pathways, develop towards the coastline and have a seaward orientation (Shohouhian et al., 2005). The canyon setting in this fabric is designed to allow air circulation through the urban canyons. Furthermore, it is also designed to use tall buildings and vegetation for reducing the heat by providing more effective shades (Najafabdi et al., 2006). Consequently, the general orientation of the urban setting in this region follows the directions of coastline and wind, whereby the streets and paths are arranged as to catch the pleasant winds coming from the sea (Ghobadian,
Fig.4: The selected prevailing canyons of the traditional and modern fabrics
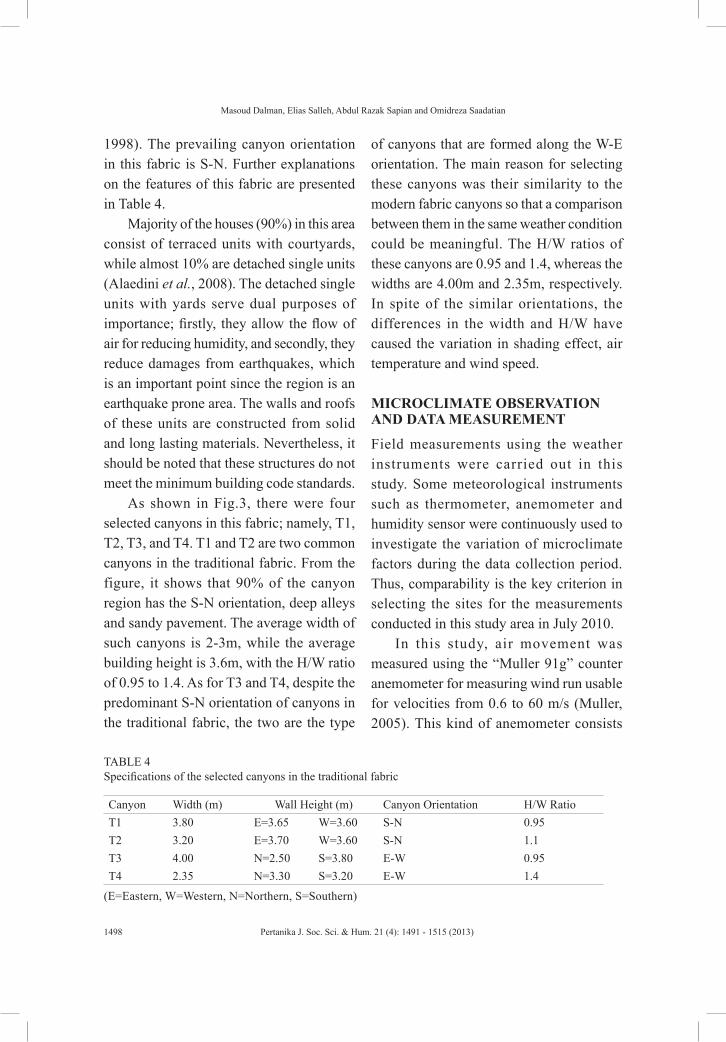
Masoud Dalman, Elias Salleh, Abdul Razak Sapian and Omidreza Saadatian
1498 Pertanika J. Soc. Sci. & Hum. 21 (4): 1491 - 1515 (2013)
1998). The prevailing canyon orientation in this fabric is S-N. Further explanations on the features of this fabric are presented in Table 4.
Majority of the houses (90%) in this area consist of terraced units with courtyards, while almost 10% are detached single units (Alaedini et al., 2008). The detached single units with yards serve dual purposes of importance; firstly, they allow the flow of air for reducing humidity, and secondly, they reduce damages from earthquakes, which is an important point since the region is an earthquake prone area. The walls and roofs of these units are constructed from solid and long lasting materials. Nevertheless, it should be noted that these structures do not meet the minimum building code standards.
As shown in Fig.3, there were four selected canyons in this fabric; namely, T1, T2, T3, and T4. T1 and T2 are two common canyons in the traditional fabric. From the figure, it shows that 90% of the canyon region has the S-N orientation, deep alleys and sandy pavement. The average width of such canyons is 2-3m, while the average building height is 3.6m, with the H/W ratio of 0.95 to 1.4. As for T3 and T4, despite the predominant S-N orientation of canyons in the traditional fabric, the two are the type
of canyons that are formed along the W-E orientation. The main reason for selecting these canyons was their similarity to the modern fabric canyons so that a comparison between them in the same weather condition could be meaningful. The H/W ratios of these canyons are 0.95 and 1.4, whereas the widths are 4.00m and 2.35m, respectively. In spite of the similar orientations, the differences in the width and H/W have caused the variation in shading effect, air temperature and wind speed.
MICROCLIMATE OBSERVATION AND DATA MEASUREMENT
Field measurements using the weather instruments were carried out in this study. Some meteorological instruments such as thermometer, anemometer and humidity sensor were continuously used to investigate the variation of microclimate factors during the data collection period. Thus, comparability is the key criterion in selecting the sites for the measurements conducted in this study area in July 2010.
In this study, air movement was measured using the “Muller 91g” counter anemometer for measuring wind run usable for velocities from 0.6 to 60 m/s (Muller, 2005). This kind of anemometer consists
TABLE 4 Specifications of the selected canyons in the traditional fabric
Canyon Width (m) Wall Height (m) Canyon Orientation H/W RatioT1 3.80 E=3.65 W=3.60 S-N 0.95T2 3.20 E=3.70 W=3.60 S-N 1.1T3 4.00 N=2.50 S=3.80 E-W 0.95T4 2.35 N=3.30 S=3.20 E-W 1.4
(E=Eastern, W=Western, N=Northern, S=Southern)
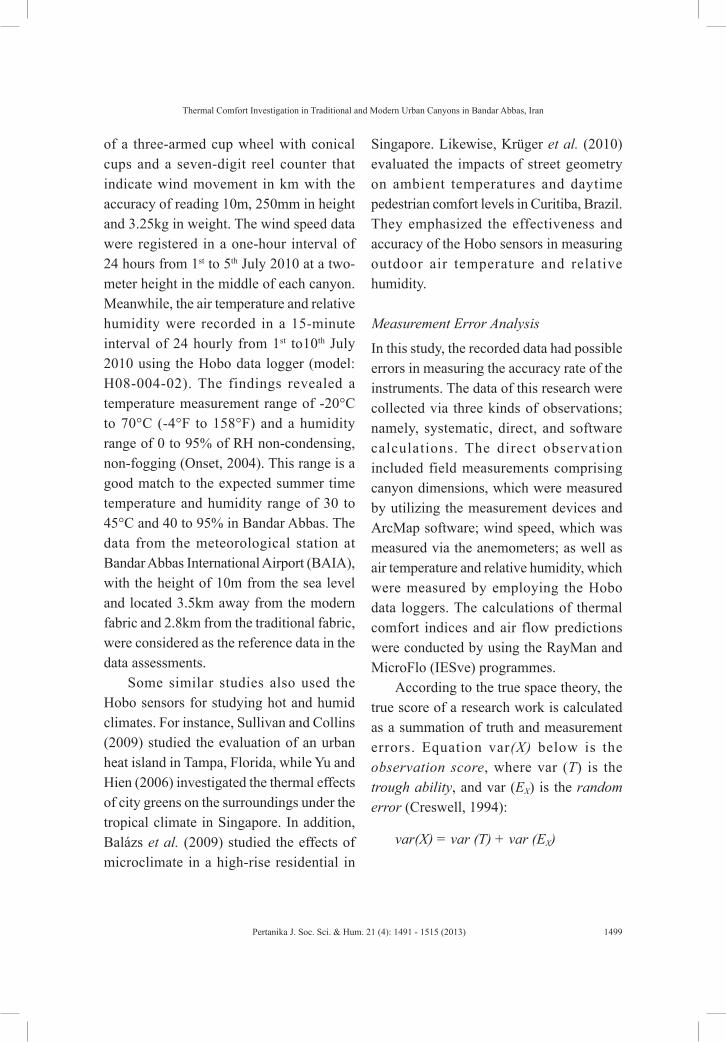
Thermal Comfort Investigation in Traditional and Modern Urban Canyons in Bandar Abbas, Iran
1499Pertanika J. Soc. Sci. & Hum. 21 (4): 1491 - 1515 (2013)
of a three-armed cup wheel with conical cups and a seven-digit reel counter that indicate wind movement in km with the accuracy of reading 10m, 250mm in height and 3.25kg in weight. The wind speed data were registered in a one-hour interval of 24 hours from 1st to 5th July 2010 at a two-meter height in the middle of each canyon. Meanwhile, the air temperature and relative humidity were recorded in a 15-minute interval of 24 hourly from 1st to10th July 2010 using the Hobo data logger (model: H08-004-02). The findings revealed a temperature measurement range of -20°C to 70°C (-4°F to 158°F) and a humidity range of 0 to 95% of RH non-condensing, non-fogging (Onset, 2004). This range is a good match to the expected summer time temperature and humidity range of 30 to 45°C and 40 to 95% in Bandar Abbas. The data from the meteorological station at Bandar Abbas International Airport (BAIA), with the height of 10m from the sea level and located 3.5km away from the modern fabric and 2.8km from the traditional fabric, were considered as the reference data in the data assessments.
Some similar studies also used the Hobo sensors for studying hot and humid climates. For instance, Sullivan and Collins (2009) studied the evaluation of an urban heat island in Tampa, Florida, while Yu and Hien (2006) investigated the thermal effects of city greens on the surroundings under the tropical climate in Singapore. In addition, Balázs et al. (2009) studied the effects of microclimate in a high-rise residential in
Singapore. Likewise, Krüger et al. (2010) evaluated the impacts of street geometry on ambient temperatures and daytime pedestrian comfort levels in Curitiba, Brazil. They emphasized the effectiveness and accuracy of the Hobo sensors in measuring outdoor air temperature and relative humidity.
Measurement Error Analysis
In this study, the recorded data had possible errors in measuring the accuracy rate of the instruments. The data of this research were collected via three kinds of observations; namely, systematic, direct, and software calculations. The direct observation included field measurements comprising canyon dimensions, which were measured by utilizing the measurement devices and ArcMap software; wind speed, which was measured via the anemometers; as well as air temperature and relative humidity, which were measured by employing the Hobo data loggers. The calculations of thermal comfort indices and air flow predictions were conducted by using the RayMan and MicroFlo (IESve) programmes.
According to the true space theory, the true score of a research work is calculated as a summation of truth and measurement errors. Equation var(X) below is the observation score, where var (T) is the trough ability, and var (EX) is the random error (Creswell, 1994):
var(X) = var (T) + var (EX)
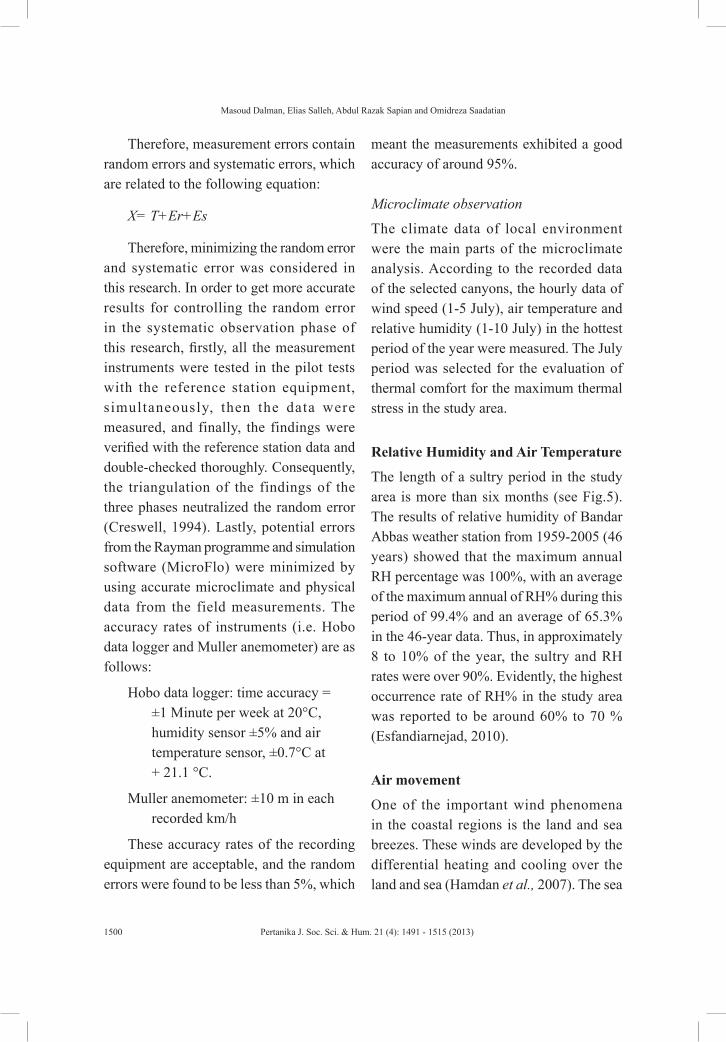
Masoud Dalman, Elias Salleh, Abdul Razak Sapian and Omidreza Saadatian
1500 Pertanika J. Soc. Sci. & Hum. 21 (4): 1491 - 1515 (2013)
Therefore, measurement errors contain random errors and systematic errors, which are related to the following equation:
X= T+Er+Es
Therefore, minimizing the random error and systematic error was considered in this research. In order to get more accurate results for controlling the random error in the systematic observation phase of this research, firstly, all the measurement instruments were tested in the pilot tests with the reference station equipment, simultaneously, then the data were measured, and finally, the findings were verified with the reference station data and double-checked thoroughly. Consequently, the triangulation of the findings of the three phases neutralized the random error (Creswell, 1994). Lastly, potential errors from the Rayman programme and simulation software (MicroFlo) were minimized by using accurate microclimate and physical data from the field measurements. The accuracy rates of instruments (i.e. Hobo data logger and Muller anemometer) are as follows:
Hobo data logger: time accuracy = ±1 Minute per week at 20°C, humidity sensor ±5% and air temperature sensor, ±0.7°C at + 21.1 °C.
Muller anemometer: ±10 m in each recorded km/h
These accuracy rates of the recording equipment are acceptable, and the random errors were found to be less than 5%, which
meant the measurements exhibited a good accuracy of around 95%.
Microclimate observation
The climate data of local environment were the main parts of the microclimate analysis. According to the recorded data of the selected canyons, the hourly data of wind speed (1-5 July), air temperature and relative humidity (1-10 July) in the hottest period of the year were measured. The July period was selected for the evaluation of thermal comfort for the maximum thermal stress in the study area.
Relative Humidity and Air Temperature
The length of a sultry period in the study area is more than six months (see Fig.5). The results of relative humidity of Bandar Abbas weather station from 1959-2005 (46 years) showed that the maximum annual RH percentage was 100%, with an average of the maximum annual of RH% during this period of 99.4% and an average of 65.3% in the 46-year data. Thus, in approximately 8 to 10% of the year, the sultry and RH rates were over 90%. Evidently, the highest occurrence rate of RH% in the study area was reported to be around 60% to 70 % (Esfandiarnejad, 2010).
Air movement
One of the important wind phenomena in the coastal regions is the land and sea breezes. These winds are developed by the differential heating and cooling over the land and sea (Hamdan et al., 2007). The sea
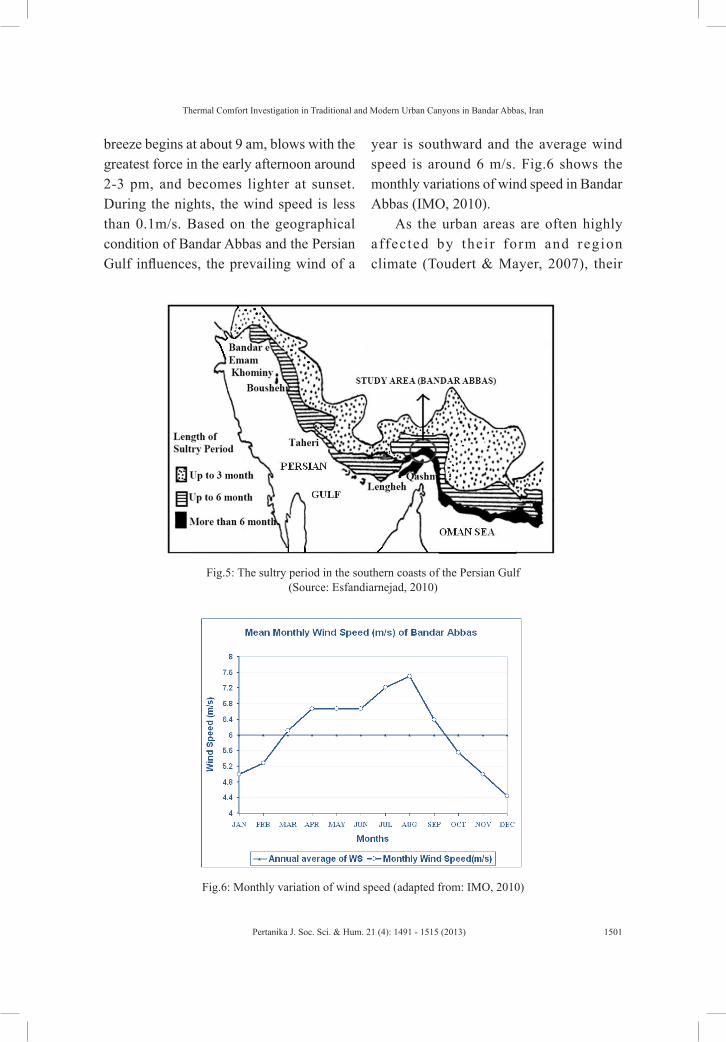
Thermal Comfort Investigation in Traditional and Modern Urban Canyons in Bandar Abbas, Iran
1501Pertanika J. Soc. Sci. & Hum. 21 (4): 1491 - 1515 (2013)
breeze begins at about 9 am, blows with the greatest force in the early afternoon around 2-3 pm, and becomes lighter at sunset. During the nights, the wind speed is less than 0.1m/s. Based on the geographical condition of Bandar Abbas and the Persian Gulf influences, the prevailing wind of a
year is southward and the average wind speed is around 6 m/s. Fig.6 shows the monthly variations of wind speed in Bandar Abbas (IMO, 2010).
As the urban areas are often highly affected by their form and region climate (Toudert & Mayer, 2007), their
Fig.5: The sultry period in the southern coasts of the Persian Gulf
(Source: Esfandiarnejad, 2010)
Fig.6: Monthly variation of wind speed (adapted from: IMO, 2010)
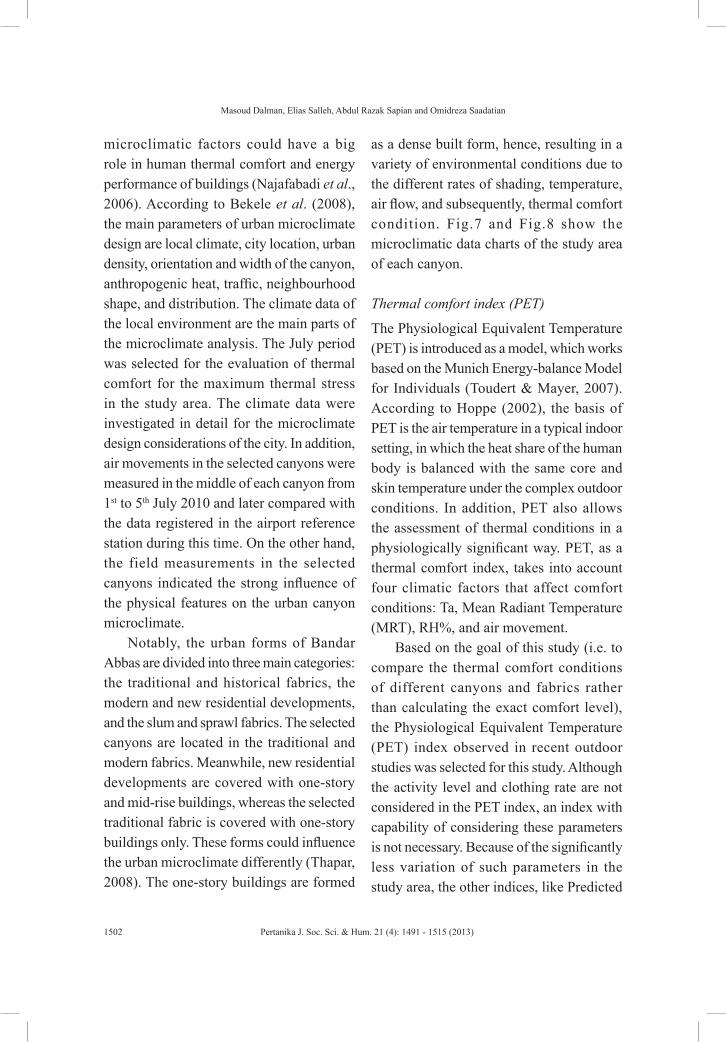
Masoud Dalman, Elias Salleh, Abdul Razak Sapian and Omidreza Saadatian
1502 Pertanika J. Soc. Sci. & Hum. 21 (4): 1491 - 1515 (2013)
microclimatic factors could have a big role in human thermal comfort and energy performance of buildings (Najafabadi et al., 2006). According to Bekele et al. (2008), the main parameters of urban microclimate design are local climate, city location, urban density, orientation and width of the canyon, anthropogenic heat, traffic, neighbourhood shape, and distribution. The climate data of the local environment are the main parts of the microclimate analysis. The July period was selected for the evaluation of thermal comfort for the maximum thermal stress in the study area. The climate data were investigated in detail for the microclimate design considerations of the city. In addition, air movements in the selected canyons were measured in the middle of each canyon from 1st to 5th July 2010 and later compared with the data registered in the airport reference station during this time. On the other hand, the field measurements in the selected canyons indicated the strong influence of the physical features on the urban canyon microclimate.
Notably, the urban forms of Bandar Abbas are divided into three main categories: the traditional and historical fabrics, the modern and new residential developments, and the slum and sprawl fabrics. The selected canyons are located in the traditional and modern fabrics. Meanwhile, new residential developments are covered with one-story and mid-rise buildings, whereas the selected traditional fabric is covered with one-story buildings only. These forms could influence the urban microclimate differently (Thapar, 2008). The one-story buildings are formed
as a dense built form, hence, resulting in a variety of environmental conditions due to the different rates of shading, temperature, air flow, and subsequently, thermal comfort condition. Fig.7 and Fig.8 show the microclimatic data charts of the study area of each canyon.
Thermal comfort index (PET)
The Physiological Equivalent Temperature (PET) is introduced as a model, which works based on the Munich Energy-balance Model for Individuals (Toudert & Mayer, 2007). According to Hoppe (2002), the basis of PET is the air temperature in a typical indoor setting, in which the heat share of the human body is balanced with the same core and skin temperature under the complex outdoor conditions. In addition, PET also allows the assessment of thermal conditions in a physiologically significant way. PET, as a thermal comfort index, takes into account four climatic factors that affect comfort conditions: Ta, Mean Radiant Temperature (MRT), RH%, and air movement.
Based on the goal of this study (i.e. to compare the thermal comfort conditions of different canyons and fabrics rather than calculating the exact comfort level), the Physiological Equivalent Temperature (PET) index observed in recent outdoor studies was selected for this study. Although the activity level and clothing rate are not considered in the PET index, an index with capability of considering these parameters is not necessary. Because of the significantly less variation of such parameters in the study area, the other indices, like Predicted
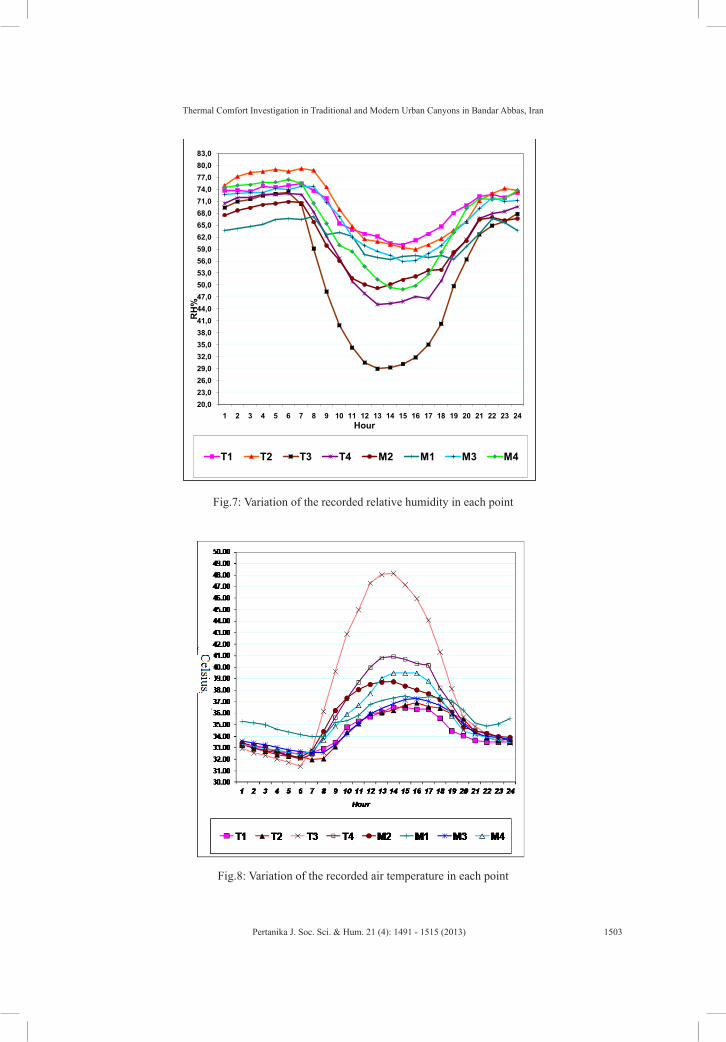
Thermal Comfort Investigation in Traditional and Modern Urban Canyons in Bandar Abbas, Iran
1503Pertanika J. Soc. Sci. & Hum. 21 (4): 1491 - 1515 (2013)
20,023,026,029,032,035,038,041,044,047,050,053,056,059,062,065,068,071,074,077,080,083,0
1 2 3 4 5 6 7 8 9 10 11 12 13 14 15 16 17 18 19 20 21 22 23 24
RH
%
Hour
T1 T2 T3 T4 M2 M1 M3 M4
Fig.7: Variation of the recorded relative humidity in each point
Fig.8: Variation of the recorded air temperature in each point
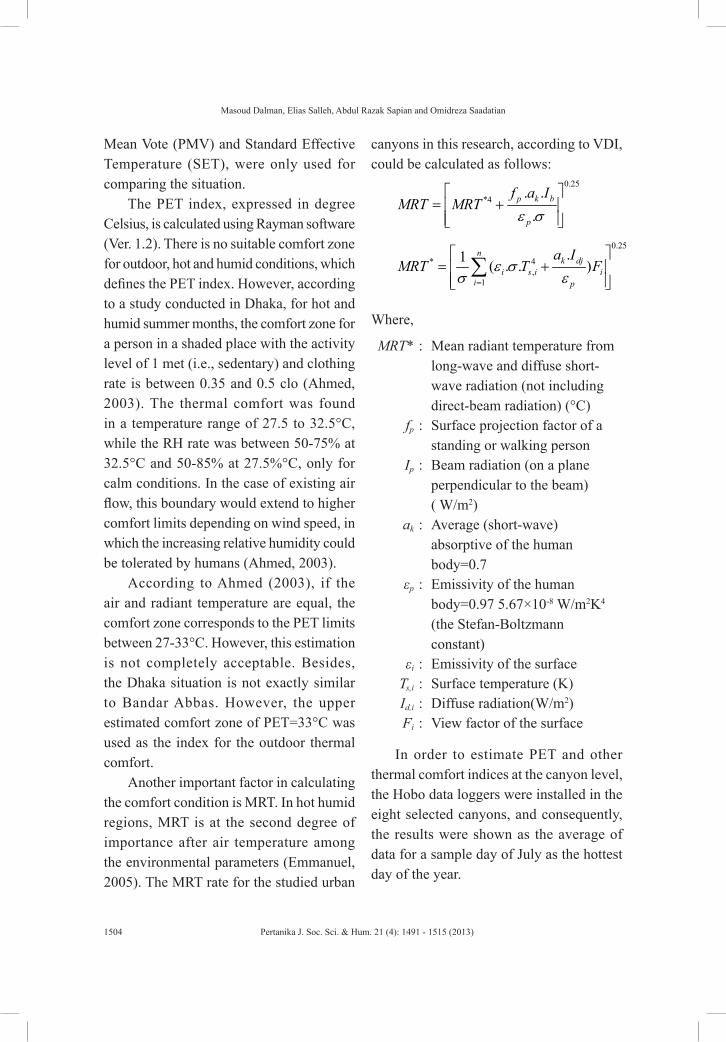
Masoud Dalman, Elias Salleh, Abdul Razak Sapian and Omidreza Saadatian
1504 Pertanika J. Soc. Sci. & Hum. 21 (4): 1491 - 1515 (2013)
Mean Vote (PMV) and Standard Effective Temperature (SET), were only used for comparing the situation.
The PET index, expressed in degree Celsius, is calculated using Rayman software (Ver. 1.2). There is no suitable comfort zone for outdoor, hot and humid conditions, which defines the PET index. However, according to a study conducted in Dhaka, for hot and humid summer months, the comfort zone for a person in a shaded place with the activity level of 1 met (i.e., sedentary) and clothing rate is between 0.35 and 0.5 clo (Ahmed, 2003). The thermal comfort was found in a temperature range of 27.5 to 32.5°C, while the RH rate was between 50-75% at 32.5°C and 50-85% at 27.5%°C, only for calm conditions. In the case of existing air flow, this boundary would extend to higher comfort limits depending on wind speed, in which the increasing relative humidity could be tolerated by humans (Ahmed, 2003).
According to Ahmed (2003), if the air and radiant temperature are equal, the comfort zone corresponds to the PET limits between 27-33°C. However, this estimation is not completely acceptable. Besides, the Dhaka situation is not exactly similar to Bandar Abbas. However, the upper estimated comfort zone of PET=33°C was used as the index for the outdoor thermal comfort.
Another important factor in calculating the comfort condition is MRT. In hot humid regions, MRT is at the second degree of importance after air temperature among the environmental parameters (Emmanuel, 2005). The MRT rate for the studied urban
canyons in this research, according to VDI, could be calculated as follows:
0.25
*4 . ..
p k b
p
f a IMRT MRT
ε σ
= +
0.25
* 4,
1
.1 ( . . )n
k dji s i i
i p
a IMRT T Fε σ
σ ε=
= + ∑
Where,
MRT* : Mean radiant temperature from long-wave and diffuse short-wave radiation (not including direct-beam radiation) (°C)
fp : Surface projection factor of a standing or walking person
Ip : Beam radiation (on a plane perpendicular to the beam) ( W/m2)
ak : Average (short-wave) absorptive of the human body=0.7
εp : Emissivity of the human body=0.97 5.67×10⁻⁸ W/m2K4
(the Stefan-Boltzmann constant)
εi : Emissivity of the surfaceTs,i : Surface temperature (K)Id,i : Diffuse radiation(W/m2)Fi : View factor of the surface
In order to estimate PET and other thermal comfort indices at the canyon level, the Hobo data loggers were installed in the eight selected canyons, and consequently, the results were shown as the average of data for a sample day of July as the hottest day of the year.
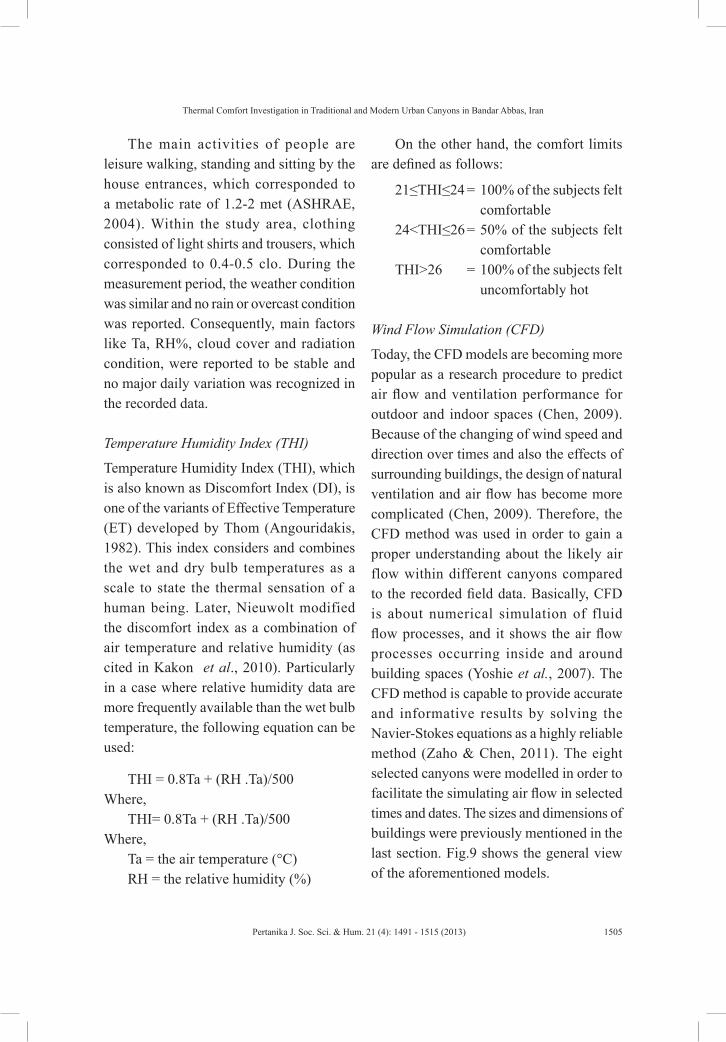
Thermal Comfort Investigation in Traditional and Modern Urban Canyons in Bandar Abbas, Iran
1505Pertanika J. Soc. Sci. & Hum. 21 (4): 1491 - 1515 (2013)
The main activities of people are leisure walking, standing and sitting by the house entrances, which corresponded to a metabolic rate of 1.2-2 met (ASHRAE, 2004). Within the study area, clothing consisted of light shirts and trousers, which corresponded to 0.4-0.5 clo. During the measurement period, the weather condition was similar and no rain or overcast condition was reported. Consequently, main factors like Ta, RH%, cloud cover and radiation condition, were reported to be stable and no major daily variation was recognized in the recorded data.
Temperature Humidity Index (THI)
Temperature Humidity Index (THI), which is also known as Discomfort Index (DI), is one of the variants of Effective Temperature (ET) developed by Thom (Angouridakis, 1982). This index considers and combines the wet and dry bulb temperatures as a scale to state the thermal sensation of a human being. Later, Nieuwolt modified the discomfort index as a combination of air temperature and relative humidity (as cited in Kakon et al., 2010). Particularly in a case where relative humidity data are more frequently available than the wet bulb temperature, the following equation can be used:
THI = 0.8Ta + (RH .Ta)/500Where,
THI= 0.8Ta + (RH .Ta)/500Where,
Ta = the air temperature (°C)RH = the relative humidity (%)
On the other hand, the comfort limits are defined as follows:
21≤THI≤24 = 100% of the subjects felt comfortable24<THI≤26 = 50% of the subjects felt comfortableTHI>26 = 100% of the subjects felt uncomfortably hot
Wind Flow Simulation (CFD)
Today, the CFD models are becoming more popular as a research procedure to predict air flow and ventilation performance for outdoor and indoor spaces (Chen, 2009). Because of the changing of wind speed and direction over times and also the effects of surrounding buildings, the design of natural ventilation and air flow has become more complicated (Chen, 2009). Therefore, the CFD method was used in order to gain a proper understanding about the likely air flow within different canyons compared to the recorded field data. Basically, CFD is about numerical simulation of fluid flow processes, and it shows the air flow processes occurring inside and around building spaces (Yoshie et al., 2007). The CFD method is capable to provide accurate and informative results by solving the Navier-Stokes equations as a highly reliable method (Zaho & Chen, 2011). The eight selected canyons were modelled in order to facilitate the simulating air flow in selected times and dates. The sizes and dimensions of buildings were previously mentioned in the last section. Fig.9 shows the general view of the aforementioned models.
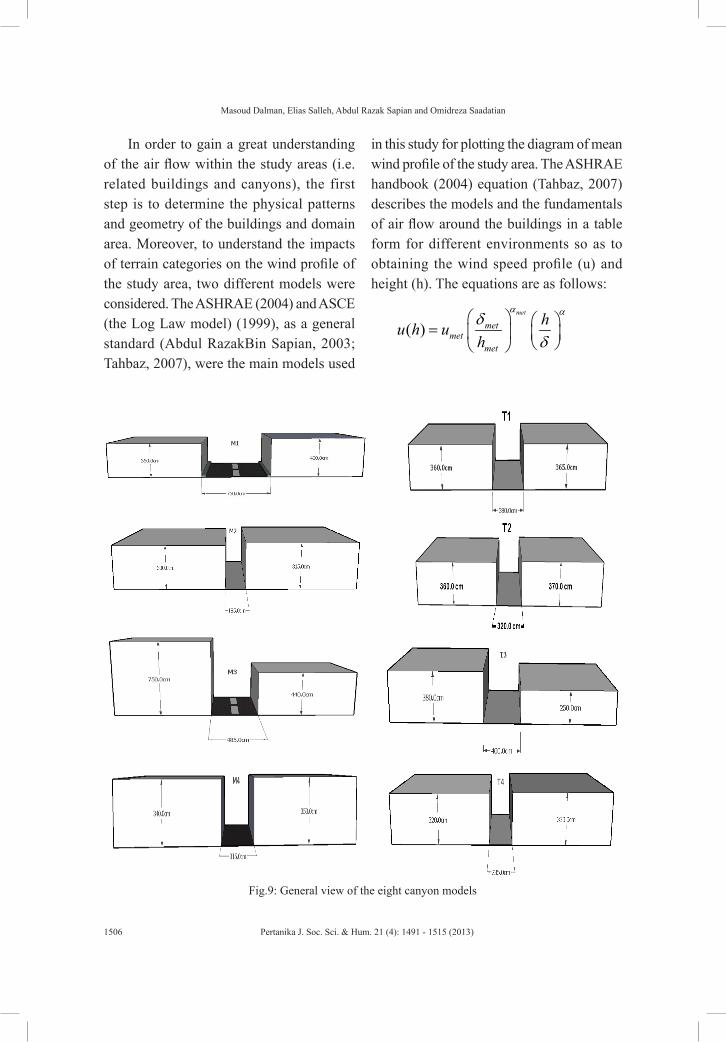
Masoud Dalman, Elias Salleh, Abdul Razak Sapian and Omidreza Saadatian
1506 Pertanika J. Soc. Sci. & Hum. 21 (4): 1491 - 1515 (2013)
Fig.9: General view of the eight canyon models
In order to gain a great understanding of the air flow within the study areas (i.e. related buildings and canyons), the first step is to determine the physical patterns and geometry of the buildings and domain area. Moreover, to understand the impacts of terrain categories on the wind profile of the study area, two different models were considered. The ASHRAE (2004) and ASCE (the Log Law model) (1999), as a general standard (Abdul RazakBin Sapian, 2003; Tahbaz, 2007), were the main models used
in this study for plotting the diagram of mean wind profile of the study area. The ASHRAE handbook (2004) equation (Tahbaz, 2007) describes the models and the fundamentals of air flow around the buildings in a table form for different environments so as to obtaining the wind speed profile (u) and height (h). The equations are as follows:
( )met
metmet
met
hu h uh
α αδδ
=
Thermal Comfort Investigation in Traditional and Modern Urban Canyons in Bandar Abbas, Iran
1507Pertanika J. Soc. Sci. & Hum. 21 (4): 1491 - 1515 (2013)
or;
10
10
1010
met
met G
z
G
metmetV
V ZZ
α
α
=
Where,
δ met = 270 m is the layer thickness for the meteorological site (assumed to be of the ‘Country’ type)
α met = 0.14 is the exponent for the meteorological site (assumed to be of the ‘Country’ type)
h met = is the measurement height for the meteorological site (assumed to be 10 m)
Meanwhile, the ASCE (1999) equation (Sapian, 2009) is as follows:
the Log Law model:
0 0[log( / ) / log( / )]Z ref refV V Z Z Z Z=
Where,Vz = mean wind speed at height ZVref = mean wind speed at someZref = reference heightZ = height for which the wind speed Vz is computedZo = roughness length or log layer constant
To explain the mean wind speed profile above the canyon level at height Z, these two equations are the auxiliary method for justifying and controlling the simulations of
wind speed profile inside the canyon level according to the field measurements.
According to the average data of wind speed (1959-2005), the mean wind speed in July was 6m/s. The wind profile of the study area had been plotted using the Log Law model (Sapian, 2003) and the ASHRAE adopted model (ASHRAE, 2004; Tahbaz, 2007), while the reference station wind speed of 6m/s was considered. The plotted data showed the numerical variation of wind speed inside the canyons level.
In order to conduct the CFD simulation for the selected canyons, the following steps using the MicroFlo (IESve) software application were carried out for each canyon in terms of date, time, wind speed (m/s), and wind direction. Based on the size of each model, a 3D boundary (computational domain) was assigned, depending upon the CFD setting (Wesseling, 2001). Notably, the simulated air flow depended on the physical factors, such as the building layout, canyon dimension and orientation, as well as upwind specification and microclimate situation of the study area. The next step is to run the simulation, and the software displays the velocity results on the Z-grid in axonometric view. This allows the users to see the contouring throughout the model (IES, 2009). However, the results of the external CFD simulation in MicroFlo was contour base displaying.
DATA ANALYSIS AND RESULTS
The conducted analyses and the results of the collected data are presented visually as graphs, tables, and charts. Establishing
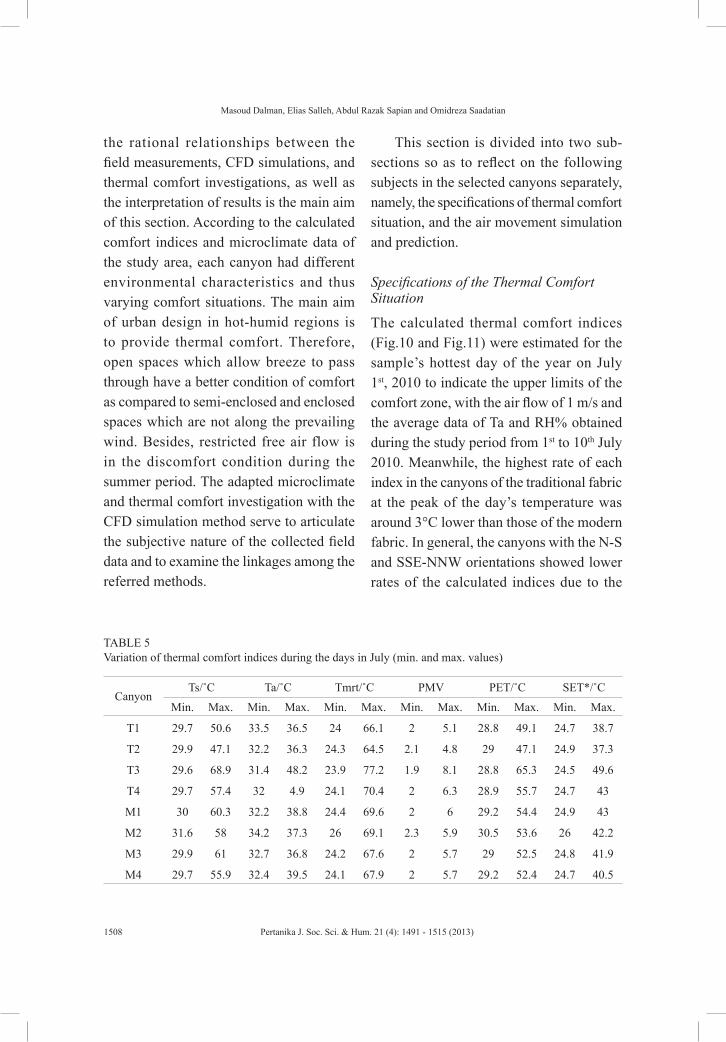
Masoud Dalman, Elias Salleh, Abdul Razak Sapian and Omidreza Saadatian
1508 Pertanika J. Soc. Sci. & Hum. 21 (4): 1491 - 1515 (2013)
the rational relationships between the field measurements, CFD simulations, and thermal comfort investigations, as well as the interpretation of results is the main aim of this section. According to the calculated comfort indices and microclimate data of the study area, each canyon had different environmental characteristics and thus varying comfort situations. The main aim of urban design in hot-humid regions is to provide thermal comfort. Therefore, open spaces which allow breeze to pass through have a better condition of comfort as compared to semi-enclosed and enclosed spaces which are not along the prevailing wind. Besides, restricted free air flow is in the discomfort condition during the summer period. The adapted microclimate and thermal comfort investigation with the CFD simulation method serve to articulate the subjective nature of the collected field data and to examine the linkages among the referred methods.
This section is divided into two sub-sections so as to reflect on the following subjects in the selected canyons separately, namely, the specifications of thermal comfort situation, and the air movement simulation and prediction.
Specifications of the Thermal Comfort Situation
The calculated thermal comfort indices (Fig.10 and Fig.11) were estimated for the sample’s hottest day of the year on July 1st, 2010 to indicate the upper limits of the comfort zone, with the air flow of 1 m/s and the average data of Ta and RH% obtained during the study period from 1st to 10th July 2010. Meanwhile, the highest rate of each index in the canyons of the traditional fabric at the peak of the day’s temperature was around 3°C lower than those of the modern fabric. In general, the canyons with the N-S and SSE-NNW orientations showed lower rates of the calculated indices due to the
TABLE 5 Variation of thermal comfort indices during the days in July (min. and max. values)
CanyonTs/˚C Ta/˚C Tmrt/˚C PMV PET/˚C SET*/˚C
Min. Max. Min. Max. Min. Max. Min. Max. Min. Max. Min. Max.
T1 29.7 50.6 33.5 36.5 24 66.1 2 5.1 28.8 49.1 24.7 38.7
T2 29.9 47.1 32.2 36.3 24.3 64.5 2.1 4.8 29 47.1 24.9 37.3
T3 29.6 68.9 31.4 48.2 23.9 77.2 1.9 8.1 28.8 65.3 24.5 49.6
T4 29.7 57.4 32 4.9 24.1 70.4 2 6.3 28.9 55.7 24.7 43
M1 30 60.3 32.2 38.8 24.4 69.6 2 6 29.2 54.4 24.9 43
M2 31.6 58 34.2 37.3 26 69.1 2.3 5.9 30.5 53.6 26 42.2
M3 29.9 61 32.7 36.8 24.2 67.6 2 5.7 29 52.5 24.8 41.9
M4 29.7 55.9 32.4 39.5 24.1 67.9 2 5.7 29.2 52.4 24.7 40.5
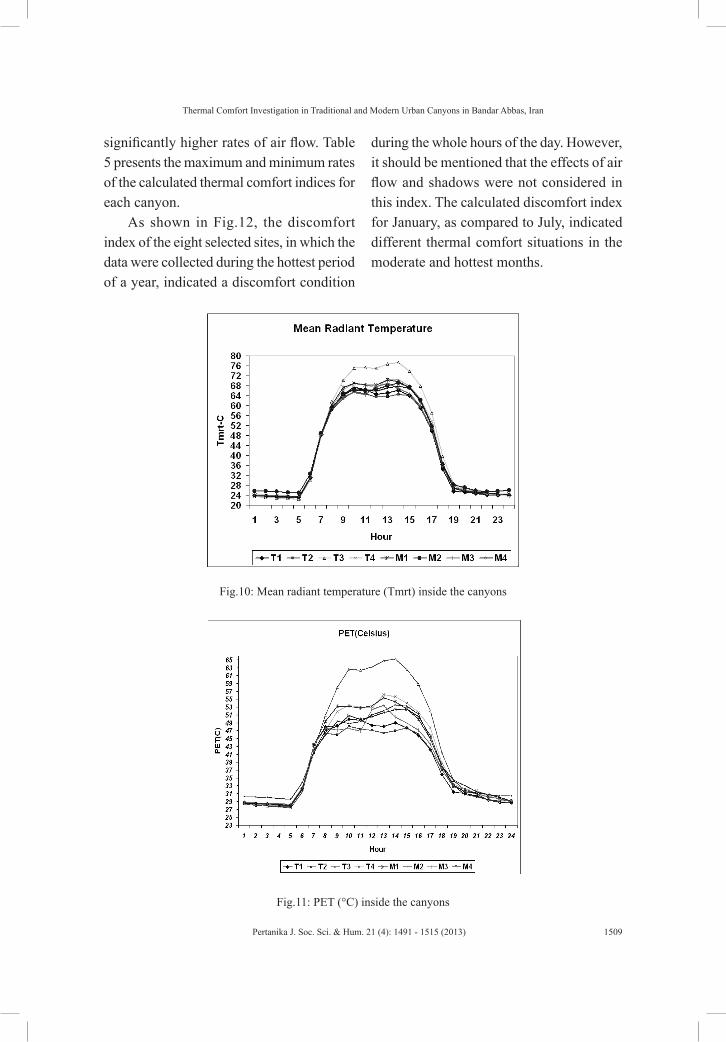
Thermal Comfort Investigation in Traditional and Modern Urban Canyons in Bandar Abbas, Iran
1509Pertanika J. Soc. Sci. & Hum. 21 (4): 1491 - 1515 (2013)
significantly higher rates of air flow. Table 5 presents the maximum and minimum rates of the calculated thermal comfort indices for each canyon.
As shown in Fig.12, the discomfort index of the eight selected sites, in which the data were collected during the hottest period of a year, indicated a discomfort condition
during the whole hours of the day. However, it should be mentioned that the effects of air flow and shadows were not considered in this index. The calculated discomfort index for January, as compared to July, indicated different thermal comfort situations in the moderate and hottest months.
Fig.10: Mean radiant temperature (Tmrt) inside the canyons
Fig.11: PET (°C) inside the canyons
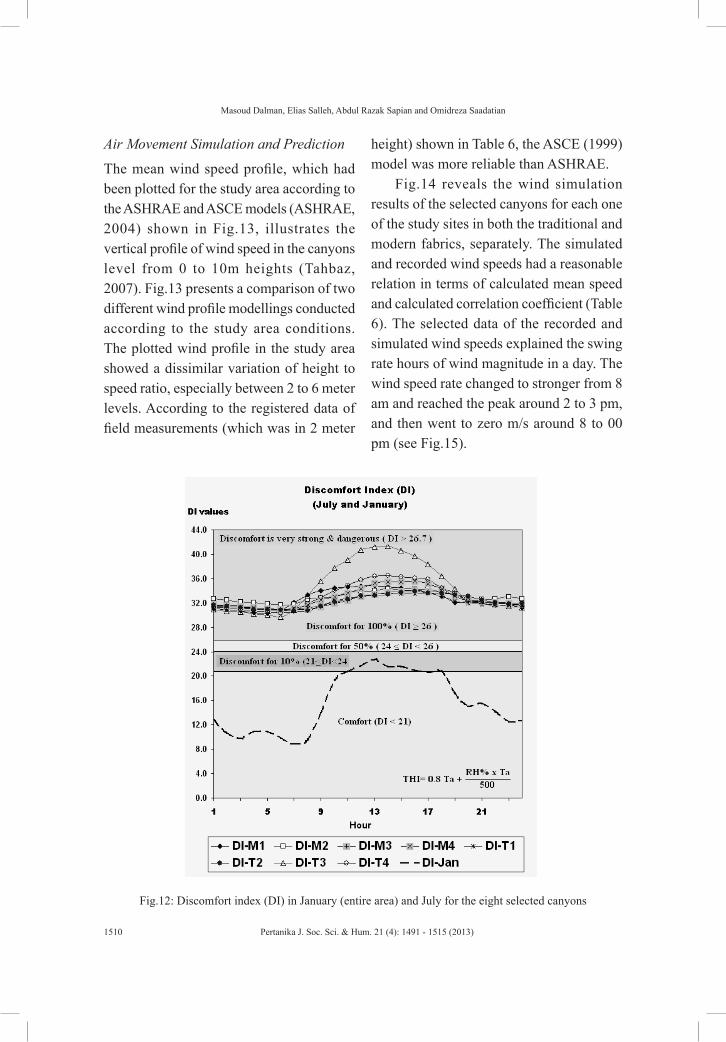
Masoud Dalman, Elias Salleh, Abdul Razak Sapian and Omidreza Saadatian
1510 Pertanika J. Soc. Sci. & Hum. 21 (4): 1491 - 1515 (2013)
Air Movement Simulation and Prediction
The mean wind speed profile, which had been plotted for the study area according to the ASHRAE and ASCE models (ASHRAE, 2004) shown in Fig.13, illustrates the vertical profile of wind speed in the canyons level from 0 to 10m heights (Tahbaz, 2007). Fig.13 presents a comparison of two different wind profile modellings conducted according to the study area conditions. The plotted wind profile in the study area showed a dissimilar variation of height to speed ratio, especially between 2 to 6 meter levels. According to the registered data of field measurements (which was in 2 meter
height) shown in Table 6, the ASCE (1999) model was more reliable than ASHRAE.
Fig.14 reveals the wind simulation results of the selected canyons for each one of the study sites in both the traditional and modern fabrics, separately. The simulated and recorded wind speeds had a reasonable relation in terms of calculated mean speed and calculated correlation coefficient (Table 6). The selected data of the recorded and simulated wind speeds explained the swing rate hours of wind magnitude in a day. The wind speed rate changed to stronger from 8 am and reached the peak around 2 to 3 pm, and then went to zero m/s around 8 to 00 pm (see Fig.15).
Fig.12: Discomfort index (DI) in January (entire area) and July for the eight selected canyons
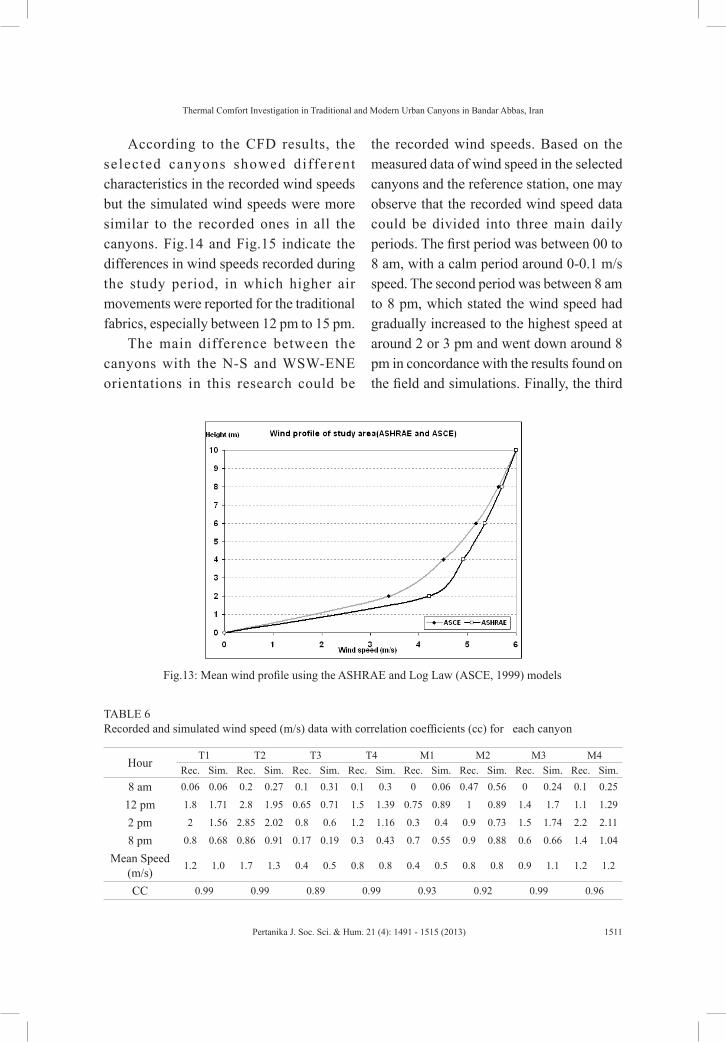
Thermal Comfort Investigation in Traditional and Modern Urban Canyons in Bandar Abbas, Iran
1511Pertanika J. Soc. Sci. & Hum. 21 (4): 1491 - 1515 (2013)
TABLE 6 Recorded and simulated wind speed (m/s) data with correlation coefficients (cc) for each canyon
HourT1 T2 T3 T4 M1 M2 M3 M4
Rec. Sim. Rec. Sim. Rec. Sim. Rec. Sim. Rec. Sim. Rec. Sim. Rec. Sim. Rec. Sim.8 am 0.06 0.06 0.2 0.27 0.1 0.31 0.1 0.3 0 0.06 0.47 0.56 0 0.24 0.1 0.25
12 pm 1.8 1.71 2.8 1.95 0.65 0.71 1.5 1.39 0.75 0.89 1 0.89 1.4 1.7 1.1 1.29
2 pm 2 1.56 2.85 2.02 0.8 0.6 1.2 1.16 0.3 0.4 0.9 0.73 1.5 1.74 2.2 2.11
8 pm 0.8 0.68 0.86 0.91 0.17 0.19 0.3 0.43 0.7 0.55 0.9 0.88 0.6 0.66 1.4 1.04
Mean Speed (m/s) 1.2 1.0 1.7 1.3 0.4 0.5 0.8 0.8 0.4 0.5 0.8 0.8 0.9 1.1 1.2 1.2
CC 0.99 0.99 0.89 0.99 0.93 0.92 0.99 0.96
Fig.13: Mean wind profile using the ASHRAE and Log Law (ASCE, 1999) models
According to the CFD results, the selected canyons showed different characteristics in the recorded wind speeds but the simulated wind speeds were more similar to the recorded ones in all the canyons. Fig.14 and Fig.15 indicate the differences in wind speeds recorded during the study period, in which higher air movements were reported for the traditional fabrics, especially between 12 pm to 15 pm.
The main difference between the canyons with the N-S and WSW-ENE orientations in this research could be
the recorded wind speeds. Based on the measured data of wind speed in the selected canyons and the reference station, one may observe that the recorded wind speed data could be divided into three main daily periods. The first period was between 00 to 8 am, with a calm period around 0-0.1 m/s speed. The second period was between 8 am to 8 pm, which stated the wind speed had gradually increased to the highest speed at around 2 or 3 pm and went down around 8 pm in concordance with the results found on the field and simulations. Finally, the third
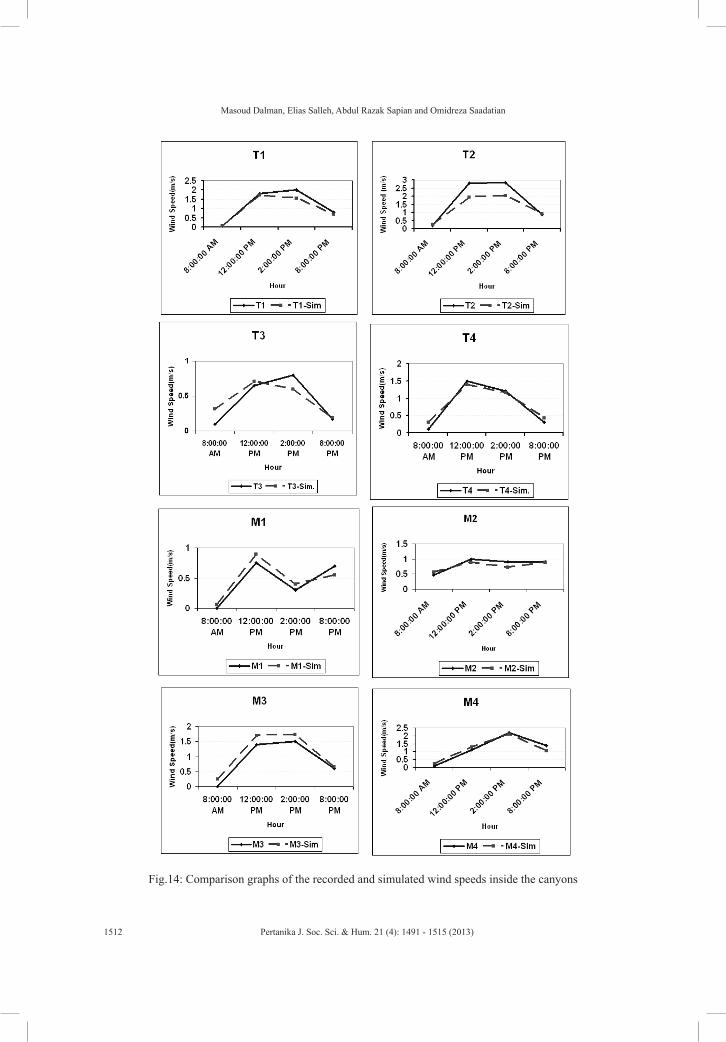
Masoud Dalman, Elias Salleh, Abdul Razak Sapian and Omidreza Saadatian
1512 Pertanika J. Soc. Sci. & Hum. 21 (4): 1491 - 1515 (2013)
Fig.14: Comparison graphs of the recorded and simulated wind speeds inside the canyons
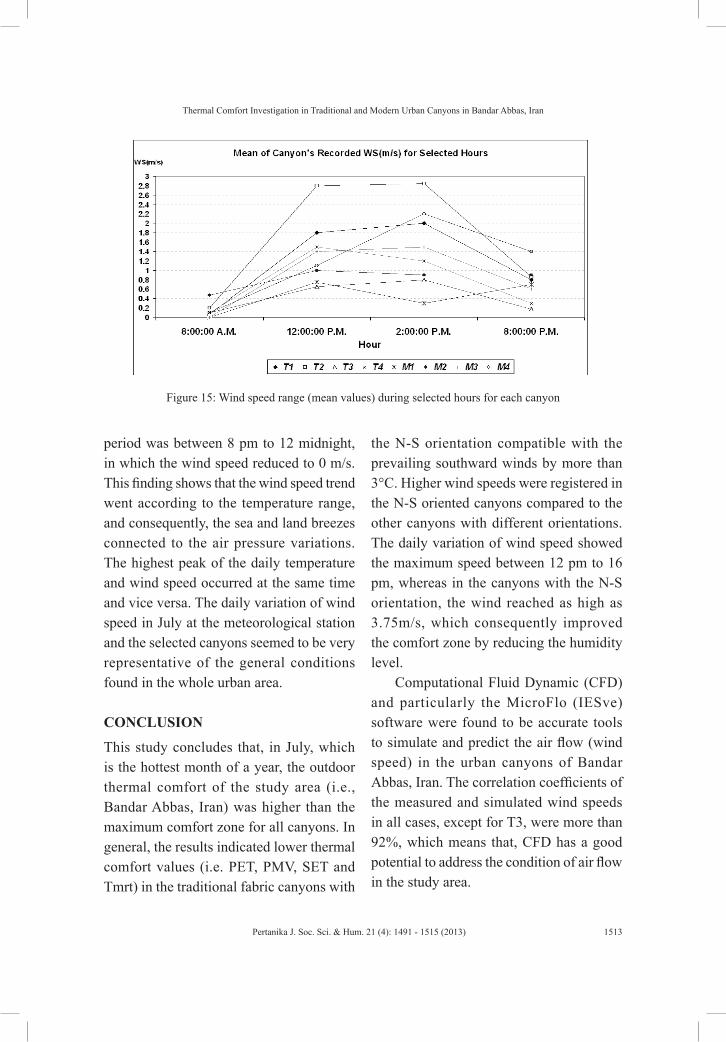
Thermal Comfort Investigation in Traditional and Modern Urban Canyons in Bandar Abbas, Iran
1513Pertanika J. Soc. Sci. & Hum. 21 (4): 1491 - 1515 (2013)
period was between 8 pm to 12 midnight, in which the wind speed reduced to 0 m/s. This finding shows that the wind speed trend went according to the temperature range, and consequently, the sea and land breezes connected to the air pressure variations. The highest peak of the daily temperature and wind speed occurred at the same time and vice versa. The daily variation of wind speed in July at the meteorological station and the selected canyons seemed to be very representative of the general conditions found in the whole urban area.
CONCLUSION
This study concludes that, in July, which is the hottest month of a year, the outdoor thermal comfort of the study area (i.e., Bandar Abbas, Iran) was higher than the maximum comfort zone for all canyons. In general, the results indicated lower thermal comfort values (i.e. PET, PMV, SET and Tmrt) in the traditional fabric canyons with
the N-S orientation compatible with the prevailing southward winds by more than 3°C. Higher wind speeds were registered in the N-S oriented canyons compared to the other canyons with different orientations. The daily variation of wind speed showed the maximum speed between 12 pm to 16 pm, whereas in the canyons with the N-S orientation, the wind reached as high as 3.75m/s, which consequently improved the comfort zone by reducing the humidity level.
Computational Fluid Dynamic (CFD) and particularly the MicroFlo (IESve) software were found to be accurate tools to simulate and predict the air flow (wind speed) in the urban canyons of Bandar Abbas, Iran. The correlation coefficients of the measured and simulated wind speeds in all cases, except for T3, were more than 92%, which means that, CFD has a good potential to address the condition of air flow in the study area.
Figure 15: Wind speed range (mean values) during selected hours for each canyon
Masoud Dalman, Elias Salleh, Abdul Razak Sapian and Omidreza Saadatian
1514 Pertanika J. Soc. Sci. & Hum. 21 (4): 1491 - 1515 (2013)
The above results revealed that the CFD procedures conducted in this research are valid and therefore could be applied to similar studies. Therefore, the methods used in this study are reliable alternative for future assessments of wind flow in urban residential canyons and outdoor spaces to obtain accurate experimental data.
REFERENCES ASHRAE. (2004). Thermal environmental conditions
for human occupancy. In A. society of & refrigerating and air-conditioning Engineers heating (Eds.) ASHRAE Standard 55, Atlanta (pp. 34-39). New York: SAGE.
Ahmed, K. S. (2003). Comfort in urban spaces: defining the boundaries of outdoor thermal comfort for the tropical urban environments. Energy and Buildings, 35(1), 103-110.
Alaedini, P., Zebadast, E., & Mousavi, K. (2008). Land market and housing dynamics in low income settlement in Iran: Examining data from three cities. World Bank and Government of Iran. (UUHRP), pp. 17-19.
Angouridakis, V. E., & Makrogiannis, T.J. (1982). The discomfort index in Thessaloniki, Greece. International J of Biometeorology, 26(1), 53-59.
Azar i Naja fAbadi , K . , Pakseresh t , S . , & Pooryousefzadeh, S. (2006). Role of Wind in Vernacular Architecture of Hot and Humid Region of Iran. Symposium on Improving Building Systems in Hot and Humid Climates.
Balázs, B., Hall, T., Roth, M., & Norford, K. (2009). Microclimate in a high-rise residential development in Singapore. Urban Climate. The seventh International Conference on Urban Climate (p 245-278). Japan: Yokohama.
Bekele, S., Johns, I., & Gokul, I. (2008). Microclimate Study of a City in Hot and Humid Climate. New York: SAGE Publication.
Chen, Q. (2009). Ventilation performance prediction for buildings: A method overview and recent applications. Building and Environment, 44(4), 848-858.
Chen, Q, Pan, N., & Guo, Z. Y. (2011). A new approach to analysis and optimization of evaporative cooling system II: Applications. Energy, 36(5), 2890-2898.
Creswell, J. W. (1994). Research design (Qualitative & Quantitative Approaches). London: Saga Publications.
Emmanuel, R. (2005). Thermal comfort implications of urbanization in a warm-humid city: the Colombo Metropolitan Region (CMR), Sri Lanka. Building and Environment, 40(12), 1591-1601.
Esri. (2008). ArcGIS Software Version 9.x. Redlands, California: Esri Corporation, www.Esri.com.
Ghobadian, V. (1998). Climatic Survey of Traditional buildings of Iran. Tehran-Iran: Tehran University Press.
Givoni, B. (1998). Climate Consideration in Building and Urban Design (p. 464). London: John Wiley & Sons.
Hamdan, M., Kandar, M., & Roshia, A. (2007). Comfortable housing model in new housing PPRT for Orang Asli, Universiti Teknologi Malaysia. UTM.
Heidari, S., & Sharples, S. (2002). A comparative analysis of short-term and long-term thermal comfort surveys in Iran. Energy and Buildings, 34(6), 607-614.
Hoppe, P. (2002). Different aspects of assessing indoor and outdoor thermal comfort. Energy and Buildings, 34(6), 661-665.
IES. (2009). Microflo (CFD) user guide. Integrated Environmental Solutions Limited (IES).
IMO. (2010). 46 years Weather Data of Bandar Abbas (1959-2005). Meteorological Organization of Iran. Tehran: ISD publications.
Thermal Comfort Investigation in Traditional and Modern Urban Canyons in Bandar Abbas, Iran
1515Pertanika J. Soc. Sci. & Hum. 21 (4): 1491 - 1515 (2013)
Johansson, E. (2006). Influence of urban geometry on outdoor thermal comfort in a hot dry climate: A study in Fez, Morocco. Building and Environment, 41(10), 1326-1338.
Kakon, A. N., Nobou, M., & Yoko, S. (2010). Assessment of thermal comfort in respect to building height in a high-density city in the tropics. American J. of Engineering and Applied Sciences, 3(3), 545-551.
Krüger, E. L., Minella, F. O., & Rasia, F. (2010). Impact of urban geometry on outdoor thermal comfort and air quality from field measurements in Curitiba, Brazil. Building and Environment, 46(3), 621-634.
Muller, A. (2005). User Manual of Counter A n e m o m e t e r M o d e l : 9 1 g . G e r m a n y -Chausseestraße: Meteorologische Instrumented K G R. FUESS.
Nunez, M., & Oke, T. R. (1977). The Energy Balance of an Urban Canyon. Journal of Applied Meteorology, 16(1), 11-19.
Onset. (2004). Hobo Micro Station User’s Guide. USA: Onset Computer Corporation.
Sapian, A. R. (2003). Possibilities of using void to improve natural cross ventilation in high-rise low cost residential building. Faculty of Built Environment. Universiti Teknologi Malaysia.
Sharmand. (2008). Revision of Bandar Abbas Master Plan. In Sharmand Consulting Engineers (Ed.), Housing and Urbanization Organization of Hormozgan Province (pp. 12-19). Tehran, ISC Publication.
Shohouhian, M., & Soflaee, F. (2005). Environmental sustainable Iranian traditional architecture in hot-humid regions. International sustainable Passive and Low Energy Cooling for the built Environment. Santorini, Greece.
Sullivan, J., & Collins, J. (2009). The use of low-cost data logging temperature sensors in the evaluation of an urban heat island in Tampa, Florida. Applied Geography Conference (pp. 10-25). Fort Worth, Texas.
Tahbaz, M. (2007). The Estimation of the Wind Speed in Urban Areas. Tehran: School of Architecture and Urban Planning Shahid Beheshti University Press.
Thapar, Y.H. (2008). Microclimate and Urban Form in Dubai. PLEA-25th Conference on Passive and Low Energy Architecture (pp. 123-143). Ireland: Dublin.
Toudert and Mayer. (2007). Effects of asymmetry, galleries, overhanging facades and vegetation on thermal comfort in urban street canyons. Solar Energy, 81(6), 742-754.
Wei, J., Zhao, J., & Chen, Q. (n.d.). Energy performance of a dual airflow window under different climates. Energy and Buildings, 42(1), 111-122.
Wesseling, P. (2001). Principles of Computational Fluid Dynamics. New York: Springer.
Yoshie, R., Mochida, A., Tominaga, Y., Kataoka, H., & Harimato, K. (2007). Cooperative project for CFD prediction of pedestrian wind environment in the Architectural Institute of Japan. Wind Engineering and Industrial Aerodynamics (95), 1551-1578.
Yu, C., & Hien, W.N. (2006). Thermal benefits of city parks. Energy and Buildings, 38(2), 105-120.

Pertanika J. Soc. Sci. & Hum. 21 (4): 1517 - 1524 (2013)
ISSN: 0128-7702 © Universiti Putra Malaysia Press
SOCIAL SCIENCES & HUMANITIESJournal homepage: http://www.pertanika.upm.edu.my/
Article history:Received: 1 November 2011Accepted: 13 February
ARTICLE INFO
E-mail addresses: [email protected] (Normahdiah S. Said), [email protected] (Hashim, M.), [email protected] (Rozita, C. R.), [email protected] (Siti Sarah, A. K.) * Corresponding author
Turning a Social Character Trait Phenomenon into a Diagnostic Web-Based Measuring Instrument Using a Grounded Theory Research Method
Normahdiah S. Said*, Hashim, M., Rozita, C. R. and Siti Sarah, A. K.Malay Department, Faculty of Modern Languages and Communication, Universiti Putra Malaysia, 43400 Serdang, Selangor, Malaysia
ABSTRACT
The formation of proverbs and phrases into poetic forms with synchronised sentence structures and rhyming expressions through authentic dictions that are engaging and meaningful are the treasures of one’s trait and nation. For some race or ethnic groups it is through these classical works of wisdom that a race or an ethnic group could prevail and remain recognised transcends time and age . A list of 26 basic components of social character traits of the Malays was traced through maxims and literary work s of wisdom. The list of social character traits will just remain a list of compilation to be read and forgotten, just like many others written and compiled by other Malay literary scholars. There is a need to make this list scientifically proven. This paper discusses on how these components were transformed into a measuring instrument through a grounded theory research method. The end product was not only a web-based diagnostic instrument to measure the conformity and deviation of an ethnic group but also a formation of a new theory that could be applied to all other ethnics and related groups in the world today that are interested in knowing and preserving their social character traits.
Keywords: Ethnic, social character trait, literary work, maxims, measuring instrument, grounded theory,
research method, theory, heritage, preservation, culture
INTRODUCTION
A lot of ethnic groups in the world today are experiencing the changing phase and loses of cultural identity at a very rapid rate either explicitly or implicitly. This has threatened the harmonization and unity amongst races or within races, especially
Normahdiah S. Said, Hashim, M., Rozita, C. R. and Siti Sarah, A. K.
1518 Pertanika J. Soc. Sci. & Hum. 21 (4): 1517 - 1524 (2013)
in a multi-racial country like Malaysia. Nonetheless, many do not want to admit that the rates of change and loses of cultural identity are happening very fast, whilst many too are sceptical that it is happening. It is about time in this globalise age where boundaries amongst nations are seemingly smaller and diminishing, ethnic groups or races think of a mechanism to overcome the issue. With the ease of disseminating knowledge at our finger tips anywhere and anytime, the rate of cultural change can not be avoided or slowed down by any race or ethnic group. The only way out is to think of ways to incorporate and integrate the national heritage and identity amongst races so that it can be upheld and move together with the wave of change. This paper reveals how a social character trait phenomenon could be transformed into an instrument that could measure conformity and deviation of an individual in its social ethnic character trait. At least having the awareness of where he or she is at now could determine ways of how to get back or perhaps redefine this social character trait to suit the needs of our borderless future net-generation citizens.
THE NEED FOR TRANSFORMATION FROM LITERARY TO SCIENTIFIC The formation of proverbs and phrases into poetic forms with synchronised sentence structures and rhyming expressions through authentic dictions that are engaging and meaningful are the treasures of one’s character trait and nation. In these poetic forms are meaningful symbolic phrases
which could be directly or indirectly analysed and enlisted as the social psyche of an ethnic group under study, that is, the Malays, an ethnic majority of Malaysia. Through observations, securitization and analysis of secondary sources of literary and cultural works and maxims, Hashim (2008) has established 26 basic social character traits of the Malays. These findings are very precious to the ethnic community as references but transforming them into something measurable could make the findings scientifically proven. How could this be done? How could a social phenomenon be scientifically proven? The way to do it is to develop it into a measurable instrument, where a degree of conformity and deviation could be calculated. Hence, such an instrument could make a social phenomenon a scientific value that could be both validated and calibrated.
Such an effort will enable social and humanity research findings be made known to the world of science, which is especially important in this intelligence era (Said, 2010). Literary and cultural findings that are not expanded and transformed into scientific methods will only be circulated and distributed amongst its members, interested parties and thinkers. Even though it has been a trend and approach for many decades, in this knowledge and intellectual age, individualisation and group conformity is no more relevant. The technological waves have resulted in the formation of new waves in knowledge discovery and acquisition through research, that is, the formation of a group of multidisciplinary thinkers. An
Turning a Social Character Trait Phenomenon into a Diagnostic Web-Based Measuring Instrument
1519Pertanika J. Soc. Sci. & Hum. 21 (4): 1517 - 1524 (2013)
example is the expansion of wave from “engineering to meta-engineering”. This expansion has involved the widening of scope, number of audiences, and thinkers with ideas and visions multi-disciplinary in nature. Therefore, there is a need for us from the social sciences to think of ways to widen our knowledge and research to fill in the gap of the integrated multi-disciplinary field that is still new. One way is by transforming literary and cultural findings into something scientific. How could this be done? There are many ways, but for this research context, the research method used is the ‘grounded theory’ research strategy approach. This type of research strategy is usually very specific and therefore relevant for interpretative research.
WHAT IS “GROUNDED THEORY”? Grounded theory is not a theory. According to Punch (as cited in Strauss, 1987), grounded theory is a method, an approach and a research strategy which he terms as research strategy . Hence, grounded theory is a research strategy that involves a process of developing a theory from research data. The research method involves the development of a theory from the inductive analysis of data. Strauss’s Qualitative Analysis for Social Scientists (1987) uses the research as an approach in an analysis mode and to test a theory.
According to history, grounded theory by Glaser and Strauss (Glaser, 1994; Strauss & Corbin, 1990) was built when they were researching a social perspective
of an organisation. The research concerned with complex social behaviour and the data were gathered using both qualitative and quantitative methods. Even though this method was built in the field of Sociology, the characteristics do not depend on a particular discipline. Instead, grounded theory could be used in multiple disciplines. Its difference from most methods is that it does not begin with a theory with hypotheses to be tested upon. The method begins with something very open-ended that in the end will lead to the development of a theory. This method is relevant in this study because the data obtained will help us understand a social phenomenon.
A WEB-BASED SELF DIAGNOSTIC TEST
A web-based self diagnostic test HB™ Melayu (Malay Character Traits and Identity - Hati Budi Melayu) is a measuring instrument that has been built using findings gathered across literary and philosophical works of the Malay world. The wisdom treasures found in poetic verses of the Malay pantun, syair (poems) and gurindam were analysed and classified into 26 basic character traits of the Malays as the basic pillars of the Malay civilization. From this, the information was transformed into something measurable and testable. The product was built to measure “How True Malay Are You?”
The Scientific instrument was built as a method that could tell us the effect and degree of deviation and conformity of a Malay individual in the Malay living norms.
Normahdiah S. Said, Hashim, M., Rozita, C. R. and Siti Sarah, A. K.
1520 Pertanika J. Soc. Sci. & Hum. 21 (4): 1517 - 1524 (2013)
Findings from the process of development have given us an overview and a universal conclusion that this approach could be used to measure deviation and conformity of other ethnic groups as well. By applying the same methodological process, the findings will help us not only to trace, restructure, redefine and rearrange a cultural norm, but also to preserve and appreciate those that have been lost, are losing and will be lost as cultural heritage treasures that transcend age and time. The software is the first of its kind and has received two silver medal awards; one for software and another for education innovativeness in INPEX, Invention and New Product Exposition, Pittsburgh, P.A. USA in 2010.
CHRONOLOGY OF THE RESEARCH PROCESS
This paper presents the chronology of the process of transformation, i.e., starting from creating the list of 26 basic components of the Malay Psyche or Social Character Traits (Hashim, 2008), identified through observation, to detailed analyses of secondary sources. Thus, the main issue presented in this paper is the chronological process of developing the 26 basic social character traits into a self-diagnostic test measuring instrument.
Step One
The first process was to develop questions from the 26 basic social character traits. The step started by composing 160 questions from the list. In order to avoid cognitive overloading, the questions were later
reconstructed and further divided into sub-sections.
Step Two
The questions were reanalysed to determine sub-divisions. Later, the 160 questions were divided into four defined clusters to enable us to understand and internalise the 26 basic social character traits. The identified clusters were educational upbringing, epistemology, values, and religion or beliefs. These four clusters were later found to become a new theory about ethnic identity.
Educational upbringing refers to how individuals get themselves educated as they grow up; this could be influenced by either or both or all the three basic contributors in one’s life; namely, parental, social and environmental surrounding and upbringings.
Epistemology is about acquisition of knowledge by individuals, either that of knowledge of the world or eschatology that is knowledge of the year after, whereby it is this knowledge that will influence the personal development of any individual.
The value cluster is about living and lifestyle that form the most important branch of development, whereby from it we could define the value norms of an individual as a respected citizen and member of the community, society, race, ethnic origin and nation.
The last cluster of beliefs or religion determines the stand and knowledge of the individuals’ belief in the group they are identified with. The principle they hold and the knowledge they acquire about their societies’ belief or religious virtues are
Turning a Social Character Trait Phenomenon into a Diagnostic Web-Based Measuring Instrument
1521Pertanika J. Soc. Sci. & Hum. 21 (4): 1517 - 1524 (2013)
important, and form a basis of their personal development not of status and wealth. The strength in this area will give us a clear picture of the relationship between religions or beliefs and the principles the individuals hold on to and practice. It will help us understand why the younger generation with high level of knowledge on religion and beliefs but still get involved in composite social problems.
Step Three
The third process is the development of a questionnaire for a pilot study to test the validity and reliability of the questions developed. For this purpose, the questionnaire was distributed to 46 respondents. These 46 respondents, who aged between 17 and 55 years, were selected randomly from rural and urban areas, including university and non-university students living in and around Wilayah Persekutuan (Putrajaya and Kuala Lumpur) and Selangor. The questionnaire was developed to find out whether a social character trait could be measured.
Here is an example of a question asked on the Educational Upbringing Cluster. When an individual was asked of his or her reaction to a number of questions on parenting, the total number of scores gathered will give some clues of the status of the individual’s character traits in the educational upbringing cluster, whether it is excellent, good, and fair or eroded.
“If someone complains some negative doings of your child, are
you going to get angry with the people who convey the complaint?” Place your answer using a Likert Scale of 1-5 “totally agree, agree, not sure, disagree, and totally disagree.”
If the respondent answers 1 to the above question, it means some form of deviation has happened in this cluster because according to the 26 Malay character traits, an individual should not be angry if he or she hears a complain. However, he or she should thank the person first and later investigate on its validity before taking the necessary steps to rectify his or her child’s behaviour.
Analysis of the data from the initial 160 questions in the pilot study gave an indication that these questions could be made into an instrument to measure the degree of conformity and deviation of an individual to its ethnic character traits. It is from these questions that the instrument was later redefined and redesigned to its present form.
Step Four
About 204 respondents have contributed to the research s tudy. There were representatives in all the 14 states in Malaysia. Analysis of the findings revealed the differences between different states. This paper does not intend to discuss the findings of the degree of conformity and deviation but instead, it portrays how the grounded strategy research method has helped the formation of an instrument to measure the
Normahdiah S. Said, Hashim, M., Rozita, C. R. and Siti Sarah, A. K.
1522 Pertanika J. Soc. Sci. & Hum. 21 (4): 1517 - 1524 (2013)
degree of conformity and deviation amongst individuals of the Malay ethnic group. Administering the questionnaire to all the 14 states in Malaysia has helped to determine the validity and reliability of the questions in gauging individuals’ degree of conformity and deviation to answer the question how true they are to the ethnic group they belong to. It is from these findings that a system was developed into a self- diagnostic web-based instrument with defined the rubrics of deviation and conformity.
Step Five
Based on the research findings, a few amendments were made to transform the instrument into a web-based and CD self-diagnostic test tool. The quality of the questions was upgraded, while some questions were added or removed to achieve an equal representation from each section. The rubrics of deviation and conformity were later developed from it . The users will be able to see their scores in each cluster by going through the questions. In addition, doing so will enable the individuals and the research team to measure and to get a true picture of the deviation and conformity of an individual for each cluster and to gauge how true the individuals are to the social character traits of the ethnic group that they represent.
RESEARCH FINDINGS FOR THE TRANSFORMATION PROCESS
The 26 social character traits are very valuable because it was developed from the poetic verses of pantun and the Malay
proverbs contained in the ethnic works of treasure and heritage. The findings remained as just data for the sciences if they were not tested scientifically.
Scientific data enable the information to be distributed and disseminated to not only interested parties, groups, thinkers or disciplines, but to a much larger audience. The process of developing it into a scientific component has proven that a sociological phenomenon could be measured, validated and calibrated. Along with the ability to measure an individual’s deviation and conformity to its ethnic social character traits, the data gathered from the process have also managed to contribute to the formation of a new theory. Through the development process, it was found that all the four clusters mentioned above (namely, educational upbringing, epistemology, value and beliefs or religion) could be applied to the formation of social character traits and identity of any ethnic, group or race in the world today. Therefore, the software could be modified and customised to measure the degree of deviation and conformity of other individuals to their ethnic groups. The only anticipated credential to make this workable is that the researcher or the research team must be very well versed of the culture, literature and heritage of the ethnic group.
IMPLEMENTATION AND CONCLUSION
This paper has discussed the process of how the transformation was made. The findings from the grounded strategy research method done manually were later used to design
Turning a Social Character Trait Phenomenon into a Diagnostic Web-Based Measuring Instrument
1523Pertanika J. Soc. Sci. & Hum. 21 (4): 1517 - 1524 (2013)
the questionnaire into a web-based format after it had been created and proved that a social character trait could be measured. The instrument was designed in two forms; one as a self-accessed web-based diagnostic test and another as CD software. The software HB™ Melayu, a measuring instrument of a Malay Social Character Trait to test “How True Malay Are You”, is available and can be accessed by all Malays and Malay diaspora, groups and communities of the world.
The system has a formula that enables interested parties to determine the percentage of how much an individual is still Malay as he or she interacts with the system. Even though this instrument could not directly help the Malay ethnic group to hold on to its culture and racial endeavours or solve its moral and social problems, it can still be used as a tool to detect where it is lacking and to propose a remedy to ensure that the future generation will not lose its cultural identity. The data, if gathered collectively, will help agencies, government bodies, and NGOs design programmes to improve and rectify what has been done in the past on policies, planning, and implementations of efforts in restoring ethnic and cultural identity, ideology and practice. The universal attributes could be modified, improvised, adapted and applied to measure cultural identity of other ethnic groups with a prerequisite that the team must be true believers and practitioners of the group in question.
ACKNOWLEDGEMENTS
We would like to convey our thanks to the Research University Grant (RUGS), Universiti Putra Malaysia for making this research possible.
REFERENCES
Awang Had Salleh. (1985). Adat Sopan dan Budi Bahasa (1st Ed.). Bandar Darulaman, Universiti Utara Malaysia: Sesekala Publication.
Al-Ghazali (2009). Pemikiran Al-Ghazali Tentang Pendidikan. Retrieved March 25, 2010 from http://tutorq.blogspot.com/2010/03/pemikiran-al-ghazali-tentang-pendidikan.html.
Glasser, B., & Strauss, A. (1968). The Discovery of Grounded Theory: Strategies for Qualitative Research. Chicago: Aldine.
Glaser, B. (Ed.). (1994). More Grounded Theory Methodology: A Reader. Mill Valley, CA: Sociology Press.
Hadijah Rahmat. (2007). Membina Minda dan Budaya Melayu Baru melalui Perekayasaan, Pendidikan Bangsa. e-Utama Journal, 1. Retrieved August 27, 2009 from http://mlcd.myplace.nie.edu.sg/hadijah_rahmat.pdf.
Hashim, M. (2008). Hati Budi Melayu Pengukuhan Menghadapi Cabaran Abad Ke-21. Serdang: Universiti Putra.
Linguistic Society Malaysia (2006). Cabaran Teknologi Maklumat kepada Pendidikan dalam Bahasa Melayu. Jurnal Persatuan Linguistik. Kuala Lumpur: Society of Linguistic Malaysia.
Ministry of Culture, Arts and Heritage. (2008) Keberkesanan Kempen Budi Bahasa Kementerian Kebudayaan Kesenian dan Warisan. Retrieved November 11, 2008, from http://www.heritage.gov.my/kekkwa/upload/link_fail/budibahasa.html.

Normahdiah S. Said, Hashim, M., Rozita, C. R. and Siti Sarah, A. K.
1524 Pertanika J. Soc. Sci. & Hum. 21 (4): 1517 - 1524 (2013)
Mustafa Haji Daud, (1995). Budi Bahasa Dalam Tamadun Islam. Kuala Lumpur: Dewan Bahasa dan Pustaka.
Said, N. S. (2007). Kajian Eksperimental bagi Membina Model Reka Bentuk Multimedia yang Mengasyikkan (An Engaging Multimedia Design Model) NEND – Norma Enagagement Multimedia Design Model. Pertanika Journal of Social Sciences & Humanities, 15(2), 75-83.
Said, N. S. (2010).Multimedia Integrasi Siri 1. Serdang: Universiti Putra Malaysia.
Said, N. S., & Siti Sarah, A. K. (2010). Prosiding Seminar Antarabangsa Linguist ik dan Pembudayaan Bahasa Melayu SALPBM VI, 5-6 October 2010, FBMK, UPM (pp. 196-202). Serdang: FBMK, UPM.
Siti Sarah A. K. and Said, N. S. (2010) Prosiding Seminar Antarabangsa Psikolinguistik II, 8-9 June 2010, Hotel Promenade, Kota Kinabalu, Sabah.( p.638-644). Serdang: FBMK, UPM and Psycholinguistic Society Malaysia. ISBN 978-983-41184-8-8.
Strauss, A., & Corbin, J. (Eds.). (1997). Grounded Theory in Practice. Thousand Oak. CA: Sage.
Ujian diagnostik untuk UPSR, PMR, SPM dan STPM. (2010) Portal Pendidikan Utusan. Retrieved March 23, 2010, from http://www.tutor.com.my/.
Pertanika J. Soc. Sci. & Hum. 21 (4): 1525 - 1532 (2013)
ISSN: 0128-7702 © Universiti Putra Malaysia Press
SOCIAL SCIENCES & HUMANITIESJournal homepage: http://www.pertanika.upm.edu.my/
Article history:Received: 2 January 2012Accepted: 19 April 2012
ARTICLE INFO
E-mail address: [email protected] (Faezeh Sivandipour)
Analysing Hardy’s Portrayal of Tess Through Christian Feminism
Faezeh SivandipourNo 2, Sadaf Complex, 17th Hezaro Yek Shab St, Kerman 7618656679, Iran
ABSTRACT
This article, through considering the main images of Christian feminism: sin, salvation and Eve, analyses Thomas Hardy’s portrayal of his female protagonist, Tess, in Tess of the D’Urbervilles (1891). It is significant that through the portrayal of Tess, Hardy conveys the same images of females as the Evangelicals do. The way Hardy portrays Tess does not pave way for any changes in the unfortunate position of the female protagonist in Tess of the D’Urbervilles. Through reading this article, a reader will discover more about the prevailing notions during that time and also about the way Hardy portrays Tess as a typical woman in the Victorian society, who is directly under the control of the existing notions in that patriarchal society. The notions of ‘angel in the house’ or the ‘relative creature’ make Tess a direct example of a typical woman in Victorian society, whose destiny and life are under the direct control of the male characters in her life. As these concepts of womanhood stress Tess’s purity and selflessness, her sins become very significant through the story, and the way she is compared to Eve as a temptress emphasises her sinfulness. She is also portrayed as the character that needs salvation more than any other characters in the story, but ironically there is no salvation and way up for her and she sinks to her tragic death. Considering the main tenets of Christian feminism in Tess of the D’Urbervilles suggests that Hardy’s portrayal of Tess is not different from the Evangelical notions of his time and does not champion women’s disadvantaged status.
Keywords: Thomas Hardy, Tess of the D’Urbervilles, Christian feminism
INTRODUCTION
Thomas Hardy was born into a religious family. He studied religion deeply and was later much influenced by the Evangelicalism of his time, at least in its given notions of women which were the popular images of
Faezeh Sivandipour
1526 Pertanika J. Soc. Sci. & Hum. 21 (4): 1525 - 1532 (2013)
womanhood such as the ‘angel in the house’ or the ‘relative creature’ who maintains the home as a heaven (Williams 17). The main ideals of a good woman were brought to the Victorian Era through Evangelicals, which defined women with recognizable characteristics, which included being modest, unassuming, unaffected and rational. Being ‘rational’ meant not to be ‘sentimental’ or have violent feelings. To Evangelicals, it was clear that man was the wiser partner and could guide woman into the appropriate area (Evans, 2001, p.11). While men could introduce women to new ideas, women were considered as private property, who had their main household duties (More, 1858, p.23). Thomas Hardy is known as a writer who knows women and has many female protagonists in his novels; this is why, many readers consider him as a feminist writer. Nevertheless, this article tries to go beyond these assumptions and analyse Hardy’s portrayal of Tess through the lens of Christian Feminism.
As for introduction, it is helpful to know the main definition of Christian feminism. Christian feminists are in agreement on the essential definition of feminism as a devotion to the humanity, decorum, and equality of all the people around the world; thus, all the feminists look for equal rights for women, but their final goal is a social direction in which women and men of all races and classes can live together in justice and harmony. According to them, human relationships have been blemished by sin, but the sexism, racism, and classism present in our world are not God’s will (Japinga,
1999, p.13). Christian feminists argue that as the Christians believe that salvation sets individuals free from the outcomes of sin and allows their souls to enter heaven when they die, while the unsaved person is separated from God, the saved person has a relationship with God that offers happiness and security. The definitions of salvation and sin are closely connected. Sin is a broken relationship between God and an individual and the evident key for their reunion is the individual’s salvation. Salvation takes place by the individual’s regret, change, ‘getting right with God’, and developing a personal relationship with Christ. As sin is considered to be rebellious against God through pride, self-seeking, and haughtiness, salvation then requires a breaking of the self. Therefore, sinful people must distinguish their weakness and failure, and try to admit their inability to save themselves or their world and finally confess their need for God (Japinga, 1999, p.107). Also, Christian feminists have two main goals; first is to provide a critique of the tradition, pointing out the ways the Christian tradition has been limiting or destructive for women, and second, to recover women’s stories from the past and the present in order to demonstrate the gifts and insights of women throughout history (Japinga, 1999, p.21). Through this, the main clues of Christian feminism – sin, salvation and the image of Eve – are tracked in this article to analyse Hardy’s portrayal of Tess. Accordingly, this article also tries to examine whether Hardy’s portrayal of Tess is in accordance with the mentioned feminists’ tenets or not.
Analysing Hardy’s Portrayal of Tess Through Christian Feminism
1527Pertanika J. Soc. Sci. & Hum. 21 (4): 1525 - 1532 (2013)
DISCUSSION
In this part, Hardy’s portrayal of Tess is examined based on the main tenets of Christian feminism by considering the main clues of ‘sin’, ‘salvation’ and the image of ‘Eve’ as a temptress to show how Hardy’s portrayal of Tess is related to deep Evangelical Christian beliefs and the so-called Victorian notions (‘the angel in the house’ or ‘the relative creature’). To start with the image of ‘sin’, a reader finds out that in most of the situations Tess feels very sinful even when somebody else has to be. Whenever Tess is alone or when she wakes up early in the morning, she feels bad: “Her depression was then terrible, and she could have hidden herself in a tomb” (106). Although it is Alec who committed sin and raped her, it is Tess instead who feels sinful and attempts to purify herself by going to church. Tess struggles a lot and at the same time tries to be happy and enjoy the company of her female companions, but it is a feeling that does not last long for her. One day, on her return home, she faces her sick child who is going to die, but her biggest worry is that the child has not been baptized. Her fear increases because she knows her child has a double doom – lack of baptism and lack of legitimacy. She cries and says, “O merciful God, have pity; have pity upon my poor baby! Heap as much anger as you want to upon me, and welcome; but pity the child!” (118). A close reading makes the reader realise that for Tess, happiness does not last long for she considers herself guilty, and deserves these miseries in order to be saved. At last,
she tries to baptize her child herself, and she does this only out of fear of God, for she considers God as a powerful Almighty who seeks revenge. In a way, Hardy shows that whatever bad that happens to Tess is because she is not as pure as a real Christian female should be. The tragedy for Tess is that although she is innocent and is as pure as she can be, all through the story, she is judged as guilty and sinful by others. Hardy reinforces this in the way she portrays Tess, and it is significant that even Tess knows herself guilty and in need of salvation. Even through Angel’s relationship with Tess, Hardy shows that sheer purity and virginity are the most important factors for males to pay attention to females. Ironically though, despite Tess’ true innocence and purity and the fact that she does not commit any sins, later in the story, she is judged by the sins of others and nobody sees her for what she really is, as if she needs salvation more than the other characters (especially the male ones). Initially, Hardy portrays Angel as a true lover who very deep inside loves Tess, and cannot ignore his feelings towards her and marry Mercy Chant (a devoted virgin, who is suggested by Angel’s parents). Angel thinks it is not necessary to be a faithful Christian as Mercy but at the end, he himself ignores all his feelings towards Tess, and this ironic because of the Christian perceptions. This is just because Tess is not a virgin and pure as a fine, Christian girl should be, so once again, Hardy defines a frame for a pure and Christian lady. While Angel at first considers Tess as a very honest girl and accepts her as she is, in the end,
Faezeh Sivandipour
1528 Pertanika J. Soc. Sci. & Hum. 21 (4): 1525 - 1532 (2013)
it is Angel himself who forgets all about Tess’ real purity and honesty and ignores her just because of his religious biases. This reminds Margaret Elvy’s (2007) idea that Christianity divides women into two main sexual types: the ‘Virgin Mary’ who is considered as the worshiped Mother and ‘Mary Magdalene the whore’. As she concludes, “Tess may be seen as a latter-day form of the ancient ‘Mary Magdalene the holy whore’, the sacred prostitutes who serves Goddesses such as Cybele and Isis. What’s clear is that Tess is not allowed to be both, mother and sexually active woman” (67). Thus, a reader may presume that a man can do everything because he is a man and is forgiven, as when Angel confesses his sin to Tess, very gently she forgives him, but when it is Tess’ turn, Angel cannot accept her for her past, and eventually, he leaves and ignores her very severely. Despite all Tess’ struggles to make him aware of her secret before their marriage, he cannot accept her because she is not as pure as he thought. It would appear that Hardy defines a limit for females’ attitudes and relationships before their marriage. On the one hand, he wants to make them aware of all the consequences of their intentional or unintentional affairs before their marriage but on the other, he portrays the males’ situation completely different from the females’. He gives males more freedom and shows that they may commit sins but they can expect the females to forgive them. This reminds us of the old patriarchal and religious belief that, because Eve tempted Adam to eat the forbidden fruit, females are doomed to suffer more than men
so they need more salvation (Japinga , 1999, p.111). That is why all through the story it is Tess who suffers more and finds out that the punishment is brutal for those who eat the apple.
As Tess’s fall starts with Alec, her salvation also begins with her sufferings through Alec’s rude behaviour. As a male character, Alec is an example of male superiority and dominance, who does whatever he wants and later turns into a preacher and is socially accepted. In contrast is Tess, who has been innocent all her life but rejected by both her family and love. All these are reminiscence of the theory of Christian feminism, which suggests that historically, men, who were the main authors of theological books and pamphlets, wrote for themselves and for their own benefit, and in this case women are seen by men as merchandise: “women, signs, goods, currency, all pass from one man to another” (Irigaray, 1985, p.107). According to Elvy (2007), this exactly happens in Hardy’s novels, and in most of these novels, women are traded by men as the marks of possession. Having sex with women is the stamp of this ‘possession’ (49). When confronted again by Tess, Alec realises his weakness and cannot control himself and so he, knowing it as her guilt, exploits it, calling her a ‘non-believer’. Although Tess does not profess to be devoutly religious and Christian, she knows her religious and social responsibilities and commitments much better than Alec. In admirable contrast to the male characters in the novel who so easily forget their own commitments, oaths
Analysing Hardy’s Portrayal of Tess Through Christian Feminism
1529Pertanika J. Soc. Sci. & Hum. 21 (4): 1525 - 1532 (2013)
and beliefs, Tess sticks by her loyalty to religion and society. At this stage of her life, she has even been strengthened enough to make Alec swear to his ‘Christianity’. Even in his seclusion with her, he denies his weakness and his wrong when he says, “Tess, as God is my judge, I meant no humbug in taking your hand!” (405). Alec wants to cheat her, himself and even God, and still he is hopefully exploitative of women when he describes Tess as Eve (411). Tess’ salvation starts with male characters’ control on her life as if they are representative for God, that is why Tess considers herself as Angel’s ‘wretched slave’ and insists him to stay with her, and the admission that her life and destiny are under his sheer control are enough reasons to make her disadvantaged. As Elvy argues, Tess is traded between Angel and Alec and they both possess her. Alec possesses her physically and sexually, while Angel possesses her sexually by a ‘negation of eroticism’. Angel emphasizes her virginity, and Alec emphasizes her eroticism (Elvy, 2007, p.49). This ‘possession’ can be a good reason for Alec and Angel’s dominance on Tess’ life, for they both consider themselves as Tess’s owner and lord. That is why, Angel becomes very angry when he discovers Tess’s secret and considers her as Alec’s wife. Consequently, he behaves in a way that Tess feels she has ruined his life, so she asks him to punish her in any way he wishes, “I agree to the conditions, Angel; because you know best what my punishment ought to be; only – only – don’t make it more than I can bear!” (323). The fact is that Alec and
Angel both have ruined Tess’s life, but it is Tess who has to feel guilty and to suffer for the sins of others. Through Alec and Angel, Tess suffers as a guilty woman has to for her salvation – according to the Christians – but unfortunately even after all her miseries and suffers, there is no way up for her and she is doomed to suffer to her death.
The o ther s igni f icant image which is very dominant in Tess of the D’Urbervilles, is the image of Tess as Eve – a temptress. Almost all the main male characters in the story consider young women as Tess to be dangerous as Eve. Tess’ real story starts when she steps into Alec’s house and becomes shocked by his unconventional behaviour. Although Tess does not have any sexual tendencies towards Alec, he wants to possess her sexually. In order to do this, he confronts her with various unexpected sexual situations and despite Tess’s effort to resist him, eventually she fails. As Elvy argues, Hardy shows how difficult it is for women to have economic independence, more like Tess who is a woman cast off by men and yet remains dependent on men and patriarchy. She really works hard but still cannot be successful (Elvy, 2007, p.48). Once, when Alec kisses her, she wipes off the spot of his kiss and wants to undo the kiss, although spiritually it is impossible, she wants to be rid of Alec and all the irritating feelings he brings on her. On the contrary, it is Alec who is exactly different from Tess and has no morals, as all his reactions are
Faezeh Sivandipour
1530 Pertanika J. Soc. Sci. & Hum. 21 (4): 1525 - 1532 (2013)
aggravating and he says, “You shall be made sorry for that! Unless, that is, you agree willingly to let me do it again, and no handkerchief” (65). Alec calls her ‘hussy’ to convince her that she is not innocent, and this is because he knows her as a fragile girl who is doomed to be neglected and misused. That is why, he swears at her and curses her, and his only reaction to her anger is his heartily laughter. All Alec’s reactions towards Tess indicate that he considers her as a weak and fragile person, who does not have any other choices, so she submits and he continues as he wishes. It is not just Alec and Angel that consider Tess a temptress as Eve, even a slogan-writer considers Tess dangerous and says, “Ah - there’s a nice bit of blank wall up by that barn standing to waste. I must put one there - one that it will be good for dangerous young females like yerself to heed. Will ye wait, missy?” (102). Here again, the representation of a man in the position of a preacher is tangible, who considers ‘young females’, as Tess, dangerous. The reader could be led to believe from reading these lines that the male characters in this story are portrayed as responsible characters, who preach and lecture, while they expect female characters to act and behave religiously but from the perspective of the males. This is why, the male characters in this story know the female characters responsible for males’ sins and weaknesses, and it is as if they want to suggest that if women are
good, then the world will become good. It is totally ironic that on the one hand, Hardy introduces Tess as a miserable person who does not have any control over managing her life without a man’s supervision, and on the other, he shows that most male characters in her life consider her as ‘dangerous’. Therefore, Hardy seems to suggest that Tess is a temptress simply because she is a woman and can tempt men. The male characters consider Tess a ‘temptress’ and they compare her to ‘Eve’, for they think they are very firm and this is Tess who all the time tempts them. In this way, Alec and Angel are self-righteous, not seeing the wrong of their own ways but blame Tess for their own weak points. Also, when Tess is with Angel, Hardy compares her to Eve and considers them as Adam and Eve (167). It is significant to note that Hardy indirectly wants to make the readers aware of a temptation, which is going to be proffered by Tess. Even the name ‘Angel’ is very ironic here, as firstly the reader considers him as a saviour, but sadly ‘Angel’ is not going to save Tess’ life from the past darkness, rather he is going to ruin the rest of it. Much in line with the thinking of the time, Hardy gives a good religious name to the male character while the female is described as ‘Eve’ – seen in religious texts as a temptress. It is noteworthy that Tess in this story is the most innocent character and at the same time, she is the most miserable one. To the end, she tries to be pure and innocent without
Analysing Hardy’s Portrayal of Tess Through Christian Feminism
1531Pertanika J. Soc. Sci. & Hum. 21 (4): 1525 - 1532 (2013)
any pretensions, but Alec and Angel, in contrast, merely pretend to be religious and moral. It is fair to surmise that if they both were sincere and meant what they had said about being good Christians, Tess’s life would not have such a tragic ending. Males like Alec and Angel behave the hypocritical way they do because it has been historical practice, similar to the way history has judged Eve through religious books.
CONCLUSION
As discussed above, it can be concluded that, Thomas Hardy’s portrayal of Tess proves that he conveys all his Evangelical beliefs in the case of their notions on women, and this explains why Hardy takes the same route in Tess of the D’Urbervilles in female portrayal. Tess of the D’Urbervilles is the story of a typical woman in the Victorian era who does not have any control over her life, but is yet introduced as a temptress many times through the story. As Elvy argues, “Men in Hardy’s world want women to stay in their place....men are active, women are passive, men act, and women are acted upon.” And when women want to usurp this status quo, they are punished (Elvy, 2007, p.50). Tess is born in this patriarchal society, with men always on the top, to serve her family, her lover, her husband and whoever in the state of power and her character is portrayed without any attempts to change her situation and make it different from the former images and stereotypes of the female characters of her time. Based on Kristin Brady (1993) viewpoint, feminist
criticism questions the ‘masculine pleasure of the text’, according to her, “Hardy’s narrators persist in constructing and interpreting female characters according to standard notions about women’s weakness, inconstancy, and tendency to hysteria” (94); therefore, through portrayal of Tess, Hardy does not attempt to champion the cause of the oppressed females or even pave the way for females’ equality with males and the pleasure of the text is a masculine pleasure. On the whole, by reading Tess of the D’Urbervilles, the reader is made to believe that women are disadvantaged and remain miserable just because of their gender and their so-called religious status. Bearing in mind the images of Christian feminism has once more made this matter tangible that Tess is considered as the origin of ‘sin’ in this novel, who most needs salvation, that is why several times during the story she is exampled as ‘Eve’ who is religiously the symbol of temptation. Thus, it is evident that in reading Hardy’s Tess of the D’Urbervilles, one can confirm that Hardy’s portrayal of Tess does not pave the way for new and promoted images for women. Hardy portrays Tess so miserable and disadvantaged that even after her salvation, there is no way up and no remedy for her and she sinks to her tragic end. To end up this article, it is noteworthy to mention Rosalind Miles view point that says, “Hardy really is a lover of women in the fullest physical sense” and according to her, Hardy has an intuitive and exalted view of women in the fullest physical sense and in better words he is a ‘womanist’ (Miles,
Faezeh Sivandipour
1532 Pertanika J. Soc. Sci. & Hum. 21 (4): 1525 - 1532 (2013)
1979, pp.25-26). As it was mentioned in the introduction, although Hardy has many female protagonists and – as many readers believe – he shows the disadvantaged status of women to have sympathy with them, it cannot be a good and acceptable reason to consider his portrayal of Tess in accordance with feminists’ tenets. As for the main tenets of Christian Feminism, it is shown that in Tess of the D’Urbervilles, there is no sign of equal rights for women, no harmony and no justice, and unlike Christian Feminists’ main goals, all the situations for Tess are limiting and destructive and there is no effort through Tess’ portrayal in order to demonstrate her gifts and insight.
REFERENCESBrady, K. (1993). Textual Hysteria: Hardy’s Narrator
on Women. In M. Higonnet (Ed.), The Sense of Sex: Feminist Perspectives on Hardy. Urbana: University of Illinois Press.
Elvy, M. (2007). Sexing Hardy: Thomas Hardy and Feminism (2nd ed). London: Crescent Moon.
Evans, M. (2001). Feminism: Critical Concepts in Literary and Cultural Studies (2nd vol). London: Routledge.
Hardy, T. (1994). Tess of the D’Urbervilles. London: Penguin.
Irigaray, L. (1985). This Sex Which Is Not One. Tr. C. Porter. New York: Cornell University Press.
Japinga, L. (1999). Feminism and Christianity: An Essential Guide. London: Abingdon Press.
Miles, R. (1979). The Women of Wessex. In A. Smith (Ed.), The Novels of Thomas Hardy. London: Vision.
More, H. (1858). Coelebs in Search of a Wife. New York: Derby and Jackson.
Williams, M. (1993). A Preface to Hardy (2nd ed). London: Longman.
Pertanika J. Soc. Sci. & Hum. 21 (4): 1533 - 1542 (2013)
ISSN: 0128-7702 © Universiti Putra Malaysia Press
SOCIAL SCIENCES & HUMANITIESJournal homepage: http://www.pertanika.upm.edu.my/
Article history:Received: 3 January 2012Accepted: 14 March 2012
ARTICLE INFO
E-mail address: [email protected] (Gyanendra Kumar Rout)
Attitude of Teachers towards Adolescence Education
Gyanendra Kumar RoutGovt. Degree College, Rikhnikhal, Pauri Garhwal, Uttarakhand-246170, India
ABSTRACT
Adolescence education in secondary stage has been received an increased attention and scholarly debates since students experience a high volume of biological and mental siftment at this stage. Teachers are the most important guides to cope them with their changes; thus, a positive attitude of teacher is an essential. With an elicit cross examining process in connection to teachers’ gender, localization, faculty and qualification was considered for practice on the institutionalisation of Adolescence Education in secondary schools at Orissa, India. A total number of 300 secondary school teachers were chosen as subjects of the study by using stratified random sampling procedure. The results of the study determined that male teachers have positive attitude towards Adolescence Education as compared to their science counterparts, whereas male teachers have favourable attitude toward the subject and urban teachers demonstrate their superiority over their rural teachers in their attitude.
Keywords: Adolescence Education, secondary school teachers, attitude
opportunities, the number of boys and girls getting education is significantly increasing. It has contributed to the rise in the average age of marriage. On the other hand, because of improvements in nutrition and health care, the age of the onset of puberty is advancing as a consequence of which, young people now have a longer interval between the onset of sexual maturity and marriage, increasing the possibility of their engagement in premarital sexual relations. Lack of knowledge, skills and access to contraception, as well as vulnerability to sexual abuse has put adolescents at a high risk of unwanted
INTRODUCTION
There are around 1 billion adolescents in the world belonging to age group 10-19 years of which 85 percent live in developing countries. India has a large adolescent population of over 190 million, who desperately need some sort of counselling to handle age-related problems and issues (Jena & Brahma, 2002). Because of the expansion of the educational
Gyanendra Kumar Rout
1534 Pertanika J. Soc. Sci. & Hum. 21 (4): 1533 - 1542 (2013)
pregnancy. In this context, the need for educational intervention at the school stage is strongly felt. The aim is to provide scientific knowledge to adolescents about various aspects of the process of growing up with particular reference to the reproductive health needs and thus enable them to cope with different problems. In this context, three major interrelated areas; namely, the process of Growing Up, STD, HIV/AIDS and Drug Abuse have been identified to constitute the core components of Adolescence Education. Thus, Adolescence Education may be understood as education to provide learners opportunities to have access to authentic information and knowledge about the process of growing up, as well as about HIV/AIDS and drug abuse (Paul, 2008). Its aim is to inculcate in them rational and responsible attitude towards sex and sexuality including HIV/AIDS and vulnerability through drug abuse (Pettifor et al., 2007).
The teachers are the main instruments of change. In fact, they are the most important determinants of success of any educational programme. In a large educational system such as ours, we cannot simply overlook the role of teacher in an area like Adolescence Education. The teacher can play his/her role both in curricular and co-curricular activities. For example, while conducting various co-curricular activities like question-box activities, group discussions, role plays, debates, essay and quiz competitions, components of Adolescence Education can be transmitted (Orji et al., 2003). The experience and expertise of the teacher can be utilised very well in organising ancillary
activities relating to Adolescence Education. Similarly, the teacher can be equally effective in counselling the adolescents, not only for their good communication skills but also for the acceptability of their suggestions. However, for the above things, the teacher must possess positive attitude towards Adolescence Education. Here, the researchers have made an attempt to learn or identify the attitude of teachers towards Adolescence Education in relation to their gender (men, women), faculty (science and arts), area (urban and rural), and qualification (graduation and post-graduation), as well as a cross examination of the above variables.
RESEARCH QUESTIONS
The following research questions were asked for the study:
1. Is there any difference of men and women teachers in their attitudes towards Adolescence Education?
2. Is there any difference of rural and urban teachers in their attitudes towards Adolescence Education?
3. Is there any difference of science and arts teachers in their attitudes towards Adolescence Education?
4. Is there any variation in the attitude of teachers towards Adolescence Education attributable to their qualification?
REVIEW OF LITERATURE
Ramachandran (1974) conducted a study on knowledge and attitude of teachers towards population education, and it was revealed that sex education in the context
Attitude of Teachers towards Adolescence Education
1535Pertanika J. Soc. Sci. & Hum. 21 (4): 1533 - 1542 (2013)
of population education is necessary to eliminate some misconceptions about reproduction. Rao (1976), in his study on the awareness of teachers on population problems and their reaction to the introduction of population education in schools, reported that the teachers favoured the teaching of sex education in schools. Meanwhile, Salkar (1974) carried out a study of the population awareness of teachers with a view to incorporating inclusion of population education in schools curriculum. The study revealed that teachers were in favour of providing sex education in school curriculum as a part of population education.
SCERT, Bihar (1996) conducted a study to assess the needs of adolescents, and it indicated that male teachers showed more positive attitudes as compared to female teachers. However, this study pointed out the need for increased interaction of students with teachers’ parents or elders. Maheswari (1972), in his study of receptiveness of school teachers to population education, revealed that 83 per cent of the teachers agreed that anatomy and physiology of human reproduction should form parts of population education. However, they were against introducing sex education in schools. Gupte (1974) conducted a study on the attitude of teachers towards introducing sex education in schools, and it revealed that majority of the teachers opined in favour of the issue and wanted it to be taught by Biology teachers, while some teachers preferred doctors to teach them the subject. The study by Rao (1974) reported
that teachers favoured the introduction of Adolescence Education in schools. Moreover, the teachers indicated their preference of a scientific approach for the teaching of sex education and felt it to be very crucial for the development of balanced personality of the students. Rao (1976) conducted a similar study on attitude of teachers towards sex education. The findings of the study suggested that 90 percent of the teachers favoured the teaching of sex education in schools, and thus, corroborating the findings of Gupte (1974) and Rao (1974). The researchers suggested the teaching of anatomy and human reproduction, health hygiene and did not favour the teaching of contraception at school stage. Sex education, as reported by the teachers, is to be integrated with existing subject like biology.
SISE Punjab (1994) conducted a study of the attitudes of teachers towards introducing Adolescence Education. Majority of the teachers, particularly male teachers, showed a favourable attitude towards the introduction of Adolescence Education. The maximum number of teachers favoured the inclusion of contents related to AIDS, STDs, physical and physiological changes and sex roles on priority basis. The study recommended identifying the training needs of teachers and development of curriculum in adolescent education by Punjab school Education Board. Population Cell, Andhra Pradesh (1995), conducted an investigation into the introduction of Adolescence Education in school curriculum, where majority of the teachers favoured the
Gyanendra Kumar Rout
1536 Pertanika J. Soc. Sci. & Hum. 21 (4): 1533 - 1542 (2013)
introduction of sex education as a part of the curriculum.
National Population Education Project (NCERT, 2001) conducted a study on sex education, which revealed that a majority of the teachers favoured the introduction of sex education in the lower classes or at the university stage. Some teachers opined that sex education should be taught in schools as a part of the population Education Programme. The teacher also felt that it could be effectively taught by them or by an expert or a doctor. In another study by NCERT (1996), it was found that Science teachers were more favourable towards Adolescence Education.
When studies by Gupte (1974), Rao(1) (1974), SISE, Punjab (1994), P.R.C. University, Kerala (1994), National Population Education Project, NCERT (1996) reported that teachers display positive attitudes towards Adolescence Education. However, studies by Maheswari (1972), and Dayal (1973) do not subscribe to such finding. Hence, teachers’ attitude towards Adolescence Education needs to be examined in relation to their gender, area, faculty and qualification, so as to understand the extent to which teachers’ factor inhibits the introduction of Adolescence Education in schools. Taking in to consideration the above literature review, the researcher selected the methodology to be used and testified it and the findings according to his own study.
COUNTRY CONTEXT
Adolescents live in developing countries accounts from more than one fifth of the
world population. India is considered as one of the largest country in terms of population and place, with 225 million adolescents, which is around 21.4% (or one-third) of the country’s total population. Female adolescents comprise almost 47 per cent of the total population. The sex ratio in the 10–19 years is 882 females for 1000 males, lower than the overall sex ratio of 933, who desperately need some sort of counselling to handle age-related problems and issues (Jena & Brahma, 2002). Meanwhile, secondary education involved children aged 14-18 years, which included 88.5 million children according to the Census, 2001. However, enrolment figures showed that only 31 million of these children were attending schools in 2001-02, indicating that two-third of the population remained out of school. The ratio is 59% for males and 49% for females. In Orissa, the total number of adolescents in secondary schools are 3,33,027, out of the total population of 3,67,06,920. Due to the expansion of the educational opportunities, the number of boys and girls getting education is significantly increasing. It has contributed to the rise in the average age of marriage. On the other hand, because of the improvements in nutrition and health care, the age of the onset of puberty is advancing, and as a consequence of which young people now have a longer interval between the onset of sexual maturity and marriage, increasing the possibility of their engagement in premarital sexual relations. Lack of knowledge, skills, and access to contraception and vulnerability to sexual abuse put the adolescents at high a risk of unwanted pregnancy. World Health
Attitude of Teachers towards Adolescence Education
1537Pertanika J. Soc. Sci. & Hum. 21 (4): 1533 - 1542 (2013)
Organisation (WHO) recognised that in the traditional society, many young people have greater risks of pregnancy-related disease and mortality. Young people face pressures towards premarital sexual activity at an early age and face the risk of unwanted pregnancies, hazards of abortion, sexually transmitted diseases and so on (UNAIDS, 2008). Many developing countries face these new realities by launching programmes for the youth with encouraging results. So far as India is concerned, nothing substantial seems to have been attempted to deal with the situation.
METHOD
Design
Descriptive survey method was used in the present study to collect information from a cross section of teachers. Thus, the study comprised dependent variable such as teachers’ attitude towards Adolescence Education and independent attribute variables such as teachers’ subject (science, arts), gender, area and age. An attempt was also made to examine the functional relationship among these independent and dependent variables.
Participants
The study was based on 300 secondary school teachers from all four regions of the state of Orissa (India), who had been selected by using the stratified random sampling procedure, where each revenue division of the State was considered as a stratum. Out of the number, 160 were men teachers and 140 were women teachers.
Materials
A three-point attitude scale on Adolescence Education, developed by Pandey et al. (NCERT) (2002) to measure attitude towards Adolescence Education, was administered on secondary school teachers. The scale contained 34 statements relating to different components of Adolescence Education, out of which 13 are positive statements and 21 are negative.
Data Collection and Interpretation techniques
The investigator met the Headmasters of the schools and explained them the importance of the study, particularly the importance of the data required for the study to be extended by the teachers. With the permission of the Headmasters, the awareness test and the attitude scale were administered on the selected teachers during their leisure periods. An appointment was fixed to administer the awareness test on students in consultation with the Headmasters. After collecting data in a phased manner, the researcher analyzed them through different statistical techniques. Three way ANOVA was also employed to examine the teachers’ attitude towards Adolescence Education in relation to their gender, area and faculty.
FINDINGS AND INTERPRETATION
Teachers’ attitude towards Adolescence Education in relation to gender, area and faculty
Three-way ANOVA was applied to examine the independent effects of gender, area and faculty and their interaction effects on the
Gyanendra Kumar Rout
1538 Pertanika J. Soc. Sci. & Hum. 21 (4): 1533 - 1542 (2013)
teachers’ attitude towards Adolescence Education. The results of the ANOVA are presented in Table 1.
The results reveal that the main effects of gender [F (1,292 = 81.907, P <.01], area [F (1, 292) = 25.671 P > .01] and faculty [F (1, 292) = 17.866 P < .01] are significant. However, the interaction effect (Gender x Area) [F, (1, 292) = 3.506 P > .01] was not found to be insignificant. Nonetheless, the interaction effect (Area x Faculty) [F, (1, 292= 9.036 P<.01] and (Area x faculty) [F,(1,292=4.476 P< .01] were found to be significant. In case of the combined effect (Gender x Area x Faculty) [P (1,292 = 17.944, P < .01], it was also found to significant.
The resu l t s show tha t ( i ) Ar ts teachers have favourable attitude towards Adolescence Education compared to their Science counterparts; (ii) Male teachers have favourable attitude towards the subject compared to female teachers; (iii) Urban teachers demonstrate their superiority over rural teachers in their attitude towards Adolescence Education, and (iv) Arts female teachers have better attitude as compared to Science female teachers. Nonetheless, there is no marked difference between the Science and Arts male teachers.
Teachers’ attitude towards Adolescence Education in relation to gender, area and qualification
Three-way ANOVA was employed to examine the independent effect of gender, area and qualification, and their interaction effects on the attitude scores of teachers
towards Adolescence Education. The results of ANOVA are presented in Table 2.
The results reveal that when the main effects of gender [F (1,292 = 36.831, P <.01] and area [F (1, 292) = 13.567 P > .01] are significant, the independent effect of qualification [F (1, 292) = .029, P > .01] is not significant. In the case of interaction effects of (Gender x Area) [F, (1, 292) = 9.262 P < .01] and the combined effect (Gender x Area x Qualification) [F,(1,292) = 6.253 P < .01], however, they are found significant, whereas the interaction effects of (Gender x qualification) [F (1, 292) = .168 P > .01], (Area x qualification) [F (1,292) = .433 P > .01] are not significant.
The results imply that male teachers possess a positive atti tude towards Adolescence Education compared to their female counterparts. Nevertheless, there is no marked difference in the attitude of graduate teachers and post graduate teachers. Meanwhile, the urban teachers display superior attitude towards Adolescence Educat ion compared to their rural counterparts. There is a marked difference in the attitude of rural men teachers compared to rural women teachers. Urban male teachers possess better attitude towards Adolescence Education as compared to their female counterparts. However, such a marked difference is not evident in the rural and urban female teachers. In particular, rural female teachers possess slightly better attitude compared to urban female teachers. Furthermore, there is a marked difference in the attitude of urban and rural male teachers. The gender gap in the case of rural
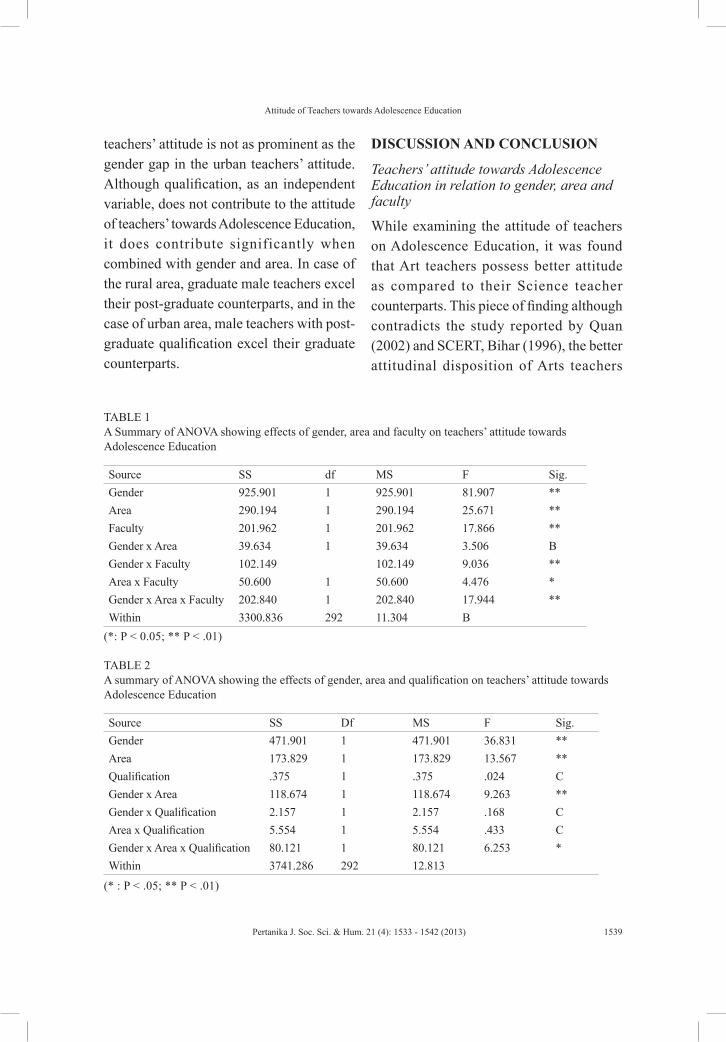
Attitude of Teachers towards Adolescence Education
1539Pertanika J. Soc. Sci. & Hum. 21 (4): 1533 - 1542 (2013)
teachers’ attitude is not as prominent as the gender gap in the urban teachers’ attitude. Although qualification, as an independent variable, does not contribute to the attitude of teachers’ towards Adolescence Education, it does contribute significantly when combined with gender and area. In case of the rural area, graduate male teachers excel their post-graduate counterparts, and in the case of urban area, male teachers with post-graduate qualification excel their graduate counterparts.
DISCUSSION AND CONCLUSION
Teachers’ attitude towards Adolescence Education in relation to gender, area and faculty
While examining the attitude of teachers on Adolescence Education, it was found that Art teachers possess better attitude as compared to their Science teacher counterparts. This piece of finding although contradicts the study reported by Quan (2002) and SCERT, Bihar (1996), the better attitudinal disposition of Arts teachers
TABLE 1 A Summary of ANOVA showing effects of gender, area and faculty on teachers’ attitude towards Adolescence Education
Source SS df MS F Sig.Gender 925.901 1 925.901 81.907 **Area 290.194 1 290.194 25.671 **Faculty 201.962 1 201.962 17.866 **Gender x Area 39.634 1 39.634 3.506 BGender x Faculty 102.149 102.149 9.036 **Area x Faculty 50.600 1 50.600 4.476 *Gender x Area x Faculty 202.840 1 202.840 17.944 **Within 3300.836 292 11.304 B
(*: P < 0.05; ** P < .01)
TABLE 2 A summary of ANOVA showing the effects of gender, area and qualification on teachers’ attitude towards Adolescence Education
Source SS Df MS F Sig.Gender 471.901 1 471.901 36.831 **Area 173.829 1 173.829 13.567 **Qualification .375 1 .375 .024 CGender x Area 118.674 1 118.674 9.263 **Gender x Qualification 2.157 1 2.157 .168 CArea x Qualification 5.554 1 5.554 .433 CGender x Area x Qualification 80.121 1 80.121 6.253 *Within 3741.286 292 12.813
(* : P < .05; ** P < .01)
Gyanendra Kumar Rout
1540 Pertanika J. Soc. Sci. & Hum. 21 (4): 1533 - 1542 (2013)
may be attributed to their greater level of awareness towards Adolescence Education.
Similarly, it was found that male teachers have positive attitude towards Adolescence Education as compared to female teachers. This finding is in line with the study reported by SISE Punjab (1994). The conservative background might have been inherent in the psyche of the female teachers to come up with better attitude.
While examining the area variation in teachers’ awareness, it was found that urban teachers have better attitude towards Adolescence Education compared to their rural counterparts. In particular, Science male teachers showed better attitude in comparison to their Arts counterparts. Urban teachers were found to be better in terms of their attitude than their rural counterparts irrespective of their faculty (UNESCO, 2009). Hence, the female Science teachers’ attitudinal disposition may be a cause of concern on the part of the educational planners to introduce Adolescence Education in school stage. With their background in Science, however, they can easily pick up the components of Adolescence Education with a bit of orientation and once they are oriented properly, they may change their attitude.
Teachers’ attitude towards Adolescence Education in relation to gender, area and qualification
The results showing the attitudinal superiority of male teachers and urban teachers may be considered as a confirmation of the findings obtained earlier. Similarly, higher
qualification not contributing to teachers’ attitude might have a close correspondence with the teachers’ low level of knowledge of Adolescence Education (SCERT, Bihar, 1996). The gender gap in attitudinal disposition in the urban areas reiterates the poor plight of urban female teachers, which is not usable to be taken into consideration (Sabia, 2006). The better attitude of the male teachers might be considered as a pointer to transform the female teachers, whereby taking into consideration a marginal rise in the attitudinal status of rural women counterparts is rather unusual. This may be attributed to the variation in the lifestyles in the rural and urban areas. In the urban areas, women display casual attitude towards different problems of adolescents but in the rural areas, women normally employ a rather careful and cautious approach (Parmar et al., 2009).
From the above discussion, it is concluded that Arts teachers have favourable attitude towards Adolescence Education as compared to their Science counterparts, whereas male teachers have favourable attitude towards the subject. Meanwhile, urban teachers demonstrate their superiority over the rural teachers in term of their attitude towards Adolescence Education.
EDUCATIONAL IMPLICATIONS
Since the study sought to focus on teachers’ attitude, an attempt was made to draw educational implications as teachers in general, and female teachers in particular, to be made conversant with the changes that occur in boys and girls during adolescence,
Attitude of Teachers towards Adolescence Education
1541Pertanika J. Soc. Sci. & Hum. 21 (4): 1533 - 1542 (2013)
as well as the facts associated with the process of growing up, HIV/AIDS& drug abuse. Adolescents should have thorough knowledge on the process of growing up such as development of secondary sex characteristics due to hormonal changes, male and female body clocks, conception, menstruation, nocturnal emission, sexual health, psycho emotional changes (interest in body image, heterosexual attraction, self identity, etc.), and socio-cultural norms (abstinence, pre- and extra-marital relations etc.). They should also have proper knowledge of AIDS/STDs and their effects on human body and health, as well as ways and means to prevent them. Along with all these things, teachers should also be acquainted with the knowledge of drug abuse like the meaning and type of drug abuse, symptoms, consequences, ways of prevention, medical treatment, social problems of drug abuse, myths, misconceptions and says ‘NO’ to drugs.
Moreover, one of the striking features of Adolescence Education is its focus on the objectives relating to attitude and behaviour. Its immediate objectives are to inculcate positive attitude and develop rational behaviour among learners in respect of their most intimate aspects of life, i.e. sexual development in them. Schools and obviously teachers in schools are key factors with the potential to contribute substantially to the attainment of these objectives.
REFERENCESDayal, S. (1973). Knowledge of School Teachers about
Family planning and their reaction to Population Education Curriculum, p. 25.
Gupte, V. (1974). A study of knowledge affect of teachers towards introduction of sex education in school curriculum. (Unpublished M.Ed. Dissertation). Bhopal University.
Jena, S. L., & Brahma, D. (2002). Janasikhya Vikash Sarance, News Letters, 20,3-4,,SCERT, Orissa.
Maheswari, J. R. (1972). A study of the receptiveness of school teachers to population Education. (Unpublished M.Ed. Thesis). Jamia Millia Islamia University.
NCERT (2001). Population and Reproductive Health Education. A training package, New Delhi
Orji, E. O., & Esaiai, O. A. (2003).Introduction of Sex Education in to Nigerian Schools: The Parents Teachers and Students Perspectives. Journal of Obstetric and Gynaecology, 23(2), 185-188.
Population Cell Andhra Pradesh. (1995). An investigation into the introduction of Adolescence Education in school curriculum. NCERT, New Delhi.
Pandey, J. L., & Yadav, S. B. (2002, January). Population Education Bulletin, 11(1), New Delhi.
Pettifor, A. E. (2007). Challenge of evaluating a national HIV prevention programme: the case of Love Life, South Africa. Sexually Transmitted Infections, 83(1), 318-322.
Paul-Ebhohimhen, V. A. et al. (2008).A Systematic Review of School-based Sexual Health Interventions to Prevent STI/HIV in sub-Saharan Africa. BMC Public Health, 8(4), 69-76.
Parmar, S., Bhatia, V., & Parma, V. (2009) Knowledge and awareness of schoolteachers in Chandigarh about HIV/AIDS. Public Health, 121(3), 223-226.
P. R. C. University, Kerala. (1994). A study on beliefs and attitude of students and teachers in Kerala regarding Human sexuality and sex education. Kerla.
Gyanendra Kumar Rout
1542 Pertanika J. Soc. Sci. & Hum. 21 (4): 1533 - 1542 (2013)
Ramachandran (1974). A study of the knowledge and attitude of teachers of Kurnool towards population education. News letter of Population study centre. Sri Venkteshwar University, Tirupati, Andhra Pradesh.
Rao, A. H. K. (1974). A study of the attitude of parents and teachers towards the introduction of sex-education in secondary schools. M.Ed. Theory, Mysore University, Mysore.
Rao, G. (1976). A study of attitude of parents and teachers forwards sex education, Population Education Unit, NCERT, New Delhi.
Salkar, K. R. (1974). A study of population awareness among school students in Goa (Std. VII to IX) as well as teaches and parents and their reactions to the inclusion of population education in the school curriculum. (Ph.D. Thesis in Education). Bombay University, India.
SISE – Punjab. (1994). A study of the attitudes of teachers towards introduction of Adolescence education programme in schools. NCERT, New Delhi.
SCERT, Bihar. (1996).Study of opinion of conditions and teaching for AIDS Education teaching in the School of Bihar, NCERT, New Delhi.
Sabia, J. J. (2006). Does Sex Education attempt Adolescent-Sexual Behaviour and Health. Journal of Policy Analysis and Management, 25(4), 783-802.
UNAIDS. (2008). Report on the global AIDS. Country Progress Report. India.
UNESCO. (2009). International Guidelines on Sexuality Education: An evidence informed approach to effective sex, relationships and HIV/STI education.
Quan, L. N. (2002). Adolescent Reproductive sexual Health case study, Vietnam. Indian Journal of Population Education, 15 & 16, 40-44.

Pertanika J. Soc. Sci. & Hum. 21 (4): 1543 - 1553 (2013)
ISSN: 0128-7702 © Universiti Putra Malaysia Press
SOCIAL SCIENCES & HUMANITIESJournal homepage: http://www.pertanika.upm.edu.my/
Article history:Received: 30 May 2011Accepted: 14 March 2012
ARTICLE INFO
E-mail addresses: [email protected] (Phoon Hooi San), [email protected] (Anna Christina Abdullah)* Corresponding author
The Implementation of Picture Exchange Communication System: A Mother’s Perspective of a Young Child with Pervasive Developmental Disorder
Phoon Hooi San* and Anna Christina AbdullahSchool of Educational Studies, Universiti Sains Malaysia, 11800 Minden, Penang, Malaysia
ABSTRACT
Picture Exchange Communication System (PECS) is a functional means of communication intervention designed for individuals with a variety of communicative challenges. The purpose of this study was to interview a mother who implemented PECS for her 3;03 year old child with Pervasive Developmental Disorder. The interview aimed to investigate a mother’s perception about the efficacy of PECS and issues related to PECS intervention. The results of the interview showed that PECS was effective in enhancing communication skills and reducing problematic behaviours. PECS also had a slight impact on speech production of the child. The issues related to PECS intervention were discussed.
Keywords: Communication, intervention, language disorder, pervasive developmental disorder, Picture
Exchange Communication System.
taught using prompting and reinforcement strategies result ing in independent communication. It was designed for early non-verbal symbolic communication intervention for individuals with pervasive developmental disorder (PDD) or autistic spectrum disorder (ASD). It teaches children to spontaneously initiate their wants through an exchange of a picture of the desired items. PECS is not designed to teach oral language, but it has implicitly encouraged oral language use in children via verbal models of language during the picture exchange.
INTRODUCTION
Picture Exchange Communication System (PECS) is an instructional intervention with augmentative communication systems that was founded by Bondy and Frost (1994). PECS is a type of modified applied behavioural analysis programme that is
Phoon Hooi San and Anna Christina Abdullah
1544 Pertanika J. Soc. Sci. & Hum. 21 (4): 1543 - 1553 (2013)
There are six phases of the PECS protocol. Phase I teaches children to initiate communication by exchanging a single picture for a highly desired item. Phase II teaches children to seek out their pictures and to travel to someone to make a request. Phase III teaches children to discriminate pictures and to choose the picture that represents their desired items. Phase IV teaches children to make a request using the sentence structure “I want ____.” Phase V teaches children to respond to the question, “What do you want?” Phase VI teaches children to comment about things in their environment, both spontaneously and in response to questions such as “What do you see?” and “What do you hear?”
PECS is a popular intervention program for children with PDD or ASD. Many studies have reported the overall success of PECS intervention. Currently, there are over 80 PECS-related publications. The first description of PECS was started in 1994 by Bondy and Frost (1994). PECS was originally designed for young children with PDD or ASD, but its use has become much more widespread. It is now used for individuals of any age, with different communication deficits such as PDD or ASD, global developmental delays, cerebral palsy, visual impairment and hearing impairment. In the following session, we look into the efficacy of PECS on children with ASD or PDD by reviewing studies which were conducted over the past 10 years.
Efficacy of PECS in increasing communication
PECS has been widely used in increasing communication skills, namely, requesting skills of children with communication deficits such as PDD or ASD. Majority of the studies investigating the efficacy of PECS have demonstrated positive outcomes. Cannella-Malone, Fant and Tullis (2010) reported that out of two individuals with severe PDD after using PECS, one showed significant improvement in requests and moderate improvement for greeting, while the other showed a moderate improvement in requests. Similarly, Dogoe, Banda and Lock (2010) found that three students with ASD quickly developed the behaviour of requesting independently following the implementation of PECS instruction. Ganz, Sigafoos, Simpson and Cook (2008) found that a 12-year-old boy increased spontaneous communication through the use of PECS and generalised across multiple trainers. Carr and Felce (2007) found that 24 children with ASD showed increased initiation of communication and dyadic communications. In Lerna, Esposito, Russo and Massagli’s (2009) study, five children with ASD showed a significant increase in the number of spontaneous requests following PECS intervention. PECS was also proven to be an effective treatment for requesting by Travis and Geiger (2010), who had carried out PECS training on two children with ASD.
Flippin, Reszka and Watson (2010) did a meta-analysis of 11 studies utilizing PECS. They evaluated the effectiveness of PECS on
The Implementation of Picture Exchange Communication System
1545Pertanika J. Soc. Sci. & Hum. 21 (4): 1543 - 1553 (2013)
communication and speech for children with ASD and concluded that PECS had a positive effect on the amount of communication of children with ASD. Likewise, Hart and Banda (2009) conducted a meta-analysis of 13 studies using PECS, and found that PECS resulted in improvements in communicative behaviour in the majority of the participants. Tien (2008) reviewed 13 studies which implemented PECS with participants aged between 1 to 12 years and reported that generally, PECS is an effective evidence-based practice for increasing functional communication for individuals with ASD. Hence, it is not surprising that PECS has yielded positive results in promoting functional communication among ASD children, as reported in previous studies. This is because PECS focuses on a requesting skill, which is a primary skill required in communication. This particular skill is consolidated in PECS by providing concrete reinforcement to the learners (Bondy & Frost, 2001).
Efficacy of PECS in increasing speech
The effectiveness of PECS in enhancing speech production of the children is questionable. There are mixed findings in this regard. Koita and Sonoyama (2004) found that a non-verbal child with ASD developed some speech after PECS intervention but its frequency was low. Ganz, Simpson and Corbin-Newsome (2008) found that participants receiving PECS training did not demonstrate increased use of spoken words. Park (2009) reported that out of three young children with ASD enrolled in the
PECS training, one showed an increase in word vocalisation, but the other two showed limited improvement. Flippin et al. (2010) and Hart and Banda (2009), who did a meta-analysis, respectively reported inconsistent or insignificant impact on the amount of speech of children who had received PECS training and PECS only occasionally led to increased speech. Preston and Carter (2009) who reviewed the efficacy of the PECS intervention concluded that its effect on speech development was unclear.
On the other hand, some research studies showed that PECS had substantial influence on the speech development of children receiving the training. Among other, Ganz, Parker and Benson (2009) reported that two out of three young boys with ASD developed intelligible speech after receiving PECS training. Similarly, Charlop-Christy, Carpenter, LeBlanc and Kelley (2002) found that three children with ASD showed concomitant increases in speech production after following PECS intervention. Ganz and Simpson (2004) reported that three young ASD children’s word utterances and complexity of grammar increased after receiving PECS training. Jurgens, Anderson and Moore (2009) found that a 3 year-old boy with ASD increased in his oral vocabulary following PECS instruction. Meanwhile, Lerna et al. (2009) revealed five children with ASD showed a significant increase in vocalizing and verbalizing on imitation undergoing a PECS intervention. Yokoyama, Naoi and Yamamoto (2006), who studied three elementary-school-aged children, reported
Phoon Hooi San and Anna Christina Abdullah
1546 Pertanika J. Soc. Sci. & Hum. 21 (4): 1543 - 1553 (2013)
that they showed emergence of intelligible vocalisation after PECS training. Carr and Felce (2007) showed that five out of 24 children who had received the PECS training showed concomitant increases in verbal production, and none of the children showed a decrease in spoken words following PECS instruction.
According to Overcash, Horton and Bondy (2010), verbal language is typically developed in Phase IV of PECS, when the constant time delay strategy used augments the use of verbal language along with PECS. Constant time delay refers to a fixed amount of time is consistently used between the trainer and the prompt. In PECS intervention, there is a 3-5 second delay added before the communication partner provides the prompt. The gap creates an opportunity for the children to attempt to talk in conjunction with the picture exchange. In addition to this, PECS provides the individual an opportunity to attempt speech in a meaningful context and differential reinforcement is used for any spontaneous attempt to verbalise in conjunction with exchanging.
Efficacy of PECS in Reducing Problematic Behaviours
PECS intervention was reported to have some impact on undesirable or contextually inappropriate behaviours in children. Through PECS intervention, some decreases in problematic behaviours were noticed for three children with ASD (Charlop-Christy et al., 2002). Frea, Arnold and Vittimberga (2001) conducted a study to examine the
effects of PECS on a student’s aggressive behaviour and reported that his aggressive behaviour was reduced in a brief amount of time when picture exchanges were available. The increased use of PECS had resulted in an increase of collateral behavioural changes and decrease of inappropriate behaviour such as grabbing, reaching and crying (Yokoyama et al., 2006). Contextually inappropriate behaviour in children could be partly due to their inability to communicate functionally. By providing the children functional ways of communication through PECS, a number of contextually inappropriate behaviours are ameliorated (Overcash et al., 2010).
However, a number of studies reported inconsistent or insignificant impact of PECS in reducing problem behaviour. Some inconsistent findings were reported in Ganz et al. (2009) when the impact of PECS on maladaptive behaviour was investigated. They found that maladaptive behaviour varied throughout baseline and intervention sessions. From the results of Harta and Banda’s (2009) meta-analysis, PECS only occasionally led to reduction in problematic behaviour. Preston and Carter, when reviewing the efficacy of PECS, concluded that there were very limited data that could adequately show that PECS training was effective in reducing challenging behaviours.
OBJECTIVES OF THE STUDY
From the literature review, it is evident that most of the studies have shown that PECS is effective in enhancing communication skills of individuals with communication deficits.
The Implementation of Picture Exchange Communication System
1547Pertanika J. Soc. Sci. & Hum. 21 (4): 1543 - 1553 (2013)
Inconsistent findings were reported for its effectiveness in speech production and in reducing challenging behaviours. However, thus far, none of the studies considered the perspective of parents who implemented PECS to their children with PDD or ASD. It is not known if parents were satisfied with the outcomes of PECS; whether they were comfortable with the way PECS was administered; whether parents encountered any challenges when administering PECS to their children; and whether PECS was an ideal intervention programme that they would recommend to other parents with a child possessing a similar problem.
Therefore, the main purpose of the present study was to interview a mother who implemented PECS for her child with PDD. The aim of the interview was to gather information about the mother’s perception of (a) the child’s improvement in communication, speech and behaviour following the implementation of PECS, (b) the strength of PECS, (c) the challenges encountered when implementing PECS, and (d) recommending PECS to parents who have children with PDD or ASD. In order to bridge the gap between the interview of this mother and the PECS training undergone by her child, a brief report on the participant’s background (setting where PECS was implemented, materials used in the training, PECS training sessions and interview session) is presented in the following section. Subsequently, a summary of the interview is discussed in the section on results.
METHOD
Participant, Setting and Materials
Alex was a 3;03 year-old boy with a diagnosis of mild pervasive developmental disorder. He had not received any formal speech and language assessments and interventions prior to PECS training. He had relatively poor eye contact and a short attention span. He had some intact contextual understandings such as “putting clothes in the laundry basket” and “throwing the diaper into the dustbin”. According to Alex’s mother, Alex had his first few words at 3 years old, which comprised words such as “three”, “eight” and “ten”. This was because she did a lot of counting with him. Nonetheless, Alex did not seem to understand the concept of numbers and these words disappeared in his speech repertoire after a month. At the time of the intervention, he had less than ten expressive vocabularies, which included “baby”, “two”, “scissors”, “pear” and “car”. His frequency of initiating speech was very low. He occasionally verbalised these words when prompted. Most of the time, he remained non-verbal and used gestures to communicate by holding the hand of communicative partners and leading them to wherever he wanted them to go, and putting their hands on whatever item that he wanted.
The setting for the training of PECS was in Alex’s home. The sessions were usually held in the morning when he was more alert. Materials consisted of toys or games (e.g., car and slide, ball, blocks, stacking rings, stickers, puzzles, toy fruits, drawing set, train, toy phone, iPad, fishing game) and
Phoon Hooi San and Anna Christina Abdullah
1548 Pertanika J. Soc. Sci. & Hum. 21 (4): 1543 - 1553 (2013)
food (e.g., yoghurt drink, water, banana, pear and grapes). A three-ring notebook with Velcro strip and colourful graphic symbols of items were used in the PECS training.
The PECS Training Sessions
The PECS training was implemented following the procedures described in the manual (Frost & Bondy, 2002). Phases I to V, as described in the training protocol, were administered in this study. The PECS training was conducted over 5 sessions, which lasted for an average of an hour each across a 3-week period. The sessions were conducted by Alex’s mother who acted as the facilitator, and a speech-language therapist who served as the trainer. After the sessions, Alex’s mother practised PECS with Alex everyday for half an hour.
Phase I. Physically-assisted Exchange
In the first training session, Alex was taught to initiate communication by exchanging a single picture for a highly desired item. He was shown a preferred item (e.g. car) by the speech-language therapist (trainer), and when he reached for the desired item, his mother (facilitator) physically assisted him to pick up a picture of the desired item and gave the picture to the trainer who was sitting near him. Open-hand cue was used by the trainer. The trainer who received the picture did not say anything until the picture was offered. At that juncture, the trainer said, “Oh, you want a car” and gave the item to Alex. The physically-assisted exchange went on for 40 times before Alex could spontaneously initiate the exchange.
The exchange without assistance went on for 55 times with five different items. Alex achieved 100% accuracy of exchanging the pictures independently without the facilitator’s assistance and without the open hand cue from the trainer.
Phase II. Expanding Spontaneity
In the second session, Alex first learned to remove the pictures from a display notebook for the exchange. Then, he was required to exchange the pictures with the trainer from a distance. In this phase, Alex was taught to be persistent and an independent communicator who could actively seek out his picture and travel to the trainer to make a request. After being assisted for 15 times, Alex consistently picked up a picture from the notebook and travelled to exchange pictures with the trainer. The exchange without assistance went on for 56 times with six different items. Alex achieved 100% accuracy of travelling to exchange the pictures independently without the facilitator’s assistance.
Phase III. Discrimination of Pictures
During the third session, Alex was required to discriminate and select the picture that represented the item he wanted. He seemed to have intact discrimination skills as he could immediately discriminate most of the pictures and handed it to the trainer. However, when he responded incorrectly, error correction strategies were used (Frost & Bondy, 2002). Ten items were exchanged in this phase. Based on 44 spontaneous
The Implementation of Picture Exchange Communication System
1549Pertanika J. Soc. Sci. & Hum. 21 (4): 1543 - 1553 (2013)
requests, Alex achieved 85% accuracy in discriminating and exchanging the pictures independently without the facilitator’s assistance.
Phase IV. Sentence Structure (using “I want”)
In the fourth session, Alex was taught to combine the object picture with the carrier phrase “I want” on a sentence strip and hand it over to the trainer. Alex placed both cards on the strip after being conditioned 22 times. Based on 62 spontaneous requests, Alex achieved 90% accuracy of placing “I want” picture and object picture and exchanging the pictures independently without the facilitator’s assistance.
Phase V. Responding to “What do you want?”
In the fifth session, Alex was required to respond to the question “What do you want?” by exchanging the sentence strip. He responded spontaneously to highly desired items such as car, pear, and iPad. However, most of the time, he still needed prompts from both his mother and the trainer for other items. More practice was needed to consolidate his ability to respond to “What do you want?” Out of 48 requests, Alex achieved 50% accuracy of responding to “What do you want?” by exchanging the sentence strip.
Interview Session
The interview session, which lasted for half an hour, was held in Alex’s home. The
interview session with Alex’s mother was audio-recorded. The interview clip was then transcribed and analysed.
RESULTS
The results were based on the interview with Alex’s mother.
Improvement in communication
Alex’s mother reported that Alex’s communication skills, especially the ability to make requests, improved tremendously after using the PECS. Alex could now tell her what he wanted through the pictures. For instance, if he wanted a pear, he would place the picture “I want” and the picture of “pear” on the Velcro strip and hand it over to his mother, and point at the pictures. Alex’s mother also claimed that he was happier as he could tell her what he wanted a bit more. Overall, Alex’s mother was very happy with the outcomes of the PECS intervention.
Improvement in speech
According to Alex’s mother, Alex showed increased speech after utilising PECS. Alex was found to utter some words spontaneously when he did the exchange. For instance, he occasionally said “car”, “pear” and “iPad”. However, his utterances were limited to a few words, as aforementioned and the initiation of speech was inconsistent. Alex’s mother expected to see more progress in Alex’s speech with PECS.
Phoon Hooi San and Anna Christina Abdullah
1550 Pertanika J. Soc. Sci. & Hum. 21 (4): 1543 - 1553 (2013)
Improvement in behaviours
After using PECS, Alex’s mother reported that Alex not only showed improvement in his communication skills, but also demonstrated improvement in his behaviour. Alex’s concentration and patience improved, and his impulsiveness reduced. He paid more attention to what he was doing and was less inclined to rush. He tended to perform the tasks given to him correctly when his attention was better. In addition to this, his temper-tantrums had reduced as he could communicate more effectively using the PECS. Alex’s ability to remain seated also increased.
The strength of the PECS intervention
Alex’s mother felt that PECS was suitable for young children like Alex, as it was like a game for Alex as well as for herself. According to her, when Alex completed the exchange successfully, he was very proud of himself. This programme made the child acquire a sense of satisfaction as he could tell his mother what he wanted, and his mother could understand him.
The challenges in implementing PECS
There were two major challenges that Alex’s mother encountered when implementing PECS. First, Alex sometimes did not pay attention to the pictures and simply picked any one to exchange with her. Second, Alex was occasionally so obsessed with a particular toy that he did not want to move on to another toy. This had stopped him from trying out other things.
The recommendation of PECS
Alex’s mother would highly recommend PECS to parents who have a child with PDD, as PECS worked out very well with Alex, and the PECS looked like a fun game to him. Most importantly, he enjoyed communicating using the PECS. Alex’s mother felt that PECS is a programme which is inexpensive, low-cost, useful, yet easy to administer.
DISCUSSION
The interview showed that Alex’s mother was very satisfied with the progress shown by Alex, mainly in his communication, after the implementation of PECS. Alex’s mother’s perception was congruent with many research studies that proved that PECS was effective in increasing communication in children with PDD or ASD (Cannella-Malone et al., 2010; Dogoe et al., 2010; Ganz et al., 2008; Carr & Felce, 2007; Lerna et al., 2009; Travis & Geiger, 2010; Flippin et al., 2010; Hart & Banda, 2009; Tien, 2008).
Alex’s mother reported that Alex had developed some spontaneous speech resulting from the implementation of PECS. However, the speech production was limited and inconsistent. This was probably because PECS was not used long enough to record significant progress in his speech production, as Alex was introduced to PECS for just five sessions over a three-week period. Verbal language generally begins approximately after one year of PECS intervention among young children (Bondy, Hoffman & Glassberg,
The Implementation of Picture Exchange Communication System
1551Pertanika J. Soc. Sci. & Hum. 21 (4): 1543 - 1553 (2013)
1999). The other possible reason was that PECS might not be effective in enhancing the development of speech. A number of studies have demonstrated that PECS did not yield positive effects on speech production. These studies included those by Koita and Sonoyama (2004), Ganz et al. (2008), Park (2009), Flippin et al. (2010), Hart and Banda (2009) and Preston and Carter (2009). Nonetheless, the effectiveness of PECS in enhancing speech needs to be further validated.
Alex’s mother observed some changes in Alex’s behaviour after the implementation of PECS. Alex’s behavioural changes included improved attention span, less out-of-seat behaviour, as well as less temper-tantrums. PECS was reported to help in reducing problematic behaviours. This is because inability to communicate will result in contextually inappropriate behaviours. When a child is provided a functional way of communication, contextually inappropriate behaviours are greatly eliminated. For instance, reduced aggressive behaviours, as reported in Frea et al. (2001), decreased undesirable behaviours such as grabbing, reaching and crying as described by Yokoyama et al. (2006), and reduction of disruptive behaviours, tantrums, grabbing, out-of-seat behaviours as reported by Charlop-Christy et al. (2002).
According to Alex’s mother, PECS was suitable for children as young as 3 years old. PECS has been implemented on a wide range of individuals with different ages, ranging from young children to adults. PECS that was implemented for young children
yielded positive outcomes. For instance, Carr and Felce (2007) implemented PECS for children aged 3 to 7 years with ASD; Schreibman (2008) introduced PECS to very young children with a mean age of 2.5 years, and Jurgens et al. (2009) carried out PECS on a 3 year-old child with ASD.
Alex’s mother highlighted two major challenges encountered when practising PECS with Alex. She claimed that Alex sometimes did not discriminate the pictures correctly due to his lack of attention. Frost and Bondy (2002) had come out with a number of error correction strategies which Alex’s mother could adopt. For instance, begin by offering Alex a choice between something highly preferred and something either relatively neutral or even negatively valued. Alex will learn the consequences through this strategy and will tend to discriminate pictures more correctly. The other challenge that was reported by Alex’s mother was object obsession. Alex’s mother probably could distract Alex by offering him a similar highly preferred item.
Alex’s mother would highly recommend the use of PECS to any parent with a child with PDD or ASD. It is not surprising as PECS has gained worldwide popularity in over 60 countries. PECS is clearly an effective functional communication system for individuals with communicative difficulties.
CONCLUSION
From the interview, it can be concluded that PECS appeared to be effectively enhancing communication skills of a young child with
Phoon Hooi San and Anna Christina Abdullah
1552 Pertanika J. Soc. Sci. & Hum. 21 (4): 1543 - 1553 (2013)
PDD. PECS also resulted in decreased challenging behaviours. Slight improvement in speech production was noted. It is hoped that the findings of the current research will provide useful insights and data that can help professionals and parents dealing with PDD children as to the possible impact of PECS on PDD children.
REFERENCESBondy, A., & Frost, L. (1994). The picture exchange
communication system. Focus on Autistic Behavior, 9, 1–19.
Bondy, A., & Frost, L, (2001). The picture exchange communication system. Behavior Modification, 25, 725–744.
Bondy, A., Hoffman, A., & Glassberg, W. (January, 1999). The Picture Exchange Communication System Training. Kansas City, MO.
Cannella-Malone, H., Fant, J., & Tullis, C. (2010). Using the Picture Exchange Communication System to Increase the Social Communication of Two Individuals with Severe Developmental Disabilities, Journal of Developmental and Physical Disabilities, 22, 149-163.
Carr, D., & Felce, J. (2007). The effects of PECS teaching to Phase III on the communicative interactions between children with autism and their teachers. Journal of Autism and Developmental Disabilities, 37, 724-737.
Charlop-Christy, M.H., Carpenter, M, Le, L., LeBlanc, L, & Kelley, K. (2002). Using the Picture Exchange Communication System (PECS) with children with autism: Assessment of PECS acquisition, speech, social-communicative behavior, and problem behaviors. Journal of Applied Behavior Analysis, 35, 213-231.
Dogoe, M., Banda, D., & Lock, R., (2010). Acquisition and Generalization of the Picture Exchange Communication System Behaviors
across Settings, Persons, and Stimulus Classes with Three Students with Autism, Education and Training in Autism and Developmental Disabilities, 45, 216-229.
Fillipin, M., Reszka, S., & Watson, L. (2010). Effectiveness of the Picture Exchange C o m m u n i c a t i o n S y s t e m ( P E C S ) o n communication and speech for children with autism spectrum disorders: A Meta-analysis. American Journal of Speech-Language Pathology, 19, 178–195.
Frea, W., Arnold, C., & Vittimberga, G. (2001). A demonstration of the effects of augmentative communication on the extreme aggressive behavior of a child with autism within an integrated preschool setting. Journal of Positive Behavior Intervention, 3, 194-198.
Frost, L., & Bondy, A. (2002). The Picture Exchange Communication System training manual (2nd Ed). Pyramid Educational Consultants, Inc.
Ganz , J . , & Simpson, R. (2004) . Effec ts on communicative requesting and speech development of the Picture Exchange Communication System in children with characteristics of autism. Journal of Autism and Developmental Disabilities, 34, 395-409.
Ganz, J., Parker, R., & Benson, J. (2009). Impact of the picture exchange communication system and collateral effects on maladaptive behavior. Augmentative and Alternative Communication, 25, 250-261.
Ganz, J., Sigafoos, J., Simpson, R., & Cook, K. (2008). Generalization of a picture alternative communication system across instructors and distance. Augmentative and Alternative Communication, 24, 89-99.
Ganz, J., Simpson, R., & Corbin-Newsome, J. (2008). The impact of the Picture Exchange Communication System on requesting and speech development in preschoolers with autism spectrum disorders and similar characteristics.
The Implementation of Picture Exchange Communication System
1553Pertanika J. Soc. Sci. & Hum. 21 (4): 1543 - 1553 (2013)
Research in Autism Spectrum Disorders, 2, 157–169.
Hart, S., & Banda, D. (2009). Picture Exchange Communication System with individuals with developmental disabilities: A meta-analysis of single subject studies. Remedial and Special Education (Online First), XX, 1-13.
Jurgens, A., Anderson, A., & Moore, D. (2009). The effect of teaching PECS to a child with autism verbal behaviour, play, and social functioning. Behavior Change, 26, 66-81.
Koita, H., & Sonoyama, S. (2004). Communication t r a in ing us ing the P ic tu re Exchange Communication System (PECS): Case study of a child with autistic disorder. Japanese Journal of Behavior Analysis, 19, 161-174.
Lerna, A., Esposito, D., Russo, L., & Massagli, A. (2009). The efficacy of the PECS for improving the communicative, relational and social skills in children with autistic disorder: Preliminary results. European Psychiatry, 24, Supplement 1.
Overcash, A., Horton, C., & Bondy, A. (2010). The Picture Exchange Communication System: Helping individuals gain functional communication. Autism Advocate (3rd Edn.), pp. 21-24.
Park, J. H. (2009). The effects of mother-implemented Picture Exchange Communication System training on spontaneous communicative behaviors of young children with autism spectrum disorders. (Doctoral Dissertation, Ohio State University).
Preston, D., & Carter, M. (2009). A review of the efficacy of the Picture Exchange Communication System Intervention. Journal of Autism and Developmental Disabilities, 39, 1471-1486.
Schreibman, L. (2008). One size does not fit all: Developing individualized treatment protocols for children with autism. Association for Behavior Analysis Newsletter, 31(3), 40-43.
Tien, K-C. (2008). Effectiveness of the Picture Exchange Communication System as a functional communication intervention for individuals with Autism Spectrum Disorders: A practice-based research synthesis. Education and Training in Developmental Disabilities, 43, 61-76.
Travis, J. & Geiger, M. (2010). The effectiveness of the Picture Exchange Communication System (PECS) for children with autism spectrum disorder (ASD): A South African pilot study. Child Language Teaching and Therapy, 26, 39-59.
Yokoyama, K., Naoi, N., & Yamamoto, J. (2006). Teaching verbal behavior using the Picture Exchange Communication System (PECS) with children with autistic spectrum disorder. Japanese Journal of Special Education, 43, 485-503.

Pertanika J. Soc. Sci. & Hum. 21 (4): 1555 - 1561 (2013)
ISSN: 0128-7702 © Universiti Putra Malaysia Press
SOCIAL SCIENCES & HUMANITIESJournal homepage: http://www.pertanika.upm.edu.my/
Article history:Received: 30 October 2011Accepted: 28 August 2012
ARTICLE INFO
E-mail address: [email protected] (Mohammad Reza Masrour) * Corresponding author
Comparison of Free-writing and Word-matching Activities as EFL Pre-reading Tasks
Mohammad Reza Masrour* and Mehdi HoseiniDepartment of English Language, Islamic Azad University, Saveh Branch, Saveh, Iran
ABSTRACT
The present study investigates the possibility of using a free-writing task as EFL pre-reading activity. It studies how the free-writing task to raise EFL readers’ schematic knowledge compares with a more traditional pre-reading activity, i.e., pre-teaching of vocabulary. The participants, who were seventy-two Iranian upper intermediate EFL students majoring in English, were assigned into three homogenous groups that were randomly labelled as ‘A’, ‘B’, and ‘C’. Two groups, namely, A and C, were randomly designated for free-writing treatment. These participants received specific instructions and practice on free-writing for 15 minutes. All the participants were then given a reading comprehension task, with a reading passage and subsequent comprehension questions. Group A was given 5 minutes to free-write about the topic of the passage before doing the test. Group B was treated with pre-teaching a list of vocabulary to be seen in the passage. Group C was treated with a combination of the free-writing activity and pre-teaching the list of vocabulary. The mean scores obtained by the three groups were submitted to data analysis using one-way analysis of variance (ANOVA) as the statistical test to determine if there was a statistically significant difference between the mean score of the three groups. Results of the data analysis showed the importance of free-writing as a pre-reading task to activate the readers’ background knowledge (schema).
Keywords: Background knowledge, EFL reading, free-writing, pr-reading task, schema activation
INTRODUCTION
Pre-reading or what Ringler and Weber (1984) call enabling activities, in addition to motivating students, are devised to facilitate reading by lightening students’ cognitive burden. It is argued that given a chance to ease into the text, students
Mohammad Reza Masrour and Mehdi Hoseini
1556 Pertanika J. Soc. Sci. & Hum. 21 (4): 1555 - 1561 (2013)
will be in a better position to make the best use of their knowledge and skills in their endeavour to reconstruct the writer’s meaning. Successful L2 reading teachers use pre-reading tasks and activities for lexically preparing the students, introducing the topic, encouraging skimming and scanning to predict, activating already existing schemata or filling any anticipated or observed gap between students’ background knowledge and the content of the reading material.
The bulk of research has demonstrated the role of conceptual and background knowledge in L2 reading comprehension and instruction (see Alderson & Urquhart, 1988; Barry & Lazarte, 1995; Carrell, 1992; Carrell & Eisterhold, 1983; Carrell & Wise, 1998; Floyd & Carrell, 1987; Hudson, 1982; Lee, 1986; Peretz & Shoham, 1990; Roller & Matambo, 1992; Tan, 1990). One of the issues in research on EFL reading is finding effective techniques for activating schemata. Brainstorming on titles or illustrations, discussing facts and listing questions are among the pre-reading activities frequently used in reading materials or suggested by research studies to activate L2 reader’s content schemata (Tomlinson & Ellis, 1988). One rather innovative pre-reading activity proposed in this study to activate L2 readers’ schemata is free-writing. An individualized brainstorming technique originally used in writing courses, free-writing is frequently used to generate ideas and improve students’ writing fluency (see Zemach & Islam, 2005). During a free-writing activity, students are usually given a topic to write about continuously, without stopping. Furthermore, they are asked to
write everything they can think of, quickly, and without worrying about spelling, grammar, or word choice. Investigating the potential of free-writing as a pre-reading task to activate L2 readers’ schemata is the focus of the present study.
This study set out to compare the effects of three pre-reading activities on L2 learners’ performance in a reading comprehension task. The pre-reading activities included a free-writing activity about the topic of the reading passage, a word matching activity where the students were asked to match a list of vocabulary from the passage with their dictionary definitions, and finally a combination of free-writing and word matching activity. The research question of the study to compare the effect of these three pre-reading activities on EFL reading comprehension was as follows: What is the effect of three pre-reading activities, i.e., free-writing, word matching, and a combination of free-writing and word matching activities on Iranian EFL learners performance in an L2 reading comprehension task?
METHODOLOGY
Subjects
The participants in the study were 72 Iranian upper intermediate EFL students (52 females and 20 males) in their third year of studies in the four-year TESOL programme at Islamic Azad University, Saveh Branch, Iran. They were students of the researcher in three different classes who had been informed that they were taking part in a research study.
Free-writing as an EFL Pre-reading Task
1557Pertanika J. Soc. Sci. & Hum. 21 (4): 1555 - 1561 (2013)
Materials
The instruments for data collection in the study were a general English proficiency test and a reading comprehension task. Nelson English Language Test 350 A (Fowler & Coe, 1976) was used to assess the general proficiency of the participants in order to assign them into three homogenous groups. The test comprised of 50 multiple choice items including items on grammar, vocabulary, and reading comprehension. The reading comprehension task that was adapted from Brook-Hart (2004) comprised a reading passage and subsequent tasks. The Instructional material used for instructional groups (namely, groups A and C) was taken from the instructional unit developed by Zemach and Islam (2005).
Design
Based on the results obtained from the English proficiency test, the participants of the study were randomly assigned into three homogenous groups of equal size (n=24), namely, Group A, Group B and Group C. The participants in two groups (A and C) were given a 15-minute instruction about how to free-write. The procedure used for free-writing was that suggested by Zemach and Islam (2005), in which students are asked to write everything they can think of, quickly, and without worrying about spelling, grammar, or word choice. They were also asked to write continuously and without stopping. The three groups were then given the same reading comprehension task, with three different pre-reading activities. The participants in Group A were given
5 minutes to free-write about the topic of the passage before doing the test. Those in Group B were given a word matching activity to pre-teach a list of vocabulary to be seen in the passage. The last group, i.e., Group C, was treated with a combination of the free-writing activity and word matching activity prior to doing the test. The scores obtained by the three groups on the reading task were used as the data for the study. One-way analysis of variance (ANOVA) was used as the statistical test to determine if there was a statistically significant difference between the mean score of the three groups. The statistical analysis was carried out using the Statistical Package for Social Sciences (SPSS) with alpha set at 0.05.
RESULTS AND DISCUSSION
Tables 1 and 2 show the description of the data and the comparison of the means for the three groups (one-way ANOVA), respectively. The highest mean score was observed in Group C (15.7500), followed by Groups A and B, with mean scores of 14.0000 and 13.7917, respectively.
The results show that while the mean score of Group A is slightly higher than that of Group B, the difference is not significant at α = 0.05. However, the mean score for Group C is significantly different and the one-way analysis of variance (ANOVA) at alpha decision level set at 0 .05 shows two subsets. This suggests that although there was no meaningful difference between free-writing and vocabulary presentation in their effect on the participants’ reading comprehension, the combination of free-
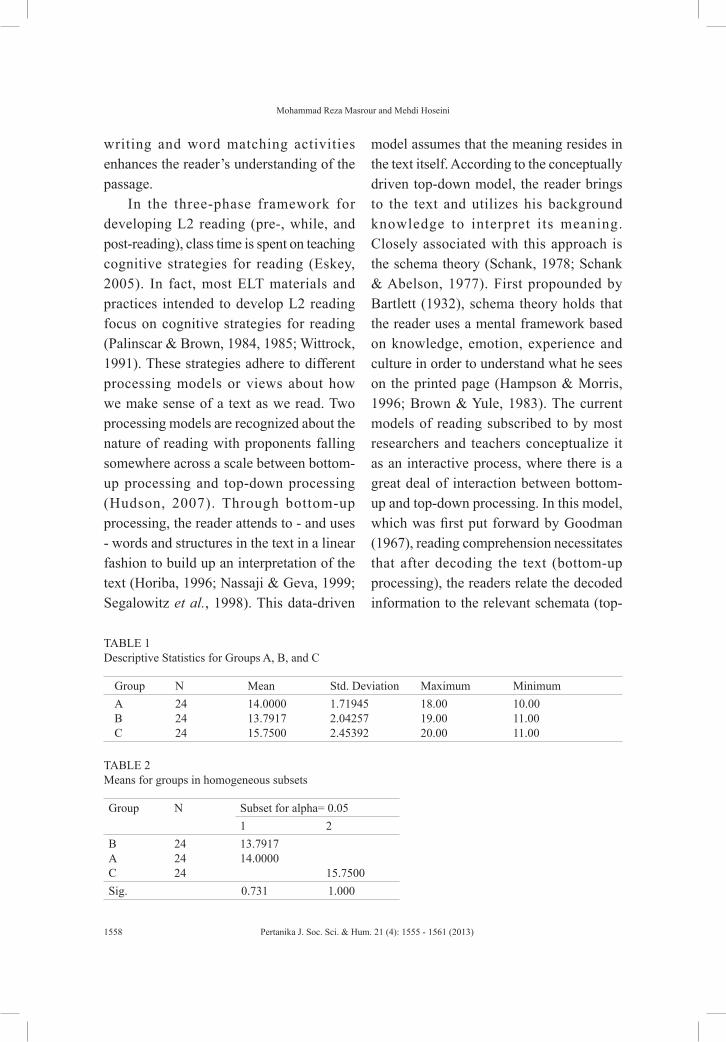
Mohammad Reza Masrour and Mehdi Hoseini
1558 Pertanika J. Soc. Sci. & Hum. 21 (4): 1555 - 1561 (2013)
writing and word matching activities enhances the reader’s understanding of the passage.
In the three-phase framework for developing L2 reading (pre-, while, and post-reading), class time is spent on teaching cognitive strategies for reading (Eskey, 2005). In fact, most ELT materials and practices intended to develop L2 reading focus on cognitive strategies for reading (Palinscar & Brown, 1984, 1985; Wittrock, 1991). These strategies adhere to different processing models or views about how we make sense of a text as we read. Two processing models are recognized about the nature of reading with proponents falling somewhere across a scale between bottom-up processing and top-down processing (Hudson, 2007). Through bottom-up processing, the reader attends to - and uses - words and structures in the text in a linear fashion to build up an interpretation of the text (Horiba, 1996; Nassaji & Geva, 1999; Segalowitz et al., 1998). This data-driven
model assumes that the meaning resides in the text itself. According to the conceptually driven top-down model, the reader brings to the text and utilizes his background knowledge to interpret its meaning. Closely associated with this approach is the schema theory (Schank, 1978; Schank & Abelson, 1977). First propounded by Bartlett (1932), schema theory holds that the reader uses a mental framework based on knowledge, emotion, experience and culture in order to understand what he sees on the printed page (Hampson & Morris, 1996; Brown & Yule, 1983). The current models of reading subscribed to by most researchers and teachers conceptualize it as an interactive process, where there is a great deal of interaction between bottom-up and top-down processing. In this model, which was first put forward by Goodman (1967), reading comprehension necessitates that after decoding the text (bottom-up processing), the readers relate the decoded information to the relevant schemata (top-
TABLE 1 Descriptive Statistics for Groups A, B, and C
Group N Mean Std. Deviation Maximum MinimumABC
242424
14.000013.791715.7500
1.719452.042572.45392
18.0019.0020.00
10.0011.0011.00
TABLE 2 Means for groups in homogeneous subsets
Group N Subset for alpha= 0.051 2
BAC
242424
13.791714.0000
15.7500Sig. 0.731 1.000
Free-writing as an EFL Pre-reading Task
1559Pertanika J. Soc. Sci. & Hum. 21 (4): 1555 - 1561 (2013)
down processing) so as to construct a meaning for the text (Nunan, 1999). These models of reading comprehension have been used as the cornerstone for teaching various L2 reading cognitive strategies. Pre-reading, while-reading and post-reading tasks and activities can now be associated with either of the above mentioned processing approaches (Eskey, 2005).
In the pre-reading phase, vocabulary building and schema building activities can be associated with bottom-up and top-down processing, respectively. Eskey (2005) reviews some research studies that show the reciprocal relationship between reading and knowledge of vocabulary, which he calls a classic chicken and egg situation: the best or possibly the only way to acquire the extensive vocabulary for proficient second language reading is reading itself, and a prerequisite for such reading is an extensive vocabulary. McDonough and Shaw (2003) contend that overloading learners with too many unfamiliar words and expressions may involve them in decoding vocabulary at the expense of reading for meaning. As Eskey (2005) argues, texts that are lexically beyond the students’ proficiency will not meet Krashen’s i+1 standard for comprehensibility. Therefore, in the pre-reading phase, the bottom-up processing is taken care of by incorporating vocabulary building through various tasks and awareness raising activities. Schema building activities on the other hand are incorporated to foster top-down processing. As mentioned before, most reading researchers and teachers currently endorse
interactive views of reading. An implication of interactive models is that the readers who are able to activate the right content schemata may be able to overcome or rather bypass their linguistic deficiency and understand the texts beyond their current level of linguistic proficiency. Consequently, schema activation tasks are frequently used by teachers and material developers to facilitate comprehension process. This could explain why the participants in Group A performed slightly better than those in Group B, though the difference was not significant.
CONCLUSION
Introducing free-writing as a pre-reading activity, the study has provide L2 reading teachers and material developers with not only an innovative schema activating task, but also a new way to integrate the reading and writing skills as suggested by research studies in both L1 and L2 reading contexts (Grabe, 2002). A final note is that there is clearly a need for further research in this area, particularly with students at different proficiency levels, as well as using more standard reading comprehension tests to compare different schema activating pre-reading tasks. There is also a possibility of the effect of the L2 learner’s cognitive style on their preference for particular pre-reading activities and therefore their overall understanding of the texts as cognitive style may affect how individuals respond to learning tasks (McDonough, 1998).
Mohammad Reza Masrour and Mehdi Hoseini
1560 Pertanika J. Soc. Sci. & Hum. 21 (4): 1555 - 1561 (2013)
REFERENCESAlderson J. C., & Urquhart A. H. (1988). This test is
unfair: I’m not an economist. In P. L., Carrell, J. Devine, & D. E., Eskey (Eds.), Interactive approaches to second language reading (pp. 168–182). New York: Cambridge University Press.
Barry, S., & Lazarte, A. (1995). Embedded clause effects on recall: Does high prior knowledge of context domain overcome syntactic complexity in students of Spanish? Modern Language Journal, 79, 491–504.
Bartlett, F. C. (1932). Remembering: A study in experimental and social psychology. London: Cambridge University Press.
Brook-Hart, G. (2004). Cambridge instant IELTS ready-to-use tasks and activities. Cambridge: Cambridge University Press.
Brown, G., & Yule, G. (1983). Discourse analysis. Cambridge: Cambridge University Press.
Carrell, P. L. (1992). Awareness of text structure: Effects on recall. Language Learning, 42, 1–20.
Carrell, P. L., & Eisterhold, J. C. (1983). Schema theory and ESL reading pedagogy. TESOL Quarterly, 17, 553–573.
Carrell, P. L., & Wise, T. E. (1998). The relationship between prior knowledge and topic interest in second language reading. Studies in Second Language Acquisition, 20, 285–309.
Eskey, D. E. (2005). Reading in second language. In E. Hinkel (Ed.), Handbook of research in second language teaching and learning (pp. 563 - 579). New Jersey: Lawrence Erlbaum Association Inc.
Floyd, P., & Carrell, P. L. (1987). Effects on ESL reading of teaching cultural content schemata. Language Learning, 37, 89–108.
Fowler, W. S., & Coe, N. (1976). Nelson English language tests. London: Butler & Tanner Ltd.
Goodman, K. S. (1967). Reading as a psycholinguistic guessing game. Journal of Reading Specialist, 4, 126 -135.
Grabe, W. (2002). Reading in a second language. In R. B. Kaplan (Ed.), Oxford handbook of applied linguistics (pp. 49 – 59). New York: Oxford University Press.
Hampson, P. J., & Morris, P. E. (1996). Understanding cognition. Oxford: Blackwell.
Horiba, Y. (1996). Comprehension process in L2 reading: Language competence, textual coherence, and inference. Studies in Second Language Acquisition, 18, 403-432.
Hudson, T. (2007). Teaching second language reading. Oxford: Oxford University Press.
Hudson, T. (1982). The effects of induced schemata on the “short circuit” in L2 reading: non-decoding factors in L2 reading performance. Language Learning, 23, 1–31.
Lee, J. F. (1986). The effects of three components of background knowledge on second language reading. Modern Language Journal, 70, 350–354.
McDonough, J., & Shaw, C. (2003). Materials and methods in ELT: a teacher’s guide. Oxford: Blackwell Publishing.
McDonough, S. (1998). Cognitive style. In H. Johnson & H. Johnson (Eds.), Encyclopedic dictionary of applied linguistics (pp. 52-54). Oxford: Blackwell Publishers Ltd.
Nassaji, H., & Geva, E. (1999). The contribution of phonological and orthographic processing skills to adult ESL reading: Evidence from native speakers of Farsi. Applied Psycholinguistics, 20, 241 -261.
Nunan, D. (1999). Second language teaching and learning. Massachusetts: Heinle & Heinle Publishers.
Free-writing as an EFL Pre-reading Task
1561Pertanika J. Soc. Sci. & Hum. 21 (4): 1555 - 1561 (2013)
Palinscar, A. and Brown, A. (1985). Reciprocal teaching: A means to a meaningful end. In J. Osborn, P. Wilson, & R.C. Anderson (Eds.), Reading education: Foundations for a literate America (pp. 299-310). MA: Lexington.
Palinscar, A., & Brown, A. (1984). Reciprocal teaching of comprehension-fostering and comprehension monitoring activities. Cognition and Instruction, 1, 117-175.
Peretz, A. S., & Shoham, M. (1990). Testing reading comprehension in LSP: Does topic familiarity affect assessed difficulty and actual performance? Reading in a Foreign Language, 7, 447–455.
Ringler, L. H., & Weber, C. K. (1984). A Language-thinking approach to reading. San Diego: Harcourt Brace Jovanovich, Inc.
Roller, C. A., & Matambo, A. R. (1992). Bilingual readers’ use of background knowledge in learning from text. TESOL Quarterly, 26, 129–141.
Schank, R. C. (1978). Predictive understanding. In R.L. Campbell & P.T. Smith (Eds.), Recent advances in the psychology of language (pp. 91 – 101) New York: Plenum Press.
Schank R. C., & Abelson, R. P. (1977). Scripts, plans, goals, and understanding. Hillsdale NJ: Erlbaum.
Segalowitz, S. J., Segalowitz, N., & Wood, A. (1998). Assessing the development of automaticity in second language word recognition. Applied Psycholinguistics, 19, 53-67.
Tan, S. H. (1990). The role of prior knowledge and language proficiency as predictors of reading comprehension among undergraduates. In J.A.L. de Jongh & D.K. Stevenson (Eds.), Individualizing the assessment of language abilities (pp. 214–224). Clevedon, England: Multilingual Matters.
Tomlinson, B., & Ellis, R. (1988). Reading: Advanced. Oxford: Oxford University Press.
Wittrock, M. C. (1991). Educational psychology, literacy, and reading comprehension. Educational Psychologist, 26(2), 109-116.
Zemach, D. E., and Islam, C. (2005). Paragraph writing from sentence to paragraph. Oxford: Macmillan Publishers Limited.

Pertanika J. Soc. Sci. & Hum. 21 (4): 1563 - 1581 (2013)
ISSN: 0128-7702 © Universiti Putra Malaysia Press
SOCIAL SCIENCES & HUMANITIESJournal homepage: http://www.pertanika.upm.edu.my/
Article history:Received: 25 October 2011Accepted: 28 August 2012
ARTICLE INFO
E-mail addresses: [email protected] (Noorli Khamis), [email protected] (Imran Ho Abdullah) * Corresponding author
Wordlists Analysis: Specialised Language Categories
Noorli Khamis1* and Imran Ho Abdullah2
1Centre of Languages and Human Development, Universiti Teknikal Malaysia Melaka (UTeM), Hang Tuah Jaya, 76109 Durian Tunggal, Melaka, Malaysia2Pusat Pengajian Bahasa dan Linguistik (PPBL), Fakulti Sains Sosial Dan Kemanusiaan, Universiti Kebangsaan Malaysia, 43600 Bangi, Selangor, Malaysia
ABSTRACT
The study of lexical and grammatical patterns in the language that a learner must assimilate is important for pedagogical considerations. Therefore, the linguistic approach in ESP classrooms today is gaining its momentum. Additionally, the adoption of corpus-based language investigation has made the attempts even more accessible; many aspects of the specialised language can be described empirically and systematically. It has been discovered that word and structure frequencies of a specialised corpus are greatly different from a large corpus. They provide insights into the features of the specialised language. Hence, this paper demonstrates the different, yet useful information about a specialised language that can be discerned from the analysis of three types of wordlist; namely, frequency wordlist, keyword list and key-keyword list. The findings inform the features of the specialised language that need to be highlighted in an ESP classroom.
Keywords: Corpus, frequency wordlist, key-keyword list, keyword list, specialised language
their companies. It is because a significant amount of language is constructed from sequences of more or less fixed forms of morphemes. These sequences finally form formulaic language distinctive to a particular language or register. If these formulaic constructions are highlighted in their contexts to the learners, learning can be reinforced. Noorzan (2005) further stresses that the study of lexical and grammatical patterns in the language that a learner must
INTRODUCTION
The study of ESP language features, in particular the lexical features, can facilitate the effective teaching of ESP. Hunston (2000) asserts that the area of ESP learning focus should be on words together with
Noorli Khamis and Imran Ho Abdullah
1564 Pertanika J. Soc. Sci. & Hum. 21 (4): 1563 - 1581 (2013)
assimilate is important for pedagogical considerations.
Additionally, the adoption of corpus-based language investigation has made the attempts to discover the lexical features of a specialised language even more exciting; many aspects of the specialised language can be described empirically and systematically. Gavioli (2005) regards ESP and specialised corpora as one happy marriage. Specialised corpora are designed with the aim to represent a sub-language and to reflect the specific purpose of a research or teaching condition. The collection of texts may be from:
a. similar contents such as science, medicine, business or philosophy, or
b. from similar text-type/ genre such as research papers, letters or books, or
c. both; such as medical research articles or science lectures, or
d. texts from other types of specialised categories such as newspaper language or academic language
This study is an effort to look into the application of corpus work in describing a specialised language from the scope of vocabulary types or language categories – AWL, GSL and Others. The focus of the paper is on the analysis of three different types of wordlists, namely, frequency wordlist, keyword list and key-keyword list of a specialised corpus. This paper aims to demonstrate the different, yet useful information about a specialised language that can be discerned from the analysis of
these wordlist types. The findings inform the features of the specialised language that need to be highlighted in ESP/EAP classrooms.
ESP VOCABULARY CATEGORIES
In vocabulary studies, Nation’s (2001) classification of vocabulary types in a text has been cited by many researchers (Chung & Nation, 2003; Tsubaki, 2004; Martinez et al., 2009). The classification of the vocabulary types is summarised in Table 1.
However, for the description of science language, there is yet a clear cut classification of the vocabulary types. The confusion mainly involves defining words constituting academic words in the specialised language. Many question the accuracy of the AWL in the ESP pedagogic context because all subject-specific course types have their own set of lexical profiling (Granger & Paquot, 2009). According to Martin (1976), academic words are words which characterise academic activities such as the research procedure, analysis and evaluation. However, the computerised approach to quantify vocabulary of specialised texts has seen the classification of ESP vocabulary in the texts into technical, sub-technical (academic words), semi-technical and non-technical words (Menon & Mukundan, 2010; Fraser, 2007; Mudraya, 2006; Baker, 1988; Perez-Parades, 2003; Worthington & Nation, 1996).
Another issue regarding the distribution of the vocabulary categories is discussed by Mukundan and Aziz (2009) who caution material developers that high coverage of
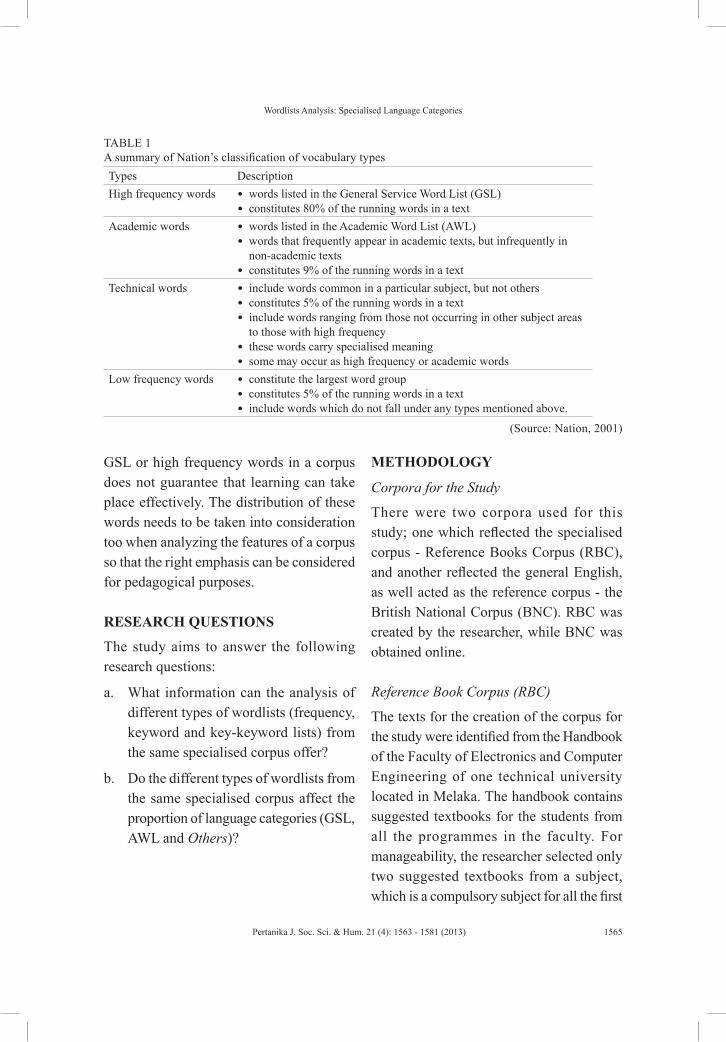
Wordlists Analysis: Specialised Language Categories
1565Pertanika J. Soc. Sci. & Hum. 21 (4): 1563 - 1581 (2013)
GSL or high frequency words in a corpus does not guarantee that learning can take place effectively. The distribution of these words needs to be taken into consideration too when analyzing the features of a corpus so that the right emphasis can be considered for pedagogical purposes.
RESEARCH QUESTIONS
The study aims to answer the following research questions:
a. What information can the analysis of different types of wordlists (frequency, keyword and key-keyword lists) from the same specialised corpus offer?
b. Do the different types of wordlists from the same specialised corpus affect the proportion of language categories (GSL, AWL and Others)?
METHODOLOGY
Corpora for the Study
There were two corpora used for this study; one which reflected the specialised corpus - Reference Books Corpus (RBC), and another reflected the general English, as well acted as the reference corpus - the British National Corpus (BNC). RBC was created by the researcher, while BNC was obtained online.
Reference Book Corpus (RBC)
The texts for the creation of the corpus for the study were identified from the Handbook of the Faculty of Electronics and Computer Engineering of one technical university located in Melaka. The handbook contains suggested textbooks for the students from all the programmes in the faculty. For manageability, the researcher selected only two suggested textbooks from a subject, which is a compulsory subject for all the first
TABLE 1 A summary of Nation’s classification of vocabulary typesTypes DescriptionHigh frequency words • words listed in the General Service Word List (GSL)
• constitutes 80% of the running words in a textAcademic words • words listed in the Academic Word List (AWL)
• words that frequently appear in academic texts, but infrequently in non-academic texts
• constitutes 9% of the running words in a textTechnical words • include words common in a particular subject, but not others
• constitutes 5% of the running words in a text• include words ranging from those not occurring in other subject areas
to those with high frequency • these words carry specialised meaning• some may occur as high frequency or academic words
Low frequency words • constitute the largest word group• constitutes 5% of the running words in a text• include words which do not fall under any types mentioned above.
(Source: Nation, 2001)
Noorli Khamis and Imran Ho Abdullah
1566 Pertanika J. Soc. Sci. & Hum. 21 (4): 1563 - 1581 (2013)
year degree students of the faculty, regardless of their different programmes. In order to ensure that the books are the students’ main references, they should be suggested as the main textbooks in the handbook, and made available in the university’s library. To reflect contemporary language usage, the selection of the books was kept at the period from year 2000 onwards. These two books are also suggested as textbooks for a few other compulsory subjects. This fact further manifests the importance of the books to the students of the faculty.
The corpus is named as the Reference Books Corpus (RBC), with 34 texts, which is actually the total number of chapters from both textbooks. The final size of RBC is 425,854 running words.
British National Corpus (BNC) – The Reference Corpus
This corpus consists of 100 million tokens, which are collected from written and spoken British English. It represents the English used from the 20th century onwards. The written collection makes up 90% of the corpus, and the samples were taken from extracts of newspapers, specialist periodicals and journals, academic books and fictions, published and unpublished letters and memoranda, as well as school and university essays. Ten percent of the corpus, which comprises of the spoken samples, was taken from unscripted informal conversations of volunteers representing various ages, regions and social classes. Apart from that, the samples were also collected from other different contexts, including formal
situations, like business and government meetings, to informal situations, like radio shows.
In this study, the BNC acts as a reference corpus to obtain any statistical information on the spread of the lexical patterns exist in the specialised corpora being studied, thus, proving whether the identified patterns are specific to the Engineering English (Meyer, 2002). In other words, BNC serves as the General English, which is used for the comparative study with the E2C.
Data Analysis Software - Wordsmith 4
The Wordsmith 4 software is a multi-function software package, which offers programmes for investigating the lexical behaviour in either a single text or a large corpus. It is considered as the best linguistic data analysis software currently available in the market (Someya, 1999), and the “swiss-army knife of lexical analysis” (Sardinha, 1996). This software features the wordlists, keyword, and concordance programmes, which offer various interesting and remarkable tools that are useful for language investigation, such as:
a. wordlists - the main function of this programme is to generate and maintain alphabetically ordered, frequency ordered or alternative kinds of wordlists, depending on the objectives of a study. A useful information offered by this programme is the statistical details of a studied corpus which include the running words (tokens), types (distinct words), STTR (standardised type token ratio), mean word length, n-letter
Wordlists Analysis: Specialised Language Categories
1567Pertanika J. Soc. Sci. & Hum. 21 (4): 1563 - 1581 (2013)
words etc. This statistical information provides the basic lexical features of the corpus for investigation. The wordlist programme was used in this study to generate the frequency wordlists of the specialised corpus to determine the lexical profiles of the specialised language according to frequency order.
b. keyword - This programme allows not only a comparison between two wordlist files, but also multiple comparisons; this means, many target files can be analysed against a reference corpus through ‘batch processing’. If a word is found to be unusually frequent in a corpus than its frequency in the reference corpus, it is a ‘keyword’. Apart from the keyword analysis, another tool used in this study is the key-keyword analysis. The key-keywords are the most frequent keywords in a corpus or any set of files. Therefore, key-key-words are basically the most typical keywords in a corpus (or genre).
c. concordance - The funct ion of concordance is quite straightforward. It displays the selected words in the contexts it appears as in the original texts. The concordancer is integrated with Wordlist and Keyword programmes. The concordance of the target words can be called up directly from these two programmes. This function is most useful to study the behaviour of a lexical unit of interest for its use, meaning and structure by displaying conveniently and clearly the repeated patterns for observation. This programme was
used throughout this study, especially when there was a need to observe the neighbouring structures of a word.
METHOD
All the wordlists (frequency, keyword, and key-keyword) of the corpus were generated with the WordSmith Tools 4.0 software, and the reference corpus employed for the study is the 1British National Corpus (BNC), which is retrievable from http://www.lexically.net/ downloads/ version4/downloading%20BNC.htm. Because this study involved a specialised corpus, as much as possible, the texts were kept ‘clean’, as how they appeared in the original texts. This clean-text policy was proposed by Sinclair (1991) for two reasons. Sinclair propounds that different researchers may set different research aims in corpus data; therefore, the analytical apparatus may cause lack of standardisation, thus, problems for later research of different natures. Another possible issue which can cause difficulties for future research is the lack of standardisation on basic linguistic features such as the identification of words and assignment of morphological division. Therefore, by keeping the texts clean, the potential issues arising from these discrepancies can be minimised.
RESULTS AND DISCUSSION
Table 2 displays the basic statistical details of RBC. The STTR value indicates that there are 27 word types in every 1000 words in RBC. STTR suggests the lexical variation or diversity of the corpus (Banerjee &
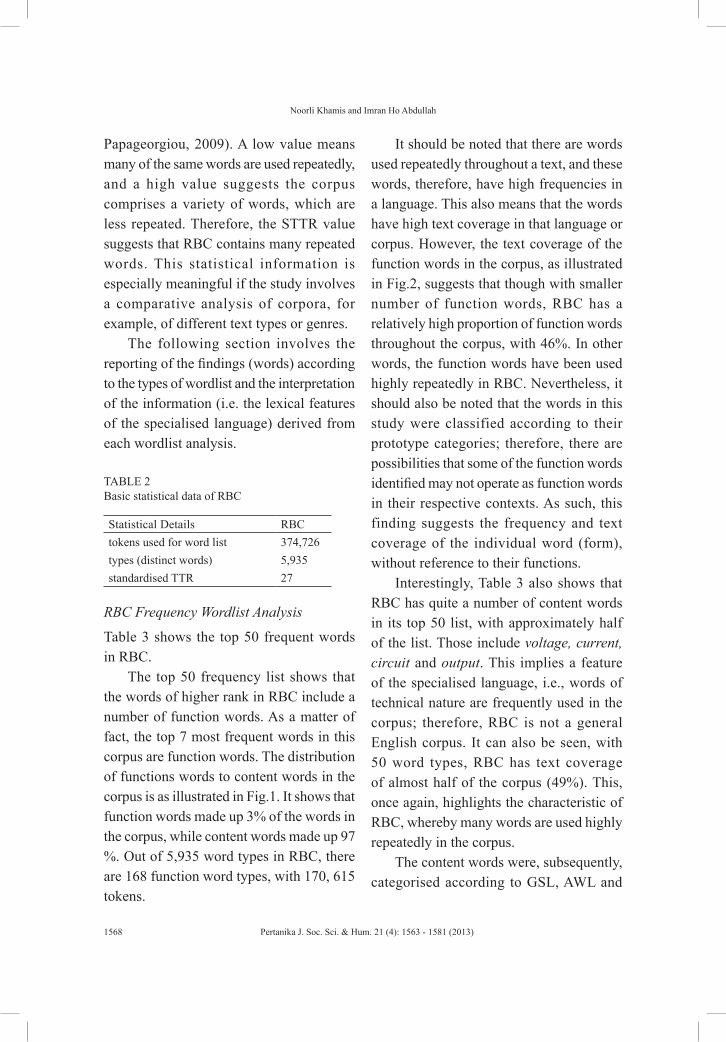
Noorli Khamis and Imran Ho Abdullah
1568 Pertanika J. Soc. Sci. & Hum. 21 (4): 1563 - 1581 (2013)
Papageorgiou, 2009). A low value means many of the same words are used repeatedly, and a high value suggests the corpus comprises a variety of words, which are less repeated. Therefore, the STTR value suggests that RBC contains many repeated words. This statistical information is especially meaningful if the study involves a comparative analysis of corpora, for example, of different text types or genres.
The following section involves the reporting of the findings (words) according to the types of wordlist and the interpretation of the information (i.e. the lexical features of the specialised language) derived from each wordlist analysis.
TABLE 2 Basic statistical data of RBC
Statistical Details RBCtokens used for word list 374,726types (distinct words) 5,935standardised TTR 27
RBC Frequency Wordlist Analysis
Table 3 shows the top 50 frequent words in RBC.
The top 50 frequency list shows that the words of higher rank in RBC include a number of function words. As a matter of fact, the top 7 most frequent words in this corpus are function words. The distribution of functions words to content words in the corpus is as illustrated in Fig.1. It shows that function words made up 3% of the words in the corpus, while content words made up 97 %. Out of 5,935 word types in RBC, there are 168 function word types, with 170, 615 tokens.
It should be noted that there are words used repeatedly throughout a text, and these words, therefore, have high frequencies in a language. This also means that the words have high text coverage in that language or corpus. However, the text coverage of the function words in the corpus, as illustrated in Fig.2, suggests that though with smaller number of function words, RBC has a relatively high proportion of function words throughout the corpus, with 46%. In other words, the function words have been used highly repeatedly in RBC. Nevertheless, it should also be noted that the words in this study were classified according to their prototype categories; therefore, there are possibilities that some of the function words identified may not operate as function words in their respective contexts. As such, this finding suggests the frequency and text coverage of the individual word (form), without reference to their functions.
Interestingly, Table 3 also shows that RBC has quite a number of content words in its top 50 list, with approximately half of the list. Those include voltage, current, circuit and output. This implies a feature of the specialised language, i.e., words of technical nature are frequently used in the corpus; therefore, RBC is not a general English corpus. It can also be seen, with 50 word types, RBC has text coverage of almost half of the corpus (49%). This, once again, highlights the characteristic of RBC, whereby many words are used highly repeatedly in the corpus.
The content words were, subsequently, categorised according to GSL, AWL and
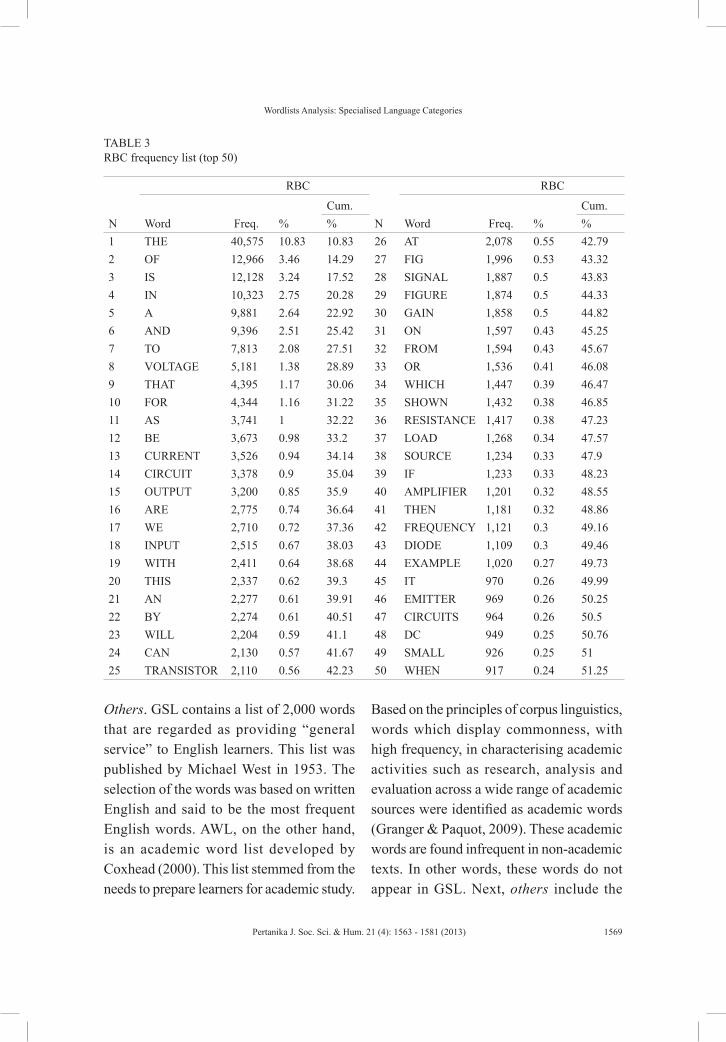
Wordlists Analysis: Specialised Language Categories
1569Pertanika J. Soc. Sci. & Hum. 21 (4): 1563 - 1581 (2013)
Others. GSL contains a list of 2,000 words that are regarded as providing “general service” to English learners. This list was published by Michael West in 1953. The selection of the words was based on written English and said to be the most frequent English words. AWL, on the other hand, is an academic word list developed by Coxhead (2000). This list stemmed from the needs to prepare learners for academic study.
Based on the principles of corpus linguistics, words which display commonness, with high frequency, in characterising academic activities such as research, analysis and evaluation across a wide range of academic sources were identified as academic words (Granger & Paquot, 2009). These academic words are found infrequent in non-academic texts. In other words, these words do not appear in GSL. Next, others include the
TABLE 3 RBC frequency list (top 50)
N
RBC
N
RBC
Word Freq. %Cum.
Word Freq. %Cum.
% %1 THE 40,575 10.83 10.83 26 AT 2,078 0.55 42.792 OF 12,966 3.46 14.29 27 FIG 1,996 0.53 43.323 IS 12,128 3.24 17.52 28 SIGNAL 1,887 0.5 43.834 IN 10,323 2.75 20.28 29 FIGURE 1,874 0.5 44.335 A 9,881 2.64 22.92 30 GAIN 1,858 0.5 44.826 AND 9,396 2.51 25.42 31 ON 1,597 0.43 45.257 TO 7,813 2.08 27.51 32 FROM 1,594 0.43 45.678 VOLTAGE 5,181 1.38 28.89 33 OR 1,536 0.41 46.089 THAT 4,395 1.17 30.06 34 WHICH 1,447 0.39 46.4710 FOR 4,344 1.16 31.22 35 SHOWN 1,432 0.38 46.8511 AS 3,741 1 32.22 36 RESISTANCE 1,417 0.38 47.2312 BE 3,673 0.98 33.2 37 LOAD 1,268 0.34 47.5713 CURRENT 3,526 0.94 34.14 38 SOURCE 1,234 0.33 47.914 CIRCUIT 3,378 0.9 35.04 39 IF 1,233 0.33 48.2315 OUTPUT 3,200 0.85 35.9 40 AMPLIFIER 1,201 0.32 48.5516 ARE 2,775 0.74 36.64 41 THEN 1,181 0.32 48.8617 WE 2,710 0.72 37.36 42 FREQUENCY 1,121 0.3 49.1618 INPUT 2,515 0.67 38.03 43 DIODE 1,109 0.3 49.4619 WITH 2,411 0.64 38.68 44 EXAMPLE 1,020 0.27 49.7320 THIS 2,337 0.62 39.3 45 IT 970 0.26 49.9921 AN 2,277 0.61 39.91 46 EMITTER 969 0.26 50.2522 BY 2,274 0.61 40.51 47 CIRCUITS 964 0.26 50.523 WILL 2,204 0.59 41.1 48 DC 949 0.25 50.7624 CAN 2,130 0.57 41.67 49 SMALL 926 0.25 5125 TRANSISTOR 2,110 0.56 42.23 50 WHEN 917 0.24 51.25
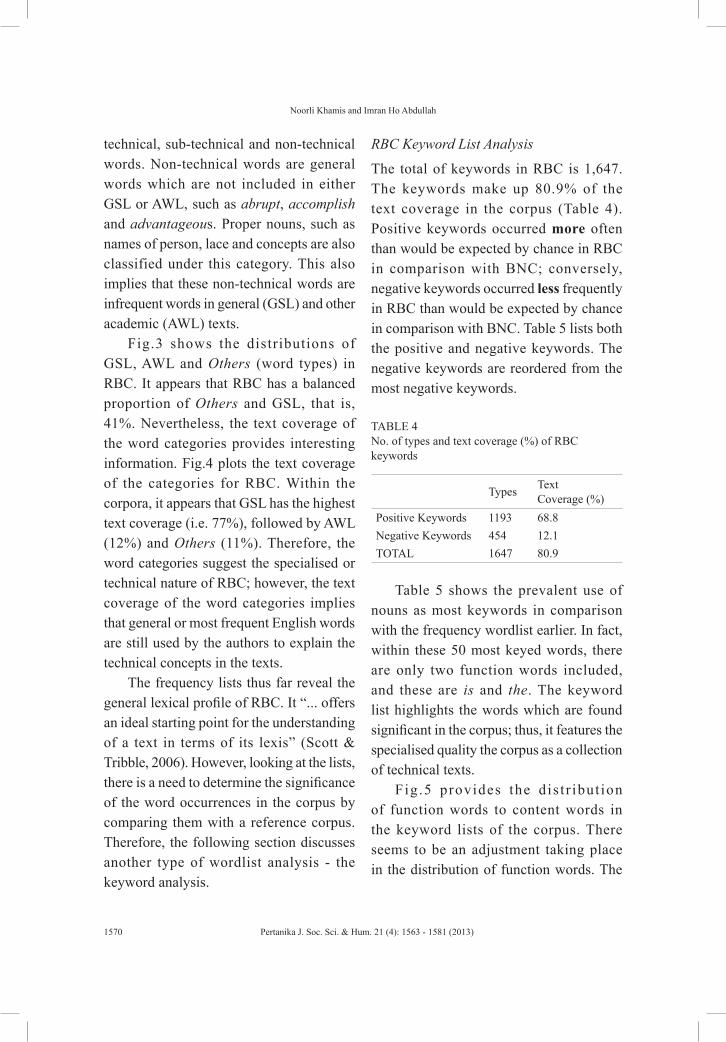
Noorli Khamis and Imran Ho Abdullah
1570 Pertanika J. Soc. Sci. & Hum. 21 (4): 1563 - 1581 (2013)
technical, sub-technical and non-technical words. Non-technical words are general words which are not included in either GSL or AWL, such as abrupt, accomplish and advantageous. Proper nouns, such as names of person, lace and concepts are also classified under this category. This also implies that these non-technical words are infrequent words in general (GSL) and other academic (AWL) texts.
Fig.3 shows the distributions of GSL, AWL and Others (word types) in RBC. It appears that RBC has a balanced proportion of Others and GSL, that is, 41%. Nevertheless, the text coverage of the word categories provides interesting information. Fig.4 plots the text coverage of the categories for RBC. Within the corpora, it appears that GSL has the highest text coverage (i.e. 77%), followed by AWL (12%) and Others (11%). Therefore, the word categories suggest the specialised or technical nature of RBC; however, the text coverage of the word categories implies that general or most frequent English words are still used by the authors to explain the technical concepts in the texts.
The frequency lists thus far reveal the general lexical profile of RBC. It “... offers an ideal starting point for the understanding of a text in terms of its lexis” (Scott & Tribble, 2006). However, looking at the lists, there is a need to determine the significance of the word occurrences in the corpus by comparing them with a reference corpus. Therefore, the following section discusses another type of wordlist analysis - the keyword analysis.
RBC Keyword List Analysis
The total of keywords in RBC is 1,647. The keywords make up 80.9% of the text coverage in the corpus (Table 4). Positive keywords occurred more often than would be expected by chance in RBC in comparison with BNC; conversely, negative keywords occurred less frequently in RBC than would be expected by chance in comparison with BNC. Table 5 lists both the positive and negative keywords. The negative keywords are reordered from the most negative keywords.
TABLE 4 No. of types and text coverage (%) of RBC keywords
Types Text Coverage (%)
Positive Keywords 1193 68.8Negative Keywords 454 12.1TOTAL 1647 80.9
Table 5 shows the prevalent use of nouns as most keywords in comparison with the frequency wordlist earlier. In fact, within these 50 most keyed words, there are only two function words included, and these are is and the. The keyword list highlights the words which are found significant in the corpus; thus, it features the specialised quality the corpus as a collection of technical texts.
Fig.5 provides the dis t r ibut ion of function words to content words in the keyword lists of the corpus. There seems to be an adjustment taking place in the distribution of function words. The
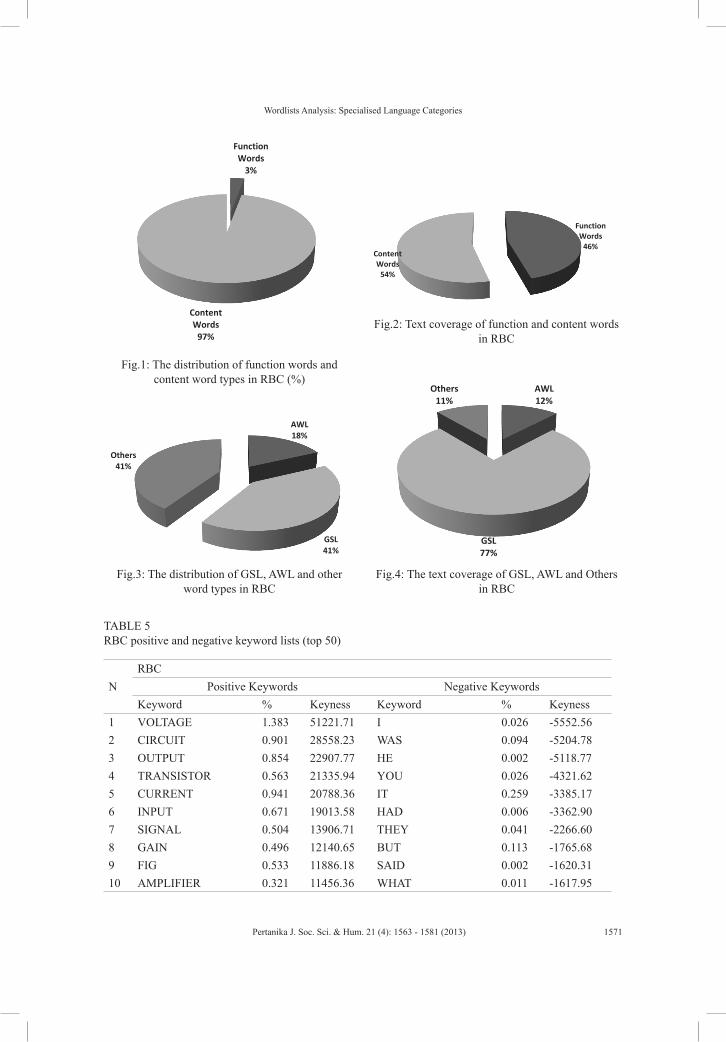
Wordlists Analysis: Specialised Language Categories
1571Pertanika J. Soc. Sci. & Hum. 21 (4): 1563 - 1581 (2013)
Function Words
3%
Content Words
97%
Function Words
46%Content Words
54%
AWL18%
GSL41%
Others41%
AWL12%
GSL77%
Others11%
Fig.1: The distribution of function words and content word types in RBC (%)
Fig.2: Text coverage of function and content words in RBC
Fig.3: The distribution of GSL, AWL and other word types in RBC
Fig.4: The text coverage of GSL, AWL and Others in RBC
TABLE 5 RBC positive and negative keyword lists (top 50)
NRBC
Positive Keywords Negative KeywordsKeyword % Keyness Keyword % Keyness
1 VOLTAGE 1.383 51221.71 I 0.026 -5552.562 CIRCUIT 0.901 28558.23 WAS 0.094 -5204.783 OUTPUT 0.854 22907.77 HE 0.002 -5118.774 TRANSISTOR 0.563 21335.94 YOU 0.026 -4321.625 CURRENT 0.941 20788.36 IT 0.259 -3385.176 INPUT 0.671 19013.58 HAD 0.006 -3362.907 SIGNAL 0.504 13906.71 THEY 0.041 -2266.608 GAIN 0.496 12140.65 BUT 0.113 -1765.689 FIG 0.533 11886.18 SAID 0.002 -1620.3110 AMPLIFIER 0.321 11456.36 WHAT 0.011 -1617.95
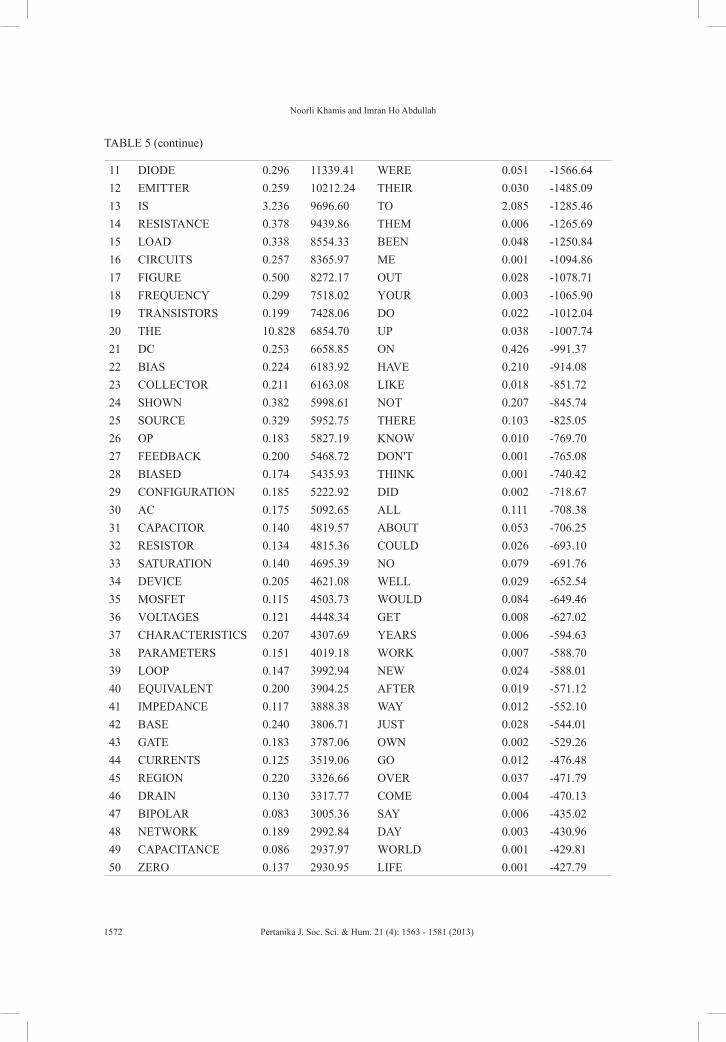
Noorli Khamis and Imran Ho Abdullah
1572 Pertanika J. Soc. Sci. & Hum. 21 (4): 1563 - 1581 (2013)
11 DIODE 0.296 11339.41 WERE 0.051 -1566.6412 EMITTER 0.259 10212.24 THEIR 0.030 -1485.0913 IS 3.236 9696.60 TO 2.085 -1285.4614 RESISTANCE 0.378 9439.86 THEM 0.006 -1265.6915 LOAD 0.338 8554.33 BEEN 0.048 -1250.8416 CIRCUITS 0.257 8365.97 ME 0.001 -1094.8617 FIGURE 0.500 8272.17 OUT 0.028 -1078.7118 FREQUENCY 0.299 7518.02 YOUR 0.003 -1065.9019 TRANSISTORS 0.199 7428.06 DO 0.022 -1012.0420 THE 10.828 6854.70 UP 0.038 -1007.7421 DC 0.253 6658.85 ON 0.426 -991.3722 BIAS 0.224 6183.92 HAVE 0.210 -914.0823 COLLECTOR 0.211 6163.08 LIKE 0.018 -851.7224 SHOWN 0.382 5998.61 NOT 0.207 -845.7425 SOURCE 0.329 5952.75 THERE 0.103 -825.0526 OP 0.183 5827.19 KNOW 0.010 -769.7027 FEEDBACK 0.200 5468.72 DON'T 0.001 -765.0828 BIASED 0.174 5435.93 THINK 0.001 -740.4229 CONFIGURATION 0.185 5222.92 DID 0.002 -718.6730 AC 0.175 5092.65 ALL 0.111 -708.3831 CAPACITOR 0.140 4819.57 ABOUT 0.053 -706.2532 RESISTOR 0.134 4815.36 COULD 0.026 -693.1033 SATURATION 0.140 4695.39 NO 0.079 -691.7634 DEVICE 0.205 4621.08 WELL 0.029 -652.5435 MOSFET 0.115 4503.73 WOULD 0.084 -649.4636 VOLTAGES 0.121 4448.34 GET 0.008 -627.0237 CHARACTERISTICS 0.207 4307.69 YEARS 0.006 -594.6338 PARAMETERS 0.151 4019.18 WORK 0.007 -588.7039 LOOP 0.147 3992.94 NEW 0.024 -588.0140 EQUIVALENT 0.200 3904.25 AFTER 0.019 -571.1241 IMPEDANCE 0.117 3888.38 WAY 0.012 -552.1042 BASE 0.240 3806.71 JUST 0.028 -544.0143 GATE 0.183 3787.06 OWN 0.002 -529.2644 CURRENTS 0.125 3519.06 GO 0.012 -476.4845 REGION 0.220 3326.66 OVER 0.037 -471.7946 DRAIN 0.130 3317.77 COME 0.004 -470.1347 BIPOLAR 0.083 3005.36 SAY 0.006 -435.0248 NETWORK 0.189 2992.84 DAY 0.003 -430.9649 CAPACITANCE 0.086 2937.97 WORLD 0.001 -429.8150 ZERO 0.137 2930.95 LIFE 0.001 -427.79
TABLE 5 (continue)
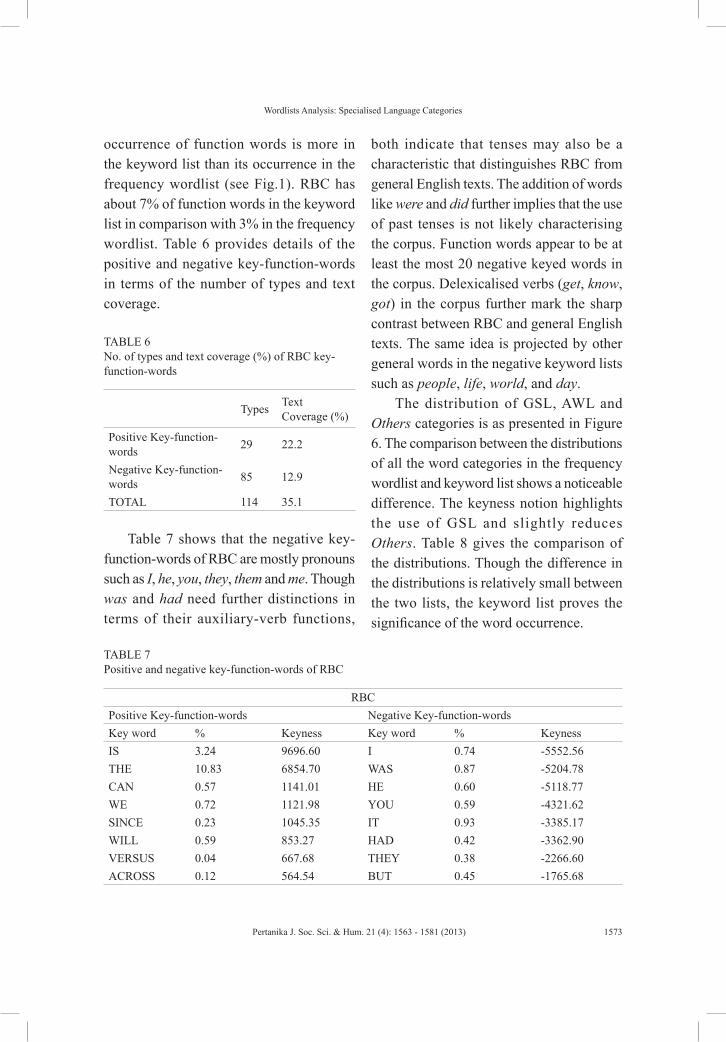
Wordlists Analysis: Specialised Language Categories
1573Pertanika J. Soc. Sci. & Hum. 21 (4): 1563 - 1581 (2013)
occurrence of function words is more in the keyword list than its occurrence in the frequency wordlist (see Fig.1). RBC has about 7% of function words in the keyword list in comparison with 3% in the frequency wordlist. Table 6 provides details of the positive and negative key-function-words in terms of the number of types and text coverage.
TABLE 6 No. of types and text coverage (%) of RBC key-function-words
Types Text Coverage (%)
Positive Key-function-words 29 22.2
Negative Key-function-words 85 12.9
TOTAL 114 35.1
Table 7 shows that the negative key-function-words of RBC are mostly pronouns such as I, he, you, they, them and me. Though was and had need further distinctions in terms of their auxiliary-verb functions,
both indicate that tenses may also be a characteristic that distinguishes RBC from general English texts. The addition of words like were and did further implies that the use of past tenses is not likely characterising the corpus. Function words appear to be at least the most 20 negative keyed words in the corpus. Delexicalised verbs (get, know, got) in the corpus further mark the sharp contrast between RBC and general English texts. The same idea is projected by other general words in the negative keyword lists such as people, life, world, and day.
The distribution of GSL, AWL and Others categories is as presented in Figure 6. The comparison between the distributions of all the word categories in the frequency wordlist and keyword list shows a noticeable difference. The keyness notion highlights the use of GSL and slightly reduces Others. Table 8 gives the comparison of the distributions. Though the difference in the distributions is relatively small between the two lists, the keyword list proves the significance of the word occurrence.
TABLE 7 Positive and negative key-function-words of RBC
RBCPositive Key-function-words Negative Key-function-wordsKey word % Keyness Key word % KeynessIS 3.24 9696.60 I 0.74 -5552.56THE 10.83 6854.70 WAS 0.87 -5204.78CAN 0.57 1141.01 HE 0.60 -5118.77WE 0.72 1121.98 YOU 0.59 -4321.62SINCE 0.23 1045.35 IT 0.93 -3385.17WILL 0.59 853.27 HAD 0.42 -3362.90VERSUS 0.04 667.68 THEY 0.38 -2266.60ACROSS 0.12 564.54 BUT 0.45 -1765.68
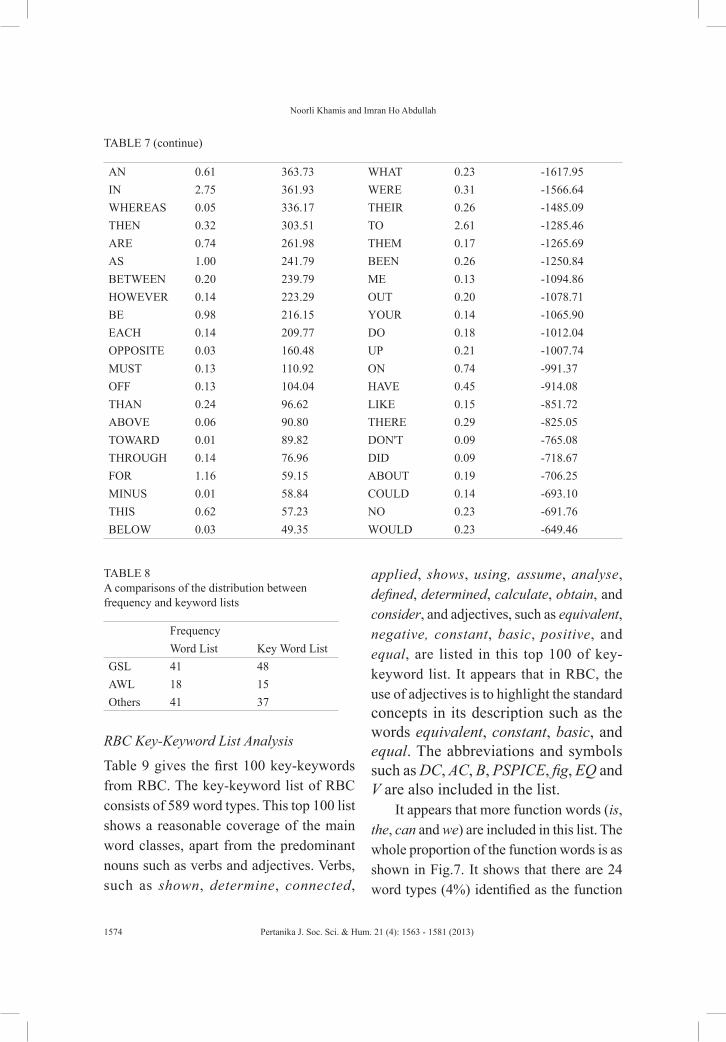
Noorli Khamis and Imran Ho Abdullah
1574 Pertanika J. Soc. Sci. & Hum. 21 (4): 1563 - 1581 (2013)
TABLE 8 A comparisons of the distribution between frequency and keyword lists
FrequencyWord List Key Word List
GSL 41 48AWL 18 15Others 41 37
RBC Key-Keyword List Analysis
Table 9 gives the first 100 key-keywords from RBC. The key-keyword list of RBC consists of 589 word types. This top 100 list shows a reasonable coverage of the main word classes, apart from the predominant nouns such as verbs and adjectives. Verbs, such as shown, determine, connected,
applied, shows, using, assume, analyse, defined, determined, calculate, obtain, and consider, and adjectives, such as equivalent, negative, constant, basic, positive, and equal, are listed in this top 100 of key-keyword list. It appears that in RBC, the use of adjectives is to highlight the standard concepts in its description such as the words equivalent, constant, basic, and equal. The abbreviations and symbols such as DC, AC, B, PSPICE, fig, EQ and V are also included in the list.
It appears that more function words (is, the, can and we) are included in this list. The whole proportion of the function words is as shown in Fig.7. It shows that there are 24 word types (4%) identified as the function
AN 0.61 363.73 WHAT 0.23 -1617.95IN 2.75 361.93 WERE 0.31 -1566.64WHEREAS 0.05 336.17 THEIR 0.26 -1485.09THEN 0.32 303.51 TO 2.61 -1285.46ARE 0.74 261.98 THEM 0.17 -1265.69AS 1.00 241.79 BEEN 0.26 -1250.84BETWEEN 0.20 239.79 ME 0.13 -1094.86HOWEVER 0.14 223.29 OUT 0.20 -1078.71BE 0.98 216.15 YOUR 0.14 -1065.90EACH 0.14 209.77 DO 0.18 -1012.04OPPOSITE 0.03 160.48 UP 0.21 -1007.74MUST 0.13 110.92 ON 0.74 -991.37OFF 0.13 104.04 HAVE 0.45 -914.08THAN 0.24 96.62 LIKE 0.15 -851.72ABOVE 0.06 90.80 THERE 0.29 -825.05TOWARD 0.01 89.82 DON'T 0.09 -765.08THROUGH 0.14 76.96 DID 0.09 -718.67FOR 1.16 59.15 ABOUT 0.19 -706.25MINUS 0.01 58.84 COULD 0.14 -693.10THIS 0.62 57.23 NO 0.23 -691.76BELOW 0.03 49.35 WOULD 0.23 -649.46
TABLE 7 (continue)
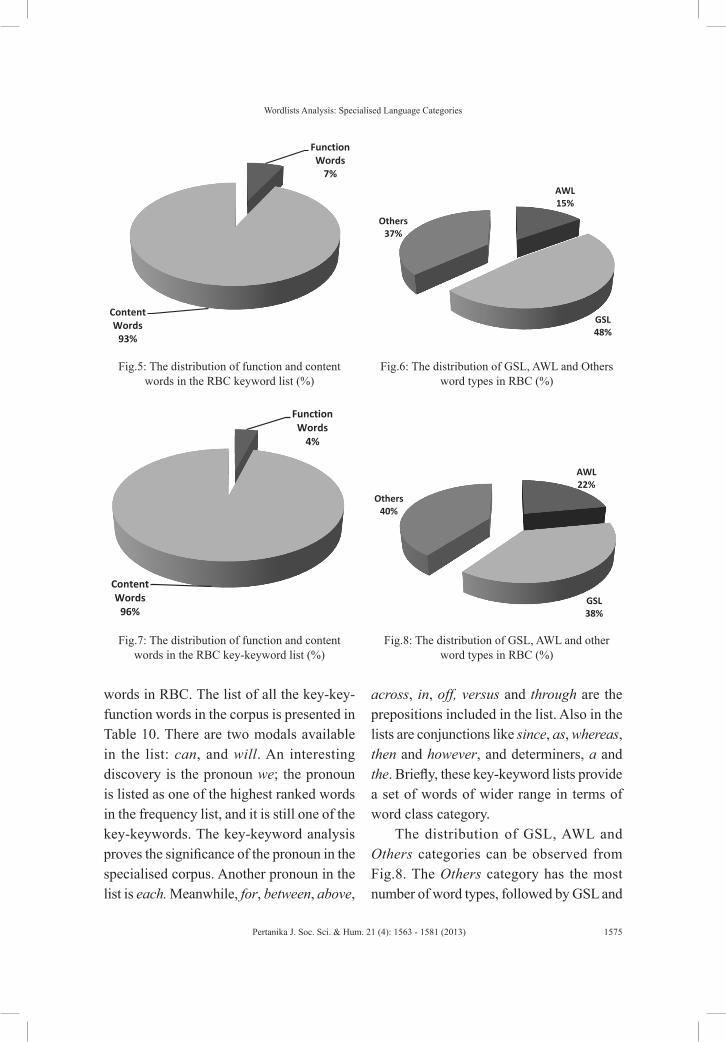
Wordlists Analysis: Specialised Language Categories
1575Pertanika J. Soc. Sci. & Hum. 21 (4): 1563 - 1581 (2013)
words in RBC. The list of all the key-key-function words in the corpus is presented in Table 10. There are two modals available in the list: can, and will. An interesting discovery is the pronoun we; the pronoun is listed as one of the highest ranked words in the frequency list, and it is still one of the key-keywords. The key-keyword analysis proves the significance of the pronoun in the specialised corpus. Another pronoun in the list is each. Meanwhile, for, between, above,
across, in, off, versus and through are the prepositions included in the list. Also in the lists are conjunctions like since, as, whereas, then and however, and determiners, a and the. Briefly, these key-keyword lists provide a set of words of wider range in terms of word class category.
The distribution of GSL, AWL and Others categories can be observed from Fig.8. The Others category has the most number of word types, followed by GSL and
Function Words
7%
Content Words
93%
AWL15%
GSL48%
Others37%
Function Words
4%
Content Words
96%
AWL22%
GSL38%
Others40%
Fig.5: The distribution of function and content words in the RBC keyword list (%)
Fig.6: The distribution of GSL, AWL and Others word types in RBC (%)
Fig.7: The distribution of function and content words in the RBC key-keyword list (%)
Fig.8: The distribution of GSL, AWL and other word types in RBC (%)
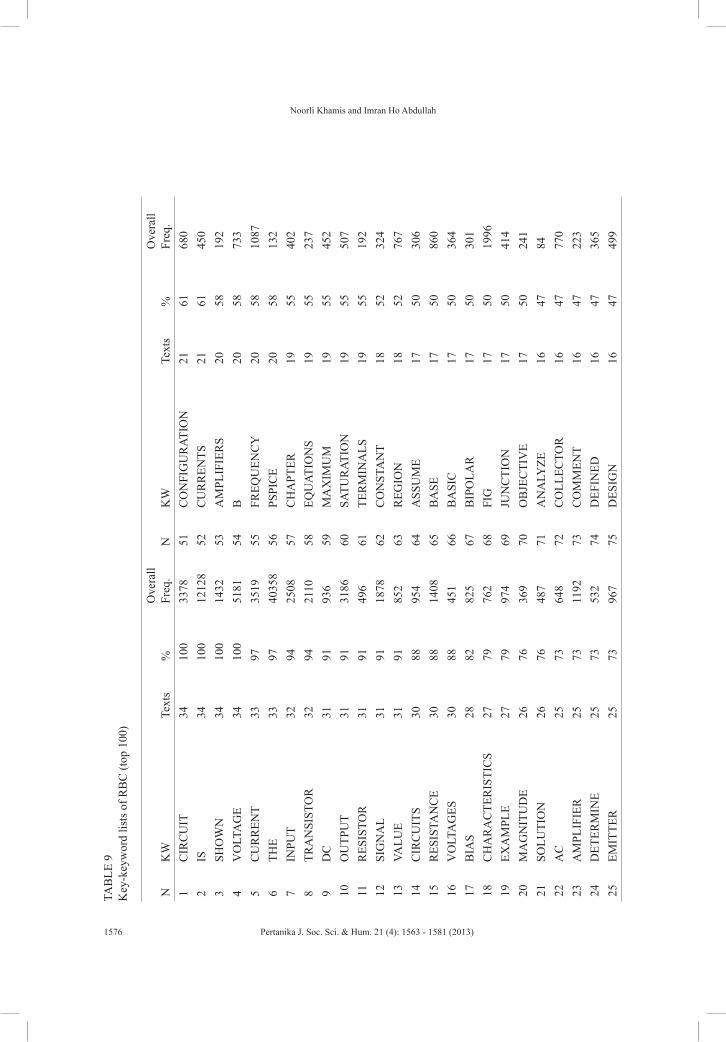
Noorli Khamis and Imran Ho Abdullah
1576 Pertanika J. Soc. Sci. & Hum. 21 (4): 1563 - 1581 (2013)
TAB
LE 9
K
ey-k
eyw
ord
lists
of R
BC
(top
100
)
NK
WTe
xts
%O
vera
ll Fr
eq.
NK
WTe
xts
%O
vera
ll Fr
eq.
1C
IRC
UIT
3410
033
7851
CO
NFI
GU
RAT
ION
2161
680
2IS
3410
012
128
52C
UR
REN
TS21
6145
03
SHO
WN
3410
014
3253
AM
PLIF
IER
S20
5819
24
VO
LTA
GE
3410
051
8154
B20
5873
35
CU
RR
ENT
3397
3519
55FR
EQU
ENC
Y20
5810
876
THE
3397
4035
856
PSPI
CE
2058
132
7IN
PUT
3294
2508
57C
HA
PTER
1955
402
8TR
AN
SIST
OR
3294
2110
58EQ
UAT
ION
S19
5523
79
DC
3191
936
59M
AX
IMU
M19
5545
210
OU
TPU
T31
9131
8660
SATU
RAT
ION
1955
507
11R
ESIS
TOR
3191
496
61TE
RM
INA
LS19
5519
212
SIG
NA
L31
9118
7862
CO
NST
AN
T18
5232
413
VALU
E31
9185
263
REG
ION
1852
767
14C
IRC
UIT
S30
8895
464
ASS
UM
E17
5030
615
RES
ISTA
NC
E30
8814
0865
BA
SE17
5086
016
VO
LTA
GES
3088
451
66B
ASI
C17
5036
417
BIA
S28
8282
567
BIP
OLA
R17
5030
118
CH
AR
AC
TER
ISTI
CS
2779
762
68FI
G17
5019
9619
EXA
MPL
E27
7997
469
JUN
CTI
ON
1750
414
20M
AG
NIT
UD
E26
7636
970
OB
JEC
TIV
E17
5024
121
SOLU
TIO
N26
7648
771
AN
ALY
ZE16
4784
22A
C25
7364
872
CO
LLEC
TOR
1647
770
23A
MPL
IFIE
R25
7311
9273
CO
MM
ENT
1647
223
24D
ETER
MIN
E25
7353
274
DEF
INED
1647
365
25EM
ITTE
R25
7396
775
DES
IGN
1647
499
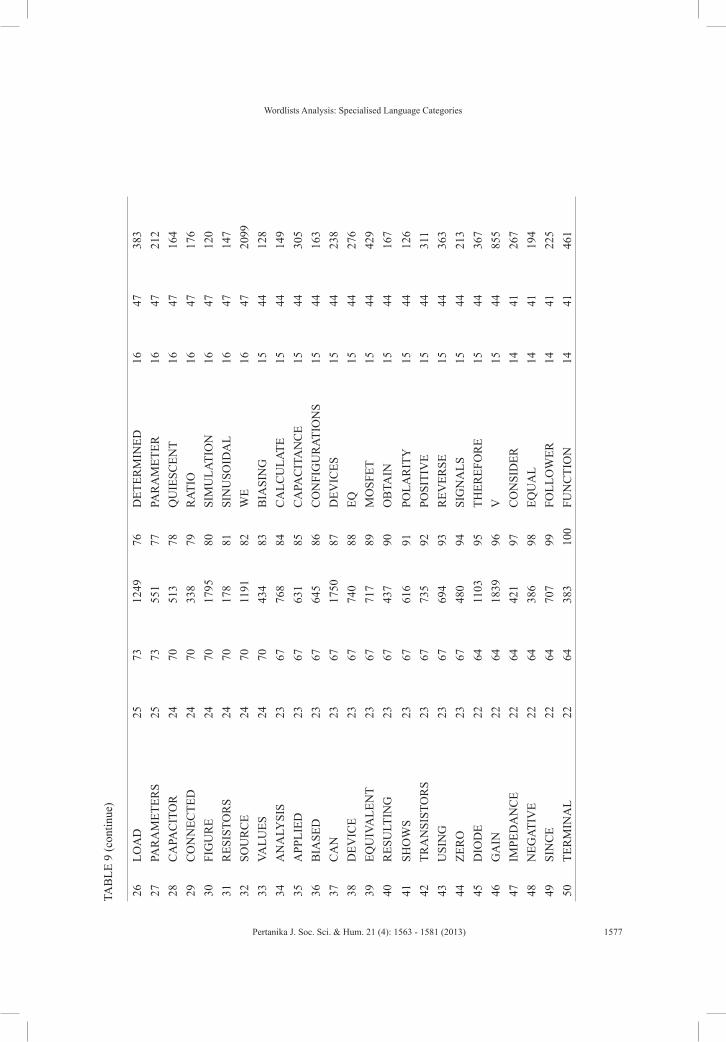
Wordlists Analysis: Specialised Language Categories
1577Pertanika J. Soc. Sci. & Hum. 21 (4): 1563 - 1581 (2013)
26LO
AD
2573
1249
76D
ETER
MIN
ED16
4738
327
PAR
AM
ETER
S25
7355
177
PAR
AM
ETER
1647
212
28C
APA
CIT
OR
2470
513
78Q
UIE
SCEN
T16
4716
429
CO
NN
ECTE
D24
7033
879
RAT
IO16
4717
630
FIG
UR
E24
7017
9580
SIM
ULA
TIO
N16
4712
031
RES
ISTO
RS
2470
178
81SI
NU
SOID
AL
1647
147
32SO
UR
CE
2470
1191
82W
E16
4720
9933
VALU
ES24
7043
483
BIA
SIN
G15
4412
834
AN
ALY
SIS
2367
768
84C
ALC
ULA
TE15
4414
935
APP
LIED
2367
631
85C
APA
CIT
AN
CE
1544
305
36B
IASE
D23
6764
586
CO
NFI
GU
RAT
ION
S15
4416
337
CA
N23
6717
5087
DEV
ICES
1544
238
38D
EVIC
E23
6774
088
EQ15
4427
639
EQU
IVA
LEN
T23
6771
789
MO
SFET
1544
429
40R
ESU
LTIN
G23
6743
790
OB
TAIN
1544
167
41SH
OW
S23
6761
691
POLA
RIT
Y15
4412
642
TRA
NSI
STO
RS
2367
735
92PO
SITI
VE
1544
311
43U
SIN
G23
6769
493
REV
ERSE
1544
363
44ZE
RO
2367
480
94SI
GN
ALS
1544
213
45D
IOD
E22
6411
0395
THER
EFO
RE
1544
367
46G
AIN
2264
1839
96V
1544
855
47IM
PED
AN
CE
2264
421
97C
ON
SID
ER14
4126
748
NEG
ATIV
E22
6438
698
EQU
AL
1441
194
49SI
NC
E22
6470
799
FOLL
OW
ER14
4122
550
TER
MIN
AL
2264
383
100
FUN
CTI
ON
1441
461
TAB
LE 9
(con
tinue
)
Noorli Khamis and Imran Ho Abdullah
1578 Pertanika J. Soc. Sci. & Hum. 21 (4): 1563 - 1581 (2013)
AWL, while in the previous two wordlists, the order is GSL, Others and AWL. This means that the key-keyword analysis has further enhanced the specialised quality of the corpus. The information obtained from the key-keyword analysis is very useful for the selection of words for the researcher’s further study because the distributions of the categories in this key-keyword list is regarded as sufficient to supply words for further analysis, taking into consideration the range covered by the words.
The frequency wordlist is able to highlights the specific features of RBC as a specialised language, in this case, technical texts. Although the frequency list shows the use of a number of function words as among the most frequent words in the corpus, there also seems to be a balanced use of high frequency content words. The coverage of the first 50 high frequency word in the corpus, i.e. 49%, suggests lesser use of words, thus, underlines the specialised quality of the RBC texts.
Next, the keyword list provides different but more detailed features of the corpus. It exposes more specific and technical words in the corpus. The analysis of the positive and negative keywords further distinguishes the specialised language in comparison with the general English texts (BNC). There are more technical nouns appear in the higher rank of the list, suggesting the technical concepts available in the specialised language. The negative keywords reveal more about the language. Nelson (2000) notes that it is possible to describe the language in a specific domain
by investigating ‘what is not found there’. This can be achieved by using the negative keywords. Apparently, pronouns, past tenses and delexicalised verbs occur less frequently in RBC, in comparison to BNC.
The key-keyword list offers more varied members in the top list. The list comprises of lesser numbe of words but still sees the dominance of nouns, with inclusions of verbs and adjectives while retaining a few function words and more abbreviations and symbols. In other words, the lists provide a good range of words, which entails the priority for analyses in describing the characteristics of RBC – the study embarked by the researcher at a later stage.
With reference to the distribution of function words, the analyses of the three wordlists show that the frequency wordlist has the lowest distribution of function words, while the keyword list has the highest distribution. Despite the fact that the distribution in the keyword lists includes the negative keywords, the proportion of positive key function words is bigger than the negative function words, and it is still the highest of all the lists. However, the key-keyword list includes function words which are significant and occur in more than 2 texts in each corpus (this parameter was set at the beginning of the analysis). Furthermore, unlike frequency and key word lists, the higher ranked key-keywords cover a wide range of function words including prepositions, pronouns, conjunctions, modals and other auxiliary verbs.
With regard to the distributions of GSL, AWL and Others categories, the
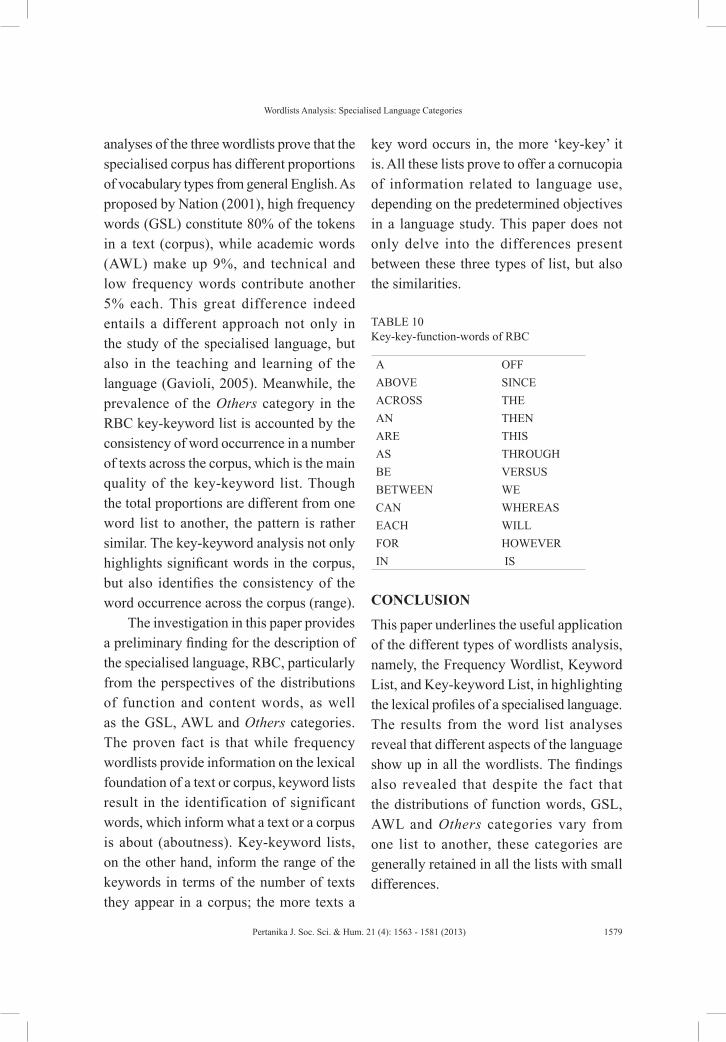
Wordlists Analysis: Specialised Language Categories
1579Pertanika J. Soc. Sci. & Hum. 21 (4): 1563 - 1581 (2013)
analyses of the three wordlists prove that the specialised corpus has different proportions of vocabulary types from general English. As proposed by Nation (2001), high frequency words (GSL) constitute 80% of the tokens in a text (corpus), while academic words (AWL) make up 9%, and technical and low frequency words contribute another 5% each. This great difference indeed entails a different approach not only in the study of the specialised language, but also in the teaching and learning of the language (Gavioli, 2005). Meanwhile, the prevalence of the Others category in the RBC key-keyword list is accounted by the consistency of word occurrence in a number of texts across the corpus, which is the main quality of the key-keyword list. Though the total proportions are different from one word list to another, the pattern is rather similar. The key-keyword analysis not only highlights significant words in the corpus, but also identifies the consistency of the word occurrence across the corpus (range).
The investigation in this paper provides a preliminary finding for the description of the specialised language, RBC, particularly from the perspectives of the distributions of function and content words, as well as the GSL, AWL and Others categories. The proven fact is that while frequency wordlists provide information on the lexical foundation of a text or corpus, keyword lists result in the identification of significant words, which inform what a text or a corpus is about (aboutness). Key-keyword lists, on the other hand, inform the range of the keywords in terms of the number of texts they appear in a corpus; the more texts a
key word occurs in, the more ‘key-key’ it is. All these lists prove to offer a cornucopia of information related to language use, depending on the predetermined objectives in a language study. This paper does not only delve into the differences present between these three types of list, but also the similarities.
TABLE 10 Key-key-function-words of RBC
A OFFABOVE SINCEACROSS THEAN THENARE THISAS THROUGHBE VERSUSBETWEEN WECAN WHEREASEACH WILLFOR HOWEVER IN IS
CONCLUSION
This paper underlines the useful application of the different types of wordlists analysis, namely, the Frequency Wordlist, Keyword List, and Key-keyword List, in highlighting the lexical profiles of a specialised language. The results from the word list analyses reveal that different aspects of the language show up in all the wordlists. The findings also revealed that despite the fact that the distributions of function words, GSL, AWL and Others categories vary from one list to another, these categories are generally retained in all the lists with small differences.
Noorli Khamis and Imran Ho Abdullah
1580 Pertanika J. Soc. Sci. & Hum. 21 (4): 1563 - 1581 (2013)
ACKNOWLEDGEMENTS
This work stemmed from a PhD study, which was sponsored by the Ministry of Higher Education, with the support from UTeM. The PhD study is currently pursued in UKM, Bangi.
REFERENCESBaker, M. (1988). Sub technical vocabulary and the
ESP teacher: An analysis of some rhetorical items in medical journal articles. Reading in a Foreign Language, 4(2), 91-105.
Banerjee, J., & Papageorgiou, S. (2009). Analysing written language. [PowerPoint slides].
Chung, T. M., & Nation, P. (2003). Technical vocabulary in specialised texts. Reading in a Foreign Language, 15(2), 103-116.
Coxhead, A. (2000). The Academic Word List: A corpus-based word list for academic purposes. In B. Kettemann & G. Marko (Eds.), The Fourth International Conference on Teaching and Language Corpora (pp. 73-89). Armsterdam: Rodopi.
Fraser, S. (2007). Providing ESP learners with the vocabulary they need: Corpora and the creation of specialized word lists. Hiroshima Studies in Language and Language Education, 10, 127-143.
Gavioli, L. (2005). Exploring corpora for ESP learning . Amsterdam: John Benjamins Publishing Company.
Granger, S., & Paquot, M. (2009). In search of a General Academic vocabulary: A corpus-driven study. Paper presented at the International Conference on L.S.P, Heraklion, Crete.
Hunston, S. (2000). Pattern grammar: A corpus-driven approach to the lexical grammar of English. Philadelphia: John Benjamins Publishing Co.
Martı´nez, I. A., Beck, S. C., & Panza, C. B. (2009).
Academic vocabulary in agriculture research articles: A corpus-based study. English for Specific Purposes 28(3), 183-198.
Martin, A. V. (1976). Teaching academic vocabulary to foreign graduate students. TESOL Quarterly, 10(1), 91-98.
Menon, S., & Mukundan, J. (2010). Analysing collocational patterns of semi-technical words in science textbooks. Pertanika Journal of Social Science and Humanities 18(2), 241 – 258.
Meyer, C. F. (2002). English corpus linguistics: An introduction. Cambridge: CUP.
Mudraya, O. (2006). Engineering English: A lexical frequency instructional model. English for Specific Purposes, 25, 235-256.
Mukundan, J., & Aziz, A. (2009). Loading and distribution of the 2000 high frequency words in Malaysian English language textbooks for form 1 to form 5. Pertanika Journal of Social Science and Humanities 17(2), 141 – 152.
Nation, I. S. P. (2001). Learning vocabulary in another language. Cambridge: Cambridge University Press.
Nelson, M. (2000). A Corpus-based Study of the Lexis of Business English and Business English Teaching Materials (Unpublished doctoral dissertation). University of Manchester, UK.
Noorzan Haji Mohd Noor. (2005). Corpus-based research for professional communication: The real perspective for language education. Paper presented at the Borneo Language Teaching Conference (BLTC), Promenade Hotel, Kota Kinabalu.
Perez-Paredes, P. (2003). Small corpora as assisting tools in the teaching of English news language: A preliminary tokens-based examination of Michaels Swan’s practical English usage news language wordlist. English for Specific Purposes World, 2(3). Retrieved from http://www.esp-world.info/articles_6/pascual.htm
Wordlists Analysis: Specialised Language Categories
1581Pertanika J. Soc. Sci. & Hum. 21 (4): 1563 - 1581 (2013)
Sardinha, B. (1996). Review: Wordsmith tools. Computers & Texts, 12. Retrieved from http://users.ox.ac.uk/~ctitext2/publish/comtxt/ct12/sardinha.html
Scott, M., & Tribble, C. (2006). Textual patterns: Key words and corpus analysis in language education. Amsterdam: John Benjamins Publishing Company.
Sinclair, J. (1991). Corpus, concordance, collocation. Oxford: OUP.
Someya, Y. (1999). A corpus-based study of lexical and grammatical features of written business English. (Master’s thesis). Graduate Department of Language and Information Sciences, University of Tokyo.
Tsubaki, M. (2004). Vocabulary in English for academic purposes: A corpus study of journal article. Bunkyo Gakuin Junior College Bulletin 4, 159-168. Retrieved from http://cicero.u-bunkyo.ac.jp/lib/kiyo/fsell2004/159-168.pdf
Worthington, D., & Nation, I. (1996). Using texts to sequence the introduction of new vocabulary in an EAP course. RELC Journal 27(2), 1-11.
ENDNOTE1 The reference corpus employed to generate the
keyword lists in this study is the British National Corpus (BNC). This corpus consists of 100 million tokens, which are collected from written and spoken British English. It represents the English used from the 20th century onwards. The licence of this modern mega-corpus can be easily obtained online at http://bncweb.info/. BNC serves as the general English, which is used for the comparative study with the specialised language, RBC.

Pertanika J. Soc. Sci. & Hum. 21 (4): 1583 - 1593 (2013)
ISSN: 0128-7702 © Universiti Putra Malaysia Press
SOCIAL SCIENCES & HUMANITIESJournal homepage: http://www.pertanika.upm.edu.my/
Article history:Received: 25 October 2011Accepted: 28 August 2012
ARTICLE INFO
E-mail addresses: [email protected] (Andrew N. Williams), [email protected] (Yah Awg Nik)* Corresponding author
One Semester of Speaking Tasks – An Experimental Approach with Low Proficiency Students
Andrew N. Williams* and Yah Awg NikCentre for Language Studies and Generic Development, Universiti Malaysia Kelantan, Karung Berkunci 36, Pengkalan Chepa, 16100 Kota Bharu, Kelantan, Malaysia
ABSTRACT
This study tested the hypothesis postulating that Malaysian undergraduate students with low proficiency would make the most rapid progress in English if all guided learning time (tutorials and lectures) in the first semester was used entirely for speaking tasks. The study took the form of a Non-Equivalent Groups design with 59 Malaysian undergraduate students in their first semester, the majority of whom had scored only Band 1 or Band 2 in the MUET exam. The students were allocated alphabetically to an experimental group of 30 students, who were taught using all of the contact hours for speaking tasks and a control group of 29 students who were taught using “as normal” method – including grammar explanation and examples; reading; writing and listening tasks. All students took a pre-test at the start of the semester and a post-test at the end of the semester, which assessed their abilities in speaking, writing, reading and listening. Since, scores did not conform to a normal distribution so the Wilcoxon Sigma rank test was used to assess the difference in the scores between the pre-test and post-test, while the ManWhitney test was used to compare the changes in the scores between the experimental and control groups. The analysis showed no significant difference between the control group and the experimental group, in terms of the changes in the scores between pre-test and post-test.
Keywords: English, Malaysian undergraduates, low proficiency, speaking tasks
INTRODUCTION
In Malaysia, children are formally taught English from the beginning of their first year of primary school, i.e. at seven years old. In addition, many begin their English learning before primary school, with up to three years in optional pre-school education.
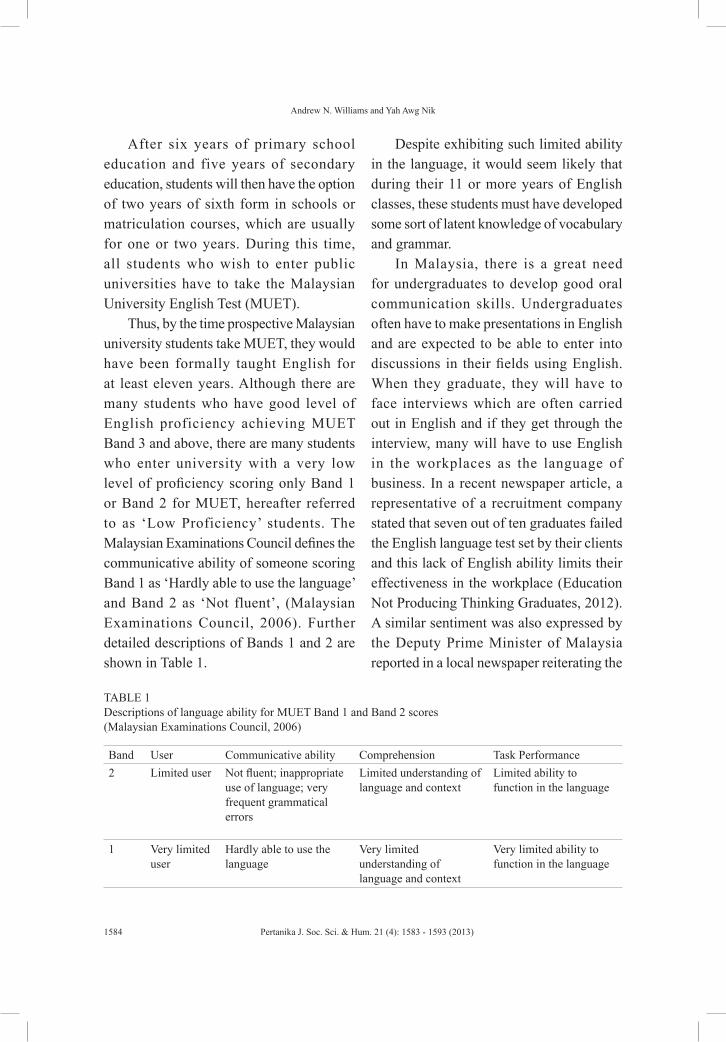
Andrew N. Williams and Yah Awg Nik
1584 Pertanika J. Soc. Sci. & Hum. 21 (4): 1583 - 1593 (2013)
After six years of primary school education and five years of secondary education, students will then have the option of two years of sixth form in schools or matriculation courses, which are usually for one or two years. During this time, all students who wish to enter public universities have to take the Malaysian University English Test (MUET).
Thus, by the time prospective Malaysian university students take MUET, they would have been formally taught English for at least eleven years. Although there are many students who have good level of English proficiency achieving MUET Band 3 and above, there are many students who enter university with a very low level of proficiency scoring only Band 1 or Band 2 for MUET, hereafter referred to as ‘Low Proficiency’ students. The Malaysian Examinations Council defines the communicative ability of someone scoring Band 1 as ‘Hardly able to use the language’ and Band 2 as ‘Not fluent’, (Malaysian Examinations Council, 2006). Further detailed descriptions of Bands 1 and 2 are shown in Table 1.
Despite exhibiting such limited ability in the language, it would seem likely that during their 11 or more years of English classes, these students must have developed some sort of latent knowledge of vocabulary and grammar.
In Malaysia, there is a great need for undergraduates to develop good oral communication skills. Undergraduates often have to make presentations in English and are expected to be able to enter into discussions in their fields using English. When they graduate, they will have to face interviews which are often carried out in English and if they get through the interview, many will have to use English in the workplaces as the language of business. In a recent newspaper article, a representative of a recruitment company stated that seven out of ten graduates failed the English language test set by their clients and this lack of English ability limits their effectiveness in the workplace (Education Not Producing Thinking Graduates, 2012). A similar sentiment was also expressed by the Deputy Prime Minister of Malaysia reported in a local newspaper reiterating the
TABLE 1 Descriptions of language ability for MUET Band 1 and Band 2 scores (Malaysian Examinations Council, 2006)
Band User Communicative ability Comprehension Task Performance 2 Limited user Not fluent; inappropriate
use of language; very frequent grammatical errors
Limited understanding of language and context
Limited ability to function in the language
1 Very limited user
Hardly able to use the language
Very limited understanding of language and context
Very limited ability to function in the language
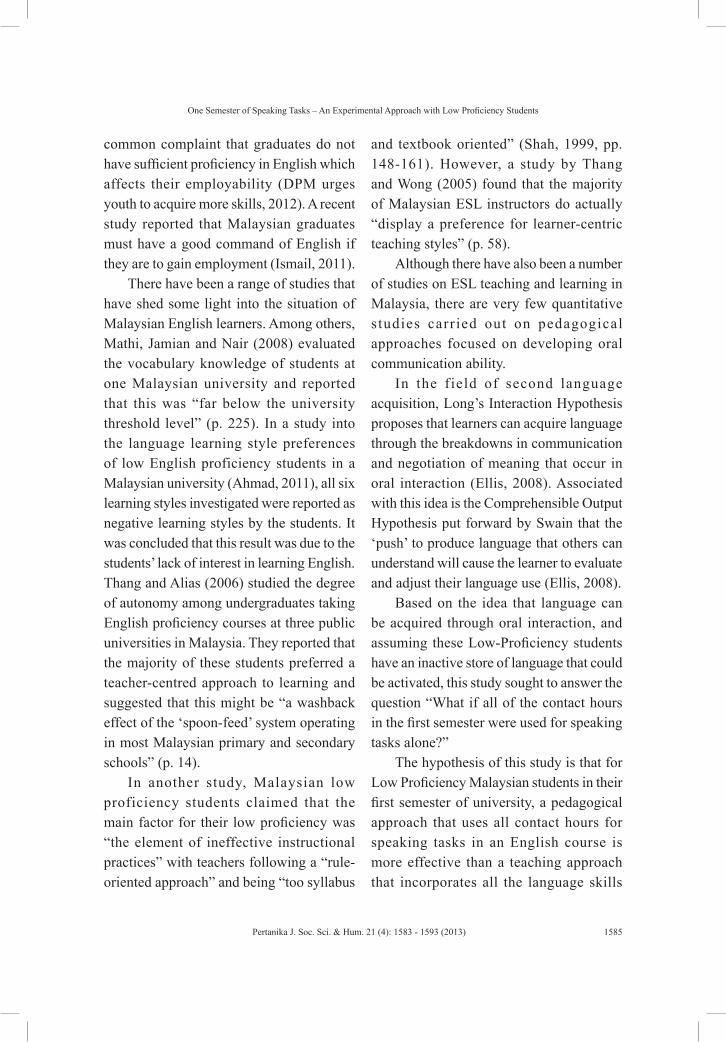
One Semester of Speaking Tasks – An Experimental Approach with Low Proficiency Students
1585Pertanika J. Soc. Sci. & Hum. 21 (4): 1583 - 1593 (2013)
common complaint that graduates do not have sufficient proficiency in English which affects their employability (DPM urges youth to acquire more skills, 2012). A recent study reported that Malaysian graduates must have a good command of English if they are to gain employment (Ismail, 2011).
There have been a range of studies that have shed some light into the situation of Malaysian English learners. Among others, Mathi, Jamian and Nair (2008) evaluated the vocabulary knowledge of students at one Malaysian university and reported that this was “far below the university threshold level” (p. 225). In a study into the language learning style preferences of low English proficiency students in a Malaysian university (Ahmad, 2011), all six learning styles investigated were reported as negative learning styles by the students. It was concluded that this result was due to the students’ lack of interest in learning English. Thang and Alias (2006) studied the degree of autonomy among undergraduates taking English proficiency courses at three public universities in Malaysia. They reported that the majority of these students preferred a teacher-centred approach to learning and suggested that this might be “a washback effect of the ‘spoon-feed’ system operating in most Malaysian primary and secondary schools” (p. 14).
In another study, Malaysian low proficiency students claimed that the main factor for their low proficiency was “the element of ineffective instructional practices” with teachers following a “rule-oriented approach” and being “too syllabus
and textbook oriented” (Shah, 1999, pp. 148-161). However, a study by Thang and Wong (2005) found that the majority of Malaysian ESL instructors do actually “display a preference for learner-centric teaching styles” (p. 58).
Although there have also been a number of studies on ESL teaching and learning in Malaysia, there are very few quantitative studies carried out on pedagogical approaches focused on developing oral communication ability.
In the field of second language acquisition, Long’s Interaction Hypothesis proposes that learners can acquire language through the breakdowns in communication and negotiation of meaning that occur in oral interaction (Ellis, 2008). Associated with this idea is the Comprehensible Output Hypothesis put forward by Swain that the ‘push’ to produce language that others can understand will cause the learner to evaluate and adjust their language use (Ellis, 2008).
Based on the idea that language can be acquired through oral interaction, and assuming these Low-Proficiency students have an inactive store of language that could be activated, this study sought to answer the question “What if all of the contact hours in the first semester were used for speaking tasks alone?”
The hypothesis of this study is that for Low Proficiency Malaysian students in their first semester of university, a pedagogical approach that uses all contact hours for speaking tasks in an English course is more effective than a teaching approach that incorporates all the language skills
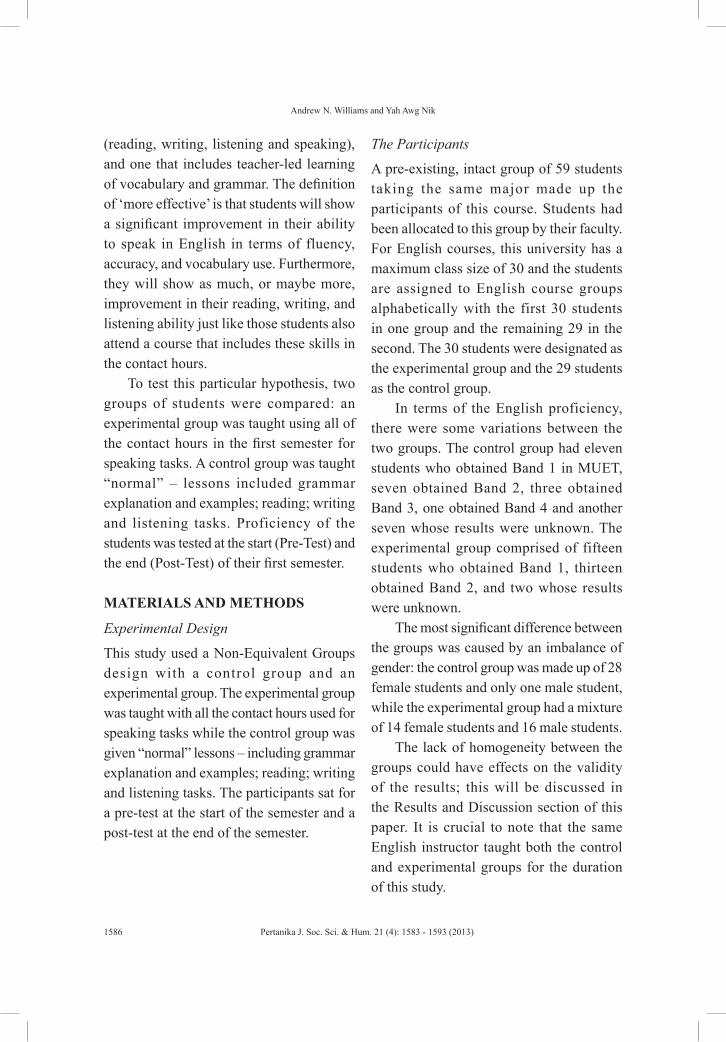
Andrew N. Williams and Yah Awg Nik
1586 Pertanika J. Soc. Sci. & Hum. 21 (4): 1583 - 1593 (2013)
(reading, writing, listening and speaking), and one that includes teacher-led learning of vocabulary and grammar. The definition of ‘more effective’ is that students will show a significant improvement in their ability to speak in English in terms of fluency, accuracy, and vocabulary use. Furthermore, they will show as much, or maybe more, improvement in their reading, writing, and listening ability just like those students also attend a course that includes these skills in the contact hours.
To test this particular hypothesis, two groups of students were compared: an experimental group was taught using all of the contact hours in the first semester for speaking tasks. A control group was taught “normal” – lessons included grammar explanation and examples; reading; writing and listening tasks. Proficiency of the students was tested at the start (Pre-Test) and the end (Post-Test) of their first semester.
MATERIALS AND METHODS
Experimental Design
This study used a Non-Equivalent Groups design with a control group and an experimental group. The experimental group was taught with all the contact hours used for speaking tasks while the control group was given “normal” lessons – including grammar explanation and examples; reading; writing and listening tasks. The participants sat for a pre-test at the start of the semester and a post-test at the end of the semester.
The Participants
A pre-existing, intact group of 59 students taking the same major made up the participants of this course. Students had been allocated to this group by their faculty. For English courses, this university has a maximum class size of 30 and the students are assigned to English course groups alphabetically with the first 30 students in one group and the remaining 29 in the second. The 30 students were designated as the experimental group and the 29 students as the control group.
In terms of the English proficiency, there were some variations between the two groups. The control group had eleven students who obtained Band 1 in MUET, seven obtained Band 2, three obtained Band 3, one obtained Band 4 and another seven whose results were unknown. The experimental group comprised of fifteen students who obtained Band 1, thirteen obtained Band 2, and two whose results were unknown.
The most significant difference between the groups was caused by an imbalance of gender: the control group was made up of 28 female students and only one male student, while the experimental group had a mixture of 14 female students and 16 male students.
The lack of homogeneity between the groups could have effects on the validity of the results; this will be discussed in the Results and Discussion section of this paper. It is crucial to note that the same English instructor taught both the control and experimental groups for the duration of this study.
One Semester of Speaking Tasks – An Experimental Approach with Low Proficiency Students
1587Pertanika J. Soc. Sci. & Hum. 21 (4): 1583 - 1593 (2013)
Details of the Assessments
The students were tested in the first two weeks of the semester in all the four language skills (Pre-Test) and then re-tested in the final week of the semester (Post-Test).
Reading was assessed using two reading passages from a sample MUET paper and the accompanying 15 questions for each test. The reading passages were selected to ensure that the topic was of comparable level of vocabulary for the Pre- and Post-Tests.
As for the Writing tests, each student was required to write a 250-word essay on a sample MUET essay title. The essay titles were chosen so that the topics were of the equivalent level for the Pre-Test and Post-Test. The essays were marked using a marking scheme allocating 10 marks for content, 15 marks for language and 5 marks for organisation.
Meanwhile, the students’ listening ability was tested using a sample IELTS listening paper comprising of 40 questions. The paper consists of four sections: in the first section, students listen to a dialogue from everyday social interaction; in the second, it is a dialogue from an academic setting; the next section is a monologue from a social setting; and the final part has a monologue from an academic setting.
In order to test Speaking, a sample IELTS speaking test was used and testing was carried out along the lines of an IELTS speaking test. This involves a single student meeting with the assessor. The first part of the test is a conversation, the next part is a two-minute monologue by the student
preceded by one-minute preparation time and the final stage is an academic discussion. The speaking test was marked by using the IELTS speaking band descriptors (IELTS Partners, n.d.), and by assigning a mark to each descriptor.
Teaching Approaches
For the experimental group, all the contact hours were used for speaking tasks. The objective of each session was for the students to spend most of their time carrying out one or more spoken dialogue tasks. However, in order to facilitate effective dialogues, vocabulary and grammar necessary for the task were sometimes pre-taught and sometimes the students would listen to a dialogue as a model. Nevertheless, these activities were limited to providing support to the dialogue tasks and were given the minimum time possible in order to keep the dialogue the focus of each session. The experimental group did some writing and reading tasks, as well as grammar exercises for their self-study time outside of the contact hours.
As for the students in the control group, their class time consisted of a more balanced approach that gave time to reading, writing, listening and speaking tasks as well as explanation of grammar and grammar exercises. Although speaking tasks were included in their contact time, it was one component among the other activities.
The semester consisted of 14 weeks during which the students had 3 hours of contact time per week, with a total of 42 hours. In addition, they were assigned self-
Andrew N. Williams and Yah Awg Nik
1588 Pertanika J. Soc. Sci. & Hum. 21 (4): 1583 - 1593 (2013)
study work that lasted about 2 hours per week.
Statistical Tools
As the sample sizes were small and the results of the pre-test, post-test and changes in scores did not conform to a normal distribution, non-parametric tests were used to assess the results. The analyses of pre-test and post-test results compared the scores for the same subject, so the Wilcoxon Sigma rank test was used as the samples are related. In order to assess the difference in changes in the scores between the two groups, the ManWhitney test was used as the samples are unrelated.
RESULTS AND DISCUSSION
The hypothesis of this study was that for students with low English language proficiency in their first semester of university, a teaching approach that uses all the contact hours for speaking tasks in an English course is more effective than a teaching approach that incorporates all the language skills (reading, writing, listening and speaking) and includes teacher-led learning of vocabulary and grammar. In this study, effectiveness was defined as students showing a significant improvement in their ability to speak in English in terms of fluency, accuracy, and vocabulary use; as well as showing as much, or maybe more, improvement in their reading, writing, and listening abilities as those whose course included these skills in the contact hours.
The results are summarised in Table 2. The statistical analysis of the results was
carried out using the Wilcoxon Sigma rank test for the comparison between the pre-test and post-test results and the Man Whitney test for comparing the changes in the scores. The results of this statistical analysis are shown in Table 3, while Table 4 displays the descriptive statistics. Nonetheless, no significant difference was found between the control group and the experimental group, in terms of the change in the scores between Pre-Test and Post-Test. This appears to support the hypothesis that students taught using all their contact hours for speaking tasks will improve in reading, writing and speaking to the same degree as those students who are taught in a class that uses contact time for reading, writing, listening tasks, and grammar exercises as well as speaking tasks. However, the results do not support the hypothesis that the experimental approach will lead to a significant improvement in speaking skills. Although there was a significant increase in the speaking ability in the experimental group, this increase was not significantly different to the increase in the control group.
Although a comparison of the changes in scores between the groups showed no significant difference, it should be noted that there were some interesting results when the groups were individually studied. The experimental group showed a significant increase in speaking test scores, although there was no improvement for those in the control group. The scores of the control group for reading rose significantly while those of the experimental group also improved, although not significantly.
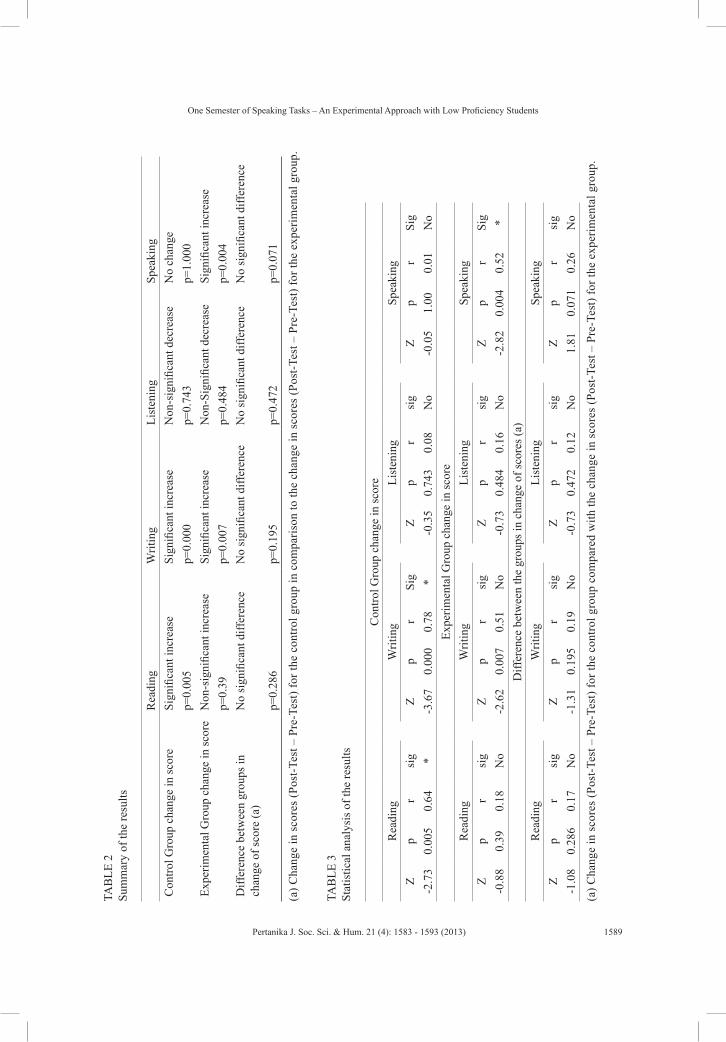
One Semester of Speaking Tasks – An Experimental Approach with Low Proficiency Students
1589Pertanika J. Soc. Sci. & Hum. 21 (4): 1583 - 1593 (2013)
TAB
LE 2
Su
mm
ary
of th
e re
sults
Rea
ding
Writ
ing
List
enin
gSp
eaki
ngC
ontro
l Gro
up c
hang
e in
scor
eSi
gnifi
cant
incr
ease
Sign
ifica
nt in
crea
seN
on-s
igni
fican
t dec
reas
eN
o ch
ange
p=0.
005
p=0.
000
p=0.
743
p=1.
000
Expe
rimen
tal G
roup
cha
nge
in sc
ore
Non
-sig
nific
ant i
ncre
ase
Sign
ifica
nt in
crea
seN
on-S
igni
fican
t dec
reas
eSi
gnifi
cant
incr
ease
p=0.
39p=
0.00
7p=
0.48
4p=
0.00
4D
iffer
ence
bet
wee
n gr
oups
in
chan
ge o
f sco
re (a
)N
o si
gnifi
cant
diff
eren
ceN
o si
gnifi
cant
diff
eren
ceN
o si
gnifi
cant
diff
eren
ceN
o si
gnifi
cant
diff
eren
ce
p=0.
286
p=0.
195
p=0.
472
p=0.
071
(a) C
hang
e in
sco
res
(Pos
t-Tes
t – P
re-T
est)
for t
he c
ontro
l gro
up in
com
paris
on to
the
chan
ge in
sco
res
(Pos
t-Tes
t – P
re-T
est)
for t
he e
xper
imen
tal g
roup
.
TAB
LE 3
St
atis
tical
ana
lysi
s of t
he re
sults
Con
trol G
roup
cha
nge
in sc
ore
Rea
ding
Writ
ing
List
enin
gSp
eaki
ngZ
pr
sig
Zp
rSi
gZ
pr
sig
Zp
rSi
g-2
.73
0.00
50.
64*
-3
.67
0.00
00.
78*
-0.3
50.
743
0.08
No
-0.0
51.
000.
01N
oEx
perim
enta
l Gro
up c
hang
e in
scor
eR
eadi
ngW
ritin
gLi
sten
ing
Spea
king
Zp
rsi
gZ
pr
sig
Zp
rsi
gZ
pr
Sig
-0.8
80.
390.
18N
o-2
.62
0.00
70.
51N
o-0
.73
0.48
40.
16N
o-2
.82
0.00
40.
52*
Diff
eren
ce b
etw
een
the
grou
ps in
cha
nge
of sc
ores
(a)
Rea
ding
Writ
ing
List
enin
gSp
eaki
ngZ
pr
sig
Zp
rsi
gZ
pr
sig
Zp
rsi
g-1
.08
0.28
60.
17N
o-1
.31
0.19
50.
19N
o-0
.73
0.47
20.
12N
o1.
810.
071
0.26
No
(a) C
hang
e in
sco
res
(Pos
t-Tes
t – P
re-T
est)
for t
he c
ontro
l gro
up c
ompa
red
with
the
chan
ge in
sco
res
(Pos
t-Tes
t – P
re-T
est)
for t
he e
xper
imen
tal g
roup
.
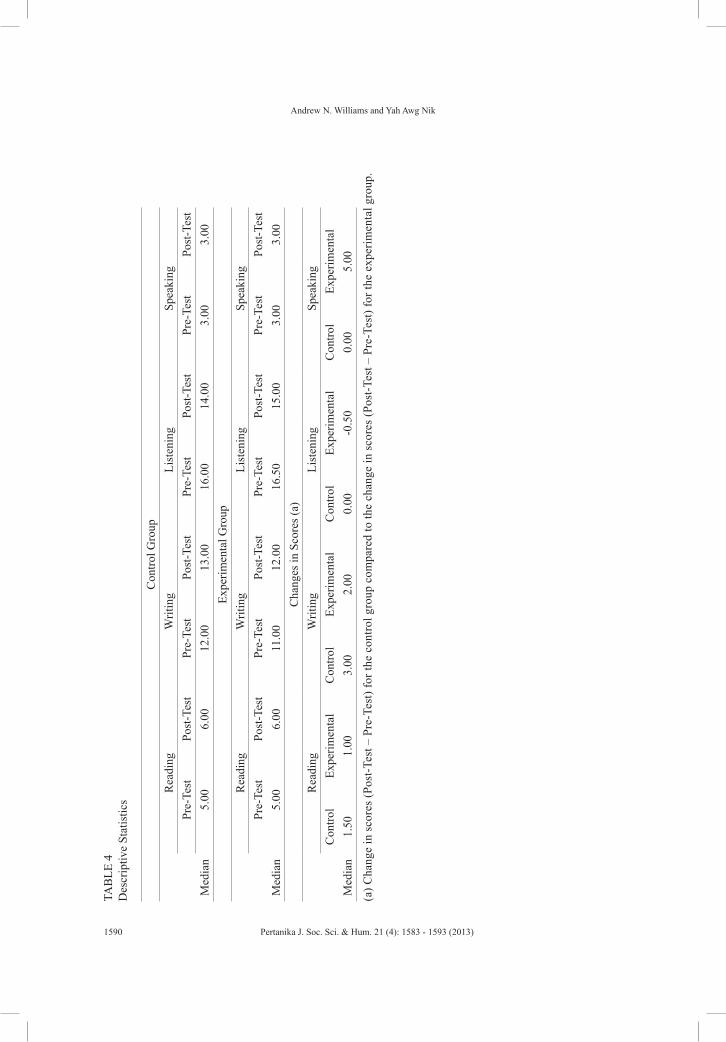
Andrew N. Williams and Yah Awg Nik
1590 Pertanika J. Soc. Sci. & Hum. 21 (4): 1583 - 1593 (2013)
TAB
LE 4
D
escr
iptiv
e St
atis
tics
Con
trol G
roup
Rea
ding
Writ
ing
List
enin
gSp
eaki
ngPr
e-Te
stPo
st-T
est
Pre-
Test
Post
-Tes
tPr
e-Te
stPo
st-T
est
Pre-
Test
Post
-Tes
tM
edia
n5.
006.
0012
.00
13.0
016
.00
14.0
03.
003.
00Ex
perim
enta
l Gro
upR
eadi
ngW
ritin
gLi
sten
ing
Spea
king
Pre-
Test
Post
-Tes
tPr
e-Te
stPo
st-T
est
Pre-
Test
Post
-Tes
tPr
e-Te
stPo
st-T
est
Med
ian
5.00
6.00
11.0
012
.00
16.5
015
.00
3.00
3.00
Cha
nges
in S
core
s (a)
Rea
ding
Writ
ing
List
enin
gSp
eaki
ngC
ontro
lEx
perim
enta
lC
ontro
lEx
perim
enta
lC
ontro
lEx
perim
enta
lC
ontro
lEx
perim
enta
lM
edia
n1.
501.
003.
002.
000.
00-0
.50
0.00
5.00
(a) C
hang
e in
sco
res
(Pos
t-Tes
t – P
re-T
est)
for t
he c
ontro
l gro
up c
ompa
red
to th
e ch
ange
in s
core
s (P
ost-T
est –
Pre
-Tes
t) fo
r the
exp
erim
enta
l gro
up.
One Semester of Speaking Tasks – An Experimental Approach with Low Proficiency Students
1591Pertanika J. Soc. Sci. & Hum. 21 (4): 1583 - 1593 (2013)
One factor that might have affected the results was the choice of the tests used to measure students’ ability. The changes in the language ability over one semester were represented by only very small changes on the MUET and IELTS scales, making marking difficult to do. Many students only improved by half a band or one band on the MUET and IELTS scales, whereas many others did not show any improvement. Alternative standard tests that measure lower levels of language ability and therefore smaller changes could have provided more conclusive results.
There are a number of extraneous factors that could have affected the results. Firstly, the groups were not homogenous; the experimental group had just over 50% male students, while the control group had only one male student. There was no significant difference between the groups in terms of the changes in the scores. It might be hypothesised that if there had been more male students in this group, the results for the control group would have been higher, which would have led to different results. However, informal observations suggest that female students are often more diligent than their male counterparts.
Secondly, although the groups could be expected to be similar as they were an original group divided into two; there was a possibility of errors due to the lack of randomness in the selection of members of the groups. This suggests possible effects of selection maturation, selection history or selection regression. However, considering the situation of these students
learning English, it seems unlikely that their backgrounds have had any serious effect on the results.
Thirdly, the effects observed could be due to the comparative ineffectiveness of teaching in the contact hours for the control group rather than the effectiveness of the method used with the experimental group. In order to rule out this factor, the study would have to be repeated with a number of different teachers participating.
The thesis of this study was based on the assumption that Low Proficiency students have some latent knowledge of vocabulary and grammar. However, in carrying out this study, it was observed that the students in the experimental group often did not have a sufficient grasp of vocabulary to complete the speaking tasks. Moreover, many did not appear to know even some basic high frequency words. This lack of vocabulary was observed to be the biggest impediment to them completing the speaking tasks successfully.
Another factor to be considered is the long-term effects of this experimental approach. The students who were taught using all the contact hours for speaking tasks showed no significant difference in their abilities compared to those who had been taught in the control group; however, this was only over one semester, and there might be long-term effects observed in subsequent semesters. The students in the control group might not have shown a significant difference in their reading, writing and listening abilities as compared to those in the experimental group, but the
Andrew N. Williams and Yah Awg Nik
1592 Pertanika J. Soc. Sci. & Hum. 21 (4): 1583 - 1593 (2013)
first semester might have laid a foundation that would enable them to make more rapid progress than the experimental group in subsequent semesters. Similarly for the experimental group, the effects of doing so much speaking might have given them a significant boost of confidence that could have led to their development of reading, writing and listening skills in subsequent semesters more rapidly than those in the control group.
It should be pointed out that even if this approach is considered effective for the first semester, it could be detrimental to the development of accurate syntax if it was to be extended beyond this period. The approach used in this study could be categorised as a communicative approach and research on communicative classrooms has shown that while the communicative approach is effective in developing fluency, it can result in a limited development of linguistic and sociolinguistic proficiency (Ellis, 2008).
CONCLUSION
Although the results are inconclusive, they do suggest that the approach of using all contact hours for speaking is at least as effective as more traditional approaches. However, various extraneous factors could have affected the results and the long-term effects on the students’ language learning in subsequent semesters have not been studied.
In order to assess if this method is a practical solution to helping Low Proficiency students more accurately, future studies should be carried out with a range of classes
and a variety of teachers. Meanwhile, assessment materials more suited to students with low proficiency would probably give a clearer view of the effectiveness of this approach.
Although inconclusive, the significant improvement in speaking results and the fact that the students improved equally in other areas as those taught in a more traditional approach is good enough to suggest that this may be a promising approach to helping students with low proficiency, and thus merits further study.
REFERENCESAhmad, A. (2011). Language Learning Sytle
Preferences of Low English Proficiency (LEP) Students in Tertiary Education. Malaysian Journal of ELT Research , 7(2), 33-62.
Murali, R. S. N., & Lai, A. (2012, March 18). DPM urges youth to acquire more skills. The Star. Retrieved from http://thestar.com.my
Education system not producing thinking graduates, say experts. (2012, March 4). The Star. Retrieved from http://thestar.com.my
Ellis, R. (2008). The Study of Second Language Acquisition.Oxford: Oxford University Press.
IELTS Partners. (n.d.). IELTS Speaking band descriptors (public version). Retrieved March 23, 2008, from IELTS: http://www.ielts.org/PDF/UOBDs_SpeakingFinal.pdf.
Ismail, D. N. (2011). Graduates’ Characteristics and Unemployment: A study among Malaysian Graduates. International Journal of Business and Social Science , 2(16), 94-102.
Malaysian Examinat ions Counci l . (2006) . Examinations: MUET Regulations, Test Specifications, Test Format and Sample Questions. Retrieved August 3, 2011, from
One Semester of Speaking Tasks – An Experimental Approach with Low Proficiency Students
1593Pertanika J. Soc. Sci. & Hum. 21 (4): 1583 - 1593 (2013)
Malaysian Examinations Council: http://mpm.edu.my.
Mathai, E. J., Janian, L. S., & Nair, S. (2008). Assessing Malaysian University Students’ English Vocabulary Knowledge. In W.S. Khanittanan (Ed.), SEALSXIV: papers from the 14th meeting of the Southeast Asian Linguistics Society (2004), Volume 1, pp. 219-237. Canberra: Pacific Linguistics.
Shah, P. (1999). Perceptions of Malaysian ESL Low Achievers About English Language Learning. Unpublished doctoral thesis, University of Connecticut, Connecticut.
Thang, S. M., & Alias, A. (2006). Investigating readiness for autonomy: A comparison of Malaysian ESL undergraduates of three public universities. Reflections on English Language Teaching , 6(1), 1-18.
Thang, S., & Wong, F. F. (2005). Teaching Styles of Malaysian ESL Instructors: An Investigation into Current Practices and Implications to English Language Teaching (ELT). Journal of Language Teaching, Linguistics and Literature, 10, 49-64.

Pertanika J. Soc. Sci. & Hum. 21 (4): 1595 - 1608 (2013)
ISSN: 0128-7702 © Universiti Putra Malaysia Press
SOCIAL SCIENCES & HUMANITIESJournal homepage: http://www.pertanika.upm.edu.my/
Article history:Received: 25 October 2011Accepted: 28 August 2012
ARTICLE INFO
E-mail address: [email protected] (Maosheng Hung) * Corresponding author
Common Patterns of Learner Characteristics Displayed by More Proficient EFL Learners
Maosheng Hung* and Ying Shing HungDepartment of Applied English, Ming Chuan University, Taoyuan, Taiwan
ABSTRACT
This qualitative research primarily explored the common patterns of three learner characteristics (i.e., motivation, learning styles, and learning strategies) shown by more proficient Taiwanese EFL learners based on their language learning experiences. The participants of this study were ten non-English-major sophomores who attended the same English Honours programme at a private university in the northern part of Taiwan. Each of these more proficient language learners was given an in-depth interview to gain information required to answer the research questions of this study. The obtained results showed that: (1) the participants were both integratively- and instrumentally-motivated learners; (2) the major learning style preferences of the participants tended to be more visual and auditory; and (3) the main learning strategies the participants frequently used when learning English included meta-cognitive strategies, memory strategy, cognitive strategies, and social strategies. Through these findings, EFL or any other language instructors could better understand what makes a proficient language learner, followed by developing appropriate teaching approaches and materials to assist their students to attain a good level of language proficiency.
Keywords: Learning strategy, learning style, motivation
INTRODUCTION
Background
With an understanding of the fast development of globalization and prompt growth of technology, it is clear that people from all over the world have more chances to speak with each other. Therefore, obtaining a second language (L2) ability
Maosheng Hung and Ying Shing Hung
1596 Pertanika J. Soc. Sci. & Hum. 21 (4): 1595 - 1608 (2013)
is extremely craved especially if the L2 skill is to be very striving in the career or any opportunities. However, research has pointed out that success or failure in second/ foreign language (FL) learning may result from numerous factors such as onset age of learning, length of learning, teaching methods and so forth (Baker & Trofimovich, 2006; Bialystok, 1997; Cadierno, 1995). Since no single factor can explain any language learning process, many researchers have transferred their research focus to learners’ individual characteristics such as motivation (e.g. Dembo & Seli, 2008; Dornyei, 2001; Gardner, 1985), learning strategies (Nunan, 1996; Reid, 1996), as well as learning styles (Lan & Oxford, 2003; Sy, 2003).
Motivation
Motivation is a term that describes people’s driving force to complete various activities. It directs a large portion of what people want to do and how well people do it. Brown (1994) defines motivation as “the extent to which you make choices about (a) a goal to pursue and (b) the effort you will devote to the pursuit” (p. 34). Johnson (1979) explained it as the “tendency to expend effort to achieve goals” (p. 283). According to the definition of Dörnyei (2001a), it is an idea of “why people decide to do something, how long they are willing to sustain the activity and how hard they are going to pursue it” (p. 8). These definitions all suggest that motivation is one of the important steps toward learning success.
Gardner and Lambert (1972) classified language learning motivation into two categories: integrative orientation and instrumental orientation. From their point of view, learners with integrative orientation extremely desire to learn the culture of the community of the target language and endeavour to participate in it. In contrast, learners with instrumental orientation tend to learn a L2 for practical purposes such as career advancement or passing examinations.
Gardner and Lambert’s motivation model only emphasizes the social aspects of learning rather than educational psychology. Hence, many researchers have attempted to modify it, and one revised version that has received much attention comes from Deci’s (1975) account of intrinsic and extrinsic motivation activities. He described intrinsic motivation activities as the ones for which there is no apparent reward except the activities themselves. People engage in the activities just for their own sake. Extrinsic motivation activities, on the other hand, are commenced by an external reward such as money or prizes.
Another framework of motivation that is specifically dealt in the classroom was proposed by Dörnyei (2001). This model consists of three components, namely, the language level, the learner level, and the learning situation level. The language level focuses on “orientations and motives related to various aspects of the L2” (p. 18). The learner level is concerned with internal and affective traits of language learners. Motivation at the learning situation level is
Common Patterns of Learner Characteristics Displayed by More Proficient EFL Learners
1597Pertanika J. Soc. Sci. & Hum. 21 (4): 1595 - 1608 (2013)
affected by various intrinsic and extrinsic motives.
Although so many modified versions of Gardner and Lambert’s motivation theory have appeared, many language researchers still have the tendency to adopt Gardner’s (1985) Attitude/Motivation Test Battery (AMTB) when investigating and explaining learners’ learning motivation. For example, Chang (2003) explored the types of learning motivation (i.e., intrinsic motivation and extrinsic motivation) shown by 334 EFL (English as a foreign language) learners at various colleges of technology in southern Taiwan. The research data were collected from questionnaires adapted from Gardner’s AMTB. The results of the study showed that the participants were inclined to be extrinsically-motivated in learning English. Another study conducted by Warden and Lin (2000) adopted Gardner’s integrative/instrumental orientations to explore what motivational inclination EFL learners at universities of technology in Taiwan tended to display in their English learning. The study found that Taiwanese technology college students considerably lacked integrative motivation because their language learning only happened in the classroom.
Learning Style
Research has indicated that learners may enjoy learning more when they are instructed with ways that consider their learning style preferences (Dunn et al., 1989). Thus, learning style, like motivation, is also a critical element in the investigation
of learners’ learning success. According to Cornett (1983), learning styles are “the overall patterns that give general direction to learning behavior” (p. 9). Davis (2001) defined them as “individuals’ characteristic and preferred ways of gathering, interpreting, organizing, and thinking about information” (p. 185). In addition, Durodoye and Hildreth (1995) described them as “a consistent pattern of behavior and performance by which an individual approaches educational experiences” (p. 242). However, there is no certain learning style that can be inferred to be better than or superior to others. Learning styles are developed normally based on each person’s personality and preferred approach of how they like receiving new information (Brown, 2007).
Among all the learning-style-related research, the experiential learning style model of Kolb (1984) and the learning style theory of Reid (1987) are the main frameworks that are most frequently used to define and categorize learners’ learning styles. In terms of Kolb’s model, there are four dimensions: Concrete Experience (CE), Abstract Conceptualization (AC), Active Experimentation (AE), and Reflective Observation (RO). The four dimensions further classify learners into four types of learning style according to whether learners receive information by concrete experience or abstract conceptualization and whether learners assimilate the information they receive by active experimentation or reflective observation. The four types of learning style include Accommodator, Diverger, Assimilator, and Converger.
Maosheng Hung and Ying Shing Hung
1598 Pertanika J. Soc. Sci. & Hum. 21 (4): 1595 - 1608 (2013)
Accommodators prefer doing and feeling to thinking and watching. Convergers are fond of low-risk active learning. Assimilators favour lectures with some demonstrations and like to reflect what they observe into their learning methods. Divergers prefer learning by logical instruction and diverging from one experience to multiple possibilities.
With regard to Reid’s theory, she surveyed 1388 non-native speakers from nine different language backgrounds in the United States about their learning style preferences in 1987. The survey was conducted by adopting the Perceptual Learning Style Preference Questionnaire (PLSPQ) designed by Reid herself. The questionnaire primarily investigated learners’ four perceptual (namely, visual, auditory, kinesthetic, and tactile) and two social (i.e., individual and group) learning style preferences. Based on her explanation, visual learners learn effectively through their eyes, auditory learners through their ears, kinesthetic learners through whole body involvement, and tactile learners through hands-on experiences. Moreover, individual learners learn effectively when they are alone, and group learners when they learn with others as a team.
Reid’s (1987) findings indicated that kinesthetic and tactile learning styles were the learning styles ESL learners particularly preferred, and group learning was the one both ESL and native English speakers least preferred. In addition, Reid also found that learners from different cultural backgrounds preferred different learning styles. Learners’ style preferences also varied with their
gender, age, proficiency level, major, length of living and learning English in the states.
Learning Strategy
After reviewing the literature on learning motivation and styles, the focus here falls on learning strategies. According to the definition of Weinstein and Mayer (1986), learning strategies are “behaviors and thoughts that a learner engages in during learning and that are intended to influence the learner’s encoding process” (p. 315). Oxford (1990) indicated that learning strategies are especially significant for language learning because “they are tools for active, self-directed involvement, which is essential for developing communicative competence” (p. 1). Furthermore, Oxford and Crookall (1989) described learning strategies as “steps taken by the learner to aid the acquisition, storage, and retrieval of information” (p. 404). However, learners have been found to use different learning strategies in their language learning (see Ehrman & Oxford, 1990; O’Malley et al., 1985). Meanwhile, learners of different genders, motivations, and learning styles adopt different learning strategies or specific actions to help them learn (Ehrman & Oxford, 1990; O’Malley et al., 1985; Oxford & Nyikos, 1989; Sy & Lious, 1994).
Many categories of language learning strategies have been identified by different researchers such as indirect and direct learning strategies (Oxford, 1985; Rubin, 1981) as well as social-affective strategies (O’Malley et al., 1985). However, the most comprehensive classification system of
Common Patterns of Learner Characteristics Displayed by More Proficient EFL Learners
1599Pertanika J. Soc. Sci. & Hum. 21 (4): 1595 - 1608 (2013)
language learning strategies was created by Oxford (1990). According to Oxford’s classification, there are two main categories, and each is further divided into three different learning strategies, namely, direct strategies (memory, cognitive, and compensation strategies) and indirect strategies (meta-cognitive, affective, and social strategies). Oxford and Crookall (1989) explained that memory strategies are techniques that are specially tailored to help learners store new information in memory and retrieve it later. Meanwhile, cognitive strategies are skills that involve manipulation or transformation of the language in some direct way such as reasoning, note taking. Compensation strategies are the behaviours used to compensate for missing knowledge of some kind such as guessing or using synonyms or circumlocution. Meta-cognitive strategies are behaviours for centring, arranging, planning, and evaluating one’s learning. Affective strategies are techniques like self-reinforcement and positive self-talk which help learners gain better control over their emotions, attitudes, and motivations related to language learning. Social strategies are actions involving other people in the language learning process.
Oxford’s classification of language learning strategies is frequently utilized to investigate and define the learning strategies that different types of language learners tend to use in their learning process. For instance, Lan and Oxford (2003) pointed out that elementary school learners with a higher English proficiency level in northern Taiwan used cognitive, compensation,
meta-cognitive, and affective strategies more often than those with a lower English proficiency level. Liao (2000) studied Taiwanese secondary school EFL learners’ learning motivation and strategies. The results showed that the extrinsically-motivated learners used social and meta-cognitive strategies more frequently than the intrinsically-motivated ones.
From the discussion above, a great number of past studies on learning motivations, styles, and strategies collected data primarily via the use of questionnaires or surveys. Other research approaches (such as interviews, etc.) were barely utilized. In addition, most of these past studies (for instance, Reid, 1987; Warden & Lin, 2000) mainly focused on the individual differences of learners’ characteristics. A few studies were conducted to examine the common features of learners’ characteristics displayed by high-proficiency language learners. As a result, in order to understand whether different data-collecting methods would lead to more accurate identification and detailed description of learner characteristics and to provide insights into what usually makes a good language learner, the current research used interviews to explore the common patterns of learning motivations, styles, and strategies shown by ten Taiwanese college EFL students who were more proficient in English speaking and listening than other normal students at the same school.
RESEARCH QUESTIONS
In accordance with the study purpose above, the researchers expected to answer the
Maosheng Hung and Ying Shing Hung
1600 Pertanika J. Soc. Sci. & Hum. 21 (4): 1595 - 1608 (2013)
following questions:
1. What are the common styles of motivation displayed by the ten more proficient Taiwanese university EFL students in the process of their English learning?
2. What are the common learning styles shown by the ten more proficient Taiwanese university EFL students in the course of their English learning?
3. What are the common learning strategies employed by the ten more proficient Taiwanese university EFL students when they study English?
METHODOLOGY
Sample
The participants of this study were all recruited from an English Honours class at a private university in northern Taiwan. This English Honours class was composed of twenty-one students, with all of them had better listening and speaking proficiencies than the students in other regular English classes. Ten out of the twenty-one students in the class were randomly selected for an in-depth interview that primarily investigated the features that made them become more proficient English learners. The ten selected participants were all females and aged around nineteen or twenty years at the time of this research. They were studying in different departments at the university such as Department of Commercial Design (Judy, Elvira, Annie, Trisha, Claire, and Cathy), Department of Information Management
(Angel), Department of Biotechnology (Betty), and Applied Chinese Department (Cindy and Amy).
Data Collection
The major research method utilized to seek answers to the research questions of this study was ten individual semi-structured interviews. Each interview lasted around 20 to 30 minutes and was undertaken in a quiet and comfortable classroom on the campus of the university, where the participants were studying. The in-depth interview consisted of five main open-ended questions (see Appendix) that specifically focused on the investigation of the three learners’ characteristics (i.e., learning motivation, learning styles, and learning strategies) of the participants during their English learning process. Before formally asking the participants the questions, the researchers normally spent a few minutes chatting with them and this was done to create a relaxing environment and atmosphere so that they could elaborate more on their responses. While chatting with the participants, the researchers first introduced themselves and then asked for the students’ agreement to audio-record the interviews. This followed the contention of Rubin and Rubin (2005) that “the researcher needs to keep a record of what was said for later analysis” (p. 110). In addition, when each interview was actually administered, the researchers would tactfully rephrase the questions if any of the interviewees had difficulties understanding them. Just as Rubin and Rubin (2005) pointed out, reassuring the conversational
Common Patterns of Learner Characteristics Displayed by More Proficient EFL Learners
1601Pertanika J. Soc. Sci. & Hum. 21 (4): 1595 - 1608 (2013)
partners tactfully may help increase their confidence in answering questions.
Procedure
The current study was carried out in the following steps. When this study was started, the researchers attempted to recruit ten students from a sophomore English Honours class at a private university in northern Taiwan as the participants. Then, the purpose of this study was explained to these ten randomly selected participants. They were also informed that the results of this study might provide insights and guidelines to help other English learners to improve their English proficiency. Next, the researchers made an appointment with each participant for an in-depth individual interview. The interview date and time were determined based on the participant’s schedule, and all the interviews were administered on the basis of the research questions of this study. In order to extract accurate and absolute information from the participants, the individual interviews were totally conducted in the participants’ native language, i.e. Mandarin Chinese. These interviews were all audio-recorded, and the recordings were later transcribed into Chinese for further categorization and analysis.
Data Analysis
After all the interviews had been completed and transcribed into Chinese, the researchers started to analyze the collected data. First, the researchers read through the transcripts thoroughly as the preparation for coding.
Second, the researchers divided each transcript into categories according to the interview questions. Next, the researchers extracted and recognized significant and relevant statements and concepts from each category. Afterwards, these statements and concepts were grouped into themes by marking with different labels. After the researchers had physically coded the interview transcripts, labels marked as ideas that described their motivation and thematic categories allowed the researchers to carry out a coherent and analytic work and to examine for the common features in the way the themes represented.
RESULTS AND DISCUSSION
Learners’ Characteristics
Motivation
Based on the ten individual interviews, two major purposes that motivated the participants to learn English well were found: 1) to get a decent job and 2) to be able to communicate with people from other countries. Based on the classification of Gardner and Lambert (1972), the participants were both instrumentally and integratively motivated language learners, and their consideration of getting a good job in the future and being able to speak with foreign people was the main attribute.
In terms of showing instrumental motivation, all the participants of the present study were particularly aware that learning English is very important for their future success in career. They had reached the age at which they might see the benefits
Maosheng Hung and Ying Shing Hung
1602 Pertanika J. Soc. Sci. & Hum. 21 (4): 1595 - 1608 (2013)
of acquiring an English ability. Unlike the compulsory English subject in high schools, English at this point plays a more serious and purposeful role in their studies. The primary goal of acquiring an English ability for them was to get a decent job after their graduation from university. Therefore, they are more motivated to acquire the language skill, and learning English has become attractive to them. The participants, Cathy, Claire, Elvira, Cindy, and Judy all pointed out in the interviews that the concern of better job opportunities in the future was the major trigger that motivated them to master English. Cathy took herself as an example and explained why she was eager to gain a certain level of English ability. She said that “as I am majoring in commercial design, English plays an important part in my future career.” Cathy indicated that it would be difficult to define the border of design and further mentioned that “to well-design and promote an international item, it is necessary to understand the culture of a country and to be able to introduce the design conception and communicate with people in the international language, English.” Meanwhile, Elvira stated that:
I think that the number of people who have this specialty is limited. And I also think having an English ability also means having an advantage. If you have this tool and professional specialty, there is a positive possibility to get a better job in the future.
Claire, like Elvira, also regarded English ability as a specialty to earn a good job. She stated that “to get a better job with this specialty, you are supposed to have some certificates such as GEPT.” She also mentioned that taking care of her current studies, being able to travel, and being interested in English motivated her to be a successful English learner.
During the interviews with the participants, some of them also reported that they were willing to seek for opportunities to use the English language with native speakers. They very much enjoyed having interactions with the native speakers because they could use the opportunities to practice the language. The participants realized the values of being communicative in the language such as making friends, being able to travel alone, and admiring other cultures. Therefore, they were also integratively-motivated to learn the language. For instance, Elvira described that “making friends, practicing English, and understanding foreign cultures are my purposes to learn English.” Moreover, Annie said:
I realized that I could not do anything when I was young travelling with parents. At that time, I knew English played a vital role because I wished to be able to communicate with people and be their friends.
One motive for Amy to become a successful English learner was that she

Common Patterns of Learner Characteristics Displayed by More Proficient EFL Learners
1603Pertanika J. Soc. Sci. & Hum. 21 (4): 1595 - 1608 (2013)
enjoyed watching English movies and wanted to be able to understand their humours and plots. She said, “My mother frequently took me for English movies when I was young. Therefore, I was deeply affected by the characters’ pronunciation in the movies and could speak in the same tone.” In Betty’s case, she got motivated to learn English by some American born Chinese pronunciation. She said:
My motivation to learn English is simple. When I was young, I saw some American born Chinese speak English. At that moment, I thought they were cool because they spoke English very fluently. Since then, I told myself to learn English well and to speak as well as them.
In sum, nearly all the participants in this study showed that they were both instrumentally and integratively motivated English learners. However, considering getting a decent job after graduation from university seemed to be a more important motive for them to learn English well.
Learning Style
The ten more proficient EFL learners in this study continued to express in the interviews that visual and auditory were their major learning style preferences (based on the model of Reid, 1987). Betty mentioned that “visual images could help memorize information”. Amy stated that “visual learning has a great impact on the learning outcome”. Elvira further described that
learning based on visual input helped her think seriously, especially when reading articles or answering questions on test sheets. She said, “I learn more when reading books with pictures and reading words.” She also stated that “If it is related to exams and grades, I would think about the questions and contents seriously.”
In addition to visual learning style, the ten participants also talked about their preference for auditory learning style when learning English. All of them explained that their learning also involved their ears. Amy said, “Auditory has a great influence on learning. For me, there is no television at home, so I have to go to my aunt’s place to watch TV. Hence, I listen to ICRT and radio more often.” Elvira stated, “Reading subtitles and listening to the pronunciation while watching English movies helped me understand new information.” Judy expressed that listening to the pronunciation of new words made it easier for her to remember the words.
From the statements given by the participants of the current study, it was apparent that all the participants showed two common types of learning styles (namely, visual and auditory) when learning English. Moreover, the ten interviewees expressed in the interviews that they enjoyed meeting foreign people and tried to learn from them different ways of looking at things. To them, learning from different people’s personal experiences and interaction with native speakers normally eased their English learning process. This piece of evidence also suggested that the ten more efficient EFL learners tended to be extroverted learners.
Maosheng Hung and Ying Shing Hung
1604 Pertanika J. Soc. Sci. & Hum. 21 (4): 1595 - 1608 (2013)
Learning Strategy
Another finding of this study showed that the common learning strategies more frequently employed by the more proficient EFL participants during their English learning process were meta-cognitive strategies, memory strategies, social strategies, and cognitive strategies.
First of all, the ten participants would normally seek opportunities to practice English. Amy said, “…being brave and open-minded to speak with native speakers helped me learn English.” Angel also said, “I like to seek opportunities to speak with foreign teachers.” Cindy stated that “to learn English well, it requires practicing more, speaking more, and listening more.” She further explained that “to be more specific, using “executive control” strategy such as making plans on calendars over the learning process is important and effective. I supervise myself to follow the studying schedules I planned and to reach the goals as planned.” Furthermore, Trisha said, “going to English cram school also helps learners learn English. The sophomore English Honours Programme (EHP) is sort of like the cram school. EHP provides an English speaking environment for learners who want to practice speaking.” According to the explanation of Oxford and Crookall (1989), behaviours used for centring, arranging, planning, and evaluating one’s learning are classified as meta-cognitive strategies. That is to say, all the ten participants had applied meta-cognitive strategies (for instance, making study plans, going to cram schools, seeking practice opportunities…) in their English learning process.
All the respondents also reported that watching English movies, TV programmes, and/or videos helped improve their English learning. Cindy said that “learning through audio-visual mediums provides English learners with a more abundant and actual language learning environment.” In other words, audio-visual mediums not only present real English in meaningful contexts and situations but also provide an authentic culture look behind the language. Elvira said, “I listen carefully and read subtitles when I watch English movies. Then I will link the images with the sounds to remember new words.” Annie said, “the strategy I frequently use is to watch a movie without the subtitle and then listen and watch carefully once. Later, watch it again with the subtitle, so I will know where I don’t understand and try to match the images with the sounds to help me learn.” According to Oxford and Crookall (1989), the strategies the participants used to create mental linkages with sounds and images from movies and help themselves remember new words and sounds are called memory strategies.
Based on the results of this study, besides the aforementioned meta-cognitive and memory strategies, other common strategies the participants frequently used to learn English included cognitive strategies and social strategies. For example, Claire mentioned, “I enrolled in English cram schools to prepare for my English proficiency tests because cram schools provided me with some authentic and mock test questions.” Angel and Elvira liked to take notes when they learned new English
Common Patterns of Learner Characteristics Displayed by More Proficient EFL Learners
1605Pertanika J. Soc. Sci. & Hum. 21 (4): 1595 - 1608 (2013)
words or sentences. Angel said, “I write down some good sentences when I read, so I can apply them to my writing.” Meanwhile, Elvira stated that “I take notes of slang and aphorisms I see in the girl’s restroom to improve my English.”
As for the social strategies used by the participants, most of them mentioned that speaking with native speakers or friends helped them to practice English. Amy asserted that “I like to learn from talking with foreign friends or classmates.” Annie said, “I like to talk to native speakers, but I would rephrase the conversation in my own words to confirm with the person I speak to when I don’t understand some words.” In contrast, Angel said, “I would ask directly if I don’t understand some parts of the conversation in order not to misunderstand.” The participants tried to seek the opportunities to use English and practice it by communicating directly in the language. Moreover, they also liked to interact with people during their learning and ask questions when they did not understand the content of any conversation.
Other than the strategies mentioned above, some participants also used compensation strategies and affective strategies. For example, Cathy, Elvira, and Amy used English synonyms to replace the words they did not know in the process of their English learning. Elvira and Trisha looked up new vocabulary in the dictionary or guessed the meaning of the words they were not familiar with while reading articles. Amy and Cindy were not afraid of making mistakes while using English with
native speakers because they thought that it could help them enhance their language skills. Judy reported that receiving praises from others and being positive in learning helped her learn English better.
CONCLUSION
The participants in this study showed some similar patterns of their learning motivation, styles, and strategies in relation to English learning. The participants’ learning motivation could be classified as instrumental motivation and integrative motivation. The former one was mainly represented by their strong desire to get a good job after graduation, and the latter one by their eagerness to be able to communicate with international communities. However, language learning success correlates not only with learning motivation but also with learning styles and learning strategies. The results of the present research also indicated that the ten participants shared common learning style preferences when learning English. In more specific, they preferred both visual and auditory representations of learning materials. Learning English through seeing and listening seemed to be effective for them. Moreover, to acquire good English proficiency, the participants voluntarily participated in extracurricular English programmes and adopted some learning strategies. The learning strategies they commonly and frequently used were meta-cognitive, memory, social, and cognitive strategies. These findings could help English or any other language instructors to better understand what makes
Maosheng Hung and Ying Shing Hung
1606 Pertanika J. Soc. Sci. & Hum. 21 (4): 1595 - 1608 (2013)
a proficient language learner, as well as to be able to use appropriate teaching approaches and materials to assist their students to achieve a good level of language proficiency.
At the end of this paper, one suggestion could be proposed for future studies. The number of the participants in this study was relatively small. In addition, the ten participants were all females and restricted to a single university’s sophomores. Thus, they could not represent all the EFL learners in Taiwan or even in other countries. Thomas (2001) stated that “the folk psychology of one culture can differ from the folk psychology of another” (p. 7). Therefore, more participants of both males and females from different levels of school and cultures should be incorporated as a more representative sample. By doing so, more valid and reliable results might be gained.
REFERENCESBaker, W., & Trofimovich, P. (2006). Perceptual paths
to accurate production of L2 vowels: The role of individual differences. International Review of Applied Linguistics, 44(3), 231-250.
Bialystok, E. (1997). The structure of age: In search of barriers to second language acquisition. Second Language Research, 13(2), 116-137.
Brown, H. D. (1994). Principles of Language Learning and Teaching (3rd Ed.). New Jersey: Prentice Hall Regents.
Brown, H. D. (1994). Principles of Language Learning and Teaching (5th Ed.). New Jersey: Prentice Hall Regents.
Cadierno, T. (1995). Formal instruction from a processing perspective: An investigation into
Spanish past tense. Modern Language Journal, 79, 179-193.
Chang, C. Y. (2003). An investigation of language learning motivation among EFL learners at technology college in Taiwan-A case study of EFL learners at Far East College. Journal of Far East College, 20(4), 915-926.
Cornett, C. (1983). What You Should Know about Teaching and Learning Styles. Bloomington, IN: Phi Delta Kappa.
Davis, B. (2001). Tools for teaching. San Francisco, CA: Jossey-Bass.
Deci, E. L. (1975). Intrinsic Motivation. NY: Plenum Press.
Dembo, M. H., & Seli, H. (2008). Motivation and learning strategies for college success: A self-management approach (3rd ed.). NJ: Lawrence Erlbaum.
Dörnyei, Z. (2001). Teaching and researching motivation. London: Pearson Education.
Dörnyei, Z. (2001). Motivational strategies in the language classroom. Cambridge: Cambridge University Press.
Dunn, R., Dunn, K., & Price, G. (1989). Learning style inventory manual. Lawrence, KS: Price Systems.
Durodoye, B., & Hildreth, B. (1995). Learning styles and the African American student. Education, 116(2), 241-247.
Ehrman, M., & Oxford, R. (1990). Adult language learning styles and strategies in an intensive training setting. Modern Language Journal, 74, 311–326.
Gardner, R. (1985). The Attitude/Motivation Test Battery: Technical Report. Retrieved from http://publish.uwo.ca/~gardner/docs/AMTBmanual.pdf.
Gardner, R. C., & Lambert, W. (1972). Attitudes and motivation in second language learning. Rowley, MA: Newbury House.
Common Patterns of Learner Characteristics Displayed by More Proficient EFL Learners
1607Pertanika J. Soc. Sci. & Hum. 21 (4): 1595 - 1608 (2013)
Johnson, D. W. (1979). Educational psychology. Englewood Cliffs, NJ: Prentice Hall.
Kolb, D. A. (1984). Experiential learning: experience as the source of learning and development. Englewood Cliffs, NJ: Prentice Hall.
Lan, R., & Oxford, R. L. (2003). Language learning strategy profiles of elementary school students in Taiwan. IRAL: International Review of Applied Linguistics in Language Teaching, 41(4), 339-379.
Liao, Y. F. (2000). Taiwanese secondary school students’ learning motivation and language learning strategies in EFL learning. Proceedings of the 12th National Conference on Linguistics, Taipei, 155-183.
Nunan, D. (1996). Learner strategy training in the classroom: An action research study. TESOL Journal, 6(1), 35-41.
O’Malley, J. M., Chamot, A. U., Stewner-Manzanares, G., Russo, R. P., & Kupper, L. (1985). Learning strategies used by beginning and intermediate ESL students. Language Learning, 35, 21-46.
Oxford, R.L. (1985). A new taxonomy for second language learning strategies. Washington, DC: ERIC Clearinghouse on Language and Linguistics.
Oxford, R. L. (1990). Language learning strategies: What every teacher know. Boston, MA: Heinle & Heinle.
Oxford, R. L., & Crookall, D. (1989). Research on language learning strategies: methods, findings, and instructional issues. Modern Language Journal, 73, 403-419.
Oxford, R. L., & Nyikos, M. (1989). Variables affecting choice of language learning strategies by university students. Modern Language Journal, 73, 291-300.
Reid, J. M. (1987). The learning style preferences of ESL students. TESOL Quarterly, 21, 87-111.
Reid, J. M. (1996). A learning styles unit for the intermediate ESL/EFL writing classroom. TESOL Journal, 6(1), 42-47.
Rubin (1981). Study of cognitive processes in second language learning. Applied Linguistics, 11, 117-131.
Rubin, H. J., & Rubin, I. S. (2005). Qualitative interviewing: the art of hearing Data. (2nd Ed.). Thousand Oaks, CA: Sage.
Sy, B. M. (2003). The language learning styles and strategies of Chinese EFL students. Selected Papers from the Twelfth International Symposium on English Teaching, Taipei, Taiwan, 521-531.
Sy. B. M., & Lious, S. T. (1994). Sex differences and language learning strategies. Proceedings of the Eleventh Conference on English Teaching and Learning in the Republic of China, Taipei, 19-51.
Thomas, R. M. (2001). Folk psychologies across cultures. Thousand Oaks, CA: Sage.
Warden, C. A., & Lin, H. J. (2000). Existence of integrative motivation in an Asian EFL setting. Foreign Language Annals, 33, 535-547.
Weinstein, C. E. and Mayer, R. E. (1986). The teaching of learning strategies. In M. C. Wittrock (Ed.), Handbook of research on teaching (3rd Ed.). New York: Macmillan

Maosheng Hung and Ying Shing Hung
1608 Pertanika J. Soc. Sci. & Hum. 21 (4): 1595 - 1608 (2013)
APPENDIX
Interview Questions
1. What do you think of learning English in Taiwan?
2. What is/are the reason(s) that motivate(s) you to learn English well?
3. What do you think your learning style(s) is/are during your English learning process? Please describe it/them in detail.
4. What are the learning strategies that you often use when learning English?
5. What are other factors that you think are important and the key elements to your learning success? Please describe them in detail.
Pertanika J. Soc. Sci. & Hum. 21 (4): 1609 - 1620 (2013)
ISSN: 0128-7702 © Universiti Putra Malaysia Press
SOCIAL SCIENCES & HUMANITIESJournal homepage: http://www.pertanika.upm.edu.my/
Article history:Received: 25 October 2011Accepted: 28 August 2012
ARTICLE INFO
E-mail address: [email protected] (Natasha Pourdana) * Corresponding author
EFL Teacher Education: Where Do Trainers’ and Trainees’ Criteria Match?
Natasha Pourdana* and Sayyed Mohammad Karimi BehbahaniDepartment of English Translation, Faculty of Literature and Foreign Languages, Islamic Azad University, Karaj Branch, Iran
ABSTRACT
Despite chronic and widespread concerns about professional abilities of EFL teachers and the success of teacher education programmes, surprisingly little attention is paid to how these abilities are being evaluated and whether trainers and trainees agree upon shared evaluation criteria. Elsewhere, it is often observed that EFL teachers at different levels of elementary, high school and university are being evaluated in entirely different ways, ranging from a strict interventionist evaluation often in case of elementary school teachers to an empowering autonomy in favour of university instructors. This work, therefore, intended to make a descriptive study of the current state of affairs in how evaluation takes places in EFL teacher education programmes in Iran and to collect and categorize pre-service trainees’ feedback to evaluation, in an attempt to shed light on some major mismatch areas between EFL trainers and trainees. Results indicated that many trainees were evaluated not by how they trained to be effective teachers, but by how they performed during training sessions as students. The required data were obtained from a variety of qualitative resources, including interviews and questionnaires, in a teacher education programme held at Islamic Azad University, Karaj Branch-Iran in 2011.
Keywords: Teacher education, EFL, evaluation, feedback, trainers, trainees
INTRODUCTION
English as Foreign Language (EFL) teacher evaluation takes place before, during and after pre-service education; all regarded as common types of assessing the degrees of course achievement and the current means of ensuring quality in teaching education profession. As a result, it is expected that
Natasha Pourdana and Sayyed Mohammad Karimi Behbahani
1610 Pertanika J. Soc. Sci. & Hum. 21 (4): 1609 - 1620 (2013)
strict admission criteria are established to make sure that only eligible candidates will be selected (Lyons, 2006). In addition, concise and calibrated evaluation criteria are the prerequisites to standardize the coursework and teacher preparation methodology which meet trainee-trainers’ needs. There is also a need for establishing explicit criteria to evaluate trainees’ practicum experience supported by follow-up diagnostic feedback to help them overcome their weaknesses and consolidate their strengths. Evaluation does not, therefore, stop with graduation but continues throughout the professional life of the trainees to minimize chances of stagnation, to constantly improve their teaching skills, to infuse feedback into the profession, and to reconstruct the current trends (Pollard, 2006).
Pre-service teacher evaluation can be described and examined in terms of three stages: (1) evaluation before formal teacher preparation, (2) evaluation during the course of teacher training programme, and (3) evaluation at the end of the teacher training programme. Every stage can be divided into several phases. Phase I is the period before the programme starts, and this includes trainees’ self-evaluation, career evaluation and evaluation in terms of admission to the programme. Phase II is the period during the programme in which trainees are required to produce professional coursework and collect clinical experience in order to meet the evaluation criteria. Finally, Phase III starts immediately after the teacher education programme ends up and encompasses all the upcoming evaluations by the stage of
employment (Scottish Educational Research Association, 2005).
The process of career evaluation begins long before a career decision is made and continues long after teaching. Cowan (2006) notes that teaching is highly visible to children due to the day-to-day nature of contact between teachers and children. This supports his idea that prospective teachers form definite ideas about teaching early on. As Phase I in evaluating prospective teachers occurs during their admission to a teacher education programme, surveys indicate that there is a considerable variability in the criteria observed in selection process. The commonly used criteria to evaluate applicants are their grade point average (GPA), submitted recommendations, English proficiency, and interview results. In 1972, in a study on 180 American Association of Colleges for Teacher Education (AACTE) member institutions, it was reported that 48 percent of the institutions were using 2.0 as the criterion level for admission, and 93 percent had a criterion level between 2.0 and 2.5 (Lunenberg & Willemse, 2006).
Although it is assumed that prospective teachers weigh the strengths and weaknesses of taking up a career in teaching before enrolling, experience shows that this is not often done objectively and rationally. Noticed by Waller (1932) as early as the 1930s, prospective teachers’ career decisions are described as distorted by wishful thinking, altered to conform to prevalent stereotypes, and coloured by fancy. The logic of impulses finally determines the choice. The concepts underlying teachers and teaching have
EFL Teacher Education: Where Do Trainers’ and Trainees’ Criteria Match?
1611Pertanika J. Soc. Sci. & Hum. 21 (4): 1609 - 1620 (2013)
undergone radical changes since Waller’s time. Relevant literature, as well as public opinions, considers a variety of motives behind selecting a teaching profession.
Largely, people have been attracted to teaching by their desires to help others learn. Those who have been fascinated by role models in their lives aspire to become role models themselves. In addition, as Arreman (2005) notes, many have been drawn to teaching as an opportunity to act upon their natural tendencies to be playful with young and energetic learners. Others may have opted for teaching as a compromise and insurance against inability to find better jobs in other more promising fields such as, law, medicine, business, and so on.
Other than that, the decision to enter a teaching position has often been influenced by parental advice and expectations. Surveys indicate for a time at least teaching has been viewed as a viable career choice for children. In two referred studies conducted with an interval of twelve years, four out of five parents said that they would encourage a daughter to enter teaching, and half reported they would do the same for a son (Arreman, 2005). Periodic surveys on teachers themselves point to a desire to work with children as the main objective for becoming a teacher. Other reasons frequently mentioned for choosing a teaching career are the perception of education in society as a significant value and the relevant job security associated with such profession (Loughran, 2006). However, the desire to join the teaching workforce is being increasingly overshadowed by the growth
in alternative opportunities thus making teaching one among many choices available (Murray & Mate, 2005).
It is however interesting to see that Boyd, Harris and Murray (2007), Koster and Dengerink (2008) report that only around 20 percent of institutions use standardized examinations in teacher evaluation. In addition, not only do the criteria tend to be minimal, but also they are used with no assurance that they relate to teaching effectiveness. One final remark regarding admission to trainees’ evaluation is that applicants can be encouraged to reapply to the final examination.
As Murray (2008) states, primarily the trainers inspired with exceptions across departments do the evaluation of trainees in teacher training programmes. Authority given to trainers in higher education in order to plan courses and to evaluate trainees makes it difficult to come up with a certain class of criteria on which pre-service trainers are held accountable for how they are evaluating. The core in evaluation is mostly to retain and comprehend material extracted from readings and lectures, and there is no doubt that a few of trainers are willing to depart from such traditions. Increasing complaints from teacher education graduates support the fact that their coursework does not match their future needs (Murray, 2008).
Swennen et al. (2008) consider trainees’ teaching practice as the most valuable educational opportunity in teacher education programmes. A rather interesting means to know what is being evaluated in trainees’ teaching practice is to ask for their own
Natasha Pourdana and Sayyed Mohammad Karimi Behbahani
1612 Pertanika J. Soc. Sci. & Hum. 21 (4): 1609 - 1620 (2013)
definition of success in the programme. On the same line, Velzen et al. (2008) have asked a group of trainees about what they would recommend their best friends do to get a grade “A” from their trainers. Based on examinees’ responses, Velzen et al. came up with the following conclusions:
• Two trainees planning to teach similar subjects under supervision of different trainers might be taught quite differently, even inconsistently, the teaching methods and principles.
• The professional course contents and the activities are mostly wide apart.
• A trainee’s grade in practicum depends highly upon whether he/she is matched or mismatched with his supervising trainer.
• Training practice does not appear to provide a theoretical framework for planning and evaluating trainees’ own instructional activities.
Murray and Mate (2005) divide pre-service teacher evaluation into three types: explicit (intentional), implicit (unintentional), and null (missing). Explicit evaluation for admission to a teacher education programme is largely a matter of considering grade point averages, scores on aptitude and English proficiency tests. In teacher education programmes, what is explicitly evaluated includes trainees’ general knowledge and verbal abilities. When other methods are used such as observation of clinical experience during training, however, the objective is mostly
to follow the trainers’ own criteria for good teaching.
Implicit evaluation is by nature difficult. Considering the congruency of the evaluation methods with course objectives, however, it is possible to monitor whether the predisposed criteria are met. Nonetheless, where evaluation is done implicitly, success is largely defined in terms of trainees’ capacity to conform to the tacit expectations of the trainers (Boyd et al., 2007). It seems surprising to notice that most often their expectations do not match trainees’ level of competency; some trainers attempt to make scholars out of their trainees, while others tend to teach trainees to make a bulletin board of dos and don’ts for every occasion.
Identifying null or missing criteria for evaluation is a process of considering both sets of explicit and implicit criteria which are not usually observed in evaluation. For example, trainers do not seem to assess how trainees learn, and how they evaluate their own abilities to process information and make decision. Giving feedback to trainees regarding how they view teaching and learning is minimal. Similarly, the trainees’ ability to be independent in collecting data and making sound judgments to address real world problems is seldom evaluated by the trainers (Boyd et al., 2007).
Evaluation plays a key role in teacher education though in most teacher education programmes a little space is normally given to how pre-service and in-service trainees are evaluated. As already mentioned, the professional practice is also rife with
EFL Teacher Education: Where Do Trainers’ and Trainees’ Criteria Match?
1613Pertanika J. Soc. Sci. & Hum. 21 (4): 1609 - 1620 (2013)
incongruence where trainees at different levels are evaluated differently (Lougharn, 2006). Although trainers most often produce a checklist of criteria they take into account in evaluating pre-service trainees, the actual evaluation is often carried out on the basis of trainers’ personal preferences, such as compliance of trainees to trainers’ preferred style of teaching, classroom respect and obedience, conformity, and so on.
The main objective in this study, therefore, is to investigate the ways trainers and trainees view evaluation and the criteria they agree upon to evaluate. Literature shows that there are mismatches between trainers and trainees not only on methods of evaluation but also on criteria for evaluation which sometimes lead to confusion and dissatisfaction on both parts. The study intends to shed some light on these thorny issues by making inquiries into and collecting surveys of the opinions and practices of those involved whether as trainers or as trainees. In order to achieve the objective of the study, a teacher evaluation checklist comprising of 10 items was designed and administered among 24 trainers and 44 trainees at Islamic Azad University, Karaj Branch, Iran.
MATERIALS AND METHODS
Participants
The participants in the study were randomly sampled from the population of EFL teacher training students at Islamic Azad University, Karaj Branch (n=107) and EFL instructors (n=61). Two samples in this study were: (1) 44 Iranian teacher training undergraduates,
ranging from 20 to 34 years of age of both genders, who were taking a course on language teaching methodology in spring 2011 at Islamic Azad University, Karaj Branch-Iran, and (2) 24 Iranian EFL instructors of both genders, all professional in language teacher education, who had been teaching 4-unit methodology courses in Spring 2011 at Islamic Azad University, Karaj Branch-Iran.
Procedure
In this study, a 5-point Likert scaled EFL teacher evaluation questionnaire was developed by the researcher and separately administrated among 24 trainers and 44 trainees. Inspired by ample related literature (Daneilson & McGreal, 2000; Boyd et al., 2007, to name a few) and the researcher’s years of personal experience, a 10-item questionnaire was supposed to ask for ratings given to a number of criteria for teacher evaluation, with 1 for completely disagree, 2 for disagree, 3 for No idea, 4 for agree, and 5 for completely agree. The researcher’s main objective was to investigate the possible mismatches in priority given to the criteria by both the trainers and trainees. The questionnaire was initially piloted with 25 language teacher education undergraduates and 5 teacher trainers, similar to the main subjects in nationality, age and teaching experience. The first draft of the questionnaires was rated and revised by two teacher education experts two weeks before the final administration on March 20, 2011. The checklist was examined for internal
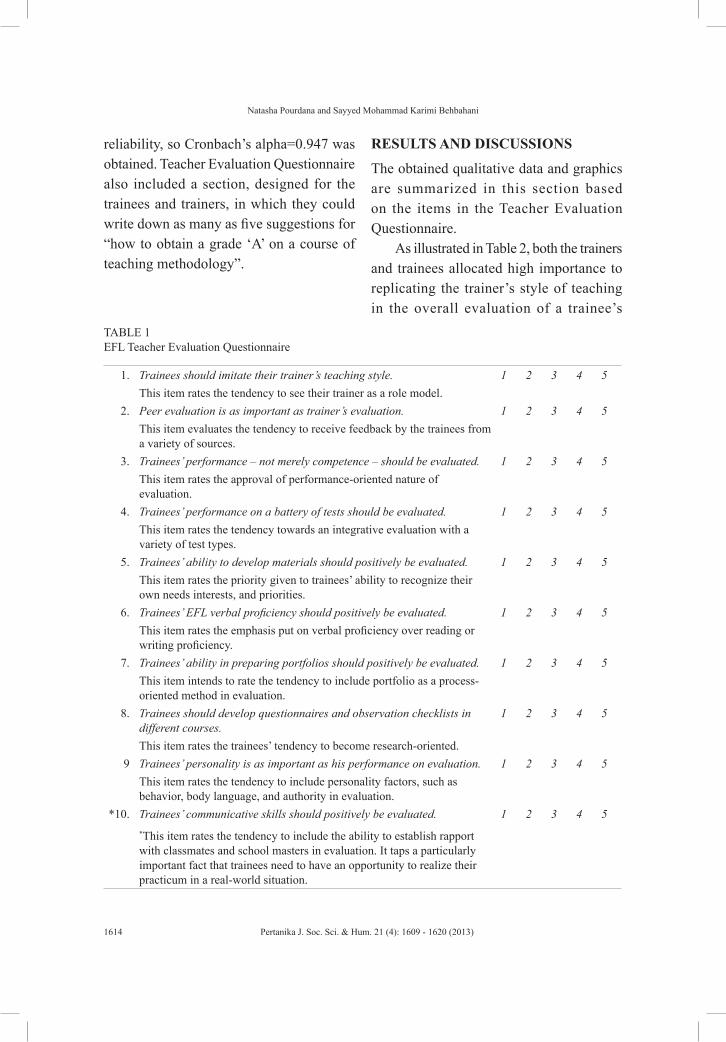
Natasha Pourdana and Sayyed Mohammad Karimi Behbahani
1614 Pertanika J. Soc. Sci. & Hum. 21 (4): 1609 - 1620 (2013)
reliability, so Cronbach’s alpha=0.947 was obtained. Teacher Evaluation Questionnaire also included a section, designed for the trainees and trainers, in which they could write down as many as five suggestions for “how to obtain a grade ‘A’ on a course of teaching methodology”.
RESULTS AND DISCUSSIONS
The obtained qualitative data and graphics are summarized in this section based on the items in the Teacher Evaluation Questionnaire.
As illustrated in Table 2, both the trainers and trainees allocated high importance to replicating the trainer’s style of teaching in the overall evaluation of a trainee’s
TABLE 1 EFL Teacher Evaluation Questionnaire
1. Trainees should imitate their trainer’s teaching style. 1 2 3 4 5This item rates the tendency to see their trainer as a role model.
2. Peer evaluation is as important as trainer’s evaluation. 1 2 3 4 5This item evaluates the tendency to receive feedback by the trainees from a variety of sources.
3. Trainees’ performance – not merely competence – should be evaluated. 1 2 3 4 5This item rates the approval of performance-oriented nature of evaluation.
4. Trainees’ performance on a battery of tests should be evaluated. 1 2 3 4 5This item rates the tendency towards an integrative evaluation with a variety of test types.
5. Trainees’ ability to develop materials should positively be evaluated. 1 2 3 4 5This item rates the priority given to trainees’ ability to recognize their own needs interests, and priorities.
6. Trainees’ EFL verbal proficiency should positively be evaluated. 1 2 3 4 5This item rates the emphasis put on verbal proficiency over reading or writing proficiency.
7. Trainees’ ability in preparing portfolios should positively be evaluated. 1 2 3 4 5This item intends to rate the tendency to include portfolio as a process-oriented method in evaluation.
8. Trainees should develop questionnaires and observation checklists in different courses.
1 2 3 4 5
This item rates the trainees’ tendency to become research-oriented.9 Trainees’ personality is as important as his performance on evaluation. 1 2 3 4 5
This item rates the tendency to include personality factors, such as behavior, body language, and authority in evaluation.
*10. Trainees’ communicative skills should positively be evaluated. 1 2 3 4 5*This item rates the tendency to include the ability to establish rapport with classmates and school masters in evaluation. It taps a particularly important fact that trainees need to have an opportunity to realize their practicum in a real-world situation.
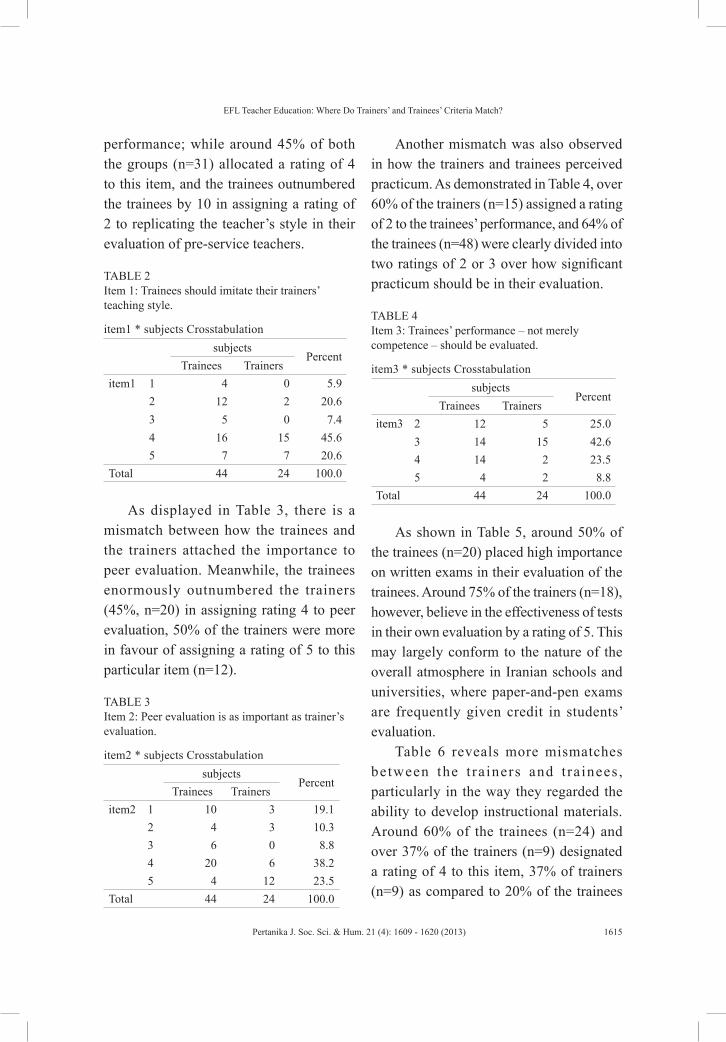
EFL Teacher Education: Where Do Trainers’ and Trainees’ Criteria Match?
1615Pertanika J. Soc. Sci. & Hum. 21 (4): 1609 - 1620 (2013)
performance; while around 45% of both the groups (n=31) allocated a rating of 4 to this item, and the trainees outnumbered the trainees by 10 in assigning a rating of 2 to replicating the teacher’s style in their evaluation of pre-service teachers.
TABLE 2 Item 1: Trainees should imitate their trainers’ teaching style.
item1 * subjects Crosstabulationsubjects
PercentTrainees Trainers
item1
1 4 0 5.92 12 2 20.63 5 0 7.44 16 15 45.65 7 7 20.6
Total 44 24 100.0
As displayed in Table 3, there is a mismatch between how the trainees and the trainers attached the importance to peer evaluation. Meanwhile, the trainees enormously outnumbered the trainers (45%, n=20) in assigning rating 4 to peer evaluation, 50% of the trainers were more in favour of assigning a rating of 5 to this particular item (n=12).
TABLE 3 Item 2: Peer evaluation is as important as trainer’s evaluation.
item2 * subjects Crosstabulationsubjects
PercentTrainees Trainers
item2
1 10 3 19.12 4 3 10.33 6 0 8.84 20 6 38.25 4 12 23.5
Total 44 24 100.0
Another mismatch was also observed in how the trainers and trainees perceived practicum. As demonstrated in Table 4, over 60% of the trainers (n=15) assigned a rating of 2 to the trainees’ performance, and 64% of the trainees (n=48) were clearly divided into two ratings of 2 or 3 over how significant practicum should be in their evaluation.
TABLE 4 Item 3: Trainees’ performance – not merely competence – should be evaluated.
item3 * subjects Crosstabulation
subjects
PercentTrainees Trainers
item3 2 12 5 25.03 14 15 42.64 14 2 23.55 4 2 8.8
Total 44 24 100.0
As shown in Table 5, around 50% of the trainees (n=20) placed high importance on written exams in their evaluation of the trainees. Around 75% of the trainers (n=18), however, believe in the effectiveness of tests in their own evaluation by a rating of 5. This may largely conform to the nature of the overall atmosphere in Iranian schools and universities, where paper-and-pen exams are frequently given credit in students’ evaluation.
Table 6 reveals more mismatches between the t ra iners and t ra inees , particularly in the way they regarded the ability to develop instructional materials. Around 60% of the trainees (n=24) and over 37% of the trainers (n=9) designated a rating of 4 to this item, 37% of trainers (n=9) as compared to 20% of the trainees
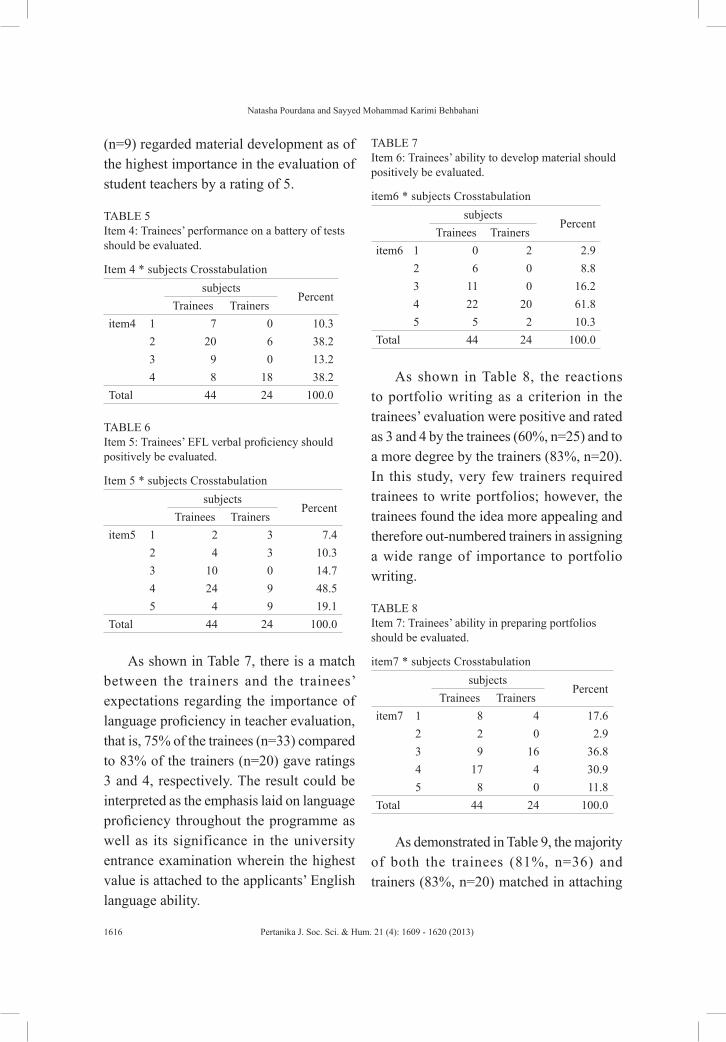
Natasha Pourdana and Sayyed Mohammad Karimi Behbahani
1616 Pertanika J. Soc. Sci. & Hum. 21 (4): 1609 - 1620 (2013)
(n=9) regarded material development as of the highest importance in the evaluation of student teachers by a rating of 5.
TABLE 5 Item 4: Trainees’ performance on a battery of tests should be evaluated.
Item 4 * subjects Crosstabulation
subjects
PercentTrainees Trainers
item4
1 7 0 10.32 20 6 38.23 9 0 13.24 8 18 38.2
Total 44 24 100.0
TABLE 6 Item 5: Trainees’ EFL verbal proficiency should positively be evaluated.
Item 5 * subjects Crosstabulation
subjects
PercentTrainees Trainers
item5
1 2 3 7.42 4 3 10.33 10 0 14.74 24 9 48.55 4 9 19.1
Total 44 24 100.0
As shown in Table 7, there is a match between the trainers and the trainees’ expectations regarding the importance of language proficiency in teacher evaluation, that is, 75% of the trainees (n=33) compared to 83% of the trainers (n=20) gave ratings 3 and 4, respectively. The result could be interpreted as the emphasis laid on language proficiency throughout the programme as well as its significance in the university entrance examination wherein the highest value is attached to the applicants’ English language ability.
TABLE 7 Item 6: Trainees’ ability to develop material should positively be evaluated.
item6 * subjects Crosstabulation
subjectsPercent
Trainees Trainersitem6
1 0 2 2.92 6 0 8.83 11 0 16.24 22 20 61.85 5 2 10.3
Total 44 24 100.0
As shown in Table 8, the reactions to portfolio writing as a criterion in the trainees’ evaluation were positive and rated as 3 and 4 by the trainees (60%, n=25) and to a more degree by the trainers (83%, n=20). In this study, very few trainers required trainees to write portfolios; however, the trainees found the idea more appealing and therefore out-numbered trainers in assigning a wide range of importance to portfolio writing.
TABLE 8 Item 7: Trainees’ ability in preparing portfolios should be evaluated.
item7 * subjects Crosstabulation
subjectsPercent
Trainees Trainersitem7
1 8 4 17.62 2 0 2.93 9 16 36.84 17 4 30.95 8 0 11.8
Total 44 24 100.0
As demonstrated in Table 9, the majority of both the trainees (81%, n=36) and trainers (83%, n=20) matched in attaching
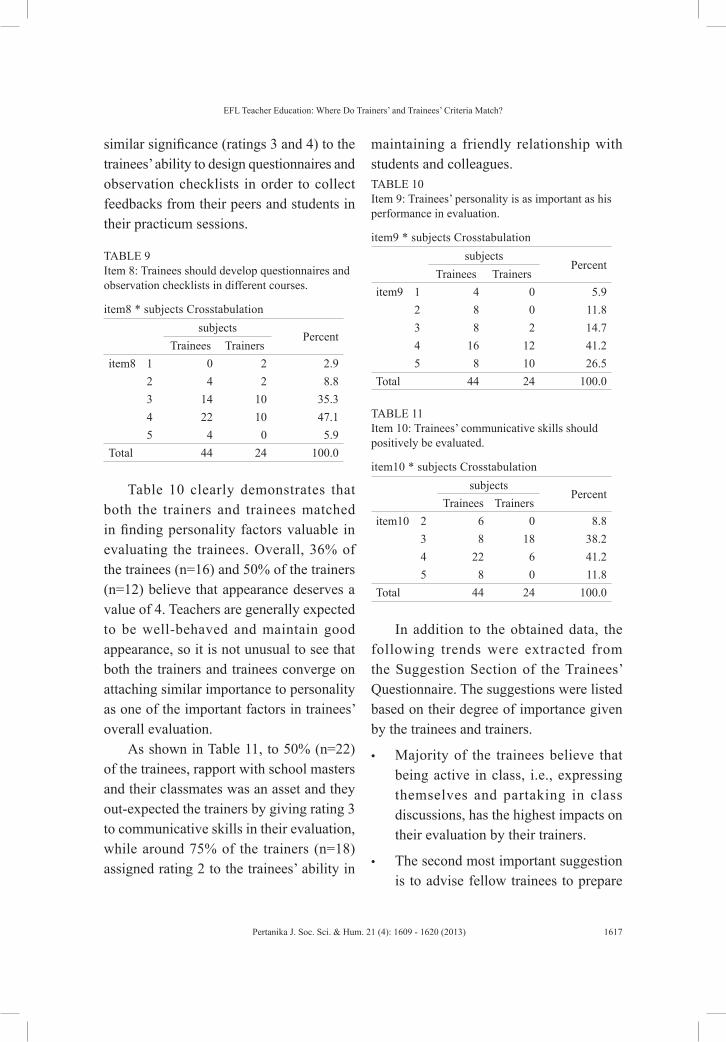
EFL Teacher Education: Where Do Trainers’ and Trainees’ Criteria Match?
1617Pertanika J. Soc. Sci. & Hum. 21 (4): 1609 - 1620 (2013)
similar significance (ratings 3 and 4) to the trainees’ ability to design questionnaires and observation checklists in order to collect feedbacks from their peers and students in their practicum sessions.
TABLE 9 Item 8: Trainees should develop questionnaires and observation checklists in different courses.
item8 * subjects Crosstabulation
subjects
PercentTrainees Trainers
item8
1 0 2 2.92 4 2 8.83 14 10 35.34 22 10 47.15 4 0 5.9
Total 44 24 100.0
Table 10 clearly demonstrates that both the trainers and trainees matched in finding personality factors valuable in evaluating the trainees. Overall, 36% of the trainees (n=16) and 50% of the trainers (n=12) believe that appearance deserves a value of 4. Teachers are generally expected to be well-behaved and maintain good appearance, so it is not unusual to see that both the trainers and trainees converge on attaching similar importance to personality as one of the important factors in trainees’ overall evaluation.
As shown in Table 11, to 50% (n=22) of the trainees, rapport with school masters and their classmates was an asset and they out-expected the trainers by giving rating 3 to communicative skills in their evaluation, while around 75% of the trainers (n=18) assigned rating 2 to the trainees’ ability in
maintaining a friendly relationship with students and colleagues.TABLE 10 Item 9: Trainees’ personality is as important as his performance in evaluation.
item9 * subjects Crosstabulation
subjects
PercentTrainees Trainers
item9
1 4 0 5.92 8 0 11.83 8 2 14.74 16 12 41.25 8 10 26.5
Total 44 24 100.0
TABLE 11 Item 10: Trainees’ communicative skills should positively be evaluated.
item10 * subjects Crosstabulation
subjects
PercentTrainees Trainers
item10
2 6 0 8.83 8 18 38.24 22 6 41.25 8 0 11.8
Total 44 24 100.0
In addition to the obtained data, the following trends were extracted from the Suggestion Section of the Trainees’ Questionnaire. The suggestions were listed based on their degree of importance given by the trainees and trainers.
• Majority of the trainees believe that being active in class, i.e., expressing themselves and partaking in class discussions, has the highest impacts on their evaluation by their trainers.
• The second most important suggestion is to advise fellow trainees to prepare
Natasha Pourdana and Sayyed Mohammad Karimi Behbahani
1618 Pertanika J. Soc. Sci. & Hum. 21 (4): 1609 - 1620 (2013)
lessons beforehand so that they can answer the trainer’s questions during class time.
• Being punctual and attentive such as listening to the trainer, taking notes during his or her lectures, regular attendance, and avoiding speech with classmates during class is another common suggestion.
• Giving lectures and presentations is recommended by trainers to their trainees. This is because it can improve the trainees’ visibility and hence positively influences their evaluation in the eye of the trainer.
• Many trainees also suggest that their peers should establish good relationships with their respective trainer to ensure his/her good evaluation.
CONCLUSION
The data collection procedure and the relevant results revealed a number of trends and attitudes that are worth mentioning. On the one hand, there is a positive reaction to this research, particularly on the side of the trainees who were excited to see their feedbacks and beliefs regarding their own evaluation being looked into. On the other, clear differences were observed in the perceptions of the trainees and trainers of the evaluation process which were also indicative of the different levels of emphasis they put on course components.
In brief, more trainees than trainers were inclined to replicate their instructors’ style of teaching and therefore expecting it
to be highly considered in their evaluation. The trainers, on the other hand, were more inclined to encourage the trainees to observe their peers and use their feedbacks and comments in their own appraisal. As for the practicum and paper-and-pen exams, it was evident that the trainees expressed similar reaction to both the components while the trainers treated them significantly differently by laying much greater emphasis on the trainees’ scores on written exams than their performance during practicum. The Iranian system of education is by far exam-oriented and it is not surprising to see a large number of trainers reflected this orientation.
Another trend that emerged from this study was the participants shared attitude towards trainees’ language proficiency. Through the researcher’s experience and informal interviews with other professionals, it is safe to say that teachers’ good language proficiency is a significant factor in their evaluation in the eyes of their students; so much as their inadequacies in teaching styles may be overlooked. In addition to linguistic abilities, teachers are also evaluated by their manners and appearance. Finally, there seemed to be a general match between the trainers and trainees regarding trainees’ rapport with school authorities, with trainees out-valuing trainers.
The qual i ta t ive data der ived from the Suggestions Section of the Trainees’ Questionnaire also indicated that evaluation is largely based on trainees’ observation of class protocol, memorizing lessons, keeping a high profile, and being on good terms with the
EFL Teacher Education: Where Do Trainers’ and Trainees’ Criteria Match?
1619Pertanika J. Soc. Sci. & Hum. 21 (4): 1609 - 1620 (2013)
trainer. Such results are indicatives that many trainees are being evaluated not by how they train to be effective teachers, but by how they perform during training as students. The evaluation also seems to be in favour of the more outspoken trainees who not only tend to appear more active in class but also manage to establish better rapport with their trainers.
Accordingly, Daneilson and McGreal (2000) state that the principles of EFL teacher education show that when trainees’ self-assessment and self-directed inquiry in their professional development, they are more likely to sustain their learning in more disciplined ways, than when outsiders impose professional development requirements. Teacher evaluation system, therefore, should include opportunities for self-evaluation so that a provision is made for professional conversation – among trainees and between trainers and trainees (Hawley & Valli, 1999).
REFERENCESArreman, I. (2005). Research as power and
knowledge: Struggles over research in teacher education. Journal of Education for Teaching, 31(3), 215-135.
Boyd, P., Harris, K., & Murray, J. (2007). Becoming a teacher educator: Guidelines for the education of newly appointed lectures in intial teacher education. Bristol: Higher Education Academy Network.
Cowan, J. (2006). On becoming an innovative university teacher: Reflection in action (2nd Ed.). Maidenhead: Open University.
Danielson, Ch., & McGreal, Th. L. (2000). Teacher Evaluation to enhance professional practice. USA: Association for Supervision and Curriculum Development.
Hawley, W., & Valli, L. (1999). The essentials of effective professional development: A new consensus. In L. Darling-Hammond & G. Sykes (Eds.), Teaching as the learning profession: Handbook of policy and practice. San Fransisco: Jossey-Bass.
Koster, B., & Dengerink, J. J. (2008). Professional standards for teacher educators: How to deal with complexity, ownership and function: Experiences from the Netherlands. European Journal of Teacher Education, 31(2), 135-149.
Loughran, J. (2006). Developing a pedagogy of teacher education: Understanding teaching and learning about teaching. New York and London: Routledge Taylor and Francis Group.
Lunenberg, M., & Willemse, M. (2006). Research and professional development of teacher educators. European Journal of Teacher Education, 29(1), 81-96.
Lyons, N. (2006). Reflective engagement as professional development in the lives of university teachers. Teachers and Teaching, 12, 151-168.
Murray, J., & Mate, T. (2005). Becoming a teacher educator: Evidence from the field. Teaching and Teacher Education, 21(2), 125-142.
Murray, J. (2008). Teacher educator’s induction into Higher Education: work-based learning in the micro communities of teacher education. European Journal of Teacher Education, 31(2), 117-133.
Pollard, A. (2006). Challenges facing educational research. Educational Review, 58, 251-268.
Scottish Educational Research Association. (2005). Ethical Guidelines for Educational Research. Glasgow: SERA.

Natasha Pourdana and Sayyed Mohammad Karimi Behbahani
1620 Pertanika J. Soc. Sci. & Hum. 21 (4): 1609 - 1620 (2013)
Swennen, A., Volman, M., & Van, M. (2008). The development of the professional identity of two teacher educators in the context of Dutch teacher education. European Journal of Teacher Education, 31(2), 169-184.
Waller, W. (1932). The sociology of teaching. New York: Wiley.
Velzen, C., Klink, M., Yaffe, E., & Swennen, A. (2008). The induction of teacher educators: The needs of beginning teacher educators. Paper presented at the ATEE conference, Brussel.
Pertanika J. Soc. Sci. & Hum. 21 (4): 1621 - 1631 (2013)
ISSN: 0128-7702 © Universiti Putra Malaysia Press
SOCIAL SCIENCES & HUMANITIESJournal homepage: http://www.pertanika.upm.edu.my/
Article history:Received: 25 October 2011Accepted: 28 August 2012
ARTICLE INFO
E-mail address: [email protected] (Gene Segarra Navera)
Teaching as Transformative Performance: Performance as Kinesis in an Argumentative Writing Class
Gene Segarra NaveraCentre for English Language Communication, National University of Singapore, 10 Architecture Drive, 117511 Singapore
ABSTRACT
The paper demonstrates how the notion of ‘performance as kinesis’ or ‘activist performance’ (Navera 2007) can be applied to the teaching of argumentative writing. In order to achieve this, the author first revisits his earlier work based on Dwight Conquergood’s (1991, 1992, 1995, 2002) notion of ‘performance as kinesis’ and how such notion may be used to conceptualize facilitation in the teaching and learning context. In this earlier piece, the author argues that when facilitation is seen as performance as kinesis, the teaching-learning situation becomes a site of negotiation, students become responsible co-creators of content and process in the teaching and learning context, and classroom participants exercise self-reflexivity. Following this brief discussion is a sample lesson that aims to demonstrate how the approach is realized in an argumentative writing class. This sample lesson is then subjected to two levels of analysis. The first looks into the significance of the specific activity-based lesson to the teaching of argument while the second points out how the overall framework of organizing the writing lesson enacts the notion of performance as kinesis. In both levels, teachers and students engage in a dialectics of action and reflection (Freire 1972, 1997) that can potentially bring about a change in their ways of thinking and acting. I conclude that the teaching of argumentation becomes transformative when the notion of performance as kinesis is materialized in the teaching-learning context. This is significant to 21st century pedagogy as it encourages the development of critical citizenship crucial to a fast-changing world.
Keywords: Argumentative writing, performance as kinesis, transformative performance
INTRODUCTION
The conceptualization of performance in contemporary times departs from the Platonic binary opposition between reality
Gene Segarra Navera
1622 Pertanika J. Soc. Sci. & Hum. 21 (4): 1621 - 1631 (2013)
and appearance. Performance is no longer just about role-playing or managing impressions. It can, on the one hand, embody cultural norms and values, that is, sustain or maintain the status quo. On the other, it can transform or change culture by challenging cultural expectations and providing alternative ways of viewing reality (Pelias, 1992; Conquergood, 1991, 1992, 1995, 2002). Performance theorist, Dwight Conquergood, suggests that performance can potentially put into question and bring about changes in current state of affairs. It can offer ways to disrupt or subvert current practices, existing realities or dominant ways of thinking and doing things. He offers the concept of ‘performance as kinesis’ while differentiating it from the mimetic rendering of performance (Conquergood, 1992). Such concept of performance underscores its potential for (re)inventing and transforming culture.
This paper rearticulates Conquergood’s notion of performance as kinesis by showing how it may be applied in the teaching of argumentative writing. Specifically, this paper aims to: (1) discuss how the notion of ‘performance as kinesis’ can be employed in teaching and (2) demonstrate through a sample lesson in argumentative writing how such notion can be applied in the language arts classroom, specifically in the teaching of argument.
TEACHING AS PERFORMANCE AS KINESIS
In the article titled ‘Performance as Kinesis: Language Teaching as Activist Performance’
(Navera 2007), I argue that Conquergood’s notion of performance as kinesis—or performance as breaking and remaking—can be employed as a lens to think about or conceptualize facilitation in particular and teaching as a whole. Reflecting on my experience as a teacher of communication arts in the Philippines using such lens, I have generated insights which I organize into three more specific conceptualizations about teaching: (1) teaching as an engagement and negotiation; (2) teaching as embodiment and retelling; and (3) teaching as transformation and synthesis. I expound on these conceptualizations below.
Teaching as an engagement and negotiationWhen I talk of teaching as an engagement and negotiation, I regard it as a social event where interaction between and among participants (that is, between teacher and students as well as among students) takes place. The interaction takes the form of question and answer, argumentation and refutation, giving information and receiving it, questioning assumptions and reaffirming reconsidered thoughts. It entails the problematizing of issues and sincere attempts at proposing solutions to address them. It is a thoughtful exercise in reflection and self-reflection aimed at working towards convergence while recognizing divergences. The exercise consequently moves towards a culture of commonality that becomes a ground for more dialogue and expansion of individual as well as collective horizons, as it were.
Teaching as Transformative Performance
1623Pertanika J. Soc. Sci. & Hum. 21 (4): 1621 - 1631 (2013)
transformative enterprise. Learners, in this case, take a more questioning role. They begin to examine closely and incisively what is there, that is, challenge the status quo. The questioning position may take the form of disrupting or destabilizing what has been neatly put together. This should result in a rethinking or re-conceptualization of existing (or dominant) vocabularies and ways of viewing and representing ourselves and the world. Transformation begins when differences are accommodated and careful reflections are made on these differences. It demands finding common threads or combining and recombining seemingly disparate ideas to develop new ways of looking at reality. Teaching as transformation enables learners—teachers and students—to work towards achieving criticality—that is, the readiness to question or problematize (which is what makes us human), to engage in a dialogue, and to be open to alternative visions and possibilities.
I wish to suggest that the conceptualization of teaching as performance—specifically as engagement and negotiation, as embodiment and retelling, and as transformation and synthesis—can very well apply to the teaching of argumentative writing. In the following section, I discuss the sample lesson on argumentative writing and explain how such lesson employs the notion of performance as kinesis and the implications of using such notion in a writing class.
Teaching as embodiment and retellingTeaching as an embodiment means that the performance of teaching necessarily creates or recreates a tradition that has been passed on from generation to generation across cultures. The very act of teaching in the classroom is itself a reaffirmation of the values of learning articulated and rearticulated by the great thinkers throughout human history. Teaching is therefore culture-maintaining and culture-producing and -reproducing.
Teaching also participates in the formation of identities of participants in the teaching-learning context as it attempts to historicize content or the subject matter. The exercise of historicizing involves the recounting and accounting for the factors and forces that have contributed to the conditions of the present or the current state of the subject matter. A historicized subject matter helps determine the position of the learner (a term that I use to refer to both teacher and students) and casts for him or her possible directions to which the subject matter may be pursued. It enables the learner to understand what and how existing knowledge both privileges and undermines, to recognize how he or she figures in the current system of privileging, and to decide on ways to deal with such system.
Teaching as transformation and synthesisWhen it becomes clear to learners why they are learning what the university or the faculty thinks they ought to learn, it is not difficult to imagine teaching as a
Gene Segarra Navera
1624 Pertanika J. Soc. Sci. & Hum. 21 (4): 1621 - 1631 (2013)
PERFORMANCE AS KINESIS IN ARGUMENTATIVE WRITING
The sample lesson (Appendix A) is an introduction to argumentative writing and is divided into two parts: (1) a list of instructional objectives and (2) the ADIDS framework which stands for activity, discussion, input, deepening, and synthesis (Victor, 2000; Daya, 2010; Ortigas, 1999). The list of instructional objectives is expressed with the students’ point of view in mind, while each part or section of the ADIDS framework consists of descriptions and specific instructions to the classroom participants, i.e., teacher and students.
The activity section provides instructions on what students are supposed to do: to write an essay of rant. The discussion allows students to process and communicate their reflections on the activity. In dyads and/ or in groups, students share their observations, interpretations, and comments on the activity using guide questions provided by the teacher or facilitator. Publishing these observations and comments through documentation and recording is encouraged while the discussion takes place. In the input section, the teacher or facilitator organizes ideas shared in the group. Basic concepts that have to do with writing an argumentative essay and how it differentiates from a rant are also presented in this section. Input is followed by deepening which involves asking students questions meant to enable them to create generalizations from the group sharing and input communicated by the teacher/ facilitator. The synthesis section provides instruction on an assignment
or post-lesson activity that would allow students to apply what is learned from the lesson, which, in this case, is developing an argumentative essay from a rant.
In the analysis of the sample lesson, I focus on two levels. In the first level of analysis I examine the significance of the activity-based lesson. In the second, I focus on the use of the ADIDS framework in organizing the lesson and how such way of organizing the lesson enables both the teacher-facilitator and the student-participants to engage in a negotiation of meanings in the classroom situation. In the course of explaining the framework, I shall cite instances from my previous and more recent experience in teaching writing courses to university students.
I would like to suggest that the activity-based lesson on transforming a rant into an argumentative essay strategically serves as an opportunity for the students to understand and appreciate argument as an embodied experience. The activity reaffirms not only the notion of argument as a language-based social phenomenon engaged in the processes of inquiry and advocacy (Zeigelmueller & Kay, 1997; Toulmin, 1958; Toulmin et al., 1979), but also as a human activity rooted in an experience of disparity between what is and what should be and the urgency to address such disparity.
To rant is to speak or write at length and aggressively about something. It is usually motivated by vehement feelings of anger, disgust or disappointment. When students are asked to write an essay of rant, the question posed is ‘What makes you angry?’
Teaching as Transformative Performance
1625Pertanika J. Soc. Sci. & Hum. 21 (4): 1621 - 1631 (2013)
or ‘What disgusts you?’ The question is supposed to stimulate a student to remember pet peeves or things that bother him. There is an outburst of emotion involved in expressing a rant through writing; and when the essay of rant is examined by another student, she comes to grips with the idea that highly emotional expressions can be overwhelming and difficult to handle. There is no way another person can argue, find reason or be reasonable with an outburst of emotions. However, when one is disgusted or angry or tremendously disappointed about something, there may be underlying reasons for doing so. The students must find and discover these through interaction with fellow students. Interaction on the essays of rant would allow them to check if the compositions, no matter how emotionally laden, are convincing enough to warrant an audience and an informed response. One way to extract reasonability in rant is to examine the difference between what is (what disgusts, what angers) with what should be (what is acceptable or what would calm people down). By showing or revealing the disparity, students realize opportunities to reconsider initial thoughts about an item that makes them angry or disgusted. Here, they begin to realize that the experience of anger or disgust is more than personal. It can have a social dimension in that the experience of disparity or disjunction between ‘what is’ and ‘what should be’ may in fact be shared by others. This, I should note, opens the possibility of transforming the rant into an argumentative essay.
To give an example, I refer to my experience in teaching argumentative writing in the Philippines.1 I distinctly remember one student who talked about her disgust for people who expectorate in public places. This behaviour, she said, is unhygienic and indicates what she considered the low level of civility of people in the community. In other words, she considered people who expectorate in public places as lacking in good manners and urbanity. Her rant, though easily regarded as reasonable (i.e., to expectorate in public is indeed insanitary), may be construed as smug because of the way she talked about it in her essay. However, upon discussion of her rant with her classmates and her reflection on what is the case (i.e., the act of expectorating in public is taken for granted) and what should be (i.e., expectorating in public should be prohibited as it is a public health-hazard), the student began to think of the act of expectorating in public beyond her personal disgust. In her argumentative essay, she argued for a prohibition of the act—a claim of policy—and went on to state and substantiate her reasons that support her claim. The example reveals that what may initially be considered a personal source of disgust or dissatisfaction may actually be a public concern.
The sharing and discussion of the essays between and among students in class also signify the social dimension of argument.
1 I taught argumentative writing in the University of the Philippines Los Banos from 1999 to 2004. Each of the classes I handled consisted of 17 to 20 students.
Gene Segarra Navera
1626 Pertanika J. Soc. Sci. & Hum. 21 (4): 1621 - 1631 (2013)
By creating opportunities for students to read and to comment on their fellow students’ written works, they are given the chance to understand how arguments circulate, get reproduced, and are negotiated through interaction. They also begin to realize the need to be critical—that is, to be discriminating in processing information and to not take utterances at face value especially when they are driven largely by human emotions. Moreover, the sharing enables students to think back and reflect on their own experiences as communicators either via the spoken or written word. They become discerning of what to say and how to say it more effectively before an audience, in a small group or in an interpersonal context.
In the same argumentative writing class I taught, the students were asked to comment and to provide feedback on their classmates’ essays of rant. This was done either in pairs or in small groups of three. By commenting on their classmates’ essays, the students were able to sound off their reactions towards the essays of rant and began to empathize with their classmates or at the very least understand where their classmates were coming from. They were also able to suggest ways on how to transform an essay of rant into a more convincing piece of writing. From a pedagogical standpoint, such an activity positions students as active communicators who are able to re-articulate ideas, paraphrase emotions, and negotiate meanings with their fellow communicators.
Meanwhile, the ADIDS framework enacts the notion of performance as kinesis. The following reasons support
such proposition: (1) it challenges the traditional ‘banking method’ (Freire, 1972); (2) it breaks the ‘culture of silence’ in the classroom by creating opportunities for the participants to share ideas, observations, and reflections based on an immediate experience as well as remote ones; (3) it positions both the teacher and students as co-creators of the learning content and process; and (4) it is provocative, and not merely evocative, in a sense that participants are encouraged to question taken-for-granted notions and to constantly seek and clarify the bases for assertions made in the teaching-learning context.
ADIDS, because it is experience-based, does not position the teacher as the ‘sage on stage’ or the expert who is the source of knowledge in the classroom. The framework rests on the assumption that students are resource persons in the classroom and that their contributions to the discussion are as vital as the input of the teacher in class. Unlike the ‘banking method’ which imposes on students what they ought to learn, the framework allows students’ ideas generated from their experience of the activity to build on, extend further or even supplant ideas introduced by the teacher. Idea-building using the ADIDS is one created not by a powerful figure but by the power of all—the power of the collective.
I believe that collective idea-building in a writing class is demonstrated when the teacher allows students to reflect on their writing experiences and also to comment on other students’ works. In a writing course that I teach at the National University of
Teaching as Transformative Performance
1627Pertanika J. Soc. Sci. & Hum. 21 (4): 1621 - 1631 (2013)
Singapore2, for instance, students in class are made to express their insights from their experiences of writing various aspects of their drafts and to comment on selected drafts projected on screen. In this exercise, their comments are regarded as legitimate and valuable as what I have to say about the drafts as a lecturer. In this set-up, it is inevitable for students and the teacher to develop shared feedback on the drafts. Hence, the role of the teacher becomes one of synthesizing ideas articulated in class and of helping the students re-articulate the learning points that they need to consider as they re-work their papers.
That the students are enabled to share ideas, observations, and reflections based on an immediate experience as well as remote ones indicates that a culture of participation is harnessed in the classroom. The ‘banking method’—which is largely the case in the use of traditional lecture—silences and represses students from providing alternative perspectives on a subject matter (Freire, 1972, pp. 45-59). On the other hand, the ADIDS framework encourages that insights coming from students be expressed (and published) because it is through their articulation that students develop the confidence to learn independently and learn with others. By making students feel that they have something significant to contribute to the discussion table, they develop trust in
2 The course, called Critical Thinking and Writing, is taken by engineering undergraduate students and requires them to write two writing assignments: an evaluation of an argumentative essay and a position paper on a topic of social concern.
themselves as learners as well as recognize the potential of learning together or cooperative learning. Cooperative learning launches opportunities for collaboration and corroboration of ideas which are both important in working in teams and in developing reasoned argumentation.
The emphasis on cooperative learning does not, however, regard the teacher input or lecture as unnecessary. In fact, in my writing course, I give mini-lectures from time to time and as the course committee requires, but as a teacher, I mostly regard these lectures as ways to augment and not to undermine what students already know. Conducted in an interactive fashion, they are meant to synthesize points articulated in class, expose students to perspectives from what has been written or said about the topic, and frame the direction and flow of the activities and assignments that students are required to do throughout the course.
The ADIDS also positions the teacher and students as co-creators of the learning content and process. The hierarchy of teacher/student is diminished and replaced by cooperation and collaboration. There is no question that the teacher who uses ADIDS enters the classroom with his prior knowledge and with knowledge generated through his preparation for the course, but he is always open to the possibility that his knowledge may have to be reconstructed or reshaped by the knowledge shared and developed by students in class. On the other hand, students assume the role of the teacher in that they come to the classroom prepared and ready to share insights from
Gene Segarra Navera
1628 Pertanika J. Soc. Sci. & Hum. 21 (4): 1621 - 1631 (2013)
their readings and experience of structured or unstructured learning activities in the classroom. Accountability and responsibility for the learning process are then shared.
In teaching writing, I recognize that my own reading of a draft essay is not the only reading. It is then important to involve the students in the critique of drafts whether through peer reviews in small groups or through a collective class critique. The collective class critique of a draft essay projected on screen3 is especially significant as students bring in their perspectives on how one might re-write the essay to make it more clear and intelligible to its intended readers. It also allows me as a teacher to make public my thoughts about the draft instead of keeping them between myself and the writer/s concerned. I open myself to students questioning why I made certain remarks about certain aspects of the draft but then this affords me that chance to explain these remarks before the class. In a way, the exercise allows me to reflect on as well as re-negotiate what I consider valuable in writing.
Another important point I wish to make about ADIDS is that it is provocative, and not merely evocative. To be evocative means to merely generate content from members of the class and this may be the case when one ends with a mere sharing of ideas and feelings after an activity. However, a provocative teaching framework—which is what ADIDS is—means that participants are
3 This is a practice that I have adopted from my observations of a class in Ideas and Exposition, a module offered by the University Town Writing Programme of NUS.
encouraged to question taken-for-granted notions and to constantly and carefully examine the bases for assertions made in the classroom. This necessarily develops the students’ critical voice and may be ensured through the deepening and synthesis parts of the framework. The deepening allows students to generalize, test, and apply ideas developed from the class discussion and the teacher’s input to the various contexts that they encounter in real life. The synthesis, on the other hand, encourages students to engage in the creation of new material based on lessons learned in class. In the case of the sample lesson, synthesis is facilitated when students are asked to write an argumentative paper based on their essays of rant, their classmates’ comments on their essays, and their reflections from their experience of the activity and of the group discussion. I believe synthesis in any writing course happens when students are enabled to make their own decisions about their writing assignments after a series of consultations and discussions. Needless to say, the exercise puts the learning points in fruition and enables the students to engage these points further.
Having expressed the reasons that support the adoption of ADIDS as a framework for teaching, I would also like to point out that it is not without limitations. The framework is most ideal for small group-sized classes and requires a considerable amount of time for it to work. Often the reality on the ground is that teachers are assigned large classes and given syllabi that cover wide-ranging topics and require a lot from the students that the classroom hardly
Teaching as Transformative Performance
1629Pertanika J. Soc. Sci. & Hum. 21 (4): 1621 - 1631 (2013)
becomes conducive to learning. Given these constraints, a number of us, with the goal of covering topics in the most efficient way possible in mind, tend to resort to more teacher talk or instruction—in other words, the banking method. The constraints of time and institutional matters notwithstanding, teachers should actively find ways not only to adjust, but also to create opportunities for a more participatory framework to flourish in their writing classrooms. Teachers, in embodying the notion of performance as kinesis, may actually choose to engage school administrators and even policy-makers in a dialogue so that pedagogical concerns become a concern of the entire school and the larger community.
CONCLUSION
I conclude that the teaching of argument potentially becomes transformative when the notion of performance as kinesis is materialized in the teaching-learning context. There are challenges to realizing its potential in the classroom context, but they are not insuperable. It is significant to 21st century pedagogy in that it encourages the development of critical citizenship crucial to a fast-changing world.
REFERENCESConquergood, D. (1988). Health theatre in a Hmong
refugee camp: Performance, communication and culture. The Drama Review, 32(3), 174-208.
Conquergood, D. (1991). Rethinking ethnography: Towards a c r i t i c a l cu l t u r a l po l i t i c s . Communication Monographs, 58(2), 179-194. Reprinted in D.S. Madison & J. Hamera (Eds.)
(2006), The SAGE handbook of performance studies. Thousand Oaks, California: Sage Publications, Inc.
Conquergood, D. (1992). Ethnography, rhetoric and performance. Quarterly Journal of Speech, 78, 80-123.
Conquergood, D. (1995). Of caravans and carnivals: Performance studies in motion. The Drama Review, 39(4), 137-141.
Conquergood, D. (2002). Performance studies: Interventions and radical research. The Drama Review, 46(2), 145-156.
Daya, R. A. (2010). Experiences of facilitators in using ADIDS as participatory approach in a training class: An exploratory study. University of Southern Mindanao Research and Development, 18(2), 171-180.
Freire, P. (1972). Pedagogy of the oppressed (trans. M. B. Ramos). New York: Penguin Books.
Freire, P. (1997). The teacher as cultural worker: Letters to those who dare teach. Boulder, Co: Westview Press.
Navera, G. S. (2007). Performance as kinesis: Facilitation and language teaching as activist performance. Reflections on English Language Teaching, 6(2), 65-75.
Ortigas, C. (1999). Group process and the inductive method. Manila, Philippines: Ateneo de Manila University Press.
Pelias, R. J. (1992). Performance studies: The interpretation of aesthetic texts. New York: St. Martin’s Press.
Pelias, R. J., & VanOosting, J. (1987). A paradigm for performance studies. Quarterly Journal of Speech, 73, 219-31.
Petraglia, J. (1995). Reconceiving writing, rethinking writing instruction . Lawrence Erlbaum Associates.

Gene Segarra Navera
1630 Pertanika J. Soc. Sci. & Hum. 21 (4): 1621 - 1631 (2013)
Toulmin, S. (1958). The uses of argument. Cambridge: Cambridge University Press.
Toulmin, S., Rieke, R., & Janik, A. (1979). An introduction to reasoning. New York: Macmillan.
Victor, M.L. (2000). Oral presentation on facilitation. Focus Group Discussion (FGD) orientation workshop for the project Rapid Appraisal of the Agricultural and Fisheries Councils on Potential and Capability for Social Mobilization. Southeast Asian Ministers of Education Organization Regional Center for Graduate Study and Research in Agriculture (SEARCA), Los Baños, Laguna, Philippines.
Ziegelmueller, G. W., & Kay, J. (1997). Argumentation: Inquiry and advocacy. USA: Allyn and Bacon.
Teaching as Transformative Performance
1631Pertanika J. Soc. Sci. & Hum. 21 (4): 1621 - 1631 (2013)
APPENDIX AArgumentative Writing: IntroductionObjectives:At the end of the lesson, the students should be able to:
1. differentiate a rant from an argument;2. familiarize themselves with the features or characteristics of an argument; and3. develop an argumentative essay from a rant by taking note of such basic concepts as
proposition, evidence, and argument as a rhetorical process and product.
ActivityTo students: Put your rant into writing. What makes you angry? Or disappointed? Or disgusted? Develop about 3 to 5 paragraphs on this one topic or idea that peeves you or incurs your wrath. Make sure to express in your essay why you are peeved or angered by it.
DiscussionTo students: Find a partner (your seatmate, or when the class is large, group yourselves into 3 or 4). Exchange essays and from your partner’s essay identify the core statement and be able to account for how such statement is established in the essay. Share your observations to your partner or the small group. Get the person’s feedback on your observations. Let her clarify if she feels the need to do so. Then, answer the following questions:
1. Was the point of your partner or group mate convincing?2. What makes it convincing? What makes it not convincing?3. What do you think would make it more convincing?4. From the observations and discussion, what generalizations can you make about what
makes a rant in written form convincing?
InputAsk 3 dyads or the groups to present their observations and insights to the class. Ask the rest of the groups if they share similar observations and quickly ask for any addition to what has been registered in the plenary. The points should be made visible by writing them on the board.Reaffirm the points raised by the class by sharing additional information about what makes a convincing essay. At this point, introduce basic concepts such as propositions of fact, value, and policy; evidence as a creative act; and the nature of argument—as an inquiry and advocacy, as a rhetorical process and product.Engage the class into further familiarizing themselves with these concepts by encouraging them to find manifestations of these concepts in their own writing—whether they be rants or formal ones.
DeepeningTo allow students to further understand the basic concepts, ask them the following questions:
1. From what we have discussed so far, what makes a convincing essay?2. What differentiates an argument from a rant?3. If you were to develop a convincing essay from your rant, what would you retain and
what would you leave out? Why?4. In relation to number 3, how else would you make your essay convincing?
Synthesis To students: Develop an argumentative essay from your rant. Make sure you make your essay convincing by being clear about your proposition, providing considerable evidence to prove your claim (you can make use of testimonies, expert opinion, analogy, parallel case, examples, etc.—all of which will be discussed in depth in the following lessons), and using clear and appropriate language—one that is devoid of emotive words and is not polarizing.

Pertanika J. Soc. Sci. & Hum. 21 (4): 1633 - 1644 (2013)
ISSN: 0128-7702 © Universiti Putra Malaysia Press
SOCIAL SCIENCES & HUMANITIESJournal homepage: http://www.pertanika.upm.edu.my/
Article history:Received: 25 October 2011Accepted: 28 August 2012
ARTICLE INFO
E-mail addresses: [email protected] (Nooreiny Maarof), [email protected] (Tan Shir Ley) * Corresponding author
The Effect of Type of Cooperative Learning Grouping on ESL Learners’ Reading Comprehension Performance
Nooreiny Maarof* and Tan Shir LeyDepartment of Method and Educational Practice, Faculty of Education, Universiti Kebangsaan Malaysia, 43600 Bangi, Malaysia
ABSTRACT
Malaysia is a multi-cultural country and this is reflected in the diversity in the classroom population that requires teachers to constantly cater to these differing students’ needs. It is believed that cooperative leaning is able to fulfil the requirements of current language learning classrooms; for it is able to address students’ diversity and promote achievement. However, recent research has shown that there is a disjuncture between principles of contemporary cooperative leaning and Asian cultures. Therefore in this study, the researchers examined the effects of the type of cooperative learning grouping (heterogeneous and friendship) on learners’ reading comprehension performance by employing a quasi-experimental design. This study involved 115 sixth semester local polytechnic students and data were collected using a reading comprehension performance test. Quantitative data were analyzed using descriptive statistics, ANOVA and t-test. The findings from the ANOVA and t-test showed significant main effects of friendship grouping in reading comprehension performance. Based on the research findings, friendship grouping in cooperative learning could be considered as a possible approach in encouraging tertiary students to be actively involved in their second language reading classroom.
Keywords: Cooperative learning, ESL reading, reading comprehension, friendship grouping, type of cooperative
learning grouping
INTRODUCTION
While English is gaining its status in the educations system of Malaysia, a gradual but significant shift has taken place; in terms of pedagogy, there is less focus on teachers and teaching and a greater emphasis is placed on learners and learning
Nooreiny Maarof and Tan Shir Ley
1634 Pertanika J. Soc. Sci. & Hum. 21 (4): 1633 - 1644 (2013)
(Clouston, 1997). In today’s education system, it can be observed that traditional instruction in the classroom is slowly being replaced by modern alternatives that are perceived to be more effective and relevant. Cooperative learning (CL) is believed to be able to fulfil the requirements of current language learning classrooms for it addresses students’ diversity, and at the same time, promotes achievement (Johnson, Johnson & Stanne, 2000). Furthermore, CL is perceived as an important social and political development strategy that serves as an alternative means of promoting social integration among various ethnic groups (Tengku Nor Rizan, 2002).
While there have been various studies on CL from the early days of this century, the amount and quality of the research on CL has accelerated tremendously in the early 1970s’ and continue unabated until today (Johnson, Johnson & Stanne, 2000). Among these studies, only a few have focused on tertiary education such as colleges and universities. According to Johnson, Johnson and Smith (1998), a paradigm shift has taken place in college teaching, in which the students are expected to interact actively with classmates and lecturers. In this situation, students need to work together to accomplish shared learning goals to maximize their own and each other’s learning.
In language learning, there are four main skills critical for students to master, namely, listening, speaking, reading and writing. Specifically, at the tertiary education level, learners are required to read, interpret and critically evaluate academic texts and
process information in written or spoken form. In addition, learners are expected to be able to comprehend lengthy texts by comparing and relating ideas to their existing schemata and reach a holistic understanding of the text (Shih, 1992, as cited in Nambiar, 2005). Since learners have been involved in reading since the elementary level, it is commonly assumed that tertiary learners are able to read and access knowledge from texts. Nonetheless, the reality is that many of the learners at tertiary institutions are ill-equipped with adequate reading ability (Pressley, Yokoi, van Meter, Van Etten & Freebern, 1997). As pointed out by Nambiar (2005), reading in the Malaysian English as a Second Language (ESL) classroom usually deals with reading a text for the purpose of answering comprehension questions and hence, it has become a rather undemanding task. Consequently, this eventually leads to attainment of minimal reading skills among tertiary level learners (Ramaiah, 1997).
CL is recognized as one of the most successful approach in educational history in terms of its effectiveness in promoting achievement through group interaction. In working cooperatively in groups, students are engaging themselves in meaningful idea-sharing sessions. Learning is made easier as the language used among peers is simplified and appears useful in discussing complex academic matters (Tengku Nor Rizan, 2002). However, recent research by Thanh-Pham and Gillies (2010) showed that there is a disjuncture between principles of CL and Asian cultures. Furthermore, it is claimed that several basic principles of
Effect of the Type of CLG on ESL Reading
1635Pertanika J. Soc. Sci. & Hum. 21 (4): 1633 - 1644 (2013)
CL such as assessment methods, resource division, group size and group formation have also been found to be unsuitable for Asian classrooms. Consequently, many researchers have begun to address the mismatches between the principles of CL and Asian culture.
In general, two main grouping methods are applied in CL, namely, heterogeneous and tracking. In the former method, students are mixed to ensure that the group comprises members of differing abilities, whereas in the latter method of grouping, students are grouped according to their levels of capacity (Thanh-Pham & Gillies, 2010). Although both the methods are widely used as parts of the guidelines in CL, there are arguments that centre on these grouping methods. Thanh-Pham and Gillies (2010) pointed out that in Asian countries, special attention should be given to the personal relationship among group members as one of the factors that can ensure the success of the group. The main aim of this proposed study is thus to investigate the effects of the type of cooperative learning grouping (CLG) method on learners’ reading comprehension performance among polytechnic students. The research question is as the following:
1. Is there a significant effect of the type of CLG on the ESL students’ reading comprehension performance?
A REVIEW OF THE RELATED LITERATURE
As pointed out by Johnson et al. (2000), CL learning is so pervasive in the field of education such that it is almost impossible
to find academic materials that do not mention or utilize this approach. According to Johnson et al. (2000, p. 2), in their meta-analysis of studies on CL, the success of CL is attributed to the fact that “CL is clearly based on theory, validated by research, and operationalized into clear procedures educators can use”. These advantages of CL could well explain the large number of teachers who use CL around the world.
Johnson et al. (2000, p. 3) further added that over the past 100 years, “there may be no other instructional strategy that simultaneously achieves such diverse outcomes”. Among this diversity of outcomes, the reading skill in both ESL and English as a Foreign Language (EFL) has dominated a large part of it. For instance, the paper written by Ghaith (2003) describes the effects of the Learning Together Cooperative Learning Model in improving EFL reading achievement and academic self-esteem, as well as in reducing the feelings of school alienation among 56 Lebanese high school learners. Though the results indicated no statistically significant differences between the control and experimental groups on the dependent variables of academic self-esteem and feelings of school alienation, it was discovered that there was a statistically significant difference in favour of the experimental group on the variable of EFL reading achievement.
Another research conducted in an EFL context is Shaaban’s (2006) study on the effects of CL on reading comprehension, vocabulary acquisition, and motivation to read. The study involved 44 fifth grade
Nooreiny Maarof and Tan Shir Ley
1636 Pertanika J. Soc. Sci. & Hum. 21 (4): 1633 - 1644 (2013)
students using a post test-only control group experimental design. I t was discovered that there was no statistically significant difference between the control and experimental group on the dependent variables of reading comprehension and vocabulary acquisition. Nonetheless, the results revealed a statistically significant difference in favour of the experimental group on the dependent variable of motivation to read and its dimensions, the value of reading, and reading self-concept.
Other than studies conducted in the EFL context, such studies were also being rigorously conducted in Malaysia. Among these studies, there were a few that reported positive results. Wan Azizah (1999) studied the effects of CL in enhancing reading among form four students. From the study, the teachers revealed that CL was only effective when the students were ready to work cooperatively.
In another study by Fazlin Shasha Abdullah (2002), the effect of CL on learning literature in ESL was investigated. The findings showed that in a literature class, about 46.2% of the students were uncertain whether they work best in a group or alone. About 38.5% of the students agreed that CL helps in learning literature while 15.4% had strongly agreed. The results provided evidence in support of the fact that the students did not have sufficient ideas or knowledge about CL and that they were still not ready to share and work in groups. For instance, the students did not know the main principles in the CL approach and more importantly, they still displayed a tendency
to be competitive rather than cooperative.Based on the studies discussed above,
it can be suggested that CL is an influential approach in the teaching of reading. However, as suggested by Johnson et al. (2000), not all practices of CL will be effective in maximizing achievement. Various aspects of CL should be taken into consideration before employing this approach in the language learning classroom. Among these various aspects, the group composition of CL is one of the most essential factors to be examined.
Type of CLG refers to the assignments of students into different groups. The mainstream CL composition is by two ability-based grouping methods, namely, the heterogeneous grouping (HG) and tracking grouping. In a HG, teachers systematically or randomly assign students to groups so that there is variety in terms of students’ ability, gender, and race. In an educational context, HG in CL is strongly recommended for it produces optimal achievement (Johnson & Johnson, 1994). Tracking, on the other hand, involves the assignment of students into groups, in which all members have a similar level of ability.
Nonetheless, recent research shows that research in the past has overlooked the importance of students’ immediate social relationships for successful group operation (Kutnick, Blatchford & Baines, 2005). Grouping in the CL method should reflect affect-based trust and social shared identity, as indicated in the recent research. Friendship grouping (FG), in which the students are allowed to choose their group
Effect of the Type of CLG on ESL Reading
1637Pertanika J. Soc. Sci. & Hum. 21 (4): 1633 - 1644 (2013)
members, tends to produce more positive results as compared to random or ability groupings (Kutnick et al., 2005; Shah & Jehn, 1993). Heilesen, Cudrio and Cheesman (2002) also found similar results, whereby the interaction among group members in an ability-based grouping was less strong compared to the members in the affinity-based grouping. This can be explained by Melles who argued that:
Wes tern mode l s o f random [grouping] put some pressure on the need to quickly develop relationship for the group process. Such spontaneous relationship forming may not come easily to all students [who] see this need of establishing relationship as essential to the successful communication and task completion (2004, p. 228).
Melles (2004) based his argument on his study with Asian students at an Australian University, in which the findings revealed that the students preferred FG to random assignment. They considered social interaction and the development of positive relationships to be the main features of CL because random assignment alone cannot promote efficiency of the group. Hence, students’ choice is deemed to be far more appropriate and effective.
In 2010, Thanh-Pham et al. conducted a study in Vietnam on 145 second year university students. These students were divided into two classes: Class 1, FG was applied while in Class 2, the students were
assigned to mixed-ability groups. Two instruments, a questionnaire and interview, were employed to collect data for the study. Both the instruments were used to investigate the students’ perceptions about responsibilities and task sharing among group members. The findings showed that the students were unsatisfied with their mixed ability group as they preferred working with their friends, with whom they were more comfortable. Besides, in FG, since the students know well their group members’ strengths and weaknesses, they could assign the tasks better according to their strong points. The researchers concluded that the Asian learners in the study tended to focus on affective factors more than on cognitive ones; the learners seemed to have emphasized on the importance of close relationships in group learning.
Phuong-Mai (2007) conducted a study in Vietnam to examine the grouping strategies that suit the Asian students. A total of 96 upper secondary school students were divided into an experimental and a control group. In the experimental group, affect-based trust groups were formed whereas the students in the control group were assigned according to their academic achievement. After four rounds of experiments, from 2005 to 2007, the data obtained from the questionnaire revealed that the students favoured working with classmates whom they personally know. Meanwhile, the students from the experimental group were more satisfied with their group formation and group learning ability. As a result, they chose to remain in the same group
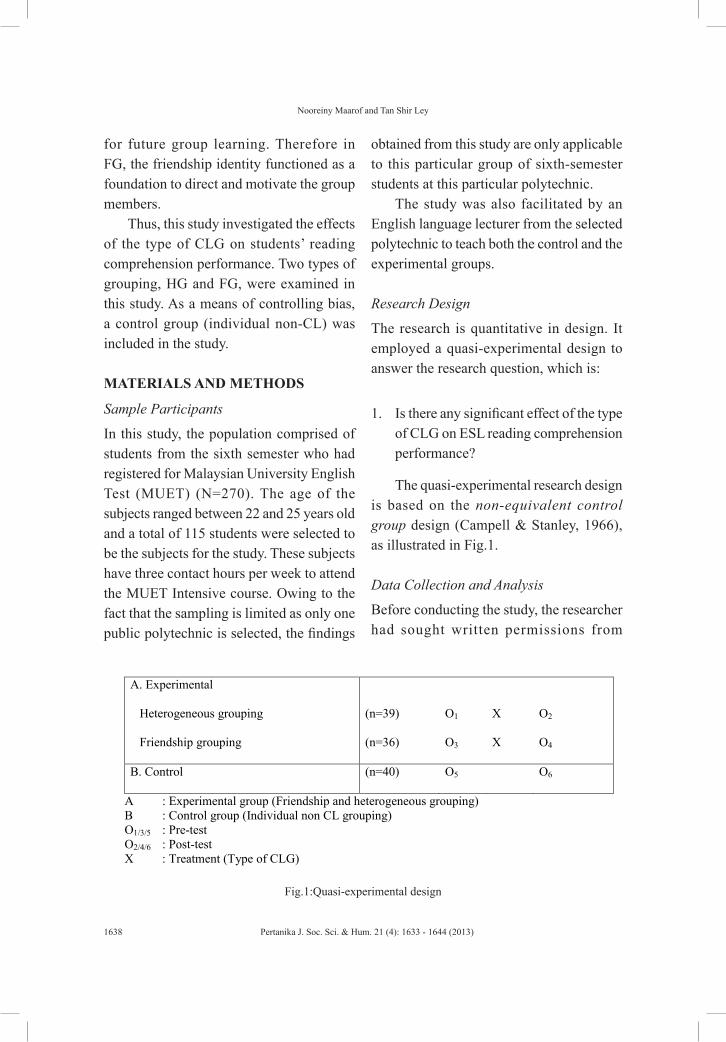
Nooreiny Maarof and Tan Shir Ley
1638 Pertanika J. Soc. Sci. & Hum. 21 (4): 1633 - 1644 (2013)
for future group learning. Therefore in FG, the friendship identity functioned as a foundation to direct and motivate the group members.
Thus, this study investigated the effects of the type of CLG on students’ reading comprehension performance. Two types of grouping, HG and FG, were examined in this study. As a means of controlling bias, a control group (individual non-CL) was included in the study.
MATERIALS AND METHODS
Sample Participants
In this study, the population comprised of students from the sixth semester who had registered for Malaysian University English Test (MUET) (N=270). The age of the subjects ranged between 22 and 25 years old and a total of 115 students were selected to be the subjects for the study. These subjects have three contact hours per week to attend the MUET Intensive course. Owing to the fact that the sampling is limited as only one public polytechnic is selected, the findings
obtained from this study are only applicable to this particular group of sixth-semester students at this particular polytechnic.
The study was also facilitated by an English language lecturer from the selected polytechnic to teach both the control and the experimental groups.
Research Design
The research is quantitative in design. It employed a quasi-experimental design to answer the research question, which is:
1. Is there any significant effect of the type of CLG on ESL reading comprehension performance?
The quasi-experimental research design is based on the non-equivalent control group design (Campell & Stanley, 1966), as illustrated in Fig.1.
Data Collection and Analysis
Before conducting the study, the researcher had sought written permissions from
A. Experimental
Heterogeneous grouping
(n=39)
O1
X
O2
Friendship grouping (n=36) O3 X O4
B. Control (n=40) O5 O6
A : Experimental group (Friendship and heterogeneous grouping) B : Control group (Individual non CL grouping) O1/3/5 : Pre-test O2/4/6 : Post-test X : Treatment (Type of CLG)
Fig.1:Quasi-experimental design
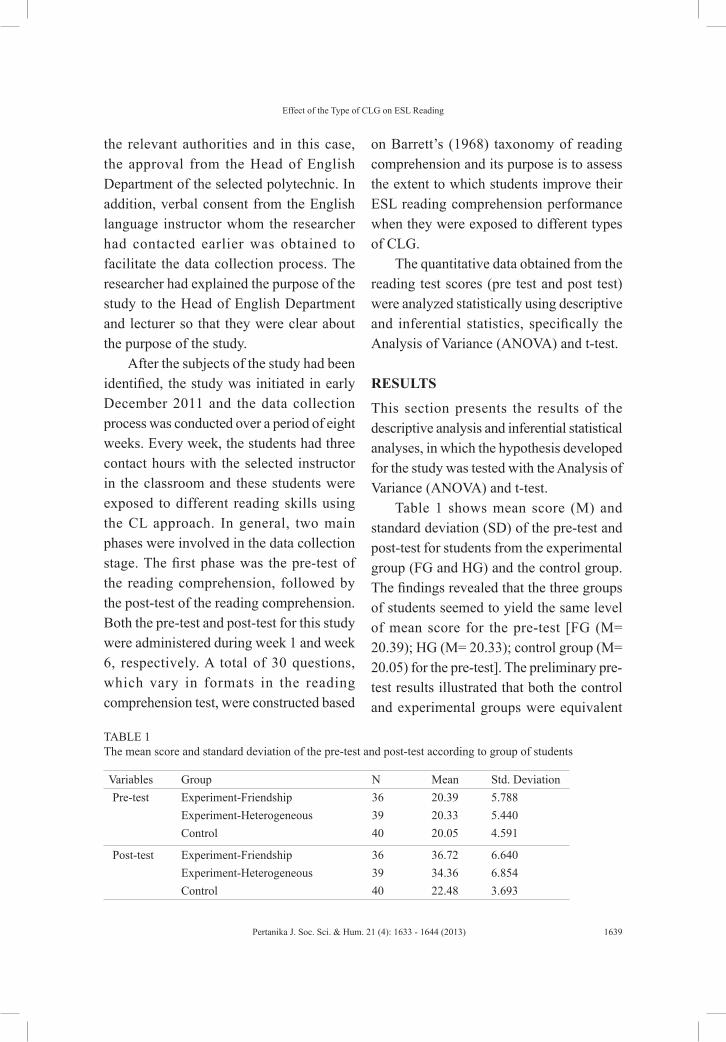
Effect of the Type of CLG on ESL Reading
1639Pertanika J. Soc. Sci. & Hum. 21 (4): 1633 - 1644 (2013)
the relevant authorities and in this case, the approval from the Head of English Department of the selected polytechnic. In addition, verbal consent from the English language instructor whom the researcher had contacted earlier was obtained to facilitate the data collection process. The researcher had explained the purpose of the study to the Head of English Department and lecturer so that they were clear about the purpose of the study.
After the subjects of the study had been identified, the study was initiated in early December 2011 and the data collection process was conducted over a period of eight weeks. Every week, the students had three contact hours with the selected instructor in the classroom and these students were exposed to different reading skills using the CL approach. In general, two main phases were involved in the data collection stage. The first phase was the pre-test of the reading comprehension, followed by the post-test of the reading comprehension. Both the pre-test and post-test for this study were administered during week 1 and week 6, respectively. A total of 30 questions, which vary in formats in the reading comprehension test, were constructed based
on Barrett’s (1968) taxonomy of reading comprehension and its purpose is to assess the extent to which students improve their ESL reading comprehension performance when they were exposed to different types of CLG.
The quantitative data obtained from the reading test scores (pre test and post test) were analyzed statistically using descriptive and inferential statistics, specifically the Analysis of Variance (ANOVA) and t-test.
RESULTS
This section presents the results of the descriptive analysis and inferential statistical analyses, in which the hypothesis developed for the study was tested with the Analysis of Variance (ANOVA) and t-test.
Table 1 shows mean score (M) and standard deviation (SD) of the pre-test and post-test for students from the experimental group (FG and HG) and the control group. The findings revealed that the three groups of students seemed to yield the same level of mean score for the pre-test [FG (M= 20.39); HG (M= 20.33); control group (M= 20.05) for the pre-test]. The preliminary pre-test results illustrated that both the control and experimental groups were equivalent
TABLE 1 The mean score and standard deviation of the pre-test and post-test according to group of students
Variables Group N Mean Std. DeviationPre-test Experiment-Friendship 36 20.39 5.788
Experiment-Heterogeneous 39 20.33 5.440Control 40 20.05 4.591
Post-test Experiment-Friendship 36 36.72 6.640Experiment-Heterogeneous 39 34.36 6.854Control 40 22.48 3.693
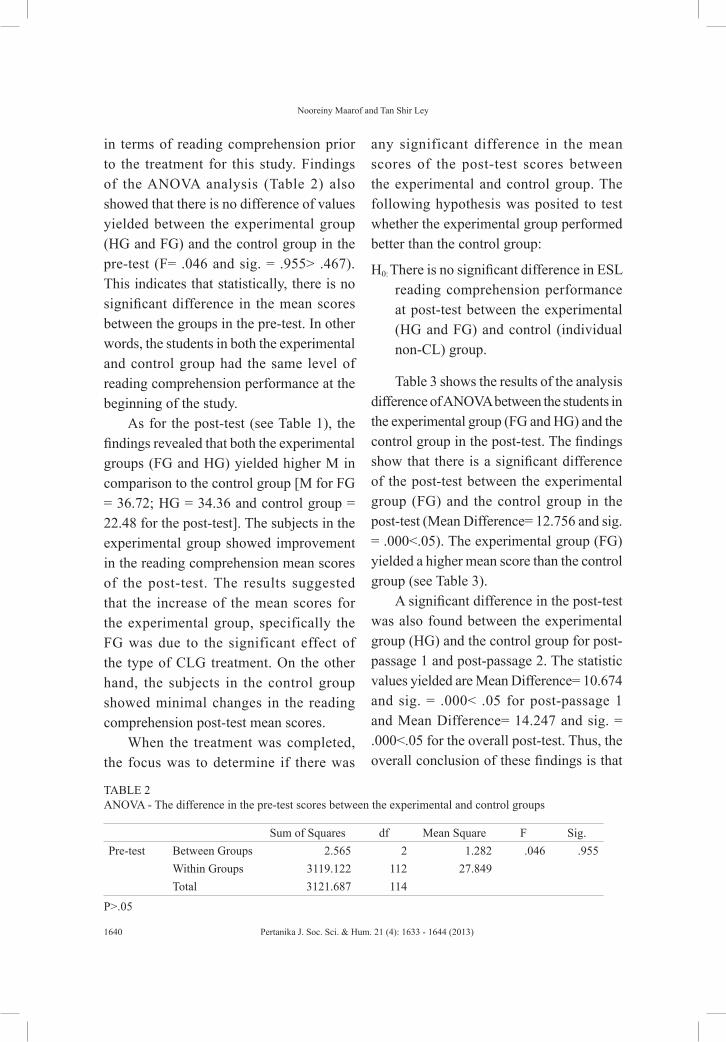
Nooreiny Maarof and Tan Shir Ley
1640 Pertanika J. Soc. Sci. & Hum. 21 (4): 1633 - 1644 (2013)
in terms of reading comprehension prior to the treatment for this study. Findings of the ANOVA analysis (Table 2) also showed that there is no difference of values yielded between the experimental group (HG and FG) and the control group in the pre-test (F= .046 and sig. = .955> .467). This indicates that statistically, there is no significant difference in the mean scores between the groups in the pre-test. In other words, the students in both the experimental and control group had the same level of reading comprehension performance at the beginning of the study.
As for the post-test (see Table 1), the findings revealed that both the experimental groups (FG and HG) yielded higher M in comparison to the control group [M for FG = 36.72; HG = 34.36 and control group = 22.48 for the post-test]. The subjects in the experimental group showed improvement in the reading comprehension mean scores of the post-test. The results suggested that the increase of the mean scores for the experimental group, specifically the FG was due to the significant effect of the type of CLG treatment. On the other hand, the subjects in the control group showed minimal changes in the reading comprehension post-test mean scores.
When the treatment was completed, the focus was to determine if there was
any significant difference in the mean scores of the post-test scores between the experimental and control group. The following hypothesis was posited to test whether the experimental group performed better than the control group:
H0: There is no significant difference in ESL reading comprehension performance at post-test between the experimental (HG and FG) and control (individual non-CL) group.
Table 3 shows the results of the analysis difference of ANOVA between the students in the experimental group (FG and HG) and the control group in the post-test. The findings show that there is a significant difference of the post-test between the experimental group (FG) and the control group in the post-test (Mean Difference= 12.756 and sig. = .000<.05). The experimental group (FG) yielded a higher mean score than the control group (see Table 3).
A significant difference in the post-test was also found between the experimental group (HG) and the control group for post-passage 1 and post-passage 2. The statistic values yielded are Mean Difference= 10.674 and sig. = .000< .05 for post-passage 1 and Mean Difference= 14.247 and sig. = .000<.05 for the overall post-test. Thus, the overall conclusion of these findings is that
TABLE 2 ANOVA - The difference in the pre-test scores between the experimental and control groups
Sum of Squares df Mean Square F Sig.Pre-test Between Groups 2.565 2 1.282 .046 .955
Within Groups 3119.122 112 27.849Total 3121.687 114
P>.05
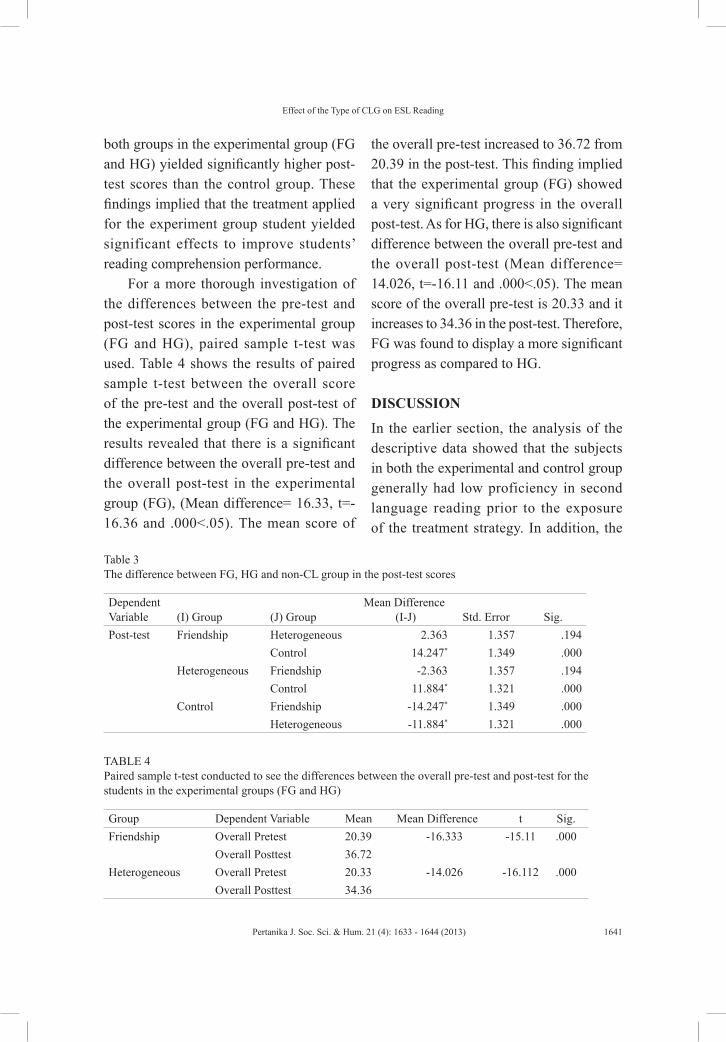
Effect of the Type of CLG on ESL Reading
1641Pertanika J. Soc. Sci. & Hum. 21 (4): 1633 - 1644 (2013)
both groups in the experimental group (FG and HG) yielded significantly higher post-test scores than the control group. These findings implied that the treatment applied for the experiment group student yielded significant effects to improve students’ reading comprehension performance.
For a more thorough investigation of the differences between the pre-test and post-test scores in the experimental group (FG and HG), paired sample t-test was used. Table 4 shows the results of paired sample t-test between the overall score of the pre-test and the overall post-test of the experimental group (FG and HG). The results revealed that there is a significant difference between the overall pre-test and the overall post-test in the experimental group (FG), (Mean difference= 16.33, t=-16.36 and .000<.05). The mean score of
the overall pre-test increased to 36.72 from 20.39 in the post-test. This finding implied that the experimental group (FG) showed a very significant progress in the overall post-test. As for HG, there is also significant difference between the overall pre-test and the overall post-test (Mean difference= 14.026, t=-16.11 and .000<.05). The mean score of the overall pre-test is 20.33 and it increases to 34.36 in the post-test. Therefore, FG was found to display a more significant progress as compared to HG.
DISCUSSION
In the earlier section, the analysis of the descriptive data showed that the subjects in both the experimental and control group generally had low proficiency in second language reading prior to the exposure of the treatment strategy. In addition, the
Table 3 The difference between FG, HG and non-CL group in the post-test scores
Dependent Variable (I) Group (J) Group
Mean Difference (I-J) Std. Error Sig.
Post-test Friendship Heterogeneous 2.363 1.357 .194Control 14.247* 1.349 .000
Heterogeneous Friendship -2.363 1.357 .194Control 11.884* 1.321 .000
Control Friendship -14.247* 1.349 .000Heterogeneous -11.884* 1.321 .000
TABLE 4 Paired sample t-test conducted to see the differences between the overall pre-test and post-test for the students in the experimental groups (FG and HG)
Group Dependent Variable Mean Mean Difference t Sig.Friendship Overall Pretest 20.39 -16.333 -15.11 .000
Overall Posttest 36.72Heterogeneous Overall Pretest 20.33 -14.026 -16.112 .000
Overall Posttest 34.36
Nooreiny Maarof and Tan Shir Ley
1642 Pertanika J. Soc. Sci. & Hum. 21 (4): 1633 - 1644 (2013)
results also illustrated that both the control and experimental groups were equivalent in terms of reading comprehension prior to the treatment for this study.
After the treatment strategy, the subjects in the experimental group showed improvement in the reading comprehension mean scores of the post-test. The results suggested that the increase of the mean scores for the experimental group, specifically FG, were possibly due to the effects of the type of CLG treatment. On the other hand, the subjects in the control group showed minimal changes in the reading comprehension post-test mean scores. The results suggested that the effect from the non-CL approach is minimal. To summarize the descriptive statistics, it could be said that that the treatment strategy of the type of CLG appeared to have substantial and positive effects on the overall reading comprehension post-test scores for the experimental group.
As for the inferential statistics, ANOVA was used to analyze the differences between the experimental group (HG and FG) and the control group for pre- and post-test. Before that, test of homogeneity, which is the requirement of ANOVA analysis, had been investigated and the result of Levene’s test showed that the samples among the groups obtained homogeneity of variances across dependent variables. Meanwhile, the findings of ANOVA showed that the students in both the experimental and control group had the same level of reading comprehension performance at the beginning of the study. In addition, the
result of the analysis difference of ANOVA between the students in the experimental group (FG and HG) and the control group also showed that those in the experimental group (FG and HG) yielded higher mean score than the students in the control group (non-CL) on the post-test.
For a deeper investigation of the differences between the pre-test and post-test scores in the experimental groups (FG and HG) and the control group (non-CL), paired sample t-test was used. The results show that there is a significant difference between the overall pre-test and the overall post-test in the experimental group (FG and HG). These findings implied that a very significant progress was attained by students in the experimental group (FG and HG) at the end of the treatment. As for the control group (non-CL), there was an increase in the mean score of the pre-test to post-test for the students in the control group (non-CL). However, the increase in the mean score was rather small. In other words, the progress made in the control group (non-CL) during the processes of teaching and learning was not as high as that of the experimental group (FG and HG).
Meanwhile, the findings from the previous section demonstrated that the students in the experimental group (FG and HG) improved significantly in the reading comprehension post-test score after the treatment. In order to examine the differences between the pre-test and post-test scores in the experimental group (FG and HG) and the control group (non-CL), the paired sample t-test was used. The results
Effect of the Type of CLG on ESL Reading
1643Pertanika J. Soc. Sci. & Hum. 21 (4): 1633 - 1644 (2013)
showed that the mean score differences are more significant in FG (16.33) than in HG (14.026). This finding implied that FG had very significant progress in the overall post-test.
Based on the descriptive and inferential statistics, it can be concluded that FG has the most positive effect on students’ reading comprehension performance, as measured by the reading comprehension test.
CONCLUSION
In relation to insights from other studies, this study produced findings that are worth considering in the implementation of cooperative learning ESL classrooms. Findings from this study illustrate that FG has a positive effect on ESL reading comprehension performance of polytechnic students. The results obtained from this study did not concur with what has been widely found in many other studies, which strongly argue that HG is more preferable and is beneficial to students. The findings of this study shed doubts on the idea of HG, which is dominant in the practice of CL. In conclusion, the present study does not intend to ignore the potential of HG, but rather suggests an alternative of grouping strategy that allows students to select their own group members. Such practice will enable students to increase their achievement while improving intra-group relations of the learners as they work in groups with people they are familiar with.
REFERENCESBarretts, T. C. (1968). What is reading? In T.
Clymer (Ed.), Innovation and change in reading instruction. 67th Yearbook of the National Society for study of Education: University of Chicago Press.
Campbell, D., & Stanley, J. (1966). Experimental and quasi experimental designs for research. Chicago: Rand McNally.
Clouston, M. (1997). Language learning strategies: An overview for L2 teachers. The Internet TESL Journal, 3(12), 10-25.
Fazlin Shasha Abdullah. (2002). The Use of Cooperative Learning in Literature in English. Unpublished Academic Exercise. Universiti Kebangsaan Malaysia, Selangor.
Gay, L. R., & Airasian, P. (2003). Educational Research. Competencies for analysis and application (7th Ed.). New Jersey: Prentice Hall.
Ghaith, G. M., & Bouzeidinne, A. R. (2003). Relationship between reading attitudes, achievement and learners’ perceptions of their Jigsaw II cooperative learning experience. Reading Psychology, 24, 105-121.
Heilesen, S. R., Cudrio Thomsen, M., & Cheesman, R. (2002). Proceedings from CSCL 2002: Computer support for collaborative learning: Foundations for CSCL community, Boulder, CA: Erlbaum.
Johnson, D. W., Johnson, R. T., & Smith, K. A. (1998). Active learning: Cooperation in the college classroom. Edina, M.N.: Interaction Book.
Johnson, D. W., & Johnson, R. T. (1994). Learning together and alone: Cooperative, competitive and individualistic learning (4th Ed.). Boston: Allyn & Bacon.
Johnson, D. W., Johnson, R. T., & Stanne, M. B. (2000). Cooperative Learning Methods: A Meta-Analysis. Retrieved from http://www.tablelearning.com/uploads/File/EXHIBIT-B.pdf.
Nooreiny Maarof and Tan Shir Ley
1644 Pertanika J. Soc. Sci. & Hum. 21 (4): 1633 - 1644 (2013)
Kutnick, P., Blatchford, P., & Baines, E. (2005). Grouping of pupils in secondary school classrooms: possible links between pedagogy and learning. Social Psychology of Education, 8, 349-374.
Melles, G. (2004). Understanding the role of language/culture in group work through qualitative interviewing. The Qualitative Report, 9(2), 216-240.
Nambiar, R. (2005). Enhancing academic literacy among tertiary learners: A Malaysian experience. 3L Journal of Language Teaching, Linguistics and Literature, 13.
Phuong-Mai, N. , Terlouw, C. , & Pilot , A. (2007). The Effectiveness Of Culturally Appropriate Cooperative Learning Among Asian Students. Retrieved from http://www.utwente.nl /elan/onderzoek/publicat ies/elandoc/2007/2007-003%20ORD%20Mai.pdf
Pressley, M., Yokoi, L., van Meter, P., Van Etten, S., & Freebern, G. (1997). Some of the reasons preparing for exams is so hard: What can be done to make it easier? Educational Psychology Review, 9, 1-38.
Ramaiah, M. (1997). Reciprocal teaching in enhancing the reading ability of ESL students at the tertiary level. Unpublished PhD. Thesis. University of Malaya, Kuala Lumpur.
Shaaban, K. (2006). An initial study of the effects of cooperative learning on reading comprehension, vocabulary acquisition, and motivation to read. Reading Psychology, 27(5), 377 – 403. Retrieved from http://www.informaworld.com/smpp/content~db=all~content=a759237164
Shah, P. P., & Jehn, K. (1993). Do friends perform better than acquaintances? The interaction of friendship, conflict and task. Group Decision and Negotiation, 2, 149-165.
Tengku Nor Rizan. (2002). The Effects of Cooperative Learning on English as a Second Language Reading Performance of Low Proficiency Undergraduates at a Public University . Unpubl ished Ph.D. Thesis , Univers i t i Kebangsaan Malaysia, Selangor.
Thanh-Pham, T. H., & Gillies, R. (2010). Group composition of cooperative learning: Does heterogeneous grouping work in Asian classrooms? International Education Studies, 3(3), 12-19.
Wan Azizah Wan Ali. (1999). The Effectiveness of Using Cooperative Learning in Enhancing Reading to Form Four Students. Unpublished Academic exercise. Universiti Kebangsaan Malaysia, Selangor.
REFEREES FOR THE PERTANIKA JOURNAL OF SOCIAL SCIENCES AND HUMANITIES
VOL. 21(4) DEC. 2013
The Editorial Board of the Journal of Social Sciences and Humanities wishes to thank the following for acting as referees for manuscripts published in this issue of JSSH.
While every effort has been made to include a complete list of referees for the period stated above, however if any name(s) have been omitted unintentionally or spelt incorrectly, please notify the Chief Executive Editor, UPM Journals at [email protected].
Any inclusion or exclusion of name(s) on this page does not commit the Pertanika Editorial Office, nor the Universiti Putra Malaysia Press or the University to provide any liability for whatsoever reason.
Special Acknowledgement
The JSSH Editorial Board gratefully acknowledges the assistance of Doreen Dillah and Ena Bhattacharyya who served as the English language editors for this issue.
Abd Rahim Bakar (UPM, Malaysia)
Abdul Rahman Embong (UKM, Malaysia)
Ahmad Esa (UTHM, Malaysia)
Aida Suraya Md Yunus (UPM, Malaysia)
Bob Chui Seng Yong (Universiti Brunei Darussalam, Brunei)
Carol Elizabeth Leon (UM, Malaysia)
Chin Yee Whah (USM, Malaysia)
Crescentia Morais (IMU, Malaysia)
Fatimah Saleh (USM, Malaysia)
Gourang Charan Nanda (B. J. B. Autonomous College, India)
Graham Thurgood (California State University, USA)
Hashimah Mohd Yunus (USM, Malaysia)
Haslinda Abdullah (UPM, Malaysia)
Intan Hashimah Mohd Hashim (USM, Malaysia)
Jariah Mohd Jan (UM, Malaysia)
Jayakaran Mukundan (UPM, Malaysia)
Kamariah Dola (UPM, Malaysia)
Lalita Sinha (USM, Malaysia)
Lee Siew Chin (UKM, Malaysia)
Leela Chakravarty (UPSI, Malaysia)
Lilly Metom (UiTM, Malaysia)
Lim Chin Haw (UKM, Malaysia)
Manimangai Mani (UPM, Malaysia)
Mashita Abdul Jabar (UTM, Malaysia)
Mohd Johari Mohd Yusof (UPM, Malaysia)
Muhammad Adli Musa (IIUM, Malaysia)
Muhd Zaimi Abd Majid (UTM, Malaysia)
Munirah Ghazali (USM, Malaysia)
Ng Kui Choo (UiTM, Malaysia)
Norzarina Mohd Zaharim (USM, Malaysia)
Patrick Yeoh (UPM, Malaysia)
Peter Davis (UPM, Malaysia)
Pushp Lata (Birla Institute of Technology and Science, India)
Ramle Abdullah (UniSZA, Malaysia)
Rosli Talif (UPM, Malaysia)
Rozainee Khairudin (UKM, Malaysia)
Saeid Pirasteh (Dewey College, Australia)
Siti Nor Yaacob (UPM, Malaysia)
Sumathi Renganathan (UTP, Malaysia)
Tan Bee Hoon (UPM, Malaysia)
Teh Chee Seng (UTAR, Malaysia)
Turiman Suandi (UPM, Malaysia)
Vahid Nimehchisalem (UPM, Malaysia)
Vilma Singh (Punjab University, India)
Wan Roselezam Wan Yahya (UPM, Malaysia)
Wang Yong Bao @ Ahmed Musa (INCEIF, Malaysia)
UPM- Universiti Putra MalaysiaUKM- Universiti Kebangsaan MalaysiaUSM- Universiti Sains Malaysia
UM- Universiti MalayaUiTM- Universiti Teknologi MaraUTM- Universiti Teknologi Malaysia
UPSI- Universiti Pendidikan Sultan IdrisIIUM- International Islamic University MalaysiaUTHM- Universiti Tun Hussein Onn Malaysia
UTP- Universiti Teknologi PetronasUniSZA- Universiti Sultan Zainal AbidinIMU- International Medical University

PertanikaOur goal is to bring high quality research to the widest possible audience
Journal of Social Sciences and Humanities
INSTRUCTIONS TO AUTHORS(Manuscript Preparation & Submission Guidelines)
Revised: February 2013
We aim for excellence, sustained by a responsible and professional approach to journal publishing. We value and support our authors in the research community.
Please read the guidelines and follow these instructions carefully; doing so will ensure that the publication of your manuscript is as rapid and efficient as possible. The Editorial Board reserves the right to return manuscripts that are not prepared in accordance with these guidelines.
About the JournalPertanika is an international peer-reviewed journal devoted to the publication of original papers, and it serves as a forum for practical approaches to improving quality in issues pertaining to tropical agriculture and its related fields. Pertanika began publication in 1978 as Journal of Tropical Agricultural Science. In 1992, a decision was made to streamline Pertanika into three journals to meet the need for specialised journals in areas of study aligned with the interdisciplinary strengths of the university. The revamped Journal of Social Sciences & Humanities (JSSH) aims to develop as a pioneer journal for the Social Sciences with a focus on emerging issues pertaining to the social and behavioural sciences as well as the humanities, particularly in the Asia Pacific region. Other Pertanika series include Journal of Tropical Agricultural Science (JTAS); and Journal of Science and Technology (JST).
JSSH is published in English and it is open to authors around the world regardless of the nationality. It is currently published four times a year i.e. in March, June, September and December.
Goal of PertanikaOur goal is to bring the highest quality research to the widest possible audience.
Quality We aim for excellence, sustained by a responsible and professional approach to journal publishing. Submissions are guaranteed to receive a decision within 12 weeks. The elapsed time from submission to publication for the articles averages 5-6 months.
Indexing of PertanikaPertanika is now over 33 years old; this accumulated knowledge has resulted Pertanika JSSH being indexed in SCOPUS (Elsevier), EBSCO, Thomson (ISI) Web of Knowledge [CAB Abstracts], DOAJ, Google Scholar, ISC, Citefactor, Rubriq and MyAIS.
Future visionWe are continuously improving access to our journal archives, content, and research services. We have the drive to realise exciting new horizons that will benefit not only the academic community, but society itself.
We also have views on the future of our journals. The emergence of the online medium as the predominant vehicle for the ‘consumption’ and distribution of much academic research will be the ultimate instrument in the dissemination of research news to our scientists and readers.
Aims and scope
Pertanika Journal of Social Sciences & Humanities aims to develop as a pioneer journal for the social sciences with a focus on emerging issues pertaining to the social and behavioural sciences as well as the humanities. Areas relevant to the scope of the journal include Social Sciences—Accounting, anthropology, Archaeology and history, Architecture and habitat, Consumer and family economics, Economics, Education, Finance, Geography, Law, Management studies, Media and communication studies, Political sciences and public policy, Population studies, Psychology, Sociology, Technology management, Tourism; Humanities—Arts and culture, Dance, Historical and civilisation studies, Language and Linguistics, Literature, Music, Philosophy, Religious studies, Sports.

Editorial StatementPertanika is the official journal of Universiti Putra Malaysia. The abbreviation for Pertanika Journal of Social Sciences & Humanities is Pertanika J. Soc. Sci. Hum.
Guidelines for AuthorsPublication policiesPertanika policy prohibits an author from submitting the same manuscript for concurrent consideration by two or more publications. It prohibits as well publication of any manuscript that has already been published either in whole or substantial part elsewhere. It also does not permit publication of manuscript that has been published in full in Proceedings. Please refer to Pertanika’s Code of Ethics for full details.
Editorial processAuthors are notified on receipt of a manuscript and upon the editorial decision regarding publication.
Manuscript review: Manuscripts deemed suitable for publication are sent to the Editorial Board members and/or other reviewers. We encourage authors to suggest the names of possible reviewers. Notification of the editorial decision is usually provided within to eight to ten weeks from the receipt of manuscript. Publication of solicited manuscripts is not guaranteed. In most cases, manuscripts are accepted conditionally, pending an author’s revision of the material.
Author approval: Authors are responsible for all statements in articles, including changes made by editors. The liaison author must be available for consultation with an editor of The Journal to answer questions during the editorial process and to approve the edited copy. Authors receive edited typescript (not galley proofs) for final approval. Changes cannot be made to the copy after the edited version has been approved.
Manuscript preparationPertanika accepts submission of mainly four types of manuscripts. Each manuscript is classified as regular or original articles, short communications, reviews, and proposals for special issues. Articles must be in English and they must be competently written and argued in clear and concise grammatical English. Acceptable English usage and syntax are expected. Do not use slang, jargon, or obscure abbreviations or phrasing. Metric measurement is preferred; equivalent English measurement may be included in parentheses. Always provide the complete form of an acronym/abbreviation the first time it is presented in the text. Contributors are strongly recommended to have the manuscript checked by a colleague with ample experience in writing English manuscripts or an English language editor.
Linguistically hopeless manuscripts will be rejected straightaway (e.g., when the language is so poor that one cannot be sure of what the authors really mean). This process, taken by authors before submission, will greatly facilitate reviewing, and thus publication if the content is acceptable.
The instructions for authors must be followed. Manuscripts not adhering to the instructions will be returned for revision without review. Authors should prepare manuscripts according to the guidelines of Pertanika.
1. Regular articleDefinition: Full-length original empirical investigations, consisting of introduction, materials and methods, results and discussion, conclusions. Original work must provide references and an explanation on research findings that contain new and significant findings.
Size: Should not exceed 5000 words or 8-10 printed pages (excluding the abstract, references, tables and/or figures). One printed page is roughly equivalent to 3 type-written pages.
2. Short communicationsDefinition: Significant new information to readers of the Journal in a short but complete form. It is suitable for the publication of technical advance, bioinformatics or insightful findings of plant and animal development and function.
Size: Should not exceed 2000 words or 4 printed pages, is intended for rapid publication. They are not intended for publishing preliminary results or to be a reduced version of Regular Papers or Rapid Papers.
3. Review articleDefinition: Critical evaluation of materials about current research that had already been published by organizing, integrating, and evaluating previously published materials. Re-analyses as meta-analysis and systemic reviews are encouraged. Review articles should aim to provide systemic overviews, evaluations and interpretations of research in a given field.
Size: Should not exceed 4000 words or 7-8 printed pages.

4. Special issuesDefinition: Usually papers from research presented at a conference, seminar, congress or a symposium.
Size: Should not exceed 5000 words or 8-10 printed pages.
5. OthersDefinition: Brief reports, case studies, comments, Letters to the Editor, and replies on previously published articles may be considered.
Size: Should not exceed 2000 words or up to 4 printed pages.
With few exceptions, original manuscripts should not exceed the recommended length of 6 printed pages (about 18 typed pages, double-spaced and in 12-point font, tables and figures included). Printing is expensive, and, for the Journal, postage doubles when an issue exceeds 80 pages. You can understand then that there is little room for flexibility.
Long articles reduce the Journal’s possibility to accept other high-quality contributions because of its 80-page restriction. We would like to publish as many good studies as possible, not only a few lengthy ones. (And, who reads overly long articles anyway?) Therefore, in our competition, short and concise manuscripts have a definite advantage.
FormatThe paper should be formatted in one column format with at least 4cm margins and 1.5 line spacing throughout. Authors are advised to use Times New Roman 12-point font. Be especially careful when you are inserting special characters, as those inserted in different fonts may be replaced by different characters when converted to PDF files. It is well known that ‘µ’ will be replaced by other characters when fonts such as ‘Symbol’ or ‘Mincho’ are used.
A maximum of eight keywords should be indicated below the abstract to describe the contents of the manuscript. Leave a blank line between each paragraph and between each entry in the list of bibliographic references. Tables should preferably be placed in the same electronic file as the text. Authors should consult a recent issue of the Journal for table layout.
Every page of the manuscript, including the title page, references, tables, etc. should be numbered. However, no reference should be made to page numbers in the text; if necessary, one may refer to sections. Underline words that should be in italics, and do not underline any other words.
We recommend that authors prepare the text as a Microsoft Word file.
1. Manuscripts in general should be organised in the following order:
o Page 1: Running title. (Not to exceed 60 characters, counting letters and spaces). This page should only contain the running title of your paper. The running title is an abbreviated title used as the running head on every page of the manuscript.
In addition, the Subject areas most relevant to the study must be indicated on this page. Select the appropriate subject areas from the Scope of the Journals provided in the Manuscript Submission Guide.
o A list of number of black and white / colour figures and tables should also be indicated on this page. Figures submitted in color will be printed in colour. See “5. Figures & Photographs” for details.
o Page 2: Author(s) and Corresponding author information. This page should contain the full title of your paper with name(s) of all the authors, institutions and corresponding author’s name, institution and full address (Street address, telephone number (including extension), hand phone number, fax number and e-mail address) for editorial correspondence. The names of the authors must be abbreviated following the international naming convention. e.g. Salleh, A.B., Tan, S.G., or Sapuan, S.M.
Authors’ addresses. Multiple authors with different addresses must indicate their respective addresses separately by superscript numbers:
George Swan1 and Nayan Kanwal2 1Department of Biology, Faculty of Science, Duke University, Durham, North Carolina, USA. 2Office of the Deputy Vice Chancellor (R&I), Universiti Putra Malaysia, Serdang, Malaysia.
o Page 3: This page should repeat the full title of your paper with only the Abstract (the abstract should be less than 250 words for a Regular Paper and up to 100 words for a Short Communication). Keywords must also be provided on this page (Not more than eight keywords in alphabetical order).
o Page 4 and subsequent pages: This page should begin with the Introduction of your article and the rest of your paper should follow from page 5 onwards.

Abbreviations. Define alphabetically, other than abbreviations that can be used without definition. Words or phrases that are abbreviated in the introduction and following text should be written out in full the first time that they appear in the text, with each abbreviated form in parenthesis. Include the common name or scientific name, or both, of animal and plant materials.
Footnotes. Current addresses of authors if different from heading.
2. Text. Regular Papers should be prepared with the headings Introduction, Materials and Methods, Results and Discussion, Conclusions in this order. Short Communications should be prepared according to “8. Short Communications.” below.
3. Tables. All tables should be prepared in a form consistent with recent issues of Pertanika and should be numbered consecutively with Arabic numerals. Explanatory material should be given in the table legends and footnotes. Each table should be prepared on a separate page. (Note that when a manuscript is accepted for publication, tables must be submitted as data - .doc, .rtf, Excel or PowerPoint file- because tables submitted as image data cannot be edited for publication.)
4. Equations and Formulae. These must be set up clearly and should be typed triple spaced. Numbers identifying equations should be in square brackets and placed on the right margin of the text.
5. Figures & Photographs. Submit an original figure or photograph. Line drawings must be clear, with high black and white contrast. Each figure or photograph should be prepared on a separate sheet and numbered consecutively with Arabic numerals. Appropriate sized numbers, letters and symbols should be used, no smaller than 2 mm in size after reduction to single column width (85 mm), 1.5-column width (120 mm) or full 2-column width (175 mm). Failure to comply with these specifications will require new figures and delay in publication. For electronic figures, create your figures using applications that are capable of preparing high resolution TIFF files acceptable for publication. In general, we require 300 dpi or higher resolution for coloured and half-tone artwork and 1200 dpi or higher for line drawings. For review, you may attach low-resolution figures, which are still clear enough for reviewing, to keep the file of the manuscript under 5 MB. Illustrations may be produced at extra cost in colour at the discretion of the Publisher; the author could be charged Malaysian Ringgit 50 for each colour page.
6. References. Literature citations in the text should be made by name(s) of author(s) and year. For references with more than two authors, the name of the first author followed by ‘et al.’ should be used.
Swan and Kanwal (2007) reported that …The results have been interpreted (Kanwal et al., 2009).
o References should be listed in alphabetical order, by the authors’ last names. For the same author, or for the same set of authors, references should be arranged chronologically. If there is more than one publication in the same year for the same author(s), the letters ‘a’, ‘b’, etc., should be added to the year.
o When the authors are more than 11, list 5 authors and then et al.
o Do not use indentations in typing References. Use one line of space to separate each reference. The name of the journal should be written in full. For example:
Mellers, B. A. (2006a). Choice and the relative pleasure of consequences. Psychological Bulletin, 126, 910-924.
Mellers, B. A. (2006b). Treatment for sexually abused children and adolescents. American Psychologist, 55, 1040-1049.
Hawe, P. (2005). Capturing the meaning of “community” in community intervention evaluation: Some contributions from community psychology. Health Promotion International, 9,199-210.
Braconier, H., & Ekholm, K. (2006). Swedish multinationals and competition from high and low wage location. Review of International Economics, 8, 448-461.
o In case of citing an author(s) who has published more than one paper in the same year, the papers should be distinguished by addition of a small letter as shown above, e.g. Jalaludin (1997a); Jalaludin (1997b).
o Unpublished data and personal communications should not be cited as literature citations, but given in the text in parentheses. ‘In press’ articles that have been accepted for publication may be cited in References. Include in the citation the journal in which the ‘in press’ article will appear and the publication date, if a date is available.

7. Examples of other reference citations:
Monographs: Kalimapour, Y.R. (2004). Images of the U.S. Around the World: A Multicultural Perspective. Albany, NY: State University of New York Press.
Chapter in Book: Bjork, R. A. (2007). Retrieval inhibition as an adaptive mechanism in human memory. In H. L. Roediger III & F. I. M. Craik (Eds.), Varieties of memory & consciousness (pp. 309-330). Hull: Hull University Press.
o Proceedings: Amir Awang. (2006). Counseling, human resources development and counseling services. In Sulaiman M. Yassin, Yahya Mat Hassan, Kamariah Abu Bakar, Esah Munji and Sabariah Mohd. Rashid (Eds.), Proceedings of Asia Pacific Conference on Human Development (p. 243-246). Serdang: Universiti Putra Malaysia.
8. Short Communications should include Introduction, Materials and Methods, Results and Discussion, Conclusions in this order. Headings should only be inserted for Materials and Methods. The abstract should be up to 100 words, as stated above. Short Communications must be 5 printed pages or less, including all references, figures and tables. References should be less than 30. A 5 page paper is usually approximately 3000 words plus four figures or tables (if each figure or table is less than 1/4 page).
*Authors should state the total number of words (including the Abstract) in the cover letter. Manuscripts that do not fulfill these criteria will be rejected as Short Communications without review.
STYLE OF THE MANUSCRIPTManuscripts should follow the style of the latest version of the Publication Manual of the American Psychological Association (APA). The journal uses American or British spelling and authors may follow the latest edition of the Oxford Advanced Learner’s Dictionary for British spellings.
SUBMISSION OF MANUSCRIPTSAll articles should be submitted electronically using the ScholarOne web-based system. ScholarOne, a Thomson Reuters product provides comprehensive workflow management systems for scholarly journals. For more information, go to our web page and click “Online Submission”.
Alternatively, you may submit the electronic files (cover letter, manuscript, and the Manuscript Submission Kit comprising Declaration and Referral form) via email directly to the Executive Editor. If the files are too large to email, mail a CD containing the files. The Manuscript Submission Guide and Submission Kit are available from the Pertanika’s home page at http://www.pertanika.upm.edu.my/home.php or from the Chief Executive Editor’s office upon request.
All articles submitted to the journal must comply with these instructions. Failure to do so will result in return of the manuscript and possible delay in publication.
Please do not submit manuscripts to the editor-in-chief or to any other office directly. All manuscripts must be submitted through the chief executive editor’s office to be properly acknowledged and rapidly processed at the address below:
Dr. Nayan KANWALChief Executive EditorPertanika Journals, UPM PressOffice of the Deputy Vice Chancellor (R&I)IDEA Tower II, UPM-MTDC Technology CentreUniversiti Putra Malaysia43400 UPM, Serdang, Selangor, Malaysia
E-mail: [email protected]; [email protected] tel: + 603-8947 1622 or visit our website at http://www.pertanika.upm.edu.my/ for further information.
Authors should retain copies of submitted manuscripts and correspondence, as materials can not be returned. Authors are required to inform the Chief Executive Editor of any change of address which occurs whilst their papers are in the process of publication.
Cover letter
All submissions must be accompanied by a cover letter detailing what you are submitting. Papers are accepted for publication in the journal on the understanding that the article is original and the content has not been published or submitted for publication elsewhere. This must be stated in the cover letter.
The cover letter must also contain an acknowledgement that all authors have contributed significantly, and that all authors are in agreement with the content of the manuscript.

The cover letter of the paper should contain (i) the title; (ii) the full names of the authors; (iii) the addresses of the institutions at which the work was carried out together with (iv) the full postal and email address, plus facsimile and telephone numbers of the author to whom correspondence about the manuscript should be sent. The present address of any author, if different from that where the work was carried out, should be supplied in a footnote.
As articles are double-blind reviewed, material that might identify authorship of the paper should be placed on a cover sheet.
Peer review Pertanika follows a double-blind peer-review process. Peer reviewers are experts chosen by journal editors to provide written assessment of the strengths and weaknesses of written research, with the aim of improving the reporting of research and identifying the most appropriate and highest quality material for the journal.
In the peer-review process, three referees independently evaluate the scientific quality of the submitted manuscripts. Authors are encouraged to indicate in the Referral form using the Manuscript Submission Kit the names of three potential reviewers, but the editors will make the final choice. The editors are not, however, bound by these suggestions..
Manuscripts should be written so that they are intelligible to the professional reader who is not a specialist in the particular field. They should be written in a clear, concise, direct style. Where contributions are judged as acceptable for publication on the basis of content, the Editor reserves the right to modify the typescripts to eliminate ambiguity and repetition, and improve communication between author and reader. If extensive alterations are required, the manuscript will be returned to the author for revision.
The Journal’s review processWhat happens to a manuscript once it is submitted to Pertanika? Typically, there are seven steps to the editorial review process:
1. The executive editor and the editorial board examine the paper to determine whether it is appropriate for the journal and should be reviewed. If not appropriate, the manuscript is rejected outright and the author is informed.
2. The executive editor sends the article-identifying information having been removed, to three reviewers. Typically, one of these is from the Journal’s editorial board. Others are specialists in the subject matter represented by the article. The executive editor asks them to complete the review in three weeks and encloses two forms: (a) referral form B and (b) reviewer’s comment form along with reviewer’s guidelines. Comments to authors are about the appropriateness and adequacy of the theoretical or conceptual framework, literature review, method, results and discussion, and conclusions. Reviewers often include suggestions for strengthening of the manuscript. Comments to the editor are in the nature of the significance of the work and its potential contribution to the literature.
3. The executive editor, in consultation with the editor-in-chief, examines the reviews and decides whether to reject the manuscript, invite the author(s) to revise and resubmit the manuscript, or seek additional reviews. Final acceptance or rejection rests with the Editorial Board, who reserves the right to refuse any material for publication. In rare instances, the manuscript is accepted with almost no revision. Almost without exception, reviewers’ comments (to the author) are forwarded to the author. If a revision is indicated, the editor provides guidelines for attending to the reviewers’ suggestions and perhaps additional advice about revising the manuscript.
4. The authors decide whether and how to address the reviewers’ comments and criticisms and the editor’s concerns. The authors submit a revised version of the paper to the executive editor along with specific information describing how they have answered’ the concerns of the reviewers and the editor.
5. The executive editor sends the revised paper out for review. Typically, at least one of the original reviewers will be asked to examine the article.
6. When the reviewers have completed their work, the executive editor in consultation with the editorial board and the editor-in-chief examine their comments and decide whether the paper is ready to be published, needs another round of revisions, or should be rejected.
7. If the decision is to accept, the paper is sent to that Press and the article should appear in print in approximately three months. The Publisher ensures that the paper adheres to the correct style (in-text citations, the reference list, and tables are typical areas of concern, clarity, and grammar). The authors are asked to respond to any queries by the Publisher. Following these corrections, page proofs are mailed to the corresponding authors for their final approval. At this point, only essential changes are accepted. Finally, the article appears in the pages of the Journal and is posted on-line.

English language editing Pertanika emphasizes on the linguistic accuracy of every manuscript published. Thus all authors are required to get their manuscripts edited by professional English language editors. Author(s) must provide a certificate confirming that their manuscripts have been adequately edited. A proof from a recognised editing service should be submitted together with the cover letter at the time of submitting a manuscript to Pertanika. All costs will be borne by the author(s).
This step, taken by authors before submission, will greatly facilitate reviewing, and thus publication if the content is acceptable.
Author material archive policyAuthors who require the return of any submitted material that is rejected for publication in the journal should indicate on the cover letter. If no indication is given, that author’s material should be returned, the Editorial Office will dispose of all hardcopy and electronic material.
CopyrightAuthors publishing the Journal will be asked to sign a declaration form. In signing the form, it is assumed that authors have obtained permission to use any copyrighted or previously published material. All authors must read and agree to the conditions outlined in the form, and must sign the form or agree that the corresponding author can sign on their behalf. Articles cannot be published until a signed form has been received.
Lag time A decision on acceptance or rejection of a manuscript is reached in 3 to 4 months (average 14 weeks). The elapsed time from submission to publication for the articles averages 5-6 months.
Hardcopies of the Journals and off printsUnder the Journal’s open access initiative, authors can choose to download free material (via PDF link) from any of the journal issues from Pertanika’s website. Under “Browse Journals” you will see a link entitled “Current Issues” or “Archives”. Here you will get access to all back-issues from 1978 onwards.
The corresponding author for all articles will receive one complimentary hardcopy of the journal in which his/her articles is published. In addition, 20 off prints of the full text of their article will also be provided. Additional copies of the journals may be purchased by writing to the executive editor.

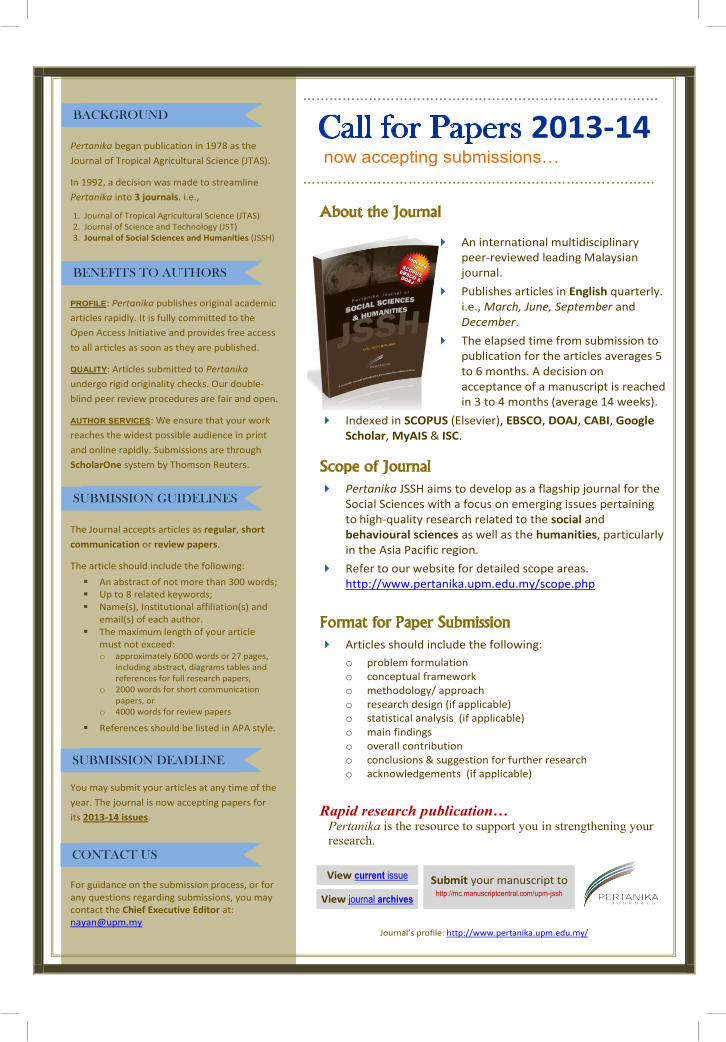
Pertanika began publication in 1978 as the
Journal of Tropical Agricultural Science (JTAS).
In 1992, a decision was made to streamline
Pertanika into 3 journals. i.e.,
1. Journal of Tropical Agricultural Science (JTAS) 2. Journal of Science and Technology (JST) 3. Journal of Social Sciences and Humanities (JSSH)
PROFILE: Pertanika publishes original academic
articles rapidly. It is fully committed to the
Open Access Initiative and provides free access
to all articles as soon as they are published.
QUALITY: Articles submitted to Pertanika
undergo rigid originality checks. Our double-
blind peer review procedures are fair and open.
AUTHOR SERVICES: We ensure that your work
reaches the widest possible audience in print
and online rapidly. Submissions are through
ScholarOne system by Thomson Reuters.
The Journal accepts articles as regular, short
communication or review papers.
The article should include the following:
An abstract of not more than 300 words; Up to 8 related keywords; Name(s), Institutional affiliation(s) and
email(s) of each author. The maximum length of your article
must not exceed: o approximately 6000 words or 27 pages,
including abstract, diagrams tables and references for full research papers,
o 2000 words for short communication papers, or
o 4000 words for review papers
References should be listed in APA style.
You may submit your articles at any time of the
year. The journal is now accepting papers for
its 2013-14 issues.
For guidance on the submission process, or for any questions regarding submissions, you may contact the Chief Executive Editor at: [email protected]
BACKGROUND
BENEFITS TO AUTHORS
………………………………………………………………………
Call for Papers 2013-14 now accepting submissions… ……………………………………………………………..………
About the Journal
An international multidisciplinary peer-reviewed leading Malaysian journal.
Publishes articles in English quarterly. i.e., March, June, September and December.
The elapsed time from submission to publication for the articles averages 5 to 6 months. A decision on acceptance of a manuscript is reached in 3 to 4 months (average 14 weeks).
Indexed in SCOPUS (Elsevier), EBSCO, DOAJ, CABI, Google Scholar, MyAIS & ISC.
Scope of Journal Pertanika JSSH aims to develop as a flagship journal for the
Social Sciences with a focus on emerging issues pertaining to high-quality research related to the social and behavioural sciences as well as the humanities, particularly in the Asia Pacific region.
Refer to our website for detailed scope areas. http://www.pertanika.upm.edu.my/scope.php
Format for Paper Submission Articles should include the following:
o problem formulation o conceptual framework o methodology/ approach o research design (if applicable) o statistical analysis (if applicable) o main findings o overall contribution o conclusions & suggestion for further research o acknowledgements (if applicable)
Rapid research publication… Pertanika is the resource to support you in strengthening your research.
Journal’s profile: http://www.pertanika.upm.edu.my/
SUBMISSION GUIDELINES
SUBMISSION DEADLINE
CONTACT US
View current issue Submit your manuscript to http://mc.manuscriptcentral.com/upm-jssh
View journal archives
Having trouble viewing this email? Click here to view online | View in a Mobile Device


Selected Articles from the International Conference of English Language Teaching (ICELT 2011)Guest Editors: Jayakaran Mukundan and Vahid Nimehchisalem
Comparison of Free-writing and Word-matching Activities as EFL Pre-reading Tasks
1555
Mohammad Reza Masrour and Mehdi Hoseini
Wordlists Analysis: Specialised Language Categories 1563Noorli Khamis and Imran Ho Abdullah
One Semester of Speaking Tasks – An Experimental Approach with Low Proficiency Students
1583
Andrew N. Williams and Yah Awg Nik
Common Patterns of Learner Characteristics Displayed by More Proficient EFL Learners
1595
Maosheng Hung and Ying Shing Hung
EFL Teacher Education: Where Do Trainers’ and Trainees’ Criteria Match? 1609Natasha Pourdana and Sayyed Mohammad Karimi Behbahani
Teaching as Transformative Performance: Performance as Kinesis in an Argumentative Writing Class
1621
Gene Segarra Navera
The Effect of Type of Cooperative Learning Grouping on ESL Learners’ Reading Comprehension Performance
1633
Nooreiny Maarof and Tan Shir Ley

Factors Influencing Preferences of Garden Iconographies 1395Mina Kaboudarahangi, Osman Mohd Tahir, Mustafa Kamal M. S. and Suhardi Maulan
Politeness in Spoken Review Genre: Viva Voce Context 1411Izadi, A.
Parenting Behaviour of Mothers, Adolescents’ Social Emotional Adjustments and their Correlates in Intact and Non-intact Malay Families in Kuala Lumpur
1431
Chiah, W. Y. and Baharudin, R.
Productive Work as Pedagogical Tool in School Education 1447Asfa M. Yasin
How Real is Real: Attitudes towards Realism in Selected Post-war British Fiction
1457
Nahid Shahbazi Moghadam and Arbaayah Ali Termizi
Islamic Work Ethics and Organizational Commitment: Evidence from Employees of Banking Institutions in Malaysia
1471
Manan, S. K., Kamaluddin, N. and Puteh Salin, A. S. A.
Thermal Comfort Investigation in Traditional and Modern Urban Canyons in Bandar Abbas, Iran
1491
Masoud Dalman, Elias Salleh, Abdul Razak Sapian and Omidreza Saadatian
Turning a Social Character Trait Phenomenon into a Diagnostic Web-Based Measuring Instrument Using a Grounded Theory Research Method
1517
Normahdiah S. Said, Hashim, M., Rozita, C. R. and Siti Sarah, A. K.
Analysing Hardy’s Portrayal of Tess Through Christian Feminism 1525Faezeh Sivandipour
Attitude of Teachers towards Adolescence Education 1533Gyanendra Kumar Rout
The Implementation of Picture Exchange Communication System: A Mother’s Perspective of a Young Child with Pervasive Developmental Disorder
1543
Phoon Hooi San and Anna Christina Abdullah
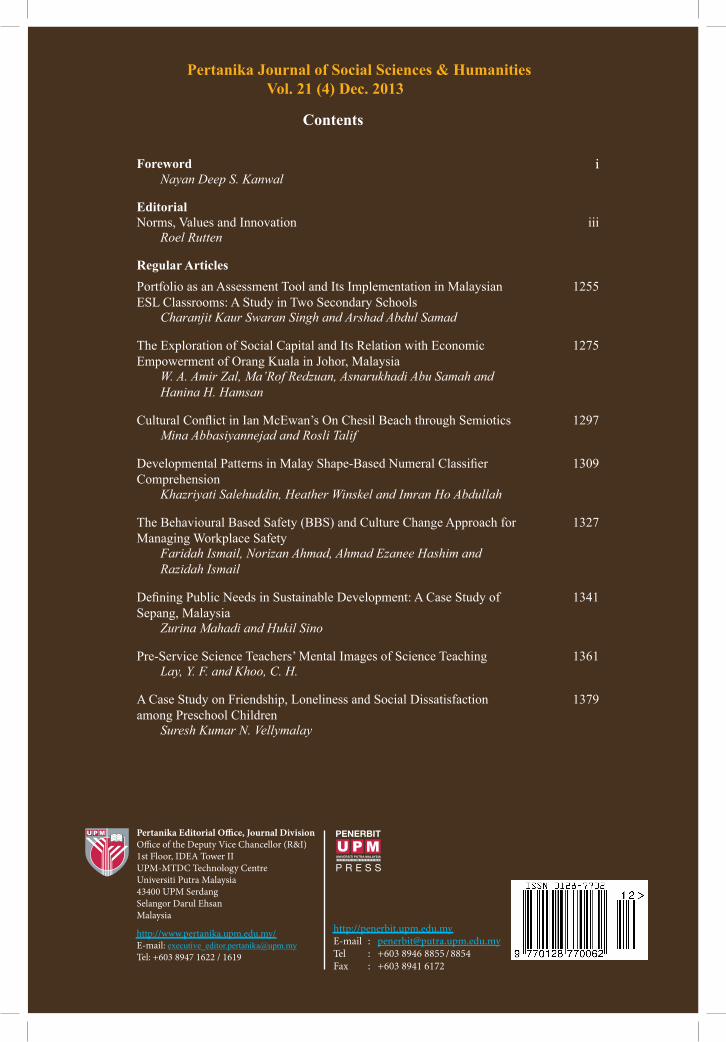
VOL. 21 (4) DEC. 2013
Vol. 21 (4) Dec. 2013
Pertanika Journal of Social Sciences & HumanitiesVol. 21 (4) Dec. 2013
Contents
ISSN 0128-7702
Pertanika Editorial O�ce, Journal DivisionO�ce of the Deputy Vice Chancellor (R&I) 1st Floor, IDEA Tower II UPM-MTDC Technology CentreUniversiti Putra Malaysia43400 UPM SerdangSelangor Darul EhsanMalaysia
http://www.pertanika.upm.edu.my/E-mail: [email protected]: +603 8947 1622 / 1619
Foreword
i
iNayan Deep S. Kanwal
EditorialNorms, Values and Innovation iii
Roel Rutten
Regular ArticlesPortfolio as an Assessment Tool and Its Implementation in Malaysian ESL Classrooms: A Study in Two Secondary Schools
1255
Charanjit Kaur Swaran Singh and Arshad Abdul Samad
The Exploration of Social Capital and Its Relation with Economic Empowerment of Orang Kuala in Johor, Malaysia
1275
W. A. Amir Zal, Ma’Rof Redzuan, Asnarukhadi Abu Samah and Hanina H. Hamsan
1297Mina Abbasiyannejad and Rosli Talif
Comprehension1309
Khazriyati Salehuddin, Heather Winskel and Imran Ho Abdullah
The Behavioural Based Safety (BBS) and Culture Change Approach for Managing Workplace Safety
1327
Faridah Ismail, Norizan Ahmad, Ahmad Ezanee Hashim and Razidah Ismail
Sepang, Malaysia1341
Zurina Mahadi and Hukil Sino
Pre-Service Science Teachers’ Mental Images of Science Teaching 1361Lay, Y. F. and Khoo, C. H.
A Case Study on Friendship, Loneliness and Social Dissatisfaction among Preschool Children
1379
Suresh Kumar N. Vellymalay