Embed Size (px)
Citation preview

Volumetric cerebral characteristics of children exposed to opiatesand other substances in utero
K. B. Walhovd1,*, V. Moe1, K. Slinning2, P. Due-Tønnessen3, A. Bjørnerud3, A. M. Dale4,5,A. van der Kouwe5, B. T. Quinn6, B. Kosofsky6, D. Greve5, and B. Fischl5,7
1Department of Psychology, University of Oslo
2National Institute of Public Health, Division of Mental Health, Oslo
3Rikshospitalet University Hospital, Oslo
4Departments of Neuroscience and Radiology, UCSD
5Athinoula A. Martinos Center, MGH
6Division of Pediatric Neurology, Cornell University
7MIT Computer Science and Artificial Intelligence Laboratory
AbstractMorphometric cerebral characteristics were studied in children with prenatal poly-substanceexposure (n =14) compared to controls (n = 14) without such exposure. Ten of the substance exposedchildren were born to mothers who used opiates (heroin) throughout the pregnancy. Groups werecompared across 16 brain measures: cortical gray matter, cerebral white matter, hippocampus,amygdala, thalamus, accumbens area, caudate, putamen, pallidum, brainstem, cerebellar cortex,cerebellar white matter, lateral ventricles, inferior lateral ventricles, and the 3rd and 4th ventricles. Inaddition, continuous measurement of thickness across the entire cortical mantle was performed.Volumetric characteristics were correlated with ability and questionnaire assessments 2 years priorto scan. Compared to controls, the substance-exposed children had smaller intracranial and brainvolumes, including smaller cerebral cortex, amygdala, accumbens area, putamen, pallidum,brainstem, cerebellar cortex, cerebellar white matter, and inferior lateral ventricles, and thinner cortexof the right anterior cingulate and lateral orbitofrontal cortex. Pallidum and putamen appearedespecially reduced in the subgroup exposed to opiates. Only volumes of the right anterior cingulate,the right lateral orbitofrontal cortex and the accumbens area, showed some association with abilityand questionnaire measures. The sample studied is rare, and hence small, so conclusions cannot bedrawn with certainty. Morphometric group differences were observed, but associations with previousbehavioral assessment were generally weak. Some of the volumetric differences, particularly thinnercortex in part of the right lateral orbitofrontal cortex, may be moderately involved in cognitive andbehavioral difficulties more frequently experienced by opiate and poly-substance exposed children.
*Corresponding author. Address: Department of Psychology, University of Oslo, PoB 1094 Blindern, 0317 Oslo, Norway, phone: +4722 84 51 30, fax: +47 22 84 50 01, e-mail: [email protected]'s Disclaimer: This is a PDF file of an unedited manuscript that has been accepted for publication. As a service to our customerswe are providing this early version of the manuscript. The manuscript will undergo copyediting, typesetting, and review of the resultingproof before it is published in its final citable form. Please note that during the production process errors may be discovered which couldaffect the content, and all legal disclaimers that apply to the journal pertain.
NIH Public AccessAuthor ManuscriptNeuroimage. Author manuscript; available in PMC 2008 July 15.
Published in final edited form as:Neuroimage. 2007 July 15; 36(4): 1331–1344.
NIH
-PA Author Manuscript
NIH
-PA Author Manuscript
NIH
-PA Author Manuscript
IntroductionPrenatal exposure to various drugs and alcohol is associated with an increased risk of regulatorydysfunction and neuropsychological difficulties (e.g. Suess et al., 1997; Moe and Slinning,2002; Moe, 2002; Slinning, 2004). This relationship can partly be explained by environmentalcorrelates of maternal substance-abuse, including higher level of social risk (Hans and Jeremy,2001), such as effects of poverty, stress, maternal psychopathology, disruptions in maternalcare, and poorer interaction with the primary caregiver. However, developmental difficultiesof children born to substance-abusing mothers likely also have potent biological foundations.To date, this is indicated by at least three lines of research: 1) Prenatally exposed childrengrowing up under optimized social conditions, i.e. in carefully chosen foster or adoptive homes,also exhibit on average lower perceptual performance and increased rate of distractibility andhyperactivity (Moe and Slinning, 2002; Moe, 2002, Slinning, 2004, Ornoy et al., 2001). BothOrnoy et al. (2001) and Moe (2002) found that adopted substance-exposed children largelyscored within normal limits on intellectual tests, but the performance IQ (and in Moe’s study,general IQ) was significantly lower than that of the comparison group. 2) In vitro studies ofcell cultures and animal models have pointed to distinct cellular mechanisms by whichexposure to alcohol, cocaine, amphetamine, and opiates cause brain alterations in thedeveloping fetus (Bhat et al., 2006; Harlan and Song, 1994,Harvey, 2004; Hu et al., 2002;Malanga and Kosofsky, 2004; Vathy, 2002). 3) Imaging and autopsy studies of childrenprenatally exposed to alcohol, cocaine, and methamphetamine generally point to structuralbrain effects. Fetal Alcohol Syndrome (FAS) has been the most studied, and has beenassociated with microcephaly and smaller overall brain volumes, with a special volumereduction in the basal ganglia, corpus callosum and cerebellum (for an overview see Riley andMcGee, 2005). In an MRI study of children exposed to methamphetamine (n = 13 exposed and15 controls), Chang et al. (2004) found no significant reduction in total brain volume, butsignificantly smaller putamen and pallidum, a trend towards smaller caudate, and significantlysmaller hippocampal volumes bilaterally. Smith et al. (2001) found cerebral metabolismdifferences, but no significant volumetric differences in either whole brain volume or any ofthe above-mentioned subcortical structures as measured in MR images of children exposed tococaine in utero (n = 14) compared to controls (n = 12).
As seen above, structural brain effects of prenatal exposure to alcohol have been rather welldocumented in human beings and some human data also exist on structural brain characteristicsin children prenatally exposed to cocaine and methamphetamine. Unfortunately, and despiteheroin use being an increasing problem in young women relative to men (Greenfield et al.,2003), there is a complete lack of human studies on cerebral effects of prenatal exposure toopiates. The cell culture studies that have been conducted indicate potentially severe negativeeffects on the developing central nervous system. For instance, Hu et al. (2002) found thatmorphine triggers approximately a fourfold increase in programmed cell death (apoptosis) inhuman fetal microglia and neurons. Vathy (2002) points out that the highest concentrations ofopioid receptors are present in several brain areas including the limbic system, thalamus,striatum, hypothalamus, midbrain and spinal cord, so a range of physiological mechanismscould be affected by opiate exposure. Along with such physiological effects, animal modelshave pointed to abnormalities in both subcortical and cortical areas following fetal opiateexposure, and as pointed out by Yanai et al. (2003), opioids, like many other neuroteratogens,affect numerous brain regions and processes. Studying embryos of rats injected with morphine,Harlan and Song (1994) found that prenatal exposure to opiates adversely affects migrationand/or survival of neurons within a few days after neurogenesis. Their study suggested that theeffect may be more evident in regions which contain neurons with mu opiate receptors, suchas parts of the caudate-putamen area of the striatum and the nucleus accumbens.
Walhovd et al. Page 2
Neuroimage. Author manuscript; available in PMC 2008 July 15.
NIH
-PA Author Manuscript
NIH
-PA Author Manuscript
NIH
-PA Author Manuscript

The present study is targeted at morphometric brain characteristics in a sample of children withprenatal poly-substance exposure. The majority of these children were born to mothers whosemain drug of choice was heroin, and who used this throughout the pregnancy. Morphometriccharacteristics are compared to a control sample without prenatal drug exposure. The effectsof substance-exposure in utero is investigated in, and compared across, the thickness of theentire cortical mantle at a point by point basis, as well as in volumes of total cortical graymatter, cerebral white matter, hippocampus, amygdala, thalamus, the accumbens area, caudate,putamen, pallidum, the brainstem, cerebellar cortex, cerebellar white matter, the lateralventricles, the inferior lateral ventricles, and the 3rd and 4th ventricles. Finally, we explorewhether neuroanatomical volumes are related to selected behavioral variables as measured bythe Wechsler Intelligence Scale for Children -Revised (WISC-R; Wechsler, 1974) and theChild Behavior Checklist (CBCL; Achenbach, 1991) at a previous assessment. To ourknowledge, this is the first study of volumetric brain characteristics including persons exposedto heroin in utero. Heroin addiction constitutes a major problem in a number of societies andmay have distinct consequences for the developing brain of the fetus. Therefore, analyses ofbrain characteristics are performed both for the total sample of poly-substance exposed childrenand for the subsample of children with known opiate exposure.
Materials and methodsSample
The present sample is drawn from a longitudinal project on the development of children bornto mothers who used illicit drugs during pregnancy (for details see Moe and Slinning, 2002;Moe 2002; Slinning, 2004). This project initially comprised 78 substance exposed children,and 58 control children born without known biological risk to mothers with no history orevidence of alcohol or illicit drug use. All were enrolled in the project in infancy. The majorityof the biological mothers of the substance-exposed children (76.9%) were enrolled in aperinatal risk project at the Ullevål Municipal Hospital by the second or third trimester ofpregnancy; 23.1% gave birth at other hospitals outside of Oslo. The risk project and an infantand family center [see 3] established contact with these families after the birth of their children.The biological mothers were referred to the perinatal risk project because of concerns aboutsubstance abuse by medical or social staff at the municipal health service. Information aboutsubstance use was based on the women’s medical and social record and on the informationgathered by the perinatal risk project team. A limitation of many studies on prenatal substanceexposure, including this one, is that regular toxicological test results for the mothers throughoutthe pregnancies are not available. Because of many of these women’s heavy substance abuseand the fact that they were polydrug and alcohol users, they often had trouble accounting forthe amount, frequency, and timing of drug use during the pregnancy period, so we have noreliable measure of amount of drug exposure. For the reasons listed above, we have onlyincluded what may be the most reliable information: the women’s main drug of choice andinformation about additional drug use.
Among the children with prenatal substance exposure, the majority (84,6%) were placed infoster care during infancy. At the time of the present study, 10 (7 exposed and 3 controls) ofthe totally 136 families had withdrawn from the project. Further, the following in the exposedgroup were excluded from the present study: children living in foster homes (n = 29), childrenwith FAS (n = 3), and children with unknown living conditions/address (n = 4). In addition,children in the control group were excluded if they were less than 9 years of age at the time ofthe present study (n = 6). The children living in foster homes were excluded because we foundit too difficult to track their biological legal parents to ask for consent. The children with FASwere excluded because they may have distinct brain characteristics, and this group was sosmall. Thus, only children prenatally exposed to illicit drugs without a diagnosis of FAS were
Walhovd et al. Page 3
Neuroimage. Author manuscript; available in PMC 2008 July 15.
NIH
-PA Author Manuscript
NIH
-PA Author Manuscript
NIH
-PA Author Manuscript

included in the present study. The control children less than 9 years of age were excluded tolimit the age difference between the exposed and control group (see below). Thus, 35 exposedchildren (31 adopted, 4 living with biological mothers) and 49 control children who were 9years of age or more at the time of study were invited to participate. 17 adopted exposed childrenand 17 control children accepted the invitation. In the exposed group, 1 child had a change ofmind and 2 were excluded due to artifacts from dental braces in the scans. For 3 of the controls,we were not able to offer suitable scan appointments. Useable scan sets were thus obtained for14 substance exposed and 14 control children. The sample characteristics of these are presentedin Table 1.
One-way ANOVAs showed significant differences between the groups in age at scan (F(1,27)= 10.973, p = .003), birth weight (F(1,27) = 16.247, p = .000), birth length (F(1,24) = 19.851,p = .000), head circumference at birth (F(1,27) = 11.962, p = .002), gestational age (F(1,27) =11.579, p = .002), McCarthy Perceptual Performance Scale at appr. 4 yrs (F(1,27) = 12.927, p= .001), total WISC-R IQ at appr. 9 yrs (F(1,26) = 10.125, p = .004), the Freedom fromDistractibility Factor from the WISC-R (F(1,26) = 14.959, p = .001), CBCL Total Problems(F (1,27) = 5.821, p = .023), CBCL Attention Problems (F(1,27) = 10.364, p = .003), and CBCLSocial Problems (F (1,27) = 13.804, p = .001). There were, however, no significant differencesacross groups with respect to gender (F(1,27) = .553, p = .464), parental socioeconomic status(SES; F(1,27) = .720, p = .404), McCarthy General Cognitive Index (GCI) at appr. 4 yrs (F(1,27) = 2.577, p = .121), and CBCL Externalizing (F(1,27) = 2.567, p = .121).
In studies such as this, there is a risk of selective participation, i.e. the parents most concernedwith their child’s health and behavior may be more willing to participate to get an MRIevaluation than those having no concerns. One-way ANOVAs were performed to see if therewere significant differences on basic parameters between the children whose families chose toparticipate and those who refused the invitation. In the adoptive group, there were no significantdifferences or trends towards differences between refusers and participants, respectively, eitherin terms of birth weight (p = .429, F(1,29) = .642, M = 3199g (SD = 698g) vs M = 2999g (SD=680g), respectively), parental socioeconomic status (SES; for a description of how this wascalculated, see Moe, 2002; p = .261, F(1,29) = 1.315, M = 3.6 (SD = 0.8) vs M = 3.9 (SD =0.7), respectively), McCarthy General Cognitive Index (McCarthy, 1972; see below for adescription) at 4 years (p = .763, F(1,28) = .093, M = 107 (SD = 12.6) vs. M = 108, SD = 15.3),respectively), or McCarthy perceptual performance score at 4 years (p = .716, F(1,28) = .135,M = 52 (SD = 9) vs M = 51 (SD = 9), respectively). Hence, there is no reason to believe thatselective recruitment of the more burdened substance-exposed children has unduly influencedthe results. The same was true for the control group, where there were also no significantdifferences or trends towards such between refusers and participants, respectively, either interms of birth weight (p = .192, F(1,47) = 1.754, M = 3673g (SD = 466g) vs M = 3864g (SD= 426g), respectively), parental socioeconomic status (p = .193, F(1,47) = 1.745, M = 3.8 (SD= 0.8) vs M = 4.1 (SD = 0.9), respectively), McCarthy General Cognitive Index at 4 years (p= .832, F(1,44) = .045, M = 115 (SD = 13) vs. M = 116 (SD = 9), respectively), or McCarthyperceptual performance score at 4 years (p = .544, F(1,45), M = 61 (SD = 10) vs M = 63 (SD= 8), respectively). A
As can be seen from Table 1, the controls that participated in the current study are on average1.5 years younger than the exposed children. There are developmental effects, includingpruning, i.e. natural developmental volume reductions, and to a lesser extent, some volumeincrease, occurring in a number of brain areas around the age of the present sample (Gogtayet al., 2004). Therefore, it would have been preferential if the groups were perfectly matchedwith regard to age. Unfortunately, if we were to achieve this, we would have lost the advantage
APlease note that full McCarthy data at 4 years was not collected for 1 of the refusing adoptees and 2 of the refusing controls.
Walhovd et al. Page 4
Neuroimage. Author manuscript; available in PMC 2008 July 15.
NIH
-PA Author Manuscript
NIH
-PA Author Manuscript
NIH
-PA Author Manuscript

of having controls that have been followed from birth, and regularly assessed with the samemethods as have the substance-exposed children. Therefore, the study was performed on theoriginal controls and age effects were controlled for statistically (see below).
The biological mothers of 10 of the substance exposed children reported opiates as their maindrug of choice. However, 9 of the mothers using opiates reported use of a range of 1-5 othersubstances during pregnancy, including benzodiazepines, neuroleptics, cannabis, alcohol,cocaine and amphetamine. Of the remaining 4 mothers not reporting heroin use, 1 reportedcocaine as main substance of choice, 2 reported psychopharmacological substances, and 1reported alcohol. However, these 4 reported use of multiple substances, includingbenzodiazepines, neuroleptics, amphetamine and alcohol. 12 of the 14 children in the exposedgroup were described with symptoms associated with neonatal abstinence syndrome (NAS;Finnegan et al., 1975), and 10 of these were medicated during the first 8 weeks after birth. Allthe biological mothers of the exposed group reported smoking tobacco during the pregnancy.One control mother reported infrequent cigarette smoking during the pregnancy. HIV statuswas obtained from the medical records of 11 of the mothers using substances, and all werenegative. None of the exposed children were affected with HIV. All substance exposed childrenmoved from their biological mothers within 6 weeks after birth. 7 of the children had 1placement prior to moving to permanent foster parents at or before 32 weeks. 6 children had2 placements prior to moving to permanent foster parents at or before 26 weeks. One child had3 placements prior to moving in with permanent foster parents at 48 weeks. That is, allsubstance exposed children were placed in permanent foster care within their first year of life,and all were later adopted by these same foster parents. The SES of the biological mothers waspredominantly low, and can safely be assumed to be lower than that of the control and adoptiveparents. SES of the birth mothers and prenatal substance exposure will therefore be closelyrelated, and a statistical separation of these variables would unfortunately not be possible.However, as seen above, the SES of the adoptive and control parents was comparable. Variancein racial origin is another variable that may be of importance for possible group differences.However, race is not normally noted in medical journals in Norway, and this was not done inthe present study either, so we can unfortunately not know this with certainty. However, allchildren appeared to be born by Norwegian caucasian mothers. There is not reason to believethat there were big differences in the racial origin of the control children and the exposedchildren.
Among the opiate exposed children, 1 was born with a myelomeningocele (MMC). All theMRI brain scans in the present study were inspected by a neuroradiologist. They were examinedfor anatomical abnormalities, including congenital changes, and the neuroradiologist lookedfor signal intensity differences/pathology in white and gray matter and examined CSF spaces.No signs of cerebral pathology were found. This was also the case with the scans of the childwith MMC. They were carefully inspected, and there was no sign of intracerebral pathology,neither hydrocephalus nor any Chiari malformation. Another of the opiate exposed childrenhad been diagnosed with Asperger’s syndrome (AS). After some consideration, we decided toinclude both of these children in the final sample. Maternal opiate addiction may be associatedwith significant prenatal risk both because of direct teratogenic factors and poor health anddietary conditions. Even though this has not been directly linked to either of the conditions inquestion, a higher rate of pathological conditions in prenatally opiate exposed children seemslikely. For instance, MMC may be associated with inadequate maternal folic acid intake, lowmaternal vitamin B12 status, and exposure to some teratogens, and about 25 % of the incidencesof AS is associated with pre- or perinatal risk (Gillberg and Cederlund, 2005; Mitchell et al.,2004). Two of the opiate exposed children were also born prematurely (gestational age (GA)< 37 weeks, namely 31 and 34 weeks), which is a known risk associated with prenatal substanceexposure (Hans, 1992). Instead of excluding these children, whose conditions may be linkedto the phenomenon being investigated, we chose to include them in the study, but perform
Walhovd et al. Page 5
Neuroimage. Author manuscript; available in PMC 2008 July 15.
NIH
-PA Author Manuscript
NIH
-PA Author Manuscript
NIH
-PA Author Manuscript

analyses both including and excluding them. Prenatal substance exposure is associated withheightened risk of attention deficits (Slinning, 2004), and 4 of the children in the present samplehad an Attention Deficit Hyperactivity Disorder (ADHD) diagnosis and were medicated forthis.
The study was approved by the regional committee for medical research ethics. All parentssigned informed consent. The children were given adapted information and all gave spokenconsent. During scanning, the children listened to audio books or music through earphonescalibrated to the scanner.
Behavioral dataAs part of previous follow ups, the present sample (and the broader groups from which it isdrawn) has been assessed with a number of cognitive and rating scale instruments (see Moeand Slinning 2002; Moe 2002; Slinning, 2004). Data from some of these are presented here.At approximately 4.5 years of age, the children were assessed with the McCarthy Scales ofChildren’s Abilities (McCarthy, 1972). This test yields a General Cognitive Index (GCI) andscores on five subscales labeled the Verbal scale, the Perceptual-Performance scale, theQuantitative scale, the Memory scale, and the Motor scale. The Verbal, Perceptual-Performance, and Quantitative scales are nonoverlapping and together constitute the GCI. Theraw scores were converted to index scores (the GCI: M = 100, SD = 16; and the five ScaleIndexes: M = 50, SD = 10). Data are presented here for the McCarthy GCI as well as theMcCarthy Perceptual Performance Scale. The latter was the scale that correlated (Pearson’scorrelation coefficient) the most with later IQ as measured, for all but 1 child, by the WechslerIntelligence Scale for Children revised (WISC-R; Wechsler, 1974) at a mean age of 8.63 (SD0.71) years (r(27) = .50, p = .008 for GCI-IQ, r(27) = .66, p = .000 for perceptual performancescale-IQ). WISC-R is a general ability measure that consists of a verbal and performance part,each composed of 6 subtests. The scores on these 12 subtests are converted to scaled scoresand all together are used in calculating IQ (M = 100, SD = 15). As seen from table 1, the meanscores at the McCarthy and the WISC-R are quite high. It is true that none of the exposedchildren show profound cognitive deficits, but the scores for these ability tests are likelysomewhat elevated since they are based on tests which norms were developed some time ago.While total IQ is calculated from all subtests, the Freedom from distractibility factor iscomprised of the Arithmetic, Digit Span and Coding subtests. It has been suggested that inaddition to resistance to the effects of distracting stimuli, this factor reflects executive and shortterm memory processes involved in planning, monitoring and evaluating task performance(Wielkiewicz, 1990). The Child Behavior Check List (CBCL; Achenbach, 1991) was alsoadministered to all children’s families at the time of administration of WISC-R. The CBCLquestionnaire is a well-validated, standardized assessment protocol for child behavior problemsdesigned for completion by primary caregivers. CBCL produces nine clinical subscales whichsums up to a total problem score. Here we report raw scores only, since Norwegian norms havenot yet been developed, and it has been found that Nordic parents seem to assess their childrensimilarly on the CBCL, but consistently lower than parents in other countries (Nøvik, 1999).The Attention Problems subscale of the CBCL is effective in identifying children withclinically diagnosed ADHD (Kadesjø et al., 2001).
MRI scanningA Siemens (Erlangen, Germany) Sonata 1.5 T MR scanner with an 8 channel head coil wasused. The pulse sequences used for morphometric analysis were: a range of 4 to7 3Dmagnetization prepared gradient echo (MPRAGE), T1-weighted sequences in succession (TR/TE/TI/FA = 2730ms/3.5ms/1000ms/7deg, matrix=256×256, FOV=256mm), with iPAT and aGRAPPA factor of 2, and a scan time of 4.3 min per volume. Each volume consisted of 128sagittal slices with slice thickness = 1.33 mm, and in-plane pixel size of 1.3 mm × 1 mm. The
Walhovd et al. Page 6
Neuroimage. Author manuscript; available in PMC 2008 July 15.
NIH
-PA Author Manuscript
NIH
-PA Author Manuscript
NIH
-PA Author Manuscript

image files in DICOM format were transferred to a Linux workstation for morphometricanalysis. All scans were inspected for movement artifacts, and poor scans were excluded priorto averaging the MPRAGEs. The mean number of MPRAGEs obtained for the exposed groupwas 4.4 (SD 0.9), versus 4.3 (SD 0.5) for the controls. The mean number of MPRAGEsaveraged was 3.1 (SD 0.7) for the exposed group and 3.4 (SD 0.6) for the controls, a non-significant difference (p = .18). The range of scans averaged was 2 to 4 in both groups. Whilenumbers for total brain volume were calculated based on the averaged MPRAGE volume andall the structures segmented in this in the whole brain segmentation procedure (see below),intracranial volume (ICV) was calculated based on 3D double flip scans obtained during thesame scanning session as the MPRAGEs (TR/TE/FA = 2.4ms/1.0ms/ 1 & 8 deg,matrix=128×128, FOV=320mm). Two such series were acquired with the body coil, and twosuch series were acquired with the head coil. A deformable template procedure, similar to the“Shrink Wrapping” procedure described by Dale and colleagues (Dale et al., 1999; Dale andSereno, 1993), was used to obtain an estimate of the smooth surface surrounding the intracranialspace (containing cerebrum and cerebellum, CSF, meninges, and brainstem to a levelimmediately below the pons).
Whole brain segmentation—The automated procedures for volumetric measures of thedifferent brain structures are described by Fischl et al. (2002). The results of manual labelingusing the validated techniques of the Center for Morphometric Analysis (e.g. Caviness et al.,1989; Kennedy et al., 1989; Seidman et al., 1999) are used to automatically extract theinformation required for automating the segmentation procedure. This procedure automaticallyassigns a neuroanatomical label to each voxel in an MRI volume based on probabilisticinformation automatically estimated from a manually labeled training set. The training setincluded adults only. A group-specific template or atlas would be considered ideal (Wilke etal., 2002), but was unfortunately not available for the present study. However, the present atlaswas deemed adequate because even though intracranial volume and brain size undergoesdramatic changes in the first few years of life, and slight changes are also seen throughout theteens, the overall intracranial and brain volume at the age in question (8-13 yrs) is very similarto that of adults (see e.g. Sgouros et al., 1999). The classification technique used employs aregistration procedure that is especially well suited to account for varying anatomies (Fischlet al., 2004) and was deemed to yield accurate results in children of the present age. Briefly,the segmentation is carried out as follows: First, an optimal linear transform is computed thatmaximizes the likelihood of the input image, given an atlas constructed from manually labeledimages. Next, a nonlinear transform is initialized with the linear one, and the image is allowedto further deform to better match the atlas. Finally, a Bayesian segmentation procedure iscarried out, and the maximum a posteriori (MAP) estimate of the labeling is computed. Thesegmentation uses three pieces of information to disambiguate labels: (1) the prior probabilityof a given tissue class occurring at a specific atlas location, (2) the likelihood of the imagegiven that tissue class, and (3) the probability of the local spatial configuration of labels giventhe tissue class. This latter term represents a large number of constraints on the space ofallowable segmentations, and prohibits label configurations that never occur in the training set(e.g. hippocampus is never anterior to amygdala). A correction for partial volume effects isperformed by estimating the percentage of each voxel occupied by each tissue class that bordersit based on the image intensity and the class means.
The technique has previously been shown to be comparable in accuracy to manual labeling(Fischl et al., 2002). The segmentations were visually inspected for accuracy. None werediscarded, but a minor segmentation error where medial white matter (WM) of the temporallobe (MTL) had been included in the hippocampal formation area was found for two subjects(one control and one substance exposed). These two errors were corrected manually. That is,the automated segmentation had in these two cases missed a few voxels of white matter thatwere misclassified as gray, but were actually part of the continuous white matter strings
Walhovd et al. Page 7
Neuroimage. Author manuscript; available in PMC 2008 July 15.
NIH
-PA Author Manuscript
NIH
-PA Author Manuscript
NIH
-PA Author Manuscript

underlining the hippocampal area. The white matter voxels that constitute the caudalboundaries of the predominantly gray matter hippocampal area were then reattached manuallyto form a continuous string of WM by filling in a few voxels in some coronal slices. Accuracyof classification was also checked in saggital and transversal views. The mentionedsegmentation errors may be due to a bias field in the scans in this area. A conventional SiemensB1 normalization was used, and the remaining inhomogeneties were in most cases benign, butmay in these two cases have led to a few incorrectly labeled voxels that were then correctedby hand.
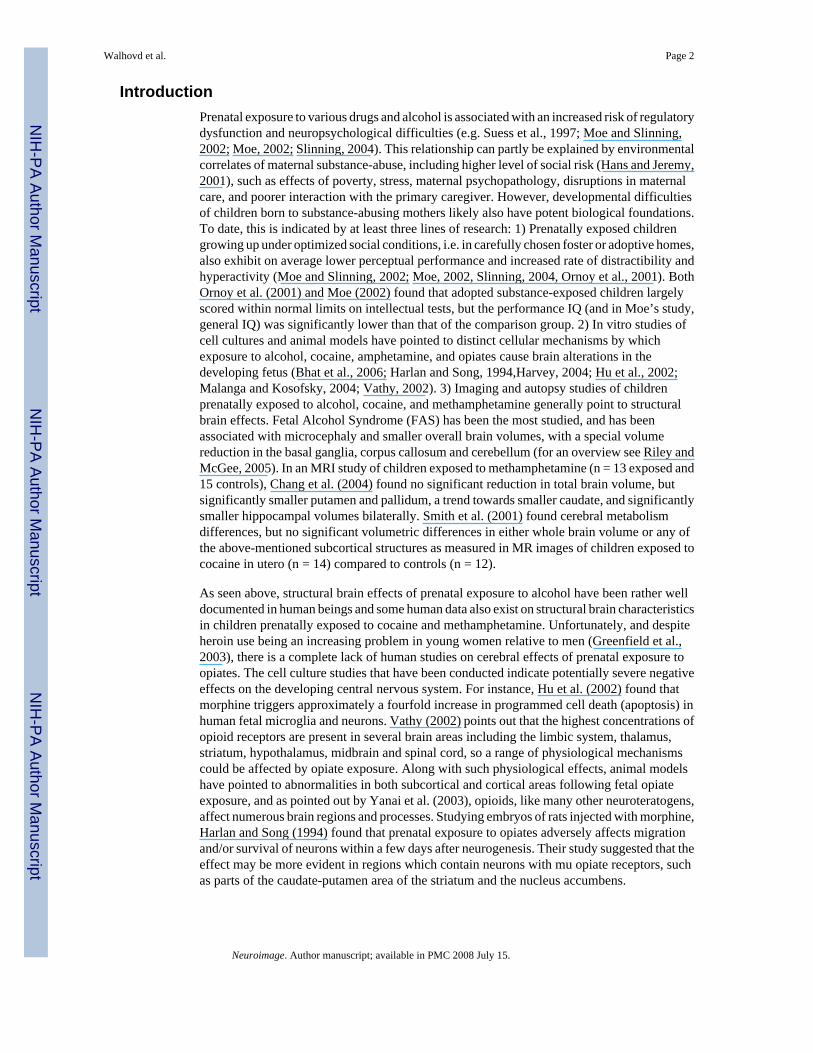
A sample of the segmentation in different coronal views is shown in Figure 1. Further imagesof the segmentation in coronal, horizontal, and saggital views can be seen in SupplementaryFigure 1. General linear model analyses showed no interactions between group and hemispherefor any volume, so for each neuroanatomical volume, the values for the left and righthemispheres were summed.
Cortical thickness analyses: The automated procedures for volumetric measurement of theentire cortical mantle are described by Salat et al. (2004). Cortical thickness measurementswere obtained by reconstructing representations of the gray/white matter boundary (Dale etal., 1999; Dale and Sereno, 1993) and the cortical surface and then calculating the distancebetween these surfaces at each point across the cortical mantle. This method uses both intensityand continuity information from the entire 3D MR volume in segmentation and deformationprocedures to construct representations of cortical thickness. The maps are created using spatialintensity gradients across tissue classes and are therefore not simply reliant on absolute signalintensity. The maps produced are not restricted to the voxel resolution of the original data andthus are capable of detecting submillimeter differences between groups (Fischl and Dale,2000). This has been validated using histology and MR (Rosas et al., 2002; Kuperberg et al.,2003). Rosas et al. (2002), have showed that measurements on MR images of autopsy brainsanalyzed similarly were within 0.25 mm of those obtained using neuropathologic methods andwere statistically indistinguishable. Thickness measures may be mapped on the ‘inflated’surface of each participant’s reconstructed brain (Dale et al., 1999; Fischl et al., 1999), allowingvisualization of data across the entire cortical surface without interference from corticalfolding. Maps were smoothed using a circularly symmetric Gaussian kernel across the surfacewith a standard deviation of 12.6 mm and averaged across participants using a non-rigid high-dimensional spherical averaging method to align cortical folding patterns (Fischl et al.,1999). This procedure provides accurate matching of morphologically homologous corticallocations among participants on the basis of each individual’s anatomy while minimizingmetric distortion, resulting in a mean measure of cortical thickness for each group at each pointon the reconstructed surface. Statistical comparisons of global data and surface maps weregenerated by computing a general linear model of the effects of each variable on thickness ateach vertex. Instead of using a corrected p-value threshold, a scale with the actual p-values isdisplayed in the figures. Since the number of participants in each group is limited, a standardcorrection for multiple comparisons will be too conservative and is not generally applied, andthe results must be evaluated with this in mind, but see below for a description of permutationtesting.
Statistical analysesThe groups differed with respect to a number of factors that we wanted to control for in theanalyses. This included age at scan and gestational age. There were no significant genderdifferences between groups, but there was a slightly larger proportion of boys in the controlgroup than in the substance-exposed group. Since gender influences brain size systematicallyalso in childhood by means of larger brains for boys (Sgouros et al., 1999), we also wanted toregress out the effects of gender in some analyses. Further, since no former study has looked
Walhovd et al. Page 8
Neuroimage. Author manuscript; available in PMC 2008 July 15.
NIH
-PA Author Manuscript
NIH
-PA Author Manuscript
NIH
-PA Author Manuscript

at cerebral morphometric characteristics in prenatal opiate exposure, we also wanted to performanalyses for this group alone, with cases of prenatal substance exposure not involving heroinexcluded. In addition, two children in this group had relatively rare medical conditions, soanalyses were also performed without them to see if they unduly influenced the results. Sincethe sample is relatively small and some of the potential confounds were strongly or exclusivelyassociated with the substance exposed group, statistic separation of these variables andexclusion of cases of known pathology may mask true effects of prenatal substance exposure.In order to balance the pros of statistic control and the cons of systematically regressing outvariables that may be of interest, and effectively further reducing the sample for analysis, weadditionally chose to perform several separate analyses varying the number of variables to beregressed out (please note that this is not the same as classic stepwise regression): Analyseswere performed comparing the groups with no other variables regressed out, then with theeffect of sex regressed out, then with the effect of sex and age at scan regressed out, and thenwith the effect of sex, age at scan and gestational age regressed out. The reason for this analysisstrategy is that the groups are so small that it is possible that statistical isolation of the variablescause undue influence from a very small number of cases and may create results which are notrepresentative. We want the reader to be able to evaluate the effects in different circumstances.As a means of correcting the cortical analysis data for multiple comparisons, permutationtesting was performed on the cortical GLM group analysis of exposed compared to controls.
Whole brain segmentation analyses—First, to study the effect group, exposed (E) vs.controls (C), on the neuroanatomical volumes, ANCOVA was performed for the whole sample(n = 14 E + 14 C) controlling for the effect of gestational age, age at scan, and gender. Second,this analysis was repeated with only the children exposed to heroin compared to controls (n =10 E + 14 C), and third, the analysis was repeated with only cases of heroin exposure excludingcases of AS and MMC (n = 8 E + 14 C). Further, these analyses were repeated also controllingfor the effect of total intracranial volume (ICV). Cortical thickness analyses: First, a generallinear model was computed comparing the effect of group only on thickness at each vertex.Second, this analysis was repeated regressing out gestational age, age at scan, and gender, andthird, the analysis was repeated with only those children exposed to heroin compared to controls(n = 10 E + 14 C), and last, the analysis was repeated with only cases of heroin exposure andexcluding cases of AS and MMC (n = 8 E + 14 C). Correlations between neuroanatomical andbehavioral variables: To explore possible functional significance of neuroanatomical variation,the studied neuroanatomical volumes, including selected cortical labels, were correlated withselected data collected at the last behavioral assessment (M = 8.62, SD 0.73 yrs of age). Wechose broad ability variables, including total IQ and the Freedom from distractibility factorfrom WISC-R. In addition, correlations were performed for the CBCL Total problems scoreand selected CBCL variables that may be associated with regulatory function, and that showedgroup differences (see table 1), including the Attention problems and Social problems scores.
ResultsWhole brain segmentation
Table 2 shows mean volumes for all brain structures for controls and substance exposedchildren with and without exposure to opiates. Table 3 depicts ANCOVA results for the effectof group when gender, age at scan and gestational age were controlled for. The analyses wereperformed comparing controls and exposed as well as subgroups excluding non-opiateexposure and cases suffering from AS and MMC. There was a significant (p ≤ .05) effect ofexposure group on ICV, total brain volume, cerebral cortical volume, and volumes ofamygdala, accumbens, putamen, pallidum, the brainstem, cerebellar cortex and cerebellarwhite matter, as well as the inferior lateral ventricles. As seen from table 2, all effects were inthe form of smaller volumes in the exposed group. The volume distributions for the different
Walhovd et al. Page 9
Neuroimage. Author manuscript; available in PMC 2008 July 15.
NIH
-PA Author Manuscript
NIH
-PA Author Manuscript
NIH
-PA Author Manuscript

groups with exposure type and risk factors indicated are shown in Figure 2. With the exceptionof volumes of the lateral ventricles and the 3rd ventricle, trends (p ≤ .10) towards smallervolumes were also observed for the other structures investigated, namely for cerebral whitematter, hippocampus, caudate, thalamus, and the 4th ventricle. The significant effects, with theexception of those for ICV, accumbens and cerebellar cortical volume, which were reduced totrends (p ≤ .10), remained significant when restricting the analyses to the smaller sample ofchildren exposed to opiates. Further, these effects largely remained, or even increased instrength, also when excluding cases of AS and MMC, reducing the sample to n = 8. Effectsizes on brain volumes of different subsamples are plotted in Figure 3. While most effect sizesremained relatively stable across different subsamples of substance exposed children, it seemsthat effect sizes on the volume of pallidum, putamen, inferior lateral ventricles, and, to someextent, the brainstem, increased when restricting the analyses to the opiate exposed onlycompared to controls. The strongest effects for the opiate exposed group were observed in thesestructures. When controlling for the effect of intracranial volume in addition to gender, age atscan, and GA, the only significant group difference was for cerebellar cortical volume (F(1,22)= 5.090, p = .034, partial eta squared = .188), with a trend for accumbens area volume (F(1,22)= 4.005, p = .058, partial eta squared = .154) in the comparison of all controls and all exposedchildren. However, when comparing controls to opiate exposed children (n =10) only, therewas a significant effect of group independent of intracranial volume on the pallidum (F(1,18)= 9.686, p = .006, partial eta squared = .350), the inferior lateral ventricles (F(1,18) = 5.885,p = .026, partial eta squared = .231), and the putamen (F(1,18) = 5.402, p = .032, partial etasquared = .231). The latter results were upheld also when excluding the cases with MMC andAS: Pallidum (F(1,16) = 9.950, p = .006, partial eta squared = .383), inferior lateral ventricles(F(1,16) = 5.810, p = .028, partial eta squared = .266, and putamen (F(1,16) = 6.410, p = .022,partial eta squared = .286) showed significant effects, and there were specific effects in thissubgroup on amygdala (F(1,16) = 4.573, p = .048, partial eta squared = .222) and brainstemvolume (F(1,16) = 4.916, p = .041, partial eta squared = .235).
Cortical thicknessResults of the general linear model of the effect of exposure group on the cortical mantle withthe effects of gender, age at scan and gestational age controlled for, are depicted in Figure 4a.Several areas were identified as being of significantly different cortical thickness across groups.Most noteworthy, areas in the anterior cingulate (ACC) and lateral orbitofrontal cortex (LOFC)of the right hemisphere were identified as thinner in the exposed group. As seen in figure 4b,this result remained significant when restricting the analysis to opiate exposed children onlycompared to controls. Most of the effects were seen in the form of relatively small areas ofthinner cortex in the exposed group relative to controls, but as seen, a few scattered areas inthe lateral cortex were identified as thicker in the exposed group. An analysis of effect ofexposure group not regressing out other variables, depicted in Figure 5, showed almostexclusively effects in the form of thinner cortex in the exposed group, indicating that the spotsof thicker cortex may to some degree be an artifact associated with the statistical separation ofthese variables. The broadest initial thinning effect, prior to regressing out other variables wasseen in the right ACC, an area which has also been implicated in both substance exposure andADHD. As seen from Figure 5, the right ACC and LOFC effects were limited by, but withstand,statistical control for potential confounds. The effects covered smaller areas, but remainedsignificant also when excluding cases of AS and MMC, that is, when reducing the opiateexposed sample to n = 8.
To see if any area of the right ACC and LOFC effects would survive correction for multiplespatial comparisons, a permutation approach was used to test the cluster-wise significancethreshold. Since this test cannot be performed with non-orthogonal designs or continuousvariables, only the effects of the initial GLM contrasting the exposed to the non-exposed
Walhovd et al. Page 10
Neuroimage. Author manuscript; available in PMC 2008 July 15.
NIH
-PA Author Manuscript
NIH
-PA Author Manuscript
NIH
-PA Author Manuscript

participants were tested with this method. The smoothing level at which effects will and willnot survive in such testing depends on the extent of the effects. Since the effects were deemedto be of unequal size, permutation testing was performed at two different smoothing levels: 10mm and 20 mm Full-Width/Half-Maximum (FWHM) respectively. Clusters were identifiedusing a vertex-wise p-value threshold of .01. Cluster-wise p-values were computed separatelyfor each smoothing level according to Nichols and Holmes (2001). This analysis indicated acluster corresponding to an area of the effect observed in the right ACC with a smoothing levelof 10 mm FWHM. This cluster, which can be seen in Supplementary Figure 2, (Talairach x,y, z coordinates 7.9, 39.1, 9.2) was 523 mm2 / 847 vertices and had a clusterwise p-value of .032. The analysis also indicated a cluster corresponding to an area of the effect observed inthe right LOFC with a smoothing level of 20 mm fwhm. This cluster, which can be seen inSupplementary Figure 3, (Talairach x, y, z coordinates 48.4, 33.7, -10.0) was 1744 mm2 / 2321vertices and had a clusterwise p-value of .021. Thus, the permutation approach indicates thateffects in the right ACC and LOFC survive a correction for multiple comparisons. In thestrictest manner, one would further correct the significance levels here for having applied twosmoothing levels, i.e. multiply the p-values by 2. This would render the clusterwise p-value ofthe ACC effect marginally insignificant in this small sample (p = .064), whereas the LOFCeffect remains significant (p = .043) also when correcting for this.
In order to further inspect the distribution of the groups within the right anterior cingulate andlateral orbitofrontal cortex, labels were drawn around the most continuous areas of these effectsites as observed for the sample as a whole when controlling for gestational age, age at scan,and gender. The results are shown in figure 6, and indicate that while there is some degree ofoverlap in cortical thickness across groups, both areas also show quite a few non-overlappingthickness values.
Correlations between neuroanatomical and behavioral variablesCorrelations between neuroanatomical and behavioral variable are shown in table 4. In general,the observed relationships were rather weak, but in the expected directions. Smallerneuroanatomical volumes were related to lower ability scores on the WISC-R and a higheramount of problems as reported on the CBCL, but in most cases these relationships did notreach statistical significance. However, the cortical labels chosen and drawn on the basis ofgroup differences, including parts of the right anterior cingulate (rACC) and right lateralorbitofrontal cortex (rLOFC) did show significant relationships with a number of behavioralvariables. Thickness of the rACC correlated significantly (p < .05) negatively with Socialproblems, and showed a trend (p < .10) towards a negative relationship with Attentionproblems. These relationships were attenuated by other variables, and were not significantindependently of gender, age at scan, and gestational age. However, thickness of the rightlateral orbitofrontal cortex correlated signifcantly (p < .05) with all behavioral variables, exceptTotal IQ, for which a positive trend (p < .10) was observed. When partialing out effectsassociated with gender, age at scan, and gestational age, thickness of this area of the lateralorbitofrontal cortex was still significantly related to Freedom from distractibility and showedtrends towards relationships with Total problems and Social problems. The only otherneuroanatomical variable showing relationships across behavioral variables, was accumbensarea volume, which correlated significantly and positively with IQ, and significantly andnegatively with Total problems and Social problems, and showed a trend towards a relationshipwith Freedom from distractibility.
DiscussionThe present findings suggest that a number of neuroanatomical volumes are smaller in childrenprenatally exposed to opiates and other substances compared to controls. There are smaller
Walhovd et al. Page 11
Neuroimage. Author manuscript; available in PMC 2008 July 15.
NIH
-PA Author Manuscript
NIH
-PA Author Manuscript
NIH
-PA Author Manuscript

brain volumes, including smaller amygdala, putamen, pallidum, brainstem, cerebellar whitematter, inferior lateral ventricles, and smaller overall cortical volume, specifically includingthinner cortex in the right rostral anterior cingulate and a region of the right lateral orbitofrontalcortex. Trends towards smaller volumes are also observed for other structures. On one hand,then, the effects seem to be of a rather general nature, with somewhat smaller regional volumesnaturally being associated with somewhat smaller total brain and intracranial volumes., Indeed,many of the regional neuroanatomical effects can be explained by differences in intracranialvolume across exposed children and controls. However, there may also be region-specificeffects beyond those that can be accounted for by general differences. Cerebellar corticalvolume was smaller in the total group of substance-exposed children independently ofintracranial volume, and there was a similar trend for smaller accumbens area. In the opiate-exposed group, there appeared to be further region-specific effects, as discussed below.
Specificity of effects of opiate exposureThe present sample is too small to allow for secure conclusions, but it seems that opiateexposure may be especially associated with a reduction of the pallidum, and also to some degreethe putamen and the inferior lateral ventricle. These are the strongest group effects observedin the present study, they are observed more strongly when excluding poly-substance exposurecases not involving opiates, and remain significant also when excluding cases of other potentialCNS pathology. Further, these volumes are significantly smaller independent of intracranialvolume in the opiate exposed group only. The smaller volume of the inferior lateral ventricle,that is, the temporal horn of the lateral ventricle, could to some degree be due to a joint effectof the structures surrounding it being smaller in the exposed group. These include the amygdala,hippocampal formation, and caudate tail. The present results partly concur with, and expandthose previously reported on prenatal substance exposure. The putamen, and especially thepallidum, has also been found to be reduced in children prenatally exposed tomethamphetamine (Chang et al., 2004). Morphological abnormalities in the anterior cingulatecortex have been identified in a rabbit model of prenatal cocaine exposure (Harvey, 2004), butthe findings of thinner cortical thickness in the right anterior cingulate and lateral orbitofrontalcortex in substance-exposed humans are novel.
Functional significance of effectsWhat functional significance may these structural reductions have? The anterior cingulate andlateral orbitofrontal cortex, parts of which were found to be thinner in the right hemisphere forthe exposed group, and the pallidum and putamen, which were among the most reducedsubcortical structures across the smaller subgroups, are critical parts of different frontal-striatalcircuits. First, the anterior cingulate cortex is considered to play a critical role in complexcognitive processsing, and its role in optimal performance may be that of reward-guidedresponse selection or modulation of autonomic tone (for a review, see Fellows and Farah,2005). Based on lesion and functional imaging studies, the lateral orbitofrontal cortex appearsto have a specific role when appropriate action requires inhibition of previously rewardedresponses (for a review, see Elliott et al, 2000). These functions are in part achieved throughthe interconnections of these frontal areas with subcortical structures, including - even thoughnot by means of direct projections - the pallidum and putamen (Alexander et al., 1986).
The present set of cerebral volume reductions appear meaningful when one considers the setof attentional and hyperactivity difficulties typically experienced by many children exposedto opiates and other substances (Moe and Slinning, 2002; Slinning, 2004). As reviewed bySeidman et al. (2005), a number of investigators have hypothesized that ADHD involvesstructural and functional brain abnormalities in frontal-striatal circuitry, and there is substantialempirical support for this hypothesis (although other brain areas including the corpus callossumand cerebellum, are also involved). Frontal-striatal circuits, of which the anterior cingulate,
Walhovd et al. Page 12
Neuroimage. Author manuscript; available in PMC 2008 July 15.
NIH
-PA Author Manuscript
NIH
-PA Author Manuscript
NIH
-PA Author Manuscript

parts of the prefrontal cortex, and the pallidum and putamen have different roles, have infunctional and/or structural neuroimaging and lesion studies repeatedly been targeted asimplicated in ADHD (for reviews, see Seidman et al., 2005; Bush et al., 2005). For instance,compared to other focal lesions, putamen strokes have been associated with an increased riskof attention-deficit/hyperactivity symptomatology (Max et al., 2002) and all four structuralimaging studies of pallidal volume in ADHD have found smaller volumes in affected children(Seidman et al., 2005). As mentioned, ADHD and related problems are highly prevalent in thepresent sample of largely opiate exposed children as indicated by the heightened diagnosis rateand elevated CBCL scores relative to controls.
There are certainly a number of other brain characteristics than volume that may influencecognition and behavior. Still, volume of neuroanatomical structures may relate to size oramount of neurons and synaptic connections, so some association with cognition and behaviormay be expected. The correlations between neuroanatomical volumes and behavioral variablesare, however, generally not strong. This may to some degree be related to noise in the material,since the behavioral assessments were done at a mean age of 8.6 years, while mean age at scanwas 10.6 years, but at least for the ability measures, quite some temporal stability would beexpected (Wechsler, 1974; Canivez and Watkins, 1999). However, the volumetric differencesare, even though statistically significant, still small in absolute terms, so it may not be verysurprising that only rather subtle possible effects on behavioral measures are found. The sampleis very small, and multiple correlations were performed. The few relationships that wereobserved would therefore not withstand strict corrections for multiple comparisons, and shouldbe interpreted with great caution. However, there is a slight hint that prenatal substanceexposure may exert an effect on distractibility, or in Wielkiewicz’s (1990) terms “executive”and short term memory processes involved in planning, monitoring and evaluating taskperformance, via the right lateral orbitofrontal cortex. This is only one possibility, but one thatis theoretically meaningful. The lateral orbitofrontal cortex is involved in response inhibition,and inhibition has been targeted as a particular executive process that may constitute a coredeficit in ADHD. In addition, accumbens volume was related to general cognitive ability. Theaccumbens has long been known to have an important role in learning and motivation (for areview, see Kelley, 1999), but we are not aware of previous studies reporting similar volume-ability relationships, and the significance of this finding is not clear.
Limitations and conclusionThere are a number of limitations to the present study, many of which cannot be avoided whenstudying effects of substance exposure in human beings. First, what constitutes a cause andwhat constitutes an effect can be questioned: the cerebral differences found could be a matterof comparing a group of healthy children to a group with a high prevalence of ADHD andrelated problems. We cannot rule out the possibility of genetic effects on brain volumes, andperhaps also ADHD-related problems in the exposed sample (see e.g. Faraone et al., 2005;Posthuma et al., 2002). Further, prenatal poly-substance exposure, and especially opiateexposure, is naturally associated with a number of risk factors that may also influenceneuroanatomical volumes to varying degrees. Besides genetic predisposition to some diseasesand cognitive difficulties, these may include poor maternal nutrition and health and increasedprobability of premature birth.
Hans and Jeremy (2001) studied children of methadone-using mothers compared to a controlgroup very carefully matched on maternal demographic and general ability factors. They foundconsistent, but rather small effects of prenatal opiate exposure on mental and psychomotorfunction throughout infancy as measured by the Bayley Scales and Infant Behavior Recordratings. They argued that much of the effect of maternal opioid drug use on the mentaldevelopment of infants is attributable to the experience of more social-environmental risk
Walhovd et al. Page 13
Neuroimage. Author manuscript; available in PMC 2008 July 15.
NIH
-PA Author Manuscript
NIH
-PA Author Manuscript
NIH
-PA Author Manuscript

factors by children in substance-abusing families. However, the control group of the presentstudy is matched with the effective caregiving environment of the exposed children (i.e. theSES of the adoptive parents). This was done in order to eliminate possible effects of a non-optimal rearing environment. Hence, it is noteworthy that the present effects on brain volumeswere found in exposed children who were placed in supportive homes at an early age, adoptedand growing up under conditions of minimal postnatal risk. These children constitute a veryrare and therefore very small sample, so conclusions cannot be drawn with certainty. However,exposure effects did persist when statistically controlling for gestational age at birth, genderand age at scan. As discussed above, cell culture and animal data do support a direct effect ofprenatal opiate and substance exposure on cerebral characteristics, including basal ganglia,limbic and frontal areas (Bhat et al., 2006; Harlan and Song, 1994; Harvey, 2004; Hu et al.,2002; Malanga and Kosofsky, 2004). Thus, the present pattern of volumetric reductions inchildren prenatally exposed to opiates may to some degree be a result of cerebral developmentalchanges brought on by substance exposure in utero.
Supplementary MaterialRefer to Web version on PubMed Central for supplementary material.
Acknowledgements
Support for this research was provided by the Institute of Psychology at the University of Oslo, the National Institutesof Health (R01-NS39581, R01-RR16594, P41-RR14075, and R01-RR13609), the Mental Illness and NeuroscienceDiscovery (MIND) Institute, and in part by the Biomedical Informatics Research Network Project (BIRN,http://www.nbirn.net), which is funded by the National Center for Research Resources at the National Institutes ofHealth (NCRR BIRN Morphometric Project BIRN002).
ReferencesAchenbach, T,M. Manual for the Child Behavior Checklist/4-18 and 1991 Profile. University of Vermont
Department of Psychiatry; Burlington: 1991.Alexander G,E, Delong M,R, Strick P,L. Parallel organization of functionally segregated circuits linking
basal ganglia and cortex. Annu Rev Neurosci 1986;9:357–381. [PubMed: 3085570]Bhat R, Chari G, Rao R. Effects of prenatal cocaine, morphine, or both on postnatal opioid (μ) receptor
development. Life Sci 2006;78:1478–1482. [PubMed: 16242731]Bush G, Valera E,M, Seidman L,E. Functional neuroimaging of attention-deficit/hyperactivity disorder:
a review and suggested future directions. Biol Psychiatry 2005;57:1273–1284. [PubMed: 15949999]Canivez GL, Watkins MW. Long term stability of the Wechsler Intelligence Scale for Children-Third
Edition among Demographic Subgroups: Gender, Race/Ethnicity, and Age. Journal ofPsychoeducational Assessment 1999;17:300–313.
Caviness V,,S, Filipek P,A, Kennedy D,N. Magnetic resonance technology in human brain science:blueprint for a program based upon morphometry. Brain Dev 1989;11:1–13. [PubMed: 2646959]
Chang L, Smith L,M, LoPresti C, Yonekura M,L, Kuo J, Walot I, Ernst T. Smaller subcortical volumesand cognitive deficits in children with prenatal methamphetamine exposure. Psychiatry ResNeuroimaging 2004;132:95–106.
Dale A,M, Fischl B, Sereno M,I. Cortical surface-based analysis I: Segmentation and surfacereconstruction. Neuroimage 1999;9:179–194. [PubMed: 9931268]
Dale A,M, Sereno M,I. Improved localization of cortical activity by combining EEG and MEG with MRIcortical surface reconstruction: a linear approach. J Cogn Neurosci 1993;5:162–176.
Elliott R, Dolan R,J, Frith C,D. Dissociable functions in the medial and lateral orbitofrontal cortex:evidence from human neuroimaging studies. Cereb Cortex 2000;10:308–317. [PubMed: 10731225]
Faraone S,V, Perlis R,H, Doyle A,E, Smoller J,W, Goralnick J,J, Holmgren M,A, Sklar P. Moleculargenetics of attention-deficit/hyperactivity disorder. Biol Psychiatry 2005;57:1313–1323. [PubMed:15950004]
Walhovd et al. Page 14
Neuroimage. Author manuscript; available in PMC 2008 July 15.
NIH
-PA Author Manuscript
NIH
-PA Author Manuscript
NIH
-PA Author Manuscript

Fellows L,K, Farah M,J. Is anterior cingulate cortex necessary for cognitive control? Brain 2005;128:788–796. [PubMed: 15705613]
Finnegan, L,P.; Kron, R,E.; Connaughton, J,F.; Emich, J,P. Neonatal abstinence syndrome: Assessmentand management. In: Harbison, R,D., editor. Perinatal Addiction. Spectrum Publications; New York:1975. p. 141-58.
Fischl B, Salat D,H, van der Kouwe A,J,W, Makris N, Ségonne F, Dale A,M. Sequence-IndependentSegmentation of Magnetic Resonance Images. NeuroImage 2004a;23(Suppl 1):S69–84. [PubMed:15501102]
Fischl B, van der Kouwe A, Destrieux C, Halgren E, Ségonne F, Salat DH, Busa E, Seidman LJ, GoldsteinJ, Kennedy D, Caviness V, Makris N, Rosen B, Dale AM. Automatically parcellating the humancerebral cortex. Cereb Cortex 2004b;14:11–22. [PubMed: 14654453]
Fischl B, Salat D,H, Busa E, Albert M, Dieterich M, Haselgrove C, van der Kouwe A, Killiany R, KennedyD, Klaveness S, Montillo A, Makris N, Rosen B, Dale A,M. Whole brain segmentation: Automatedlabeling of neuroanatomical structures in the human brain. Neuron 2002;33:341–355. [PubMed:11832223]
Fischl B, Dale A,M. Measuring the thickness of the human cerebral cortex from magnetic resonanceimages. Proc Natl Acad Sci USA 2000;97:11050–11055. [PubMed: 10984517]
Fischl B, Sereno M,I, Dale A,M. Cortical surface-based analysis: II. Inflation, flattening, and a surface-based coordinate system. Neuroimage 1999;9:195–207. [PubMed: 9931269]
Gillberg C, Cederlund M. Asperger Syndrome: Familial and Pre- and Perinatal Factors. J Autism DevDisord 2005;35:159–166. [PubMed: 15909402]
Gogtay N, Giedd J,N, Lusk L, Hayashi K,M, Greenstein D, Vaituzis A,C, Nugent T,F 3rd. Herman D,H,Clasen L,S, Toga A,W, Rapoport J,L, Thompson P,M. Dynamic mapping of human corticaldevelopment during childhood through early adulthood. Proc Natl Acad Sci USA 2004;101:8174–8179. [PubMed: 15148381]
Greenfield S,F, Manwani S,G, Nargiso J,E. Epidemiology of substance use disorders in women. ObstetGynecol Clin North Am 2003;30:413–446. [PubMed: 14664320]
Hans S,L, Jeremy R,J. Postneonatal mental and motor development of infants exposed in utero to opioiddrugs. Infant Mental Health Journal 2001;22:300–315.
Hans, S,L. Maternal opioid drug use and child development. In: Zagon, I.; Slotkin, T., editors. MaternalSubstance Abuse and the Developing Nervous System. Academic Press; New York: 1992. p.177-213.
Harlan R,E, Song D,D. Prenatal morphine treatment and the development of the striatum. Regul Pept1994;54:117–118.
Harvey J,A. Cocaine effects on the developing brain: current status. Neurosci Biobehav Rev2004;27:751–764. [PubMed: 15019425]
Hu S, Sheng W,S, Lokensgard J,R, Peterson P,K. Morphine induces apoptosis of human microglia andneurons. Neuropharmacology 2002;42:829–836. [PubMed: 12015209]
Kadesjø C, Kadesjø B, Haggløf B, Gillberg C. ADHD in Swedish 3-to-7-year-old children. J Am AcadChild Adoles Psychiatry 2001;40:1021–1028.
Kelley AE. Neural integrative activities of nucleus accumbens subregions in relation to learning andmemory. Psychobiology 1999;27:198–213.
Kennedy D,N, Filipek P,A, Caviness V,S. Anatomic segmentation and volumetric calculations in nuclearmagnetic resonance imaging. IEEE Trans Med Imaging 1989;8:1–7. [PubMed: 18230494]
Kuperberg GR, Broome MR, McGuire PK, David AS, Eddy M, Ozawa F, Goff D, West WC, WilliamsSCR, van der Kouwe AJW, Salat DH, Dale AM, Fischl B. Regionally Localized Thinning of theCerebral Cortex in Schizophrenia. Arch Gen Psychiatry 2003;60:878–888. [PubMed: 12963669]
Malanga, C,J.; Kosofsky, B,E. Effects of drugs of abuse on brain development. In: Charney, D,S.; Nestler,E,J., editors. Neurobiology of mental illness. 2nd edition. Oxford University Press; New York: 2004.p. 720-739.
Max J,E, Fox P,T, Lancaster J,L, Kochunov P, Mathews K, Manes F,F, Robertson B,A, Arndt S, RobinD,A, Lansing A,E. Putamen lesions and the development of attention-deficit/hyperactivitysymptomatology. J Am Acad Child Adolesc Psychiatry 2002;41:563–571. [PubMed: 12014789]
Walhovd et al. Page 15
Neuroimage. Author manuscript; available in PMC 2008 July 15.
NIH
-PA Author Manuscript
NIH
-PA Author Manuscript
NIH
-PA Author Manuscript

McCarthy, D. Manual for the McCarthy Scales of Children’s Abilities. The Psychological Corporation;New York, NY: 1971.
Mitchell L,E, Adzick N,S, Melchionne J, Pasquariello P,S, Sutton L,N, Whitehead A,S. Spina befida.Lancet 2004;364:1885–1895. [PubMed: 15555669]
Moe V. Foster-placed and adopted children exposed in utero to opiates and other substances: Predictionand outcome at four and a half years. Developmental and behavioral pediatrics 2002;23:330–339.
Moe V, Slinning K. Prenatal drug exposure and the conceptualization of long-term effects. Scand JPsychol 2002;43:41–47. [PubMed: 11885759]
Nichols TE, Holmes AP. Nonparametric Permutation Tests For Functional Neuroimaging: A Primer withExamples. Hum Brain Mapp 2001;15:1–25. [PubMed: 11747097]
Nøvik T,S. Validity of the Child Behavior Checklist in a Norwegian sample. Europ Child AdolescPsychiatry 1999;8:247–254.
Ornoy A, Segal J, Bar-Hamburger R, Greenbaum C. Developmental outcome of school-age children bornto mothers with heroin dependency: importance of environmental factors. Dev Med Child Neurol2001;43:668–675. [PubMed: 11665823]
Posthuma D, De Geus E,J, Baaré W,F,C, Pol H,E,H, Kahn R,S, Boomsma D,I. The association betweenbrain volume and intelligence is of genetic origin. Nat Neurosci 2002;5:83–84. [PubMed: 11818967]
Riley E,P, McGee C,L. Fetal alcohol spectrum disorders: an overview with emphasis on changes in brainand behavior. Exp Biol Med 2005;230:357–365.
Rosas HD, Liu AK, Hersch S, Glessner M, Ferrante RJ, Salat DH, van der Kouwe A, Jenkins BG, DaleAM, Fischl B. Regional and progressive thinning of the cortical ribbon in Huntington’s disease.Neurology 2002;58:695–701. [PubMed: 11889230]
Salat D,H, Buckner R,L, Snyder A,Z, Greve D,N, Desikan R,S,R, Busa E, Morris J,C, Dale A,M, FischlB. Thinning of the cerebral cortex in aging. Cereb Cortex 2004;14:721–730. [PubMed: 15054051]
Seidman L,J, Valera E,M, Makris N. Structural brain imaging of attention-deficit/hyperactivity disorder.Biol Psychiatry 2005;57:1263–1272. [PubMed: 15949998]
Seidman L,J, Faraone S,V, Goldstein J,M, Goodman J,M, Kremen W,S, Toomey R, Tourville J, KennedyD, Makris N, Caviness V,S, Tsuang M,T. Thalamic and amygdala-hippocampal volume reductionsin first-degree relatives of patients with schizophrenia: an MRI-based morphometric analysis. BiolPsychiatry 1999;46:941–954. [PubMed: 10509177]
Sgouros S, Goldin JH, Hockley AD, Wake MJC, Natarajan K. Intracranial volume change in childhood.J Neurosurg 1999;91:610–616. [PubMed: 10507383]
Slinning K. Foster placed children prenatally exposed to poly-substances--attention-related problems atages 2 and 4 1/2. Eur Child Adolesc Psychiatry 2004;13:19–27. [PubMed: 14991428]
Smith L,M, Chang L, Yonekura M,L, Grob C, Osborn D, Ernst T. Brain proton magnetic resonancespectroscopy and imaging in children exposed to cocaine in utero. Pediatrics 2001;107:227–231.[PubMed: 11158451]
Suess P,E, Newlin D,B. Motivation, sustained attention, and autonomic regulation in school-age boysexposed in utero to opiates and alcohol. Exp Clin Psychopharmacol 1997;5:375–387. [PubMed:9386964]
Vathy I. Prenatal opiate exposure: long-term CNS consequences in the stress system of the offspring.Psychoneuroendocrinology 2002;27:273–283. [PubMed: 11750783]
Wechsler, D. Wechsler Intelligence Scale for Children - Revised. The Psychological Corporation; NewYork: 1974.
Wielkiewicz R,M. Interpreting Low Scores on the WISC-R Third Factor: It’s More Than Distractibility.Psychological Assess 1990;2:91–97.
Wilke M, Schmithorst VJ, Holland SK. Assessment of Spatial Normalization of Whole-Brain MagneticResonance Images in Children. Hum Brain Mapp 2002;17:48–60. [PubMed: 12203688]
Yanai J, Huleihel R, Izrael M, Metsuyanim M, Shahak H, Vatury O, Yaniv SP. Functional changes afterprenatal opiate exposure related to opiate receptors’ regulated alterations in cholinergic innervation.Int J Neuropsychopharmacol 2003;6:253–265. [PubMed: 12974992]
Walhovd et al. Page 16
Neuroimage. Author manuscript; available in PMC 2008 July 15.
NIH
-PA Author Manuscript
NIH
-PA Author Manuscript
NIH
-PA Author Manuscript

Figure 1.A sample of the automated segmentation of the brain volumes of two healthy 10 year old boys.Bottom: normal control. Top: opiate exposed. Voxel size is 1 mm3.
Walhovd et al. Page 17
Neuroimage. Author manuscript; available in PMC 2008 July 15.
NIH
-PA Author Manuscript
NIH
-PA Author Manuscript
NIH
-PA Author Manuscript

Figure 2.Volume distributions measured in number of voxels (mm3, y-axis) and plotted according toage (x-axis) for the different groups with exposure type and risk factors indicated. The linesindicate group means for all exposed children together and controls, respectively.
Walhovd et al. Page 18
Neuroimage. Author manuscript; available in PMC 2008 July 15.
NIH
-PA Author Manuscript
NIH
-PA Author Manuscript
NIH
-PA Author Manuscript

Figure 3.Partial eta squares plotted for comparison of effect sizes of group when the effect of age atscan, gestational age at birth, and gender is controlled for. ANOVAS were performed for allcontrols (n = 14) compared to A) all substance exposed (n = 14, df = 1, 23), B) opiate exposedonly (n =10, df = 1,19), C) opiate exposed without MMC or AS (n = 8, df = 1, 17).
Walhovd et al. Page 19
Neuroimage. Author manuscript; available in PMC 2008 July 15.
NIH
-PA Author Manuscript
NIH
-PA Author Manuscript
NIH
-PA Author Manuscript

Figure 4.Results of a general linear model depicting the effect of exposure group on the cortical mantlewhen the effects of gender, age at scan and gestational age at birth were regressed out. Resultsare shown for group differences between controls and A) all exposed children, and B) opiateexposed children only.
Walhovd et al. Page 20
Neuroimage. Author manuscript; available in PMC 2008 July 15.
NIH
-PA Author Manuscript
NIH
-PA Author Manuscript
NIH
-PA Author Manuscript

Figure 5.The scatterplots illustrate the effects of different combination of regressors on cortical thicknessin the right hemisphere. The effects are projected onto an inflated brain (left: lateral view, right:medial view). Since there are several possible confounds that correlate with the primaryvariable of interest (prenatal exposure to opiates), the general linear model approach wasrepeated systematically with different variables regressed out. As can be seen, the effects areas strong when only the opiate exposed children are included as when all the exposed childrenare included, even though the sample size is smaller (10 vs. 14 exposed). Further, it can beseen that the effects in parts of the right anterior cingulate and lateral orbitofrontal cortexsurvive control for a number of possible confounds.
Walhovd et al. Page 21
Neuroimage. Author manuscript; available in PMC 2008 July 15.
NIH
-PA Author Manuscript
NIH
-PA Author Manuscript
NIH
-PA Author Manuscript

Figure 6.Scatterplots showing the mean thickness of the cerebral cortex in two specific frontal brainareas: a part of anterior cingulate cortex and a part of the lateral orbitofrontal cortex in the righthemisphere. The areas are manually drawn on an inflated brain, which makes it possible to seeinside the sulci of the brain surface. The lines represent the mean thickness in the two areasfor the each of the two groups.
Walhovd et al. Page 22
Neuroimage. Author manuscript; available in PMC 2008 July 15.
NIH
-PA Author Manuscript
NIH
-PA Author Manuscript
NIH
-PA Author Manuscript

NIH
-PA Author Manuscript
NIH
-PA Author Manuscript
NIH
-PA Author Manuscript
Walhovd et al. Page 23Ta
ble
1Sa
mpl
e ch
arac
teris
tics o
f the
two
grou
ps.A
Exp
osed
gro
up (7
F/ 7
M)
Con
trol
gro
up (5
F/ 9
M)
Mea
nSD
Ran
geM
ean
SDR
ange
Age
at s
can
11.3
1.7
8.6-
13.9
9.8
0.3
9.0-
10.2
Birt
h w
eigh
t (g)
2999
680
2015
-430
038
6442
631
00-4
615
Birt
h le
ngth
(cm
)B47
.63.
044
-52
51.5
1.4
49-5
4B
irth
head
circ
umf.
34.1
2.0
31.0
-37.
036
.11.
134
.0-3
8.0
Ges
tatio
nal a
ge (w
)38
.12.
731
-40
40.7
1.1
39-4
2A
bstin
ence
s at b
irthC
2.1
1.1
0-3
----
---
---
----
--SE
S3.
90.
72.
5-5.
04.
10.
92.
5-5.
0M
cCar
thy
GC
I 4 y
rs10
8.4
15.3
87-1
3611
6.1
9.4
100-
128
McC
arth
y PP
S 4y
rsD
50.9
9.3
39-6
462
.98.
449
-78
WIS
C-R
IQ 9
yrsE
98.9
9.8
84-1
1711
4.4
14.9
93-1
45Fr
ee. f
rom
dis
tract
ibili
ty27
.64.
817
-34
34.9
4.9
24-4
0C
BC
L To
tal p
robl
.29
.017
.95-
7215
.012
.10-
41C
BC
L Ex
tern
aliz
ing
8.6
5.2
1-15
5.4
5.4
0-16
CB
CL
Atte
ntio
n pr
obl.
4.9
3.5
0-13
1.5
1.9
0-6
CB
CL
Soci
al p
robl
.2-
62-
10-
70.
40.
60-
2
A As s
een,
the
mea
ns fo
r the
WIS
C-R
and
McC
arth
y sc
ores
are
qui
te h
igh.
Thi
s lik
ely
partl
y re
flect
s kno
wn
elev
atio
n of
scor
es si
nce
norm
s for
thes
e te
sts w
ere
deve
lope
d so
me
time
ago.
B Obt
aine
d fo
r 12
child
ren
in th
e ex
pose
d gr
oup
and
13 in
the
cont
rol g
roup
CA
t a ra
ting
scal
e w
here
0 =
non
e, 1
= m
ild, 2
= m
oder
ate,
and
3 =
seve
re
DM
cCar
thy
Perc
eptu
al P
erfo
rman
ce S
cale
E WIS
C_R
scor
es w
ere
obta
ined
for 1
3 ch
ildre
n in
the
expo
sed
grou
p, a
ll in
the
cont
rol g
roup
Neuroimage. Author manuscript; available in PMC 2008 July 15.

NIH
-PA Author Manuscript
NIH
-PA Author Manuscript
NIH
-PA Author Manuscript
Walhovd et al. Page 24Ta
ble
2M
ean
brai
n vo
lum
es in
mm
3 (SD
) sho
wn
for a
ll co
ntro
ls (n
= 1
4) a
nd a
ll po
ly-s
ubst
ance
exp
osed
chi
ldre
n w
ithou
t (n
= 4)
and
with
(n =
10) o
piat
e ex
posu
re.
Gro
up M
eans
and
SD
s in
mm
3
Vol
ume
Con
trol
sE
xpos
ed n
on-o
piat
eE
xpos
ed o
piat
eM
SDM
SDM
SD
ICV
1543
736
1136
2714
2443
817
1866
1477
098
1968
27T
otal
bra
in12
3319
381
300
1158
444
1113
5611
9614
919
3924
Cer
ebra
l cor
tex
5729
5040
615
5417
2144
620
5431
9473
676
Cer
ebra
l wm
4159
2740
615
3922
8448
049
4259
2699
229
Hip
poca
mpu
s83
5053
578
5215
1979
8213
57A
myg
dala
3649
352
3259
433
3503
675
Acc
umbe
ns20
6422
816
7633
318
3621
0C
auda
te83
4981
775
0620
8873
4499
6Pu
tam
en12
248
787
1149
513
4511
242
2070
Palli
dum
3839
311
3777
676
3525
774
Tha
lam
us14
780
642
1375
016
3114
142
1769
Bra
inst
em19
698
934
1903
626
2019
165
3390
Cer
ebel
lar
cort
ex11
3464
1037
310
2095
7151
1062
0410
312
Cer
ebel
lar
wm
3227
043
3830
542
3006
3007
454
79L
at. v
entr
icle
s10
166
3962
9494
4527
8824
2246
Inf.
lat.
vent
ricl
es82
925
374
641
250
526
43rd
ven
tric
le10
6921
587
328
885
416
04th
ven
tric
le24
8865
422
1021
116
5138
2
Neuroimage. Author manuscript; available in PMC 2008 July 15.

NIH
-PA Author Manuscript
NIH
-PA Author Manuscript
NIH
-PA Author Manuscript
Walhovd et al. Page 25Ta
ble
3G
roup
diff
eren
ces i
n br
ain
volu
mes
whe
n th
e ef
fect
of a
ge a
t sca
n, g
esta
tiona
l age
at b
irth,
and
gen
der i
s con
trolle
d fo
r. A
NO
VA
s wer
epe
rfor
med
with
all
cont
rols
(n =
14)
com
pare
d to
a) a
ll su
bsta
nce
expo
sed
(n =
14,
df =
1, 2
3), b
) opi
ate
expo
sed
only
(n =
10, d
f = 1
,19)
,c)
opi
ate
expo
sed
with
out M
MC
or A
S (n
= 8
, df =
1, 1
7).
Vol
ume
Con
trol
s/ a
ll ex
pose
dC
ontr
ols/
opi
ate
expo
sed
Con
trol
s/ h
ealth
y op
iate
exp
osed
Fp
Fp
Fp
ICV
4.72
3.0
403.
663
.071
3.02
4.1
00T
otal
bra
in6.
094
.021
5.47
8.0
305.
740
.028
Cer
ebra
l cor
tex
4.27
6.0
504.
771
.042
5.45
6.0
32C
ereb
ral w
m3.
932
.059
2.94
7.1
022.
659
.121
Hip
poca
mpu
s4.
012
.057
3.12
9.0
934.
452
.050
Am
ygda
la7.
096
.014
5.29
2.0
338.
443
.010
Acc
umbe
ns8.
047
.009
4.26
8.0
534.
723
.044
Cau
date
3.05
6.0
943.
837
.065
4.15
8.0
57Pu
tam
en6.
797
.016
9.99
1.0
0510
.851
.004
Palli
dum
7.45
3.0
1215
.790
.001
15.4
40.0
01T
hala
mus
3.74
4.0
652.
539
.128
4.09
1.0
59B
rain
stem
5.68
4.0
267.
111
.015
8.71
6.0
09C
ereb
ella
r co
rtex
7.18
4.0
133.
520
.076
2.77
9.1
14C
ereb
ella
r w
m5.
851
.024
6.72
1.0
185.
580
.030
Lat
. ven
tric
les
.403
.532
.505
.486
.507
.486
Inf.
lat.
vent
ricl
es4.
806
.039
9.78
5.0
068.
948
.008
3rd v
entr
icle
2.92
2.1
012.
922
.104
3.50
8.0
784th
ven
tric
le3.
509
.074
4.79
4.0
413.
997
.062
Neuroimage. Author manuscript; available in PMC 2008 July 15.

NIH
-PA Author Manuscript
NIH
-PA Author Manuscript
NIH
-PA Author Manuscript
Walhovd et al. Page 26Ta
ble
4C
orre
latio
ns fo
r neu
roan
atom
ical
and b
ehav
iora
l var
iabl
es. r
AC
C an
d rLO
FC =
parts
of th
e rig
ht an
terio
r cin
gula
te an
d lat
eral
orbi
tofr
onta
lco
rtex
as c
hose
n an
d dr
awn
on th
e ba
sis
of g
roup
eff
ects
as
depi
cted
in F
igur
e 6.
Num
bers
in p
aren
thes
es: a
ge a
t sca
n, g
ende
r, an
dge
stat
iona
l age
par
tiale
d ou
t, bo
ld: p
<.0
5, it
alic
s: p
< .1
0.
Vol
ume
Tot
al IQ
Free
from
dis
trac
t.T
otal
pro
blem
sA
ttent
ion
prob
lem
sSo
cial
pro
blem
s
rAC
C.2
1 (-
.04)
.27
(-.0
5)-.0
8 (.2
2)-.3
3 (.0
7)-.3
9 (-
.06)
rLO
FC.3
6 (.2
6).5
0 (.4
7)-.4
1 (-
.35)
-.50
(-.2
7)-.5
9 (-
.38)
ICV
.16
(.13)
.08
(.11)
-.13
(-.0
5).0
1 (.0
0)-.1
2 (-
.19)
Tot
al b
rain
.12
(.18)
.00
(.11)
-.09
(-.0
8).1
0 (.0
4)-.0
6 (-
.17)
Cer
ebra
l cor
tex
.25
(.24)
.11
(.10)
-.15
(-.0
6).0
3 (.1
1)-.1
1 (-
.09)
Cer
ebra
l wm
.02
(.18)
-.10
(.14)
.06
(.00)
.24
(.06)
.08
(-.1
0)H
ippo
cam
pus
.15
(.20)
.05
(.08)
.21
(-.2
3)-.0
2 (-
.07)
-.18
(-.3
4)A
myg
dala
.21
(.28)
.04
(.16)
-.05
(.02)
.20
(.23)
-.03
(-.1
2)A
ccum
bens
.40
(.29)
.36
(.32)
-.40
(-.2
7)-.2
2 (-
.07)
-.43
(-.4
2)C
auda
te.3
5 (.2
3).2
7 (.1
2)-.2
8 (-
.13)
-.18
(.00)
-.33
(-.3
3)Pu
tam
en.3
0 (.3
3).1
4 (.1
3)-.2
3 (-
.17)
-.05
(.03)
-.22
(-.2
3)Pa
llidu
m.2
0 (.3
0).1
4 (.2
7)-.2
1 (-
.25)
.01
(-.0
8)-.1
2 (-
.31)
Tha
lam
us.3
2 (.3
1).1
8 (.2
0)-.2
6 (-
.22)
-.01
(-.0
4)-.1
5 (-
.37)
Bra
inst
em.0
3 (.0
6)-.0
8 (.0
4)-.2
2 (-
.30)
-.01
(-.2
3)-.1
8 (-
.47)
Cer
ebel
lar
cort
ex-.0
8 (-
.30)
-.02
(-.1
3)-.3
5 (-
.26)
-.26
(-.2
8)-.3
4 (-
.39)
Cer
ebel
lar
wm
-.05
(-.0
7).0
2 (.1
1)-.2
9 (-
.33)
-.16
(-.3
3)-.1
5 (-
.22)
Lat
. Ven
tric
les
-.03
(-.1
4).0
0 (-
.08)
-.06
(.05)
-.08
(.00)
-.27
(-.2
9)In
f. la
t. ve
ntri
cles
.08
(-.0
3).0
3 (-
.12)
-.25
(-.1
4)-.3
0 (-
.16)
-.54
(-.46
)3rd
ven
tric
le.2
9 (.1
1).1
8 (-
.03)
-.26
(-.0
8)-.2
3 (-
.00)
-.42
(-.3
7)4th
ven
tric
le.0
9 (-
.23)
.07
(-.3
0)-.1
9 (.1
0)-.2
4 (-
.12)
-.36
(-.1
7)
Neuroimage. Author manuscript; available in PMC 2008 July 15.


