Embed Size (px)
Citation preview

- Bogotá - Colombia - Bogotá - Colombia - Bogotá - Colombia - Bogotá - Colombia - Bogotá - Colombia - Bogotá - Colombia - Bogotá - Colombia - Bogotá - Colombia - Bogotá -

1
Wage Adjustment Practices and the Link between Price and Wages:
Survey Evidence from Colombian Firms♣
Ana María Iregui B. [email protected]
Ligia Alba Melo B. [email protected]
María Teresa Ramírez G. [email protected]
Abstract
The aim of this paper is to explore firms’ wage adjustment practices in the Colombian formal labor market; specifically, the timing and frequency of wage increases, as well as the link between wage and price changes. To this end, we use an ad hoc survey of 1,305 small, medium and large firms belonging to all economic sectors, except the public sector. The results show most of the firms adjust base wages annually, mainly during the first quarter, which suggests wage changes in Colombia are time-dependent. Also, wage increases were concentrated around observed inflation and none of the firms cut wages. Moreover, factors associated with the performance of firms and workers alike are the main determinants of wage adjustments. Regarding the link between wages and price changes, econometric results indicate this relationship is stronger in sectors where labor costs represent a higher share of total costs and in firms operating in sectors with higher labor productivity.
Keywords: wage increases, labor market, survey evidence, logit models, Colombia
JEL Classification: D22, J30, C25
♣The authors are senior researchers with the Research Unit of the Deputy Governor’s Office at Banco de la República (Central Bank of Colombia). They would like to thank Adolfo Cobo and Rafael Puyana for their comments, as well as Karina Acosta for her research assistance. The participation of the firms that agreed to complete the survey also is appreciated. The opinions expressed herein are those of the authors and do not necessarily reflect the views of Banco de la República or its Board of Directors.

2
I. Introduction
Wage and price setting mechanisms play an important role in the transmission of monetary
policy. According to Taylor (1999), when prices and wages are sticky, an increase in
money supply affects output and employment in the short run. In the long run, however, the
real economy is not affected by changes in money supply, because prices and wages
gradually adjust and real money balances return to their initial level. The timing and
frequency of wage-setting decisions are also relevant for the transmission of monetary
policy to the real economy. In fact, monetary policy shocks should have larger effects on
real variables after the decision on wage adjustments has been made and wages are
relatively rigid. Conversely, when wage-setting decisions are uniformly distributed
throughout the year and contracts last longer, the timing of monetary policy innovations
within the year becomes less relevant (Olivei and Tenreyro, 2010).
In addition, the link between wage and price adjustments is important in terms of its
implications for the effectiveness of monetary policy. Empirical evidence has shown price
and wage-setting practices are quite heterogeneous and changes in these variables are not
synchronized (e.g. Copaciu et al. 2010; Virbickas, 2010; Marques et al. 2010, Druant et al.
2009). These results could affect the size and the persistence of monetary policy shocks that
affect output (Gali, 1994, Rotemberg and Woodford, 1999 and Taylor, 1999).
The aim of this paper is to shed light, at the microeconomic level, on firms’ wage
adjustment practices in the Colombian formal labor market through the use of a survey. In

3
the existing literature, surveys at the firm level have focused mainly on wage rigidities.1 In
this paper, we explore other aspects of wage setting; specifically, the timing and frequency
of wage increases as well as the link between wage and price changes. In particular, we use
an ad hoc survey of 1,305 small, medium and large firms from all sectors of the economy,
except the public sector. One of the main benefits of using surveys is the possibility of
asking firms directly about wage-setting practices, which allows for information that could
not be obtained from databases, either at individual or firm level. In addition, the survey
provides evidence for the micro-foundation of the Central Bank’s models.
The Eurosystem Wage Dynamics Network (WDN) conducted an ad hoc survey on price and
wage-setting behavior among 17,000 firms in 17 countries of the European Union between
the end of 2007 and the first half of 2008.2 Within this network, a study of the frequency,
timing and the relationship between wage and pricing policies and adjustments was carried
out by Druant et al. (2009) for 15 countries. The results show European firms adjust wages
less frequently than prices and country characteristics (i.e., labor market institutions) are
relevant for wage adjustments, whereas sectoral differences are crucial for price changes.
They also found that wages and prices feed into each other at the firm level.
Moreover, as part of the WDN, Marques et al. (2010) provide evidence on price and wage
dynamics for the Portuguese economy. Their findings show most of the firms change
1See for example, Agell and Lundborg (1995, 2003), Amirault et al. (2009), Babecký et al. (2010), Bewley (1995, 1998, 1999), Blinder and Choi (1990), Campbell and Kamlani (1997), Copaciu et al. (2010) and Kawaguchi and Ohtake (2008). 2 For details on the WDN firm survey, see European Central Bank, Wage Dynamics in Europe: Final Report of the Wage Dynamics Network (WDN),December 2009.

4
wages once a year, mainly in January, which could be explained by collective bargaining
agreements at the sectoral or firm levels. They also investigated the relationship between
the timing of price and wage revisions and found the presence of some synchronization
between price and wage changes for half the firms. Virbickas (2010) researched the wage
and price-setting behavior of Lithuanian firms. The author found that Lithuania firms adjust
wages more than once a year, whereas adjustments in other countries within the WDN
generally take place once a year. The results also indicate a firm’s production technology,
labor compensation practices and market competition might affect the frequency of wage
and price changes.
Finally, Copaciu et al. (2010) studied the price- setting patterns of Romanian firms, also by
means of an ad hoc survey, which includes a section on wage setting behavior. They found
wages are stickier than prices; firms change wages, especially in January; and wage
adjustments are affected by changes in productivity.
In the case of Colombia, the literature on the link between price and wage changes is quite
scant and focuses on the impact of the minimum wage on prices. For example, Misas and
Oliveros (1994) evaluated the causality among several monthly indicators of prices (i.e. the
Consumer Price Index) and wages (i.e. the Index of Industrial Wages and the minimum
wage) during the period from January 1982 to March 1994. They found the minimum wage
and the Consumer Price Index feed into each other in Granger’s sense. Arango et al. (2010)
study the effect of changes in the minimum wage on the price of food away from home
during the period 1999-2008, using monthly prices by item at the establishment level. The

5
authors found there is a contemporary response in prices to changes in the minimum wage.
Specifically, a 10% increase in the minimum wage leads to a contemporary increase of
1.33% in the price of food away from home.
This paper contributes to that literature and provides insights for understanding wage-
setting behavior and the connection between wage and price adjustments. The results show
most of the firms surveyed adjust the base wages of their workers annually, mainly during
the first quarter. This suggests wage changes in Colombia are time-dependent. Also, wage
increases were concentrated around observed inflation and none of the firms cut wages.
Moreover, factors associated to the performance of firms and workers alike are the main
determinants of wage adjustments. Regarding the link between wage and price changes, our
findings indicate this relationship is stronger in sectors where labor costs represent a higher
share of total costs and in firms operating in sectors with higher labor productivity.
The paper is divided into four sections, apart from this introduction. In the second section,
we briefly discuss the survey on which our analysis is based. We then go on to analyze the
timing and frequency of wage adjustments and empirically study the factors that could
determine wage increases. In the fourth section, we investigate the link between wage and
price changes. The conclusions are described in the last section.

6
II. Survey Design
The analysis in this paper is based on a survey of 1,305 Colombian firms. It was designed
to explore wage-setting mechanisms, the nature and sources of wage rigidities, and the link
between wages and prices (Iregui et al. 2009a). In addition, the survey provided data on
several firm characteristics (e.g. the economic sector, labor contracts, collective bargaining
agreements and types of remuneration), which facilitated the characterization of firms in
the empirical analysis. The survey also was designed to obtain responses for four
occupational groups: managers, professionals, technicians and assistants, and unskilled
workers.
A representative sample of firms was used for the survey. This allowed us to generalize the
results to the population under study: namely 39,004 small, medium and large-scale legally
constituted companies3 from all sectors of the economy, except the public sector.4 These
firms are located in 13 cities and account for 70% of the formal employment in Colombia.5
Stratified random sampling was used to select the sample. Nine strata were considered.
They correspond to the following economic sectors: agriculture, forestry and fishing; trade;
construction; electricity, gas, water and mining; manufacturing; financial services;
transport, storage and communications; education and health; and other services. It is worth
3 Firms with less than 10 employees were excluded. 4 The public sector was excluded, because the wages of public employees are set mostly by government decree. 5 The cities are Bogotá, Bucaramanga, Barranquilla, Cali, Cartagena, Medellín, Manizales, Pereira and their metropolitan areas. Barrancabermeja, Buga, Tuluá, Girardot and Rionegro also were included.

7
noting that 1,305 firms replied to our survey. The firms that did not answer the
questionnaire were replaced by companies with similar characteristics.6 The survey was
applied during the first half of 2009, when the economy was showing signs of a slowdown
in activity, low inflation and rising unemployment.
All the results presented henceforth are generalized for the population. Also, coefficients of
variation (cve) were calculated for each answer. The estimates did not exceed 5%,
indicating the reliability of the population estimates.
III. Wage Adjustment Practices
A. Timing and Frequency of Wage Changes
The survey inquired about practices regarding wage increases.7This information is useful
not only to determine whether wage adjustments follow a time-dependent rule or a state-
dependent rule, but also to provide the Central Bank with several elements to guide
monetary policy. In fact, according to Olivei and Tenreyro (2010), the synchronization of
wage setting decisions is important to the transmission of monetary policy to the real
economy, since monetary policy innovations should have larger effect on real variables
after the decision has been taken and wages are relatively rigid.
6 For details regarding the survey design and its implementation, see Iregui et al., 2009a. 7 See Appendix 1 for relevant questions of the survey. Also, a Spanish version of the complete questionnaire is available in Iregui et al. (2009a).

8
On the contrary, if wage-setting decisions are distributed uniformly throughout the year and
contracts last longer, the timing of monetary policy innovations within the year becomes
less relevant. 8 For example, Olivei and Tenreyro (2010) indicate that wage-setting
decisions in Japan and the United States are negotiated annually and are concentrated in the
first two quarters of the year in Japan and in the final quarter in the United States. In
France, wages are changed once a year, on average, with two separate spikes in the
distribution of wage-setting decisions: one in January and the other in July (Druant et al.,
2009). On the contrary, wage bargaining negotiations in Germany take place throughout the
year, and contracts tend to last from one to three years.
Regarding the frequency of wage changes, the results of our survey show over 95% of
firms increase the base pay of their workers on a yearly basis.9 Annual wage adjustments do
not take into account temporary price shocks that might arise during the year, preventing
transitory inflationary shocks from becoming permanent. In addition, wage increases are
concentrated in the first quarter, especially in January (Graph 1). These results suggest
wage changes in Colombia are time-dependent and support a wage adjustment, although
such adjustments are not distributed equally throughout the year, as Taylor proposed
originally (1999). Accordingly, monetary policy innovations should have effect on the real
economy during the first quarter of the year.
8 From the perspective of the model, what is relevant is the time when the negotiation is carried out, rather than the date when the outcome takes effect (Olivei and Tenreyro, 2010). 9 For employees subject to collective bargaining agreements and for all other employees, 97% and 96% of the firms increase the base pay of their workers on a yearly basis, respectively.

9
Graph 1 Month in which the Last Increase in Base Wages Became Effective
(% of Firms)
Source: Authors’ calculations
Evidence supporting a time-dependent adjustment in base wages is reported for other
countries as well. For example, the Wage Dynamics Network found with respect to the 17
European countries that belong to this project, about 60% of the firms, on average, adjust
their wages once a year and 30% do so in January.10 Amirault et al. (2009) reported 89% of
Canadian firms increase their wages at fixed intervals, whereas Babecký et al. (2008) found
56% of Czech firms adjust wages in January.
Moreover, the results of our survey, disaggregated by economic sector, show the same
pattern emerges with a spike in the distribution of wage increases in January (Graph 2).
However, it is worth noting that, although 44.6% of the firms in the financial services
sector increased base wages in January, 36.9% did so during February and March; in the
10 See Wage Dynamics Network (2009).
56,7
18,7 13,1 11,5
60,7
25,7
8,8 4,7
0
10
20
30
40
50
60
70
January February to March April to June July to December
Subject to collective agreements Other

10
manufacturing and education and health sectors, about 54% of the wage increases were
conducted in January, and close to 26% during February and March. In any case, the
majority of firms in all sectors increase base wages during the first quarter.
Graph 2 Month the Last Wage Increase Took Effect, by Sector
(% of Firms)
Source: Author's calculation.
Taking into account the importance of price and wage adjustment practices for the
effectiveness of monetary policy, we compared our results to those of recent studies on
price-setting behavior in Colombia. In general, the empirical evidence suggests time-
dependent rules are more widespread in wage adjustments than in price changes. In fact,
studies done for Colombia using both monthly price reports (Julio et al., 2009) and survey
evidence (Misas et al., 2009) found substantial heterogeneity regarding time and state-
dependent price adjustment practices, contrary to the common practice of adjusting wages
0,0 10,0 20,0 30,0 40,0 50,0 60,0 70,0 80,0 90,0
Agriculture, forestry, fishing
Trade
Construction
Electricity, gas, water, mining
Manufacturing
Financial services
Transport, storage, communications
Education, health
Other services
July-December April-June February-March January

11
according to a time-dependent rule. For instance, Julio et al. (2009) found time dependency
is more common in services subject to price regulation, such as education and health
services and transport and communication, as well as in services highly dependent on
minimum wages (e.g. food away from home, personal services and apparel). Conversely,
the pricing rule for perishable food items was found to be state- dependent. In turn, Misas
et al. (2009), who surveyed firms in the agricultural and manufacturing sectors, found
71.5% of firms review their prices according to the time-dependent rule, while 28.5%
review prices when the economy is subject to some type of shock (state -dependent rule).
In addition, firms adjust wages less frequently than prices.11 According to our survey, wage
adjustments generally are carried out annually (96% of the firms), mainly in January,
whereas the results of the prices-setting behavior studies indicate the median duration of
price spells for Colombian consumer prices is 6.4 months, when excluding the rental price
of housing. Julio et al. (2009) also found prices are more flexible for goods than for
services. The more flexible items are household utilities and perishable foods. Their price
duration is close to four (4) months, while the least flexible are education and medical care
services, with respective price durations of 16 months and 13 months. In turn, Misas et al.
(2009) found firms in the manufacturing sector change prices less frequently than those in
the agricultural sector.12
11This result is consistent with the evidence found by Druant et al. (2009) for European countries, where wages tend to remain unchanged for nearly 15 months, on average, while prices stay constant for around 10 months. 12 Based on a price-setting survey, Parra et al. (2010) found the frequency of price changes is determined mainly by product features, the degree of competence facing the firm, contractual agreements and the economic sector where the firm operates.

12
B. Wage Increases
Regarding the last base wage increase, the majority of firms in the population under study
made an average increase roughly equivalent to the rate of inflation observed in 2008
(7.67%). Graph 3 shows the histograms of the distribution of the average nominal wage
change between 2008 and 2009, for each occupational position. As illustrated, none of the
companies cut wages and there is a spike around the observed rate of inflation. In the case
of unskilled workers, wage changes were concentrated near this value for about 60% of the
firms, whereas this percentage is close to 40% for managers. The high concentration of
observations around the reported inflation rate, especially in the case of unskilled workers,
could be associated with the existence of a minimum wage in Colombia, which is adjusted
annually according to past inflation.
In general, the histograms of the distribution of wage changes present evidence of wage
rigidities for all occupational groups, since the data cluster around the observed inflation
rate and there are no wage cuts. The high concentration of observations around past
inflation might be evidence of downward real wage rigidity, which could be explained by
the Colombian practice of adjusting wages, either in line with the inflation rate for the
previous year or with the increase in the minimum wage. This result, together with the low
frequency of wage changes, provides evidence of wage stickiness in the Colombian formal
labor market.13
13 See Iregui et al. (2009b and 2010) for an analysis of downward wage rigidities in Colombia.

13
Graph 3 Average Wage Increases by Occupational Group: 2009/2008 (%)
Source: Authors’ calculations
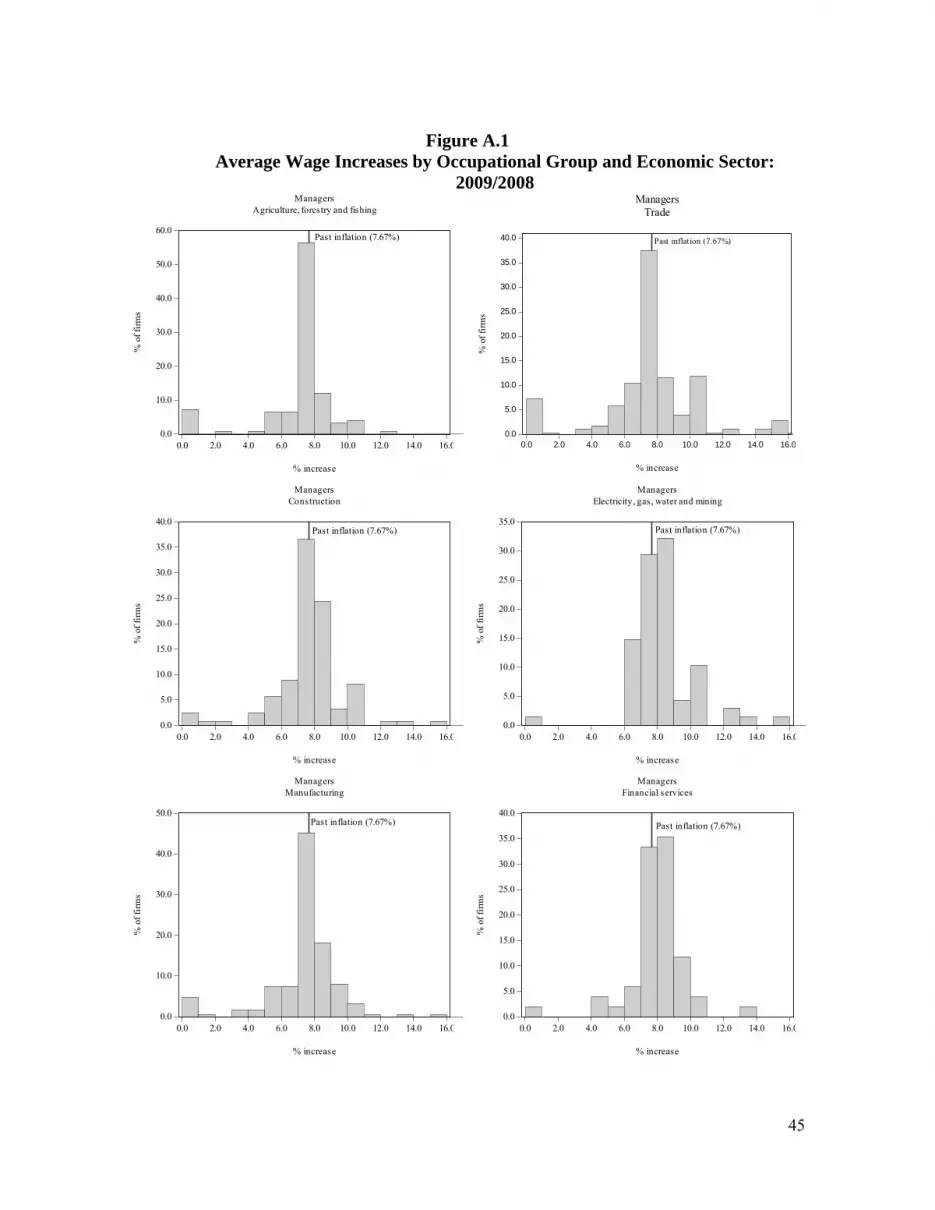
Finally, at the sectoral level, it is worth noting that the largest increases for all occupational
groups were recorded in the electricity, gas, water and mining sector, whereas the smallest
increases were in manufacturing, in the case of managers and professionals, and in
transport, storage and communications, in the case of technicians and assistants and
unskilled workers (Graph 4). As to wage increases by firm location and occupational group,
0.0
10.0
20.0
30.0
40.0
50.0
0.0 2.0 4.0 6.0 8.0 10.0 12.0 14.0 16.0
Perc
enta
ge o
f firm
s
Managers
Past inflation (7.67%)
Percentage increase
0.0
10.0
20.0
30.0
40.0
50.0
0.0 2.0 4.0 6.0 8.0 10.0 12.0 14.0 16.0
Perc
enta
ge o
f firm
s
Professionals
Past inflation (7.67%)
Percentage increase
0.0
10.0
20.0
30.0
40.0
50.0
60.0
0.0 2.0 4.0 6.0 8.0 10.0 12.0 14.0 16.0
Perc
enta
ge o
f firm
s
Technicians and Assistants
Past inflation (7.67%)
Percentage increase
0.0
10.0
20.0
30.0
40.0
50.0
60.0
70.0
0.0 2.0 4.0 6.0 8.0 10.0 12.0 14.0 16.0
Perc
enta
ge o
f firm
s
Unskilled workers
Past inflation (7.67%)
Percentage increase

14
the results show average base wage increases were higher in Bogotá for all occupational
groups than in the rest of the country.
Graph 4 Average Increase in Base Wages by Occupational Group and Sector:
2009/2008, (%)
Source: Authors’ calculations
C. Determinants of Wage Increases
Next, to better understand the factors that firms consider when deciding on wage
adjustments, we estimated cross-section models using both firm and sector characteristics.
In particular, the dependent variable is the percentage of the 2008/2009 base wage
increases. The explanatory variables allow for differences in economic sectors and
geographical variability (location). We considered the electricity, gas, water and mining
sector and cities other than Bogotá (the nation’s capital) as the reference categories in the
6,60 6,80 7,00 7,20 7,40 7,60 7,80 8,00 8,20 8,40
Agriculture, forestry, fishingTrade
ConstructionElectricity, gas, water, mining
ManufacturingFinancial services
Transport, storage, communicationsEducation, health
Other services
Unskilled workers Technicians and assistants Professionals Managers
15
regression. Firm size also is included and is measured by the number of employees
(Ln_employees). In addition, to take into account the characteristics and composition of the
labor force, we included the share of managers and professionals (% skilled workers), the
percentage of workers earning the minimum wage (% minimum wage earners), the
percentage of workers earning comprehensive wages (% comprehensive wage
earners),14the share of employees on a permanent employment contract (% permanent
workers), the share of employees on a temporary employment contract (% temporary
workers), and the logarithm of the average wage for each occupational group (Ln_wages).
A dummy variable that takes the value of one (1) if the firm has any form of collective
agreement (Collective agreements) was considered to evaluate the importance of collective
wage agreements. Furthermore, we included dummy variables to account for the presence
of flexible benefits and variable pay. Labor costs as a share of total costs also were included
to approximate labor intensity. Finally, a dummy variable that takes the value of one (1) if
the firm exports part of its production (d_exports) and a dummy that takes the value of one
(1) if the firm is a subsidiary of a multinational company were included as well.
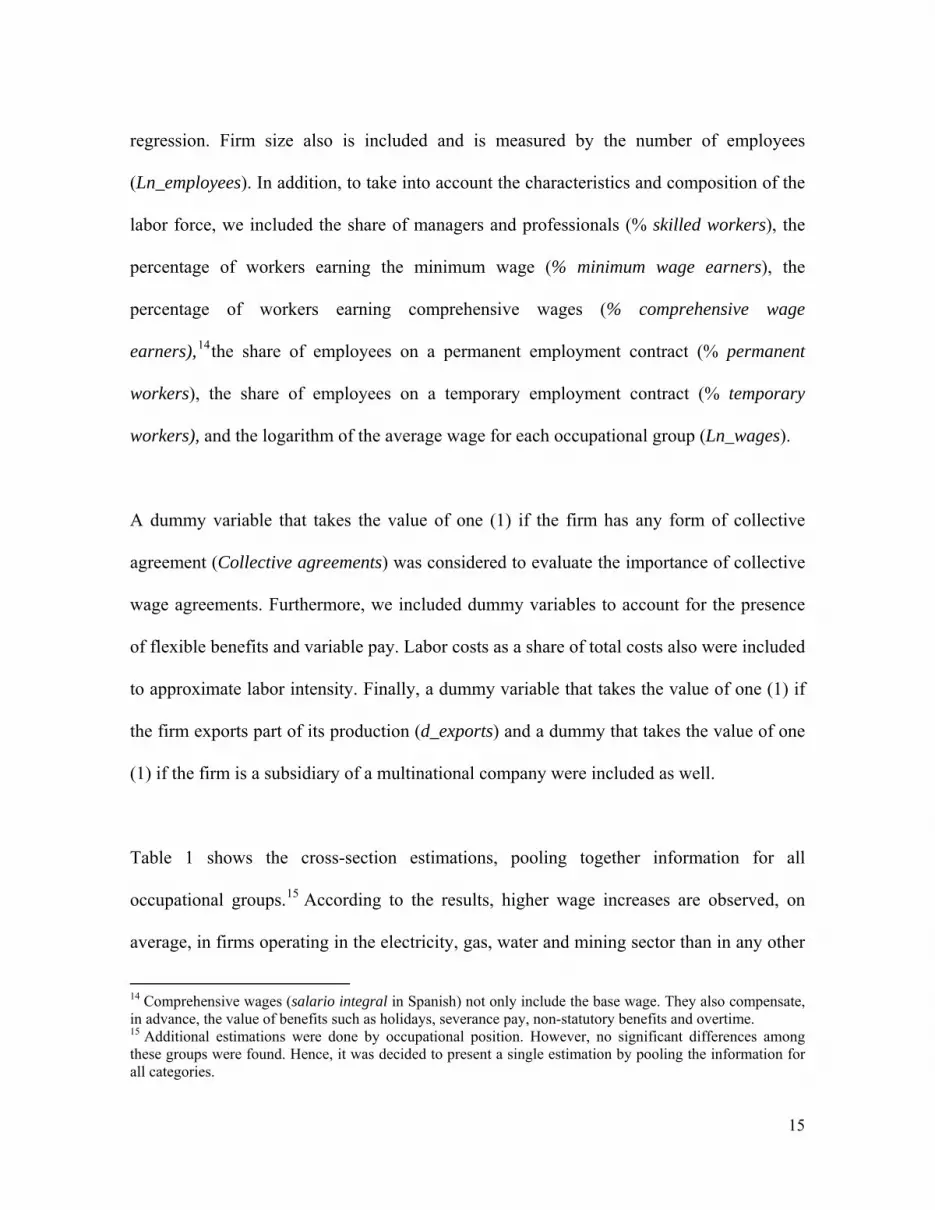
Table 1 shows the cross-section estimations, pooling together information for all
occupational groups.15 According to the results, higher wage increases are observed, on
average, in firms operating in the electricity, gas, water and mining sector than in any other
14 Comprehensive wages (salario integral in Spanish) not only include the base wage. They also compensate, in advance, the value of benefits such as holidays, severance pay, non-statutory benefits and overtime. 15 Additional estimations were done by occupational position. However, no significant differences among these groups were found. Hence, it was decided to present a single estimation by pooling the information for all categories.

16
sector. Regarding firm size, the coefficient is negative and significant, indicating that, for
the year 2009, firms with fewer employees made, on average, higher wage increases.
Moreover, firms with a higher percentage of female workers, on average, made smaller
wage increases. The presence of variable pay and the percentage of employees earning
comprehensive wages are statistically significant and positive in explaining wage increases.
Finally, wage increases are higher in exporting firms than in non-exporting ones, possibly
indicating that higher revenues from exports (total Colombian exports increased 25%
during 2007/2008) resulted in larger wage increases.
A model including sectoral labor productivity (measured as the real value added per
employee) as an additional regressor was also estimated. The results, not reported here,
indicate this variable is positive and highly significant, suggesting that higher wage
increases were carried out in sectors with higher labor productivity, as is the case of the
electricity, gas, water and mining sector, which according to the national accounts has the
highest labor productivity in the country.
An additional exercise was conducted to identify several factors that could affect the
likelihood of the average wage increase being higher than the observed rate of inflation. To
this end, a logit model was estimated using the pooled data mentioned earlier. The
dependent variable takes the value of one (1), if the firm decided on average wage increases
above past inflation, and zero, if not. In the case of managers it should be noted that 39% of
firms increased wages above past inflation; in the case of professionals, technicians and
assistants and unskilled workers, these percentages were 36%, 33% and 30%, respectively.

17
Table 1 Determinants of Wage Increases: Cross-section Estimations
(Weighted Estimations) Dependent variable: Wage Increase (%)
Explanatory Variables Coefficient/Standard Error
Agriculture, forestry, fishing -0.5901*** (0.2034)Trade -0.3672** (0.1648)Construction -0.4149** (0.2018)Manufacturing -0.9035*** (0.1585)Financial services -0.1215 (0.1803)Transport, storage and comm. -0.8177*** (0.1763)Education and health -0.2031 (0.1866)Other services -0.2835* (0.1503)Location 0.1105 (0.0830)Ln_employees -0.1217*** (0.0283)% permanent workers 0.1339 (0.0988)% temporary workers -0.0410 (0.2671)% female workers -0.6751*** (0.1977)% minimum wage earners -0.1860 (0.1416)% comprehensive wage earners 0.7922* (0.4556)Flexible benefits 0.1037 (0.0911)Variable pay 0.1745** (0.0849)Collective agreements 0.0712 (0.0934)% labor costs 0.0014 (0.0023)Subsidiary -multinational -0.2437** (0.1067)Ln_wages -0.0364 (0.0412)d_exports 0.2826*** (0.1052)% skilled workers -0.2438 (0.2021)Constant 9.1515*** (0.0000) Number of observations 4,671 Pseudo R2 0.0192
Notes: Robust standard errors in parentheses. (*), (**) and (***) denote statistical significance at 10, 5 and 1 percent, respectively. Source: Authors’ calculations

18
Marginal effects were calculated at the means of the independent variables (Table 2). As
can be seen, when comparing sectoral probabilities to the reference category (electricity,
gas, water and mining), the coefficients for all sectors are negative and significant,
suggesting that firms in the electricity, gas, water and mining sector are more likely to
increase wages above inflation. In fact, when calculating average probabilities by sector,
the results show these probabilities are higher in the electricity, gas, water and mining
sector, followed by the financial services sector, whereas the lowest probabilities were
found in the agriculture, forestry and fishing and manufacturing sectors. 16 Also, the
probability of increasing wages above inflation increases for all economic sectors with the
qualification of the labor force (Table 3). Regarding firm location, those located in Bogotá
are more likely to increase wages above inflation than firms located in the rest of the
country. When looking at each occupational position, the same results emerged (Table 4).
As to the number of employees, logit estimates indicate the higher the percentage of female
workers and the share of skilled workers, the less the likelihood of wages being increased
above inflation (Table 2). The likelihood also decreases if the firm is a subsidiary of a
multinational company. Furthermore, when the share of minimum wage earners increases,
the probability of increasing wages above inflation declines. This could be explained by the
fact that the minimum wage increase for 2008/2009 was equal to the observed rate of
inflation. On the contrary, the likelihood of raising wages above inflation increases, if the
firm has flexible benefits, a higher percentage of comprehensive wage earners and a higher
16 A model including sectoral labor productivity as an additional regressor was estimated as well. The results, not reported here, indicate the likelihood of increasing wages above inflation increases in more productive sectors, such as the electricity, gas, water and mining sector.

19
average wage level. Finally, the probability increases if the firm has any kind of collective
agreement, which could indicate its employees have more bargaining power when deciding
wage adjustments.
Table 2 Likelihood of Wage Increases above the Observed Rate of Inflation
Marginal Effects (Weighted)
Explanatory variables Coefficient/standard error
Agriculture, forestry, fishing -0.1796*** (0.0268) Trade -0.1476*** (0.0314) Construction -0.1684*** (0.0276) Manufacturing -0.2307*** (0.0260) Financial services -0.0820** (0.0418) Transport, storage and comm. -0.171*** (0.0253) Education and health -0.126*** (0.0363) Other services -0.1192*** (0.0313) Location 0.1051*** (0.0167) Ln_employees -0.0219*** (0.0070) % permanent workers 0.0218 (0.0227) % temporary workers -0.0626 (0.0476) % female workers -0.1467*** (0.0416) %minimum wage earners -0.1163*** (0.0327) % comprehensive wage earners 0.2362*** (0.0638) Flexible benefits 0.0495*** (0.0187) Variable pay 0.0216 (0.0182) Collective agreements 0.1043*** (0.0289) %labor costs 0.0002 (0.0005) Subsidiary-multinational -0.0627** (0.0264) Ln_wages 0.0477*** (0.0090) d_exports 0.0207 (0.0230) % skilled workers -0.1005** (0.0432) Number of observations 4,671 Pseudo R2 0.0192
Notes: Robust standard errors in parentheses. (*), (**) and (***) denote statistical significance at 10, 5 and 1 percent, respectively. Source: Authors’ calculations

20
Table 3 Likelihood of Increasing Wages above Inflation, by Sector and Occupational Position
Managers ProfessionalsTechnicians
and assistants
Unskilled workers
Agriculture, forestry and fishing 0.3275 0.2983 0.2701 0.2506
Trade 0.3939 0.3602 0.3264 0.3021
Construction 0.3823 0.3454 0.3051 0.2819
Electricity, gas, water and mining 0.6367 0.6030 0.5643 0.5288
Manufacturing 0.3337 0.2954 0.2657 0.2425
Financial services 0.5302 0.4735 0.4323 0.3913
Transport, storage and communications 0.3714 0.3429 0.3057 0.2811
Education and health 0.3601 0.3151 0.2870 0.2500
Other services 0.4306 0.3953 0.3536 0.3143 Source: Authors’ calculations
Table 4
Likelihood of Increasing Wages above Inflation, by Firm Location and Occupational Position
Managers Professionals Technicians
and assistants Unskilled workers
Bogotá 0.4480 0.4076 0.3695 0.3386
Rest of the country 0.3267 0.2948 0.2685 0.2466 Source: Authors’ calculations
D. Relevant Factors in Determining Base Wage Increases
We also asked the firms surveyed about the aspects affecting wage increases. Specifically,
the respondents were asked to rate, on a scale of one (1) (not important) to four (4) (very
important), the importance of certain factors in determining base wage changes. These
factors included the firm's profitability, its productivity, merits or individual performance,

21
past inflation, employee’s wage level, minimum wage increase, expected inflation, the
central bank's inflation target, national / union policies, collective pay agreements, wages of
similar employees outside the firm, and the unemployment rate. We calculated the mean
score of the answers to allow for comparisons. Following Blinder (1991), a mean score
greater than or equal to 3.0 is considered as excellent and a score of less than 1.5 as very
poor; a mean score greater than or equal to 2.5 is considered as reasonably strong.
Table 5 shows the ranking of factors according to the importance assigned by the firms
(average score).17 In general, one sees the factors associated with the firm’s performance
are the main determinants of wage adjustments, followed by factors associated with the
worker’s performance. Subsequently, the firms rank inflation and the minimum wage
increase. Finally, firms consider aggregate factors, such as unemployment, and national/
sectoral policies, as less important in defining wage increases.
Specifically, in the case of managers and professionals, the firm’s profitability is the factor
reported by firms as being the most important when determining wage increases, followed
by the firm’s productivity, merits or individual performance, past inflation and the
employee’s wage level.
17 The average scores obtained were ordered and t statistics were calculated for each option to test whether the mean differences between contiguous alternatives were statistically significant. In all cases, the results show the null hypothesis of equal average scores is rejected, with a confidence level of 99%.

22
Table 5 Importance of Factors in Determining Wages Increases
Factors Mean
Score* Mean Difference Tests
Differences** p-value Managers
Firm's profitability 3.02 0.13 0.000 Firm's productivity 2.89 0.20 0.000 Merits or individual performance 2.69 0.01 0.000 Past inflation 2.68 0.14 0.000 Employee’s wage level 2.54 0.14 0.000 Minimum wage increase 2.40 0.10 0.000 Expected inflation 2.30 0.18 0.000 Central Bank's inflation target 2.12 0.07 0.000 National / sectoral policies 2.05 0.05 0.000 Collective pay agreements 2.00 0.07 0.000 Wages of similar employees outside the firm 1.93 0.19 0.000 Unemployment rate 1.74
Professionals Firm's profitability 3.09 0.12 0.000 Firm's productivity 2.97 0.14 0.000Merits or individual performance 2.83 0.06 0.000Past inflation 2.77 0.14 0.000Employee’s wage level 2.63 0.13 0.000Minimum wage increase 2.50 0.13 0.000Collective pay agreements 2.37 0.03 0.000Expected inflation 2.34 0.20 0.000Central Bank's inflation target 2.14 0.09 0.000National / sectoral policies 2.05 0.08 0.000Wages of similar employees outside the firm 1.97 0.22 0.000Unemployment rate 1.75
Technicians, Assistants and Unskilled Workers Collective pay agreements 3.23 0.21 0.000 Minimum wage increase 3.02 0.01 0.000Firm's profitability 3.01 0.11 0.000Firm's productivity 2.90 0.16 0.000Past inflation 2.74 0.08 0.000Merits or individual performance 2.66 0.19 0.000Employee’s wage level 2.47 0.15 0.000Expected inflation 2.32 0.22 0.000Central Bank's inflation target 2.10 0.16 0.000National / sectoral policies 1.94 0.08 0.000Wages of similar employees outside the firm 1.86 0.07 0.000Unemployment rate 1.79 Note: *Mean score based on the following scale: 1 = not important, 2 = of minor importance, 3 = moderately important, 4 = very important. **Mean difference between two adjacent factors. Source: Authors’ calculations

23
The existence of collective agreements and the minimum wage increase are the most
important factors in determining wage increases for technicians, assistants and unskilled
workers. In general, these results are similar to those observed at the sectoral level.
However, in the case of managers and professionals, past inflation is the factor that firms
reported as being the most important for wage increases in the financial services sector and
in education and health.
One of the main interests of this survey was to inquire about the relevance of inflation in
wage increases. For this reason, past inflation, expected inflation and the central bank’s
inflation target were included in the list of important factors determining wage increases.
The ranking of the various alternatives indicates firms are "backward looking," since past
inflation is more important to them when determining wage increases. In particular and for
all occupational positions, about 60% of the firms consider past inflation as important or
very important. Conversely, 42% of the firms expected inflation to be important or very
important when considering wage adjustments. Moreover, although the Central Bank
announces the inflation target before the start of wage negotiations, 35% of the firms
surveyed consider the central bank’s target as important or very important.
Next, we estimate ordered logit models18 to control for firm characteristics that might
explain the main factors firms take into account when defining base wage increases. The
dependent variable increases with the importance of considering such factors. It takes
18 As in the previous case, we estimated a single model by pooling together the information for all occupational groups.

24
values from one (1) to four (4), where 1 = not important, 2 = of minor importance, 3 =
moderately important and 4 = very important. We used the same set of benchmark
explanatory variables as before. In addition, we introduced dummies variables to account
for the different occupational positions, with less skilled workers being the reference
category. In all models, we maintained the four categories for the dependent variables,
since the threshold parameters estimated are statistically different from one another.19
To simplify presentation of the results, Table 6 shows the marginal effects on the highest
probability category (very important) for the ordered logit model. For the alternatives
associated with the performance of the firms, such as their profitability and productivity,
the results show these factors are more important for managers and professionals than for
less skilled workers. In addition, as the number of employees of the firm increases and for
firms that use variable pay as part of their remuneration package, the likelihood of
considering these firms features as determinants of wage adjustment increases.
Furthermore, as the average wage increases, the likelihood declines. In the case of the
firm's profitability, the estimates suggest the likelihood of considering this factor reduces as
the percentage of employees earning the minimum wage and the percentage of employees
on permanent contracts increases. In turn, the probability that a firm considers its
productivity as an important factor increases for firms that are subsidiaries of multinational
companies.
19 A Wald test was used to test the difference among the threshold parameters. The results of the tests, as well as the marginal effects for all the models, may be obtained from the authors upon request.

25
Table 6 Determinants of the Main Factors Firms Used in Defining Base Wage Increases
(Marginal Effects for Ordered Logit Models1/, Weighted) Variables Firm's profitability Firm's productivity Merits or individual
performance Employee’s wage level
Agriculture, forestry, fishing -0.0512 (0.0406) -0.0558 (0.0377) -0.0169 (0.0347) -0.0012 (0.0246) Trade 0.0203 (0.0401) -0.0355 (0.0349) -0.0093 (0.0301) -0.0035 (0.0221) Construction -0.0379 (0.0419) -0.0463 (0.0373) -0.0368 (0.0317) -0.0592*** (0.0184) Manufacturing -0.0862** (0.0394) -0.0906** (0.0354) -0.1219*** (0.0258) -0.0614*** (0.0189) Financial services -0.2849*** (0.0320) -0.2442*** (0.0311) -0.1467*** (0.0271) -0.1009*** (0.0172) Transport, storage and comm. -0.0632 (0.0385) -0.1051*** (0.0315) -0.0459 (0.0289) -0.0111 (0.0223) Education and health -0.0540 (0.0452) -0.1171*** (0.0366) -0.0911*** (0.0287) -0.0353 (0.0221) Other services 0.1314*** (0.0427) 0.0816** (0.0392) 0.1048*** (0.0374) 0.0782*** (0.0297) Ln_employees 0.0235*** (0.0076) 0.0281*** (0.0069) 0.0109* (0.0057) 0.0057 (0.0038) % permanent workers -0.0503** (0.0230) -0.0030 (0.0216) -0.0105 (0.0191) -0.0052 (0.0117) % temporary workers 0.0328 (0.0448) -0.0221 (0.0441) 0.0591 (0.0388) -0.0119 (0.0250) Flexible benefits 0.0201 (0.0201) 0.0169 (0.0194) 0.0012 (0.0159) 0.0046 (0.0108) Variable pay 0.0291 (0.0189) 0.0320* (0.0181) 0.0298** (0.0150) 0.0249** (0.0102) Collective agreements -0.0331 (0.0277) -0.0326 (0.0280) -0.0811*** (0.0210) -0.0208 (0.0152) %labor costs -0.0007 (0.0005) -0.0001 (0.0004) -0.0003 (0.0003) -0.0005** (0.0002) Subsidiary –multinational 0.0377 (0.0341) 0.0600* (0.0325) 0.1256*** (0.0306) 0.0559*** (0.0211) % skilled workers -0.0271 (0.0421) 0.0033 (0.0405) -0.0275 (0.0338) -0.0110 (0.0231) Ln_wages -0.0437** (0.0185) -0.0543*** (0.0175) 0.0204 (0.0147) d_exports -0.0386 (0.0238) -0.0310 (0.0231) 0.0380* (0.0206) -0.0107 (0.0139) % comprehensive wage earners 0.0686 (0.0727) 0.0181 (0.0774) 0.0967 (0.0639) -0.0042 (0.0405) %minimum wage earners -0.0756** (0.0358) 0.0262 (0.0338) -0.0898*** (0.0292) -0.0871*** (0.0195) d_managers 0.0986*** (0.0378) 0.1029*** (0.0355) -0.0197 (0.0293) 0.0194* (0.0117) d_professionals 0.0809*** (0.0266) 0.0841*** (0.0258) 0.0393* (0.0215) 0.0411*** (0.0120) Number of observations 3,712 3,712 3,712 3,712 Pseudo R2 0.0373 0.0265 0.0308 0.0262
Notes: Robust standard errors in parentheses. (*), (**) and (***) denote statistical significance at 10, 5 and 1 per cent, respectively. The dependent variable increases with the likelihood, ranging from one (1) to four (4), where 1 = not important, 2 = of minor importance, 3 = moderately important and 4 = very important. 1/The table presents only marginal effects on the probability that the option is very important. Source: Authors’ calculations.

26
Table 6 (cont’) Determinants of the Main Factors Firms Used in Defining Base Wage Increases
(Marginal Effects for Ordered Logit Models1/, Weighted) Variables Past inflation Expected inflation Inflation target Minimum wage
increase Collective pay agreements2/
Agriculture, forestry, fishing -0.1140*** (0.0298) -0.0008 (0.0249) 0.0059 (0.0231) -0.0554* (0.0325) -0.1818*** (0.0477) Trade -0.0911*** (0.0308) 0.0400* (0.0222) -0.0012 (0.0188) -0.0575* (0.0308) 0.0257 (0.0927) Construction -0.1056*** (0.0290) -0.0092 (0.0215) -0.0112 (0.0199) -0.1187*** (0.0275) -0.0896 (0.1165) Manufacturing -0.1239*** (0.0296) 0.0087 (0.0224) -0.0335* (0.0178) -0.1116*** (0.0303) -0.1111 (0.0695) Financial services -0.1531*** (0.0286) -0.0203 (0.0237) -0.0374* (0.0217) -0.1718*** (0.0303) -0.2851*** (0.0486) Transport, storage and comm. -0.0731** (0.0304) 0.0102 (0.0221) -0.0225 (0.0173) -0.0504 (0.0312) -0.0831 (0.0648) Education and health -0.0708** (0.0361) -0.0224 (0.0232) 0.0199 (0.026) -0.0986*** (0.0323) -0.0839 (0.0787) Other services 0.0028 (0.0357) 0.1097*** (0.0286) 0.1087*** (0.0276) 0.0580 (0.0362) -0.1712*** (0.0528) Ln_employees 0.0328*** (0.0058) 0.0101** (0.004) 0.0108*** (0.0037) 0.0081 (0.0064) 0.0235 (0.0178) % permanent workers 0.0017 (0.0199) 0.0160 (0.0136) 0.0179 (0.0122) -0.0420** (0.0208) 0.1825*** (0.0598) % temporary workers -0.0078 (0.0367) 0.0216 (0.0235) 0.0224 (0.0217) 0.0403 (0.0423) 0.3095*** (0.1141) Flexible benefits 0.0059 (0.0158) -0.0182* (0.0102) 0.0005 (0.0095) -0.0324* (0.0172) -0.0506 (0.0422) Variable pay 0.0392** (0.0153) 0.0312*** (0.0104) 0.0239** (0.0095) 0.0107 (0.0163) 0.0138 (0.0448) Collective agreements 0.1734*** (0.0266) 0.0648*** (0.0195) 0.0394** (0.0163) 0.0458* (0.0268) %labor costs -0.0003 (0.0004) 0.0001 (0.0002) -0.0002 (0.0002) -0.0005 (0.0004) 0.0032*** (0.0009) Subsidiary-multinational 0.0515** (0.0261) 0.0252 (0.0172) 0.0259 (0.0170) -0.0004 (0.0287) 0.0104 (0.0519) % skilled workers 0.0258 (0.0333) 0.0555** (0.0229) 0.0084 (0.0215) -0.0251 (0.0383) 0.0078 (0.1183) Ln_wages -0.0361** (0.0149) -0.0343*** (0.0096) -0.0309*** (0.0089) -0.0767*** (0.0148) -0.0513 (0.0438) d_exports 0.0217 (0.0199) -0.0253* (0.0134) -0.0002 (0.0123) 0.0110 (0.0225) -0.0448 (0.0587) % comprehensive wage earners 0.1984*** (0.0707) -0.0594 (0.0416) 0.0296 (0.037) 0.0513 (0.0642) -0.0186 (0.1516) %minimum wage earners 0.0189 (0.0310) 0.0093 (0.0201) 0.0045 (0.0173) 0.1368*** (0.0308) -0.1142 (0.0779) d_managers 0.0435 (0.0304) 0.0535** (0.0209) 0.0573*** (0.0195) -0.0721** (0.0294) -0.2603*** (0.0688) d_professionals 0.0351 (0.0218) 0.0352** (0.0150) 0.0363*** (0.0140) -0.0935*** (0.0214) -0.2054*** (0.0507) Number of observations 3,712 3,712 3,712 3,712 559 Pseudo R2 0.0265 0.0156 0.0118 0.0463 0.1214 Notes: Robust standard errors in parentheses. (*), (**) and (***) denote statistical significance at 10, 5 and 1 per cent, respectively. The dependent variable increases with the likelihood, ranging from one (1)to four (4), where 1 = not important, 2 = of minor importance, 3 = moderately important and 4 = very important. 1/The table presents only marginal effects on the probability that the option is very important. 2/ Only for firms that have any kind of collective agreement. Source: Authors’ calculations.

27
Regarding workers’ characteristics, such as merits or individual performance and the
employee’s wage level, the results indicate the likelihood of considering these factors
increases when the firm is a subsidiary of a multinational company and when the firm uses
variable pay. It declines as the number of employees earning minimum wages increases.
Specifically, the probability of firms taking individual performance into account in wage
adjustments increases with firm size and for exporting firms. On the contrary, the
probability of considering this factor as important declines among firms with collective pay
agreements, where wage adjustments are negotiate between employees and employers. The
estimates indicate the average wage level is an important factor in determining wage
adjustments only in the case of managers and professionals. As expected, the share of labor
cost negatively affects the probability of considering the average wage level as an
important factor in wage adjustments.
Turning to the role played by inflation (i.e. past inflation, expected inflation and the
inflation target), the results show firm size positively affects the likelihood of firms
considering this factor as important when defining wage increases. Similarly, the presence
of collective agreements and variable pay has a positive effect on that probability. Also, for
managers and professionals, the probability of taking inflation into account as an important
factor when determining wage adjustments is higher with respect to less skilled workers.
When considering the annual minimum wage increase, the estimates show the likelihood of
using this factor as important in wage adjustments for managers and professionals is lower
than for less skilled workers. In turn, firms with collective agreements are more likely to

28
consider this factor than the other firms. In addition, the share of employees earning the
minimum wage also has a positive influence, as expected. The presence of flexible benefits
acts in the opposite direction, as does the share of employees on a permanent employment
contract and the average wage level.
Finally, for firms with collective agreements, the likelihood of considering such agreements
is lower for managers and professionals than less skilled workers. The share of labor costs
and the percentage of workers on permanent contracts have a negative impact on the
likelihood of considering collective agreements when defining wage increases.
IV. The Link between Wage and Price Adjustments
The interaction between wage and price adjustments is important for central banks, given
the implications for the effectiveness of monetary policy.20 The survey asked firms about
the relevance of this link for Colombian firms. Specifically, we questioned firms about the
importance of wage increases when it comes to adjusting the price of their
products/services. The results show wage adjustments are not important for 37.3% of the
firms and of minor importance to 20.9% when changing prices, whereas for 19.7% and
22.2% of the firms see wage adjustments as very important and important, respectively
20See for example Druant et al. (2009) and Wage Dynamics Network (2009).

(Graph
report
Source:
Althou
change
instanc
of the
nearly
accoun
21In thefound cfactors decidina contem
h 5).21These
a relative st
How Im
Authors’ calcula
ugh there g
es, the pass
ce, wage inc
firms in the
y 50% of th
nt for nearly
eir survey of prchanges in thefirms consider
ng on price champorary respo
0%
5%
10%
15%
20%
25%
30%
35%
40%
e results are
trong link be
mportant ar
ations
generally is
s-through of
creases are i
e education a
e firms in t
y 14% of th
rice-setting be cost of raw mr when adjustinges. In the panse in prices to
19,7%
Very impor
e similar to
etween price
Ge Wage IncProducts/S
not a relati
f wages to
important or
and health s
the agricultu
he consumer
havior for the
materials and cing prices, whiarticular case oo changes in th
22,2
rtant Impo
those found
s and wages
Graph 5 reases to th
Services? (%
ive strong r
prices is pa
r very impor
ector and in
ure, forestry
price index
manufacturingchanges in theile labor costs
of food away frhe minimum wa
2%
rtant Oim
d in Europe,
s (Wage Dyn
he Adjustme% firms)
relationship
articularly h
rtant in settin
n “other serv
y and fishing
x basket, acc
g and agricultue prices charge
are one of therom home, Araage.
20,9%
Of minor mportance
N
, where 15%
namics Netwo
ent in Prices
between w
high in som
ng prices for
vices”; the sa
g sector (Ta
cording to an
ural sectors, Med by competite least importaango et al. (201
37,2%
Not important
% of the firm
ork, 2009).
s for
age and pri
e sectors. F
r roughly 60
ame is true f
able 7), whi
n approxima
Misas et al. (200tors are the mant reasons wh10) found there
t
29
ms
ice
For
0%
for
ich
ate
09) main
hen e is

30
estimate. These results also suggest the interaction between wages and prices is stronger in
sectors where labor costs account for a larger share of total costs. In fact, our survey results
indicate the average labor cost share is about 40% for education and health and “other
services”.
For 86.3% of the firms in the financial services sector and 63.8% of the firms in the
electricity, gas, water and mining sector the link between wage and price adjustment is of
minor importance or not important. Taking firm size into consideration, there is no
significant variation across firms; this link is important or very important for 41.9% of the
small firms surveyed, 44.9% of the medium-sized firms and 38.7% of the large firms.
Table 7 Importance of Wage Increases in the Adjustment of Prices for Products and / or
Services, by Economic Sector (% of Responses)
Economic sector Very
important Important Of minor
importance Not
important Agriculture, forestry, fishing 24.5 25.2 19.5 30.8 Trade 11.5 26.5 24.0 38.0 Construction 21.7 22.5 18.6 37.2 Electricity, gas, water, mining 11.6 24.6 31.9 31.9 Manufacturing 20.6 24.3 20.2 34.9 Financial services 7.8 5.9 21.6 64.7 Transport, storage, communications 21.1 16.6 19.4 42.9 Education, health 27.7 32.5 15.7 24.1 Other services 37.5 21.9 18.7 21.9
Source: Authors’ calculations
The characteristics of firms could help us to understand whether or not they influenced the
link between wage and price adjustments. Hence, an ordered logit model was estimated.

31
The dependent variable increases with the importance of the interaction between both
variables. It takes values from one (1) to four (4), where 1 = not important, 2 = of minor
importance, 3 = moderately important and 4 = very important. Table 8 shows the marginal
effects of the highest probability category (very important). The results confirm that an
increase in labor costs as a share of total costs, as a proxy of labor intensity, raises the
likelihood that wages will pass-through to prices. This result is consistent with the findings
of Bertola et al. (2010) and Druant et al. (2009), based on the Wage Dynamic Network
survey, which found a strong relationship between a high labor share and the pass-through
of wages to prices. Furthermore, firms operating in the education and health and “other
services” sectors, where the labor share is the highest, are more likely to pass wage
increases on to prices than in the reference sector (electricity, gas, water and mining).
Conversely, the pass-through of wages to prices is less likely in the financial sector. In turn,
as the proportion of technicians and unskilled workers increases with respect to managers
and professionals and for firms located in cities other than the capital, so does the
probability of wage increases being incorporated into price increases.
An additional ordered logit estimation was done with sectoral variables such as capital
intensity, measured as the ratio of gross operating surplus to employee compensation and
labor productivity.22 According to the findings, firms operating in sectors with higher labor
productivity are more likely to pass wage increases on to prices. Conversely, the pass-
through of wages to prices is less for firms in sectors with higher capital intensity.
22 Results are not reported here, but are available upon request.

32
Table 8 Link between Wages and Price Adjustments
(Marginal Effects for an Ordered Logit Model1/, Weighted)
Explanatory variables Coefficient/standard error
Agriculture, forestry, fishing -0.0097 (0.0372) Trade -0.0231 (0.0310) Construction 0.0017 (0.0383) Manufacturing 0.0157 (0.0379) Financial services -0.1056*** (0.0297) Transport, storage and comm. -0.0297 (0.0313) Education and health 0.1329** (0.0639) Other services 0.1690*** (0.0529) Location -0.0817*** (0.0185) Ln_employees -0.0002 (0.0073) % permanent workers -0.0416* (0.0238) % temporary workers 0.0008 (0.0424) % female workers -0.0224 (0.0404) %minimum wage earners 0.0388 (0.0345) % comprehensive wage earners 0.0013 (0.0628) Flexible benefits 0.0001 (0.0175) Variable pay 0.0006 (0.0187) Collective agreements -0.0046 (0.0257) %labor costs 0.0010** (0.0005) Subsidiary-multinational -0.0023 (0.0262) d_exports 0.0058 (0.0248) % skilled workers -0.0969** (0.0440) Number of observations 1,304 Pseudo R2 0.0529
Notes: Robust standard errors in parentheses. (*), (**) and (***) denote statistical significance at 10, 5 and 1 per cent, respectively. The dependent variable is a categorical one, increasing with the importance of the link between wages and prices adjustments and ranging from one (1) to four (4), where 1 = not important, 2 = of minor importance, 3 = moderately important and 4 = very important. 1/The table shows only marginal effects on the probability that the option is very important. Source: Authors’ calculations
In the case of firms that indicated wage increases are important or very important in price
adjustments, we asked how long it took them to adjust prices once the wage change took

33
place. The results show 34% of these firms transfer wage increases to prices in less than a
month, 42.3% do so between one and three months and 10.7% between three and six
months. The remaining 13% take more than six months to pass wage increases on to prices
(Figure 1). A breakdown by sector shows some differences. In particular, firms involved in
education and health, agriculture, forestry and fishing, and “other services,” which are the
sectors with the highest share of labor costs, are quicker about translating wage increases
into prices that firms in the remaining sectors. In fact, around 45% of these firms pass wage
increases on prices in less than one month. With regard to firm size, the results show little
variation.
Finally, the firms that indicated wage increases are of minor importance or not important
for price adjustments argued the most important reasons for not changing their prices were
the presence of controlled or regulated prices (45%), competition in their sector (26%), the
wage increase that does not justify a price change (23.2%), and low labor costs as a share of
total costs (5.8%) (Figure 1). Some differences emerged at the sectoral level. For example,
firms involved in the financial services, construction, transport, storage and
communications, and electricity, gas, water and mining sectors do not pass wage increases
on to prices, mainly due to the presence of regulated or controlled prices. The probabilities
obtained from a multinomial logit model in which the dependent variable corresponds to
each of the reasons for not adjusting prices after wage increases, confirm that regulated or
controlled prices is the most important reason in most sectors for not changing prices
(Table 9). In turn, competition in the sector is an important reason for not transferring wage

increa
which
How
Sourc
ases into pri
h are sectors
Very importw long does it
Betwe
Betw
M
ce: Authors’ cal
ce hikes for
generally su
L
Impor
tant/importantake to make t
Less than one(34.0%
een one and th(42.3%)
ween three and (10.7%)
More than six (13.0%)
culations.
r firms in th
ubject to mor
FLink betwee
rtance of wag
nt (41.9%)the adjustmen
e month)
hree months)
six months)
months)
he trade, ma
re competitio
Figure 1 en Wages an
ge increases in
nt?Of mWhy
anufacturing
on.
nd Prices
n price adjus
minor importy does your fir
int
Regul
Compemarke
Wag
Low
g and agricu
sments.
tance/Not imprm not translatto price hikes?
lated or contro(45.0%)
etition in the set for products
(26.0%)
ge changes do price chang
(5.8%)
w share of laboportion of tot
(23.2%
ultural secto
portant (58.1%te wage increa?
olled prices)
sector (in the or services))
not justify ges
or cost as a tal cost
%)
34
ors,
%)ases

35
Table 9 Reasons Why Firms do not Adjust Prices for Products/Services after Wage Adjustments:
Probabilities by Sector Regulated or
controlled prices
Competition in the sector
Low labor costs as a share
of total costs
Wage changes do not justify price changes
Agriculture, forestry, fishing 0.3901 0.4088 0.0323 0.1688
Trade 0.3067 0.3497 0.0449 0.2985
Construction 0.5630 0.2097 0.0157 0.2116
Electricity, gas, water, mining 0.4741 0.2232 0.0404 0.2623
Manufacturing 0.3897 0.3426 0.0608 0.2069
Financial services 0.5932 0.1170 0.0679 0.2218
Transport, storage, comm. 0.5543 0.2241 0.0462 0.1754
Education and health 0.6772 0.0922 0.0678 0.1728
Other services 0.4539 0.1766 0.1136 0.2558 Source: Authors’ calculations
V. Conclusions
This paper provides elements to understand the wage adjustment practices firms use, as
well as the link between wage and price changes in the Colombian formal labor market,
since we directly ask firms about their wage-setting policies. Specifically, we surveyed
1,305 small, medium and large firms belonging to all sectors of the economy, except the
public sector. The results show over 95% of the firms surveyed increase their workers’ base
pay annually, mainly during the first quarter, suggesting that wage changes in Colombia are
time-dependent. Accordingly, monetary policy innovations should have smaller effects on
the real economy during the first quarter of the year.

36
When comparing our results to those of recent price-setting studies for Colombia, we found
firms adjust wages less frequently than prices. In fact, the results from the price-setting
behavior studies indicate the median duration of price spells is about six months for
Colombian consumer prices , excluding the rental price of housing, whereas wage
adjustments generally are carry out annually. The empirical evidence also suggests time
dependent wage adjustments are more common than time-dependent price changes.
Regarding base wage increases, the majority of firms in the population under study made
an average increase close to observed inflation and none of the companies cut wages. These
findings could suggest the presence of downward wage rigidity, which can be explained by
the Colombian practice of adjusting wages in line with the inflation rate of the previous
year or with the increase in the minimum wage. This result, coupled with the low frequency
of wage changes, provides evidence of wage stickiness in the Colombian formal labor
market. Moreover, the high concentration of observations near observed inflation rate,
especially in the case of unskilled workers, could be associated with the existence of a
minimum wage in Colombia, which is annually adjusted according to past inflation.
When we asked the firms under study about the aspects affecting wage increases, their
responses point to factors associated with the firm’s performance as the main determinants
of wage adjustments, followed by worker performance. Next, the firms take into account
the behavior of inflation and the minimum wage increase. Firms rank aggregate factors
such as unemployment and national / sectoral policies as less important in defining wage
increases. Concerning the role of inflation in wage adjustments, the survey findings indicate

37
firms are "backward looking"; for them, past inflation is more important than expected
inflation when determining wage increases. In addition and even though the Central Bank
announces the inflation target prior to the start of wage negotiations, 35% of firms consider
the central bank’s target as important or very important.
Given the implications of the interaction between wage and price adjustments for the
effectiveness of monetary policy, the survey asked firms about the importance of wage
increases in the adjustment of the prices for their products/services. The results show wage
adjustments are not important to 37% of the firms when changing prices, whereas 20%
consider them to be very important. Although the relationship between wage and price
changes is not especially strong, the pass-through of wages to prices is particularly high in
some sectors. For example, wage increases are important or very important in setting prices
for around 60% of the firms surveyed in the education and health sector and in “other
services”. These results suggest the interaction between wages and prices is stronger in
sectors where labor costs as a share of the total cost is higher. Additionally, firms operating
in sectors with higher labor productivity are more likely to pass wage increases on to prices.
Conversely, the pass-through of wages to prices declines in sectors with higher capital
intensity.

38
References
Agell, J., Lundborg, P., 1995. Theories of pay and unemployment: Survey evidence from
Swedish manufacturing firms. Scandinavian Journal of Economics, 97 (2), 295-307.
Agell, J., Lundborg, P., 2003. Survey evidence on wage rigidity and unemployment:
Sweden in the 1990s. Scandinavian Journal of Economics, 105 (1), 15-29.
Amirault, D., Fenton, P., Laflèche, T., 2009. Asking about wages: Results from the Bank of
Canada’s wage setting survey. Paper presented at the XIV Meeting of the Central Bank
Researchers Network of the Americas, Salvador, Bahía, Brazil, 11 – 13 November.
Arango, L.E., Ardila, L. K., Gómez, M. I., 2010. Efecto del cambio del salario mínimo en
el precio de las comidas fuera del hogar en Colombia. Borradores de Economía, #584,
Banco de la República.
Babecký, J., Dybczak, K., Galuščák, K., 2008.Survey on wage and price formation of
Czech firms. Czech National Bank, Working Paper Series, # 12, December.
Babecký, J., Du Caju, P., Kosma, D., Lawless, M., Messina, J., Rõõm, T., 2010. Downward
nominal and real wage rigidity: Survey evidence from European firms. Scandinavian
Journal of Economics, 112 (4), 884-910.

39
Bertola, G.; Dabusinskas; A., Hoebericht, M., Izquierdo,M., Kwapil, C., Montornès, J.,
Radowski, D., 2010. Price, wage and employment response to shocks: Evidence from the
WDN survey. Deutsche Bundesbank, Discussion Paper Series 1: Economic Studies, No
02/2010.
Bewley, T. F., 1995. A depressed labor market as explained by participants. The American
Economic Review, 85 (2), Papers and Proceedings, 250-254.
Bewley, T. F., 1998. Why not cut pay? Alfred Marshall Lecture. European Economic
Review, 42 (3-5), 459-490.
Bewley, T., 1999. Why wages don’t fall during a recession. Cambridge, MA: Harvard
University Press.
Blinder, A., Choi, D., 1990. A shred of evidence on theories of wage stickiness. Quarterly
Journal of Economics, 105 (4), 1003-1015.
Blinder, A., 1991. Why are prices sticky? Preliminary results from an interview study. The
American Economic Review, 81 (2), 89-96.
Campbell, C. M., Kamlani, K. S., 1997. The reasons for wage rigidity: Evidence from a
survey of firms. Quarterly Journal of Economics, 112 (3), 759-789.

40
Copaciu, M., Neagu, F., Braun-Erdei, H., 2010. Survey evidence on price setting patterns
of Romanian firms. Managerial and Decision Economics, 31 (2-3), 235-247.
Druant, M., Fabiani, S., Kezdi, G., Lamo, A., Martins, F., Sabbatini, R., 2009. How are
firms’ wages and prices linked: Survey evidence in Europe. Working Paper, # 174,
National Bank of Belgium.
Gali, J., 1994. Monopolistic competition, business cycles, and the composition of aggregate
demand. Journal of Economic Theory, 63 (1), 73-96.
Iregui, A. M., Melo, L. A., Ramírez, M. T., 2010. Downward wage rigidities and other
firms’ responses to an economic slowdown: Evidence from a survey of Colombian firms.
Borradores de Economía, # 612, Banco de la República.
Iregui, A. M., Melo, L. A., Ramírez, M. T., 2009a. Formación e incrementos de salarios en
Colombia: Un estudio microeconómico a partir de una encuesta a nivel de firma.
Borradores de Economía, # 582, Banco de la República.
Iregui, A. M., Melo, L. A., Ramírez, M. T., 2009b. Are wages rigid in Colombia?
Empirical evidence based on a sample of wages at the firm level. Borradores de Economía,
#571i, Banco de la República.

41
Julio, J.M., Zárate, H. M., Hernández, M. D., 2009. The stickiness of Colombian consumer
prices. Borradores de Economía, # 578, Banco de la República.
Kawaguchi, D., Ohtake, F., 2008. Testing the morale theory of nominal wage rigidity.
Industrial & Labor Relations Review, 61 (1), Article 3.
Marques, C.R., Martins, F., Portugal, P., 2010. Price and wage formation in Portugal.
European Central Bank , Working Paper Series # 1225.
Misas, M., López, E., Parra, J.C., 2009. La formación de precios en las empresas
colombianas: Evidencia a partir de una encuesta directa. Borradores de Economía, # 569,
Banco de la República.
Misas, M., Oliveros, H., 1994. La relación entre salarios y precios en Colombia: Un análisis
econométrico. Borradores de Economía, # 7, Banco de la República.
Parra, J.C., Misas, M.,López, E., 2010. Heterogeneidad en la fijación de precios en
Colombia: Análisis de sus determinantes a partir de modelos de conteo. Borradores de
Economía, # 628, Banco de la República.
Olivei, G., Tenreyro, S., 2010. Wage setting patterns and monetary policy: International
evidence. Journal of Monetary Economics, 57 (7), 785-802.

42
Rotemberg, J., Woodford, M., 1999. The cyclical behavior of prices and costs. In Taylor, J.
B. and Woodford, M. (Eds.), Handbook of Macroeconomics,. Elsevier; Vol. 1, Part 2,
1051-1135.
Taylor, J. B., 1999. Staggered price and wage setting in macroeconomics. In Taylor, J. B.
and Woodford, M. (Eds.), Handbook of Macroeconomics, Elsevier; Vol. 1, Part 2, 1009-
1050.
Virbickas, E., 2010. Wage and price setting behavior of Lithuanian firms. European Central
Bank, Working Paper Series, # 1198.
Wage Dynamics Network., 2009. Wage dynamics in Europe: Final Report of the Wage
Dynamics Network (WDN), December. Available at:
http://www.ecb.europa.eu/home/pdf/wdn_finalreport_dec2009.pdf.

43
Appendix 1
Questionnaire: Wage Increases
P16. How frequently do you increase base wages? On average, how often are base wages changed in your company?
Subject to collective
agreement Subject to collective agreement
(non- union) Others
a. Yearly 1 1 1
b. Twice a year 2 2 2
c. More than twice a year 3 3 3
d. Less than once per year 4 4 4 P16A. In what particular month are wages likely to increase?
a. Subject to collective agreement Jan Feb Mar Apr May Jun Jul Aug Sep Oct Nov Dec b. Subject to collective agreement (non- union)
Jan Feb Mar Apr May Jun Jul Aug Sep Oct Nov Dec
c. Others Jan Feb Mar Apr May Jun Jul Aug Sep Oct Nov Dec
P16B. Last year, what was the average increase in base wages? Percentage change
a. Managers
b. Professionals
c. Technicians and assistants
d. Unskilled workers P17.How important was each of the following factors in determining the last wage increase, based on the following scale: 1 = not important, 2 = of minor importance, 3 = moderately important, 4 = very important and 9 = not applicable.
Managers Professionals Technicians, assistants, and unskilled workers
a. Minimum wage increase 1 2 3 4 9 1 2 3 4 9 1 2 3 4 9 b. Firm’s productivity 1 2 3 4 9 1 2 3 4 9 1 2 3 4 9 c. Past inflation 1 2 3 4 9 1 2 3 4 9 1 2 3 4 9 d. Expected inflation 1 2 3 4 9 1 2 3 4 9 1 2 3 4 9 e. Central Bank’s inflation target 1 2 3 4 9 1 2 3 4 9 1 2 3 4 9 f. Unemployment rate 1 2 3 4 9 1 2 3 4 9 1 2 3 4 9 g. Collective pay agreements 1 2 3 4 9 1 2 3 4 9 1 2 3 4 9 h. Firm’s profitability 1 2 3 4 9 1 2 3 4 9 1 2 3 4 9 i. National / union policies 1 2 3 4 9 1 2 3 4 9 1 2 3 4 9 j. Merits or individual performance 1 2 3 4 9 1 2 3 4 9 1 2 3 4 9 k. Wages of similar employees outside the firm 1 2 3 4 9 1 2 3 4 9 1 2 3 4 9 l. Employee’s wage level 1 2 3 4 9 1 2 3 4 9 1 2 3 4 9

44
P18. If there is a collective agreement in your firm, was the last change in the base wages of your workers covered by collective agreements (union and non-union) compared to those not covered by the agreements: a. The same 1 b. Higher 2 c. Lower 3 d. Not applicable 4
P19. How important are your wage changes related to those of your products/services price changes? a. Very important 1 (Go to P19A) b. Moderately important 2 (Go to P19A) c. Of minor importance 3 (Go to P19B) d. Not important 4 (Go to P19B)
P19A. How long does it take for your firm to adjust the prices of your products / services once the change in wages takes place?
a. Less than one month 1 b. Between 1 and 3
months 2 c. Between 3 and 6 months 3 d. More than 6
months 4
P19B. Why does not your firm adjust the prices of your products / services? a. Regulated or controlled prices 1 b. Competition in the sector (in the market for products or services) 2 c. Low share of labor costs in total costs 3 d. Wage changes do not justify price changes 4
45
Figure A.1 Average Wage Increases by Occupational Group and Economic Sector:
2009/2008
0.0
10.0
20.0
30.0
40.0
50.0
60.0
0.0 2.0 4.0 6.0 8.0 10.0 12.0 14.0 16.0
% o
f firm
s
ManagersAgriculture, forestry and fishing
Past inflation (7.67%)
% increase
0.0
5.0
10.0
15.0
20.0
25.0
30.0
35.0
40.0
0.0 2.0 4.0 6.0 8.0 10.0 12.0 14.0 16.0
% o
f firm
s
ManagersTrade
Past inflation (7.67%)
% increase
0.0
5.0
10.0
15.0
20.0
25.0
30.0
35.0
40.0
0.0 2.0 4.0 6.0 8.0 10.0 12.0 14.0 16.0
% o
f firm
s
ManagersConstruction
Past inflation (7.67%)
% increase
0.0
5.0
10.0
15.0
20.0
25.0
30.0
35.0
0.0 2.0 4.0 6.0 8.0 10.0 12.0 14.0 16.0
% o
f firm
sManagers
Electricity, gas, water and mining
Past inflation (7.67%)
% increase
0.0
10.0
20.0
30.0
40.0
50.0
0.0 2.0 4.0 6.0 8.0 10.0 12.0 14.0 16.0
% o
f firm
s
ManagersManufacturing
Past inflation (7.67%)
% increase
0.0
5.0
10.0
15.0
20.0
25.0
30.0
35.0
40.0
0.0 2.0 4.0 6.0 8.0 10.0 12.0 14.0 16.0
% o
f firm
s
ManagersFinancial services
Past inflation (7.67%)
% increase

46
Figure A.1 (Continued) Average Wage Increases by Occupational Group and Economic Sector:
2009/2008
0.0
10.0
20.0
30.0
40.0
50.0
0.0 2.0 4.0 6.0 8.0 10.0 12.0 14.0 16.0
% o
f firm
s
ManagersTransport, storage and communications
Past inflation (7.67%)
% increase
0.0
10.0
20.0
30.0
40.0
50.0
0.0 2.0 4.0 6.0 8.0 10.0 12.0 14.0 16.0
% o
f firm
s
ManagersEducation and health
Past inflation (7.67%)
% increase
0.0
10.0
20.0
30.0
40.0
50.0
60.0
0.0 2.0 4.0 6.0 8.0 10.0 12.0 14.0 16.0
% o
f firm
s
ManagersOther services
Past inflation (7.67%)
% increase
0.0
10.0
20.0
30.0
40.0
50.0
60.0
0.0 2.0 4.0 6.0 8.0 10.0 12.0 14.0 16.0
% o
f firm
sProfessionals
Agriculture, forestry and fishing
Past inflation (7.67%)
% increase
0.0
10.0
20.0
30.0
40.0
50.0
0.0 2.0 4.0 6.0 8.0 10.0 12.0 14.0 16.0
% o
f firm
s
ProfessionalsTrade
Past inflation (7.67%)
% increase
0.0
10.0
20.0
30.0
40.0
50.0
0.0 2.0 4.0 6.0 8.0 10.0 12.0 14.0 16.0
% o
f firm
s
ProfessionalsConstruction
Past inflation (7.67%)
% increase

47
Figure A.1 (Continued) Average Wage Increases by Occupational Group and Economic Sector:
2009/2008
0.0
4.0
8.0
12.0
16.0
20.0
24.0
28.0
32.0
36.0
0.0 2.0 4.0 6.0 8.0 10.0 12.0 14.0 16.0
% o
f firm
s
ProfessionalsElectricity, gas, water and mining
Past inflation(7.67%)
% increase
0.0
10.0
20.0
30.0
40.0
50.0
60.0
0.0 2.0 4.0 6.0 8.0 10.0 12.0 14.0 16.0
% o
f firm
s
ProfessionalsManufacturing
Past inflation (7.67%)
% increase
0.0
10.0
20.0
30.0
40.0
50.0
0.0 2.0 4.0 6.0 8.0 10.0 12.0 14.0 16.0
% o
f firm
s
ProfessionalsFinancial services
Past inflation (7.67%)
% increase
0.0
10.0
20.0
30.0
40.0
50.0
0.0 2.0 4.0 6.0 8.0 10.0 12.0 14.0 16.0
% o
f firm
sProfessionals
Transport, storage and communications
Past inflation (7.67%)
% increase
0.0
10.0
20.0
30.0
40.0
50.0
0.0 2.0 4.0 6.0 8.0 10.0 12.0 14.0 16.0
% o
f firm
s
ProfessionalsEducation and health
Past inflation (7.67%)
% increase
0.0
10.0
20.0
30.0
40.0
50.0
60.0
0.0 2.0 4.0 6.0 8.0 10.0 12.0 14.0 16.0
% o
f firm
s
ProfessionalsOther services
Past inflation (7.67%)
% increase

48
Figure A.1 (Continued) Average Wage Increases by Occupational Group and Economic Sector:
2009/2008
0.0
10.0
20.0
30.0
40.0
50.0
60.0
70.0
0.0 2.0 4.0 6.0 8.0 10.0 12.0 14.0 16.0
% o
f firm
s
Technicians and assistantsAgriculture, forestry and fishing
Past inflation (7.67%)
% increase
0.0
10.0
20.0
30.0
40.0
50.0
0.0 2.0 4.0 6.0 8.0 10.0 12.0 14.0 16.0
% o
f firm
s
Technicians and assistantsTrade
Past inflation (7.67%)
% increase
0.0
10.0
20.0
30.0
40.0
50.0
60.0
0.0 2.0 4.0 6.0 8.0 10.0 12.0 14.0 16.0
% o
f firm
s
Technicians and assistantsConstruction
Past inflation (7.67%)
% increase
0.0
5.0
10.0
15.0
20.0
25.0
30.0
35.0
40.0
0.0 2.0 4.0 6.0 8.0 10.0 12.0 14.0 16.0
% o
f firm
sTechnicians and assistants
Electricity, gas, water and mining
Past inflation (7.67%)
% increase
0.0
10.0
20.0
30.0
40.0
50.0
60.0
70.0
0.0 2.0 4.0 6.0 8.0 10.0 12.0 14.0 16.0
% o
f firm
s
Technicians and assistantsManufacturing
Past inflation (7.67%)
% increase
0.0
10.0
20.0
30.0
40.0
50.0
60.0
0.0 2.0 4.0 6.0 8.0 10.0 12.0 14.0 16.0
% o
f firm
s
Technicians and assistantsFinancial services
Past inflation (7.67%)
% increase

49
Figure A.1 (Continued) Average Wage Increases by Occupational Group and Economic Sector:
2009/2008
0.0
10.0
20.0
30.0
40.0
50.0
60.0
0.0 2.0 4.0 6.0 8.0 10.0 12.0 14.0 16.0
% o
f firm
s
Technicians and assistantsTransport, storage and communications
Past inflation (7.67%)
% increase
0.0
10.0
20.0
30.0
40.0
50.0
60.0
0.0 2.0 4.0 6.0 8.0 10.0 12.0 14.0 16.0
% o
f firm
s
Technicians and assistantsEducation and health
Past inflation (7.67%)
% increase
0.0
10.0
20.0
30.0
40.0
50.0
60.0
0.0 2.0 4.0 6.0 8.0 10.0 12.0 14.0 16.0
% o
f firm
s
Technicians and assistantsOther services
Past inflation (7.67%)
% increase
0.0
10.0
20.0
30.0
40.0
50.0
60.0
70.0
0.0 2.0 4.0 6.0 8.0 10.0 12.0 14.0 16.0
% o
f firm
sUnskilled workers
Agriculture, forestry and fishing
Past inflation (7.67%)
% increase
0.0
10.0
20.0
30.0
40.0
50.0
60.0
0.0 2.0 4.0 6.0 8.0 10.0 12.0 14.0 16.0
% o
f firm
s
Unskilled workersTrade
Past inflation (7.67%)
% increase
0.0
10.0
20.0
30.0
40.0
50.0
60.0
70.0
0.0 2.0 4.0 6.0 8.0 10.0 12.0 14.0 16.0
% o
f firm
s
Unskilled workersConstruction
Past inflation (7.67%)
% increase

50
Figure A.1 (Continued) Average Wage Increases by Occupational Group and Economic Sector:
2009/2008
0.0
5.0
10.0
15.0
20.0
25.0
30.0
35.0
40.0
0.0 2.0 4.0 6.0 8.0 10.0 12.0 14.0 16.0
% o
f firm
s
Unskilled workersElectricity, gas, water and mining
Past inflation (7.67%)
% increase
0.0
10.0
20.0
30.0
40.0
50.0
60.0
70.0
0.0 2.0 4.0 6.0 8.0 10.0 12.0 14.0 16.0
% o
f firm
s
Unskilled workersManufacturing
Past inflation (7.67%)
% increase
0.0
10.0
20.0
30.0
40.0
50.0
60.0
0.0 2.0 4.0 6.0 8.0 10.0 12.0 14.0 16.0
% o
f firm
s
Unskilled workersFinancial services
Past inflation (7.67%)
% increase
0.0
10.0
20.0
30.0
40.0
50.0
60.0
70.0
0.0 2.0 4.0 6.0 8.0 10.0 12.0 14.0 16.0
% o
f firm
sUnskilled workers
Transport, storage and communications
Past inflation (7.67%)
% increase
0.0
10.0
20.0
30.0
40.0
50.0
60.0
0.0 2.0 4.0 6.0 8.0 10.0 12.0 14.0 16.0
% o
f firm
s
Unskilled workersEducation and health
Past inflation (7.67%)
% increase
0.0
10.0
20.0
30.0
40.0
50.0
60.0
0.0 2.0 4.0 6.0 8.0 10.0 12.0 14.0 16.0
% o
f firm
s
Unskilled workersOther services
Past inflation (7.67%)
% increase

51
Figure A.2 Average Wage Increases by Occupational Group and Firm Location:
2009/2008
0.0
5.0
10.0
15.0
20.0
25.0
30.0
35.0
40.0
0.0 2.0 4.0 6.0 8.0 10.0 12.0 14.0 16.0
% o
f firm
s
ManagersBogotá
Past inflation (7.67%)
% increase
0.0
10.0
20.0
30.0
40.0
50.0
0.0 2.0 4.0 6.0 8.0 10.0 12.0 14.0 16.0
% o
f firm
s
ManagersRest of the country
Past inflation (7.67%)
% increase
0.0
10.0
20.0
30.0
40.0
50.0
0.0 2.0 4.0 6.0 8.0 10.0 12.0 14.0 16.0
% o
f firm
s
ProfessionalsBogotá
Past inflation (7.67%)
% increase
0.0
10.0
20.0
30.0
40.0
50.0
60.0
0.0 2.0 4.0 6.0 8.0 10.0 12.0 14.0 16.0
% o
f firm
sProfessionals
Rest of the country
Past inflation (7.67%)
% increase
0.0
10.0
20.0
30.0
40.0
50.0
60.0
0.0 2.0 4.0 6.0 8.0 10.0 12.0 14.0 16.0
% o
f firm
s
Technicians and assistantsBogotá
Past inflation (7.67%)
% increase
0.0
10.0
20.0
30.0
40.0
50.0
60.0
0.0 2.0 4.0 6.0 8.0 10.0 12.0 14.0 16.0
% o
f firm
s
Technicians and assistantsRest of the country
Past inflation (7.67%)
% increase

52
Figure A.2 (Continued) Average Wage Increases by Occupational Group and Firm Location:
2009/2008
0.0
10.0
20.0
30.0
40.0
50.0
60.0
0.0 2.0 4.0 6.0 8.0 10.0 12.0 14.0 16.0
% o
f firm
s
Unskilled workersBogotá
Past inflation (7.67%)
% increase
0.0
10.0
20.0
30.0
40.0
50.0
60.0
70.0
0 2 4 6 8 10 12 14 16%
of f
irms
Unskilled workersRest of the country
Past inflation (7.67%)
% increase

53
Figure A.3 Average Wage Increases by Occupational Group and Firm Size: 2009/2008
0.0
10.0
20.0
30.0
40.0
50.0
0.0 2.0 4.0 6.0 8.0 10.0 12.0 14.0 16.0
% o
f firm
s
ManagersSmall firms
Past inflation (7.67%)
% increase
0.0
10.0
20.0
30.0
40.0
50.0
0.0 2.0 4.0 6.0 8.0 10.0 12.0 14.0 16.0
% o
f firm
s
ManagersMedium firms
Past inflation (7.67%)
% increase
0.0
10.0
20.0
30.0
40.0
50.0
0.0 2.0 4.0 6.0 8.0 10.0 12.0 14.0 16.0
% o
f firm
s
ManagersLarge firms
Past inflation (7.67%)
% increase
0.0
10.0
20.0
30.0
40.0
50.0
60.0
0.0 2.0 4.0 6.0 8.0 10.0 12.0 14.0 16.0
% o
f firm
sProfessionals
Small firms
Past inflation (7.67%)
% increase
0.0
10.0
20.0
30.0
40.0
50.0
0.0 2.0 4.0 6.0 8.0 10.0 12.0 14.0 16.0
% o
f firm
s
ProfessionalsMedium firms
Past inflation (7.67%)
% increase
0.0
10.0
20.0
30.0
40.0
50.0
0.0 2.0 4.0 6.0 8.0 10.0 12.0 14.0 16.0
% o
f firm
s
ProfessionalsLarge firms
Past inflation
% increase

54
Figure A.3 (Continued) Average Wage Increases by Occupational Group and Firm Size: 2009/2008
0.0
10.0
20.0
30.0
40.0
50.0
60.0
0.0 2.0 4.0 6.0 8.0 10.0 12.0 14.0 16.0
% o
f firm
s
Technicians and assistantsSmall firms
Past inflation (7.67%)
% increase
0.0
10.0
20.0
30.0
40.0
50.0
60.0
0.0 2.0 4.0 6.0 8.0 10.0 12.0 14.0 16.0
% o
f firm
s
Technicians and assistantsMedium firms
Past inflation (7.67%)
% increase
0.0
10.0
20.0
30.0
40.0
50.0
60.0
0.0 2.0 4.0 6.0 8.0 10.0 12.0 14.0 16.0
% o
f firm
s
Technicians and assistantsLarge firms
Past inflation (7.67%)
% increase
0.0
10.0
20.0
30.0
40.0
50.0
60.0
70.0
0.0 2.0 4.0 6.0 8.0 10.0 12.0 14.0 16.0
% o
f firm
sUnskilled workers
Small firms
Past inflation (7.67%)
% increase
0.0
10.0
20.0
30.0
40.0
50.0
60.0
70.0
0.0 2.0 4.0 6.0 8.0 10.0 12.0 14.0 16.0
% o
f firm
s
Unskilled workersMedium firms
Past inflation (7.67%)
% increase
0.0
10.0
20.0
30.0
40.0
50.0
60.0
0.0 2.0 4.0 6.0 8.0 10.0 12.0 14.0 16.0
% o
f firm
s
Unskilled workersLarge firms
Past inflation (7.67%)
% increase


