Embed Size (px)
Citation preview

a Corresponding author: [email protected]
Wake structures of two side by side spheres in a tripped boundary layer flow
Eyüb Canli1,a, Muammer Özgören1, Sercan Dogan1, Muharrem Hilmi Aksoy1 and Huseyin Akilli2 1Selcuk University, Mechanical Engineering Department, Konya 42003, Turkey 2Cukurova University, Mechanical Engineering Department, Adana, Turkey
Abstract. Two independent spheres were placed in a side by side arrangement and flow structure in the wake region of the spheres was investigated with a Particle Image Velocimetry (PIV) system when the spheres were in a boundary layer over a flat plate as a special case. Reynolds number was 5000 based on the sphere diameter which was 42.5 mm. Boundary layer was tripped 8mm away from the leading edge of the flat plate with a 5 mm trip wire. The thickness of the hydrodynamically developed boundary layer was determined as 63mm which was larger than the sphere diameter of D=42.5mm. Wake region of the spheres was examined from point of flow physics for the different sphere locations in the ranges of 0�G/D �1.5 and 0�S/D �1.5 where G and S were the distance between the spheres and the distance between the bottom point of the spheres and the flat plate surface, respectively. Depending on the different sphere locations, instantaneous and time averaged vorticity data, scalar values of time-averaged velocity components and their root mean square (rms) values and time averaged vorticity data are presented in the study for the evaluation of wake region of the spheres. It is demonstrated that the gap between the two spheres and the interaction between the gap and the boundary layer greatly affects flow pattern, especially when spheres are located near to the flat plate surface, i.e. S/D=0.1 for 0�G/D �1.5. Different distances between the spheres resulted in various flow patterns as the spheres were approached to the flat plate. The distance S/D=0.1 for all gap values has the strongest effect on the wake structures. Beyond G/D=1.0, the sphere wakes tend to be similar to single sphere case. The instantaneous vorticity fields of the side by side arrangements comprised wavy structures in higher level comparing to an individual sphere case. The gap flow intensifies the occurrence of small scale eddies in the wake region. The submersion rate of the spheres actually determines the characteristics of the wake region and is affected from boundary layer flow in a gradually decreasing manner.
1 Introduction As a bluff body, spheres can be seen in many engineering applications comprising flow in different conditions. Flow around a single sphere and double sphere arrangements have been investigated experimentally with various methods. Some of them can be listed here as laser Doppler anemometer, dye visualization, smoke visualization, hot wire anemometer. However these methods suffer from results without quantitative values or point values instead of simultaneous areal values. Despite the attraction due to complex flow as a result of free shear layer and flow separation from aforementioned sphere arrangements, there are limited studies conducted with a particle image velocimetry (PIV) system.
Due to the three-dimensional flow, it was stated by Ozgoren et al. [1] that wake flow of a sphere is more complex than a cylinder for Re=5000 and Re=10000 considering PIV results. Similarly, flow around a single sphere for Re=11000 was also dealt experimentally by
[2]. In numerical analyses side, Yun et al. [3]’s study can be given as an example in which authors suggested that shear layer plays an important role in the wake flow of a sphere in respect of vortices alongside of wake instabilities for Re=3700 and 10000. They utilized Large Eddy Simulation (LES). Other numerical studies for a single sphere case are given in [4-9].
Vortex shedding is another important phenomenon for flow around bluff bodies. Engineers can improve their designs considering vortex shedding frequency and its possible results. Here, Strouhal number (St) is vortex shedding frequency (f) times characteristic length (D) divided by free stream velocity (U�). For references to the investigation of Strouhal Number of a sphere submerged in a flow, [10, 11] can be given for Re between 300 and 40000. Others are Leweke et al. [12] utilizing flow visualization with dye for Re=320, Tsuji et. al. [13] for Re between 8000 and 16000, Achenbach [14] for Re=1000 and Achenbach [15] for Re = 105–106. Generally periods of vortex shedding were determined in
DOI: 10.1051/C© Owned by the authors, published by EDP Sciences, 2014
,/
0 20 14 (2014)2 01
67epjconf
EPJ Web of Conferences4 6 702014
This is an Open Access article distributed under the terms of the Creative Commons Attribution License 2.0, which permits unrestricted use, distribution, and reproduction in any medium, provided the original work is properly cited.
Article available at http://www.epj-conferences.org or http://dx.doi.org/10.1051/epjconf/20146702014

these studies and these periods were expressed in terms of experimental parameters and St number.
Beside to complex flow around a sphere, further complications occur when an external boundary layer interferes to the flow area such as a flat plate. These complications are mainly due to flow between sphere and flat plate surface and non-uniform velocity profile acting upon wake region of the spheres. There are examples of such situation in industrial applications. When a spherical geometry located near to a flat surface such as a wall or ground, the interaction between developing velocity profile in the boundary layer of the flat surface and flow around the sphere cause vortex shedding characteristic to change dramatically. As an example to these changes, Ozgoren et al. [16] stated that aforementioned interaction results in asymmetry in the strength of vortex shedding from upper and lower sides of the sphere and changes the direction of the mean force acting over the body away from the plane wall. Ozgoren et al. [16] placed a sphere having 42.5mm diameter in a 63mm thick turbulent boundary layer for Re=5000 in order to investigate the wake flow of the sphere via a PIV system. They reported effects of changing sphere locations on the wake flow in a logical order, so that one can conclude about the flow around a similar geometry with kinematic similarity. For much higher Re numbers, Tsuji’s study [17] is a good instance because the interaction between the boundary layer velocity profile of an external surface and flow around a sphere was investigated in a wind tunnel for Re=83000. In a study of [18], flow around a sphere touching to a flat surface was investigated and forces acting upon the sphere were evaluated in respect of aerodynamics. This event is not significant only for aerodynamics but also for heat transfer. Heat transfer can be improved by using a sphere on a flat surface as indicated in [19] as a good example. Hetsroni et. al. [20] reported that preliminary information about flow around a body mounted on a flat surface was essential from the point of view of heat exchangers and fluid mechanics applications.
Another study field for flow around spheres is about incoming flow conditions. The importance of free stream turbulence level was emphasized by Tyagi et. al. [21] for the wake of a sphere. They indicated that large organized motions were suppressed by the free-stream turbulence. Moradian et. al. [22] focused on the effects of turbulence intensity of free-stream for Re=22000 to 80000. Drag coefficient was found lower when turbulence intensity was higher while they use integral length scale as a parameter of free stream turbulence.
Investigating flow around more than one spheres is another important investigation area for the researchers considering especially fluids carrying particles or other industrial applications. In the numerical approaches, [13, 23-29] can be given as exemplary studies. These studies are similar to each other in placing a secondary sphere around a single sphere and investigating the flow structure. As a representative, study given in [5] reports about simulation of two spheres, located in a uniform free flow at Re numbers of 50, 100, 150 and they stated that distance between spheres up to four sphere diameters has a lowering effect on drag force acting on the spheres and
when the distance is greater than four sphere diameters, drag coefficients slightly increased till 21 sphere diameters. In another study, authors used two spheres in a numerical analyses and they change one sphere in a range between 0o and 90o according to the other sphere [24]. The change of the angle at every analysis step was 15o
while the distance between spheres was changed from 1.5 sphere diameters to 3 sphere diameters for Re=300-600. They found that increase of the Re number and distance between spheres decreased the effects of the two sphere arrangement. There are also some experimental works to assess the flow around double sphere arrangements. In another study made by [30] informs about experiments for wake structures of periodic coupled double spheres for Re between 200 and 350. At similar Re numbers, namely at Re 200, flow structure around a leading sphere and a following one was reported [26]. The significant findings in this study are effects of distance between particles and size of the spheres on drag force. Tsuji et. al. [28] measured force acting on two and three sphere arrangements and visualizes the flow. Drag force was found to be increased when spheres were close to each other while distance between them is smaller than two sphere diameters. Studies cited in [31, 32] can be given as the other notable studies in the literature. For sphere arrangements more than two spheres, for example, Ozgoren [33] comprises a wide informative literature survey and a case study of equilateral-triangular arrangement of the three spheres investigated via the PIV system in the present report.
In this study, wake structures of two side by side spheres in a tripped boundary layer are evaluated in respect of aforementioned aspects from the literature by means of experimental data from a PIV system. Experiments were conducted when Re=5000 defined according to the sphere diameter.
2 Experimental setup and procedure The system PIV system used in this work was extensively described in [34, 35]. Thus, data needed for the evaluation of the results are presented here. The layout of the spheres is given in figure 1 schematically. When Re number was arranged to 5000 defined for the sphere diameter, turbulence intensity for the free stream was less than 1%. The free-stream velocity was 118 mm/s. Sphere diameter was 42.5 mm. The bar used for holding the spheres has a diameter of 5 mm. Connection between the rod and the spheres were made at the upper points of the spheres. The Froude Number was =0.08 for the water channel at these conditions.
Dantec Flow Manager was used for the calculation of the vector field. 32x32 pixel interrogation area was selected which corresponds to 0.072Dx0.072D area in the captured image field. For satisfying Nyquist criterion, interrogation area was overlapped with itself at a rate of 50%. Image capturing speed was 15 Hz and total measurement time was 23.33 seconds for a single layout.
In order to develop a velocity profile for the boundary layer, flow was tripped 80 mm later from the leading edge of a flat plate. Plate total length was 2000mm.
EPJ Web of Conferences
02014-p.2

Tripwire diameter was 5mm. One of the experimental parameters was the distance between sphere bottom points and the flat plate surface and denoted with “S” in this study. In order to express S value without dimensions, it was divided by the sphere diameter. So S/D was changed between 0 to 1.5, totally 5 levels changing asymmetrically. Another parameter was the gap between the spheres and denoted with “G”. Similarly G/D for five arrangement was changed from 0 to 1.5.
Velocity profile in the developed turbulent boundary layer of the study compared with the with power law curve is given in figure 2. This profile was obtained 1400 mm away from the leading edge of the plate. At this point, boundary layer thickness was measured as 63 mm. The ratios of the displacement �* and momentum � thicknesses relative to the boundary layer thickness were found to be �*/�=0.18 and �/� =0.13 respectively. The boundary layer shape factor H= �*/� is 1.42 which is very close to the well known range of 1.2<H<1.4 for fully developed turbulent flow.
Figure 1. Schematic layout of double sphere located in the boundary layer.
Figure 2. Velocity profile in the developed turbulent boundary layer of the study compared with the with power law curve [16].
3 Results
All figures in results section contain all sphere arrangements, i.e. six levels of S/D between 0 and 1.50 and five levels of G/D between 0 and 1.50. All dimensions are normalized using sphere diameter and free stream velocity where applicable. Experimental data are provided via instantaneous and time averaged vector maps, contour maps of time averaged streamwise and cross stream velocity component values, contour map of time averaged vorticity values, contour map of streamwise velocity fluctuations, in the same order stated here. Appearance of the data was improved by means of image processing software in order to provide sufficient details in the figures for scientific evaluation. Figure 3 is organized for the instantaneous velocity vectors for all experimental arrangements of the present study. Figure 3 is the only graphic that shows instantaneous data. Other graphics were prepared for time averaged data. A lot of vortex-ring shaped protrusions can be seen in the figure referring to the shear-layer instability along the boundary of the wake and free-stream flow regions. G/D=0 and G/D=0.25 arrangements always exhibits the largest wake area among other arrangements and thus shear layers due to spheres are very significant. An important part of the flow energy should be converted to circulatory flow, turbulence and vortices because of these wide wakes. The wakes at other gap arrangements are relatively smaller. Shear layers of the spheres in the measurement plane tend to enter into the near wake due to momentum transfer from outside to inside of the wake. In the instantaneous velocity vector maps, a lot of saddle like points are apparent. This data gives idea about 3D flow which cause to source and sink points due to flow entering outside of the measurement plane. When compared to a wake of the cylinder, instantaneous data of the sphere reveal more points of this kind [35]. The case of two spheres doesn’t exhibit a significant difference in this aspect. Instantaneous velocity patterns present large-scale waviness and rotate slowly around its axis while traveling further to downstream of the spheres as explained by [3, 11, 33, 34, and 36].
EFM 2013
02014-p.3

Figure 4 illustrates time average vector maps of the experimental parameters. Here, boundary layer effect can be seen as a general view of lengths of vectors. As they move away from the flat plate surface, vectors getting bigger. This figure shows that the velocity of the gap flow is slightly higher from the main stream and approaches to same value at G/D=1.50.
Streamwise velocity component u*=u/U� have negative scalar values immediately downstream of the sphere(s) while those of v*=v/U� have negative and positive values. Also, these contours indicate a highly fluctuated flow because of the rapid changes of unsteady flow as it can be seen in figure 5 and 6.
In figure 7, time averaged vorticity values are presented. This figure shows that the significant vortices occur at the near proximity of the spheres and when gap is initiated; newly developed vortex contours don’t seem to be effected from each other as we conclude from the maximum averaged scalar values.
It can be said that pressure drag force is increased and pressure drag force is decreased for G/D=0.25 and 0.50 due to the flow through the gap which is recorded for Re=200 by [26]. However at G/D=1.5 level, flow through gap has a velocity value nearly same as the free stream velocity so the effect of the gap is insignificant. Distributions of streamwise velocity components, <u*>, indicate the locations of free stagnation points which are clearly seen in figure 5 Scalar values of the velocity components exhibit an energetic wake area of the sphere arrangements. At G/D=0 arrangements a large reverse flow region downstream of the sphere arrangements occurs. All graphics containing scalar values are denoted with maximum and minimum labels of the values. Negative pairs are more dominant owing to the lower velocity magnitudes in the boundary layer for G/D=0.0 and S/D=0.0. On the other hand, The wake patterns are considerably asymmetrical for G/D=1.5 and S/D=1.5.
Averaging vorticity values for the measurement period causes small-scale vortices, Kelvin Helmholtz vortices and downstream part of the large scale broken vorticity streets to be lost due to the extinction between positive and negative values of vorticity. The mixing layer in the downstream region of the flow is dominated by the negative time-averaged vorticity < � *>. Time-averaged vortices concentrated along the shear layer of each sphere with a large size. In the case of the side by side spheres arrangement, the vortex patterns became very complex under the influence of the interaction because the vortices downstream of the individual spheres were three-dimensional.
Streamwise velocity fluctuations, <*rmsu > are given in
figure 8. These velocity fluctuations indicate the rate of unsteadiness of the flow and flow unsteadiness is higher at the sphere side of close proximity of points where upper and lower shear layers of each sphere are merging in respect of streamwise velocity fluctuation. Also maximum values of the velocity fluctuation occur at a point farther away from the sphere as we get away from the flat plate surface. This means that, increasing main flow speed due to the distance from the boundaries, move fluctuation maximum to downstream direction. It can be
also conclude that the significant velocity fluctuation occurs in the wake of the sphere arrangements and figure 8 shows another valuable visual that enable us the limits of the wakes of the present study.
As a special case combining boundary layer flow with the flow around two side by side spheres, it can be said that flow complications like turbulence, vorticity, unsteadiness are amplified with this arrangement comparing to the single sphere case which is reported in [1, 16].
4 Conclusions Results of the present study revealed that relatively small distances between the flat plate surface and bottom points of the spheres have stronger effect on the wake flow as expected due to the interaction between velocity profile and wake of the sphere. The causes of unstable wake can be listed as circulatory flow motion of vortical flow, rate of entrainment and viscous flow region. Another strong factor is the jet like flow at gaps between flat plate surface and sphere bottom points and between spheres. Momentum transfer at these positions changes wake structures significantly. Mainly these factors prevent symmetry in the wakes of the two spheres, free shear layers of the spheres have different strength comparing with each other at measurement plane. At all arrangements, the effect of boundary layer can be observed, however intensity of these effects are very significant till S/D=0.50 and after this level S/D=1.00 and S/D=1.50 levels have lower effects.
Drag and lift forces may change dynamically concluding from the instantaneous flow data near proximity of the flat plate surface where the directions of the vectors change randomly. Of course all these effects formed through downstream of the spheres.
The general flow structure (i.e. turbulence statistics, the wake size and the formations of critical points) in the wakes of the spheres and their close proximity, vary with the initiation of the gap and continue to varying with its increase. The double spheres are seemed as a uncommon bluff body in the measurement plane for G/D=0. When gap is initiated, flow through the gap greatly affects the wakes. We evaluate the influence of the boundary layer to the wakes by considering wake sizes of the sphere arrangements i.e. the wakes are getting smaller as the spheres getting distant to the flat plate surface. The influence of the boundary layer flow on the wakes becomes negligible for S/D=1.5.
Acknowledgments The authors would like to acknowledge the funding of The Scientific and Technological Research Council of Turkey under contract No:109R028, Scientific Research Projects Office of Cukurova University Contract No: AAP20025, Selcuk University’s Scientific Research Project Office and DPT project Contract No: 2009K12180. Also authors would like to thank to Prof. Dr. Besir SAH�N for his precious support and guidance.
EPJ Web of Conferences
02014-p.4

References 1. M. Ozgoren, E. Pinar, B. Sahin, H. Akilli, Int. J.
Heat Fluid Flow, 32(6), 1138 (2011) 2. Y.II.J. Jang, S.J. Lee, Exp. Fluids. 44(6), 905 (2008) 3. G. Yun, D. Kim, H. Choi, Phys Fluids. 18(1),
015102 (2006) 4. R. Hassanzadeh, B. Sahin, M. Ozgoren, Int J of
Comput Fluid D. 25(10), 535 (2011) 5. I. Kim, S. Elgobashi, W.A. Sirignano, J. Fluid Mech.
246, 465 (1993) 6. A.G. Tomboulides, S.A. Orszag, G.E. Karniadakis,
The Proceedings of The First International Offshore and Polar Engineering Conference (Heriot-Watt University, Edinburgh, The United Kingdom, 1991, 316)
7. D.S. Dandy, H.A. Dwyer, J. Fluid Mech. 216, 381 (1990)
8. T.A. Johnson, V.C. Patel, J. Fluid Mech 378, 19 (1990)
9. B. Cichocki, B.U. Felderhof, R. Schmitz, Physico Chem. Hyd 10, 383 (1988)
10. M. Kiya, H. Ishikawa, H. Sakamoto, J. Wind Eng. Ind. Aerod. 8, 1219 (2001)
11. H. Sakamoto, H. Haniu, J. Fluids Eng. 112, 386 (1990)
12. T. Leweke, M. Provansal, D. Ormie`res, R. Lebescond, Phys. Fluid. 11(9), 12 (1999)
13. Y. Tsuji, N. Kato, T. Tanaka, Int. J. Multiph Flow 17, 343 (1991)
14. E. Achenbach, J. Fluid Mech. 54, 565 (1972) 15. E. Achenbach, J. Fluid Mech. 62(2), 209 (1974) 16. M. Ozgoren, A. Okbaz, S. Dogan, B. Sahin, H. Akilli
Exp. Ther. and Fluid Sci., 44, 62 (2013) 17. T. Tsutsui, J. Wind Eng. and Indus. Aerodynmc. 96,
779 (2008)
18. S. Okamoto, Turb. Shear Flow 2, 246 (1980) 19. R.A. Seban, G.L. Caldwell, J. of Heat Trans.,
Transaction of ASME 408 (1968) 20. G. Hetsroni, C.F. Li, A. Mosyak, I. Tiselj, Int. J. of
Multp. Flows, 27, 1127 (2001) 21. H. Tyagi, R. Liu, S.K.D. Ting, C.R. Johnston, Exp.
Ther. and Fluid Sci. 30, 587 (2006) 22. N. Moradian, S.-K.D. Ting, S. Cheng, Exp. Ther.
and Fluid Sci. 33, 460 (2009) 23. R. Hassanzadeh, B. Sahin, M. Ozgoren, J. of Mech.
Sci. and Tech., 27(5), 1971 (2013) 24. A. Jadoon, L. Prahl, J. Revstedt, Eur J. Mech B-Fluid
29, 43 (2010) 25. L. Prahl, A. Hölzer, D. Arlov, J.Revstedt, M.
Sommerfeld, L. Fuchs, Int. J. Multiph Flow 33, 707 (2007)
26. R.C. Chen, J.L. Wu, Chem. Eng. Sci. 55 1143 (2000) 27. T. Tsuji, R. Narutomi, T. Yokomine, S. Ebara, A.
Shimizu, Int. J. Multiph Flow. 29, 1431 (2003) 28. Y. Tsuji, Y. Morikawan, K. Terashima, Int. J.
Multiph Flow 8, 71 (1982) 29. S. Kim, Phys Fluids 30, 2309 (1987) 30. L. Schouveiler, A. Brydon, T. Leweke, M.C.
Thompson, Eur J. Mech. B-Fluids 23, 137 (2004) 31. K.C. Lee, Aeronautical Quarterly 30, 371 (1979) 32. L. Prahl, A. Jadoon, J. Revstedt, Int. J. Multiph Flow
35, 963 (2009) 33. M. Ozgoren, Int. J. of Multp. Flow, 53, 54,
Doi:10.1016/j.ijmultiphaseflow.2013.02.001 (2013) 34. P. Engin, B. Sahin, M. Ozgoren, and H. Akilli, I&EC
Research DOI: 10.1021/ie4022732 (2013) 35. M. Ozgoren,. Flow Meas. and Instrum. 17, 225
(2006) 36. J.S. Wu, G.M. Faeth, AIAA J. 3(8), 1448 (1993)
EFM 2013
02014-p.5

Figure 3. Comparison of normalized instantaneous velocity fields V* for two side-by-side spheres for gap ratios 0�G/D�1.5 and distances between the plate and bottom section of the spheres 0�S/D�1.5.
EPJ Web of Conferences
02014-p.6

Figure 4. Comparison of time-averaged velocity fields < V*> for two side-by-side spheres for gap ratios 0�G/D�1.5 and distances between the plate and bottom section of the spheres 0�S/D�1.5.
EFM 2013
02014-p.7

Figure 5. Comparison of time-averaged velocity components in x direction < u*> for two side-by-side spheres for gap ratios 0�G/D�1.5 and distances between the plate and bottom section of the spheres 0�S/D�1.5.
EPJ Web of Conferences
02014-p.8

Figure 6. Comparison of time-averaged velocity components in y direction < v*> for two side-by-side spheres for gap ratios 0�G/D�1.5 and distances between the plate and bottom section of the spheres 0�S/D�1.5.
EFM 2013
02014-p.9
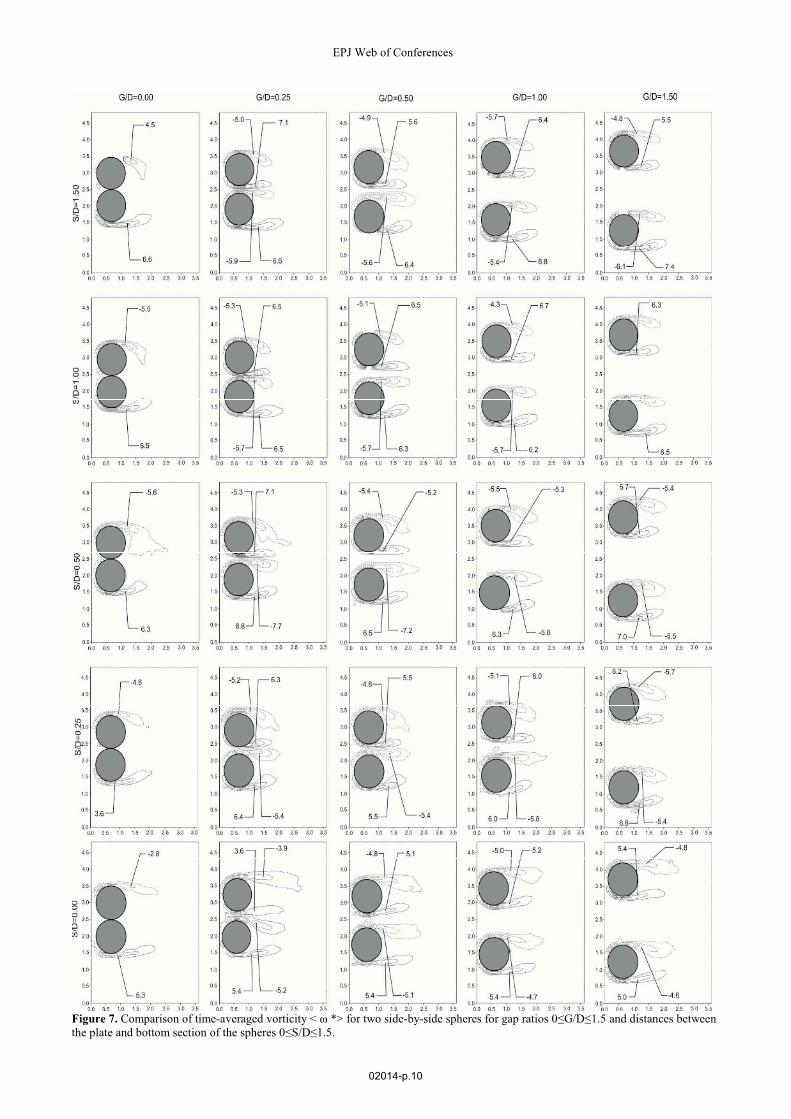
Figure 7. Comparison of time-averaged vorticity < � *> for two side-by-side spheres for gap ratios 0�G/D�1.5 and distances between the plate and bottom section of the spheres 0�S/D�1.5.
EPJ Web of Conferences
02014-p.10

Figure 8. Comparison of time-averaged streamwise velocity fluctuations <
*rmsu >for two side-by-side spheres for gap ratios 0�G/D�1.5
and distances between the plate and bottom section of the spheres 0�S/D�1.5.
EFM 2013
02014-p.11


![Wake Forest Jurist [Winter 2014] - DigitalNC](https://img.pdfslide.net/doc/110x75/633bc8bd0bda17ca1b0effa9/wake-forest-jurist-winter-2014-digitalnc.jpg)


