Embed Size (px)
Citation preview
B O N N E V I L L E P O W E R A D M I N I S T R A T I O N
Walla Walla Basin Spring Chinook Hatchery Program
Final Environmental Impact Statement
May 2018
DOE/EIS-0495

Walla Walla Basin Spring Chinook Hatchery Program
Final
Environmental Impact Statement
DOE/EIS-0495
Bonneville Power Administration
The Confederated Tribes of the Umatilla Indian Reservation
Oregon Department of Fish and Wildlife
May 2018

Walla Walla Basin Spring Chinook Hatchery Program Final Environmental Impact Statement
Abstract
Responsible Agency: U.S. Department of Energy - Bonneville Power Administration (BPA)
Title of Proposed Project: Walla Walla Basin Spring Chinook Hatchery Program
Cooperating Agencies: The Confederated Tribes of the Umatilla Indian Reservation (CTUIR), Oregon Department
of Fish and Wildlife (ODFW)
States Involved: Oregon and Washington
Abstract: BPA proposes to fund construction and operation of a hatchery for spring Chinook salmon
(Oncorhynchus tshawytscha) in the Walla Walla River basin in northeast Oregon. The proposed hatchery would be
constructed at an existing fish facility operated by the Confederated Tribes of the Umatilla Indian Reservation on the
South Fork Walla Walla River near Milton-Freewater in Umatilla County, Oregon. The CTUIR would own and
operate the hatchery, which would augment spring Chinook fish populations available for harvest and aid in
establishing a naturally spawning spring Chinook population in the Walla Walla River basin.
BPA is considering two action alternatives and a no action alternative. Alternative 1, identified as the Preferred
Alternative, includes construction of a hatchery for production of up to 500,000 Walla Walla spring Chinook smolts
and release of juvenile and adult spring Chinook into Walla Walla River tributaries in both Oregon and Washington.
Alternative 2 would be similar to Alternative 1, but would also include relocation to the proposed Walla Walla
Hatchery of the production of Umatilla spring Chinook from the existing Umatilla Hatchery near Irrigon, Oregon.
The proposed Walla Walla Hatchery was identified in the Northwest Power and Conservation Council’s Fish and
Wildlife Program, a regional program designed to protect and rebuild fish and wildlife populations affected by
hydropower development in the Columbia River Basin.
The environmental impact statement (EIS) analyzes impacts to surface and groundwater, fish, vegetation,
socioeconomics, environmental justice, cultural resources, wetlands, floodplains, wildlife, air quality, climate
change, noise, visual quality, and recreation. BPA requested comments to help determine the scope of the EIS in
May 2013 and June 2014. The Draft EIS was published on October 7, 2014. Public comments on the Draft EIS were
received through November 24, 2014. The Final EIS addresses comments made on the Draft EIS.
For additional information, contact:
Chad Hamel, Supervisory Environmental Protection Specialist
Bonneville Power Administration
P. O. Box 3621, KEC-4
Portland, OR 97208-3621
Telephone: (503) 230-5564
Email: [email protected]
For additional copies of this document, please call 1-800-622-4520 and ask for the document by name. You may
also request additional copies by writing to:
Bonneville Power Administration
P.O. Box 3621
Portland, Oregon 97208
ATT: Public Information Center – CHDL-1
The EIS is also on the Internet at: www.bpa.gov/goto/WallaWallaHatchery
For additional information on USDOE NEPA activities, please contact Office of NEPA Policy and Compliance,
GC-54, U.S. Department of Energy, 1000 Independence Avenue S.W., Washington D.C. 20585-0103, phone: 1-800-
472-2756; or visit the USDOE NEPA web site at https://www.energy.gov/nepa/office-nepa-policy-and-compliance

Walla Walla Basin Spring Chinook Hatchery Program Final Environmental Impact Statement
Contents i
Contents Executive Summary ...................................................................................................................... 1
Underlying Need for Action ....................................................................................................... 1
Purposes ...................................................................................................................................... 1
Public Involvement ..................................................................................................................... 2
Proposed Action and Alternatives .............................................................................................. 2
Alternative 1: Preferred Alternative ........................................................................................ 2
Alternative 2 ............................................................................................................................ 3
No Action Alternative ............................................................................................................. 3
Environmental Consequences ..................................................................................................... 4
Chapter 1. Purpose of and Need for Action .............................................................................. 1
1.1 Underlying Need for Action ................................................................................................ 3
1.2 Purposes ............................................................................................................................... 3
1.3 Process and Planning Background ....................................................................................... 4
1.3.1 Northwest Power Act/Council’s Fish and Wildlife Program ....................................... 4
1.3.2 Columbia Basin Fish Accords ...................................................................................... 5
1.3.3 Tribal Treaty Fishing and Management Rights under U.S. v. Oregon ......................... 5
1.3.4 CTUIR Natural Resources Management Approach...................................................... 5
1.4 Recent Spring Chinook Activities in the Walla Walla Basin .............................................. 6
1.5 Umatilla Spring Chinook Program ...................................................................................... 7
1.6 Cooperating Agencies .......................................................................................................... 8
1.7 Public Involvement .............................................................................................................. 9
1.7.1 Scoping ......................................................................................................................... 9
1.7.2 Public Review of Draft EIS ........................................................................................ 10
Chapter 2. Alternatives Including the Proposed Action .......................................................... 1
2.1 Proposed Action ................................................................................................................... 1
2.2 Alternative 1: Preferred Alternative .................................................................................... 1
2.2.1 Facilities ........................................................................................................................ 4
2.2.2 Operations ................................................................................................................... 10
2.2.3 Phased Approach and Management Criteria ............................................................... 12
2.2.4 Monitoring and Evaluation ......................................................................................... 15
2.2.5 Construction Schedule, Personnel, and Equipment Requirements ............................. 16
2.2.6 Funding: Alternative 1 ................................................................................................ 16
2.3 Alternative 2 ...................................................................................................................... 16
2.3.1 Facilities ...................................................................................................................... 16
2.3.2 Operations ................................................................................................................... 19
2.3.3 Construction Schedule, Personnel, and Equipment Requirements. ............................ 20
2.3.4 Funding – Alternative 2 .............................................................................................. 20
2.4 No Action Alternative ........................................................................................................ 20
Walla Walla Basin Spring Chinook Hatchery Program
ii Contents
2.5 Alternatives Considered but Eliminated from Detailed Evaluation in this EIS ................ 21
2.5.1 Alternatives Considered in the Walla Walla Spring Chinook Hatchery Master Plan 21
2.5.2 Alternatives Proposed During Scoping ....................................................................... 22
2.5.3 Alternative Facility Designs for Walla Walla Hatchery ............................................. 23
2.6 Comparison of Alternatives ............................................................................................... 23
2.7 Summary of Environmental Effects .................................................................................. 25
Chapter 3. Affected Environment and Environmental Consequences ................. 1
3.1 Introduction .......................................................................................................................... 1
3.2 Overview of Walla Walla Basin .......................................................................................... 2
3.2.1 Geography ..................................................................................................................... 2
3.2.2 History and Status of Spring Chinook in the Walla Walla Basin ................................. 2
3.3 Surface and Groundwater Quantity and Rights ................................................................... 5
3.3.1 Analysis Area ................................................................................................................ 5
3.3.2 Applicable Regulations ................................................................................................. 5
3.3.3 Affected Environment ................................................................................................... 5
3.3.4 Sources and Types of Impact ........................................................................................ 9
3.3.5 Effects of Alternative 1: Preferred Alternative ............................................................. 9
3.3.6 Effects of Alternative 2 ............................................................................................... 12
3.3.7 Mitigation Measures ................................................................................................... 14
3.3.8 Effects of the No Action Alternative .......................................................................... 15
3.4 Water Quality ..................................................................................................................... 15
3.4.1 Analysis Area .............................................................................................................. 16
3.4.2 Applicable Regulations ............................................................................................... 16
3.4.3 Affected Environment ................................................................................................. 17
3.4.4 Sources and Types of Impact ...................................................................................... 20
3.4.5 Effects of Alternative 1: Preferred Alternative ........................................................... 21
3.4.6 Effects of Alternative 2 ............................................................................................... 27
3.4.7 Mitigation Measures ................................................................................................... 29
3.4.8 Effects of the No Action Alternative .......................................................................... 31
3.5 Fish ..................................................................................................................................... 31
3.5.1 Analysis Area .............................................................................................................. 31
3.5.2 Applicable Regulations ............................................................................................... 31
3.5.3 Affected Environment ................................................................................................. 32
3.5.4. Sources and Types of Impact ..................................................................................... 37
3.5.5 Effects of Alternative 1: Preferred Alternative ........................................................... 38
3.5.6 Effects of Alternative 2 ............................................................................................... 47
3.5.7 Mitigation Measures ................................................................................................... 50
3.5.8 Effects of the No Action Alternative .......................................................................... 51
3.6 Vegetation and Noxious Weeds ......................................................................................... 51
Final Environmental Impact Statement
Contents iii
3.6.1 Analysis Area .............................................................................................................. 51
3.6.2 Applicable Regulations ............................................................................................... 51
3.6.3 Affected Environment ................................................................................................. 52
3.6.4 Sources and Types of Impact ...................................................................................... 55
3.6.5 Effects of Alternative 1 ............................................................................................... 56
3.6.6 Effects of Alternative 2 ............................................................................................... 57
3.6.7 Mitigation Measures ................................................................................................... 57
3.6.8 Effects of the No Action Alternative .......................................................................... 58
3.7 Socioeconomics and Environmental Justice ...................................................................... 59
3.7.1 Analysis Area .............................................................................................................. 59
3.7.2 Affected Environment ................................................................................................. 59
3.7.3 Sources and Types of Impacts .................................................................................... 62
3.7.4 Effects of Alternative 1 ............................................................................................... 63
3.7.5 Effects of Alternative 2 ............................................................................................... 67
3.7.6 Mitigation Measures ................................................................................................... 68
3.7.7 Effects of the No Action Alternative .......................................................................... 68
3.8 Cultural Resources ............................................................................................................. 69
3.8.1 Analysis Area .............................................................................................................. 69
3.8.2 Applicable Regulations ............................................................................................... 69
3.8.3 Affected Environment ................................................................................................. 69
3.8.4 Sources and Types of Impact ...................................................................................... 71
3.8.5 Effects of Alternative 1 and Alternative 2 .................................................................. 71
3.8.6 Mitigation Measures ................................................................................................... 71
3.8.7 Effects of the No Action Alternative .......................................................................... 72
3.9 Wetlands, Waters of the United States, and Floodplains ................................................... 72
3.9.1 Analysis Area .............................................................................................................. 72
3.9.2 Applicable Regulations ............................................................................................... 72
3.9.3 Affected Environment ................................................................................................. 72
3.9.4 Effects of Alternative 1 and Alternative 2 .................................................................. 73
3.9.5 Mitigation Measures ................................................................................................... 74
3.9.6 Effects of the No Action Alternative .......................................................................... 74
3.10 Wildlife ............................................................................................................................ 74
3.10.1 Analysis Area ............................................................................................................ 74
3.10.2 Affected Environment ............................................................................................... 74
3.10.3 Sources and Types of Impact .................................................................................... 76
3.10.4 Effects of Alternative 1 and Alternative 2 ................................................................ 76
3.10.5 Mitigation Measures ................................................................................................. 77
3.10.6 Effects of the No Action Alternative ........................................................................ 77
Walla Walla Basin Spring Chinook Hatchery Program
iv Contents
3.11 Air Quality and Climate Change ..................................................................................... 77
3.11.1 Analysis Area ............................................................................................................ 77
3.11.2 Applicable Regulations ............................................................................................. 77
3.11.3 Affected Environment ............................................................................................... 77
3.11.4 Sources and Types of Impacts .................................................................................. 79
3.11.5 Effects of Alternative 1 and Alternative 2 ................................................................ 79
3.11.6 Mitigation Measures ................................................................................................. 81
3.11.7 Effects of the No Action Alternative ........................................................................ 81
3.12 Noise ................................................................................................................................ 81
3.12.1 Analysis Area ............................................................................................................ 81
3.12.2 Affected Environment ............................................................................................... 81
3.12.3 Sources and Types of Impact .................................................................................... 82
3.12.4 Effects of Alternative 1 and Alternative 2 ................................................................ 82
3.12.5 Mitigation Measures ................................................................................................. 83
3.12.6 Effects of the No Action Alternative ........................................................................ 83
3.13 Visual Quality and Recreation ......................................................................................... 83
3.13.1. Analysis Area ........................................................................................................... 83
3.13.2 Affected Environment ............................................................................................... 83
3.13.3 Effects of Alternative 1 and Alternative 2 ................................................................ 84
3.13.4 Mitigation Measures ................................................................................................. 85
3.13.5 Effects of the No Action Alternative ........................................................................ 85
3.14 Cumulative Effects .......................................................................................................... 86
3.14.1 Surface and Groundwater Quantity and Rights ........................................................ 87
3.14.2 Water Quality ............................................................................................................ 87
3.14.3 Fish ............................................................................................................................ 88
3.14.4 Vegetation and Noxious Weeds ................................................................................ 90
3.14.5 Socioeconomics and Environmental Justice ............................................................. 91
3.14.6 Cultural Resources .................................................................................................... 91
3.14.7 Wetlands, Waters of the United States, and Floodplains .......................................... 91
3.14.8 Wildlife ..................................................................................................................... 92
3.14.9 Air Quality ................................................................................................................ 92
3.14.10 Noise ....................................................................................................................... 92
3.14.11 Visual and Recreation ............................................................................................. 92
3.15 Adverse Effects That Cannot Be Avoided and Irreversible and Irretrievable
Commitments of Resources ................................................................................................... 93
3.16 Short-Term Use of the Environment and Effects on Long-Term Productivity ............... 93
Chapter 4. Environmental Consultation and Coordination .................................. 1
4.1 National Environmental Policy Act ..................................................................................... 1
4.2 Wildlife and Habitat ............................................................................................................. 1
Final Environmental Impact Statement
Contents v
4.2.1 Endangered Species Act................................................................................................ 1
4.2.2 Fish and Wildlife Conservation Act and Fish and Wildlife Coordination Act ............. 3
4.2.3 Migratory Birds ............................................................................................................. 3
4.2.4 Bald Eagle and Golden Eagle Protection Act ............................................................... 4
4.2.5 Magnuson-Stevens Fishery Conservation and Management Act of 1976 .................... 4
4.3 Heritage Conservation and Cultural Resources Protection .................................................. 4
4.4 Floodplains and Wetlands (Executive Orders 11988 and 11990) ....................................... 5
4.5 State, Area-wide, and Local Plans ....................................................................................... 6
4.5.1 Walla Walla Subbasin Plan ........................................................................................... 6
4.5.2 Umatilla County Comprehensive Plan .......................................................................... 6
4.6 Clean Water Act ................................................................................................................... 6
4.7 Farmland Protection Policy Act ........................................................................................... 6
4.8 Noise Control Act ................................................................................................................ 7
4.9 Clean Air Act ....................................................................................................................... 7
4.10 Resource Conservation and Recovery Act (RCRA), Toxic Substances Control Act
(TSCA) and Federal Insecticide, Fungicide and Rodenticide Act (FIFRA) ........................... 7
4.11 Environmental Justice ........................................................................................................ 7
4.12 Energy Conservation at Federal Facilities ......................................................................... 8
Chapter 5. References ............................................................................................................... 5-1 Chapter 6. List of Preparers .................................................................................................... 6-1
Chapter 7. Agencies, Organizations, and Persons Contacted to Receive EIS ..................... 7-1 Chapter 8. Glossary .................................................................................................................. 8-1 Appendix A. Scoping Comment Summary ............................................................................ A-1
Appendix B. Monitoring and Evaluation Plan Summary .................................................... B-1
Appendix C. Construction Equipment Estimate .................................................................. C-1 Appendix D. Fish Species Known or Likely to be Found in the Walla Walla
River Basin ............................................................................................................................. D-1
Appendix E. Financial Disclosure .......................................................................................... E-1 Appendix F. Public Comments on Draft EIS ......................................................................... F-1
Comment Letters and Public Meeting Comments ...................................................................... 2
Comments and Responses by Category .................................................................................... 18
Need for Project .................................................................................................................... 18
Scope of EIS ......................................................................................................................... 18
Phased Approach .................................................................................................................. 19
Alternatives ........................................................................................................................... 20
Water Supply ........................................................................................................................ 23
Water Quality ........................................................................................................................ 24
Fish ........................................................................................................................................ 27
Harvest .................................................................................................................................. 29
Access to Fishing Sites ......................................................................................................... 30
Wildlife ................................................................................................................................. 30
Walla Walla Basin Spring Chinook Hatchery Program
vi Contents
Vegetation ............................................................................................................................. 31
Monitoring and Evaluation ................................................................................................... 32
Project Costs ......................................................................................................................... 33
Issues Beyond the Scope of this EIS ..................................................................................... 33
List of Figures
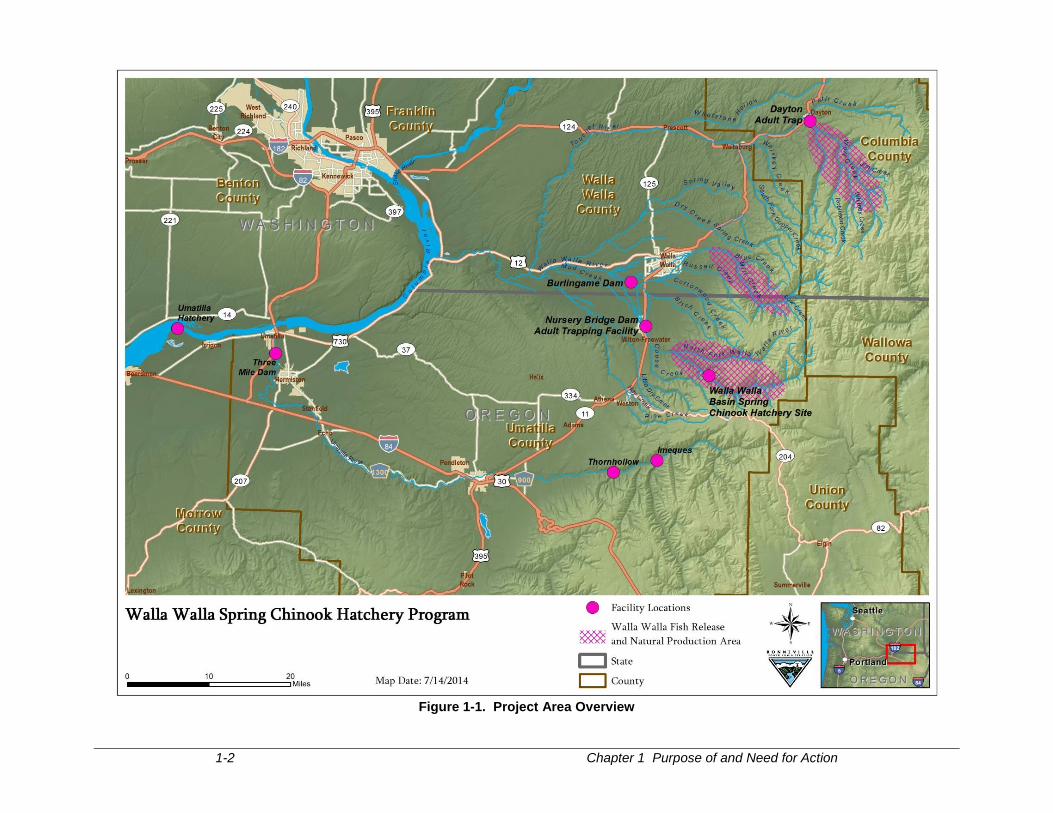
Figure 1-1. Project Area Overview .............................................................................................. 1-2
Figure 2-1. Existing Facilities, South Fork Walla Walla Adult Holding and Spawning Facility 2-2
Figure 2-2. Proposed Project Facilities and Spring Chinook Release Locations: Alternative 1:
Preferred Alternative .................................................................................................................... 2-3
Figure 2-3. Proposed New Facilities at South Fork Walla Walla Hatchery Site: Alternative 1
(Preferred Alternative) ................................................................................................................. 2-6
Figure 2-4. Locations of Walla Walla and Umatilla Spring Chinook Program Activities ........ 2-17
Figure 2-5. Proposed New Facilities at South Fork Walla Walla Hatchery Site: Alternative 2 2-18
Figure 2-6. Water Reuse System Diagram ............................................................................... 2-19
Figure 3-1. Spring Chinook Adult Returns to Nursery Bridge Dam, Upper Walla Walla River,
2007-2017 .................................................................................................................................... 3-3
Figure 3-2. Spring Chinook Captured in the Dayton Adult Trap, Touchet River, 2000-2012 ... 3-3
Figure 3-3. Spring Chinook Distribution in the Walla Walla River Basin ................................. 3-4
Figure 3-4. Known Steelhead Distribution in the Walla Walla River Basin ............................ 3-34
Figure 3-5. Known Bull Trout Distribution in the Walla Walla River Basin ........................... 3-36
Figure 3-6. Forested and Riparian Areas at the Existing South Fork Facility .......................... 3-52
Figure 3-7. Weedy Open Field at South Fork Facility Behind Generator Building ................. 3-53
Figure 3-8. Socioeconomics and Environmental Justice Analysis Area .................................. 3-59
List of Tables
Table 2-1. Summary of water uses for the Walla Walla Spring Chinook Hatchery .................... 2-5
Table 2-2. Comparison of the alternatives by purposes ............................................................. 2-24
Table 2-3. Summary of impacts of the alternatives ................................................................... 2-25
Table 3-1. Estimated net water availability for the South Fork Walla Walla River, Oregon ...... 3-6
Table 3-2. Actual available water flows in the South Fork Walla Walla River .......................... 3-7
Table 3-3. Effect of hatchery withdrawals on instream flows without pumpback: Alternative 1 . 3-
11
Table 3-4. Effect of hatchery withdrawals on instream flows: Alternative 2 with Reuse ......... 3-13
Table 3-5. Effect of hatchery withdrawals on instream flows: Alternative 2 without Reuse .... 3-14
Table 3-6. Oregon 303(d) listings for the South Fork and mainstem Walla Walla River ......... 3-17
Table 3-7. Special-status fish species known or likely to be found in the Walla Walla River
system ........................................................................................................................................ 3-33
Table 3-8. Noxious weed species in the analysis area ............................................................... 3-55
Table 3-9. Present and reasonably foreseeable future projects in the Walla Walla basin ......... 3-86
Table B-1. Program performance indicators, metrics and monitoring and evaluation methods B-1
Table F-1. Draft EIS Comment Submittals................................................................................. F-1
Final Environmental Impact Statement
Executive Summary S-1
Executive Summary
Bonneville Power Administration (BPA) proposes to fund construction and operation of a spring
Chinook salmon (Oncorhynchus tshawytscha) hatchery in the Walla Walla River basin in
northeast Oregon. The hatchery would be owned and operated by the Confederated Tribes of the
Umatilla Indian Reservation (CTUIR). It would augment spring Chinook fish populations
available for harvest and aid in establishing a naturally spawning spring Chinook population in
the Walla Walla River basin.
The proposed hatchery was identified in the Northwest Power and Conservation Council’s
(Council) Fish and Wildlife Program, which is a regional program designed to protect and
rebuild fish and wildlife populations affected by hydropower development in the Columbia River
Basin. The Council was created in part to develop and maintain this Program. As part of its
responsibilities, the Council makes recommendations to BPA concerning which proposed fish
and wildlife projects to fund. The CTUIR’s proposed hatchery is one of the projects that the
Council has identified for potential BPA funding.
Underlying Need for Action
BPA needs to respond to the CTUIR’s request to fund their Council-reviewed proposal to
construct and operate a hatchery for spring Chinook salmon in the Walla Walla River basin.
The CTUIR proposed the project because indigenous Walla Walla River spring Chinook were
extirpated from the Walla Walla River basin in the early to mid-1900s, and recent reintroduction
efforts have been unsuccessful in meeting basin goals. Spring Chinook raised at the proposed
new hatchery would augment populations for harvest and help meet Walla Walla basin goals to
establish a naturally spawning population. Supporting these spring Chinook recovery efforts
would help BPA mitigate for the effects of the Federal Columbia River Power System (FCRPS)
on fish.
Purposes
In meeting the need for action, BPA seeks to achieve the following purposes:
Support efforts to mitigate for effects of the FCRPS on fish and wildlife in the mainstem
Columbia River and its tributaries pursuant to the Pacific Northwest Electric Power
Planning and Conservation Act of 1980 (Northwest Power Act) (16 U.S. Code (USC)
839 et seq.).
Assist in carrying out commitments related to proposed hatchery actions that are
contained in the 2008 Columbia Basin Fish Accords Memorandum of Agreement with
the CTUIR and others.
Implement BPA’s Fish and Wildlife Implementation Plan Environmental Impact
Statement and Record of Decision policy direction, which calls for protecting weak
stocks, while sustaining overall populations of fish for their economic and cultural value.
Improve the fitness and survival of spring Chinook released in the Umatilla basin.
Minimize harm to natural and human resources, including species listed under the
Endangered Species Act (ESA) (16 USC 1531 et seq.).
Walla Walla Basin Spring Chinook Hatchery Program
S-2 Executive Summary
Public Involvement
BPA published a Notice of Intent to prepare an Environmental Impact Statement (EIS) in the
Federal Register on March 28, 2013 and solicited public comments through May 15, 2013.
Letters describing the proposed action and public involvement opportunities were sent to
property owners in the vicinity of proposed facilities and activities; to federal, tribal, state, and
local agencies and governments in the region; and to other individuals and organizations that had
expressed interest in BPA and CTUIR projects in this area in the past.
Two public meetings were held—one in Milton-Freewater, Oregon on April 16, 2013; and one in
Dayton, Washington on April 17, 2013. In addition to comments received at the meetings, 24
letters and phoned-in comments were received during the scoping period. BPA requested
additional comments from June 2, 2014 to July 1, 2014 on the proposal to expand the scope of
the project to include relocation of Umatilla spring Chinook production, during which eight
comments were received. All comments received can be viewed via the project website and
were used to help identify issues to be addressed in this EIS.
The Draft EIS was published in October 2014. Public meetings were held in Dayton,
Washington on October 29, 2014 and in Milton-Freewater on October 30, 2014. BPA received
five letters and emails in addition to the comments offered at the meetings. Copies of the written
comments are included in Appendix F, as well as summaries of comments from each meeting.
The appendix provides responses to the comments and indicates how the comments were
considered in revisions to the Draft EIS. All comments received can be viewed via the project
website: www.bpa.gov/goto/WallaWallaHatchery.
Proposed Action and Alternatives
BPA is proposing to fund construction and operation of the Walla Walla Basin Spring Chinook
Hatchery at an existing CTUIR fish facility on the South Fork Walla Walla River near Milton-
Freewater in Umatilla County, Oregon. BPA has identified Alternative 1 from the Draft EIS as
the Preferred Alternative.
Alternative 1: Preferred Alternative
Alternative 1 would include the construction and operation of a hatchery with the capacity to
produce up to 500,000 spring Chinook smolts; development of a local broodstock from adult
returns to the Walla Walla basin; and release of spring Chinook smolts and adults at several
locations in the Walla Walla River basin. See Chapter 2, Section 2.2 for details. New and
modified facilities, which would all be within the existing property boundaries, include:
A new 32,634-square-foot hatchery building that would contain incubation, early rearing, and
grow-out tanks; administrative and visitor facilities; and associated equipment.
A new 3,242-square-foot shop building for operations and maintenance vehicles, equipment
storage, and a work area.
A new 816-square-foot water treatment headbox.
Modifications to the existing river intake and related structures to increase year-round
accessibility to river water, including a sluice/slide gate at the downstream end of the intake
basin to ensure adequate water elevation in the forebay.
Possible replacement of the existing Johnson screen within the forebay with a new heated
horizontal traveling screen to ensure year-round operation of the intake system, as frazil ice
and anchor ice can be an issue in this watershed.
Final Environmental Impact Statement
Executive Summary S-3
An effluent pumpback system to maintain instream flows during low-flow periods. The
work would include constructing an intake diversion box, pump wet well, valve vault and
associated conveyance piping to discharge the flow into the outfall piping just upstream of
the outfall structure.
Minor repairs to the juvenile bypass channel.
A new 6,000-square-foot sand filter drain field adjacent to the new hatchery building.
4,660 feet of new water supply pipelines.
Replacement of one former rental house (now removed) and two existing staff residences
that are in poor condition with three new staff residences, each approximately 2,200 square
feet including garage.
New gravel and asphalt surfacing, visitor entrance, and parking area.
A new chain link fence to enclose the facility and landscaping in some areas.
Alternative 2
Alternative 2 would consist of all the same actions proposed with Alternative 1, but the hatchery
would be built to accommodate incubation and rearing of an additional 810,000 spring Chinook
for the existing Umatilla basin program. See Chapter 2, Section 2.3 for details. The additional
facilities required would include the following:
A larger, 51,800-square foot grow-out building to house an additional 17 circular tanks.
Installation of a water reuse system.
An additional 1,260 linear feet of piping would be required, for a total of 5,960 feet of
new pipe.
Spring Chinook would no longer be reared at the Umatilla Hatchery, but other aspects of the
Umatilla spring Chinook program, such as acclimation and release sites, would not change, and the
Umatilla Hatchery would stay in operation and continue to produce other fish.
No Action Alternative
Under the No Action Alternative, BPA would not fund the Walla Walla Basin Spring Chinook
Hatchery program. No new facilities would be constructed, no new artificial propagation
activities would be implemented, and no long-term in-basin source (natural or hatchery) of
spring Chinook production would be available for the Walla Walla River. The current release of
out-of-basin smolts, funded under the Mitchell Act and by Bureau of Indian Affairs, and
incorporated into the 2018-2027 U.S. v. Oregon Management Agreement, is expected to continue
for the foreseeable future.
Under the No Action Alternative, spring Chinook for the Umatilla basin program would continue
to be reared at Umatilla Hatchery as is currently done.
Walla Walla Basin Spring Chinook Hatchery Program
S-4 Executive Summary
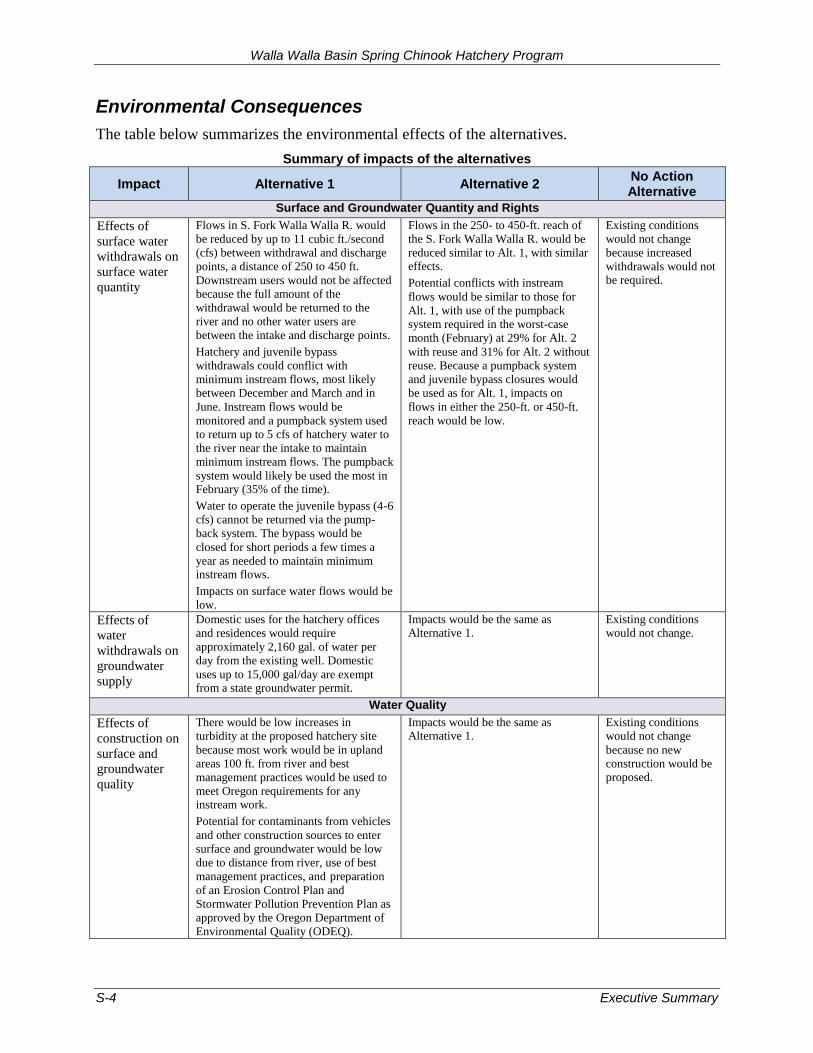
Environmental Consequences
The table below summarizes the environmental effects of the alternatives.
Summary of impacts of the alternatives
Impact Alternative 1 Alternative 2 No Action Alternative
Surface and Groundwater Quantity and Rights
Effects of
surface water
withdrawals on
surface water
quantity
Flows in S. Fork Walla Walla R. would
be reduced by up to 11 cubic ft./second
(cfs) between withdrawal and discharge
points, a distance of 250 to 450 ft.
Downstream users would not be affected
because the full amount of the
withdrawal would be returned to the
river and no other water users are
between the intake and discharge points.
Hatchery and juvenile bypass
withdrawals could conflict with
minimum instream flows, most likely
between December and March and in
June. Instream flows would be
monitored and a pumpback system used
to return up to 5 cfs of hatchery water to
the river near the intake to maintain
minimum instream flows. The pumpback
system would likely be used the most in February (35% of the time).
Water to operate the juvenile bypass (4-6
cfs) cannot be returned via the pump-
back system. The bypass would be
closed for short periods a few times a
year as needed to maintain minimum instream flows.
Impacts on surface water flows would be
low.
Flows in the 250- to 450-ft. reach of
the S. Fork Walla Walla R. would be
reduced similar to Alt. 1, with similar effects.
Potential conflicts with instream
flows would be similar to those for
Alt. 1, with use of the pumpback
system required in the worst-case
month (February) at 29% for Alt. 2
with reuse and 31% for Alt. 2 without
reuse. Because a pumpback system
and juvenile bypass closures would
be used as for Alt. 1, impacts on
flows in either the 250-ft. or 450-ft.
reach would be low.
Existing conditions
would not change
because increased
withdrawals would not
be required.
Effects of
water
withdrawals on
groundwater
supply
Domestic uses for the hatchery offices
and residences would require
approximately 2,160 gal. of water per
day from the existing well. Domestic
uses up to 15,000 gal/day are exempt from a state groundwater permit.
Impacts would be the same as Alternative 1.
Existing conditions would not change.
Water Quality
Effects of
construction on
surface and
groundwater
quality
There would be low increases in
turbidity at the proposed hatchery site
because most work would be in upland
areas 100 ft. from river and best
management practices would be used to
meet Oregon requirements for any instream work.
Potential for contaminants from vehicles
and other construction sources to enter
surface and groundwater would be low
due to distance from river, use of best
management practices, and preparation
of an Erosion Control Plan and
Stormwater Pollution Prevention Plan as
approved by the Oregon Department of
Environmental Quality (ODEQ).
Impacts would be the same as Alternative 1.
Existing conditions
would not change
because no new
construction would be proposed.
Final Environmental Impact Statement
Executive Summary S-5
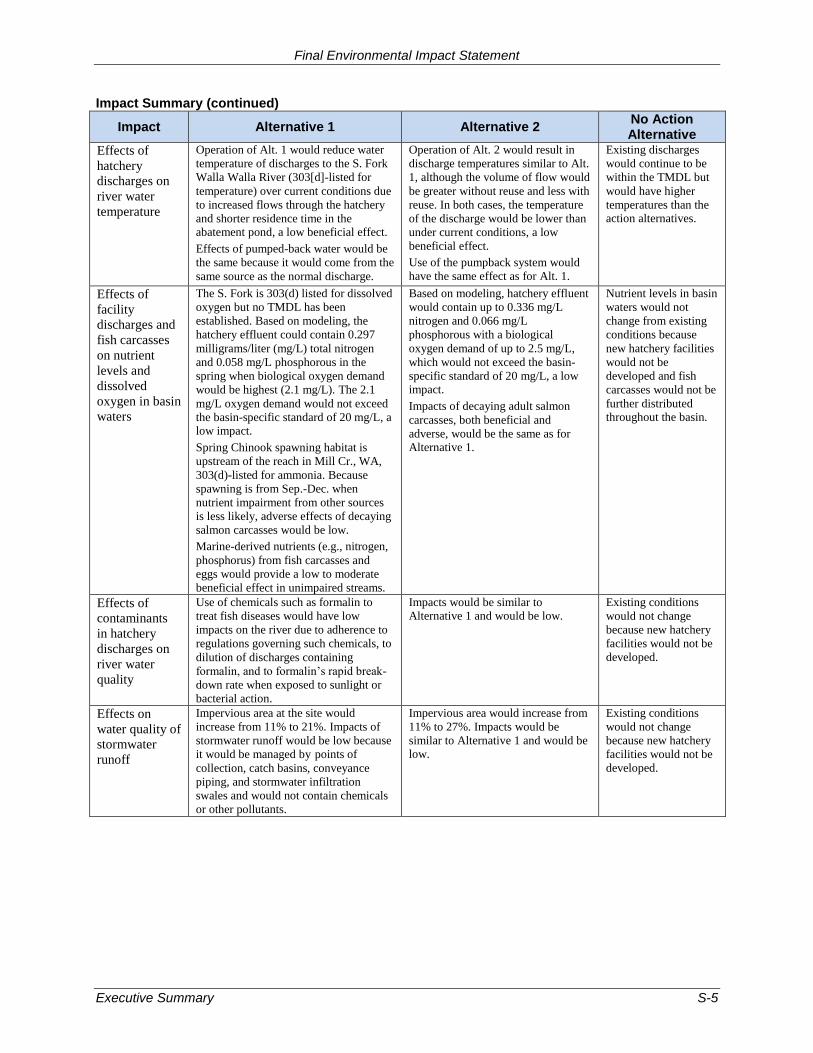
Impact Summary (continued)
Impact Alternative 1 Alternative 2 No Action Alternative
Effects of
hatchery
discharges on
river water
temperature
Operation of Alt. 1 would reduce water
temperature of discharges to the S. Fork
Walla Walla River (303[d]-listed for
temperature) over current conditions due
to increased flows through the hatchery
and shorter residence time in the abatement pond, a low beneficial effect.
Effects of pumped-back water would be
the same because it would come from the
same source as the normal discharge.
Operation of Alt. 2 would result in
discharge temperatures similar to Alt.
1, although the volume of flow would
be greater without reuse and less with
reuse. In both cases, the temperature
of the discharge would be lower than
under current conditions, a low
beneficial effect.
Use of the pumpback system would
have the same effect as for Alt. 1.
Existing discharges
would continue to be
within the TMDL but
would have higher
temperatures than the action alternatives.
Effects of
facility
discharges and
fish carcasses
on nutrient
levels and
dissolved
oxygen in basin
waters
The S. Fork is 303(d) listed for dissolved
oxygen but no TMDL has been
established. Based on modeling, the
hatchery effluent could contain 0.297
milligrams/liter (mg/L) total nitrogen
and 0.058 mg/L phosphorous in the
spring when biological oxygen demand
would be highest (2.1 mg/L). The 2.1
mg/L oxygen demand would not exceed
the basin-specific standard of 20 mg/L, a low impact.
Spring Chinook spawning habitat is
upstream of the reach in Mill Cr., WA,
303(d)-listed for ammonia. Because
spawning is from Sep.-Dec. when
nutrient impairment from other sources
is less likely, adverse effects of decaying
salmon carcasses would be low.
Marine-derived nutrients (e.g., nitrogen,
phosphorus) from fish carcasses and
eggs would provide a low to moderate
beneficial effect in unimpaired streams.
Based on modeling, hatchery effluent
would contain up to 0.336 mg/L
nitrogen and 0.066 mg/L
phosphorous with a biological
oxygen demand of up to 2.5 mg/L,
which would not exceed the basin-
specific standard of 20 mg/L, a low impact.
Impacts of decaying adult salmon
carcasses, both beneficial and
adverse, would be the same as for Alternative 1.
Nutrient levels in basin
waters would not
change from existing
conditions because
new hatchery facilities
would not be
developed and fish
carcasses would not be
further distributed throughout the basin.
Effects of
contaminants
in hatchery
discharges on
river water
quality
Use of chemicals such as formalin to
treat fish diseases would have low
impacts on the river due to adherence to
regulations governing such chemicals, to
dilution of discharges containing
formalin, and to formalin’s rapid break-
down rate when exposed to sunlight or
bacterial action.
Impacts would be similar to Alternative 1 and would be low.
Existing conditions
would not change
because new hatchery
facilities would not be
developed.
Effects on
water quality of
stormwater
runoff
Impervious area at the site would
increase from 11% to 21%. Impacts of
stormwater runoff would be low because
it would be managed by points of
collection, catch basins, conveyance
piping, and stormwater infiltration
swales and would not contain chemicals
or other pollutants.
Impervious area would increase from
11% to 27%. Impacts would be
similar to Alternative 1 and would be low.
Existing conditions
would not change
because new hatchery
facilities would not be
developed.
Walla Walla Basin Spring Chinook Hatchery Program
S-6 Executive Summary
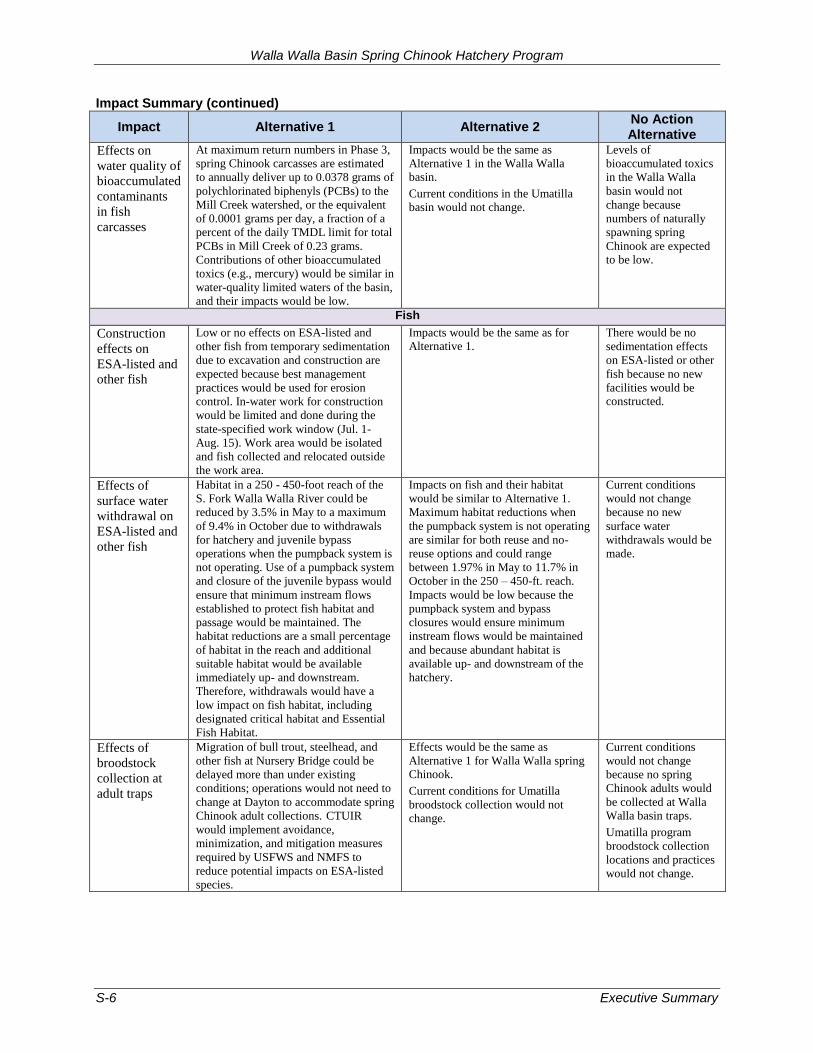
Impact Summary (continued)
Impact Alternative 1 Alternative 2 No Action Alternative
Effects on
water quality of
bioaccumulated
contaminants
in fish
carcasses
At maximum return numbers in Phase 3,
spring Chinook carcasses are estimated
to annually deliver up to 0.0378 grams of
polychlorinated biphenyls (PCBs) to the
Mill Creek watershed, or the equivalent
of 0.0001 grams per day, a fraction of a
percent of the daily TMDL limit for total
PCBs in Mill Creek of 0.23 grams.
Contributions of other bioaccumulated
toxics (e.g., mercury) would be similar in
water-quality limited waters of the basin,
and their impacts would be low.
Impacts would be the same as
Alternative 1 in the Walla Walla basin.
Current conditions in the Umatilla basin would not change.
Levels of
bioaccumulated toxics
in the Walla Walla
basin would not
change because
numbers of naturally
spawning spring
Chinook are expected to be low.
Fish
Construction
effects on
ESA-listed and
other fish
Low or no effects on ESA-listed and
other fish from temporary sedimentation
due to excavation and construction are
expected because best management
practices would be used for erosion
control. In-water work for construction
would be limited and done during the
state-specified work window (Jul. 1-
Aug. 15). Work area would be isolated
and fish collected and relocated outside
the work area.
Impacts would be the same as for Alternative 1.
There would be no
sedimentation effects
on ESA-listed or other
fish because no new
facilities would be constructed.
Effects of
surface water
withdrawal on
ESA-listed and
other fish
Habitat in a 250 - 450-foot reach of the
S. Fork Walla Walla River could be
reduced by 3.5% in May to a maximum
of 9.4% in October due to withdrawals
for hatchery and juvenile bypass
operations when the pumpback system is
not operating. Use of a pumpback system
and closure of the juvenile bypass would
ensure that minimum instream flows
established to protect fish habitat and
passage would be maintained. The
habitat reductions are a small percentage
of habitat in the reach and additional
suitable habitat would be available
immediately up- and downstream.
Therefore, withdrawals would have a
low impact on fish habitat, including
designated critical habitat and Essential
Fish Habitat.
Impacts on fish and their habitat
would be similar to Alternative 1.
Maximum habitat reductions when
the pumpback system is not operating
are similar for both reuse and no-
reuse options and could range
between 1.97% in May to 11.7% in
October in the 250 – 450-ft. reach.
Impacts would be low because the
pumpback system and bypass
closures would ensure minimum
instream flows would be maintained
and because abundant habitat is
available up- and downstream of the
hatchery.
Current conditions
would not change
because no new
surface water
withdrawals would be
made.
Effects of
broodstock
collection at
adult traps
Migration of bull trout, steelhead, and
other fish at Nursery Bridge could be
delayed more than under existing
conditions; operations would not need to
change at Dayton to accommodate spring
Chinook adult collections. CTUIR
would implement avoidance,
minimization, and mitigation measures
required by USFWS and NMFS to
reduce potential impacts on ESA-listed
species.
Effects would be the same as
Alternative 1 for Walla Walla spring Chinook.
Current conditions for Umatilla
broodstock collection would not
change.
Current conditions
would not change
because no spring
Chinook adults would
be collected at Walla Walla basin traps.
Umatilla program
broodstock collection
locations and practices
would not change.
Final Environmental Impact Statement
Executive Summary S-7
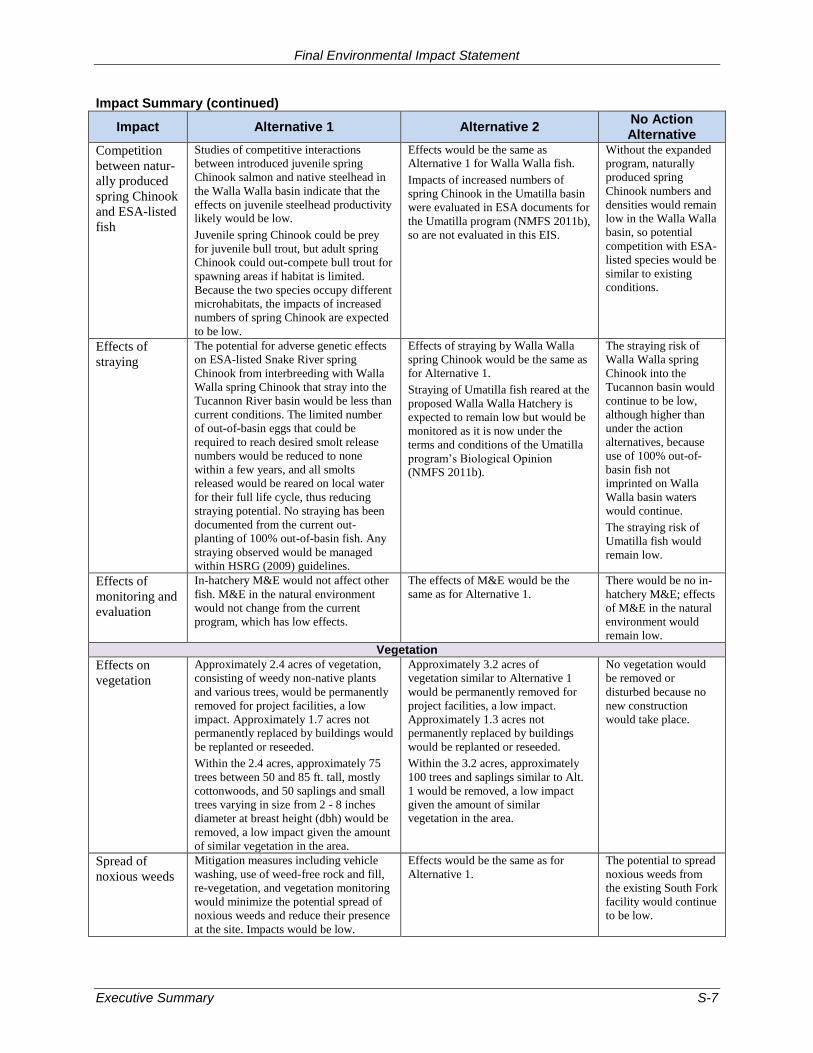
Impact Summary (continued)
Impact Alternative 1 Alternative 2 No Action Alternative
Competition
between natur-
ally produced
spring Chinook
and ESA-listed
fish
Studies of competitive interactions
between introduced juvenile spring
Chinook salmon and native steelhead in
the Walla Walla basin indicate that the
effects on juvenile steelhead productivity likely would be low. Juvenile spring Chinook could be prey
for juvenile bull trout, but adult spring
Chinook could out-compete bull trout for
spawning areas if habitat is limited.
Because the two species occupy different
microhabitats, the impacts of increased
numbers of spring Chinook are expected
to be low.
Effects would be the same as Alternative 1 for Walla Walla fish.
Impacts of increased numbers of
spring Chinook in the Umatilla basin
were evaluated in ESA documents for
the Umatilla program (NMFS 2011b),
so are not evaluated in this EIS.
Without the expanded
program, naturally
produced spring
Chinook numbers and
densities would remain
low in the Walla Walla
basin, so potential
competition with ESA-
listed species would be
similar to existing
conditions.
Effects of
straying
The potential for adverse genetic effects
on ESA-listed Snake River spring
Chinook from interbreeding with Walla
Walla spring Chinook that stray into the
Tucannon River basin would be less than
current conditions. The limited number
of out-of-basin eggs that could be
required to reach desired smolt release
numbers would be reduced to none
within a few years, and all smolts
released would be reared on local water
for their full life cycle, thus reducing
straying potential. No straying has been
documented from the current out-
planting of 100% out-of-basin fish. Any
straying observed would be managed
within HSRG (2009) guidelines.
Effects of straying by Walla Walla
spring Chinook would be the same as
for Alternative 1.
Straying of Umatilla fish reared at the
proposed Walla Walla Hatchery is
expected to remain low but would be
monitored as it is now under the
terms and conditions of the Umatilla
program’s Biological Opinion
(NMFS 2011b).
The straying risk of
Walla Walla spring
Chinook into the
Tucannon basin would
continue to be low,
although higher than
under the action
alternatives, because
use of 100% out-of-
basin fish not
imprinted on Walla
Walla basin waters would continue.
The straying risk of
Umatilla fish would
remain low.
Effects of
monitoring and
evaluation
In-hatchery M&E would not affect other
fish. M&E in the natural environment
would not change from the current
program, which has low effects.
The effects of M&E would be the
same as for Alternative 1.
There would be no in-
hatchery M&E; effects
of M&E in the natural
environment would
remain low.
Vegetation
Effects on
vegetation
Approximately 2.4 acres of vegetation,
consisting of weedy non-native plants
and various trees, would be permanently
removed for project facilities, a low
impact. Approximately 1.7 acres not
permanently replaced by buildings would
be replanted or reseeded.
Within the 2.4 acres, approximately 75
trees between 50 and 85 ft. tall, mostly
cottonwoods, and 50 saplings and small
trees varying in size from 2 - 8 inches
diameter at breast height (dbh) would be
removed, a low impact given the amount
of similar vegetation in the area.
Approximately 3.2 acres of
vegetation similar to Alternative 1
would be permanently removed for
project facilities, a low impact.
Approximately 1.3 acres not
permanently replaced by buildings
would be replanted or reseeded.
Within the 3.2 acres, approximately
100 trees and saplings similar to Alt.
1 would be removed, a low impact
given the amount of similar vegetation in the area.
No vegetation would
be removed or
disturbed because no
new construction
would take place.
Spread of
noxious weeds
Mitigation measures including vehicle
washing, use of weed-free rock and fill,
re-vegetation, and vegetation monitoring
would minimize the potential spread of
noxious weeds and reduce their presence
at the site. Impacts would be low.
Effects would be the same as for
Alternative 1.
The potential to spread
noxious weeds from
the existing South Fork
facility would continue
to be low.
Walla Walla Basin Spring Chinook Hatchery Program
S-8 Executive Summary
Impact Summary (continued)
Impact Alternative 1 Alternative 2 No Action Alternative
Socioeconomics
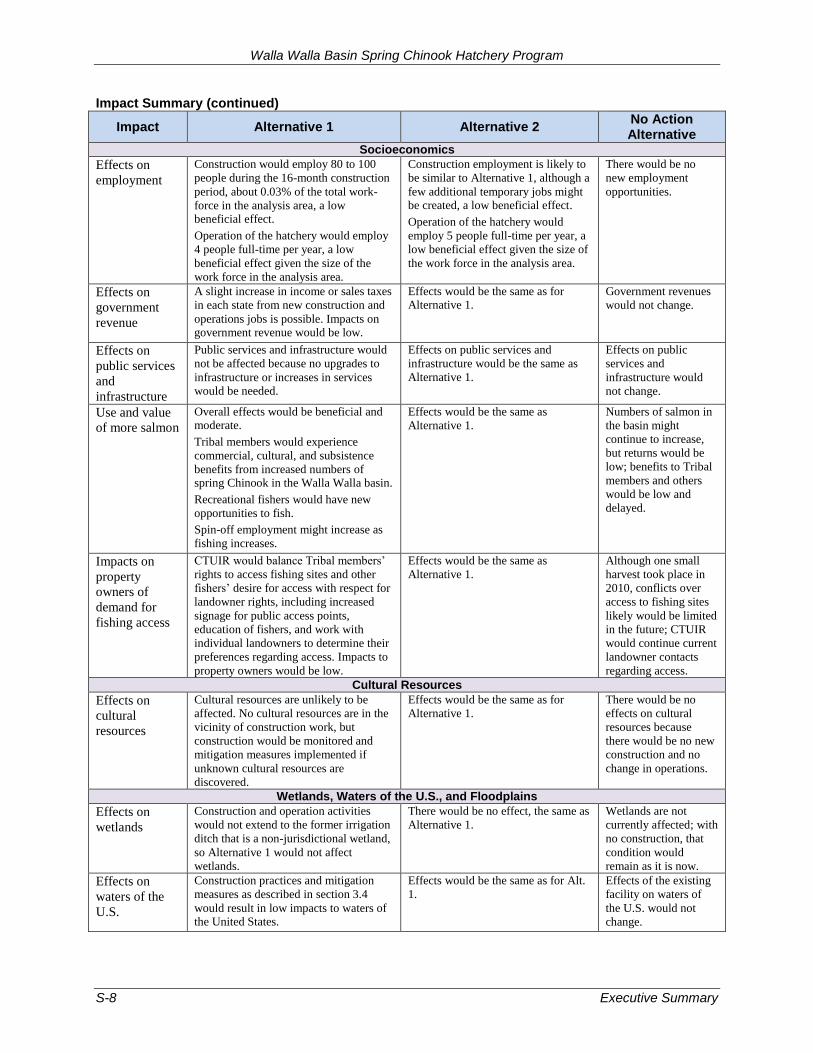
Effects on
employment
Construction would employ 80 to 100
people during the 16-month construction
period, about 0.03% of the total work-
force in the analysis area, a low beneficial effect.
Operation of the hatchery would employ
4 people full-time per year, a low
beneficial effect given the size of the
work force in the analysis area.
Construction employment is likely to
be similar to Alternative 1, although a
few additional temporary jobs might be created, a low beneficial effect.
Operation of the hatchery would
employ 5 people full-time per year, a
low beneficial effect given the size of
the work force in the analysis area.
There would be no
new employment
opportunities.
Effects on
government
revenue
A slight increase in income or sales taxes
in each state from new construction and
operations jobs is possible. Impacts on government revenue would be low.
Effects would be the same as for Alternative 1.
Government revenues
would not change.
Effects on
public services
and
infrastructure
Public services and infrastructure would
not be affected because no upgrades to
infrastructure or increases in services would be needed.
Effects on public services and
infrastructure would be the same as
Alternative 1.
Effects on public
services and
infrastructure would
not change.
Use and value
of more salmon
Overall effects would be beneficial and moderate.
Tribal members would experience
commercial, cultural, and subsistence
benefits from increased numbers of spring Chinook in the Walla Walla basin.
Recreational fishers would have new
opportunities to fish.
Spin-off employment might increase as
fishing increases.
Effects would be the same as
Alternative 1.
Numbers of salmon in
the basin might
continue to increase,
but returns would be
low; benefits to Tribal
members and others
would be low and
delayed.
Impacts on
property
owners of
demand for
fishing access
CTUIR would balance Tribal members’
rights to access fishing sites and other
fishers’ desire for access with respect for
landowner rights, including increased
signage for public access points,
education of fishers, and work with
individual landowners to determine their
preferences regarding access. Impacts to
property owners would be low.
Effects would be the same as
Alternative 1.
Although one small
harvest took place in
2010, conflicts over
access to fishing sites
likely would be limited
in the future; CTUIR
would continue current
landowner contacts
regarding access.
Cultural Resources
Effects on
cultural
resources
Cultural resources are unlikely to be
affected. No cultural resources are in the
vicinity of construction work, but
construction would be monitored and
mitigation measures implemented if
unknown cultural resources are
discovered.
Effects would be the same as for
Alternative 1.
There would be no
effects on cultural
resources because
there would be no new
construction and no
change in operations.
Wetlands, Waters of the U.S., and Floodplains
Effects on
wetlands
Construction and operation activities
would not extend to the former irrigation
ditch that is a non-jurisdictional wetland,
so Alternative 1 would not affect
wetlands.
There would be no effect, the same as
Alternative 1.
Wetlands are not
currently affected; with
no construction, that
condition would
remain as it is now.
Effects on
waters of the
U.S.
Construction practices and mitigation
measures as described in section 3.4
would result in low impacts to waters of the United States.
Effects would be the same as for Alt.
1.
Effects of the existing
facility on waters of
the U.S. would not
change.
Final Environmental Impact Statement
Executive Summary S-9
Impact Summary (continued)
Impact Alternative 1 Alternative 2 No Action Alternative
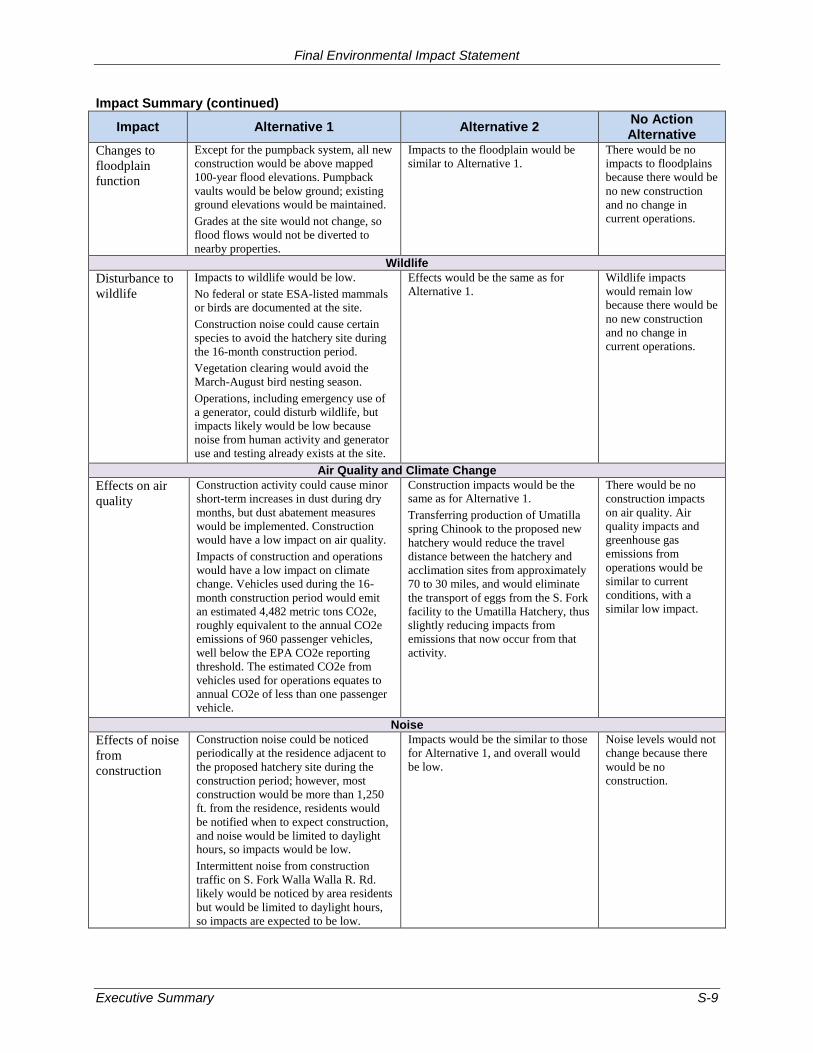
Changes to
floodplain
function
Except for the pumpback system, all new
construction would be above mapped
100-year flood elevations. Pumpback
vaults would be below ground; existing ground elevations would be maintained.
Grades at the site would not change, so
flood flows would not be diverted to
nearby properties.
Impacts to the floodplain would be
similar to Alternative 1.
There would be no
impacts to floodplains
because there would be
no new construction
and no change in
current operations.
Wildlife
Disturbance to
wildlife
Impacts to wildlife would be low.
No federal or state ESA-listed mammals or birds are documented at the site.
Construction noise could cause certain
species to avoid the hatchery site during
the 16-month construction period.
Vegetation clearing would avoid the
March-August bird nesting season.
Operations, including emergency use of
a generator, could disturb wildlife, but
impacts likely would be low because
noise from human activity and generator
use and testing already exists at the site.
Effects would be the same as for
Alternative 1.
Wildlife impacts
would remain low
because there would be
no new construction
and no change in
current operations.
Air Quality and Climate Change
Effects on air
quality
Construction activity could cause minor
short-term increases in dust during dry
months, but dust abatement measures
would be implemented. Construction would have a low impact on air quality.
Impacts of construction and operations
would have a low impact on climate
change. Vehicles used during the 16-
month construction period would emit
an estimated 4,482 metric tons CO2e,
roughly equivalent to the annual CO2e
emissions of 960 passenger vehicles,
well below the EPA CO2e reporting
threshold. The estimated CO2e from
vehicles used for operations equates to
annual CO2e of less than one passenger
vehicle.
Construction impacts would be the same as for Alternative 1.
Transferring production of Umatilla
spring Chinook to the proposed new
hatchery would reduce the travel
distance between the hatchery and
acclimation sites from approximately
70 to 30 miles, and would eliminate
the transport of eggs from the S. Fork
facility to the Umatilla Hatchery, thus
slightly reducing impacts from
emissions that now occur from that
activity.
There would be no
construction impacts
on air quality. Air
quality impacts and
greenhouse gas
emissions from
operations would be
similar to current
conditions, with a
similar low impact.
Noise
Effects of noise
from
construction
Construction noise could be noticed
periodically at the residence adjacent to
the proposed hatchery site during the
construction period; however, most
construction would be more than 1,250
ft. from the residence, residents would
be notified when to expect construction,
and noise would be limited to daylight hours, so impacts would be low.
Intermittent noise from construction
traffic on S. Fork Walla Walla R. Rd.
likely would be noticed by area residents
but would be limited to daylight hours,
so impacts are expected to be low.
Impacts would be the similar to those
for Alternative 1, and overall would
be low.
Noise levels would not
change because there
would be no
construction.
Walla Walla Basin Spring Chinook Hatchery Program
S-10 Executive Summary
Impact Summary (continued)
Impact Alternative 1 Alternative 2 No Action Alternative
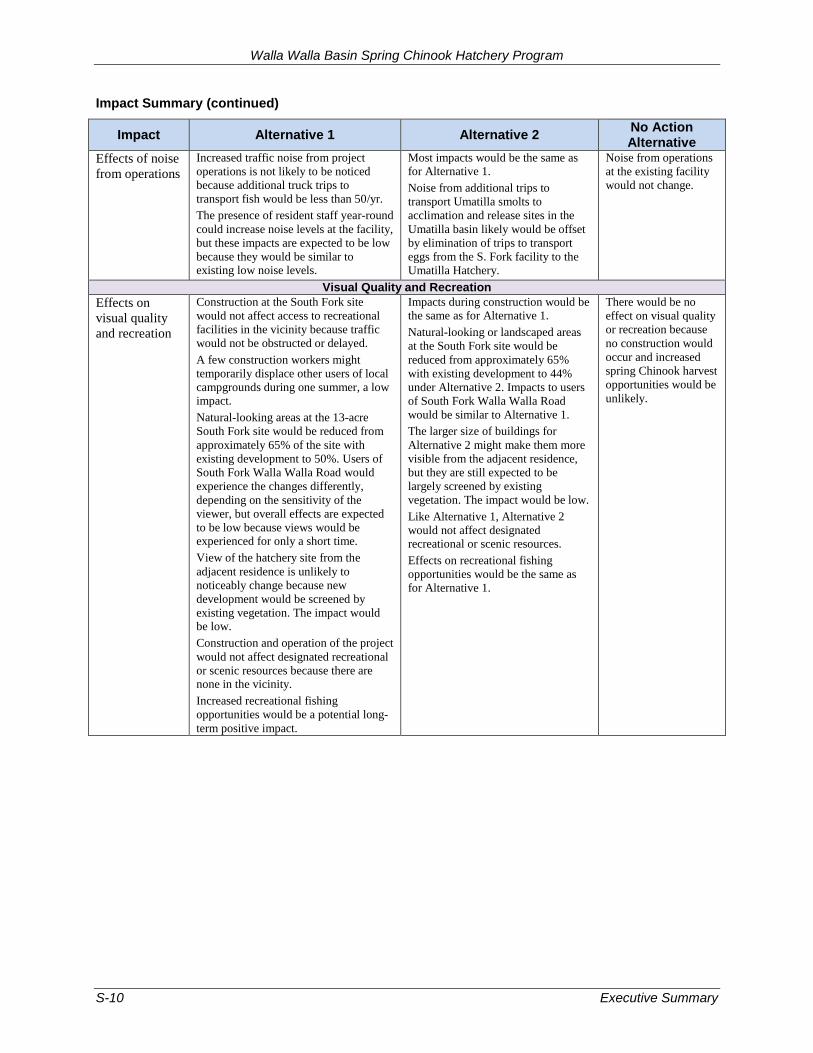
Effects of noise
from operations
Increased traffic noise from project
operations is not likely to be noticed
because additional truck trips to
transport fish would be less than 50/yr.
The presence of resident staff year-round
could increase noise levels at the facility,
but these impacts are expected to be low
because they would be similar to existing low noise levels.
Most impacts would be the same as for Alternative 1.
Noise from additional trips to
transport Umatilla smolts to
acclimation and release sites in the
Umatilla basin likely would be offset
by elimination of trips to transport
eggs from the S. Fork facility to the
Umatilla Hatchery.
Noise from operations
at the existing facility
would not change.
Visual Quality and Recreation
Effects on
visual quality
and recreation
Construction at the South Fork site
would not affect access to recreational
facilities in the vicinity because traffic
would not be obstructed or delayed.
A few construction workers might
temporarily displace other users of local
campgrounds during one summer, a low impact.
Natural-looking areas at the 13-acre
South Fork site would be reduced from
approximately 65% of the site with
existing development to 50%. Users of
South Fork Walla Walla Road would
experience the changes differently,
depending on the sensitivity of the
viewer, but overall effects are expected
to be low because views would be experienced for only a short time.
View of the hatchery site from the
adjacent residence is unlikely to
noticeably change because new
development would be screened by
existing vegetation. The impact would be low.
Construction and operation of the project
would not affect designated recreational
or scenic resources because there are none in the vicinity.
Increased recreational fishing
opportunities would be a potential long-
term positive impact.
Impacts during construction would be the same as for Alternative 1.
Natural-looking or landscaped areas
at the South Fork site would be
reduced from approximately 65%
with existing development to 44%
under Alternative 2. Impacts to users
of South Fork Walla Walla Road
would be similar to Alternative 1.
The larger size of buildings for
Alternative 2 might make them more
visible from the adjacent residence,
but they are still expected to be
largely screened by existing
vegetation. The impact would be low.
Like Alternative 1, Alternative 2
would not affect designated recreational or scenic resources.
Effects on recreational fishing
opportunities would be the same as
for Alternative 1.
There would be no
effect on visual quality
or recreation because
no construction would
occur and increased
spring Chinook harvest
opportunities would be
unlikely.
Final Environmental Impact Statement
Chapter 1 Purpose of and Need for Action 1-1
Chapter 1. Purpose of and Need for Action
Notable Differences in this Chapter from the Draft EIS
A new purpose has been added (see Section 1.2).
A new Section 1.7.2 summarizes comments from public review of the Draft EIS.
Bonneville Power Administration (BPA) proposes to fund construction and operation of a spring
Chinook salmon (Oncorhynchus tshawytscha) hatchery in the Walla Walla River basin in
northeast Oregon (see Figure 1-1). This proposed hatchery, referred to as the Walla Walla Basin
Spring Chinook Hatchery, would be owned and operated by the Confederated Tribes of the
Umatilla Indian Reservation (CTUIR) and would be constructed at an existing CTUIR fish
facility on the South Fork Walla Walla River near Milton-Freewater in Umatilla County,
Oregon. The hatchery would augment spring Chinook fish populations available for harvest and
aid in establishing a naturally spawning spring Chinook population in the Walla Walla River
basin.
The proposal includes construction of a hatchery for production of spring Chinook, development
of a local broodstock from adult returns to the Walla Walla basin, and release of juvenile and
adult spring Chinook into Walla Walla River tributaries in both Oregon and Washington. In
addition, an alternative is being considered that would include relocation of the production of
Umatilla spring Chinook from the existing Umatilla hatchery near Irrigon, Oregon, to the
proposed Walla Walla Hatchery.
The proposed hatchery was identified in the Northwest Power and Conservation Council’s
(Council) Fish and Wildlife Program, which is a regional program designed to protect and
rebuild fish and wildlife populations affected by hydropower development in the Columbia River
Basin. The Council was created in part to develop and maintain this Program, and as part of its
responsibilities, it makes recommendations to BPA concerning which proposed fish and wildlife
projects to fund. The CTUIR’s proposed hatchery is one of the projects that the Council has
identified for potential BPA funding.
BPA has prepared this environmental impact statement (EIS) under the National Environmental
Policy Act of 1969 (NEPA) (42 USC 4321 et seq.) and its implementing regulations to assess
the potential environmental impacts of the proposed project before making a decision concerning
project funding. The EIS evaluates two action alternatives and the No Action alternative as
required by Council on Environmental Quality’s implementing regulations for NEPA (Code of
Federal Regulations [CFR] 1502.14(d)). These alternatives are described in more detail in
Chapter 2.
This chapter of the EIS describes BPA’s need to take action, the purposes that BPA seeks to
achieve in addressing the need, the history of the Walla Walla Basin Spring Chinook Hatchery
Program, and the hatchery review process. The chapter also identifies the cooperating agencies
involved in the development of this EIS and summarizes the public involvement processes and
comments received.
1-2 Chapter 1 Purpose of and Need for Action
Figure 1-1. Project Area Overview
Final Environmental Impact Statement
Chapter 1 Purpose of and Need for Action 1-3
1.1 Underlying Need for Action
BPA needs to respond to the CTUIR’s request to fund their Council-reviewed proposal to
construct and operate a hatchery for spring Chinook salmon in the Walla Walla River basin.
The CTUIR proposed the project because indigenous Walla Walla River spring Chinook were
extirpated from the Walla Walla River basin in the early to mid-1900s, and recent reintroduction
efforts have been unsuccessful in meeting basin goals. Spring Chinook raised at the proposed
new hatchery would augment populations for harvest and help meet Walla Walla basin goals to
establish a naturally spawning population. Supporting these spring Chinook recovery efforts
would help BPA mitigate for the effects on fish of the Federal Columbia River Power System
(FCRPS).
1.2 Purposes
In meeting the need for action, BPA seeks to achieve the following purposes:
Support efforts to mitigate for effects of the FCRPS on fish and wildlife in the mainstem
Columbia River and its tributaries pursuant to the Pacific Northwest Electric Power
Planning and Conservation Act of 1980 (Northwest Power Act) (16 U.S. Code (USC)
839 et seq.).
Assist in carrying out commitments related to proposed hatchery actions that are
contained in the 2008 Columbia Basin Fish Accords Memorandum of Agreement with
the CTUIR and others.
Implement BPA’s Fish and Wildlife Implementation Plan Environmental Impact
Statement and Record of Decision policy direction, which calls for protecting weak
stocks, while sustaining overall populations of fish for their economic and cultural value.
Improve the fitness and survival of spring Chinook released in the Umatilla basin.
Minimize harm to natural and human resources, including species listed under the
Endangered Species Act (ESA) (16 USC 1531 et seq.).
In addition to purposes BPA seeks to achieve, the CTUIR seeks a preferred alternative that
would:
Develop a localized spring Chinook broodstock (fish used in the hatchery for breeding)
for the Walla Walla basin.
Assist in recolonizing habitat by increasing the abundance of natural spawners in the
South Fork Walla Walla River, Mill Creek, and the Touchet River.
Provide opportunities for Tribal and non-Tribal harvest in the Walla Walla basin.
Maintain consistency with the visions and goals of other regional plans, including the
Walla Walla Subbasin Plan and the Columbia River Anadromous Fish Restoration Plan
of the Nez Perce, Umatilla, Warm Springs and Yakama Tribes (Wy-Kan-Ush-Mi Wa-
Kish-Wit).
Maintain consistency with the Tribal First Foods and River Vision management
directives.
Walla Walla Basin Spring Chinook Hatchery Program
1-4 Chapter 1 Purpose of and Need for Action
1.3 Process and Planning Background
1.3.1 Northwest Power Act/Council’s Fish and Wildlife Program
The Northwest Power Act (16 USC Sections 839b(h)(10)(A) and (11)(A)(i)) directs BPA to
protect, mitigate, and enhance fish and wildlife affected by the development and operation of
federal hydroelectric facilities on the Columbia River and its tributaries. To assist in
accomplishing this, the Northwest Power and Conservation Council makes recommendations to
BPA concerning which fish and wildlife projects to fund. CTUIR’s proposal is one of those
projects recommended to BPA by the Council.
In 1987, the Northeast Oregon Hatchery Program (NEOH) was established as part of the
Council’s Columbia River Basin Fish and Wildlife Program. It was the initial artificial
production planning effort by fishery co-managers for restoring anadromous fish runs in
northeast Oregon, including the Walla Walla basin. The NEOH Program called for development
of artificial production facilities which would produce between 2.3 and 3.0 million Chinook
salmon and steelhead smolts designated for release into the Hood, Umatilla, Walla Walla,
Grande Ronde, and Imnaha River basins and elsewhere. The proposed Walla Walla Basin
Spring Chinook Hatchery Program grew out of the NEOH Program.
In 2004, the Walla Walla Subbasin Plan prepared for the Council (Walla Walla County and
Walla Walla Basin Watershed Council 2004) identified spring Chinook salmon as one of three
focal species for the plan, noting that the fish co-managers agreed that restoration of spring
Chinook in the subbasin was a priority. The plan noted that EDT (Ecosystem Diagnosis and
Treatment) modeling predicted that the Walla Walla subbasin had “a much greater production
potential for spring Chinook than it now displays, as historical abundance was estimated at
17,929 spawners.”
As part of its Fish and Wildlife Program, the Council has a three-step process for review of
artificial propagation projects (i.e., hatcheries) proposed for BPA funding (NPCC 2006). Step 1
is conceptual planning, represented primarily by master plan development and approval. The
master plan provides the scientific rationale for the activities proposed as part of a fish
production program, and presents initial designs for proposed new facilities. Step 2 provides
preliminary designs and cost estimates and environmental review. Step 3 is the final design
review. The Council’s Independent Scientific Review Panel (ISRP) reviews the proposed
projects as they move from one stage of the process to the next.
The Council and the ISRP reviewed several drafts of the Walla Walla Spring Chinook Hatchery
Master Plan prepared by CTUIR, providing feedback on the scientific goals and methods, which
resulted in the phased approach to spring Chinook reintroduction in the Walla Walla basin
described in Chapter 2, Section 2.2.3. On October 8, 2013, the Council recommended that BPA
and the CTUIR move to Step 2 of the Council’s process. In addition to meeting BPA’s NEPA
obligations, this EIS addresses the environmental review requirements of Step 2.
The Walla Walla Basin Spring Chinook Master Plan is incorporated by reference in this EIS
(CTUIR 2013). It includes biological data, ecological rationale, and environmental and
engineering research used to support much of the analysis in the EIS.
Final Environmental Impact Statement
Chapter 1 Purpose of and Need for Action 1-5
1.3.2 Columbia Basin Fish Accords
On May 2, 2008, BPA, Bureau of Reclamation (USBOR), and U.S. Army Corps of Engineers
(Corps), signed an agreement with three tribes, including the CTUIR, to work as partners to
provide tangible survival benefits for salmon recovery. The 2008 Columbia Basin Fish Accords
Memorandum of Agreement between the Three Treaty Tribes and FCRPS Action Agencies
includes agreement to fund the proposed Walla Walla spring Chinook hatchery, contingent on
site-specific NEPA and other environmental compliance review.
1.3.3 Tribal Treaty Fishing and Management Rights under U.S. v. Oregon
In the Treaty of 1855 with the United States, Umatilla Tribes and others reserved “the exclusive
right of taking fish in the streams running through or bordering said reservation” and “at all other
usual and accustomed stations in common with the citizens of the Territory….” (12 Stat. 945,
1855). The treaty recognized the central role salmon played in the life of tribal members.
Beginning in the early 1900s, federal court cases, culminating in the United States versus Oregon
(U.S. v. Oregon) proceeding, clarified the CTUIR and other Columbia River treaty tribes’ fishing
rights. Today, the Columbia River treaty tribes are recognized as fisheries managers together
with state and federal fisheries agencies. The tribes have a treaty right to harvest up to half the
harvestable surplus of fish.
CTUIR exercises its fisheries management authority in many ways, including as a party to
U.S. v. Oregon. Through the ongoing U.S. v. Oregon process, the parties to the case develop and
update the Columbia River harvest and production management plans. The current plan, the
2018-2027 U.S. v. Oregon Management Agreement, is an order of the Federal District Court for
the District of Oregon. The plan acknowledges the potential for increased smolt releases from
the Walla Walla Spring Chinook Hatchery Program, the subject of this EIS. However, BPA is
not a party to U.S. v. Oregon. BPA is not privy to the parties’ deliberations and does not
influence the decisions the parties make.
1.3.4 CTUIR Natural Resources Management Approach
Salmon are a part of the spiritual and cultural identity of the Columbia River tribes. Salmon also
play an important role in the economic well-being of tribal members. Restoring spring Chinook
salmon to the Walla Walla basin would help the tribes to exercise their treaty-reserved fishing
rights as well as provide for fishing by sport and commercial fishers.
The important role of salmon in the life of the CTUIR is reflected in the underlying mission
statement of tribal natural resource managers. The mission of the CTUIR’s Department of
Natural Resources is to protect, restore, and enhance the First Foods—water, salmon, deer, cous,
and huckleberry—for the perpetual cultural, economic, and sovereign benefit of the CTUIR.
CTUIR accomplishes this by using traditional ecological and cultural knowledge and science to
inform: 1) population and habitat management goals and actions; and 2) natural resource policies
and regulatory mechanisms.
A First Foods River Vision is used by CTUIR to define healthy floodplain characteristics
necessary for aquatic first food species, and therefore provides the basis for CTUIR project
planning, implementation, and monitoring.
Walla Walla Basin Spring Chinook Hatchery Program
1-6 Chapter 1 Purpose of and Need for Action
1.4 Recent Spring Chinook Activities in the Walla Walla Basin
Spring Chinook have essentially been absent from the Walla Walla River basin for over 75 years.
“The last run of importance was reported in 1925 and entered the river in May and early June”
(Van Cleave and Ting 1960). Losses have generally been attributed to the development of
agriculture and related irrigation diversions and channel dewatering within the basin, thus
degrading habitat and constraining fish passage (CTUIR 1990, 2001; USACE 1997). In
addition, the construction of federal hydropower dams on the Columbia River changed the
character of the mainstem migration corridor from a free-flowing river to a series of
impoundments. This development altered juvenile and adult migratory patterns, further
compromising salmonid lifecycles (CTUIR 2008).
The need for a hatchery production program to re-establish spring Chinook in the Walla Walla
basin was identified in several planning efforts, including the Council’s 1987 and 1994 Fish and
Wildlife Programs, the Walla Walla Subbasin Plan (Walla Walla County et al. 2004), and Wy-
Kan-Ush-Mi Wa-Kish-Wit (CRITFC 1995), among others. Each of these documents identifies
hatchery production as a critical element in meeting both in-basin and Columbia River Basin
salmon restoration goals.
The need for habitat improvement in the Walla Walla basin was also identified in various plans,
including the Walla Walla Subbasin Plan. The Subbasin Plan identified specific areas where
structural fish passage improvements, increased instream flows, and improved riparian habitat
would benefit all fish, including spring Chinook.
While a master plan addressing Walla Walla basin hatchery issues was being developed under
the Council’s Fish and Wildlife Program (see Section 1.3.1); and while passage, flow, and
habitat were being improved in the basin, two interim production actions to address the spring
Chinook restoration goals in the Walla Walla basin were implemented. The first action, initiated
in 2000, was an adult out-planting program. From 2000 to 2008, adult spring Chinook from
Ringold Springs Hatchery1 and the Umatilla River were out-planted into both the South Fork
Walla Walla River (Oregon) and Mill Creek (Oregon/Washington) in a program funded by
BPA.2 These fish successfully spawned and produced the first returns in 2004. The South Fork
out-plants were discontinued in 2009 as natural and hatchery returns to the upper Walla Walla
increased. The Mill Creek out-plants have continued. Adult outplants to the Touchet River
subbasin in Washington began in 2015. Lack of a consistent source of adults for out-planting
and continued infusion of out-of-basin adults limit the ability of recent and current actions to
provide enough returning adults to supply local broodstock and to meet harvest and natural
production goals for the Walla Walla basin.
Beginning in 2005, the second action implemented was a program to release 250,000 yearling
smolts in the basin. At first, smolts were produced at Little White Salmon National Fish
Hatchery (NFH); the program was transferred to Carson NFH3 in 2009. Both hatcheries are on
tributaries to the Columbia River, east of Bonneville Dam. This program, funded by National
1 Ringold Springs Hatchery is on the Columbia River north of Richland, Washington.
2 On July 31, 2001, BPA completed NEPA documentation on the Experimental Out-planting of Surplus Hatchery
Adult Spring Chinook Salmon in the Walla Walla River Basin, Project No. 2000-038-00. 3 The Little White Salmon National Fish Hatchery is on the Little White Salmon River at Cook, Washington.
Carson National Fish Hatchery is north of Stevenson, Washington, at the confluence of Wind River and Tyee
Creek.
Final Environmental Impact Statement
Chapter 1 Purpose of and Need for Action 1-7
Oceanic and Atmospheric Administration (NOAA) Fisheries under the Mitchell Act of 1938 (16
USC Section 755-757) and by Bureau of Indian Affairs, was incorporated into the 2008-2017
U.S. v. Oregon Management Agreement and remains in the new 2018-2027 Agreement. It is
expected to continue at least until a decision is made on the program that is the subject of this
EIS. Initial smolt-to-adult returns from the first three complete returns have averaged 0.33%. At
this rate, adults would not return in sufficient numbers to provide adequate fish for broodstock
development, natural production, and harvest (see Section 2.2.3).
Since spring Chinook restoration in the Walla Walla basin was first envisioned, considerable
progress has been made to improve habitat in the basin. Fish passage, including removal of
irrigation dams and installation of fish screens and ladders, has been improved. Measures to
increase year-round flows in rivers and streams have been implemented, including in the Walla
Walla River near the Oregon/Washington border. Riparian habitat has been improved through
fencing and plantings, and floodplains and river channels have been reconstructed to restore their
natural function (G. James, 2011 and pers. comm., April 2013). Similar projects continue to be
implemented throughout the basin, thus improving in-basin conditions that contribute to the
successful reintroduction of naturally reproducing populations of spring Chinook (CTUIR 2008).
Monitoring results from the adult out-plants and smolt releases are encouraging (see Chapter 3,
Section 3.2.2), suggesting that many of these measures have been effective (Schwartz et al.
2005). However, the limiting factors analysis in the Walla Walla Subbasin Plan made clear that
spring Chinook restoration and attainment of harvest and other objectives likely is not feasible
without hatchery actions (Walla Walla County and Walla Walla Basin Watershed Council 2004).
1.5 Umatilla Spring Chinook Program
The Umatilla Fish Hatchery is located adjacent to the Columbia River, 3.5 miles west of Irrigon,
Oregon. The hatchery is used for egg incubation and rearing of spring Chinook, fall Chinook
and summer steelhead for release in the Umatilla River. The Umatilla Hatchery was
recommended for development under the Council’s Fish and Wildlife Program and began
operation in 1991. BPA funds the hatchery, which is operated by the Oregon Department of Fish
and Wildlife (ODFW).
Artificial propagation of spring Chinook is used as a component of the Umatilla fisheries
restoration program to achieve natural and hatchery adult return goals as described in the
Umatilla Hatchery Master Plan (CTUIR and ODFW 1989). The 2018 Annual Operating Plan for
Umatilla Hatchery includes production of 810,000 spring Chinook smolts (54,000 pounds) for
acclimated release into the Umatilla River. The Annual Operating Plan is available at
http://www.dfw.state.or.us/fish/HOP/Umatilla_HOP.pdf.
Umatilla Hatchery’s water source consists of four satellite wells and one Ranney well that were
designed to provide 15,000 gallons per minute (gpm). (A Ranney well extracts water from an
aquifer and has connection to a surface water source like a river or lake.) Surface water is not
used at Umatilla Hatchery. Based on this amount of water, the hatchery was expected to produce
290,000 pounds of salmon and steelhead. Contrary to expectations, the water supply has never
been sufficient to meet the entire production goal since 1991 when hatchery operation began
(Bovay Northwest 1994). In 1994, the maximum flow from the Ranney collector well and the
four satellite wells was 9,000 gpm. Currently hatchery wells produce an average of only 4,700
to 5,000 gpm. When tested in 2013, water supplies at the hatchery reached an all-time low of
Walla Walla Basin Spring Chinook Hatchery Program
1-8 Chapter 1 Purpose of and Need for Action
4,736 gpm. The limited water supply has reduced current total fish production at Umatilla
Hatchery to approximately 96,500 pounds, of which 50,400 pounds are spring Chinook.
In the past, spring Chinook released into the Umatilla River were reared at out-of-basin
hatcheries; however, those groups mostly failed to meet return expectations due to poor health
and survival issues. This out-of-basin production was gradually shifted to Umatilla Hatchery,
where survival rates were 3 to 4 times higher during comparative years. To allow this shift to
happen within the existing water supply constraints, some of the spring Chinook production
needed to be transferred to acclimation ponds in November, because the hatchery does not have
the well water capacity to rear these fish through the winter. An additional reason for
implementing the fall transfer strategy came from physiological measurements collected on fish
reared at Umatilla Hatchery, which suggested that these groups may be smolting before their
release into the river (due to constant well water temperatures). Therefore, it was hypothesized
that an earlier transfer to acclimation ponds in the Umatilla basin, where fish would receive a
longer exposure to ambient river temperatures, would synchronize the timing of smoltification
with their release into the river.
The fall transfer program was successful in the early years but has been less successful recently.
During six of the first seven years, smolts were acclimated for the full term. However, in nine of
the ten years between 2004 and 2014, smolts were released in December or January instead of in
April due to icing conditions at the acclimation facilities. When comparing survival rates for the
fall transfer (no early release) to the normal acclimation period, smolt-to-adult survival rates
were approximately 31% higher for the fall transfer group (Clarke et al 2012). Since 2004,
however, survival rates for fall transfer fish released early due to icing problems were more than
80% lower than the standard transfer group released in April (Clarke et al. 2014).
Although the fall transfer strategy resulted in improved survival for years when the fall transfer
groups were acclimated full term; and though it increased rearing capacity at Umatilla Hatchery
by reducing fish biomass and water use during the critical fall-winter period when fish biomass
peaks, the benefits are offset by the significant reduction in survival when fall-transfer fish must
be released early due to icing conditions. The record adult spring Chinook return to the Umatilla
River in 2014 is thought to be largely the result of the only time in the last 10 years that fall
transfer resulted in the fish successfully acclimating for the full period (Blakely, ODFW, pers.
comm., 7-11-2014).
Moving production of Umatilla River spring Chinook to the proposed Walla Walla hatchery
would continue attempts to improve the fitness of the fish and, ultimately, their survival.
1.6 Cooperating Agencies
The CTUIR is a cooperating agency for this EIS and provided information and reviewed the EIS
for consistency with its program goals. As co-manager of fish and wildlife resources in the
Walla Walla basin with ODFW and the Washington Department of Fish and Wildlife (WDFW),
and because of its long-term cultural interest in the project, the CTUIR must consider the
potential effects of the project on the tribal community and the natural resources it manages.
ODFW is a cooperating agency on this EIS due to its role as manager of the Umatilla Hatchery
and its role, with CTUIR, as co-manager of spring Chinook in the Umatilla and Walla Walla
basins.
Final Environmental Impact Statement
Chapter 1 Purpose of and Need for Action 1-9
1.7 Public Involvement
1.7.1 Scoping
BPA published a Notice of Intent to prepare an EIS in the Federal Register on March 28, 2013.
A public comment period ending May 15, 2013 provided opportunities for interested parties to
help define the range of issues to be addressed in the EIS. Letters describing the proposed action
and upcoming public involvement opportunities were sent to property owners in the vicinity of
proposed facilities and activities; to federal, tribal, state, and local agencies and governments in
the region; and to other individuals and organizations that had expressed interest in BPA and
CTUIR projects in this area in the past. Two meetings were held to present information about
the project and to allow attendees to ask questions and provide comments to BPA on the scope of
the EIS. Meetings were in Milton-Freewater, Oregon on April 16, 2013; and in Dayton,
Washington on April 17, 2013. The CTUIR also provided comments at a meeting in Mission,
Oregon on April 18, 2013. In addition, 24 letters and phoned-in comments were received during
the scoping period, which was extended until May 15 in response to public requests. BPA
requested additional comments from June 2, 2014 to July 1, 2014 on the proposal to expand the
scope of the project to include relocation of Umatilla spring Chinook production, during which
eight comments were received.
Comments from both scoping periods included the following:
Opinions about whether the project is needed and its purposes.
Questions about whether the project is an “Accord” project and how it would be funded.
Questions about the project design—use of recirculating systems, source of electricity,
whether the project includes Nursery Bridge flow enhancement and bank stabilization,
and need for barriers to prevent fish from entering tributaries.
Suggested alternatives—use of Gardena [Burlingame] Irrigation Dam for broodstock
collection, surge tanks and gravity fed systems, alternative hatchery sites, expansion of
existing hatcheries, and the need to improve habitat first.
Questions about operation—production levels, expected return rates, timing, management
priorities, management of returning adults, hatchery operation life-span, and the
monitoring and evaluation plan.
Concerns about harvest and existing fisheries—who would be able to harvest fish, where
would they be harvested, and whether additional restrictions would be applied.
Questions about consequences of not implementing the project—financial and
employment effects on Tribes, other possible options for meeting CTUIR’s goals, and
ability of the Tribes to exercise their treaty rights.
Concerns about access to fishing sites—the potential for trespass across private property,
and the ability of tribal and non-tribal anglers to access fishing sites in areas of limited
public access.
Questions about effects on landowners’ access to their property, irrigation water, and
livestock access to the river.
Questions about economic impacts—county tax revenue, benefits of harvest, hatchery
employment, and potential impacts on minority and low-income populations.
Concerns about impacts to existing fish and wildlife and their habitat, conflicts between
hatchery and wild fish, water quantity and water rights, water quality from hatchery
effluent, health and safety.
Walla Walla Basin Spring Chinook Hatchery Program
1-10 Chapter 1 Purpose of and Need for Action
Concerns about the effects of other activities in the basin on the success of the project.
Concerns about the NEPA process—the length of the comment period, adequacy of the
mailing list, how the public will know their comments have been heard, and whether
there will be other opportunities to review the proposal.
Concerns about costs, that money is well spent.
Appendix A contains a more detailed summary of the comments and where they are addressed in
the EIS. The project website includes the full text of the written comments and a summary of the
public meeting comments. The project website is at: www.bpa.gov/goto/WallaWallaHatchery.
1.7.2 Public Review of Draft EIS
The Draft EIS was published in October 2014. A public comment period opened on October 7,
2014 and closed on November 24, 2014. Two public meetings were held to present the primary
conclusions from the DEIS and to take questions and comments on the proposal and the EIS.
The first meeting was in Dayton, Washington on October 29, 2014; the second was in Milton-
Freewater, Oregon on October 30, 2014. In addition to the comments and questions from the
public meetings, BPA received five letters and emailed comments. This section summarizes the
comments received. Appendix F includes copies of the comment letters and emails and the
comment summaries from the public meetings, and it provides responses to all the comments,
including where changes were made to the EIS if applicable.
Comments from the meetings and other comments included the following:
Questions regarding the need for the project, including whether a cost-benefit analysis
was done, and questions about project costs.
Questions about how project proponents were chosen.
Concerns that certain subjects were not addressed adequately as well as comments that
the Draft EIS adequately addressed concerns raised during scoping.
Requests for more information on the project phases and goals and on the assumptions
made about whether habitat improvements will be sufficient to sustain a restored spring
Chinook population.
Specific questions and comments on Alternatives 1 and 2.
Support for the No Action Alternative or continued habitat improvements before a
hatchery is developed.
Concerns about whether the hatchery will reduce the amount of water available to other
water users in the basin and whether hatchery withdrawals will affect riparian vegetation.
Concerns about water quality degradation from hatchery discharges and carcasses of
naturally spawning program fish.
Concerns that a restored population of spring Chinook would be listed under ESA, thus
reducing fishing opportunities for other species.
Concerns about effects on other aquatic species, including bull trout.
Concerns about harvest and existing fisheries—who would be able to harvest fish, where
would they be harvested, and whether additional restrictions would be applied.
Concerns about the potential for trespass across private property to access fishing sites.
Corrections to the gray wolf discussion and questions about effects on spotted owls.
Concerns about the effects on wildlife and habitat from removal of riparian vegetation.
Concerns about the monitoring and evaluation program.
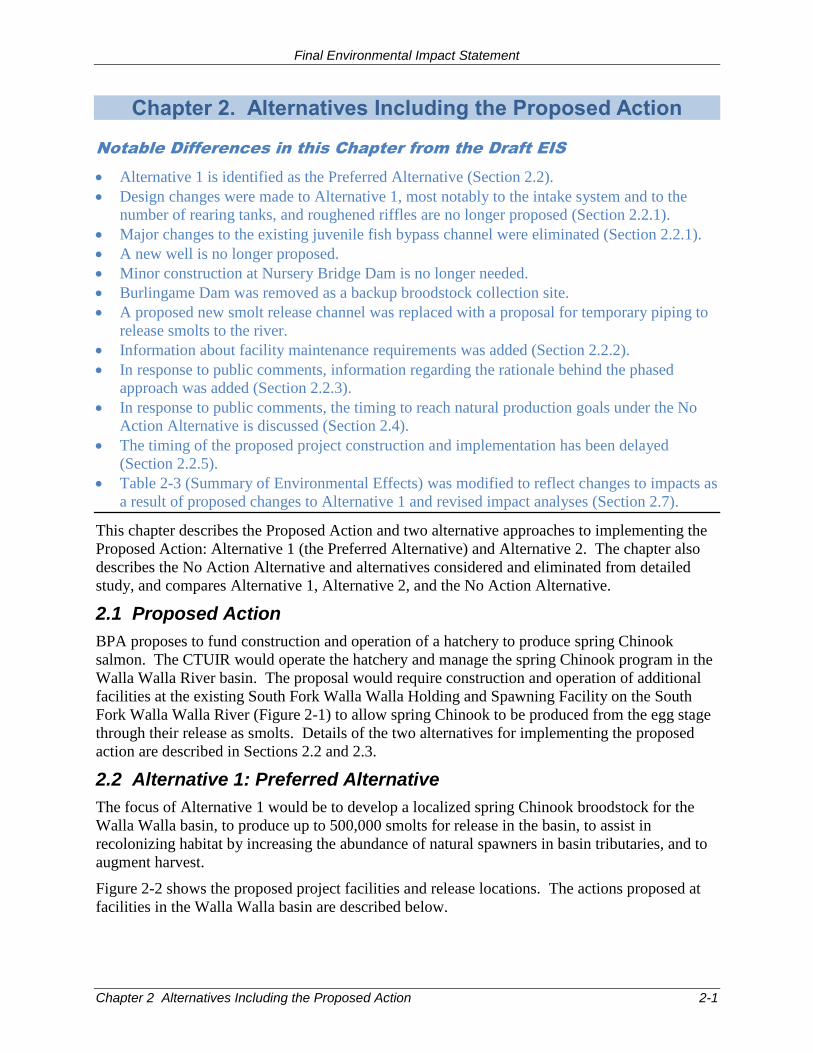
Final Environmental Impact Statement
Chapter 2 Alternatives Including the Proposed Action 2-1
Chapter 2. Alternatives Including the Proposed Action
Notable Differences in this Chapter from the Draft EIS
Alternative 1 is identified as the Preferred Alternative (Section 2.2).
Design changes were made to Alternative 1, most notably to the intake system and to the
number of rearing tanks, and roughened riffles are no longer proposed (Section 2.2.1).
Major changes to the existing juvenile fish bypass channel were eliminated (Section 2.2.1).
A new well is no longer proposed.
Minor construction at Nursery Bridge Dam is no longer needed.
Burlingame Dam was removed as a backup broodstock collection site.
A proposed new smolt release channel was replaced with a proposal for temporary piping to
release smolts to the river.
Information about facility maintenance requirements was added (Section 2.2.2).
In response to public comments, information regarding the rationale behind the phased
approach was added (Section 2.2.3).
In response to public comments, the timing to reach natural production goals under the No
Action Alternative is discussed (Section 2.4).
The timing of the proposed project construction and implementation has been delayed
(Section 2.2.5).
Table 2-3 (Summary of Environmental Effects) was modified to reflect changes to impacts as
a result of proposed changes to Alternative 1 and revised impact analyses (Section 2.7).
This chapter describes the Proposed Action and two alternative approaches to implementing the
Proposed Action: Alternative 1 (the Preferred Alternative) and Alternative 2. The chapter also
describes the No Action Alternative and alternatives considered and eliminated from detailed
study, and compares Alternative 1, Alternative 2, and the No Action Alternative.
2.1 Proposed Action
BPA proposes to fund construction and operation of a hatchery to produce spring Chinook
salmon. The CTUIR would operate the hatchery and manage the spring Chinook program in the
Walla Walla River basin. The proposal would require construction and operation of additional
facilities at the existing South Fork Walla Walla Holding and Spawning Facility on the South
Fork Walla Walla River (Figure 2-1) to allow spring Chinook to be produced from the egg stage
through their release as smolts. Details of the two alternatives for implementing the proposed
action are described in Sections 2.2 and 2.3.
2.2 Alternative 1: Preferred Alternative
The focus of Alternative 1 would be to develop a localized spring Chinook broodstock for the
Walla Walla basin, to produce up to 500,000 smolts for release in the basin, to assist in
recolonizing habitat by increasing the abundance of natural spawners in basin tributaries, and to
augment harvest.
Figure 2-2 shows the proposed project facilities and release locations. The actions proposed at
facilities in the Walla Walla basin are described below.
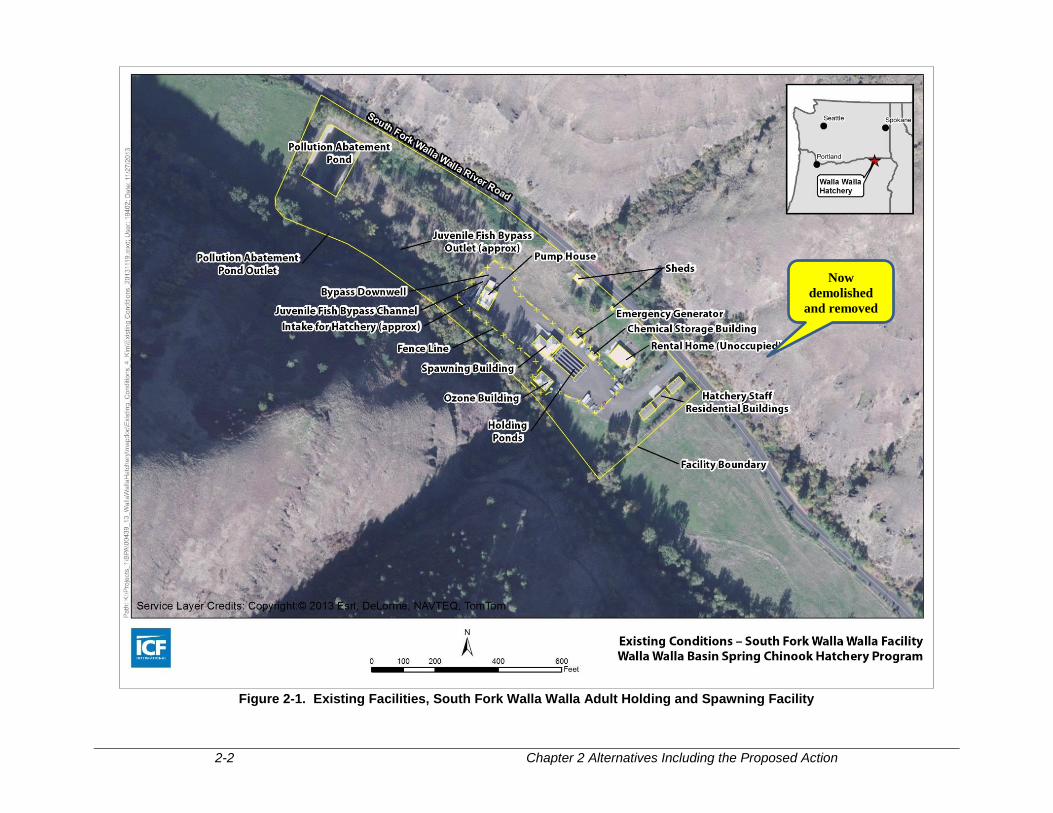
2-2 Chapter 2 Alternatives Including the Proposed Action
Figure 2-1. Existing Facilities, South Fork Walla Walla Adult Holding and Spawning Facility
Now
demolished
and removed
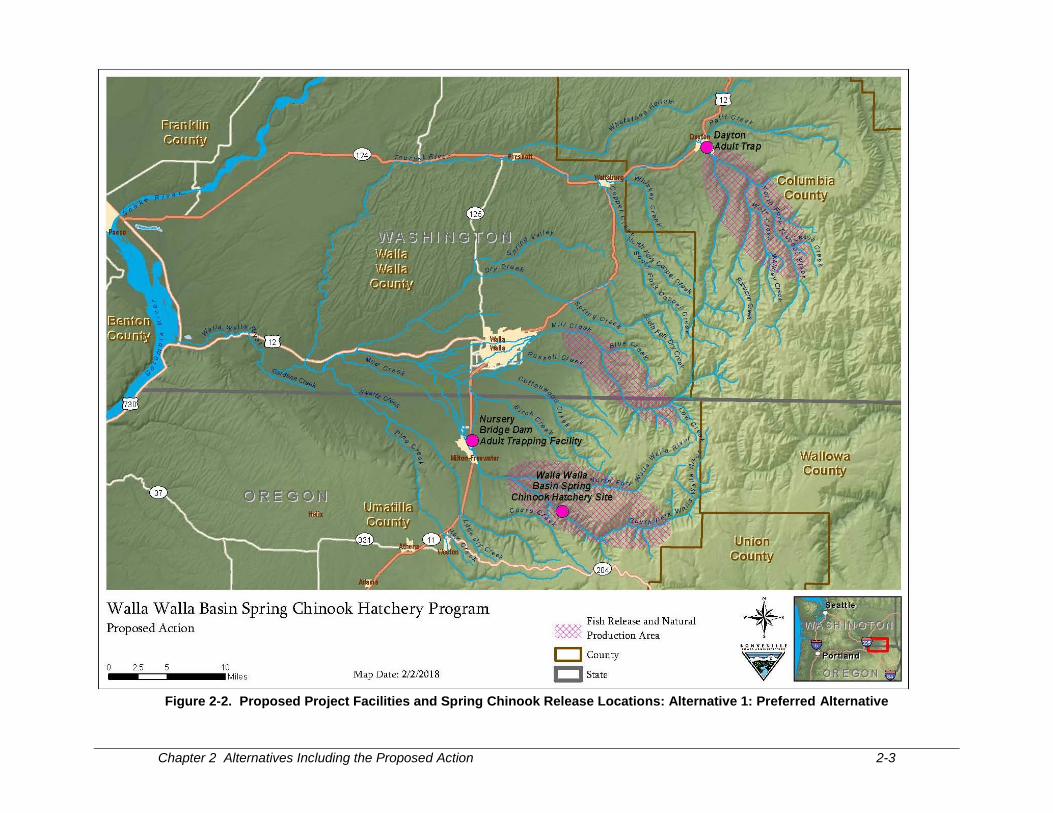
Chapter 2 Alternatives Including the Proposed Action 2-3
Figure 2-2. Proposed Project Facilities and Spring Chinook Release Locations: Alternative 1: Preferred Alternative
Walla Walla Basin Spring Chinook Hatchery Program
2-4 Chapter 2 Alternatives Including the Proposed Action
2.2.1 Facilities
Proposed Hatchery, South Fork Walla Walla River
Existing Facilities
The South Fork Walla Walla Adult Holding and Spawning facility (South Fork facility) is
located on 13 acres of BPA-owned property at river mile 5.2 of the South Fork Walla Walla
River. Figure 2-1 shows the layout of the existing facility and buildings. It has a spawning
building; holding ponds for adult fish; a surface water intake structure, including a trash rack,
screen, and juvenile bypass channel; a 430-foot long release pipe that returns juveniles from the
bypass to the river; a pump house; a pollution abatement pond (i.e., a settling pond that filters
solids from the hatchery water before it is discharged to the river through pipes 450 feet
downstream of the intake); a chemical storage building; a building that houses the emergency
generator; a building where effluent from the adult holding ponds was treated with ozone (now
decommissioned); and staff residences. Constructed in 1996, the South Fork facility currently is
operated as a satellite to the Umatilla Hatchery, which is adjacent to the Columbia River near
Irrigon, Oregon (Figure 1-1). In May and June, spring Chinook adults are collected at Three
Mile Dam on the Umatilla River and transported to the South Fork facility, where they are held
for 3-4 months until they are ready to be spawned. Once the fish are spawned, their eggs are
transported to the Umatilla Hatchery for incubation and rearing of the juvenile fish. Holding and
spawning of Umatilla program Chinook would continue at the proposed facility under
Alternative 1 and would be funded under the Walla Walla Hatchery O&M budget (BPA Project
No. 2000-038-02).
New Construction
New hatchery facilities would be constructed at the existing South Fork site. The additions
would provide for incubation, early rearing, grow-out, and final release of up to 500,000 spring
Chinook smolts. The existing adult holding and spawning facility has the capacity to handle
adult fish from the current Umatilla programs as well as the adults that would be collected and
spawned for the proposed Walla Walla basin program.
New and modified facilities, which would all be within the existing property boundaries
(Figure 2-3), include:
A new 32,634-square-foot hatchery building that would contain incubation, early rearing, and
grow-out tanks; administrative and visitor facilities; and associated equipment.
A new 3,242-square-foot shop building for operations and maintenance vehicles, equipment
storage, and a work area.
A new 816-square-foot water treatment headbox.
Modifications to the existing river intake and related structures to increase year-round
accessibility to river water, including a sluice/slide gate at the downstream end of the intake
basin to ensure adequate water elevation in the forebay. See “Hatchery Surface Water
Intake” below.
Possible replacement of the existing Johnson screen within the forebay with a new heated
horizontal traveling screen to ensure year-round operation of the intake system, as frazil ice
and anchor ice can be an issue in this watershed.. See “Hatchery Surface Water Intake”
section below for more detail.
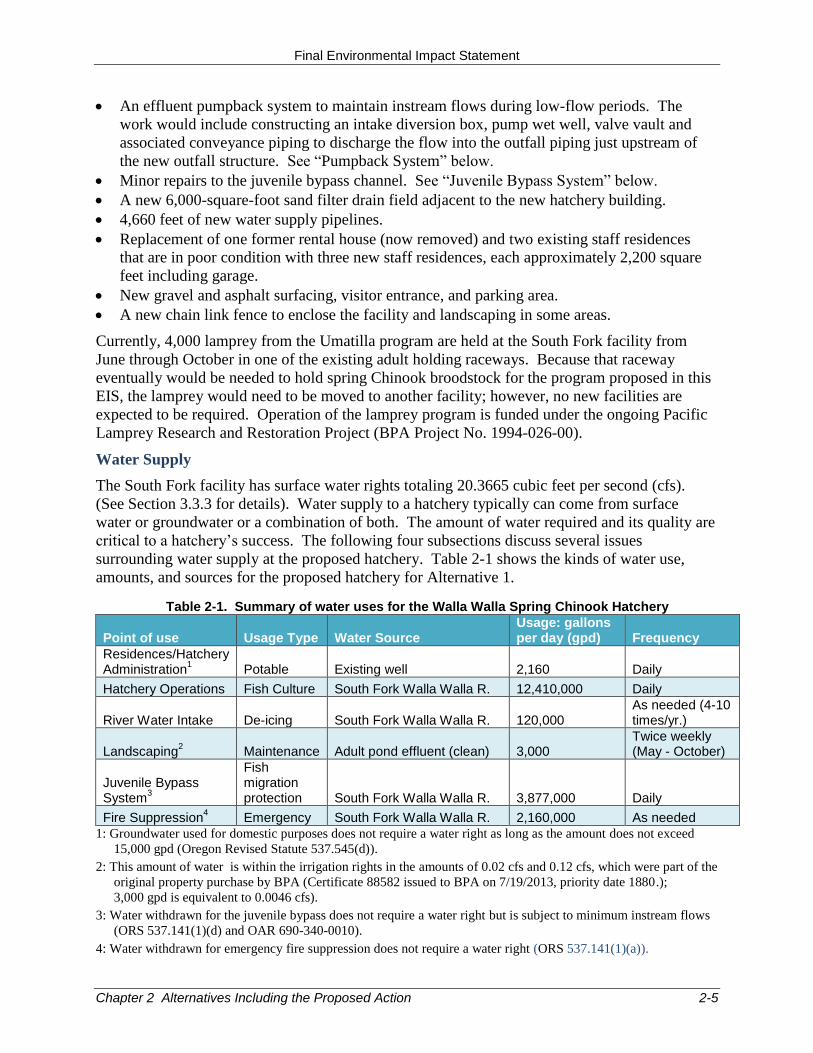
Final Environmental Impact Statement
Chapter 2 Alternatives Including the Proposed Action 2-5
An effluent pumpback system to maintain instream flows during low-flow periods. The
work would include constructing an intake diversion box, pump wet well, valve vault and
associated conveyance piping to discharge the flow into the outfall piping just upstream of
the new outfall structure. See “Pumpback System” below.
Minor repairs to the juvenile bypass channel. See “Juvenile Bypass System” below.
A new 6,000-square-foot sand filter drain field adjacent to the new hatchery building.
4,660 feet of new water supply pipelines.
Replacement of one former rental house (now removed) and two existing staff residences
that are in poor condition with three new staff residences, each approximately 2,200 square
feet including garage.
New gravel and asphalt surfacing, visitor entrance, and parking area.
A new chain link fence to enclose the facility and landscaping in some areas.
Currently, 4,000 lamprey from the Umatilla program are held at the South Fork facility from
June through October in one of the existing adult holding raceways. Because that raceway
eventually would be needed to hold spring Chinook broodstock for the program proposed in this
EIS, the lamprey would need to be moved to another facility; however, no new facilities are
expected to be required. Operation of the lamprey program is funded under the ongoing Pacific
Lamprey Research and Restoration Project (BPA Project No. 1994-026-00).
Water Supply
The South Fork facility has surface water rights totaling 20.3665 cubic feet per second (cfs).
(See Section 3.3.3 for details). Water supply to a hatchery typically can come from surface
water or groundwater or a combination of both. The amount of water required and its quality are
critical to a hatchery’s success. The following four subsections discuss several issues
surrounding water supply at the proposed hatchery. Table 2-1 shows the kinds of water use,
amounts, and sources for the proposed hatchery for Alternative 1.
Table 2-1. Summary of water uses for the Walla Walla Spring Chinook Hatchery
Point of use Usage Type Water Source Usage: gallons per day (gpd) Frequency
Residences/Hatchery Administration
1 Potable Existing well 2,160 Daily
Hatchery Operations Fish Culture South Fork Walla Walla R. 12,410,000 Daily
River Water Intake De-icing South Fork Walla Walla R. 120,000 As needed (4-10 times/yr.)
Landscaping2 Maintenance Adult pond effluent (clean) 3,000
Twice weekly (May - October)
Juvenile Bypass System
3
Fish migration protection South Fork Walla Walla R. 3,877,000 Daily
Fire Suppression4 Emergency South Fork Walla Walla R. 2,160,000 As needed
1: Groundwater used for domestic purposes does not require a water right as long as the amount does not exceed
15,000 gpd (Oregon Revised Statute 537.545(d)).
2: This amount of water is within the irrigation rights in the amounts of 0.02 cfs and 0.12 cfs, which were part of the
original property purchase by BPA (Certificate 88582 issued to BPA on 7/19/2013, priority date 1880.);
3,000 gpd is equivalent to 0.0046 cfs).
3: Water withdrawn for the juvenile bypass does not require a water right but is subject to minimum instream flows
(ORS 537.141(1)(d) and OAR 690-340-0010).
4: Water withdrawn for emergency fire suppression does not require a water right (ORS 537.141(1)(a)).
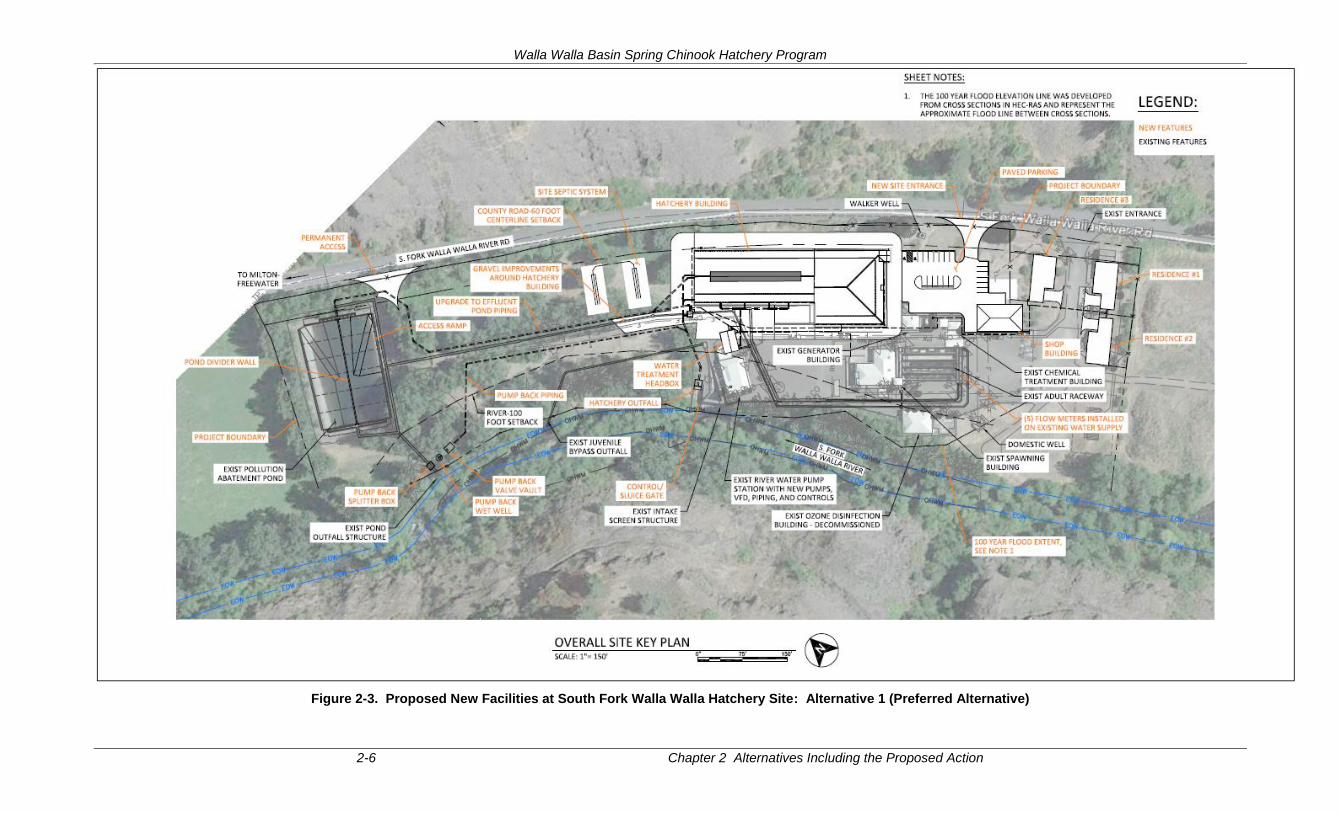
Walla Walla Basin Spring Chinook Hatchery Program
2-6 Chapter 2 Alternatives Including the Proposed Action
Figure 2-3. Proposed New Facilities at South Fork Walla Walla Hatchery Site: Alternative 1 (Preferred Alternative)
Final Environmental Impact Statement
Chapter 2 Alternatives Including the Proposed Action 2-7
Surface Water and Rearing Methods
The original proposal presented during scoping meetings in spring of 2013 assumed use of 16
outdoor rectangular raceways to rear the fish to smolt stage (see Section 2.5.3). Water use
analyses indicated that during periods of maximum water use, hatchery water requirements could
exceed the hatchery’s water right of 20.3665 cubic feet per second (cfs). As a result, BPA and
CTUIR decided to propose use of circular tanks for the rearing and grow-out phases of fish
production. Sixteen 10-foot-diameter rearing tanks and ten 30-foot-diameter grow-out tanks
would accommodate rearing of up to 500,000 spring Chinook to smolt stage, with an estimated
maximum water withdrawal requirement of 19.2 cfs for all spring Chinook adult holding,
incubation and rearing requirements. This amount is greater than the amount proposed in the
Draft EIS because project managers wanted to add more rearing tanks in order to reduce fish
densities, which would improve the health and condition of the smolts at release. The proposal
in the Draft EIS was for only ten 24- to 27-foot-diameter tanks.
Compared with traditional raceways, circular tanks allow hatchery operators to optimize various
operational criteria (e.g., rearing densities, flow rates, fish swimming speed, and water
conditioning goals) to achieve the desired level of fish production with available water flows.
This is because a circular shape can improve rearing conditions through self-cleaning flow
patterns and by better distribution of dissolved oxygen while using less water and minimizing
crowding that can occur at the upstream end of rectangular raceways.
Smolts destined for the South Fork Walla Walla River would be released to a quiet area below
the pumpback outfall via temporary pipes connected to pumps. Smolts destined for the Touchet
River would be trucked to the release site and gravity-discharged from the truck.
Pumpback System
To further minimize water withdrawal effects, a pumpback system is proposed. With circular
rearing tanks, approximately 80% of the water withdrawn for hatchery use would be returned to
the river at the main outfall structure approximately 5 feet from the downstream end of the
intake; the remainder (up to 5 cfs), which contains the solids that collect at the bottom of the
tanks, would be routed through the pollution abatement pond. A pump and pipe would be
installed that would return clean water from the pollution abatement pond back to the main
outfall structure when instream flows approach minimums, thus ensuring no reduction in river
flows in the 450-foot section of river between the intake and pollution abatement outfall that
would otherwise occur. The system would be used only when the hatchery’s withdrawals from
the river would reduce river flows below state-established instream flows, or when river flows
are already below instream minimums. Equipment would be installed in the hatchery to allow
daily monitoring of flows recorded at a new gauge upstream of the hatchery at Harris Park.
Chapter 3, Section 3.3, discusses the water supply issues and their impacts in detail.
Hatchery Surface Water Intake
Tests conducted during the initial planning stage for this project indicated that the intake
structure that provides river water to the existing adult holding and spawning facility might not
be able to supply the full amount of water needed for the proposed hatchery during certain
conditions, such as during low-flow periods or cold weather. The river bed is now a foot lower
than when the South Fork facility was constructed in 1996, which means the average water level
is also lower. Subsequent tests showed that modifications to ensure adequate water supply to the
Walla Walla Basin Spring Chinook Hatchery Program
2-8 Chapter 2 Alternatives Including the Proposed Action
hatchery are more limited than was anticipated in the Draft EIS and now require only installation
of a sluice gate at the downstream end of the intake basin to maintain proper water surface
elevations in the intake forebay. All work would be on existing structures, and only limited in-
water work would be required. No roughened riffle or other instream work is proposed.
Sluice gate: An upward-opening sluice gate at the end of the intake sluice channel would be
installed to replace the existing dam boards. The purpose of the gate is twofold: 1) to maintain a
constant water surface elevation in the intake forebay that allows adequate submergence for the
pumps, and 2) to enable any bedload material that accumulates in the channel to be washed
away. Installation of the sluice gate would require a small cofferdam around the end of the
sluiceway during the in-water work period only. The existing concrete sluiceway would be
modified to include channel guides and steel support for the sluice gate. The sluice gate would
slide into the guides and seal along the bottom of the sluice channel. The gate’s framing would
be grouted into place to avoid leakage.
Intake de-icing. Experience at the existing facility in the winter has shown that ice builds up at
the intake, thus affecting the amount of water that can be withdrawn to supply the hatchery. By
maintaining the depth of water with the sluice gate at the intake screens, the effects of ice can be
reduced while maintaining sufficient open surface area to adequately supply the hatchery. It is
not certain if additional equipment would be needed, and the existing screen was NOAA-
compliant when it was installed. If needed to further reduce icing effects, the existing screen
could be replaced with a NOAA-compliant screen system, which would be a combination of
plastic materials, moving screens, and/or a screen heating system. The heating system
(potentially heating coils with reuse water) would provide just enough heat to prevent frazzle ice
from adhering to the screen. If a heating system is incorporated, it would be used only during
brief periods of extreme cold temperatures. All new screen components would be installed
within the concrete area of the intake, so in-water work area isolation within the river would not
be required.
Juvenile Bypass System
The existing facility includes a bypass system that keeps juvenile fish from entering or impinging
on the surface water intake. The bypass system requires 4-6 cfs to operate. The bypass exit is
250 feet downstream of the intake. Although the bypass does not require a water right, Oregon
Water Resources Department (OWRD) considers any withdrawals to operate the bypass that
reduce instream flows below the mandated minimum instream flows, or below natural flows
without any withdrawals, as injurious to the instream flow water right, which is senior to the
hatchery water right. Because water from the bypass cannot be pumped back without potentially
injuring fish in the bypass, there are times when withdrawals to operate the bypass, combined
with withdrawals for hatchery operations, could reduce flows for the 250 feet between the inlet
and exit of the bypass structure, even with the pumpback system operating. BPA and CTUIR
propose to close the bypass when its operation would otherwise cause instream or natural flows
to be below the mandated minimums. Estimated timing for such closures and their effects are
discussed in Section 3.5.4.
Minor repairs to walls in the bypass channel are proposed. Over the life of the facility, the
concrete walls that form the channel guiding fish into the bypass pipe have tilted/buckled
slightly, precluding the removal of the stoplogs within the channel. The backfill against the
walls would be removed and the walls “jacked” out with hydraulic rams to their designed
Final Environmental Impact Statement
Chapter 2 Alternatives Including the Proposed Action 2-9
position. Structural cross braces would maintain the walls in a plumb position and the walls
would be backfilled with concrete material and aggregates. Any cracks that have formed due to
the deformation of the walls would be repaired with standard concrete repair methods. No other
modifications to the fish bypass are anticipated. This work would be done under dry conditions
and no work would be done in the river, so no work-area isolation would be required.
Groundwater
Two groundwater aquifers underlie the South Fork facility: the Columbia River Basalt aquifer,
which can reach depths of several thousand feet throughout its range, and a shallower alluvial
aquifer, which is thought to occur at depths of up to approximately one hundred feet at the
project site.
The project site is currently served by a well that draws from the deeper basalt aquifer (at a depth
of approximately 180 feet). Water from this well is treated and used only for domestic purposes
at the residences and in the adult spawning building. Water free of hydrogen sulfide and related
ions is needed to rear salmon, and the current well poses a significant treatment problem for
these substances. Although groundwater is generally considered to provide cleaner water with
more constant and manageable temperatures (particularly important for the incubation period,
when fish are more vulnerable); and use of well water also minimizes the need to treat incoming
surface water for incubation; surveys and test wells completed in the spring of 2014 found
insufficient supplies of accessible groundwater from the shallow aquifer. Therefore, only
disinfected surface water would be used for incubation at the hatchery. Domestic needs would
be supplied from the existing well.
The existing facility does not hold a groundwater permit because domestic use is exempt from
requiring a permit as long as flow is limited to no more than 15,000 gallons per day and the use
is considered to be beneficial (OWRD 2013b; Oregon Revised Statute 537.545(d)). The existing
well at the facility falls within this exemption. A conservative estimate assumes domestic uses
for the hatchery and residences would require a total of about 2,160 gallons per day, which
would not exceed the exemption threshold.
Proposed Broodstock Collection Facilities
Nursery Bridge Dam Adult Trap
Broodstock for the Walla Walla Hatchery program would be collected at the existing adult
trapping facility on the Walla Walla River in Milton-Freewater, Oregon (Figure 2-1). No
construction would be required. Changes to existing operations at this trap are discussed in
Chapter 3, Section 3.5.
Dayton Adult Trap
Broodstock would be collected at Dayton Trap on the Touchet River in the Washington portion
of the Walla Walla basin if returns are sufficient to do so after meeting natural spawning and
harvest goals for the Touchet. The trap is operated by Washington Department of Fish and
Wildlife (WDFW) for steelhead about nine months of the year. If this trap is used, spring
Chinook broodstock collections would be done with existing facilities under existing operating
conditions. Currently, spring Chinook adults are collected at the trap and passed upstream for
natural spawning; that activity would continue under the proposed project.
Walla Walla Basin Spring Chinook Hatchery Program
2-10 Chapter 2 Alternatives Including the Proposed Action
2.2.2 Operations
Program Goals
CTUIR’s goals for the Walla Walla spring Chinook hatchery program are to (1) provide in-basin
harvest for treaty and non-treaty fisheries and (2) restore natural spawning. The presence of
naturally spawning salmon in the river in places and times where they spawned historically is of
cultural value to the CTUIR (CTUIR 2013). To meet these goals, the program would be
implemented in three phases, moving from one phase to another based on predefined numeric
“triggers.” The phases and triggers are discussed in Section 2.2.3.
Actions proposed to meet the program goals include:
Develop a locally adapted broodstock.
Produce spring Chinook smolts capable of surviving and returning as adults in sufficient
numbers to provide harvest opportunities, broodstock, and natural spawning.
Release smolts in areas where adults are expected to return.
Plant adults in streams where natural spawning is expected to be successful.
These actions are described in more detail below.
Broodstock Development
The program’s goal is to develop a broodstock (fish used in the hatchery for breeding) that is
adapted to conditions in the Walla Walla River system. A locally adapted broodstock is
expected to increase the percentage of fish that return as adults over what has been seen from
releases of out-of-basin fish. Currently, the spring Chinook smolts out-planted in the South Fork
Walla Walla River are the progeny of a lower Columbia River hatchery stock (Carson stock) that
are incubated and reared to smolt stage at Carson Fish Hatchery near Bonneville Dam. To
develop a locally adapted Walla Walla basin stock, approximately 350 adults that return to the
Walla Walla basin would be collected at the Nursery Bridge Dam fishway to provide the
broodstock for the hatchery, although returns in early years might not be sufficient to meet this
number and might need to be supplemented by adults or eggs from other basins. As survival
rates and hatchery returns increase and more fish are produced in the natural environment
(natural production), the progeny from of out-of-basin adults would be reduced or eliminated,
and the percentage of natural-origin4 adults in the broodstock would increase. After returns to
the Touchet River become established, broodstock might also be collected at the Dayton Trap.
Section 2.2.3 discusses details of the methods proposed to develop the broodstock.
Spring Chinook Production
Spring Chinook eggs from the broodstock would be incubated, then hatched and reared to smolt
stage at the South Fork facility, with the goal of providing up to 500,000 smolts for release in the
basin. These numbers are expected to eventually produce enough returning adults to provide for
broodstock needs, to meet the goals for treaty and non-treaty harvest in the Walla Walla basin,
and to provide for natural spawning.
4 Adult returns to the basin that are progeny of fish that spawned in the natural environment are called natural-origin
returns or natural-origin recruits (NORs); adults that return from smolts raised in the hatchery and released in the
basin are called hatchery-origin returns or hatchery-origin recruits (HORs).
Final Environmental Impact Statement
Chapter 2 Alternatives Including the Proposed Action 2-11
Smolt Releases
Initially, the program proposes to release up to 400,000 smolts from the hatchery into the South
Fork Walla Walla River, with up to 100,000 smolts proposed for release into the Touchet River
in Washington, near Dayton. The smolts released into the South Fork would be released into the
river from the hatchery when they are ready to migrate. The Touchet fish would be trucked to
the release site as smolts and directly released into the stream. The exact release point in the
Touchet has not been determined but would be in the reach from the town of Dayton upstream to
the confluence of the North Fork Touchet River and Wolf Creek (RM 53-55) (Figure 2-1).
Release numbers could vary as the program develops, and would be determined by management
criteria or “Decision Rules” (see Section 2.2.3). In the final phase of the program, the number of
smolts released into the South Fork Walla Walla River would be reduced (see Section 2.2.3,
Phase 3). The program would continue to release 100,000 yearlings each year into the Touchet
in all phases of the proposed program.
Adult Out-plants
An ongoing program of planting adults would continue in streams where natural spawning is
expected to be successful. This program was begun in 2000 and was undertaken as an interim
measure, to contribute to the CTUIR’s cultural objective of having fish spawn where they did in
the past, and to jump-start natural production until a full in-basin hatchery program could be
proposed and implemented. As the proposed program matures and adult returns from the
hatchery releases increase, the number of adults planted in Mill Creek and the Touchet River
would be increased (up to a total of 450 fish in each subbasin).
Transportation Requirements
Current operations at the South Fork facility require adult spring Chinook for the Umatilla
program to be transported from Three Mile Dam on the Umatilla River to the South Fork facility
for holding and spawning. The number of trips per year averages 31. These trips would
continue, but as noted in Section 2.2.1, are not part of Alternative 1.
An average of 31 trips each year from Nursery Bridge Dam to the South Fork facility, a distance
of 13 miles, would be required to provide broodstock for the Walla Walla program. Adult out-
plants to the Touchet River (a 50-mile trip) and Mill Creek (a 30-mile trip) would require 3 to 10
trips from the South Fork facility each year, depending on the size of the transport vehicle and
the number of adults available for out-planting. Smolt releases into the Touchet River would
require between 2 and 5 trips from the hatchery to the release site, also depending on the size of
the truck. However, the four 200-mile trips required to transport smolts from Carson Hatchery in
the lower Columbia River to the South Fork facility would cease.
Facility Maintenance Requirements
Silt would be removed from the intake bay monthly using a vacuum brush. The material would
be discharged to a manhole and from there it would flow to the abatement pond. Debris removal
from the intake trash rack would be done as needed (as is done currently) using a jib crane
installed at the intake structure, eliminating the need to work instream. Silt and debris would be
disposed at an approved disposal site.
Walla Walla Basin Spring Chinook Hatchery Program
2-12 Chapter 2 Alternatives Including the Proposed Action
2.2.3 Phased Approach and Management Criteria
The program would be implemented in three phases, moving from one phase to another based on
predefined “triggers.” Section 2.3.1 of the Master Plan (CTUIR 2013) details assumptions that
provide the basis for the proposed action and the three-phased approach. The following, from
the introduction to that section, summarizes the nature of the assumptions.
Natural spring Chinook production potential is based on updated Ecosystem Diagnosis and
Treatment (EDT) habitat analysis. EDT results for current South Fork Walla Walla River
habitat conditions were used to generate a Beverton-Holt production function used to
estimate natural production potential for Phase 1 and 2. The Beverton-Holt function is a
population model for predicting an expected number of individuals from one generation to
the next. For Phase 3, the analysis is based on an assumption that habitat will improve
consistent with that described in the Snake River Recovery Plan for Southeast Washington
(Recovery Plan) (SRRB 2011, Appendices D and E).
Out-of-basin survival and harvest rates are based on data presented in:
• The Comparative Survival Study (CSS) (Tuomikoski et al. 2012) (http://www.fpc.org/)
and
• The 2010 Federal Columbia River Power System Supplemental Consultation (NOAA
2010).
Hatchery operation assumptions were developed specifically to meet program objectives.
The two primary assumptions that determine whether the program purpose will be achieved
are:
1. Smolt to adult return rates for hatchery yearlings
2. Forecast of habitat quality and quantity in Phase 3
The phases reflect different natural and hatchery survival conditions and therefore differ in
purpose and in the priority for disposition of the returning adults.
Phase 1: Local Adaptation, Natural Spawning and Harvest
Phase 2: Harvest Augmentation and Transition to an Integrated Program
Phase 3: Integrated Harvest and Demographic Safety Net
The transitions from phase to phase are driven by biological criteria, not scheduled time frames,
as described for each phase below. A set of management criteria (Decision Rules) would be
used to manage each phase of the program, as detailed in the Master Plan (CTUIR 2013). The
rules are designed to ensure that program objectives are achieved over time. The triggers are
based on natural production and harvest goals established in the Walla Walla Subbasin Plan
(Walla Walla County et al. 2004) and the Wy-Kan-Ush-Mi Wah-Kish-Wit tribal fish restoration
plan (CRITFC 1995). It is expected that the criteria for Phase 1 would be met soon after the new
hatchery is in operation, and that, unless current habitat quality has been underestimated, Phase 2
would begin soon after opening the new hatchery and continue for at least 15 years.
Project proponents recognize that there is uncertainty about natural production capacity and
hatchery survival, and that therefore there is a chance that the criteria for transitioning to Phase 3
might be observed sooner than expected, or that a “false trigger” might cause a transition to
Phase 3 before natural production is sustainable. Hence, the project proposes to revert to Phase 2
if the three-year running average falls below 300 natural-origin returns. It is possible that the
Final Environmental Impact Statement
Chapter 2 Alternatives Including the Proposed Action 2-13
program would shift back and forth between Phase 2 and Phase 3, in a sense probing the ability
of the natural environment to sustain a naturally spawning population.
The following section summarizes the goals of each phase and the criteria that would be used to
determine when the program is ready to move into the next phase (CTUIR 2013).
Phase 1: Local Adaptation, Natural Spawning, and Harvest
In Phase 1, the hatchery program would:
Develop a locally adapted hatchery population of spring Chinook.
Produce the fish needed to populate habitat in the basin.
Provide an in-basin harvest.
The program would use the returning hatchery-origin and natural-origin adults in the following
priority:
1. Meet hatchery broodstock needs, using local returns to the extent possible.
2. Provide adults for natural spawning, with release locations and out-planting strategies
designed to encourage full use of available habitat.
3. Provide harvest in the basin for tribal and sport fisheries when run size allows.
Phase 1 would move to Phase 2 when the three-year running average (geometric mean)5 of
natural-origin plus hatchery-origin returning adults is greater than 1,000. The value of 1,000 was
selected as an indicator that the hatchery program could now rely solely on returns to the Walla
Walla basin as broodstock (CTUIR 2013). Fish counts at dams and spawning surveys would be
used to estimate total adult returns to the basin each year.
Phase 2: Harvest Augmentation and Transition to an Integrated Program
In Phase 2, the program would:
Provide fish for in-basin tribal and sport fisheries.
Begin the transition toward an integrated harvest program.6
Continue to produce the fish needed to populate habitat in the basin.
In Phase 2, the survival rate of the hatchery population is expected to improve, because the
broodstock would then be all from Walla Walla basin returns. The survival rate of the hatchery
fish released in the basin as smolts that return to the basin as adults (smolt-to-adult return [SAR])
is expected to exceed 0.55 percent over time; the current survival rate of smolts reared out-of-
basin and released without acclimation into the South Fork Walla Walla is 0.33 percent, which is
not sufficient to meet harvest, broodstock, and natural production goals (CTUIR 2013).
In Phase 2, the program would use the returning hatchery-origin and natural-origin adults in the
following priority:
5 The geometric mean is a type of or mean . It indicates the typical value of a set of numbers by using the average
product of their values (as opposed to the which uses their sum). The geometric mean is defined arithmetic mean
as the of the nth root of the numbers (where n is the count of numbers in the set). product6 An “integrated harvest program” is an integrated hatchery program, the purpose of which is to provide harvest. “A
fundamental purpose of an integrated hatchery program is to increase abundance [for harvest], while minimizing
the genetic divergence of a hatchery broodstock from a naturally spawning population” (HSRG 2009). This is
achieved by incorporating natural-origin spawners in the hatchery broodstock. See Glossary (Chapter 8) for more
detailed definition of an integrated hatchery program.
Walla Walla Basin Spring Chinook Hatchery Program
2-14 Chapter 2 Alternatives Including the Proposed Action
1. Meet hatchery broodstock needs, using only fish returning to the Walla Walla River basin
(i.e., eliminating out-of-basin broodstock). A minimum of 20 percent (calculated as a
five-year running average) of the broodstock would be made up of natural-origin returns.
2. Achieve an escapement target of 1,100 adults (natural-origin plus hatchery-origin) to the
South Fork Walla Walla River. (Escapement is the number of fish allowed to “escape”
harvest and broodstock collection to spawn naturally.)
3. Provide adults/jacks for harvest in sport and tribal fisheries.
4. Provide adults for natural spawning in Mill Creek and the Touchet River, with release
locations and out-planting strategies designed to encourage full use of available habitat.
Non-treaty sport fisheries would harvest primarily hatchery-origin fish. Tribal fisheries could
include both natural- and hatchery-origin fish, numbers of which would be based on a sliding
scale depending on the run size. Hatchery-origin fish surplus to broodstock and natural
spawning escapement would be out-planted into the Touchet River or Mill Creek, or harvested.
Phase 2 would move to Phase 3 when the three-year running average of natural-origin adult
returns to the basin is greater than 750 as measured at Nursery Bridge Dam. This abundance
level is chosen as an indication that the natural population may be able to support an integrated
harvest program. The Interior Columbia Basin Technical Recovery Team (ICTRT) abundance
criterion for the smallest viable spring Chinook population is 500 adults (ICTRT 2007).
If the three-year geometric mean of hatchery-origin plus natural-origin adult returns to the basin
falls below 310 as measured at Nursery Bridge Dam, the managers would consider reverting to
the Phase 1 Decision Rules. Based on assumptions about such factors as the number of eggs per
female, the percentage of adults collected that are female, and survivals through the incubation
and rearing process, CTUIR estimates that 310 is the minimum number of adults needed to meet
smolt release targets. They might also reevaluate the choice of broodstock for the program
(CTUIR 2013). Detailed rationale for the numbers is in the Master Plan (CTUIR 2013).
Phase 3: Integrated Harvest and Demographic Safety Net
Phase 3 purposes differ for the South Fork Walla Walla and the Touchet/Mill Creek systems.
The purpose of the South Fork component of the hatchery program in Phase 3 is to augment
harvest through an integrated harvest program and provide a demographic safety net for the
natural population in case the natural population is reduced. The purpose of the Touchet River
component of the program would continue to be natural spawning and harvest.
Hatchery-origin adults surplus to broodstock and South Fork Walla Walla River escapement
needs would be released in Mill Creek or the Touchet River, or would be used to meet
subsistence needs of the CTUIR. Note that the Touchet is not expected to increase natural spring
Chinook production in the foreseeable future due to degraded habitat and passage conditions
which are unlikely to improve substantially in the near future; hence the need for continued out-
planting of hatchery fish to support natural spawning.
If the three-year geometric mean of natural-origin adult returns to the basin falls below 300, as
measured at Nursery Bridge Dam, managers would consider reverting to the Phase 2 Decision
Rules (CTUIR 2013). Rationale for this number is in the Master Plan (CTUIR 2013).
The South Fork Walla Walla smolt release numbers would be reduced as the 5-year geometric
mean of the total returns to the Walla Walla reaches 5,500 adults (natural-origin plus hatchery-
origin). The South Fork releases would be considered for reduction or termination when the 5-
Final Environmental Impact Statement
Chapter 2 Alternatives Including the Proposed Action 2-15
year mean return exceeds 5,500 natural-origin adults. The Touchet program would continue to
release 100,000 yearlings each year. It would serve two purposes in the long term: 1) as a safety
net for the South Fork natural population, and 2) as continued support for natural spawning and
harvest in the Touchet River. The South Fork program may be reinstated if it falls below the
abundance triggers.
The Master Plan, as quoted below, acknowledges the uncertainty of being able to reach a self-
sustaining population of spring Chinook that would be sufficient to meet both harvest and natural
spawning goals.
Global climate change may cause Walla Walla River temperatures to increase over time.
This change may be sufficient to overwhelm the beneficial actions being undertaken to
improve habitat conditions in the basin. The end result may be that sustainable natural
spring Chinook production may not be possible. Therefore, the need to use artificial
production to meet harvest goals may continue indefinitely. This possibility is the reason
that management triggers are used to determine when one phase of the program ends and
another begins (CTUIR 2013).
2.2.4 Monitoring and Evaluation
Monitoring and evaluation for the Walla Walla spring Chinook program would be conducted by
CTUIR and WDFW under the existing Walla Walla River Basin Monitoring and Evaluation
project (BPA Project No. 2000-039-00). This project, in part, seeks to describe the fish
performance, status and trend data for ESA recovery, population restoration, and “First Foods”
management within the Umatilla Indian Reservation ceded lands. The program identifies
hatchery fish using PIT tags, fin-clips, and coded-wire tags to monitor their survival through
various stages of their migration and their rate of survival to adults. Salmonids, including
steelhead and bull trout as well as spring Chinook, are also trapped at existing juvenile and adult
traps throughout the basin; and spawning areas in the Walla Walla and Touchet rivers and Mill
Creek are surveyed to count redds7 and estimate natural production. These activities, which
would continue regardless of the decision made on the proposed project, would provide the
means to evaluate the success of the hatchery program. Specifically, the program would:
Determine estimates for natural- and hatchery-origin fish to quantify Viable Salmonid
Population Parameters in the Walla Walla basin.
Determine if the hatchery program is achieving its biological objectives for each program
phase.
Determine program effectiveness in terms of survival and reproductive success of
hatchery fish.
Determine progress toward harvest and natural spawning goals.
Determine whether hatchery fish are straying into other river basins besides the Walla
Walla basin.
The existing program operates under permit number TE844468-11 from U.S. Fish and Wildlife
Service (USFWS) and permit number 16466-2R from National Marine Fisheries Service
(NMFS). Currently there is no proposal to change the kinds of monitoring and evaluation
activities and their locations in the natural environment, and the impacts of the in-hatchery-
7 A redd is a nest the fish digs in the river gravel in which to deposit its eggs.
Walla Walla Basin Spring Chinook Hatchery Program
2-16 Chapter 2 Alternatives Including the Proposed Action
components of the program would not affect other resources (see Section 3.5.5). Appendix B
summarizes the hatchery program’s monitoring and evaluation plan.
2.2.5 Construction Schedule, Personnel, and Equipment Requirements
If BPA decides to fund Alternative 1, construction is expected to begin in July of 2018 and
completed by winter of 2019. The first smolt releases from new production would be in 2021.
At the peak of construction, there would be a maximum of 40 to 60 workers working at the same
time. Based on an expected 16-month construction period, estimates of the type of vehicles that
could be used to transport equipment, materials, and workers to the hatchery site are listed in
Appendix C. During the 11 months of maximum construction activity at the hatchery site,
cement mixers, dump trucks, and vehicles to transport larger construction equipment such as
excavators would average about 10 different vehicles for a total of 20 trips per vehicle per
month. Effects of construction activities are discussed in appropriate sections of Chapter 3.
2.2.6 Funding: Alternative 1
Funding for construction and operation of this project would come from BPA’s Fish and Wildlife
Program budget, which helps fund the regional program to protect and rebuild fish and wildlife
populations affected by hydropower development in the Columbia River Basin.
2.3 Alternative 2
In addition to the 500,000 spring Chinook for the Walla Walla basin, under Alternative 2, up to
810,000 spring Chinook for the existing Umatilla basin program would be incubated and reared
to the smolt stage at the proposed Walla Walla Hatchery, for a total production of 1,310,000 fish.
Spring Chinook would no longer be reared at Umatilla Hatchery.
Broodstock for the Umatilla program would continue to be collected at Three Mile Dam
(Figure 2-4), and those adults would continue to be held and spawned at the existing South Fork
Walla Walla Holding and Spawning Facility as they are currently; however, their eggs would be
incubated and reared at the proposed Walla Walla Hatchery for production of the Umatilla stock.
The additional 810,000 spring Chinook smolts reared at the proposed Walla Walla Hatchery
would be transported to two existing sites in the Umatilla basin, Imeques and Thornhollow, for
acclimation and release (see Figure 2-4). Spring Chinook are acclimated and released at these
sites under the current Umatilla spring Chinook program.
2.3.1 Facilities
Most facility requirements for Alternative 2 would be the same as for Alternative 1, with the
following exceptions.
An additional 17 circular tanks to accommodate the production of the 810,000 Umatilla
spring Chinook smolts, for a total of 27 circular tanks, each approximately 24 – 27 feet in
diameter, in a grow-out building of 51,880 square feet (Figure 2-5).
Installation of a water reuse system in addition to the pumpback system. Figure 2-6
under “Water Reuse System” below shows how the water reuse system works with
circular rearing tanks. The option of delaying installation of the reuse system is also
being considered. The water use requirements and impacts of the immediate or delayed
installation and use of these systems are discussed in Chapter 3, Section 3.3.
An additional 1,260 linear feet of piping, for a total of 5,960 feet of new pipe.
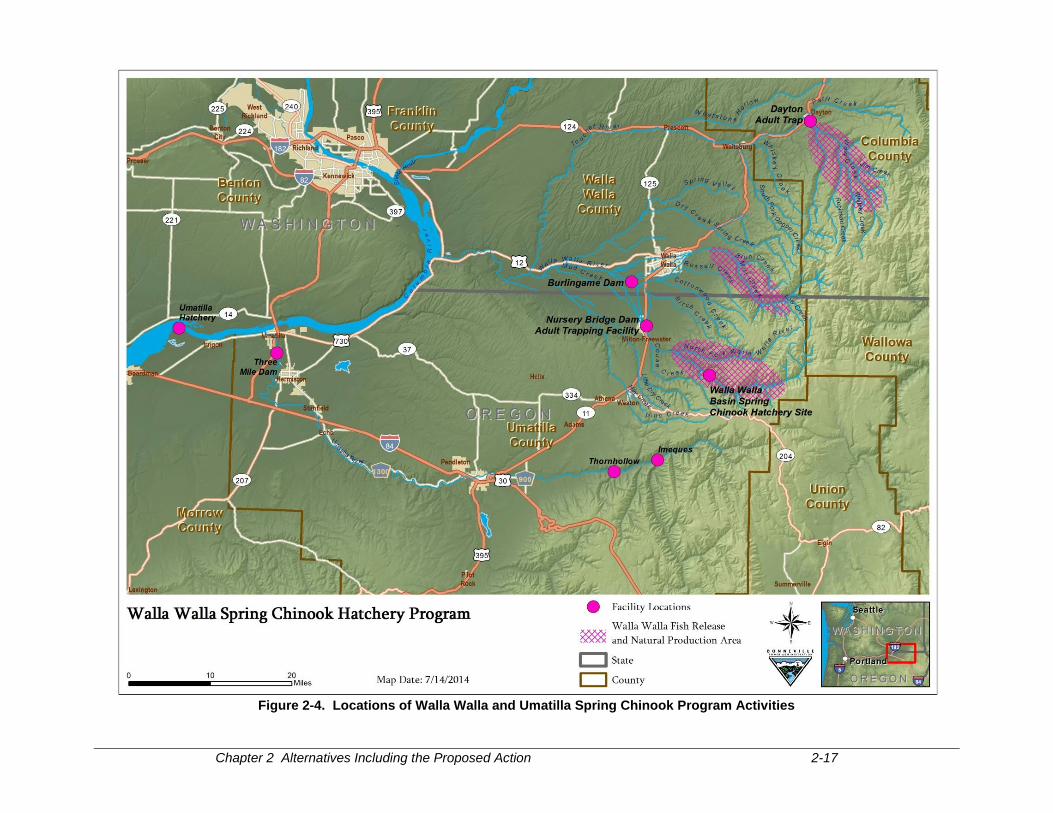
Chapter 2 Alternatives Including the Proposed Action 2-17
Figure 2-4. Locations of Walla Walla and Umatilla Spring Chinook Program Activities
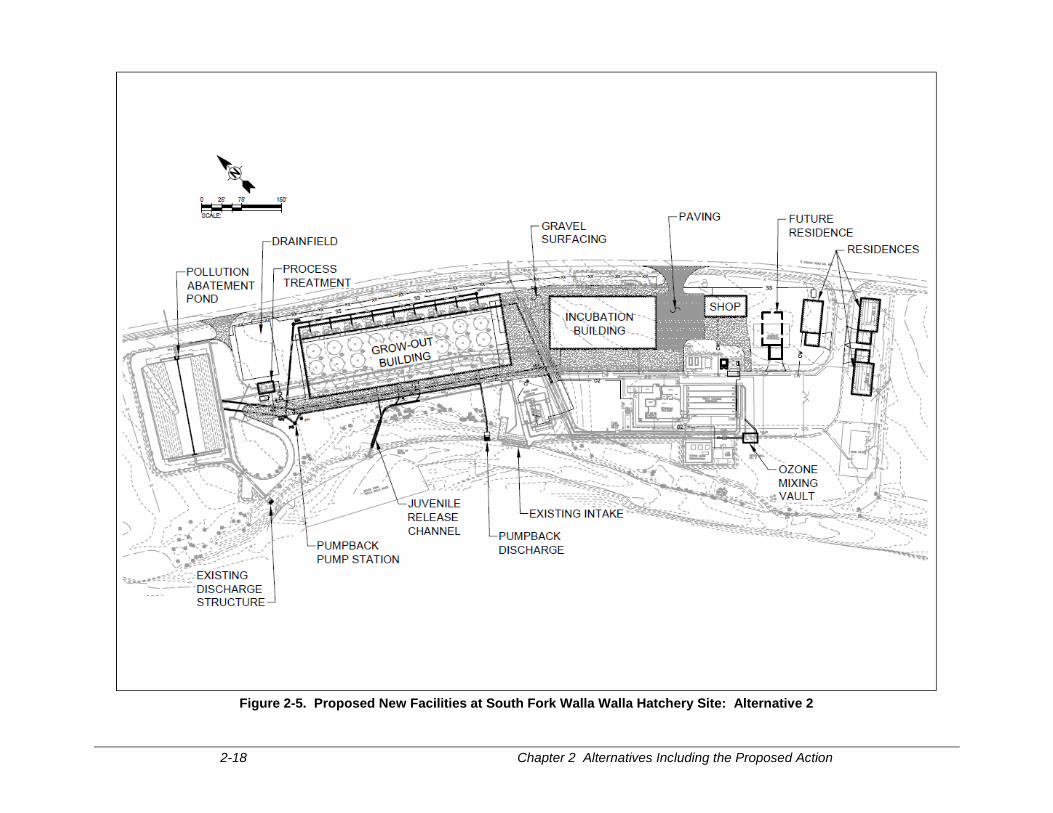
2-18 Chapter 2 Alternatives Including the Proposed Action
Figure 2-5. Proposed New Facilities at South Fork Walla Walla Hatchery Site: Alternative 2
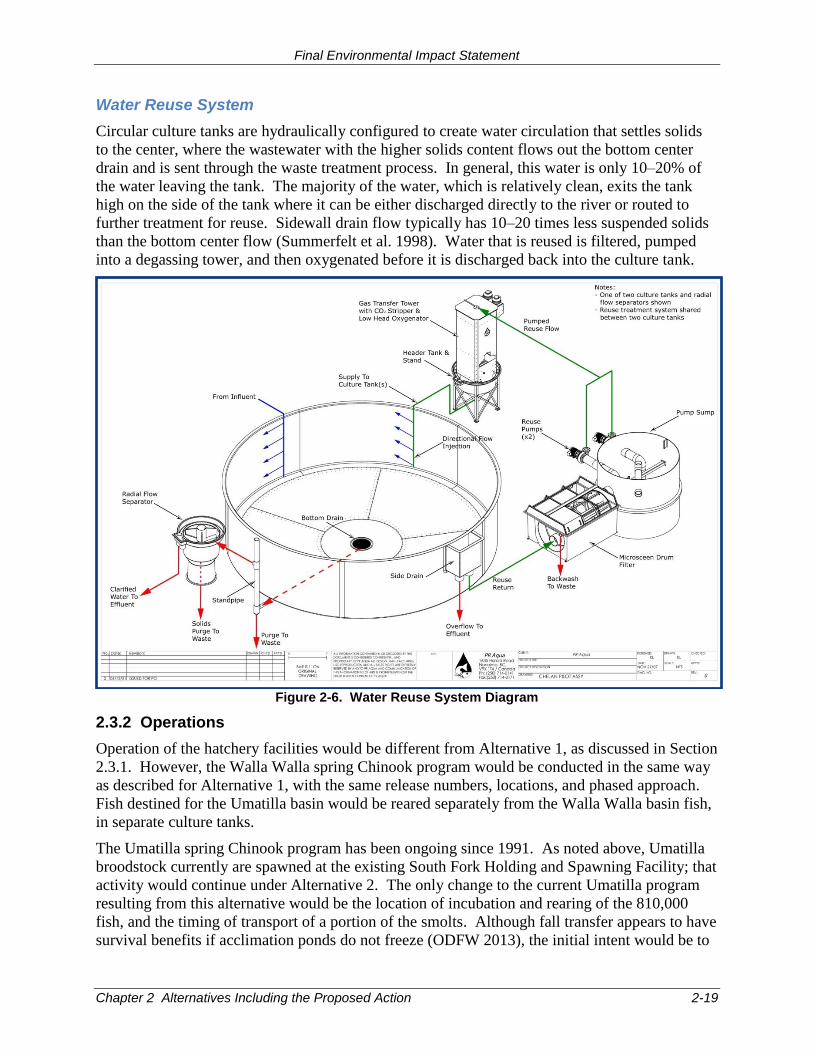
Final Environmental Impact Statement
Chapter 2 Alternatives Including the Proposed Action 2-19
Water Reuse System
Circular culture tanks are hydraulically configured to create water circulation that settles solids
to the center, where the wastewater with the higher solids content flows out the bottom center
drain and is sent through the waste treatment process. In general, this water is only 10–20% of
the water leaving the tank. The majority of the water, which is relatively clean, exits the tank
high on the side of the tank where it can be either discharged directly to the river or routed to
further treatment for reuse. Sidewall drain flow typically has 10–20 times less suspended solids
than the bottom center flow (Summerfelt et al. 1998). Water that is reused is filtered, pumped
into a degassing tower, and then oxygenated before it is discharged back into the culture tank.
Figure 2-6. Water Reuse System Diagram
2.3.2 Operations
Operation of the hatchery facilities would be different from Alternative 1, as discussed in Section
2.3.1. However, the Walla Walla spring Chinook program would be conducted in the same way
as described for Alternative 1, with the same release numbers, locations, and phased approach.
Fish destined for the Umatilla basin would be reared separately from the Walla Walla basin fish,
in separate culture tanks.
The Umatilla spring Chinook program has been ongoing since 1991. As noted above, Umatilla
broodstock currently are spawned at the existing South Fork Holding and Spawning Facility; that
activity would continue under Alternative 2. The only change to the current Umatilla program
resulting from this alternative would be the location of incubation and rearing of the 810,000
fish, and the timing of transport of a portion of the smolts. Although fall transfer appears to have
survival benefits if acclimation ponds do not freeze (ODFW 2013), the initial intent would be to
Walla Walla Basin Spring Chinook Hatchery Program
2-20 Chapter 2 Alternatives Including the Proposed Action
rear all Umatilla spring Chinook groups on the ambient-temperature surface water at the
proposed Walla Walla Hatchery, which is cooler than the well water at the Umatilla Hatchery,
and transport acclimation groups in March to existing acclimation facilities in the Umatilla basin
(Figure 2-4). Thus there would be no risk of losing fall-transferred fish during freezing
conditions at the acclimation sites (which has happened in 9 of the last 10 years) while ensuring
they do not smolt too early (see discussion in Section 1.3.5). The current need to transport some
fish in November would thus be eliminated for the foreseeable future. The ongoing ODFW
Umatilla Hatchery Monitoring and Evaluation project (BPA Project No. 1990-005-00) would
continue to evaluate the survival and performance of spring Chinook reared at the Walla Walla
hatchery for the Umatilla River Restoration Program. Methods are described in the
“Comprehensive Research, Monitoring, and Evaluation Plan for Umatilla Subbasin Summer
Steelhead and Chinook Salmon” (CTUIR and ODFW 2006).
2.3.3 Construction Schedule, Personnel, and Equipment Requirements.
These elements are generally the same as for Alternative 1.
2.3.4 Funding – Alternative 2
Construction funding would come from the same program as Alternative 1. Alternative 2
construction costs would be about 40 to 50 percent more than Alternative 1.
Funding for operations and maintenance of the proposed Walla Walla hatchery would be split
between the Umatilla and Walla Walla programs.
Funding for other aspects of the Umatilla spring Chinook program, including operation and
maintenance of the acclimation facilities and the monitoring and evaluation program, is unlikely
to change from current funding agreements.
2.4 No Action Alternative
Under the No Action Alternative, BPA would not fund the Walla Walla Basin Spring Chinook
Hatchery program, but would continue to fund the existing adult out-planting program (BPA
Project No. 2000-038-00) for an undetermined period. No new facilities would be constructed,
no new artificial propagation activities would be implemented, and no long-term in-basin source
(natural or hatchery) of spring Chinook production would be available for the Walla Walla
River. The current release of out-of-basin smolts, funded under the Mitchell Act and by Bureau
of Indian Affairs, would continue as identified in the 2018-2027 U.S. v. Oregon Management
Agreement.
Under the No Action Alternative, spring Chinook for the Umatilla basin program would continue
to be reared at Umatilla Hatchery as is currently done.
Due to the low survival rates of the non-acclimated smolts produced from out-of-basin
broodstock, it is unlikely that the goal of 5,500 natural-origin adults could be achieved under the
No Action alternative. Under the current program without a hatchery, the 10-year (2006-2015)
geometric mean for adult escapement above Nursery Bridge Dam is 329 adults (ranging from 97
to 1,194 fish). A linear regression model, using current adult return numbers and extrapolating,
predicts only 2,207 adult returns after 100 hundred years (G. Shippentower, CTUIR, pers. comm.
10/9/17).
Final Environmental Impact Statement
Chapter 2 Alternatives Including the Proposed Action 2-21
2.5 Alternatives Considered but Eliminated from Detailed Evaluation in this EIS
2.5.1 Alternatives Considered in the Walla Walla Spring Chinook Hatchery Master Plan
In its 2008 draft of the Master Plan for the Walla Walla spring Chinook program (CTUIR 2008),
the CTUIR identified several alternative approaches to achieve their goals for Walla Walla basin
spring Chinook, which are to provide in‐basin harvest for treaty and non‐treaty fisheries and to
restore natural spawning in a manner consistent with the long-term goal to reestablish a self-
sustaining naturally spawning population (CTUIR 20013a, Section 1.2 and Appendix F). The
following discussion briefly describes those alternatives and why CTUIR chose not to pursue
them (CTUIR 2008; CTUIR 2013, Appendix F).
Partial Production at South Fork Walla Walla Facility
Under this alternative, incubation and early rearing facilities would be added at the site of
CTUIR’s existing adult holding and spawning facility on the South Fork Walla Walla River.
The earthen final rearing pond at Ringold Springs Hatchery on the Columbia River north of
Richland, Washington, would be upgraded and modified so that juveniles could be collected for
transport. Juvenile acclimation facilities would be constructed at the South Fork facility to
expose the fish to waters of the Walla Walla River prior to release. Once facilities were
constructed, fry produced at the expanded South Fork facility would be transported to Ringold
Springs Hatchery for final rearing, and then full-term smolts would be returned to the South Fork
facility to be acclimated and released into the South Fork Walla Walla River.
Because 0.30% survival rates from historical releases at Ringold Springs Hatchery (Byrne et al.
1997) were lower than the 0.55% projected for the preferred alternative (i.e., Alternative 1 in this
EIS), this alternative would require production of 917,000 yearling smolts in order to meet spring
Chinook adult return goals. The stress of repeated handling and transport of fish also contributes
to lower survival rates (Piper et al. 1982; Cuenco et al. 1993; Integrated Hatchery Operations
Team 1995). Additionally, importing and releasing hatchery fish reared out of the basin would
not be consistent with Hatchery Scientific Review Group (HSRG) recommendations for hatchery
programs (HSRG 2004), which state that science indicates hatchery programs will be more
successful if cultured fish are adapted to the environment in which they are reared and released.
Therefore, this alternative was not selected for further analysis (CTUIR 2013, Appendix F).
Full Production at Existing Facilities
Under this alternative, no production facilities would be added to the existing South Fork facility.
Incubation and early rearing would be done at Little White Salmon National Fish Hatchery in the
Columbia River Gorge. Parr would be transferred from Little White Salmon to Ringold Springs
Hatchery for final rearing. The earthen final rearing pond at Ringold Springs Hatchery would be
upgraded and modified so that juveniles could be collected for transport. Juvenile acclimation
facilities would be constructed at the South Fork facility. Full-term smolts would be transported
from Ringold Springs to the South Fork facility, then acclimated and released into the South
Fork Walla Walla River.
This alternative had survival rate and hatchery practices problems like those identified for
Alternative 1; thus it was eliminated from further consideration (CTUIR 2013, Appendix F).
Walla Walla Basin Spring Chinook Hatchery Program
2-22 Chapter 2 Alternatives Including the Proposed Action
Adult Out-planting Program - No Juvenile Production
This alternative would reinitiate the adult out-planting program that was conducted between
2000 and 2008 (see Section 1.4 of this EIS), using 500,000 yearling spring Chinook smolts
released at Ringold Springs Hatchery. Similar to Alternative 2, incubation and early rearing
would occur at Little White Salmon National Fish Hatchery. Parr would be transferred from
Little White Salmon to Ringold Springs for final rearing and release. Adults returning to
Ringold Springs would be transported to the Walla Walla basin for out-planting. At a survival
rate of 0.30%, up to 1,500 adults would be expected to return to Ringold Springs Hatchery.
These adults would be captured, transported to the South Fork Walla Walla Holding and
Spawning Facility for summer holding, and out-planted into natural production areas in the
Walla Walla basin just prior to spawning. Of the 1,500 available adults, 1,000 would be out-
planted into the South Fork Walla Walla River, 300 into the Touchet River and 200 into Mill
Creek. No in-basin smolt production program would be pursued under this alternative.
This alternative would preclude co-managers from meeting goals for in-basin harvest in the
foreseeable future and would not achieve CTUIR’s objective of providing locally produced
spring Chinook. No capital outlays would be required for construction of new facilities;
however, annual costs associated with adult transport would increase. Releases of out-of-basin
fish to the Walla Walla River would continue, a practice that is inconsistent with HSRG
guidelines for hatchery program operations (HSRG 2004). For these reasons, this alternative
was not carried forward for more detailed analysis (CTUIR 2013, Appendix F).
2.5.2 Alternatives Proposed During Scoping
During the spring 2013 scoping period for the EIS (see Section 1.7), citizens suggested the
following alternatives to the proposed action. At that time, the proposed action was to fund
construction and operation of a hatchery for Walla Walla basin spring Chinook only. No
additional alternatives were suggested during the spring 2014 scoping period.
Use surge tanks and gravity-fed systems to reduce the number of pumps required.
Due to the lack of slope at the proposed hatchery site, gravity-fed systems cannot be used, so this
alternative was eliminated from further analysis.
Build a new hatchery elsewhere, such as on the North Fork of the John Day River.
A new hatchery in another basin would not provide a reintroduced spring Chinook population
and harvest opportunities in the Walla Walla basin, so this alternative was not evaluated in the
EIS.
Use the existing hatchery at Lyons Ferry (as steelhead production changes) or other
existing hatcheries; expand existing hatcheries.
As discussed in Section 2.5.1, CTUIR considered using existing hatcheries in the draft of its
Master Plan (CTUIR 2013). In the case of Lyons Ferry, production space is not currently or
expected to be available for a 500,000 spring Chinook smolt program throughout the entire
rearing cycle, which includes overlapping time periods for successive brood years. Thus, due to
lack of production space at Lyons, this alternative was not analyzed in the EIS.
Final Environmental Impact Statement
Chapter 2 Alternatives Including the Proposed Action 2-23
Improve habitat before building a hatchery; “native” fish populations are improving on
their own.
As discussed in Chapter 1, various organizations have worked on improving habitat and passage
in the Walla Walla basin, and conditions are improving. However, efforts to reintroduce spring
Chinook using stocks not locally adapted to the basin to date have not resulted in survivals
sufficient to establish a naturally reproducing population in harvestable numbers; therefore,
habitat improvement, while being continued by a variety of entities in the basin, is not
considered adequate by itself to re-establish spring Chinook populations.
Develop more fishing holes
This alternative is outside the scope of the EIS and would not result in establishing a naturally
reproducing population of spring Chinook in the Walla Walla basin or produce fish in
harvestable numbers. Therefore, this alternative is not addressed further in the EIS.
2.5.3 Alternative Facility Designs for Walla Walla Hatchery
The 30% design presented in the Walla Walla Spring Chinook Hatchery Master Plan called for
16 new outdoor raceways to rear the 500,000 spring Chinook that were proposed for release in
the Walla Walla River basin (CTUIR 2013). Subsequent analyses for the Draft EIS indicated
that, while the existing surface water right for the hatchery historically has been adequate to
supply the full hatchery demand for water, water supply might be constrained in the future due to
the requirement to maintain instream flows during periods of extremely low flows in the South
Fork Walla Walla River. As a result of these analyses, BPA and CTUIR began evaluations of
other designs that might require less water or that would use water more efficiently. They
subsequently decided to propose use of circular tanks for rearing, with the option of installing a
water reuse system and/or pumpback system, as described for Alternatives 1 and 2. See Sections
2.2 and 2.3 in Chapter 2 and the detailed discussion in Chapter 3, Section 3.3, for a description of
how these systems work and their effects on water supply.
2.6 Comparison of Alternatives
Table 2-2 compares how well Alternative 1, Alternative 2, and the No Action Alternative meet
BPA’s purposes as listed in Chapter 1, Section 1.2. Table 2-2 summarizes the environmental
effects of Alternative 1, Alternative 2, and the No Action Alternative that are discussed in detail
in Chapter 3.
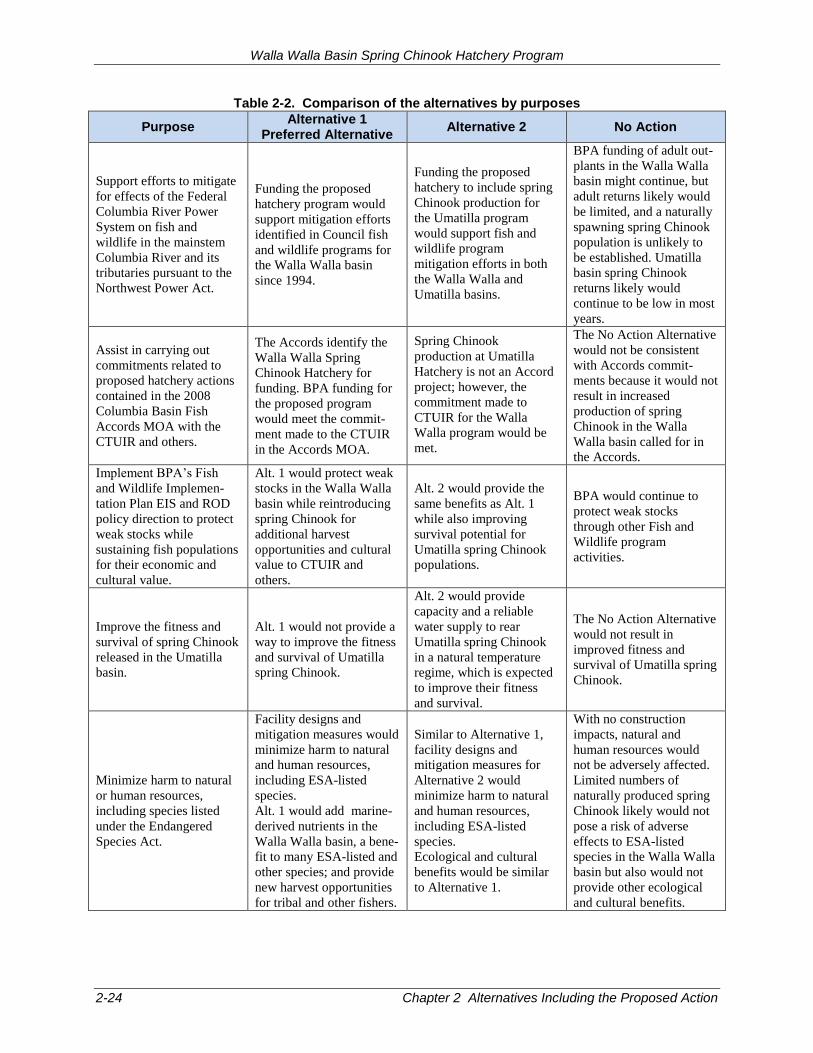
Walla Walla Basin Spring Chinook Hatchery Program
2-24 Chapter 2 Alternatives Including the Proposed Action
Table 2-2. Comparison of the alternatives by purposes
Purpose Alternative 1
Preferred Alternative Alternative 2 No Action
Support efforts to mitigate
for effects of the Federal
Columbia River Power
System on fish and
wildlife in the mainstem
Columbia River and its
tributaries pursuant to the
Northwest Power Act.
Funding the proposed
hatchery program would
support mitigation efforts
identified in Council fish
and wildlife programs for
the Walla Walla basin
since 1994.
Funding the proposed
hatchery to include spring
Chinook production for
the Umatilla program
would support fish and
wildlife program
mitigation efforts in both
the Walla Walla and
Umatilla basins.
BPA funding of adult out-
plants in the Walla Walla
basin might continue, but
adult returns likely would
be limited, and a naturally
spawning spring Chinook
population is unlikely to
be established. Umatilla
basin spring Chinook
returns likely would
continue to be low in most
years.
Assist in carrying out
commitments related to
proposed hatchery actions
contained in the 2008
Columbia Basin Fish
Accords MOA with the
CTUIR and others.
The Accords identify the
Walla Walla Spring
Chinook Hatchery for
funding. BPA funding for
the proposed program
would meet the commit-
ment made to the CTUIR
in the Accords MOA.
Spring Chinook
production at Umatilla
Hatchery is not an Accord
project; however, the
commitment made to
CTUIR for the Walla
Walla program would be
met.
The No Action Alternative
would not be consistent
with Accords commit-
ments because it would not
result in increased
production of spring
Chinook in the Walla
Walla basin called for in
the Accords.
Implement BPA’s Fish
and Wildlife Implemen-
tation Plan EIS and ROD
policy direction to protect
weak stocks while
sustaining fish populations
for their economic and
cultural value.
Alt. 1 would protect weak
stocks in the Walla Walla
basin while reintroducing
spring Chinook for
additional harvest
opportunities and cultural
value to CTUIR and
others.
Alt. 2 would provide the
same benefits as Alt. 1
while also improving
survival potential for
Umatilla spring Chinook
populations.
BPA would continue to
protect weak stocks
through other Fish and
Wildlife program
activities.
Improve the fitness and
survival of spring Chinook
released in the Umatilla
basin.
Alt. 1 would not provide a
way to improve the fitness
and survival of Umatilla
spring Chinook.
Alt. 2 would provide
capacity and a reliable
water supply to rear
Umatilla spring Chinook
in a natural temperature
regime, which is expected
to improve their fitness
and survival.
The No Action Alternative
would not result in
improved fitness and
survival of Umatilla spring
Chinook.
Minimize harm to natural
or human resources,
including species listed
under the Endangered
Species Act.
Facility designs and
mitigation measures would
minimize harm to natural
and human resources,
including ESA-listed
species.
Alt. 1 would add marine-
derived nutrients in the
Walla Walla basin, a bene-
fit to many ESA-listed and
other species; and provide
new harvest opportunities
for tribal and other fishers.
Similar to Alternative 1,
facility designs and
mitigation measures for
Alternative 2 would
minimize harm to natural
and human resources,
including ESA-listed
species.
Ecological and cultural
benefits would be similar
to Alternative 1.
With no construction
impacts, natural and
human resources would
not be adversely affected.
Limited numbers of
naturally produced spring
Chinook likely would not
pose a risk of adverse
effects to ESA-listed
species in the Walla Walla
basin but also would not
provide other ecological
and cultural benefits.
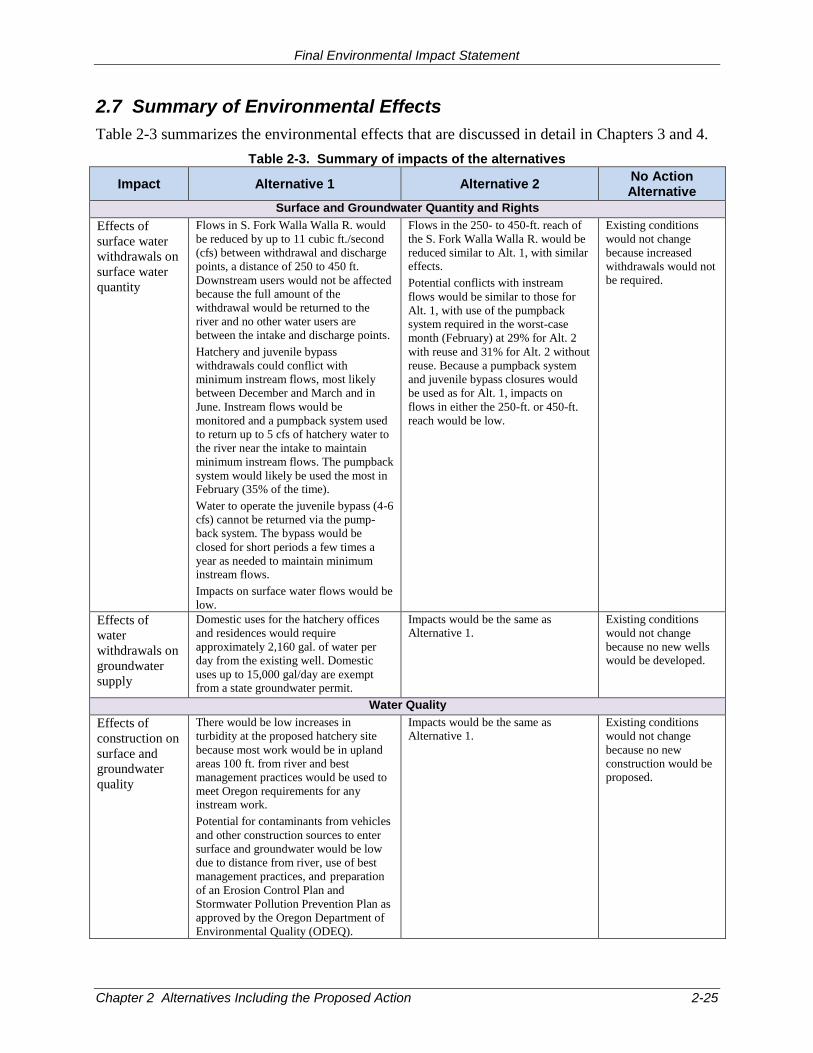
Final Environmental Impact Statement
Chapter 2 Alternatives Including the Proposed Action 2-25
2.7 Summary of Environmental Effects
Table 2-3 summarizes the environmental effects that are discussed in detail in Chapters 3 and 4.
Table 2-3. Summary of impacts of the alternatives
Impact Alternative 1 Alternative 2 No Action Alternative
Surface and Groundwater Quantity and Rights
Effects of
surface water
withdrawals on
surface water
quantity
Flows in S. Fork Walla Walla R. would
be reduced by up to 11 cubic ft./second
(cfs) between withdrawal and discharge
points, a distance of 250 to 450 ft.
Downstream users would not be affected
because the full amount of the
withdrawal would be returned to the
river and no other water users are
between the intake and discharge points.
Hatchery and juvenile bypass
withdrawals could conflict with
minimum instream flows, most likely
between December and March and in
June. Instream flows would be
monitored and a pumpback system used
to return up to 5 cfs of hatchery water to
the river near the intake to maintain
minimum instream flows. The pumpback
system would likely be used the most in February (35% of the time).
Water to operate the juvenile bypass (4-6
cfs) cannot be returned via the pump-
back system. The bypass would be
closed for short periods a few times a
year as needed to maintain minimum instream flows.
Impacts on surface water flows would be
low.
Flows in the 250- to 450-ft. reach of
the S. Fork Walla Walla R. would be
reduced similar to Alt. 1, with similar effects.
Potential conflicts with instream
flows would be similar to those for
Alt. 1, with use of the pumpback
system required in the worst-case
month (February) at 29% for Alt. 2
with reuse and 31% for Alt. 2 without
reuse. Because a pumpback system
and juvenile bypass closures would
be used as for Alt. 1, impacts on
flows in either the 250-ft. or 450-ft.
reach would be low.
Existing conditions
would not change
because increased
withdrawals would not
be required.
Effects of
water
withdrawals on
groundwater
supply
Domestic uses for the hatchery offices
and residences would require
approximately 2,160 gal. of water per
day from the existing well. Domestic
uses up to 15,000 gal/day are exempt from a state groundwater permit.
Impacts would be the same as Alternative 1.
Existing conditions
would not change
because no new wells would be developed.
Water Quality
Effects of
construction on
surface and
groundwater
quality
There would be low increases in
turbidity at the proposed hatchery site
because most work would be in upland
areas 100 ft. from river and best
management practices would be used to
meet Oregon requirements for any instream work.
Potential for contaminants from vehicles
and other construction sources to enter
surface and groundwater would be low
due to distance from river, use of best
management practices, and preparation
of an Erosion Control Plan and
Stormwater Pollution Prevention Plan as
approved by the Oregon Department of
Environmental Quality (ODEQ).
Impacts would be the same as Alternative 1.
Existing conditions
would not change
because no new
construction would be proposed.
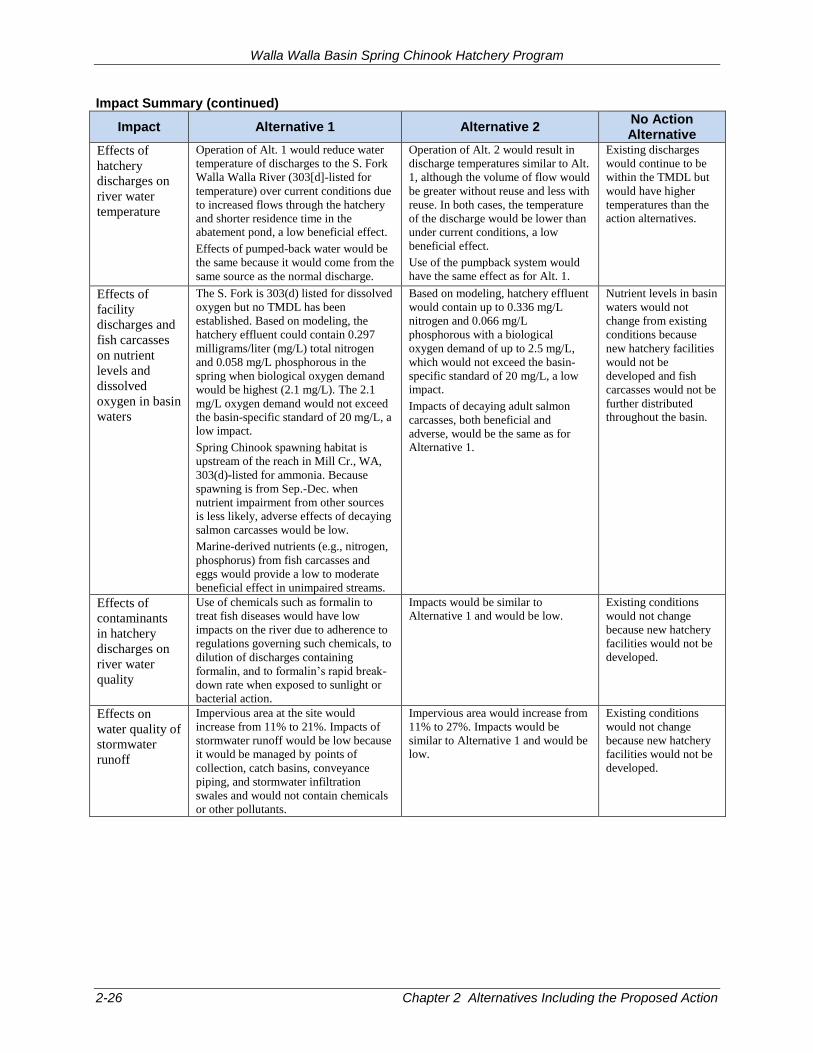
Walla Walla Basin Spring Chinook Hatchery Program
2-26 Chapter 2 Alternatives Including the Proposed Action
Impact Summary (continued)
Impact Alternative 1 Alternative 2 No Action Alternative
Effects of
hatchery
discharges on
river water
temperature
Operation of Alt. 1 would reduce water
temperature of discharges to the S. Fork
Walla Walla River (303[d]-listed for
temperature) over current conditions due
to increased flows through the hatchery
and shorter residence time in the abatement pond, a low beneficial effect.
Effects of pumped-back water would be
the same because it would come from the
same source as the normal discharge.
Operation of Alt. 2 would result in
discharge temperatures similar to Alt.
1, although the volume of flow would
be greater without reuse and less with
reuse. In both cases, the temperature
of the discharge would be lower than
under current conditions, a low
beneficial effect.
Use of the pumpback system would
have the same effect as for Alt. 1.
Existing discharges
would continue to be
within the TMDL but
would have higher
temperatures than the action alternatives.
Effects of
facility
discharges and
fish carcasses
on nutrient
levels and
dissolved
oxygen in basin
waters
The S. Fork is 303(d) listed for dissolved
oxygen but no TMDL has been
established. Based on modeling, the
hatchery effluent could contain 0.297
milligrams/liter (mg/L) total nitrogen
and 0.058 mg/L phosphorous in the
spring when biological oxygen demand
would be highest (2.1 mg/L). The 2.1
mg/L oxygen demand would not exceed
the basin-specific standard of 20 mg/L, a low impact.
Spring Chinook spawning habitat is
upstream of the reach in Mill Cr., WA,
303(d)-listed for ammonia. Because
spawning is from Sep.-Dec. when
nutrient impairment from other sources
is less likely, adverse effects of decaying
salmon carcasses would be low.
Marine-derived nutrients (e.g., nitrogen,
phosphorus) from fish carcasses and
eggs would provide a low to moderate
beneficial effect in unimpaired streams.
Based on modeling, hatchery effluent
would contain up to 0.336 mg/L
nitrogen and 0.066 mg/L
phosphorous with a biological
oxygen demand of up to 2.5 mg/L,
which would not exceed the basin-
specific standard of 20 mg/L, a low impact.
Impacts of decaying adult salmon
carcasses, both beneficial and
adverse, would be the same as for Alternative 1.
Nutrient levels in basin
waters would not
change from existing
conditions because
new hatchery facilities
would not be
developed and fish
carcasses would not be
further distributed throughout the basin.
Effects of
contaminants
in hatchery
discharges on
river water
quality
Use of chemicals such as formalin to
treat fish diseases would have low
impacts on the river due to adherence to
regulations governing such chemicals, to
dilution of discharges containing
formalin, and to formalin’s rapid break-
down rate when exposed to sunlight or
bacterial action.
Impacts would be similar to Alternative 1 and would be low.
Existing conditions
would not change
because new hatchery
facilities would not be
developed.
Effects on
water quality of
stormwater
runoff
Impervious area at the site would
increase from 11% to 21%. Impacts of
stormwater runoff would be low because
it would be managed by points of
collection, catch basins, conveyance
piping, and stormwater infiltration
swales and would not contain chemicals
or other pollutants.
Impervious area would increase from
11% to 27%. Impacts would be
similar to Alternative 1 and would be low.
Existing conditions
would not change
because new hatchery
facilities would not be
developed.
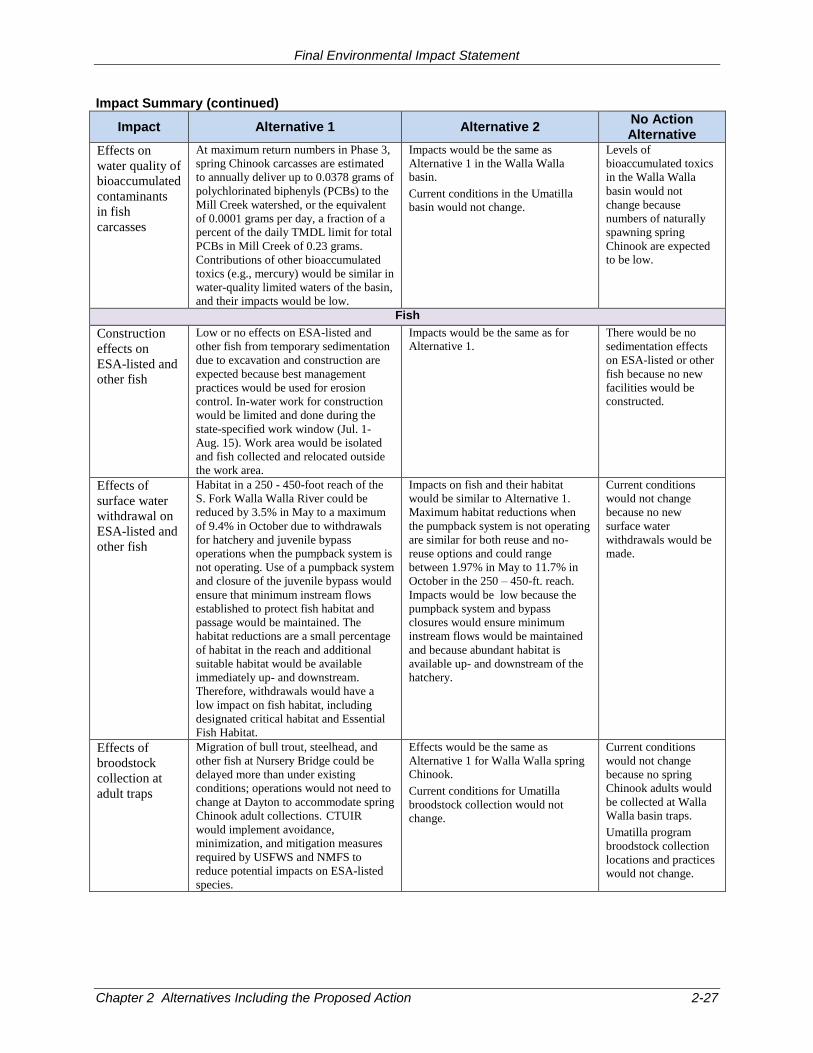
Final Environmental Impact Statement
Chapter 2 Alternatives Including the Proposed Action 2-27
Impact Summary (continued)
Impact Alternative 1 Alternative 2 No Action Alternative
Effects on
water quality of
bioaccumulated
contaminants
in fish
carcasses
At maximum return numbers in Phase 3,
spring Chinook carcasses are estimated
to annually deliver up to 0.0378 grams of
polychlorinated biphenyls (PCBs) to the
Mill Creek watershed, or the equivalent
of 0.0001 grams per day, a fraction of a
percent of the daily TMDL limit for total
PCBs in Mill Creek of 0.23 grams.
Contributions of other bioaccumulated
toxics (e.g., mercury) would be similar in
water-quality limited waters of the basin,
and their impacts would be low.
Impacts would be the same as
Alternative 1 in the Walla Walla basin.
Current conditions in the Umatilla basin would not change.
Levels of
bioaccumulated toxics
in the Walla Walla
basin would not
change because
numbers of naturally
spawning spring
Chinook are expected to be low.
Fish
Construction
effects on
ESA-listed and
other fish
Low or no effects on ESA-listed and
other fish from temporary sedimentation
due to excavation and construction are
expected because best management
practices would be used for erosion
control. In-water work for construction
would be limited and done during the
state-specified work window (Jul. 1-
Aug. 15). Work area would be isolated
and fish collected and relocated outside
the work area.
Impacts would be the same as for Alternative 1.
There would be no
sedimentation effects
on ESA-listed or other
fish because no new
facilities would be constructed.
Effects of
surface water
withdrawal on
ESA-listed and
other fish
Habitat in a 250 - 450-foot reach of the
S. Fork Walla Walla River could be
reduced by 3.5% in May to a maximum
of 9.4% in October due to withdrawals
for hatchery and juvenile bypass
operations when the pumpback system is
not operating. Use of a pumpback system
and closure of the juvenile bypass would
ensure that minimum instream flows
established to protect fish habitat and
passage would be maintained. The
habitat reductions are a small percentage
of habitat in the reach and additional
suitable habitat would be available
immediately up- and downstream.
Therefore, withdrawals would have a
low impact on fish habitat, including
designated critical habitat and Essential
Fish Habitat.
Impacts on fish and their habitat
would be similar to Alternative 1.
Maximum habitat reductions when
the pumpback system is not operating
are similar for both reuse and no-
reuse options and could range
between 1.97% in May to 11.7% in
October in the 250 – 450-ft. reach.
Impacts would be low because the
pumpback system and bypass
closures would ensure minimum
instream flows would be maintained
and because abundant habitat is
available up- and downstream of the
hatchery.
Current conditions
would not change
because no new
surface water
withdrawals would be
made.
Effects of
broodstock
collection at
adult traps
Migration of bull trout, steelhead, and
other fish at Nursery Bridge could be
delayed more than under existing
conditions; operations would not need to
change at Dayton to accommodate spring
Chinook adult collections. CTUIR
would implement avoidance,
minimization, and mitigation measures
required by USFWS and NMFS to
reduce potential impacts on ESA-listed
species.
Effects would be the same as
Alternative 1 for Walla Walla spring Chinook.
Current conditions for Umatilla
broodstock collection would not
change.
Current conditions
would not change
because no spring
Chinook adults would
be collected at Walla Walla basin traps.
Umatilla program
broodstock collection
locations and practices
would not change.
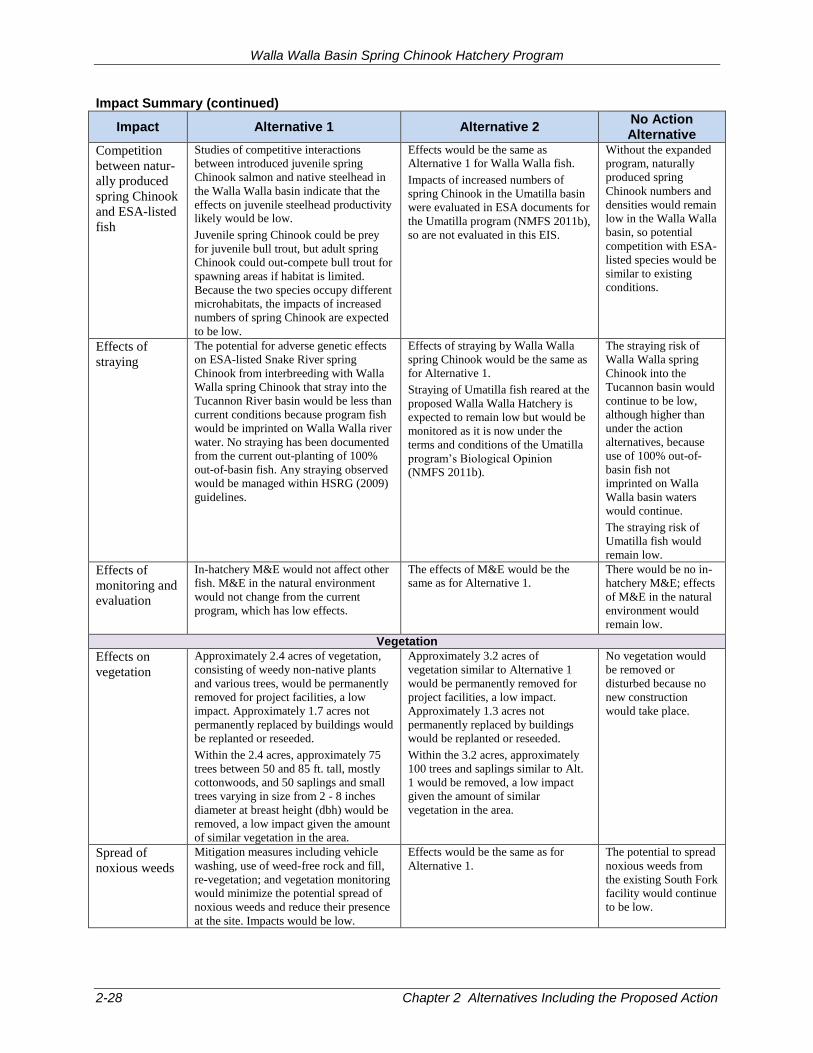
Walla Walla Basin Spring Chinook Hatchery Program
2-28 Chapter 2 Alternatives Including the Proposed Action
Impact Summary (continued)
Impact Alternative 1 Alternative 2 No Action Alternative
Competition
between natur-
ally produced
spring Chinook
and ESA-listed
fish
Studies of competitive interactions
between introduced juvenile spring
Chinook salmon and native steelhead in
the Walla Walla basin indicate that the
effects on juvenile steelhead productivity likely would be low. Juvenile spring Chinook could be prey
for juvenile bull trout, but adult spring
Chinook could out-compete bull trout for
spawning areas if habitat is limited.
Because the two species occupy different
microhabitats, the impacts of increased
numbers of spring Chinook are expected
to be low.
Effects would be the same as Alternative 1 for Walla Walla fish.
Impacts of increased numbers of
spring Chinook in the Umatilla basin
were evaluated in ESA documents for
the Umatilla program (NMFS 2011b),
so are not evaluated in this EIS.
Without the expanded
program, naturally
produced spring
Chinook numbers and
densities would remain
low in the Walla Walla
basin, so potential
competition with ESA-
listed species would be
similar to existing
conditions.
Effects of
straying
The potential for adverse genetic effects
on ESA-listed Snake River spring
Chinook from interbreeding with Walla
Walla spring Chinook that stray into the
Tucannon River basin would be less than
current conditions because program fish
would be imprinted on Walla Walla river
water. No straying has been documented
from the current out-planting of 100%
out-of-basin fish. Any straying observed
would be managed within HSRG (2009)
guidelines.
Effects of straying by Walla Walla
spring Chinook would be the same as
for Alternative 1.
Straying of Umatilla fish reared at the
proposed Walla Walla Hatchery is
expected to remain low but would be
monitored as it is now under the
terms and conditions of the Umatilla
program’s Biological Opinion
(NMFS 2011b).
The straying risk of
Walla Walla spring
Chinook into the
Tucannon basin would
continue to be low,
although higher than
under the action
alternatives, because
use of 100% out-of-
basin fish not
imprinted on Walla
Walla basin waters would continue.
The straying risk of
Umatilla fish would
remain low.
Effects of
monitoring and
evaluation
In-hatchery M&E would not affect other
fish. M&E in the natural environment
would not change from the current
program, which has low effects.
The effects of M&E would be the same as for Alternative 1.
There would be no in-
hatchery M&E; effects
of M&E in the natural
environment would
remain low.
Vegetation
Effects on
vegetation
Approximately 2.4 acres of vegetation,
consisting of weedy non-native plants
and various trees, would be permanently
removed for project facilities, a low
impact. Approximately 1.7 acres not
permanently replaced by buildings would
be replanted or reseeded.
Within the 2.4 acres, approximately 75
trees between 50 and 85 ft. tall, mostly
cottonwoods, and 50 saplings and small
trees varying in size from 2 - 8 inches
diameter at breast height (dbh) would be
removed, a low impact given the amount
of similar vegetation in the area.
Approximately 3.2 acres of
vegetation similar to Alternative 1
would be permanently removed for
project facilities, a low impact.
Approximately 1.3 acres not
permanently replaced by buildings
would be replanted or reseeded.
Within the 3.2 acres, approximately
100 trees and saplings similar to Alt.
1 would be removed, a low impact
given the amount of similar
vegetation in the area.
No vegetation would
be removed or
disturbed because no
new construction
would take place.
Spread of
noxious weeds
Mitigation measures including vehicle
washing, use of weed-free rock and fill,
re-vegetation; and vegetation monitoring
would minimize the potential spread of
noxious weeds and reduce their presence
at the site. Impacts would be low.
Effects would be the same as for
Alternative 1.
The potential to spread
noxious weeds from
the existing South Fork
facility would continue
to be low.
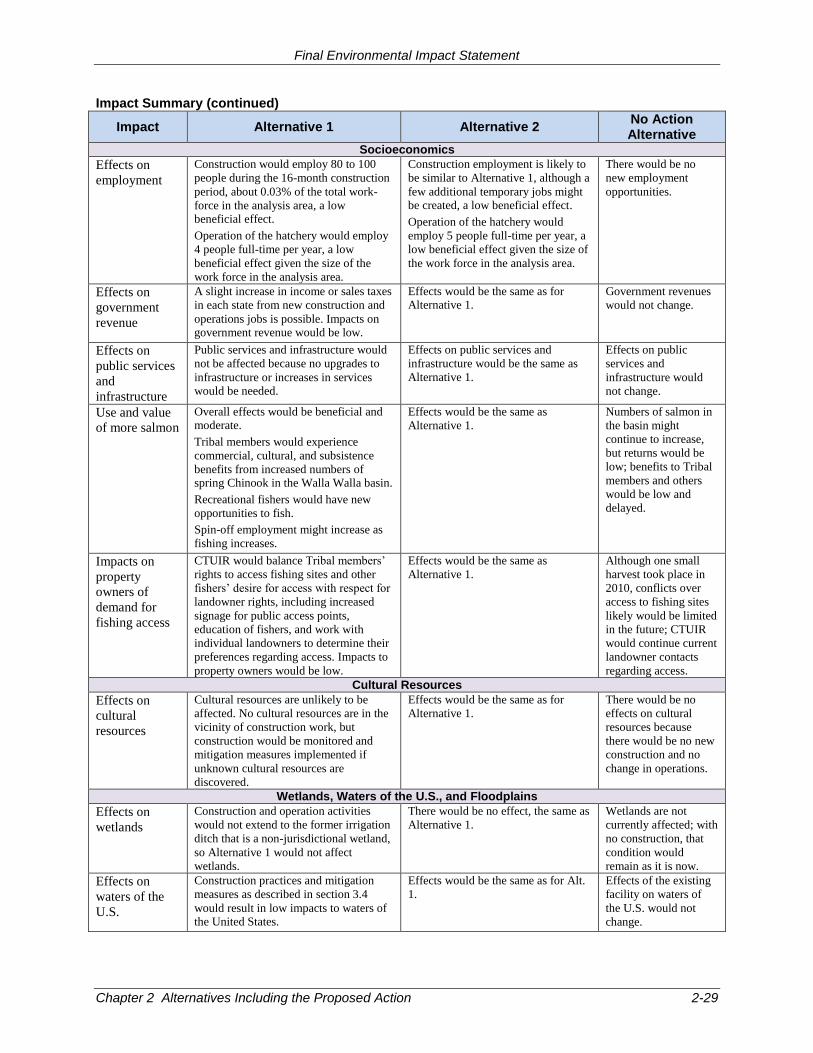
Final Environmental Impact Statement
Chapter 2 Alternatives Including the Proposed Action 2-29
Impact Summary (continued)
Impact Alternative 1 Alternative 2 No Action Alternative
Socioeconomics
Effects on
employment
Construction would employ 80 to 100
people during the 16-month construction
period, about 0.03% of the total work-
force in the analysis area, a low beneficial effect.
Operation of the hatchery would employ
4 people full-time per year, a low
beneficial effect given the size of the
work force in the analysis area.
Construction employment is likely to
be similar to Alternative 1, although a
few additional temporary jobs might be created, a low beneficial effect.
Operation of the hatchery would
employ 5 people full-time per year, a
low beneficial effect given the size of
the work force in the analysis area.
There would be no
new employment
opportunities.
Effects on
government
revenue
A slight increase in income or sales taxes
in each state from new construction and
operations jobs is possible. Impacts on government revenue would be low.
Effects would be the same as for Alternative 1.
Government revenues
would not change.
Effects on
public services
and
infrastructure
Public services and infrastructure would
not be affected because no upgrades to
infrastructure or increases in services would be needed.
Effects on public services and
infrastructure would be the same as
Alternative 1.
Effects on public
services and
infrastructure would
not change.
Use and value
of more salmon
Overall effects would be beneficial and moderate.
Tribal members would experience
commercial, cultural, and subsistence
benefits from increased numbers of spring Chinook in the Walla Walla basin.
Recreational fishers would have new
opportunities to fish.
Spin-off employment might increase as
fishing increases.
Effects would be the same as
Alternative 1.
Numbers of salmon in
the basin might
continue to increase,
but returns would be
low; benefits to Tribal
members and others
would be low and
delayed.
Impacts on
property
owners of
demand for
fishing access
CTUIR would balance Tribal members’
rights to access fishing sites and other
fishers’ desire for access with respect for
landowner rights, including increased
signage for public access points,
education of fishers, and work with
individual landowners to determine their
preferences regarding access. Impacts to
property owners would be low.
Effects would be the same as
Alternative 1.
Although one small
harvest took place in
2010, conflicts over
access to fishing sites
likely would be limited
in the future; CTUIR
would continue current
landowner contacts
regarding access.
Cultural Resources
Effects on
cultural
resources
Cultural resources are unlikely to be
affected. No cultural resources are in the
vicinity of construction work, but
construction would be monitored and
mitigation measures implemented if
unknown cultural resources are
discovered.
Effects would be the same as for
Alternative 1.
There would be no
effects on cultural
resources because
there would be no new
construction and no
change in operations.
Wetlands, Waters of the U.S., and Floodplains
Effects on
wetlands
Construction and operation activities
would not extend to the former irrigation
ditch that is a non-jurisdictional wetland,
so Alternative 1 would not affect
wetlands.
There would be no effect, the same as
Alternative 1.
Wetlands are not
currently affected; with
no construction, that
condition would
remain as it is now.
Effects on
waters of the
U.S.
Construction practices and mitigation
measures as described in section 3.4
would result in low impacts to waters of the United States.
Effects would be the same as for Alt.
1.
Effects of the existing
facility on waters of
the U.S. would not
change.
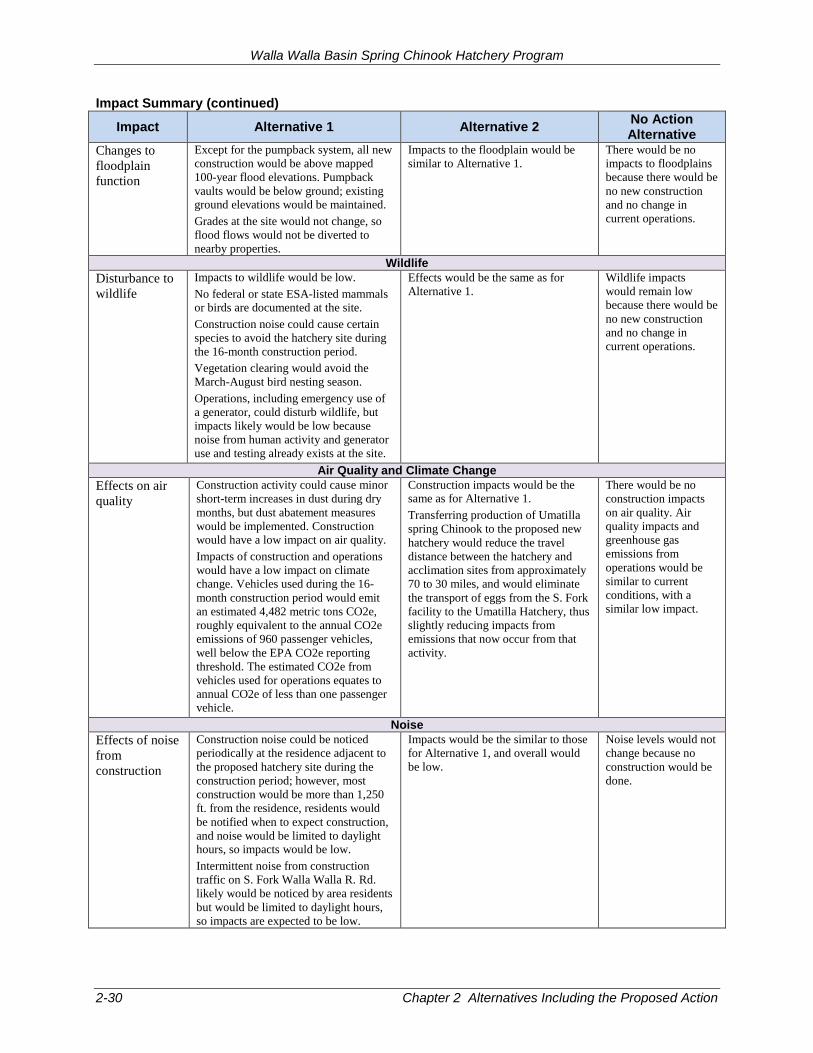
Walla Walla Basin Spring Chinook Hatchery Program
2-30 Chapter 2 Alternatives Including the Proposed Action
Impact Summary (continued)
Impact Alternative 1 Alternative 2 No Action Alternative
Changes to
floodplain
function
Except for the pumpback system, all new
construction would be above mapped
100-year flood elevations. Pumpback
vaults would be below ground; existing ground elevations would be maintained.
Grades at the site would not change, so
flood flows would not be diverted to
nearby properties.
Impacts to the floodplain would be
similar to Alternative 1.
There would be no
impacts to floodplains
because there would be
no new construction
and no change in
current operations.
Wildlife
Disturbance to
wildlife
Impacts to wildlife would be low.
No federal or state ESA-listed mammals or birds are documented at the site.
Construction noise could cause certain
species to avoid the hatchery site during
the 16-month construction period.
Vegetation clearing would avoid the
March-August bird nesting season.
Operations, including emergency use of
a generator, could disturb wildlife, but
impacts likely would be low because
noise from human activity and generator
use and testing already exists at the site.
Effects would be the same as for
Alternative 1.
Wildlife impacts
would remain low
because there would be
no new construction
and no change in
current operations.
Air Quality and Climate Change
Effects on air
quality
Construction activity could cause minor
short-term increases in dust during dry
months, but dust abatement measures
would be implemented. Construction would have a low impact on air quality.
Impacts of construction and operations
would have a low impact on climate
change. Vehicles used during the 16-
month construction period would emit
an estimated 4,482 metric tons CO2e,
roughly equivalent to the annual CO2e
emissions of 960 passenger vehicles,
well below the EPA CO2e reporting
threshold. The estimated CO2e from
vehicles used for operations equates to
annual CO2e of less than one passenger
vehicle.
Construction impacts would be the same as for Alternative 1.
Transferring production of Umatilla
spring Chinook to the proposed new
hatchery would reduce the travel
distance between the hatchery and
acclimation sites from approximately
70 to 30 miles, and would eliminate
the transport of eggs from the S. Fork
facility to the Umatilla Hatchery, thus
slightly reducing impacts from
emissions that now occur from that
activity.
There would be no
construction impacts
on air quality. Air
quality impacts and
greenhouse gas
emissions from
operations would be
similar to current
conditions, with a
similar low impact.
Noise
Effects of noise
from
construction
Construction noise could be noticed
periodically at the residence adjacent to
the proposed hatchery site during the
construction period; however, most
construction would be more than 1,250
ft. from the residence, residents would
be notified when to expect construction,
and noise would be limited to daylight hours, so impacts would be low.
Intermittent noise from construction
traffic on S. Fork Walla Walla R. Rd.
likely would be noticed by area residents
but would be limited to daylight hours,
so impacts are expected to be low.
Impacts would be the similar to those
for Alternative 1, and overall would
be low.
Noise levels would not
change because no
construction would be
done.
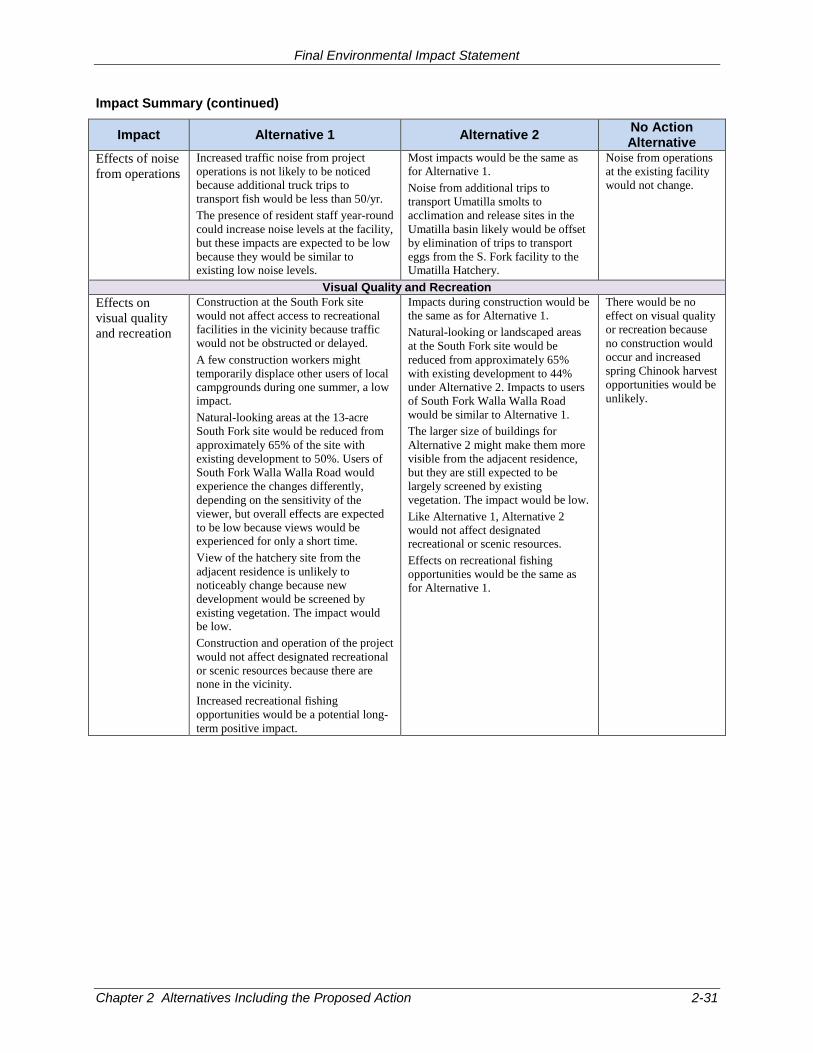
Final Environmental Impact Statement
Chapter 2 Alternatives Including the Proposed Action 2-31
Impact Summary (continued)
Impact Alternative 1 Alternative 2 No Action Alternative
Effects of noise
from operations
Increased traffic noise from project
operations is not likely to be noticed
because additional truck trips to
transport fish would be less than 50/yr.
The presence of resident staff year-round
could increase noise levels at the facility,
but these impacts are expected to be low
because they would be similar to existing low noise levels.
Most impacts would be the same as for Alternative 1.
Noise from additional trips to
transport Umatilla smolts to
acclimation and release sites in the
Umatilla basin likely would be offset
by elimination of trips to transport
eggs from the S. Fork facility to the Umatilla Hatchery.
Noise from operations
at the existing facility
would not change.
Visual Quality and Recreation
Effects on
visual quality
and recreation
Construction at the South Fork site
would not affect access to recreational
facilities in the vicinity because traffic
would not be obstructed or delayed.
A few construction workers might
temporarily displace other users of local
campgrounds during one summer, a low impact.
Natural-looking areas at the 13-acre
South Fork site would be reduced from
approximately 65% of the site with
existing development to 50%. Users of
South Fork Walla Walla Road would
experience the changes differently,
depending on the sensitivity of the
viewer, but overall effects are expected
to be low because views would be experienced for only a short time.
View of the hatchery site from the
adjacent residence is unlikely to
noticeably change because new
development would be screened by
existing vegetation. The impact would be low.
Construction and operation of the project
would not affect designated recreational
or scenic resources because there are none in the vicinity.
Increased recreational fishing
opportunities would be a potential long-
term positive impact.
Impacts during construction would be the same as for Alternative 1.
Natural-looking or landscaped areas
at the South Fork site would be
reduced from approximately 65%
with existing development to 44%
under Alternative 2. Impacts to users
of South Fork Walla Walla Road
would be similar to Alternative 1.
The larger size of buildings for
Alternative 2 might make them more
visible from the adjacent residence,
but they are still expected to be
largely screened by existing
vegetation. The impact would be low.
Like Alternative 1, Alternative 2
would not affect designated recreational or scenic resources.
Effects on recreational fishing
opportunities would be the same as
for Alternative 1.
There would be no
effect on visual quality
or recreation because
no construction would
occur and increased
spring Chinook harvest
opportunities would be
unlikely.

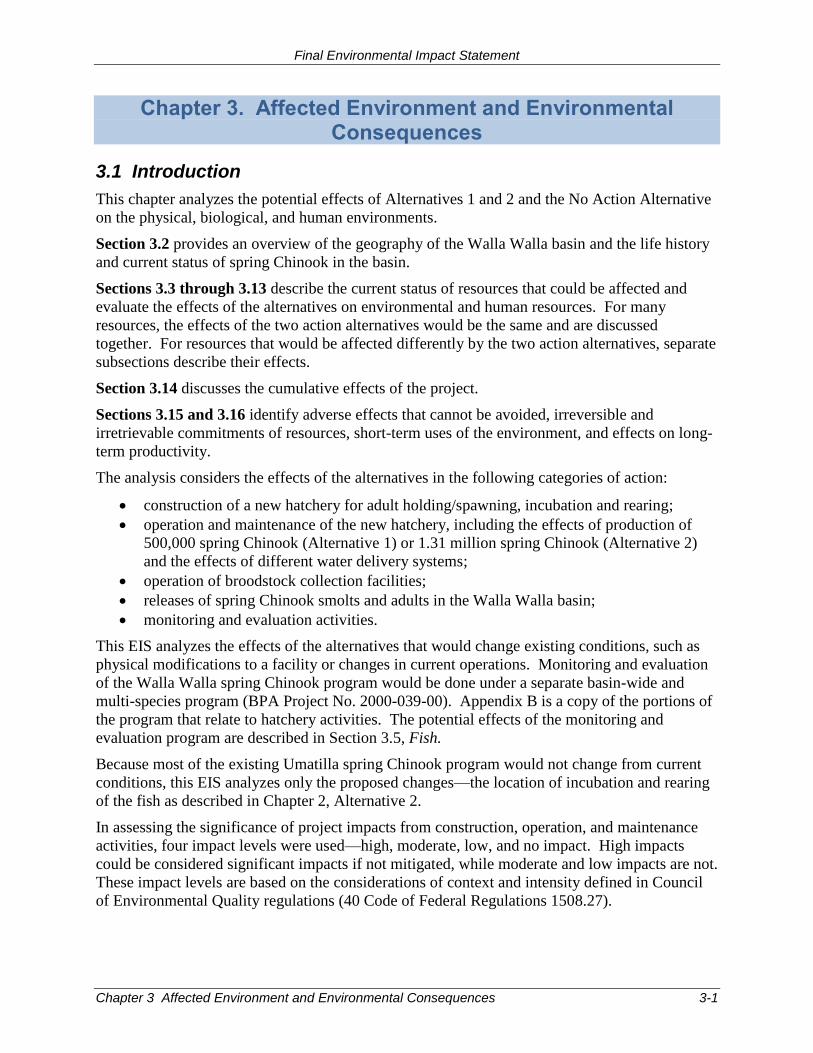
Final Environmental Impact Statement
Chapter 3 Affected Environment and Environmental Consequences 3-1
Chapter 3. Affected Environment and Environmental Consequences
3.1 Introduction
This chapter analyzes the potential effects of Alternatives 1 and 2 and the No Action Alternative
on the physical, biological, and human environments.
Section 3.2 provides an overview of the geography of the Walla Walla basin and the life history
and current status of spring Chinook in the basin.
Sections 3.3 through 3.13 describe the current status of resources that could be affected and
evaluate the effects of the alternatives on environmental and human resources. For many
resources, the effects of the two action alternatives would be the same and are discussed
together. For resources that would be affected differently by the two action alternatives, separate
subsections describe their effects.
Section 3.14 discusses the cumulative effects of the project.
Sections 3.15 and 3.16 identify adverse effects that cannot be avoided, irreversible and
irretrievable commitments of resources, short-term uses of the environment, and effects on long-
term productivity.
The analysis considers the effects of the alternatives in the following categories of action:
construction of a new hatchery for adult holding/spawning, incubation and rearing;
operation and maintenance of the new hatchery, including the effects of production of
500,000 spring Chinook (Alternative 1) or 1.31 million spring Chinook (Alternative 2)
and the effects of different water delivery systems;
operation of broodstock collection facilities;
releases of spring Chinook smolts and adults in the Walla Walla basin;
monitoring and evaluation activities.
This EIS analyzes the effects of the alternatives that would change existing conditions, such as
physical modifications to a facility or changes in current operations. Monitoring and evaluation
of the Walla Walla spring Chinook program would be done under a separate basin-wide and
multi-species program (BPA Project No. 2000-039-00). Appendix B is a copy of the portions of
the program that relate to hatchery activities. The potential effects of the monitoring and
evaluation program are described in Section 3.5, Fish.
Because most of the existing Umatilla spring Chinook program would not change from current
conditions, this EIS analyzes only the proposed changes—the location of incubation and rearing
of the fish as described in Chapter 2, Alternative 2.
In assessing the significance of project impacts from construction, operation, and maintenance
activities, four impact levels were used—high, moderate, low, and no impact. High impacts
could be considered significant impacts if not mitigated, while moderate and low impacts are not.
These impact levels are based on the considerations of context and intensity defined in Council
of Environmental Quality regulations (40 Code of Federal Regulations 1508.27).
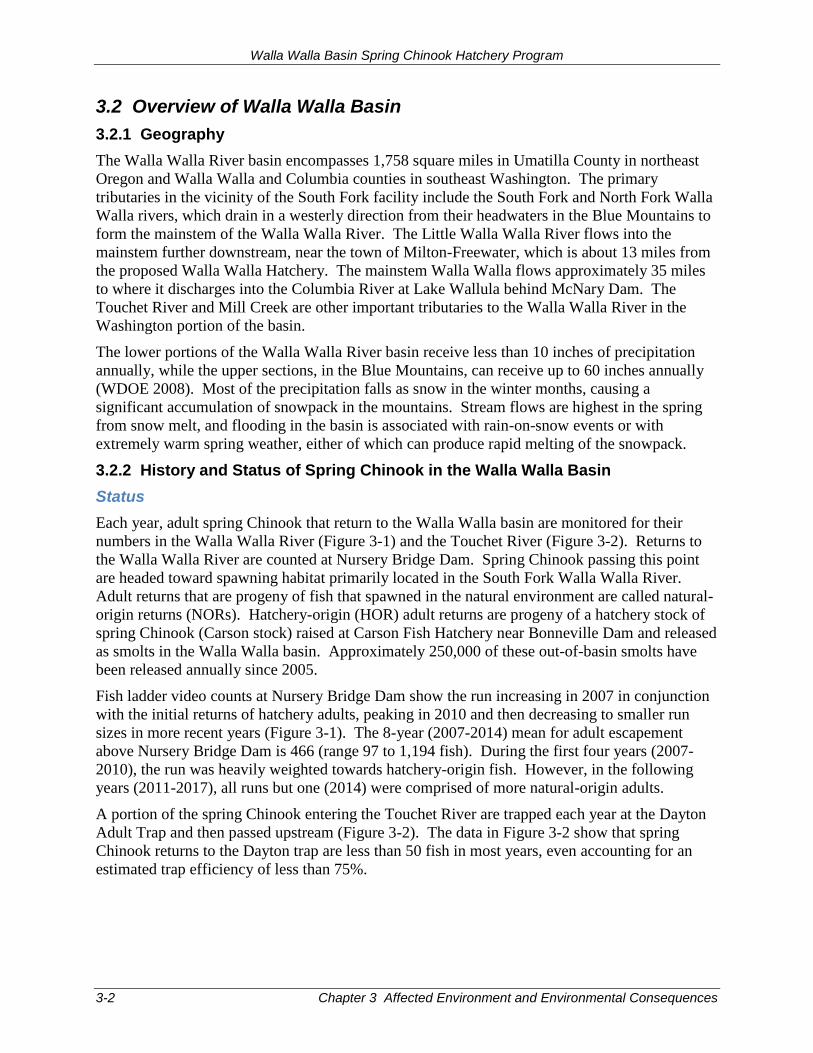
Walla Walla Basin Spring Chinook Hatchery Program
3-2 Chapter 3 Affected Environment and Environmental Consequences
3.2 Overview of Walla Walla Basin
3.2.1 Geography
The Walla Walla River basin encompasses 1,758 square miles in Umatilla County in northeast
Oregon and Walla Walla and Columbia counties in southeast Washington. The primary
tributaries in the vicinity of the South Fork facility include the South Fork and North Fork Walla
Walla rivers, which drain in a westerly direction from their headwaters in the Blue Mountains to
form the mainstem of the Walla Walla River. The Little Walla Walla River flows into the
mainstem further downstream, near the town of Milton-Freewater, which is about 13 miles from
the proposed Walla Walla Hatchery. The mainstem Walla Walla flows approximately 35 miles
to where it discharges into the Columbia River at Lake Wallula behind McNary Dam. The
Touchet River and Mill Creek are other important tributaries to the Walla Walla River in the
Washington portion of the basin.
The lower portions of the Walla Walla River basin receive less than 10 inches of precipitation
annually, while the upper sections, in the Blue Mountains, can receive up to 60 inches annually
(WDOE 2008). Most of the precipitation falls as snow in the winter months, causing a
significant accumulation of snowpack in the mountains. Stream flows are highest in the spring
from snow melt, and flooding in the basin is associated with rain-on-snow events or with
extremely warm spring weather, either of which can produce rapid melting of the snowpack.
3.2.2 History and Status of Spring Chinook in the Walla Walla Basin
Status
Each year, adult spring Chinook that return to the Walla Walla basin are monitored for their
numbers in the Walla Walla River (Figure 3-1) and the Touchet River (Figure 3-2). Returns to
the Walla Walla River are counted at Nursery Bridge Dam. Spring Chinook passing this point
are headed toward spawning habitat primarily located in the South Fork Walla Walla River.
Adult returns that are progeny of fish that spawned in the natural environment are called natural-
origin returns (NORs). Hatchery-origin (HOR) adult returns are progeny of a hatchery stock of
spring Chinook (Carson stock) raised at Carson Fish Hatchery near Bonneville Dam and released
as smolts in the Walla Walla basin. Approximately 250,000 of these out-of-basin smolts have
been released annually since 2005.
Fish ladder video counts at Nursery Bridge Dam show the run increasing in 2007 in conjunction
with the initial returns of hatchery adults, peaking in 2010 and then decreasing to smaller run
sizes in more recent years (Figure 3-1). The 8-year (2007-2014) mean for adult escapement
above Nursery Bridge Dam is 466 (range 97 to 1,194 fish). During the first four years (2007-
2010), the run was heavily weighted towards hatchery-origin fish. However, in the following
years (2011-2017), all runs but one (2014) were comprised of more natural-origin adults.
A portion of the spring Chinook entering the Touchet River are trapped each year at the Dayton
Adult Trap and then passed upstream (Figure 3-2). The data in Figure 3-2 show that spring
Chinook returns to the Dayton trap are less than 50 fish in most years, even accounting for an
estimated trap efficiency of less than 75%.
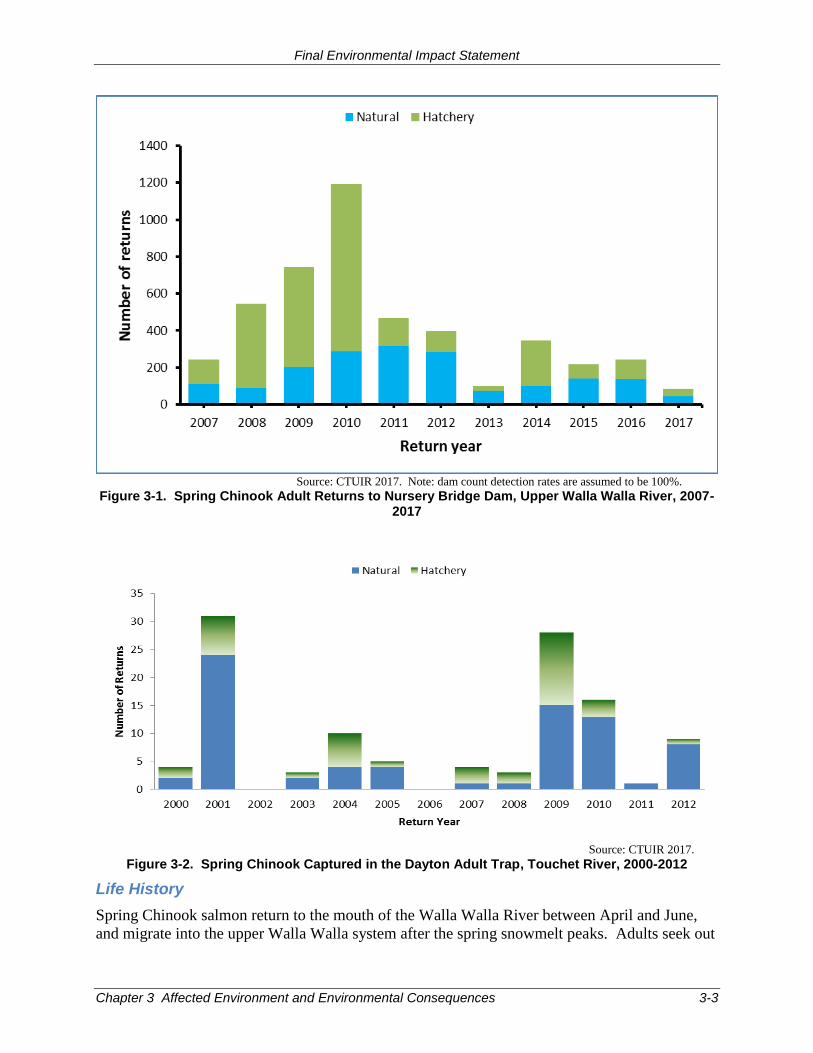
Final Environmental Impact Statement
Chapter 3 Affected Environment and Environmental Consequences 3-3
Source: CTUIR 2017. Note: dam count detection rates are assumed to be 100%.
Figure 3-1. Spring Chinook Adult Returns to Nursery Bridge Dam, Upper Walla Walla River, 2007-2017
Source: CTUIR 2017.
Figure 3-2. Spring Chinook Captured in the Dayton Adult Trap, Touchet River, 2000-2012
Life History
Spring Chinook salmon return to the mouth of the Walla Walla River between April and June,
and migrate into the upper Walla Walla system after the spring snowmelt peaks. Adults seek out
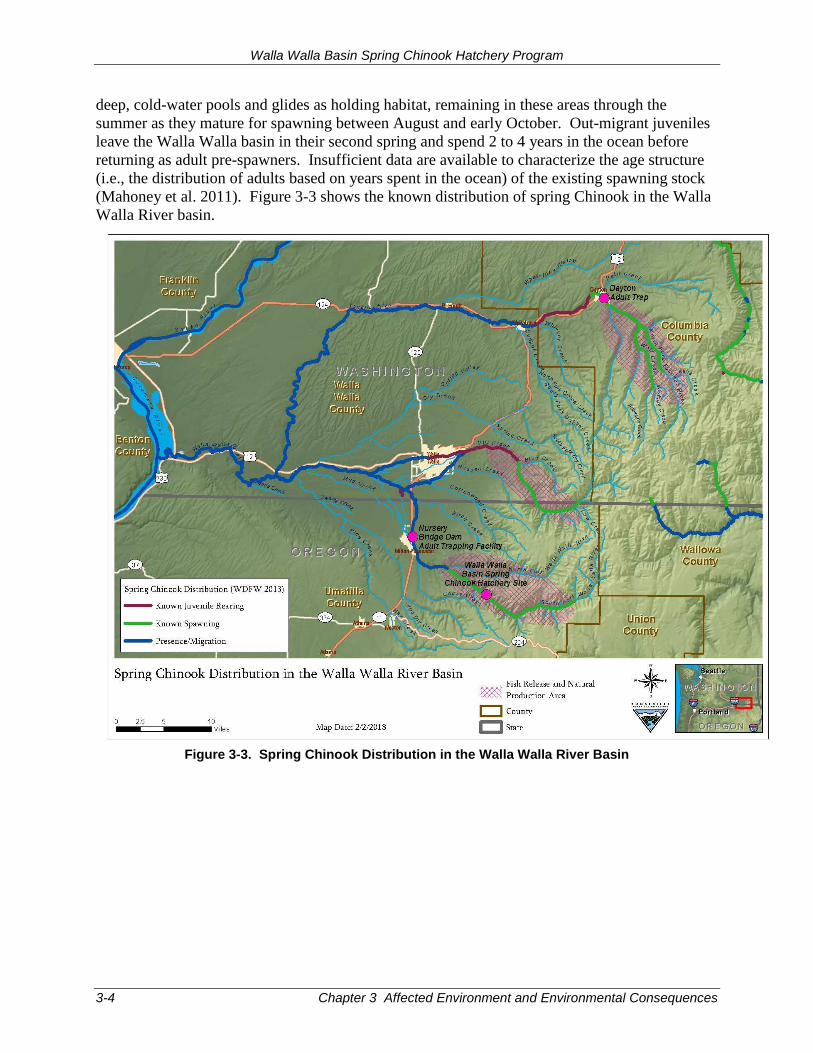
Walla Walla Basin Spring Chinook Hatchery Program
3-4 Chapter 3 Affected Environment and Environmental Consequences
deep, cold-water pools and glides as holding habitat, remaining in these areas through the
summer as they mature for spawning between August and early October. Out-migrant juveniles
leave the Walla Walla basin in their second spring and spend 2 to 4 years in the ocean before
returning as adult pre-spawners. Insufficient data are available to characterize the age structure
(i.e., the distribution of adults based on years spent in the ocean) of the existing spawning stock
(Mahoney et al. 2011). Figure 3-3 shows the known distribution of spring Chinook in the Walla
Walla River basin.
Figure 3-3. Spring Chinook Distribution in the Walla Walla River Basin
Final Environmental Impact Statement
Chapter 3 Affected Environment and Environmental Consequences 3-5
3.3 Surface and Groundwater Quantity and Rights
Notable Differences in this Section from the Draft EIS
For both alternatives, there is less reduction in river flows in the 450-foot reach between the
intake and abatement pond discharge when the pumpback system is not being used, due to
most process water being returned at the intake structure instead of 450 feet downstream.
See Sections 3.3.5 and 3.3.6, Surface Water Use.
For both alternatives, effects on instream flows of operating the juvenile fish bypass system
have been identified and include proposed changes to bypass operations. See Sections 3.3.5
and 3.3.6.
Neither a new well or use of groundwater are proposed for de-icing the intake system,
resulting in less potential impact to groundwater levels and nearby wells. See Section 3.3.5,
Groundwater Use.
3.3.1 Analysis Area
The analysis area for water quantity and rights includes the South Fork Walla Walla River
downstream to where the mainstem Walla Walla River enters the Columbia River (Figure 3-1).
The analysis area for groundwater includes the two aquifers underlying the facility: the deeper,
confined Columbia River basalt aquifer and the shallower alluvial aquifer.
3.3.2 Applicable Regulations
Under Oregon law, all water is publicly owned, and water users must obtain a permit from the
OWRD to use water from any source, including both surface water and groundwater (Oregon
Revised Statutes 537.130). Appropriation of water resources is done through these permits, and
the law is based on the principle of prior appropriation. The oldest water right-holder has
priority over water users with more recent permits.
3.3.3 Affected Environment
Surface Water
Surface Water Flows
Historically, Walla Walla River flows have been low due to agricultural diversions for irrigation.
During the irrigation season, water was diverted at the Little Walla Walla diversion in Milton-
Freewater, Oregon, resulting in the river often drying up during the summer. Irrigators,
regulators, and others, including the Walla Walla Basin Watershed Council, have implemented
various measures to manage the water resource to maintain year-round flow in the river since
approximately 2000 (Walla Walla Basin Watershed Council 2009).
According to the OWRD, water resources of the Walla Walla basin on the whole continue to be
over-allocated; that is, more water is demanded by water users than can be met by surface or
groundwater supplies. However, in the upstream reaches of the system, including the South Fork
Walla Walla River, the net water availability is positive, as discussed below. Table 3-1 provides
a breakdown of water flow, use, and availability for the South Fork Walla Walla River. The
following parameters are presented in Table 3-1.
Estimated Unimpaired Stream Flow represents conditions that would exist in the absence
of consumptive use or reservoir storage.
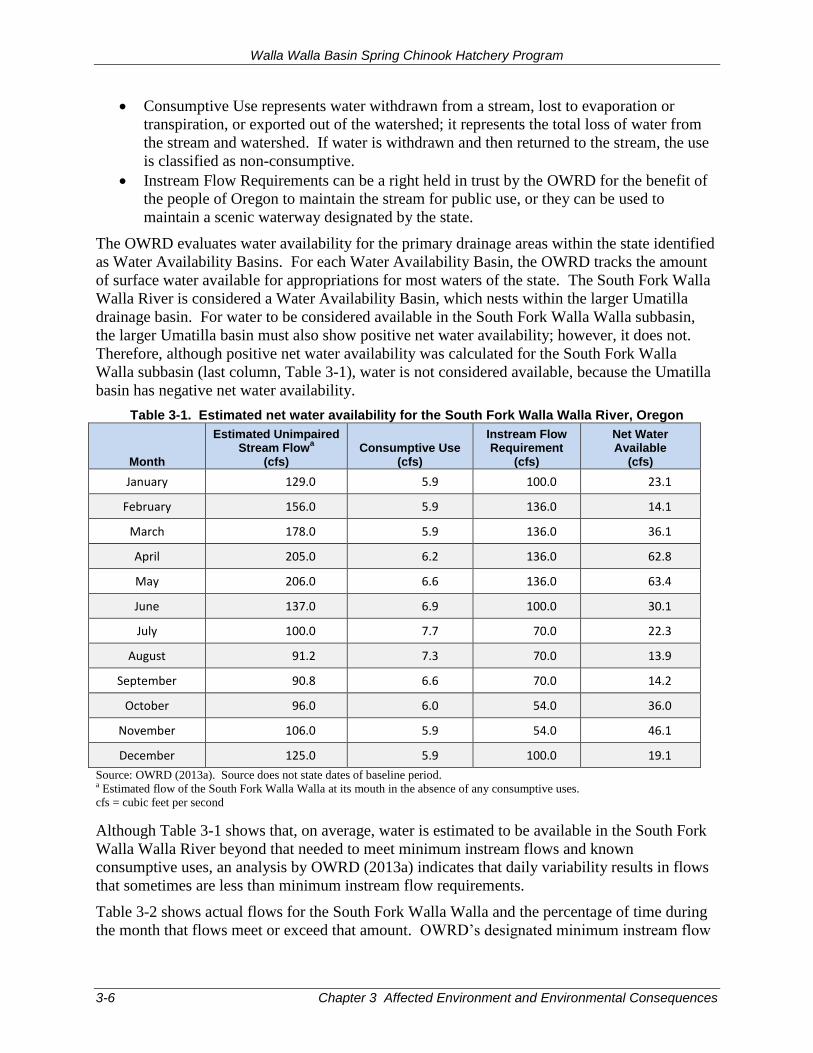
Walla Walla Basin Spring Chinook Hatchery Program
3-6 Chapter 3 Affected Environment and Environmental Consequences
Consumptive Use represents water withdrawn from a stream, lost to evaporation or
transpiration, or exported out of the watershed; it represents the total loss of water from
the stream and watershed. If water is withdrawn and then returned to the stream, the use
is classified as non-consumptive.
Instream Flow Requirements can be a right held in trust by the OWRD for the benefit of
the people of Oregon to maintain the stream for public use, or they can be used to
maintain a scenic waterway designated by the state.
The OWRD evaluates water availability for the primary drainage areas within the state identified
as Water Availability Basins. For each Water Availability Basin, the OWRD tracks the amount
of surface water available for appropriations for most waters of the state. The South Fork Walla
Walla River is considered a Water Availability Basin, which nests within the larger Umatilla
drainage basin. For water to be considered available in the South Fork Walla Walla subbasin,
the larger Umatilla basin must also show positive net water availability; however, it does not.
Therefore, although positive net water availability was calculated for the South Fork Walla
Walla subbasin (last column, Table 3-1), water is not considered available, because the Umatilla
basin has negative net water availability.
Table 3-1. Estimated net water availability for the South Fork Walla Walla River, Oregon
Month
Estimated Unimpaired Stream Flow
a
(cfs) Consumptive Use
(cfs)
Instream Flow Requirement
(cfs)
Net Water Available
(cfs)
January 129.0 5.9 100.0 23.1
February 156.0 5.9 136.0 14.1
March 178.0 5.9 136.0 36.1
April 205.0 6.2 136.0 62.8
May 206.0 6.6 136.0 63.4
June 137.0 6.9 100.0 30.1
July 100.0 7.7 70.0 22.3
August 91.2 7.3 70.0 13.9
September 90.8 6.6 70.0 14.2
October 96.0 6.0 54.0 36.0
November 106.0 5.9 54.0 46.1
December 125.0 5.9 100.0 19.1
Source: OWRD (2013a). Source does not state dates of baseline period.
a Estimated flow of the South Fork Walla Walla at its mouth in the absence of any consumptive uses.
cfs = cubic feet per second
Although Table 3-1 shows that, on average, water is estimated to be available in the South Fork
Walla Walla River beyond that needed to meet minimum instream flows and known
consumptive uses, an analysis by OWRD (2013a) indicates that daily variability results in flows
that sometimes are less than minimum instream flow requirements.
Table 3-2 shows actual flows for the South Fork Walla Walla and the percentage of time during
the month that flows meet or exceed that amount. OWRD’s designated minimum instream flow
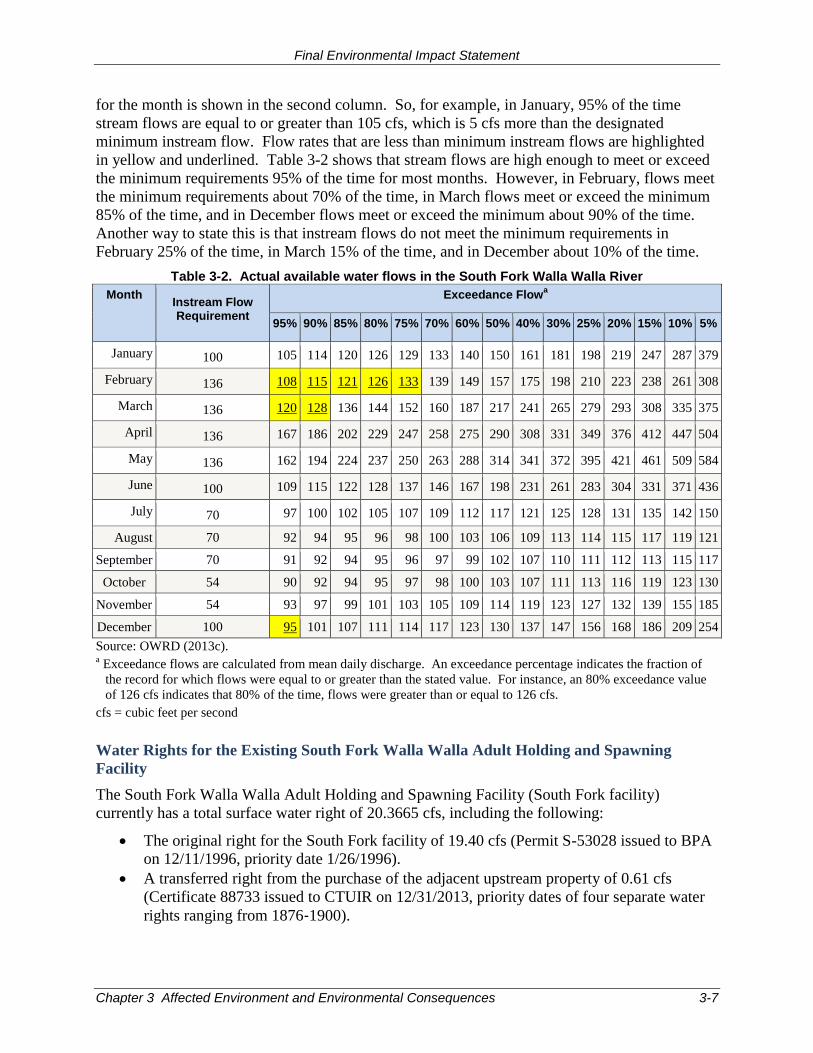
Final Environmental Impact Statement
Chapter 3 Affected Environment and Environmental Consequences 3-7
for the month is shown in the second column. So, for example, in January, 95% of the time
stream flows are equal to or greater than 105 cfs, which is 5 cfs more than the designated
minimum instream flow. Flow rates that are less than minimum instream flows are highlighted
in yellow and underlined. Table 3-2 shows that stream flows are high enough to meet or exceed
the minimum requirements 95% of the time for most months. However, in February, flows meet
the minimum requirements about 70% of the time, in March flows meet or exceed the minimum
85% of the time, and in December flows meet or exceed the minimum about 90% of the time.
Another way to state this is that instream flows do not meet the minimum requirements in
February 25% of the time, in March 15% of the time, and in December about 10% of the time.
Table 3-2. Actual available water flows in the South Fork Walla Walla River
Month Instream Flow Requirement
Exceedance Flowa
95% 90% 85% 80% 75% 70% 60% 50% 40% 30% 25% 20% 15% 10% 5%
January 100 105 114 120 126 129 133 140 150 161 181 198 219 247 287 379
February 136 108 115 121 126 133 139 149 157 175 198 210 223 238 261 308
March 136 120 128 136 144 152 160 187 217 241 265 279 293 308 335 375
April 136 167 186 202 229 247 258 275 290 308 331 349 376 412 447 504
May 136 162 194 224 237 250 263 288 314 341 372 395 421 461 509 584
June 100 109 115 122 128 137 146 167 198 231 261 283 304 331 371 436
July 70 97 100 102 105 107 109 112 117 121 125 128 131 135 142 150
August 70 92 94 95 96 98 100 103 106 109 113 114 115 117 119 121
September 70 91 92 94 95 96 97 99 102 107 110 111 112 113 115 117
October 54 90 92 94 95 97 98 100 103 107 111 113 116 119 123 130
November 54 93 97 99 101 103 105 109 114 119 123 127 132 139 155 185
December 100 95 101 107 111 114 117 123 130 137 147 156 168 186 209 254
Source: OWRD (2013c). a Exceedance flows are calculated from mean daily discharge. An exceedance percentage indicates the fraction of
the record for which flows were equal to or greater than the stated value. For instance, an 80% exceedance value
of 126 cfs indicates that 80% of the time, flows were greater than or equal to 126 cfs.
cfs = cubic feet per second
Water Rights for the Existing South Fork Walla Walla Adult Holding and Spawning
Facility
The South Fork Walla Walla Adult Holding and Spawning Facility (South Fork facility)
currently has a total surface water right of 20.3665 cfs, including the following:
The original right for the South Fork facility of 19.40 cfs (Permit S-53028 issued to BPA
on 12/11/1996, priority date 1/26/1996).
A transferred right from the purchase of the adjacent upstream property of 0.61 cfs
(Certificate 88733 issued to CTUIR on 12/31/2013, priority dates of four separate water
rights ranging from 1876‐1900).
Walla Walla Basin Spring Chinook Hatchery Program
3-8 Chapter 3 Affected Environment and Environmental Consequences
Irrigation rights in the amounts of 0.02 cfs and 0.12 cfs, which were part of the original
property purchase by BPA (Certificate 88582 issued to BPA on 7/19/2013, priority date
1880).
A right in the amount of 0.195 cfs (Certificate 88581 issued to BPA on 7/19/13; priority
dates of two separate water rights include 1883 and 1893).
A right in the amount of 0.0375 cfs or 1.5 Miner’s inches (Certificate 88134 issued to
BPA on 6/27/13, priority date 1880).
Operation of the juvenile fish bypass, which normally requires 4 – 6 cfs, does not require a water
right (ORS 537.141(1)(d)).
Other Surface Water Rights/Uses in the Analysis Area
The majority of surface water rights for the Walla Walla River watershed are for agricultural
uses. The 19.4 cfs water right for the South Fork facility is the most junior water right in the
basin (Ladd, OWRD, pers. comm., 11-27-13).
Groundwater
Approximately 63% of water rights in the Walla Walla basin are for groundwater (Snake River
Salmon Recovery Board 2011). Information about groundwater in the Walla Walla basin is
limited, but in general, groundwater tables appear to be declining (Snake River Salmon Recovery
Board 2011). Groundwater sources at the project site have not been explored in detail; however,
it is known that two groundwater aquifers underlie the South Fork facility: the Columbia River
Basalt aquifer, which can reach depths of several thousand feet throughout its range, and a
shallower alluvial aquifer, which is thought to occur at depths of up to approximately one
hundred feet at the project site.
The primary aquifer used in the Walla Walla basin is the basalt aquifer. It is a confined aquifer,
meaning the water is sealed between rock layers and is under pressure. The shallow alluvial
aquifer is also used as a source of water in the basin, but it is a discontinuous aquifer, meaning it
is broken into distinct portions that do not flow between one another because they are blocked by
an impervious surface, such as rock. Preliminary studies of the project site indicate that
groundwater from the basalt aquifer at depths less than 500 feet has temperatures ranging from
60 to 70 degrees Fahrenheit (°F), high concentrations of hydrogen sulfide, and potentially
inconsistent supply. The shallow aquifer produces limited amounts of water in many areas,
including at the property adjacent to the South Fork facility. The shallow alluvial aquifer has not
been explored or characterized at the South Fork site; however, it probably produces less water
than the deeper basalt aquifer and likely is strongly influenced by water quantity and quality
characteristics of the South Fork Walla Walla River (McMillen 2011).
The project site currently is served by a well that draws from the deeper basalt aquifer (at a depth
of approximately 180 feet). Water quality from this source is not adequate to support the
proposed hatchery operations but is treated and used currently for domestic supply. The existing
facility does not hold a groundwater right permit because the current use is exempted from
requiring a permit (OWRD 2013b). Per Oregon Revised Statute 537.545(d), domestic use is
exempt from requiring a permit as long as flow is limited to no more than 15,000 gallons per day
and the use is considered to be beneficial. The existing well at the facility falls within this
exemption.
Final Environmental Impact Statement
Chapter 3 Affected Environment and Environmental Consequences 3-9
A well located on property owned by CTUIR adjacent to and upstream of the project site draws
from the shallow alluvial aquifer. The property was modified to improve habitat under a
separate project funded by BPA (BPA Project No. 2698-011-00) and does not require use of the
existing well (Jonathan Thompson, CTUIR, pers. comm., 1-16-14). The remaining 24 wells
identified in the vicinity (within approximately 6 miles) of the South Fork facility draw from the
deeper basalt aquifer (SPF Water Engineering, pers. comm., 9-27-10).
3.3.4 Sources and Types of Impact
Construction activity would require the use of small amounts of surface water, primarily
during hot weather.
Withdrawal of water from the South Fork Walla Walla River for hatchery operations
would reduce flows by up to 5 cfs within a limited section of the river (approximately
450 feet between the intake structure and the abatement pond discharge); when combined
with the withdrawals for operation of the juvenile fish bypass, instream flows could be
reduced by up to 11 cfs for 250 feet of this reach, the distance between the intake and the
bypass exit.
During certain months of the year, there could be insufficient water in the South Fork
Walla Walla River to meet both hatchery demand and instream flow requirements within
the 450-foot reach between the existing hatchery intake and the abatement pond
discharge and/or within the 250-foot reach between the intake and juvenile bypass exit.
Landscaping maintenance could require approximately 3,000 gallons per day twice a
week between May and October.
3.3.5 Effects of Alternative 1: Preferred Alternative
Surface Water Use
Construction Effects
Construction activities could require water for dust abatement and other measures, especially
during hot weather. Construction water needed would be a maximum of approximately 10,000
gallons per day during hot weather, to be obtained from the intake forebay using a NMFS-
compliant screened pump. More normal construction usage likely would average 5,000 gallons
per day during warmer months, and 500 gallons per day in the winter. The maximum amount
used would be the equivalent of 0.02 cubic feet per second (cfs), well within just one of the
senior water rights assigned to the facility (Certificate 88134), which allows the withdrawal of
0.0375 cfs year-round. Impacts to surface water quantity, minimum instream flows, and
downstream water rights holders would be low.
Operational Effects
Alternative 1 proposes to rear up to 500,000 spring Chinook smolts in circular rearing tanks.
Circular tanks allow hatchery operators flexibility to alter criteria such as rearing densities and
flow rates to achieve the desired level of fish production and fish condition using available water.
Circular tanks use water efficiently to rapidly remove solid wastes, distribute oxygenated water
uniformly, and allow for a range of swim speeds for the fish. Because the tanks have two drains
(one near the top of the tank and one at the bottom), only 20% of the water used in these tanks
(the water at the bottom of the tank that contains the nutrients and suspended solids) needs to be
discharged to the abatement pond. The remaining 80% of the water can be discharged back to
the river. In addition, circular tanks can be operated at low water exchange rates while
Walla Walla Basin Spring Chinook Hatchery Program
3-10 Chapter 3 Affected Environment and Environmental Consequences
maintaining desirable flow velocities, water movement patterns within the tanks, and self-
cleaning characteristics (Timmons and Ebeling n.d.).
As noted in Section 3.3.3, the South Fork facility has a total surface water right of 20.3665 cfs.
The existing facility uses up to 13 cfs during part of the year for the adult holding and spawning
activity, and approximately 6 cfs in late April through mid-October for the fish bypass. Under
Alternative 1, the conceptual design for the new hatchery would require the withdrawal of up to
19.4 cfs, not including the juvenile bypass. Under normal conditions, the majority of that water
would be returned to the river via the proposed new discharge pipe near the intake structure, with
up to 5 cfs of the water being discharged from the abatement pond 450 feet downstream. The
juvenile bypass exit is 250 feet downstream of the intake. In the 250-foot reach between the
intake and the bypass exit, river flow could be reduced by up to approximately 11 cfs; in the 200-
foot reach between the bypass exit and the abatement pond discharge, flows could be reduced by
up to 5 cfs.
Table 3-3 shows the hatchery’s average water demand by month, including the bypass.
Although no users other than the South Fork facility withdraw water from this section of the
river, this reach is subject to minimum instream flow requirements. The hatchery’s 19.4 cfs
water right is the most junior in the South Fork Walla Walla River subbasin (Ladd, OWRD,
pers. comm., 11-27-13). Because it is also junior to the instream flow requirement and
constitutes the majority of the hatchery’s total water right of 20.3665 cfs, the hatchery would be
subject to curtailment in an amount commensurate with reduced instream flows (Ladd, OWRD,
pers. comm., 11-27-13). The hatchery’s remaining water rights (0.9556 cfs) are more senior
than the instream flow requirements and could still be exercised during low-water periods, but
that amount is insufficient to maintain even minimal hatchery operation. In addition, although
the juvenile bypass does not require a water right to operate, it is subject to instream flows.
Discussions with OWRD established that OWRD would consider any withdrawals to operate the
hatchery and the bypass that reduce instream flows below the mandated minimum instream flows
(or below natural flows without any withdrawals) as injurious to the instream flow water right,
which is senior to the hatchery water right.
As shown in Table 3-2, under existing conditions, at times stream flows do not meet the
minimum requirements in February, March, and December. Although natural river flows are
lower in summer, in winter the combination of higher minimum instream flow requirements and
natural flows that are at times too low to meet those requirements mean that Alternative 1 has
more potential to affect instream flows in the winter than in the summer. As a result, from
December through April and possibly in June, Alternative 1 would increase the potential that
minimum flows would not be met in the 450-foot reach between the intake and discharge
(Table 3-3).
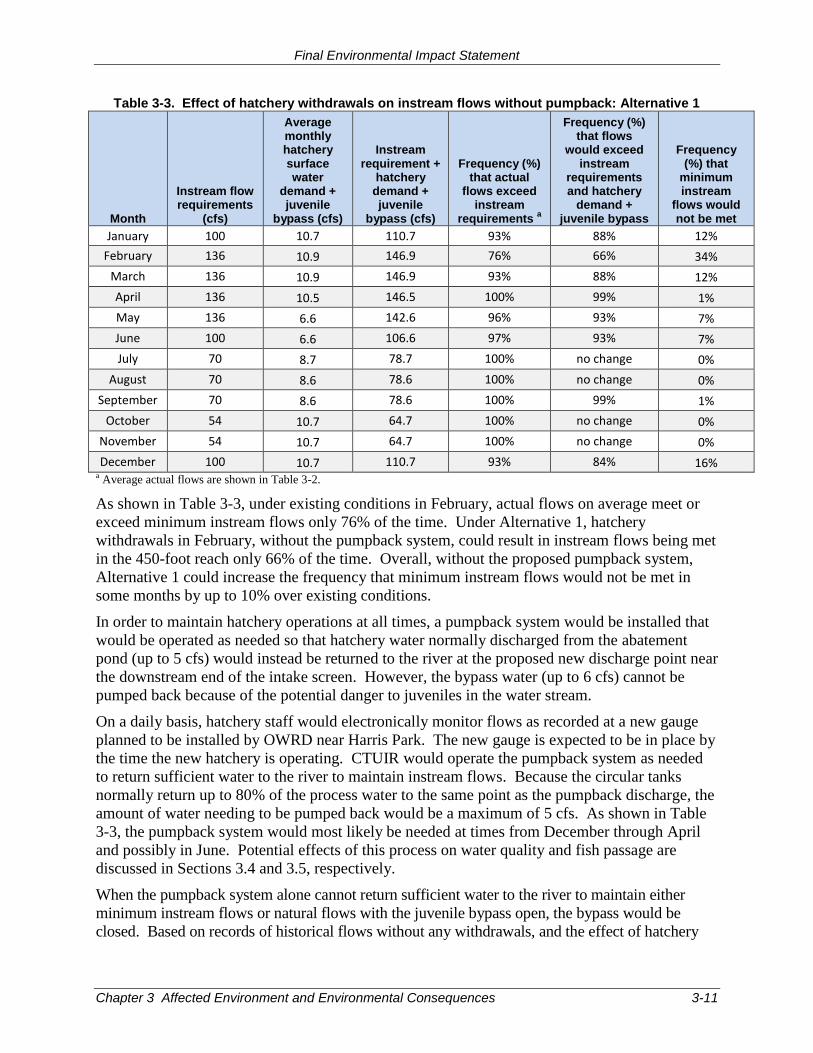
Final Environmental Impact Statement
Chapter 3 Affected Environment and Environmental Consequences 3-11
Table 3-3. Effect of hatchery withdrawals on instream flows without pumpback: Alternative 1
Month
Instream flow requirements
(cfs)
Average monthly hatchery surface water
demand + juvenile
bypass (cfs)
Instream requirement +
hatchery demand + juvenile
bypass (cfs)
Frequency (%) that actual
flows exceed instream
requirements a
Frequency (%) that flows
would exceed instream
requirements and hatchery
demand + juvenile bypass
Frequency (%) that
minimum instream
flows would not be met
January 100 10.7 110.7 93% 88% 12%
February 136 10.9 146.9 76% 66% 34%
March 136 10.9 146.9 93% 88% 12%
April 136 10.5 146.5 100% 99% 1%
May 136 6.6 142.6 96% 93% 7%
June 100 6.6 106.6 97% 93% 7%
July 70 8.7 78.7 100% no change 0%
August 70 8.6 78.6 100% no change 0%
September 70 8.6 78.6 100% 99% 1%
October 54 10.7 64.7 100% no change 0%
November 54 10.7 64.7 100% no change 0%
December 100 10.7 110.7 93% 84% 16% a Average actual flows are shown in Table 3-2.
As shown in Table 3-3, under existing conditions in February, actual flows on average meet or
exceed minimum instream flows only 76% of the time. Under Alternative 1, hatchery
withdrawals in February, without the pumpback system, could result in instream flows being met
in the 450-foot reach only 66% of the time. Overall, without the proposed pumpback system,
Alternative 1 could increase the frequency that minimum instream flows would not be met in
some months by up to 10% over existing conditions.
In order to maintain hatchery operations at all times, a pumpback system would be installed that
would be operated as needed so that hatchery water normally discharged from the abatement
pond (up to 5 cfs) would instead be returned to the river at the proposed new discharge point near
the downstream end of the intake screen. However, the bypass water (up to 6 cfs) cannot be
pumped back because of the potential danger to juveniles in the water stream.
On a daily basis, hatchery staff would electronically monitor flows as recorded at a new gauge
planned to be installed by OWRD near Harris Park. The new gauge is expected to be in place by
the time the new hatchery is operating. CTUIR would operate the pumpback system as needed
to return sufficient water to the river to maintain instream flows. Because the circular tanks
normally return up to 80% of the process water to the same point as the pumpback discharge, the
amount of water needing to be pumped back would be a maximum of 5 cfs. As shown in Table
3-3, the pumpback system would most likely be needed at times from December through April
and possibly in June. Potential effects of this process on water quality and fish passage are
discussed in Sections 3.4 and 3.5, respectively.
When the pumpback system alone cannot return sufficient water to the river to maintain either
minimum instream flows or natural flows with the juvenile bypass open, the bypass would be
closed. Based on records of historical flows without any withdrawals, and the effect of hatchery
Walla Walla Basin Spring Chinook Hatchery Program
3-12 Chapter 3 Affected Environment and Environmental Consequences
and bypass withdrawals on those flows, it is estimated that the bypass would need to be closed, on
average, the number of days per month as shown below. In most cases, the days in any particular
month would not be consecutive. Effects on juvenile fish that could be present during these
periods are discussed in Section 3.5.5 but are expected to be low.
January 4 days
February 10 days
March 4 days
May 1 days
June 1 days
December 5 days
The need for and frequency of these operations would vary from year to year, depending on
monitored flows.
Landscaping maintenance is the only consumptive use for surface water proposed at the
hatchery, estimated at up to 3,000 gallons per day (approximately 0.005 cfs) twice a week from
May through October (Chapter 2, Section 2.2.1, Table 2-1). This amount would not exceed the
existing facility’s senior irrigation water rights (see Section 3.3.3).
Because there would be no effect on water users downstream of the proposed hatchery, and
because the hatchery would be operated within its available water right and would not conflict
with instream flow requirements, there would be no impact on surface water quantity or rights.
Groundwater Use
Groundwater would not be used for construction activities.
Under Alternative 1, the existing deep groundwater well that is used to supply domestic water to
the site would likely continue to be the source for domestic uses. The three proposed residences
and hatchery domestic uses would require a total of approximately 2,160 gallons per day
(Chapter 2, Section 2.2.1, Table 2-1). As mentioned previously, if groundwater is used for
domestic purposes, as long as the flow is limited to no more than 15,000 gallons per day, it
would be exempt from groundwater right permit requirements (Oregon Revised Statutes
537.545(d)). These domestic uses would fall within the exemption.
During initial installation, the existing well was allowed to flow for 1 hour, during which a yield
of 100 gallons per minute (gpm) was reported (SPF Water Engineering, pers. comm., 9-27-14).
This is an artesian well, which means that the groundwater is under pressure and does not require
pumping. Based on a projected domestic peak demand of 20 gpm, an additional well would not
be needed for domestic purposes; therefore, those uses would not affect groundwater.
3.3.6 Effects of Alternative 2
Effects of construction activities on surface and groundwater supply and downstream water
rights holders would be the same as for Alternative 1.
Alternative 2 proposes to rear up to 810,000 additional spring Chinook, for a total of 1.31 million
fish, which would require approximately 27 circular rearing tanks. A water reuse system is
proposed for this alternative, but an option of delaying installation of the reuse system is also
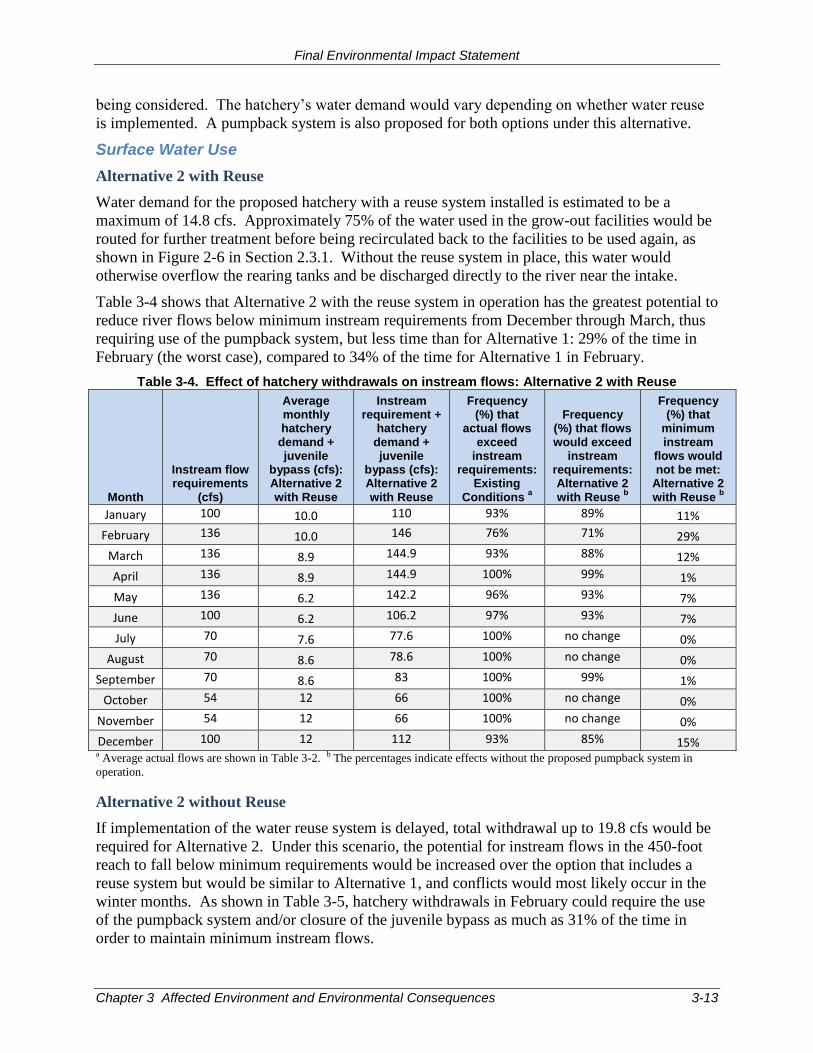
Final Environmental Impact Statement
Chapter 3 Affected Environment and Environmental Consequences 3-13
being considered. The hatchery’s water demand would vary depending on whether water reuse
is implemented. A pumpback system is also proposed for both options under this alternative.
Surface Water Use
Alternative 2 with Reuse
Water demand for the proposed hatchery with a reuse system installed is estimated to be a
maximum of 14.8 cfs. Approximately 75% of the water used in the grow-out facilities would be
routed for further treatment before being recirculated back to the facilities to be used again, as
shown in Figure 2-6 in Section 2.3.1. Without the reuse system in place, this water would
otherwise overflow the rearing tanks and be discharged directly to the river near the intake.
Table 3-4 shows that Alternative 2 with the reuse system in operation has the greatest potential to
reduce river flows below minimum instream requirements from December through March, thus
requiring use of the pumpback system, but less time than for Alternative 1: 29% of the time in
February (the worst case), compared to 34% of the time for Alternative 1 in February.
Table 3-4. Effect of hatchery withdrawals on instream flows: Alternative 2 with Reuse
Month
Instream flow requirements
(cfs)
Average monthly hatchery
demand + juvenile
bypass (cfs): Alternative 2 with Reuse
Instream requirement +
hatchery demand + juvenile
bypass (cfs): Alternative 2 with Reuse
Frequency (%) that
actual flows exceed
instream requirements:
Existing Conditions
a
Frequency (%) that flows would exceed
instream requirements: Alternative 2 with Reuse
b
Frequency (%) that
minimum instream
flows would not be met:
Alternative 2 with Reuse
b
January 100 10.0 110 93% 89% 11%
February 136 10.0 146 76% 71% 29%
March 136 8.9 144.9 93% 88% 12%
April 136 8.9 144.9 100% 99% 1%
May 136 6.2 142.2 96% 93% 7%
June 100 6.2 106.2 97% 93% 7%
July 70 7.6 77.6 100% no change 0%
August 70 8.6 78.6 100% no change 0%
September 70 8.6 83 100% 99% 1%
October 54 12 66 100% no change 0%
November 54 12 66 100% no change 0%
December 100 12 112 93% 85% 15% a Average actual flows are shown in Table 3-2. b The percentages indicate effects without the proposed pumpback system in
operation.
Alternative 2 without Reuse
If implementation of the water reuse system is delayed, total withdrawal up to 19.8 cfs would be
required for Alternative 2. Under this scenario, the potential for instream flows in the 450-foot
reach to fall below minimum requirements would be increased over the option that includes a
reuse system but would be similar to Alternative 1, and conflicts would most likely occur in the
winter months. As shown in Table 3-5, hatchery withdrawals in February could require the use
of the pumpback system and/or closure of the juvenile bypass as much as 31% of the time in
order to maintain minimum instream flows.
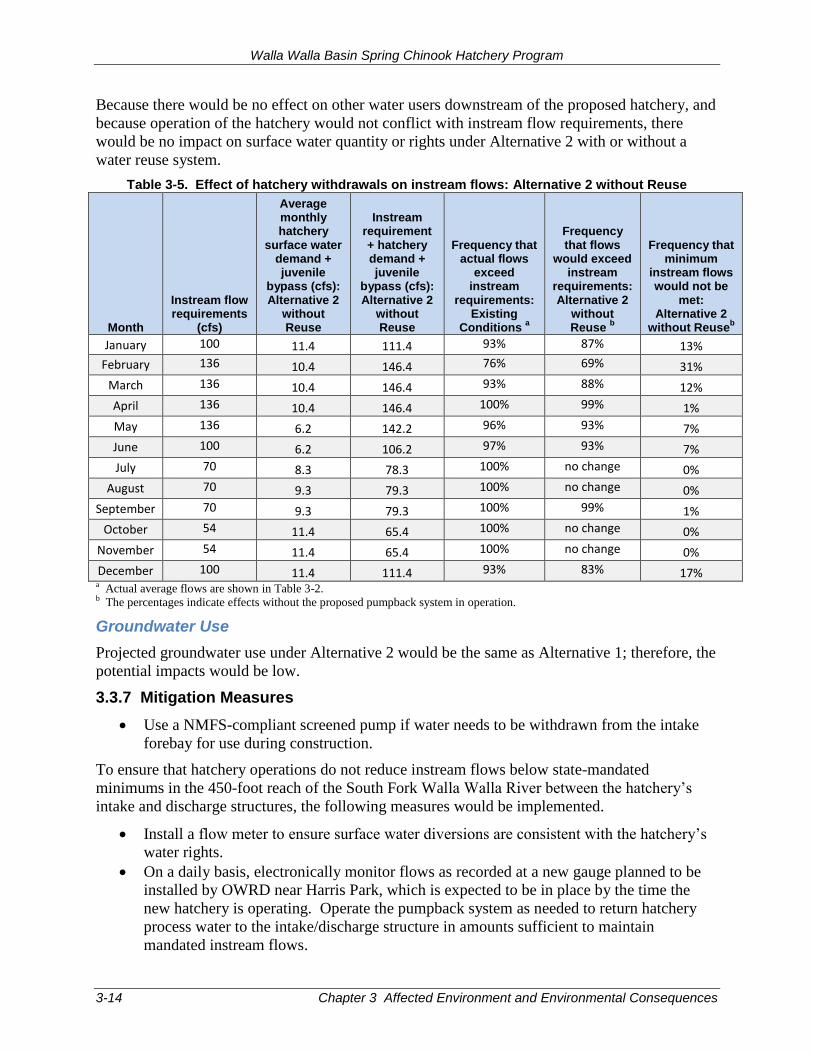
Walla Walla Basin Spring Chinook Hatchery Program
3-14 Chapter 3 Affected Environment and Environmental Consequences
Because there would be no effect on other water users downstream of the proposed hatchery, and
because operation of the hatchery would not conflict with instream flow requirements, there
would be no impact on surface water quantity or rights under Alternative 2 with or without a
water reuse system.
Table 3-5. Effect of hatchery withdrawals on instream flows: Alternative 2 without Reuse
Month
Instream flow requirements
(cfs)
Average monthly hatchery
surface water demand + juvenile
bypass (cfs): Alternative 2
without Reuse
Instream requirement + hatchery demand + juvenile
bypass (cfs): Alternative 2
without Reuse
Frequency that actual flows
exceed instream
requirements: Existing
Conditions a
Frequency that flows
would exceed instream
requirements: Alternative 2
without Reuse
b
Frequency that minimum
instream flows would not be
met: Alternative 2
without Reuseb
January 100 11.4 111.4 93% 87% 13%
February 136 10.4 146.4 76% 69% 31%
March 136 10.4 146.4 93% 88% 12%
April 136 10.4 146.4 100% 99% 1%
May 136 6.2 142.2 96% 93% 7%
June 100 6.2 106.2 97% 93% 7%
July 70 8.3 78.3 100% no change 0%
August 70 9.3 79.3 100% no change 0%
September 70 9.3 79.3 100% 99% 1%
October 54 11.4 65.4 100% no change 0%
November 54 11.4 65.4 100% no change 0%
December 100 11.4 111.4 93% 83% 17% a Actual average flows are shown in Table 3-2. b The percentages indicate effects without the proposed pumpback system in operation.
Groundwater Use
Projected groundwater use under Alternative 2 would be the same as Alternative 1; therefore, the
potential impacts would be low.
3.3.7 Mitigation Measures
Use a NMFS-compliant screened pump if water needs to be withdrawn from the intake
forebay for use during construction.
To ensure that hatchery operations do not reduce instream flows below state-mandated
minimums in the 450-foot reach of the South Fork Walla Walla River between the hatchery’s
intake and discharge structures, the following measures would be implemented.
Install a flow meter to ensure surface water diversions are consistent with the hatchery’s
water rights.
On a daily basis, electronically monitor flows as recorded at a new gauge planned to be
installed by OWRD near Harris Park, which is expected to be in place by the time the
new hatchery is operating. Operate the pumpback system as needed to return hatchery
process water to the intake/discharge structure in amounts sufficient to maintain
mandated instream flows.
Final Environmental Impact Statement
Chapter 3 Affected Environment and Environmental Consequences 3-15
Curtail operation of the juvenile fish bypass when flows are low enough that use of the
pumpback system would not maintain minimum instream flows.
3.3.8 Effects of the No Action Alternative
Under the No Action Alternative, additional facilities would not be constructed and the potential
for conflict would continue the same as under existing conditions. Surface water withdrawals up
to 11 cfs would continue in the 250-foot reach between the intake and the exit for the juvenile
bypass, and approximately 5 cfs in the 200-foot reach between the bypass exit and the abatement
pond discharge structure. In the months the facility and bypass are operating (mid-April through
October) there is a potential for conflict with minimum instream flow requirements for two days
in May and three days in June (based on water flow data between 1990 and 2012; McClintock,
BPA, pers. comm., 4-4-18). However, the facility operators reduce or close flows to the bypass
when river flows drop to the minimum instream flow level.
The effects of the existing facility on water supply would continue to be low for the following
reasons:
Withdrawals do not affect any other water users in the 250- to 450-foot reach;
The 5 - 11 cfs withdrawn is too small a percentage of normal flows 90% of the time
during May and June (194 cfs and 115 cfs respectively; Table 3-2) to noticeably reduce
fish habitat or other beneficial uses for which instream flows were established.
Potential impacts to minimum instream flows are mitigated.
Groundwater withdrawals for domestic use would continue to be minimal and consistent with
applicable water law. Therefore, groundwater impacts of the existing facility would continue to
be low.
3.4 Water Quality
Notable Differences in this Section from the Draft EIS
Because construction of roughened riffles, a smolt release channel, and changes to the
juvenile bypass system are no longer proposed, the water quality impacts that were
associated with those actions have been removed.
With the elimination of roughened riffles and other stream-side work, the amount of riparian
vegetation removed is too minimal to warrant consideration for shade/temperature effects on
water quality.
Overall water quality impacts during construction are greatly reduced for Alternative 1, due
to the minimal amount of in-water work required. See Section 3.4.5, Construction Effects,
Surface Waters.
Revised modeling shows near-zero change to stream temperature for Alternative 1 because
the amount of water that would be used has increased and the system hydraulic architecture
has changed. See Section 3.4.5, Operational Effects, Water Temperature.
There would be no effects of ozone treatment because the treatment building has been
decommissioned.
Walla Walla Basin Spring Chinook Hatchery Program
3-16 Chapter 3 Affected Environment and Environmental Consequences
3.4.1 Analysis Area
The analysis area for surface water resources includes the South Fork Walla Walla River
downstream of the proposed hatchery, as well as areas in the Walla Walla River basin where
spring Chinook salmon might go as they are returning to spawn (Figure 2-1). The analysis area
for groundwater includes the two aquifers underlying the facility: the deeper Columbia River
Basalt aquifer and the shallower alluvial aquifer.
3.4.2 Applicable Regulations
Federal Clean Water Act
The Clean Water Act (33 USC 1251 et seq.) is the primary federal law that protects the quality of
the nation’s surface waters, including lakes, rivers, and coastal wetlands. In accordance with the
Act, any discharge of pollutants into the nation’s waters is prohibited unless specifically
authorized by a permit. The applicable sections of the Clean Water Act are discussed below.
Because the South Fork facility is located approximately 20 miles south of the Washington state
border, the analysis focuses primarily on Oregon regulations.
Water Quality Certification (Section 401)
Under Section 401, a permit to conduct an activity that causes discharges into waters of the
United States is issued only after the affected state certifies that existing water quality standards
would not be violated if the permit were issued. Oregon Department of Environmental Quality
(ODEQ) is the agency that would provide the certification for the South Fork facility. The
state’s process is triggered when a permit is required under the Clean Water Act, such as a
National Pollutant Discharge Elimination System (NPDES) permit (Section 402) or a U.S. Army
Corps of Engineers Section 404 permit (see Section 3.9 Wetlands and Floodplains).
National Pollutant Discharge Elimination System (Section 402)
Section 402 regulates the discharge of any pollutant (except dredged or fill material) into waters
of the United States and requires an NPDES permit for point-source discharges. The NPDES
program in Oregon is administered through the ODEQ.
Water Quality Impairments (Section 303[d])
Section 303 of the Clean Water Act requires each state to provide a list of impaired waters that
do not meet or are expected not to meet state water quality standards as defined by Section
303(d), and to develop Total Maximum Daily Loads (TMDLs) from all pollution sources for such
impaired water bodies.
Oregon Water Quality Standards
ODEQ Water Quality Standards: Beneficial Uses, Policies, and Criteria for Oregon (Oregon
Administrative Rules 340-041-0001) outline the state’s plan to manage the quality of public
waters in Oregon. The rules define water quality criteria and describe beneficial uses and
discharge requirements that apply to all waters in Oregon. When water quality standards are
developed for a particular parameter such as temperature, the first step is to identify the
beneficial use sensitive to that parameter. The standards are then set based on the levels needed
to protect the beneficial use of the water body in question.
Oregon Administrative Rule 340-041-0330 contains requirements specific to the Walla Walla
River basin to protect beneficial uses, which include public and private domestic water supply,
Final Environmental Impact Statement
Chapter 3 Affected Environment and Environmental Consequences 3-17
industrial water supply, irrigation, livestock watering, fish and aquatic life, wildlife and hunting,
fishing, boating, water contact recreation, aesthetic quality, and hydropower. Designations are in
place for the South Fork Walla Walla River and Walla Walla River mainstem to protect bull
trout spawning and juvenile rearing habitat, and salmon and trout rearing and migration habitat.
Rules applicable to specific water quality parameters are discussed in the appropriate sections
below.
3.4.3 Affected Environment
Surface Water Quality
In the analysis area, project construction and operation could most directly affect the South Fork
Walla Walla River downstream to the mainstem Walla Walla River (Figure 2-1). These rivers
are currently designated as impaired on Oregon’s and Washington’s 303(d) lists for temperature
and dissolved oxygen (ODEQ 2013; WDOE 2013a). Because temperature is a concern within
the entire Walla Walla River basin, a TMDL was adopted in 2005. The Walla Walla Subbasin
Stream Temperature Total Maximum Daily Load and Water Quality Management Plan analyzes
the water temperature limitations in the basin and sets limits on the contribution from human
sources that could increase temperatures for basin waterways (ODEQ 2005).
Table 3-6 provides the 303(d) listings for the South Fork Walla Walla River and Walla Walla
River mainstem that have the potential to be affected by the action alternatives. The 2012
Category column in the table provides additional information about the status of each reach.
Table 3-6. Oregon 303(d) listings for the South Fork and mainstem Walla Walla River
Water Body Parameter 2012 Category
Walla Walla River Dissolved oxygen 4A 1
Polychlorinated biphenyls 4A
Temperature 4A
South Fork Walla Walla River Dissolved oxygen 5 2
Temperature 4A Source: WDOE 2013a; ODEQ 2013.
1. Category 4A indicates a TMDL is in place for the given parameter.
2. Category 5 indicates that the water body is impaired for the given parameter and that a TMDL needs to be developed.
Washington State Department of Ecology has established a TMDL for several organic pollutants,
including PCBs, in Washington portions of the Walla Walla basin (WDOE 2008). For example,
Mill Creek is listed for polychlorinated biphenyls (PCBs), with a TMDL in place from January
through June. These areas would not be affected by modifications to project facilities, but could
be of concern with increasing numbers of returning adult spring Chinook.
Temperature
Water temperatures affect aquatic life and human health in a variety of ways, but are primarily of
concern because bacterial growth rates increase in proportion to water temperature, thereby
affecting the risk of pathogens in human water supplies. Sufficiently high temperatures are
lethal to fish, but adverse effects such as reduced growth rates and physiological stress may
occur at lower temperatures (ODEQ 1995). Causes of impaired temperature conditions include
low stream flows resulting from agricultural diversions, removal or alteration of riparian
vegetation, and modification of the stream channel. Temperature conditions are most critical
Walla Walla Basin Spring Chinook Hatchery Program
3-18 Chapter 3 Affected Environment and Environmental Consequences
during summer and early fall, when low stream flows coupled with high solar input result in
increased water temperatures (WDOE 2008).
In parts of the analysis area, baseline river temperatures are already higher than the applicable
standards. This is the case with the South Fork Walla Walla River, where substantial warming
from human sources has occurred, and river temperatures regularly exceed the existing standards
to protect rearing, spawning, and migration of bull trout and salmon as defined by Oregon
Administrative Rule 340-041-0028(4) (ODEQ 2005). Data collected at the existing adult
holding and spawning facility from August 15 to October 1, 2013 indicate that the Columbia
River bull trout spawning and juvenile rearing temperature criterion (defined as a seven-day-
average maximum temperature of 53.6 degrees Fahrenheit) was exceeded 20% of the time (Scott
and Reiser 2014). Computer modeling has shown that these biologically based criteria are not
attainable in the summer even at conditions approaching natural in much of the basin. Therefore,
the target of the TMDL is to maintain cumulative temperature increases within 0.5ºF when these
conditions occur (ODEQ 2005).
Although temperature conditions are of concern for the South Fork Walla Walla and mainstem
Walla Walla rivers, based on studies completed in support of the development of the TMDL,
ODEQ concluded that operations at the existing adult holding and spawning facility caused no
detectable temperature increase in the South Fork Walla Walla River (ODEQ 2005). Operations
at the time of the study included use of the existing abatement pond, which has the greatest
potential to increase the temperature of water used at the facility because it is and would continue
to be the largest surface area exposed to the sun for the longest time (see Section 3.4.5 Effects of
Alternative 1, and Section 3.4.6 Effects of Alternative 2).
Additionally, data collected in the immediate vicinity of the existing facility in the summer of
2013 (August 15 to October 1) showed upstream temperatures (in the stream channel near the
facility’s water diversion) to be an average of 0.38ºF cooler than temperatures immediately
downstream of the facility’s discharge structure, with a minimum difference of 0.07ºF and a
maximum of 0.66ºF (Reiser 2013b). The average upstream temperature during this period was
50.81ºF and the average downstream temperature was 51.21ºF. The observed temperature
differences are negligible in the context of normal variation due to other considerations such as
temperature gage location, and confirm that the current facility discharge does not measurably
alter temperature in the receiving water.
Dissolved Oxygen
As noted in Table 3-6, the Walla Walla River mainstem and the South Fork Walla Walla River
are listed as impaired based on low dissolved oxygen concentrations. Salmon have been
observed to actively avoid areas with low levels of dissolved oxygen (Hallock et al. 1970). Low
oxygen levels can affect their swimming performance (Davis et. al 1963) and can slow their
growth because fish spend less time actively feeding (Kramer 1987; Brett 1979; Doudoroff and
Shumway 1970). If oxygen levels become low enough, fish may even die (Hicks 2000). As
water temperature rises, the metabolic rates of salmon increase, thus increasing their demand for
oxygen (Ebersole et al. 2001).
Factors contributing to low dissolved oxygen are complicated but can in part be related to high
nutrient loads and temperature. The lowest dissolved oxygen levels typically occur between late
June and early September during seasonally high temperatures and low flows. The amount of
oxygen that can be dissolved in water (saturation level) is lower at high water temperatures, and
Final Environmental Impact Statement
Chapter 3 Affected Environment and Environmental Consequences 3-19
the low measured dissolved oxygen levels in the summer months may be at least partially due to
elevated water temperatures.
Nutrients
Although neither the Walla Walla River nor the South Fork Walla Walla River is 303(d)-listed
for high nutrient levels, the South Fork is listed for dissolved oxygen, which can be affected by
changes in nutrient levels. Increased nutrients, primarily in the form of nitrogen or phosphorous,
can contribute to problems with dissolved oxygen, especially in aquatic systems that are deficient
in one or the other of these essential nutrients. This is because increased levels of nutrients can
lead to increased growth of aquatic plants such as algae, and also increased growth of bacteria.
Bacteria use oxygen, as do aquatic plants, during times of the day when they cannot
photosynthesize (at night). Because of this, dissolved oxygen levels in nutrient-enriched lakes
and streams typically decline during the night, sometimes reaching levels low enough to be of
concern for other aquatic life, such as fish. Increased decaying matter from algal blooms also
requires the consumption of oxygen to break down the decaying material. The increased aquatic
productivity can also have other harmful ecological effects, such as changes in the types of
organisms found and changes in aquatic food webs.
Biological oxygen demand is another way of measuring nutrient loading. It measures how much
oxygen is consumed when bacteria consume the nutrients that are present in a water body.
Biological oxygen demand directly affects the amount of dissolved oxygen in rivers and streams.
The greater the biological oxygen demand, the more rapidly oxygen is depleted in the stream.
This means that less oxygen is available to higher forms of aquatic life. The consequences of
high biological oxygen demand are the same as those for low dissolved oxygen (USEPA 2012).
Biological oxygen demand was monitored upstream and downstream of the existing South Fork
facility in August and September 2013. Biological oxygen demand was 1 milligram per liter
(mg/L) at the upstream location and not detectable at the downstream location, which represents
a negligible difference (Table Rock Analytical Laboratory 2013). These values are typical of
excellent water quality and indicate extremely low concentrations of nutrients in the South Fork
near the existing facility.
Sedimentation and Turbidity
Sediment can alter water quality by creating turbidity, which reduces water clarity and can harm
the gills of fish. Sediment can also alter aquatic habitat by weighting the grain size distribution
of bed materials toward fine-grained materials, which degrade spawning and rearing habitat in a
broad variety of ways, such as by reducing salmonid egg and alevin survival (Koski 1966,
Tappel and Bjornn 1983). Coarser sediment can also deposit in the stream channel, altering its
form and function (Leopold et al. 1964).
Turbidity was monitored upstream and downstream of the existing South Fork facility in August
and September 2013. These data indicate that turbidity measured as total suspended solids (TSS)
was not detectable at the upstream location and was 1 milligram per liter (mg/L) at the
downstream location, a negligible difference (Table Rock Analytical Laboratory 2013). This
value of turbidity (1 mg/L) is indicative of very clear water, highly suitable for beneficial uses
such as drinking water or salmonid habitat.
Walla Walla Basin Spring Chinook Hatchery Program
3-20 Chapter 3 Affected Environment and Environmental Consequences
Polychlorinated Biphenyls and Chlorinated Pesticides
Polychlorinated Biphenyls (PCBs) and chlorinated pesticides such as DDT are the basis of
impairments in some parts of the Walla Walla River basin in Washington, but no such
impairments are identified in the Oregon portion of the basin (WDOE 2007; ODEQ 2013).
These contaminants are commonly referred to as “legacy pollutants” because they are no longer
used, but they are found in soils and sediments, and sometimes fish tissue, due to historical use.
In the Washington portion of the Walla Walla basin, Mill Creek is 303(d)-listed for PCBs, and a
TMDL is in place for the entire watershed to control PCBs.
Groundwater Quality
Due to the proximity of the South Fork site to the South Fork Walla Walla River, it is anticipated
that groundwater is relatively shallow in this area. Information collected during installation of
the adjacent site’s shallow well indicates groundwater levels of approximately 9 feet (SPF
Engineering, pers. comm., 9-27-13). Water quality in the alluvial aquifer is unknown, but is
assumed to be similar to river water quality, due to the likely connection between the
groundwater table and the river.
3.4.4 Sources and Types of Impact
Construction and operation of the proposed facilities at the South Fork facility could cause
impacts on water quality as described below.
Construction
Erosion from upland soil-disturbing activities could increase sedimentation and turbidity
in nearby waters.
In-water work in the South Fork of the Walla Walla River would cause short-term
turbidity.
Construction activities create a risk of chemical leaks or spills, which could impair water
quality if conveyed to nearby surface waters or if infiltrated to groundwater in the
unconfined shallow alluvial aquifer.
Operations
Exposure of hatchery water to warm air temperatures and solar radiation as it moves
through the rearing tanks and abatement pond could increase the temperature of water
discharged into the South Fork Walla Walla River.
Water discharged from the hatchery that contains nutrients from fish food and wastes
could increase nutrient levels in the river, which could encourage the growth of aquatic
plants and bacteria, alter dissolved oxygen levels, and increase sedimentation in the river.
Chemicals and other pollutants from hatchery processes could contaminate water
discharged into the South Fork Walla Walla River.
Chemicals and other pollutants from hatchery operations could collect on impervious
surfaces and be washed off and carried by stormwater into the South Fork Walla Walla
River where they could adversely affect fish and other aquatic species.
Carcasses of returning spring Chinook salmon would contribute increased nutrients in
spawning areas, which can have both beneficial and adverse effects.
Returning spring Chinook salmon could transfer and concentrate toxic substances, such
as mercury, from marine to freshwater environments (Compton et al. 2006).
Final Environmental Impact Statement
Chapter 3 Affected Environment and Environmental Consequences 3-21
3.4.5 Effects of Alternative 1: Preferred Alternative
Construction Effects
Surface Waters
To construct the new facilities, the areas would be excavated, fill materials and concrete as
needed to support the structures would be placed, and then the facilities would be constructed.
Pipelines would require excavations approximately six feet deep and two feet wide, but most soil
would be replaced once the pipe is laid. Excavated soil not reused would be disposed at a
county-approved disposal site. Approximately 3,900 cubic yards of excavated soil would require
disposal for Alternative 1.
During construction, erosion and sediment-laden runoff from construction areas could enter the
South Fork Walla Walla River. Although the river is not listed as impaired for turbidity,
sediments entering a stream could result in a measurable increase in turbidity, thereby affecting
water quality, as well as fish and fish habitat. For a discussion of these impacts on fish, see
Section 3.5 Fish.
Although the proposed facilities would be relatively close to the South Fork Walla Walla River,
the majority of construction would be in upland areas more than 100 feet from the river.
Because the site is nearly flat, any runoff from disturbed ground on most of the site is expected
to filter through vegetation before reaching the river, or it would be contained using best
management practices that include clearing limits, erosion control fencing and filtration,
covering stockpiled soils, and re-vegetating exposed areas (Section 3.4.7).
One activity would require in-water work. The hatchery surface water intake would be modified
as described in Section 2.2.1. Activity would consist of installing a sluice gate at the
downstream end of the intake basin to maintain proper water surface elevations in the intake
forebay. If the intake de-icing system is installed (see Chapter 2, Section 2.2.1, Hatchery Surface
Water Intake), its installation would not affect water quality because all work would be done on
the concrete portion of the intake, so no polluting materials or sediment would enter the river and
no work-area isolation would be required.
In-water work in the South Fork Walla Walla River has the potential to temporarily increase
turbidity during construction. For in-water work, a temporary cofferdam would be installed and
the work area would be dewatered. The cofferdam would be created by placing sand bags to
isolate a portion of the channel, fish would be collected and relocated outside the work area, and
then water would be pumped out of the isolated area, allowing modification of the hatchery
surface water intake within the isolated area. Placement and removal of the cofferdam would
temporarily increase turbidity. Turbidity increases would occur for the duration of cofferdam
placement and again for the duration of cofferdam removal. The water removed from the
isolated area would be pumped into the adjacent upland and allowed to infiltrate; it would not
affect water quality in the river. All in-water work would be done within the July 1 – August 15
work window established by ODFW to protect fish.
In-water work would comply with Oregon Administrative Rule 340-041-0036 turbidity
restrictions. This rule limits turbidity levels in surface waters to no more than a 10% cumulative
increase over the baseline turbidity level, as measured relative to a control point immediately
upstream of construction. Specific measures to be implemented are listed in Section 3.4.7, and
would include preparation of an Erosion Control Plan and Stormwater Pollution Prevention Plan
Walla Walla Basin Spring Chinook Hatchery Program
3-22 Chapter 3 Affected Environment and Environmental Consequences
as approved by ODEQ under the NPDES Stormwater Construction General Permit. The plan
would be consistent with applicable measures outlined for construction conditions east of the
Cascade Range (WDOE 2004).
Materials used during construction, such as paint, concrete, and oil, diesel fuel, and hydraulic
fluid in vehicles and equipment, could leak or spill and enter nearby waterways, adversely
affecting water quality. The potential for water quality contamination would be minimized by
use of best management practices such as developing and implementing a spill prevention and
response plan, restricting refueling to locations where spilled materials would not enter
waterways, and storing fuel and maintaining vehicles in designated areas away from waterways
(Section 3.4.7).
Construction of Alternative 1 is expected to result in low impacts to surface water quality,
because the majority of construction would take place in upland areas and construction best
management practices would be used.
Groundwater
Materials used during construction as described above could leak and infiltrate to groundwater in
the shallow alluvial aquifer. The potential for contamination would be minimized through
implementation of the best management practices, such as developing and implementing a spill
prevention and response plan, restricting refueling locations, and storing fuel and maintaining
vehicles on impervious surfaces provided with facilities to collect and contain spilled materials
(Section 3.4.7). Therefore, construction of Alternative 1 likely would have low impacts on
groundwater quality.
Operational Effects
NPDES Permit
Originally, the South Fork facility operated under the State of Oregon’s Acclimation Facility
Permit (General Permit 300J), which has since expired. Permit coverage was withdrawn because
it was determined the facility produced less fish than the minimum amount for which a permit
was required (20,000 pounds). Under Alternative 1, the proposed hatchery could require a new
NPDES permit because the pounds of fish reared would exceed 20,000 pounds at times if the
maximum 500,000 smolts are produced. Project-specific standards might also be required for
temperature and dissolved oxygen (Daniello, ODEQ, pers. comm., 7-25-14), and/or for
substances in the hatchery discharge such as total suspended solids or formalin.
Water Temperature
The temperature TMDL developed for the Walla Walla River basin does not allow facilities to
discharge water that could result in temperatures that would exceed biologically based criteria to
protect rearing, spawning, and migration of bull trout and salmon (Oregon Administrative Rule
340-041-0028[4]). Because stream temperatures in much of the basin, including in the South
Fork (Section 3.4.3) are higher than these criteria in the summer months, the TMDL established
an excess capacity reserve of 0.5ºF for future discharges during those times of year.
For this analysis, a physically-based temperature model was constructed to predict the
temperature of the hatchery effluent and the resulting temperature increases in the South Fork
Walla Walla River downstream of the hatchery discharge structure during the summer months.
In the proposed hatchery, the temperature of hatchery process water would increase as it passes
Final Environmental Impact Statement
Chapter 3 Affected Environment and Environmental Consequences 3-23
through the facility, due to exposure to warmer ambient air temperatures, the heat transferred
from hatchery equipment, and direct exposure to solar radiation. The effects of these heat
sources were evaluated in a temperature model (ICF 2018). The model considers the dimensions
and heat-conductive properties of hatchery structures, the amount of water each structure holds,
the calculated residence times in each structure, the ambient air temperatures at the facility, and
the effects of direct exposure to the sun.
Temperature model outputs show that Alternative 1 would result in a slight increase in stream
temperature (average of 0.04°F, maximum of 0.07°F) due to increases in water temperature at
both discharges (i.e., the intake structure and the abatement pond discharge). This is a smaller
increase than occurs under existing operations, for which the model indicates a potential
temperature increase averaging 0.16ºF, with a maximum of 0.36ºF. This is very close to the
temperature difference of 0.38ºF recorded by Scott and Reiser (2014), suggesting that the
temperature model is accurately simulating the thermal conditions at the facility.
The modeled temperature reduction relative to current conditions occurs primarily because all
process water from the existing facility currently is discharged through the abatement pond,
which is a fully exposed structure with high potential for solar heating. Under the proposed
action, approximately 80% of all hatchery process water is discharged directly to the river,
without passing through the abatement pond. Also, the effective size of the abatement pond
would be reduced by 50% relative to current conditions (the abatement pond would be divided
into two cells, only one of which would be used at any given time), so the area exposed to solar
heating would also be reduced by 50% compared to current conditions.
The TMDL for the South Fork Walla Walla River included the discharges from the existing
facility as part of the baseline condition (ODEQ 2005). Because operation under Alternative 1 is
expected to reduce river temperatures relative to that baseline condition, the potential impacts
from thermal loading would be low.
As described in Section 3.3, a pumpback system would be used at times to pump hatchery
process water back to the river near the intake to minimize conflict with minimum instream
flows. The water would be pumped back from the abatement pond discharge pipe. Accordingly,
pumpback operations would not alter the predicted improvement in water discharge
temperatures.
If the de-icing system is installed (see Chapter 2, Section 2.2.1, Hatchery Surface Water Intake),
river water temperature would not be raised noticeably because the system would be used only
under extremely cold conditions; therefore, the temperature TMDL would not be exceeded.
Nutrient Loading, Dissolved Oxygen, and Sedimentation
Under Alternative 1, operation of the hatchery would result in an increased release of nutrients
into the South Fork Walla Walla River. Increased nutrients could result in algae growth and
subsequent decreases in dissolved oxygen that could adversely affect fish and other aquatic
species. Nutrients in hatchery water discharges would primarily be in the form of nitrogen,
phosphorous, and increased suspended solids (TSS) in the water column from fish feces and
uneaten food particles. As discussed in Section 3.4.3, biological oxygen demand is also used as
an indicator of nutrient loading.
Based on maximum fish production goals, anticipated feed rates and concentrations, fish
densities, size at release, flow rates, and tank designs proposed under Alternative 1, nutrient load
Walla Walla Basin Spring Chinook Hatchery Program
3-24 Chapter 3 Affected Environment and Environmental Consequences
modeling indicates the hatchery effluent concentrations could reach 0.297 mg/L total nitrogen
and 0.058 mg/L phosphorous in the spring when biological oxygen demand is estimated to be
highest (2.1 mg/L). These peak concentrations would occur when the hatchery fish are at their
largest and eating the most food (Vinci, pers. comm., 6-27-14).
No baseline data are readily available for nutrient levels in the South Fork Walla Walla River,
but given that it is 303(d)-listed for dissolved oxygen, it is possible that increased nitrogen and
phosphorous could contribute to localized water quality impacts. Although no TMDL has been
developed for dissolved oxygen, specific standards are in place per Oregon Administrative Rule
340-041-0016 to protect beneficial uses that might be adversely affected by low dissolved
oxygen. Basin-specific criteria issued are listed in Oregon Administrative Rule 340-041-0336.
During the permitting process, if it is determined that nutrients could cause or contribute to the
existing dissolved oxygen impairment, ODEQ would develop load and wasteload allocations for
the nutrients to ensure compliance with Oregon Administrative Rules 340-041-0016 and 340-
041-0336 (ODEQ 2014) prior to issuing the necessary NPDES permit. Although no specific
standards are provided for nitrogen or phosphorous, basin-specific criteria require that biological
oxygen demand does not exceed 20 mg/L. Under Alternative 1, modeled biological oxygen
demand would peak at 2.1 mg/L.
Increased nutrient loading could also increase sediments in the discharge water; sediments are
measured as total suspended solids (TSS). Increased sediments can adversely affect fish and
aquatic habitat by reducing water clarity and harming the gills of fish. Sediment can also alter
aquatic habitat by weighting the grain size distribution of bed materials toward fine-grained
materials, which degrade spawning and rearing habitat in a broad variety of ways, such as by
reducing salmonid egg and alevin survival. As indicated in Section 3.4.3 under “Sedimentation
and Turbidity,” no detectable TSS values were measured upstream of the South Fork facility, and
values of 1.0 mg/L were recorded in August and September 2013 downstream of the existing
hatchery (Table Rock Analytical Laboratory 2013).
Under Alternative 1, the highest modeled levels of TSS peaked at 2.1 mg/L in the spring when
hatchery fish would be biggest and eating the most (Vinci, pers. comm., 6-27-14). This level is
well below the maximum criterion of 20 mg/L TSS that has been specifically developed for the
Walla Walla River basin (Oregon Administrative Rule 340-041-0336).
Because the pumpback system would be supplied by the same process water that otherwise
would be released at the abatement pond discharge, the water quality impacts of pumpback
operation would be the same as those described above.
Hatchery effluent concentrations would comply with the terms of the NPDES permit and would
be below applicable water quality standards; therefore, Alternative 1 would have low impacts on
water quality from increased nutrients in the river.
Alternative 1 could indirectly contribute to nutrient loading in the analysis area as increased
numbers of spring Chinook return to spawning areas. While the marine nutrients from these
carcasses are generally viewed as ecologically beneficial because they are a food source for
juvenile salmon and other aquatic species, in systems that are already impaired by other nutrient
sources, the carcasses could add to that impairment (Compton et al. 2006). Within the analysis
area, the greatest potential for effect would occur in Mill Creek, in the Washington portion of the
Walla Walla basin, which is listed for ammonia, a contributing factor to nutrient problems.
Final Environmental Impact Statement
Chapter 3 Affected Environment and Environmental Consequences 3-25
Nutrients in Mill Creek are derived from human waste (septic systems and municipal wastewater
treatment systems) and agricultural sources that currently affect stream reaches downstream of
spawning habitat (WDOE 2007, 2013a, 2013b). Current and proposed future adult outplants in
Mill Creek are upstream of the impaired areas. Moreover, the delivery of marine-derived
nutrients in the form of carcasses of planted adults that have finished spawning or of naturally
spawning fish occurs during periods when nutrient impairment is less likely (September to mid-
December), while nutrients from human sources are greatest in the summer. Marine-derived
nutrients are also processed through the riverine nutrient cycle differently than nutrients from
typical human sources (Chaloner et al. 2002, 2007; Chaloner and Wipfli 2002; Kohler et al.
2013; Merz and Moyle 2006), so increasing salmon biomass would not compound the effects of
existing nutrient pollution in the same way as an equal amount of nutrients from human sources.
Thus, the impact from decaying adult carcasses on nutrient concentrations in spawning streams is
expected to be low.
Contaminants
Therapeutic chemicals are used for control of diseases in hatchery fish. Chemicals include
formalin, iodophor, and antibiotics. Formalin is a known human carcinogen, and other
chemicals can have harmful effects on humans and aquatic resources if discharged to the river in
heavy concentrations. However, formalin is used because it breaks down quickly when exposed
to sunlight or bacterial action (within a few hours, depending on factors such as temperature) and
thus has temporary effects on water quality (USFDA 1995).
Therapeutic chemicals are regulated under EPA’s Effluent Limitations Guidelines and New
Source Performance Standards for the Concentrated Aquatic Animal Production Point Source
Category (Federal Register Volume 69, Number 162). This guidance establishes limitations for
aquaculture chemicals intended to protect human and environmental health. All chemical
handling, application, and disposal would adhere to regulations established by U.S. Department
of Agriculture, U.S. Food and Drug Administration Center for Veterinary Medicine, and other
state and federal entities.
To ensure that the proposed hatchery facilities operate in compliance with all applicable fish
health guidelines and facility operation standards and protocols, annual reports indicating level
of compliance with applicable standards and criteria must be submitted to ODFW and WDFW,
and periodic audits would be performed. Staff would be trained in the proper use, transport,
handling, and storage of all chemicals to minimize dangers of overexposure or accidental release
to the environment. Appropriate safety equipment would be provided, and chemicals would be
stored in areas designed to contain chemicals in the event of a leak or accidental spill. Any used
absorbent materials containing controlled chemicals would be disposed consistent with the
applicable federal, state, and local regulations (McMillen 2011). Because the use of these
therapeutic chemicals would follow accepted standard practices, and because treatment
applications would be applied only when necessary and typically would be of short duration, the
potential impacts on receiving water quality would be low. Because the pumpback system
would be supplied by the same process water that would otherwise be released at the hatchery
discharge structure, the water quality impacts of pumpback operation would be the same as those
described above.
Operation of the pumpback system could result in slight increases in the risk of concentrating
pathogens in the hatchery process water if pumpback water were to be taken back into the
Walla Walla Basin Spring Chinook Hatchery Program
3-26 Chapter 3 Affected Environment and Environmental Consequences
hatchery; however, this impact would be minimized by commingling the pumpback discharge
with the main hatchery water discharge, located immediately downstream of the intake (within
the intake structure). Additionally, best management practices at the hatchery would
substantially reduce pathogens in hatchery process water and fish, as detailed by CTUIR (2017).
Therefore, impacts associated with the spread of pathogens would be low.
In addition to hatchery processes that could directly affect water quality, as the numbers of
returning spring Chinook salmon adults increase, their decaying carcasses could deliver toxic
substances from marine to freshwater environments. Substances such as mercury and other
heavy metals; and dioxins, PCBs, and other organic contaminants that adversely affect fish and
human health can accumulate in relatively high concentrations in fish bodies throughout their
lives (Compton et al. 2006). Carcasses contaminated with these substances could be problematic
in systems that are already impaired by other pollutant sources or that host very large biomass of
anadromous species (Compton et al. 2006). Potential contamination associated with fish
carcasses could result in adverse effects in the Washington state portion of the Walla Walla
River basin where Washington State Department of Ecology has established a TMDL for several
organic pollutants, including PCBs (WDOE 2008).
However, Alternative 1 would only slightly increase the amount of organic pollutants in the
analysis area relative to existing sources. For example, the daily load allocation for total PCBs in
Mill Creek is 0.23 gram (230,000 micrograms), which is specified in the TMDL only from
January through June. When studied in the 1990s, Columbia River spring Chinook salmon
averaged 27 micrograms of PCBs per kilogram of body weight (USEPA 2002), which is
generally consistent with levels observed in spring Chinook salmon elsewhere in the Pacific
Northwest (Missildine 2005; O’Neill et al. 1998).
Maximum spring Chinook abundance in Mill Creek is likely to be seen during Phase III of the
proposed program, when adult returns and out-planting could be as high as 2,000 fish (CTUIR
2013). Assuming an average weight of 7 kilograms, this would equate to delivery of up to
0.0378 gram (37,800 micrograms) of PCBs to the Mill Creek watershed each year, or the
equivalent of 0.0001 gram (1,036 micrograms) per day. This represents a fraction of a percent of
the daily TMDL limit. In addition, spring Chinook salmon carcasses would be appearing in the
basin primarily between September and mid-December, outside the period during which the
TMDL applies in Mill Creek. Based on a comparison of observed tissue concentrations and
applicable TMDL limits, as described in the previous paragraph, this conclusion is likely to
apply to any other persistent organic pollutants (e.g., pesticides) that might be in salmon
carcasses. Thus, the contribution to contaminant concentrations from decaying salmon carcasses
in spawning streams is expected to be low.
Stormwater Management
Effects on water quality of stormwater runoff at the hatchery would be low. The existing site
was graded to facilitate sheet flow and infiltration on the site. Under existing conditions,
stormwater that collects on impervious surfaces at the site, such as building roofs and exposed
concrete surfaces, is directed to the ground via gutters, downspouts, and direct runoff. Because
the site is relatively flat, stormwater is filtered by existing vegetation and percolates into the soil
before reaching the river. The total estimated impervious surface added on the South Fork
property would increase from 11% to 21% under Alternative 1. The largest area of new
impervious surface would be from a roof used to cover the hatchery building. No equipment
Final Environmental Impact Statement
Chapter 3 Affected Environment and Environmental Consequences 3-27
would be housed on the roof that could result in accidental leaks or exposure of stormwater to
sources of pollution. Water collected on the roof would consist essentially of rainwater.
Chemicals and other potential pollutants would be properly stored in accordance with applicable
regulations (see Section 4.10), so are unlikely to enter stormwater runoff. Under current designs
for the new facility, points of collection, catch basins, conveyance piping, and stormwater
infiltration swales would be established to keep stormwater from the river. The infiltration
swales likely would be located in the center landscaping area of the parking lot and adjacent to
the parking lot and hatchery building (see Chapter 2, Figure 2-3).
3.4.6 Effects of Alternative 2
Construction Effects
Surface Waters
Construction impacts on surface water under Alternative 2 would be similar to those discussed
under Alternative 1. Although a larger area would be disturbed under Alternative 2 to
accommodate the larger grow-out building, the duration and nature of the proposed construction
activities are expected to be similar to Alternative 1. Approximately 6,400 cubic yards of
excavated soil would require disposal for Alternative 2. Excavated soil not reused would be
disposed at a county-approved disposal site. Incorporation of the same best management
practices as described for Alternative 1 would ensure that construction-related impacts on water
quality are low.
Groundwater
Construction impacts on groundwater under Alternative 2 would not differ from those discussed
under Alternative 1 and would be low.
Operational Effects
NPDES Permit
Because the maximum number of fish proposed to be produced at the hatchery would be more
than double the maximum numbers produced under Alternative 1, Alternative 2 would require an
individual NPDES Permit under Section 402 of the Clean Water Act to be issued by ODEQ
(Daniello, ODEQ, pers. comm., 7-25-14). An individual permit would be required to
demonstrate compliance with the temperature TMDL and potentially to address the 303(d) listing
for dissolved oxygen.
Water Temperature
As indicated by the temperature modeling results (ICF 2014), Alternative 2 has the potential to
increase the temperature of hatchery process water between the intake and discharge structures
by 0.13ºF. If the reuse system is not immediately installed, the increase in temperature would be
only 0.02ºF.
The reasons for lower hatchery discharge water temperatures are similar to Alternative 1.
Because the volume of water diverted into the facility would be greater than under current
conditions, the residence time of water within the hatchery, especially in the abatement pond,
would be reduced, giving the water less time to absorb heat. Secondly, incubation water would
be chilled to a temperature of between 39ºF (4ºC) and 44ºF (7ºC). Chilling of hatchery intake
Walla Walla Basin Spring Chinook Hatchery Program
3-28 Chapter 3 Affected Environment and Environmental Consequences
water further reduces the water temperature of the hatchery effluent. Use of the pumpback
system would not change these effects, as discussed previously.
Because operation of Alternative 2 is expected to reduce river temperatures relative to existing
conditions, the potential impacts from thermal loading would be low.
Nutrient Loading, Dissolved Oxygen, and Sedimentation
Similar to Alternative 1, operation of Alternative 2 without water reuse would release more
nutrients into the South Fork Walla Walla River, compared to current conditions. Nutrient load
modeling for Alternative 2 without reuse indicates that hatchery effluent would contain up to
0.336 mg/L nitrogen and 0.066 mg/L phosphorous with a biological oxygen demand of up to 2.5
mg/L (Vinci, pers. comm., 6-27-14). As discussed under Alternative 1, during the permitting
process, if nutrients are found to cause or contribute to the dissolved oxygen impairment, ODEQ
would develop load and wasteload allocations for the nutrients to ensure compliance with
Oregon Administrative Rules 340-041-0016 and 340-041-0336 (ODEQ 2014) prior to issuing
the necessary NPDES permit. Modeled biological oxygen demand under this alternative would
peak at 2.4 mg/L, well below the basin-specific criteria of 20 mg/L. Under Alternative 2, TSS
levels are predicted to reach up to 2.4 mg/L, which are also below the basin-specific criteria of
20 mg/L (Oregon Administrative Rule 340-041-0336).
Incorporation of a water reuse system would further reduce nutrient loading in hatchery effluent,
compared to the impacts of Alternative 2 without reuse. This is because water reuse systems
minimize water use and concentrate wastes into a relatively small volume of effluent (Chen et al.
1997). Concentrating wastes reduces the volume of wastewater to be treated and provides
increased waste treatment efficiency. Even though the waste concentrations may be relatively
higher, the cumulative waste load discharged to receiving waters from reuse systems is generally
much lower in TSS and biological oxygen demand (Chen et al. 2002). This is in part because
water reuse systems require a higher degree of treatment to maintain water quality. The used
water is filtered, degassed, and oxygenated before it is pumped back for reuse (Summerfelt and
Vinci 2009). For example, systems using water reuse have been shown to capture up to 97% of
TSS (Ebling and Vinci 2011).
The water quality impacts of pumpback operation would be the same as those described for
Alternative 1.
Because hatchery effluent concentrations would not exceed anticipated applicable water quality
standards, impacts on water quality from nutrient loading under Alternative 2, with or without
reuse, and with or without operation of the pumpback system, would be low.
Impacts resulting from increased numbers of spring Chinook salmon returning to spawning areas
in the Walla Walla River basin would be the same as discussed under Alternative 1. Releases of
spring Chinook salmon into the Umatilla River basin would continue as they are now under the
existing Umatilla spring Chinook salmon program, effects of which were evaluated in the
Biological Opinion for the program (NMFS 2011b).
Contaminants
Contaminants potentially added to water via hatchery operations would be similar to those
discussed under Alternative 1.
Final Environmental Impact Statement
Chapter 3 Affected Environment and Environmental Consequences 3-29
Stormwater Management
Under Alternative 2, the majority of the hatchery site stormwater would continue to be directed
to the soil for percolation as it is currently. Due to the flat topography of the site, stormwater
would be filtered by existing vegetation and would percolate into the soil before reaching the
river. Impervious area at the site would increase from 11% currently to 27%, largely associated
with the expanded roof over the larger rearing facilities under Alternative 2; however, similar to
Alternative 1, no equipment would be housed on the roof that could result in accidental leaks or
exposure of stormwater to sources of pollution. This increased runoff could possibly overflow
the rain garden swales and flow into the river. However, runoff from the roof would not be
considered pollution-generating, because no mechanical equipment would be stored or operated
on the roof. Management of other potential pollutants would be the same as for Alternative 1.
Therefore, impacts on water quality of stormwater from the site would be low.
3.4.7 Mitigation Measures
The following best management practices would be used for both action alternatives to avoid and
minimize impacts on surface and groundwater quality.
For the in-water work, install a temporary cofferdam, remove and relocate fish, and de-
water the work area as necessary.
Limit work within the stream channel to the in-water work period (July 1 through
August 15) established by ODFW.
To the extent possible, conduct ground-disturbing construction activities during the dry
season (between June 1 and November 1).
Minimize the size of the construction disturbance area and the amount of vegetation
removed to the greatest extent possible.
Visibly mark staging areas and clearing or disturbance limits with orange plastic fencing
or similar methods.
Maintain consistency with the turbidity standards outlined in Oregon Administrative Rule
340-041-0036 through the use of erosion control methods such as filter bags, sediment
traps or catch basins, vegetative strips, berms, jersey barriers, fiber blankets, bonded fiber
matrices, geotextiles, mulches or compost, wattles and silt fences.8
8 Filter bags are used to collect sediment from water being pumped from a water body. Once the sediment-laden
bag is full, it can be disposed of so that the trapped sediment does not enter other waterways and increase turbidity.
Sediment traps or catch basins are temporary ponds built on construction sites to capture sediment-laden runoff to
prevent eroded soil from reaching nearby waterways.
Vegetative strips slow the movement of water so suspended soil will settle and not be carried to nearby waterways.
Berms are small areas typically made of earth that serve to slow surface runoff so suspended soil can settle before
water enters nearby waterways.
Jersey barriers are typically concrete or plastic structures that serve to slow surface runoff so suspended soil can
settle before water enters nearby waterways.
Fiber blankets are usually made of woven materials such as jute or straw and are laid on exposed soil to minimize
erosion from wind or surface water runoff.
Bonded fiber matrices are mulches that consist of a continuous layer of fiber strands held together by a water-
resistant bonding agent.
Geotextiles are permeable fabrics that can be used to minimize erosion in a variety of ways, most typically when
used to construct retaining structures or silt fences.
Walla Walla Basin Spring Chinook Hatchery Program
3-30 Chapter 3 Affected Environment and Environmental Consequences
Keep temporary erosion controls that are identified on project drawings in place until
construction is completed and the site is restored.
During construction, inspect all erosion controls daily to ensure they are working
adequately. If inspection shows that the erosion controls are ineffective, mobilize work
crews immediately to make repairs or to install replacements or additional controls as
necessary.
Remove sediment from control devices once it has reached one-third of the exposed
height of the control.
Implement a spill prevention and response plan that requires storage of fuel and other
potential pollutants in a secure location at least 150 feet from water bodies; ensures that
spill containment and cleanup materials are readily available on site and restocked within
24 hours, if used; and ensures that, in the event of a spill, contractors are trained to
immediately contain the spill, eliminate the source, and deploy appropriate measures to
clean and dispose of spilled materials in accordance with federal, state, and local
regulations.
Do not operate machinery, construction vehicles, or equipment in the river unless
specifically authorized by a permit.
Use special hydraulic fluids in vehicles used for instream work.
Inspect all equipment daily for fuel, oil, or hydraulic leaks, and maintain vehicles to
prevent any of these fluids from entering the river.
Restrict refueling and servicing operations to locations where any spilled material would
not enter natural or human-made drainage conveyances, and that would be at least 150
feet from the river.
Use pumps, funnels, absorbent pads, and drip pans when fueling or servicing vehicles.
Store, fuel, and maintain vehicles and equipment in designated staging areas located a
minimum of 150 feet from the river.
Monitor discharges from the hatchery for temperature, total suspended solids, formalin,
dissolved oxygen, and other parameters as required by conditions of the NPDES permit,
and report results as specified in the permit.
Store chemicals in areas designed to contain the chemical in the event of a spill.
Dispose any used absorbent materials containing controlled chemicals consistent with the
Material Safety Data Sheet and applicable federal, state, and local regulations.
Train staff in the proper use, handling, storage, and disposal of chemicals and hazardous
materials used at the hatchery.
Ensure stormwater swales and other means to divert stormwater from the river are
functioning properly.
Mulches and compost come from ground-up or decaying plant materials that can be spread on the ground to
minimize erosion.
Wattles consist of matted fibers bundled together to create a tube-like structure that can be placed within runoff
channels to slow the flow of sediment-laden water and as perimeter barriers to prevent sediment from entering
waterways.
Silt fences are most typically made from fabric or permeable plastic and are used to slow the movement of
sediment-laden stormwater over land.
Final Environmental Impact Statement
Chapter 3 Affected Environment and Environmental Consequences 3-31
3.4.8 Effects of the No Action Alternative
The No Action Alternative would require no new construction; thus, it would have no
construction-related impacts. The existing adult holding and spawning facility would continue to
operate as it does currently and would require no new NPDES permit. Recent data indicate that
the current facility is not adversely affecting surface water quality, as discussed previously.
3.5 Fish
Notable Differences in this Section from the Draft EIS
Because the proposal no longer includes roughened riffles, a smolt release channel, or
changes to the length of the fish bypass channel, the amount of stream channel habitat
affected by cofferdams and in-water work during construction is greatly reduced, thus
reducing impacts to fish.
For both alternatives, there would be less reduction in habitat in the 450-foot reach between
the intake and abatement pond discharge when the pumpback system is not being used, due
to most process water being returned at the intake structure instead of 450 feet downstream.
Habitat reductions in the 250-foot reach between the intake and the juvenile bypass exit have
been identified.
In response to public comment on the Draft EIS, the levels of marine-derived nutrients from
increased numbers of spring Chinook carcasses in the basin have been clarified.
Impacts from the monitoring and evaluation program (Project # 2000-039-00) have been
identified.
3.5.1 Analysis Area
The analysis area for fish includes areas in the Walla Walla River basin where proposed facilities
would be constructed and operated and where spring Chinook salmon might return to spawn
(Chapter 2, Figure 2-1; Chapter 3, Figure 3-3).
3.5.2 Applicable Regulations
Because the proposed project would be funded by BPA, as a federal agency BPA is required to
consult with the National Marine Fisheries Service (NMFS) and U.S. Fish and Wildlife Service
(USFWS) under Section 7(a)(2) of the ESA for the impacts its funding may have on ESA-listed
species and their habitat. Essential fish habitat (EFH) consultation requirements under Section
305(b)(2) of the Magnuson-Stevens Fishery Conservation and Management Act (Magnuson-
Stevens Act) (16 USC 1801 et seq.) also apply.
The purpose of ESA consultation is to analyze the potential effects of the project on ESA-listed
fish and designated critical habitat, and to identify measures to avoid, minimize, and mitigate any
adverse effects to the extent practicable. EFH consultation under the Magnuson Stevens Act is
intended to document potential harm to essential habitats used by species that are managed under
federal fisheries management plans, measures for avoiding and minimizing adverse effects, and
any conservation measures used to offset these effects.
Walla Walla Basin Spring Chinook Hatchery Program
3-32 Chapter 3 Affected Environment and Environmental Consequences
3.5.3 Affected Environment
The Walla Walla River system has a relatively diverse fish community. It includes a mixture of
native and introduced species, with introduced species more common in the lower reaches of the
watershed in areas inundated by warm water near the confluence with the Columbia River.
Table 3-7 lists fish species known or likely to be found in the Walla Walla River system that
have special status under the ESA or under state programs in Oregon and Washington.
Appendix D contains a more comprehensive list of fish species in the Walla Walla River system.
Under ESA, a species listed as endangered is any species that is in danger of extinction
throughout all or a significant portion of its range; a threatened species is any species that is
likely to become endangered in the foreseeable future throughout all or a significant portion of
its range. “Species of Concern” is an informal term not defined in ESA that refers to species that
the USFWS are considering as candidates for listing under the ESA; the term commonly refers to
species that are declining or appear to be in need of conservation.
Three distinct populations of salmonids are found in the analysis area, including the Mid-
Columbia River Distinct Population Segment (DPS) of steelhead and the Columbia River Basin
DPS of bull trout. The third, the Mid-Columbia River Evolutionarily Significant Unit (ESU) of
spring-run Chinook salmon, is considered to be extirpated from the analysis area. However, it
once occupied the Walla Walla River basin and has begun to be reintroduced. Section 3.2.2
discusses life history, current status, historical distribution, and habitat preferences for spring
Chinook.
The NMFS listed the steelhead DPS as a threatened species under the ESA on March 25, 1999
(64 FR 14517), and again after a review, on January 5, 2006 (71 FR 834). The bull trout DPS
was listed as a threatened species by USFWS on June 10, 1998 (63 FR 31647). No other fish
species in the analysis area are listed under the ESA, but the Pacific lamprey, river lamprey, and
margined sculpin are identified by USFWS as federal species of concern.
On September 2, 2005, the Walla Walla River basin was designated critical habitat under the
ESA for Mid-Columbia steelhead (70 FR 52630); and on October 6, 2004, for Columbia River
bull trout, (69 FR 59995, revised October 18, 2010, 75 FR 63898). The basin is also designated
as EFH for Chinook salmon under the Magnuson-Stevens Act.
The designation for critical habitat under the ESA considers the quality of physical and
biological features of the existing habitat that are needed for life and successful reproduction of
the species (50 CFR Part 424, Federal Register Vol. 81, No. 28 February 11, 2016).
The basin provides the following physical and biological features of critical habitat for steelhead.
Steelhead distribution in the basin is shown in Figure 3-4.
Freshwater spawning sites with water quantity and quality conditions and substrate
supporting spawning, incubation, and larval development.
Freshwater rearing sites with:
o water quality and forage supporting juvenile development;
o natural cover such as shade, submerged and overhanging large wood, log jams and
beaver dams, aquatic vegetation, large rocks and boulders, side channels, and
undercut banks.
Freshwater migration corridors free of obstruction and excessive predation.
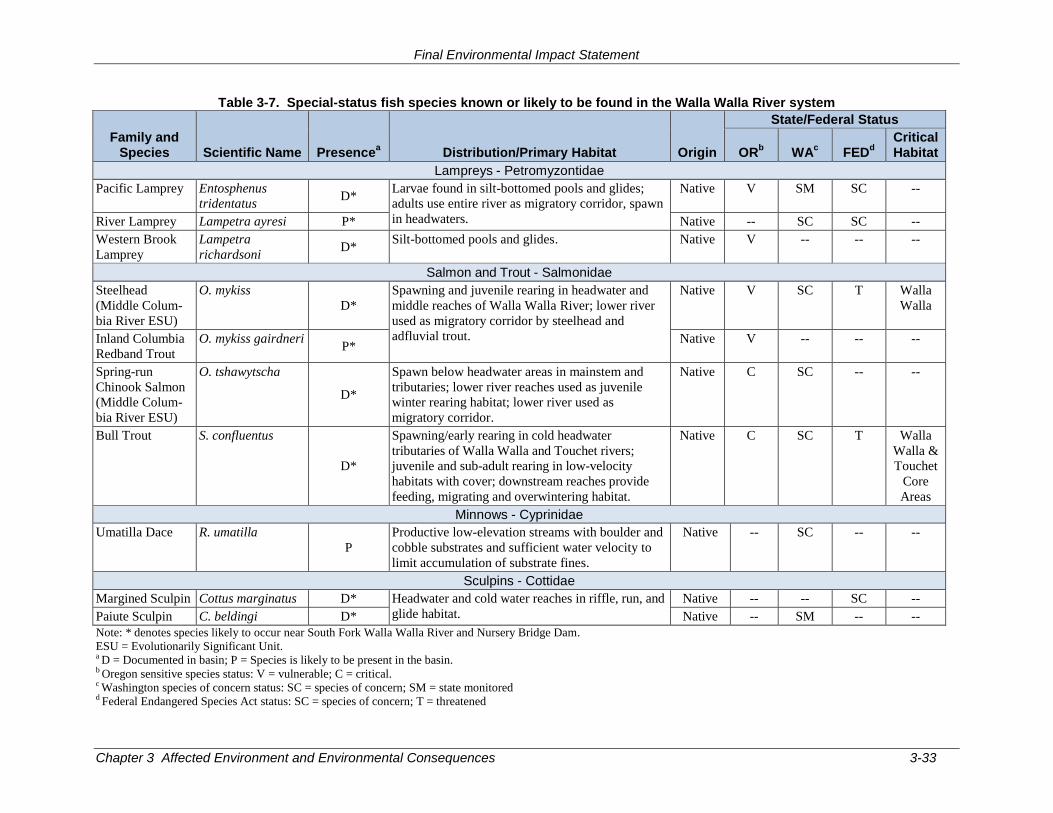
Final Environmental Impact Statement
Chapter 3 Affected Environment and Environmental Consequences 3-33
Table 3-7. Special-status fish species known or likely to be found in the Walla Walla River system
Family and Species Scientific Name Presence
a Distribution/Primary Habitat Origin
State/Federal Status
ORb WA
c FED
d
Critical Habitat
Lampreys - Petromyzontidae
Pacific Lamprey Entosphenus
tridentatus D*
Larvae found in silt-bottomed pools and glides;
adults use entire river as migratory corridor, spawn
in headwaters.
Native V SM SC --
River Lamprey Lampetra ayresi P* Native -- SC SC --
Western Brook
Lamprey
Lampetra
richardsoni D*
Silt-bottomed pools and glides. Native V -- -- --
Salmon and Trout - Salmonidae
Steelhead
(Middle Colum-
bia River ESU)
O. mykiss
D*
Spawning and juvenile rearing in headwater and
middle reaches of Walla Walla River; lower river
used as migratory corridor by steelhead and
adfluvial trout.
Native V SC T Walla
Walla
Inland Columbia
Redband Trout
O. mykiss gairdneri P*
Native V -- -- --
Spring-run
Chinook Salmon
(Middle Colum-
bia River ESU)
O. tshawytscha
D*
Spawn below headwater areas in mainstem and
tributaries; lower river reaches used as juvenile
winter rearing habitat; lower river used as
migratory corridor.
Native C SC -- --
Bull Trout S. confluentus
D*
Spawning/early rearing in cold headwater
tributaries of Walla Walla and Touchet rivers;
juvenile and sub-adult rearing in low-velocity
habitats with cover; downstream reaches provide
feeding, migrating and overwintering habitat.
Native C SC T Walla
Walla &
Touchet
Core
Areas
Minnows - Cyprinidae
Umatilla Dace R. umatilla
P
Productive low-elevation streams with boulder and
cobble substrates and sufficient water velocity to
limit accumulation of substrate fines.
Native -- SC -- --
Sculpins - Cottidae
Margined Sculpin Cottus marginatus D* Headwater and cold water reaches in riffle, run, and
glide habitat.
Native -- -- SC --
Paiute Sculpin C. beldingi D* Native -- SM -- --
Note: * denotes species likely to occur near South Fork Walla Walla River and Nursery Bridge Dam.
ESU = Evolutionarily Significant Unit. a D = Documented in basin; P = Species is likely to be present in the basin. b Oregon sensitive species status: V = vulnerable; C = critical. c Washington species of concern status: SC = species of concern; SM = state monitored d Federal Endangered Species Act status: SC = species of concern; T = threatened
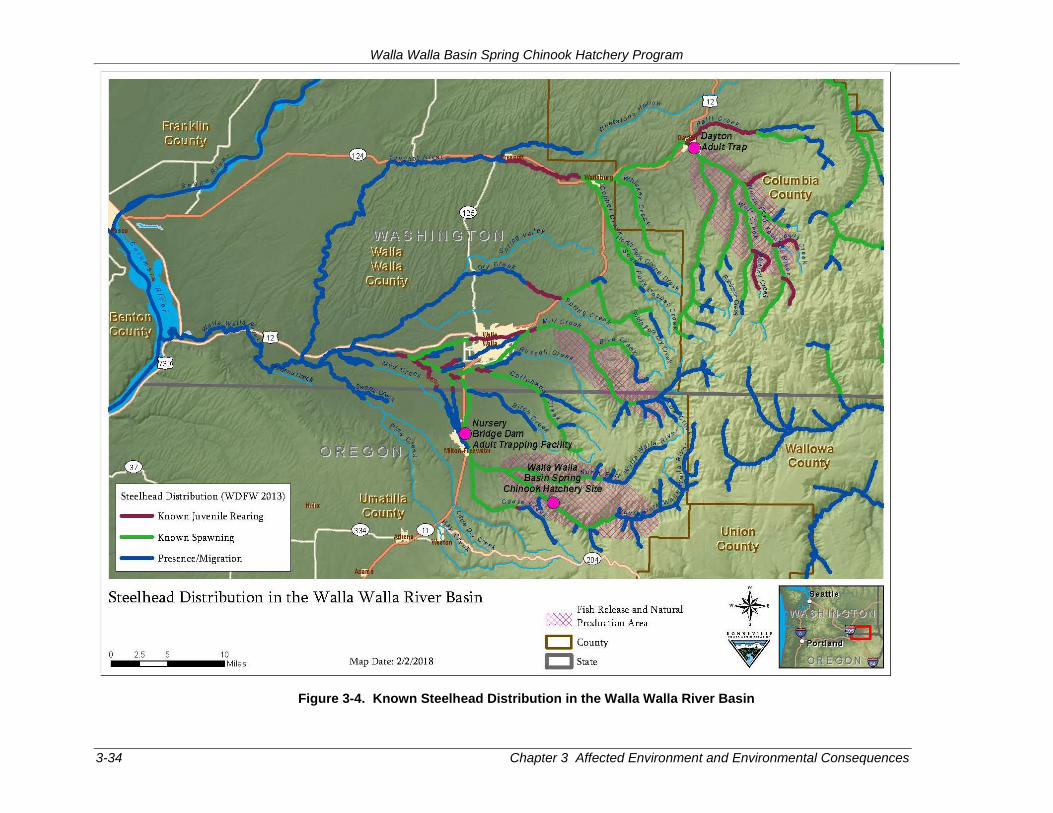
Walla Walla Basin Spring Chinook Hatchery Program
3-34 Chapter 3 Affected Environment and Environmental Consequences
Figure 3-4. Known Steelhead Distribution in the Walla Walla River Basin
Final Environmental Impact Statement
Chapter 3 Affected Environment and Environmental Consequences 3-35
The Walla Walla River basin provides the following physical and biological features for bull
trout. Bull trout distribution is shown in Figure 3-5.
Springs, seeps, groundwater sources, and subsurface water connectivity (hyporheic
flows) to contribute to water quality and quantity and provide thermal refugia.
Migratory habitats with minimal physical, biological, or water quality impediments
between spawning, rearing, overwintering, and freshwater and marine foraging habitats,
including but not limited to permanent, partial, intermittent, or seasonal barriers.
An abundant food base, including terrestrial organisms of riparian origin, aquatic
macroinvertebrates, and forage fish.
Complex river, stream, lake, reservoir, and marine shoreline aquatic environments, and
processes that establish and maintain these aquatic environments, with features such as
large wood, side channels, pools, undercut banks and unembedded substrates, to provide
a variety of depths, gradients, velocities, and structure.
Water temperatures ranging from 2 degrees Celsius (°C) to 15°C (36 degrees Fahrenheit
[°F] to 59°F), with adequate thermal refugia available for temperatures that exceed the
upper end of this range. Specific temperatures within this range will depend on bull trout
life‐history stage and form; geography; elevation; diurnal and seasonal variation; shading,
such as that provided by riparian habitat; streamflow; and local groundwater influence.
In spawning and rearing areas, substrate of sufficient amount, size, and composition to
ensure success of egg and embryo survival, fry emergence, and young‐of‐the‐year and
juvenile survival.
A natural hydrograph including peak, high, low, and base flows within historic and
seasonal ranges or, if flows are controlled, minimal flow departure from a natural
hydrograph.
Sufficient water quality and quantity such that normal reproduction, growth, and survival
are not inhibited.
Sufficiently low levels of occurrence of nonnative predatory (e.g., lake trout, walleye,
northern pike, smallmouth bass), interbreeding (e.g., brook trout), or competing (e.g.,
brown trout) species that, if present, are adequately temporally and spatially isolated from
bull trout.
Essential Fish Habitat is defined as the bodies of water and substrate required for fish
spawning, breeding, feeding, and habitat where they can grow to maturity (50 CFR §600.10).
Essential Fish Habitat effectively includes all freshwater habitats used by spring Chinook
salmon in the Walla Walla River basin, with emphasis on spawning and rearing habitats and
migratory corridors.
The section of the South Fork Walla Walla River adjacent to the South Fork facility has a
moderate gradient; a mixture of riffle, pool, and run habitats; and predominantly cobble
substrates. The bank-full width immediately adjacent to the hatchery ranges from
approximately 40 to 100 feet. The channel has a largely intact riparian canopy with the
exception of the segment of the north bank covered by the river intake structure. Habitat
conditions appear to be favorable for juvenile salmon and steelhead, as well as resident trout
and other native fish species.
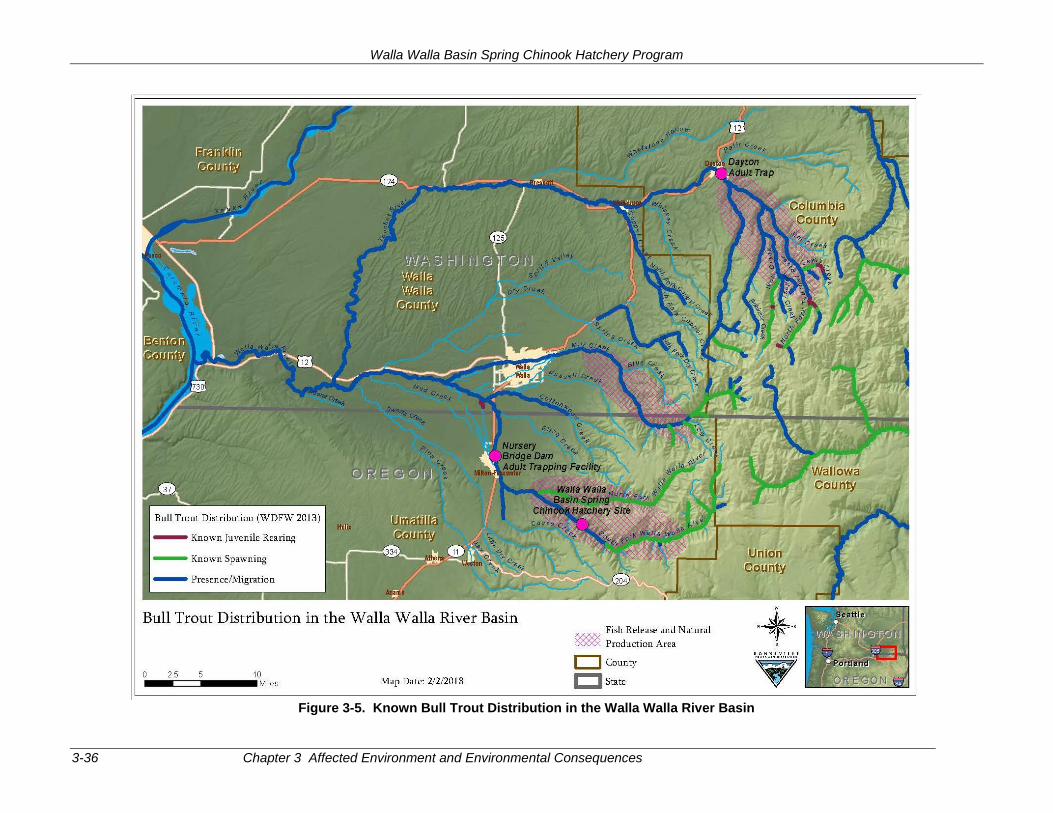
Walla Walla Basin Spring Chinook Hatchery Program
3-36 Chapter 3 Affected Environment and Environmental Consequences
Figure 3-5. Known Bull Trout Distribution in the Walla Walla River Basin
Final Environmental Impact Statement
Chapter 3 Affected Environment and Environmental Consequences 3-37
3.5.4. Sources and Types of Impact
The potential effects of the alternatives on fish and fish habitat fall into two general categories:
facility effects and the effects of increased numbers of spring Chinook salmon. The analysis
focuses on ESA-listed steelhead and bull trout because these species are declining, and they
provide a useful indicator for potential effects on other fish species.
Facility Effects
Construction activity that requires in-water work could entail fish removal and relocation,
which can adversely affect fish by exposing them to injury and increased stress.
Installation of a cofferdam to isolate the work area could temporarily disturb aquatic
habitat. Fish not removed from the work area could be harmed by suction dredging and
dewatering pumps, by being trapped on pump screens by the force of moving water and
injured or killed, and by being exposed to increased risk of asphyxiation.
Construction activities could mobilize sediment and increase turbidity in the river,
causing fish to avoid the area or temporarily stop feeding, or causing mortality of eggs
and alevins in spawning gravel.
Water withdrawals for hatchery operations could marginally reduce flows in the South
Fork Walla Walla River, which could degrade habitat for fish and other aquatic species in
the 250- to 450-foot segment of the river between the intake and bypass exit or the
abatement pond discharge.
Discharges from the South Fork facility could result in localized changes in water quality,
possibly resulting in fish and fish habitat being adversely affected.
Broodstock collection activities would temporarily block passage through fishways,
delaying upstream migration of steelhead, bull trout, and possibly resident trout species.
Delayed migration may lead to stress, increased risk of poaching and predation, and
decreased ability to survive. Non-target species may accidentally be collected with
spring Chinook broodstock. Capture and handling of non-target species could lead to
stress and injury.
Increased Numbers of Spring Chinook Salmon
Increasing numbers of naturally and/or artificially produced juvenile and adult spring
Chinook in the Walla Walla River basin could result in more competition with other
species for food and habitat, potentially influencing the survival and reproductive success
of bull trout, steelhead, and other native fish species.
Increased numbers of fish returning to spawn could stray into adjacent basins where
different ESUs have evolved, resulting in interbreeding and adverse genetic effects.
Increasing abundance of spring Chinook salmon would bring more marine-derived
nutrients to the Walla Walla River basin from their carcasses and eggs, resulting in
increased food web productivity benefitting native and introduced fish species. Adverse
effects could occur in waters where nutrient levels are too high, potentially causing
adverse impacts on fish and other aquatic species.
The carcasses of returning spring Chinook salmon could carry toxic substances, including
metals and persistent organic contaminants, which could increase the loading of these
substances in surface waters, potentially resulting in detrimental effects on fish
development, immune system function, and overall health.
Walla Walla Basin Spring Chinook Hatchery Program
3-38 Chapter 3 Affected Environment and Environmental Consequences
3.5.5 Effects of Alternative 1: Preferred Alternative
Facility Effects
Construction Effects
The majority of the proposed construction activities would be in upland areas more than 100 feet
from the South Fork Walla Walla River. In-water construction would be required only for
installation of a gate in the lower end of the sluice channel
During summer, juvenile steelhead and bull trout likely would be present and small enough to
enter the intake forebay. Other fish listed in Table 3-7, such as lamprey and other trout species,
might also be present. Therefore, in-water work would take place only during the July 1 to
August 15 work window as specified by ODFW.
Before in-water construction begins, the work area would be isolated using a cofferdam. To
minimize exposure to suction dredging, risk of impingement, and asphyxiation, fish would be
collected using either nets or electrofishing and returned to the river outside the work area.
Handling of fish during removal could result in injury and increased stress that could directly
contribute to decreased survival. Additionally, electrofishing could cause spinal injury,
especially in juvenile fish, which could also contribute to decreased survival rates or death. Fish
handling and removal is routinely required during construction projects requiring in-water work.
NMFS has developed protocols for accomplishing these activities to minimize impacts to fish
(NMFS 2000). Project-specific state and federal fish collection permits also would specify
methods and time frames. The proposed project would follow these requirements.
The hatchery surface water intake would be modified as described in Section 2.2.1.
Modification would consist of installing a sluice gate at the downstream end of the intake basin
to maintain proper water surface elevations in the intake forebay. The work would be performed
within a cofferdam, temporarily affecting a total of 230 square feet of in-water habitat,
approximately half of which is already impacted by the existing intake structure.
As discussed in Section 3.4 Water Quality, construction activities would result in minor
increases in turbidity that would be managed within the existing limits set by Oregon
Administrative Rule 340-041-0036 to protect fish and fish habitat.
Given the location, limited duration, and limited extent of the in-water work activities, these
short-term effects would not measurably reduce the availability of fish prey resources in the
South Fork Walla Walla River because aquatic macroinvertebrate communities typically recover
rapidly from disturbance (Fowler 2004; Miller and Golladay 1996; Miller et al. 2007). Given the
small amount of area that would be affected and the short-term nature of these impacts, no
substantial changes to the physical and biological features of designated critical habitat for
steelhead and bull trout in the vicinity of the South Fork facility are likely (see Section 3.5.3 for
the list of those elements). Therefore, the overall impact would be low.
Operational Effects
Maintenance of the Intake System
Silt would be removed from the intake bay monthly using a vacuum brush. The material would
be discharged to a manhole and from there it would flow to the abatement pond. Debris removal
from the intake trash rack would be done as needed (as it is currently) using a jib crane installed
Final Environmental Impact Statement
Chapter 3 Affected Environment and Environmental Consequences 3-39
at the intake structure, eliminating the need to work instream. Silt and debris would be disposed
at an approved disposal site. Impacts on fish from maintenance of the intake system would be
low.
Surface Water Withdrawals and Fish Habitat
As discussed in greater detail in Section 3.3 Surface and Groundwater Quantity and Rights, the
proposed new hatchery would withdraw up to 19.4 cfs during certain periods of the year and
would divert an additional 4-6 cfs to the juvenile fish bypass. Approximately 80% of the
19.4 cfs diversion would be returned to the river at the intake structure; the remainder (up to
5 cfs) would be discharged at the abatement pond outlet 450 feet downstream. The fish bypass
water would be discharged at the fish bypass exit, 250 feet downstream of the intake structure.
However, in order to meet instream flow requirements (see Section 3.3.5), the pumpback system
would be operated when necessary, and the fish bypass would be closed when the pumpback
system could not return enough water to the river to meet instream or natural flows.
The pumpback system would most likely need to be operated at times from December through
April and in June; fish bypass closure could be necessary at times from December through
March (4 to 10 days per month) and, rarely, in May or June (1 day per month, long-term
average). The need for and frequency of these operations would vary from year to year,
depending on monitored flows, and the bypass closure days are unlikely to be consecutive. Fish
that venture into the forebay are not trapped within the intake and can swim back out to the river
even when the bypass is temporarily closed. Therefore, fish are not expected to be adversely
affected by the bypass closures.
Fish Passage: As discussed in Section 3.3, operation of the hatchery under Alternative 1 has the
potential to increase the frequency with which minimum instream flow requirements are not met,
primarily during the winter months (Table 3-3). Instream flows have been established in
collaboration with ODFW, USFWS, and NMFS to protect passage and habitat for sensitive
species. However, as discussed in Section 3.3, flow monitoring data show that at times during
the winter, flows do not meet these minimum requirements, even under natural conditions with
no withdrawals. CTUIR would monitor instream flows and would operate the pumpback system
when flows in the affected reach fall below the minimum instream requirements or when the
withdrawals would otherwise cause river flows between the intake and the discharge to fall
below the minimum requirements. In the worst case (February), this could happen as much as
34% of the time (Table 3-3). The pumpback system would return hatchery process water to the
South Fork Walla Walla River near the downstream end of the intake screen, up to the amount
sufficient to maintain the natural flow or the minimum instream flow for that period. As stated
above, when the pumpback system alone cannot return sufficient water to the river to maintain
either minimum instream flows or natural flows with the juvenile bypass open, the bypass would
be closed. These measures would ensure that withdrawals for Alternative 1 would not adversely
affect passage for ESA-listed fish.
Fish Habitat: At times when the pumpback system is not being operated, i.e., at times when
instream flows exceed minimum instream flow requirements, flows in the 200-foot reach of the
South Fork between the juvenile bypass exit and the abatement pond discharge would be reduced
relative to current conditions. The amount of the reduction would vary throughout the year
depending on hatchery demand, from a May/June minimum of 0.6 cfs to a February/March
maximum of 4.9 cfs. Comparison of these withdrawals to the 50% exceedance flows recorded in
Walla Walla Basin Spring Chinook Hatchery Program
3-40 Chapter 3 Affected Environment and Environmental Consequences
the river (Table 3-2) shows that, when the pumpback system is not being operated, the flow
reduction would vary between a minimum of 0.19% in May to a maximum of 4.56% in October,
with most reductions on the order of 3%. This could cause a reduction in the amount of instream
habitat available in the 200-foot reach between the bypass exit and the abatement pond
discharge. In the 250-foot reach between the intake and the juvenile bypass exit, habitat
reductions would be greater due to the 6 cfs withdrawn to operate the bypass, with a minimum
reduction of 3.5% in May to a maximum of 9.4% in October.
Although the reduced flows represent a potential reduction in fish habitat, Figures 3-4 and 3-5
show that abundant spawning habitat for steelhead and bull trout is available upstream and
downstream of the hatchery; at least 20 miles of suitable habitat would continue to be available
and unaffected by the project (CTUIR 2001). Although flows adjacent to the hatchery would be
reduced, minimum instream flows would be maintained. Therefore, reduced flows between the
intake and the bypass exit or between the bypass exit and the abatement pond discharge would
not adversely affect habitat for ESA-listed or other species.
For these reasons, Alternative 1 is expected to have a low impact on fish and fish habitat,
including Essential Fish Habitat for Chinook salmon.
Hatchery Discharges
As discussed in Section 3.4 Water Quality, although Alternative 1 has the potential to add
contaminants to water that would be discharged into the South Fork Walla Walla River,
operational water quality impacts would be low. Potential contaminants include byproducts
from products used for disease control, such as formalin. As discussed in Section 3.4, water
containing formalin would be diluted and breaks down rapidly, and hatchery discharges would
meet NPDES requirements. In addition, Shephard et al. (2015) have established that hatchery
discharges of this chemical are innocuous to both mid-Columbia steelhead and bull trout.
Therefore, these contaminants are unlikely to affect fish.
Uneaten food and fish waste from the juvenile rearing facilities could increase the levels of
nutrients in the South Fork Walla Walla River. As noted in Section 3.4, total suspended and
settleable solids in the discharges would not exceed levels that could result in adverse effects on
water quality and fish.
Water discharged from the proposed hatchery also could affect stream temperatures, primarily as
a result of the water’s exposure to the sun while in the abatement pond (Section 3.4). Elevated
river temperatures can increase bacterial growth rates, thereby increasing the risk of pathogens in
water. Increased water temperatures can also harm fish by reducing growth rates, increasing
physiological stress, or even causing death.
Under current conditions, the applicable water temperature standard of 53.6oF (OAR 340-041-
0028(3)(f)), designated to protect bull trout spawning and rearing, is, on occasion, exceeded in
the South Fork during the summer months (see Section 3.4.3). This temperature standard is the
most protective standard under Oregon regulations and is more protective than the standards
designated for other species of fish; thus it protects Chinook salmon and steelhead in the South
Fork as well bull trout. The temperature analysis finds that Alternative 1 would result in reduced
hatchery process water discharge temperatures relative to current conditions (Section 3.4).
Therefore, Alternative 1 would result in lower temperature-related impacts on fish and their
Final Environmental Impact Statement
Chapter 3 Affected Environment and Environmental Consequences 3-41
habitat compared to current conditions. Impacts on fish and their habitat as a result of water
temperature changes would thus be low.
Experimental projects in other basins have placed decaying adult carcasses in aquatic habitats to
boost food web productivity. This activity would not take place under Alternative 1, because
broodstock would be routinely treated with formalin and fish anesthetics, and carcass placement
could introduce these substances to the environment. All broodstock carcasses would be
transported to landfills for disposal, so there would be no effects on fish or aquatic habitats.
Pathogens and diseases could be brought into the hatchery by fish transferred from another
facility or in hatchery intake water. Hatchery design and practices are intended to minimize the
potential for both introduction and spread of pathogens and diseases within the facility, and of
pathogens or diseases being released into receiving waters. Pathogens or diseases in hatchery
discharges or in hatchery fish could result in disease or death in wild salmonids (HSRG 2004).
However, with rare exceptions, pathogens found in most waters are endemic to the basin.
Brannon et al. (2004) concluded there was very little evidence to suggest that hatcheries
routinely transmit disease to wild fish. Many native fish populations have co-evolved with
certain pathogens, and research has shown in these cases that there is not a high risk of
transmission of certain fish diseases from hatchery to wild fish populations (Amos and Thomas
2002).
Best management practices would be implemented as part of the standard hatchery operating
procedures to minimize the spread of disease. Such practices would include treating hatchery
water for pathogens using ultraviolet radiation, maintaining optimal fish culture conditions (e.g.,
rearing densities, use of circular rearing tanks, water exchange rates), applying therapeutic
chemicals to control diseases (e.g., iodophor, formalin, antibiotics), conducting regular facility
inspections, and certifying disease-free stock at various stages in the rearing process. These
practices are detailed in the hatchery and genetic management plan for the proposed program
(CTUIR 2017), which has been reviewed and approved by NMFS (2018).
Operation of the pumpback system could result in slight increases in the risk of concentrating
pathogens in the hatchery process water if pumpback water were to be taken back into the
hatchery; however, this impact would be minimized by commingling the pumpback discharge
with the main hatchery water discharge, located immediately downstream of the intake (within
the intake structure). Additionally, as discussed above, best management practices at the
hatchery would substantially reduce pathogens in hatchery process water and fish (CTUIR
2017). Therefore, impacts associated with the spread of pathogens would be low.
Broodstock Collection
Under Alternative 1, spring Chinook salmon broodstock would be collected at Nursery Bridge
Dam. Broodstock could also be collected at the Dayton Adult Trap if sufficient numbers of
spring Chinook return to the Touchet River. Collection would require the temporary closure of
fishways at these locations to direct migrating spring Chinook into a holding trap. Gating of the
fishways for broodstock collection could delay upstream migration of adult ESA-listed Mid-
Columbia steelhead and Columbia River bull trout, as well as larger resident trout species.
Currently, fish passage is periodically blocked or has the potential to be blocked at the proposed
collection sites as a result of ongoing monitoring and evaluation or facility maintenance
activities. Since 2004, video monitoring methods have been used to count spring Chinook
Walla Walla Basin Spring Chinook Hatchery Program
3-42 Chapter 3 Affected Environment and Environmental Consequences
passing through the Nursery Bridge Dam fish ladders, eliminating much of the need for trapping
activities (Mahoney et al. 2009, 2011). However, the ladders have periodically been closed in
the past and could be closed in the future. For example, closures of up to 10 consecutive days
per year are allowed at this location for facility maintenance. Additional activities that could
result in ladder closures related to the collection of monitoring data may also occur as allowed
under CTUIR’s existing ESA Section 10 permit (NMFS Section 10 take permit for summer
steelhead, Permit 16446‐2R; expires on December 31, 2021; and USFWS Section 10 take permit
for bull trout, Permit TE‐844468‐11, expires on April 29, 2019). Passage is also currently
periodically blocked at the Dayton Adult Trap for the collection of broodstock for the Touchet
Endemic Steelhead program and for monitoring data as allowed by existing permits (NMFS
2018). Fish are detained, then transferred to upstream spawning areas after data collection.
Implementation of the proposed project would increase the duration and frequency of blockage
compared with existing conditions at Nursery Bridge Dam. It is anticipated that broodstock
would be collected between May 1 and June 30 with closures potentially lasting for up to 24
hours a day, and for as many as 4 days per week. If fish are collected at the Dayton Trap,
collection would be conducted in conjunction with ongoing activities and would not result in
additional closures compared with existing operations.
The consequences of migration delay can vary depending on site-specific conditions and context.
Extended migration delay lasting more than 24 hours or delay during periods when temperature
and habitat conditions are unfavorable can have a number of adverse effects on salmonids.
Delayed migration in high-current areas can increase energy expenditure, reducing energy
reserves necessary for successful spawning. Delay during periods with elevated water
temperatures can increase exposure to unfavorable temperature conditions, resulting in reduced
survival and fitness. Migration delay in locations without suitable cover can expose migrating
fish to predation and poaching (Cuenco and McCullough 1996; McCullough et al. 2001). Bull
trout and steelhead that are inadvertently captured with spring Chinook would have to be
separated and released, leading to stress and possible injury that could reduce survival and fitness
or result in death.
Because collection activities could affect ESA-listed species, BPA is consulting on the effects of
the proposed project with the USFWS (bull trout) and has consulted with NMFS on the effects to
steelhead. To ensure that potential effects on ESA-listed fish species are minimized, including
impacts from broodstock collection, CTUIR would implement the avoidance, minimization, and
mitigation measures identified by USFWS and NMFS during these consultations. These
measures would include, but are not limited to, limiting the duration and frequency of collection
activities to avoid and minimize migration delays, and minimizing stress and injury from
handling and release after inadvertent capture in traps. See also Monitoring and Evaluation
below and Section 4.2.1.
Increased Numbers of Spring Chinook Salmon
Competitive Ecological Interactions
Ultimately, the goal of the proposed project is 5,500 adult spring Chinook returning to the Walla
Walla River basin to spawn each year. This is more than four times greater than the largest
number yet recorded at Nursery Bridge Dam. Increased numbers of spring Chinook could
increase competition with other fish for habitat and food, thereby influencing the survival and
reproductive success of bull trout, steelhead, and other native fish species.
Final Environmental Impact Statement
Chapter 3 Affected Environment and Environmental Consequences 3-43
Although steelhead and redband trout share spawning habitat with spring Chinook salmon,
Chinook spawn during a different time of the year (Howell and Sankovich 2012; Mahoney et al.
2009, 2011; Mendel et al. 2007; Starcevich et al. 2012; Weeber et al. 2007). Specifically,
Chinook salmon spawn in the fall, while steelhead and resident trout species spawn in the spring.
Therefore, spring Chinook would not compete with steelhead and other trout for spawning
habitat.
Juvenile spring Chinook typically emerge from the spawning gravel earlier than steelhead,
giving them the competitive advantage of being larger within the first two years. Long co-
evolution of these species has resulted in selective partitioning into different microhabitats,
limiting the extent of direct competitive interactions. Studies of competitive interactions
between introduced juvenile spring Chinook salmon and native steelhead, including site-specific
studies in the Walla Walla River basin (Underwood et al. 1995), indicate that the effects on
juvenile steelhead productivity are minimal (Hillman et al. 1987; McMichael et al. 1999).
In contrast, the timing of bull trout and spring Chinook salmon spawning in the Walla Walla
River basin overlaps almost completely, and there is the potential for partial overlap in spawning
habitat selection. Currently, the majority of bull trout spawning in the South Fork Walla Walla
River occurs between Skiphorton Creek (RM 17.7) and Reser Creek (RM 20.9), and in the lower
reaches of these creeks and other upstream tributaries (Anglin et al. 2008b). In the South Fork
Walla Walla, spring Chinook spawn primarily between RM 5 and RM 14 (Mahoney et al. 2011).
In Mill Creek, bull trout spawn primarily upstream of RM 26 (Howell and Sankovich 2012;
Mahoney et al. 2009, 2011; Starcevich et al. 2012; Weeber et al. 2007), while spring Chinook
primarily spawn between RM 11 and RM 25 (Mahoney et al. 2009, 2011). This headwater-
oriented distribution of bull trout spawning also occurs in the Touchet River system, with spring
Chinook generally spawning downstream of areas used by bull trout (Mahoney et al. 2011;
Mendel et al. 2007). However, as spring Chinook numbers increase, there is a greater chance for
more overlap, resulting in adverse effects on bull trout because adult spring Chinook have a size-
based competitive advantage over adult bull trout. The size advantage allows spring Chinook to
out-compete bull trout for spawning sites, limiting the amount of spawning habitat available.
Spring Chinook are also capable of displacing bull trout and superimposing their own redds on
bull trout redds, resulting in the exposure and death of bull trout eggs.
Where juvenile spring Chinook salmon and bull trout distribution overlap, juvenile bull trout
were typically larger than juvenile spring Chinook and had a clear competitive advantage
(Young 2004). This size difference was sufficiently large in some cases that bull trout were
observed feeding on juvenile spring Chinook. Additionally, Underwood et al. (1995) found no
evidence of substantial competition for rearing habitat between these species in several
southwest Washington streams. These streams included Mill Creek, a Walla Walla River
tributary, and the nearby Tucannon River. They observed that the species used dissimilar
microhabitats, and microhabitat use by each species was the same among streams. Therefore,
due to this temporal and spatial separation in habitat use, increased numbers of spring Chinook
salmon in the basin is expected to result in low impacts on bull trout and other fish species.
Genetic Effects
Interbreeding between fish of different origins can result in negative genetic effects. For
example, the interbreeding between hatchery-origin fish and native fish of the same species can
result in impairment or loss of the characteristics in a native population that allow it to adapt to
Walla Walla Basin Spring Chinook Hatchery Program
3-44 Chapter 3 Affected Environment and Environmental Consequences
the local environment. This effect can occur when introduced fish stray into adjacent systems
occupied by different ESUs of the same species.
The proposed project would introduce more hatchery-origin spring Chinook into the Walla Walla
River basin. However, because a native population no longer exists in the basin, there would be
no effect from hatchery-origin genes mixing with native populations.
There is a slight potential that, as the numbers of spring Chinook returning to spawn increase,
project fish could stray into adjacent river basins inhabited by different spring Chinook
populations. For example, the Tucannon River basin, located approximately 70 river miles away
in Washington, is the closest river basin supporting a spring Chinook salmon population: the
Snake River spring/summer Chinook ESU, a distinct population listed as threatened under the
ESA. The potential for straying is inherently a risk for anadromous fish because some fish stray
naturally (an adaptive mechanism ensuring that suitable habitat is colonized soon after it
becomes available), and because environmental factors such as river flows, passage conditions,
and temperature can affect fish migration, causing fish to end up in other spawning areas.
Under this alternative, the potential for straying would likely be lower than existing conditions,
because broodstock and adults would be collected from within the Walla Walla River basin and
smolts and adults would be released in the basin. These fish would be imprinted to waters of the
basin and would be drawn to return to the same general area. In the initial stages of the proposed
project, broodstock and/or eggs may continue to be supplemented from the Carson National Fish
Hatchery if local returns are insufficient to meet hatchery production goals. Fish from these
sources would be reared full-cycle in the Walla Walla basin, and would be fully imprinted to
basin waters, so they would be at no higher risk of straying than those produced from Walla
Walla returns. Overall, fewer progeny would come from out of the basin compared to the
existing program, and despite the current use of fish originating from outside the basin, no
straying into adjacent basins has been observed (Gallinat and Ross 2011, 2012). BPA consulted
with NMFS on this issue (as well as on other potential program effects on ESA-listed fish under
NMFS jurisdiction), and as part of that process submitted a Hatchery and Genetics Management
Plan to the agency (CTUIR 2017). In its 2018 Biological Opinion on programs in the Walla
Walla basin, the agency found that “[t]he data … suggests that straying into listed areas is a
relatively rare occurrence; an average of ≤ 1 fish per year for all terminal areas where fish were
detected at either a hatchery or on the spawning grounds, … a number unlikely to have a
detectable effect on the listed populations where spring Chinook salmon from the …Walla Walla
are recovered/detected.” (NMFS 2018).
As the hatchery program develops a locally adapted population, any initial risk of straying is
expected to substantially decrease (CTUIR 2013). CTUIR would manage straying at levels
recommended by the HSRG (5% of total spawning returns) to minimize potential genetic
impacts of potential intermixing (HSRG 2009). CTUIR would adipose-clip all hatchery-origin
fish released in the basin, and would coded-wire-tag (CWT) a representative group of hatchery
fish to allow for monitoring of straying rates (CTUIR 2017). In the event that straying rates
exceed acceptable thresholds, CTUIR would reduce hatchery production to decrease the total
number of hatchery-origin adults.
For these reasons, genetic impacts on other fish from Walla Walla spring Chinook would be low.
Final Environmental Impact Statement
Chapter 3 Affected Environment and Environmental Consequences 3-45
Effects on Food Web Productivity
The reintroduction of Walla Walla spring Chinook salmon would increase the delivery of
marine-derived nutrients to the aquatic ecosystem in the Walla Walla River basin in the form of
salmon eggs and decaying salmon carcasses. At the high end, the modeled peak number of adult
returns (8,000) could represent at least 50 metric tons of marine-derived nutrients in the form of
salmon carcasses (CTUIR 2013); however, these numbers do not represent spawning
escapement, due to activities such as harvest and collection of adults for broodstock. For
example, the natural spawning escapement goal for the South Fork Walla Walla is 1,100 fish, so
nutrient amounts from salmon carcasses would be correspondingly less than the modeled
maximum. Un-spawned eggs and carcasses are eaten directly by juvenile fish and by macro-
invertebrates that are in turn preyed on by juvenile fish. In addition, carcasses are deposited in
riparian habitats by animals and flood waters, indirectly benefiting salmon by contributing
nutrients to the riparian environment. This is expected to increase ecosystem productivity in
ways that would benefit native fish populations and other aquatic species.
The importance of marine-derived nutrients to ecological function has been documented in
numerous studies, both as a direct food source for juvenile salmon and the contribution of
nutrients to nutrient cycles in riverine and adjacent upland habitats (Bilby et al. 1998; Cederholm
et al. 1999; Chaloner et al. 2002, 2007; Chaloner and Wipfli 2002; Heintz et al. 2004; Kohler et
al. 2012, 2013; Lessard and Merrit 2006; Merz and Moyle 2006; Naimen et al. 2002; Strobel et
al. 2009; Wipfli et al. 2004; Zhang et al. 2003). The proposed project would increase the overall
biomass of anadromous fish returning to the Walla Walla River system, and this biomass would
be distributed throughout areas used by other species of concern, including bull trout and
steelhead. The preponderance of ongoing research indicates that this would increase ecosystem
productivity in the affected watersheds, expanding the prey and foraging resources available for
juvenile salmonids and other fish species. This would be expected to increase both the number
and condition of juvenile salmonids (Quinn and Peterson 1996), which by extension could
increase the marine survival of anadromous salmonids from the Walla Walla River basin (Ward
and Slaney 1988) and the amount and quality of prey available to fish-eating sub-adult and adult
bull trout, resulting in a moderate impact.
Long-Term Effects on Water Quality
Increased numbers of spring Chinook salmon present an increased source of marine-derived
nutrients in areas where fish return to spawn in the form of decaying carcasses. This is generally
viewed as beneficial to fish as discussed above. Although increased nutrient delivery to
ecosystems that are already impaired by other sources of nutrients has been identified as a
potential source of adverse water quality impacts (Compton et al. 2006), this would not likely be
the case in the analysis area for the reasons discussed in Section 3.4 Water Quality. Because
increased nutrient loading from returning spring Chinook would be unlikely to result in adverse
water quality impact in the analysis area, there probably would be no corresponding adverse
effects on fish.
Although salmon have been identified as a vector for delivery of bioaccumulating toxic
substances such as mercury and PCBs from marine to freshwater environments (Compton et al.
2006), as discussed in Section 3.4, the potential contribution of such substances by program fish
would be low and thus likely would have no adverse effects on other fish species.
Walla Walla Basin Spring Chinook Hatchery Program
3-46 Chapter 3 Affected Environment and Environmental Consequences
Monitoring and Evaluation
Monitoring and evaluation for the Walla Walla spring Chinook program would be conducted by
CTUIR and WDFW under the existing Walla Walla Basin Natural Production Monitoring and
Evaluation Project (BPA Project # 2000-039-00). This project identifies hatchery fish using PIT
tags, fin-clips, and coded-wire tags to monitor their survival through various stages of their
migration and their rate of survival to adults. Salmonids, including steelhead and bull trout as
well as spring Chinook, are also trapped at existing juvenile and adult traps throughout the basin;
and spawning areas in the Walla Walla and Touchet rivers and Mill Creek are surveyed to count
redds9 and estimate natural production. These activities, which would continue regardless of the
decision made on the proposed project, would provide the means to evaluate the success of the
hatchery program.
Except for additional in-hatchery monitoring that includes tagging and clipping the fish produced
there, no new activities, new locations, or new facilities are proposed as part of the hatchery
program evaluated in this EIS. Monitoring and evaluation specific to the hatchery program is
provided in detail in Appendix B. These activities would have no effects on other resources,
including ESA-listed or other fish.
The existing program primarily studies the status, distribution, and survival of steelhead, bull
trout, and spring Chinook in the natural environment. Because monitoring equipment is now in
place and no new equipment or facilities are proposed at this time, the program affects only fish.
This project operates under the following permits: NOAA section 10 permit for summer
steelhead – 16446-2R that expires 12/31/2021; and USFWS Take Permit for bull trout - Permit
TE-844468-11 issued to CTUIR, signed 4/30/2015, expires 4/29/2019. WDFW holds a 4D
permit for sampling steelhead and a cooperative compliance letter from USFWS for bull trout
associated with this project, as well as other permits associated with hatchery steelhead releases
and associated natural fish sampling in the Touchet River.
Monitoring and evaluation activities typically involve trapping adult and juvenile fish to
enumerate and/or tag them; or capturing them by other means such as electrofishing, beach
seining, or hook-and-line fishing. The effects of trapping fish are discussed under Broodstock
Collection above and include migration delays, handling stress, and occasionally, mortality.
Electrofishing is done following NMFS guidelines (NMFS 2000) but can still result in injury or
mortality, as can other methods of capture. Effects of redd surveys, typically done by wading
through or adjacent to a stream, generally are limited to fish temporarily leaving the area.
The effects of the program were evaluated in a Biological Opinion received from NMFS on
February 13, 2018. The monitoring and evaluation activities evaluated in that opinion and the
potential annual “take”10
of ESA-listed steelhead include:
In the Walla Walla basin: adult trapping at Nursery Bridge Dam, rotary screw trapping of
juveniles and adults, fish salvage (seines and electrofishing), and redd surveys. The total
estimated annual take for all activities is 500 adults encountered with 10 mortalities; and
9,500 juveniles encountered with 180 mortalities (NMFS 2018, Table 7). Details of the
9 A redd is a nest the fish digs in the river gravel in which to deposit its eggs. 10
“Take” is defined by NMFS and USFWS as to harass by survey, capture, handle, mark, and release. Mortality
might or might not occur as a result of any of these activities, but the activities are still considered “take.”
Final Environmental Impact Statement
Chapter 3 Affected Environment and Environmental Consequences 3-47
number of adults and juveniles encountered for each activity are provided in NMFS 2018,
Table 7.
In the Touchet basin: adult trapping at Dayton, Coppei Creek, Patit Creek and Dry Creek;
rotary screw trapping of adults and juveniles in the Touchet River; and juvenile
abundance monitoring that includes electrofishing, beach seining, and hook-and-line
fishing using barbless hooks and no bait. The total estimated annual take for all activities
is 1,370 adults encountered with 28 mortalities; and 15,600 juveniles encountered with
447 mortalities (NMFS 2018, Table 3). Details of the number of adults and juveniles
encountered for each activity are provided in NMFS 2018, Table 3.
The Walla Walla basin monitoring and evaluation activities affecting bull trout are conducted
under the above-mentioned USFWS Section 10 permit TE-844468-11 issued to CTUIR, which
expires 4/29/2019. It authorizes the CTUIR to annually take listed bull trout while conducting
project activities in accordance with the study plans or biological assessment (as modified by the
Special Terms and Conditions) accompanying the permit application. Estimated annual take is
200 individuals of all age classes, with less than 3% mortality (CTUIR 2017).
Because the monitoring and evaluation program in the natural environment has been ongoing for
many years and operates successfully under existing permits from NMFS and USFWS, with low
impacts to other fish species, the effects of the program on ESA-listed and other fish is expected
to be low.
3.5.6 Effects of Alternative 2
Facility Effects
Construction Effects
Construction impacts under Alternative 2 would result in the same impacts described for
Alternative 1. Mitigation measures would also be the same as for Alternative 1.
Operational Effects
Maintenance of the Intake System
Impacts due to maintenance of the intake system under Alternative 2 would be the same as for
Alternative 1.
Surface Water Withdrawals and Fish Habitat
Fish Passage: As discussed in Section 3.3.6 Surface and Groundwater Quantity and Rights, the
volume of water withdrawn for hatchery operations would vary depending on whether CTUIR
implemented a water reuse system to recirculate water through the grow-out facility. If the reuse
system is installed, Alternative 2 would require withdrawals of up to 14.8 cfs. Without the water
reuse system, Alternative 2 would require peak flows of up to 19.8 cfs. Tables 3-4 and 3-5 show
the frequency that instream flows would not be met in the affected reach with and without reuse.
However, similar to Alternative 1, CTUIR would monitor river flows and would operate the
pumpback system when needed to return hatchery process water back to the intake so that
required minimum instream flows are maintained. Also, as in Alternative 1, the juvenile bypass
would be closed as needed.
Fish Habitat: At times when the pumpback system is not being operated, i.e., at times when
instream flows exceed minimum instream flow requirements, flows in the 200-foot reach of the
Walla Walla Basin Spring Chinook Hatchery Program
3-48 Chapter 3 Affected Environment and Environmental Consequences
South Fork between the hatchery intake and the discharge would be reduced relative to current
conditions. The amount of the reduction would vary throughout the year depending on hatchery
demand, from a May minimum of 2.2 cfs to an October-December maximum of 6 cfs.
Comparison of these withdrawals to the 50% exceedance flows recorded in the river (Table 3-2)
shows that, when the pumpback system is not being operated, the habitat reduction for
Alternative 2 with reuse would vary between a minimum of 0.7% in May to a maximum of 5.8%
in October in the 200-foot reach between the bypass exit and the abatement pond discharge. In
the 250-foot reach between the intake and the juvenile bypass exit, habitat reductions would be
greater due to the 6 cfs withdrawn to operate the bypass, with a minimum reduction of 1.97% in
May to a maximum of 11.7% in October.
If Alternative 2 is implemented without the water reuse system, habitat reductions when the
pumpback system is not operating would be similar to Alternative 2 with reuse, ranging from
0.7% to 5.2% in the 200-foot reach between the bypass exit and abatement pond discharge, and
from 1.97% to 11.1% in the 250-foot reach from the intake to the bypass exit.
Although the reduced flows represent a potential reduction in fish habitat, Figures 3-4 and 3-5
show that abundant spawning habitat for steelhead and bull trout is available upstream and
downstream of the hatchery; at least 20 miles of suitable habitat would continue to be available
and unaffected by the project (CTUIR 2001). Although flows adjacent to the hatchery would be
reduced, minimum instream flows would be maintained. Therefore, reduced flows between the
intake and the bypass exit or between the bypass exit and the abatement pond discharge would
not adversely affect habitat for ESA-listed or other species.
For these reasons, Alternative 2, with or without reuse, is expected to have a low impact on fish
and fish habitat, including Essential Fish Habitat for spring Chinook salmon.
Hatchery Discharges
Under Alternative 2, increased fish production would result in a greater potential for impacts on
water quality compared to Alternative 1. As discussed in Section 3.4, the impacts would not
exceed levels put in place for the protection of fish and fish habitat. For these reasons, the
potential impacts of changes in the quality of hatchery effluent that could affect fish would also
be low.
Broodstock Collection
Broodstock collected for the Walla Walla spring Chinook program would be at the same
numbers and would be done in the same manner at Nursery Bridge Dam as described for
Alternative 1, with the same low impacts. Broodstock collected at Three Mile Dam for the
Umatilla spring Chinook that would be incubated and reared at the proposed Walla Walla
hatchery would not change from current approved numbers, practices, and permits.
Increased Numbers of Spring Chinook Salmon
Alternative 2 would result in the same impacts on fish associated with increased numbers of
spring Chinook salmon returning to spawning areas in the Walla Walla River basin as were
described for Alternative 1.
In its Biological Opinion on the Umatilla Hatchery program, NMFS (2011b) indicated that
“[i]mpacts on listed steelhead in the Umatilla River through competition and predation may
occur if hatchery locations are changed and if the number of hatchery salmon released increases
Final Environmental Impact Statement
Chapter 3 Affected Environment and Environmental Consequences 3-49
from those proposed and evaluated in this opinion.” Under Alternative 2, releases of Umatilla
spring Chinook into the Umatilla River basin would continue in the same numbers as under the
current program. However, with the transfer of the Umatilla production to the proposed Walla
Walla hatchery, the Umatilla fish slated for acclimation would be moved from the hatchery to
existing acclimation sites in March, rather than attempting to acclimate some of the fish over the
winter, as is currently the practice.
Part of the reason for implementing the current over-winter acclimation strategy for the Umatilla
spring Chinook (in addition to water supply problems at Umatilla Hatchery) came from
physiological measurements collected on fish reared at the Umatilla Hatchery, which suggested
that these groups might be smolting before their release into the river due to the constant well
water temperatures on which they are raised.11
It was hypothesized that an earlier transfer to
acclimation, where fish would receive a longer exposure to ambient river temperatures, would
synchronize the timing of smoltification with release to the river (Blakely, ODFW, pers. comm.,
7-11-2014).
Transferring all the fish for acclimation in March would not change the potential for interactions
with other fish as described in the NMFS 2011 Biological Opinion for the Umatilla Hatchery
program (NMFS 2011b) because the conditions as described in the Opinion (below) would
remain the same as they are now.
NMFS (2011[a]) identified the potential for hatchery-produced fish to compete with and
prey upon ESA-listed salmon and steelhead. In this opinion, NMFS determined that the
proposed release of spring Chinook salmon…would not pose a risk to listed steelhead in
the Umatilla River through competition because a majority of the hatchery salmon are
acclimated for a period of time, and allowed to volitionally emigrate. Those that are
direct stream released and those that are acclimated, are released at a size to support
smoltification, released in locations below the primary spawning and early rearing
habitat, tend to partition habitat between themselves and other species, and the hatchery
salmon tend to emigrate quickly out of the basin… With regards to predation, NMFS
determined that the same attributes described for competition applied for predation and
because the juvenile steelhead in the areas below the acclimation facilities and the direct
stream release locations tend to be too large to be prey to the hatchery spring Chinook
salmon. (NMFS 2011b, p. 87)
The potential exists that straying of the Umatilla spring Chinook produced at the proposed Walla
Walla Hatchery could increase due to the change in the waters in which they are reared.
However, as indicated in the Biological Opinion for the Umatilla program, stray rates to the
Tucannon (the basin of primary concern because it contains a population of ESA-listed spring
Chinook) have been low in most years. For brood year 2009, only 0.89% of adults strayed.
From run years 1989 to 2010 the average stray rate was only 1.1% (Clarke et al. 2013), although
the majority of the straying is to the Tucannon River. As stated in the Biological Opinion:
The take, under the ESA, of listed Tucannon River spring Chinook salmon as a result of
stray Umatilla River hatchery spring Chinook salmon has been reduced over the past few
years to a level well below the 5% level identified by Grant (1997) as potentially leading
11
This can result in a higher proportion of fish returning to the target basin as smaller fish that have spent a year or
less in the ocean (jacks or minijacks); some researchers suggest that this means fewer adult males available for
harvest and spawning (Harsted et al. 2014).
Walla Walla Basin Spring Chinook Hatchery Program
3-50 Chapter 3 Affected Environment and Environmental Consequences
to adverse effects on population diversity. However…the proposed marking strategy for
the Umatilla spring Chinook salmon program should continue indefinitely along with
monitoring to determine if the trend in reduced straying continues. NMFS believes that,
at the levels of straying observed in 2008 and 2009, the Umatilla spring Chinook salmon
program is not likely to contribute to outbreeding effects and increased risk to population
diversity on the listed Tucannon River spring Chinook salmon population. (NMFS 2011b,
p. 66).
Monitoring and Evaluation
Effects of the Walla Walla basin monitoring and evaluation program would be the same as
described for Alternative 1.
The ongoing ODFW Umatilla Hatchery Monitoring & Evaluation project (BPA Project
No. 1990-005-00) would continue to evaluate fish culture practices and the performance of
Umatilla spring Chinook reared at the Walla Walla Fish Hatchery, including the rate of straying,
and would abide by all the terms and conditions of the Biological Opinion. See Section 4.2.1 for
a discussion of consultation requirements.
3.5.7 Mitigation Measures
The following measures are proposed to minimize construction impacts on fish.
Isolate in-water work areas and remove and relocate fish from those areas as necessary
consistent with approved state and federal protocols for this practice, including:
o Conduct in-water work during the July 1 to August 15 in-water work window.
o Use low-impact methods to remove fish (e.g., herding of fish using seines).
o Apply the most protective available protocols for electrofishing and fish handling
(e.g., NMFS 2000).
Use construction best management practices to limit turbidity impacts on surface waters
to no more than a 10% cumulative increase over the baseline turbidity level, as measured
relative to a control point immediately upstream of construction. Additional measures to
protect water quality, including measures to prevent contamination in the river from spills
of chemicals and other substances, are outlined in Section 3.4.7.
Use best management practices during construction consistent with USFWS
recommendations for lampreys (USFWS 2010).
The following measures are proposed to minimize operations impacts on fish.
Monitor instream flows against minimum instream flow requirements (see Section 3.3.7).
Collect broodstock at Nursery Bridge in accordance with timing and other conditions as
required by NMFS and USFWS. These could include:
o Minimize the number of hours per day and days per week broodstock are collected.
o Minimize operation of the collection trap when water temperatures increase and
approach 15°C, if bull trout or steelhead are present.
o Remove and release species other than spring Chinook from the collection trap as
quickly as practicable, unless specific permits are acquired to cover collection of
other species.
o Tag Walla Walla spring Chinook and monitor out-of-basin straying through the
existing Walla Walla River Basin Monitoring and Evaluation Program (BPA Project
Final Environmental Impact Statement
Chapter 3 Affected Environment and Environmental Consequences 3-51
No. 2000-039-00). If straying rates exceed acceptable thresholds, reduce hatchery
production to decrease the total number of hatchery-origin adults.
If Alternative 2 is selected, tag Umatilla spring Chinook and monitor out-of-basin
straying as it is now under the ODFW Umatilla Hatchery Monitoring and Evaluation
project (BPA Project No. 1990-005-00), in accordance with the terms and conditions of
the Biological Opinion (NMFS 2011[b]).
3.5.8 Effects of the No Action Alternative
Under the No Action Alternative, there would be no construction impacts on ESA-listed fish or
other fish species. CTUIR would continue to import Carson-origin spring Chinook smolts for
release in the South Fork Walla Walla River. Adults, as available from the Umatilla Hatchery
spring Chinook program (see Chapter 1, Section 1.4), would continue to be out-planted in Mill
Creek and possibly the Touchet River. Spring Chinook salmon are likely to continue evolving
into a locally adapted naturally reproducing population in the South Fork Walla Walla River,
albeit at a slower rate than would occur under the two action alternatives (CTUIR 2017).
Minimal straying risk into the Tucannon River basin would continue similar to existing
conditions. Abundance levels might remain similar to current numbers. However, without the
development of a local broodstock and in-basin rearing of spring Chinook salmon, survival rates
are not expected to reach the point where a self-sustaining population could be established in the
Walla Walla basin. Consequently, the No Action Alternative would likely maintain the current
environmental baseline for fish and aquatic habitat in the Walla Walla River basin.
3.6 Vegetation and Noxious Weeds
Notable Differences in this Section from the Draft EIS
Because construction at Nursery Bridge Dam is no longer proposed, there would be no
spread of noxious weeds at that location.
Because most of the stream-side work was eliminated from the proposal, the amount of
riparian vegetation that would be removed is near zero. See Section 3.6.5.
Additional detail on the type and amount of upland vegetation disturbed or removed has been
added. See Section 3.6.5.
3.6.1 Analysis Area
The analysis area for vegetation and noxious weeds includes the South Fork facility where
ground-disturbing construction activities could occur, including access roads and staging areas.
3.6.2 Applicable Regulations
Noxious weeds are defined and regulated at federal, state, and local levels. The Plant Protection
Act of 2000 (7 USC 7701 et seq.) consolidates the major statutes pertaining to plant protection
and quarantine in the United States (USFWS 2012).
The state of Oregon regulates noxious weeds under multiple laws, including (1) Oregon Revised
Statute Chapter 569–Weed Control, (2) Oregon Revised Statute Chapter 570–Plant Pest and
Disease Control; Invasive Species, and (3) Oregon Administrative Rule 603-052-1200–
Quarantine; Noxious Weeds (ODA 2013a).
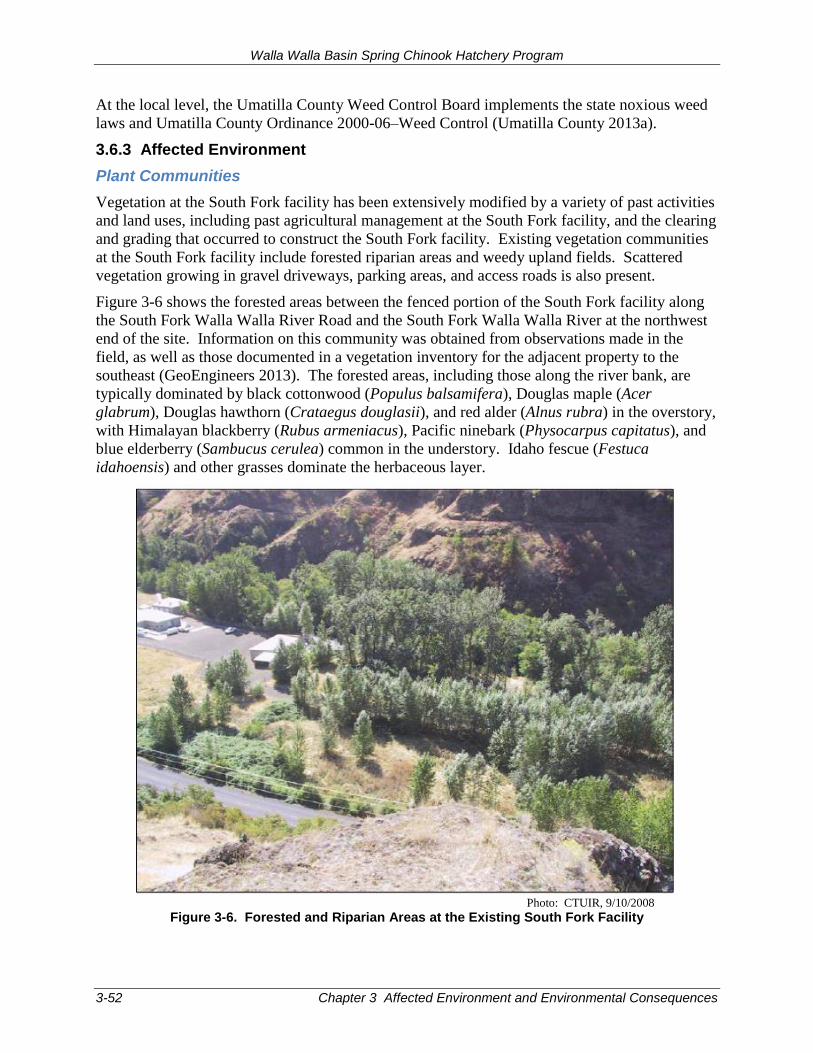
Walla Walla Basin Spring Chinook Hatchery Program
3-52 Chapter 3 Affected Environment and Environmental Consequences
At the local level, the Umatilla County Weed Control Board implements the state noxious weed
laws and Umatilla County Ordinance 2000-06–Weed Control (Umatilla County 2013a).
3.6.3 Affected Environment
Plant Communities
Vegetation at the South Fork facility has been extensively modified by a variety of past activities
and land uses, including past agricultural management at the South Fork facility, and the clearing
and grading that occurred to construct the South Fork facility. Existing vegetation communities
at the South Fork facility include forested riparian areas and weedy upland fields. Scattered
vegetation growing in gravel driveways, parking areas, and access roads is also present.
Figure 3-6 shows the forested areas between the fenced portion of the South Fork facility along
the South Fork Walla Walla River Road and the South Fork Walla Walla River at the northwest
end of the site. Information on this community was obtained from observations made in the
field, as well as those documented in a vegetation inventory for the adjacent property to the
southeast (GeoEngineers 2013). The forested areas, including those along the river bank, are
typically dominated by black cottonwood (Populus balsamifera), Douglas maple (Acer
glabrum), Douglas hawthorn (Crataegus douglasii), and red alder (Alnus rubra) in the overstory,
with Himalayan blackberry (Rubus armeniacus), Pacific ninebark (Physocarpus capitatus), and
blue elderberry (Sambucus cerulea) common in the understory. Idaho fescue (Festuca
idahoensis) and other grasses dominate the herbaceous layer.
Photo: CTUIR, 9/10/2008
Figure 3-6. Forested and Riparian Areas at the Existing South Fork Facility
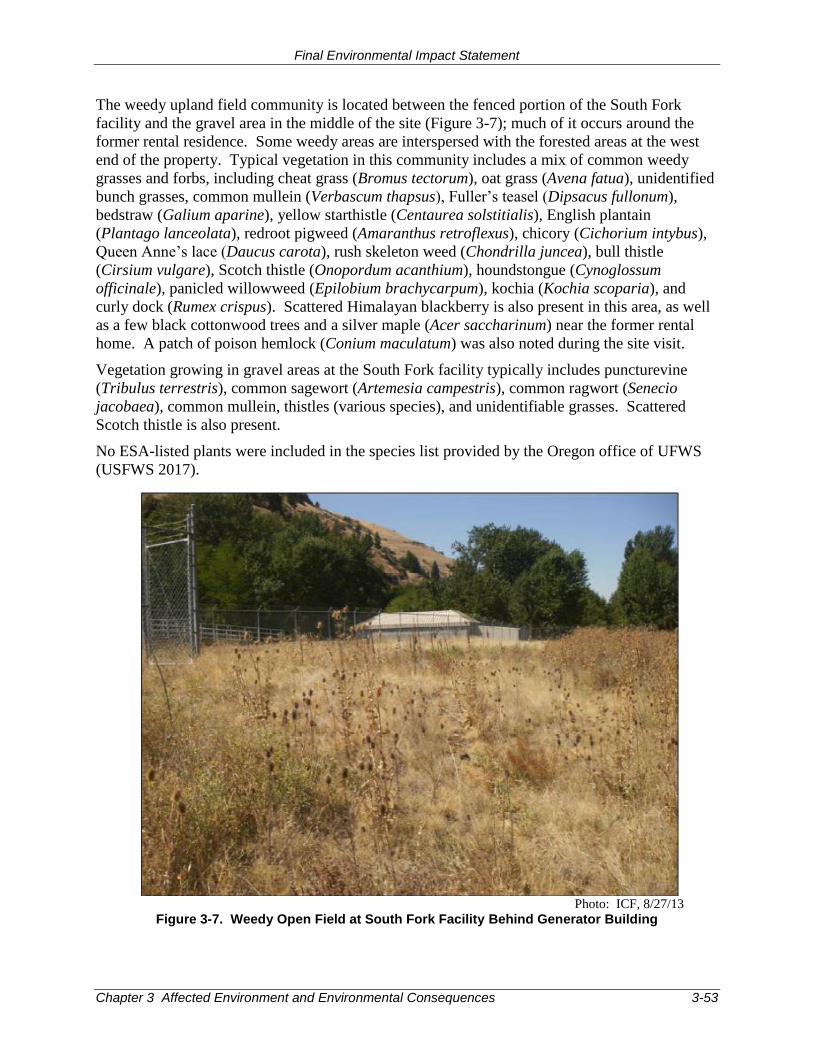
Final Environmental Impact Statement
Chapter 3 Affected Environment and Environmental Consequences 3-53
The weedy upland field community is located between the fenced portion of the South Fork
facility and the gravel area in the middle of the site (Figure 3-7); much of it occurs around the
former rental residence. Some weedy areas are interspersed with the forested areas at the west
end of the property. Typical vegetation in this community includes a mix of common weedy
grasses and forbs, including cheat grass (Bromus tectorum), oat grass (Avena fatua), unidentified
bunch grasses, common mullein (Verbascum thapsus), Fuller’s teasel (Dipsacus fullonum),
bedstraw (Galium aparine), yellow starthistle (Centaurea solstitialis), English plantain
(Plantago lanceolata), redroot pigweed (Amaranthus retroflexus), chicory (Cichorium intybus),
Queen Anne’s lace (Daucus carota), rush skeleton weed (Chondrilla juncea), bull thistle
(Cirsium vulgare), Scotch thistle (Onopordum acanthium), houndstongue (Cynoglossum
officinale), panicled willowweed (Epilobium brachycarpum), kochia (Kochia scoparia), and
curly dock (Rumex crispus). Scattered Himalayan blackberry is also present in this area, as well
as a few black cottonwood trees and a silver maple (Acer saccharinum) near the former rental
home. A patch of poison hemlock (Conium maculatum) was also noted during the site visit.
Vegetation growing in gravel areas at the South Fork facility typically includes puncturevine
(Tribulus terrestris), common sagewort (Artemesia campestris), common ragwort (Senecio
jacobaea), common mullein, thistles (various species), and unidentifiable grasses. Scattered
Scotch thistle is also present.
No ESA-listed plants were included in the species list provided by the Oregon office of UFWS
(USFWS 2017).
Photo: ICF, 8/27/13
Figure 3-7. Weedy Open Field at South Fork Facility Behind Generator Building
Walla Walla Basin Spring Chinook Hatchery Program
3-54 Chapter 3 Affected Environment and Environmental Consequences
Noxious Weeds
Noxious weeds are defined as plant species that cause harm to humans, agricultural interests
(e.g., crops, livestock, irrigation), recreation, wildlife, or any public or private property (ODA
2013a). Noxious weeds are aggressive plants that can contribute to the loss of native vegetation;
loss of habitat, especially in riparian areas; degradation of forage quality on adjacent rangelands
and pastures; and damage to adjacent croplands both in regard to crop yields and potential
damage to machinery. Many of the noxious weed species found on the site—including yellow
starthistle, kochia, houndstongue, poison hemlock, and puncturevine—are also poisonous to
livestock and horses.
The Plant Protection Act of 2000 is administered by the U.S. Department of Agriculture (USDA)
through the Animal and Plant Health Inspection Service. As part of the Federal Noxious Weed
Program, the Animal and Plant Health Inspection Service also maintains the Federal Noxious
Weed List, which is primarily composed of known noxious species that are not yet present or
well established in the U.S. Most noxious weed species that have already become a problem on
a local or regional level are not included on this list.
The Oregon Department of Agriculture (ODA) leads coordination and management of state-
listed noxious weeds through their Noxious Weed Control Program. The ODA maintains the
State Noxious Weed List and groups weed species into the following three categories for the
purpose of prioritizing and implementing control projects (ODA 2013a).
A – Includes weeds of economic importance that are either not known to occur in Oregon
or that occur in small enough infestations to make eradication/containment possible.
Weeds are included in this category when the presence of such species in neighboring
states makes future occurrence in Oregon seem imminent. The recommended action for
infestations of A-classified weeds is eradication or intensive control.
B – Includes weeds of economic importance that are regionally abundant, but that may
have limited distribution in some counties. Recommended actions for B-classified weeds
involve limited to intensive control at the state, county, or regional level as determined on
a case-by-case basis. Where implementation of a fully integrated statewide management
plan is not feasible, biological control (when available) is to be the main control
approach.
T – Priority noxious weeds designated by the Oregon State Weed Board as target species
for ODA to develop and implement a statewide management plan. T-classified noxious
weeds are selected from either the A or B list.
The Umatilla County Weed Control Board implements the state noxious weed laws and county
ordinance and assists land owners and managers in dealing with noxious weeds on public and
private lands. Umatilla County maintains its own noxious weed list that includes those weeds on
the state’s list that are currently found growing or are known to have previously grown in
Umatilla County. Like the state list, these weeds are grouped into A- and B-classified weeds.
The list also identifies a Most Wanted Weed based on the current noxious weed populations
observed in the county.
Herbicides are applied to weeds annually at the existing South Fork facility (Lovrak, pers.
comm., Sept. 2013). Application is limited to the fenced-in portion of the facility and to the
areas along the pollution abatement pond, outfalls, and on-site gravel road; the area between the
South Fork facility and South Fork Walla Walla River Road is not treated.
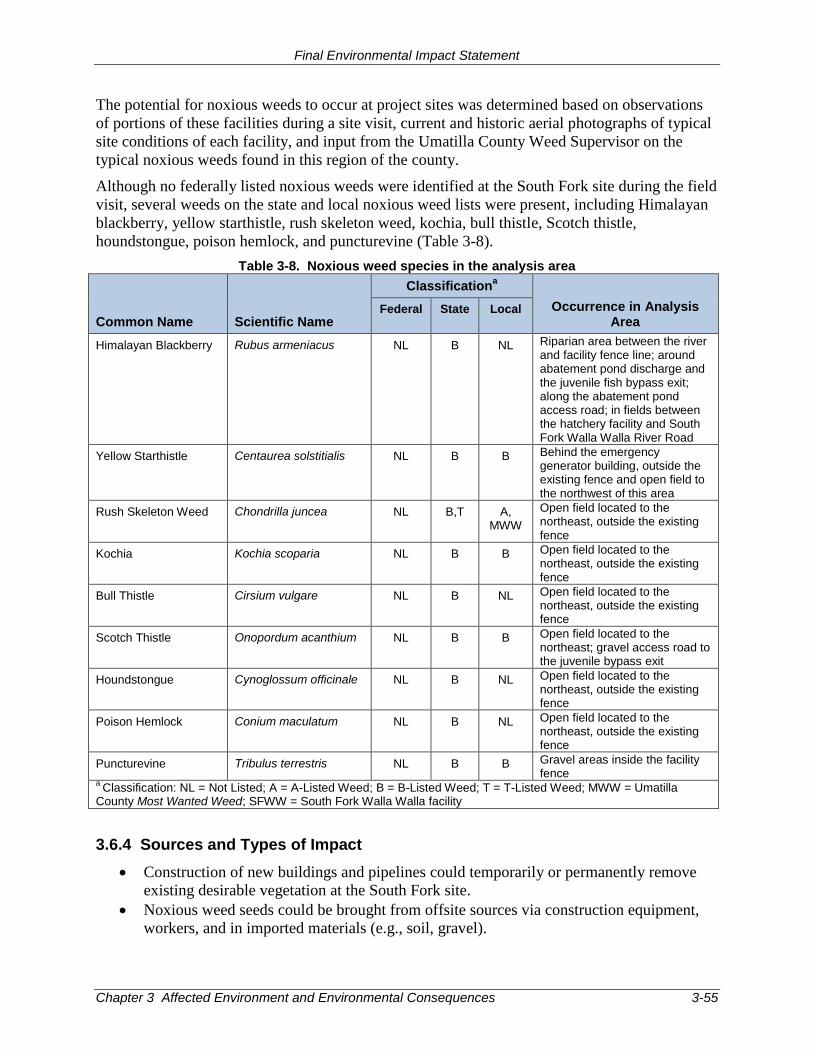
Final Environmental Impact Statement
Chapter 3 Affected Environment and Environmental Consequences 3-55
The potential for noxious weeds to occur at project sites was determined based on observations
of portions of these facilities during a site visit, current and historic aerial photographs of typical
site conditions of each facility, and input from the Umatilla County Weed Supervisor on the
typical noxious weeds found in this region of the county.
Although no federally listed noxious weeds were identified at the South Fork site during the field
visit, several weeds on the state and local noxious weed lists were present, including Himalayan
blackberry, yellow starthistle, rush skeleton weed, kochia, bull thistle, Scotch thistle,
houndstongue, poison hemlock, and puncturevine (Table 3-8).
Table 3-8. Noxious weed species in the analysis area
Common Name Scientific Name
Classificationa
Occurrence in Analysis Area
Federal State Local
Himalayan Blackberry Rubus armeniacus NL B NL Riparian area between the river and facility fence line; around abatement pond discharge and the juvenile fish bypass exit; along the abatement pond access road; in fields between the hatchery facility and South Fork Walla Walla River Road
Yellow Starthistle Centaurea solstitialis NL B B Behind the emergency generator building, outside the existing fence and open field to the northwest of this area
Rush Skeleton Weed Chondrilla juncea NL B,T A, MWW
Open field located to the northeast, outside the existing fence
Kochia Kochia scoparia NL B B Open field located to the northeast, outside the existing fence
Bull Thistle Cirsium vulgare NL B NL Open field located to the northeast, outside the existing fence
Scotch Thistle Onopordum acanthium NL B B Open field located to the northeast; gravel access road to the juvenile bypass exit
Houndstongue Cynoglossum officinale NL B NL Open field located to the northeast, outside the existing fence
Poison Hemlock Conium maculatum NL B NL Open field located to the northeast, outside the existing fence
Puncturevine Tribulus terrestris NL B B Gravel areas inside the facility fence
a Classification: NL = Not Listed; A = A-Listed Weed; B = B-Listed Weed; T = T-Listed Weed; MWW = Umatilla
County Most Wanted Weed; SFWW = South Fork Walla Walla facility
3.6.4 Sources and Types of Impact
Construction of new buildings and pipelines could temporarily or permanently remove
existing desirable vegetation at the South Fork site.
Noxious weed seeds could be brought from offsite sources via construction equipment,
workers, and in imported materials (e.g., soil, gravel).
Walla Walla Basin Spring Chinook Hatchery Program
3-56 Chapter 3 Affected Environment and Environmental Consequences
Clearing and grubbing for site preparation, excavating for building construction,
stockpiling soil, and using construction equipment could result in the spread of existing
sources of noxious weeds both onsite and offsite.
Bare, disturbed, and compacted soils resulting from construction activities would be
vulnerable to weed invasion, as would exposed soil stockpiles.
3.6.5 Effects of Alternative 1
The new buildings and associated facilities proposed at the South Fork facility would occupy
approximately 3.3 acres in the upland area of the site (Figure 2-3); of this amount, approximately
2.4 acres would require new disturbance. The affected areas consist primarily of weedy, non-
native plants, such as cheatgrass, teasel, and other common weeds, as well a large patch of
Himalayan blackberry and a few stands of cottonwood (Figure 3-7). Construction of the upland
facilities would require the removal of the weedy vegetation and approximately 75 trees greater
than 10 inches in diameter at breast height (dbh), ranging in height from approximately 50 to 85
feet. Of these, most are black cottonwoods; six are Douglas-firs between 53 and 66 feet tall on
the north side of the site along South Fork River Road. More than 50 alder and cottonwood
saplings and small trees that vary in size from 2 to 8 inches dbh would also be removed.
Although cottonwood trees are excellent migration and breeding habitat for various bird species,
the stands slated for removal are young and lack the complex shrub understory that supports a
diversity of macroinvertebrate food species important to avian nest success (Scheeler 2017). The
site contains abundant similar habitat, and disturbed areas not permanently converted to
buildings and gravel or asphalt would be replanted with drought-tolerant native species;
therefore, impacts would be low to moderate.
Modifications to the intake would potentially impact five linear feet of the river bank. The
remaining work would be in already disturbed areas of the intake’s concrete ramp and within the
concrete sluice channel. Small vegetation within five feet downstream of the intake would be
cleared to allow for a fish transport pipe to be laid on the ground. The pipe would be routed
close to the concrete wall on the downstream side of the intake. The fish transfer pipe would lie
on the ground during periods when the fish are being pumped from the hatchery and placed in
the river. Once transfer to the river is complete, the pipe would be removed and stored within
the hatchery. This activity would take place once a year for approximately 2-3 days.
Maintaining a clear path for laying out the pipe annually would be the only impact to the river
bank area.
Construction could introduce noxious weeds from offsite or could redistribute noxious weeds
within the construction activity area. Several of the species found in the analysis area produce
seeds that readily stick to clothing, shoes, and car/truck tires (e.g., houndstongue, puncturevine).
Released weed seeds could cling to vehicles and the clothing or boots of workers and could be
transported to other parts of the site or offsite. Root fragments from plants like rush skeleton
weed are capable of regenerating new plants and could remain in soils at the site or at disposal
locations offsite.
The proposed expansion work at the existing South Fork facility could also lead to the increased
spread of existing sources of noxious weeds found at the site and on adjacent properties.
Areas disturbed by construction also provide exposed soils that are at risk of invasion by weeds
dispersed by natural means (e.g., wind, animals). Many weed species present at the South Fork
facility (e.g., yellow starthistle) are capable of quickly forming dense colonies, which are
Final Environmental Impact Statement
Chapter 3 Affected Environment and Environmental Consequences 3-57
difficult to eradicate. This risk would be mitigated through weed control best management
practices before, during, and after construction (see Section 3.6.7). Following construction,
disturbed areas would be planted or hydroseeded with desirable species, either native or non-
native, to minimize the risk of noxious weed establishment in these areas. Gravel areas of the
existing and future facilities could support scattered individuals of certain noxious weed species
(e.g., thistles, puncturevine), but substantial infestation of such areas is unlikely and mitigation is
not required for gravel areas.
Because much of the on- and off-site herbaceous vegetation is non-native, the potential for
noxious weeds to displace native plant communities is relatively low. On site, potential impacts
on livestock and cropland are not an issue because the site is not used for rangeland or
agricultural production. Although such activities do occur on lands adjacent to the South Fork
facility, the potential for construction vehicles or workers to inadvertently carry noxious weed
seeds or plant parts onto those properties would be relatively low because those sites are not part
of the proposed construction zone, and construction vehicles would be washed as they enter and
leave. Although natural dispersal mechanisms could transport seeds from onsite weeds to
adjacent properties, this potential is not likely to increase as a result of Alternative 1 because
bare areas would be re-vegetated once construction is complete.
Facility operations would not include ground-disturbing activities or the transfer of materials
such as soil or gravel that would directly contribute to the dispersal of noxious weeds. Because
noxious weeds already exist in the analysis area, weed control measures are currently
implemented and would continue after construction of Alternative 1.
With implementation of the proposed mitigation measures described in Section 3.6.7,
Alternative 1 would have low impacts on vegetation and from the spread of noxious weeds.
3.6.6 Effects of Alternative 2
Similar to Alternative 1, construction of Alternative 2 would result in the permanent removal of
vegetation at the South Fork facility. Impacts would be the same as described above, with the
exception that Alternative 2 would occupy an additional 0.8 acre to accommodate construction of
a larger grow-out building (Figure 2-5). This would require a larger building footprint (3.2 acres
total) and the reconfiguration of associated piping, utilities, and support systems (e.g., process
treatment facility, pumpback pump station) within the project site. It would also require the
realignment of the existing abatement pond access road and the removal of approximately 100
red alder and black cottonwood trees varying in size from 2 to 8 inches dbh.
Similar to Alternative 1, Alternative 2 would affect areas that are dominated by Himalayan
blackberry and weedy herbaceous species, as well as small trees, including cottonwood and alder
saplings. Although more small trees would be removed under Alternative 2, with
implementation of the proposed mitigation measures described in Section 3.6.7, the overall
impact of vegetation removal would be low. The potential to spread noxious weeds would also
be low.
3.6.7 Mitigation Measures
The following measures are proposed to avoid or minimize impacts on vegetation.
Once the final design and locations of the South Fork hatchery facilities are determined
and before construction begins, survey all areas of proposed ground disturbance for
Walla Walla Basin Spring Chinook Hatchery Program
3-58 Chapter 3 Affected Environment and Environmental Consequences
noxious weeds, including structure footprints, construction equipment access routes, and
equipment/material staging areas.
Flag locations and densities of noxious weed species found, and identify those species
that pose the highest risk of spreading to other areas on or adjacent to the site.
Consult appropriate staff from CTUIR, Umatilla County Weed Control department, or
the ODA Noxious Weed Program to prioritize weed control activities on the site and to
determine the most effective and practicable actions to control the spread of such weeds
before, during, and after construction.
Establish a vehicle and equipment wash station near where pavement ends and gravel or
dirt access roads begin, if feasible. Use wash stations to clean construction vehicles and
equipment prior to entering and leaving each work area.
Prohibit discharge of vehicle wash water into any stream or water body.
Limit construction activities to the area needed to work effectively in order to disturb
native or desirable plant communities as little as possible.
Obtain rock, fill, and erosion control materials such as straw bales from weed-free
sources to the extent practicable.
Educate and train workers to ensure practices are in place to minimize the spread of
weeds.
Reseed or replant all disturbed areas after construction, at the appropriate time period for
germination or effective growth, with a drought-tolerant native seed mix or plants.
Monitor seeded and planted areas with at least three field visits per year until disturbed
areas are stabilized (defined as at least 70% cover by native or acceptable non-native
species) and reseed or replant if necessary to ensure native vegetation is established.
One year after construction, conduct a weed survey of all areas disturbed by construction
to determine if there are new weed infestations; implement appropriate control measures
as needed.
Replant any riparian vegetation disturbed during construction with native species.
3.6.8 Effects of the No Action Alternative
Under the No Action Alternative, there would be no impacts to vegetation related to
construction. Current operation and maintenance activities would likely continue, including
annual spraying of noxious weeds within the active operations area at the facility. Because there
is no existing vegetation management in the open field to the northeast of the South Fork facility,
the state- and county-listed noxious weeds in this field could expand their population in this and
adjacent areas via natural dispersal (e.g., wind). Overall, the potential for the spread of noxious
weeds under the No Action Alternative would be low, the same as it is now.
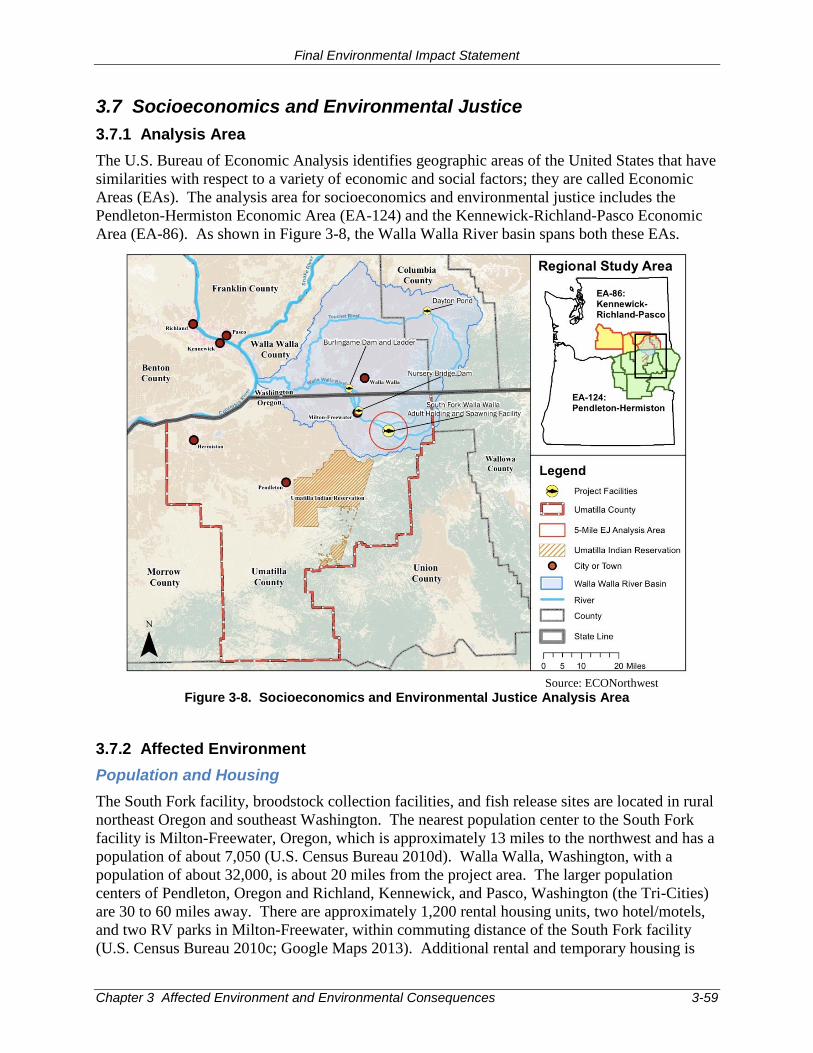
Final Environmental Impact Statement
Chapter 3 Affected Environment and Environmental Consequences 3-59
3.7 Socioeconomics and Environmental Justice
3.7.1 Analysis Area
The U.S. Bureau of Economic Analysis identifies geographic areas of the United States that have
similarities with respect to a variety of economic and social factors; they are called Economic
Areas (EAs). The analysis area for socioeconomics and environmental justice includes the
Pendleton-Hermiston Economic Area (EA-124) and the Kennewick-Richland-Pasco Economic
Area (EA-86). As shown in Figure 3-8, the Walla Walla River basin spans both these EAs.
Source: ECONorthwest
Figure 3-8. Socioeconomics and Environmental Justice Analysis Area
3.7.2 Affected Environment
Population and Housing
The South Fork facility, broodstock collection facilities, and fish release sites are located in rural
northeast Oregon and southeast Washington. The nearest population center to the South Fork
facility is Milton-Freewater, Oregon, which is approximately 13 miles to the northwest and has a
population of about 7,050 (U.S. Census Bureau 2010d). Walla Walla, Washington, with a
population of about 32,000, is about 20 miles from the project area. The larger population
centers of Pendleton, Oregon and Richland, Kennewick, and Pasco, Washington (the Tri-Cities)
are 30 to 60 miles away. There are approximately 1,200 rental housing units, two hotel/motels,
and two RV parks in Milton-Freewater, within commuting distance of the South Fork facility
(U.S. Census Bureau 2010c; Google Maps 2013). Additional rental and temporary housing is
Walla Walla Basin Spring Chinook Hatchery Program
3-60 Chapter 3 Affected Environment and Environmental Consequences
available in Walla Walla, the Tri-Cities, and Pendleton. Harris Park, a Umatilla County park and
campground, is located on the South Fork Walla Walla River Road about 3.5 miles southeast of
the project site and offers the closest accommodations for RVs.
Employment and Income
In 2010, about 331,000 people age 16 and over were employed in some capacity (full- or part-
time) in the analysis area. About 80% of the employment in the region is in Washington. Of
CTUIR members, about 66% of the population 16 years and over was employed in some
capacity in 2010 (U.S. Census Bureau 2010b). In 2012, unemployment rates across the regional
analysis area remained higher than historical averages, at just over 8%. Unemployment among
CTUIR tribal members was about 12% in 2010 (U.S. Census Bureau 2010b). In 2010, per-capita
personal income was about $32,000 in EA-124 and about $35,000 in EA-86. These figures are
all below those for the states of Oregon ($37,020) and Washington ($43,444), and the United
States ($40,504) (USBEA 2013).
Government Revenue
State, county, and local governments rely on a variety of revenue sources to fund public services
and programs. At the state level, the majority of revenue comes from taxes assessed on income
in Oregon and from the general sales tax in Washington. At the county and local levels, taxes
are assessed on property. Revenue from property taxes funds schools, city and county
governments, and special districts, such as fire, road, and water. Additional tax revenue at the
state and local levels comes from taxes on other goods and services, such as fuel and lodging.
Oregon has no broad-based sales tax, though Washington does.
In Oregon, county assessors appraise most real and personal property. The fiscal year 2012–
2013 total assessed value of property in Umatilla County was $4.7 billion, and the total amount
of property tax certified for collection was about $74 million (Oregon Department of Revenue
2013a). BPA owns the land on which the South Fork facility is located and is exempt from
paying property taxes because it is a federal agency. It also does not pay local or state
governments any other payments for fees in lieu of taxes. CTUIR owns the improvements on the
property (i.e., the buildings and infrastructure) and is also exempt from paying property taxes.
In Oregon, individuals and corporations pay income taxes. Personal income tax revenue
collections in 2011 were about $5.1 billion (Oregon Department of Revenue 2013b). Corporate
tax receipts in fiscal year 2011–2012 were about $448 million (Oregon Department of Revenue
2013c).
In Oregon, public and private lodging owners who provide temporary overnight accommodations
must pay a state lodging tax of 1% of the amount charged to consumers. Local governments also
may levy a transient lodging tax in addition to the state tax. Revenue collections in 2012 ranged
from $24,000 in Milton-Freewater to almost $800,000 in Pendleton. State-level tax receipts
collected from lodging in Umatilla County generated about $180,000 in revenue in 2012 (Oregon
Department of Revenue 2013d). In Washington, the state collects a 2% lodging tax, and the City
of Walla Walla collects an additional room charge that ranges from $1.25 to $1.50 per room per
night stay, depending on the location of the hotel/motel (Washington State Department of
Revenue 2010).
Final Environmental Impact Statement
Chapter 3 Affected Environment and Environmental Consequences 3-61
Public Services and Infrastructure
The Umatilla County Sheriff’s Office provides law enforcement services in Umatilla County and
has primary jurisdiction over the South Fork facility. The Oregon State Police provide additional
patrols and enforcement on the interstate, state, and secondary highways surrounding the
hatchery site, and work with the sheriff’s office in performing other law-enforcement duties as
required. The city of Milton-Freewater has a police department and is the closest incorporated
community to the South Fork facility. The Walla Walla County Sheriff’s office has primary
jurisdiction over the project facilities in Washington. The Milton-Freewater Rural Fire
Department is the primary provider of fire protection services in the immediate area of the South
Fork facility, including structural and wildland fire suppression as well as emergency medical
services. Residential and commercial waste in the rural areas surrounding Milton Freewater is
handled and processed by Humbert Refuse and Recycling, located outside of Milton Freewater
(Humbert-Granger, pers. comm., 9-11-13). The South Fork facility is located along the paved,
two-lane South Fork Walla Walla River Road, which is maintained by the Umatilla County
Public Works Department. The road leading to the South Fork facility, Walla Walla River Road
(also maintained by the county), intersects with the closest highway (Oregon Route 11) in the
City of Milton-Freewater. Milton-Freewater City Light and Power provides electrical service to
the facility.
Use and Value of Salmon
Spring Chinook salmon that return to the Walla Walla River basin are part of six distinct
fisheries as they migrate through the Columbia Basin: Lower Columbia River Commercial,
Lower Columbia River Sport, Columbia River Tribal Commercial, Columbia River Tribal
Ceremonial and Subsistence, Walla Walla basin Sport, and Walla Walla basin Tribal Ceremonial
and Subsistence. Data are not sufficient to quantify the number of spring Chinook salmon
originating in the Walla Walla River basin that are harvested in each of the six fisheries.
However, between 2007 and 2014, the number of adult spring Chinook returning to the Walla
Walla River, as counted at Nursery Bridge Dam, ranged from 97 to 1,194 fish, and averaged 466
per year. Estimates for spring Chinook returns to the Touchet River are unreliable, but are likely
fewer than 50 fish in most years (CTUIR 2017).
In the Walla Walla River basin, spring Chinook salmon fishing has been very limited for tribal
purposes, and sport fishing has not been opened to date. In June 2010, CTUIR was able to open
a brief tribal season, which took place between the South Fork facility and Harris Park. CTUIR
set a 100-fish harvest limit for this fishery, and tribal members caught 6 fish (James, pers.
comm.). Returns have not been robust enough since 2010 to reopen the tribal fishery. There are
no recorded recreational harvests of spring Chinook in the Walla Walla River basin, going back
at least to 1957 (Mendel, pers. comm., 10-18-13). Although no spring Chinook sport fisheries
are currently designated in the Walla Walla River basin in Oregon or Washington, the Oregon
and Washington Departments of Fish and Wildlife (ODFW and WDFW, respectively) are in the
early stages of coordinating with CTUIR to plan for future spring Chinook fisheries (Duke, pers.
comm., 10-16-13; Mendel, pers. comm., 10-18-13). Like Umatilla spring Chinook harvest
management, it is expected that both tribal and sport fishery opportunities would be managed to
provide equal harvest opportunities for each.
Salmon populations generate economic value in several ways. Some of the value arises through
direct harvest or use of the fish by commercial fisherman and recreational anglers. Recreational
Walla Walla Basin Spring Chinook Hatchery Program
3-62 Chapter 3 Affected Environment and Environmental Consequences
anglers also derive value (increases in personal well-being) from the enjoyment of the experience
of fishing. Spring Chinook harvested in cultural and subsistence fisheries are valuable insofar as
they provide sustenance and reinforce cultural and spiritual identity and relationships among the
individuals in the tribal community. This value is not quantifiable in monetary terms, but is an
important part of an assessment of total economic value. In addition to these harvest-related
values, some people value salmon even if they never fish or use the fish. This value arises
because people are willing to pay to ensure the long-term survival of the species for current and
future generations.
Environmental Justice
Executive Order 12898 directs federal agencies to identify and address the disproportionately
high and adverse effects of their programs, policies, and activities on minority populations and
low-income populations (collectively, environmental justice populations). The Council on
Environmental Quality directs environmental justice analyses to consider communities where
ethnic and racial minorities exceed 50% of the population; where 20% of the population of a
given area was below the federal poverty level at some point over the last 12 months; or where
the percent of the ethnic and racial minority population is “meaningfully greater” than the
percent in the surrounding area (CEQ 1997).
Within a five-mile radius of the South Fork facility—the area where direct interactions between
project activities and the human environment are most likely to occur—there are no communities
that meet these criteria. However, the eastern edge of the Umatilla Indian Reservation lies about
ten miles west of the South Fork facility. The reservation falls short of the qualifying thresholds
for an environmental justice population, by measures of both race and ethnicity (45.1% of the
population is American Indian) and poverty rate (16.2%), but these levels are meaningfully
greater than the surrounding area (3% of the Umatilla County population is American Indian,
and 15.8% of the Umatilla County population falls below the poverty level) (U.S. Census Bureau
2010a).
3.7.3 Sources and Types of Impacts
The following kinds of effects on social and economic concerns are evaluated in this section.
Population increases due to construction crews or operations staff could increase demand
for housing that could not be met by the existing housing market.
Construction and operation could result in increased employment and income.
Conversion of properties from taxable to tax exempt status could reduce the amount of
tax revenue collected by a county, thereby reducing financial resources available to the
local community.
Increased demand for public services, including fire protection, law enforcement, water
supply, electrical service, wastewater treatment, education, and roads, could result in
adverse impacts on people and property if existing public services and infrastructure are
inadequate.
Increased numbers of spring Chinook salmon could result in beneficial effects on the
financial and social well-being of tribal members, recreational anglers, and society at
large.
During the scoping process and review of the draft EIS, commenters expressed concern
that, as more spring Chinook salmon return to the Walla Walla River basin, trespassing,
Final Environmental Impact Statement
Chapter 3 Affected Environment and Environmental Consequences 3-63
littering, or vandalism could increase if individuals access fishing sites through private
property.
The potential for the proposed project to affect minority and/or low-income populations
is considered to determine if those populations would be disproportionately affected
compared to the population of the region as a whole.
3.7.4 Effects of Alternative 1
Population and Housing
Alternative 1 could generate a short-term increase in the population of the regional analysis area
during construction, if workers from out of the region temporarily relocate to work on the
project. At the peak of construction, there would be a maximum of 40 to 60 workers working at
the same time. Most of these workers would likely be from the region and already accounted for
in the population. Any temporary population increase from the employment of non-local
workers would be small, relative to the overall size of the population within the regional analysis
area, and would occur during periods—not the entire duration—of the 16-month construction
period.
Non-local workers would most likely seek rental housing and accommodations in hotels, motels,
or RV parks in the area. Rental housing and hotel/motel availability in the communities within
commuting distance (e.g., Milton-Freewater and Walla Walla) is sufficient to absorb this small
and temporary increase in demand during the construction period. Therefore, long-term effects,
such as reductions in available housing in the area and associated increased housing costs, would
not occur. If non-local workers choose to stay nearby in the more limited campground and cabin
facilities in Harris Park, especially during the busy summer season, they could temporarily
displace customary recreational users of the facility; however, because camping is limited to 10
days, and cooking and food is not allowed in the cabins (harrispark.webs.com), it is unlikely that
construction workers would use these facilities for extended periods.
Operations under Alternative 1 would require four full-time employees. Two or three existing
employees would assist during the peak work periods, which would be spawning (August and
September) and egg picking (December). Even if some employees are new hires from outside
the region, the resulting population increase would be a tiny fraction of the overall size of the
regional population. Thus, Alternative 1 would likely have a low impact on population and
housing because it would lead to a small increase in population and demand for housing over the
long term.
Employment and Income
Alternative 1 would employ an estimated combined total of 80 to 100 workers over the duration
of the entire 16-month construction period, which represents a small proportion of the current
workforce in the analysis area (about 0.03%, based on a workforce of about 331,000 in 2010).
Therefore, although any unemployed individuals who receive a job as a result of Alternative 1
could consider the effect substantial, construction of the proposed facilities would have a low
and temporary impact on the overall labor market. If qualified CTUIR or other tribal applicants
are available to fill full-time positions during operation, they would be given preference in the
hiring process (James, pers. comm., 9-3-13).
Costs of facility construction include expenditures on materials, equipment, and labor, some of
which would be spent locally in the analysis area. These local expenditures would have ripple
Walla Walla Basin Spring Chinook Hatchery Program
3-64 Chapter 3 Affected Environment and Environmental Consequences
effects on the economy, as workers and businesses receiving income would re-spend some of the
money locally, the workers and businesses who receive that money would also re-spend some
locally, and so on. These direct and indirect expenditures would represent a small proportion of
the total annual income in the analysis area (about 0.08% of total personal income in the analysis
area, which was about $25 billion in 2011). Thus, the impacts on income from construction of
Alternative 1 are expected to be low.
During operation of the hatchery, Alternative 1 would employ four people full-time per year and
two or three other staff members would assist, as they do now, during peak word periods as
described above. This employment would have a low effect on the regional labor market in the
long-run, but would represent a positive impact for those people who receive jobs, especially if
they would otherwise be unemployed. However, expenditures would represent less than 0.005%
of total personal income in the analysis area (about $25 billion in 2011). Thus the impacts on
income from operating the proposed project are expected to be low.
Government Revenue
The project could benefit government revenues through increased income tax collections in
Oregon, sales tax collections on materials procured in Washington, and lodging taxes from non-
local workers staying in hotels and motels during construction and operation of the project.
However, the number of jobs and the resulting income effects would be small and mostly
temporary, so that the impacts on increased tax revenues from Alternative 1 are expected to be
low when compared to annual tax collections in each category. The existing site is exempt from
property taxes because the landowner, BPA, is a federal agency. CTUIR owns the
improvements on the existing site and would own the future improvements, but it also is exempt
from property taxes.
Public Services and Infrastructure
Alternative 1 is not expected to lead to large population changes in the long-term, so it would not
affect public services tied to permanent housing, schools, and other similar public services and
infrastructure. It would not require additional connections to public water or sewer
infrastructure, so impacts on those utilities also are not expected. Construction and operation of
the proposed facility would generate solid waste; however, the Humbert Refuse and Recycling
Center has sufficient capacity to absorb any waste generated from Alternative 1 (Humbert-
Granger, pers. comm., 9-11-13). The electrical service lines and transformer were originally
sized to accommodate a year-round hatchery, so no major equipment would need to be added.
The net increase in facility load is expected to be accommodated within the utility’s existing
resource base.
Construction activities may temporarily increase the risk of a major accident or incident
requiring emergency services. The Milton-Freewater Rural Fire Department, the local and
regional medical facilities, the Umatilla County Sheriff’s Office, and the Milton-Freewater
Police Department all have the capacity, including labor and necessary equipment, to handle
such an emergency, if it arises. Moreover, the risk to public health and safety associated with
construction activities would be minimized as discussed in Section 3.7.6.
Construction activities would also increase heavy truck and passenger vehicle traffic on South
Fork Walla Walla Road, which is maintained by Umatilla County. This road is the main access
route to Harris Park at the end of the road about 3.5 miles to the east, as well as to other private
Final Environmental Impact Statement
Chapter 3 Affected Environment and Environmental Consequences 3-65
properties east and west of the South Fork facility. Although the increased numbers of heavy
trucks (primarily dump trucks and cement trucks) and passenger vehicles likely would be
noticeable to residents and frequent users of South Fork Walla Walla Road during the peak
months of construction activity (average 20 truck trips/weekday and 30 passenger vehicle
trips/weekday for approximately 11 months), equipment would not be large enough to obstruct
or delay traffic (P. Rader, McMillen Jacobs, pers. comm. 02-21-18). Noise effects of the
increased traffic from construction and operation of the hatchery are discussed in Section 3.12
Noise.
Comments received during the scoping period and review of the draft EIS raised concerns about
the impact of trespassing if spring Chinook fishing opportunities improve. If additional fisheries
increase trespass across private land adjacent to the Walla Walla River and its tributaries, with
associated littering and vandalism, demand for law enforcement services could increase. This
could impose additional demands on the Umatilla County Sheriff’s Office and the Walla Walla
County Sheriff’s office. Fishery access issues are addressed in more detail in the subsection
below entitled Access and Land Use Impacts on Private Landowners.
Use and Value of Salmon
Alternative 1 is anticipated to increase the number of spring Chinook salmon in the Columbia
River Basin by between 1,400 to 19,050 fish per year, and would support new and expanded
sport and tribal fisheries in the Walla Walla River basin. Assuming the Columbia River Basin
supports a stable baseline salmon population of 2 million fish, Alternative 1 would increase fish
populations basin-wide by about 0.07 to 0.95%—a small change for commercial, recreational,
and tribal ceremonial and subsistence fisheries in the mainstem of the Columbia River.
The impacts in the Walla Walla River basin, however, would be greater. Alternative 1 would,
over time, result in increased economic value to tribal members, recreational anglers, and society
at large. Tribal members would derive value from commercial, cultural, and subsistence use of
the fish. Alternative 1 would also positively affect CTUIR’s ability to preserve and carry on
their cultural traditions in the Walla Walla River basin in the long run. These traditions are
intertwined with the cultural, spiritual, and physical well-being of the CTUIR community and
depend on the restoration and continuation of salmon populations across their traditional range.
Recreational anglers would enjoy the market value of the fish themselves, as well as
improvements to their economic well-being from opportunities to fish closer to home or in new
settings. Individuals throughout Oregon, Washington, and the U.S. may also derive value from
knowing that spring Chinook salmon runs have been restored to another watershed within their
traditional range.
The economic impacts associated with restoring spring Chinook salmon to the Walla Walla basin
also include increases in income for businesses that benefit from increased fishing activity. For
example, as sport angling increases in the Walla Walla River basin, it may result in new
economic opportunities for local guides, outfitting, and outdoor supply shops. Visits by more
anglers from outside the region might also result in more income for local businesses that
provide services to tourists.
Comments received during the scoping period and review of the draft EIS asked whether the
proposed project would cause fisheries on other species to be closed down or reduced. The
project would not reduce or close fisheries on other species; spring Chinook are not an ESA-
Walla Walla Basin Spring Chinook Hatchery Program
3-66 Chapter 3 Affected Environment and Environmental Consequences
listed species in the Walla Walla basin and thus would not require protection during existing
fisheries for other species.
Access and Land Use Impacts on Private Landowners
The Walla Walla River and its tributaries flow primarily through private land. The CTUIR
reserved the right to fish, hunt, and gather traditional foods and medicines throughout their
traditional lands in their treaty with the U.S. Government in 1855. In U.S. v. Winans (198 US
371, 381-382), the U.S. Supreme Court held that tribal members may cross private lands to
access their traditional fisheries:
“The contingency of the future ownership of the lands, therefore, was foreseen and
provided for -- in other words, the Indians were given a right in the land -- the right of
crossing it to the river -- the right to occupy it to the extent and for the purpose
mentioned. No other conclusion would give effect to the treaty. And the right was
intended to be continuing against the United States and its grantees as well as against the
State and its grantees.”
Oregon and Washington law provides that the stream itself is owned by the public and is
accessible for floating and wading, but it does not allow anglers to access water via private
property, or fish from banks that are privately owned. There are legal access points at public
parks and bridges in both Oregon and Washington. In Washington, where more fishing activity
currently takes place, WDFW and private land owners have increased signage to indicate where
legal access points are located, and where trespassing would occur, resulting in reduced conflicts
between anglers and landowners (Blackman, pers. comm., 10-21-13).
As numbers of spring Chinook increase in the Walla Walla River basin, it is likely that CTUIR,
ODFW, and WDFW would establish recurring tribal and recreational fisheries in the basin. Over
time, these fisheries would support higher harvest limits and draw more anglers. If private
landowners experience increased trespassing, vandalism, or littering on their land, they may call
on local law enforcement to intervene and enforce private property and trespass laws. Thus,
Alternative 1 could increase the demand for the Umatilla and Walla Walla County Sheriff
officers as discussed previously. It could also require ODFW and WDFW staff to respond to
complaints and increase public education efforts to anglers and landowners in the basin (Mendel,
pers. comm., 10-18-13; Blackman, pers. comm., 10-21-13).
As fisheries expand in the future, it is expected that CTUIR would work with tribal fishers and
landowners to minimize potential conflicts and mitigate any issues that arise. Preceding tribal
fishing activity, CTUIR representatives would engage private property owners along stretches of
river where there are access points. The representative would provide information about the
timing and nature of the fishing activity and, where there is access provided conditionally by
private landowners, determine the landowner’s preferences for allowing or denying access.
During fishing activity, monitors would let anglers know where access is allowed and ensure
fishers are respecting private property. After the fishing activity, CTUIR representatives would
check in with property owners and anglers to assess how the notification worked and learn any
lessons for the future (James, pers. comm., Sept. and Oct. 2013).
Neither BPA nor CTUIR can impose new restrictions on landowners’ use of their land as part of
the proposed project.
Final Environmental Impact Statement
Chapter 3 Affected Environment and Environmental Consequences 3-67
Environmental Justice
As documented in the Affected Environment section, there are no identified environmental
justice populations in the vicinity of the South Fork facility where the primary construction and
operational activities associated with the proposed project would occur. Therefore, Alternative 1
would not disproportionately adversely affect environmental justice populations. By increasing
fish populations and opportunities for commercial harvest and cultural and traditional use
fisheries, Alternative 1 is expected to result in beneficial socioeconomic impacts on the CTUIR,
including individuals residing at the reservation west of the South Fork facility.
3.7.5 Effects of Alternative 2
Population and Housing
The impacts of Alternative 2 on regional population and housing would be similar to or the same
as those of Alternative 1. Relative to Alternative 1, Alternative 2 could require a small increase
in the number of construction jobs during the construction phase, and a small increase in the
number of jobs associated with additional fish rearing activities during the operations phase.
This might translate into an increase in the number of jobs associated with fish rearing at the
South Fork facility, and a decrease in the number of these jobs at the Umatilla hatchery. The
increase in population and housing demand under Alternative 2 would be minimal and would not
result in a quantifiable difference compared to Alternative 1. Therefore, Alternative 2 would
have low impacts on population and housing for the same reasons discussed above under
Alternative 1.
Employment and Income
The impacts of Alternative 2 on regional employment and income would be similar to those of
Alternative 1. Under Alternative 2, staffing at the hatchery would be five full-time employees
and one part-time employee, with two to three other employees assisting during peak work
periods as they would for Alternative 1. This might translate into a changed location for the
additional jobs, but would not affect employment regionally. Therefore, Alternative 2 would
have low impacts on employment and income for the same reasons discussed for Alternative 1.
Costs for construction of facilities include expenditures on materials, equipment, and labor, some
of which would be spent locally in the analysis area. These local expenditures would have ripple
effects on the economy, as workers and businesses receiving income would re-spend some of the
money locally, the workers and businesses who receive that money would also re-spend some
locally, and so on. Although larger than under Alternative 1, these direct and indirect
expenditures still would represent only about 0.1% of total personal income in the analysis area.
Thus, the impacts on income from construction of Alternative 2 are expected to be low.
Government Revenue
Alternative 2 would have the same impacts on government revenue as Alternative 1.
Public Services and Infrastructure
The impacts of Alternative 2 on public services and infrastructure would be similar to those of
Alternative 1. Alternative 2 might require slight increases in electricity demand relative to
Alternative 1. Increased electrical demand would be specifically related to increased fish
production and operation of a water reuse system if implemented. However, the net increase in
Walla Walla Basin Spring Chinook Hatchery Program
3-68 Chapter 3 Affected Environment and Environmental Consequences
facility load is still expected to be accommodated within the electric utility’s existing resource
base and would result in a low impact.
Use and Value of Salmon
The impacts of Alternative 2 on the uses and values of salmon would be the same as those of
Alternative 1.
Access and Land Use Impacts on Private Landowners
Alternative 2 would have the same access and land use impacts on private landowners as
Alternative 1.
Environmental Justice
As indicated in Section 3.7.2, there are no identified environmental justice populations in the
vicinity of the South Fork facility where the primary construction and operational activities
associated with Alternative 2 would occur. Therefore, Alternative 2 would not
disproportionately adversely affect environmental justice populations. By increasing fish
populations and opportunities for commercial harvest and cultural and traditional use fisheries,
Alternative 2 is expected to result in beneficial socioeconomic impacts on the CTUIR, including
individuals residing at the reservation west of the South Fork facility.
3.7.6 Mitigation Measures
Use standard practices to avoid risks to public health and safety, including preparation of
a Spill Prevention and Response Plan (see Section 3.4.7) and proper use and disposal of
chemicals and hazardous substances during construction, operation, and maintenance of
the proposed facility (see Section 4.10).
Provide information, possibly including signs, regarding public access to fishing sites.
Educate anglers on rights of access to fishing sites.
Work with individual landowners to determine their preferences regarding access.
3.7.7 Effects of the No Action Alternative
Under the No Action Alternative, there would be no construction activities. Operation of the
South Fork facility as a satellite facility for the Umatilla Hatchery program would continue under
the existing CTUIR contract (BPA Project No. 1983-435-00). New socioeconomic effects
associated with the two action alternatives would not occur, such as impacts to population and
housing, employment and income, government revenues, and public services and infrastructure.
Under the No Action Alternative, continuation of the spring Chinook smolt-release program in
the Walla Walla basin, which is funded by other entities, would be contingent on negotiations
among parties involved (see Chapter 1, Section 1.4). It is unclear how long the adult out-plant
program, which is funded by BPA, would continue. However, under this alternative, given
experience with survival rates of spring Chinook in the basin to date under existing programs
(see Section 3.2.2), self-sustaining spring Chinook salmon populations in the Walla Walla River
basin are unlikely to be established in the same timeframe as under the action alternatives, and
might not become established at all. Therefore, under the No Action Alternative, members of the
CTUIR would not be able to exercise their treaty rights to fish throughout the full range of their
ancestral homeland and would not reap the socioeconomic benefits described above.
Final Environmental Impact Statement
Chapter 3 Affected Environment and Environmental Consequences 3-69
3.8 Cultural Resources
3.8.1 Analysis Area
The analysis focuses on the South Fork Walla Walla proposed hatchery site and the adjacent
CTUIR property to the southeast where ground disturbance might be expected. No ground
disturbance is expected at the proposed or potential future broodstock collection sites, which are
already highly developed, and cultural resources at those sites would not be affected.
3.8.2 Applicable Regulations
Cultural resources include things and places that demonstrate evidence of human occupation or
activity related to history, architecture, archaeology, engineering, and culture. As defined by 36
CFR 800, the implementing regulations of the National Historic Preservation Act (NHPA; 16
USC 470 et seq.), historic properties are a subset of cultural resources and are any district, site,
building, structure, artifact, ruin, object, work of art, or natural feature important in human
history that meets defined eligibility criteria for the National Register of Historic Places.
The NHPA requires that cultural resources be inventoried and evaluated for eligibility for listing
in the National Register and that federal agencies evaluate and consider effects of their actions
on these resources. Cultural resources are evaluated for National Register eligibility using four
criteria commonly known as Criterion A, B, C, or D, as identified in 36 CFR Part 60.4(a–d).
These criteria include an examination of the cultural resource’s age, integrity (of location,
design, setting, materials, workmanship, feeling and association), and significance in American
culture, among other things. A cultural resource must meet at least one criterion to be eligible
for listing in the National Register.
Historic properties include prehistoric resources that predate European contact and settlement.
Traditional cultural properties are properties that are eligible for inclusion in the National
Register because of their association with the cultural practices or beliefs of a living community
that are rooted in that community’s history and are important in maintaining the continuing
cultural identity of the community (Parker and King 1998).
Other applicable regulations are discussed in Chapter 4, Section 4.3.
3.8.3 Affected Environment
This section describes native groups as they existed in the mid-nineteenth century. At and
immediately following contact with Euro-American cultures, these societies were significantly
altered as a result of population losses from exotic diseases, encroachment on territory and
resources, and partial assimilation into European culture.
The project area lies in the Plateau cultural area, and within the Weíiletpu (Cayuse),
Imatalalamláma (Umatilla), and Walúulapam (Walla Walla) traditional territory. Basically
riverine in their settlement patterns, the principal food items in the diet of the Plateau people
were fish, wild game, and roots. Diets varied from group to group and from family to family on
the Plateau, depending upon personal preference and geographical and seasonal availability and
abundance (Anastasio 1972; Walker 1971; Marshall 1977).
Tamánwit is “the traditional philosophy and law of the people—the foundation of a physical and
spiritual way of life that would sustain Plateau peoples for thousands of years” (Conner and Lang
2006). Tamánwit “is an ideology by which all things of the earth were placed by the Creator for
a purpose. The works of the Creator were given behaviors that were unchangeable, and until
Walla Walla Basin Spring Chinook Hatchery Program
3-70 Chapter 3 Affected Environment and Environmental Consequences
time’s end, these laws are to be kept” (Morning Owl 2006). The people’s purpose is “to take
care of all that was given them” (Conner and Lang 2006). The Creator decreed to the people that
they have a reciprocal responsibility to respectfully care for, harvest, share, and consume
traditional foods, or the foods may be lost. Neither can survive without the other. Since the
beginning of time tamánwit has taken care of the traditional foods and guided the CTUIR in
preserving them (Sampson 2006).
Contact between Native Americans and Euro-Americans on the Columbia Plateau began with the
Lewis and Clark expedition, which followed the Snake River down to the Columbia River. On
their return trip, the Corps of Discovery followed the Walla Walla River for one mile from its
mouth and then traveled overland to and up the Touchet River (Moulton 1991).
One of the most important historic events to occur in the region was the negotiation and signing
of the Treaty of 1855 between the Imatalamláma, Weyíiletpu, and Walúulapam and the United
States government. Treaties became necessary in part because the United States government was
encouraging its citizens to move to tribal lands in what was known as Oregon and Washington
Territories without first addressing the Indians’ claims to the land.
On May 29, 1855, a Council was convened on Mill Creek in the Walla Walla Valley to discuss
the current situation in the area and to negotiate treaties. Isaac Stevens, Governor of Washington
Territory, and Joel Palmer, Superintendent of Indian Affairs for Oregon Territory, officiated.
They met with chiefs, delegates, and headmen from the Niimíipuu (Nez Perce), Weyíiletpu,
Walúulapam, Mamachatpam (Yakama) and Peluucpuu (Palus); representatives of other tribes
also were present. Three treaties were signed that created the Umatilla Indian Reservation, the
Yakama Indian Reservation, and the Nez Perce Indian Reservation. The outcome of the treaty
negotiations was that the Walúulapam, Imatalamłáma, and Weyíiletpu retained a reservation in
the Weyíiletpu homeland. The tribes ceded 6.4 million acres to the United States, reserved rights
for fishing, hunting, gathering foods and medicines, and pasturing livestock, and reserved
510,000 acres on which to live. The treaty was signed on June 9, 1855.
Traditional fishing sites of the Walúulapam and Weyíiletpu, known as 'imchaha and 'imchahapa,
are located adjacent to the project area (Swindell 1942). Here tribal members harvested salmon
and eels with spears and dip nets. Spearing and gaffing of salmon also occurred at other
locations along the north and south forks of the Walla Walla River. Núshnupa (“at the nose”)
was located at the confluence of the North and South Forks of the Walla Walla River
(approximately five miles from the project area) and was used by the Walúulapam and
Weyíiletpu to spear and gaff salmon, trout and lamprey.
In 1881, in order to more efficiently get lumber to the town of Milton for railroad construction,
the Oregon Improvement Company constructed a flume (a wooden trough elevated on trestles)
(Gilbert 1882). “This flume was built by Dr. N.G. Blalock” (Willis 1937). The first of Blalock’s
sawmills on Blalock Mountain was constructed by Harry G. Gilbert in 1878 and he served as the
engineer for the first year; the parts for the sawmill came from Dr. Dorsey Baker’s abandoned
sawmill on Mill Creek (Roberts n.d.). From the mill, the lumber traveled downslope for one
mile into Flume Canyon and continued for seven more miles to a point just above the Pacific
Power and Light powerhouse (Roberts n.d.). In total, the flume “carried timber products from
ten to fifteen miles above Milton, on the south fork of the Walla Walla River down to the
railroad at Milton… and this Mountain on the account of the building of the flume, was called
Final Environmental Impact Statement
Chapter 3 Affected Environment and Environmental Consequences 3-71
Blalock Mountain” (Willis 1937). The flume, eventually constructed to cover 21 miles, was
abandoned in 1890 (Anonymous 1962).
A flume that once served the Pacific Power and Light Powerhouse begins at the headwaters of
the South Fork Walla Walla River (Bailor et al. 1993). A portion of it is on the property adjacent
to the South Fork site. Using gravity, the flume piped water from the river to the powerhouse,
where the water was used to generate electricity. The historic powerhouse in Milton-Freewater
is no longer in use.
3.8.4 Sources and Types of Impact
Excavation for project facilities could disturb or destroy buried artifacts or human
remains if they are present.
New facilities could visually conflict with any historically significant buildings or
structures that might be within view of the proposed new facilities.
3.8.5 Effects of Alternative 1 and Alternative 2
Previously conducted archaeological work on the South Fork property in the early 1990s
(Burney 1991 and Bailor et al. 1993) included archaeological survey and shovel testing. No
resources were documented; however the accompanying excavation forms revealed possible
artifacts. Therefore, in August 2013, the staff from the CTUIR Cultural Resources Protection
Program conducted an archaeological survey that included 23 shovel test pits at approximately
20-meter intervals in portions of the existing South Fork facility where excavation for proposed
new facilities is expected (Miller 2013). Surveyors observed no archeological materials at the
site.
The project area is adjacent to traditional fishing sites of the Walúulapam and Weíiletpu
(Swindell 1942). The proposed project is expected to have a beneficial effect on tribal fishing
due the increased numbers of spring Chinook expected to be produced by the program, which are
expected to return to these traditional fishing areas.
Neither of the flumes described in Section 3.8.3 would be affected by the two action alternatives,
either visually or physically. Although Flume Canyon is in the same general area as the
proposed hatchery, the hatchery site is not in the canyon and would not affect any remnants of
the flume in the vicinity. The portion of the Pacific Power and Light flume on the adjacent
upstream property is on a hillside and is not near any construction activity.
In the absence of known National Register-eligible archeological or historic resources at the
South Fork site, neither of the two action alternatives is expected to adversely affect cultural
resources. In a letter dated April 1, 2014, the Oregon State Historic Preservation Officer
concurred with the finding that the project would have no effect on any known cultural resources
(Ainslie 2014). However, as described in “Mitigation” below, the site would be monitored by
cultural resource professionals during construction.
3.8.6 Mitigation Measures
Because there are many traditional use areas in the vicinity and artifacts have been
recovered nearby, monitor the ground-disturbing portions of the project using cultural
resource personnel from CTUIR.
Walla Walla Basin Spring Chinook Hatchery Program
3-72 Chapter 3 Affected Environment and Environmental Consequences
If artifacts are found during construction, cease work in the area until it can be assessed
by professional cultural resources staff in consultation with BPA, the State Historic
Preservation Office (SHPO), and the CTUIR.
If human remains are inadvertently discovered, cease all work and contact law
enforcement, BPA, SHPO, and the CTUIR immediately.
3.8.7 Effects of the No Action Alternative
Because no construction would take place under the No Action Alternative, the potential to
disturb archeological or historical resources would not exist. However, the likely benefit to tribal
fishing in the vicinity of traditional fishing areas would not take place, or at best would be
delayed.
3.9 Wetlands, Waters of the United States, and Floodplains
Notable Differences in this Section from the Draft EIS
Mapping of flood elevations indicates that most new facilities would be outside the 100-year
flood elevation.
3.9.1 Analysis Area
The analysis area is the South Fork facility property.
3.9.2 Applicable Regulations
The U.S. Department of Energy requires that impacts to floodplains and wetlands be assessed
and alternatives for protection of these resources be evaluated in accordance with Compliance
with Floodplain/Wetlands Environmental Review Requirements (10 CFR 1022.12); Executive
Order 11988, Floodplain Management; and Executive Order 11990, Protection of Wetlands.
Authorization from the U.S. Army Corps of Engineers (Corps) is required in accordance with the
provisions of Section 404 of the Clean Water Act when dredged or fill material is discharged into
waters of the United States, including wetlands. Oregon Department of State Lands also reviews
applications to the Corps under Section 404.
3.9.3 Affected Environment
Wetlands and Waters of the United States
In order to be regulated by the Corps under the Clean Water Act, a wetland must meet certain
criteria. A wetland delineation manual prepared by the Corps recognizes that the three
parameters of hydrology, hydric soils (soils subject to saturation/inundation), and hydrophytic
(water-loving) vegetation are generally found in wetlands and that these parameters are
important in the establishment and maintenance of wetland communities (USACE 1987). To be
considered a “jurisdictional” wetland regulated by the Corps, an area must exhibit all three
characteristics: hydrology, hydrophytes, and hydric soils (USACE 1987).
A wetlands and waters of the U.S. assessment was conducted on June 24th and 25th, 2013 to
identify and delineate jurisdictional wetlands and waters. The site is situated on a nearly flat to
gently sloping valley bottom along a high alluvial terrace adjacent to the South Fork of the Walla
Walla River. Vegetation at the site consists of a mixture of native and non-native naturalized
Final Environmental Impact Statement
Chapter 3 Affected Environment and Environmental Consequences 3-73
grasses and forbs (e.g., Western fescue, cheat grass) with a few shrubs (e.g., crabapple,
Himalayan blackberry) and trees (e.g., black cottonwood). The area has a mix of planted and
naturally recruited vegetation with an established riparian forest along the river. Soils at the site
are primarily mapped as Veazie silt loam, which is a partially hydric soil (NRCS 2013). The
National Wetland Inventory (NWI) depicts two wetlands within the site. One NWI polygon
depicts the South Fork Walla Walla River (R3UBH) and the other an adjacent wetland (R3USC)
(USFWS 2013).
The South Fork Walla Walla River flows along the southwestern boundary of the site; it is a
jurisdictional water, meaning it is regulated under the Clean Water Act or under state or local
regulations. The Ordinary High Water Line identified on the project plans was verified during
the site visit. The river bank at the project site is typically rocky and steep, with anthropogenic
(human-created) levees adjacent to the river and no adjacent wetlands. Two ephemeral drainages
were observed to flow into the site through roadside ditches and culverts under the South Fork
Walla Walla River Road; however, a defined channel connection to the Walla Walla River was
not observed. The area identified on the NWI maps as a seasonally flooded riverine wetland
(R3USC) was found during the site visit to be an upland riparian forest that did not exhibit a
dominance of wetland vegetation or other wetland indicators (Wilson 2014).
The entire site was traversed on foot, and wetland sample plot data were collected in six
locations. The plots were in areas identified for hatchery development that had the highest
potential to exhibit wetland characteristics. The majority of the site was dominated by upland
vegetation; four of the six plots lacked indicators of wetland hydrology and hydric soils (Wilson
2014).
The fifth plot, located in a roadside ditch, contained hydric soils and vegetation, but indicators of
wetland hydrology were not present. The portion of the ditch that was dominated by wetland
vegetation was approximately 30 feet long by 3 feet wide. Other portions of the ditch were
dominated by upland species such as Himalayan blackberry, and the areas adjacent to the ditch in
the sixth plot did not contain hydric soils. The ditch appeared to dissipate in the pasture to the
south of the project site and did not have a direct channel connection to the South Fork of the
Walla Walla River. Subsequent correspondence revealed that the roadside ditch was an old
irrigation diversion ditch for a downstream property owner that has not been used recently
(McClintock, BPA, pers. comm., 5-12-14; Nice, Tetra Tech, pers. comm., 5-13-14). Because the
ditch was created by humans and does not have a direct channel connection to the South Fork of
the Walla Walla River, it would not be considered a jurisdictional wetland or water by the Corps
or the Oregon Department of State Lands in accordance with Oregon Administrative Rule 141-
085-0515 (Wilson 2014).
Floodplains
The Federal Emergency Management Agency (FEMA) identifies areas with a one percent
chance of being flooded in a given year as 100-year floodplains. There are no FEMA-mapped
floodplain maps for the proposed hatchery site.
3.9.4 Effects of Alternative 1 and Alternative 2
Based on the results of the wetland determination field survey, and because construction of
hatchery facilities under either alternative would not extend to the former irrigation ditch, the
project would have no direct or indirect effect on wetlands.
Walla Walla Basin Spring Chinook Hatchery Program
3-74 Chapter 3 Affected Environment and Environmental Consequences
Modifications to the hatchery intake would require in-water work in the South Fork Walla Walla
River, which could temporarily increase turbidity during construction. Specific effects and
mitigation measures are described in Section 3.4. Construction practices and mitigation
measures as described in that section would result in low impacts to waters of the United States.
With one possible exception, all new hatchery facilities would be two feet above the 100-year
flood elevation as mapped by consultants (pers. comm., Derek Nelson, McMillen Jacobs
4/10/2018; and pers. comm.) (see Chapter 2, Figure 2-3). The pumpback station may be inside
the 100-year flood elevation, but it would be placed in vaults below ground, and existing ground
elevations would be maintained. The vaults would not obstruct flood flows.
The existing river water intake and discharge structures are within the floodplain, and because
these structures must withdraw and discharge river water, there is no alternative to their location.
The installation of a gate in the lower end of the sluice channel at the existing intake structure
would not change or obstruct flood flows.
There are no planned changes in grades on the hatchery grounds that could direct or divert flood
flows in such a way as to affect properties either upstream or downstream of the project site.
3.9.5 Mitigation Measures
Use mitigation measures to prevent erosion and other effects of construction as described
in detail in Section 3.4.7.
3.9.6 Effects of the No Action Alternative
Because there would be no new construction under the No Action Alternative, there would be no
effects on wetlands or floodplains.
3.10 Wildlife
Notable Differences in this Section from the Draft EIS
The state ESA listing for the gray wolf was corrected (see Section 3.10.2).
Information on migratory birds and the federal ESA-listed western yellow-billed cuckoo at
the project site was added (see Section 3.10.2).
Mitigation for impacts to migratory birds was identified (new Section 3.10.5).
3.10.1 Analysis Area
The analysis area is the South Fork Walla Walla proposed hatchery site.
3.10.2 Affected Environment
No federal or state ESA-listed wildlife species have been documented within 1,000 feet of the
analysis area.
In Oregon, the gray wolf is listed as Endangered under the federal ESA in “that portion of OR
west of the centerline of Highway 395 and Highway 78 north of Burns Junction and that portion
of OR west of the centerline of Highway 95 south of Burns Junction” (USFWS 2017). This
listing area does not overlap the project area. There is no critical habitat for gray wolf in the
project area.
Final Environmental Impact Statement
Chapter 3 Affected Environment and Environmental Consequences 3-75
The gray wolf was de-listed as endangered under Oregon’s state ESA on November 9, 2015
(www.dfw.state.or.us), although they are still protected by the Oregon Wolf Conservation and
Management Plan and Oregon statute. Wolves have been documented near the project site,
which is adjacent to the Area of Known Wolf Activity for the Umatilla pack. On Oct. 26, 2013,
ODFW biologists radio-collared and released two young wolves in a forested area east of
Weston, Oregon, approximately 8 miles south of Milton-Freewater. The young male and female
are members of the Umatilla River Pack (ODFW, http://www.dfw.state.or.us/Wolves).
Western yellow-billed cuckoo (Coccyzus americanus), listed as Threatened under the federal
ESA, could potentially occur in portions of the project area, according to the official species list
provided by the Oregon office of USFWS (USFWS 2017). However, a recent search identified
no recorded occurrences, at any time, within the project area (USGS 2017). In the region
surrounding the project area, breeding cuckoos most often occur in dense, low gradient (less than
3% slope) willow bottoms with wide floodplain conditions such as occur along the Willamette
and lower Columbia rivers (70 FR 48548-48652). Eight sightings were recorded in Eastern
Washington between 1950 and 2000 (WDFW 2012). Critical habitat has been designated for
this species but does not occur in the project area.
There are documented detections of long-legged myotis (Myotis volans) at the site. This bat is a
federal Species of Concern and a state Vulnerable species (Oregon Biodiversity Information
Center, September 24, 2010). It is found mostly in forested mountain regions and river valleys,
but also at high elevations. It feeds on insects and can fly 100 miles in a night
(http://www.dfw.state.or.us). Summer day roosts include trees, rock crevices, fissures in stream
banks, and abandoned buildings. The bat hibernates in winter; hibernation sites include caves
and mines.
Other wildlife, including deer, bears, raptors including bald eagles, and smaller mammals and
birds, including migratory birds, probably use the area at times. For example, bear scat was
observed during a field visit in September 2013; the bear probably was attracted to the abundant
blackberries ripe at the time. Bald eagles are found in Umatilla County
(http://www.fws.gov/oregonfwo), but there are no known nests in the vicinity of the South Fork
facility. The one documented active golden eagle nest in Umatilla County is miles from the
project site (Isaacs 2011, Figure 2).
While recognizing that surveys normally are done during the breeding season, in December
2017, CTUIR staff conducted a brief survey of bird nests at the site, with the following results
(Scheeler 2017):
Within the greater Walla Walla Hatchery site, no evidence was detected of any perennial
nests, such as for bald eagles, osprey, other raptors, or herons, which use their nests year
after year.
Three cup-shaped annual songbird nests were detected, indicating past use of the stands;
species are unknown at this time.
The development of naturally occurring cavities was noted in several of the larger
cottonwood trees that could potentially serve as nest sites for cavity nesting songbirds or
small owls. No direct evidence of excavation or use was seen.
While the forested riparian areas and cottonwood stands (Section 3.6.3) probably provide habitat
for birds and small mammals, the habitat is not unique to the area, and there is no critical habitat
designated under ESA at the South Fork site.
Walla Walla Basin Spring Chinook Hatchery Program
3-76 Chapter 3 Affected Environment and Environmental Consequences
3.10.3 Sources and Types of Impact
Potential impacts to wildlife from project activities include the following:
Noise from the use of construction equipment and the presence of workers during
construction and operation of the facility could disrupt existing wildlife migration,
feeding, and foraging behavior.
Clearing and grading of vegetation and soil could result in removal, loss, and
fragmentation of potential wildlife habitat.
Clearing during bird nesting season could result in destruction of active nests and loss of
that season’s progeny.
3.10.4 Effects of Alternative 1 and Alternative 2
The most likely impact to wildlife from either alternative is construction-related disturbance
(noise and visual). Because the construction period would be approximately the same for the
alternatives, wildlife would be affected similarly under either alternative. Potential wildlife
disturbance from the proposed construction activities would depend on several factors, including
sound levels, duration, and surrounding topography and vegetation. The sound produced by
conventional construction equipment, measured at a distance of 50 feet, typically ranges from
about 75 to 90 decibels (dB): 78 dB for a dump truck, 80 dB for an excavator, 85 dB for a back
hoe, and 87 dB for a bulldozer (LHSFNA 2009). Generally, disturbance activities would be
limited to the immediate hatchery site, although noise from heavy machinery could extend
approximately 600 to 1,000 feet outward from the site before diminishing to ambient levels.
Adjacent hills and topographic changes in the landscape would reduce this distance by blocking
or absorbing the sound.
Because wolves likely would be only transients in the project area; because the project site is not
in designated critical habitat for wolves; and because wolves tolerate a certain amount of human
activity, they are unlikely to be adversely affected by the construction of project facilities. If bats
occupy the site, high levels of construction activity could cause them to avoid the area during the
day; however, since they feed primarily between dusk and dawn, when construction would not
be occurring, they might continue to forage in the area. Because the project area lacks open,
wide floodplains (the western yellow-billed cuckoo’s preferred nesting habitat), their presence is
extremely unlikely. Therefore, the project would not affect the yellow-billed cuckoo or its
critical habitat. See Chapter 4, Section 4.2.1 for a discussion of BPA’s consultation with
USFWS on ESA-listed species under Section 7 of ESA.
Most of the area to be developed has already been cleared of trees and contains primarily weedy
grasses and Himalayan blackberry, along with a number of cottonwood stands (see Section 3.6
for details). Although riparian corridors supporting mature cottonwood gallery forests are
important breeding areas and migration corridors for a wide variety of avian species, the stands
slated for removal are younger cottonwoods that lack any complex native shrub understory,
which would support a diversity of macroinvertebrate food species important to avian nest
success. Permanent removal of the approximately 75 trees, mostly cottonwoods, and more than
50 alder and cottonwood saplings, is unlikely to adversely affect wildlife or birds, including
migratory birds, since similar habitat is available at and adjacent to the hatchery site.
Temporarily disturbed areas would be seeded or planted with native species. While it is possible
that bats occupy fissures in the river bank and could be displaced if the construction disturbs or
Final Environmental Impact Statement
Chapter 3 Affected Environment and Environmental Consequences 3-77
changes this habitat, the streambank work would be limited to five linear feet and there is
abundant similar habitat in the vicinity. Thus, the impacts on wildlife, including ESA-listed
wildlife, from construction of either Alternative 1 or Alternative 2 would be low.
The year-round presence of hatchery staff is unlikely to disturb wildlife that already use the
South Fork site because they most likely are accustomed to human presence due to workers and
residents at the site and at the adjacent property (a residence and farmland). Therefore, operation
of the proposed hatchery would have low impacts on wildlife, including ESA-listed wildlife.
Increasing numbers of naturally spawning spring Chinook salmon in the Walla Walla basin
could provide a food source for bears, bald eagles, and other fish-eating wildlife, a moderate
beneficial effect.
3.10.5 Mitigation Measures
Do not clear vegetation during the migratory bird nesting season (approximately March
15 to August 15).
3.10.6 Effects of the No Action Alternative
Because there would be no construction, there would be no effects on wildlife from construction
noise or human presence and no impacts to habitat from vegetation clearing or other construction
activity. Facility operations would disturb wildlife in the area the same as it does now.
3.11 Air Quality and Climate Change
Notable Differences in this Section from the Draft EIS
A project-specific analysis of the effects of greenhouse gas emissions was done.
3.11.1 Analysis Area
The analysis area for air quality includes the South Fork Walla Walla River Road in the vicinity
of construction activities; regional Air Quality Index areas (see Section 3.11.3); and the global
climate.
3.11.2 Applicable Regulations
Clean Air Act (42 U.S.C. 7401 et seq.)
Oregon Administrative Rules (OAR) 340-204-0020 - 0040
EPA Rule on Mandatory Reporting of Greenhouse Gases (40 CFR Part 98)
Executive Order 13693 “Planning for Sustainability in the Next Decade”
3.11.3 Affected Environment
The Environmental Protection Agency (EPA) and the Oregon Department of Environmental
Quality (ODEQ) both have responsibility for air quality in the state of Oregon. The EPA has
established National Ambient Air Quality Standards (NAAQS) to protect the public from air
pollution (42 U.S.C. 7401 et seq.). The NAAQS focus on “criteria pollutants,” which are
pollutants of particular concern for human health including carbon monoxide, particulate matter,
ozone, sulfur dioxide, lead, and nitrogen dioxide. The ODEQ is responsible for monitoring and
enforcing air quality standards in Oregon.
Walla Walla Basin Spring Chinook Hatchery Program
3-78 Chapter 3 Affected Environment and Environmental Consequences
The air pollutants of greatest concern in the region surrounding the project site are ground-level
ozone, commonly known as smog; and fine particulate matter (mostly from wood smoke, other
combustion sources, cars and dust), known as PM2.5 (2.5 micrometers and smaller diameter)
(ODEQ 2012b).
The project area is in attainment with the NAAQS (ODEQ 2017). This means that the
concentrations of criteria pollutants in the area are historically below (in attainment with) the
thresholds described in the NAAQS. Attainment status is a federal designation determined by
the EPA based on the NAAQS.
The Air Quality Index (AQI) is an EPA health index which normalizes the various air pollutants
in order to report one health level. The AQI is updated hourly and posted online by EPA at
https://www.airnow.gov and on the ODEQ website. The AQI defines standards as Good,
Moderate, Unhealthy for Sensitive Groups, Unhealthy, and Very Unhealthy (Alert). The closest
communities to the South Fork facility where air quality is monitored are Hermiston and
Pendleton. In 2014, Hermiston’s AQI, based on ozone, for the months of May through
September was mostly in the Good range. Pendleton’s 2014 AQI for the year, based on fine
particulates (PM2.5), was largely Good, with 40 Moderate days in fall and winter (ODEQ 2015).
Greenhouse gases (GHGs) are chemical compounds in the earth’s atmosphere that absorb and
trap infrared radiation (heat) that is reflected or emitted from the surface of the earth. The
trapping and subsequent buildup of heat in the atmosphere creates a greenhouse-like effect that
maintains a global temperature warm enough to sustain life (EIA 2009). Some forms of GHGs
can be produced either by natural processes or as a result of human activities. However, the
current scientific consensus is that human-made sources are increasing atmospheric GHG
concentrations to levels that will raise the earth’s average temperature.
Total human-caused GHG emissions were the highest in human history from 2000 to 2010 and
reached 49 gigatons of carbon dioxide equivalent (CO2e)12
per year in 2010 (Intergovernmental
Panel on Climate Change [IPCC] 2014a). Annual GHG emissions grew on average by 1.0
gigaton of CO2e (2.2 percent) per year from 2000 to 2010 compared to 0.4 gigaton (1.3 percent)
increase per year from 1970 to 2000. Since 1980 global mean surface temperatures have
increased by 1.7 degrees Fahrenheit and are predicted to increase an additional 0.5 to 8.6 degrees
Fahrenheit by 2100, depending on future total global emissions of greenhouse gases (IPCC
2014b). In the Pacific Northwest Region, an increase in annual temperature between 3.3 and 9.7
degrees Fahrenheit may be realized between 2070 and 2099 (Mote et al. 2014).
Increases in Earth’s temperature may result in accelerated melting of artic sea ice and glaciers,
decreased periods of ice cover on lakes and rivers, changes in hydrology associated with early
melting and decreased snow packs, changes in growing seasons and plant hardiness zones,
changes in surface water characteristics, and increased extreme weather (Melillo et al. 2014).
All of these changes could have a ripple effect on agricultural production, human health, public
infrastructure, water supplies, hydropower generation, and terrestrial, aquatic, and marine
ecosystems. While models predict that atmospheric concentrations of all greenhouse gases and
temperatures will increase over the next century due to human activity, the extent and rate of
12
CO2e is a unit of measure used by the Intergovernmental Panel on Climate Change that takes into account the
global warming potential of each of the emitted greenhouse gases using global warming potential factors.
Final Environmental Impact Statement
Chapter 3 Affected Environment and Environmental Consequences 3-79
change resulting from an individual project or action is difficult to predict, especially on a global
scale.
3.11.4 Sources and Types of Impacts
Construction projects are established as sources of air pollution and are subject to the provisions
of Oregon air quality regulations (OAR 340-200-0020). Typical air pollutants from construction
sites include dust, vehicle emissions and particulate emissions from activities such as burning of
cleared vegetation. In significant amounts, these pollutants can be a public health hazard,
especially for people with respiratory ailments; and they can reduce visibility on roads, highways
and in scenic areas to the detriment of public safety or enjoyment. In addition, vehicle emissions
and combustion of fossil fuels during project operations, as well as during construction, can
contribute to climate change. The hatchery does not fall within the category of an industrial
facility or agricultural operation that would have air quality emissions regulated by Oregon DEQ.
Human activities result in the emission of four main forms of GHG that contribute to climate
change (EPA 2016a), three of which are applicable to this analysis:
Carbon dioxide is the major GHG emitted (EPA 2016b). Carbon dioxide enters the
atmosphere as a result of activities, such as land use changes, the burning of fossil fuels (e.g.,
coal, natural gas, oil, and wood products), and the manufacturing of cement. Carbon dioxide
emissions resulting from the combustion of coal, oil, and gas constitute 84 percent of all U.S.
GHG emissions (EPA 2016b). Before the industrial revolution, carbon dioxide
concentrations in the atmosphere were roughly stable at 280 parts per million. By 2015,
carbon dioxide levels had increased to 401 parts per million, a 43 percent increase (EPA
2016b).
Methane is emitted during the processing and transport of fossil fuels, through intensive
animal farming, and by the degradation of organic waste. Concentrations of methane in the
atmosphere have more than doubled since preindustrial levels (EPA 2016b).
Nitrous oxide is emitted during agricultural and industrial activities and during the
combustion of fossil fuels and solid waste. Atmospheric levels of nitrous oxide have risen
since the 1920s, reaching 328 parts per billion in 2015 (EPA 2016b).
Fluorinated gases, including hydrofluorocarbons, perfluorocarbons, and sulfur hexaflouride,
are synthetic compounds emitted through industrial processes. They sometimes replace
ozone-depleting compounds such as chlorofluorocarbons (CFCs) in insulating foams,
refrigeration, and air conditioning. Although fluorinated gases are emitted in small
quantities, fluorinated gases are the most potent and longest lasting type of greenhouse gas
emitted by humans (EPA 2016a). Activities that emit fluorinated gases are not proposed as
any part of this project, and thus are not included in the impact analysis.
3.11.5 Effects of Alternative 1 and Alternative 2
Construction and operation of project facilities would cause minor short-term increases in air
emissions from vehicles. The primary impact on air quality during the approximately 16-month
construction period, which would be the same for either alternative, would be dust during the
summer and early fall. However, the construction crew would use dust abatement measures as
necessary to ensure that traffic on South Fork Walla Walla Road would not be affected by
Walla Walla Basin Spring Chinook Hatchery Program
3-80 Chapter 3 Affected Environment and Environmental Consequences
reduced visibility (see Section 3.11.6). Vegetation removed for construction activities would not
be burned. Therefore, the effects of construction activity on air quality would be low.
In the event of a power outage, the temporary emergency use of a diesel generator at the hatchery
would cause minor short-term adverse impacts on air quality from diesel emissions; however,
this low effect already occurs at the existing facility.
EPA’s Mandatory Reporting of Greenhouse Gases Rule (40 CFR Part 98) requires reporting of
GHG emissions data for sources that emit 25,000 metric tons of carbon dioxide equivalent
(CO2e) or more per year, roughly equivalent to the CO2e13
emitted by 5,353 passenger vehicles
per year (EPA 2017a). The rule requires federal reporting of GHG emissions; it does not require
any other action (40 CFR Parts 86, 87, 89 et al.).
Although proposed hatchery projects are reasonably certain to fall well below the federal
reporting threshold, BPA evaluated the most significant sources of GHG emissions that would
result from project implementation.
GHG emissions were calculated using the EPA simplified GHG emissions calculator (EPA
2017b) based on contractor-provided vehicle and equipment fuel consumption estimates
(Appendix C). According to BPA’s calculations, construction associated with the Walla Walla
Hatchery project would result in an estimated 4,482 metric tons of CO2e for the entire 16-month
construction period. The estimated CO2e emissions from construction of the facilities equate to
roughly the annual CO2e emissions of approximately 960 passenger vehicles (EPA 2017a), well
below the EPA CO2e reporting threshold. Because of the relatively low amount of GHG
contribution from the project and the temporary nature of the impact (i.e., the 16-month
construction period), it is expected that the construction of the Walla Walla Hatchery would have
a minor, short-term adverse impact on climate change.
Operations and maintenance-related vehicles are planned to be powered by gasoline and diesel
combustion motors and therefore would contribute incrementally to atmospheric GHG
concentrations. Use of the emergency backup diesel generator would also result in some GHG
emissions during the time it is required for backup power or testing. The estimated CO2e from
vehicles associated with operations equates to annual CO2e of less than one passenger vehicle
(EPA 2017b). Alternative 2 might slightly reduce emissions from transportation of the Umatilla
spring Chinook over current conditions, because the transport distance for Umatilla spring
Chinook pre-smolts from the proposed Walla Walla hatchery to acclimation sites in the Umatilla
basin would be approximately 30 miles compared to approximately 70 miles from the Umatilla
Hatchery to those sites. Given these minimal contributions to GHG concentrations, the project’s
operational impact on climate change is expected to be low.
Although water quantity and quality data collected for this project indicate that stream flows and
temperatures currently are adequate to support this project (see Section 3.3), climate change
could result in increased water temperature and reduced stream flow. For example, “one-third of
the current habitat for the Northwest’s salmon and other cold water fish will no longer be
13
A carbon dioxide equivalent (CO2e) is a metric measure used to compare the emissions from various GHGs based
upon their global warming potential (GWP). GWP is defined is a measure of the total energy that a gas absorbs
over a particular period of time (usually 100 years), compared to carbon dioxide. CO2e are commonly expressed as
"million metric tons of carbon dioxide equivalents (MMT CO2e)." The CO2e for a gas is derived by multiplying the
tons of the gas by the associated GWP: MMT CO2e = (million metric tons of a gas) * (GWP of the gas). Carbon
Dioxide’s CO2e = 1.
Final Environmental Impact Statement
Chapter 3 Affected Environment and Environmental Consequences 3-81
suitable for them by the end of this century as key temperature thresholds are exceeded” (Karl et
al. 2009). It has also been suggested that up to 40 percent of Northwest salmon populations may
be lost by 2050 (Battin et al. 2007). In addition, projections made by the University of
Washington’s Climate Impacts Group indicate that higher air temperatures associated with
climate change likely will correlate to an earlier spring runoff and thus lower summer flows.
Higher air temperatures also will correlate to higher evapotranspiration rates and a longer
growing season that would further exacerbate summer low flows. In light of these possible
effects of climate change, BPA and CTUIR have proposed methods to reduce water demand at
the hatchery, as described in Chapter 2, Sections 2.2 and 2.3, and in Chapter 3, Section 3.3.
3.11.6 Mitigation Measures
Dust abatement measures would be used as necessary during construction to minimize the effects
of dust on nearby properties and users of South Fork Walla Walla River Road. They would be
implemented considering soil type, equipment used, prevailing wind direction, and the effects of
other erosion and sediment control measures. Specific measures include the following:
Sequence and schedule work to reduce the amount of bare soil exposed to wind erosion.
Do not apply dust-abatement additives and stabilization chemicals (typically magnesium
chloride, calcium chloride salts, or ligninsulfonate) within at least 25 feet of the river
channel (distances might be greater where vegetation is sparse) and apply them so as to
minimize the likelihood that they would enter the river.
Do not use petroleum-based products for dust abatement.
Avoid application of dust abatement chemicals during or just before wet weather, and in
areas that could result in unfiltered delivery of the dust abatement materials to the river.
Ensure spill containment equipment is available during application of dust abatement
chemicals.
Maintain motorized equipment used for construction and operation to minimize
emissions.
3.11.7 Effects of the No Action Alternative
With no construction, there would be no impacts to air quality and no new greenhouse gas
emissions. The existing facility, including the emergency generator and vehicles used in the
existing program, would continue with the current levels of emissions, which are considered a
low impact.
3.12 Noise
3.12.1 Analysis Area
The analysis area includes noise-sensitive properties, such as residences or campgrounds, within
600 to 1,000 feet of the proposed hatchery; and residential areas along South Fork Walla Walla
Road.
3.12.2 Affected Environment
Although Oregon DEQ no longer enforces noise regulations, they are still enforceable by local
authorities (http://www.oregon.gov/deq/Residential/Pages/noise.aspx). The proposed hatchery
does not meet the definition of an industrial or commercial facility. Only one residence, which
Walla Walla Basin Spring Chinook Hatchery Program
3-82 Chapter 3 Affected Environment and Environmental Consequences
would be considered a noise-sensitive property,14
is within 1,000 feet of the boundaries of the
hatchery property (it is approximately 750 feet from the west end of the property). No properties
defined as quiet areas are within 1,000 feet of the hatchery site (Oregon Administrative Rules
Chapter 340, Division 35).
3.12.3 Sources and Types of Impact
Construction noise could disturb nearby residents.
Increased traffic during operations could add to existing highway noise.
3.12.4 Effects of Alternative 1 and Alternative 2
Construction is estimated to take place over the course of approximately 16 months. Residents
along South Fork Walla Walla Road likely would notice increased traffic noise from large
trucks, primarily during weekdays between 7 a.m. and 6 p.m. During approximately 11 months
of the maximum construction activity, large trucks such as dump trucks or concrete mixers could
average approximately 20 trips per day per month.
Construction noise likely would be noticed at the residence adjacent to the South Fork facility,
depending on wind and other conditions. The sound produced by conventional construction
equipment, measured at a distance of 50 feet, typically ranges from about 75 to 90 decibels (dB):
78 dB for a dump truck, 80 dB for an excavator, 85 dB for a back hoe, and 87 dB for a bulldozer
(LHSFNA 2009). Noise from heavy machinery could extend approximately 600 to 1,000 feet
outward from the site before diminishing to ambient levels. Ambient noise levels at the site are
unknown; however, rural areas typically have an ambient noise level of 35 to 40 dB (WSDOT
2007). Site conditions such as the presence of the road and river could contribute to noisier than
typical background noise for rural areas. In addition, agricultural activities on the adjacent
property could include machinery that would influence ambient noise levels.
Most construction would take place more than 1,250 feet from the residence. The closest
construction activity would be during abatement pond modifications, which would be within
approximately 650 feet, and the temporary construction vehicle access road would be a similar
distance from the residence. Construction would be limited to daylight hours (primarily 7 a.m. to
6 p.m.); it would not take place at night, when ambient conditions would be quieter. Neighbors
and other interested parties would be informed when to expect construction activity. Therefore,
the effect of construction noise is expected to be low.
Increased traffic due to additional trips to transport broodstock to the hatchery and smolts and
adults from the hatchery is unlikely to be noticed by residents, because there would be a
maximum of 46 additional trips per year for Alternative 1 (B. Zimmerman, CTUIR, pers. comm.,
2-12-14). Under Alternative 2, the trips to transport Umatilla spring Chinook eggs from the
South Fork facility to the Umatilla Hatchery would be eliminated but likely offset by the trips to
transport smolts to acclimation and release sites in the Umatilla basin; therefore, traffic noise
impacts of Alternative 2 likely would be similar to Alternative 1. Operation of the proposed
14 "Noise Sensitive Property" means real property normally used for sleeping, or normally used as schools, churches,
hospitals or public libraries. Property used in industrial or agricultural activities is not Noise Sensitive Property
unless it meets the above criteria in more than an incidental manner. "Quiet Area" means any land or facility
designated by the [Environmental Quality] Commission as an appropriate area where the qualities of serenity,
tranquility, and quiet are of extraordinary significance and serve an important public need, such as, without being
limited to, a wilderness area, national park, state park, game reserve, wildlife breeding area, or amphitheater.
Final Environmental Impact Statement
Chapter 3 Affected Environment and Environmental Consequences 3-83
hatchery is unlikely to exceed noise standards for facilities in noise-sensitive and quiet areas,
which tend to range from 50 to 55 dBA.15
Therefore, operational noise impacts of the action
alternatives would be low.
3.12.5 Mitigation Measures
To reduce the potential for temporary, adverse noise impacts during construction, the following
mitigation measures would be used:
Provide the construction schedule to residents of the property to the west of the South
Fork facility and other interested parties to inform them of when they might experience
construction-related noise.
Limit construction to daylight hours (7:00 a.m. to 6:00 p.m.).
Turn off construction equipment when not in use for prolonged periods.
Ensure all construction equipment is equipped with noise-reducing mufflers.
Operate and maintain all equipment to minimize noise.
3.12.6 Effects of the No Action Alternative
Under the No Action Alternative, no new facilities would be built and there would be no new
sources of noise at the South Fork facility. Noise levels from existing operations would continue
at existing low levels.
3.13 Visual Quality and Recreation
3.13.1. Analysis Area
The analysis area for these resources encompasses the land and water from which the proposed
hatchery and Nursery Bridge broodstock collection site can be seen or which could be affected
by program activities.
3.13.2 Affected Environment
The only identified recreational facility within several miles of the hatchery site is Harris Park, a
Umatilla County park and campground, about 3.5 miles southeast of the project site, less than
half a mile from the end of the South Fork Walla Walla River Road. A hiking, mountain biking,
horseback-riding, and motorcycling trail begins at the end of the road on Bureau of Land
Management (BLM) land and heads into the Blue Mountains to the east, towards the Umatilla
National Forest. The area is designated by BLM as an Area of Critical Environmental Concern.
Visitors use the area for picnicking, birding, fishing, and other activities, but overnight camping,
all-terrain vehicles and 4-wheel-drive vehicles are not allowed
(https://www.blm.gov/or/districts/vale/recreation/files/southfork2004.pdf).
Numerous recreational sites and trails are on the Umatilla National Forest, the boundaries of
which are approximately 10 miles southeast of the proposed hatchery site; however, the primary
15 "dBA" means the sound pressure level in decibels measured using the "A" weighted decibel scale on a sound level
meter. The “A” weighted decibel scale is a logarithmic measurement of sound based on the decibel but weighted
to approximate the human perception of sound and is commonly used for measuring environmental and industrial
noise levels. Decibels are usually measured with a filter that emphasizes sounds in certain frequencies. The "A" filter (dBA)
is the one most frequently used. The "C" filter (dBC) puts more weight on low-frequency sounds such as the bass in amplified music.
Walla Walla Basin Spring Chinook Hatchery Program
3-84 Chapter 3 Affected Environment and Environmental Consequences
access to these areas is via other roads and highways to the north and south of the South Fork
Walla Walla River Road. No designated scenic areas, scenic byways, public trails, or public
boat ramps are in the analysis area, including at Nursery Bridge Dam.
The only nearby residence in the analysis area is adjacent to the hatchery site, approximately 750
feet west of the property boundary.
3.13.3 Effects of Alternative 1 and Alternative 2
This section discusses potential effects of construction and operation on recreational and scenic
resources. Effects on air quality and the increased noise from construction and operations traffic
are discussed in Sections 3.11 and 3.12.
Construction
Construction impacts would be essentially the same for both alternatives. Due to the distance of
established recreational facilities from the South Fork site and the lack of designated scenic
resources in the analysis area, construction at the two sites would not adversely affect users of
recreational facilities.
Construction activities would not obstruct traffic on South Fork Walla Walla Road; equipment
large enough to stop traffic to allow its passage on the road would not be required (P. Rader,
McMillen Jacobs, pers. comm. 02-21-18); therefore, users of Harris Park and trails to the
southeast would not be delayed (see Section 3.7.4).
If, during construction, non-local workers choose to stay in the campground and cabin facilities
in Harris Park, especially during the busy summer season, they could temporarily displace other
recreational users of the facility. However, because the majority of the 40 – 60 construction
workers present at any given time is expected to come from within the region (Section 3.7.4);
and because camping is limited to 10 days and cooking and food is not allowed in the cabins
(www.co.umatilla.or.us/Parks), few if any non-local workers present for an extended period are
likely to use these facilities. Therefore, construction impacts on scenic and recreation resources
would be low.
Operations
Insofar as motorists and other users of the South Fork Walla Walla River Road are sensitive to
its scenic qualities, expansion of the existing South Fork facility would increase the number of
buildings in what is now a largely rural landscape. Although the site currently contains buildings
and other constructed facilities such as holding ponds, approximately 65% of the 13-acre site
contains natural-looking or landscaped areas. Under Alternative 1, this amount would be
reduced to 50% and under Alternative 2 to 44% of the site. The most noticeable change would
be the proposed new incubation and grow-out building, which would be sited adjacent to the
road. At approximately 72,000 square feet, the incubation and grow-out buildings for
Alternative 2 would be more than twice as large as the single hatchery building proposed for
Alternative 1 (approximately 33,000 square feet). However, new buildings would replace at
least one residence that has been somewhat unsightly in the past and would occupy areas that are
now mostly weeds or bare dirt and gravel. Users of the road could perceive the presence of the
facilities differently, depending on a variety of factors, including whether they are sensitive to a
change in what they are accustomed to seeing, or on how sensitive they are to large man-made
structures in a rural environment. However, passersby would see the facility for only a short
Final Environmental Impact Statement
Chapter 3 Affected Environment and Environmental Consequences 3-85
time, and the facility would not be visible from any designated recreational facilities, including
Harris Park, which is 3.5 miles from the proposed hatchery.
The new facilities are not expected to noticeably change the view of the facility from the
residence on the adjacent property to the west. Most of the existing vegetation at that end of the
hatchery site would remain, or disturbed areas, such as for the new drain field (the closest
construction to the residence, within approximately 1,250 feet), would be replanted with native
vegetation. Under Alternative 2, the west end of the grow-out building would be approximately
1,000 feet from the adjacent residence but is expected to be largely screened by existing
vegetation. Therefore, the impact on views from the adjacent property is expected to be low.
Any users of the river would not notice any change to the facility because new structures would
be located at least 100 feet from the river and because most vegetation screening the facility from
the river would not be removed or would be replanted.
Broodstock collection activity at Nursery Bridge would coincide with ongoing monitoring and
evaluation activities that take place during May and June and is unlikely to be noticeable to
residents or visitors to the area.
Based on the discussion above, construction and operation of the proposed facilities would have
no or low impacts on views from the adjacent residence and from recreational facilities in the
area. Because the views of the facility by users of the South Fork Walla Walla River Road
would be short and temporary, the overall impact on the perceived scenic quality in the vicinity
of the facility is expected to be low to moderate. As more spring Chinook return to the Walla
Walla basin, recreational fishing opportunities are expected to increase. Despite concerns of
some local landowners regarding effects of anglers trespassing to gain access to the river (see
Section 3.7.4), this effect is expected to be low because the CTUIR will help educate anglers and
will coordinate with landowners..
3.13.4 Mitigation Measures
The following mitigation measures would reduce the temporary visual impacts during and after
construction.
Conduct all construction work during daylight hours to avoid the use of nighttime
illumination of work areas.
Require contractors to maintain clean construction sites.
Use dust abatement measures to avoid impacts to users of South Fork Walla Walla Road.
See Section 3.11.6 for specific measures.
Reseed or replant disturbed areas with appropriate vegetation once construction is
completed, and inspect the areas periodically to verify adequate growth has occurred.
See Section 3.6.7 for specific measures.
3.13.5 Effects of the No Action Alternative
Under the No Action Alternative, no new facilities would be constructed; therefore, the existing
visual quality at the South Fork facility and along South Fork Walla Walla Road would not
change, nor would there be potential effects on recreational users of Harris Park. However, the
potential to establish a recreational spring Chinook fishery would be reduced.
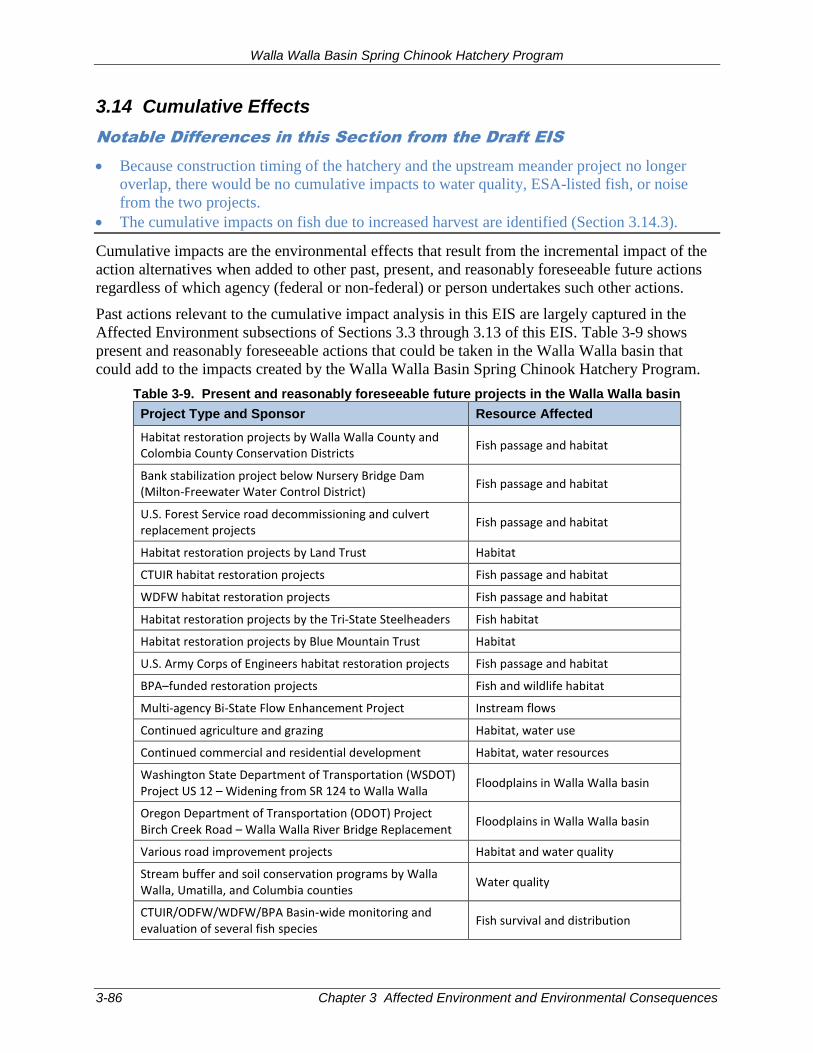
Walla Walla Basin Spring Chinook Hatchery Program
3-86 Chapter 3 Affected Environment and Environmental Consequences
3.14 Cumulative Effects
Notable Differences in this Section from the Draft EIS
Because construction timing of the hatchery and the upstream meander project no longer
overlap, there would be no cumulative impacts to water quality, ESA-listed fish, or noise
from the two projects.
The cumulative impacts on fish due to increased harvest are identified (Section 3.14.3).
Cumulative impacts are the environmental effects that result from the incremental impact of the
action alternatives when added to other past, present, and reasonably foreseeable future actions
regardless of which agency (federal or non-federal) or person undertakes such other actions.
Past actions relevant to the cumulative impact analysis in this EIS are largely captured in the
Affected Environment subsections of Sections 3.3 through 3.13 of this EIS. Table 3-9 shows
present and reasonably foreseeable actions that could be taken in the Walla Walla basin that
could add to the impacts created by the Walla Walla Basin Spring Chinook Hatchery Program.
Table 3-9. Present and reasonably foreseeable future projects in the Walla Walla basin
Project Type and Sponsor Resource Affected
Habitat restoration projects by Walla Walla County and Colombia County Conservation Districts
Fish passage and habitat
Bank stabilization project below Nursery Bridge Dam (Milton-Freewater Water Control District)
Fish passage and habitat
U.S. Forest Service road decommissioning and culvert replacement projects
Fish passage and habitat
Habitat restoration projects by Land Trust Habitat
CTUIR habitat restoration projects Fish passage and habitat
WDFW habitat restoration projects Fish passage and habitat
Habitat restoration projects by the Tri-State Steelheaders Fish habitat
Habitat restoration projects by Blue Mountain Trust Habitat
U.S. Army Corps of Engineers habitat restoration projects Fish passage and habitat
BPA–funded restoration projects Fish and wildlife habitat
Multi-agency Bi-State Flow Enhancement Project Instream flows
Continued agriculture and grazing Habitat, water use
Continued commercial and residential development Habitat, water resources
Washington State Department of Transportation (WSDOT) Project US 12 – Widening from SR 124 to Walla Walla
Floodplains in Walla Walla basin
Oregon Department of Transportation (ODOT) Project Birch Creek Road – Walla Walla River Bridge Replacement
Floodplains in Walla Walla basin
Various road improvement projects Habitat and water quality
Stream buffer and soil conservation programs by Walla Walla, Umatilla, and Columbia counties
Water quality
CTUIR/ODFW/WDFW/BPA Basin-wide monitoring and evaluation of several fish species
Fish survival and distribution
Final Environmental Impact Statement
Chapter 3 Affected Environment and Environmental Consequences 3-87
3.14.1 Surface and Groundwater Quantity and Rights
The analysis area for cumulative effects on surface and groundwater quantity and rights is the
South Fork Walla Walla River subbasin. As noted in Section 3.3, surface water is considered to
be over-allocated in the Walla Walla basin as a whole, although water remains available in the
upper reaches of the basin, including in the South Fork Walla Walla River subbasin. However,
because use of surface water would essentially be non-consumptive and would be managed
within the hatchery’s existing water right, neither action alternative would contribute to a
cumulative effect on surface water quantity and water rights for any downstream water users.
As discussed in Section 3.3., the proposed hatchery’s surface water rights are largely junior to
other water rights in the area; thus, the cumulative effects of increased water use in the basin and
global climate change are most likely to affect hatchery operations, not the other way around. In
low-flow years, which could occur more often with the effects of global climate change and
increasing demand for water resources throughout the Walla Walla River basin by ongoing
development (Table 3-9), there could be insufficient water to meet peak hatchery demand and
satisfy minimum instream flow requirements in the 450-foot stretch of the South Fork Walla
Walla River between in the intake and discharge facilities. However, as discussed in Section 3.3,
this effect would be minimized by implementation of water use efficiency measures, including
pumpback and/or water reuse systems.
It is unlikely that the action alternatives would contribute to the general decline that appears to be
occurring in the regional aquifer as discussed in Section 3.3.3 (SPF Water Engineering pers.
comm., 9-27-10). As discussed in Section 3.3.5 and 3.3.6, water from the existing well would be
used only for domestic purposes, as it is now, although the amount of water used might increase
due to year-round occupation of the new residences. Because the amount used would not exceed
the limits for domestic uses, the cumulative impacts of the action alternatives would result in a
low impact on groundwater.
Existing agricultural activities, city water systems, and other development throughout the basin
would continue to create a consumptive demand for water. When combined with the impacts of
other past, present and reasonably foreseeable future projects affecting the South Fork Walla
Walla River, the cumulative impact on surface and groundwater quantity and rights from either
action alternative is low, because only the small amount of water used for domestic purposes and
for landscaping would be consumptive uses.
3.14.2 Water Quality
Water quality concerns within the analysis area for cumulative effects center around those water
bodies in the Walla Walla basin that have been listed as impaired under the Clean Water Act.
Specifically, impairments include temperature and dissolved oxygen on the South Fork Walla
Walla River and the Walla Walla River (ODEQ 2013) and nutrients and PCBs in the Washington
portion of the Walla Walla River basin, including the Walla Walla River and Mill Creek (WDOE
2008). As shown in Table 3-9, although continued development could potentially contribute to
further impairment of these parameters in the analysis area in general, past and expected future
restoration and habitat improvement projects have improved overall water quality and would
continue to do so. For example, a BPA-funded CTUIR project immediately upstream of the
proposed hatchery site (BPA Project No. 2698-011-00) engineered meanders in the South Fork
Walla Walla River. The 44-acre project, completed in 2015, reduced channelization of the river
in a 0.75-mile segment, thereby slowing water velocities, increasing adult holding/spawning and
Walla Walla Basin Spring Chinook Hatchery Program
3-88 Chapter 3 Affected Environment and Environmental Consequences
juvenile rearing habitat for fish, and reducing down-cutting in the streambed during periods of
high flows.
As the action alternatives increase the number of returning adults, their carcasses could add to
existing high nutrient levels or levels of bioaccumulating toxic substances in portions of the
Walla Walla River basin when combined with existing and future sources of nutrients and toxics.
Existing state and federal water quality management efforts could be affected. However, as
discussed in Section 3.4 Water Quality, the proposed project’s contribution is expected to be low
in comparison to other sources of pollutants in the basin and to existing loading limits specified
in TMDLs. In addition, as discussed in Section 3.5.5, studies have shown that the addition of
salmon carcasses provide nutrient enrichment to aquatic and riparian ecosystems, thereby
increasing their productivity and biodiversity.
No specific actions in the vicinity of the South Fork facility were identified that could combine
with construction or operation of the proposed hatchery to result in a cumulative impact on water
quality of the South Fork Walla Walla River or the Walla Walla River. Therefore, overall
cumulative impacts on water quality would be low.
3.14.3 Fish
The analysis area for cumulative impacts to fish is the Walla Walla River basin. Several projects
in the basin are designed to improve aquatic habitat conditions for native salmonid species
(Table 3-9). These projects include habitat restoration, fish passage and diversion screening
improvements, and improved stream flow management implemented in conjunction with the
ESA recovery plan for steelhead (NMFS 2009) and the Walla Walla Subbasin Plan under the
Council’s Fish and Wildlife Program (Walla Walla County et al. 2004). The South Fork Walla
Walla River floodplain restoration project described above is one such project. Fish passage and
levee setback work planned below Nursery Bridge Dam will improve habitat conditions for fish
rearing and passage and will improve access to spawning grounds upstream of the diversion. A
multi-agency Bi-State Flow Enhancement Project, if funded and implemented, could increase
instream flows in the Walla Walla River that would improve upstream migration conditions and
increase rearing habitat; the target date for implementation is 2025 (Walla Walla Watershed
Flow Study Steering Committee 2017).
The projects in the basin coordinate actions and share information among fisheries biologists,
tribes, local governments, citizen groups, and state and federal agencies in both Oregon and
Washington through the Middle Columbia Recovery Forum. Decision-making about the level of
hatchery production, out-planting of adult spawners in the basin, and harvest rates would be
guided by research, monitoring, and evaluation under the Walla Walla River Basin Monitoring
and Evaluation program, a basin-wide program (BPA Project No. 2000-039-00). The
coordination of basin fish and habitat restoration efforts, including the proposed project, is
expected to result in a cumulative beneficial impact.
As documented in Section 3.5 Fish, the proposed project could affect several fish species.
Juvenile spring Chinook could be a food source for bull trout, a positive impact; however,
juvenile spring Chinook and steelhead could compete for rearing habitat, although the two
species tend to use different micro-habitats. While bull trout and spring Chinook spawn timing
overlaps, in the Walla Walla basin there is little spatial overlap in spawning areas, although this
could change as spring Chinook numbers increase. These native species once co-existed at
abundant levels in the Walla Walla Basin, and ongoing efforts in the basin to improve habitat for
Final Environmental Impact Statement
Chapter 3 Affected Environment and Environmental Consequences 3-89
all species could increase the amount of habitat available. As a result, the cumulative impact of
the proposal, when considered with the impacts of other projects on fish, would be low to
moderate depending on the success of the project in reintroducing spring Chinook, on the
success of habitat improvement projects, and on the success of recovery programs for ESA-listed
fish.
Overall, the effect of the proposed project in combination with other ongoing and planned fish
habitat and restoration programs is expected to result in improvements in aquatic habitat
conditions in the Walla Walla River basin. The extent to which these benefits are realized would
depend on how the Walla Walla ecosystem and its fish species respond to the environmental
effects of climate change. The projected changes in hydrology and temperature are likely to
negatively affect aquatic ecosystems in the Columbia Basin, with bull trout and other salmonids
being especially sensitive.
Impact analyses of climate change impacts suggest that temperature increases alone will render
2–7% of existing salmonid habitat in the Pacific Northwest unsuitable by 2030, 5–20% by 2060,
and 8–33% by 2090. Salmon habitat is likely to be more severely impacted because anadromous
species are restricted to lower elevation habitats that are likely to experience even warmer
temperatures. Salmon habitat loss would be most severe in Oregon and Idaho, with potential
losses exceeding 40% by 2090. Loss of salmon habitat in Washington would be less severe, with
the worst case showing about a 22% loss by 2090. These estimates do not consider the
associated impact of changing hydrology (ISAB 2007). Ecological changes are likely to occur in
all the tributary systems of the Columbia Basin. Thus, although numerous projects throughout
the Walla Walla River basin could contribute to increased fish populations and habitat, the
benefits of the improvements could be reduced by climate change.
The Master Plan for this project took a more optimistic approach to the effect of climate change
combined with habitat restoration projects ongoing in the Walla Walla basin.
As climate and streams warm, tributary habitats will become increasingly important because
they usually provide the cool waters for salmonids and other cool-water species in a
watershed. Ongoing habitat restoration efforts in the Walla Walla River and its tributaries
are consistent with tributary habitat restoration measures recommended in ISAB (2007) and
may help to offset some of the local negative effects of future climate change. Habitat
improvement projects in the system may improve the natural river channel characteristics,
floodplain function, hydraulic and sediment regimes, and habitat connectivity. Restoring
Walla Walla tributaries to more natural conditions will create a healthy, functioning
riparian community providing numerous benefits to fish and wildlife (including reduced
water temperatures and improved habitat connectivity). Expected outcomes would benefit
salmonids through a healthy, functioning floodplain and riparian community, an increase in
spawning and rearing habitat for salmonids, an increase in instream habitat diversity, and
upslope stabilization (CTUIR 2013, Section 4.17).
The proposed action includes increasing production of spring Chinook salmon in part to increase
tribal and recreational fishing opportunities in the Walla Walla River basin. Harvest rates for all
harvests are addressed in other forums, such as the U.S. v. Oregon management agreement
discussions, and are the set by a variety of fish managers.
Walla Walla Basin Spring Chinook Hatchery Program
3-90 Chapter 3 Affected Environment and Environmental Consequences
If the proposed action is successful, projected ranges of in-basin harvest numbers for hatchery
and natural-origin adult spring Chinook are as follows (CTUIR 2013):
Phase I – 39 to 704
Phase II – 446 to 982
Phase III – 221 to 1,780
Fish other than spring Chinook, including steelhead and bull trout, might be unintentionally
killed or kept during harvest for spring Chinook or other in-basin harvests. Therefore, the
potential exists for the cumulative effects of all in-basin harvests to increase adverse effects on
ESA-listed fish. For example, fish that are captured and released would experience stress and
injury from hooking, handling, and air exposure. A percentage of these fish could suffer stress
and injury sufficient to lead to immediate or delayed mortality.
Rates of hooking mortality vary considerably across studies and species. For example, hooking
mortality rates ranging from 4.1 to 10.6% in Kenai River spring Chinook salmon have been
documented (Bendock and Alexandersdottir 1993). WDFW assumes a hooking mortality rate of
5% for fisheries management purposes, based on examination of hooking mortality observed in
surveys of actual catch (Mongillo 1984). Steelhead hooking mortality rates observed across
multiple studies ranged from 0 to 10% (Hooton 2001). Smaller resident fish, such as trout, are
likely to experience higher levels of hooking mortality in comparison to large anadromous fish.
For example, cutthroat trout mortality rates ranging from 10.8% to as high as 58.6% have been
observed (Hooton 2001). Bull trout mortality rates are generally low, ranging from l.1 to 2.5%
(Hooton 2001).
During existing in-basin fisheries, tribal and/or state staff routinely monitor anglers’ catch to
quantify the level of harvest as well as the incidental harvest and projected mortality of ESA-
listed fish. This monitoring would be expanded to include any spring Chinook recreational
fishery that might be established in addition to existing harvests, and would be used to manage
local fisheries and to minimize incidental injury and mortality of ESA-listed species. Therefore,
the cumulative impact of incidental harvest of ESA-listed fish during new spring Chinook
fisheries would be low.
3.14.4 Vegetation and Noxious Weeds
The analysis area for cumulative effects on vegetation and noxious weeds is the area along the
South Fork Walla Walla River Road within a few miles of the proposed hatchery. Historic and
ongoing agriculture, livestock grazing activities, and development projects have removed
vegetation and resulted in the presence of many species of noxious weeds in the analysis area
and throughout Umatilla County. As shown in Table 3-9, no known development projects are
currently planned in the vicinity of the proposed hatchery site, although ongoing agricultural and
grazing activities would continue to contribute to the spread of invasive plants. However,
existing and planned restoration efforts would in part offset these impacts by improving
vegetation conditions and control of invasive plants, primarily in riparian areas. Although the
proposal could result in the minimal spread of weed species after mitigation, given that the
amount of vegetation affected at the project site is relatively small (between 2.4 and 3.2 acres)
when compared to the area affected by agricultural activities and livestock grazing in the county,
the cumulative impact of the proposal on vegetation and noxious weeds would be low.
Final Environmental Impact Statement
Chapter 3 Affected Environment and Environmental Consequences 3-91
3.14.5 Socioeconomics and Environmental Justice
The analysis area for cumulative effects includes Umatilla County in Oregon and Walla Walla
County in Washington. As discussed in Section 3.7.4 and 3.7.5, the two action alternatives
would result in low impacts on population, housing, employment, income, or government
revenue and would therefore, in combination with other regional activities, have a cumulative
low impact on these resources. Although the alternatives could result in a minor increased
demand for public services and infrastructure, no large-scale development projects are planned in
the vicinity of the South Fork facility in either Umatilla or Walla Walla counties (Jennings, pers.
comm., 9-3-13; Donovan, pers. comm., 10-25-13). Although general development in the
analysis area would continue over time (Table 3-9), local planning provides a process for
increasing services to meet forecasted demand.
As shown in Table 3-9, numerous restoration and habitat enhancement projects have been
occurring and are planned for the foreseeable future. These projects would continue to improve
conditions for fish and wildlife, including spring Chinook salmon and fisheries for other species.
Although the effect would largely be beneficial, the corresponding increase in fishing
opportunities could result in access issues to fishing sites through private lands. CTUIR and
others would work together to address any access issues through landowner outreach, signage,
and other measures as described in Section 3.7. Thus, the cumulative effect on public services
and infrastructure would be low for either action alternative.
3.14.6 Cultural Resources
The analysis area for cumulative effects is the Walla Walla River basin. As discussed in Section
3.8 Cultural Resources, construction and operation of the proposed project is not expected to
adversely affect cultural resources under either of the action alternatives; therefore, the proposal
would not contribute to adverse cumulative effects on cultural resources in the basin. With the
increase in tribal fishing opportunities in the basin, combined with other fish and habitat
restoration efforts, the proposed project, if successful, would have moderate to high cumulative
beneficial effects on tribal access to an important cultural resource—spring Chinook salmon.
3.14.7 Wetlands, Waters of the United States, and Floodplains
The analysis area for wetlands, waters of the U.S., and floodplains is the South Fork Walla Walla
River subbasin. As discussed in Section 3.9 Wetlands, Waters of the United States, and
Floodplains, neither action alternative would affect wetlands, and effects on waters of the U.S.
would be low, so the proposed action would have no measurable cumulative effects on those
resources.
Because fish hatcheries require access to water, they usually are in or near floodplains. As stated
in Section 3.9, no FEMA floodplain maps have been identified for the portion of the South Fork
Walla Walla River where the proposed hatchery would be located Consultants’ mapping of 100-
year flood elevations indicate that most new project facilities would be located at least two feet
above the 100-year flood elevation, with one exception that would not affect floodplain function.
See the detailed discussion in Section 3.9.4. Therefore, when considered with other activities in
area floodplains, including ongoing agriculture, the action alternatives would not have
cumulative impacts on area floodplain function or flood potential.
Walla Walla Basin Spring Chinook Hatchery Program
3-92 Chapter 3 Affected Environment and Environmental Consequences
3.14.8 Wildlife
The analysis area for cumulative effects is the Walla Walla River basin. As discussed in Section
3.10 Wildlife, because only small amounts of vegetation would be removed, and because the
proposed hatchery site is already developed and experiences regular human activity, construction
and operation of either action alternative would have primarily low, temporary disturbance
effects on wildlife species, including ESA-listed species. Therefore, when combined with other
development and human activity in the region as listed in Table 3-9, the proposed project would
have low cumulative effects on wildlife.
3.14.9 Air Quality
The analysis area for cumulative effects is the Walla Walla River basin. As discussed in
Section 3.11, the action alternatives would cause low, short-term effects on air quality, primarily
from increased dust during construction, impacts that would be mitigated. Therefore, the action
alternatives would have low cumulative impacts on air quality when combined with agricultural
and other activities in the region that increase particulate levels and reduce the region’s air
quality. Emissions from vehicles and equipment used during construction and operation of the
facility would be below EPA reporting levels for greenhouse gas emissions; therefore, the action
alternatives would have low cumulative effects on the potential for climate change when
considered with vehicle use and other sources of emissions in the region.
3.14.10 Noise
The analysis area for cumulative effects of noise is the area along the South Fork Walla Walla
River Road within 3 miles either direction of the proposed facility. Construction noise from the
action alternatives would have temporary low to moderate local impacts. No other construction
activity is proposed in the vicinity during the projected construction period, and there is little
existing traffic at that end of the South Fork Walla Walla River Road; therefore, there would be
low cumulative impact to local noise levels during the 16-month construction period. Operation
of the proposed hatchery could slightly increase noise levels at the hatchery due to year-round
activity, but noise levels would not exceed Oregon noise standards for quiet areas, and there are
no known new sources of noise that would have long-term cumulative effects on the one nearby
residence.
3.14.11 Visual and Recreation
The analysis area for cumulative effects on visual and recreation resources is primarily the South
Fork Walla Walla River Road, although effects of increased fishing opportunities could be
experienced basin-wide. As discussed in Section 3.13, there are no recreational or scenic
resources in the vicinity of the proposed project facilities that would be affected by the project
except Harris Park, about 3.5 miles from the hatchery site. Construction workers might displace
other potential campers in the summer months, but effects would be temporary and likely low.
No other known activities in the area would combine with construction of the proposed project to
cumulatively affect Harris Park during the construction period. The proposed project would
have no cumulative long-term effect on recreational facilities.
If successful, the project could, in combination with habitat improvements and other actions
being undertaken in the basin, have a moderate cumulative effect by increasing fishing
opportunities for recreational fishers in the basin, a beneficial effect.
Final Environmental Impact Statement
Chapter 3 Affected Environment and Environmental Consequences 3-93
As discussed in Section 3.13, effects of the action alternatives on the visual quality of the area
are expected to be low. No other known projects would combine with the proposed project to
cause cumulative beneficial or adverse impacts on the area’s visual quality.
3.15 Adverse Effects That Cannot Be Avoided and Irreversible and Irretrievable Commitments of Resources
Periodic reduction in flows up to 11 cfs in a 250 - 450-foot reach of the South Fork Walla
Walla River.
Short-term minor increases in sediment in the South Fork Walla Walla River.
Minor increases in nutrient levels from hatchery discharges.
Minor increases in bioaccumulated toxics from salmon carcasses in basin waters.
Potential loss of ESA-listed fish to competition with spring Chinook, or to trapping for
spring Chinook broodstock.
Low potential to spread noxious weeds to and from construction sites.
Short-term avoidance by wildlife of the proposed hatchery site due to construction
activity.
Emissions of greenhouse gases during construction and hatchery operation, which would
minimally contribute to greenhouse gas concentrations.
Irreversible uses of fuel, office supplies, petroleum products, chemicals, and other
operational supplies. Some building materials and equipment might be re-usable, but
much of it would not.
3.16 Short-Term Use of the Environment and Effects on Long-Term Productivity
The proposed Walla Walla Basin Spring Chinook Hatchery Program is expected to enhance
productivity of the aquatic environment through salmon population increases, from which other
aquatic and terrestrial species including humans may derive benefits. The land developed for the
hatchery facilities would be permanently taken out of vegetative productivity. Construction
activities would temporarily affect more land than would be permanently developed, but long-
term productivity would not likely be adversely affected because of the measures that would be
taken to restore disturbed, undeveloped areas to pre-existing condition or better (replanting with
native species, weed control, standard construction BMPs, etc.).

Final Environmental Impact Statement
Chapter 4 Environmental Consultation and Coordination 4-1
Chapter 4. Environmental Consultation and Coordination
Notable Differences in this Chapter from the Draft EIS
Information regarding ESA permits and consultations was added. See Section 4.2.1.
Proposed conservation measures at the new facility are identified. See Section 4.12.
Numerous federal, state, and local environmental laws, administrative requirements, and plans
are reviewed as part of BPA’s NEPA analysis. This chapter reviews the program’s compliance
and consistency with these laws, requirements, and plans.
4.1 National Environmental Policy Act
The National Environmental Policy Act of 1969 as amended (42 U.S.C. 4321 et seq.) requires
federal agencies to assess and disclose the effects of proposed actions on the environment before
making a decision to proceed. This EIS has been prepared to meet BPA’s NEPA requirements.
BPA and the CTUIR conducted scoping meetings with interested and potentially affected parties
and provided other opportunities to contribute to the development of the draft EIS. Various
individuals, agencies, and organizations identified issues to be considered in the environmental
analysis (see Chapter 1, Section 1.7 and Appendix A). The draft EIS was sent to regulatory
agencies and other interested organizations and individuals for review and comment (see
Chapter 7 for the contact list). BPA considered all comments provided during the comment
period (October 10 to November 24, 2014). Revisions, corrections, and clarifications to the
analysis for the final EIS were made as appropriate; the full list of comments and BPA’s
responses to them are provided in Appendix F. BPA will document its final decision in a Record
of Decision no sooner than 30 days after the Final EIS has been issued.
4.2 Wildlife and Habitat
4.2.1 Endangered Species Act
The Endangered Species Act of 1973 and its amendments (ESA, 16 U.S.C. 1531 et seq.) require
federal agencies to ensure that their actions do not jeopardize the continued existence of
endangered or threatened species or destroy or adversely modify their critical habitats. The
effects on species listed under ESA are discussed in Chapter 3 of this EIS: Section 3.5 Fish and
Section 3.10 Wildlife; there are no ESA-listed plant species at the proposed hatchery site. Based
on the information in these sections, on September 20, 2017, a Hatchery and Genetics
Management Plan (HGMP) was submitted to NMFS, and on February 26, 2018, a Biological
Assessment was submitted to USFWS for formal consultation under Section 7 of the ESA.
The current Carson NFH/Walla Walla spring Chinook smolt release program is funded by
NOAA Fisheries under the Mitchell Act of 1938 (16 USC Section 755-757) and by Bureau of
Indian Affairs. It was described in the Hatchery and Genetic Management Plan (HGMP)
(CTUIR 2009) submitted to NOAA Fisheries in May 2009. An amendment to the HGMP that
proposed changes to the adult outplanting program funded by BPA was submitted in 2012. No
Biological Opinion was received. However, it is assumed that, at a minimum, the current smolt
release program has been evaluated and approved as part of NMFS’ Mitchell Act Biological
Opinion issued in January 2017 (NMFS 2017).
Walla Walla Basin Spring Chinook Hatchery Program
4-2 Chapter 4 Environmental Consultation and Coordination
Maintenance of fish passage facilities at Nursery Bridge Dam was evaluated in the following
Biological Opinion:
Endangered Species Act Biological Opinion and Magnuson-Stevens Fishery
Conservation and Management Act Essential Fish Habitat Response for the Nursery
Bridge Dam Fishway Facility Operation and Maintenance Activities, Walla Walla
Subbasin, Garrison Creek-Walla Walla River Subwatershed (HUC 170701020704),
Umatilla County, Oregon, August 26, 2011; and
The ongoing Walla Walla Basin Natural Production Monitoring and Evaluation Project under
which basin-wide M&E is conducted is funded by BPA as BPA project number 2000-039-00.
That project has the following permits: NOAA section 10 permit for summer steelhead – 16446-
2R that expires 12/31/2021; and USFWS Take Permit for bull trout - Permit TE-844468-11
issued to CTUIR, signed 4/30/2015, expires 4/29/2019 – see Section 15). WDFW holds a 4D
permit for sampling steelhead and a cooperative compliance letter from USFWS for bull trout
associated with this project, as well as other permits associated with hatchery steelhead releases
and associated natural fish sampling in the Touchet River.
BPA received a Biological Opinion from NMFS on February 13, 2018, which covered the
proposed Walla Walla Hatchery construction and operation and several other projects in the
Walla Walla basin, as well as the monitoring and evaluation program associated with the
proposed Walla Walla Hatchery (see Section 3.5 and Appendix B). The only conservation
measure NMFS applied to the Walla Walla Hatchery program was to “obtain a NPDES permit
before increasing production at …Walla Walla Hatchery to 500,000 spring Chinook salmon and
notify NMFS if the permit has interim limit(s).” The terms and conditions NMFS applied to the
monitoring and evaluation program are as follows:
The BPA shall review and approve ODFW, CTUIR, and WDFW activities as described in
the annual statements of work for the … Walla Walla Spring Chinook Salmon [program]
and associated RM&E [Research Monitoring and Evaluation] to ensure they are
consistent with the BPA-funded portion of the Proposed Action, including:
a. Providing advance notice of any change in hatchery program operation and
implementation that potentially increases the amount or extent of take, or results in an
effect of take not previously considered.
b. Providing notice if monitoring reveals an increase in the amount or extent of take, or
discovers an effect of the Proposed Action not considered in this opinion.
c. Notifying NMFS SFD [Sustainable Fisheries Division] within 48 hours after
knowledge of exceeding any authorized take. The applicants shall submit a written
report, and/or convene a discussion with NMFS to discuss why the authorized take was
exceeded within two weeks of the event.
BPA had not received a Biological Opinion from USFWS when this Final EIS was written. BPA
will not issue a Record of Decision on the project until the agency receives a Biological Opinion
from USFWS.
Umatilla Hatchery programs have an approved HGMP (ODFW and CTUIR 2011) and a signed
Biological Opinion (NMFS 2011) for their current operations, including spring Chinook
production. If Alternative 2 in this EIS were to become the preferred alternative (it currently is
Final Environmental Impact Statement
Chapter 4 Environmental Consultation and Coordination 4-3
not), BPA, as the federal agency that funds the Umatilla Hatchery, would send NMFS a
description of the change to the Umatilla program. Because Umatilla spring Chinook broodstock
collection, adult holding and spawning, acclimation, and release numbers and locations would
remain the same, transferring incubation and rearing to the proposed Walla Walla Hatchery is
not expected to change the overall impacts described in the Biological Opinion. (See
Section 3.5.6 for a detailed discussion of potential impacts.) Monitoring of straying rates and
other performance issues would continue as is being done under the existing monitoring and
evaluation program (Umatilla Hatchery Monitoring and Evaluation, BPA Project No. 1990-005-
00). The Walla Walla HGMP (CTUIR 2017) would need to be revised to include the proposed
rearing of more fish if Alternative 2 were to be selected as the preferred alternative.
4.2.2 Fish and Wildlife Conservation Act and Fish and Wildlife Coordination Act
The Fish and Wildlife Conservation Act of 1980 (16 U.S.C. 2901 et seq.), encourages federal
agencies to conserve and promote conservation of game and non-game species and their habitats.
This project is designed to restore spring Chinook salmon in areas from which it was extirpated,
and to contribute to the ecological balance of the Walla Walla River basin by providing a source
of nutrients to other species. See Chapter 3, Section 3.5.
The Fish and Wildlife Coordination Act of 1934 (16 U.S.C. 661 et seq.) also requires federal
agencies to consult with the USFWS and state fish and wildlife agencies when “waters of any
stream or other body of water are proposed or authorized, permitted or licensed to be impounded,
diverted…or otherwise controlled or modified” by permit or license. The USFWS, ODFW and
WDFW were sent copies of the Draft EIS, and BPA and CTUIR are coordinating with these
agencies on many issues related to construction and operation of the project, including
construction work windows, mitigation measures, and program management criteria.
The proposed action would divert waters of the South Fork Walla Walla River to rear spring
Chinook salmon. This use would not consume the water but would use it briefly and then
discharge it back into the river. This use would enhance the potential to restore naturally
reproducing populations of spring Chinook.
4.2.3 Migratory Birds
Migratory Bird Treaty Act
The Migratory Bird Treaty Act (16 U.S.C. 703-712) prohibits the taking, killing, or possession of
migratory birds except as allowed by the Secretary of the Interior. The list of migratory birds is
found in 50 CFR 10, and permit regulations are found in 50 CFR 21. Nearly all native birds in
the United States are on the list. This project would not take, kill, or possess migratory birds.
See additional detail in Section 3.10.
Executive Order 13186, Responsibilities of Federal Agencies to Protect Migratory Birds
Executive Order 13186, issued on January 17, 2001, directs each federal agency undertaking
actions that may negatively impact migratory bird populations to work with the USFWS to
develop an agreement to conserve those birds. The protocols developed by this consultation are
intended to guide future agency regulatory actions and policy decisions; renewal of permits,
contracts, or other agreements; and the creation of or revisions to land management plans. This
order also requires that the environmental analysis process include effects of federal actions on
Walla Walla Basin Spring Chinook Hatchery Program
4-4 Chapter 4 Environmental Consultation and Coordination
migratory birds. On August 3, 2006, the USFWS and the U.S. Department of Energy signed a
Memorandum of Understanding (MOU) to complement the Executive Order. BPA, as part of
the Department of Energy, will work cooperatively in accordance with the protocols of the
MOU.
Minor amounts of migratory bird habitat would be affected by the proposal, but if any nests are
identified in areas to be cleared, they would not be removed or destroyed during nesting season
(see Section 3.10).
4.2.4 Bald Eagle and Golden Eagle Protection Act
The federal Bald Eagle and Golden Eagle Protection Act (16 CFR 668-668d) prohibits the
taking, possession, purchase, sale, barter, transport, export, or import of any bald or golden eagle
or any part, nest, or egg of a bald or golden eagle, except for certain scientific, exhibition, and
religious purposes. The Act only covers intentional acts or acts in “wanton disregard” of the
safety of bald or golden eagles. Neither bald eagles nor golden eagles would be taken or
otherwise harmed by this project, and no nests have been identified at the project site. The most
likely effect would be beneficial, by increasing a source of food for bald eagles—spring Chinook
salmon.
4.2.5 Magnuson-Stevens Fishery Conservation and Management Act of 1976
National Marine Fisheries Service is responsible for ensuring compliance with the Magnuson-
Stevens Fishery Conservation and Management Act of 1976 (16 USC 1801 et seq.). Public Law
104-297, the Sustainable Fisheries Act of 1996, amended the Magnuson-Stevens Act to establish
requirements for evaluating and consulting on adverse effects to essential fish habitat (EFH).
EFH includes all streams, lakes, ponds, wetlands, and other viable water bodies, and most of the
habitat historically accessible to salmon necessary for spawning, breeding, feeding or growth to
maturity.
The facilities associated with the Walla Walla Basin Spring Chinook Hatchery Program are
located in EFH for Chinook salmon. Sections 3.5.5 and 3.5.6 discuss effects of the action
alternatives on fish habitat, including EFH for Chinook salmon. Consultation with NMFS on
EFH was initiated with submittal of the HGMP for the proposed program (CTUIR 2017) and
concluded with the Biological Opinion (NMFS 2018). As stated in Section 3.3 of the Opinion:
NMFS believes that the Proposed Action, as described in the HGMP and the ITS [Incidental
Take Statement] includes the best approaches to avoid or minimize … adverse effects in most
areas. Thus, NMFS has no conservation recommendations specifically for Chinook …
salmon EFH. However, the Reasonable and Prudent Measures, and Terms and Conditions
included in the ITS are likely to address potential EFH effects.
4.3 Heritage Conservation and Cultural Resources Protection
The National Historic Preservation Act of 1966 as amended (54 USC 300101) requires federal
agencies to take into account the potential effects of their undertakings on properties that are
listed or eligible for listing on the National Register of Historic Places. Consultation must occur
with the State Historic Preservation Office, Indian tribes that attach religious and cultural
significance to historic properties that may be affected by an undertaking, and additional
consulting parties regarding the inventory and evaluation of properties potentially eligible for
National Register nomination; and to determine whether the project would adversely affect them.
Final Environmental Impact Statement
Chapter 4 Environmental Consultation and Coordination 4-5
BPA consulted with Oregon and Washington State Historic Preservation Offices as well as with
area tribes, including CTUIR, the Confederated Tribes and Bands of the Yakama Nation, the Nez
Perce Tribe of Idaho, and the Confederated Tribes of the Warm Springs Reservation of Oregon.
Cultural resource surveys conducted by the CTUIR at the proposed hatchery site where ground
might be disturbed (Chapter 3, Section 3.8) identified no cultural resources that would be
affected. Findings were shared with the Oregon State Historic Preservation Office (SHPO) and
the CTUIR in February 2014. The Oregon SHPO concurred with these findings on April 1, 2014
(Ainslie 2014). Construction at the South Fork facility would be monitored by a cultural
resources specialist; if construction reveals cultural resources at the site, work would stop
immediately until the site could be assessed by professional cultural resources staff in
consultation with BPA, CTUIR, and the Oregon State Historic Preservation Office. Consultation
might need to be re-initiated to determine how to avoid or mitigate adverse effects.
Facilities proposed on federal or Tribal land would follow the requirements of the
Archaeological Resource Protection Act (16 U.S.C. 470aa-mm). The proposed hatchery is on
land owned by BPA.
The Archaeological and Historic Preservation Act (16 U.S.C. 469 et seq.) directs federal
agencies to notify the Secretary of the Interior if they find that a federal action might cause the
destruction of significant scientific, prehistoric or archaeological data. As stated above, on-site
surveys identified no cultural materials at the proposed construction site.
If human remains are found on federal lands, the requirements of the Native American Graves
Protection and Repatriation Act (25 U.S.C. 3001 et seq.) and its implementing regulations (43
CFR 10.4) provide protection, notification and consultation procedures for the federal agency
with jurisdiction and control over the land.
Executive Order 13175, Consultation and Coordination with Indian Tribes, states that the U. S.
government will continue to work with Indian Tribes on a government-to-government basis to
address issues concerning tribal self-government, trust resources, and Indian tribal treaty and
other rights. BPA and CTUIR are working together on the Walla Walla Basin Spring Chinook
Hatchery Program. The program would contribute to the spirit of intergovernmental
cooperation, and if implemented, has the potential to enhance the culturally significant tribal
ceremonial and subsistence fishery for spring Chinook salmon in the Walla Walla basin.
BPA also complies with other laws and directives for the management of cultural resources:
Antiquities Act of 1906 (16 U.S.C. § 431-433)
Historic Sites Act of 1935 (16 U.S.C. § 461-467)
Executive Order 13007, Indian Sacred Sites
American Indian Religious Freedom Act of 1978 ( 42 U.S.C. § 1996, 1996a).
4.4 Floodplains and Wetlands (Executive Orders 11988 and 11990)
The U.S. Department of Energy requires that impacts to floodplains and wetlands be assessed
and alternatives for protection of these resources be evaluated in accordance with Executive
Orders 11988 and 11990, along with the Compliance with Floodplain/Wetlands Environmental
Review Requirements (10 CFR 1022.12). As discussed in Chapter 3, Section 3.9, no wetlands
would be affected by the proposal.
Walla Walla Basin Spring Chinook Hatchery Program
4-6 Chapter 4 Environmental Consultation and Coordination
There is no FEMA map of the 100-year floodplain at the proposed hatchery site. As discussed in
Chapter 3, Section 3.9, consultant mapping of 100-year flood elevations indicates that all but one
new structure would be at least two feet above the 100-year flood elevation. As explained in
Section 3.9.4, that structure would not affect flood flows or floodplain function.
4.5 State, Area-wide, and Local Plans
4.5.1 Walla Walla Subbasin Plan
The proposed Walla Walla Basin Spring Chinook Hatchery Program is consistent with the goals
of the Walla Walla Subbasin Plan, which recognized the desire to restore populations of spring
Chinook salmon to the basin, although specific numeric goals had not been established at that
time (Walla Walla County et al. 2004).
4.5.2 Umatilla County Comprehensive Plan
The proposed hatchery is in an area designated “North/South Ag” in the Umatilla County
Comprehensive Plan (Umatilla County Planning Department 1983). This general designation
allows for a variety of uses. Because the basic use of the site, which currently contains an adult
holding and spawning facility for salmon, would not change, the new facilities are expected to be
consistent with the Comprehensive Plan.
4.6 Clean Water Act
The Clean Water Act of 1977 (33 U.S.C. 1251 et seq.) is the principal federal law governing
water pollution control. It regulates discharges into waters of the United States. Two of the
primary instruments for implementing this Act are Sections 401 and Section 402, both of which
are delegated by the federal government to Oregon Department of Environmental Quality to
administer. The project’s compliance with these two sections of the Clean Water Act is
discussed in Chapter 3, Section 3.4.
Authorization from the U.S. Army Corps of Engineers is required in accordance with the
provisions of Section 404 of the Clean Water Act when dredged or fill material is discharged into
waters of the United States, including wetlands. Neither action alternative would affect wetlands
(see Sections 3.9 and 4.4 for more discussion). However, in-water work at the South Fork
facility would require a Section 404 permit. See Chapter 3, Section 3.4 for details of the work
required and its effects.
4.7 Farmland Protection Policy Act
The Farmland Protection Policy Act (7 U.S.C. 4201 et seq.) directs federal agencies to identify
and quantify adverse effects of federal programs on farmlands. The purpose of the act is to
minimize the number of programs that unnecessarily contribute to the conversion of agricultural
land to non-agricultural purposes. Veazie silt loam soils at the proposed hatchery site are
classified as Prime Farmland if irrigated. However, the site is currently partially developed as a
salmon adult holding and spawning facility; it is not farmed now and has not been for many
years. The small size of the remaining undeveloped portions of the hatchery property are not
suitable for agriculture and are not irrigated. No ground would be disturbed at any of the
proposed broodstock collection facilities. Therefore, existing or potential farmland would not be
affected by either action alternative.
Final Environmental Impact Statement
Chapter 4 Environmental Consultation and Coordination 4-7
4.8 Noise Control Act
The Noise Control Act of 1972 (42 U.S.C. 4901 et seq.) promotes an environment free from
noise that jeopardizes human health and welfare. Federal and state regulations establish
guidelines that implement the intent of the act. No local noise standards exist for areas that
would be affected by the proposed project. As described in Section 3.12, both action alternatives
would have temporary and low noise impacts, and mitigation measures are identified to further
reduce noise impacts. Temporary construction noise during daylight hours is exempt from state
and federal standards.
4.9 Clean Air Act
Emissions produced by construction and operation of the proposed project facilities must meet
standards of the Clean Air Act and the amendments of 1970 (42 U.S.C. 7401 et seq.). In Oregon,
the authority for ensuring compliance with this act is delegated to Oregon Department of
Environmental Quality. Neither action alternative would violate current clean air standards, as
described in Chapter 3, Section 3.11.
4.10 Resource Conservation and Recovery Act (RCRA), Toxic Substances Control Act (TSCA) and Federal Insecticide, Fungicide and Rodenticide Act (FIFRA)
The Resource Conservation and Recovery Act (42 U.S.C. 6901 et seq.) regulates the disposal of
hazardous wastes. The Toxic Substances Control Act (15 U.S.C. 2601) gives authority to the
EPA to regulate substances that present unreasonable risks to public health and the environment.
The federal Insecticide, Fungicide and Rodenticide Act (7 U.S.C. 136 (a-y)) authorizes the EPA
to prescribe conditions for use of pesticides.
Construction, operation, and maintenance of the proposed facilities would meet the guidelines
for use, handling, storage, and disposal of hazardous substances. Necessary permits would be
obtained if regulated pesticide products are used.
Chemicals used at the proposed new hatchery may include chlorine and formalin, and possibly
other chemicals. Staff would be trained in their proper use, transport, handling, and storage to
minimize dangers of over-exposure or accidental release to the environment. Appropriate safety
equipment would be provided, and chemicals would be stored in areas designed to contain the
chemical in the event of a spill. Any used absorbent materials containing controlled chemicals
would be disposed consistent with the Material Safety Data Sheet and applicable federal, state,
and local regulations.
The types and amounts of chemicals used at a hatchery or rearing facility depend upon site-
specific conditions, fish culture practices, and types of parasites or disease organisms being
treated. All chemical handling, application, and disposal would comply with applicable federal,
state, and other regulations to protect human and environmental health.
4.11 Environmental Justice
Executive Order 12898 directs federal agencies to consider the effects of their programs, policies
and activities on minority and low-income populations (environmental justice populations).
Federal agencies are required to assess the impacts their actions may have on these groups in
their NEPA analyses. The potential for the Walla Walla Basin Spring Chinook Hatchery
Walla Walla Basin Spring Chinook Hatchery Program
4-8 Chapter 4 Environmental Consultation and Coordination
Program to affect low-income communities and minority populations is discussed in Chapter 3,
Section 3.7. There would be no impacts to environmental justice populations from either action
alternative.
4.12 Energy Conservation at Federal Facilities
Executive Order 13514 states that federal agencies should “[identify] and [analyze] impacts
from energy usage and alternative energy sources in all Environmental Impact Statements and
Environmental Assessments for proposals for new or expanded Federal facilities under the
National Environmental Policy Act of 1969, as amended (42 U.S.C. 4321 et seq.).” The
proposed design for the hatchery includes replacing three pumps at the existing facility. The
amount of energy saved will be more than 50% of what they currently use, resulting in a
potential energy efficiency rebate from Milton-Freewater City Light and Power of $16,000.
LED lighting would be used in all the facilities on site, and ductless heat pumps for the
residential heating and additional insulation will be used in the residences.
Final Environmental Impact Statement
Chapter 5 References 5-1
Chapter 5. References
Ainslie, Jessica A. 2014. Letter to Don Rose from Jessica A. Ainslie, SHPO Archeologist RE: SHPO
Case No. 13-1007, Walla Walla Basin Spring Chinook Hatchery Program (2000-038-01). April 1,
2014.
Al-Chokhachy, R., and P. Budy. 2007. Summer microhabitat use of fluvial bull trout in eastern Oregon
streams. North American Journal of Fisheries Management 27:1068–1081.
Amos, K. and J. Thomas. 2002. Disease interactions between wild and cultured fish: observations and
lessons learned in the Pacific Northwest. Bull. Eur. Ass. Fish Pathol. 22(2):95-102.
Anastasio, Angelo. 1972. The Southern Plateau: An Ecological Analysis of Intergroup Relations.
Northwest Anthropological Research Notes, vol. 6(2).
Anderson Perry & Associates, Inc. 2010. City of Milton-Freewater, Oregon. Water Management and
Conservation Plan Update. October. La Grande, OR.
Anglin, D. R., D. G. Gallion, M. Barrows, C. Newlon, P. Sankovich, T. J. Kisaka, and H. Schaller.
2008a. Bull Trout Distribution, Movements and Habitat Use in the Walla Walla and Umatilla River
Basins—2004 Annual Progress Report. Prepared for the U.S. Army Corps of Engineers, Walla Walla
District by the U.S. Fish and Wildlife Service, Columbia River Fisheries Program. MIPR Contract
Number: W68SBV90271448.
Anglin, Donald R., Darren Gallion, Marshall Barrows, Courtney Newlon, and Ryan Kock. 2008b.
Current Status of Bull Trout Abundance, Connectivity, and Habitat Conditions in the Walla
Walla Subbasin. U.S. Fish and Wildlife Service, Columbia River Fisheries Program Office,
Vancouver, WA.
Anonymous. 1962. Early History of the Milton-Freewater Area. Valley Herald, Inc. Milton-Freewater,
OR.
Bailor, Tom, Michael Burney and Jeff Van Pelt. 1993. Report on the Results of Cultural Resource
Investigations Including Limited Testing at the Fred Gray and South Fork Walla Walla Locations and
the Results of the Cursory Examination of the Three mile Dam Location for the BPA Fisheries
Enhancement Projects. Confederated Tribes of the Umatilla Indian Reservation Department of
Economic and Community Development, Mission, OR.
Battin, J., M.W. Wiley, M.H. Ruckelshaus, R.N. Palmer, E. Korb, K.K. Bartz, and H. Imaki. 2007.
Projected impacts of climate change on salmon habitat restoration. Proceedings of the National
Academy of Sciences. 104(16), 6720-6725.
Bendock, T. and M. Alexandersdottir. 1993. Hooking mortality of adult chinook salmon released in the
Kenai River, Alaska. North American Journal of Fisheries Management 13:540-549.
Bilby, R. E., B. R. Fransen, P. A. Bisson, and J. K. Walter. 1998. Response of juvenile coho salmon
(Oncorhynchus kisutch) and steelhead (Oncorhynchus mykiss) to the addition of salmon carcasses to
two streams in southwestern Washington, USA. Canadian Journal of Fisheries and Aquatic Sciences
55:1909–1918.
Blackman, Barry (Sergeant). Walla Walla County Sherriff’s Office. 10/21/13 – Telephone Interview.
Blakeley, Kevin. John Day Watershed Manager, ODFW. Personal communication. 7/11/2014.
Bovay Northwest, Inc. 1994. Study of Water Supplies for Irrigon and Umatilla Fish Hatcheries During
John Day Reservoir Minimal Operating Pool. Report for the USACE. Contract DACW 68-92-D-008.
Walla Walla Basin Spring Chinook Hatchery Program
5-2 Chapter 5 References
Brannon, E. L., D. F. Amend, M. A Cronin, J. E. Lannan, S. LaPatra, W. J. McNeil, R. E. Noble, C. E.
Smith, A. J. Talbot, G. A. Wedemeyer, and H. Westers. 2004. The controversy about salmon
hatcheries. Fisheries 29(9):12-31.
Brett, J.R. 1979. Environmental factors and growth. In: W.S. Hoar and D. J. Randall (eds.) Fish
Physiology, Vol. 8, pp. 599–675. London, New York: Academic Press.
http://www.worldcatlibraries.org/wcpa/top3mset/afa569d8b93b6f00.html.
Burney, Michael S. 1985. The Results of Test Excavations Conducted at Sites 45GA119, 45GA120,
45GA122, and 45GA124, in the Blue Mountains South of Pomeroy, Garfield County, Washington.
Submitted to the Umatilla National Forest. Western Archaeological Consultants, Inc., Boulder, CO.
Burney, Michael S. 1991. An Interim Report Regarding the Cultural Resource Inventory and Limited
Testing of Four Test Drill Sites as Part of the Bonneville Power Administration, Confederated Tribes
of the Umatilla Indian Reservation Fisheries Enhancement Project, Umatilla County, OR.
Confederated Tribes of the Umatilla Indian Reservation, Mission, OR.
Byrne, J., H. Fuss, and C. Ashbrook. 1997. Annual Coded Wire Tag Program Washington Missing
Production Groups. Project No. 89-66. Prepared for Bonneville Power Administration, Portland,
OR.
Carlin, J. L., M. Consoer, C. Hagen, M. Johnson, B. Mahoney, J. McDermet and J. Schwartz. 2012.
Population and habitat characteristics of margined sculpin, Cottus marginatus, in the Walla Walla
watershed (Oregon, Washington, U.S.A.). Northwest Science 86(3):153–167.
CBFWA (Columbia Basin Fish and Wildlife Authority). No Date. Umatilla and Walla Walla basins
Fisheries Restoration Programs. Confederated Tribes of the Umatilla Indian Reservation. Pendleton,
OR.
Cederholm, C. J., M. D. Kunze, T. Murota, and A. Sibatani. 1999. Pacific salmon carcasses: Essential
contributions of nutrients and energy for aquatic and terrestrial ecosystems. Fisheries 24:6–15.
CEQ (Council on Environmental Quality). 1997. Guidance Under the National Environmental Policy
Act. Washington, D.C. Available: http://www.whitehouse.gov/administration/eop/ceq. Accessed:
09/02/13.
Chaloner, D. T., and M. S. Wipfli. 2002. Influence of decomposing Pacific salmon carcasses on
macroinvertebrate growth and standing stock in southeastern Alaska streams. Journal of the North
American Benthological Society 21:430–442.
Chaloner, D. T., K. M. Martin, M. S. Wipfli, P. H. Ostrom, and G. A. Lamberti. 2002. Marine carbon
and nitrogen in southeastern Alaska stream food webs: evidence from artificial and natural streams.
Canadian Journal of Fisheries and Aquatic Sciences 59:1257–1265.
Chaloner, D. T., G. A. Lamberti, A. D. Cak, N. L. Blair, and R. T. Edwards. 2007. Inter-annual variation
in responses of water chemistry and epilithon to Pacific salmon spawners in an Alaskan stream.
Freshwater Biology 52:478–490.
Chen, S., D. Stechey, R. F Malone. 1997. Suspended solids control in recirculating aquaculture systems.
In: Aquaculture water reuse systems: Engineering design and management. M. B. Timmons and T.
M. Losordo. Amsterdam, The Netherlands, Elsevier. 27: 61-100.
Chen, S., S.T. Summerfelt, T. Losordo, and R. Malone. 2002. Recirculating systems, effluents, and
treatments. In: Aquaculture and the Environment in the United States, edited by J.R. Tomasso, pp.
119–140. Baton Rouge, LA: United States Aquaculture Society. As cited in Summerfelt and Vinci
2009.
Christiansen, Jack. Aquaculture Engineer, USFWS. Personal communication. November 13, 2013.
Final Environmental Impact Statement
Chapter 5 References 5-3
Clarke, Lance R., William A. Cameron, Robert S. Hogg, Richard W. Carmichael, Sam T. Onjukka,
Melissa G. White, and Julie Keniry. 2013. Umatilla Hatchery Monitoring and Evaluation Annual
Report, 1/1/2013 - 12/31/2013. Report to the Bonneville Power Administration, project # 1990-005-
00, Portland, OR.
Clarke, L. R., W. A. Cameron, and R. W. Carmichael. 2012. Performance of spring Chinook salmon
reared in acclimation ponds for two and four months before release. North American Journal of
Aquaculture 74:65-72.
Clarke, L. R., W. A. Cameron, R. S. Hogg, and R. W. Carmichael. 2014. Umatilla Hatchery Monitoring
and Evaluation. Annual progress report to Bonneville Power Administration, Project 1990-005-00,
Portland, Oregon.
Columbia Conservation District. 2004. Tucannon Subbasin Plan. Prepared for the Northwest Power and
Conservation Council. Available: http://www.nwcouncil.org/fw/subbasinplanning/tucannon/plan.
Committee on Protection and Management of Pacific Northwest Anadromous Salmonids. 1996.
Upstream: Salmon and Society in the Pacific Northwest. Washington, DC: National Academy Press.
Comparative Survival Study Oversight Committee and Fish Passage Center. 2012. Comparative
Survival Study (CSS) of PIT-tagged Spring/Summer/Fall Chinook, Summer Steelhead, and Sockeye:
2012 Annual Report. BPA Contract #19960200. Pg. 86. Available:
http://www.fpc.org/documents/CSS/2012%20CSS%20Annual%20Report--Final.pdf. Accessed:
09/02/13.
Compton, J. E., C. P. Andersen, D. L. Phillips, J. R. Brooks, M. G. Johnson, M. R. Church, W. E.
Hogsett, M. A. Cairns, P. T. Rygiewicz, B. C. McComb, and C. D. Shaff. 2006. Ecological and
water quality consequences of nutrient addition for salmon restoration in the Pacific Northwest.
Frontiers in Ecology and the Environment 4:18–26.
Coyle, T., D. Karl, and G. Mendel. 2001. Assessment of Salmonids and their Habitat Conditions in the
Walla Walla River Basin within Washington: 2000 Annual Report. Prepared by the Washington
Department of Fish and Wildlife for the Bonneville Power Administration. Project Number
199802000, Contract Number 00000485-00001. 116 pp.
CRITFC (Columbia River Intertribal Fish Commission). 1995. Wy-Kan-Ush-Mi-Wah-Kish-Wit: The
Columbia River Anadromous Fish Restoration Plan of the Nez Perce, Umatilla, Warm Springs and
Yakama Tribes. CRITFC, Portland, OR.
Cryer, E. 1992. Recent applications of ozone in freshwater fish hatchery systems. In: Blogoslawski,
W.J. (Ed.), Proceedings of the 3rd International Symposium on the Use of Ozone in Aquatic Systems.
International Ozone Associate Pan American Committee, Norwalk, CT. pp. 134-154.
CTUIR (Confederated Tribes of the Umatilla Indian Reservation). 1990. Walla Walla River Subbasin
Salmon and Steelhead Production Plan. Columbia Basin System Planning, Walla Walla Subbasin,
September 1990. Submitted to Northwest Power Planning Council and Columbia Basin Fish and
Wildlife Authority, Portland, OR.
CTUIR. 2001. Walla Walla Subbasin Summary, August 2001. Prepared for the Northwest Power
Planning Council, Portland, OR.
Walla Walla Basin Spring Chinook Hatchery Program
5-4 Chapter 5 References
CTUIR. 2008. Walla Walla Spring Chinook Hatchery Master Plan. Prepared by the Confederated
Tribes of the Umatilla Indian Reservation and Jones and Stokes. August 2008.
CTUIR. 2013. Walla Walla Spring Chinook Hatchery Master Plan. Prepared by the Confederated
Tribes of the Umatilla Indian Reservation for the Bonneville Power Administration and Northwest
Power and Conservation Council. Pendleton, OR. June 2013. Available:
https://www.cbfish.org/Project.mvc/ProjectDocuments/2000-038-01
CTUIR. 2017. Hatchery and Genetic Management Plan for the Walla Walla Hatchery Spring Chinook
Program. Prepared by the Confederated Tribes of the Umatilla Indian Reservation, Oregon
Department of Fish and Wildlife and Washington Department of Fish and Wildlife for the Bonneville
Power Administration and National Marine Fisheries Service. Pendleton, OR. September 2017.
CTUIR and ODFW (Confederated Tribes of the Umatilla Indian Reservation and Oregon Department of
Fish and Wildlife). 1989. Umatilla Hatchery Master Plan. Report for the Northwest Power Planning
Council, Portland, OR.
CTUIR and ODFW. 2006. Comprehensive Research, Monitoring, and Evaluation Plan for Umatilla
Subbasin Summer Steelhead and Chinook Salmon.
Cuenco M. L., and D. A. McCullough. 1996. Framework for Estimating Salmon Survival as a Function
of Habitat Condition. Columbia River Inter-Tribal Fish Commission Report #96-04, Portland, OR.
Available: http://www.critfc.org/reports/.
Davis, G. E., J. Foster, C. E. Warren, and P. Doudoroff. 1963. The influence of oxygen concentration on
the swimming performance of juvenile Pacific salmon at various temperatures. Transactions of the
American Fisheries Society, 92:111–124. http://dx.doi.org/10.1577/1548-
8659(1963)92[111:TIOOCO]2.0.CO2. Accessed: 10/19/10.
Donovan, Steve. Senior Planner, Walla Walla County. 10/25/13 – Telephone Interview.
Doudoroff, P. and D.L. Shumway. 1970. Dissolved oxygen requirements of freshwater fishes. FAO
Fisheries Technical Paper no.86. Rome, Italy: Food and Agriculture Organization of the United
Nations. Available:
http://www.sjrdotmdl.org/concept_model/bioeffects_model/documents/DoudoroffShumway1970.pdf.
Accessed: 11/4/10.
Duke, Bill. District Biologist, Umatilla Watershed District. Oregon Department of Fish and Wildlife
(ODFW). 10/16/13 – Telephone Interview.
Durfey, Dan. Umatilla County Weed Supervisor, Umatilla County Weed Control Department.
Pendleton, OR. Telephone discussion and email exchange with Matt Kuziensky of ICF International
about commonly observed weeds in the Milton-Freewater, OR, area and assistance with weed
identification. September 12, 2013.
Ebersole, J. L; W. J. Liss, and C. A. Frissell. 2001. Relationship between stream temperatures, thermal
refugia and rainbow trout Oncorhynchus mykiss abundance in aridland streams in the northwestern
United States. Ecology of Freshwater Fish 10:1–10. Available: http://dx.doi.org/10.1034/j.1600-
0633.2001.100101.x. Accessed on 10/19/10.
Ebling and Vinci. 2011. Solids Capture. Recirculating Aquaculture Systems Short Course. Available:
https://ag.arizona.edu/azaqua/ista/ISTA7/RecircWorkshop/Workshop%20PP%20%20&%20Misc%20
Papers%20Adobe%202006/5%20Solids%20Capture/Solids%20Control.pdf. Accessed on July 13,
2014.
EIA (Energy Information Administration). 2009. Energy and the Environment. Greenhouse Gases
Basics. Available:
Final Environmental Impact Statement
Chapter 5 References 5-5
http://tonto.eia.doe.gov/energyexplained/index.cfm?page=environment_about_ghg. Accessed: July
19, 2010.
English, Cindy. Appraisal Tech, Umatilla County Assessment and Taxation Department. 09/06/13 –
Telephone Interview.
Fish Passage Center. 2013. Adult Salmon Annual Totals. Available:
http://www.fpc.org/adultsalmon/adultqueries/Adult_Annual_Totals_Query_form.html. Accessed:
08/26/13.
Flagg, T. A., and C. F. Nash (eds.). 1999. A Conceptual Framework for Conservation Hatchery
Strategies for Pacific Salmonids. U.S. Department of Commerce, National Marine Fisheries Service
NOAA Technical Memorandum NMFS-NWFSC-38. 54 pp.
Ford, M.J. 2002. Selection in captivity during supportive breeding may reduce fitness in the wild.
Conservation Biology 16:815-825.
Fowler, R. T. 2004. The recovery of benthic invertebrate communities following dewatering in two
braided rivers. Hydrobiologia 523(1):17–28.
Gallinat, M. P., and L. A. Ross. 2011. Tucannon River Spring Chinook Salmon Hatchery Evaluation
Program 2010 Annual Report to U.S. Fish and Wildlife Service, Cooperative Agreement 1411-09-
J012. Washington Department of Fish and Wildlife, Olympia, WA.
Gallinat, M. P. and L. A. Ross. 2012. Tucannon River Spring Chinook Salmon Hatchery Evaluation
Program 2011 Annual Report. Prepared by the Washington Department of Fish and Wildlife for the
U.S. Fish and Wildlife Service, Lower Snake River Compensation Plan Office under Cooperative
Agreement: 14110-B-J012. Report # FPA 12-02.
GeoEngineers. 2013. Vegetation Inventory—Kentch Property. (GeoEngineers 2698-011-00). Spokane,
WA. Prepared for Confederated Tribes of the Umatilla Indian Reservation, Pendleton, OR.
Gilbert, Frank T. 1882. Historic Sketches of Umatilla County, Oregon. House of Walling, Portland, OR.
Google Maps. 2013. Washington and Oregon - 2013 Imagery. Available:
https://www.google.com/maps/preview. Accessed: 09/01/13.
Grant, S.W. (editor). 1997. Genetic effects of straying of non-native hatchery fish into natural
populations: Proceedings of the workshop. U.S. Department of Commerce, NOAA Tech. Memo.
NMFS-NWFSC-30. 130 pp.
Hallock, R. J., R. F. Elwell, and D. H. Fry, Jr. 1970. Migrations of adult king salmon Oncorhynchus
tshawytscha in the San Joaquin Delta. California Department of Fish and Game. Fish Bulletin 151.
Available: http://www.sjrdotmdl.org/concept_model/bioeffects_model/documents/Hallock1970.pdf.
Accessed: 11/4/10.
Hammerschmidt, C. R. and W. M. Fitzgerald. 2006. Methylmercury in freshwater fish linked to
atmospheric mercury deposition. Environmental Science and Technology 40(24):7764–7770.
Harsted, D.L., D.A. Larsen, and B.R. Beckman. 2014. Variation in Minijack Rate among Hatchery
Populations of Columbia River Basin Chinook Salmon. Transactions of the American Fisheries
Society, vol. 143, Issue 3. May 2014.
Heintz, R. A., B. D. Nelson, J. Hudson, M. Larsen, L. Holland, and M. Wipfli. 2004. Marine subsidies in
freshwater: Effects of salmon carcasses on lipid class and fatty acid composition of juvenile coho
salmon. Transactions of the American Fisheries Society 133:559–567.
Hicks, M. 2000. Evaluating criteria for the protection of aquatic life in Washington’s surface water
quality standards—dissolved oxygen. Draft discussion paper and literature summary. Revised
Walla Walla Basin Spring Chinook Hatchery Program
5-6 Chapter 5 References
December 2002. Pp. 44–46, pg. 76. Washington State Department of Ecology, Pub. No. 00-10-071,
Olympia, WA. Available: http://www.sjrdotmdl.org/concept_model/bio-
effects_model/documents/Hicks2000.pdf. Accessed: 11/4/10.
Hillman, T. W., J. S. Griffith and W. S. Platts. 1987. Summer and winter habitat selection by juvenile
Chinook salmon in a highly sedimented Idaho stream. Transactions of the American Fisheries
Society 116:185–195.
Hooton, R. S. 2001. Facts and Issues Associated with Restricting Terminal Gear Types in the
Management of Sustainable Steelhead Sport Fisheries in British Columbia. Ministry of Environment,
Lands and Parks, Nanaimo, British Columbia. April 2001.
Houghton, R. 2010. Carbon Researcher, The Woods Hole Research Center. Understanding the Carbon
Cycle. Available: http://www.whrc.org/carbon/index.htm. Accessed: January 29, 2010.
Howell, P. J. and P. M. Sankovich. 2012. An evaluation of redd counts as a measure of bull trout
population size and trend. North American Journal of Fisheries Management 32(1):1–13.
HSRG (Hatchery Scientific Review Group). 2004. Hatchery Reform: Principles and Recommendations
of the HSRG. Lars Mobrand (chair), John Barr, Lee Blankenship, Don Campton, Trevor Evelyn, Tom
Flagg, Conrad Mahnken, Robert Piper, Paul Seidel, Lisa Seeb and Bill Smoker. Seattle, WA. April
2004. Available:
pihv021c1.bud.bpa.gov/cifs_user_data_01/Users/aes9611/Desktop/www.hatcheryreform.org.
HSRG. 2009. Columbia River Hatchery Reform System-Wide Report. February 2009. Available:
http://www.hatcheryreform.us).
HSRG et al. 2004. HSRG/Washington Department of Fish and Wildlife/Northwest Indian Fisheries
Commission Technical Discussion Paper #1. Integrated Hatchery Programs.
Humbert-Granger, Cindy. Manager, Humbert Refuse and Recycling. 09/11/13 – Telephone Interview.
ICF International. 2014. Temperature Modeling Technical Report for the Walla Walla Basin Spring
Chinook Hatchery Project. Prepared For: Bonneville Power Administration. Portland, OR. July
2014.
ICF International. 2018. Temperature Modeling Technical Report for the Walla Walla Basin Spring
Chinook Hatchery Project. Prepared For: Bonneville Power Administration. Portland, OR. March
2018.
ICTRT (Interior Columbia Basin Technical Recovery Team). 2007. Viability Criteria for Application to
Interior Columbia Basin Salmonid ESUs.
IHOT (Integrated Hatchery Operations Team). 1995. Policies and Procedures for Columbia Basin
Anadromous Salmonid Hatcheries. Prepared for Bonneville Power Administration, Portland, OR.
Intergovernmental Panel on Climate Change (IPCC). 2014a. Summary for Policymakers. In: Climate
Change 2014, Mitigation of Climate Change. Contribution of Working Group III to the Fifth
Assessment Report of the Intergovernmental Panel on Climate Change [Edenhofer, O., R. Pichs-
Madruga, Y. Sokona, E. Farahani, S. Kadner, K. Seyboth, A. Adler, I. Baum, S. Brunner, P.
Eickemeier, B.Kriemann, J. Savolainen, S. Schlomer, C. von Stechow, T. Zwickel and J.C. Minx
(eds.)]. Cambridge University Press, Cambridge, United Kingdom and New York, NY, USA.
IPCC. 2014b: Climate Change 2014: Synthesis Report. Contribution of Working Groups I, II and III to
the Fifth Assessment Report of the Intergovernmental Panel on Climate Change [Core Writing Team,
R.K. Pachauri and L.A. Meyer (eds.)]. IPCC, Geneva, Switzerland.
Isaacs, F. B. 2011. Golden eagles (Aquila chrysaetos) nesting in Oregon, 2011. 1st Annual Report,
Revised, 16 April 2012. Oregon Eagle Foundation, Inc., Klamath Falls, OR.
Final Environmental Impact Statement
Chapter 5 References 5-7
ISAB (Independent Scientific Advisory Board). 2007. Climate Change Impacts on Columbia River
Basin Fish and Wildlife. ISAB Climate Change Report, ISAB 2007-2. May 11, 2007.
James, Gary. 2011. Fisheries Program Manager, CTUIR Department of Natural Resources. Presentation
to Future of Our Salmon Conference, June 1 and 2, 2011. Available: http://www.salmonforall.org.
James, Gary. Fisheries Program Manager, CTUIR Department of Natural Resources. 09/03/13 and
10/17/13 – Telephone Interviews.
Jennings, Richard, Senior Planner, Umatilla County Planning Department. Phone conversation with
Austin Rempel, ECONorthwest on September 3, 2013.
Karl, Thomas R., Jerry M. Melillo, and Thomas C. Peterson, (eds.). 2009. Global Climate Change
Impacts in the United States. Cambridge University Press.
Kessavalou, A, J.W. Doran, A.R. Mosier, R.A. Drijber. 1998. Greenhouse Gas Fluxes Following Tillage
and Wetting in a Wheat-fallow Cropping System. Journal of Environmental Quality 27:1105–1116.
Kohler, A. E., T. N. Pearsons, J. S. Zendt, M. G. Mesa, C. L. Johnson, and P. J. Connolly. 2012.
Nutrient enrichment with salmon carcass analogs in the Columbia River basin, USA: A stream food
web analysis. Transactions of the American Fisheries Society 141:802–824.
Kohler, A. E., P. C. Kusnierz, T. Copeland, D. A. Venditti, L. Denny, J. Gable, B. A. Lewis, R. Kinzer,
B. Barnett, and M. S. Wipfli. 2013. Salmon-mediated nutrient flux in selected streams of the
Columbia River basin, USA. Canadian Journal of Fisheries and Aquatic Sciences 70:502–512.
Koski, K Victor. 1966. The survival of coho salmon (Oncorhynchus kisutch) from egg deposition to
emergence in three Oregon coastal streams. Master's thesis, Oregon State University. 98 pp.
Available http://www.krisweb.com/biblio/gen_osu_koski_1966_ms.pdf.
Kramer D. L. 1987. Dissolved oxygen and fish behavior. Environmental Biology of Fishes 18:81–92.
http://dx.doi.org/10.1007/BF00002597. Accessed: 10/19/10.
Ladd, Mike, Regional Water Master, Oregon Water Resources Department. Phone conversation with
Kim Marcotte, ICF. November 27, 2013.
Ladd, Mike. Regional Water Master, Oregon Water Resources Department. Email July 21,2014.
Ladd, Mike. Regional Water Master, Oregon Water Resources Department. Email to Gerald
McClintock, Project Manager, BPA. September 3, 2015.
Leopold, Luna B., M.G. Wolman, and J.P. Miller. 1964. Fluvial Processes in Geomorphology, San
Francisco, W.H. Freeman and Co. 522 pp.
Lessard, J. L. and R. W. Merritt. 2006. Influence of marine-derived nutrients from spawning salmon on
aquatic insect communities in southeast Alaskan streams. Oikos 113:334–343.
Leynen, M., L. Duvivier, P. Girboux, and F. Ollevier. 1998. Ecotoxicology and Environmental Safety.
October. 41(2): pages 176-179.
LHSFNA (Laborer’s Health and Safety Fund for North America). 2009. LHSFNA website.
http://www.lhsfna.org/index.cfm.
Lovrak, Jon. Umatilla Hatchery Satellite Facilities Operations and Maintenance Project Leader,
Confederated Tribes of the Umatilla Indian Reservation, Department of Natural Resources. In person
meeting and email correspondence with Matt Kuziensky of ICF International on existing weed
control program at South Fork Walla Walla facility. September 9 through 16, 2013.
Mahoney, B. D., M. Lambert, P. Bronson, J. Olsen, and J. Schwartz. 2008. Walla Walla Natural
Production Monitoring and Evaluation Project: FY 2006 Annual Report. Prepared by the
Walla Walla Basin Spring Chinook Hatchery Program
5-8 Chapter 5 References
Confederated Tribes of the Umatilla Indian Reservation and Walla Walla Community College for the
Bonneville Power Administration, Project No. 2000-039-00. Contract Numbers 33613.
Mahoney, B. D., G. Mendel, M. Lambert, J. Trump, J. Olsen, P. Bronson, M. Gembala, and M. Gallinat.
2009. Walla Walla Subbasin Monitoring and Evaluation Project: 2007 and 2008 Annual Report.
Prepared by the Confederated Tribes of the Umatilla Indian Reservation and Washington Department
of Fish and Wildlife, Report for the Bonneville Power Administration, Project No. 2000-039-00.
Contract Numbers 33613, 33657, 36928, 37130, 26471 & 25722.
Mahoney, B. D., G. Mendel, R. Weldert, J. Trump, J. Olsen, M. Gembala, M. Gallinat and L. Ross. 2011.
Walla Walla Subbasin Monitoring and Evaluation Project: 2009 and 2010 Annual Report. Prepared
by the Confederated Tribes of the Umatilla Indian Reservation and Washington Department of Fish
and Wildlife, Report for the Bonneville Power Administration, Project No. 2000-039-00. Contract
Numbers 33613, 33657, 36928, 37130, 26471 & 25722.
Martin, S. W., M. A. Schuck, K. Underwood, and A. T. Scholz. 1992. Investigations of Bull Trout
(Salvelinus confluentus), Steelhead Trout (Oncorhynchus mykiss), and Spring Chinook Salmon (0.
tshawytscha) Interactions in Southeast Washington Streams – 1991 Annual Report. Prepared by the
Eastern Washington University Department of Biology and the Washington Department of Wildlife
for the Bonneville Power Administration. Project No. 90-53, Contract No. DE-BI79-91BP17758.
206 pp.
Marshall, Alan G. 1977. Nez Perce Social Groups: An Ecological Interpretation. Unpublished Ph.D.
dissertation, Department of Anthropology, Washington State University, Pullman, WA.
McCullough, D., S. Spaulding, D. Sturdevant, and M. Hicks. 2001. Summary of Technical Literature
Examining the Physiological Effects of Temperature on Salmonids. Issue Paper 5. EPA Region 10
Temperature Water Quality Criteria Guidance Development Project. U.S. Environmental Protection
Agency Report EPA-910-D-01-005. May 2001.
McMichael, G. A., T. N. Pearsons and S. A. Leider. 1999. Behavioral interactions among hatchery‐reared steelhead smolts and wild Oncorhynchus mykiss in natural streams. North American Journal
of Fisheries Management 19:948–956.
McMillen, LLC. 2011. Walla Walla Hatchery Pre-Design Engineering Support – Final Pre-Design
Report. Bonneville Power Administration/CTUIR.
McMillen, LLC. 2013. Calculations of Formalin Use and Resulting Concentrations in Effluent.
Provided to ICF by McMillen, LLC.
McMillen, Mort, P.E. and Mark Reiser, P.E. 2013. Senior project managers for SFWW Hatchery design
engineers McMillen, LLC. Technical Memorandum B1 - Draft Incubation and Rearing Alternatives
to Jay Marcotte, BPA. August 8, 2013.
Melillo, J.M., T.C. Richmond, and G.W. Yohe, Eds. 2014. Highlights of Climate Change Impacts in the
United States: The Third National Climate Assessment. U.S. Global Change Research Program,
148 pp.
Mendel, G., C. Fulton and R. Weldert. 2003. An Investigation Into the Migratory Behavior of Bull Trout
(Salvelinus confluentus) in the Touchet River Basin. Prepared for the U.S. Fish and Wildlife Service
by the Washington Department of Fish and Wildlife.
Mendel, G., J. Trump, M. Gembala, S. Blankenship, and T. Kassler. 2007. Assessment of Salmonids and
Their Habitat Conditions in the Walla Walla River Basin within Washington: 2006 Annual Report.
Prepared by the Washington Department of Fish and Wildlife for the Bonneville Power
Administration. Project Number 199802000, Contract Number 00021599.
Final Environmental Impact Statement
Chapter 5 References 5-9
Mendel, Glen. District Fish Biologist, Washington Department of Fish and Wildlife (WDFW). 10/18/13
– Telephone Interview.
Merz, J. E. and P. B. Moyle. 2006. Salmon, wildlife, and wine: marine-derived nutrients in human-
dominated ecosystems of central California. Ecological Applications 16(3):999–1009.
Miller, A. M., and S. W. Golladay. 1996. Effects of spates and drying on macroinvertebrate assemblages
of an intermittent and a perennial prairie stream. Journal of the North American Benthological
Society 15(4):670–689.
Miller, Carey L. 2013. Archaeological Testing for the Proposed Hatchery at the Adult Holding and
Spawning Facility along the South Fork Walla Walla River, Umatilla County, Oregon. Report
prepared for the CTUIR Fisheries Program and Bonneville Power Administration. Confederated
Tribes of the Umatilla Indian Reservation, Pendleton, OR. November 19, 2013.
Miller, S. W., D. Wooster, and J. Li. 2007. Resistance and resilience of macroinvertebrates to irrigation
water withdrawals. Freshwater Biology 52:2494–2510.
Missildine, B. 2005. Polychlorinated Biphenyl Concentrations in Adult Chinook Salmon (Oncorhynchus
tshawytscha) Returning to Coastal and Puget Sound Hatcheries. Master’s thesis. Evergreen State
College, Olympia, WA. February 2005.
Mongillo, P. E. 1984. A Summary of Salmonid Hooking Mortality. Washington Department of Game,
Fish Management Division. Olympia, WA.
Mongillo, P. E., and M. Hallock. 1998. Washington State Status Report for the Margined Sculpin.
Olympia, Washington, Washington Department of Fish and Wildlife. September. 15 pp.
Mote, P., A. K. Snover, S. Capalbo, S. D. Eigenbrode, P. Glick, J. Littell, R. Raymondi, and S. Reeder.
2014. Ch. 21: Northwest. Climate Change Impacts in the United States: The Third National Climate
Assessment, J. M. Melillo, T.C. Richmond, and G. W. Yohe, Eds., U.S. Global Change Research
Program, 487-513. doi:10.7930/J04Q7RWX.
Moulton, Gary E. (editor). 1991. The Journals of the Lewis and Clark Expedition: March 23-June 9,
1806. University of Nebraska Press, Lincoln, NE.
Naiman, R. J., R. E. Bilby, D. E. Schindler, and J. M. Helfield. 2002. Pacific salmon, nutrients, and the
dynamics of freshwater and riparian ecosystems. Ecosystems 5:399–417.
NMFS (National Marine Fisheries Service). 2000. Guidelines for Electrofishing Waters Containing
Salmonids Listed Under the Endangered Species Act. Portland, Oregon and Santa Rosa, California.
June. U.S. Department of Commerce, NOAA Southwest Fisheries Science Center. Available:
http://www.nwr.noaa.gov/ESA‐Salmon‐Regulations‐Permits/4d‐Rules/upload/electro2000.pdf.
NMFS. 2009. Middle Columbia River Steelhead Distinct Population Segment ESA Recovery Plan.
Prepared by the U.S. Department of Commerce, National Marine Fisheries Service Northwest
Region. 260 pp. + Appendices.
NMFS. 2011a. Effects of Hatchery Programs on Salmon and Steelhead Populations: Reference
Document for NMFS ESA Hatchery Consultations. March 7, 2011. NMFS Northwest Regional
Office, Salmon Management Division. Portland, OR. 50 pp.
Walla Walla Basin Spring Chinook Hatchery Program
5-10 Chapter 5 References
NMFS. 2011b. Endangered Species Act (ESA) Section 7(a)(2) Biological Opinion and Magnuson-
Stevens Fishery Conservation and Management Act Essential Fish Habitat (EFH) Consultation:
Umatilla River Spring Chinook Salmon, Fall Chinook Salmon, and Coho Salmon Hatchery Programs.
NMFS Consultation Number: 2010/06511. Action Agencies (sic): Bonneville Power Administration.
Program Operators: Confederated Tribes of the Umatilla Indian Reservation, Oregon Department of
Fish and Wildlife. March 15, 2011.
NMFS. 2017. Endangered Species Act (ESA) Section 7(a)(2) Biological Opinion and Magnuson-
Stevens Fishery Conservation and Management Act Essential Fish Habitat (EFH) Consultation:
NOAA’s National Marine Fisheries Service’s implementation of the Mitchell Act Final
Environmental Impact Statement preferred alternative and administration of Mitchell Act hatchery
funding. NMFS Consultation Number: NWR-2014-697.
NMFS. 2018. Endangered Species Act (ESA) Section 7(a)(2) Biological Opinion and Magnuson-
Stevens Fishery Conservation and Management Act Essential Fish Habitat (EFH) Consultation, Mid-
Columbia River Steelhead and Spring Chinook Salmon Hatchery programs. NMFS Consultation
Number: WCR-2017-7615.
NPCC (Northwest Power and Conservation Council). 2006. Three-Step Review Process. Document
2006-21. November 2006.
NRCS (Natural Resources Conservation Service). 2013. Web Soil Survey.
http://websoilsurvey.nrcs.usda.gov/app/HomePage.htm. Accessed June 2013.
ODA (Oregon Department of Agriculture). 2013a. Noxious Weed Policy and Classification System—
2013. Oregon Department of Agriculture, Noxious Weed Control Program. Salem, OR.
ODA. 2013b. Noxious Weed List and Plant Profiles. Available:
http://www.oregon.gov/ODA/PLANT/WEEDS/Pages/statelist2.aspx. Accessed: September 9, 2013.
ODEQ (Oregon Department of Environmental Quality). 1995. Temperature: 1992-1994 Water quality
standards review. Final Issue Paper. 122pp. Available:
http://www.deq.state.or.us/wq/standards/temperature.htm.
ODEQ. 2005. Walla Walla Subbasin Stream Temperature Total Maximum Daily Load and Water
Quality Management Plan. August 2005.
ODEQ. 2007. General Permit, National Pollutant Discharge Elimination System, Waste Discharge
Permit. http://www.deq.state.or.us/wq/wqpermit/docs/general/npdes300j/permit.pdf.
ODEQ. 2012a. Walla Walla Basin in Oregon: Temperature TMDL Fact Sheet . 05-ER-004. Available:
http://www.deq.state.or.us/wq/pubs/factsheets/tmdls/wallawalla.pdf. Accessed: September 19, 2013.
Last updated February 29, 2012.
ODEQ. 2017. Nonattainment Areas. Available: http://www.oregon.gov/deq/aq/Pages/Nonattainment-
Areas.aspx. Accessed on November 21, 2017.
ODEQ. 2013. Water Quality Assessment Database, Clean Water Act Water Quality Assessment,
Oregon’s 2010 Integrated Report. Database download for the Walla Walla subbasin. Available:
http://www.deq.state.or.us/wq/assessment/rpt2010/search.asp#db. Data downloaded on September
23, 2013.
ODEQ. 2014. Oregon’s Nutrient Management Program, Aron Borok, Water Quality Standards
Specialist. June 2014. Available:
http://www.deq.state.or.us/wq/standards/docs/NutrientManagementReport.pdf
ODEQ. 2015. 2014 Oregon Air Quality Data Summaries. Available:
http://www.deq.state.or.us/aq/forms/aqdatasum2014.pdf
Final Environmental Impact Statement
Chapter 5 References 5-11
ODFW (Oregon Department of Fish and Wildlife). 2008a. Oregon Department of Fish and Wildlife
Sensitive Species: Frequently Asked Questions and Sensitive Species List Organized by Taxon.
Available: http://www.dfw.state.or.us/wildlife/diversity/species/docs/SSL_by_taxon.pdf. Accessed:
December 12, 2013.
ODFW. 2008b. Oregon Guidelines for Timing of In-Water Work to Protect Fish and Wildlife Resources.
Available:
http://www.dfw.state.or.us/lands/inwater/Oregon_Guidelines_for_Timing_of_%20InWater_work200
8.pdf. Accessed: December 12, 2013.
ODFW and CTUIR. 2011. Hatchery and Genetic Management Plan for the Umatilla Spring Chinook
Program. Operated by ODFW and CTUIR. Funded by Bonneville Power Administration.
Approved on April 20, 2011.
O’Neil S. M., J. E. West, and J. C. Hoeman. 1998. Spatial Trends in the Concentration of
Polychlorinated Biphenyls (PCBs) in Chinook (Oncorhynchus Tshawytscha) and Coho Salmon (O.
Kisutch) in Puget Sound and Factors Affecting PCB Accumulation: Results from the Puget Sound
Ambient Monitoring Program. In: R. Strickland (ed). Puget Sound Research ’98 Proceedings.
Seattle, WA: Puget Sound Water Quality Action Team.
Oregon Biodiversity Information Center. http://orbic.pdx.edu. Accessed: Sept. 24, 2013.
Oregon Department of Revenue. 2013a. Oregon Property Tax Statistics: Fiscal Year 2012-2013.
Available: http://www.oregon.gov/dor/STATS/docs/303-405-13/property-tax-stats_303-405_2012-
13.pdf. Accessed: 09/02/13.
Oregon Department of Revenue. 2013b. Oregon Personal Income Tax Statistics: Characteristics of
Filers 2013 Edition, Tax Year 2011. Available: http://www.oregon.gov/dor/PERTAX/docs/or-
personal-income-tax-2011-statistics_101-406_2013.pdf. Accessed: 09/02/13.
Oregon Department of Revenue. 2013c. Oregon Corporate Excise Tax and Income Tax: Characteristics
of Corporate Tax Payers: 2012 Edition. Available: http://www.oregon.gov/dor/BUS/docs/corporate-
excise-income_102-405_2012.pdf. Accessed: 09/02/13.
Oregon Department of Revenue. 2013d. Oregon's State Transient Lodging Tax: Program Description,
Revenue, and Characteristics of Taxpayers, Calendar Years 2004-2012. Available:
http://www.oregon.gov/dor/STATS/docs/state-lodging-report_604-005_2013.pdf. Accessed:
09/02/13.
OWRD (Oregon Water Resources Department). 2013a. Water Resource Department Water Availability
Detailed Analysis Report. Available:
http://apps.wrd.state.or.us/apps/wars/wars_display_wa_tables/display_wa_complete_report.aspx?ws_
id=70564&exlevel=80&scenario_id=1. Accessed: September 11, 2013.
OWRD. 2013b. Water Rights Information Query. Available:
http://apps.wrd.state.or.us/apps/wr/wrinfo/default.aspx. Accessed: September 26, 2013.
OWRD. 2013c. Statistical Summary of monthly flows for gage 14010000, 2000-2012. Available:
http://apps.wrd.state.or.us/apps/sw/hydro_report/gage_summary.aspx?station_nbr=14010000&start_d
ate=1/1/2000&end_date=9/30/2012&tolerance=0&fdcCase=usgs&record_status=PUB.
Quinn T. P. and N. P. Peterson. 1996. The influence of habitat complexity and fish size on over-winter
survival and growth of individually marked juvenile coho salmon (Oncorhynchus kisutch) in Big Beef
Creek, Washington. Canadian Journal of Fisheries and Aquatic Sciences 53:1555–1564.
Parker, P.L. and T.F. King. 1998. Guidelines for Evaluating and Documenting Traditional Cultural
Properties. Revised. National Register Bulletin 38. U.S. Department of the Interior, National Park
Service: National Register, History, and Education Division. Washington, D.C.
Walla Walla Basin Spring Chinook Hatchery Program
5-12 Chapter 5 References
Piper, R., I. McLain, L. Orem, J. McCarran, L. Fowler, and J. Leonard. 1982. Fish Hatchery
Management. United States Department of Interior, Fish and Wildlife Service, Washington D.C.
Reiser, Mark. 2013a. Senior project manager for SFWW Hatchery design engineers McMillen LLC,
Email communication with Erin Healy, ICF International. September 24, 2013.
Reiser, Mark. 2013b. Senior project manager for SFWW Hatchery design engineers McMillen LLC,
Email communication with Erin Healy, ICF International. October 2, 2013.
Reiser, Mark. 2013c. Email to Kim Marcotte, ICF, regarding the Alternatives Memo. November 11,
2013.
Roberts, Lee W. n.d. Pioneer Doctor Gave Name to Blalock Lake, Mountain. Electronic document,
http:www.museum.bmi.net/Pioneer%20Trails/Blalock%20Saw%20Mills.htm. Accessed November
14, 2013.
Shephard, Burt, Andrea LaTier, and Catherine Gockel. 2015. NPDES General Permit WAG130000
Federal Aquaculture Facilities and Aquaculture Facilities Located in Indian Country within the
Boundaries of Washington State, Biological Evaluation For Endangered Species Act Section 7
Consultation with the National Marine Fisheries Service and the U.S. Fish and Wildlife Service.
EPA. Available: https://www.epa.gov/sites/production/files/2017-09/documents/r10-npdes-
washington-aquaculture-gp-wag130000-biological-evaluation-2015.pdf
Snake River Salmon Recovery Board. 2011. Draft Snake River Salmon Recovery Plan for Southeast
Washington. Prepared for Washington Governor’s Salmon Recovery Office.
Scheeler, Carl. 2017. Avian Nest Survey of Walla Walla Hatchery Site Project # 2000-038-00. Memo to
Brian Zimmerman, Fish Passage/Artificial Production Supervisor, CTUIR, December 20, 2017.
Schwartz, J.D.M., P. Kissner, M. Lambert, B.D. Mahoney & C. Contor. 2005. Walla Walla Basin
Natural Production Monitoring and Evaluation Project Progress Report, 2003. In: C.T.U.I.R (ed.)
report submitted to Bonneville Power Administration, Project No. 2000-039-00.
Scott, Andrew, Biologist, and Mark Reiser, Senior Project Manager, McMillen, LLC. 2014.
Memorandum to Jay Marcotte, Bonneville Power Administration on January 22, 2014 regarding
South Fork Walla Walla–CTUIR Hatchery Water Quality Data Collection.
Spence, B. C., G. A. Lominicky, R. M. Hughes, and R. P. Novitski. 1996. An Ecosystem Approach to
Salmonid Conservation. Prepared by ManTech Environmental Research Services Corp. TR-4501-96-
6057.
SPF Water Engineering. Memorandum from Terry M. Scanlan and Kevin Boggs to Mort McMillen of
McMillen LLC, on September 27, 2010.
Starcevich, S. J., P. J. Howell, S. E Jacobs and P. M. Sankovich. 2012. Seasonal movement and
distribution of fluvial adult bull trout in selected watersheds in the Mid-Columbia River and Snake
River basins. PLoS ONE 7(5):e37257.
Strobel, B., D. R. Shively, and B. B. Roper. 2009. Salmon carcass movements in forest streams. North
American Journal of Fisheries Management 29:702–714.
Final Environmental Impact Statement
Chapter 5 References 5-13
Summerfelt, S. T. and B. J. Vinci. 2009. Better Management Practices for Recirculating Aquaculture
Systems. In: Environmental Best Management Practices for Aquaculture (eds C. S. Tucker and J. A.
Hargreaves), Wiley-Blackwell, Oxford, UK. doi: 10.1002/9780813818672.ch10.
Summerfelt, Steven and Brian Vinci. Unpublished data. Ozonation and UV Disinfection. Available:
https://ag.arizona.edu/azaqua/ista/ISTA7/RecircWorkshop/Workshop%20PP%20%20&%20Misc%20
Papers%20Adobe%202006/9%20Ozone%20&%20UV/Ozonation%20UV%20Disinfection.pdf.
Accessed: July 24, 2014.
Swindell, Edward G., Jr. 1942. Report on Source, Nature, and Extent of the Fishing, Hunting, and
Miscellaneous Related Rights of Certain Indian Tribes in Washington and Oregon, Together with
Affidavits Showing Locations of a number of Usual and Accustomed Fishing Grounds and Stations.
United States Department of the Interior, Office of Indian Affairs, Division of Forestry and Grazing,
Los Angeles, CA.
Table Rock Analytical Laboratory. 2013. Turbidity Sample Results for Job Number 13091K. Pendleton,
OR.
Tappel, P.D., and T.C. Bjornn. 1983. A new method of relating size of spawning gravel to salmonid
embryo survival. North American Journal of Fisheries Management 3:123-135.
Timmons, M. B., and J. M. Ebeling. n.d. Culture Tank Design. Available:
http://ag.arizona.edu/azaqua/ista/ISTA7/RecircWorkshop/Workshop%20PP%20%20&%20Misc%20
Papers%20Adobe%202006/4%20Culture%20Tank%20Design/Culture%20Tank%20Design.pdf.
Accessed: July 21, 2014.
Umatilla County. 2005. Umatilla County Community Wildfire Protection Plan. Available:
http://www.oregon.gov/odf/fire/umatillablue.pdf. Accessed: 09/03/13.
Umatilla County. 2013a. Umatilla County Weed Control Page. Available:
http://www.co.umatilla.or.us/weed.htm. Accessed: August 9, 2013.
Umatilla County. 2013b. Umatilla County Noxious Weed List. Available:
http://www.co.umatilla.or.us/weed.htm. Accessed: August 9, 2013.
Umatilla County Planning Department. 1983. Umatilla County Comprehensive Plan, Amended. May
1983. Pendleton, OR.
Underwood, K., S. Martin, M. Schuck, and A. Scholz. 1995. Investigations of Bull Trout (Salvelinus
confluentus), Steelhead Trout (Oncorhynchus mykiss), and Spring Chinook Salmon (O. tshawytscha)
Interactions in Southeast Washington Streams. Prepared by Eastern Washington University and the
Washington Department of Fish and Wildlife for the Bonneville Power Administration. Project No.
1990-05300, BPA Report DOE/BP-17758-2, 186 electronic pages.
USACE (U.S. Army Corps of Engineers). 1987. Field Guide for Wetland Delineation: 1987 Corps of
Engineers Manual. Technical Report.
USACE. 1997. Reconnaissance Report – Walla Walla River Watershed. U.S. Army Corps of Engineers,
Walla Walla District, Walla Walla, WA.
USBEA (U.S. Bureau of Economic Analysis). Regional Economic Accounts, BEARFACTS (Accessed
August 23, 2013).
U.S. Census Bureau. 2010. 2010 American Community Survey. Available: http://factfinder2.census.gov.
Accessed: 09/04/13.
U.S. Census Bureau. 2010a. 2006-2010 American Community Survey, Table B17021: Poverty Status Of
Individuals In The Past 12 Months; Population for whom poverty status is determined – Block Group
3, Census Tract 9501, Umatilla County, Oregon; Block Group 4, Census Tract 9501, Umatilla
Walla Walla Basin Spring Chinook Hatchery Program
5-14 Chapter 5 References
County, Oregon; Umatilla County, Oregon; Oregon State, Oregon. Data Set: American Community
Survey 2006-2010.
U.S. Census Bureau. 2010b. 20062010 American Community Survey American Indian and Alaska
Native Tables, Table DP03: Selected Economic Characteristics - Confederated Tribes of the Umatilla
Indian Reservation tribal grouping alone or in any combination (K97K99) & (100299) or (300,
A01Z99) or (400999). Data Set: American Community Survey 20062010 American Indian and
Alaska Natives. Available: http://factfinder2.census.gov. Accessed: 09/02/13.
U.S. Census Bureau. 2010c. 2010 Decennial Census, Table DP-1: Profile of General Population and
Housing Characteristics—Milton-Freewater city, Oregon; Umatilla County, Oregon. Data Set:
Census 2010 Summary File 1. Available: http://factfinder2.census.gov. Accessed: 09/02/13.
U.S. Census Bureau. 2010d. 2010 Decennial Census, Table P1: TOTAL POPULATION; Total
population — Milton-Freewater city, Oregon; Pendleton city, Oregon; Kennewick city, Washington;
Pasco city, Washington; Richland city, Washington; Walla Walla city, Washington; Umatilla County,
Oregon. Data Set: Census 2010 Summary File 1. Available: http://factfinder2.census.gov.
Accessed: 09/02/13.
U.S. Census Bureau. 2013. 2006-2010 American Community Survey. Selected Economic
Characteristics, American Community Survey American Indian and Alaska Natives. Available:
http://factfinder2.census.gov. Accessed: 09/02/13.
USDA (U.S. Department of Agriculture). 2012. Federal Noxious Weed List. Updated February 1, 2012.
Available: http://www.aphis.usda.gov/plant_health/plant_pest_info/weeds/downloads/weedlist.pdf.
Accessed: September 9, 2013.
USDA. 2013. Plant Health—Noxious Weed Program. Available:
http://www.aphis.usda.gov/plant_health/plant_pest_info/weeds/. Accessed: September 11, 2013.
USEPA (U.S. Environmental Protection Agency). 1999. EPA Guidance Manual, Alternative
Disinfectants and Oxidants. Chapter 3: Ozone; Chapter 8: Ultraviolet Radiation. Available:
http://water.epa.gov/lawsregs/rulesregs/sdwa/mdbp/upload/2001_01_12_mdbp_alter_chapt_8.pdf and
chapt_3.pdf. Accessed: October 28, 2013.
USEPA. 2002. Columbia River Basin Fish Contaminant Survey 1996–1998. Seattle, WA: US EPA.
Report 910-R-02-006.
USEPA. 2012. Section 5.2 Biological Oxygen Demand and Dissolved Oxygen. Available:
http://water.epa.gov/type/rsl/monitoring/vms52.cfm. Accessed: July 23, 2014.
USEPA. 2016a. Climate Change Indicators: Greenhouse Gases. Available:
https://www.epa.gov/climate-indicators/greenhouse-gases.
USEPA. 2016b. Climate Change Indicators: Atmospheric Concentrations of Greenhouse Gases.
Available: https://www.epa.gov/climate-indicators/climate-change-indicators-atmospheric-
concentrations-greenhouse-gases.
USEPA. 2017a. Greenhouse Gas Equivalencies Calculator. Available:
https://www.epa.gov/energy/greenhouse-gas-equivalencies-calculato. Accessed on November 21,
2017.
USEPA. 2017b. Center for Corporate Climate Leadership Simplified GHG Emissions Calculator. Last
updated January 2017. Available: https://www.epa.gov/climateleadership/center-corporate-climate-
leadership-simplified-ghg-emissions-calculator. Accessed on November 21, 2017.
USFDA (U.S. Food and Drug Administration). 1995. Environmental Risk Assessment for the Use of
Formalin in the Control of External Parasites on Fish. January.
Final Environmental Impact Statement
Chapter 5 References 5-15
USFDA. 2014. Approved Animal Drug Products (Green Book). Section 2 – Active Ingredients.
Available:
http://www.fda.gov/downloads/AnimalVeterinary/Products/ApprovedAnimalDrugProducts/UCM042
860.pdf. Accessed February 12, 2014.
USFWS (U.S. Fish and Wildlife Service). 2002a. Umatilla-Walla Walla Rivers recovery unit, Oregon.
Chapter 10 in U.S. Fish and Wildlife Service, Bull Trout (Salvelinus confluentus) Draft Recovery
Plan. Portland, OR. 153 pp. Available: http://www.fws.gov/pacific/bulltrout/recovery.html.
USFWS. 2002b. Snake River Washington recovery unit. Chapter 24 in U.S. Fish and Wildlife Service,
Bull Trout (Salvelinus confluentus) Draft Recovery Plan. Portland, OR. 134 pp. Available:
http://www.fws.gov/pacific/bulltrout/recovery.html.
USFWS. 2010. Best Management Practices to Minimize Adverse Effects on Pacific Lamprey.
USFWS. 2012. Invasive Species Laws and Regulations. Available:
http://www.fws.gov/invasives/laws.html. Accessed: September 11, 2013.
USFWS. 2013. National Wetland Inventory. http://www.fws.gov/wetlands/Data/Mapper.html.
Accessed June 2013.
USFWS. 2017. Official Species List for Proposed WW Hatchery Program Facilities - Umatilla
Co. Consultation Code: 01EOFW00-2018-SLI-0061, Event Code: 01EOFW00-2018-E-
00121. Provided by Oregon Fish and Wildlife Office, Portland, OR. October 31, 2017.
USGCRP (United States Global Change Research Program). 2009. Global Climate Change Impacts in
the United States. National Oceanic and Atmospheric Administration (Lead Agency), Washington,
D.C., 2009. Available: http://www.globalchange.gov/usimpacts.
USGS (U.S. Geological Survey). 2017. Results of BISON database search for yellow-billed cuckoo.
Available: https://bison.usgs.gov/#home. Accessed: October 31, 2017.
Van Cleave, R. and R. Ting. 1960. The condition of salmon stocks in the John Day, Umatilla, Walla
Walla, Grande Ronde, and Imnaha Rivers as reported by various fisheries agencies. Available from
University of Washington Library, Seattle, WA.
Walker, Dewaard. 1971. American Indians of Idaho, Vol. I. University of Idaho, Moscow, ID.
Walla Walla Basin Watershed Council. 2009. Flow Restoration: Water in the Walla Walla River.
Available: http://www.wwbwc.org/index.php?option=com_content&view
=article&id=118&catid=40&Itemid=121. Accessed: September 13, 2013.
Walla Walla County and the Walla Walla Basin Watershed Council. 2004. Walla Walla Subbasin Plan.
Prepared for the Northwest Power and Conservation Council. May 2004. Available:
http://www.nwcouncil.org/fw/subbasinplanning/wallawalla/plan.
Walla Walla Watershed Flow Study Steering Committee. 2017. Walla Walla Basin Integrated Flow
Enhancement Study. Prepared for: Office of Columbia River, Washington Department of Ecology.
Submitted by: Walla Walla Watershed Management Partnership. November 2017.
Ward, B. R. and P. A. Slaney. 1988. Life history and smolt-to-adult survival of Keogh River steelhead
trout (Salmo gairdneri) and the relationship to smolt size. Canadian Journal of Fisheries and
Aquatic Sciences 45:1110–1122.
Washington State Department of Revenue. 2010. Walla Walla City Tourism Promotion Area Lodging
Charge Rate Change. Available:
http://dor.wa.gov/Docs/Pubs/SpecialNotices/2010/sn_10_WallaWallaTPA.pdf. Accessed: 09/07/13.
Walla Walla Basin Spring Chinook Hatchery Program
5-16 Chapter 5 References
WDFW (Washington Department of Fish and Wildlife). 2012. Yellow-billed Cuckoo (Coccyzus
americanus). Available: http://wdfw.wa.gov/conservation/endangered/species/yellow-
billed_cuckoo.pdf. Accessed: June 5, 2015.
WDOE (Washington Department of Ecology). 2004. Stormwater Management Manual for Eastern
Washington. Prepared by the WDOE Water Quality Program. Publication Number 04-10-076.
September 2004. 715 pp.
WDOE. 2007. Walla Walla River Basin pH and Dissolved Oxygen Total Maximum Daily Load and
Water Quality Improvement Report. Publication No. 07-03-010. June.
WDOE. 2008. Walla Walla Watershed PCBs, Chlorinated Pesticides, Fecal Coliform, Temperature, pH
& Dissolved Oxygen Total Maximum Daily Load – Water Quality Implementation Plan. Washington
Department of Ecology, Water Quality Program. Publication No. 08-10-094. Olympia, WA.
WDOE. 2013a. Water Quality Assessment for Washington. 303(d)/305(b) Integrated Report Viewer.
Online Database. Available: http://apps.ecy.wa.gov/wats/Default.aspx. Accessed: September 27,
2013.
WDOE. 2013b. Water Quality Improvement Project Pataha Creek Area: Multi-Parameter. Available:
http://www.ecy.wa.gov/programs/wq/tmdl/PatahaTMDL.html. Accessed: October 30, 2013.
Weeber, M. A., S. J. Starcevich, S. Jacobs, and P. J. Howell. 2007. Migratory Patterns, Structure,
Abundance, and Status of Bull Trout Populations from Subbasins in the Columbia Plateau and Blue
Mountain Provinces - 2006 Annual Report (March 1, 2006–February 28, 2007). Prepared by the
Oregon Department of Fish and Wildlife and the U.S. Forest Service for the Bonneville Power
Administration. Project Number 199405400. Contract Number 26681.
Willis, Park Weed. 1937. Notes and Documents: Early Recollections and Impressions of Umatilla
County, Oregon. Pacific Northwest Quarterly, vol. 28(3), 301-311. University of Washington,
Seattle, WA.
Wilson, Jesse. 2014. Walla Walla Hatchery Wetland Determination. May 14, 2014.
Wipfli, M. S., J. P. Hudson, and J. P. Caouette. 2004. Restoring productivity of salmon-based food
webs: Contrasting effects of salmon carcass and salmon carcass analog additions on stream-resident
salmonids. Transactions of the American Fisheries Society 133:1440–1454.
WSDOT (Washington State Department of Transportation). 2007. Advanced Training Manual:
Biological Assessment Preparation for Transportation Projects. Available:
pihv021c1.bud.bpa.gov/cifs_user_data_01/Users/aes9611/Desktop/www.wsdot.gov/Environment/Bio
logy/BA/default.htm#BAManual. February 2007.
Young, K. A. 2004. Asymmetric competition, habitat selection, and niche overlap in juvenile salmonids.
Ecology 85:134–149.
Zhang, Y. X., J. N. Negishi, J. S. Richardson, and R. Kolodziejczyk. 2003. Impacts of marine-derived
nutrients on stream ecosystem functioning. Proceedings of the Royal Society of London Series B—
Biological Sciences 270:2117–2123.
Final Environmental Impact Statement
Chapter 6 EIS Preparers and Reviewers 6-1
Chapter 6. List of Preparers
Preparers
Name/Organization/Education/Experience/EIS Contribution
Ken Cherry/ICF International (ICF)/B.A./27 years/editing
Eric Doyle/ICF/M.S./15 years’ experience/fisheries
Chris Earle/ICF/PhD./23 years’ experience/water resources and fisheries
Katey Grange/BPA/12 years’ experience/BS Aquatic and Fisheries Science, Masters in
Environmental and Coastal Management/climate change, contractor oversight
Chad Hamel P.E., P.M.P./BPA/Supervisory Environmental Protection Specialist/MS Civil
Engineering/13 years’ experience/contractor oversight and EIS review
Erin Healy/ICF/M.S./23 years’ experience/water resources
Matt Kuziensky/ICF/M. En./20 years’ experience/invasive plants
Jay Marcotte/BPA/Project Manager/BS Geography/38 years’ experience/project information and
EIS review
Kim Marcotte/ICF/M.S./10 years’ experience/technical review and writing
Stacy Mason/BPA/NEPA Compliance Officer/BS Aquatic Biology/28 years’ experience/EIS
guidance and review
Gerald McClintock/BPA/Civil Engineer/Project Manager/B.S. Civil Engineering/34 years’
experience/project management/design review
Chris Moelter/ICF/M.S./6 years’ experience/socioeconomics and environmental justice
Grant Novak/ICF/M.S. Environmental Sustainability Management, B.S. Marine Fisheries
Biology/12 years’ experience/water temperature model, fish impacts, water quality
Rori Perkins/CRGT, Inc./B.S. Anthropology/11 years’ experience/GIS analysis
Sarah Reich/ECONorthwest/M.A./7 years’ experience/socioeconomics and environmental justice
Austin Remple/ECONorthwest/B.A./1 year experience/socioeconomics and environmental
justice
Eric Rosenblum/Rosenblum Environmental LLC/PhD. Aquatic Toxicology and Environmental
Science/9 years’ experience/water quantity, water quality
Sacha Selim/ICF/B.S./7 years’ experience/GIS
Tom Souhlas/ECONorthwest/M.S./5 years’ experience/socioeconomic impacts (related to
fisheries)
Jesse Wilson/CRGT, Inc./B.S. Biology/9 years’ experience/wetlands
Judith Woodward/MBO Partners/B.A. Geography and Arts & Letters/40 years’
experience/environmental project lead and EIS writer/editor

Final Environmental Impact Statement
Chapter 7 Agencies, Organizations, and Persons Contacted to Receive EIS 7-1
Chapter 7. Agencies, Organizations, and Persons Contacted to Receive EIS
Federal Agencies
Environmental Protection Agency
National Marine Fisheries Service
U.S. Fish and Wildlife Service
U.S. Forest Service, Umatilla National Forest
Bureau of Land Management
U.S. Army Corps of Engineers, Walla Walla District
Bureau of Indian Affairs
State Agencies
Oregon Department of Environmental Quality
Oregon Water Resources Department
Oregon Department of Fish and Wildlife, Bruce
Eddy, Colleen Fagan, Kevin Blakely
Oregon State Parks and Recreation Department
Washington Department of Ecology
Washington Department of Fish and Wildlife, Glen
Mendel
Local Governments
Umatilla County Board of Commissioners
City of Milton-Freewater, Rick Rambo
City of Dayton
City of Pendleton
Milton-Freewater Water Control District
Walla Walla River Irrigation District
M-F Unified School District #7
Milton-Freewater School District #31
Tribes or Tribal Groups
Confederated Tribes of the Umatilla Indian
Reservation
Confederated Tribes and Bands of the Yakama
Nation
Nez Perce Tribe of Idaho
Confederated Tribes of the Warm Springs
Reservation of Oregon
Public Officials
Oregon State Representative Greg Smith District 57
Oregon State Representative Greg Barreto District 58
Oregon State Senator Bill Hansell
U.S. Representative Greg Walden, Oregon
U.S. Senator Ron Wyden, Oregon
U.S. Senator Jeff Merkley, Oregon
Richard Whitman, Natural Resource Policy Advisor,
Office of Governor Kate Brown of Oregon
Steve Martin, Director, Snake River Salmon
Recovery Board
U.S. Senator Patty Murray, Washington
U.S. Senator Maria Cantwell, Washington
U.S. Representative Cathy McMorris Rodgers,
Washington
Educational Institutions
Blue Mt. Community College
Businesses
A & B Asphalt Inc.
Atargatis Strategies Group, LLC
B & M Farms Inc.
Baker Boyer National Bank
Bank of America Oregon
Cayuse Vineyards LLC
Charter Communications
Church of Jesus Christ of Latter-Day Saints
Della I Pettry Conservatorship
Duffco Properties LLC
Eastern Ore. Property Dev. LLC
Freewater Oregon LLC
Horizon Projects Inc.
James Spence Properties Inc.
Jo Wes Construction Inc.
Key Meadowbrook Village LLC
Walla Walla Basin Spring Chinook Hatchery Program
7-2 Chapter 7 Agencies, Organizations, and Persons Contacted to Receive EIS
Mackey Vineyards LLC
Mason Grove Associates
Milton-Freewater & Hudson Bay Irrigation Co.
Milton-Freewater Holdings LLC
Milton-Freewater Post #24 American Legion
Milton-Freewater Orchard Homes Inc.
Morgan Inn Hospitality LLC
Odoms Family LLC
Pendleton Grain Growers Inc.
Qwest Corporation
Roloff Farms Inc.
Sam Lefore Fruit Farms Inc.
Schmidt Limited Partnership
Smith Frozen Foods Inc.
Soper Enterprises LLC
Sunwest Trust, Inc.
The Associates Finance Ser Inc
Upper Columbia Corporation of Seventh Day
Adventist Church
Washington Park Apartments LP
Yeager Properties LLC
Utilities
Milton-Freewater City Light & Power
Umatilla Electric Cooperative
Columbia Rural Electric Association
Interest Groups
Trout Unlimited (ID)
Washington Wildlife Federation (WA)
NW Guides and Anglers Association (OR)
Association of Northwest Steelheaders (OR)
National Wildlife Federation (WA)
Sierra Club, Northwest WA Field Office,
Pacific Coast Fed. of Fishermen's Assoc.
Salmon for All, Oliver Waldman, Program Director;
Bruce Buckmaster
River Network, Wendy Wilson
Liz Woodruff
Native Fish Society (OR, WA)
Native Fish Society, Bill Bakke, Director of Science
and Conservation
Walla Walla Watershed Management Partnership,
Brian Wolcott, Cathy Schaeffer
Media
Confederated Umatilla Journal
East Oregonian
Walla Walla Union-Bulletin
Valley Herald Milton-Freewater
Libraries
Adams Public Library
Athena Public Library
Eastern Washington University Library
Echo Public Library
Helix Public Library
Hermiston Public Library
Milton-Freewater Public Library
Pendleton Public Library
Pilot Rock Public Library
Portland State University, Branford Price Millar
Library
Stanfield Public Library
Ukiah Public Library
Umatilla Public Library
Weston Public Library
Office of Secretary of State, Washington State
Library
Regional Federal Depository Library Coordinator,
Oregon State Library
Individuals
Adler Steven & Medica Gina
Aguilar Lorena & Ocampo Saul
Alejandre Jose G
Alva Francisco F
Alvarez Jorge N & Patricia A
Alvarez Jose & Najera Carmen
Alvarez Refugio & Maria E
Ambriz-Diaz Ramon & Gloria
Final Environmental Impact Statement
Chapter 7 Agencies, Organizations, and Persons Contacted to Receive EIS
Ambriz-Diaz Rogelio
Americh Michael & Gorrell-Americh
Amon Scott D & Debra R
Angel Luis F & Angelina
Arbayo-Morales Jose M
Arbogast Allen J (Le) & Arbogast Colten
Baker Robert & Kimberly
Baker Stanley W
Banek Thomas N & Carolyn A
Bell Jerry & Eloise S
Bell Wallace R
Beyer Suzanne C
Billings Paul & Maxine
Billings Stanley M & Luerna J
Bingman James H
Birdwell Benton & Sharleen
Birdwell Stephen P Jr & Mindy L Jr
Bishop Linda
Bliss Brandon
Boehm Terry W & Linda L
Bolen Romeo & Nevah
Bond Joseph H Jr
Bratton Mary L & Joshua C
Brown Douglas I (Trs)
Brumbach Mike E & Leatrice
Brumbach Tom & Cindy L
Brunot Ronald L & Judy A
Bullock Lance D Et Al
Bullock Loren G & Heather K
Burdick Delores J
Cabral Nancy S
Campbell Scott L & Katherine E
Campos-Diaz Isaias & Ana L
Carson Anita M
Casper Hazel I
Castle Delmer P
Castle Peter M & Barbara A
Cate Roy Jr & Murandalee
Cazares Alfonso & Adela
Ceja Juan Carlos & Luvia Z
Clark Rod E & Sylvia A
Clutter Sherrill G
Combs Kevin T & Sandra M
Connors Nora & Smith Franklin
Corona Miguel & Andrade Delfina
Cortez Jorge Trinidad
Cruzaley Jesus & Maria I
Custer Kittee
Dabulskis Kelly A
Dalgliesh Donald G & Dorothy
Daugherty Bill & Traci L
Davenport Kenneth L &
Davis Gail M & Gail M (Trustee)
Davis John R & Karen
Dee Donna D
Della I Pettry Conservatorship
Demaris Dave
Diaz Arturo & Rafaela
Diaz Audel & Maria C L
Diaz Erasmo Medina & Moreno Maria Ibarra
Diaz Jose & Rosa
Diaz Mariano & Concepcion
Dickson Thomas & Sally
Dodd Margaret
Dorscheimer Patricia Et Al
Duff Aaron R & Katie
Duncan Rebecca E & Howard
Dyer Jeffrey D
Edgerly Ruebon G & Ludyme S
Elliott Larry J
Elsey Joe T & Londo Ashlee M
Ephlin Mary L
Erb James E
Eszler Lana D
Evans Anna M (Le) Evans Donald
Evans Donald & Leonard
Evans Dwayne & Marci
Feliciano Flava C
Flores Antonio & Albertina A
Flores Francisco & Margarita
Flores Norma & Celso
Frazier Joe L & Debora
Free Carol S
Freske Douglas S & Marnie K
Fuentes Pedro B & Maria A
Garcia Antonio & April M
Garcia Antonio Delgado&Delgado Berta D
Garcia Araceli
Walla Walla Basin Spring Chinook Hatchery Program
Chapter 7 Agencies, Organizations, and Persons Contacted to Receive EIS
Garcia Ballesteros & Maria S
Garcia Beth E
Gardner Rebecca A
Garlitz Donald D & Linda K
Garriott Marcene (Trs)
Garton Thelma J
Gay Lynette E
Gilmore Lydia Etal
Gonzalez Eleazar
Gonzalez Hector & Teresa Argueta
Goodwin Gary R & Mary
Graves German & Viramontes Vanessa
Green Gena L & Albert C
Grimaldi Jose G
Grimaldi Juan Pablo & Lorena
Grimes Timothy J & Jennie L
Gutierrez Pedro & Magdalena
Hallmark Parvin L & Ellen M (Trs)
Hamby William Earl & Cynthia Rae
Hammill Stewart A & Vera E
Hann Brian & Allison
Hanrahan Rebecca R
Hansen David A & Deborah K
Hansen Orlin (Trs) & Hansen Mildred (Trs)
Harrington Helen
Harris Sandra K
Harris Sylvia M
Harshfield John & Pauline
Harvey Laurie Marie
Hayes Ronald C & Karen G
Hearn Clara M & Charles
Heine Clayton L & Eva M
Herman Elizabeth
Hernandez Hermino & Eudocia
Hernandez Marco A & Daniela M
Hill Sharon K & Noreen Paul R
Hilling Robert D & Susan L
Hinton Harry & Linda J
Hirsch Karen D
Hodgen Ronald D & Faye E
Hoffmeister Mark G & Monette M
Holderness Timothy
Huber Merrianne
Hudkins John K & Sheila D
Humbert Bob & Humbert Joe
Humbert Boyd & Tonya
Humbert Robert W & Norma P (Trs) (Le)
Huntington William H
Hutchins Robert & Karin
Ibarra Javier M & Josefina M
Ibarra Omar
Jackson Richard A
Jaimes Joaquin E & Martha M
Jensen Albert & Ronald
Jensen Jeffrey A
Jensen Patricia A & Robert L
Jimenez Fernando
Jimenez Miguel A
Jimenez Miguel Angel
Johnson Linda S
Johnson Robert W
Johnson Robin & Tyler
Johnston Jerry A
Johnston Margaret M
Jones Herman & Brenda & Etal
Jorgensen Dagmar Ej
Karr Juanita P
Kaup Erma B (Trs)
Kelly Norman (Estate)
Key Kari J
Kiesz Kimberly J
Kin Ng Wing & Hong Ma Zheng
King Hannelore M
Knapp Linden & Shauna
Kralman Norman F
Kyriazis-Wesner Dawn M
Lampson Clark E & Lyla J
Lane Terri L & Jack R
Langley Richard D & Elizabeth
Lara Damian L & Maricela
Lara Nicolas D & Claudia
Lawrence Benjamin G &Mary Elizabeth
Lawrence E F (Le)& Talbott S &Lawrence R
Ledford Darold E
Lees Robert L & Ellen G
Lefore Sam Jr & Donna (Trs)
Lenz Richard L & Myra V
Lewis Floyd E & H Ruth
Final Environmental Impact Statement
Chapter 7 Agencies, Organizations, and Persons Contacted to Receive EIS
Litchfield Gary L
Lockie Linda L
Londo Ashlee M
Loree David E
Lowrie Donna (Trs)
Lugo Erica
Luisi William E & Mary T
Luke Linda K & Luke Billy A & Sally J
Lyon John Orrin & Carol M
Lyon Marlan & Roberta
Lyon Mildred I
Lyon Mildred I
Madsen Randall L Et Al
Martin Gwendolyn K (Trs)
Martin Peter E (Trustee)
Martinez Alfonso Jr & Elvira
Mccallum Jack W
Mccormack William
Mccoy Ron D & Deane A
Mckain Dale B & Custer Kittee
Mclaughlin Barbara A
Meeks Susan & Larry J
Mercer Margaret A & Sheets Brandon
Meyer Jeannie
Meza Alejandro & Lorenza
Meza Fernando P & Maricela
Miller Kristofer Jon
Minson Seth R Et Al
Molina Vanessa
Molk John J & Janis L
Moore Logan E Jr
Moreno Arturo & Yajaira
Moreno Oscar M & Ines & Edith
Morreira Andrew
Morris John T Jr & Linda K
Munoz Crustberto & Mary V
Murdoch William B L
Navarre Don & Gina
Ng Wing Kin & Ma Zheng Hong
Nickolatos Dan & Kathleen
Nilson Steve
Nissen Kenneth & Augusta
Nored James D & Jan A
Noreen Paul R
Norton Scott D & Robynne L
Obert Alton W
Ocampo Misael
Odman Mitch B & Debora L
Olson Dennis F & Laura J (Trustees)
Oneill Mark J & Mary J
Ortega Reynaldo & Maribel
Partin Jerry D & Judy W
Partin Ray W & Twila D
Partin Shauna R
Patton Judy
Petersen Gregory C
Peterson Dennis Lee
Phillips Gregory Scott & Deann M
Phillips Jennifer J & Gary C
Piceno Pedro Gerardo
Pike Charles L & Aldeen C
Pineda Jose A
Pineda Rodrigo A
Polich Rosemary
Potter Ernestine
Powell Robert R & Powell Richard E
Price Gary B & Sharon M
Price Peter N Sr & Sandra L
Price Robert E
Pulliam Brian K
Pureco Jose M
Quesney Jesus U
Quesney Loreto & Valentina
Quintal Kenneth
Rachor George L & Lola Jean
Ralph John P
Ralph Raymond E
Ramsey Daniel & Nancy
Ransom Betty
Ray Joanne E
Ray Leslie A & Debbie
Reid Ted W
Rencken Dean R
Rich Robert D & Vesper Joy
Ridout Robert E Et Al
Robertson David G & Janelle
Robinson Darlene Ingle
Robles Javier & Obdulia
Walla Walla Basin Spring Chinook Hatchery Program
Chapter 7 Agencies, Organizations, and Persons Contacted to Receive EIS
Rodighiero Vernon R & Penelope L
Rodriguez Lucy A & J Asuncion
Rodriquez Isidro & Gonzalez Maricela
Roff Bryan L
Roff Joseph V & Judith
Rohn Thomas E & Diane Leslie
Romero Consuelo H & Marisela A
Romero Martin & Imelda F
Romero Vicente & Adriana V
Rorden Jolene L & Potter Kevin L
Rosales Jose & Sonia
Rubio Herlinda & Mejia M Christina
Ruiz David Jr & Olivares Leslie
Russell Greg Et Al
Salas Jamie & Maria A
Saldana Francisco
Saldana Salvador & Alice Ruiz
Sallee Robert B & Sherry A
Salyer Donna L (Le) & Kraft Tammy
Salyer Kathleen
Sanchez Daniel & Toscano Maria
Sandberg James A & Sallie
Sandoval Jorge
Sandoval Maria J
Schafer Scott G & Carole J
Schmeckpeper Gerald J & Connie L
Schmierer Ervin & Lucille
Schmierer Jerry D & Ronda D
Schnell Ludvina
Seaquist Paul R
Sherer Charles R & Connie
Shinner Janice E
Shockman Jerome W & Linda
Shrum Frank L & Frances L
Siddle Tammy L
Simon Arthur & Geraldine
Simon Jamie A
Simpson Joan
Sloan Don G & Bobbie J
Smith Arby Jr & Tincher Rachael
Smith D & Ruth E & Lampson C E & L J
Smith Georgetta
Snook Jeffrey A & Sandra K
Solis Blanca Z
Spencer Lollae M & Elwood C
Springer Jeremy A
St Clair Jason N & Rebecca S
Stanford Ruth B & Steven E
Steadman Thomas E & Ferriba L
Stephens A (Le) & Stephens Cheryl
Stevens Michael & Louaine
Stevens Walter E Jr & Tracie R
Stimmel Robert E & Carol J
Stocke Juanita B
Stocke Lynn V & Nita
Stolz Marcell & Valerie
Stolz Mineard
Strasser Shirley A
Teklu Setota
Ten Eyck Shirley (Le) & Jordan Kathy
Tharp Walter R & Sharon Sue
Thompson Daryl A & Peggy C
Timmons Marvin & Margaret
Timmons Steve & Celinda A
Tinoco Jose Luis & Rafaela C
Torres Adam & Etelvina
Torres Rafael & Elvira
Trumbull Wayne & Charlotte
Tvrz August T Jr
Urueta Corona Jose Manuel
Valdes Linda L
Valenzuela Miguel A &Martinez Juanita S
Vandeurs Ralph G & Susan
Velting Mary H
Villegas Jose & Garcia Hortencia
Walker Gerald Dee & Connie K
Wallace Norman A
Walter Barbara A
Ward Idena B & Hahn Raymond M
Webb Robert J & Webb Radene C
Weissenfluh Marilyn
Welch Frank T
Wells Wanda
Wheeler Kyle & Marie
Whipple Rachel I & Cindy
White William C (Trs)
Whitmore Lance & Janice
Widner Greg & Tammy

Final Environmental Impact Statement
Chapter 7 Agencies, Organizations, and Persons Contacted to Receive EIS
Widner Mildred (Trs)
Wightman A John & Mary E
Wigley Lori J
Wilcox John D & Remy L
Williams Kenneth R & Marjorie L
Woodhall Kevin G & Deborah M
Woolcut Heather & Randy
Wright Shane L & Larue-Wright Sharee S
Wrinkle Linda M

Final Environmental Impact Statement
Chapter 8 Glossary 8-1
Chapter 8. Glossary
Adfluvial: Adfluvial fish live in lakes and migrate into rivers or streams to spawn.
Alevin: The third stage of the salmonid life cycle, between eyed eggs and fry. Alevins are larval
salmonids, typically about one inch long, that have hatched from the egg but have not yet fully
absorbed their yolk sac, and generally have not emerged from the spawning gravel (redd). Alevins
remain in the redd for approximately one month until their yolk sac is completely digested, and then
emerge from the gravel as fry to hunt for food on their own.
Areas of Critical Environmental Concern: A Bureau of Land Management Program that designates
public lands where special management is required in order to protect the area's values. To be
eligible for designation as an ACEC, an area must meet criteria for both relevance and importance.
An ACEC possesses significant historic, cultural, or scenic values, fish or wildlife resources
(including habitat, communities, or species), natural processes or systems, or natural hazards. In
addition, the significance of these values and resources must be substantial in order to satisfy the
importance criteria.
Broodstock: Adult fish used in the hatchery for breeding.
Confined aquifer: A confined aquifer has limited continuity with other aquifers and surface waters.
Consumptive use: Consumptive use represents water withdrawn from a stream, lost to evaporation or
transpiration, or exported out of the watershed; it represents the total loss of water from the stream
and watershed.
Critical Habitat: Habitat essential to the conservation of an endangered or threatened species listed
under the ESA that has been designated by USFWS or NMFS.
Demographic safety net: A hatchery program, the purpose of which is to serve as backup in case the
naturally spawning population abundance is reduced, either catastrophically or gradually over time, to
levels where it may not be sustainable.
DPS (Distinct Population Segment): Refers to a vertebrate population or group of populations that are
different from other populations of the species and that are considered to be important in relation to
the entire species. It is the smallest taxonomic division eligible for protection under the Endangered
Species Act.
EFH (Essential Fish Habitat): Defined in the Magnuson-Stevens Act as “...those waters and substrate
necessary to fish for spawning, breeding, feeding, or growth to maturity.” The rules promulgated by
NMFS in 1997 and 2002 further clarify EFH with the following definitions:
waters—aquatic areas and their associated physical, chemical, and biological properties that are
used by fish and may include aquatic areas historically used by fish where appropriate;
substrate—sediment, hard bottom, structures underlying the waters, and associated biological
communities;
necessary—the habitat required to support a sustainable fishery and the managed species’
contribution to a healthy ecosystem; and
spawning, breeding, feeding, or growth to maturity—stages representing a species’ full life cycle.
EIS (Environmental Impact Statement): An analysis of the environmental effects of major federal
actions as required under the National Environmental Policy Act of 1969.
Environmental Justice Populations: Low-income and minority populations protected under Executive
Order 12898 from disproportionate adverse effects of federal projects.
ESA: Endangered Species Act of 1973.
Walla Walla Basin Spring Chinook Hatchery Program
8-2 Chapter 8 Glossary
Escapement: The proportion of an anadromous fish population that escapes fisheries and broodstock
collection and reaches the freshwater spawning grounds.
ESU (Evolutionarily Significant Unit): A Pacific salmon population or group of populations that is
substantially reproductively isolated from other salmon populations and that represents an important
component of the evolutionary legacy of the species.
Extirpation: The loss of a local or regional population of a species (local extinction).
Eyed eggs: The second stage of the salmonid life cycle, between embryos and alevin. Eyed eggs
develop approximately one month after eggs have been fertilized when the embryo inside the egg
develops an eye. This stage typically lasts for one month until the eyed eggs hatch and alevin
emerge.
Frazil ice: Submerged ice attached or anchored to the bottom; can form in fast-flowing rivers
during periods of extreme cold.
Fry: The fourth stage of a salmonid life cycle, between alevin and parr. Fry move in schools and
actively feed in the river on zooplankton until they grow large enough to eat aquatic insects and other
larger food. Some species begin their downstream migration to the ocean as fry, while other species
stay in the freshwater for up to three years.
HOR (Hatchery–Origin Returns or Hatchery-Origin Recruits): Fish incubated and reared in a
hatchery and released as juveniles, that return as adults to the river into which they were released.
Integrated Harvest Program: An integrated hatchery program (see next definition), the purpose of
which is to provide harvest. “A fundamental purpose of an integrated hatchery program is to increase
abundance [for harvest], while minimizing the genetic divergence of a hatchery broodstock from a
naturally spawning population” (HSRG 2009). This is achieved by incorporating natural origin
spawners in the hatchery broodstock.
Integrated Hatchery Program: A hatchery program that manages wild and hatchery fish as one gene
pool (natural-origin fish are included in the broodstock and hatchery-origin fish are allowed to spawn
in the wild). A program is considered an integrated type if the intent is for the natural environment to
drive the adaptation and fitness of a composite population of fish that spawn both in a hatchery and in
the wild. For a natural/hatchery composite population at equilibrium (Ford 2002), the influence of the
hatchery and natural environments on the adaptation of the composite population is indicated by:
…the proportion of natural-origin broodstock in the hatchery (pNOB) and the proportion of hatchery-
origin fish in the natural spawning escapement (pHOS). The larger the ratio pNOB/(pHOS+pNOB),
the greater the strength of selection in the natural environment relative to that of the hatchery
environment. This ratio is referred to as the Proportionate Natural Influence (PNI). In order for the
natural environment to dominate selection, this ratio must exceed 0.5 (HSRG 2004).
Jacks: "Jack" salmon return to fresh water one or two years earlier than their counterparts. Typically
they are smaller than those that remain in the ocean longer, but they are sexually mature.
Jurisdictional wetlands and waters: Wetlands and water bodies that are protected either under the
federal Clean Water Act Section 404 or under state or local regulations.
Macroinvertebrates: Organisms without a backbone that are large enough to see without the aid of a
microscope such as insects, worms, or clams.
Mitchell Act: Enacted in 1938 and amended in 1946 (16 U.S.C. 755-757; 52 Stat. 345). Authorizes the
Secretary of the Interior to implement activities for the conservation of fishery resources in the
Columbia River Basin, and specifically directs the establishment of salmon hatcheries, ongoing
engineering and biological surveys and experiments, and installation of fish protective devices. It
Final Environmental Impact Statement
Chapter 8 Glossary 8-3
also authorizes agreements with State fishery agencies (Oregon, Washington, and Idaho) and the
construction of facilities on State-owned lands. Federal activities in the Columbia River Basin are
carried out by the Department of Commerce (NOAA).
NOR (Natural-Origin Returns or Natural-Origin Recruits): Adult fish returns to a river basin that are
progeny of fish that spawned in the natural environment.
Non-consumptive water use: If water is withdrawn and then returned to the stream, the use is classified
as non-consumptive.
Parr: The fifth stage of the salmonid life cycle, between fry and smolt. Parr have distinct markings (parr
marks) to camouflage them from predators as they feed on aquatic insects and other larger prey in a
stream environment.
Primary Constituent Elements: The physical and biological features needed for life and successful
reproduction of the species.
Prior appropriation: The principle of prior appropriation dictates the oldest water right is the last to be
shut off in the event of low stream flows. The person with the oldest water right can demand the full
extent of his or her water right regardless of whether sufficient water remains for more junior water
users.
Ranney well: A patented type of well used to extract water from an aquifer that is in direct connection to
a surface water source such as a river or lake.
Redd: The nest dug in the gravel substrate of streams for egg deposition during spawning by salmonids.
Recruits: Fish that have survived long enough to become part of (i.e., recruited into) a population at a
defined age (e.g., a natural-origin fish that survives to spawn in the wild is a natural-origin recruit).
The number of recruits per spawner is a method of analyzing population productivity.
Reservoir storage: Retaining water for later use, such as domestic use.
Riparian: Adjacent to or living on river banks.
Salmonid: A fish belonging to the family Salmonidae, which includes salmon, trout and chars. Some
species of salmonids are anadromous (e.g., coho salmon, Chinook salmon, steelhead trout), and some
species remain in freshwater throughout their life cycle (e.g., rainbow trout, bull trout).
SARs (Smolt-to-Adult Returns): The percentage of fish released as smolts that return as adults.
Smolt: The sixth stage of the salmonid life cycle, between parr and ocean-stage adult. Smolts undergo
physiological and behavioral transformations as they migrate downstream that prepare them for the
transition to the saltwater environment.
Species of Concern: Species whose conservation status is of concern to the U.S. Fish and Wildlife
Service, but for which further information is still needed. Such species receive no legal protection
and use of the term does not necessarily imply that a species will eventually be proposed for listing
under the Endangered Species Act.
Threatened Species: Under ESA, any plants or animals that are likely to become endangered species
within the foreseeable future throughout all or a significant portion of their ranges and which have
been listed as threatened by the USFWS or the NMFS.
U.S. v. Oregon: A 1969 federal court decision that legally upheld the reserved fishing rights of the
Columbia River treaty tribes (Nez Perce, Umatilla, Warm Springs and Yakama tribes) and ruled that
the tribes had reserved rights to fish at “all usual and accustomed” places whether on or off
reservation. In 1975, the ruling was amended to quantify the “fair and equitable share” of the
resource as 50% of all harvestable fish destined for the tribes’ traditional fishing places.
Walla Walla Basin Spring Chinook Hatchery Program
8-4 Chapter 8 Glossary
Vulnerable Species: Oregon Department of Fish and Wildlife identifies sensitive species in the state of
Oregon, in addition to species it considers threatened or endangered. These species are assigned to
two subcategories. “Critical” sensitive species are imperiled with extirpation from a specific
geographic area of the state because of small population sizes, habitat loss or degradation, and/or
immediate threats. Critical species may decline to point of qualifying for threatened or endangered
status if conservation actions are not taken. “Vulnerable” sensitive species are facing one or more
threats to their populations and/or habitats. Vulnerable species are not currently imperiled with
extirpation from a specific geographic area or the state but could become so with continued or
increased threats to populations and/or habitats.
Wetlands: For the purposes of the Clean Water Act, wetlands must meet a three-parameter set of criteria
that includes the presence of hydrophytic (water-loving) vegetation, wetland hydrology, and hydric
soils (soils subject to saturation/inundation). All three parameters must be present, under normal
circumstances, and the wetland must be connected to or have a significant nexus with “waters of the
U.S.” for an area to be designated as a jurisdictional wetland under the Clean Water Act.
Final Environmental Impact Statement
Appendix A Scoping Comment Summary A-1
Appendix A. Scoping Comment Summary
The following is a summary of written and oral comments provided during scoping for the
proposed project. BPA offered two scoping periods for this project. The first was held from
March 30 to May 15, 2013. When the second alternative was added, a second scoping period
was held from June 2 to July 1, 2014. The comments received from both scoping periods are
included in this summary. For the full text of the written comments and a summary of comments
from the public meetings and phoned-in comments, see the project website,
www.bpa.gov/goto/WallaWallaHatchery. Comments were considered in the analysis and
preparation of the EIS and are addressed in the various chapters as indicated below.
Need for Project
Project is a waste of money.
Reintroduction is important to the Tribes.
Need statement should be framed broadly to ensure a robust analysis of alternatives.
The Tribe already has a hatchery, they don’t need another one.
Given conflicts among various entities in regard to wild fish versus hatchery fish, why is
a new hatchery being proposed here when the future of other hatcheries in Oregon is in
jeopardy?
These issues are addressed in Chapter 1. Unlike in other basins in Oregon, there is no wild
population of spring Chinook in the Walla Walla basin that would be affected by the
introduction of hatchery fish. For more information on fish interactions, see Section 3.5.
Project Purposes
The purpose should be to increase fishing opportunities for residents of the Walla Walla
basin, not gillnet fishers on the Columbia.
Concerned that the proposed project won’t benefit sport fishers.
Is this project an Accord project?
BPA and CTUIR have identified purposes that the project should achieve in Chapter 1,
Section 1.2. They include providing increased harvest opportunities for tribal and non-tribal
fishers and assisting in meeting Accord commitments.
Program Description
The following issues related to Alternative 1 are addressed in Chapter 2, Section 2.2.
What is a realistic goal for the number of fish from the hatchery.
At what point is the hatchery closed down because it has reached its goal—how long will
500,000 production level be necessary.
What percentage return is expected from the project?
Will there be a need to trap and count fish returning to the Touchet?
What factors will trigger program changes?
How fast will the program ramp up to full production—agreements are not in place with
co-managers.
What will management priorities be for broodstock collection, natural production, out-
planting, fishery implementation?
Walla Walla Basin Spring Chinook Hatchery Program
A-2 Appendix A Scoping Comment Summary
Why does the program propose only 50% natural-origin fish in the broodstock in the
long-term—why not more?
How will returning adults be managed in the Walla Walla basin?
What will be done with the fish when they return?
The following issues are discussed variously in Chapter 2 and in Chapter 3.
Does the utility have adequate power to energize all the new equipment or will funding
be available to provide it if necessary?
Is the proposal part of an integrated management program?
Is work at Nursery Bridge being coordinated with ongoing bank stabilization efforts in
this reach?
Are you planning to enhance flows at Nursery Bridge Dam?
Will barriers be placed at the mouth of Washington tributaries to prevent fish from going
upstream?
Costs/funding
Does funding for this project come at the financial expense of other projects?
Is the project funded by utility ratepayers?
Would the program be funded through the Mitchell Act?
Concerned that the project will increase costs to the people.
Monitor costs carefully to ensure money is well spent.
See Chapter 2, Sections 2.2.6 and 2.3.4.
No Action Alternative
What options would be available to the Tribe if the recommendation is not to fund the
project?
Would there be a financial impact to the Tribes if the decision is not to fund?
Consequences of not funding would mean that it would take longer to rebuild the spring
Chinook population, it would take longer for the Tribes to exercise their treaty rights,
there would be foregone revenue from the jobs lost, and training opportunities for tribal
staff would be lost.
The No Action Alternative is described in Chapter 2, Section 2.4, and its consequences are
addressed throughout Chapter 3.
Other Alternatives
Use the Gardena Irrigation Dam for broodstock collection. The facility at Gardena Dam
(Burlingame) was proposed as a back-up broodstock collection site but has since been
eliminated from the proposal.
The design should consider using a recirculating aquaculture system. This design is
being considered as part of Alternative 2.
The following alternatives were considered but eliminated from detailed consideration. See
Section 2.5.2.
The project design should consider surge tanks and gravity fed systems to reduce the
number of pumps required.
Final Environmental Impact Statement
Appendix A Scoping Comment Summary A-3
Build a new hatchery elsewhere, such as on the North Fork of the John Day River, where
river conditions are better for fishing than on the Walla Walla in Oregon, which is too
fast, except upstream where there is no access because it’s on private property.
Use the existing hatchery at Lyons Ferry (as steelhead production changes) or other
existing hatcheries.
Expand existing hatcheries instead of building a new one.
Improve habitat before building a hatchery.
Develop more fishing holes.
Is this the best investment—would it be better to invest in habitat, since “native” fish
populations are improving on their own.
Harvest/fishing opportunities
Concerned that the project will reduce or eliminate existing fishing opportunities in the
Walla Walla River, upper reach of Mill Creek, or the Touchet River.
Worried that fishing opportunities for recreational fishers of steelhead or redband trout
will be restricted.
Worried that an existing fishery would be totally closed to protect spring Chinook.
Harvest and fishing opportunities and impacts are discussed in Chapter 3, Section 3.7.
Access
There is no access to sports fishers in the only suitable fishing habitat on the Walla Walla
(in upstream areas) because it is all private land.
Are tribal members legally allowed to cross private land to access fishing sites?
Will this project increase tribal access across private land?
Consider impacts of increased tribal access to fishing sites (litter, etc.).
Will people trespass on private land to catch these fish?
How will tribal members get access across private land to fish and exercise their treaty
rights?
If there is litigation about access issues, who will pay those expenses?
Issues of access to fishing sites are discussed in Chapter 3, Section 3.7.
Socioeconomics/Environmental Justice
Concerned that the project will result in more regulations.
Will the project affect landowner rights—how they use their land, including access to
their property and access to the river by livestock?
Will you do an economic impact analysis?
Will Umatilla County receive any additional tax revenue or payments in lieu of taxes?
If the property reverts to tribal ownership, will taxes continue to be paid?
Evaluating total harvest (ocean, mainstem, tributary) will bolster economic
impact/benefit of the hatchery.
Will tribal members be employed to care for the fish?
Moving [Umatilla] production to Walla Walla will improve the economy of that area.
EPA provided guidance on assessing impacts to minority and low-income populations
and Indian Tribes under the Environmental Justice program.
These issues are discussed in Chapter 3, Section 3.7.
Walla Walla Basin Spring Chinook Hatchery Program
A-4 Appendix A Scoping Comment Summary
Fish
What will be the interactions between the released spring Chinook smolts and species
that are already there?
Is there adequate habitat to support the additional numbers of Chinook?
Are there predator issues?
Consider the effect of hatchery chemicals in hatchery discharge water on other aquatic
species.
Describe the life cycle of salmon.
Discuss reasons for low returns.
Consider effects on other fish in the basin of disease, viruses, parasites, and bacteria in
hatchery fish.
Will the Chinook prey on other fish, such as bull trout?
Evaluate the potential for straying.
Does the project have to get an incidental take permit?
Discuss historical numbers of spring Chinook in the basin.
Define “natural fish.”
Concerned that the program include adequate tagging and monitoring of hatchery fish to
avoid impacts to nearby populations of wild, ESA-listed spring Chinook.
We need to take care of the [spring Chinook] smolts and get them to the ocean.
Spring Chinook status in the Walla Walla basin is discussed in Chapter 3, Section 3.2.2;
impacts to other fish are discussed in Chapter 3, Section 3.5.
Wildlife
Concerned that project will remove habitat for wildlife such as possums and foxes. See
Chapter 3, Section 3.10.
Water Quantity and Water Rights
What would be the impacts on the Zell Ditch point of diversion?
Where will hatchery water come from?
Will the project affect the amount of water in the river?
Consider effects on water users, including agricultural users.
Evaluate the amount of loss through evaporation.
Will the existing water right of 25-26 cfs [cubic feet per second] be adequate for the
project?
This project is not a “bucket for bucket” water exchange like the Umatilla project—how
will water rights be affected?
Concerned that the Tribe wants to take away irrigation rights from landowners.
Will we be asked to give up water for spring Chinook (we’ve already given up water for
bull trout)?
In low-water years, will there be enough water for fish and agriculture both, or will the
water go to agriculture?
Water quantity and water rights issues are discussed in Chapter 3, Section 3.3.
Final Environmental Impact Statement
Appendix A Scoping Comment Summary A-5
Water Quality
Concerned that proposed hatchery would cause water quality impacts downstream in
Washington, which has problems such as high summer water temperatures, low dissolved
oxygen (DO) levels, high pH, high levels of fecal coliform bacteria, and pollution by
chlorinated pesticides and polychlorinated biphenyls (PCBs).
EIS should evaluate hatchery effects on water temperature, nutrient inputs that could
cause DO and pH problems, turbidity, PCB contamination of fish food, and introduction
of PCBs to the river in effluent and hatchery fish tissues.
Are hatchery fish injected with antibiotics or treated with fungicides, and if so, how
often?
Do these chemicals affect water quality?
What water quality monitoring will be done?
Will water be monitored for formalin, antibiotics, or other chemicals?
What water treatment facilities will be at the hatchery?
Is water quality in the watershed good enough to support spring Chinook?
Will water quality changes affect certification for organic producers?
Look at DEQ water quality permit requirements.
The existing facility operates under a general DEQ water quality permit for hatcheries—
no increases in water temperature are currently allowed (temperature TMDL has no waste
load allocation).
BPA and CTUIR need to work with DEQ on this issue.
EIS should demonstrate compliance with state and federal water quality standards,
including National Pollutant Discharge Elimination System requirements.
Water quality issues are discussed in Chapter 3, Section 3.4 (Water Quality), and to a certain
extent in Section 3.5 (Fish).
Cultural Resources
Study impacts on cultural resources; the fish are important as one of the Tribe’s First
Foods. See Chapter 3, Section 3.8.
Treaty Rights
Putting fish back in the river will allow the Tribe to exercise its treaty rights as defined in
the Treaty of 1855, which they have not been able to do for 100 years.
Treaty rights cannot be exercised if there are no fish in the river.
Treaty rights are discussed in Chapter 3, Section 3.7.
Health and Safety
Will this project affect the safety of the levees that protect surrounding land from
flooding?
Consider effects on children’s health and safety under Executive Order 13045.
EPA provided guidance on evaluation impacts of hazardous wastes both by and to the
project.
EPA provided guidance on considering impacts to air quality and of greenhouse gas
emissions.
Walla Walla Basin Spring Chinook Hatchery Program
A-6 Appendix A Scoping Comment Summary
Air quality and greenhouse gas emissions are discussed in Chapter 3, Section 3.11. Other
issues of public health and safety are discussed in various sections of Chapters 3 and 4.
Cumulative Impacts/Risks to Project Success
Consider effects of agricultural activities on water quality from a fish perspective.
What are the risks to the project?
Channelization in the river, e.g. below Nursery Bridge Dam, increases velocities, which
isn’t good for fish.
Will fish be able to pass Nursery Bridge Dam?
Down-cutting in the river along the levees below Nursery Bridge Dam could prevent the
fish from passing the dam.
Has there been coordination with upstream land uses, such as on USFS land?
Fires upstream could affect the project by increasing erosion and reducing water quality.
Wind projects above the hatchery could create erosion from new roads—incentives to
build wind farms are counter-productive.
What are the cumulative effects of other projects that could affect this project?
Removal of water for irrigation increases temperatures, concentrates pollution.
Will water use across state boundaries be studied as it affects the ability of Chinook to
return to this basin—if you can’t protect instream flows in Washington, the hatchery
investment might be worthless.
Want to see improved habitat to reduce problems for fish as they return.
Consider the effect of climate change on the success of the project.
EPA provided guidance on evaluating cumulative impacts.
Cumulative impacts and risks to project success are discussed in Chapter 3, Section 3.14,
and to a certain degree in Section 3.3 (Surface and Ground Water Quantity and Rights) and
Section 3.11 (Air Quality and Climate Change).
Support project
CTUIR is doing God’s work in restoring spring Chinook to the Walla Walla basin.
Support the increased fishing opportunities in this watershed.
The Tribes are looking forward to seeing the project finally started and finished.
Great idea, let’s do it.
Project will help restore runs and benefit both Indians and non-Indians.
Happy to hear rivers and streams in the basin are slated to become spring Chinook
salmon rivers.
Keep up the good work.
Look forward to seeing fish in Panther Creek again; support the project.
Oppose project
Opposed to any new fish hatchery on the Walla Walla River; we are too early with the
hatchery.
NEPA process
Comment period is too short. The scoping comment period was extended for 15 days
based on the concern expressed at the scoping meetings.
Final Environmental Impact Statement
Appendix A Scoping Comment Summary A-7
Not all affected folks are reached. Please see Chapter 7 for the list of agencies,
organizations, and individuals contacted.
Milton-Freewater Water Control District should be included in correspondence. The
District is on the mailing list.
How large an area will be studied? The amount of area studied depends on the resource
potentially affected. See each resource section in Chapter 3, where the analysis area for
that resource is defined.
Can the public review the plan to comment on changes it might cause in the basin. This
draft EIS provides the opportunity to review the proposal and its effects.
Can scoping comments be written up and distributed so meeting attendees can check for
accuracy. Scoping comments were recorded on BPA’s website as soon as they were
received to allow members of the public to view them; they are summarized in this
section.
Need to see evidence that we are heard and our ideas acted on. This appendix identifies
where comments made by the public are addressed in the EIS.
EPA requires submissions of EISs through e-NEPA but requests a paper copy for the
Region 10 office. Thank you for your comment.
EPA provided guidance on developing project-specific significance criteria. Thank you
for your comment.
Miscellaneous
Who has jurisdiction over the fish—tribes, Oregon, Washington? The tribes and the fish
and wildlife departments of Oregon and Washington are co-managers of fish resources in
those two states; federal agencies also have jurisdiction over fish listed under the
Endangered Species Act.
Why are there two fish ladders when there are no fish in the Walla Walla River at Milton-
Freewater? Fish, including bull trout and steelhead, are in the Walla Walla River, as
monitoring at Nursery Bridge Dam shows. See Chapter 3, Section 3.5.
The Tribes have built strong partnerships with other stakeholders in the basin. Thank you
for your comment.
The U.S. Army Corps of Engineers is happy to share information about its project below
Nursery Bridge Dam. Thank you for your comment.
Explain the government-to-government consultation that took place between [BPA] and
tribal governments and how issues raised were addressed in the selection of the proposed
alternative. See Chapter 1.
EPA provided guidance on considering impacts to aquatic resources, wetlands, and
riparian areas. See Chapter 3.
Issues Beyond the Scope of the EIS
Water flows need to be protected so there is adequate water for fish to return to the Walla
Walla.
Fix channelization problems at Milton-Freewater.
Use the money to protect the Joe West Bridge.
Concerned that the Tribe’s work to put in a “spawning area” caused the river to flood the
highway above Joe West Bridge.
What are the impacts of “ghost nets” in the Columbia River?
Walla Walla Basin Spring Chinook Hatchery Program
A-8 Appendix A Scoping Comment Summary
What proportion of fish produced at this hatchery will be harvested in the ocean and
downriver by sport and tribal fishers?
Consider impacts of ocean and mainstem harvest on this proposal.
Monitor how river is treated at Milton-Freewater and questionable activities at Nursery
Bridge.
Why spend millions of dollars to raise both salmon and trout for introduction into these
streams to feed the protected predator bull trout. Bull trout being a protected species is
crazy and should be rescinded.
The following comments were made about marking project fish. Marking is established in
the monitoring and evaluation program, which is being implemented under a different BPA-
funded project that monitors several fish species throughout the Walla Walla River basin
(Walla Walla River Basin Monitoring and Evaluation, BPA Project No. 2000-039-00);
therefore, the M&E program is not evaluated as part of this EIS. For anyone interested in
the current plan, we have attached the M&E program for the spring Chinook portion of that
program as Appendix B.
There should be mandatory fin clipping on project fish.
The Tribes do not support mass marking (fin clipping) because it allows non-Indian
anglers and harvesters to capture more project fish in selective fisheries downstream.
It is possible to obtain an exemption to mass marking through U.S. v. Oregon.
Current program has a low tag rate—proposal increases releases by 100% with no
specified tag rate.
Need more discussion of tag rate and type of tag.
Recommend more than 30% of fish be tagged to monitor straying, survival, and progress
toward achieving program goals, with potential to reduce tag rate once results
demonstrate no need for the high rate.
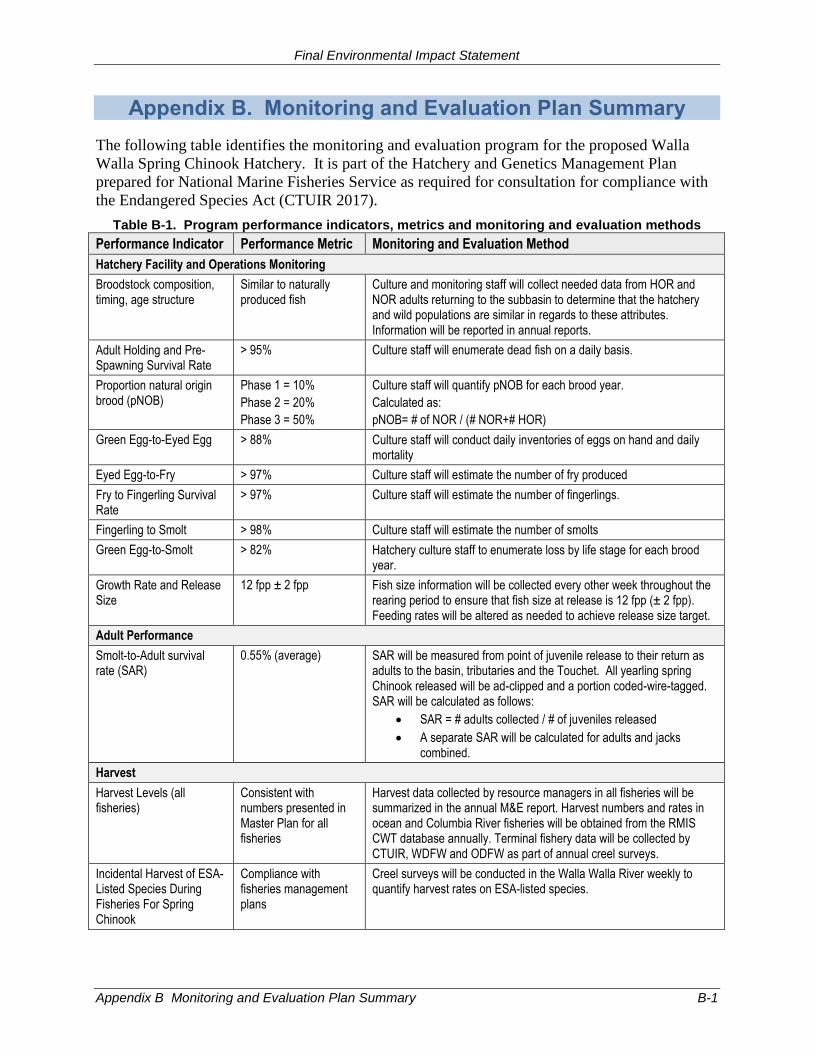
Final Environmental Impact Statement
Appendix B Monitoring and Evaluation Plan Summary B-1
Appendix B. Monitoring and Evaluation Plan Summary
The following table identifies the monitoring and evaluation program for the proposed Walla
Walla Spring Chinook Hatchery. It is part of the Hatchery and Genetics Management Plan
prepared for National Marine Fisheries Service as required for consultation for compliance with
the Endangered Species Act (CTUIR 2017).
Table B-1. Program performance indicators, metrics and monitoring and evaluation methods
Performance Indicator Performance Metric Monitoring and Evaluation Method
Hatchery Facility and Operations Monitoring
Broodstock composition, timing, age structure
Similar to naturally produced fish
Culture and monitoring staff will collect needed data from HOR and NOR adults returning to the subbasin to determine that the hatchery and wild populations are similar in regards to these attributes. Information will be reported in annual reports.
Adult Holding and Pre-Spawning Survival Rate
> 95% Culture staff will enumerate dead fish on a daily basis.
Proportion natural origin brood (pNOB)
Phase 1 = 10%
Phase 2 = 20%
Phase 3 = 50%
Culture staff will quantify pNOB for each brood year.
Calculated as:
pNOB= # of NOR / (# NOR+# HOR)
Green Egg-to-Eyed Egg > 88% Culture staff will conduct daily inventories of eggs on hand and daily mortality
Eyed Egg-to-Fry > 97% Culture staff will estimate the number of fry produced
Fry to Fingerling Survival Rate
> 97% Culture staff will estimate the number of fingerlings.
Fingerling to Smolt > 98% Culture staff will estimate the number of smolts
Green Egg-to-Smolt > 82% Hatchery culture staff to enumerate loss by life stage for each brood year.
Growth Rate and Release Size
12 fpp ± 2 fpp Fish size information will be collected every other week throughout the rearing period to ensure that fish size at release is 12 fpp (± 2 fpp). Feeding rates will be altered as needed to achieve release size target.
Adult Performance
Smolt-to-Adult survival rate (SAR)
0.55% (average) SAR will be measured from point of juvenile release to their return as adults to the basin, tributaries and the Touchet. All yearling spring Chinook released will be ad-clipped and a portion coded-wire-tagged. SAR will be calculated as follows:
SAR = # adults collected / # of juveniles released
A separate SAR will be calculated for adults and jacks combined.
Harvest
Harvest Levels (all fisheries)
Consistent with numbers presented in Master Plan for all fisheries
Harvest data collected by resource managers in all fisheries will be summarized in the annual M&E report. Harvest numbers and rates in ocean and Columbia River fisheries will be obtained from the RMIS CWT database annually. Terminal fishery data will be collected by CTUIR, WDFW and ODFW as part of annual creel surveys.
Incidental Harvest of ESA-Listed Species During Fisheries For Spring Chinook
Compliance with fisheries management plans
Creel surveys will be conducted in the Walla Walla River weekly to quantify harvest rates on ESA-listed species.
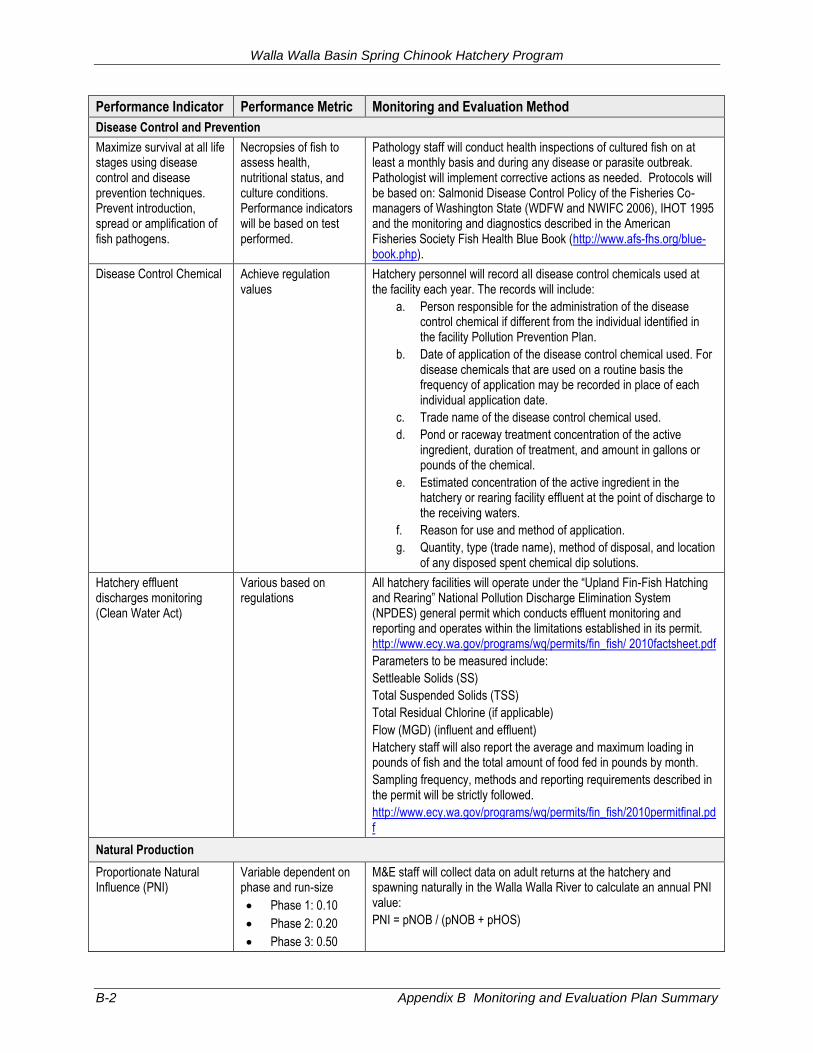
Walla Walla Basin Spring Chinook Hatchery Program
B-2 Appendix B Monitoring and Evaluation Plan Summary
Performance Indicator Performance Metric Monitoring and Evaluation Method
Disease Control and Prevention
Maximize survival at all life stages using disease control and disease prevention techniques. Prevent introduction, spread or amplification of fish pathogens.
Necropsies of fish to assess health, nutritional status, and culture conditions. Performance indicators will be based on test performed.
Pathology staff will conduct health inspections of cultured fish on at least a monthly basis and during any disease or parasite outbreak. Pathologist will implement corrective actions as needed. Protocols will be based on: Salmonid Disease Control Policy of the Fisheries Co-managers of Washington State (WDFW and NWIFC 2006), IHOT 1995 and the monitoring and diagnostics described in the American Fisheries Society Fish Health Blue Book (http://www.afs-fhs.org/blue-book.php).
Disease Control Chemical Achieve regulation values
Hatchery personnel will record all disease control chemicals used at the facility each year. The records will include:
a. Person responsible for the administration of the disease control chemical if different from the individual identified in the facility Pollution Prevention Plan.
b. Date of application of the disease control chemical used. For disease chemicals that are used on a routine basis the frequency of application may be recorded in place of each individual application date.
c. Trade name of the disease control chemical used.
d. Pond or raceway treatment concentration of the active ingredient, duration of treatment, and amount in gallons or pounds of the chemical.
e. Estimated concentration of the active ingredient in the hatchery or rearing facility effluent at the point of discharge to the receiving waters.
f. Reason for use and method of application.
g. Quantity, type (trade name), method of disposal, and location of any disposed spent chemical dip solutions.
Hatchery effluent discharges monitoring (Clean Water Act)
Various based on regulations
All hatchery facilities will operate under the “Upland Fin-Fish Hatching and Rearing” National Pollution Discharge Elimination System (NPDES) general permit which conducts effluent monitoring and reporting and operates within the limitations established in its permit. http://www.ecy.wa.gov/programs/wq/permits/fin_fish/ 2010factsheet.pdf
Parameters to be measured include:
Settleable Solids (SS)
Total Suspended Solids (TSS)
Total Residual Chlorine (if applicable)
Flow (MGD) (influent and effluent)
Hatchery staff will also report the average and maximum loading in pounds of fish and the total amount of food fed in pounds by month.
Sampling frequency, methods and reporting requirements described in the permit will be strictly followed.
http://www.ecy.wa.gov/programs/wq/permits/fin_fish/2010permitfinal.pdf
Natural Production
Proportionate Natural Influence (PNI)
Variable dependent on phase and run-size
Phase 1: 0.10
Phase 2: 0.20
Phase 3: 0.50
M&E staff will collect data on adult returns at the hatchery and spawning naturally in the Walla Walla River to calculate an annual PNI value:
PNI = pNOB / (pNOB + pHOS)
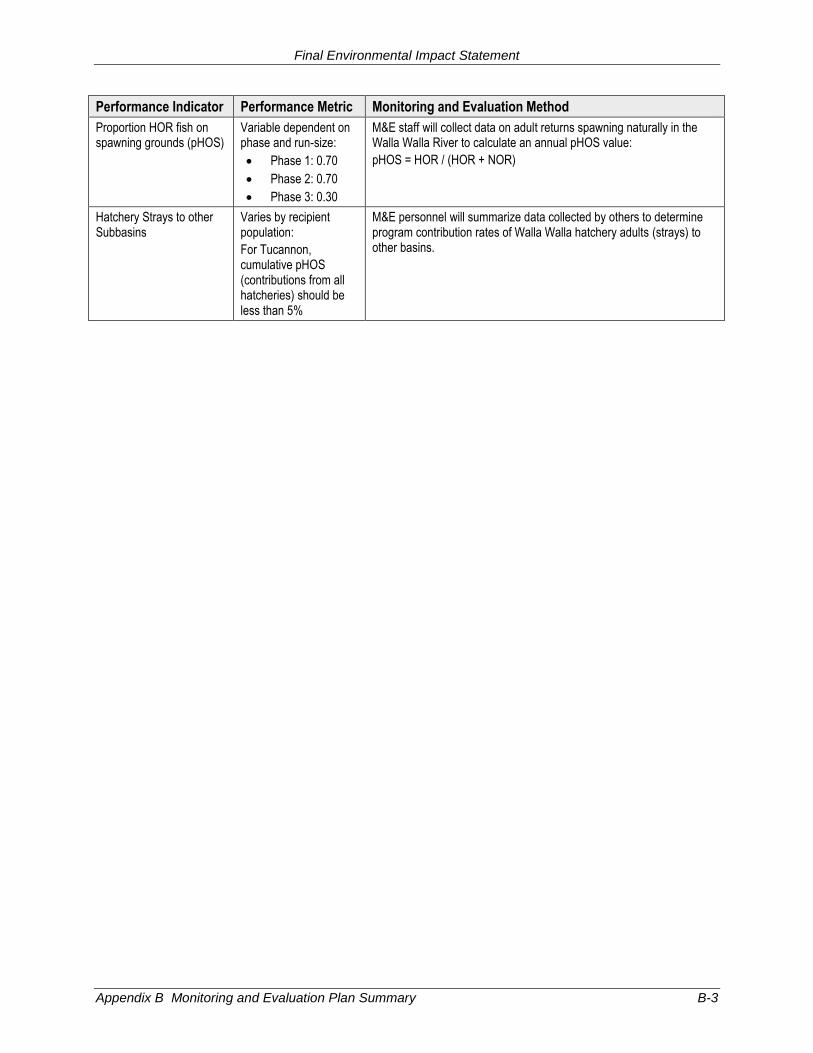
Final Environmental Impact Statement
Appendix B Monitoring and Evaluation Plan Summary B-3
Performance Indicator Performance Metric Monitoring and Evaluation Method
Proportion HOR fish on spawning grounds (pHOS)
Variable dependent on phase and run-size:
Phase 1: 0.70
Phase 2: 0.70
Phase 3: 0.30
M&E staff will collect data on adult returns spawning naturally in the Walla Walla River to calculate an annual pHOS value:
pHOS = HOR / (HOR + NOR)
Hatchery Strays to other Subbasins
Varies by recipient population:
For Tucannon, cumulative pHOS (contributions from all hatcheries) should be less than 5%
M&E personnel will summarize data collected by others to determine program contribution rates of Walla Walla hatchery adults (strays) to other basins.

Final Environmental Impact Statement
Appendix C Construction Equipment Estimate C-1
Appendix C. Construction Equipment Estimate
The following table shows current estimates for the types of construction vehicles that would be
used during construction of the proposed hatchery, the number of trips by vehicle type per month
for each of the estimated 16-month construction period and the amount of fuel used. These
estimates were provided by McMillen Jacobs Associates on August 11, 2017 and are estimates
only; the actual construction period could vary depending on final construction requirements as
well as weather and other unpredictable variables.
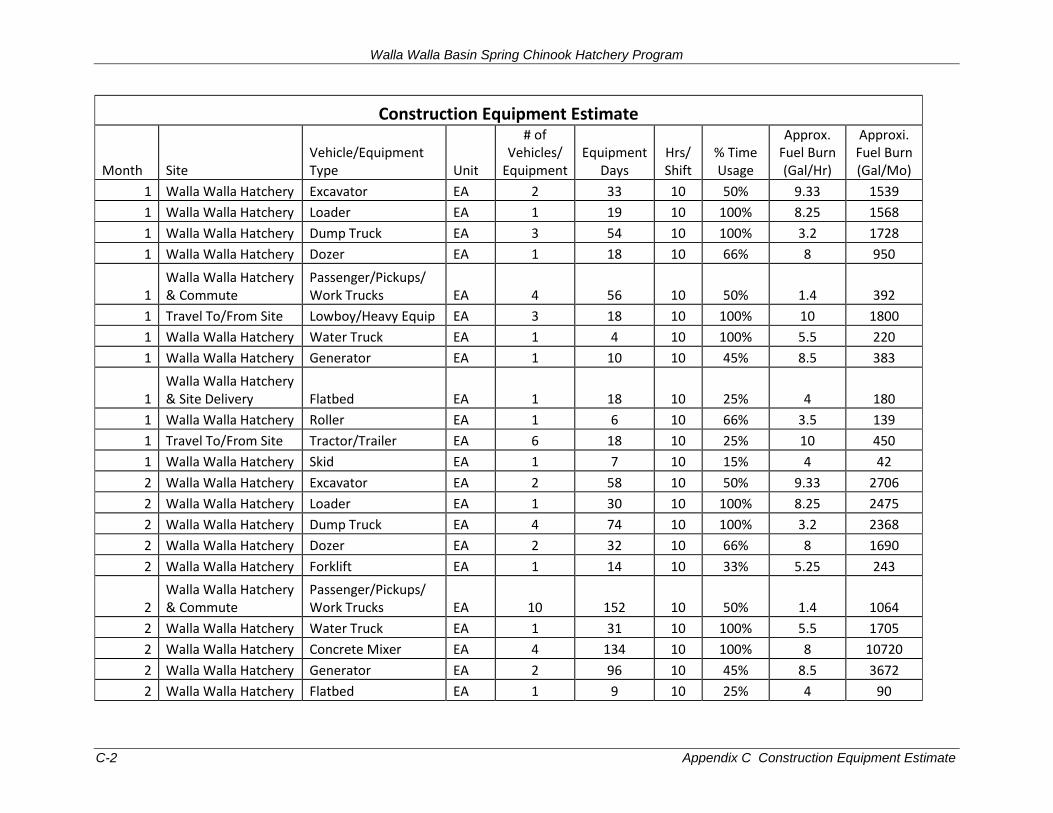
Walla Walla Basin Spring Chinook Hatchery Program
C-2 Appendix C Construction Equipment Estimate
Construction Equipment Estimate
Month Site Vehicle/Equipment Type Unit
# of Vehicles/
Equipment Equipment
Days Hrs/ Shift
% Time Usage
Approx. Fuel Burn (Gal/Hr)
Approxi. Fuel Burn (Gal/Mo)
1 Walla Walla Hatchery Excavator EA 2 33 10 50% 9.33 1539
1 Walla Walla Hatchery Loader EA 1 19 10 100% 8.25 1568
1 Walla Walla Hatchery Dump Truck EA 3 54 10 100% 3.2 1728
1 Walla Walla Hatchery Dozer EA 1 18 10 66% 8 950
1 Walla Walla Hatchery & Commute
Passenger/Pickups/ Work Trucks EA 4 56 10 50% 1.4 392
1 Travel To/From Site Lowboy/Heavy Equip EA 3 18 10 100% 10 1800
1 Walla Walla Hatchery Water Truck EA 1 4 10 100% 5.5 220
1 Walla Walla Hatchery Generator EA 1 10 10 45% 8.5 383
1 Walla Walla Hatchery & Site Delivery Flatbed EA 1 18 10 25% 4 180
1 Walla Walla Hatchery Roller EA 1 6 10 66% 3.5 139
1 Travel To/From Site Tractor/Trailer EA 6 18 10 25% 10 450
1 Walla Walla Hatchery Skid EA 1 7 10 15% 4 42
2 Walla Walla Hatchery Excavator EA 2 58 10 50% 9.33 2706
2 Walla Walla Hatchery Loader EA 1 30 10 100% 8.25 2475
2 Walla Walla Hatchery Dump Truck EA 4 74 10 100% 3.2 2368
2 Walla Walla Hatchery Dozer EA 2 32 10 66% 8 1690
2 Walla Walla Hatchery Forklift EA 1 14 10 33% 5.25 243
2 Walla Walla Hatchery & Commute
Passenger/Pickups/ Work Trucks EA 10 152 10 50% 1.4 1064
2 Walla Walla Hatchery Water Truck EA 1 31 10 100% 5.5 1705
2 Walla Walla Hatchery Concrete Mixer EA 4 134 10 100% 8 10720
2 Walla Walla Hatchery Generator EA 2 96 10 45% 8.5 3672
2 Walla Walla Hatchery Flatbed EA 1 9 10 25% 4 90
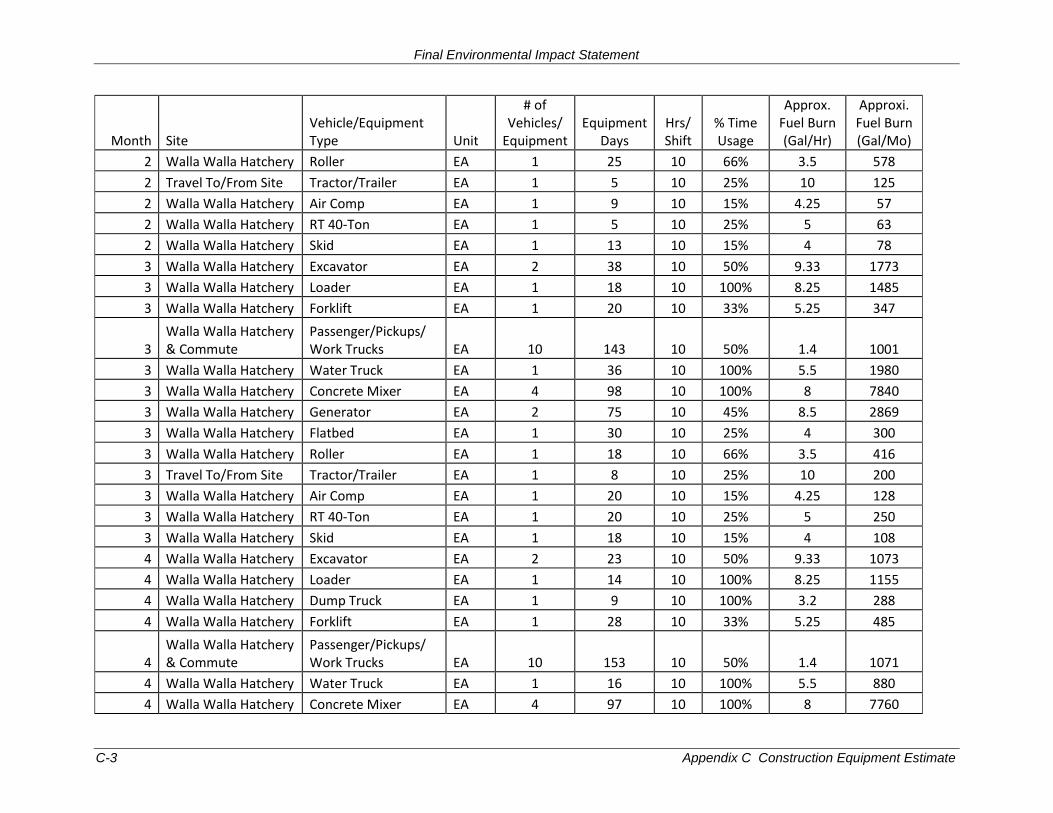
Final Environmental Impact Statement
C-3 Appendix C Construction Equipment Estimate
Month Site Vehicle/Equipment Type Unit
# of Vehicles/
Equipment Equipment
Days Hrs/ Shift
% Time Usage
Approx. Fuel Burn (Gal/Hr)
Approxi. Fuel Burn (Gal/Mo)
2 Walla Walla Hatchery Roller EA 1 25 10 66% 3.5 578
2 Travel To/From Site Tractor/Trailer EA 1 5 10 25% 10 125
2 Walla Walla Hatchery Air Comp EA 1 9 10 15% 4.25 57
2 Walla Walla Hatchery RT 40-Ton EA 1 5 10 25% 5 63
2 Walla Walla Hatchery Skid EA 1 13 10 15% 4 78
3 Walla Walla Hatchery Excavator EA 2 38 10 50% 9.33 1773
3 Walla Walla Hatchery Loader EA 1 18 10 100% 8.25 1485
3 Walla Walla Hatchery Forklift EA 1 20 10 33% 5.25 347
3 Walla Walla Hatchery & Commute
Passenger/Pickups/ Work Trucks EA 10 143 10 50% 1.4 1001
3 Walla Walla Hatchery Water Truck EA 1 36 10 100% 5.5 1980
3 Walla Walla Hatchery Concrete Mixer EA 4 98 10 100% 8 7840
3 Walla Walla Hatchery Generator EA 2 75 10 45% 8.5 2869
3 Walla Walla Hatchery Flatbed EA 1 30 10 25% 4 300
3 Walla Walla Hatchery Roller EA 1 18 10 66% 3.5 416
3 Travel To/From Site Tractor/Trailer EA 1 8 10 25% 10 200
3 Walla Walla Hatchery Air Comp EA 1 20 10 15% 4.25 128
3 Walla Walla Hatchery RT 40-Ton EA 1 20 10 25% 5 250
3 Walla Walla Hatchery Skid EA 1 18 10 15% 4 108
4 Walla Walla Hatchery Excavator EA 2 23 10 50% 9.33 1073
4 Walla Walla Hatchery Loader EA 1 14 10 100% 8.25 1155
4 Walla Walla Hatchery Dump Truck EA 1 9 10 100% 3.2 288
4 Walla Walla Hatchery Forklift EA 1 28 10 33% 5.25 485
4 Walla Walla Hatchery & Commute
Passenger/Pickups/ Work Trucks EA 10 153 10 50% 1.4 1071
4 Walla Walla Hatchery Water Truck EA 1 16 10 100% 5.5 880
4 Walla Walla Hatchery Concrete Mixer EA 4 97 10 100% 8 7760
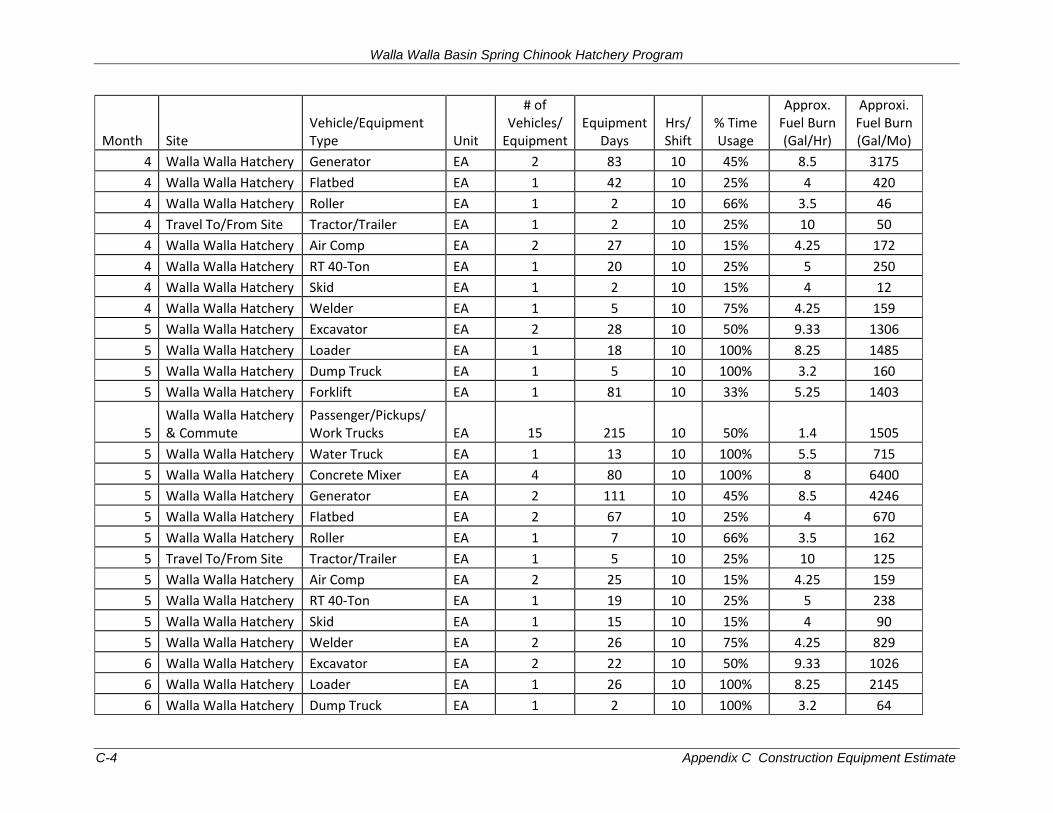
Walla Walla Basin Spring Chinook Hatchery Program
C-4 Appendix C Construction Equipment Estimate
Month Site Vehicle/Equipment Type Unit
# of Vehicles/
Equipment Equipment
Days Hrs/ Shift
% Time Usage
Approx. Fuel Burn (Gal/Hr)
Approxi. Fuel Burn (Gal/Mo)
4 Walla Walla Hatchery Generator EA 2 83 10 45% 8.5 3175
4 Walla Walla Hatchery Flatbed EA 1 42 10 25% 4 420
4 Walla Walla Hatchery Roller EA 1 2 10 66% 3.5 46
4 Travel To/From Site Tractor/Trailer EA 1 2 10 25% 10 50
4 Walla Walla Hatchery Air Comp EA 2 27 10 15% 4.25 172
4 Walla Walla Hatchery RT 40-Ton EA 1 20 10 25% 5 250
4 Walla Walla Hatchery Skid EA 1 2 10 15% 4 12
4 Walla Walla Hatchery Welder EA 1 5 10 75% 4.25 159
5 Walla Walla Hatchery Excavator EA 2 28 10 50% 9.33 1306
5 Walla Walla Hatchery Loader EA 1 18 10 100% 8.25 1485
5 Walla Walla Hatchery Dump Truck EA 1 5 10 100% 3.2 160
5 Walla Walla Hatchery Forklift EA 1 81 10 33% 5.25 1403
5 Walla Walla Hatchery & Commute
Passenger/Pickups/ Work Trucks EA 15 215 10 50% 1.4 1505
5 Walla Walla Hatchery Water Truck EA 1 13 10 100% 5.5 715
5 Walla Walla Hatchery Concrete Mixer EA 4 80 10 100% 8 6400
5 Walla Walla Hatchery Generator EA 2 111 10 45% 8.5 4246
5 Walla Walla Hatchery Flatbed EA 2 67 10 25% 4 670
5 Walla Walla Hatchery Roller EA 1 7 10 66% 3.5 162
5 Travel To/From Site Tractor/Trailer EA 1 5 10 25% 10 125
5 Walla Walla Hatchery Air Comp EA 2 25 10 15% 4.25 159
5 Walla Walla Hatchery RT 40-Ton EA 1 19 10 25% 5 238
5 Walla Walla Hatchery Skid EA 1 15 10 15% 4 90
5 Walla Walla Hatchery Welder EA 2 26 10 75% 4.25 829
6 Walla Walla Hatchery Excavator EA 2 22 10 50% 9.33 1026
6 Walla Walla Hatchery Loader EA 1 26 10 100% 8.25 2145
6 Walla Walla Hatchery Dump Truck EA 1 2 10 100% 3.2 64
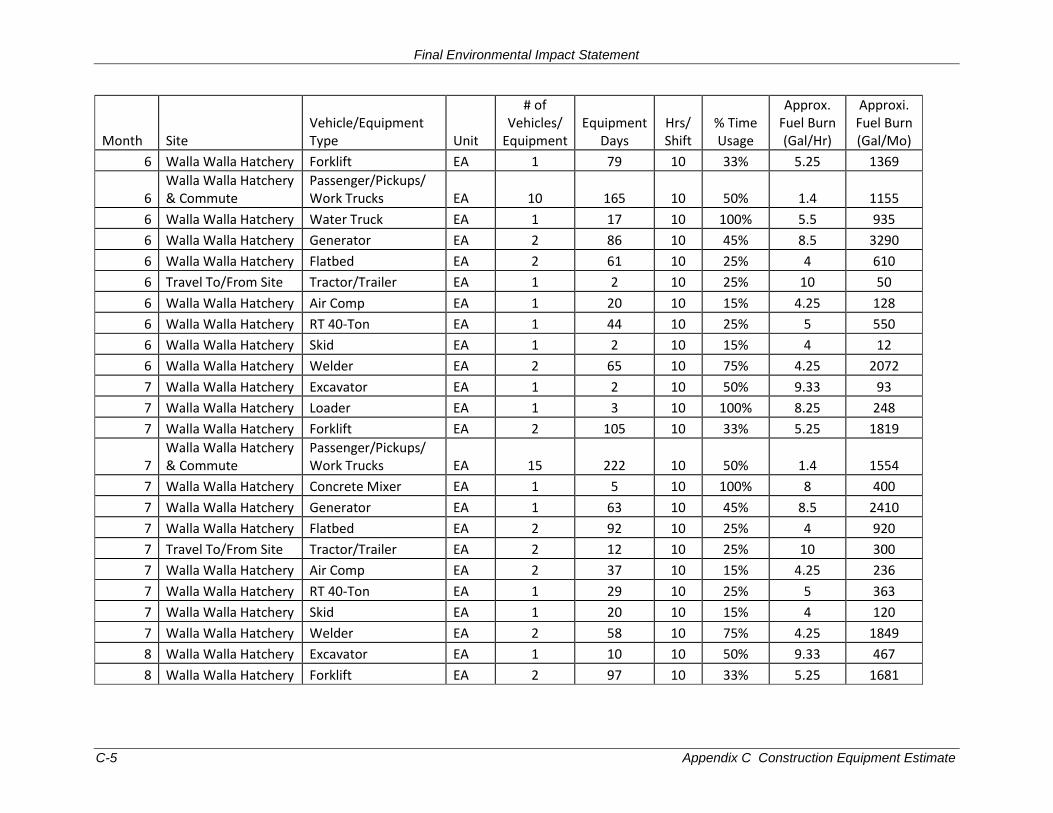
Final Environmental Impact Statement
C-5 Appendix C Construction Equipment Estimate
Month Site Vehicle/Equipment Type Unit
# of Vehicles/
Equipment Equipment
Days Hrs/ Shift
% Time Usage
Approx. Fuel Burn (Gal/Hr)
Approxi. Fuel Burn (Gal/Mo)
6 Walla Walla Hatchery Forklift EA 1 79 10 33% 5.25 1369
6 Walla Walla Hatchery & Commute
Passenger/Pickups/ Work Trucks EA 10 165 10 50% 1.4 1155
6 Walla Walla Hatchery Water Truck EA 1 17 10 100% 5.5 935
6 Walla Walla Hatchery Generator EA 2 86 10 45% 8.5 3290
6 Walla Walla Hatchery Flatbed EA 2 61 10 25% 4 610
6 Travel To/From Site Tractor/Trailer EA 1 2 10 25% 10 50
6 Walla Walla Hatchery Air Comp EA 1 20 10 15% 4.25 128
6 Walla Walla Hatchery RT 40-Ton EA 1 44 10 25% 5 550
6 Walla Walla Hatchery Skid EA 1 2 10 15% 4 12
6 Walla Walla Hatchery Welder EA 2 65 10 75% 4.25 2072
7 Walla Walla Hatchery Excavator EA 1 2 10 50% 9.33 93
7 Walla Walla Hatchery Loader EA 1 3 10 100% 8.25 248
7 Walla Walla Hatchery Forklift EA 2 105 10 33% 5.25 1819
7 Walla Walla Hatchery & Commute
Passenger/Pickups/ Work Trucks EA 15 222 10 50% 1.4 1554
7 Walla Walla Hatchery Concrete Mixer EA 1 5 10 100% 8 400
7 Walla Walla Hatchery Generator EA 1 63 10 45% 8.5 2410
7 Walla Walla Hatchery Flatbed EA 2 92 10 25% 4 920
7 Travel To/From Site Tractor/Trailer EA 2 12 10 25% 10 300
7 Walla Walla Hatchery Air Comp EA 2 37 10 15% 4.25 236
7 Walla Walla Hatchery RT 40-Ton EA 1 29 10 25% 5 363
7 Walla Walla Hatchery Skid EA 1 20 10 15% 4 120
7 Walla Walla Hatchery Welder EA 2 58 10 75% 4.25 1849
8 Walla Walla Hatchery Excavator EA 1 10 10 50% 9.33 467
8 Walla Walla Hatchery Forklift EA 2 97 10 33% 5.25 1681
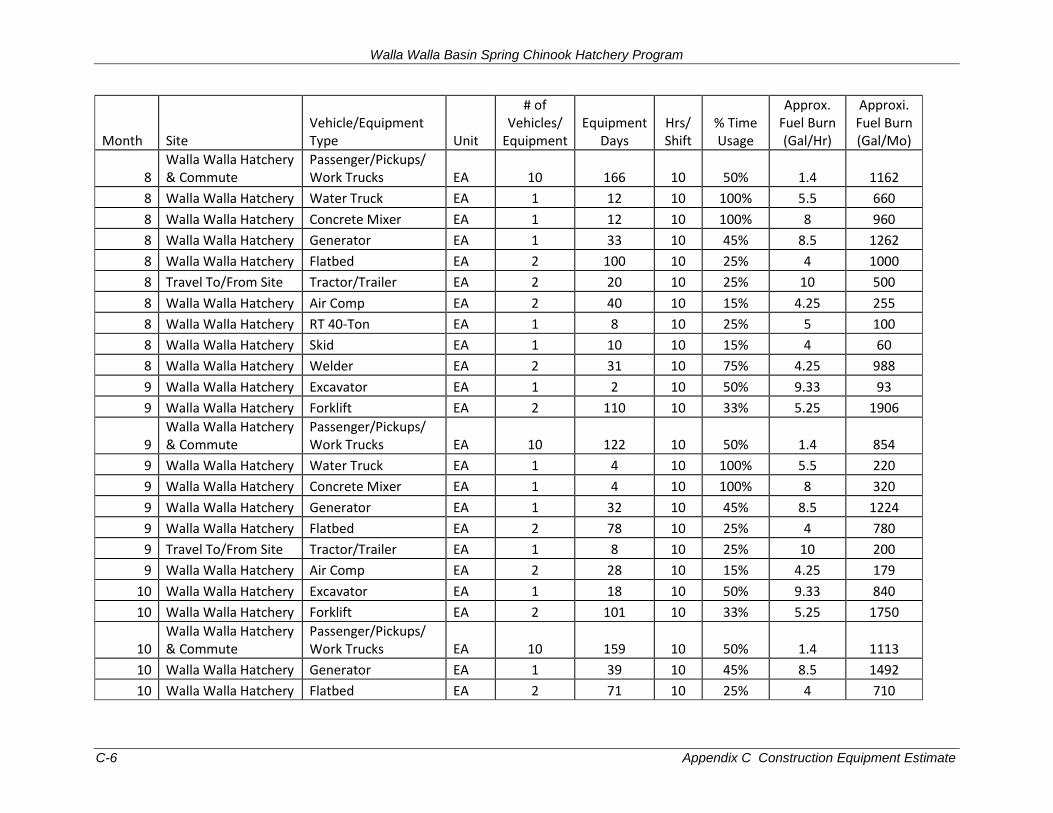
Walla Walla Basin Spring Chinook Hatchery Program
C-6 Appendix C Construction Equipment Estimate
Month Site Vehicle/Equipment Type Unit
# of Vehicles/
Equipment Equipment
Days Hrs/ Shift
% Time Usage
Approx. Fuel Burn (Gal/Hr)
Approxi. Fuel Burn (Gal/Mo)
8 Walla Walla Hatchery & Commute
Passenger/Pickups/ Work Trucks EA 10 166 10 50% 1.4 1162
8 Walla Walla Hatchery Water Truck EA 1 12 10 100% 5.5 660
8 Walla Walla Hatchery Concrete Mixer EA 1 12 10 100% 8 960
8 Walla Walla Hatchery Generator EA 1 33 10 45% 8.5 1262
8 Walla Walla Hatchery Flatbed EA 2 100 10 25% 4 1000
8 Travel To/From Site Tractor/Trailer EA 2 20 10 25% 10 500
8 Walla Walla Hatchery Air Comp EA 2 40 10 15% 4.25 255
8 Walla Walla Hatchery RT 40-Ton EA 1 8 10 25% 5 100
8 Walla Walla Hatchery Skid EA 1 10 10 15% 4 60
8 Walla Walla Hatchery Welder EA 2 31 10 75% 4.25 988
9 Walla Walla Hatchery Excavator EA 1 2 10 50% 9.33 93
9 Walla Walla Hatchery Forklift EA 2 110 10 33% 5.25 1906
9 Walla Walla Hatchery & Commute
Passenger/Pickups/ Work Trucks EA 10 122 10 50% 1.4 854
9 Walla Walla Hatchery Water Truck EA 1 4 10 100% 5.5 220
9 Walla Walla Hatchery Concrete Mixer EA 1 4 10 100% 8 320
9 Walla Walla Hatchery Generator EA 1 32 10 45% 8.5 1224
9 Walla Walla Hatchery Flatbed EA 2 78 10 25% 4 780
9 Travel To/From Site Tractor/Trailer EA 1 8 10 25% 10 200
9 Walla Walla Hatchery Air Comp EA 2 28 10 15% 4.25 179
10 Walla Walla Hatchery Excavator EA 1 18 10 50% 9.33 840
10 Walla Walla Hatchery Forklift EA 2 101 10 33% 5.25 1750
10 Walla Walla Hatchery & Commute
Passenger/Pickups/ Work Trucks EA 10 159 10 50% 1.4 1113
10 Walla Walla Hatchery Generator EA 1 39 10 45% 8.5 1492
10 Walla Walla Hatchery Flatbed EA 2 71 10 25% 4 710
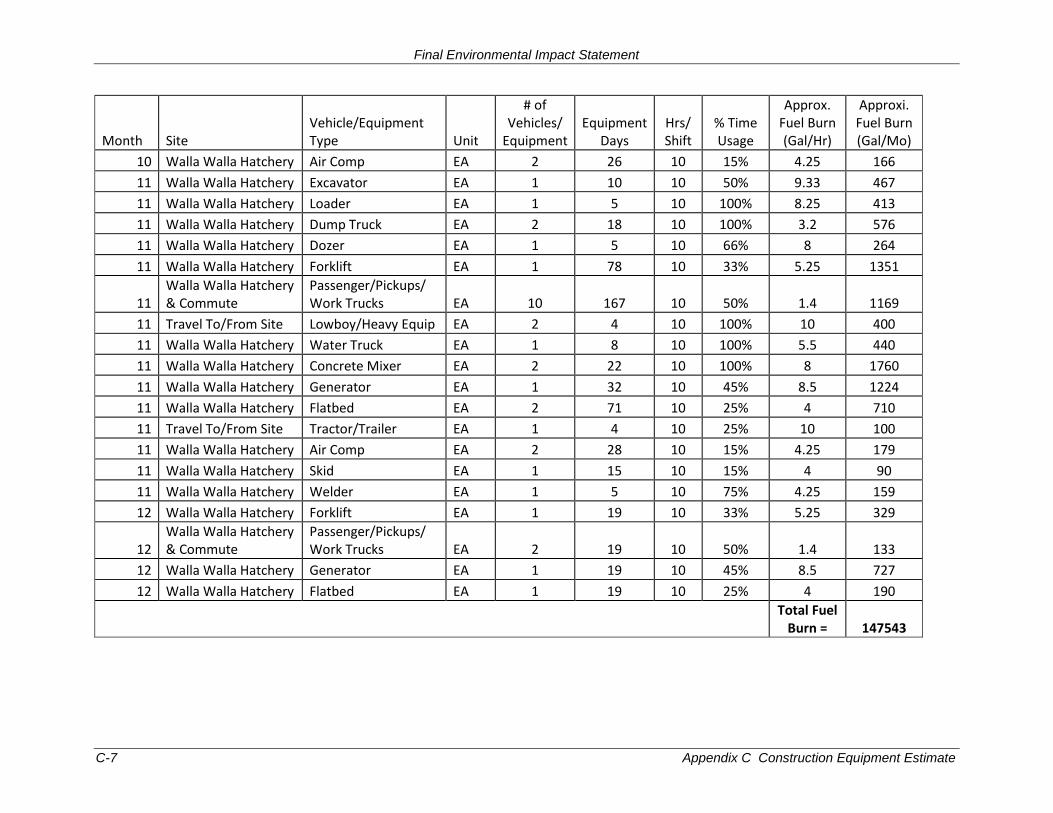
Final Environmental Impact Statement
C-7 Appendix C Construction Equipment Estimate
Month Site Vehicle/Equipment Type Unit
# of Vehicles/
Equipment Equipment
Days Hrs/ Shift
% Time Usage
Approx. Fuel Burn (Gal/Hr)
Approxi. Fuel Burn (Gal/Mo)
10 Walla Walla Hatchery Air Comp EA 2 26 10 15% 4.25 166
11 Walla Walla Hatchery Excavator EA 1 10 10 50% 9.33 467
11 Walla Walla Hatchery Loader EA 1 5 10 100% 8.25 413
11 Walla Walla Hatchery Dump Truck EA 2 18 10 100% 3.2 576
11 Walla Walla Hatchery Dozer EA 1 5 10 66% 8 264
11 Walla Walla Hatchery Forklift EA 1 78 10 33% 5.25 1351
11 Walla Walla Hatchery & Commute
Passenger/Pickups/ Work Trucks EA 10 167 10 50% 1.4 1169
11 Travel To/From Site Lowboy/Heavy Equip EA 2 4 10 100% 10 400
11 Walla Walla Hatchery Water Truck EA 1 8 10 100% 5.5 440
11 Walla Walla Hatchery Concrete Mixer EA 2 22 10 100% 8 1760
11 Walla Walla Hatchery Generator EA 1 32 10 45% 8.5 1224
11 Walla Walla Hatchery Flatbed EA 2 71 10 25% 4 710
11 Travel To/From Site Tractor/Trailer EA 1 4 10 25% 10 100
11 Walla Walla Hatchery Air Comp EA 2 28 10 15% 4.25 179
11 Walla Walla Hatchery Skid EA 1 15 10 15% 4 90
11 Walla Walla Hatchery Welder EA 1 5 10 75% 4.25 159
12 Walla Walla Hatchery Forklift EA 1 19 10 33% 5.25 329
12 Walla Walla Hatchery & Commute
Passenger/Pickups/ Work Trucks EA 2 19 10 50% 1.4 133
12 Walla Walla Hatchery Generator EA 1 19 10 45% 8.5 727
12 Walla Walla Hatchery Flatbed EA 1 19 10 25% 4 190
Total Fuel Burn = 147543

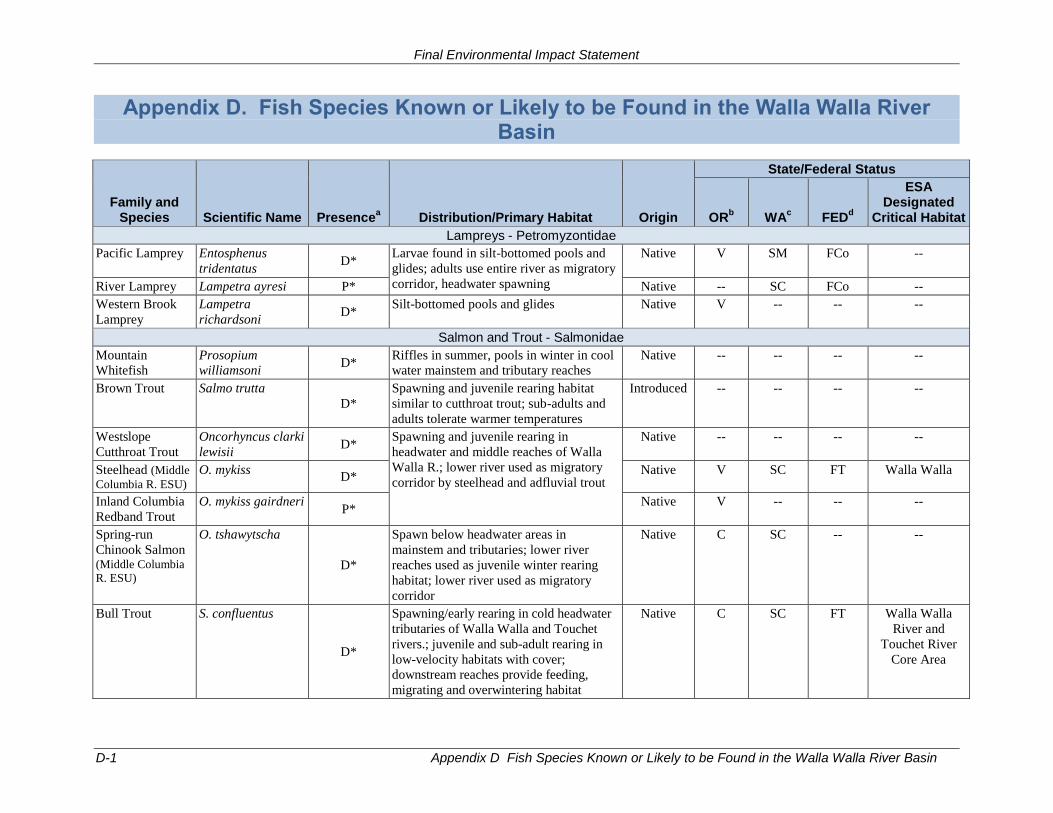
Final Environmental Impact Statement
D-1 Appendix D Fish Species Known or Likely to be Found in the Walla Walla River Basin
Appendix D. Fish Species Known or Likely to be Found in the Walla Walla River Basin
Family and Species Scientific Name Presence
a Distribution/Primary Habitat Origin
State/Federal Status
ORb WA
c FED
d
ESA Designated
Critical Habitat
Lampreys - Petromyzontidae
Pacific Lamprey Entosphenus
tridentatus D*
Larvae found in silt-bottomed pools and
glides; adults use entire river as migratory
corridor, headwater spawning
Native V SM FCo --
River Lamprey Lampetra ayresi P* Native -- SC FCo --
Western Brook
Lamprey
Lampetra
richardsoni D*
Silt-bottomed pools and glides Native V -- -- --
Salmon and Trout - Salmonidae
Mountain
Whitefish
Prosopium
williamsoni D*
Riffles in summer, pools in winter in cool
water mainstem and tributary reaches
Native -- -- -- --
Brown Trout Salmo trutta
D*
Spawning and juvenile rearing habitat
similar to cutthroat trout; sub-adults and
adults tolerate warmer temperatures
Introduced -- -- -- --
Westslope
Cutthroat Trout
Oncorhyncus clarki
lewisii D*
Spawning and juvenile rearing in
headwater and middle reaches of Walla
Walla R.; lower river used as migratory
corridor by steelhead and adfluvial trout
Native -- -- -- --
Steelhead (Middle
Columbia R. ESU) O. mykiss
D* Native V SC FT Walla Walla
Inland Columbia
Redband Trout
O. mykiss gairdneri P*
Native V -- -- --
Spring-run
Chinook Salmon (Middle Columbia
R. ESU)
O. tshawytscha
D*
Spawn below headwater areas in
mainstem and tributaries; lower river
reaches used as juvenile winter rearing
habitat; lower river used as migratory
corridor
Native C SC -- --
Bull Trout S. confluentus
D*
Spawning/early rearing in cold headwater
tributaries of Walla Walla and Touchet
rivers.; juvenile and sub-adult rearing in
low-velocity habitats with cover;
downstream reaches provide feeding,
migrating and overwintering habitat
Native C SC FT Walla Walla
River and
Touchet River
Core Area
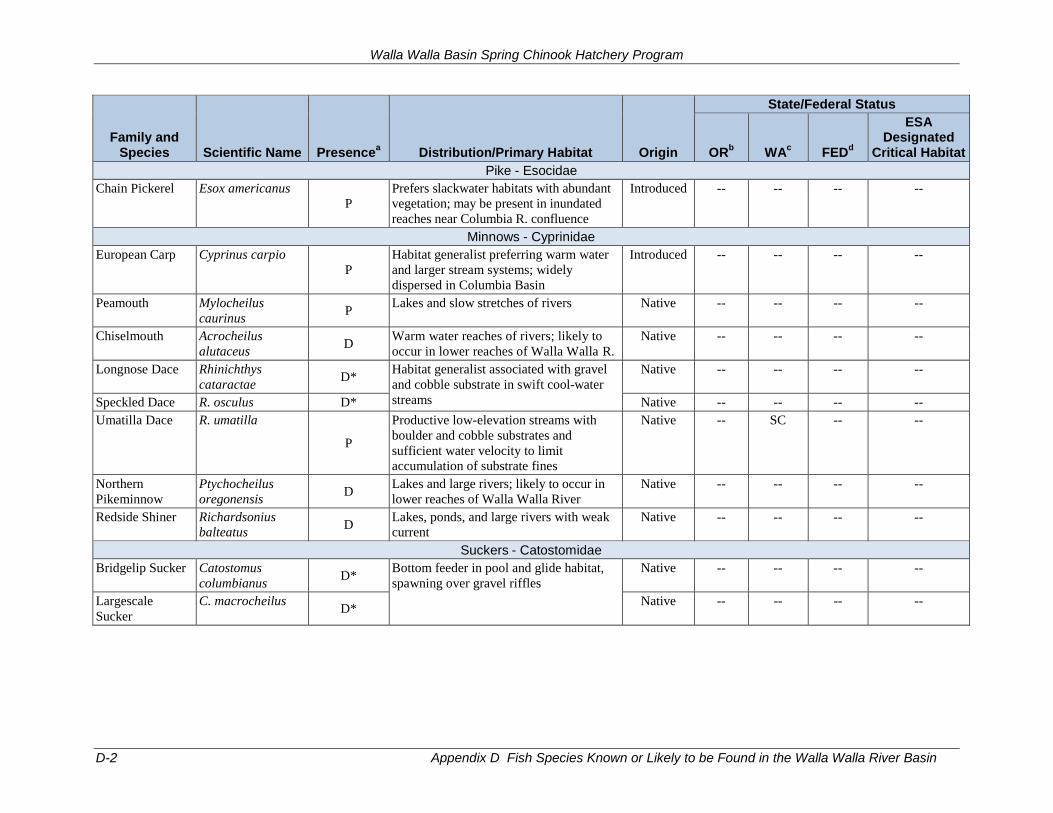
Walla Walla Basin Spring Chinook Hatchery Program
D-2 Appendix D Fish Species Known or Likely to be Found in the Walla Walla River Basin
Family and Species Scientific Name Presence
a Distribution/Primary Habitat Origin
State/Federal Status
ORb WA
c FED
d
ESA Designated
Critical Habitat
Pike - Esocidae
Chain Pickerel Esox americanus
P
Prefers slackwater habitats with abundant
vegetation; may be present in inundated
reaches near Columbia R. confluence
Introduced -- -- -- --
Minnows - Cyprinidae
European Carp Cyprinus carpio
P
Habitat generalist preferring warm water
and larger stream systems; widely
dispersed in Columbia Basin
Introduced -- -- -- --
Peamouth Mylocheilus
caurinus P
Lakes and slow stretches of rivers Native -- -- -- --
Chiselmouth Acrocheilus
alutaceus D
Warm water reaches of rivers; likely to
occur in lower reaches of Walla Walla R.
Native -- -- -- --
Longnose Dace Rhinichthys
cataractae D*
Habitat generalist associated with gravel
and cobble substrate in swift cool-water
streams
Native -- -- -- --
Speckled Dace R. osculus D* Native -- -- -- --
Umatilla Dace R. umatilla
P
Productive low-elevation streams with
boulder and cobble substrates and
sufficient water velocity to limit
accumulation of substrate fines
Native -- SC -- --
Northern
Pikeminnow
Ptychocheilus
oregonensis D
Lakes and large rivers; likely to occur in
lower reaches of Walla Walla River
Native -- -- -- --
Redside Shiner Richardsonius
balteatus D
Lakes, ponds, and large rivers with weak
current
Native -- -- -- --
Suckers - Catostomidae
Bridgelip Sucker Catostomus
columbianus D*
Bottom feeder in pool and glide habitat,
spawning over gravel riffles
Native -- -- -- --
Largescale
Sucker
C. macrocheilus D*
Native -- -- -- --
Walla Walla Basin Spring Chinook Hatchery Program Final Environmental Impact Statement
Appendix E Financial Disclosure E-1
Appendix E. Financial Disclosure
ICF International

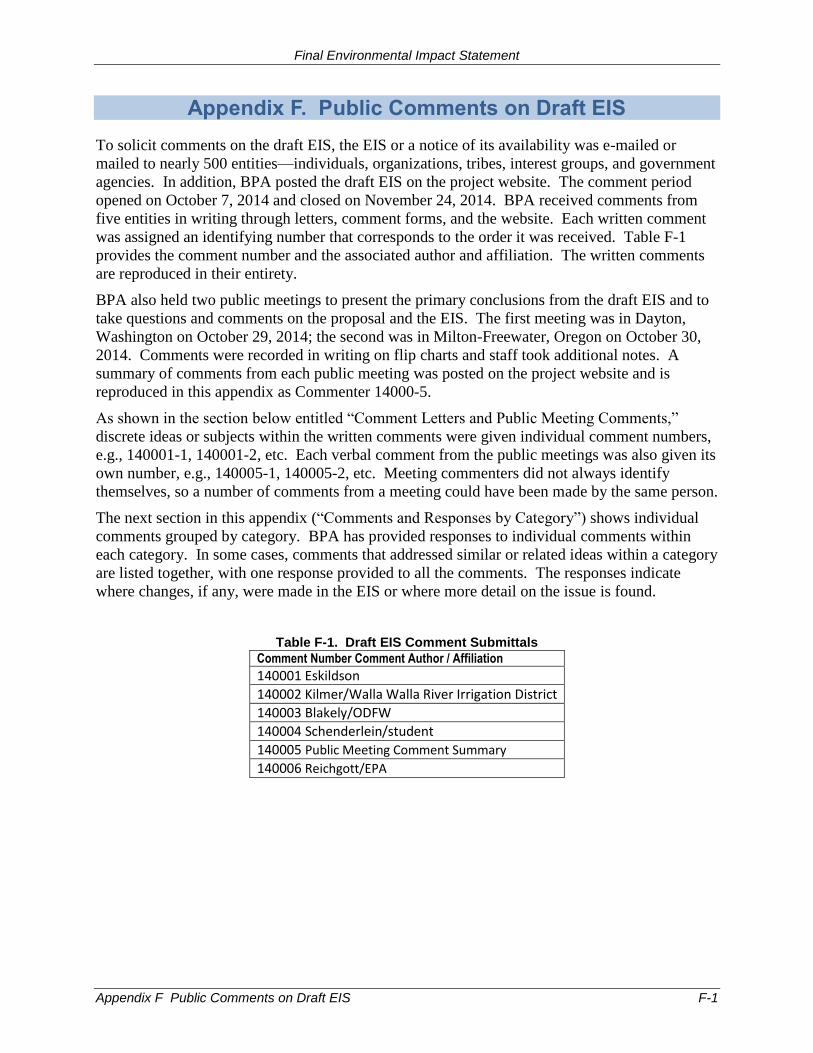
Final Environmental Impact Statement
Appendix F Public Comments on Draft EIS F-1
Appendix F. Public Comments on Draft EIS
To solicit comments on the draft EIS, the EIS or a notice of its availability was e-mailed or
mailed to nearly 500 entities—individuals, organizations, tribes, interest groups, and government
agencies. In addition, BPA posted the draft EIS on the project website. The comment period
opened on October 7, 2014 and closed on November 24, 2014. BPA received comments from
five entities in writing through letters, comment forms, and the website. Each written comment
was assigned an identifying number that corresponds to the order it was received. Table F-1
provides the comment number and the associated author and affiliation. The written comments
are reproduced in their entirety.
BPA also held two public meetings to present the primary conclusions from the draft EIS and to
take questions and comments on the proposal and the EIS. The first meeting was in Dayton,
Washington on October 29, 2014; the second was in Milton-Freewater, Oregon on October 30,
2014. Comments were recorded in writing on flip charts and staff took additional notes. A
summary of comments from each public meeting was posted on the project website and is
reproduced in this appendix as Commenter 14000-5.
As shown in the section below entitled “Comment Letters and Public Meeting Comments,”
discrete ideas or subjects within the written comments were given individual comment numbers,
e.g., 140001-1, 140001-2, etc. Each verbal comment from the public meetings was also given its
own number, e.g., 140005-1, 140005-2, etc. Meeting commenters did not always identify
themselves, so a number of comments from a meeting could have been made by the same person.
The next section in this appendix (“Comments and Responses by Category”) shows individual
comments grouped by category. BPA has provided responses to individual comments within
each category. In some cases, comments that addressed similar or related ideas within a category
are listed together, with one response provided to all the comments. The responses indicate
where changes, if any, were made in the EIS or where more detail on the issue is found.
Table F-1. Draft EIS Comment Submittals
Comment Number Comment Author / Affiliation
140001 Eskildson
140002 Kilmer/Walla Walla River Irrigation District
140003 Blakely/ODFW
140004 Schenderlein/student
140005 Public Meeting Comment Summary
140006 Reichgott/EPA
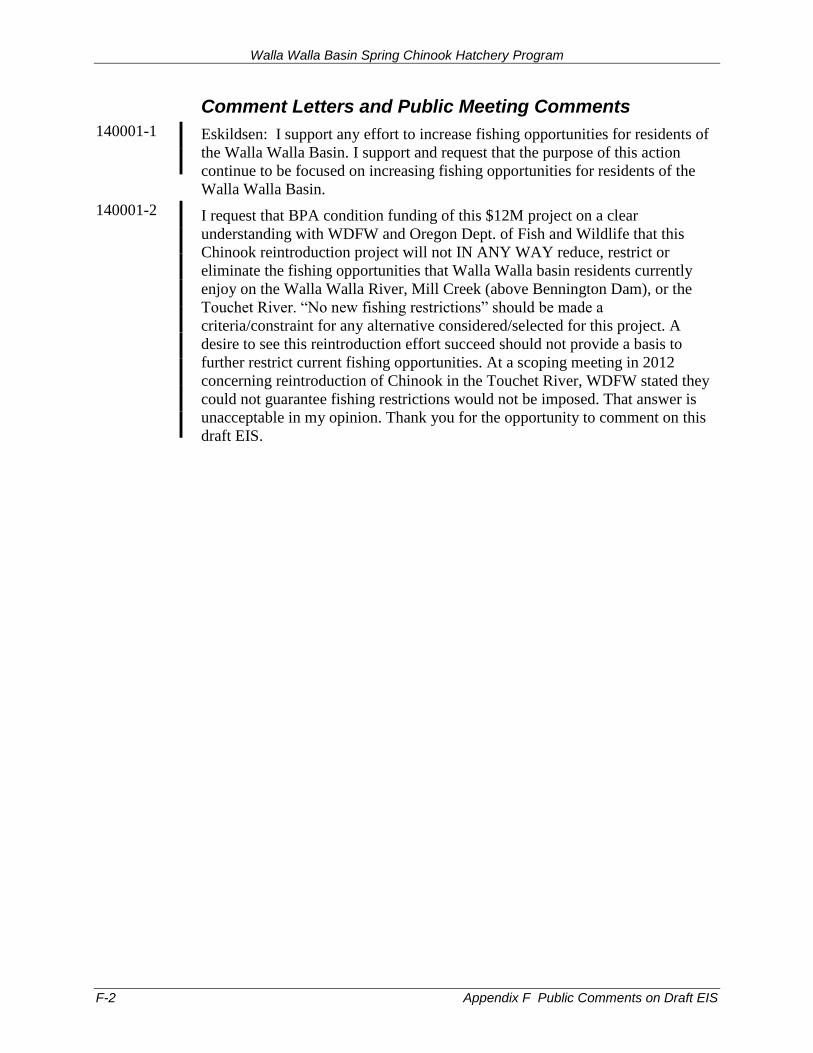
Walla Walla Basin Spring Chinook Hatchery Program
F-2 Appendix F Public Comments on Draft EIS
140001-1
140001-2
Comment Letters and Public Meeting Comments
Eskildsen: I support any effort to increase fishing opportunities for residents of
the Walla Walla Basin. I support and request that the purpose of this action
continue to be focused on increasing fishing opportunities for residents of the
Walla Walla Basin.
I request that BPA condition funding of this $12M project on a clear
understanding with WDFW and Oregon Dept. of Fish and Wildlife that this
Chinook reintroduction project will not IN ANY WAY reduce, restrict or
eliminate the fishing opportunities that Walla Walla basin residents currently
enjoy on the Walla Walla River, Mill Creek (above Bennington Dam), or the
Touchet River. “No new fishing restrictions” should be made a
criteria/constraint for any alternative considered/selected for this project. A
desire to see this reintroduction effort succeed should not provide a basis to
further restrict current fishing opportunities. At a scoping meeting in 2012
concerning reintroduction of Chinook in the Touchet River, WDFW stated they
could not guarantee fishing restrictions would not be imposed. That answer is
unacceptable in my opinion. Thank you for the opportunity to comment on this
draft EIS.
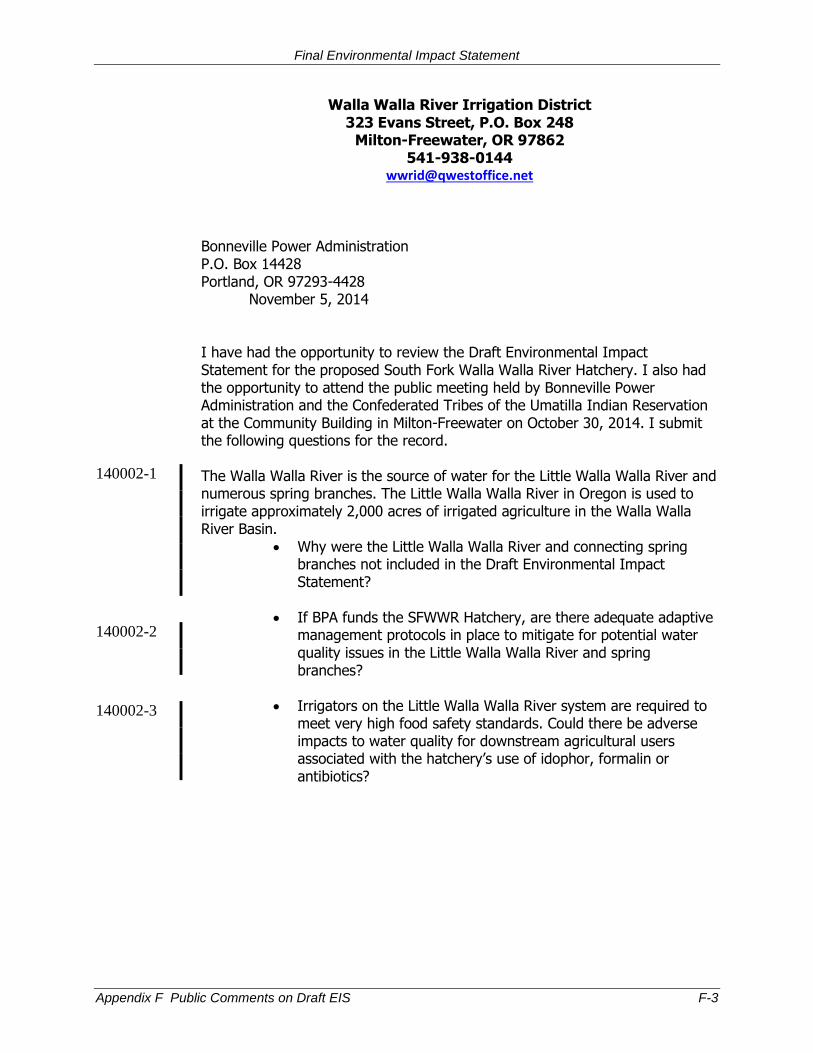
Final Environmental Impact Statement
Appendix F Public Comments on Draft EIS F-3
140002-1
140002-2
140002-3
Walla Walla River Irrigation District 323 Evans Street, P.O. Box 248
Milton-Freewater, OR 97862 541-938-0144
Bonneville Power Administration P.O. Box 14428 Portland, OR 97293-4428 November 5, 2014 I have had the opportunity to review the Draft Environmental Impact Statement for the proposed South Fork Walla Walla River Hatchery. I also had the opportunity to attend the public meeting held by Bonneville Power Administration and the Confederated Tribes of the Umatilla Indian Reservation at the Community Building in Milton-Freewater on October 30, 2014. I submit the following questions for the record. The Walla Walla River is the source of water for the Little Walla Walla River and numerous spring branches. The Little Walla Walla River in Oregon is used to irrigate approximately 2,000 acres of irrigated agriculture in the Walla Walla River Basin.
Why were the Little Walla Walla River and connecting spring branches not included in the Draft Environmental Impact Statement?
If BPA funds the SFWWR Hatchery, are there adequate adaptive management protocols in place to mitigate for potential water quality issues in the Little Walla Walla River and spring branches?
Irrigators on the Little Walla Walla River system are required to meet very high food safety standards. Could there be adverse impacts to water quality for downstream agricultural users associated with the hatchery’s use of idophor, formalin or antibiotics?
Walla Walla Basin Spring Chinook Hatchery Program
F-4 Appendix F Public Comments on Draft EIS
140002-4
140002-5
140002-6
140002-7
140002-8
140002-9
140002-10
140002-11
140002-12
140002-13
According to the DEIS, if the peak goal of 8,000 returning Spring Chinook adults is achieved, there would be at least 50 metric tons of marine derived nutrients from salmon carcasses in the Walla Walla River system.
Would the increased mercury, nitrogen, ammonia and PCB levels have a negative impact to water quality in the Little Walla Walla River?
Would the irrigators that have used the Little Walla Walla River as their primary source of irrigation water for over 100 years still be able to meet food safety standards if Little Walla Walla River water quality is degraded as a result of increased nutrient loads from Spring Chinook carcasses in the Walla Walla River?
What would be the impact to wild fish and other aquatic species in the Little Walla Walla River and spring branches?
The West Little Walla Walla River is listed as category 5 on the
303(D) list for temperature and dissolved oxygen. Could the increased nutrient load further degrade water quality in this natural stream?
Since 2005, approximately 250,000 smolts have been released each year in Walla Walla River. According to the DEIS, the average return is 357.
Has there been a cost to benefit analysis done for this project?
The average natural origin return is currently 145. How did you come up with the peak goal of 8,000 returning adults in the Draft Environmental Impact Statement?
Are there historical numbers available for spring Chinook in the Walla Walla River?
If returning progeny are not going to be clipped are they considered a natural stock and could the reestablished Spring Chinook be listed under the ESA?
What is the impact on the ecosystem if future habitat improvements are not made to the Walla Walla River?
What is the impact on the success of this project if future habitat improvements are not made to the Walla Walla River?
Final Environmental Impact Statement
Appendix F Public Comments on Draft EIS F-5
140002-14
140002-15
140002-16
Bull Trout and Steelhead are currently listed as threatened under the Endangered Species Act.
It has been documented that spring Chinook could out-compete bull trout for spawning sites. If BPA funds the SFWWR hatchery, are there adequate adaptive management protocols in place to mitigate for potential declines in the ESA listed species populations?
The recently published 10 year bull trout recovery synthesis by Utah State University for USFWS identifies the need to keep the SFWWR as healthy as possible in order to stabilize the existing Bull Trout population. Recovery of the species would require projects to improve habitat and flow conditions in the lower levee section of the Walla Walla River.
How much additional water is needed in the Walla Walla River to support the new population of Spring Chinook?
Does it make more sense to complete the necessary habitat improvements to the system before introducing more fish to the hostile levee environment we currently have?
Sincerely, Teresa Kilmer District Manger Walla Walla River Irrigation District
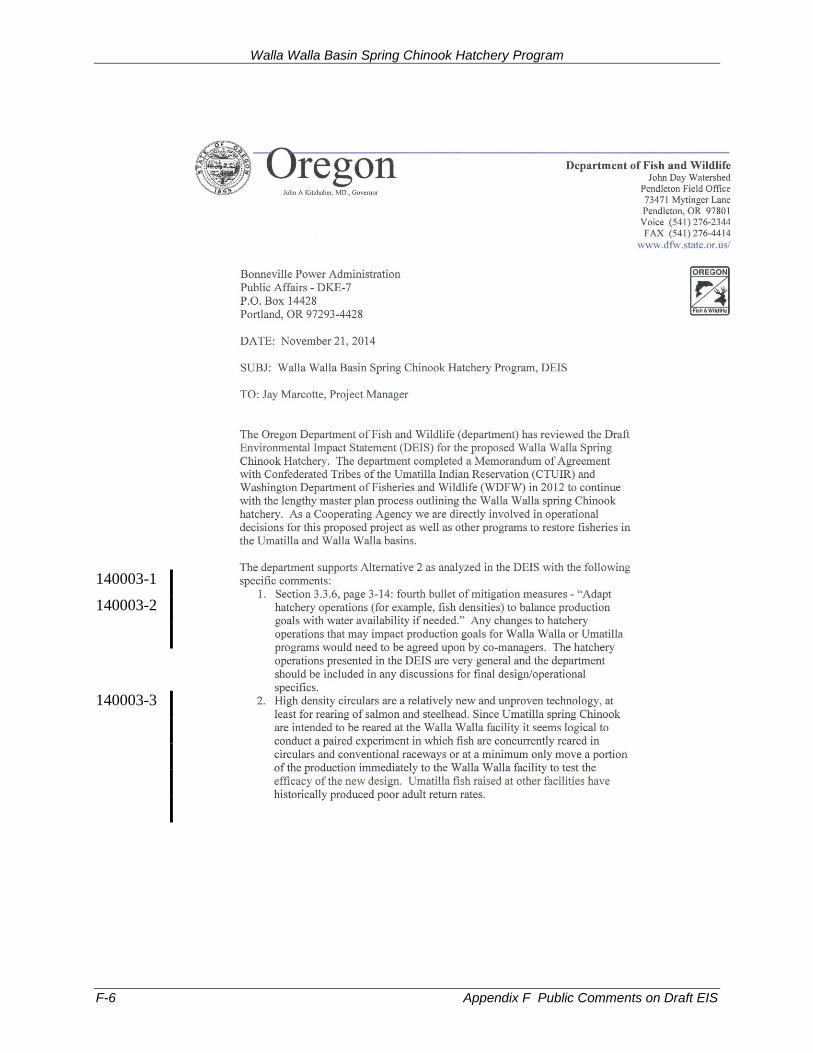
Walla Walla Basin Spring Chinook Hatchery Program
F-6 Appendix F Public Comments on Draft EIS
140003-1
140003-2
140003-3
Final Environmental Impact Statement
Appendix F Public Comments on Draft EIS F-7
140003-4
140003-5
140003-6
Walla Walla Basin Spring Chinook Hatchery Program
F-8 Appendix F Public Comments on Draft EIS
140004-1
140004-2
140004-3
140004-4
140004-5
Bonneville Power Administration
P.O. Box 14428
Portland, OR 97293-4428 November 24, 2014
This environmental impact statement is in accordance to the draft DOE/EIS
0495 of Walla Walla hatchery Spring Chinook hatchery program.
I am finishing up as an undergraduate in the behavior sciences in Biology.
Primarily my focuses of studies have been in animal behaviors and conservation
biology. The studies in conservation have allowed me to have a discipline in my
actions regarding conservation based upon facts and working systems.
The underlying need for an action plan regarding the implementation of
constructing a hatchery for the Spring Chinook is commendable. Though the
purpose of the hatchery program involves the improvement fitness and survival
of the Spring Chinook by the releasing into the Umatilla basin for an end goal to
have a naturally spawning population; a few concerns are needed to be
addressed in the environment draft. It seems as there is a lack explanation and
emphasis in the harm a hatchery could inflict on the natural habitat and the
species listed under the Endangered Species Act either as state listed or federally
listed. I propose a no change action based upon wanting improved in-basin
conditions. When having a complex environment it allows for a higher species
diversity which will then give certain species a variety of habitat and more
niches.
Another action needed before an alternative is considered is taking further
management plans to ensure the protection of the endangered species from the
construction and maintaining of the hatchery. What are the procedures for best
management practices stated in the impact statement? Is a conservation biologist
a resource in building the practices?
The effects of noise on the wildlife depend upon the type of noise produced and
the duration of the noise. The effects on birds alone show that noise pollution
can cause physical damage to the ears, chronic stress responses, avoidance of
area, changes in foraging, change in reproductive success, changes in vocal
communities, and interferences to hear predators (Ortega 2012). A study done
on the Spotted Owl, which resides in Oregon, is a federally endangered species
that is known or believed to occur in Columbia County in Oregon. The study
was done by Glenn et al. (2004) in Oregon and found that the Spotted Owl is
found in fragmented old forest (which is composed of multilayered canopies and
a large diameter trees) in which they roost and nest. It was also found that they
changed patterns based upon quality of habitat and because they do not expand
home range there is a decline in species numbers. It could be said that they
could also change patterns due to the proximity of the hatchery noise; a follow-
up on the Spotted Owl patterns would be needed to see if noise would a negative
impact on the species.
Final Environmental Impact Statement
Appendix F Public Comments on Draft EIS F-9
140004-6
140004-7
140004-8
140004-9
Lastly protecting the riparian habitat is a must. One study on aquatic conditions
(teels et. al. 2006) found that the biological integrity of fish populations was
correlated with the physical attributes to the stream. If there was an absence of
vegetation the stream would have a higher then normal temperature and little or
none cover for fish, but if vegetation was present it would cause a positive local
effect and a spatial effect. The local effect was being able to provide shade, an
input of organic matter and the maintaining of local back stability. The spatial
effect was causes the overall stream nutrient input, normal temperature and a
normal flow regime. Having 1.7 and 1.3 acres of riparian destroyed and then
replanted and reseeded in alternative 1 and alternative 2 respectably could cause
temperature decline at a local level. Also removing 50 alder and cottonwood
trees in alternative 1 or removing 100 alder and cottonwood trees could cause
negative effects on the surrounding habitat and local stream nutrients. Riparian
vegetation provides needed ecological functions including reducing erosion, trap
sediments and potential pollutants, it will stabilize banks and allow habitat for
wildlife such as the endangered Yellow-billed Cuckoos which breed in riparian
habitats.
Riparian habitats allow for movement between communities and contain a
greater species richness of birds then upland forests. A study by Peak et. at
(2006) found that cottonwoods and willows will have a greater mortality when
there is a decreasing groundwater levels and that cottonwoods reach maximum
height 60 to 75 years after planting. Due to such a long time of mature height,
replanting cottonwoods after the hatchery is build wouldn’t provide habitat for
birds or the positive effects for streams. The big problem lies in that if the
hatchery is build and running what effect would be on the riparian habitat
around the hatchery as well as downstream when flow is reduced by 12.8 cubic
ft/s (alternative 1) or 14.8 cubic ft/s (alternative 2) between the hatchery and the
withdrawal and discharge points?
It’s first to note that Gary Meffe who studied salmon hatcheries on the Pacific
coast of North America (1992) found that from statistical research and historical
trends indicate hatcheries will fail to meet its intended function and that while
their was a widespread hatchery development for Pacific salmon, over 100
populations have gone extinct. Paul Angermeier (2008) even states that
hatcheries could accelerate the rate of extinction and cause biodiversity loss.
However, if a hatchery is established it must meet a maximum sustainable
biomass and human resources (Rahel 2008).
Walla Walla Basin Spring Chinook Hatchery Program
F-10 Appendix F Public Comments on Draft EIS
140004-10
One of the concerns is the question as to why is there a lack of consistent source
of adults for out-planting and the infusion of the out-of-basin adults limit the
ability for recent and current in providing the adults to meet harvest and
production goals. Could it be from a lack of resources resulting in competition
of spawning areas? Studies have shown that inferior competitors cannot coexist
when a superior competitor is present in a large number. Could it be from water
quality? Could inadequate soil patterns (nutrients, organic material) or no
vertical structures, such as canopies from riparian habitat to provide shade cause
poor quality? I feel that more analysis is recommended to figure out why the
current efforts are unsuccessful.
Schenderlein
Final Environmental Impact Statement
Appendix F Public Comments on Draft EIS F-11
140005-1
140005-2
140005-3
140005-4
140005-5
140005-6
140005-7
140005-8
140005-9
140005-10
140005-11
140005-12
140005-13
Two meetings were held to provide an opportunity for the public to comment on the Draft EIS. One was in Dayton, Washington on October 29, 2014 and the other in Milton-Freewater, Oregon on October 30, 2014. The following summarizes the comments that were made.
Dayton Public Meeting 10/29/2014
Comments transcribed by Don Rose
What are water quality effects of leftover salmon carcasses?
What is the cost of the pumpback system?
What is the significance of Burlingame on the map?
What is the impact on bull trout of spring chinook releases?
Where will fishing be allowed? Are there defined tribal areas and non-tribal?
What is the difference between the in-basin harvest and a tribal and non-tribal fishery (EIS p. 2-11)?
Questions from neighbors involve trespass rights. Can owner say they don’t want fishing on their property?
Landowner likes the state notifying him by letter when they will be there.
If someone knocks on his door and asks if they can fish on his property, he would say yes, but don’t leave bait cans and beer cans.
ODFW/CTUIR should have a meeting with locals to announce how fisheries will be managed.
I hope it works, I think it’s a great idea.
How will the smolt distribution go?
Will the reintroduced stock get listed and fishing not be allowed?
Walla Walla Basin Spring Chinook Hatchery Program
F-12 Appendix F Public Comments on Draft EIS
140005-14
140005-15
140005-16
140005-17
140005-18
140005-19
140005-20
140005-21
140005-22
140005-23
140005-24
140005-25
140005-26
140005-27
140005-28
140005-29
140005-30
140005-31
Milton-Freewater Public Meeting 10/30/2014
Comments transcribed by Don Rose
Brian Wolcott:
Concerned about formalin and antibiotics going into the river affecting water quality.
Concerned about spread of disease from smolts to native fish.
Adding nutrients to system – will it increase algae?
Have there been macro invertebrate studies above and below hatcheries to find out impacts?
Other places he has been where there are hatcheries there seemed to be less native fish.
Will this hatchery require an individual NPDES permit.
How are they handling freezing of the intake screens?
General comments:
What about other predators in the system, i.e. otters. How will they affect the juveniles? Will predator population be increased? Aren’t you throwing a lot of money into something that won’t work?
Worried about getting water shut off because of listed fish in the river. Last thing he wants.
Are fish going to be clipped?
Is the hatchery really non-consumptive in terms of water? Will the hatchery reduce the amount of water in the Walla Walla River that is available for other consumptive uses?
Are fish going to cause a senior water right holder to be curtailed?
All it takes is one judge to say these fish should be protected.
When SFWW Adult Holding facility was put in, they had the first blue-green bloom. What is existing biological Dissolved Oxygen (DO)?
Ron Brown: Works really close w/EPA. There are places where water quality is affected by hatcheries.
Little Walla Walla not included in analysis; during spawning, they are in full irrigation. Ditch joins with little WW River. Will carcasses cause ammonia, or other problems?
Meet Global Gap safety regs – work closely w/DEQ.
What happens to the sediment from the settling pond?
Final Environmental Impact Statement
Appendix F Public Comments on Draft EIS F-13
140005-32
140005-33
140005-34
140005-35
140005-36
140005-37
140005-38
140005-39
140005-40
140005-41
140005-42
140005-43
140005-44
140005-45
140005-46
Explain about toxics used on the site.
What if the assumption that bull trout won’t be affected is wrong?
Are pesticides used in the hatchery?
Would there be a water quality impact downstream of the hatchery that would negatively affect existing downstream water users?
Concerned about downstream effects of the constructed riffle.
What is the cost to build and maintain?
Who owns the project?
What is the breakdown on what is the cost to ratepayers per household?
Why is the tribe chosen to manage the facility?
What about competition, why not a corporation?
Will tribe benefit commercially from the fish harvest?
Am I going to see tribal members on my property harvesting fish?
Have you been to Palmer Junction? Tribal police are blocking access to the river.
What is the difference between the phases of program?
How can the power system be safe-guarded to prevent fish losses.
Walla Walla Basin Spring Chinook Hatchery Program
F-14 Appendix F Public Comments on Draft EIS
140006-1
140006-2
Final Environmental Impact Statement
Appendix F Public Comments on Draft EIS F-15
140006-3
140006-4
140006-5
140006-6
140006-7
140006-8
140006-9
140006-10
Walla Walla Basin Spring Chinook Hatchery Program
F-16 Appendix F Public Comments on Draft EIS
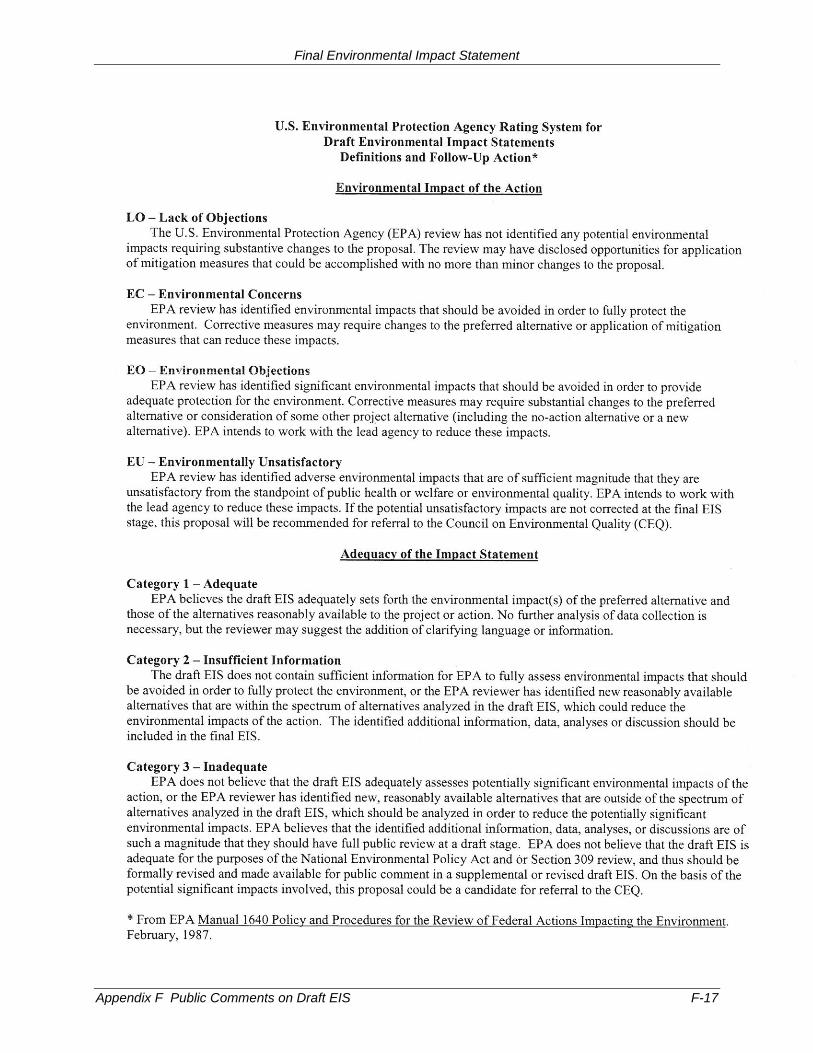
Final Environmental Impact Statement
Appendix F Public Comments on Draft EIS F-17
Walla Walla Basin Spring Chinook Hatchery Program
F-18 Appendix F Public Comments on Draft EIS
Comments and Responses by Category
Need for Project
Comment 140002-8: Has there been a cost to benefit analysis done for this project?
Response: Cost/benefit analyses are not required under NEPA. Section 1502.23 of the
regulations implementing NEPA states:
For purposes of complying with the Act [NEPA], the weighing of the merits and drawbacks
of the various alternatives need not be displayed in a monetary cost-benefit analysis and
should not be when there are important qualitative considerations.
Chapter 3, Section 3.7.4, including the subsection Use and Value of Salmon, discusses certain
economic effects of the action alternatives; however, experience has shown that it is extremely
difficult to objectively quantify qualitative benefits such as the increase in marine-derived
nutrients from salmon carcasses, the restoration of a species that once occupied the basin, or the
restoration of an important part of the culture of the Columbia River Indian tribes.
If the decision on the proposed action were based solely on quantifiable financial costs and
benefits, then the costs would outweigh the direct and indirect employment attributable to the
project and the financial value of the harvest in the region.
Comment 140004-1: The underlying need for an action plan regarding the implementation of constructing a hatchery for the Spring Chinook is commendable. Though the purpose of the hatchery program involves the improvement fitness and survival of the Spring Chinook by the releasing into the Umatilla basin for an end goal to have a naturally spawning population; a few concerns are needed to be addressed in the environment draft.
Response: Thank you for your comment. It should be noted that the action alternatives propose
to release spring Chinook in the Walla Walla basin, not the Umatilla basin.
Comment 140005-41: Why is the tribe chosen to manage the facility?
Comment 140005-42: What about competition, why not a corporation?
Response: Chapter 1, Section 1.3.1, explains the history behind the development of the proposed
action. The proposal that is the subject of this EIS is part of the Northwest Power and
Conservation Council’s Fish and Wildlife Program. CTUIR proposed the project to the Council
through a Master Plan, which is the first step in a 3-step review process established by the
Council. The 3-step process includes public and independent scientific reviews. The Council
determines which project proposals to recommend to BPA for NEPA review and potential
funding. BPA does not select the entities that manage these projects.
Comment 140005-11: I hope it works, I think it’s a great idea.
Response: Thank you for your comment.
Scope of EIS
Comment 140002-1: The Walla Walla River is the source of water for the Little Walla Walla River and numerous spring branches. The Little Walla Walla River in Oregon is used to irrigate approximately 2,000 acres of irrigated agriculture in the Walla Walla River Basin.
Why were the Little Walla Walla River and connecting spring branches not included in the Draft Environmental Impact Statement?
Final Environmental Impact Statement
Appendix F Public Comments on Draft EIS F-19
Response: Chapter 3, Section 3.2.1 has been modified to include the Little Walla Walla River as
a tributary to the Walla Walla River.
Comment 140004-2: It seems as there is a lack [of] explanation and emphasis in the harm a hatchery could inflict on the natural habitat and the species listed under the Endangered Species Act either as state listed or federally listed.
Response: Evaluations of harm to natural habitat and species listed under the state and federal
ESA are in Chapter 3, Sections 3.5 (Fish), 3.6 (Vegetation and Noxious Weeds), 3.9 (Wetlands
and Floodplains), and 3.10 (Wildlife).
Comment 140006-1: Our [EPA’s] review of the Draft…EIS considers the expected environmental impacts of the proposed action and the adequacy of the EIS in meeting the procedural and public disclosure requirements of NEPA. We are rating the Draft EIS Lack of Objections (LO). A copy of our rating system is enclosed16.
Response: Thank you for your comment.
Comment 140006-2: The Draft EIS is responsive to our [EPA’s] April, 2013 comments. Our project specific recommendations focused on water quality, climate change adaptation, and sustainable/green design.
Response: Thank you for your comment.
Phased Approach
Comment 140005-45: What is the difference between the phases of program?
Response: Chapter 2, Section 2.2.4, explains the different goals for each phase of the program in
detail. In brief, the phases reflect different natural and hatchery survival conditions and therefore
differ in purpose and in the priority for disposition of the returning adults.
Phase 1: Local Adaptation, Natural Spawning and Harvest
Phase 2: Harvest Augmentation and Transition to an Integrated Program
Phase 3: Integrated Harvest and Demographic Safety Net
Comment 140006-8: …we [EPA] believe the final EIS should include additional information on Phase 3 of the hatchery’s operation…
Response: Information has been added to Chapter 2, Section 2.2.3 (Phased Approach and
Management Criteria).
Comment 140006-10: Also, because [fish] losses have generally been attributed to habitat degradation and fish passage constraints, we recommend that the final EIS include additional information describing how habitat improvements in the basin are or will be adequate to sustain a return of 5,500 natural-origin adults over the long term.
Response: In Chapter 3, Section 3.14.3, the cumulative impacts analysis discusses, to the extent
possible, the effects of recent, ongoing, and future habitat improvements. The section also cites
a 2007 analysis that estimated climate change could cause loss of salmon habitat in Northwest
states as high as 40% by 2090 (Independent Scientific Advisory Board), with losses being most
severe in Oregon and Idaho. Thus, the effects of climate change could offset the benefits of
habitat improvements.
16
For definitions of the term LO, see the full text of EPA’s letter (comment letter 140006) in this appendix.
Walla Walla Basin Spring Chinook Hatchery Program
F-20 Appendix F Public Comments on Draft EIS
As noted in text added to that section, the Master Plan that provides the basis for the Preferred
Alternative takes a more optimistic view of habitat improvements and climate change. However,
the Master Plan also acknowledges that climate change could create conditions that would
require hatchery production to continue indefinitely in order to meet harvest goals. We have
added information from the Master Plan to Chapter 2, Section 2.2.3 that summarizes the
assumptions project proponents made about how habitat improvements will be monitored in
conjunction with spring Chinook abundance to determine if the Phase 3 goals can be achieved.
Comment 140002-9: The average natural origin return is currently 145. How did you come up with the peak goal of 8,000 returning adults in the Draft Environmental Impact Statement?
Response: Chapter 2, Section 2.2.3, provides a summary of the complex analysis prepared for
the project Master Plan (CTUIR 2013), in which the escapement goals for each of the three
phases of the project were established. The expected average outcome of each phase of the
spring Chinook program was calculated using the all‐H analyzer (AHA) model. The wide range
in outcomes is due to both systematic and random variation in survival over 80 generations. The
8,000 returning adults is a number used in the analysis of effects to establish what the project
would expect to be the highest possible adult return and is not a management goal. The text in
Section 3.5.5, Operational Effects, Effects on Food Web Productivity has been clarified.
Alternatives
Alternative 1
Comment 140005-3: What is the significance of Burlingame on the map?
Response: At the Draft EIS planning stage, Burlingame Dam was proposed to be used as a back-
up site to collect broodstock for the project in the event that water levels in the Walla Walla
River were too low for returning spring Chinook adults to reach the primary broodstock
collection point at Nursery Bridge Dam. However, that alternative collection site has been
eliminated from the proposal.
Comment 140005-12: How will the smolt distribution go?
Response: As stated in Chapter 2, Section 2.2.2, the project would release 400,000 smolts into
the South Fork Walla Walla River directly from the hatchery; up to 100,000 smolts would be
trucked to a release point, as yet unspecified, in the Touchet River near Dayton, Washington.
Comment 140005-20: How are they handling freezing of the intake screens?
Response: River water would be used, possibly with a heated traveling screen. See Chapter 2,
Section 2.2.1, Water Supply.
Alternative 2
Comment 140003-1: [Oregon Department of Fish and Wildlife] supports Alternative 2.
Comment 140003-3: High density circulars are a relatively new and unproven technology, at least for rearing of salmon and steelhead. Since Umatilla spring Chinook are intended to be reared at the Walla Walla facility it seems logical to conduct a paired experiment in which fish are concurrently reared in circulars and conventional raceways or at a minimum only move a portion of the production immediately to the Walla Walla facility to test the efficacy of the new design. Umatilla fish raised at other facilities have historically produced poor adult return rates.
Final Environmental Impact Statement
Appendix F Public Comments on Draft EIS F-21
Response: We appreciate ODFW’s support of this alternative; however, BPA’s Preferred
Alternative is Alternative 1. Since traditional raceways are not proposed for the Walla Walla
Hatchery, if Alternative 2 were to be selected, an experiment to confirm the efficacy of the
proposed circular rearing vessels would likely need to involve production of only a portion of the
Umatilla spring Chinook at the Walla Walla facility. The co-managers would need to agree to
any such experiment.
Comment 140006-5: [W]e believe that water reuse should be a required component of constructing Alternative 2….because it would save energy by reducing the need to utilize the pumpback system and because it would reduce the risk of river flows below state-established minimums.
Response: If Alternative 2 were to be implemented, a reuse system would reduce the need for
the pumpback system; however, during February, which is the month with the highest likelihood
to violate instream flows, it would reduce the need by only about 2% compared to Alternative 2
without reuse. See Section 3.3.6. Due to use of the pumpback system and other mitigation
measures, there should be no risk of any of the action alternatives violating state-established
minimum instream flows.
No Action Alternative
Comment 140004-4: Another action needed before an alternative is considered is taking further management plans to ensure the protection of the endangered species from the construction and maintaining of the hatchery. What are the procedures for best management practices stated in the impact statement? Is a conservation biologist a resource in building the practices?
Response: Mitigation measures to ensure protection of endangered and threatened species
during construction and operation are part of the action alternatives and are listed in detail,
particularly in Chapter 3, Section 3.5 (Fish). Biologists from CTUIR, the state fish and wildlife
agencies, and regulatory agencies including NMFS and USFWS, as well as independent
consultants, all have contributed to developing mitigation measures. Consultations with
regulatory agencies and co-managers will ensure construction and operation activities adequately
protect ESA-listed species and other important species such as lamprey.
Comment 140004-10: One of the concerns is the question as to why is there a lack of consistent source of adults for out-planting and [why] the infusion of the out-of-basin adults limit[s] the ability … in providing the adults to meet harvest and production goals. Could it be from a lack of resources resulting in competition [for] spawning areas? Studies have shown that inferior competitors cannot coexist when a superior competitor is present in a large number. Could it be from water quality? Could inadequate soil patterns (nutrients, organic material) or no vertical structures, such as canopies from riparian habitat to provide shade cause poor quality? I feel that more analysis is recommended to figure out why the current efforts are unsuccessful.
Response: Although there was some initial success, the spring Chinook salmon reintroduction
program in the Walla Walla basin has been limited for several reasons. Under the current
program, the source of adults for outplanting in the Walla Walla River is the Umatilla basin.
Although adults have been available in most years, the highest priority is to provide fish for the
Umatilla basin program; as a result, in low return years, the number available for outplanting in
the Walla Walla basin may be limited. The adults returning to the Walla Walla River are from
smolts that are the progeny of fish from a different river basin. The smolts are reared far from
the Walla Walla basin, on lower Columbia River water. These fish are not acclimated to the
water of the Walla Walla basin and thus have a lower survival rate than would fish that have
Walla Walla Basin Spring Chinook Hatchery Program
F-22 Appendix F Public Comments on Draft EIS
been reared on the waters to which they are expected to return to spawn. Models show that the
survival rate of these out-of-basin fish is too low to provide enough natural spawners to re-
populate the Walla Walla basin. These issues are discussed at length in the Master Plan (CTUIR
2013).
The current program has addressed many limiting factors in the Walla Walla basin, such as water
quantity and quality, passage improvement, and stream habitat enhancement. Although
additional habitat and flow enhancement work is needed, enough improvements continue and
have been completed to warrant initiation of a salmon reintroduction program. Monitoring of
salmon reintroduction is ongoing and will continue to inform adaptive management.
Comment 140006-9: We recommend that the final EIS compare – to the extent possible – the likely time-periods needed to reach a return of 5,500 natural-origin adults under no-action and the action alternatives.
Response: It should be noted that CTUIR’s primary purpose of the hatchery program is to
augment harvest, for both tribal and non-tribal fishers; establishing a naturally spawning
population is the secondary purpose, and the long-term vision is that the natural spawning
population will become self-sustaining at some point in the distant future. For the proposed
action, the Master Plan (CTUIR 2013) states that the three-phase process could take a minimum
of 20 years, with Phase 2 lasting at least 15 years (see Section 2.2.3). However, due to the low
survival rates of the non-acclimated smolts produced from out-of-basin broodstock, it is unlikely
that the No Action Alternative would achieve the goal of 5,500 natural-origin adults. Under the
current program, the 10-year (2006-2015) geometric mean for adult escapement above Nursery
Bridge Dam is 329 adults (ranging from 97 to 1,194 fish). A linear regression model, using
current adult return numbers and extrapolating, predicts only 2,207 adult returns after 100
hundred years (G. Shippentower, CTUIR, pers. comm. 10/9/17). Additional explanation has
been added to the description of the No Action Alternative in Chapter 2 (Section 2.4).
Habitat Improvements
Comment 140002-12: What is the impact [of the proposed project] on the ecosystem if future habitat improvements are not made to the Walla Walla River?
Comment 140002-13: What is the impact on the success of this project if future habitat improvements are not made to the Walla Walla River?
Comment 140002-16: Does it make more sense to complete the necessary habitat improvements to the system before introducing more fish to the hostile levee environment we currently have?
Comment 140004-3: I propose a no change action based upon wanting improved in-basin conditions. When having a complex environment it allows for a higher species diversity which will then give certain species a variety of habitat and more niches.
Response: The action alternatives would be unlikely to affect the ecosystem if future habitat
improvements are not made. The more likely effect of no future habitat improvements would be
a limitation on the numbers of spring Chinook (and other species) that could occupy the basin.
Habitat improvement projects in the basin have been ongoing since at least 1997 and are
expected to continue for years to come. Past projects included removing barriers to fish passage,
restoring wetlands and floodplain functions, and establishing minimum instream flows. The
proposal for the hatchery was postponed for several years in order to complete critical instream
flow improvements and passage projects such as new fish ladders and screens at irrigation
Final Environmental Impact Statement
Appendix F Public Comments on Draft EIS F-23
diversions. By 2013, enough habitat and passage work had been completed that CTUIR
considered it feasible to propose the spring Chinook hatchery and reintroduction program.
Chapter 3, Section 3.14, summarizes ongoing and future habitat projects sponsored by a variety
of agencies and organizations. The project’s Master Plan (CTUIR 2013) contains a more
extensive list of projects implemented and planned when that document was published, as well
as the assumptions the project proponents made about the influence of future improvements on
the success of the proposed action. A summary of those assumptions from the Master Plan has
been added to Chapter 2, Section 2.2.3.
Water Supply
Comment 140002-15: The recently published 10 year bull trout recovery synthesis by Utah State University for USFWS identifies the need to keep the SFWWR as healthy as possible in order to stabilize the existing Bull Trout population. Recovery of the species would require projects to improve habitat and flow conditions in the lower levee section of the Walla Walla River. How much additional water is needed in the Walla Walla River to support the new population of Spring Chinook?
Response: As stated in the response to comments regarding habitat improvements (above), while
recognizing that additional work needs to be done, CTUIR determined that the completion of
new fish ladder and screen projects and initial instream flow enhancements provided adequate
conditions to support spring Chinook reintroduction in the Walla Walla basin. While this project
is not proposing that additional water be provided in the Walla Walla River to support a restored
spring Chinook population, efforts to enhance flows continue in the basin. For example, a
current Bi-State Flow Enhancement Project has a Walla Walla River instream flow target of
150 cfs through June for spring Chinook upstream migration (which would also improve
upstream bull trout migration during that period) and 65 cfs in the summer months to increase
rearing habitat. Project planning has been ongoing since 2015 with state and federal funding.
Oversight is provided by a Steering Committee comprised of various local stakeholders
representing state, federal, counties, cities, irrigators and CTUIR. A November 2017 project
report (Walla Walla Watershed Flow Study Steering Committee 2017) identified several project
alternatives to address instream flow targets. These are being studied further, with a preferred
alternative expected by 2019 and implementation by about 2025 (G. James, CTUIR, pers. comm.
3-2-18).
As stated in the response to comments about habitat improvement above, past projects have
improved flows in the Walla Walla River system, and ongoing projects such as those described
in Section 3.14 Cumulative Effects are expected to continue to improve flows for all species.
150005-24: Is the hatchery really non-consumptive in terms of water? Will the hatchery reduce the amount of water in the Walla Walla River that is available for other consumptive uses?
Comment 150005-25: Are fish going to cause a senior water right holder to be curtailed?
Response: Withdrawals of water from the South Fork Walla Walla River for the hatchery are
considered non-consumptive because the full amount of the withdrawal is returned to the river.
As noted in Chapter 3, Sections 3.3.3 and 3.3.5, the water right at the existing South Fork facility
is the most junior in the basin. Hatchery use cannot legally, and would not in practice, affect any
water right holder. The hatchery withdrawals must not violate instream minimum flows, and any
withdrawals made would be returned to the river between 250 and 450 feet downstream of the
intake (up to 11 cfs), or within 5 feet of the intake (the majority of the withdrawals). There are
Walla Walla Basin Spring Chinook Hatchery Program
F-24 Appendix F Public Comments on Draft EIS
no other water users in the 450-foot river reach between the intake and discharge points, and
with the full amount of withdrawal returned to the river at the discharge points, downstream
users would not be affected.
Comment 140003-2: Section 3.3.6, page 3-14: fourth bullet of mitigation measures – “Adapt hatchery operations (for example, fish densities) to balance production goals with water availability if needed.” Any changes to hatchery operations that may impact production goals for Walla Walla or Umatilla programs would need to be agreed upon by co-managers. The hatchery operations presented in the DEIS are very general and the department [ODFW] should be included in any discussions for final design/operational specifics.
Response: The fourth bullet in Section 3.3.7 of the Final EIS (the section was incorrectly
numbered in the DEIS) was deleted as not needed given other mitigation measures proposed.
However, the need for CTUIR to coordinate with the co-managers and regulatory agencies such
as NMFS and USFWS on various aspects of the program is acknowledged throughout the EIS.
Comment 140006-4: We [EPA] recommended that the Draft EIS describe how climate change effects have been considered. We agree that lower summer flows are a potential climate change impact and support your proposed methods to reduce water demand at the hatchery – such as circular rearing tanks as opposed to raceways and a pumpback system to help avoid reducing river flows below state-established minimum instream flows.
Response: Thank you for your comment. Effects of climate change on the action alternatives
are discussed in Chapter 3, Section 3.11.5 and in the Cumulative Effects Section, 3.14.9.
Comment 140006-6: …because accurate flow data will be an important part of managing the hatchery’s impact on the river over time, we recommend that the existing gage at Harris Park be upgraded. This upgrade will help the Oregon Water Resources Department and hatchery operators better monitor flows at the intake.
Response: A new gauge near Harris Park is expected to be in place by the time the hatchery is
operational.
Comment 140006-7: For sustainable/green design we [EPA] recommended consideration of surge tanks and gravity fed systems to reduce the number of pumps needed and a recirculating aquaculture system. Thanks to the Draft EIS, we now understand that a gravity fed system is not possible due to a lack of slope at the site. And, the Draft EIS’s water reuse system proposal is responsive to our recirculating aquaculture recommendation.
Response: Thank you for your comment; however, it should be noted that a reuse system is not
proposed for Alternative 1, the Preferred Alternative. Use of circular rearing tanks and the
pumpback system, as well as closing the juvenile bypass system if necessary, ensure that the
hatchery withdrawals would be returned to the river without affecting instream flows. Because
all hatchery withdrawals are returned to the river between 250 and 450 downstream of the intake,
with no other water users in that reach, the hatchery’s use of river water is considered non-
consumptive. See Chapter 3, Section 3.3 for details.
Water Quality
Comment 140005-19: Will this hatchery require an individual NPDES permit.
Response: If production exceeds 20,000 pounds of fish, an individual National Pollution
Discharge Elimination System (NPDES) permit would be required. Production of 500,000
Final Environmental Impact Statement
Appendix F Public Comments on Draft EIS F-25
spring Chinook smolts would exceed 20,000 pounds at times. Oregon’s Department of
Environmental Quality (DEQ) would issue the permit. See Chapter 3, Section 3.4.5.
Comment 140002-2: If BPA funds the SFWWR Hatchery, are there adequate adaptive management protocols in place to mitigate for potential water quality issues in the Little Walla Walla River and spring branches?
Response: Hatchery discharges are not expected to affect downstream water users (see Chapter
3, Sections 3.4.5 and 3.4.6). In any case, the Little Walla Walla River and spring branches are
too far downstream from the proposed hatchery to have any possibility of being affected by its
discharges. Hatchery discharge water would be monitored at the outlets to ensure discharges do
not exceed water quality standards.
Comment 140005-28: Works really close w/EPA. There are places where water quality is affected by hatcheries.
Comment 140005-35: Would there be a water quality impact downstream of the hatchery that would negatively affect existing downstream water users?
Response: Operation of the proposed hatchery is not expected to affect water quality for
downstream users in any rivers or streams of the basin. Analysis in Chapter 3, Sections 3.4.5
and 3.4.6 shows that water discharged from the facility would not violate any existing state water
quality standards.
Comment 140002-3: Irrigators on the Little Walla Walla River system are required to meet very high food safety standards. Could there be adverse impacts to water quality for downstream agricultural users associated with the hatchery’s use of idophor, formalin or antibiotics?
Comment 140005-14: Concerned about formalin and antibiotics going into the river affecting water quality.
Comment 140005-32: Explain about toxics used on the site.
Comment 140005-34: Are pesticides used in the hatchery?
Response: Chapter 3, Sections 3.4.5 and 3.4.6 “Contaminants” discuss the potential for effects
on water quality from chemicals used in the hatchery. Formalin breaks down quickly (generally
within a few hours) when exposed to sunlight, and discharges containing formalin must be
diluted to certain standards when entering the river. All chemicals used in the hatchery must
meet U.S. Food and Drug Administration standards. Therefore, there would be low or no
impacts to water quality from chemical use.
Necessary permits would be obtained if regulated pesticide products are used. All chemical
handling, application, and disposal would comply with applicable federal, state, and other
regulations to protect human and environmental health. See also the previous response.
Comments 140002-4/5/6/7: According to the DEIS, if the peak goal of 8,000 returning Spring Chinook adults is achieved, there would be at least 50 metric tons of marine derived nutrients from salmon carcasses in the Walla Walla River system.
Would the increased mercury, nitrogen, ammonia and PCB levels have a negative impact to water quality in the Little Walla Walla River?
Would the irrigators that have used the Little Walla Walla River as their primary source of irrigation water for over 100 years still be able to meet food safety standards if Little Walla Walla River water quality is degraded as a result of
Walla Walla Basin Spring Chinook Hatchery Program
F-26 Appendix F Public Comments on Draft EIS
increased nutrient loads from Spring Chinook carcasses in the Walla Walla River?
What would be the impact to wild fish and other aquatic species in the Little Walla Walla River and spring branches?
The West Little Walla Walla River is listed as category 5 on the 303(D) list for temperature and dissolved oxygen. Could the increased nutrient load further degrade water quality in this natural stream?
Comment 140005-1: What are water quality effects of leftover salmon carcasses?
Comment 140005-29: Little Walla Walla not included in analysis; during spawning, they are in full irrigation. Ditch joins with Little WW River. Will carcasses cause ammonia or other problems?
Response: The adult return management goal to the Walla Walla Basin is 5,500; 8,000 is a
modeled maximum number of adult returns. Activities such as harvest, fish escapement into the
Touchet River and Mill Creek, and broodstock collection at Nursery Bridge ladder would greatly
reduce the number of fish that would spawn and die above the Little Walla Walla River. The
natural production goal for the South Fork Walla Walla is about 1,100 spawners. This number is
less than what is thought to be the historic spring Chinook numbers. The text in Section 3.5.5,
Operational Effects, Effects on Food Web Productivity has been clarified.
Chapter 3, Section 3.4.5 discusses the potential for impact from nutrients and toxic substances
that could be in fish carcasses. The analysis uses the example of potential returns to Mill Creek,
which is 303(d) listed for ammonia and PCBs, to demonstrate that the amount of nutrients and
toxics from fish carcasses would not impair that stream because the carcasses would be deposited
during fall and winter when nutrients and toxics from human sources are low, and because
marine-derived nutrients are processed in the riverine nutrient cycle differently from typical
human sources. The analysis concludes that salmon carcasses would have a low adverse impact
on water quality and aquatic species in the basin (Section 3.5.5), and would provide beneficial
marine-derived nutrients in the ecosystem.
Comment 140005-16: Adding nutrients to system – will it increase algae?
Comment 140005-27: When SFWW Adult Holding facility was put in, they had the first blue-green bloom. What is existing biological Dissolved Oxygen (DO)?
Response: As discussed in Chapter 3, Section 3.4.3, biological oxygen demand is another way
of measuring nutrients in the river; nutrients can increase the potential for algae and reduce
dissolved oxygen in the river. Biological oxygen demand measures how much oxygen is
consumed when bacteria consume the nutrients that are present in a water body. The greater the
biological oxygen demand, the more rapidly oxygen is depleted in the stream. This means that
less oxygen is available to higher forms of aquatic life. The consequences of high biological
oxygen demand are the same as those for low dissolved oxygen (USEPA 2012). Biological
oxygen demand was monitored upstream and downstream of the existing South Fork facility in
August and September 2013. Biological oxygen demand was 1 milligram per liter (mg/L) at the
upstream location and not detectable at the downstream location, which represents a negligible
difference (Table Rock Analytical Laboratory 2013). These values are typical of excellent water
quality and indicate extremely low concentrations of nutrients in the South Fork near the existing
facility.
Final Environmental Impact Statement
Appendix F Public Comments on Draft EIS F-27
The analysis in Sections 3.4.5 and 3.4.6 shows that, in the spring, when fish are at their largest
and eating the most food, the biological oxygen demand would increase from existing conditions
to between 2.1 mg/L to 2.5 mg/L, depending on the alternative. These levels are well below the
state standard of 20 mg/L.
Comment 140005-31: What happens to the sediment from the settling pond?
Response: The settling pond (abatement pond) is being divided into sections so that one section
can be taken out of service and cleaned while the other remains functional. When one side of the
pond is being cleaned, a septic pump truck would remove any remaining liquids and solids from
the pond and would transport and dispose them off site according to Oregon State regulations.
Comment 140005-36: Concerned about downstream effects of the constructed riffle.
Response: The constructed riffle is no longer part of either action alternative.
Comment 140006-3: With regard to water quality, the Draft EIS usefully describes how project facilities would comply with federal and state water quality standards and related permitting requirements. We appreciate, for example, your construction of a physically-based temperature model to predict the temperature for hatchery effluent and resulting temperature increases in the South Fork Walla Walla River. We also recognize your model’s result that both action alternatives would reduce river temperatures relative to existing conditions as a potential environmental benefit. For permitting, we appreciate your inclusion of up-to-date information, based on personal communications with Oregon Department of Environmental Quality.
Response: Thank you for your comment.
Fish
Comment 140002-10: Are there historical numbers available for spring Chinook in the Walla Walla River?
Response: An analysis documented in the Walla Walla Subbasin Plan (Walla Walla County and
Walla Walla Basin Watershed Council 2004) states: “The EDT [Ecosystem Diagnosis and
Treatment] model predicted that the Walla Walla Subbasin had a much greater production
potential for spring Chinook than it now displays, as historical abundance was estimated at
17,929 spawners…” This information has been added to Chapter 1, Section 1.3.1.
Comment 140002-11: If returning progeny are not going to be clipped are they considered a natural stock and could the reestablished Spring Chinook be listed under the ESA?
Comment 140005-13: Will the reintroduced stock get listed and fishing not be allowed?
Comment 140005-22: Worried about getting water shut off because of listed fish in the river. Last thing he wants.
Comment 140005-23: Are fish going to be clipped?
Comment 140005-26: All it takes is one judge to say these fish should be protected.
Response: Hatchery smolts would be fin-clipped, but the progeny of hatchery adults that spawn
in the wild would not. Because the spring Chinook population is considered extirpated in the
Walla Walla basin, it would not be listed under ESA if the population were to be restored.
Comment 140005-15: Concerned about spread of disease from smolts to native fish.
Response: As stated in Chapter 3, Section 3.5.5, Brannon et al. (2004) concluded there was very
little evidence to suggest that hatcheries routinely transmit disease to wild fish. Many native fish
Walla Walla Basin Spring Chinook Hatchery Program
F-28 Appendix F Public Comments on Draft EIS
populations have co-evolved with certain pathogens, and research has shown in these cases that
there is not a high risk of transmission of certain fish diseases from hatchery to wild fish
populations (Amos and Thomas 2002).
Best management practices would be implemented as part of the standard hatchery operating
procedures to minimize the spread of disease. Such practices would include treating hatchery
water for pathogens using ultraviolet radiation, maintaining optimal fish culture conditions (e.g.,
rearing densities, use of circular rearing tanks, water exchange rates), applying therapeutic
chemicals to control diseases (e.g., iodophor, formalin, antibiotics), conducting regular facility
inspections, and certifying disease-free stock at various stages in the rearing process (McMillen
2011).
Comment 140005-17: Have there been macro invertebrate studies above and below hatcheries to find out impacts?
Response: Studies cited in Chapter 3, Section 3.5.5 indicate that macroinvertebrates recover
quickly from disturbance, so construction effects on them would be low.
Comment 140004-9: … Gary Meffe who studied salmon hatcheries on the Pacific coast of North America (1992) found that from statistical research and historical trends indicate hatcheries will fail to meet [their] intended function and that while [there] was a widespread hatchery development for Pacific salmon, over 100 populations have gone extinct. Paul Angermeier (2008) even states that hatcheries could accelerate the rate of extinction and cause biodiversity loss. However, if a hatchery is established it must meet a maximum sustainable biomass and human resources (Rahel 2008).
Comment 140005-18: Other places [the speaker] has been where there are hatcheries there seemed to be less native fish.
Response: As stated in Chapter 1, Section 1.4, spring Chinook salmon are considered extirpated
from the Walla Walla basin, so there is no “native” population of spring Chinook in the basin
that would be affected by introduction of hatchery fish. The proposed program is designed to
replace the existing program that releases out-of-basin smolts with one that develops a locally
adapted population, which is a major goal of hatchery reform recommendations (HSRG 2004).
Hatcheries in the Columbia River Basin continue to undergo modification in their practices to
avoid impacts to native fish of other species. Chapter 3, Section 3.5.5, details the measures that
would be taken by the proposed Walla Walla Hatchery to avoid construction or operational
impacts to native fish. In addition, the numbers of hatchery fish allowed to spawn in the wild
would be controlled, also to avoid impacts to native fish of other species and to progeny of
naturally spawning spring Chinook that are expected to increase in number as the program
develops —see Chapter 2, Section 2.2.4.
Bull trout
Comment 140002-14: It has been documented that spring Chinook could out-compete bull trout for spawning sites. If BPA funds the SFWWR hatchery, are there adequate adaptive management protocols in place to mitigate for potential declines in the ESA listed species populations?
Comment 140005-4: What is the impact on bull trout of spring chinook releases?
Response: Chapter 3, Section 3.5.5 documents the potential impact of spring Chinook on bull
trout. Spring Chinook smolts could provide prey for bull trout. As numbers of naturally
Final Environmental Impact Statement
Appendix F Public Comments on Draft EIS F-29
spawning adult spring Chinook increase, it is possible they could compete with bull trout for
spawning areas because spawn timing of the two species overlaps; however, studies in the Walla
Walla basin have shown that the two species tend to use different spawning habitats, so impacts
of spring Chinook on bull trout are expected to be low.
The monitoring and evaluation program (funded under a separate project, BPA Project No. 2000-
039-00) has been ongoing since 2000 and will continue. This program monitors many variables,
including the numbers, locations, and survival rates of bull trout, steelhead, and spring Chinook
in the basin. If monitoring shows adverse changes to these factors for bull trout or steelhead,
evaluations will be done to determine if the cause could be attributed to spring Chinook. If it is
determined that spring Chinook are adversely affecting the listed species, adaptive measures,
such as reducing releases or escapement of spring Chinook, will be undertaken.
Harvest
Comment 140001-1: I support any effort to increase fishing opportunities for residents of the Walla Walla Basin. I support and request that the purpose of this action continue to be focused on increasing fishing opportunities for residents of the Walla Walla Basin.
Response: Thank you for your comment.
Comment 140001-2: I request that BPA condition funding of this $12M project on a clear understanding with WDFW and Oregon Dept. of Fish and Wildlife that this Chinook reintroduction project will not IN ANY WAY reduce, restrict or eliminate the fishing opportunities that Walla Walla basin residents currently enjoy on the Walla Walla River, Mill Creek (above Bennington Dam), or the Touchet River. “No new fishing restrictions” should be made a criteria/constraint for any alternative considered/selected for this project. A desire to see this reintroduction effort succeed should not provide a basis to further restrict current fishing opportunities. At a scoping meeting in 2012 concerning reintroduction of Chinook in the Touchet River, WDFW stated they could not guarantee fishing restrictions would not be imposed. That answer is unacceptable in my opinion.
Comment 140005-13: Will the reintroduced stock get listed and fishing not be allowed?
Response: In Chapter 1, Section 1.1, the EIS states: “Spring chinook raised at the proposed new
hatchery would augment populations for harvest and help meet Walla Walla basin goals to
establish a naturally spawning population.” [emphasis added]
While neither WDFW nor ODFW can guarantee that fishing restrictions would not be imposed
for other reasons, they would not be imposed because of the proposed action. Because the spring
Chinook population in the Walla Walla basin is considered extirpated, a restored population
would not be subject to ESA listing; therefore, current harvest opportunities on other fish species
would not be affected by greater numbers of naturally spawning spring Chinook.
Comment 140005-5: Where will fishing be allowed? Are there defined tribal areas and non-tribal?
Response: When runs are sufficient to support fisheries, participation is expected to be from
both states and CTUIR. The first non-tribal harvest opportunities would be in Washington and
additional fisheries are expected to occur upstream in Oregon. CTUIR would adopt fisheries in
both states. As has been the case for the Umatilla salmon reintroduction program, harvest would
be managed on an “equal opportunity basis” with identical quotas for both state and tribal
fisheries.
Walla Walla Basin Spring Chinook Hatchery Program
F-30 Appendix F Public Comments on Draft EIS
Comment 140005-6: What is the difference between the in-basin harvest and a tribal and non-tribal fishery (EIS p. 2-11)?
Response: The language regarding harvests in Phase 1 and Phase 2 of the proposed program
was clarified to indicate that there is no difference in the category of harvest in each phase (see
Section 2.2.3). The only difference between tribal and sport fisheries is that non-treaty sport
fisheries would harvest primarily hatchery-origin fish. Tribal fisheries could include both
natural- and hatchery-origin fish, numbers of which would be based on a sliding scale depending
on the run size.
Comment 140005-42: Will the tribe benefit commercially from the fish harvest?
Response: Like the neighboring Umatilla program, the Walla Walla program is not expected to
provide commercial fisheries in the Walla Walla basin; however, downstream commercial
fisheries are expected to benefit from the Walla Walla spring Chinook program.
Comment 140005-8: Landowner likes the state notifying him by letter when they will be there.
Comment 140005-10: ODFW/CTUIR should have a meeting with locals to announce how fisheries will be managed.
Response: When harvests are established, ODFW and CTUIR would consider these
recommendations. Walla Walla harvest management is expected to be similar to the Umatilla
program, where both Indian and non-Indian harvests are equal, with regulations posted in
advance of the open seasons.
Access to Fishing Sites
Comment 140005-7: Questions from neighbors involve trespass rights. Can owner say they don’t want fishing on their property?
Comment 140005-43: Am I going to see tribal members on my property harvesting fish?
Response: As discussed in Chapter 3, Section 3.7.4 “Access and Land Use Impacts on Private
Landowners”, in U.S. v. Winans (198 US 371, 381-382), the U.S. Supreme Court held that Tribal
members may cross private lands to access their traditional fisheries. CTUIR would balance
Tribal members’ rights to access fishing sites and other fishers’ desire for access with respect for
landowner rights, including increased signage for public access points, education of fishers, and
work with individual landowners to determine their preferences regarding access.
Comment 140005-44: Have you been to Palmer Junction? Tribal police are blocking access to the river.
Response: Palmer Junction is on the Grande Ronde River below Lookingglass Creek, in Union
County, Oregon—which is not near the Walla Walla River basin. CTUIR’s harvest manager was
consulted and was not aware of what the commenter was referring to.
Comment 140005-9: If someone knocks on his door and asks if they can fish on his property, he would say yes, but don’t leave bait cans and beer cans.
Response: Thank you for your comment.
Wildlife
Comment 140003-6: All references to “ESA-listed gray wolf” need to be referenced as “State ESA-listed”. The federal listing is applicable only to the [west] of highway 395 in Umatilla
Final Environmental Impact Statement
Appendix F Public Comments on Draft EIS F-31
County which is a significant distance from the proposed hatchery. Section 3.10.2…should be edited as follows:
“No federal or state ESA-listed wildlife species have been documented within 1,000 feet of the
analysis area. The gray wolf, listed as endangered under the Oregon’s state ESA, has not been
documented within 1,000 feet of near the project site, but wolves could be transient in the area
which is adjacent to the Area of Known Wolf Activity for the Umatilla pack. … “
Response: Some of those edits have been made; however, since this letter was written, the gray
wolf was removed from the state ESA endangered species list. See Section 3.10.2.
Comment 140004-5: The effects of noise on the wildlife depend upon the type of noise produced and the duration of the noise. The effects on birds alone show that noise pollution can cause physical damage to the ears, chronic stress responses, avoidance of area, changes in foraging, change in reproductive success, changes in vocal communities, and interferences to hear predators (Ortega 2012). A study done on the Spotted Owl, which resides in Oregon, is a federally endangered species that is known or believed to occur in Columbia County in Oregon. The study was done by Glenn et al. (2004) in Oregon and found that the Spotted Owl is found in fragmented old forest (which is composed of multilayered canopies and a large diameter trees) in which they roost and nest. It was also found that they changed patterns based upon quality of habitat and because they do not expand home range there is a decline in species numbers. It could be said that they could also change patterns due to the proximity of the hatchery noise; a follow-up on the Spotted Owl patterns would be needed to see if noise would a negative impact on the species.
Response: As the commenter notes, the northern spotted owl resides in Columbia County,
Oregon. The proposed project is approximately 300 miles from Columbia County, Oregon, and
contains no multi-canopied old forest habitat required for spotted owls (see Chapter 3, Section
3.6 Vegetation and Noxious Weeds). Columbia County, Washington, is in the project area but it
is at least 180 miles east of the spotted owl’s range in Washington (http://ecos.fws.gov).
Therefore, the proposed action would not affect spotted owls. The EIS identified the potential
effects of construction and operations noise on wildlife, including mammals and birds, in
Chapter 3, Section 3.10.
Comment 140005-21: What about other predators in the system, i.e. otters. How will they affect the juveniles? Will predator population be increased? Aren’t you throwing a lot of money into something that won’t work?
Response: As discussed in Chapter 3, Section 3.10.4, some predators in the Walla Walla basin
could benefit from the program, but the benefit is expected to be moderate and not a threat to the
program’s success.
Vegetation
Comment 140004-6: … Lastly protecting the riparian habitat is a must. One study on aquatic conditions (teels et. al. 2006) found that the biological integrity of fish populations was correlated with the physical attributes to the stream. If there was an absence of vegetation the stream would have a higher [than] normal temperature and little or [no] cover for fish, but if vegetation was present it would cause a positive local effect and a spatial effect. The local effect was being able to provide shade, an input of organic matter and the maintaining of local [bank] stability. The spatial effect was causes the overall stream nutrient input, normal temperature and a normal flow regime. Having 1.7 and 1.3 acres of riparian destroyed and then replanted and reseeded in alternative 1 and alternative 2 [respectively] could cause temperature decline at a
Walla Walla Basin Spring Chinook Hatchery Program
F-32 Appendix F Public Comments on Draft EIS
local level. Also removing 50 alder and cottonwood trees in alternative 1 or removing 100 alder and cottonwood trees could cause negative effects on the surrounding habitat and local stream nutrients. Riparian vegetation provides needed ecological functions including reducing erosion, trap sediments and potential pollutants, it will stabilize banks and allow habitat for wildlife such as the endangered Yellow-billed Cuckoos which breed in riparian habitats.
Riparian habitats allow for movement between communities and contain a greater species richness of birds then upland forests.
Response: The potential for removal of riparian vegetation to adversely affect fish was noted in
Ch. 3, Section 3.5.4. The amount to be removed for the preferred alternative is much less than
the amount predicted in the draft EIS and, as discussed in Section 3.5.5, would be too small to
adversely affect fish habitat. Likewise, the amount of riparian vegetation to be removed is too
small to affect habitat for birds or other wildlife, including the yellow-billed cuckoo, which is
unlikely to inhabit the project area. See Chapter 3, Section 3.10.4. It should be noted that most
of the alder and cottonwoods that would be removed are in upland areas, out of the riparian zone
(see Chapter 3, Section 3.6.5 and 3.6.6).
Comment 140004-7: A study by Peak et. at (2006) found that cottonwoods and willows will have a greater mortality when there is a decreasing groundwater level and that cottonwoods reach maximum height 60 to 75 years after planting. Due to such a long time of mature height, replanting cottonwoods after the hatchery is [built] wouldn’t provide habitat for birds or the positive effects for streams. …
Response: Surface water withdrawals for the hatchery would not affect groundwater levels, even
in the affected reach. As noted above, all but one or two alders or cottonwoods that were
projected to be removed were in the upland areas of the site, not adjacent to the river. With the
current proposed design, the small amount of riparian vegetation that might be removed would
be shrub-sized and would grow quickly to pre-construction size, potentially within 3 years. See
Section 3.6.5.
Comment 140004-8: [I]f the hatchery is [built] and running what effect would be on the riparian habitat around the hatchery as well as downstream when flow is reduced by 12.8 cubic ft/s (alternative 1) or 14.8 cubic ft/s (alternative 2) between the hatchery and the withdrawal and discharge points?
Response: Minimum instream flows would be maintained at all times by use of the pumpback
system and/or by closure of the juvenile bypass, as needed. When flows are high enough that the
pumpback system would not be required, riparian vegetation between the intake and discharge
would not be adversely affected because the 5 - 11 cfs of the withdrawals that would not be
returned immediately below the intake would not reduce river levels lower than fluctuations that
occur naturally. See Section 3.5.5.
Monitoring and Evaluation
Comment 140003-4: General comment for Appendix B: CTUIR and WDFW need to assure that the metrics used to measure the performance indicators from the Monitoring and Evaluation Plan Summary are consistent with Columbia Basin Region high level indicators from the collaborative efforts of the Coordinated Assessments Project through the StreamNet program of the Pacific States Marine Fisheries Commission.
Response: CTUIR intends that program monitoring and evaluation will be consistent with
regional standards and data bases. The M&E plan has been reviewed by co-managers and the
Final Environmental Impact Statement
Appendix F Public Comments on Draft EIS F-33
Council and its Independent Science Review Panel, and if modifications are required in the
future, will be made in consultation with those parties.
Comment 140003-5: Performance monitoring of the Umatilla rearing component by the BPA funded Umatilla M&E project should be cited as described in the report titled “Comprehensive Research, Monitoring, and Evaluation Plan for Umatilla Subbasin Summer Steelhead and Chinook Salmon” (CTUIR and ODFW, 2006). This plan is not cited in the reference section of the draft.
Response: This information has been added to Chapter 2, Section 2.3.2 and to the References
Section (Chapter 5).
Project Costs
Comment 140005-2: What is the cost of the pumpback system?
Response: The pumpback system would cost approximately $273,500.
Comment 140005-37: What is the cost to build and maintain?
Response: Estimates for hatchery construction have ranged from $13 million to $20 million.
Annual O&M costs for the hatchery would be approximately $1.2 million plus annual inflation.
Comment 140005-39: What is the breakdown on the cost to ratepayers per household?
Response: BPA markets electricity to other utilities on a wholesale basis. BPA does not serve
individual households. The cost of the proposed action would be a small fraction of BPA’s total
operating costs; this project itself would not affect rates a household level. See Section 2.2.6.
Issues Beyond the Scope of this EIS
Comment 140005-30: Meet GlobalG.A.P. safety regs – work closely w/DEQ.
Response: The GLOBALG.A.P. Aquaculture Standard is a voluntary certification program for
hatchery-based farm species, designed to allow commercial producers to identify “the status of
your product throughout the entire production and supply chain, from farm to retailer.”
(http://www.globalgap.org/uk_en/for-producers/aquaculture/).
The proposed hatchery would not be farming fish for commercial sale, so such a certification
would not apply to this program. The proposed Walla Walla program would provide fish for
tribal and sport harvests and begin to restore a naturally spawning population of spring Chinook.
It would adhere to standards set by the Integrated Hatchery Operations Team for fish health; by
Oregon DEQ for water quality; by NMFS, USFWS, state fish and wildlife agencies and others
for effects on other species as discussed throughout the EIS.
Comment 140005-46: How can the power system be safe-guarded to prevent fish losses.
Response: The efforts to prevent fish losses from the Federal Columbia River Power System are
the subject of numerous analyses and projects by BPA, the U.S. Army Corps of Engineers,
NMFS, and many other stakeholders in the region. Discussion and analysis of these efforts are
beyond the scope of this EIS.


BONNEVILLE POWER ADMINISTRATION
DOE/BP 4812 ▪May 2018


