Embed Size (px)
Citation preview
See discussions, stats, and author profiles for this publication at: https://www.researchgate.net/publication/349677476
Waste Heat Driven Membrane Distillation for Industrial Wastewater
Treatment
Thesis · March 2021
CITATIONS
0READS
69
1 author:
Some of the authors of this publication are also working on these related projects:
Wastewater treatment through membrane distillation in Semiconductor Industries View project
Membrane Distillation for flue gas condensate cleaning in cogeneration plants View project
imtisal-e- Noor
KTH Royal Institute of Technology
12 PUBLICATIONS 34 CITATIONS
SEE PROFILE
All content following this page was uploaded by imtisal-e- Noor on 08 March 2021.
The user has requested enhancement of the downloaded file.
Waste Heat Driven Membrane Distillation for
Industrial Wastewater Treatment
IMTISAL-E-NOOR
Doctoral Thesis 2021
Academic Dissertation which, with due permission of the KTH Royal Institute of
Technology and Aalto University, is submitted for public defense on Monday the
1st March 2021, at 8:00 a.m. via Zoom in KTH Royal Institute of Technology,
Sweden.
Department of Energy Technology
School of Industrial Engineering and
Management
KTH Royal Institute of Technology
Stockholm, Sweden
Department of Bioproducts and
Biosystems
School of Chemical Engineering
Aalto University
Espoo, Finland

Imtisal-e-Noor, Doctoral Thesis-2021
Imtisal-e-Noor, Doctoral Thesis-2021
This doctoral dissertation is completed under Erasmus Mundus Joint Doctoral
Programme, Environomical Pathways for Sustainable Energy Services (SELECT+)
for the degree of Doctor of Philosophy from KTH Royal Institute of Technology,
Sweden and degree of Doctor of Science (Technology) from Aalto University,
Finland.
© Imtisal-e-Noor
Aalto University publication series
DOCTORAL DISSERTATIONS 184/2020
ISBN (printed): 978-952-64-0131-7
ISBN (pdf): 978-952-64-0132-4
ISSN 1799-4934
ISSN 1799-4942 (electronic)
TRITA-ITM-AVL 2021:2
ISBN: 978-91-7873-774-1
Printed by: Universitetsservice US-AB, Sweden, 2021

Imtisal-e-Noor, Doctoral Thesis-2021
Imtisal-e-Noor, Doctoral Thesis-2021
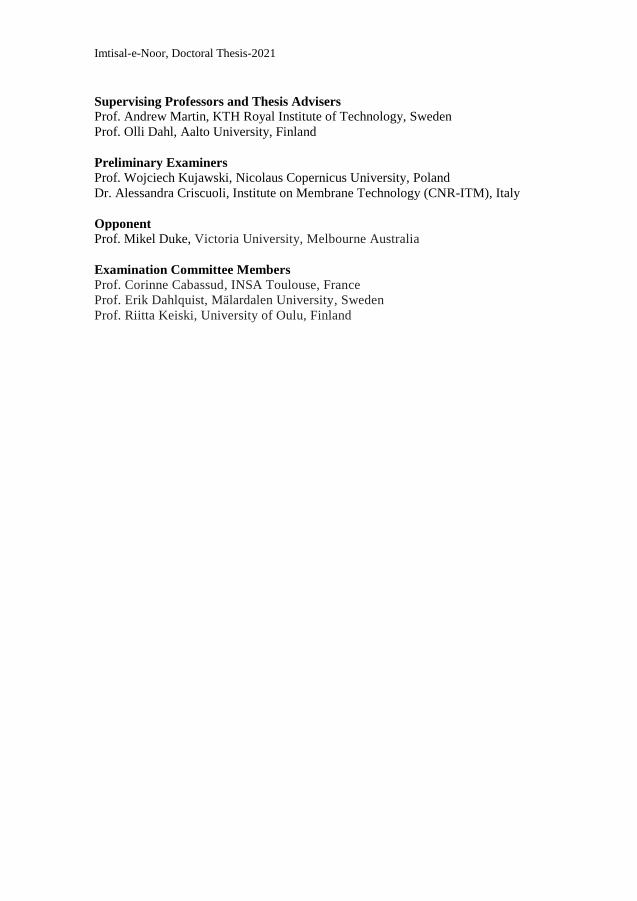
Supervising Professors and Thesis Advisers
Prof. Andrew Martin, KTH Royal Institute of Technology, Sweden
Prof. Olli Dahl, Aalto University, Finland
Preliminary Examiners
Prof. Wojciech Kujawski, Nicolaus Copernicus University, Poland
Dr. Alessandra Criscuoli, Institute on Membrane Technology (CNR-ITM), Italy
Opponent
Prof. Mikel Duke, Victoria University, Melbourne Australia
Examination Committee Members
Prof. Corinne Cabassud, INSA Toulouse, France
Prof. Erik Dahlquist, Mälardalen University, Sweden
Prof. Riitta Keiski, University of Oulu, Finland

Imtisal-e-Noor, Doctoral Thesis-2021

Imtisal-e-Noor, Doctoral Thesis-2021
To my beloved parents Azhar Iqbal Sheikh and Zahida Jabeen

Imtisal-e-Noor, Doctoral Thesis-2021
Imtisal-e-Noor, Doctoral Thesis-2021
i
Abstract
The European Union has placed a high priority on reaching the goals described in
the 2030 Agenda for Sustainable Development. This aim has provided added
momentum to member-state environmental regulatory authorities to further tighten
the discharge limits of industrial wastewater. These measures strongly influence
existing industrial practices as many traditional wastewater treatment methods
cannot achieve these strict release limits. Moreover, industrial sectors are
encouraged to employ a zero liquid discharge strategy for advanced wastewater
management, particularly for process water reuse. Emphasis is thus now placed on
improved water treatment systems to recover, reuse and release water in a manner
that protects natural resources, guarantees stringent regulatory constraints and
ensures financial viability. In this context membrane distillation (MD) is a
promising industrial wastewater treatment technology capable of meeting these
requirements while utilizing low-grade heat sources.
This thesis focuses on experimental investigations and techno-economic analysis of
waste heat driven MD systems for water purification in two water-intensive
industries: nano-electronics facilities and cogeneration plants. Samples collected at
relevant facilities were tested in an air gap MD bench unit and a semi-commercial
pilot plant, with a focus on separation efficiency and potential for achieving high
recovery ratios. For the techno-economic analysis of the industrial scale system,
the performance of the chosen semi-commercial unit was considered to evaluate the
full-scale system operation in terms of thermal energy demand and expected water
purification cost. Various thermal integration approaches were investigated while
considering locally available heat sources to realize the energy requirements of the
specific MD system. The selected case studies include: removal of
tetramethylammonium hydroxide (TMAH) from photolithography process
wastewater in nano-electronics industries; treatment of chemical mechanical
planarization (CMP) process wastewater in nano-electronics industries; and water
recovery through advanced flue gas condensate treatment from municipal solid
waste incineration and biofuel fired cogeneration plants.
The results from nano-electronics wastewater treatment tests showed that high-
quality permeate could be recovered while observing good to excellent separation
efficiencies of analyzed contaminants. Moreover, the proposed advanced flue gas
condensate treatment is also proved successful while removing the pollutants up to
the concentration levels of parts per billion. The proposed pretreatment step, pH
adjustment of MD feeds, enhanced ammonia removal efficiency in all cases.
Compared to current practices, the separation efficiencies of the considered MD
based processes are improved. The simulation results indicate that the required
thermal energy for operating large scale MD systems is readily available via
internal waste heat sources of nano-electronics facilities for handling typical
volumes of the mentioned wastewaters. In cogeneration plants, district heating
supply and return lines are well suited as the heat source and heat sink to manage
Imtisal-e-Noor, Doctoral Thesis-2021
ii
industrial-scale MD systems effectively. The process economy shows that the unit
water treatment cost is mainly constrained by thermal energy cost. In case when the
price of heat is considered negligible, the unit water treatment cost is significantly
lower than the competing technologies.
Keywords: Membrane Distillation, Experimental investigations, Techno-economic,
Wastewater, Flue gas condensate, Waste heat, District heating, Nano-electronics,
Cogeneration, Sustainable development
Imtisal-e-Noor, Doctoral Thesis-2021
iii
Sammanfattning
Den Europeiska Unionen har lagt högt prioritet på uppfyllelsen av de målen som
finns i 2030 Agenda för Hållbar Utveckling. Denna ambition har gett ytterligare fart
till medlemsländernas miljöförvaltningar för att strama åt utsläppsnivåer av
industriella avloppsvatten. Dessa åtgärder har stor betydelse för existerande
förhållningssätt i industrin eftersom många traditionella metoder för rening av
avloppsvatten når inte de åtstramade utsläppsnivåerna. Dessutom finns det en
uppmaning hos industrin att implementera strategier för noll utsläpp, framför allt
för återanvändning av processvatten. Betoningen ligger på förbättrad
vattenreningsteknik för återhämtning, återanvändning och utsläpp av vatten på det
sättet som skyddar naturresurser, garanterar tuffa miljölagstiftningar och
säkerställer ekonomin. I detta sammanhang är membrandestillering (MD) en
lovande teknik för rening av avloppsvatten och är kapabel att bemöta dessa krav
genom utnyttjandet av låg-temperatur värmekällor.
Denna avhandling fokuserar på experimentella undersökningar och tekno-
ekonomiska utvärderingar av spillvärmedrivna MD-system för vattenrening i två
vattenintensiva industrier: nano-elektronisk tillverkning och kraftvärmeverk.
Vattenprover hämtade från relevanta anläggningar testades i en luftspalt MD rigg i
bänkskala och hos en halv-kommersiell pilotanläggning, med fokus på
separationsverkningsgrad och möjligheten att nå en hög grad av uppkoncentrering.
För den tekno-ekonomiska analysen av ett system i industriellt skal undersöktes
prestandan hos den valda halv-kommersiell enhet för att utvärdera drift i fullt skal
gällande termiskt energibehov och förväntad kostnad för renat vatten. Olika
termiska integreringssätt utvärderades med hänsyn till lokala värmekällor för att
tillgodose energibehoven hos det specifika MD-systemet. De valda fallstudierna
omfattar: avskiljning av tetrametylammonium hydroxid (TMAH) från
fotolitografiska avloppsvatten i nano-elektronisk tillverkning; behandling av
kemisk-mekanisk utjämning (CMP) avloppsvatten i nano-elektronisk tillverkning;
och uppkoncentrering genom avancerad rening av rökgaskondensat från
kraftvärmeverk med hushållsavfall och biobränsle som energikällor.
Resultat från rening av avloppsvatten hos nano-elektronisk tillverkning visade att
permeat med hög kvalité kunde åstadkommits med hög separationsverkningsgrad
hos de analyserade föroreningarna. Det föreslagna systemet för rening av
rökgaskondensat var också framgångsrikt med avskiljning av föroreningar upp till
miljarddelar. Förbehandlingen genom pH-justering av råvattnet ledde till förbättrad
ammoniak-avskiljning i alla fallstudier. I jämförelse med dagens tekniker fanns det
en förbättring med MD-teknik gällande separationsverkningsgrad. Resultaten från
simuleringar för nano-elektronisk tillverkning visade att den nödvändiga
termiskenergin finns tillgänglig för MD-system i stort skal genom utnyttjandet av
intern spillvärme. Hos kraftvärmeverk passar fjärrvärmeledning och –returlinjor bra
som värmekällor respektive värmesänka. Processekonomin visar att kostnaden för
renat vatten är mest beroende av kostnaden för värmen. I de fall där
Imtisal-e-Noor, Doctoral Thesis-2021
iv
värmekostnaden är noll ligger reningskostnaden mycket lägre än konkurrerande
teknik.
Nyckelord: membrandestillering, experimentella undersökningar, tekno-ekonomin,
avloppsvatten, rökgaskondensat, spillvärme, fjärrvärme, nano-elektronik,
kraftvärme, hållbar utveckling
Imtisal-e-Noor, Doctoral Thesis-2021
v
Acknowledgements
All the praise be to Allah, the Almighty. Here, first, I would like to thank Him for
His continued kindness, favor and blessings which enabled me to reach this level of
my education. Though being far from home and living alone for years was a bit
hard for me yet the outcome of the endeavor proved more rewarding. Therefore, I
collectively count this period of my life as one of the best times, and it was
wonderful. Obviously, this became possible with the help, support, guidance,
timesharing, and the more, generous cooperation extended by the ones connected to
me. I, therefore, want to thank every one of them individually.
I would like to express my sincere gratitude to my principal advisors, Prof. Andrew
Martin at KTH Royal Institute of Technology, Sweden and Prof. Olli Dahl at Aalto
University, Finland for their continued guidance, support and encouragement
throughout the course of my Ph.D. Special thanks to my industrial mentor, Aapo
Sääsk (Scarab Development AB) for the enlightening discussions with him
throughout my Ph.D. study.
I appreciate the valuable feedback and constructive comments offered by Dr. Daniel
M. Woldemariam (Waterapp), Dr. Alaa Kullab (Scarab Development AB) and Dr.
Ershad Khan (Xzero AB). I am grateful for the technical support and suggestions
from Henrik Dolfe (Scarab Development AB), Jaime Camalich (HVR Water
Purification), Miriam Åslin (Xzero AB), Alexander Fornsäter (Xzero AB), Leif
Pettersson (KTH) and Göran Arntyr (KTH). Advices and comments given by Jan
Coenen (imec), Bo Bängtsson (Bäcken Industrifysik), Andreas Neuber (Applied
Materials), Rushikesh Matkar (Intel Corporation), Jan Lundgren (Stockholm
Exergi), Mohammad Bisher Kazkaz (Stockholm Exergi) and Sara Sjögren
(Stockholm Exergi) have been a great help for the industrial case studies. I take this
chance to thank Prof. Massimo Santarelli (Politecnico di Torino) for his feedback
and contribution as a co-author in one of the publications.
I want to express my greatest appreciation to Assoc. Prof. Kerstin Forsberg from
the Department of Chemical Engineering (KTH) for evaluating the midterm and
final seminars and giving valuable feedback on the draft thesis that helped
me improve its quality. I am also thankful to Dr. Maryna Henrysson, Dr. Francesco
Gardumi and Dr. Jens Fridh from the Department of Energy Technology (KTH) for
their constructive feedback on the progress of this research.
I am grateful to the pre-examiners Prof. Wojciech Kujawski (Nicolaus Copernicus
University) and Dr. Alessandra Criscuoli (Institute on Membrane Technology,
ITM-CNR) for their time in reviewing and evaluating this Ph.D. thesis. Many
thanks to my Ph.D. thesis opponent Prof. Mikel Duke (Victoria University) and all
the jury members Prof. Corinne Cabassud (INSA Toulouse), Prof. Erik Dahlquist
(Mälardalens University) and Prof. Riitta Keiski (University of Oulu) for their
participation in the Ph.D. defense.
Imtisal-e-Noor, Doctoral Thesis-2021
vi
I would like to acknowledge the Erasmus Mundus Joint Doctoral Programme
SELECT+, Swedish Energy Agency, Xzero AB and KTH Royal Institute of
Technology for their financial support for the research I conducted. I also would
like to express my gratitude to the InnoEnergy organization for providing me a
great platform to foster innovation and entrepreneurship skills through the Ph.D.
school program. I would like to offer my special thanks to Chamindie Senaratne for
facilitating all activities involving SELECT+ mobility and the joint doctoral
program issues. I want to express my gratitude to Sirje Liukko for her support in
practical and administrative issues related to Ph.D. thesis pre-examination to
graduation. I truly appreciate all the staffs in the Department of Energy Technology
at KTH and in the Department of Bioproducts and Biosystems at Aalto University
who made my stay at the two institutes comfortable and fruitful.
I want to show my appreciation to my colleagues and friends who contributed to my
study and personal life in one way or the other. Special thanks to Getnet Tadesse
Ayele, Moritz Wegener, Mahrokh Samavati, Manuel Betancourt, Mexitli Eva,
Azhar Uddin and all of those who are affiliated with the SELECT+ Ph.D.
programme who shared with me their experiences. I deeply thank all my other
colleagues and friends at KTH and Aalto University. I owe my deepest gratitude to
Komal Khan who has been always there for me with great compassion and support.
My heartfelt appreciation goes to my parents Azhar Iqbal Sheikh and Zahida Jabeen
for making me what I am today. Their selfless fatherly and motherly support and
encouragement made me explore new avenues and directions in life for seeking my
own destiny at its best possible. As a result, it paved the way for me to reach up to
here. Without their continuous and unparalleled love, help and support, I could
never experience the joy of life. This journey would not have been possible without
them, and I dedicate this milestone to them. I am grateful to my lovely siblings,
Taal Azhar, Arsalan Azhar Sheikh and Gul Jabeen for being part of my life. I feel
extremely lucky to have them in my life. Finally, to my caring husband M. Hussam
Khaliq, you are my encouragement and hope.
Imtisal-E-Noor
March 2021, Stockholm
Imtisal-e-Noor, Doctoral Thesis-2021
vii
Publications appended to thesis
Journal Articles
I. Imtisal-e- Noor, Jan Coenen, Andrew Martin, Olli Dahl and Miriam
Åslin, "Experimental investigation and techno-economic analysis of
tetramethylammonium hydroxide removal from wastewater in nano-
electronics manufacturing via membrane distillation," Journal of
Membrane Science, 2019, Volume 579, p. 283-293.
https://doi.org/10.1016/j.memsci.2019.02.067.
II. Imtisal-e- Noor, Jan Coenen, Andrew Martin and Olli Dahl, "Performance
assessment of chemical mechanical planarization wastewater treatment in
nano-electronics industries using membrane distillation," Separation and
Purification Technology, 2020, Volume 235, 116201.
https://doi.org/10.1016/j.seppur.2019.116201.
III. Imtisal-e- Noor, Andrew Martin and Olli Dahl, "Techno-economic system
analysis of membrane distillation process for treatment of chemical
mechanical planarization wastewater in nano-electronics industries,"
Separation and Purification Technology, 2020, Volume 248, 117013.
https://doi.org/10.1016/j.seppur.2020.117013.
IV. Imtisal-e- Noor, Andrew Martin and Olli Dahl, "Water recovery from flue
gas condensate in municipal solid waste fired cogeneration plants using
membrane distillation," Chemical Engineering Journal, 2020, Volume 399,
125707. https://doi.org/10.1016/j.cej.2020.125707.
V. Imtisal-e- Noor, Andrew Martin and Olli Dahl, "District heating driven
membrane distillation for advanced flue gas condensate treatment in
combined heat and power plants," Journal of Cleaner Production, 2021, In
press, 125979. https://doi.org/10.1016/j.jclepro.2021.125979.
Imtisal-e-Noor, Doctoral Thesis-2021
viii
Author’s Contributions
Paper I: Lead author IN performed the literature review, curated and analyzed
industrial data, developed the methodology, executed experiments and done techno-
economic studies, performed analysis and interpretation of the results, and was the
main responsible person for writing the original manuscript. JC and MÅ were also
involved in performing experiments and sample analysis. The roles of AM and OD
included mentoring and reviewing the article.
Paper II: Lead author IN performed the literature review, developed the
methodology, executed experiments, performed analysis and interpretation of the
results, and was the main responsible person for writing the original manuscript. JC
participated in sample analysis. The roles of AM and OD included mentoring and
reviewing the article.
Paper III: Lead author IN performed the literature review, curated and analyzed
industrial data, developed the methodology, done techno-economic studies,
performed analysis and interpretation of the results, and was the main responsible
person for writing the original manuscript. The roles of AM and OD included
mentoring and reviewing the article.
Paper IV: Lead author IN performed the literature review, curated and analyzed
industrial data, developed the methodology, executed experiments and done techno-
economic studies, performed analysis and interpretation of the results, and was the
main responsible person for writing the original manuscript. The roles of AM and
OD included mentoring and reviewing the article.
Paper V: Lead author IN performed the literature review, curated and analyzed
industrial data, developed the methodology, executed experiments and done techno-
economic studies, performed analysis and interpretation of the results, and was the
main responsible person for writing the original manuscript. The roles of AM and
OD included mentoring and reviewing the article.
Imtisal-e-Noor, Doctoral Thesis-2021
ix
Publications not appended to thesis
Peer-reviewed Conference Articles
1. Imtisal-e- Noor, Andrew Martin and Olli Dahl, "Membrane distillation -
A new approach for treating wastewater in nano-electronics industries,"
Proceedings of the 31st International Conference on Efficiency, Cost,
Optimization, Simulation and Environmental Impact of Energy Systems,
June 17-22, 2018, Guimarães, Portugal, Article ID: 462.
2. Imtisal-e- Noor, Andrew Martin and Massimo Santarelli, "Exergy
analysis of air gap membrane distillation unit for chemical mechanical
polishing wastewater treatment," Proceedings of the International
Conference on Innovative Applied Energy, March 14-15, 2019, Oxford,
UK, ISBN: 978-1-912532-05-6, Article ID: 159.
3. Imtisal-e- Noor, Mahrokh Samavati and Andrew Martin, "Modelling and
techno-economic analysis of membrane distillation system for flue gas
condensate cleaning," Proceedings of the 33rd International Conference on
Efficiency, Cost, Optimization, Simulation and Environmental Impact of
Energy Systems, June 29-July 3, 2020, Osaka, Japan, ISBN: 978-1-
713814-06-1, p. 2132-2140, Article ID: 354.
Peer-reviewed Conference Abstracts
4. Imtisal-e- Noor, Andrew Martin and Olli Dahl, "Waste water treatment in
semiconductor industry through membrane distillation," 5th International
Scientific Conference on Pervaporation, Vapor Permeation and Membrane
Distillation, June 20-23, 2017, Torun, Poland.
5. Imtisal-e- Noor, Andrew Martin, Miriam Åslin, Jan Coenen and Henrik
Dolfe, "Performance of membrane distillation for TMAH wastewater
treatment in nano-electronics industries - Case study: imec, Belgium,"
Ultrapure Micro 2018, May 30-June 1, 2018, Austin, Texas, USA.
6. Imtisal-e- Noor, Andrew Martin and Olli Dahl, "PureBlue–Water
purification solutions," InnoEnergy PhD School Annual Conference 2018,
October 3-5, 2018, Budapest, Hungary.
7. Imtisal-e- Noor, Andrew Martin, Miriam Åslin, Jan Coenen and Olli
Dahl, "Chemical mechanical planarization wastewater treatment using
membrane distillation," Ultrapure Micro 2019, June 5-7, 2019, Phoenix,
Arizona, USA.
Imtisal-e-Noor, Doctoral Thesis-2021
x
8. Imtisal-e- Noor, Andrew Martin and Henrik Dolfe, "Flue gas condensate
cleaning via air gap membrane distillation," International Membrane
Science & Technology Conference, February 2-6, 2020, Sydney,
Australia.
Method Articles
9. Imtisal-e- Noor, Andrew Martin and Olli Dahl, "Process design of
industrial-scale membrane distillation system for wastewater treatment in
nano-electronics fabrication facilities," MethodsX, 2020, Volume 7,
101066. https://doi.org/10.1016/j.mex.2020.101066.
10. Imtisal-e- Noor, Andrew Martin and Olli Dahl, "Evaluation of membrane
distillation technology for condensate cleaning in MSW-fired cogeneration
plants," MethodsX, submitted.
Imtisal-e-Noor, Doctoral Thesis-2021
xi
Nomenclature and Abbreviations
Symbols A area, m2
C cost, USD
cp specific heat, J/kgK
c′ concentration, ppm
c′F concentration factor
d degression constant
E electrical power, kW
Ex exergy flow rate, kW
h heat transfer coefficient, W/m2K
i index
J transmembrane flux, L/m2h
L lang factor
mw molecular weight, g/mol
ṁ mass flow rate, kg/s
n lifetime, years
N number
P pressure, bar
Q heat transfer rate, kW
Q specific energy, kWh/m3
r recovery ratio
R gas constant, J/molK
T temperature, °C
U overall heat transfer coefficient, W/m2K
V volume, m3
V volumetric flow rate, m3/h
X capacity of equipment
z interest rate, %
ß number of dissociation species in contaminant
ρ density, kg/m3
ƞ exergy efficiency, %
φ heat recovery factor
μ pump efficiency, %
∆ difference
Subscripts
a annual
A atmospheric
c coolant
cap capital
CEPCI chemical engineering plant cost index
CF contingencies fees
ch chemical
CO contractor fees
Imtisal-e-Noor, Doctoral Thesis-2021
xii
comp component of the system
cv convective heat transfer
DPC direct permanent capital
des destruction
el electrical
eq equipment
f feed
HX heat exchanger
i inlet
I insurance
ISBL inside battery limits
ir irreversibility
j contaminant in stream
k stream in process
L location
LS land and site development
m membrane
mech mechanical
n net
o outlet
om operating and maintenance
OSBL outside battery limits
p permeate
PS plant startup
r retentate
rf retrofitting
R reference
s surface
solv solvent
sys system
T total
TCI total capital investment
TDC total depreciable capital
TPC total permanent capital
th thermal
w water
WC working capital
v vapor
Abbreviations AGMD Air Gap Membrane Distillation
CAPEX Capital Expenditure
CHP Combined Heat and Power
CMP Chemical Mechanical Planarization
COD Chemical Oxygen Demand
CV-AFS Cold Vapor-Atomic Fluorescence Spectrometry
Imtisal-e-Noor, Doctoral Thesis-2021
xiii
DCMD Direct Contact Membrane Distillation
DH District Heating
ED Electrodialysis
EDI Electrodeionization
EPA Environmental Protection Agency
ICs Integrated Circuits
IC Ion Chromatography
ICP-MS Inductively Coupled Plasma-Mass Spectrometry
ICP-OES Inductively Coupled Plasma-Optical Emission Spectrometry
imec Interuniversity Microelectronics Centre
IVL Svenska Miljöinstitutet (Swedish Environmental Research
Institute)
KTH Kungliga Tekniska Högskolan (Royal Institute of Technology)
LCOW Levelized Cost Of Water
LEP Liquid Entry Pressure
MGMD Material Gap Membrane Distillation
MD Membrane Distillation
MF Microfiltration
MEMD Multi-Effect Membrane Distillation
NF Nanofiltration
MSW Municipal Solid Waste
OPMEX Operational and Maintenance Expenditure
OMD Osmotic Membrane Distillation
PV Photovoltaic
PE Polyethylene
PP Polypropylene
PTFE Polytetrafluoroethylene
PVDF Polyvinylidene fluoride
PFA Perfluoroalkoxy alkanes
RO Reverse Osmosis
SDGs Sustainable Development Goals
SGMD Sweeping Gas Membrane Distillation
TDS Total Dissolved Solids
TMAH Tetramethyl Ammonium Hydroxide
TOC Total Organic Carbon
TSGMD Thermostatic Sweeping Gas Membrane Distillation
UF Ultrafiltration
UNEP United Nations Environment Programme
UV Ultraviolet
VMD Vacuum Membrane Distillation
VMEMD Vacuum Multi-Effect Membrane Distillation
VOCs Volatile Organic Compounds
VRF Volume Reduction Factor
ZLD Zero Liquid Discharge

Imtisal-e-Noor, Doctoral Thesis-2021
xiv
Imtisal-e-Noor, Doctoral Thesis-2021
xv
Table of Contents
Chapter 1 Introduction ........................................................................................... 1
1.1 Research objectives and questions .................................................................. 3
1.2 Contributions to state of the art ....................................................................... 4
1.3 Outline of the thesis ........................................................................................ 5
Chapter 2 Context and literature review .............................................................. 7
2.1 Membrane distillation ..................................................................................... 7
2.1.1 Working principles ................................................................................................ 7
2.1.2 Membrane materials and properties ....................................................................... 8
2.1.3 MD module configurations .................................................................................... 9
2.1.4 Integrated MD module configurations ................................................................. 12
2.2 Potential low-grade heat sources ................................................................... 13
2.2.1 Solar energy ......................................................................................................... 13
2.2.2 Geothermal energy .............................................................................................. 14
2.2.3 Waste heat ........................................................................................................... 14
2.3 MD applications ............................................................................................ 15
2.4 Nano-electronics industries: wastewater and waste heat ............................... 17
2.5 Cogeneration plants: flue gas condensate and district heating ...................... 20
Chapter 3 Methodology ........................................................................................ 23
3.1 Experimental setups ...................................................................................... 23
3.2 Experimental methods and system analyses ................................................. 27
3.2.1 Separation efficiency ........................................................................................... 27
3.2.2 Transmembrane flux and reconcentration study .................................................. 28
3.2.3 Energy analysis .................................................................................................... 29
3.2.4 Exergy analysis .................................................................................................... 30
3.2.5 Performance of scaled-up system ........................................................................ 32
3.2.6 Economic analysis ............................................................................................... 34
Chapter 4 Performance assessment of membrane distillation for wastewater
treatment in nano-electronics facilities (Appended articles I, II and III) ........ 39
4.1 Technical performance of Xzero laboratory prototype ................................. 41
4.1.1 Separation efficiency ........................................................................................... 41
4.1.2 Module performance............................................................................................ 47
4.2 Integrated large-scale systems ....................................................................... 51
Imtisal-e-Noor, Doctoral Thesis-2021
xvi
4.2.1 TMAH wastewater treatment............................................................................... 52
4.2.2 CMP wastewater treatment .................................................................................. 53
4.3 Economic assessment .................................................................................... 55
4.4 Concluding remarks ...................................................................................... 58
Chapter 5 Water recovery from flue gas condensate in combined heat and
power plants using membrane distillation (Appended articles IV and V) ....... 59
5.1 Stockholm Exergi facilities ........................................................................... 61
5.1.1 Högdalen CHP facilities ...................................................................................... 61
5.1.2 Bristaverket CHP facilities .................................................................................. 62
5.2 Technical performance of Xzero laboratory prototype and pilot plant ......... 63
5.2.1 Separation efficiency ........................................................................................... 63
5.2.2 Module performance............................................................................................ 71
5.3 Integrated large-scale systems ....................................................................... 73
5.4 Economic assessment .................................................................................... 76
5.5 Concluding remarks ...................................................................................... 78
Chapter 6 Conclusion and future work ............................................................... 81
6.1 Future work ................................................................................................... 83
References .............................................................................................................. 85
Appendix .............................................................................................................. 109
Imtisal-e-Noor, Doctoral Thesis-2021
xvii
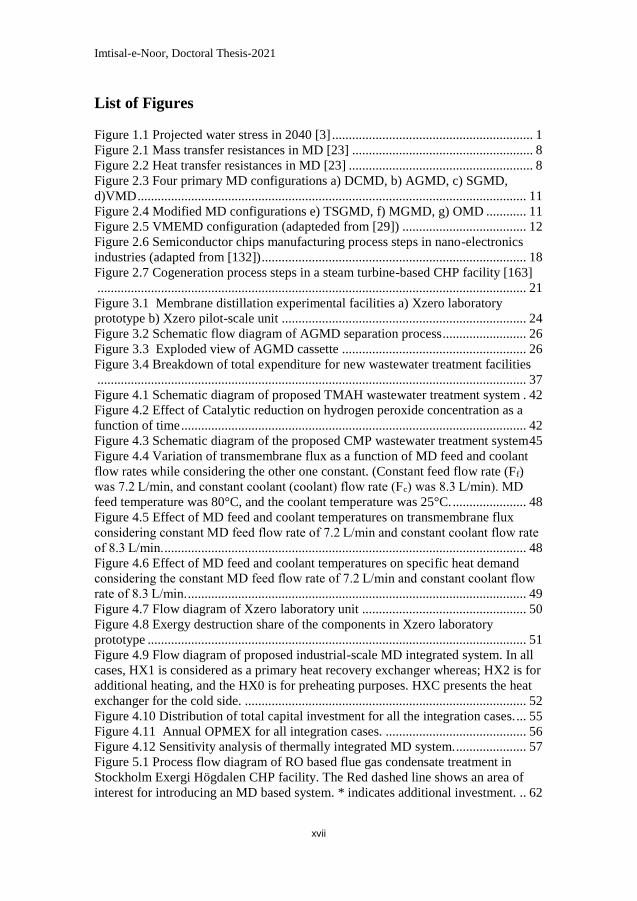
List of Figures
Figure 1.1 Projected water stress in 2040 [3] ............................................................ 1 Figure 2.1 Mass transfer resistances in MD [23] ...................................................... 8 Figure 2.2 Heat transfer resistances in MD [23] ....................................................... 8 Figure 2.3 Four primary MD configurations a) DCMD, b) AGMD, c) SGMD,
d)VMD .................................................................................................................... 11 Figure 2.4 Modified MD configurations e) TSGMD, f) MGMD, g) OMD ............ 11 Figure 2.5 VMEMD configuration (adapteded from [29]) ..................................... 12 Figure 2.6 Semiconductor chips manufacturing process steps in nano-electronics
industries (adapted from [132]) ............................................................................... 18 Figure 2.7 Cogeneration process steps in a steam turbine-based CHP facility [163]
................................................................................................................................ 21 Figure 3.1 Membrane distillation experimental facilities a) Xzero laboratory
prototype b) Xzero pilot-scale unit ......................................................................... 24 Figure 3.2 Schematic flow diagram of AGMD separation process ......................... 26 Figure 3.3 Exploded view of AGMD cassette ....................................................... 26 Figure 3.4 Breakdown of total expenditure for new wastewater treatment facilities
................................................................................................................................ 37 Figure 4.1 Schematic diagram of proposed TMAH wastewater treatment system . 42 Figure 4.2 Effect of Catalytic reduction on hydrogen peroxide concentration as a
function of time ....................................................................................................... 42 Figure 4.3 Schematic diagram of the proposed CMP wastewater treatment system45 Figure 4.4 Variation of transmembrane flux as a function of MD feed and coolant
flow rates while considering the other one constant. (Constant feed flow rate (Ff)
was 7.2 L/min, and constant coolant (coolant) flow rate (Fc) was 8.3 L/min). MD
feed temperature was 80°C, and the coolant temperature was 25°C. ...................... 48 Figure 4.5 Effect of MD feed and coolant temperatures on transmembrane flux
considering constant MD feed flow rate of 7.2 L/min and constant coolant flow rate
of 8.3 L/min. ............................................................................................................ 48 Figure 4.6 Effect of MD feed and coolant temperatures on specific heat demand
considering the constant MD feed flow rate of 7.2 L/min and constant coolant flow
rate of 8.3 L/min. ..................................................................................................... 49 Figure 4.7 Flow diagram of Xzero laboratory unit ................................................. 50 Figure 4.8 Exergy destruction share of the components in Xzero laboratory
prototype ................................................................................................................. 51 Figure 4.9 Flow diagram of proposed industrial-scale MD integrated system. In all
cases, HX1 is considered as a primary heat recovery exchanger whereas; HX2 is for
additional heating, and the HX0 is for preheating purposes. HXC presents the heat
exchanger for the cold side. .................................................................................... 52 Figure 4.10 Distribution of total capital investment for all the integration cases. ... 55 Figure 4.11 Annual OPMEX for all integration cases. .......................................... 56 Figure 4.12 Sensitivity analysis of thermally integrated MD system. ..................... 57 Figure 5.1 Process flow diagram of RO based flue gas condensate treatment in
Stockholm Exergi Högdalen CHP facility. The Red dashed line shows an area of
interest for introducing an MD based system. * indicates additional investment. .. 62
Imtisal-e-Noor, Doctoral Thesis-2021
xviii
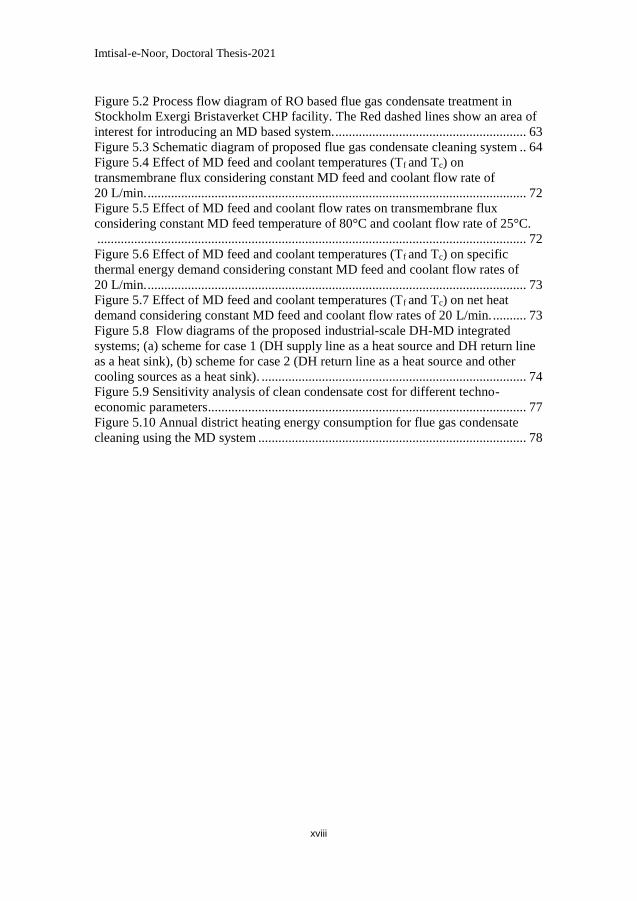
Figure 5.2 Process flow diagram of RO based flue gas condensate treatment in
Stockholm Exergi Bristaverket CHP facility. The Red dashed lines show an area of
interest for introducing an MD based system. ......................................................... 63 Figure 5.3 Schematic diagram of proposed flue gas condensate cleaning system .. 64 Figure 5.4 Effect of MD feed and coolant temperatures (Tf and Tc) on
transmembrane flux considering constant MD feed and coolant flow rate of
20 L/min. ................................................................................................................. 72 Figure 5.5 Effect of MD feed and coolant flow rates on transmembrane flux
considering constant MD feed temperature of 80°C and coolant flow rate of 25°C.
................................................................................................................................ 72 Figure 5.6 Effect of MD feed and coolant temperatures (Tf and Tc) on specific
thermal energy demand considering constant MD feed and coolant flow rates of
20 L/min. ................................................................................................................. 73 Figure 5.7 Effect of MD feed and coolant temperatures (Tf and Tc) on net heat
demand considering constant MD feed and coolant flow rates of 20 L/min. .......... 73 Figure 5.8 Flow diagrams of the proposed industrial-scale DH-MD integrated
systems; (a) scheme for case 1 (DH supply line as a heat source and DH return line
as a heat sink), (b) scheme for case 2 (DH return line as a heat source and other
cooling sources as a heat sink). ............................................................................... 74 Figure 5.9 Sensitivity analysis of clean condensate cost for different techno-
economic parameters ............................................................................................... 77 Figure 5.10 Annual district heating energy consumption for flue gas condensate
cleaning using the MD system ................................................................................ 78
Imtisal-e-Noor, Doctoral Thesis-2021
xix
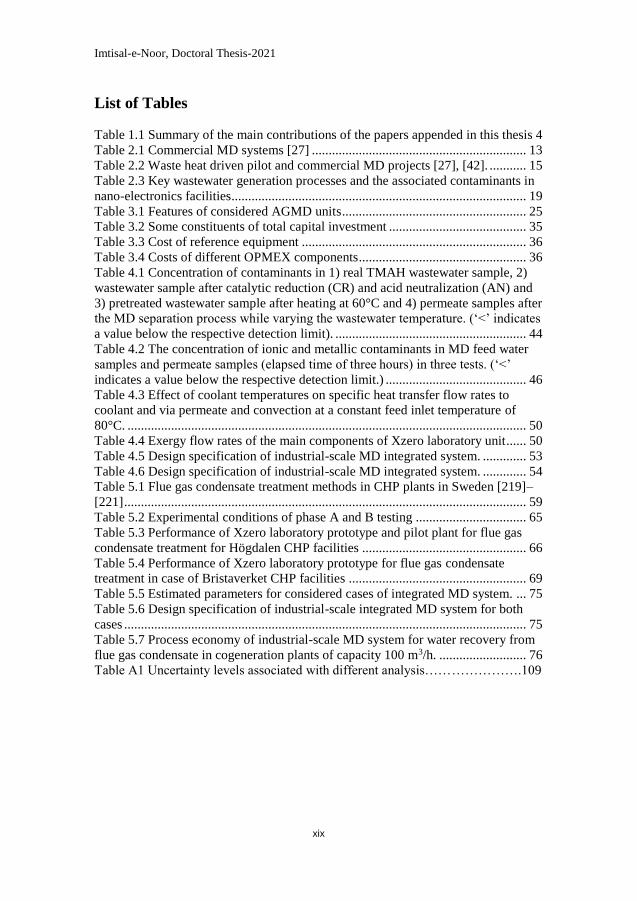
List of Tables
Table 1.1 Summary of the main contributions of the papers appended in this thesis 4 Table 2.1 Commercial MD systems [27] ................................................................ 13 Table 2.2 Waste heat driven pilot and commercial MD projects [27], [42]. ........... 15 Table 2.3 Key wastewater generation processes and the associated contaminants in
nano-electronics facilities........................................................................................ 19 Table 3.1 Features of considered AGMD units ....................................................... 25 Table 3.2 Some constituents of total capital investment ......................................... 35 Table 3.3 Cost of reference equipment ................................................................... 36 Table 3.4 Costs of different OPMEX components .................................................. 36 Table 4.1 Concentration of contaminants in 1) real TMAH wastewater sample, 2)
wastewater sample after catalytic reduction (CR) and acid neutralization (AN) and
3) pretreated wastewater sample after heating at 60°C and 4) permeate samples after
the MD separation process while varying the wastewater temperature. (‘<’ indicates
a value below the respective detection limit). ......................................................... 44 Table 4.2 The concentration of ionic and metallic contaminants in MD feed water
samples and permeate samples (elapsed time of three hours) in three tests. (‘<’
indicates a value below the respective detection limit.) .......................................... 46 Table 4.3 Effect of coolant temperatures on specific heat transfer flow rates to
coolant and via permeate and convection at a constant feed inlet temperature of
80°C. ....................................................................................................................... 50 Table 4.4 Exergy flow rates of the main components of Xzero laboratory unit...... 50 Table 4.5 Design specification of industrial-scale MD integrated system. ............. 53 Table 4.6 Design specification of industrial-scale MD integrated system. ............. 54 Table 5.1 Flue gas condensate treatment methods in CHP plants in Sweden [219]–
[221] ........................................................................................................................ 59 Table 5.2 Experimental conditions of phase A and B testing ................................. 65 Table 5.3 Performance of Xzero laboratory prototype and pilot plant for flue gas
condensate treatment for Högdalen CHP facilities ................................................. 66 Table 5.4 Performance of Xzero laboratory prototype for flue gas condensate
treatment in case of Bristaverket CHP facilities ..................................................... 69 Table 5.5 Estimated parameters for considered cases of integrated MD system. ... 75 Table 5.6 Design specification of industrial-scale integrated MD system for both
cases ........................................................................................................................ 75 Table 5.7 Process economy of industrial-scale MD system for water recovery from
flue gas condensate in cogeneration plants of capacity 100 m3/h. .......................... 76 Table A1 Uncertainty levels associated with different analysis………………….109

Imtisal-e-Noor, Doctoral Thesis-2021
xx
Imtisal-e-Noor, Doctoral Thesis-2021
1
Chapter 1 Introduction
Water is one of the key pillars of sustainable development. However, the
continuously increasing world population and changing consumption patterns place
extreme pressure on finite, vulnerable water resources. Additionally, the water
footprint of the industrial sector continues to grow exponentially in concert with
rapid economic development, which puts substantial demand for fresh water
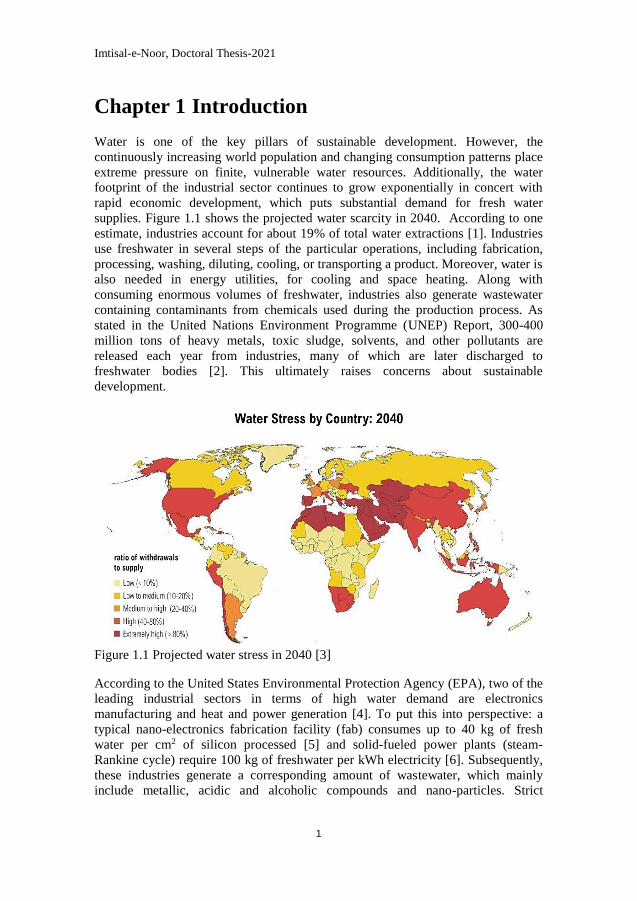
supplies. Figure 1.1 shows the projected water scarcity in 2040. According to one
estimate, industries account for about 19% of total water extractions [1]. Industries
use freshwater in several steps of the particular operations, including fabrication,
processing, washing, diluting, cooling, or transporting a product. Moreover, water is
also needed in energy utilities, for cooling and space heating. Along with
consuming enormous volumes of freshwater, industries also generate wastewater
containing contaminants from chemicals used during the production process. As
stated in the United Nations Environment Programme (UNEP) Report, 300-400
million tons of heavy metals, toxic sludge, solvents, and other pollutants are
released each year from industries, many of which are later discharged to
freshwater bodies [2]. This ultimately raises concerns about sustainable
development.
Figure 1.1 Projected water stress in 2040 [3]
According to the United States Environmental Protection Agency (EPA), two of the
leading industrial sectors in terms of high water demand are electronics
manufacturing and heat and power generation [4]. To put this into perspective: a
typical nano-electronics fabrication facility (fab) consumes up to 40 kg of fresh
water per cm2 of silicon processed [5] and solid-fueled power plants (steam-
Rankine cycle) require 100 kg of freshwater per kWh electricity [6]. Subsequently,
these industries generate a corresponding amount of wastewater, which mainly
include metallic, acidic and alcoholic compounds and nano-particles. Strict
Imtisal-e-Noor, Doctoral Thesis-2021
2
environmental regulations embodied in UN sustainable development goals (SDGs)
6 (Clean Water and Sanitation), 9 (Industry, Innovation, and Infrastructure) and 12
(Responsible Consumption & Production) mandate the use of advanced pollution
controls to realize tightened discharge limits of industrial effluent. Moreover,
industries are recommended to adopt a zero liquid discharge (ZLD) approach for
advanced water management. In the nano-electronics sector, the focus is to improve
wastewater treatment systems for ensuring high environmental performance, along
with the reduction of wastewater volumes. In combined heat and power (CHP)
plants, the emphasis is placed on advanced methods for flue gas condensate
cleaning for the elimination of toxic compounds in effluents, including recovery for
boiler make-up water.
Industries have considered various technologies for treating industrial effluents
involving either mechanical, electrical or thermal separation. Membrane separation
methods are widespread due to their outstanding performance and other favorable
traits. The conventional membrane technologies include reverse osmosis (RO),
micro-filtration (MF), ultra-filtration (UF), nano-filtration (NF) and pervaporation
[7]–[9]. Among them, RO is a proven and well-established technology and is
typically considered the core of a water treatment system. However, many
fundamental shortcomings are associated with RO based systems which are yet to
be overcome [10]. For instance, RO has comparatively higher electrical energy
demand to manage high operating pressures. The necessarily-high mechanical load
subsequently reduces membrane performance efficiency. Moreover, RO requires
harsh pretreatment chemicals for countering bio-fouling on membrane surfaces.
Furthermore, RO cannot efficiently handle certain high-concentration feedstocks
due to some practical constraints, mainly, limitations associated with higher
pressure levels. Additionally, many RO applications struggle with sludge disposal
problems, which are required to be resolved by improving the water recovery ratio
in order to minimize sludge volumes. Hence alternative membrane techniques are
of high interest, which may retain the advantages of the established methods while
enhancing robustness, achieving high recovery ratios, reducing electrical energy
demand, minimizing chemical requirements, decreasing sludge volumes,
diminishing bio-fouling issues, and simplifying process integration.
In this context, membrane distillation (MD) is a promising technology with highly
favorable water purification characteristics. MD employs a hydrophobic membrane
to allow only water vapor and volatiles (if present) to pass through the membrane
pores while leaving behind the dissolved contaminants in the feed solution [11].
The vapor transport is primarily driven by the temperature difference between the
feed and permeate sides. The process theoretically provides complete removal of
non-volatiles, including cells, metals, ions, macromolecules and colloids. It
typically operates at lower temperatures than the conventional distillation and much
lower pressure than the RO process [12]. Additionally, MD has other potential
advantages compared to RO as follows: (1) improved separation efficiency; (2)
higher recovery ratios; (3) reduced fouling issues; (4) lower mechanical stress; (5)
less-sensitivity to fluctuating concentration levels; (6) lower electricity demand; (7)
Imtisal-e-Noor, Doctoral Thesis-2021
3
highly concentrated retentate; and (8) reduced capital expenditures. These attributes
ensure enhanced performance of MD technology as compared to RO-based
alternatives.
Since MD is a thermally driven process, the principal challenge for realizing its
industrial applications is linked with high thermal power demand and concurrent
operational expenses that limit the technology's commercialization. Nonetheless, a
considerable amount of sustainable, affordable and locally derived waste heat is
available in numerous industries and can offer MD scope to showcase its potential.
To this end, it is also necessary to draw attention to thermal integration with due
consideration of thermal energy supply from heat sources along with dissipation to
heat sinks for the specific application. Utilization of locally available energy (waste
heat) sources for driving an MD system can not only treat wastewater within or
beyond the governing environmental regulations but can also enhance sustainability
and potentially reduce carbon dioxide emissions for a particular process. This
situation results in a dual benefit in terms of ecological aspects.
1.1 Research objectives and questions
The main aim of this research is to introduce and evaluate waste heat driven
membrane distillation for industrial wastewater treatment in nano-electronics
manufacturing facilities and cogeneration plants. In alignment with the primary
aim, the sub-objectives are defined including:
1) Identification of potential wastewater treatment applications of MD
technology in nano-electronics industries and cogeneration plants, and
thorough understanding of the types of locally available waste heat sources
applicable to industrial-scale MD based processes;
2) Characterization of single-cassette laboratory-scale and multi-cassette
pilot-scale air gap MD facilities in terms of their technical performance for
different feedstocks obtained from nano-electronics and cogeneration
facilities while varying operating conditions;
3) Techno-economic assessment of thermal integration options for industrial-
scale MD systems for effluent treatment in selected industries.
Within the defined scope of the aforementioned aim and sub-objectives, three
research questions were posed as follows:
1) What are the separation efficiencies of the MD systems for various
contaminants considering the selected wastewaters as feedstocks? Is there
a need for any other complementary pretreatment or post-treatment
processes for complete separation?
Imtisal-e-Noor, Doctoral Thesis-2021
4
2) What are product yield, specific thermal and electrical energy demand and
exergy efficiency, and how is the energy distributed and exergy destroyed
by different components of the system?
3) Are the proposed waste heat driven MD systems technically viable and
have economic superiority for the industrial effluent treatment compared
with existing systems? How do different techno-economic parameters
affect the process economy?
1.2 Contributions to state of the art
Taking the above-mentioned research objectives and questions into consideration,
contributions of this thesis linked to the appended papers are summarized in Table
1.1.
Table 1.1 Summary of the main contributions of the papers appended in this thesis
Papers I, II, IV and V
Research topic Introduction of MD systems in water-intensive industries
Contributions to
state of the art Exploration of photolithography and chemical mechanical
planarization wastewaters treatment as the potential
applications for MD technology in nano-electronics
facilities
Comparison of flue gas condensate treatment in municipal
solid waste incineration and biofuel-fired cogeneration
facilities using MD systems
Inspection for required pre/post-treatment steps and
determination of potential mechanisms attributed to the
separation of contaminants Yield, energy and exergy analyses of the MD systems for
different conditions
Papers I, III, IV and V
Research topic Techno-economic system analysis of thermally integrated
industrial-scale MD for wastewater treatment in nano-
electronics and cogeneration facilities
Contributions to
state of the art Identification and comparison of locally available waste
heat sources applicable for thermal integration with MD in
nano-electronics and cogeneration facilities
Process design of thermally integrated industrial-scale MD
based systems for particular applications according to the
requirements of generic nano-electronics and cogeneration
facilities
Economic assessment of thermally integrated MD systems
at different scales for retrofitted and new wastewater
treatment facilities
Imtisal-e-Noor, Doctoral Thesis-2021
5
1.3 Outline of the thesis
The thesis is divided into six chapters, as follows:
Chapter 1 states the context and motivation for this research work and includes
objectives, research questions, a summary of the main contributions to state of the
art and an outline of the thesis report.
Chapter 2 provides a review of membrane distillation technology, along with
specific industrial applications under consideration.
Chapter 3 presents the methodology of the thesis for performed experimental and
techno-economic studies.
Chapter 4 includes the experimental investigation of membrane distillation for the
treatment of different wastewaters released from the nano-electronics
manufacturing facilities. This chapter also consists of the techno-economic
feasibility of locally available waste heat driven membrane distillation for
wastewater treatment in nano-electronics industries.
Chapter 5 explores the competitiveness of membrane distillation versus
conventional approaches for water recovery from flue gas condensate in municipal
solid waste and biofuel-fired cogeneration plants. This chapter also covers the
techno-economic system analysis of district heating driven MD for advanced flue
gas condensate treatment in cogeneration plants.
Chapter 6 provides a conclusion and future outlook.

Imtisal-e-Noor, Doctoral Thesis-2021
6
Imtisal-e-Noor, Doctoral Thesis-2021
7
Chapter 2 Context and literature review
This chapter provides an overview of the membrane distillation technology,
including its industrial applications. Background of the industries under
consideration, their wastewater streams and locally available waste heat sources are
also presented.
2.1 Membrane distillation
In 1963, Bruce R. Bodell [13] introduced a system based on the air-filled porous
hydrophobic membrane for converting the non-portable liquids to drinkable water.
However, the research did not publish the membrane geometry and structure and
did not quantify the results. Later, in 1967, Peter K Weyl [14] investigated the
polytetrafluoroethylene (PTFE) hydrophobic membrane (thickness: 3.2 mm, pore
size: 9 mm and porosity: ~ 42 %) to improve the efficiency of water desalination. In
the same year, Findley [15] was the first to publish the fundamental principles and
outcomes of direct contact membrane distillation. However, in the mid-1980s, with
the introduction of highly porous hydrophobic materials, the interest in membrane
distillation technology was boosted substantially [16]. Lawson et al. [17], Alklaibi
et al. [18], Tomaszewska et al. [16], Drioli et al. [19]–[21], El-Bourawi et al. [22],
Alkhudhiri et al. [23], Khayet et al. [24], [25], Wang et al. [26], Thomas et al. [27]
and Tibi et al. [28] have presented detailed reviews on membrane distillation (MD),
including its development, membrane properties and potential applications. These
studies show that MD technology has been investigated at the academic level quite
extensively, where publications regarding experimental studies are mostly focused
on the development of membrane materials and parametric investigations.
However, very few are related to industrial applications of MD technology,
although the process has been known for more than forty years.
2.1.1 Working principles
Membrane distillation, a non-isothermal membrane separation process, presents a
two-fold barrier during purification: membrane hydrophobicity that provides high
recovery ratios with high-quality permeate production; and separation owing to
differentiation in the volatility of various contaminants. The term ‘membrane
distillation’ is originated from a conventional distillation process modified with
membrane separation. The main driving force is the temperature difference across
the membrane, which ultimately creates a vapor pressure difference between the
feed and the permeate sides of the membrane [23]. The MD feed operating
conditions are usually temperature in the range of 50-90°C and ambient pressure
[18], [21], [23]. The water transport in the MD system can be summarized in three
stages: (1) vapor gap is formed at the interface of hot feed solution and membrane
surface; (2) water vapor is transported through the hydrophobic membrane; (3)
water vapor is condensed at the interface of cold side membrane and permeate
solution [29]. The involved phase separation in the MD process is attributed to the
vapor-liquid equilibrium, where the latent heat of evaporation/condensation induces
Imtisal-e-Noor, Doctoral Thesis-2021
8
the phase change process [30]. During the process, the latent heat associated with
permeate vapor dissipated on the other side of the membrane to the cold stream.
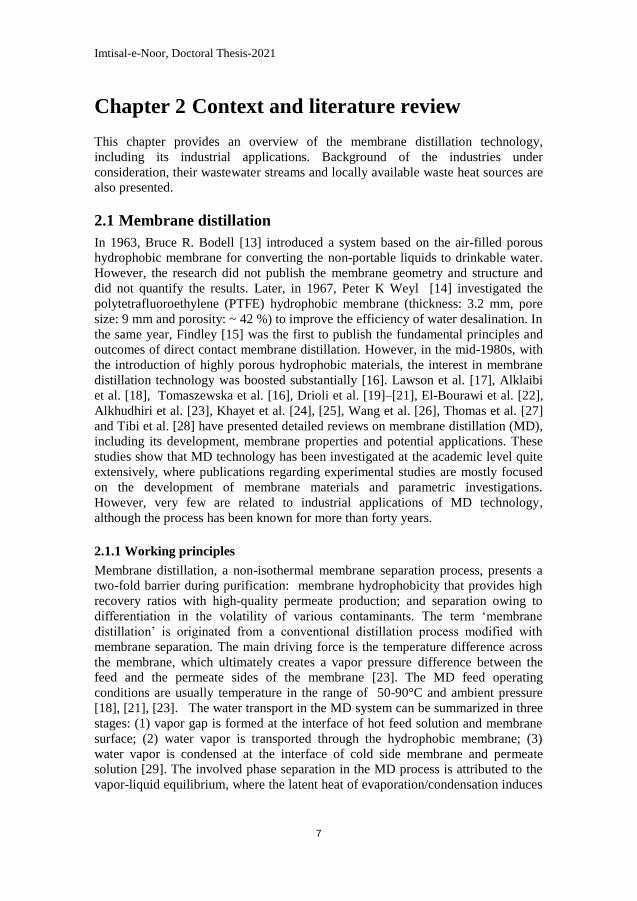
The mass transfer phenomenon in the MD process is governed by three principal
mechanisms: Poiseuille flow (viscous flow), Knudsen diffusion and molecular
diffusion. Consequently, specific resistances are associated with the momentum
transfer to the membrane (viscous resistance), with the membrane itself (Knudsen
resistance) and with the collision of molecules (molecular resistance). The
concentration boundary layer and surface resistances are usually negligible during
the mass transfer phenomenon. In contrast, the thermal boundary layer
significantly affects mass transfer in the MD process [20], [23]. Figure 2.1 presents
mass transfer resistances in the MD process.
Figure 2.1 Mass transfer resistances in MD [23]
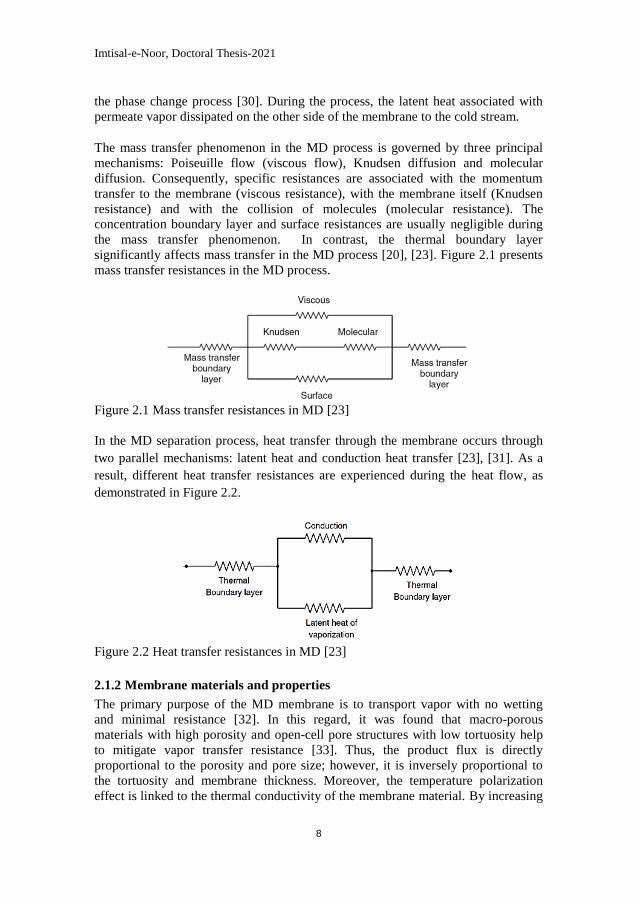
In the MD separation process, heat transfer through the membrane occurs through
two parallel mechanisms: latent heat and conduction heat transfer [23], [31]. As a
result, different heat transfer resistances are experienced during the heat flow, as
demonstrated in Figure 2.2.
Figure 2.2 Heat transfer resistances in MD [23]
2.1.2 Membrane materials and properties
The primary purpose of the MD membrane is to transport vapor with no wetting
and minimal resistance [32]. In this regard, it was found that macro-porous
materials with high porosity and open-cell pore structures with low tortuosity help
to mitigate vapor transfer resistance [33]. Thus, the product flux is directly
proportional to the porosity and pore size; however, it is inversely proportional to
the tortuosity and membrane thickness. Moreover, the temperature polarization
effect is linked to the thermal conductivity of the membrane material. By increasing
Imtisal-e-Noor, Doctoral Thesis-2021
9
the porosity and pore-size, the thermal conductivity of the membrane is reduced due
to the air captured inside the polymer matrix. This leads to a reduction in
conductive heat transfer through the membrane. On the contrary, the convective
heat transfer associated with the transmembrane flux increases across the
membrane. Furthermore, high hydrophobicity, small pores and high tortuosity
contribute to the anti-wetting properties [32], [34]. Therefore, for an effective MD
application following properties of the membrane material are suggested [33], [34]:
1. Moderately small pore size (0.1-1µm)
2. High porosity (80-90%)
3. Low tortuosity factor (1-3)
4. Adequate chemical, thermal and physical resistance
5. Reasonable liquid entry pressure (LEP, 2.5 bar) and contact angle (>105○)
6. Long term stability
7. High heat transfer and low mass transfer resistances
8. Reduced thickness (10-200 µm)
Considering these properties, polymeric materials are generally used owing to their
low cost and ease in manufacturing [28]. (Presently, membranes composed of
ceramics, metals and carbon nanotubes are also under consideration for this purpose
[35]–[38].) Commonly applied membrane materials are polytetrafluoroethylene
(PTFE), polyethylene (PE), polypropylene (PP), polyvinylidene fluoride (PVDF),
and perfluoroalkoxy alkanes (PFA) [39]–[44].
Hollow fiber and flat-sheet membrane geometries are traditionally used in MD
modules [26], [42], [45]. The hollow fiber module has a very high packing density.
It has a large membrane active area with a compact structure that makes it favorable
for commercial usage. On the other hand, plate and frame modules can easily be
constructed and cleaned, but they have lower packing density than the hollow fiber
modules [46]. However, the active membrane area can be increased while
introducing layers of flat-sheet MD membranes. The damaged membranes are
readily detachable in the flat-sheet modules; therefore, it is widely employed for
both laboratory and industrial-scales applications [42].
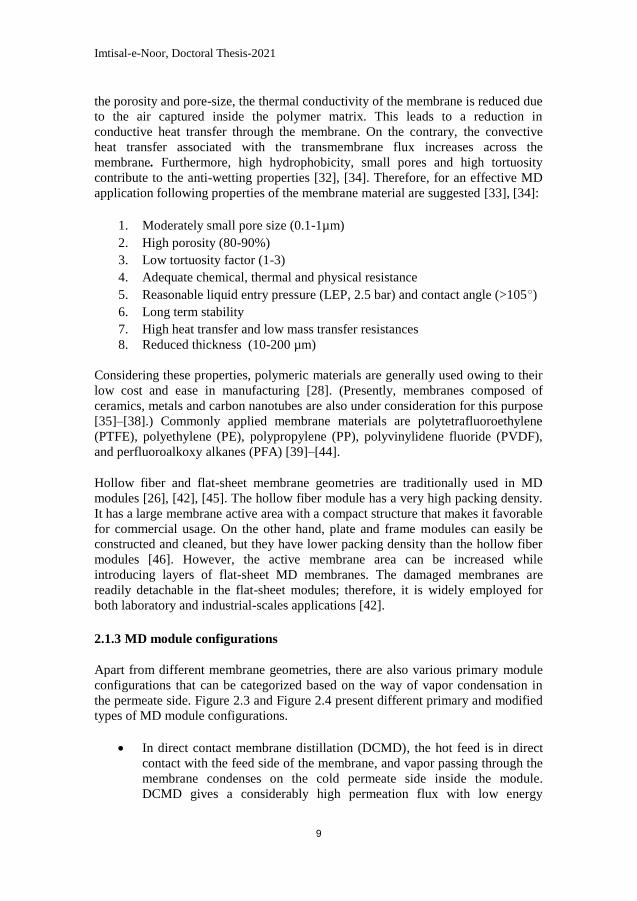
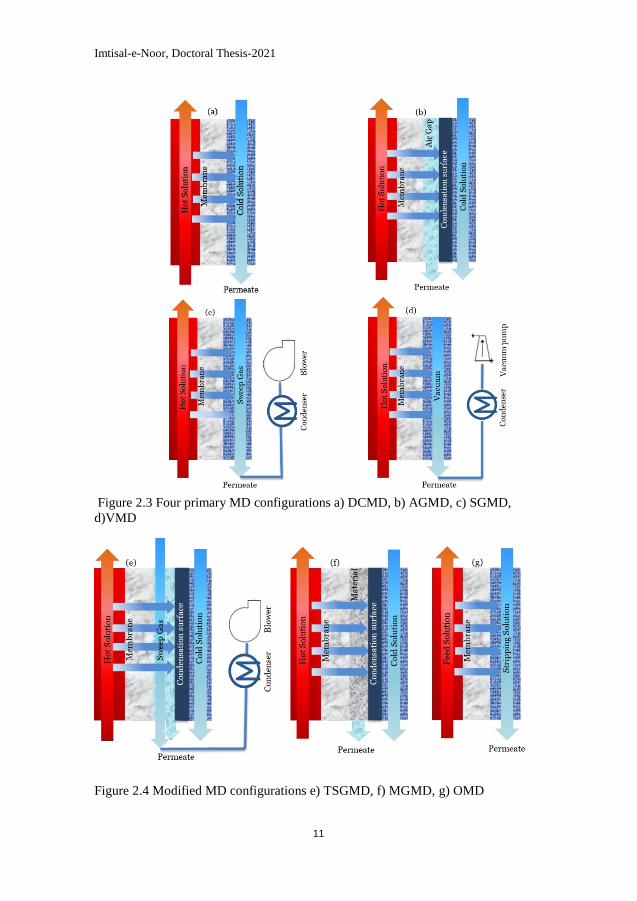
2.1.3 MD module configurations
Apart from different membrane geometries, there are also various primary module
configurations that can be categorized based on the way of vapor condensation in
the permeate side. Figure 2.3 and Figure 2.4 present different primary and modified
types of MD module configurations.
In direct contact membrane distillation (DCMD), the hot feed is in direct
contact with the feed side of the membrane, and vapor passing through the
membrane condenses on the cold permeate side inside the module.
DCMD gives a considerably high permeation flux with low energy
Imtisal-e-Noor, Doctoral Thesis-2021
10
efficiency, a drawback linked to heat losses due to conduction. [21], [41],
[47].
In air gap membrane distillation (AGMD), the hot feed is in direct contact
with the membrane, but stagnant air is introduced between the membrane
and condensation surface to reduce the heat loss. The vapor condenses on
the cold condensation surface. Due to the air gap, additional mass transfer
resistance is experienced in this structure. [23], [34], [48].
In sweeping gas membrane distillation (SGMD), the cold, inert sweeping
gas is introduced at the permeate side, which reduces the heat loss and
enhances the mass transfer coefficient. Condensation of water vapors takes
place outside the membrane module. The drawback involves in this
configuration is the diffusion of a small volume of permeate in a high
volume of sweep gas. [34], [49].
In vacuum membrane distillation (VMD), a pump is used to form a
vacuum at the permeate side, whereas the condensation happens outside
the module, and heat loss is insignificant due to conduction. However, a
high risk of pore wetting is associated with VMD configuration [32], [34],
[48].
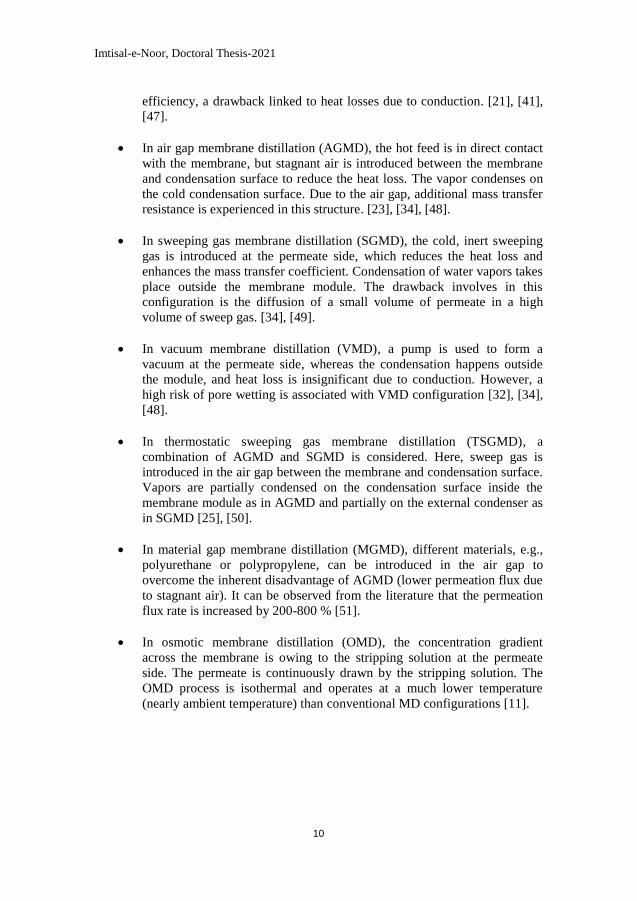
In thermostatic sweeping gas membrane distillation (TSGMD), a
combination of AGMD and SGMD is considered. Here, sweep gas is
introduced in the air gap between the membrane and condensation surface.
Vapors are partially condensed on the condensation surface inside the
membrane module as in AGMD and partially on the external condenser as
in SGMD [25], [50].
In material gap membrane distillation (MGMD), different materials, e.g.,
polyurethane or polypropylene, can be introduced in the air gap to
overcome the inherent disadvantage of AGMD (lower permeation flux due
to stagnant air). It can be observed from the literature that the permeation
flux rate is increased by 200-800 % [51].
In osmotic membrane distillation (OMD), the concentration gradient
across the membrane is owing to the stripping solution at the permeate
side. The permeate is continuously drawn by the stripping solution. The
OMD process is isothermal and operates at a much lower temperature
(nearly ambient temperature) than conventional MD configurations [11].
Imtisal-e-Noor, Doctoral Thesis-2021
11
Figure 2.3 Four primary MD configurations a) DCMD, b) AGMD, c) SGMD,
d)VMD
Figure 2.4 Modified MD configurations e) TSGMD, f) MGMD, g) OMD
Imtisal-e-Noor, Doctoral Thesis-2021
12
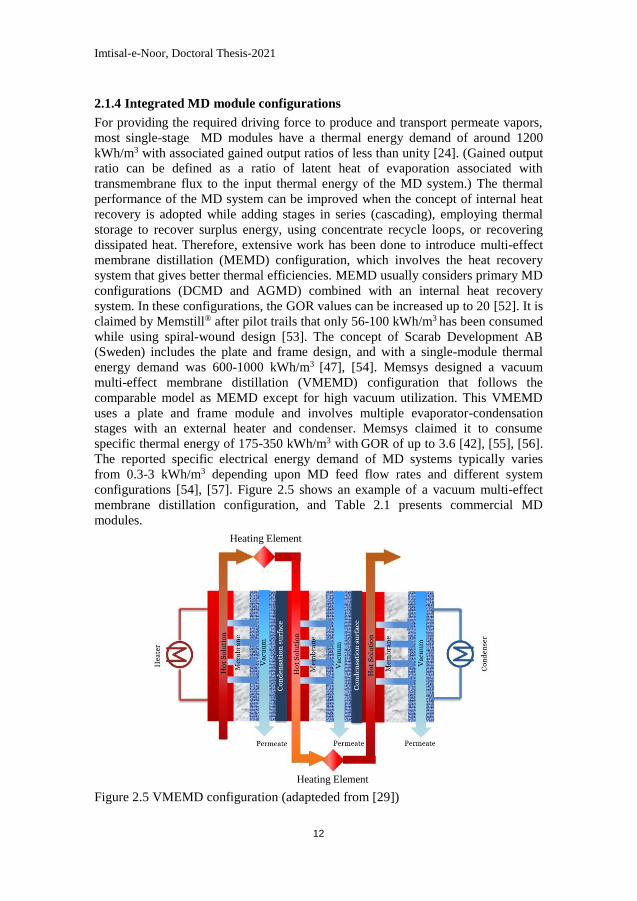
2.1.4 Integrated MD module configurations
For providing the required driving force to produce and transport permeate vapors,
most single-stage MD modules have a thermal energy demand of around 1200
kWh/m3 with associated gained output ratios of less than unity [24]. (Gained output
ratio can be defined as a ratio of latent heat of evaporation associated with
transmembrane flux to the input thermal energy of the MD system.) The thermal
performance of the MD system can be improved when the concept of internal heat
recovery is adopted while adding stages in series (cascading), employing thermal
storage to recover surplus energy, using concentrate recycle loops, or recovering
dissipated heat. Therefore, extensive work has been done to introduce multi-effect
membrane distillation (MEMD) configuration, which involves the heat recovery
system that gives better thermal efficiencies. MEMD usually considers primary MD
configurations (DCMD and AGMD) combined with an internal heat recovery
system. In these configurations, the GOR values can be increased up to 20 [52]. It is
claimed by Memstill® after pilot trails that only 56-100 kWh/m3 has been consumed
while using spiral-wound design [53]. The concept of Scarab Development AB
(Sweden) includes the plate and frame design, and with a single-module thermal
energy demand was 600-1000 kWh/m3 [47], [54]. Memsys designed a vacuum
multi-effect membrane distillation (VMEMD) configuration that follows the
comparable model as MEMD except for high vacuum utilization. This VMEMD
uses a plate and frame module and involves multiple evaporator-condensation
stages with an external heater and condenser. Memsys claimed it to consume
specific thermal energy of 175-350 kWh/m3 with GOR of up to 3.6 [42], [55], [56].
The reported specific electrical energy demand of MD systems typically varies
from 0.3-3 kWh/m3 depending upon MD feed flow rates and different system
configurations [54], [57]. Figure 2.5 shows an example of a vacuum multi-effect
membrane distillation configuration, and Table 2.1 presents commercial MD
modules.
Figure 2.5 VMEMD configuration (adapteded from [29])
Heating Element
Heating Element
Imtisal-e-Noor, Doctoral Thesis-2021
13
Table 2.1 Commercial MD systems [27]
Technology
developer
Technology/system MD configuration and
membrane geometry
Scarab Development
AB, Sweden
Xzero system AGMD (flat-sheet)
Solar Springs GmbH,
Germany
A spin-off from Fraunhofer Institute
for solar energy systems
AGMD (spiral-wound)
TNO, Netherlands Memstill promoted by Aquastill,
Keppel Seghers and Bule Gold
technologies
DCMD and AGMD
(spiral-wound and flat-
sheet)
Memsys GmbH,
Germany
Licensed to Aquaver. New Concept
Holdings Limited acquired assets of
Memsys in 2016
VMEMD (flat-sheet)
KmX Corporation,
Canada
Aqua-sepTM technology VMD (hollow-fiber)
2.2 Potential low-grade heat sources
MD operates at lower temperatures, yet it has comparatively higher thermal energy
demand than other membrane techniques. Therefore, it is instructive to couple MD
with the inexpensive low-grade heat sources for fulfilling the thermal energy
requirement of the operation while making the technology sustainable,
environmentally friendly and profitable [12], [58]. Potential low-grade heat sources
for thermally integrated MD systems include solar energy, geothermal energy and
waste heat.
2.2.1 Solar energy
For the last few decades, solar-powered MD systems are the most investigated
integrations for desalination purposes where different MD module configurations
were considered, including DCMD, AGMD and VMEMD [59], [60]. Different
geometries of solar collectors have been employed for this purpose: flat plate [60]–
[63]; evacuated tube [59], [64], [65]; compound parabolic [60], [65]; solar still and
solar pond [66]–[68]. These solar collectors can either be connected with MD via a
single loop or two loops [61], [69]. In some studies, along with solar thermal
collectors, photovoltaic (PV) panels are also integrated with the MD systems to
provide electrical energy for the pumps and other usages [61], [69], [70]. The
examined solar-powered MD plants have a capacity of few liters per day to
10 m3/day where the heat is supplied at low temperature (50-85°C) [59], [62], [69].
The reported levelized cost of water (LCOW) ranged from 5-85 $/m3 when solar-
powered MD systems were used [27], [71]. For small-scale application and remote
areas, solar-powered MD systems are quite competitive to comparative
technologies; however, its commercialization for industrial applications is very
limited due to low flux, large collector area requirement and the intermittent nature
of solar radiation.
Imtisal-e-Noor, Doctoral Thesis-2021
14
2.2.2 Geothermal energy
In contrast to solar energy, there is a negligible daily or seasonal shift associated
with a geothermal energy source; however, it is quite variable depending upon the
geographical location. There are very few studies that presented the concept of
either geothermal energy driven MD system or MD for geothermal water
purification using DCMD, AGMD and VMD [72]–[75]. Geothermal energy driven
MD systems are specified for the locations where geothermal fields are present, and
there is a need to obtain potable water and/or water for crop irrigation (due to
critical water shortage and contaminated available water). The temperature range
for geothermal energy can be between 40-95◦C. The considered locations include
Cerro Prieto in Mexico, Momotombo in Nicaragua and Lake Poopó in Bolivia [72];
Ranau, Sabah in Malaysia [73]; Masson Greenhouse in New Mexico [74] and
Tunisian geothermal springs [75], [76]. Considering warm geothermal water can
save up to 95% of the total energy consumption of the MD system [73]. The LCOW
can be between 0.50-130 $/m3 when the plant is operated with geothermal energy
[24], [27].
2.2.3 Waste heat
Waste heat may be present in different forms, but the key source of waste heat is
hot streams from power generation and industrial processes. Waste heat is broadly
defined as a form of sustainable energy, and its temperature ranges between 50–
800°C [77]. Various waste heat sources are identified in the literature to fulfill the
thermal energy requirement of the MD system. These waste heat sources include
heat recovery chiller water [78], boiler blowdown, steam diverted from bleed
streams and cooling water system stream [79], diesel engine exhaust [80], cooling
tower blowdown [81], district heating [54], [82] and exhaust flue gas/sanitized
sludge in biogas plant/anaerobic membrane bioreactor [83]–[86]. Moreover, hybrid
sources, i.e., combined solar energy and waste heat sources, are also investigated to
operate MD systems [87].
The concept of waste heat driven MD systems has been used by most of the main
companies in the market. Pilot and commercial MD projects have considered
AGMD and VMEMD modules with the flat sheet, hollow fiber and spiral wound
membrane geometries. The reported LCOW is 0.26-5.5 $/m3 [24], [27]. The
comparison among different low-grade heat sources depicts that waste heat sources
can be more reliable, environmentally friendly and inexpensive. Table 2.2
summarizes waste heat sources driven pilot and commercial MD projects.
Imtisal-e-Noor, Doctoral Thesis-2021
15
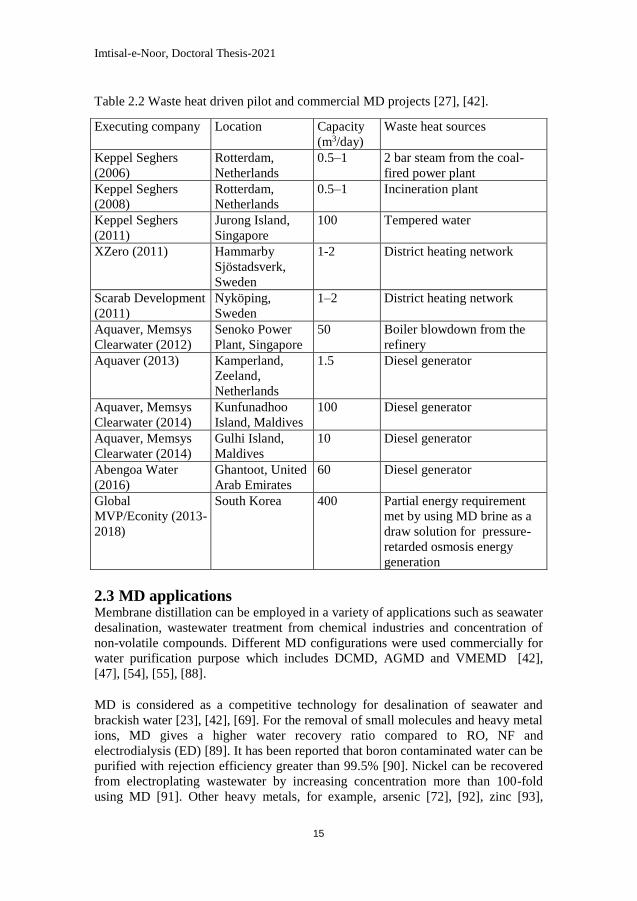
Table 2.2 Waste heat driven pilot and commercial MD projects [27], [42].
2.3 MD applications Membrane distillation can be employed in a variety of applications such as seawater
desalination, wastewater treatment from chemical industries and concentration of
non-volatile compounds. Different MD configurations were used commercially for
water purification purpose which includes DCMD, AGMD and VMEMD [42],
[47], [54], [55], [88].
MD is considered as a competitive technology for desalination of seawater and
brackish water [23], [42], [69]. For the removal of small molecules and heavy metal
ions, MD gives a higher water recovery ratio compared to RO, NF and
electrodialysis (ED) [89]. It has been reported that boron contaminated water can be
purified with rejection efficiency greater than 99.5% [90]. Nickel can be recovered
from electroplating wastewater by increasing concentration more than 100-fold
using MD [91]. Other heavy metals, for example, arsenic [72], [92], zinc [93],
Executing company Location Capacity
(m3/day)
Waste heat sources
Keppel Seghers
(2006)
Rotterdam,
Netherlands
0.5–1 2 bar steam from the coal-
fired power plant
Keppel Seghers
(2008)
Rotterdam,
Netherlands
0.5–1 Incineration plant
Keppel Seghers
(2011)
Jurong Island,
Singapore
100 Tempered water
XZero (2011) Hammarby
Sjöstadsverk,
Sweden
1-2 District heating network
Scarab Development
(2011)
Nyköping,
Sweden
1–2 District heating network
Aquaver, Memsys
Clearwater (2012)
Senoko Power
Plant, Singapore
50 Boiler blowdown from the
refinery
Aquaver (2013) Kamperland,
Zeeland,
Netherlands
1.5 Diesel generator
Aquaver, Memsys
Clearwater (2014)
Kunfunadhoo
Island, Maldives
100 Diesel generator
Aquaver, Memsys
Clearwater (2014)
Gulhi Island,
Maldives
10 Diesel generator
Abengoa Water
(2016)
Ghantoot, United
Arab Emirates
60 Diesel generator
Global
MVP/Econity (2013-
2018)
South Korea 400 Partial energy requirement
met by using MD brine as a
draw solution for pressure-
retarded osmosis energy
generation
Imtisal-e-Noor, Doctoral Thesis-2021
16
chromium [93] and gold [94], can also be removed entirely from the contaminated
water.
It is also found that MD is favorable for the treatment of polluted water with
radioactive substances [95], [96]. Moreover, MD has the potential to treat the oily
water/produced water from the industries [97]–[99]. MD process can also be
considered for the removal of inorganic matters like ammonia [100]–[102] and
halogenated volatile organic compounds (VOCs) [103]–[105].
Mineral acids (hydrochloric acid [106], [107], sulfuric acid [108], [109]), fruit
juices [110]–[112], sugar [113] and alcohol [114]–[116] can be concentrated either
in the permeate stream or in feed stream depending upon the volatility and vapor
pressure of the components. MD can also be used for the concentration of natural
food colorants [117] and de-alcoholization of wine [118]. MD showed a high
rejection percentage (>99%) for all dairy components while concentrating skimmed
milk and whey processing [119].
Furthermore, MD is a promising technique in the field of pharmaceuticals, where it
can be used as a waste concentration method. Low-level pharmaceutical
contamination in wastewater can be removed with the help of this separation
technique [54], [120]. Anti-inflammatory, topical anesthetic, analgesic, and
antihistamine medicines such as ibuprofen, dibucaine, acetaminophen, and
diphenhydramine, respectively, were reported to be concentrated through MD with
carbon nanotube immobilized membranes [120]. The textile industry is another
sector where the MD separation technique could treat wastewater with a high
recovery rate. The successful treatment of synthetic feed solutions containing dyes
and salts was shown in previous works where chemical oxygen demand (COD)
removal was better through MD than RO and NF [121], [122].
In the nano-electronics industries, MD was considered for supplying ultrapure
water from freshwater [78]. However, more complex wastewater streams were not
investigated using the MD process. There are also some preliminary experimental
studies where MD was employed in the power industry for flue gas desulfurization
wastewater treatment [123], concentrating cooling tower blowdown [124], [125]
and for flue gas condensate cleaning [126]–[128]. It was observed that particles and
heavy metals could be separated successfully; however, ammonium could not be
readily managed, which needs to address further.
Based on the previous record of MD applications and current requirement of
advanced wastewater management in water-intensive industries, the following
industrial case studies are selected and included in this work as potential MD
applications:
Treatment of wastewater released from Interuniversity Microelectronics Centre
(imec), Belgium: Nano-electronics manufacturing employs various specialty
chemicals, thus necessitating wastewater treatment. This case study determines
Imtisal-e-Noor, Doctoral Thesis-2021
17
the feasibility of MD separation technology for the treatment of challenging
wastewaters released from nano-electronics fab and identifies locally available
waste heat sources required for MD operation. Research campaigns include
experiments and techno-economic system analysis. The findings are presented
in Chapter 4.
Water recovery from flue gas condensate released from Stockholm Exergi
cogeneration facilities, Sweden: The concept involves replacing multistep RO
based flue gas condensate treatment with MD based technology. Högdalen and
Brista CHP facilities are considered as examples for municipal solid waste
incineration and biofuel-fired cogeneration plants, where along with the
removal of non-volatile contaminants, ammonium separation was also studied.
The detailed experimental investigation and district heating driven MD system
analysis for this case study are discussed in Chapter 5.
The additional background information about selected industries, their wastewaters
and locally available thermal energy sources has been described in sections 2.4 and
2.5.
2.4 Nano-electronics industries: wastewater and waste heat
In 1958 Jack Kilby, from Texas Instruments labs, was the first person to publish a
patent on the fundamental principles of integrated circuits (ICs) manufacturing.
Following then, fabricating transistors on a silicon wafer became a practice to
manufacture ICs [129]–[131]. The fabrication method of these ICs is quite
complicated, as described in Figure 2.6.
1. In the first step, a high-purity silicon ingot is created, which is further
divided into the silicon wafers of 200-300 mm diameter.
2. In the second step, these silicon wafers are coated with a silicon dioxide
film, and then a dopant is diffused to modify its electrical features.
Following that, layers of desired conducting/insulating materials are
deposited on the top of the doped silicon substrate, depending upon the
application.
3. In the next step, the wafer surface is coated with photoresist. Later on, the
circuit pattern is printed on the device's specific zones using
photolithography technology. In this method, a photomask is employed to
project a particular ICs pattern on the wafer by exposing the photoresist to
ultraviolet (UV) light. The weakened/soluble photoresist is then removed
using a developer solution.
After that, a plasma stream is used for etching the pattern trace to
eliminate materials and chemically reactive free radicals. The
etching process typically helps produce vertical profiles necessary
for the minuscule features in today's densely packed chip designs.
Following plasma etching, a photoresist stripper is employed to
remove the residual photoresist. These steps are recurred 30-40
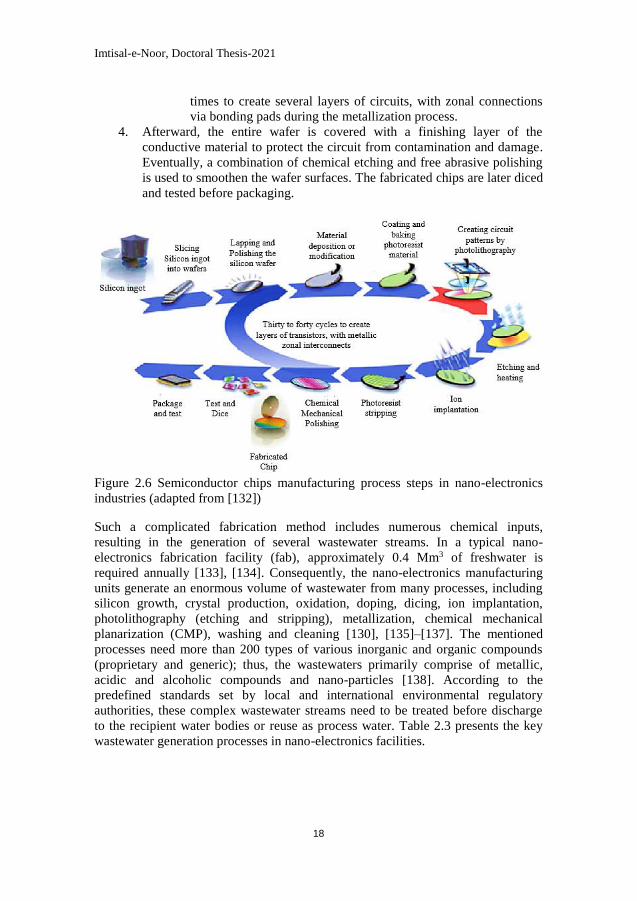
Imtisal-e-Noor, Doctoral Thesis-2021
18
times to create several layers of circuits, with zonal connections
via bonding pads during the metallization process.
4. Afterward, the entire wafer is covered with a finishing layer of the
conductive material to protect the circuit from contamination and damage.
Eventually, a combination of chemical etching and free abrasive polishing
is used to smoothen the wafer surfaces. The fabricated chips are later diced
and tested before packaging.
Figure 2.6 Semiconductor chips manufacturing process steps in nano-electronics
industries (adapted from [132])
Such a complicated fabrication method includes numerous chemical inputs,
resulting in the generation of several wastewater streams. In a typical nano-
electronics fabrication facility (fab), approximately 0.4 Mm3 of freshwater is
required annually [133], [134]. Consequently, the nano-electronics manufacturing
units generate an enormous volume of wastewater from many processes, including
silicon growth, crystal production, oxidation, doping, dicing, ion implantation,
photolithography (etching and stripping), metallization, chemical mechanical
planarization (CMP), washing and cleaning [130], [135]–[137]. The mentioned
processes need more than 200 types of various inorganic and organic compounds
(proprietary and generic); thus, the wastewaters primarily comprise of metallic,
acidic and alcoholic compounds and nano-particles [138]. According to the
predefined standards set by local and international environmental regulatory
authorities, these complex wastewater streams need to be treated before discharge
to the recipient water bodies or reuse as process water. Table 2.3 presents the key
wastewater generation processes in nano-electronics facilities.
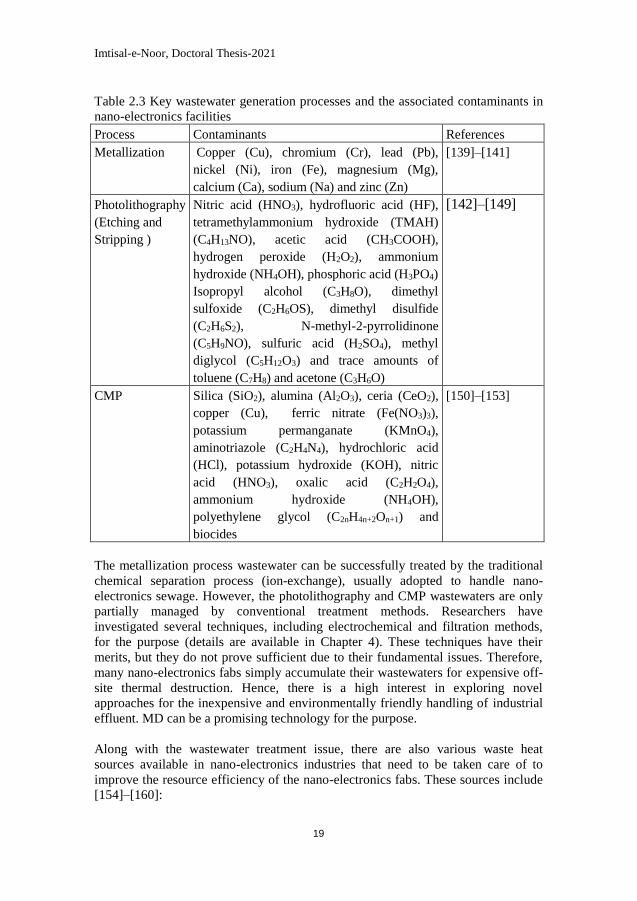
Imtisal-e-Noor, Doctoral Thesis-2021
19
Table 2.3 Key wastewater generation processes and the associated contaminants in
nano-electronics facilities
Process Contaminants References
Metallization Copper (Cu), chromium (Cr), lead (Pb),
nickel (Ni), iron (Fe), magnesium (Mg),
calcium (Ca), sodium (Na) and zinc (Zn)
[139]–[141]
Photolithography
(Etching and
Stripping )
Nitric acid (HNO3), hydrofluoric acid (HF),
tetramethylammonium hydroxide (TMAH)
(C4H13NO), acetic acid (CH3COOH),
hydrogen peroxide (H2O2), ammonium
hydroxide (NH4OH), phosphoric acid (H3PO4)
Isopropyl alcohol (C3H8O), dimethyl
sulfoxide (C2H6OS), dimethyl disulfide
(C2H6S2), N-methyl-2-pyrrolidinone
(C5H9NO), sulfuric acid (H2SO4), methyl
diglycol (C5H12O3) and trace amounts of
toluene (C7H8) and acetone (C3H6O)
[142]–[149]
CMP Silica (SiO2), alumina (Al2O3), ceria (CeO2),
copper (Cu), ferric nitrate (Fe(NO3)3),
potassium permanganate (KMnO4),
aminotriazole (C2H4N4), hydrochloric acid
(HCl), potassium hydroxide (KOH), nitric
acid (HNO3), oxalic acid (C2H2O4),
ammonium hydroxide (NH4OH),
polyethylene glycol (C2nH4n+2On+1) and
biocides
[150]–[153]
The metallization process wastewater can be successfully treated by the traditional
chemical separation process (ion-exchange), usually adopted to handle nano-
electronics sewage. However, the photolithography and CMP wastewaters are only
partially managed by conventional treatment methods. Researchers have
investigated several techniques, including electrochemical and filtration methods,
for the purpose (details are available in Chapter 4). These techniques have their
merits, but they do not prove sufficient due to their fundamental issues. Therefore,
many nano-electronics fabs simply accumulate their wastewaters for expensive off-
site thermal destruction. Hence, there is a high interest in exploring novel
approaches for the inexpensive and environmentally friendly handling of industrial
effluent. MD can be a promising technology for the purpose.
Along with the wastewater treatment issue, there are also various waste heat
sources available in nano-electronics industries that need to be taken care of to
improve the resource efficiency of the nano-electronics fabs. These sources include
[154]–[160]:
Imtisal-e-Noor, Doctoral Thesis-2021
20
1. Condenser outlet water from chillers (temperature range: 35-90◦ C; thermal
power: 3.5-12 MW)
2. Exhaust air from VOCs combustion abatement systems (temperature
range: 350-400◦C; thermal power: 0.25-0.5 MW)
3. Process cooling water from manufacturing tools (temperature range: 35-
90◦ C; thermal power: 2.5-3.5 MW)
4. Spent stripper (sulfuric acid) from photoresist stripping and spent etchant
(phosphoric acid) from nitride etching (temperature range: 90-200◦C;
thermal power: 0.5-1 MW)
5. Dissipated heat from steam generators, compressors and pumps (widely
distributed temperature range)
Usually, the total amount of waste heat released from the typical nano-electronics
facilities is about 35–40 MW [78]. Recovery of this waste heat can not only
increase energy efficiency but also reduce CO2 emissions.
2.5 Cogeneration plants: flue gas condensate and district heating
In 1882 Thomas Edison's Pearl Street Station in the United States was the first
power plant to apply the concept of combined heat and power (CHP) generation
[161]. Since then, CHP (also known as cogeneration) systems have been widely
adopted to produce electricity and valuable thermal energy using an integrated
approach. CHP facilities employ various fuels, including natural gas/oil, coal,
biomass, or waste, to provide thermal energy to the system. There are principally
three different thermodynamic cycles that are considered for CHP systems [162]:
1. Rankine or steam cycle where water is used as a working fluid that passes
through four stages process including adiabatic/isentropic compression;
isobaric heat addition (superheated steam formation); adiabatic/isentropic
expansion (power generation); and isobaric heat rejection (heat recovered).
The Rankine cycle is mostly considered for steam turbine-based CHP
systems.
2. Brayton or Joule cycle where air/gas is considered as a working fluid. It
mostly runs as an open cycle and generally follows the same stages as the
Rankine cycle. Brayton cycle is typically opted for gas turbine-based CHP
systems.
3. Otto cycle or Diesel cycle considers gas as a working fluid. In the Otto
cycle, gas sequentially passes through adiabatic/isentropic compression,
isochoric heat addition, adiabatic/isentropic expansion and isochoric heat
release. For the Diesel cycle, the heat addition stage is isobaric instead of
isochoric. These cycles are typical in the case of internal combustion
engines.
For large-scale CHP plants, the steam turbine-based process is the most common
one, whereas, for small-scale systems, gas turbines and engines are considered.
Figure 2.7 shows the schematic of a typical steam turbine-based CHP facility where
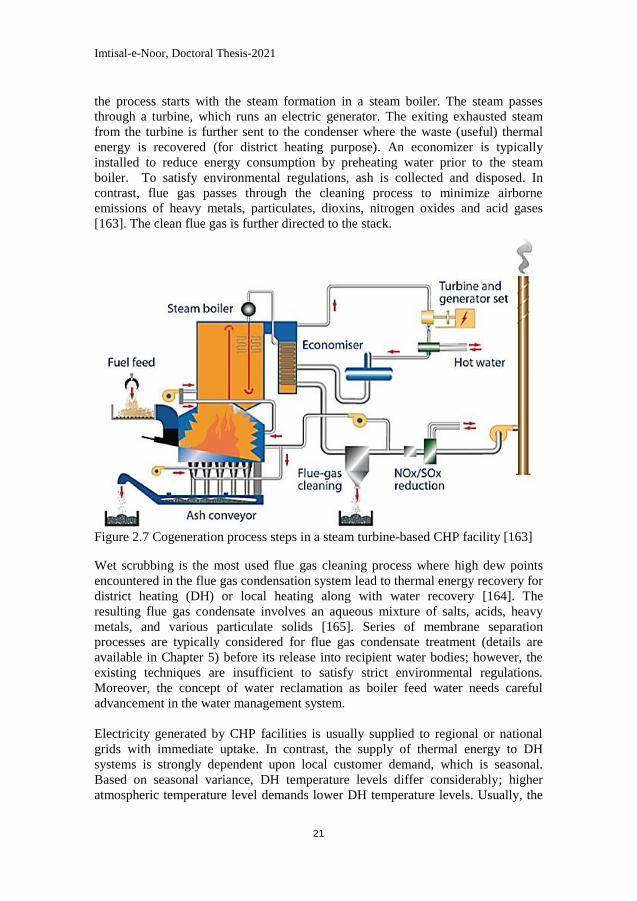
Imtisal-e-Noor, Doctoral Thesis-2021
21
the process starts with the steam formation in a steam boiler. The steam passes
through a turbine, which runs an electric generator. The exiting exhausted steam
from the turbine is further sent to the condenser where the waste (useful) thermal
energy is recovered (for district heating purpose). An economizer is typically
installed to reduce energy consumption by preheating water prior to the steam
boiler. To satisfy environmental regulations, ash is collected and disposed. In
contrast, flue gas passes through the cleaning process to minimize airborne
emissions of heavy metals, particulates, dioxins, nitrogen oxides and acid gases
[163]. The clean flue gas is further directed to the stack.
Figure 2.7 Cogeneration process steps in a steam turbine-based CHP facility [163]
Wet scrubbing is the most used flue gas cleaning process where high dew points
encountered in the flue gas condensation system lead to thermal energy recovery for
district heating (DH) or local heating along with water recovery [164]. The
resulting flue gas condensate involves an aqueous mixture of salts, acids, heavy
metals, and various particulate solids [165]. Series of membrane separation
processes are typically considered for flue gas condensate treatment (details are
available in Chapter 5) before its release into recipient water bodies; however, the
existing techniques are insufficient to satisfy strict environmental regulations.
Moreover, the concept of water reclamation as boiler feed water needs careful
advancement in the water management system.
Electricity generated by CHP facilities is usually supplied to regional or national
grids with immediate uptake. In contrast, the supply of thermal energy to DH
systems is strongly dependent upon local customer demand, which is seasonal.
Based on seasonal variance, DH temperature levels differ considerably; higher
atmospheric temperature level demands lower DH temperature levels. Usually, the
Imtisal-e-Noor, Doctoral Thesis-2021
22
temperatures of DH supply lines differ from 70°C in the summer to 100°C in the
winter, whereas the DH return lines temperatures range from 35 to 65°C
correspondingly [166], [167]. In Sweden, more than half of the net heating demand
of the residential sector was fulfilled by DH systems in 2017 [168]. Moreover, there
are various industries where DH applications are commercial, such as food
processing plants, electronics industries, forestry industries, steel and metal
processing plants, vehicle manufacturing industries, beverage industries, pulp and
paper industries, chemical industries, pharmaceuticals industries, and cogeneration
facilities [169].
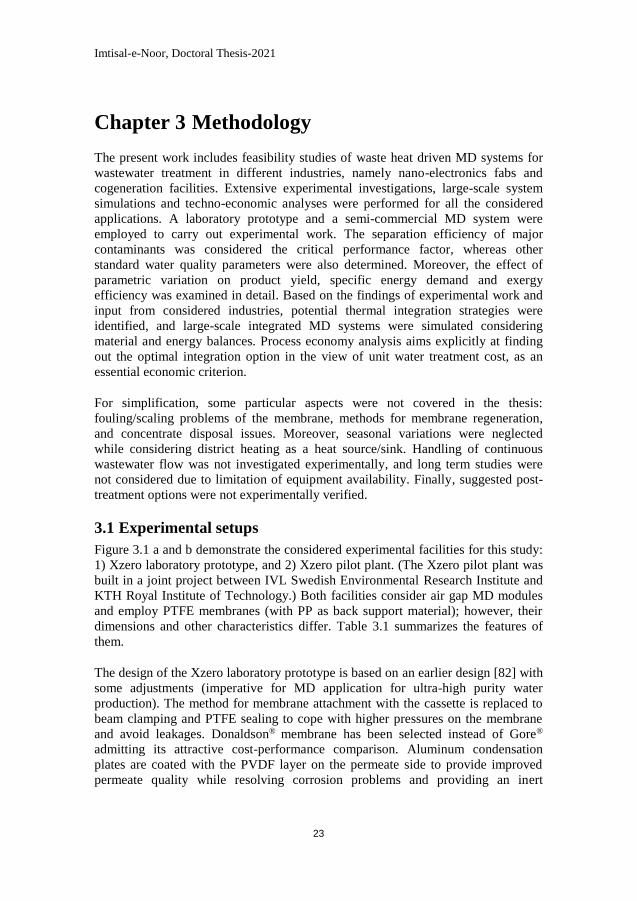
Imtisal-e-Noor, Doctoral Thesis-2021
23
Chapter 3 Methodology
The present work includes feasibility studies of waste heat driven MD systems for
wastewater treatment in different industries, namely nano-electronics fabs and
cogeneration facilities. Extensive experimental investigations, large-scale system
simulations and techno-economic analyses were performed for all the considered
applications. A laboratory prototype and a semi-commercial MD system were
employed to carry out experimental work. The separation efficiency of major
contaminants was considered the critical performance factor, whereas other
standard water quality parameters were also determined. Moreover, the effect of
parametric variation on product yield, specific energy demand and exergy
efficiency was examined in detail. Based on the findings of experimental work and
input from considered industries, potential thermal integration strategies were
identified, and large-scale integrated MD systems were simulated considering
material and energy balances. Process economy analysis aims explicitly at finding
out the optimal integration option in the view of unit water treatment cost, as an
essential economic criterion.
For simplification, some particular aspects were not covered in the thesis:
fouling/scaling problems of the membrane, methods for membrane regeneration,
and concentrate disposal issues. Moreover, seasonal variations were neglected
while considering district heating as a heat source/sink. Handling of continuous
wastewater flow was not investigated experimentally, and long term studies were
not considered due to limitation of equipment availability. Finally, suggested post-
treatment options were not experimentally verified.
3.1 Experimental setups
Figure 3.1 a and b demonstrate the considered experimental facilities for this study:
1) Xzero laboratory prototype, and 2) Xzero pilot plant. (The Xzero pilot plant was
built in a joint project between IVL Swedish Environmental Research Institute and
KTH Royal Institute of Technology.) Both facilities consider air gap MD modules
and employ PTFE membranes (with PP as back support material); however, their
dimensions and other characteristics differ. Table 3.1 summarizes the features of
them.
The design of the Xzero laboratory prototype is based on an earlier design [82] with
some adjustments (imperative for MD application for ultra-high purity water
production). The method for membrane attachment with the cassette is replaced to
beam clamping and PTFE sealing to cope with higher pressures on the membrane
and avoid leakages. Donaldson® membrane has been selected instead of Gore®
admitting its attractive cost-performance comparison. Aluminum condensation
plates are coated with the PVDF layer on the permeate side to provide improved
permeate quality while resolving corrosion problems and providing an inert
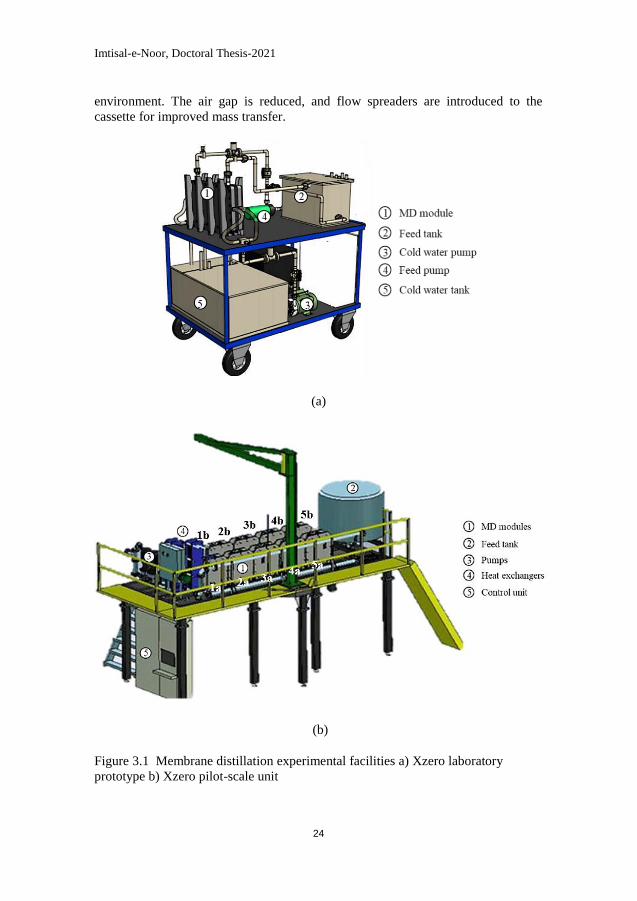
Imtisal-e-Noor, Doctoral Thesis-2021
24
environment. The air gap is reduced, and flow spreaders are introduced to the
cassette for improved mass transfer.
(a)
(b)
Figure 3.1 Membrane distillation experimental facilities a) Xzero laboratory
prototype b) Xzero pilot-scale unit
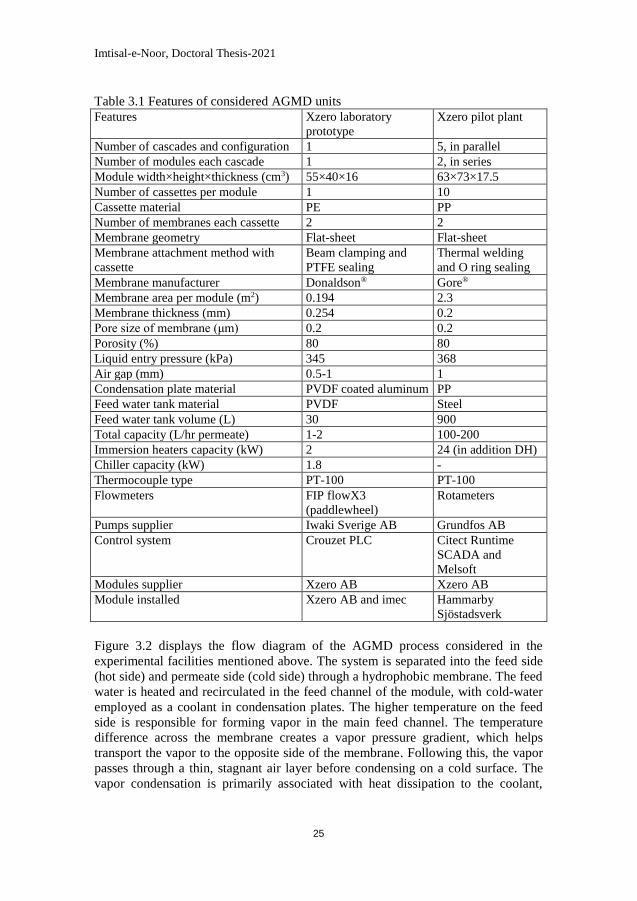
Imtisal-e-Noor, Doctoral Thesis-2021
25
Table 3.1 Features of considered AGMD units
Features Xzero laboratory
prototype
Xzero pilot plant
Number of cascades and configuration 1 5, in parallel
Number of modules each cascade 1 2, in series
Module width×height×thickness (cm3) 55×40×16 63×73×17.5
Number of cassettes per module 1 10
Cassette material PE PP
Number of membranes each cassette 2 2
Membrane geometry Flat-sheet Flat-sheet
Membrane attachment method with
cassette
Beam clamping and
PTFE sealing
Thermal welding
and O ring sealing
Membrane manufacturer Donaldson® Gore®
Membrane area per module (m2) 0.194 2.3
Membrane thickness (mm) 0.254 0.2
Pore size of membrane (μm) 0.2 0.2
Porosity (%) 80 80
Liquid entry pressure (kPa) 345 368
Air gap (mm) 0.5-1 1
Condensation plate material PVDF coated aluminum PP
Feed water tank material PVDF Steel
Feed water tank volume (L) 30 900
Total capacity (L/hr permeate) 1-2 100-200
Immersion heaters capacity (kW) 2 24 (in addition DH)
Chiller capacity (kW) 1.8 -
Thermocouple type PT-100 PT-100
Flowmeters FIP flowX3
(paddlewheel)
Rotameters
Pumps supplier Iwaki Sverige AB Grundfos AB
Control system Crouzet PLC Citect Runtime
SCADA and
Melsoft
Modules supplier Xzero AB Xzero AB
Module installed Xzero AB and imec Hammarby
Sjöstadsverk
Figure 3.2 displays the flow diagram of the AGMD process considered in the
experimental facilities mentioned above. The system is separated into the feed side
(hot side) and permeate side (cold side) through a hydrophobic membrane. The feed
water is heated and recirculated in the feed channel of the module, with cold-water
employed as a coolant in condensation plates. The higher temperature on the feed
side is responsible for forming vapor in the main feed channel. The temperature
difference across the membrane creates a vapor pressure gradient, which helps
transport the vapor to the opposite side of the membrane. Following this, the vapor
passes through a thin, stagnant air layer before condensing on a cold surface. The
vapor condensation is primarily associated with heat dissipation to the coolant,
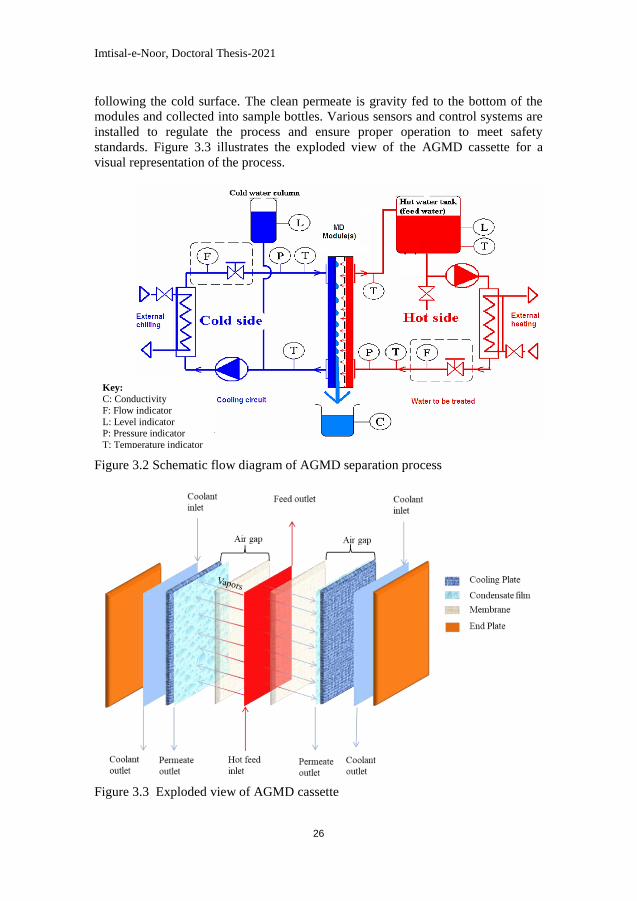
Imtisal-e-Noor, Doctoral Thesis-2021
26
following the cold surface. The clean permeate is gravity fed to the bottom of the
modules and collected into sample bottles. Various sensors and control systems are
installed to regulate the process and ensure proper operation to meet safety
standards. Figure 3.3 illustrates the exploded view of the AGMD cassette for a
visual representation of the process.
Figure 3.2 Schematic flow diagram of AGMD separation process
Figure 3.3 Exploded view of AGMD cassette
Key:
C: Conductivity
F: Flow indicator
L: Level indicator P: Pressure indicator
T: Temperature indicator
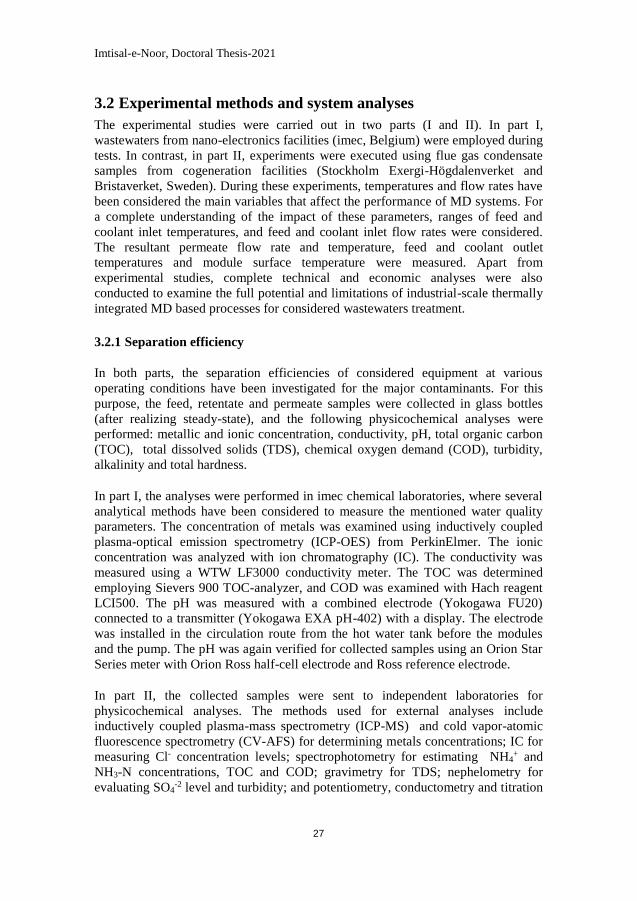
Imtisal-e-Noor, Doctoral Thesis-2021
27
3.2 Experimental methods and system analyses
The experimental studies were carried out in two parts (I and II). In part I,
wastewaters from nano-electronics facilities (imec, Belgium) were employed during
tests. In contrast, in part II, experiments were executed using flue gas condensate
samples from cogeneration facilities (Stockholm Exergi-Högdalenverket and
Bristaverket, Sweden). During these experiments, temperatures and flow rates have
been considered the main variables that affect the performance of MD systems. For
a complete understanding of the impact of these parameters, ranges of feed and
coolant inlet temperatures, and feed and coolant inlet flow rates were considered.
The resultant permeate flow rate and temperature, feed and coolant outlet
temperatures and module surface temperature were measured. Apart from
experimental studies, complete technical and economic analyses were also
conducted to examine the full potential and limitations of industrial-scale thermally
integrated MD based processes for considered wastewaters treatment.
3.2.1 Separation efficiency
In both parts, the separation efficiencies of considered equipment at various
operating conditions have been investigated for the major contaminants. For this
purpose, the feed, retentate and permeate samples were collected in glass bottles
(after realizing steady-state), and the following physicochemical analyses were
performed: metallic and ionic concentration, conductivity, pH, total organic carbon
(TOC), total dissolved solids (TDS), chemical oxygen demand (COD), turbidity,
alkalinity and total hardness.
In part I, the analyses were performed in imec chemical laboratories, where several
analytical methods have been considered to measure the mentioned water quality
parameters. The concentration of metals was examined using inductively coupled
plasma-optical emission spectrometry (ICP-OES) from PerkinElmer. The ionic
concentration was analyzed with ion chromatography (IC). The conductivity was
measured using a WTW LF3000 conductivity meter. The TOC was determined
employing Sievers 900 TOC-analyzer, and COD was examined with Hach reagent
LCI500. The pH was measured with a combined electrode (Yokogawa FU20)
connected to a transmitter (Yokogawa EXA pH-402) with a display. The electrode
was installed in the circulation route from the hot water tank before the modules
and the pump. The pH was again verified for collected samples using an Orion Star
Series meter with Orion Ross half-cell electrode and Ross reference electrode.
In part II, the collected samples were sent to independent laboratories for
physicochemical analyses. The methods used for external analyses include
inductively coupled plasma-mass spectrometry (ICP-MS) and cold vapor-atomic
fluorescence spectrometry (CV-AFS) for determining metals concentrations; IC for
measuring Cl- concentration levels; spectrophotometry for estimating NH4+ and
NH3-N concentrations, TOC and COD; gravimetry for TDS; nephelometry for
evaluating SO4-2 level and turbidity; and potentiometry, conductometry and titration
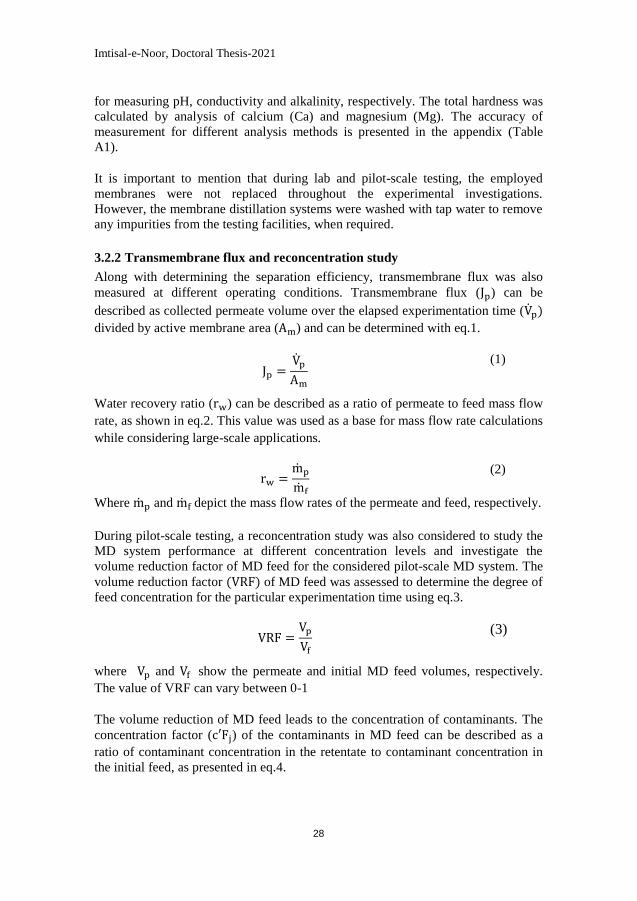
Imtisal-e-Noor, Doctoral Thesis-2021
28
for measuring pH, conductivity and alkalinity, respectively. The total hardness was
calculated by analysis of calcium (Ca) and magnesium (Mg). The accuracy of
measurement for different analysis methods is presented in the appendix (Table
A1).
It is important to mention that during lab and pilot-scale testing, the employed
membranes were not replaced throughout the experimental investigations.
However, the membrane distillation systems were washed with tap water to remove
any impurities from the testing facilities, when required.
3.2.2 Transmembrane flux and reconcentration study
Along with determining the separation efficiency, transmembrane flux was also
measured at different operating conditions. Transmembrane flux (Jp) can be
described as collected permeate volume over the elapsed experimentation time (Vp)
divided by active membrane area (Am) and can be determined with eq.1.
Jp =Vp
Am
(1)
Water recovery ratio (rw) can be described as a ratio of permeate to feed mass flow
rate, as shown in eq.2. This value was used as a base for mass flow rate calculations
while considering large-scale applications.
rw =mp
mf
(2)
Where mp and mf depict the mass flow rates of the permeate and feed, respectively.
During pilot-scale testing, a reconcentration study was also considered to study the
MD system performance at different concentration levels and investigate the
volume reduction factor of MD feed for the considered pilot-scale MD system. The
volume reduction factor (VRF) of MD feed was assessed to determine the degree of
feed concentration for the particular experimentation time using eq.3.
VRF =Vp
Vf
(3)
where Vp and Vf show the permeate and initial MD feed volumes, respectively.
The value of VRF can vary between 0-1
The volume reduction of MD feed leads to the concentration of contaminants. The
concentration factor (c′Fj) of the contaminants in MD feed can be described as a
ratio of contaminant concentration in the retentate to contaminant concentration in
the initial feed, as presented in eq.4.
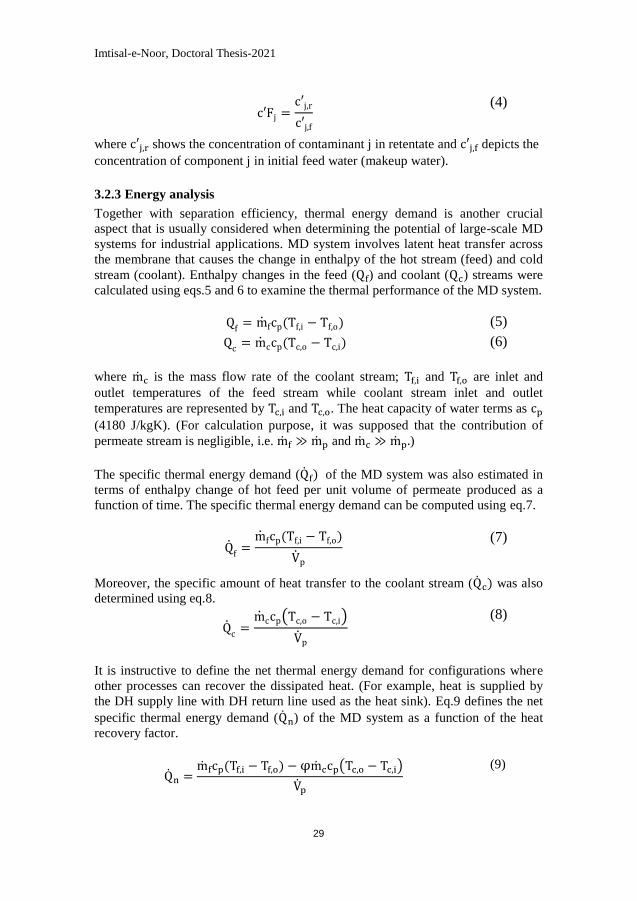
Imtisal-e-Noor, Doctoral Thesis-2021
29
c′Fj =c′j,r
c′j,f
(4)
where c′j,r shows the concentration of contaminant j in retentate and c′j,f depicts the
concentration of component j in initial feed water (makeup water).
3.2.3 Energy analysis
Together with separation efficiency, thermal energy demand is another crucial
aspect that is usually considered when determining the potential of large-scale MD
systems for industrial applications. MD system involves latent heat transfer across
the membrane that causes the change in enthalpy of the hot stream (feed) and cold
stream (coolant). Enthalpy changes in the feed (Qf) and coolant (Qc) streams were
calculated using eqs.5 and 6 to examine the thermal performance of the MD system.
Qf = mfcp(Tf,i − Tf,o) (5)
Qc = mccp(Tc,o − Tc,i) (6)
where mc is the mass flow rate of the coolant stream; Tf,i and Tf,o are inlet and
outlet temperatures of the feed stream while coolant stream inlet and outlet
temperatures are represented by Tc,i and Tc,o. The heat capacity of water terms as cp
(4180 J/kgK). (For calculation purpose, it was supposed that the contribution of
permeate stream is negligible, i.e. mf ≫ mp and mc ≫ mp.)
The specific thermal energy demand (Qf) of the MD system was also estimated in
terms of enthalpy change of hot feed per unit volume of permeate produced as a
function of time. The specific thermal energy demand can be computed using eq.7.
Qf =mfcp(Tf,i − Tf,o)
Vp
(7)
Moreover, the specific amount of heat transfer to the coolant stream (Qc) was also
determined using eq.8.
Qc =mccp(Tc,o − Tc,i)
Vp
(8)
It is instructive to define the net thermal energy demand for configurations where
other processes can recover the dissipated heat. (For example, heat is supplied by
the DH supply line with DH return line used as the heat sink). Eq.9 defines the net
specific thermal energy demand (Qn) of the MD system as a function of the heat
recovery factor.
Qn =mfcp(Tf,i − Tf,o) − φmccp(Tc,o − Tc,i)
Vp
(9)
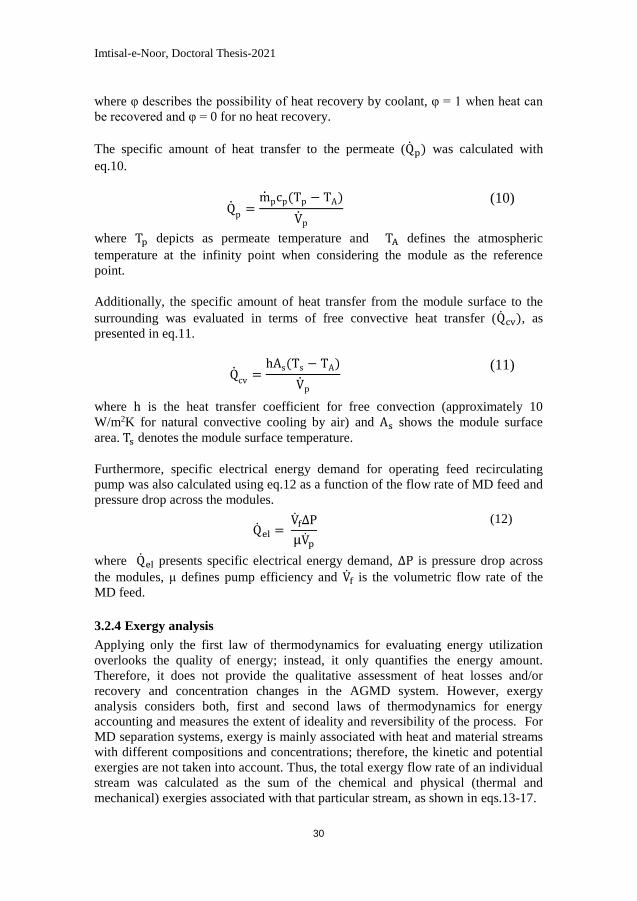
Imtisal-e-Noor, Doctoral Thesis-2021
30
where φ describes the possibility of heat recovery by coolant, φ = 1 when heat can
be recovered and φ = 0 for no heat recovery.
The specific amount of heat transfer to the permeate (Qp) was calculated with
eq.10.
Qp
=mpcp(Tp − TA)
Vp
(10)
where Tp depicts as permeate temperature and TA defines the atmospheric
temperature at the infinity point when considering the module as the reference
point.
Additionally, the specific amount of heat transfer from the module surface to the
surrounding was evaluated in terms of free convective heat transfer (Qcv), as
presented in eq.11.
Qcv =hAs(Ts − TA)
Vp
(11)
where h is the heat transfer coefficient for free convection (approximately 10
W/m2K for natural convective cooling by air) and As shows the module surface
area. Ts denotes the module surface temperature.
Furthermore, specific electrical energy demand for operating feed recirculating
pump was also calculated using eq.12 as a function of the flow rate of MD feed and
pressure drop across the modules.
Qel = Vf∆P
μVp
(12)
where Qel presents specific electrical energy demand, ∆P is pressure drop across
the modules, μ defines pump efficiency and Vf is the volumetric flow rate of the
MD feed.
3.2.4 Exergy analysis
Applying only the first law of thermodynamics for evaluating energy utilization
overlooks the quality of energy; instead, it only quantifies the energy amount.
Therefore, it does not provide the qualitative assessment of heat losses and/or
recovery and concentration changes in the AGMD system. However, exergy
analysis considers both, first and second laws of thermodynamics for energy
accounting and measures the extent of ideality and reversibility of the process. For
MD separation systems, exergy is mainly associated with heat and material streams
with different compositions and concentrations; therefore, the kinetic and potential
exergies are not taken into account. Thus, the total exergy flow rate of an individual
stream was calculated as the sum of the chemical and physical (thermal and
mechanical) exergies associated with that particular stream, as shown in eqs.13-17.
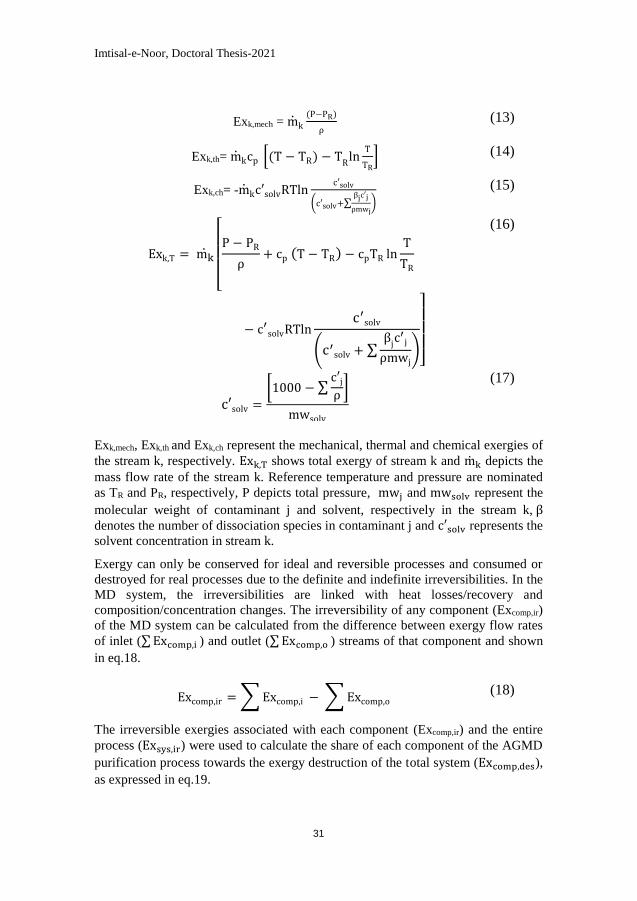
Imtisal-e-Noor, Doctoral Thesis-2021
31
Exk,mech = mk
(P−PR)
ρ (13)
Exk,th= mkcp [(T − TR) − TRln
T
TR] (14)
Exk,ch= -mkc′solvRTlnc′solv
(c′solv+∑βjc′j
ρmwj) (15)
Exk,T = mk
[ P − PR
ρ+ cp (T − TR) − cpTR ln
T
TR
− c′solvRTln
c′solv
(c′solv + ∑
βjc′
j
ρmwj)]
(16)
c′solv =
[1000 − ∑c′jρ]
mwsolv
(17)
Exk,mech, Exk,th and Exk,ch represent the mechanical, thermal and chemical exergies of
the stream k, respectively. Exk,T shows total exergy of stream k and mk depicts the
mass flow rate of the stream k. Reference temperature and pressure are nominated
as TR and PR, respectively, P depicts total pressure, mwj and mwsolv represent the
molecular weight of contaminant j and solvent, respectively in the stream k, β
denotes the number of dissociation species in contaminant j and c′solv represents the
solvent concentration in stream k.
Exergy can only be conserved for ideal and reversible processes and consumed or
destroyed for real processes due to the definite and indefinite irreversibilities. In the
MD system, the irreversibilities are linked with heat losses/recovery and
composition/concentration changes. The irreversibility of any component (Excomp,ir)
of the MD system can be calculated from the difference between exergy flow rates
of inlet (∑Excomp,i ) and outlet (∑Excomp,o ) streams of that component and shown
in eq.18.
Excomp,ir = ∑ Excomp,i − ∑ Excomp,o (18)
The irreversible exergies associated with each component (Excomp,ir) and the entire
process (Exsys,ir) were used to calculate the share of each component of the AGMD
purification process towards the exergy destruction of the total system (Excomp,des),
as expressed in eq.19.
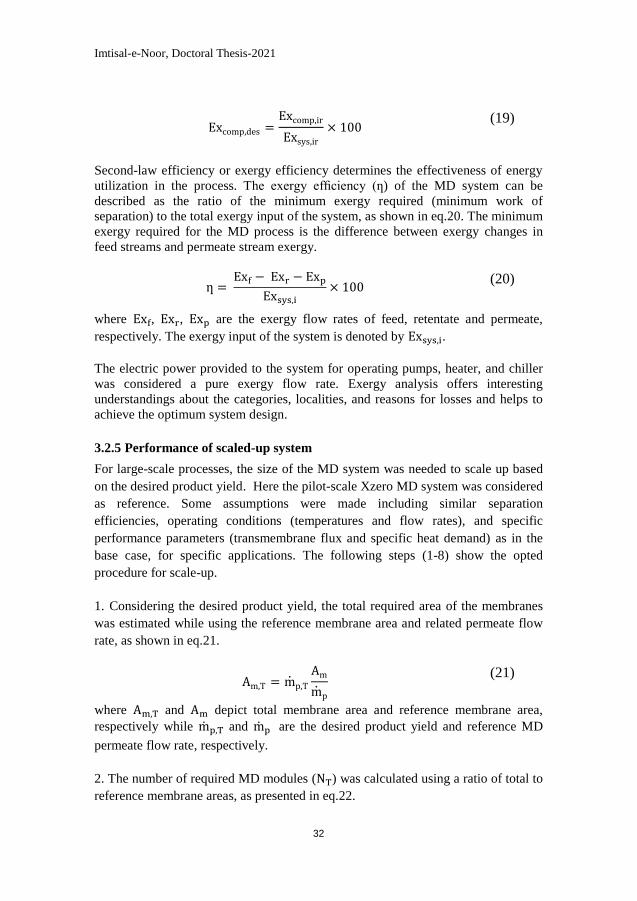
Imtisal-e-Noor, Doctoral Thesis-2021
32
Excomp,des =Excomp,ir
Exsys,ir
× 100 (19)
Second-law efficiency or exergy efficiency determines the effectiveness of energy
utilization in the process. The exergy efficiency (ƞ) of the MD system can be
described as the ratio of the minimum exergy required (minimum work of
separation) to the total exergy input of the system, as shown in eq.20. The minimum
exergy required for the MD process is the difference between exergy changes in
feed streams and permeate stream exergy.
ƞ = Exf − Exr − Exp
Exsys,i
× 100 (20)
where Exf, Exr, Exp are the exergy flow rates of feed, retentate and permeate,
respectively. The exergy input of the system is denoted by Exsys,i.
The electric power provided to the system for operating pumps, heater, and chiller
was considered a pure exergy flow rate. Exergy analysis offers interesting
understandings about the categories, localities, and reasons for losses and helps to
achieve the optimum system design.
3.2.5 Performance of scaled-up system
For large-scale processes, the size of the MD system was needed to scale up based
on the desired product yield. Here the pilot-scale Xzero MD system was considered
as reference. Some assumptions were made including similar separation
efficiencies, operating conditions (temperatures and flow rates), and specific
performance parameters (transmembrane flux and specific heat demand) as in the
base case, for specific applications. The following steps (1-8) show the opted
procedure for scale-up.
1. Considering the desired product yield, the total required area of the membranes
was estimated while using the reference membrane area and related permeate flow
rate, as shown in eq.21.
Am,T = mp,T
Am
mp
(21)
where Am,T and Am depict total membrane area and reference membrane area,
respectively while mp,T and mp are the desired product yield and reference MD
permeate flow rate, respectively.
2. The number of required MD modules (NT) was calculated using a ratio of total to
reference membrane areas, as presented in eq.22.
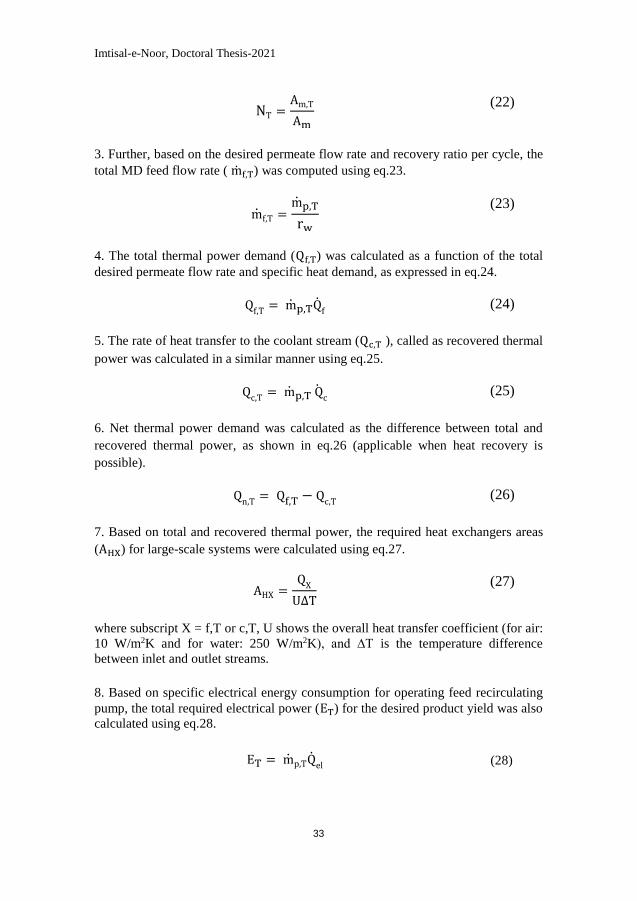
Imtisal-e-Noor, Doctoral Thesis-2021
33
NT =Am,T
Am
(22)
3. Further, based on the desired permeate flow rate and recovery ratio per cycle, the
total MD feed flow rate ( mf,T) was computed using eq.23.
mf,T =mp,T
rw
(23)
4. The total thermal power demand (Qf,T) was calculated as a function of the total
desired permeate flow rate and specific heat demand, as expressed in eq.24.
Qf,T
= mp,TQf (24)
5. The rate of heat transfer to the coolant stream (Qc,T ), called as recovered thermal
power was calculated in a similar manner using eq.25.
Qc,T = mp,T Qc (25)
6. Net thermal power demand was calculated as the difference between total and
recovered thermal power, as shown in eq.26 (applicable when heat recovery is
possible).
Qn,T = Qf,T − Qc,T (26)
7. Based on total and recovered thermal power, the required heat exchangers areas
(AHX) for large-scale systems were calculated using eq.27.
AHX =QX
U∆T
(27)
where subscript X = f,T or c,T, U shows the overall heat transfer coefficient (for air:
10 W/m2K and for water: 250 W/m2K), and ∆T is the temperature difference
between inlet and outlet streams.
8. Based on specific electrical energy consumption for operating feed recirculating
pump, the total required electrical power (ET) for the desired product yield was also
calculated using eq.28.
ET = mp,TQel (28)
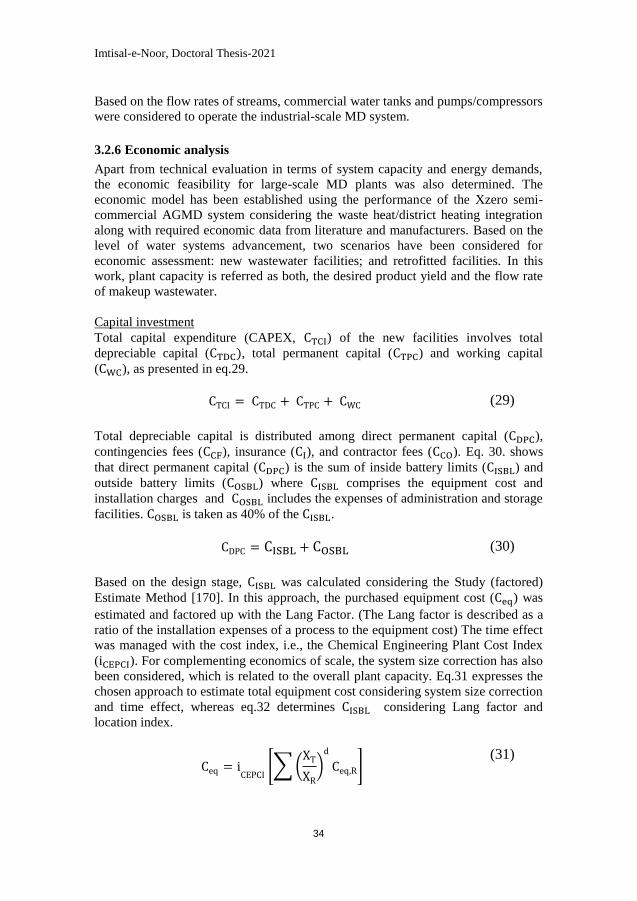
Imtisal-e-Noor, Doctoral Thesis-2021
34
Based on the flow rates of streams, commercial water tanks and pumps/compressors
were considered to operate the industrial-scale MD system.
3.2.6 Economic analysis
Apart from technical evaluation in terms of system capacity and energy demands,
the economic feasibility for large-scale MD plants was also determined. The
economic model has been established using the performance of the Xzero semi-
commercial AGMD system considering the waste heat/district heating integration
along with required economic data from literature and manufacturers. Based on the
level of water systems advancement, two scenarios have been considered for
economic assessment: new wastewater facilities; and retrofitted facilities. In this
work, plant capacity is referred as both, the desired product yield and the flow rate
of makeup wastewater.
Capital investment
Total capital expenditure (CAPEX, CTCI) of the new facilities involves total
depreciable capital (CTDC), total permanent capital (CTPC) and working capital
(CWC), as presented in eq.29.
CTCI = CTDC + CTPC + CWC (29)
Total depreciable capital is distributed among direct permanent capital (CDPC),
contingencies fees (CCF), insurance (CI), and contractor fees (CCO). Eq. 30. shows
that direct permanent capital (CDPC) is the sum of inside battery limits (CISBL) and
outside battery limits (COSBL) where CISBL comprises the equipment cost and
installation charges and COSBL includes the expenses of administration and storage
facilities. COSBL is taken as 40% of the CISBL.
CDPC = CISBL + COSBL (30)
Based on the design stage, CISBL was calculated considering the Study (factored)
Estimate Method [170]. In this approach, the purchased equipment cost (Ceq) was
estimated and factored up with the Lang Factor. (The Lang factor is described as a
ratio of the installation expenses of a process to the equipment cost) The time effect
was managed with the cost index, i.e., the Chemical Engineering Plant Cost Index
(iCEPCI). For complementing economics of scale, the system size correction has also
been considered, which is related to the overall plant capacity. Eq.31 expresses the
chosen approach to estimate total equipment cost considering system size correction
and time effect, whereas eq.32 determines CISBL considering Lang factor and
location index.
Ceq = iCEPCI
[∑(XT
XR
)d
Ceq,R] (31)
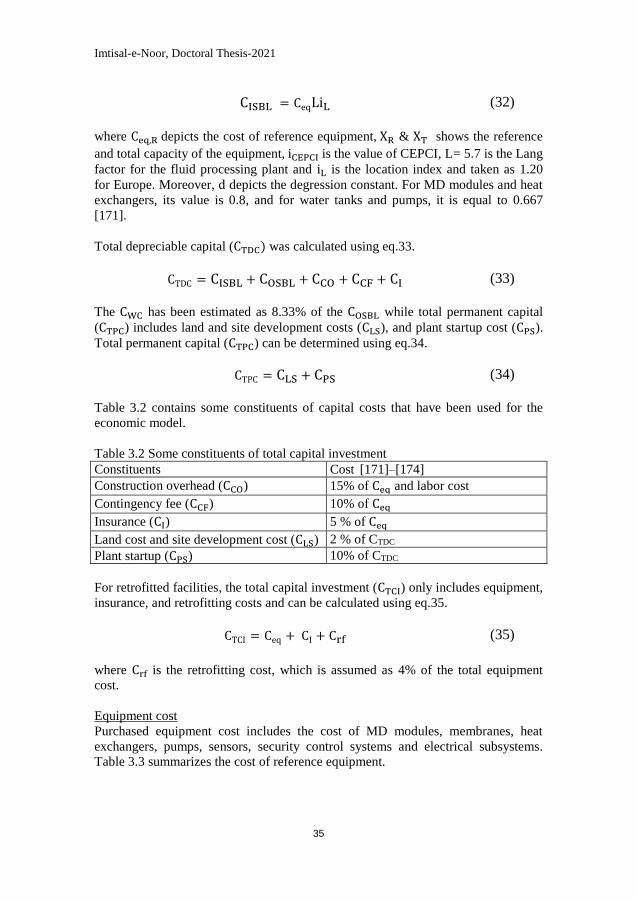
Imtisal-e-Noor, Doctoral Thesis-2021
35
CISBL = CeqLiL (32)
where Ceq,R depicts the cost of reference equipment, XR & XT shows the reference
and total capacity of the equipment, iCEPCI is the value of CEPCI, L= 5.7 is the Lang
factor for the fluid processing plant and iL is the location index and taken as 1.20
for Europe. Moreover, d depicts the degression constant. For MD modules and heat
exchangers, its value is 0.8, and for water tanks and pumps, it is equal to 0.667
[171].
Total depreciable capital (CTDC) was calculated using eq.33.
CTDC = CISBL + COSBL + CCO + CCF + CI
(33)
The CWC has been estimated as 8.33% of the COSBL while total permanent capital
(CTPC) includes land and site development costs (CLS), and plant startup cost (CPS).
Total permanent capital (CTPC) can be determined using eq.34.
CTPC = CLS + CPS
(34)
Table 3.2 contains some constituents of capital costs that have been used for the
economic model.
Table 3.2 Some constituents of total capital investment
Constituents Cost [171]–[174]
Construction overhead (CCO) 15% of Ceq and labor cost
Contingency fee (CCF) 10% of Ceq
Insurance (CI) 5 % of Ceq
Land cost and site development cost (CLS) 2 % of CTDC
Plant startup (CPS) 10% of CTDC
For retrofitted facilities, the total capital investment (CTCI) only includes equipment,
insurance, and retrofitting costs and can be calculated using eq.35.
CTCI = Ceq + CI + Crf
(35)
where Crf is the retrofitting cost, which is assumed as 4% of the total equipment
cost.
Equipment cost
Purchased equipment cost includes the cost of MD modules, membranes, heat
exchangers, pumps, sensors, security control systems and electrical subsystems.
Table 3.3 summarizes the cost of reference equipment.
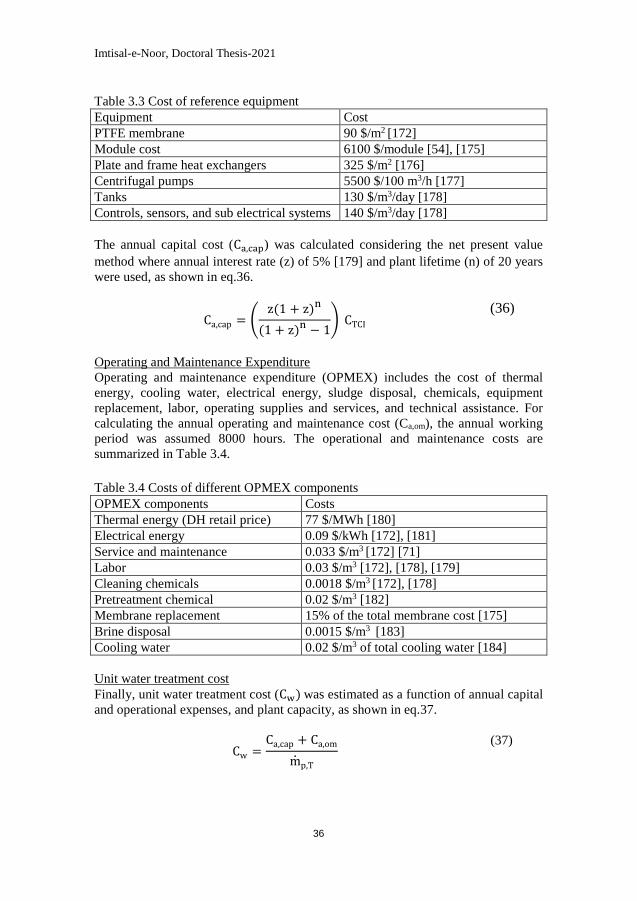
Imtisal-e-Noor, Doctoral Thesis-2021
36
Table 3.3 Cost of reference equipment
Equipment Cost
PTFE membrane 90 $/m2 [172]
Module cost 6100 $/module [54], [175]
Plate and frame heat exchangers 325 $/m2 [176]
Centrifugal pumps 5500 $/100 m3/h [177]
Tanks 130 $/m3/day [178]
Controls, sensors, and sub electrical systems 140 $/m3/day [178]
The annual capital cost (Ca,cap) was calculated considering the net present value
method where annual interest rate (z) of 5% [179] and plant lifetime (n) of 20 years
were used, as shown in eq.36.
Ca,cap = (z(1 + z)n
(1 + z)n − 1) CTCI
(36)
Operating and Maintenance Expenditure
Operating and maintenance expenditure (OPMEX) includes the cost of thermal
energy, cooling water, electrical energy, sludge disposal, chemicals, equipment
replacement, labor, operating supplies and services, and technical assistance. For
calculating the annual operating and maintenance cost (Ca,om), the annual working
period was assumed 8000 hours. The operational and maintenance costs are
summarized in Table 3.4.
Table 3.4 Costs of different OPMEX components
OPMEX components Costs
Thermal energy (DH retail price) 77 $/MWh [180]
Electrical energy 0.09 $/kWh [172], [181]
Service and maintenance 0.033 $/m3 [172] [71]
Labor 0.03 $/m3 [172], [178], [179]
Cleaning chemicals 0.0018 $/m3 [172], [178]
Pretreatment chemical 0.02 $/m3 [182]
Membrane replacement 15% of the total membrane cost [175]
Brine disposal 0.0015 $/m3 [183]
Cooling water 0.02 $/m3 of total cooling water [184]
Unit water treatment cost
Finally, unit water treatment cost (Cw) was estimated as a function of annual capital
and operational expenses, and plant capacity, as shown in eq.37.
Cw =Ca,cap + Ca,om
mp,T
(37)
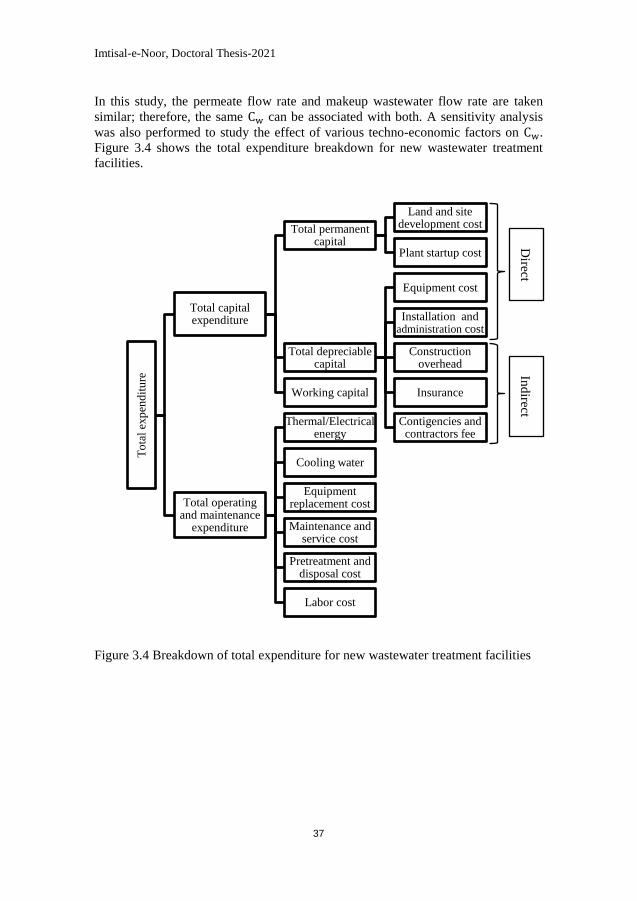
Imtisal-e-Noor, Doctoral Thesis-2021
37
In this study, the permeate flow rate and makeup wastewater flow rate are taken
similar; therefore, the same Cw can be associated with both. A sensitivity analysis
was also performed to study the effect of various techno-economic factors on Cw.
Figure 3.4 shows the total expenditure breakdown for new wastewater treatment
facilities.
Figure 3.4 Breakdown of total expenditure for new wastewater treatment facilities
To
tal
exp
end
itu
re
Total capital expenditure
Total permanent capital
Land and site development cost
Plant startup cost
Total depreciable capital
Equipment cost
Installation and administration cost
Construction overhead
Insurance
Contigencies and contractors fee
Working capital
Total operating and maintenance
expenditure
Thermal/Electrical energy
Cooling water
Equipment replacement cost
Maintenance and service cost
Pretreatment and disposal cost
Labor cost
Direct
capital co
st
Ind
irect
capital co
st

Imtisal-e-Noor, Doctoral Thesis-2021
38
Imtisal-e-Noor, Doctoral Thesis-2021
39
Chapter 4 Performance assessment of membrane
distillation for wastewater treatment in nano-
electronics facilities (Appended articles I, II
and III)
In nano-electronics industries, photolithography and chemical mechanical
planarization (CMP) are two of the key processes which release significant volumes
of complex wastewaters [145], [150]. Based on the nature of the processes, the
physicochemical properties of these wastewaters differ. For example,
photolithographic wastewater mainly consists of tetramethylammonium hydroxide
(TMAH) along with spent etching and stripping chemicals. TMAH, in its pure
form, is a non-volatile, highly water-soluble strong alkali (pH ~12) with a thermal
decomposition temperature of >65○C [185]. In contrast, the CMP wastewater
generally involves nano-sized silica (SiO2), alumina (Al2O3) and ceria (CeO2)
particles, and copper (Cu) with a combination of several chemical additives
[151]. The CMP wastewater contains approximately 3-12 % solids by weight, and
pH levels range from 6.8-10 [150], [186]–[188]. These wastewaters are highly
alkaline and exhibit high corrosivity and acute toxicity. Moreover, they are
considered as a source for eutrophication in recipient water bodies. Given this, the
current challenge for the nano-electronics industries is to treat these wastewaters
properly, according to the stringent environmental regulations. For this purpose,
many technologies are explored.
For TMAH wastewater treatment, the list includes electrodialysis, catalytic
oxidation, ion exchange, membrane bioreactor, reverse osmosis and biological
treatment. Wang et al. [189] presented a combined process of electrodialysis,
activated carbon and ceramic filtration for TMAH recovery. The outcomes show
that TMAH can be concentrated up to 8%. Huang et al. [190] developed an
oxidative degradation system while employing ultraviolet light-activated persulfate.
The researchers were able to reduce the TMAH concentration up to 20 ppm.
Citraningrum et al. [191] employed weak and strong acid cation resins for TMAH
wastewater treatment and showed reasonable performance. Chen et al. [192]
presented a combination of membrane bioreactor and reverse osmosis methods, and
the outcomes showed that the high-quality water was recovered, with conductivity
~150 µS/cm and TOC ~2.5 ppm. You et al. [193] used membrane photoreactor,
anoxic membrane bioreactor, and a combination of both for TMAH removal. The
results show that the separation efficiency of TMAH was around 80%. Chen et al.
[194] established autotrophic nitrogen removal over nitrite process in an anoxic up-
flow bioreactor. The outcomes present that 90% of the total nitrogen was removed.
Innocenzi et al. [145] reported the aerobic biodegradation process as a successful
option for TMAH wastewater treatment in electronics industries. In this work, 99%
of biodegradation was achieved. In a related study, Ferella et al. [195] presented the
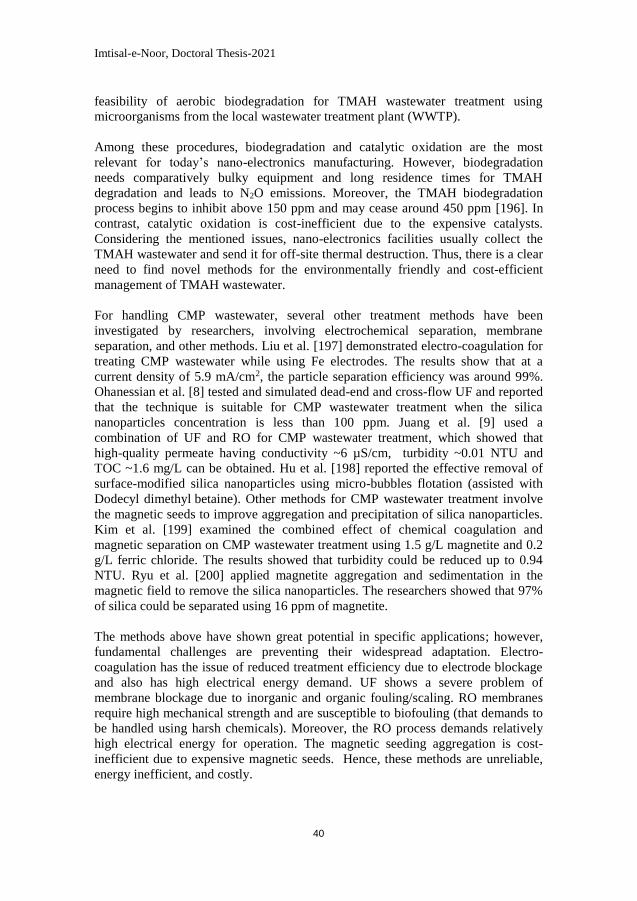
Imtisal-e-Noor, Doctoral Thesis-2021
40
feasibility of aerobic biodegradation for TMAH wastewater treatment using
microorganisms from the local wastewater treatment plant (WWTP).
Among these procedures, biodegradation and catalytic oxidation are the most relevant for today’s nano-electronics manufacturing. However, biodegradation
needs comparatively bulky equipment and long residence times for TMAH
degradation and leads to N2O emissions. Moreover, the TMAH biodegradation
process begins to inhibit above 150 ppm and may cease around 450 ppm [196]. In
contrast, catalytic oxidation is cost-inefficient due to the expensive catalysts.
Considering the mentioned issues, nano-electronics facilities usually collect the
TMAH wastewater and send it for off-site thermal destruction. Thus, there is a clear
need to find novel methods for the environmentally friendly and cost-efficient
management of TMAH wastewater.
For handling CMP wastewater, several other treatment methods have been
investigated by researchers, involving electrochemical separation, membrane
separation, and other methods. Liu et al. [197] demonstrated electro-coagulation for
treating CMP wastewater while using Fe electrodes. The results show that at a
current density of 5.9 mA/cm2, the particle separation efficiency was around 99%.
Ohanessian et al. [8] tested and simulated dead-end and cross-flow UF and reported
that the technique is suitable for CMP wastewater treatment when the silica
nanoparticles concentration is less than 100 ppm. Juang et al. [9] used a
combination of UF and RO for CMP wastewater treatment, which showed that
high-quality permeate having conductivity ~6 µS/cm, turbidity ~0.01 NTU and
TOC ~1.6 mg/L can be obtained. Hu et al. [198] reported the effective removal of
surface-modified silica nanoparticles using micro-bubbles flotation (assisted with
Dodecyl dimethyl betaine). Other methods for CMP wastewater treatment involve
the magnetic seeds to improve aggregation and precipitation of silica nanoparticles.
Kim et al. [199] examined the combined effect of chemical coagulation and
magnetic separation on CMP wastewater treatment using 1.5 g/L magnetite and 0.2
g/L ferric chloride. The results showed that turbidity could be reduced up to 0.94
NTU. Ryu et al. [200] applied magnetite aggregation and sedimentation in the
magnetic field to remove the silica nanoparticles. The researchers showed that 97%
of silica could be separated using 16 ppm of magnetite.
The methods above have shown great potential in specific applications; however,
fundamental challenges are preventing their widespread adaptation. Electro-
coagulation has the issue of reduced treatment efficiency due to electrode blockage
and also has high electrical energy demand. UF shows a severe problem of
membrane blockage due to inorganic and organic fouling/scaling. RO membranes
require high mechanical strength and are susceptible to biofouling (that demands to
be handled using harsh chemicals). Moreover, the RO process demands relatively
high electrical energy for operation. The magnetic seeding aggregation is cost-
inefficient due to expensive magnetic seeds. Hence, these methods are unreliable,
energy inefficient, and costly.
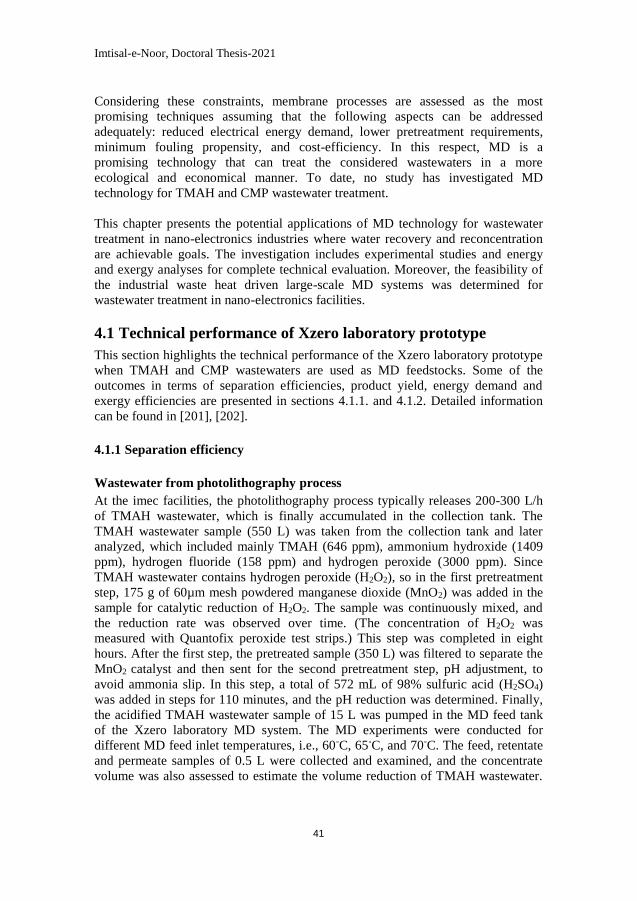
Imtisal-e-Noor, Doctoral Thesis-2021
41
Considering these constraints, membrane processes are assessed as the most
promising techniques assuming that the following aspects can be addressed
adequately: reduced electrical energy demand, lower pretreatment requirements,
minimum fouling propensity, and cost-efficiency. In this respect, MD is a
promising technology that can treat the considered wastewaters in a more
ecological and economical manner. To date, no study has investigated MD
technology for TMAH and CMP wastewater treatment.
This chapter presents the potential applications of MD technology for wastewater
treatment in nano-electronics industries where water recovery and reconcentration
are achievable goals. The investigation includes experimental studies and energy
and exergy analyses for complete technical evaluation. Moreover, the feasibility of
the industrial waste heat driven large-scale MD systems was determined for
wastewater treatment in nano-electronics facilities.
4.1 Technical performance of Xzero laboratory prototype
This section highlights the technical performance of the Xzero laboratory prototype
when TMAH and CMP wastewaters are used as MD feedstocks. Some of the
outcomes in terms of separation efficiencies, product yield, energy demand and
exergy efficiencies are presented in sections 4.1.1. and 4.1.2. Detailed information
can be found in [201], [202].
4.1.1 Separation efficiency
Wastewater from photolithography process
At the imec facilities, the photolithography process typically releases 200-300 L/h
of TMAH wastewater, which is finally accumulated in the collection tank. The
TMAH wastewater sample (550 L) was taken from the collection tank and later
analyzed, which included mainly TMAH (646 ppm), ammonium hydroxide (1409
ppm), hydrogen fluoride (158 ppm) and hydrogen peroxide (3000 ppm). Since
TMAH wastewater contains hydrogen peroxide (H2O2), so in the first pretreatment
step, 175 g of 60µm mesh powdered manganese dioxide (MnO2) was added in the
sample for catalytic reduction of H2O2. The sample was continuously mixed, and
the reduction rate was observed over time. (The concentration of H2O2 was
measured with Quantofix peroxide test strips.) This step was completed in eight
hours. After the first step, the pretreated sample (350 L) was filtered to separate the
MnO2 catalyst and then sent for the second pretreatment step, pH adjustment, to
avoid ammonia slip. In this step, a total of 572 mL of 98% sulfuric acid (H2SO4)
was added in steps for 110 minutes, and the pH reduction was determined. Finally,
the acidified TMAH wastewater sample of 15 L was pumped in the MD feed tank
of the Xzero laboratory MD system. The MD experiments were conducted for
different MD feed inlet temperatures, i.e., 60◦C, 65◦C, and 70◦C. The feed, retentate
and permeate samples of 0.5 L were collected and examined, and the concentrate
volume was also assessed to estimate the volume reduction of TMAH wastewater.
Imtisal-e-Noor, Doctoral Thesis-2021
42
Figure 4.1 shows the schematic diagram of the employed TMAH wastewater
treatment system.
Figure 4.1 Schematic diagram of proposed TMAH wastewater treatment system
Figure 4.2 presents the effect of the addition of manganese dioxide on hydrogen
peroxide reduction over time. It was found that more than 95% of H2O2 was
catalytically reduced during the operation and converted into the H2O and O2 gas.
(Foaming at the surface of TMAH wastewater and downward displacement of the
wastewater was noticed). It was also seen that the trend exhibits an exponential
decrease of H2O2 concentration level after each MnO2 intake, which gradually
stabilized over time. Eqs. 1 and 2 show the observed reduction reactions:
MnO2 + 2H2O2 → MnO2 + O2 + 2H2O (1)
2H2O2 → O2 + 2H2O (2)
Figure 4.2 Effect of Catalytic reduction on hydrogen peroxide concentration as a
function of time
The collected TMAH wastewater sample also includes NH4OH and HF, whose
equilibriums are considerably affected by changing pH and temperature levels. At
higher pH levels, NH4OH equilibrium is directed towards NH3 gas, which is very
likely to pass through the membrane at elevated feed temperatures. In order to avoid
the NH3 slip, acid neutralization is performed as pretreatment. Consequently, the pH
value of the TMAH wastewater sample was reduced to 2.94 linked to the pKa value
(3.18) of HF, while considering the Henderson-Hasselbach relation. With pH
reduction, the desired NH4OH equilibrium was achieved, where the NH3 (volatile)
was converted to NH4+ ions (nonvolatile). Eq. 3 shows the reversible equilibrium
reaction of NH4OH [203].
Imtisal-e-Noor, Doctoral Thesis-2021
43
NH3 + H2O ⇄ NH4+ + OH−
(3)
In parallel, the chemical equilibrium of HF (mentioned in eq. 4) has been directed
from F- ions (nonvolatile) to HF gas (volatile) that may release from the TMAH
wastewater sample at elevated temperature.
H+ + F− ⇄ HF (4)
Table 4.1 presents the results of physicochemical analyses of the TMAH
wastewater sample, pretreated wastewater samples at room temperature and after
heating at 60 °C, and permeate samples at different feed temperatures. It was
noticed that after acid neutralization, the concentration of sulfate (SO4-2) ions was
increased significantly in the pretreated TMAH wastewater due to the addition of
H2SO4. Moreover, the nitrite (NO2-) ions were created and appeared in the
wastewater owing to the oxidation of NH4OH while the TMAH wastewater was
stored in the collection tank. In contrast to the pretreated sample, the hot feed
(preheated TMAH wastewater after pretreatment) sample showed a higher
concentration of TMAH. The reason might be a higher water evaporation rate at
elevated temperatures. However, at higher temperatures, the marginal degassing of
HF gas was also observed.
Considering MD treated permeates, the concentration of NH4OH and TMAH was
reduced to an acceptable level. Moreover, the levels of analyzed metals, NO2- and
Na+ ions, and H2O2 were below the detection limits. However, the concentration of
F- ions in the permeate samples was considerably high, i.e., 125-147 ppm. The
reason was the presence of highly volatile HF gas in hot MD feed, which was
passed through the membrane to the permeate side. Other ions, including SO4-2, Cl-
and NO3- have quite low concentration. It is noteworthy that manganese (from
catalyst MnO2) did not appear in the permeate samples. While analyzing the MD
performance at different feed temperatures, the results show that elevated
temperatures lead to slightly enhanced separation efficiency due to improved
driving force (vapor pressure difference) and, in some cases, owing to enhanced
solubility. While analyzing the carbon content in permeate samples, no definite
trend was noted with varying temperatures, which indicates that the thermal
decomposition of TMAH was not observed. Nevertheless, it is known that TMAH
thermal decomposition temperature is above 65°C; hence, for TMAH wastewater
treatment, the recommended MD feed temperature is ≤ 65°C. The other water
quality parameters were also studied and presented in [201].
During the reconcentration study, the achieved wastewater volume reduction factor
was ~0.7 after eight hours of the MD separation process. The obtained permeate
quality satisfies most local environmental standards for discharge to the recipient,
except for F- ions concentration. To handle F- ions concentration, using strong base
anion resin/activated alumina can be a favorable approach before disposal or reuse
of the permeate as process water [204], [205].
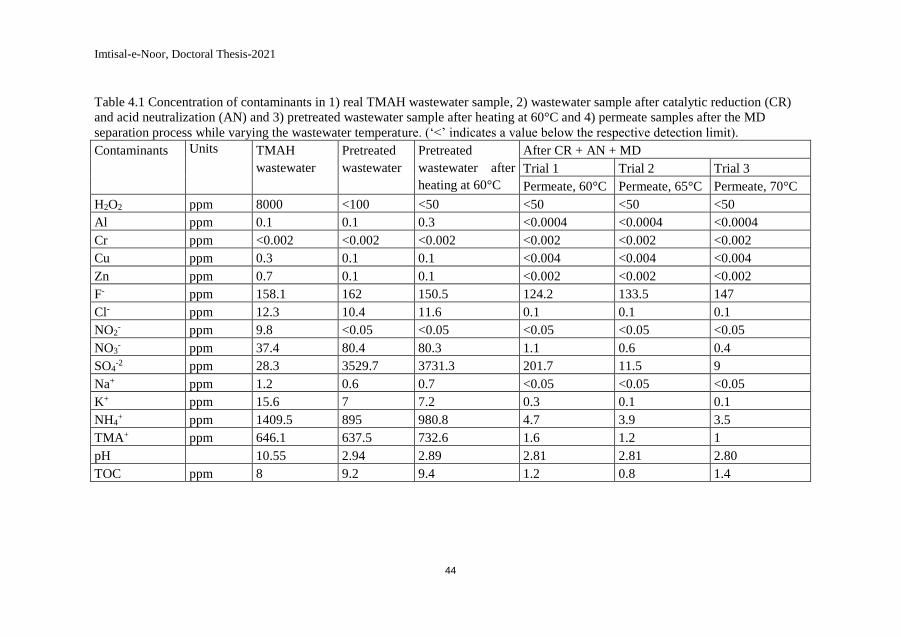
Imtisal-e-Noor, Doctoral Thesis-2021
44
Table 4.1 Concentration of contaminants in 1) real TMAH wastewater sample, 2) wastewater sample after catalytic reduction (CR)
and acid neutralization (AN) and 3) pretreated wastewater sample after heating at 60°C and 4) permeate samples after the MD
separation process while varying the wastewater temperature. (‘<’ indicates a value below the respective detection limit).
Contaminants Units TMAH
wastewater
Pretreated
wastewater
Pretreated
wastewater after
heating at 60°C
After CR + AN + MD
Trial 1 Trial 2 Trial 3
Permeate, 60°C Permeate, 65°C Permeate, 70°C
H2O2 ppm 8000 <100 <50 <50 <50 <50
Al ppm 0.1 0.1 0.3 <0.0004 <0.0004 <0.0004
Cr ppm <0.002 <0.002 <0.002 <0.002 <0.002 <0.002
Cu ppm 0.3 0.1 0.1 <0.004 <0.004 <0.004
Zn ppm 0.7 0.1 0.1 <0.002 <0.002 <0.002
F- ppm 158.1 162 150.5 124.2 133.5 147
Cl- ppm 12.3 10.4 11.6 0.1 0.1 0.1
NO2- ppm 9.8 <0.05 <0.05 <0.05 <0.05 <0.05
NO3- ppm 37.4 80.4 80.3 1.1 0.6 0.4
SO4-2 ppm 28.3 3529.7 3731.3 201.7 11.5 9
Na+ ppm 1.2 0.6 0.7 <0.05 <0.05 <0.05
K+ ppm 15.6 7 7.2 0.3 0.1 0.1
NH4+ ppm 1409.5 895 980.8 4.7 3.9 3.5
TMA+ ppm 646.1 637.5 732.6 1.6 1.2 1
pH 10.55 2.94 2.89 2.81 2.81 2.80
TOC ppm 8 9.2 9.4 1.2 0.8 1.4
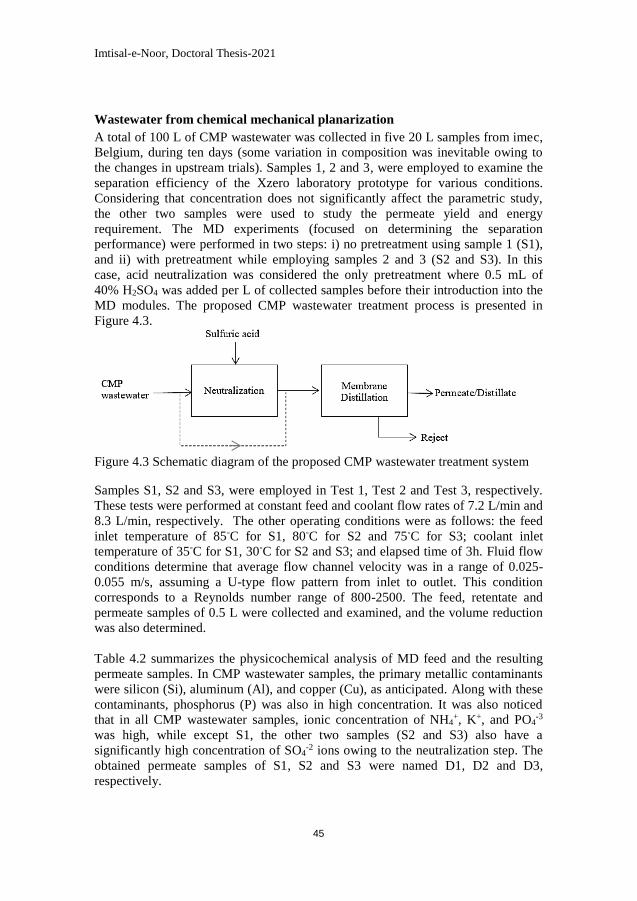
Imtisal-e-Noor, Doctoral Thesis-2021
45
Wastewater from chemical mechanical planarization
A total of 100 L of CMP wastewater was collected in five 20 L samples from imec,
Belgium, during ten days (some variation in composition was inevitable owing to
the changes in upstream trials). Samples 1, 2 and 3, were employed to examine the
separation efficiency of the Xzero laboratory prototype for various conditions.
Considering that concentration does not significantly affect the parametric study,
the other two samples were used to study the permeate yield and energy
requirement. The MD experiments (focused on determining the separation
performance) were performed in two steps: i) no pretreatment using sample 1 (S1),
and ii) with pretreatment while employing samples 2 and 3 (S2 and S3). In this
case, acid neutralization was considered the only pretreatment where 0.5 mL of
40% H2SO4 was added per L of collected samples before their introduction into the
MD modules. The proposed CMP wastewater treatment process is presented in
Figure 4.3.
Figure 4.3 Schematic diagram of the proposed CMP wastewater treatment system
Samples S1, S2 and S3, were employed in Test 1, Test 2 and Test 3, respectively.
These tests were performed at constant feed and coolant flow rates of 7.2 L/min and
8.3 L/min, respectively. The other operating conditions were as follows: the feed
inlet temperature of 85◦C for S1, 80◦C for S2 and 75◦C for S3; coolant inlet
temperature of 35◦C for S1, 30◦C for S2 and S3; and elapsed time of 3h. Fluid flow
conditions determine that average flow channel velocity was in a range of 0.025-
0.055 m/s, assuming a U-type flow pattern from inlet to outlet. This condition
corresponds to a Reynolds number range of 800-2500. The feed, retentate and
permeate samples of 0.5 L were collected and examined, and the volume reduction
was also determined.
Table 4.2 summarizes the physicochemical analysis of MD feed and the resulting
permeate samples. In CMP wastewater samples, the primary metallic contaminants
were silicon (Si), aluminum (Al), and copper (Cu), as anticipated. Along with these
contaminants, phosphorus (P) was also in high concentration. It was also noticed
that in all CMP wastewater samples, ionic concentration of NH4+, K+, and PO4
-3
was high, while except S1, the other two samples (S2 and S3) also have a
significantly high concentration of SO4-2 ions owing to the neutralization step. The
obtained permeate samples of S1, S2 and S3 were named D1, D2 and D3,
respectively.
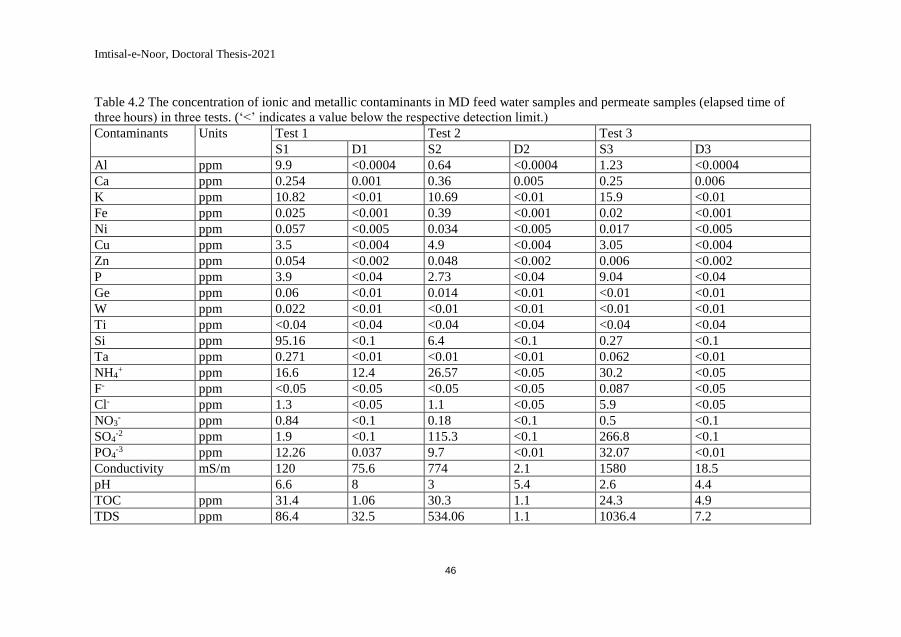
Imtisal-e-Noor, Doctoral Thesis-2021
46
Table 4.2 The concentration of ionic and metallic contaminants in MD feed water samples and permeate samples (elapsed time of
three hours) in three tests. (‘<’ indicates a value below the respective detection limit.)
Contaminants Units Test 1 Test 2 Test 3
S1 D1 S2 D2 S3 D3
Al ppm 9.9 <0.0004 0.64 <0.0004 1.23 <0.0004
Ca ppm 0.254 0.001 0.36 0.005 0.25 0.006
K ppm 10.82 <0.01 10.69 <0.01 15.9 <0.01
Fe ppm 0.025 <0.001 0.39 <0.001 0.02 <0.001
Ni ppm 0.057 <0.005 0.034 <0.005 0.017 <0.005
Cu ppm 3.5 <0.004 4.9 <0.004 3.05 <0.004
Zn ppm 0.054 <0.002 0.048 <0.002 0.006 <0.002
P ppm 3.9 <0.04 2.73 <0.04 9.04 <0.04
Ge ppm 0.06 <0.01 0.014 <0.01 <0.01 <0.01
W ppm 0.022 <0.01 <0.01 <0.01 <0.01 <0.01
Ti ppm <0.04 <0.04 <0.04 <0.04 <0.04 <0.04
Si ppm 95.16 <0.1 6.4 <0.1 0.27 <0.1
Ta ppm 0.271 <0.01 <0.01 <0.01 0.062 <0.01
NH4+ ppm 16.6 12.4 26.57 <0.05 30.2 <0.05
F- ppm <0.05 <0.05 <0.05 <0.05 0.087 <0.05
Cl- ppm 1.3 <0.05 1.1 <0.05 5.9 <0.05
NO3- ppm 0.84 <0.1 0.18 <0.1 0.5 <0.1
SO4-2 ppm 1.9 <0.1 115.3 <0.1 266.8 <0.1
PO4-3 ppm 12.26 0.037 9.7 <0.01 32.07 <0.01
Conductivity mS/m 120 75.6 774 2.1 1580 18.5
pH 6.6 8 3 5.4 2.6 4.4
TOC ppm 31.4 1.06 30.3 1.1 24.3 4.9
TDS ppm 86.4 32.5 534.06 1.1 1036.4 7.2
Imtisal-e-Noor, Doctoral Thesis-2021
47
Concerning MD permeate samples, the results show that the concentration of
analyzed metals was below the detection limits except Ca, which was also
considerably low. However, the separation efficiency of NH4+ ions was not
substantial, i.e., ~25% owing to highly volatile NH3 vapor in S1. With the
pretreatment of other feed samples (S2 and S3), the formation of NH4+ ions (non-
volatile) was favored in feed samples due to low pH. Consequently, the separation
efficiency of NH4+ ions was improved by three-fold, following quite low
concentrations of NH4+ ions (<0.05 ppm) in permeate samples. The other ions,
including NO3-, Cl-, SO4
-2 and F-, remained undetectable in the permeate samples
along with quite low levels of PO4-3 (0.03 ppm in S1). The resulting quality allows
the permeate to get released into the recipient water bodies or reuse it as process
water. When comparing overall performance in terms of separation efficiency, MD
displays promising results as opposed to other available methods, including electro
micro-filtration [206], an integration of electro-dialysis and RO [207] and a
combination of UF and RO [9].
Since the permeate was discharged from the MD system, the volume of the initial
feed samples was reduced by the factor of ~0.3 in three hours, which led to a
gradual increase in ionic and metallic concentration in the retentate samples.
However, for metallic Ni and Cl- ions, the initial feed has higher levels than the
concentrated retentate. The reason might be that these contaminants were adsorbed
on the membrane surface. Detailed results are included in [202].
4.1.2 Module performance
In addition to separation efficiency, permeate yield, energy analysis, and exergy
efficiency of the Xzero laboratory prototype were also determined. As mentioned in
the previous section, CMP wastewater samples were selected as MD feed, while
assuming that composition and concentration change does not have any significant
impact on the parametric study. During this study, ranges of feed inlet flow rates
(3.5-7.2 L/min), coolant inlet flow rates (3.5-8.3 L/min), feed inlet temperatures
(65-85°C), and coolant inlet temperatures (15-35°C) were considered.
Yield analysis
When performing yield analysis, the defining criterion for AGMD performance is
transmembrane flux; therefore, it is critically investigated for the mentioned
operating parameters. In the first set of experiments, the variation of
transmembrane flux was linked to the feed and coolant inlet flow rates at constant
feed temperature (80°C) and coolant temperature (25°C). The second set of tests
considered the effect of feed and coolant temperatures on transmembrane flux with
constant feed flow rate (7.2 L/min) and coolant flow rate (8.3 L/min). The outcomes
from the first set of experiments demonstrate that the increase in feed and coolant
flow rates at constant temperatures provide higher transmembrane flux, which
adopts a positive linear trend, as presented in Figure 4.4. The reasons involve
reduced boundary layer resistance, higher bulk temperature along the feed channel
(at higher feed flow rates), and increased vapor condensation rate (at higher cold
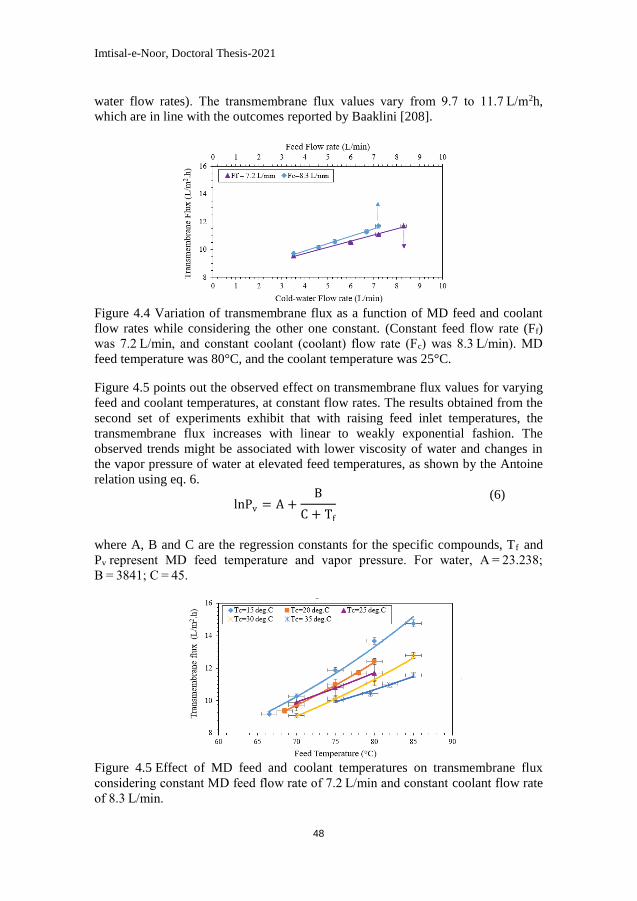
Imtisal-e-Noor, Doctoral Thesis-2021
48
water flow rates). The transmembrane flux values vary from 9.7 to 11.7 L/m2h,
which are in line with the outcomes reported by Baaklini [208].
Figure 4.4 Variation of transmembrane flux as a function of MD feed and coolant
flow rates while considering the other one constant. (Constant feed flow rate (Ff)
was 7.2 L/min, and constant coolant (coolant) flow rate (Fc) was 8.3 L/min). MD
feed temperature was 80°C, and the coolant temperature was 25°C.
Figure 4.5 points out the observed effect on transmembrane flux values for varying
feed and coolant temperatures, at constant flow rates. The results obtained from the
second set of experiments exhibit that with raising feed inlet temperatures, the
transmembrane flux increases with linear to weakly exponential fashion. The
observed trends might be associated with lower viscosity of water and changes in
the vapor pressure of water at elevated feed temperatures, as shown by the Antoine
relation using eq. 6.
lnPv = A +B
C + Tf
(6)
where A, B and C are the regression constants for the specific compounds, Tf and
Pv represent MD feed temperature and vapor pressure. For water, A = 23.238;
B = 3841; C = 45.
Figure 4.5 Effect of MD feed and coolant temperatures on transmembrane flux
considering constant MD feed flow rate of 7.2 L/min and constant coolant flow rate
of 8.3 L/min.
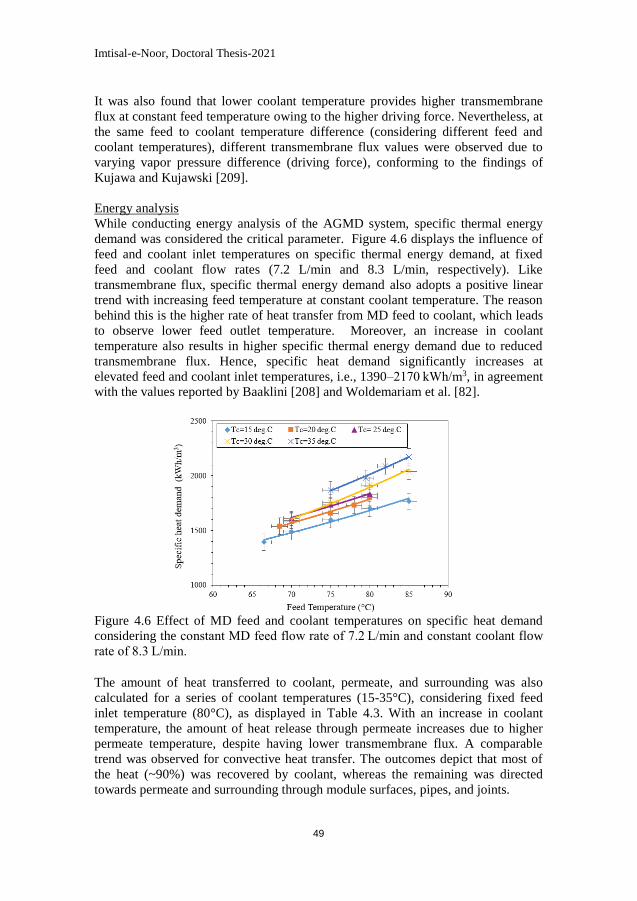
Imtisal-e-Noor, Doctoral Thesis-2021
49
It was also found that lower coolant temperature provides higher transmembrane
flux at constant feed temperature owing to the higher driving force. Nevertheless, at
the same feed to coolant temperature difference (considering different feed and
coolant temperatures), different transmembrane flux values were observed due to
varying vapor pressure difference (driving force), conforming to the findings of
Kujawa and Kujawski [209].
Energy analysis
While conducting energy analysis of the AGMD system, specific thermal energy
demand was considered the critical parameter. Figure 4.6 displays the influence of
feed and coolant inlet temperatures on specific thermal energy demand, at fixed
feed and coolant flow rates (7.2 L/min and 8.3 L/min, respectively). Like
transmembrane flux, specific thermal energy demand also adopts a positive linear
trend with increasing feed temperature at constant coolant temperature. The reason
behind this is the higher rate of heat transfer from MD feed to coolant, which leads
to observe lower feed outlet temperature. Moreover, an increase in coolant
temperature also results in higher specific thermal energy demand due to reduced
transmembrane flux. Hence, specific heat demand significantly increases at
elevated feed and coolant inlet temperatures, i.e., 1390–2170 kWh/m3, in agreement
with the values reported by Baaklini [208] and Woldemariam et al. [82].
Figure 4.6 Effect of MD feed and coolant temperatures on specific heat demand
considering the constant MD feed flow rate of 7.2 L/min and constant coolant flow
rate of 8.3 L/min.
The amount of heat transferred to coolant, permeate, and surrounding was also
calculated for a series of coolant temperatures (15-35°C), considering fixed feed
inlet temperature (80°C), as displayed in Table 4.3. With an increase in coolant
temperature, the amount of heat release through permeate increases due to higher
permeate temperature, despite having lower transmembrane flux. A comparable
trend was observed for convective heat transfer. The outcomes depict that most of
the heat (~90%) was recovered by coolant, whereas the remaining was directed
towards permeate and surrounding through module surfaces, pipes, and joints.
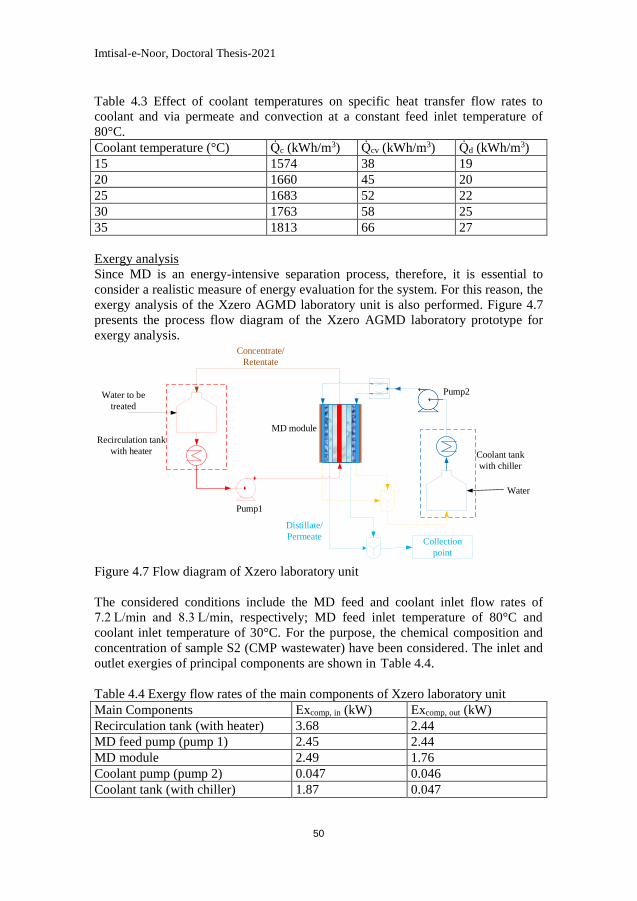
Imtisal-e-Noor, Doctoral Thesis-2021
50
Table 4.3 Effect of coolant temperatures on specific heat transfer flow rates to
coolant and via permeate and convection at a constant feed inlet temperature of
80°C.
Coolant temperature (°C) Qc (kWh/m3) Qcv (kWh/m3) Qd (kWh/m3)
15 1574 38 19
20 1660 45 20
25 1683 52 22
30 1763 58 25
35 1813 66 27
Exergy analysis Since MD is an energy-intensive separation process, therefore, it is essential to
consider a realistic measure of energy evaluation for the system. For this reason, the
exergy analysis of the Xzero AGMD laboratory unit is also performed. Figure 4.7
presents the process flow diagram of the Xzero AGMD laboratory prototype for
exergy analysis. Concentrate/
Retentate
Distillate/
Permeate
MD module
Pump1
Pump2Water to be
treated
Collection
point
Coolant tank
with chiller
Recirculation tank
with heater
Water
Figure 4.7 Flow diagram of Xzero laboratory unit
The considered conditions include the MD feed and coolant inlet flow rates of
7.2 L/min and 8.3 L/min, respectively; MD feed inlet temperature of 80°C and
coolant inlet temperature of 30°C. For the purpose, the chemical composition and
concentration of sample S2 (CMP wastewater) have been considered. The inlet and
outlet exergies of principal components are shown in Table 4.4.
Table 4.4 Exergy flow rates of the main components of Xzero laboratory unit
Main Components Excomp, in (kW) Excomp, out (kW)
Recirculation tank (with heater) 3.68 2.44
MD feed pump (pump 1) 2.45 2.44
MD module 2.49 1.76
Coolant pump (pump 2) 0.047 0.046
Coolant tank (with chiller) 1.87 0.047
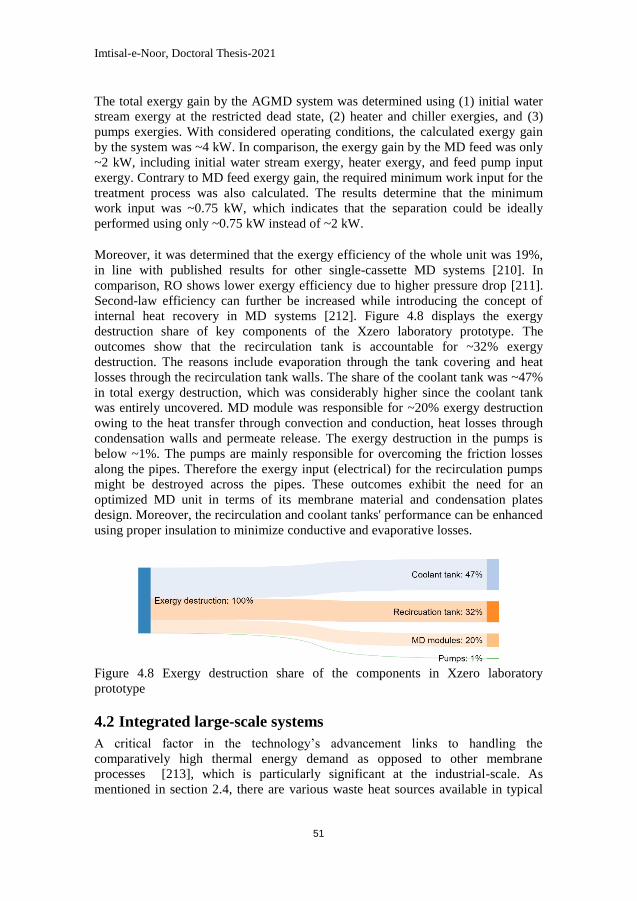
Imtisal-e-Noor, Doctoral Thesis-2021
51
The total exergy gain by the AGMD system was determined using (1) initial water
stream exergy at the restricted dead state, (2) heater and chiller exergies, and (3)
pumps exergies. With considered operating conditions, the calculated exergy gain
by the system was ~4 kW. In comparison, the exergy gain by the MD feed was only
~2 kW, including initial water stream exergy, heater exergy, and feed pump input
exergy. Contrary to MD feed exergy gain, the required minimum work input for the
treatment process was also calculated. The results determine that the minimum
work input was ~0.75 kW, which indicates that the separation could be ideally
performed using only ~0.75 kW instead of ~2 kW.
Moreover, it was determined that the exergy efficiency of the whole unit was 19%,
in line with published results for other single-cassette MD systems [210]. In
comparison, RO shows lower exergy efficiency due to higher pressure drop [211].
Second-law efficiency can further be increased while introducing the concept of
internal heat recovery in MD systems [212]. Figure 4.8 displays the exergy
destruction share of key components of the Xzero laboratory prototype. The
outcomes show that the recirculation tank is accountable for ~32% exergy
destruction. The reasons include evaporation through the tank covering and heat
losses through the recirculation tank walls. The share of the coolant tank was ~47%
in total exergy destruction, which was considerably higher since the coolant tank
was entirely uncovered. MD module was responsible for ~20% exergy destruction
owing to the heat transfer through convection and conduction, heat losses through
condensation walls and permeate release. The exergy destruction in the pumps is
below ~1%. The pumps are mainly responsible for overcoming the friction losses
along the pipes. Therefore the exergy input (electrical) for the recirculation pumps
might be destroyed across the pipes. These outcomes exhibit the need for an
optimized MD unit in terms of its membrane material and condensation plates
design. Moreover, the recirculation and coolant tanks' performance can be enhanced
using proper insulation to minimize conductive and evaporative losses.
Figure 4.8 Exergy destruction share of the components in Xzero laboratory
prototype
4.2 Integrated large-scale systems
A critical factor in the technology’s advancement links to handling the
comparatively high thermal energy demand as opposed to other membrane
processes [213], which is particularly significant at the industrial-scale. As
mentioned in section 2.4, there are various waste heat sources available in typical
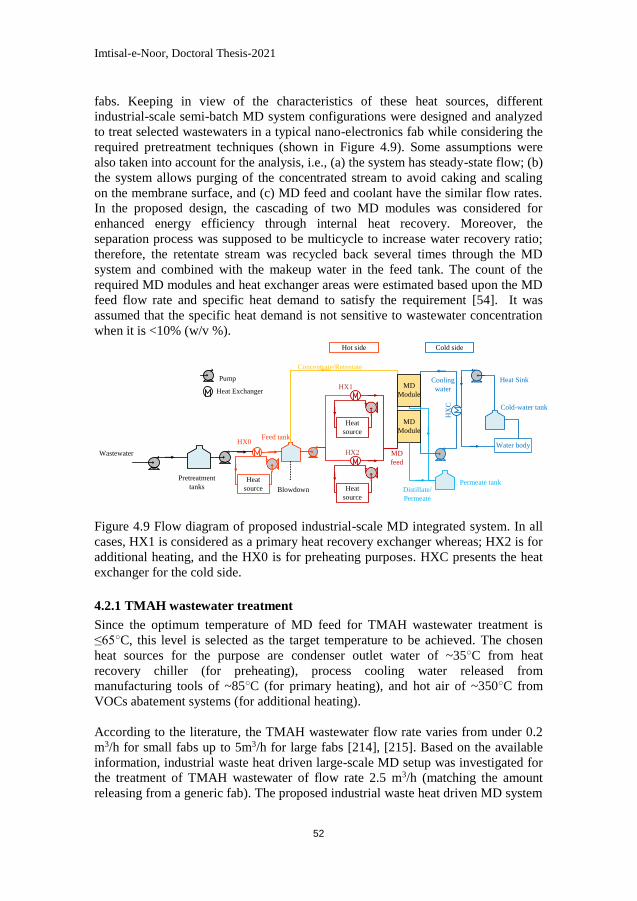
Imtisal-e-Noor, Doctoral Thesis-2021
52
fabs. Keeping in view of the characteristics of these heat sources, different
industrial-scale semi-batch MD system configurations were designed and analyzed
to treat selected wastewaters in a typical nano-electronics fab while considering the
required pretreatment techniques (shown in Figure 4.9). Some assumptions were
also taken into account for the analysis, i.e., (a) the system has steady-state flow; (b)
the system allows purging of the concentrated stream to avoid caking and scaling
on the membrane surface, and (c) MD feed and coolant have the similar flow rates.
In the proposed design, the cascading of two MD modules was considered for
enhanced energy efficiency through internal heat recovery. Moreover, the
separation process was supposed to be multicycle to increase water recovery ratio;
therefore, the retentate stream was recycled back several times through the MD
system and combined with the makeup water in the feed tank. The count of the
required MD modules and heat exchanger areas were estimated based upon the MD
feed flow rate and specific heat demand to satisfy the requirement [54]. It was
assumed that the specific heat demand is not sensitive to wastewater concentration
when it is <10% (w/v %).
Feed tank
Concentrate/Retentate
MD
feed
Distillate/
Permeate
Wastewater
Pretreatment
tanks Blowdown
Heat Exchanger
Pump
Permeate tankHeat
source
Heat
source
HX0
HX1
HX
C
MD
Module
MD
Module
Cold-water tank
Water body
Heat
source
HX2
Hot side Cold side
Heat Sink Cooling
water
Figure 4.9 Flow diagram of proposed industrial-scale MD integrated system. In all
cases, HX1 is considered as a primary heat recovery exchanger whereas; HX2 is for
additional heating, and the HX0 is for preheating purposes. HXC presents the heat
exchanger for the cold side.
4.2.1 TMAH wastewater treatment
Since the optimum temperature of MD feed for TMAH wastewater treatment is
≤65○C, this level is selected as the target temperature to be achieved. The chosen
heat sources for the purpose are condenser outlet water of ~35○C from heat
recovery chiller (for preheating), process cooling water released from
manufacturing tools of ~85○C (for primary heating), and hot air of ~350○C from
VOCs abatement systems (for additional heating).
According to the literature, the TMAH wastewater flow rate varies from under 0.2
m3/h for small fabs up to 5m3/h for large fabs [214], [215]. Based on the available
information, industrial waste heat driven large-scale MD setup was investigated for
the treatment of TMAH wastewater of flow rate 2.5 m3/h (matching the amount
releasing from a generic fab). The proposed industrial waste heat driven MD system
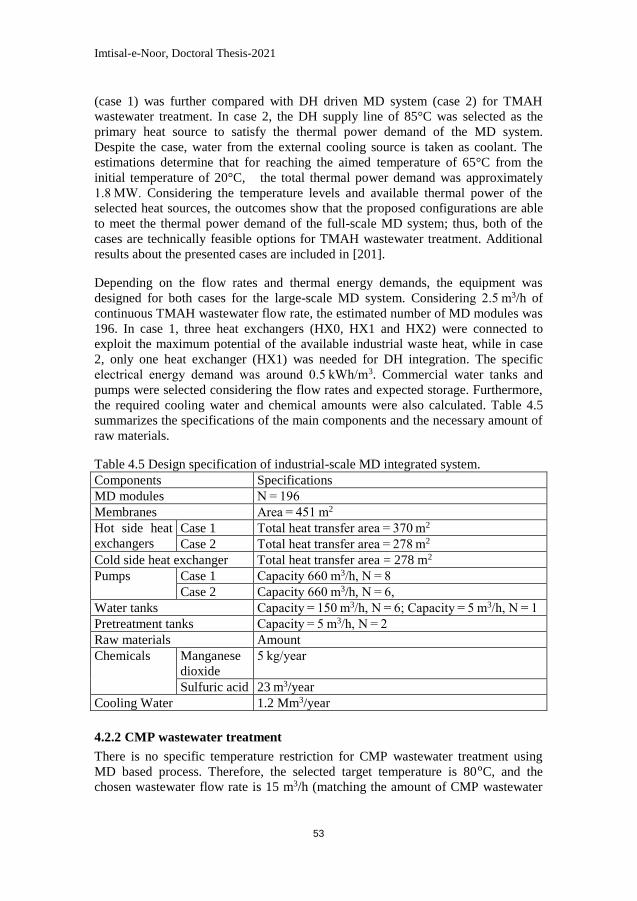
Imtisal-e-Noor, Doctoral Thesis-2021
53
(case 1) was further compared with DH driven MD system (case 2) for TMAH
wastewater treatment. In case 2, the DH supply line of 85°C was selected as the
primary heat source to satisfy the thermal power demand of the MD system.
Despite the case, water from the external cooling source is taken as coolant. The
estimations determine that for reaching the aimed temperature of 65°C from the
initial temperature of 20°C, the total thermal power demand was approximately
1.8 MW. Considering the temperature levels and available thermal power of the
selected heat sources, the outcomes show that the proposed configurations are able
to meet the thermal power demand of the full-scale MD system; thus, both of the
cases are technically feasible options for TMAH wastewater treatment. Additional
results about the presented cases are included in [201].
Depending on the flow rates and thermal energy demands, the equipment was
designed for both cases for the large-scale MD system. Considering 2.5 m3/h of
continuous TMAH wastewater flow rate, the estimated number of MD modules was
196. In case 1, three heat exchangers (HX0, HX1 and HX2) were connected to
exploit the maximum potential of the available industrial waste heat, while in case
2, only one heat exchanger (HX1) was needed for DH integration. The specific
electrical energy demand was around 0.5 kWh/m3. Commercial water tanks and
pumps were selected considering the flow rates and expected storage. Furthermore,
the required cooling water and chemical amounts were also calculated. Table 4.5
summarizes the specifications of the main components and the necessary amount of
raw materials.
Table 4.5 Design specification of industrial-scale MD integrated system.
Components Specifications
MD modules N = 196
Membranes Area = 451 m2
Hot side heat
exchangers
Case 1 Total heat transfer area = 370 m2
Case 2 Total heat transfer area = 278 m2
Cold side heat exchanger Total heat transfer area = 278 m2
Pumps Case 1 Capacity 660 m3/h, N = 8
Case 2 Capacity 660 m3/h, N = 6,
Water tanks Capacity = 150 m3/h, N = 6; Capacity = 5 m3/h, N = 1
Pretreatment tanks Capacity = 5 m3/h, N = 2
Raw materials Amount
Chemicals Manganese
dioxide
5 kg/year
Sulfuric acid 23 m3/year
Cooling Water 1.2 Mm3/year
4.2.2 CMP wastewater treatment
There is no specific temperature restriction for CMP wastewater treatment using
MD based process. Therefore, the selected target temperature is 80°C, and the
chosen wastewater flow rate is 15 m3/h (matching the amount of CMP wastewater
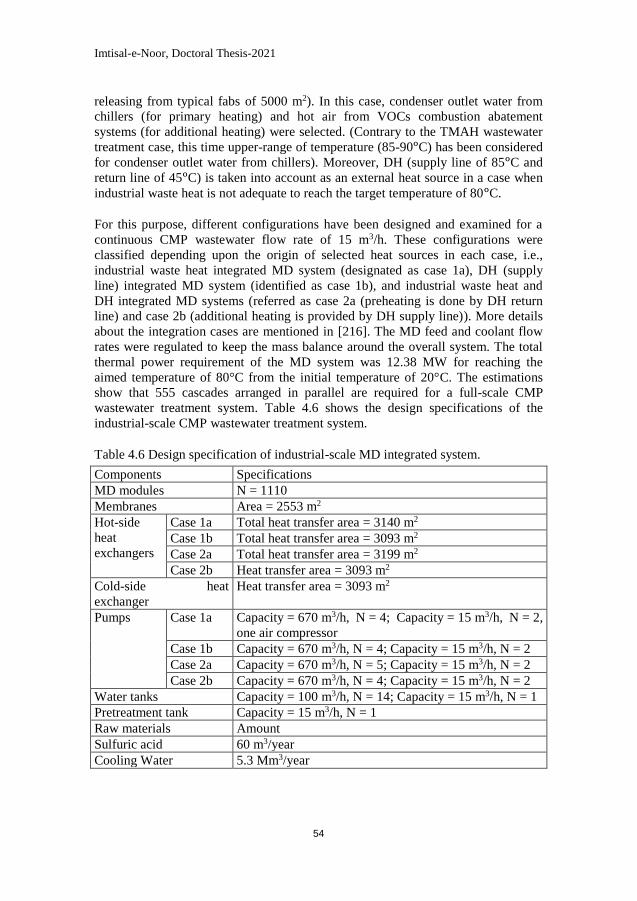
Imtisal-e-Noor, Doctoral Thesis-2021
54
releasing from typical fabs of 5000 m2). In this case, condenser outlet water from
chillers (for primary heating) and hot air from VOCs combustion abatement
systems (for additional heating) were selected. (Contrary to the TMAH wastewater
treatment case, this time upper-range of temperature (85-90°C) has been considered
for condenser outlet water from chillers). Moreover, DH (supply line of 85°C and
return line of 45°C) is taken into account as an external heat source in a case when
industrial waste heat is not adequate to reach the target temperature of 80°C.
For this purpose, different configurations have been designed and examined for a
continuous CMP wastewater flow rate of 15 m3/h. These configurations were
classified depending upon the origin of selected heat sources in each case, i.e.,
industrial waste heat integrated MD system (designated as case 1a), DH (supply
line) integrated MD system (identified as case 1b), and industrial waste heat and
DH integrated MD systems (referred as case 2a (preheating is done by DH return
line) and case 2b (additional heating is provided by DH supply line)). More details
about the integration cases are mentioned in [216]. The MD feed and coolant flow
rates were regulated to keep the mass balance around the overall system. The total
thermal power requirement of the MD system was 12.38 MW for reaching the
aimed temperature of 80°C from the initial temperature of 20°C. The estimations
show that 555 cascades arranged in parallel are required for a full-scale CMP
wastewater treatment system. Table 4.6 shows the design specifications of the
industrial-scale CMP wastewater treatment system.
Table 4.6 Design specification of industrial-scale MD integrated system.
Components Specifications
MD modules N = 1110
Membranes Area = 2553 m2
Hot-side
heat
exchangers
Case 1a Total heat transfer area = 3140 m2
Case 1b Total heat transfer area = 3093 m2
Case 2a Total heat transfer area = 3199 m2
Case 2b Heat transfer area = 3093 m2
Cold-side heat
exchanger
Heat transfer area = 3093 m2
Pumps Case 1a Capacity = 670 m3/h, N = 4; Capacity = 15 m3/h, N = 2,
one air compressor
Case 1b Capacity = 670 m3/h, N = 4; Capacity = 15 m3/h, N = 2
Case 2a Capacity = 670 m3/h, N = 5; Capacity = 15 m3/h, N = 2
Case 2b Capacity = 670 m3/h, N = 4; Capacity = 15 m3/h, N = 2
Water tanks Capacity = 100 m3/h, N = 14; Capacity = 15 m3/h, N = 1
Pretreatment tank Capacity = 15 m3/h, N = 1
Raw materials Amount Sulfuric acid 60 m3/year
Cooling Water 5.3 Mm3/year
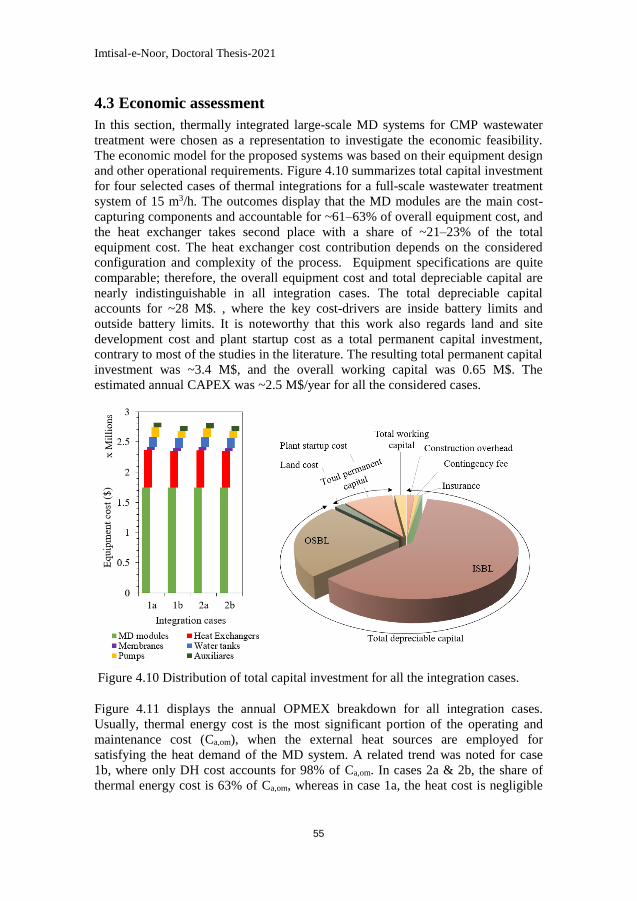
Imtisal-e-Noor, Doctoral Thesis-2021
55
4.3 Economic assessment
In this section, thermally integrated large-scale MD systems for CMP wastewater
treatment were chosen as a representation to investigate the economic feasibility.
The economic model for the proposed systems was based on their equipment design
and other operational requirements. Figure 4.10 summarizes total capital investment
for four selected cases of thermal integrations for a full-scale wastewater treatment
system of 15 m3/h. The outcomes display that the MD modules are the main cost-
capturing components and accountable for ~61–63% of overall equipment cost, and
the heat exchanger takes second place with a share of ~21–23% of the total
equipment cost. The heat exchanger cost contribution depends on the considered
configuration and complexity of the process. Equipment specifications are quite
comparable; therefore, the overall equipment cost and total depreciable capital are
nearly indistinguishable in all integration cases. The total depreciable capital
accounts for ~28 M$. , where the key cost-drivers are inside battery limits and
outside battery limits. It is noteworthy that this work also regards land and site
development cost and plant startup cost as a total permanent capital investment,
contrary to most of the studies in the literature. The resulting total permanent capital
investment was ~3.4 M$, and the overall working capital was 0.65 M$. The
estimated annual CAPEX was ~2.5 M$/year for all the considered cases.
Figure 4.10 Distribution of total capital investment for all the integration cases.
Figure 4.11 displays the annual OPMEX breakdown for all integration cases.
Usually, thermal energy cost is the most significant portion of the operating and
maintenance cost (Ca,om), when the external heat sources are employed for
satisfying the heat demand of the MD system. A related trend was noted for case
1b, where only DH cost accounts for 98% of Ca,om. In cases 2a & 2b, the share of
thermal energy cost is 63% of Ca,om, whereas in case 1a, the heat cost is negligible
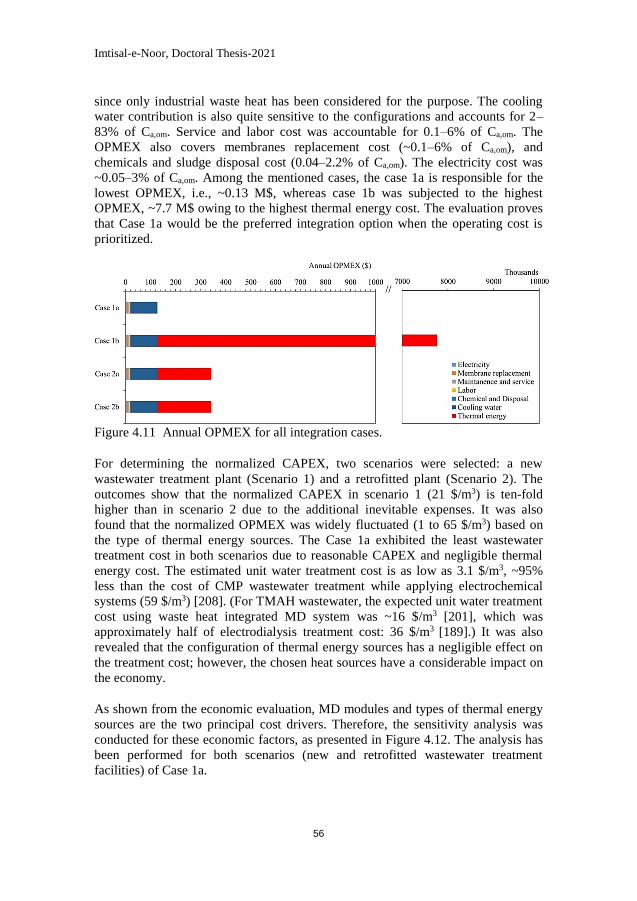
Imtisal-e-Noor, Doctoral Thesis-2021
56
since only industrial waste heat has been considered for the purpose. The cooling
water contribution is also quite sensitive to the configurations and accounts for 2–
83% of Ca,om. Service and labor cost was accountable for 0.1–6% of Ca,om. The
OPMEX also covers membranes replacement cost (~0.1–6% of Ca,om), and
chemicals and sludge disposal cost (0.04–2.2% of Ca,om). The electricity cost was
~0.05–3% of Ca,om. Among the mentioned cases, the case 1a is responsible for the
lowest OPMEX, i.e., ~0.13 M$, whereas case 1b was subjected to the highest
OPMEX, ~7.7 M$ owing to the highest thermal energy cost. The evaluation proves
that Case 1a would be the preferred integration option when the operating cost is
prioritized.
Figure 4.11 Annual OPMEX for all integration cases.
For determining the normalized CAPEX, two scenarios were selected: a new
wastewater treatment plant (Scenario 1) and a retrofitted plant (Scenario 2). The
outcomes show that the normalized CAPEX in scenario 1 (21 $/m3) is ten-fold
higher than in scenario 2 due to the additional inevitable expenses. It was also
found that the normalized OPMEX was widely fluctuated (1 to 65 $/m3) based on
the type of thermal energy sources. The Case 1a exhibited the least wastewater
treatment cost in both scenarios due to reasonable CAPEX and negligible thermal
energy cost. The estimated unit water treatment cost is as low as 3.1 $/m3, ~95%
less than the cost of CMP wastewater treatment while applying electrochemical
systems (59 $/m3) [208]. (For TMAH wastewater, the expected unit water treatment
cost using waste heat integrated MD system was ~16 $/m3 [201], which was
approximately half of electrodialysis treatment cost: 36 $/m3 [189].) It was also
revealed that the configuration of thermal energy sources has a negligible effect on
the treatment cost; however, the chosen heat sources have a considerable impact on
the economy.
As shown from the economic evaluation, MD modules and types of thermal energy
sources are the two principal cost drivers. Therefore, the sensitivity analysis was
conducted for these economic factors, as presented in Figure 4.12. The analysis has
been performed for both scenarios (new and retrofitted wastewater treatment
facilities) of Case 1a.
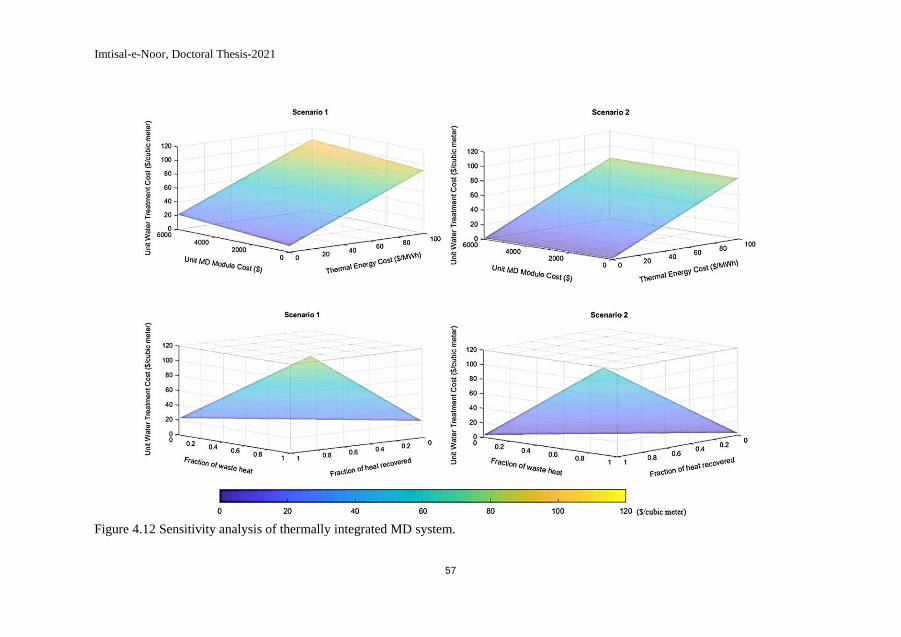
Imtisal-e-Noor, Doctoral Thesis-2021
57
Figure 4.12 Sensitivity analysis of thermally integrated MD system.
Imtisal-e-Noor, Doctoral Thesis-2021
58
While studying the effect of variation of the MD modules costs, it was found that
treatment cost can be reduced up to 15.7 $/m3 in scenario 1 and up to 2.5 $/m3 in
scenario 2, when module cost is decreased by 50%, and heat cost is supposed
negligible. The cost per unit thermal energy varies depending on the heat sources,
i.e., 0–100 $/MWh in that case, unit water cost can also be altered between ~22-105
$/m3 in scenario 1, while it ranges from ~3-86 $/m3 in scenario 2, with reference
MD module unit cost. Moreover, unit water treatment cost values were also
estimated while varying the amount of waste heat used and total heat recovered.
The outcomes show that when only external heat sources were considered without a
heat recovery option, the water cost may increase to 86 $/m3 in scenario 1, with a
heat cost of 77 $/MWh. However, it can be reduced to 75% when only industrial
waste heat sources were taken into account without heat recovery. Similar results
can be obtained when the option of an external heat source with complete heat
recovery was selected (quite impractical). In scenario 2, when industrial waste heat
was considered, the unit water treatment cost can be as low as 3.12 $/m3.
4.4 Concluding remarks
This chapter presented the techno-economic performance of the membrane
distillation (MD) process for the treatment of different wastewaters from nano-
electronics industries. Case studies of imec, Belgium, have been chosen for the
purpose, and the Xzero laboratory prototype was employed for experimental
investigations. It was found that catalytic reduction and acid neutralization were the
required pretreatment methods when wastewater from the photolithography process
was considered. However, in the case of chemical mechanical planarization
wastewater, only neutralization was needed before the MD separation step.
Moreover, for the treatment of the photolithography process wastewater, the
optimal MD feed temperature was 65°C since, above this temperature, the TMAH
decomposition starts happening. The experimental results determine that high-
quality permeate was recovered, having a reasonably low concentration of the
major contaminants, in most cases, below detection limits. (The fluoride issue can
be easily managed using an ion-exchanger, as an add-on step).
The parametric study of the Xzero laboratory prototype shows that the maximum
transmembrane flux was 14.8 L/m2h at the feed to the coolant temperature
difference of 70°C. The specific thermal energy demand was ranged from 1390 to
2170 kWh/m3 depending on the feed and coolant temperatures. In contrast, the
achievable exergy efficiency was ~19%. The techno-economic system analysis of
full-scale MD process shows that the estimated thermal energy demand can be
readily managed using industrial waste heat sources of the nano-electronics
facilities. Resultantly, the expected unit water treatment cost was around 3-16 $/m3,
reasonably lower than the treatment cost associated with competitive methods.
Sensitivity analysis confirms that thermal energy cost and the fraction of industrial
waste heat utilization are the critical determinants, which can change the unit water
treatment cost significantly.
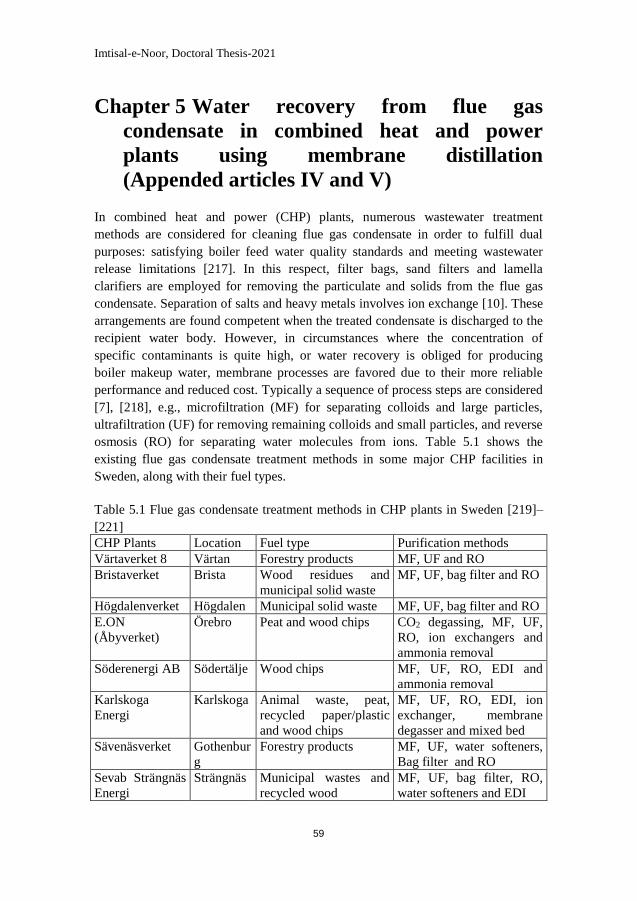
Imtisal-e-Noor, Doctoral Thesis-2021
59
Chapter 5 Water recovery from flue gas
condensate in combined heat and power
plants using membrane distillation
(Appended articles IV and V)
In combined heat and power (CHP) plants, numerous wastewater treatment
methods are considered for cleaning flue gas condensate in order to fulfill dual
purposes: satisfying boiler feed water quality standards and meeting wastewater
release limitations [217]. In this respect, filter bags, sand filters and lamella
clarifiers are employed for removing the particulate and solids from the flue gas
condensate. Separation of salts and heavy metals involves ion exchange [10]. These
arrangements are found competent when the treated condensate is discharged to the
recipient water body. However, in circumstances where the concentration of
specific contaminants is quite high, or water recovery is obliged for producing
boiler makeup water, membrane processes are favored due to their more reliable
performance and reduced cost. Typically a sequence of process steps are considered
[7], [218], e.g., microfiltration (MF) for separating colloids and large particles,
ultrafiltration (UF) for removing remaining colloids and small particles, and reverse
osmosis (RO) for separating water molecules from ions. Table 5.1 shows the
existing flue gas condensate treatment methods in some major CHP facilities in
Sweden, along with their fuel types.
Table 5.1 Flue gas condensate treatment methods in CHP plants in Sweden [219]–
[221]
CHP Plants Location Fuel type Purification methods
Värtaverket 8 Värtan Forestry products MF, UF and RO
Bristaverket Brista Wood residues and
municipal solid waste
MF, UF, bag filter and RO
Högdalenverket Högdalen Municipal solid waste MF, UF, bag filter and RO
E.ON
(Åbyverket)
Örebro Peat and wood chips CO2 degassing, MF, UF,
RO, ion exchangers and
ammonia removal
Söderenergi AB Södertälje Wood chips MF, UF, RO, EDI and
ammonia removal
Karlskoga
Energi
Karlskoga Animal waste, peat,
recycled paper/plastic
and wood chips
MF, UF, RO, EDI, ion
exchanger, membrane
degasser and mixed bed
Sävenäsverket Gothenbur
g
Forestry products MF, UF, water softeners,
Bag filter and RO
Sevab Strängnäs
Energi Strängnäs Municipal wastes and
recycled wood MF, UF, bag filter, RO,
water softeners and EDI
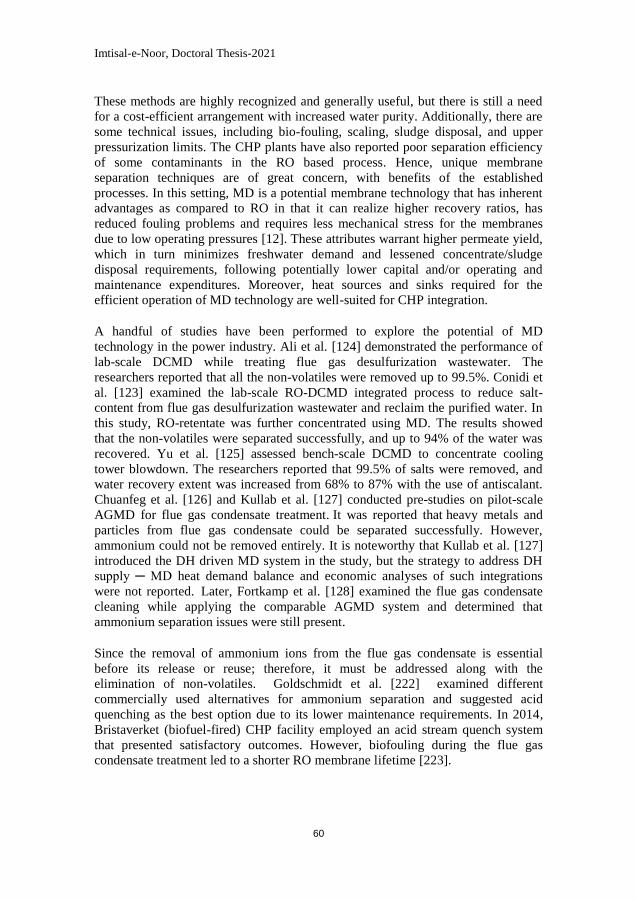
Imtisal-e-Noor, Doctoral Thesis-2021
60
These methods are highly recognized and generally useful, but there is still a need
for a cost-efficient arrangement with increased water purity. Additionally, there are
some technical issues, including bio-fouling, scaling, sludge disposal, and upper
pressurization limits. The CHP plants have also reported poor separation efficiency
of some contaminants in the RO based process. Hence, unique membrane
separation techniques are of great concern, with benefits of the established
processes. In this setting, MD is a potential membrane technology that has inherent
advantages as compared to RO in that it can realize higher recovery ratios, has
reduced fouling problems and requires less mechanical stress for the membranes
due to low operating pressures [12]. These attributes warrant higher permeate yield,
which in turn minimizes freshwater demand and lessened concentrate/sludge
disposal requirements, following potentially lower capital and/or operating and
maintenance expenditures. Moreover, heat sources and sinks required for the
efficient operation of MD technology are well-suited for CHP integration.
A handful of studies have been performed to explore the potential of MD
technology in the power industry. Ali et al. [124] demonstrated the performance of
lab-scale DCMD while treating flue gas desulfurization wastewater. The
researchers reported that all the non-volatiles were removed up to 99.5%. Conidi et
al. [123] examined the lab-scale RO-DCMD integrated process to reduce salt-
content from flue gas desulfurization wastewater and reclaim the purified water. In
this study, RO-retentate was further concentrated using MD. The results showed
that the non-volatiles were separated successfully, and up to 94% of the water was
recovered. Yu et al. [125] assessed bench-scale DCMD to concentrate cooling
tower blowdown. The researchers reported that 99.5% of salts were removed, and
water recovery extent was increased from 68% to 87% with the use of antiscalant.
Chuanfeg et al. [126] and Kullab et al. [127] conducted pre-studies on pilot-scale
AGMD for flue gas condensate treatment. It was reported that heavy metals and
particles from flue gas condensate could be separated successfully. However,
ammonium could not be removed entirely. It is noteworthy that Kullab et al. [127]
introduced the DH driven MD system in the study, but the strategy to address DH
supply ─ MD heat demand balance and economic analyses of such integrations
were not reported. Later, Fortkamp et al. [128] examined the flue gas condensate
cleaning while applying the comparable AGMD system and determined that
ammonium separation issues were still present.
Since the removal of ammonium ions from the flue gas condensate is essential
before its release or reuse; therefore, it must be addressed along with the
elimination of non-volatiles. Goldschmidt et al. [222] examined different
commercially used alternatives for ammonium separation and suggested acid
quenching as the best option due to its lower maintenance requirements. In 2014,
Bristaverket (biofuel-fired) CHP facility employed an acid stream quench system
that presented satisfactory outcomes. However, biofouling during the flue gas
condensate treatment led to a shorter RO membrane lifetime [223].
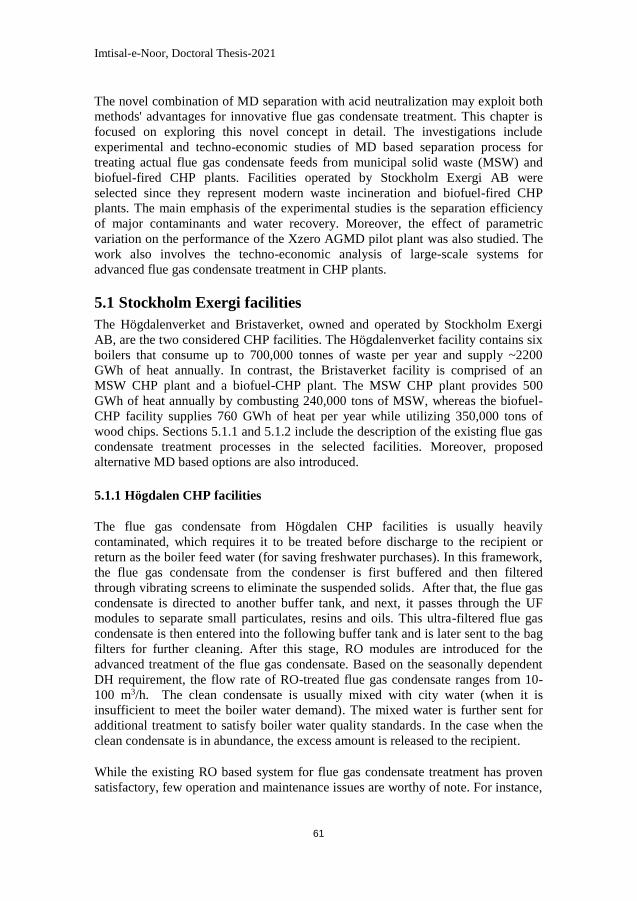
Imtisal-e-Noor, Doctoral Thesis-2021
61
The novel combination of MD separation with acid neutralization may exploit both
methods' advantages for innovative flue gas condensate treatment. This chapter is
focused on exploring this novel concept in detail. The investigations include
experimental and techno-economic studies of MD based separation process for
treating actual flue gas condensate feeds from municipal solid waste (MSW) and
biofuel-fired CHP plants. Facilities operated by Stockholm Exergi AB were
selected since they represent modern waste incineration and biofuel-fired CHP
plants. The main emphasis of the experimental studies is the separation efficiency
of major contaminants and water recovery. Moreover, the effect of parametric
variation on the performance of the Xzero AGMD pilot plant was also studied. The
work also involves the techno-economic analysis of large-scale systems for
advanced flue gas condensate treatment in CHP plants.
5.1 Stockholm Exergi facilities
The Högdalenverket and Bristaverket, owned and operated by Stockholm Exergi
AB, are the two considered CHP facilities. The Högdalenverket facility contains six
boilers that consume up to 700,000 tonnes of waste per year and supply ~2200
GWh of heat annually. In contrast, the Bristaverket facility is comprised of an
MSW CHP plant and a biofuel-CHP plant. The MSW CHP plant provides 500
GWh of heat annually by combusting 240,000 tons of MSW, whereas the biofuel-
CHP facility supplies 760 GWh of heat per year while utilizing 350,000 tons of
wood chips. Sections 5.1.1 and 5.1.2 include the description of the existing flue gas
condensate treatment processes in the selected facilities. Moreover, proposed
alternative MD based options are also introduced.
5.1.1 Högdalen CHP facilities
The flue gas condensate from Högdalen CHP facilities is usually heavily
contaminated, which requires it to be treated before discharge to the recipient or
return as the boiler feed water (for saving freshwater purchases). In this framework,
the flue gas condensate from the condenser is first buffered and then filtered
through vibrating screens to eliminate the suspended solids. After that, the flue gas
condensate is directed to another buffer tank, and next, it passes through the UF
modules to separate small particulates, resins and oils. This ultra-filtered flue gas
condensate is then entered into the following buffer tank and is later sent to the bag
filters for further cleaning. After this stage, RO modules are introduced for the
advanced treatment of the flue gas condensate. Based on the seasonally dependent
DH requirement, the flow rate of RO-treated flue gas condensate ranges from 10-
100 m3/h. The clean condensate is usually mixed with city water (when it is
insufficient to meet the boiler water demand). The mixed water is further sent for
additional treatment to satisfy boiler water quality standards. In the case when the
clean condensate is in abundance, the excess amount is released to the recipient.
While the existing RO based system for flue gas condensate treatment has proven
satisfactory, few operation and maintenance issues are worthy of note. For instance,
Imtisal-e-Noor, Doctoral Thesis-2021
62
UF modules encounter severe biofouling issues that have increased the maintenance
frequency from two cleanings per year to one cleaning per week and have also
reduced the yield by four-fold. The problem is resolved by sodium hypochlorite
(NaOCl) dosing in the buffer tanks. Moreover, the membrane scaling in RO
modules may cause serious concerns for the long-term operation of the modules.
Furthermore, the RO removal efficiency of specific contaminants is no longer
adequate due to tightened environmental controls. For example, this process faces
the challenge of maintaining acceptable levels of ammonia (NH3) and mercury
(Hg), pointing to the need for additional investments in water treatment technology.
The alternative arrangement involves off-loading the RO based system, downstream
of the shaking screens with MD based system. Figure 5.1 shows the existing RO-
based flue gas condensate treatment process in Stockholm Exergi (municipal solid
waste (MSW) fired) Högdalen cogeneration facilities [223].
MF
shaking
screens
UFBag
filtersRO
Buffer
tank
Buffered
flue gas
condensate
Reject Water
City water
Raw water
tankRaw
boiler feed
Buffer
tank
Ion
exchanger*
Recipient
Figure 5.1 Process flow diagram of RO based flue gas condensate treatment in
Stockholm Exergi Högdalen CHP facility. The Red dashed line shows an area of
interest for introducing an MD based system. * indicates additional investment.
5.1.2 Bristaverket CHP facilities
The flue gas condensate treatment system of the Bristaverket CHP facilities is
displayed in Figure 5.2. The flue gas condensate from the MSW incineration CHP
plant is first passed through MF bag filters to remove the suspended solids. After
that, it is sent to UF modules and subsequent set of bag filters to separate the
residual solids and small particulates. For further cleaning, it then flows through RO
filters. The RO treated flue gas condensate is next introduced to an ion exchanger
before entering into a condensate collection tank. Ion exchangers are specifically
used to remove the remaining metals, i.e., mercury (Hg). The typical volumetric
flow rate of flue gas condensate from the MSW-CHP plant is around 20 m3/h.
In the biofuel-fired CHP plant, the flue gas condensate is sent to MF shaking
screens and is then exposed to ultraviolet (UV) light for microorganism control.
Afterward, it follows an analogous route of flue gas condensate treatment for MSW
incineration CHP plant (exception: ion exchangers are not considered in this case).
From the biofuel-fired CHP plant, around 40 m3/h of flue gas condensate is added
into the collection tank.
Imtisal-e-Noor, Doctoral Thesis-2021
63
Later, based on requirements, the clean condensate is sent to various destinations:
1) discharged to the recipient water bodies after pH adjustment; 2) sent for
advanced treatment to produce boiler feed water; 3) directed to ash slag in the waste
fired boiler.
MF shaking
screensUF Bag filters ROUV
Flue gas
condensate
from bio-fuel
fired CHP
plant
Reject
Water
NaOH
Collection
tank
Raw boiler
feed water
Reject
Water
Municipal
final check
To ash
slag
Recipient
NaOHH2SO4
MF bag
filtersUF Bag filters RO
Flue gas
condensate
from MSW
CHP plant Ion
exchnager
Figure 5.2 Process flow diagram of RO based flue gas condensate treatment in
Stockholm Exergi Bristaverket CHP facility. The Red dashed lines show an area of
interest for introducing an MD based system.
In the MSW incineration and biofuel-fired CHP plants, it is reported that the MF
and UF modules are facing challenges concerning biofouling. These issues lead to
the requirement for an advanced wastewater management system, which can
potentially resolve the problem in an eco-friendly and economical manner.
5.2 Technical performance of Xzero laboratory prototype and
pilot plant
This section includes experimental investigations for flue gas condensate treatment
via the Xzero AGMD facilities, in which the primary focus is on the separation
efficiency of the main contaminants and feed reconcentration (associated with
volume reduction). Moreover, parametric studies are also presented to demonstrate
the potential of the system.
5.2.1 Separation efficiency
The experimental study was conducted in two phases (A and B). In phase A, flue
gas condensate samples from Högdalenverket were tested, while in phase B, flue
gas condensate samples from Bristaverket were considered.
In phase A (linked to Högdalen CHP facilities), actual flue gas condensate samples
were collected from MF shaking screens outlet and further referred as S1-A (while
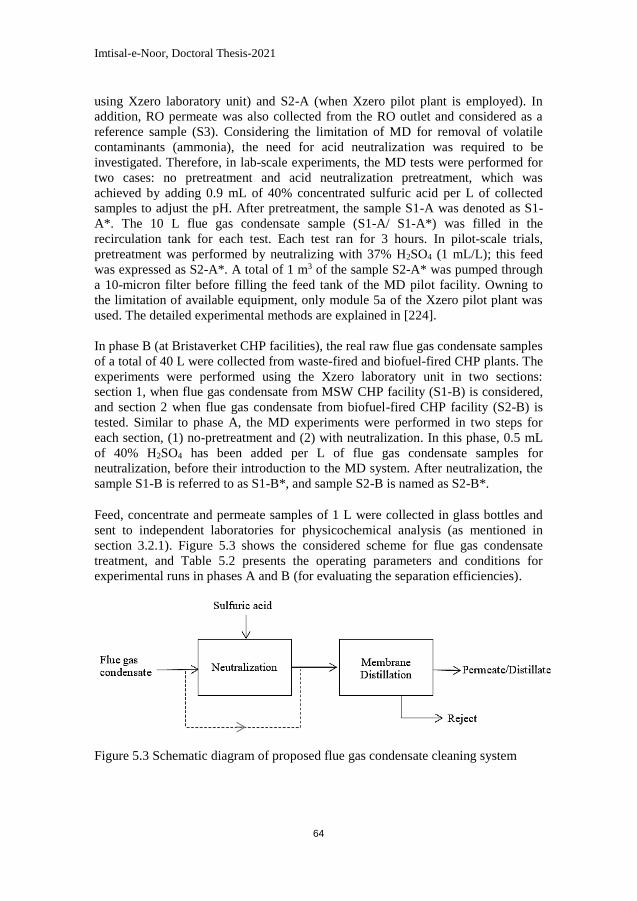
Imtisal-e-Noor, Doctoral Thesis-2021
64
using Xzero laboratory unit) and S2-A (when Xzero pilot plant is employed). In
addition, RO permeate was also collected from the RO outlet and considered as a
reference sample (S3). Considering the limitation of MD for removal of volatile
contaminants (ammonia), the need for acid neutralization was required to be
investigated. Therefore, in lab-scale experiments, the MD tests were performed for
two cases: no pretreatment and acid neutralization pretreatment, which was
achieved by adding 0.9 mL of 40% concentrated sulfuric acid per L of collected
samples to adjust the pH. After pretreatment, the sample S1-A was denoted as S1-
A*. The 10 L flue gas condensate sample (S1-A/ S1-A*) was filled in the
recirculation tank for each test. Each test ran for 3 hours. In pilot-scale trials,
pretreatment was performed by neutralizing with 37% H2SO4 (1 mL/L); this feed
was expressed as S2-A*. A total of 1 m3 of the sample S2-A* was pumped through
a 10-micron filter before filling the feed tank of the MD pilot facility. Owning to
the limitation of available equipment, only module 5a of the Xzero pilot plant was
used. The detailed experimental methods are explained in [224].
In phase B (at Bristaverket CHP facilities), the real raw flue gas condensate samples
of a total of 40 L were collected from waste-fired and biofuel-fired CHP plants. The
experiments were performed using the Xzero laboratory unit in two sections:
section 1, when flue gas condensate from MSW CHP facility (S1-B) is considered,
and section 2 when flue gas condensate from biofuel-fired CHP facility (S2-B) is
tested. Similar to phase A, the MD experiments were performed in two steps for
each section, (1) no-pretreatment and (2) with neutralization. In this phase, 0.5 mL
of 40% H2SO4 has been added per L of flue gas condensate samples for
neutralization, before their introduction to the MD system. After neutralization, the
sample S1-B is referred to as S1-B*, and sample S2-B is named as S2-B*.
Feed, concentrate and permeate samples of 1 L were collected in glass bottles and
sent to independent laboratories for physicochemical analysis (as mentioned in
section 3.2.1). Figure 5.3 shows the considered scheme for flue gas condensate
treatment, and Table 5.2 presents the operating parameters and conditions for
experimental runs in phases A and B (for evaluating the separation efficiencies).
Figure 5.3 Schematic diagram of proposed flue gas condensate cleaning system
Imtisal-e-Noor, Doctoral Thesis-2021
65
Table 5.2 Experimental conditions of phase A and B testing
Phase A Phase B
Högdalen CHP facilities Bristaverket CHP
facilities
Parameters Xzero laboratory
prototype
Xzero pilot
plant
Xzero laboratory
prototype
Feed sample volume (L) 10 1000 10
Feed temperature (°C) 70 55, 70, 80 70
Coolant temperature (°C) 18 15 18
Feed flow rate (L/min) 4.9 10 4.9
Coolant flow rate (L/min) 6.8 10 6.8
Permeate sample Size (L) 1 1 1
Phase A (Hödgalen CHP facilities)
Table 5.3 summarizes the outcomes of physicochemical analysis of raw flue gas
condensate samples (S1-A and S2-A), pretreated flue gas condensates (S1-A* and
S2-A*) and their resulting permeate samples. The obtained permeate samples of S1-
A and S2-A (no pretreatment) are named as D1-A and D2-A, whereas the
permeates of S1-A* and S2-A* (with neutralization) are denoted as D1-A* and D2-
A*, respectively.
Considering sample D1-A, most of the analyzed metals were under detection limits
except Cd and Pb; however, their concentration was below the maximum
acceptable levels. Moreover, the obtained concentrations of Na, Hg and Zn were
lower in comparison to the related values of RO permeate (S3). In the case of ions,
the separation efficiency of MD for Cl- and SO4-2 was >99%, whereas the
concentration of ammonium ions was not substantially reduced, i.e., ~35% owing to
the high volatility of ammonia. Resultantly, higher conductivity of sample D1-A
was observed than that of the S3 sample. This finding points to the need for
pretreatment via acid neutralization. It was found that after pH adjustment,
ammonium concentration in D1-A* was <0.05 ppm, which was lower than the
achievable value (3.32 ppm) for RO permeate (S3). When the quality of D1-A and
D1-A* was compared, it was found that metallic concentrations were similar in MD
permeate samples. The concentration levels of all analyzed metals in D1-A* were
following regulated limits except Cd. Considering other water quality parameters,
the values for D1-A* were found comparable to the respective values for the RO
permeate sample (S3). Since acid neutralization was taken into account as a
pretreatment step, the pH of samples D1-A* was comparatively low (~5). More
results are discussed in [224].
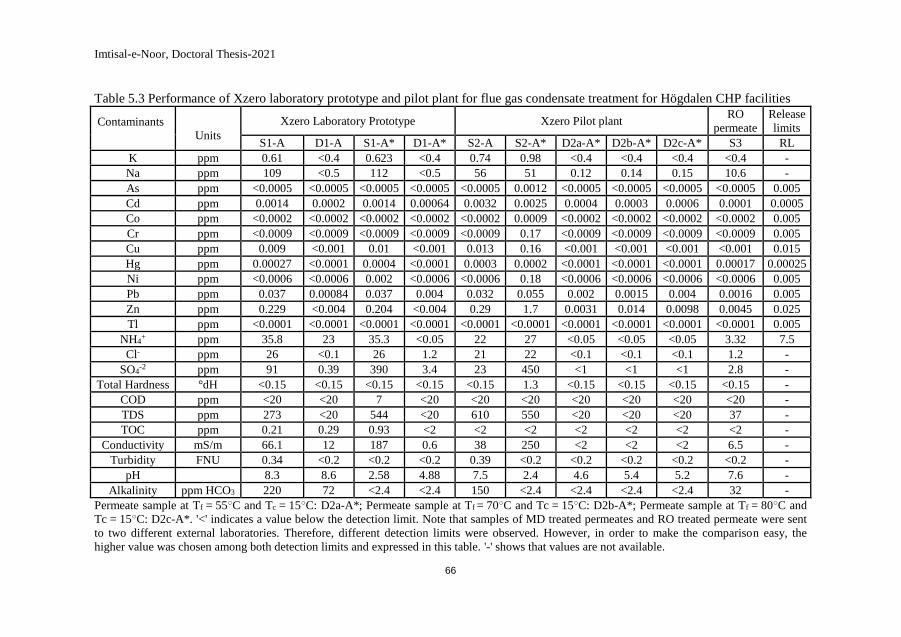
Imtisal-e-Noor, Doctoral Thesis-2021
66
Table 5.3 Performance of Xzero laboratory prototype and pilot plant for flue gas condensate treatment for Högdalen CHP facilities
Contaminants
Units
Xzero Laboratory Prototype Xzero Pilot plant RO
permeate
Release
limits
S1-A D1-A S1-A* D1-A* S2-A S2-A* D2a-A* D2b-A* D2c-A* S3 RL
K ppm 0.61 <0.4 0.623 <0.4 0.74 0.98 <0.4 <0.4 <0.4 <0.4 -
Na ppm 109 <0.5 112 <0.5 56 51 0.12 0.14 0.15 10.6 -
As ppm <0.0005 <0.0005 <0.0005 <0.0005 <0.0005 0.0012 <0.0005 <0.0005 <0.0005 <0.0005 0.005
Cd ppm 0.0014 0.0002 0.0014 0.00064 0.0032 0.0025 0.0004 0.0003 0.0006 0.0001 0.0005
Co ppm <0.0002 <0.0002 <0.0002 <0.0002 <0.0002 0.0009 <0.0002 <0.0002 <0.0002 <0.0002 0.005
Cr ppm <0.0009 <0.0009 <0.0009 <0.0009 <0.0009 0.17 <0.0009 <0.0009 <0.0009 <0.0009 0.005
Cu ppm 0.009 <0.001 0.01 <0.001 0.013 0.16 <0.001 <0.001 <0.001 <0.001 0.015
Hg ppm 0.00027 <0.0001 0.0004 <0.0001 0.0003 0.0002 <0.0001 <0.0001 <0.0001 0.00017 0.00025
Ni ppm <0.0006 <0.0006 0.002 <0.0006 <0.0006 0.18 <0.0006 <0.0006 <0.0006 <0.0006 0.005
Pb ppm 0.037 0.00084 0.037 0.004 0.032 0.055 0.002 0.0015 0.004 0.0016 0.005
Zn ppm 0.229 <0.004 0.204 <0.004 0.29 1.7 0.0031 0.014 0.0098 0.0045 0.025
Tl ppm <0.0001 <0.0001 <0.0001 <0.0001 <0.0001 <0.0001 <0.0001 <0.0001 <0.0001 <0.0001 0.005
NH4+ ppm 35.8 23 35.3 <0.05 22 27 <0.05 <0.05 <0.05 3.32 7.5
Cl- ppm 26 <0.1 26 1.2 21 22 <0.1 <0.1 <0.1 1.2 -
SO4-2 ppm 91 0.39 390 3.4 23 450 <1 <1 <1 2.8 -
Total Hardness °dH <0.15 <0.15 <0.15 <0.15 <0.15 1.3 <0.15 <0.15 <0.15 <0.15 -
COD ppm <20 <20 7 <20 <20 <20 <20 <20 <20 <20 -
TDS ppm 273 <20 544 <20 610 550 <20 <20 <20 37 -
TOC ppm 0.21 0.29 0.93 <2 <2 <2 <2 <2 <2 <2 -
Conductivity mS/m 66.1 12 187 0.6 38 250 <2 <2 <2 6.5 -
Turbidity FNU 0.34 <0.2 <0.2 <0.2 0.39 <0.2 <0.2 <0.2 <0.2 <0.2 -
pH 8.3 8.6 2.58 4.88 7.5 2.4 4.6 5.4 5.2 7.6 -
Alkalinity ppm HCO3 220 72 <2.4 <2.4 150 <2.4 <2.4 <2.4 <2.4 32 -
Permeate sample at Tf = 55○C and Tc = 15○C: D2a-A*; Permeate sample at Tf = 70○C and Tc = 15○C: D2b-A*; Permeate sample at Tf = 80○C and
Tc = 15○C: D2c-A*. '<' indicates a value below the detection limit. Note that samples of MD treated permeates and RO treated permeate were sent
to two different external laboratories. Therefore, different detection limits were observed. However, in order to make the comparison easy, the
higher value was chosen among both detection limits and expressed in this table. '-' shows that values are not available.
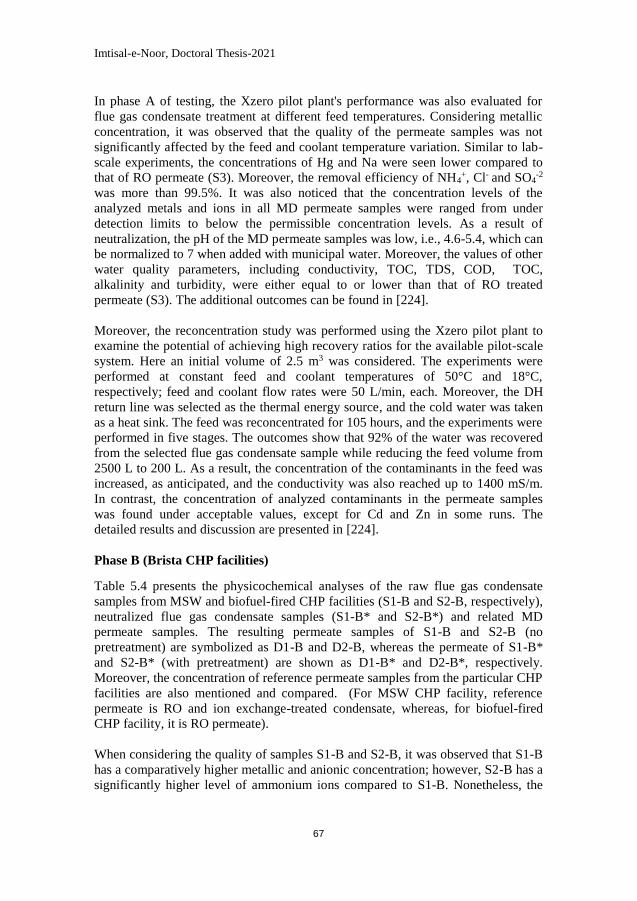
Imtisal-e-Noor, Doctoral Thesis-2021
67
In phase A of testing, the Xzero pilot plant's performance was also evaluated for
flue gas condensate treatment at different feed temperatures. Considering metallic
concentration, it was observed that the quality of the permeate samples was not
significantly affected by the feed and coolant temperature variation. Similar to lab-
scale experiments, the concentrations of Hg and Na were seen lower compared to
that of RO permeate (S3). Moreover, the removal efficiency of NH4+, Cl- and SO4
-2
was more than 99.5%. It was also noticed that the concentration levels of the
analyzed metals and ions in all MD permeate samples were ranged from under
detection limits to below the permissible concentration levels. As a result of
neutralization, the pH of the MD permeate samples was low, i.e., 4.6-5.4, which can
be normalized to 7 when added with municipal water. Moreover, the values of other
water quality parameters, including conductivity, TOC, TDS, COD, TOC,
alkalinity and turbidity, were either equal to or lower than that of RO treated
permeate (S3). The additional outcomes can be found in [224].
Moreover, the reconcentration study was performed using the Xzero pilot plant to
examine the potential of achieving high recovery ratios for the available pilot-scale
system. Here an initial volume of 2.5 m3 was considered. The experiments were
performed at constant feed and coolant temperatures of 50°C and 18°C,
respectively; feed and coolant flow rates were 50 L/min, each. Moreover, the DH
return line was selected as the thermal energy source, and the cold water was taken
as a heat sink. The feed was reconcentrated for 105 hours, and the experiments were
performed in five stages. The outcomes show that 92% of the water was recovered
from the selected flue gas condensate sample while reducing the feed volume from
2500 L to 200 L. As a result, the concentration of the contaminants in the feed was
increased, as anticipated, and the conductivity was also reached up to 1400 mS/m.
In contrast, the concentration of analyzed contaminants in the permeate samples
was found under acceptable values, except for Cd and Zn in some runs. The
detailed results and discussion are presented in [224].
Phase B (Brista CHP facilities)
Table 5.4 presents the physicochemical analyses of the raw flue gas condensate
samples from MSW and biofuel-fired CHP facilities (S1-B and S2-B, respectively),
neutralized flue gas condensate samples (S1-B* and S2-B*) and related MD
permeate samples. The resulting permeate samples of S1-B and S2-B (no
pretreatment) are symbolized as D1-B and D2-B, whereas the permeate of S1-B*
and S2-B* (with pretreatment) are shown as D1-B* and D2-B*, respectively.
Moreover, the concentration of reference permeate samples from the particular CHP
facilities are also mentioned and compared. (For MSW CHP facility, reference
permeate is RO and ion exchange-treated condensate, whereas, for biofuel-fired
CHP facility, it is RO permeate).
When considering the quality of samples S1-B and S2-B, it was observed that S1-B
has a comparatively higher metallic and anionic concentration; however, S2-B has a
significantly higher level of ammonium ions compared to S1-B. Nonetheless, the
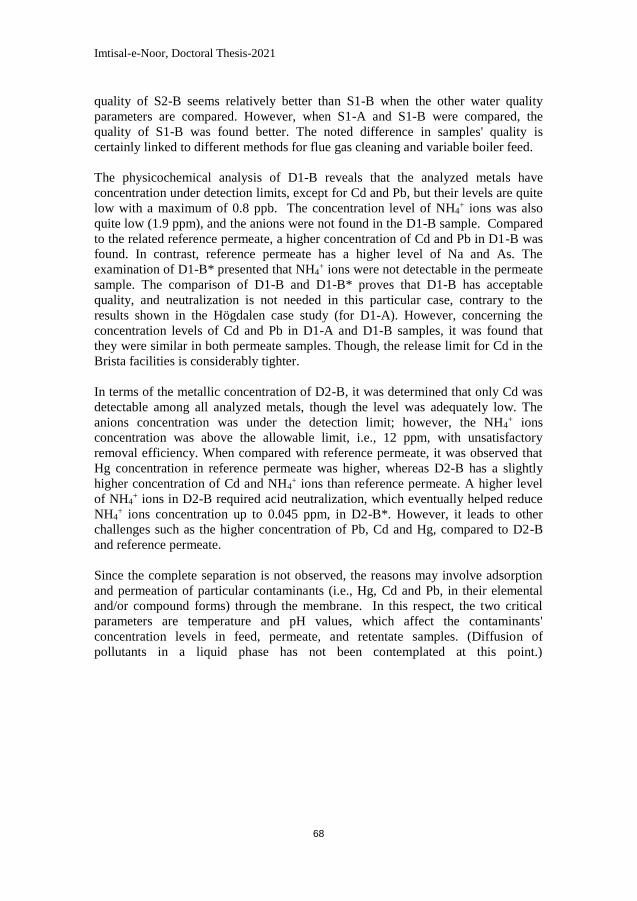
Imtisal-e-Noor, Doctoral Thesis-2021
68
quality of S2-B seems relatively better than S1-B when the other water quality
parameters are compared. However, when S1-A and S1-B were compared, the
quality of S1-B was found better. The noted difference in samples' quality is
certainly linked to different methods for flue gas cleaning and variable boiler feed.
The physicochemical analysis of D1-B reveals that the analyzed metals have
concentration under detection limits, except for Cd and Pb, but their levels are quite
low with a maximum of 0.8 ppb. The concentration level of NH4+ ions was also
quite low (1.9 ppm), and the anions were not found in the D1-B sample. Compared
to the related reference permeate, a higher concentration of Cd and Pb in D1-B was
found. In contrast, reference permeate has a higher level of Na and As. The
examination of D1-B* presented that NH4+ ions were not detectable in the permeate
sample. The comparison of D1-B and D1-B* proves that D1-B has acceptable
quality, and neutralization is not needed in this particular case, contrary to the
results shown in the Högdalen case study (for D1-A). However, concerning the
concentration levels of Cd and Pb in D1-A and D1-B samples, it was found that
they were similar in both permeate samples. Though, the release limit for Cd in the
Brista facilities is considerably tighter.
In terms of the metallic concentration of D2-B, it was determined that only Cd was
detectable among all analyzed metals, though the level was adequately low. The
anions concentration was under the detection limit; however, the NH4+ ions
concentration was above the allowable limit, i.e., 12 ppm, with unsatisfactory
removal efficiency. When compared with reference permeate, it was observed that
Hg concentration in reference permeate was higher, whereas D2-B has a slightly
higher concentration of Cd and NH4+ ions than reference permeate. A higher level
of NH4+ ions in D2-B required acid neutralization, which eventually helped reduce
NH4+ ions concentration up to 0.045 ppm, in D2-B*. However, it leads to other
challenges such as the higher concentration of Pb, Cd and Hg, compared to D2-B
and reference permeate.
Since the complete separation is not observed, the reasons may involve adsorption
and permeation of particular contaminants (i.e., Hg, Cd and Pb, in their elemental
and/or compound forms) through the membrane. In this respect, the two critical
parameters are temperature and pH values, which affect the contaminants'
concentration levels in feed, permeate, and retentate samples. (Diffusion of
pollutants in a liquid phase has not been contemplated at this point.)
Imtisal-e-Noor, Doctoral Thesis-2021
69
Table 5.4 Performance of Xzero laboratory prototype for flue gas condensate treatment in case of Bristaverket CHP facilities Contaminants Units Waste to Energy CHP facility Biofuel-fired CHP facility
S1-B D1-B S1-B* D1-B* Reference
permeate
S2-B D2-B S2-B* D2-B* Reference
permeate
HR Release
Limit
Na ppm 27 <0.5 23 0.33 3.37 0.18 <0.5 1.2 0.22 <0.5 8.01 -
K ppm 2.1 <0.4 2 <0.4 <0.4 0.15 <0.4 0.24 <0.4 <0.4 <0.4 -
As ppm <0.0005 <0.0005 0.00021 <0.0005 0.000507 <0.0005 <0.0005 <0.0005 <0.0005 <0.0005 <0.0005 0.001
Al ppm <0.01 <0.01 0.17 <0.01 <0.01 <0.01 <0.01 0.027 <0.01 <0.01 <0.01 -
Pb ppm 0.0034 0.00082 0.0079 0.0017 <0.0005 0.001 <0.0005 0.0042 0.00095 <0.0005 <0.0005 0.0015
Cd ppm 0.00054 0.00037 0.00061 0.00032 <0.00005 0.00039 0.00011 0.00053 0.00018 <0.00005 <0.00005 0.00008
Cu ppm 0.0033 <0.001 0.14 0.0017 <0.001 <0.001 <0.001 0.011 <0.001 <0.001 <0.001 0.002
Hg ppm 0.00059 <0.0001 0.00029 <0.0001 <0.0001 0.0016 <0.0001 0.0025 0.00099 0.00018 0.00021 0.0002
Mo ppm 0.0006 <0.0005 0.00038 <0.0005 <0.0005 <0.0005 <0.0005 <0.0005 <0.0005 <0.0005 <0.0005 -
Ni ppm 0.0012 <0.0006 0.058 <0.0006 <0.0006 <0.0006 <0.0006 0.015 <0.0006 <0.0006 <0.0006 0.001
Tl ppm <0.0001 <0.0001 <0.0001 <0.0001 <0.0001 <0.0001 <0.0001 <0.0001 <0.0001 <0.0001 <0.0001 0.0005
Zn ppm 0.0089 <0.004 0.28 <0.004 <0.004 <0.004 <0.004 0.022 <0.004 <0.004 <0.004 0.01
Cl- ppm 14 <0.1 15 <0.1 - 7.5 <0.1 8.6 0.14 - - -
SO4-2 ppm 37 <1 360 <1 - <1 <1 430 <1 - <1 -
NH4+ ppm 1.1 1.9 0.46 <0.01 1.21 36 12 37 0.045 1.59 4.75 5
TOC ppm 2.7 <2 4.5 <2 - <2 <2 <2 <2 - - -
COD ppm <20 <20 < 20 <20 - <20 <20 <20 <20 - - -
TDS ppm 140 <20 450 <20 - <20 <20 450 <20 - - -
Total Hardness °dH 4.4 <0.15 4.2 <0.15 - <0.15 <0.15 <0.15 <0.15 - - -
Turbidity FNU <0.1 0.13 1.2 <0.1 - 0.13 <0.1 0.71 <0.1 - - -
pH 7.9 7.2 2.4 4.8 5.5 7.6 8.8 2.3 3.7 5.2 - -
Conductivity mS/m 28 <2.0 210 <2.0 22 26 6.1 290 10 19 - -
Alkalinity ppm
HCO3
89 7.1 <2 <2 - 77 41 <2 <2 - - -
'<' indicates a value below the detection limit. Note that samples of MD treated permeate and RO treated permeates were sent to two different
external laboratories. Therefore, different detection limits were observed. However, in order to make the comparison easy, the higher value was
chosen among both detection limits and expressed in this table. '-' shows that values are not available.
Imtisal-e-Noor, Doctoral Thesis-2021
70
The observed non-ideal separation of contaminants may attribute to the following
potential mechanisms:
Higher temperature levels increase the vapor pressure of some elements (or
their compounds) as well as improve the solubility of various salts. For
instance, elemental Hg shows high vapor pressure (volatility) at elevated
temperatures; on the other hand, the increase in solubility of HgCl2 (rich in flue
gas condensate) can be observed at the higher temperature, that may lead to the
presence of Hg both in permeate and concentrate [225]. The elemental Cd is
also quite volatile and insoluble; however, CdCl2 (abundant in flue gas
condensate) is very soluble in water, and its solubility improves with an
increase in temperature [226]. The other contaminants, for example, PbCl2 is
sparingly soluble but highly volatile; however, at elevated temperatures, it also
shows higher solubility.
The variation in the pH level may alter the speciation of elements in the
solution as well as change the surface charge of the polymeric (PTFE)
membrane.
Depending upon the chemical and thermodynamic stability of the elements
and their compounds in the solution, their speciation at a certain pH level
can be defined by the Pourbaix diagram [227]. For instance, oxides of Hg,
Pb and Cd may not be observed when the pH of the solution is <4 [227]–
[229]. Therefore, the acidic flue gas condensate might not contain these
oxides. Moreover, at lower pH levels, the NH3 concentration is negligible
since the equilibrium favors the formation of NH4+ in aqueous solution
[230]. The change in pH level alters the electrostatic interactions among the
membrane surface and charged solutes, which determine the permeation or
retention of the contaminants; counter-ions attract towards the membrane
surface; however, co-ions show the opposite behavior [231]–[233]. This
might be another explanation of the presence of Hg, Cd and Pb in the
permeate samples. Additionally, the solubility of some salts is also affected by their
associated anions and pH levels, which can be described by Le Chatelier's
principle [234]. In the acidic flue gas condensate samples, the solubility of
almost all sparingly soluble salts (whose anion is the conjugate base of a
weak acid) is enhanced dramatically. However, with pH change, no to
little effect can be recorded on the solubility of the salt whose anion is the
conjugate base of a strong acid or stronger weak acid, respectively (for
instance, sulfates and chlorides).
Thus the performance of the MD systems may considerably be influenced by higher
temperatures and lower pH values due to the change in properties of the MD
membrane and contaminants.
Imtisal-e-Noor, Doctoral Thesis-2021
71
Combined Scenario
At the Bristaverket facilities, clean condensates from both plants are typically
mixed and referred as HR. The comparison of D1-B and D2-B* with HR indicates
that MD permeate samples have a relatively higher concentration level of Pb, Cd
and Hg (only in case of D2-B*); however, HR shows comparatively higher amounts
of Hg (in case of D1-B), Na, and NH4+ ions. The final comparison of the values of
MD permeates with release limits (RL) reports that D1-B and D2-B* have partially
fulfilled the RL requirement. For improving the performance of the MD system, the
mixing of permeates is considered as one of the options. The results tell that when
D2-B and D2-B* are mixed in the ratio of 4 to 1, the quality of the mixed permeate
(M1) was much closer to the desired outcome. Moreover, when M1 is added in the
equal amount of D1-B, the mixed permeate (M12) fulfills the regulatory
requirements, except for Cd. The detailed outcomes are presented in [235]. To
manage the concentration of Cd, existing ion exchangers with cation resins can be
employed as an add-on before releasing the clean condensate to water bodies or
reuse as boiler/process feed water. [236].
5.2.2 Module performance
Apart from determining the removal efficiencies of MD systems, a parametric study
was conducted for analyzing the system performance at different operating flow
rates and temperatures. For understanding the impact of these parameters on the
performance of MD pilot plant, ranges of feed and coolant flow rates (10-25 L/min,
in increments of 5 L/min), feed inlet temperatures (50-90°C, in increments of 5°C),
and coolant inlet temperatures (15-55°C, in increments of 5°C) were employed.
For this study, neutralized flue gas condensate sample, S2-A* (from Högdalen CHP
facilities) was taken as MD feed, considering that composition and concentration
change does not significantly affect the parametric study.
Yield analysis
Figure 5.4 and Figure 5.5 present the effect of MD feed and coolant temperatures
and flow rates on transmembrane flux. The outcomes show that lower coolant
temperatures and higher feed temperatures were linked to comparatively higher
transmembrane flux due to improved driving force. Moreover, the higher feed to
coolant temperature difference resulted in greater flux. It is noteworthy that, for the
same temperature difference between feed and coolant streams, slightly higher
transmembrane flux was obtained at higher feed temperatures. The maximum
achievable flux was 7.2 L/m2h, at the feed temperature of 80°C and coolant
temperatures of 15°C. Concerning the effect of flow rates at constant temperatures,
it was found that an increase in MD feed and coolant flow rates improved the
transmembrane flux and exhibited a positive linear trend. These outcomes are in
line with the results shown in section 4.1.2
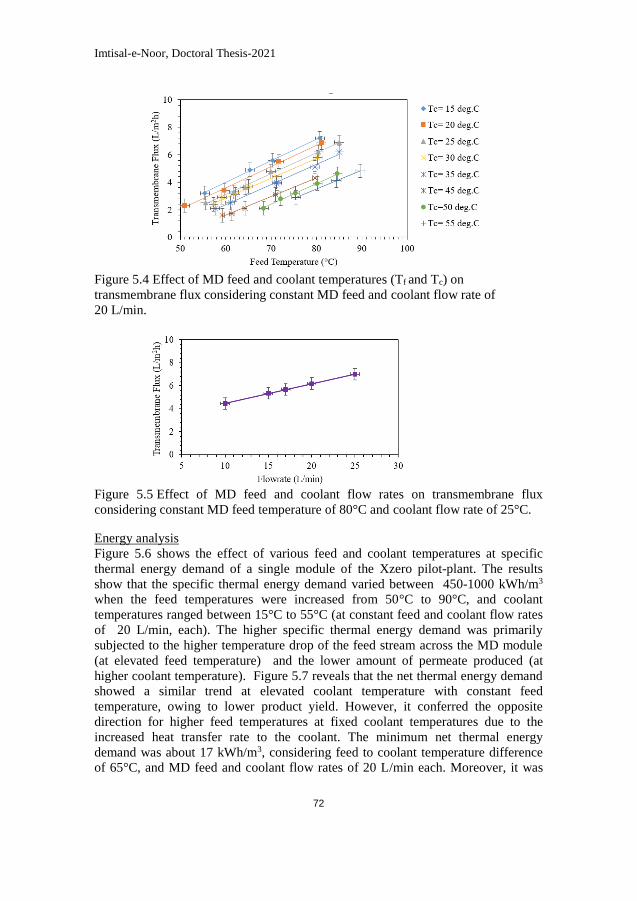
Imtisal-e-Noor, Doctoral Thesis-2021
72
Figure 5.4 Effect of MD feed and coolant temperatures (Tf and Tc) on
transmembrane flux considering constant MD feed and coolant flow rate of
20 L/min.
Figure 5.5 Effect of MD feed and coolant flow rates on transmembrane flux
considering constant MD feed temperature of 80°C and coolant flow rate of 25°C.
Energy analysis
Figure 5.6 shows the effect of various feed and coolant temperatures at specific
thermal energy demand of a single module of the Xzero pilot-plant. The results
show that the specific thermal energy demand varied between 450-1000 kWh/m3
when the feed temperatures were increased from 50°C to 90°C, and coolant
temperatures ranged between 15°C to 55°C (at constant feed and coolant flow rates
of 20 L/min, each). The higher specific thermal energy demand was primarily
subjected to the higher temperature drop of the feed stream across the MD module
(at elevated feed temperature) and the lower amount of permeate produced (at
higher coolant temperature). Figure 5.7 reveals that the net thermal energy demand
showed a similar trend at elevated coolant temperature with constant feed
temperature, owing to lower product yield. However, it conferred the opposite
direction for higher feed temperatures at fixed coolant temperatures due to the
increased heat transfer rate to the coolant. The minimum net thermal energy
demand was about 17 kWh/m3, considering feed to coolant temperature difference
of 65°C, and MD feed and coolant flow rates of 20 L/min each. Moreover, it was
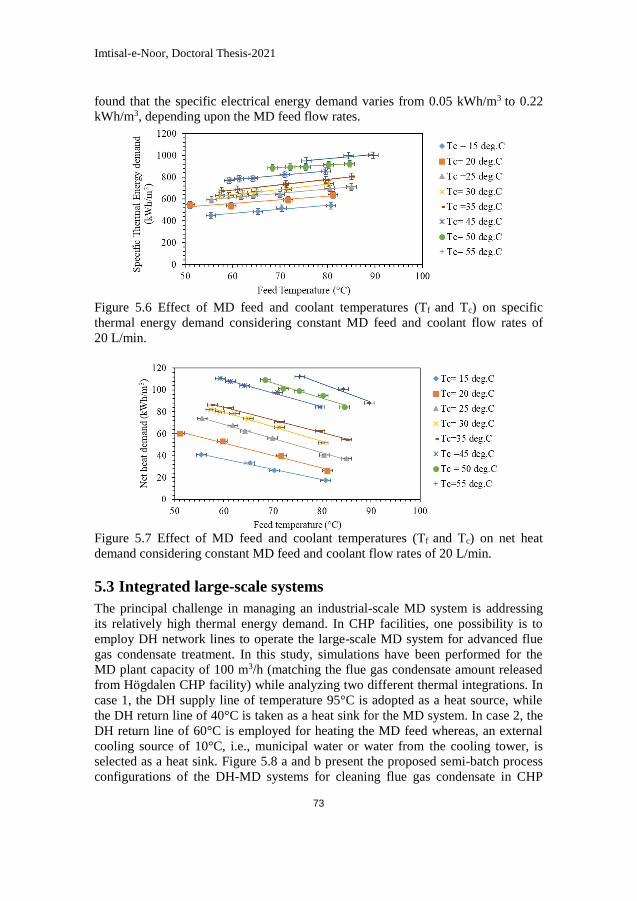
Imtisal-e-Noor, Doctoral Thesis-2021
73
found that the specific electrical energy demand varies from 0.05 kWh/m3 to 0.22
kWh/m3, depending upon the MD feed flow rates.
Figure 5.6 Effect of MD feed and coolant temperatures (Tf and Tc) on specific
thermal energy demand considering constant MD feed and coolant flow rates of
20 L/min.
Figure 5.7 Effect of MD feed and coolant temperatures (Tf and Tc) on net heat
demand considering constant MD feed and coolant flow rates of 20 L/min.
5.3 Integrated large-scale systems
The principal challenge in managing an industrial-scale MD system is addressing
its relatively high thermal energy demand. In CHP facilities, one possibility is to
employ DH network lines to operate the large-scale MD system for advanced flue
gas condensate treatment. In this study, simulations have been performed for the
MD plant capacity of 100 m3/h (matching the flue gas condensate amount released
from Högdalen CHP facility) while analyzing two different thermal integrations. In
case 1, the DH supply line of temperature 95°C is adopted as a heat source, while
the DH return line of 40°C is taken as a heat sink for the MD system. In case 2, the
DH return line of 60°C is employed for heating the MD feed whereas, an external
cooling source of 10°C, i.e., municipal water or water from the cooling tower, is
selected as a heat sink. Figure 5.8 a and b present the proposed semi-batch process
configurations of the DH-MD systems for cleaning flue gas condensate in CHP
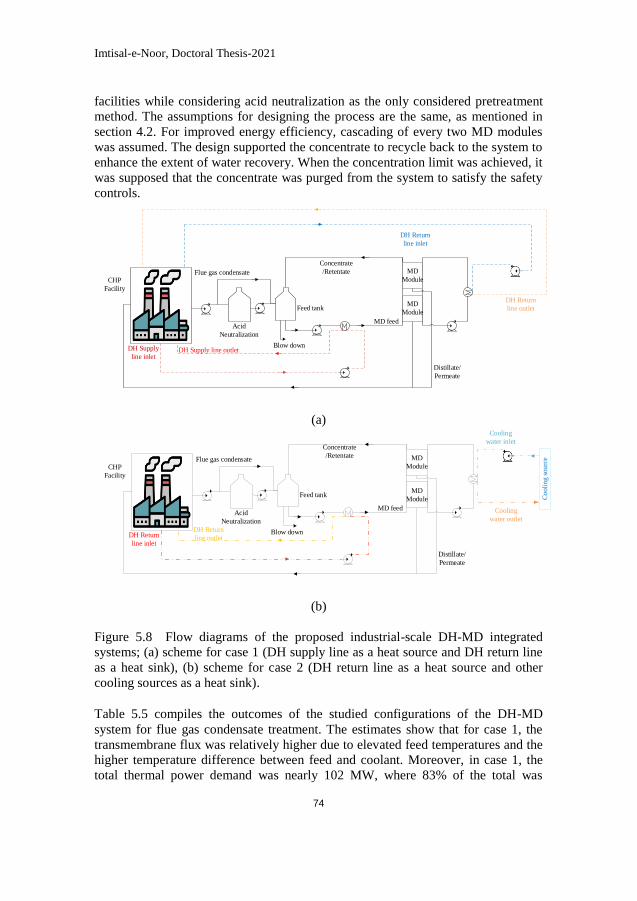
Imtisal-e-Noor, Doctoral Thesis-2021
74
facilities while considering acid neutralization as the only considered pretreatment
method. The assumptions for designing the process are the same, as mentioned in
section 4.2. For improved energy efficiency, cascading of every two MD modules
was assumed. The design supported the concentrate to recycle back to the system to
enhance the extent of water recovery. When the concentration limit was achieved, it
was supposed that the concentrate was purged from the system to satisfy the safety
controls.
Flue gas condensate
Concentrate
/Retentate
MD feed
Distillate/
Permeate
Acid
Neutralization
Feed tank DH Return
line outlet
DH Return
line inlet
DH Supply
line inletDH Supply line outlet
CHP
Facility
MD
Module
MD
Module
Blow down
(a)
Flue gas condensate
Concentrate
/Retentate
MD feed
Distillate/
Permeate
Acid
Neutralization
Feed tank
DH Return
line inlet
DH Return
line outlet
CHP
Facility
MD
Module
MD
Module Co
oli
ng s
ou
rce
Cooling
water inlet
Cooling
water outlet
Blow down
(b)
Figure 5.8 Flow diagrams of the proposed industrial-scale DH-MD integrated
systems; (a) scheme for case 1 (DH supply line as a heat source and DH return line
as a heat sink), (b) scheme for case 2 (DH return line as a heat source and other
cooling sources as a heat sink).
Table 5.5 compiles the outcomes of the studied configurations of the DH-MD
system for flue gas condensate treatment. The estimates show that for case 1, the
transmembrane flux was relatively higher due to elevated feed temperatures and the
higher temperature difference between feed and coolant. Moreover, in case 1, the
total thermal power demand was nearly 102 MW, where 83% of the total was
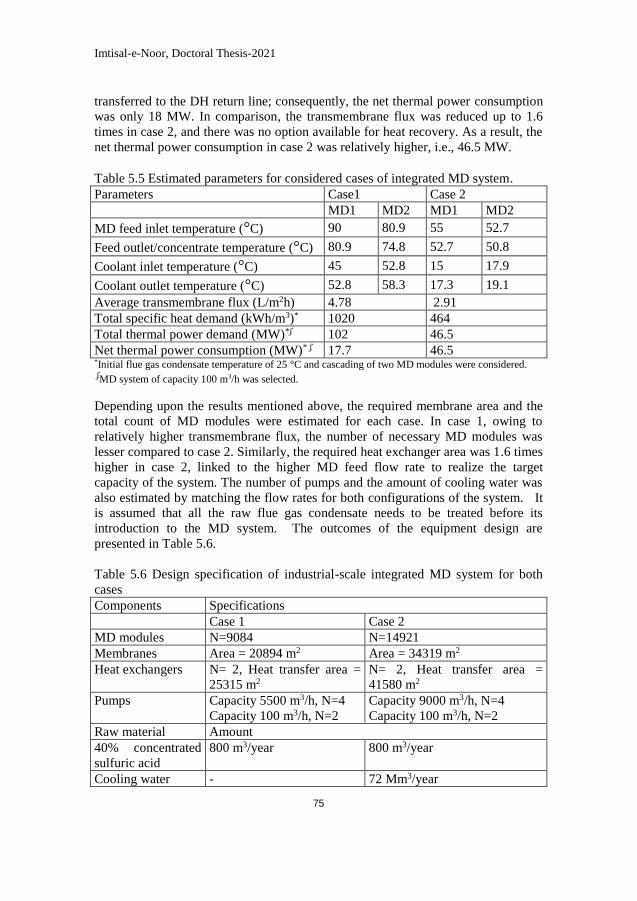
Imtisal-e-Noor, Doctoral Thesis-2021
75
transferred to the DH return line; consequently, the net thermal power consumption
was only 18 MW. In comparison, the transmembrane flux was reduced up to 1.6
times in case 2, and there was no option available for heat recovery. As a result, the
net thermal power consumption in case 2 was relatively higher, i.e., 46.5 MW.
Table 5.5 Estimated parameters for considered cases of integrated MD system.
Parameters Case1 Case 2
MD1 MD2 MD1 MD2
MD feed inlet temperature (°C) 90 80.9 55 52.7
Feed outlet/concentrate temperature (°C) 80.9 74.8 52.7 50.8
Coolant inlet temperature (°C) 45 52.8 15 17.9
Coolant outlet temperature (°C) 52.8 58.3 17.3 19.1
Average transmembrane flux (L/m2h) 4.78 2.91
Total specific heat demand (kWh/m3)* 1020 464
Total thermal power demand (MW)*ʄ 102 46.5
Net thermal power consumption (MW)* ʄ 17.7 46.5 *Initial flue gas condensate temperature of 25 °C and cascading of two MD modules were considered. ʄMD system of capacity 100 m3/h was selected.
Depending upon the results mentioned above, the required membrane area and the
total count of MD modules were estimated for each case. In case 1, owing to
relatively higher transmembrane flux, the number of necessary MD modules was
lesser compared to case 2. Similarly, the required heat exchanger area was 1.6 times
higher in case 2, linked to the higher MD feed flow rate to realize the target
capacity of the system. The number of pumps and the amount of cooling water was
also estimated by matching the flow rates for both configurations of the system. It
is assumed that all the raw flue gas condensate needs to be treated before its
introduction to the MD system. The outcomes of the equipment design are
presented in Table 5.6.
Table 5.6 Design specification of industrial-scale integrated MD system for both
cases
Components Specifications
Case 1 Case 2
MD modules N=9084 N=14921
Membranes Area = 20894 m2 Area = 34319 m2
Heat exchangers N= 2, Heat transfer area =
25315 m2
N= 2, Heat transfer area =
41580 m2
Pumps Capacity 5500 m3/h, N=4
Capacity 100 m3/h, N=2
Capacity 9000 m3/h, N=4
Capacity 100 m3/h, N=2
Raw material Amount
40% concentrated
sulfuric acid
800 m3/year 800 m3/year
Cooling water - 72 Mm3/year
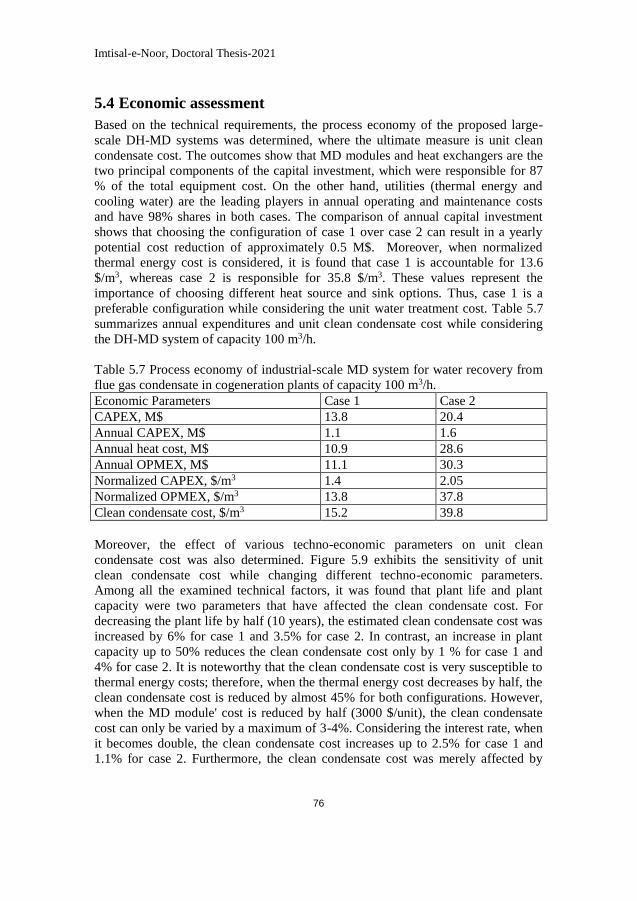
Imtisal-e-Noor, Doctoral Thesis-2021
76
5.4 Economic assessment
Based on the technical requirements, the process economy of the proposed large-
scale DH-MD systems was determined, where the ultimate measure is unit clean
condensate cost. The outcomes show that MD modules and heat exchangers are the
two principal components of the capital investment, which were responsible for 87
% of the total equipment cost. On the other hand, utilities (thermal energy and
cooling water) are the leading players in annual operating and maintenance costs
and have 98% shares in both cases. The comparison of annual capital investment
shows that choosing the configuration of case 1 over case 2 can result in a yearly
potential cost reduction of approximately 0.5 M$. Moreover, when normalized
thermal energy cost is considered, it is found that case 1 is accountable for 13.6
$/m3, whereas case 2 is responsible for 35.8 $/m3. These values represent the
importance of choosing different heat source and sink options. Thus, case 1 is a
preferable configuration while considering the unit water treatment cost. Table 5.7
summarizes annual expenditures and unit clean condensate cost while considering
the DH-MD system of capacity 100 m3/h.
Table 5.7 Process economy of industrial-scale MD system for water recovery from
flue gas condensate in cogeneration plants of capacity 100 m3/h.
Economic Parameters Case 1 Case 2
CAPEX, M$ 13.8 20.4
Annual CAPEX, M$ 1.1 1.6
Annual heat cost, M$ 10.9 28.6
Annual OPMEX, M$ 11.1 30.3
Normalized CAPEX, $/m3 1.4 2.05
Normalized OPMEX, $/m3 13.8 37.8
Clean condensate cost, $/m3 15.2 39.8
Moreover, the effect of various techno-economic parameters on unit clean
condensate cost was also determined. Figure 5.9 exhibits the sensitivity of unit
clean condensate cost while changing different techno-economic parameters.
Among all the examined technical factors, it was found that plant life and plant
capacity were two parameters that have affected the clean condensate cost. For
decreasing the plant life by half (10 years), the estimated clean condensate cost was
increased by 6% for case 1 and 3.5% for case 2. In contrast, an increase in plant
capacity up to 50% reduces the clean condensate cost only by 1 % for case 1 and
4% for case 2. It is noteworthy that the clean condensate cost is very susceptible to
thermal energy costs; therefore, when the thermal energy cost decreases by half, the
clean condensate cost is reduced by almost 45% for both configurations. However,
when the MD module' cost is reduced by half (3000 $/unit), the clean condensate
cost can only be varied by a maximum of 3-4%. Considering the interest rate, when
it becomes double, the clean condensate cost increases up to 2.5% for case 1 and
1.1% for case 2. Furthermore, the clean condensate cost was merely affected by
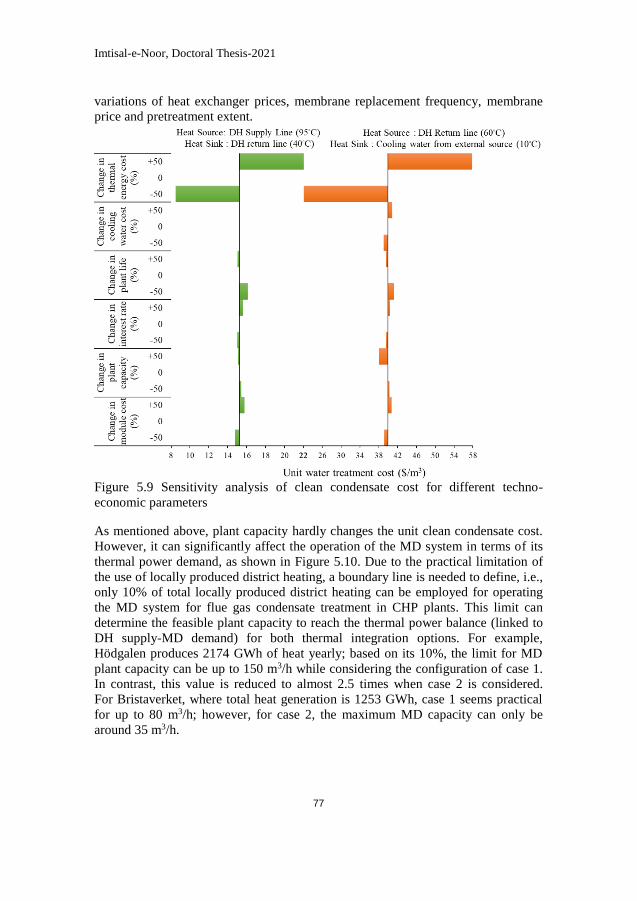
Imtisal-e-Noor, Doctoral Thesis-2021
77
variations of heat exchanger prices, membrane replacement frequency, membrane
price and pretreatment extent.
Figure 5.9 Sensitivity analysis of clean condensate cost for different techno-
economic parameters
As mentioned above, plant capacity hardly changes the unit clean condensate cost.
However, it can significantly affect the operation of the MD system in terms of its
thermal power demand, as shown in Figure 5.10. Due to the practical limitation of
the use of locally produced district heating, a boundary line is needed to define, i.e.,
only 10% of total locally produced district heating can be employed for operating
the MD system for flue gas condensate treatment in CHP plants. This limit can
determine the feasible plant capacity to reach the thermal power balance (linked to
DH supply-MD demand) for both thermal integration options. For example,
Hödgalen produces 2174 GWh of heat yearly; based on its 10%, the limit for MD
plant capacity can be up to 150 m3/h while considering the configuration of case 1.
In contrast, this value is reduced to almost 2.5 times when case 2 is considered.
For Bristaverket, where total heat generation is 1253 GWh, case 1 seems practical
for up to 80 m3/h; however, for case 2, the maximum MD capacity can only be
around 35 m3/h.
Imtisal-e-Noor, Doctoral Thesis-2021
78
Figure 5.10 Annual district heating energy consumption for flue gas condensate
cleaning using the MD system
It is noteworthy to mention that this study has considered a conservative approach
when taking the district heating price (77 $/MWh, retail price); however, the actual
DH production cost may vary from 5-15 $/MWh. In the latter condition, the flue
gas condensate treatment cost in case 1 can be reduced up to 2.43 $/m3, with the
normalized operational cost of ~0.8 $/m3 comparable to the cost for RO based
treatment [223]. Furthermore, in waste-fired CHP plants, case 1 configuration
would incur an added fuel (MSW) volume, which in turn leads to the economic
benefit of MSW power plant and, at a larger scale, to environmental benefit.
However, handling Cd accounts for an additional 0.5 $/m3 to 4 $/m3 for adsorption.
This cost includes adsorbent, sludge treatment, and electricity costs [237].
5.5 Concluding remarks
This chapter presented the performance of membrane distillation (MD) technology
for advanced flue gas condensate treatment in combined heat and power plants,
with the Högdalenverket and Bristaverket facilities selected for experimental
campaigns at the laboratory and pilot-scale. Considering the separation efficiencies
and quality of permeate, the findings reveal that the MD based system is well suited
for the waste-fired CHP facilities. The need for pretreatment (acid-neutralization)
mainly depends on the ammonia content in MD feed. Compared to the performance
of the existing RO based treatment system, the MD treated permeate quality was
improved, i.e., a higher number of elements showed concentrations under detection
limits; lower heavy metals concentrations were observed; lower levels of
Högdalen
Brista
Imtisal-e-Noor, Doctoral Thesis-2021
79
ammonium were obtained; and lower values of conductivity, alkalinity and TDS
were maintained. During the reconcentration study, more than 92% of the water
was recovered, and removal efficiency remained high, except for cadmium and zinc
in some tests. For the biofuel-fired CHP facility, the high-quality permeate can be
achieved according to strict environmental regulations with the mixing of the
permeates of raw and neutralized flue gas condensates. The issue of cadmium can
be resolved using existing ion exchangers. The parametric study shows that the
thermal specific heat demand of a single module of the Xzero pilot plant varies
between 400-1000 kWh/m3, depending on MD feed and coolant temperatures. The
technical analysis of the industrial-scale MD system of capacity 100 m3/h tells that
the annual thermal energy consumption can be approximately 140 GWh, when
district heating supply and return lines are used to operate the MD system as the
heat source and sink, respectively. Process economy evaluation determines that the
expected unit clean condensate cost can be as low as 2.5 $/m3 for the system, as
mentioned above.

Imtisal-e-Noor, Doctoral Thesis-2021
80
Imtisal-e-Noor, Doctoral Thesis-2021
81
Chapter 6 Conclusion and future work
In this thesis, the potential of waste heat driven membrane distillation systems has
been explored in terms of their techno-economic feasibility, covering applications
in two major water-intensive industries, nano-electronics facilities and cogeneration
plants. The techno-economic evaluation of these systems embodied the principal
research objective.
In nano-electronics facilities, the main purpose was to remove pollutants from the
effluent streams of photolithography and chemical mechanical planarization
processes. The analysis of the photolithography wastewater has determined the
presence of four key contaminants: tetramethylammonium hydroxide (TMAH),
hydrogen peroxide, ammonium hydroxide and hydrogen fluoride. A sequence of
catalytic reduction (to decompose hydrogen peroxide), acid neutralization (to avoid
ammonia slip) and membrane distillation process (to separate non-volatiles) was
used to remove the mentioned substances to acceptable limits except for fluoride,
which can be efficiently handled using strong alkali resins. Since TMAH has a
thermal degradation temperature above 65○C, the MD feed temperature should be
prudently chosen. For the chemical mechanical planarization wastewater, the
primary contaminants were nano-sized silica and alumina particles, and copper;
however, the analysis determined that along with key pollutants, ammonium
hydroxide was also present. The combination of acid neutralization and membrane
distillation provided complete removal of all analyzed contaminants. Thus,
disposing of the MD treated wastewater into recipient water bodies is acceptable
under EU Directive 91/271/EEC concerning urban wastewater treatment and can
also be reused further in cooling towers, wet scrubbers and other facilities.
In cogeneration plants, advanced cleaning of flue gas condensate for water recovery
was investigated considering municipal solid waste and biofuel-fired boilers. The
raw flue gas condensate was mainly an aqueous mixture of heavy metals, salts,
acids and particulate solids. The investigation of the integrated acid neutralization-
membrane distillation process exhibited encouraging results in terms of the
complete removal of the analyzed contaminants, except for cadmium in a few runs.
The reconcentration study determined that the volume of tested flue gas condensate
was reduced by 12.5 times, and more than 90% of clean water could be recovered
for further reuse as boiler feed water. The proposed approach pointed out that it is
technically expedient to partially offload the RO based cleaning processes with
membrane distillation based processes.
Imtisal-e-Noor, Doctoral Thesis-2021
82
The parametric study presented that product yield and specific thermal energy
demand fluctuated with varying feed and coolant temperatures and flow rates.
Product yield could be enhanced by increasing the driving forces, primarily feed
temperature and feed to coolant temperature difference. In contrast, at elevated feed
and coolant temperatures, a less energy-efficient process is observed. Compared
with pilot plant trials, the laboratory prototype showed comparatively higher
specific thermal energy demand due to the absence of an internal heat recovery
system. The specific electrical energy demand was directly proportional to the flow
rates and pressure drop across the MD modules. Moreover, the exergy analysis
determined that more customized membrane materials, proper insulation and
improved condensation plates design can optimize the performance of MD systems.
For large-scale systems, the critical test is to satisfy the high thermal energy
demand of the MD systems. The waste heat released from the nano-electronics
industries and district heating generated by the CHP plants were found adequate to
perform the necessary operation for treating local effluent streams, i.e., wastewaters
or flue gas condensate. Different thermal integrations schemes for MD systems
were compared and categorized based on their technical feasibility and origin of
considered heat sources/sinks. These schemes could also improve sustainability and
help reduce carbon dioxide emissions. Therefore, they may recognize twofold
benefit systems in environmental perspectives.
Finally, the detailed economic model was developed for new and retrofitted
industrial-scale MD facilities. For capital investment, MD modules were shown as
key contributors, whereas, in the operating expenses, the thermal energy cost took
the lead when no free heat is available. This indicates that any advancement in
system design that focuses on improving the MD modules’ performance while
minimizing the thermal energy demand will eventually magnify the economic
superiority of such applications. In supplement to financial gains, a zero liquid
discharge scenario could also be realized with the MD technology. The final check
was the unit water treatment cost. The estimate of unit water treatment cost showed
that the proposed processes for specific applications are economically viable
compared to current practices when the thermal energy cost is negligible.
In summation, membrane distillation presents technical, environmental and
economic advantages for the examined applications. These findings add to a
growing body of literature on membrane distillation industrial applications.
Moreover, this study provides a paradigm for related applications of membrane
distillation in the future. Furthermore, installing such MD systems in the respective
Imtisal-e-Noor, Doctoral Thesis-2021
83
industries would lead to lower freshwater use while reducing wastewater pollution
and reusing the recovered water.
6.1 Future work
Though the studied methods proved promising, there may still be limitations on the
resource side, i.e., availability of local waste heat sources (associated with
managing heat recovery for handling the locally generated effluent). Therefore, for
practical implementations of the proposed systems, the analysis should be extended
to incorporate operational factors of the particular industry and their corresponding
influence on available thermal energy and wastewater treatment. Proper business
models for these projects have not been presented in this work but would support
further analysis. Investigation of dynamic aspects of proposed thermal integrations
would be a reasonable extension of this study, which may provide a better
understanding of system performance and how the proposed approaches can be
optimized in techno-economic terms. Moreover, other thermal integration options
should be studied, such as steam extraction from turbines to operate the MD system
in CHP plants. In nano-electronics industries, an integrated approach to treat
combined (all in one) wastewater streams, while using the available waste-heat
sources, needs to be further studied. More investigations would be required to
examine the performance of a large-scale MD system installed in-field (for
managing continuous input of wastewater). Additionally, the improvement in
existing MD units (including module structure, membrane material and
condensation plate material) is required for operating the industrial-scale MD
system more efficiently. Furthermore, the suggested post-treatments would need to
be appropriately investigated in combination with analyzed methods. The
repercussions of the fouling and concentrate disposal can be other concerning
issues. Beyond this, a detailed life cycle assessment of the proposed systems should
be performed.

Imtisal-e-Noor, Doctoral Thesis-2021
84
Imtisal-e-Noor, Doctoral Thesis-2021
85
References
[1] “Aquastat Main Database,” Food and Agriculture Organization of the
United Nations (FAO), 2016. [Online]. Available:
http://www.fao.org/nr/water/aquastat/data/query/index.html. [Accessed: 04-
Sep-2020].
[2] M. Palaniappan et al., “Clearing the waters: a focus on water quality
solutions,” United Nations Environment Programme, Nairobi, ISBN: 978-
92-807-3074-6, 2010.
[3] T. Luo, R. Young, and P. Reig, “Ranking the World’s Most Water-Stressed
Countries in 2040,” World Resources Institute, 2015. [Online]. Available:
https://www.wri.org/blog/2015/08/ranking-world-s-most-water-stressed-
countries-2040.
[4] United States Environmental Protection Agency, “Water Use and Water
Waste at Industrial Facilities.” [Online]. Available:
https://www.epa.gov/sustainability/lean-water-toolkit-chapter-2. [Accessed:
05-Jul-2020].
[5] M. S. Branham, “Semiconductors and Sustainability : Energy and Materials
Use in Integrated Circuit Manufacturing,” Masters Thesis Report,
Massachusetts Institute of Technology, 2008.
[6] T. J. Feeley et al., “Water: A critical resource in the thermoelectric power
industry,” Energy, vol. 33, no. 1, pp. 1–11, Jan. 2008.
[7] K. Kylhammar, “Comparative Evaluation of Membrane Based Condensate
Treatment Systems for Biomass-fired CHP Plants,” Masters Thesis Report,
Lund University, 2018.
[8] K. Ohanessian et al., “Dead-end and crossflow ultrafiltration process
modelling: Application on chemical mechanical polishing wastewaters,”
Chem. Eng. Res. Des., vol. 158, pp. 164–176, Jun. 2020.
[9] L.-C. Juang, D.-H. Tseng, H.-Y. Lin, C.-K. Lee, and T.-M. Liang,
“Treatment of Chemical Mechanical Polishing Wastewater for Water Reuse
by Ultrafiltration and Reverse Osmosis Separation,” Environ. Eng. Sci., vol.
25, no. 7, pp. 1091–1098, Aug. 2008.
[10] N. P. Cheremisinoff, “Membrane Separation Technologies,” in Handbook
of Water and Wastewater Treatment Technologies, Elsevier, 2002, pp. 335–
Imtisal-e-Noor, Doctoral Thesis-2021
86
371.
[11] M. Khayet and T. Matsuura, Membrane Distillation: Principles and
Applications. Elsevier, 2011.
[12] A. Deshmukh et al., “Membrane distillation at the water-energy nexus:
limits, opportunities, and challenges,” Energy Environ. Sci., vol. 11, no. 5,
pp. 1177–1196, Mar. 2018.
[13] B. R. Bodell, “Distillation of saline water using silicone rubber membrane,”
US3361645A, 1963.
[14] P. K. Weyl, “Recovery of demineralized water from saline waters,”
US3340186A, 1967.
[15] M. E. Findley, “Vaporization through Porous Membranes,” Ind. Eng.
Chem. Process Des. Dev., vol. 6, no. 2, pp. 226–230, Apr. 1967.
[16] M. Gryta, M. Tomaszewska, and K. Karakulski, “Wastewater treatment by
membrane distillation,” Desalination, vol. 198, no. 1–3, pp. 67–73, Oct.
2006.
[17] K. W. Lawson and D. R. Lloyd, “Membrane distillation,” J. Memb. Sci.,
vol. 124, no. 1, pp. 1–25, Feb. 1997.
[18] A. M. Alklaibi and N. Lior, “Membrane-distillation desalination: Status and
potential,” Desalination, vol. 171, no. 2, pp. 111–131, Jan. 2005.
[19] A. Ali, R. A. Tufa, F. Macedonio, E. Curcio, and E. Drioli, “Membrane
technology in renewable-energy-driven desalination,” Renew. Sustain.
Energy Rev., vol. 81, pp. 1–21, Jan. 2018.
[20] E. Curcio and E. Drioli, “Membrane Distillation and Related Operations—
A Review,” Sep. Purif. Rev., vol. 34, no. 1, pp. 35–86, Jan. 2005.
[21] E. Drioli, A. Ali, and F. Macedonio, “Membrane distillation: Recent
developments and perspectives,” Desalination, vol. 356, pp. 56–84, Jan.
2015.
[22] M. S. El-Bourawi, Z. Ding, R. Ma, and M. Khayet, “A framework for better
understanding membrane distillation separation process,” J. Memb. Sci.,
vol. 285, no. 1–2, pp. 4–29, Nov. 2006.
Imtisal-e-Noor, Doctoral Thesis-2021
87
[23] A. Alkhudhiri, N. Darwish, and N. Hilal, “Membrane distillation: A
comprehensive review,” Desalination, vol. 287, pp. 2–18, Feb. 2012.
[24] M. Khayet, “Solar desalination by membrane distillation: Dispersion in
energy consumption analysis and water production costs (a review),”
Desalination, vol. 308, pp. 89–101, Jan. 2013.
[25] M. Khayet, “Membranes and theoretical modeling of membrane distillation:
A review,” Adv. Colloid Interface Sci., vol. 164, no. 1–2, pp. 56–88, May
2011.
[26] P. Wang and T.-S. Chung, “Recent advances in membrane distillation
processes: Membrane development, configuration design and application
exploring,” J. Memb. Sci., vol. 474, pp. 39–56, Jan. 2015.
[27] N. Thomas, M. O. Mavukkandy, S. Loutatidou, and H. A. Arafat,
“Membrane distillation research & implementation: Lessons from the
past five decades,” Sep. Purif. Technol., vol. 189, pp. 108–127, Dec. 2017.
[28] F. Tibi, A. Charfi, J. Cho, and J. Kim, “Fabrication of polymeric
membranes for membrane distillation process and application for
wastewater treatment: Critical review,” Process Saf. Environ. Prot., vol.
141, pp. 190–201, Sep. 2020.
[29] B. Jiao, A. Cassano, and E. Drioli, “Recent advances on membrane
processes for the concentration of fruit juices: a review,” J. Food Eng., vol.
63, no. 3, pp. 303–324, Aug. 2004.
[30] V. Belessiotis, S. Kalogirou, and E. Delyannis, “Membrane Distillation,” in
Thermal Solar Desalination, Elsevier, 2016, pp. 191–251.
[31] R. S and Z. H, “Modelisation of Membrane Distillation: Mass and Heat
Transfer in Air Gap Membrane Distillation,” J. Membr. Sci. Technol., vol.
6, no. 2, pp. 1–9, Jun. 2016.
[32] C. Cabassud and D. Wirth, “Membrane distillation for water desalination:
How to chose an appropriate membrane?,” Desalination, vol. 157, no. 1–3,
pp. 307–314, Aug. 2003.
[33] L. Eykens, K. De Sitter, C. Dotremont, L. Pinoy, and B. Van der Bruggen,
“How To Optimize the Membrane Properties for Membrane Distillation: A
Review,” Ind. Eng. Chem. Res., vol. 55, no. 35, pp. 9333–9343, Sep. 2016.
Imtisal-e-Noor, Doctoral Thesis-2021
88
[34] M. Mahdi, A. Shirazi, and A. Kargari, “A Review on Applications of
Membrane Distillation (MD) Process for Wastewater Treatment,” J.
Membr. Sci. Res., vol. 1, no. 3, pp. 101–112, Oct. 2015.
[35] S. Roy, M. Bhadra, and S. Mitra, “Enhanced desalination via functionalized
carbon nanotube immobilized membrane in direct contact membrane
distillation,” Sep. Purif. Technol., vol. 136, pp. 58–65, Nov. 2014.
[36] L. D. Tijing et al., “Superhydrophobic nanofiber membrane containing
carbon nanotubes for high-performance direct contact membrane
distillation,” J. Memb. Sci., vol. 502, pp. 158–170, Mar. 2016.
[37] J.-G. Lee et al., “Theoretical modeling and experimental validation of
transport and separation properties of carbon nanotube electrospun
membrane distillation,” J. Memb. Sci., vol. 526, pp. 395–408, Mar. 2017.
[38] H. Ramlow, R. K. M. Ferreira, C. Marangoni, and R. A. F. Machado,
“Ceramic membranes applied to membrane distillation: A comprehensive
review,” Int. J. Appl. Ceram. Technol., vol. 16, no. 6, pp. 2161–2172, Nov.
2019.
[39] F. Liu, N. A. Hashim, Y. Liu, M. R. M. Abed, and K. Li, “Progress in the
production and modification of PVDF membranes,” J. Memb. Sci., vol. 375,
no. 1–2, pp. 1–27, Jun. 2011.
[40] J. Zhang, J.-D. Li, and S. Gray, “Effect of applied pressure on performance
of PTFE membrane in DCMD,” J. Memb. Sci., vol. 369, no. 1–2, pp. 514–
525, Mar. 2011.
[41] H. J. Hwang, K. He, S. Gray, J. Zhang, and I. S. Moon, “Direct contact
membrane distillation (DCMD): Experimental study on the commercial
PTFE membrane and modeling,” J. Memb. Sci., vol. 371, no. 1–2, pp. 90–
98, Apr. 2011.
[42] L. Camacho et al., “Advances in Membrane Distillation for Water
Desalination and Purification Applications,” Water, vol. 5, no. 1, pp. 94–
196, Jan. 2013.
[43] D. Hou, H. Fan, Q. Jiang, J. Wang, and X. Zhang, “Preparation and
characterization of PVDF flat-sheet membranes for direct contact
membrane distillation,” Sep. Purif. Technol., vol. 135, pp. 211–222, Oct.
2014.
Imtisal-e-Noor, Doctoral Thesis-2021
89
[44] S. Munirasu, F. Banat, A. A. Durrani, and M. A. Haija, “Intrinsically
superhydrophobic PVDF membrane by phase inversion for membrane
distillation,” Desalination, vol. 417, pp. 77–86, Sep. 2017.
[45] N. Peng et al., “Evolution of polymeric hollow fibers as sustainable
technologies: Past, present, and future,” Prog. Polym. Sci., vol. 37, no. 10,
pp. 1401–1424, Oct. 2012.
[46] S. Zare and A. Kargari, “Membrane properties in membrane distillation,” in
Emerging Technologies for Sustainable Desalination Handbook, Elsevier,
2018, pp. 107–156.
[47] Y. M. Manawi, M. Khraisheh, A. K. Fard, F. Benyahia, and S. Adham,
“Effect of operational parameters on distillate flux in direct contact
membrane distillation (DCMD): Comparison between experimental and
model predicted performance,” Desalination, vol. 336, no. 1, pp. 110–120,
Mar. 2014.
[48] S. Cerneaux, I. Strużyńska, W. M. Kujawski, M. Persin, and A. Larbot,
“Comparison of various membrane distillation methods for desalination
using hydrophobic ceramic membranes,” J. Memb. Sci., vol. 337, no. 1–2,
pp. 55–60, Jul. 2009.
[49] Z. Xie, T. Duong, M. Hoang, C. Nguyen, and B. Bolto, “Ammonia removal
by sweep gas membrane distillation,” Water Res., vol. 43, no. 6, pp. 1693–
1699, Apr. 2009.
[50] M. . Garcıa-Payo, C. . Rivier, I. . Marison, and U. von Stockar, “Separation
of binary mixtures by thermostatic sweeping gas membrane distillation,” J.
Memb. Sci., vol. 198, no. 2, pp. 197–210, Apr. 2002.
[51] L. Francis, N. Ghaffour, A. A. Alsaadi, and G. L. Amy, “Material gap
membrane distillation: A new design for water vapor flux enhancement,” J.
Memb. Sci., vol. 448, pp. 240–247, Dec. 2013.
[52] F. He, J. Gilron, and K. K. Sirkar, “High water recovery in direct contact
membrane distillation using a series of cascades,” Desalination, vol. 323,
pp. 48–54, Aug. 2013.
[53] J. H. Hanemaaijer, “Memstill® — low cost membrane distillation
technology for seawater desalination,” Desalination, vol. 168, p. 355, Aug.
2004.
Imtisal-e-Noor, Doctoral Thesis-2021
90
[54] D. Woldemariam, A. Kullab, U. Fortkamp, J. Magner, H. Royen, and A.
Martin, “Membrane distillation pilot plant trials with pharmaceutical
residues and energy demand analysis,” Chem. Eng. J., vol. 306, pp. 471–
483, Dec. 2016.
[55] W. Heinzl, S. Büttner, and G. Lange, “Industrialized modules for MED
Desalination with polymer surfaces,” Desalin. Water Treat., vol. 42, no. 1–
3, pp. 177–180, Apr. 2012.
[56] M. Burhan, M. W. Shahzad, D. Ybyraiymkul, S. J. Oh, N. Ghaffour, and K.
C. Ng, “Performance investigation of MEMSYS vacuum membrane
distillation system in single effect and multi-effect mode,” Sustain. Energy
Technol. Assessments, vol. 34, pp. 9–15, Aug. 2019.
[57] O. R. Lokare, S. Tavakkoli, V. Khanna, and R. D. Vidic, “Importance of
feed recirculation for the overall energy consumption in membrane
distillation systems,” Desalination, vol. 428, pp. 250–254, Feb. 2018.
[58] D. González, J. Amigo, and F. Suárez, “Membrane distillation: Perspectives
for sustainable and improved desalination,” Renew. Sustain. Energy Rev.,
vol. 80, pp. 238–259, Dec. 2017.
[59] J.-G. Lee, W.-S. Kim, J.-S. Choi, N. Ghaffour, and Y.-D. Kim, “Dynamic
solar-powered multi-stage direct contact membrane distillation system:
Concept design, modeling and simulation,” Desalination, vol. 435, pp. 278–
292, Jun. 2018.
[60] G. Zaragoza, A. Ruiz-Aguirre, and E. Guillén-Burrieza, “Efficiency in the
use of solar thermal energy of small membrane desalination systems for
decentralized water production,” Appl. Energy, vol. 130, pp. 491–499, Oct.
2014.
[61] A. Chafidz, E. D. Kerme, I. Wazeer, Y. Khalid, A. Ajbar, and S. M. Al-
Zahrani, “Design and fabrication of a portable and hybrid solar-powered
membrane distillation system,” J. Clean. Prod., vol. 133, pp. 631–647, Oct.
2016.
[62] R. G. Raluy, R. Schwantes, V. J. Subiela, B. Peñate, G. Melián, and J. R.
Betancort, “Operational experience of a solar membrane distillation
demonstration plant in Pozo Izquierdo-Gran Canaria Island (Spain),”
Desalination, vol. 290, pp. 1–13, Mar. 2012.
[63] M. Asim, M. Imran, M. K. H. Leung, N. T. Uday Kumar, A. R. Martin, and
Imtisal-e-Noor, Doctoral Thesis-2021
91
F. Kashif, “Experimental analysis of solar thermal integrated MD system
for cogeneration of drinking water and hot water for single family villa in
Dubai using flat plate and evacuated tube solar collectors,” Desalin.
WATER Treat., vol. 92, pp. 46–59, Oct. 2017.
[64] Y. Wang, Z. Xu, N. Lior, and H. Zeng, “An experimental study of solar
thermal vacuum membrane distillation desalination,” Desalin. Water Treat.,
pp. 1–11, Jun. 2014.
[65] G. Mohan, U. Kumar, M. K. Pokhrel, and A. Martin, “A novel solar
thermal polygeneration system for sustainable production of cooling, clean
water and domestic hot water in United Arab Emirates: Dynamic simulation
and economic evaluation,” Appl. Energy, vol. 167, pp. 173–188, Apr. 2016.
[66] K. Nakoa, K. Rahaoui, A. Date, and A. Akbarzadeh, “An experimental
review on coupling of solar pond with membrane distillation,” Sol. Energy,
vol. 119, pp. 319–331, Sep. 2015.
[67] F. Suárez and R. Urtubia, “Tackling the water-energy nexus: an assessment
of membrane distillation driven by salt-gradient solar ponds,” Clean
Technol. Environ. Policy, vol. 18, no. 6, pp. 1697–1712, Aug. 2016.
[68] K. Rahaoui et al., “Sustainable Membrane Distillation Coupled with Solar
Pond,” Energy Procedia, vol. 110, pp. 414–419, Mar. 2017.
[69] M. R. Qtaishat and F. Banat, “Desalination by solar powered membrane
distillation systems,” Desalination, vol. 308, pp. 186–197, Jan. 2013.
[70] A. Chafidz, S. Al-Zahrani, M. N. Al-Otaibi, C. F. Hoong, T. F. Lai, and M.
Prabu, “Portable and integrated solar-driven desalination system using
membrane distillation for arid remote areas in Saudi Arabia,” Desalination,
vol. 345, pp. 36–49, Jul. 2014.
[71] F. E. Ahmed, R. Hashaikeh, and N. Hilal, “Solar powered desalination –
Technology, energy and future outlook,” Desalination, vol. 453, pp. 54–76,
Mar. 2019.
[72] B. Tomaszewska et al., “Use of low-enthalpy and waste geothermal energy
sources to solve arsenic problems in freshwater production in selected
regions of Latin America using a process membrane distillation – Research
into model solutions,” Sci. Total Environ., vol. 714, p. 136853, Apr. 2020.
[73] R. Sarbatly and C.-K. Chiam, “Evaluation of geothermal energy in
Imtisal-e-Noor, Doctoral Thesis-2021
92
desalination by vacuum membrane distillation,” Appl. Energy, vol. 112, pp.
737–746, Dec. 2013.
[74] F. Y. C. Huang, L. Laumbach, R. Reprogle, and C. Medin, “Geothermal
Membrane Distillation in Industrial Greenhouse Applications: Membrane
Fabrication and Characterization,” Environ. Eng. Sci., vol. 35, no. 8, pp.
815–828, Aug. 2018.
[75] S. Bouguecha and M. Dhahbi, “Fluidised bed crystalliser and air gap
membrane distillation as a solution to geothermal water desalination,”
Desalination, vol. 152, no. 1–3, pp. 237–244, Feb. 2003.
[76] S. Bouguecha, B. Hamrouni, and M. Dhahbi, “Small scale desalination
pilots powered by renewable energy sources: case studies,” Desalination,
vol. 183, no. 1–3, pp. 151–165, Nov. 2005.
[77] A. Mahmoudi, M. Fazli, and M. R. Morad, “A recent review of waste heat
recovery by Organic Rankine Cycle,” Appl. Therm. Eng., vol. 143, pp. 660–
675, Oct. 2018.
[78] C. Liu and A. Martin, “Applying membrane distillation in high purity water
production for semiconductor industry,” Ultrapure Water, vol. 23, no. 3,
pp. 32–38, Apr. 2006.
[79] C. W. Morrow, B. P. Dwyer, S. W. Webb, and S. J. Altman, “Water
Recovery Using Waste Heat from Coal Fired Power Plants,” Sandia
National Laboratories, California, Report No. SAND2011-0258, 2011.
[80] R. Schwantes et al., “Membrane distillation: Solar and waste heat driven
demonstration plants for desalination,” Desalination, vol. 323, pp. 93–106,
Aug. 2013.
[81] N. E. Koeman-Stein, R. J. M. Creusen, M. Zijlstra, C. K. Groot, and W. B.
P. van den Broek, “Membrane distillation of industrial cooling tower
blowdown water,” Water Resour. Ind., vol. 14, pp. 11–17, Jun. 2016.
[82] D. Woldemariam, A. Kullab, E. U. Khan, and A. Martin, “Recovery of
ethanol from scrubber-water by district heat-driven membrane distillation:
Industrial-scale technoeconomic study,” Renew. Energy, vol. 128, pp. 484–
494, Dec. 2018.
[83] E. U. Khan, B. Mainali, A. Martin, and S. Silveira, “Techno-economic
analysis of small scale biogas based polygeneration systems: Bangladesh
Imtisal-e-Noor, Doctoral Thesis-2021
93
case study,” Sustain. Energy Technol. Assessments, vol. 7, pp. 68–78, Sep.
2014.
[84] X. Song et al., “An anaerobic membrane bioreactor – membrane distillation
hybrid system for energy recovery and water reuse: Removal performance
of organic carbon, nutrients, and trace organic contaminants,” Sci. Total
Environ., vol. 628–629, pp. 358–365, Jul. 2018.
[85] E. U. Khan and Å. Nordberg, “Thermal integration of membrane distillation
in an anaerobic digestion biogas plant – A techno-economic assessment,”
Appl. Energy, vol. 239, pp. 1163–1174, Apr. 2019.
[86] F. Yilmaz, M. Ozturk, and R. Selbas, “Design and thermodynamic
assessment of a biomass gasification plant integrated with Brayton cycle
and solid oxide steam electrolyzer for compressed hydrogen production,”
Int. J. Hydrogen Energy, Mar. 2020.
[87] L. Huang et al., “Solar-driven co-generation of electricity and water by
evaporation cooling,” Desalination, vol. 488, p. 114533, Aug. 2020.
[88] J. A. Andrés-Mañas, L. Roca, A. Ruiz-Aguirre, F. G. Acién, J. D. Gil, and
G. Zaragoza, “Application of solar energy to seawater desalination in a pilot
system based on vacuum multi-effect membrane distillation,” Appl. Energy,
vol. 258, p. 114068, Jan. 2020.
[89] W. Peng and I. C. Escobar, “Rejection Efficiency of Water Quality
Parameters by Reverse Osmosis and Nanofiltration Membranes,” Environ.
Sci. Technol., vol. 37, no. 19, pp. 4435–4441, Oct. 2003.
[90] B. Ozbey-Unal, D. Y. Imer, B. Keskinler, and I. Koyuncu, “Boron removal
from geothermal water by air gap membrane distillation,” Desalination,
vol. 433, pp. 141–150, May 2018.
[91] H. C. Duong et al., “A novel application of membrane distillation to
facilitate nickel recovery from electroplating wastewater,” Environ. Sci.
Pollut. Res., vol. 26, no. 23, pp. 23407–23415, Aug. 2019.
[92] S. K. Hubadillah et al., “Removal of As(iii) and As(v) from water using
green, silica-based ceramic hollow fibre membranes via direct contact
membrane distillation,” RSC Adv., vol. 9, no. 6, pp. 3367–3376, Jan. 2019.
[93] X.-Y. Lou, Z. Xu, A.-P. Bai, M. Resina-Gallego, and Z.-G. Ji, “Separation
and Recycling of Concentrated Heavy Metal Wastewater by Tube
Imtisal-e-Noor, Doctoral Thesis-2021
94
Membrane Distillation Integrated with Crystallization,” Membranes
(Basel)., vol. 10, no. 1, p. 19, Jan. 2020.
[94] B. G. Reis, A. L. B. Araújo, M. C. S. Amaral, and H. C. Ferraz,
“Comparison of Nanofiltration and Direct Contact Membrane Distillation
as an alternative for gold mining effluent reclamation,” Chem. Eng.
Process. - Process Intensif., vol. 133, pp. 24–33, Nov. 2018.
[95] H. Liu and J. Wang, “Treatment of radioactive wastewater using direct
contact membrane distillation,” J. Hazard. Mater., vol. 261, pp. 307–315,
Oct. 2013.
[96] I. V. Korolkov et al., “Modification of PET ion track membranes for
membrane distillation of low-level liquid radioactive wastes and salt
solutions,” Sep. Purif. Technol., vol. 227, p. 115694, Nov. 2019.
[97] F. Ricceri et al., “Desalination of Produced Water by Membrane
Distillation: Effect of the Feed Components and of a Pre-treatment by
Fenton Oxidation,” Sci. Rep., vol. 9, no. 1, p. 14964, Dec. 2019.
[98] S. Tavakkoli, O. Lokare, R. Vidic, and V. Khanna, “Shale gas produced
water management using membrane distillation: An optimization-based
approach,” Resour. Conserv. Recycl., vol. 158, p. 104803, Jul. 2020.
[99] I. A. Said, T. R. Chomiak, Z. He, and Q. Li, “Low-cost high-efficiency
solar membrane distillation for treatment of oil produced waters,” Sep.
Purif. Technol., vol. 250, p. 117170, Nov. 2020.
[100] M. Shi, Q. He, L. Feng, L. Wu, and S. Yan, “Techno-economic evaluation
of ammonia recovery from biogas slurry by vacuum membrane distillation
without pH adjustment,” J. Clean. Prod., vol. 265, p. 121806, Aug. 2020.
[101] A. Zoungrana, İ. H. Zengin, O. K. Türk, and M. Çakmakcı, “Ammoniacal
nitrogen reclamation by membrane distillation from high ammonia polluted
solutions,” Chem. Pap., vol. 74, no. 6, pp. 1903–1915, Jun. 2020.
[102] N. Khumalo et al., “Water recovery from hydrolysed human urine samples
via direct contact membrane distillation using PVDF/PTFE membrane,”
Sep. Purif. Technol., vol. 211, pp. 610–617, Mar. 2019.
[103] X. Li, J. Li, and L. Wu, “Vacuum membrane distillation to remove ethyl
acetate from aqueous solutions,” Desalin. Water Treat., vol. 52, no. 25–27,
pp. 5158–5164, Jul. 2014.
Imtisal-e-Noor, Doctoral Thesis-2021
95
[104] S. Pedram, H. R. Mortaheb, and F. Arefi-Khonsari, “Plasma treatment of
polyethersulfone membrane for benzene removal from water by air gap
membrane distillation,” Environ. Technol., vol. 39, no. 2, pp. 157–171, Jan.
2018.
[105] J. Zhang, N. Li, D. Ng, I. A. Ike, Z. Xie, and S. Gray, “Depletion of VOC in
wastewater by vacuum membrane distillation using a dual-layer membrane:
mechanism of mass transfer and selectivity,” Environ. Sci. Water Res.
Technol., vol. 5, no. 1, pp. 119–130, 2019.
[106] S. Kalla, S. Upadhyaya, K. Singh, and R. Baghel, “Development of heat
and mass transfer correlations and recovery calculation for HCl–water
azeotropic separation using air gap membrane distillation,” Chem. Pap.,
vol. 73, no. 10, pp. 2449–2460, Oct. 2019.
[107] M. Madhumala, D. Madhavi, T. Sankarshana, and S. Sridhar, “Recovery of
hydrochloric acid and glycerol from aqueous solutions in chloralkali and
chemical process industries by membrane distillation technique,” J. Taiwan
Inst. Chem. Eng., vol. 45, no. 4, pp. 1249–1259, Jul. 2014.
[108] Z. Si, D. Han, Y. Liu, Y. Li, and K. Chen, “Performance analysis of treating
sulfuric acid solution by the combined system of vacuum membrane
distillation and mechanical vapor recompression,” Chem. Eng. Process. -
Process Intensif., vol. 150, p. 107890, Apr. 2020.
[109] Z. Si et al., “Study on vacuum membrane distillation coupled with
mechanical vapor recompression system for the concentration of sulfuric
acid solution,” J. Brazilian Soc. Mech. Sci. Eng., vol. 41, no. 11, p. 473,
Nov. 2019.
[110] H. Julian, F. Yaohanny, A. Devina, R. Purwadi, and I. G. Wenten, “Apple
juice concentration using submerged direct contact membrane distillation
(SDCMD),” J. Food Eng., vol. 272, p. 109807, May 2020.
[111] C. A. Quist-Jensen et al., “Direct contact membrane distillation for the
concentration of clarified orange juice,” J. Food Eng., vol. 187, pp. 37–43,
Oct. 2016.
[112] S. Ahmad et al., “Mass transfer modelling of hollow fiber membrane
contactor for apple juice concentration using osmotic membrane
distillation,” Sep. Purif. Technol., vol. 250, p. 117209, Nov. 2020.
[113] M. M. A. Shirazi, A. Kargari, D. Bastani, M. Soleimani, and L. Fatehi,
Imtisal-e-Noor, Doctoral Thesis-2021
96
“Study on commercial membranes and sweeping gas membrane distillation
for concentrating of glucose syrup,” J. Membr. Sci. Res., vol. 6, no. 1, pp.
47–57, 2020.
[114] R. Kumar, A. K. Ghosh, and P. Pal, “Fermentative ethanol production from
Madhuca indica flowers using immobilized yeast cells coupled with solar
driven direct contact membrane distillation with commercial hydrophobic
membranes,” Energy Convers. Manag., vol. 181, pp. 593–607, Feb. 2019.
[115] O. Gupta, S. Roy, and S. Mitra, “Microwave Induced Membrane
Distillation for Enhanced Ethanol–Water Separation on a Carbon Nanotube
Immobilized Membrane,” Ind. Eng. Chem. Res., vol. 58, no. 39, pp. 18313–
18319, Oct. 2019.
[116] O. Gupta, S. Roy, and S. Mitra, “Low temperature recovery of acetone–
butanol–ethanol (ABE) fermentation products via microwave induced
membrane distillation on carbon nanotube immobilized membranes,”
Sustain. Energy Fuels, vol. 4, no. 7, pp. 3487–3499, May. 2020.
[117] C. A. Nayak and N. K. Rastogi, “Comparison of osmotic membrane
distillation and forward osmosis membrane processes for concentration of
anthocyanin,” Desalin. Water Treat., vol. 16, no. 1–3, pp. 134–145, Apr.
2010.
[118] S. Varavuth, R. Jiraratananon, and S. Atchariyawut, “Experimental study on
dealcoholization of wine by osmotic distillation process,” Sep. Purif.
Technol., vol. 66, no. 2, pp. 313–321, Apr. 2009.
[119] A. Hausmann, P. Sanciolo, T. Vasiljevic, U. Kulozik, and M. Duke,
“Performance assessment of membrane distillation for skim milk and whey
processing,” J. Dairy Sci., vol. 97, no. 1, pp. 56–71, Jan. 2014.
[120] K. Gethard, O. Sae-Khow, and S. Mitra, “Carbon nanotube enhanced
membrane distillation for simultaneous generation of pure water and
concentrating pharmaceutical waste,” Sep. Purif. Technol., vol. 90, pp. 239–
245, Apr. 2012.
[121] S. Leaper, A. Abdel-Karim, T. A. Gad-Allah, and P. Gorgojo, “Air-gap
membrane distillation as a one-step process for textile wastewater
treatment,” Chem. Eng. J., vol. 360, pp. 1330–1340, Mar. 2019.
[122] N. M. Mokhtar, W. J. Lau, A. F. Ismail, S. Kartohardjono, S. O. Lai, and H.
C. Teoh, “The potential of direct contact membrane distillation for
Imtisal-e-Noor, Doctoral Thesis-2021
97
industrial textile wastewater treatment using PVDF-Cloisite 15A
nanocomposite membrane,” Chem. Eng. Res. Des., vol. 111, pp. 284–293,
Jul. 2016.
[123] C. Conidi et al., “Treatment of Flue Gas Desulfurization Wastewater by an
Integrated Membrane-Based Process for Approaching Zero Liquid
Discharge,” Membranes (Basel)., vol. 8, no. 4, p. 117, Nov. 2018.
[124] A. Ali, A. Criscuoli, F. Macedonio, P. Argurio, A. Figoli, and E. Drioli,
“Direct contact membrane distillation for the treatment of wastewater for a
cooling tower in the power industry,” H2Open J., vol. 1, no. 1, pp. 57–68,
Jul. 2018.
[125] X. Yu, H. Yang, H. Lei, and A. Shapiro, “Experimental evaluation on
concentrating cooling tower blowdown water by direct contact membrane
distillation,” Desalination, vol. 323, pp. 134–141, Aug. 2013.
[126] L. Chuanfeng and A. Martin, “Membrane Distillation and Applications for
Water Purification in Thermal Cogeneration : A Pre-study,” Värmeforsk
NV - 909, 2005.
[127] A. Kullab and A. Martin, “Membrane distillation and applications for water
purification in thermal cogeneration plants,” Sep. Purif. Technol., vol. 76,
no. 3, pp. 231–237, Jan. 2011.
[128] U. Fortkamp, H. Royen, M. Klingspor, Ö. Ekengren, A. Martin, and D. M.
Woldemariam, “Membrane Distillation pilot tests for different
wastewaters,” IVL Swedish Environmental Research Institute Ltd.,
Stockholm, Report No. B 2236, 2015.
[129] J. S. Kilby, “Miniaturized electronic circuits,” US3138743 A, 1964.
[130] P. Van Zant, Microchip Fabrication, Sixth Edition: A Practical Guide to
Semiconductor Processing. McGraw-Hill Education, 2013.
[131] S. Boyd and D. Dornfeld, “Semiconductor Manufacturing,” in Green
Manufacturing, Springer, Boston, MA, 2013, pp. 153–178.
[132] P. van Gerven, “ASML for beginners,” 2017. [Online]. Available:
https://bits-chips.nl/artikel/asml-for-beginners/. [Accessed: 06-Jun-2020].
[133] C. L. Lai and S. H. Lin, “Treatment of chemical mechanical polishing
wastewater by electrocoagulation: system performances and sludge settling
Imtisal-e-Noor, Doctoral Thesis-2021
98
characteristics,” Chemosphere, vol. 54, no. 3, pp. 235–242, Jan. 2004.
[134] G. Corlett, “Targeting water use for chemical mechanical polishing,” Solid
State Technol., vol. 43, no. 6, pp. 201–202, Jun. 2000.
[135] G. E. McGuire, Semiconductor Materials and Process Technology
Handbook: For Very Large Scale Integration (VLSI) and Ultra Large Scale
Integration (ULSI). Noyes Publications, 1988.
[136] K. Reinhardt and W. Kern, Handbook of Silicon Wafer Cleaning
Technology, 2nd Edition. Elsevier Science, 2008.
[137] D. G. Gilles and R. C. Loehr, “Waste Generation and Minimization in
Semiconductor Industry,” J. Environ. Eng., vol. 120, no. 1, pp. 72–86, Jan.
1994.
[138] C. Shen, P. Tran, and P. Minh Ly, “Chemical Waste Management in the
U.S. Semiconductor Industry,” Sustainability, vol. 10, no. 5, p. 1545, May
2018.
[139] C. N. Haas and V. Tare, “Application of ion exchangers to recovery of
metals from semiconductor wastes,” React. Polym. Ion Exch. Sorbents, vol.
2, no. 1–2, pp. 61–70, Jan. 1984.
[140] C. R. Simpson, Environmental Issues in the Electronics/semiconductor
Industries and: Electrochemical/photochemical Methods for Pollution
Abatement. Electrochemical Society, 1998.
[141] Y. C. Wong, V. Moganaragi, and N. A. Atiqah, “Physico-chemical
Investigation of Semiconductor Industrial Wastewater,” in Ecological
Technologies for Industrial Wastewater Management: Petrochemicals,
Metals, Semi-Conductors, and Paper Industries, Apple Academic Press,
2015, pp. 153–165.
[142] T. Ouslimane, S. Aoudj, M. Amara, and N. Drouiche, “Removal of Copper
and Fluoride from Mixed Cu-CMP and Fluoride-Bearing Wastewaters by
Electrocoagulation,” Int. J. Environ. Res., vol. 11, no. 5–6, pp. 677–684,
Dec. 2017.
[143] K. Mitsumori and N. Inoue, “Silicon etching,” in Scientific Wet Process
Technology for Innovative LSI/FPD Manufacturing, 2016.
[144] H. Sugawara and T. Imaoka, “Chemical waste reclamation technology,” in
Imtisal-e-Noor, Doctoral Thesis-2021
99
Scientific Wet Process Technology for Innovative LSI/FPD Manufacturing,
2016.
[145] V. Innocenzi et al., “Treatment of TMAH solutions from the
microelectronics industry: A combined process scheme,” J. Water Process
Eng., vol. 31, p. 100780, Oct. 2019.
[146] S. Ojima and T. Ohmi, “Wet vapor resist stripping technology,” in
Scientific Wet Process Technology for Innovative LSI/FPD Manufacturing,
2016.
[147] C.-F. Chen and J.-J. Liang, “Using a source–receptor approach to
characterize the volatile organic compounds from control device exhaust in
a science park,” Environ. Sci. Pollut. Res., vol. 20, no. 3, pp. 1526–1536,
Mar. 2013.
[148] Y. D. Chaniago, J.-K. Kim, M.-J. Park, K.-K. Koo, and M. Lee, “Design
and modeling of optimal distillation sequence for recovery of valuable
components from a waste photoresist stripper,” J. Mater. Cycles Waste
Manag., vol. 18, no. 2, pp. 366–376, Apr. 2016.
[149] H.-H. Cheng, T.-T. Pien, Y.-C. Lee, I.-C. Lu, and L.-M. Whang, “Effects of
copper on biological treatment of NMF- and MDG-containing wastewater
from TFT-LCD industry,” Chemosphere, vol. 258, p. 127125, Nov. 2020.
[150] S. Babu, Advances in Chemical Mechanical Planarization (CMP). Elsevier
Science, 2016.
[151] D. E. Speed, “Environmental aspects of planarization processes,” in
Advances in Chemical Mechanical Planarization (CMP), S. Babu, Ed.
Elsevier, 2016, pp. 229–269.
[152] M. Krishnan, J. W. Nalaskowski, and L. M. Cook, “Chemical Mechanical
Planarization: Slurry Chemistry, Materials, and Mechanisms,” Chem. Rev.,
vol. 110, no. 1, pp. 178–204, Jan. 2010.
[153] G. B. Basim, “Effect of slurry aging on stability and performance of
chemical mechanical planarization process,” Adv. Powder Technol., vol. 22,
no. 2, pp. 257–265, Mar. 2011.
[154] TRANE-A business of American Standard Companies, “Water-side heat
recovery,” TRANE, 2007. [Online]. Available:
https://www.trane.com/content/dam/Trane/Commercial/global/products-
Imtisal-e-Noor, Doctoral Thesis-2021
100
systems/education-training/engineers-newsletters/waterside-
design/admapn023en_0207.pdf. [Accessed: 28-Dec-2017].
[155] R. P. Kathey Ferland, “Industrial Waste heat Recovery [Roundtable
Meeting],” Texas Industries of the Furure, 2007. [Online]. Available:
https://texasiof.ceer.utexas.edu/PDF/Documents_Presentations/Roundtables
/RoundTable_0807.pdf. [Accessed: 28-Dec-2017].
[156] O. Suenaga, T. Ohmi, and S. Kobayashi, “Semiconductor manufacturing
facility,” US6370897B1, 2002.
[157] I. Dubov, “Heat recovery, energy savings for semiconductor plant,”
ASHRAE J., vol. 46, no. 12, pp. 56-58+60, Dec. 2005.
[158] Y.-C. Chang, “A novel energy conservation method—optimal chiller
loading,” Electr. Power Syst. Res., vol. 69, no. 2–3, pp. 221–226, May
2004.
[159] B. Bängtsson, Bäcken Industrifysik. Personal Communication, 2019.
[160] A. Neuber, Applied Materials. Personal Communication, 2019.
[161] General Electric, “The Distributed Energy Transformation,” 2018.
[162] E. Thorin, J. Sandberg, and J. Yan, “Combined Heat and Power,” in
Handbook of Clean Energy Systems, Chichester, UK: John Wiley & Sons,
Ltd, 2015, pp. 1–11.
[163] “KMW Energi, Sweden.” [Online]. Available: https://kmwenergy.com/.
[164] S. Zhao et al., “Simultaneous heat and water recovery from flue gas by
membrane condensation: Experimental investigation,” Appl. Therm. Eng.,
vol. 113, pp. 843–850, Feb. 2017.
[165] National Research Council (US) Committee on Health Effects of Waste
Incineration. Waste Incineration & Public Health. 3, “Incineration
Processes and Environmental Releases.” Washington (DC): National
Academies Press (US); 2000. [Online]. Available:
https://www.ncbi.nlm.nih.gov/books/NBK233627/
[166] H. Gadd and S. Werner, “Achieving low return temperatures from district
heating substations,” Appl. Energy, vol. 136, pp. 59–67, Dec. 2014.
Imtisal-e-Noor, Doctoral Thesis-2021
101
[167] S. Werner, “District heating and cooling in Sweden,” Energy, vol. 126, pp.
419–429, May 2017.
[168] D. Lundqvist, “District Energy in Sweden,” Euroheat & Power, 2019.
[Online]. Available: https://www.euroheat.org/knowledge-hub/district-
energy-sweden/. [Accessed: 07-Aug-2020].
[169] K.-M. Steen, U. Sagebrand, and H. Walletun, “Att använda fjärrvärme i
industriprocesser,” Energiforsk, Stockholm, ISBN 978-91-7673-155-0,
Report No. 2015:155, 2015.
[170] D. W. Green and R. H. Perry, Perry’s Chemical Engineers’ Handbook,
Eighth Edition. McGraw-Hill Education, 2007.
[171] D. Winter, “Membrane Distillation – A Thermodynamic, Technological and
Economic Analysis,” Doctoral Thesis Report, University of Kaiserslautern,
2014.
[172] E. Drioli, E. Curcio, G. Di Profio, F. Macedonio, and A. Criscuoli,
“Integrating Membrane Contactors Technology and Pressure-Driven
Membrane Operations for Seawater Desalination: Energy, Exergy and
Costs Analysis,” Chem. Eng. Res. Des., vol. 84, no. 3, pp. 209–220, Mar.
2006.
[173] M. S. Peters and K. D. Timmerhaus, Plant design and economics for
chemical engineers. McGraw-Hill, 1991.
[174] W. D. Seider, J. D. Seader, D. R. Lewin, and S. Widagdo, “Cost
Accounting and Capital Cost Estimation,” in Product and Process Design
Principles: Synthesis, Analysis and Design, Third., J. Welter, Ed. Donald
Fowley, 2004, p. 768.
[175] Medesol Report, “Performance and cost estimations of final industrial-size
of MEDESOL-2 technology,” University of La Laguna, Spain, 2010.
[176] G. F. Hewitt and S. J. Pugh, “Approximate Design and Costing Methods for
Heat Exchangers,” Heat Transf. Eng., vol. 28, no. 2, pp. 76–86, Feb. 2007.
[177] H. P. Loh, J. Lyons, and C. W. White, “Process Equipment Cost
Estimation, Final Report,” National Energy Technology Laboratory,
Pittsburgh, PA, and Morgantown, WV (United States), Report No.
DOE/NETL-2002/1169, Jan. 2002.
Imtisal-e-Noor, Doctoral Thesis-2021
102
[178] K. K. Sirkar, Pilot-scale Studies for Direct Contact Membrane Distillation-
based Desalination Process. US Department of the Interior, Bureau of
Reclamation, 2009.
[179] U. K. Kesieme, N. Milne, H. Aral, C. Y. Cheng, and M. Duke, “Economic
analysis of desalination technologies in the context of carbon pricing, and
opportunities for membrane distillation,” Desalination, vol. 323, pp. 66–74,
Aug. 2013.
[180] S. Werner, “European district heating price series,” Energiforsk,
Stockholm, ISBN 978-91-7673-316-5, Report No. 2016:316, 2016.
[181] Eurostat, “Electricity price statistics,” 2019. [Online]. Available:
https://ec.europa.eu/eurostat/statistics-
explained/index.php/Electricity_price_statistics#Electricity_prices_for_non
-household_consumers. [Accessed: 29-Nov-2019].
[182] ICIS, “Indicative chemical prices,” Chemical Industry News, Chemical
Prices & Chemical Suppliers from ICIS., 2019. [Online]. Available:
https://www.icis.com/explore/commodities/chemicals/channel-info-
chemicals-a-z/. [Accessed: 27-Sep-2019].
[183] R. Schwantes, K. Chavan, D. Winter, C. Felsmann, and J. Pfafferott,
“Techno-economic comparison of membrane distillation and MVC in a
zero liquid discharge application,” Desalination, vol. 428, pp. 50–68, Feb.
2018.
[184] R. Turton, R. C. Bailie, W. B. Whiting, and J. A. Shaeiwitz, Analysis,
Synthesis, and Design of Chemical Processes. Prentice Hall, 2009.
[185] Y. Nishi and R. Doering, Handbook of Semiconductor Manufacturing
Technology. Taylor & Francis, 2000.
[186] J.-C. Tsai, M. Kumar, S.-Y. Chen, and J.-G. Lin, “Nano-bubble flotation
technology with coagulation process for the cost-effective treatment of
chemical mechanical polishing wastewater,” Sep. Purif. Technol., vol. 58,
no. 1, pp. 61–67, Dec. 2007.
[187] W. Den and C. Huang, “Electrocoagulation for removal of silica nano-
particles from chemical–mechanical-planarization wastewater,” Colloids
Surfaces A Physicochem. Eng. Asp., vol. 254, no. 1–3, pp. 81–89, Mar.
2005.
Imtisal-e-Noor, Doctoral Thesis-2021
103
[188] R. Lo and S.-L. Lo, “A pilot plant study using ceramic membrane
microfiltration, carbon adsorption and reverse osmosis to treat CMP
(chemical mechanical polishing) wastewater,” Water Supply, vol. 4, no. 1,
pp. 111–118, Feb. 2004.
[189] Y. Wang, Z. Zhang, C. Jiang, and T. Xu, “Electrodialysis Process for the
Recycling and Concentrating of Tetramethylammonium Hydroxide
(TMAH) from Photoresist Developer Wastewater,” Ind. Eng. Chem. Res.,
vol. 52, no. 51, pp. 18356–18361, Dec. 2013.
[190] J. Huang, K.-S. Wang, and C. Liang, “Oxidative degradation of
tetramethylammonium hydroxide (TMAH) by UV/persulfate and associated
acute toxicity assessment,” J. Environ. Sci. Heal. Part A, vol. 52, no. 9, pp.
930–937, Jul. 2017.
[191] H. M. Citraningrum, J. C. Liu, and J. M. Chern, “Removal of
Tetramethylammonium Hydroxide From Solution Using Ion Exchange,”
IEEE Trans. Semicond. Manuf., vol. 26, no. 2, pp. 214–220, May 2013.
[192] T. K Chen and N. J. Chen, “Combined membrane bioreactor (MBR) and
reverse osmosis (RO) system for thin-film transistor - Liquid crystal display
TFT-LCD, industrial wastewater recycling,” Water Sci. Technol., vol. 50,
pp. 99–106, Feb. 2004.
[193] S.-J. You, G. U. Semblante, Y.-P. Chen, and T.-C. Chang, “Combined
photocatalysis and membrane bioreactor for the treatment of feedwater
containing thin film transistor-liquid crystal display discharge,” Environ.
Technol., vol. 36, no. 21, pp. 2681–2690, Nov. 2015.
[194] S.-Y. Chen, L.-A. Lu, and J.-G. Lin, “Biodegradation of
tetramethylammonium hydroxide (TMAH) in completely autotrophic
nitrogen removal over nitrite (CANON) process,” Bioresour. Technol., vol.
210, pp. 88–93, Jun. 2016.
[195] F. Ferella et al., “Aerobic Treatment of Waste Process Solutions from the
Semiconductor Industry: From Lab to Pilot Scale,” Sustainability, vol. 11,
no. 14, p. 3923, Jul. 2019.
[196] T.-H. Hu et al., “Biological treatment of TMAH (tetra-methyl ammonium
hydroxide) in a full-scale TFT-LCD wastewater treatment plant,”
Bioresour. Technol., vol. 113, pp. 303–310, Jun. 2012.
[197] Y.-H. Liu, C.-Y. Lin, J.-H. Huang, and S.-C. Yen, “Particle removal
Imtisal-e-Noor, Doctoral Thesis-2021
104
performance and its kinetic behavior during oxide-CMP wastewater
treatment by electrocoagulation,” J. Taiwan Inst. Chem. Eng., vol. 60, pp.
520–524, Mar. 2016.
[198] N. Hu et al., “BS12-assisted flotation for the intensification of SNPs
separation from CMP wastewater using a novel flotation column,” J.
Hazard. Mater., vol. 344, pp. 788–796, Feb. 2018.
[199] Y.-G. Kim, J.-B. Song, D. Yang, W. J. Kim, S.-H. Kim, and H. Lee,
“Purification of Chemical Mechanical Polishing Wastewater via
Superconducting High Gradient Magnetic Separation System with Optimal
Coagulation Process,” IEEE Trans. Appl. Supercond., vol. 25, no. 3, pp. 1–
5, Jun. 2015.
[200] H.-D. Ryu, H.-S. Kang, and S.-I. Lee, “Enhancing the separation of silica
nanoparticles from backside grinding (BG) wastewater with synthesized
magnetite,” Sep. Purif. Technol., vol. 165, pp. 130–136, Jun. 2016.
[201] I.- Noor, J. Coenen, A. Martin, O. Dahl, and M. Åslin, “Experimental
investigation and techno-economic analysis of tetramethylammonium
hydroxide removal from wastewater in nano-electronics manufacturing via
membrane distillation,” J. Memb. Sci., vol. 579, pp. 283–293, Jun. 2019.
[202] I.- Noor, J. Coenen, A. Martin, and O. Dahl, “Performance assessment of
chemical mechanical planarization wastewater treatment in nano-
electronics industries using membrane distillation,” Sep. Purif. Technol., p.
116201, Oct. 2019.
[203] S. Körner, S. K. Das, S. Veenstra, and J. E. Vermaat, “The effect of pH
variation at the ammonium/ammonia equilibrium in wastewater and its
toxicity to Lemna gibba,” Aquat. Bot., vol. 71, no. 1, pp. 71–78, Sep. 2001.
[204] M. T. Samadi, M. Zarrabi, M. N. Sepehr, S. M. Ramhormozi, S. Azizian,
and A. Amrane, “Removal of fluoride ions by ion exchange resin: kinetic
and equilibrium studies,” Environ. Eng. Manag. J., vol. 13, no. 1, pp. 205–
214, Jan. 2014.
[205] J. Singh, P. Singh, and A. Singh, “Fluoride ions vs removal technologies: A
study,” Arab. J. Chem., vol. 9, no. 6, pp. 815–824, Nov. 2016.
[206] G. C. . Yang, T.-Y. Yang, and S.-H. Tsai, “Crossflow electro-
microfiltration of oxide-CMP wastewater,” Water Res., vol. 37, no. 4, pp.
785–792, Feb. 2003.
Imtisal-e-Noor, Doctoral Thesis-2021
105
[207] G. C. . Yang and T.-Y. Yang, “Reclamation of high quality water from
treating CMP wastewater by a novel crossflow
electrofiltration/electrodialysis process,” J. Memb. Sci., vol. 233, no. 1–2,
pp. 151–159, Apr. 2004.
[208] D. Baaklini, “Performance analysis of Air Gap Membrane Distillation:
Comparison of PTFE membranes,” Master Thesis Report, KTH Royal
Institute of Technology, 2011.
[209] J. Kujawa and W. Kujawski, “Driving force and activation energy in air-
gap membrane distillation process,” Chem. Pap., vol. 69, no. 11, pp. 1438–
1444, Jan. 2015.
[210] D. Woldemariam, A. Martin, and M. Santarelli, “Exergy Analysis of Air-
Gap Membrane Distillation Systems for Water Purification Applications,”
Appl. Sci., vol. 7, no. 3, p. 301, Mar. 2017.
[211] Y. Cerci, “Exergy analysis of a reverse osmosis desalination plant in
California,” Desalination, vol. 142, no. 3, pp. 257–266, Mar. 2002.
[212] S. Al-Obaidani, E. Curcio, F. Macedonio, G. Di Profio, H. Al-Hinai, and E.
Drioli, “Potential of membrane distillation in seawater desalination:
Thermal efficiency, sensitivity study and cost estimation,” J. Memb. Sci.,
vol. 323, no. 1, pp. 85–98, Oct. 2008.
[213] H. Susanto, “Towards practical implementations of membrane distillation,”
Chem. Eng. Process. Process Intensif., vol. 50, no. 2, pp. 139–150, Feb.
2011.
[214] A. Chuang, “The Opportunities and Challenges of Waste-Recycling for
Semiconductor Plants,” Semicon Taiwan. [Online]. Available:
http://www.semicontaiwan.org/en/sites/semicontaiwan.org/files/data16/doc
s/K1-TSMC_Arthur Chuang-presentation slide.pdf. [Accessed: 19-Jul-
2018].
[215] K. Hirano, J. Okamura, T. Taira, K. Sano, A. Toyoda, and M. Ikeda, “An
efficient treatment technique for TMAH wastewater by catalytic oxidation,”
IEEE Trans. Semicond. Manuf., vol. 14, no. 3, pp. 202–206, Aug. 2001.
[216] I.- Noor, A. Martin, and O. Dahl, “Techno-economic system analysis of
membrane distillation process for treatment of chemical mechanical
planarization wastewater in nano-electronics industries,” Sep. Purif.
Technol., p. 117013, May 2020.
Imtisal-e-Noor, Doctoral Thesis-2021
106
[217] M. Hellman, “Handbook-Water treatment for energy producing plants,”
Energiforsk, Stockholm, ISBN 978-91-7673-113-0, Report No. 2015:113,
2015.
[218] J. Uotila, “Heat Recovery and Environmental Impacts of Flue Gas
Condensing,” Masters Thesis Report, Aalto University, 2015.
[219] L. Wiig, K. Lundkvist, B. Goldschmidt, and H. Östfeldt, “Mikrobiell
tillväxt i rökgaskondensatreningar,” Energiforsk, Stockholm, ISBN 978-91-
7673-489-6, Report No. 2018:489, 2018.
[220] “Radscan Intervex Projects.” [Online]. Available: www.radscan.se.
[Accessed: 12-Dec-2019].
[221] M. Teppler, J. Wood, and P. Buzzell, “Flue Gas Condensate and Energy
Recovery,” The Mcilvaine Company, Karlskoga, Report No. IWC-08-17,
2017.
[222] B. Goldschmidt, L. Wiig, and M. Lord, “Minskning av ammoniumhalt i
rökgaskondensat,” Energiforsk, Stockholm, ISBN 978-91-7673-194-9,
Report No. 2015:194, 2015.
[223] J. Lundgren, Stockholm Exergi. Personal Communication, 2018.
[224] I.- Noor, A. Martin, and O. Dahl, “Water recovery from flue gas condensate
in municipal solid waste fired cogeneration plants using membrane
distillation,” Chem. Eng. J., vol. 399, p. 125707, Nov. 2020.
[225] J. Gaffney and N. Marley, “In-depth review of atmospheric mercury:
sources, transformations, and potential sinks,” Energy Emiss. Control
Technol., p. 1, Aug. 2014.
[226] B. J. Lerner, “Removal of mercury and cadmium and their compounds from
incinerator flue gases,” US5569436A, 29-Oct-1996.
[227] M. Pourbaix, Atlas of electrochemical equilibria in aqueous solutions, 2nd
ed. National Association of Corrosion Engineers, 1974.
[228] A. Spyropoulou, Y. G. Lazarou, and C. Laspidou, “Mercury Speciation in
the Water Distribution System of Skiathos Island, Greece,” Proceedings,
vol. 2, no. 11, p. 668, Aug. 2018.
[229] S. B. Lyon, “Corrosion of Lead and its Alloys,” in Shreir’s Corrosion,
Imtisal-e-Noor, Doctoral Thesis-2021
107
Elsevier, 2010, pp. 2053–2067.
[230] K. Emerson, R. C. Russo, R. E. Lund, and R. V Thurston, “Aqueous
Ammonia Equilibrium Calculations: Effect of pH and Temperature,” J.
Fish. Res. Board Canada, vol. 32, no. 12, pp. 2379–2383, Dec. 1975.
[231] J. López-García, F. Cupessala, P. Humpolíček, and M. Lehocký, “Physical
and Morphological Changes of Poly(tetrafluoroethylene) after Using Non-
Thermal Plasma-Treatments,” Materials (Basel)., vol. 11, no. 10, p. 2013,
Oct. 2018.
[232] J. Kheriji, D. Tabassi, and B. Hamrouni, “Removal of Cd(II) ions from
aqueous solution and industrial effluent using reverse osmosis and
nanofiltration membranes,” Water Sci. Technol., vol. 72, no. 7, p. 1206,
Sep. 2015.
[233] A. K. An, J. Guo, S. Jeong, E.-J. Lee, S. A. A. Tabatabai, and T. Leiknes,
“High flux and antifouling properties of negatively charged membrane for
dyeing wastewater treatment by membrane distillation,” Water Res., vol.
103, pp. 362–371, Oct. 2016.
[234] H. L. Le Chatelier, “A general statement of the laws of chemical
equilibrium,” Comptes rendus, vol. 99, pp. 786–789, Jan. 1884.
[235] I.- Noor, A. Martin, and O. Dahl, “District heating driven membrane
distillation for advanced flue gas condensate treatment in combined heat
and power plants,” J. Clean. Prod., In press, p. 125979, Jan. 2021.
[236] K. Pyrzynska, “Removal of cadmium from wastewaters with low-cost
adsorbents,” J. Environ. Chem. Eng., vol. 7, no. 1, p. 102795, Feb. 2019.
[237] G. Kyzas and M. Kostoglou, “Green Adsorbents for Wastewaters: A
Critical Review,” Materials (Basel)., vol. 7, no. 1, pp. 333–364, Jan. 2014.

Imtisal-e-Noor, Doctoral Thesis-2021
108
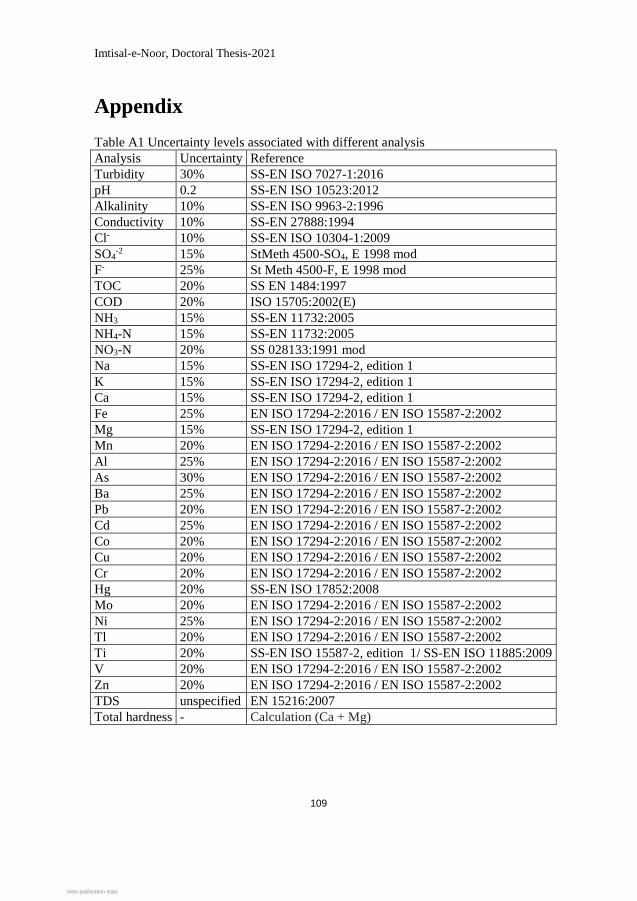
Imtisal-e-Noor, Doctoral Thesis-2021
109
Appendix
Table A1 Uncertainty levels associated with different analysis
Analysis Uncertainty Reference
Turbidity 30% SS-EN ISO 7027-1:2016
pH 0.2 SS-EN ISO 10523:2012
Alkalinity 10% SS-EN ISO 9963-2:1996
Conductivity 10% SS-EN 27888:1994
Cl- 10% SS-EN ISO 10304-1:2009
SO4-2 15% StMeth 4500-SO4, E 1998 mod
F- 25% St Meth 4500-F, E 1998 mod
TOC 20% SS EN 1484:1997
COD 20% ISO 15705:2002(E)
NH3 15% SS-EN 11732:2005
NH4-N 15% SS-EN 11732:2005
NO3-N 20% SS 028133:1991 mod
Na 15% SS-EN ISO 17294-2, edition 1
K 15% SS-EN ISO 17294-2, edition 1
Ca 15% SS-EN ISO 17294-2, edition 1
Fe 25% EN ISO 17294-2:2016 / EN ISO 15587-2:2002
Mg 15% SS-EN ISO 17294-2, edition 1
Mn 20% EN ISO 17294-2:2016 / EN ISO 15587-2:2002
Al 25% EN ISO 17294-2:2016 / EN ISO 15587-2:2002
As 30% EN ISO 17294-2:2016 / EN ISO 15587-2:2002
Ba 25% EN ISO 17294-2:2016 / EN ISO 15587-2:2002
Pb 20% EN ISO 17294-2:2016 / EN ISO 15587-2:2002
Cd 25% EN ISO 17294-2:2016 / EN ISO 15587-2:2002
Co 20% EN ISO 17294-2:2016 / EN ISO 15587-2:2002
Cu 20% EN ISO 17294-2:2016 / EN ISO 15587-2:2002
Cr 20% EN ISO 17294-2:2016 / EN ISO 15587-2:2002
Hg 20% SS-EN ISO 17852:2008
Mo 20% EN ISO 17294-2:2016 / EN ISO 15587-2:2002
Ni 25% EN ISO 17294-2:2016 / EN ISO 15587-2:2002
Tl 20% EN ISO 17294-2:2016 / EN ISO 15587-2:2002
Ti 20% SS-EN ISO 15587-2, edition 1/ SS-EN ISO 11885:2009
V 20% EN ISO 17294-2:2016 / EN ISO 15587-2:2002
Zn 20% EN ISO 17294-2:2016 / EN ISO 15587-2:2002
TDS unspecified EN 15216:2007
Total hardness - Calculation (Ca + Mg)
View publication statsView publication stats