Embed Size (px)
Citation preview
Pergamon
0360-1323(94)E0033-N
Building and Environment, Vol. 30, No. 1, pp. 19-28, 1995
Coovrieht RZ 1994 Ekvier Science Ltd Printed.k &ea;Britain. All rights reserved
036&1323/95 S9.50f0.00
Water Permeation Through Cracked Single Skin Masonry
S. SELVARAJAH* A. J. JOHNSTON*
Single skin masonry is an important form of wall construction and if it contains small cracks, moisture can permeate from the outside to the inside of the wall. An experimental study of water seepage through small cracks in masonry has been undertaken that focuses on the influence on the seepage rate of various geometric and environmental parameters, including rainfall intensity, wind speed, crack width and crack orientation. The experimental program embraces four simulated rainfall intensities,$ve wind speeds, three crack widths and crack orientations in the horizontal and vertical directions. Experimental results suggest that increases in the rainfall intensity, the wind speed and the crack width all lead to increased seepage. Thresholds are identifiedfor these environ- mental conditions, beyond which the seepage rate does not sign@icantly increase.
_
INTRODUCTION
WALLS of buildings should maintain structural integ- rity while providing an effective barrier to water seepage. The presence of water in walls leads to :
(a) a reduction in the comfort level experienced by occupants of the building ;
(b) a decrease in its strength ; (c) a degradation of its aesthetic value [l] ; (d) the growth of fungus in poorly ventilated areas
PI ; (e) an increase in the operating costs associated with
either air-conditioning or heating the building.
Killip and Cheetham [3] suggest that 50% of the defects associated with buildings are linked to dampness and that 54% of these are caused by rain water penetration. Water penetration through walls requires a supply of water on the outside of the wall, a route for the water to travel through the wall and a driving force to push it along this route. The quantity of water pen- etrating through a wall is believed to be strongly allied with (i) the intensity and frequency of rain impacting on the building and (ii) the strength of wind impinging on the wall. Wind generates a pressure differential between the inside and outside of the wall and this provides the necessary force to push water through the wall. Possible routes for water seepage include through pores in the masonry, through openings at joints (often between different wall materials) and through cracks in the masonry, or mortar [4].
The main reasons for excessive openings at joints that exacerbate seepage are improper design detailing, poor workmanship during the construction of the wall, or, the failure to provide watertight joints between the non-
*Department of Civil and Systems Engineering, James Cook University of North Queensland, Queensland 48 11, Australia.
traditional prefabricated components of the wall. Aging and deterioration of sealants are a common source of crack development in walls [S]. Another factor that influences the formation of cracks in masonry walls is movements in the vicinity of the structure. The formation of cracks is often due to the footings of the building, or the lintels or beams within the walls, being too flexible which causes overstressing of masonry and this leads to the development of cracks.
The velocity and duration of wind and its direction relative to a wall are important parameters that govern the rate of water flow through it. Marsh [5] reports that the amount of rain driven onto the outside surface of a wall is directly proportional to the product of the rainfall rate and the wind speed.
LITERATURE REVIEW
Mechanisms are described by Garden [6] that help identify the important processes associated with water seepage through masonry walls and Garden emphasises that the success of a number of traditional wall systems in resisting water penetration is related to the presence of air cavities in the walls. Rain water blown on to walls normally provides an accumulation of water on the exterior of the building. Wide roof overhangs, although minimising rain wetting of low buildings, are usually incapable of keeping high walls dry, or of giving adequate protection to tall buildings during cyclones or heavy rain- storms. The amount of water present on the exterior of a wall depends on the absorptivity and moisture storage capacity of surface materials as well as the rainfall rate. During a storm, wall surfaces that have low absorptivity and low moisture storage capacity are usually covered with films of water whose thicknesses increase towards ground level.
When wind blows on the outside face of a building it produces a pressure differential between the inside and
19
20 S. Selvarajah and A. J. Johnston
outside of a wall. The kinetic energy of the water particles, capillary suction effects, gravity and air pressure differ- ences all contribute to the extent of water seepage through a wall. It is generally understood that rain drops are carried by air flow through cracks and if the crack widths are small enough these drops will decompose into smaller droplets on impact with the internal surfaces of the cracks.
Baker et al. [7] describe the pressure flow charac- teristics obtained when undertaking a number of full- scale model tests. They verify the well-known crack flow equations over a range of experimental conditions and a simple graphical method is presented to predict air flow through various crack geometries. From experiments on three crack geometries, they recommend a quadratic relationship between air flowrate and pressure drop. An expression that incorporates discharge coefficients is also suggested for calculating crack leakage and this relation- ship is claimed to have application over a wide range of Z/ReR, values ; Z is the depth of the crack in the direction of water flow, Re is Reynolds number and R, is the hydraulic radius of the conduit flow.
Fazio and Kontopidis [S] review the research under- taken by Killip and Cheetham [3] that enunciates the pressure equalisation principle. This principle (also known as the rain screen principle) is used to explain the reduction of rain penetrating through exterior walls. Pressure equalisation can be achieved by constructing an open rain screen wall with vent holes in the outer wythe (partition) of the wall structure while the inner wythe has small capillary cracks in it. Partial pressure equalisation is established across the outer wythe of the wall and this restricts the passage of rain into the cavity space, so reducing the quantity of water reaching the inner wythe. Water leakage through the outer wythe is proportional to the pressure difference across it and the area of vent holes is therefore crucial in the design of these types of wall.
Fazio and Kontopidis [8] conclude that the cavity pres- sure is equal to the average wind pressure acting on the wall of the building for cases where the outer wythe has only cracks and no vent holes. In contrast, if there are uniformly distributed vent holes in the outer wythe then the cavity pressure is usually assumed to be less than the average wind pressure.
An experimental study undertaken by Killip and Chee- tham [3] describes measurements of air and water flowra- tes through solid and diaphragm walls. For a given air pressure, water penetration initially increases fairly rap- idly with increase in spray rate until a peak value is reached. For these continuous water spray tests, the seep- age rate was observed to vary linearly with the difference in air pressure between the inside and the outside of the wall.
The volume flow rate of air (Q) is suggested by Rathbone [9] to be directly proportional to the differ- ential pressure (dp) raised to the power (n). The trend of their experimental results can be expressed as
Q = KC&-CT, (1)
where Kis the permeability coefficient and Cis a constant. The values of K, C and n depend on the type of panel
under consideration and Rathbone [9] provides values for five such panels that are commonly encountered in practice. From these results he concludes that the air flowrate is strongly related to the porosity of the wall unit and that capillary and surface tension forces play important roles in many wall seepage situations.
A numerical model using finite difference approxi- mations is outlined in [lo] and [ 111 and it has the capacity to predict heat and moisture transfer through buildings over a wide variety of environmental conditions and geo- metries. Moisture transfer is shown to be dependent upon its interaction with different parts of the structure (linings, framing, cavities, internal layers and mem- branes) and upon relevant fluid transfer mechanisms, in particular air exchange and vapour diffusion. The model structure is divided into a number of elements that have nodes and the spacing between these nodes is based on the knowledge of physics governing the behaviour of the particular component under investigation. Moisture movement within the structure is assumed to be air-borne convection and vapour diffusion and is presumed to be strongly related to capillary forces and evaporationcon- densation mechanisms in the wall. For conditions where the temperature gradients are reasonably small the driv- ing mechanism is provided by vapour pressure, par- ticularly below the fibre saturation point for organic materials or in the hygroscopic region for inorganic materials. The reported results from numerical and ana- lytical models compare favourably with experimental data.
EXPERIMENTAL FACILITY
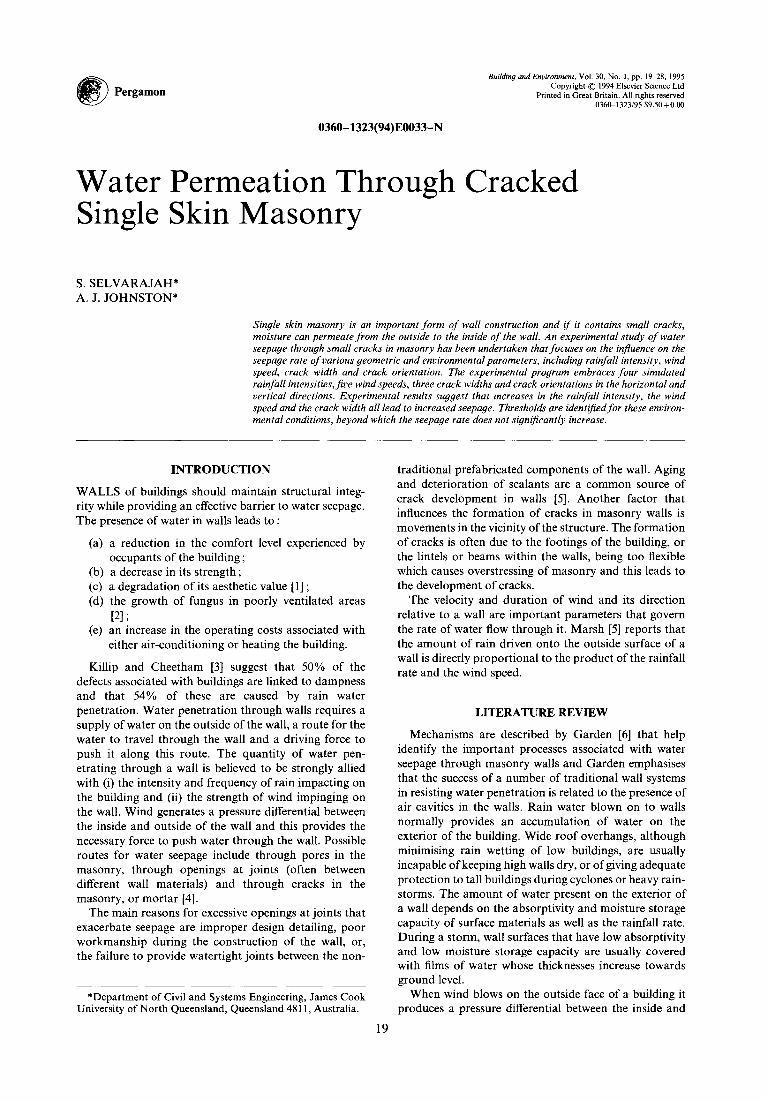
The experimental facility used to measure the seepage rate of simulated wind driven rain through open cracks in masonry blocks utilises an airtight pressure test chamber whose design was based on procedures described in [ 121. One of the vertical sides of the 950 mm x 950 mm x 100 mm chamber (Fig. 1) has an opening that houses the test specimen. The specimen is mounted flush with the inside face of the chamber and to avoid air and water leakage it is sealed in position with a rubberised preparation. An observation window allows viewing of the front face of the specimen during testing. To encourage a uniform distribution of water flowing down the vertical face of the test section the specimen was given a coating of med- ium grain sand mixed with paint.
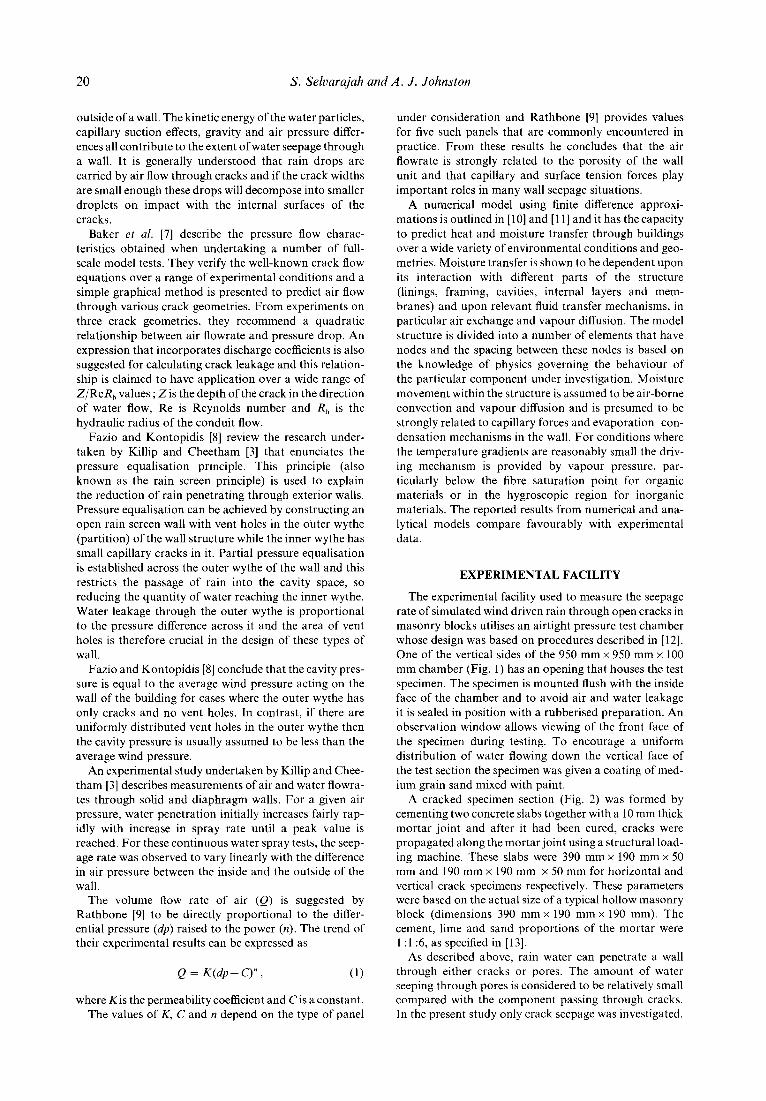
A cracked specimen section (Fig. 2) was formed by cementing two concrete slabs together with a 10 mm thick mortar joint and after it had been cured, cracks were propagated along the mortar joint using a structural load- ing machine. These slabs were 390 mm x 190 mm x 50 mm and 190 mm x 190 mm x 50 mm for horizontal and vertical crack specimens respectively. These parameters were based on the actual size of a typical hollow masonry block (dimensions 390 mm x 190 mm x 190 mm). The cement, lime and sand proportions of the mortar were 1 : 1 :6, as specified in [ 131.
As described above, rain water can penetrate a wall through either cracks or pores. The amount of water seeping through pores is considered to be relatively small compared with the component passing through cracks. In the present study only crack seepage was investigated.
Water Permeation in Cracked Single Skin Masonry 21
I w380 mm+ _ . . . . ..^...~.......I..-
Water discharge
tH Pipe Water resetvoir
rotation mechanism to facilitate vettical and
hon’zontal crack otfentations
* Front View
c1 1 Back View
ti
-- mpressed 1 SUPPlY
Fig. 1. Experimental test facility.
To separate the two components two coats of “Rai- naway” water repellent were applied to both the internal and external surfaces of the specimens to effectively elim- inate the water penetration into its pores and ensure that all seepage was through cracks. The selection of this particular water repellent was made on the basis of an exploratory study of the water absorption characteristics
exhibited by different sealing compounds. This study involved measuring the absorption rate of the sample by weighing it before and after immersion in water. The water-proofing preparation was then applied to the sam- ple and a measurement of absorption rate was repeated. The sample was then kept in water for a week to evaluate whether the prolonged immersion in water had any effect
on its absorption rate. From observations made on typical building walls,
the majority of the cracks were noted to be along the mortar joints. These cracks were often found to propa- gate from the top to the bottom of the wall and usually continuously, followed the vertical and horizontal mortar
joints. In the present investigation the cemented slabs were allowed to cure for 40 days before cracks were induced by employing an Avery Universal Testing Machine that gradually increased the shear load acting along the mortar joint. Both the pieces of cracked speci- mens received two coats of “Rainaway” water repellent on all surfaces. The crack widths were set at values of 0.7, 1.0 and 2.0 mm by inserting thin metal spacing elements at the four corners of the crack.
A sparge bar water spray is located above the cracked specimen at a horizontal distance of 50 mm from the front surface of the cracked specimen. The spray is in the form of a pipe that has holes of 1 mm diameter at spacings of 25 mm and this configuration promotes a uniform thickness of water film flowing down over the test section. The supply water passes through a pressure valve to
k-390 mm-1
Mortar I 50 mm
10 mm
r 50 mm
Metal s:acers to set Crack
crack width
Fig. 2. Test specimen.
minimise the flow fluctuations in the main supply line and through a rotameter that measures flowrate. A fine filter is incorporated in the line to prevent any small solid particles in the supply water from blocking the spray jets.
The required air pressure differentials across the test specimen are provided by a compressed air supply line that is fitted with a control valve. A horizontal pipe with 3 mm diameter holes staggered along the length is used to supply air to the chamber. Care is taken so that the air jets do not directly strike the water film flowing down the specimen and this is to ensure that there are minimal local variations in the thickness of the water film and its velocity. Pressure inside the chamber is measured using a water manometer, capable of reading within? 1 mm (water) accuracy.
A tray and bucket mechanism attached to the back of the chamber collects the water seeping through the crack. The exit face of the crack is covered with a steel plate to capture any high velocity water droplets exiting from the cracks.
TEST PARAMETERS
On the basis of previous research associated with crack seepage four test parameters were selected for scrutiny, i.e. pressure difference between the outside and inside of the wall, the rain induced spray rate on the outside of the wall, the width and the orientation of the crack.
Pressure difference Previous researchers have used constant air pressure
(simulating steady state static wind velocity) in the tests when measuring the resistance to water penetration of permeable walls. The British Standards Institution [14]
and the American Society for Testing and Materials [12] use static pressures of up to 50 mm water head.
The basic serviceability wind speeds used for the cal- culation of pressures in the present study correspond to Australian geographic regions A, B, C and D specified in the Australian Wind Loading Code [15], viz. 38, 38, 45 and 50 ms-‘, respectively. These wind velocities incor- porate appropriate gusting factors. For a 5 m high build- ing, pressure values of 7 17, 7 17, 1006 and 1242 Pa were calculated, respectively, for these conditions in a Terrain Category 2 and values of 352, 352,494 and 609 Pa for a Terrain Category 3. Terrain Category 2 is described as
22 S. Selvarajah and A. J. Johnston
an open terrain grassland with a few well-scattered obstructions having heights generally from 1.5 to 10.0 m and Category 3 is a terrain with numerous closely spaced obstructions having the size of domestic houses.
After considering these wind pressures the following differential pressures were selected for testing: 35 mm water head (343 Pa) ; 50 mm water head (490 Pa) ; 80 mm water head (784 Pa) ; 100 mm water head (980 Pa) ; and 120 mm water head (1176 Pa).
Spray rate Rainfall intensities for certain locations throughout
Australia were extracted from Australian Rainfall and Runoff [16], and these ranged from 74 mm h-’ falling over a six minute period in Hobart, Tasmania to 396 mm h-’ falling over the same period in Innisfail, Queensland. Reference [12] specifies that a spray rate of 138.7 I hh’ over a square metre of specimen is equivalent to 140 mm
h-’ of rain. The four spray rates with the equivalent [rainfall intensities] chosen for testing were therefore : 115.2 I h-r [127.6 mm hh’] ; 132.0 1 h-r [146.2 mm h-‘1 ; 184.8 1 h-’ [204.7 mm h-‘1 ; and 240.0 I h-’ [265.9 mm h-l].
Crack width
A survey was conducted of 70 cracks observed in typi- cal prototype conditions and it indicated that the majority of the cracks are approximately 0.7 mm wide internally with the width at the mouth being slightly larger. Reference [18] places cracks into categories and degrees of damage based on the width of the crack ; for example, ‘hairline’ cracks (width < 0.1 mm) lead to ‘neg- ligible’ damage while 15 mm wide cracks can cause ‘sev-
ere’ damage. Crack widths of 0.7, 1.0 and 2.0 mm were selected for the study and these are within the category of ‘slight damage’.
Crack orientation and lengths
The seepage rate is also likely to be strongly dependent upon the area and the orientation of the crack. One vertical crack length (180 mm) and one horizontal crack length (380 mm) were tested and the choice of these lengths was based on the size of a standard building block (390mmxl90mmx190mm).
EXPERIMENTAL RESULTS
A total of 120 experimental tests were undertaken to evaluate the seepage rate of water through masonry cracks under different simulated environmental conditions.
(1) Pressure difference between the inside and outside of the wall : 343,490,784,980 and 1176 (Pa).
(2) Spray rate : 115.2, 132.0, 184.8 and 240.0 (1 hh’). (3) Crack width : 0.7, 1 .O and 2.0 (mm). (4) Crack orientation : horizontal and vertical.
Certain sources of experimental errors were identified and the following measures were employed to minimise them.
(1) The average humidity close to the test area was
(2)
(3)
recorded to determine the magnitude of evap- oration losses. The collected seepage water was weighed using a digital balance that had an accuracy of up to three decimal places. To quantify variations in the water absorption rate of the test specimen, a control specimen was tre- ated with the same water repellent as the test speci- men and its absorption rate was continually moni- tored. This was done by immersing the control specimen in water for the same period as the test specimen was exposed to spraying during testing.
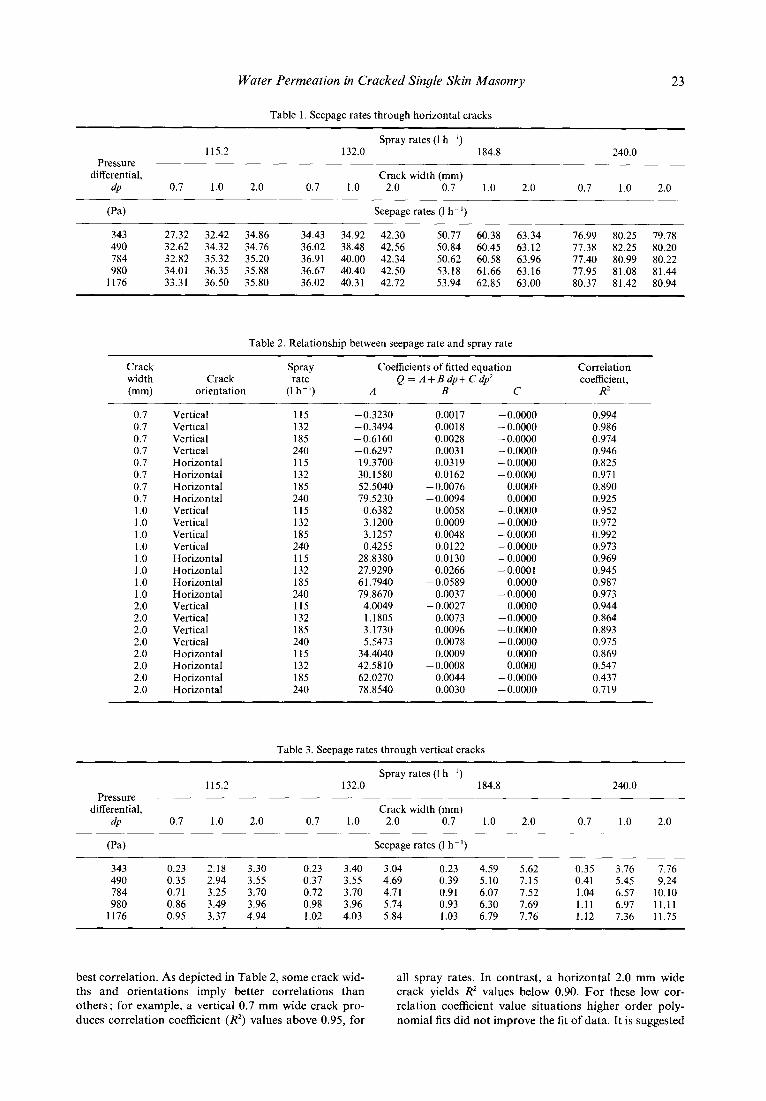
The water seepage rates through horizontal cracks (380 mm long) for different spray rates, pressure differences and crack widths are presented in Table 1. They are characterised by quadratic relationships in terms of the pressure differences (dp), as given in Table 2. The majority of correlation coefficients (R’) utilising this data
fitting procedure are above 0.83, except for the data from the 2.0 mm crack for spray rates between 132.0 and 240.0 I h-‘. The water seepages for the three vertical crack widths (180 mm long) for different pressure drops and spray conditions are given in Table 3. Again these seepage rates are correlated with pressure differences using a quadratic relationship (R’ > 0.86) presented in Table 2.
DISCUSSION OF EXPERIMENTAL RESULTS
The experimental results generally indicate that the seepage rate through cracks in walls is dependent on crack orientation and width, pressure difference between outside and inside of wall (wind induced) and water spray rate (rain induced) acting on the outside of the wall,
Crack orientation and width-horizontal and vertical cracks
The seepage rates through horizontal cracks (Table 1) are generally higher than those through corresponding vertical cracks (Table 3) and this is because the ‘capture’ areas of the water on the outside of the specimen are very different. The width of flow contributing water to the horizontal crack is the full length of the crack whereas for the vertical crack the corresponding contributing ‘length’ is only the crack width.
With vertical cracks, seepage through the 0.7 mm crack is significantly smaller than that through the 1 .O and 2.0 mm cracks and this behaviour may be associated with the presence of significant surface tension forces in the narrowest crack case. Physical observations indicated that water particles often rolled down the outside face of the wall without entering the crack and because of the presence of strong surface tension forces a film of water bridged the entry to the crack and this ‘bridge’ restricted seepage.
Pressure dij‘erence (wind induced) From experimental study Baker et al. [7] conclude that
the relationship between single-phase volumetric air flow rate through cracks and pressure difference can be adequately represented by a quadratic relationship. In the present study a quadratic relationship between seep- age rate and pressure difference also appears to give the
Water Permeation in Cracked Single Skin Masonry 23
Table 1. Seepage rates through horizontal cracks
Pressure differential,
dp 0.7
115.2
1.0 2.0 0.7
Spray rates (1 h- ‘) 132.0 184.8 240.0
Crack width (mm) 1.0 2.0 0.7 1.0 2.0 0.7 1.0 2.0
(Pa)
343 490 784 980
1176
27.32 32.42 34.86 32.62 34.32 34.76 32.82 35.32 35.20 34.01 36.35 35.88 33.31 36.50 35.80
Seepage rates (I h-i)
34.43 34.92 42.30 50.77 60.38 63.34 36.02 38.48 42.56 50.84 60.45 63.12 36.91 40.00 42.34 50.62 60.58 63.96 36.67 40.40 42.50 53.18 61.66 63.16 36.02 40.31 42.72 53.94 62.85 63.00
76.99 80.25 79.78 77.38 82.25 80.20 77.40 80.99 80.22 77.95 81.08 81.44 80.37 81.42 80.94
Table 2. Relationship between seepage rate and spray rate
Crack width (mm)
Crack orientation
Spray Coefficients of fitted equation rate Q = A+Bdp+Cdp2
(1 h-‘) A B c
0.7 Vertical 115 -0.3230 0.0017 -0.0000 0.994 0.7 Vertical 132 -0.3494 0.0018 - 0.0000 0.986 0.7 Vertical 185 -0.6160 0.0028 -0.0000 0.974 0.7 Vertical 240 -0.6297 0.003 1 - 0.0000 0.946 0.7 Horizontal 115 19.3700 0.0319 - 0.0000 0.825 0.7 Horizontal 132 30.1580 0.0162 -0.0000 0.971 0.7 Horizontal 185 52.5040 - 0.0076 0.0000 0.890 0.7 Horizontal 240 79.5230 -0.0094 0.0000 0.925 1.0 Vertical 115 0.6382 0.0058 -0.0000 0.952 1.0 Vertical 132 3.1200 0.0009 - 0.0000 0.972 1.0 Vertical 185 3.1257 0.0048 -0.0000 0.992 1.0 Vertical 240 0.4255 0.0122 - 0.0000 0.973 1.0 Horizontal 115 28.8380 0.0130 - 0.0000 0.969 1.0 Horizontal 132 27.9290 0.0266 -0.0001 0.945 1.0 Horizontal 185 61.7940 -0.0589 0.0000 0.987 1.0 Horizontal 240 79.8670 0.0037 - 0.0000 0.973 2.0 Vertical 115 4.0049 - 0.0027 0.0000 0.944 2.0 Vertical 132 1.1805 0.0073 -0.0000 0.864 2.0 Vertical 185 3.1730 0.0096 - 0.0000 0.893 2.0 Vertical 240 5.5473 0.0078 - 0.0000 0.975 2.0 Horizontal 115 34.4040 0.0009 0.0000 0.869 2.0 Horizontal 132 42.5810 - 0.0008 0.0000 0.547 2.0 Horizontal 185 62.0270 0.0044 -0.0000 0.437 2.0 Horizontal 240 78.8540 0.0030 -0.0000 0.719
Correlation coefficient,
R2
Table 3. Seepage rates through vertical cracks
Pressure differential,
dp
Spray rates (1 hh’) 115.2 132.0 184.8 240.0
Crack width (mm) 0.7 1.0 2.0 0.7 1.0 2.0 0.7 1.0 2.0 0.7 1.0 2.0
(Pa)
343 490 784 980
1176
0.23 2.18 3.30 0.23 0.35 2.94 3.55 0.37 0.71 3.25 3.70 0.72 0.86 3.49 3.96 0.98 0.95 3.37 4.94 1.02
Seepage rates (1 h-i)
3.40 3.04 0.23 4.59 5.62 0.35 3.76 7.76 3.55 4.69 0.39 5.10 7.15 0.41 5.45 9.24 3.70 4.71 0.91 6.07 7.52 1.04 6.57 10.10 3.96 5.74 0.93 6.30 7.69 1.11 6.97 11.11 4.03 5.84 1.03 6.79 7.76 1.12 7.36 11.75
best correlation. As depicted in Table 2, some crack wid- all spray rates. In contrast, a horizontal 2.0 mm wide ths and orientations imply better correlations than crack yields R2 values below 0.90. For these low cor- others; for example, a vertical 0.7 mm wide crack pro- relation coefficient value situations higher order poly- duces correlation coefficient (R') values above 0.95, for nomial fits did not improve the fit of data. It is suggested
24 S. Seivarajah and A. J. Johnston
100 (a) Horizontal crack - 0.70 mm wide
“0 200 400 600 600 1000 1200 Pressure drop (pa)
(c) Horizontal crack - 1 .OO mm wide
looc
0 200 400 600 600 1000 1200 Pressure drop (pa)
(e) Horizontal crack - 2.00 mm wide
p’;;
t F---j
200 400 600 600 1000 1200
Pressure drop (pa)
(b) Vertical crack - 0.70 mm wide
200 400 600 600 1000 1200 Pressure drop (pa)
12 (d) Vertical crack - 1 .OO mm wide
1 z : 10 .c F
01 - ’ ’ ’ - ’ * ’ . ’ * 1 0 200 400 600 600 1000 1200
Pressure drop (pa)
l2 r- (0 - Vertical crack - 2.00 mm wide
d q
0 6 l
OL. 0 200 400 600 600 1000 1200
Pressure drop (pa)
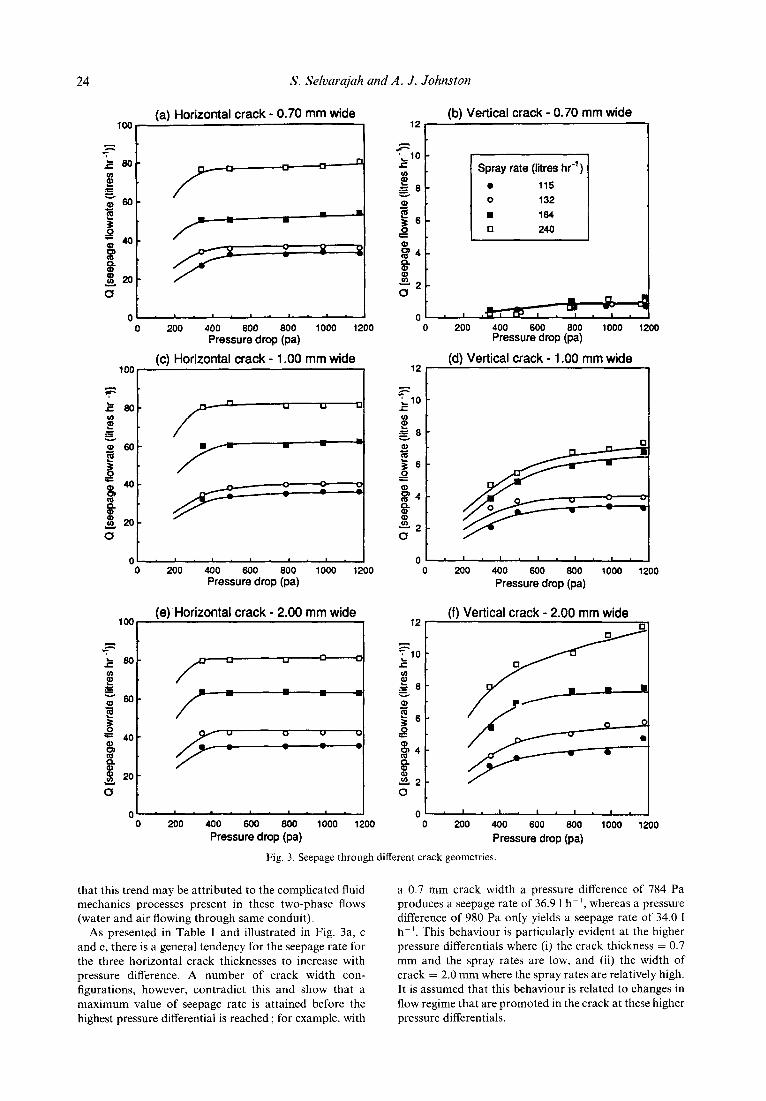
Fig. 3. Seepage through different crack geometries.
that this trend may be attributed to the complicated fluid mechanics processes present in these two-phase flows
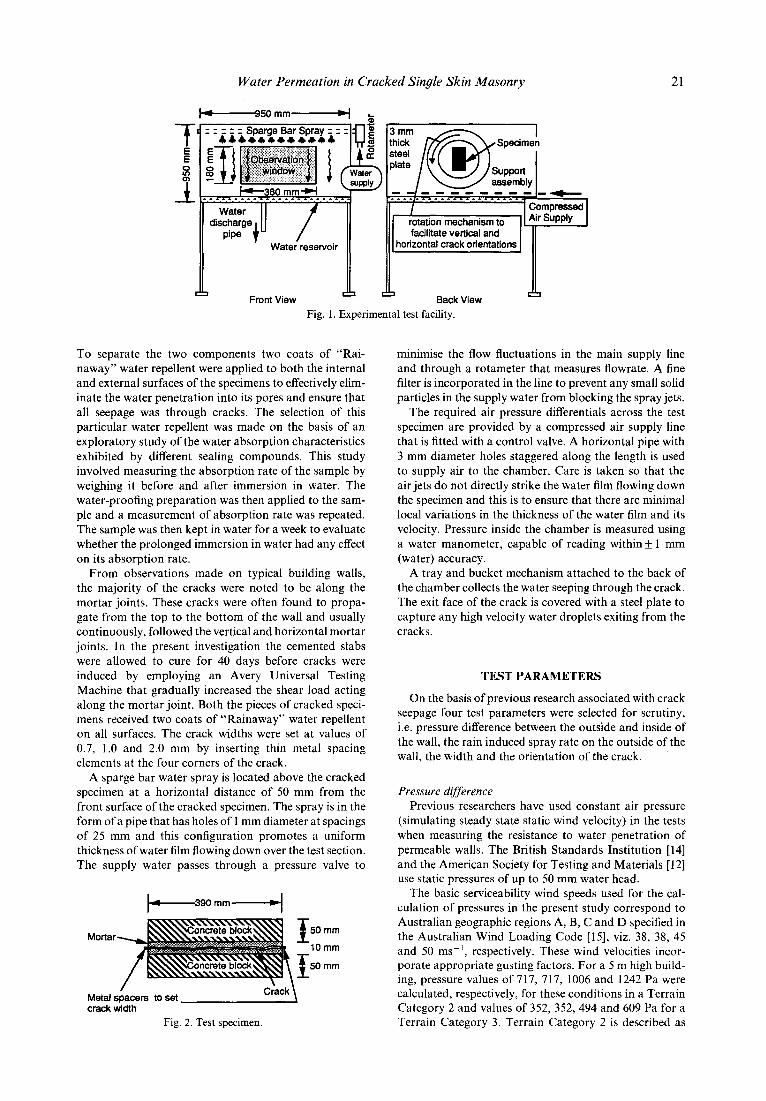
(water and air flowing through same conduit). As presented in Table 1 and illustrated in Fig. 3a, c
and e, there is a general tendency for the seepage rate for the three horizontal crack thicknesses to increase with pressure difference. A number of crack width con- figurations, however, contradict this and show that a maximum value of seepage rate is attained before the highest pressure differential is reached ; for example, with
a 0.7 mm crack width a pressure difference of 784 Pa produces a seepage rate of 36.9 I h-‘, whereas a pressure difference of 980 Pa only yields a seepage rate of 34.0 1 h-‘. This behaviour is particularly evident at the higher pressure differentials where (i) the crack thickness = 0.7 mm and the spray rates are low, and (ii) the width of crack = 2.0 mm where the spray rates are relatively high. It is assumed that this behaviour is related to changes in flow regime that are promoted in the crack at these higher pressure differentials.
Water Permeation in Cracked Single Skin Masonry 25
(a) Spray rate 115 litres hr-’ (b) Spray rate 132 litres hr“
f:i -;:;;I
Data scatter
2.1 2.5 1.9 2.5 A Ic R u- B
0 200 400 600 600 1000 1200
2 2
.
; 60- T-z s.
7.9 A 6.5 5.4 5.6 6.7
g Q
40- hJ fi ”
A 4 0 4 0
8
.
g 20-
u . 3.2 4.3 4.0 4.8 4.8 I
0 ’ .r., A &
’ .- .*. -0 200 400 600 600 1000 1200
Pressure drop (pa) Pressure drop (pa)
Crack Crack Crack Crack width orientation width orientation
o 0.7 Horizontal a 0.7 Vertical 0 1.0 Horizontal n 1.0 Vertical A 2.0 Horizontal A 2.0 Vertical
%:, (c) Spray rate 185 litres hr-’ ,
v)
?! .e 12.6 12.3 13.3 10.0 9.1 = Q) 60 - A 0 h iii
fI
z 0 0 0 0 0 *
0 E Q) 40 - P $
3 20 - 0
0 200 400 600 600 1000 1200 0 200 400 600 600 1000 1200 Pressure drop (pa) Pressure drop (pa)
(d) Spray rate 240 litres hrl I
3.3 4.9 3.6 3.5 1:
0 g A h w ” I
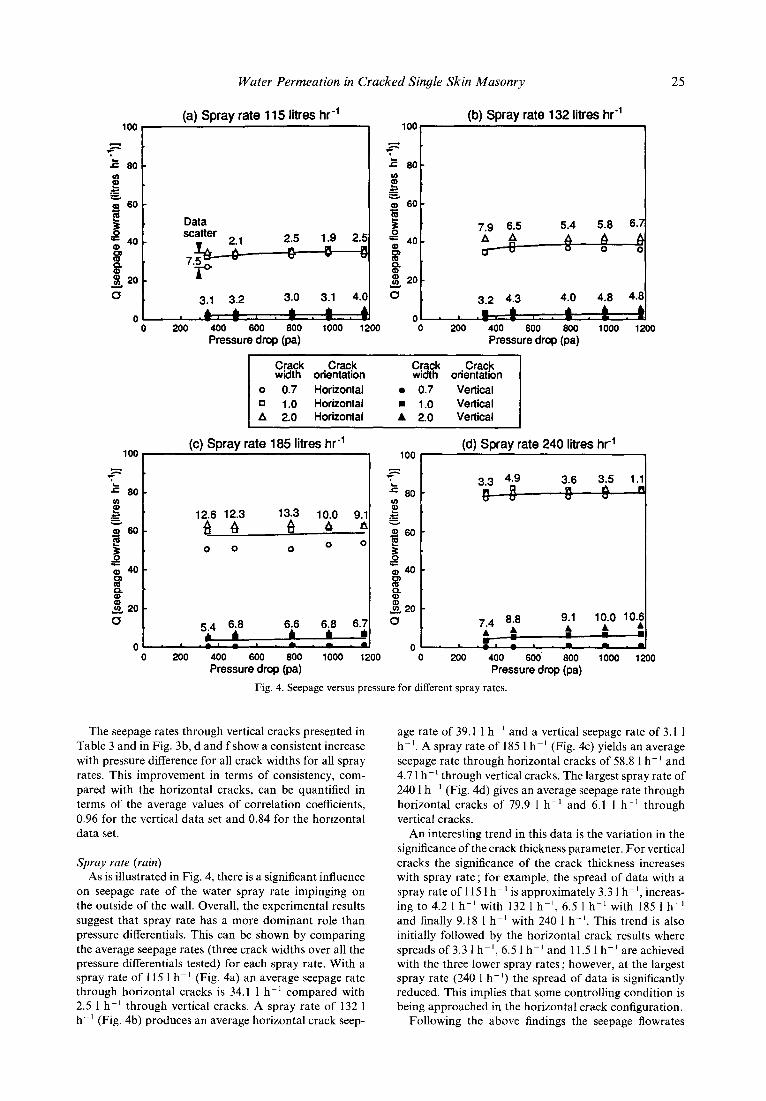
Fig. 4. Seepage versus pressure for different spray rates.
The seepage rates through vertical cracks presented in Table 3 and in Fig. 3b, d and f show a consistent increase with pressure difference for all crack widths for all spray rates. This improvement in terms of consistency, com- pared with the horizontal cracks, can be quantified in terms of the average values of correlation coefficients, 0.96 for the vertical data set and 0.84 for the horizontal data set.
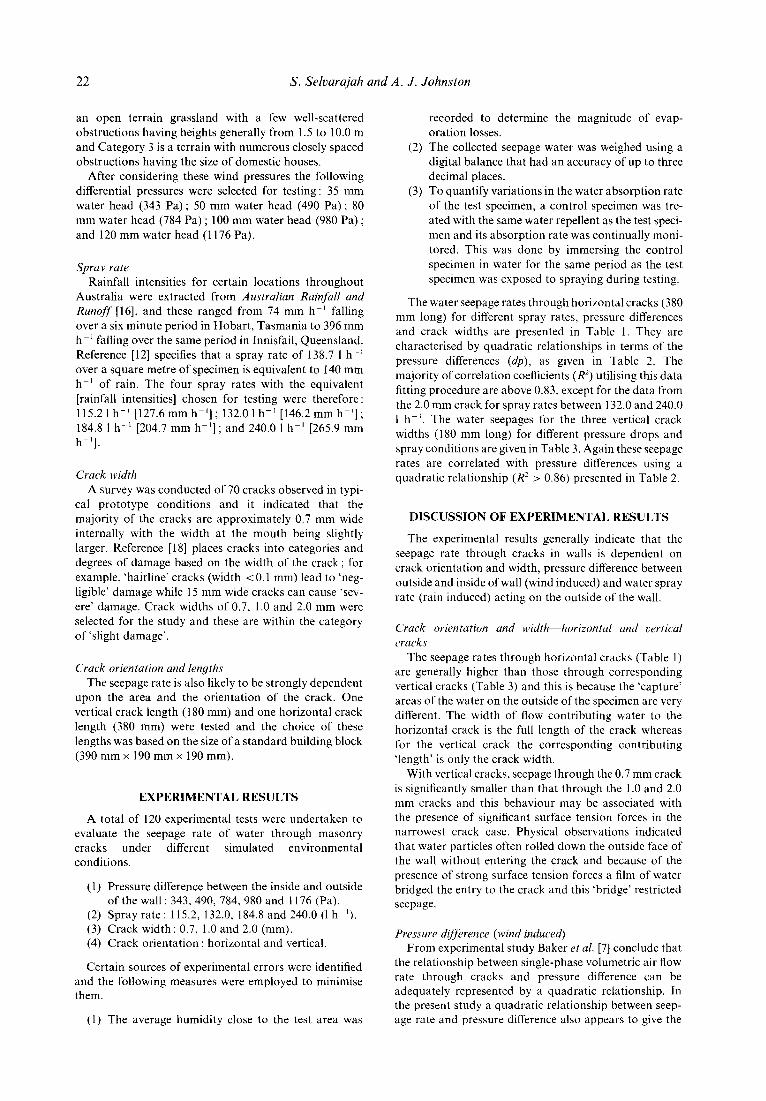
Spray rate (rain) As is illustrated in Fig. 4, there is a significant influence
on seepage rate of the water spray rate impinging on the outside of the wall. Overall, the experimental results suggest that spray rate has a more dominant role than pressure differentials. This can be shown by comparing
the average seepage rates (three crack widths over all the pressure differentials tested) for each spray rate. With a spray rate of 115 1 h-’ (Fig. 4a) an average seepage rate through horizontal cracks is 34.1 1 hh’ compared with 2.5 1 h-’ through vertical cracks. A spray rate of 132 1 hh’ (Fig. 4b) produces an average horizontal crack seep-
age rate of 39.1 1 h-’ and a vertical seepage rate of 3.1 1 h-‘. A spray rate of 185 1 h-’ (Fig. 4c) yields an average seepage rate through horizontal cracks of 58.8 1 h-’ and 4.7 1 h-’ through vertical cracks. The largest spray rate of 240 1 h-’ (Fig. 4d) gives an average seepage rate through horizontal cracks of 79.9 1 h-’ and 6.1 1 hh’ through vertical cracks.
An interesting trend in this data is the variation in the significance of the crack thickness parameter. For vertical cracks the significance of the crack thickness increases with spray rate; for example, the spread of data with a spray rate of 115 1 h-’ is approximately 3.3 1 h-‘, increas- ing to 4.2 1 h-’ with 132 1 h-l, 6.5 1 h-’ with 185 1 h-’ and finally 9.18 1 h-’ with 240 1 h-‘. This trend is also initially followed by the horizontal crack results where spreads of 3.3 1 hh’, 6.5 1 h-’ and 11.5 1 h-’ are achieved with the three lower spray rates ; however, at the largest spray rate (240 1 h-‘) the spread of data is significantly reduced. This implies that some controlling condition is being approached in the horizontal crack configuration.
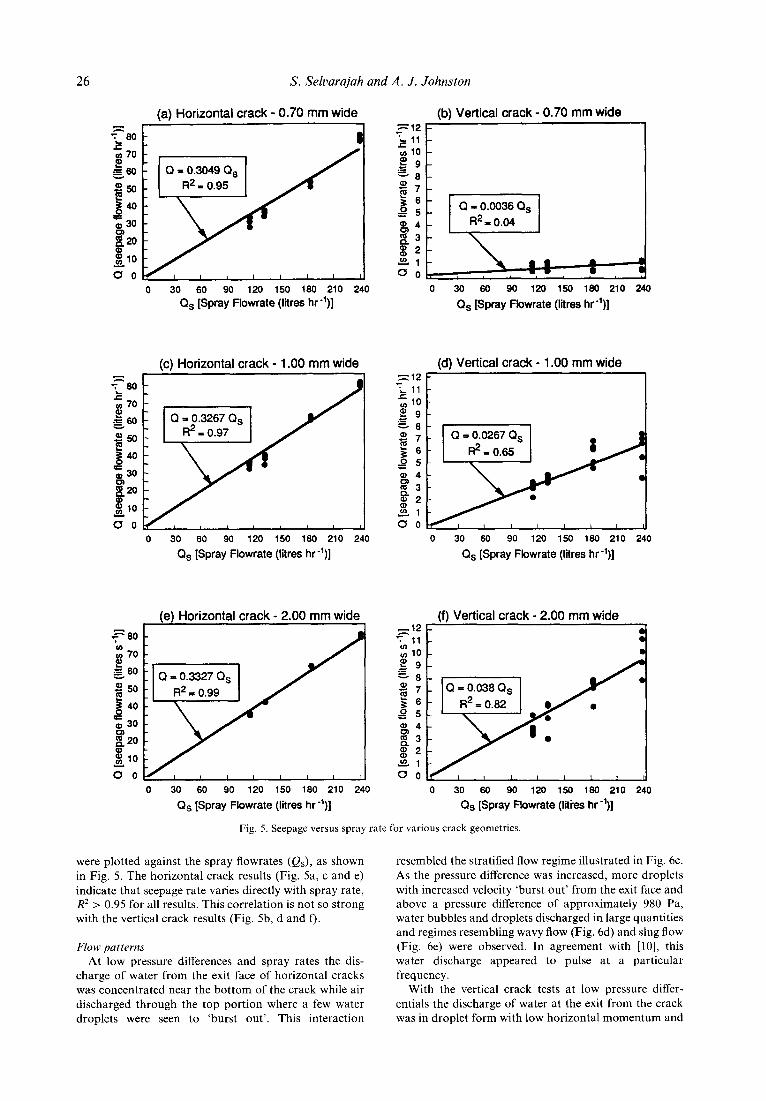
Following the above findings the seepage flowrates
26 S. Selvarajah and A. J. Johnston
(a) Horizontal crack - 0.70 mm wide
%o c
0 30 60 90 120 150 180 210 240
Q, [Spray Flowrate (l&es hr -‘)I
(c) Horizontal crack - 1 .OO mm wide
- Q = 0.3267 Qs
0 30 60 90 120 150 160 210 240
Q, [Spray Flowrate (litres hr -‘)I
(e) Horizontal crack - 2.00 mm wide I
: Q = 0.3327 Q,
0 30 60 90 120 150 160 210 240
Qs [Spray Flowrate (lives hr -‘)I
(b) Vertical crack - 0.70 mm wide Cl2 i ‘; zll -
gl0 - L9- z
ga 2
7-
s6- g5-
Q = 0.0036 Q,
84 I+= 0.04
iTi.3 % 2- =I- 1
aou 4,: , l
0 30 60 90 120 150 160 210 240
0s [Spray Flowrate (liires hr-‘)]
(d) Vertical crack - 1 .OO mm wide
0 30 60 90 120 150 160 210 240
Qs [Spray Flowrate (litres hr “)I
(f) Vertical crack - 2.00 mm wide
0 30 60 90 120 150 160 210 240
Qs [Spray Flowrate (lities hr -‘)I
Fig. 5. Seepage versus spray rate for various crack geometries
were plotted against the spray flowrates (QJ, as shown in Fig. 5. The horizontal crack results (Fig. 5a, c and e) indicate that seepage rate varies directly with spray rate, R* > 0.95 for all results. This correlation is not so strong with the vertical crack results (Fig. 5b, d and f).
Flow patterns At low pressure differences and spray rates the dis-
charge of water from the exit face of horizontal cracks was concentrated near the bottom of the crack while air discharged through the top portion where a few water droplets were seen to ‘burst out’. This interaction
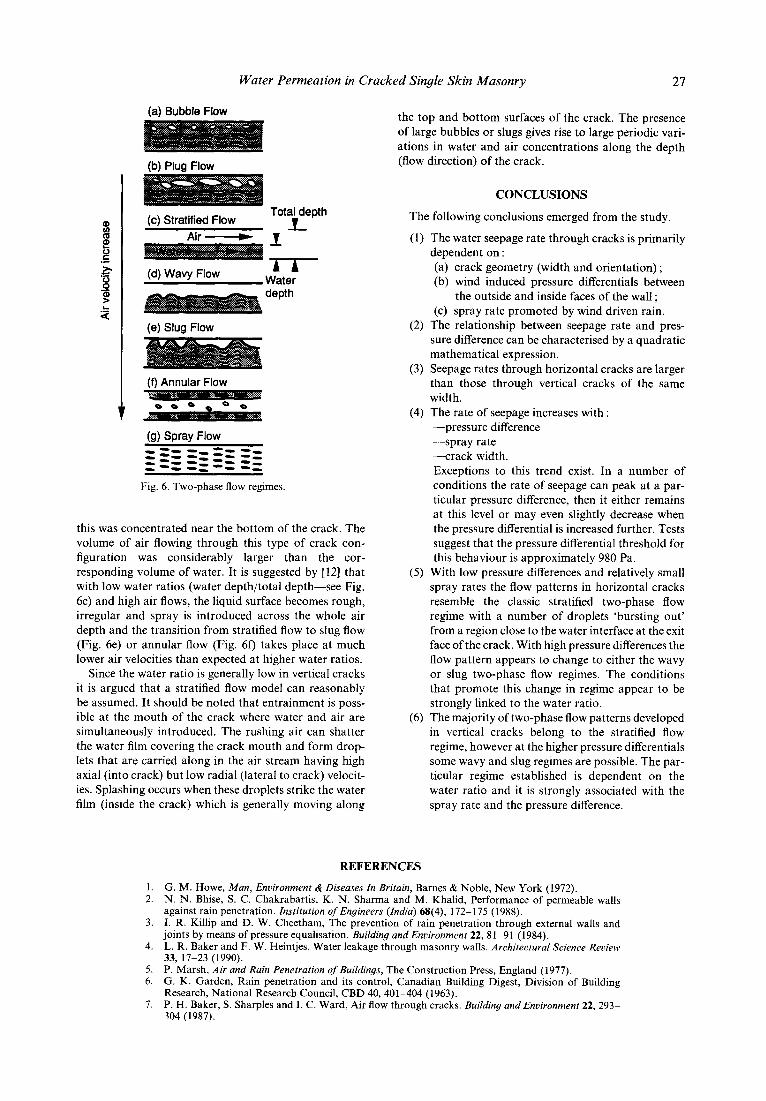
resembled the stratified flow regime illustrated in Fig. 6c. As the pressure difference was increased, more droplets with increased velocity ‘burst out’ from the exit face and above a pressure difference of approximately 980 Pa, water bubbles and droplets discharged in large quantities and regimes resembling wavy flow (Fig. 6d) and slug flow (Fig. 6e) were observed. In agreement with [lo], this water discharge appeared to pulse at a particular frequency.
With the vertical crack tests at low pressure differ- entials the discharge of water at the exit from the crack was in droplet form with low horizontal momentum and
Water Permeation in Cracked Single Skin Masonry 27
(a) Bubble Flow
(b) Plug Flow
CONCLUSIONS
(c) Stratified Flow TotaLdepth The following conclusions emerged from the study. . ,
L Air- W
(d) Wavy Flow Water depth
(e) Slug Flow
(f) Annular Flow
(9) Spray Flow
Fig. 6. Two-phase flow regimes
this was concentrated near the bottom of the crack. The volume of air flowing through this type of crack con- figuration was considerably larger than the cor- responding volume of water. It is suggested by [12] that with low water ratios (water depth/total depth-see Fig. 6c) and high air flows, the liquid surface becomes rough, irregular and spray is introduced across the whole air depth and the transition from stratified flow to slug flow (Fig. 6e) or annular flow (Fig. 6f) takes place at much lower air velocities than expected at higher water ratios.
Since the water ratio is generally low in vertical cracks it is argued that a stratified flow model can reasonably be assumed. It should be noted that entrainment is poss- ible at the mouth of the crack where water and air are simultaneously introduced. The rushing air can shatter the water film covering the crack mouth and form drop- lets that are carried along in the air stream having high axial (into crack) but low radial (lateral to crack) velocit- ies. Splashing occurs when these droplets strike the water film (inside the crack) which is generally moving along
the top and bottom surfaces of the crack. The presence of large bubbles or slugs gives rise to large periodic vari- ations in water and air concentrations along the depth (flow direction) of the crack.
(1)
(2)
(3)
(4)
(5)
(6)
The water seepage rate through cracks is primarily dependent on : (a) crack geometry (width and orientation) ; (b) wind induced pressure differentials between
the outside and inside faces of the wall ; (c) spray rate promoted by wind driven rain.
The relationship between seepage rate and pres- sure difference can be characterised by a quadratic mathematical expression. Seepage rates through horizontal cracks are larger than those through vertical cracks of the same width. The rate of seepage increases with : -pressure difference -spray rate -crack width. Exceptions to this trend exist. In a number of conditions the rate of seepage can peak at a par- ticular pressure difference, then it either remains at this level or may even slightly decrease when the pressure differential is increased further. Tests suggest that the pressure differential threshold for this behaviour is approximately 980 Pa.
With low pressure differences and relatively small spray rates the flow patterns in horizontal cracks resemble the classic stratified two-phase flow regime with a number of droplets ‘bursting out’ from a region close to the water interface at the exit face of the crack. With high pressure differences the flow pattern appears to change to either the wavy or slug two-phase flow regimes. The conditions that promote this change in regime appear to be strongly linked to the water ratio. The majority of two-phase flow patterns developed in vertical cracks belong to the stratified flow regime, however at the higher pressure differentials some wavy and slug regimes are possible. The par- ticular regime established is dependent on the water ratio and it is strongly associated with the spray rate and the pressure difference.
REFERENCES
1. G. M. Howe, Man, Environment & Diseases In Britain, Barnes & Noble, New York (1972). 2. N. N. Bhise, S. C. Chakrabartis, K. N. Sharma and M. Khalid. Performance of uermeable walls
against rain penetration. Institution of Engineers (India) 68(4), 172-175 (1988). L 3. I. R. Kilhp and D. W. Cheetham, The prevention of rain penetration through external walls and
joints by means of pressure equalisation. Building and Environment 22, 81-91 (1984). 4. L. R. Baker and F. W. Heintjes, Water leakage through masonry walls. Archifectural Science Reoiew
33, 17-23 (1990). 5. P. Marsh, Air and Rain Penetration of Buildings, The Construction Press, England (1977). 6. G. K. Garden, Rain penetration and its control, Canadian Building Digest, Division of Building
Research, National Research Council, CBD 40, 401-404 (1963). 7. P. H. Baker, S. Sharples and I. C. Ward, Air flow through cracks, Building and Environment 22, 293%
304 (1987).
28 S. Selvarajah and A. J. Johnston
8.
9.
10.
11.
12.
13.
14.
15. 16. 17.
P. Fazio and T. Kontopidis, Cavity pressure in rain screen walls. Building and Enuironmenf 23, 137- 143 (1988). A. J. Rathbone, Rain and air penetration performance of concrete block work, Technical report 553, Cement and Concrete Association (Aust.) (1982). M. J. Cunningham, Modelling of moisture transfer in structures--I. Building and Enaironment 25, 55-61 (1990). M. J. Cunningham, Modelling of moisture transfer in structures-II. Building and Environment 25, 85-94 (1990). American Society for Testing and Materials, Standard test method for water penetration and leakage through masonry, ASTM Designation E5 14-86 (1986). Joint Committee of the New South Wales Public Works Department and the Association of Con- sulting Structural Engineers of New South Wales, Masonry code of practice (1984). British Standards Institution, Methods of test for resistance to air and water penetration, permeable walling constructions (water penetration), British Standard 4315(2) (1970). Standards Association of Australia, Wind loading code, AS 1170.2-1989 (1989). The Institution of Engineers, Australia, Australian rainfall and runoff (1987). CSIRO Division of Building, Construction and Engineering, Guide to home owners on foundation maintenance and footing performance-information sheet no. 10 (1991).


