Embed Size (px)
Citation preview
Preliminary Design Report
Town of Buena Vista
Water Treatment PlantSeptember 30, 2021
PRELIMINARY DESIGN REPORT
FOR THE
TOWN OF BUENA VISTA
WATER TREATMENT PLANT
JVA, Inc.
1512 Larimer Street
Denver, CO 80202
phone: 303-444-1951
JVA Project No. 1133e
SEPTEMBER 30, 2021
Town of Buena Vista Preliminary Design Report i
TABLE OF CONTENTS
EXECUTIVE SUMMARY ............................................................................................................ 1
SOURCE WATER ................................................................................................................ 1
PROJECT ALTERNATIVES ...................................................................................................... 1
PROJECT RECOMMENDATION ............................................................................................. 2
SECTION 1 – BASIC PROJECT INFORMATION ............................................................................. 3
PROJECT LOCATION .......................................................................................................... 3
EXISTING RAW WATER SOURCES .......................................................................................... 3
EXISTING WATER TREATMENT PLANT ..................................................................................... 5
DISTRIBUTION AND STORAGE ............................................................................................... 6
POPULATION AND DEMAND PROJECTIONS .......................................................................... 8
SECTION 2 – SOURCE WATER QUALITY ................................................................................... 10
INFILTRATION GALLERY WATER .......................................................................................... 10
SURFACE WATER ............................................................................................................. 11
SECTION 3 – TREATMENT ALTERNATIVES .................................................................................. 15
PRETREATMENT ALTERNATIVES (FOR SURFACE WATER) .......................................................... 15
TREATMENT ALTERNATIVES (FOR IG AND SURFACE WATER) ................................................... 19
DISINFECTION ALTERNATIVES (FOR IG AND SURFACE WATER) ............................................... 22
FLUORIDATION TREATMENT ALTERNATIVES (IG AND SURFACE WATER) .................................... 25
ALTERNATIVE SCREENING .................................................................................................. 27
SECTION 4 – PROJECT ALTERNATIVES .................................................................................... 29
INFILTRATION GALLERY ALTERNATIVE .................................................................................. 29
COTTONWOOD CREEK SURFACE WATER ALTERNATIVE ......................................................... 35
PRIORITIZATION AND PHASING ........................................................................................... 44
SECTION 5 – PROJECT RECOMMENDATION ............................................................................ 45
SECTION 6 – IMPLEMENTATION .............................................................................................. 49
CDPHE DESIGN CRITERIA AND PERMITTING ....................................................................... 49
EQUIPMENT PRESELECTION ................................................................................................ 49
CONSTRUCTION MANAGER AT RISK (CMAR) PROCESS DESCRIPTION ................................... 50
ANTICIPATED PROJECT SCHEDULE ..................................................................................... 51
Town of Buena Vista Preliminary Design Report ii
LIST OF TABLES
TABLE 1 – NON-MONETARY CONSIDERATIONS OF PROJECT ALTERNATIVES ................................... 2
TABLE 2 – PROJECT COSTS COMPARISON ................................................................................ 2
TABLE 3 – TOWN OF BUENA VISTA RAW WATER ........................................................................ 5
TABLE 4 – SUMMARY OF RAW INFILTRATION GALLERY WATER QUALITY ....................................... 10
TABLE 5 – SUMMARY OF RAW COTTONWOOD CREEK WATER QUALITY ...................................... 11
TABLE 6 – TREATMENT ALTERNATIVES FOR IG AND SURFACE WATER ........................................... 15
TABLE 7 – TOC REMOVAL REQUIREMENTS .............................................................................. 16
TABLE 8 – PRE-OXIDATION ALTERNATIVES ANALYSIS................................................................. 17
TABLE 9 – PRETREATMENT ALTERNATIVE ANALYSIS .................................................................... 18
TABLE 10 – FILTRATION TREATMENT ALTERNATIVE ANALYSIS ..................................................... 21
TABLE 11 – DISINFECTION ALTERNATIVES ANALYSIS ................................................................. 24
TABLE 12 – FLUORIDATION ALTERNATIVES ANALYSIS ................................................................. 26
TABLE 13 – IG TREATMENT ALTERNATIVES ............................................................................... 27
TABLE 14 – SURFACE WATER TREATMENT ALTERNATIVES ........................................................... 28
TABLE 15 – DISINFECTION ALTERNATIVES ................................................................................ 28
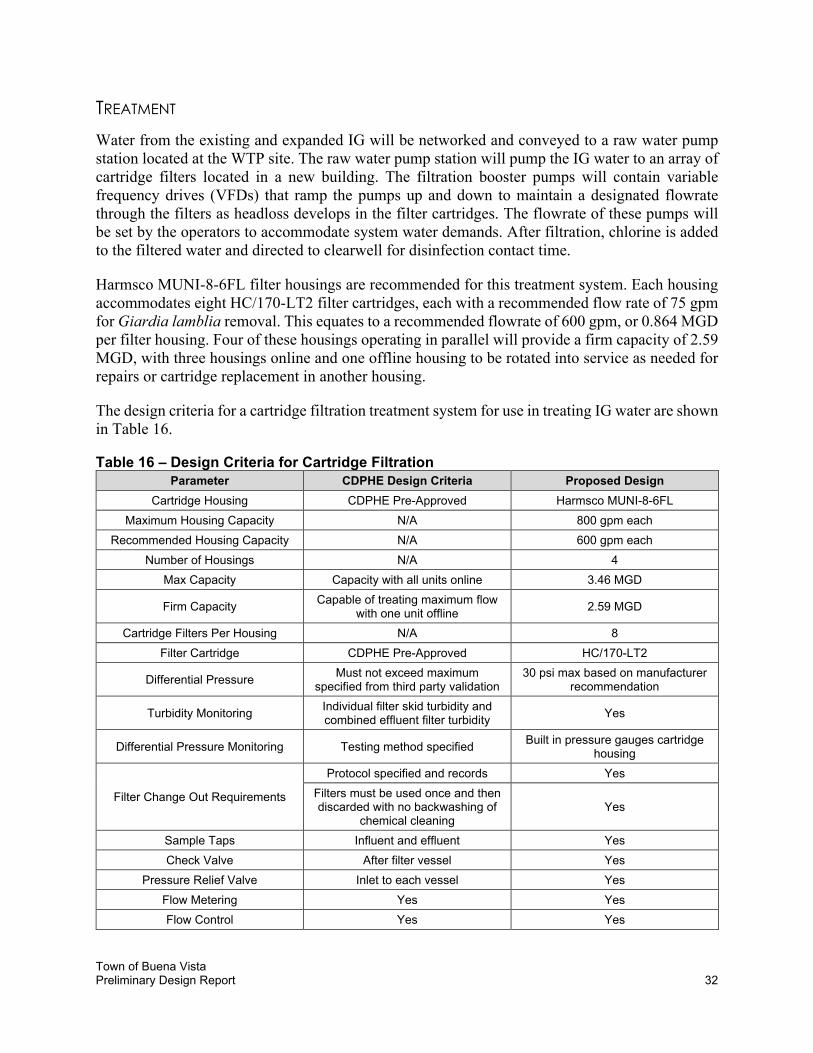
TABLE 16 – DESIGN CRITERIA FOR CARTRIDGE FILTRATION ........................................................ 32
TABLE 17 – DISINFECTION DESIGN CRITERIA ............................................................................ 33
TABLE 18 – DESIGN CRITERIA FOR PRETREATMENT CHEMICAL ADDITION .................................... 38
TABLE 19 – DESIGN CRITERIA FOR FLOCCULATION AND SEDIMENTATION .................................... 39
TABLE 20 – DESIGN CRITERIA FOR MEMBRANE FILTERS ............................................................. 40
TABLE 21 – ANTICIPATED PROJECT SCHEDULE ........................................................................ 51
Town of Buena Vista Preliminary Design Report iii
LIST OF FIGURES
FIGURE 1 – EXIST SERVICE AREA .............................................................................................. 4
FIGURE 2 – EXISTING INTAKE STRUCTURE.................................................................................... 5
FIGURE 3 – EXISTING WTP SITE PLAN........................................................................................ 7
FIGURE 4 – FUTURE WATER PRODUCTION ................................................................................. 9
FIGURE 5 – PLATE SETTLERS ................................................................................................... 18
FIGURE 6 – GRAVITY MEMBRANE .......................................................................................... 20
FIGURE 7 – IG PILOT SETUP ................................................................................................... 21
FIGURE 8 – CHLORINE DOSING EQUIPMENT ............................................................................ 23
FIGURE 9 – DEEP TRENCHING TECHNOLOGY ........................................................................... 29
FIGURE 10 – PROPOSED IG IMPROVEMENTS PFD .................................................................... 30
FIGURE 11 – PROPOSED IG IMPROVEMENTS LAYOUT ............................................................... 31
FIGURE 12 – COTTONWOOD CREEK ...................................................................................... 35
FIGURE 13 – PROPOSED SURFACE WATER IMPROVEMENTS PFD ................................................ 36
FIGURE 14 – PROPOSED SURFACE WATER IMPROVEMENTS LAYOUT ........................................... 37
FIGURE 15 – PROPOSED PROJECT IMPROVEMENTS PFD ........................................................... 46
FIGURE 16 – PROPOSED PROJECT IMPROVEMENTS SITE PLAN .................................................... 47

Town of Buena Vista Preliminary Design Report iv
APPENDICES
APPENDIX A – WATER QUALITY RESULTS
APPENDIX B – CALCULATIONS
APPENDIX C – BUDGETARY EQUIPMENT INFO
APPENDIX D – HGE REPORT
APPENDIX E – O&M COSTS AND OPCS
Town of Buena Vista Preliminary Design Report 1
EXECUTIVE SUMMARY
The Town of Buena Vista (Town) relies on the Infiltration Gallery (IG) located in Gorrel Meadows to supply raw water year-round for the Town’s potable water demand. The existing IG and supporting infrastructure has a maximum production rate of 1.15 million gallons per day (MGD). Summer peak day demand currently exceeds 1.15 MGD, and the Town supplements the IG with water from Well 2. This report evaluates alternatives to construct a new water treatment plant (WTP) that can treat up to 2.5 MGD of potable water utilizing the Town’s full water rights from Cottonwood Creek.
SOURCE WATER
The Town’s water rights allow the Town to source a maximum of 2.5 MGD from either the Gorrel Meadows or Cottonwood Creek. An existing WTP designed to treat surface water directly from Cottonwood Creek was abandoned in 1999. The IG water is superior quality and requires less treatment than the Cottonwood Creek surface water. Currently the IG is classified as groundwater but will likely be reclassified as groundwater under the direct influence (GWUDI) of surface water which will require compliance filtration. The Cottonwood Creek surface water contains constituents of concern including iron and total organic carbon (TOC) that will require treatment processes designed to target their removal to comply with Colorado’s Primary Drinking Water Regulations.
PROJECT ALTERNATIVES This report analyzed alternatives to treat either the IG water or Cottonwood Creek surface water. Since the IG is better water quality, any treatment process that is sufficient for Cottonwood Creek surface water will also be sufficient for IG water. The Town’s goals are to:
• Supply high quality water to the Town’s customers
• Have reliable and redundant water supply and treatment system
• Maintain a Class B operator requirement, if possible
• Limit operations, maintenance, and capital cost
The project alternative to treat IG water includes installing a new redundant IG with a 2.5 MGD capacity, compliance cartridge filtration, pH adjustment, and onsite sodium hypochlorite generation. The project alternative to treat Cottonwood Creek surface water includes reconstructing the Cottonwood Creek intake structure, rehabbing the presedimentation pond, installing pretreatment, gravity membrane filters, and onsite sodium hypochlorite generation.
The draft Town of Buena Vista Water Resources Master Plan (WRMP), prepared by Wright Water Engineers, Incorporated, dated August 23, 2021, recommends the Town have the ability to treat both IG water and Cottonwood Creek surface water. The project alternative to treat both IG and Cottonwood Creek surface water includes installing a new redundant IG with a 2.5 MGD capacity, reconstructing the Cottonwood Creek intake structure, rehabbing the presedimentation pond,
Town of Buena Vista Preliminary Design Report 2
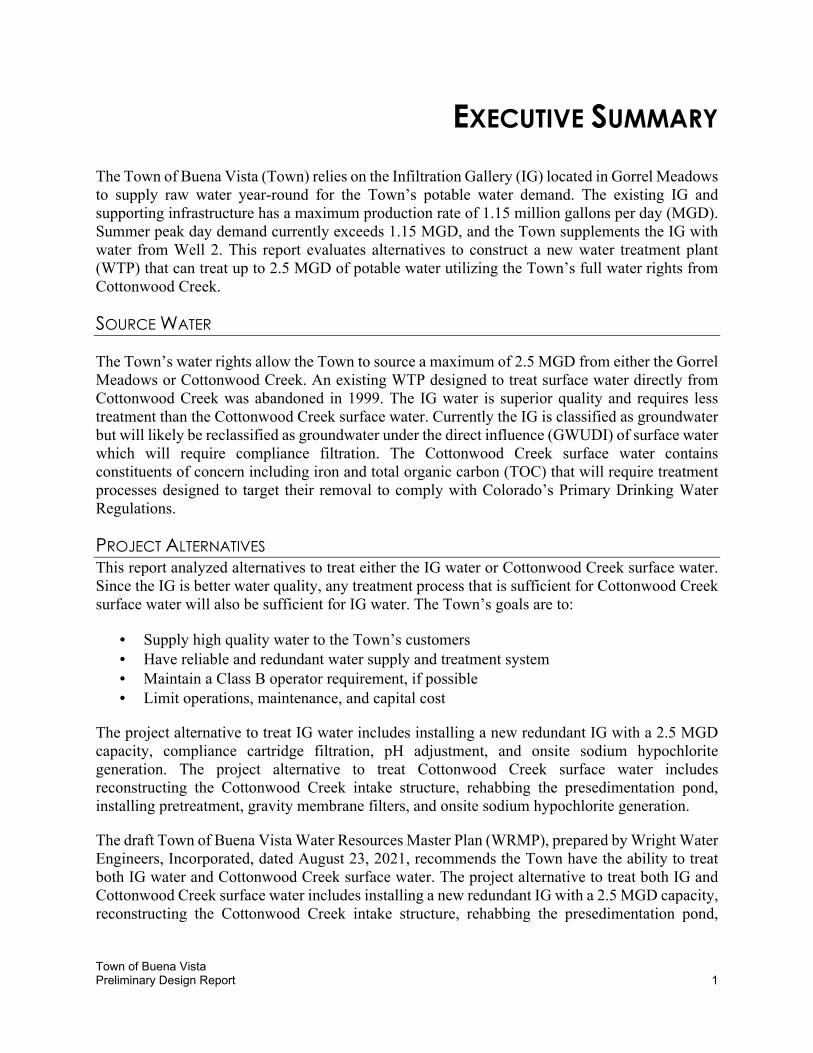
installing pretreatment, gravity membrane filters, pH adjustment, and onsite sodium hypochlorite generation. Table 1 summarizes the non-monetary considerations for the two projects.
Table 1 – Non-Monetary Considerations of Project Alternatives Project Alternative Advantages Disadvantages
IG using Cartridge Filtration
• Superior water quality • Simpler treatment • Lower ORC license required • No liquid waste stream
• Cannot utilize Cottonwood Creek surface water
• Throw away cartridges
IG and Cottonwood Creek Surface Water using Gravity Membranes
• Redundant sources • More resilient treatment process
• Requires pretreatment • Liquid waste stream • Higher ORC license required
*ORC is the operator in responsible charge
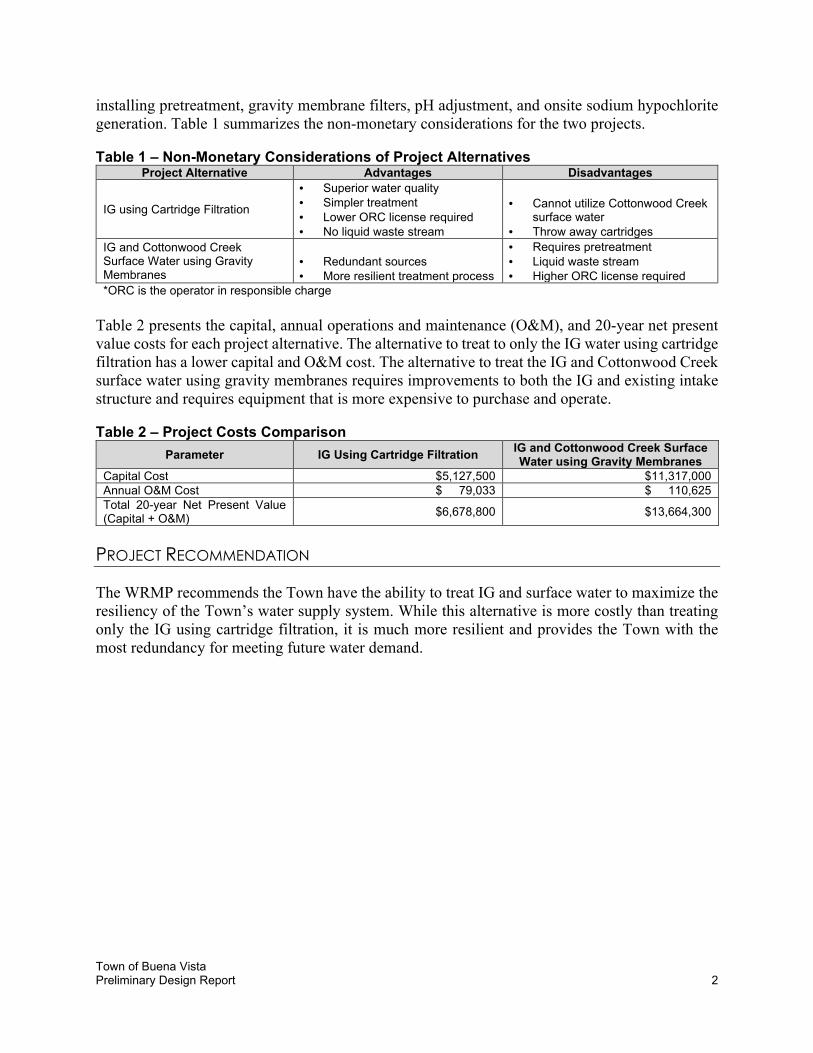
Table 2 presents the capital, annual operations and maintenance (O&M), and 20-year net present value costs for each project alternative. The alternative to treat to only the IG water using cartridge filtration has a lower capital and O&M cost. The alternative to treat the IG and Cottonwood Creek surface water using gravity membranes requires improvements to both the IG and existing intake structure and requires equipment that is more expensive to purchase and operate.
Table 2 – Project Costs Comparison
Parameter IG Using Cartridge Filtration IG and Cottonwood Creek Surface Water using Gravity Membranes
Capital Cost $5,127,500 $11,317,000 Annual O&M Cost $ 79,033 $ 110,625 Total 20-year Net Present Value (Capital + O&M)
$6,678,800 $13,664,300
PROJECT RECOMMENDATION
The WRMP recommends the Town have the ability to treat IG and surface water to maximize the resiliency of the Town’s water supply system. While this alternative is more costly than treating only the IG using cartridge filtration, it is much more resilient and provides the Town with the most redundancy for meeting future water demand.
Town of Buena Vista Preliminary Design Report 3
SECTION 1 – BASIC PROJECT INFORMATION
The Town of Buena Vista (Town) owns and operates a community water system (PWSID No. CO 0108300) that provides drinking water to residential, municipal, and commercial customers located within the Town’s service area. The population within the Town’s service area is approximately 2,906 full time residents. The Town is considering improvements to the water treatment plant (WTP) to meet surface water treatment regulations and to increase capacity for meeting current and future water demands as the population continues to grow within the service area. The Town owns senior surface water rights for Cottonwood Creek that are currently not being fully exercised due to limitations of their existing water treatment process capabilities. In this preliminary design report, alternatives for treatment and increasing the capacity of the WTP are evaluated. The Town also owns an existing surface water treatment plant with a treatment capacity of 1.0 million gallons per day (MGD), which has been decommissioned since 1999.
The Town’s WTP receives water from an infiltration gallery (IG) located within the North Cottonwood Creek alluvium, known as Gorrel Meadows, located to the west of the WTP. Raw water collected by the IG is currently considered to be groundwater by the Colorado Department of Public Health and Environment (CDPHE) and therefore only requires disinfection prior to distribution. However, it is likely the IG source will be reclassified as groundwater under direct influence (GWUDI) of surface water in the future. The IG is currently the primary source of water for the Town. The Town has three additional ground water wells. The Town relies on Well 2 to supplement IG water during high demand. Together, these two sources have a maximum production of approximately 1.15 MGD.
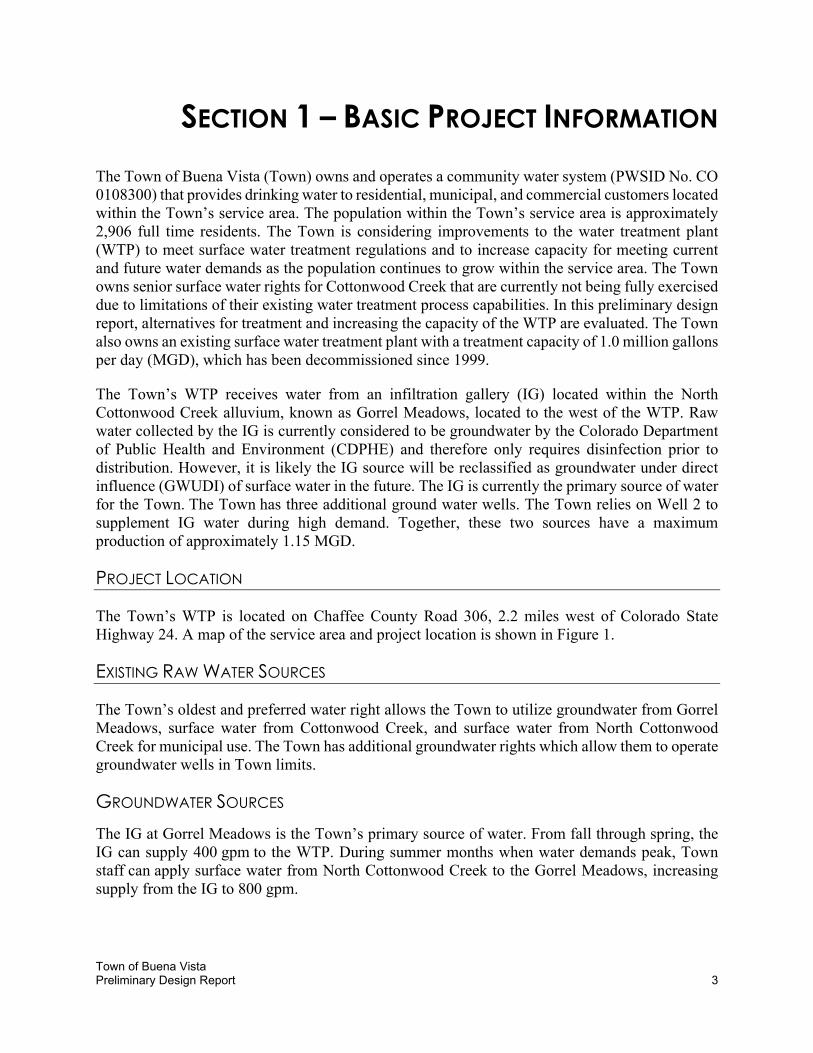
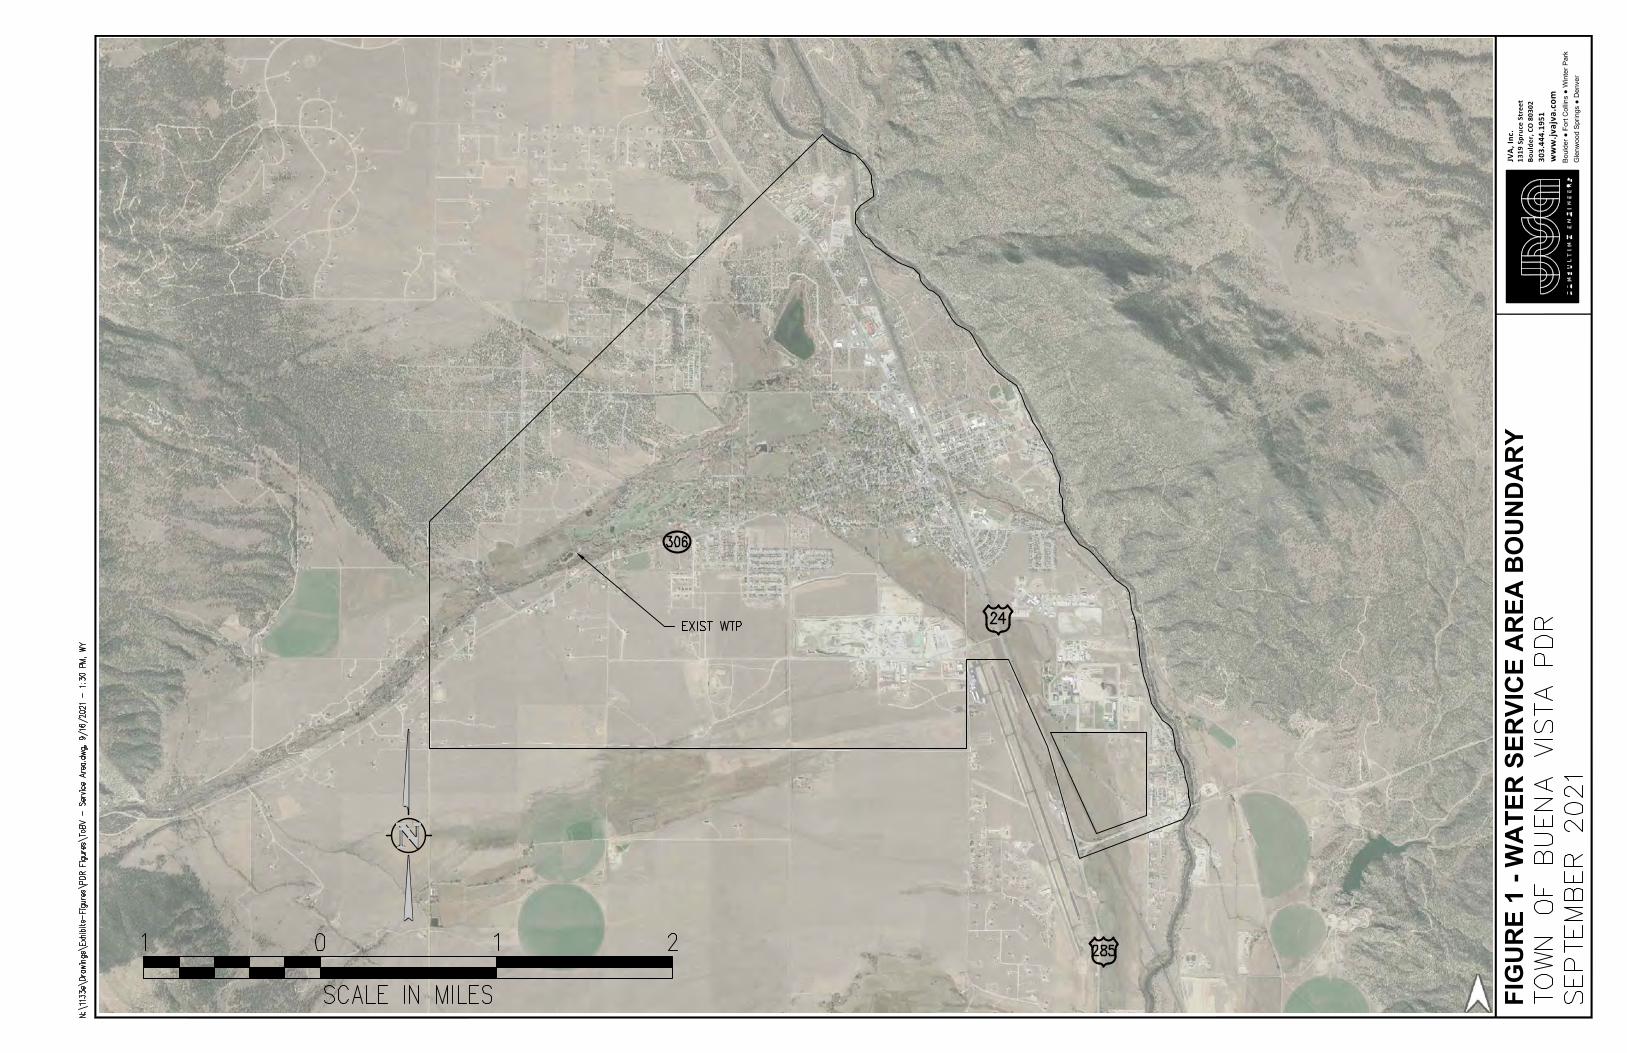
PROJECT LOCATION
The Town’s WTP is located on Chaffee County Road 306, 2.2 miles west of Colorado State Highway 24. A map of the service area and project location is shown in Figure 1.
EXISTING RAW WATER SOURCES
The Town’s oldest and preferred water right allows the Town to utilize groundwater from Gorrel Meadows, surface water from Cottonwood Creek, and surface water from North Cottonwood Creek for municipal use. The Town has additional groundwater rights which allow them to operate groundwater wells in Town limits.
GROUNDWATER SOURCES
The IG at Gorrel Meadows is the Town’s primary source of water. From fall through spring, the IG can supply 400 gpm to the WTP. During summer months when water demands peak, Town staff can apply surface water from North Cottonwood Creek to the Gorrel Meadows, increasing supply from the IG to 800 gpm.
FIG
UR
E 1
- WA
TER
SER
VIC
E A
REA
BO
UN
DA
RY
1319
Spr
uce
Stre
etBo
ulde
r, CO
803
0230
3.44
4.19
51w
ww
.jvaj
va.c
om
JVA,
Inc.
Boul
der ●
For
t Col
lins
● W
inte
r Par
kG
lenw
ood
Sprin
gs ●
Den
ver
Town of Buena Vista Preliminary Design Report 5
Well 1, which is located at the Rodeo Grounds, has a production rate of 15 gallons per minute (gpm). Water from Well 1 only provides water to the rodeo grounds and is not connected to the distribution system. Well 2 is a 100-foot deep alluvial well located at the WTP site and is used to supplement flows from the IG. When in production, groundwater from Well 2 is combined with water from the IG in a vault located on the northeast side of the WTP and disinfected with chlorine prior to entering the distribution system. Well 3 is located at the River Park on the east side of Town and is disinfected at the well site prior to entering the distribution system. A summary of the existing groundwater wells is provided in Table 3.
Table 3 – Town of Buena Vista Raw Water
Well Name Permit No. Production Rate
(gpm)
Depth
(ft) Use
IG 51396-F 1178 10 Domestic
Well 1 (Rodeo Grounds) 77257-F 15 57 Domestic, Municipal
Well 2 (At WTP) 78212-F 150 100 Domestic, Municipal
Well 3 (At River Park) 78531-F 100 88 Domestic, Municipal
SURFACE WATER SOURCES
The Town’s senior water rights on Cottonwood Creek allow water to be diverted at the Town’s intake structure, referred to as the grizzly. Under current operations, the Town can reliably divert up to 3.88 CFS, or 2.5 MGD during the irrigation season, which is April through October.
EXISTING WATER TREATMENT PLANT
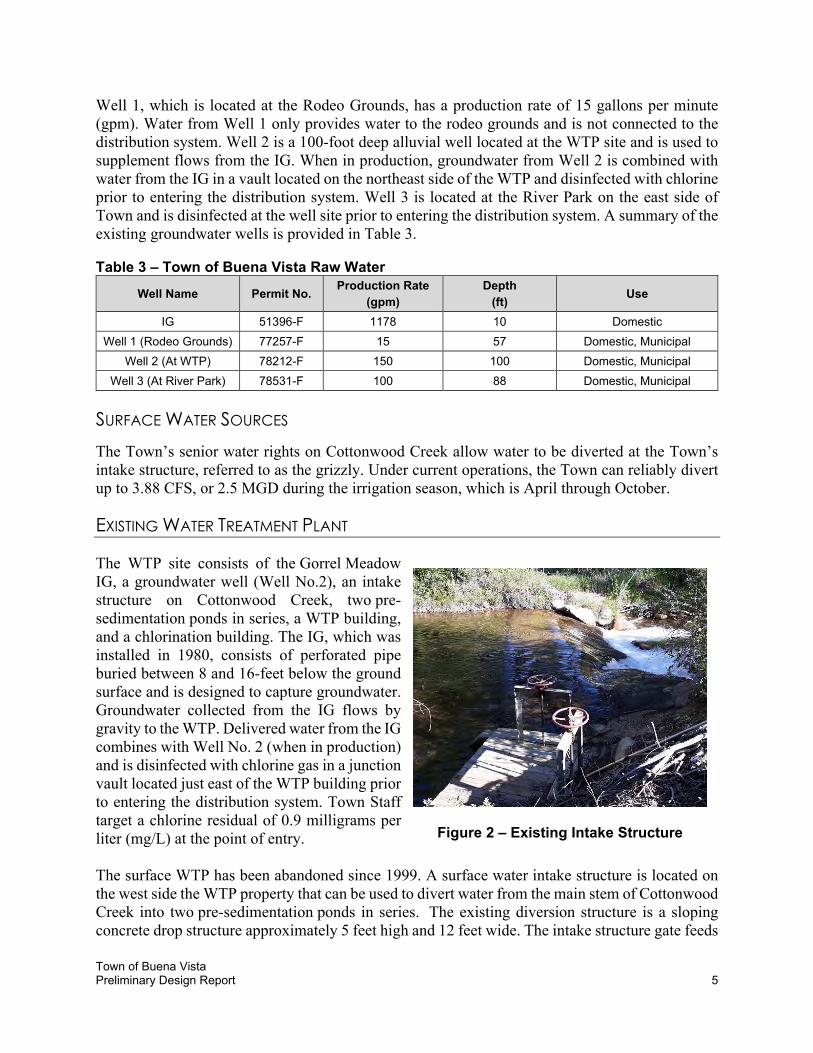
The WTP site consists of the Gorrel Meadow IG, a groundwater well (Well No.2), an intake structure on Cottonwood Creek, two pre-sedimentation ponds in series, a WTP building, and a chlorination building. The IG, which was installed in 1980, consists of perforated pipe buried between 8 and 16-feet below the ground surface and is designed to capture groundwater. Groundwater collected from the IG flows by gravity to the WTP. Delivered water from the IG combines with Well No. 2 (when in production) and is disinfected with chlorine gas in a junction vault located just east of the WTP building prior to entering the distribution system. Town Staff target a chlorine residual of 0.9 milligrams per liter (mg/L) at the point of entry. The surface WTP has been abandoned since 1999. A surface water intake structure is located on the west side the WTP property that can be used to divert water from the main stem of Cottonwood Creek into two pre-sedimentation ponds in series. The existing diversion structure is a sloping concrete drop structure approximately 5 feet high and 12 feet wide. The intake structure gate feeds
Figure 2 – Existing Intake Structure
Town of Buena Vista Preliminary Design Report 6
an 18-inch pipe and flows by gravity to the pre-sedimentation ponds. The elevation of the weir at
the point of diversion is a key variable for controlling the flow rate to the WTP and influences the
floodplain. Peak stream flow ranges from 100 to 800 cubic feet per second (cfs) and the design of
the diversion will be constrained by the impact on the floodplain.
Raw water flows by gravity from the lined 1-million-gallon (MG) pre-sedimentation ponds to the
WTP building through a 18-inch ductile iron pipe. The WTP building, which was built in 1974,
houses the treatment system which includes chemical pretreatment with a rapid mix system,
flocculation, mixed media filtration, a backwash pumping and handling system, and
a clearwell. The chemical pretreatment system consists of a polyaluminum chloride (PACl)
storage tank and chemical feed pumps, a 6,000-gallon Alum storage tank, and a polymer chemical
feed system. The chemicals are injected after the raw water enters the building, the water passes
through a rapid mix, and then the flow of water is split between the two flocculation basins. Each
basin is equipped with three over/under wooden baffles. The capacity of each flocculation basin
is estimated to be 0.52 MGD (based on minimum flocculation time of 30 minutes), for a combined
1.03 MGD capacity.
Water from each flocculation basin then flows into a multi-media gravity filter. Each filter has 144
square feet of surface area. The filter media consists of 18-inches of anthracite, 12-inches of silica
sand, a layer of garnet, and 15-inches of gravel. The filters are not equipped with a filter-to-waste
option and therefor, do not meet current CDPHE design criteria. The capacity of the filters is
estimated to be 1.04 MGD per train, or 2.07 MGD combined capacity. Filtered water is piped to
a single, unbaffled, 33,000 gallon clearwell. Finished water can flow from the clearwell into the
distribution system via a gravity pipeline, which is currently plugged to isolate the abandoned
WTP from distribution.
The clearwell is equipped with a single vertical turbine pump used for filter backwash. The
backwash flow rate is 2,500 gpm and is controlled through a modulating valve. Backwash waste
is piped to one of two lined ponds located on the north side of the WTP. Decant from the backwash
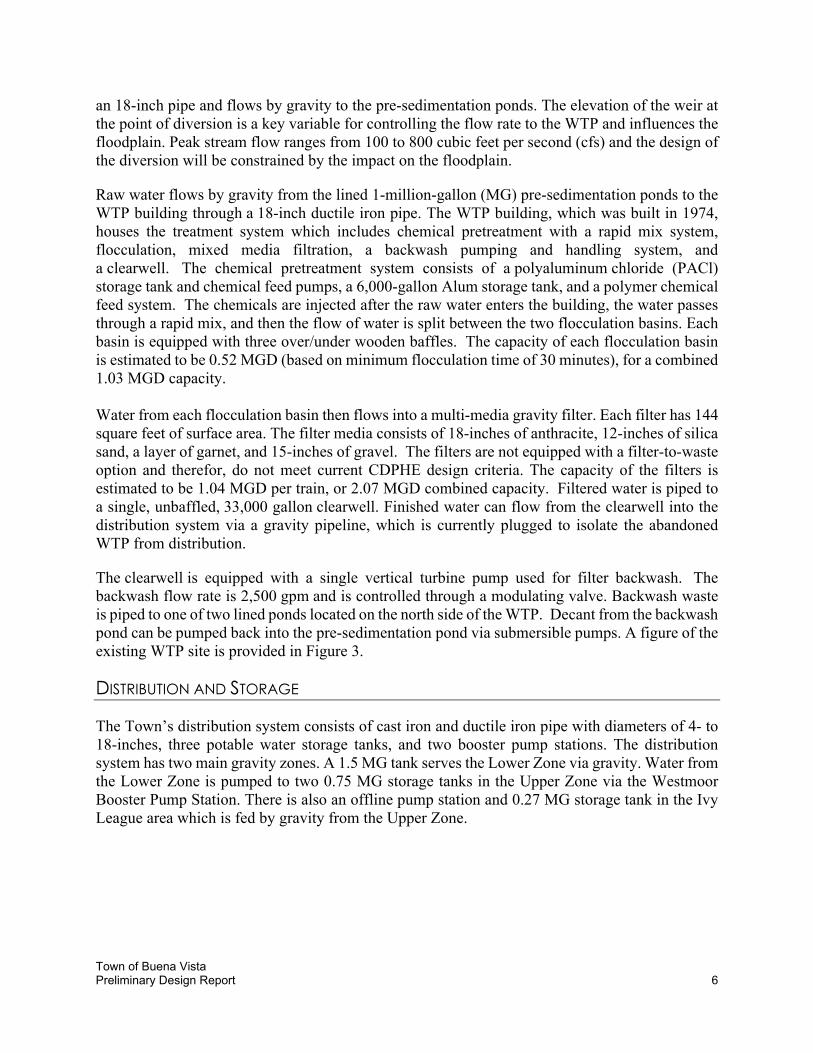
pond can be pumped back into the pre-sedimentation pond via submersible pumps. A figure of the
existing WTP site is provided in Figure 3.
DISTRIBUTION AND STORAGE
The Town’s distribution system consists of cast iron and ductile iron pipe with diameters of 4- to
18-inches, three potable water storage tanks, and two booster pump stations. The distribution
system has two main gravity zones. A 1.5 MG tank serves the Lower Zone via gravity. Water from
the Lower Zone is pumped to two 0.75 MG storage tanks in the Upper Zone via the Westmoor
Booster Pump Station. There is also an offline pump station and 0.27 MG storage tank in the Ivy
League area which is fed by gravity from the Upper Zone.
FIG
UR
E 3
- EXI
ST W
TP13
19 S
pruc
e St
reet
Boul
der,
CO 8
0302
303.
444.
1951
ww
w.jv
ajva
.com
JVA,
Inc.
Boul
der ●
For
t Col
lins
● W
inte
r Par
kG
lenw
ood
Sprin
gs ●
Den
ver
Town of Buena Vista Preliminary Design Report 8
POPULATION AND DEMAND PROJECTIONS
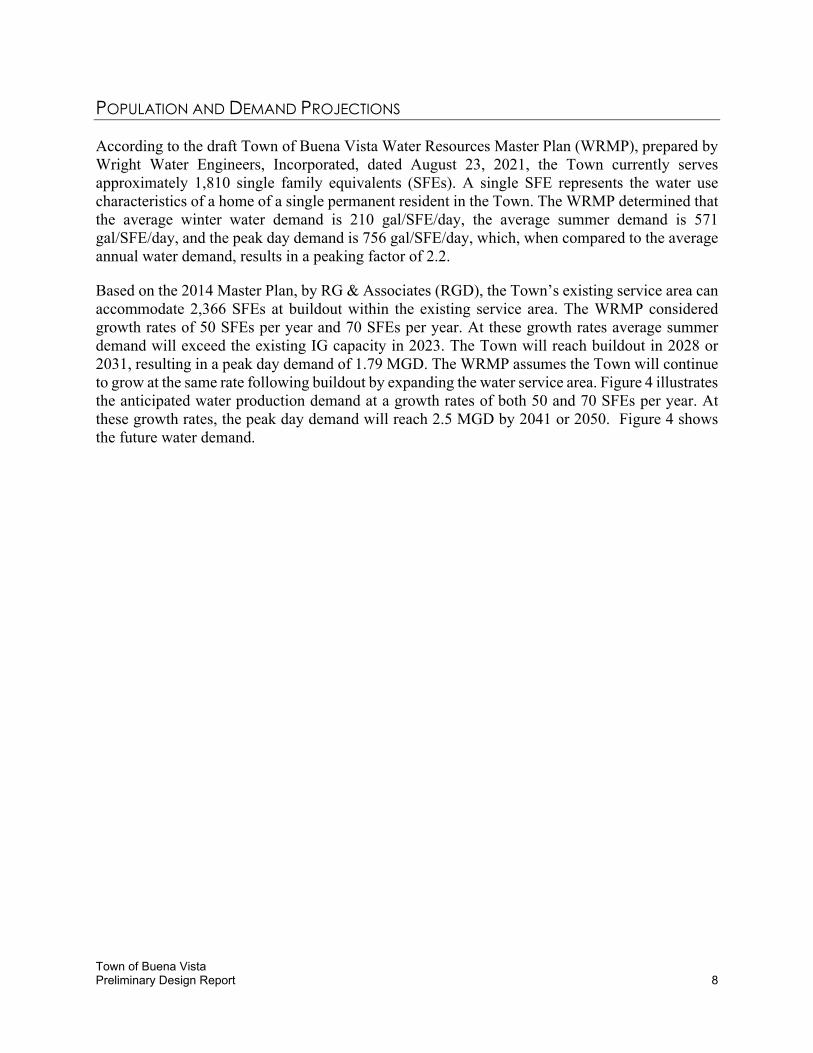
According to the draft Town of Buena Vista Water Resources Master Plan (WRMP), prepared by Wright Water Engineers, Incorporated, dated August 23, 2021, the Town currently serves approximately 1,810 single family equivalents (SFEs). A single SFE represents the water use characteristics of a home of a single permanent resident in the Town. The WRMP determined that the average winter water demand is 210 gal/SFE/day, the average summer demand is 571 gal/SFE/day, and the peak day demand is 756 gal/SFE/day, which, when compared to the average annual water demand, results in a peaking factor of 2.2.
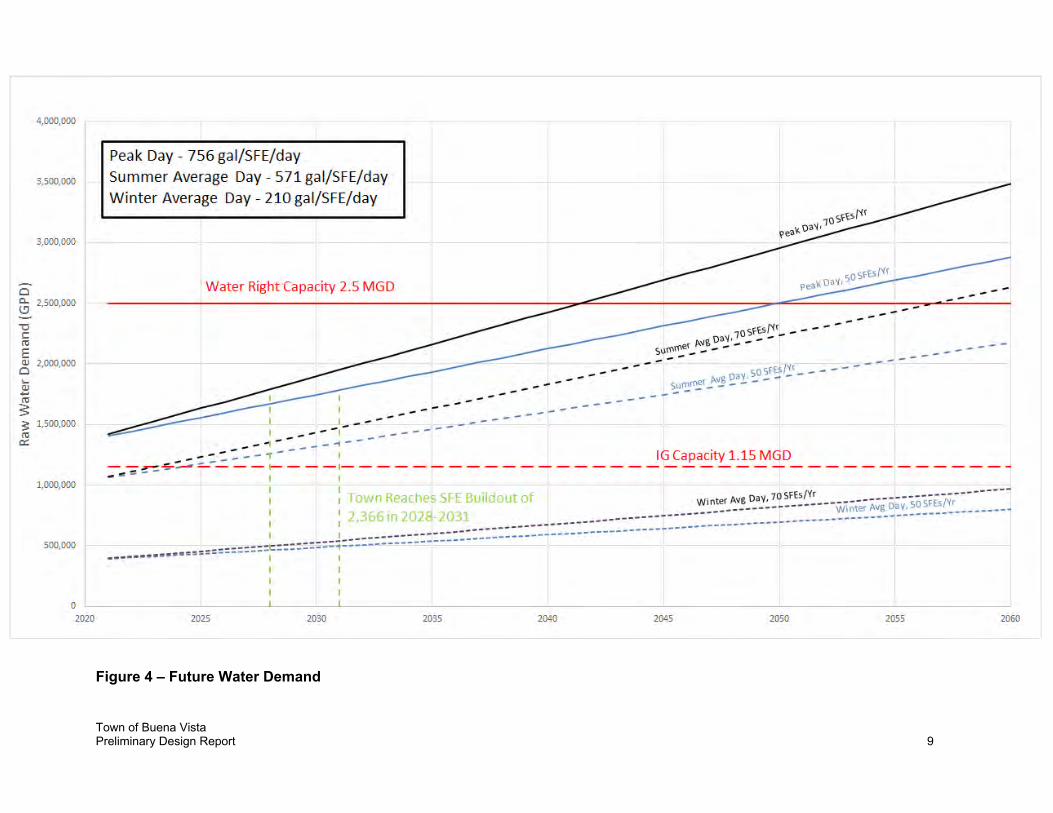
Based on the 2014 Master Plan, by RG & Associates (RGD), the Town’s existing service area can accommodate 2,366 SFEs at buildout within the existing service area. The WRMP considered growth rates of 50 SFEs per year and 70 SFEs per year. At these growth rates average summer demand will exceed the existing IG capacity in 2023. The Town will reach buildout in 2028 or 2031, resulting in a peak day demand of 1.79 MGD. The WRMP assumes the Town will continue to grow at the same rate following buildout by expanding the water service area. Figure 4 illustrates the anticipated water production demand at a growth rates of both 50 and 70 SFEs per year. At these growth rates, the peak day demand will reach 2.5 MGD by 2041 or 2050. Figure 4 shows the future water demand.
Town of Buena Vista Preliminary Design Report 9
Figure 4 – Future Water Demand
Town of Buena Vista Preliminary Design Report 10
SECTION 2 – SOURCE WATER QUALITY
Historical and recent water quality samples collected from the IG and Cottonwood Creek surface water are analyzed in this section. Understanding the water quality from each source is key to determining the processes necessary to treat the water to comply with Colorado’s Primary Drinking Water Regulations (Regulations). The Regulations establish enforceable maximum contaminant levels (MCLs) for various constituents in the finished water provided to customers. The Regulations also include secondary maximum contaminant levels (SMCLs) for some constituents, which are recommended levels. Water quality lab results can be found in Appendix A.
INFILTRATION GALLERY WATER
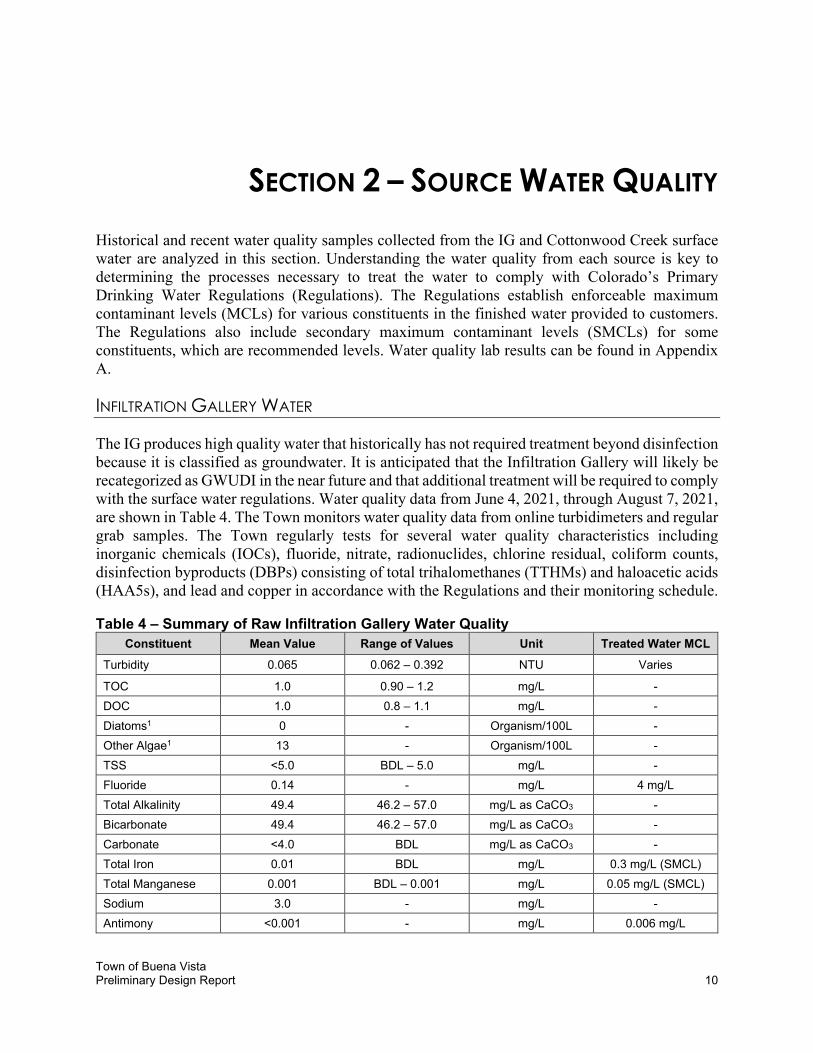
The IG produces high quality water that historically has not required treatment beyond disinfection because it is classified as groundwater. It is anticipated that the Infiltration Gallery will likely be recategorized as GWUDI in the near future and that additional treatment will be required to comply with the surface water regulations. Water quality data from June 4, 2021, through August 7, 2021, are shown in Table 4. The Town monitors water quality data from online turbidimeters and regular grab samples. The Town regularly tests for several water quality characteristics including inorganic chemicals (IOCs), fluoride, nitrate, radionuclides, chlorine residual, coliform counts, disinfection byproducts (DBPs) consisting of total trihalomethanes (TTHMs) and haloacetic acids (HAA5s), and lead and copper in accordance with the Regulations and their monitoring schedule.
Table 4 – Summary of Raw Infiltration Gallery Water Quality
Constituent Mean Value Range of Values Unit Treated Water MCL
Turbidity 0.065 0.062 – 0.392 NTU Varies
TOC 1.0 0.90 – 1.2 mg/L -
DOC 1.0 0.8 – 1.1 mg/L -
Diatoms1 0 - Organism/100L -
Other Algae1 13 - Organism/100L -
TSS <5.0 BDL – 5.0 mg/L -
Fluoride 0.14 - mg/L 4 mg/L
Total Alkalinity 49.4 46.2 – 57.0 mg/L as CaCO3 -
Bicarbonate 49.4 46.2 – 57.0 mg/L as CaCO3 -
Carbonate <4.0 BDL mg/L as CaCO3 -
Total Iron 0.01 BDL mg/L 0.3 mg/L (SMCL)
Total Manganese 0.001 BDL – 0.001 mg/L 0.05 mg/L (SMCL)
Sodium 3.0 - mg/L -
Antimony <0.001 - mg/L 0.006 mg/L
Town of Buena Vista Preliminary Design Report 11
Constituent Mean Value Range of Values Unit Treated Water MCL
Arsenic <0.001 - mg/L 0.010 mg/L
Barium 0.011 - mg/L 2.0 mg/L
Beryllium <0.001 - mg/L 0.004 mg/L
Cadmium <0.001 - mg/L 0.005 mg/L
Chromium <0.001 - mg/L 0.1 mg/L
Mercury <0.001 - mg/L 0.002 mg/L
Nickel <0.001 - mg/L -
Selenium <0.001 - mg/L 0.05 mg/L
Thallium <0.001 - mg/L 0.02 /L
1Samples collected 9/22/2011
*BDL is Below Detectable Limit, TSS is Total Suspended Solid, TOC is Total Organic Carbon, DOC is Dissolved Organic Carbon
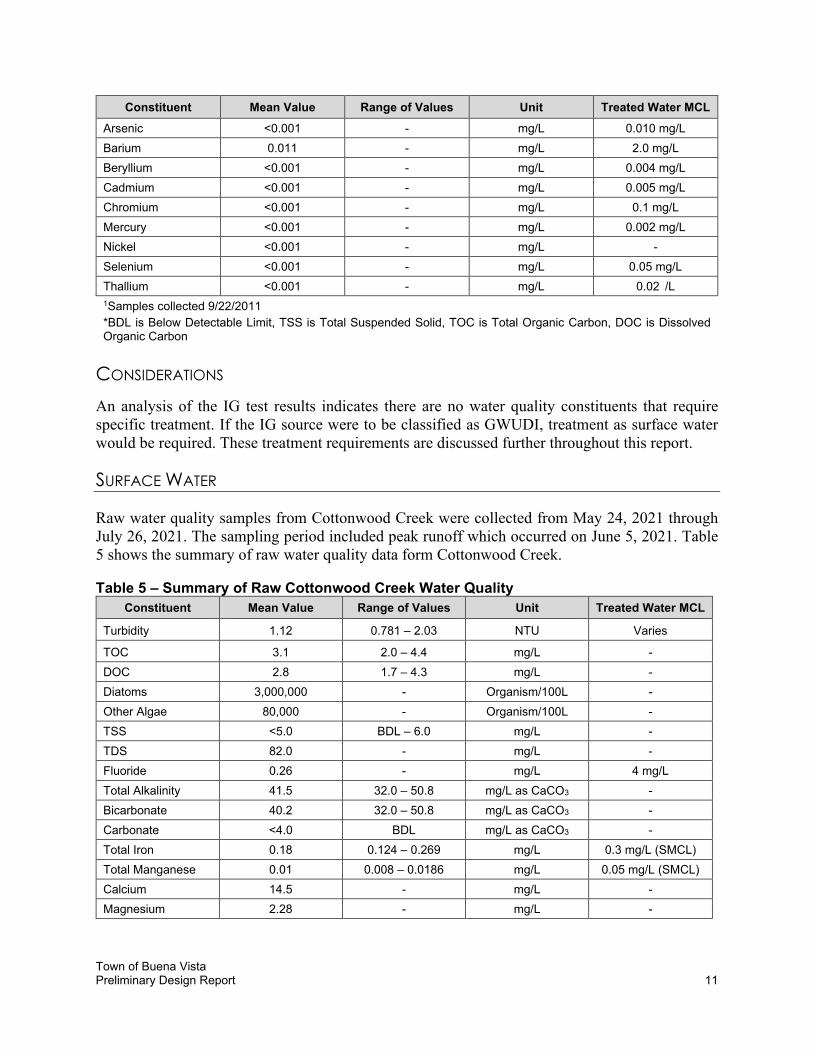
CONSIDERATIONS
An analysis of the IG test results indicates there are no water quality constituents that require specific treatment. If the IG source were to be classified as GWUDI, treatment as surface water would be required. These treatment requirements are discussed further throughout this report.
SURFACE WATER
Raw water quality samples from Cottonwood Creek were collected from May 24, 2021 through July 26, 2021. The sampling period included peak runoff which occurred on June 5, 2021. Table 5 shows the summary of raw water quality data form Cottonwood Creek.
Table 5 – Summary of Raw Cottonwood Creek Water Quality
Constituent Mean Value Range of Values Unit Treated Water MCL
Turbidity 1.12 0.781 – 2.03 NTU Varies
TOC 3.1 2.0 – 4.4 mg/L -
DOC 2.8 1.7 – 4.3 mg/L -
Diatoms 3,000,000 - Organism/100L -
Other Algae 80,000 - Organism/100L -
TSS <5.0 BDL – 6.0 mg/L -
TDS 82.0 - mg/L -
Fluoride 0.26 - mg/L 4 mg/L
Total Alkalinity 41.5 32.0 – 50.8 mg/L as CaCO3 -
Bicarbonate 40.2 32.0 – 50.8 mg/L as CaCO3 -
Carbonate <4.0 BDL mg/L as CaCO3 -
Total Iron 0.18 0.124 – 0.269 mg/L 0.3 mg/L (SMCL)
Total Manganese 0.01 0.008 – 0.0186 mg/L 0.05 mg/L (SMCL)
Calcium 14.5 - mg/L -
Magnesium 2.28 - mg/L -
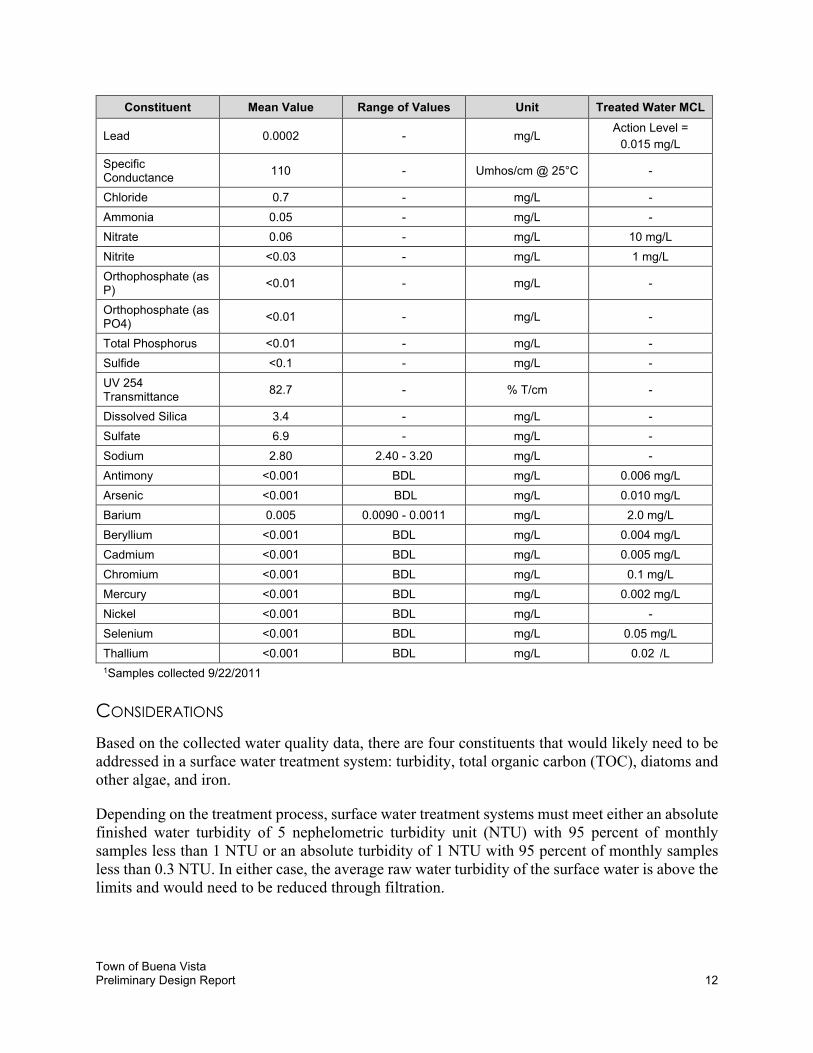
Town of Buena Vista Preliminary Design Report 12
Constituent Mean Value Range of Values Unit Treated Water MCL
Lead 0.0002 - mg/L Action Level =
0.015 mg/L
Specific
Conductance 110 - Umhos/cm @ 25°C -
Chloride 0.7 - mg/L -
Ammonia 0.05 - mg/L -
Nitrate 0.06 - mg/L 10 mg/L
Nitrite <0.03 - mg/L 1 mg/L
Orthophosphate (as P) <0.01 - mg/L -
Orthophosphate (as PO4) <0.01 - mg/L -
Total Phosphorus <0.01 - mg/L -
Sulfide <0.1 - mg/L -
UV 254 Transmittance 82.7 - % T/cm -
Dissolved Silica 3.4 - mg/L -
Sulfate 6.9 - mg/L -
Sodium 2.80 2.40 - 3.20 mg/L -
Antimony <0.001 BDL mg/L 0.006 mg/L
Arsenic <0.001 BDL mg/L 0.010 mg/L
Barium 0.005 0.0090 - 0.0011 mg/L 2.0 mg/L
Beryllium <0.001 BDL mg/L 0.004 mg/L
Cadmium <0.001 BDL mg/L 0.005 mg/L
Chromium <0.001 BDL mg/L 0.1 mg/L
Mercury <0.001 BDL mg/L 0.002 mg/L
Nickel <0.001 BDL mg/L -
Selenium <0.001 BDL mg/L 0.05 mg/L
Thallium <0.001 BDL mg/L 0.02 /L
1Samples collected 9/22/2011
CONSIDERATIONS
Based on the collected water quality data, there are four constituents that would likely need to be addressed in a surface water treatment system: turbidity, total organic carbon (TOC), diatoms and other algae, and iron.
Depending on the treatment process, surface water treatment systems must meet either an absolute finished water turbidity of 5 nephelometric turbidity unit (NTU) with 95 percent of monthly samples less than 1 NTU or an absolute turbidity of 1 NTU with 95 percent of monthly samples less than 0.3 NTU. In either case, the average raw water turbidity of the surface water is above the limits and would need to be reduced through filtration.
Town of Buena Vista Preliminary Design Report 13
TOC can react with disinfectants to create a series of compounds called DBPs that can have long-term health effects with chronic exposure. Part of the prevention of DBP formation is removing TOC prior to disinfection. Particulate organic carbon is more easily removed by settling and filtration. Dissolved Organic Carbon (DOC), which is more difficult to remove, makes up the majority fraction of the TOC in the surface water samples collected. As such, a pretreatment process involving coagulant dosing followed by flocculation and sedimentation will likely need to be included prior to disinfection if surface water is used as a long-term water source.
A surface water pilot using cartridge filters found that rapid filter blinding occurred despite filter feed turbidities that were well within the acceptable range. A particulate analysis performed on the spent cartridge filters found that some combination of diatomaceous and non-diatomaceous algae and minerals is suspected to be the cause of the short filter run times. Diatoms and minerals can be removed through a robust pretreatment process.
Iron can be an esthetic concern in drinking water by creating unpleasant odors and tastes and staining water fixtures when it is oxidized in the distribution system or in household plumbing. Although the raw water total iron concentration was below the SMCL of 0.30 milligram per liter (mg/L), concentrations are high enough to warrant treatment and removal, which can be accomplished by oxidizing the iron to a precipitable form prior to sedimentation or filtration.
IMPACTS FROM NATURAL DISASTERS
Water from Cottonwood Creek, or any drainage within the Upper Arkansas valley, is susceptible to natural disaster events such as fires, mudslides, and flooding. Given the proximity to heavily forested areas, and historic droughts within the watershed, fires can occur either naturally (i.e. lightning strikes) or manmade. During active burning, ash and contaminants become part of the soil matrix and with limited to no vegetation are prone to runoff into streams, ditches, lakes and reservoirs. After a burn, rainstorms, flooding, and mudslides will result in large sediment transport concentrated ash, contaminants, and nutrients to wash into streams, rivers, and downstream reservoirs, as natural erosion prevention has been removed from the watershed. These materials will ultimately make their way to the raw water sources and WTP treatment processes and can have adverse effects on plant operations and treatment and resulting drinking water quality.
Impacts to water quality and treatment processes is not limited to surface water. Recent studies have found that water quality contaminants, such as heavy metals and radionuclides, that are present in surface water as a result of wildfires, can also have lasting impacts on aquifers and ground water supplies. Specifically, high sediment loads and contaminated water from Cottonwood Creek could have negative effects on the IG production rates, as well as the water quality.
The best way to mitigate risk from wildfires is for the Town to develop plans and strategies for managing watersheds to protect against floods, fires and mudslides and having appropriate water treatment barriers for treating compromised waters. It is recommended that the Town participate in regional efforts to develop a source water protection plan, which may provide guidance in the event of a wildfires or floods. Early warning detection systems on the main stem of Cottonwood Creek and North Cottonwood Creek is one such mitigation effort that will detect targeted water
Town of Buena Vista Preliminary Design Report 14
quality parameters (i.e. turbidity, conductivity, pH, temperature). Large sediments loading and high turbidity events can be managed through a robust pretreatment system prior to filtration and disinfection. For radionuclide contamination, a selective media filtration system or reverse osmosis may be needed, depending on the radionuclide species that are present. In addition, special considerations for residuals handling must be made, as the material removed from the drinking water may contain high concentrations of metals and radionuclides and may not be disposed of a municipal landfill.
Another risk associated with wildfires are the presence of perfluorinated compounds in drinking water sources. Perfluorinated compounds include compounds such as perfluorooctane sulfonate (PFOS) and perfluorooctanoic acid (PFOA), as well as other structurally related compounds. PFOS and PFOA are human-made, fully fluorinated, organic compounds that are stable and resist typical environmental degradation processes, resulting in them building up in the environment. PFOs have been used in fire retardant foam which subsequently can leach into water supplies. The Town is in a moderately forested area that could be impacted by forest fires in which fire retardant may be applied.
In May 2016, the Environmental Protection Agency (EPA) established drinking water health advisories of 70 parts per trillion (0.07 micrograms per liter (µg/L)) for the combined concentrations of PFOS and PFOA. Above these levels, EPA recommends drinking water systems take steps to assess contamination, inform consumers, and limit exposure. Although the EPA has not issued a MCL for drinking water for PFOS and PFOA, several states have established drinking water and groundwater guidelines. Colorado has yet to establish these guidelines.
Town of Buena Vista Preliminary Design Report 15
SECTION 3 – TREATMENT ALTERNATIVES
This section explores pretreatment, treatment, and disinfection alternatives that can treat the Town’s raw water to comply with the Regulations and meet the Town’s goals which are:
• Supply high quality water to the Town’s customers
• Have reliable and redundant water supply and treatment system
• Maintain a Class B operator requirement, if possible
• Limit operations and maintenance (O&M) costs and capital cost
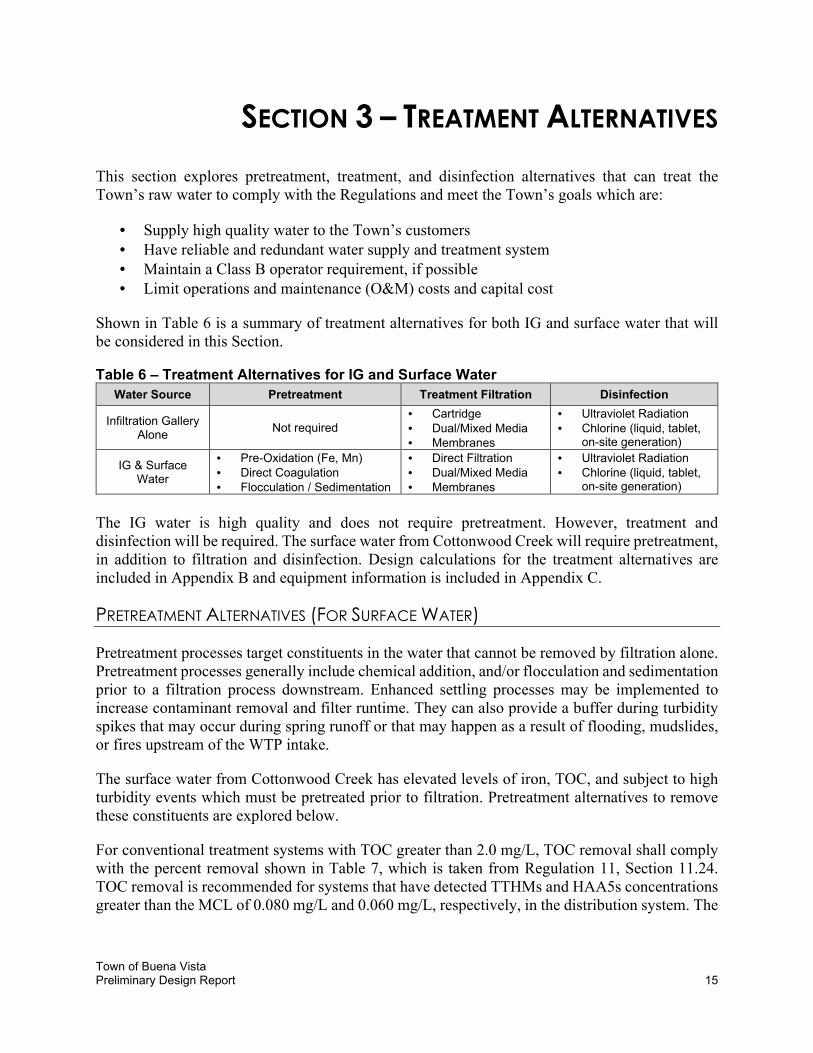
Shown in Table 6 is a summary of treatment alternatives for both IG and surface water that will be considered in this Section.
Table 6 – Treatment Alternatives for IG and Surface Water
Water Source Pretreatment Treatment Filtration Disinfection
Infiltration Gallery Alone
Not required • Cartridge • Dual/Mixed Media • Membranes
• Ultraviolet Radiation • Chlorine (liquid, tablet,
on-site generation)
IG & Surface Water
• Pre-Oxidation (Fe, Mn) • Direct Coagulation • Flocculation / Sedimentation
• Direct Filtration • Dual/Mixed Media • Membranes
• Ultraviolet Radiation • Chlorine (liquid, tablet,
on-site generation)
The IG water is high quality and does not require pretreatment. However, treatment and disinfection will be required. The surface water from Cottonwood Creek will require pretreatment, in addition to filtration and disinfection. Design calculations for the treatment alternatives are included in Appendix B and equipment information is included in Appendix C.
PRETREATMENT ALTERNATIVES (FOR SURFACE WATER)
Pretreatment processes target constituents in the water that cannot be removed by filtration alone. Pretreatment processes generally include chemical addition, and/or flocculation and sedimentation prior to a filtration process downstream. Enhanced settling processes may be implemented to increase contaminant removal and filter runtime. They can also provide a buffer during turbidity spikes that may occur during spring runoff or that may happen as a result of flooding, mudslides, or fires upstream of the WTP intake.
The surface water from Cottonwood Creek has elevated levels of iron, TOC, and subject to high turbidity events which must be pretreated prior to filtration. Pretreatment alternatives to remove these constituents are explored below.
For conventional treatment systems with TOC greater than 2.0 mg/L, TOC removal shall comply with the percent removal shown in Table 7, which is taken from Regulation 11, Section 11.24. TOC removal is recommended for systems that have detected TTHMs and HAA5s concentrations greater than the MCL of 0.080 mg/L and 0.060 mg/L, respectively, in the distribution system. The
Town of Buena Vista Preliminary Design Report 16
TOC percent removal requirements based on source water TOC and source water alkalinity are summarized in Table 7.
Table 7 – TOC Removal Requirements
Source Water TOC (mg/L)
Source Water Alkalinity (mg/L as CaCO3)
0-60 >60-120 >120
Required Step 1 TOC Percent Removal
>2.0-4.0 35.0 25.0 15.0
>4.0-8.0 45.0 35.0 25.0
>8.0 50.0 40.0 30.0
The surface water’s TOC concentration ranges between 2.0 mg/L and 4.4 mg/L and the alkalinity ranges from 32.0 mg/L as CaCO3 to 50.8 mg/L as CaCO3. The Town would be required to achieve 35 percent to 45 percent TOC removal depending on the TOC concentration.
ALTERNATIVE 1 – PRE-OXIDATION
Pre-oxidation includes adding an oxidant chemical to the raw surface water which will help with treating the TOC and iron in the Cottonwood Creek surface water. The chemical would be injected upstream of the main treatment processes and oxidized constituents would be removed through a downstream settling or filtration process.
Three oxidants were evaluated to target the removal of TOC and iron: Potassium permanganate, sodium permanganate, and chlorine dioxide. Permanganates are useful in oxidizing iron, manganese, taste and odor compounds, and are beneficial in controlling nuisance organisms, and control of formation of DBPs by oxidizing precursor compounds, such as TOC, and reducing the demand for additional disinfection downstream. Potassium permanganate is a solid powder and requires batching to a 2 to 3 percent solution by the operator. Sodium permanganate is delivered in liquid form. Approximately 1 mg of permanganate is required to oxidize 1 mg of iron in the raw water. The resultant dosing for either permanganate is anticipated to be between 0.1 and 1.0 mg/L, based on preliminary raw water quality information. Jar testing would be required to determine the seasonal optimal dosing range, as well as TOC removal rates. Permanganate can require up to 30 minutes of contact time to fully oxidize the targeted constituents.
Chlorine dioxide is also useful in oxidizing iron and TOC. It has a much faster, nearly instantaneous reaction time, however, it results in production of chlorite and chlorate ions, which are disinfection byproducts. Approximately 1.2 mg of chlorine dioxide is required to oxidize 1 mg of iron in the raw water. The resultant dose for chlorine dioxide would be between 0.2 and 1.0 mg/L. Jar testing would be required in order to determine the optimal dosing range for oxidant selection. A summary of the advantages and disadvantages for each oxidant is provided in Table 8.
Town of Buena Vista Preliminary Design Report 17
Table 8 – Pre-Oxidation Alternatives Analysis
Alternative Advantages Disadvantages
Potassium Permanganate
• Lowest chemical cost
• May be delivered in liquid or powdered form
• Longest reaction time
• Largest contact volume requirements
• Highest capital cost
• Limited effectiveness for TOC
Sodium Permanganate
• Chemical delivered as a liquid, reducing chemical makeup time as compared to potassium permanganate
• Faster reaction rate than potassium permanganate
• Reduced contact volume
• Higher O&M and delivery cost than potassium permanganate
• Limited effectiveness for TOC removal
Chlorine Dioxide
• Effective for TOC removal
• Instant oxidation reaction, minimal contact volume required
• Powerful Oxidant and Disinfectant.
• Smaller footprint
• Chlorite monitoring required
• Highest O&M cost
• Potential to increase DBPs during summer months (chlorite)
ALTERNATIVE 2A – COAGULATION (DIRECT FILTRATION)
Coagulation is the addition of a coagulant chemical to target TOC and turbidity removal. The coagulant is injected upstream of the main treatment process and mixed into the raw water. Mixing can be induced via a static mixer or rapid mixer depending on the main treatment process that follows. For direct filtration, the majority of precipitated constituents are filtered out by the main treatment process.
Direct coagulation and filtration is not a recommended option for treating surface water from Cottonwood Creek, as it contains high levels of TOC in dissolved form, iron, and diatoms. In addition, the surface water is subject to turbidity spikes during spring runoff events that will lead to low filter run times and reduce the efficiency of the filtration process.
ALTERNATIVE 2B – COAGULATION WITH FLOCCULATION AND SEDIMENTATION (CONVENTIONAL
FILTRATION)
The main difference between conventional treatment and direct filtration is the inclusion of the flocculation and sedimentation process for removal of flocculated particles prior to filtration and reducing the formation potential of Disinfection Byproducts (DBPs) associated with TOC and chlorine. With certain raw water quality, flocculation and sedimentation will reduce TOC and particulates of concern prior to filtration and allow for increased filter run times.
Town of Buena Vista Preliminary Design Report 18
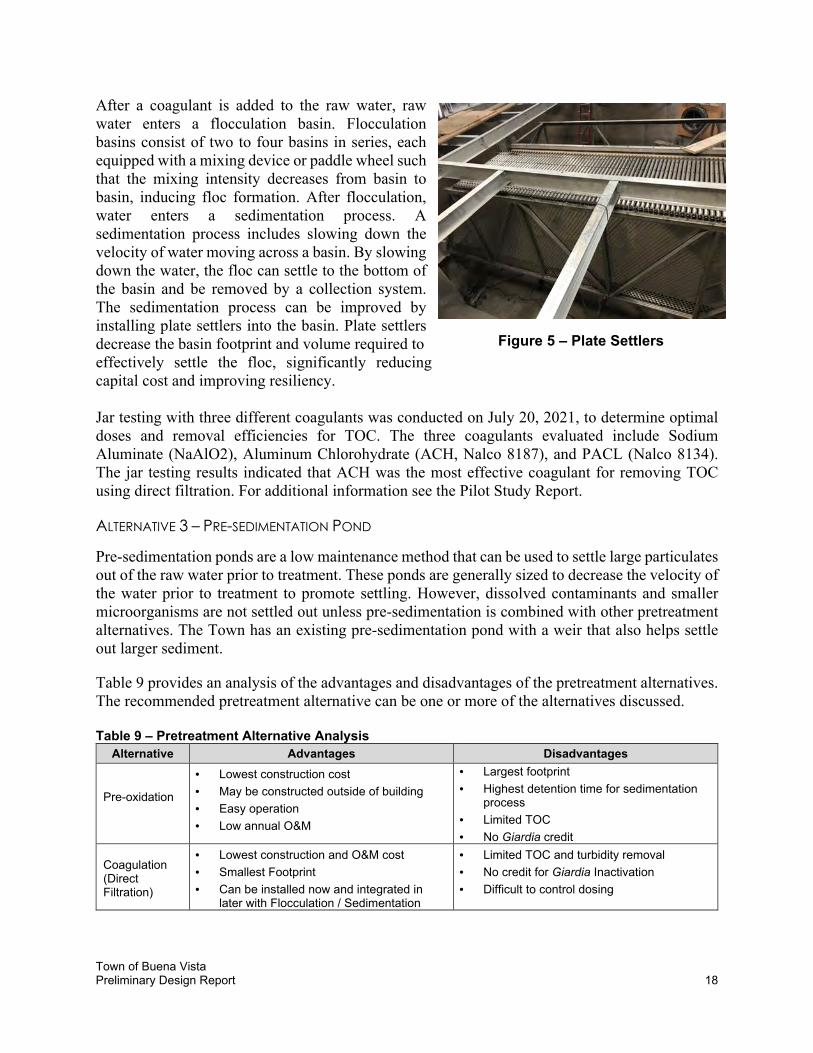
After a coagulant is added to the raw water, raw water enters a flocculation basin. Flocculation basins consist of two to four basins in series, each equipped with a mixing device or paddle wheel such that the mixing intensity decreases from basin to basin, inducing floc formation. After flocculation, water enters a sedimentation process. A sedimentation process includes slowing down the velocity of water moving across a basin. By slowing down the water, the floc can settle to the bottom of the basin and be removed by a collection system. The sedimentation process can be improved by installing plate settlers into the basin. Plate settlers decrease the basin footprint and volume required to effectively settle the floc, significantly reducing capital cost and improving resiliency. Jar testing with three different coagulants was conducted on July 20, 2021, to determine optimal doses and removal efficiencies for TOC. The three coagulants evaluated include Sodium Aluminate (NaAlO2), Aluminum Chlorohydrate (ACH, Nalco 8187), and PACL (Nalco 8134). The jar testing results indicated that ACH was the most effective coagulant for removing TOC using direct filtration. For additional information see the Pilot Study Report.
ALTERNATIVE 3 – PRE-SEDIMENTATION POND
Pre-sedimentation ponds are a low maintenance method that can be used to settle large particulates out of the raw water prior to treatment. These ponds are generally sized to decrease the velocity of the water prior to treatment to promote settling. However, dissolved contaminants and smaller microorganisms are not settled out unless pre-sedimentation is combined with other pretreatment alternatives. The Town has an existing pre-sedimentation pond with a weir that also helps settle out larger sediment.
Table 9 provides an analysis of the advantages and disadvantages of the pretreatment alternatives. The recommended pretreatment alternative can be one or more of the alternatives discussed. Table 9 – Pretreatment Alternative Analysis
Alternative Advantages Disadvantages
Pre-oxidation
• Lowest construction cost
• May be constructed outside of building
• Easy operation
• Low annual O&M
• Largest footprint
• Highest detention time for sedimentation process
• Limited TOC
• No Giardia credit
Coagulation (Direct Filtration)
• Lowest construction and O&M cost
• Smallest Footprint
• Can be installed now and integrated in later with Flocculation / Sedimentation
• Limited TOC and turbidity removal
• No credit for Giardia Inactivation
• Difficult to control dosing
Figure 5 – Plate Settlers
Town of Buena Vista Preliminary Design Report 19
Alternative Advantages Disadvantages
Coagulation with Flocculation and Sedimentation
• Most reliable
• Able to treat turbidity over 500 NTUs
• Very effective for TOC removal
• 0.5 log inactivation for Giardia
• Handles varying water quality
• Larger Footprint
• Higher capital and O&M costs
• Produces a sedimentation residuals
Pre-sedimentation
• Low maintenance and cost
• Allows for raw water equalization and blending and discrete particle settling
• Less reliable for particulate removal
• Larger footprint
• May have algae growth
• No Giardia inactivation credit
TREATMENT ALTERNATIVES (FOR IG AND SURFACE WATER)
Since it is anticipated the IG will be reclassified as GWUDI the Regulations require a filtration step similar to Cottonwood Creek. Filtration is a physical barrier such as mixed media, membranes, or cartridges. These three alternatives are explored below. Note that any alternative that can effectively treat surface water can also treat IG water.
ALTERNATIVE 1 – MIXED MEDIA FILTRATION
The Town is familiar with mixed media filtration from the abandoned WTP. It is possible to repurpose the four basins (two filter basins and two flocculation basins) for mixed or dual medial filtration. All four basins are of identical size (12 ft x 12 ft) and depth and are common wall to the existing filter gallery. More current technology utilizes molded plastic underdrains with lower profile and air scour rather than surface wash. The existing vertical turbine pump that provides backwash supply will need to be replaced along with expansion of the existing backwash recovery ponds. The existing flocculation basins will need to be outfitted with media and piping penetrations to match the other two filters. The clearwell could be repurposed for chlorine contact and backwash supply.
Based on historic operations for treating surface water, mixed media filtration will require pretreatment for particulate and precursor removal for increasing filter run times and reducing backwash volumes and waste. Historically, the mixed media filters had short run times, requiring operating staff to spend the night during certain times of the year to meet water demand. The frequent filter clogging is likely due to the large quantity of diatoms and algae discovered in the Cottonwood Creek surface water. Their removal through sedimentation will improve mixed media filter run times.
Proprietary packaged treatment units are available that offer coagulation, contact adsorption clarification and filtration with a significantly smaller footprint compared to conventional treatment systems. However, CDPHE classifies these proprietary packaged systems as direct filtration systems because they do not meet design criteria for flocculation and sedimentation hydraulic retention times.
Town of Buena Vista Preliminary Design Report 20
ALTERNATIVE 2 – MEMBRANES
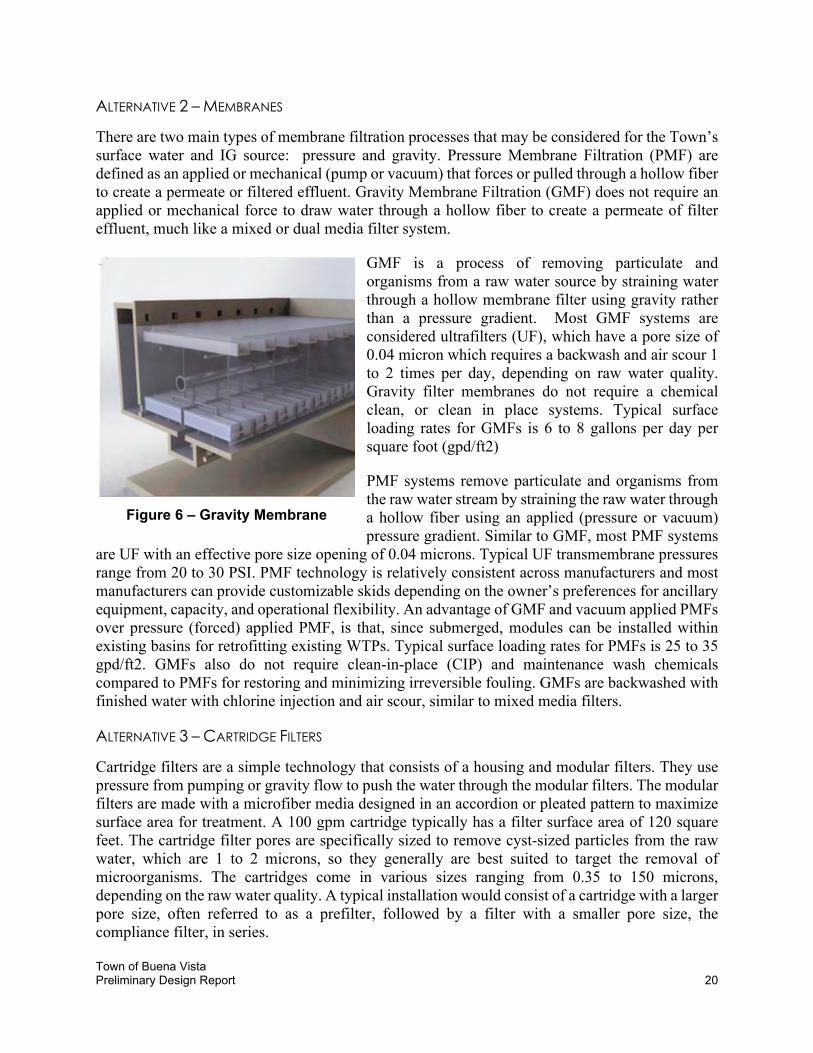
There are two main types of membrane filtration processes that may be considered for the Town’s surface water and IG source: pressure and gravity. Pressure Membrane Filtration (PMF) are defined as an applied or mechanical (pump or vacuum) that forces or pulled through a hollow fiber to create a permeate or filtered effluent. Gravity Membrane Filtration (GMF) does not require an applied or mechanical force to draw water through a hollow fiber to create a permeate of filter effluent, much like a mixed or dual media filter system.
GMF is a process of removing particulate and organisms from a raw water source by straining water through a hollow membrane filter using gravity rather than a pressure gradient. Most GMF systems are considered ultrafilters (UF), which have a pore size of 0.04 micron which requires a backwash and air scour 1 to 2 times per day, depending on raw water quality. Gravity filter membranes do not require a chemical clean, or clean in place systems. Typical surface loading rates for GMFs is 6 to 8 gallons per day per square foot (gpd/ft2)
PMF systems remove particulate and organisms from the raw water stream by straining the raw water through a hollow fiber using an applied (pressure or vacuum) pressure gradient. Similar to GMF, most PMF systems
are UF with an effective pore size opening of 0.04 microns. Typical UF transmembrane pressures range from 20 to 30 PSI. PMF technology is relatively consistent across manufacturers and most manufacturers can provide customizable skids depending on the owner’s preferences for ancillary equipment, capacity, and operational flexibility. An advantage of GMF and vacuum applied PMFs over pressure (forced) applied PMF, is that, since submerged, modules can be installed within existing basins for retrofitting existing WTPs. Typical surface loading rates for PMFs is 25 to 35 gpd/ft2. GMFs also do not require clean-in-place (CIP) and maintenance wash chemicals compared to PMFs for restoring and minimizing irreversible fouling. GMFs are backwashed with finished water with chlorine injection and air scour, similar to mixed media filters.
ALTERNATIVE 3 – CARTRIDGE FILTERS
Cartridge filters are a simple technology that consists of a housing and modular filters. They use pressure from pumping or gravity flow to push the water through the modular filters. The modular filters are made with a microfiber media designed in an accordion or pleated pattern to maximize surface area for treatment. A 100 gpm cartridge typically has a filter surface area of 120 square feet. The cartridge filter pores are specifically sized to remove cyst-sized particles from the raw water, which are 1 to 2 microns, so they generally are best suited to target the removal of microorganisms. The cartridges come in various sizes ranging from 0.35 to 150 microns, depending on the raw water quality. A typical installation would consist of a cartridge with a larger pore size, often referred to as a prefilter, followed by a filter with a smaller pore size, the compliance filter, in series.
Figure 6 – Gravity Membrane
Town of Buena Vista Preliminary Design Report 21
In order for cartridge filters to comply with Regulation 11 for surface water systems, it must be demonstrated that the turbidity entering into (influent) the compliance filters is less than or equal to 1.49 NTU. One or more of the following methods may be submitted as proof:
1. Turbidity results – A minimum of one turbidity reading per week from March through June showing raw water turbidity or pretreatment turbidity reliably achieving less than 1.49 NTU.
2. Pilot/demonstration study – A pilot or demonstration with the proposed compliance cartridge filter showing the ability to reliably achieve less than 1.49 NTU downstream of the compliance filter for at least one month during the critical or most challenging period.
3. Particulate removal study – A minimum of weekly results from particulate studies showing the ability to reliably achieve less than 1.49 NTU prior to the compliance filter for at least a two month period during critical or most challenging period.
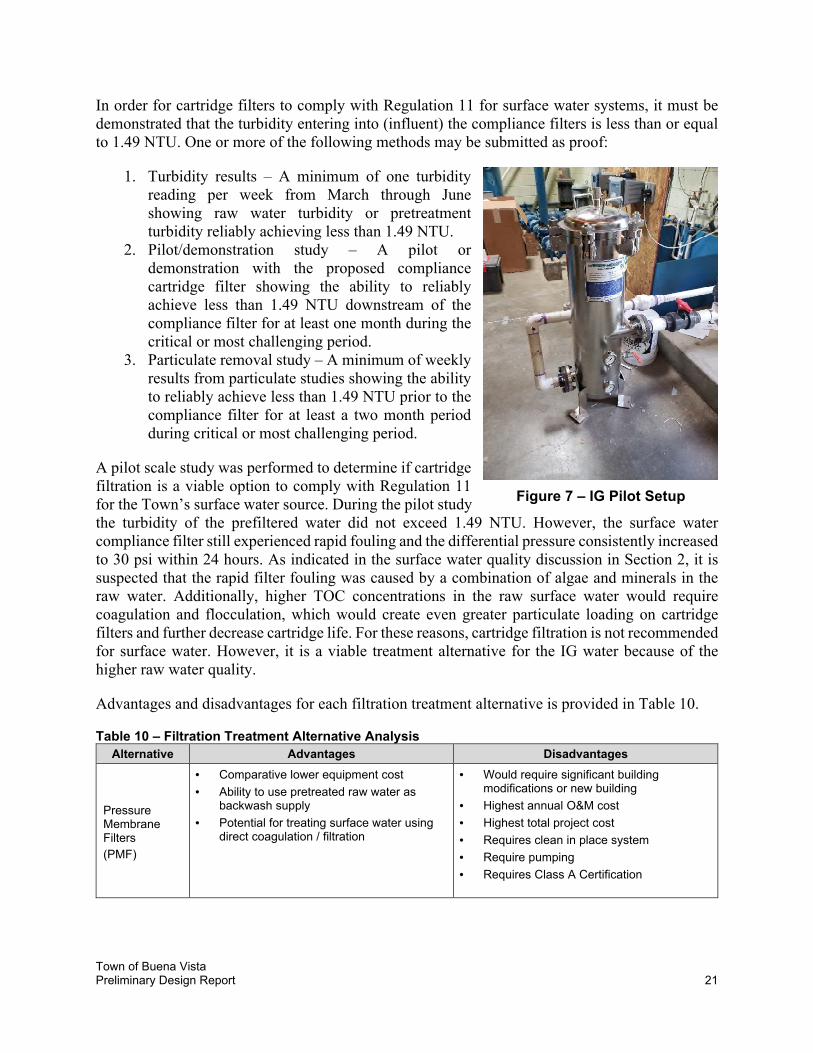
A pilot scale study was performed to determine if cartridge filtration is a viable option to comply with Regulation 11 for the Town’s surface water source. During the pilot study the turbidity of the prefiltered water did not exceed 1.49 NTU. However, the surface water compliance filter still experienced rapid fouling and the differential pressure consistently increased to 30 psi within 24 hours. As indicated in the surface water quality discussion in Section 2, it is suspected that the rapid filter fouling was caused by a combination of algae and minerals in the raw water. Additionally, higher TOC concentrations in the raw surface water would require coagulation and flocculation, which would create even greater particulate loading on cartridge filters and further decrease cartridge life. For these reasons, cartridge filtration is not recommended for surface water. However, it is a viable treatment alternative for the IG water because of the higher raw water quality.
Advantages and disadvantages for each filtration treatment alternative is provided in Table 10.
Table 10 – Filtration Treatment Alternative Analysis
Alternative Advantages Disadvantages
Pressure Membrane Filters
(PMF)
• Comparative lower equipment cost
• Ability to use pretreated raw water as backwash supply
• Potential for treating surface water using direct coagulation / filtration
• Would require significant building modifications or new building
• Highest annual O&M cost
• Highest total project cost
• Requires clean in place system
• Require pumping
• Requires Class A Certification
Figure 7 – IG Pilot Setup
Town of Buena Vista Preliminary Design Report 22
Alternative Advantages Disadvantages
Gravity Membrane Filters
(GMF)
• Existing WTP building and filter / floc basins can be modified to fit filters
• Potential for treating surface water using direct coagulation / filtration
• Lowest total project cost
• No chemical clean system required
• No pumping required
• Requires air scour system
• Requires additional storage in clearwell for backwash water
• Requires Class A Certification
Cartridge Filtration
• Lowest O&M cost
• Lowest equipment costs
• No chemicals
• Simple process and does not require Class A operation certification
• Not suitable for surface water
Mixed Media Filtration
• Moderate O&M costs (less than PMF and GMF
• Simple Operations and operator familiarity
• Low chemical usage (filter aid)
• Existing WTP filter and floc basins could be used with an expansion
• Must have conventional pretreatment upstream to be effective
• Requires addition storage in clearwell for backwash water
Proprietary Filtration Systems
• Modular and cost effective
• Has some pretreatment with adsorption clarification
• Higher chemical usage compared to conventional filtration systems
• Only 2.0 log removal for Giardia
DISINFECTION ALTERNATIVES (FOR IG AND SURFACE WATER)
The Town currently utilizes chlorine gas for disinfection. Due to operational issues, and health and safety concerns, the Town would like to consider an alternative disinfection system. Three alternative chlorine disinfection systems are evaluated below. In addition, Ultraviolet (UV) radiation is evaluated to supplement chlorine disinfection. UV can reduce the amount of chlorine and the contact time for Giardia and Virus log removal.
CHLORINE DISINFECTION
Chlorine is the most common disinfectant for public water systems because it is readily available, cost effective, and maintains a residual in the distribution system. The three chlorine alternatives explored below are bulk liquid sodium hypochlorite, calcium hypochlorite, and onsite generated sodium hypochlorite.
ALTERNATIVE 1 – SODIUM HYPOCHLORITE
Sodium hypochlorite, NaOCl, is the most widely used chemical for disinfection in Colorado. It is available in various solution concentrations but most often, a 10 or 12.5-percent solution is used for municipal application. At a 12.5-percent concentration, sodium hypochlorite has 12 to 20-percent of available chlorine. Most municipal treatment entities can receive cost-competitive pricing for chemicals when full tanker trucks are delivered on a regular basis. The standard capacity for a bulk tanker truck is approximately 4,500 gallons. The Town would use an estimated 1,400 gallons per month of 12.5-percent sodium hypochlorite at a flow rate of 80-percent of 2.5 MGD for 30 days.
Town of Buena Vista Preliminary Design Report 23
Sodium hypochlorite is typically dosed with a chemical metering pump that introduces the hypochlorite into the process via injection quills inserted into a pipe. The pumps can be paced by inputs from a programmable logic controller (PLC) either on a flow or target chlorine residual basis or both such that the dose rate changes automatically with changes in process flow or chlorine demand.
Disinfection with sodium hypochlorite for a 2.5 MGD plant would require a Class C Water Treatment Operator license. Sodium hypochlorite is classified as a corrosive material and building codes require hazardous (H) occupancy requirements for storage of over 500 gallons. H-occupancy requirements include continuous ventilation, fire barriers, fire sprinklers, secondary containment, and backup power.
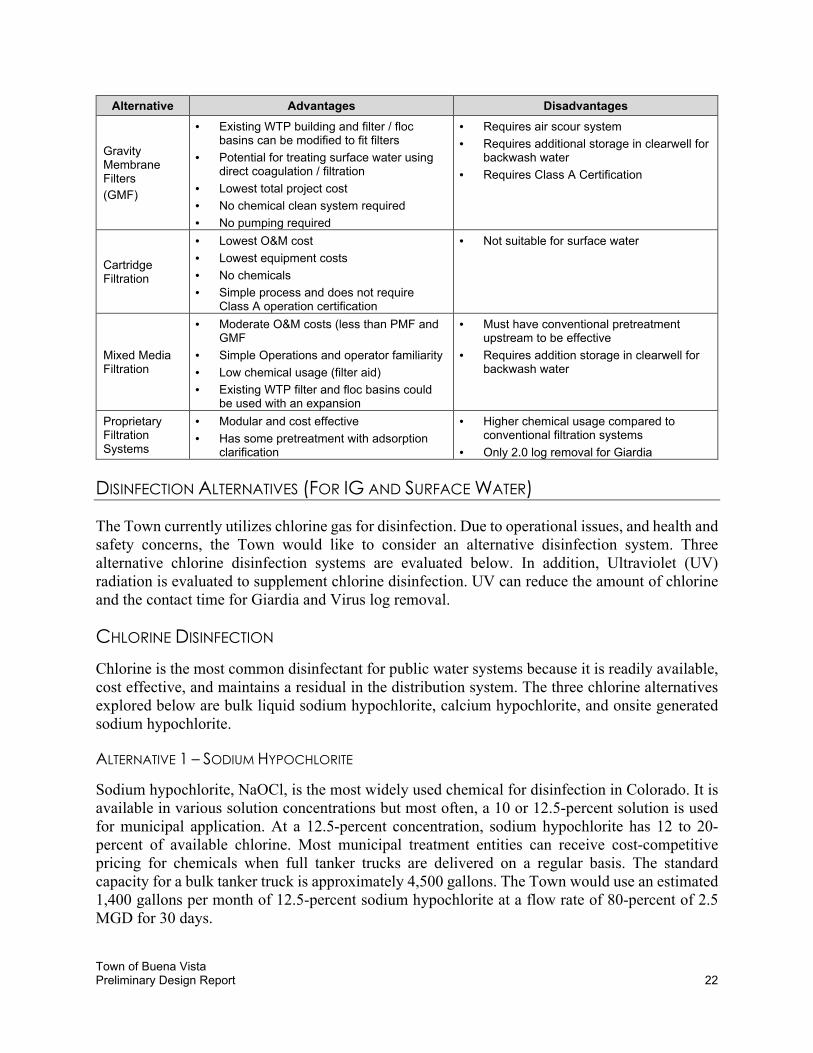
ALTERNATIVE 2 – CALCIUM HYPOCHLORITE
Calcium hypochlorite, Ca(OCl)2, is commonly used in smaller facilities and is available in a tablet form or powder that is dissolved in water prior to application. In solution, it has 65 to 70-percent
available chlorine. Calcium hypochlorite tablets typically come in 50-lb pales. While tablet or powder storage does not require secondary containment, a 2.5 MGD plant may require up to 15 pales per month.
Calcium hypochlorite dosing is often achieved via a tablet contactor, in which a stack or pile of tablets is submerged in the process flow. The water dissolves the tablets, introducing hypochlorous acid into the water. The contactors are typically designed such that higher flowrates result in greater submergence of the tablets so that a dose rate proportional to flow is maintained.
Disinfection with calcium hypochlorite for a 2.5 MGD plant would require a Class C Water Treatment Operator license. Calcium hypochlorite
is classified as a corrosive materials. However, H-occupancy requirements are only required when storage exceeds 5,000-pounds.
ALTERNATIVE 3 – ONSITE HYPOCHLORITE GENERATION
An alternative to receiving deliveries of chlorine chemicals is to generate a low-strength sodium hypochlorite on site using salt brine and electricity. This way the Town would not be reliant on a third party for chemical deliveries and operations staff would not be exposed to hazardous chemical storage or transportation. In contrast with sodium and calcium hypochlorite dosing, on-site hypochlorite generation requires regular maintenance of the equipment and salt handling.
Disinfection with on-site sodium hypochlorite for a 2.5 MGD plant would require a Class B Water Treatment Operator license. Onsite sodium hypochlorite generators create a 0.8 to 1-percent solution
Figure 8 – Chlorine Dosing Equipment
Town of Buena Vista Preliminary Design Report 24
of sodium hypochlorite which is not considered to by corrosive so no H-occupancy requirements
would apply.
ULTRAVIOLET LIGHT
UV light can be used to supplement chlorine disinfection. UV light of a certain frequency disrupts
the DNA of pathogenic microorganisms and prevents them from reproducing and causing disease.
With improvements of the technology, UV has become a popular and cost-effective approach to
disinfection. UV consists of installing a pressurized bank of UV lights in a closed pipe system.
Some important considerations when using UV for disinfection is that while it is effective at
deactivating larger pathogenic microorganisms in water, such as Giardia Lamblia, it is less reliable
for deactivating smaller ones, such as viruses. Furthermore, UV does not have any lasting
disinfecting action after initial contact. For both of these reasons, UV is typically used for primary
disinfection and must be followed by secondary chemical disinfection using chlorine for viral
removal and to create a residual chlorine concentration to prevent contamination in the distribution
system.
Typical maintenance tasks include initiating and/or monitoring clean-in-place cycles, and cleaning
and replacing the UV lamps and sleeves. Despite this maintenance, a UV system could reduce the
required volume of a chlorine contact chamber to such a degree that it could prove cost effective.
For example, installing UV to meet the additional 0.5-log Giardia disinfection required for
cartridge filtration results in reducing the clearwell volume by approximately 60,000-gallons.
Disinfection with Ultraviolet Light for a 2.5 MGD plant would require a Class C Water Treatment
Operator license.
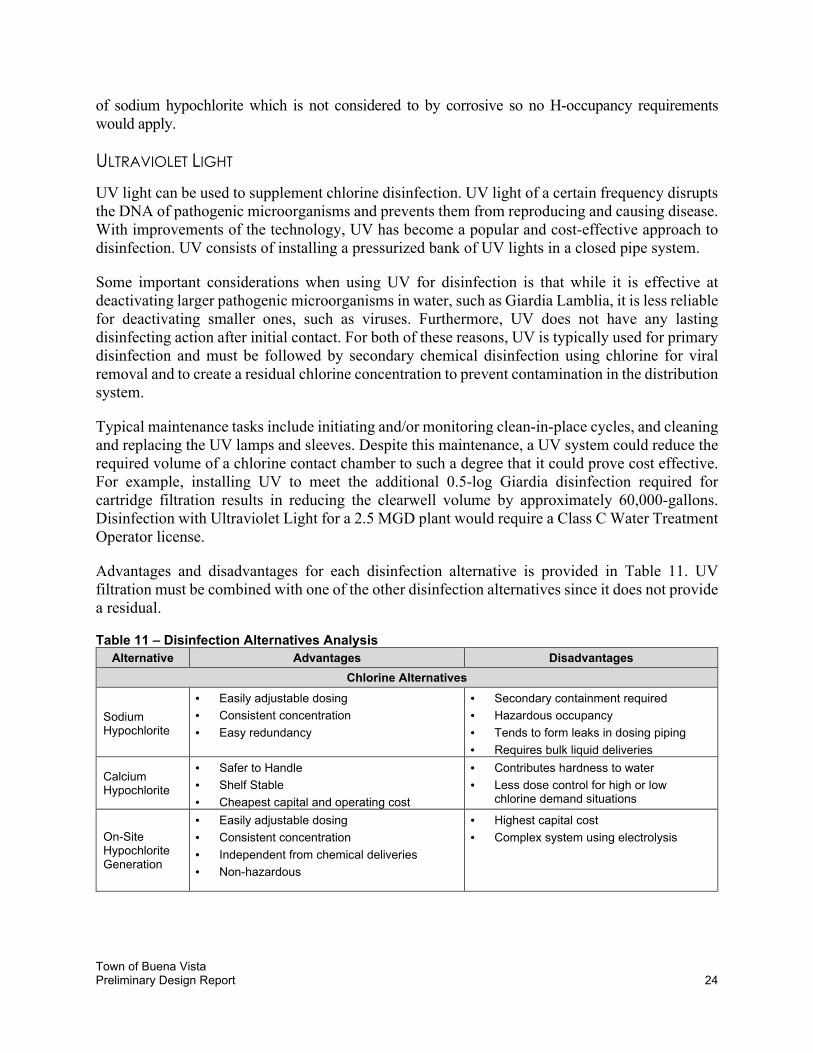
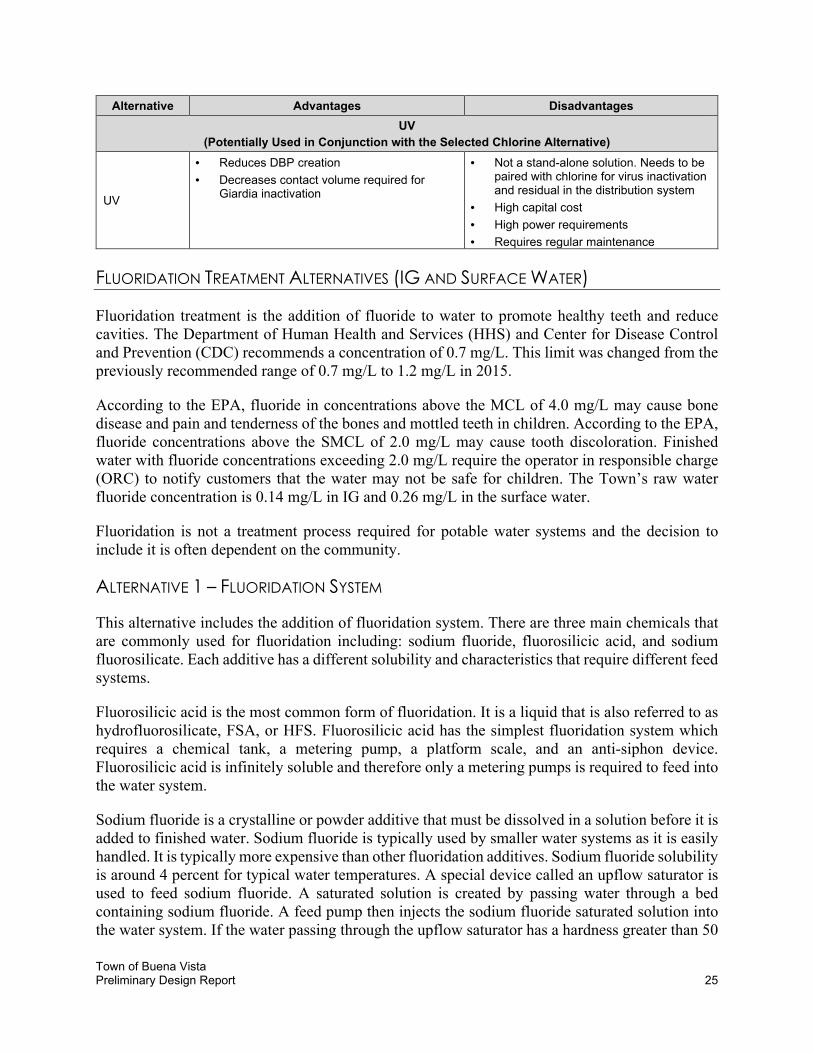
Advantages and disadvantages for each disinfection alternative is provided in Table 11. UV
filtration must be combined with one of the other disinfection alternatives since it does not provide
a residual.
Table 11 – Disinfection Alternatives Analysis
Alternative Advantages Disadvantages
Chlorine Alternatives
Sodium Hypochlorite
• Easily adjustable dosing
• Consistent concentration
• Easy redundancy
• Secondary containment required
• Hazardous occupancy
• Tends to form leaks in dosing piping
• Requires bulk liquid deliveries
Calcium Hypochlorite
• Safer to Handle
• Shelf Stable
• Cheapest capital and operating cost
• Contributes hardness to water
• Less dose control for high or low chlorine demand situations
On-Site Hypochlorite Generation
• Easily adjustable dosing
• Consistent concentration
• Independent from chemical deliveries
• Non-hazardous
• Highest capital cost
• Complex system using electrolysis
Town of Buena Vista Preliminary Design Report 25
Alternative Advantages Disadvantages
UV
(Potentially Used in Conjunction with the Selected Chlorine Alternative)
UV
• Reduces DBP creation
• Decreases contact volume required for Giardia inactivation
• Not a stand-alone solution. Needs to be paired with chlorine for virus inactivation and residual in the distribution system
• High capital cost
• High power requirements
• Requires regular maintenance
FLUORIDATION TREATMENT ALTERNATIVES (IG AND SURFACE WATER)
Fluoridation treatment is the addition of fluoride to water to promote healthy teeth and reduce cavities. The Department of Human Health and Services (HHS) and Center for Disease Control and Prevention (CDC) recommends a concentration of 0.7 mg/L. This limit was changed from the previously recommended range of 0.7 mg/L to 1.2 mg/L in 2015.
According to the EPA, fluoride in concentrations above the MCL of 4.0 mg/L may cause bone disease and pain and tenderness of the bones and mottled teeth in children. According to the EPA, fluoride concentrations above the SMCL of 2.0 mg/L may cause tooth discoloration. Finished water with fluoride concentrations exceeding 2.0 mg/L require the operator in responsible charge (ORC) to notify customers that the water may not be safe for children. The Town’s raw water fluoride concentration is 0.14 mg/L in IG and 0.26 mg/L in the surface water.
Fluoridation is not a treatment process required for potable water systems and the decision to include it is often dependent on the community.
ALTERNATIVE 1 – FLUORIDATION SYSTEM
This alternative includes the addition of fluoridation system. There are three main chemicals that are commonly used for fluoridation including: sodium fluoride, fluorosilicic acid, and sodium fluorosilicate. Each additive has a different solubility and characteristics that require different feed systems.
Fluorosilicic acid is the most common form of fluoridation. It is a liquid that is also referred to as hydrofluorosilicate, FSA, or HFS. Fluorosilicic acid has the simplest fluoridation system which requires a chemical tank, a metering pump, a platform scale, and an anti-siphon device. Fluorosilicic acid is infinitely soluble and therefore only a metering pumps is required to feed into the water system.
Sodium fluoride is a crystalline or powder additive that must be dissolved in a solution before it is added to finished water. Sodium fluoride is typically used by smaller water systems as it is easily handled. It is typically more expensive than other fluoridation additives. Sodium fluoride solubility is around 4 percent for typical water temperatures. A special device called an upflow saturator is used to feed sodium fluoride. A saturated solution is created by passing water through a bed containing sodium fluoride. A feed pump then injects the sodium fluoride saturated solution into the water system. If the water passing through the upflow saturator has a hardness greater than 50
Town of Buena Vista Preliminary Design Report 26
mg/L it must be softened prior to passing through the upflow saturator. This is a much more operationally intensive system and requires more equipment as compared to fluorosilicic acid system.
Sodium fluorosilicate is also referred to as sodium silicofluoride, which is a powder additive that must be dissolved in a solution prior to mixing with finished water. This feed system would require dry chemical storage area, day tank and mixing system, a metering pump, a platform scale, and an anti-siphon device.
Dry feed systems can be used for sodium fluorosilicate and sodium fluoride. Dry feeder systems are designed to feed dry powered chemicals at a predetermined rate and can be metered by volume or by gravity. Volumetric dry feeders are easier to operate, are less expensive, deliver small quantities, and are less accurate compared to gravimetric dry feeders which are capable of delivering large quantities of dry chemical, are more expensive, and are more accurate. Typical volumetric dry feeders use a rotating feed screw that moves a set volume of material from the hopper to the mixing tank where a mechanical mixer will mix the material with water. There are two types of gravimetric feeders, the first type is based on weight loss of the hopper, and the second is based on the weight of the material on a section of belt. The material is then deposited into a mixing tank like the volumetric dry feeder and mixed with water. Dry material is dangerous to load and requires the operators to suit up in additional personal protective equipment (PPE) while handling the chemical. Due to the hazards associated with the dry chemicals, it would be recommended to have a separate, designated area for the fluoride feed system with improvements to the ventilation system.
Fluoridation requires a Class B operator certification at a plant capacity of 2.5 MGD. Since these chemicals are hazardous, H-occupancy building code requirements will apply.
ALTERNATIVE 2 – NO FLUORIDATION
No fluoridation is the simplest alternative for the Town. The Town currently does not fluoridate and it is not a required treatment process by the Regulations. This alternative would not accrue the Town any capital and O&M costs. In addition, the Town’s surface water from Cottonwood Creek has an average fluoride concentration of 0.26 mg/L, which provides some level of oral health benefit.
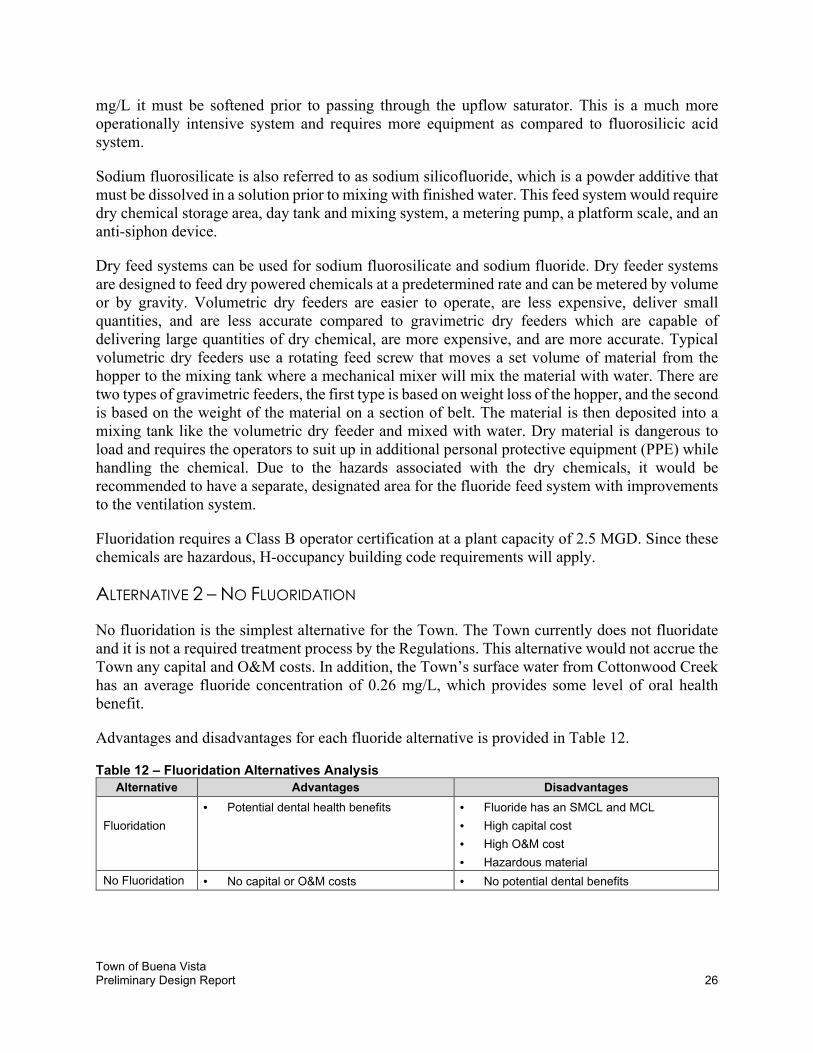
Advantages and disadvantages for each fluoride alternative is provided in Table 12.
Table 12 – Fluoridation Alternatives Analysis
Alternative Advantages Disadvantages
Fluoridation • Potential dental health benefits • Fluoride has an SMCL and MCL
• High capital cost
• High O&M cost
• Hazardous material
No Fluoridation • No capital or O&M costs • No potential dental benefits
Town of Buena Vista Preliminary Design Report 27
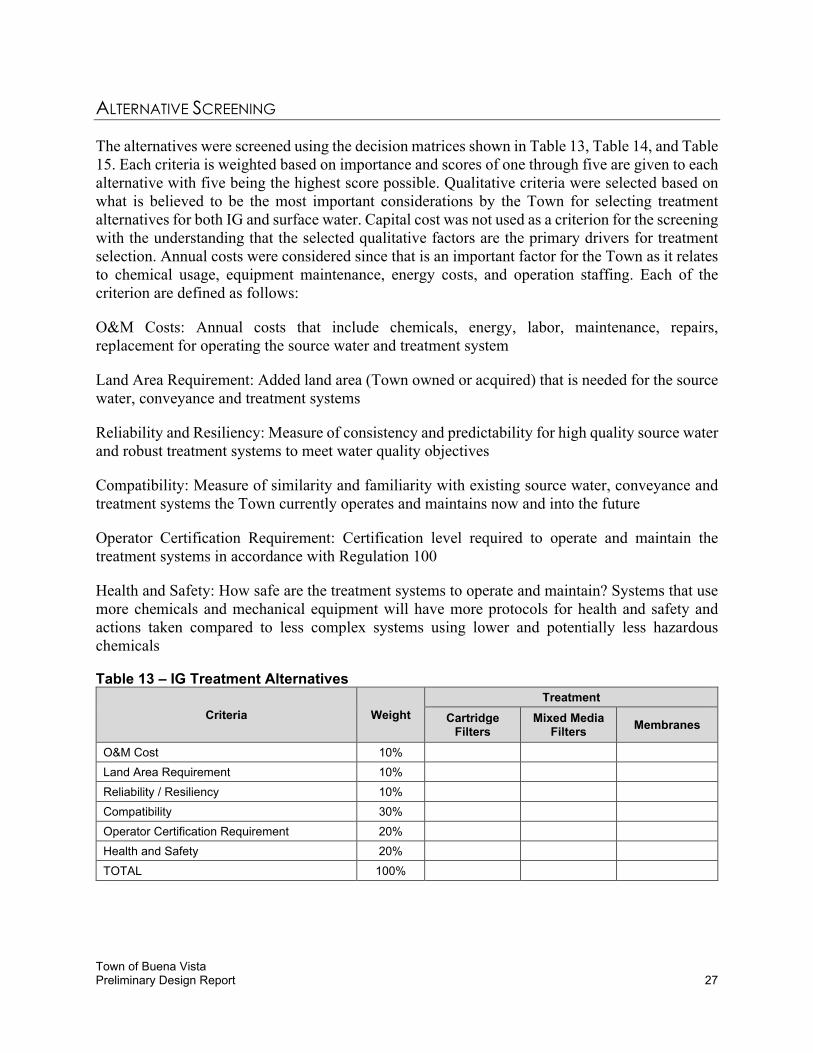
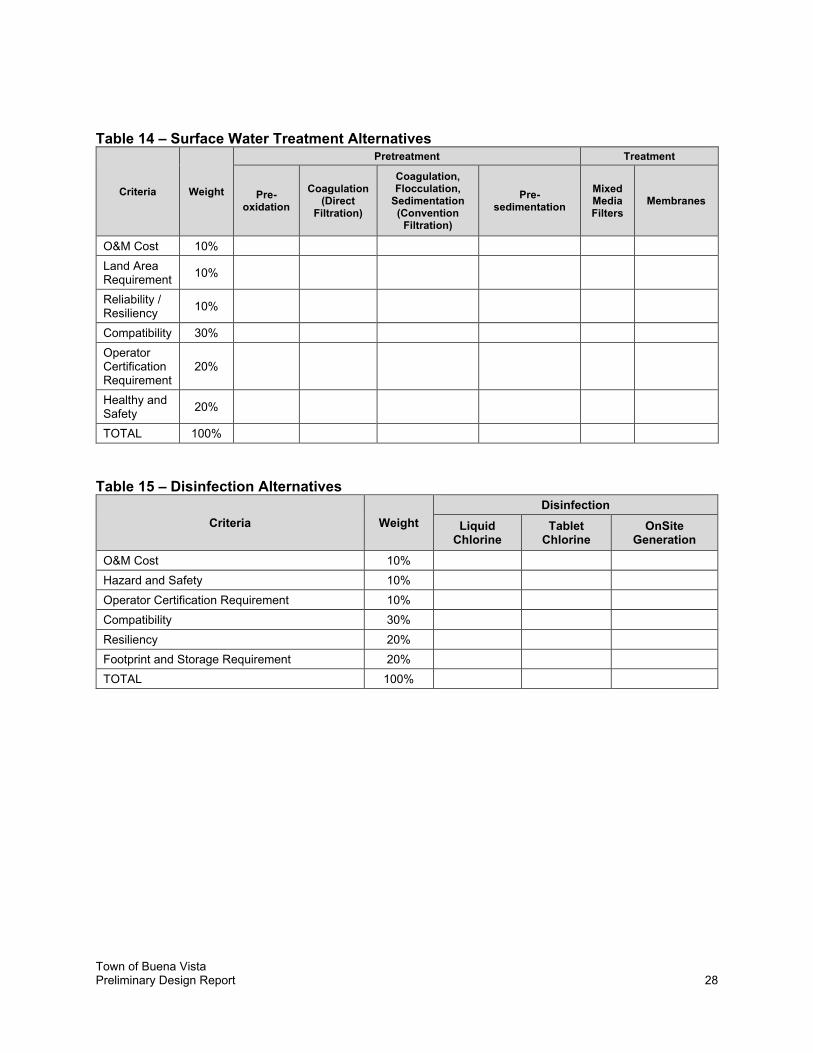
ALTERNATIVE SCREENING
The alternatives were screened using the decision matrices shown in Table 13, Table 14, and Table 15. Each criteria is weighted based on importance and scores of one through five are given to each alternative with five being the highest score possible. Qualitative criteria were selected based on what is believed to be the most important considerations by the Town for selecting treatment alternatives for both IG and surface water. Capital cost was not used as a criterion for the screening with the understanding that the selected qualitative factors are the primary drivers for treatment selection. Annual costs were considered since that is an important factor for the Town as it relates to chemical usage, equipment maintenance, energy costs, and operation staffing. Each of the criterion are defined as follows:
O&M Costs: Annual costs that include chemicals, energy, labor, maintenance, repairs, replacement for operating the source water and treatment system
Land Area Requirement: Added land area (Town owned or acquired) that is needed for the source water, conveyance and treatment systems
Reliability and Resiliency: Measure of consistency and predictability for high quality source water and robust treatment systems to meet water quality objectives
Compatibility: Measure of similarity and familiarity with existing source water, conveyance and treatment systems the Town currently operates and maintains now and into the future
Operator Certification Requirement: Certification level required to operate and maintain the treatment systems in accordance with Regulation 100
Health and Safety: How safe are the treatment systems to operate and maintain? Systems that use more chemicals and mechanical equipment will have more protocols for health and safety and actions taken compared to less complex systems using lower and potentially less hazardous chemicals
Table 13 – IG Treatment Alternatives
Criteria Weight
Treatment
Cartridge Filters
Mixed Media Filters
Membranes
O&M Cost 10%
Land Area Requirement 10%
Reliability / Resiliency 10%
Compatibility 30%
Operator Certification Requirement 20%
Health and Safety 20%
TOTAL 100%
Town of Buena Vista Preliminary Design Report 28
Table 14 – Surface Water Treatment Alternatives
Criteria Weight
Pretreatment Treatment
Pre-oxidation
Coagulation (Direct
Filtration)
Coagulation, Flocculation,
Sedimentation (Convention
Filtration)
Pre-sedimentation
Mixed Media Filters
Membranes
O&M Cost 10%
Land Area Requirement
10%
Reliability / Resiliency
10%
Compatibility 30%
Operator Certification Requirement
20%
Healthy and Safety
20%
TOTAL 100%
Table 15 – Disinfection Alternatives
Criteria Weight
Disinfection
Liquid Chlorine
Tablet Chlorine
OnSite Generation
O&M Cost 10%
Hazard and Safety 10%
Operator Certification Requirement 10%
Compatibility 30%
Resiliency 20%
Footprint and Storage Requirement 20%
TOTAL 100%
Town of Buena Vista Preliminary Design Report 29
SECTION 4 – PROJECT ALTERNATIVES
This section discusses the alternatives to treat either the IG water or Cottonwood Creek surface water. The Cottonwood Creek surface water quality as described in previous sections will require some level of pretreatment prior to filtration for meeting drinking water regulations and reliable treatment operations. Any treatment process that works for surface water will be acceptable for the IG water. Considerations for operator certification, reliability / resiliency health and safety, operations and maintenance, and capital cost are discussed for each source recommendation.
INFILTRATION GALLERY ALTERNATIVE
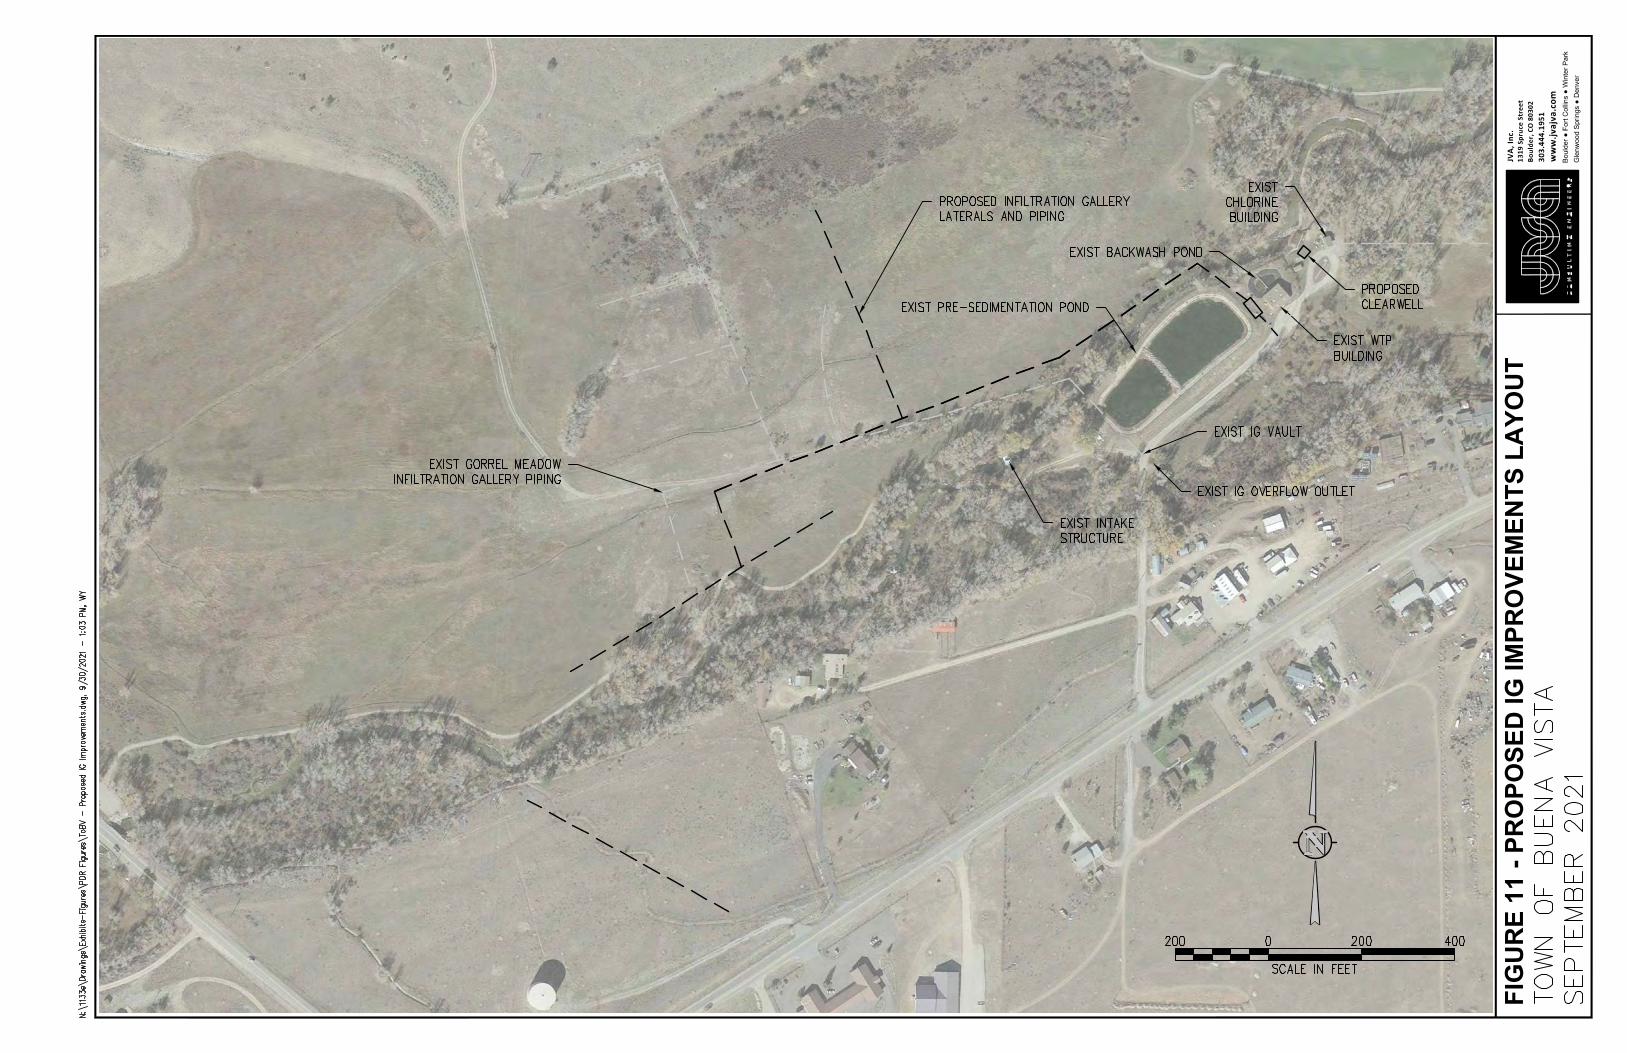
From a water quality perspective, the IG is the preferable water source. Pretreatment for IG water is not needed due to the historically high water quality throughout the year. The IG source water has been serving the Town since 1974 and has never exceeded secondary and primary drinking water standards. The IG infrastructure in Gorrel Meadows will need to be expanded to meet the maximum production flowrate of 2.5 MGD. Recommended improvements to the IG supply, treatment, and disinfection are detailed below. A preliminary process flow diagram (PFD) and layout are shown in Figure 10 and Figure 11.
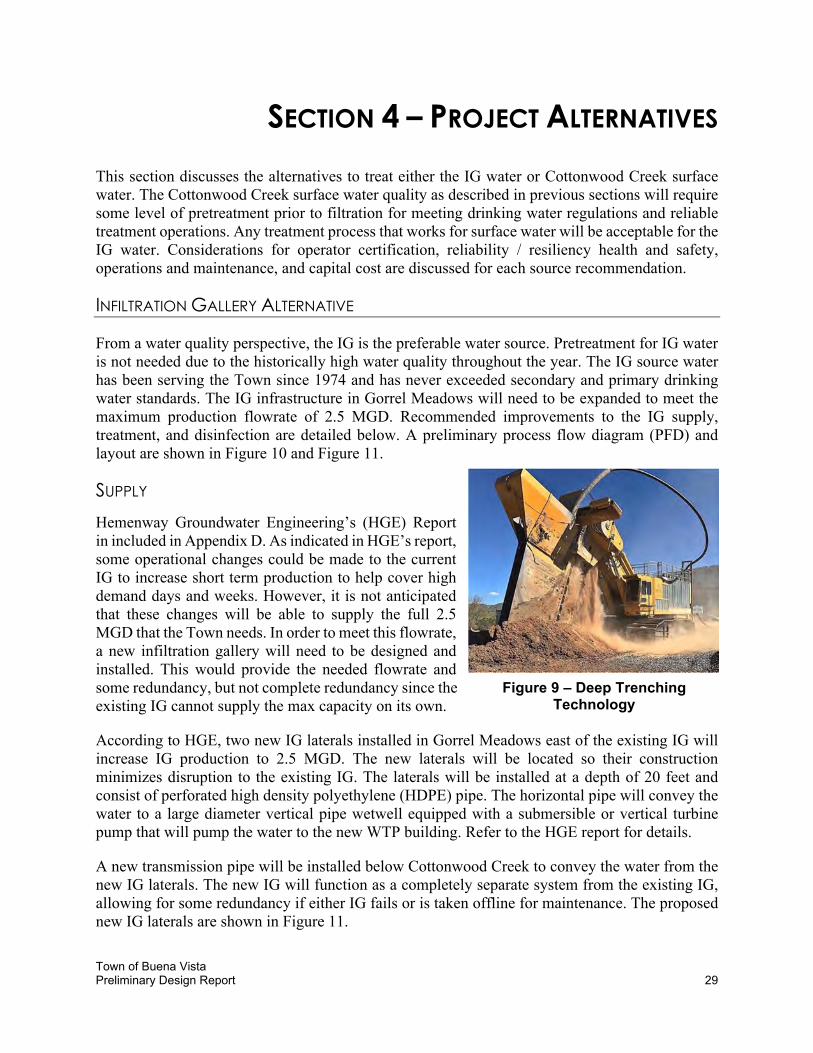
SUPPLY
Hemenway Groundwater Engineering’s (HGE) Report in included in Appendix D. As indicated in HGE’s report, some operational changes could be made to the current IG to increase short term production to help cover high demand days and weeks. However, it is not anticipated that these changes will be able to supply the full 2.5 MGD that the Town needs. In order to meet this flowrate, a new infiltration gallery will need to be designed and installed. This would provide the needed flowrate and some redundancy, but not complete redundancy since the existing IG cannot supply the max capacity on its own.
According to HGE, two new IG laterals installed in Gorrel Meadows east of the existing IG will increase IG production to 2.5 MGD. The new laterals will be located so their construction minimizes disruption to the existing IG. The laterals will be installed at a depth of 20 feet and consist of perforated high density polyethylene (HDPE) pipe. The horizontal pipe will convey the water to a large diameter vertical pipe wetwell equipped with a submersible or vertical turbine pump that will pump the water to the new WTP building. Refer to the HGE report for details.
A new transmission pipe will be installed below Cottonwood Creek to convey the water from the new IG laterals. The new IG will function as a completely separate system from the existing IG, allowing for some redundancy if either IG fails or is taken offline for maintenance. The proposed new IG laterals are shown in Figure 11.
Figure 9 – Deep Trenching Technology
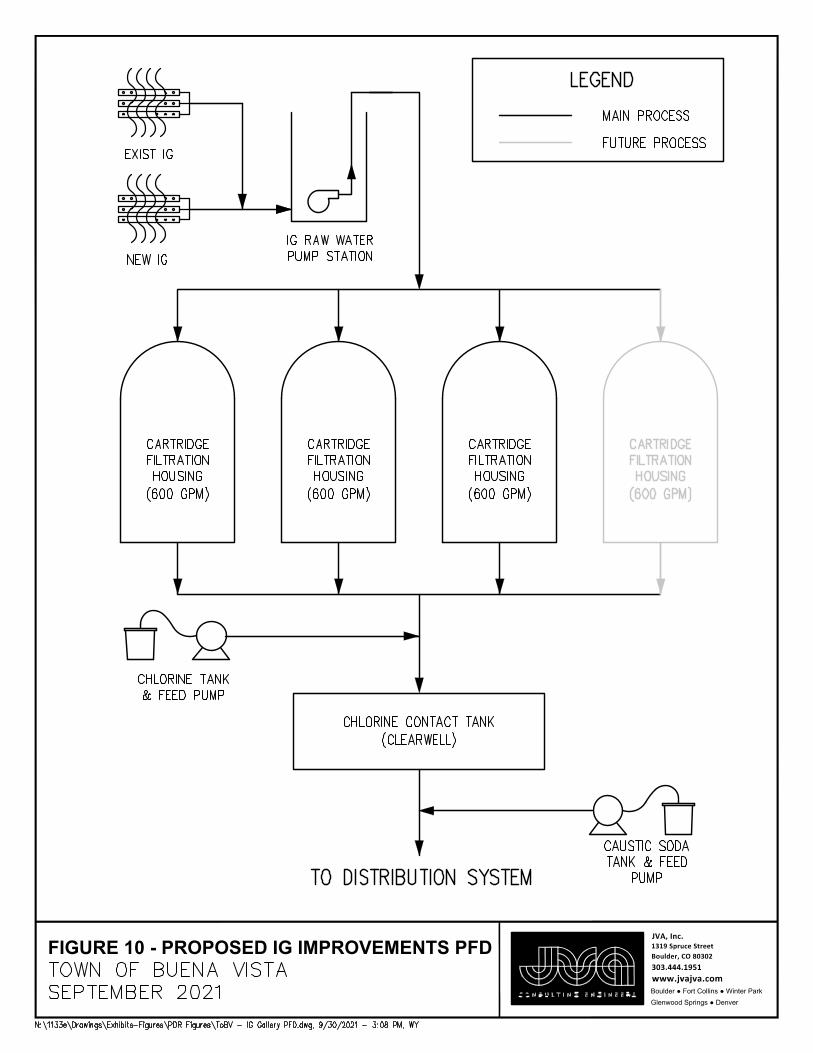
FIGURE 10 - PROPOSED IG IMPROVEMENTS PFD 1319 Spruce StreetBoulder, CO 80302303.444.1951www.jvajva.com
JVA, Inc.
Boulder ● Fort Collins ● Winter ParkGlenwood Springs ● Denver
FIG
UR
E 11
- PR
OPO
SED
IG IM
PRO
VEM
ENTS
LA
YOU
T13
19 S
pruc
e St
reet
Boul
der,
CO 8
0302
303.
444.
1951
ww
w.jv
ajva
.com
JVA,
Inc.
Boul
der ●
For
t Col
lins
● W
inte
r Par
kG
lenw
ood
Sprin
gs ●
Den
ver
Town of Buena Vista Preliminary Design Report 32
TREATMENT
Water from the existing and expanded IG will be networked and conveyed to a raw water pump station located at the WTP site. The raw water pump station will pump the IG water to an array of cartridge filters located in a new building. The filtration booster pumps will contain variable frequency drives (VFDs) that ramp the pumps up and down to maintain a designated flowrate through the filters as headloss develops in the filter cartridges. The flowrate of these pumps will be set by the operators to accommodate system water demands. After filtration, chlorine is added to the filtered water and directed to clearwell for disinfection contact time.
Harmsco MUNI-8-6FL filter housings are recommended for this treatment system. Each housing accommodates eight HC/170-LT2 filter cartridges, each with a recommended flow rate of 75 gpm for Giardia lamblia removal. This equates to a recommended flowrate of 600 gpm, or 0.864 MGD per filter housing. Four of these housings operating in parallel will provide a firm capacity of 2.59 MGD, with three housings online and one offline housing to be rotated into service as needed for repairs or cartridge replacement in another housing.
The design criteria for a cartridge filtration treatment system for use in treating IG water are shown in Table 16.
Table 16 – Design Criteria for Cartridge Filtration
Parameter CDPHE Design Criteria Proposed Design
Cartridge Housing CDPHE Pre-Approved Harmsco MUNI-8-6FL
Maximum Housing Capacity N/A 800 gpm each
Recommended Housing Capacity N/A 600 gpm each
Number of Housings N/A 4
Max Capacity Capacity with all units online 3.46 MGD
Firm Capacity Capable of treating maximum flow
with one unit offline 2.59 MGD
Cartridge Filters Per Housing N/A 8
Filter Cartridge CDPHE Pre-Approved HC/170-LT2
Differential Pressure Must not exceed maximum
specified from third party validation 30 psi max based on manufacturer
recommendation
Turbidity Monitoring Individual filter skid turbidity and combined effluent filter turbidity
Yes
Differential Pressure Monitoring Testing method specified Built in pressure gauges cartridge
housing
Filter Change Out Requirements
Protocol specified and records Yes
Filters must be used once and then discarded with no backwashing of
chemical cleaning Yes
Sample Taps Influent and effluent Yes
Check Valve After filter vessel Yes
Pressure Relief Valve Inlet to each vessel Yes
Flow Metering Yes Yes
Flow Control Yes Yes
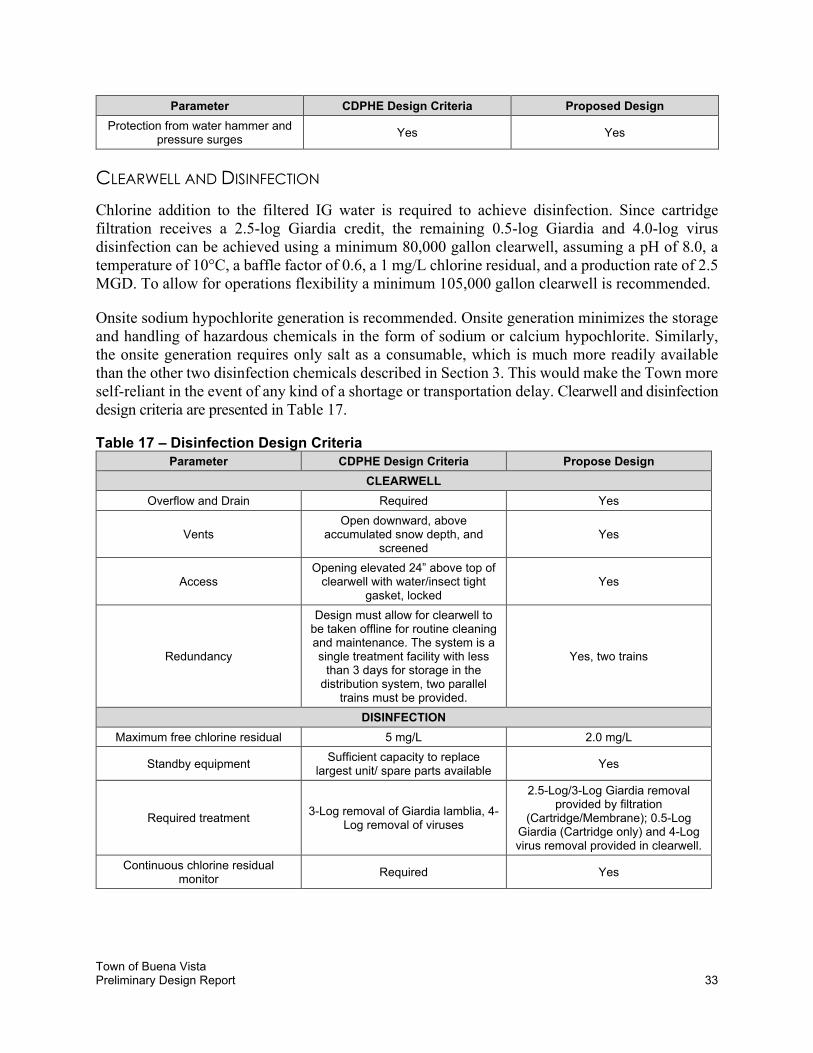
Town of Buena Vista Preliminary Design Report 33
Parameter CDPHE Design Criteria Proposed Design
Protection from water hammer and pressure surges
Yes Yes
CLEARWELL AND DISINFECTION
Chlorine addition to the filtered IG water is required to achieve disinfection. Since cartridge filtration receives a 2.5-log Giardia credit, the remaining 0.5-log Giardia and 4.0-log virus disinfection can be achieved using a minimum 80,000 gallon clearwell, assuming a pH of 8.0, a temperature of 10°C, a baffle factor of 0.6, a 1 mg/L chlorine residual, and a production rate of 2.5 MGD. To allow for operations flexibility a minimum 105,000 gallon clearwell is recommended.
Onsite sodium hypochlorite generation is recommended. Onsite generation minimizes the storage and handling of hazardous chemicals in the form of sodium or calcium hypochlorite. Similarly, the onsite generation requires only salt as a consumable, which is much more readily available than the other two disinfection chemicals described in Section 3. This would make the Town more self-reliant in the event of any kind of a shortage or transportation delay. Clearwell and disinfection design criteria are presented in Table 17.
Table 17 – Disinfection Design Criteria
Parameter CDPHE Design Criteria Propose Design
CLEARWELL
Overflow and Drain Required Yes
Vents Open downward, above
accumulated snow depth, and screened
Yes
Access Opening elevated 24” above top of
clearwell with water/insect tight gasket, locked
Yes
Redundancy
Design must allow for clearwell to be taken offline for routine cleaning and maintenance. The system is a single treatment facility with less
than 3 days for storage in the distribution system, two parallel
trains must be provided.
Yes, two trains
DISINFECTION
Maximum free chlorine residual 5 mg/L 2.0 mg/L
Standby equipment Sufficient capacity to replace
largest unit/ spare parts available Yes
Required treatment 3-Log removal of Giardia lamblia, 4-
Log removal of viruses
2.5-Log/3-Log Giardia removal provided by filtration
(Cartridge/Membrane); 0.5-Log Giardia (Cartridge only) and 4-Log virus removal provided in clearwell.
Continuous chlorine residual monitor
Required Yes
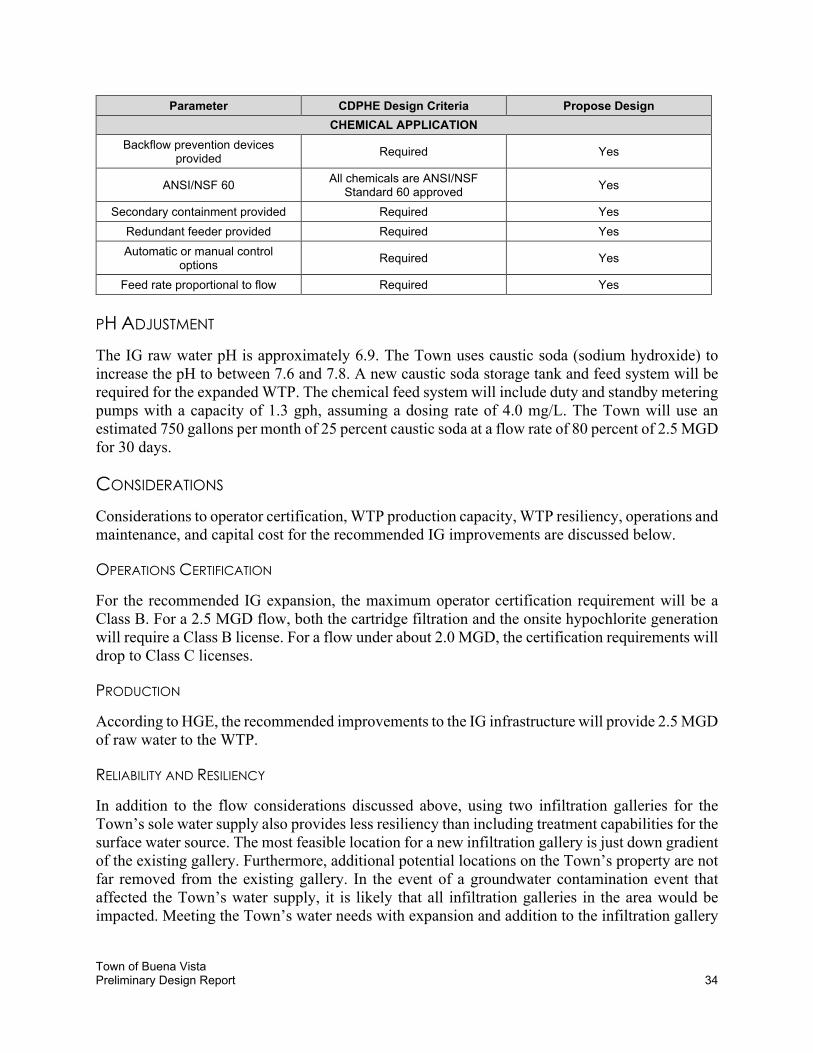
Town of Buena Vista Preliminary Design Report 34
Parameter CDPHE Design Criteria Propose Design
CHEMICAL APPLICATION
Backflow prevention devices provided
Required Yes
ANSI/NSF 60 All chemicals are ANSI/NSF
Standard 60 approved Yes
Secondary containment provided Required Yes
Redundant feeder provided Required Yes
Automatic or manual control options
Required Yes
Feed rate proportional to flow Required Yes
PH ADJUSTMENT
The IG raw water pH is approximately 6.9. The Town uses caustic soda (sodium hydroxide) to increase the pH to between 7.6 and 7.8. A new caustic soda storage tank and feed system will be required for the expanded WTP. The chemical feed system will include duty and standby metering pumps with a capacity of 1.3 gph, assuming a dosing rate of 4.0 mg/L. The Town will use an estimated 750 gallons per month of 25 percent caustic soda at a flow rate of 80 percent of 2.5 MGD for 30 days.
CONSIDERATIONS
Considerations to operator certification, WTP production capacity, WTP resiliency, operations and maintenance, and capital cost for the recommended IG improvements are discussed below.
OPERATIONS CERTIFICATION
For the recommended IG expansion, the maximum operator certification requirement will be a Class B. For a 2.5 MGD flow, both the cartridge filtration and the onsite hypochlorite generation will require a Class B license. For a flow under about 2.0 MGD, the certification requirements will drop to Class C licenses.
PRODUCTION
According to HGE, the recommended improvements to the IG infrastructure will provide 2.5 MGD of raw water to the WTP.
RELIABILITY AND RESILIENCY
In addition to the flow considerations discussed above, using two infiltration galleries for the Town’s sole water supply also provides less resiliency than including treatment capabilities for the surface water source. The most feasible location for a new infiltration gallery is just down gradient of the existing gallery. Furthermore, additional potential locations on the Town’s property are not far removed from the existing gallery. In the event of a groundwater contamination event that affected the Town’s water supply, it is likely that all infiltration galleries in the area would be impacted. Meeting the Town’s water needs with expansion and addition to the infiltration gallery
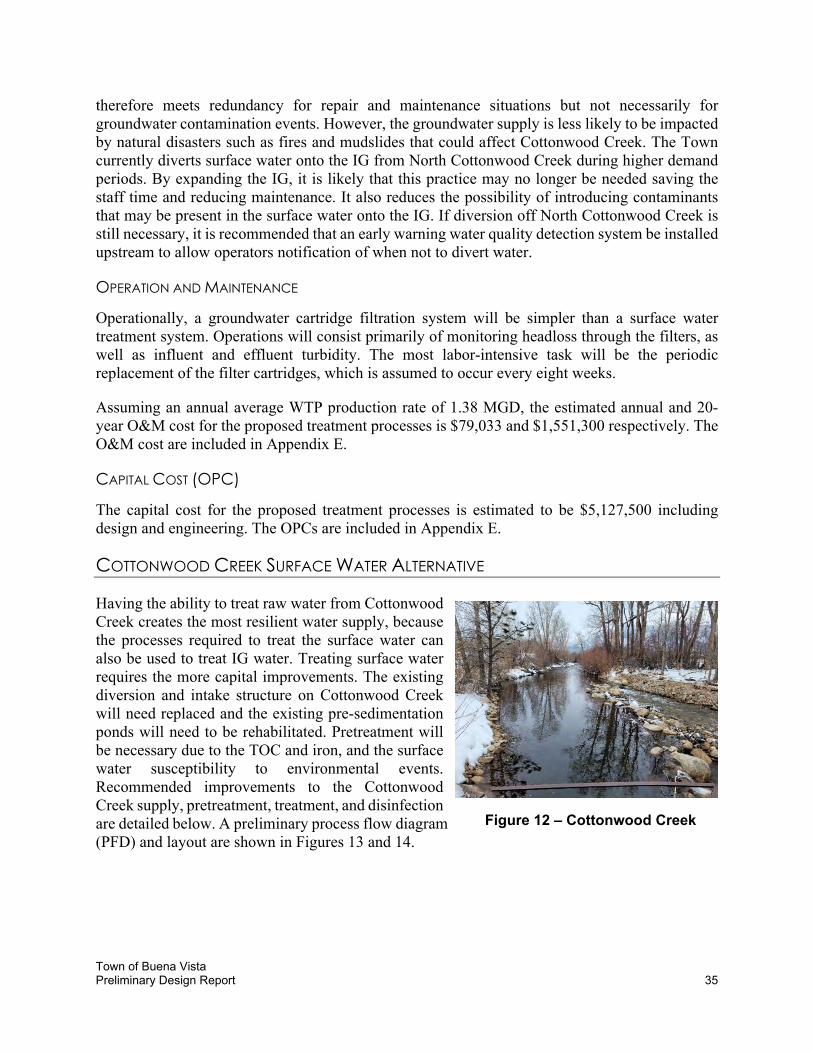
Town of Buena Vista Preliminary Design Report 35
therefore meets redundancy for repair and maintenance situations but not necessarily for groundwater contamination events. However, the groundwater supply is less likely to be impacted by natural disasters such as fires and mudslides that could affect Cottonwood Creek. The Town currently diverts surface water onto the IG from North Cottonwood Creek during higher demand periods. By expanding the IG, it is likely that this practice may no longer be needed saving the staff time and reducing maintenance. It also reduces the possibility of introducing contaminants that may be present in the surface water onto the IG. If diversion off North Cottonwood Creek is still necessary, it is recommended that an early warning water quality detection system be installed upstream to allow operators notification of when not to divert water.
OPERATION AND MAINTENANCE
Operationally, a groundwater cartridge filtration system will be simpler than a surface water treatment system. Operations will consist primarily of monitoring headloss through the filters, as well as influent and effluent turbidity. The most labor-intensive task will be the periodic replacement of the filter cartridges, which is assumed to occur every eight weeks.
Assuming an annual average WTP production rate of 1.38 MGD, the estimated annual and 20-year O&M cost for the proposed treatment processes is $79,033 and $1,551,300 respectively. The O&M cost are included in Appendix E.
CAPITAL COST (OPC)
The capital cost for the proposed treatment processes is estimated to be $5,127,500 including design and engineering. The OPCs are included in Appendix E.
COTTONWOOD CREEK SURFACE WATER ALTERNATIVE
Having the ability to treat raw water from Cottonwood Creek creates the most resilient water supply, because the processes required to treat the surface water can also be used to treat IG water. Treating surface water requires the more capital improvements. The existing diversion and intake structure on Cottonwood Creek will need replaced and the existing pre-sedimentation ponds will need to be rehabilitated. Pretreatment will be necessary due to the TOC and iron, and the surface water susceptibility to environmental events. Recommended improvements to the Cottonwood Creek supply, pretreatment, treatment, and disinfection are detailed below. A preliminary process flow diagram (PFD) and layout are shown in Figures 13 and 14.
Figure 12 – Cottonwood Creek
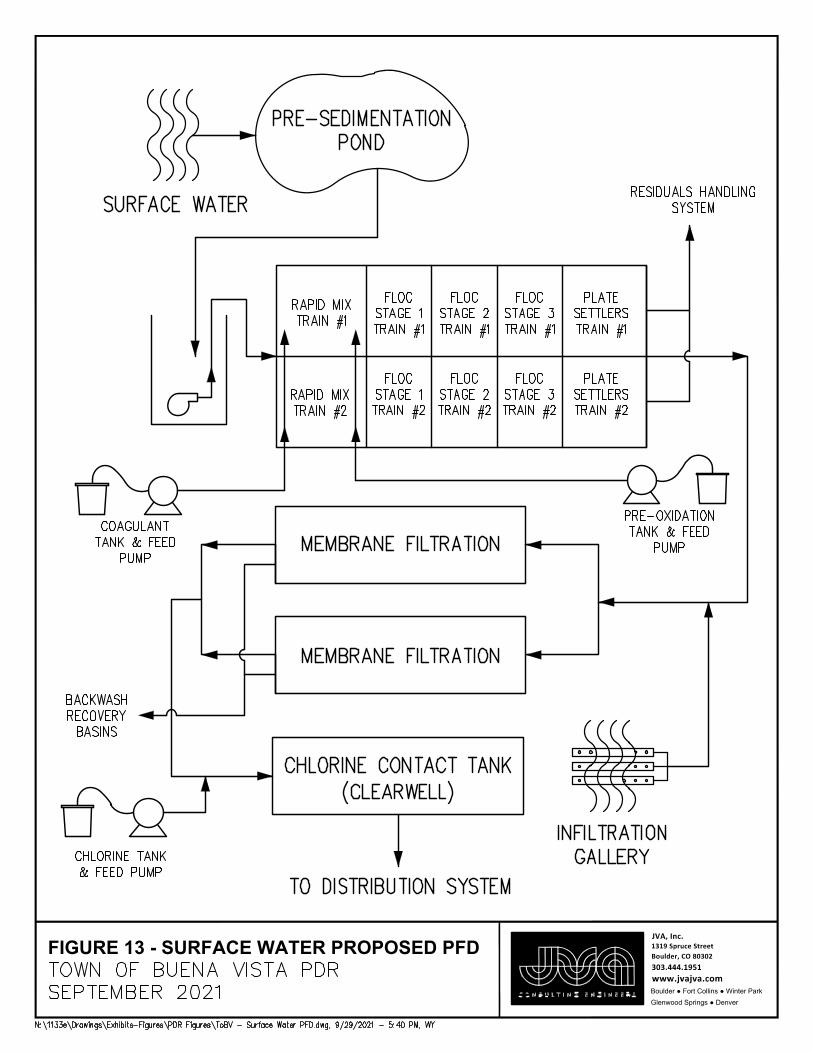
FIGURE 13 - SURFACE WATER PROPOSED PFD 1319 Spruce StreetBoulder, CO 80302303.444.1951www.jvajva.com
JVA, Inc.
Boulder ● Fort Collins ● Winter ParkGlenwood Springs ● Denver
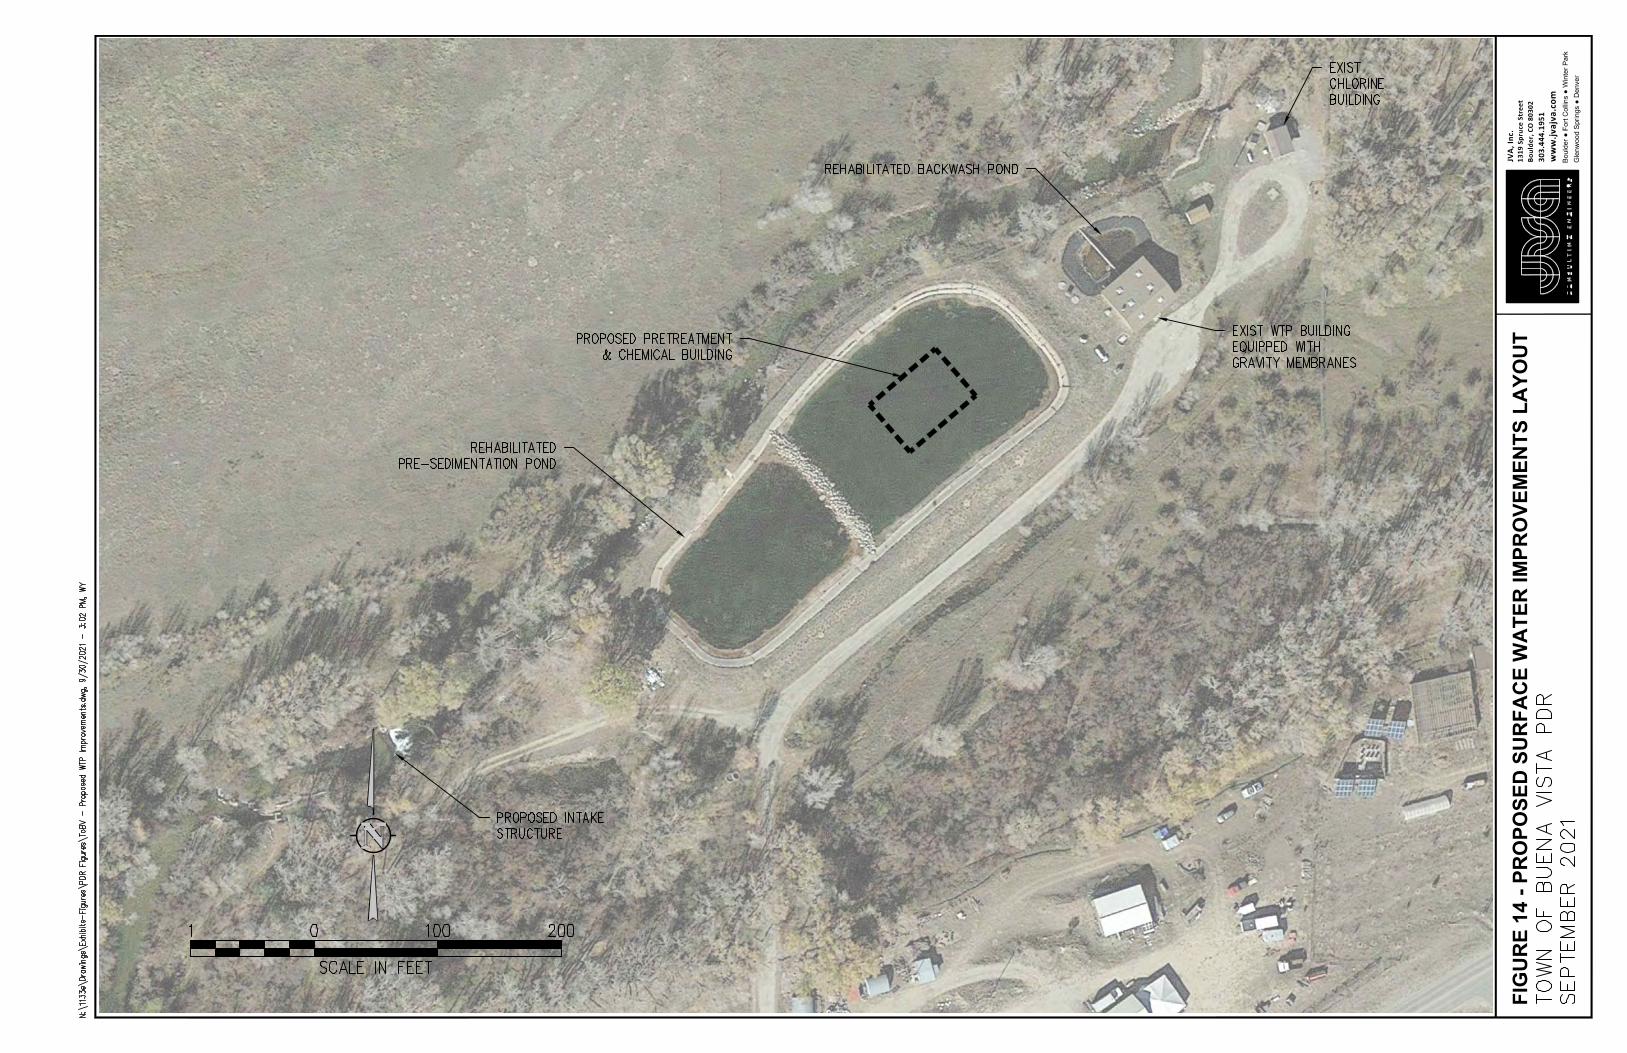
FIG
UR
E 14
- PR
OPO
SED
SU
RFA
CE
WA
TER
IMPR
OVE
MEN
TS L
AYO
UT
1319
Spr
uce
Stre
etBo
ulde
r, CO
803
0230
3.44
4.19
51w
ww
.jvaj
va.c
om
JVA,
Inc.
Boul
der ●
For
t Col
lins
● W
inte
r Par
kG
lenw
ood
Sprin
gs ●
Den
ver
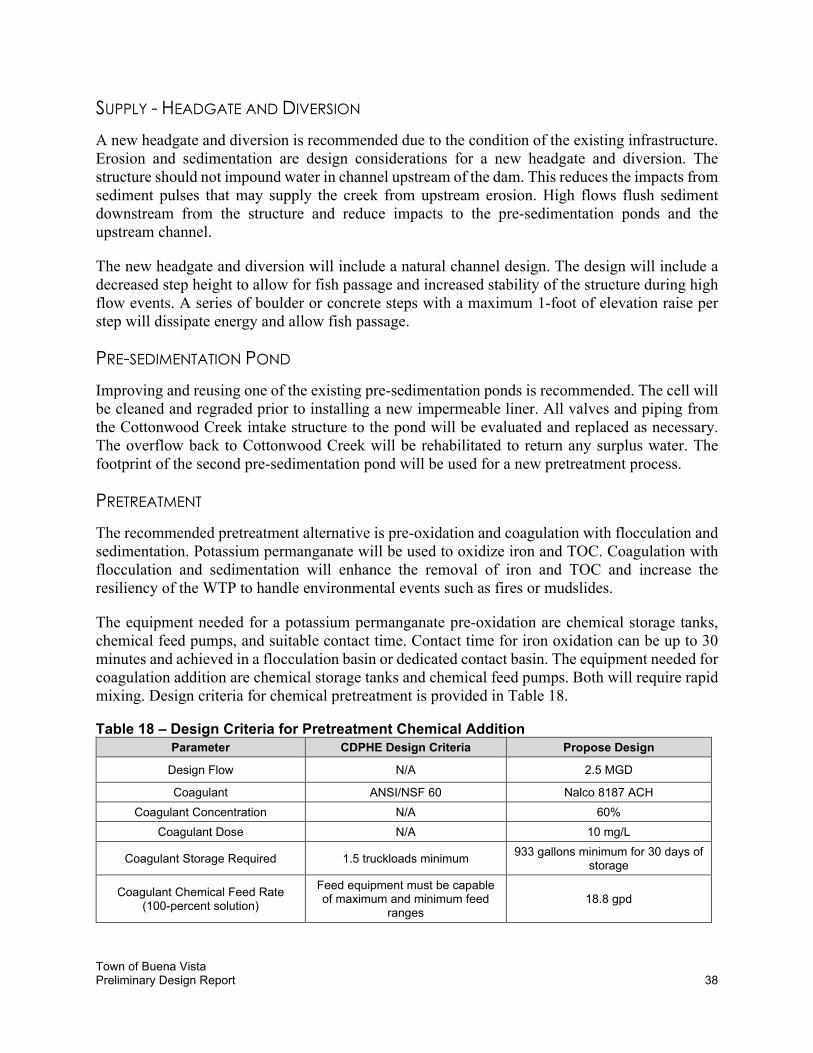
Town of Buena Vista Preliminary Design Report 38
SUPPLY - HEADGATE AND DIVERSION
A new headgate and diversion is recommended due to the condition of the existing infrastructure. Erosion and sedimentation are design considerations for a new headgate and diversion. The structure should not impound water in channel upstream of the dam. This reduces the impacts from sediment pulses that may supply the creek from upstream erosion. High flows flush sediment downstream from the structure and reduce impacts to the pre-sedimentation ponds and the upstream channel.
The new headgate and diversion will include a natural channel design. The design will include a decreased step height to allow for fish passage and increased stability of the structure during high flow events. A series of boulder or concrete steps with a maximum 1-foot of elevation raise per step will dissipate energy and allow fish passage.
PRE-SEDIMENTATION POND
Improving and reusing one of the existing pre-sedimentation ponds is recommended. The cell will be cleaned and regraded prior to installing a new impermeable liner. All valves and piping from the Cottonwood Creek intake structure to the pond will be evaluated and replaced as necessary. The overflow back to Cottonwood Creek will be rehabilitated to return any surplus water. The footprint of the second pre-sedimentation pond will be used for a new pretreatment process.
PRETREATMENT
The recommended pretreatment alternative is pre-oxidation and coagulation with flocculation and sedimentation. Potassium permanganate will be used to oxidize iron and TOC. Coagulation with flocculation and sedimentation will enhance the removal of iron and TOC and increase the resiliency of the WTP to handle environmental events such as fires or mudslides.
The equipment needed for a potassium permanganate pre-oxidation are chemical storage tanks, chemical feed pumps, and suitable contact time. Contact time for iron oxidation can be up to 30 minutes and achieved in a flocculation basin or dedicated contact basin. The equipment needed for coagulation addition are chemical storage tanks and chemical feed pumps. Both will require rapid mixing. Design criteria for chemical pretreatment is provided in Table 18.
Table 18 – Design Criteria for Pretreatment Chemical Addition
Parameter CDPHE Design Criteria Propose Design
Design Flow N/A 2.5 MGD
Coagulant ANSI/NSF 60 Nalco 8187 ACH
Coagulant Concentration N/A 60%
Coagulant Dose N/A 10 mg/L
Coagulant Storage Required 1.5 truckloads minimum 933 gallons minimum for 30 days of
storage
Coagulant Chemical Feed Rate (100-percent solution)
Feed equipment must be capable of maximum and minimum feed
ranges 18.8 gpd
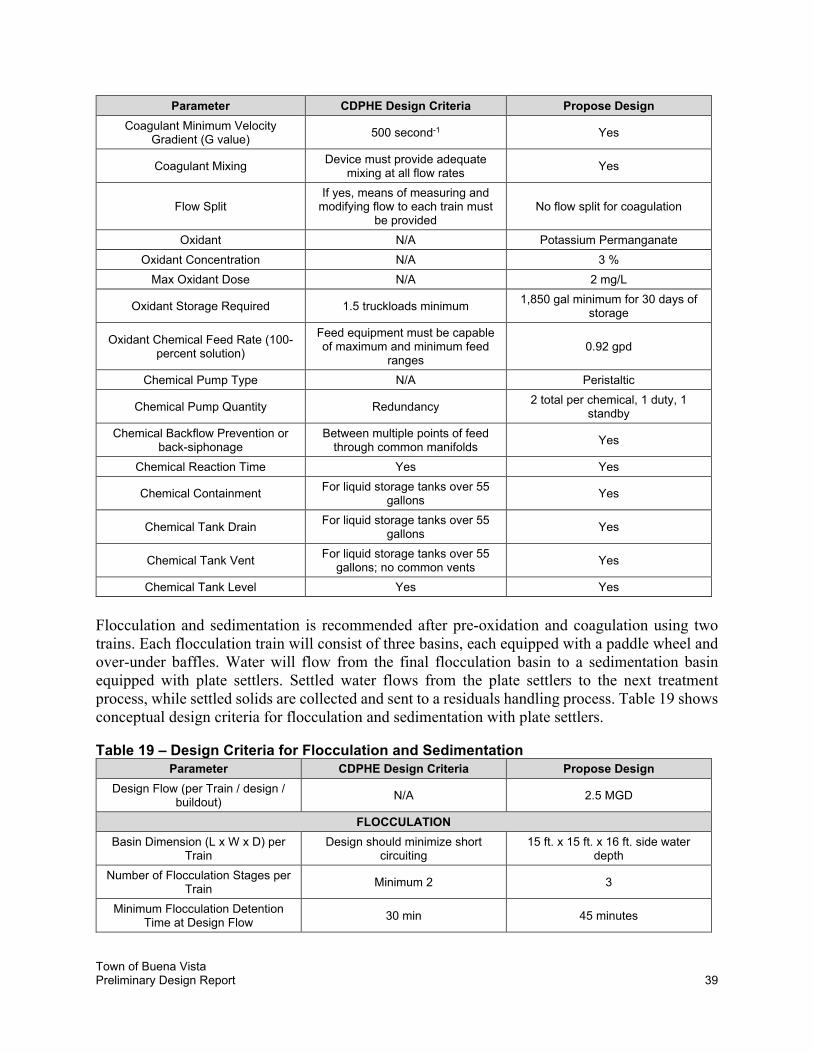
Town of Buena Vista Preliminary Design Report 39
Parameter CDPHE Design Criteria Propose Design
Coagulant Minimum Velocity Gradient (G value)
500 second-1 Yes
Coagulant Mixing Device must provide adequate
mixing at all flow rates Yes
Flow Split If yes, means of measuring and
modifying flow to each train must be provided
No flow split for coagulation
Oxidant N/A Potassium Permanganate
Oxidant Concentration N/A 3 %
Max Oxidant Dose N/A 2 mg/L
Oxidant Storage Required 1.5 truckloads minimum 1,850 gal minimum for 30 days of
storage
Oxidant Chemical Feed Rate (100-percent solution)
Feed equipment must be capable of maximum and minimum feed
ranges 0.92 gpd
Chemical Pump Type N/A Peristaltic
Chemical Pump Quantity Redundancy 2 total per chemical, 1 duty, 1
standby
Chemical Backflow Prevention or back-siphonage
Between multiple points of feed through common manifolds
Yes
Chemical Reaction Time Yes Yes
Chemical Containment For liquid storage tanks over 55
gallons Yes
Chemical Tank Drain For liquid storage tanks over 55
gallons Yes
Chemical Tank Vent For liquid storage tanks over 55
gallons; no common vents Yes
Chemical Tank Level Yes Yes
Flocculation and sedimentation is recommended after pre-oxidation and coagulation using two trains. Each flocculation train will consist of three basins, each equipped with a paddle wheel and over-under baffles. Water will flow from the final flocculation basin to a sedimentation basin equipped with plate settlers. Settled water flows from the plate settlers to the next treatment process, while settled solids are collected and sent to a residuals handling process. Table 19 shows conceptual design criteria for flocculation and sedimentation with plate settlers.
Table 19 – Design Criteria for Flocculation and Sedimentation
Parameter CDPHE Design Criteria Propose Design
Design Flow (per Train / design / buildout)
N/A 2.5 MGD
FLOCCULATION
Basin Dimension (L x W x D) per Train
Design should minimize short circuiting
15 ft. x 15 ft. x 16 ft. side water depth
Number of Flocculation Stages per Train
Minimum 2 3
Minimum Flocculation Detention Time at Design Flow
30 min 45 minutes
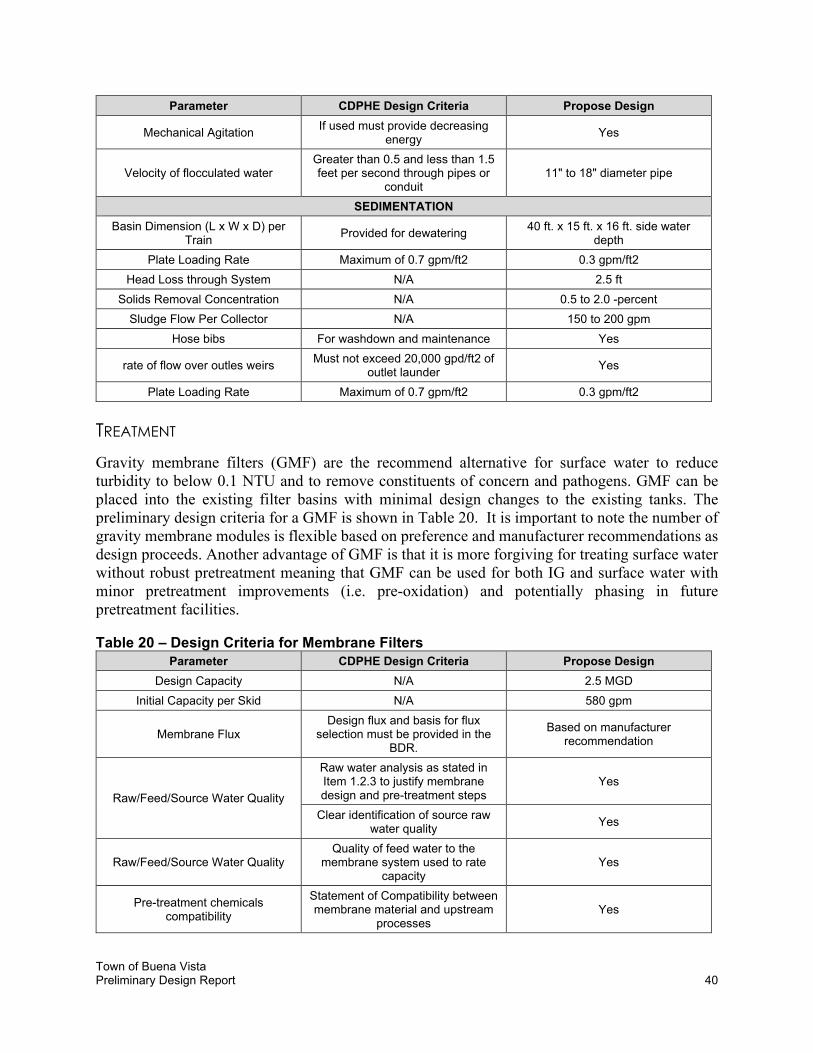
Town of Buena Vista Preliminary Design Report 40
Parameter CDPHE Design Criteria Propose Design
Mechanical Agitation If used must provide decreasing
energy Yes
Velocity of flocculated water Greater than 0.5 and less than 1.5 feet per second through pipes or
conduit 11" to 18" diameter pipe
SEDIMENTATION
Basin Dimension (L x W x D) per Train
Provided for dewatering 40 ft. x 15 ft. x 16 ft. side water
depth
Plate Loading Rate Maximum of 0.7 gpm/ft2 0.3 gpm/ft2
Head Loss through System N/A 2.5 ft
Solids Removal Concentration N/A 0.5 to 2.0 -percent
Sludge Flow Per Collector N/A 150 to 200 gpm
Hose bibs For washdown and maintenance Yes
rate of flow over outles weirs Must not exceed 20,000 gpd/ft2 of
outlet launder Yes
Plate Loading Rate Maximum of 0.7 gpm/ft2 0.3 gpm/ft2
TREATMENT
Gravity membrane filters (GMF) are the recommend alternative for surface water to reduce turbidity to below 0.1 NTU and to remove constituents of concern and pathogens. GMF can be placed into the existing filter basins with minimal design changes to the existing tanks. The preliminary design criteria for a GMF is shown in Table 20. It is important to note the number of gravity membrane modules is flexible based on preference and manufacturer recommendations as design proceeds. Another advantage of GMF is that it is more forgiving for treating surface water without robust pretreatment meaning that GMF can be used for both IG and surface water with minor pretreatment improvements (i.e. pre-oxidation) and potentially phasing in future pretreatment facilities.
Table 20 – Design Criteria for Membrane Filters
Parameter CDPHE Design Criteria Propose Design
Design Capacity N/A 2.5 MGD
Initial Capacity per Skid N/A 580 gpm
Membrane Flux Design flux and basis for flux
selection must be provided in the BDR.
Based on manufacturer recommendation
Raw/Feed/Source Water Quality
Raw water analysis as stated in Item 1.2.3 to justify membrane design and pre-treatment steps
Yes
Clear identification of source raw water quality
Yes
Raw/Feed/Source Water Quality Quality of feed water to the
membrane system used to rate capacity
Yes
Pre-treatment chemicals compatibility
Statement of Compatibility between membrane material and upstream
processes Yes
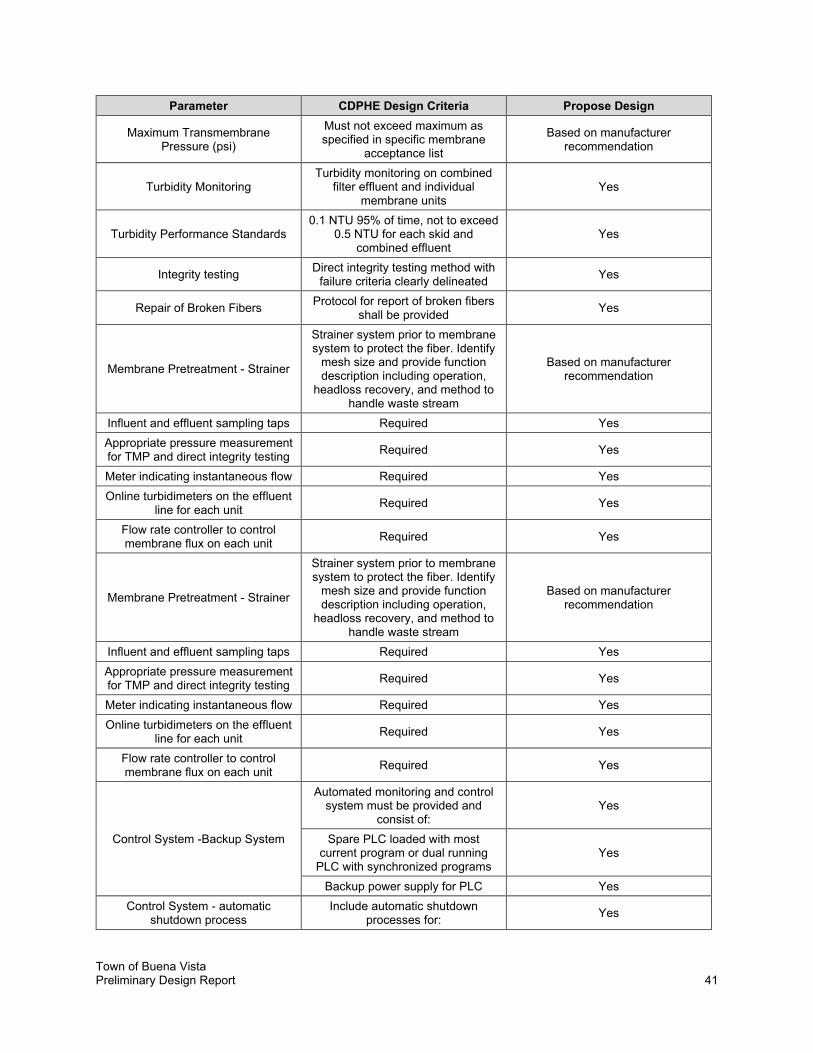
Town of Buena Vista Preliminary Design Report 41
Parameter CDPHE Design Criteria Propose Design
Maximum Transmembrane Pressure (psi)
Must not exceed maximum as specified in specific membrane
acceptance list
Based on manufacturer recommendation
Turbidity Monitoring Turbidity monitoring on combined
filter effluent and individual membrane units
Yes
Turbidity Performance Standards 0.1 NTU 95% of time, not to exceed
0.5 NTU for each skid and combined effluent
Yes
Integrity testing Direct integrity testing method with
failure criteria clearly delineated Yes
Repair of Broken Fibers Protocol for report of broken fibers
shall be provided Yes
Membrane Pretreatment - Strainer
Strainer system prior to membrane system to protect the fiber. Identify
mesh size and provide function description including operation,
headloss recovery, and method to handle waste stream
Based on manufacturer recommendation
Influent and effluent sampling taps Required Yes
Appropriate pressure measurement for TMP and direct integrity testing
Required Yes
Meter indicating instantaneous flow Required Yes
Online turbidimeters on the effluent line for each unit
Required Yes
Flow rate controller to control membrane flux on each unit
Required Yes
Control System -Backup System
Automated monitoring and control system must be provided and
consist of: Yes
Spare PLC loaded with most current program or dual running
PLC with synchronized programs Yes
Backup power supply for PLC Yes
Control System - automatic shutdown process
Include automatic shutdown processes for:
Yes
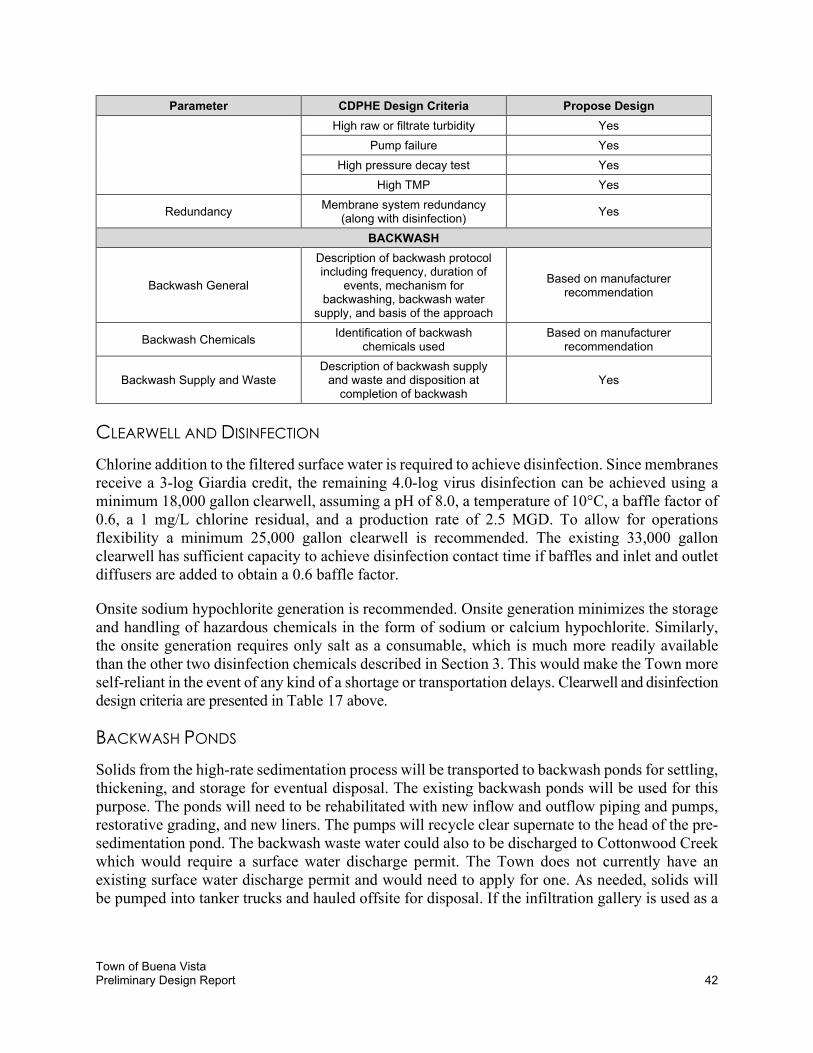
Town of Buena Vista Preliminary Design Report 42
Parameter CDPHE Design Criteria Propose Design
High raw or filtrate turbidity Yes
Pump failure Yes
High pressure decay test Yes
High TMP Yes
Redundancy Membrane system redundancy
(along with disinfection) Yes
BACKWASH
Backwash General
Description of backwash protocol including frequency, duration of
events, mechanism for backwashing, backwash water
supply, and basis of the approach
Based on manufacturer recommendation
Backwash Chemicals Identification of backwash
chemicals used Based on manufacturer
recommendation
Backwash Supply and Waste Description of backwash supply
and waste and disposition at completion of backwash
Yes
CLEARWELL AND DISINFECTION
Chlorine addition to the filtered surface water is required to achieve disinfection. Since membranes receive a 3-log Giardia credit, the remaining 4.0-log virus disinfection can be achieved using a minimum 18,000 gallon clearwell, assuming a pH of 8.0, a temperature of 10°C, a baffle factor of 0.6, a 1 mg/L chlorine residual, and a production rate of 2.5 MGD. To allow for operations flexibility a minimum 25,000 gallon clearwell is recommended. The existing 33,000 gallon clearwell has sufficient capacity to achieve disinfection contact time if baffles and inlet and outlet diffusers are added to obtain a 0.6 baffle factor.
Onsite sodium hypochlorite generation is recommended. Onsite generation minimizes the storage and handling of hazardous chemicals in the form of sodium or calcium hypochlorite. Similarly, the onsite generation requires only salt as a consumable, which is much more readily available than the other two disinfection chemicals described in Section 3. This would make the Town more self-reliant in the event of any kind of a shortage or transportation delays. Clearwell and disinfection design criteria are presented in Table 17 above.
BACKWASH PONDS
Solids from the high-rate sedimentation process will be transported to backwash ponds for settling, thickening, and storage for eventual disposal. The existing backwash ponds will be used for this purpose. The ponds will need to be rehabilitated with new inflow and outflow piping and pumps, restorative grading, and new liners. The pumps will recycle clear supernate to the head of the pre-sedimentation pond. The backwash waste water could also to be discharged to Cottonwood Creek which would require a surface water discharge permit. The Town does not currently have an existing surface water discharge permit and would need to apply for one. As needed, solids will be pumped into tanker trucks and hauled offsite for disposal. If the infiltration gallery is used as a
Town of Buena Vista Preliminary Design Report 43
primary water source, solids accumulation is expected to be minimal and require very infrequent pumping.
CONSIDERATIONS
Considerations to operator certification, WTP production capacity, WTP resiliency, operations and maintenance, and capital cost for the recommended Cottonwood Creek surface water improvements are discussed below.
OPERATOR CERTIFICATION
For the recommended surface water treatment system, the required operator certification requirement would be a Class A. For 2.5 MGD production, both coagulant addition and membrane filtration will require a Class A license, while the permanganate dosing and onsite hypochlorite generation will require Class B. For a flow less than 2.0 MGD, the certification requirements would drop to Class B and Class C licenses for the respective processes.
PRODUCTION
There is typically sufficient flow in Cottonwood Creek to supply the 2.5 MGD, as long as the Town’s water rights permit.
RESILIENCY
Incorporating the capacity to treat either 2.5 MGD of water from Cottonwood Creek or the infiltration gallery provides the most resiliency possible because the alternative source can be used if either groundwater or surface water becomes unavailable for use.
OPERATION AND MAINTENANCE
As indicated by the higher operator certification requirements, the proposed surface water treatment system would represent significantly more complex operations and maintenance than the cartridge filtration system. Pretreatment chemical dosing, of potassium permanganate and coagulant require dosing calculations and regular jar testing to ensure the proper balance between effective dosing and chemical usage. The rapid mixers, flocculators, and high-rate settling basins include motors and many moving parts that would require periodic greasing and parts replacement. The membrane filtration involves the fine tuning of numerous setpoints and periodic cleanings of different intensities.
The estimated annual and 20-year O&M cost for the proposed treatment processes is $110,625 and $2,347,300, respectively. The O&M cost are included in Appendix .
CAPITAL COST (OPC)
The capital cost for the proposed treatment processes is estimated to be $12,751,000. The OPCs are included in Appendix E.
Town of Buena Vista Preliminary Design Report 44
PRIORITIZATION AND PHASING
The IG water quality is superior. If the Town intends to install treatment for Cottonwood Creek surface water but rely on IG water as the primary raw water source, the Town may consider not installing flocculation and sedimentation at this time. Membranes will effectively treat IG water, and membranes with pre-oxidation and coagulation will effectively treat Cottonwood Creek surface water most of the year. By removing the flocculation and sedimentation processes, the WTP will not remove as much TOC and will be more susceptible to environmental events such as fires and mudslides.
The main concern with not removing sufficient TOC is that the chlorine could react with the TOC to form DBPs in the distribution system. However, DBPs compliance is based on a rolling annual average, so if the Town uses surface water for one month of the year, while the IG is offline, the rolling annual average will most likely remain below the MCL. The risk of environmental impacts is decreased if the Town can treat both IG water and Cottonwood Creek surface water. If an environmental event impacts Cottonwood Creek, the Town could use IG water.
By not installing flocculation and sedimentation now, the Town could reduce the cost of a surface WTP. The WTP will not be as resilient, but it should be adequate if the IG is the primary water source for the majority of the year. The surface WTP can be designed for the addition of flocculation and sedimentation in the future, if the Town begins to rely more on Cottonwood Creek surface water.
If the Town chooses to treat the IG water through cartridge filtration, a Class C operator license is required while the WTPs rated capacity is below 2.0 MGD. If the WTP rated capacity expands to 2.5 MGD, a Class B operator license is required. If the Town chooses to treat surface water, a Class B operator license is required while the WTP’s rated capacity is below 2.0 MGD and licensing requirements will change to Class A once the rated capacity expands to 2.5 MGD.
Town of Buena Vista Preliminary Design Report 45
SECTION 5 – PROJECT RECOMMENDATION
The WRMP recommends the Town should have the ability to treat IG and surface water to allow for maximum redundancy and flexibility to provide water for the Town’s customers. The IG provides high quality water that requires minimal treatment and is more resilient against natural disasters, while the surface water is more predictable in terms of capacity and can provide reliable redundancy. Installing a new IG will not provide full redundancy to the water system because the existing IG does not have a 2.5 MGD capacity while the surface water source requires pretreatment in order to remove constituents of concern. By including IG and surface water improvements in the final recommended project, the Town may choose to use the more pristine IG source the majority of the time while still having the flexibility to use the surface water when the IG capacity is not sufficient. A preliminary process flow diagram (PFD) and layout are shown in Figure 15 and Figure 16, respectively.
The project recommendation includes a 2.5 MGD firm capacity WTP that will be initially approved for 2.0 MGD capacity. By designing for a larger firm capacity but permitting for a lower capacity, the Town is able to keep a Class B ORC license until the WTP demand exceeds 2.0 MGD. Once the water demand is near 2.0 MGD, the Town can apply for a rate increase and become permitted for a 2.5 MGD plant without having to complete capital projects to increase the capacity of the WTP. The ORC will also need to have a Class A license when the Town applies for a rate increase.
INFILTRATION GALLERY SUPPLY
Installing a new IG will increase capacity from Gorrel Meadows to 2.5 MGD. As discussed in Section 5, the new IG will be comprised of laterals made of HDPE pipe installed at a depth of 20 feet. The new IG will be a completely separate system from the existing IG, which will provide some redundancy for the Town.
COTTONWOOD CREEK SURFACE WATER SUPPLY
A new intake structure at Cottonwood Creek will include a new headgate and diversion. As described in Section 4, the new headgate and diversion will have a natural design that will allow for fish passage, maintain the stability of the structure, protect from erosion and reduce impacts to the pre-sedimentation pond and upstream channel.
PRETREATMENT
Pretreatment will include pre-sedimentation pond improvements, pre-oxidation and direct coagulation. A full flocculation and sedimentation system can be installed in the future, if needed or as Town relies more on surface water.
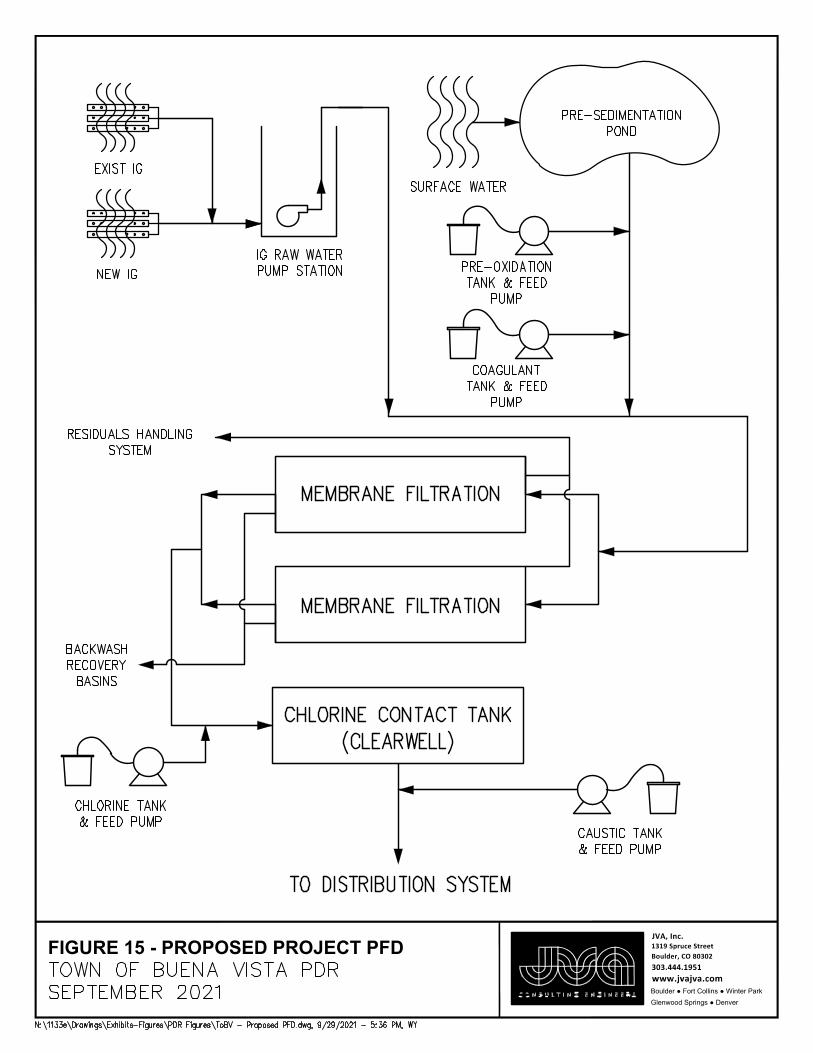
FIGURE 15 - PROPOSED PROJECT PFD 1319 Spruce StreetBoulder, CO 80302303.444.1951www.jvajva.com
JVA, Inc.
Boulder ● Fort Collins ● Winter ParkGlenwood Springs ● Denver
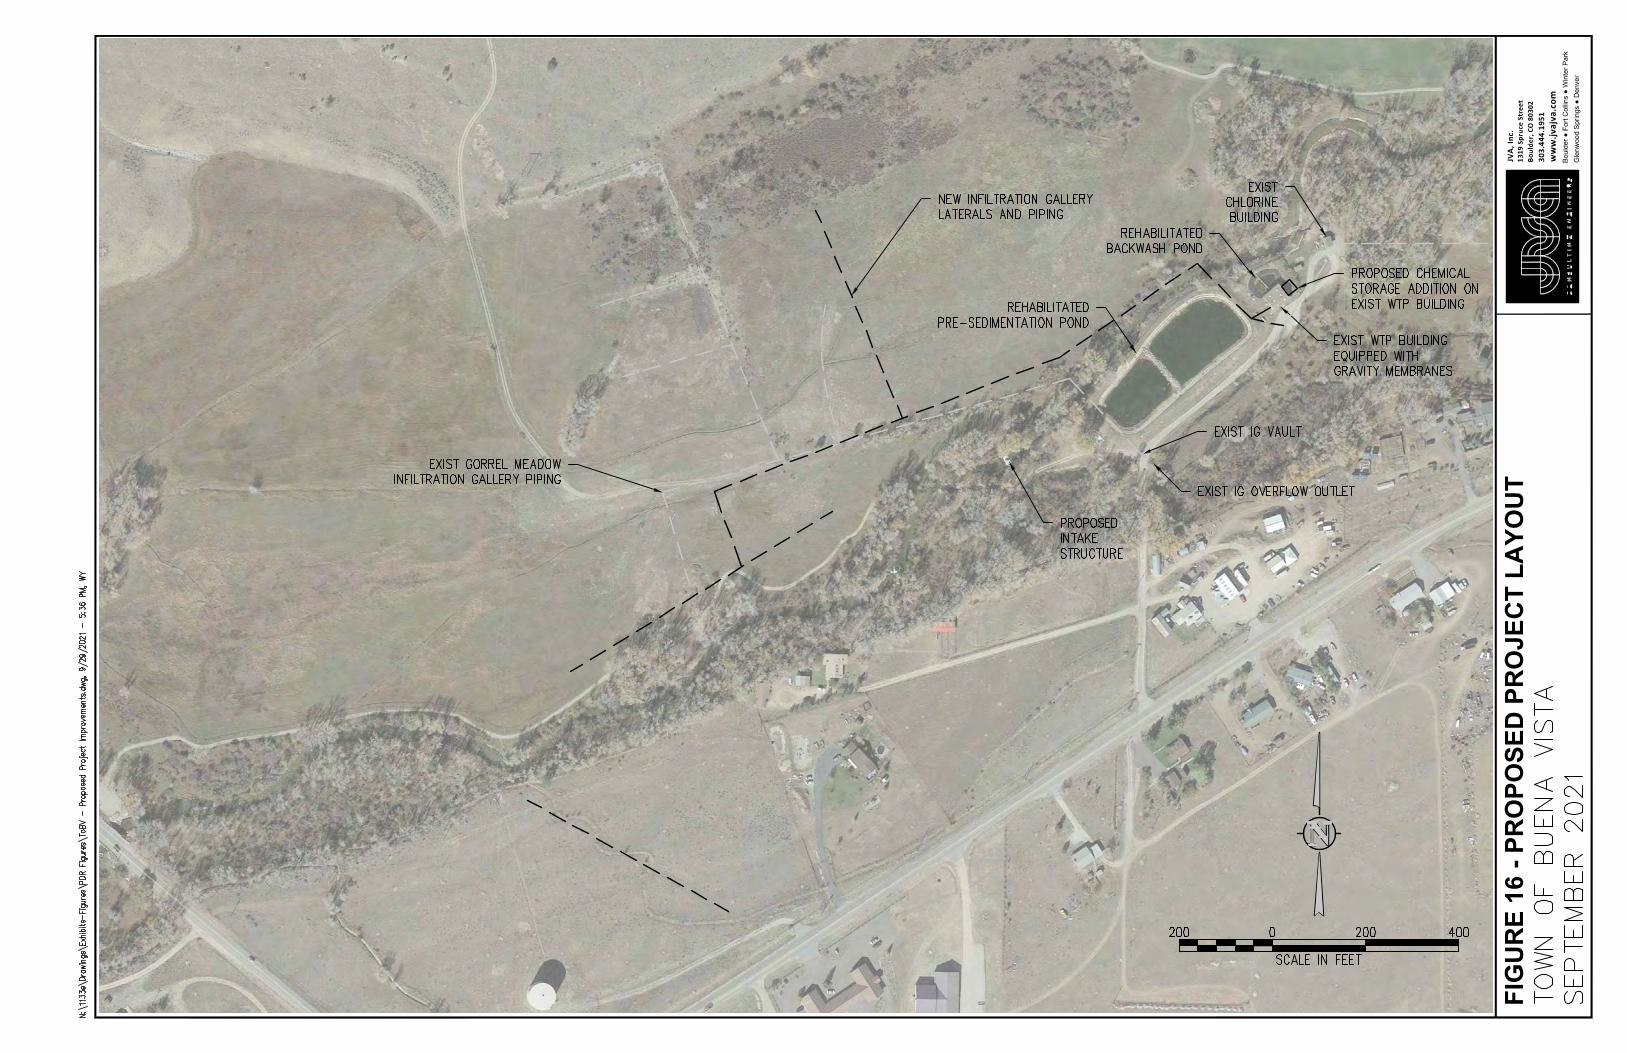
FIG
UR
E 16
- PR
OPO
SED
PR
OJE
CT
LAYO
UT
1319
Spr
uce
Stre
etBo
ulde
r, CO
803
0230
3.44
4.19
51w
ww
.jvaj
va.c
om
JVA,
Inc.
Boul
der ●
For
t Col
lins
● W
inte
r Par
kG
lenw
ood
Sprin
gs ●
Den
ver
Town of Buena Vista Preliminary Design Report 48
The pre-sedimentation pond will be rehabilitated with a new liner. Any necessary improvements to the valves and piping from the intake structure to the pre-sedimentation pond will be included. Potassium permanganate will be used to oxidize iron and TOC. ACH coagulant will be used to remove iron and TOC.
TREATMENT
Gravity membranes will be installed for treatment filtration so the Town will have the ability to treat surface water, as discussed in Section 4. The gravity membranes will be installed in the existing concrete basins in the existing WTP building, reducing construction costs. Water from the IG and the surface water will combine in a pipeline and gravity flow to the membranes.
CLEARWELL AND DISINFECTION
The existing 33,000 gallon clearwell has sufficient capacity to achieve 4-log removal of virus inactivation since gravity membranes will be installed. The existing clearwell does not have any baffles. Baffles will be installed to increase the baffling factor in the clearwell, thereby increasing the capacity of the clearwell. An onsite sodium hypochlorite generator will be installed for disinfection. As discussed in Section 4, the materials necessary for onsite generation are more readily available than other disinfection chemicals. Only one onsite sodium hypochlorite generation system will be installed, with space for a future onsite generator. Rather than a redundant onsite generation system, the Town can store 10-percent liquid sodium hypochlorite solution onsite in 55 gallon or smaller drums as backup. Spare parts for the single sodium hypochlorite system will be stored onsite.
The filtered water from the membranes will be dosed with sodium hypochlorite prior to gravity flowing into the existing clearwell.
PH ADJUSTMENT
As discussed in Section 4, caustic soda will be added to adjust pH when the Town is utilizing IG water. The chemical feed system will consist of a duty and standby pump system and bulk storage tank. From the clearwell, the treated water will flow by gravity to the distribution system.
CAPITAL COST (OPC)
The capital cost for the recommended treatment processes is estimated to be $11,317,000. The OPCs are included in Appendix E.
Town of Buena Vista Preliminary Design Report 49
SECTION 6 – IMPLEMENTATION
This section explores permitting, equipment preselection, construction manager at risk (CMAR) project delivery method, and anticipated schedule to implement the recommended improvements.
CDPHE DESIGN CRITERIA AND PERMITTING
In accordance with the Regulations, the CDPHE Engineering Section reviews and approves drawings and specifications relating to new or modified WTPs. CDPHE reviews for compliance with Policy 5 – Design Criteria for Potable Water Systems (Design Criteria).
Permitting with CDPHE requires submission of a Basis of Design Report (BDR) in accordance with the Design Criteria. This submission will include all required forms, design calculations, and an updated opinion of probable cost. The BDR includes project and system information, sources of potential contamination, water quality data, process flow diagrams and hydraulics profiles, a capacity evaluation and design calculations, a monitoring and sampling evaluation, a geotechnical report, residuals handling, a preliminary plan of operation, impacts to corrosivity, and other supplemental or pertinent information, along with 60-percent drawings and specifications. The CDPHE Appendix B: BDR Template will be included with the submission and stamped by a licensed Professional Engineer. JVA will review the BDR with the Town and incorporate any comments into the packet prior to submission to CDPHE. JVA will respond to CDPHE requests for information and incorporate CDPHE comments into the final design.
EQUIPMENT PRESELECTION
Pre-selection of the major process equipment is recommended to expedite the overall schedule, reduce conflicts during construction, and provide the highest level of equipment design input from the Town. Pretreatment, filtration, and chemical delivery equipment is recommended for pre-selection.
JVA will work with the Town to pre-select the major process equipment through a formal competitive process. Formal Request for Proposals (RFPs) will be advertised to qualified manufacturers with preliminary drawings and specifications for the proposed improvements. JVA will tabulate the proposals and review with the Town to make a firm selection. Before finalizing the scope and cost from the manufacturer, the drawings and specifications will be developed to a minimum 30 percent level and modifications of the proposal will be negotiated with the selected manufacturer to meet the final design capacities, layout, and specific design features for the Buena Vista WTP.
After selection of the major process equipment, the final proposals with scope of supply, performance guarantee, and cost will be incorporated into the Pre-selected Equipment specification section of the Project Manual and incorporated into the 60 percent drawings to be submitted to CDPHE for BDR approval.
Town of Buena Vista Preliminary Design Report 50
CONSTRUCTION MANAGER AT RISK (CMAR) PROCESS DESCRIPTION
The proposed delivery method is Construction Manager at Risk (CMAR). This is a delivery defined by the Design Build Institute of America (DBIA). Generally, it is a commitment by a general contractor to deliver the project within a defined schedule and price. The CMAR delivery process helps to separate and mitigate risk and responsibility for all parties. The general contractor is at the table with the owner and engineer to help value engineer and provide constructability suggestions in real time prior to construction. The engineer represents the owner during the process to negotiate with the contractor and refine the drawings and specifications per the value engineering and constructability efforts. The CMAR contractor will bid the project to subcontractors and in an open book process share these prices to the owner and engineer. Generally, subcontractors are selected based on best value. The preconstruction efforts of the CMAR, Town, and engineer culminate in a guaranteed maximum price (GMP). The GMP is open book and will be based on the decisions made during the value engineering and constructability meetings.
The procurement for CMAR is a public and competitive process. The engineer completes 30 percent drawings and specifications and publicly advertises for CMAR services. The CMAR RFP is based on a defined budget and includes a bid for lump sum preconstruction services, bid for lump sum general conditions cost, bid for percentage for overhead and profit, value engineering and constructability ideas, firm qualifications and reference projects, firm financials, and a proposed schedule to complete the work. Upon receipt of the proposals, the Town and engineer evaluate each submission for price, overall scope, firm experience, motivation, schedule, reference projects, and firm capability. The highest ranked proposal will be recommended for selection.
The project is awarded to the selected CMAR general contractor; however, the amount of the award is for the lump sum fee to assist the engineer and owner with value engineering and constructability decisions. This fee is generally a fraction of a percent of the total project cost. The initial process promotes team building between the owner, engineer, and contractor and provides investment from all parties. The goal of the value engineering phase of the project is to arrive at a GMP for a scope of work that incorporates the critical process items and project goals of the owner. It is an open book process, allowing the general contractor to provide real-time pricing for proposed additions, deletions, and revisions to the project scope before construction commences. Once the team is within the budget of the owner, the GMP is finalized, and the drawings and specifications are finalized based on the agreed upon scope.
There are multiple advantages to CMAR project delivery. The CMAR process encourages team building and partnering between the owner, engineer, and contractor. The general contractor provides input and is involved with the project cost and construction schedule. The process allows for value engineering early in the process, before construction has started, and provides an early guarantee of project cost. Collaboration during the design phase and contractor input can reduce the construction duration and incorporate constructability benefits. Generally, a contingency is agreed upon before construction commences and is included in the GMP. This eliminates change orders when unforeseen conditions arise or items are added to the project scope during construction. The biggest advantage is being able to deliver a project for a GMP according to the
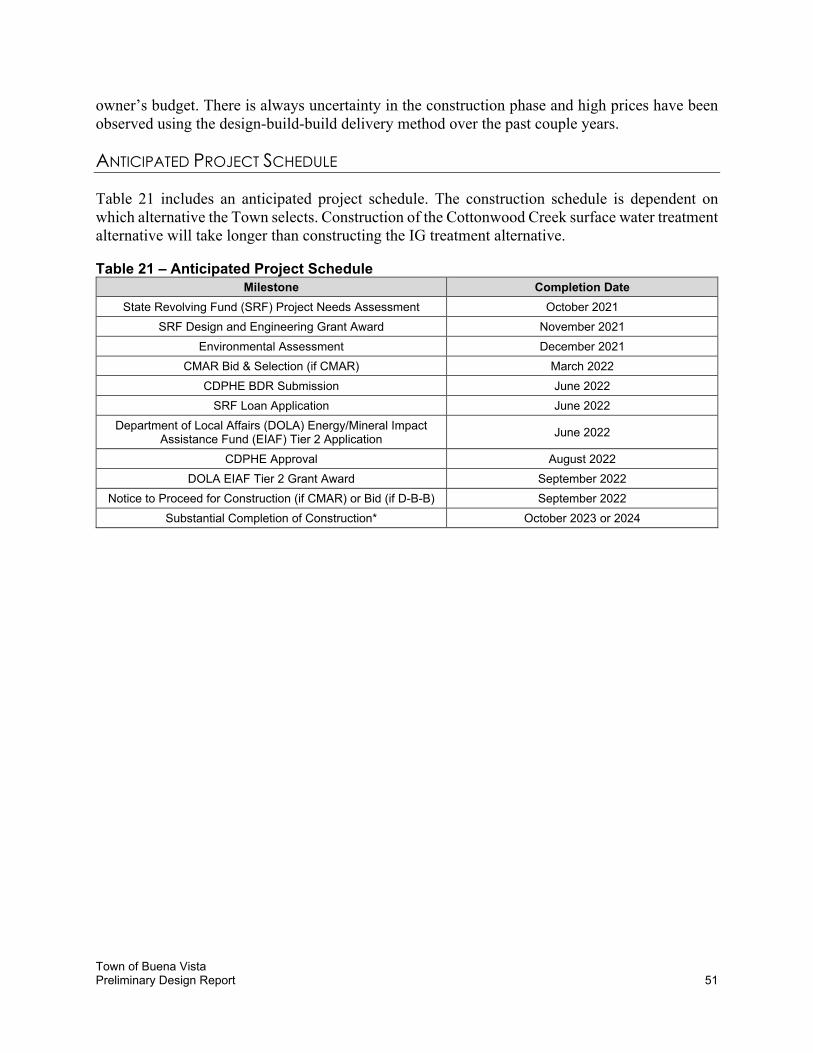
Town of Buena Vista Preliminary Design Report 51
owner’s budget. There is always uncertainty in the construction phase and high prices have been observed using the design-build-build delivery method over the past couple years.
ANTICIPATED PROJECT SCHEDULE
Table 21 includes an anticipated project schedule. The construction schedule is dependent on which alternative the Town selects. Construction of the Cottonwood Creek surface water treatment alternative will take longer than constructing the IG treatment alternative.
Table 21 – Anticipated Project Schedule
Milestone Completion Date
State Revolving Fund (SRF) Project Needs Assessment October 2021
SRF Design and Engineering Grant Award November 2021
Environmental Assessment December 2021
CMAR Bid & Selection (if CMAR) March 2022
CDPHE BDR Submission June 2022
SRF Loan Application June 2022
Department of Local Affairs (DOLA) Energy/Mineral Impact Assistance Fund (EIAF) Tier 2 Application
June 2022
CDPHE Approval August 2022
DOLA EIAF Tier 2 Grant Award September 2022
Notice to Proceed for Construction (if CMAR) or Bid (if D-B-B) September 2022
Substantial Completion of Construction* October 2023 or 2024

APPENDIX A – WATER QUALITY RESULTS
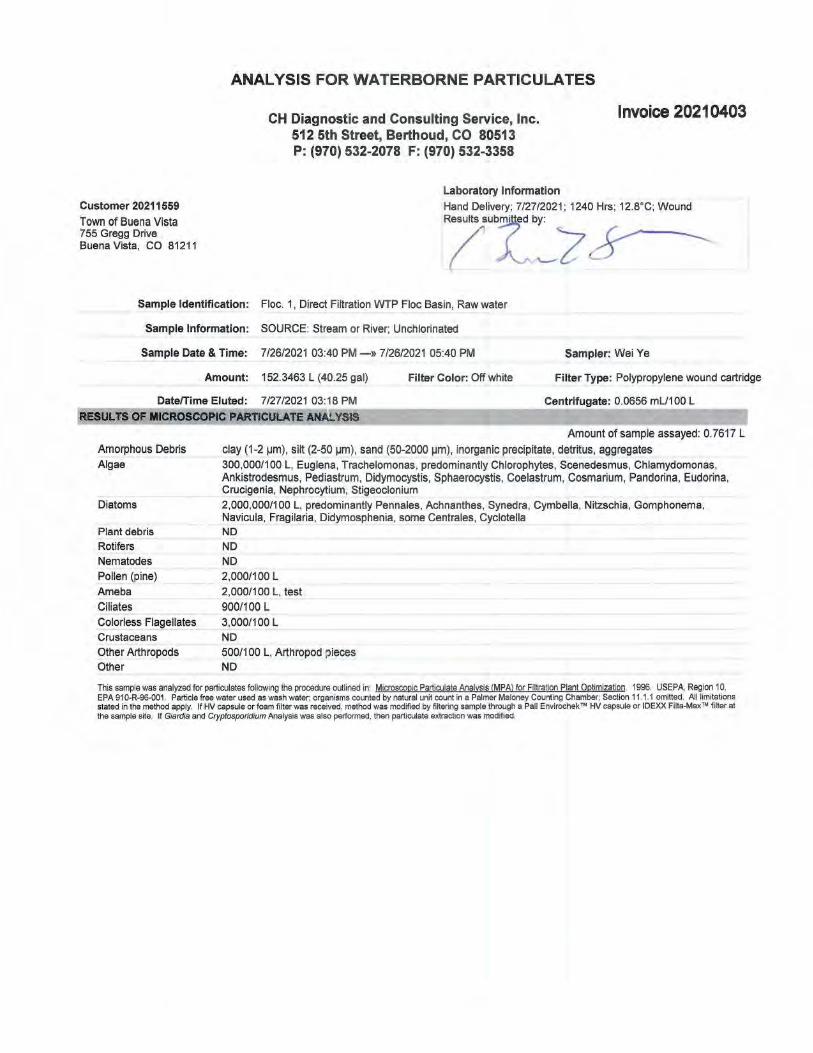
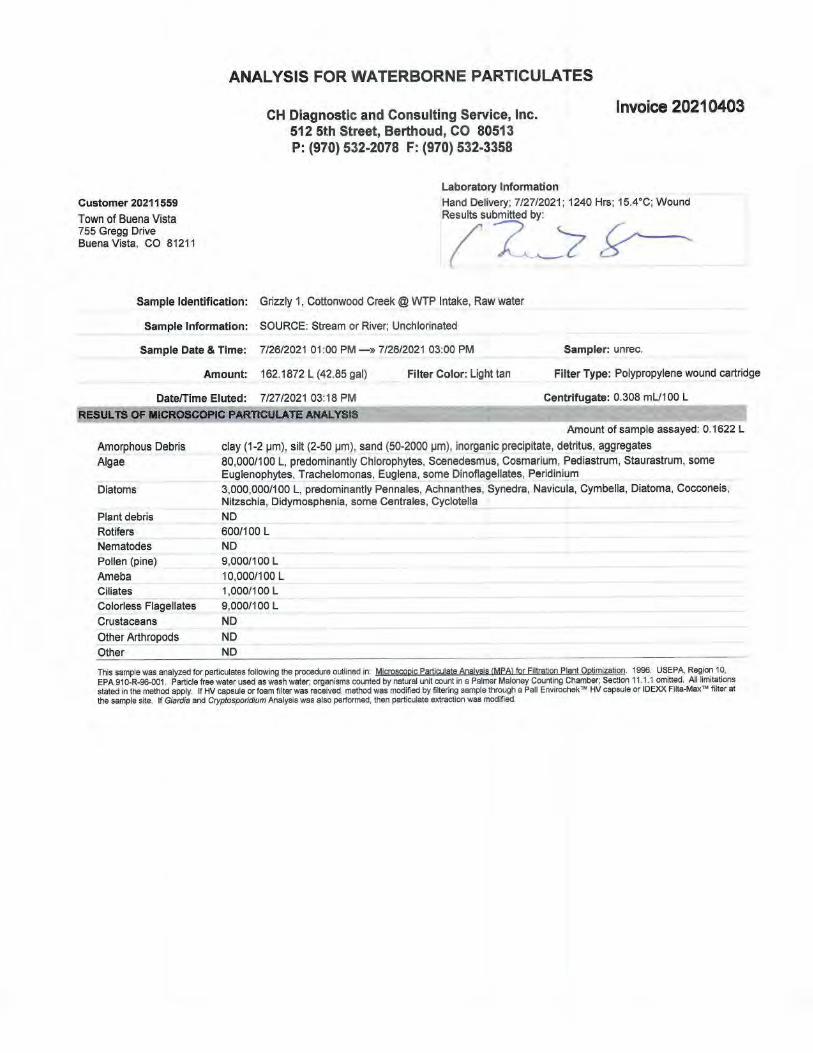
Lab Control ID: 21M02209Received: Jun 16, 2021Reported: Jul 08, 2021
Purchase Order No.None Received
ANALYTICAL REPORT
Report may only be copied in its entirety.Results reported herein relate only to discrete samplessubmitted by the client. Hazen Research, Inc. does not warrantthat the results are representative of anything other than thesamples that were received in the laboratory
By:____________________________________ Jessica Axen Analytical Laboratories Director
An Employee-Owned CompanyFile: 21M02209 R1.pdf
An Employee-Owned Company
X-Ray Diffraction (XRD) Analysis
Two samples, shown in Table 1, were analyzed to identify and quantify the mineral constituents.
Table 1. Samples Analyzed
Number Hazen ID
1 21M02209-1
2 21M02209-2
The samples were ground in a mortar and pestle and scanned on a zero-background plate1.
Please note the detection limit of XRD analysis for certain constituents can be as high as 2 to 5 %. High
background and humps in the XRD patterns between 20° and 40° 2-theta indicate the samples contain an
amorphous component. Data given in Table 2 are for crystalline components only.
A summary of the results is shown in Table 2 and the diffraction patterns are presented in Figures 1-2.
1 Analysis performed using a Bruker D8 Advance XRD with Davinci design and a Lynxeye detector
utilizing cobalt radiation produced at 35 kV and 40 mA. The scan range is 5°-85° 2theta, with a step of 0.02° 2theta and a time per step of 0.4 s. Mineral amounts calculated by the peak relative intensity and area method (RIR).
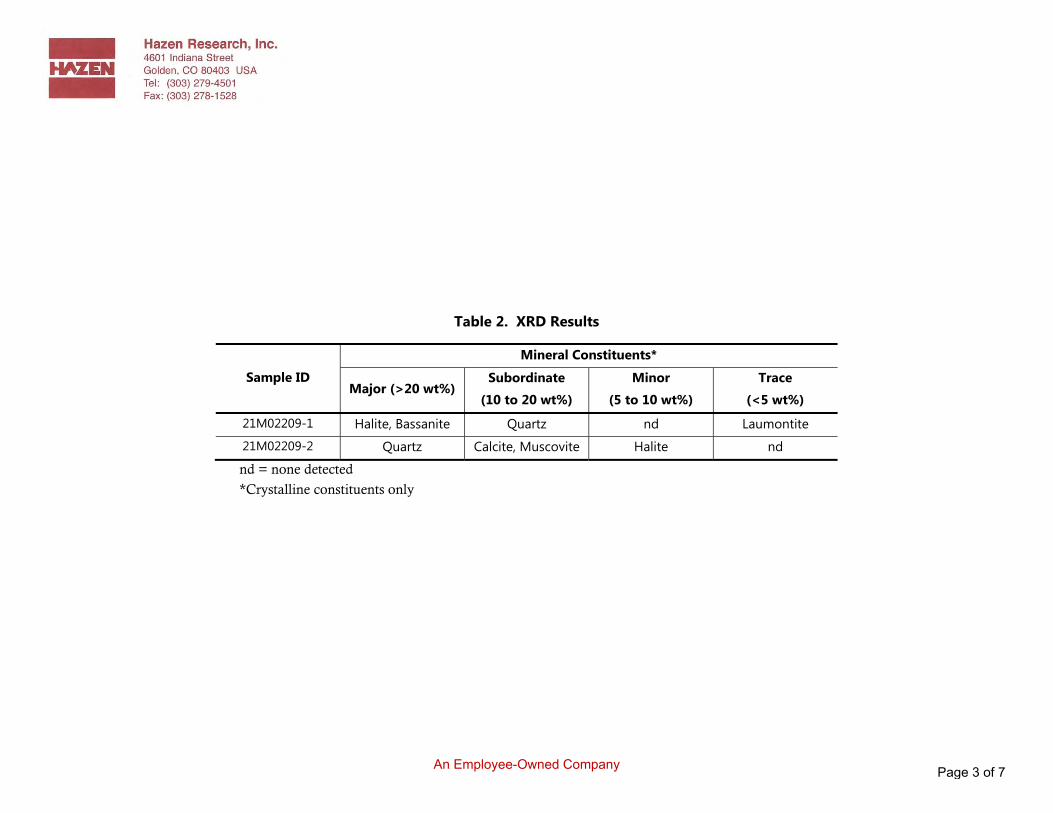
An Employee-Owned Company
Table 2. XRD Results
Sample ID
Mineral Constituents*
Major (>20 wt%) Subordinate
(10 to 20 wt%)
Minor
(5 to 10 wt%)
Trace
(<5 wt%)
21M02209-1 Halite, Bassanite Quartz nd Laumontite
21M02209-2 Quartz Calcite, Muscovite Halite nd
nd = none detected
*Crystalline constituents only
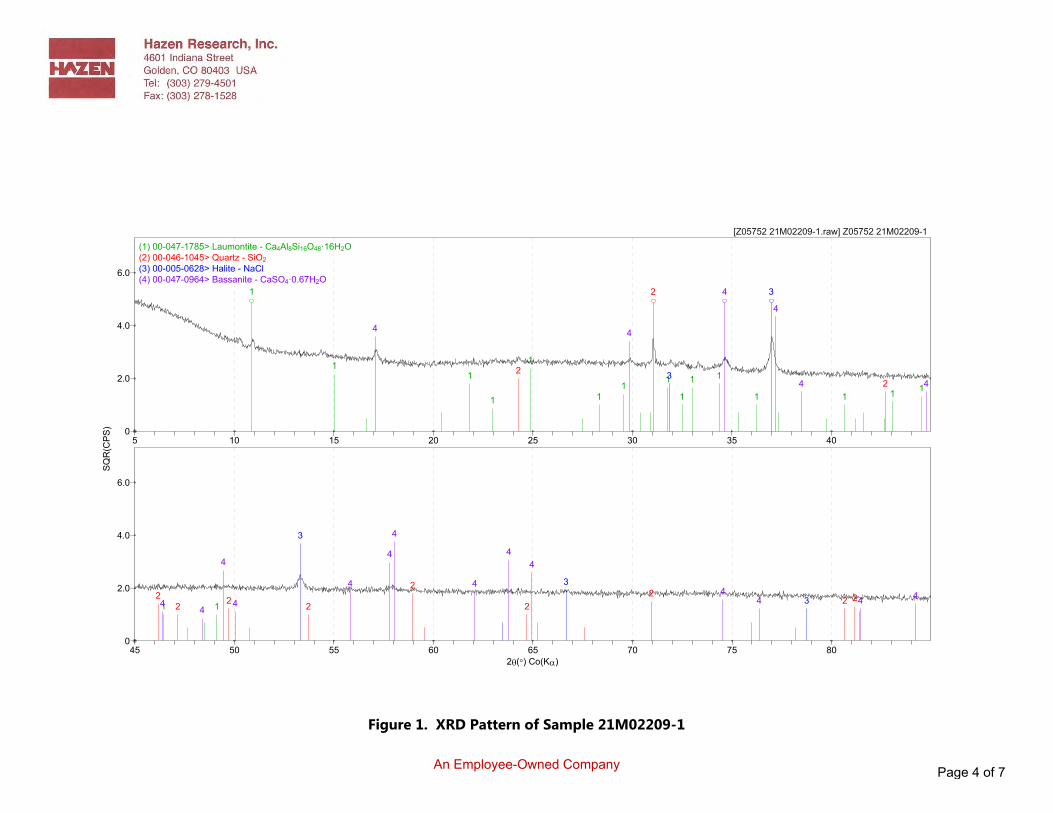
An Employee-Owned Company
Figure 1. XRD Pattern of Sample 21M02209-1
1
1111 1 1
1 1111111
2
22
3
3
4
4
4 4
44
5 10 15 20 25 30 35 400
2.0
4.0
6.0
11
222 2222 2 2
3
3
3
4
444 4
444 44 444
4
45 50 55 60 65 70 75 802�(�) Co(K�)
0
2.0
4.0
6.0
[Z05752 21M02209-1.raw] Z05752 21M02209-1(1) 00-047-1785> Laumontite - Ca4Al8Si16O48·16H2O(2) 00-046-1045> Quartz - SiO2(3) 00-005-0628> Halite - NaCl(4) 00-047-0964> Bassanite - CaSO4·0.67H2O
SQR
(CPS
)
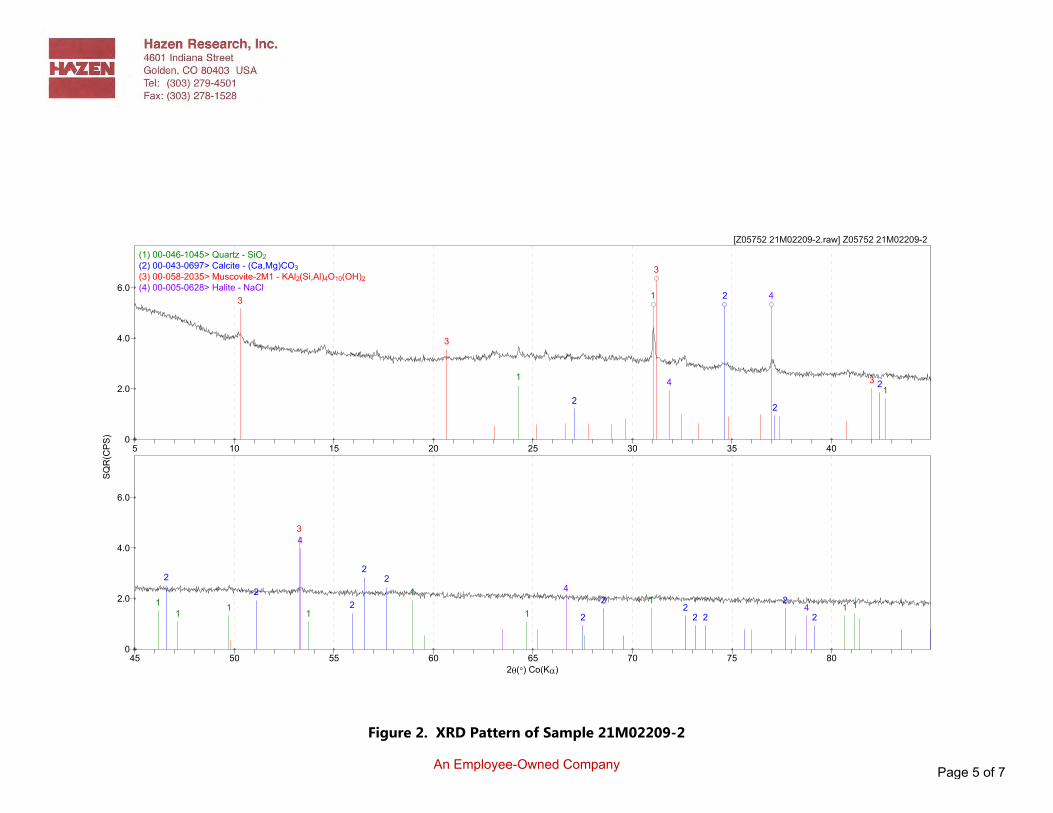
An Employee-Owned Company
Figure 2. XRD Pattern of Sample 21M02209-2
1
11
2
2
22
3
3
3
3
4
4
5 10 15 20 25 30 35 400
2.0
4.0
6.0
111 1111 1 1
22 2
22 22 2
222 2
34
4
4
45 50 55 60 65 70 75 802�(�) Co(K�)
0
2.0
4.0
6.0
[Z05752 21M02209-2.raw] Z05752 21M02209-2(1) 00-046-1045> Quartz - SiO2(2) 00-043-0697> Calcite - (Ca,Mg)CO3(3) 00-058-2035> Muscovite-2M1 - KAl2(Si,Al)4O10(OH)2(4) 00-005-0628> Halite - NaCl
SQR
(CPS
)
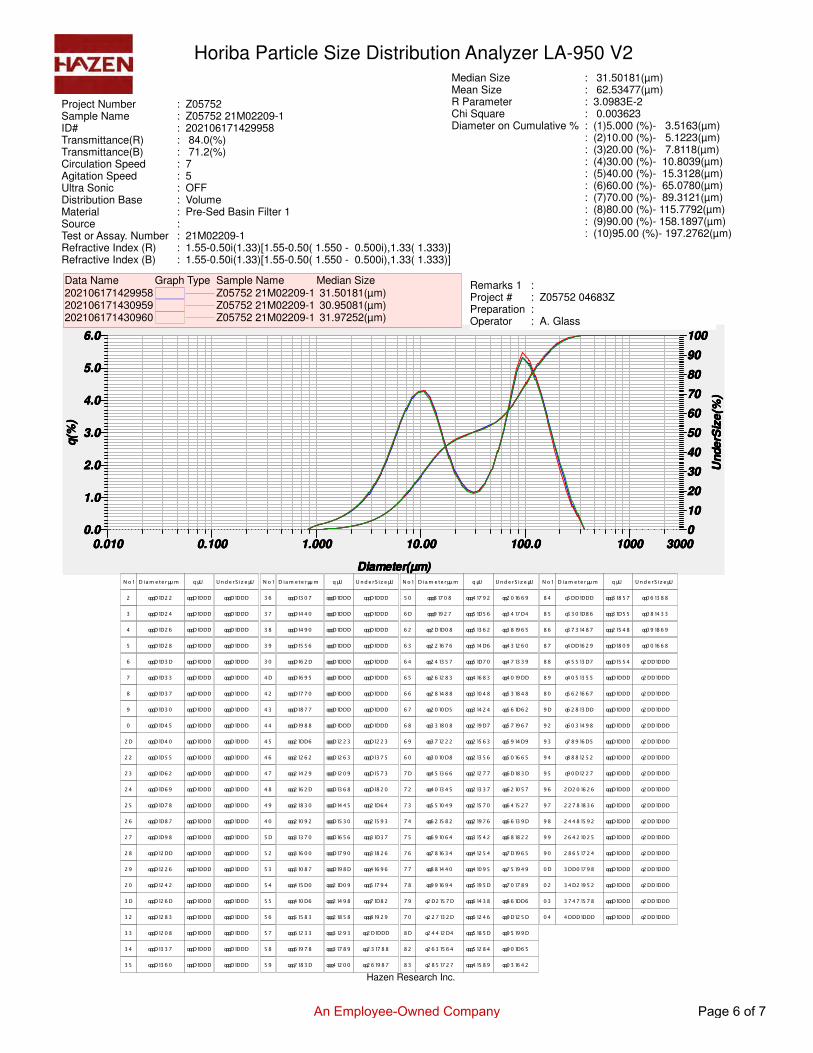
2021.06.17 14:45:132021.06.17 14:45:132021.06.17 14:45:132021.06.17 14:45:13
1 / 11 / 11 / 11 / 1
Median SizeMean SizeR ParameterChi SquareDiameter on Cumulative %
::::::::::::::
31.50181(μm) 62.53477(μm)3.0983E-2 0.003623(1)5.000 (%)- 3.5163(μm)(2)10.00 (%)- 5.1223(μm)(3)20.00 (%)- 7.8118(μm)(4)30.00 (%)- 10.8039(μm)(5)40.00 (%)- 15.3128(μm)(6)60.00 (%)- 65.0780(μm)(7)70.00 (%)- 89.3121(μm)(8)80.00 (%)- 115.7792(μm)(9)90.00 (%)- 158.1897(μm)(10)95.00 (%)- 197.2762(μm)
Horiba Particle Size Distribution Analyzer LA-950 V2
Project NumberSample NameID#Transmittance(R)Transmittance(B)Circulation SpeedAgitation SpeedUltra SonicDistribution BaseMaterialSourceTest or Assay. NumberRefractive Index (R)Refractive Index (B)
::::::::::::::
Z05752Z05752 21M02209-1202106171429958 84.0(%) 71.2(%)75OFFVolumePre-Sed Basin Filter 1
21M02209-11.55-0.50i(1.33)[1.55-0.50( 1.550 - 0.500i),1.33( 1.333)]1.55-0.50i(1.33)[1.55-0.50( 1.550 - 0.500i),1.33( 1.333)]
q(%
)q(
%)
q(%
)q(
%)
Diameter(μm)Diameter(μm)Diameter(μm)Diameter(μm)
Und
erS
ize(
%)
Und
erS
ize(
%)
Und
erS
ize(
%)
Und
erS
ize(
%)
0.00.00.00.0
6.06.06.06.0
1.01.01.01.0
2.02.02.02.0
3.03.03.03.0
4.04.04.04.0
5.05.05.05.0
0.0100.0100.0100.010 30003000300030000.1000.1000.1000.100 1.0001.0001.0001.000 10.0010.0010.0010.00 100.0100.0100.0100.0 10001000100010000000
100100100100
10101010
20202020
30303030
40404040
50505050
60606060
70707070
80808080
90909090
Remarks 1Project #PreparationOperator
::::
Z05752 04683Z
A. Glass
Data Name202106171429958202106171430959202106171430960
Graph Type Sample NameZ05752 21M02209-1Z05752 21M02209-1Z05752 21M02209-1
Median Size 31.50181(μm) 30.95081(μm) 31.97252(μm)
�� �
�
�
�
�
�
�
��
��
��
��
��
�
�
��
��
�
��
��
��
��
��
� ��� � �� ���� �
���� ����
���� ����
���� ���
���� ����
���� ����
���� ����
���� ���
���� ���
���� ����
���� ���
���� ����
���� ���
���� ���
���� ���
���� ���
���� ����
���� ����
���� ���
���� ����
���� ���
���� ����
���� �� �
���� ���
���� ��
� �� �
���� ����
���� ����
���� ����
���� ����
���� ����
���� ����
���� ����
���� ����
���� ����
���� ����
���� ����
���� ����
���� ����
���� ����
���� ����
���� ����
���� ����
���� ����
���� ����
���� ����
���� ����
���� ����
���� ����
���� ����
���� �� � � �� �
���� ����
���� ����
���� ����
���� ����
���� ����
���� ����
���� ����
���� ����
���� ����
���� ����
���� ����
���� ����
���� ����
���� ����
���� ����
���� ����
���� ����
���� ����
���� ����
���� ����
���� ����
���� ����
���� ����
���� ����
�� �
�
�
��
��
�
��
��
��
��
��
�
�
��
��
�
��
��
��
��
��
�
�
��
��
� ��� � �� ���� �
���� ��
���� ���
���� ���
���� ���
���� ���
���� ���
���� �
���� ��
���� ����
���� ���
���� ���
���� ����
���� ���
���� ���
���� � ��
���� ��
���� �
���� � �
���� ���
���� � �
���� ����
��� ����
��� ���
��� ����
� �� �
���� ����
���� ����
���� ����
���� ����
���� ����
���� ����
���� ����
���� ����
���� ����
���� ����
���� ���
���� �� �
���� ���
���� ����
���� ���
���� ��
���� ��
���� ����
���� �� �
���� ����
���� ����
���� ����
���� ���
���� ��
���� �� � � �� �
���� ����
���� ����
���� ����
���� ����
���� ����
���� ����
���� ����
���� ����
���� ����
���� ����
���� ���
���� ���
���� ���
���� ���
���� ����
���� ���
���� ���
���� ��
���� ���
��� ����
���� ����
���� ����
���� ���
��� ���
�� �
�
�
�
�
�
�
�
�
�
�
�
�
�
�
�
��
��
��
� ��� � �� ���� �
���� � �
���� ���
���� �� �
���� �
���� ���
��� ����
���� ����
��� � ��
���� �� �
��� ����
��� � ��
���� ��
��� ����
���� � ��
��� ����
��� � �
��� ���
���� ���
���� ���
���� ���
��� ����
���� ����
��� ���
���� ��
� �� �
���� ���
���� ���
���� ���
���� ���
���� ��
���� ���
���� � ��
���� ����
���� ���
���� ���
���� ���
���� ��
���� ���
���� ��
���� ��
���� ����
���� ����
���� � ��
���� ����
��� ����
��� ���
���� ����
���� ����
���� ����
���� �� � � �� �
��� ��
���� ���
���� ���
���� ��
��� ����
��� ����
���� ����
��� ���
��� ��
���� ����
��� ��
��� ����
��� � �
��� ���
�� ����
��� ����
��� ���
��� ����
�� ���
��� ���
���� ����
���� ����
��� ���
�� � ���
�� �
��
��
�
�
��
��
�
��
��
��
��
��
�
�
��
��
�
�
�
�
�
� ��� � �� ���� �
���� ����
��� ���
��� ���
���� ���
���� ���
�� � ����
��� �
��� ����
� � ����
��� ���
���� ����
�� � ���
��� ��
��� ���
���� ����
��� � ��
��� ���
��� ���
���� ����
�� ���
���� ����
� �� �
���� ���
���� ����
���� ����
���� �� �
���� ����
���� ����
���� ����
���� ����
���� ����
���� ����
���� ����
���� ����
���� ����
���� ����
���� ����
���� ����
���� ����
���� ����
���� ����
���� ����
���� ����
���� �� � � �� �
�� ����
�� � ����
�� � ���
�� ��
���� ����
���� ����
���� ����
���� ����
���� ����
���� ����
���� ����
���� ����
���� ����
���� ����
���� ����
���� ����
���� ����
���� ����
���� ����
���� ����
���� ����
Hazen Research Inc.
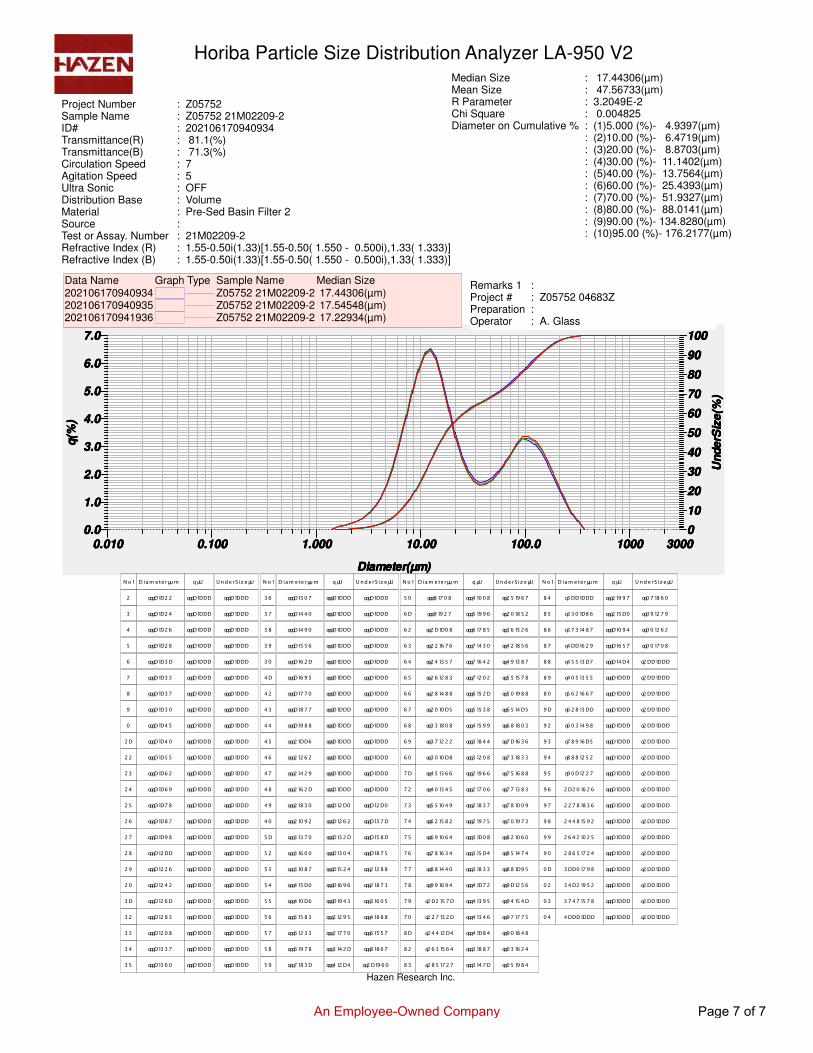
2021.06.17 09:44:502021.06.17 09:44:502021.06.17 09:44:502021.06.17 09:44:50
1 / 11 / 11 / 11 / 1
Median SizeMean SizeR ParameterChi SquareDiameter on Cumulative %
::::::::::::::
17.44306(μm) 47.56733(μm)3.2049E-2 0.004825(1)5.000 (%)- 4.9397(μm)(2)10.00 (%)- 6.4719(μm)(3)20.00 (%)- 8.8703(μm)(4)30.00 (%)- 11.1402(μm)(5)40.00 (%)- 13.7564(μm)(6)60.00 (%)- 25.4393(μm)(7)70.00 (%)- 51.9327(μm)(8)80.00 (%)- 88.0141(μm)(9)90.00 (%)- 134.8280(μm)(10)95.00 (%)- 176.2177(μm)
Horiba Particle Size Distribution Analyzer LA-950 V2
Project NumberSample NameID#Transmittance(R)Transmittance(B)Circulation SpeedAgitation SpeedUltra SonicDistribution BaseMaterialSourceTest or Assay. NumberRefractive Index (R)Refractive Index (B)
::::::::::::::
Z05752Z05752 21M02209-2202106170940934 81.1(%) 71.3(%)75OFFVolumePre-Sed Basin Filter 2
21M02209-21.55-0.50i(1.33)[1.55-0.50( 1.550 - 0.500i),1.33( 1.333)]1.55-0.50i(1.33)[1.55-0.50( 1.550 - 0.500i),1.33( 1.333)]
q(%
)q(
%)
q(%
)q(
%)
Diameter(μm)Diameter(μm)Diameter(μm)Diameter(μm)
Und
erS
ize(
%)
Und
erS
ize(
%)
Und
erS
ize(
%)
Und
erS
ize(
%)
0.00.00.00.0
7.07.07.07.0
1.01.01.01.0
2.02.02.02.0
3.03.03.03.0
4.04.04.04.0
5.05.05.05.0
6.06.06.06.0
0.0100.0100.0100.010 30003000300030000.1000.1000.1000.100 1.0001.0001.0001.000 10.0010.0010.0010.00 100.0100.0100.0100.0 10001000100010000000
100100100100
10101010
20202020
30303030
40404040
50505050
60606060
70707070
80808080
90909090
Remarks 1Project #PreparationOperator
::::
Z05752 04683Z
A. Glass
Data Name202106170940934202106170940935202106170941936
Graph Type Sample NameZ05752 21M02209-2Z05752 21M02209-2Z05752 21M02209-2
Median Size 17.44306(μm) 17.54548(μm) 17.22934(μm)
�� �
�
�
�
�
�
�
��
��
��
��
��
�
�
��
��
�
��
��
��
��
��
� ��� � �� ���� �
���� ����
���� ����
���� ���
���� ����
���� ����
���� ����
���� ���
���� ���
���� ����
���� ���
���� ����
���� ���
���� ���
���� ���
���� ���
���� ����
���� ����
���� ���
���� ����
���� ���
���� ����
���� �� �
���� ���
���� ��
� �� �
���� ����
���� ����
���� ����
���� ����
���� ����
���� ����
���� ����
���� ����
���� ����
���� ����
���� ����
���� ����
���� ����
���� ����
���� ����
���� ����
���� ����
���� ����
���� ����
���� ����
���� ����
���� ����
���� ����
���� ����
���� �� � � �� �
���� ����
���� ����
���� ����
���� ����
���� ����
���� ����
���� ����
���� ����
���� ����
���� ����
���� ����
���� ����
���� ����
���� ����
���� ����
���� ����
���� ����
���� ����
���� ����
���� ����
���� ����
���� ����
���� ����
���� ����
�� �
�
�
��
��
�
��
��
��
��
��
�
�
��
��
�
��
��
��
��
��
�
�
��
��
� ��� � �� ���� �
���� ��
���� ���
���� ���
���� ���
���� ���
���� ���
���� �
���� ��
���� ����
���� ���
���� ���
���� ����
���� ���
���� ���
���� � ��
���� ��
���� �
���� � �
���� ���
���� � �
���� ����
��� ����
��� ���
��� ����
� �� �
���� ����
���� ����
���� ����
���� ����
���� ����
���� ����
���� ����
���� ����
���� ����
���� ����
���� ����
���� ����
���� ����
���� ���
���� ���
���� ����
���� �� �
���� ����
���� ��
���� ����
���� ����
���� �
���� ����
���� ����
���� �� � � �� �
���� ����
���� ����
���� ����
���� ����
���� ����
���� ����
���� ����
���� ����
���� ����
���� ����
���� ����
���� ����
���� ����
���� ���
���� ���
���� ����
���� ���
���� ����
���� ���
���� � �
���� ����
��� ���
���� ��
���� ��
�� �
�
�
�
�
�
�
�
�
�
�
�
�
�
�
�
��
��
��
� ��� � �� ���� �
���� � �
���� ���
���� �� �
���� �
���� ���
��� ����
���� ����
��� � ��
���� �� �
��� ����
��� � ��
���� ��
��� ����
���� � ��
��� ����
��� � �
��� ���
���� ���
���� ���
���� ���
��� ����
���� ����
��� ���
���� ��
� �� �
���� � �
���� ���
��� ���
��� ���
��� ���
��� �� �
��� ����
���� ����
���� ����
���� ����
���� �� �
���� ��
���� �
���� ���
���� ���
���� �� �
���� ����
���� ����
���� ���
���� ����
���� ���
���� ����
���� ���
���� ���
���� �� � � �� �
���� ��
��� ����
��� ���
���� ���
���� ���
���� ���
��� ����
��� ����
��� �� �
��� ��
��� ����
��� ���
�� ����
��� � �
�� ���
���� �
���� ���
���� ����
���� ���
���� ����
��� ��
��� ����
�� � ���
�� � ����
�� �
��
��
�
�
��
��
�
��
��
��
��
��
�
�
��
��
�
�
�
�
�
� ��� � �� ���� �
���� ����
��� ���
��� ���
���� ���
���� ���
�� � ����
��� �
��� ����
� � ����
��� ���
���� ����
�� � ���
��� ��
��� ���
���� ����
��� � ��
��� ���
��� ���
���� ����
�� ���
���� ����
� �� �
���� ���
���� ���
���� � ��
���� ��
���� ����
���� ����
���� ����
���� ����
���� ����
���� ����
���� ����
���� ����
���� ����
���� ����
���� ����
���� ����
���� ����
���� ����
���� ����
���� ����
���� ����
���� �� � � �� �
�� ��
�� � ���
�� ���
�� � �
���� ����
���� ����
���� ����
���� ����
���� ����
���� ����
���� ����
���� ����
���� ����
���� ����
���� ����
���� ����
���� ����
���� ����
���� ����
���� ����
���� ����
Hazen Research Inc.

Lab Control ID: 21M02222Received: Jun 17, 2021Reported: Jul 08, 2021
Purchase Order No.Buena Vista Pilot 01
ANALYTICAL REPORT
Report may only be copied in its entirety.Results reported herein relate only to discrete samplessubmitted by the client. Hazen Research, Inc. does not warrantthat the results are representative of anything other than thesamples that were received in the laboratory
By:____________________________________ Jessica Axen Analytical Laboratories Director
An Employee-Owned CompanyFile: 21M02222 R1.pdf
An Employee-Owned Company
X-Ray Diffraction (XRD) Analysis
Three samples, shown in Table 1, were analyzed to identify and quantify the mineral constituents.
Table 1. Samples Analyzed
Number Hazen ID
1 21M02222-1
2 21M02222-2
3 21M02222-3
The samples were ground in a mortar and pestle and scanned on a zero-background plate1.
Please note the detection limit of XRD analysis for certain constituents can be as high as 2 to 5 %. High
background and humps in the XRD patterns between 20° and 40° 2-theta indicate the samples contain an
amorphous component. Data given in Table 2 are for crystalline components only.
A summary of the results is shown in Table 2 and the diffraction patterns are presented in Figures 1-3.
1 Analysis performed using a Bruker D8 Advance XRD with Davinci design and a Lynxeye detector
utilizing cobalt radiation produced at 35 kV and 40 mA. The scan range is 5°-85° 2theta, with a step of 0.02° 2theta and a time per step of 0.4 s. Mineral amounts calculated by the peak relative intensity and area method (RIR).
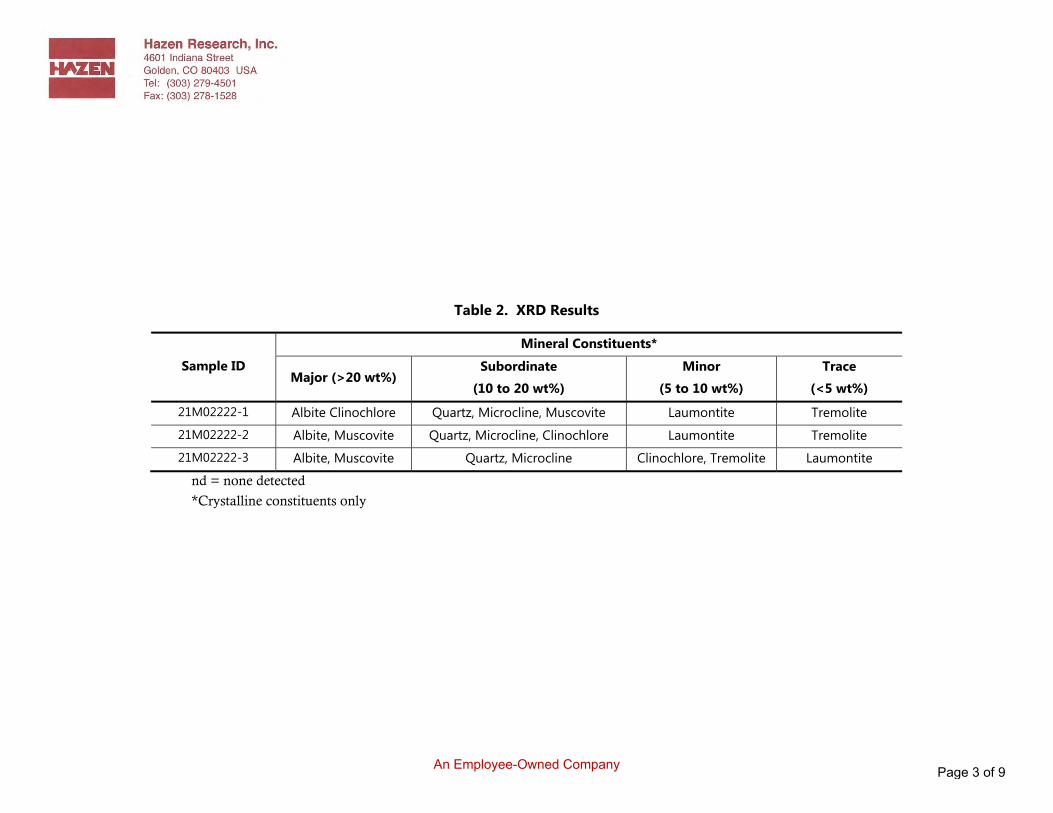
An Employee-Owned Company
Table 2. XRD Results
Sample ID
Mineral Constituents*
Major (>20 wt%) Subordinate
(10 to 20 wt%)
Minor
(5 to 10 wt%)
Trace
(<5 wt%)
21M02222-1 Albite Clinochlore Quartz, Microcline, Muscovite Laumontite Tremolite
21M02222-2 Albite, Muscovite Quartz, Microcline, Clinochlore Laumontite Tremolite
21M02222-3 Albite, Muscovite Quartz, Microcline Clinochlore, Tremolite Laumontite
nd = none detected
*Crystalline constituents only
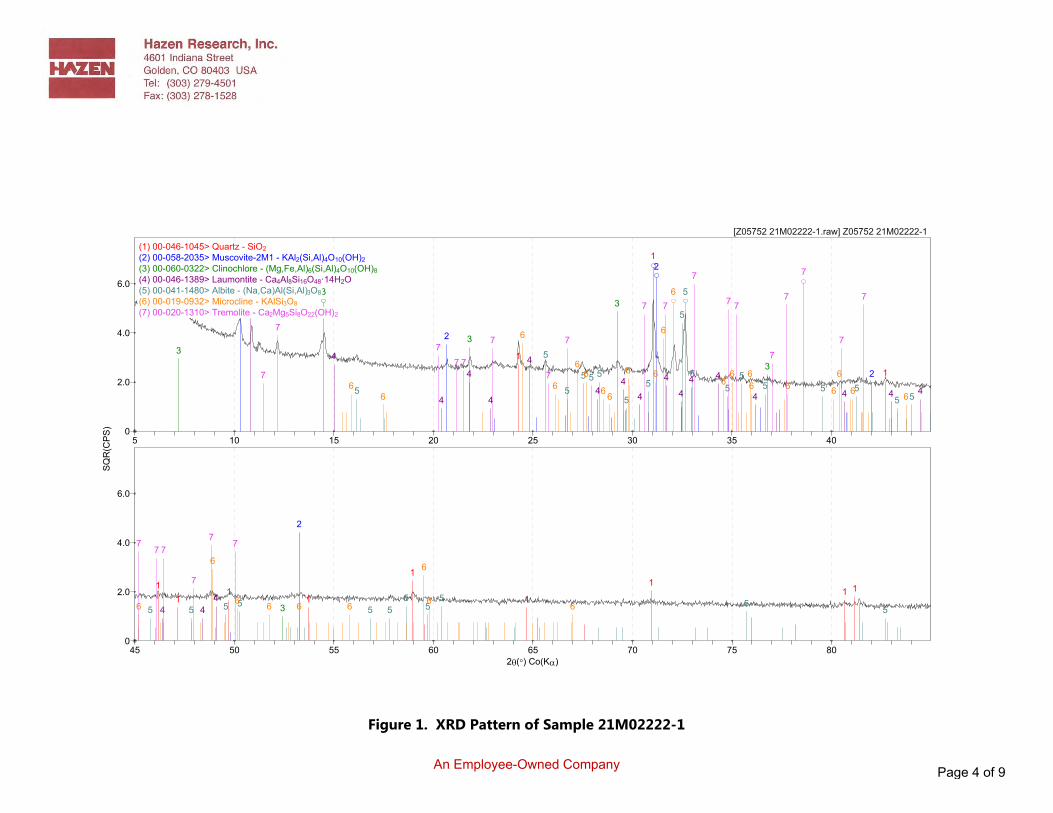
An Employee-Owned Company
Figure 1. XRD Pattern of Sample 21M02222-1
1
1
1
2
2
2
2
33
33
3
4
4 44 44 44
4 4444 444 4
5
5
5
5 5 55 5 5 5 55 555 555
6
66
66 66 6 66
6 6666 6 66 66 6
77
7 777 7 7
77 7 7
77
777 7
5 10 15 20 25 30 35 400
2.0
4.0
6.0
111 111
1 1 1
2
34
44555 555 555 55
66
66 666 6 6
777
7 7
7
45 50 55 60 65 70 75 802�(�) Co(K�)
0
2.0
4.0
6.0
[Z05752 21M02222-1.raw] Z05752 21M02222-1(1) 00-046-1045> Quartz - SiO2(2) 00-058-2035> Muscovite-2M1 - KAl2(Si,Al)4O10(OH)2(3) 00-060-0322> Clinochlore - (Mg,Fe,Al)6(Si,Al)4O10(OH)8(4) 00-046-1389> Laumontite - Ca4Al8Si16O48·14H2O(5) 00-041-1480> Albite - (Na,Ca)Al(Si,Al)3O8(6) 00-019-0932> Microcline - KAlSi3O8(7) 00-020-1310> Tremolite - Ca2Mg5Si8O22(OH)2
SQR
(CPS
)
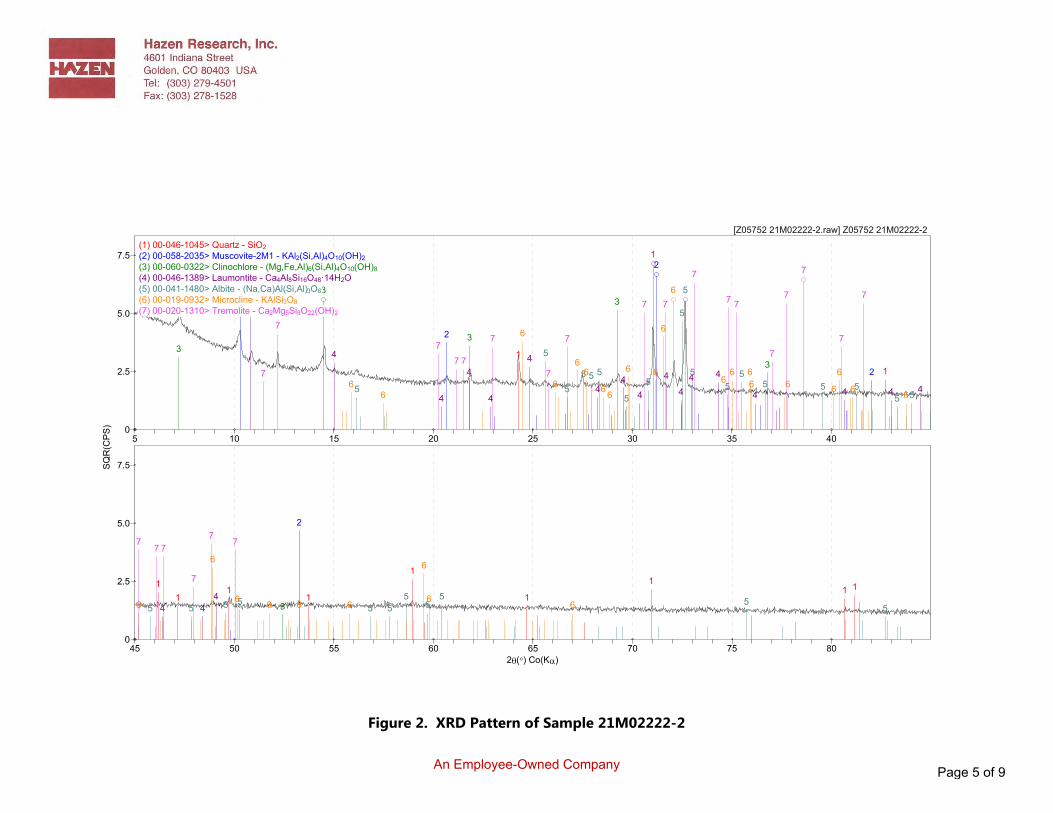
An Employee-Owned Company
Figure 2. XRD Pattern of Sample 21M02222-2
1
1
1
2
2
2
2
33
33
3
4
4 44 44 44
4 4444 444 4
5
5
5
5 5 55 5 5 5 55 555 555
6
66
66 66 6 66
6 6666 6 66 66 6
77
7 777 7 7
77 7 7
77
777 7
5 10 15 20 25 30 35 400
2.5
5.0
7.5
111 111
1 1 1
2
34
44555 555 555 55
66
66 666 6 6
777
7 7
7
45 50 55 60 65 70 75 802�(�) Co(K�)
0
2.5
5.0
7.5
[Z05752 21M02222-2.raw] Z05752 21M02222-2(1) 00-046-1045> Quartz - SiO2(2) 00-058-2035> Muscovite-2M1 - KAl2(Si,Al)4O10(OH)2(3) 00-060-0322> Clinochlore - (Mg,Fe,Al)6(Si,Al)4O10(OH)8(4) 00-046-1389> Laumontite - Ca4Al8Si16O48·14H2O(5) 00-041-1480> Albite - (Na,Ca)Al(Si,Al)3O8(6) 00-019-0932> Microcline - KAlSi3O8(7) 00-020-1310> Tremolite - Ca2Mg5Si8O22(OH)2
SQR
(CPS
)
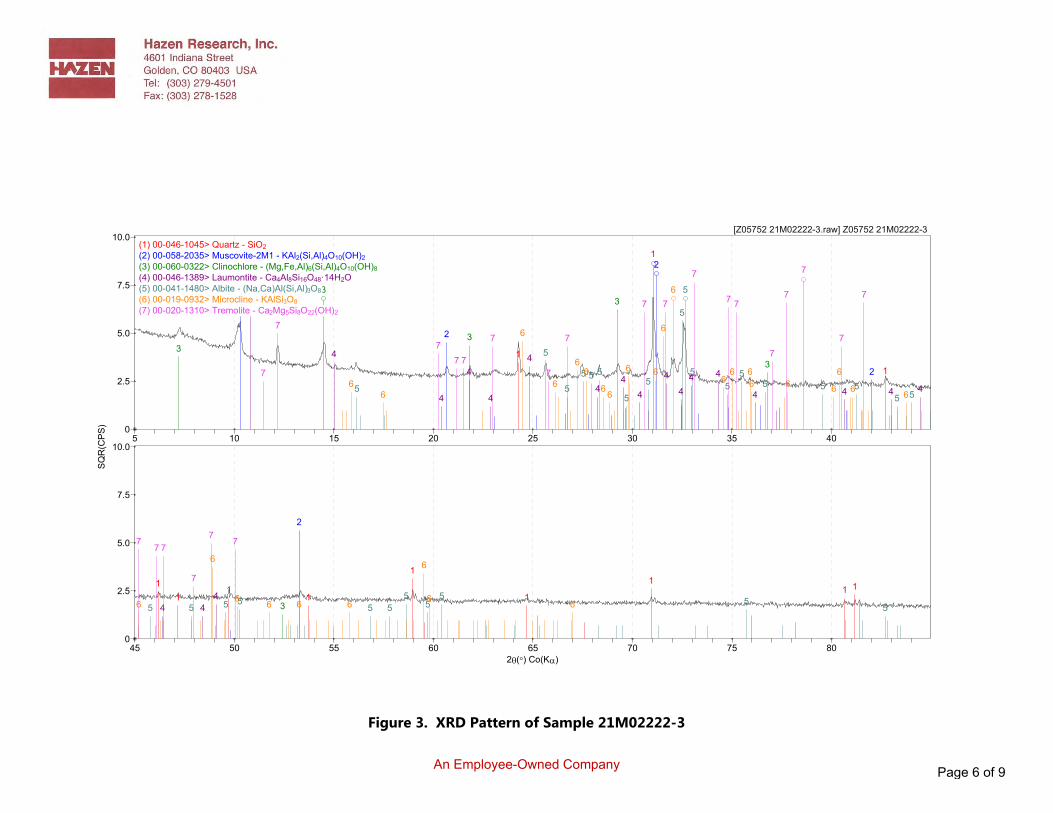
An Employee-Owned Company
Figure 3. XRD Pattern of Sample 21M02222-3
1
1
1
2
2
2
2
33
33
3
4
4 44 44 44
4 4444 444 4
5
5
5
5 5 55 5 5 5 55 555 555
6
66
6 6 66 6 666 6666 6 66 66 6
77
7 777 7 7
77 7 7
77
777 7
5 10 15 20 25 30 35 400
2.5
5.0
7.5
10.0
111 111
1 1 1
2
34
44555 555 555 55
66
66 666 6 6
777
7 7
7
45 50 55 60 65 70 75 802�(�) Co(K�)
0
2.5
5.0
7.5
10.0
[Z05752 21M02222-3.raw] Z05752 21M02222-3(1) 00-046-1045> Quartz - SiO2(2) 00-058-2035> Muscovite-2M1 - KAl2(Si,Al)4O10(OH)2(3) 00-060-0322> Clinochlore - (Mg,Fe,Al)6(Si,Al)4O10(OH)8(4) 00-046-1389> Laumontite - Ca4Al8Si16O48·14H2O(5) 00-041-1480> Albite - (Na,Ca)Al(Si,Al)3O8(6) 00-019-0932> Microcline - KAlSi3O8(7) 00-020-1310> Tremolite - Ca2Mg5Si8O22(OH)2
SQR
(CPS
)
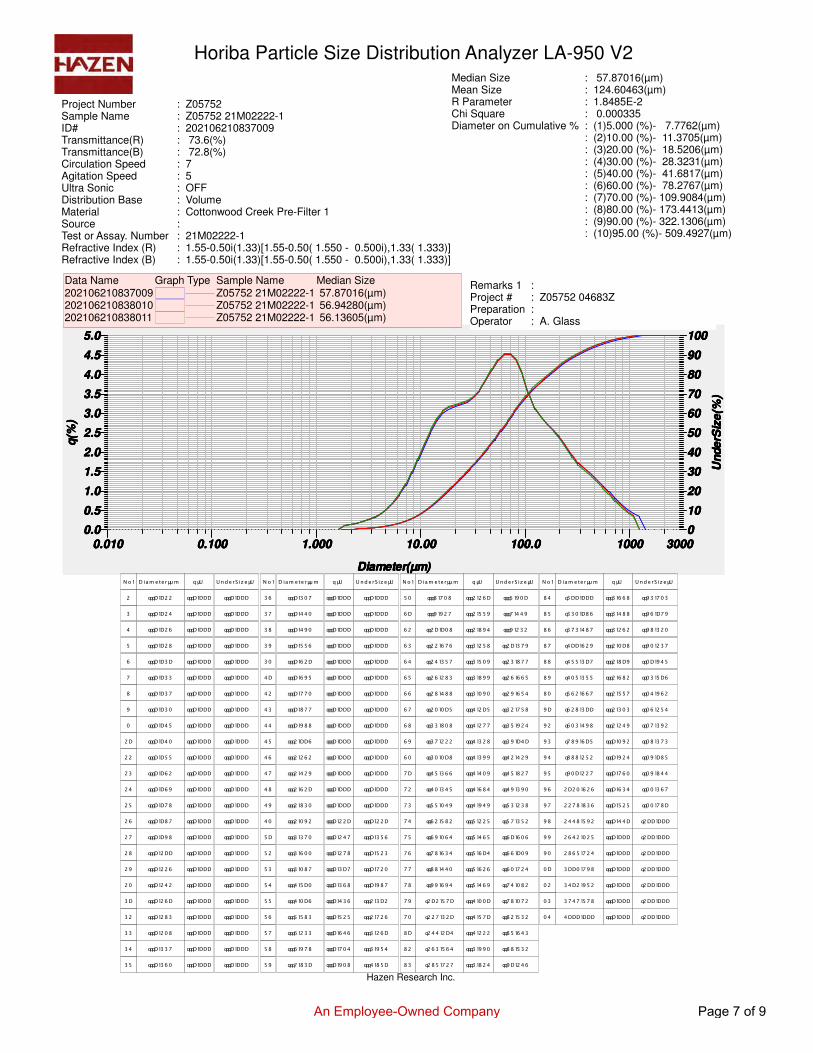
2021.06.21 08:43:222021.06.21 08:43:222021.06.21 08:43:222021.06.21 08:43:22
1 / 11 / 11 / 11 / 1
Median SizeMean SizeR ParameterChi SquareDiameter on Cumulative %
::::::::::::::
57.87016(μm)124.60463(μm)1.8485E-2 0.000335(1)5.000 (%)- 7.7762(μm)(2)10.00 (%)- 11.3705(μm)(3)20.00 (%)- 18.5206(μm)(4)30.00 (%)- 28.3231(μm)(5)40.00 (%)- 41.6817(μm)(6)60.00 (%)- 78.2767(μm)(7)70.00 (%)- 109.9084(μm)(8)80.00 (%)- 173.4413(μm)(9)90.00 (%)- 322.1306(μm)(10)95.00 (%)- 509.4927(μm)
Horiba Particle Size Distribution Analyzer LA-950 V2
Project NumberSample NameID#Transmittance(R)Transmittance(B)Circulation SpeedAgitation SpeedUltra SonicDistribution BaseMaterialSourceTest or Assay. NumberRefractive Index (R)Refractive Index (B)
::::::::::::::
Z05752Z05752 21M02222-1202106210837009 73.6(%) 72.8(%)75OFFVolumeCottonwood Creek Pre-Filter 1
21M02222-11.55-0.50i(1.33)[1.55-0.50( 1.550 - 0.500i),1.33( 1.333)]1.55-0.50i(1.33)[1.55-0.50( 1.550 - 0.500i),1.33( 1.333)]
q(%
)q(
%)
q(%
)q(
%)
Diameter(μm)Diameter(μm)Diameter(μm)Diameter(μm)
Und
erS
ize(
%)
Und
erS
ize(
%)
Und
erS
ize(
%)
Und
erS
ize(
%)
0.00.00.00.0
5.05.05.05.0
0.50.50.50.5
1.01.01.01.0
1.51.51.51.5
2.02.02.02.0
2.52.52.52.5
3.03.03.03.0
3.53.53.53.5
4.04.04.04.0
4.54.54.54.5
0.0100.0100.0100.010 30003000300030000.1000.1000.1000.100 1.0001.0001.0001.000 10.0010.0010.0010.00 100.0100.0100.0100.0 10001000100010000000
100100100100
10101010
20202020
30303030
40404040
50505050
60606060
70707070
80808080
90909090
Remarks 1Project #PreparationOperator
::::
Z05752 04683Z
A. Glass
Data Name202106210837009202106210838010202106210838011
Graph Type Sample NameZ05752 21M02222-1Z05752 21M02222-1Z05752 21M02222-1
Median Size 57.87016(μm) 56.94280(μm) 56.13605(μm)
�� �
�
�
�
�
�
�
��
��
��
��
��
�
�
��
��
�
��
��
��
��
��
� ��� � �� ���� �
���� ����
���� ����
���� ���
���� ����
���� ����
���� ����
���� ���
���� ���
���� ����
���� ���
���� ����
���� ���
���� ���
���� ���
���� ���
���� ����
���� ����
���� ���
���� ����
���� ���
���� ����
���� �� �
���� ���
���� ��
� �� �
���� ����
���� ����
���� ����
���� ����
���� ����
���� ����
���� ����
���� ����
���� ����
���� ����
���� ����
���� ����
���� ����
���� ����
���� ����
���� ����
���� ����
���� ����
���� ����
���� ����
���� ����
���� ����
���� ����
���� ����
���� �� � � �� �
���� ����
���� ����
���� ����
���� ����
���� ����
���� ����
���� ����
���� ����
���� ����
���� ����
���� ����
���� ����
���� ����
���� ����
���� ����
���� ����
���� ����
���� ����
���� ����
���� ����
���� ����
���� ����
���� ����
���� ����
�� �
�
�
��
��
�
��
��
��
��
��
�
�
��
��
�
��
��
��
��
��
�
�
��
��
� ��� � �� ���� �
���� ��
���� ���
���� ���
���� ���
���� ���
���� ���
���� �
���� ��
���� ����
���� ���
���� ���
���� ����
���� ���
���� ���
���� � ��
���� ��
���� �
���� � �
���� ���
���� � �
���� ����
��� ����
��� ���
��� ����
� �� �
���� ����
���� ����
���� ����
���� ����
���� ����
���� ����
���� ����
���� ����
���� ����
���� ����
���� ����
���� ����
���� ����
���� ����
���� ����
���� ���
���� ���
���� ���
���� ���
���� ���
���� ����
���� ��
���� � �
���� �� �
���� �� � � �� �
���� ����
���� ����
���� ����
���� ����
���� ����
���� ����
���� ����
���� ����
���� ����
���� ����
���� ����
���� ����
���� ����
���� ����
���� ����
���� ���
���� ����
���� ��
���� ���
���� ����
���� ��
���� ���
���� ����
���� ����
�� �
�
�
�
�
�
�
�
�
�
�
�
�
�
�
�
��
��
��
� ��� � �� ���� �
���� � �
���� ���
���� �� �
���� �
���� ���
��� ����
���� ����
��� � ��
���� �� �
��� ����
��� � ��
���� ��
��� ����
���� � ��
��� ����
��� � �
��� ���
���� ���
���� ���
���� ���
��� ����
���� ����
��� ���
���� ��
� �� �
���� ���
���� ����
���� ����
���� ����
���� �� �
���� ����
���� � �
���� ����
���� ��
���� ����
���� ����
���� �� �
���� ���
���� ����
���� ����
���� ���
���� ���
���� ��
���� ���
���� � �
���� ���
���� ����
���� ���
���� ����
���� �� � � �� �
���� �� �
��� ����
���� ����
���� ���
���� ��
��� ��
���� ���
���� ���
���� ����
���� ����
���� ����
���� ���
���� ���
���� ����
��� ����
��� �
�� �� �
�� ���
��� � ��
��� � �
���� ����
���� ���
���� ����
���� ���
�� �
��
��
�
�
��
��
�
��
��
��
��
��
�
�
��
��
�
�
�
�
�
� ��� � �� ���� �
���� ����
��� ���
��� ���
���� ���
���� ���
�� � ����
��� �
��� ����
� � ����
��� ���
���� ����
�� � ���
��� ��
��� ���
���� ����
��� � ��
��� ���
��� ���
���� ����
�� ���
���� ����
� �� �
���� ��
���� ����
���� ���
���� � ��
���� ����
���� ���
���� ���
���� �� �
���� ����
���� � ��
���� ����
���� �
���� ���
���� ����
���� ����
���� ����
���� ����
���� ����
���� ����
���� ����
���� ����
���� �� � � �� �
���� � �
��� ���
���� ���
��� ���
�� � ����
�� � ���
�� � ���
�� ����
�� ����
�� � ���
�� � ����
�� � ����
�� ��
�� ���
���� ����
���� ����
���� ����
���� ����
���� ����
���� ����
���� ����
Hazen Research Inc.
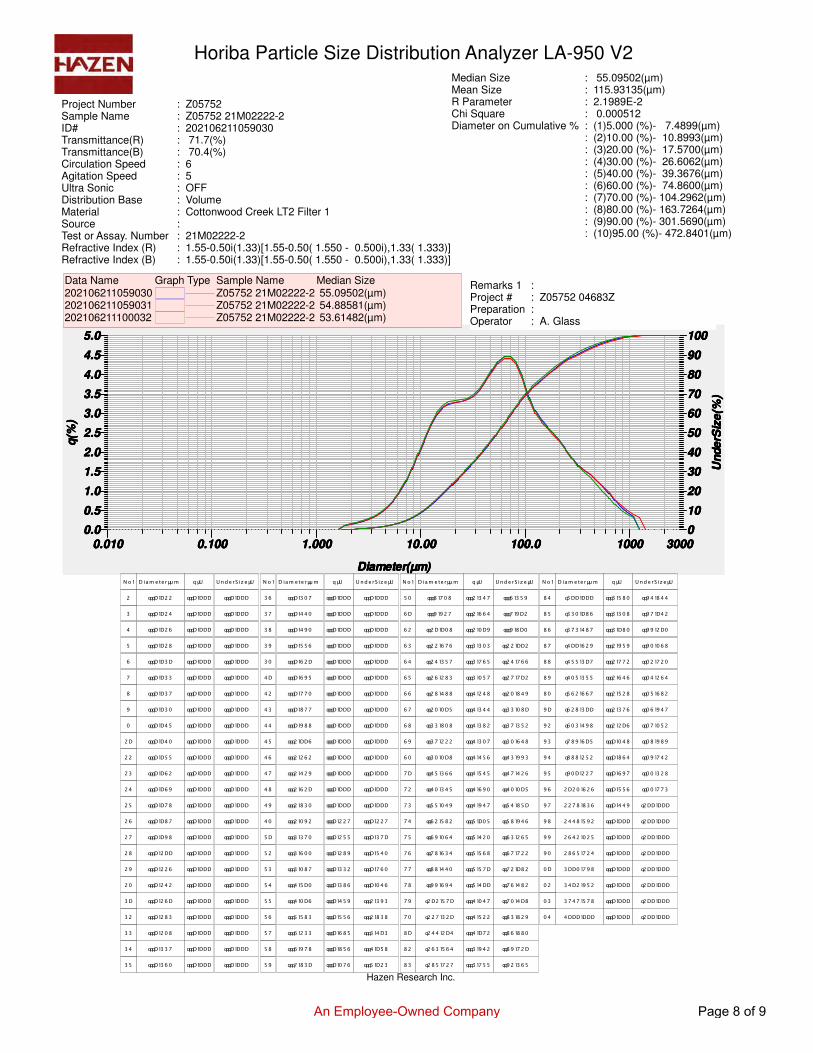
2021.06.21 11:00:512021.06.21 11:00:512021.06.21 11:00:512021.06.21 11:00:51
1 / 11 / 11 / 11 / 1
Median SizeMean SizeR ParameterChi SquareDiameter on Cumulative %
::::::::::::::
55.09502(μm)115.93135(μm)2.1989E-2 0.000512(1)5.000 (%)- 7.4899(μm)(2)10.00 (%)- 10.8993(μm)(3)20.00 (%)- 17.5700(μm)(4)30.00 (%)- 26.6062(μm)(5)40.00 (%)- 39.3676(μm)(6)60.00 (%)- 74.8600(μm)(7)70.00 (%)- 104.2962(μm)(8)80.00 (%)- 163.7264(μm)(9)90.00 (%)- 301.5690(μm)(10)95.00 (%)- 472.8401(μm)
Horiba Particle Size Distribution Analyzer LA-950 V2
Project NumberSample NameID#Transmittance(R)Transmittance(B)Circulation SpeedAgitation SpeedUltra SonicDistribution BaseMaterialSourceTest or Assay. NumberRefractive Index (R)Refractive Index (B)
::::::::::::::
Z05752Z05752 21M02222-2202106211059030 71.7(%) 70.4(%)65OFFVolumeCottonwood Creek LT2 Filter 1
21M02222-21.55-0.50i(1.33)[1.55-0.50( 1.550 - 0.500i),1.33( 1.333)]1.55-0.50i(1.33)[1.55-0.50( 1.550 - 0.500i),1.33( 1.333)]
q(%
)q(
%)
q(%
)q(
%)
Diameter(μm)Diameter(μm)Diameter(μm)Diameter(μm)
Und
erS
ize(
%)
Und
erS
ize(
%)
Und
erS
ize(
%)
Und
erS
ize(
%)
0.00.00.00.0
5.05.05.05.0
0.50.50.50.5
1.01.01.01.0
1.51.51.51.5
2.02.02.02.0
2.52.52.52.5
3.03.03.03.0
3.53.53.53.5
4.04.04.04.0
4.54.54.54.5
0.0100.0100.0100.010 30003000300030000.1000.1000.1000.100 1.0001.0001.0001.000 10.0010.0010.0010.00 100.0100.0100.0100.0 10001000100010000000
100100100100
10101010
20202020
30303030
40404040
50505050
60606060
70707070
80808080
90909090
Remarks 1Project #PreparationOperator
::::
Z05752 04683Z
A. Glass
Data Name202106211059030202106211059031202106211100032
Graph Type Sample NameZ05752 21M02222-2Z05752 21M02222-2Z05752 21M02222-2
Median Size 55.09502(μm) 54.88581(μm) 53.61482(μm)
�� �
�
�
�
�
�
�
��
��
��
��
��
�
�
��
��
�
��
��
��
��
��
� ��� � �� ���� �
���� ����
���� ����
���� ���
���� ����
���� ����
���� ����
���� ���
���� ���
���� ����
���� ���
���� ����
���� ���
���� ���
���� ���
���� ���
���� ����
���� ����
���� ���
���� ����
���� ���
���� ����
���� �� �
���� ���
���� ��
� �� �
���� ����
���� ����
���� ����
���� ����
���� ����
���� ����
���� ����
���� ����
���� ����
���� ����
���� ����
���� ����
���� ����
���� ����
���� ����
���� ����
���� ����
���� ����
���� ����
���� ����
���� ����
���� ����
���� ����
���� ����
���� �� � � �� �
���� ����
���� ����
���� ����
���� ����
���� ����
���� ����
���� ����
���� ����
���� ����
���� ����
���� ����
���� ����
���� ����
���� ����
���� ����
���� ����
���� ����
���� ����
���� ����
���� ����
���� ����
���� ����
���� ����
���� ����
�� �
�
�
��
��
�
��
��
��
��
��
�
�
��
��
�
��
��
��
��
��
�
�
��
��
� ��� � �� ���� �
���� ��
���� ���
���� ���
���� ���
���� ���
���� ���
���� �
���� ��
���� ����
���� ���
���� ���
���� ����
���� ���
���� ���
���� � ��
���� ��
���� �
���� � �
���� ���
���� � �
���� ����
��� ����
��� ���
��� ����
� �� �
���� ����
���� ����
���� ����
���� ����
���� ����
���� ����
���� ����
���� ����
���� ����
���� ����
���� ����
���� ����
���� ����
���� ����
���� ���
���� ����
���� ����
���� ����
���� ���
���� ����
���� ���
���� ���
���� ���
���� �
���� �� � � �� �
���� ����
���� ����
���� ����
���� ����
���� ����
���� ����
���� ����
���� ����
���� ����
���� ����
���� ����
���� ����
���� ����
���� ����
���� ���
���� ���
���� ���
���� �
���� � �
���� ����
���� ����
���� ����
���� ����
���� ����
�� �
�
�
�
�
�
�
�
�
�
�
�
�
�
�
�
��
��
��
� ��� � �� ���� �
���� � �
���� ���
���� �� �
���� �
���� ���
��� ����
���� ����
��� � ��
���� �� �
��� ����
��� � ��
���� ��
��� ����
���� � ��
��� ����
��� � �
��� ���
���� ���
���� ���
���� ���
��� ����
���� ����
��� ���
���� ��
� �� �
���� ���
���� ��
���� � ��
���� �� �
���� ��
���� � �
���� ����
���� ����
���� ����
���� ��
���� ���
���� ����
���� ��
���� ���
���� �� �
���� ���
���� ���
���� ���
���� ����
���� � �
���� ����
���� ���
���� ����
���� ���
���� �� � � �� �
��� ����
��� ����
���� ���
���� ����
���� �
��� ���
��� ����
���� � ��
��� ����
��� ���
���� ����
��� ���
��� � ��
���� ����
���� ���
��� ���
�� ���
��� ����
�� ����
�� ����
���� ����
��� ���
���� ���
���� ���
�� �
��
��
�
�
��
��
�
��
��
��
��
��
�
�
��
��
�
�
�
�
�
� ��� � �� ���� �
���� ����
��� ���
��� ���
���� ���
���� ���
�� � ����
��� �
��� ����
� � ����
��� ���
���� ����
�� � ���
��� ��
��� ���
���� ����
��� � ��
��� ���
��� ���
���� ����
�� ���
���� ����
� �� �
���� ���
���� �� �
���� ���
���� ����
���� ��
���� ��
���� ����
���� ��
���� ���
���� � ��
���� ���
���� ��
���� ���
���� ����
���� ����
���� ����
���� ����
���� ����
���� ����
���� ����
���� ����
���� �� � � �� �
���� ����
��� ����
���� ���
��� � �
�� � ��
�� � ���
�� � ���
�� ���
�� � ��
�� � ����
�� � ���
�� ����
�� ��
���� ����
���� ����
���� ����
���� ����
���� ����
���� ����
���� ����
���� ����
Hazen Research Inc.
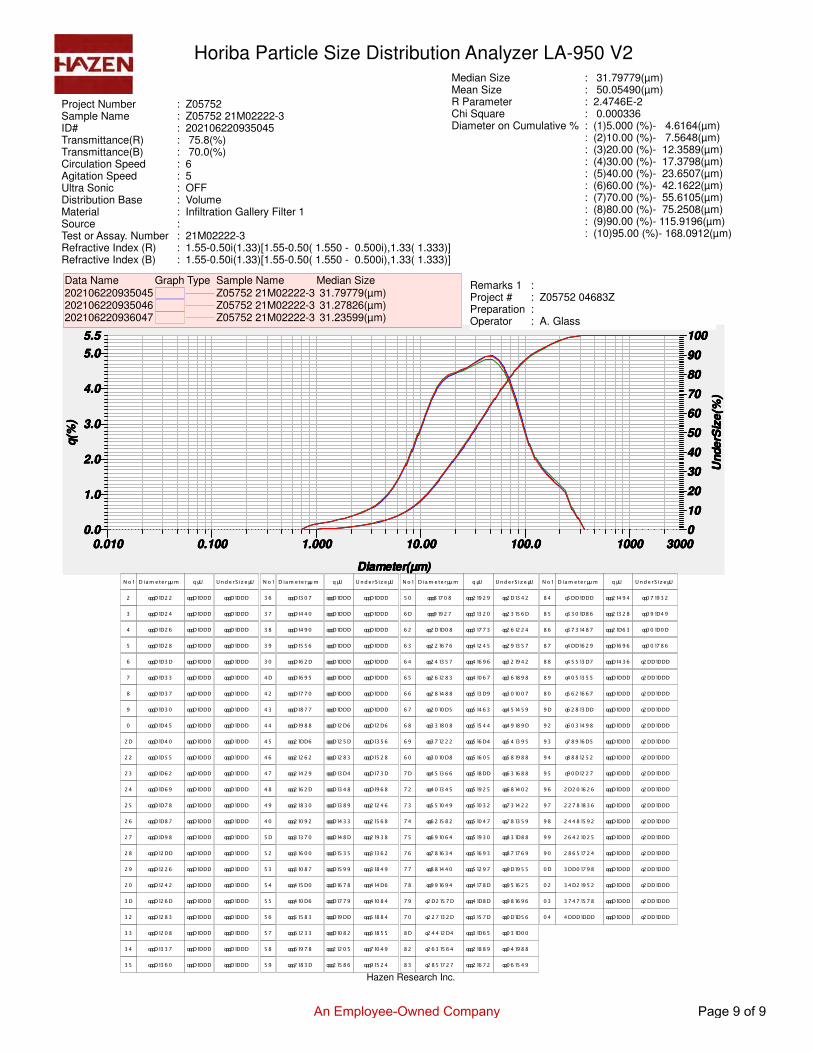
2021.06.22 10:25:132021.06.22 10:25:132021.06.22 10:25:132021.06.22 10:25:13
1 / 11 / 11 / 11 / 1
Median SizeMean SizeR ParameterChi SquareDiameter on Cumulative %
::::::::::::::
31.79779(μm) 50.05490(μm)2.4746E-2 0.000336(1)5.000 (%)- 4.6164(μm)(2)10.00 (%)- 7.5648(μm)(3)20.00 (%)- 12.3589(μm)(4)30.00 (%)- 17.3798(μm)(5)40.00 (%)- 23.6507(μm)(6)60.00 (%)- 42.1622(μm)(7)70.00 (%)- 55.6105(μm)(8)80.00 (%)- 75.2508(μm)(9)90.00 (%)- 115.9196(μm)(10)95.00 (%)- 168.0912(μm)
Horiba Particle Size Distribution Analyzer LA-950 V2
Project NumberSample NameID#Transmittance(R)Transmittance(B)Circulation SpeedAgitation SpeedUltra SonicDistribution BaseMaterialSourceTest or Assay. NumberRefractive Index (R)Refractive Index (B)
::::::::::::::
Z05752Z05752 21M02222-3202106220935045 75.8(%) 70.0(%)65OFFVolumeInfiltration Gallery Filter 1
21M02222-31.55-0.50i(1.33)[1.55-0.50( 1.550 - 0.500i),1.33( 1.333)]1.55-0.50i(1.33)[1.55-0.50( 1.550 - 0.500i),1.33( 1.333)]
q(%
)q(
%)
q(%
)q(
%)
Diameter(μm)Diameter(μm)Diameter(μm)Diameter(μm)
Und
erS
ize(
%)
Und
erS
ize(
%)
Und
erS
ize(
%)
Und
erS
ize(
%)
0.00.00.00.0
5.55.55.55.5
1.01.01.01.0
2.02.02.02.0
3.03.03.03.0
4.04.04.04.0
5.05.05.05.0
0.0100.0100.0100.010 30003000300030000.1000.1000.1000.100 1.0001.0001.0001.000 10.0010.0010.0010.00 100.0100.0100.0100.0 10001000100010000000
100100100100
10101010
20202020
30303030
40404040
50505050
60606060
70707070
80808080
90909090
Remarks 1Project #PreparationOperator
::::
Z05752 04683Z
A. Glass
Data Name202106220935045202106220935046202106220936047
Graph Type Sample NameZ05752 21M02222-3Z05752 21M02222-3Z05752 21M02222-3
Median Size 31.79779(μm) 31.27826(μm) 31.23599(μm)
�� �
�
�
�
�
�
�
��
��
��
��
��
�
�
��
��
�
��
��
��
��
��
� ��� � �� ���� �
���� ����
���� ����
���� ���
���� ����
���� ����
���� ����
���� ���
���� ���
���� ����
���� ���
���� ����
���� ���
���� ���
���� ���
���� ���
���� ����
���� ����
���� ���
���� ����
���� ���
���� ����
���� �� �
���� ���
���� ��
� �� �
���� ����
���� ����
���� ����
���� ����
���� ����
���� ����
���� ����
���� ����
���� ����
���� ����
���� ����
���� ����
���� ����
���� ����
���� ����
���� ����
���� ����
���� ����
���� ����
���� ����
���� ����
���� ����
���� ����
���� ����
���� �� � � �� �
���� ����
���� ����
���� ����
���� ����
���� ����
���� ����
���� ����
���� ����
���� ����
���� ����
���� ����
���� ����
���� ����
���� ����
���� ����
���� ����
���� ����
���� ����
���� ����
���� ����
���� ����
���� ����
���� ����
���� ����
�� �
�
�
��
��
�
��
��
��
��
��
�
�
��
��
�
��
��
��
��
��
�
�
��
��
� ��� � �� ���� �
���� ��
���� ���
���� ���
���� ���
���� ���
���� ���
���� �
���� ��
���� ����
���� ���
���� ���
���� ����
���� ���
���� ���
���� � ��
���� ��
���� �
���� � �
���� ���
���� � �
���� ����
��� ����
��� ���
��� ����
� �� �
���� ����
���� ����
���� ����
���� ����
���� ����
���� ����
���� ����
���� ����
���� ���
���� ����
���� ����
���� ����
���� ����
���� ����
���� ����
���� ����
���� ����
���� ����
���� ��
���� ��
���� ����
���� � ��
���� �� �
���� ���
���� �� � � �� �
���� ����
���� ����
���� ����
���� ����
���� ����
���� ����
���� ����
���� ����
���� ���
���� ���
���� ����
���� ���
���� ���
���� ���
���� ���
���� ����
���� ���
���� ����
���� ���
���� � ��
���� ����
��� ����
��� � ��
���� ����
�� �
�
�
�
�
�
�
�
�
�
�
�
�
�
�
�
��
��
��
� ��� � �� ���� �
���� � �
���� ���
���� �� �
���� �
���� ���
��� ����
���� ����
��� � ��
���� �� �
��� ����
��� � ��
���� ��
��� ����
���� � ��
��� ����
��� � �
��� ���
���� ���
���� ���
���� ���
��� ����
���� ����
��� ���
���� ��
� �� �
���� ����
���� ���
���� ��
���� ����
���� ��
���� �
���� ����
���� ���
���� ����
���� ���
���� � �
���� ����
���� ����
���� � ��
���� � �
���� ���
���� ���
���� ���
���� ���
���� ����
���� ���
���� ���
���� ����
���� ��
���� �� � � �� �
���� ����
���� ���
��� ����
���� ���
���� ����
��� ����
��� �
���� ����
���� ����
���� ����
���� ����
��� ���
��� �� �
��� ����
��� ����
���� ����
��� ��
���� ����
���� ���
���� ��
�� � ���
�� � ��
�� � ����
�� ����
�� �
��
��
�
�
��
��
�
��
��
��
��
��
�
�
��
��
�
�
�
�
�
� ��� � �� ���� �
���� ����
��� ���
��� ���
���� ���
���� ���
�� � ����
��� �
��� ����
� � ����
��� ���
���� ����
�� � ���
��� ��
��� ���
���� ����
��� � ��
��� ���
��� ���
���� ����
�� ���
���� ����
� �� �
���� ����
���� ����
���� ���
���� ��
���� ���
���� ����
���� ����
���� ����
���� ����
���� ����
���� ����
���� ����
���� ����
���� ����
���� ����
���� ����
���� ����
���� ����
���� ����
���� ����
���� ����
���� �� � � �� �
�� ����
�� � ����
�� �� �
�� ��
���� ����
���� ����
���� ����
���� ����
���� ����
���� ����
���� ����
���� ����
���� ����
���� ����
���� ����
���� ����
���� ����
���� ����
���� ����
���� ����
���� ����
Hazen Research Inc.

APPENDIX B – CALCULATIONS
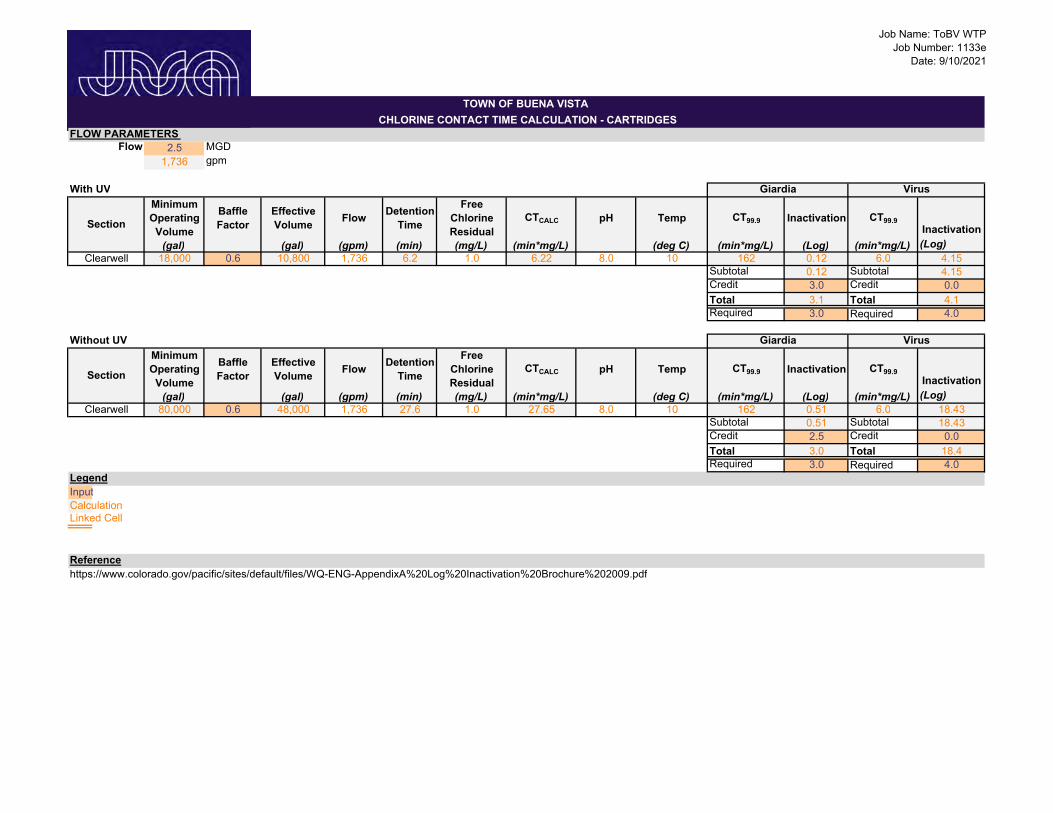
Job Name: ToBV WTP
Job Number: 1133e
Date: 9/10/2021
Flow 2.5 MGD
1,736 gpm
With UV
Minimum
Operating
Volume
Baffle
Factor
Effective
VolumeFlow
Detention
Time
Free
Chlorine
Residual
CTCALC pH Temp CT99.9 Inactivation CT99.9
Inactivation
(gal) (gal) (gpm) (min) (mg/L) (min*mg/L) (deg C) (min*mg/L) (Log) (min*mg/L) (Log)
18,000 0.6 10,800 1,736 6.2 1.0 6.22 8.0 10 162 0.12 6.0 4.15
Subtotal 0.12 Subtotal 4.15
Credit 3.0 Credit 0.0
Total 3.1 Total 4.1
Required 3.0 Required 4.0
Without UV
Minimum
Operating
Volume
Baffle
Factor
Effective
VolumeFlow
Detention
Time
Free
Chlorine
Residual
CTCALC pH Temp CT99.9 Inactivation CT99.9
Inactivation
(gal) (gal) (gpm) (min) (mg/L) (min*mg/L) (deg C) (min*mg/L) (Log) (min*mg/L) (Log)
80,000 0.6 48,000 1,736 27.6 1.0 27.65 8.0 10 162 0.51 6.0 18.43
Subtotal 0.51 Subtotal 18.43
Credit 2.5 Credit 0.0
Total 3.0 Total 18.4
Required 3.0 Required 4.0
Input
Calculation
Linked Cell
https://www.colorado.gov/pacific/sites/default/files/WQ-ENG-AppendixA%20Log%20Inactivation%20Brochure%202009.pdf
TOWN OF BUENA VISTA
CHLORINE CONTACT TIME CALCULATION - CARTRIDGES
FLOW PARAMETERS
Giardia Virus
Section
Section
Legend
Reference
Clearwell
Clearwell
Giardia Virus
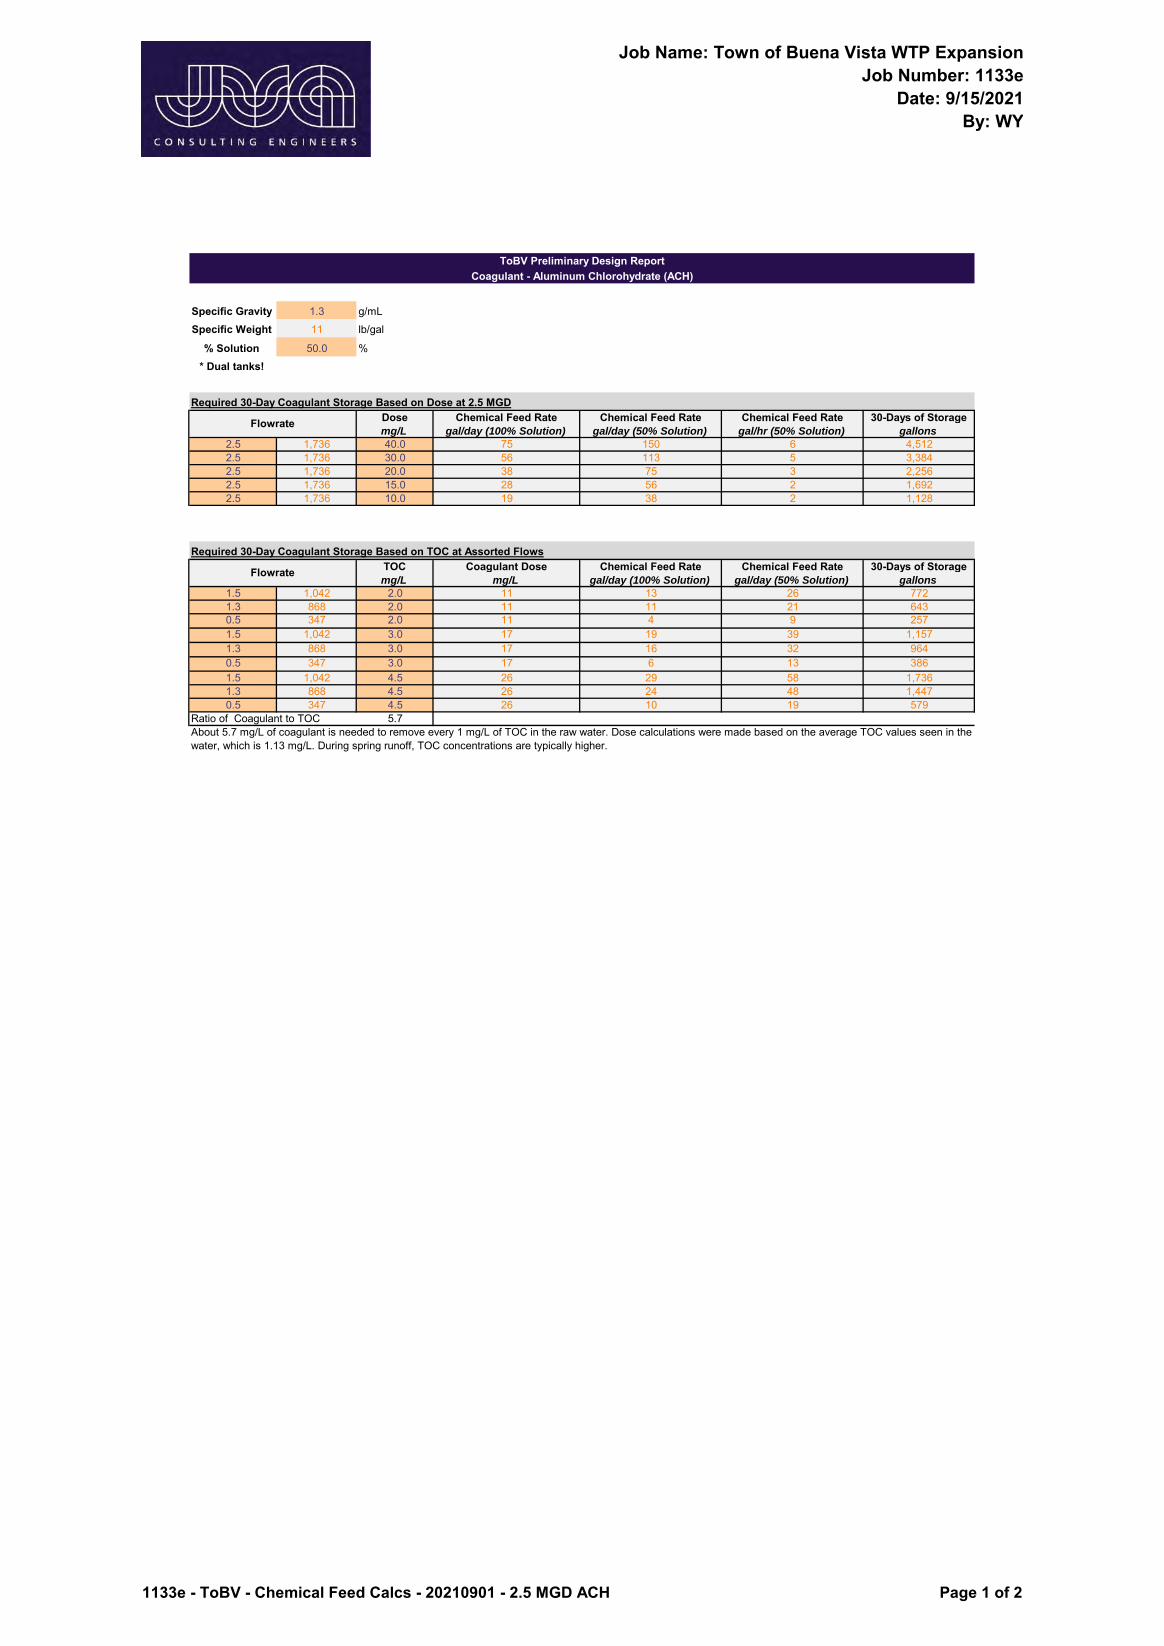
Job Name: Town of Buena Vista WTP ExpansionJob Number: 1133e
Date: 9/15/2021By: WY
Specific Gravity 1.3 g/mLSpecific Weight 11 lb/gal
% Solution 50.0 % * Dual tanks!
Dose Chemical Feed Rate Chemical Feed Rate Chemical Feed Rate 30-Days of Storagemg/L gal/day (100% Solution) gal/day (50% Solution) gal/hr (50% Solution) gallons
2.5 1,736 40.0 75 150 6 4,5122.5 1,736 30.0 56 113 5 3,3842.5 1,736 20.0 38 75 3 2,2562.5 1,736 15.0 28 56 2 1,6922.5 1,736 10.0 19 38 2 1,128
TOC Coagulant Dose Chemical Feed Rate Chemical Feed Rate 30-Days of Storagemg/L mg/L gal/day (100% Solution) gal/day (50% Solution) gallons
1.5 1,042 2.0 11 13 26 7721.3 868 2.0 11 11 21 6430.5 347 2.0 11 4 9 2571.5 1,042 3.0 17 19 39 1,1571.3 868 3.0 17 16 32 9640.5 347 3.0 17 6 13 3861.5 1,042 4.5 26 29 58 1,7361.3 868 4.5 26 24 48 1,4470.5 347 4.5 26 10 19 579
Ratio of Coagulant to TOC 5.7
ToBV Preliminary Design ReportCoagulant - Aluminum Chlorohydrate (ACH)
About 5.7 mg/L of coagulant is needed to remove every 1 mg/L of TOC in the raw water. Dose calculations were made based on the average TOC values seen in the water, which is 1.13 mg/L. During spring runoff, TOC concentrations are typically higher.
Required 30-Day Coagulant Storage Based on Dose at 2.5 MGD
Flowrate
Required 30-Day Coagulant Storage Based on TOC at Assorted Flows
Flowrate
1133e - ToBV - Chemical Feed Calcs - 20210901 - 2.5 MGD ACH Page 1 of 2
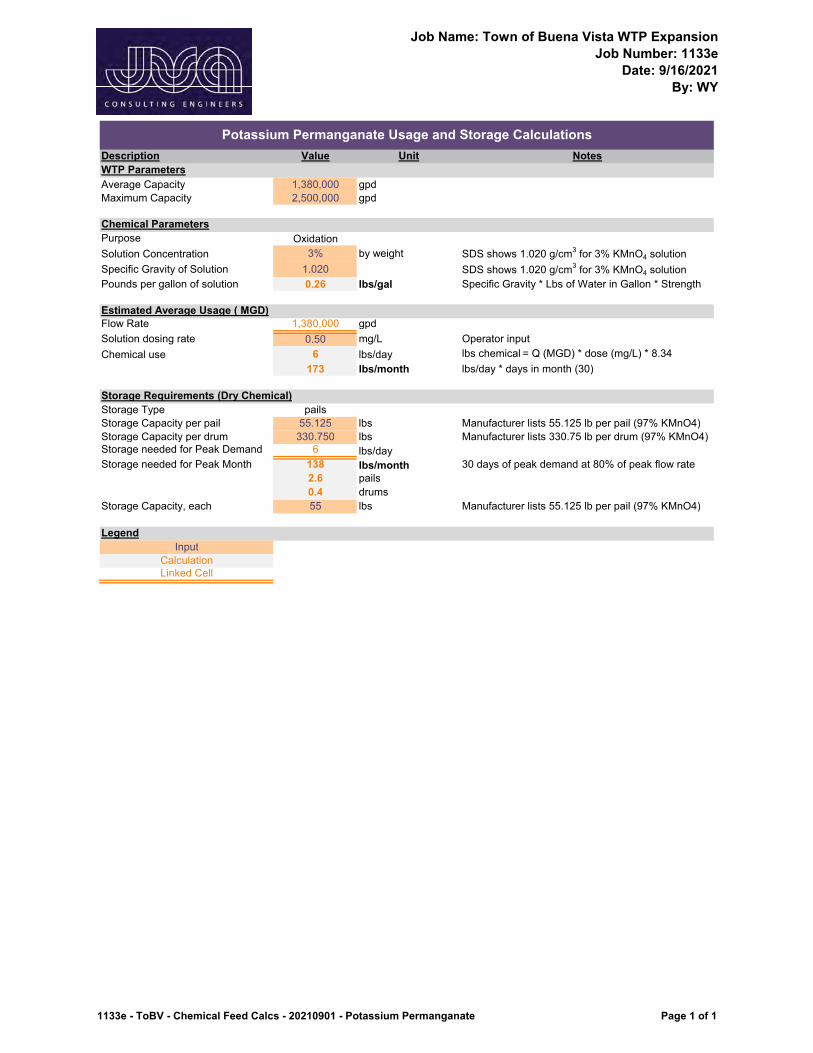
Job Name: Town of Buena Vista WTP Expansion
Job Number: 1133e
Date: 9/16/2021
By: WY
Description Value Unit Notes
WTP Parameters
Average Capacity 1,380,000 gpd
Maximum Capacity 2,500,000 gpd
Chemical Parameters
Purpose Oxidation
Solution Concentration 3% by weight SDS shows 1.020 g/cm3 for 3% KMnO4 solution
Specific Gravity of Solution 1.020 SDS shows 1.020 g/cm3 for 3% KMnO4 solution
Pounds per gallon of solution 0.26 lbs/gal Specific Gravity * Lbs of Water in Gallon * Strength
Estimated Average Usage ( MGD)
Flow Rate 1,380,000 gpd
Solution dosing rate 0.50 mg/L Operator input
Chemical use 6 lbs/day lbs chemical = Q (MGD) * dose (mg/L) * 8.34
173 lbs/month lbs/day * days in month (30)
Storage Requirements (Dry Chemical)
Storage Type pails
Storage Capacity per pail 55.125 lbs Manufacturer lists 55.125 lb per pail (97% KMnO4)
Storage Capacity per drum 330.750 lbs Manufacturer lists 330.75 lb per drum (97% KMnO4)
Storage needed for Peak Demand 6 lbs/day
Storage needed for Peak Month 138 lbs/month 30 days of peak demand at 80% of peak flow rate
2.6 pails
0.4 drums
Storage Capacity, each 55 lbs Manufacturer lists 55.125 lb per pail (97% KMnO4)
Legend
Input
Calculation
Linked Cell
Potassium Permanganate Usage and Storage Calculations
1133e - ToBV - Chemical Feed Calcs - 20210901 - Potassium Permanganate Page 1 of 1
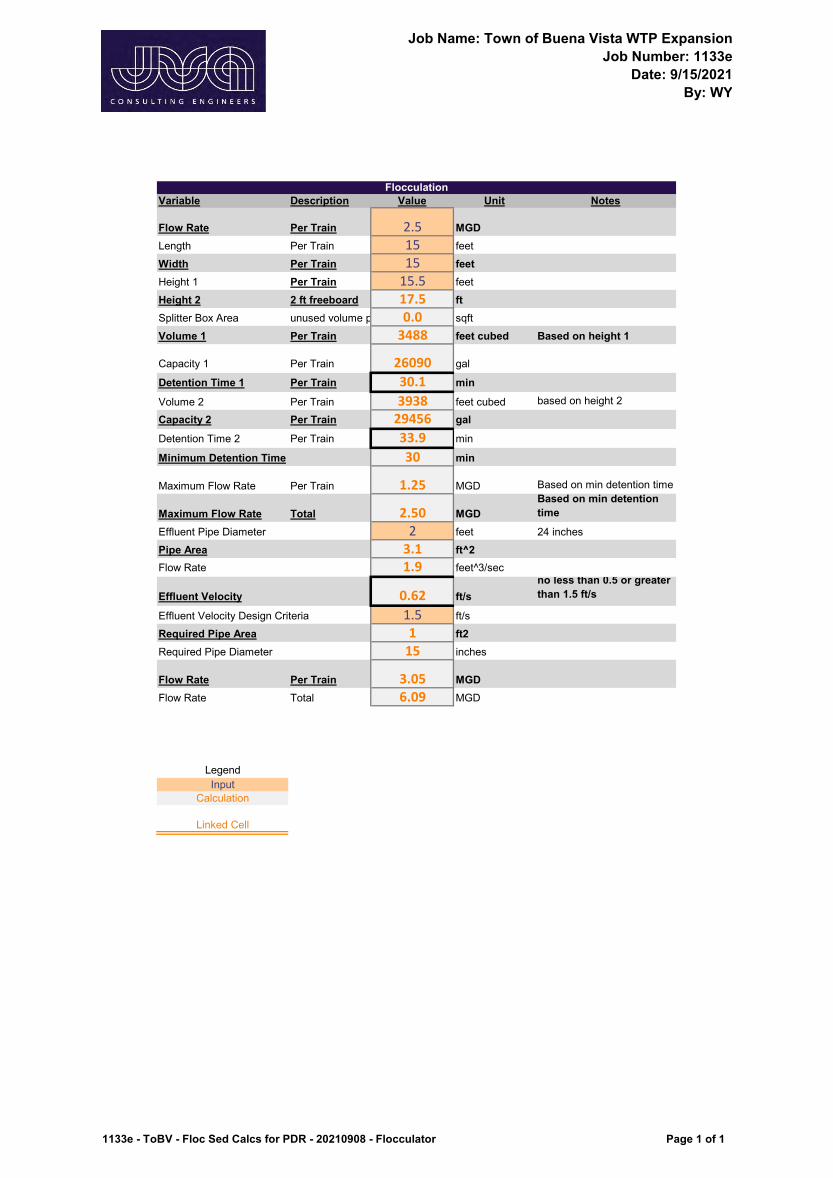
Job Name: Town of Buena Vista WTP Expansion Job Number: 1133e
Date: 9/15/2021By: WY
Variable Description Value Unit Notes
Flow Rate Per Train 2.5 MGDLength Per Train 15 feetWidth Per Train 15 feetHeight 1 Per Train 15.5 feetHeight 2 2 ft freeboard 17.5 ftSplitter Box Area unused volume p 0.0 sqftVolume 1 Per Train 3488 feet cubed Based on height 1
Capacity 1 Per Train 26090 gal
Detention Time 1 Per Train 30.1 min
Volume 2 Per Train 3938 feet cubed based on height 2
Capacity 2 Per Train 29456 galDetention Time 2 Per Train 33.9 min
Minimum Detention Time 30 min
Maximum Flow Rate Per Train 1.25 MGD Based on min detention time
Maximum Flow Rate Total 2.50 MGDBased on min detention time
Effluent Pipe Diameter 2 feet 24 inchesPipe Area 3.1 ft^2Flow Rate 1.9 feet^3/sec
Effluent Velocity 0.62 ft/sno less than 0.5 or greaterthan 1.5 ft/s
Effluent Velocity Design Criteria 1.5 ft/sRequired Pipe Area 1 ft2Required Pipe Diameter 15 inches
Flow Rate Per Train 3.05 MGDFlow Rate Total 6.09 MGD
LegendInput
Calculation
Linked Cell
Flocculation
1133e - ToBV - Floc Sed Calcs for PDR - 20210908 - Flocculator Page 1 of 1
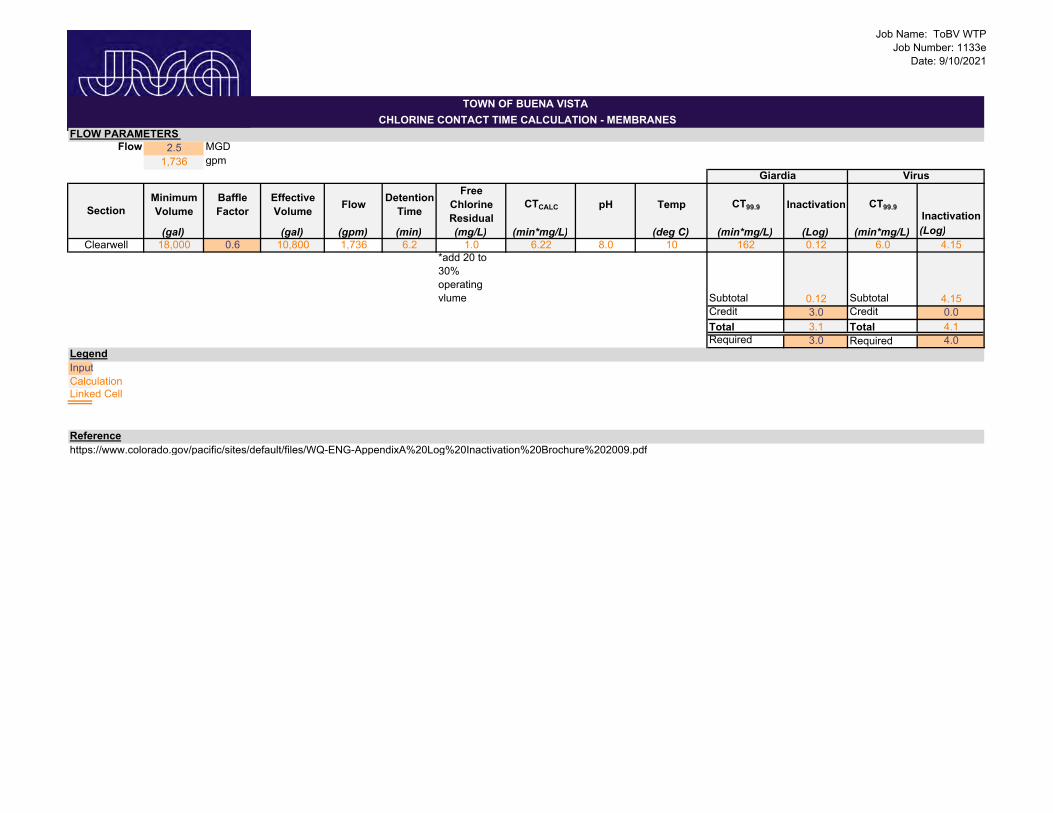
Job Name: ToBV WTP
Job Number: 1133e
Date: 9/10/2021
Flow 2.5 MGD
1,736 gpm
Minimum
Volume
Baffle
Factor
Effective
VolumeFlow
Detention
Time
Free
Chlorine
Residual
CTCALC pH Temp CT99.9 Inactivation CT99.9
Inactivation
(gal) (gal) (gpm) (min) (mg/L) (min*mg/L) (deg C) (min*mg/L) (Log) (min*mg/L) (Log)
18,000 0.6 10,800 1,736 6.2 1.0 6.22 8.0 10 162 0.12 6.0 4.15
*add 20 to
30%
operating
vlume Subtotal 0.12 Subtotal 4.15
Credit 3.0 Credit 0.0
Total 3.1 Total 4.1
Required 3.0 Required 4.0
Input
Calculation
Linked Cell
https://www.colorado.gov/pacific/sites/default/files/WQ-ENG-AppendixA%20Log%20Inactivation%20Brochure%202009.pdf
TOWN OF BUENA VISTA
CHLORINE CONTACT TIME CALCULATION - MEMBRANES
Giardia Virus
FLOW PARAMETERS
Legend
Reference
Section
Clearwell

APPENDIX C – BUDGETARY EQUIPMENT INFO
In the past, low pressure membranes promised to improve water quality and eliminate pathogens in municipal water supplies, but early generations were costly. This led to designs intended to maximize flux but the tradeoff was complexity for backwashing and cleaning and a reduced membrane life.
Now SUEZ has the solution to these challenges. SUEZ’s Membrane Gravity Filter (MGF) provides several benefits including:
• elimination of chemical cleaning
• high recovery and infrequent backwashing
• extended membrane life
• membrane quality water delivered simply
“SUEZ’s MGF helped us rehab our filters and increase our giardia log removal credit from CDPHE. This let us avoid a costly clearwell reconstruction.”
– Bill Greco, Glacier Club - Durango, CO
For more information on SUEZ’s MGF, contact: Grant MacInnis, SUEZ Water Technologies & Solutions (720) 855-7296 – [email protected]
Bill Peretti, Coombs Hopkins (303) 477-1970 – [email protected]
solutions for drinking water facilities
D.O.V.E.1 finds 75% of Colorado surface water plants have a Giardia issue
get membrane quality water – delivered without the headaches. contact us today.
1CDPHE Disinfection Outreach Verification Effort
budget proposal for the
Buena Vista Membrane Gravity Filter Budget Proposal
august 2021 proposal number: 11231971gm
submitted by: Grant MacInnis 2913 Quitman St. Denver, CO 80212 [email protected] 303-396-9532
local representation by: Coombs Hopkins Bill Peretti [email protected]
note: See end of this proposal for a list of SUEZ Company trademarks that might appear in this document.
SUEZ confidential and proprietary information
Page 2 of 9
table of contents
1 technical and engineering details ..................................................................... 3
1.1 basis of design ................................................................................................ 3
2 system process description and scope ........................................................... 4
2.1 Membrane Gravity Filtration with ZeeWeed 1000 ........................................... 4
2.2 proposed MGF system configuration .............................................................. 5
2.3 scope of supply by SUEZ ................................................................................ 6
2.4 customer equipment to be supplied by customer and reused by SUEZ .............................................................................................................. 6
3 commercial offer ................................................................................................. 7
3.1 budgetary pricing ............................................................................................. 7
3.2 equipment shipment and delivery .................................................................... 7
3.3 freight .............................................................................................................. 7
3.4 bonds .............................................................................................................. 7
3.5 pricing notes .................................................................................................... 8
3.6 conditional offering .......................................................................................... 8
SUEZ Water Technologies & Solutions confidential and proprietary information
The enclosed materials are considered proprietary property of SUEZ Water Technologies & Solutions (SUEZ). No assignments either implied or expressed, of intellectual property rights, data, know how, trade secrets or licenses of use thereof are given. All information is provided exclusively to the addressee and agents of the addressee for the purposes of evaluation and is not to be reproduced or divulged to other parties, nor used for manufacture or other means, without the express written consent of SUEZ. The acceptance of this document will be construed as an acceptance of the foregoing.
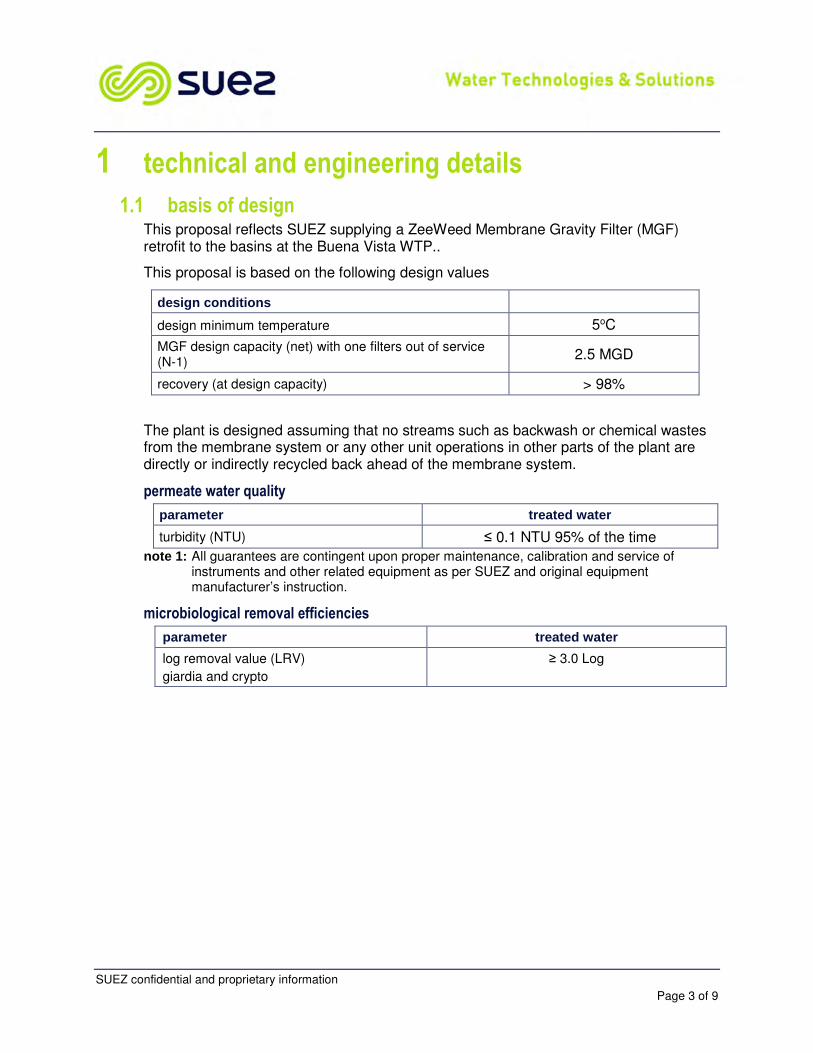
SUEZ confidential and proprietary information
Page 3 of 9
1 technical and engineering details
1.1 basis of design This proposal reflects SUEZ supplying a ZeeWeed Membrane Gravity Filter (MGF) retrofit to the basins at the Buena Vista WTP..
This proposal is based on the following design values
design conditions
design minimum temperature 5oC
MGF design capacity (net) with one filters out of service (N-1)
2.5 MGD
recovery (at design capacity) > 98%
The plant is designed assuming that no streams such as backwash or chemical wastes from the membrane system or any other unit operations in other parts of the plant are directly or indirectly recycled back ahead of the membrane system.
permeate water quality
parameter treated water
turbidity (NTU) ≤ 0.1 NTU 95% of the time
note 1: All guarantees are contingent upon proper maintenance, calibration and service of instruments and other related equipment as per SUEZ and original equipment manufacturer’s instruction.
microbiological removal efficiencies
parameter treated water
log removal value (LRV)
giardia and crypto
≥ 3.0 Log
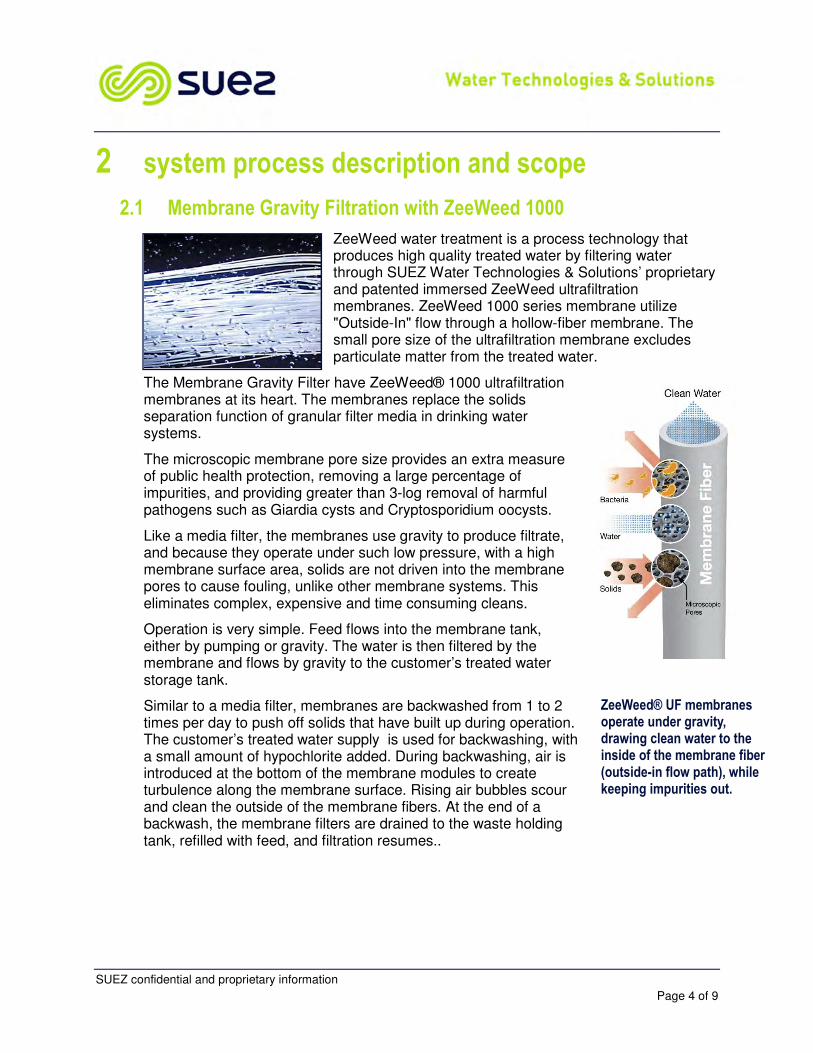
SUEZ confidential and proprietary information
Page 4 of 9
2 system process description and scope
2.1 Membrane Gravity Filtration with ZeeWeed 1000
ZeeWeed water treatment is a process technology that produces high quality treated water by filtering water through SUEZ Water Technologies & Solutions’ proprietary and patented immersed ZeeWeed ultrafiltration membranes. ZeeWeed 1000 series membrane utilize "Outside-In" flow through a hollow-fiber membrane. The small pore size of the ultrafiltration membrane excludes particulate matter from the treated water.
The Membrane Gravity Filter have ZeeWeed® 1000 ultrafiltration membranes at its heart. The membranes replace the solids separation function of granular filter media in drinking water systems.
The microscopic membrane pore size provides an extra measure of public health protection, removing a large percentage of impurities, and providing greater than 3-log removal of harmful pathogens such as Giardia cysts and Cryptosporidium oocysts.
Like a media filter, the membranes use gravity to produce filtrate, and because they operate under such low pressure, with a high membrane surface area, solids are not driven into the membrane pores to cause fouling, unlike other membrane systems. This eliminates complex, expensive and time consuming cleans.
Operation is very simple. Feed flows into the membrane tank, either by pumping or gravity. The water is then filtered by the membrane and flows by gravity to the customer’s treated water storage tank.
Similar to a media filter, membranes are backwashed from 1 to 2 times per day to push off solids that have built up during operation. The customer’s treated water supply is used for backwashing, with a small amount of hypochlorite added. During backwashing, air is introduced at the bottom of the membrane modules to create turbulence along the membrane surface. Rising air bubbles scour and clean the outside of the membrane fibers. At the end of a backwash, the membrane filters are drained to the waste holding tank, refilled with feed, and filtration resumes..
ZeeWeed® UF membranes operate under gravity, drawing clean water to the inside of the membrane fiber (outside-in flow path), while keeping impurities out.
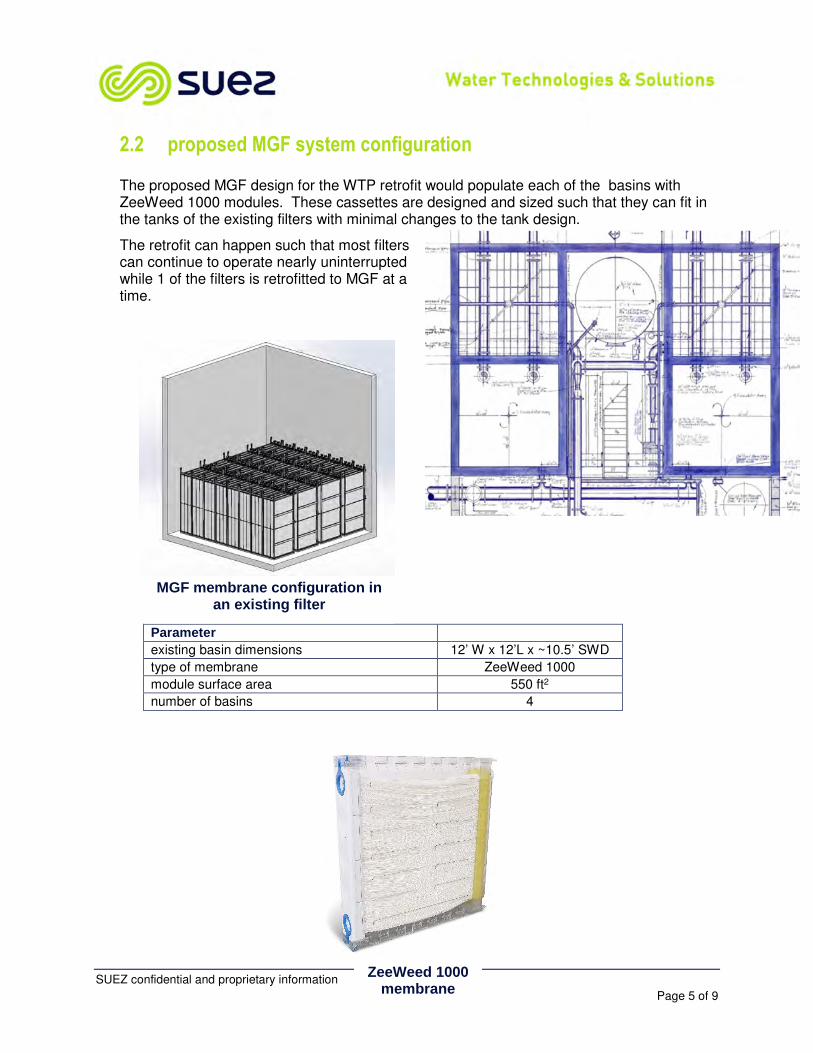
SUEZ confidential and proprietary information
Page 5 of 9
2.2 proposed MGF system configuration
The proposed MGF design for the WTP retrofit would populate each of the basins with ZeeWeed 1000 modules. These cassettes are designed and sized such that they can fit in the tanks of the existing filters with minimal changes to the tank design.
The retrofit can happen such that most filters can continue to operate nearly uninterrupted while 1 of the filters is retrofitted to MGF at a time.
Parameter
existing basin dimensions 12’ W x 12’L x ~10.5’ SWD
type of membrane ZeeWeed 1000
module surface area 550 ft2
number of basins 4
MGF membrane configuration in an existing filter
ZeeWeed 1000 membrane
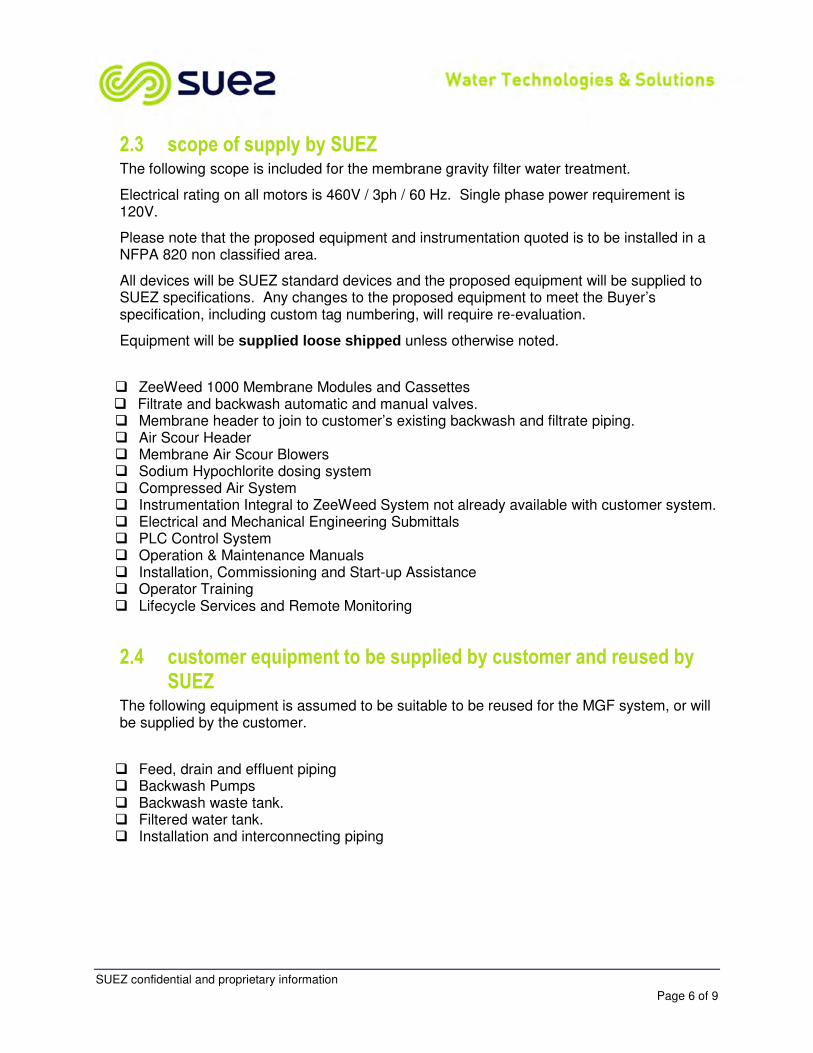
SUEZ confidential and proprietary information
Page 6 of 9
2.3 scope of supply by SUEZ The following scope is included for the membrane gravity filter water treatment.
Electrical rating on all motors is 460V / 3ph / 60 Hz. Single phase power requirement is 120V.
Please note that the proposed equipment and instrumentation quoted is to be installed in a NFPA 820 non classified area.
All devices will be SUEZ standard devices and the proposed equipment will be supplied to SUEZ specifications. Any changes to the proposed equipment to meet the Buyer’s specification, including custom tag numbering, will require re-evaluation.
Equipment will be supplied loose shipped unless otherwise noted.
ZeeWeed 1000 Membrane Modules and Cassettes Filtrate and backwash automatic and manual valves. Membrane header to join to customer’s existing backwash and filtrate piping. Air Scour Header Membrane Air Scour Blowers Sodium Hypochlorite dosing system Compressed Air System Instrumentation Integral to ZeeWeed System not already available with customer system. Electrical and Mechanical Engineering Submittals PLC Control System Operation & Maintenance Manuals Installation, Commissioning and Start-up Assistance Operator Training Lifecycle Services and Remote Monitoring
2.4 customer equipment to be supplied by customer and reused by SUEZ
The following equipment is assumed to be suitable to be reused for the MGF system, or will be supplied by the customer.
Feed, drain and effluent piping Backwash Pumps Backwash waste tank. Filtered water tank. Installation and interconnecting piping
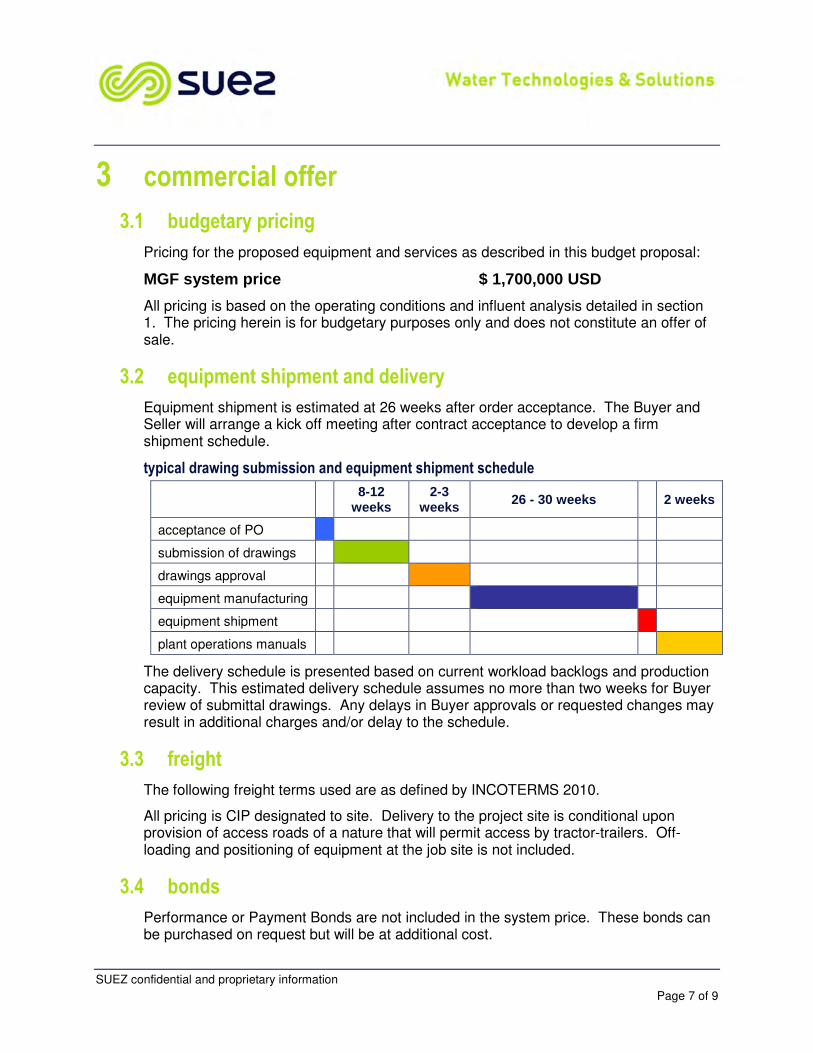
SUEZ confidential and proprietary information
Page 7 of 9
3 commercial offer
3.1 budgetary pricing
Pricing for the proposed equipment and services as described in this budget proposal:
MGF system price $ 1,700,000 USD
All pricing is based on the operating conditions and influent analysis detailed in section 1. The pricing herein is for budgetary purposes only and does not constitute an offer of sale.
3.2 equipment shipment and delivery
Equipment shipment is estimated at 26 weeks after order acceptance. The Buyer and Seller will arrange a kick off meeting after contract acceptance to develop a firm shipment schedule.
typical drawing submission and equipment shipment schedule
8-12
weeks 2-3
weeks 26 - 30 weeks 2 weeks
acceptance of PO
submission of drawings
drawings approval
equipment manufacturing
equipment shipment
plant operations manuals
The delivery schedule is presented based on current workload backlogs and production capacity. This estimated delivery schedule assumes no more than two weeks for Buyer review of submittal drawings. Any delays in Buyer approvals or requested changes may result in additional charges and/or delay to the schedule.
3.3 freight
The following freight terms used are as defined by INCOTERMS 2010.
All pricing is CIP designated to site. Delivery to the project site is conditional upon provision of access roads of a nature that will permit access by tractor-trailers. Off-loading and positioning of equipment at the job site is not included.
3.4 bonds
Performance or Payment Bonds are not included in the system price. These bonds can be purchased on request but will be at additional cost.
SUEZ confidential and proprietary information
Page 8 of 9
3.5 pricing notes
All prices quoted are in USD.
Any applicable sales or value added tax is not included.
The Buyer will pay all applicable Local, State/Provincial, or Federal taxes and Duties.
The equipment delivery date, start date, and date of commencement of operations are to be negotiated.
Commercial Terms and Conditions shall be in accordance with Seller’s Standard Terms and Conditions of Sale.
3.6 conditional offering
Buyer understands that this proposal has been issued based upon the information provided by Buyer, and currently available to Seller, at the time of proposal issuance. Any changes or discrepancies in site conditions (including but not limited to system influent characteristics, changes in Environmental Health and Safety (“EH&S”) conditions, and/or newly discovered EH&S concerns, Buyer’s financial standing, Buyer’s requirements, or any other relevant change, or discrepancy in, the factual basis upon which this proposal was created, may lead to changes in the offering, including but not limited to changes in pricing, warranties, quoted specifications, or terms and conditions. Seller’s offering in this proposal is conditioned upon a full Seller EH&S, and Buyer financial review.

SUEZ confidential and proprietary information
Page 9 of 9
SUEZ Water Technologies & Solutions confidential and proprietary information
The following are trademarks of SUEZ Water Technologies & Solutions and may be registered in one or more countries:
InSight, ZeeWeed and ZENON.

APPENDIX D – HGE REPORT
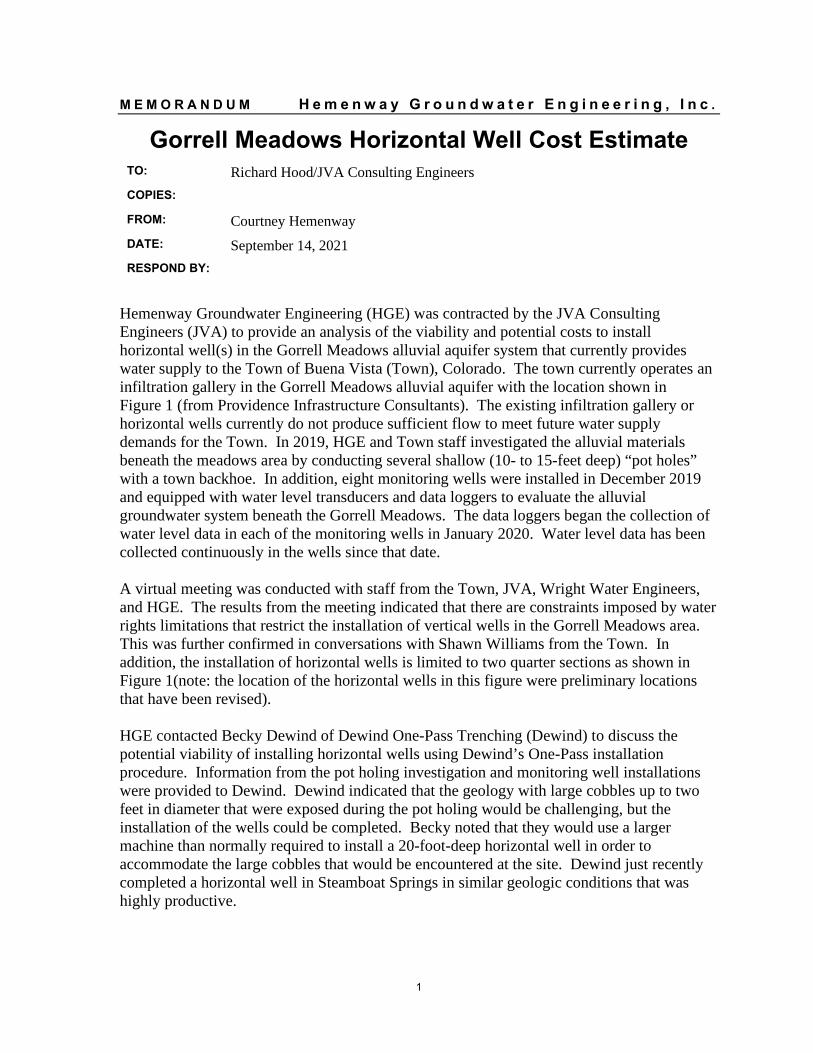
1
M E M O R A N D U M H e m e n w a y G r o u n d w a t e r E n g i n e e r i n g , I n c .
Gorrell Meadows Horizontal Well Cost Estimate TO: Richard Hood/JVA Consulting Engineers COPIES: FROM: Courtney Hemenway DATE: September 14, 2021 RESPOND BY:
Hemenway Groundwater Engineering (HGE) was contracted by the JVA Consulting Engineers (JVA) to provide an analysis of the viability and potential costs to install horizontal well(s) in the Gorrell Meadows alluvial aquifer system that currently provides water supply to the Town of Buena Vista (Town), Colorado. The town currently operates an infiltration gallery in the Gorrell Meadows alluvial aquifer with the location shown in Figure 1 (from Providence Infrastructure Consultants). The existing infiltration gallery or horizontal wells currently do not produce sufficient flow to meet future water supply demands for the Town. In 2019, HGE and Town staff investigated the alluvial materials beneath the meadows area by conducting several shallow (10- to 15-feet deep) “pot holes” with a town backhoe. In addition, eight monitoring wells were installed in December 2019 and equipped with water level transducers and data loggers to evaluate the alluvial groundwater system beneath the Gorrell Meadows. The data loggers began the collection of water level data in each of the monitoring wells in January 2020. Water level data has been collected continuously in the wells since that date. A virtual meeting was conducted with staff from the Town, JVA, Wright Water Engineers, and HGE. The results from the meeting indicated that there are constraints imposed by water rights limitations that restrict the installation of vertical wells in the Gorrell Meadows area. This was further confirmed in conversations with Shawn Williams from the Town. In addition, the installation of horizontal wells is limited to two quarter sections as shown in Figure 1(note: the location of the horizontal wells in this figure were preliminary locations that have been revised). HGE contacted Becky Dewind of Dewind One-Pass Trenching (Dewind) to discuss the potential viability of installing horizontal wells using Dewind’s One-Pass installation procedure. Information from the pot holing investigation and monitoring well installations were provided to Dewind. Dewind indicated that the geology with large cobbles up to two feet in diameter that were exposed during the pot holing would be challenging, but the installation of the wells could be completed. Becky noted that they would use a larger machine than normally required to install a 20-foot-deep horizontal well in order to accommodate the large cobbles that would be encountered at the site. Dewind just recently completed a horizontal well in Steamboat Springs in similar geologic conditions that was highly productive.
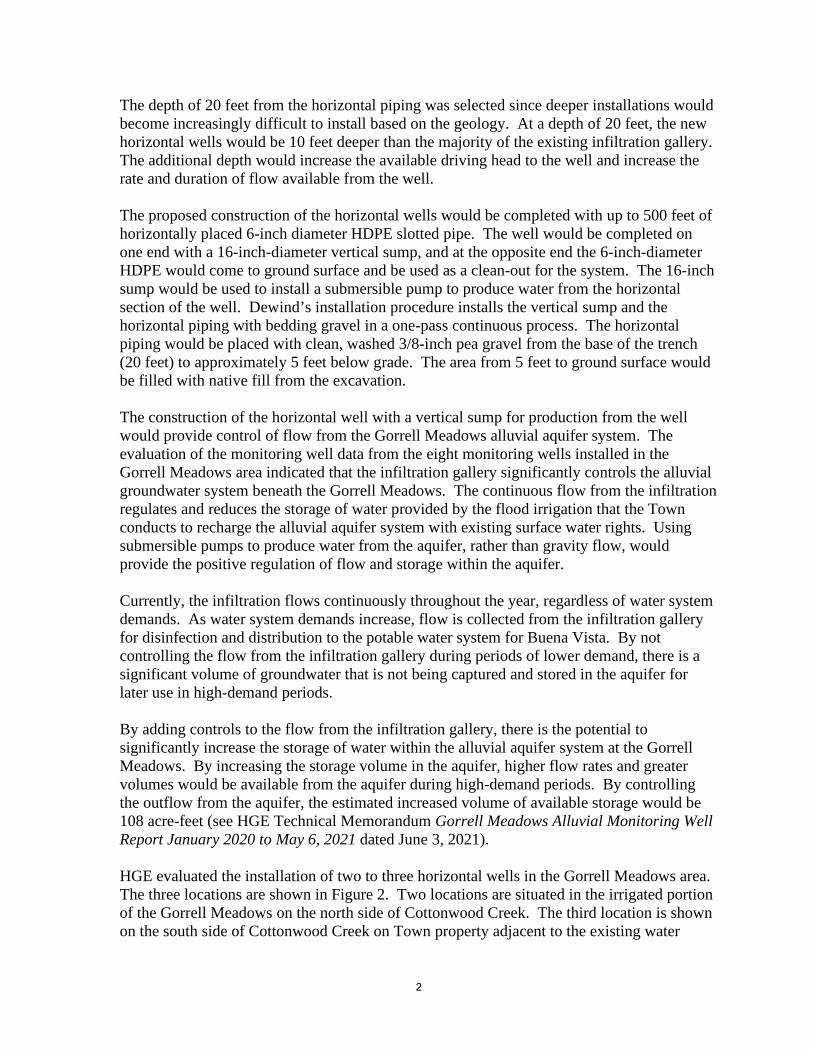
2
The depth of 20 feet from the horizontal piping was selected since deeper installations would become increasingly difficult to install based on the geology. At a depth of 20 feet, the new horizontal wells would be 10 feet deeper than the majority of the existing infiltration gallery. The additional depth would increase the available driving head to the well and increase the rate and duration of flow available from the well. The proposed construction of the horizontal wells would be completed with up to 500 feet of horizontally placed 6-inch diameter HDPE slotted pipe. The well would be completed on one end with a 16-inch-diameter vertical sump, and at the opposite end the 6-inch-diameter HDPE would come to ground surface and be used as a clean-out for the system. The 16-inch sump would be used to install a submersible pump to produce water from the horizontal section of the well. Dewind’s installation procedure installs the vertical sump and the horizontal piping with bedding gravel in a one-pass continuous process. The horizontal piping would be placed with clean, washed 3/8-inch pea gravel from the base of the trench (20 feet) to approximately 5 feet below grade. The area from 5 feet to ground surface would be filled with native fill from the excavation. The construction of the horizontal well with a vertical sump for production from the well would provide control of flow from the Gorrell Meadows alluvial aquifer system. The evaluation of the monitoring well data from the eight monitoring wells installed in the Gorrell Meadows area indicated that the infiltration gallery significantly controls the alluvial groundwater system beneath the Gorrell Meadows. The continuous flow from the infiltration regulates and reduces the storage of water provided by the flood irrigation that the Town conducts to recharge the alluvial aquifer system with existing surface water rights. Using submersible pumps to produce water from the aquifer, rather than gravity flow, would provide the positive regulation of flow and storage within the aquifer. Currently, the infiltration flows continuously throughout the year, regardless of water system demands. As water system demands increase, flow is collected from the infiltration gallery for disinfection and distribution to the potable water system for Buena Vista. By not controlling the flow from the infiltration gallery during periods of lower demand, there is a significant volume of groundwater that is not being captured and stored in the aquifer for later use in high-demand periods. By adding controls to the flow from the infiltration gallery, there is the potential to significantly increase the storage of water within the alluvial aquifer system at the Gorrell Meadows. By increasing the storage volume in the aquifer, higher flow rates and greater volumes would be available from the aquifer during high-demand periods. By controlling the outflow from the aquifer, the estimated increased volume of available storage would be 108 acre-feet (see HGE Technical Memorandum Gorrell Meadows Alluvial Monitoring Well Report January 2020 to May 6, 2021 dated June 3, 2021). HGE evaluated the installation of two to three horizontal wells in the Gorrell Meadows area. The three locations are shown in Figure 2. Two locations are situated in the irrigated portion of the Gorrell Meadows on the north side of Cottonwood Creek. The third location is shown on the south side of Cottonwood Creek on Town property adjacent to the existing water
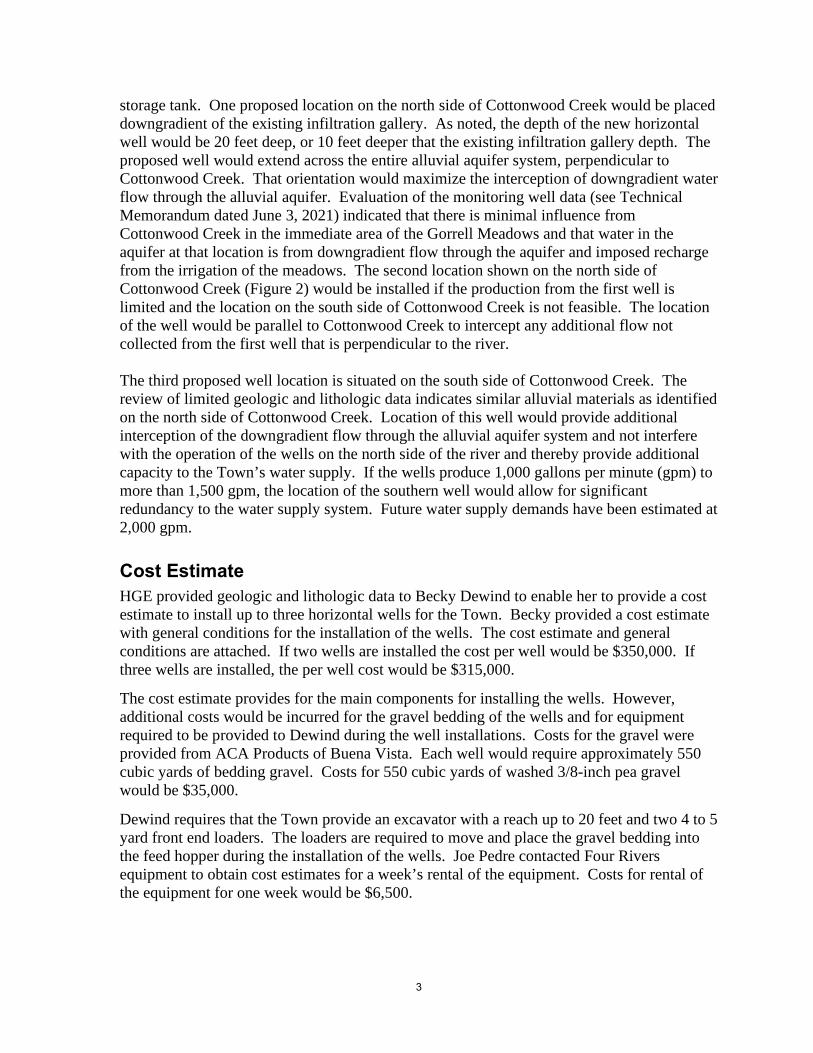
3
storage tank. One proposed location on the north side of Cottonwood Creek would be placed downgradient of the existing infiltration gallery. As noted, the depth of the new horizontal well would be 20 feet deep, or 10 feet deeper that the existing infiltration gallery depth. The proposed well would extend across the entire alluvial aquifer system, perpendicular to Cottonwood Creek. That orientation would maximize the interception of downgradient water flow through the alluvial aquifer. Evaluation of the monitoring well data (see Technical Memorandum dated June 3, 2021) indicated that there is minimal influence from Cottonwood Creek in the immediate area of the Gorrell Meadows and that water in the aquifer at that location is from downgradient flow through the aquifer and imposed recharge from the irrigation of the meadows. The second location shown on the north side of Cottonwood Creek (Figure 2) would be installed if the production from the first well is limited and the location on the south side of Cottonwood Creek is not feasible. The location of the well would be parallel to Cottonwood Creek to intercept any additional flow not collected from the first well that is perpendicular to the river. The third proposed well location is situated on the south side of Cottonwood Creek. The review of limited geologic and lithologic data indicates similar alluvial materials as identified on the north side of Cottonwood Creek. Location of this well would provide additional interception of the downgradient flow through the alluvial aquifer system and not interfere with the operation of the wells on the north side of the river and thereby provide additional capacity to the Town’s water supply. If the wells produce 1,000 gallons per minute (gpm) to more than 1,500 gpm, the location of the southern well would allow for significant redundancy to the water supply system. Future water supply demands have been estimated at 2,000 gpm. Cost Estimate HGE provided geologic and lithologic data to Becky Dewind to enable her to provide a cost estimate to install up to three horizontal wells for the Town. Becky provided a cost estimate with general conditions for the installation of the wells. The cost estimate and general conditions are attached. If two wells are installed the cost per well would be $350,000. If three wells are installed, the per well cost would be $315,000.
The cost estimate provides for the main components for installing the wells. However, additional costs would be incurred for the gravel bedding of the wells and for equipment required to be provided to Dewind during the well installations. Costs for the gravel were provided from ACA Products of Buena Vista. Each well would require approximately 550 cubic yards of bedding gravel. Costs for 550 cubic yards of washed 3/8-inch pea gravel would be $35,000.
Dewind requires that the Town provide an excavator with a reach up to 20 feet and two 4 to 5 yard front end loaders. The loaders are required to move and place the gravel bedding into the feed hopper during the installation of the wells. Joe Pedre contacted Four Rivers equipment to obtain cost estimates for a week’s rental of the equipment. Costs for rental of the equipment for one week would be $6,500.
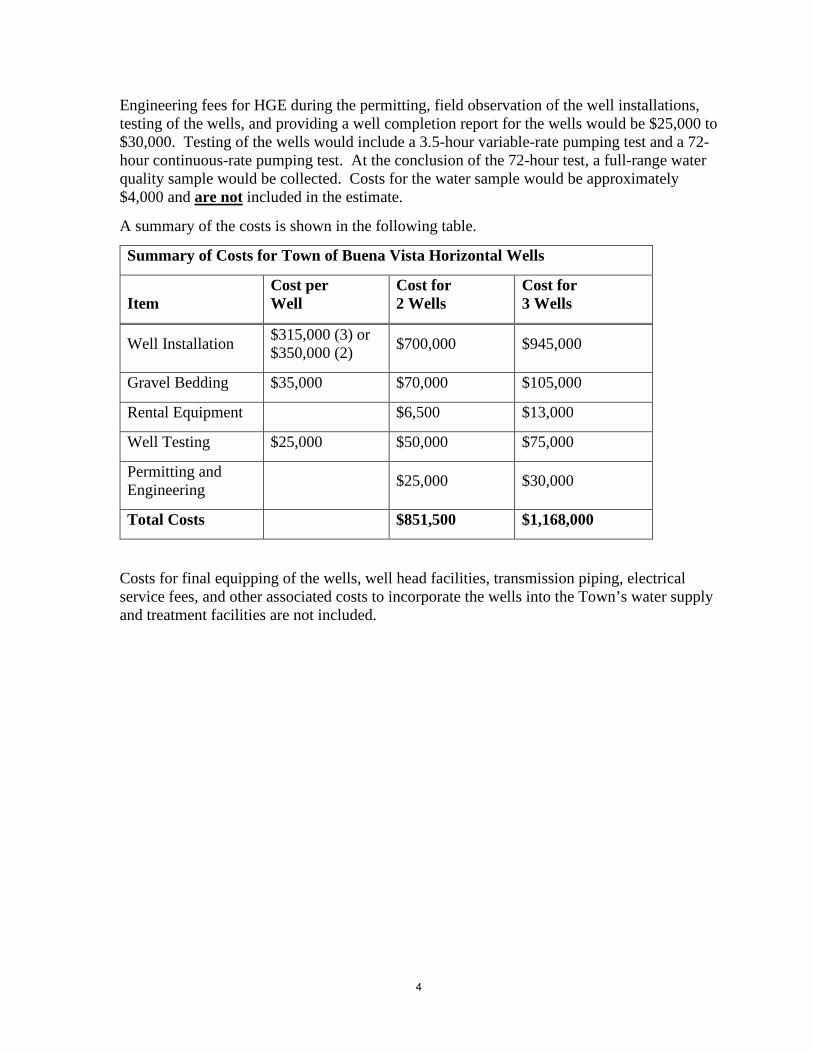
4
Engineering fees for HGE during the permitting, field observation of the well installations, testing of the wells, and providing a well completion report for the wells would be $25,000 to $30,000. Testing of the wells would include a 3.5-hour variable-rate pumping test and a 72-hour continuous-rate pumping test. At the conclusion of the 72-hour test, a full-range water quality sample would be collected. Costs for the water sample would be approximately $4,000 and are not included in the estimate.
A summary of the costs is shown in the following table.
Summary of Costs for Town of Buena Vista Horizontal Wells
Item Cost per Well
Cost for 2 Wells
Cost for 3 Wells
Well Installation $315,000 (3) or $350,000 (2) $700,000 $945,000
Gravel Bedding $35,000 $70,000 $105,000
Rental Equipment $6,500 $13,000
Well Testing $25,000 $50,000 $75,000
Permitting and Engineering $25,000 $30,000
Total Costs $851,500 $1,168,000
Costs for final equipping of the wells, well head facilities, transmission piping, electrical service fees, and other associated costs to incorporate the wells into the Town’s water supply and treatment facilities are not included.

5
FIGURES
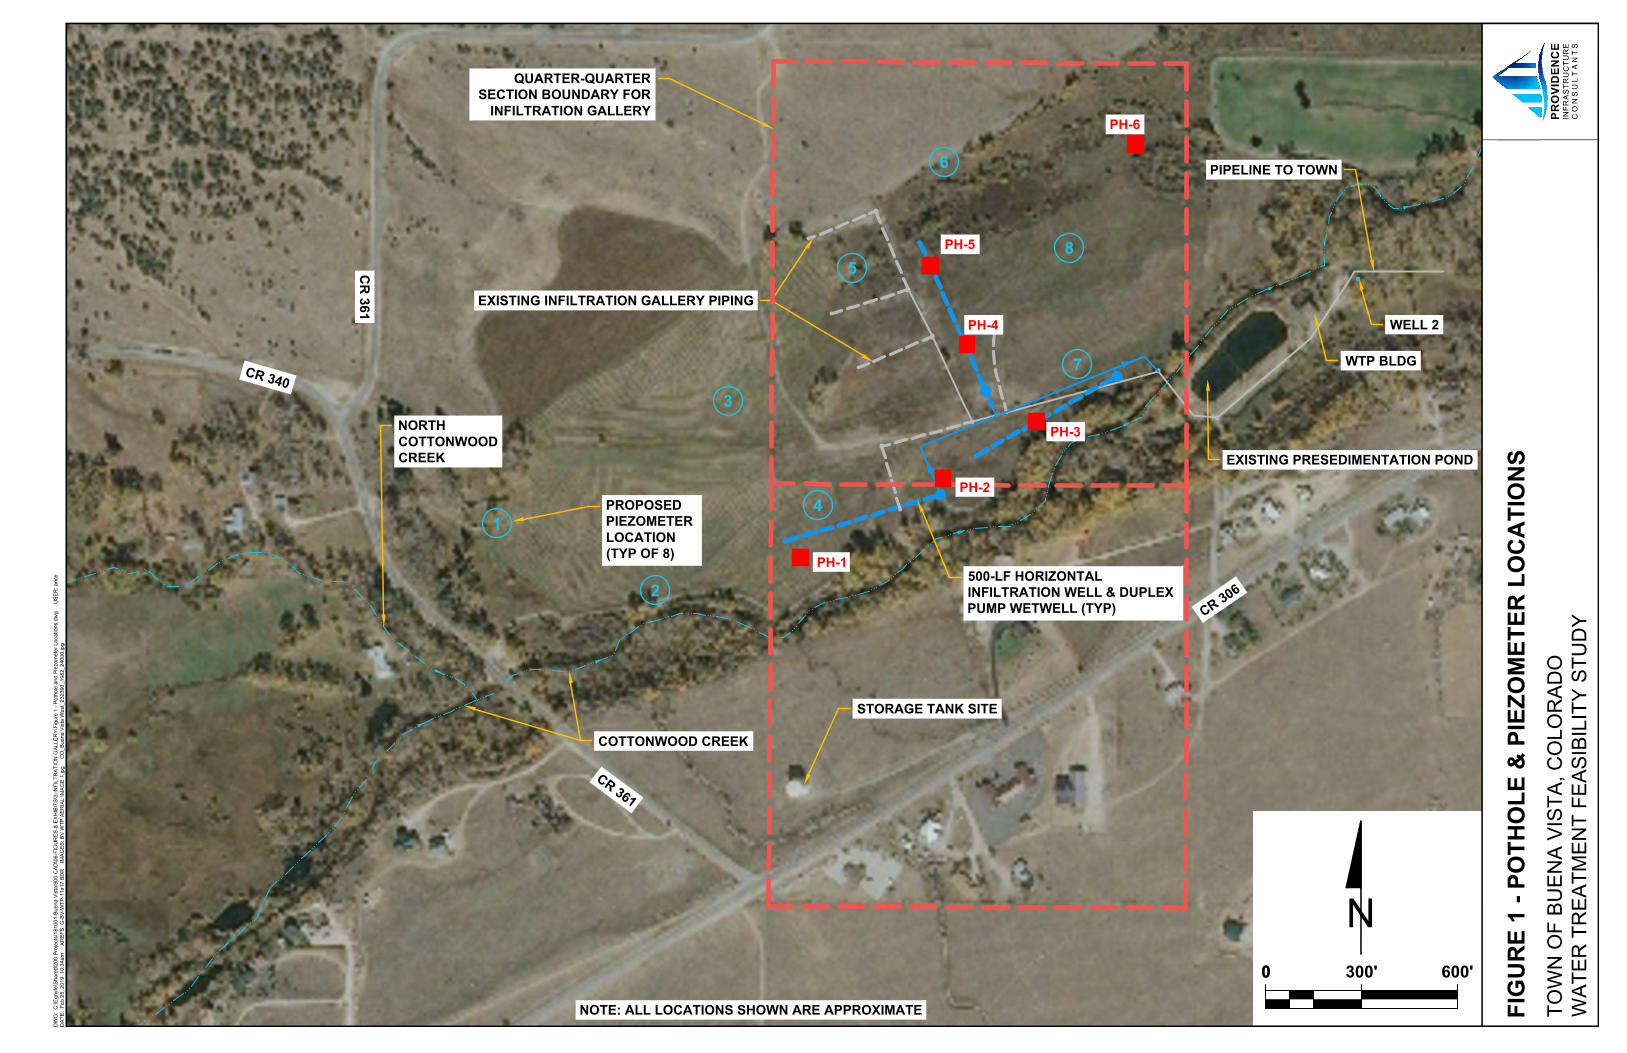
STORAGE TANK SITE
WELL 2
CR 306
EXISTING PRESEDIMENTATION POND
EXISTING INFILTRATION GALLERY PIPING
NORTHCOTTONWOODCREEK
COTTONWOOD CREEK
CR 361
CR 340
CR
361
PIPELINE TO TOWN
NOTE: ALL LOCATIONS SHOWN ARE APPROXIMATE
QUARTER-QUARTERSECTION BOUNDARY FOR
INFILTRATION GALLERY
WTP BLDG
500-LF HORIZONTALINFILTRATION WELL & DUPLEXPUMP WETWELL (TYP)
1
2
3
4
5
6
8
7
PH-6
PH-5
PH-4
PH-3
PH-2
PH-1
PROPOSEDPIEZOMETERLOCATION(TYP OF 8)
N
DW
G:
C:\E
gnyt
e\Sh
ared
\200
Pro
ject
s\18
1001
-Bue
na V
ista
\900
CAD
\06-
FIG
UR
ES &
EXH
IBIT
S\3-
INFI
LTR
ATIO
N G
ALLE
RY\
Figu
re 1
- Po
thol
e an
d Pi
ezom
eter
Loc
atio
ns.d
wg
U
SER
: aric
eD
ATE:
Feb
25,
201
9 1
0:34
am
XR
EFS:
G-B
V-W
TP-1
1x17
BD
R
IMAG
ES: B
V W
TP A
ERIA
L IM
AGE
1.jp
g
CO
_Bue
na V
ista
Wes
t_23
2390
_198
2_24
000.
jpg
TOW
N O
F BU
ENA
VIST
A, C
OLO
RAD
OW
ATER
TR
EATM
ENT
FEAS
IBIL
ITY
STU
DY
PRO
VIDE
NCE
INFR
ASTR
UC
TUR
EC
ON
SU
LT
AN
TS
FIG
UR
E 1
- PO
THO
LE &
PIE
ZOM
ETER
LO
CA
TIO
NS
00 300' 600'
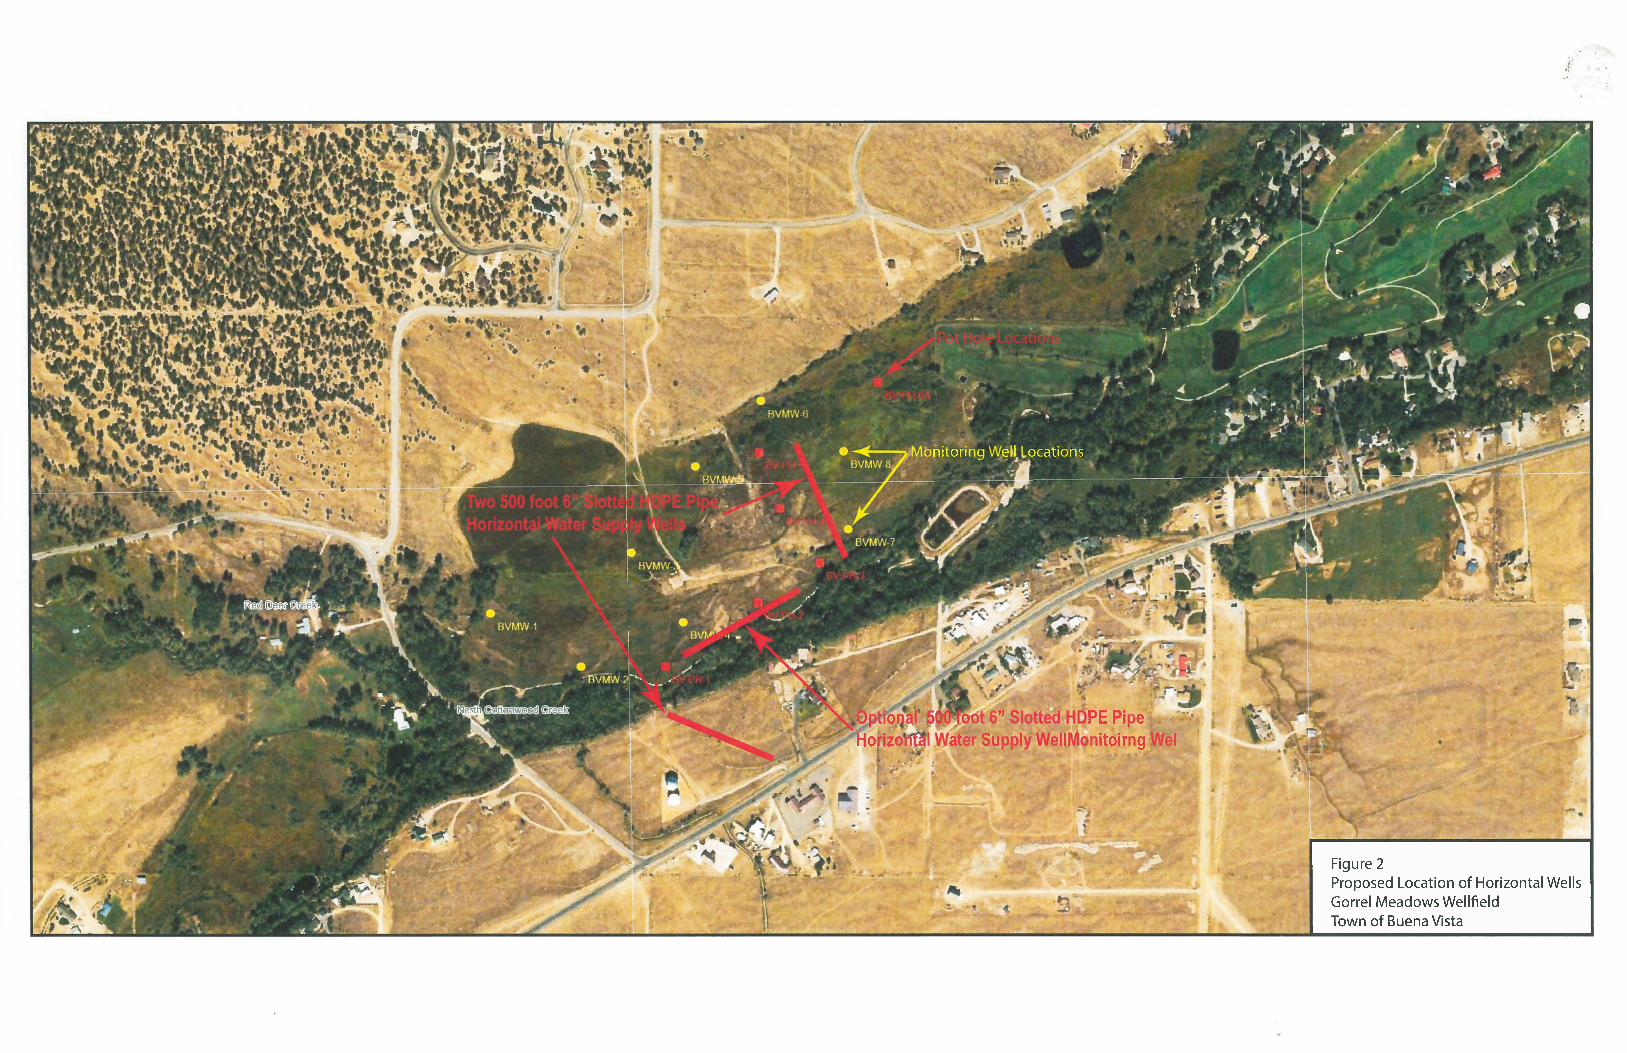
6
DEWIND COST ESTIMATE
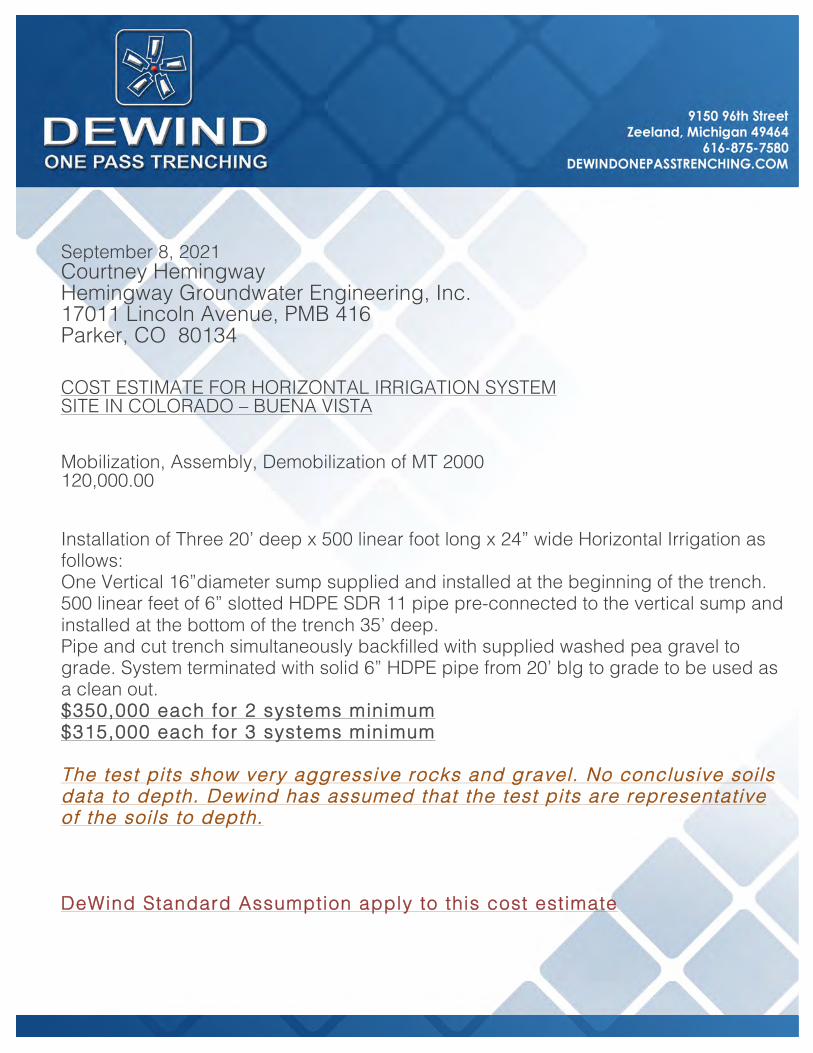
September 8, 2021 Courtney Hemingway Hemingway Groundwater Engineering, Inc. 17011 Lincoln Avenue, PMB 416 Parker, CO 80134 COST ESTIMATE FOR HORIZONTAL IRRIGATION SYSTEM SITE IN COLORADO – BUENA VISTA Mobilization, Assembly, Demobilization of MT 2000 120,000.00 Installation of Three 20’ deep x 500 linear foot long x 24” wide Horizontal Irrigation as follows: One Vertical 16”diameter sump supplied and installed at the beginning of the trench. 500 linear feet of 6” slotted HDPE SDR 11 pipe pre-connected to the vertical sump and installed at the bottom of the trench 35’ deep. Pipe and cut trench simultaneously backfilled with supplied washed pea gravel to grade. System terminated with solid 6” HDPE pipe from 20’ blg to grade to be used as a clean out. $350,000 each for 2 systems minimum $315,000 each for 3 systems minimum The test pits show very aggressive rocks and gravel. No conclusive soils data to depth. Dewind has assumed that the test pits are representative of the soils to depth.
DeWind Standard Assumption apply to this cost estimate
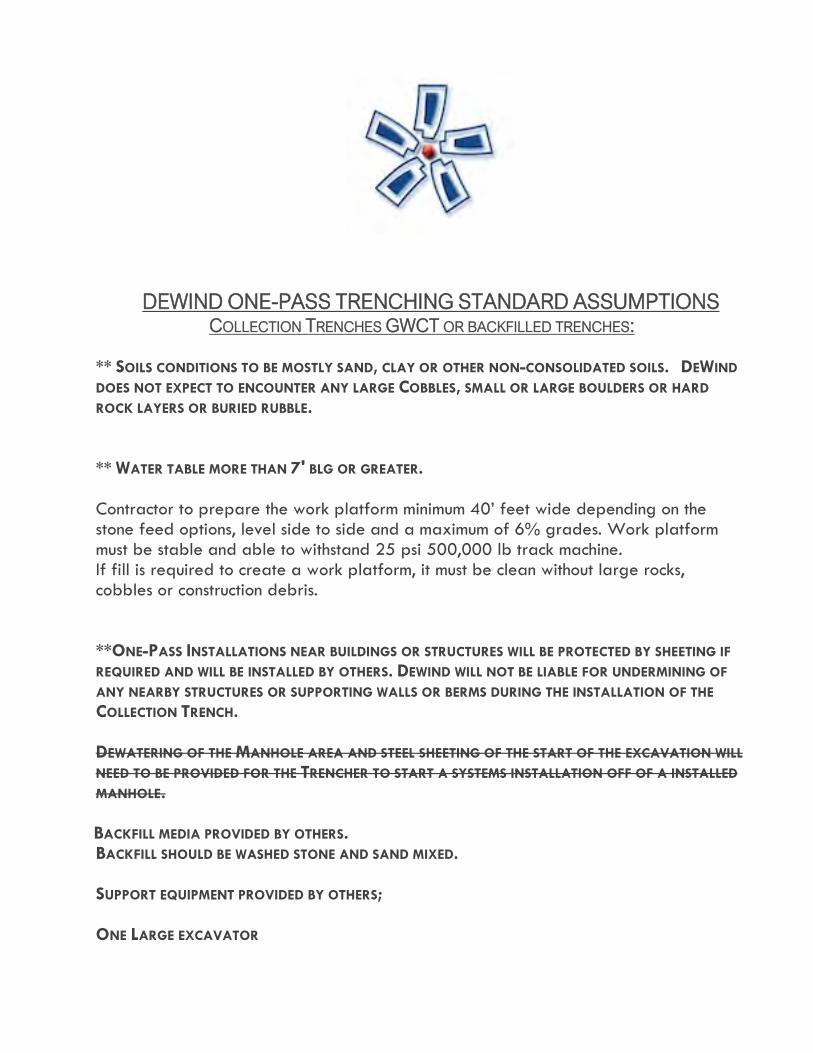
DEWIND ONE-PASS TRENCHING STANDARD ASSUMPTIONS COLLECTION TRENCHES GWCT OR BACKFILLED TRENCHES:
** SOILS CONDITIONS TO BE MOSTLY SAND, CLAY OR OTHER NON-CONSOLIDATED SOILS. DEWIND DOES NOT EXPECT TO ENCOUNTER ANY LARGE COBBLES, SMALL OR LARGE BOULDERS OR HARD ROCK LAYERS OR BURIED RUBBLE. ** WATER TABLE MORE THAN 7' BLG OR GREATER. Contractor to prepare the work platform minimum 40’ feet wide depending on the stone feed options, level side to side and a maximum of 6% grades. Work platform must be stable and able to withstand 25 psi 500,000 lb track machine. If fill is required to create a work platform, it must be clean without large rocks, cobbles or construction debris.
**ONE-PASS INSTALLATIONS NEAR BUILDINGS OR STRUCTURES WILL BE PROTECTED BY SHEETING IF REQUIRED AND WILL BE INSTALLED BY OTHERS. DEWIND WILL NOT BE LIABLE FOR UNDERMINING OF ANY NEARBY STRUCTURES OR SUPPORTING WALLS OR BERMS DURING THE INSTALLATION OF THE COLLECTION TRENCH. DEWATERING OF THE MANHOLE AREA AND STEEL SHEETING OF THE START OF THE EXCAVATION WILL NEED TO BE PROVIDED FOR THE TRENCHER TO START A SYSTEMS INSTALLATION OFF OF A INSTALLED MANHOLE.
BACKFILL MEDIA PROVIDED BY OTHERS. BACKFILL SHOULD BE WASHED STONE AND SAND MIXED.
SUPPORT EQUIPMENT PROVIDED BY OTHERS;
ONE LARGE EXCAVATOR
TWO 4-5 YARD LOADERS. ONE SET OF FORKS MANLIFT STONE BOX 75 KW GEN SET LARGER TRENCHES REQUIRE A CRANE FOR ASSEMBLY ** NO UNION LABOR REQUIRED. ** NO FEDERAL, STATE OR LOCAL WAGES REQUIRED. ** SITE CONDITIONS ARE LEVEL D. ** DEWIND WILL NOT BE REQUIRED TO PROVIDE PERFORMANCE BOND. * WINTER WORK EXCLUDED. ** DEWIND WILL BE ALLOWED TO WORK ALL DAY LIGHT HOURS 7 DAYS A WEEK. ** CONTRACTOR WILL PROVIDE ANY REQUIRED SITE SAFETY, CONSTRUCTION SUPPORT, AND/OR ENGINEERING OVERSITE REQUIRED TO WORK 7 DAYS A WEEK 10 HOUR DAYS. THE INSTALLATION OF THE COLLECTION TRENCH WILL BE CONSECUTIVE AND UNINTERUPTED
WITHOUT DELAYS. CONTRACTOR IS RESPONSIBLE FOR THE FOLLOWING: ** PROVIDED CLEAR ACCESS INTO THE SITE FOR THE TRENCHER AND CONTRUCTION
EQUIPMENT. ** A STABLE WORK AREA AND SITE PATH FOR THE EQUIPMENT MUST BE PROVIDED. ** IF REQUIRED, THE CONTRACTOR IS RESPONSIBLE FOR THE SUPPLY AND MANAGEMENT OF
CRANE MATS. WORKING OFF CRANE MATS WILL BE AN ADDITIONAL COST. TBD ** SURVEY STAKING OF THE COLLECTION TRENCH ALIGNMENTS CENTERLINE WITH AN
ADDITIONAL SET OF STAKES OFF SET 20’ FROM CENTERLINE. ** ALL SITE PREP AND RESTORATION INCLUDING SPOILS HANDLING BY OTHERS.
** PERMITS OR APPROVALS, ENGINEER DRAWINGS AND POST AS BUILT DRAWINGS. ** SITE RESTORATION BY OTHERS. ** DEWIND ASSUMES THE TRENCHER CAN BE POWER WASHED OFF OVER THE NEWLY
INSTALLED GWCT AND WASH WATER CAN PURCULATE DOWN THRU THE SOILS. IF A WASH
PAD AND MANAGEMENT OF WASH WATER IS REQUIRED THAT TASK WILL BE BY OTHERS ** SITE SAFETY AND AIR MONITORING BY OTHERS IF REQUIRED. ** ANY SUPPORT DEWIND MAY UNEXPECTEDLY NEED DURING THE INSTALLATION. CANADIAN PROJECTS: GST OR PST IS NOT INCLUDED IN THE PROPOSAL ALL PRICES ARE IN USD NO WINTER WORK. HAULING DURING FROST LAW SEASON EXTRA. PERMA FROST MUST BE OUT OF THE GROUND BEFORE INSTALLATIONS. ** NO PERFORMANCE BONDS will not be provided– Due to the cost savings provided by utilizing the DeWind One-Pass Trenching Technology DeWind will not provide performance Bonds for GWCT’s.

APPENDIX E – O&M COSTS AND OPCS
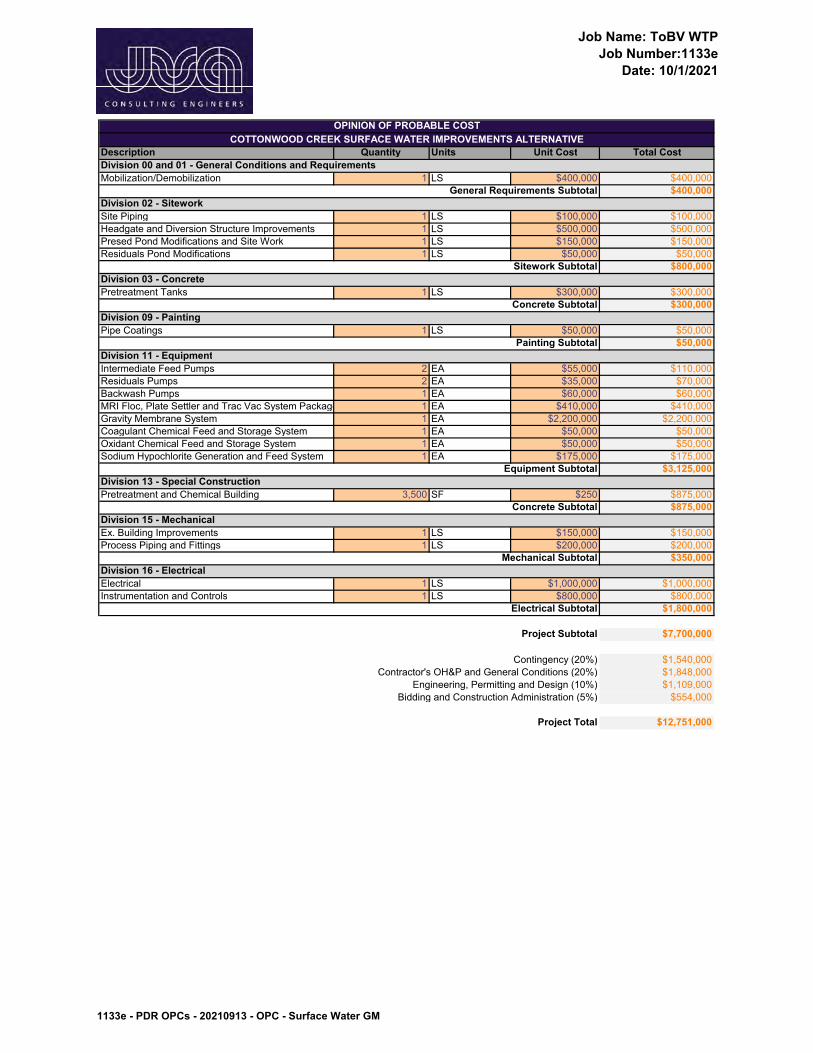
Job Name: ToBV WTP
Job Number:1133e
Date: 10/1/2021
Description Quantity Units Unit Cost Total Cost
Mobilization/Demobilization 1 LS $400,000 $400,000
$400,000
Site Piping 1 LS $100,000 $100,000
Headgate and Diversion Structure Improvements 1 LS $500,000 $500,000
Presed Pond Modifications and Site Work 1 LS $150,000 $150,000
Residuals Pond Modifications 1 LS $50,000 $50,000
$800,000
Pretreatment Tanks 1 LS $300,000 $300,000
$300,000
Pipe Coatings 1 LS $50,000 $50,000
$50,000
Intermediate Feed Pumps 2 EA $55,000 $110,000
Residuals Pumps 2 EA $35,000 $70,000
Backwash Pumps 1 EA $60,000 $60,000
MRI Floc, Plate Settler and Trac Vac System Package 1 EA $410,000 $410,000
Gravity Membrane System 1 EA $2,200,000 $2,200,000
Coagulant Chemical Feed and Storage System 1 EA $50,000 $50,000
Oxidant Chemical Feed and Storage System 1 EA $50,000 $50,000
Sodium Hypochlorite Generation and Feed System 1 EA $175,000 $175,000
$3,125,000
Pretreatment and Chemical Building 3,500 SF $250 $875,000
$875,000
Ex. Building Improvements 1 LS $150,000 $150,000
Process Piping and Fittings 1 LS $200,000 $200,000
$350,000
Electrical 1 LS $1,000,000 $1,000,000
Instrumentation and Controls 1 LS $800,000 $800,000
$1,800,000
Project Subtotal $7,700,000
Contingency (20%) $1,540,000
Contractor's OH&P and General Conditions (20%) $1,848,000
Engineering, Permitting and Design (10%) $1,109,000
Bidding and Construction Administration (5%) $554,000
Project Total $12,751,000
OPINION OF PROBABLE COST
Equipment Subtotal
Division 15 - Mechanical
Division 13 - Special Construction
Concrete Subtotal
Electrical Subtotal
Division 16 - Electrical
Mechanical Subtotal
Division 02 - Sitework
Division 03 - Concrete
Division 09 - Painting
Sitework Subtotal
Concrete Subtotal
Division 11 - Equipment
Painting Subtotal
COTTONWOOD CREEK SURFACE WATER IMPROVEMENTS ALTERNATIVE
Division 00 and 01 - General Conditions and Requirements
General Requirements Subtotal
1133e - PDR OPCs - 20210913 - OPC - Surface Water GM
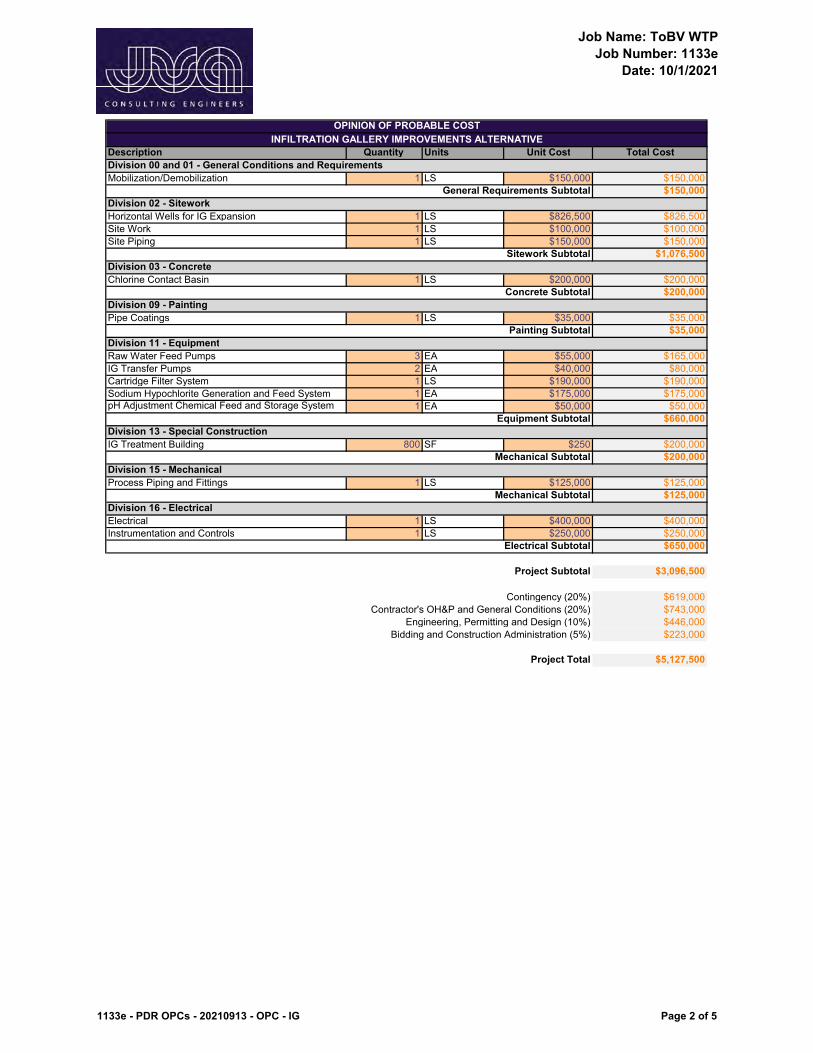
Job Name: ToBV WTP
Job Number: 1133e
Date: 10/1/2021
Description Quantity Units Unit Cost Total Cost
Mobilization/Demobilization 1 LS $150,000 $150,000
$150,000
Horizontal Wells for IG Expansion 1 LS $826,500 $826,500
Site Work 1 LS $100,000 $100,000
Site Piping 1 LS $150,000 $150,000
$1,076,500
Chlorine Contact Basin 1 LS $200,000 $200,000
$200,000
Pipe Coatings 1 LS $35,000 $35,000
$35,000
Raw Water Feed Pumps 3 EA $55,000 $165,000
IG Transfer Pumps 2 EA $40,000 $80,000
Cartridge Filter System 1 LS $190,000 $190,000
Sodium Hypochlorite Generation and Feed System 1 EA $175,000 $175,000pH Adjustment Chemical Feed and Storage System 1 EA $50,000 $50,000
$660,000
IG Treatment Building 800 SF $250 $200,000
$200,000
Process Piping and Fittings 1 LS $125,000 $125,000
$125,000
Electrical 1 LS $400,000 $400,000
Instrumentation and Controls 1 LS $250,000 $250,000
$650,000
Project Subtotal $3,096,500
Contingency (20%) $619,000
Contractor's OH&P and General Conditions (20%) $743,000
Engineering, Permitting and Design (10%) $446,000
Bidding and Construction Administration (5%) $223,000
Project Total $5,127,500
OPINION OF PROBABLE COST
Sitework Subtotal
Division 03 - Concrete
Concrete Subtotal
Division 09 - Painting
Painting Subtotal
Division 11 - Equipment
Equipment Subtotal
Division 15 - Mechanical
Mechanical Subtotal
Division 16 - Electrical
Electrical Subtotal
Division 13 - Special Construction
Mechanical Subtotal
INFILTRATION GALLERY IMPROVEMENTS ALTERNATIVE
Division 00 and 01 - General Conditions and Requirements
General Requirements Subtotal
Division 02 - Sitework
1133e - PDR OPCs - 20210913 - OPC - IG Page 2 of 5
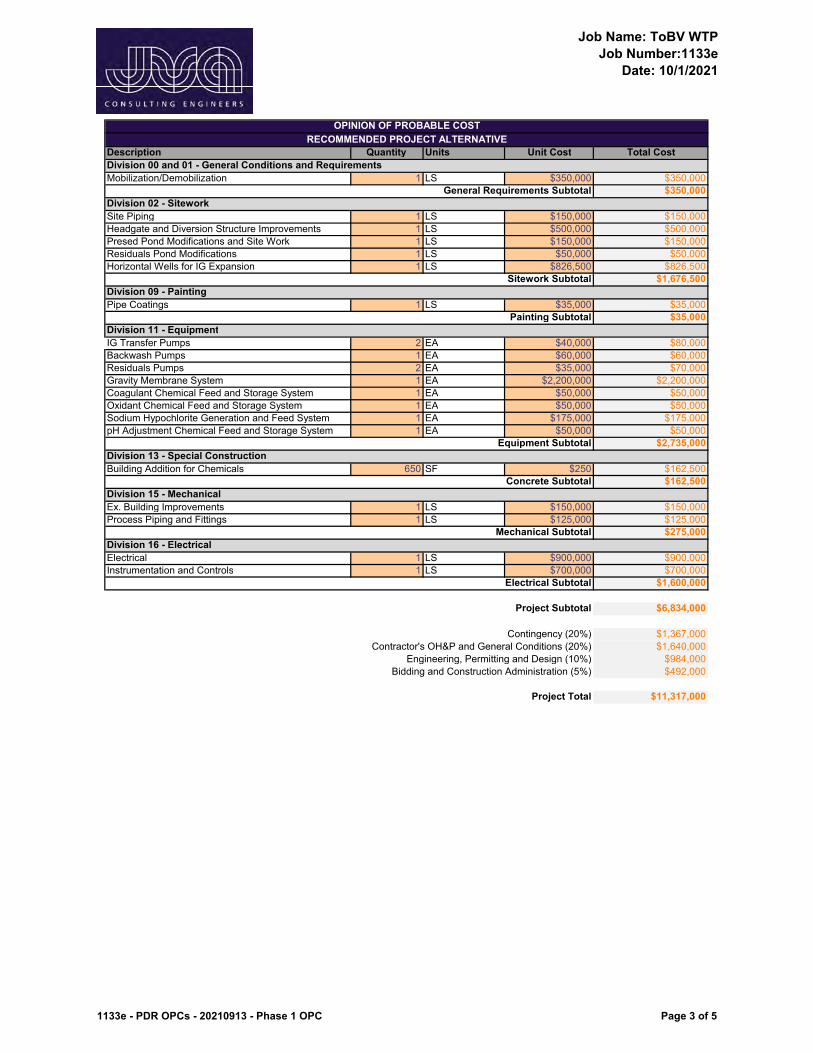
Job Name: ToBV WTP
Job Number:1133e
Date: 10/1/2021
Description Quantity Units Unit Cost Total Cost
Mobilization/Demobilization 1 LS $350,000 $350,000
$350,000
Site Piping 1 LS $150,000 $150,000
Headgate and Diversion Structure Improvements 1 LS $500,000 $500,000
Presed Pond Modifications and Site Work 1 LS $150,000 $150,000
Residuals Pond Modifications 1 LS $50,000 $50,000
Horizontal Wells for IG Expansion 1 LS $826,500 $826,500
$1,676,500
Pipe Coatings 1 LS $35,000 $35,000
$35,000
IG Transfer Pumps 2 EA $40,000 $80,000
Backwash Pumps 1 EA $60,000 $60,000
Residuals Pumps 2 EA $35,000 $70,000
Gravity Membrane System 1 EA $2,200,000 $2,200,000
Coagulant Chemical Feed and Storage System 1 EA $50,000 $50,000
Oxidant Chemical Feed and Storage System 1 EA $50,000 $50,000
Sodium Hypochlorite Generation and Feed System 1 EA $175,000 $175,000
pH Adjustment Chemical Feed and Storage System 1 EA $50,000 $50,000
$2,735,000
Building Addition for Chemicals 650 SF $250 $162,500
$162,500
Ex. Building Improvements 1 LS $150,000 $150,000
Process Piping and Fittings 1 LS $125,000 $125,000
$275,000
Electrical 1 LS $900,000 $900,000
Instrumentation and Controls 1 LS $700,000 $700,000
$1,600,000
Project Subtotal $6,834,000
Contingency (20%) $1,367,000
Contractor's OH&P and General Conditions (20%) $1,640,000
Engineering, Permitting and Design (10%) $984,000
Bidding and Construction Administration (5%) $492,000
Project Total $11,317,000
General Requirements Subtotal
Division 02 - Sitework
Sitework Subtotal
Division 09 - Painting
Painting Subtotal
Division 11 - Equipment
OPINION OF PROBABLE COST
RECOMMENDED PROJECT ALTERNATIVE
Division 00 and 01 - General Conditions and Requirements
Electrical Subtotal
Division 13 - Special Construction
Concrete Subtotal
Equipment Subtotal
Division 15 - Mechanical
Mechanical Subtotal
Division 16 - Electrical
1133e - PDR OPCs - 20210913 - Phase 1 OPC Page 3 of 5
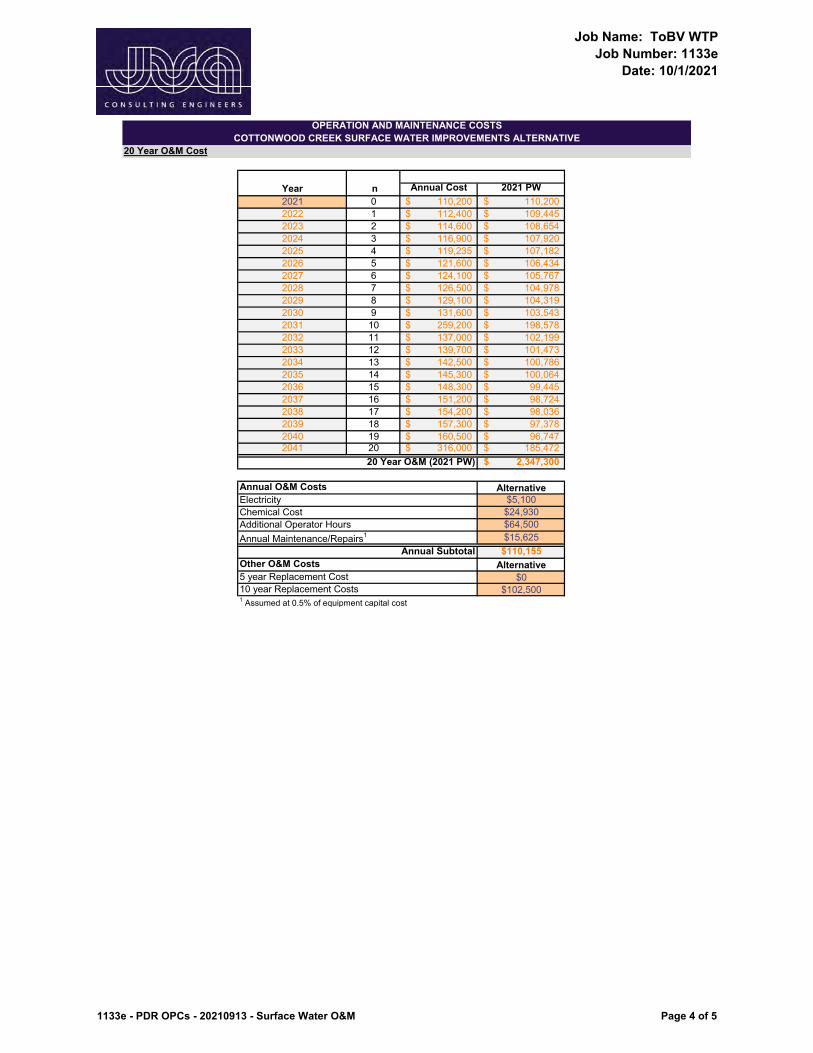
Job Name: ToBV WTP
Job Number: 1133e
Date: 10/1/2021
20 Year O&M Cost
Annual Cost 2021 PW
2021 0 110,200$ 110,200$
2022 1 112,400$ 109,445$
2023 2 114,600$ 108,654$
2024 3 116,900$ 107,920$
2025 4 119,235$ 107,182$
2026 5 121,600$ 106,434$
2027 6 124,100$ 105,767$
2028 7 126,500$ 104,978$
2029 8 129,100$ 104,319$
2030 9 131,600$ 103,543$
2031 10 259,200$ 198,578$
2032 11 137,000$ 102,199$
2033 12 139,700$ 101,473$
2034 13 142,500$ 100,786$
2035 14 145,300$ 100,064$
2036 15 148,300$ 99,445$
2037 16 151,200$ 98,724$
2038 17 154,200$ 98,036$
2039 18 157,300$ 97,378$
2040 19 160,500$ 96,747$ 2041 20 316,000$ 185,472$
2,347,300$
Alternative$5,100
$24,930
$64,500
$15,625
$110,155
Alternative
$0
$102,5001 Assumed at 0.5% of equipment capital cost
OPERATION AND MAINTENANCE COSTS
Other O&M Costs
10 year Replacement Costs
5 year Replacement Cost
Annual Subtotal
Chemical Cost
COTTONWOOD CREEK SURFACE WATER IMPROVEMENTS ALTERNATIVE
Electricity
Annual Maintenance/Repairs1
Annual O&M Costs
Year n
20 Year O&M (2021 PW)
Additional Operator Hours
1133e - PDR OPCs - 20210913 - Surface Water O&M Page 4 of 5
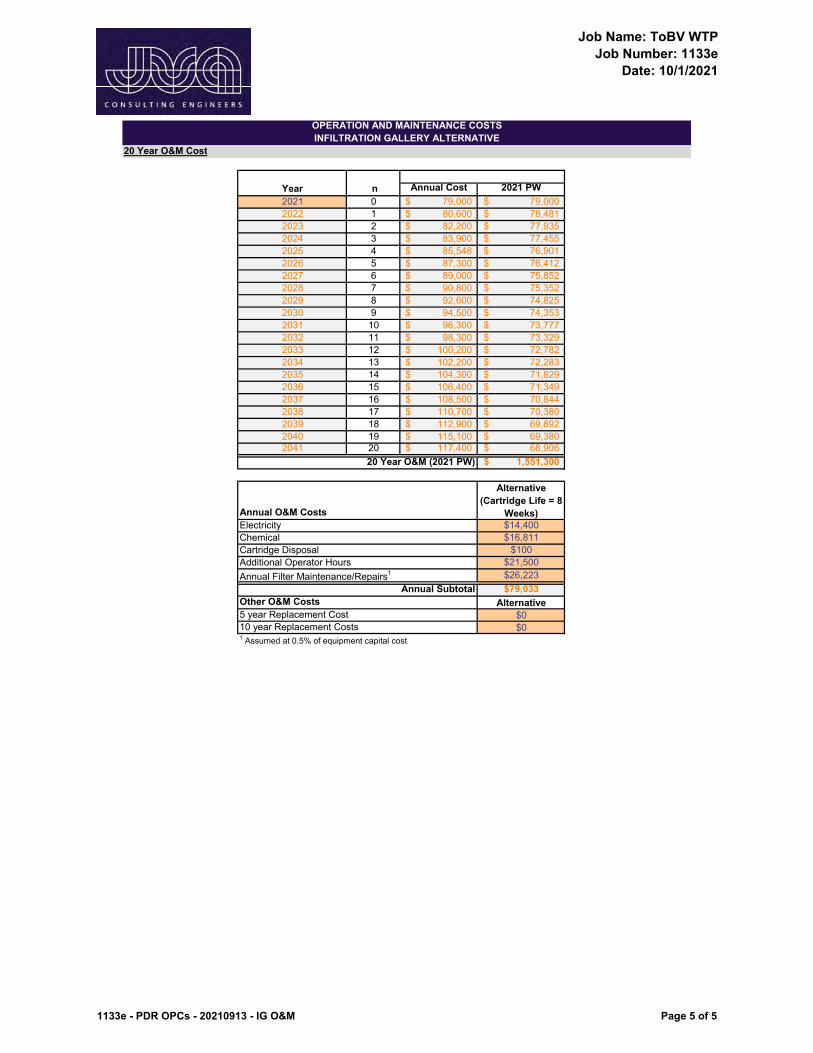
Job Name: ToBV WTP
Job Number: 1133e
Date: 10/1/2021
20 Year O&M Cost
Annual Cost 2021 PW
2021 0 79,000$ 79,000$
2022 1 80,600$ 78,481$
2023 2 82,200$ 77,935$
2024 3 83,900$ 77,455$
2025 4 85,548$ 76,901$
2026 5 87,300$ 76,412$
2027 6 89,000$ 75,852$
2028 7 90,800$ 75,352$
2029 8 92,600$ 74,825$
2030 9 94,500$ 74,353$
2031 10 96,300$ 73,777$
2032 11 98,300$ 73,329$
2033 12 100,200$ 72,782$
2034 13 102,200$ 72,283$
2035 14 104,300$ 71,829$
2036 15 106,400$ 71,349$
2037 16 108,500$ 70,844$
2038 17 110,700$ 70,380$
2039 18 112,900$ 69,892$
2040 19 115,100$ 69,380$ 2041 20 117,400$ 68,906$
1,551,300$
Alternative
(Cartridge Life = 8
Weeks)$14,400
$16,811
$100
$21,500
$26,223
$79,033
Alternative
$0
$01 Assumed at 0.5% of equipment capital cost
OPERATION AND MAINTENANCE COSTS
Annual O&M Costs
Electricity
Chemical
Cartridge Disposal
Annual Filter Maintenance/Repairs1
Annual Subtotal
Other O&M Costs
5 year Replacement Cost
10 year Replacement Costs
Additional Operator Hours
20 Year O&M (2021 PW)
INFILTRATION GALLERY ALTERNATIVE
Year n
1133e - PDR OPCs - 20210913 - IG O&M Page 5 of 5


