Embed Size (px)
Citation preview

Watershed Hydrology
Runoff

Fig. Surface and subsurface processes occurring at a watershed or basin scale.
Runoff
Surface Runoff Subsurface Runoff
StreamflowOverlandFlow
VadoseZoneFlow
GW Flow
Streamflow (Total Runoff) = Overland
Flow + Baseflow + Interflow
Vadose-Zone Flow = Deep Percolation +
Shallow Interflow +
Deep Interflow
Groundwater Flow = Baseflow + Other
GW Discharge
Direct Runoff = Overland Flow +
Interflow+ rainfall
on the surface of the
stream
Direct Runoff -It is the part of the runoff which enters the stream immediately after
the rainfall.
Base flow- The delayed flow that reaches a stream essentially as groundwater flow.

Effluent stream- The streams which receive groundwater flow.
Influent stream- The streams which contribute to the groundwater flow.


The main factors affecting the runoff from a catchment
area are:
a) Precipitation characteristics
(Intensity and Duration)
b) Shape and size of catchment
c) Topography
d) Geologic characteristics
e) Meteorological characteristics
(Temperature, wind speed, and humidity)
f) Storage characteristics of a catchment
Factors Affecting Runoff

Topography
Soil
Geology
Vegetation
Land use
Stream network
Principal factors contributing to variability of hydrologic
processes are
Types of Watersheds
Size **
Land use **
Mean slope
Length
Runoff volume
Peak discharge
Time to peak runoff
Base flow
Infiltration rate
Evapotranspiration
Interception
Erosion
Affects
Mini Watershed:0.1 ha- 100 haMicro Watershed: 100 ha -1000 haMili Watershed: 1000 ha- 10000haSub Watershed: 10000 ha- 50000 haWatershed: 50000 ha-2 lakh haCatchment : 2 -1 0 lakh haBasin: 10- 50 lakh ha

Classification of Watersheds by Size
SIZE AREA (km2)
Small <250
Medium 250 to 2500
Large >2500

Estimation of Peak Runoff Rate
Consider a rainfall of uniform intensity and very long duration
occurring over a basin/watershed/catchment.
Time taken for a drop of water from the farthest part of the
catchment to reach the outlet as tc= time of concentration, it is
obvious that if the rainfall continues beyond tc, the runoff will be
constant and at the peak value.
The runoff rate gradually increases from zero to a constant value

Peak Runoff Rate
Where,
C is coefficient of runoff = (runoff/rainfall),
A is area of the catchment (ha)
I is the mean intensity of rainfall (mm/hr) for a duration equal to tc .
(rational method)
Time of Concentration(tc)
tc = 0.01947 L0.77S−0.385
Where,
tc is time of concentration (minutes);
L is maximum length of travel of water(m)
S is slope of the catchment = ΔH/L (ΔH is difference in elevation
between the most remote point on the catchment and the outlet)
Kirpich Equation (1940)


An urban catchment has an area of 85 ha. The slope of the
catchment is 0.006 and the maximum length of travel of water is
950m. The maximum depth of rainfall with a 25 year return period
is as below:
Duration (min) 5 10 20 30 40 60
Depth of rainfall (mm) 17 26 40 50 57 62
If a culvert for drainage at the outlet of this area is to be designed for a
return period of 25 years, estimate the required peak-flow rate, by assuming
the runoff coefficient as 0.3.
If in the urban area of, the land use of the area and the corresponding runoff
coefficient are as given below, calculate the equivalent runoff coefficient.
Land Use Area (ha) Runoff coefficient
Roads 8 0.7
Lawn 17 0.1
Residential area 50 0.3
Industrial area 10 0.8

Large watersheds
Less sensitive to high-intensity-rainfalls of short
duration
Well-developed channel networks and channel phase,
and, thus, channel storage is dominant.
Dominant land phase and overland flow.
Relatively less evident channel phase.
Highly sensitive to high-intensity, short duration rainfalls.
Small watersheds

Two watersheds of the same size may behave very
differently if they do not have similar land and channel
phases
Small watersheds are usually least heterogeneous and
large watersheds are most heterogeneous (Spatial
variability of watershed characteristics increases with
size).
As the watershed size increases, storage increases and
averaging of hydrologic processes increases as a result.
The effect of averaging is to linearise the watershed
behavior. On the average, small watersheds are more
nonlinear than large watersheds

Classification of Watersheds by Land Use
Urban watersheds: urban hydrology
Agricultural watersheds: agricultural hydrology
Forest watersheds: forest hydrology
Mountainous watersheds: mountain hydrology
Desert watersheds: desert hydrology
Coastal watersheds: coastal hydrology
Wetland/marsh watersheds: wetland hydrology
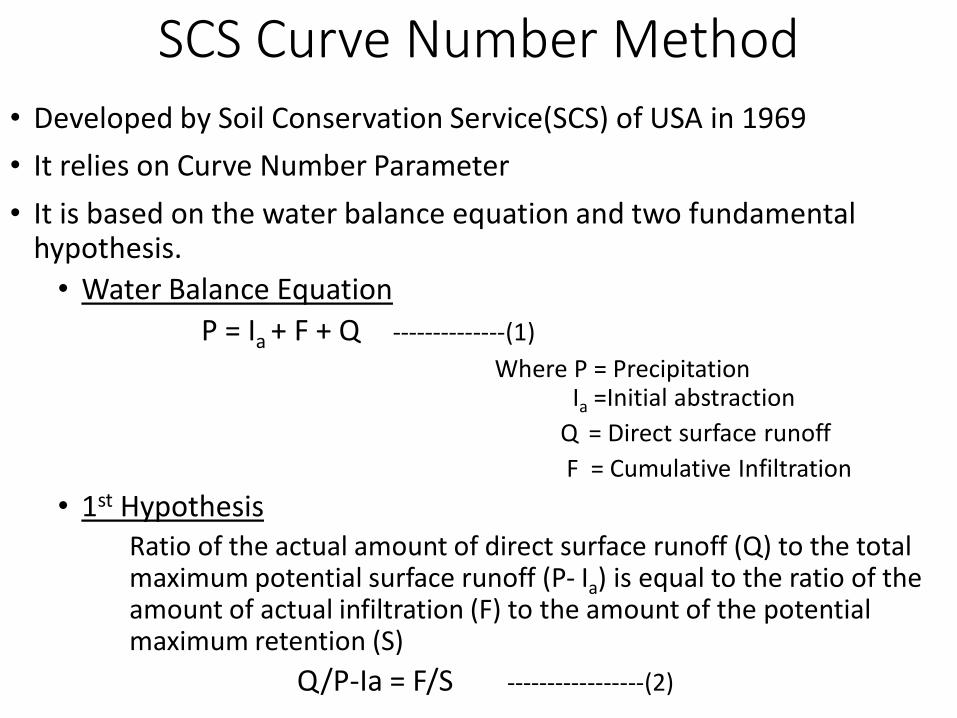
SCS Curve Number Method• Developed by Soil Conservation Service(SCS) of USA in 1969
• It relies on Curve Number Parameter
• It is based on the water balance equation and two fundamental hypothesis.
• Water Balance Equation
P = Ia + F + Q --------------(1)
Where P = Precipitation Ia =Initial abstraction
Q = Direct surface runoff
F = Cumulative Infiltration
• 1st HypothesisRatio of the actual amount of direct surface runoff (Q) to the total maximum potential surface runoff (P- Ia) is equal to the ratio of the amount of actual infiltration (F) to the amount of the potential maximum retention (S)
Q/P-Ia = F/S -----------------(2)

SCS Curve Number Method• 2nd Hypothesis
The amount of initial abstraction is some fraction of the potential maximum retention
Ia= λ S -------------(3)
Where λ is fraction
Combining equation 1 and 2
Q = (P - Ia)2/(P - Ia + S) ---------------- (4)
Put the value of Ia in equation 4 we get
Q = (P - λ S)2/P + S(1- λ)
• S depends upon Soil, Vegetation, Land Use, Antecedent Moisture
Content and expressed in terms of CURVE NUMBER .

SCS Curve Number Method• 2nd Hypothesis
The amount of initial abstraction is some fraction of the potential
S = (25400/CN) - 254
Here S is expressed in mm
CN =25400/(S+254)
Range of CN is 100>=CN >=0
When CN is 100 then, Potential retention(S) = 0
When CN is 0 then, Potential retention(S) =100 (Infinity abstraction by Catchment)
• CN depends on- 1) Soil type 2) Land Use Land Cover
3)Antecedent Moisture Condition

SCS Curve Number Method• Soil type
• Group A : Low runoff Potential means high infiltration rate• Example: Deep Sand, Aggregated Silt
• Group B: Moderately low runoff potential means moderate infiltration rate• Example: Sandy loam, red sandy loam
• Group C: Moderately high runoff potential means low infiltration rate when thoroughly wetted• Example: Clayey loam, Shallow sandy loam
• Group D: High runoff Potential means Soil having very low infiltation rate• Example: Deep black clay Soil, Saline soil

SCS Curve Number Method
• Antecedent Moisture Condition• AMC 1 : Soil is dry but not to wilting point
• AMC 2:Avg. condition of soil moisture
• AMC 3: Sufficient rainfall occurs in past 5 days

Quantitative Characteristics of Watershed
Physical Characteristics
Stream Characteristics
Drainage area
Basin slope
Basin shape
Centroid or Centre of gravity of the basin
Stream order/ channel order
Stream frequency
Stream length
Channel slope
Channel profile
Drainage density

Stream Ordering System
Horton-Strahler’s ordering scheme
Shreve’s ordering scheme
The order of the basin is the order of its highest order stream
First-order streams are defined as those channels that have no tributaries
(Discharge depends fully on overland flow)
The junction of two first-order streams form a second-order stream
A third-order channel is formed by the junction of two second-order channels

Basin Length (Lb)
Basin length is defined in more
than one way:
1. The greatest straight-line distance between any two points on the
perimeter.
2. The greatest distance between the outlet and any point on the
perimeter.
3. The length of the main stream from its source (projected to the
perimeter) to the outlet (most commonly used).
Outlet
The number of stream channels per unit area is called the
stream frequency
Stream frequency

• Drainage density (Dd) is defined as the length of stream
channel per unit area.
• Drainage basins with high drainage densities indicate
that a large proportion of the precipitation runs off
• On the other hand., low drainage densities indicate that
most rainfall infiltrates the ground
Drainage Density
Dd =L
A
L = Total length of all channels of all orders, A= Basin area;
Basin Slopeh = fall in meters,
L = horizontal distance (length) over which the fall occurs
(longest path of travel of the stream)S =
h
L
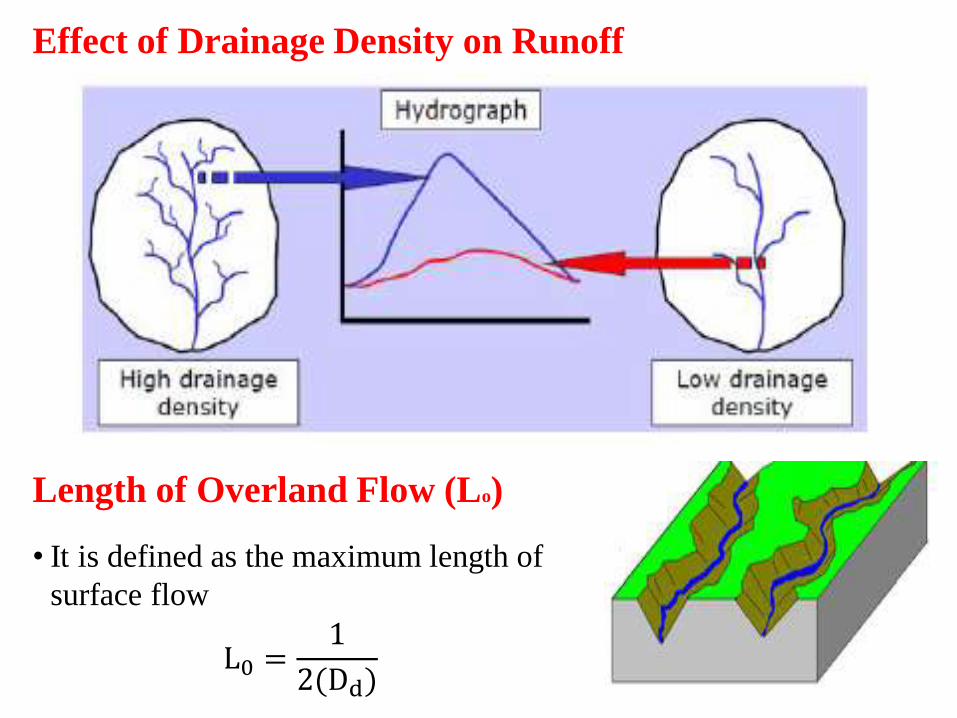
Effect of Drainage Density on Runoff
Length of Overland Flow (Lo)
• It is defined as the maximum length of
surface flow
L0 =1
2(Dd)

For more compact watersheds,the runoff hydrograph is expectedto be sharper with a greater peakand shorter duration
If a watershed is long andnarrow, then it will take longerfor water to travel fromwatershed extremities to theoutlet and the resulting runoffhydrograph will be flatter
Watershed shape influences the hydrograph shape
(especially for small watersheds)


