Embed Size (px)
Citation preview
Wealth Transmission and Inequality Among Hunter-Gatherers
Eric Alden Smitha, Kim Hillb, Frank Marlowec, David Nolind, Polly Wiessnere, MichaelGurvenf, Samuel Bowlesg, Monique Borgerhoff Mulderh, Tom Hertzi, and Adrian BelljEric Alden Smith: [email protected] Dept. of Anthropology, University of Washington, Box 353100, Seattle WA 98195-3100, USA;206-543-5240b School of Human Evolution and Social Change, Arizona State University, Tempe, AZc Dept. of Anthropology, Florida State University, Tallahassee, FL 32306d Carolina Population Center, University of North Carolina, Chapel Hill, NCe Dept. of Anthropology, University of Utah, Salt Lake City, UT 84108f Integrative Anthropological Sciences Program, University of California-Santa Barbara, SantaBarbara, CA 93106g Behavioral Sciences Program, Santa Fe Institute, 1399 Hyde Park Rd., Santa Fe, NM, 87501;Faculty of Economics, University of Sienah Dept. of Anthropology and Graduate Group in Ecology, University of California-Davis, Davis CA95616i International University College of Turin, Piazza Carlo Felice 18, 10121, Torino, Italyj Graduate Group in Ecology, University of California-Davis, Davis, CA 95616
AbstractWe report quantitative estimates of intergenerational transmission and population-wide inequalityfor wealth measures in a set of hunter-gatherer populations. Wealth is defined broadly as factorsthat contribute to individual or household well-being, ranging from embodied forms such asweight and hunting success to material forms such household goods, as well as relational wealth inexchange partners. Intergenerational wealth transmission is low to moderate in these populations,but is still expected to have measurable influence on an individual’s life chances. Wealthinequality (measured with Gini coefficients) is moderate for most wealth types, matching whatqualitative ethnographic research has generally indicated (if not the stereotype of hunter-gatherersas extreme egalitarians). We discuss some plausible mechanisms for these patterns, and suggestways in which future research could resolve questions about the role of wealth in hunter-gatherersocial and economic life.
IntroductionIn this article we characterize the main features and dimensions of variation of wealthtransmission in hunter-gatherer societies. We begin by defining the socioeconomic category“hunter-gatherer” as a production system. We then discuss wealth characteristics, wealthinheritance, and socioeconomic inequality among ethnographically known hunter-gatherers.The next section provides ethnographic background and outline of data collection methods
Correspondence to: Eric Alden Smith, [email protected].
NIH Public AccessAuthor ManuscriptCurr Anthropol. Author manuscript; available in PMC 2011 February 1.
Published in final edited form as:Curr Anthropol. 2010 February ; 51(1): 19–34. doi:10.1086/648530.
NIH
-PA Author Manuscript
NIH
-PA Author Manuscript
NIH
-PA Author Manuscript
for five sample populations (Ache, Hadza, Ju/’hoansi, Lamalerans, and Meriam). Here wealso present quantitative results regarding various wealth categories and their importance, aswell as intergenerational wealth transmission, for each of these societies (as well as onemeasure for the Tsimane, a horticultural-forager population discussed in more detail in thepaper on horticulturalists in this forum by Gurven et al.). The concluding sectionsummarizes our findings on the magnitude and patterning of intergenerational wealthtransmission in the sample populations, and discusses their relation to the broader set ofhunter-gatherer societies.
Hunter-Gatherer Production SystemsWe define hunter-gatherer (forager) production systems as those that subsist primarily onundomesticated species of plants and animals, even if some domesticated species or theirproducts are obtained through trade or ancillary cultivation. In practice, degree of relianceon domesticates ranges along a continuum, with few if any extant societies falling at thezero point. Ethnographies and cross-cultural databases, however, do describe a large sampleof societies with total or near-total dependence on foraging (Table 1).
Ethnographically described hunter-gatherers constitute a numerically small but theoreticallycrucial set of societies. If our species is some 200,000 years old, the strictly hunting-gathering phase occupied well over ninety percent of its history; societies relying primarilyor even exclusively on foraging persisted in various parts of the globe well into the twentiethcentury. Both ethnographic and archaeological records testify to considerable diversity inthese societies, and contemporary foragers are by no means survivals of some unchangedPaleolithic lifeway (Kelly 1995). This diversity encompasses ecological, demographic,economic, sociopolitical, and ideological variation, to the point that some have questionedhow meaningful the “hunter-gatherer” label can be (as reviewed in Kelly 1995). We find thecategory too useful to abandon, but recognize the need for some distinctions within it.
Focusing on ethnographically described hunter-gatherers, we can differentiate smaller, moremobile societies whose members reside in camps or villages of a few dozen people or less,engage in considerable residential mobility, and lack formal hereditary political officialsfrom larger, more sedentary groups with year-round or seasonal villages, and hereditarysocial and political ranking. This distinction is less typological (as the defining variables arecontinuous rather than categorical) and more easily related to wealth transmission thandistinctions such as immediate-return/delayed-return (Woodburn 1982) or forager/collector(Binford 1980). Residential mobility in a large sample of hunter-gatherers ranges from 0 to58 moves per year, with a mean of 7.6 and a median of 5.0 (Table 1). Among the smaller butmore geographically representative sample of foraging societies in the Standard Cross-Cultural Sample (Murdock and White 1980), over two thirds are classed as “nomadic” or“semi-nomadic,” and less than a tenth as “sedentary” (Table 2). We have removedequestrian societies, and a few primarily horticultural cases, from the datasets summarizedin Table 1. While recognizing that most cross-cultural databases suffer to various degreesfrom problems of reliability, representativeness, and sampling bias, our hope is that patternsthey reveal are meaningful if not terribly precise.
Although the diversity encompassed in the foraging production system is great, it has itslimits. Constraints on the degree to which resource productivity can be intensified, plusexclusion from many resource-rich habitats (by agricultural peoples), results in lowerpopulation densities and much smaller camps or villages than is typical of horticultural andagricultural populations (see Table 1; compare with Gurven et al., and Shenk et al., thisissue). Comparative analyses of fertility have demonstrated that forager populations havesomewhat lower fertility rates than agricultural (but not necessarily than horticultural orpastoral) populations (Bentley et al. 1993;Sellen and Mace 1997). This difference has in turn
Smith et al. Page 2
Curr Anthropol. Author manuscript; available in PMC 2011 February 1.
NIH
-PA Author Manuscript
NIH
-PA Author Manuscript
NIH
-PA Author Manuscript
been ascribed to the effects of lower mobility and more early-weaning foods in agriculturalpopulations; however, detailed cross-cultural analysis shows that agropastoral populationsdo not differ from foragers in weaning food availability or average age at weaning, but dohave earlier onset of weaning (Sellen and Smay 2001;Sellen 2007). Juvenile survival ratesare also lower in well-studied forager populations as compared to horticultural and pastoralones (Gurven and Kaplan 2007).
Wealth and Inequality in Hunter-Gatherer SocietiesAs detailed in the introductory paper for this CA Forum (Bowles, Smith, and BorgerhoffMulder; see also Borgerhoff Mulder et al. 2009), we define wealth as any attribute of theindividual that contributes to a flow of valued goods or services. This broad definition issubdivided into wealth classes (embodied, material, and relational wealth) eachencompassing various wealth types (such as hunting success, household goods, or sharingpartnerships), as detailed below.
Our collective judgment, based on many combined years of field research plus the publishedethnographic corpus, is that in most foraging societies, variation in material wealth has lesseffect on well-being than does variation in other forms of wealth, such as health or socialconnections. This generalization is more likely to hold for mobile low-density foragers(which constitute the great majority of ethnographically described foraging societies—seeTables 1 and 2) than for sedentary high-density foragers. There are at least three reasons forthis. First, high mobility reduces the possibility or profitability of investment in land or fixedfacilities (e.g., weirs, permanent houses). Accordingly, land ownership among high-mobilitygroups is overwhelmingly communal and cannot be transmitted to individuals or kin groups(Table 2). Second, reduced mobility depends on dense and predictable resource patches(e.g., salmon streams), and access to these patches is often controlled by kin groups or othersubsets of the population; if variation in patch productivity is great enough, those whocontrol the richest patches can exchange access to them for economic and political services(Boone 1992;Smith and Choi 2007). When resource abundance is less concentrated, accessis harder to control; individuals can therefore resist any moves towards institutionalizedinequality, including “voting with their feet” to relocate elsewhere if necessary. Finally,mobility makes it harder to accumulate material property. Moveable material property, suchas tools, clothing, and valuables, is generally treated as individual property and is oftentransmitted to descendant kin (Table 2). In most foraging societies, however, such propertycan usually be manufactured by any adult of the appropriate gender, or obtained fairlyreadily; exceptions include items involving highly specialized manufacture or obtainedthrough limited trade contacts, as well as wealth and prestige goods in some sedentary andless egalitarian societies.
Most adults in hunter-gatherer societies actively contribute to food production andprocessing, as well as tool manufacture and maintenance. In addition, child care andprovisioning is generally a parental duty. Most of these forms of labor require considerablestrength and stamina, visual acuity, and other aspects of good health. As a result, we expectsomatic wealth to be of prime importance to success and well-being. On the other hand,those who suffer periodically from suboptimal somatic endowments can usually rely on aidfrom others in the form of food-sharing, assistance with child care, and protection indisputes. This social insurance is normative and widely available, but some evidencesuggests that the quality of such aid will vary according to the “relational wealth”(reputation, size and quality of the social network) of the needy individual or household(Gurven, et al. 2000; Wiessner 2002; Nolin 2008).
Knowledge presents some special difficulties. Information needed to successfully harvestresources and process them into food or other goods is widely available (on a gender-
Smith et al. Page 3
Curr Anthropol. Author manuscript; available in PMC 2011 February 1.
NIH
-PA Author Manuscript
NIH
-PA Author Manuscript
NIH
-PA Author Manuscript
specific basis), though some exceptions apply, particularly in more sedentary foragingsocieties (e.g., manufacture of complex watercraft). Knowledge concerning ritual practicesand trading partnerships, however, is often more differentially distributed. Commonly,certain individuals have esoteric knowledge held to be useful in curing illness, combatingsorcery, or predicting weather and availability of game. Although relatively few hunter-gatherer societies have well-defined social strata or politico-religious offices (Table 2), ourimpression is that the great majority do recognize important differences in specializedrealms of knowledge, differences which may have status correlates and yet coexist withnormative and de facto egalitarianism in other forms of wealth (e.g., Bird and Bliege Bird2009).
In sum, a primary constraint on material-wealth accumulation and inequality in hunter-gatherer societies is the degree of residential mobility, which in turn is heavily influenced byspatiotemporal resource variability (Cashdan 1992; Kelly 1995). Generalizations aboutwealth and inequality differ greatly depending on whether one focuses on the more mobilelow-density foragers, or the smaller set of sedentary high-density foragers; the latter, afterall, includes societies (e.g., Northwest Coast, Calusa) with slavery, hereditary nobility,stores of durable valuables, and other features strongly related to intergenerational wealthtransmission.
Ethnographic Sample and MethodsOverview of Sample Populations
The five populations discussed and analyzed in detail below include the Ache of SouthAmerica, the Hadza and the Ju/’hoansi of sub-Saharan Africa, the Lamalerans in southeastAsia, and the Meriam of Melanesia. In addition, we provide an analysis of hunting returnrates among the Tsimane, a South American horticulturalist-forager society discussed atlength by Gurven et al. in this forum.
Three of these populations (Ache, Hadza, and Ju/’hoansi) are clearly at the low-density,high-mobility end of the scale, with values in these measures as well as residential groupsize close to the averages for a large sample of foragers (Table 3), although Ache in the pre-settlement period have very high estimated residential mobility. In contrast, two populationsare very sedentary and (for foragers) high density: Lamalerans (coastal sea hunters) andMeriam (coastal fisher-horticulturalists), each inhabiting one large village. It is noteworthythat the two high-density populations are characterized by high reliance on marine resources,a pattern found in larger samples of forager populations (Kelly 1995: Tables 6-2, 6-4;Marlowe 2005: Figures 4, 5). However, even the Lamalerans and Meriam display relativelylow levels of socioeconomic inequality compared to some other sedentary coastal foragerssuch as Northwest Coast Indians, Chumash, or Calusa.
AcheEthnographic background—The Northern Ache lived as isolated hunter-gatherers inthe tropical forests of Eastern Paraguay until peaceful contacts with outsiders in the 1970s.At first contact the population contained 557 individuals, scattered in a dozen or moreresidential bands of flexible composition roaming a region of about 20,000 km2. Thetraditional economy was based on hunting medium sized mammals (about 80% of allcalories come from armadillos, paca, white-lipped peccaries, capuchin monkeys, & tapir)with bow and arrow, extracting palm starch and hearts (about 10% of all calories), andcollecting larva, honey, and fruits (about 10% of all calories). Residential bands were highlycooperative, with individuals regularly adopting complimentary roles in food acquisitionthrough the day (Hill 2002), and sharing all game, and a good portion of other foods
Smith et al. Page 4
Curr Anthropol. Author manuscript; available in PMC 2011 February 1.
NIH
-PA Author Manuscript
NIH
-PA Author Manuscript
NIH
-PA Author Manuscript
between most band members (Kaplan and Hill 1985). Band members also regularly caredfor each other’s children and freely exchanged or provided a variety of goods and services.Only mate acquisition was markedly competitive rather than cooperative.
Ache residential bands ideally centered around a father and his adult sons, but in practicebands often consisted of bilateral kin (a core set of brothers, or brothers and sisters, theirchildren, some affinal kin, etc.). Membership in these bands changed frequently althoughcore sets of kin were almost always together. Bands had no formal leadership, there were noritual or ceremonial divisions, and no marriage prescriptions or proscriptions other thanavoidance of all first cousins. Clubfights were organized as a form of ritual combat betweenmen with grudges, and close kin alliances often determined “teams” of combatants. Statuswas attained through killing others, hunting skill, and personal charisma related to oratoryskills and emotional connections. Women participated in decisions but did not wield equalinfluence to men, and were often quite subservient. Their main activities were intensivechildcare (the forest contains many mortal dangers for small children), transportation offamily goods, and extraction of palm products.
After contact in the 1970s, the Northern Ache, along with three other independent dialectgroups of Ache, were relocated to six reservation settlements. Three of these near theMbaracayu forest reserve have been intensively studied. The reservation economy is basedon subsistence farming (manioc, maize, beans, peanuts, melons, etc.) and frequent treks intothe forest. A few individuals are engaged in nearby wage labor (or teach school). Moredetails on general aspects of Ache ethnography are available in prior publications (e.g., Hill1994; Hill and Hurtado 1996; Hill and Hurtado 1999) and approximately 130 publicationson the behavioral ecology of the Ache are available at Kim Hill’s research website (Hilln.d.).
Wealth measures—Ache “wealth” can be conceptualized in three dimensions. First,some individuals produce more resources on a consistent basis (higher income), and whenalone or in small camps, they and their families experience higher resource consumption. Ifexcess production is shared in a partially contingent fashion high producers may also obtaina greater share of the valuable contributions of other band members (including food, but alsoother goods and services). But, differential access to the goods and services of others(including reproductive access) can also be attained through high quality socialrelationships, which constitute a non-material form of Ache wealth. Finally, both productionlevels and social relationships are affected by embodied wealth (body size, health, cognitiveability, etc.), which also affects basic fitness components such as mortality and fertility rates.Thus transmissible wealth comes in the form of somatic endowment, productive ability, andsocial relationships, all of which are potentially heritable.
Body weight is a good measure of somatic endowment because growth is an indicator ofchildhood disease resistance, and body size associates positively with productive potentialand fertility in mammals (Hill and Hurtado 1996). Ache weight has been repeatedlymeasured with an electronic bathroom scale from 1980 to the present. The body weights ofall individuals who were measured when over age 18 were employed for analyses. Parentalweight was defined as the average of mother’s and father’s weight, with controls for singleparents, as well as for age and sex of offspring (see supplementary online materials [Hertz,et al. 2010] for details).
Hunting return rates are the best measure of variability in overall food production for Achemen (there is no equivalent measurement for women). We have monitored the huntingsuccess of Ache men at three communities since 1980. Early data is derived from directobservation by focal follows. Return rates in more recent years are based on informant
Smith et al. Page 5
Curr Anthropol. Author manuscript; available in PMC 2011 February 1.
NIH
-PA Author Manuscript
NIH
-PA Author Manuscript
NIH
-PA Author Manuscript
reported hunting success in weekly systematic interviews. All data were converted to a dailyreturn rate (kg. game live weight per day of hunting) and the five year average wascalculated for each man during each five year period from 1980 to 2007 (Hill and Kintigh2009). Five year averages were plotted by mean age of each hunter during the period andthen smoothed with a Lowess regression in order to determine the age shape of the huntingreturns function. The residual of each man’s average from the Lowess age curve was thenused to calculate how much above or below the typical hunting returns (in kg/day) each manwas for his age. The residuals from each five year period for each man were then averagedover his lifetime to get a measure of how good of a hunter he had been for his age during theentire 27 years of monitoring. Son’s age residuals of hunting return rate were regressed onfather’s age residuals in order to determine whether men who were good hunters for theirage have sons who are also good hunters for their age. These estimates were also correctedfor measurement error; reliability was determined by comparing many-period averages(which were available for some hunters) to averages over subsets of the full period. Theoverall reliability of the hunting data was estimated to be 0.68.
HadzaEthnographic background—The Hadza live in a savanna-woodland habitat aroundLake Eyasi, south of Ngorongoro Crater and Serengeti National Park in northern Tanzania.Our best estimate of the population is 1000 (Blurton Jones, Hawkes, and O’Connell 2002).Hadza live in camps that average 30 people and move location about every 1.5 months;people often visit or move to other camps as well. This fluid movement helps explain Hadzaegalitarianism; when anyone tries to boss others around they simply move away from thebossy person (Woodburn 1982). The most common form of Hadza camp is one that consistsof two or three sisters and their families; when their mother is alive she is likely to alsoreside in the same camp (Blurton Jones, Hawkes, and O’Connell 2005, Woodburn 1964).
The Hadza are central place provisioners (Marlowe 2006). They often feed themselves whileforaging but also take food back to camp. Women gather fruit and berries, and dig tubers,usually in groups of 3–8 plus some children. Because all women in a foraging party tend tohave a haul of the same foods, most of their food may go to their own household, but often itis shared with anyone in camp. Once back in camp women roast up some of their tubers tofeed all the children present, or send them to a group of men sitting in the men’s place. Mencollect honey and use bows and arrows to hunt a wide range of game from small (e.g., rockhyrax) to large (e.g., giraffe). Men usually hunt alone. Once an animal is hit, the hunter mayreturn to camp and get other men to help him track the wounded animal. When men bringhoney back to camp it often gets shared with those present; but unlike larger game, it cansometimes be concealed and directed to a man’s household (Marlowe 2003). When menbring medium-sized and large game into camp it is shared widely across households(Hawkes, O’Connell, and Blurton Jones 2001b, Woodburn 1998) but even small game andhoney are often shared widely. Despite the widespread sharing, on average the portion of ahunter’s catch retained in his household is larger than the share given to each otherhousehold (Wood and Marlowe, in preparation).
Hadza have no land or property inheritance, nor accumulated material wealth. Even thoughextremely egalitarian, men who are the best hunters have slightly more prestige, as well asmore surviving offspring (Hawkes, O’Connell, and Blurton Jones 2001, Marlowe 1999,Marlowe 2003). They achieve this not by having more wives over time, but from having ahigher chance of marrying young women upon divorce (Marlowe 2000). Hadza womenusually acquire a great deal of food well into their seventies. Hawkes et al (2001a) foundchildren’s growth rates were predicted by their mothers’ food returns rather than theirfathers’ food returns. They concluded that better hunters achieve their greater RS by
Smith et al. Page 6
Curr Anthropol. Author manuscript; available in PMC 2011 February 1.
NIH
-PA Author Manuscript
NIH
-PA Author Manuscript
NIH
-PA Author Manuscript
marrying better gatherers. However, their sample was small and covered only 12 months. Ina preliminary analysis of a much larger dataset, there is no evidence that husbands and wivesare assortatively mated with regard to foraging returns. When stepfathers are excluded, mendo bring in more food when they have more dependants (Marlowe 1999, Marlowe 2003).
Wealth measures—The wealth measures used here are weight, grip strength, andforaging success. These measures get at biological traits that might be relevant even forother traits that could be counted as social capital, such as foraging skills. Theanthropometric data were taken on all people in camp, and many people were measuredmore than once per year over the years 2001–2006. Stature and weight have been measuredby previous researchers and there is little to no change in the Hadza over the years (BlurtonJones 2006; Hiernaux and Hartono 1980; Marlowe and Berbesque 2009). Weight wasmeasured using a Tanita bioelectrical impedence scale, and grip strength was measure with adynamometer. Strength appears to be important among the Hadza. Women need strength todig tubers; men need to be strong to pull larger bows, which send arrows faster to theirtarget, and to chop into trees to access honey. Both sexes need to carry heavy loads of food(and often children) long distances. Weight and strength, which are correlated, account formuch of the effect age alone has on these skills. Weight predicted kilograms of tubersacquired per hour by women, men, and children, and strength was correlated with archeryskill for males (Blurton Jones and Marlowe 2002).
Foraging success was measured for a composite of all foraging activity. The raw data are aperson’s sum total of all foods brought back to camp per observation day. The weight offoods brought into camp was converted to kilocalories to compute a foraging productivityscore (mean daily kcal) for each camp resident, men, women, and children. During theobservation periods, almost all women and all men went out from camp to forage every day,women for an average of about four hours and men about six hours. The measure of parent-offspring correspondence in foraging success reported here excludes mother-daughter pairs,as these relatives usually dug tubers together and thus including them would over-estimateactual correspondences.
Ju/’hoansiEthnographic background—The Ju/’hoansi Bushmen of the Kalahari desert are one ofthe most thoroughly egalitarian societies known in the ethnographic record, enforcing both“equality of opportunity” as young people start out in life and “equality of outcome”throughout the life cycle. Those who seek to possess more material goods, food, or status areleveled by other group members (Lee 1979;Wiessner 2005). Nonetheless, those who excelin hunting, healing, hxaro exchange and social skills and who return benefits to the groupsare recognized as //haiha (//aihadi for women), which can be glossed as “one who hasthings” or “leader” (Wiessner 2002).
The Ju/’hoansi population of some 2000 considered here inhabit N.W. Botswana and N.E.Namibia (Biesele 1993; Howell 2002; Lee 1979; Lee and DeVore 1968; Marshall 1976;Shostak 1981; Wilmsen 1989). Until the mid- 1970s Ju/’hoansi subsisted primarily throughforaging. When living as foragers, the Ju/’hoan bands inhabited territories with enough foodand water to sustain a band in the average year. Each Ju/’hoan man and woman inheritedaccess to the territory of his or her mother and father, and could claim a strong hold byassembling kin with similar rights to jointly occupying the land. Spatial and temporalvariation in resources, including the availability of water, was high. To buffer fromenvironmental and social risks, the Ju/’hoansi engaged in a system of exchange called hxaro,delayed exchange of gifts indicating an underlying relationship of commitment to mutualsupport in times of need.
Smith et al. Page 7
Curr Anthropol. Author manuscript; available in PMC 2011 February 1.
NIH
-PA Author Manuscript
NIH
-PA Author Manuscript
NIH
-PA Author Manuscript
Wealth measures—The wealth measure used here is number of hxaro partners, a measureof relational wealth. On average, the Ju/’hoansi in the early 1970s had 16 hxaro partners(range 2–42) who were well-distributed in space within a radius of 200 km, and over peopleof different ages, sexes and abilities. When in need, a person would pack up his or herfamily, visit a partner and reside in their camp for as long as necessary. Hxaro ties alsoplayed a major role in arranging marriages. Census data collected by Richard Lee andWiessner indicate that 93% of all extended visits recorded were made to hxaro partners, andon average 3.3 months a year were spent living in the camps of partners (Wiessner 1981;1982). Hxaro was done with consanguineous kin inherited from either parent or formedduring a lifetime with siblings, cousins, aunts and uncles etc., but only with affines inexceptional cases. Because of rules for exogamy, it was extremely rare that spouses sharedthe same hxaro partners.
Spheres of hxaro waxed and waned throughout the life cycle. Young people began theirreproductive career with an average of 13 partnerships, enough to see them through hardtimes. When the first of their children mature to marriageable age, Ju/’hoansi doubled theirspheres of hxaro to an average of 24 partners. With old age and decreased mobility andproductive capacity, elders’ hxaro spheres narrowed to an average of 12 partners.Partnerships could be passed parents to children as they aged or at their funerals when theirchildren took some of their possessions, gave them to one of the deceased’s partners andasked that the relationship be continued. Ju/’hoansi marriages were arranged and hxaroplayed a major role in locating spouses and contracting marriages. Hxaro partnerships werelinked together to form chains that wound for hundreds of kilometers through the Kalahariand tapped into the broader trade networks of southern Africa. Ju/’hoansi who were wellconnected in hxaro had a better chance of acquiring desired material possessions from afar.
Data on hxaro ties were collected from 59 individuals in three randomly selected villages,including residents as well as visitors to the village who stayed for weeks or months duringthe four-month period of the study. Individuals were first asked to list all of their hxaropartners, their name, sex, age, marital status, kin relation to ego, area of land rights andcurrent residence. Subsequently individuals in the sample were asked to lay out all of theirworldly possessions and discuss how they had obtained each one. Of 1483 possessionsrecorded, 69% were received in hxaro from partners listed by ego, 27% were recentlybought or made and 4% received from non-Bushmen or Bushmen who were not hxaropartners. Number of hxaro partners correlated with number of possessions owned by theindividual, number of possible alternative residences, hunting success for men, ability as ahealer, and social competence (Wiessner 2002).
LamaleraEthnographic background—Lamalera is a village of just over 1200 people and about317 households located on the Indonesian island of Lembata, in southeast Indonesia. In thepast Lamalera might have been characterized as a complex foraging society. A permanentresident population subsisted almost entirely from maritime foraging and trading withagricultural villages of the interior. Differences in material wealth among households werelikely less pronounced in the past than they are now, but status differences existed. Twoautochthonous clans and three founding clans claimed greater status and authority than otherclans that, according to tradition, arrived later. This created a broad, horizontal hierarchyamong clans. A man’s social status was tied to that of his clan, or his personal prowess as ahunter (Alvard and Gillespie 2004) and his material success to that of his lineage whosemembers cooperatively operated a whaling boat or téna. (Alvard and Nolin 2002, Alvard2003).
Smith et al. Page 8
Curr Anthropol. Author manuscript; available in PMC 2011 February 1.
NIH
-PA Author Manuscript
NIH
-PA Author Manuscript
NIH
-PA Author Manuscript
In the early 1900s the Catholic Church brought formal education to the village (Barnes1996). With this development, Lamalerans were well positioned to take advantage ofopportunities in the expanding Dutch (and later Indonesian) civil administrativeinfrastructure. Expansion of the wage labor market outside the village brought furtheropportunities. Consequent emigration has been a feature of Lamaleran demography for mostof the past century (Barnes 1986). The traditional authority structure among clans persistsand continues to dominate the internal affairs of the village. However, there is now moresocial differentiation among individual families based on success of kin outside the village.Despite these changes, in 2006 the economy within the village remained largely asubsistence economy of fishing and hunting. Aside from school teaching and a handful ofgovernment posts, there were no wage labor opportunities within the village.
Wealth measures—Four wealth measures are available for Lamalera: household wealth,sharing network ties, boat shares, and reproductive success.
Household wealth is an indication of the household’s access to money and can also beinterpreted as a proximate measure of the household’s connection to the market economy.Household wealth is measured on an eight-point Mokken scale based on features ofresidents’ homes (see Nolin 2008). Houses are traditionally inherited by the youngest son,unless the house is the lineage great house, in which case the oldest son has the right ofinheritance. However, in 2006 most houses (70%) had been built by their current occupants.Neolocality has long been encouraged by the Church, and a house is considered by most tobe a prerequisite for marriage. Young unmarried men often pursue wage labor opportunitiesin regional towns to save money for the construction of a home. Parents may also contributeto these costs, if able, as may emigrant kin. Remittances from successful emigrant siblingsor offspring may also be an important source of cash for later improvements to the house.Correlations between parents’ and child’s household wealth may therefore be due to similaraccess to outside remittances rather than transfers of wealth from the parents to the child.
Sharing ties to and from a household are an indication of how well the household is bufferedagainst harvest variance. Additionally, the people with whom one has established sharingrelationships may also be those upon whom one can rely for other forms of aid. In thisrespect, sharing network ties may be a proxy for one’s broader support network. Themeasure used here sums together the number of other households to whom the focalhousehold usually gives food (its out-degree) and the number of other households fromwhom the focal household usually receives food (its in-degree). These data were collectedby household census in 2006. Secondary sharing in Lamalera is completely discretionary.There are no formally recognized sharing partnerships such as are found in some othersocieties, and therefore no sharing roles to inherit. However, parents and children may havesimilarly sized sharing networks for a number of reasons. First, they are kin to the samepeople, and since sharing occurs more commonly among kin, this may lead to similarnetwork ties. Second, when children reside near their parents they may share with the sameneighboring non-relatives. Finally, parents and children have similar access to resourceswhich may make them similarly attractive to others as sharing partners, and similarly able togive to others.
Household boat shares were calculated as the sum of shares in boats held by all residents ofa household. Shares can vary in size depending on the type of shares, the number of shareholders of that share, and the prey type caught (see Alvard 2002 for discussion), but here arecounted as single units. Shares in whaling boats remain the primary source of food for mostLamaleran households. Obtaining such shares depends largely on kinship, but being able tocontribute to boat maintenance as well as having the support of other share holders may alsobe important factors. Shares are inherited by the surviving spouse, provided there is one.
Smith et al. Page 9
Curr Anthropol. Author manuscript; available in PMC 2011 February 1.
NIH
-PA Author Manuscript
NIH
-PA Author Manuscript
NIH
-PA Author Manuscript
Otherwise the share holder’s resident sons divide the share. These rights only persist untilshare rights are reallocated, which happens periodically when the boat undergoesrefurbishment. Boats are owned by lineages, and adult members of the owning lineage maysecure a share at this time by contributing to the costs of refurbishment. Those that alreadyhold a boat share are also expected to contribute, if able, in order to retain their share. Someroles in the boat (boat master, harpooner, master carpenter) are nominally heritable, but if anheir shows no interest then someone else may take the role.
For Lamalera, reproductive success was defined as the number of offspring surviving to oneyear or longer. Reproductive histories were collected in 2006 for all current household headsand their spouses. Respondents were specifically asked about deceased children and wereasked to provide ages of death. Infant and child mortality is high in Lamalera, so livingoffspring aged less than one year were discounted by the probability of surviving to oneyear.
MeriamEthnographic background—Mer (aka Murray Island) is a small island in Torres Strait,between mainland Australia and Papua New Guinea. Meriam, the indigenous residents ofMer and adjacent islands, have linguistic, genetic, and cultural links to the south coast ofPapua New Guinea, and to Melanesia more broadly. The island’s 1998 population was 430individuals of Meriam descent, residing in approximately 85 households (plus a handful oftemporary non-Meriam residents). The Torres Strait as a whole is administered by the Stateof Queensland and the Commonwealth of Australia. Although many Meriam men had longbeen engaged in industries in Australia (especially pearling, sugarcane, and railroads) untilabout 1975, when Australian welfare payments were first made available to all indigenousAustralians, the Meriam on the islands were nearly full-time subsistence horticulturalists andmarine foragers. Subsistence revolved around planting tropical yams, bananas, sugarcane,coconuts, and introduced New World crops such as manioc, sweet potatoes, and corn, andharvesting marine fish, shellfish, and sea turtles. Today, horticulture is nearly moribund, andcarbohydrates and other goods are readily purchased at the community store. Yet fishing,hunting, and shellfish collecting remain a critical component of Meriam subsistenceeconomy: mean daily per capita consumption rates in 1998 averaged 630 kilocalories ofmeat and 40 grams of protein. More than 80% of these calories were supplied by turtleduring the nesting season. (For additional ethnographic description, see Beckett 1988;Bliege Bird and Bird 1997; Haddon 1906; Sharp 1992.)
Success in turtle hunting plays an important role in status differences among Meriam men.Hunting of green sea turtles (Chelonia mydas) occurs throughout the year, but particularlyduring the non-nesting season (May to September). Hunting is a cooperative, entirely malepursuit with distinct roles: younger men serve as crew members or “jumpers” (arpeir le)under the direction of the hunt leaders (ariemer le) who are generally older, with more skilland experience, and ultimately held responsible for the success or failure of hunts.Typically, turtles obtained through hunting (as contrasted with turtle collecting on the beachduring the nesting season) are distributed to multiple households or to island-wide feasts,and the hunters receive no material recompense (Bliege Bird et al. 2001, 2002; Smith andBliege Bird 2000; Smith et al. 2003).
Wealth measures—Meriam have complex rules of land ownership and inheritance,involving patrilineal clans but with some land inheritance by unmarried daughters (or otherdesignated female heirs). However, detailed land ownership data for a representative sampleof Meriam are not available; in addition, with the near cessation of horticulture in recentyears, the effects of land inheritance on other social and economic variables is likely much
Smith et al. Page 10
Curr Anthropol. Author manuscript; available in PMC 2011 February 1.
NIH
-PA Author Manuscript
NIH
-PA Author Manuscript
NIH
-PA Author Manuscript
diminished. Inheritance of other substantial material property is for the most part a veryrecent phenomenon, as permanent housing and other durable goods have not beenwidespread until the last several decades; the prime exception to this would be prizeddouble-outrigger canoes, but these have been displaced by motorboats.
The only wealth measure used here is male reproductive success (RS), measured as numberof children alive at time of data collection (1998), regardless of age. It is customary to adjustfor early-childhood mortality by measuring only offspring surviving to at least age 5;however, because residents of Mer have access to a staffed medical clinic and fairly rapid airevacuation to a hospital, such mortality is relatively low, ca. 6% cumulative mortality to age5 (Australian Institute of Health and Welfare 2005). There is some artificial contraceptionpracticed, but incidence data are not available; Meriam birth rates have been relatively lowprior to access to such technology, for at least the last century (Haddon 1898).
Results and DiscussionWealth Classes and Their Importance
After considerable group discussion, each researcher estimated a value for each of the majorwealth classes (embodied, material, and relational) in the population she/he studied. Thesevalues, which we label α, are defined as the percentage change in a family’s wellbeingassociated with a percentage change in the wealth class in question, holding other wealthclasses constant at the average level. The α estimates are fractions that sum to unity,reflecting their derivation from the Cobb-Douglas production function (see paper by Gurvenet al. in this issue for details). The estimates for our five focal hunter-gatherer populationsare provided in Table 4. Note that the α values are not statistical estimates based onmeasurements, but rather judgments of each researcher based on months or years offieldwork with each respective population.
The researchers generally agreed that relational wealth is of greatest importance, but beyondthat there is no clear consensus (Table 4). However, the relative α values for embodied andmaterial wealth roughly correspond to the position of these five societies along the mobility/density continuum, with the most mobile populations (Ache, Hadza) having high values forembodied and very low values for material wealth, the sedentary/high-density populationsroughly equal α’s for these two categories of wealth, and the Ju/’hoansi grouping with thesedentary populations despite their low density and relatively high mobility (Table 4). Notethat Ju/’hoansi place considerable emphasis on ties to particular homelands (n!ore) to whichthey have foraging rights based on kinship and residence (Lee 1979;Wiessner 2002 andabove), a form of (communal) material wealth; in contrast, Ache and Hadza practice muchmore open-access foraging on their lands.
Intergenerational Wealth TransmissionAs discussed in the introductory paper in this CA forum, we measure intergenerationalwealth transmission with the unit-free coefficient β, which estimates the “elasticity” inwealth for parent-offspring pairs, or the percentage change in wealth in the secondgeneration associated with a one percent change in parental wealth. Table 5 presents thesewealth-transmission measures by wealth type for each of the five focal populations (plus onemeasure for Tsimane, otherwise treated in the paper on horticultural societies in this forum).Sample sizes vary substantially, tending to be larger for more easily measured variables, andrange from 26 parent-offspring pairs to nearly 200. The method of calculating β requirescomparable information on parents and offspring, and sometimes sex-specific pairings. Formany individuals, censoring due to death prior to study or to emigration from the study arealeaves many unpaired individuals.
Smith et al. Page 11
Curr Anthropol. Author manuscript; available in PMC 2011 February 1.
NIH
-PA Author Manuscript
NIH
-PA Author Manuscript
NIH
-PA Author Manuscript
We have eight measures of four types of embodied wealth from five populations: weight,grip strength, reproductive success, and foraging success. In contrast, material wealth isrepresented by only two measures (shares in whaling-boat harvest, and an index of housingquality), both from Lamalera. Similarly, relational wealth is represented by only twomeasures, exchange (hxaro) partners among Ju/’hoansi, and food-sharing partners inLamalera. Given this very uneven representation, it is not reasonable to make statisticalcomparisons between wealth classes for just the hunter-gatherer cases; instead, see theconcluding paper in this forum, where measures from the full set of societies can becompared.
We can, however, offer interpretations of particular wealth measures in individual societies.With regard to intergenerational transmission of hunting skills, the Ache results show norelationship between fathers’ and sons’ age-corrected hunting return rates (Figure 1.a). Thismight seem surprising, since men do inherit the genetic component of their father’s somatictraits (body size, strength, athleticism, intelligence, etc.), which should have some impact onhunting success. However, all Ache boys hunt with many different men, receive little or noformal instruction from their fathers, and often don’t live with biological fathers during teenyears. Thus, the lack of a relationship between hunting success of fathers and sons is not acomplete surprise. Ache men whom Hill has interviewed suggest that most of their skillcame from their own practice during teen years in the forest, and from listening to stories byother men, as well as from observing the hunting process (but not necessarily with father asthe model). The similar measure for the Hadza (foraging success) includes gathering as wellas hunting, and females as well as males (though mother-daughter pairs are excluded fromthe calculated β, for reasons explained above); it also is close to zero.
In contrast, among the Tsimane we find a quite high β (0.384) for father-son hunting returns,measured as calories gained per hour spent foraging. Young Tsimane males are likely to gohunting with their fathers (and sometimes other male relatives) up until the point where theycan hunt alone, generally in their late teen years. Thus, there is a greater likelihood that aTsimane hunter had his father as the prime or even only model for hunting skills in hisformative years than is the case for the Ache, and fathers who hunt frequently may be morelikely to have sons who actively hunt. Dyads come from four interfluvial Tsimane villageswhere hunting is fairly common due to the low population density and near proximity ofremote forest (Gurven, Kaplan, and Gutierrez 2006); since local animal densities and otherconditions will affect hunting return rates, the β for Tsimane hunting returns was calculatedwith village dummy variables to control for any possibility that we were measuring theeffects of correlation in location of father-son pairs rather than transmission of ability orskill.
Neither of the β values for reproductive success rise to high levels. The lack of associationbetween parents’ and childrens’ reproductive success among Lamalerans has severalpossible explanations. One is that cooperative acquisition of food followed by food-sharingbetween household tends to reduce differences between households in access to foodresources. Another possibility is that the lack of association is due to generational changes infertility patterns. There is some evidence (Nolin, unpublished) that the age at marriage inLamalera has increased substantially throughout the 20th Century. A secular trend towardsdelayed reproduction and reduced fertility may reduce any association between parents’ andchildren’s reproductive success. While crewmen, and especially harpooners, exhibit higherreproductive success than non-hunters (Alvard and Gillespie 2004) any man can participatein the fishery. The role of harpooner is nominally heritable, but in practice can be pursuedby any youth who shows promise.
Smith et al. Page 12
Curr Anthropol. Author manuscript; available in PMC 2011 February 1.
NIH
-PA Author Manuscript
NIH
-PA Author Manuscript
NIH
-PA Author Manuscript
Previous research with the Meriam has shown that being a turtle hunter, and particularly ahunt leader, is associated with greatly elevated age-specific reproductive success (Smith etal. 2003). This RS differential is not found for Meriam men who have reputations asparticularly good fishermen, political leaders, traditional dancers, “ladies men,” or “hardworkers.” Among Meriam women, those with reputations as “hardworking” do havesomewhat elevated mean RS, but these women are disproportionately married to turtlehunters (Smith et al. 2003). The estimated transmission coefficient for Meriam parent-childRS is effectively nil (Table 5). This agrees with previous findings that pairs of Meriambrothers of roughly the same age where only one is a turtle hunters show the samedivergence in RS as the full set of Meriam hunters vs. non-hunters, and that patrilineagedoes not predict hunting role (Smith et al. 2003). The conclusion seems to be that, whatevercombination of abilities, experience, and motivation lead some Meriam men to succeed inturtle hunting or other RS-correlated attributes does not tend to be passed from parent tooffspring. Similarly, differences in female RS in this population do not seem to correlatewith parentage. Given the relatively egalitarian nature of Meriam social life, and theemphasis on personal achievement, these results are as might be expected. Although thesample size is small (91 pairs, smallest of the whole set of 12 RS measures in the project),the low β value is also found in most other cases where this wealth type was measured (seeother papers in this CA Forum). However, it is intriguing that Hill and Hurtado (1996:414)found a substantial correlation for RS of sons and their parents (but not for daughters); sex-specific transmission of RS should be explored in future studies.
Our two β measures for body weight show a substantial degree of parent-child transmission(about 0.3 for Hadza, about 0.5 for Ache), the pattern also found in other populationsmeasured in this project. Given the considerable degree of inter-household food-sharingamong Ache (Kaplan and Hill 1985) and Hadza (Sherry and Marlowe 2007), and the low βfor Ache hunting success (<0.1), the parent-child weight relationship in these twopopulations may be substantially due to genetic inheritance in disease resistance or someother unmeasured variable.
In the category of material wealth, our only two measures come from the same population,the whaling village of Lamalera, Indonesia. Household wealth exhibits moderate associationbetween parents and children. The index of wealth here is based on features of householdconstruction, improvements that generally require materials that must be purchased withcash. However, there is very little opportunity for wage labor in the village (aside fromteaching or a few government posts). One way for men (especially young, unmarried men)to acquire money is to take occasional temporary construction jobs in the district capitol.However, another important source of cash may be remittances from other close familymembers who have found permanent jobs outside the village. Insofar as both parents andchildren have access to the same source of remittance money (say, from the same son/brother) they may manifest similar levels of household wealth. In this case wealth may beacting as much as a proxy indicator of social capital as of material wealth. In contrast, sharesthat Lamalerans own in whaling boat (téna) harvests do not show a significantintergenerational elasticity, and the estimated effect size is rather small (Figure 1.b). Thismay be because parental influence is less important than more general support within one’slineage for securing shares in the lineage’s téna. Other ways of securing boat shares includeseeking shares from affinal lineages or through repeated, long-term participation in the crewof another lineage’s boat. Parental influence is likely minimal in either case.
Finally, we have two measures of relational wealth. There is a moderate relationship (β≈0.2)in the size of hxaro spheres between Ju/’hoansi parents and offspring (Figure 1.c). Thisrelationship is dependent on two factors. The first was the size and strength of spheres ofhxaro that parents maintained until old age for their children to inherit. Approximately 25%
Smith et al. Page 13
Curr Anthropol. Author manuscript; available in PMC 2011 February 1.
NIH
-PA Author Manuscript
NIH
-PA Author Manuscript
NIH
-PA Author Manuscript
of hxaro partnerships were passed on from parents to children as parents aged or upon theirdeaths when children took their possessions, gave them to parent’s partners, and asked thatthe relationship be continued (Wiessner 1986). The second factor was social competence.Some children were competent to “replace” parents who had an active social sphere; otherswere not. Few children of parents with narrow hxaro spheres expanded their spheres farbeyond those of their parents (i.e., “upward mobility” in hxaro was infrequent).
The highest β value for Lamalera is in food-sharing partnerships. Sharing ties are morecommon between geographically and genealogically closer households (Nolin 2008).Because parents and children share a common set of kin they are likely to share many of thesame partners, and their total number of partners may vary with the number of close kin inthe village. The tendency for children to reside near their parents is mild in Lamalera, butwhen it does occur parents and children are likely to have sharing ties to the sameresidentially close neighbors. Even when children establish households further away, theymay maintain sharing relationships with neighbors near their natal household. Socialrelationships such as food-sharing relationships differ from other types of wealth in thatpossession by the parents is not mutually exclusive of possession by the children. Grownchildren can have established sharing relationships with the same other households as theirparents. In fact, parents may be instrumental in helping their children establish these types ofsocial relationships as they enter early adulthood (Scelza 2009).
Wealth InequalityAlthough our primary focus in this project is on intergenerational wealth transmission, wehave an interest in the corresponding degree of wealth inequality, and how this might varyby wealth type, production system, and other factors. Table 5 lists the Gini coefficient foreach wealth type in our sample. We use the Gini because of its wide usage, unit-freedefinition, and intuitive meaning: the coefficient can range from zero (completely equality)to unity (all wealth held by a single household). For comparison, Ginis of monetary incomerange from about 0.25 in several Scandinavian countries to over 0.6 in some poor countries,with the U.S. at about 0.41 (UNDP 2007). Most Ginis for our eleven wealth types are in themoderate range, few being less than 0.1 or greater than 0.4 (Table 5); the lowest Ginis arethose for weight (both <0.1), and the highest is for Lamaleran boat shares (0.47). There aretoo few measures of material and relational wealth to discern a pattern by wealth class (butsee the concluding paper in this CA Forum).
To characterize an overall measure of wealth inequality for the sample populations, weweight the average Gini coefficient for each wealth class (Table 5) by the average α(importance for well-being) of that wealth class (Table 4). The resultant estimate equals0.25, very close to the simple arithmetic average of the Ginis in Table 5 (0.27).
ConclusionsWhat Shapes Intergenerational Wealth Transfer?
The analyses presented above reveal certain patterns regarding wealth (broadly defined) inour sample of hunter-gatherer populations. One is that certain types of wealth are morelikely to be transmitted to offspring than others. Of course, the patterns we see could bespurious, given our small number of cases. But the replication of some of these patternsacross populations, and indeed across production systems (as discussed in other papers inthis forum), makes that less likely. For example, adult body weight is highly correlatedbetween parents and offspring in our two cases, and similar values in non-foragerpopulations are reported elsewhere in this issue. Similarly, our two measures of relational
Smith et al. Page 14
Curr Anthropol. Author manuscript; available in PMC 2011 February 1.
NIH
-PA Author Manuscript
NIH
-PA Author Manuscript
NIH
-PA Author Manuscript
wealth, involving exchange partners, display moderate values (β > 0.2) which are alsoechoed in most of the other populations analyzed in this project.
Yet similar levels of intergenerational transmission do not imply similar causal mechanisms.Weight correlations reflect some mix of genetic and environmental causes. With variation infood intake effectively muted by the widespread food-sharing found in our populations (andmost other hunter-gatherers), genetic variation might be freed to play a larger role in shapingadult weight. In the case of exchange partners, there may be some relevant genetic variation(e.g., in determinants of personality), but this likely takes a back seat to social anddemographic variables such as the number of close kin one happens to have alive (importantat least for the Ju/’hoansi case) or the social position of one’s parents.
Some other patterns of wealth transmission are discordant between our five populations.Long-term hunting return rates have a quite high transmission coefficient among theTsimane (β=0.38) but are close to zero for the Ache. Since hunting success has been foundto predict reproductive success (RS) in most hunter-gatherer populations where the datahave been analyzed, including all six of the populations treated in this paper (reviewed inSmith 2004; Gurven and von Rueden 2006), determining whether the Tsimane pattern or theAche one is more widespread is of considerable interest.
As for RS itself, we treat it here (and elsewhere in this forum) as a form of wealth; but itcould justifiably be considered an outcome of wealth transmission (or consumption) as well,shaped by ecological, political economic, and evolutionary factors. In any case, thetransmission coefficients for our cases are quite low, matching most of the RS data fromother populations analyzed in this forum. Interestingly, a recent study analyzing genetic(mtDNA) data from a set of thiry-seven populations concludes that matrilineal fertilityinheritance is more frequent in hunter-gatherer populations than in agricultural ones (Blumet al. 2006). The authors speculate that in hunter-gatherer populations, individuals belongingto large kin networks may benefit from stronger social support, resulting in more offspring.This hypothesis is consistent with ethnographic analyses of Ju/’hoansi by Draper and Hames(2000) and Wiessner (2002), and links to recent theory about the evolutionary dynamics ofcooperative breeding (Clutton-Brock 2002; Kokko, Johnstone and Wright 2002; Hrdy2005).
How Egalitarian Are Hunter-Gatherers?Hunter-gatherers have long been anthropology’s favorite exemplar—of whatever social,political, or moral principle an analyst wishes to support. The twists and turns in thisintellectual history have been ably reviewed elsewhere (e.g., Winterhalder 1993; Kelly1995; Marlowe 2005). We wish to avoid any suggestion of endorsing a new stereotype forwhat is inherently a diverse set of societies. However, we do think our findings support areassessment of the view that hunter-gatherers (with a few obvious exceptions) arecharacterized by pervasive equality in wealth and life chances.
The intergenerational wealth transmission coefficients estimated here range from values thatare very low and statistically indistinguishable from zero to ones near or above 0.4. Let usfocus on intermediate values of β≈0.25, close to several measures (Table 5). While farbelow a perfect transmission rate of 1.0, this measure indicates a fairly high bias in the lifechances according to the parent’s wealth. Indeed, as detailed in the introductory paper in thisforum by Bowles et al., β=0.25 implies that a child born into the top wealth decile of thepopulation is 5 times more likely to remain in the top wealth decile than a child whoseparents were in the bottom decile. Even a β of 0.1 implies that a child born into the topwealth decile is twice as likely to remain there as is one born into the bottom decile. Theseresults suggest that in hunter-gatherer populations, even those with extensive food-sharing
Smith et al. Page 15
Curr Anthropol. Author manuscript; available in PMC 2011 February 1.
NIH
-PA Author Manuscript
NIH
-PA Author Manuscript
NIH
-PA Author Manuscript
and other leveling devices (Cashdan 1982), the offspring of those better off will tend toremain so, and conversely.
But how much wealth inequality actually exists in these populations? The Gini coefficientslisted in Table 5 are low compared to contemporary societies, and even to agricultural andpastoral populations (see other papers in this forum); but they are far from negligible.Excluding the low coefficients for weight, the Ginis range from 0.2 to 0.5, and evenincluding weight the α-weighted average is 0.25 (Table 5). This value is the same as theincome inequality in contemporary Denmark (0.25), the country with lowest such value in2007 (UNDP 2007). Thus, to the extent that our measures for this set of foragers arerepresentative, wealth inequality is moderate—that is to say, very low by current worldstandards, but far from a state of “primitive communism” (cf. Lee 1988).
The combined picture from the intergenerational transmission (β) and inequality (Gini)estimates suggests we may need to rethink the conventional portrayal of foragers as highlyegalitarian and unconcerned with wealth. Even classic examples of hunter-gatherer societydisplay more inequality than is widely appreciated. For example, evidence indicates thatleadership was much stronger among the Ju/’hoansi in the past before the Bantu arrived,with the best foraging areas (n!ore) held by strong families (Wiessner 2002), and thelanguage has distinct words for poor, ordinary and rich.
What Remains to Be Done?This research raises many more questions than it answers—a commonplace that isemphatically true here. Due to space limitations, we can only mention the most pressing ofthese. First, we clearly need more wealth measures, particularly for material and relationalwealth classes. Given the high importance we assign to relational wealth (α≈0.4), and theethnographic evidence of its impact on status, this wealth class is especially in need offurther detailed study and analysis.
Second, we need more work focused on the development of institutionalized inequality inhunter-gatherers. For historic reasons, there are no extant “complex” foraging societies ofthe sort once found in places such as the Northwest Coast, and hence we had no hope ofincluding a representative in this project. But the findings reported here do offer potentialinsights into such societies, and how they might have developed (under the rightsocioecological conditions) from less hierarchical systems. In particular, we need to minethe results of this project to address the question of what conditions allow wealth to bemonopolized. We hypothesize that there are at least two main differences betweenestablishing inequalities on the basis of social ties versus material property. First, one cansuccessfully pass on material property to a child who is not too bright or competent, andothers can help him or her manage the advantage, but this is generally not possible withrelational wealth. Second, it is much harder to construct institutions to transmit social tiesand knowledge than it is for material wealth. To test these (and related hypotheses) we willneed additional data-sets detailing the degree of intergenerational wealth transmission forvarious forms of wealth, and the processes that support or constrain such transmission.
AcknowledgmentsWe thank Sam Bowles and Monique Borgerhoff Mulder for inviting us to participate in this challenging butrewarding comparative and interdisciplinary project, and the Behavioral Sciences Program Santa Fe Institute forsupport. The individual coauthors would like to thank their research sponsors and collaborators: EAS thanks theNational Science Foundation for funding field research among the Meriam, Doug Bird and Rebecca Bliege Bird fortheir role as primary researchers, and the people of Mer (particularly the Passi family) for their generosity andassistance. KH thanks the Ache of Kue Tuvy, Arroyo Bandera, and Chupa Pou, and the assistance of MagdalenaHurtado and Fermino Chachugi. FM thanks NSF for funding the Hadza project, COSTECH for permission to
Smith et al. Page 16
Curr Anthropol. Author manuscript; available in PMC 2011 February 1.
NIH
-PA Author Manuscript
NIH
-PA Author Manuscript
NIH
-PA Author Manuscript
conduct research, Audax Mabulla, Daudi Peterson, Johannes and Lene Kleppe for assistance in Tanzania, and theHadza. DN thanks the people of Lamalera, the Blikololong family, Dr. Dedi Adhuri, the Indonesian Institute ofSciences (LIPI), and Michael Alvard; research in Lamalera supported by NSF grant BCS-0514559. PW thanks theJu/’hoansi of /Kae/Kae and Dobe for a lot of patience and help.
Literature CitedAlvard MS. Carcass ownership and meat distribution by big-game cooperative hunters. Research in
Economic Anthropology 2002;21:99–131.Alvard MS. Kinship, lineage, and an evolutionary perspective on the structure of cooperative big game
hunting groups in Indonesia. Human Nature 2003;14(2):129–163.Alvard MS, Gillespie A. Good Lamalera whale hunters accrue reproductive benefits. Research in
Economic Anthropology 2004;24:225–248.Alvard MS, Nolin D. Rousseau’s whale hunt? Coordination among big-game hunters. Current
Anthropology 2002;43(4):533–559.Australian Institute of Health and Welfare. The health and welfare of Australia’s Aboriginal and
Torres Strait Islander peoples 2005. Canberra: Australian Bureau of Statistics; 2005. Chapter 9:Mortality; p. 147-151.
Barnes RH. Educated fishermen: social consequences of development in an Indonesian whalingcommunity. Bulletin de l’Ecole Française d’Extrème-Orient 1986;75:295–314.
Barnes, RH. Sea hunters of Indonesia. Oxford: Clarendon Press; 1996.Beckett, JR. The Torres Strait Islanders: Custom and colonialism. Cambridge: Cambridge University
Press; 1988.Bentley GR, Goldberg T, Jasienska G. The fertility of agricultural and non-agricultural traditional
societies. Population Studies 1993;47:269–281.Biesele, M. Women like meat: The folklore and foraging ideology of the Kalahari Ju/’hoan.
Bloomington: Indiana University Press; 1993.Binford LR. Willow smoke and dogs’ tails: hunter-gatherer settlement systems and archaeological site
formation. American Antiquity 1980;45:4–20.Bird, DW.; Bliege Bird, R. Competing to be leaderless: Food sharing and magnanimity among Martu
aborigines. In: Kantner, J.; Vaughn, K.; Eerkins, J., editors. The emergence of leadership:Transitions in decision making from small-scale to middle-range societies. Santa Fe: SAR Press;2009.
Bliege Bird RL, Bird DW. Delayed reciprocity and tolerated theft: the behavioral ecology of foodsharing strategies. Current Anthropology 1997;38(1):49–78.
Bliege Bird RL, Bird DW, Smith EA, Kushnick G. Risk and reciprocity in Meriam food sharing.Evolution and Human Behavior 2002;23(4):297–321.
Bliege Bird RL, Smith EA, Bird DW. The hunting handicap: costly signaling in human foragingstrategies. Behavioral Ecology and Sociobiology 2001;50:9–19.
Blum MGB, Heyer E, François O, Austerlitz F. Matrilineal fertility inheritance detected in hunter-gatherer populations using the imbalance of gene genealogies. PLoS Genetics 2006;2(8):e122,1138–1146. [PubMed: 16933997]
Blurton Jones, N. Contemporary hunter-gatherers and human life history evolution. In: Hawkes, K.;Paine, R., editors. The evolution of human life history. Santa Fe: SAR Press; 2006. p. 231-66.
Blurton Jones N, Hawkes K, O’Connell JF. Antiquity of postreproductive life: Are there modernimpacts on hunter-gatherer postreproductive life spans? American Journal of Human Biology2002;14:184–205. [PubMed: 11891933]
Blurton Jones, N.; Hawkes, K.; O’Connell, J. Hadza grandmothers as helpers: Residence data. In:Voland, E.; Chasiotis, A.; Schiefenhovel, W., editors. Grandmotherhood. New Brunswick: RutgersUniversity Press; 2005. p. 160-176.
Blurton Jones N, Marlowe FW. Selection for delayed maturity: does it take 20 years to learn to huntand gather? Human Nature 2002;13(2):199–238.
Smith et al. Page 17
Curr Anthropol. Author manuscript; available in PMC 2011 February 1.
NIH
-PA Author Manuscript
NIH
-PA Author Manuscript
NIH
-PA Author Manuscript
Boone, JL. Competition, conflict, and the development of hierarchies. In: Smith, EA.; Winterhalder,B., editors. Evolutionary ecology and human behavior. Hawthorne, NY: Aldine de Gruyter; 1992.p. 301-337.
Borgerhoff Mulder M, Bowles S, Hertz T, Bell Adrian, Beise J, Clark G, Fazzio I, Gurven M, Hill K,Hooper PL, Irons W, Kaplan H, Leonetti D, Low B, Marlowe F, McElreath R, Naidu S, Nolin D,Piraino P, Quinlan R, Schniter E, Sear R, Shenk M, Smith EA, von Rueden C, Wiessner P.Intergenerational transmission of wealth and dynamics of inequality in pre-modern societies.Science. 2009 in press.
Cashdan EA. Egalitarianism among hunters and gatherers. American Anthropologist 1980;82:116–20.Cashdan, EA. Spatial organization and habitat use. In: Smith, EA.; Winterhalder, B., editors.
Evolutionary ecology and human behavior. Hawthorne, NY: Aldine de Gruyter; 1992. p. 237-266.Clutton-Brock TH. Breeding together: kin selection and mutualism in cooperative vertebrates. Science
2002;296:69–72. [PubMed: 11935014]Draper P, Hames R. Birth order, sibling investment, and fertility among Ju/’hoansi (!Kung). Human
Nature 2000;11(2):117–156.Gurven M, Kaplan H, Gutierrez M. How long does it take to become a proficient hunter? Implications
for the evolution of delayed growth. Journal of Human Evolution 2006;51:454–470. [PubMed:16797055]
Gurven M, Allen-Arave W, Hill K, Hurtado M. “It’s a wonderful life”: signaling generosity among theAche of Paraguay. Evolution and Human Behavior 2000;21(4):263–282. [PubMed: 10899478]
Gurven M, Kaplan H. Longevity among hunter-gatherers: a cross-cultural examination. Population andDevelopment Review 2007;33(2):321–365.
Gurven M, von Rueden C. Hunting, social status and biological fitness. Social Biology 2006;53:81–99.Haddon, AC., editor. Reports of the Cambridge Anthropological Expedition to Torres Straits. Vol. VI.
Cambridge: The University Press; 1906. Sociology, magic, and religion of the eastern islanders.Hawkes K, O’Connell JF, Blurton Jones NG. Hunting and nuclear families: some lessons from the
Hadza about men’s work. Current Anthropology 2001a;42(5):681–709.Hawkes K, O’Connell JF, Blurton Jones NG. Hadza meat sharing. Evolution and Human Behavior
2001b;22(2):113–142. [PubMed: 11282309]Hertz T, Bell A, Piraino P, Naidu S. Appendix: Estimating the Inheritance of Wealth in Pre-Modern
Societies. Electronic enhancement to CA Forum on Inheritance and Inequality. CurrentAnthropology 2010;51(1)
Hiernaux J, Hartono DB. Physical measurements of the adult Hadza of Tanzania. Annals of HumanBiology 1980;4:339–346. [PubMed: 7436347]
Hill K. Altruistic cooperation during foraging by the Ache, and the evolved human predisposition tocooperate. Human Nature 2002;13(1):105–128.
Hill, K. Research web site. n.dhttp://www.public.asu.edu/~krhill3/Index.htmlHill, K. The Ache. In: Wilbert, J., editor. Encyclopedia of World Cultures, Volume 7. Boston: G.K.
Hall-Macmillan; 1994. p. 3-7.Hill, K.; Hurtado, AM. Ache life history: The ecology and demography of a foraging people.
Hawthorne, NY: Aldine de Gruyter; 1996.Hill, K.; Hurtado, AM. The Ache of Paraguay. In: Lee, R.; Daly, R., editors. The Cambridge
encyclopedia of hunters and gatherers. Cambridge: Cambridge University Press; 1999. p. 92-96.Howell, NW. Demography of the Dobe !Kung (revised second edition). New York: Academic Press;
2000.Hrdy, SB. Evolutionary context of human development: the cooperative breeding model. In: Carter,
C.; Ahner, L.; Grossman, K.; Hrdy, S.; Lamb, M.; Porges, S.; Sachser, N., editors. Attachment andbonding: A new synthesis. Cambridge, MA: MIT Press; 2005.
Kaplan H, Hill K. Food sharing among Ache foragers: Tests of explanatory hypotheses. CurrentAnthropology 1985;26(2):223–46.
Kelly, RL. The foraging spectrum: diversity in hunter-gatherer lifeways. Washington, D.C:Smithsonian Institution Press; 1995.
Smith et al. Page 18
Curr Anthropol. Author manuscript; available in PMC 2011 February 1.
NIH
-PA Author Manuscript
NIH
-PA Author Manuscript
NIH
-PA Author Manuscript
Kokko H, Johnstone RA, Wright J. The evolution of parental and alloparental effort in cooperativelybreeding groups: when should helpers pay to stay? Behavioral Ecology 2002;13(3):291–300.
Lee, RB. The !Kung San: Men, women and work in a foraging society. Cambridge, New York:Cambridge University Press; 1979.
Lee, RB. Reflections on primitive communism. In: Ingold, T.; Riches, D.; Woodburn, J., editors.Hunters and gatherers volume 1: History, evolution and social change. Oxford: Berg; 1988. p.252-68.
Lee, RB.; DeVore, I. Kalahari hunter-gatherers: Studies of the !Kung San and their neighbors.Cambridge: Cambridge University Press; 1976.
Marlowe FW. Showoffs or providers? The parenting effort of Hadza men. Evolution and HumanBehavior 1999;20(6):391–404.
Marlowe FW. The patriarch hypothesis: an alternative explanation of menopause. Human Nature2000;11(1):27–42.
Marlowe FW. A critical period for provisioning by Hadza men: implications for pair bonding.Evolution and Human Behavior 2003;24:217–229.
Marlowe FW. Marital residence among foragers. Current Anthropology 2004;45(2):277–284.Marlowe FW. Hunter-gatherers and human evolution. Evolutionary Anthropology 2005;14(2):54–67.Marlowe, FW. Central place provisioning: The Hadza as an example. In: Hohmann, G.; Robbins, M.;
Boesch, C., editors. Feeding ecology in apes and other primates. Cambridge: CambridgeUniversity Press; 2006. p. 359-377.
Marlowe FW, Berbesque JC. Tubers as fallback foods and their impact on Hadza hunter-gatherers.American Journal of Physical Anthropology. 2009
Murdock, GP.; White, DR. Standard cross-cultural sample. Barry, H.; Schlegel, A., editors. Pittsburgh,PA: University of Pittsburgh Press; 1980. p. 3-43.
Nolin, D. Doctoral dissertation. Seattle: University of Washington; 2008. Food-sharing networks inLamalera, Indonesia: Tests of adaptive hypotheses.
Scelza B. Father’s presence speeds the social and reproductive careers of sons in a contemporaryAustralian Aboriginal society. UCLA: Anthropology. submitted.
Sellen DW. Infant and young child feeding practices: Evolution, recent cross cultural variation andcontemporary public health challenges. Annual Review of Nutrition 2007;27:123–147.
Sellen DW, Mace R. Fertility and mode of subsistence: a phylogenetic analysis. Current Anthropology1997;38:878–889.
Sellen DW, Smay DB. Relationship between subsistence and age at weaning in “preindustrialsocieties”. Human Nature 2001;12(1):47–87.
Sharp, N. Stars of Tagai: The Torres Strait Islanders. Canberra: Aboriginal Studies Press; 1993.Sherry D, Marlowe FW. Anthropometric data indicate nutritional homogeneity in Hadza foragers of
Tanzania. American Journal of Human Biology 2007;19:107–118. [PubMed: 17160974]Shostak, M. Nisa: The life and words of a !Kung woman. Cambridge: Harvard University Press; 1981.Smith EA, Bliege Bird RL. Turtle hunting and tombstone opening: Public generosity as costly
signaling. Evolution and Human Behavior 2000;21(4):245–261. [PubMed: 10899477]Smith EA, Bliege Bird RL, Bird DW. The benefits of costly signaling: Meriam turtle hunters.
Behavioral Ecology 2003;14(1):116–126.Smith, EA.; Choi, J-K. The emergence of inequality in small-scale societies: Simple scenarios and
agent-based simulations. In: Kohler, T.; van der Leeuw, S., editors. The model-based archaeologyof socionatural systems. Santa Fe: SAR Press; 2007. p. 105-119 .p. 241-244.
UNDP. 2007/2008 Human Development Report. United Nations Development Program; 2008 Mar 24.p. 15http://hdrstats.undp.org/indicators/147.html2009
Wiessner P. Measuring the impact of social ties on nutritional status among the !Kung San. SocialScience Information 1981;20:641–78.
Wiessner, P. Risk, reciprocity, and social influence on !Kung San economics. In: Leacock, E.; Lee, R.,editors. Politics and history in band societies. Cambridge: Cambridge University Press; 1982. p.61-84.
Smith et al. Page 19
Curr Anthropol. Author manuscript; available in PMC 2011 February 1.
NIH
-PA Author Manuscript
NIH
-PA Author Manuscript
NIH
-PA Author Manuscript
Wiessner, P. !Kung San networks in a generational perspective. In: Biesele, M.; Gordon, R.; Lee, R.,editors. The past and future of !Kung ethnography: Essays in honor of Lorna Marshall. Hamburg:Helmut Buske Verlag; 1986. p. 103-36.
Wiessner P. Hunting, healing, and hxaroexchange: a long term perspective on !Kung (Ju/’hoansi)large-game hunting. Evolution and Human Behavior 2002;23(6):407–436.
Wiessner P. Norm enforcement among the Ju/’hoansi Bushmen: A case of strong reciprocity? HumanNature 2005;16(2):115–145.
Wilmsen, EN. Land Filled with Flies: A Political Economy of the Kalahari. Chicago and London:University of Chicago Press; 1989.
Winterhalder B. Work, resources, and population in foraging societies. Man 1993;28:321–340.Wood, BM.; Marlowe, FW. Where do Hadza men’s foods go?. Harvard University: Department of
Anthropology; n.dWoodburn, J. Doctoral dissertation. Cambridge University; 1964. The social organization of the Hadza
of North Tanganyika.Woodburn J. Egalitarian societies. Man 1982;17:431–51.Woodburn, J. Sharing is not a form of exchange: an analysis of property-sharing in immediate-return
hunter-gatherer societies. In: Hann, CM., editor. Property relations: Renewing the anthropologicaltradition. Cambridge: Cambridge University Press; 1998. p. 48-63.
World Cultures. Cross-cultural data files. La Jolla, CA: World Cultures; 2005. World Cultures.
Smith et al. Page 20
Curr Anthropol. Author manuscript; available in PMC 2011 February 1.
NIH
-PA Author Manuscript
NIH
-PA Author Manuscript
NIH
-PA Author Manuscript
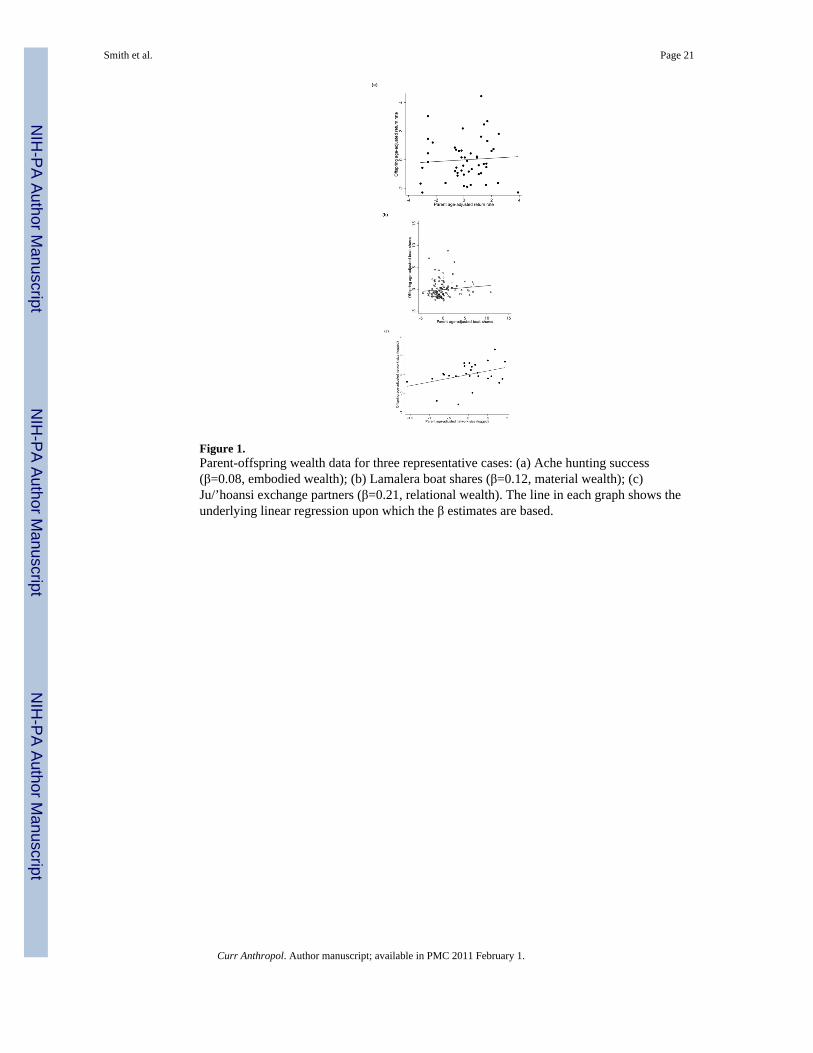
Figure 1.Parent-offspring wealth data for three representative cases: (a) Ache hunting success(β=0.08, embodied wealth); (b) Lamalera boat shares (β=0.12, material wealth); (c)Ju/’hoansi exchange partners (β=0.21, relational wealth). The line in each graph shows theunderlying linear regression upon which the β estimates are based.
Smith et al. Page 21
Curr Anthropol. Author manuscript; available in PMC 2011 February 1.
NIH
-PA Author Manuscript
NIH
-PA Author Manuscript
NIH
-PA Author Manuscript
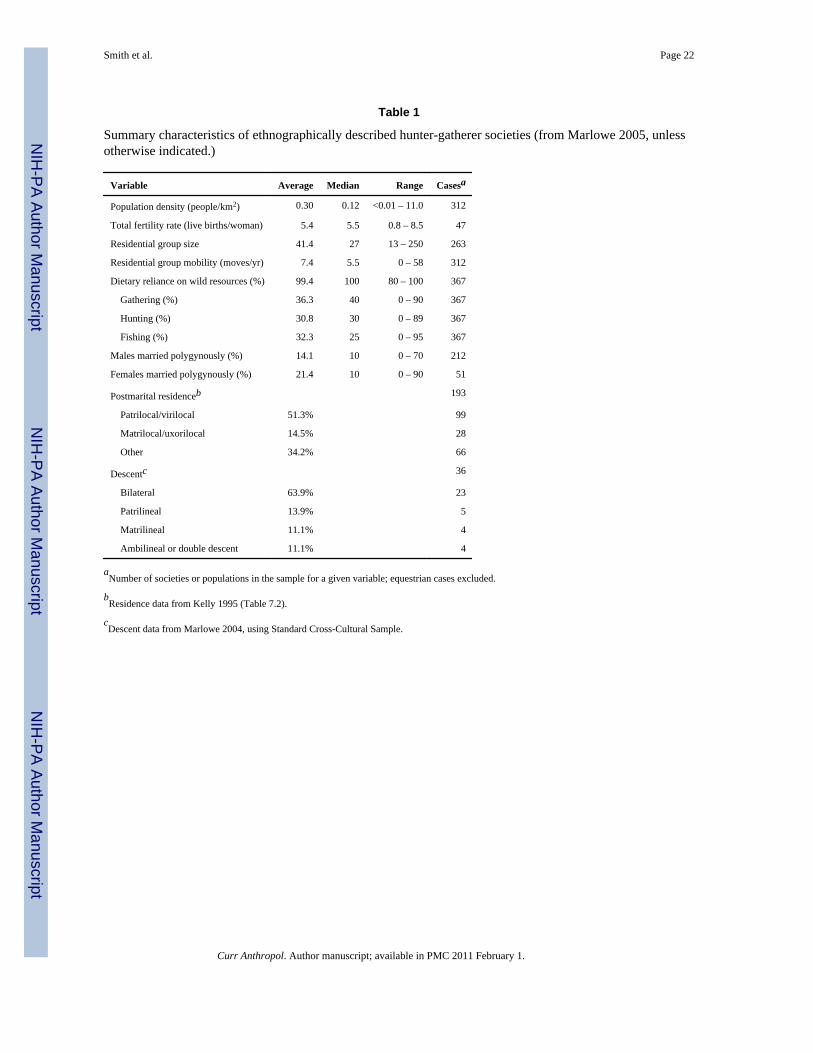
NIH
-PA Author Manuscript
NIH
-PA Author Manuscript
NIH
-PA Author Manuscript
Smith et al. Page 22
Table 1
Summary characteristics of ethnographically described hunter-gatherer societies (from Marlowe 2005, unlessotherwise indicated.)
Variable Average Median Range Casesa
Population density (people/km2) 0.30 0.12 <0.01 – 11.0 312
Total fertility rate (live births/woman) 5.4 5.5 0.8 – 8.5 47
Residential group size 41.4 27 13 – 250 263
Residential group mobility (moves/yr) 7.4 5.5 0 – 58 312
Dietary reliance on wild resources (%) 99.4 100 80 – 100 367
Gathering (%) 36.3 40 0 – 90 367
Hunting (%) 30.8 30 0 – 89 367
Fishing (%) 32.3 25 0 – 95 367
Males married polygynously (%) 14.1 10 0 – 70 212
Females married polygynously (%) 21.4 10 0 – 90 51
Postmarital residenceb 193
Patrilocal/virilocal 51.3% 99
Matrilocal/uxorilocal 14.5% 28
Other 34.2% 66
Descentc 36
Bilateral 63.9% 23
Patrilineal 13.9% 5
Matrilineal 11.1% 4
Ambilineal or double descent 11.1% 4
aNumber of societies or populations in the sample for a given variable; equestrian cases excluded.
bResidence data from Kelly 1995 (Table 7.2).
cDescent data from Marlowe 2004, using Standard Cross-Cultural Sample.
Curr Anthropol. Author manuscript; available in PMC 2011 February 1.
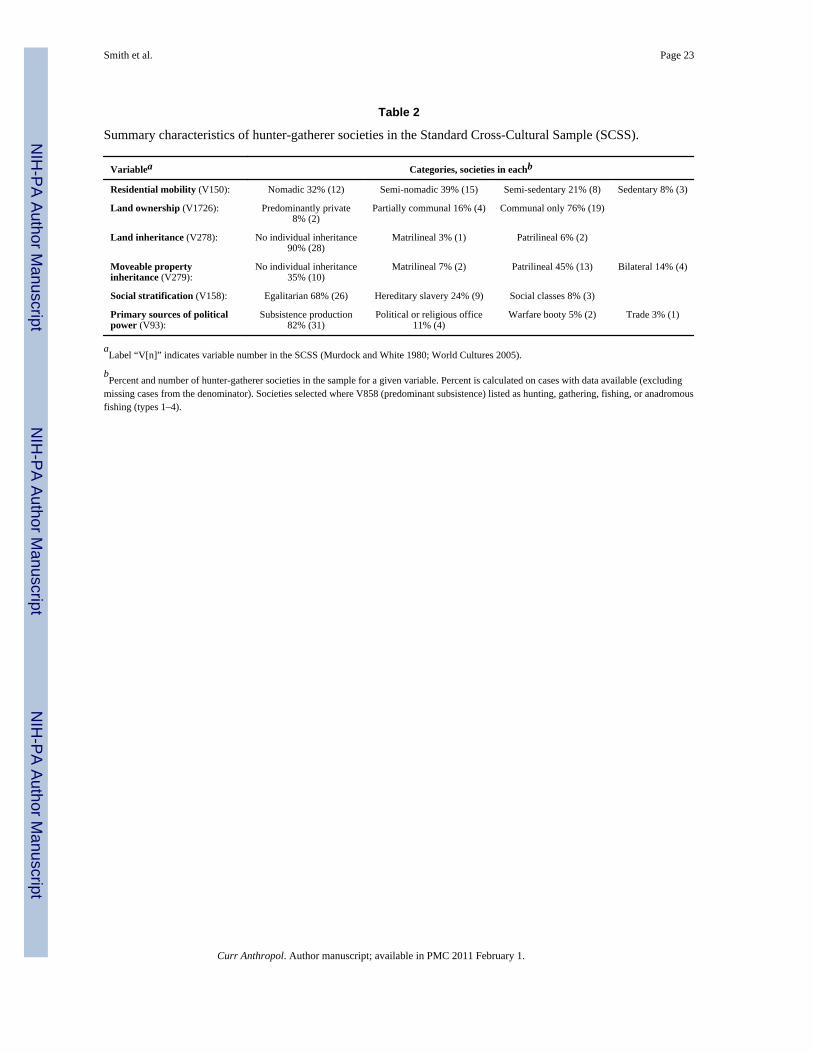
NIH
-PA Author Manuscript
NIH
-PA Author Manuscript
NIH
-PA Author Manuscript
Smith et al. Page 23
Table 2
Summary characteristics of hunter-gatherer societies in the Standard Cross-Cultural Sample (SCSS).
Variablea Categories, societies in eachb
Residential mobility (V150): Nomadic 32% (12) Semi-nomadic 39% (15) Semi-sedentary 21% (8) Sedentary 8% (3)
Land ownership (V1726): Predominantly private8% (2)
Partially communal 16% (4) Communal only 76% (19)
Land inheritance (V278): No individual inheritance90% (28)
Matrilineal 3% (1) Patrilineal 6% (2)
Moveable propertyinheritance (V279):
No individual inheritance35% (10)
Matrilineal 7% (2) Patrilineal 45% (13) Bilateral 14% (4)
Social stratification (V158): Egalitarian 68% (26) Hereditary slavery 24% (9) Social classes 8% (3)
Primary sources of politicalpower (V93):
Subsistence production82% (31)
Political or religious office11% (4)
Warfare booty 5% (2) Trade 3% (1)
aLabel “V[n]” indicates variable number in the SCSS (Murdock and White 1980; World Cultures 2005).
bPercent and number of hunter-gatherer societies in the sample for a given variable. Percent is calculated on cases with data available (excluding
missing cases from the denominator). Societies selected where V858 (predominant subsistence) listed as hunting, gathering, fishing, or anadromousfishing (types 1–4).
Curr Anthropol. Author manuscript; available in PMC 2011 February 1.
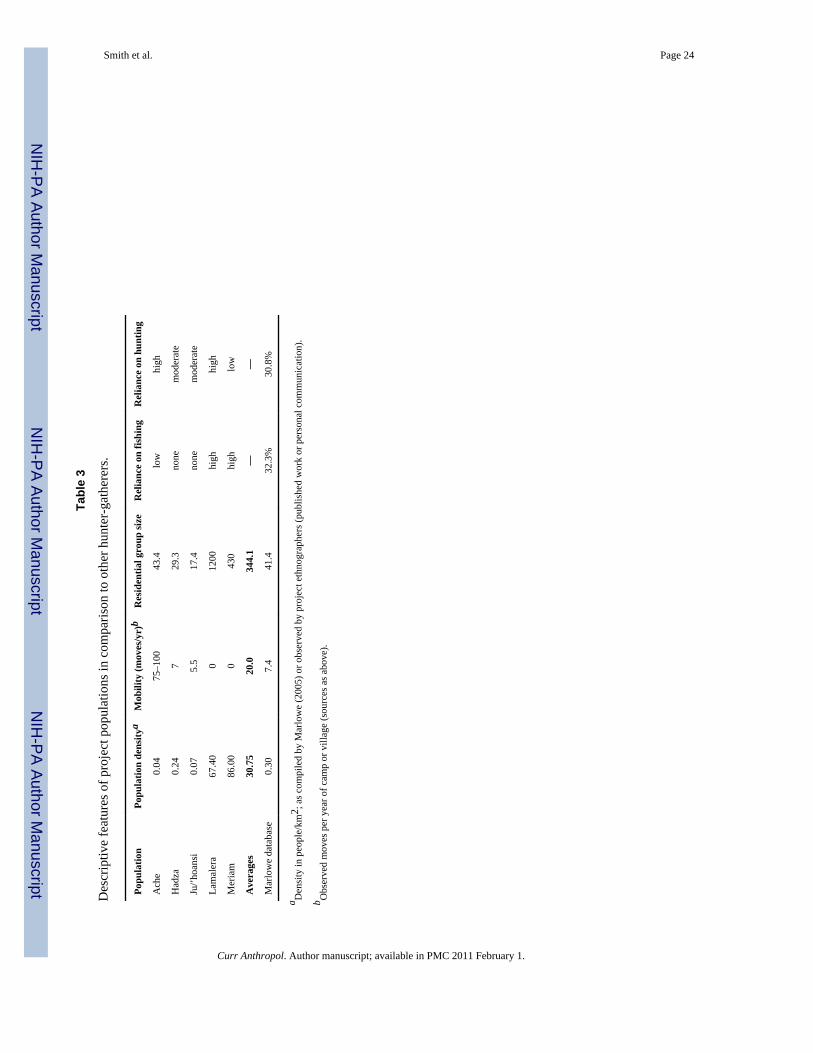
NIH
-PA Author Manuscript
NIH
-PA Author Manuscript
NIH
-PA Author Manuscript
Smith et al. Page 24
Tabl
e 3
Des
crip
tive
feat
ures
of p
roje
ct p
opul
atio
ns in
com
paris
on to
oth
er h
unte
r-ga
ther
ers.
Popu
latio
nPo
pula
tion
dens
itya
Mob
ility
(mov
es/y
r)b
Res
iden
tial g
roup
size
Rel
ianc
e on
fish
ing
Rel
ianc
e on
hun
ting
Ach
e0.
0475
–100
43.4
low
high
Had
za0.
247
29.3
none
mod
erat
e
Ju/’h
oans
i0.
075.
517
.4no
nem
oder
ate
Lam
aler
a67
.40
012
00hi
ghhi
gh
Mer
iam
86.0
00
430
high
low
Ave
rage
s30
.75
20.0
344.
1—
—
Mar
low
e da
taba
se0.
307.
441
.432
.3%
30.8
%
a Den
sity
in p
eopl
e/km
2 ; a
s com
pile
d by
Mar
low
e (2
005)
or o
bser
ved
by p
roje
ct e
thno
grap
hers
(pub
lishe
d w
ork
or p
erso
nal c
omm
unic
atio
n).
b Obs
erve
d m
oves
per
yea
r of c
amp
or v
illag
e (s
ourc
es a
s abo
ve).
Curr Anthropol. Author manuscript; available in PMC 2011 February 1.
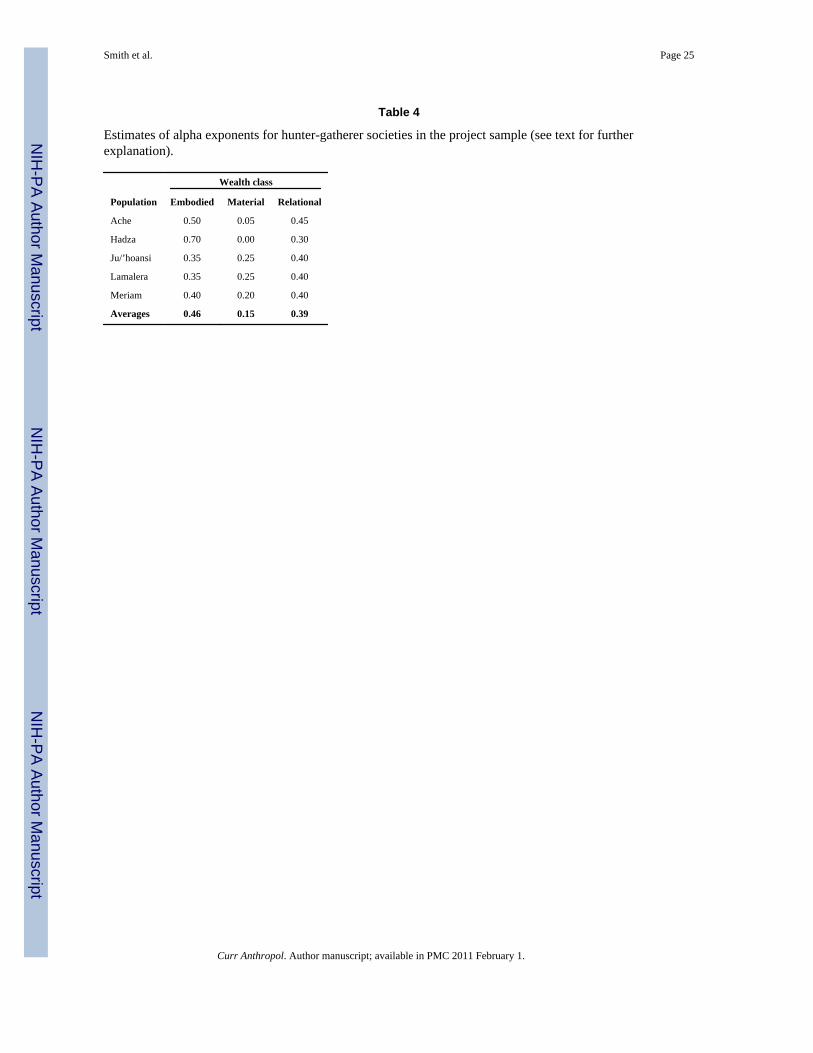
NIH
-PA Author Manuscript
NIH
-PA Author Manuscript
NIH
-PA Author Manuscript
Smith et al. Page 25
Table 4
Estimates of alpha exponents for hunter-gatherer societies in the project sample (see text for furtherexplanation).
Wealth class
Population Embodied Material Relational
Ache 0.50 0.05 0.45
Hadza 0.70 0.00 0.30
Ju/’hoansi 0.35 0.25 0.40
Lamalera 0.35 0.25 0.40
Meriam 0.40 0.20 0.40
Averages 0.46 0.15 0.39
Curr Anthropol. Author manuscript; available in PMC 2011 February 1.
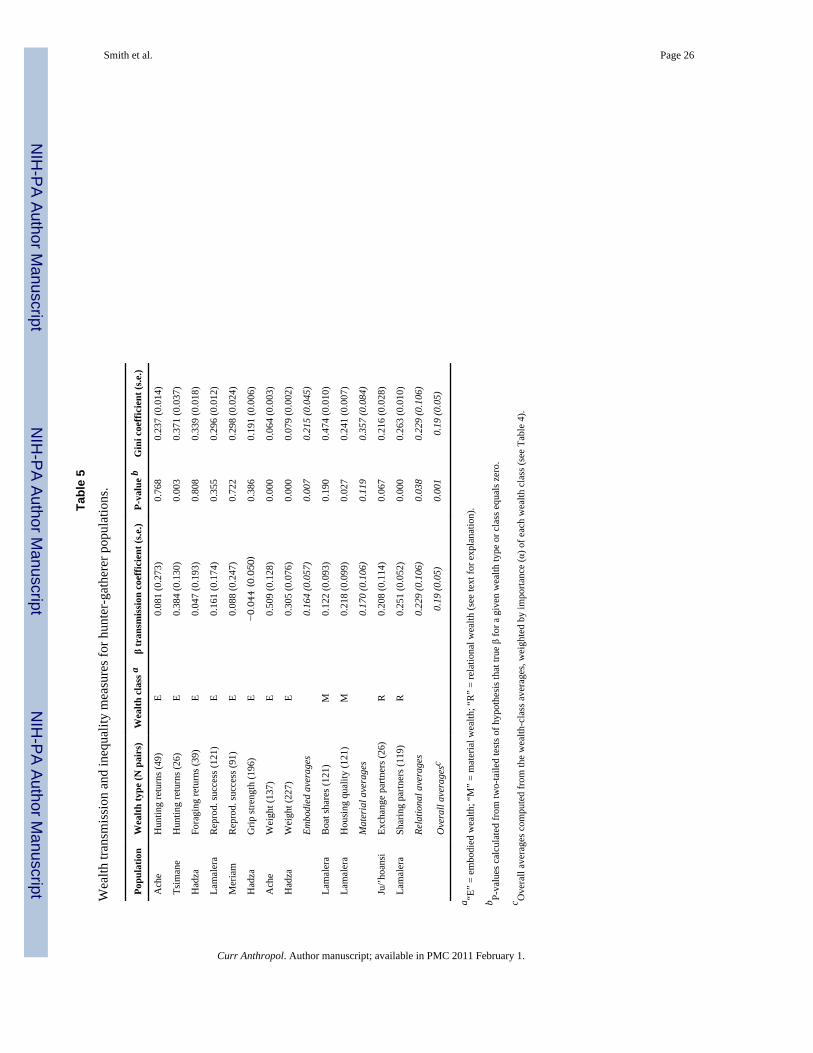
NIH
-PA Author Manuscript
NIH
-PA Author Manuscript
NIH
-PA Author Manuscript
Smith et al. Page 26
Tabl
e 5
Wea
lth tr
ansm
issi
on a
nd in
equa
lity
mea
sure
s for
hun
ter-
gath
erer
pop
ulat
ions
.
Popu
latio
nW
ealth
type
(N p
airs
)W
ealth
cla
ss a
β tr
ansm
issi
on c
oeffi
cien
t (s.e
.)P-
valu
e b
Gin
i coe
ffici
ent (
s.e.)
Ach
eH
untin
g re
turn
s (49
)E
0.08
1 (0
.273
)0.
768
0.23
7 (0
.014
)
Tsim
ane
Hun
ting
retu
rns (
26)
E0.
384
(0.1
30)
0.00
30.
371
(0.0
37)
Had
zaFo
ragi
ng re
turn
s (39
)E
0.04
7 (0
.193
)0.
808
0.33
9 (0
.018
)
Lam
aler
aR
epro
d. su
cces
s (12
1)E
0.16
1 (0
.174
)0.
355
0.29
6 (0
.012
)
Mer
iam
Rep
rod.
succ
ess (
91)
E0.
088
(0.2
47)
0.72
20.
298
(0.0
24)
Had
zaG
rip st
reng
th (1
96)
E−0.
044
(0.0
50)
0.38
60.
191
(0.0
06)
Ach
eW
eigh
t (13
7)E
0.50
9 (0
.128
)0.
000
0.06
4 (0
.003
)
Had
zaW
eigh
t (22
7)E
0.30
5 (0
.076
)0.
000
0.07
9 (0
.002
)
Embo
died
ave
rage
s0.
164
(0.0
57)
0.00
70.
215
(0.0
45)
Lam
aler
aB
oat s
hare
s (12
1)M
0.12
2 (0
.093
)0.
190
0.47
4 (0
.010
)
Lam
aler
aH
ousi
ng q
ualit
y (1
21)
M0.
218
(0.0
99)
0.02
70.
241
(0.0
07)
Mat
eria
l ave
rage
s0.
170
(0.1
06)
0.11
90.
357
(0.0
84)
Ju/’h
oans
iEx
chan
ge p
artn
ers (
26)
R0.
208
(0.1
14)
0.06
70.
216
(0.0
28)
Lam
aler
aSh
arin
g pa
rtner
s (11
9)R
0.25
1 (0
.052
)0.
000
0.26
3 (0
.010
)
Rela
tiona
l ave
rage
s0.
229
(0.1
06)
0.03
80.
229
(0.1
06)
Ove
rall
aver
ages
c0.
19 (0
.05)
0.00
10.
19 (0
.05)
a “E”
= em
bodi
ed w
ealth
; “M
” =
mat
eria
l wea
lth; “
R”
= re
latio
nal w
ealth
(see
text
for e
xpla
natio
n).
b P-va
lues
cal
cula
ted
from
two-
taile
d te
sts o
f hyp
othe
sis t
hat t
rue β
for a
giv
en w
ealth
type
or c
lass
equ
als z
ero.
c Ove
rall
aver
ages
com
pute
d fr
om th
e w
ealth
-cla
ss a
vera
ges,
wei
ghte
d by
impo
rtanc
e (α
) of e
ach
wea
lth c
lass
(see
Tab
le 4
).
Curr Anthropol. Author manuscript; available in PMC 2011 February 1.


