Embed Size (px)
Citation preview
arX
iv:0
909.
1701
v1 [
astr
o-ph
.HE
] 9
Sep
200
9Astronomy & Astrophysicsmanuscript no. 12953 c© ESO 2014January 12, 2014
WEBT multiwavelength monitoring and XMM-Newton observati onsof BL Lacertae in 2007–2008
Unveiling different emission components ⋆
C. M. Raiteri1, M. Villata1, A. Capetti1, M. F. Aller2, U. Bach3, P. Calcidese4, M. A. Gurwell5, V. M. Larionov6,7,J. Ohlert8, K. Nilsson9, A. Strigachev10, I. Agudo11, H. D. Aller2, R. Bachev10, E. Benıtez12, A. Berdyugin9,
M. Bottcher13, C. S. Buemi14, S. Buttiglione15, D. Carosati16, P. Charlot17,18, W. P. Chen19, D. Dultzin12, E. Forne20,L. Fuhrmann3, J. L. Gomez11, A. C. Gupta21, J. Heidt22, D. Hiriart12, W.-S. Hsiao19, M. Jelınek23, S. G. Jorstad24,G. N. Kimeridze25, T. S. Konstantinova6, E. N. Kopatskaya6, A. Kostov10, O. M. Kurtanidze25, A. Lahteenmaki26,
L. Lanteri1, L. V. Larionova6, P. Leto27,14, G. Latev28, J.-F. Le Campion17,18, C.-U. Lee29, R. Ligustri30, E. Lindfors9,A. P. Marscher31, B. Mihov10, M. G. Nikolashvili25, Y. Nikolov10,28, E. Ovcharov28, D. Principe13, T. Pursimo32,B. Ragozzine13, R. M. Robb33, J. A. Ros20, A. C. Sadun34, R. Sagar21, E. Semkov10, L. A. Sigua25, R. L. Smart1,
M. Sorcia12, L. O. Takalo9, M. Tornikoski26, C. Trigilio14, K. Uckert13, G. Umana14, A. Valcheva10, and A. Volvach35
(Affiliations can be found after the references)
ABSTRACT
Context. BL Lacertae is the prototype of the blazar subclass named after it. Yet, it has occasionally shown a peculiar behaviour that has questioneda simple interpretation of its broad-band emission in termsof synchrotron plus synchrotron self-Compton (SSC) radiation.Aims. In the 2007–2008 observing season we carried out a new multiwavelength campaign of the Whole Earth Blazar Telescope (WEBT) on BLLacertae, involving three pointings by the XMM-Newton satellite in July and December 2007, and January 2008, to study its emission properties,particularly in the optical–X-ray energy range.Methods. The source was monitored in the optical-to-radio bands by 37telescopes. The brightness level was relatively low. Some episodes of veryfast variability were detected in the optical bands. Flux changes had larger amplitude at the higher radio frequencies than at longer wavelengths.Results. The X-ray spectra acquired by the EPIC instrument onboard XMM-Newton are well fitted by a power law with photon indexΓ ∼ 2and photoelectric absorption exceeding the Galactic value. However, when taking into account the presence of a molecular cloud on the line ofsight, the EPIC data are best fitted by a double power law, implying a concave X-ray spectrum. The spectral energy distributions (SEDs) builtwith simultaneous radio-to-X-ray data at the epochs of the XMM-Newton observations suggest that the peak of the synchrotron emission lies inthe near-IR band, and show a prominent UV excess, besides a slight soft-X-ray excess. A comparison with the SEDs corresponding to previousobservations with X-ray satellites shows that the X-ray spectrum is very variable, since it can change from extremely steep to extremely hard,and can be more or less curved in intermediate states. We ascribe the UV excess to thermal emission from the accretion disc, and the otherbroad-band spectral features to the presence of two synchrotron components, with their related SSC emission. We fit the thermal emission with ablack body law and the non-thermal components by means of a helical jet model. The fit indicates a disc temperature>∼ 20000 K and a luminosity>∼ 6× 1044erg s−1.
Key words. galaxies: active – galaxies: BL Lacertae objects: general –galaxies: BL Lacertae objects: individual: BL Lacertae – galaxies: jets
1. Introduction
BL Lacertae is the prototype of one of the two blazar subclasses,the BL Lac objects, the other subclass being represented bythe flat-spectrum radio quasars (FSRQs). Common features ofblazars are: i) extreme flux variability at all wavelengths,fromradio to γ-ray frequencies, on a wide variety of time scales,from long-term (months, years) oscillations to intra-day vari-ability (IDV); ii) high radio and optical polarization; iii) bright-ness temperatures exceeding the Compton limit; iv) superlumi-nal motion of the radio components. The commonly acceptedparadigm foresees that their non-thermal emission comes from a
Send offprint requests to: C. M. Raiteri⋆ The radio-to-optical data presented in this paper are stored in
the WEBT archive (http://www.oato.inaf.it/blazars/webt/);for questions regarding their availability, please contact the WEBTPresident Massimo Villata ([email protected]).
plasma jet closely aligned with the line of sight. The jet is gen-erated by a supermassive black hole fed by infall of matter froman accretion disc. The broad-band spectral energy distribution(SED) of a blazar, given in the common log(νFν) versus logνrepresentation, shows two wide bumps. The low-energy bump,which extends from the radio to the optical–UV (for some BLLacs up to X-ray) frequencies, is ascribed to synchrotron radi-ation by relativistic electrons in the jet. The high-energybump,covering the X-ray toγ-ray energies, is likely due to inverse-Compton scattering of seed photons off the relativistic electrons.According to the synchrotron self Compton (SSC) model, theseed photons are the synchrotron photons themselves. In con-trast, the external Compton (EC) scenario foresees that seed pho-tons may enter the jet either directly from the accretion disc(e.g. Dermer et al., 1992), or reprocessed by the broad line re-gion (e.g. Sikora et al., 1994) or hot corona surrounding thedisc(e.g. Ghisellini & Tavecchio, 2009). SSC models usually fairly
2 C. M. Raiteri et al.: WEBT multiwavelength monitoring and XMM-Newton observations of BL Lacertae in 2007–2008
explain the SEDs of the low-luminosity blazars, i.e. the BL Lacobjects, while EC models are needed to fit the SEDs of theFSRQs. However, recent multiwavelength studies on a num-ber of blazars, which included observations by theγ-ray satel-lite AGILE, have shown that multiple SSC and/or EC compo-nents are necessary to explain the observed high-energy fluxes(see e.g. Chen et al., 2008; Pucella et al., 2008; Vercelloneet al.,2009; D’Ammando et al., 2009; Donnarumma et al., 2009a).
In addition to these two non-thermal jet components, theSEDs of quasar-type blazars sometimes show a “blue bump” inbetween, which is thought to be the signature of the thermal radi-ation emitted from the accretion disc. Indeed, the spectra of theseobjects usually display prominent broad emission lines, whichare most likely produced by photoionization of the broad lineregion due to the disc radiation.
On the contrary, BL Lacs are by definition almost fea-tureless objects (equivalent width less than 5 Å in their restframe, Stickel et al. 1991). It was hence a surprise whenVermeulen et al. (1995), and soon after Corbett et al. (1996), dis-covered a broad Hα (and Hβ) emission line in the spectrum ofBL Lacertae, whose luminosity (∼ 1041 erg s−1) and full-widthhalf-maximum (∼ 4000 km s−1) are comparable to those of typeI Seyfert galaxies such as NGC 4151. Subsequent spectroscopicmonitoring of this source by Corbett et al. (2000) showed thatthe Hα equivalent width is approximately inversely proportionalto the optical continuum flux. This suggested that the broad lineregion is photoionized by a radiation source that is not the sameproducing the optical continuum. The photoionising radiationwould most likely come from the accretion disc.
Another important issue comes from the results obtained byRavasio et al. (2003). They analyzed the X-ray data acquiredby BeppoSAX from October 31 to November 2, 2000, duringan extensive multiwavelength campaign. When constructingthesource SED with contemporaneous data, it was evident that thesteep X-ray spectrum was offset with respect to the extrapolationof the optical one. One possible explanation was the presence ofan extra component in addition to the synchrotron and inverse-Compton ones.
Finally, according to Madejski et al. (1999) andBottcher & Bloom (2000), the explanation of theγ-rayflux detected by the EGRET instrument on board the CGROsatellite during the 1997 optical outburst (see Bloom et al.,1997) requires an EC emission component in addition to theSSC one.
Taken together, these results suggest that in BL Lacertae theinterpretation of the broad-band emission may require a morecomplex scenario than that usually envisaged for the BL Lacobjects, involving just one synchrotron plus its SSC emission.
In the last decade, BL Lacertae has been extensively stud-ied by the Whole Earth Blazar Telescope (WEBT) collabo-ration1, which has carried out several multiwavelength cam-paigns on this object (Villata et al., 2002; Ravasio et al., 2002;Bottcher et al., 2003; Villata et al., 2004b,a; Bach et al.,2006;Papadakis et al., 2007; Villata et al., 2009), collecting tens ofthousands of optical-to-radio data. These studies were focusedon its multiwavelength flux variability, colour behaviour,corre-lations among flux variations in different bands, possible peri-odicity of the radio outbursts. The main aim of the new WEBTcampaign organized in the 2007–2008 observing season was in-stead to address the problem of disentangling the possible mul-tiple contributions to the BL Lac flux from the radio band toγ-rays. For this sake, the optical-to-radio monitoring by theWEBT
1 http://www.oato.inaf.it/blazars/webt/
was complemented by three pointings by the XMM-Newtonsatellite. Moreover, we also obtained optical spectra withthe 3.6m Telescopio Nazionale Galileo (TNG) to investigate the prop-erties of the Hα broad emission line, and possibly infer informa-tion on the accretion disc. The results of the spectroscopicstudywill be reported elsewhere.
This paper is organised as follows. In Sect. 2 we present theWEBT optical-to-radio light curves. The analysis of the XMM-Newton data is reported in Sect. 3. In Sect. 4 we show the SEDscorresponding to the XMM-Newton epochs, and compare themwith those related to previous observations by X-ray satellites.The interpretation of the XMM-Newton SEDs is discussed inSect. 5. Finally, Sect. 6 contains a summary and discussion ofthe main results.
2. Multifrequency observations by the WEBT
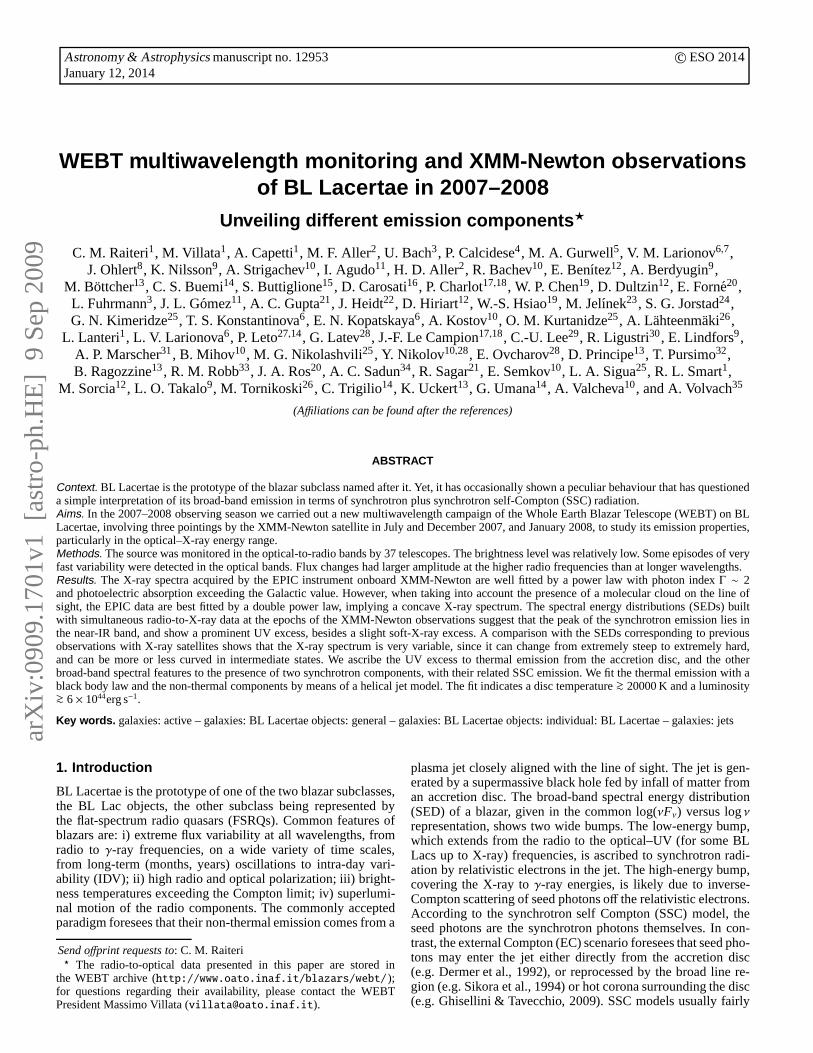
The new WEBT campaign on BL Lacertae took place in the2007–2008 observing season. The participating observatoriesare listed in Table 1. Optical and near-IR data were collectedas instrumental magnitudes of the source and reference starsin the same field to apply the same calibration (Bertaud et al.,1969; Fiorucci & Tosti, 1996). The light curves obtained by as-sembling all datasets were carefully inspected to correct for sys-tematic offsets and to reduce data scatter by binning noisy datataken by the same observer within a few minutes. The resultsare shown in Fig. 1, where the vertical lines indicate the epochsof the three XMM-Newton pointings. We can see a noticeableflux variability, which progressively increases its amplitude go-ing from the I to the B band. By considering only the periodof common monitoring (before JD= 2454500), the maximumvariability amplitude (maximum−minimum) is 1.42, 1.46, 1.50,and 1.55 mag in theI, R, V, andB bands, respectively. The near-IR time coverage is inferior to the optical one, but the near-IRdata are important to add information to the SED (see Sect. 5).
The majority of the variability episodes have a time scale ofa few days, but we can also recognise a long-term increasingtrend starting from JD∼ 2454300, as well as a few very fastevents. One of these involved a brightening of about 0.9 mag in24 hours, fromR ∼ 14.6 on JD= 2454301.5 to R ∼ 13.7 thenight after, when observations at the Valle d’Aosta Observatoryshowed a source brightening of∼ 0.3 mag in less than 3 hours.This behaviour was confirmed by observations in theV andI bands, ruling out that this rapid flux increase was an arti-fact. Similar fast variations are not uncommon in BL Lacertae.When analysing the 13248R-band data acquired by the WEBT(Villata et al., 2002, 2004b,a, 2009, and this paper) during1500nights over more than 15 years, though with inhomogeneoussampling, we can distinguish between two kinds of rapid fluxvariability.
– Fast and noticeable intraday variations: we consider varia-tions ≥ 0.25 mag with rate≥ 0.1 mag/hour. These werefound in 25 nights out of 677 nights where the observingtime coverage is≥ 2.5 hours, with the maximum amplitudeepisode involving a change∆R = 0.52 in about 3.9 hours.
– Large interday variations: we consider variations≥ 0.75 magin ≤ 36 hours. These were observed 6 times, and the abovementioned episode (about 0.9 mag in 24 hours) is the mostextreme one.
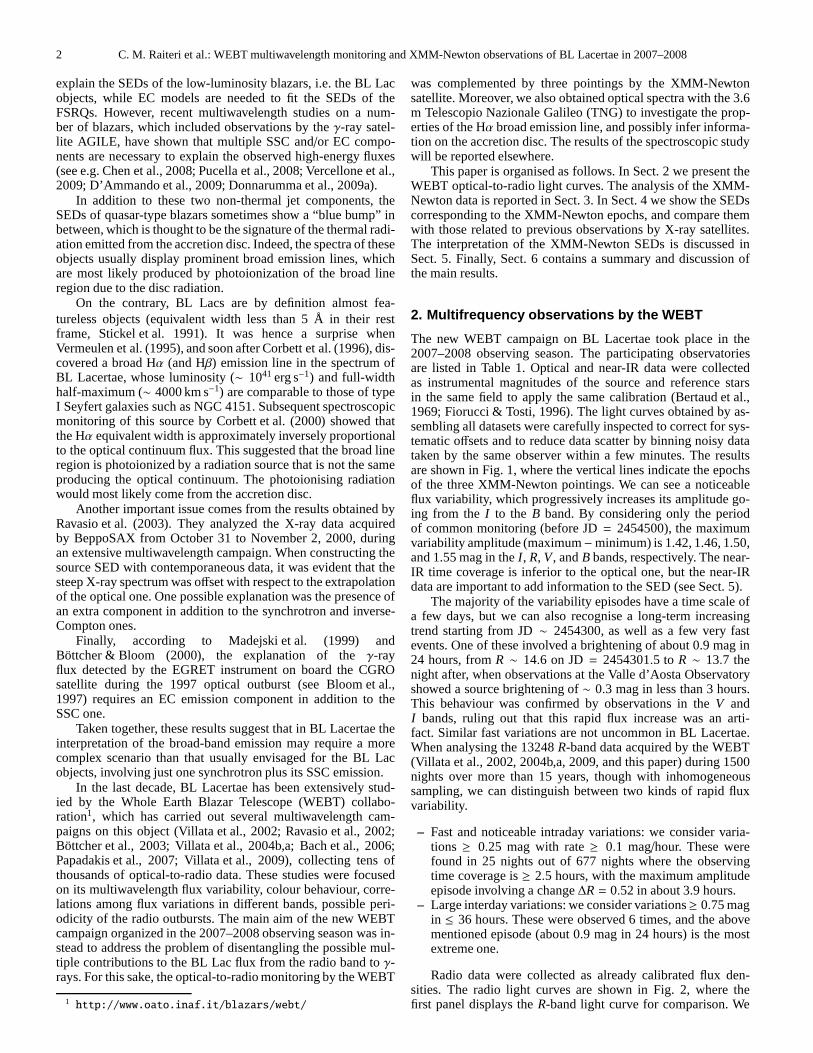
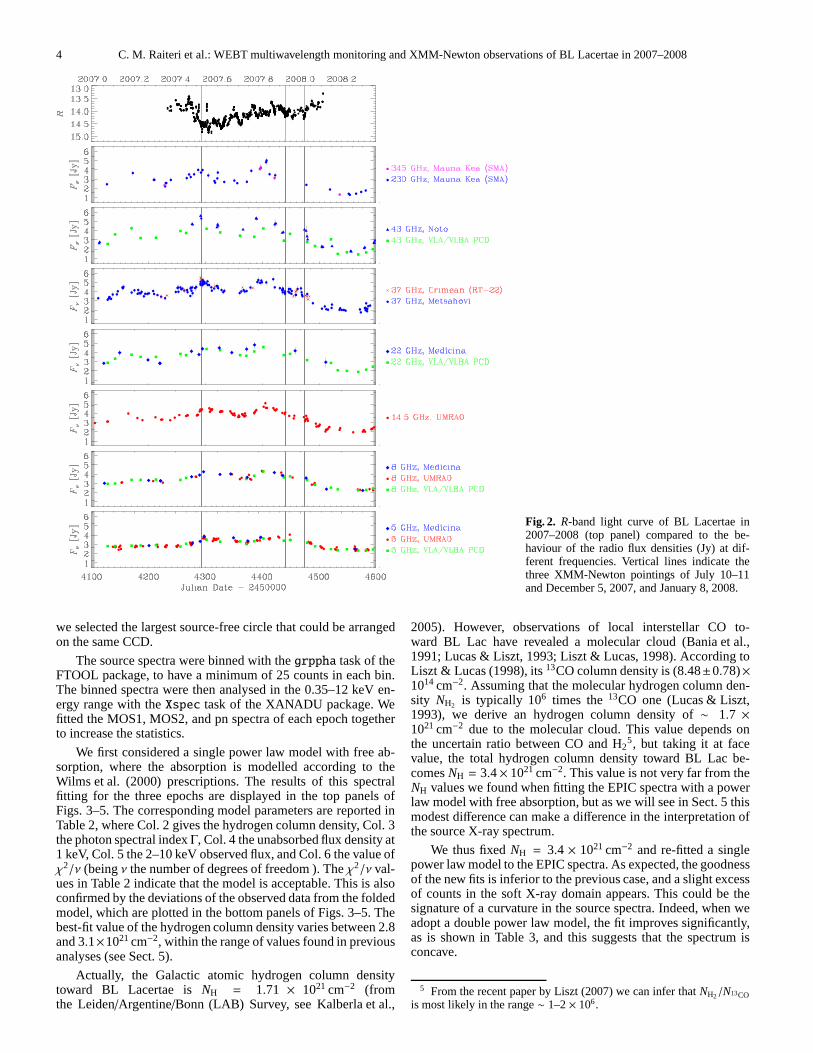
Radio data were collected as already calibrated flux den-sities. The radio light curves are shown in Fig. 2, where thefirst panel displays theR-band light curve for comparison. We
C. M. Raiteri et al.: WEBT multiwavelength monitoring and XMM-Newton observations of BL Lacertae in 2007–2008 3
Fig. 1. Optical UBVRI and near-IRJHK lightcurves of BL Lacertae in the 2007–2008 ob-serving season. Vertical lines indicate the threeXMM-Newton pointings of July 10–11 andDecember 5, 2007, and January 8, 2008.
also included data from the VLA/VLBA Polarization CalibrationDatabase (PCD)2. As expected, the radio flux variations, whichare more evident at the shortest wavelengths, are smoother thanthe optical variations3, and the radio time scales are longer.Moreover, the long-term increasing trend characterising the op-tical light curve is not recognisable in the radio band. Accordingto Villata et al. (2009), the optical outbursts of BL Lacertae areusually followed by high-frequency radio events, with timede-lays of at least 100 days, which can grow to 200 or even 300days, depending on the relative orientation of the correspond-ing emitting regions in the jet. Hence, the high optical level ob-served at the beginning of our observing period, in May–June2007, might be related to the bright radio state that is visible atthe higher radio frequencies around JD= 24544004.
2 http://www.vla.nrao.edu/astro/calib/polar/3 This is even more evident when comparing radio flux densitiesto
optical flux densities instead of magnitudes.4 Indeed, the PCD shows no further radio event until May 2009, the
43 GHz flux density remaining below 3 Jy.
3. Observations by XMM-Newton
The X-ray Multi-Mirror Mission (XMM) - Newton satellite ob-served the source on July 10–11 and December 5, 2007, and thenon January 8, 2008 (PI: C. M. Raiteri).
3.1. EPIC data
The European Photon Imaging Camera (EPIC) onboard XMM-Newton includes three detectors: MOS1, MOS2 (Turner et al.,2001), and pn (Struder et al., 2001). Since a bright state ofthesource could not be excluded, we chose a medium filter toavoid possible contamination by lower-energy photons; more-over, we selected a small-window configuration to minimizepossible photon pile-up.
Data were reduced with the Science Analysis System (SAS)software, version 8.0.1, following the same standard procedureadopted in Raiteri et al. (2007b). A temporal filtering was ap-plied to discard high-background periods. Source spectra wereextracted from circular regions of∼ 40 arcsec radius. The MOSbackground was estimated on external CCDs, while for the pn
4 C. M. Raiteri et al.: WEBT multiwavelength monitoring and XMM-Newton observations of BL Lacertae in 2007–2008
Fig. 2. R-band light curve of BL Lacertae in2007–2008 (top panel) compared to the be-haviour of the radio flux densities (Jy) at dif-ferent frequencies. Vertical lines indicate thethree XMM-Newton pointings of July 10–11and December 5, 2007, and January 8, 2008.
we selected the largest source-free circle that could be arrangedon the same CCD.
The source spectra were binned with thegrppha task of theFTOOL package, to have a minimum of 25 counts in each bin.The binned spectra were then analysed in the 0.35–12 keV en-ergy range with theXspec task of the XANADU package. Wefitted the MOS1, MOS2, and pn spectra of each epoch togetherto increase the statistics.
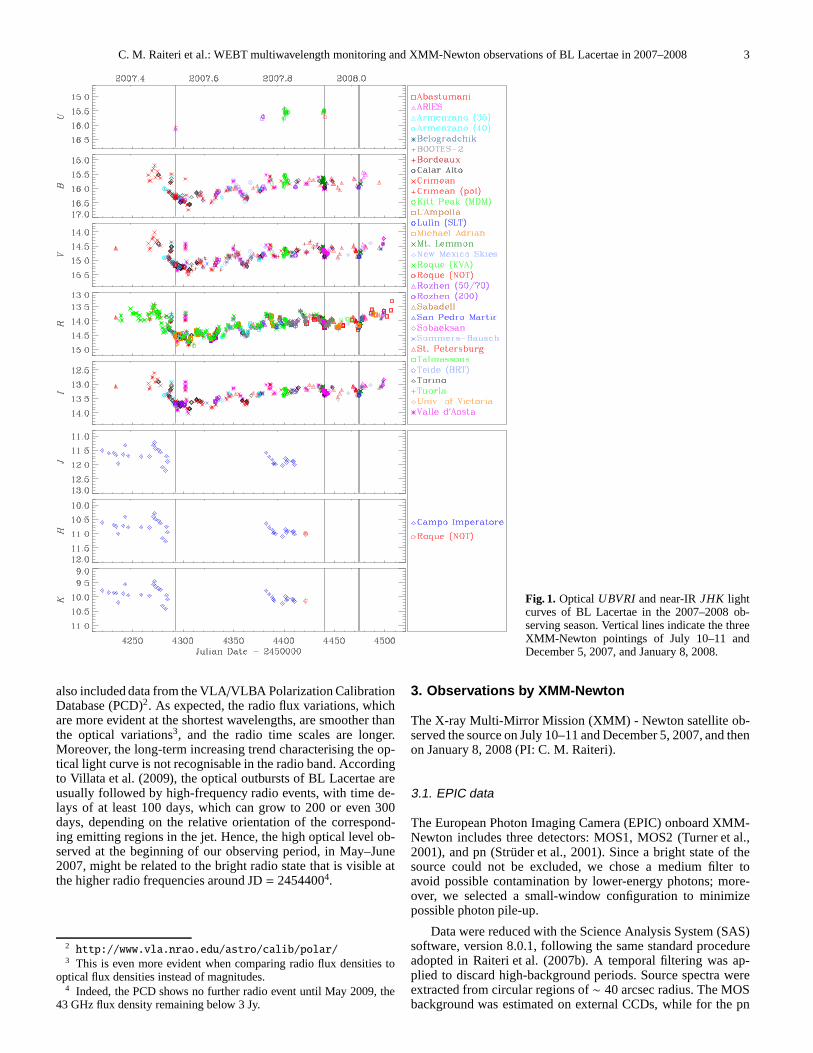
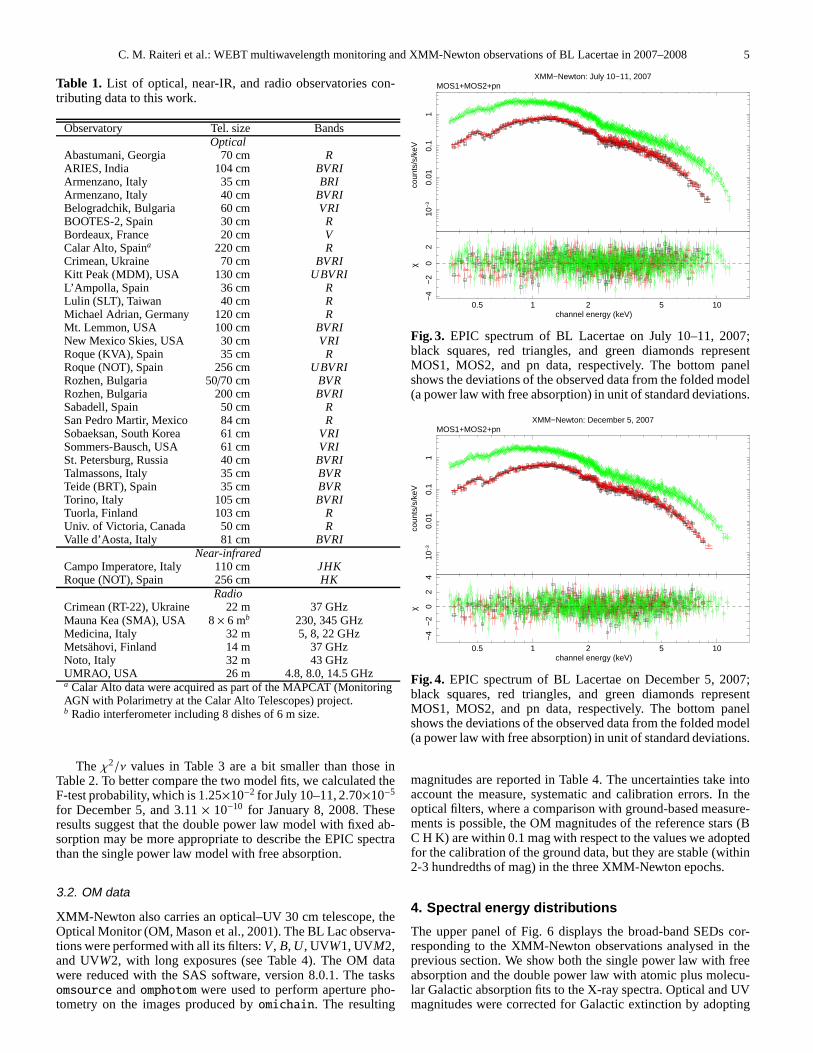
We first considered a single power law model with free ab-sorption, where the absorption is modelled according to theWilms et al. (2000) prescriptions. The results of this spectralfitting for the three epochs are displayed in the top panels ofFigs. 3–5. The corresponding model parameters are reportedinTable 2, where Col. 2 gives the hydrogen column density, Col.3the photon spectral indexΓ, Col. 4 the unabsorbed flux density at1 keV, Col. 5 the 2–10 keV observed flux, and Col. 6 the value ofχ2/ν (beingν the number of degrees of freedom ). Theχ2/ν val-ues in Table 2 indicate that the model is acceptable. This is alsoconfirmed by the deviations of the observed data from the foldedmodel, which are plotted in the bottom panels of Figs. 3–5. Thebest-fit value of the hydrogen column density varies between2.8and 3.1×1021cm−2, within the range of values found in previousanalyses (see Sect. 5).
Actually, the Galactic atomic hydrogen column densitytoward BL Lacertae isNH = 1.71 × 1021 cm−2 (fromthe Leiden/Argentine/Bonn (LAB) Survey, see Kalberla et al.,
2005). However, observations of local interstellar CO to-ward BL Lac have revealed a molecular cloud (Bania et al.,1991; Lucas & Liszt, 1993; Liszt & Lucas, 1998). According toLiszt & Lucas (1998), its13CO column density is (8.48±0.78)×1014 cm−2. Assuming that the molecular hydrogen column den-sity NH2 is typically 106 times the13CO one (Lucas & Liszt,1993), we derive an hydrogen column density of∼ 1.7 ×1021 cm−2 due to the molecular cloud. This value depends onthe uncertain ratio between CO and H2
5, but taking it at facevalue, the total hydrogen column density toward BL Lac be-comesNH = 3.4× 1021 cm−2. This value is not very far from theNH values we found when fitting the EPIC spectra with a powerlaw model with free absorption, but as we will see in Sect. 5 thismodest difference can make a difference in the interpretation ofthe source X-ray spectrum.
We thus fixedNH = 3.4 × 1021 cm−2 and re-fitted a singlepower law model to the EPIC spectra. As expected, the goodnessof the new fits is inferior to the previous case, and a slight excessof counts in the soft X-ray domain appears. This could be thesignature of a curvature in the source spectra. Indeed, whenweadopt a double power law model, the fit improves significantly,as is shown in Table 3, and this suggests that the spectrum isconcave.
5 From the recent paper by Liszt (2007) we can infer thatNH2/N13COis most likely in the range∼ 1–2× 10⁶.
C. M. Raiteri et al.: WEBT multiwavelength monitoring and XMM-Newton observations of BL Lacertae in 2007–2008 5
Table 1. List of optical, near-IR, and radio observatories con-tributing data to this work.
Observatory Tel. size BandsOptical
Abastumani, Georgia 70 cm RARIES, India 104 cm BVRIArmenzano, Italy 35 cm BRIArmenzano, Italy 40 cm BVRIBelogradchik, Bulgaria 60 cm VRIBOOTES-2, Spain 30 cm RBordeaux, France 20 cm VCalar Alto, Spaina 220 cm RCrimean, Ukraine 70 cm BVRIKitt Peak (MDM), USA 130 cm UBVRIL’Ampolla, Spain 36 cm RLulin (SLT), Taiwan 40 cm RMichael Adrian, Germany 120 cm RMt. Lemmon, USA 100 cm BVRINew Mexico Skies, USA 30 cm VRIRoque (KVA), Spain 35 cm RRoque (NOT), Spain 256 cm UBVRIRozhen, Bulgaria 50/70 cm BVRRozhen, Bulgaria 200 cm BVRISabadell, Spain 50 cm RSan Pedro Martir, Mexico 84 cm RSobaeksan, South Korea 61 cm VRISommers-Bausch, USA 61 cm VRISt. Petersburg, Russia 40 cm BVRITalmassons, Italy 35 cm BVRTeide (BRT), Spain 35 cm BVRTorino, Italy 105 cm BVRITuorla, Finland 103 cm RUniv. of Victoria, Canada 50 cm RValle d’Aosta, Italy 81 cm BVRI
Near-infraredCampo Imperatore, Italy 110 cm JHKRoque (NOT), Spain 256 cm HK
RadioCrimean (RT-22), Ukraine 22 m 37 GHzMauna Kea (SMA), USA 8× 6 mb 230, 345 GHzMedicina, Italy 32 m 5, 8, 22 GHzMetsahovi, Finland 14 m 37 GHzNoto, Italy 32 m 43 GHzUMRAO, USA 26 m 4.8, 8.0, 14.5 GHza Calar Alto data were acquired as part of the MAPCAT (MonitoringAGN with Polarimetry at the Calar Alto Telescopes) project.b Radio interferometer including 8 dishes of 6 m size.
The χ2/ν values in Table 3 are a bit smaller than those inTable 2. To better compare the two model fits, we calculated theF-test probability, which is 1.25×10⁻² for July 10–11, 2.70×10⁻⁵
for December 5, and 3.11× 10⁻¹⁰ for January 8, 2008. Theseresults suggest that the double power law model with fixed ab-sorption may be more appropriate to describe the EPIC spectrathan the single power law model with free absorption.
3.2. OM data
XMM-Newton also carries an optical–UV 30 cm telescope, theOptical Monitor (OM, Mason et al., 2001). The BL Lac observa-tions were performed with all its filters:V, B, U, UVW1, UVM2,and UVW2, with long exposures (see Table 4). The OM datawere reduced with the SAS software, version 8.0.1. The tasksomsource andomphotom were used to perform aperture pho-tometry on the images produced byomichain. The resulting
10−
30.
010.
11
coun
ts/s
/keV
MOS1+MOS2+pnXMM−Newton: July 10−11, 2007
1 100.5 2 5
−4
−2
02
χ
channel energy (keV)
Fig. 3. EPIC spectrum of BL Lacertae on July 10–11, 2007;black squares, red triangles, and green diamonds representMOS1, MOS2, and pn data, respectively. The bottom panelshows the deviations of the observed data from the folded model(a power law with free absorption) in unit of standard deviations.
10−
30.
010.
11
coun
ts/s
/keV
MOS1+MOS2+pnXMM−Newton: December 5, 2007
1 100.5 2 5
−4
−2
02
4
χ
channel energy (keV)
Fig. 4. EPIC spectrum of BL Lacertae on December 5, 2007;black squares, red triangles, and green diamonds representMOS1, MOS2, and pn data, respectively. The bottom panelshows the deviations of the observed data from the folded model(a power law with free absorption) in unit of standard deviations.
magnitudes are reported in Table 4. The uncertainties take intoaccount the measure, systematic and calibration errors. Intheoptical filters, where a comparison with ground-based measure-ments is possible, the OM magnitudes of the reference stars (BC H K) are within 0.1 mag with respect to the values we adoptedfor the calibration of the ground data, but they are stable (within2-3 hundredths of mag) in the three XMM-Newton epochs.
4. Spectral energy distributions
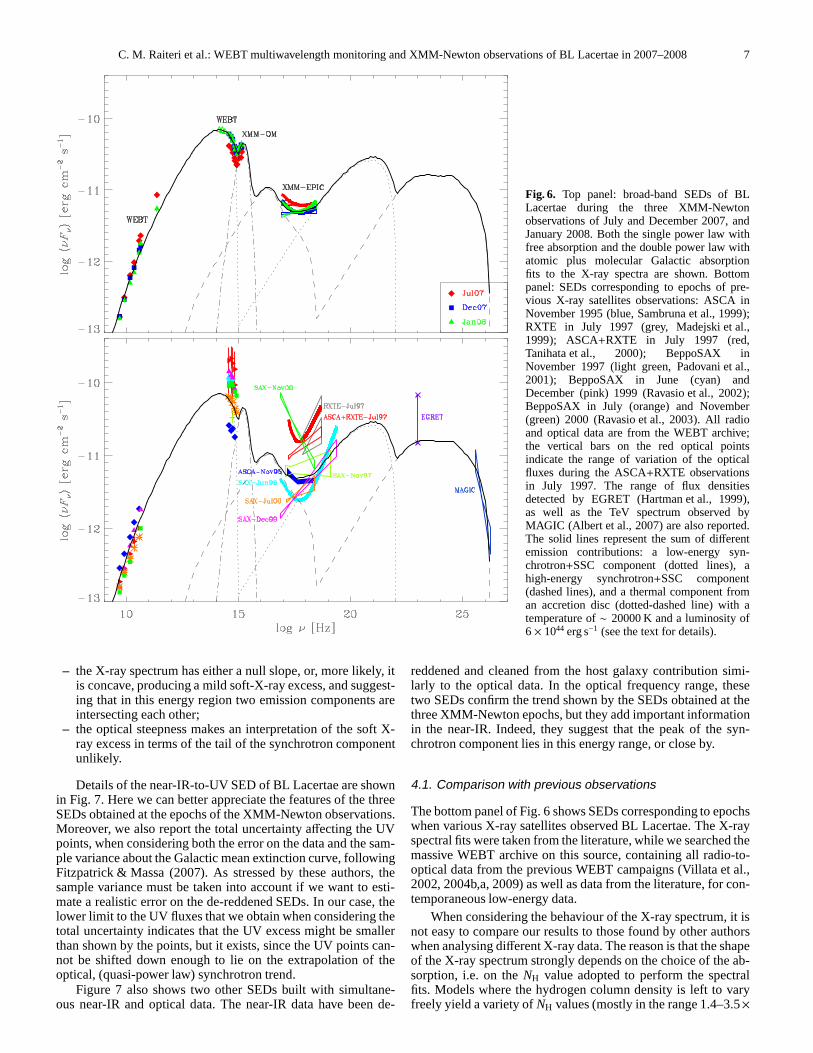
The upper panel of Fig. 6 displays the broad-band SEDs cor-responding to the XMM-Newton observations analysed in theprevious section. We show both the single power law with freeabsorption and the double power law with atomic plus molecu-lar Galactic absorption fits to the X-ray spectra. Optical and UVmagnitudes were corrected for Galactic extinction by adopting
6 C. M. Raiteri et al.: WEBT multiwavelength monitoring and XMM-Newton observations of BL Lacertae in 2007–2008
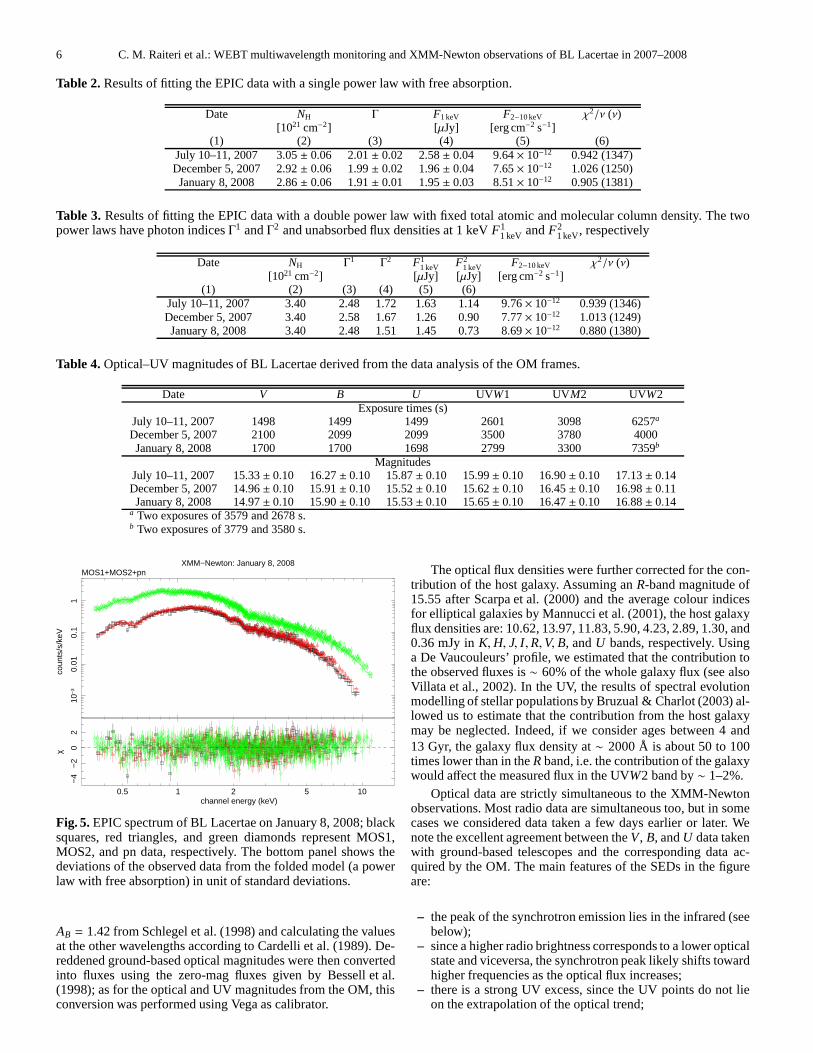
Table 2.Results of fitting the EPIC data with a single power law with free absorption.
Date NH Γ F1 keV F2−10 keV χ2/ν (ν)[1021 cm−2] [µJy] [erg cm−2 s−1]
(1) (2) (3) (4) (5) (6)July 10–11, 2007 3.05± 0.06 2.01± 0.02 2.58± 0.04 9.64× 10⁻¹² 0.942 (1347)December 5, 2007 2.92± 0.06 1.99± 0.02 1.96± 0.04 7.65× 10⁻¹² 1.026 (1250)January 8, 2008 2.86± 0.06 1.91± 0.01 1.95± 0.03 8.51× 10⁻¹² 0.905 (1381)
Table 3. Results of fitting the EPIC data with a double power law with fixed total atomic and molecular column density. The twopower laws have photon indicesΓ1 andΓ2 and unabsorbed flux densities at 1 keVF1
1 keV andF21 keV, respectively
Date NH Γ1 Γ2 F11 keV F2
1 keV F2−10 keV χ2/ν (ν)[1021 cm−2] [µJy] [µJy] [erg cm−2 s−1]
(1) (2) (3) (4) (5) (6)July 10–11, 2007 3.40 2.48 1.72 1.63 1.14 9.76× 10⁻¹² 0.939 (1346)December 5, 2007 3.40 2.58 1.67 1.26 0.90 7.77× 10⁻¹² 1.013 (1249)January 8, 2008 3.40 2.48 1.51 1.45 0.73 8.69× 10⁻¹² 0.880 (1380)
Table 4.Optical–UV magnitudes of BL Lacertae derived from the data analysis of the OM frames.
Date V B U UVW1 UVM2 UVW2Exposure times (s)
July 10–11, 2007 1498 1499 1499 2601 3098 6257a
December 5, 2007 2100 2099 2099 3500 3780 4000January 8, 2008 1700 1700 1698 2799 3300 7359b
MagnitudesJuly 10–11, 2007 15.33± 0.10 16.27± 0.10 15.87± 0.10 15.99± 0.10 16.90± 0.10 17.13± 0.14December 5, 2007 14.96± 0.10 15.91± 0.10 15.52± 0.10 15.62± 0.10 16.45± 0.10 16.98± 0.11January 8, 2008 14.97± 0.10 15.90± 0.10 15.53± 0.10 15.65± 0.10 16.47± 0.10 16.88± 0.14
a Two exposures of 3579 and 2678 s.b Two exposures of 3779 and 3580 s.
10−
30.
010.
11
coun
ts/s
/keV
MOS1+MOS2+pnXMM−Newton: January 8, 2008
1 100.5 2 5
−4
−2
02
χ
channel energy (keV)
Fig. 5.EPIC spectrum of BL Lacertae on January 8, 2008; blacksquares, red triangles, and green diamonds represent MOS1,MOS2, and pn data, respectively. The bottom panel shows thedeviations of the observed data from the folded model (a powerlaw with free absorption) in unit of standard deviations.
AB = 1.42 from Schlegel et al. (1998) and calculating the valuesat the other wavelengths according to Cardelli et al. (1989). De-reddened ground-based optical magnitudes were then convertedinto fluxes using the zero-mag fluxes given by Bessell et al.(1998); as for the optical and UV magnitudes from the OM, thisconversion was performed using Vega as calibrator.
The optical flux densities were further corrected for the con-tribution of the host galaxy. Assuming anR-band magnitude of15.55 after Scarpa et al. (2000) and the average colour indicesfor elliptical galaxies by Mannucci et al. (2001), the host galaxyflux densities are: 10.62, 13.97, 11.83, 5.90, 4.23, 2.89, 1.30, and0.36 mJy inK,H, J, I,R,V, B, andU bands, respectively. Usinga De Vaucouleurs’ profile, we estimated that the contribution tothe observed fluxes is∼ 60% of the whole galaxy flux (see alsoVillata et al., 2002). In the UV, the results of spectral evolutionmodelling of stellar populations by Bruzual & Charlot (2003) al-lowed us to estimate that the contribution from the host galaxymay be neglected. Indeed, if we consider ages between 4 and13 Gyr, the galaxy flux density at∼ 2000 Å is about 50 to 100times lower than in theR band, i.e. the contribution of the galaxywould affect the measured flux in the UVW2 band by∼ 1–2%.
Optical data are strictly simultaneous to the XMM-Newtonobservations. Most radio data are simultaneous too, but in somecases we considered data taken a few days earlier or later. Wenote the excellent agreement between theV, B, andU data takenwith ground-based telescopes and the corresponding data ac-quired by the OM. The main features of the SEDs in the figureare:
– the peak of the synchrotron emission lies in the infrared (seebelow);
– since a higher radio brightness corresponds to a lower opticalstate and viceversa, the synchrotron peak likely shifts towardhigher frequencies as the optical flux increases;
– there is a strong UV excess, since the UV points do not lieon the extrapolation of the optical trend;
C. M. Raiteri et al.: WEBT multiwavelength monitoring and XMM-Newton observations of BL Lacertae in 2007–2008 7
Fig. 6. Top panel: broad-band SEDs of BLLacertae during the three XMM-Newtonobservations of July and December 2007, andJanuary 2008. Both the single power law withfree absorption and the double power law withatomic plus molecular Galactic absorptionfits to the X-ray spectra are shown. Bottompanel: SEDs corresponding to epochs of pre-vious X-ray satellites observations: ASCA inNovember 1995 (blue, Sambruna et al., 1999);RXTE in July 1997 (grey, Madejski et al.,1999); ASCA+RXTE in July 1997 (red,Tanihata et al., 2000); BeppoSAX inNovember 1997 (light green, Padovani et al.,2001); BeppoSAX in June (cyan) andDecember (pink) 1999 (Ravasio et al., 2002);BeppoSAX in July (orange) and November(green) 2000 (Ravasio et al., 2003). All radioand optical data are from the WEBT archive;the vertical bars on the red optical pointsindicate the range of variation of the opticalfluxes during the ASCA+RXTE observationsin July 1997. The range of flux densitiesdetected by EGRET (Hartman et al., 1999),as well as the TeV spectrum observed byMAGIC (Albert et al., 2007) are also reported.The solid lines represent the sum of differentemission contributions: a low-energy syn-chrotron+SSC component (dotted lines), ahigh-energy synchrotron+SSC component(dashed lines), and a thermal component froman accretion disc (dotted-dashed line) with atemperature of∼ 20000 K and a luminosity of6× 1044 erg s−1 (see the text for details).
– the X-ray spectrum has either a null slope, or, more likely, itis concave, producing a mild soft-X-ray excess, and suggest-ing that in this energy region two emission components areintersecting each other;
– the optical steepness makes an interpretation of the soft X-ray excess in terms of the tail of the synchrotron componentunlikely.
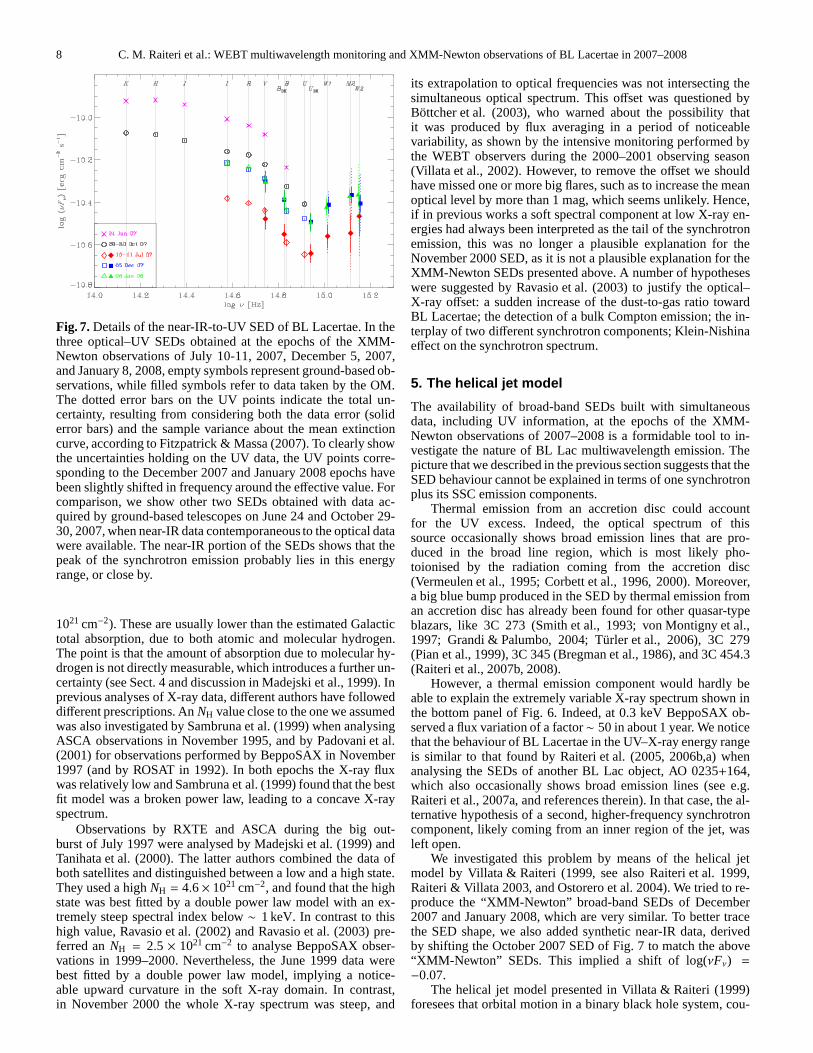
Details of the near-IR-to-UV SED of BL Lacertae are shownin Fig. 7. Here we can better appreciate the features of the threeSEDs obtained at the epochs of the XMM-Newton observations.Moreover, we also report the total uncertainty affecting the UVpoints, when considering both the error on the data and the sam-ple variance about the Galactic mean extinction curve, followingFitzpatrick & Massa (2007). As stressed by these authors, thesample variance must be taken into account if we want to esti-mate a realistic error on the de-reddened SEDs. In our case, thelower limit to the UV fluxes that we obtain when considering thetotal uncertainty indicates that the UV excess might be smallerthan shown by the points, but it exists, since the UV points can-not be shifted down enough to lie on the extrapolation of theoptical, (quasi-power law) synchrotron trend.
Figure 7 also shows two other SEDs built with simultane-ous near-IR and optical data. The near-IR data have been de-
reddened and cleaned from the host galaxy contribution simi-larly to the optical data. In the optical frequency range, thesetwo SEDs confirm the trend shown by the SEDs obtained at thethree XMM-Newton epochs, but they add important informationin the near-IR. Indeed, they suggest that the peak of the syn-chrotron component lies in this energy range, or close by.
4.1. Comparison with previous observations
The bottom panel of Fig. 6 shows SEDs corresponding to epochswhen various X-ray satellites observed BL Lacertae. The X-rayspectral fits were taken from the literature, while we searched themassive WEBT archive on this source, containing all radio-to-optical data from the previous WEBT campaigns (Villata et al.,2002, 2004b,a, 2009) as well as data from the literature, forcon-temporaneous low-energy data.
When considering the behaviour of the X-ray spectrum, it isnot easy to compare our results to those found by other authorswhen analysing different X-ray data. The reason is that the shapeof the X-ray spectrum strongly depends on the choice of the ab-sorption, i.e. on theNH value adopted to perform the spectralfits. Models where the hydrogen column density is left to varyfreely yield a variety ofNH values (mostly in the range 1.4–3.5×
8 C. M. Raiteri et al.: WEBT multiwavelength monitoring and XMM-Newton observations of BL Lacertae in 2007–2008
Fig. 7.Details of the near-IR-to-UV SED of BL Lacertae. In thethree optical–UV SEDs obtained at the epochs of the XMM-Newton observations of July 10-11, 2007, December 5, 2007,and January 8, 2008, empty symbols represent ground-based ob-servations, while filled symbols refer to data taken by the OM.The dotted error bars on the UV points indicate the total un-certainty, resulting from considering both the data error (soliderror bars) and the sample variance about the mean extinctioncurve, according to Fitzpatrick & Massa (2007). To clearly showthe uncertainties holding on the UV data, the UV points corre-sponding to the December 2007 and January 2008 epochs havebeen slightly shifted in frequency around the effective value. Forcomparison, we show other two SEDs obtained with data ac-quired by ground-based telescopes on June 24 and October 29-30, 2007, when near-IR data contemporaneous to the optical datawere available. The near-IR portion of the SEDs shows that thepeak of the synchrotron emission probably lies in this energyrange, or close by.
1021 cm−2). These are usually lower than the estimated Galactictotal absorption, due to both atomic and molecular hydrogen.The point is that the amount of absorption due to molecular hy-drogen is not directly measurable, which introduces a further un-certainty (see Sect. 4 and discussion in Madejski et al., 1999). Inprevious analyses of X-ray data, different authors have followeddifferent prescriptions. AnNH value close to the one we assumedwas also investigated by Sambruna et al. (1999) when analysingASCA observations in November 1995, and by Padovani et al.(2001) for observations performed by BeppoSAX in November1997 (and by ROSAT in 1992). In both epochs the X-ray fluxwas relatively low and Sambruna et al. (1999) found that the bestfit model was a broken power law, leading to a concave X-rayspectrum.
Observations by RXTE and ASCA during the big out-burst of July 1997 were analysed by Madejski et al. (1999) andTanihata et al. (2000). The latter authors combined the dataofboth satellites and distinguished between a low and a high state.They used a highNH = 4.6× 1021 cm−2, and found that the highstate was best fitted by a double power law model with an ex-tremely steep spectral index below∼ 1 keV. In contrast to thishigh value, Ravasio et al. (2002) and Ravasio et al. (2003) pre-ferred anNH = 2.5 × 1021 cm−2 to analyse BeppoSAX obser-vations in 1999–2000. Nevertheless, the June 1999 data werebest fitted by a double power law model, implying a notice-able upward curvature in the soft X-ray domain. In contrast,in November 2000 the whole X-ray spectrum was steep, and
its extrapolation to optical frequencies was not intersecting thesimultaneous optical spectrum. This offset was questioned byBottcher et al. (2003), who warned about the possibility thatit was produced by flux averaging in a period of noticeablevariability, as shown by the intensive monitoring performed bythe WEBT observers during the 2000–2001 observing season(Villata et al., 2002). However, to remove the offset we shouldhave missed one or more big flares, such as to increase the meanoptical level by more than 1 mag, which seems unlikely. Hence,if in previous works a soft spectral component at low X-ray en-ergies had always been interpreted as the tail of the synchrotronemission, this was no longer a plausible explanation for theNovember 2000 SED, as it is not a plausible explanation for theXMM-Newton SEDs presented above. A number of hypotheseswere suggested by Ravasio et al. (2003) to justify the optical–X-ray offset: a sudden increase of the dust-to-gas ratio towardBL Lacertae; the detection of a bulk Compton emission; the in-terplay of two different synchrotron components; Klein-Nishinaeffect on the synchrotron spectrum.
5. The helical jet model
The availability of broad-band SEDs built with simultaneousdata, including UV information, at the epochs of the XMM-Newton observations of 2007–2008 is a formidable tool to in-vestigate the nature of BL Lac multiwavelength emission. Thepicture that we described in the previous section suggests that theSED behaviour cannot be explained in terms of one synchrotronplus its SSC emission components.
Thermal emission from an accretion disc could accountfor the UV excess. Indeed, the optical spectrum of thissource occasionally shows broad emission lines that are pro-duced in the broad line region, which is most likely pho-toionised by the radiation coming from the accretion disc(Vermeulen et al., 1995; Corbett et al., 1996, 2000). Moreover,a big blue bump produced in the SED by thermal emission froman accretion disc has already been found for other quasar-typeblazars, like 3C 273 (Smith et al., 1993; von Montigny et al.,1997; Grandi & Palumbo, 2004; Turler et al., 2006), 3C 279(Pian et al., 1999), 3C 345 (Bregman et al., 1986), and 3C 454.3(Raiteri et al., 2007b, 2008).
However, a thermal emission component would hardly beable to explain the extremely variable X-ray spectrum showninthe bottom panel of Fig. 6. Indeed, at 0.3 keV BeppoSAX ob-served a flux variation of a factor∼ 50 in about 1 year. We noticethat the behaviour of BL Lacertae in the UV–X-ray energy rangeis similar to that found by Raiteri et al. (2005, 2006b,a) whenanalysing the SEDs of another BL Lac object, AO 0235+164,which also occasionally shows broad emission lines (see e.g.Raiteri et al., 2007a, and references therein). In that case, the al-ternative hypothesis of a second, higher-frequency synchrotroncomponent, likely coming from an inner region of the jet, wasleft open.
We investigated this problem by means of the helical jetmodel by Villata & Raiteri (1999, see also Raiteri et al. 1999,Raiteri & Villata 2003, and Ostorero et al. 2004). We tried tore-produce the “XMM-Newton” broad-band SEDs of December2007 and January 2008, which are very similar. To better tracethe SED shape, we also added synthetic near-IR data, derivedby shifting the October 2007 SED of Fig. 7 to match the above“XMM-Newton” SEDs. This implied a shift of log(νFν) =−0.07.
The helical jet model presented in Villata & Raiteri (1999)foresees that orbital motion in a binary black hole system, cou-
C. M. Raiteri et al.: WEBT multiwavelength monitoring and XMM-Newton observations of BL Lacertae in 2007–2008 9
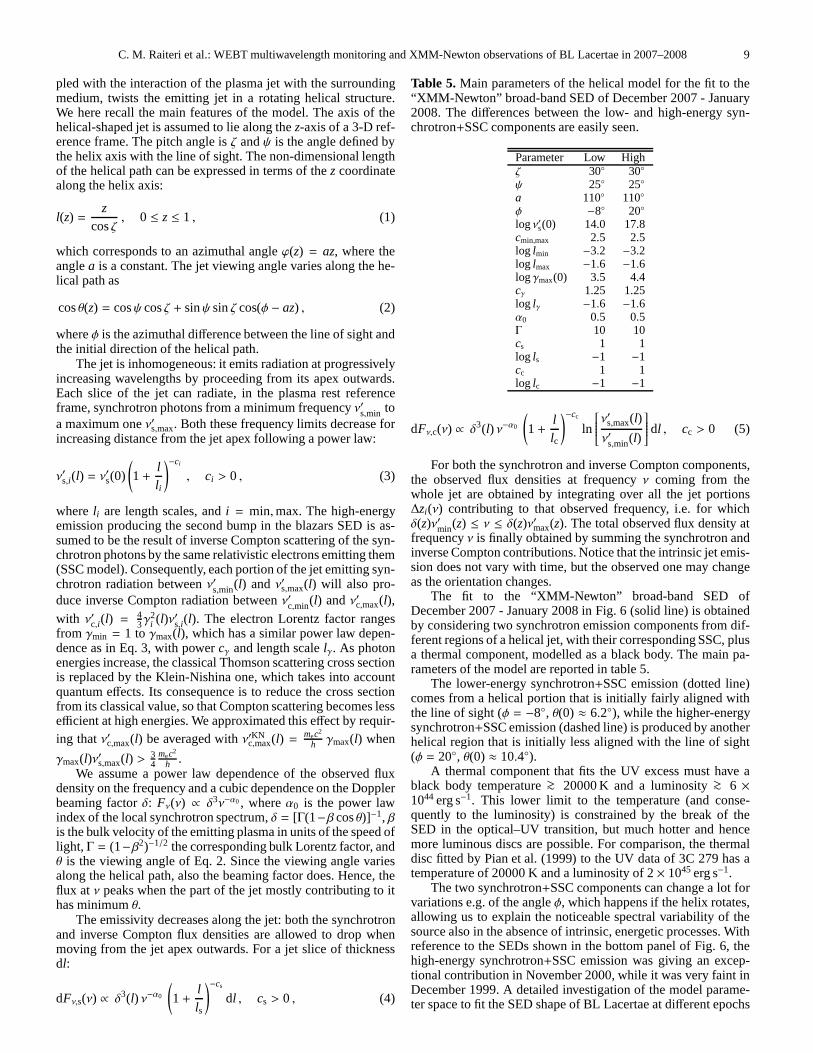
pled with the interaction of the plasma jet with the surroundingmedium, twists the emitting jet in a rotating helical structure.We here recall the main features of the model. The axis of thehelical-shaped jet is assumed to lie along thez-axis of a 3-D ref-erence frame. The pitch angle isζ andψ is the angle defined bythe helix axis with the line of sight. The non-dimensional lengthof the helical path can be expressed in terms of thez coordinatealong the helix axis:
l(z) =z
cosζ, 0 ≤ z ≤ 1 , (1)
which corresponds to an azimuthal angleϕ(z) = az, where theanglea is a constant. The jet viewing angle varies along the he-lical path as
cosθ(z) = cosψ cosζ + sinψ sinζ cos(φ − az) , (2)
whereφ is the azimuthal difference between the line of sight andthe initial direction of the helical path.
The jet is inhomogeneous: it emits radiation at progressivelyincreasing wavelengths by proceeding from its apex outwards.Each slice of the jet can radiate, in the plasma rest referenceframe, synchrotron photons from a minimum frequencyν′s,min toa maximum oneν′s,max. Both these frequency limits decrease forincreasing distance from the jet apex following a power law:
ν′s,i(l) = ν′s(0)
(
1+lli
)−ci
, ci > 0 , (3)
whereli are length scales, andi = min,max. The high-energyemission producing the second bump in the blazars SED is as-sumed to be the result of inverse Compton scattering of the syn-chrotron photons by the same relativistic electrons emitting them(SSC model). Consequently, each portion of the jet emittingsyn-chrotron radiation betweenν′s,min(l) andν′s,max(l) will also pro-duce inverse Compton radiation betweenν′c,min(l) andν′c,max(l),
with ν′c,i(l) =43γ
2i (l)ν′s,i(l). The electron Lorentz factor ranges
from γmin = 1 to γmax(l), which has a similar power law depen-dence as in Eq. 3, with powercγ and length scalelγ. As photonenergies increase, the classical Thomson scattering crosssectionis replaced by the Klein-Nishina one, which takes into accountquantum effects. Its consequence is to reduce the cross sectionfrom its classical value, so that Compton scattering becomes lessefficient at high energies. We approximated this effect by requir-ing thatν′c,max(l) be averaged withν′KN
c,max(l) =mec2
h γmax(l) when
γmax(l)ν′s,max(l) >34
mec2
h .We assume a power law dependence of the observed flux
density on the frequency and a cubic dependence on the Dopplerbeaming factorδ: Fν(ν) ∝ δ3ν−α0, whereα0 is the power lawindex of the local synchrotron spectrum,δ = [Γ(1−β cosθ)]−1, βis the bulk velocity of the emitting plasma in units of the speed oflight, Γ = (1−β2)−1/2 the corresponding bulk Lorentz factor, andθ is the viewing angle of Eq. 2. Since the viewing angle variesalong the helical path, also the beaming factor does. Hence,theflux at ν peaks when the part of the jet mostly contributing to ithas minimumθ.
The emissivity decreases along the jet: both the synchrotronand inverse Compton flux densities are allowed to drop whenmoving from the jet apex outwards. For a jet slice of thicknessdl:
dFν,s(ν) ∝ δ3(l) ν−α0
(
1+lls
)−cs
dl , cs > 0 , (4)
Table 5. Main parameters of the helical model for the fit to the“XMM-Newton” broad-band SED of December 2007 - January2008. The differences between the low- and high-energy syn-chrotron+SSC components are easily seen.
Parameter Low Highζ 30◦ 30◦
ψ 25◦ 25◦
a 110◦ 110◦
φ −8◦ 20◦
logν′s(0) 14.0 17.8cmin,max 2.5 2.5log lmin −3.2 −3.2log lmax −1.6 −1.6logγmax(0) 3.5 4.4cγ 1.25 1.25log lγ −1.6 −1.6α0 0.5 0.5Γ 10 10cs 1 1log ls −1 −1cc 1 1log lc −1 −1
dFν,c(ν) ∝ δ3(l) ν−α0
(
1+llc
)−cc
ln
ν′s,max(l)
ν′s,min(l)
dl , cc > 0 (5)
For both the synchrotron and inverse Compton components,the observed flux densities at frequencyν coming from thewhole jet are obtained by integrating over all the jet portions∆zi(ν) contributing to that observed frequency, i.e. for whichδ(z)ν′min(z) ≤ ν ≤ δ(z)ν′max(z). The total observed flux density atfrequencyν is finally obtained by summing the synchrotron andinverse Compton contributions. Notice that the intrinsic jet emis-sion does not vary with time, but the observed one may changeas the orientation changes.
The fit to the “XMM-Newton” broad-band SED ofDecember 2007 - January 2008 in Fig. 6 (solid line) is obtainedby considering two synchrotron emission components from dif-ferent regions of a helical jet, with their corresponding SSC, plusa thermal component, modelled as a black body. The main pa-rameters of the model are reported in table 5.
The lower-energy synchrotron+SSC emission (dotted line)comes from a helical portion that is initially fairly aligned withthe line of sight (φ = −8◦, θ(0) ≈ 6.2◦), while the higher-energysynchrotron+SSC emission (dashed line) is produced by anotherhelical region that is initially less aligned with the line of sight(φ = 20◦, θ(0) ≈ 10.4◦).
A thermal component that fits the UV excess must have ablack body temperature>∼ 20000 K and a luminosity>∼ 6 ×1044 erg s−1. This lower limit to the temperature (and conse-quently to the luminosity) is constrained by the break of theSED in the optical–UV transition, but much hotter and hencemore luminous discs are possible. For comparison, the thermaldisc fitted by Pian et al. (1999) to the UV data of 3C 279 has atemperature of 20000 K and a luminosity of 2× 1045 erg s−1.
The two synchrotron+SSC components can change a lot forvariations e.g. of the angleφ, which happens if the helix rotates,allowing us to explain the noticeable spectral variabilityof thesource also in the absence of intrinsic, energetic processes. Withreference to the SEDs shown in the bottom panel of Fig. 6, thehigh-energy synchrotron+SSC emission was giving an excep-tional contribution in November 2000, while it was very faint inDecember 1999. A detailed investigation of the model parame-ter space to fit the SED shape of BL Lacertae at different epochs
10 C. M. Raiteri et al.: WEBT multiwavelength monitoring andXMM-Newton observations of BL Lacertae in 2007–2008
goes beyond the scope of this paper. We notice however that ourmodel fit produces a GeV spectrum with photon indexΓ ≈ 2 andcan fairly reproduce the TeV spectrum observed by the MAGICtelescope in 2005 (Albert et al., 2007).
6. Discussion and conclusions
The WEBT campaign on BL Lacertae in the 2007–2008 ob-serving season involved 37 optical-to-radio telescopes. They ob-served the source in a relatively faint state. Nevertheless, somefast variability episodes were detected in the optical bands, su-perposed to a long-term flux increasing trend. During the cam-paign, three observations by the XMM-Newton satellite addedinformation on the UV and X-ray states of the source.
The broad-band SEDs built with simultaneous data taken atthe epochs of the XMM-Newton observations show a clear UVexcess. The high UV fluxes are explained if we assume a contri-bution by thermal radiation from the accretion disc.
On the other side, the corresponding X-ray spectra indicateapossible soft excess. When comparing our X-ray data with pre-vious data from other satellites, the X-ray spectrum appears tovary dramatically, so the soft excess cannot be ascribed to theaccretion disc and/or hot corona surrounding it. A much morevariable emission contribution is required.
We found that the broad-band SEDs of BL Lacertae canbe explained in terms of two synchrotron emission componentswith their corresponding SSC radiation, plus a thermal compo-nent representing the contribution of the accretion disc. Whenfitting these two non-thermal components by means of the heli-cal jet model of Villata & Raiteri (1999), and the thermal onewith a black body law, we find that the accretion disc has atemperature>∼ 20000 K and a luminosity>∼ 6 × 1044 erg s−1.Taking into account thatL = ηMc2, with η ≃ 0.06 in the case ofSchwarzschild’s metric (Shakura & Sunyaev, 1973), we can de-rive a lower limit to the accretion rate:M >∼ 0.2 M⊙ yr−1. And ifwe assume that the luminosity equals the Eddington’s critical lu-minosity, we can also infer a lower limit to the black hole mass:MBH >∼ 6× 10⁶M⊙. This value scales asLEdd/L.
A further emission component coming from inverse-Compton scattering on external photons from the disc and/or thebroad line region might be present, but it is not needed to fit theobservations, so we think that its possible contribution would bea minor one. Its modelling would introduce additional parame-ters that we could not reliably constrain.
Being aware that also other interpretations might be able toaccount for the observations reported in this paper, we noticethat a helical jet model is motivated by some observing evidence.Indeed, VLBA/VLBI studies of the jet structure in AGNs haverevealed bent jet morphologies that are suggestive of streamingmotions along a helical path (see e.g. Lister, 2001) or that themagnetic field may present a helical geometry (Gabuzda et al.,2004); this is also true for BL Lacertae (Tateyama et al., 1998;Denn et al., 2000; Marscher et al., 2008; O’Sullivan & Gabuzda,2009, see also Stirling et al. 2003). Moreover, a rotating heli-cal path in a curved jet was invoked by Villata et al. (2009) toexplain the optical and radio behaviour of BL Lacertae in thelast forty years, in particular the alternation of enhancedandsuppressed optical activity, accompanied by hard and soft radioevents, respectively. If the jet has a helical structure, differentportions of the jet may be well aligned with the line of sight,with consequent Doppler beaming of the emitted radiation. Thetwo emission components proposed in our modelling could cor-respond to two of these regions, the higher-energy one beinglo-cated closer to the jet apex. An analogous picture was suggested
by Villata & Raiteri (1999) for Mkn 501, whose radio-to-X-raymultiepoch SED was explained in terms of two jet regions withdifferent curvature. Alternatively, we can imagine that the twocontributions come from two interweaved helical filaments,butwe regard this hypothesis as less likely.
Finally, we mention that also in the case of Mkn 421, a pos-sible explanation for its X-ray and optical flux behaviour duringthe June 2008 flare implies the existence of two different syn-chrotron emitting regions in the jet (Donnarumma et al., 2009b).
Further multiwavelength observations, including GeV datafrom the Fermi satellite, and TeV data from ground-basedCherenkov telescopes, will help verify our interpretation.
Acknowledgements. This work is partly based on observations made with theNordic Optical Telescope, operated on the island of La Palmajointly byDenmark, Finland, Iceland, Norway, and Sweden, in the Spanish Observatoriodel Roque de los Muchachos of the Instituto de Astrofisica de Canarias, and onobservations collected at the German-Spanish Calar Alto Observatory, jointlyoperated by the MPIA and the IAA-CSIC. AZT-24 observations are madewithin an agreement between Pulkovo, Rome and Teramo observatories. TheSubmillimeter Array is a joint project between the Smithsonian AstrophysicalObservatory and the Academia Sinica Institute of Astronomyand Astrophysicsand is funded by the Smithsonian Institution and the Academia Sinica. This re-search has made use of data from the University of Michigan Radio AstronomyObservatory, which is supported by the National Science Foundation and byfunds from the University of Michigan. This work is partly based on ob-servation from Medicina and Noto telescopes operated by INAF - Istitutodi Radioastronomia. The Torino team acknowledges financialsupport by theItalian Space Agency through contract ASI-INAF I/088/06/0 for the Studyof High-Energy Astrophysics. Acquisition of the MAPCAT data at the CalarAlto Observatory is supported in part by the Spanish “Ministerio de Cienciae Innovacion” through grant AYA2007-67626-C03-03. The Metsahovi teamacknowledges the support from the Academy of Finland. This research waspartially supported by Scientific Research Fund of the Bulgarian Ministry ofEducation and Sciences (BIn - 13/09). St.Petersburg University team acknowl-edges support from RFBR grant 09-02-00092. Observations atthe Abastumani70-cm meniscus were partially supported by the Georgian National ScienceFoundation grant GNSF/ST-08/4-404. This research has made use of NASA’sAstrophysics Data System.
ReferencesAlbert, J., Aliu, E., Anderhub, H., et al. 2007, ApJ, 666, L17Bach, U., Villata, M., Raiteri, C. M., et al. 2006, A&A, 456, 105Bania, T. M., Marscher, A. P., & Barvainis, R. 1991, AJ, 101, 2147Bertaud, C., Dumortier, B., Veron, P., et al. 1969, A&A, 3, 436Bessell, M. S., Castelli, F., & Plez, B. 1998, A&A, 333, 231Bloom, S. D., Bertsch, D. L., Hartman, R. C., et al. 1997, ApJ,490, L145Bottcher, M. & Bloom, S. D. 2000, AJ, 119, 469Bottcher, M., Marscher, A. P., Ravasio, M., et al. 2003, ApJ, 596, 847Bregman, J. N., Glassgold, A. E., Huggins, P. J., et al. 1986,ApJ, 301, 708Bruzual, G. & Charlot, S. 2003, MNRAS, 344, 1000Cardelli, J. A., Clayton, G. C., & Mathis, J. S. 1989, ApJ, 345, 245Chen, A. W., D’Ammando, F., Villata, M., et al. 2008, A&A, 489, L37Corbett, E. A., Robinson, A., Axon, D. J., & Hough, J. H. 2000,MNRAS, 311,
485Corbett, E. A., Robinson, A., Axon, D. J., et al. 1996, MNRAS,281, 737D’Ammando, F., Pucella, G., Raiteri, C. M., et al. 2009, A&A,submittedDenn, G. R., Mutel, R. L., & Marscher, A. P. 2000, ApJS, 129, 61Dermer, C. D., Schlickeiser, R., & Mastichiadis, A. 1992, A&A, 256, L27Donnarumma, I., Pucella, G., Vittorini, V., et al. 2009a, ApJ, submittedDonnarumma, I., Vittorini, V., Vercellone, S., et al. 2009b, ApJ, 691, L13Fiorucci, M. & Tosti, G. 1996, A&AS, 116, 403Fitzpatrick, E. L. & Massa, D. 2007, ApJ, 663, 320Gabuzda, D. C., Murray,E., & Cronin, P. 2004, MNRAS, 351, L89Ghisellini, G. & Tavecchio, F. 2009, MNRAS, 397, 985Grandi, P. & Palumbo, G. G. C. 2004, Science, 306, 998Hartman, R. C., Bertsch, D. L., Bloom, S. D., et al. 1999, ApJS, 123, 79Kalberla, P. M. W., Burton, W. B., Hartmann, D., et al. 2005, A&A, 440, 775Lister, M. L. 2001, ApJ, 562, 208Liszt, H. S. 2007, A&A, 476, 291Liszt, H. S. & Lucas, R. 1998, A&A, 339, 561Lucas, R. & Liszt, H. S. 1993, A&A, 276, L33+Madejski, G. M., Sikora, M., Jaffe, T., et al. 1999, ApJ, 521, 145Mannucci, F., Basile, F., Poggianti, B. M., et al. 2001, MNRAS, 326, 745
C. M. Raiteri et al.: WEBT multiwavelength monitoring and XMM-Newton observations of BL Lacertae in 2007–2008 11
Marscher, A. P., Jorstad, S. G., D’Arcangelo, F. D., et al. 2008, Nature, 452, 966Mason, K. O., Breeveld, A., Much, R., et al. 2001, A&A, 365, L36Ostorero, L., Villata, M., & Raiteri, C. M. 2004, A&A, 419, 913O’Sullivan, S. P. & Gabuzda, D. C. 2009, MNRAS, 393, 429Padovani, P., Costamante, L., Giommi, P., et al. 2001, MNRAS, 328, 931Papadakis, I. E., Villata, M., & Raiteri, C. M. 2007, A&A, 470, 857Pian, E., Urry, C. M., Maraschi, L., et al. 1999, ApJ, 521, 112Pucella, G., Vittorini, V., D’Ammando, F., et al. 2008, A&A,491, L21Raiteri, C. M. & Villata, M. 2003, in Proc. of the First ENIGMAMeeting, held
at Mayschoss, Germany, May 11-14, 2003, Eds.: M. Hauser, U. Bach, & S.Britzen, 326
Raiteri, C. M., Villata, M., Capetti, A., et al. 2007a, A&A, 464, 871Raiteri, C. M., Villata, M., Ibrahimov, M. A., et al. 2005, A&A, 438, 39Raiteri, C. M., Villata, M., Kadler, M., et al. 2006a, A&A, 459, 731Raiteri, C. M., Villata, M., Kadler, M., et al. 2006b, A&A, 452, 845Raiteri, C. M., Villata, M., Larionov, V. M., et al. 2008, A&A, 491, 755Raiteri, C. M., Villata, M., Larionov, V. M., et al. 2007b, A&A, 473, 819Raiteri, C. M., Villata, M., Tosti, G., et al. 1999, A&A, 352,19Ravasio, M., Tagliaferri, G., Ghisellini, G., et al. 2002, A&A, 383, 763Ravasio, M., Tagliaferri, G., Ghisellini, G., et al. 2003, A&A, 408, 479Sambruna, R. M., Ghisellini, G., Hooper, E., et al. 1999, ApJ, 515, 140Scarpa, R., Urry, C. M., Falomo, R., Pesce, J. E., & Treves, A.2000, ApJ, 532,
740Schlegel, D. J., Finkbeiner, D. P., & Davis, M. 1998, ApJ, 500, 525Shakura, N. I. & Sunyaev, R. A. 1973, A&A, 24, 337Sikora, M., Begelman, M. C., & Rees, M. J. 1994, ApJ, 421, 153Smith, P. S., Schmidt, G. D., & Allen, R. G. 1993, ApJ, 409, 604Stickel, M., Fried, J. W., Kuehr, H., Padovani, P., & Urry, C.M. 1991, ApJ, 374,
431Stirling, A. M., Cawthorne, T. V., Stevens, J. A., et al. 2003, MNRAS, 341, 405Struder, L., Briel, U., Dennerl, K., et al. 2001, A&A, 365, L18Tanihata, C., Takahashi, T., Kataoka, J., et al. 2000, ApJ, 543, 124Tateyama, C. E., Kingham, K. A., Kaufmann, P., et al. 1998, ApJ, 500, 810Turler, M., Chernyakova, M., Courvoisier, T. J.-L., et al.2006, A&A, 451, L1Turner, M. J. L., Abbey, A., Arnaud, M., et al. 2001, A&A, 365,L27Vercellone, S., Chen, A. W., Vittorini, V., et al. 2009, ApJ,690, 1018Vermeulen, R. C., Ogle, P. M., Tran, H. D., et al. 1995, ApJ, 452, L5+Villata, M. & Raiteri, C. M. 1999, A&A, 347, 30Villata, M., Raiteri, C. M., Aller, H. D., et al. 2004a, A&A, 424, 497Villata, M., Raiteri, C. M., Kurtanidze, O. M., et al. 2004b,A&A, 421, 103Villata, M., Raiteri, C. M., Kurtanidze, O. M., et al. 2002, A&A, 390, 407Villata, M., Raiteri, C. M., Larionov, V. M., et al. 2009, A&A, 501, 455von Montigny, C., Aller, H., Aller, M., et al. 1997, ApJ, 483,161Wilms, J., Allen, A., & McCray, R. 2000, ApJ, 542, 914
1 INAF, Osservatorio Astronomico di Torino, Italy2 Department of Astronomy, University of Michigan, MI, USA3 Max-Planck-Institut fur Radioastronomie, Bonn, Germany4 Osservatorio Astronomico della Regione Autonoma Valle
d’Aosta, Italy5 Harvard-Smithsonian Center for Astroph., Cambridge, MA, USA6 Astron. Inst., St.-Petersburg State Univ., Russia7 Pulkovo Observatory, St. Petersburg, Russia8 Michael Adrian Observatory, Trebur, Germany9 Tuorla Observatory, Dept. of Physics and Astronomy, Univ. of
Turku, Piikkio, Finland10 Inst. of Astronomy, Bulgarian Academy of Sciences, Sofia,Bulgaria11 Instituto de Astrofısica de Andalucıa (CSIC), Granada, Spain12 Instituto de Astronomıa, Universidad Nacional AutonomadeMexico, Mexico13 Department of Physics and Astronomy, Ohio Univ., OH, USA14 INAF, Osservatorio Astrofisico di Catania, Italy15 SISSA-ISAS, Trieste, Italy16 Armenzano Astronomical Observatory, Italy17 Universite de Bordeaux, Observatoire Aquitain des Sciences del’Univers, Floirac, France18 CNRS, Laboratoire d’Astrophysique de Bordeaux – UMR 5804,Floirac, France19 Institute of Astronomy, National Central University, Taiwan20 Agrupacio Astronomica de Sabadell, Spain21 ARIES, Manora Peak, Nainital, India22 ZAH, Landessternwarte Heidelberg, Heidelberg, Germany23 Inst. de Astrofısica de Andalucıa, CSIC, Spain
24 Inst. for Astrophysical Research, Boston University, MA, USA25 Abastumani Astrophysical Observatory, Georgia26 Metsahovi Radio Obs., Helsinki Univ. of Technology, Finland27 INAF, Istituto di Radioastronomia, Sezione di Noto, Italy28 Sofia University, Bulgaria29 Korea Astronomy and Space Science Institute, South Korea30 Circolo Astrofili Talmassons, Italy31 Institute for Astrophysical Research, Boston University,MA,USA32 Nordic Optical Telescope, Santa Cruz de La Palma, Spain33 Dept. of Physics and Astronomy, Univ. of Victoria, Victoria,Canada34 Dept. of Phys., Univ. of Colorado Denver, Denver, CO USA35 Radio Astronomy Lab. of Crimean Astrophysical Observatory,Ukraine


