Embed Size (px)
Citation preview

WWEEEEKK 22

1
1
Lecture Notes
Week Two, Day One(Session I: 08:30 – 10:30)
Program on the Appraisal of Infrastructure Projects with Private
Participation
2
COSTS AND BENEFITS OF
ELECTRICITY INVESTMENTS

2
3
Economic Valuation of Additional Electricity Supply
• Willingness to pay for new connections• Willingness to pay for more reliable
service• Resource cost savings from replacement
of more expensive generation plants• Marginal cost pricing
4
ECONOMIC VALUE OF ELECTRICITYFOR NEW CONNECTIONS OR FOR REDUCTION OF
WITH ROTATING POWER SHORTAGES
Assuming willingness to pay (WTP) of all customers are also evenly distributed from highest 0P’ to lowest P0
m:
Economic Value of Additional Power Supply = ((PMAX+ P0m)/2) * (Q’-Q0)
Shaded area = economic value of shortage power
(Q’-Q0) = Power shortage, evenly rotated to all customers
Q00
P0m
PMAX=P’ D
FC
D0
S0
B
Quantity
$
Q’
3
5
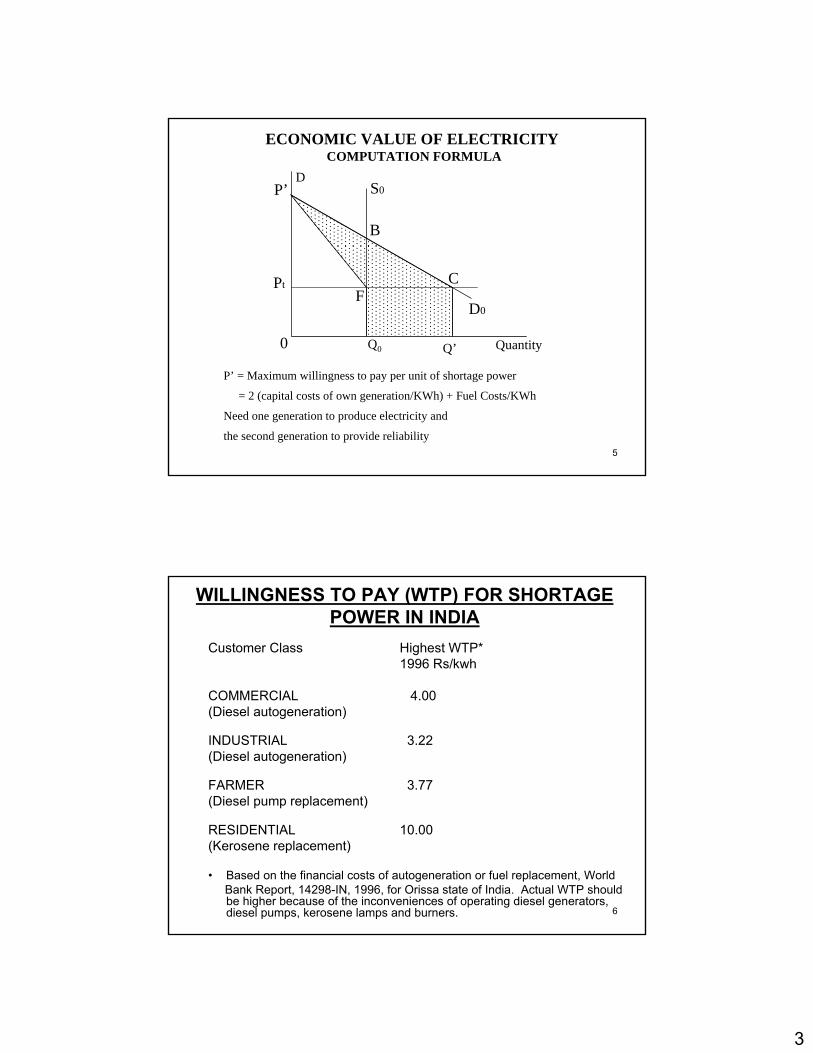
ECONOMIC VALUE OF ELECTRICITY COMPUTATION FORMULA
P’ = Maximum willingness to pay per unit of shortage power
= 2 (capital costs of own generation/KWh) + Fuel Costs/KWh
Need one generation to produce electricity and
the second generation to provide reliability
0
Pt
P’D
F
Q0
C
D0
S0
B
QuantityQ’
6
WILLINGNESS TO PAY (WTP) FOR SHORTAGE POWER IN INDIA
Customer Class Highest WTP*1996 Rs/kwh
COMMERCIAL 4.00(Diesel autogeneration)
INDUSTRIAL 3.22(Diesel autogeneration)
FARMER 3.77(Diesel pump replacement)
RESIDENTIAL 10.00(Kerosene replacement)
• Based on the financial costs of autogeneration or fuel replacement, WorldBank Report, 14298-IN, 1996, for Orissa state of India. Actual WTP should be higher because of the inconveniences of operating diesel generators, diesel pumps, kerosene lamps and burners.

4
7
Total Own-generation Cost ($/kWh) 0.169
Average Power Price (Gross of Tax, $/kWh) 0.037
Maximum Willingness To Pay ($/kWh) 0.212
Average Willingness To Pay ($/kWh) 0.125
OWN-GENERATION COST AND WILLINGNESS TO PAY IN MEXICO
8
1. Based on willingness to pay• Based on customers survey
2. Based on actual costs to users
3. Based on linear relationship between GDP and electricity consumption of industrial/commercial users
Estimated Cost of Power Failure

5
9
Estimated Cost of Power Failure*1. Based on Willingness to Pay
• Based on customers survey (Contingent valuation)Ontario Hydro Estimates of Outage Costs (1981 US$/kwh)
Duration Large Small Commercial ResidentialManufacturers Manufacturers
1 min 58.76 83.25 1.96 0.1720 min 8.81 13.56 1.66 0.151 hr 4.35 7.16 1.68 0.052 hr 3.75 7.35 2.52 0.034 hr 1.87 8.13 2.10 0.038 hr 1.80 6.42 1.89 0.0216 hr 1.45 4.96 1.75 0.02Average** 2.15 6.38 1.98 0.12All groups average***: 1.96 Average power price: 0.025
Average willingness for power during outage = 78.4 times average power price.
English Estimate (1996): 4 $/kwh* C.W. Gellings and J.H. Chamberlin, Demand-Side Management: Concepts and Methods,
Liburn, Georgia, The Fairmont Press, Inc., 1988. ** Based on system simulation model *** Based on shares: 13.5/13.5/39/34 %.
10
Estimated Cost of Power Failure (continued)
2. Based on actual costs to users (Loss in contribution to profits)
* Source: Table 7-10, Roop Jyoti, Investment Appraisal of Management Strategies for Addressing Uncertainties in Power Supply in the Context of Nepalese Manufacturing Enterprises, PhD Thesis, The Kennedy School of Government, Harvard University,December, 1998.
Year 1 2 3 4 5
Firm 1 5.56 2.73 5.01 1.50 3.43 Firm 2 3.31 2.86 1.71 3.24 3.76 Firm 3 15.25 11.77 14.37 12.16 5.26 Average each year 8.04 5.79 7.03 5.63 4.15 Average all years 6.13
COST OF POWER FAILURE IN NEPAL*(Multiples of electric tariff)

6
11
Estimated Cost of Power Failure (continued)San Diego (sudden outage of a few hours)*
(1981 US $/kwh)
Industrial CommercialDirect User 2.79 2.40Employees of Direct User 0.21 0.09Indirect User 0.12 0.13Total 3.12 2.62Multiples of Av Tariff** 62.4 52.4
Key West, Florida (rotating blackout for 26 days)*% of Cost MultiplesTime of Price
Nonresidential Users 4.8 $2.30/kwh 46.0
* Electric Power Research Institute study EPRI EA-1215, 1981, Vol. 2. ** Average price in 1981 is 0.05 $/kwh.
12
Estimated Cost of Power Failure (continued)
3. Based on linear relationship between GDP and electricity consumption of industrial/commercial users*
Outage cost = 1.35 (1981$/kwh) Or:
= 27 (multiples of the average power price)
* M. L. Telson, “The Economics of Alternative Levels of Reliability for Electric Power Generation Systems,” Bell Journal of Economics, Autumn, 1975.

7
13
Summary:Average power outage cost ranges from 6 to 80 times of the average power price.
14
Investment in New Generation to obtain Cost
Savings

8
15
8760 hrs
CapacityMW
Load Duration Curve hours for Year
8760 hrs
CapacityMW
Load Curve hours for Year
Peak hours Off-Peak hours
16
Calculation of Marginal Cost of Electricity Supply
• During the off-peak hours when the capacity is not fully utilized, the marginal cost in any given hour is the marginal running cost (fuel and operating cost per Kwh) of the most expensive plant operating during that hour.
• During the peak hours, when generation capacity is fully utilized, the marginal cost of electricity per Kwh is equal to the marginal running cost of the most expensive plant running at the time plus the capital costs of adding more generation capacity, expressed as a cost per Kwh of peak energy supplied.

9
17
2
3
4 MC1=0.03/KWH
Optimal Stacking of Thermal
MC2=0.04/KWH
MC3=0.05/KWH
MC4=0.08+ 400(0.15)/1000=0.14/KWH
H2 H3 H4
1000 1500 4500
CapacityKwH
0.08 $4001
0.05 $6002
0.04 $7003
0.03 $10004
Fuel Cost
Capital Cost
Plant
H4 solve for the minimum number of hours to run a plant 4 or the maximum number to run plant 3.
v = r+ d =0.15v(K4)+f4(H4)=v(K3)+f3(H4)
0.15(1000)+0.03(H4)=0.15(700)+0.04(H4)(150-105)=0.4(H4)-0.03(H4)
45=0.01H4
H4=4500
1
18
Contribution to Generation Investments
Hours Price MC Amount $/yr.Plant 1: 1000 * (0.14 – 0.08) = 60
Plant 2: 1000 * (0.14 – 0.05) = 90
Plant 3: 1000 * (0.14 – 0.04) = 100
Plant 4: 1000 * (0.14 – 0.03) = 110
Plant 3: 500 * (0.05 – 0.04) = 5
Plant 4: 500 * (0.05 – 0.03) = 10
Plant 4: 3000 * (0.04 – 0.03) = 30
Total contribution per year = $405
Annualized Cost of Generation Investments
Capital Annual Cost v Cost
Plant 1: 400 * 0.15 = 60
Plant 2: 600 * 0.15 = 90
Plant 3: 700 * 0.15 = 105
Plant 4: 1000 * 0.15 = 150
Total capital cost of system $405 per year.
90
100
110
1000 1500 4500
60
5
10 30
60
90
105
150Plant 4
Plant 3
Plant 2
Plant 1
Total: $ 405

10
19
Stacking Problem: when do we replace a thermal plant?
Output of plant #5 that substitutes for plant #1 = Q1
H2
KW
1 (2)
2 (3)
3 (4)
4 (5)
Hydro storage
H1
H3
H4
Output of plant #5 that substitutes for plant #2 = Q2
Output of plant #5 that substitutes for plant #3 = Q3
Output of plant #5 that substitutes for plant #4 = Q4
Load curve for plants 2,3,4 after 5 is introduced
0.025
0.034
0.043
0.052
0.081
Marginal Running Cost per Kwh
Plant No.
• Assume plant #5 has equal capacity to each of the other plants we would then have to shift all of the plants up one stage in production, thus there is no need to use plant number one now.
Benefits to Plant #5: It is going to be producing most of the time. Part of the time 5 is effectively substituting for 4, part for 3, part for 2, and part for 1.
The question is whether or not we should build plant #5. We use the most efficient plant first and then use the next most efficient and so on until the least efficient we need to meet demand.
20
Two approaches to calculating benefits
A. The new plant is used to substitute for part of the other plants that now do not produce as much as previously:Benefits Q4 x (0.03 – 0.02)
Q3 x (0.04 – 0.02)Q2 x (0.05 – 0.02)Q1 x (0.08 – 0.02)Total A
B. Alternative approach• Let H1, H2, H3, H4, be amount of electricity previously produced by plants 1
to 4.
Original Total Cost New Total CostH4 x 0.03 H4 x 0.02H3 x 0.04 H3 x 0.03H2 x 0.05 H2 x 0.04H1 x 0.08 H1 x 0.05Total B Total C
Total A = Total B -Total C. • We now compare total A with the annual capital cost of plant 5.

11
21
The Situation where variations in the efficiency of thermal plants are taken into account
The optimum price to charge at any hour is the marginal running cost of the oldest (least efficient) thermal plant that is in operation during that hour.
In this case, the benefits attributable to an investment in new capacityturn out to be the savings in system costs that the investment makespossible; and the present value of expected benefits is
[ ]∑ ∑∞
+=
−−
=
+−1
1
1)1()()(),(
jt
tjj
krjCkCtkH
C(k) - the marginal running cost of a plant built in year kH(k,t) - the number of kilowatt-hours in the production of which a new
plant would substitute for plants built in year kC(j) – running cost of plant j
22
When the plant is new, it is generating benefits all the time, but as it ages, and is supplanted at the base of the system by more
efficient plants, it generates benefits only part of the time.
Given this, the key investment criterion can be represented quite simply if we assume that the function
[ ]∑ −=−
=
1j
1k)j(C)k(C)t,k(H)t,j(B
Declines exponentially through time at annual rate of y.
.....,)r1(
)y1(B)r1(
)y1(Br1
)y1(B3
31J
2
21J1J +
+−
++−
++− +++

12
23
Marginal Cost Pricing of Electricity
• Efficient pricing of electricity.The basic assumption that we make is that the demand for electricity is increasing over time, 5-10% each year. Therefore with existing capacity economic rents will increase over time.
24
Growth of Economic Rent Over Time
A B
Dt0
Dt1
Dt2
Q
Price of electricity • If choice is to either stay at
A capacity forever, or to stay at B forever, then we add up the consumer surpluses between A and B to see if B plant is worthwhile to install.
A B
Dt0
Dt1
Dt2
Q
Price of electricity
C
0
0
• If we expand capacity from A to B to C in subsequent time period.
Benefits of ABenefits of B
Benefits of C

13
25
Load Curve for Hours of Day
• We start with the assumption that all we have are homogeneous thermal plants.
Qt0
Qt1
Hours of day
Capacity in K.W.
0
K0
• If demand increases to Qt1 we either ration the available electricity or we build more capacity.
26
Load Curve for Hours of Day• by varying the price of electricity through time we can spread out
demand so that it does not exceed capacity.
Qt00
Hours of day
Capacity in K.W.
0
K0
• It is possible to keep quantity demanded constant by varying theprice with the use of a surcharge.
• Let Ki be the length of time each surcharge is operative. Si is the difference between MC and the price charged, then:
12
3
4
Surcharge cents
Si = Surcharge
∑=m
iiiKS rent economic Total
• It is the economic rent accruing to the existing capacity.

14
27
Example• A kilowatt is the measure of capacity.
• 1 K.W. of capacity can produce 8760 Kilowatt hour (KWH) per year.
• Assume it costs $400 /kw of capital cost, and the social opportunity cost of capital plus depreciation = 12%. Therefore we need $48 of rent per year before we install another additional k.w. of capacity.
• As demand increases through time we require a higher surcharge in order to contain capacity. Price used to ration capacity.
• This will generate more economic rent, and if this rent is big enough it would warrant an expansion of capacity.
• The objective of pricing in this way is to have it reflect social opportunity cost or supply price.
• In practical cases the price does not vary continuously with time but we have surcharges that go on and off at certain time periods.
28
Example (Cont’d)
• The “Load Factor” = KWH generated/8760 kwh
• Capital costs of per KW of capacity = 400/KW
• 10% interest + 2% depr = $48/yr
• Marginal running costs = 3 cents per KWH
• Peak hours are 2400 out of the year
• Off peak optimal charge is 3 cents per KWH
• On peak optimal charge is 5 cents per KWH
• Implicit rent of any new capacity = 2400 x 2 cents = $48/year

15
29
Choice of different types of Electricity Generation Technologies to make
Electricity Generation System
• Thermal Generation:– Nuclear– Large fossil fuel plants– Combined cycle plants– Gas turbines
• Hydro Power– Run of the Stream– Daily Reservoir– Pump Storage
30
Thermal vs. Hydro Generation
• The thermal capacity is relatively homogeneous if capacity costs are higher generally fuel costs are lower. e.g. Coal plant versus combined cycle plant.
• With hydro storage or use of the stream every particular site is different.
• Costs may range over a 5 fold difference.

16
31
Run of the Stream• No choice of when the water will come.• Water comes at a zero marginal cost, therefore should use
it when it comes.• Suppose river runs for 8760 hrs. at full generation capacity. • We will assume that the highest potential output during the
year of the run of the stream is always less than total demand. Some thermal is being used.
• Peak hours = 2400• Off peak hours = 6360• Savings as compared to thermal plant (from previous example)• 2400 x 5¢ 120.00 Peak rationed price = 5 ¢• 6360 x 3¢ 190.80 off peak MRC of thermal = 3 ¢
310.80 per yearQuestion: Is US$ 310.80 per year enough to pay for run of
stream capital plus running costs?
32
Daily Reservoir• Constructed to meet the peak day hours.• To store water during the off peak for use during the
peak hours.• We don't generate any more electricity but we use the
same amount of water and use it to produce peak priced electricity i.e. (5¢) instead of off peak (3¢) electricity.
• Instead of 2400 x 5 ¢ = $120.006360 x 3 ¢ = $190.80
= $310.80• We get 8760 x 5 ¢ = $438.00. Net benefits = $127.20• The costs are that of building the reservoir and the
additional hydro generating capacity so as to generate more electricity in the peak hours.

17
33
Daily Reservoir (Cont’d)• If previous run of stream generated 100 KW for 24
hours, now we will generate 300 KW for 8 hours.
• The gain from this switch in water is what we compare with the extra cost.
• If we now produce off peak electricity with thermal instead of run-of-the stream then this opportunity cost is calculated when calculating the opportunity costs of the daily reservoir.
• The additional marginal running costs of the thermal plants needed to meet the off peak demand are deducted from the benefits of switching off-peak run-of-stream water to peak time water.
34
Pump Storage• We use off peak electricity to pump water up to a high area so that it can
be released to produce electricity during peak demand periods.
Example:
• It takes 1.4 KWH off peak to produce 1KWH on peak
• Off peak value = 3 ¢ KWH Peak = 5 ¢ KWH
• There is a profit here of [(5¢ - 3¢*1.4) = (5¢ - 4.2 ¢)] = 0.8 ¢/KWH of peak hour generated
• Pump storage is becoming feasible because of the existence of nuclear and very large fossil fuel plants.
• These plants are very costly to shut off and on.
• Therefore, their surplus in off peak hours is very cheap electricity.
• With large storage at top and bottom of till, a very small stream is all that is needed to produce a very large power station and use nuclear power to pump water back up on off peak hours.

18
35
Multipurpose Dams• Multipurpose dams are used for irrigation, power and flood control. • However, with multipurpose dams it is possible to have conflicting
objectives.• For example, it may be the case that irrigation water is needed in
summer, but electrical power is at its lowest demand in summer. • We may have to adjust prices of electricity to shift some of the
demand to times when irrigation water is required.• The different objectives have to be weighted.• A useful solution is to provide the water during the peak time hours
for electricity and then build a small regulatory dam to provide water for irrigation.
• The conflicting objectives may cause us to not have any optimal strategy over the year, but we still may be able to maximize during the day.
• In this case we still will have to have a larger thermal capacity than in the case of no irrigation objective.
36
How do we price for the peak if the alternative is thermal generation?
• Assume quantity of water available is fixed.
• With an increase in peak demand we have to increase the thermal capacity and it is based on this cost that we have to calculate the peak time surcharge.
Hydro
8760 hrs
Capacity
Thermal 2
Hydro
Thermal 1
Suppose system peak = 2,400 hours Thermal peak = 4,000 hours• It is over the 4,000 hours that we spread the capital costs of new thermal
plants. If $48/kw needed per year to cover the capital costs then we only require a surcharge of 1.2 ¢/Kwh (4800¢/4000hrs. = 1.2¢/Kwh)
• To find the price that should be charged for electricity during the peak hours, we add the capacity charge of 1.2 ¢ to the costs marginal running cost of the least efficient thermal plant operating during these hours.
• As long as we peak with hydro storage then the benefit of increasing hydro is the thermal peak cost.
2400 4000

19
37
Lecture Notes
Week Two, Day One(Session II: 10:15 – 12:00)
Program on the Appraisal of Infrastructure Projects with Private
Participation
APPRAISAL OF
EL-KUREIMAT
COMBINED
CYCLE POWER PLANT

20
39
PROPOSED EL KUREIMAT (MODULE II) PLANT
• Proposed El Kureimat Combined Cycle Power Project is about 90 km south of Cairo
• Inside the existing El Kureimat Power Station
• Module II will not share any facilities with the existing plant
• Construction of 750 MW (2x250 MW gas turbine and 1x250 MW steam turbine) combine cycle power plant• Construction period: start in 2005, two gas turbines
operational in 2008 and steam turbine in 2009• Total cost € 264.1 million with foreign component of
72.9% • A loan application to AfDB for € 173.6 million (65.7%),
government guarantee is offered
40
PLANT OPERATION• Project operational life is 40 years from 2008• Replacement investment for the gas turbines after 25 years • Plant net generation capacity is 691 MW after deducting ISO factor
(5%) and auxiliary consumption (3%)• Annual plant utilization rate is 80%, reduced by 0.50% p.a.• Fuel Cost: natural gas consumption rate of 0.16 m3/kWh, supplied
by state gas utility to project at 0.141 EGP/m3 (US$ 2.35 cent/m3)• Operations and Maintenance (O&M) Costs: Fixed generation O&M is
estimated at US$ 15.8 million p.a. and variable O&M at 1.57 US$/MWh
• Periodic maintenance of gas turbines every 5 years at a cost of US$ 10 million
• Terms for AfDB loan: interest rate of 4.5% p.a.; repayment period of 20 years, including a 5-year grace period and a commitment charge of 0.25%

21
41
ELECTRICITY SECTOR IN EGYPT • Unlike a number of other countries, Government of Egypt places
a high priority on having a well-managed electricity system that supports every sector of economy
• Growth in electricity demand, that mirrors the economic development, averaged 6.2% p.a. over period of 1999-2004
• No power shortages have been experienced in Egypt during the last decade
• Egyptian Electricity Holding Company (EEHC) is integrated utility that is responsible for generation, transmission and distribution of electric power
• EEHC consists of 15 companies, organized by function and geographical area: 5 generation, 1 transmission and 9 distribution companies
• On generation side, total installed capacity at the end of 2004 was 14,091 MW: 2,100 MW of hydro, 11,914 MW of thermal and 77 MW of wind
• Thermal units type: 8.9% gas turbines, 73.8% steam turbines, and 17.4% combine cycle units
42
PURPOSE OF PROJECT APPRAISAL
• Government of Egypt is the guarantor for loan, and EEHC is the borrower and executing agency with excellent past record
• What do we need to worry about?
• Six specific questions:1) Does the project ensure the least-cost way of meeting power
demand by EEHC?2) What is the magnitude of financial benefits realized by the
electric utility?3) What are the cashflow implications for the utility in terms of
servicing the debt obligations of the proposed project? 4) To what extent does this project contribute to Egyptian
economy?5) Who are stakeholders and by how much do they benefit, or
lose, as a consequence of this project?6) What are the risk factors that affect the project and how can
the uncertainty and risk exposure be mitigated?

22
43
“WITH” AND “WITHOUT” PROJECT• Egyptian authorities realized decades ago that it is worthwhile to
maintain a modern power system in order to have an affordable and reliable energy supply
• Country has the second largest power system on African continent, and 99% of potential consumers have been connected to grid, one of highest rates among all developing countries
• Under the “without” project scenario EEHC will supply sufficient electricity to meet the demand it faces, regardless where additional power might come from: own generation or purchases from private BOOT plants
• The “without” scenario would also include other elements of the proposed system expansion plan, which will enhance the reliability and generation capacity of the utility until 2014/15
• Specific feature of the “with” scenario of this project is that with implementation of this new efficient combine cycle plant, projected demand will be met at a lower generation cost to EEHC
44
• The incremental change introduced by the plant is change in the mix of plants that EEHC would operate
• Currently, during the off-peak the company uses a number of steam plants in base load together with a few existing combine cycle plants and its limited hydro potential; while at the peak time, additional capacity is provided by gas turbines
• Since both steam and gas units operate with a substantially higher fuel and O&M costs, proposed plant will enable EEHC to reduce the use of its most inefficient units
• Therefore, financial benefits from proposed plant are savings ofrunning costs of steam plants during the off-peak regime, and savings on operation and capital cost of gas plants at the system peak
• No additional energy sales should be credited as financial benefits

23
45
Impact of Project on System Dispatch (MWh/year)
8,760 hours/year
Hydro and Wind
Combined Cycle
Steam Units
Gas Units
Capacity (MW)
Replacement of gas units during peak times (MWh/year)
Replacement of steam units during off- peak times (MWh/year)
700 hours/year
46
FINANCIAL BENEFITS• Off-Peak Savings: cash saved by the electric utility on operation of
steam plants. Average fuel consumption on steam plants is 0.202 m3/kWh of natural gas while consumption by proposed combine cycle plant is only 0.161 m3/kWh. Average O&M costs of existing steam plants are EGP 4.0 Piaster/kWh, while proposed plant has EGP 3.4 Piaster/kWh. The off-peak load is supplied by hydro, wind, existing combine cycle and steam units during 8060 hours/year.
• Peak Savings: summation of the peak fuel savings, peak O&M savings and capital costs associated with the installation of gas turbines for reserve capacity. Average system fuel consumption on gas plants is 0.375 m3/kWh of natural gas. Average O&M costs on gas units are EGP 4.0 Piaster/kWh. Capital savings are basicallythe avoided cost of gas turbine capacity, and it is estimated as EGP 31.4 Piaster/kWh (US$ 5.22 cent/kWh).
• Capital savings on installation of gas turbine capacity: cost of gas turbine installed is US$ 400 per kW, expected to serve 25 years, generating a weighted average cost of capital (WACC) for project of 5.0% p.a., then the annual depreciation charge is US$ 16 p.a., and the required return on capital is US$ 20.5 p.a.
• Total capital charge per annum will be US$ 36.51 per kW of installed capacity. This charge must be amortized over amount ofenergy generated during a year. Since gas turbines are operated 700 hours/year then the corresponding capital charge on energy amounts to US$ 5.22 cent/kWh = 36.51 US$/kW / 700 hours.

24
47
Cash Flow Statement for Project: Total Investment Perspective, 2005 prices (million EGP)
INFLOWS 2005 2006 2007 2008 2009 2010 2011 2012 2013 2014 2015 2020 2025 2030 2033 2035 2040 2045 2048System off-peak cost savings 0 0 0 111 275 324 323 322 322 321 316 306 297 285 188 275 265 256 0System peak cost savings 0 0 0 53 134 159 158 157 159 158 157 152 146 141 92 136 131 126 0Other revenues 0 0 0 22 55 65 66 66 64 65 64 62 61 59 37 56 54 52 290
Total Inflows 0 0 0 186 463 548 547 545 545 544 536 520 504 485 317 467 450 434 290OUTFLOWS
Investment Costs 160 673 836 333 88 0 0 0 0 0 0 0 0 0 644 0 0 0 0Operating Costs
Fuel costs 0 0 0 60 152 181 182 182 178 179 178 173 168 164 103 155 150 145 0O&M 0 0 0 47 101 109 109 108 169 108 108 106 105 103 48 102 100 99 0Labor 0 0 0 19 33 33 33 33 33 34 34 34 35 36 36 37 38 38 0Change in working capital 0 0 0 24 -2 0 1 1 1 1 1 1 1 1 2 1 1 1 5
Total Outflows 160 673 836 482 372 323 324 324 381 321 320 314 309 304 834 294 288 283 5NET CASH FLOW BEFORE FINANCING -160 -673 -836 -297 92 225 223 221 165 222 216 206 195 182 -517 172 162 151 285
Add: loan disbursement 114 468 571 163 58 0 0 0 0 0 0 0 0 0 0 0 0 0 0Less: Loan repayment + fees + charges 3 7 26 50 57 58 141 135 128 122 116 89 67 0 0 0 0 0 0NET CASH FLOW AFTER FINANCING -49 -211 -290 -184 93 167 82 86 36 100 100 117 129 182 -517 172 162 151 285
FNPV, real (million EGP) @ ROE: 6% 740.1FIRR: 12.3%
Levelized energy cost, real (US cent/kWh) 1.71
ADSCR = Net system savings over project debt repayments 1.58 1.64 1.28 1.82 1.86 2.30 2.93DSCR = PV of net system savings over PV of project debt repayments 1.91 1.95 2.00 2.10 2.14 2.46 2.93
48
ELECTRIC UTILITY AND DEBT SERVICE
• EEHC is an integrated utility responsible for generation, transmission and distribution of electric power in Egypt. To meet projected energy demand, EEHC has developed an expansion plan that aims at expanding the generation and transmission capacity between 2005 and 2012.
• Tariffs: The average system tariff is EGP 14.22 piaster/kWh (US$ 2.37 cent/kWh). Government has allowed EEHC to raise tariffs by not more than 5.0% a year over the period 2005-10 in nominal terms. There is no automatic mechanism linking tariffs to inflation.
• Billing Cycle and Accounts Receivable: All customers are metered and billing cycle of EEHC is about 150 days at the end of 2004. The bulk of A/R is owed by government and public sector. Government has approved a number of measures in an effort to settle its accounts with the EEHC over next years.

25
49
EEHC Cash Flow Projection and Debt Service, Current Prices (billion
EGP)REVENUES 2005 2006 2007 2008 2009 2010 2011 2012 2013 2014 2015 2016 2017 2018 2019 2020 2021 2022 2023 2024 2025 2026
Sales of Energy 12.3 13.9 15.7 17.7 20.0 22.6 25.1 27.9 30.3 31.4 32.5 33.6 34.8 36.0 37.3 38.6 40.0 41.4 42.8 44.4 45.9 47.5Change in Accounts Receivable 0.2 0.3 0.6 0.1 0.0 0.0 -0.5 -0.6 -0.5 -0.2 -0.2 -0.2 -0.2 -0.2 -0.3 -0.3 -0.3 -0.3 -0.3 -0.3 -0.3 -0.3Other revenues 0.8 0.9 1.0 1.1 1.2 1.4 1.5 1.7 1.8 1.9 1.9 2.0 2.1 2.2 2.2 2.3 2.4 2.5 2.6 2.7 2.8 2.8
Total Revenues 13.4 15.1 17.3 18.9 21.2 24.0 26.1 29.0 31.7 33.1 34.2 35.4 36.7 38.0 39.3 40.7 42.1 43.6 45.1 46.7 48.4 50.1EXPENDITURES
Investment Costs 5.8 6.0 7.5 8.0 9.1 8.8 8.7 8.6 0.0 0.0 0.0 0.0 0.0 0.0 0.0 0.0 0.0 0.0 0.0 0.0 0.0 0.0Operating Costs
Fuel costs 3.4 3.9 4.4 4.8 5.3 5.9 6.7 7.5 8.6 8.9 9.1 9.5 9.9 10.3 10.7 10.9 11.4 11.8 12.3 12.8 13.1 13.7Purchases for sale 1.7 1.8 1.9 1.9 2.0 2.1 2.1 2.2 2.3 2.4 2.4 2.5 2.6 2.7 2.8 2.9 3.0 3.1 3.2 3.3 3.4 3.6Salaries and wages 3.2 3.6 4.1 4.7 5.2 5.9 6.7 7.6 8.4 8.4 8.9 9.3 9.7 10.2 10.4 10.9 11.4 11.9 12.5 12.7 13.4 14.0Materials & services input 1.9 2.2 2.4 2.8 3.2 3.6 4.0 4.5 5.0 5.2 5.2 5.5 5.7 6.0 6.2 6.2 6.5 6.8 7.2 7.4 7.4 7.8Net interest expenses 2.0 2.0 2.0 2.0 2.0 2.0 2.0 2.0 2.0 2.0 2.0 2.0 2.0 2.0 2.0 2.0 2.0 2.0 2.0 2.0 2.0 2.0Change in working capital 1.0 0.6 0.6 0.6 0.6 0.8 1.0 1.1 1.1 0.3 0.3 0.5 0.5 0.6 0.4 0.4 0.6 0.6 0.7 0.5 0.5 0.8
Total Expenditures 19.1 20.1 22.9 24.8 27.5 29.0 31.2 33.5 27.4 27.3 28.0 29.3 30.4 31.8 32.4 33.4 35.0 36.3 37.9 38.7 40.0 41.8NET CASH FLOW BEFORE FINANCIN -5.7 -4.9 -5.5 -5.9 -6.3 -5.1 -5.1 -4.5 4.2 5.8 6.2 6.1 6.3 6.2 6.9 7.3 7.1 7.3 7.2 8.0 8.4 8.2
Add: Loan Disbursements 4.8 4.7 6.1 6.3 7.3 7.0 7.0 6.8 0.0 0.0 0.0 0.0 0.0 0.0 0.0 0.0 0.0 0.0 0.0 0.0 0.0 0.0Less: Additional Interest Expense 0.1 0.4 0.6 0.9 1.2 1.6 2.1 2.5 6.2 6.1 6.0 5.8 5.7 5.6 5.4 5.3 5.1 5.0 4.8 4.7 4.5 4.2NET CASH FLOW AFTER FINANCING -1.0 -0.5 0.0 -0.5 -0.2 0.4 -0.2 -0.2 -2.0 -0.3 0.3 0.3 0.6 0.6 1.5 2.0 2.0 2.3 2.4 3.3 3.9 4.0
Annual Debt Service Coverage Ratio (ADSCR) 1.70 1.66 0.68 0.96 1.04 1.04 1.10 1.11 1.27 1.37 1.39 1.47 1.49 1.71 1.86Debt Service Capacity Ratio (DSCR) 1.21 1.15 1.09 1.15 1.17 1.19 1.22 1.24 1.26 1.26 1.23 1.19 1.12 1.00 1.86
50
TARIFF ADJUSTMENT• No Additional Tariff Increases after 2010: In a situation where
only 5% nominal adjustment is undertaken until 2010 and tariff is inflation-adjusted on annual basis thereafter, EEHC may have some liquidity gaps and will not be able to pay off all its debtobligations without an external injection of funds in 2013-14.
• One-Time Real Increase of Tariffs by 6.0% in 2011: ADSCR is equal 1.0 in worst period of loan repayment, year 2013. This adjustment is in addition to the already committed 5% p.a. nominal tariff increases over the period 2005-10 under the assumption of a 3.5% annual rate of inflation. On top of that, EEHC would have to adjust the tariffs for inflation in followingyears.
2011 2012 2013 2014 2015 2016 2017 2018 2019 2020 2021 2022 2023 2024 2025
ADSCR 2.40 2.36 1.00 1.23 1.39 1.41 1.49 1.52 1.70 1.84 1.88 1.99 2.05 2.31 2.50
DSCR 1.65 1.56 1.48 1.54 1.59 1.62 1.65 1.67 1.70 1.70 1.67 1.62 1.52 1.35 2.50

26
51
• Nominal Increase of Tariffs by 5.75% p.a. over 2011-15: Government continues the nominal tariff increase over the period 2011-15 but now with a rate of 5.75% per year.
• The two options, whether to raise tariffs once-for-all by 6.0% in real terms in 2011 or to phase out this increase over 2011-15 through nominal increases of 5.75%, are roughly equivalent, provided that the domestic inflation rate remains within the 3.5% p.a. range.
• Any unexpected increase in the inflation will erode the revenues of the electric utility.
2011 2012 2013 2014 2015 2016 2017 2018 2019 2020 2021 2022 2023 2024 2025
ADSCR 1.92 2.13 1.00 1.42 1.67 1.73 1.83 1.88 2.08 2.24 2.31 2.45 2.54 2.83 3.06
DSCR 1.90 1.84 1.77 1.88 1.94 1.98 2.02 2.06 2.09 2.09 2.06 1.99 1.87 1.65 3.06
52
ECONOMIC APPRAISAL• Economic Value of Natural Gas. Egypt is endowed with substantial reserves of natural
gas which are mainly underdeveloped. Domestic prices are regulated by Government and kept low, substantially less than international prices. Industrial users pay 0.220 EGP/m3. EEHC has a preferential agreement with state-controlled natural gas utility EGEAS. Subsidized cost of natural gas for EEHC is 0.141 EGP/m3.
• Netback Value of Natural Gas Exports: Natural gas production sufficiently covers all domestic needs, and the excess is exported as liquefied natural gas (LNG). Shipment of LNG by the EGEAS is facilitated through contracts but contractual prices are not known. A specific formula of LNG price was developed by gas exporters to be used during contract negotiations:
LNG Price (US$/GJ) = 0.1567 * Crude Oil Price (US$/bbl) + 0.79• For crude price of 30 US$/barrel, corresponding price of LNG will be 5.49 US$/GJ.
There are processing and shipping costs for natural gas, comprising about 3.50 US$/GJ, which implies that border value of natural gas is 1.99 US$/GJ. This figure translates into US$ 2.29 per cubic feet. There is an existing gas pipeline to the Module I of El Kureimat plant, no new pipeline will be needed for Module II. The average domestic cost of gas delivery from the EGEAS to the plant is 0.29 US$/cuf.
• Netback value of natural gas is 2.00 US$/cuf (0.057 US$/m3). With exchange rate of 6.0 EGP/US$, netback value is 0.34 EGP/m3.

27
53
Economic Resource Flow Statement, 2005 prices (million EGP)
BENEFITS 2005 2006 2007 2008 2009 2010 2011 2012 2013 2014 2015 2016 2017 2018 2019 2020 2025 2030 2033 2035 2040 2045 2048System off-peak cost savings 0 0 0 183 451 528 528 527 530 528 517 518 515 515 512 502 488 467 310 450 435 420 0System peak cost savings 0 0 0 83 209 248 248 246 252 250 247 246 245 243 242 239 231 222 145 214 206 199 0Other benefits 0 0 0 0 0 0 0 0 0 0 0 0 0 0 0 0 0 0 0 0 0 0 316
Total Benefits 0 0 0 266 660 776 776 773 781 779 764 764 760 758 755 741 719 689 455 664 641 619 316COSTS
Investment Costs 156 654 812 315 86 0 0 0 0 0 0 0 0 0 0 0 0 0 644 0 0 0 0Operating Costs
Fuel costs 0 0 0 100 255 304 305 305 298 301 299 300 300 289 292 290 283 275 173 261 251 243 0O&M 0 0 0 39 83 89 89 89 146 88 88 88 88 145 87 87 86 85 39 84 83 81 0Labor 0 0 0 18 32 32 32 32 32 33 33 33 33 33 33 33 34 35 35 36 36 37 0Change in working capital 0 0 0 37 -4 -1 0 0 0 0 0 0 0 0 0 0 0 0 2 0 0 0 -21
Total Costs 156 654 812 509 453 425 426 426 477 422 420 421 421 467 412 411 403 395 894 380 370 362 -21NET RESOURCE FLOW -156 -654 -812 -243 207 352 350 347 305 357 343 343 339 291 342 331 316 295 -439 284 271 257 337
NPV, real (million EGP) @ EOCK: 10% 654.7EIRR: 13.8%
Levelized Energy Cost, real (US cent/kWh) 2.42
• Economic Value of Capital Assets and O&M. Investment costs are mainly tradable items, except civil works, economic valuation removes all import duties and other indirect taxes imposed on the items. In addition, values of foreign exchange premium and shadow price ofnon-tradable outlays are incorporated. O&M expenditures are also tradable items.
• For non-tradable civil works, analysis also looks at distortions in inputs markets (i.e., taxes and subsidies on goods and services used in civil works).
54
STAKEHOLDER IMPACTSAllocation of Externalities, 2005 prices (million EGP)
GOVERNMENT Taxes, subsidies, FEP
PETROLEUM EXPORTER Savings
PUBLIC SECTOR Net Impact
BENEFITS System off-peak cost savings 123.1 1,367.3 1,490.4 System peak cost savings 54.0 599.6 653.6 Other revenues -468.8 0.0 -468.8
Total Benefits -291.7 1,966.9 1,675.2 COSTS
Investment Costs -54.4 0.0 -54.4 Operating Costs
Fuel costs 72.9 809.8 882.7 O&M -149.2 0.0 -149.2 Labor -8.0 0.0 -8.0 Change in working capital 3.6 0.0 3.6
Total Costs -135.1 809.8 674.7 NET EXTERNALITY FLOW -156.6 1,157.1 1,000.5

28
55
SENSITIVITY ANALYSIS: CRITICAL FACTORS
Direct effect on the EEHC revenues and profitability. The management controls the efficiency to a large extent.
Invoicing efficiency
Direct effect on the EEHC revenues and profitability. The management controls the efficiency to a large extent.
Collection efficiency
Tremendous impact on the EEHC revenues and profitability. As of now the management can not change the tariffs without approval by the Cabinet of Ministers.
Electricity Tariffs
Large effect on the EEHC generation decisions and, as a consequence, on the project. Beyond management control; based on economic factors and policies.
Electricity Demand Growth
Little impact on the financial results, but it is the main factor of economic viability of the project and allocation of stakeholder impacts. Beyond Egypt’s control.
World price of crude oil
Critical impact on performance of project and electric utility. Beyond management control. The Government directly controls the prices for oil and natural gas in Egypt.
Cost of natural gas to the EEHC
Mainly affects the investment costs and loan repayment. Beyond Egypt’s control; based on EU policies and economy.
EU inflation
Large effects on operating costs, working capital and interest rate on loan. Beyond management control; based on economic factors and policies.
Domestic inflation
Reduction of benefits. Management can control it.Plant utilization
Direct increase of investment costs. Management can control it to a large extent.Investment cost overruns
Impact and risk significanceFactors
56
RISK ANALYSIS• Expected value of financial NPV (EGP 546.9 million) is different from
deterministic outcome of the financial analysis of EGP 740.1 million. • Result also shows that no possibility of having a financial loss exists. • At extreme lower end of possible range, minimum gain (EGP 222.4
million) is about 8.1% of investment value of project, while in best case scenario maximum gain (EGP 869.8 million) is 31.6% of initial value of investment.
Frequency Chart
Certai nty i s 0.21% from -Infini ty to 222.4 milli on EGP
Mean = 546.9.000
.006
.013
.019
.025
0
63
126
189
252
222.4 384.3 546.1 708.0 869.8
10,000 Trials 9,970 Displayed
Forecast: FNPV@ROE

29
57
• Debt service ratios are also tested through risk analysis, using base case of the utility cashflows without additional tariff adjustment beyond 2010 but with assumption of annual inflation adjustment after 2010.
• Expected values of all debt ratios are lower than in deterministic analysis, implying that ability of the EEHC to service debt in a timely manner is not as optimistic as in deterministic analysis.
• In 2011 and 2012, probability of substandard ratios is at a very low level, below one percent. However, in 2013 and 2014 when first debt repayments of loans on EL Kureimat plant and other projects undertaken within the expansion program are due, likelihood of having an insufficient cashflows is 100% certain.
ADSCR DSCR 2011 2012 2013 2014 2015 2011 2012 2013 2014 Deterministic Value: 1.70 1.67 0.68 0.96 1.05 1.21 1.15 1.09 1.15 Risk Statistics:
Mean 1.53 1.51 0.61 0.74 0.83 1.08 1.02 0.96 1.01 St. Dev. 0.24 0.24 0.10 0.11 0.13 0.06 0.05 0.05 0.05 Minimum 0.96 0.92 0.40 0.46 0.51 0.92 0.86 0.80 0.84 Maximum 2.26 2.15 0.87 1.00 1.21 1.28 1.21 1.15 1.18 Prob. Sub-standard 0.1% 0.4% 100% 100% 90.2% 5.7% 35.6% 75.9% 41.6%
58
• In regard to the economic results, economic NPV has recorded an expected value of EGP 473.8 million, and probability of having a return below economic cost of capital of 10.0% real is 2.6%.
• It should be noted that the economic internal rate of return never becomes zero or negative.
• In worst case scenario maximum loss (EGP -169.3 million) is about 7.0% of investment value of project, while in best case scenariomaximum gain (EGP 1,150.2 million) is 47.6%.
Frequency Chart
Certai nty i s 2.58% from -Infini ty to 0.0 mil lion EGP
Mean = 473.8.000
.006
.011
.017
.022
0
55.5
111
166.5
222
-169.3 160.6 490.4 820.3 1,150.2
10,000 Trials 9,909 Displayed
Forecast: ENPV@EOCK

30
59
CONCLUSION
• Nature of proposed combine cycle generation plant is a provision of additional capacity to a large electricity utility. Role of this plant is to substitute existing steam plants during off-peak time and to avoid installation of additional gas turbine capacity during the peak load.
• New efficient combine cycle plant is able to supply power at a lower cost than existing generating units, and within that environment project has a very little chance of weak financial or economic performance.
• On project basis, the service of loan by AfDB is well covered bycash savings that the project will generate for EEHC.
• The repayment of loan is however in hands of EEHC financial operation and unless an additional tariff increases are undertaken in 2010-15, the company is likely to have difficulty with repayment.
60
Lecture Notes
Week Two, Day Two(Session I: 08:30 – 10:00)
Program on the Appraisal of Infrastructure Projects with Private
Participation

31
61
PUBLIC PRIVATE PARTNERSHIPS: The Public
Sector Comparator
62
Private Public Partnerships in Infrastructure
• A major new user of project financing techniques• Infrastructure traditionally financed and managed by
governments• Demand for infrastructure has been growing faster than
government funding available, particularly in emerging economies.
• Recent trend has been to involve the private sector in the supply and provision of these services
• For example: Roads, Bridges and Tunnels, Light Rail Networks, Airports and Airport control Systems, Water and Sanitation, Electricity Generation, Hospitals, Schools, Prisons

32
63
Private Public Partnerships in Infrastructure
• For a PPP to be successful, there has to be a clear benefit for both the public and the private partners
• In the spectrum of public sector verses private sector service delivery, PPPs lie somewhere between simply the government contracting –out of a set of service delivery to the private sector and a complete private market to plan, design, build and operate a facility that provides the service
64
Private Participation in Infrastructure (PPIs)
• Private sector involvement requires commercial rates of return
• Projects have to lend themselves to generating these returns.
• The public partner typically gains in the sense that a desired project is implemented without any financial strain on the budget

33
65
Private Participation in Infrastructure (PPIs)
• In many instances, the governments receive tax payments from the project, and in certain cases, a share of the profits.
• The structure of the partnership can vary along a spectrum from a leading private sector role to a marginal one.
66
Different PPP Models
Degree of Private Sector Involvement
Degr
ee o
f Priv
ate
Sect
or R
isk
Design-Build
Government
Operation / Maintenance Service /License
Design-Build-Operate
Lease-Develop-Operate
Build-Lease-Operate-Transfer
Build-Own-Operate-Transfer
Build-Own-Operate
Buy-Build-Operate
Privatisation

34
67
Public-Private Partnership Models
• Design-Build (DB): Under this model, the government contracts with a private partner to design and build a facility in accordance with the requirements set by the government. After completing the facility, the government assumes responsibility for operating and maintaining the facility. This method of procurement is also referred to as Build-Transfer (BT).
• Design-Build-Maintain (DBM): This model is similar to Design-Build except that the private sector also maintains the facility. The public sector retains responsibility for operations.
68
Public-Private Partnership Models (Cont.)
• Design-Build-Operate (DBO): Under this model, the private sector designs and builds a facility. Once the facility is completed, the title for the new facility is transferred to the public sector, while the private sector operates the facility for a specified period. This procurement model is also referred to as Build-Transfer-Operate (BTO).
• Design-Build-Operate-Maintain (DBOM): This model combines the responsibilities of design-build procurements with the operations and maintenance of a facility for a specified period by a private sector partner. At the end of that period, the operation of the facility is transferred back to the public sector. This method of procurement is also referred to as Build- Operate-Transfer (BOT).

35
69
Public-Private Partnership Models (Cont.)
• Build-Own-Operate-Transfer (BOOT): The government grants a franchise to a private partner to finance, design, build and operate a facility for a specific period of time. Ownership of the facility is transferred back to the public sector at the end of that period.
• Build-Own-Operate (BOO): The government grants the right to finance, design, build, operate and maintain a project to a private entity, which retains ownership of the project. The private entity is not required to transfer the facility back to the government.
70
Public-Private Partnership Models (Cont.)• Design-Build-Finance-Operate/Maintain (DBFO, DBFM or
DBFO/M): Under this model, the private sector designs, builds, finances, operates and/or maintains a new facility under a long-term lease. At the end of the lease term, the facility is transferred to the public sector. In some countries, DBFO/M covers both BOO and BOOT. PPPs can also be used for existing services and facilities in addition to new ones. Some of these models are described below.
• Concession: The government grants a private entity exclusive right to provide operate and maintain an asset over a long period of time in accordance with performance requirements set forth by the government. The public sector retains ownership of the original asset, while the private operator retains ownership over any improvements made during the concession period.
36
71
Public-Private Partnership Models (Cont.)
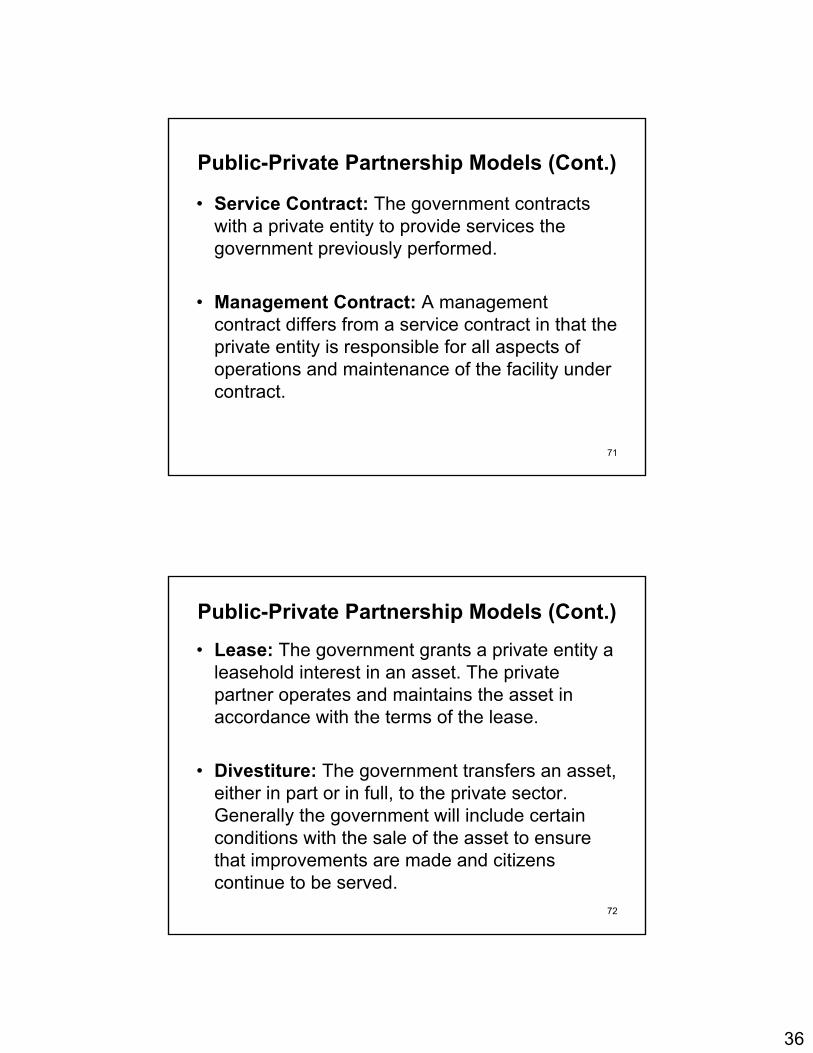
• Service Contract: The government contracts with a private entity to provide services the government previously performed.
• Management Contract: A management contract differs from a service contract in that the private entity is responsible for all aspects of operations and maintenance of the facility under contract.
72
Public-Private Partnership Models (Cont.)
• Lease: The government grants a private entity a leasehold interest in an asset. The private partner operates and maintains the asset in accordance with the terms of the lease.
• Divestiture: The government transfers an asset, either in part or in full, to the private sector. Generally the government will include certain conditions with the sale of the asset to ensure that improvements are made and citizens continue to be served.

37
73
Public Private Partnerships (PPPs)
Main characteristics of PPPs are:1. Private sector is given responsibilities for one or
more of the following tasks:i. Defining and designing the project ii. Financing the capital costs of the projectiii. Building the capital physical assets (road, bridge)iv. Operating and maintaining the assets in order to deliver the
product/servicev. Significant risks is transferred from the government to private
sector2. Bundling of responsibilities or the
allocation of two or more tasks to a unique partner(s)
3. Allocation of the financing task, private financing.
74
Public Private Partnerships (PPPs)Why PPPs have become an alternative to traditional methods for the provision
of public services?1. Ex ante Competition (Private sector firms compete to do project)
Marshaling the pro-efficiency forces of competition lowers costs.
Competition at the bidding stage, ex ante.Less likely that tax payers will get value for their money if
such ex-ante competition does not exist2. Scarce Skills
Private sector has skills not available in the public sectorAllocate certain tasks to a private partner who has the skills and also the incentive to reform at a high level
3. Poor Labor RelationsPrivate sector through the forces of competition may offer
a skilled, efficient and flexible labor force. The public sector labor management may be inflexible due to tradition, civil service laws, and political protection of certain groups of workers

38
75
Public Private Partnerships (PPPs)4. Innovation
Some parts of the project may need new approaches andinnovative thinkingThe extend of PPPs will depend on the complementarities
between the tasks5. Risk
Major risk can be managed better by private sector (ex.construction-delay risk, being contractor and operator giveincentive to minimize such risk)Political risk is better managed by public sector
6. Economies of scale Private sector is taking advantage of economies of scale fromthe operation of similar project in other jurisdictions, the PPP option becomes more attractive
76
Public Private Partnerships (PPPs)
7. Observability and measurability of qualityConcerns about the quality of servicesThe partnership agreement should specify the requiredquality, provide the measurement of verification of quality andprovide for enforcement of the contracts’ requirement.
8. Constrains on public sector borrowingBeing in depth and further borrowing risk on deteriorating of government, credit rating cost of borrowing increasesAllocating the financial tasks to the private sector
PPPs should be embraced only when they allow government to provide services of an acceptable quality at lower cost to taxpayers (consumers)

39
77
Risk Analysis
• PPPs involve a range of risks:– Construction risks: relate to deign problems, building
cost overrun and project delays– Financial risks: variability in interest rates, exchange
rate and other factors affecting financing costs– Availability risks: relate to continuity and quality of
service provided and in turn depend on “availability”of an asset
– Demand risks: relate to ongoing need for the service– Residual value risk: relate to future market price of
assets
78
Risk Analysis• It is necessary to achieve significant risk transfer in order
to derive the full benefits from the capital inflows from the private sector and the management change
• Financing costs of risk transfer and pricing of risk are important in efficient allocation of risks
• Risk Transfer and Financing Costs– With complete market in risk bearing, project risk is not affected
by the particular source of financing (finance theory)– Incomplete markets in risk bearing affect project risk as sources
of financing defines the risk of project– Various sources of financing will determine how this risk will be
allocated– Private sector transfers risk to financial markets– Governments transfer it to taxpayers in general

40
79
Risk Analysis• Pricing of Risk
– To use PPPs, government must compare cost of public investment and provision of service with using PPPs to provide the service
– PPPs sometimes are an efficient way for government to relieve its risks
– Government has to pay for the risks that it transfers to the private sector
– Project-specific risk (e.g. interruption of supply of building materials, labor problems, unfavorable weather, etc) can be diversified across a number of government or private sector projects and need not be priced by the government
80
Risk Analysis
– Market risk reflects the economic developments that affect all projects and cannot be diversified and should be priced properly
– private sector demands a discount rate that includes a risk premium on the risk free discount rate that typically government uses

41
81
Competition and Regulation in PPPs• Private sector efficiency is main reason for PPPs• Competition is the important source of efficiency
in both the private and public sector• Competition in award of construction and service
contracts necessary to foster competition, managerial improvement and spur innovation
• In the case where private sector sells to public sector, there is little scope for competition after the contract is awarded and government usually regulate prices
• Price regulation and incentive based regulations are used to increase output, hold down prices, limit monopoly profits
82
Prerequisites for PPPs Success
• Political commitment• Good governance• Government expertise• Effective Project Appraisal and Selection

42
83
Risk Transfer• Need for Risk Transfer to the Private Sector
– Determines whether PPPs is a better option than to have public investment and government provision of service
– Influences the appropriateness of accounting and reporting treatment of PPPs
• Risk Transfer and Ownership– PPPs are legally owned by private and are legally
mandated to bear the risks of the project– If government bears ownership related risks, it is in effect
the owner of the asset, and in that case the PPPs will be indistinguishable from traditional methods of financing
– Different risks are associated with owning and operating an asset and risk transfer can be assessed by reference to these rights and obligations
84
Risk Transfer• In the case where ownership related risks are not specified
by PPP contracts, risk transfer can be assessed by reference to the overall risk characteristics of the PPPs
• In the Non-separable contracts (ownership and service elements cannot be distinguished) the balance between demand risks and residual value risk borne by government is used in the UK
• Demand risk is borne by government if service payments to a private operator are independent of future need for the service
• Residual value risk is borne by the government if the asset is transferred to the government at more or less than its residual value
• Other factors such as government guarantees, extent of government influence over asset design and operation can be used to assess the degree of risk that has been transferred away from the government

43
85
Lecture Notes
Week Two, Day Two(Session II: 10:15 – 12:00)
Program on the Appraisal of Infrastructure Projects with Private
Participation
86
ELEMENTS OF
PROJECT FINANCE

44
87
What is Project Finance?
• No universally accepted definition of the term “Project Financing” -- different people use it in different senses.
• Project financing refers to a financing in which lenders to a project look primarily to the cash flow and assets of that project as the source of payment of their loans.
PROJECT FINANCE
88
• Full Recourse - lenders look initially to the cash flow and assets of the project for debt repayment but ultimately can look to a creditworthy sponsor for any shortfalls.
• Non-Recourse - lenders look solely to the cash flow and assets of the project for debt repayment. There is no guarantee that they will be paid.
• Limited Recourse - all financing between full and non-recourse. Lenders look partially to project cash flow and assets for debt repayment. In defined circumstances they look to project sponsors for debt repayment. Two categories:– Fall away, initially full-recourse then non-recourse (e.g. post-
completion)– True limited recourse - residual risks to sponsors (e.g. market)
Three Categories of Project Financing

45
89
Origins and Development of Project Finance
• Project financing had its origins in the energy industry in industrialized countries (oil & gas production loans).
• Later extended to transportation (mainly gas and oil pipelines), mining, utilities and large industrial projects.
• Scope further expanded to include all kinds of infrastructure projects.
• Today even medium-scale projects (US $5 million) can use project finance
90
Main Characteristics of Suitable Investments for Projects Financing
• The ideal candidates for project financing are capital investment projects that
• are capable of functioning as independent economic units,
• can be completed without undue uncertainty, and
• When completed, will be worth demonstrably more than they cost to complete.

46
91
Why Project Financing? (cont’d)
• Project Owners’ Perspective– Achievement of Economics of scale– Risk minimization– Preservation of borrowing capacity and
credit rating– Release of free cash flow– Reduce Legal or Regulatory costs– Country specific accounting and/or tax
benefits
92
Size and Cost of Financing for Projects
• Project financing should be pursued when it will achieve a lower after-tax cost of capital than conventional financing.
• In an extreme case, the sponsors’ credit may be so weak that it is unable to obtain sufficient funds to finance a project at a reasonable cost on its own.
• Project financing may then offer the only practical means available for financing the project.
47
93
Achieving Economies of Scale
• Two or more producers can benefit from joining
together to build a single facility when there are
economies of scale in production.
• For example, two aluminum producers might decide
to build a single aluminum processing plant near a
location where each has a large supply of bauxite.
94
Risk Minimization• A joint venture permits the sponsors to share a
project’s risks.
• If a project’s capital cost is large in relation to the sponsor’s capitalization, a decision to undertake the project alone might jeopardize the sponsor’s future.
• Similarly, a project may be too large for the host country to finance prudently from its treasury.
• To reduce its own risk exposure, the sponsor or host country can enlist one or more joint-venture partners.

48
95
Expanded Debt Capacity• Project financing enables a project sponsor to finance the project
on someone else’s credit.• Often, that someone else is the purchaser(s) of the project’s
output.• If the output purchaser’s credit standing is higher than that of the
project sponsors, the project will be able to borrow funds more cheaply than the project sponsors could on their own.
• A project can rise funds on the basis of contractual commitmentswhen (1) the purchasers enter into long-term contracts to buy the project output and (2) the contract provisions are tight enough to ensure adequate cash flow to the project, enabling it to serviceits debt fully under all reasonably foreseeable circumstances.
• If there are contingencies in which cash flow might be inadequate, supplemental credit support arrangements will be required to cover these contingencies.
96
Release of Free Cash Flow
• The project entity typically has a finite life.
• Its “dividend policy” is usually specified contractually at the time any outside equity financing is arranged.
• Cash flow not needed to cover operating expenses, pay debt service, or make capital improvements-so called free cash flow – must normally be distributed to the project’s equity investors.
• Thus, under a project financing arrangement, it is the equity investors, rather than professional managers (as is normally thecase with companies) who get to decide how the project’s free cash flow will be reinvested.

49
97
Reduced Legal or Regulatory Costs• Certain types of projects, such as cogeneration
projects, involve legal or regulatory costs that an experienced project operator can bear more cheaply than an inexperienced sponsor can.
• For example, a chemical company or an oil company that undertakes a cogeneration project on its own would face significant costs because of an unfamiliar technology and legal and regulatory requirements.
Tax and Accountability Issues– Organizing a project on a project financing basis
with a specific type of organization may lower total tax burden on project
98
Why Project Financing?
• Lenders’ Perspective–Competitive pressures: other
banks are doing the business–Seeking higher returns–Easier to assess risks in project
finance situation

50
99
• Reduced Cost of Resolving Financial Distress Problems
• The structure of a project’s liabilities will normally be less complex than the structure of each sponsor’s liabilities.
• A project entity’s capital structure typically has just one class of debt, and the number of other potential claimants is likely to be small.
Easier to Understand the Nature of the Project’s Business
100
Disadvantages of Project Financing• Project financing will not necessarily lead to a lower cost of capital in
all circumstances.• Project financings are costly to arrange, and these costs may
outweigh the advantages enumerated above.• Complexity of Project Financings: Project financing is structured
around a set of contracts that must be negotiated by all the parties to a project.
• Indirect Credit Support: For any given degree of leverage in the capital structure, the cost of debt is typically higher in a project financing than in a comparable conventional financing because ofthe indirect nature of the credit support. The credit support for a project financing is provided through contractual commitments rather than through a direct promise to pay.
• Higher Transaction Cost: Because of their greater complexity, project financings involve higher transaction costs than comparable conventional financings.

51
101
Main Characteristics of Project Finance (Summary)
– Project is a distinct legal entity.– Project assets, project-related contracts, and
project cash flows are separated to a large degree from the sponsors.
– Sponsors provide limited or no recourse to cash flow from other assets.
– Lenders may have recourse to their funds through other stakeholders through various types of security arrangements.
– Two-phase financing is common.
102
The Basic Elements of a Project Financing
Contractor
Operator
Investors
Input Supply Contract
Construction Contract
Input Supplier
Lenders
Equity Project Finance Debt
Project Company
Support Agreement
Concession Agreement or License
Government or other Public Sector
authorities
Offtake Contract
Offtaker
Operator & Maintenance Contract
Finance
OR

52
103
Legal Ownership Structures for Project Financing
Special Purpose Vehicles(SPV)
104
Legal Ownership Structures for Project Financing
(Special Purpose Vehicle (SPV))• Choice influenced by tax, accounting,
regulatory, risk allocation considerations as well as access to, and cost of, capital.
• Examples of legal ownership forms are:– Undivided Joint Interest– Corporation– Partnership– Limited Liability Company

53
105
Undivided Joint Interest• Liability is several and unlimited• Each sponsor is responsible for providing its pro
rata share of cost. Advantageous if sponsors have different credit strengths.
• Tax consequences flow through directly to sponsors.
• Project is not legal entity for accounting purposes –proportional consolidation of assets and liabilities.
106
Partnership• Can have general partners and limited liability partners
• Must have at least one general partner
• Liability of general partners may be joint or several but liability is unlimited
• Partnership owns assets and raises equity and debt
• Tax consequences flow through directly to sponsors
• Reflection of project’s assets and liabilities on partner’s balance sheets depends on ownership share.
• In USA, full consolidation if over 50%, none if less.

54
107
Corporation• No liability to project owners• Corporation owns assets and raises equity
and debt• Tax consequences do not flow through
directly to sponsors unless there is full consolidation
• Taxation of income at the corporation and shareholder level, with perhaps of tax levels.
• Reflection of project’s assets and liabilities on partner’s balance sheets depends on ownership share.
• In USA, full consolidation if over 50%, none if less.
108
Limited Liability Company• No liability to project owners• Company owns assets and raises equity and
debt• Tax consequences flow through directly to
sponsors (deductions may not include investment tax credits).
• Reflection of project’s assets and liabilities on partner’s balance sheets depends on ownership share.
• In USA, full consolidation if over 50%, none if less.

55
109
Prerequisites for Project Financing
• Financial Analysis
• Economic Analysis
• Risk Analysis
110
Prerequisites for Project Financing(cont’d)
• Financial Analysis is concerned with:
– project’s overall financial viability and sustainability--NPV, financial ratios, etc.
– Project’s ability to service its debt--coverage ratios; and generate sufficient returns--ROA, ROE.

56
111
Prerequisites for Project Financing(cont’d)
• Economic Analysis is concerned with:
– Economic fundamentals of project
– Economic viability of project
112
Prerequisites for Project Financing(cont’d)
• Risk Analysis is concerned with
– identifying the different areas of project risk
– identifying the impact of changes in risky variables on project’s economic and financial viability

57
113
Lecture Notes
Week Two, Day Three(Session I: 08:30 – 10:00)
Program on the Appraisal of Infrastructure Projects with Private
Participation
114
Project Financing and
Managing Project Risks

58
115
Definition of Project Completion• Principle Categories of Risk: Pre-Completion and
Post-Completion• Physical Completion
– Project is physically complete according to technical design criteria.
• Mechanical Completion– Project can sustain production at a specified
capacity for a certain period of time.• Financial Completion (financial sustainability)
– Project can produce under a certain unit cost for a certain period of time & meets certain financial ratios (current ratio, Debt/Equity, Debt Service Capacity ratios)
116
Management and Alleviation of RisksPrinciple Categories of Risk: Pre-Completion and Post-
Completion
A:Pre-Completion Risks:Some Examples ofWays to Reduce or Shift Risk
Types of Risks Away from Financial Institution•Participant Risks
-Sponsor commitment to project - Reduce Magnitude of investment?
-Require Lower Debt/Equity ratio-Finance investment through equity then by debt
– Financially weak sponsor - Attain Third party credit support for weak sponsor (e.g.,Letter of Credit)- Cross default to other sponsors
•Construction/Design defects - Experienced Contractor- Turn key construction contract
59
117
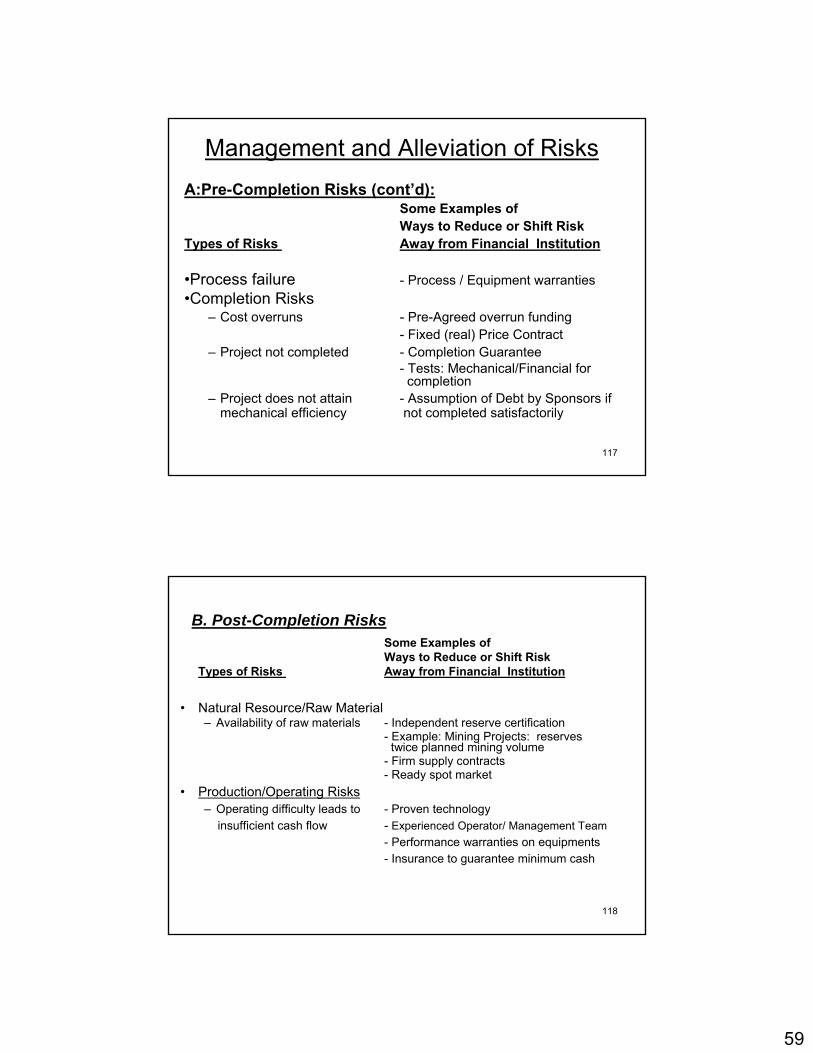
Management and Alleviation of RisksA:Pre-Completion Risks (cont’d):
Some Examples ofWays to Reduce or Shift Risk
Types of Risks Away from Financial Institution
•Process failure - Process / Equipment warranties•Completion Risks
– Cost overruns - Pre-Agreed overrun funding- Fixed (real) Price Contract
– Project not completed - Completion Guarantee- Tests: Mechanical/Financial for completion
– Project does not attain - Assumption of Debt by Sponsors if mechanical efficiency not completed satisfactorily
118
B. Post-Completion RisksSome Examples ofWays to Reduce or Shift Risk
Types of Risks Away from Financial Institution
• Natural Resource/Raw Material– Availability of raw materials - Independent reserve certification
- Example: Mining Projects: reserves twice planned mining volume
- Firm supply contracts- Ready spot market
• Production/Operating Risks– Operating difficulty leads to - Proven technology
insufficient cash flow - Experienced Operator/ Management Team- Performance warranties on equipments- Insurance to guarantee minimum cash

60
119
Some Examples ofWays to Reduce or Shift Risk
Types of Risks Away from Financial Institution
• Market Risk–Volume -cannot sell entire output - Long term contract with
creditworthy buyers: take-or-pay; take-if-delivered; take-and-pay
–Price - cannot sell output at profit - Minimum volume/floor price provisions - Price escalation provisions
• Abandonment Risk–Sponsors walk away from project - Abandonment test in agreement
for banks to run project closure based on historical andprojected costs and revenues
B. Post-Completion Risks
120
FORCE MAJEURE RISK• This category concerns the risk that some discrete event might
impair, or prevent altogether, the operation of the project for a pro-longed period of time after the project has been completed and placed in operation.
• Lenders normally insist on being protected from loss caused by force majeure.
• Certain events of force majeure, such as fires or earthquakes, can be insured against.
• Lenders will require assurances from financially capable partiesthat the project's debt service requirements will be met in the event force majeure occurs.
• If force majeure results in abandonment of the project, lenders typically require repayment of project debt on an accelerated basis – debt service reserve fund.
• In the case of events covered by insurance, lenders will requirethe project sponsors to pledge the right to receive insurance payments as part of the security for project loans.

61
121
ENVIRONMENTAL RISK• Environmental risk is present when the environmental effects
of a project might cause a delay in the project's development or necessitate a costly redesign.
• For example, in connection with a mining project, disposal of tailings is often a very sensitive environmental issue that can add significantly to the cost of operations.
• Interestingly, the frequent changes in environmental regulations in the United States (at both the state and federal levels), and, the legal challenges mounted by environmental groups, have given rise to significant environmental risks for environmentally sensitive projects in the United States.
122
POLITICAL RISK
• Covers range of issues from political risk assurances nationalization/ expropriation changes in tax and other laws, currency inconvertibility, etc.
• Political risk can be ameliorated by borrowing funds for the project from local banks (which would suffer financially if the project is unable to repay project debt because its assets were expropriated).

62
123
• It can also be mitigated by borrowing funds for the project from the World Bank, the Inter-American Development Bank, or some other multilateral financing agency, if the host countryis relying on such agencies to fund public expenditures (expropriation would jeopardize such funding).
• In addition, project sponsors can often arrange political risk insurance to cover a wide range of political risks.– Assumption of debt– Official insurance: OPIC, COFACE, EXIM– Private insurance: AIG, LLOYDS– Offshore Escrow Accounts
POLITICAL RISK MANAGEMENT
124
Some Examples ofWays to Reduce or Shift Risk
Types of Risks Away from Financial Institution
• Other Risks: Not really project risks but may include:–Syndication risk - Secure strong lead financial institution–Currency risk - Currency swaps / hedges –Interest rate exposure - Interest rate swaps –Rigid debt service - Built-in flexibility in debt service
obligations–Hair trigger defaults
63
125
Security Arrangements
126
Security Arrangements
– Ensure project completion (physical, mechanical and financial).
– Upon completion, ensure that project generates sufficient cash to cover operating expenses and meet debt service requirements.
– Ensure that the project can service debt in the event of disruption in operations (including force majeure situations).
Objectives
64
127
Elements of a Security Package
a) Mortgage on project assetsb) Turnkey contractsc) Sale & purchase contractual agreementsd) Sponsors’ commitment/support/pledgese) Financial covenantsf) Guaranteesg) Insuranceh) Escrow funds
128
A) Mortgage on Project Assets
• If financial institution has mortgage on assets of project it can take over assets if loans are not repaid.
• First Mortgage lien on project’s fixed assets (land, buildings and machinery) means that the financial institution has first claim on fixed assets.
• Works well for industrial projects and power projects but not so for other infrastructure projects (such as highway projects).
• Not possible in case of concessions or BOTs—Sponsor guarantees will be necessary

65
129
Mortgage on Project Assets (cont’d)
• Weak Mortgage Legal Framework is often a problem. For example,– No mortgage law in project country– No mortgage of land allowed to foreigners– If fixed assets are mortgaged, no other
assurance can be used by lender.
130
B) Off Take and Supply Contracts• Off take contracts obligate buyers of the of the project’s
output to provide credit support to the project and to share in its risks.
• Raw material supply agreements obligate providers of the project’s inputs to provide credit support to the project and to share in its risks. For example, suppliers of telephone switching and transmission equipment for all phone project.
• Contracts specify certain remedies when deliveries are not received or made.
• Off take and supply agreements are often requested by lenders to provide credit support for a project.
• Often supplemented by sponsors’ assurances and commitments.

66
131
B) Off Take Contracts• Take and Pay (Take-if-Offered)
ContractA contract obligating the buyer of the project’s
output to take delivery and pay for the output only if the project is able to deliver them. No payment is required unless the project is able to make deliveries.
• Take or Pay ContractA contract obligating the buyer of the project’s output to pay for the output, regardless of whether the purchaser takes delivery. Cash payments are usually credited against charges for future delivers.
132
B) Off Take Contracts (cont’d)
• Hell-or-High-Water ContractSimilar to take-or-pay except there are no “outs”. Buyer has to pay in all events even if output is not produced and even in cases of force majeure.
• Throughput AgreementAn agreement according to which the shipper agrees to ship a specified amount of product through the pipeline within a certain time period. Throughput generates sufficient cash to cover operating costs and service debt.

67
133
B) Off Take Contracts (cont’d)
• Cost of Service ContractThis contract requires each sponsor to pay his proportionate share of project costs and receive its share of project output.
• Tolling AgreementThe agreement requires each sponsor to pay its share of tolling charges for processing a raw material. Typically raw material is owned by project sponsors.
134
C) Raw Material Supply Agreements
• Supply or Pay ContractContract obligates the raw material supplier to furnish the required amounts of the raw material specified in the contract or else make payments to the project entity that are sufficient to cover the project’s debt service.

68
135
• An obligation by other buyers to increase their respective shares of purchases in case one of the buyers goes into default; or by a other suppliers of raw material to increase their respective shares of supply if one supplier goes into default, hence enhancing the strength of the agreements.
• Each of the buyers/suppliers coinsures the obligations of the other buyers/suppliers.
• A step-up provision is often included in the purchase and supply contracts if there are multiple buyers of the project’s output/suppliers of raw material.
D) Step-Up Provisions
136
E) Sponsors’ Commitment/ Support/ Pledges
• Project Funds AgreementAgreement by sponsors to provide additional funds as needed--typically until project completion.

69
137
E) Sponsors’ Support (cont’d)
• Share Retention AgreementAn agreement by the shareholders not to sell their shares, or alternatively to hold a specified amount of shares.
138
E) Sponsors’ Support (cont’d)
• Capital Subscription AgreementAn obligation by creditworthy parties to buy the
securities of the project entity for cash to the
extent required to cover any cash short-falls by
the project.
Typically, common stock or subordinated debt
(junior securities)

70
139
E) Sponsors’ Support (cont’d)• Clawback Agreement• An agreement by project sponsors to contribute cash to
the project in return for project-issued securities (typically, common stock or subordinated debt) to the extent that they:
(1) Received cash dividends from the project company or
(2) Realized project-related tax benefits due to investments in the project.
• In case of cash dividends, contribution is equal to dividends.
• In case of tax benefits, contribution obligation is limited to the cash value of the project-related tax benefits.
140
E) Sponsors’ Support (cont’d)
• Assignment to the lenders of the project’s right to receive payments under its different contracts.
• Assignment to the lender of insurance payments.
• Pledges of project shares to the lender.

71
141
F) Financial Covenants
• Main objective is to restrain the scope of activities of the project entity. Examples are:– Limiting the ability to pay dividends.– Limiting the ability to expand without prior
permission.
142
G) Guarantees
• Sponsor Guarantees.• Third Party Guarantees.
– Government guarantees.– Export Credit Agency Guarantees.– Multilateral lending institution guarantees.
• Full Vs Partial Guarantees

72
143
H) Insurance• Taken out to protect against certain risks—
mostly force majeure risks. Insurance will cover the cost of damage caused by natural disasters ensuring that the project remains a viable operating entity.
• May be also used to insure against business interruption.
• Lenders will insist upon insurance when the ability of the obligated parties to repay project debt on an accelerated basis is questionable.
144
I) Escrow Funds• A fund established upon the requirement of the
lenders to hold cash that can be used towards debt
servicing.
• Typically contains between 12 and 18 months of
debt service.
• Cash can be withdrawn from the escrow fund if the
project’s cash flow from operations does not cover
the project’s debt service requirements.

73
145
Lecture Notes
Week Two, Day Four(Session I: 08:30 – 10:00)
Program on the Appraisal of Infrastructure Projects with Private
Participation
146
Project Contractual Structures

74
147
Overview of Contractual Structures
• The long-term success of a new infrastructure project is dependent on the correct identification of both the benefits andthe risks associated with it.
• Correct identification must be followed by appropriate allocation of these benefits and risks - the latter to the party best able to minimise or control them at realistic cost.
• The project sponsors and the Special Purpose Vehicle (SPV), or the project, should, analyse the risks arising under each project contract, identify which party is to take these risks and ensure that the appropriate provisions appear in the relevant contracts to achieve this.
• The lenders and their advisers will need to satisfy themselves that this has been achieved under the contractual structure and other relevant laws, in a way that is consistent with the assumptions underlying the financial plan.
148
Overview of Contractual Structures (Cont.)
• A number of parties with differing interests will be involved in the project, the final pattern of risk allocation will be made within a contractual framework that reflects the outcome of negotiations and commercial compromise, and one that also takes into account the relevant legislative framework.
• There are several different perspectives to keep in mind in any general discussion of project contracts.
• These documents will represent long-term commercial agreements designed to project the interests of the project sponsors.
• They will allocate the perceived risks associated with the project between the different participants.
• The project will need to have its risks reduced to the point that it is “bankable”.
• These considerations will pull the parties in somewhat differentdirections as the documents are structured and negotiated.
75
149
Definitions of Project Contracts
• There is no single definition of the term ‘project contracts’.
• It tends to be used loosely to describe all the documents needed to allow the transaction to go ahead, other than the financing documents.
• It represents all of the commercial agreements, licenses, contracts, leases and corporate documents that underpin the deal that is being financed.
150
Definitions of Project Contracts (Cont’d)
• Many rights required by the project (SPV) will be acquired by contract. Some rights might be, for example EU laws allow for common use of transmission systems for electricity, telecommunication.
• Applicable laws relating to such diverse matters as environmental liability and labour rights will have an effect on the SPV’s business.
• It is necessary to identify on a project-by-project basis the impact of such rights and liabilities.
76
151
• The project contracts form the heart of any Build-Operate-Transfer (BOT) project.
• The scope of the individual contracts will vary from project to project.
• The project contracts encountered on a power project will in many respects look very different from those needed on a road or rail project or a telecommunications financing.
Definitions of Project Contracts (Cont’d)
152
Typical List of Contracts• a concession agreement or government licence;• a consortium (or other collaboration) agreement between the sponsors; • a shareholders or other joint venture agreement;• a construction contract (or engineering, procurement and construction contract
(EPC));• construction sub-contracts, supply agreements and warranties; • an operation and maintenance agreement; • a supply contract (e.g. fuel supply); • an off-take agreement for purchase of the completed facility’s product (e.g. a
power purchase agreement with the electricity board); • throughput and ‘tolling’ agreements (on a pipeline project); • a site lease or other document of entitlement to land; • ancillary government permits and planning consents (e.g. import licences,
central bank permits, planning consent etc.); • agreements with local utilities (e.g. water and electricity);• project insurances and related documents; and • technology/operating licences.

77
153
Central Project Contracts1. Consortium Agreement
• For, every large-scale infrastructure project a number of sponsors will come together in order to promote a project and participate in it as a consortium.
• Typically, a construction company and/or supplier of major plant or feed-stock and a future operator of the new business will cooperate to establish or bid for a project.
• These parties have a common interest in seeing that the project business is established and financed.
• The consortia for independent power plants (IPPs) typically included a major turnkey contractor, an operator and a regional electricity company as the buyer of the output.
154
Consortium Agreement (Cont’d)• Each member of such a consortium will also have
different interests to promote in its separate dealings with the SPV.
• For example, a construction company or supplier will inevitably look for favorable terms in the construction or supply contract.
• The operator, on the other hand, will be concerned that the performance of the completed works will allow it to control maintenance costs and maximize its profits from operation.
• The operator may also seek to limit its liability and financial exposure to the SPV.

78
155
Consortium Agreement (Cont’d)• The following must have to be answered:
– What exactly is the role of each party? – How much human and economic resources will
each party commit to different phases of the project’s development?
– How will each party protect its commercial interests in the project, whilst placing suitable restrictions on its potential liabilities?
– How will decisions be made by the consortium/ SPV and contracts with it drawn up?
– How will losses be apportioned (often a relevant tax consideration)?
156
Agreement Terms• A consortium or collaboration agreement usually takes the
form of a relatively short document setting out an obligation tocollaborate in the initial phases of the project’s development and to commit certain resources to it. The main provisions will cover the following areas:
– Cooperation and resourcing– Decision making– Costs– Reserved roles– Termination and withdrawal– Exclusivity and confidentiality

79
157
2. Project Vehicle• The differing interests amongst the consortium will need
to agree the legal form in which the project business will operate and the nature of their individual participation in that form.
• The legal structure of the SPV will need to take into account the following main factors: – the sponsors’ need for an appropriate joint venture vehicle
which offers the protection of limited liability;
– the fiscal treatment of the SPV, the sponsors/consortium members and key suppliers to or purchasers of the product of the project, and in particular, how losses in the early years can best be used in the business of the project or the consortium members;
158
Exhibit 1: A Typical Corporate Structure
Sponsor holding company
Sponsor holding company
Sponsor holding company
Sponsor Sponsor Sponsor
Holding Company
Concessionaire/ SPV
33.3%33.3%
33.3%
100%
Public sector entity
Concession agreement

80
159
3. Shareholders Agreement
• The contractual rights and obligations of the sponsors in relation to the SPV will be partly governed by the constitution of the SPV, which deals with their position as individual shareholders of the SPV.
• It is usual to have a shareholders agreement or joint venture agreement (‘shareholders agreement’) regulating the relationship of the sponsors among themselves.
160
Key Areas to be Negotiated1-Management and Decision Making• Management and decision-making mechanisms tend to be the
central issues in joint venture negotiations, and are likely to include the following specific questions: – Where the equity contributions of the sponsors differ, how will
board representation be structured? – Will different classes of shares be necessary? – How will decision making be split as between the board and
general meeting? – Which decisions can be made on a majority basis (simple or
weighted) and which will require unanimity? – How will minority interests be protected without creating
obstructive safeguards? – What provisions will be included to resolve deadlocks?

81
161
2-Equity Commitments• A number of questions can arise in respect of the
equity contributions as the shareholders agreement is finalised. – Balancing contributions– Timing of contributions – Contingent contributions
3-Termination Events and Withdrawal• The termination events in the shareholders
agreement will be comparatively straightforward, relating (for example) to a breach of the agreement and insolvency.
Key Areas to be Negotiated (Cont.)
162
4-Pre-Emption Rights
• Safeguard on any right to sell down to a third party, shareholders are likely to insist on pre-emption rights in the shareholders agreement.
5-Restrictions on Competition• The agreement will usually contain a clause restricting
the ability of any shareholder to compete with the project (i.e. competition law).
6-Taxation Issues• The aim will be for losses to be utilised to advantage,
while profits are sheltered. The use of group and consortium relief may need consideration.
Key Areas to be Negotiated (Cont.)

82
163
4. Construction Contract• This is a fundamental commercial contract for all concerned
because: – It is likely to absorb the majority of the SPV’s capital
expenditure. – The quality and efficacy of the design and construction of
the plant will impact on project expenditure and revenues throughout project operation.
• In the case of concession-based contracts or licences to operate, completion of construction and commissioning by a specific date is likely to be a fundamental condition of the concession or licence.
• A ‘traditional form’ approach may be adopted, for example, with the employer (SPV) engaging a design consultant directly himself, and then hiring a contractor separately to implement the construction works.
• This structure will basically absolve the contractor from liability for design faults in the works and of responsibility for the design development process as the works proceed.
164
Construction Contract (Cont’d)• The most common approach encountered on PPP project
financings, however, is the ‘turn-key’ design-and-build (or ‘engineer-and-construct’) contract.
• This places responsibility for essentially all aspects of designand construction in the hands of a single contractor (or group of contractors), giving the SPV the benefit of single-point responsibility should defects appear in the works, and avoiding the greater administrative and organisational complexity that often goes with the alternative contract strategies.
• The turn-key approach tends to recommend itself to lenders on the basis that it enables a clearer and more robust assumption of risk to be achieved than with any other approach (fixed price and fixed timetable).
• The contractor can (in theory) offer a fixed price and a fixed timetable for the entire construction works, thus contributing to a clearer overall pattern of risk allocation.
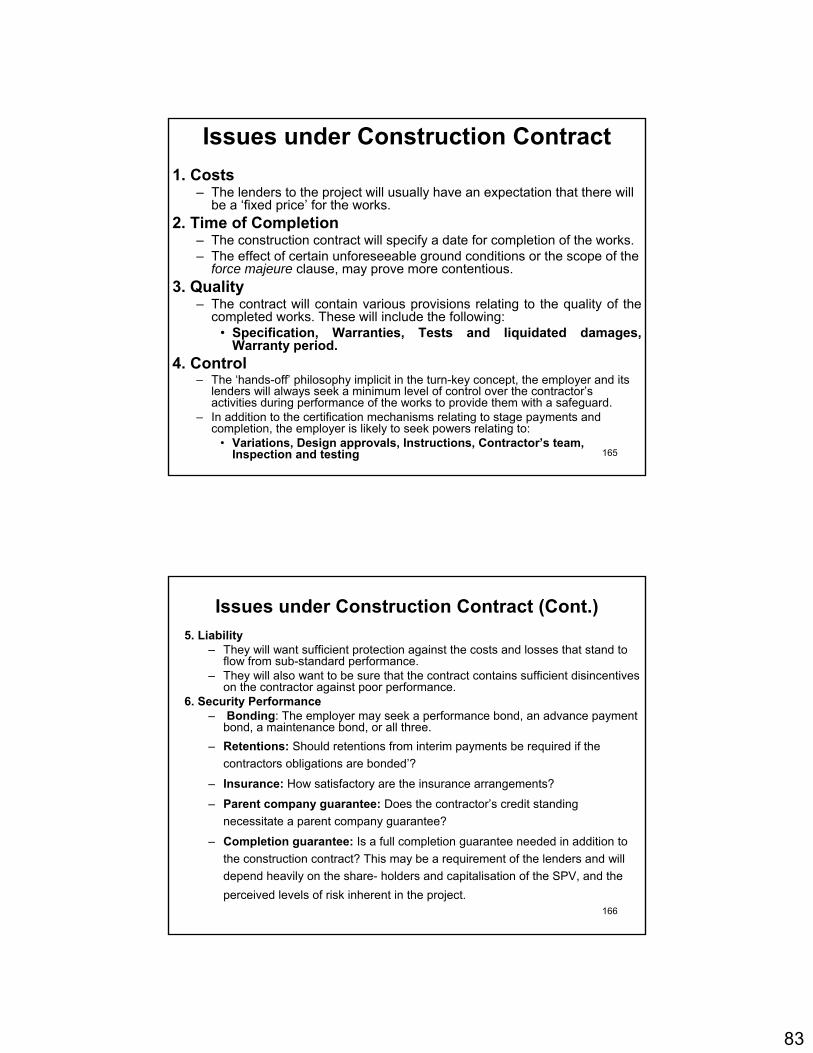
83
165
Issues under Construction Contract1. Costs
– The lenders to the project will usually have an expectation that there will be a ‘fixed price’ for the works.
2. Time of Completion– The construction contract will specify a date for completion of the works. – The effect of certain unforeseeable ground conditions or the scope of the
force majeure clause, may prove more contentious. 3. Quality
– The contract will contain various provisions relating to the quality of the completed works. These will include the following:
• Specification, Warranties, Tests and liquidated damages, Warranty period.
4. Control– The ‘hands-off’ philosophy implicit in the turn-key concept, the employer and its
lenders will always seek a minimum level of control over the contractor’s activities during performance of the works to provide them with a safeguard.
– In addition to the certification mechanisms relating to stage payments and completion, the employer is likely to seek powers relating to:
• Variations, Design approvals, Instructions, Contractor’s team, Inspection and testing
166
Issues under Construction Contract (Cont.)5. Liability
– They will want sufficient protection against the costs and losses that stand to flow from sub-standard performance.
– They will also want to be sure that the contract contains sufficient disincentives on the contractor against poor performance.
6. Security Performance– Bonding: The employer may seek a performance bond, an advance payment
bond, a maintenance bond, or all three.– Retentions: Should retentions from interim payments be required if the
contractors obligations are bonded’?
– Insurance: How satisfactory are the insurance arrangements?
– Parent company guarantee: Does the contractor’s credit standing necessitate a parent company guarantee?
– Completion guarantee: Is a full completion guarantee needed in addition to the construction contract? This may be a requirement of the lenders and will depend heavily on the share- holders and capitalisation of the SPV, and the perceived levels of risk inherent in the project.

84
167
5. Operation And Maintenance Agreement• The host government’s requirements as to the operation
and maintenance (O&M) of the project facilities will be set out in the concession agreement.
• To ensure that the relevant operational requirements are met, the SPV will usually need to enter into an agreement with a specialist operator.
• The agreement is customarily referred to as an operation and maintenance agreement. Where the operator is unable to undertake the full maintenance programme, it might sub-contract all or part of the maintenance work to a separate contractor.
• The operator will often be given a number of performance-related responsibilities, so that its own pattern of risk and reward is linked to that of the project itself.
168
Key Terms of O&M Agreement• Timing: The O&M agreement will normally come into effect not later than
the commissioning and testing of the project facilities. • Payment: Fixed price, Cost plus fee, Performance-based fees. • Warranties: The operator will normally be expected to give assurances as
to the standard of performance of its obligations under the O&M agreement.
• Insurance: O&M agreement will determine which party is responsible for placing the required insurance cover in relation to the operational phase of the project.
• Record keeping and inspection: banks and governments will wish to reserve the right to inspect the facilities and the records of the operator and the operator should also be required to report regularly to these parties on the operation and performance of the facilities.
• Technology and training: The O&M agreement should address issues such as the ownership and use of any intellectual property rights relating to the project and restrictions on the transfer of technology.
• Remedies and termination: The O&M agreement should provide for the circumstances in which it may be terminated by either party, typically following unremedied breach of contract or insolvency-related events.

85
169
6. Supply contracts• These set up contractual commitments of the
supplier to supply to the SPV a minimum quantity or volume of a raw material or specialist product (for example, gas for a gas-fired power plant) over a given length of time.
• The equity investors and lenders will need to analyze future sources of supply and predict movements in the cost of supply in deciding whether to accept the risks associated with uncertainty of supply and volatility of cost.
• Supply contracts not only ensure feedstock, but also establish the cost to the SPV of its major raw material over a long period, usually by indexing the purchase price to a relevant basket of commodities where there is no recognised market price.
170
7 Offtake contracts
• An offtake contract will commit a purchaser to take a certain quantity or volume or percentage of production from the project business on an agreed pricing formula.
• Key terms of contracts covered previously: Take and pay, take or pay, Hell or High Water, Throughput agreement.

86
171
Risk Associated with Project• ‘Country’ Risk -that ill-defined bundle of economic and political risks that
go to define the ‘investment climate’ of a particular country;
• Interest rate, Inflation and Currency Risk– can the project’s economics support external increases in interest and inflation rates or adverse changes in exchange rates?
• Change of Law – all commercial enterprises in a particular country may potentially be disadvantaged by changes in law.
• Contract Counterparty Performance– will the parties to the different project contracts perform as anticipated? If they do not, certain remedies are likely to be available under the contracts.
• Refinancing Risk – there may be an assumption behind the construction-phase financing that the loans will be refinanced after completion.
172
• Construction Risk – BOT project lenders will only lend against suitable completion-related undertakings and guarantees. It is rare for any contractor or sponsor to take on this risk on an unqualified basis.
• Credit Standing. The parties to the project contracts must have the credit standing to support their undertakings, and limitations of liability must be suitably restricted.
• Force Majeure. Force majeure provisions need very careful consideration. A force majeure clause will relieve a party of liability for failing to perform its contractual obligations forreasons beyond its control.
• Consistency. The lenders will wish to compare certain common provisions across the project contracts and consider the implications of any inconsistencies.
Risk Associated with Project (Cont.)

87
173
Conflicts of interest• It is to be expected that the project sponsors or consortium members will have come together in
order to further their separate commercial interests as, for example, construction companies, operators, suppliers and offtakers, and that investment in the SPV is but a means to an end.
• The objective of sponsors who become equity investors should be to minimise the risks being assumed by the SPV under the contractual matrix, in order to enhance the value of their investment and to ensure that the project will be bankable.
• In their capacity as counterparties to contracts with the SPV they will naturally tend to expect the company to assume risks which, using the ability to control test, should perhaps be taken by the counterparty.
• An area where the SPV is particularly vulnerable is that of cost overruns at the level of construction or operation and maintenance.
Security• The lenders will usually need to take appropriate security over the project contracts as part of
their security package. • In negotiating the terms of the agreements, the ability of the SPV to assign its rights under them
to the lenders without the need for the counterparty’s consent often proves contentious. • Their rights take the form of ‘step-in rights’, set out in the relevant agreement itself or -more
usually -in a direct agreement with them.
Risk Associated with Project (Cont.)
174
Conclusion• The approach to project contracts is becoming increasingly
sophisticated. • A more thorough analysis of the risks of the project business
leads to more transparent negotiation and the recognition of theneed to control the inherent conflicts of interest between key parties.
• The need to achieve ‘bankability’ can actually assist in the resolution of these conflicts and an appropriate allocation of risk through the project contracts.
• The combination of the tension between different parties with differing commercial objectives, the need to achieve a financeable structure and the many different areas of specialist knowledge involved, means that structuring a coherent and workable set of project contracts often presents a considerable challenge.

88
175
Lecture Notes
Week Two, Day Four(Session II: 10:15 – 12:00)
Program on the Appraisal of Infrastructure Projects with Private
Participation
Limited Recourse Financing of the Limited Recourse Financing of the Sofia Water System ConcessionSofia Water System Concession
Dr. Christopher ShugartDr. Christopher Shugart
Part I

89
Lecture topicsLecture topics
I. Overview and Process
II. Dealing with the Risks
III. Project Finance Loan Agreement
IV. Lender’s Financial Model
Key factsKey facts
Twenty-five-year full concession for water and wastewater system of Sofia, BulgariaCovers operation and investments – and financingPopulation: 1.2 millionFirst major municipal infrastructure concession in BulgariaFirst water concession or privatisation in Bulgaria

90
Some figures in 2000Some figures in 2000
98% population in service area connected to water supply82% connected to wastewater system1,642 employees in water companyUnaccounted-for water: 62%Household water & wastewater tariff: €0.22 per m3 (cf. 2006: €0.36)
ProcessProcess
EBRD (in London) worked with the Municipality of Sofia from the beginning of the process
– Mayor wanted fair, transparent, best-practice process
– First visit by EBRD: June 1996– Explored objectives, constraints, alternatives– Worked together to develop “concept paper”
91
First stage of processFirst stage of process
Purposes of preliminary “concept” work– Understand objectives, preferences, constraints,
etc., of Municipality and main stakeholders– Identify all potential obstacles and major risks:
factors that could seriously jeopardize success– Develop concept just enough (but no more than
that) so that Municipality could give meaningfulgo-ahead (no major surprises later)
– Scope further preparatory work needing to be done
ProcessProcessEBRD then mobilised an advisory team –“transaction team”
– Financial, technical, legal– Led by PricewaterhouseCoopers – with
participation of Hyder Consulting and Cameron McKenna (and local consultants)
– Funded by EU, City contribution and success fee– City contracted out role of City project manager to
local law firm Eurolex– Role of EBRD from then on became less
prominent to avoid any appearance of conflict of interest

92
Different roles of EBRD at this pointDifferent roles of EBRD at this point
Quality control concerning work of transaction teamFeedback to give point of view of bankers (and potential lender to the project)General “good practice” comments on all aspect
– But without imposing any obligation on City or transaction team to accept
Tough scrutiny of procurement process– Required if EBRD was to become a lender– Desired by Mayor, too
Overview of procurement processOverview of procurement process
PrequalificationInvitation to tenderSubmission of proposalsEvaluation of proposals
– Technical– Financial
Selection of preferred bidderFinal negotiationsSigning of concession contract

93
PrequalificationPrequalification
Criteria– Relevant experience– Financial capability– Implementation approach– Discussion of key issues
Judgmental criteria in addition to bright-line criteriaRanking to arrive at shortlistAll the major international water utility companies (at that time) were selected as bidders
Invitation to tenderInvitation to tender
Procedures for biddingIncluded Information MemorandumCore was draft full concession agreement
– Circulated twice to bidders and EBRD for comments – before inclusion in final invitation to tender

94
Fundamental approach of concession contractFundamental approach of concession contract
The concession was performance driven– Detailed list of service standards (about 70), with
year-by-year targets
No obligation on concessionaire to make specific capital expenditures (capex)But two general requirements about capex:
– In any two consecutive years, the concessionaire must achieve 75% of the level of capex it proposed in bidding
– Minimum US$150 million capital expenditures over first 15 years
Evaluation of proposalsEvaluation of proposals
Municipality set up Evaluation Committee– Included members of city council from opposition
parties also– Same committee had reviewed and approved
tender documents, including draft concession contract
Technical aspects of evaluation– Threshold (pass/fail) criterion– Enters into final evaluation score, too

95
Evaluation of proposalsEvaluation of proposals
Financial aspects– Service requirements (output based) set by
Municipality– Bidder proposing lowest tariff (net present value)
receives best financial score– Note that proposed tariff would generate revenue
that should cover future costs; but information about existing asset condition, etc., was very poor
Weighted financialWeighted financial--technical evaluation scoretechnical evaluation score
Basic formula(F × w1) + (T × w2), where w1 + w2 = 1
Before invitation to tender, an exercise was conducted with the Evaluation Committee to determine the weights
– Based on explicit trade-off they were willing to make between the two types of criteria
Result (a surprise to them) was very small weight on technical aspects

96
Background to financial bid: tariff settingBackground to financial bid: tariff setting
Initial base tariffs for entire concession term (in principle) were fixed at the level proposed by the winning bidder
The financial criteria used in bid evaluation should make sense in relation to the contract provisions
– (Was this the case in Sofia?)
Background to financial bid: tariff settingBackground to financial bid: tariff setting
Base tariffs indexed to composite price index– Consumer price index– Wage index– Electricity price index– BGN/EUR exchange rate (designed to cover senior
debt and foreign inputs only)
Several full-cost pass-through items – e.g.:– Raw water costs– Certain capital works outside normal
responsibilities

97
Background to financial bid: tariff settingBackground to financial bid: tariff setting
Tariffs adjusted for limited number of specified events
– E.g. certain types of change in law– No general catch-all clause for all events beyond
concessionaire’s control– Adjustments carried out on an incremental cash
flow basis so that real incremental IRR equals a fixed value set in Concession Agreement, based on bidder’s financial model
Background to financial bid: tariff settingBackground to financial bid: tariff setting“Scheduled Review” at end of three years
– Based on revised investment plan for entire concession term, among other things
– Idea is that tariffs will be reset to cover all reasonable future capital and operating expenditures
– Tariffs reset to generate target real IRR specified in Concession Contract (but not taking into account actual past expenditures)
– Price setting is based on long-term discounted cash flow method rather than regulatory accounting method typically used by economic regulators (involving regulatory asset base, rate of return, depreciation, etc.)

98
Background to financial bid: tariff settingBackground to financial bid: tariff setting
Question: In light of the Scheduled Review, is this a classic PPP, or more like a regulated utility company? (even though no regulator per se at time the contract was signed)
Financial bidFinancial bid
If the actual tariffs in a particular year will retain no “memory” of the bid, then the bid has no consequences and hence is not meaningful for that yearSo one corrective approach is to make sure that the financial bid has some real consequences later onApproach in Sofia was to give the permitted rate of return a “haircut” to the extent that actual tariffs after the Scheduled Review exceeded the tariffs that were bid

99
Financial bidFinancial bid
Potential problems with the “haircut” approachPotential for gaming by bidders. Suppose, in bidding, they:
– Underestimate their future costs AND
– Overestimate their needed rate of return
What might the result be?
Final negotiationsFinal negotiations
Minor changes made to draft concession contract that was used in bidding, but the Municipality was concerned to limit the extent of the changes so as to prevent the procurement process from being called into question
Underlying principle: at the least, there should be no doubt that even if the finalcontract had been used in bidding, this would not have changed the top ranking of the winning bidder

100
Outcome: commercial closeOutcome: commercial close
Winner: Joint venture, International Water Limited + United Utilities
– IWL was owned 50:50 by Bechtel (U.S.) and Edison(Italy)
– Sponsor then set up Bulgarian concessionaire company: Sofiyska Voda (SV) (with 25% City stake)
Concession agreement signed in December 1999
FinancingFinancing
Financial negotiations– Sponsors came to EBRD to seek financing– Term Sheet negotiations; Loan Agreement
negotiations (very much “project finance” model)– EBRD required certain modifications to the
concession agreement; had to negotiate these with both parties, in effect
– Lender’s financial model developed– Negotiation of a “direct agreement” with City– All financing agreements signed in December 2000

101
FinancingFinancing
EBRD was senior lender (with two participating commercial banks)Loan: €31 million; 15-year maturityHedging agreement: interest rate capBorrower was Sofijska Voda: no recourse to Municipality; limited recourse to sponsorsRemaining funds came from sponsor equity (including contingent equity) and internally generated cash
EquitySubscription
Direct Agreement (step-in rights)
Technical Services Agreement
Concession Agreement
EBRD
Municipalityof Sofia
SofiyskaVoda
SponsorConsortium
EBRD Loan Agreement
Transaction structureTransaction structure
Customers

102
Transaction structureTransaction structure
Key agreements– Amendment to Concession Agreement– Direct Agreement– (Senior) Loan Agreement– Accounts Agreement– Subordinated Loan Agreement– Technical Services Agreements– Shareholder Funds and Subordination Agreement– Share Subscription and Shareholders’ Agreement– Security agreements (share pledge; charge over
accounts; movables pledge; receivables pledge)
Regulatory setRegulatory set--upup
At the time the project was prepared, there was no national economic regulator for water services in Bulgaria
City officials were enjoying the recent decentralization of many powers and were pleased to have escaped from central control
Decision was made to rely on a regime of “regulation by contract”
A concession monitoring unit, Omonit, was set up . Explicitly an agent of the Municipality, not an independent regulator

103
Regulatory setRegulatory set--upup
Dispute Resolution Board (CDRB)
Arbitral tribunal
Municipality Sofiyska Voda
Monitoring unit(OMONIT)
Information about performance
Specific decisions
“Flow” of regulatory rules
Progress after one year (transition period)Progress after one year (transition period)
Improved customer interface– Call centres; customer service centres; billing
database
Improved revenue collection– Massive clearing of aged debt
Full compliance with wastewater treatment standards within six months

104
Progress ...Progress ...
Selected priority investments– Pumping station; pipeline; water meters; service
connections; improved IT system– Targeted rehabilitation of mains in certain city
areas with history of leakage (water) and flooding (sewers)
Improved management structure and human resources planning
– Multi-functional units– Limited number of compulsory redundancies.
Good labour relations
Progress ...Progress ...Improved procurement methods and increased outsourcing of activities (incl. management buy-outs)
– Savings of 15–20% from improved procurement of goods and services
– Outsourcing: e.g. network repair contracts; sewerage maintenance
Tariff adjustment mechanism working smoothlyImproved information systems
– GIS; integrated asset management; preparation for drainage and network modelling studies, etc.
105
Progress ...Progress ...
Major area where improvement was needed: relations between Sofijska Voda and the City’s Concession Monitoring Unit (OMONIT)
– The City set up an “independent” unit to monitor the concession
– Recurrent institutional problem with oversight or monitoring units for concessions: How to avoid both extremes: (i) capture by concessionaire; or(ii) creation of over-zealous, micro-managing crusader? (Add to those two a third possibility: (iii) weak and ineffectual body − apathy)
– OMONIT tends to fall into category (ii)
Progress ...Progress ...
– Some rough moments – vicious circle developed. Could the two parties learn to live with each other?
– OMONIT needed to learn not to make meddlesome demands and to try not to micro-manage
– Sofijska Voda needed to try harder to break the vicious circle and win OMONIT’s confidence by being more forthcoming with information

106
Vicious circle of mistrustVicious circle of mistrustAs the Scheduled Review approached, the possibilities for disputes were numerous − if the parties entered into the process with a mistrustful attitudeQuestion for reflection: How can you encourage a trusting relationship in a PSP arrangement?
– Have we bankers, lawyers, economists and engineers spent too little time thinking about this fundamental “process” question?
Chronology 2003Chronology 2003−−2006 2006 EBRD becomes 18.8% shareholder of SV (2003)
Omonit recommends fines for failure to “invest”; CDRB procedures invoked (2003)
CDRB rules SV in compliance with investment requirement (2004)
“Scheduled Review” starts (2004, a year late)
Mayor Sofianski resigns from office (2004)
Mayoral election campaign of 2005; issues become politicized; Omonit leaks confidential information to press
Accusations of corruption: “excessive perks” for foreign staff
Negotiations over revised Concession Agreement (started 2005)
Legislation to set up water regulator (2005)
Water regulator formally established and staffed (January 2006)

107
Limited Recourse Financing of the Limited Recourse Financing of the Sofia Water System ConcessionSofia Water System Concession
Dr. Christopher ShugartDr. Christopher Shugart
Part II
Lecture topicsLecture topics
I. Overview and Process
II. Dealing with the Risks
III. Project Finance Loan Agreement
IV. Lender’s Financial Model

108
IntroductionIntroduction
Non-recourse nature of deal means that risks borne by Sofijska Voda (SV) are risks to the lender
IntroductionIntroduction
The City’s approach to setting out risk allocation in the concession agreement was, for the most part, to allocate only those risks to SV over which SV had considerable control. Mainly:
– Types, quantities and cost of inputs (in real terms) needed to achieve the specified service targets (both opex and capex)
– Billing and revenue collection
City agreed to accept most other risks

109
IntroductionIntroductionSome exceptions:
– Interest rate risk– Concessionaire bears most demand risk (to be
discussed later)– Change-of-law risk falls on concessionaire if it
affects all Bulgarian companies and if does not relate to environmental laws (e.g. corporate profit tax)
– Concessionaire bears increased costs due to war, civil disorder, terrorism or general industrial action (strikes) if these circumstances do not prevent the concessionaire from complying with its obligations or if these circumstances do not involve damage to system assets
Methods of dealing with the risksMethods of dealing with the risks
Provisions in concession agreement to allocate risk to customers or City. E.g.:
– Tariff indexation (customers bear inflation risk)– Tariff adjustment for specified events (customers
bear risk)– Indemnity by City for any losses or claims arising
from breach of environmental laws that occurred before the concessionaire took over the system

110
Methods of dealing with the risksMethods of dealing with the risks
Provisions in other contracts to allocate risk to entities other than SV. E.g.:
– SV’s contracts with industrial customers contain provisions ensuring that customers’ liability to SV for loss or damages arising from discharges of unacceptable wastewater into the sewerage system is not limited in any way
Methods of dealing with the risksMethods of dealing with the risks
Loan Agreement contains numerous positive and negative covenants to deal with risk of borrower not behaving the way the lender wants it to behave
– To deal with possible divergence between lender and shareholder interests
– To deal with possible divergence between shareholders and managers of project company

111
Methods of dealing with the risksMethods of dealing with the risks
Require sufficient equity in capital structure of SV
– The more equity, the less debt. So the cash flow “cushion” is greater
– Sensitivity and scenario analysis was carried out for this purpose, using the lender’s financial model
Methods of dealing with the risksMethods of dealing with the risks
Legal rights beyond the project contracts. E.g.:
– EBRD has “preferred creditor status”– Bilateral investment treaties

112
Methods of dealing with the risksMethods of dealing with the risks
Take comfort from extra-legal incentives and influences
– Influence of international financial institutions– International reputation of sponsors
Possibly important risks: demandPossibly important risks: demandSummary risk analysis
(−) Concession agreement places most demand riskon SV: high proportion of SV’s costs are fixedand agreed tariff is expressed in unit terms (price per cubic metre)
(−) No mechanism to adjust the tariff periodically for changes in overall demand (see Aside)
(−) Limited ability of SV to manage demand (virtually entire population is already connected)
(+) 60–70% of households were individually metered already; and tariffs are not expected to rise much (in real terms)
(Cont’d)

113
Possibly important risks: demandPossibly important risks: demand
Summary risk analysis (cont’d)(+) Demand projections will be updated, and tariffs
adjusted, after three years (Scheduled Review)(+) Under the (amended) concession agreement,
tariff adjustments in response to modifications in performance requirements will be calculated based on demand forecasts determined at the time the adjustment is made (not the initial demand forecasts)
(+) Equity cushion (for residual risk) – based on sensitivity and scenario analysis
AsideAside: Automatic correction for demand: Automatic correction for demandTo make the needed correction, the amount Kt must be added to the allowed revenue for year t, where
⎟⎟⎠
⎞⎜⎜⎝
⎛−×′×−=
−
−−
1
11 ˆ1)1(
t
ttt Q
QFK α,
where 0 ≤ α ≤ 1.
ARt Allowed revenue for year t, before the volume correction, based on most recent price review
tQ̂ Stipulated (forecast) quantity of water to be sold in year t (as determined at most recent price review)
Qt Actual quantity of water sold in year t Vt Component of allowed revenue for year t relating to variable costs per cubic meter of
water billed Ft Fixed-cost revenue component allowed to be recovered in year t before volume
correction: )ˆ( tttt QVARF ×−≡ Kt Volume correction to be applied to year t F’t Allowed fixed-cost revenue component in year t after volume correction: F’t = Ft + Kt

114
Possibly important risks: internal cash flowPossibly important risks: internal cash flow
Risk of insufficient internally generated cash(−) In base case, over 50% of needed financing
comes from internally generated cash (from tariff revenue)
(+) Base case is thought to be conservative with respect to efficiency gains and reduction of administrative losses
(+) Equity cushion (residual risk)
Possibly important risks: completionPossibly important risks: completion
No significant risk(+) No distinct plant or component of physical
system that needs to be constructed or rehabilitated for system to function (cf. water or wastewater treatment plant BOT)

115
Possibly important risks: cost overrunsPossibly important risks: cost overruns
Summary risk analysis(−) SV is obligated to meet specified service targets
over time, and capex and opex budgets could be insufficient
(+) Technical due diligence indicates that this risk is low
(+) Capital expenditure budget includes a large contingencies line
(+) Revised expenditure budgets after first three years will be compensated (if needed) by an adjustment to tariffs
Possibly important risks: inflation; Possibly important risks: inflation; forexforexInflation
(−) Cost of inputs (in nominal prices) likely to increase over time
(+) Tariffs are linked to a composite index that includes elements related to local and Eurozone inflation
Exchange rate (leva/euro)(−) If leva depreciates, euro debt service and
tradables will cost more in leva terms(+) Indexation formula for tariffs includes an
exchange rate component sufficient to cover senior debt as well as foreign costs

116
Possibly important risks: affordabilityPossibly important risks: affordability
Social and political acceptability of tariffs(+) Household tariffs were comparatively low (about
60% of average price for 27 major Bulgarian cities and towns)
(+) Base tariffs to rise only about 6% in real terms in first three years, and then remain at that level
(+) Special mechanism in concession agreement to deal with economic distress due to unaffordable tariffs
Possibly important risks: uncontrollable eventsPossibly important risks: uncontrollable events
Uncontrollable events; change in law; force majeure
(+) Mechanisms in concession agreement provide for ample tariff adjustments for various specified events
(+) Low risk involving those few types of events that escape from ambit of these provisions

117
Possibly important risks: dispute resolutionPossibly important risks: dispute resolution
Summary risk analysis
(+) Well-developed first-step dispute review mechanism, “CDRB”
(+) Arbitration conducted under UNCITRAL Rules
(+) Respected, international appointing authority (Vienna Arbitral Centre)
(−) Place of arbitration must be Sofia (because both parties are Bulgarian persons): some (slight) risk of court interference
More on dispute resolutionMore on dispute resolution
There was no national regulator for water utilities in Bulgaria when the contract was signed
– (Note that a regulator has now been established)
The Sofia arrangement, as originally intended, was based on pure regulation-by-contract

118
More on dispute resolutionMore on dispute resolution
Concession Dispute Resolution Board (CDRB)
– Modelled after the “dispute review boards” (DRBs) that are increasingly common in the construction industry
– Prerequisite to arbitration, if there is a dispute– Three members: chairperson (lawyer trained in
arbitration and ADR); technical member; financial member
– There is an appointing authority in case the parties cannot agree on the selection of members
More on dispute resolutionMore on dispute resolution
CDRB (cont’d)
– In place from start of contract – before a dispute arises. Periodic site visits by the board
– Informal procedures; inquisitorial style permitted– Parties’ lawyers cannot speak for the parties in the
hearing, unless the CDRB asks the lawyer a question
– CDRB members can use their own expertise in deciding a case

119
More on dispute resolutionMore on dispute resolution
CDRB (cont’d)
– If either party disagrees with the CDRB decision within 30 days, it can take the case to arbitration; otherwise, the decision automatically becomes a binding amendment to the concession agreement
– The CDRB decision can be admitted as evidence in subsequent arbitration
Regulatory institutions for the Sofia concessionRegulatory institutions for the Sofia concession
Dispute Resolution Board (CDRB)
Arbitral tribunal
Municipality Sofijska Voda
Monitoring unit(OMONIT)
“Flow” of regulatory rules
Information about performance
Specific decisions
120
Regulation of the Sofia concessionRegulation of the Sofia concession
Possible weaknesses in the original regulatory arrangements for the Sofia project
– Possibly did not provide enough detailed rules to deal with the complex circumstances that may arise − especially the general price review
o But perhaps it is virtually impossible for the rules to be “complete” enough
– Possibly depended on discretion of a type and degree that neither the CDRB nor the arbitral tribunal are well-equipped to handle
– Possibly did not have sufficient aura of legitimacy
Possibly important risks: political riskPossibly important risks: political riskMunicipal political risk
(−) City could breach concession agreement – or make life miserable for SV in more subtle ways
(+) Broad political consensus achieved over period of project preparation
(+) Concession awarded after transparent international competitive bidding: this should increase public and political acceptance
(+) Concession agreement not unbalanced(+) EBRD involvement(+) Termination payment by City for any type of
default includes at least outstanding debt. (So city political risk ultimately involves city credit risk)

121
Possibly important risks: political riskPossibly important risks: political risk
National political and regulatory risk(+) National government has no direct control over
SV (beyond setting water and wastewater standards, etc.)
(+) Presumably, any future national regulatory regime would have to respect the concession agreement (i.e., in US terminology, no “impairment” of contract by later change in law)
Possibly important risks: concessionaire defaultPossibly important risks: concessionaire default
Concessionare default and City termination of concession agreement
(+) Lender has “step-in” rights under “direct agreement” with City (more on this in Part III)

122
Possibly important risks: procurementPossibly important risks: procurement
Public-procurement risk(−) A judicial challenge to the procurement process
had been initiated in Sofia courts by one of the losing bidders
(+) City agreed to give certain guarantees in case the concession was declared invalid as a result of this challenge
244
Lecture Notes
Week Two, Day Five(Session I: 08:30 – 10:00)
Program on the Appraisal of Infrastructure Projects with Private
Participation

123
Limited Recourse Financing of the Limited Recourse Financing of the Sofia Water System ConcessionSofia Water System Concession
Dr. Christopher ShugartDr. Christopher Shugart
Part III
Lecture topicsLecture topics
I. Overview and Process
II. Dealing with the Risks
III. Project Finance Loan Agreement
IV. Lender’s Financial Model

124
Typical main sections of an international term Typical main sections of an international term loan agreement (the starting point)loan agreement (the starting point)
Purpose and definitions
The loan– Amount
– Drawdowns
– Fees and interest
– Repayment
– Prepayment and cancellation by borrower
– Suspension and cancellation by bank
International term loan agreementInternational term loan agreement
*Conditions precedent
*Covenants (undertakings)
Representations and warranties
*Events of default
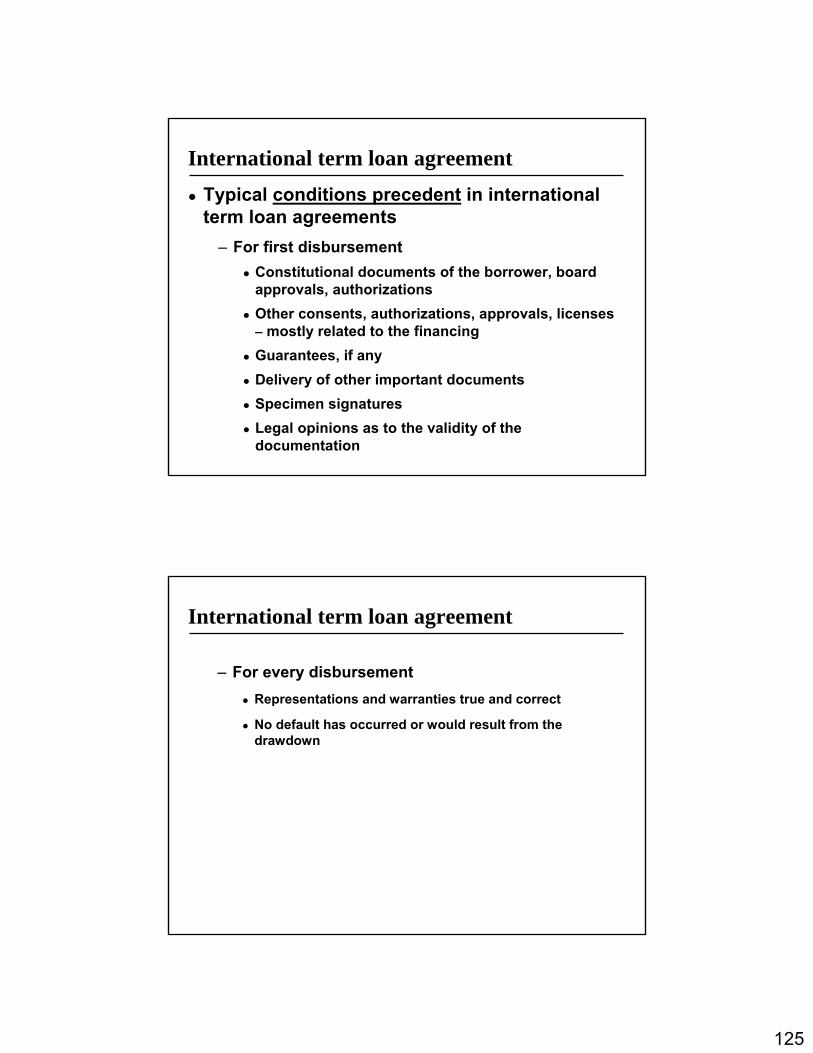
125
International term loan agreementInternational term loan agreementTypical conditions precedent in international term loan agreements
– For first disbursementConstitutional documents of the borrower, board approvals, authorizationsOther consents, authorizations, approvals, licenses – mostly related to the financingGuarantees, if anyDelivery of other important documentsSpecimen signaturesLegal opinions as to the validity of the documentation
International term loan agreementInternational term loan agreement
– For every disbursementRepresentations and warranties true and correct
No default has occurred or would result from the drawdown

126
International term loan agreementInternational term loan agreementTypical covenants in international term loan agreement
– Provide periodic financial statements– Provide other specified documents and
information– Notify lender of occurrence of any event of default– Comply with all required authorisations, licenses,
etc.– (Possibly) Use loan only for specified purpose– (Possibly) Keep properties and assets insured– Negative pledge
No security interest permitted on assets
International term loan agreementInternational term loan agreement
Covenants (cont’d)– Pari passu ranking– Not dispose of all or substantial part of assets– Not make any loans or guarantees– Not change nature or scope of business, enter into
mergers, etc.– Maintain specified values for certain financial
indicators – e.g.:minimum net worth debt-equity ratio current ratiointerest cover

127
International term loan agreementInternational term loan agreementTypical events of default in international term loan agreement
– Non-payment of debt service or fees– Breach of any obligation in loan agreement– Misrepresentation– Cross default– Insolvency, liquidation, bankruptcy– Cessation of business– Nationalization– Has become unlawful for borrower to perform
obligations– “Material adverse change”
What is different about project finance?What is different about project finance?
Single-purpose company
Source of revenue is often public authority or publicly owned company
Business activities determined rigidly by set of contracts: concession contract (or equivalent) is the key
– “Contract is king”– Little flexibility; little room for manoeuvre
High gearing

128
What is different about project finance?What is different about project finance?
Majority shareholding by project sponsorsCompany is to a large extent a “financing vehicle”Lender seeks to limit discretion of project company
– Restrictions on business activities: don’t want managers to have free hand to throw cash around
– This deals with divergence between lender and shareholder interests
– Also helps shareholders deal with divergence between shareholder and manager interests
Key features of project finance loan agreementKey features of project finance loan agreement
Extra or tougher conditions precedent, covenants and events of default (more later about this)
Importance and effect of project “completion”– Concept of “completion”– Completion guarantee
Loan repayments– Repayments can be keyed to projected cash flows– Prepayment fee more likely than in corporate loan
(Compared with typical term loan agreement)(Compared with typical term loan agreement)

129
Typical project finance loan agreementTypical project finance loan agreement
Cover ratios as key tool– Including forward-looking ratios (cf. corporate
loan)
As part of financing package, “direct agreements” and step-in rights
Security arrangementsSecurity arrangements
Purpose: to seal off all assets and cash flow quickly and make them quickly available to the lender if needed
Two major categories: – Security interests (charges, liens, mortgages,
pledges, etc.) over assets
– Methods of collecting and preserving cash flows (lockbox or escrow arrangements)

130
Security arrangementsSecurity arrangements
Security interests or assignments (or similar) regarding:
– All tangible assets– Shares in the SPV– Project accounts– Debt service reserve account– Receivables– Insurance– Concession contract– Construction contract– Etc., etc., etc.
Security arrangementsSecurity arrangements
Purpose– Permits complete step-in
– Aids control over cash flows
– Defensive

131
Security arrangementsSecurity arrangements
Accounts agreement permits tight control over cash flows
– Lender has agreement with borrower’s bank
– Different accounts for different purposes
– “Waterfall” of payments from main account
– No withdrawals permitted after event of default
Credit enhancementCredit enhancement
Third party guarantees
Letters of credit from banks

132
Project finance: additional conditions precedentProject finance: additional conditions precedent
For first disbursement– Since business activities are well-specified, the
list of permits and authorisations can be much more detailed
– Signed financing documentsSecurity documents
Equity agreement
Completion guarantee
Direct agreements
Interest hedging agreement
Project finance: additional conditions precedentProject finance: additional conditions precedent
For first disbursement (cont’d)
– Project accounts agreement
– Executed project contractsConcession agreement
Supply agreements
Purchase agreements
O&M agreement
– Licenses and permits relating to the project
– Insurance documents

133
Project finance: additional conditions precedentProject finance: additional conditions precedent
For every disbursement– Required drawdowns and equity injections under
other financing agreements made
– Sufficient funds are available to achieve completion (taking into account any actual or projected cost overruns)
– (Possibly) Cover ratio test (“drawdown cover ratio”)
Project finance: additional covenantsProject finance: additional covenants
In general, very extensive and detailed covenantsNo change to the project plan without consent of lenderComply with the terms of project contractsEnforce its rights under project contractsNo modification of any key contracts (e.g. concession contract, construction contract, O&M contract)

134
Project finance: additional covenantsProject finance: additional covenants“Reserved discretions”
– Lender allowed to decide how borrower should exercise certain discretionary decisions given to it under the project agreements
Not change the operator or major contractorsNot abandon the project unless it becomes uneconomicNo payment of dividends except according to the cash-flow waterfall
– Sometimes not for the first X years– May be subject also to “lock-up cover ratio”
Project finance: additional covenantsProject finance: additional covenants
No capital expenditures except for specified project-related capex Tight controls over any payments to parties related to project sponsors
– E.g. technical assistance agreements
Elaborate insurance requirementsTight controls on other debtProvide periodic information about the projectMany other “do your best, work hard, and be prudent” covenants

135
Project finance: additional events of defaultProject finance: additional events of default
Those related to breach of the extra covenants
Failure to achieve completion by a long-stop date
Breach of cover ratio (“default ratio”)
Destruction of material part of project
Defaults under any project contract
Any major project contract ceases to be in full force and effect
Project finance: additional events of defaultProject finance: additional events of default
Financing insufficient to cover projected costs (as updated periodically)
Any change in the shareholding of the project company before a specified date
Creeping expropriation; regulatory changes
Abandonment of the project

136
271
Lecture Notes
Week Two, Day Five(Session II: 10:15 – 12:00)
Program on the Appraisal of Infrastructure Projects with Private
Participation
Limited Recourse Financing of the Limited Recourse Financing of the Sofia Water System ConcessionSofia Water System Concession
Dr. Christopher ShugartDr. Christopher Shugart
Part IV

137
Lecture topicsLecture topics
I. Overview and Process
II. Dealing with the Risks
III. Project Finance Loan Agreement
IV. Lender’s Financial Model
IntroductionIntroduction
The project used two Excel financial models on a continuing basisOne model (6 MB) was part of the concession agreement (“CA Model”)
– Developed by the bidder and presented as part of its offer
– Then, subject to review by the City’s financial advisors, modified for use in the tariff adjustment procedure contained in the concession agreement

138
IntroductionIntroduction
Another model (4 MB) was part of the Loan Agreement (“Lender’s Model”)
– Developed by the EBRD– Used for (i) assessing the deal and negotiating the
Loan Agreement and then (ii) determining compliance with the Loan Agreement
IntroductionIntroduction
One reason for having two separate models is that the lender wanted to be able to forecast financial results without being constrained by any agreement the City and the concessionaire might reach from time to time on estimated future costs
– E.g.: Whenever the CA Model is used to determine a tariff adjustment, the lender will take the resulting tariff profile and put it into the Lender’s Model
Another reason was that the CA Model contained modules used for bidding purposes but no longer needed – too cumbersome

139
Use in negotiations: sensitivities & scenariosUse in negotiations: sensitivities & scenarios
Trial testing of a multitude of variablesBoiled these down to a few key variables (for which we also estimated rough, subjective confidence intervals):
– Demand (i.e. volume of water consumed)– Revenue collection ratio– Cost overruns (both capex and opex)– Inflation– Exchange rate
Use in negotiations: sensitivities & scenariosUse in negotiations: sensitivities & scenarios
Base case, for comparison
– Min. ADSCR: 1.9
– Internally generated cash: EUR 52m
– Sponsor funds: EUR 12m

140
Use in negotiations: sensitivities & scenariosUse in negotiations: sensitivities & scenarios
Decreased demand for water. Per capita water consumption decreases over first 5 years to a level 20% below base case, and then remains at that level.
The project is most sensitive to changes in demand. But even in these extreme (and unlikely) conditions, financial viability is maintained. Min. ADSCR: 1.2 Int. gen. cash: EUR 43m Sponsor funds: EUR 19m
Since the Scheduled Review at the end of year 3 will adjust tariffs for the best current projections of demand, this sensitivity test assumes in effect that projections made at that time (for the period starting in year 6) will be 25% greater than actual consumption.
Use in negotiations: sensitivities & scenariosUse in negotiations: sensitivities & scenarios
Cost overruns. Annual opex 20% greater than base case over entire term of concession, and annual capex 25% greater beginning after 3½ years (i.e. after Scheduled Review).
Min. ADSCR: 1.4 Int. gen. cash: EUR 44m Sponsor funds: EUR 21.5m
Highly unlikely: in effect, after 3½ years, opex and capex must be increased beyond any adjustments made as a result of new information obtained during the first three years.

141
Use in negotiations: sensitivities & scenariosUse in negotiations: sensitivities & scenarios
Exchange rate risk. Real exchange rate (BGN/EUR) depreciation of 50% takes place at beginning of year 6.
Even with a massive depreciation, the tariff indexation mechanism works well enough to protect cash flows, despite some deterioration of the ADSCR. Min. ADSCR: 1.5 Int. gen. cash: EUR 52m Sponsor funds: EUR 12m
A more accurate compensation would take place for any depreciation that occurs in connection with the abandonment of the currency board, since the tariff adjustment mechanism for that event involves a re-running of the contractual financial model, rather than compensation by way of the indexation formula.
Use in negotiations: sensitivities & scenariosUse in negotiations: sensitivities & scenarios
After much internal discussion (including discussion with technical advisors), we tested numerous “highly pessimistic” scenarios, combining several variablesWe settled on one Illustrative Highly Pessimistic Scenario

142
Use in negotiations: sensitivities & scenariosUse in negotiations: sensitivities & scenariosHighly pessimistic scenario. (Indicated deviations are relative to base case.) (i) Real exchange rate
(BGN/EUR) depreciation of 15% at beginning of year 6.
(ii) BGN inflation 3 percentage points higher in every year.
(iii) Per capita consumption decreases total of 8% over first 3 years; adjustment takes place at Scheduled Review; then consumption decreases a total of 10% over next 5 years, remaining there.
(iv) Revenue collection decreases from 92% to 85% from years 2 to 5, then rises to 90% and remains there.
(v) Opex up 10% starting in year 4 and remains there.
(vi) Capex up 5% starting in year 4 and remains there.
The Company is still able to make debt service payments, despite greatly reduced net cash flow. Almost the entire committed amount of Sponsor funds is used. Min. ADSCR: 1.1 Int. gen. cash: EUR 42m Sponsor funds: EUR 21.6m
The combined occurrence of all of these circumstances (to the degrees indicated) is highly unlikely.
An increase in BGN inflation has been included in this scenario because, even though inflation is covered in the indexation formula, a minor mismatch means that, in certain periods, the compensation is not 100%.
The capex component is not as great as the opex component because a substantial contingency (averaging about 9% and confirmed by the Bank’s technical advisor) is already built into the base case capex budget.
Use in negotiations: sensitivities & scenariosUse in negotiations: sensitivities & scenarios
This scenario was used to size the debt and equity contributions to total financing. Method used was to increase debt and decrease equity until the borrower almost defaults on its debt service obligations (in the model)When the assumptions are set back to the base case (with debt determined as above), the “Base Case Cover Ratios” pop out

143
Detailed look: residential sales volumeDetailed look: residential sales volume
Average residential billed quantity at that time was 143 litres/capita/day. (Presuming administrative losses of 25% of consumption, actual average consumption would be 190 l/c/d)Method of billing
– About 800,000 people (67%) had individual apartment (or house) meters
– About 400,000 people were billed according to bulk meter for entire apartment building (i.e. bulk meter reading minus sum of individual meter readings) on per capita or per apartment basis
Detailed look: residential sales volumeDetailed look: residential sales volume
Key consideration in looking at the impact of changes in consumption: tariffs would be reset (if necessary) after three years (Scheduled Review) to reflect actual demand and best demand forecasts at that time

144
Detailed look: residential sales volumeDetailed look: residential sales volume
Original provision in concession agreement (open to various interpretations):
[At the Scheduled Review, the tariffs shall be adjusted]“taking into account applicable changes in Capital Costs, Operating Costs and other relevant parameters, including demand projections and financing arrangements, associated with and/or arising from” [certain studies to be carried out and the revised investment plan].
Detailed look: residential sales volumeDetailed look: residential sales volume
EBRD requested greater clarity, and a new sentence was added:
“For the avoidance of doubt, the demand projections to be used for this purpose shall take into account all information available at the time of the Scheduled Review which is relevant for projecting future demand.”

145
Detailed look: residential sales volumeDetailed look: residential sales volume
Factors most important up to Scheduled Review
– Reduction of “administrative losses” (meter underregistration, thefts and tampering). Our base case estimate was that 25% of actual consumption was not billed and that this would decrease to 16% by end of 2003. SV planned extensive programme of bulk meter replacement. (Recent results − under old management − had shown a 26% increase in metered quantities for 2,000 out of 11,000 bulk meters when new meters were installed)
Detailed look: residential sales volumeDetailed look: residential sales volume
– Reduction in demand as more apartments are individually metered
– Reduced commericial and industrial use (20% of total demand) due to industrial restructuring (big unknown): e.g. cellulose plant

146
Detailed look: residential sales volumeDetailed look: residential sales volume
Factors important for the long term, after resetting the figures at Scheduled Review
– Population changes– Decreases due to continuing programme of
individual household meter installation– Decreases in demand as internal plumbing as
repaired or replaced (long-term price elasticity of demand)
– Increased household income and income elasticity of demand (washing machines, car washing, watering lawns, etc.)
– Changes in industrial water use
Detailed look: residential sales volumeDetailed look: residential sales volume
Special issue: unanticipated tariff increases and price elasticity of demand
– If City accepts that SV should be compensated by a tariff increase for specified events, then why shouldn’t SV also be compensated for loss of revenue caused by decreased demand caused by such a tariff increase? (Indirect effect)
– Accepted in principle, but great debate over how causal link could be adequately demonstrated

147
Detailed look: residential sales volumeDetailed look: residential sales volume
– Finally, it was agreed (in the amendment to the concession agreement) that a reasonable forecast price elasticity effect could be taken into account in resetting tariffs and that either party could then seek to revise the adjustment after two years if it could reasonably demonstrate that the actual effect had been different from the estimate. (But no bright-line tests for any of this)
Detailed look: residential sales volumeDetailed look: residential sales volumeBase case forecasts, December 2000
2001 2002 2003 2004
Population connected '000 1167 1171 1175 1179Per capita consumption litres/cap/day 190 190 190 190Total residential consumption cu. m. ('000) 80931 81209 81486 81764Admin. losses as % of consumption 24.1% 20.5% 16.9% 13.3%
Total residential billing* cu. m ('000) 61427 64561 67715 70889
Residential billing per capita litres/cap/day 144 151 158 165
Banking Case, May 2002 (2001: actual)2001 2002 2003 2004
Population connected '000 1176 1178 1180 1181Per capita consumption litres/cap/day 203 203 203 203Total residential consumption cu. m. ('000) 87136 87284 87432 87506Admin. losses as % of consumption 25.7% 23.9% 22.1% 20.5%
Total residential billing* cu. m ('000) 64742 66423 68110 69567
Residential billing per capita litres/cap/day 151 154 158 161

148
Compliance with coverCompliance with cover--ratio loan covenantsratio loan covenants
Kinds of cover ratios used– Annual debt service cover ratio (ADSCR):
minimum ratio of yearly forecast free cash flow to debt service until loan is entirely repaid. (Note: free cash flow is calculated after subtracting agreed capex)
– Loan life cover ratio (LLCR): ratio of present value of free cash flow (until loan is entirely repaid) to outstanding debt
Note that both ratios are forward looking
Compliance with coverCompliance with cover--ratio loan covenantsratio loan covenants
Ratio-related conditions and covenants– After first five years, additional equity (up to
specified maximum) to be injected (and hence some debt repaid) if necessary to achieve specified values for ADSCR and LLCR. Allows high gearing during initial period
– SV will not (without the lender’s prior consent) agree with the City to any adjustment in tariffs (i.e. due to a modification of service standards or other performance requirements) if this would result in a decrease in the ADSCR or LLCR (unless the ratios remain above the values of the Base Case Ratios)

149
Compliance with coverCompliance with cover--ratio loan covenantsratio loan covenants
– Insurance proceeds may be used by SV to restore normal operating conditions only if ADSCR and LLCR would equal or exceed specified values (after application of proceeds); otherwise, lender has the right to apply insurance proceeds towards repayment of the loan
Compliance with coverCompliance with cover--ratio loan covenantsratio loan covenants
– SV not allowed to make any distributions to shareholders if ADSCR or LLCR drop below specified values (Lock-Up Ratios)
– Event of Default if ADSCR or LLCR drop below specified values (Default Ratios)
150
Compliance with coverCompliance with cover--ratio loan covenantsratio loan covenants
The beauty of using forward-looking cover ratios is that you have a nice way of giving a more precise and quantitative definition to the phrase typically found in certain loan covenants: “… if [the specified incident] could have a material adverse effect on the Borrower’s ability to comply with its obligations under the Loan Agreement”
““Banking CaseBanking Case”” proceduresprocedures
Critical importance of cover ratios in this deal means that agreement has to reached on exactly how the Lender’s Model will be periodically updated The Loan Agreement contains a seven-page annex describing “Banking Case Procedures”. The following topics are coveredWhen a Banking Case must be or may be prepared (i.e. when should the model be updated?)
– At each Interest Payment Date– Other defined circumstances

151
““Banking CaseBanking Case”” proceduresprocedures
How each assumption in the model is determined. E.g.:
– External reference for some – e.g.: Bloomberg Implied Forwards Curve for forecasts of Euribor interest rate; macroeconomic assumptions from EBRD Chief Economist
– Methodology specified: e.g. use PPP for leva/euroexchange rate (despite currency board in effect at present)
– Who makes starting proposal for each assumption?
““Banking CaseBanking Case”” proceduresprocedures
The special case of capex: service (output) targets (set out in concession agreement) ⇒“Engineering Targets” ⇒ capex plan ⇒ capex costs for model
– Examples of service targets (quantitative targets specified for each year of the concession period): water pressure; water quality; percentage of water lost through leakage; burst rate; sewer flooding rate

152
““Banking CaseBanking Case”” proceduresprocedures
– Examples of Engineering Targets (all with reference to a given period): kilometres of water mains (in various categories) to be replaced; number of service pipes to be replaced; number of bulk meters to be repaired; number of customer meters to be replaced; number of network models to be completed
– The concession agreement does not specify Engineering Targets, but without them, one cannot go from service targets to a capex plan – and hence to future costs needed for the model
““Banking CaseBanking Case”” proceduresprocedures
Step-by-step procedure (with time periods) for agreeing the Banking CaseDispute resolution (for Banking Case only) by expert (technical expert or financial expert, as appropriate): expert’s decision is final and binding
– Designation of “apppointing authority” who will choose expert if parties cannot agree on one

153
““Banking CaseBanking Case”” proceduresprocedures
Which cover ratios are in effect during any period in which a Banking Case is being disputed? E.g.:
– Lock-Up Ratios are as in the version proposed by the lender (even if disputed by the borrower)
– Default Ratios are as in the most recently agreed (or determined) Banking Case


