Embed Size (px)
Citation preview
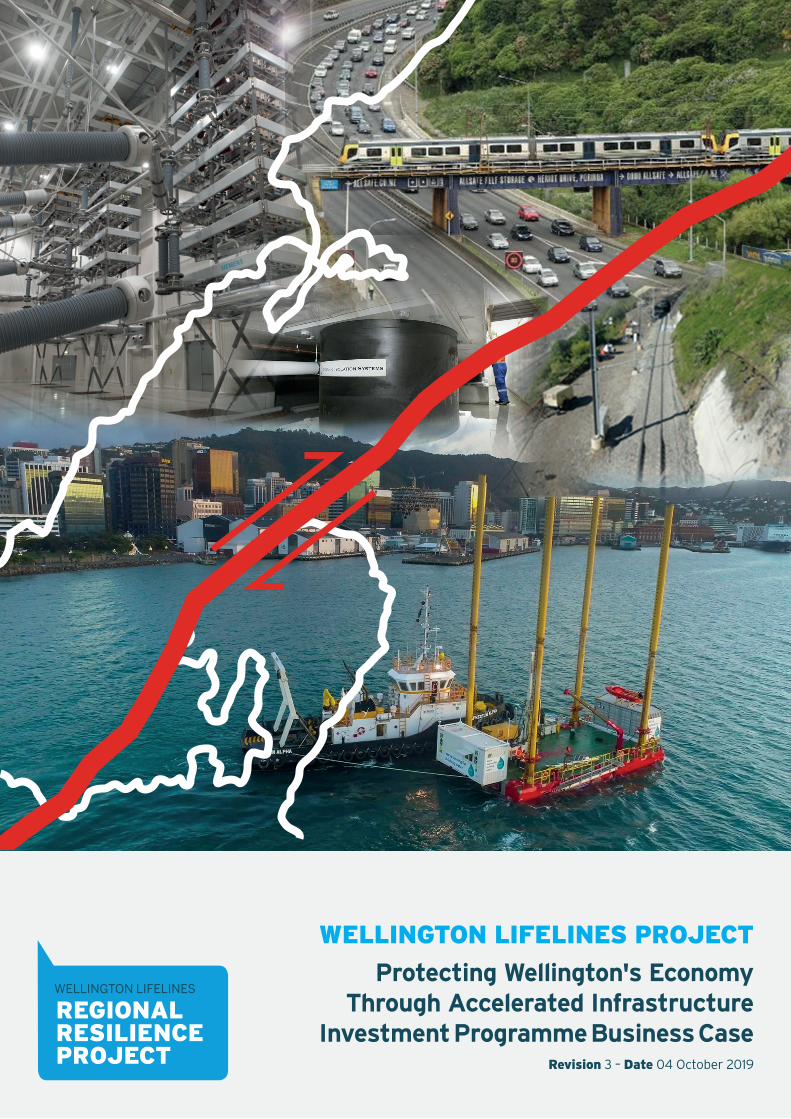
REGIONAL RESILIENCE PROJECT
WELLINGTON LIFELINES
WELLINGTON LIFELINES PROJECT
Protecting Wellington's Economy Through Accelerated Infrastructure
Investment Programme Business CaseRevision 3 – Date 04 October 2019
ii / Wellington Lifelines – Regional Resilience Project
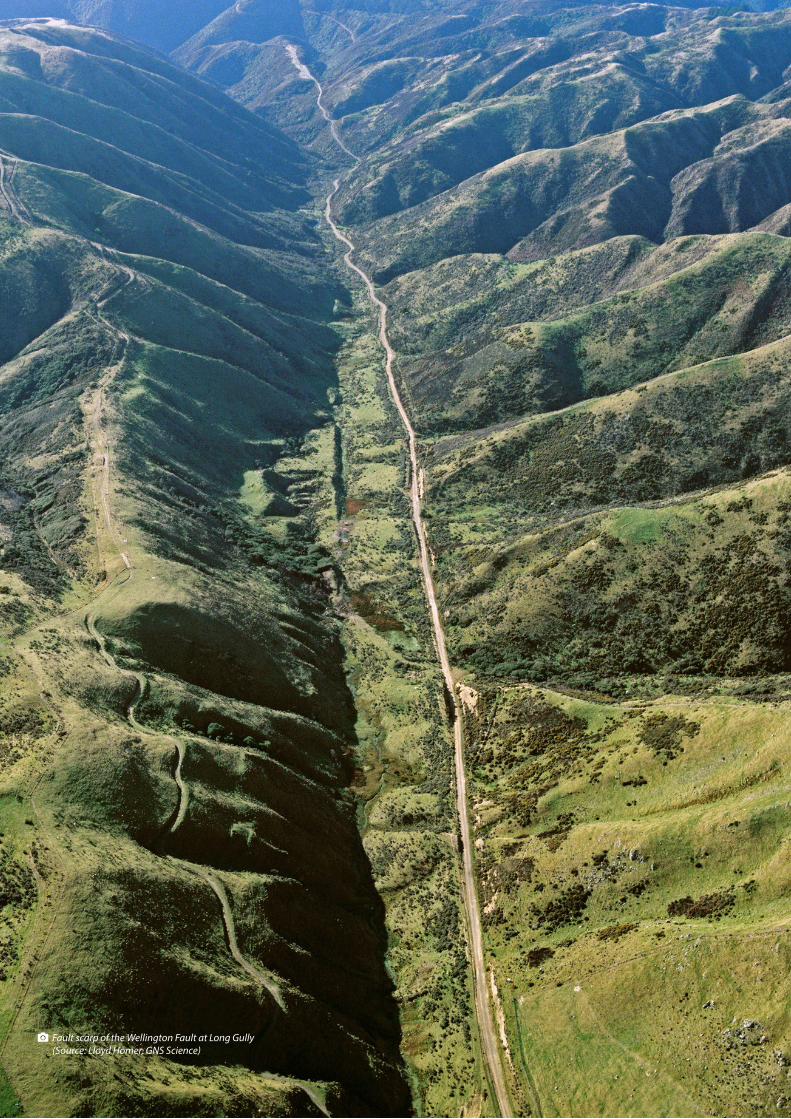
Camera Fault scarp of the Wellington Fault at Long Gully (Source: Lloyd Homer, GNS Science)
Wellington Lifelines – Regional Resilience Project / iii
Foreword
The probability of a major earthquake hitting our capital city of Wellington is widely accepted. In recent years local councils have worked on increasing household resilience and have tightened building codes to protect lives in such an occurrence, but this focus on readiness has not been reflected in other areas of emergency preparedness. Saving lives is paramount, but the survivors of a major disaster also need to be able to function in a working economy after the event. In the case of Wellington, the need for economic resilience is critical, not only for the half a million people who live in the region, but also for the nation.
The bald figure of 13.5% of New Zealand’s GDP does not tell the entire story of why Wellington’s economy is important. Not only is it the seat of Government and the transport hub between the North and South Islands, but its large knowledge sector also has New Zealand’s fastest growth in digital businesses. This concentration of services financial and technology sectors makes it vulnerable to loss of firms who rely on intellectual capital and have the agility to move quickly to another place – not necessarily in New Zealand – should their current location be unsustainable.
To ensure rapid economic recovery following a major earthquake, it is imperative that core infrastructure is as resilient as possible. In 2016 the Wellington Lifelines Group took up this challenge and began its Regional Resilience Project.
The project analysed the economic costs of not being prepared for “the big one” and then analysed the savings to the nation if we were prepared, with infrastructure sufficiently resilient to be able to maintain services or recover rapidly. The latter scenario included the appropriate sequencing of work over a twenty-year period to reflect interdependencies between the various types of infrastructure.
The headline figures are that a coordinated investment of $3.9 billion would save
the nation $6 billion in the aftermath of a magnitude 7.5 earthquake on the Wellington Fault.
There are other paybacks as well - the quantitative analysis modelled only a narrow slice of the benefits. For example, it did not include the “business as usual” benefits for society from having the individual projects delivered in a rational and sequenced way over a twenty year horizon, or the resilience benefits in the face of more frequent but lower impact events such as floods or smaller earthquakes. The modelling related only to an extremely large earthquake, but the work programme would provide protection in many other circumstances.
Nor did the study capture two other benefits that have been the subject of increasing public scrutiny in the years following the Christchurch earthquake sequence – firstly, social wellbeing benefits and, secondly, the value to society of underpinning financial confidence in a region.
Regarding social benefits, we are not aware that the cost of reduced societal wellbeing has been exactly quantified in Christchurch. However, it is clear that faster recovery would help mitigate the high levels of stress and anxiety that are experienced in a major event and that are a cost not only to individuals but to the whole community.
On the second point, instilling confidence in a city or region is critical in terms of attracting investment and maintaining adequate insurance cover. This plan would underpin that confidence in Wellington. Current conversations on a proposed transport plan for Wellington (“Let’s Get Welly Moving”) and a high-level regional investment plan would be better informed by, and would benefit from, the prudent approach taken in this plan, which is about building in resilience.
No person or organisation can totally guarantee against infrastructure failure in a large event, but this plan provides a
sequenced and inter-related map of what is required to substantially enhance resilience, thus reduce the risk to the economy.
With this part of the work now complete, the question is: who is responsible for ensuring delivery and who will champion this plan to completion?
Wellington’s infrastructure is owned by a mix of central government, local government and private sector shareholders and the project so far has been a shared process between management and technical staff of those utilities. However, the challenge now rests with decision-makers in boardrooms, council rooms and the Beehive to achieve a high degree of collaboration.
Delivering the outcomes we have identified will require a re-think of investment plans because we will be asking elected representatives, company governors and senior managers to agree to sequence their work to take account of interdependencies, rather than each organisation running its own separate programme. Central government will have a key leadership role and will need to work with the Lifeline providers to drive that interdependent approach.
Investment in resilience is always front-of-mind immediately after an event but the urgency fades with time. This study is a compelling case for action. It is not a quick fix, but if we do not start and complete it we are gambling against the probability of an event.
The prize for getting this right will be a highly resilient Wellington: future-proofing an important part of New Zealand.
Dame Fran Wilde
Chair, Wellington Lifelines Group (WeLG)
iv / Wellington Lifelines – Regional Resilience Project
Executive SummarySignificant benefits identified by improving Wellington and New Zealand’s infrastructure resilience to earthquake eventsThis study details how investing in infrastructure resilience will reduce the national economic impact of a large Wellington earthquake by more than $6 billion. In addition to the avoided economic losses, there will be significant social benefits achieved through Wellington’s communities surviving and thriving after a major seismic event.
The study is the first of this size and complexity ever undertaken in New Zealand. It considers the interdependencies of 16 infrastructure providers in order to identify a step-change improvement to the Wellington region’s resilience to a large earthquake.
Many of the resilience projects are already on long term asset plans and have funding earmarked. This study identifies that if the interdependent infrastructure projects are accelerated and delivered in a priority order, there will be significant benefits to Wellington and New Zealand’s economy when a major earthquake occurs.
Wellington is vital to New Zealand’s economy but is currently very vulnerable to large seismic events Wellington is a vibrant and growing capital city and a key contributor to the New Zealand economy. It is the seat of Government, has high concentrations of professional and value-added services, is a centre for arts and innovation, a key tourist destination and also fulfils a role as a vital transport link between the North and South Islands. Wellington contributes 13.5% of New Zealand’s gross domestic product (GDP), has a significant place in the national identity and is home to more than 400,000 people.
Wellington’s vulnerability to a major earthquake is well-known and it is not a question of if, but when “the big one” will occur. The imminent questions are: how
big will the economic and social impact be when the earthquake happens and what can be proactively done about this? To give confidence to Wellington residents and the people of New Zealand, as well as international investors, insurers and visitors, we must have a credible plan in place to minimise the potentially devastating impact of a disaster in Wellington.
The recent Kaikoura and Canterbury earthquakes demonstrated the need to build resilient infrastructure in our cities. Evidence from our domestic experience and recent international disasters has shown that communal infrastructure is critical to habitability and, when it fails, cities can quickly become unliveable. When key infrastructure is out or operating at degraded levels of service, people leave, productivity drops and communities - and the economy - suffer as a result. Lifeline infrastructure organisations are key service providers to our cities and regions. They have a major role to play in minimising the impacts of hazard events.
Lifeline organisations have historically planned their resilience investments independently and over long periods of time. The drawback of this approach is that planning can become disaggregated and projects delayed due to a lack of urgency and/or internal competition from other priority projects. Even more compelling is that a city’s overall resilience is inherently interdependent across lifelines. For example, there is limited benefit in building a resilient water network, if the electricity network is not equally resilient so that pumping stations can function after an earthquake. Lack of co-ordination in planning resilience projects will result in suboptimal investment outcomes.
Integrated infrastructure approach to understand and model Wellington’s economic resilience This study draws on the expert knowledge held by Wellington Lifeline Infrastructure providers. Each Lifeline organisation
helped identify infrastructure projects that would increase resilience and support faster economic recovery in the Wellington region in the aftermath of a 7.5 magnitude earthquake. A preferred programme of infrastructure projects was identified and modelled in RiskScape (by GNS Science) and MERIT (by Market Economics) to understand potential economic benefits flowing from pre-earthquake investment. RiskScape and MERIT are the most advanced outage and economic modelling tools available and it is the first time that these have been applied on this scale to provide insights into the national economic impacts of any large natural disaster.
Demonstration of benefits of improving Wellington Region’s resilience The first key finding from the modelling was that if a magnitude 7.5 earthquake occurs on the Wellington Fault with no investment (the do-nothing scenario), the expected loss to New Zealand’s GDP over a 5-year period will exceed $16 billion (this is in 2016 dollars and excludes recovery costs or building damage - it is just the economic impact).
The second key finding from the modelling was that if the preferred investment programme is implemented before the earthquake occurs, the expected economic loss reduces to $10 billion over a 5-year period, and a $6 billion impact to New Zealand’s economy is avoided. This reduction in economic loss is due to the reduction in outage durations on key lifeline infrastructure with the preferred programme implemented. The people of Wellington will be less impacted and economic activity in New Zealand will return to normal sooner.
Preferred programme of infrastructure investment to deliver maximum resilience benefitsThe preferred programme of investment comprises 25 resilience projects at an estimated total capital cost of $3.9 billion. This cost is not all extra or new expenditure,
as many of the projects identified already feature in the long-term capital plans of Wellington’s infrastructure providers. Additionally, many of the projects are justified on the primary (non-resilience) benefits they provide to the people of Wellington. By undertaking smart prioritisation and acceleration of these infrastructure improvements, the ‘”business as usual” benefits are also further amplified.
The programme includes projects across the fuel, transport, electricity, telecommunications, water and gas sectors. Projects have been scheduled across a 20-year time horizon and have been arranged so that interdependencies between projects and other lifeline services are considered. Fuel, road, and electricity projects were found to provide the greatest resilience benefit to other projects.
The investment programme has been broken into three equal phases with projects in Phase One (years one to seven) typically being of higher feasibility and more fully solutioned. Investment in Phase One will lay the foundations, while scoping and planning of Phase Two and Three initiatives should commence immediately.
Funding capital costs for Phase One is 28% committed, 20% contingent with a small amount of revenue from user payments. Approximately 51% remains unfunded at this stage. In order to ensure that there is adequate funding at the right time, central government will need to be involved. This does not mean that central government needs to fund the 51% - the lifeline entities themselves will need to work out new funding mechanisms over forthcoming years and will require consumer/community understanding and support. There will be difficult conversations about long versus short term thinking - conversations that will benefit from central government leadership, given the national economic value of the approach.
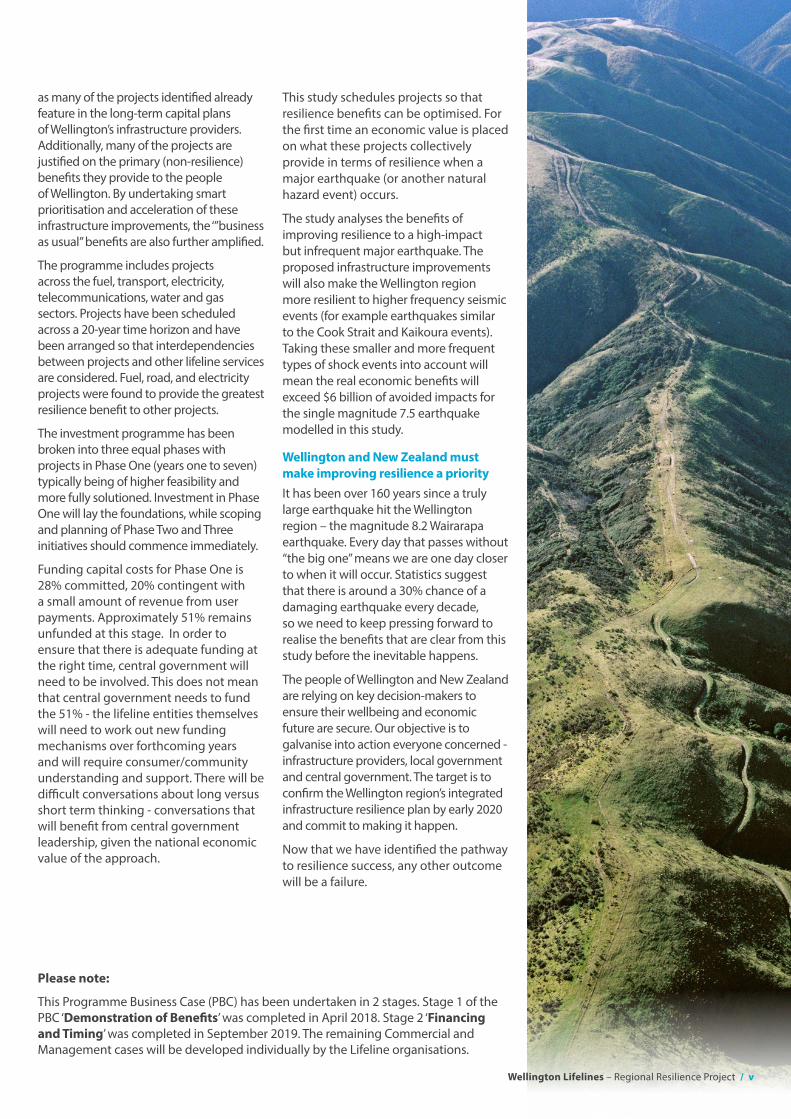
This study schedules projects so that resilience benefits can be optimised. For the first time an economic value is placed on what these projects collectively provide in terms of resilience when a major earthquake (or another natural hazard event) occurs.
The study analyses the benefits of improving resilience to a high-impact but infrequent major earthquake. The proposed infrastructure improvements will also make the Wellington region more resilient to higher frequency seismic events (for example earthquakes similar to the Cook Strait and Kaikoura events). Taking these smaller and more frequent types of shock events into account will mean the real economic benefits will exceed $6 billion of avoided impacts for the single magnitude 7.5 earthquake modelled in this study.
Wellington and New Zealand must make improving resilience a priority It has been over 160 years since a truly large earthquake hit the Wellington region – the magnitude 8.2 Wairarapa earthquake. Every day that passes without “the big one” means we are one day closer to when it will occur. Statistics suggest that there is around a 30% chance of a damaging earthquake every decade, so we need to keep pressing forward to realise the benefits that are clear from this study before the inevitable happens.
The people of Wellington and New Zealand are relying on key decision-makers to ensure their wellbeing and economic future are secure. Our objective is to galvanise into action everyone concerned - infrastructure providers, local government and central government. The target is to confirm the Wellington region’s integrated infrastructure resilience plan by early 2020 and commit to making it happen.
Now that we have identified the pathway to resilience success, any other outcome will be a failure.
Wellington Lifelines – Regional Resilience Project / v
Please note:
This Programme Business Case (PBC) has been undertaken in 2 stages. Stage 1 of the PBC ‘Demonstration of Benefits’ was completed in April 2018. Stage 2 ‘Financing and Timing’ was completed in September 2019. The remaining Commercial and Management cases will be developed individually by the Lifeline organisations.
vi / Wellington Lifelines – Regional Resilience Project
Contents
Executive Summary ivGlossary of Abbreviations x
PART A – THE STRATEGIC CASE 11 Integrated Infrastructure Resilience to Protect Wellington’s Economy 3
1.1 Integrated Infrastructure Resilience 3 1.2 Context of this Document 4 1.3 Elements of Resilience and Focus of this PBC 4 1.4 Development of the PBC 4
2 Strategic Context for Investing in Wellington’s Resilience 5 2.1 Wellington’s Seismic Risk 5 2.2 Wellington’s Geographic and Infrastructure Context 5 2.3 The Economic Context – The Importance of Wellington to New Zealand 8
3 Alignment to Existing Strategies 11 3.1 Strategic Mandate 11 3.2 Summary of Existing Strategies 11
4 Investment Objectives 15 4.1 Problems, benefits and investment objectives 15
5 Risks, Constraints and Dependencies 17 5.1 Risks 17 5.2 Constraints and Dependencies 18 5.3 Opportunities 19
[Explanatory Statement: In producing this report Aurecon has relied on inputs supplied by GNS Science under contract to GWRC and information from other parties. The report is provided strictly on the basis that the information that has been provided is accurate, complete and adequate.
While all due care has been taken by Aurecon in compiling this draft report Aurecon can neither warrant nor take responsibility for the accuracy of the GNS work or such other parties. Aurecon takes no responsibility and disclaims all liability whatsoever for any loss or damage that
the client or any other party may suffer resulting from any conclusions based on information provided to Aurecon, except to the extent that Aurecon expressly indicates in the report that it has verified the information to its satisfaction.]
Wellington Lifelines – Regional Resilience Project / vii
PART B – EXPLORING THE PREFERRED WAY FORWARD 216 Options Identification and Assessment 23
6.1 Critical Success Factors 23 6.2 Option Generation 24 6.3 Options removed from scope 24 6.4 Options not Assessed but Retained 24 6.5 Options Remaining 25 6.6 Short-listing Assessment 27
7 Programme Development 29 7.1 Base Case 29 7.2 Projects included in the recommended programme 29 7.3 RiskScape and MERIT 39 7.4 Application 40 7.5 RiskScape 40 7.6 The MERIT Model 41 7.7 Summary of Results 41 7.8 Other Initiatives 42 7.9 Programme Implementation 42
8 The Financial Case 489 The Commercial and Management Cases 50
9.1 Outlining the commercial strategy 5010 Next Steps 50

1 / Wellington Lifelines – Regional Resilience Project
PART A – THE STRATEGIC CASE

Wellington Lifelines – Regional Resilience Project / 2
3 / Wellington Lifelines – Regional Resilience Project
1. Integrated Infrastructure Resilience to Protect Wellington’s Economy
The Wellington Lifelines Regional Resilience Project is an initiative of the Wellington Lifelines Group (WeLG) which recognised the need for a step-change and an integrated approach to increase the resilience of lifeline services. Local Councils and others have put great effort into imbuing the population with resilience. However, in the case of a large earthquake, Wellington’s infrastructure also needs to be resilient, not only for people, but to ensure that business can continue after the event and to substantially minimise GDP loss for New Zealand.
1.1 – Integrated Infrastructure Resilience
This project was initiated because all infrastructure providers want to collaborate to address infrastructure deficiencies and, more explicitly, show the significant value of understanding interdependencies between different lifeline services. Working together ensures any investment is focussed on the best results for the building of resilience for the region, not just for each individual utility.
The work addresses the likely economic impact of a M7.5 earthquake to help inform options to reduce the economic
effects through targeted infrastructure investments. Given Wellington’s strategic importance as a transport hub with a large advanced economy and its role as the capital city, such investments will also benefit the wider national economy.
The work is being carried out with Central Government as a part funder, together with local government and the infrastructure providers. It is closely aligned with regional resilience initiatives1 and built environment resilience initiatives.
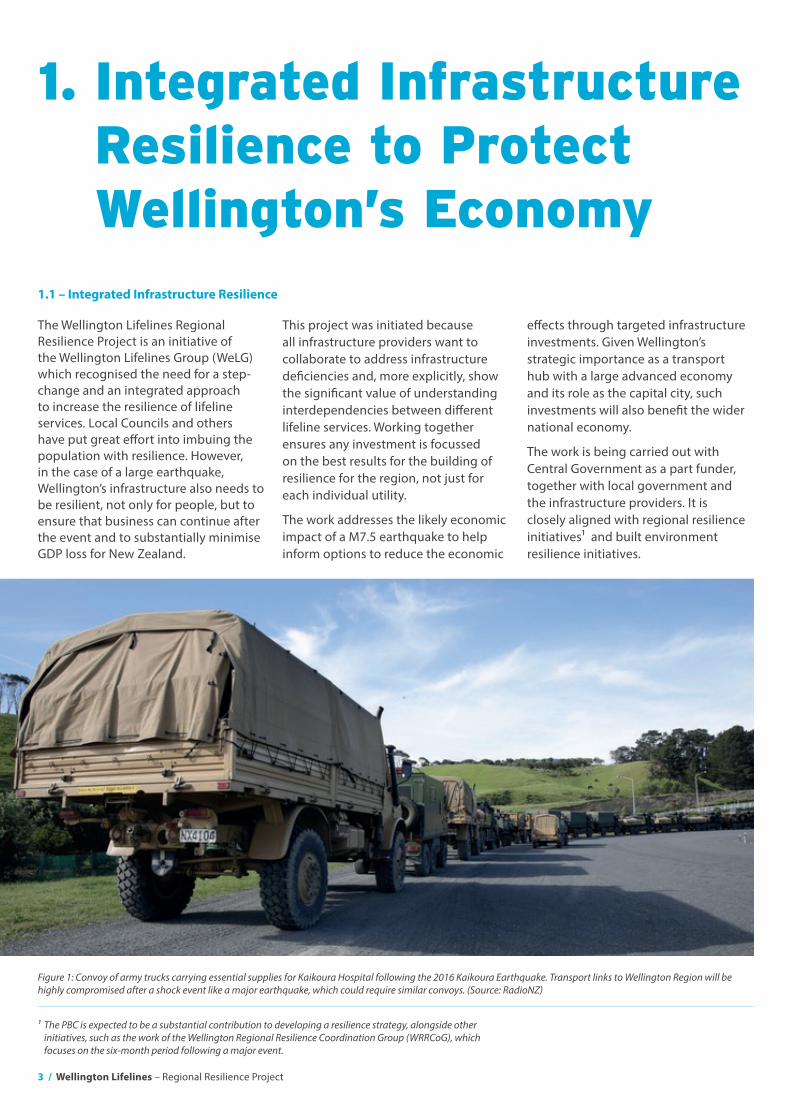
Figure 1: Convoy of army trucks carrying essential supplies for Kaikoura Hospital following the 2016 Kaikoura Earthquake. Transport links to Wellington Region will be highly compromised after a shock event like a major earthquake, which could require similar convoys. (Source: RadioNZ)
1 The PBC is expected to be a substantial contribution to developing a resilience strategy, alongside other initiatives, such as the work of the Wellington Regional Resilience Coordination Group (WRRCoG), which focuses on the six-month period following a major event.
Wellington Lifelines – Regional Resilience Project / 4
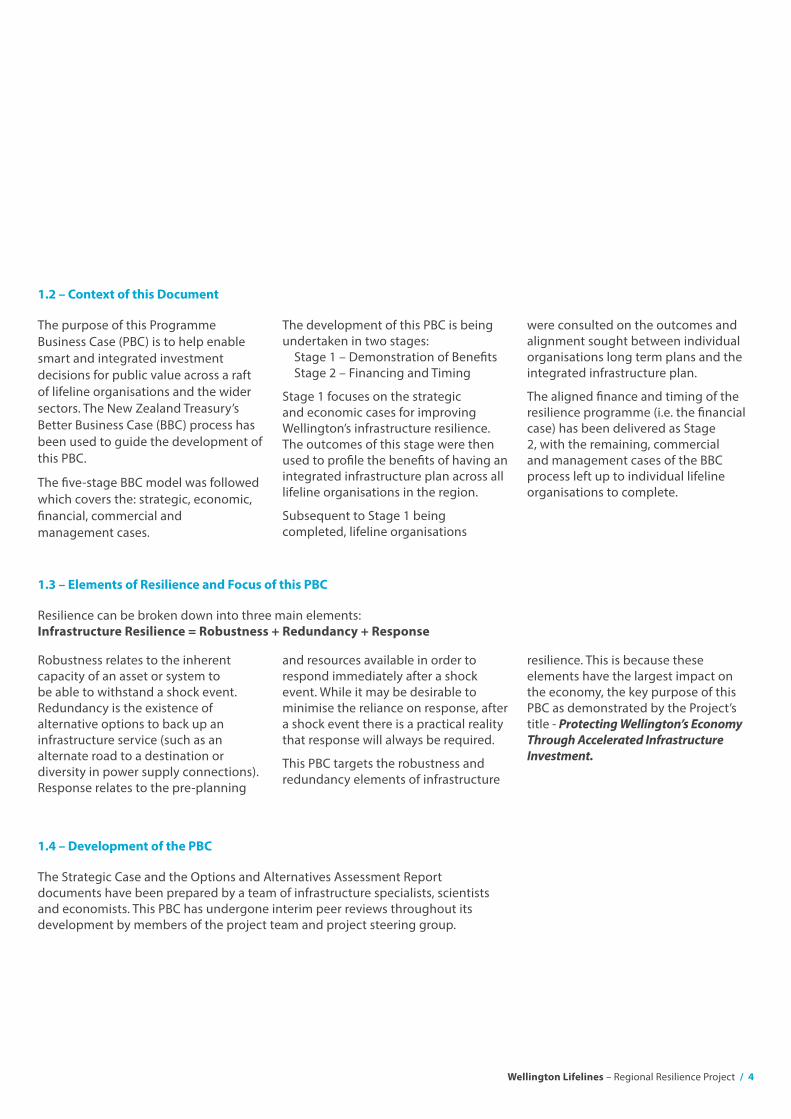
The purpose of this Programme Business Case (PBC) is to help enable smart and integrated investment decisions for public value across a raft of lifeline organisations and the wider sectors. The New Zealand Treasury’s Better Business Case (BBC) process has been used to guide the development of this PBC.
The five-stage BBC model was followed which covers the: strategic, economic, financial, commercial and management cases.
The Strategic Case and the Options and Alternatives Assessment Report documents have been prepared by a team of infrastructure specialists, scientists and economists. This PBC has undergone interim peer reviews throughout its development by members of the project team and project steering group.
Robustness relates to the inherent capacity of an asset or system to be able to withstand a shock event. Redundancy is the existence of alternative options to back up an infrastructure service (such as an alternate road to a destination or diversity in power supply connections). Response relates to the pre-planning
1.2 – Context of this Document
1.4 – Development of the PBC
1.3 – Elements of Resilience and Focus of this PBC
The development of this PBC is being undertaken in two stages: Stage 1 – Demonstration of Benefits Stage 2 – Financing and Timing
Stage 1 focuses on the strategic and economic cases for improving Wellington’s infrastructure resilience. The outcomes of this stage were then used to profile the benefits of having an integrated infrastructure plan across all lifeline organisations in the region.
Subsequent to Stage 1 being completed, lifeline organisations
and resources available in order to respond immediately after a shock event. While it may be desirable to minimise the reliance on response, after a shock event there is a practical reality that response will always be required.
This PBC targets the robustness and redundancy elements of infrastructure
were consulted on the outcomes and alignment sought between individual organisations long term plans and the integrated infrastructure plan.
The aligned finance and timing of the resilience programme (i.e. the financial case) has been delivered as Stage 2, with the remaining, commercial and management cases of the BBC process left up to individual lifeline organisations to complete.
resilience. This is because these elements have the largest impact on the economy, the key purpose of this PBC as demonstrated by the Project’s title - Protecting Wellington’s Economy Through Accelerated Infrastructure Investment.
Resilience can be broken down into three main elements: Infrastructure Resilience = Robustness + Redundancy + Response
5 / Wellington Lifelines – Regional Resilience Project
2. Strategic Context for Investing in Wellington’s Resilience
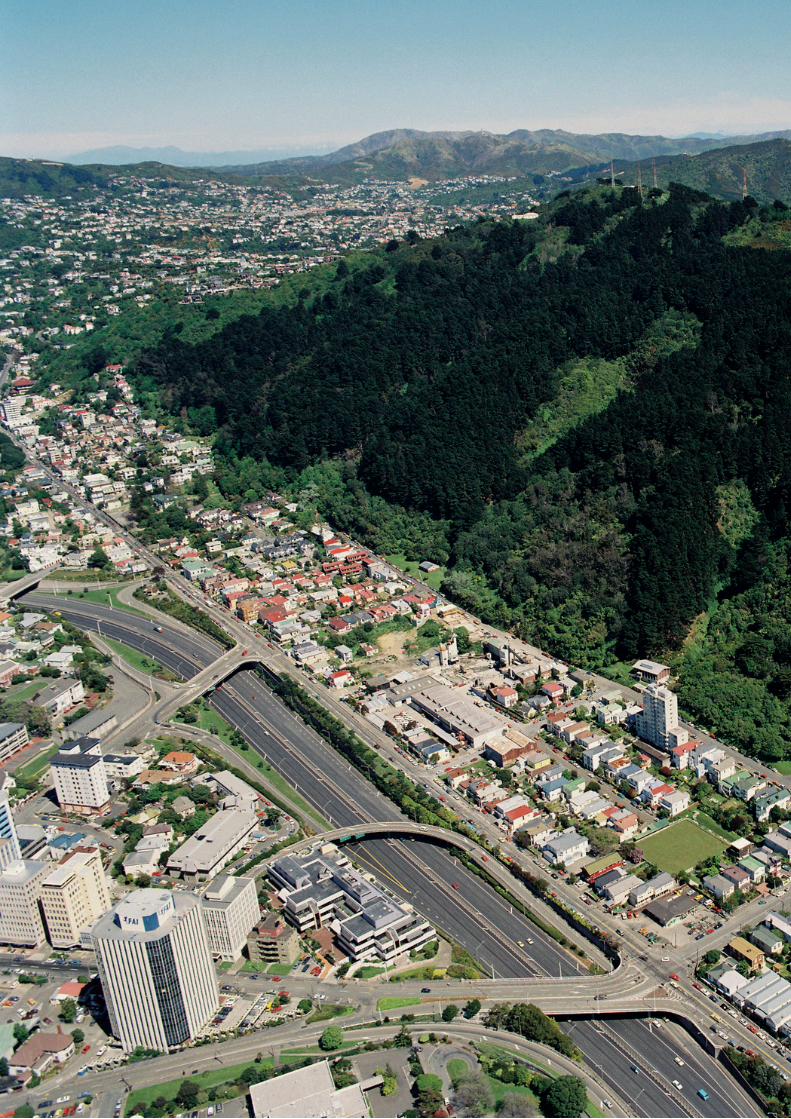
The potential for a major shock event, especially a large earthquake affecting Wellington, is well known. A wealth of studies, reports and experience show that the Wellington Region (focussing on the western side from Wellington City in the south-west to Kapiti Coast and Upper Hutt in the north and north-
Some of Wellington’s infrastructure is highly vulnerable to physical shock events such as earthquakes. This is due to the historic build quality, the location of the region’s lifeline services being heavily constrained to limited geographic corridors suitable for these services, and the infrastructure crossing fault lines in multiple locations.
The pattern of urban development of the western part of the Wellington Region is shaped by its seismic history. The Wellington Fault line that forms the western side of the Hutt Valley and the escarpment to the south is but one of a series of fault lines that have raised the hills and formed the valleys. The whole area is being lifted as the Australasian Plate is being under-thrust by the subducting Pacific Plate (Hikurangi Subduction Zone). Infrastructure and regional development has taken place over and around these seismically-created geographic features.
The western side of the Wellington Region at the south-west corner of the North Island has a physical geography that makes it especially vulnerable to major events. This is because a large
2.1 – Wellington’s Seismic Risk
2.2 – Wellington’s Geographic and Infrastructure Context
east) is highly vulnerable to a major physical shock event.
While the physical impacts of an earthquake are appreciated, the likely economic consequences have not been fully grasped. This Resilience Project has simulated the impact of a M7.5
earthquake to provide information and to enable systematic analysis on how the vital lifelines perform following the event. This information has been used to assess specific potential coordinated investments across the lifeline organisations.
“When” not “If”- Large Earthquake in Wellington RegionMajor earthquakes in 1848, 1855, 1942, and 2016 caused significant damage in the Wellington Region since European settlement in about 1840. In addition, geological research has identified many more large earthquakes resulting from rupture of the regional active faults over the past several thousand years. Therefore, it is certain that the region will be exposed to the threat of strong earthquakes in the future.
The current National Seismic Hazard Model of 2010 (NSHM2010)2 has synthesised the research data to derive the average recurrence interval of various levels of shaking on the Modified Mercalli Intensity (MMI) scale (refer to Appendix A for more details on the MM Intensity scale). For a firm soil site in Wellington there is an average ~30-year recurrence interval for MMI 7, ~120 years for MMI 8 and ~ 400 years for MMI 9.3
For reference, the February 2011 Canterbury Earthquake typically had MMI values of 9 in the Christchurch Central Business District. The 2013 Seddon and 2016 Kaikoura earthquakes resulted in MMI values in Wellington of about 6 and 7.
Future earthquakes that will cause damage in Wellington could be centred on nearby active faults (Wairarapa, Wellington, Ohariu), the Hikurangi subduction fault extending beneath Wairarapa and Wellington, or rupture of more distant faults in northern South Island (including the Alpine Fault), Cook Strait, or further north and northeast in Manawatu, Wairarapa and southern Hawkes Bay.
2 Information from the NZ National Seismic Hazard Model supplied by Russ Van Dissen, GNS Science
3 Abridged and adapted from: https://www.geonet.org.nz/earthquake/mmi
Wellington Lifelines – Regional Resilience Project / 6
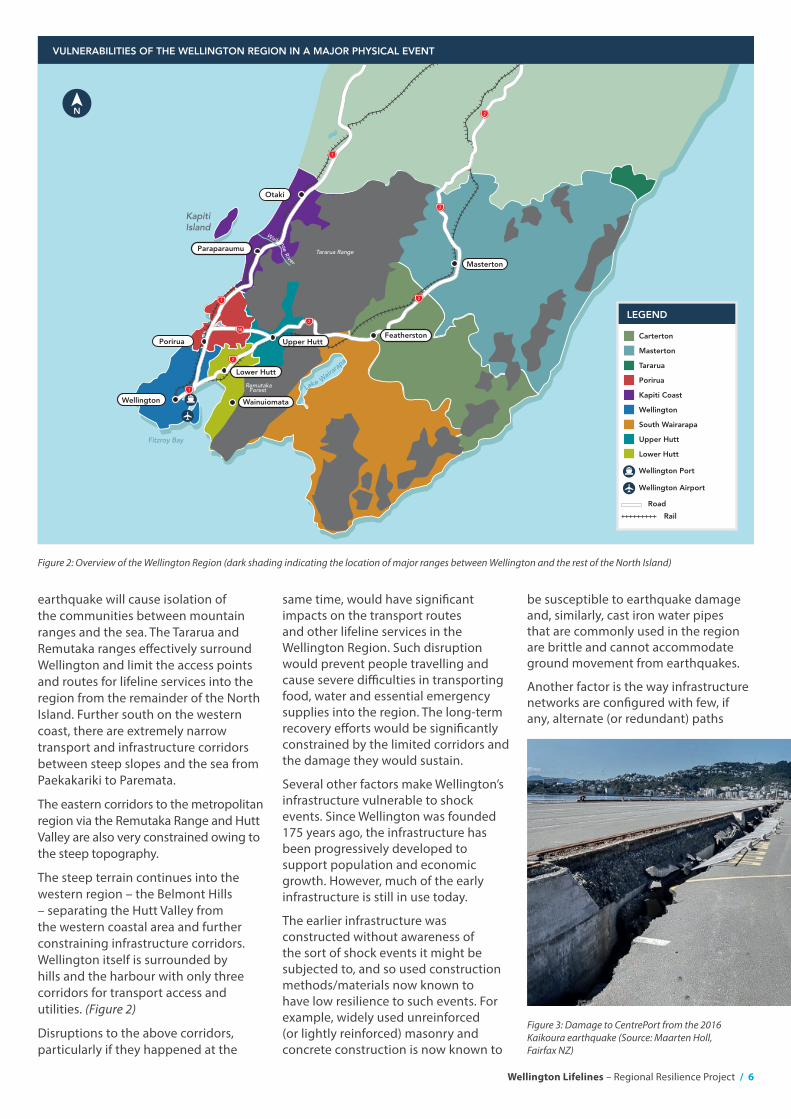
earthquake will cause isolation of the communities between mountain ranges and the sea. The Tararua and Remutaka ranges effectively surround Wellington and limit the access points and routes for lifeline services into the region from the remainder of the North Island. Further south on the western coast, there are extremely narrow transport and infrastructure corridors between steep slopes and the sea from Paekakariki to Paremata.
The eastern corridors to the metropolitan region via the Remutaka Range and Hutt Valley are also very constrained owing to the steep topography.
The steep terrain continues into the western region – the Belmont Hills – separating the Hutt Valley from the western coastal area and further constraining infrastructure corridors. Wellington itself is surrounded by hills and the harbour with only three corridors for transport access and utilities. (Figure 2)
Disruptions to the above corridors, particularly if they happened at the
same time, would have significant impacts on the transport routes and other lifeline services in the Wellington Region. Such disruption would prevent people travelling and cause severe difficulties in transporting food, water and essential emergency supplies into the region. The long-term recovery efforts would be significantly constrained by the limited corridors and the damage they would sustain.
Several other factors make Wellington’s infrastructure vulnerable to shock events. Since Wellington was founded 175 years ago, the infrastructure has been progressively developed to support population and economic growth. However, much of the early infrastructure is still in use today.
The earlier infrastructure was constructed without awareness of the sort of shock events it might be subjected to, and so used construction methods/materials now known to have low resilience to such events. For example, widely used unreinforced (or lightly reinforced) masonry and concrete construction is now known to
be susceptible to earthquake damage and, similarly, cast iron water pipes that are commonly used in the region are brittle and cannot accommodate ground movement from earthquakes.
Another factor is the way infrastructure networks are configured with few, if any, alternate (or redundant) paths
LEGEND
VULNERABILITIES OF THE WELLINGTON REGION IN A MAJOR PHYSICAL EVENT
Wellington
South Wairarapa
Upper Hutt
Kapiti Coast
Lower Hutt
Wellington Port
Rail
Road
Wellington Airport
Porirua
Tararua
Masterton
Carterton
Waikanae River
Fitzroy Bay
Kapiti Island
Upper Hutt
Masterton
Otaki
Remutaka Forest
Tararua Range
Lake Waira
rapa
Wainuiomata
Featherston
Wellington
Porirua
Paraparaumu
Lower Hutt
1
1
1
58
2
2
2
2
2
NN
Figure 2: Overview of the Wellington Region (dark shading indicating the location of major ranges between Wellington and the rest of the North Island)
Figure 3: Damage to CentrePort from the 2016 Kaikoura earthquake (Source: Maarten Holl, Fairfax NZ)
7 / Wellington Lifelines – Regional Resilience Project
to enable services to continue to be provided if they are damaged by a shock event. For example, there is a lack of practical alternative transport routes or water/electricity connectivity once primary routes are severed.
With reference to the Canterbury and Kaikoura Earthquakes previously described (refer excerpt: Large Earthquake in Wellington Region – “When” not “If”), even relatively low to moderate levels of shaking from these earthquakes caused considerable disruption to the Wellington Region including affecting the normal functioning of infrastructure networks. Most notably, there was damage to the port which is a key link in providing a
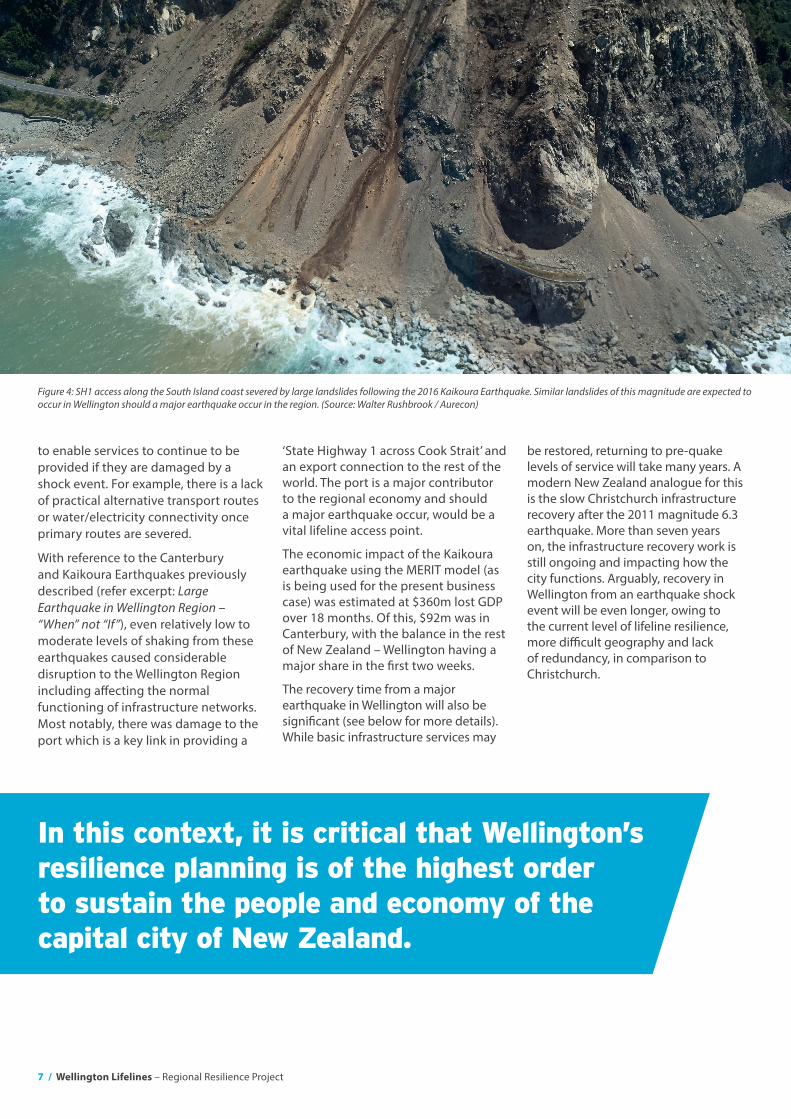
Figure 4: SH1 access along the South Island coast severed by large landslides following the 2016 Kaikoura Earthquake. Similar landslides of this magnitude are expected to occur in Wellington should a major earthquake occur in the region. (Source: Walter Rushbrook / Aurecon)
In this context, it is critical that Wellington’s resilience planning is of the highest order to sustain the people and economy of the capital city of New Zealand.
‘State Highway 1 across Cook Strait’ and an export connection to the rest of the world. The port is a major contributor to the regional economy and should a major earthquake occur, would be a vital lifeline access point.
The economic impact of the Kaikoura earthquake using the MERIT model (as is being used for the present business case) was estimated at $360m lost GDP over 18 months. Of this, $92m was in Canterbury, with the balance in the rest of New Zealand – Wellington having a major share in the first two weeks.
The recovery time from a major earthquake in Wellington will also be significant (see below for more details). While basic infrastructure services may
be restored, returning to pre-quake levels of service will take many years. A modern New Zealand analogue for this is the slow Christchurch infrastructure recovery after the 2011 magnitude 6.3 earthquake. More than seven years on, the infrastructure recovery work is still ongoing and impacting how the city functions. Arguably, recovery in Wellington from an earthquake shock event will be even longer, owing to the current level of lifeline resilience, more difficult geography and lack of redundancy, in comparison to Christchurch.
Wellington Lifelines – Regional Resilience Project / 8
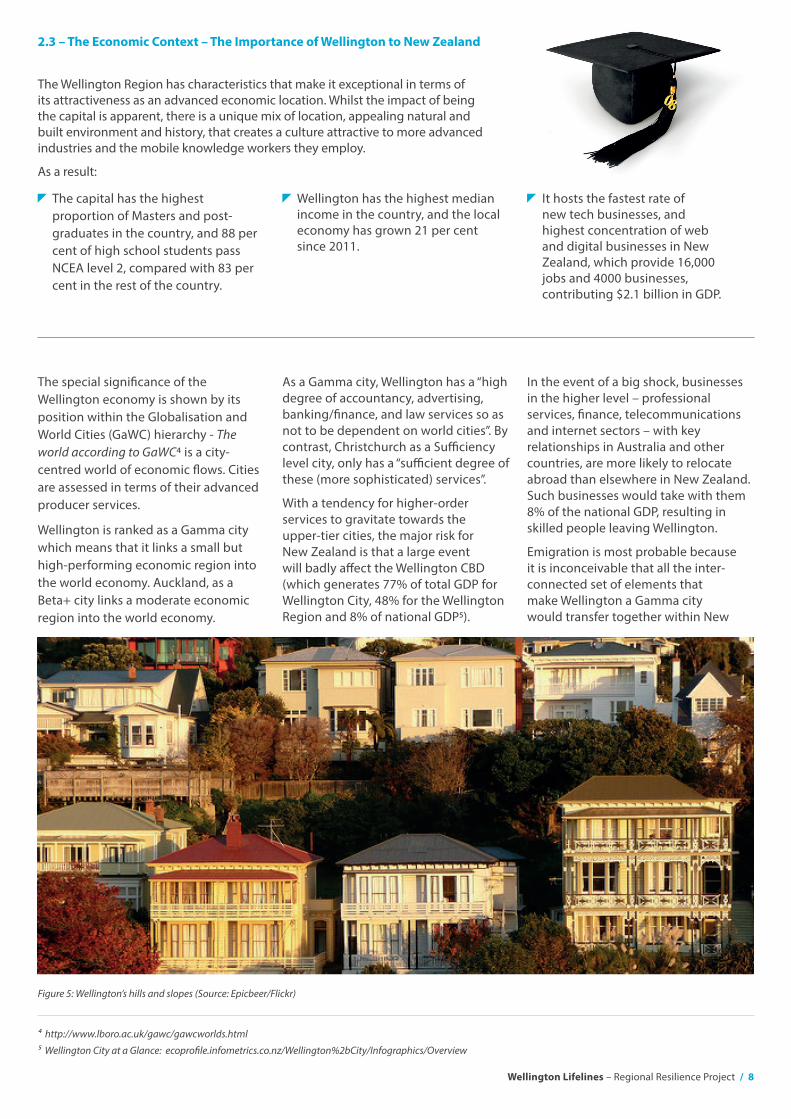
The capital has the highest proportion of Masters and post-graduates in the country, and 88 per cent of high school students pass NCEA level 2, compared with 83 per cent in the rest of the country.
The special significance of the Wellington economy is shown by its position within the Globalisation and World Cities (GaWC) hierarchy - The world according to GaWC4 is a city-centred world of economic flows. Cities are assessed in terms of their advanced producer services.
Wellington is ranked as a Gamma city which means that it links a small but high-performing economic region into the world economy. Auckland, as a Beta+ city links a moderate economic region into the world economy.
2.3 – The Economic Context – The Importance of Wellington to New Zealand
Wellington has the highest median income in the country, and the local economy has grown 21 per cent since 2011.
As a Gamma city, Wellington has a “high degree of accountancy, advertising, banking/finance, and law services so as not to be dependent on world cities”. By contrast, Christchurch as a Sufficiency level city, only has a “sufficient degree of these (more sophisticated) services”.
With a tendency for higher-order services to gravitate towards the upper-tier cities, the major risk for New Zealand is that a large event will badly affect the Wellington CBD (which generates 77% of total GDP for Wellington City, 48% for the Wellington Region and 8% of national GDP5).
It hosts the fastest rate of new tech businesses, and highest concentration of web and digital businesses in New Zealand, which provide 16,000 jobs and 4000 businesses, contributing $2.1 billion in GDP.
In the event of a big shock, businesses in the higher level – professional services, finance, telecommunications and internet sectors – with key relationships in Australia and other countries, are more likely to relocate abroad than elsewhere in New Zealand. Such businesses would take with them 8% of the national GDP, resulting in skilled people leaving Wellington.
Emigration is most probable because it is inconceivable that all the inter-connected set of elements that make Wellington a Gamma city would transfer together within New
The Wellington Region has characteristics that make it exceptional in terms of its attractiveness as an advanced economic location. Whilst the impact of being the capital is apparent, there is a unique mix of location, appealing natural and built environment and history, that creates a culture attractive to more advanced industries and the mobile knowledge workers they employ.
As a result:
4 http://www.lboro.ac.uk/gawc/gawcworlds.html
5 Wellington City at a Glance: ecoprofile.infometrics.co.nz/Wellington%2bCity/Infographics/Overview
Figure 5: Wellington’s hills and slopes (Source: Epicbeer/Flickr)
9 / Wellington Lifelines – Regional Resilience Project
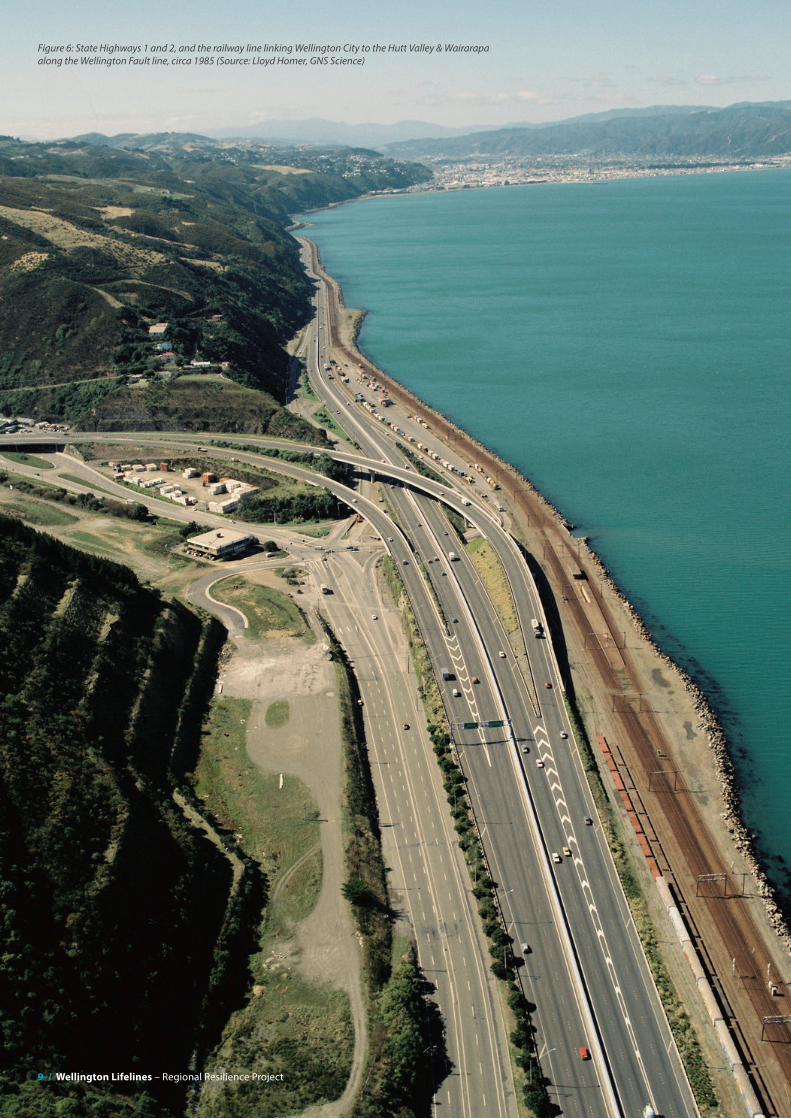
Figure 6: State Highways 1 and 2, and the railway line linking Wellington City to the Hutt Valley & Wairarapa along the Wellington Fault line, circa 1985 (Source: Lloyd Homer, GNS Science)
Wellington Lifelines – Regional Resilience Project / 10
Zealand. Wellington has unique characteristics; ideal location, making it easily accessible from the North and South islands, a strong culture of arts, creativity and innovation that includes its high-performance, globally recognised Digital Technologies sector, and the seat of Government. It has a very appealing setting with easy access to the natural environment. All this makes it attractive for high-level businesses and the ‘creative classes’. It is probable, in the event of a major earthquake, that significant components of the economy would move to the upper tier cities in the region with similar profiles – notably Melbourne and Sydney – with consequent losses to the New Zealand economy. Even once Government returned to Wellington it could be expected that there would be permanent losses.
The Wellington Resiliency Strategy6 quotes a BERL study finding that a significant earthquake in Wellington could result in New Zealand losing about 1-2% of its current GDP per year. The Net
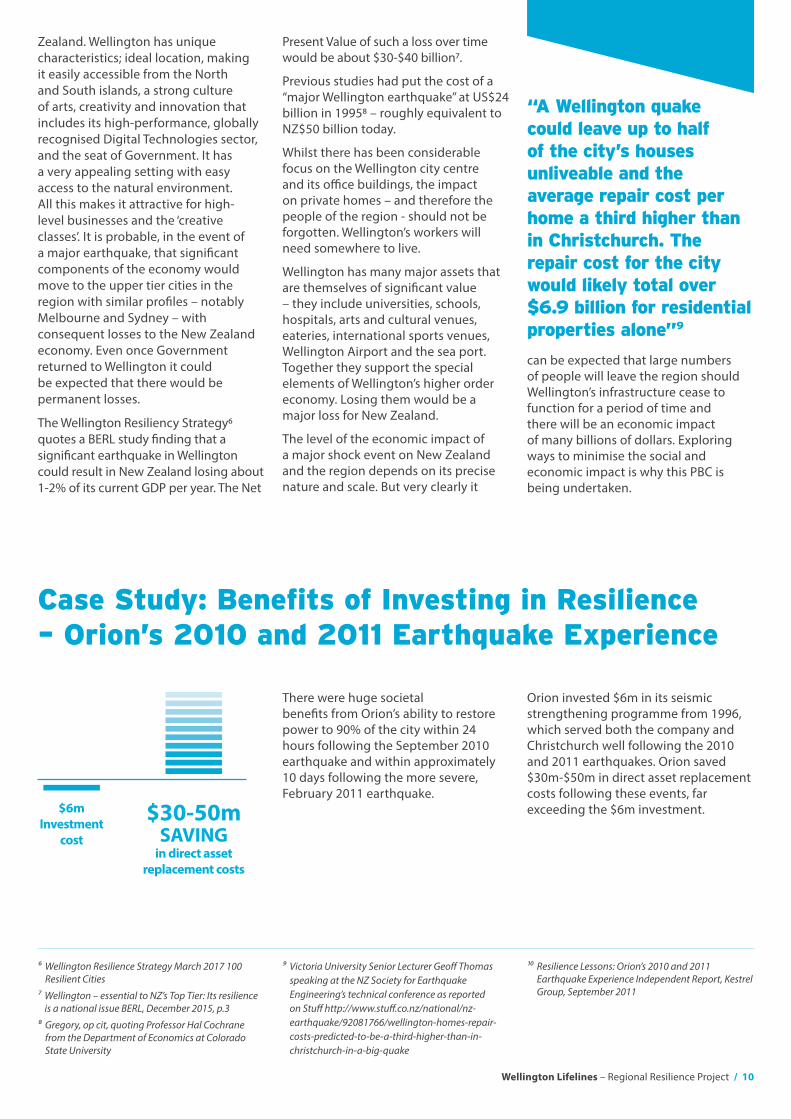
There were huge societal benefits from Orion’s ability to restore power to 90% of the city within 24 hours following the September 2010 earthquake and within approximately 10 days following the more severe, February 2011 earthquake.
Present Value of such a loss over time would be about $30-$40 billion7.
Previous studies had put the cost of a “major Wellington earthquake” at US$24 billion in 19958 – roughly equivalent to NZ$50 billion today.
Whilst there has been considerable focus on the Wellington city centre and its office buildings, the impact on private homes – and therefore the people of the region - should not be forgotten. Wellington’s workers will need somewhere to live.
Wellington has many major assets that are themselves of significant value – they include universities, schools, hospitals, arts and cultural venues, eateries, international sports venues, Wellington Airport and the sea port. Together they support the special elements of Wellington’s higher order economy. Losing them would be a major loss for New Zealand.
The level of the economic impact of a major shock event on New Zealand and the region depends on its precise nature and scale. But very clearly it
6 Wellington Resilience Strategy March 2017 100 Resilient Cities
7 Wellington – essential to NZ’s Top Tier: Its resilience is a national issue BERL, December 2015, p.3
8 Gregory, op cit, quoting Professor Hal Cochrane from the Department of Economics at Colorado State University
9 Victoria University Senior Lecturer Geoff Thomas speaking at the NZ Society for Earthquake Engineering’s technical conference as reported on Stuff http://www.stuff.co.nz/national/nz-earthquake/92081766/wellington-homes-repair-costs-predicted-to-be-a-third-higher-than-in-christchurch-in-a-big-quake
10 Resilience Lessons: Orion’s 2010 and 2011 Earthquake Experience Independent Report, Kestrel Group, September 2011
“A Wellington quake could leave up to half of the city’s houses unliveable and the average repair cost per home a third higher than in Christchurch. The repair cost for the city would likely total over $6.9 billion for residential properties alone”9
Case Study: Benefits of Investing in Resilience – Orion’s 2010 and 2011 Earthquake Experience
Orion invested $6m in its seismic strengthening programme from 1996, which served both the company and Christchurch well following the 2010 and 2011 earthquakes. Orion saved $30m-$50m in direct asset replacement costs following these events, far exceeding the $6m investment.$6m
Investment cost
$30-50mSAVING
in direct asset replacement costs
can be expected that large numbers of people will leave the region should Wellington’s infrastructure cease to function for a period of time and there will be an economic impact of many billions of dollars. Exploring ways to minimise the social and economic impact is why this PBC is being undertaken.
11 / Wellington Lifelines – Regional Resilience Project
3. Alignment to Existing Strategies
3.1 – Strategic Mandate
3.2 – Summary of Existing Strategies
This PBC is the most realistic study undertaken in New Zealand to date, in terms of the level of detail and complexity of the analysis. It provides an in-depth assessment of the interdependencies between lifelines, and details the benefits of a combined suite of interventions that would not be realised if these were assessed separately.
One of the key drivers for improving infrastructure resilience is provided by the Civil Defence Emergency Management Act 2002, which states that lifeline services (utilities) must “function at the fullest possible extent during and after an emergency”. This is why lifeline services have taken the initiative to work together to lessen the impact of an earthquake hazard event.
A summary of previous WeLG studies and their findings can be found in Appendix B.
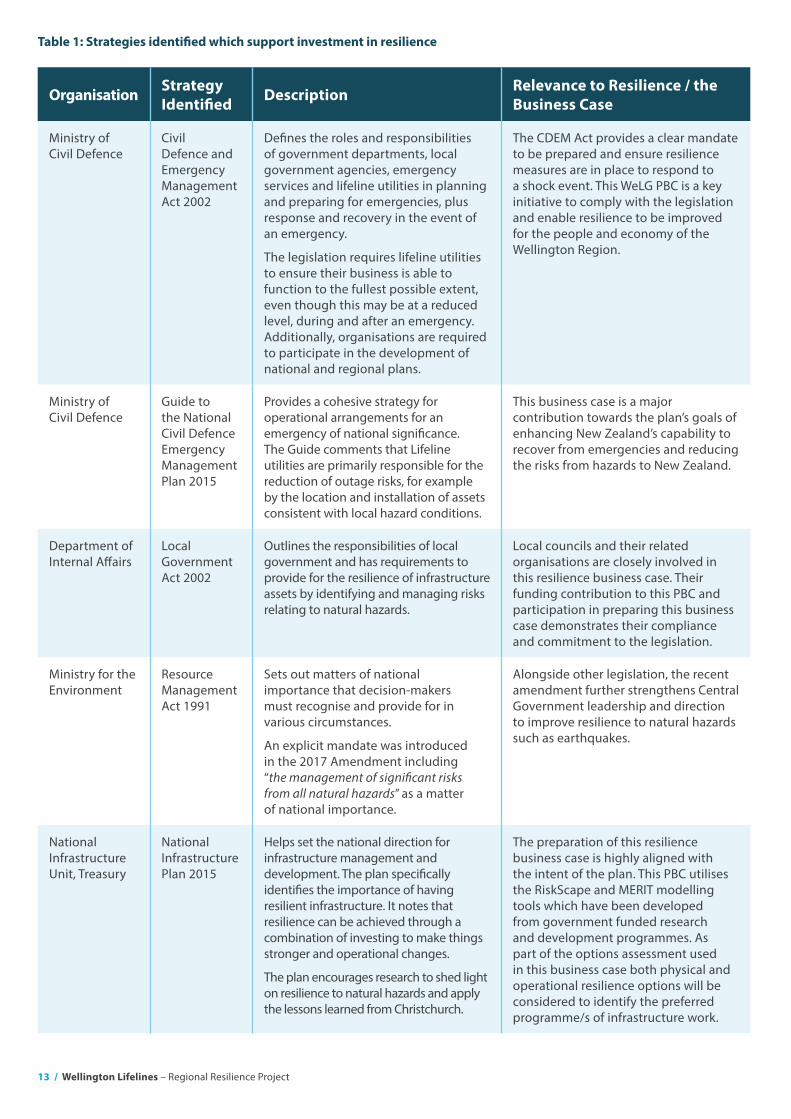
Table 1 overleaf provides a summary of strategies which support the investment in the Wellington Region’s Resilience. Appendix C contains more exhaustive details of each piece of supporting information.
Given the large number of organisations covering multiple infrastructure types, there is no individual document that could be described as New Zealand’s definitive lifeline resilience strategy. However, a variety of plans, policies and strategies exist that collectively provide the strategic context for preparing this business case. Some of the plans are in the Civil Defence Emergency Management sector, while others are found in more general infrastructure plans, often for a particular infrastructure type. These plans for particular infrastructure are important as they show how resilience fits within the organisations’ overall priorities.
Additionally, New Zealand is a signatory in the United Nations Sendai Framework
for Disaster Risk Reduction. The purpose of the framework is to substantially reduce disaster risk and losses in lives, health effects, livelihoods and economic impacts. This PBC is highly aligned with the priorities of the Sendai Framework:
Understanding disaster risk
Strengthening disaster risk governance to manage disaster risk
Investing in disaster risk reduction for resilience
Enhancing disaster preparedness for effective response and to “Build Back Better” in recovery, rehabilitation and reconstruction.
The legislative and organisational frameworks provide a strong mandate for lifeline services to plan for emergencies and improve resilience.
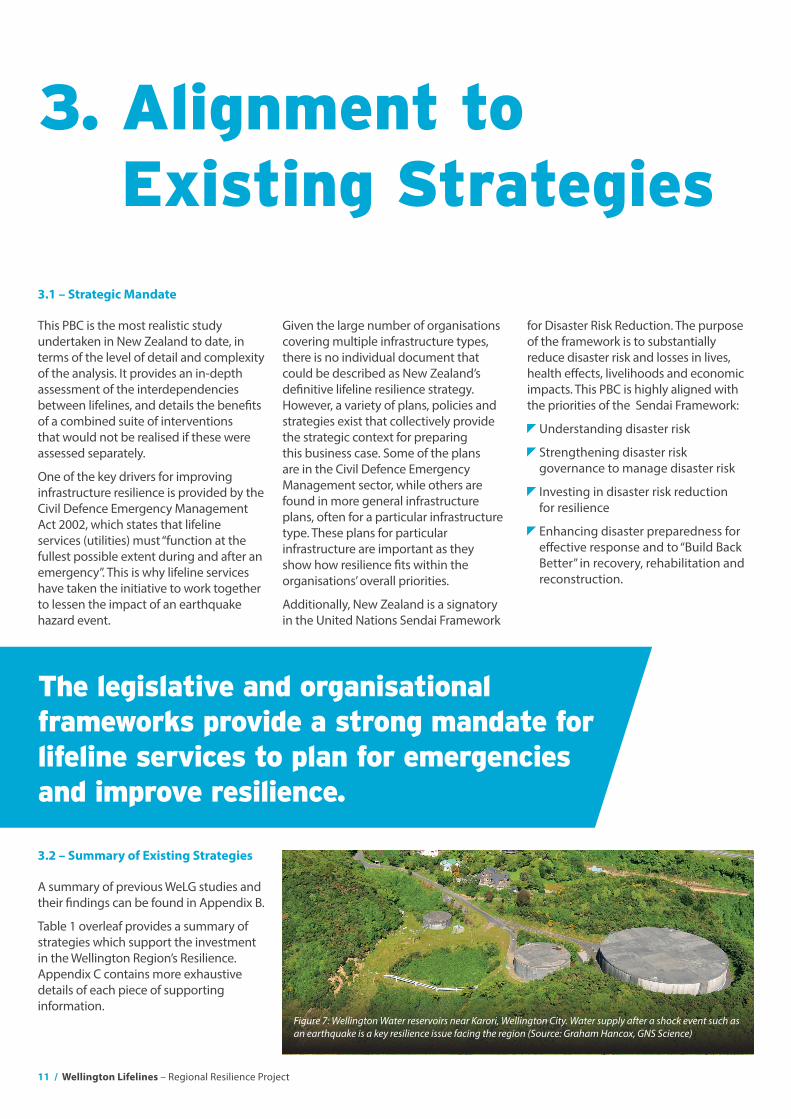
Figure 7: Wellington Water reservoirs near Karori, Wellington City. Water supply after a shock event such as an earthquake is a key resilience issue facing the region (Source: Graham Hancox, GNS Science)
Wellington Lifelines – Regional Resilience Project / 12
13 / Wellington Lifelines – Regional Resilience Project
Table 1: Strategies identified which support investment in resilience
Organisation Strategy Identified Description Relevance to Resilience / the
Business Case
Ministry of Civil Defence
Civil Defence and Emergency Management Act 2002
Defines the roles and responsibilities of government departments, local government agencies, emergency services and lifeline utilities in planning and preparing for emergencies, plus response and recovery in the event of an emergency.
The legislation requires lifeline utilities to ensure their business is able to function to the fullest possible extent, even though this may be at a reduced level, during and after an emergency. Additionally, organisations are required to participate in the development of national and regional plans.
The CDEM Act provides a clear mandate to be prepared and ensure resilience measures are in place to respond to a shock event. This WeLG PBC is a key initiative to comply with the legislation and enable resilience to be improved for the people and economy of the Wellington Region.
Ministry of Civil Defence
Guide to the National Civil Defence Emergency Management Plan 2015
Provides a cohesive strategy for operational arrangements for an emergency of national significance. The Guide comments that Lifeline utilities are primarily responsible for the reduction of outage risks, for example by the location and installation of assets consistent with local hazard conditions.
This business case is a major contribution towards the plan’s goals of enhancing New Zealand’s capability to recover from emergencies and reducing the risks from hazards to New Zealand.
Department of Internal Affairs
Local Government Act 2002
Outlines the responsibilities of local government and has requirements to provide for the resilience of infrastructure assets by identifying and managing risks relating to natural hazards.
Local councils and their related organisations are closely involved in this resilience business case. Their funding contribution to this PBC and participation in preparing this business case demonstrates their compliance and commitment to the legislation.
Ministry for the Environment
Resource Management Act 1991
Sets out matters of national importance that decision-makers must recognise and provide for in various circumstances.
An explicit mandate was introduced in the 2017 Amendment including “the management of significant risks from all natural hazards” as a matter of national importance.
Alongside other legislation, the recent amendment further strengthens Central Government leadership and direction to improve resilience to natural hazards such as earthquakes.
National Infrastructure Unit, Treasury
National Infrastructure Plan 2015
Helps set the national direction for infrastructure management and development. The plan specifically identifies the importance of having resilient infrastructure. It notes that resilience can be achieved through a combination of investing to make things stronger and operational changes.
The plan encourages research to shed light on resilience to natural hazards and apply the lessons learned from Christchurch.
The preparation of this resilience business case is highly aligned with the intent of the plan. This PBC utilises the RiskScape and MERIT modelling tools which have been developed from government funded research and development programmes. As part of the options assessment used in this business case both physical and operational resilience options will be considered to identify the preferred programme/s of infrastructure work.
Wellington Lifelines – Regional Resilience Project / 14
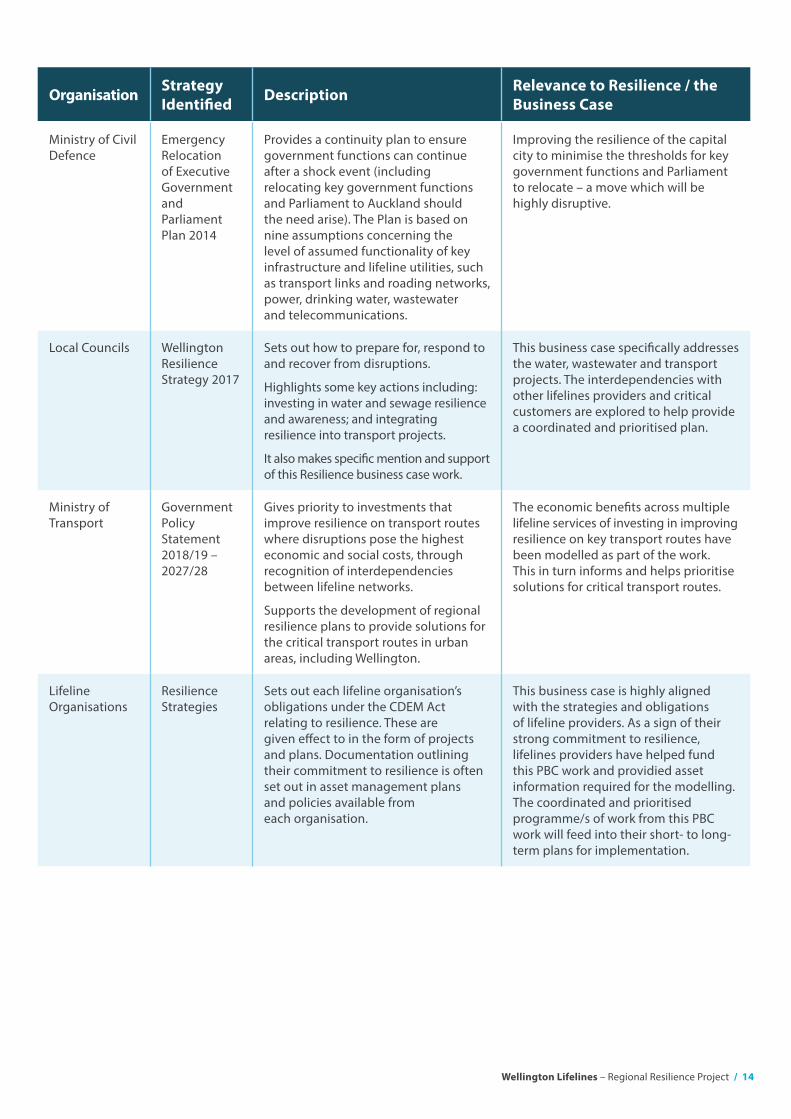
Ministry of Civil Defence
Emergency Relocation of Executive Government and Parliament Plan 2014
Provides a continuity plan to ensure government functions can continue after a shock event (including relocating key government functions and Parliament to Auckland should the need arise). The Plan is based on nine assumptions concerning the level of assumed functionality of key infrastructure and lifeline utilities, such as transport links and roading networks, power, drinking water, wastewater and telecommunications.
Improving the resilience of the capital city to minimise the thresholds for key government functions and Parliament to relocate – a move which will be highly disruptive.
Local Councils Wellington Resilience Strategy 2017
Sets out how to prepare for, respond to and recover from disruptions.
Highlights some key actions including: investing in water and sewage resilience and awareness; and integrating resilience into transport projects.
It also makes specific mention and support of this Resilience business case work.
This business case specifically addresses the water, wastewater and transport projects. The interdependencies with other lifelines providers and critical customers are explored to help provide a coordinated and prioritised plan.
Ministry of Transport
Government Policy Statement 2018/19 – 2027/28
Gives priority to investments that improve resilience on transport routes where disruptions pose the highest economic and social costs, through recognition of interdependencies between lifeline networks.
Supports the development of regional resilience plans to provide solutions for the critical transport routes in urban areas, including Wellington.
The economic benefits across multiple lifeline services of investing in improving resilience on key transport routes have been modelled as part of the work. This in turn informs and helps prioritise solutions for critical transport routes.
Lifeline Organisations
Resilience Strategies
Sets out each lifeline organisation’s obligations under the CDEM Act relating to resilience. These are given effect to in the form of projects and plans. Documentation outlining their commitment to resilience is often set out in asset management plans and policies available from each organisation.
This business case is highly aligned with the strategies and obligations of lifeline providers. As a sign of their strong commitment to resilience, lifelines providers have helped fund this PBC work and providied asset information required for the modelling. The coordinated and prioritised programme/s of work from this PBC work will feed into their short- to long-term plans for implementation.
Organisation Strategy Identified Description Relevance to Resilience / the
Business Case
15 / Wellington Lifelines – Regional Resilience Project
4. Investment Objectives
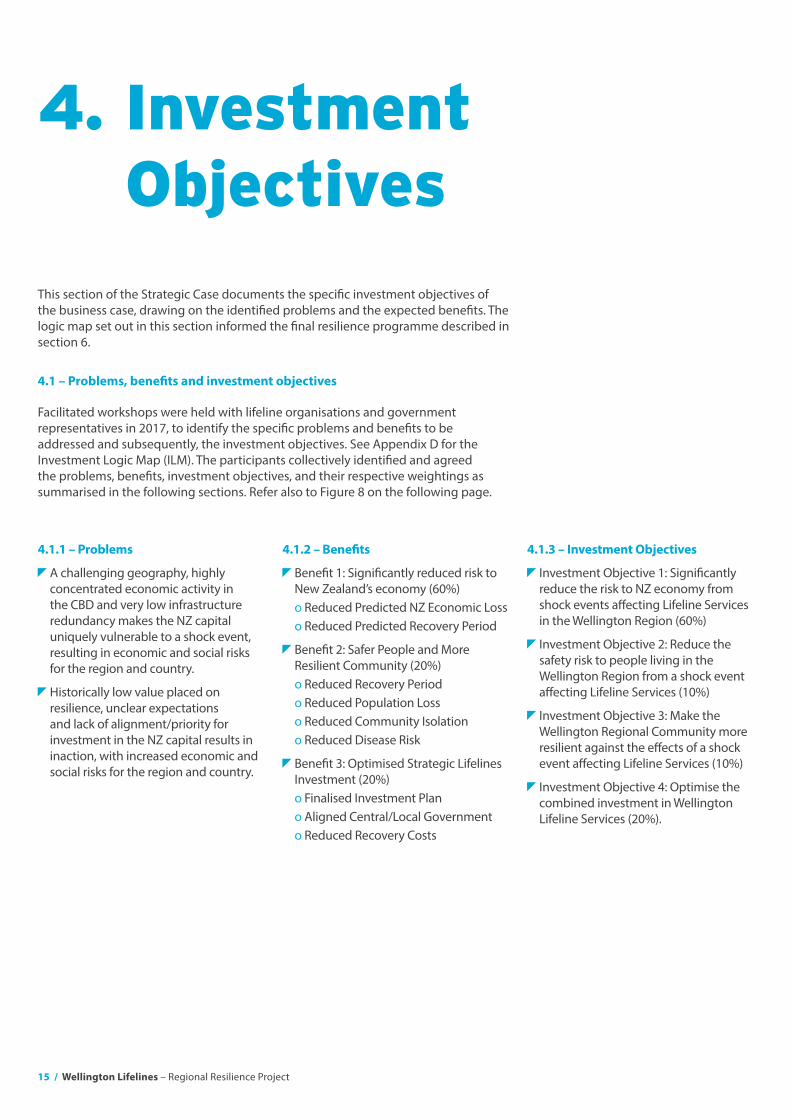
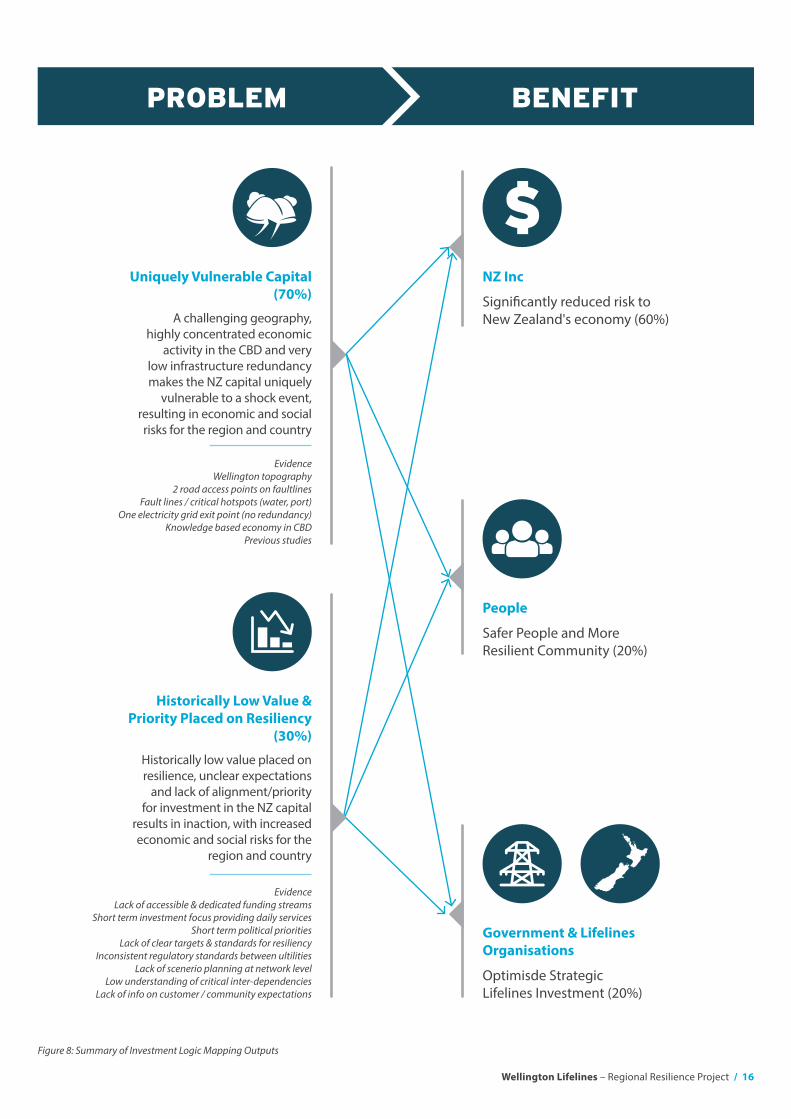
This section of the Strategic Case documents the specific investment objectives of the business case, drawing on the identified problems and the expected benefits. The logic map set out in this section informed the final resilience programme described in section 6.
Facilitated workshops were held with lifeline organisations and government representatives in 2017, to identify the specific problems and benefits to be addressed and subsequently, the investment objectives. See Appendix D for the Investment Logic Map (ILM). The participants collectively identified and agreed the problems, benefits, investment objectives, and their respective weightings as summarised in the following sections. Refer also to Figure 8 on the following page.
4.1 – Problems, benefits and investment objectives
4.1.1 – Problems
A challenging geography, highly concentrated economic activity in the CBD and very low infrastructure redundancy makes the NZ capital uniquely vulnerable to a shock event, resulting in economic and social risks for the region and country.
Historically low value placed on resilience, unclear expectations and lack of alignment/priority for investment in the NZ capital results in inaction, with increased economic and social risks for the region and country.
4.1.2 – Benefits
Benefit 1: Significantly reduced risk to New Zealand’s economy (60%) o Reduced Predicted NZ Economic Loss o Reduced Predicted Recovery Period
Benefit 2: Safer People and More Resilient Community (20%) o Reduced Recovery Period o Reduced Population Loss o Reduced Community Isolation o Reduced Disease Risk
Benefit 3: Optimised Strategic Lifelines Investment (20%) o Finalised Investment Plan o Aligned Central/Local Government o Reduced Recovery Costs
4.1.3 – Investment Objectives
Investment Objective 1: Significantly reduce the risk to NZ economy from shock events affecting Lifeline Services in the Wellington Region (60%)
Investment Objective 2: Reduce the safety risk to people living in the Wellington Region from a shock event affecting Lifeline Services (10%)
Investment Objective 3: Make the Wellington Regional Community more resilient against the effects of a shock event affecting Lifeline Services (10%)
Investment Objective 4: Optimise the combined investment in Wellington Lifeline Services (20%).
Wellington Lifelines – Regional Resilience Project / 16
Figure 8: Summary of Investment Logic Mapping Outputs
PROBLEM BENEFIT
Uniquely Vulnerable Capital (70%)
A challenging geography, highly concentrated economic
activity in the CBD and very low infrastructure redundancy makes the NZ capital uniquely
vulnerable to a shock event, resulting in economic and social risks for the region and country
NZ Inc
Significantly reduced risk to New Zealand's economy (60%)
People
Safer People and More Resilient Community (20%)
Government & Lifelines Organisations
Optimisde Strategic Lifelines Investment (20%)
Historically Low Value & Priority Placed on Resiliency
(30%)
Historically low value placed on resilience, unclear expectations
and lack of alignment/priority for investment in the NZ capital
results in inaction, with increased economic and social risks for the
region and country
EvidenceWellington topography
2 road access points on faultlinesFault lines / critical hotspots (water, port)
One electricity grid exit point (no redundancy)Knowledge based economy in CBD
Previous studies
EvidenceLack of accessible & dedicated funding streams
Short term investment focus providing daily servicesShort term political priorities
Lack of clear targets & standards for resiliencyInconsistent regulatory standards between ultilities
Lack of scenerio planning at network levelLow understanding of critical inter-dependencies
Lack of info on customer / community expectations
17 / Wellington Lifelines – Regional Resilience Project
5. Risks, Constraints and Dependencies
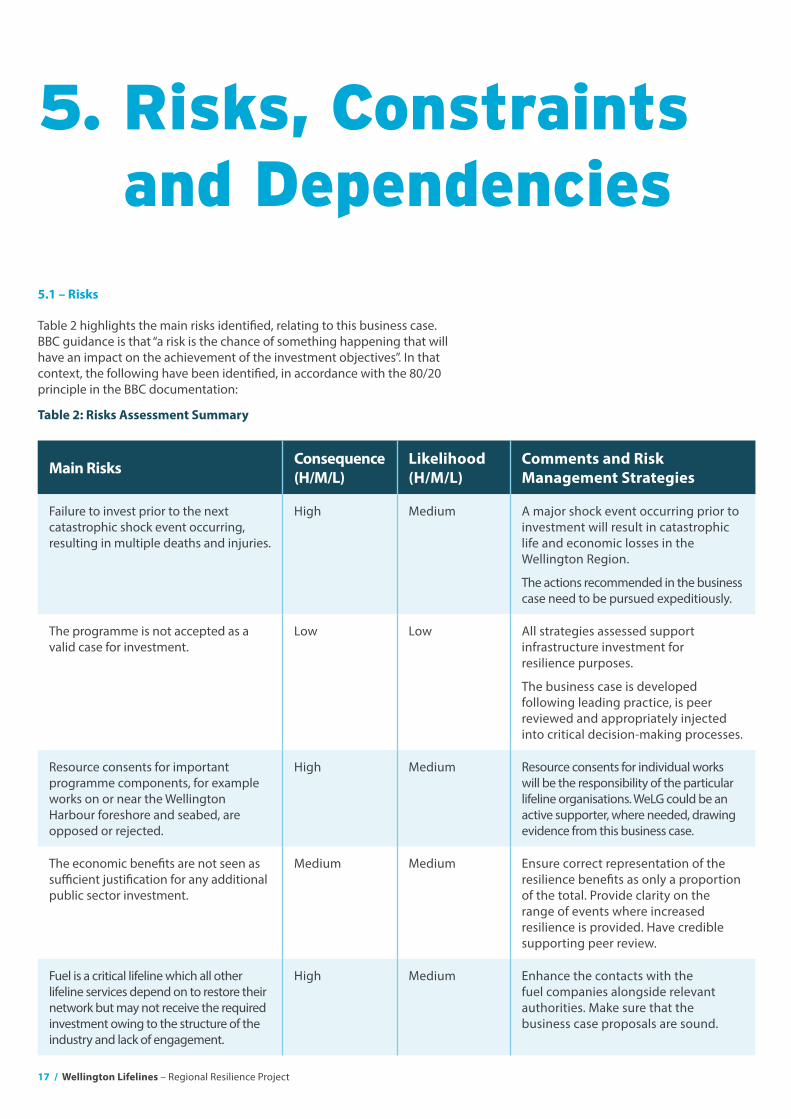
Table 2 highlights the main risks identified, relating to this business case. BBC guidance is that “a risk is the chance of something happening that will have an impact on the achievement of the investment objectives”. In that context, the following have been identified, in accordance with the 80/20 principle in the BBC documentation:
5.1 – Risks
Table 2: Risks Assessment Summary
Main Risks Consequence (H/M/L)
Likelihood (H/M/L)
Comments and Risk Management Strategies
Failure to invest prior to the next catastrophic shock event occurring, resulting in multiple deaths and injuries.
High Medium A major shock event occurring prior to investment will result in catastrophic life and economic losses in the Wellington Region.
The actions recommended in the business case need to be pursued expeditiously.
The programme is not accepted as a valid case for investment.
Low Low All strategies assessed support infrastructure investment for resilience purposes.
The business case is developed following leading practice, is peer reviewed and appropriately injected into critical decision-making processes.
Resource consents for important programme components, for example works on or near the Wellington Harbour foreshore and seabed, are opposed or rejected.
High Medium Resource consents for individual works will be the responsibility of the particular lifeline organisations. WeLG could be an active supporter, where needed, drawing evidence from this business case.
The economic benefits are not seen as sufficient justification for any additional public sector investment.
Medium Medium Ensure correct representation of the resilience benefits as only a proportion of the total. Provide clarity on the range of events where increased resilience is provided. Have credible supporting peer review.
Fuel is a critical lifeline which all other lifeline services depend on to restore their network but may not receive the required investment owing to the structure of the industry and lack of engagement.
High Medium Enhance the contacts with the fuel companies alongside relevant authorities. Make sure that the business case proposals are sound.
Wellington Lifelines – Regional Resilience Project / 18
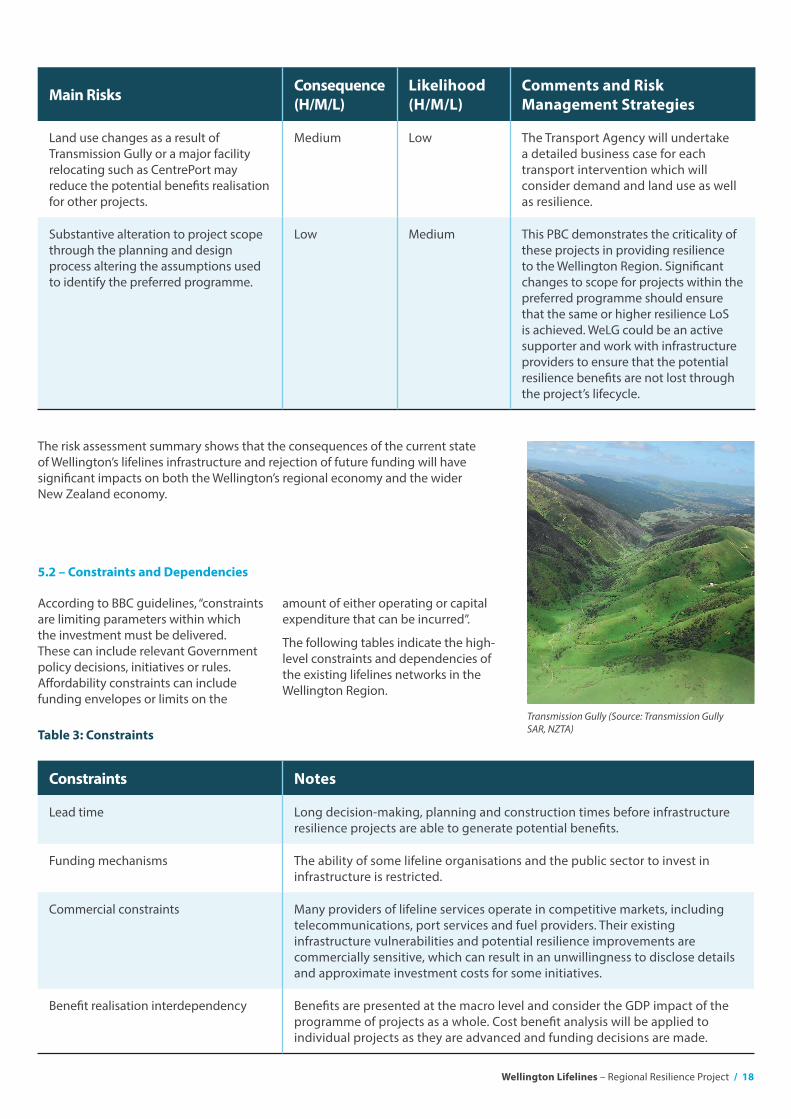
According to BBC guidelines, “constraints are limiting parameters within which the investment must be delivered. These can include relevant Government policy decisions, initiatives or rules. Affordability constraints can include funding envelopes or limits on the
The risk assessment summary shows that the consequences of the current state of Wellington’s lifelines infrastructure and rejection of future funding will have significant impacts on both the Wellington’s regional economy and the wider New Zealand economy.
5.2 – Constraints and Dependencies
Table 3: Constraints
Constraints Notes
Lead time Long decision-making, planning and construction times before infrastructure resilience projects are able to generate potential benefits.
Funding mechanisms The ability of some lifeline organisations and the public sector to invest in infrastructure is restricted.
Commercial constraints Many providers of lifeline services operate in competitive markets, including telecommunications, port services and fuel providers. Their existing infrastructure vulnerabilities and potential resilience improvements are commercially sensitive, which can result in an unwillingness to disclose details and approximate investment costs for some initiatives.
Benefit realisation interdependency Benefits are presented at the macro level and consider the GDP impact of the programme of projects as a whole. Cost benefit analysis will be applied to individual projects as they are advanced and funding decisions are made.
Main Risks Consequence (H/M/L)
Likelihood (H/M/L)
Comments and Risk Management Strategies
Land use changes as a result of Transmission Gully or a major facility relocating such as CentrePort may reduce the potential benefits realisation for other projects.
Medium Low The Transport Agency will undertake a detailed business case for each transport intervention which will consider demand and land use as well as resilience.
Substantive alteration to project scope through the planning and design process altering the assumptions used to identify the preferred programme.
Low Medium This PBC demonstrates the criticality of these projects in providing resilience to the Wellington Region. Significant changes to scope for projects within the preferred programme should ensure that the same or higher resilience LoS is achieved. WeLG could be an active supporter and work with infrastructure providers to ensure that the potential resilience benefits are not lost through the project’s lifecycle.
amount of either operating or capital expenditure that can be incurred”.
The following tables indicate the high-level constraints and dependencies of the existing lifelines networks in the Wellington Region.
Transmission Gully (Source: Transmission Gully SAR, NZTA)
19 / Wellington Lifelines – Regional Resilience Project
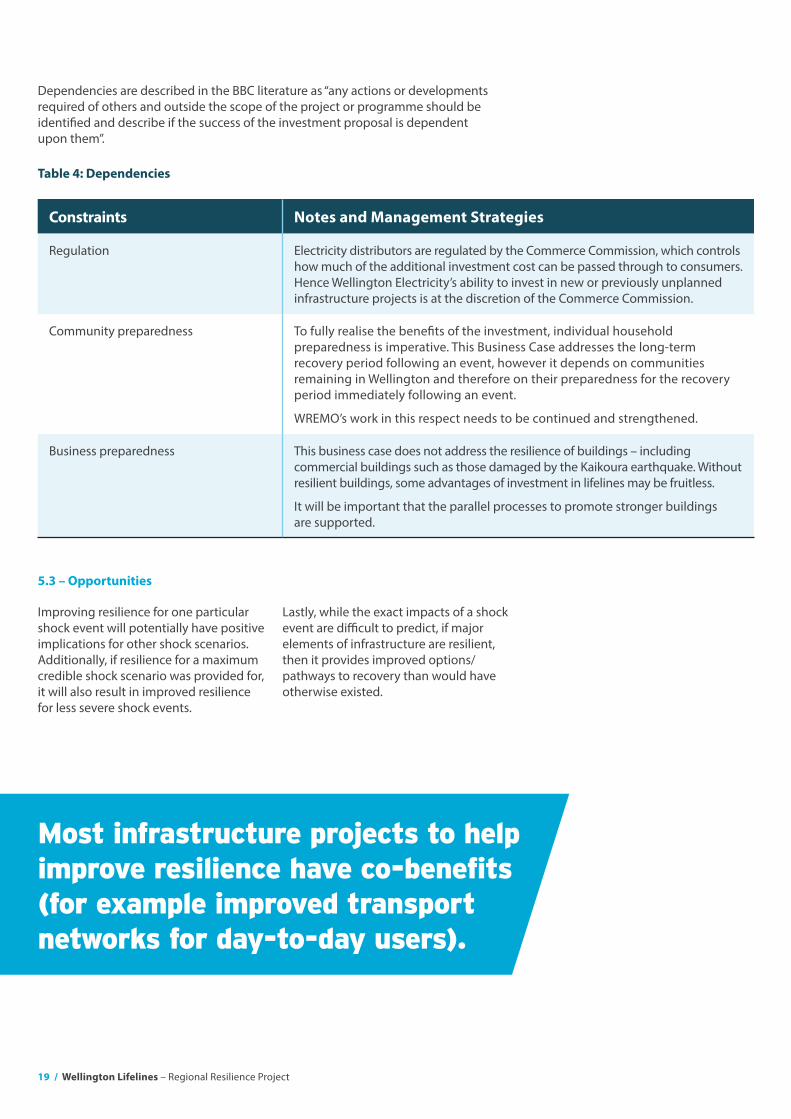
Dependencies are described in the BBC literature as “any actions or developments required of others and outside the scope of the project or programme should be identified and describe if the success of the investment proposal is dependent upon them”.
Table 4: Dependencies
Constraints Notes and Management Strategies
Regulation Electricity distributors are regulated by the Commerce Commission, which controls how much of the additional investment cost can be passed through to consumers. Hence Wellington Electricity’s ability to invest in new or previously unplanned infrastructure projects is at the discretion of the Commerce Commission.
Community preparedness To fully realise the benefits of the investment, individual household preparedness is imperative. This Business Case addresses the long-term recovery period following an event, however it depends on communities remaining in Wellington and therefore on their preparedness for the recovery period immediately following an event.
WREMO’s work in this respect needs to be continued and strengthened.
Business preparedness This business case does not address the resilience of buildings – including commercial buildings such as those damaged by the Kaikoura earthquake. Without resilient buildings, some advantages of investment in lifelines may be fruitless.
It will be important that the parallel processes to promote stronger buildings are supported.
Improving resilience for one particular shock event will potentially have positive implications for other shock scenarios. Additionally, if resilience for a maximum credible shock scenario was provided for, it will also result in improved resilience for less severe shock events.
5.3 – Opportunities
Lastly, while the exact impacts of a shock event are difficult to predict, if major elements of infrastructure are resilient, then it provides improved options/pathways to recovery than would have otherwise existed.
Most infrastructure projects to help improve resilience have co-benefits (for example improved transport networks for day-to-day users).

Wellington Lifelines – Regional Resilience Project / 20
21 / Wellington Lifelines – Regional Resilience Project
PART B – EXPLORING THE PREFERRED WAY FORWARD

Wellington Lifelines – Regional Resilience Project / 22
23 / Wellington Lifelines – Regional Resilience Project
6 . Options Identification and Assessment
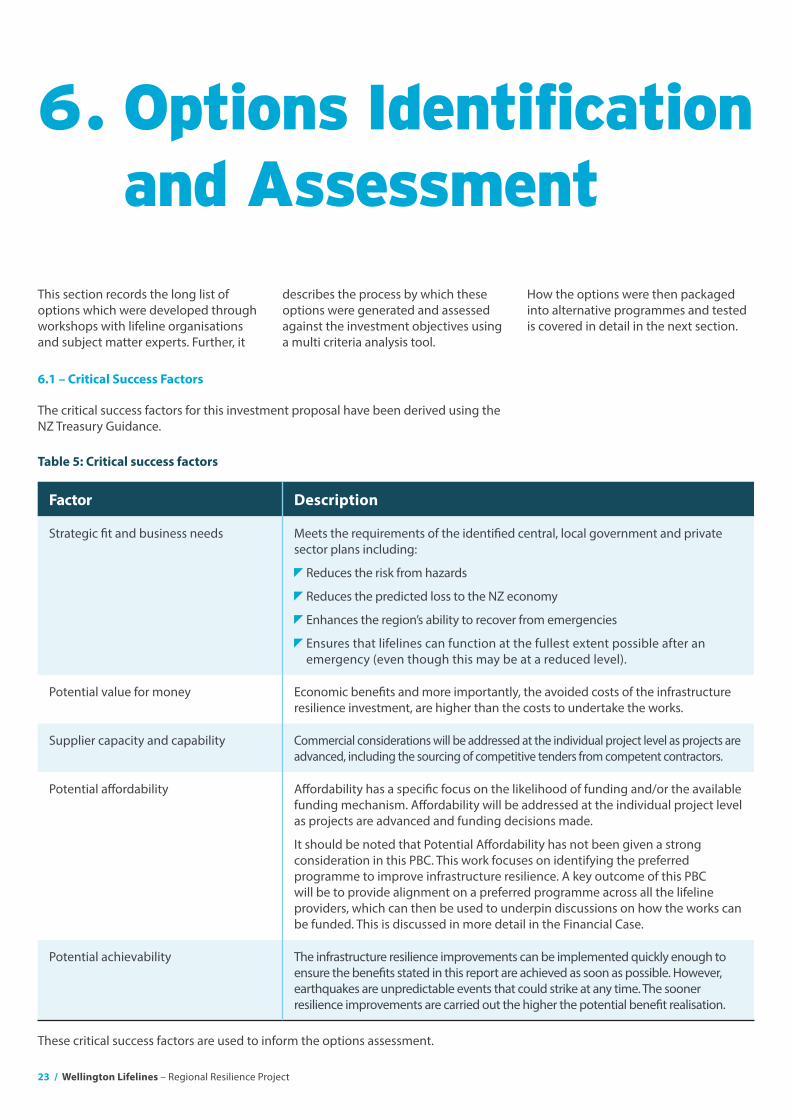
This section records the long list of options which were developed through workshops with lifeline organisations and subject matter experts. Further, it
The critical success factors for this investment proposal have been derived using the NZ Treasury Guidance.
These critical success factors are used to inform the options assessment.
6.1 – Critical Success Factors
Table 5: Critical success factors
Factor Description
Strategic fit and business needs Meets the requirements of the identified central, local government and private sector plans including:
Reduces the risk from hazards
Reduces the predicted loss to the NZ economy
Enhances the region’s ability to recover from emergencies
Ensures that lifelines can function at the fullest extent possible after an emergency (even though this may be at a reduced level).
Potential value for money Economic benefits and more importantly, the avoided costs of the infrastructure resilience investment, are higher than the costs to undertake the works.
Supplier capacity and capability Commercial considerations will be addressed at the individual project level as projects are advanced, including the sourcing of competitive tenders from competent contractors.
Potential affordability Affordability has a specific focus on the likelihood of funding and/or the available funding mechanism. Affordability will be addressed at the individual project level as projects are advanced and funding decisions made.
It should be noted that Potential Affordability has not been given a strong consideration in this PBC. This work focuses on identifying the preferred programme to improve infrastructure resilience. A key outcome of this PBC will be to provide alignment on a preferred programme across all the lifeline providers, which can then be used to underpin discussions on how the works can be funded. This is discussed in more detail in the Financial Case.
Potential achievability The infrastructure resilience improvements can be implemented quickly enough to ensure the benefits stated in this report are achieved as soon as possible. However, earthquakes are unpredictable events that could strike at any time. The sooner resilience improvements are carried out the higher the potential benefit realisation.
describes the process by which these options were generated and assessed against the investment objectives using a multi criteria analysis tool.
How the options were then packaged into alternative programmes and tested is covered in detail in the next section.
Wellington Lifelines – Regional Resilience Project / 24
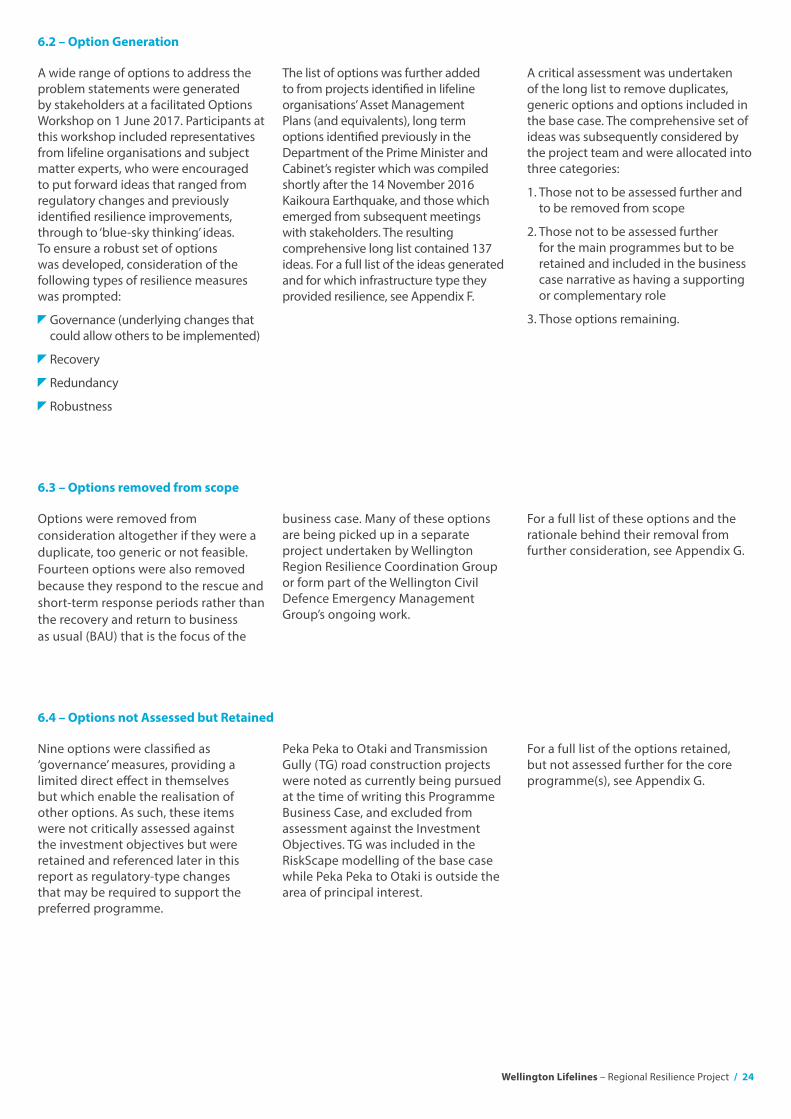
A wide range of options to address the problem statements were generated by stakeholders at a facilitated Options Workshop on 1 June 2017. Participants at this workshop included representatives from lifeline organisations and subject matter experts, who were encouraged to put forward ideas that ranged from regulatory changes and previously identified resilience improvements, through to ‘blue-sky thinking’ ideas. To ensure a robust set of options was developed, consideration of the following types of resilience measures was prompted:
Governance (underlying changes that could allow others to be implemented)
Recovery
Redundancy
Robustness
Options were removed from consideration altogether if they were a duplicate, too generic or not feasible. Fourteen options were also removed because they respond to the rescue and short-term response periods rather than the recovery and return to business as usual (BAU) that is the focus of the
Nine options were classified as ‘governance’ measures, providing a limited direct effect in themselves but which enable the realisation of other options. As such, these items were not critically assessed against the investment objectives but were retained and referenced later in this report as regulatory-type changes that may be required to support the preferred programme.
6.2 – Option Generation
6.3 – Options removed from scope
6.4 – Options not Assessed but Retained
The list of options was further added to from projects identified in lifeline organisations’ Asset Management Plans (and equivalents), long term options identified previously in the Department of the Prime Minister and Cabinet’s register which was compiled shortly after the 14 November 2016 Kaikoura Earthquake, and those which emerged from subsequent meetings with stakeholders. The resulting comprehensive long list contained 137 ideas. For a full list of the ideas generated and for which infrastructure type they provided resilience, see Appendix F.
business case. Many of these options are being picked up in a separate project undertaken by Wellington Region Resilience Coordination Group or form part of the Wellington Civil Defence Emergency Management Group’s ongoing work.
Peka Peka to Otaki and Transmission Gully (TG) road construction projects were noted as currently being pursued at the time of writing this Programme Business Case, and excluded from assessment against the Investment Objectives. TG was included in the RiskScape modelling of the base case while Peka Peka to Otaki is outside the area of principal interest.
A critical assessment was undertaken of the long list to remove duplicates, generic options and options included in the base case. The comprehensive set of ideas was subsequently considered by the project team and were allocated into three categories:
1. Those not to be assessed further and to be removed from scope
2. Those not to be assessed further for the main programmes but to be retained and included in the business case narrative as having a supporting or complementary role
3. Those options remaining.
For a full list of these options and the rationale behind their removal from further consideration, see Appendix G.
For a full list of the options retained, but not assessed further for the core programme(s), see Appendix G.
25 / Wellington Lifelines – Regional Resilience Project
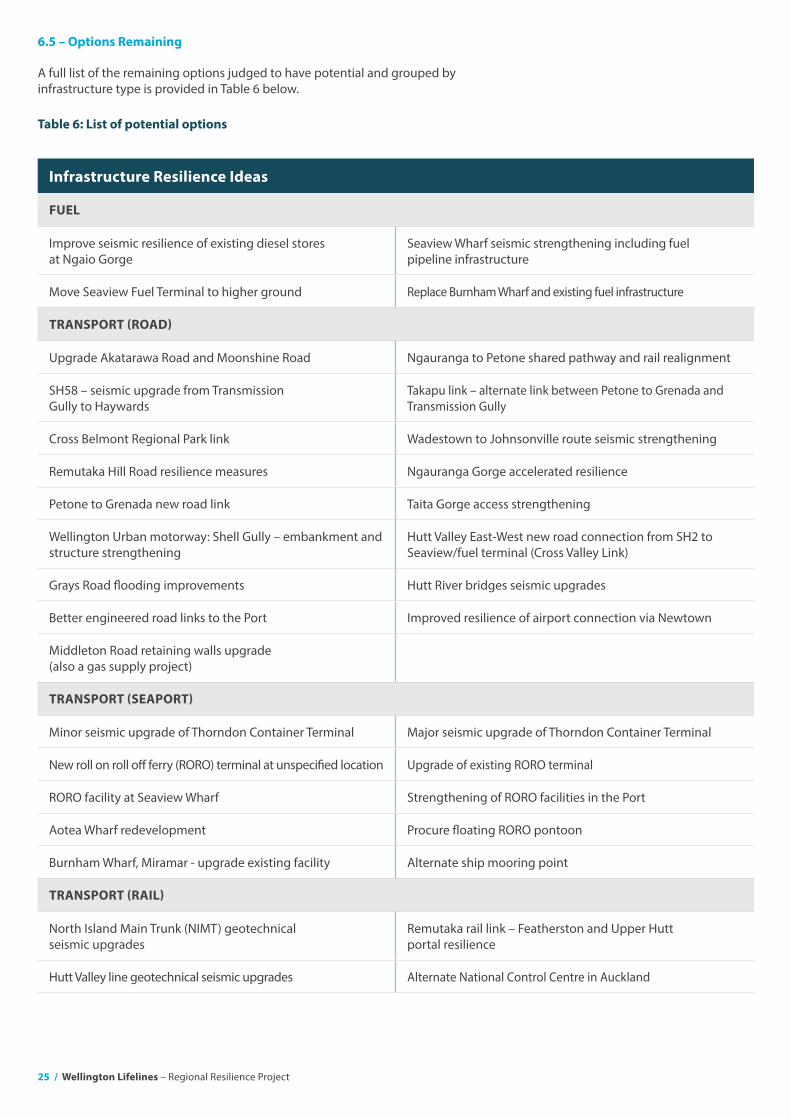
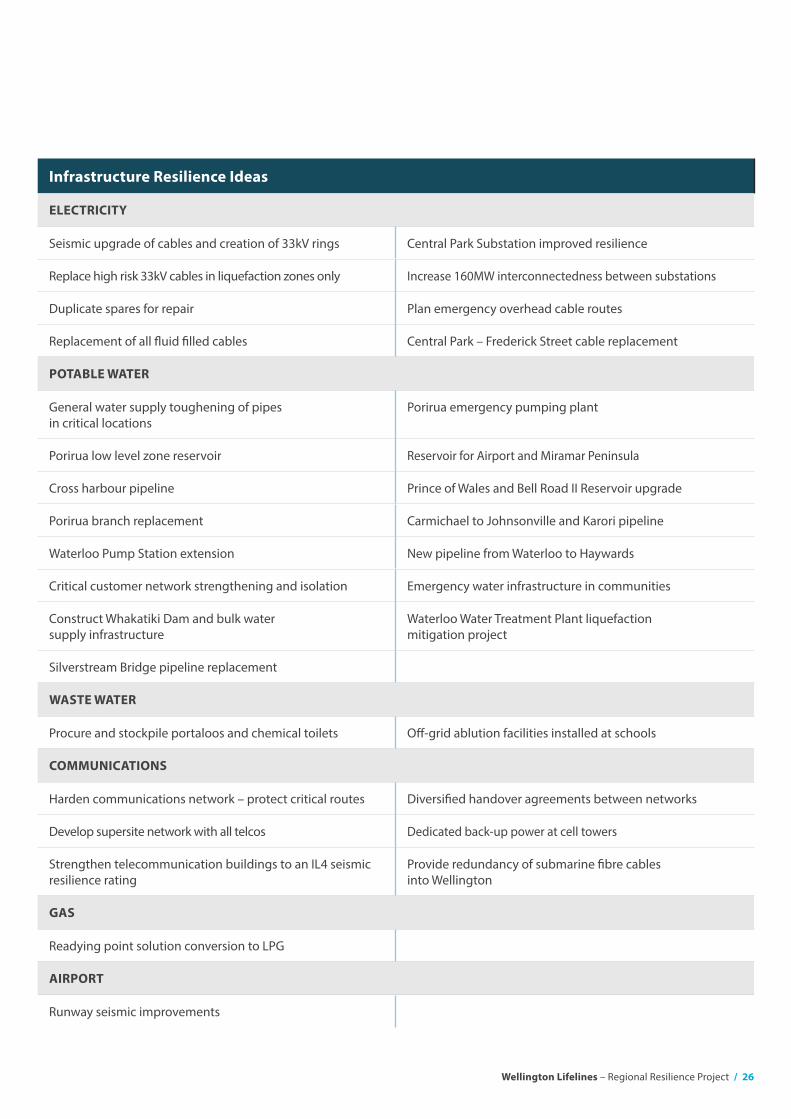
A full list of the remaining options judged to have potential and grouped by infrastructure type is provided in Table 6 below.
6.5 – Options Remaining
Table 6: List of potential options
Infrastructure Resilience Ideas
FUEL
Improve seismic resilience of existing diesel stores at Ngaio Gorge
Seaview Wharf seismic strengthening including fuel pipeline infrastructure
Move Seaview Fuel Terminal to higher ground Replace Burnham Wharf and existing fuel infrastructure
TRANSPORT (ROAD)
Upgrade Akatarawa Road and Moonshine Road Ngauranga to Petone shared pathway and rail realignment
SH58 – seismic upgrade from Transmission Gully to Haywards
Takapu link – alternate link between Petone to Grenada and Transmission Gully
Cross Belmont Regional Park link Wadestown to Johnsonville route seismic strengthening
Remutaka Hill Road resilience measures Ngauranga Gorge accelerated resilience
Petone to Grenada new road link Taita Gorge access strengthening
Wellington Urban motorway: Shell Gully – embankment and structure strengthening
Hutt Valley East-West new road connection from SH2 to Seaview/fuel terminal (Cross Valley Link)
Grays Road flooding improvements Hutt River bridges seismic upgrades
Better engineered road links to the Port Improved resilience of airport connection via Newtown
Middleton Road retaining walls upgrade (also a gas supply project)
TRANSPORT (SEAPORT)
Minor seismic upgrade of Thorndon Container Terminal Major seismic upgrade of Thorndon Container Terminal
New roll on roll off ferry (RORO) terminal at unspecified location Upgrade of existing RORO terminal
RORO facility at Seaview Wharf Strengthening of RORO facilities in the Port
Aotea Wharf redevelopment Procure floating RORO pontoon
Burnham Wharf, Miramar - upgrade existing facility Alternate ship mooring point
TRANSPORT (RAIL)
North Island Main Trunk (NIMT) geotechnical seismic upgrades
Remutaka rail link – Featherston and Upper Hutt portal resilience
Hutt Valley line geotechnical seismic upgrades Alternate National Control Centre in Auckland
Wellington Lifelines – Regional Resilience Project / 26
Infrastructure Resilience Ideas
ELECTRICITY
Seismic upgrade of cables and creation of 33kV rings Central Park Substation improved resilience
Replace high risk 33kV cables in liquefaction zones only Increase 160MW interconnectedness between substations
Duplicate spares for repair Plan emergency overhead cable routes
Replacement of all fluid filled cables Central Park – Frederick Street cable replacement
POTABLE WATER
General water supply toughening of pipes in critical locations
Porirua emergency pumping plant
Porirua low level zone reservoir Reservoir for Airport and Miramar Peninsula
Cross harbour pipeline Prince of Wales and Bell Road II Reservoir upgrade
Porirua branch replacement Carmichael to Johnsonville and Karori pipeline
Waterloo Pump Station extension New pipeline from Waterloo to Haywards
Critical customer network strengthening and isolation Emergency water infrastructure in communities
Construct Whakatiki Dam and bulk water supply infrastructure
Waterloo Water Treatment Plant liquefaction mitigation project
Silverstream Bridge pipeline replacement
WASTE WATER
Procure and stockpile portaloos and chemical toilets Off-grid ablution facilities installed at schools
COMMUNICATIONS
Harden communications network – protect critical routes Diversified handover agreements between networks
Develop supersite network with all telcos Dedicated back-up power at cell towers
Strengthen telecommunication buildings to an IL4 seismic resilience rating
Provide redundancy of submarine fibre cables into Wellington
GAS
Readying point solution conversion to LPG
AIRPORT
Runway seismic improvements
27 / Wellington Lifelines – Regional Resilience Project
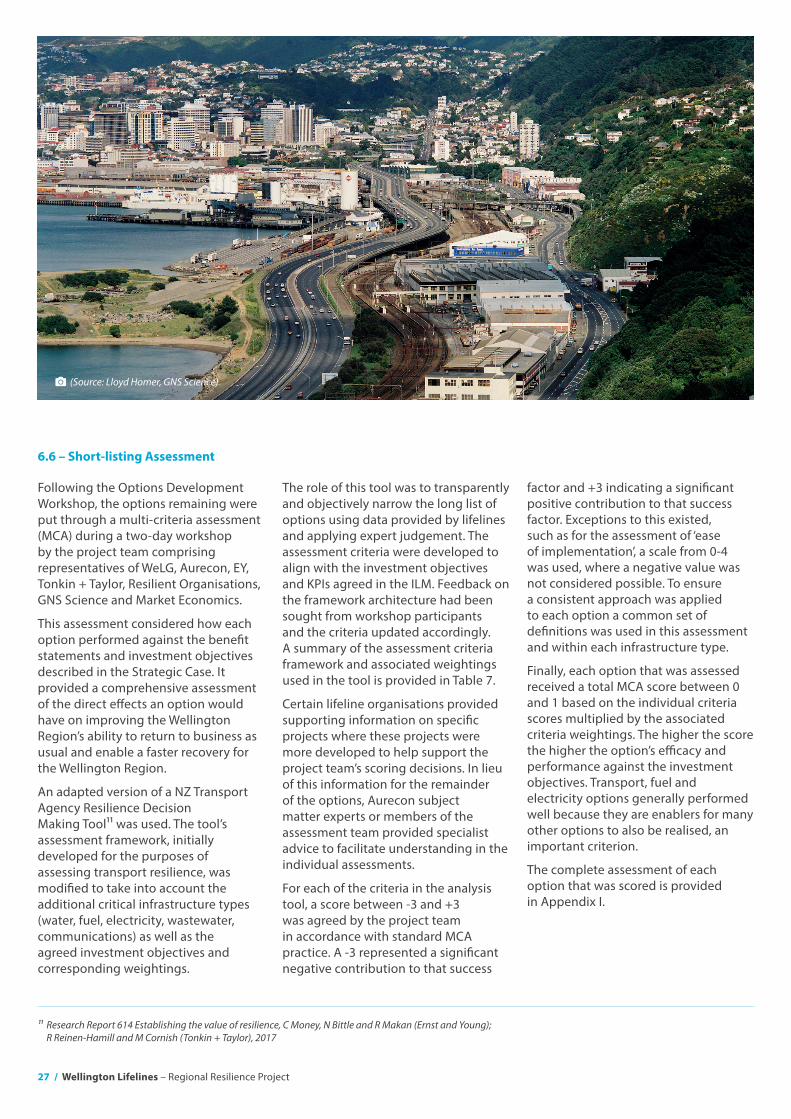
Following the Options Development Workshop, the options remaining were put through a multi-criteria assessment (MCA) during a two-day workshop by the project team comprising representatives of WeLG, Aurecon, EY, Tonkin + Taylor, Resilient Organisations, GNS Science and Market Economics.
This assessment considered how each option performed against the benefit statements and investment objectives described in the Strategic Case. It provided a comprehensive assessment of the direct effects an option would have on improving the Wellington Region’s ability to return to business as usual and enable a faster recovery for the Wellington Region.
An adapted version of a NZ Transport Agency Resilience Decision Making Tool11 was used. The tool’s assessment framework, initially developed for the purposes of assessing transport resilience, was modified to take into account the additional critical infrastructure types (water, fuel, electricity, wastewater, communications) as well as the agreed investment objectives and corresponding weightings.
6.6 – Short-listing Assessment
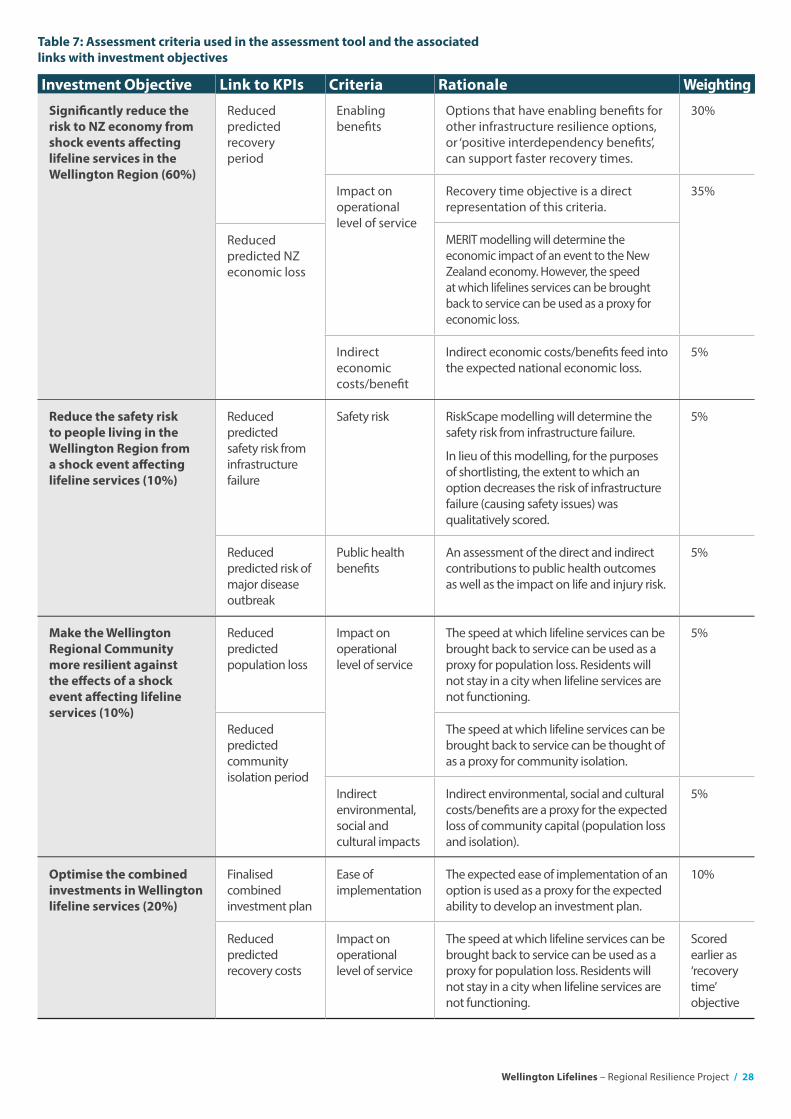
The role of this tool was to transparently and objectively narrow the long list of options using data provided by lifelines and applying expert judgement. The assessment criteria were developed to align with the investment objectives and KPIs agreed in the ILM. Feedback on the framework architecture had been sought from workshop participants and the criteria updated accordingly. A summary of the assessment criteria framework and associated weightings used in the tool is provided in Table 7.
Certain lifeline organisations provided supporting information on specific projects where these projects were more developed to help support the project team’s scoring decisions. In lieu of this information for the remainder of the options, Aurecon subject matter experts or members of the assessment team provided specialist advice to facilitate understanding in the individual assessments.
For each of the criteria in the analysis tool, a score between -3 and +3 was agreed by the project team in accordance with standard MCA practice. A -3 represented a significant negative contribution to that success
factor and +3 indicating a significant positive contribution to that success factor. Exceptions to this existed, such as for the assessment of ‘ease of implementation’, a scale from 0-4 was used, where a negative value was not considered possible. To ensure a consistent approach was applied to each option a common set of definitions was used in this assessment and within each infrastructure type.
Finally, each option that was assessed received a total MCA score between 0 and 1 based on the individual criteria scores multiplied by the associated criteria weightings. The higher the score the higher the option’s efficacy and performance against the investment objectives. Transport, fuel and electricity options generally performed well because they are enablers for many other options to also be realised, an important criterion.
The complete assessment of each option that was scored is provided in Appendix I.
11 Research Report 614 Establishing the value of resilience, C Money, N Bittle and R Makan (Ernst and Young); R Reinen-Hamill and M Cornish (Tonkin + Taylor), 2017
Camera (Source: Lloyd Homer, GNS Science)
Wellington Lifelines – Regional Resilience Project / 28
Investment Objective Link to KPIs Criteria Rationale Weighting
Significantly reduce the risk to NZ economy from shock events affecting lifeline services in the Wellington Region (60%)
Reduced predicted recovery period
Enabling benefits
Options that have enabling benefits for other infrastructure resilience options, or ‘positive interdependency benefits’, can support faster recovery times.
30%
Impact on operational level of service
Recovery time objective is a direct representation of this criteria.
35%
MERIT modelling will determine the economic impact of an event to the New Zealand economy. However, the speed at which lifelines services can be brought back to service can be used as a proxy for economic loss.
Reduced predicted NZ economic loss
Indirect economic costs/benefit
Indirect economic costs/benefits feed into the expected national economic loss.
5%
Reduce the safety risk to people living in the Wellington Region from a shock event affecting lifeline services (10%)
Reduced predicted safety risk from infrastructure failure
Safety risk RiskScape modelling will determine the safety risk from infrastructure failure.
In lieu of this modelling, for the purposes of shortlisting, the extent to which an option decreases the risk of infrastructure failure (causing safety issues) was qualitatively scored.
5%
Reduced predicted risk of major disease outbreak
Public health benefits
An assessment of the direct and indirect contributions to public health outcomes as well as the impact on life and injury risk.
5%
Make the Wellington Regional Community more resilient against the effects of a shock event affecting lifeline services (10%)
Reduced predicted population loss
Impact on operational level of service
The speed at which lifeline services can be brought back to service can be used as a proxy for population loss. Residents will not stay in a city when lifeline services are not functioning.
5%
Reduced predicted community isolation period
The speed at which lifeline services can be brought back to service can be thought of as a proxy for community isolation.
Indirect environmental, social and cultural impacts
Indirect environmental, social and cultural costs/benefits are a proxy for the expected loss of community capital (population loss and isolation).
5%
Optimise the combined investments in Wellington lifeline services (20%)
Finalised combined investment plan
Ease of implementation
The expected ease of implementation of an option is used as a proxy for the expected ability to develop an investment plan.
10%
Reduced predicted recovery costs
Impact on operational level of service
The speed at which lifeline services can be brought back to service can be used as a proxy for population loss. Residents will not stay in a city when lifeline services are not functioning.
Scored earlier as ‘recovery time’ objective
Table 7: Assessment criteria used in the assessment tool and the associated links with investment objectives
29 / Wellington Lifelines – Regional Resilience Project
This section explains how a recommended programme was developed to address the problems identified in the Strategic Case, with the expectation that it would generate the benefits sought. It describes the ‘options’ included. The full development and analysis process is covered in Appendix H.
Initially, three draft programmes were developed, beginning with an assessment of the ‘critical vulnerabilities’
to Wellington, namely fuel and transport access, and the options that best performed in responding to these vulnerabilities, at different levels of investment.
Options for the next most critical lifeline, electricity, were reviewed and assigned to programmes according to their expected scale of investment, followed by the remaining infrastructure types in descending order of vulnerability.
The resultant three programmes represented de facto low, medium and high investment. As the options were selected for each programme, interdependencies were also considered which led to certain options being required across all of the programmes. These three programmes were refined and reduced to one programme with the assistance of lifeline, council and central government representatives, and using specialist analytical tools, RiskScape and MERIT, described below.
The base case was established as the base-line against which the efficacy of the improvement programmes could be tested. The base case comprises the existing utility and transport networks, along with the projects already under construction or committed for construction in the near future, including
This section shows the full recommended programme and sets out the individual projects included. They have been grouped by the specific lifeline infrastructure type to which the resilience is provided. Six of the projects are committed by lifeline organisations for future construction, and therefore were automatically selected for the programme, other projects are those that are considered ‘must-dos’ for the Wellington Region given they are enablers of other lifelines recoveries or emerged from the analysis.
7.1 – Base Case
7.2 – Projects included in the recommended programme
the Transmission Gully motorway, which already provides a partial transport connection for bringing in fuel and supplies to the region from the north. GNS Science modelled the base case in RiskScape to measure outage periods for each infrastructure type.
7. Programme Development
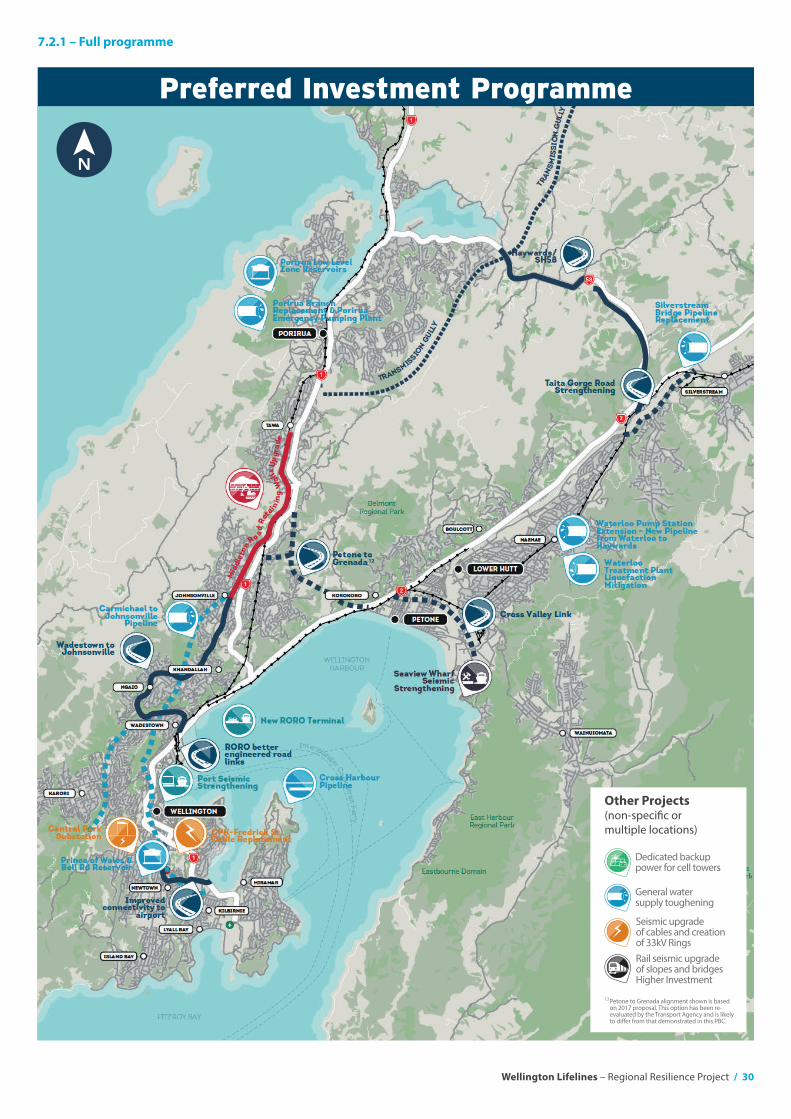
Wellington Lifelines – Regional Resilience Project / 30
7.2.1 – Full programme
Preferred Investment Programme
Other Projects (non-specific or multiple locations)
Dedicated backup power for cell towers
Rail seismic upgrade of slopes and bridges Higher Investment
12 Petone to Grenada alignment shown is based on 2017 proposal. This option has been re-evaluated by the Transport Agency and is likely to differ from that demonstrated in this PBC.
Seismic upgrade of cables and creation of 33kV Rings
General water supply toughening
N
12
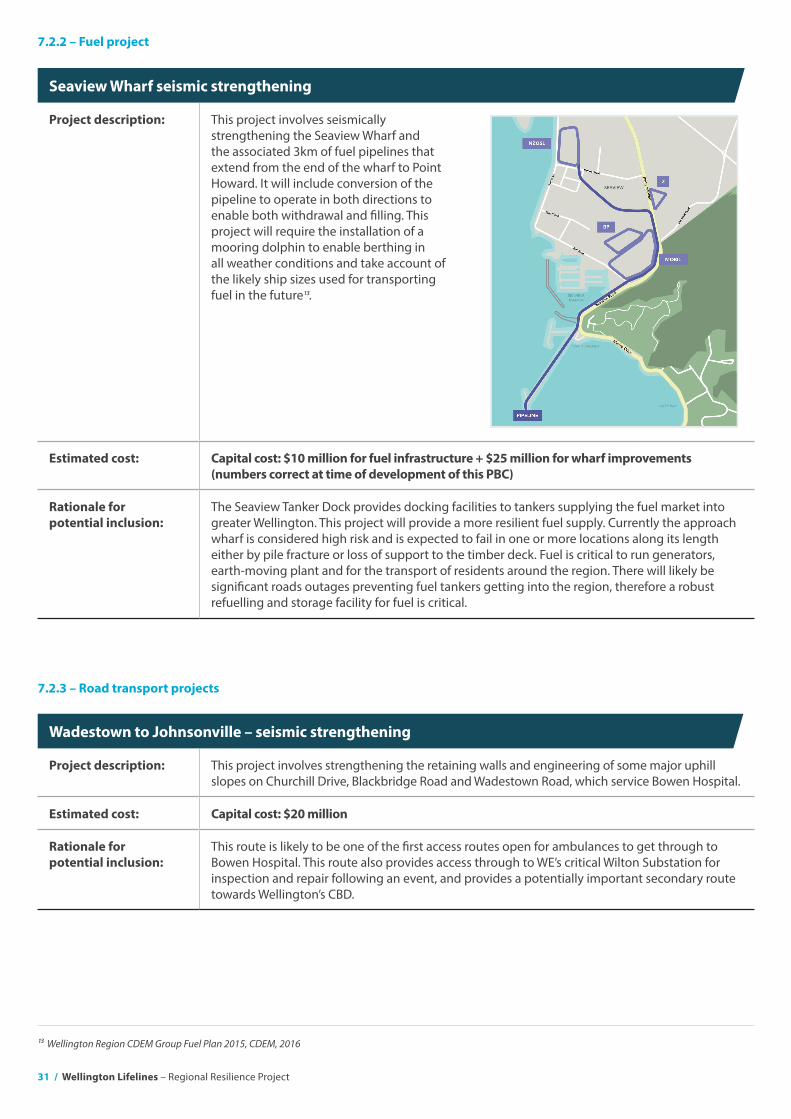
31 / Wellington Lifelines – Regional Resilience Project
Seaview Wharf seismic strengthening
Project description: This project involves seismically strengthening the Seaview Wharf and the associated 3km of fuel pipelines that extend from the end of the wharf to Point Howard. It will include conversion of the pipeline to operate in both directions to enable both withdrawal and filling. This project will require the installation of a mooring dolphin to enable berthing in all weather conditions and take account of the likely ship sizes used for transporting fuel in the future13.
Estimated cost: Capital cost: $10 million for fuel infrastructure + $25 million for wharf improvements (numbers correct at time of development of this PBC)
Rationale for potential inclusion:
The Seaview Tanker Dock provides docking facilities to tankers supplying the fuel market into greater Wellington. This project will provide a more resilient fuel supply. Currently the approach wharf is considered high risk and is expected to fail in one or more locations along its length either by pile fracture or loss of support to the timber deck. Fuel is critical to run generators, earth-moving plant and for the transport of residents around the region. There will likely be significant roads outages preventing fuel tankers getting into the region, therefore a robust refuelling and storage facility for fuel is critical.
Wadestown to Johnsonville – seismic strengthening
Project description: This project involves strengthening the retaining walls and engineering of some major uphill slopes on Churchill Drive, Blackbridge Road and Wadestown Road, which service Bowen Hospital.
Estimated cost: Capital cost: $20 million
Rationale for potential inclusion:
This route is likely to be one of the first access routes open for ambulances to get through to Bowen Hospital. This route also provides access through to WE’s critical Wilton Substation for inspection and repair following an event, and provides a potentially important secondary route towards Wellington’s CBD.
7.2.2 – Fuel project
7.2.3 – Road transport projects
13 Wellington Region CDEM Group Fuel Plan 2015, CDEM, 2016
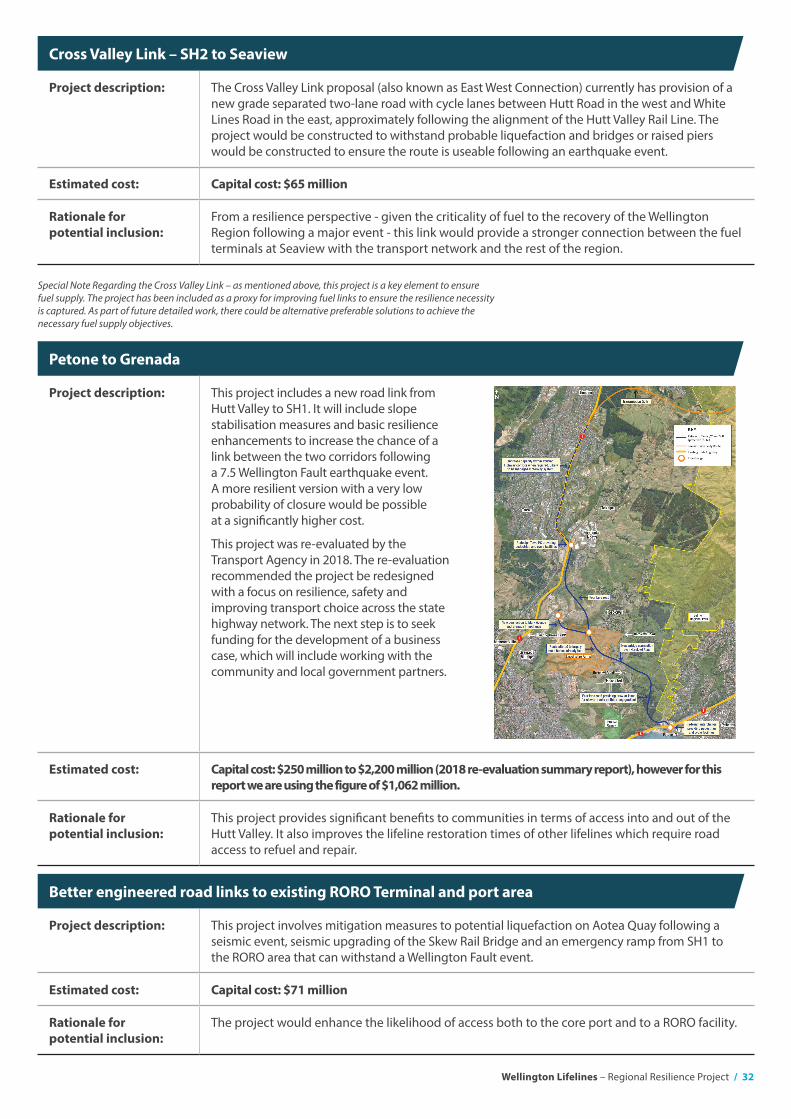
Wellington Lifelines – Regional Resilience Project / 32
Petone to Grenada
Project description: This project includes a new road link from Hutt Valley to SH1. It will include slope stabilisation measures and basic resilience enhancements to increase the chance of a link between the two corridors following a 7.5 Wellington Fault earthquake event. A more resilient version with a very low probability of closure would be possible at a significantly higher cost.
This project was re-evaluated by the Transport Agency in 2018. The re-evaluation recommended the project be redesigned with a focus on resilience, safety and improving transport choice across the state highway network. The next step is to seek funding for the development of a business case, which will include working with the community and local government partners.
Estimated cost: Capital cost: $250 million to $2,200 million (2018 re-evaluation summary report), however for this report we are using the figure of $1,062 million.
Rationale for potential inclusion:
This project provides significant benefits to communities in terms of access into and out of the Hutt Valley. It also improves the lifeline restoration times of other lifelines which require road access to refuel and repair.
Cross Valley Link – SH2 to Seaview
Project description: The Cross Valley Link proposal (also known as East West Connection) currently has provision of a new grade separated two-lane road with cycle lanes between Hutt Road in the west and White Lines Road in the east, approximately following the alignment of the Hutt Valley Rail Line. The project would be constructed to withstand probable liquefaction and bridges or raised piers would be constructed to ensure the route is useable following an earthquake event.
Estimated cost: Capital cost: $65 million
Rationale for potential inclusion:
From a resilience perspective - given the criticality of fuel to the recovery of the Wellington Region following a major event - this link would provide a stronger connection between the fuel terminals at Seaview with the transport network and the rest of the region.
Better engineered road links to existing RORO Terminal and port area
Project description: This project involves mitigation measures to potential liquefaction on Aotea Quay following a seismic event, seismic upgrading of the Skew Rail Bridge and an emergency ramp from SH1 to the RORO area that can withstand a Wellington Fault event.
Estimated cost: Capital cost: $71 million
Rationale for potential inclusion:
The project would enhance the likelihood of access both to the core port and to a RORO facility.
Special Note Regarding the Cross Valley Link – as mentioned above, this project is a key element to ensure fuel supply. The project has been included as a proxy for improving fuel links to ensure the resilience necessity is captured. As part of future detailed work, there could be alternative preferable solutions to achieve the necessary fuel supply objectives.
33 / Wellington Lifelines – Regional Resilience Project
Resilience of airport connectivity to city network via Newtown
Project description: This project involves emergency response planning for the roads alongside the Hospital and the Constable Street and Crawford Street areas. It would involve potential interventions around the Mt Victoria Tunnel portals to protect from landslides either side and reduce the tunnel outage time.
Estimated cost: Capital cost: $10 million
Rationale for potential inclusion:
This project provides access from Wellington Airport through to the CBD should the Evans Bay route be blocked due to landslides. This provides access through to the airport for personnel, for both the response and recovery periods. Note: The airport runway is assumed to be open after 3 days for emergency/military flights, with the full runway disrupted for 3 months, returning to full service within 6 months.
Middleton Road retaining walls upgrade
Project description: This project involves the strengthening of retaining walls for gas main protection or alternatively the re-laying of the gas main on the uphill side of the slope. Minor improvements to batter slopes may also be included to reduce the amount of material likely to slide during an event, and therefore reduce the recovery time.
Estimated cost: Capital cost: $50 million
Rationale for potential inclusion:
By strengthening the existing retaining walls there will be fewer and smaller landslides along Middleton Road from an earthquake event, therefore improving the recovery time for the gas main which is currently located beneath Middleton Road. This project also provides an alternate route through Johnsonville should there be damage closing SH1.
SH58/Haywards Resilience Improvements from Transmission Gully to Hutt Valley
Project description: This project involves the stabilisation of slopes above SH58 at Haywards Hill from SH2 to summit (just east of Mt Cecil Rd). It is in addition to the 2.5km of safety improvements currently committed on SH58 between TG and SH2.
Estimated cost: Capital cost: $24 million
Rationale for potential inclusion:
This project will provide alternate access through to Porirua from the Hutt Valley. This will allow residents of the Hutt Valley to travel through to Wellington City via Porirua (and vice versa) in the likely event that access along the SH2 coastal road is cut off. This project will also provide access for fuel trucks to transport fuel from Petone through the region. The safety improvements element of this project has been committed.
Taita Gorge Access – strengthening road network
Project description: This project includes slope stabilisation and upgrading of the walls supporting the Eastern Hutt Road just north of Stokes Valley Road roundabout.
Estimated cost: Capital cost: $2.5 million
Rationale for potential inclusion:
This project will help prevent collapse of the Eastern Hutt Road into the Hutt River, maintaining access up the eastern side of Taita Gorge following an event. This project also helps maintain access to Hutt Hospital.
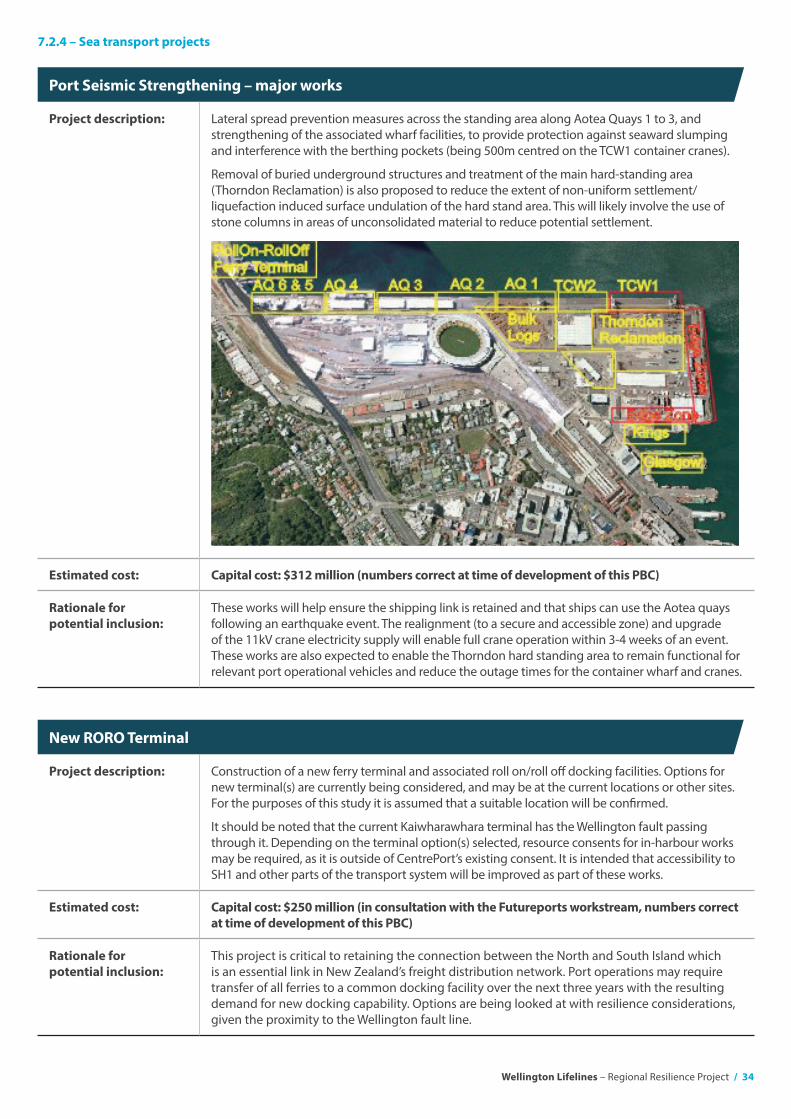
Wellington Lifelines – Regional Resilience Project / 34
Port Seismic Strengthening – major works
Project description: Lateral spread prevention measures across the standing area along Aotea Quays 1 to 3, and strengthening of the associated wharf facilities, to provide protection against seaward slumping and interference with the berthing pockets (being 500m centred on the TCW1 container cranes).
Removal of buried underground structures and treatment of the main hard-standing area (Thorndon Reclamation) is also proposed to reduce the extent of non-uniform settlement/liquefaction induced surface undulation of the hard stand area. This will likely involve the use of stone columns in areas of unconsolidated material to reduce potential settlement.
Estimated cost: Capital cost: $312 million (numbers correct at time of development of this PBC)
Rationale for potential inclusion:
These works will help ensure the shipping link is retained and that ships can use the Aotea quays following an earthquake event. The realignment (to a secure and accessible zone) and upgrade of the 11kV crane electricity supply will enable full crane operation within 3-4 weeks of an event. These works are also expected to enable the Thorndon hard standing area to remain functional for relevant port operational vehicles and reduce the outage times for the container wharf and cranes.
New RORO Terminal
Project description: Construction of a new ferry terminal and associated roll on/roll off docking facilities. Options for new terminal(s) are currently being considered, and may be at the current locations or other sites. For the purposes of this study it is assumed that a suitable location will be confirmed.
It should be noted that the current Kaiwharawhara terminal has the Wellington fault passing through it. Depending on the terminal option(s) selected, resource consents for in-harbour works may be required, as it is outside of CentrePort’s existing consent. It is intended that accessibility to SH1 and other parts of the transport system will be improved as part of these works.
Estimated cost: Capital cost: $250 million (in consultation with the Futureports workstream, numbers correct at time of development of this PBC)
Rationale for potential inclusion:
This project is critical to retaining the connection between the North and South Island which is an essential link in New Zealand’s freight distribution network. Port operations may require transfer of all ferries to a common docking facility over the next three years with the resulting demand for new docking capability. Options are being looked at with resilience considerations, given the proximity to the Wellington fault line.
7.2.4 – Sea transport projects
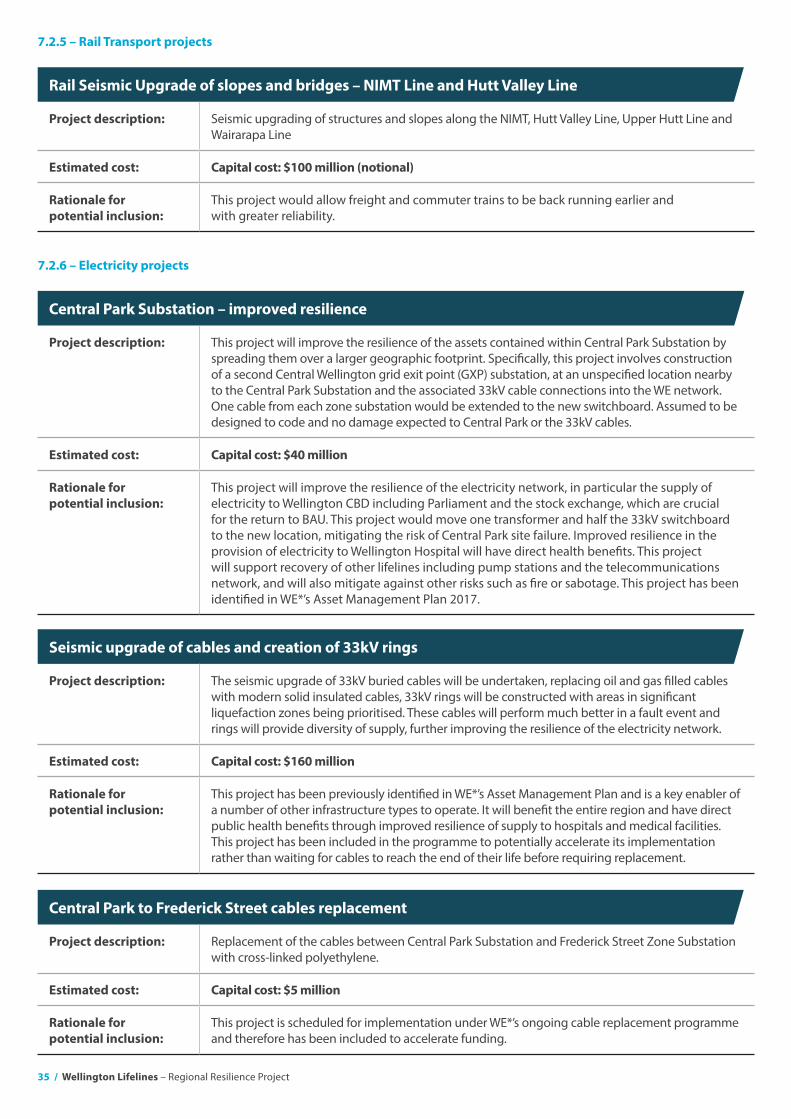
35 / Wellington Lifelines – Regional Resilience Project
Rail Seismic Upgrade of slopes and bridges – NIMT Line and Hutt Valley Line
Project description: Seismic upgrading of structures and slopes along the NIMT, Hutt Valley Line, Upper Hutt Line and Wairarapa Line
Estimated cost: Capital cost: $100 million (notional)
Rationale for potential inclusion:
This project would allow freight and commuter trains to be back running earlier and with greater reliability.
Central Park Substation – improved resilience
Project description: This project will improve the resilience of the assets contained within Central Park Substation by spreading them over a larger geographic footprint. Specifically, this project involves construction of a second Central Wellington grid exit point (GXP) substation, at an unspecified location nearby to the Central Park Substation and the associated 33kV cable connections into the WE network. One cable from each zone substation would be extended to the new switchboard. Assumed to be designed to code and no damage expected to Central Park or the 33kV cables.
Estimated cost: Capital cost: $40 million
Rationale for potential inclusion:
This project will improve the resilience of the electricity network, in particular the supply of electricity to Wellington CBD including Parliament and the stock exchange, which are crucial for the return to BAU. This project would move one transformer and half the 33kV switchboard to the new location, mitigating the risk of Central Park site failure. Improved resilience in the provision of electricity to Wellington Hospital will have direct health benefits. This project will support recovery of other lifelines including pump stations and the telecommunications network, and will also mitigate against other risks such as fire or sabotage. This project has been identified in WE*’s Asset Management Plan 2017.
Seismic upgrade of cables and creation of 33kV rings
Project description: The seismic upgrade of 33kV buried cables will be undertaken, replacing oil and gas filled cables with modern solid insulated cables, 33kV rings will be constructed with areas in significant liquefaction zones being prioritised. These cables will perform much better in a fault event and rings will provide diversity of supply, further improving the resilience of the electricity network.
Estimated cost: Capital cost: $160 million
Rationale for potential inclusion:
This project has been previously identified in WE*’s Asset Management Plan and is a key enabler of a number of other infrastructure types to operate. It will benefit the entire region and have direct public health benefits through improved resilience of supply to hospitals and medical facilities. This project has been included in the programme to potentially accelerate its implementation rather than waiting for cables to reach the end of their life before requiring replacement.
Central Park to Frederick Street cables replacement
Project description: Replacement of the cables between Central Park Substation and Frederick Street Zone Substation with cross-linked polyethylene.
Estimated cost: Capital cost: $5 million
Rationale for potential inclusion:
This project is scheduled for implementation under WE*’s ongoing cable replacement programme and therefore has been included to accelerate funding.
7.2.5 – Rail Transport projects
7.2.6 – Electricity projects
Wellington Lifelines – Regional Resilience Project / 36
Cross Harbour Pipeline
Project description: This project involves the installation of a 12.7km underwater pipeline from Seaview to Evans Bay and with a connection to the Carmichael Reservoir. The pipeline will be trenched into the seafloor as well as on land. It will likely be constructed of electrofused 500mm (ID) HDPE.
Estimated cost: Capital cost: $139 million
Rationale for potential inclusion:
Provision of an alternate major bulk water main provides resilience to the network, should the existing watermain be ruptured by a Wellington Fault event. Without this alternative pipeline Wellington City will be without water for an extended period of time.
General water supply toughening acceleration
Project description: Upgrading a critical network of pipes to ductile pipes, approximately 152km total length and predominantly watermains and mains-to-reservoirs.
Priority 1 Upgrades: Total length 50km ($120million)
Priority 2 Upgrades: Total length 100km ($420million)
Estimated cost: Capital cost: $654 million
Rationale for potential inclusion:
Upgrading of the core network to ensure critical customers can quickly access network water services.
7.2.7 – Potable Water projects
Porirua Branch Replacement & Emergency Pumping Plant
Project description: This project involves construction of a 1150mm Concrete Lined Steel (CLS) fully-welded watermain from Moonshine Valley Tee to Cleat Street, and a 345mm welded steel pipe through from Cleat Street to SH1, including a 300mm bridge crossing with isolation valves. Construction also includes a 345mm butt-welded steel pipeline along Mana.
Provision of a containerised emergency water treatment facility which can treat 10-15ML of water a day. Water will be drawn from a tributary near the Tee in the Moonshine Valley and pumped into the Porirua Branch Main once treated.
Estimated cost: Capital cost: $33 million
Rationale for potential inclusion:
An emergency water treatment station is required to extract and treat water from an identified river source. The branch replacement is required as the existing pipeline will suffer severe damage due to age, materials and joint type.
37 / Wellington Lifelines – Regional Resilience Project
Porirua Low Level Zone Reservoirs
Project description: Providing an additional 9ML reservoir, near the existing Porirua Low Level 1 and 2 Reservoirs and providing an additional 3ML of storage at Takapuwahia. Reservoirs will be fed by the upgraded Porirua Branch main and constructed to an ultimate limit state of a 1-in-2500 year event and a serviceability limit state to withstand a 1-in-1000-year event.
Estimated cost: Capital cost: $25 million
Rationale for potential inclusion:
Elsdon reservoir supports a long-term supply to Kenepuru reservoir and the wider Porirua zones not initially served until reticulation is restored.
Waterloo Pump Station extension and new pipeline from Waterloo to Haywards
Project description: Installation of a new pump system adjacent to Waterloo Water Treatment Plant, and provision of a 1067mm (OD) CLS fully welded watermain from Waterloo Pump Station to the Haywards Valve, including a new flexible Wellington Faultline crossing.
Estimated cost: Capital cost: $126 million
Rationale for potential inclusion:
There is no connection between the Te Marua river supplied system and the Waterloo aquifer-supplied system. This connection allows Wellington Water to focus energy on restarting a single plant that can effectively meet all initial regional water demands.
Prince of Wales and Bell Road Reservoir Upgrade
Project description: This project involves replacing the existing Bell Road Reservoir with a new 10ML reservoir and construction of a new 35ML reservoir at the Prince of Wales (Omaroro) site. These will be constructed to withstand an ultimate limit state of a 1-in-2500 year event and a serviceability limit state to withstand a 1-in-1000-year event.
Estimated cost: Capital cost: $78 million
Rationale for potential inclusion:
The existing Bell Road Reservoir is over 100 years old and does not meet current seismic standards. If it was to fail it could potentially take out the Central Park Substation in its path causing a cascade of lifeline asset failures and loss of life. A larger reservoir at Omaroro is required to support flows from the cross-harbour pipeline.
Waterloo Water Treatment Plant liquefaction project
Project description: This project involves measures to mitigate liquefaction risk and improve the ground at the southern end of the site or providing additional structural support.
Estimated cost: Capital cost: $2 million
Rationale for potential inclusion:
This initiative would enable the Waterloo Water Treatment Plant to remain operational and bulk water to be supplied to the network following a major quake.
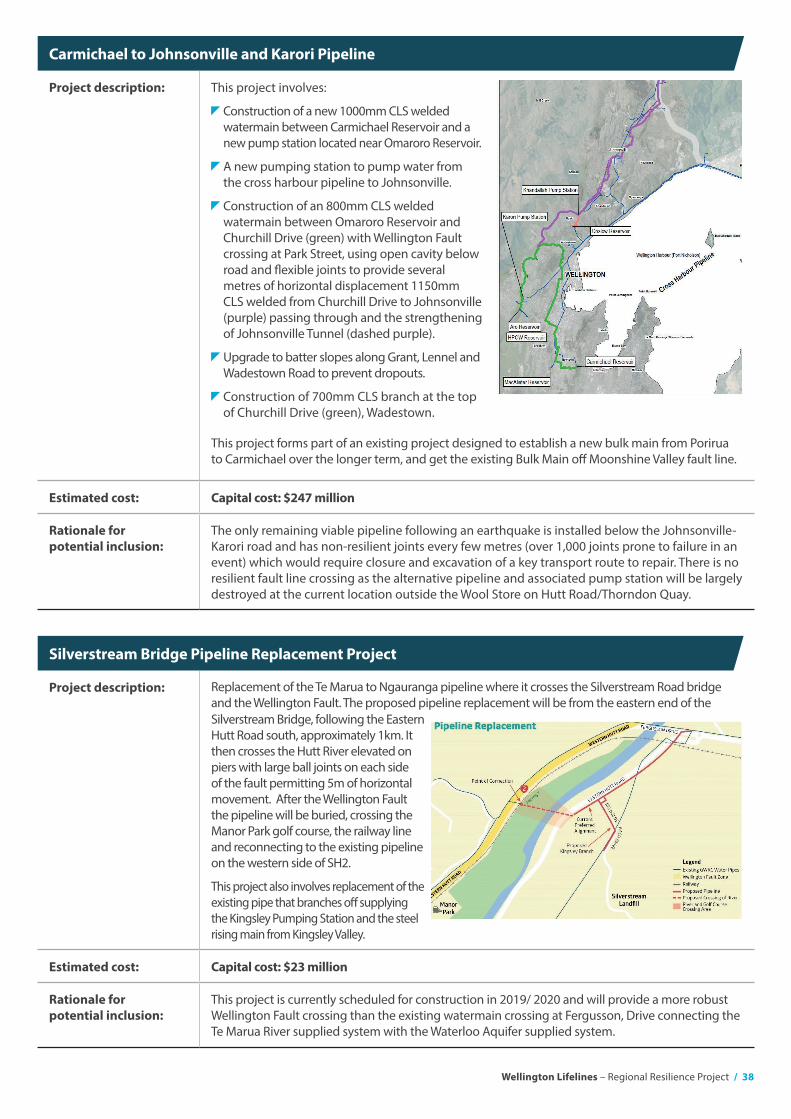
Wellington Lifelines – Regional Resilience Project / 38
Carmichael to Johnsonville and Karori Pipeline
Project description: This project involves:
Construction of a new 1000mm CLS welded watermain between Carmichael Reservoir and a new pump station located near Omaroro Reservoir.
A new pumping station to pump water from the cross harbour pipeline to Johnsonville.
Construction of an 800mm CLS welded watermain between Omaroro Reservoir and Churchill Drive (green) with Wellington Fault crossing at Park Street, using open cavity below road and flexible joints to provide several metres of horizontal displacement 1150mm CLS welded from Churchill Drive to Johnsonville (purple) passing through and the strengthening of Johnsonville Tunnel (dashed purple).
Upgrade to batter slopes along Grant, Lennel and Wadestown Road to prevent dropouts.
Construction of 700mm CLS branch at the top of Churchill Drive (green), Wadestown.
Estimated cost: Capital cost: $247 million
Rationale for potential inclusion:
The only remaining viable pipeline following an earthquake is installed below the Johnsonville-Karori road and has non-resilient joints every few metres (over 1,000 joints prone to failure in an event) which would require closure and excavation of a key transport route to repair. There is no resilient fault line crossing as the alternative pipeline and associated pump station will be largely destroyed at the current location outside the Wool Store on Hutt Road/Thorndon Quay.
This project forms part of an existing project designed to establish a new bulk main from Porirua to Carmichael over the longer term, and get the existing Bulk Main off Moonshine Valley fault line.
Silverstream Bridge Pipeline Replacement Project
Project description:
Silverstream Bridge, following the Eastern Hutt Road south, approximately 1km. It then crosses the Hutt River elevated on piers with large ball joints on each side of the fault permitting 5m of horizontal movement. After the Wellington Fault the pipeline will be buried, crossing the Manor Park golf course, the railway line and reconnecting to the existing pipeline on the western side of SH2.
This project also involves replacement of the existing pipe that branches off supplying the Kingsley Pumping Station and the steel rising main from Kingsley Valley.
Estimated cost: Capital cost: $23 million
Rationale for potential inclusion:
This project is currently scheduled for construction in 2019/ 2020 and will provide a more robust Wellington Fault crossing than the existing watermain crossing at Fergusson, Drive connecting the Te Marua River supplied system with the Waterloo Aquifer supplied system.
Replacement of the Te Marua to Ngauranga pipeline where it crosses the Silverstream Road bridge and the Wellington Fault. The proposed pipeline replacement will be from the eastern end of the
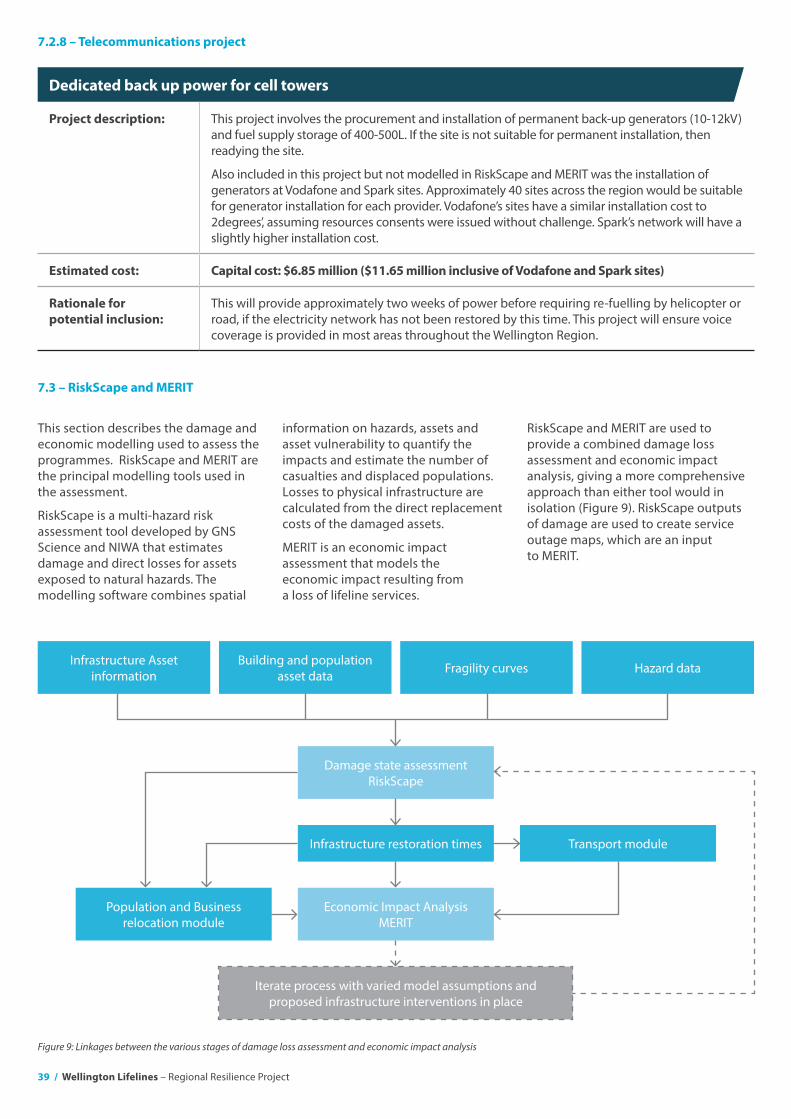
39 / Wellington Lifelines – Regional Resilience Project
Dedicated back up power for cell towers
Project description: This project involves the procurement and installation of permanent back-up generators (10-12kV) and fuel supply storage of 400-500L. If the site is not suitable for permanent installation, then readying the site.
Also included in this project but not modelled in RiskScape and MERIT was the installation of generators at Vodafone and Spark sites. Approximately 40 sites across the region would be suitable for generator installation for each provider. Vodafone’s sites have a similar installation cost to 2degrees’, assuming resources consents were issued without challenge. Spark’s network will have a slightly higher installation cost.
Estimated cost: Capital cost: $6.85 million ($11.65 million inclusive of Vodafone and Spark sites)
Rationale for potential inclusion:
This will provide approximately two weeks of power before requiring re-fuelling by helicopter or road, if the electricity network has not been restored by this time. This project will ensure voice coverage is provided in most areas throughout the Wellington Region.
7.2.8 – Telecommunications project
7.3 – RiskScape and MERIT
This section describes the damage and economic modelling used to assess the programmes. RiskScape and MERIT are the principal modelling tools used in the assessment.
RiskScape is a multi-hazard risk assessment tool developed by GNS Science and NIWA that estimates damage and direct losses for assets exposed to natural hazards. The modelling software combines spatial
information on hazards, assets and asset vulnerability to quantify the impacts and estimate the number of casualties and displaced populations. Losses to physical infrastructure are calculated from the direct replacement costs of the damaged assets.
MERIT is an economic impact assessment that models the economic impact resulting from a loss of lifeline services.
RiskScape and MERIT are used to provide a combined damage loss assessment and economic impact analysis, giving a more comprehensive approach than either tool would in isolation (Figure 9). RiskScape outputs of damage are used to create service outage maps, which are an input to MERIT.
Infrastructure Asset information
Building and population asset data Fragility curves
Infrastructure restoration times
Population and Business relocation module
Transport module
Damage state assessmentRiskScape
Economic Impact AnalysisMERIT
Iterate process with varied model assumptions and proposed infrastructure interventions in place
Hazard data
Figure 9: Linkages between the various stages of damage loss assessment and economic impact analysis
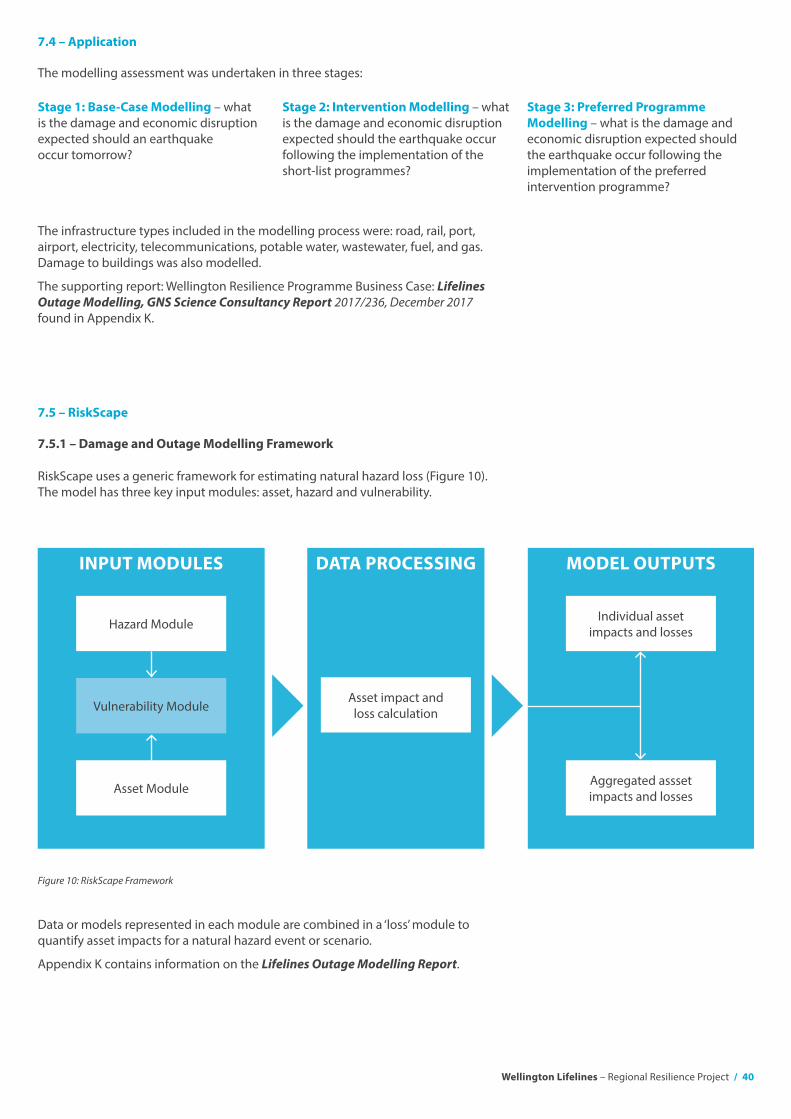
Wellington Lifelines – Regional Resilience Project / 40
7.4 – Application
7.5.1 – Damage and Outage Modelling Framework
7.5 – RiskScape
Stage 1: Base-Case Modelling – what is the damage and economic disruption expected should an earthquake occur tomorrow?
The modelling assessment was undertaken in three stages:
RiskScape uses a generic framework for estimating natural hazard loss (Figure 10). The model has three key input modules: asset, hazard and vulnerability.
Data or models represented in each module are combined in a ‘loss’ module to quantify asset impacts for a natural hazard event or scenario.
Appendix K contains information on the Lifelines Outage Modelling Report.
Figure 10: RiskScape Framework
The infrastructure types included in the modelling process were: road, rail, port, airport, electricity, telecommunications, potable water, wastewater, fuel, and gas. Damage to buildings was also modelled.
The supporting report: Wellington Resilience Programme Business Case: Lifelines Outage Modelling, GNS Science Consultancy Report 2017/236, December 2017 found in Appendix K.
Stage 2: Intervention Modelling – what is the damage and economic disruption expected should the earthquake occur following the implementation of the short-list programmes?
Stage 3: Preferred Programme Modelling – what is the damage and economic disruption expected should the earthquake occur following the implementation of the preferred intervention programme?
INPUT MODULES DATA PROCESSING MODEL OUTPUTS
Hazard Module Individual asset impacts and losses
Asset impact and loss calculationVulnerability Module
Asset Module Aggregated assset impacts and losses
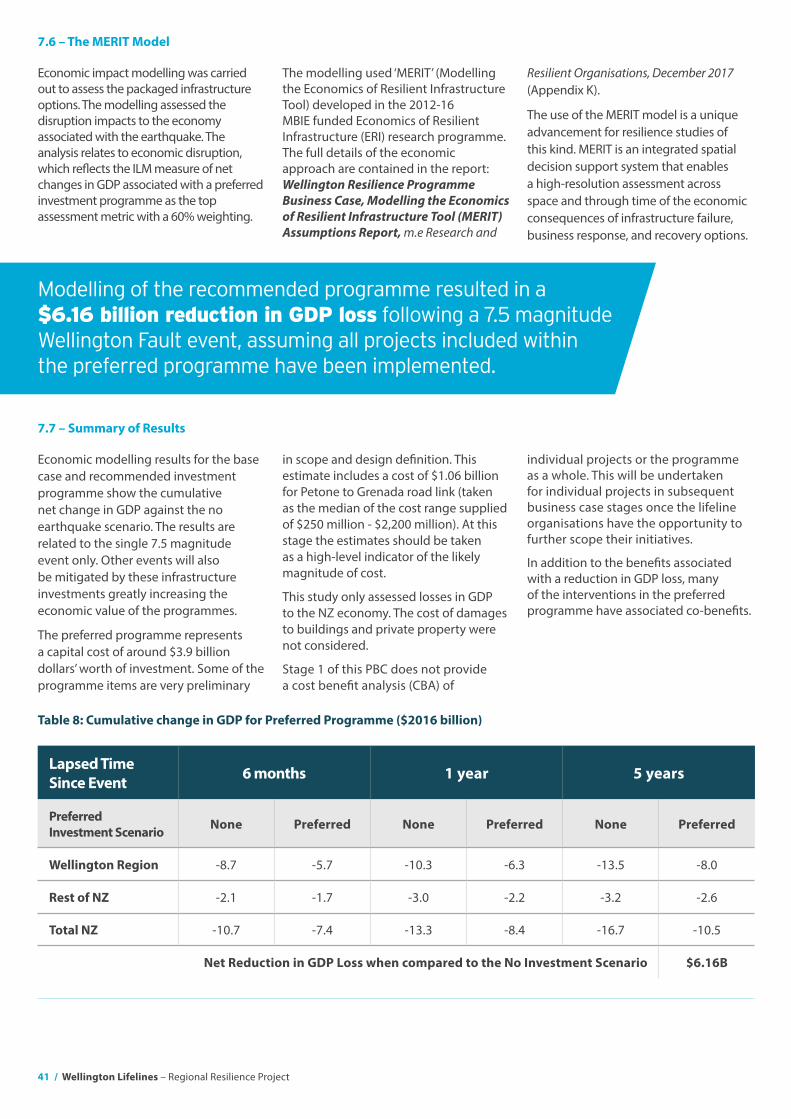
41 / Wellington Lifelines – Regional Resilience Project
7.6 – The MERIT Model
7.7 – Summary of Results
Economic impact modelling was carried out to assess the packaged infrastructure options. The modelling assessed the disruption impacts to the economy associated with the earthquake. The analysis relates to economic disruption, which reflects the ILM measure of net changes in GDP associated with a preferred investment programme as the top assessment metric with a 60% weighting.
Economic modelling results for the base case and recommended investment programme show the cumulative net change in GDP against the no earthquake scenario. The results are related to the single 7.5 magnitude event only. Other events will also be mitigated by these infrastructure investments greatly increasing the economic value of the programmes.
The preferred programme represents a capital cost of around $3.9 billion dollars’ worth of investment. Some of the programme items are very preliminary
The modelling used ‘MERIT’ (Modelling the Economics of Resilient Infrastructure Tool) developed in the 2012-16 MBIE funded Economics of Resilient Infrastructure (ERI) research programme. The full details of the economic approach are contained in the report: Wellington Resilience Programme Business Case, Modelling the Economics of Resilient Infrastructure Tool (MERIT) Assumptions Report, m.e Research and
in scope and design definition. This estimate includes a cost of $1.06 billion for Petone to Grenada road link (taken as the median of the cost range supplied of $250 million - $2,200 million). At this stage the estimates should be taken as a high-level indicator of the likely magnitude of cost.
This study only assessed losses in GDP to the NZ economy. The cost of damages to buildings and private property were not considered.
Stage 1 of this PBC does not provide a cost benefit analysis (CBA) of
Resilient Organisations, December 2017 (Appendix K).
The use of the MERIT model is a unique advancement for resilience studies of this kind. MERIT is an integrated spatial decision support system that enables a high-resolution assessment across space and through time of the economic consequences of infrastructure failure, business response, and recovery options.
individual projects or the programme as a whole. This will be undertaken for individual projects in subsequent business case stages once the lifeline organisations have the opportunity to further scope their initiatives.
In addition to the benefits associated with a reduction in GDP loss, many of the interventions in the preferred programme have associated co-benefits.
Table 8: Cumulative change in GDP for Preferred Programme ($2016 billion)
Lapsed Time Since Event 6 months 1 year 5 years
Preferred Investment Scenario None Preferred None Preferred None Preferred
Wellington Region -8.7 -5.7 -10.3 -6.3 -13.5 -8.0
Rest of NZ -2.1 -1.7 -3.0 -2.2 -3.2 -2.6
Total NZ -10.7 -7.4 -13.3 -8.4 -16.7 -10.5
Net Reduction in GDP Loss when compared to the No Investment Scenario $6.16B
Modelling of the recommended programme resulted in a $6.16 billion reduction in GDP loss following a 7.5 magnitude Wellington Fault event, assuming all projects included within the preferred programme have been implemented.
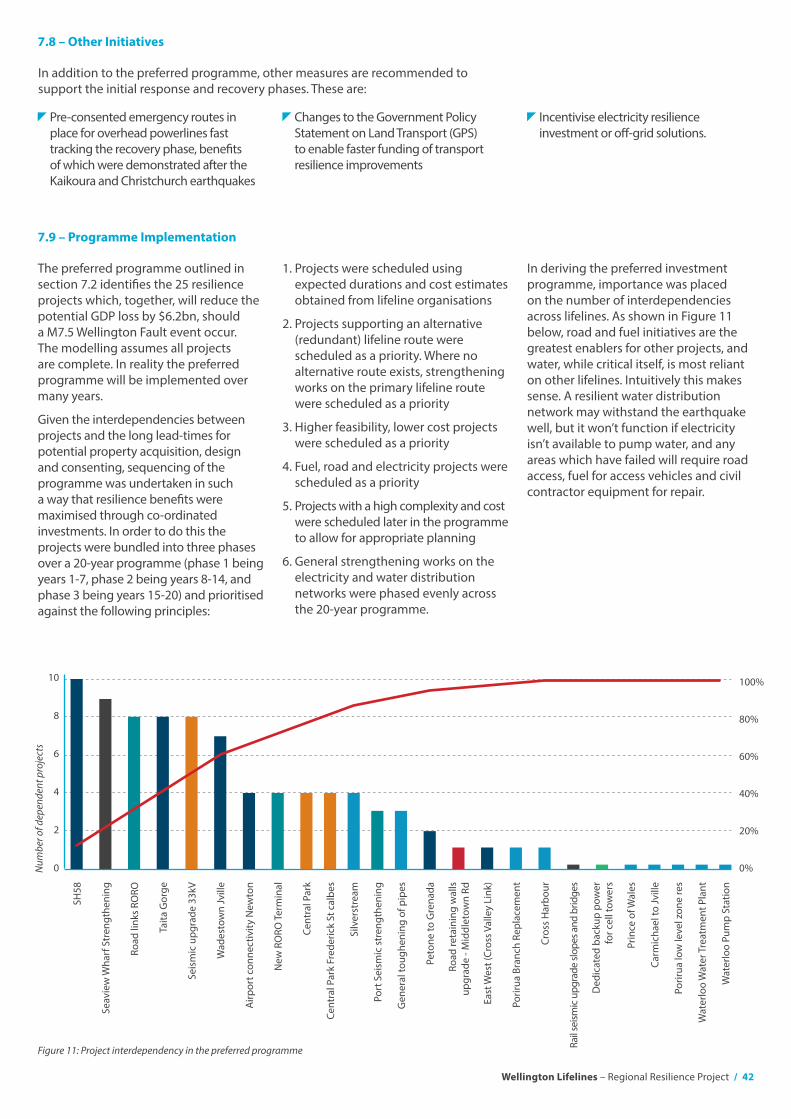
Wellington Lifelines – Regional Resilience Project / 42
0 0%
2 20%
4 40%
6 60%
8 80%
10 100%
7.8 – Other Initiatives
7.9 – Programme Implementation
Pre-consented emergency routes in place for overhead powerlines fast tracking the recovery phase, benefits of which were demonstrated after the Kaikoura and Christchurch earthquakes
Changes to the Government Policy Statement on Land Transport (GPS) to enable faster funding of transport resilience improvements
In addition to the preferred programme, other measures are recommended to support the initial response and recovery phases. These are:
The preferred programme outlined in section 7.2 identifies the 25 resilience projects which, together, will reduce the potential GDP loss by $6.2bn, should a M7.5 Wellington Fault event occur. The modelling assumes all projects are complete. In reality the preferred programme will be implemented over many years.
Given the interdependencies between projects and the long lead-times for potential property acquisition, design and consenting, sequencing of the programme was undertaken in such a way that resilience benefits were maximised through co-ordinated investments. In order to do this the projects were bundled into three phases over a 20-year programme (phase 1 being years 1-7, phase 2 being years 8-14, and phase 3 being years 15-20) and prioritised against the following principles:
Incentivise electricity resilience investment or off-grid solutions.
1. Projects were scheduled using expected durations and cost estimates obtained from lifeline organisations
2. Projects supporting an alternative (redundant) lifeline route were scheduled as a priority. Where no alternative route exists, strengthening works on the primary lifeline route were scheduled as a priority
3. Higher feasibility, lower cost projects were scheduled as a priority
4. Fuel, road and electricity projects were scheduled as a priority
5. Projects with a high complexity and cost were scheduled later in the programme to allow for appropriate planning
6. General strengthening works on the electricity and water distribution networks were phased evenly across the 20-year programme.
In deriving the preferred investment programme, importance was placed on the number of interdependencies across lifelines. As shown in Figure 11 below, road and fuel initiatives are the greatest enablers for other projects, and water, while critical itself, is most reliant on other lifelines. Intuitively this makes sense. A resilient water distribution network may withstand the earthquake well, but it won’t function if electricity isn’t available to pump water, and any areas which have failed will require road access, fuel for access vehicles and civil contractor equipment for repair.
Figure 11: Project interdependency in the preferred programme
SH58
Gen
eral
toug
heni
ng o
f pip
es
Seav
iew
Wha
rf S
tren
gthe
ning
Peto
ne to
Gre
nada
Road
link
s RO
RO
Road
reta
inin
g w
alls
up
grad
e - M
iddl
etow
n Rd
Taita
Gor
ge
East
Wes
t (Cr
oss V
alle
y Li
nk)
Seis
mic
upg
rade
33k
V
Porir
ua B
ranc
h Re
plac
emen
t
Wad
esto
wn
Jvill
e
Cros
s H
arbo
ur
Airp
ort c
onne
ctiv
ity N
ewto
n
Rail
seism
ic u
pgra
de sl
opes
and
brid
ges
New
RO
RO Te
rmin
al
Ded
icat
ed b
acku
p po
wer
fo
r cel
l tow
ers
Cent
ral P
ark
Prin
ce o
f Wal
es
Cent
ral P
ark
Fred
eric
k St
cal
bes
Carm
icha
el to
Jvill
e
Wat
erlo
o Pu
mp
Stat
ion
Silv
erst
ream
Porir
ua lo
w le
vel z
one
res
Port
Sei
smic
str
engt
heni
ng
Wat
erlo
o W
ater
Tre
atm
ent P
lant
Num
ber o
f dep
ende
nt p
roje
cts
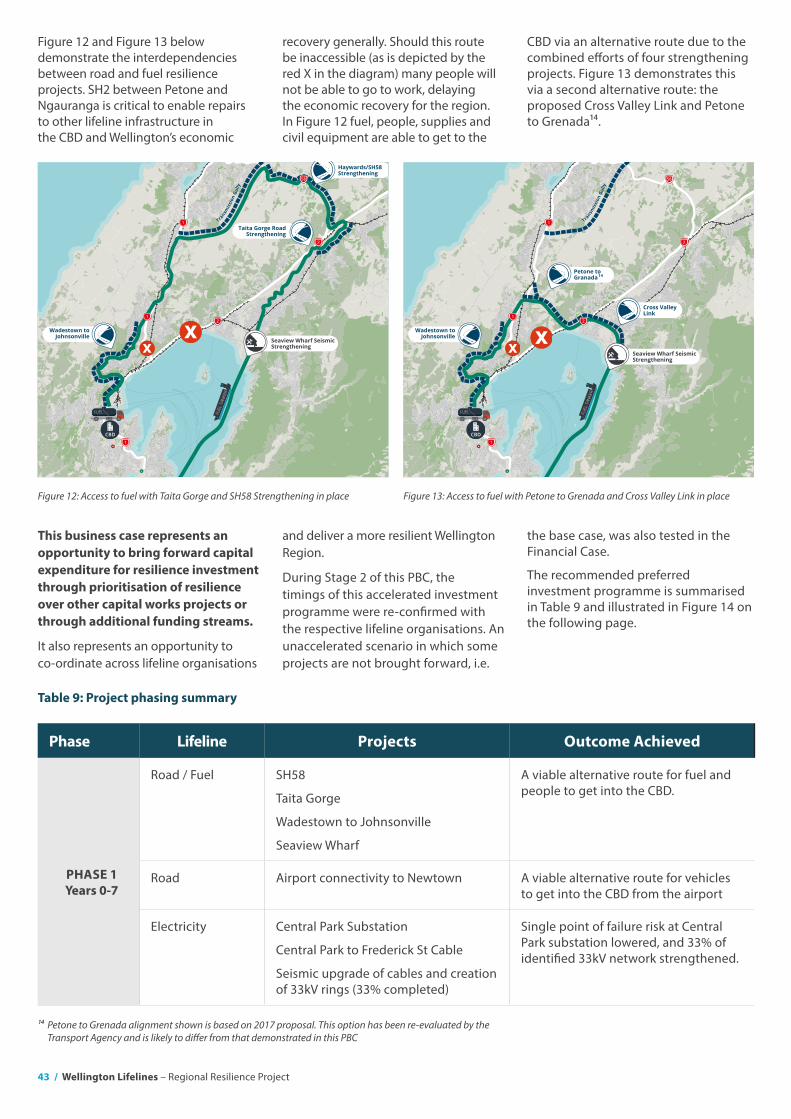
43 / Wellington Lifelines – Regional Resilience Project
Figure 12 and Figure 13 below demonstrate the interdependencies between road and fuel resilience projects. SH2 between Petone and Ngauranga is critical to enable repairs to other lifeline infrastructure in the CBD and Wellington’s economic
This business case represents an opportunity to bring forward capital expenditure for resilience investment through prioritisation of resilience over other capital works projects or through additional funding streams.
It also represents an opportunity to co-ordinate across lifeline organisations
recovery generally. Should this route be inaccessible (as is depicted by the red X in the diagram) many people will not be able to go to work, delaying the economic recovery for the region. In Figure 12 fuel, people, supplies and civil equipment are able to get to the
and deliver a more resilient Wellington Region.
During Stage 2 of this PBC, the timings of this accelerated investment programme were re-confirmed with the respective lifeline organisations. An unaccelerated scenario in which some projects are not brought forward, i.e.
FITZROY BAY
Interislander Cook S
trait Ferry1
1
1
1
2
2
58 2
Wadestown to Johnsonville
Transm
issi
on G
ully
FUEL FUEL
TAN
KER
Cross Valley Link
Petone to Granada
Seaview Wharf Seismic Strengthening
CBD
1
1
1
2
2
58 2
FITZROY BAY
Interislander Cook S
trait Ferry
1
1
1
1
2
2
58 2
Taita Gorge Road Strengthening
Haywards/SH58 Strengthening
Wadestown to Johnsonville
FUEL
Transm
issi
on G
ully
FUEL
TAN
KER
CBD
Seaview Wharf Seismic Strengthening
1
1
1
2
2
58 2
CBD via an alternative route due to the combined efforts of four strengthening projects. Figure 13 demonstrates this via a second alternative route: the proposed Cross Valley Link and Petone to Grenada14.
the base case, was also tested in the Financial Case.
The recommended preferred investment programme is summarised in Table 9 and illustrated in Figure 14 on the following page.
Figure 13: Access to fuel with Petone to Grenada and Cross Valley Link in placeFigure 12: Access to fuel with Taita Gorge and SH58 Strengthening in place
Table 9: Project phasing summary
Phase Lifeline Projects Outcome Achieved
Road / Fuel SH58
Taita Gorge
Wadestown to Johnsonville
Seaview Wharf
A viable alternative route for fuel and people to get into the CBD.
Road Airport connectivity to Newtown A viable alternative route for vehicles to get into the CBD from the airport
Electricity Central Park Substation
Central Park to Frederick St Cable
Seismic upgrade of cables and creation of 33kV rings (33% completed)
Single point of failure risk at Central Park substation lowered, and 33% of identified 33kV network strengthened.
PHASE 1Years 0-7
14 Petone to Grenada alignment shown is based on 2017 proposal. This option has been re-evaluated by the Transport Agency and is likely to differ from that demonstrated in this PBC
14
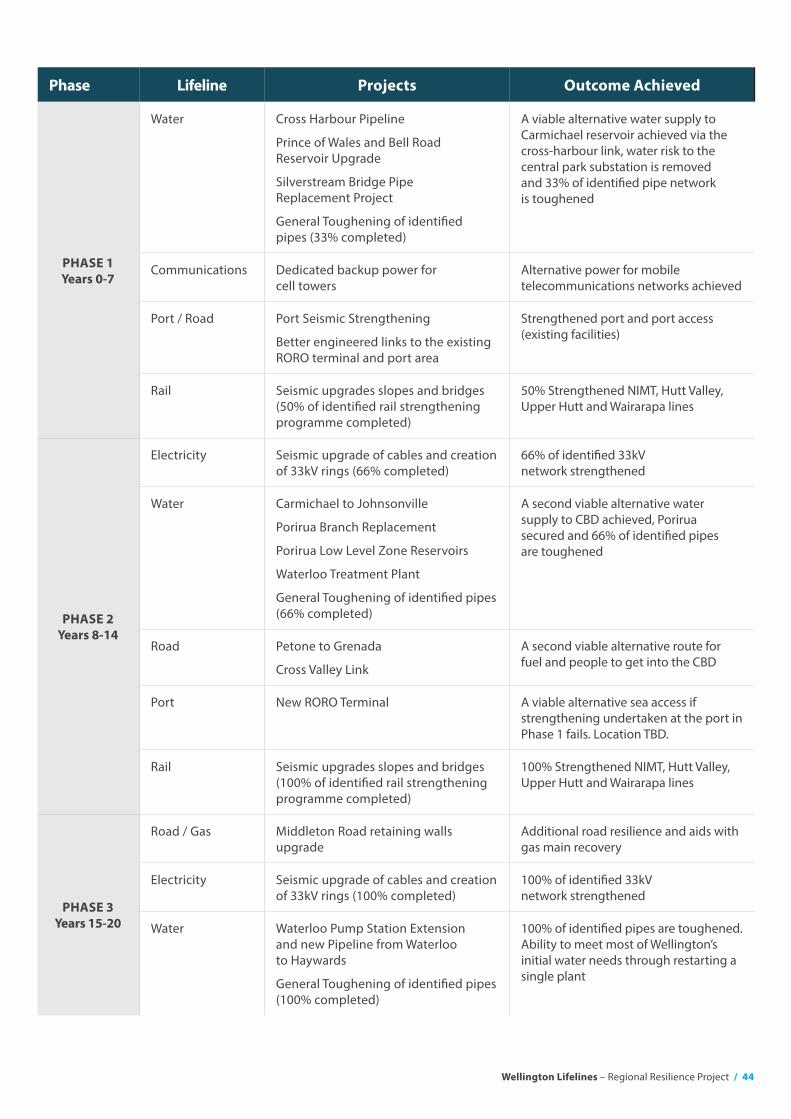
Wellington Lifelines – Regional Resilience Project / 44
Phase Lifeline Projects Outcome Achieved
Water Cross Harbour Pipeline
Prince of Wales and Bell Road Reservoir Upgrade
Silverstream Bridge Pipe Replacement Project
General Toughening of identified pipes (33% completed)
A viable alternative water supply to Carmichael reservoir achieved via the cross-harbour link, water risk to the central park substation is removed and 33% of identified pipe network is toughened
Communications Dedicated backup power for cell towers
Alternative power for mobile telecommunications networks achieved
Port / Road Port Seismic Strengthening
Better engineered links to the existing RORO terminal and port area
Strengthened port and port access (existing facilities)
Rail Seismic upgrades slopes and bridges (50% of identified rail strengthening programme completed)
50% Strengthened NIMT, Hutt Valley, Upper Hutt and Wairarapa lines
Electricity Seismic upgrade of cables and creation of 33kV rings (66% completed)
66% of identified 33kV network strengthened
Water Carmichael to Johnsonville
Porirua Branch Replacement
Porirua Low Level Zone Reservoirs
Waterloo Treatment Plant
General Toughening of identified pipes (66% completed)
A second viable alternative water supply to CBD achieved, Porirua secured and 66% of identified pipes are toughened
Road Petone to Grenada
Cross Valley Link
A second viable alternative route for fuel and people to get into the CBD
Port New RORO Terminal A viable alternative sea access if strengthening undertaken at the port in Phase 1 fails. Location TBD.
Rail Seismic upgrades slopes and bridges (100% of identified rail strengthening programme completed)
100% Strengthened NIMT, Hutt Valley, Upper Hutt and Wairarapa lines
Road / Gas Middleton Road retaining walls upgrade
Additional road resilience and aids with gas main recovery
Electricity Seismic upgrade of cables and creation of 33kV rings (100% completed)
100% of identified 33kV network strengthened
Water Waterloo Pump Station Extension and new Pipeline from Waterloo to Haywards
General Toughening of identified pipes (100% completed)
100% of identified pipes are toughened. Ability to meet most of Wellington’s initial water needs through restarting a single plant
PHASE 1Years 0-7
PHASE 2Years 8-14
PHASE 3Years 15-20
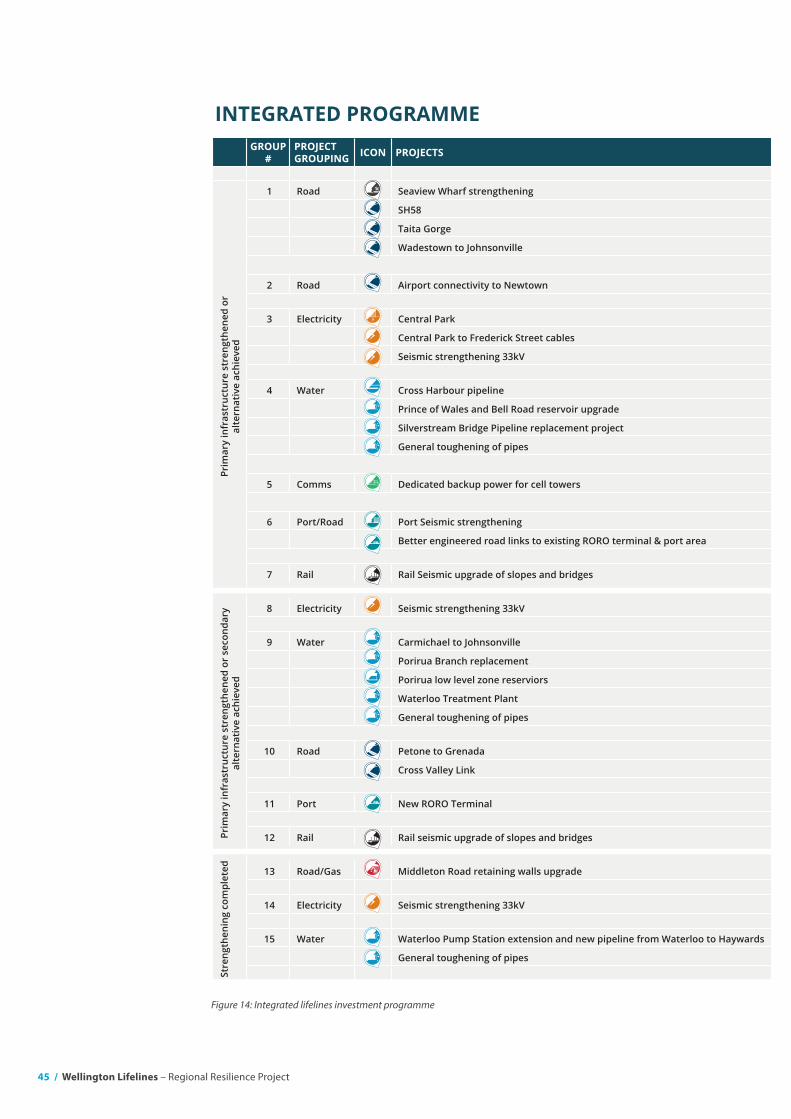
45 / Wellington Lifelines – Regional Resilience Project
PHASE 1 PHASE 2 PHASE 3YEARS YEARS YEARS
GROUP#
PROJECT GROUPING ICON PROJECTS 2019 2020 2021 2022 2023 2024 2025 2026 2027 2028 2029 2030 2031 2032 2033 2034 2035 2036 2037 2038 2039
Prim
ary
infr
astr
uctu
re s
tren
gthe
ned
or
alte
rnat
ive
achi
eved
1 Road Seaview Wharf strengthening
SH58
Taita Gorge , veh
Wadestown to Johnsonville
2 Road Airport connectivity to Newtown
3 Electricity Central Park
Central Park to Frederick Street cables
Seismic strengthening 33kV
4 Water Cross Harbour pipeline
Prince of Wales and Bell Road reservoir upgrade
Silverstream Bridge Pipeline replacement project
General toughening of pipes
5 Comms Dedicated backup power for cell towers
6 Port/Road Port Seismic strengthening
Better engineered road links to existing RORO terminal & port area
7 Rail Rail Seismic upgrade of slopes and bridges
Prim
ary
infr
astr
uctu
re s
tren
gthe
ned
or s
econ
dary
alte
rnat
ive
achi
eved
8 Electricity Seismic strengthening 33kV
9 Water Carmichael to Johnsonville
Porirua Branch replacement
Porirua low level zone reserviors
Waterloo Treatment Plant
General toughening of pipes
10 Road Petone to Grenada
Cross Valley Link
11 Port New RORO Terminal
12 Rail Rail seismic upgrade of slopes and bridges
Stre
ngth
enin
g co
mpl
eted 13 Road/Gas Middleton Road retaining walls upgrade
14 Electricity Seismic strengthening 33kV
15 Water Waterloo Pump Station extension and new pipeline from Waterloo to Haywards
General toughening of pipes
Outcome: NIMT, Hutt Valley, Upper Hutt and Wairarapa Lines 100% strengthened
Additional road resilience and aids with gas main recovery
Outcome: 100% of identified 33kV network strengthened
Outcome: 100% of identified pipe network toughened. Ability to service most of Wellington’s initial needs through restarting 1 piece of plant
Outcome: 66% of identified 33kV network strengthened
Outcome: Second redundant supply achieved by Carmichael to Johnsonville, Porirua secured and 66% of identified pipe network toughened
Outcome: Second redundant route for fuel, vehicles and people into/out of the Hutt Valley
Outcome: Viable alternative sea access if port fails
Outcome: First redundant route between Airport and CBD
Outcome: First redundancy achieved at Central Park. 33% of identified 33kV network strenghtened
Outcome: First redundant supply achieved by cross harbour pipeline, risk to Central Park removed and 33% of identified pipe network toughened
Outcome: First redundant level of power for comms network achieved
Outcome: Strengthened Port and port access (existing facilities)
Outcome: First redundant route for fuel, vehicles and people into/out of the Hutt Valley
Outcome: NIMT, Hutt Valley, Upper Hutt and Wairarapa Lines 50% strengthened
INTEGRATED PROGRAMME
Figure 14: Integrated lifelines investment programme
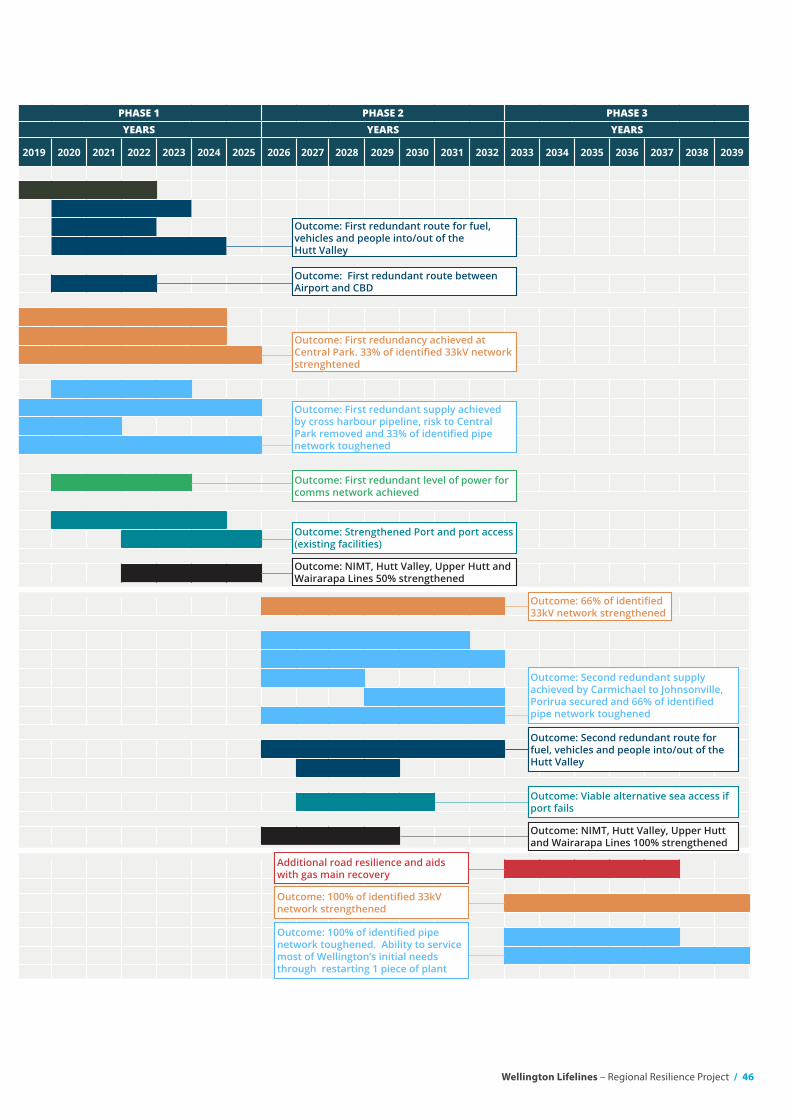
Wellington Lifelines – Regional Resilience Project / 46
PHASE 1 PHASE 2 PHASE 3YEARS YEARS YEARS
GROUP#
PROJECT GROUPING ICON PROJECTS 2019 2020 2021 2022 2023 2024 2025 2026 2027 2028 2029 2030 2031 2032 2033 2034 2035 2036 2037 2038 2039
Prim
ary
infr
astr
uctu
re s
tren
gthe
ned
or
alte
rnat
ive
achi
eved
1 Road Seaview Wharf strengthening
SH58
Taita Gorge , veh
Wadestown to Johnsonville
2 Road Airport connectivity to Newtown
3 Electricity Central Park
Central Park to Frederick Street cables
Seismic strengthening 33kV
4 Water Cross Harbour pipeline
Prince of Wales and Bell Road reservoir upgrade
Silverstream Bridge Pipeline replacement project
General toughening of pipes
5 Comms Dedicated backup power for cell towers
6 Port/Road Port Seismic strengthening
Better engineered road links to existing RORO terminal & port area
7 Rail Rail Seismic upgrade of slopes and bridges
Prim
ary
infr
astr
uctu
re s
tren
gthe
ned
or s
econ
dary
alte
rnat
ive
achi
eved
8 Electricity Seismic strengthening 33kV
9 Water Carmichael to Johnsonville
Porirua Branch replacement
Porirua low level zone reserviors
Waterloo Treatment Plant
General toughening of pipes
10 Road Petone to Grenada
Cross Valley Link
11 Port New RORO Terminal
12 Rail Rail seismic upgrade of slopes and bridges
Stre
ngth
enin
g co
mpl
eted 13 Road/Gas Middleton Road retaining walls upgrade
14 Electricity Seismic strengthening 33kV
15 Water Waterloo Pump Station extension and new pipeline from Waterloo to Haywards
General toughening of pipes
Outcome: NIMT, Hutt Valley, Upper Hutt and Wairarapa Lines 100% strengthened
Additional road resilience and aids with gas main recovery
Outcome: 100% of identified 33kV network strengthened
Outcome: 100% of identified pipe network toughened. Ability to service most of Wellington’s initial needs through restarting 1 piece of plant
Outcome: 66% of identified 33kV network strengthened
Outcome: Second redundant supply achieved by Carmichael to Johnsonville, Porirua secured and 66% of identified pipe network toughened
Outcome: Second redundant route for fuel, vehicles and people into/out of the Hutt Valley
Outcome: Viable alternative sea access if port fails
Outcome: First redundant route between Airport and CBD
Outcome: First redundancy achieved at Central Park. 33% of identified 33kV network strenghtened
Outcome: First redundant supply achieved by cross harbour pipeline, risk to Central Park removed and 33% of identified pipe network toughened
Outcome: First redundant level of power for comms network achieved
Outcome: Strengthened Port and port access (existing facilities)
Outcome: First redundant route for fuel, vehicles and people into/out of the Hutt Valley
Outcome: NIMT, Hutt Valley, Upper Hutt and Wairarapa Lines 50% strengthened
INTEGRATED PROGRAMME
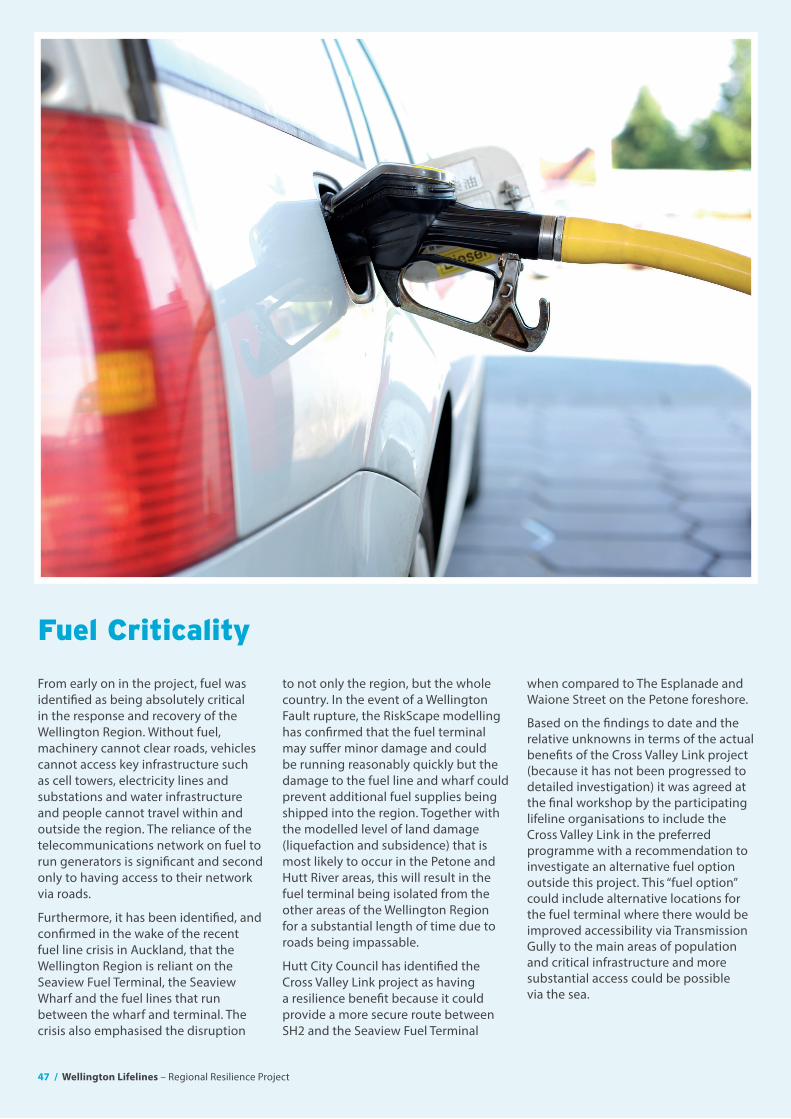
47 / Wellington Lifelines – Regional Resilience Project
Fuel Criticality
From early on in the project, fuel was identified as being absolutely critical in the response and recovery of the Wellington Region. Without fuel, machinery cannot clear roads, vehicles cannot access key infrastructure such as cell towers, electricity lines and substations and water infrastructure and people cannot travel within and outside the region. The reliance of the telecommunications network on fuel to run generators is significant and second only to having access to their network via roads.
Furthermore, it has been identified, and confirmed in the wake of the recent fuel line crisis in Auckland, that the Wellington Region is reliant on the Seaview Fuel Terminal, the Seaview Wharf and the fuel lines that run between the wharf and terminal. The crisis also emphasised the disruption
to not only the region, but the whole country. In the event of a Wellington Fault rupture, the RiskScape modelling has confirmed that the fuel terminal may suffer minor damage and could be running reasonably quickly but the damage to the fuel line and wharf could prevent additional fuel supplies being shipped into the region. Together with the modelled level of land damage (liquefaction and subsidence) that is most likely to occur in the Petone and Hutt River areas, this will result in the fuel terminal being isolated from the other areas of the Wellington Region for a substantial length of time due to roads being impassable.
Hutt City Council has identified the Cross Valley Link project as having a resilience benefit because it could provide a more secure route between SH2 and the Seaview Fuel Terminal
when compared to The Esplanade and Waione Street on the Petone foreshore.
Based on the findings to date and the relative unknowns in terms of the actual benefits of the Cross Valley Link project (because it has not been progressed to detailed investigation) it was agreed at the final workshop by the participating lifeline organisations to include the Cross Valley Link in the preferred programme with a recommendation to investigate an alternative fuel option outside this project. This “fuel option” could include alternative locations for the fuel terminal where there would be improved accessibility via Transmission Gully to the main areas of population and critical infrastructure and more substantial access could be possible via the sea.
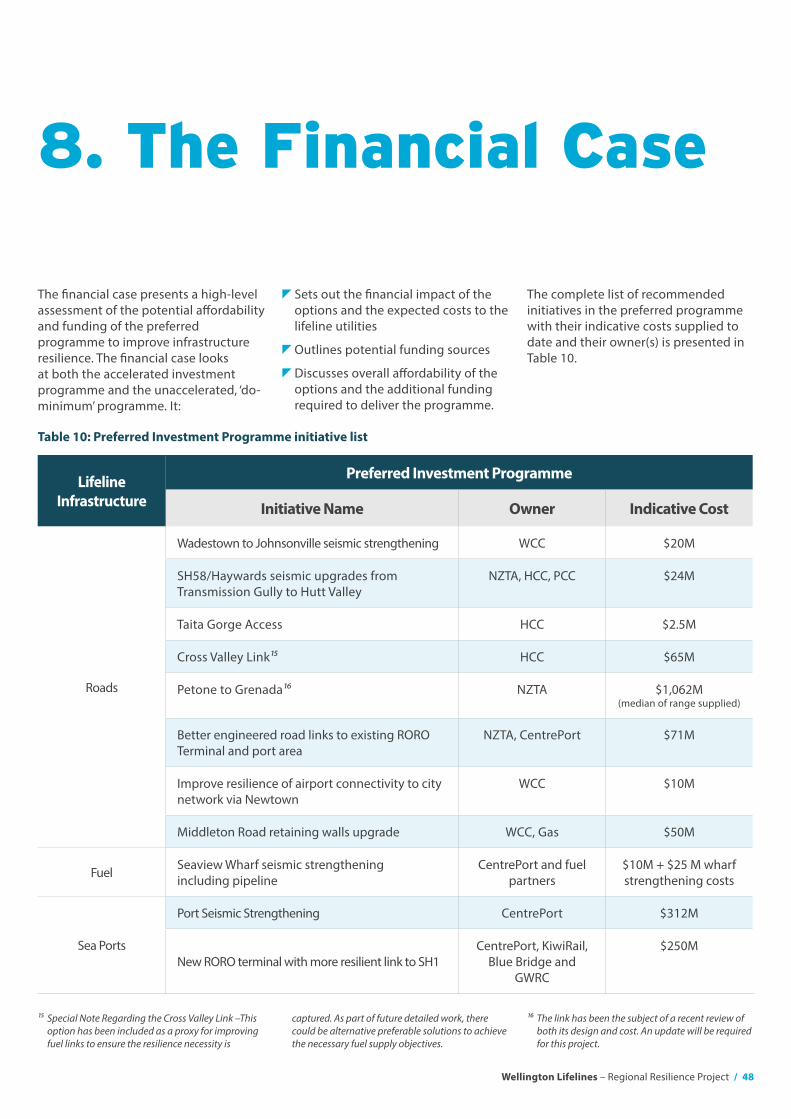
Wellington Lifelines – Regional Resilience Project / 48
8. The Financial Case
The financial case presents a high-level assessment of the potential affordability and funding of the preferred programme to improve infrastructure resilience. The financial case looks at both the accelerated investment programme and the unaccelerated, ‘do-minimum’ programme. It:
Sets out the financial impact of the options and the expected costs to the lifeline utilities
Outlines potential funding sources
Discusses overall affordability of the options and the additional funding required to deliver the programme.
The complete list of recommended initiatives in the preferred programme with their indicative costs supplied to date and their owner(s) is presented in Table 10.
Table 10: Preferred Investment Programme initiative list
Lifeline Infrastructure
Preferred Investment Programme
Initiative Name Owner Indicative Cost
Roads
Wadestown to Johnsonville seismic strengthening WCC $20M
SH58/Haywards seismic upgrades from Transmission Gully to Hutt Valley
NZTA, HCC, PCC $24M
Taita Gorge Access HCC $2.5M
Cross Valley Link15 HCC $65M
Petone to Grenada16 NZTA $1,062M (median of range supplied)
Better engineered road links to existing RORO Terminal and port area
NZTA, CentrePort $71M
Improve resilience of airport connectivity to city network via Newtown
WCC $10M
Middleton Road retaining walls upgrade WCC, Gas $50M
Fuel Seaview Wharf seismic strengthening including pipeline
CentrePort and fuel partners
$10M + $25 M wharf strengthening costs
Sea Ports
Port Seismic Strengthening CentrePort $312M
New RORO terminal with more resilient link to SH1CentrePort, KiwiRail,
Blue Bridge and GWRC
$250M
15 Special Note Regarding the Cross Valley Link –This option has been included as a proxy for improving fuel links to ensure the resilience necessity is
captured. As part of future detailed work, there could be alternative preferable solutions to achieve the necessary fuel supply objectives.
16 The link has been the subject of a recent review of both its design and cost. An update will be required for this project.
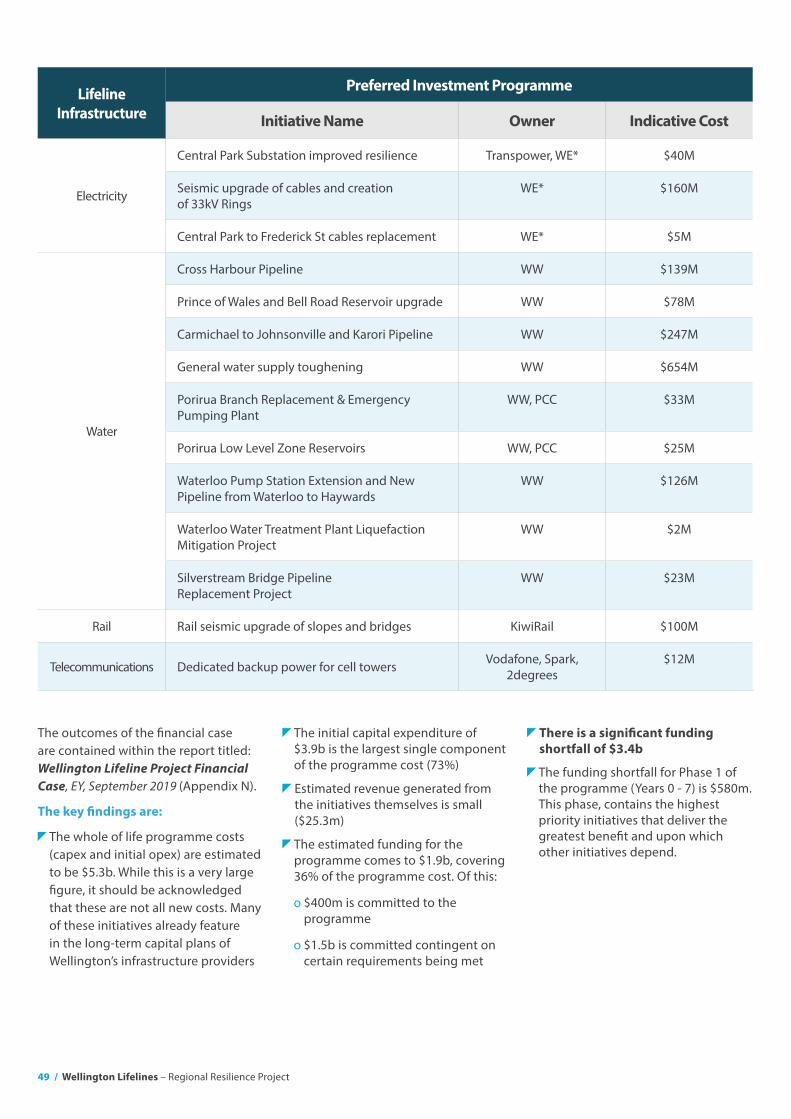
49 / Wellington Lifelines – Regional Resilience Project
Lifeline Infrastructure
Preferred Investment Programme
Initiative Name Owner Indicative Cost
Electricity
Central Park Substation improved resilience Transpower, WE* $40M
Seismic upgrade of cables and creation of 33kV Rings
WE* $160M
Central Park to Frederick St cables replacement WE* $5M
Water
Cross Harbour Pipeline WW $139M
Prince of Wales and Bell Road Reservoir upgrade WW $78M
Carmichael to Johnsonville and Karori Pipeline WW $247M
General water supply toughening WW $654M
Porirua Branch Replacement & Emergency Pumping Plant
WW, PCC $33M
Porirua Low Level Zone Reservoirs WW, PCC $25M
Waterloo Pump Station Extension and New Pipeline from Waterloo to Haywards
WW $126M
Waterloo Water Treatment Plant Liquefaction Mitigation Project
WW $2M
Silverstream Bridge Pipeline Replacement Project
WW $23M
Rail Rail seismic upgrade of slopes and bridges KiwiRail $100M
Telecommunications Dedicated backup power for cell towers Vodafone, Spark, 2degrees
$12M
The outcomes of the financial case are contained within the report titled: Wellington Lifeline Project Financial Case, EY, September 2019 (Appendix N).
The key findings are:
The whole of life programme costs (capex and initial opex) are estimated to be $5.3b. While this is a very large figure, it should be acknowledged that these are not all new costs. Many of these initiatives already feature in the long-term capital plans of Wellington’s infrastructure providers
The initial capital expenditure of $3.9b is the largest single component of the programme cost (73%)
Estimated revenue generated from the initiatives themselves is small ($25.3m)
The estimated funding for the programme comes to $1.9b, covering 36% of the programme cost. Of this:
o $400m is committed to the programme
o $1.5b is committed contingent on certain requirements being met
There is a significant funding shortfall of $3.4b
The funding shortfall for Phase 1 of the programme (Years 0 - 7) is $580m. This phase, contains the highest priority initiatives that deliver the greatest benefit and upon which other initiatives depend.
Wellington Lifelines – Regional Resilience Project / 50
In a programme business case, it is customary to outline the commercial case – broadly what services would be required and how they would be procured and the management case – covering an outline project plan, risk management and programme and business assurance arrangements.
To date Stage 1 ‘Demonstration of Benefits’ and Stage 2 ‘Financing and Timing’ have been completed. In the preceding pages the PBC has demonstrated that completing the programme of works identified will significantly improve Wellington’s economic recovery following major earthquake. It has also proposed an optimised schedule that would deliver the work in a co-ordinated and timely manner.
The funding and affordability have been outlined in the financial case, which has demonstrated that significant additional funding is required in
9. The Commercial and Management Cases
10. Next Steps
9.1 – Outlining the commercial strategy
In this instance, it is not possible to provide such an outline owing to the wide diversity both of the projects in the combined programme and of the responsible organisations themselves. It will be up to each responsible lifeline organisation to develop their commercial and management cases. It is important to note, however, that each responsible
order to implement the accelerated programme and realise resilience benefits sooner.
Next steps for the PBC involve taking the outcomes of Stage 1 and Stage 2 back to individual lifeline organisations and to local and central government. The aim of this is to generate an imperative to take action.
All of the lifeline organisations involved will need to develop their commercial and management cases and respond to this call to action.
It is clear that a coalition across local and central government and the private
organisation is a well-established entity accustomed to procuring and managing the types of projects identified in the programme. Indeed, many of the projects represent business-as-usual for the organisations except that this business case demonstrates the value from those projects happening sooner than they might otherwise.
sector will be required to progress this step and address the funding shortfall.
New funding mechanisms will need to be worked out over forthcoming years by the lifeline entities and will require the community’s understanding and support. The public conversations must be fully informed and honest about the consequences of inaction.
Given the national economic value of this investment, this coalition will benefit from central government leadership because the ultimate economic and social cost of catastrophic failure following a major event is borne by the Crown.
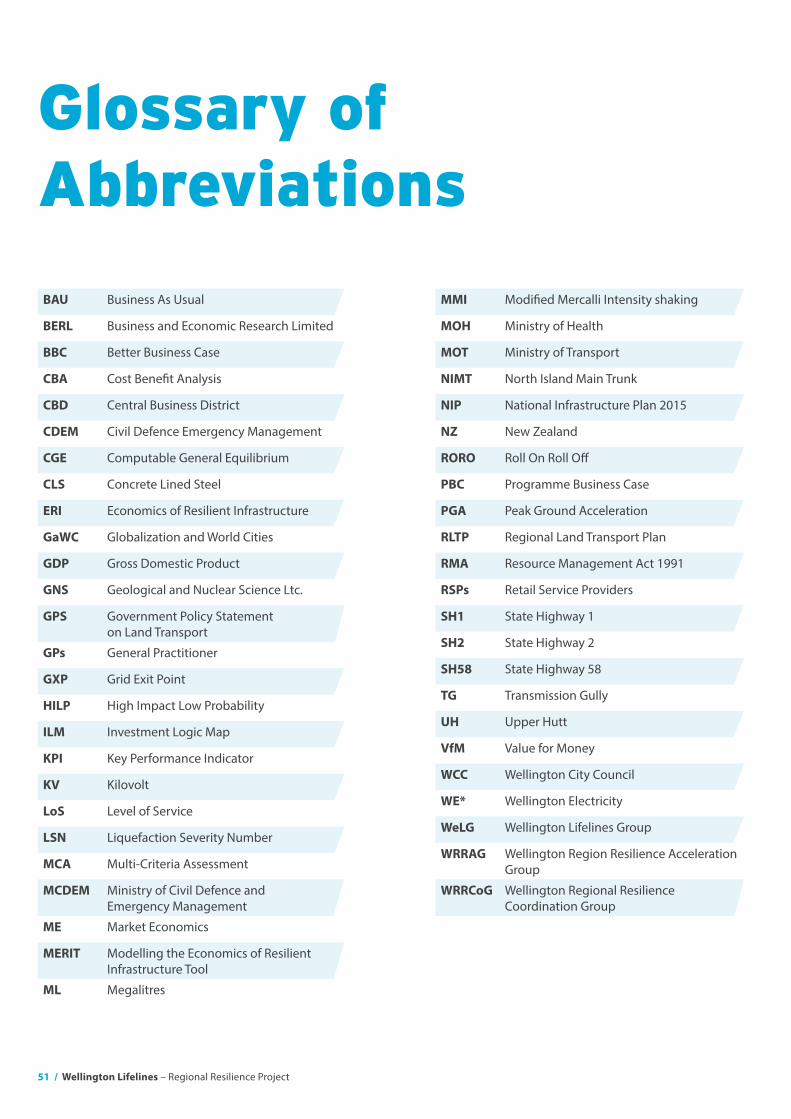
51 / Wellington Lifelines – Regional Resilience Project
Glossary of Abbreviations
BAU Business As Usual
BERL Business and Economic Research Limited
BBC Better Business Case
CBA Cost Benefit Analysis
CBD Central Business District
CDEM Civil Defence Emergency Management
CGE Computable General Equilibrium
CLS Concrete Lined Steel
ERI Economics of Resilient Infrastructure
GaWC Globalization and World Cities
GDP Gross Domestic Product
GNS Geological and Nuclear Science Ltc.
GPS Government Policy Statement on Land Transport
GPs General Practitioner
GXP Grid Exit Point
HILP High Impact Low Probability
ILM Investment Logic Map
KPI Key Performance Indicator
KV Kilovolt
LoS Level of Service
LSN Liquefaction Severity Number
MCA Multi-Criteria Assessment
MCDEM Ministry of Civil Defence and Emergency Management
ME Market Economics
MERIT Modelling the Economics of Resilient Infrastructure Tool
ML Megalitres
MMI Modified Mercalli Intensity shaking
MOH Ministry of Health
MOT Ministry of Transport
NIMT North Island Main Trunk
NIP National Infrastructure Plan 2015
NZ New Zealand
RORO Roll On Roll Off
PBC Programme Business Case
PGA Peak Ground Acceleration
RLTP Regional Land Transport Plan
RMA Resource Management Act 1991
RSPs Retail Service Providers
SH1 State Highway 1
SH2 State Highway 2
SH58 State Highway 58
TG Transmission Gully
UH Upper Hutt
VfM Value for Money
WCC Wellington City Council
WE* Wellington Electricity
WeLG Wellington Lifelines Group
WRRAG Wellington Region Resilience Acceleration Group
WRRCoG Wellington Regional Resilience Coordination Group
REGIONAL RESILIENCE PROJECT
WELLINGTON LIFELINES

Wellington Lifelines – Regional Resilience Project / 52
Document Control Record
Aurecon New Zealand Limited
A: Spark Central Level 8, 42-52 Willis Street Wellington 6011
PO Box 1591 Wellington 6140 New Zealand
T: +64 4 472 9589
F: +64 4 472 9922
W: aurecongroup.com
A person using documents or data accepts the risk of:
a) Using the documents or data in electronic form without requesting and checking them for accuracy against the original hard copy version.
b) Using the documents or data for any purpose not agreed to in writing
DOCUMENT CONTROL
Report title Document titles
Revision Date Revision details/status Author Reviewer Approver
0 21 December 2017 Draft for PSG
John Allard / Cassandra Kenworthy
Melanie Muirson / Chris Money
Walter Rushbrook
1 22 March 2018 Incorporation of PSG feedback
John Allard / Lars Mueller
Cassandra Kenworthy Simon Prebble
2 13 April 2018 Final (Stage 1) John Allard / Lars Mueller
Cassandra Kenworthy Simon Prebble
3 04 October 2019
Final (Stage 1 and Stage 2)
Cassandra Kenworthy Simon Prebble
Current revision 3
Front Cover – From the Top and Left to Right: 1. Hayward HVDC Transpower inter-island electricity link convertor station; 2. Ngauranga interchange; 3 Hayward HVDC Transpower inter-island electricity link convertor station seismic base isolation; 4. Pukerua Bay to Paekakariki railway slope stability works; 5. Investigations to improve the resilience of Wellington's water supply.
REGIONAL RESILIENCE PROJECT
WELLINGTON LIFELINES WELLINGTON LIFELINES PROJECTProtecting Wellington's Economy Through Accelerated
Infrastructure Investment Programme Business Case
APPENDICES
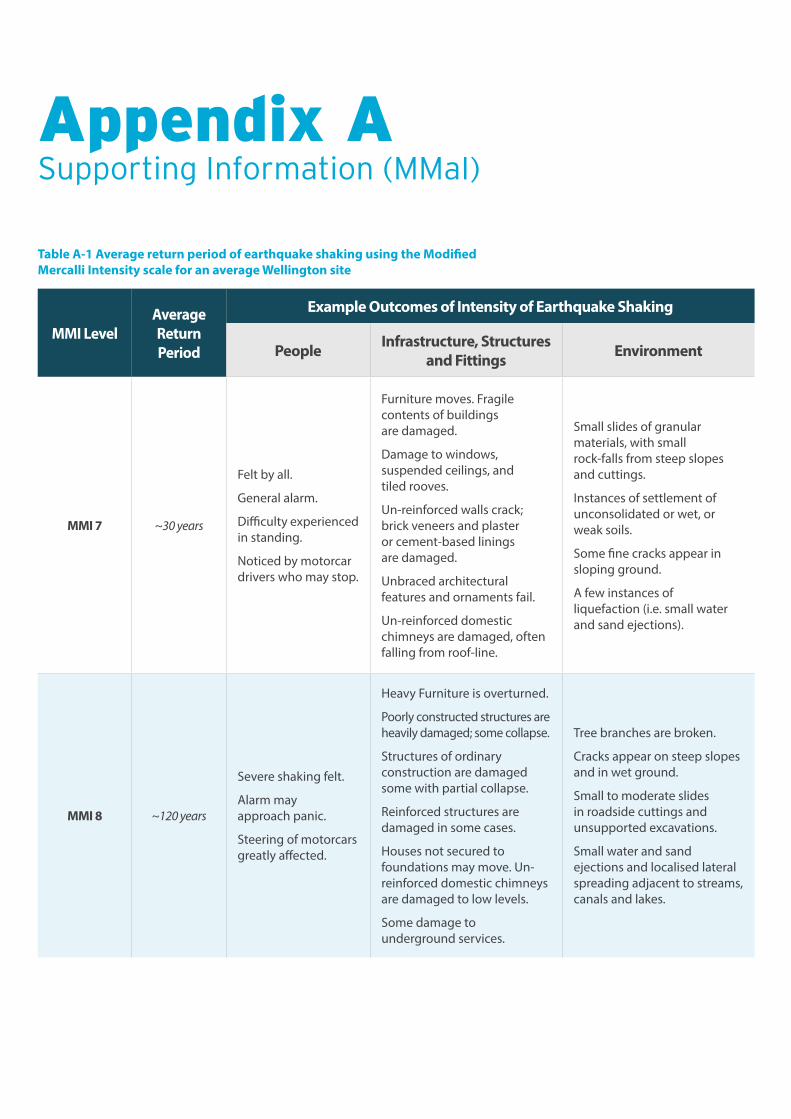
Appendix ASupporting Information (MMaI)
Table A-1 Average return period of earthquake shaking using the Modified Mercalli Intensity scale for an average Wellington site
MMI LevelAverage Return Period
Example Outcomes of Intensity of Earthquake Shaking
People Infrastructure, Structures and Fittings Environment
MMI 7 ~30 years
Felt by all.
General alarm.
Difficulty experienced in standing.
Noticed by motorcar drivers who may stop.
Furniture moves. Fragile contents of buildings are damaged.
Damage to windows, suspended ceilings, and tiled rooves.
Un-reinforced walls crack; brick veneers and plaster or cement-based linings are damaged.
Unbraced architectural features and ornaments fail.
Un-reinforced domestic chimneys are damaged, often falling from roof-line.
Small slides of granular materials, with small rock-falls from steep slopes and cuttings.
Instances of settlement of unconsolidated or wet, or weak soils.
Some fine cracks appear in sloping ground.
A few instances of liquefaction (i.e. small water and sand ejections).
MMI 8 ~120 years
Severe shaking felt.
Alarm may approach panic.
Steering of motorcars greatly affected.
Heavy Furniture is overturned.
Poorly constructed structures are heavily damaged; some collapse.
Structures of ordinary construction are damaged some with partial collapse.
Reinforced structures are damaged in some cases.
Houses not secured to foundations may move. Un-reinforced domestic chimneys are damaged to low levels.
Some damage to underground services.
Tree branches are broken.
Cracks appear on steep slopes and in wet ground.
Small to moderate slides in roadside cuttings and unsupported excavations.
Small water and sand ejections and localised lateral spreading adjacent to streams, canals and lakes.
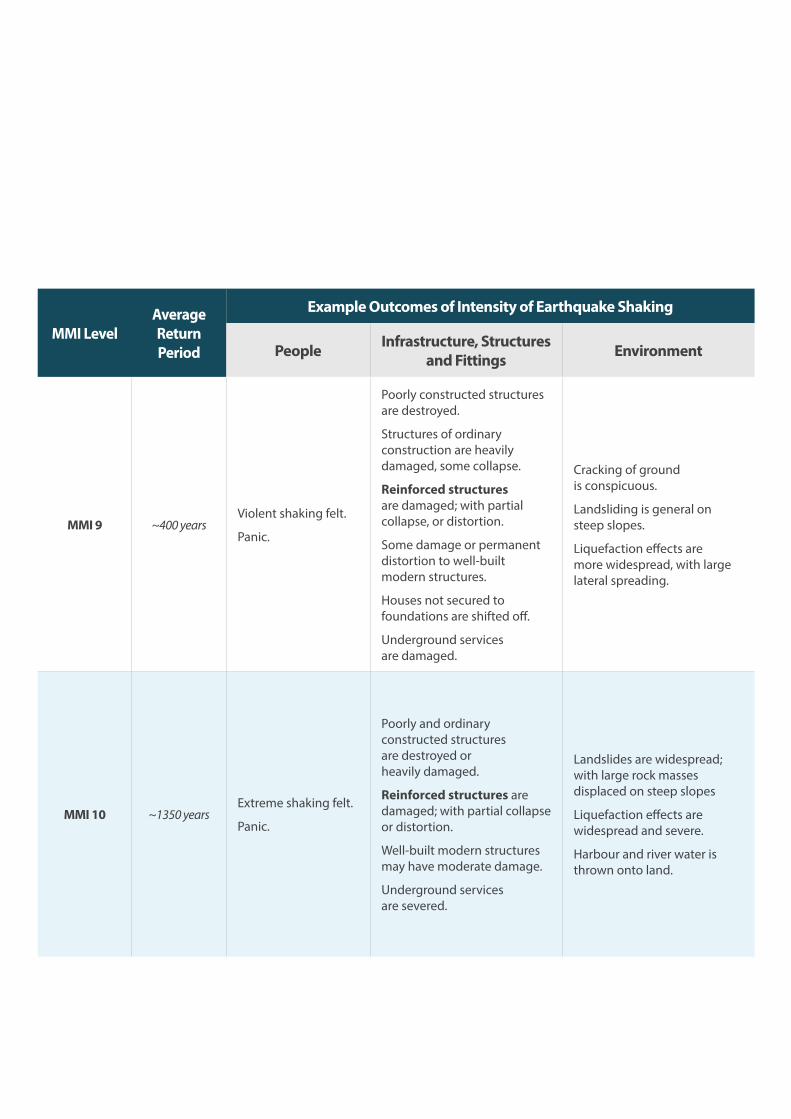
MMI LevelAverage Return Period
Example Outcomes of Intensity of Earthquake Shaking
People Infrastructure, Structures and Fittings Environment
MMI 9 ~400 yearsViolent shaking felt.
Panic.
Poorly constructed structures are destroyed.
Structures of ordinary construction are heavily damaged, some collapse.
Reinforced structures are damaged; with partial collapse, or distortion.
Some damage or permanent distortion to well-built modern structures.
Houses not secured to foundations are shifted off.
Underground services are damaged.
Cracking of ground is conspicuous.
Landsliding is general on steep slopes.
Liquefaction effects are more widespread, with large lateral spreading.
MMI 10 ~1350 yearsExtreme shaking felt.
Panic.
Poorly and ordinary constructed structures are destroyed or heavily damaged.
Reinforced structures are damaged; with partial collapse or distortion.
Well-built modern structures may have moderate damage.
Underground services are severed.
Landslides are widespread; with large rock masses displaced on steep slopes
Liquefaction effects are widespread and severe.
Harbour and river water is thrown onto land.
Appendix BEarlier Studies and their Findings
Previous studies set the scene for the current business case and highlight how imperative it is that the business case addresses outstanding issues and helps make the region more resilient for the good of the New Zealand economy and people of the region. They show work to date, and gaps to address.
The Lifeline Response priorities paper represents the outcome of a WeLG project to create a framework for the prioritisation of lifeline restoration during and following an emergency. The framework was used to identify which facilities should be prioritised for response. The project also had the
This report acted as a catalyst for significant further investigation and investment by highlighting the restoration times – and how much greater they are than may generally be perceived. As stated in the Foreword by the WeLG Chair “The contents of this report make sober reading. The complexities of restoring essential services after a severe earthquake are considerable and the job will not be achieved quickly. There is much at stake. Not only does the region comprise 11 per cent of the country’s population, but it also generates 15 per cent of its GDP. Wellington is the
Lifeline response priorities: 7 April 201516
Lifeline utilities restoration times for metropolitan Wellington following a Wellington fault earthquake17
16 Wellington lifelines group/Wellington Region Emergency management Office/Wairarapa Engineering Lifelines Association 7 April 2015
17 Report to the Wellington CDEM Group Joint Committee from the Wellington Lifelines Group, November 2012
objective to “inform the risk reduction and resilience enhancements of the region’s lifeline utilities”. As such, the project very much formed a starting point for the current business case.
The paper observed that the framework “is necessarily high-level
seat of government and the transport hub between North and South islands. Many organisations have their national headquarters in the capital’s CBD so that a severe earthquake would affect operations far beyond the city” (page 5).
The report focuses on likely restoration times for key lifeline utility services following a major earthquake involving a rupture of the Wellington Fault. Accordingly, it is based on the same core scenario as the present business case and the identified restoration times help represent a starting point (or base case).
due to the complexity of attempting to balance various priorities and interdependencies”; it uses the MCDEM prioritisation framework as its basis. This PBC aims to assist in exploring some of that complexity.
The report was based on studies completed just prior to the release of the WeLG report, and based on the expert opinions of the lifelines staff at the time. It only touched upon interdependency issues between lifeline sectors at a relatively light level.
The report included the restoration times (under a set of necessary but reasonable assumptions) for most utilities. Refer to Table 1. As can be seen, the time to restore services will result in significant disruption to the people and organisations based in Wellington.
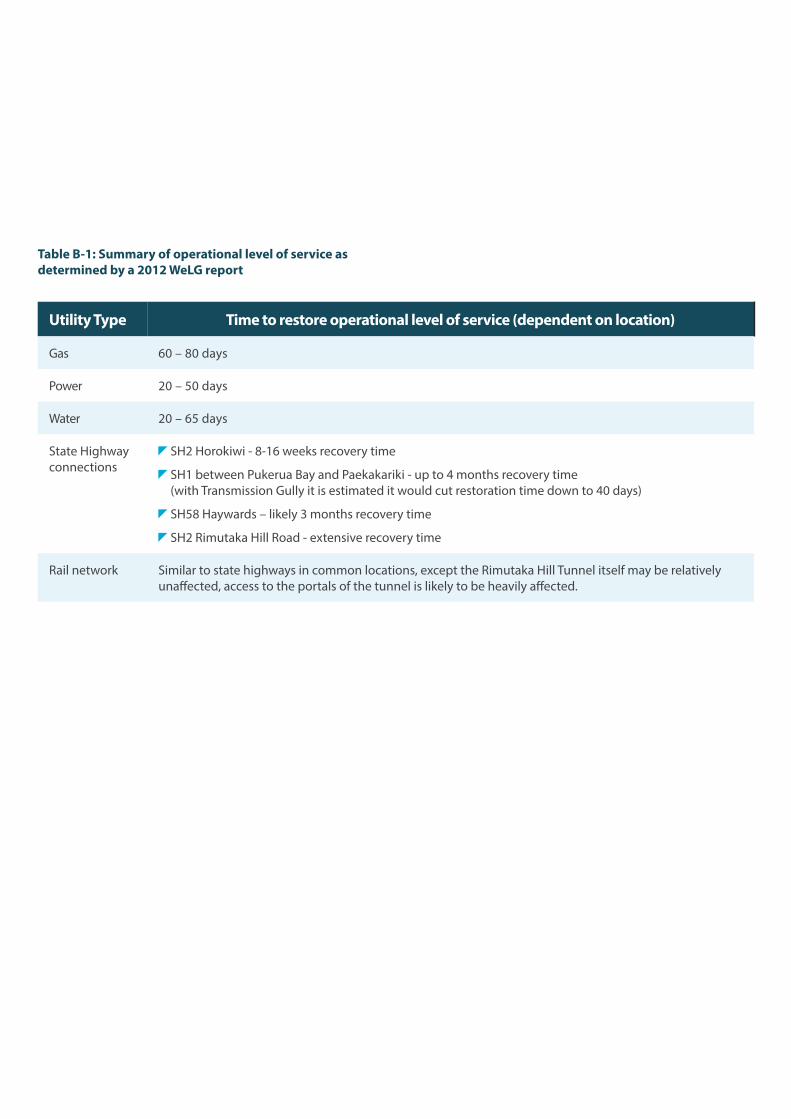
Table B-1: Summary of operational level of service as determined by a 2012 WeLG report
Utility Type Time to restore operational level of service (dependent on location)
Gas 60 – 80 days
Power 20 – 50 days
Water 20 – 65 days
State Highway connections
SH2 Horokiwi - 8-16 weeks recovery time
SH1 between Pukerua Bay and Paekakariki - up to 4 months recovery time (with Transmission Gully it is estimated it would cut restoration time down to 40 days)
SH58 Haywards – likely 3 months recovery time
SH2 Rimutaka Hill Road - extensive recovery time
Rail network Similar to state highways in common locations, except the Rimutaka Hill Tunnel itself may be relatively unaffected, access to the portals of the tunnel is likely to be heavily affected.
Appendix CSummary of Strategic Documentation
The Guide to the National CDEM Strategy constitutes an effective cohesive strategy, which has four goals:
Goal 1: increase community awareness, understanding, preparedness, and participation in respect of CDEM
Goal 2: reduce the risks from hazards to New Zealand
Goal 3: enhance New Zealand’s capability to manage emergencies
Goal 4: enhance New Zealand’s capability to recover from emergencies.
The CDEM Strategy and Guide refer specifically to Lifeline utilities as entities that provide infrastructure services to the community such as water, wastewater, transport, energy, and telecommunications. The guide notes that Lifeline utilities have responsibilities for planning and coordinating in a way that enables the continuation of these services in an emergency, with assistance from CDEM Groups, MCDEM, and other relevant government agencies and regulatory bodies.
The preparation of this business case for WeLG on behalf of the lifeline organisations is important in helping them to fulfil their statutory responsibilities especially concerning reduction and planning cooperatively.
The Guide further comments that Lifeline utilities are primarily responsible for the reduction of outage risks, for example, by the location and installation of assets consistent with local hazard conditions. Lifeline utilities are also primarily responsible for preparing readiness arrangements for emergency responses when outages occur.
Guide to the National CDEM Plan 2015
Guide to the National CDEM Plan 2015 – supporting information
Lifeline utilities
Consistency of this business case with the guide and act
This programme business case is a major contribution towards Goal 4 and will be expected to contribute to Goal 2.
The National CDEM Plan 2015 and Guide are supported by three supporting plans issued by the Director of CDEM. One is the Wellington Earthquake National Initial Response Plan, discussed below.
The Guide states that Lifeline utilities have duties under section 60 of the Act.
Every Lifeline utility identified in Schedule 1 must:
a) Ensure that it is able to function to the fullest possible extent, even though this may be at a reduced level, during and after an emergency
b) Make available to the Director of CDEM in writing, on request, its plan for functioning during and after an emergency.
To help fulfil their duties under section 60 of the Act, all lifeline utilities are to—
The Guide defines reduction as identifying and analysing risks to life and property from hazards, taking steps to eliminate those risks if practicable, and, if not, reducing the magnitude of their impact and the likelihood of their occurrence to an acceptable level. The objective of reduction is to take preventive steps to avoid or mitigate adverse consequences.
Section 6 of the Resource Management Act 1991 (RMA) sets out matters of national importance that decision-makers must recognise and provide for in various circumstances.
The current action to develop a business case to reduce the economic cost of a major event affecting Wellington aligns to the wider government aims for resilience in New Zealand.
This business case proposal is being developed as part of an integrated
This document (http://www.civildefence.govt.nz/assets/Uploads/publications/dgl-16-14-Lifeline-Utilities-and-CDEM-Groups.pdf ) notes, in Section 2.1 that lifeline utilities need to “consider the service delivery expectations and service delivery capacity for a range of disruptions. Each lifeline utility needs to determine the optimal level of service that meets their obligations, and plan for the delivery of this level of service.”
a) Develop business continuity plans to:
i) Identify critical assets and business processes, assess their vulnerabilities, and undertake appropriate actions to reduce the risks they face
ii) Outline response and recovery arrangements, including appropriate contracting arrangements with key suppliers
Role of lifeline utilities during reduction and readiness
Reduction
Resource Management Act
National level aims for resilience
Lifeline utilities and CDEM: Director’s guideline for lifeline utilities and civil defence emergency management groups (DGL 16/14)
b) Focus on both reduction and readiness, including planning co-operatively with—
i) Other lifeline utilities (whether or not in the same sector), especially those on which they are dependent; and
ii) Relevant government agencies
iii) CDEM Groups; and
c) Regularly test and exercise their response arrangements and participate in the National CDEM Exercise Programme.
The principles underlying reduction are to:
d) Achieve acceptable levels of risk through sustainable and practicable reduction measures to provide the best long-term solutions; and
e) Reduce the risks to communities from hazards
Section 6 of the RMA has recently been amended to add ‘the management of significant risks from natural hazards’. The intent of this change is to provide an explicit mandate for decision-makers to manage significant risks from all
approach, which has been Government-coordinated with separate but inter-connected streams. These streams of work have looked at actions that can be taken to enhance resilience within one month, between one month and six months and beyond six months – this business case. The catalyst for developing the de facto strategy was
natural hazards (as defined in section 2 of the RMA) as part of any Part 2 assessment.
These changes came into force on 19 April 2017.
the Kaikoura Earthquake of November 2016.
An urgent review of the Wellington Earthquake National Initial Response Plan by the Ministry of Civil Defence and Emergency Management (MCDEM) confirmed that the Wellington Region faces a unique set of risks and
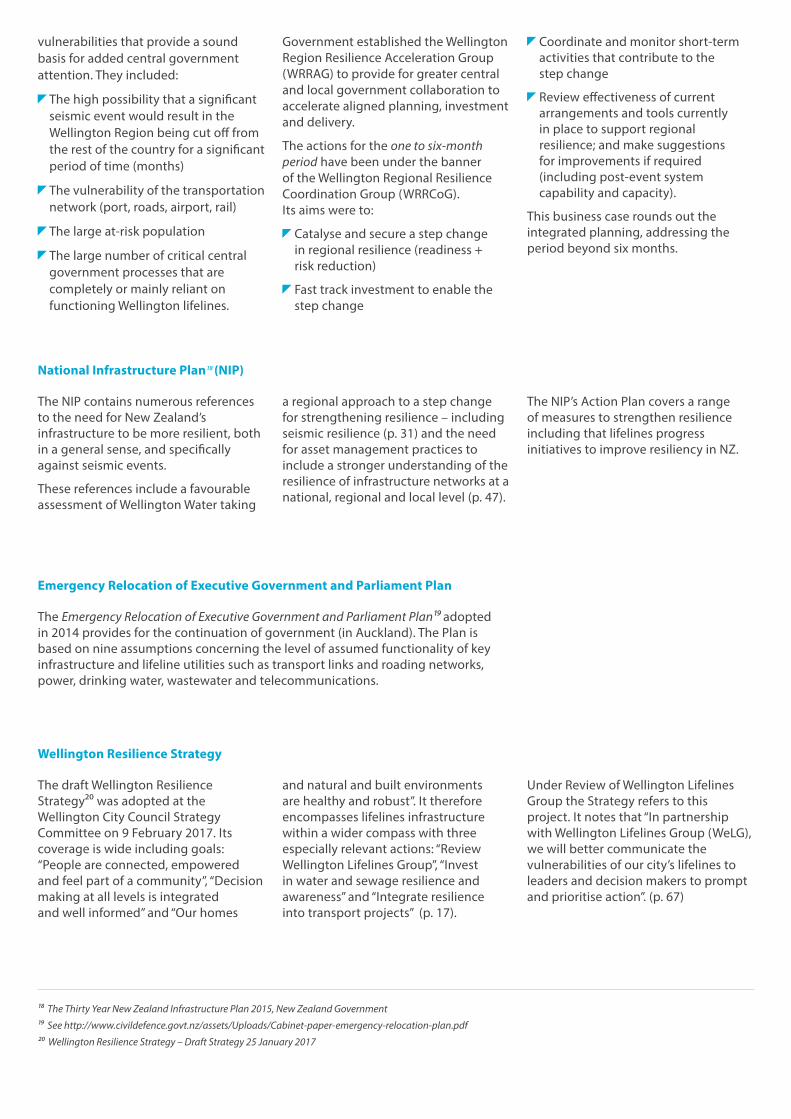
vulnerabilities that provide a sound basis for added central government attention. They included:
The high possibility that a significant seismic event would result in the Wellington Region being cut off from the rest of the country for a significant period of time (months)
The vulnerability of the transportation network (port, roads, airport, rail)
The large at-risk population
The large number of critical central government processes that are completely or mainly reliant on functioning Wellington lifelines.
Government established the Wellington Region Resilience Acceleration Group (WRRAG) to provide for greater central and local government collaboration to accelerate aligned planning, investment and delivery.
The actions for the one to six-month period have been under the banner of the Wellington Regional Resilience Coordination Group (WRRCoG). Its aims were to:
Catalyse and secure a step change in regional resilience (readiness + risk reduction)
Fast track investment to enable the step change
Coordinate and monitor short-term activities that contribute to the step change
Review effectiveness of current arrangements and tools currently in place to support regional resilience; and make suggestions for improvements if required (including post-event system capability and capacity).
This business case rounds out the integrated planning, addressing the period beyond six months.
18 The Thirty Year New Zealand Infrastructure Plan 2015, New Zealand Government
19 See http://www.civildefence.govt.nz/assets/Uploads/Cabinet-paper-emergency-relocation-plan.pdf
20 Wellington Resilience Strategy – Draft Strategy 25 January 2017
The NIP contains numerous references to the need for New Zealand’s infrastructure to be more resilient, both in a general sense, and specifically against seismic events.
These references include a favourable assessment of Wellington Water taking
The Emergency Relocation of Executive Government and Parliament Plan19 adopted in 2014 provides for the continuation of government (in Auckland). The Plan is based on nine assumptions concerning the level of assumed functionality of key infrastructure and lifeline utilities such as transport links and roading networks, power, drinking water, wastewater and telecommunications.
The draft Wellington Resilience Strategy20 was adopted at the Wellington City Council Strategy Committee on 9 February 2017. Its coverage is wide including goals: “People are connected, empowered and feel part of a community”, “Decision making at all levels is integrated and well informed” and “Our homes
National Infrastructure Plan18 (NIP)
Emergency Relocation of Executive Government and Parliament Plan
Wellington Resilience Strategy
a regional approach to a step change for strengthening resilience – including seismic resilience (p. 31) and the need for asset management practices to include a stronger understanding of the resilience of infrastructure networks at a national, regional and local level (p. 47).
The NIP’s Action Plan covers a range of measures to strengthen resilience including that lifelines progress initiatives to improve resiliency in NZ.
and natural and built environments are healthy and robust”. It therefore encompasses lifelines infrastructure within a wider compass with three especially relevant actions: “Review Wellington Lifelines Group”, “Invest in water and sewage resilience and awareness” and “Integrate resilience into transport projects” (p. 17).
Under Review of Wellington Lifelines Group the Strategy refers to this project. It notes that “In partnership with Wellington Lifelines Group (WeLG), we will better communicate the vulnerabilities of our city’s lifelines to leaders and decision makers to prompt and prioritise action”. (p. 67)
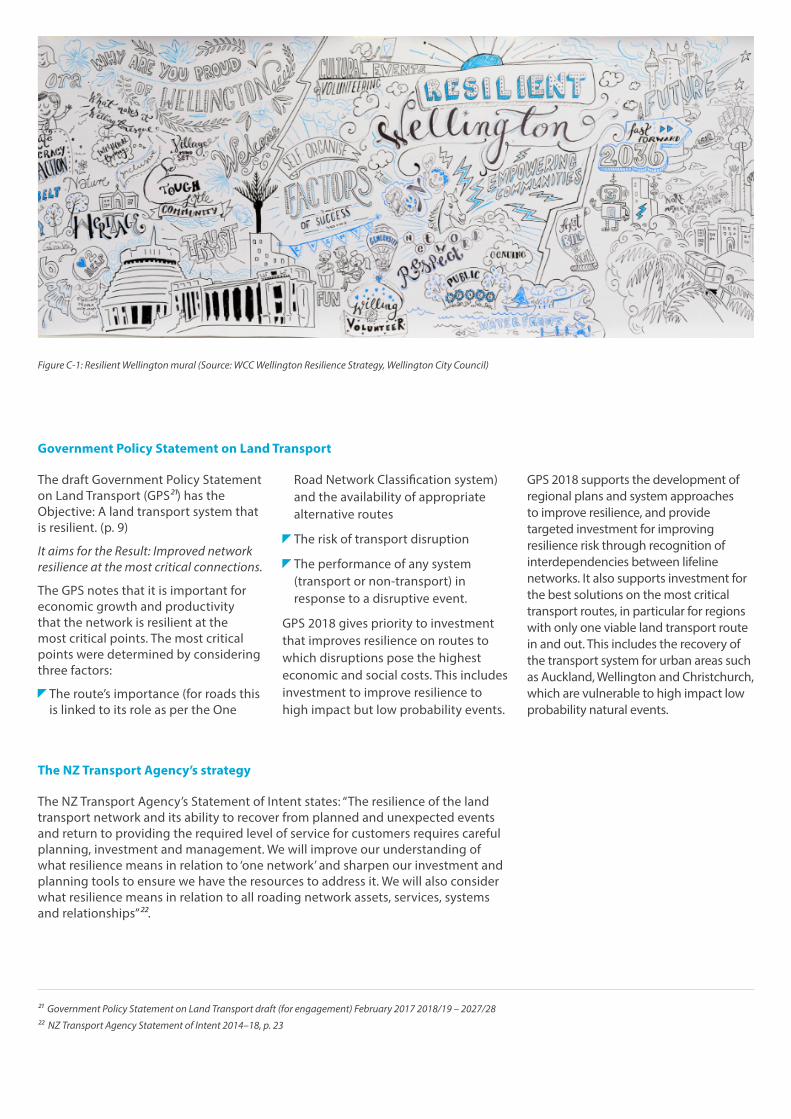
21 Government Policy Statement on Land Transport draft (for engagement) February 2017 2018/19 – 2027/28
22 NZ Transport Agency Statement of Intent 2014–18, p. 23
The draft Government Policy Statement on Land Transport (GPS21) has the Objective: A land transport system that is resilient. (p. 9)
It aims for the Result: Improved network resilience at the most critical connections.
The GPS notes that it is important for economic growth and productivity that the network is resilient at the most critical points. The most critical points were determined by considering three factors:
The route’s importance (for roads this is linked to its role as per the One
The NZ Transport Agency’s Statement of Intent states: “The resilience of the land transport network and its ability to recover from planned and unexpected events and return to providing the required level of service for customers requires careful planning, investment and management. We will improve our understanding of what resilience means in relation to ‘one network’ and sharpen our investment and planning tools to ensure we have the resources to address it. We will also consider what resilience means in relation to all roading network assets, services, systems and relationships”22.
Government Policy Statement on Land Transport
The NZ Transport Agency’s strategy
Road Network Classification system) and the availability of appropriate alternative routes
The risk of transport disruption
The performance of any system (transport or non-transport) in response to a disruptive event.
GPS 2018 gives priority to investment that improves resilience on routes to which disruptions pose the highest economic and social costs. This includes investment to improve resilience to high impact but low probability events.
GPS 2018 supports the development of regional plans and system approaches to improve resilience, and provide targeted investment for improving resilience risk through recognition of interdependencies between lifeline networks. It also supports investment for the best solutions on the most critical transport routes, in particular for regions with only one viable land transport route in and out. This includes the recovery of the transport system for urban areas such as Auckland, Wellington and Christchurch, which are vulnerable to high impact low probability natural events.
Figure C-1: Resilient Wellington mural (Source: WCC Wellington Resilience Strategy, Wellington City Council)
The Wellington RLTP contains a significant section on resilience, which addresses both High Probability, Low Impact and High Impact, Low Probability events. The latter are defined in the RLTP as including a significant magnitude earthquake (7+), major volcanic eruption or a tsunami.
Each lifeline provider is at a different stage in developing their individual asset management and resilience plans. This section gives a brief snapshot of a limited number of the plans to illustrate typical content and some of the issues being faced by lifeline organisations, as well as a summary of the status of the plans as known at May 2017. Knowing
Wellington Regional Land Transport Plan (RLTP)
Individual lifelines planning
The RLTP gives the key resilience problem for Wellington’s regional transport network as:Regional infrastructure that is vulnerable to disruption by unplanned events is potentially resulting in an unacceptable cost of severance and restricted ability to recover over time.
the status of present plans provides the starting point for a central aim of the business case – to enhance and better integrate all organisations’ planning (and delivery) of enhanced resilience.
The councils with their wider responsibilities and tight statutory framework generally have well-documented plans. As described above
The priority action areas are:
“The development of business cases in relation to the region’s resilience issues will help to determine the best resilience solutions and packages and will help to guide the priority order in which projects should be undertaken.”
(S. 4.6) Wellington City Council has a comprehensive resilience strategy.
The degree of planning and documentation among the utilities is very variable. In some cases, it may be that there is significant planning that has occurred, but it is not known publicly for reasons of commercial sensitivity.
Typically for the councils, Upper Hutt City Council has an Infrastructure Strategy24 whichcontains references to increasing resilience in respect of multiple assets. It comments that “Well maintained infrastructure located in the right place and provided for at the right time, with sufficient capacity and
Wellington Water is a good example of a lifeline organisation that has taken a systematic approach to resilience. It has produced strategic cases for water supply and wastewater. The water supply example identified problems relating to the multiple
Upper Hutt City Council
Wellington Water
resilience is critical to the economic prosperity, and social well-being of people living and working in Upper Hutt (emphasis added, p. 3). Similarly, it notes that a purpose of its services is “Ensuring our community is resilient to change as a result of foreseen and unforeseen events – natural hazards,
crossings of numerous fault lines by the metropolitan water supply; the likelihood of long-term outages as a result of the state of the network and ground conditions; the linear configuration of the supply network and the expectation of metropolitan
climate change, changes in demand” (p.3). In the specific section on Resilience of Infrastructure Assets (p. 8) specific vulnerabilities are identified affecting the water supply reticulation network, the roading network and a number of bridges with a commitment for upgrading.
area utilities being disrupted. The strategic case also sets out the expected benefits, strategic responses and desired outcomes. The conclusion from the strategic case was the need to do more to enable Wellington Water to comply with the CDEM Act.
23 Wellington Regional Land Transport Plan 2015 p. 119 – p. 124
24 Infrastructure Strategy, 2015 – 2045, Upper Hutt City Council, January 2015
25 Water Supply Resilience Strategic Case, Wellington Water, August 2015
Wellington Electricity is among the better publicly documented of the Lifeline Organisations26. It is an example of a lifeline organisation that is well aware of its need to address resilience and is taking active steps to do so. Nevertheless, it reports there is currently no additional funding for
The councils have reasonably complete and integrated infrastructure plans that address resilience. NZTA has advanced planning to enhance the resilience of the state highway network. Five out of the remaining 17 lifeline organisations
The Transport Agency is well advanced with its resilience planning27, having developed a national programme business case, undertaken research on its value28 and developed multiple areas of policy and guidance29. Of particular interest is the way that resilience has
Wellington Electricity
All lifelines
NZTA
resilience expenditure, and budget for any resilience work comes out of the annual capex budget (page 100).
During 2016 Wellington Electricity studied options to improve the overall resiliency of the network for HILP events (such as a major earthquake). Together with Wellington Water, Wellington
been addressed for major projects with, for example, the Transmission Gully business case has a very specific objective: to to provide an alternative strategic link for Wellington that improves regional network resilience and route security.
Electricity engaged with regionally critical consumers, focusing on learning the requirements of each of these consumers and getting a better understanding of their requirements after a severe disaster event, including backup power and water storage capabilities.
26 Wellington Electricity 10 Year Asset Management Plan 1 April 2017 - 31 March 2027
27 State Highway Network Resilience National Programme Business Case
28 Research Report 614 Establishing the value of resilience
28 https://www.nzta.govt.nz/assets/Highways-Information-Portal/Technical-disciplines/Resilience/Resilience-project/Resources-and-information/Resilience-strategic-case-best-practice-and-insights-Final.pdf
are known to have some form of plan. Therefore, there are 12 organisations where the plans do not exist or are kept confidential and are unlikely to be integrated across the sector.
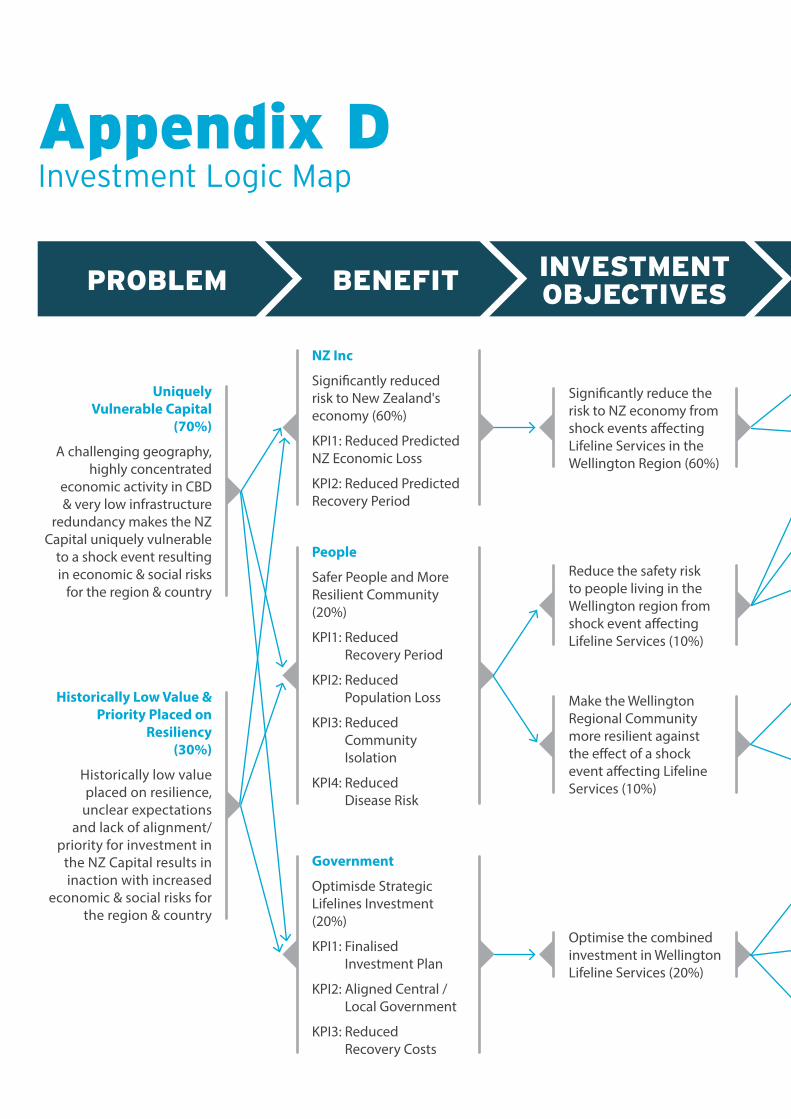
Appendix DInvestment Logic Map
PROBLEM BENEFIT INVESTMENT OBJECTIVES
Uniquely Vulnerable Capital
(70%)
A challenging geography, highly concentrated
economic activity in CBD & very low infrastructure
redundancy makes the NZ Capital uniquely vulnerable
to a shock event resulting in economic & social risks
for the region & country
NZ Inc
Significantly reduced risk to New Zealand's economy (60%)
KPI1: Reduced Predicted NZ Economic Loss
KPI2: Reduced Predicted Recovery Period
Significantly reduce the risk to NZ economy from shock events affecting Lifeline Services in the Wellington Region (60%)
Reduce the safety risk to people living in the Wellington region from shock event affecting Lifeline Services (10%)
Make the Wellington Regional Community more resilient against the effect of a shock event affecting Lifeline Services (10%)
Optimise the combined investment in Wellington Lifeline Services (20%)
People
Safer People and More Resilient Community (20%)
KPI1: Reduced Recovery Period
KPI2: Reduced Population Loss
KPI3: Reduced Community Isolation
KPI4: Reduced Disease Risk
Government
Optimisde Strategic Lifelines Investment (20%)
KPI1: Finalised Investment Plan
KPI2: Aligned Central / Local Government
KPI3: Reduced Recovery Costs
Historically Low Value & Priority Placed on
Resiliency (30%)
Historically low value placed on resilience,
unclear expectations and lack of alignment/
priority for investment in the NZ Capital results in inaction with increased
economic & social risks for the region & country
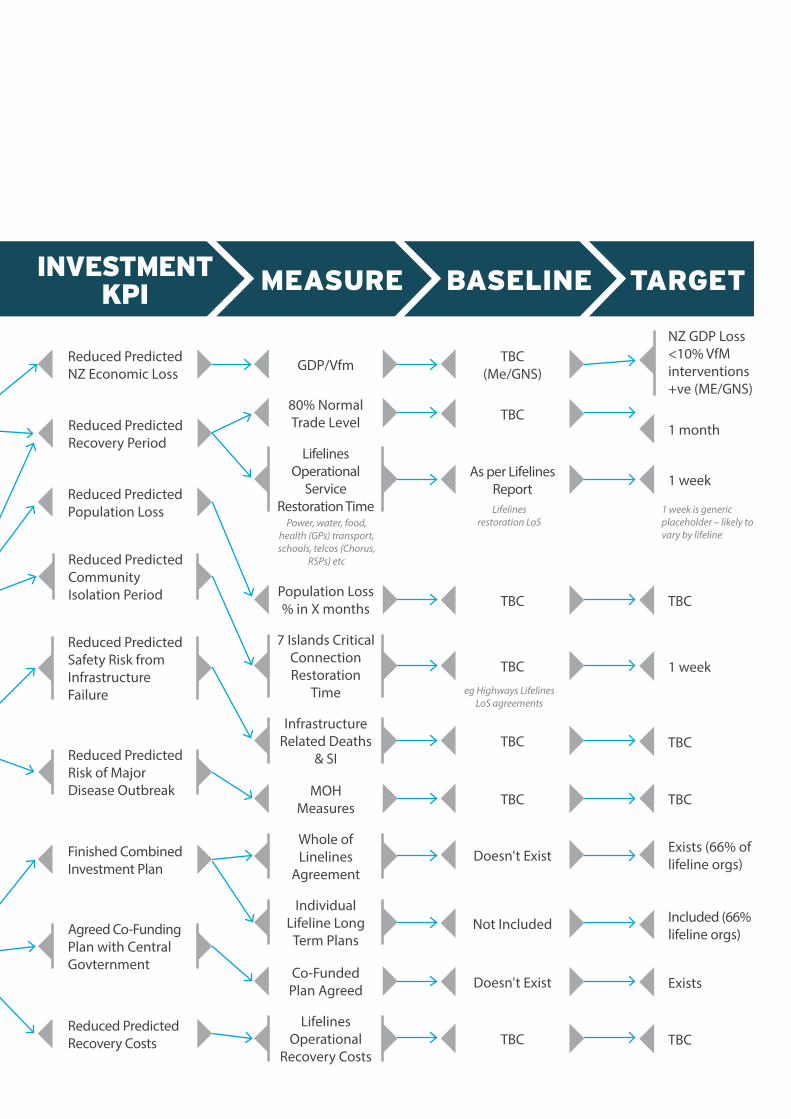
INVESTMENT KPI MEASURE BASELINE TARGET
Reduced Predicted NZ Economic Loss GDP/Vfm
MOH Measures
Whole of Linelines
Agreement
Individual Lifeline Long Term Plans
Co-Funded Plan Agreed
Lifelines Operational
Recovery Costs
Population Loss % in X months
7 Islands Critical Connection Restoration
Time
Infrastructure Related Deaths
& SI
Lifelines Operational
Service Restoration Time
80% Normal Trade Level
TBC (Me/GNS)
As per Lifelines Report
TBC 1 month
1 week
1 week
TBC
TBC
TBC
Exists
TBC
Exists (66% of lifeline orgs)
Included (66% lifeline orgs)
TBC
TBC
TBC
TBC
TBC
Doesn't Exist
Doesn't Exist
Not Included
NZ GDP Loss <10% VfM interventions +ve (ME/GNS)
Reduced Predicted Recovery Period
Reduced Predicted Population Loss
Finished Combined Investment Plan
Reduced Predicted Recovery Costs
Reduced Predicted Community Isolation Period
Reduced Predicted Risk of Major Disease Outbreak
Agreed Co-Funding Plan with Central Govternment
Reduced Predicted Safety Risk from Infrastructure Failure
Power, water, food, health (GPs) transport, schools, telcos (Chorus,
RSPs) etc
Lifelines restoration LoS
1 week is generic placeholder – likely to vary by lifeline
eg Highways Lifelines LoS agreements
Appendix EAbout Wellington Lifelines Group
CentrePort Limited
Porirua City Council
GNS Science
Powerco
Greater Wellington Regional Council
Transpower
Learn from each other and co-ordinate activities
Facilitate discussion, particularly on hazard understanding and risk reduction measures on the Wellington Region’s infrastructure
Identify the effects of hazards on infrastructure, and to mitigate against those effects
Hutt City Council
Upper Hutt City Council
Kapiti Coast District Council
Wellington City Council
KiwiRail
Wellington Electricity Lines Ltd
Facilitate increased understanding of the interdependencies between infrastructure organisations
Develop best practice approaches to risk reduction, readiness, response and recovery for lifelines
Maintain awareness of the importance of lifelines, and of reducing their vulnerabilities.
The Wellington Lifelines Group (or WeLG) was established in 1993 to co-ordinate the physical risk management activities of Wellington utility and transport service providers.
Members of the Wellington Lifelines Group are:
The Wellington Lifelines Group works with its members to:
NZ Transport Agency
Wellington International Airport Ltd
Nova Energy
Wellington Water
The stakeholders for the lifeline organisations are their customers, and in some cases shareholders or ratepayers, and the Government.

Appendix FInitial Option List
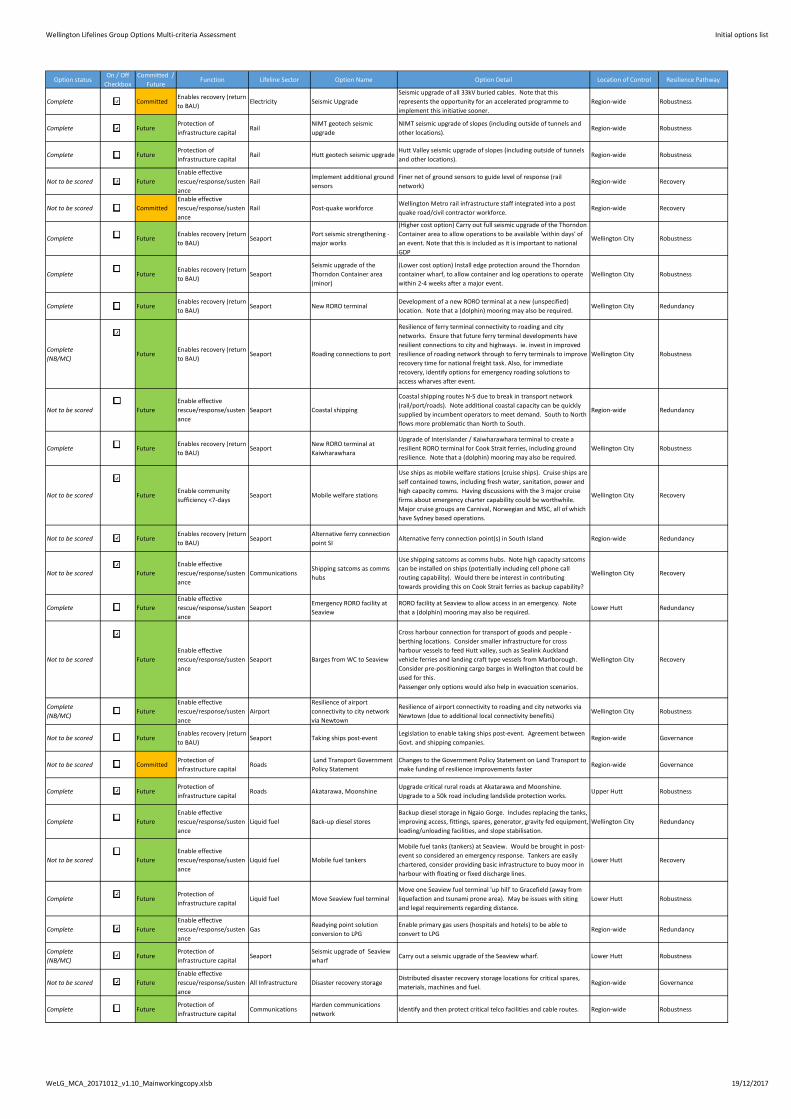
Wellington Lifelines Group Options Multi‐criteria Assessment Initial options list
Option statusOn / Off
Checkbox
Committed /
FutureFunction Lifeline Sector Option Name Option Detail Location of Control Resilience Pathway
Complete TRUE CommittedEnables recovery (return
to BAU)Electricity Seismic Upgrade
Seismic upgrade of all 33kV buried cables. Note that this
represents the opportunity for an accelerated programme to
implement this initiative sooner.
Region‐wide Robustness
Complete TRUE FutureProtection of
infrastructure capitalRail
NIMT geotech seismic
upgrade
NIMT seismic upgrade of slopes (including outside of tunnels and
other locations).Region‐wide Robustness
Complete TRUE FutureProtection of
infrastructure capitalRail Hutt geotech seismic upgrade
Hutt Valley seismic upgrade of slopes (including outside of tunnels
and other locations).Region‐wide Robustness
Not to be scored FALSE Future
Enable effective
rescue/response/susten
ance
RailImplement additional ground
sensors
Finer net of ground sensors to guide level of response (rail
network)Region‐wide Recovery
Not to be scored FALSE Committed
Enable effective
rescue/response/susten
ance
Rail Post‐quake workforceWellington Metro rail infrastructure staff integrated into a post
quake road/civil contractor workforce.Region‐wide Recovery
Complete TRUE FutureEnables recovery (return
to BAU)Seaport
Port seismic strengthening ‐
major works
(Higher cost option) Carry out full seismic upgrade of the Thorndon
Container area to allow operations to be available 'within days' of
an event. Note that this is included as it is important to national
GDP
Wellington City Robustness
Complete TRUE FutureEnables recovery (return
to BAU)Seaport
Seismic upgrade of the
Thorndon Container area
(minor)
(Lower cost option) Install edge protection around the Thorndon
container wharf, to allow container and log operations to operate
within 2‐4 weeks after a major event.
Wellington City Robustness
Complete TRUE FutureEnables recovery (return
to BAU)Seaport New RORO terminal
Development of a new RORO terminal at a new (unspecified)
location. Note that a (dolphin) mooring may also be required. Wellington City Redundancy
Complete
(NB/MC)TRUE Future
Enables recovery (return
to BAU)Seaport Roading connections to port
Resilience of ferry terminal connectivity to roading and city
networks. Ensure that future ferry terminal developments have
resilient connections to city and highways. ie. invest in improved
resilience of roading network through to ferry terminals to improve
recovery time for national freight task. Also, for immediate
recovery, identify options for emergency roading solutions to
access wharves after event.
Wellington City Robustness
Not to be scored FALSE Future
Enable effective
rescue/response/susten
ance
Seaport Coastal shipping
Coastal shipping routes N‐S due to break in transport network
(rail/port/roads). Note additional coastal capacity can be quickly
supplied by incumbent operators to meet demand. South to North
flows more problematic than North to South.
Region‐wide Redundancy
Complete TRUE FutureEnables recovery (return
to BAU)Seaport
New RORO terminal at
Kaiwharawhara
Upgrade of Interislander / Kaiwharawhara terminal to create a
resilient RORO terminal for Cook Strait ferries, including ground
resilience. Note that a (dolphin) mooring may also be required.
Wellington City Robustness
Not to be scored FALSE FutureEnable community
sufficiency <7‐daysSeaport Mobile welfare stations
Use ships as mobile welfare stations (cruise ships). Cruise ships are
self contained towns, including fresh water, sanitation, power and
high capacity comms. Having discussions with the 3 major cruise
firms about emergency charter capability could be worthwhile.
Major cruise groups are Carnival, Norwegian and MSC, all of which
have Sydney based operations.
Wellington City Recovery
Not to be scored FALSE FutureEnables recovery (return
to BAU)Seaport
Alternative ferry connection
point SIAlternative ferry connection point(s) in South Island Region‐wide Redundancy
Not to be scored FALSE Future
Enable effective
rescue/response/susten
ance
CommunicationsShipping satcoms as comms
hubs
Use shipping satcoms as comms hubs. Note high capacity satcoms
can be installed on ships (potentially including cell phone call
routing capability). Would there be interest in contributing
towards providing this on Cook Strait ferries as backup capability?
Wellington City Recovery
Complete TRUE Future
Enable effective
rescue/response/susten
ance
SeaportEmergency RORO facility at
Seaview
RORO facility at Seaview to allow access in an emergency. Note
that a (dolphin) mooring may also be required. Lower Hutt Redundancy
Not to be scored FALSE Future
Enable effective
rescue/response/susten
ance
Seaport Barges from WC to Seaview
Cross harbour connection for transport of goods and people ‐
berthing locations. Consider smaller infrastructure for cross
harbour vessels to feed Hutt valley, such as Sealink Auckland
vehicle ferries and landing craft type vessels from Marlborough.
Consider pre‐positioning cargo barges in Wellington that could be
used for this.
Passenger only options would also help in evacuation scenarios.
Wellington City Recovery
Complete
(NB/MC)TRUE Future
Enable effective
rescue/response/susten
ance
Airport
Resilience of airport
connectivity to city network
via Newtown
Resilience of airport connectivity to roading and city networks via
Newtown (due to additional local connectivity benefits)Wellington City Robustness
Not to be scored FALSE FutureEnables recovery (return
to BAU)Seaport Taking ships post‐event
Legislation to enable taking ships post‐event. Agreement between
Govt. and shipping companies.Region‐wide Governance
Not to be scored FALSE CommittedProtection of
infrastructure capitalRoads
Land Transport Government
Policy Statement
Changes to the Government Policy Statement on Land Transport to
make funding of resilience improvements fasterRegion‐wide Governance
Complete TRUE FutureProtection of
infrastructure capitalRoads Akatarawa, Moonshine
Upgrade critical rural roads at Akatarawa and Moonshine.
Upgrade to a 50k road including landslide protection works.Upper Hutt Robustness
Complete TRUE Future
Enable effective
rescue/response/susten
ance
Liquid fuel Back‐up diesel stores
Backup diesel storage in Ngaio Gorge. Includes replacing the tanks,
improving access, fittings, spares, generator, gravity fed equipment,
loading/unloading facilities, and slope stabilisation.
Wellington City Redundancy
Not to be scored FALSE Future
Enable effective
rescue/response/susten
ance
Liquid fuel Mobile fuel tankers
Mobile fuel tanks (tankers) at Seaview. Would be brought in post‐
event so considered an emergency response. Tankers are easily
chartered, consider providing basic infrastructure to buoy moor in
harbour with floating or fixed discharge lines.
Lower Hutt Recovery
Complete TRUE FutureProtection of
infrastructure capitalLiquid fuel Move Seaview fuel terminal
Move one Seaview fuel terminal 'up hill' to Gracefield (away from
liquefaction and tsunami prone area). May be issues with siting
and legal requirements regarding distance.
Lower Hutt Robustness
Complete TRUE Future
Enable effective
rescue/response/susten
ance
GasReadying point solution
conversion to LPG
Enable primary gas users (hospitals and hotels) to be able to
convert to LPGRegion‐wide Redundancy
Complete
(NB/MC)TRUE Future
Protection of
infrastructure capitalSeaport
Seismic upgrade of Seaview
wharfCarry out a seismic upgrade of the Seaview wharf. Lower Hutt Robustness
Not to be scored FALSE Future
Enable effective
rescue/response/susten
ance
All Infrastructure Disaster recovery storageDistributed disaster recovery storage locations for critical spares,
materials, machines and fuel.Region‐wide Governance
Complete TRUE FutureProtection of
infrastructure capitalCommunications
Harden communications
networkIdentify and then protect critical telco facilities and cable routes. Region‐wide Robustness
WeLG_MCA_20171012_v1.10_Mainworkingcopy.xlsb 19/12/2017
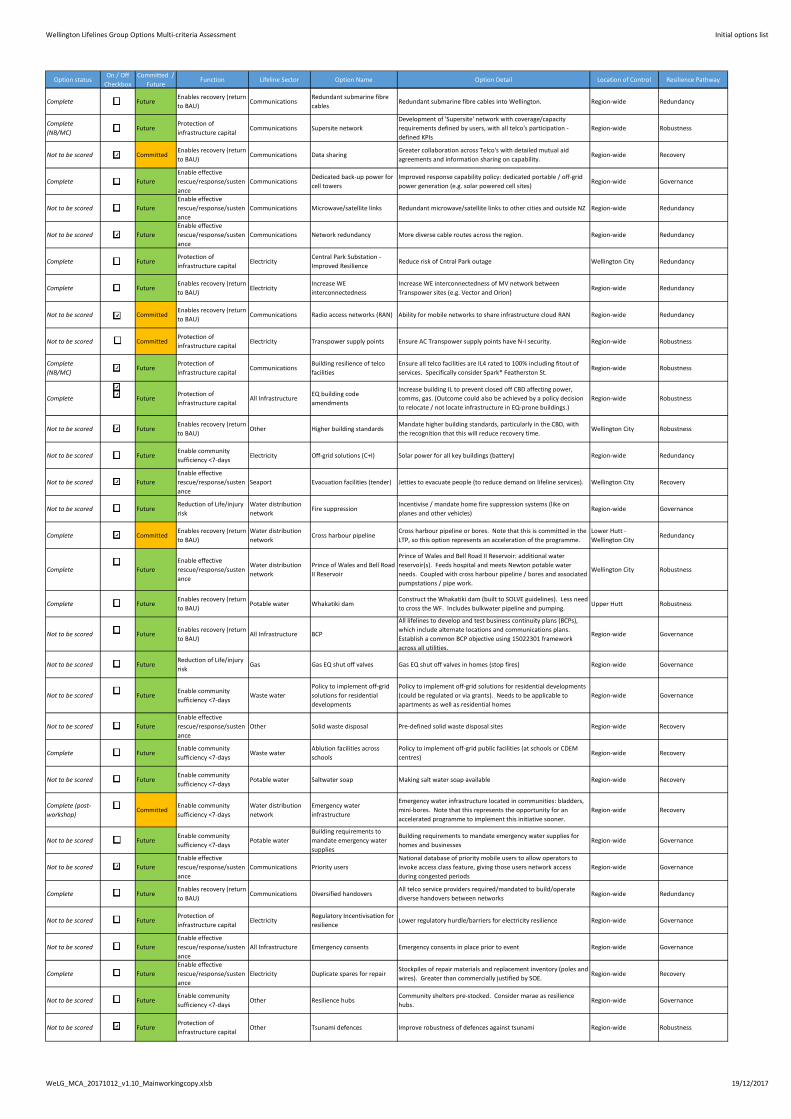
Wellington Lifelines Group Options Multi‐criteria Assessment Initial options list
Option statusOn / Off
Checkbox
Committed /
FutureFunction Lifeline Sector Option Name Option Detail Location of Control Resilience Pathway
Complete TRUE FutureEnables recovery (return
to BAU)Communications
Redundant submarine fibre
cablesRedundant submarine fibre cables into Wellington. Region‐wide Redundancy
Complete
(NB/MC)TRUE Future
Protection of
infrastructure capitalCommunications Supersite network
Development of 'Supersite' network with coverage/capacity
requirements defined by users, with all telco's participation ‐
defined KPIs
Region‐wide Robustness
Not to be scored FALSE CommittedEnables recovery (return
to BAU)Communications Data sharing
Greater collaboration across Telco's with detailed mutual aid
agreements and information sharing on capability.Region‐wide Recovery
Complete TRUE Future
Enable effective
rescue/response/susten
ance
CommunicationsDedicated back‐up power for
cell towers
Improved response capability policy: dedicated portable / off‐grid
power generation (e.g. solar powered cell sites)Region‐wide Governance
Not to be scored FALSE Future
Enable effective
rescue/response/susten
ance
Communications Microwave/satellite links Redundant microwave/satellite links to other cities and outside NZ Region‐wide Redundancy
Not to be scored FALSE Future
Enable effective
rescue/response/susten
ance
Communications Network redundancy More diverse cable routes across the region. Region‐wide Redundancy
Complete TRUE FutureProtection of
infrastructure capitalElectricity
Central Park Substation ‐
Improved ResilienceReduce risk of Cntral Park outage Wellington City Redundancy
Complete TRUE FutureEnables recovery (return
to BAU)Electricity
Increase WE
interconnectedness
Increase WE interconnectedness of MV network between
Transpower sites (e.g. Vector and Orion)Region‐wide Redundancy
Not to be scored FALSE CommittedEnables recovery (return
to BAU)Communications Radio access networks (RAN) Ability for mobile networks to share infrastructure cloud RAN Region‐wide Redundancy
Not to be scored FALSE CommittedProtection of
infrastructure capitalElectricity Transpower supply points Ensure AC Transpower supply points have N‐I security. Region‐wide Robustness
Complete
(NB/MC)TRUE Future
Protection of
infrastructure capitalCommunications
Building resilience of telco
facilities
Ensure all telco facilities are IL4 rated to 100% including fitout of
services. Specifically consider Spark* Featherston St.Region‐wide Robustness
Complete TRUE FutureProtection of
infrastructure capitalAll Infrastructure
EQ building code
amendments
Increase building IL to prevent closed off CBD affecting power,
comms, gas. (Outcome could also be achieved by a policy decision
to relocate / not locate infrastructure in EQ‐prone buildings.)
Region‐wide Robustness
Not to be scored FALSE FutureEnables recovery (return
to BAU)Other Higher building standards
Mandate higher building standards, particularly in the CBD, with
the recognition that this will reduce recovery time.Wellington City Robustness
Not to be scored FALSE FutureEnable community
sufficiency <7‐daysElectricity Off‐grid solutions (C+I) Solar power for all key buildings (battery) Region‐wide Redundancy
Not to be scored FALSE Future
Enable effective
rescue/response/susten
ance
Seaport Evacuation facilities (tender) Jetties to evacuate people (to reduce demand on lifeline services). Wellington City Recovery
Not to be scored FALSE FutureReduction of Life/injury
risk
Water distribution
networkFire suppression
Incentivise / mandate home fire suppression systems (like on
planes and other vehicles)Region‐wide Governance
Complete TRUE CommittedEnables recovery (return
to BAU)
Water distribution
networkCross harbour pipeline
Cross harbour pipeline or bores. Note that this is committed in the
LTP, so this option represents an acceleration of the programme.
Lower Hutt ‐
Wellington CityRedundancy
Complete TRUE Future
Enable effective
rescue/response/susten
ance
Water distribution
network
Prince of Wales and Bell Road
II Reservoir
Prince of Wales and Bell Road II Reservoir: additional water
reservoir(s). Feeds hospital and meets Newton potable water
needs. Coupled with cross harbour pipeline / bores and associated
pumpstations / pipe work.
Wellington City Robustness
Complete TRUE FutureEnables recovery (return
to BAU)Potable water Whakatiki dam
Construct the Whakatiki dam (built to SOLVE guidelines). Less need
to cross the WF. Includes bulkwater pipeline and pumping.Upper Hutt Robustness
Not to be scored FALSE FutureEnables recovery (return
to BAU)All Infrastructure BCP
All lifelines to develop and test business continuity plans (BCPs),
which include alternate locations and communications plans.
Establish a common BCP objective using 15022301 framework
across all utilities.
Region‐wide Governance
Not to be scored FALSE FutureReduction of Life/injury
riskGas Gas EQ shut off valves Gas EQ shut off valves in homes (stop fires) Region‐wide Governance
Not to be scored FALSE FutureEnable community
sufficiency <7‐daysWaste water
Policy to implement off‐grid
solutions for residential
developments
Policy to implement off‐grid solutions for residential developments
(could be regulated or via grants). Needs to be applicable to
apartments as well as residential homes
Region‐wide Governance
Not to be scored FALSE Future
Enable effective
rescue/response/susten
ance
Other Solid waste disposal Pre‐defined solid waste disposal sites Region‐wide Recovery
Complete TRUE FutureEnable community
sufficiency <7‐daysWaste water
Ablution facilities across
schools
Policy to implement off‐grid public facilities (at schools or CDEM
centres)Region‐wide Recovery
Not to be scored FALSE FutureEnable community
sufficiency <7‐daysPotable water Saltwater soap Making salt water soap available Region‐wide Recovery
Complete (post‐
workshop)TRUE Committed
Enable community
sufficiency <7‐days
Water distribution
network
Emergency water
infrastructure
Emergency water infrastructure located in communities: bladders,
mini‐bores. Note that this represents the opportunity for an
accelerated programme to implement this initiative sooner.
Region‐wide Recovery
Not to be scored FALSE FutureEnable community
sufficiency <7‐daysPotable water
Building requirements to
mandate emergency water
supplies
Building requirements to mandate emergency water supplies for
homes and businessesRegion‐wide Governance
Not to be scored FALSE Future
Enable effective
rescue/response/susten
ance
Communications Priority users
National database of priority mobile users to allow operators to
invoke access class feature, giving those users network access
during congested periods
Region‐wide Governance
Complete TRUE FutureEnables recovery (return
to BAU)Communications Diversified handovers
All telco service providers required/mandated to build/operate
diverse handovers between networksRegion‐wide Redundancy
Not to be scored FALSE FutureProtection of
infrastructure capitalElectricity
Regulatory Incentivisation for
resilience Lower regulatory hurdle/barriers for electricity resilience Region‐wide Governance
Not to be scored FALSE Future
Enable effective
rescue/response/susten
ance
All Infrastructure Emergency consents Emergency consents in place prior to event Region‐wide Governance
Complete TRUE Future
Enable effective
rescue/response/susten
ance
Electricity Duplicate spares for repairStockpiles of repair materials and replacement inventory (poles and
wires). Greater than commercially justified by SOE.Region‐wide Recovery
Not to be scored FALSE FutureEnable community
sufficiency <7‐daysOther Resilience hubs
Community shelters pre‐stocked. Consider marae as resilience
hubs.Region‐wide Governance
Not to be scored FALSE FutureProtection of
infrastructure capitalOther Tsunami defences Improve robustness of defences against tsunami Region‐wide Robustness
WeLG_MCA_20171012_v1.10_Mainworkingcopy.xlsb 19/12/2017
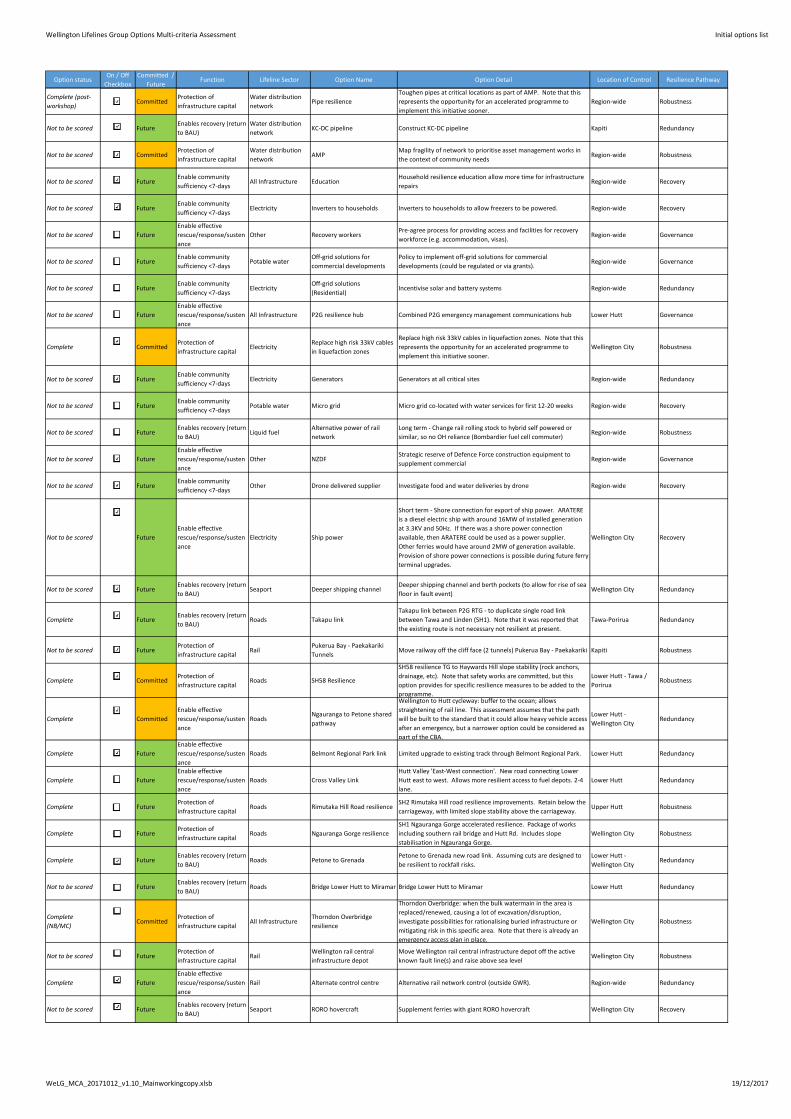
Wellington Lifelines Group Options Multi‐criteria Assessment Initial options list
Option statusOn / Off
Checkbox
Committed /
FutureFunction Lifeline Sector Option Name Option Detail Location of Control Resilience Pathway
Complete (post‐
workshop)TRUE Committed
Protection of
infrastructure capital
Water distribution
networkPipe resilience
Toughen pipes at critical locations as part of AMP. Note that this
represents the opportunity for an accelerated programme to
implement this initiative sooner.
Region‐wide Robustness
Not to be scored FALSE FutureEnables recovery (return
to BAU)
Water distribution
networkKC‐DC pipeline Construct KC‐DC pipeline Kapiti Redundancy
Not to be scored FALSE CommittedProtection of
infrastructure capital
Water distribution
networkAMP
Map fragility of network to prioritise asset management works in
the context of community needsRegion‐wide Robustness
Not to be scored FALSE FutureEnable community
sufficiency <7‐daysAll Infrastructure Education
Household resilience education allow more time for infrastructure
repairsRegion‐wide Recovery
Not to be scored FALSE FutureEnable community
sufficiency <7‐daysElectricity Inverters to households Inverters to households to allow freezers to be powered. Region‐wide Recovery
Not to be scored FALSE Future
Enable effective
rescue/response/susten
ance
Other Recovery workersPre‐agree process for providing access and facilities for recovery
workforce (e.g. accommodation, visas).Region‐wide Governance
Not to be scored FALSE FutureEnable community
sufficiency <7‐daysPotable water
Off‐grid solutions for
commercial developments
Policy to implement off‐grid solutions for commercial
developments (could be regulated or via grants). Region‐wide Governance
Not to be scored FALSE FutureEnable community
sufficiency <7‐daysElectricity
Off‐grid solutions
(Residential)Incentivise solar and battery systems Region‐wide Redundancy
Not to be scored FALSE Future
Enable effective
rescue/response/susten
ance
All Infrastructure P2G resilience hub Combined P2G emergency management communications hub Lower Hutt Governance
Complete TRUE CommittedProtection of
infrastructure capitalElectricity
Replace high risk 33kV cables
in liquefaction zones
Replace high risk 33kV cables in liquefaction zones. Note that this
represents the opportunity for an accelerated programme to
implement this initiative sooner.
Wellington City Robustness
Not to be scored FALSE FutureEnable community
sufficiency <7‐daysElectricity Generators Generators at all critical sites Region‐wide Redundancy
Not to be scored FALSE FutureEnable community
sufficiency <7‐daysPotable water Micro grid Micro grid co‐located with water services for first 12‐20 weeks Region‐wide Recovery
Not to be scored FALSE FutureEnables recovery (return
to BAU)Liquid fuel
Alternative power of rail
network
Long term ‐ Change rail rolling stock to hybrid self powered or
similar, so no OH reliance (Bombardier fuel cell commuter)Region‐wide Robustness
Not to be scored FALSE Future
Enable effective
rescue/response/susten
ance
Other NZDF Strategic reserve of Defence Force construction equipment to
supplement commercialRegion‐wide Governance
Not to be scored FALSE FutureEnable community
sufficiency <7‐daysOther Drone delivered supplier Investigate food and water deliveries by drone Region‐wide Recovery
Not to be scored FALSE Future
Enable effective
rescue/response/susten
ance
Electricity Ship power
Short term ‐ Shore connection for export of ship power. ARATERE
is a diesel electric ship with around 16MW of installed generation
at 3.3KV and 50Hz. If there was a shore power connection
available, then ARATERE could be used as a power supplier.
Other ferries would have around 2MW of generation available.
Provision of shore power connections is possible during future ferry
terminal upgrades.
Wellington City Recovery
Not to be scored FALSE FutureEnables recovery (return
to BAU)Seaport Deeper shipping channel
Deeper shipping channel and berth pockets (to allow for rise of sea
floor in fault event)Wellington City Redundancy
Complete TRUE FutureEnables recovery (return
to BAU)Roads Takapu link
Takapu link between P2G RTG ‐ to duplicate single road link
between Tawa and Linden (SH1). Note that it was reported that
the existing route is not necessary not resilient at present.
Tawa‐Porirua Redundancy
Not to be scored FALSE FutureProtection of
infrastructure capitalRail
Pukerua Bay ‐ Paekakariki
TunnelsMove railway off the cliff face (2 tunnels) Pukerua Bay ‐ Paekakariki Kapiti Robustness
Complete TRUE CommittedProtection of
infrastructure capitalRoads SH58 Resilience
SH58 resilience TG to Haywards Hill slope stability (rock anchors,
drainage, etc). Note that safety works are committed, but this
option provides for specific resilience measures to be added to the
programme.
Lower Hutt ‐ Tawa /
PoriruaRobustness
Complete TRUE Committed
Enable effective
rescue/response/susten
ance
RoadsNgauranga to Petone shared
pathway
Wellington to Hutt cycleway: buffer to the ocean; allows
straightening of rail line. This assessment assumes that the path
will be built to the standard that it could allow heavy vehicle access
after an emergency, but a narrower option could be considered as
part of the CBA.
Lower Hutt ‐
Wellington CityRedundancy
Complete TRUE Future
Enable effective
rescue/response/susten
ance
Roads Belmont Regional Park link Limited upgrade to existing track through Belmont Regional Park. Lower Hutt Redundancy
Complete TRUE Future
Enable effective
rescue/response/susten
ance
Roads Cross Valley Link
Hutt Valley 'East‐West connection'. New road connecting Lower
Hutt east to west. Allows more resilient access to fuel depots. 2‐4
lane.
Lower Hutt Redundancy
Complete TRUE FutureProtection of
infrastructure capitalRoads Rimutaka Hill Road resilience
SH2 Rimutaka Hill road resilience improvements. Retain below the
carriageway, with limited slope stability above the carriageway.Upper Hutt Robustness
Complete TRUE FutureProtection of
infrastructure capitalRoads Ngauranga Gorge resilience
SH1 Ngauranga Gorge accelerated resilience. Package of works
including southern rail bridge and Hutt Rd. Includes slope
stabilisation in Ngauranga Gorge.
Wellington City Robustness
Complete TRUE FutureEnables recovery (return
to BAU)Roads Petone to Grenada
Petone to Grenada new road link. Assuming cuts are designed to
be resilient to rockfall risks.
Lower Hutt ‐
Wellington CityRedundancy
Not to be scored FALSE FutureEnables recovery (return
to BAU)Roads Bridge Lower Hutt to Miramar Bridge Lower Hutt to Miramar Lower Hutt Redundancy
Complete
(NB/MC)TRUE Committed
Protection of
infrastructure capitalAll Infrastructure
Thorndon Overbridge
resilience
Thorndon Overbridge: when the bulk watermain in the area is
replaced/renewed, causing a lot of excavation/disruption,
investigate possibilities for rationalising buried infrastructure or
mitigating risk in this specific area. Note that there is already an
emergency access plan in place.
Wellington City Robustness
Not to be scored FALSE FutureProtection of
infrastructure capitalRail
Wellington rail central
infrastructure depot
Move Wellington rail central infrastructure depot off the active
known fault line(s) and raise above sea levelWellington City Robustness
Complete TRUE Future
Enable effective
rescue/response/susten
ance
Rail Alternate control centre Alternative rail network control (outside GWR). Region‐wide Redundancy
Not to be scored FALSE FutureEnables recovery (return
to BAU)Seaport RORO hovercraft Supplement ferries with giant RORO hovercraft Wellington City Recovery
WeLG_MCA_20171012_v1.10_Mainworkingcopy.xlsb 19/12/2017
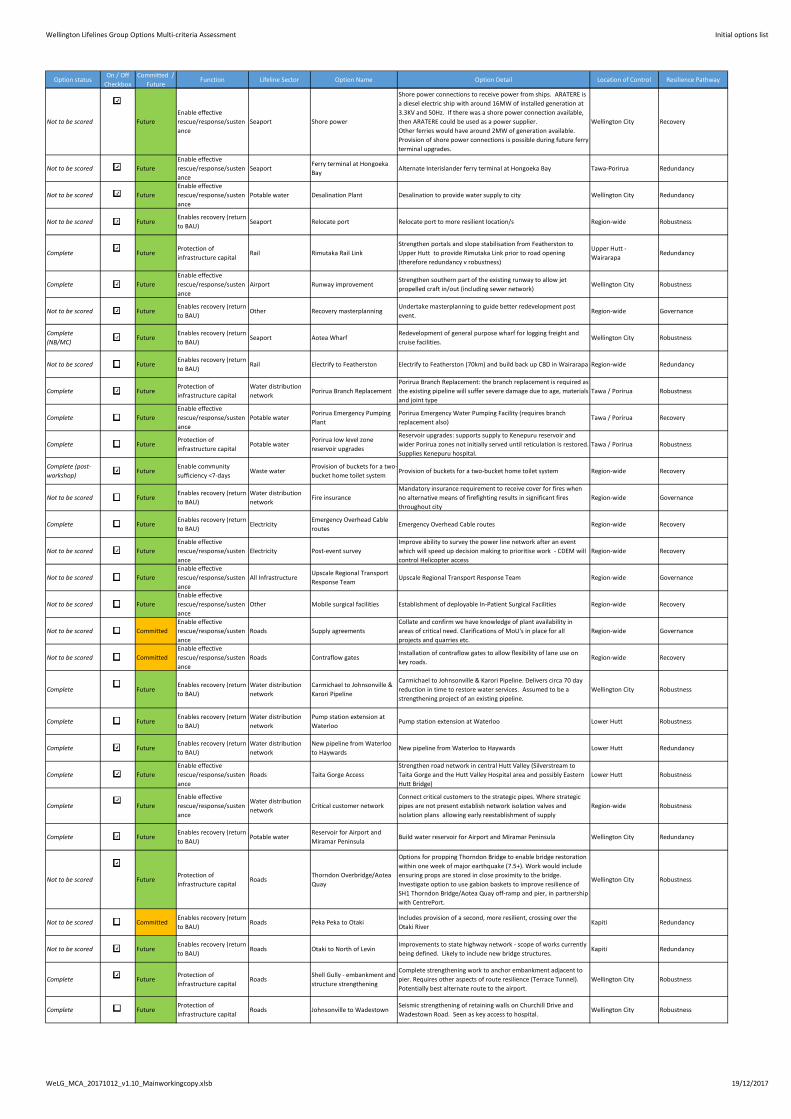
Wellington Lifelines Group Options Multi‐criteria Assessment Initial options list
Option statusOn / Off
Checkbox
Committed /
FutureFunction Lifeline Sector Option Name Option Detail Location of Control Resilience Pathway
Not to be scored FALSE Future
Enable effective
rescue/response/susten
ance
Seaport Shore power
Shore power connections to receive power from ships. ARATERE is
a diesel electric ship with around 16MW of installed generation at
3.3KV and 50Hz. If there was a shore power connection available,
then ARATERE could be used as a power supplier.
Other ferries would have around 2MW of generation available.
Provision of shore power connections is possible during future ferry
terminal upgrades.
Wellington City Recovery
Not to be scored FALSE Future
Enable effective
rescue/response/susten
ance
SeaportFerry terminal at Hongoeka
BayAlternate Interislander ferry terminal at Hongoeka Bay Tawa‐Porirua Redundancy
Not to be scored FALSE Future
Enable effective
rescue/response/susten
ance
Potable water Desalination Plant Desalination to provide water supply to city Wellington City Redundancy
Not to be scored FALSE FutureEnables recovery (return
to BAU)Seaport Relocate port Relocate port to more resilient location/s Region‐wide Robustness
Complete TRUE FutureProtection of
infrastructure capitalRail Rimutaka Rail Link
Strengthen portals and slope stabilisation from Featherston to
Upper Hutt to provide Rimutaka Link prior to road opening
(therefore redundancy v robustness)
Upper Hutt ‐
WairarapaRedundancy
Complete TRUE Future
Enable effective
rescue/response/susten
ance
Airport Runway improvementStrengthen southern part of the existing runway to allow jet
propelled craft in/out (including sewer network)Wellington City Robustness
Not to be scored FALSE FutureEnables recovery (return
to BAU)Other Recovery masterplanning
Undertake masterplanning to guide better redevelopment post
event.Region‐wide Governance
Complete
(NB/MC)TRUE Future
Enables recovery (return
to BAU)Seaport Aotea Wharf
Redevelopment of general purpose wharf for logging freight and
cruise facilities. Wellington City Robustness
Not to be scored FALSE FutureEnables recovery (return
to BAU)Rail Electrify to Featherston Electrify to Featherston (70km) and build back up CBD in Wairarapa Region‐wide Redundancy
Complete TRUE FutureProtection of
infrastructure capital
Water distribution
networkPorirua Branch Replacement
Porirua Branch Replacement: the branch replacement is required as
the existing pipeline will suffer severe damage due to age, materials
and joint type
Tawa / Porirua Robustness
Complete TRUE Future
Enable effective
rescue/response/susten
ance
Potable waterPorirua Emergency Pumping
Plant
Porirua Emergency Water Pumping Facility (requires branch
replacement also)Tawa / Porirua Recovery
Complete TRUE FutureProtection of
infrastructure capitalPotable water
Porirua low level zone
reservoir upgrades
Reservoir upgrades: supports supply to Kenepuru reservoir and
wider Porirua zones not initially served until reticulation is restored.
Supplies Kenepuru hospital.
Tawa / Porirua Robustness
Complete (post‐
workshop)TRUE Future
Enable community
sufficiency <7‐daysWaste water
Provision of buckets for a two‐
bucket home toilet systemProvision of buckets for a two‐bucket home toilet system Region‐wide Recovery
Not to be scored FALSE FutureEnables recovery (return
to BAU)
Water distribution
networkFire insurance
Mandatory insurance requirement to receive cover for fires when
no alternative means of firefighting results in significant fires
throughout city
Region‐wide Governance
Complete TRUE FutureEnables recovery (return
to BAU)Electricity
Emergency Overhead Cable
routesEmergency Overhead Cable routes Region‐wide Recovery
Not to be scored FALSE Future
Enable effective
rescue/response/susten
ance
Electricity Post‐event survey
Improve ability to survey the power line network after an event
which will speed up decision making to prioritise work ‐ CDEM will
control Helicopter access
Region‐wide Recovery
Not to be scored FALSE Future
Enable effective
rescue/response/susten
ance
All InfrastructureUpscale Regional Transport
Response Team Upscale Regional Transport Response Team Region‐wide Governance
Not to be scored FALSE Future
Enable effective
rescue/response/susten
ance
Other Mobile surgical facilities Establishment of deployable In‐Patient Surgical Facilities Region‐wide Recovery
Not to be scored FALSE Committed
Enable effective
rescue/response/susten
ance
Roads Supply agreements
Collate and confirm we have knowledge of plant availability in
areas of critical need. Clarifications of MoU's in place for all
projects and quarries etc.
Region‐wide Governance
Not to be scored FALSE Committed
Enable effective
rescue/response/susten
ance
Roads Contraflow gatesInstallation of contraflow gates to allow flexibility of lane use on
key roads.Region‐wide Recovery
Complete TRUE FutureEnables recovery (return
to BAU)
Water distribution
network
Carmichael to Johnsonville &
Karori Pipeline
Carmichael to Johnsonville & Karori Pipeline. Delivers circa 70 day
reduction in time to restore water services. Assumed to be a
strengthening project of an existing pipeline.
Wellington City Robustness
Complete TRUE FutureEnables recovery (return
to BAU)
Water distribution
network
Pump station extension at
WaterlooPump station extension at Waterloo Lower Hutt Robustness
Complete TRUE FutureEnables recovery (return
to BAU)
Water distribution
network
New pipeline from Waterloo
to HaywardsNew pipeline from Waterloo to Haywards Lower Hutt Redundancy
Complete TRUE Future
Enable effective
rescue/response/susten
ance
Roads Taita Gorge Access
Strengthen road network in central Hutt Valley (Silverstream to
Taita Gorge and the Hutt Valley Hospital area and possibly Eastern
Hutt Bridge)
Lower Hutt Robustness
Complete TRUE Future
Enable effective
rescue/response/susten
ance
Water distribution
networkCritical customer network
Connect critical customers to the strategic pipes. Where strategic
pipes are not present establish network isolation valves and
isolation plans allowing early reestablishment of supply
Region‐wide Robustness
Complete TRUE FutureEnables recovery (return
to BAU)Potable water
Reservoir for Airport and
Miramar PeninsulaBuild water reservoir for Airport and Miramar Peninsula Wellington City Redundancy
Not to be scored FALSE FutureProtection of
infrastructure capitalRoads
Thorndon Overbridge/Aotea
Quay
Options for propping Thorndon Bridge to enable bridge restoration
within one week of major earthquake (7.5+). Work would include
ensuring props are stored in close proximity to the bridge.
Investigate option to use gabion baskets to improve resilience of
SH1 Thorndon Bridge/Aotea Quay off‐ramp and pier, in partnership
with CentrePort.
Wellington City Robustness
Not to be scored FALSE CommittedEnables recovery (return
to BAU)Roads Peka Peka to Otaki
Includes provision of a second, more resilient, crossing over the
Otaki RiverKapiti Redundancy
Not to be scored FALSE FutureEnables recovery (return
to BAU)Roads Otaki to North of Levin
Improvements to state highway network ‐ scope of works currently
being defined. Likely to include new bridge structures. Kapiti Redundancy
Complete TRUE FutureProtection of
infrastructure capitalRoads
Shell Gully ‐ embankment and
structure strengthening
Complete strengthening work to anchor embankment adjacent to
pier. Requires other aspects of route resilience (Terrace Tunnel).
Potentially best alternate route to the airport.
Wellington City Robustness
Complete TRUE FutureProtection of
infrastructure capitalRoads Johnsonville to Wadestown
Seismic strengthening of retaining walls on Churchill Drive and
Wadestown Road. Seen as key access to hospital.Wellington City Robustness
WeLG_MCA_20171012_v1.10_Mainworkingcopy.xlsb 19/12/2017
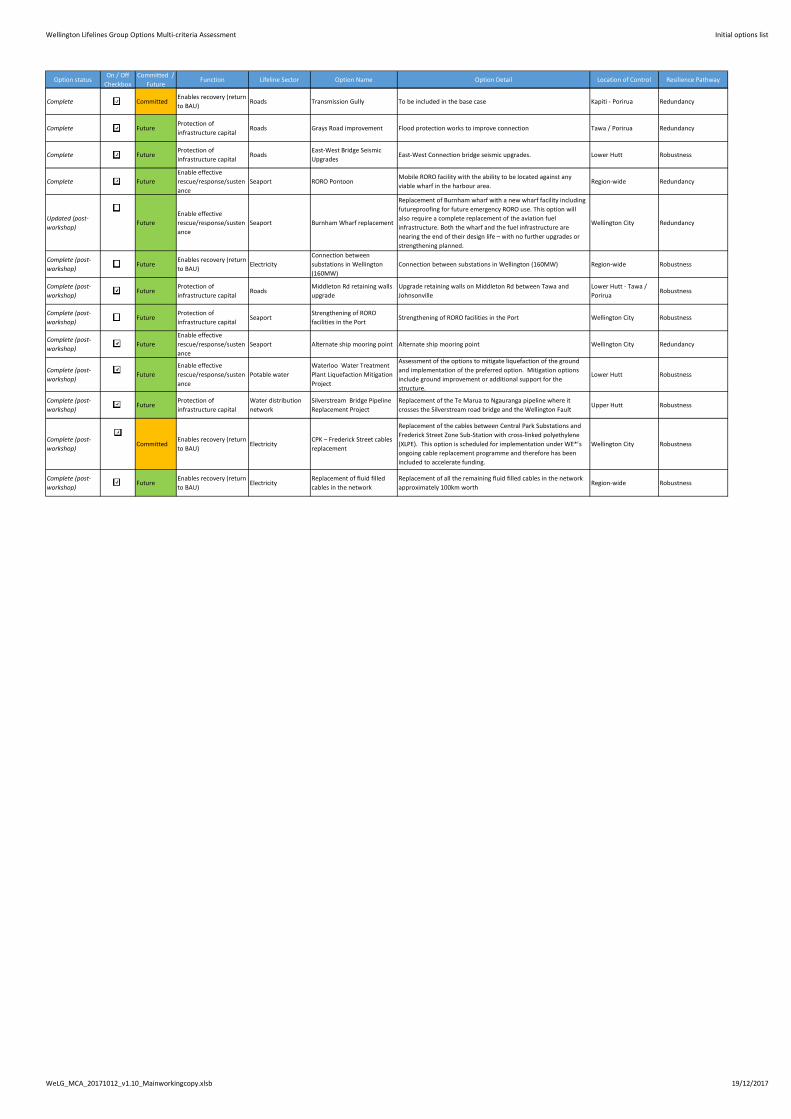
Wellington Lifelines Group Options Multi‐criteria Assessment Initial options list
Option statusOn / Off
Checkbox
Committed /
FutureFunction Lifeline Sector Option Name Option Detail Location of Control Resilience Pathway
Complete TRUE CommittedEnables recovery (return
to BAU)Roads Transmission Gully To be included in the base case Kapiti ‐ Porirua Redundancy
Complete TRUE FutureProtection of
infrastructure capitalRoads Grays Road improvement Flood protection works to improve connection Tawa / Porirua Redundancy
Complete TRUE FutureProtection of
infrastructure capitalRoads
East‐West Bridge Seismic
UpgradesEast‐West Connection bridge seismic upgrades. Lower Hutt Robustness
Complete TRUE Future
Enable effective
rescue/response/susten
ance
Seaport RORO PontoonMobile RORO facility with the ability to be located against any
viable wharf in the harbour area.Region‐wide Redundancy
Updated (post‐
workshop)TRUE Future
Enable effective
rescue/response/susten
ance
Seaport Burnham Wharf replacement
Replacement of Burnham wharf with a new wharf facility including
futureproofing for future emergency RORO use. This option will
also require a complete replacement of the aviation fuel
infrastructure. Both the wharf and the fuel infrastructure are
nearing the end of their design life – with no further upgrades or
strengthening planned.
Wellington City Redundancy
Complete (post‐
workshop)TRUE Future
Enables recovery (return
to BAU)Electricity
Connection between
substations in Wellington
(160MW)
Connection between substations in Wellington (160MW) Region‐wide Robustness
Complete (post‐
workshop)TRUE Future
Protection of
infrastructure capitalRoads
Middleton Rd retaining walls
upgrade
Upgrade retaining walls on Middleton Rd between Tawa and
Johnsonville
Lower Hutt ‐ Tawa /
PoriruaRobustness
Complete (post‐
workshop)TRUE Future
Protection of
infrastructure capitalSeaport
Strengthening of RORO
facilities in the PortStrengthening of RORO facilities in the Port Wellington City Robustness
Complete (post‐
workshop)TRUE Future
Enable effective
rescue/response/susten
ance
Seaport Alternate ship mooring point Alternate ship mooring point Wellington City Redundancy
Complete (post‐
workshop)TRUE Future
Enable effective
rescue/response/susten
ance
Potable water
Waterloo Water Treatment
Plant Liquefaction Mitigation
Project
Assessment of the options to mitigate liquefaction of the ground
and implementation of the preferred option. Mitigation options
include ground improvement or additional support for the
structure.
Lower Hutt Robustness
Complete (post‐
workshop)TRUE Future
Protection of
infrastructure capital
Water distribution
network
Silverstream Bridge Pipeline
Replacement Project
Replacement of the Te Marua to Ngauranga pipeline where it
crosses the Silverstream road bridge and the Wellington FaultUpper Hutt Robustness
Complete (post‐
workshop)TRUE Committed
Enables recovery (return
to BAU)Electricity
CPK – Frederick Street cables
replacement
Replacement of the cables between Central Park Substations and
Frederick Street Zone Sub‐Station with cross‐linked polyethylene
(XLPE). This option is scheduled for implementation under WE*’s
ongoing cable replacement programme and therefore has been
included to accelerate funding.
Wellington City Robustness
Complete (post‐
workshop)TRUE Future
Enables recovery (return
to BAU)Electricity
Replacement of fluid filled
cables in the network
Replacement of all the remaining fluid filled cables in the network
approximately 100km worth Region‐wide Robustness
WeLG_MCA_20171012_v1.10_Mainworkingcopy.xlsb 19/12/2017
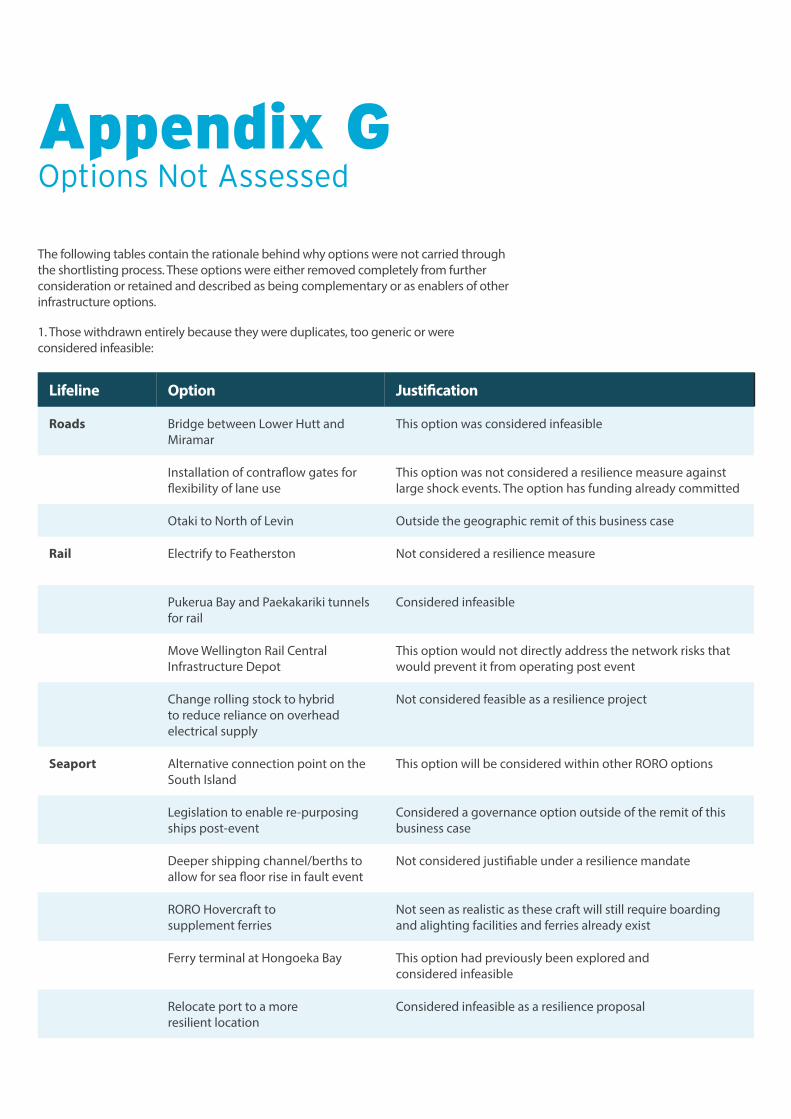
Appendix GOptions Not Assessed
The following tables contain the rationale behind why options were not carried through the shortlisting process. These options were either removed completely from further consideration or retained and described as being complementary or as enablers of other infrastructure options.
1. Those withdrawn entirely because they were duplicates, too generic or were considered infeasible:
Lifeline Option Justification
Roads Bridge between Lower Hutt and Miramar
This option was considered infeasible
Installation of contraflow gates for flexibility of lane use
This option was not considered a resilience measure against large shock events. The option has funding already committed
Otaki to North of Levin Outside the geographic remit of this business case
Rail Electrify to Featherston Not considered a resilience measure
Pukerua Bay and Paekakariki tunnels for rail
Considered infeasible
Move Wellington Rail Central Infrastructure Depot
This option would not directly address the network risks that would prevent it from operating post event
Change rolling stock to hybrid to reduce reliance on overhead electrical supply
Not considered feasible as a resilience project
Seaport Alternative connection point on the South Island
This option will be considered within other RORO options
Legislation to enable re-purposing ships post-event
Considered a governance option outside of the remit of this business case
Deeper shipping channel/berths to allow for sea floor rise in fault event
Not considered justifiable under a resilience mandate
RORO Hovercraft to supplement ferries
Not seen as realistic as these craft will still require boarding and alighting facilities and ferries already exist
Ferry terminal at Hongoeka Bay This option had previously been explored and considered infeasible
Relocate port to a more resilient location
Considered infeasible as a resilience proposal
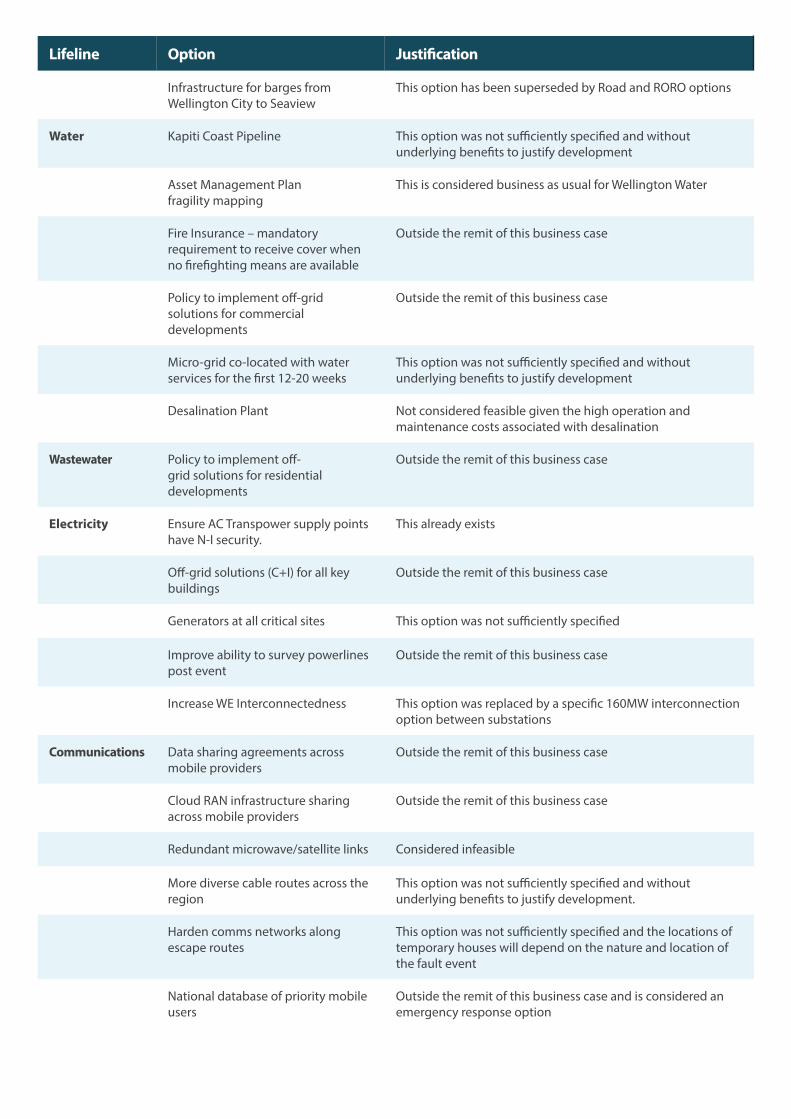
Infrastructure for barges from Wellington City to Seaview
This option has been superseded by Road and RORO options
Water Kapiti Coast Pipeline This option was not sufficiently specified and without underlying benefits to justify development
Asset Management Plan fragility mapping
This is considered business as usual for Wellington Water
Fire Insurance – mandatory requirement to receive cover when no firefighting means are available
Outside the remit of this business case
Policy to implement off-grid solutions for commercial developments
Outside the remit of this business case
Micro-grid co-located with water services for the first 12-20 weeks
This option was not sufficiently specified and without underlying benefits to justify development
Desalination Plant Not considered feasible given the high operation and maintenance costs associated with desalination
Wastewater Policy to implement off-grid solutions for residential developments
Outside the remit of this business case
Electricity Ensure AC Transpower supply points have N-I security.
This already exists
Off-grid solutions (C+I) for all key buildings
Outside the remit of this business case
Generators at all critical sites This option was not sufficiently specified
Improve ability to survey powerlines post event
Outside the remit of this business case
Increase WE Interconnectedness This option was replaced by a specific 160MW interconnection option between substations
Communications Data sharing agreements across mobile providers
Outside the remit of this business case
Cloud RAN infrastructure sharing across mobile providers
Outside the remit of this business case
Redundant microwave/satellite links Considered infeasible
More diverse cable routes across the region
This option was not sufficiently specified and without underlying benefits to justify development.
Harden comms networks along escape routes
This option was not sufficiently specified and the locations of temporary houses will depend on the nature and location of the fault event
National database of priority mobile users
Outside the remit of this business case and is considered an emergency response option
Lifeline Option Justification
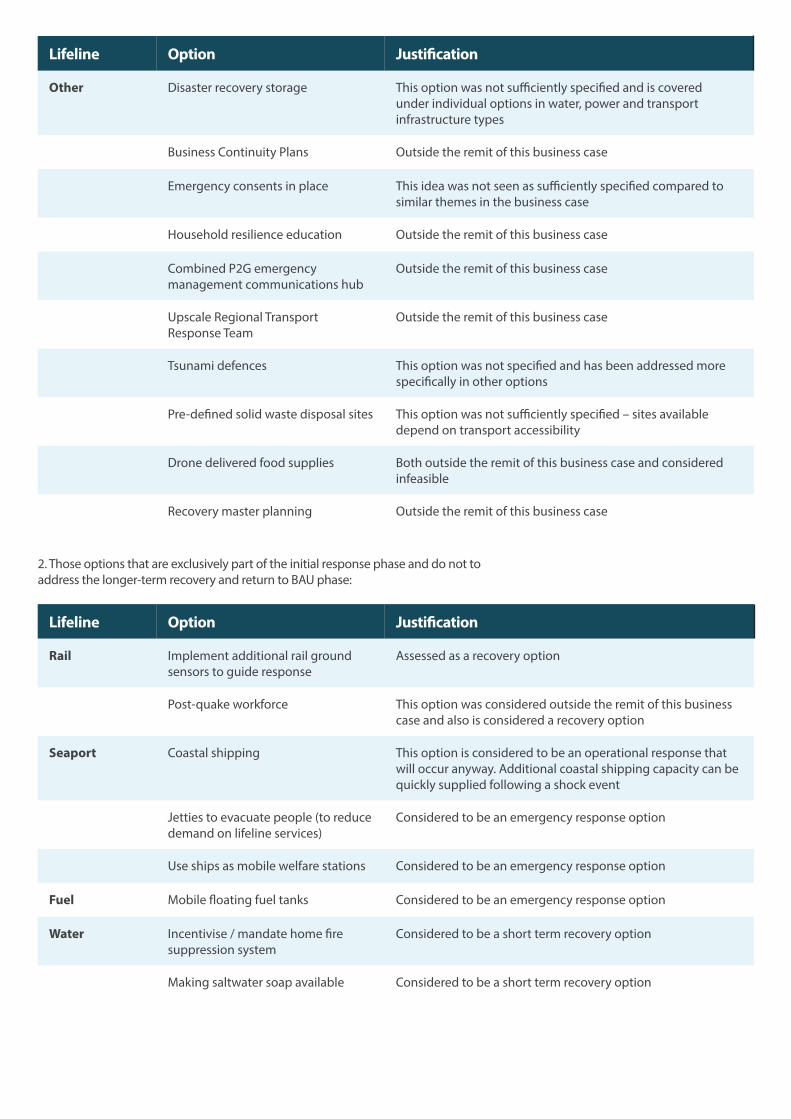
Other Disaster recovery storage This option was not sufficiently specified and is covered under individual options in water, power and transport infrastructure types
Business Continuity Plans Outside the remit of this business case
Emergency consents in place This idea was not seen as sufficiently specified compared to similar themes in the business case
Household resilience education Outside the remit of this business case
Combined P2G emergency management communications hub
Outside the remit of this business case
Upscale Regional Transport Response Team
Outside the remit of this business case
Tsunami defences This option was not specified and has been addressed more specifically in other options
Pre-defined solid waste disposal sites This option was not sufficiently specified – sites available depend on transport accessibility
Drone delivered food supplies Both outside the remit of this business case and considered infeasible
Recovery master planning Outside the remit of this business case
Lifeline Option Justification
2. Those options that are exclusively part of the initial response phase and do not to address the longer-term recovery and return to BAU phase:
Lifeline Option Justification
Rail Implement additional rail ground sensors to guide response
Assessed as a recovery option
Post-quake workforce This option was considered outside the remit of this business case and also is considered a recovery option
Seaport Coastal shipping This option is considered to be an operational response that will occur anyway. Additional coastal shipping capacity can be quickly supplied following a shock event
Jetties to evacuate people (to reduce demand on lifeline services)
Considered to be an emergency response option
Use ships as mobile welfare stations Considered to be an emergency response option
Fuel Mobile floating fuel tanks Considered to be an emergency response option
Water Incentivise / mandate home fire suppression system
Considered to be a short term recovery option
Making saltwater soap available Considered to be a short term recovery option
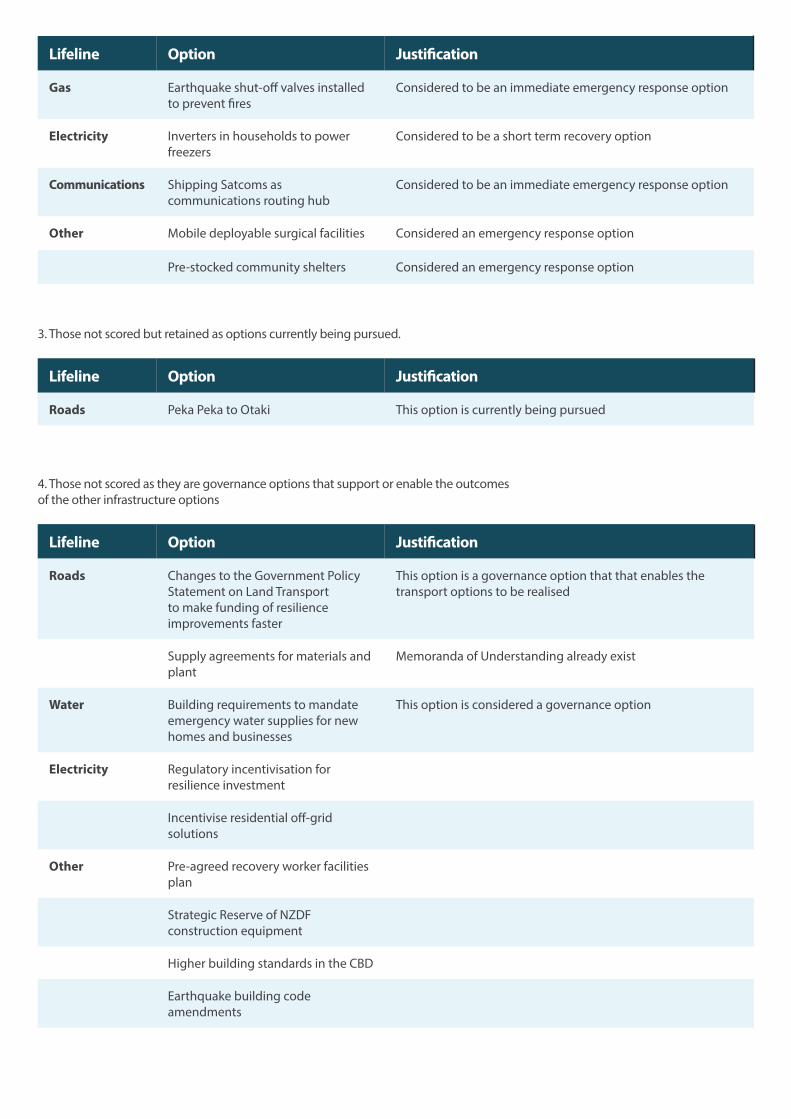
Lifeline Option Justification
3. Those not scored but retained as options currently being pursued.
4. Those not scored as they are governance options that support or enable the outcomes of the other infrastructure options
Lifeline Option Justification
Roads Peka Peka to Otaki This option is currently being pursued
Lifeline Option Justification
Roads Changes to the Government Policy Statement on Land Transport to make funding of resilience improvements faster
This option is a governance option that that enables the transport options to be realised
Supply agreements for materials and plant
Memoranda of Understanding already exist
Water Building requirements to mandate emergency water supplies for new homes and businesses
This option is considered a governance option
Electricity Regulatory incentivisation for resilience investment
Incentivise residential off-grid solutions
Other Pre-agreed recovery worker facilities plan
Strategic Reserve of NZDF construction equipment
Higher building standards in the CBD
Earthquake building code amendments
Gas Earthquake shut-off valves installed to prevent fires
Considered to be an immediate emergency response option
Electricity Inverters in households to power freezers
Considered to be a short term recovery option
Communications Shipping Satcoms as communications routing hub
Considered to be an immediate emergency response option
Other Mobile deployable surgical facilities Considered an emergency response option
Pre-stocked community shelters Considered an emergency response option
Appendix HProgramme Options Development and Analysis
Page 1
Appendix H: Programme Options Development and Analysis
H1 Programme Development
This appendix supports Section 7 of the PBC. It further explains how two possible programmes of options were developed to address the problems identified in the Strategic Case. It records the long list of options which were developed through workshops with lifelines organisations and subject matter experts. Further, it describes the process by which these options were generated, assessed against the investment objectives using a multi criteria analysis tool and packaged into three alternate programmes for refinement and testing with the stakeholder group, which reduced the programmes to two. How the agreed two alternative programmes were then tested and a preferred programme selected is covered in detail in the next section.
Initially, three draft programmes were developed that represented de facto low, medium and high investment.
The potential programmes were presented to lifelines organisations, councils and DPMC representatives at a workshop on 20 July 2017 as a starting point to establish the programme alternatives that would be taken forward for testing in RiskScape and MERIT (see below). At this workshop, participants moved several options that previously sat in the medium programme, down to the lower investment programme to reflect their criticality. The programmes were refined and subsequently it was agreed that two programmes would be taken forward to the detailed analysis stage. Maps of the interventions proposed for these programmes can be found in Appendix J.
The commercial viability of the various port and the fuel terminal options was raised as an issue by participants. Although the ease of implementation was assessed to a minor degree in the MCA, options considered not commercially viable were not automatically excluded at this stage in the assessment. Further discussion on the commercial viability of options, especially those for which there are competing providers in the market, such as fuel companies and Cook Strait ferry providers, were undertaken with the lifeline organisations individually following the workshop. From these discussions, the preferred ferry and fuel options were included in each programme alternative.
An assessment of the individual options making up each programme is provided below. MCA scores were used as a ‘first-cut’ for assessing the viability and responsiveness of individual projects, rather than a basis for programme allocation. The MCA score for each option in the resultant programmes can be found in Appendix I.
H1.1 Base Case
The base case was established as the base-line against which the efficacy of the improvement programmes could be tested. It included TG, which is three years into its six-year construction phase and has been included in the base case. TG is considered a ‘game changer’ providing resilient access deep into the region. As well as being a commitment, with large amounts of earthworks already completed and plant on-site it was clear that TG will be able to function as a through route following an earthquake, providing a critical transport connection for bringing in fuel and supplies to the region from the north. It therefore was considered as part of the base case.
Page 2
H1.2 Projects common to both programmes
The following projects were common to both programme alternatives. Six of the projects are committed by lifelines organisations for future construction, and therefore were automatically selected for all programme alternatives. The remaining projects were considered ‘must-dos’ for the Wellington Region as they are enablers of other lifelines recoveries. For the projects which were included in the final recommended programme, they have simply been named here, with a more detailed description provided in Section 7.2 of the PBC.
Seaview Wharf seismic strengthening
Wadestown to Johnsonville – seismic strengthening
Middleton Road retaining walls upgrade
SH58/Haywards Resilience Improvements from Transmission Gully to Hutt Valley
Taita Gorge Access – strengthening road network
Port Seismic Strengthening – major works
New RORO Terminal
Central Park Substation – improved resilience
Central Park to Frederick Street cables replacement
Cross Harbour Pipeline
General water supply toughening acceleration
Porirua Branch Replacement & Emergency Pumping Plant
Porirua Low Level Zone Reservoirs
Waterloo Pump Station extension and new pipeline from Waterloo to Haywards
Waterloo Water Treatment Plant liquefaction project
Prince of Wales and Bell Road Reservoir Upgrade
Carmichael to Johnsonville and Karori Pipeline
Silverstream Bridge Pipeline Replacement Project
Dedicated back up power for cell towers
And projects subsequently excluded:
Ngauranga Gorge Accelerate Resilience – slope stabilisation
Project description:
This project involves the stabilisation of slopes along SH1 through either cut backs and reducing batters or providing protection from landslides.
Estimated cost: Capital cost: $3 million
Rationale for potential inclusion:
It is assumed that all the potentially weak slopes through the Ngauranga Gorge will be stabilised ensuring the road remains open following an earthquake event and providing access through to Johnsonville, Tawa and Porirua.
Ngauranga to Petone Shared Pathway
Project description:
Construction of a 4m wide shared path between Petone and Ngauranga on the Seaward side of the railway line. Additional reclamation will be required to what has been previously reclaimed. The works also involve building a new seawall. Enhanced options also include straightening of the railway line at selected locations. Furthermore, enhancements to the road could include additional
Page 3
Ngauranga to Petone Shared Pathway lanes or relocating the road further away from the toes of the steep slopes which are prone to failures during earthquakes.
Estimated cost: Capital cost: $85 million
Rationale for potential inclusion:
The shared path can be used for access following an event away from the steep and unstable hills which SH2 runs close to. The reclamation and new sea wall will be constructed to a higher design standard than the existing wall hence improving its resilience in a quake events plus severe storm events.
Burnham Wharf replacement
Project description:
Replacement of Burnham Wharf with a new seismically resilient wharf facility including futureproofing for future emergency RORO use. This project will require a complete replacement of the aviation fuel infrastructure also as it is near the end of its design life.
Estimated cost: Capital cost: not costed
Rationale for potential inclusion:
Burnham Wharf provides a facility for ships carrying aviation fuel to dock and fill up the fuel tanks located nearby. 20 tanker trucks per day would be required to bring the equivalent volume of fuel from Seaview for airport operations. The reclamation beside Burnham Wharf is likely to liquefy or spread. These effects may result in severe structural damage to the wharf which is 1920s era reinforced concrete with low ductility and in a deteriorated state. Improving the resilience of the wharf and fuel infrastructure is essential to ensuring the airport can continue to operate following a quake event.
Emergency water infrastructure in communities
Project description:
Emergency water infrastructure located in communities: bladders, mini-bores.
Estimated cost: Capital cost: $30 million
Rationale for potential inclusion:
This project has been committed and therefore this represents the opportunity for an accelerated programme to implement this initiative sooner. It is included as a complementary project that allows more people to remain in the region and work on the recovery.
Ablution facilities across schools
Project description:
Provision of pit latrines (or similar) at those schools that are likely to be emergency assistance centres.
Estimated cost: Capital cost: $20 million
Rationale for potential inclusion:
This project will be a community facility that can used to sustain society in the short to medium term after a shock event. It will also ensure self-sufficiency at schools to enable them to reopen as soon as possible following a quake and the associated school communities can remain.
Provision of buckets for a two bucket home toilet system
Project description:
Provision of two bucket system for separation of solid and liquid human waste and on site storage. The system will cost each household approximately $210 each.
Estimated cost: Capital cost: nil
Page 4
Provision of buckets for a two bucket home toilet system
Rationale for potential inclusion:
This project will ensure self-sufficiency for the period immediately following a quake while the wastewater distribution networks are being repaired.
Readying point solution LPG supplies
Project description:
This project involves conversion of connections and vapourisers for critical customers (hospitals, prisons and similar facilities) from reticulated natural gas supply to tanked LPG supply. The connections would take 7 days and then the LPG would be supplied via Isotainer (container based LPG tanks of which approximately 20 are available in NZ) which would be trucked into Wellington (via road or RORO). Other customers that rely on gas (e.g. restaurants, hotels) could also be converted from reticulated natural gas to LPG and supplied with small LPG tanks. This would be a short conversion process and then tanks would be trucked in from outside the region.
Estimated cost: Capital cost: $2 million
Rationale for potential inclusion:
This project will support the recovery period following a major shake.
H1.3 Lower Investment Level Programme
This programme is made up of the smaller scale projects (both in size and cost) and includes those projects listed in H1.2 above as well as:
Minor Rail Seismic Upgrade of slopes and structures – NIMT Line and Hutt Valley Line, and
Hutt River bridges strengthening
Project description:
Potential strengthening of any bridge across the Hutt River to add redundancy and robustness
Estimated cost: Capital cost: not specified
Rationale for potential inclusion:
The Hutt River is a major obstacle to connectivity in the valley where having multiple bridges available could be an asset.
H1.4 Higher Investment Level Programme
This programme is made up of the larger scale projects that require the higher investment levels. These projects are typically the larger infrastructure new builds or upgrades which, prior to modelling, are believed to provide higher infrastructure resilience than those in the Lower Investment Programme. These are in conjunction with the projects in H1.2 above as well as:
Cross Valley Link
Petone to Grenada
Better engineered road links to existing RORO Terminal and port area
Resilience of airport connectivity to city network via Newtown
Seismic upgrade of 33kV buried cables, and
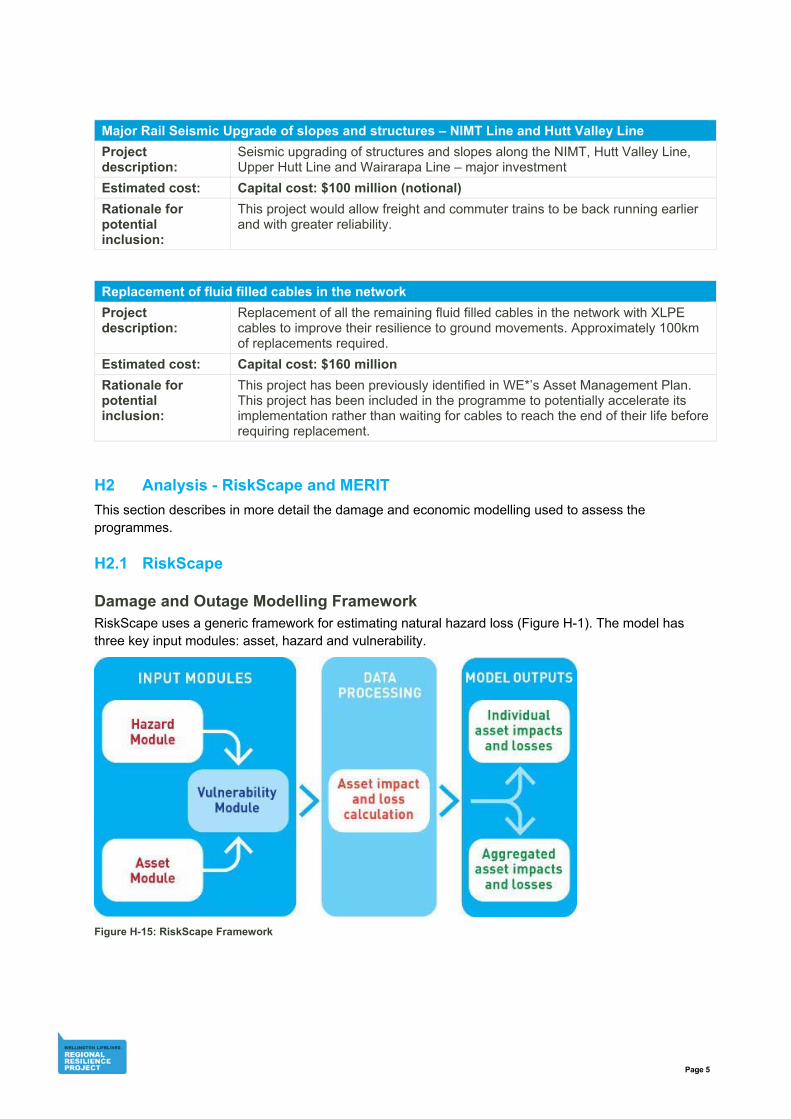
Page 5
Major Rail Seismic Upgrade of slopes and structures – NIMT Line and Hutt Valley Line
Project description:
Seismic upgrading of structures and slopes along the NIMT, Hutt Valley Line, Upper Hutt Line and Wairarapa Line – major investment
Estimated cost: Capital cost: $100 million (notional)
Rationale for potential inclusion:
This project would allow freight and commuter trains to be back running earlier and with greater reliability.
Replacement of fluid filled cables in the network
Project description:
Replacement of all the remaining fluid filled cables in the network with XLPE cables to improve their resilience to ground movements. Approximately 100km of replacements required.
Estimated cost: Capital cost: $160 million
Rationale for potential inclusion:
This project has been previously identified in WE*’s Asset Management Plan. This project has been included in the programme to potentially accelerate its implementation rather than waiting for cables to reach the end of their life before requiring replacement.
H2 Analysis - RiskScape and MERIT
This section describes in more detail the damage and economic modelling used to assess the programmes.
H2.1 RiskScape
Damage and Outage Modelling Framework RiskScape uses a generic framework for estimating natural hazard loss (Figure H-1). The model has three key input modules: asset, hazard and vulnerability.
Figure H-15: RiskScape Framework
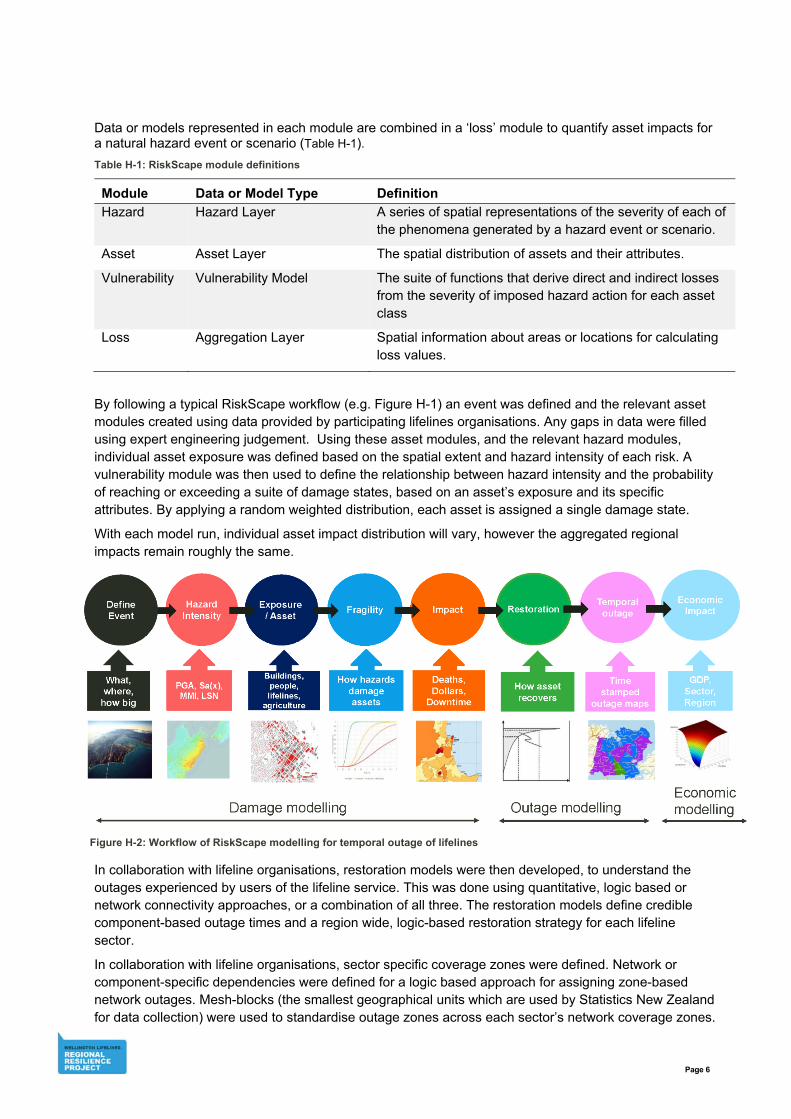
Page 6
Data or models represented in each module are combined in a ‘loss’ module to quantify asset impacts for a natural hazard event or scenario (Table H-1).
Table H-1: RiskScape module definitions
Module Data or Model Type Definition
Hazard Hazard Layer A series of spatial representations of the severity of each of the phenomena generated by a hazard event or scenario.
Asset Asset Layer The spatial distribution of assets and their attributes.
Vulnerability Vulnerability Model The suite of functions that derive direct and indirect losses from the severity of imposed hazard action for each asset class
Loss Aggregation Layer Spatial information about areas or locations for calculating loss values.
By following a typical RiskScape workflow (e.g. Figure H-1) an event was defined and the relevant asset modules created using data provided by participating lifelines organisations. Any gaps in data were filled using expert engineering judgement. Using these asset modules, and the relevant hazard modules, individual asset exposure was defined based on the spatial extent and hazard intensity of each risk. A vulnerability module was then used to define the relationship between hazard intensity and the probability of reaching or exceeding a suite of damage states, based on an asset’s exposure and its specific attributes. By applying a random weighted distribution, each asset is assigned a single damage state.
With each model run, individual asset impact distribution will vary, however the aggregated regional impacts remain roughly the same.
In collaboration with lifeline organisations, restoration models were then developed, to understand the outages experienced by users of the lifeline service. This was done using quantitative, logic based or network connectivity approaches, or a combination of all three. The restoration models define credible component-based outage times and a region wide, logic-based restoration strategy for each lifeline sector.
In collaboration with lifeline organisations, sector specific coverage zones were defined. Network or component-specific dependencies were defined for a logic based approach for assigning zone-based network outages. Mesh-blocks (the smallest geographical units which are used by Statistics New Zealand for data collection) were used to standardise outage zones across each sector’s network coverage zones.
Figure H-2: Workflow of RiskScape modelling for temporal outage of lifelines
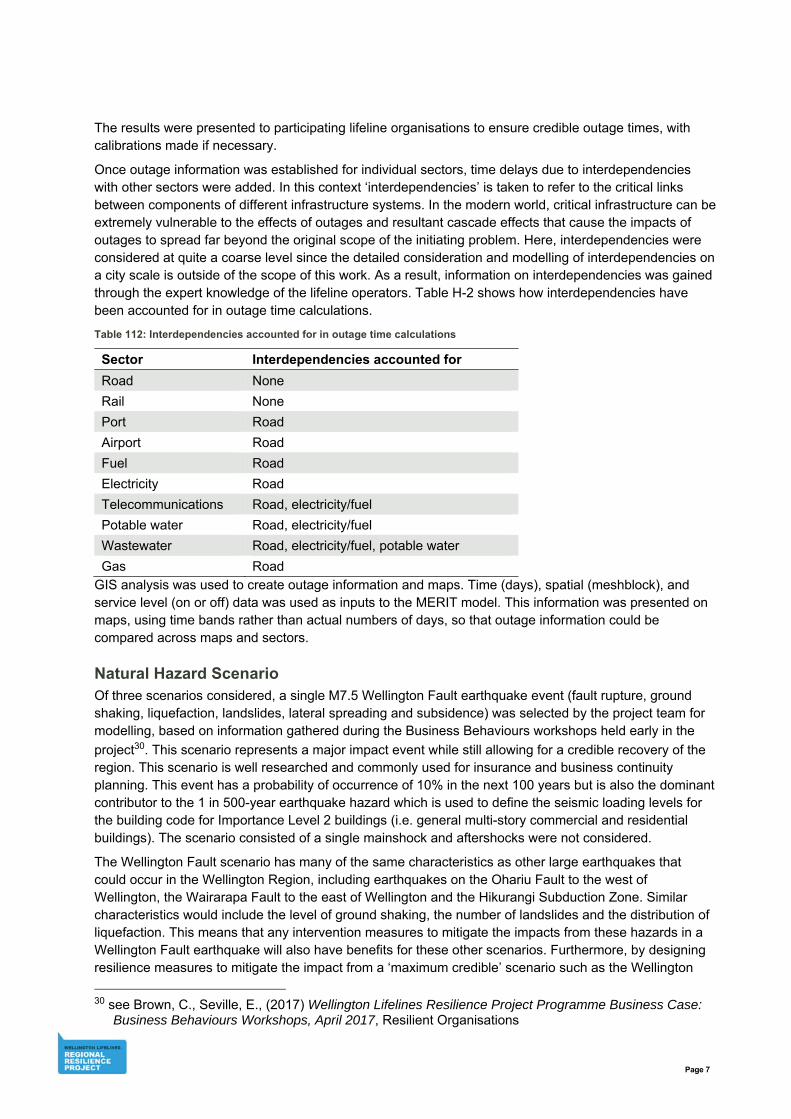
Page 7
The results were presented to participating lifeline organisations to ensure credible outage times, with calibrations made if necessary.
Once outage information was established for individual sectors, time delays due to interdependencies with other sectors were added. In this context ‘interdependencies’ is taken to refer to the critical links between components of different infrastructure systems. In the modern world, critical infrastructure can be extremely vulnerable to the effects of outages and resultant cascade effects that cause the impacts of outages to spread far beyond the original scope of the initiating problem. Here, interdependencies were considered at quite a coarse level since the detailed consideration and modelling of interdependencies on a city scale is outside of the scope of this work. As a result, information on interdependencies was gained through the expert knowledge of the lifeline operators. Table H-2 shows how interdependencies have been accounted for in outage time calculations.
Table 112: Interdependencies accounted for in outage time calculations
Sector Interdependencies accounted for
Road None
Rail None
Port Road
Airport Road
Fuel Road
Electricity Road
Telecommunications Road, electricity/fuel
Potable water Road, electricity/fuel
Wastewater Road, electricity/fuel, potable water
Gas Road GIS analysis was used to create outage information and maps. Time (days), spatial (meshblock), and service level (on or off) data was used as inputs to the MERIT model. This information was presented on maps, using time bands rather than actual numbers of days, so that outage information could be compared across maps and sectors.
Natural Hazard Scenario Of three scenarios considered, a single M7.5 Wellington Fault earthquake event (fault rupture, ground shaking, liquefaction, landslides, lateral spreading and subsidence) was selected by the project team for modelling, based on information gathered during the Business Behaviours workshops held early in the
project30. This scenario represents a major impact event while still allowing for a credible recovery of the region. This scenario is well researched and commonly used for insurance and business continuity planning. This event has a probability of occurrence of 10% in the next 100 years but is also the dominant contributor to the 1 in 500-year earthquake hazard which is used to define the seismic loading levels for the building code for Importance Level 2 buildings (i.e. general multi-story commercial and residential buildings). The scenario consisted of a single mainshock and aftershocks were not considered.
The Wellington Fault scenario has many of the same characteristics as other large earthquakes that could occur in the Wellington Region, including earthquakes on the Ohariu Fault to the west of Wellington, the Wairarapa Fault to the east of Wellington and the Hikurangi Subduction Zone. Similar characteristics would include the level of ground shaking, the number of landslides and the distribution of liquefaction. This means that any intervention measures to mitigate the impacts from these hazards in a Wellington Fault earthquake will also have benefits for these other scenarios. Furthermore, by designing resilience measures to mitigate the impact from a ‘maximum credible’ scenario such as the Wellington
30 see Brown, C., Seville, E., (2017) Wellington Lifelines Resilience Project Programme Business Case:
Business Behaviours Workshops, April 2017, Resilient Organisations
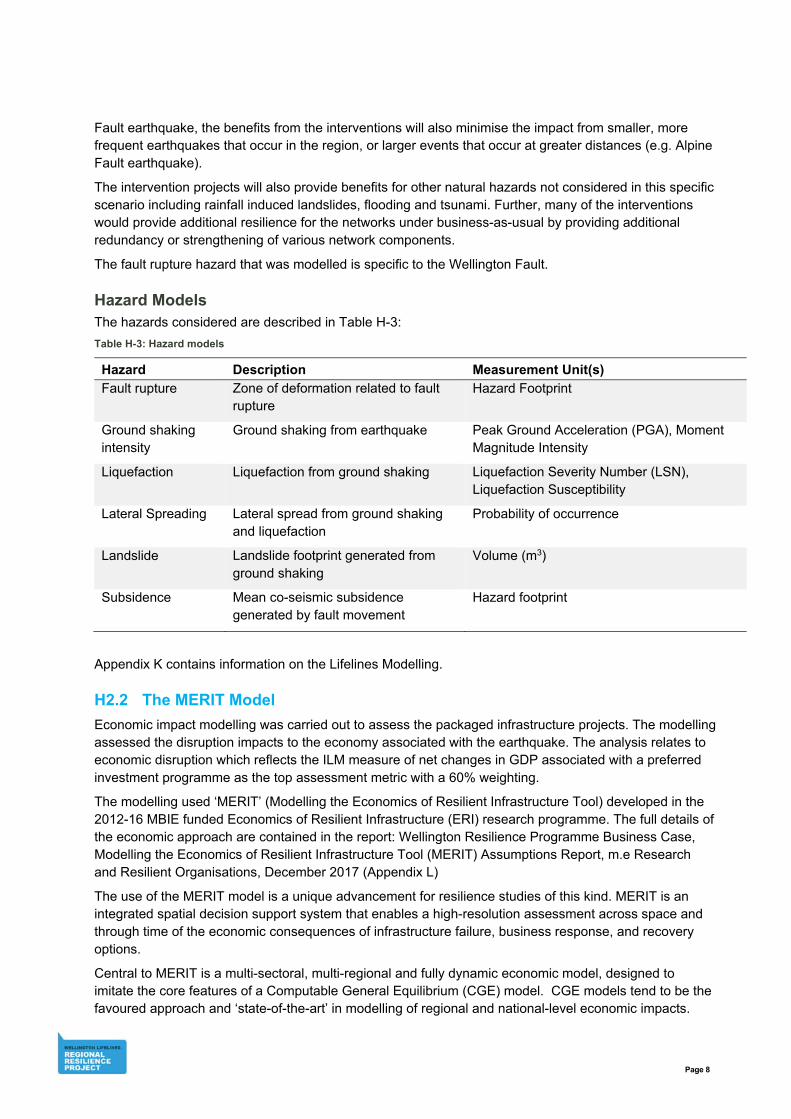
Page 8
Fault earthquake, the benefits from the interventions will also minimise the impact from smaller, more frequent earthquakes that occur in the region, or larger events that occur at greater distances (e.g. Alpine Fault earthquake).
The intervention projects will also provide benefits for other natural hazards not considered in this specific scenario including rainfall induced landslides, flooding and tsunami. Further, many of the interventions would provide additional resilience for the networks under business-as-usual by providing additional redundancy or strengthening of various network components.
The fault rupture hazard that was modelled is specific to the Wellington Fault.
Hazard Models The hazards considered are described in Table H-3:
Table H-3: Hazard models
Hazard Description Measurement Unit(s)
Fault rupture Zone of deformation related to fault rupture
Hazard Footprint
Ground shaking intensity
Ground shaking from earthquake Peak Ground Acceleration (PGA), Moment Magnitude Intensity
Liquefaction Liquefaction from ground shaking Liquefaction Severity Number (LSN), Liquefaction Susceptibility
Lateral Spreading Lateral spread from ground shaking and liquefaction
Probability of occurrence
Landslide Landslide footprint generated from ground shaking
Volume (m3)
Subsidence Mean co-seismic subsidence generated by fault movement
Hazard footprint
Appendix K contains information on the Lifelines Modelling.
H2.2 The MERIT Model
Economic impact modelling was carried out to assess the packaged infrastructure projects. The modelling assessed the disruption impacts to the economy associated with the earthquake. The analysis relates to economic disruption which reflects the ILM measure of net changes in GDP associated with a preferred investment programme as the top assessment metric with a 60% weighting.
The modelling used ‘MERIT’ (Modelling the Economics of Resilient Infrastructure Tool) developed in the 2012-16 MBIE funded Economics of Resilient Infrastructure (ERI) research programme. The full details of the economic approach are contained in the report: Wellington Resilience Programme Business Case, Modelling the Economics of Resilient Infrastructure Tool (MERIT) Assumptions Report, m.e Research and Resilient Organisations, December 2017 (Appendix L)
The use of the MERIT model is a unique advancement for resilience studies of this kind. MERIT is an integrated spatial decision support system that enables a high-resolution assessment across space and through time of the economic consequences of infrastructure failure, business response, and recovery options.
Central to MERIT is a multi-sectoral, multi-regional and fully dynamic economic model, designed to imitate the core features of a Computable General Equilibrium (CGE) model. CGE models tend to be the favoured approach and ‘state-of-the-art’ in modelling of regional and national-level economic impacts.
Page 9
Among the advantages of these types of models are the whole-of-economy coverage, the capture of induced impacts and ‘general equilibrium’ impacts.
Although MERIT incorporates the core features of a CGE model, it differs from a standard CGE model in that it is formulated as a System Dynamics model using finite difference equations. This is an innovative extension to economic modelling undertaken in part to improve its ability to capture the impacts of events over time. MERIT is a simulation model, acknowledging that in meeting these constraints there is a transition pathway through which the economy must pass. MERIT is particularly appropriate for natural hazard events as it can directly account for out-of-equilibrium dynamics that often emerge in a disrupted economy.
Once information is transformed into appropriate inputs and MERIT is run, it can produce a variety of indicators to help assess economic impacts of an infrastructure outage in aggregate and by industry. The model can thus not only be used to assess the economic consequence of a natural hazard event resulting from infrastructure failure, but also to inform resilience-building and investment initiatives.
The MERIT modelling calculates economic impacts over a 5-year timeframe following a quake event, assuming that the event takes place at the present time. A 5-year time frame was selected for the modelling as it was considered a balance between two competing considerations: (1) covering a period sufficiently long to capture some of the ongoing consequences of the disruption, and (2) recognising that the further out in time from the event, the greater the uncertainty in outcomes. It is quite likely that the impacts of the event will continue to be felt long after five years, for example through population movement, business relocation, and the ongoing implications of lost income flow, and to the extent that this occurs, the reported results will underestimate the impacts. Over time, however, there are other dynamics that may play out and which are highly uncertain and contentious, for example whether there may be community and policy initiatives to ‘re-invent Wellington’, or the extent to which the rebuild activities provide some possibilities to put in place more modern and better capital.
It is also important to recognise that following a large disruption event, the period of rebuild activities may be quite significant and be responsible for stimulating economic activity. Based on the Christchurch experience, relatively little rebuild would be expected to take place in the first few years after the event. A large portion of rebuild activity is likely to be funded by international transfers via insurance/reinsurance, but some will be funded privately and via local/central government. As much of the reconstruction will relate to non-infrastructure property rebuild, particularly commercial and residential buildings, it is likely to occur regardless of the infrastructure resilience-enhancing investments that are the focus of this study. The economic consequences of rebuild activities have been deliberately excluded from the modelling, in line with the focus on reducing the negative consequences of economic disruption following a major event, particularly as a result of loss of infrastructure service provision.
Details on how the suite of MERIT tools was developed, how it works, and previous applications are provided in the references of the Assumptions Report (Appendix L).
Applying MERIT to Wellington To apply MERIT to the Wellington Fault earthquake scenario, the first step was to evaluate any modifications required. To do this, a series of workshops with stakeholders were held to understand how sensitive the Wellington economy would be to infrastructure and other disaster disruptions. Each workshop explored how disaster disruptions (infrastructure and community disruptions) could affect Wellington’s habitability, liveability and business viability. Economic tipping points and key enablers and barriers to a successful Wellington post-disaster recovery were also explored.
To fully capture the consequences of the event, it was necessary to develop a set of bespoke models for this project, mostly addressing aspects of transportation and tourism disruption as well as the propensity for people and business relocation and the effects of isolation. Overall, the following drivers of economic system change following a major earthquake event were incorporated into the MERIT modelling process (Figure H-3).
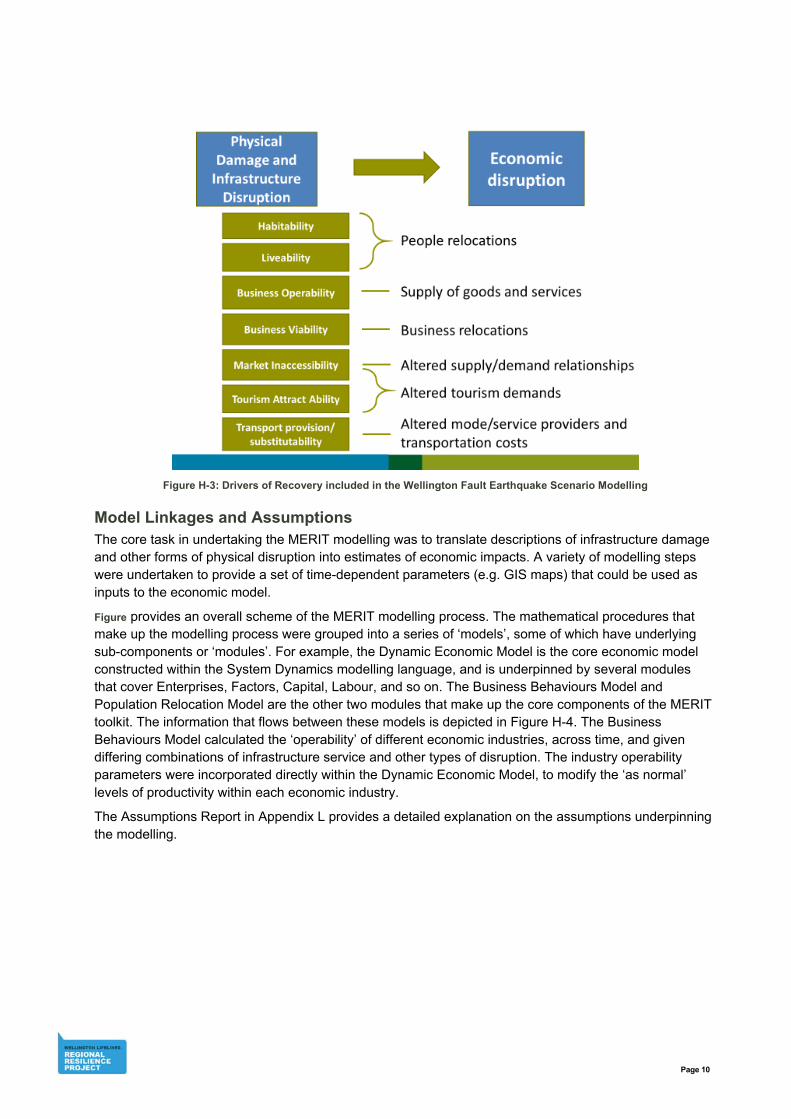
Page 10
Figure H-3: Drivers of Recovery included in the Wellington Fault Earthquake Scenario Modelling
Model Linkages and Assumptions The core task in undertaking the MERIT modelling was to translate descriptions of infrastructure damage and other forms of physical disruption into estimates of economic impacts. A variety of modelling steps were undertaken to provide a set of time-dependent parameters (e.g. GIS maps) that could be used as inputs to the economic model.
Figure provides an overall scheme of the MERIT modelling process. The mathematical procedures that make up the modelling process were grouped into a series of ‘models’, some of which have underlying sub-components or ‘modules’. For example, the Dynamic Economic Model is the core economic model constructed within the System Dynamics modelling language, and is underpinned by several modules that cover Enterprises, Factors, Capital, Labour, and so on. The Business Behaviours Model and Population Relocation Model are the other two modules that make up the core components of the MERIT toolkit. The information that flows between these models is depicted in Figure H-4. The Business Behaviours Model calculated the ‘operability’ of different economic industries, across time, and given differing combinations of infrastructure service and other types of disruption. The industry operability parameters were incorporated directly within the Dynamic Economic Model, to modify the ‘as normal’ levels of productivity within each economic industry.
The Assumptions Report in Appendix L provides a detailed explanation on the assumptions underpinning the modelling.
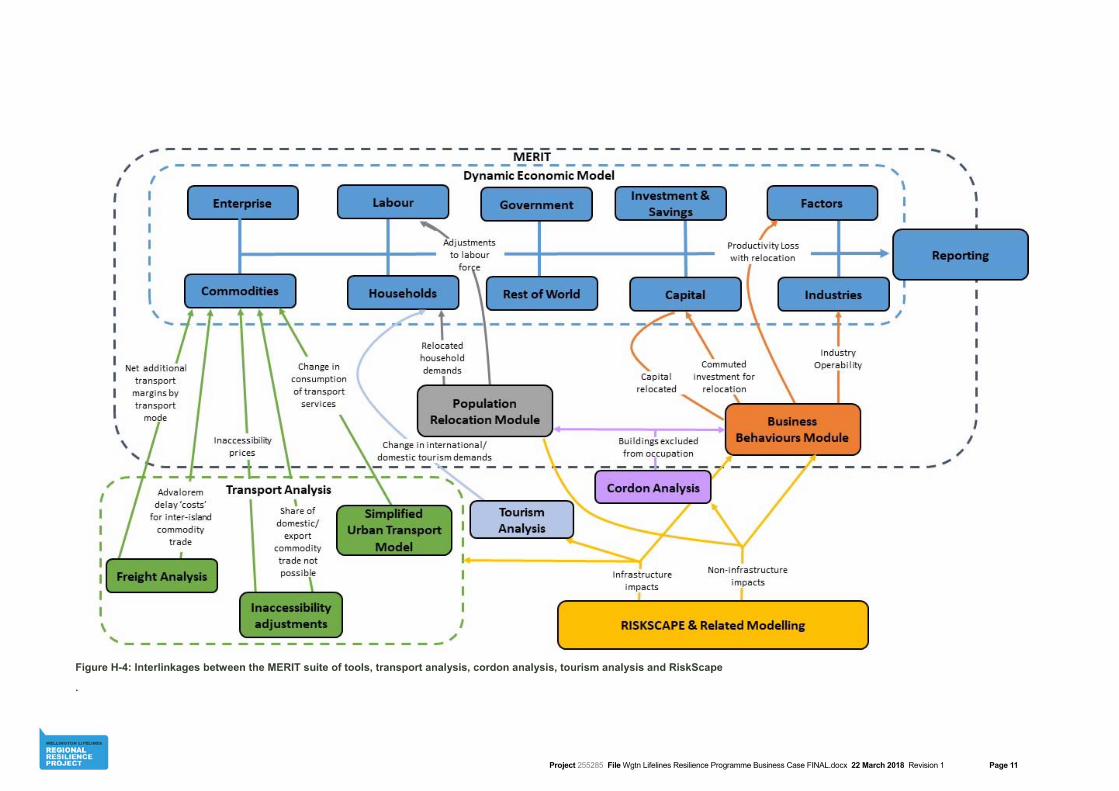
Project 255285 File Wgtn Lifelines Resilience Programme Business Case FINAL.docx 22 March 2018 Revision 1 Page 11
Figure H-4: Interlinkages between the MERIT suite of tools, transport analysis, cordon analysis, tourism analysis and RiskScape
.
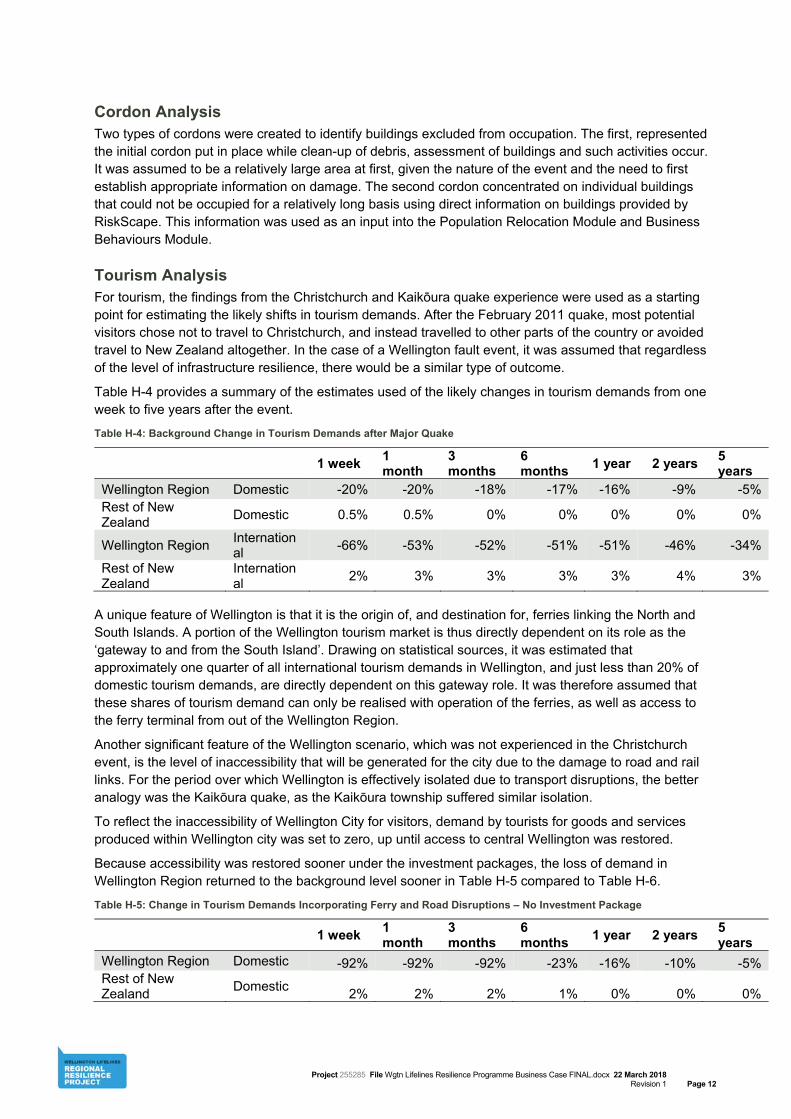
Project 255285 File Wgtn Lifelines Resilience Programme Business Case FINAL.docx 22 March 2018 Revision 1 Page 12
Cordon Analysis Two types of cordons were created to identify buildings excluded from occupation. The first, represented the initial cordon put in place while clean-up of debris, assessment of buildings and such activities occur. It was assumed to be a relatively large area at first, given the nature of the event and the need to first establish appropriate information on damage. The second cordon concentrated on individual buildings that could not be occupied for a relatively long basis using direct information on buildings provided by RiskScape. This information was used as an input into the Population Relocation Module and Business Behaviours Module.
Tourism Analysis For tourism, the findings from the Christchurch and Kaikōura quake experience were used as a starting point for estimating the likely shifts in tourism demands. After the February 2011 quake, most potential visitors chose not to travel to Christchurch, and instead travelled to other parts of the country or avoided travel to New Zealand altogether. In the case of a Wellington fault event, it was assumed that regardless of the level of infrastructure resilience, there would be a similar type of outcome.
Table H-4 provides a summary of the estimates used of the likely changes in tourism demands from one week to five years after the event.
Table H-4: Background Change in Tourism Demands after Major Quake
1 week 1 month
3 months
6 months
1 year 2 years 5 years
Wellington Region Domestic -20% -20% -18% -17% -16% -9% -5% Rest of New Zealand
Domestic 0.5% 0.5% 0% 0% 0% 0% 0%
Wellington Region International
-66% -53% -52% -51% -51% -46% -34%
Rest of New Zealand
International
2% 3% 3% 3% 3% 4% 3%
A unique feature of Wellington is that it is the origin of, and destination for, ferries linking the North and South Islands. A portion of the Wellington tourism market is thus directly dependent on its role as the ‘gateway to and from the South Island’. Drawing on statistical sources, it was estimated that approximately one quarter of all international tourism demands in Wellington, and just less than 20% of domestic tourism demands, are directly dependent on this gateway role. It was therefore assumed that these shares of tourism demand can only be realised with operation of the ferries, as well as access to the ferry terminal from out of the Wellington Region.
Another significant feature of the Wellington scenario, which was not experienced in the Christchurch event, is the level of inaccessibility that will be generated for the city due to the damage to road and rail links. For the period over which Wellington is effectively isolated due to transport disruptions, the better analogy was the Kaikōura quake, as the Kaikōura township suffered similar isolation.
To reflect the inaccessibility of Wellington City for visitors, demand by tourists for goods and services produced within Wellington city was set to zero, up until access to central Wellington was restored.
Because accessibility was restored sooner under the investment packages, the loss of demand in Wellington Region returned to the background level sooner in Table H-5 compared to Table H-6.
Table H-5: Change in Tourism Demands Incorporating Ferry and Road Disruptions – No Investment Package
1 week 1 month
3 months
6 months
1 year 2 years 5 years
Wellington Region Domestic -92% -92% -92% -23% -16% -10% -5% Rest of New Zealand
Domestic 2% 2% 2% 1% 0% 0% 0%
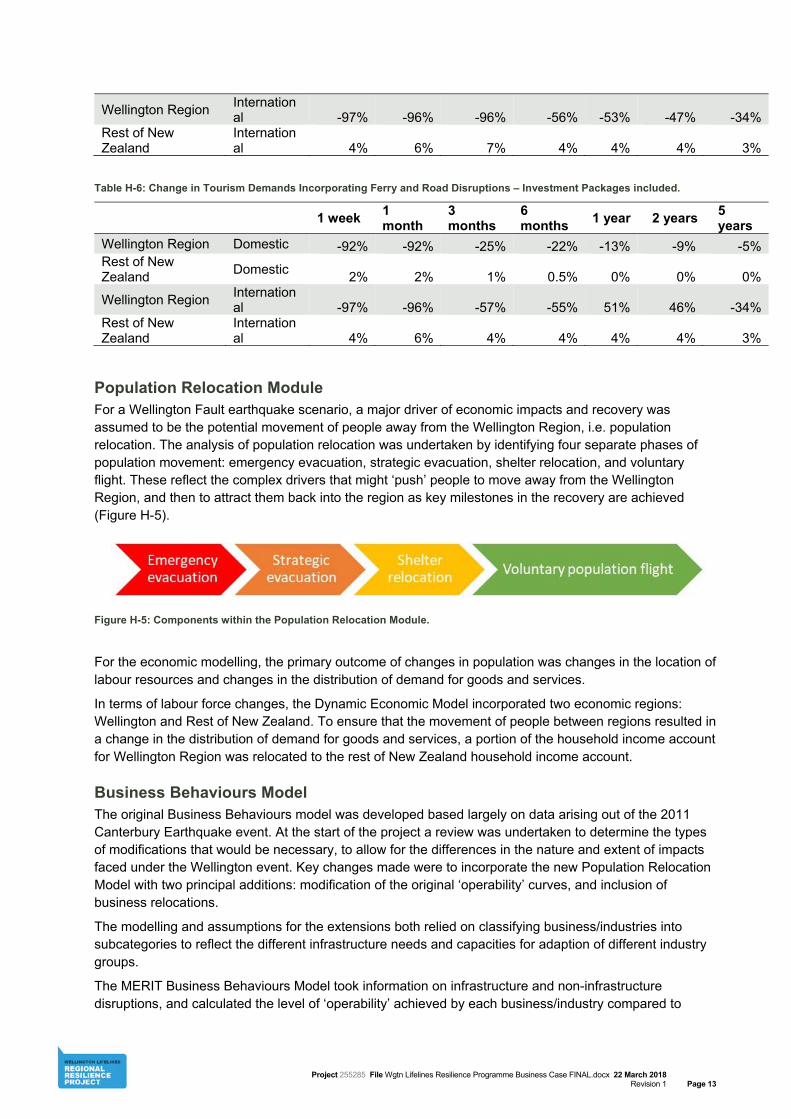
Project 255285 File Wgtn Lifelines Resilience Programme Business Case FINAL.docx 22 March 2018 Revision 1 Page 13
Wellington Region International -97% -96% -96% -56% -53% -47% -34%
Rest of New Zealand
International 4% 6% 7% 4% 4% 4% 3%
Table H-6: Change in Tourism Demands Incorporating Ferry and Road Disruptions – Investment Packages included.
1 week 1 month
3 months
6 months
1 year 2 years 5 years
Wellington Region Domestic -92% -92% -25% -22% -13% -9% -5% Rest of New Zealand
Domestic 2% 2% 1% 0.5% 0% 0% 0%
Wellington Region International -97% -96% -57% -55% 51% 46% -34%
Rest of New Zealand
International 4% 6% 4% 4% 4% 4% 3%
Population Relocation Module For a Wellington Fault earthquake scenario, a major driver of economic impacts and recovery was assumed to be the potential movement of people away from the Wellington Region, i.e. population relocation. The analysis of population relocation was undertaken by identifying four separate phases of population movement: emergency evacuation, strategic evacuation, shelter relocation, and voluntary flight. These reflect the complex drivers that might ‘push’ people to move away from the Wellington Region, and then to attract them back into the region as key milestones in the recovery are achieved (Figure H-5).
Figure H-5: Components within the Population Relocation Module.
For the economic modelling, the primary outcome of changes in population was changes in the location of labour resources and changes in the distribution of demand for goods and services.
In terms of labour force changes, the Dynamic Economic Model incorporated two economic regions: Wellington and Rest of New Zealand. To ensure that the movement of people between regions resulted in a change in the distribution of demand for goods and services, a portion of the household income account for Wellington Region was relocated to the rest of New Zealand household income account.
Business Behaviours Model The original Business Behaviours model was developed based largely on data arising out of the 2011 Canterbury Earthquake event. At the start of the project a review was undertaken to determine the types of modifications that would be necessary, to allow for the differences in the nature and extent of impacts faced under the Wellington event. Key changes made were to incorporate the new Population Relocation Model with two principal additions: modification of the original ‘operability’ curves, and inclusion of business relocations.
The modelling and assumptions for the extensions both relied on classifying business/industries into subcategories to reflect the different infrastructure needs and capacities for adaption of different industry groups.
The MERIT Business Behaviours Model took information on infrastructure and non-infrastructure disruptions, and calculated the level of ‘operability’ achieved by each business/industry compared to
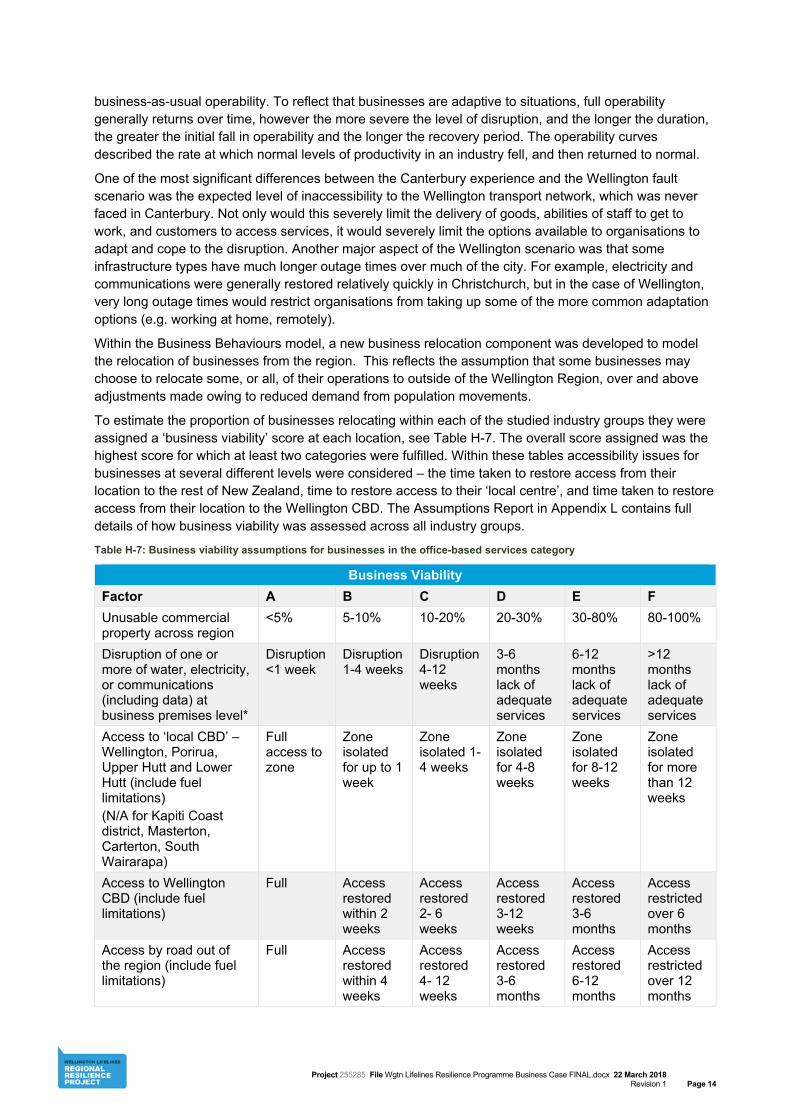
Project 255285 File Wgtn Lifelines Resilience Programme Business Case FINAL.docx 22 March 2018 Revision 1 Page 14
business-as-usual operability. To reflect that businesses are adaptive to situations, full operability generally returns over time, however the more severe the level of disruption, and the longer the duration, the greater the initial fall in operability and the longer the recovery period. The operability curves described the rate at which normal levels of productivity in an industry fell, and then returned to normal.
One of the most significant differences between the Canterbury experience and the Wellington fault scenario was the expected level of inaccessibility to the Wellington transport network, which was never faced in Canterbury. Not only would this severely limit the delivery of goods, abilities of staff to get to work, and customers to access services, it would severely limit the options available to organisations to adapt and cope to the disruption. Another major aspect of the Wellington scenario was that some infrastructure types have much longer outage times over much of the city. For example, electricity and communications were generally restored relatively quickly in Christchurch, but in the case of Wellington, very long outage times would restrict organisations from taking up some of the more common adaptation options (e.g. working at home, remotely).
Within the Business Behaviours model, a new business relocation component was developed to model the relocation of businesses from the region. This reflects the assumption that some businesses may choose to relocate some, or all, of their operations to outside of the Wellington Region, over and above adjustments made owing to reduced demand from population movements.
To estimate the proportion of businesses relocating within each of the studied industry groups they were assigned a ‘business viability’ score at each location, see Table H-7. The overall score assigned was the highest score for which at least two categories were fulfilled. Within these tables accessibility issues for businesses at several different levels were considered – the time taken to restore access from their location to the rest of New Zealand, time to restore access to their ‘local centre’, and time taken to restore access from their location to the Wellington CBD. The Assumptions Report in Appendix L contains full details of how business viability was assessed across all industry groups.
Table H-7: Business viability assumptions for businesses in the office-based services category
Business Viability
Factor A B C D E F
Unusable commercial property across region
<5% 5-10% 10-20% 20-30% 30-80% 80-100%
Disruption of one or more of water, electricity, or communications (including data) at business premises level*
Disruption <1 week
Disruption 1-4 weeks
Disruption 4-12 weeks
3-6 months lack of adequate services
6-12 months lack of adequate services
>12 months lack of adequate services
Access to ‘local CBD’ – Wellington, Porirua, Upper Hutt and Lower Hutt (include fuel limitations) (N/A for Kapiti Coast district, Masterton, Carterton, South Wairarapa)
Full access to zone
Zone isolated for up to 1 week
Zone isolated 1-4 weeks
Zone isolated for 4-8 weeks
Zone isolated for 8-12 weeks
Zone isolated for more than 12 weeks
Access to Wellington CBD (include fuel limitations)
Full Access restored within 2 weeks
Access restored 2- 6 weeks
Access restored 3-12 weeks
Access restored 3-6 months
Access restricted over 6 months
Access by road out of the region (include fuel limitations)
Full Access restored within 4 weeks
Access restored 4- 12 weeks
Access restored 3-6 months
Access restored 6-12 months
Access restricted over 12 months
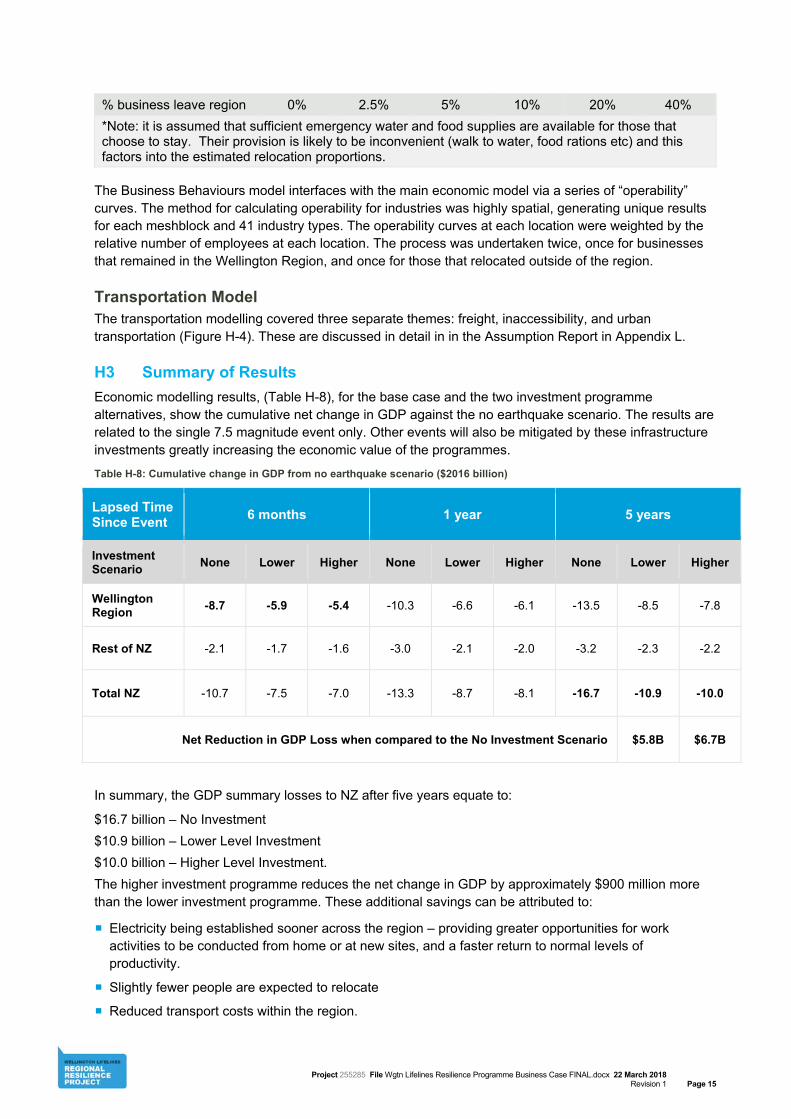
Project 255285 File Wgtn Lifelines Resilience Programme Business Case FINAL.docx 22 March 2018 Revision 1 Page 15
% business leave region 0% 2.5% 5% 10% 20% 40%
*Note: it is assumed that sufficient emergency water and food supplies are available for those that choose to stay. Their provision is likely to be inconvenient (walk to water, food rations etc) and this factors into the estimated relocation proportions.
The Business Behaviours model interfaces with the main economic model via a series of “operability” curves. The method for calculating operability for industries was highly spatial, generating unique results for each meshblock and 41 industry types. The operability curves at each location were weighted by the relative number of employees at each location. The process was undertaken twice, once for businesses that remained in the Wellington Region, and once for those that relocated outside of the region.
Transportation Model The transportation modelling covered three separate themes: freight, inaccessibility, and urban transportation (Figure H-4). These are discussed in detail in in the Assumption Report in Appendix L.
H3 Summary of Results
Economic modelling results, (Table H-8), for the base case and the two investment programme alternatives, show the cumulative net change in GDP against the no earthquake scenario. The results are related to the single 7.5 magnitude event only. Other events will also be mitigated by these infrastructure investments greatly increasing the economic value of the programmes.
Table H-8: Cumulative change in GDP from no earthquake scenario ($2016 billion)
Lapsed Time Since Event
6 months 1 year 5 years
Investment Scenario
None Lower Higher None Lower Higher None Lower Higher
Wellington Region
-8.7 -5.9 -5.4 -10.3 -6.6 -6.1 -13.5 -8.5 -7.8
Rest of NZ -2.1 -1.7 -1.6 -3.0 -2.1 -2.0 -3.2 -2.3 -2.2
Total NZ -10.7 -7.5 -7.0 -13.3 -8.7 -8.1 -16.7 -10.9 -10.0
Net Reduction in GDP Loss when compared to the No Investment Scenario $5.8B $6.7B
In summary, the GDP summary losses to NZ after five years equate to:
$16.7 billion – No Investment
$10.9 billion – Lower Level Investment
$10.0 billion – Higher Level Investment.
The higher investment programme reduces the net change in GDP by approximately $900 million more than the lower investment programme. These additional savings can be attributed to:
Electricity being established sooner across the region – providing greater opportunities for work activities to be conducted from home or at new sites, and a faster return to normal levels of productivity.
Slightly fewer people are expected to relocate
Reduced transport costs within the region.
Project 255285 File Wgtn Lifelines Resilience Programme Business Case FINAL.docx 22 March 2018 Revision 1 Page 16
Both programmes also contained interventions that were not able to be modelled in RiskScape and MERIT as they were not going to produce a significant impact on the outage maps, but were included in the programmes as they may have an impact on the network as a whole or facilitate other projects. The rationale for their inclusion in each programme is included in their individual descriptions in Section 7.2 in the PBC.
H4 Programme Overview
The RiskScape and MERIT modelling results for both programmes were presented to lifelines organisations at a workshop. There were seven projects that differed between the two programmes. In order to identify which initiatives best achieved the investment objectives, the MCA scores for each of the seven projects were revisited to help determine the preferred way forward.
The resulting preferred programme, subject to formal confirmation, is essentially a hybrid of the two alternative programme options. It was identified that one initiative: 160MW interconnectedness between substations was a duplicate of another: Central Park to Frederick Street cables replacement, and hence was also removed from the programme.
Four projects were subsequently removed from the core programme following discussion with the Steering Group either because they relate principally to recovery – the wastewater and gas projects or because their efficacy is uncertain – the Ngauranga to Petone Shared Pathway.
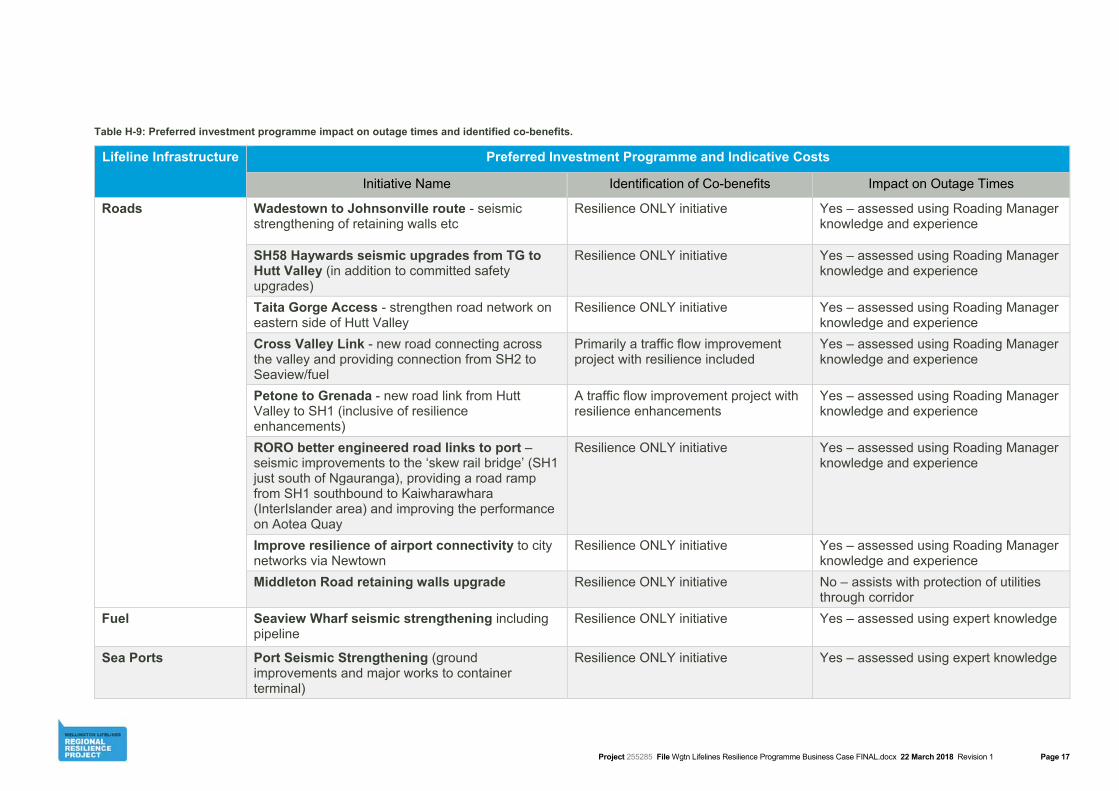
Project 255285 File Wgtn Lifelines Resilience Programme Business Case FINAL.docx 22 March 2018 Revision 1 Page 17
Table H-9: Preferred investment programme impact on outage times and identified co-benefits.
Lifeline Infrastructure Preferred Investment Programme and Indicative Costs
Initiative Name Identification of Co-benefits Impact on Outage Times
Roads Wadestown to Johnsonville route - seismic strengthening of retaining walls etc
Resilience ONLY initiative Yes – assessed using Roading Manager knowledge and experience
SH58 Haywards seismic upgrades from TG to Hutt Valley (in addition to committed safety upgrades)
Resilience ONLY initiative Yes – assessed using Roading Manager knowledge and experience
Taita Gorge Access - strengthen road network on eastern side of Hutt Valley
Resilience ONLY initiative Yes – assessed using Roading Manager knowledge and experience
Cross Valley Link - new road connecting across the valley and providing connection from SH2 to Seaview/fuel
Primarily a traffic flow improvement project with resilience included
Yes – assessed using Roading Manager knowledge and experience
Petone to Grenada - new road link from Hutt Valley to SH1 (inclusive of resilience enhancements)
A traffic flow improvement project with resilience enhancements
Yes – assessed using Roading Manager knowledge and experience
RORO better engineered road links to port – seismic improvements to the ‘skew rail bridge’ (SH1 just south of Ngauranga), providing a road ramp from SH1 southbound to Kaiwharawhara (InterIslander area) and improving the performance on Aotea Quay
Resilience ONLY initiative Yes – assessed using Roading Manager knowledge and experience
Improve resilience of airport connectivity to city networks via Newtown
Resilience ONLY initiative Yes – assessed using Roading Manager knowledge and experience
Middleton Road retaining walls upgrade Resilience ONLY initiative No – assists with protection of utilities through corridor
Fuel
Seaview Wharf seismic strengthening including pipeline
Resilience ONLY initiative Yes – assessed using expert knowledge
Sea Ports Port Seismic Strengthening (ground improvements and major works to container terminal)
Resilience ONLY initiative Yes – assessed using expert knowledge
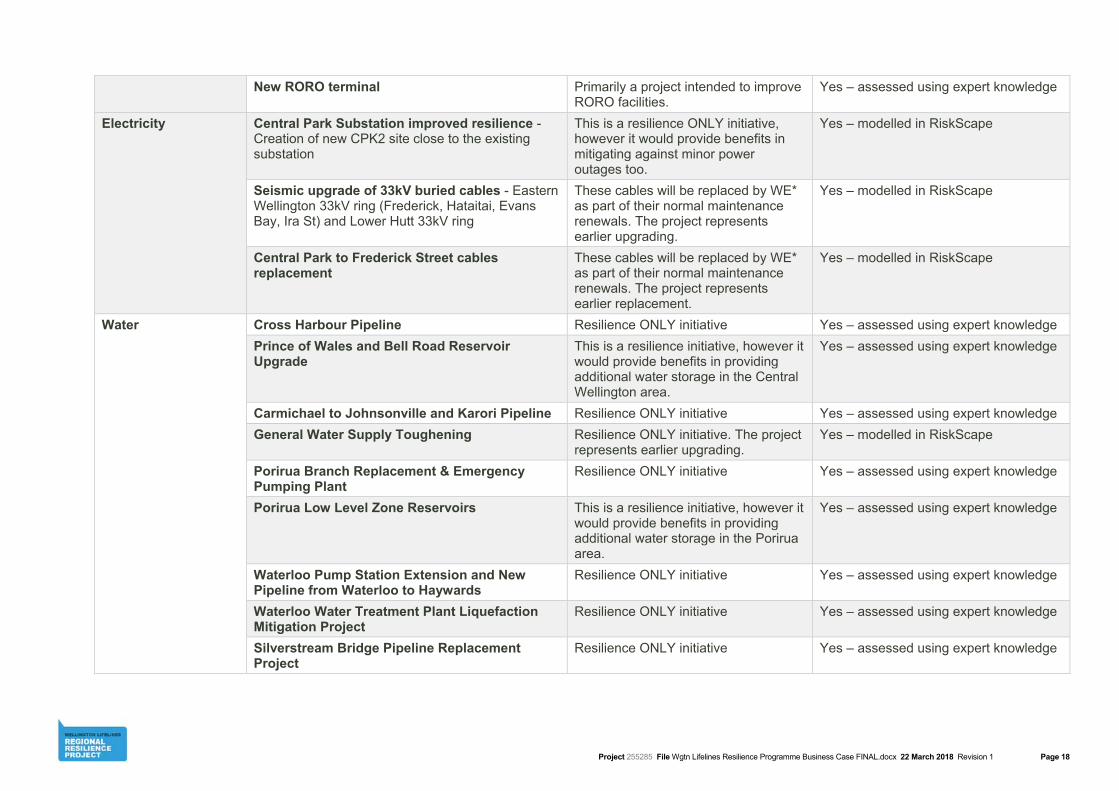
Project 255285 File Wgtn Lifelines Resilience Programme Business Case FINAL.docx 22 March 2018 Revision 1 Page 18
New RORO terminal Primarily a project intended to improve RORO facilities.
Yes – assessed using expert knowledge
Electricity Central Park Substation improved resilience - Creation of new CPK2 site close to the existing substation
This is a resilience ONLY initiative, however it would provide benefits in mitigating against minor power outages too.
Yes – modelled in RiskScape
Seismic upgrade of 33kV buried cables - Eastern Wellington 33kV ring (Frederick, Hataitai, Evans Bay, Ira St) and Lower Hutt 33kV ring
These cables will be replaced by WE* as part of their normal maintenance renewals. The project represents earlier upgrading.
Yes – modelled in RiskScape
Central Park to Frederick Street cables replacement
These cables will be replaced by WE* as part of their normal maintenance renewals. The project represents earlier replacement.
Yes – modelled in RiskScape
Water Cross Harbour Pipeline Resilience ONLY initiative Yes – assessed using expert knowledge
Prince of Wales and Bell Road Reservoir Upgrade
This is a resilience initiative, however it would provide benefits in providing additional water storage in the Central Wellington area.
Yes – assessed using expert knowledge
Carmichael to Johnsonville and Karori Pipeline Resilience ONLY initiative Yes – assessed using expert knowledge
General Water Supply Toughening Resilience ONLY initiative. The project represents earlier upgrading.
Yes – modelled in RiskScape
Porirua Branch Replacement & Emergency Pumping Plant
Resilience ONLY initiative Yes – assessed using expert knowledge
Porirua Low Level Zone Reservoirs This is a resilience initiative, however it would provide benefits in providing additional water storage in the Porirua area.
Yes – assessed using expert knowledge
Waterloo Pump Station Extension and New Pipeline from Waterloo to Haywards
Resilience ONLY initiative Yes – assessed using expert knowledge
Waterloo Water Treatment Plant Liquefaction Mitigation Project
Resilience ONLY initiative Yes – assessed using expert knowledge
Silverstream Bridge Pipeline Replacement Project
Resilience ONLY initiative Yes – assessed using expert knowledge
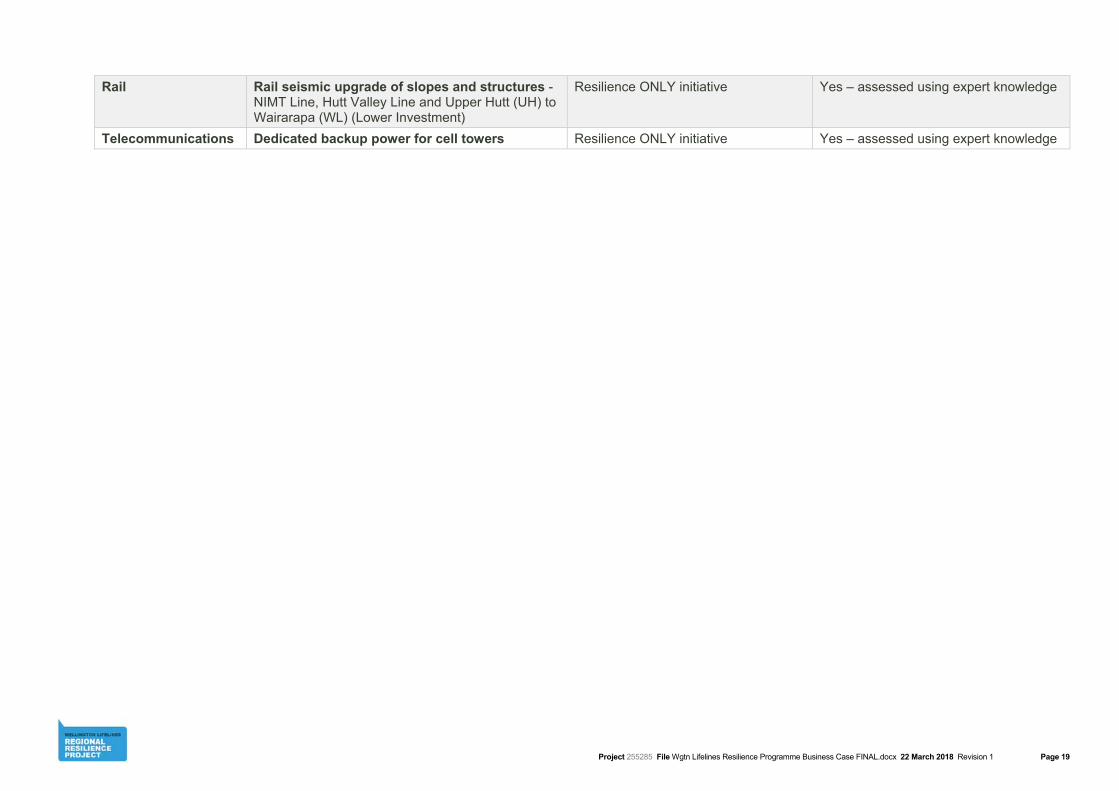
Project 255285 File Wgtn Lifelines Resilience Programme Business Case FINAL.docx 22 March 2018 Revision 1 Page 19
Rail Rail seismic upgrade of slopes and structures - NIMT Line, Hutt Valley Line and Upper Hutt (UH) to Wairarapa (WL) (Lower Investment)
Resilience ONLY initiative Yes – assessed using expert knowledge
Telecommunications Dedicated backup power for cell towers Resilience ONLY initiative Yes – assessed using expert knowledge

Project 255285 File Wgtn Lifelines Resilience Programme Business Case FINAL.docx 22 March 2018 Revision 1 Page 20
Should an event occur before all of the initiatives are implemented the full potential benefit from investment may not be realised, owing to the interdependence between lifelines.
The loss of potential value to the Wellington and New Zealand economy, from an event, decreases with the preferred programme (Table H-10). The loss of industry value to Wellington is significantly improved from the base case. For example, the loss to the Financial and Business Services and Government, Education and Health Service sectors is reduced by $2.2 and $1.3 billion respectively (net of the base case).
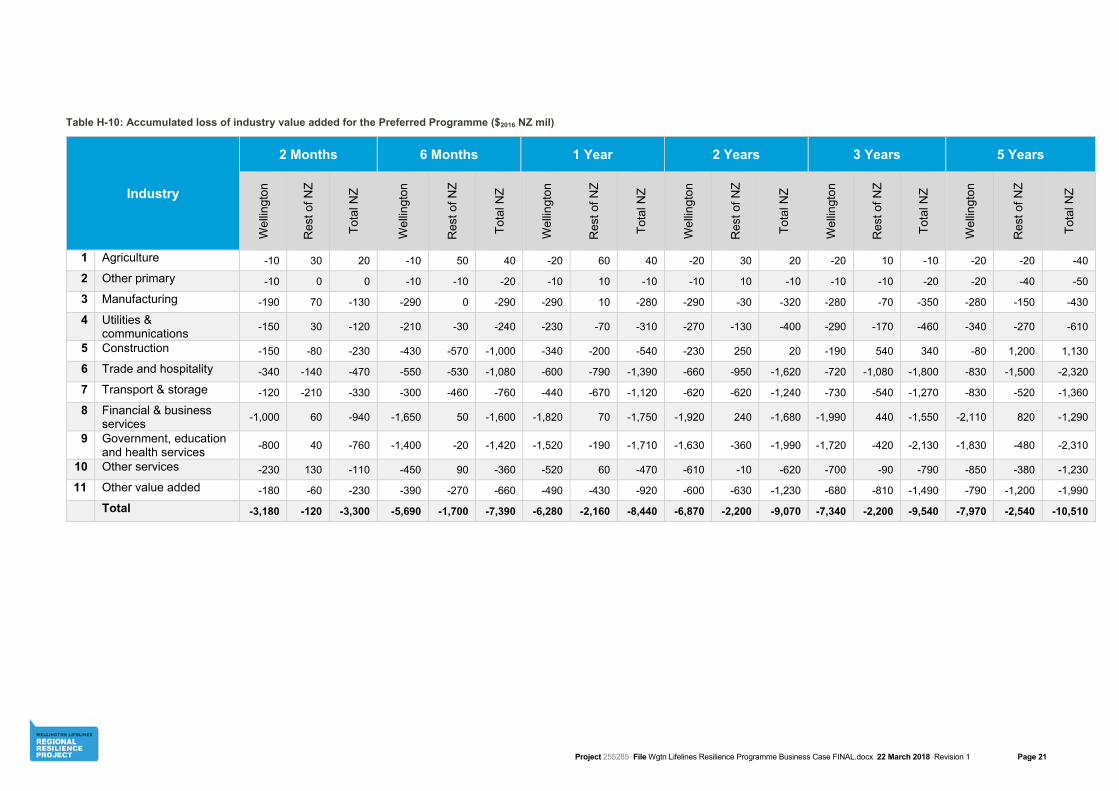
Project 255285 File Wgtn Lifelines Resilience Programme Business Case FINAL.docx 22 March 2018 Revision 1 Page 21
Table H-10: Accumulated loss of industry value added for the Preferred Programme ($2016 NZ mil)
Industry
2 Months 6 Months 1 Year 2 Years 3 Years 5 Years
Wel
lingt
on
Res
t of N
Z
Tot
al N
Z
Wel
lingt
on
Res
t of N
Z
Tot
al N
Z
Wel
lingt
on
Res
t of N
Z
Tot
al N
Z
Wel
lingt
on
Res
t of N
Z
Tot
al N
Z
Wel
lingt
on
Res
t of N
Z
Tot
al N
Z
Wel
lingt
on
Res
t of N
Z
Tot
al N
Z
1 Agriculture -10 30 20 -10 50 40 -20 60 40 -20 30 20 -20 10 -10 -20 -20 -40
2 Other primary -10 0 0 -10 -10 -20 -10 10 -10 -10 10 -10 -10 -10 -20 -20 -40 -50
3 Manufacturing -190 70 -130 -290 0 -290 -290 10 -280 -290 -30 -320 -280 -70 -350 -280 -150 -430
4 Utilities & communications
-150 30 -120 -210 -30 -240 -230 -70 -310 -270 -130 -400 -290 -170 -460 -340 -270 -610
5 Construction -150 -80 -230 -430 -570 -1,000 -340 -200 -540 -230 250 20 -190 540 340 -80 1,200 1,130
6 Trade and hospitality -340 -140 -470 -550 -530 -1,080 -600 -790 -1,390 -660 -950 -1,620 -720 -1,080 -1,800 -830 -1,500 -2,320
7 Transport & storage -120 -210 -330 -300 -460 -760 -440 -670 -1,120 -620 -620 -1,240 -730 -540 -1,270 -830 -520 -1,360
8 Financial & business services
-1,000 60 -940 -1,650 50 -1,600 -1,820 70 -1,750 -1,920 240 -1,680 -1,990 440 -1,550 -2,110 820 -1,290
9 Government, education and health services
-800 40 -760 -1,400 -20 -1,420 -1,520 -190 -1,710 -1,630 -360 -1,990 -1,720 -420 -2,130 -1,830 -480 -2,310
10 Other services -230 130 -110 -450 90 -360 -520 60 -470 -610 -10 -620 -700 -90 -790 -850 -380 -1,230
11 Other value added -180 -60 -230 -390 -270 -660 -490 -430 -920 -600 -630 -1,230 -680 -810 -1,490 -790 -1,200 -1,990
Total -3,180 -120 -3,300 -5,690 -1,700 -7,390 -6,280 -2,160 -8,440 -6,870 -2,200 -9,070 -7,340 -2,200 -9,540 -7,970 -2,540 -10,510
Appendix IProgramme Alternative Multi-criteria Assessments
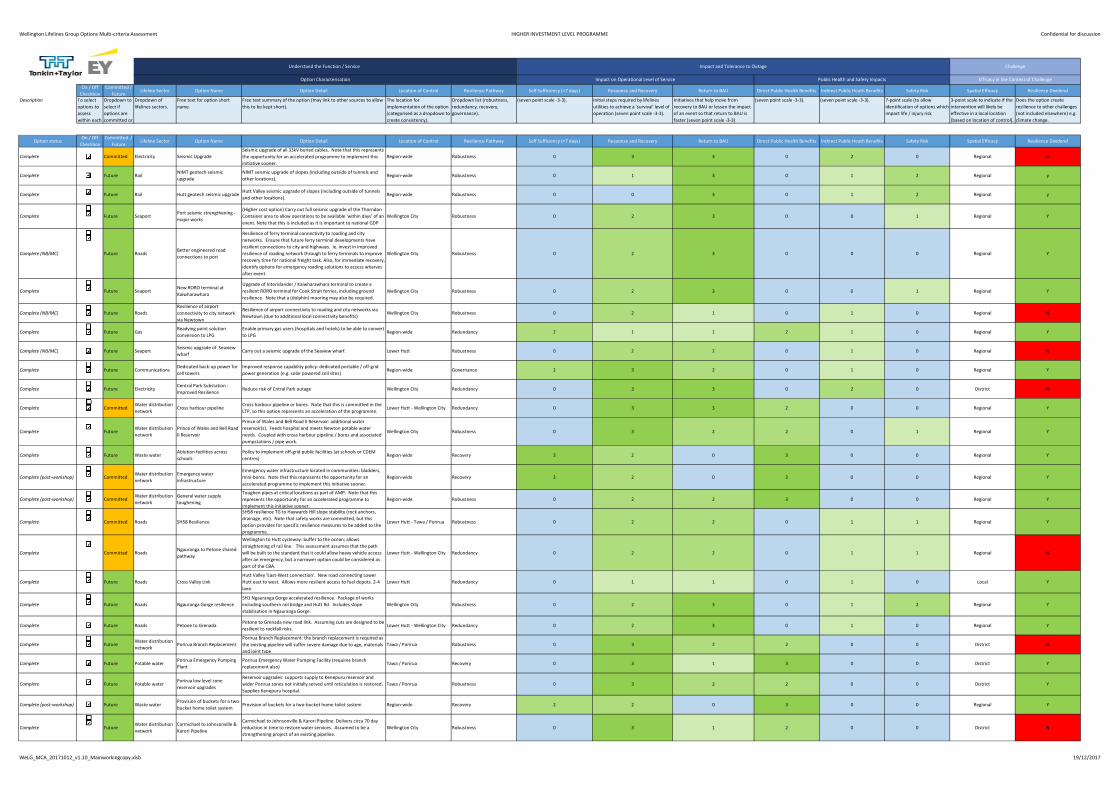
Wellington Lifelines Group Options Multi‐criteria Assessment HIGHER INVESTMENT LEVEL PROGRAMME Confidential for discussion
On / Off
Checkbox
Committed /
FutureLifeline Sector Option Name Option Detail Location of Control Resilience Pathway Self Sufficiency (<7 days) Response and Recovery Return to BAU Direct Public Health Benefits Indirect Public Heath Benefits Safety Risk Spatial Efficacy Resilience Dividend
Description To select
options to
assess
within each
Dropdown to
select if
options are
committed or
Dropdown of
lifelines sectors.
Free text for option short
name.
Free text summary of the option (may link to other sources to allow
this to be kept short).
The location for
implementation of the option
(categorised as a dropdown to
create consistency).
Dropdown list (robustness,
redundancy, recovery,
governance).
(seven point scale ‐3‐3). Initial steps required by lifelines
utilities to achieve a 'survival' level of
operation (seven point scale ‐3‐3).
Initiatives that help move from
recovery to BAU or lessen the impact
of an event so that return to BAU is
faster (seven point scale ‐3‐3)
(seven point scale ‐3‐3). (seven point scale ‐3‐3). 7‐point scale (to allow
identification of options which
impact life / injury risk
3‐point scale to indicate if the
intervention will likely be
effective in a local location
(based on location of control),
Does the option create
resilience to other challenges
(not included elsewhere) e.g.
climate change.
Option statusOn / Off
Checkbox
Committed /
FutureLifeline Sector Option Name Option Detail Location of Control Resilience Pathway Self Sufficiency (<7 days) Response and Recovery Return to BAU Direct Public Health Benefits Indirect Public Heath Benefits Safety Risk Spatial Efficacy Resilience Dividend
Complete TRUE Committed Electricity Seismic Upgrade
Seismic upgrade of all 33kV buried cables. Note that this represents
the opportunity for an accelerated programme to implement this
initiative sooner.
Region‐wide Robustness 0 3 3 0 2 0 Regional N
Complete TRUE Future RailNIMT geotech seismic
upgrade
NIMT seismic upgrade of slopes (including outside of tunnels and
other locations).Region‐wide Robustness 0 1 3 0 1 2 Regional y
Complete TRUE Future Rail Hutt geotech seismic upgradeHutt Valley seismic upgrade of slopes (including outside of tunnels
and other locations).Region‐wide Robustness 0 0 3 0 1 2 Regional y
Complete TRUE Future SeaportPort seismic strengthening ‐
major works
(Higher cost option) Carry out full seismic upgrade of the Thorndon
Container area to allow operations to be available 'within days' of an
event. Note that this is included as it is important to national GDP
Wellington City Robustness 0 2 3 0 0 1 Regional Y
Complete (NB/MC) TRUE Future RoadsBetter engineered road
connections to port
Resilience of ferry terminal connectivity to roading and city
networks. Ensure that future ferry terminal developments have
resilient connections to city and highways. ie. invest in improved
resilience of roading network through to ferry terminals to improve
recovery time for national freight task. Also, for immediate recovery,
identify options for emergency roading solutions to access wharves
after event.
Wellington City Robustness 0 2 3 0 0 0 Regional Y
Complete TRUE Future SeaportNew RORO terminal at
Kaiwharawhara
Upgrade of Interislander / Kaiwharawhara terminal to create a
resilient RORO terminal for Cook Strait ferries, including ground
resilience. Note that a (dolphin) mooring may also be required.
Wellington City Robustness 0 2 3 0 0 1 Regional Y
Complete (NB/MC) TRUE Future Roads
Resilience of airport
connectivity to city network
via Newtown
Resilience of airport connectivity to roading and city networks via
Newtown (due to additional local connectivity benefits)Wellington City Robustness 0 2 1 0 1 0 Regional N
Complete TRUE Future GasReadying point solution
conversion to LPG
Enable primary gas users (hospitals and hotels) to be able to convert
to LPGRegion‐wide Redundancy 2 1 1 2 1 0 Regional Y
Complete (NB/MC) TRUE Future SeaportSeismic upgrade of Seaview
wharfCarry out a seismic upgrade of the Seaview wharf. Lower Hutt Robustness 0 2 2 0 1 0 Regional N
Complete TRUE Future CommunicationsDedicated back‐up power for
cell towers
Improved response capability policy: dedicated portable / off‐grid
power generation (e.g. solar powered cell sites)Region‐wide Governance 2 3 2 0 1 0 Regional Y
Complete TRUE Future ElectricityCentral Park Substation ‐
Improved ResilienceReduce risk of Cntral Park outage Wellington City Redundancy 0 3 3 0 2 0 District N
Complete TRUE CommittedWater distribution
networkCross harbour pipeline
Cross harbour pipeline or bores. Note that this is committed in the
LTP, so this option represents an acceleration of the programme.Lower Hutt ‐ Wellington City Redundancy 0 3 3 2 0 0 Regional Y
Complete TRUE FutureWater distribution
network
Prince of Wales and Bell Road
II Reservoir
Prince of Wales and Bell Road II Reservoir: additional water
reservoir(s). Feeds hospital and meets Newton potable water
needs. Coupled with cross harbour pipeline / bores and associated
pumpstations / pipe work.
Wellington City Robustness 0 3 2 2 0 1 Regional Y
Complete TRUE Future Waste waterAblution facilities across
schools
Policy to implement off‐grid public facilities (at schools or CDEM
centres)Region‐wide Recovery 3 2 0 3 0 0 Regional Y
Complete (post‐workshop) TRUE CommittedWater distribution
network
Emergency water
infrastructure
Emergency water infrastructure located in communities: bladders,
mini‐bores. Note that this represents the opportunity for an
accelerated programme to implement this initiative sooner.
Region‐wide Recovery 3 2 0 3 0 0 Regional Y
Complete (post‐workshop) TRUE CommittedWater distribution
network
General water supply
toughening
Toughen pipes at critical locations as part of AMP. Note that this
represents the opportunity for an accelerated programme to
implement this initiative sooner.
Region‐wide Robustness 0 2 2 3 0 0 Regional Y
Complete TRUE Committed Roads SH58 Resilience
SH58 resilience TG to Haywards Hill slope stability (rock anchors,
drainage, etc). Note that safety works are committed, but this
option provides for specific resilience measures to be added to the
programme.
Lower Hutt ‐ Tawa / Porirua Robustness 0 2 2 0 1 1 Regional Y
Complete TRUE Committed RoadsNgauranga to Petone shared
pathway
Wellington to Hutt cycleway: buffer to the ocean; allows
straightening of rail line. This assessment assumes that the path
will be built to the standard that it could allow heavy vehicle access
after an emergency, but a narrower option could be considered as
part of the CBA.
Lower Hutt ‐ Wellington City Redundancy 0 2 2 0 1 1 Regional N
Complete TRUE Future Roads Cross Valley Link
Hutt Valley 'East‐West connection'. New road connecting Lower
Hutt east to west. Allows more resilient access to fuel depots. 2‐4
lane.
Lower Hutt Redundancy 0 1 1 0 1 0 Local Y
Complete TRUE Future Roads Ngauranga Gorge resilience
SH1 Ngauranga Gorge accelerated resilience. Package of works
including southern rail bridge and Hutt Rd. Includes slope
stabilisation in Ngauranga Gorge.
Wellington City Robustness 0 2 3 0 1 2 Regional Y
Complete TRUE Future Roads Petone to GrenadaPetone to Grenada new road link. Assuming cuts are designed to be
resilient to rockfall risks.Lower Hutt ‐ Wellington City Redundancy 0 2 3 0 1 0 Regional Y
Complete TRUE FutureWater distribution
networkPorirua Branch Replacement
Porirua Branch Replacement: the branch replacement is required as
the existing pipeline will suffer severe damage due to age, materials
and joint type
Tawa / Porirua Robustness 0 3 2 2 0 0 District N
Complete TRUE Future Potable waterPorirua Emergency Pumping
Plant
Porirua Emergency Water Pumping Facility (requires branch
replacement also)Tawa / Porirua Recovery 0 3 1 3 0 0 District Y
Complete TRUE Future Potable waterPorirua low level zone
reservoir upgrades
Reservoir upgrades: supports supply to Kenepuru reservoir and
wider Porirua zones not initially served until reticulation is restored.
Supplies Kenepuru hospital.
Tawa / Porirua Robustness 0 3 2 2 0 0 District Y
Complete (post‐workshop) TRUE Future Waste waterProvision of buckets for a two‐
bucket home toilet systemProvision of buckets for a two‐bucket home toilet system Region‐wide Recovery 2 2 0 3 0 0 Regional Y
Complete TRUE FutureWater distribution
network
Carmichael to Johnsonville &
Karori Pipeline
Carmichael to Johnsonville & Karori Pipeline. Delivers circa 70 day
reduction in time to restore water services. Assumed to be a
strengthening project of an existing pipeline.
Wellington City Robustness 0 3 1 2 0 0 District N
Option Characterisation Impact on Operational Level of Service Public Health and Safety Impacts Efficacy in the Context of Challenge
Understand the Function / Service Impact and Tolerance to Outage Challenge
WeLG_MCA_20171012_v1.10_Mainworkingcopy.xlsb 19/12/2017
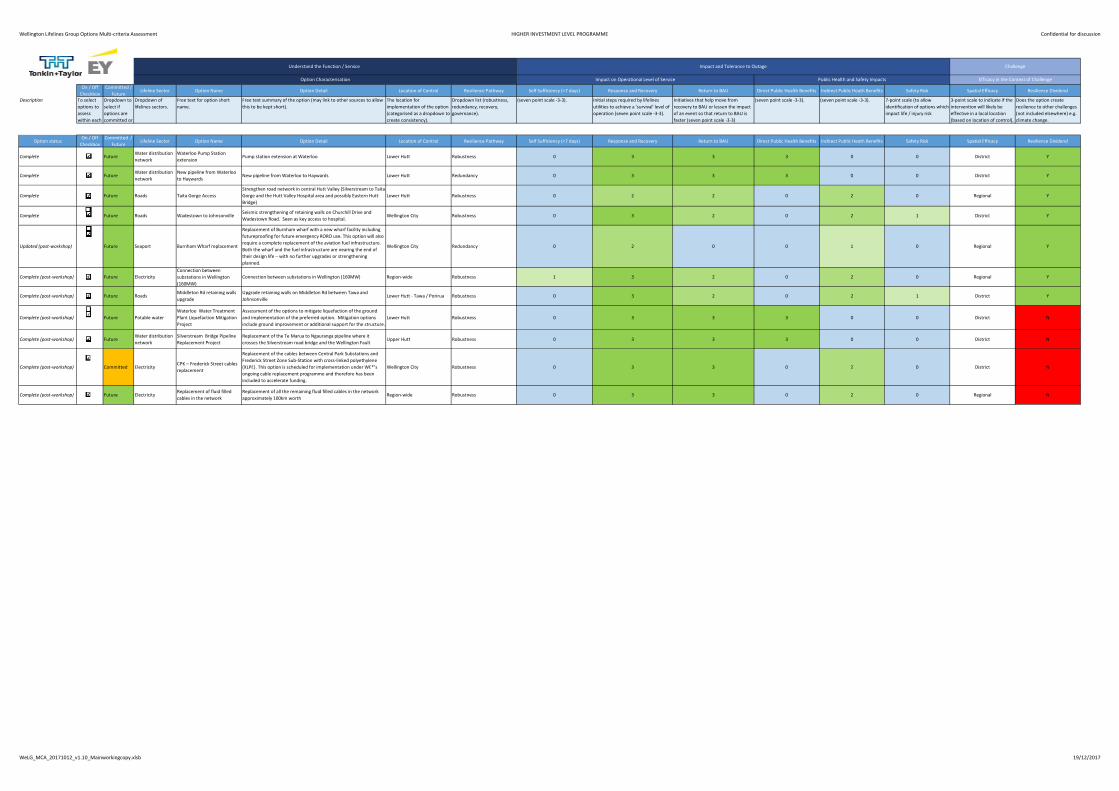
Wellington Lifelines Group Options Multi‐criteria Assessment HIGHER INVESTMENT LEVEL PROGRAMME Confidential for discussion
On / Off
Checkbox
Committed /
FutureLifeline Sector Option Name Option Detail Location of Control Resilience Pathway Self Sufficiency (<7 days) Response and Recovery Return to BAU Direct Public Health Benefits Indirect Public Heath Benefits Safety Risk Spatial Efficacy Resilience Dividend
Description To select
options to
assess
within each
Dropdown to
select if
options are
committed or
Dropdown of
lifelines sectors.
Free text for option short
name.
Free text summary of the option (may link to other sources to allow
this to be kept short).
The location for
implementation of the option
(categorised as a dropdown to
create consistency).
Dropdown list (robustness,
redundancy, recovery,
governance).
(seven point scale ‐3‐3). Initial steps required by lifelines
utilities to achieve a 'survival' level of
operation (seven point scale ‐3‐3).
Initiatives that help move from
recovery to BAU or lessen the impact
of an event so that return to BAU is
faster (seven point scale ‐3‐3)
(seven point scale ‐3‐3). (seven point scale ‐3‐3). 7‐point scale (to allow
identification of options which
impact life / injury risk
3‐point scale to indicate if the
intervention will likely be
effective in a local location
(based on location of control),
Does the option create
resilience to other challenges
(not included elsewhere) e.g.
climate change.
Option statusOn / Off
Checkbox
Committed /
FutureLifeline Sector Option Name Option Detail Location of Control Resilience Pathway Self Sufficiency (<7 days) Response and Recovery Return to BAU Direct Public Health Benefits Indirect Public Heath Benefits Safety Risk Spatial Efficacy Resilience Dividend
Option Characterisation Impact on Operational Level of Service Public Health and Safety Impacts Efficacy in the Context of Challenge
Understand the Function / Service Impact and Tolerance to Outage Challenge
Complete TRUE FutureWater distribution
network
Waterloo Pump Station
extensionPump station extension at Waterloo Lower Hutt Robustness 0 3 3 3 0 0 District Y
Complete TRUE FutureWater distribution
network
New pipeline from Waterloo
to HaywardsNew pipeline from Waterloo to Haywards Lower Hutt Redundancy 0 3 3 3 0 0 District Y
Complete TRUE Future Roads Taita Gorge Access
Strengthen road network in central Hutt Valley (Silverstream to Taita
Gorge and the Hutt Valley Hospital area and possibly Eastern Hutt
Bridge)
Lower Hutt Robustness 0 2 2 0 2 0 Regional Y
Complete TRUE Future Roads Wadestown to JohnsonvilleSeismic strengthening of retaining walls on Churchill Drive and
Wadestown Road. Seen as key access to hospital.Wellington City Robustness 0 3 2 0 2 1 District Y
Updated (post‐workshop) TRUE Future Seaport Burnham Wharf replacement
Replacement of Burnham wharf with a new wharf facility including
futureproofing for future emergency RORO use. This option will also
require a complete replacement of the aviation fuel infrastructure.
Both the wharf and the fuel infrastructure are nearing the end of
their design life – with no further upgrades or strengthening
planned.
Wellington City Redundancy 0 2 0 0 1 0 Regional Y
Complete (post‐workshop) TRUE Future Electricity
Connection between
substations in Wellington
(160MW)
Connection between substations in Wellington (160MW) Region‐wide Robustness 1 3 2 0 2 0 Regional Y
Complete (post‐workshop) TRUE Future RoadsMiddleton Rd retaining walls
upgrade
Upgrade retaining walls on Middleton Rd between Tawa and
JohnsonvilleLower Hutt ‐ Tawa / Porirua Robustness 0 3 2 0 2 1 District Y
Complete (post‐workshop) TRUE Future Potable water
Waterloo Water Treatment
Plant Liquefaction Mitigation
Project
Assessment of the options to mitigate liquefaction of the ground
and implementation of the preferred option. Mitigation options
include ground improvement or additional support for the structure.
Lower Hutt Robustness 0 3 3 3 0 0 District N
Complete (post‐workshop) TRUE FutureWater distribution
network
Silverstream Bridge Pipeline
Replacement Project
Replacement of the Te Marua to Ngauranga pipeline where it
crosses the Silverstream road bridge and the Wellington FaultUpper Hutt Robustness 0 3 3 3 0 0 District N
Complete (post‐workshop) TRUE Committed ElectricityCPK – Frederick Street cables
replacement
Replacement of the cables between Central Park Substations and
Frederick Street Zone Sub‐Station with cross‐linked polyethylene
(XLPE). This option is scheduled for implementation under WE*’s
ongoing cable replacement programme and therefore has been
included to accelerate funding.
Wellington City Robustness 0 3 3 0 2 0 District N
Complete (post‐workshop) TRUE Future ElectricityReplacement of fluid filled
cables in the network
Replacement of all the remaining fluid filled cables in the network
approximately 100km worth Region‐wide Robustness 0 3 3 0 2 0 Regional N
WeLG_MCA_20171012_v1.10_Mainworkingcopy.xlsb 19/12/2017
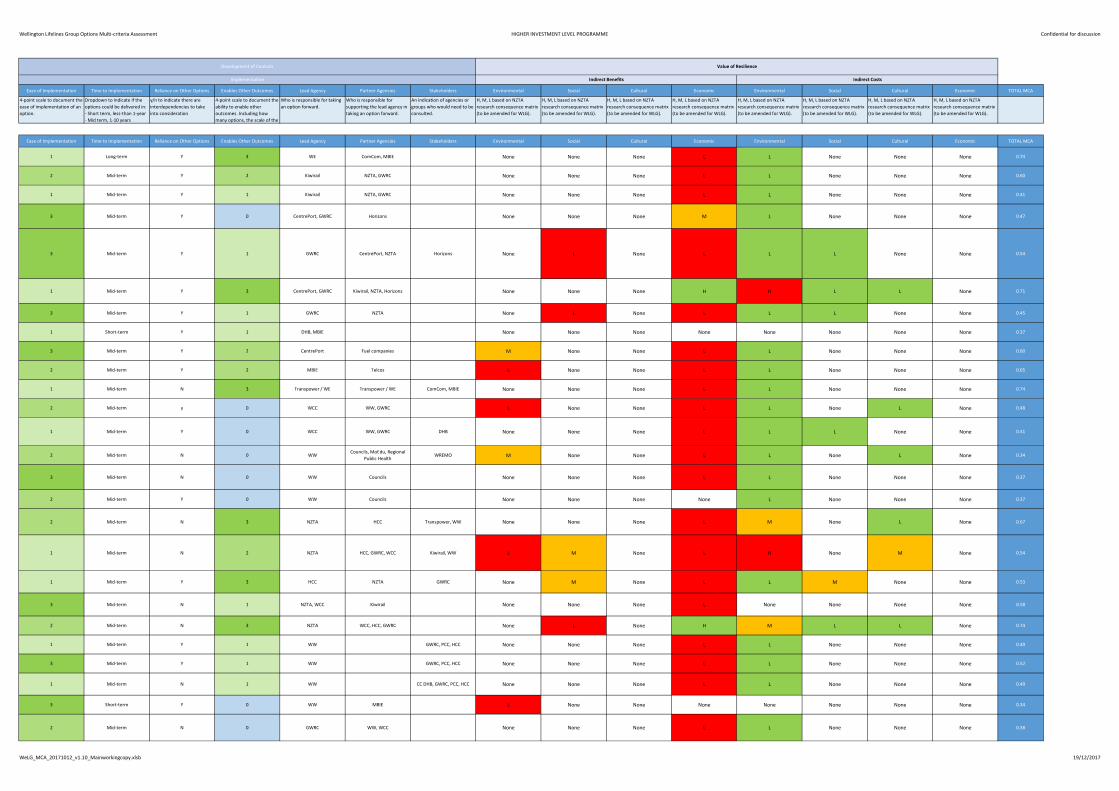
Wellington Lifelines Group Options Multi‐criteria Assessment HIGHER INVESTMENT LEVEL PROGRAMME Confidential for discussion
Ease of Implementation Time to Implementation Reliance on Other Options Enables Other Outcomes Lead Agency Partner Agencies Stakeholders Environmental Social Cultural Economic Environmental Social Cultural Economic TOTAL MCA
4‐point scale to document the
ease of implementation of an
option.
Dropdown to indicate if the
options could be delivered in:
‐ Short term, less‐than 1‐year
‐ Mid term, 1‐10 years
y/n to indicate there are
interdependencies to take
into consideration
4‐point scale to document the
ability to enable other
outcomes. Including how
many options, the scale of the
Who is responsible for taking
an option forward.
Who is responsible for
supporting the lead agency in
taking an option forward.
An indication of agencies or
groups who would need to be
consulted.
H, M, L based on NZTA
research consequence matrix
(to be amended for WLG).
H, M, L based on NZTA
research consequence matrix
(to be amended for WLG).
H, M, L based on NZTA
research consequence matrix
(to be amended for WLG).
H, M, L based on NZTA
research consequence matrix
(to be amended for WLG).
H, M, L based on NZTA
research consequence matrix
(to be amended for WLG).
H, M, L based on NZTA
research consequence matrix
(to be amended for WLG).
H, M, L based on NZTA
research consequence matrix
(to be amended for WLG).
H, M, L based on NZTA
research consequence matrix
(to be amended for WLG).
Ease of Implementation Time to Implementation Reliance on Other Options Enables Other Outcomes Lead Agency Partner Agencies Stakeholders Environmental Social Cultural Economic Environmental Social Cultural Economic TOTAL MCA
1 Long‐term Y 3 WE ComCom, MBIE None None None L L None None None 0.74
2 Mid‐term Y 2 Kiwirail NZTA, GWRC None None None L L None None None 0.60
1 Mid‐term Y 1 Kiwirail NZTA, GWRC None None None L L None None None 0.41
3 Mid‐term Y 0 CentrePort, GWRC Horizons None None None M L None None None 0.47
3 Mid‐term Y 1 GWRC CentrePort, NZTA Horizons None L None L L L None None 0.54
1 Mid‐term Y 3 CentrePort, GWRC Kiwirail, NZTA, Horizons None None None H H L L None 0.71
3 Mid‐term Y 1 GWRC NZTA None L None L L L None None 0.45
1 Short‐term Y 1 DHB, MBIE None None None None None None None None 0.37
3 Mid‐term Y 2 CentrePort Fuel companies M None None L L None None None 0.60
2 Mid‐term Y 2 MBIE Telcos L None None L L None None None 0.65
1 Mid‐term N 3 Transpower / WE Transpower / WE ComCom, MBIE None None None L L None None None 0.74
2 Mid‐term y 0 WCC WW, GWRC L None None L L None L None 0.48
1 Mid‐term Y 0 WCC WW, GWRC DHB None None None L L L None None 0.41
2 Mid‐term N 0 WWCouncils, MoEdu, Regional
Public HealthWREMO M None None L L None L None 0.34
3 Mid‐term N 0 WW Councils None None None L L None None None 0.37
2 Mid‐term Y 0 WW Councils None None None None L None None None 0.37
2 Mid‐term N 3 NZTA HCC Transpower, WW None None None L M None L None 0.67
1 Mid‐term N 2 NZTA HCC, GWRC, WCC Kiwirail, WW L M None L H None M None 0.54
1 Mid‐term Y 3 HCC NZTA GWRC None M None L L M None None 0.53
3 Mid‐term N 1 NZTA, WCC Kiwirail None None None L None None None None 0.58
2 Mid‐term N 3 NZTA WCC, HCC, GWRC None L None H M L L None 0.74
1 Mid‐term Y 1 WW GWRC, PCC, HCC None None None L L None None None 0.49
3 Mid‐term Y 1 WW GWRC, PCC, HCC None None None L L None None None 0.52
1 Mid‐term N 1 WW CC DHB, GWRC, PCC, HCC None None None L L None None None 0.49
3 Short‐term Y 0 WW MBIE L None None None None None None None 0.34
2 Mid‐term N 0 GWRC WW, WCC None None None L L None None None 0.38
Indirect Benefits Indirect CostsImplementation
Development of Controls Value of Resilience
WeLG_MCA_20171012_v1.10_Mainworkingcopy.xlsb 19/12/2017
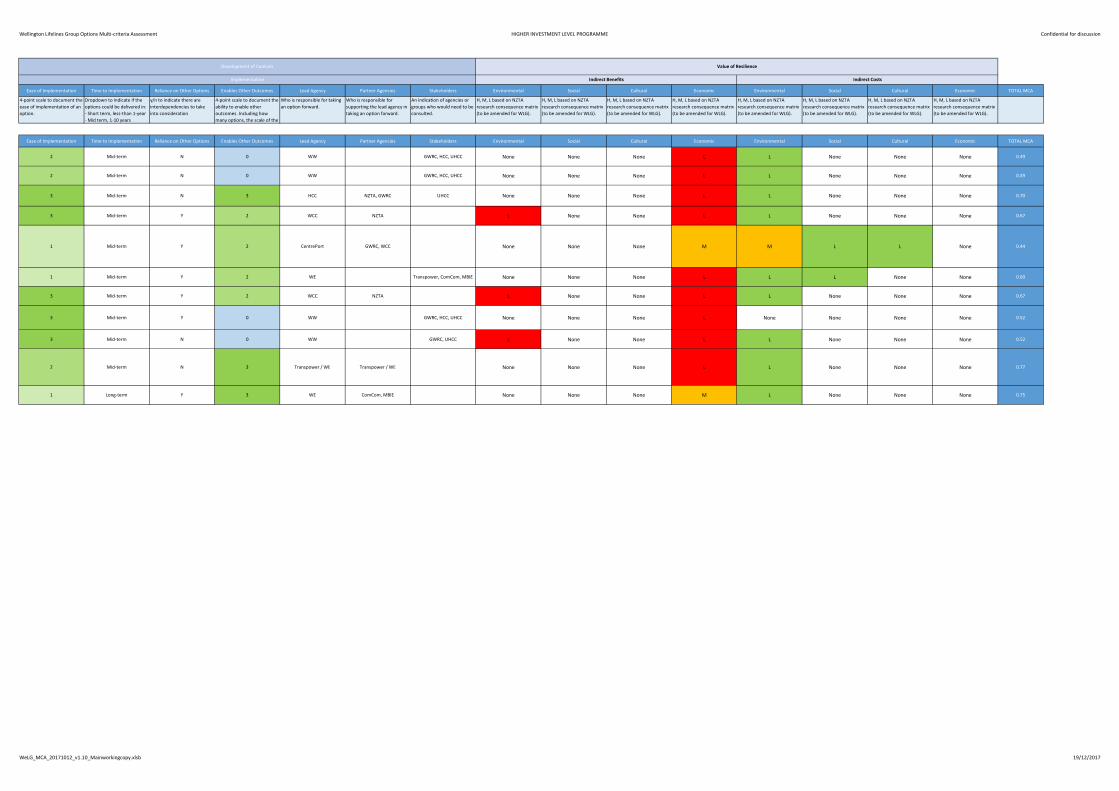
Wellington Lifelines Group Options Multi‐criteria Assessment HIGHER INVESTMENT LEVEL PROGRAMME Confidential for discussion
Ease of Implementation Time to Implementation Reliance on Other Options Enables Other Outcomes Lead Agency Partner Agencies Stakeholders Environmental Social Cultural Economic Environmental Social Cultural Economic TOTAL MCA
4‐point scale to document the
ease of implementation of an
option.
Dropdown to indicate if the
options could be delivered in:
‐ Short term, less‐than 1‐year
‐ Mid term, 1‐10 years
y/n to indicate there are
interdependencies to take
into consideration
4‐point scale to document the
ability to enable other
outcomes. Including how
many options, the scale of the
Who is responsible for taking
an option forward.
Who is responsible for
supporting the lead agency in
taking an option forward.
An indication of agencies or
groups who would need to be
consulted.
H, M, L based on NZTA
research consequence matrix
(to be amended for WLG).
H, M, L based on NZTA
research consequence matrix
(to be amended for WLG).
H, M, L based on NZTA
research consequence matrix
(to be amended for WLG).
H, M, L based on NZTA
research consequence matrix
(to be amended for WLG).
H, M, L based on NZTA
research consequence matrix
(to be amended for WLG).
H, M, L based on NZTA
research consequence matrix
(to be amended for WLG).
H, M, L based on NZTA
research consequence matrix
(to be amended for WLG).
H, M, L based on NZTA
research consequence matrix
(to be amended for WLG).
Ease of Implementation Time to Implementation Reliance on Other Options Enables Other Outcomes Lead Agency Partner Agencies Stakeholders Environmental Social Cultural Economic Environmental Social Cultural Economic TOTAL MCA
Indirect Benefits Indirect CostsImplementation
Development of Controls Value of Resilience
2 Mid‐term N 0 WW GWRC, HCC, UHCC None None None L L None None None 0.49
2 Mid‐term N 0 WW GWRC, HCC, UHCC None None None L L None None None 0.49
3 Mid‐term N 3 HCC NZTA, GWRC UHCC None None None L L None None None 0.70
3 Mid‐term Y 2 WCC NZTA L None None L L None None None 0.67
1 Mid‐term Y 2 CentrePort GWRC, WCC None None None M M L L None 0.44
1 Mid‐term Y 2 WE Transpower, ComCom, MBIE None None None L L L None None 0.60
3 Mid‐term Y 2 WCC NZTA L None None L L None None None 0.67
3 Mid‐term Y 0 WW GWRC, HCC, UHCC None None None L None None None None 0.52
3 Mid‐term N 0 WW GWRC, UHCC L None None L L None None None 0.52
2 Mid‐term N 3 Transpower / WE Transpower / WE None None None L L None None None 0.77
1 Long‐term Y 3 WE ComCom, MBIE None None None M L None None None 0.75
WeLG_MCA_20171012_v1.10_Mainworkingcopy.xlsb 19/12/2017
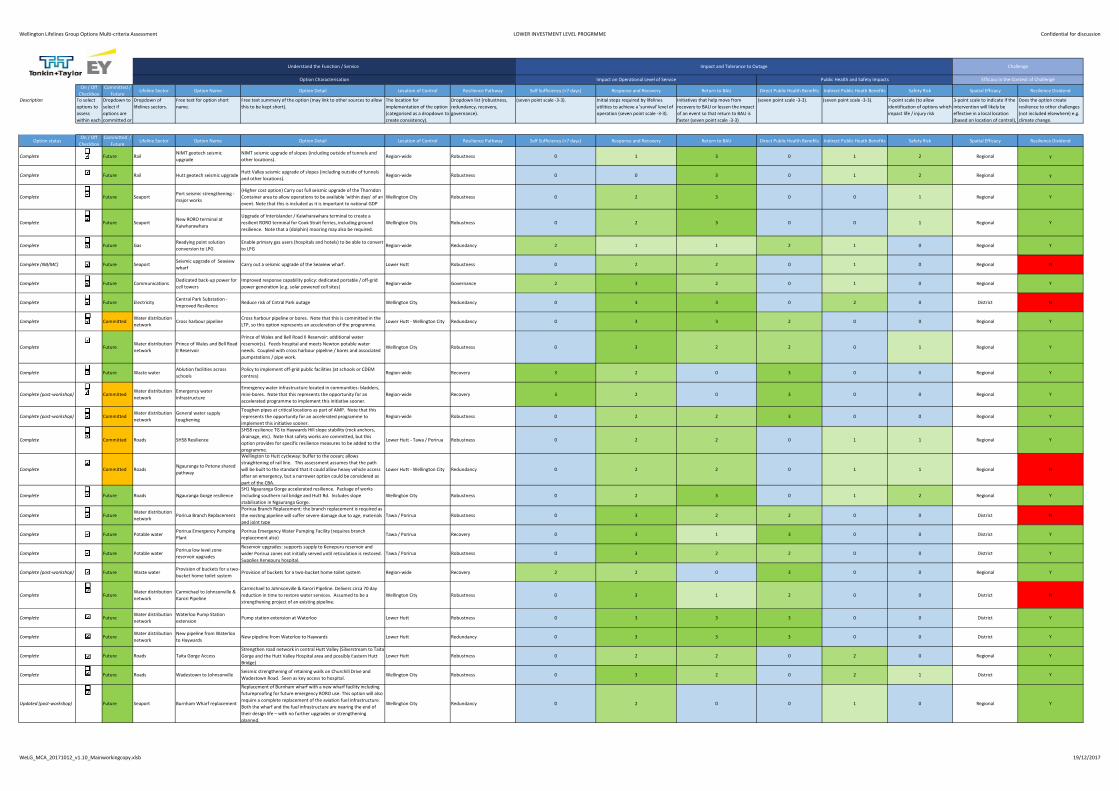
Wellington Lifelines Group Options Multi‐criteria Assessment LOWER INVESTMENT LEVEL PROGRMME Confidential for discussion
On / Off
Checkbox
Committed /
FutureLifeline Sector Option Name Option Detail Location of Control Resilience Pathway Self Sufficiency (<7 days) Response and Recovery Return to BAU Direct Public Health Benefits Indirect Public Heath Benefits Safety Risk Spatial Efficacy Resilience Dividend
Description To select
options to
assess
within each
Dropdown to
select if
options are
committed or
Dropdown of
lifelines sectors.
Free text for option short
name.
Free text summary of the option (may link to other sources to allow
this to be kept short).
The location for
implementation of the option
(categorised as a dropdown to
create consistency).
Dropdown list (robustness,
redundancy, recovery,
governance).
(seven point scale ‐3‐3). Initial steps required by lifelines
utilities to achieve a 'survival' level of
operation (seven point scale ‐3‐3).
Initiatives that help move from
recovery to BAU or lessen the impact
of an event so that return to BAU is
faster (seven point scale ‐3‐3)
(seven point scale ‐3‐3). (seven point scale ‐3‐3). 7‐point scale (to allow
identification of options which
impact life / injury risk
3‐point scale to indicate if the
intervention will likely be
effective in a local location
(based on location of control),
Does the option create
resilience to other challenges
(not included elsewhere) e.g.
climate change.
Option statusOn / Off
Checkbox
Committed /
FutureLifeline Sector Option Name Option Detail Location of Control Resilience Pathway Self Sufficiency (<7 days) Response and Recovery Return to BAU Direct Public Health Benefits Indirect Public Heath Benefits Safety Risk Spatial Efficacy Resilience Dividend
Complete TRUE Future RailNIMT geotech seismic
upgrade
NIMT seismic upgrade of slopes (including outside of tunnels and
other locations).Region‐wide Robustness 0 1 3 0 1 2 Regional y
Complete TRUE Future Rail Hutt geotech seismic upgradeHutt Valley seismic upgrade of slopes (including outside of tunnels
and other locations).Region‐wide Robustness 0 0 3 0 1 2 Regional y
Complete TRUE Future SeaportPort seismic strengthening ‐
major works
(Higher cost option) Carry out full seismic upgrade of the Thorndon
Container area to allow operations to be available 'within days' of an
event. Note that this is included as it is important to national GDP
Wellington City Robustness 0 2 3 0 0 1 Regional Y
Complete TRUE Future SeaportNew RORO terminal at
Kaiwharawhara
Upgrade of Interislander / Kaiwharawhara terminal to create a
resilient RORO terminal for Cook Strait ferries, including ground
resilience. Note that a (dolphin) mooring may also be required.
Wellington City Robustness 0 2 3 0 0 1 Regional Y
Complete TRUE Future GasReadying point solution
conversion to LPG
Enable primary gas users (hospitals and hotels) to be able to convert
to LPGRegion‐wide Redundancy 2 1 1 2 1 0 Regional Y
Complete (NB/MC) TRUE Future SeaportSeismic upgrade of Seaview
wharfCarry out a seismic upgrade of the Seaview wharf. Lower Hutt Robustness 0 2 2 0 1 0 Regional N
Complete TRUE Future CommunicationsDedicated back‐up power for
cell towers
Improved response capability policy: dedicated portable / off‐grid
power generation (e.g. solar powered cell sites)Region‐wide Governance 2 3 2 0 1 0 Regional Y
Complete TRUE Future ElectricityCentral Park Substation ‐
Improved ResilienceReduce risk of Cntral Park outage Wellington City Redundancy 0 3 3 0 2 0 District N
Complete TRUE CommittedWater distribution
networkCross harbour pipeline
Cross harbour pipeline or bores. Note that this is committed in the
LTP, so this option represents an acceleration of the programme.Lower Hutt ‐ Wellington City Redundancy 0 3 3 2 0 0 Regional Y
Complete TRUE FutureWater distribution
network
Prince of Wales and Bell Road
II Reservoir
Prince of Wales and Bell Road II Reservoir: additional water
reservoir(s). Feeds hospital and meets Newton potable water
needs. Coupled with cross harbour pipeline / bores and associated
pumpstations / pipe work.
Wellington City Robustness 0 3 2 2 0 1 Regional Y
Complete TRUE Future Waste waterAblution facilities across
schools
Policy to implement off‐grid public facilities (at schools or CDEM
centres)Region‐wide Recovery 3 2 0 3 0 0 Regional Y
Complete (post‐workshop) TRUE CommittedWater distribution
network
Emergency water
infrastructure
Emergency water infrastructure located in communities: bladders,
mini‐bores. Note that this represents the opportunity for an
accelerated programme to implement this initiative sooner.
Region‐wide Recovery 3 2 0 3 0 0 Regional Y
Complete (post‐workshop) TRUE CommittedWater distribution
network
General water supply
toughening
Toughen pipes at critical locations as part of AMP. Note that this
represents the opportunity for an accelerated programme to
implement this initiative sooner.
Region‐wide Robustness 0 2 2 3 0 0 Regional Y
Complete TRUE Committed Roads SH58 Resilience
SH58 resilience TG to Haywards Hill slope stability (rock anchors,
drainage, etc). Note that safety works are committed, but this
option provides for specific resilience measures to be added to the
programme.
Lower Hutt ‐ Tawa / Porirua Robustness 0 2 2 0 1 1 Regional Y
Complete TRUE Committed RoadsNgauranga to Petone shared
pathway
Wellington to Hutt cycleway: buffer to the ocean; allows
straightening of rail line. This assessment assumes that the path
will be built to the standard that it could allow heavy vehicle access
after an emergency, but a narrower option could be considered as
part of the CBA.
Lower Hutt ‐ Wellington City Redundancy 0 2 2 0 1 1 Regional N
Complete TRUE Future Roads Ngauranga Gorge resilience
SH1 Ngauranga Gorge accelerated resilience. Package of works
including southern rail bridge and Hutt Rd. Includes slope
stabilisation in Ngauranga Gorge.
Wellington City Robustness 0 2 3 0 1 2 Regional Y
Complete TRUE FutureWater distribution
networkPorirua Branch Replacement
Porirua Branch Replacement: the branch replacement is required as
the existing pipeline will suffer severe damage due to age, materials
and joint type
Tawa / Porirua Robustness 0 3 2 2 0 0 District N
Complete TRUE Future Potable waterPorirua Emergency Pumping
Plant
Porirua Emergency Water Pumping Facility (requires branch
replacement also)Tawa / Porirua Recovery 0 3 1 3 0 0 District Y
Complete TRUE Future Potable waterPorirua low level zone
reservoir upgrades
Reservoir upgrades: supports supply to Kenepuru reservoir and
wider Porirua zones not initially served until reticulation is restored.
Supplies Kenepuru hospital.
Tawa / Porirua Robustness 0 3 2 2 0 0 District Y
Complete (post‐workshop) TRUE Future Waste waterProvision of buckets for a two‐
bucket home toilet systemProvision of buckets for a two‐bucket home toilet system Region‐wide Recovery 2 2 0 3 0 0 Regional Y
Complete TRUE FutureWater distribution
network
Carmichael to Johnsonville &
Karori Pipeline
Carmichael to Johnsonville & Karori Pipeline. Delivers circa 70 day
reduction in time to restore water services. Assumed to be a
strengthening project of an existing pipeline.
Wellington City Robustness 0 3 1 2 0 0 District N
Complete TRUE FutureWater distribution
network
Waterloo Pump Station
extensionPump station extension at Waterloo Lower Hutt Robustness 0 3 3 3 0 0 District Y
Complete TRUE FutureWater distribution
network
New pipeline from Waterloo
to HaywardsNew pipeline from Waterloo to Haywards Lower Hutt Redundancy 0 3 3 3 0 0 District Y
Complete TRUE Future Roads Taita Gorge Access
Strengthen road network in central Hutt Valley (Silverstream to Taita
Gorge and the Hutt Valley Hospital area and possibly Eastern Hutt
Bridge)
Lower Hutt Robustness 0 2 2 0 2 0 Regional Y
Complete TRUE Future Roads Wadestown to JohnsonvilleSeismic strengthening of retaining walls on Churchill Drive and
Wadestown Road. Seen as key access to hospital.Wellington City Robustness 0 3 2 0 2 1 District Y
Updated (post‐workshop) TRUE Future Seaport Burnham Wharf replacement
Replacement of Burnham wharf with a new wharf facility including
futureproofing for future emergency RORO use. This option will also
require a complete replacement of the aviation fuel infrastructure.
Both the wharf and the fuel infrastructure are nearing the end of
their design life – with no further upgrades or strengthening
planned.
Wellington City Redundancy 0 2 0 0 1 0 Regional Y
Option Characterisation Impact on Operational Level of Service Public Health and Safety Impacts Efficacy in the Context of Challenge
Understand the Function / Service Impact and Tolerance to Outage Challenge
WeLG_MCA_20171012_v1.10_Mainworkingcopy.xlsb 19/12/2017
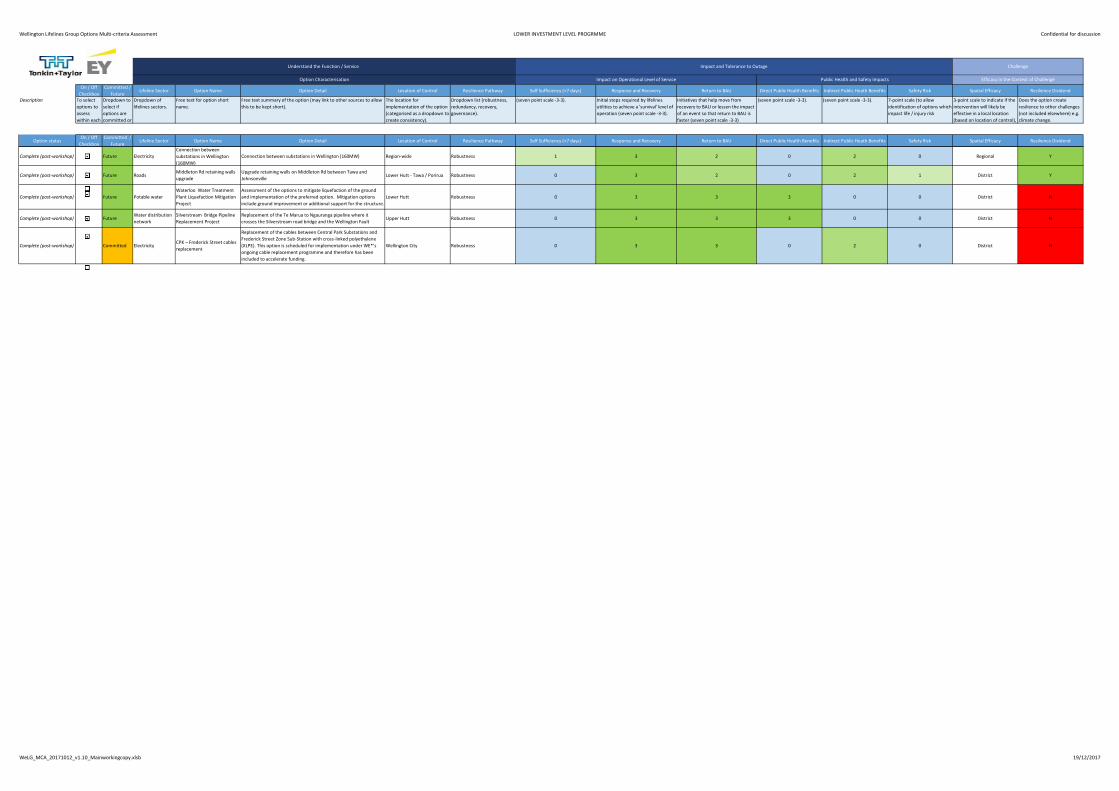
Wellington Lifelines Group Options Multi‐criteria Assessment LOWER INVESTMENT LEVEL PROGRMME Confidential for discussion
On / Off
Checkbox
Committed /
FutureLifeline Sector Option Name Option Detail Location of Control Resilience Pathway Self Sufficiency (<7 days) Response and Recovery Return to BAU Direct Public Health Benefits Indirect Public Heath Benefits Safety Risk Spatial Efficacy Resilience Dividend
Description To select
options to
assess
within each
Dropdown to
select if
options are
committed or
Dropdown of
lifelines sectors.
Free text for option short
name.
Free text summary of the option (may link to other sources to allow
this to be kept short).
The location for
implementation of the option
(categorised as a dropdown to
create consistency).
Dropdown list (robustness,
redundancy, recovery,
governance).
(seven point scale ‐3‐3). Initial steps required by lifelines
utilities to achieve a 'survival' level of
operation (seven point scale ‐3‐3).
Initiatives that help move from
recovery to BAU or lessen the impact
of an event so that return to BAU is
faster (seven point scale ‐3‐3)
(seven point scale ‐3‐3). (seven point scale ‐3‐3). 7‐point scale (to allow
identification of options which
impact life / injury risk
3‐point scale to indicate if the
intervention will likely be
effective in a local location
(based on location of control),
Does the option create
resilience to other challenges
(not included elsewhere) e.g.
climate change.
Option statusOn / Off
Checkbox
Committed /
FutureLifeline Sector Option Name Option Detail Location of Control Resilience Pathway Self Sufficiency (<7 days) Response and Recovery Return to BAU Direct Public Health Benefits Indirect Public Heath Benefits Safety Risk Spatial Efficacy Resilience Dividend
Option Characterisation Impact on Operational Level of Service Public Health and Safety Impacts Efficacy in the Context of Challenge
Understand the Function / Service Impact and Tolerance to Outage Challenge
Complete (post‐workshop) TRUE Future Electricity
Connection between
substations in Wellington
(160MW)
Connection between substations in Wellington (160MW) Region‐wide Robustness 1 3 2 0 2 0 Regional Y
Complete (post‐workshop) TRUE Future RoadsMiddleton Rd retaining walls
upgrade
Upgrade retaining walls on Middleton Rd between Tawa and
JohnsonvilleLower Hutt ‐ Tawa / Porirua Robustness 0 3 2 0 2 1 District Y
Complete (post‐workshop) TRUE Future Potable water
Waterloo Water Treatment
Plant Liquefaction Mitigation
Project
Assessment of the options to mitigate liquefaction of the ground
and implementation of the preferred option. Mitigation options
include ground improvement or additional support for the structure.
Lower Hutt Robustness 0 3 3 3 0 0 District N
Complete (post‐workshop) TRUE FutureWater distribution
network
Silverstream Bridge Pipeline
Replacement Project
Replacement of the Te Marua to Ngauranga pipeline where it
crosses the Silverstream road bridge and the Wellington FaultUpper Hutt Robustness 0 3 3 3 0 0 District N
Complete (post‐workshop) TRUE Committed ElectricityCPK – Frederick Street cables
replacement
Replacement of the cables between Central Park Substations and
Frederick Street Zone Sub‐Station with cross‐linked polyethylene
(XLPE). This option is scheduled for implementation under WE*’s
ongoing cable replacement programme and therefore has been
included to accelerate funding.
Wellington City Robustness 0 3 3 0 2 0 District N
WeLG_MCA_20171012_v1.10_Mainworkingcopy.xlsb 19/12/2017
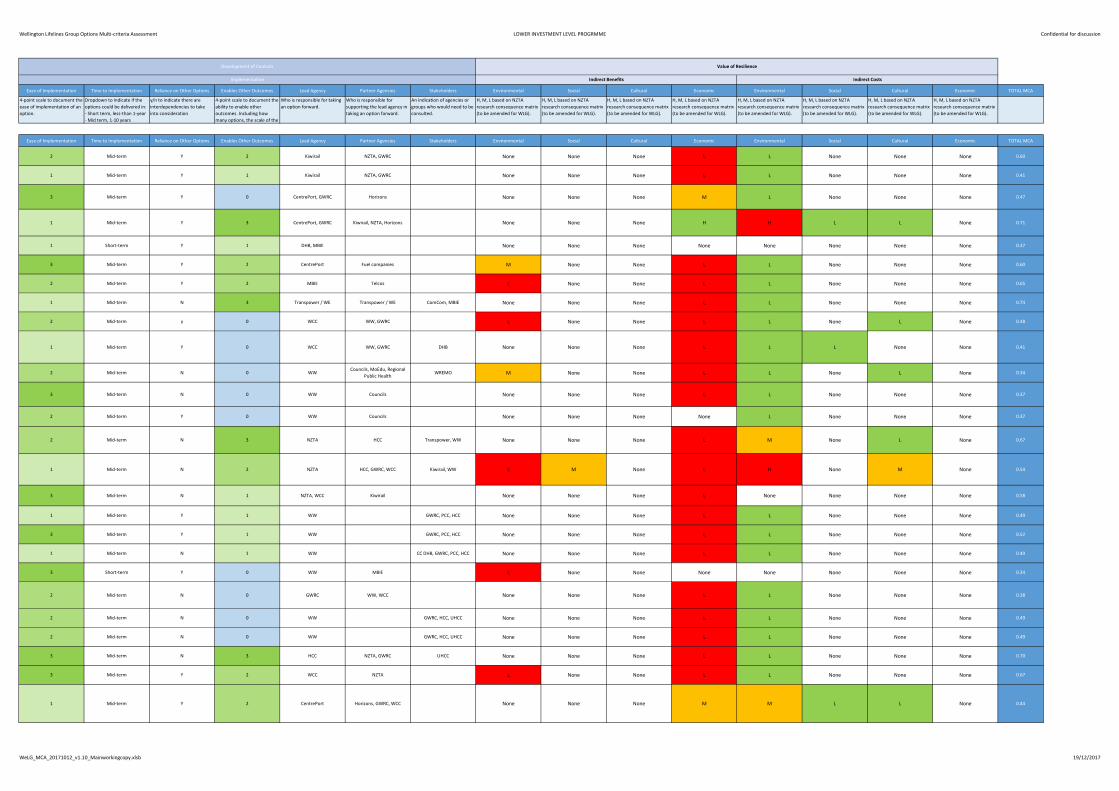
Wellington Lifelines Group Options Multi‐criteria Assessment LOWER INVESTMENT LEVEL PROGRMME Confidential for discussion
Ease of Implementation Time to Implementation Reliance on Other Options Enables Other Outcomes Lead Agency Partner Agencies Stakeholders Environmental Social Cultural Economic Environmental Social Cultural Economic TOTAL MCA
4‐point scale to document the
ease of implementation of an
option.
Dropdown to indicate if the
options could be delivered in:
‐ Short term, less‐than 1‐year
‐ Mid term, 1‐10 years
y/n to indicate there are
interdependencies to take
into consideration
4‐point scale to document the
ability to enable other
outcomes. Including how
many options, the scale of the
Who is responsible for taking
an option forward.
Who is responsible for
supporting the lead agency in
taking an option forward.
An indication of agencies or
groups who would need to be
consulted.
H, M, L based on NZTA
research consequence matrix
(to be amended for WLG).
H, M, L based on NZTA
research consequence matrix
(to be amended for WLG).
H, M, L based on NZTA
research consequence matrix
(to be amended for WLG).
H, M, L based on NZTA
research consequence matrix
(to be amended for WLG).
H, M, L based on NZTA
research consequence matrix
(to be amended for WLG).
H, M, L based on NZTA
research consequence matrix
(to be amended for WLG).
H, M, L based on NZTA
research consequence matrix
(to be amended for WLG).
H, M, L based on NZTA
research consequence matrix
(to be amended for WLG).
Ease of Implementation Time to Implementation Reliance on Other Options Enables Other Outcomes Lead Agency Partner Agencies Stakeholders Environmental Social Cultural Economic Environmental Social Cultural Economic TOTAL MCA
2 Mid‐term Y 2 Kiwirail NZTA, GWRC None None None L L None None None 0.60
1 Mid‐term Y 1 Kiwirail NZTA, GWRC None None None L L None None None 0.41
3 Mid‐term Y 0 CentrePort, GWRC Horizons None None None M L None None None 0.47
1 Mid‐term Y 3 CentrePort, GWRC Kiwirail, NZTA, Horizons None None None H H L L None 0.71
1 Short‐term Y 1 DHB, MBIE None None None None None None None None 0.37
3 Mid‐term Y 2 CentrePort Fuel companies M None None L L None None None 0.60
2 Mid‐term Y 2 MBIE Telcos L None None L L None None None 0.65
1 Mid‐term N 3 Transpower / WE Transpower / WE ComCom, MBIE None None None L L None None None 0.74
2 Mid‐term y 0 WCC WW, GWRC L None None L L None L None 0.48
1 Mid‐term Y 0 WCC WW, GWRC DHB None None None L L L None None 0.41
2 Mid‐term N 0 WWCouncils, MoEdu, Regional
Public HealthWREMO M None None L L None L None 0.34
3 Mid‐term N 0 WW Councils None None None L L None None None 0.37
2 Mid‐term Y 0 WW Councils None None None None L None None None 0.37
2 Mid‐term N 3 NZTA HCC Transpower, WW None None None L M None L None 0.67
1 Mid‐term N 2 NZTA HCC, GWRC, WCC Kiwirail, WW L M None L H None M None 0.54
3 Mid‐term N 1 NZTA, WCC Kiwirail None None None L None None None None 0.58
1 Mid‐term Y 1 WW GWRC, PCC, HCC None None None L L None None None 0.49
3 Mid‐term Y 1 WW GWRC, PCC, HCC None None None L L None None None 0.52
1 Mid‐term N 1 WW CC DHB, GWRC, PCC, HCC None None None L L None None None 0.49
3 Short‐term Y 0 WW MBIE L None None None None None None None 0.34
2 Mid‐term N 0 GWRC WW, WCC None None None L L None None None 0.38
2 Mid‐term N 0 WW GWRC, HCC, UHCC None None None L L None None None 0.49
2 Mid‐term N 0 WW GWRC, HCC, UHCC None None None L L None None None 0.49
3 Mid‐term N 3 HCC NZTA, GWRC UHCC None None None L L None None None 0.70
3 Mid‐term Y 2 WCC NZTA L None None L L None None None 0.67
1 Mid‐term Y 2 CentrePort Horizons, GWRC, WCC None None None M M L L None 0.44
Indirect Benefits Indirect CostsImplementation
Development of Controls Value of Resilience
WeLG_MCA_20171012_v1.10_Mainworkingcopy.xlsb 19/12/2017
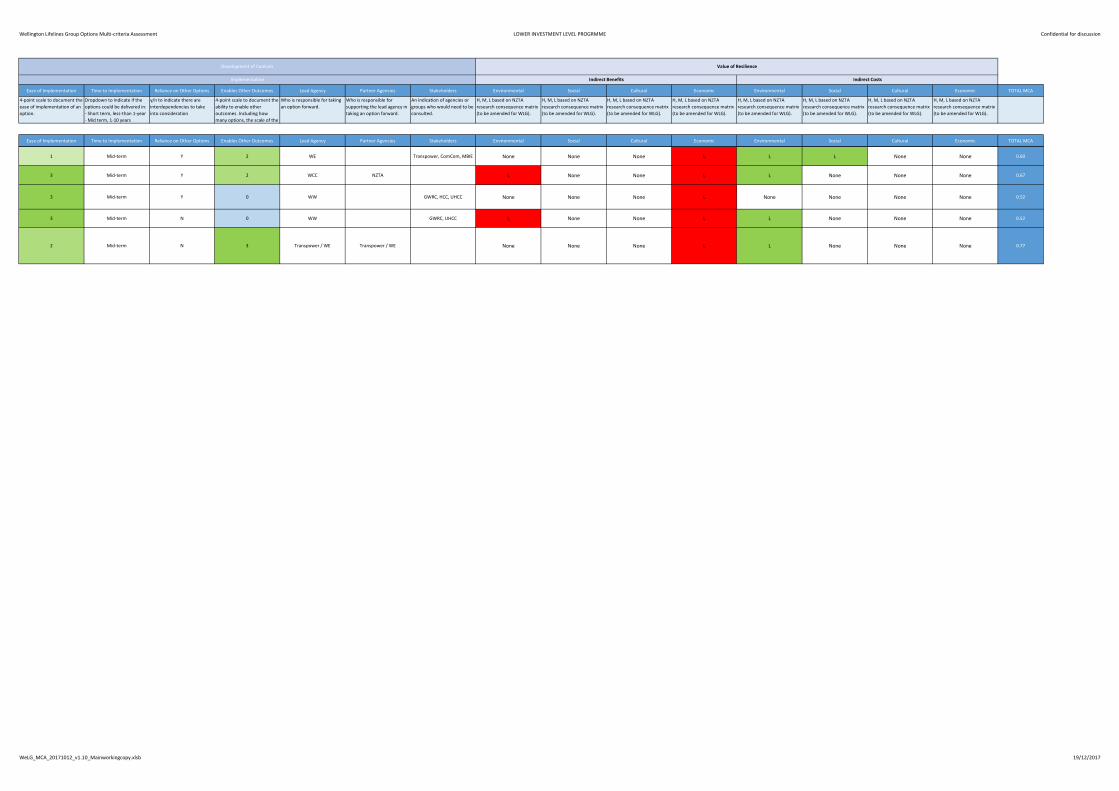
Wellington Lifelines Group Options Multi‐criteria Assessment LOWER INVESTMENT LEVEL PROGRMME Confidential for discussion
Ease of Implementation Time to Implementation Reliance on Other Options Enables Other Outcomes Lead Agency Partner Agencies Stakeholders Environmental Social Cultural Economic Environmental Social Cultural Economic TOTAL MCA
4‐point scale to document the
ease of implementation of an
option.
Dropdown to indicate if the
options could be delivered in:
‐ Short term, less‐than 1‐year
‐ Mid term, 1‐10 years
y/n to indicate there are
interdependencies to take
into consideration
4‐point scale to document the
ability to enable other
outcomes. Including how
many options, the scale of the
Who is responsible for taking
an option forward.
Who is responsible for
supporting the lead agency in
taking an option forward.
An indication of agencies or
groups who would need to be
consulted.
H, M, L based on NZTA
research consequence matrix
(to be amended for WLG).
H, M, L based on NZTA
research consequence matrix
(to be amended for WLG).
H, M, L based on NZTA
research consequence matrix
(to be amended for WLG).
H, M, L based on NZTA
research consequence matrix
(to be amended for WLG).
H, M, L based on NZTA
research consequence matrix
(to be amended for WLG).
H, M, L based on NZTA
research consequence matrix
(to be amended for WLG).
H, M, L based on NZTA
research consequence matrix
(to be amended for WLG).
H, M, L based on NZTA
research consequence matrix
(to be amended for WLG).
Ease of Implementation Time to Implementation Reliance on Other Options Enables Other Outcomes Lead Agency Partner Agencies Stakeholders Environmental Social Cultural Economic Environmental Social Cultural Economic TOTAL MCA
Indirect Benefits Indirect CostsImplementation
Development of Controls Value of Resilience
1 Mid‐term Y 2 WE Transpower, ComCom, MBIE None None None L L L None None 0.60
3 Mid‐term Y 2 WCC NZTA L None None L L None None None 0.67
3 Mid‐term Y 0 WW GWRC, HCC, UHCC None None None L None None None None 0.52
3 Mid‐term N 0 WW GWRC, UHCC L None None L L None None None 0.52
2 Mid‐term N 3 Transpower / WE Transpower / WE None None None L L None None None 0.77
WeLG_MCA_20171012_v1.10_Mainworkingcopy.xlsb 19/12/2017
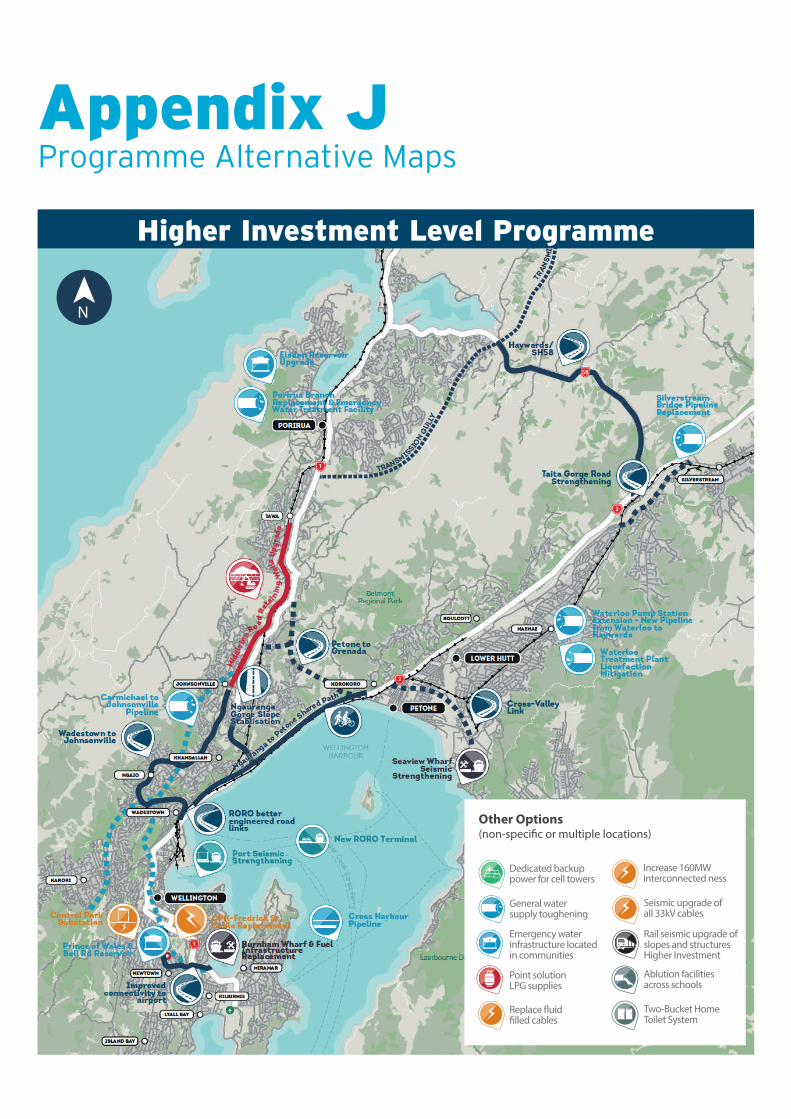
Appendix JProgramme Alternative Maps
Higher Investment Level Programme
Other Options (non-specific or multiple locations)
Dedicated backup power for cell towers
Point solution LPG supplies
Seismic upgrade of all 33kV cables
Rail seismic upgrade of slopes and structures Higher Investment
Replace fluid filled cables
Ablution facilities across schools
Two-Bucket Home Toilet System
Increase 160MW interconnected ness
General water supply toughening
Emergency water infrastructure located in communities
N
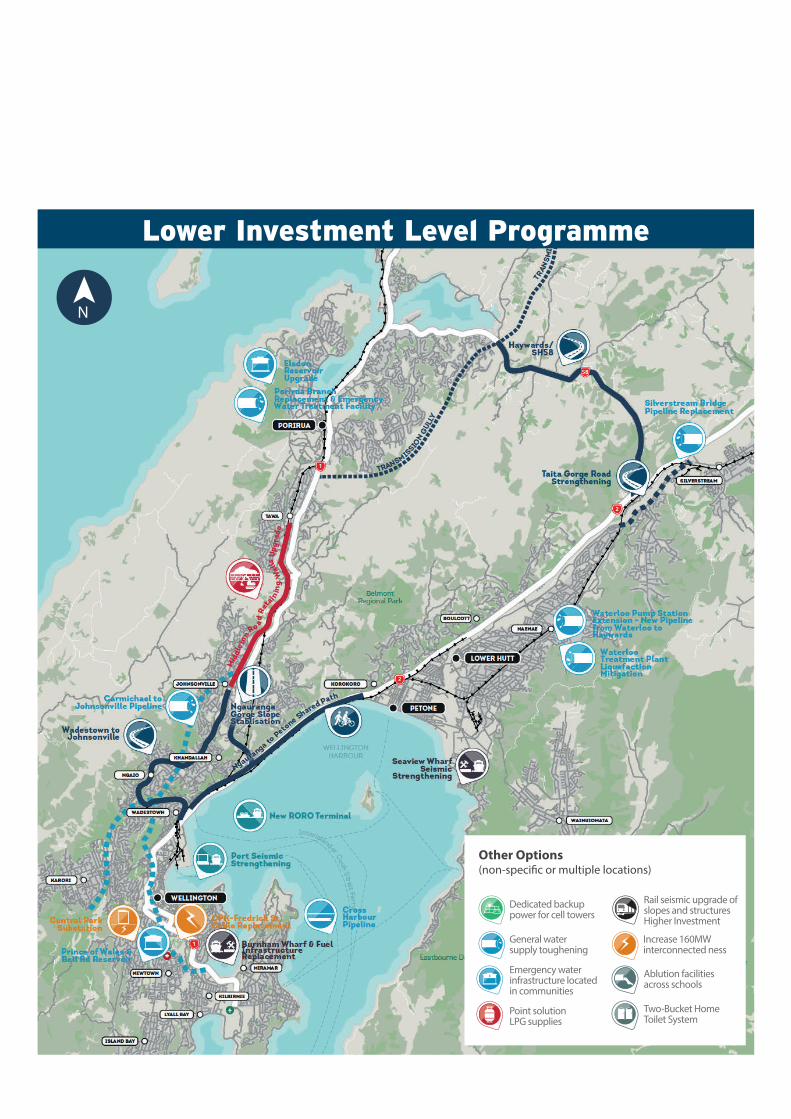
Lower Investment Level Programme
Other Options (non-specific or multiple locations)
Dedicated backup power for cell towers
Point solution LPG supplies
Rail seismic upgrade of slopes and structures Higher Investment
Ablution facilities across schools
Two-Bucket Home Toilet System
Increase 160MW interconnected ness
General water supply toughening
Emergency water infrastructure located in communities
N
Appendix KLifelines Outage Modelling (RiskScape)

GNS Science Consultancy Report 2017/236December 2017
Wellington Resilience Programme Business Case: Lifelines Outage Modelling
E. Grace (comp)
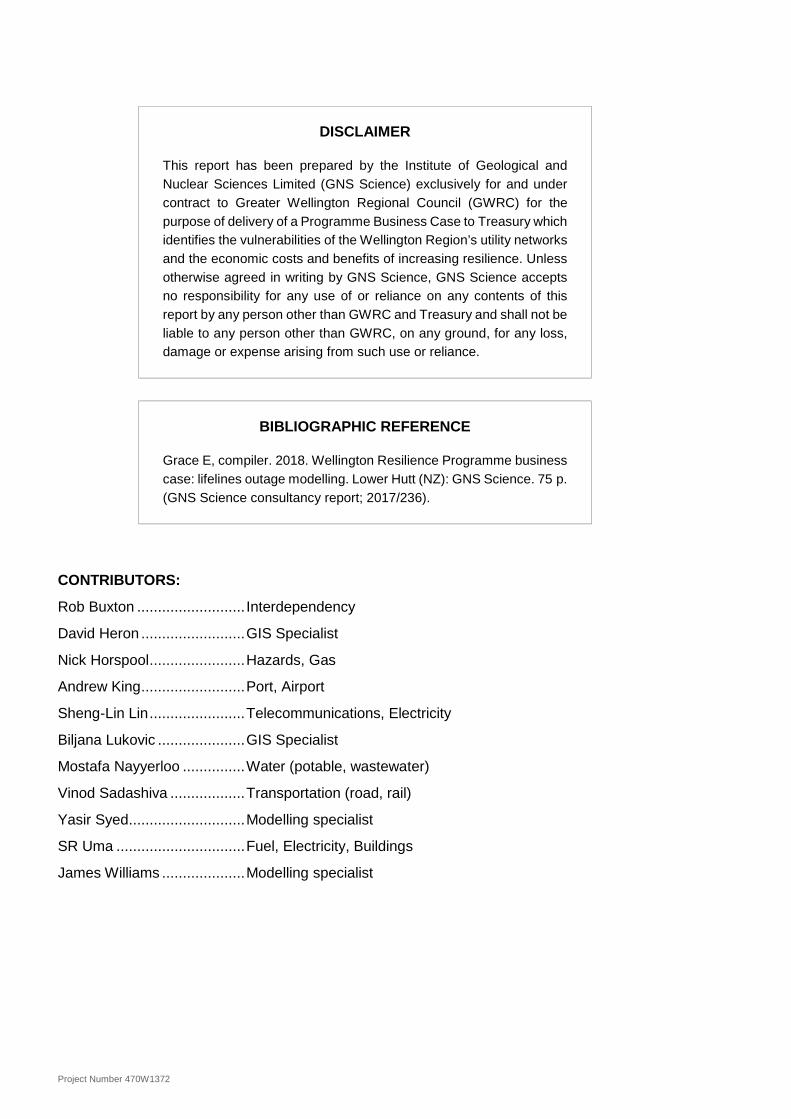
Project Number 470W1372
CONTRIBUTORS:
Rob Buxton .......................... Interdependency
David Heron ......................... GIS Specialist
Nick Horspool ....................... Hazards, Gas
Andrew King ......................... Port, Airport
Sheng-Lin Lin ....................... Telecommunications, Electricity
Biljana Lukovic ..................... GIS Specialist
Mostafa Nayyerloo ............... Water (potable, wastewater)
Vinod Sadashiva .................. Transportation (road, rail)
Yasir Syed ............................ Modelling specialist
SR Uma ............................... Fuel, Electricity, Buildings
James Williams .................... Modelling specialist
DISCLAIMER
This report has been prepared by the Institute of Geological and Nuclear Sciences Limited (GNS Science) exclusively for and under contract to Greater Wellington Regional Council (GWRC) for the purpose of delivery of a Programme Business Case to Treasury which identifies the vulnerabilities of the Wellington Region’s utility networks and the economic costs and benefits of increasing resilience. Unless otherwise agreed in writing by GNS Science, GNS Science accepts no responsibility for any use of or reliance on any contents of this report by any person other than GWRC and Treasury and shall not be liable to any person other than GWRC, on any ground, for any loss, damage or expense arising from such use or reliance.
BIBLIOGRAPHIC REFERENCE
Grace E, compiler. 2018. Wellington Resilience Programme business case: lifelines outage modelling. Lower Hutt (NZ): GNS Science. 75 p. (GNS Science consultancy report; 2017/236).
Confidential 2017
GNS Science Consultancy Report 2017/236 i
CONTENTS
EXECUTIVE SUMMARY ....................................................................................................... V
1.0 INTRODUCTION ........................................................................................................ 1
1.1 BACKGROUND ................................................................................................... 1 1.2 OVERVIEW OF MODELLING TOOLS ....................................................................... 2 1.3 SCOPE OF MODELLING ...................................................................................... 3 1.4 SCOPE OF THIS REPORT .................................................................................... 3
2.0 DAMAGE AND OUTAGE MODELLING FRAMEWORK ............................................ 5
2.1 OVERVIEW OF PROCESS .................................................................................... 5 2.2 RISKSCAPE BACKGROUND ................................................................................. 5 2.3 DAMAGE MODELLING ......................................................................................... 6 2.4 TEMPORAL SERVICE OUTAGE MAP CREATION ..................................................... 7
3.0 NATURAL HAZARD SCENARIO ............................................................................... 9
4.0 HAZARD MODELS .................................................................................................. 11
4.1 FAULT RUPTURE MODEL .................................................................................. 12 4.2 GROUND SHAKING........................................................................................... 13 4.3 LIQUEFACTION ................................................................................................ 14 4.4 LATERAL SPREADING ....................................................................................... 15 4.5 LANDSLIDES .................................................................................................... 16 4.6 CO-SEISMIC SUBSIDENCE ................................................................................ 17
5.0 TRANSPORTATION LIFELINES.............................................................................. 19
5.1 ROADS ........................................................................................................... 19 5.1.1 Asset Data ........................................................................................................19 5.1.2 Vulnerability and Impact Modelling...................................................................20 5.1.3 Base-Case Outages .........................................................................................23 5.1.4 Intervention outages .........................................................................................25 5.1.5 Preferred Programme Outages ........................................................................27
5.2 RAIL ............................................................................................................... 28 5.2.1 Assets ...............................................................................................................28 5.2.2 Vulnerability and Impact Modelling...................................................................29 5.2.3 Base-case Outages ..........................................................................................30 5.2.4 Intervention Outages ........................................................................................30 5.2.5 Preferred Programme Outages ........................................................................30
5.3 PORT .............................................................................................................. 31 5.3.1 Base-Case Outages .........................................................................................31 5.3.2 Intervention Outages ........................................................................................31 5.3.3 Preferred Programme Outages ........................................................................31
5.4 AIRPORT ......................................................................................................... 32 5.4.1 Base-Case Outages .........................................................................................32 5.4.2 Intervention Outages ........................................................................................32 5.4.3 Preferred Programme Outages ........................................................................32
6.0 UTILITIES LIFELINES .............................................................................................. 33
Confidential 2017
ii GNS Science Consultancy Report 2017/236
6.1 FUEL .............................................................................................................. 33 6.1.1 Assets ...............................................................................................................33 6.1.2 Vulnerability and Impact Modelling...................................................................33 6.1.3 Base-Case Outages .........................................................................................34 6.1.4 Intervention Outages ........................................................................................35 6.1.5 Preferred Programme Outages ........................................................................35
6.2 ELECTRICITY ................................................................................................... 36 6.2.1 Assets ...............................................................................................................36 6.2.2 Vulnerability and Damage Models....................................................................37 6.2.3 Base-Case Outages .........................................................................................40 6.2.4 Intervention Outages ........................................................................................42 6.2.5 Outage associated with Preferred Investment Programme .............................44
6.3 TELECOMMUNICATIONS.................................................................................... 45 6.3.1 Asset Data ........................................................................................................45 6.3.2 Vulnerability and impact modelling ...................................................................45 6.3.3 Base-Case Outages .........................................................................................47 6.3.4 Intervention Outages ........................................................................................48 6.3.5 Preferred Programme Outages ........................................................................49
6.4 WATER ........................................................................................................... 50 6.4.1 Asset Data ........................................................................................................50 6.4.2 Vulnerability and Impact Modelling...................................................................50 6.4.3 Base-Case Outages .........................................................................................52 6.4.4 Intervention Outages ........................................................................................53 6.4.5 Preferred Programme Outages ........................................................................55
6.5 WASTE WATER ............................................................................................... 55 6.5.1 Vulnerability and Damage Modelling ................................................................56 6.5.2 Base-Case Outages .........................................................................................57 6.5.3 Intervention Outages ........................................................................................57 6.5.4 Preferred Programme Outages ........................................................................58
6.6 GAS ............................................................................................................... 59 6.6.1 Asset Data ........................................................................................................59 6.6.2 Vulnerability and Impact Modelling...................................................................59 6.6.3 Base-Case Outages .........................................................................................61 6.6.4 Interventions .....................................................................................................62 6.6.5 Preferred Programme Outages ........................................................................62
7.0 NON-INFRASTRUCTURE ........................................................................................ 63
7.1 BUILDINGS ...................................................................................................... 63 7.1.1 Asset Data ........................................................................................................63 7.1.2 Impact modelling ..............................................................................................63 7.1.3 Functional Down-time .......................................................................................65
8.0 SUMMARY ............................................................................................................... 67
9.0 ACKNOWLEDGMENTS ........................................................................................... 69
10.0 REFERENCES ......................................................................................................... 71
APPENDICES ...................................................................................................................... 73
Confidential 2017
GNS Science Consultancy Report 2017/236 iii
FIGURES
Figure 1.1 Linkages between the various stages of damage loss assessment and economic impact analysis for the Wellington Resilience PBC. ................................................................................. 2
Figure 2.1 RiskScape Framework. ................................................................................................................ 5 Figure 2.2 Workflow of modelling for temporal outage of lifelines. ................................................................ 6 Figure 4.1 Map of location of Wellington-Hutt Valley Segment of the Wellington Fault (red) and
deformation zone (Berryman, 1990; Stirling et al., 2012). .......................................................... 12 Figure 4.2 Peak Ground Acceleration (PGA) for Wellington Fault Scenario. ............................................... 13 Figure 4.3 Mean LSN (left) and liquefaction susceptibility (right) values for the Wellington Fault scenario
(Dellow, Perrin and Ries, 2015). ................................................................................................. 14 Figure 4.4 Map showing lateral spreading zones of varying occurrence probabilities in Lower Hutt and
Wainuiomata. ............................................................................................................................. 15 Figure 4.5 A single realisation of landslide distribution from the RiskScape NZTA Tool landslide model for
the Wellington region. Landslides are shown in red. .................................................................. 16 Figure 4.6 Estimated subsidence (dark blue) extent (areas below MSL) resulting from a M7.5 Wellington
Fault earthquake (based on Townsend et al., 2016). ................................................................. 17 Figure 5.1 Transportation zones and routes selected for damage modelling. ............................................. 19 Figure 5.2 Service Disruption Level for modelled roads. ............................................................................. 22 Figure 5.3 Railway assets modelled. ........................................................................................................... 28 Figure 5.4 Modelled damage to the Wellington Region rail network. ........................................................... 29 Figure 5.5 Restoration times for port assets in Wellington. Red text is base-case outage times, blue text
is intervention and preferred programme outages. ..................................................................... 31 Figure 5.6 Asset bundles for Wellington International Airport. ..................................................................... 32 Figure 6.1 Seaview fuel storage facilities. ................................................................................................... 33 Figure 6.2 Outage map for fuel service to critical customers (left) and general customers (right) from the
Seaview facility. .......................................................................................................................... 34 Figure 6.3 outage times for fuel service to critical and general customers with low investment
interventions (left) and high investment interventions (right). ..................................................... 35 Figure 6.4 Modelled damage to the Wellington Region electricity network in the base case. ...................... 39 Figure 6.5 Electricity network components and component hierarchy (left to right). .................................... 40 Figure 6.6 Outage map for electricity service for base-case scenario. ........................................................ 41 Figure 6.7 Updated electricity network outage for low (left) and high (right) investment programmes. ....... 43 Figure 6.8 Updated electricity outage for preferred programme. ................................................................. 44 Figure 6.9 Modelled damage to the Wellington Region telecommunications network. ................................ 46 Figure 6.10 Outage times for telecommunication services (data, cellular and landline) in the base-case. .... 47 Figure 6.11 Outage times for telecommunication services (data, cellular and landline) for low (left) and
high (right) investment programmes. .......................................................................................... 48 Figure 6.12 Outage times for telecommunication services (data, cellular and landline) for preferred
programme. ................................................................................................................................ 49 Figure 6.13 Greater Wellington Regional Council bulk water supply network (Greater Wellington Regional
Council, 2014). ........................................................................................................................... 50 Figure 6.14 Modelled damage to the Wellington Region water network. ....................................................... 51 Figure 6.15 Outage map for non-potable (left) and potable (right) water services. ........................................ 52 Figure 6.16 Outage map for non-potable (left) and potable (right) water services for low and high
investment intervention programmes. ........................................................................................ 54
Confidential 2017
iv GNS Science Consultancy Report 2017/236
Figure 6.17 Outage map for non-potable (left) and potable (right) water services for the preferred programme. ................................................................................................................................ 55
Figure 6.18 Modelled damage to the Wellington Region waste water network. ............................................ 56 Figure 6.19 Outage times for waste water collection (left) and treatment (right) services. ............................ 57 Figure 6.20 Outage times for waste water collection (left) and treatment (right) for low and high
investment programmes. ............................................................................................................ 58 Figure 6.21 Outage map for waste water collection (left) and treatment (right) for the preferred programme.
................................................................................................................................................... 58 Figure 6.22 Modelled damage to the Wellington Region gas network. .......................................................... 60 Figure 6.23 Outage times for gas to critical and general customers. ............................................................. 61 Figure 6.24 Outage times for gas to critical (left) and general (right) customers incorporating the
intervention project to supply critical customers with bottled gas or isotainers. .......................... 62 Figure 7.1 Modelled damage states for Wellington Region buildings. ......................................................... 64 Figure 7.2 Example of cordon zones (red) in Wellington CBD associated with > DS4 buildings for a
single scenario realisation. ......................................................................................................... 65
TABLES
Table 2.1 RiskScape module definitions. ..................................................................................................... 6 Table 4.1 Hazard models used for Welling Resilience PBC modelling. ...................................................... 11 Table 5.1 Service Disruption Levels for all hazards (Sadashiva, King and Matcham, 2017). ..................... 21 Table 5.2 Road zone outage times (days) for response. ............................................................................ 23 Table 5.3 Road zone outage times (days) for recovery. ............................................................................. 24 Table 5.4 Low Investment road outage times (days) for response. ............................................................ 26 Table 5.5 Higher Investment road outage times (days) for response. ........................................................ 27 Table 5.6 Rail network outage times for base case. ................................................................................... 30 Table 5.7 Rail network outage times considering intervention programme. ............................................... 30 Table 6.1 Electricity network data used in the project. ............................................................................... 36 Table 6.2 Electricity assets vulnerability models. ....................................................................................... 37 Table 6.3 Damage state and recovery time definitions............................................................................... 38 Table 6.4 Telecommunications asset vulnerability models. ........................................................................ 45 Table 6.5 Summary of potable water asset vulnerability models. ............................................................... 51 Table 6.6 Waste water assets vulnerability models. ................................................................................... 56 Table 6.7 Summary of gas network asset vulnerability models. ................................................................. 59
APPENDICES
A1.0 CALIBRATED VULNERABILITY MODELS FOR ELECTRICITY ASSETS ................. 75
APPENDIX TABLES
Table A2.1 Ground Shaking Vulnerability Model for Buried Electricity Cables. ............................................ 75
Confidential 2017
GNS Science Consultancy Report 2017/236 v
EXECUTIVE SUMMARY
GNS Science, Market Economics and Resilience Organisations have undertaken damage and economic modelling to provide an evidence-base for the assessment of infrastructure programmes to improve Wellington’s resilience to a major earthquake event. The outputs of the modelling are being used by Aurecon to inform the writing of a business case for infrastructure investment on behalf of the Wellington Lifelines Group.
A Mw7.5 Wellington Fault earthquake event and associated perils (fault rupture, ground shaking, liquefaction, landslides, lateral spreading, subsidence) was used to assess damage and economic disruption to the following infrastructure types: road, rail, port, airport, electricity, telecommunications, potable water, wastewater, fuel, and gas. Damage to buildings was also modelled. This modelling produced damage under the base-case: what is the damage and economic disruption expected should an earthquake occur tomorrow with current infrastructure? Two further stages of modelling were also undertaken:
1. Intervention Modelling – what is the damage and economic disruption expected should the same earthquake occur following the implementation of either of two separate infrastructure intervention programmes (two separate sets of results)? and
2. Preferred Programme Modelling – what is the damage and economic disruption expected should the same earthquake occur following the implementation of a preferred intervention programme?
The modelling tools RiskScape and MERIT were used. Workshops with lifeline providers were held to determine the extent of damage expected to the networks and the restoration strategies of the lifelines given that damage. This information was used to create temporal service outage maps that show the level of lifeline service expected throughout the region over time. These service outage maps were fed into MERIT, the economic model, which calculated a range of economic parameters including the change in GDP out to 5 years from the event as a measure of the disruption to the economy.
This report sets out the assumptions in the damage modelling and outage map creation process, and presents the final outage maps from each of the three stages of modelling. A companion report sets out the assumptions in the MERIT modelling process (Smith N., Brown C., McDonald G., Seville E., Ayers M., Kim J. 2017: Wellington Resilience Programme Business Case: Modelling the Economics of Resilient Infrastructure Tool (MERIT) Assumptions Report). Both this report and the companion MERIT report inform the business case report being prepared by Aurecon (Allard, J., Kenworthy, C. 2017: Programme Business Case for Infrastructure Investment to Ensure the Wellington Region can Rebound after a Major Earthquake).

Confidential 2017
GNS Science Consultancy Report 2017/236 1
1.0 INTRODUCTION
1.1 BACKGROUND
The Wellington Lifelines Group is running a process to prepare a Programme Business Case for investment in the resilience of Wellington’s infrastructure. As part of this process, GNS Science, Market Economics and Resilience Organisations have undertaken damage and economic modelling to provide an evidence-base for the assessment of investment programmes. The outputs of the modelling are being used by Aurecon to inform the writing of the business case.
The Programme Business Case process has been run by Aurecon and has generally involved working with the lifeline organisations to identify infrastructure investment objects, generate a list of infrastructure investment projects, shortlist those projects and arrange them into infrastructure investment programmes, select a preferred programme of infrastructure investment to be included in the business case, and finally, write the Programme Business Case.
The modelling process has occurred in parallel to the business case process and has informed decisions made by lifeline organisations as the process has progressed. The modelling involved three stages:
Stage 1: Base-Case Modelling – what is the damage to infrastructure and buildings and economic disruption expected should an earthquake occur tomorrow with the current infrastructure?
Stage 2: Intervention Modelling – what is the damage and economic disruption expected should the same earthquake occur following the implementation of either of two separate infrastructure intervention programmes? This stage produced two separate sets of results, one for a higher investment programme and one for a lower investment programme. The programmes modelling were the result of the Aurecon-led business case process.
Stage 3: Preferred Programme Modelling – what is the damage and economic disruption expected should the same earthquake occur following the implementation of a preferred infrastructure intervention programme? The programme modelled in this stage was that selected by the lifeline organisations as the preferred infrastructure investment programme. The programme was a middle-ground between the higher and lower investment programmes, including all the projects from the lower investment programme and some of the projects from the higher investment programme.
These three sets of results allow comparisons to be made, so that the impact of the intervention programmes can be assessed in the business case.
More detail of the business case process can be found in the business case document prepared by Aurecon (Allard, J., Kenworthy, C. 2017: Programme Business Case for Infrastructure Investment to Ensure the Wellington Region can Rebound after a Major Earthquake)
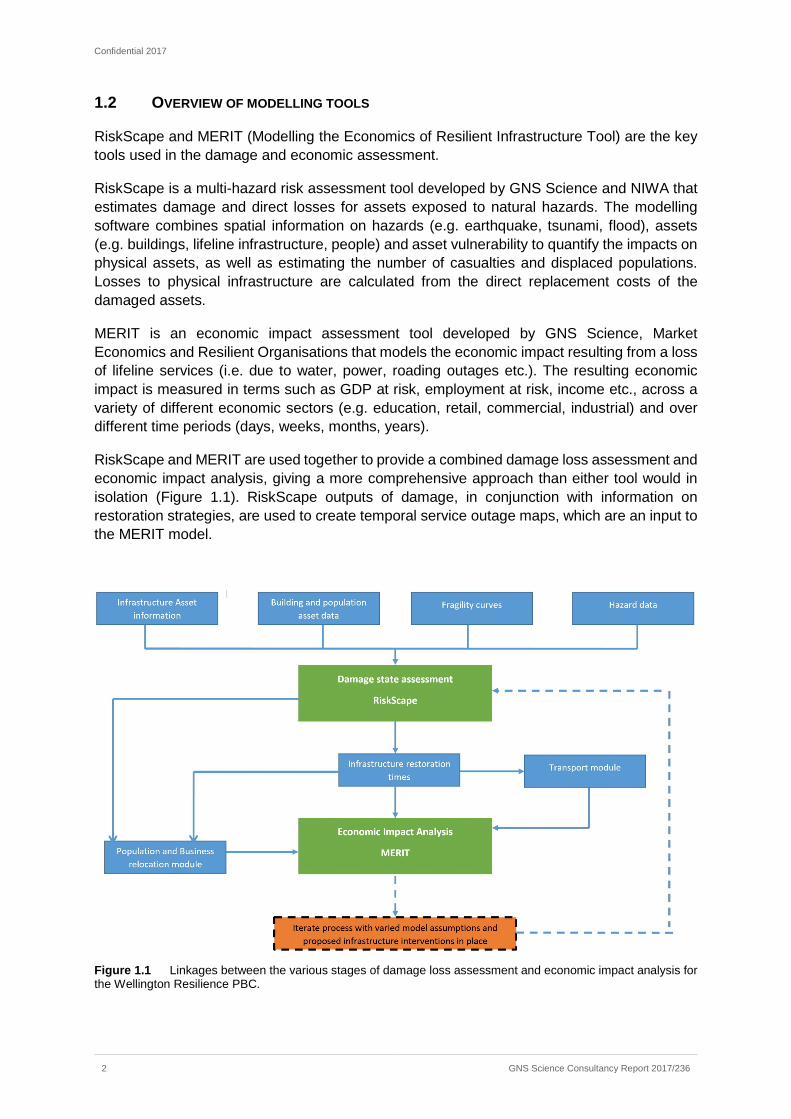
Confidential 2017
2 GNS Science Consultancy Report 2017/236
1.2 OVERVIEW OF MODELLING TOOLS
RiskScape and MERIT (Modelling the Economics of Resilient Infrastructure Tool) are the key tools used in the damage and economic assessment.
RiskScape is a multi-hazard risk assessment tool developed by GNS Science and NIWA that estimates damage and direct losses for assets exposed to natural hazards. The modelling software combines spatial information on hazards (e.g. earthquake, tsunami, flood), assets (e.g. buildings, lifeline infrastructure, people) and asset vulnerability to quantify the impacts on physical assets, as well as estimating the number of casualties and displaced populations. Losses to physical infrastructure are calculated from the direct replacement costs of the damaged assets.
MERIT is an economic impact assessment tool developed by GNS Science, Market Economics and Resilient Organisations that models the economic impact resulting from a loss of lifeline services (i.e. due to water, power, roading outages etc.). The resulting economic impact is measured in terms such as GDP at risk, employment at risk, income etc., across a variety of different economic sectors (e.g. education, retail, commercial, industrial) and over different time periods (days, weeks, months, years).
RiskScape and MERIT are used together to provide a combined damage loss assessment and economic impact analysis, giving a more comprehensive approach than either tool would in isolation (Figure 1.1). RiskScape outputs of damage, in conjunction with information on restoration strategies, are used to create temporal service outage maps, which are an input to the MERIT model.
Figure 1.1 Linkages between the various stages of damage loss assessment and economic impact analysis for the Wellington Resilience PBC.
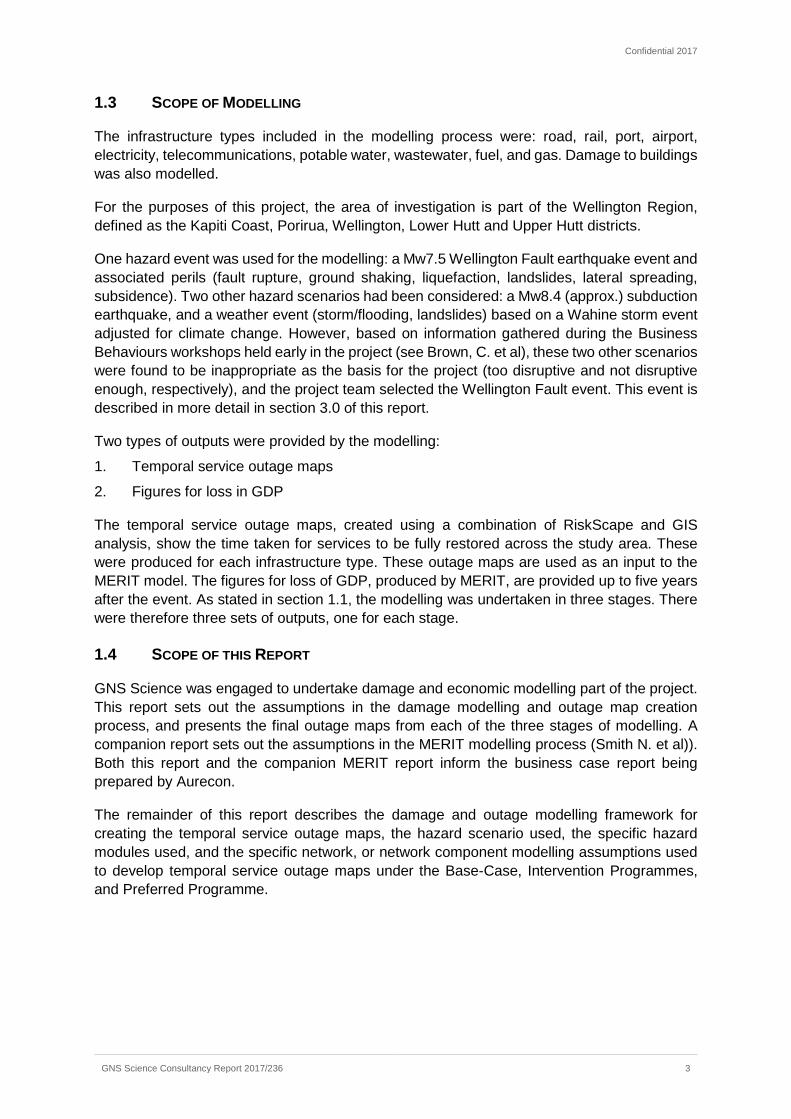
Confidential 2017
GNS Science Consultancy Report 2017/236 3
1.3 SCOPE OF MODELLING
The infrastructure types included in the modelling process were: road, rail, port, airport, electricity, telecommunications, potable water, wastewater, fuel, and gas. Damage to buildings was also modelled.
For the purposes of this project, the area of investigation is part of the Wellington Region, defined as the Kapiti Coast, Porirua, Wellington, Lower Hutt and Upper Hutt districts.
One hazard event was used for the modelling: a Mw7.5 Wellington Fault earthquake event and associated perils (fault rupture, ground shaking, liquefaction, landslides, lateral spreading, subsidence). Two other hazard scenarios had been considered: a Mw8.4 (approx.) subduction earthquake, and a weather event (storm/flooding, landslides) based on a Wahine storm event adjusted for climate change. However, based on information gathered during the Business Behaviours workshops held early in the project (see Brown, C. et al), these two other scenarios were found to be inappropriate as the basis for the project (too disruptive and not disruptive enough, respectively), and the project team selected the Wellington Fault event. This event is described in more detail in section 3.0 of this report.
Two types of outputs were provided by the modelling:
1. Temporal service outage maps
2. Figures for loss in GDP
The temporal service outage maps, created using a combination of RiskScape and GIS analysis, show the time taken for services to be fully restored across the study area. These were produced for each infrastructure type. These outage maps are used as an input to the MERIT model. The figures for loss of GDP, produced by MERIT, are provided up to five years after the event. As stated in section 1.1, the modelling was undertaken in three stages. There were therefore three sets of outputs, one for each stage.
1.4 SCOPE OF THIS REPORT
GNS Science was engaged to undertake damage and economic modelling part of the project. This report sets out the assumptions in the damage modelling and outage map creation process, and presents the final outage maps from each of the three stages of modelling. A companion report sets out the assumptions in the MERIT modelling process (Smith N. et al)). Both this report and the companion MERIT report inform the business case report being prepared by Aurecon.
The remainder of this report describes the damage and outage modelling framework for creating the temporal service outage maps, the hazard scenario used, the specific hazard modules used, and the specific network, or network component modelling assumptions used to develop temporal service outage maps under the Base-Case, Intervention Programmes, and Preferred Programme.

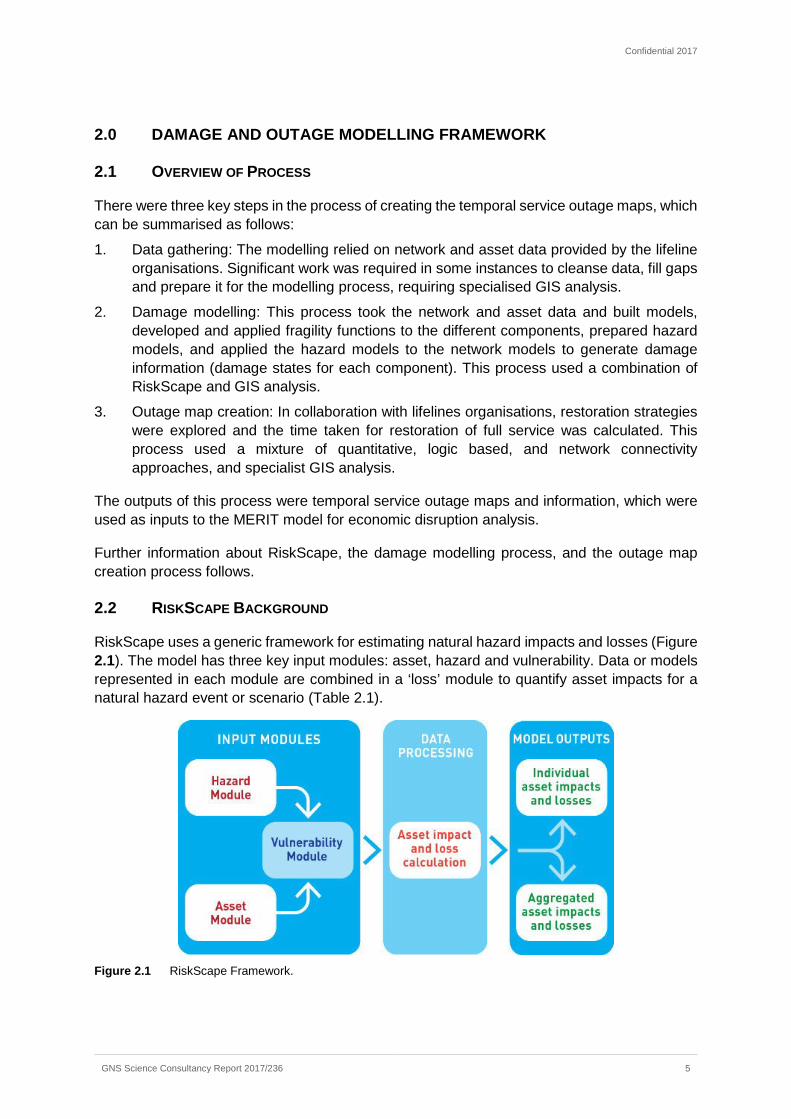
Confidential 2017
GNS Science Consultancy Report 2017/236 5
2.0 DAMAGE AND OUTAGE MODELLING FRAMEWORK
2.1 OVERVIEW OF PROCESS
There were three key steps in the process of creating the temporal service outage maps, which can be summarised as follows:
1. Data gathering: The modelling relied on network and asset data provided by the lifeline organisations. Significant work was required in some instances to cleanse data, fill gaps and prepare it for the modelling process, requiring specialised GIS analysis.
2. Damage modelling: This process took the network and asset data and built models, developed and applied fragility functions to the different components, prepared hazard models, and applied the hazard models to the network models to generate damage information (damage states for each component). This process used a combination of RiskScape and GIS analysis.
3. Outage map creation: In collaboration with lifelines organisations, restoration strategies were explored and the time taken for restoration of full service was calculated. This process used a mixture of quantitative, logic based, and network connectivity approaches, and specialist GIS analysis.
The outputs of this process were temporal service outage maps and information, which were used as inputs to the MERIT model for economic disruption analysis.
Further information about RiskScape, the damage modelling process, and the outage map creation process follows.
2.2 RISKSCAPE BACKGROUND
RiskScape uses a generic framework for estimating natural hazard impacts and losses (Figure 2.1). The model has three key input modules: asset, hazard and vulnerability. Data or models represented in each module are combined in a ‘loss’ module to quantify asset impacts for a natural hazard event or scenario (Table 2.1).
Figure 2.1 RiskScape Framework.
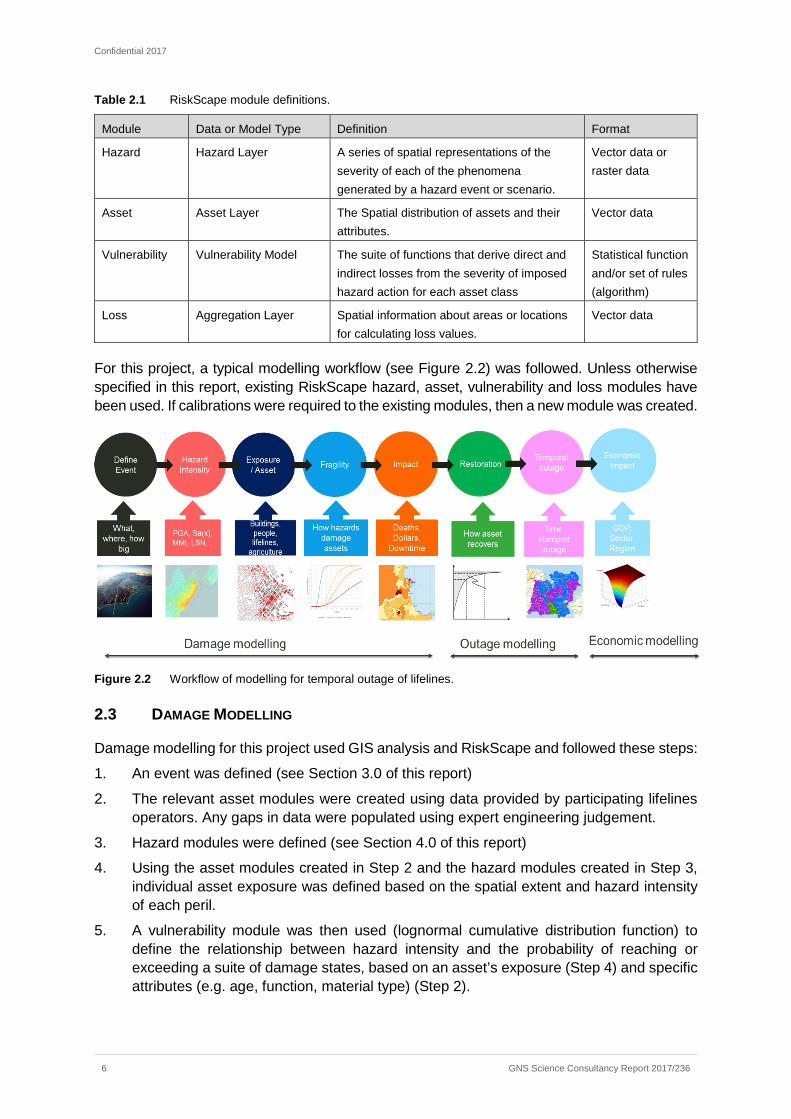
Confidential 2017
6 GNS Science Consultancy Report 2017/236
Table 2.1 RiskScape module definitions.
Module Data or Model Type Definition Format
Hazard Hazard Layer A series of spatial representations of the severity of each of the phenomena generated by a hazard event or scenario.
Vector data or raster data
Asset Asset Layer The Spatial distribution of assets and their attributes.
Vector data
Vulnerability Vulnerability Model The suite of functions that derive direct and indirect losses from the severity of imposed hazard action for each asset class
Statistical function and/or set of rules (algorithm)
Loss Aggregation Layer Spatial information about areas or locations for calculating loss values.
Vector data
For this project, a typical modelling workflow (see Figure 2.2) was followed. Unless otherwise specified in this report, existing RiskScape hazard, asset, vulnerability and loss modules have been used. If calibrations were required to the existing modules, then a new module was created.
Figure 2.2 Workflow of modelling for temporal outage of lifelines.
2.3 DAMAGE MODELLING
Damage modelling for this project used GIS analysis and RiskScape and followed these steps:
1. An event was defined (see Section 3.0 of this report)
2. The relevant asset modules were created using data provided by participating lifelines operators. Any gaps in data were populated using expert engineering judgement.
3. Hazard modules were defined (see Section 4.0 of this report)
4. Using the asset modules created in Step 2 and the hazard modules created in Step 3, individual asset exposure was defined based on the spatial extent and hazard intensity of each peril.
5. A vulnerability module was then used (lognormal cumulative distribution function) to define the relationship between hazard intensity and the probability of reaching or exceeding a suite of damage states, based on an asset’s exposure (Step 4) and specific attributes (e.g. age, function, material type) (Step 2).
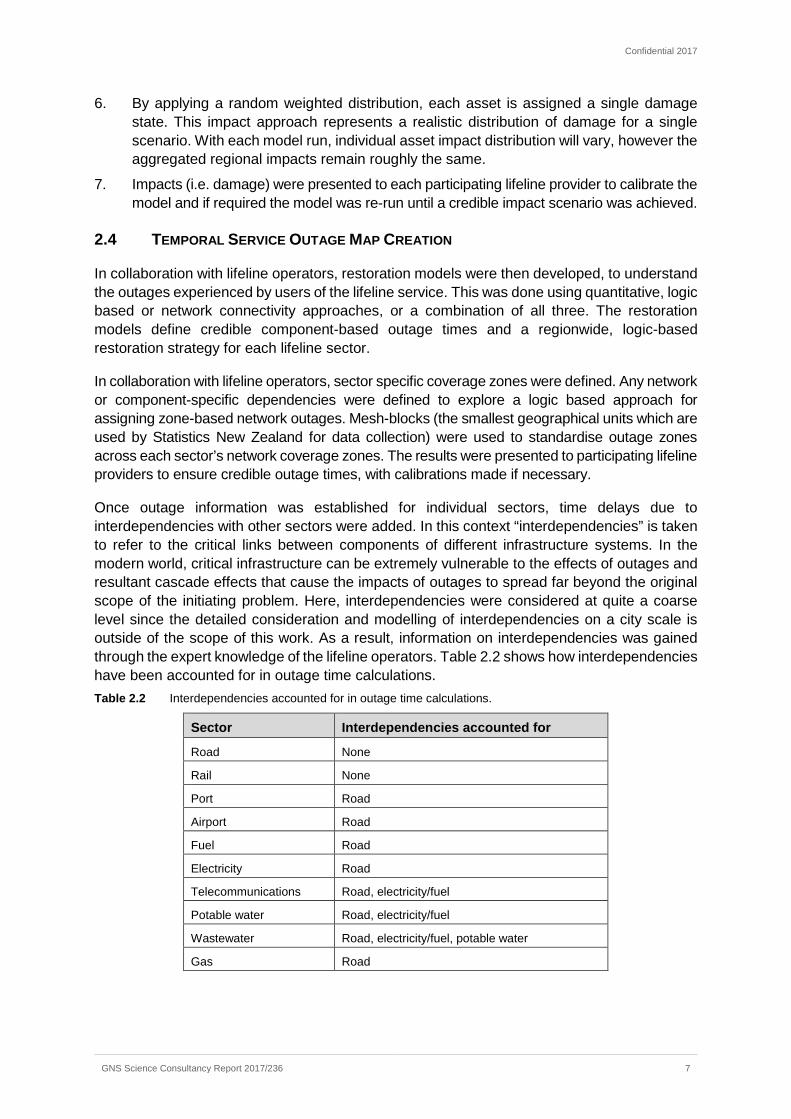
Confidential 2017
GNS Science Consultancy Report 2017/236 7
6. By applying a random weighted distribution, each asset is assigned a single damage state. This impact approach represents a realistic distribution of damage for a single scenario. With each model run, individual asset impact distribution will vary, however the aggregated regional impacts remain roughly the same.
7. Impacts (i.e. damage) were presented to each participating lifeline provider to calibrate the model and if required the model was re-run until a credible impact scenario was achieved.
2.4 TEMPORAL SERVICE OUTAGE MAP CREATION
In collaboration with lifeline operators, restoration models were then developed, to understand the outages experienced by users of the lifeline service. This was done using quantitative, logic based or network connectivity approaches, or a combination of all three. The restoration models define credible component-based outage times and a regionwide, logic-based restoration strategy for each lifeline sector.
In collaboration with lifeline operators, sector specific coverage zones were defined. Any network or component-specific dependencies were defined to explore a logic based approach for assigning zone-based network outages. Mesh-blocks (the smallest geographical units which are used by Statistics New Zealand for data collection) were used to standardise outage zones across each sector’s network coverage zones. The results were presented to participating lifeline providers to ensure credible outage times, with calibrations made if necessary.
Once outage information was established for individual sectors, time delays due to interdependencies with other sectors were added. In this context “interdependencies” is taken to refer to the critical links between components of different infrastructure systems. In the modern world, critical infrastructure can be extremely vulnerable to the effects of outages and resultant cascade effects that cause the impacts of outages to spread far beyond the original scope of the initiating problem. Here, interdependencies were considered at quite a coarse level since the detailed consideration and modelling of interdependencies on a city scale is outside of the scope of this work. As a result, information on interdependencies was gained through the expert knowledge of the lifeline operators. Table 2.2 shows how interdependencies have been accounted for in outage time calculations. Table 2.2 Interdependencies accounted for in outage time calculations.
Sector Interdependencies accounted for
Road None
Rail None
Port Road
Airport Road
Fuel Road
Electricity Road
Telecommunications Road, electricity/fuel
Potable water Road, electricity/fuel
Wastewater Road, electricity/fuel, potable water
Gas Road

Confidential 2017
8 GNS Science Consultancy Report 2017/236
GIS analysis was used to create outage information and maps. Time (days), spatial (meshblock), and service level (on or off) data was provided to the MERIT modellers. Representations of this information was presented on maps, using time bands rather than actual numbers of days, so that outage information could be compared across maps and sectors. This was considered useful by the project team for presenting the information in the business case workshops.
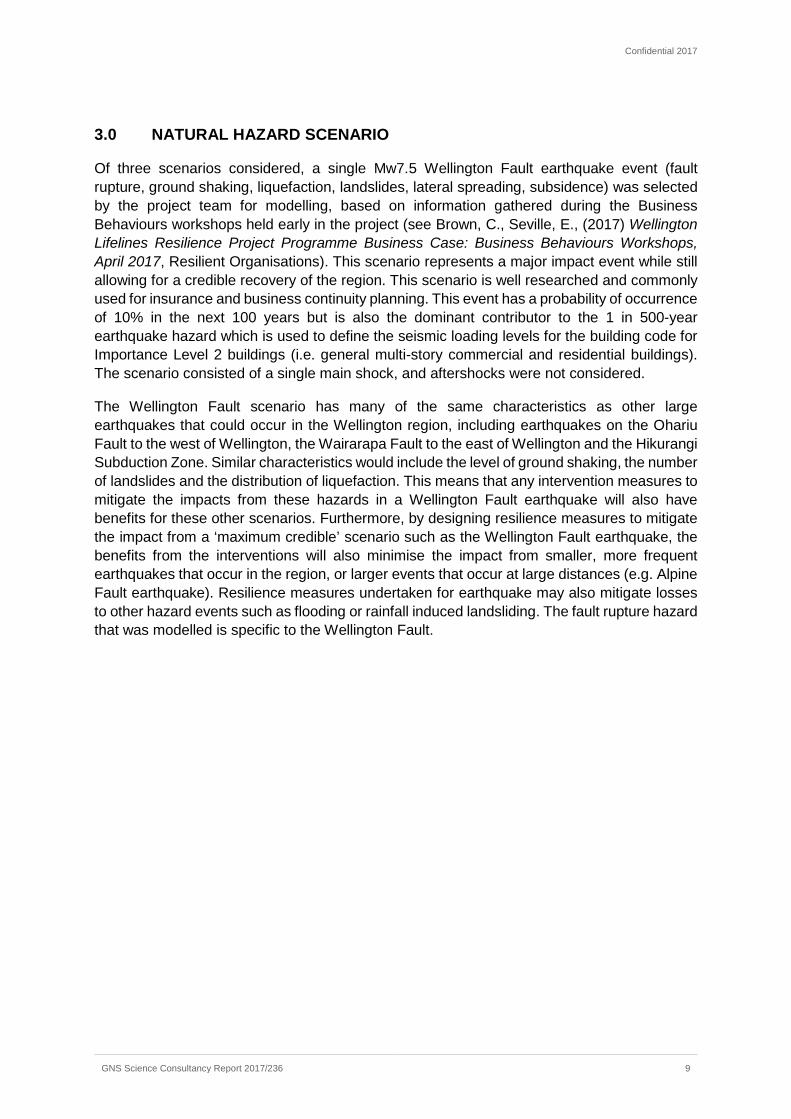
Confidential 2017
GNS Science Consultancy Report 2017/236 9
3.0 NATURAL HAZARD SCENARIO
Of three scenarios considered, a single Mw7.5 Wellington Fault earthquake event (fault rupture, ground shaking, liquefaction, landslides, lateral spreading, subsidence) was selected by the project team for modelling, based on information gathered during the Business Behaviours workshops held early in the project (see Brown, C., Seville, E., (2017) Wellington Lifelines Resilience Project Programme Business Case: Business Behaviours Workshops, April 2017, Resilient Organisations). This scenario represents a major impact event while still allowing for a credible recovery of the region. This scenario is well researched and commonly used for insurance and business continuity planning. This event has a probability of occurrence of 10% in the next 100 years but is also the dominant contributor to the 1 in 500-year earthquake hazard which is used to define the seismic loading levels for the building code for Importance Level 2 buildings (i.e. general multi-story commercial and residential buildings). The scenario consisted of a single main shock, and aftershocks were not considered.
The Wellington Fault scenario has many of the same characteristics as other large earthquakes that could occur in the Wellington region, including earthquakes on the Ohariu Fault to the west of Wellington, the Wairarapa Fault to the east of Wellington and the Hikurangi Subduction Zone. Similar characteristics would include the level of ground shaking, the number of landslides and the distribution of liquefaction. This means that any intervention measures to mitigate the impacts from these hazards in a Wellington Fault earthquake will also have benefits for these other scenarios. Furthermore, by designing resilience measures to mitigate the impact from a ‘maximum credible’ scenario such as the Wellington Fault earthquake, the benefits from the interventions will also minimise the impact from smaller, more frequent earthquakes that occur in the region, or larger events that occur at large distances (e.g. Alpine Fault earthquake). Resilience measures undertaken for earthquake may also mitigate losses to other hazard events such as flooding or rainfall induced landsliding. The fault rupture hazard that was modelled is specific to the Wellington Fault.

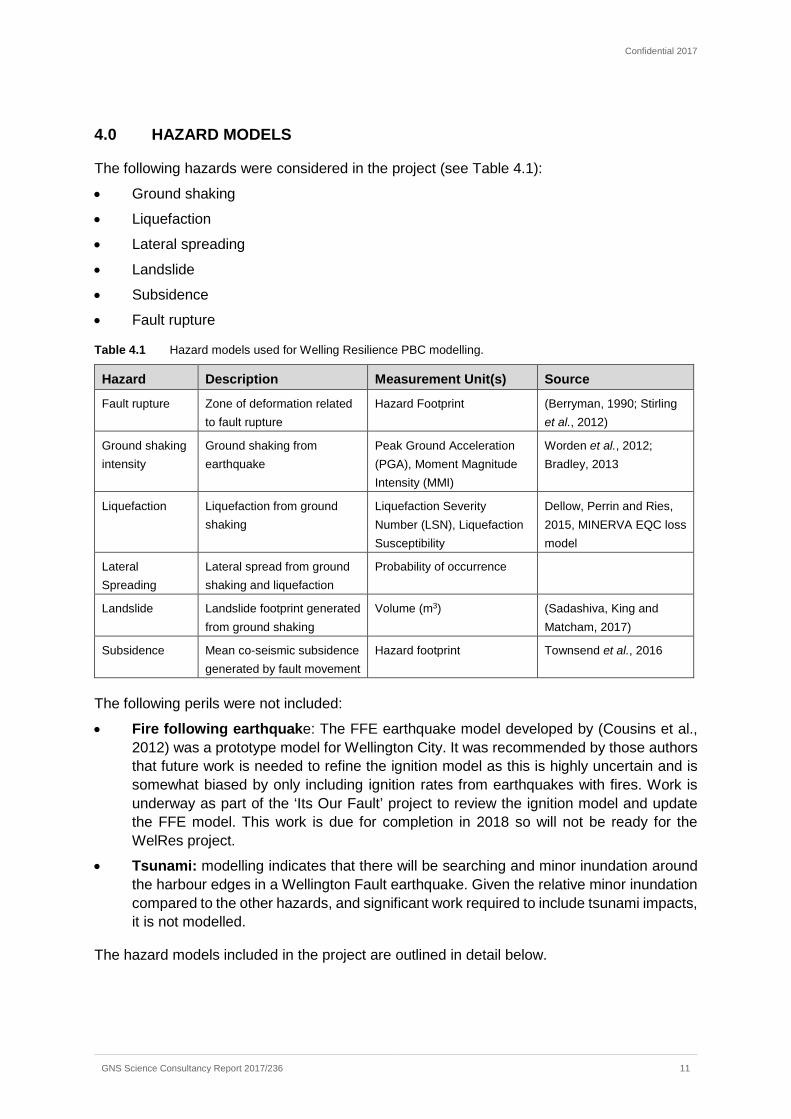
Confidential 2017
GNS Science Consultancy Report 2017/236 11
4.0 HAZARD MODELS
The following hazards were considered in the project (see Table 4.1):
• Ground shaking
• Liquefaction
• Lateral spreading
• Landslide
• Subsidence
• Fault rupture
Table 4.1 Hazard models used for Welling Resilience PBC modelling.
Hazard Description Measurement Unit(s) Source
Fault rupture Zone of deformation related to fault rupture
Hazard Footprint (Berryman, 1990; Stirling et al., 2012)
Ground shaking intensity
Ground shaking from earthquake
Peak Ground Acceleration (PGA), Moment Magnitude Intensity (MMI)
Worden et al., 2012; Bradley, 2013
Liquefaction Liquefaction from ground shaking
Liquefaction Severity Number (LSN), Liquefaction Susceptibility
Dellow, Perrin and Ries, 2015, MINERVA EQC loss model
Lateral Spreading
Lateral spread from ground shaking and liquefaction
Probability of occurrence
Landslide Landslide footprint generated from ground shaking
Volume (m3) (Sadashiva, King and Matcham, 2017)
Subsidence Mean co-seismic subsidence generated by fault movement
Hazard footprint Townsend et al., 2016
The following perils were not included:
• Fire following earthquake: The FFE earthquake model developed by (Cousins et al., 2012) was a prototype model for Wellington City. It was recommended by those authors that future work is needed to refine the ignition model as this is highly uncertain and is somewhat biased by only including ignition rates from earthquakes with fires. Work is underway as part of the ‘Its Our Fault’ project to review the ignition model and update the FFE model. This work is due for completion in 2018 so will not be ready for the WelRes project.
• Tsunami: modelling indicates that there will be searching and minor inundation around the harbour edges in a Wellington Fault earthquake. Given the relative minor inundation compared to the other hazards, and significant work required to include tsunami impacts, it is not modelled.
The hazard models included in the project are outlined in detail below.
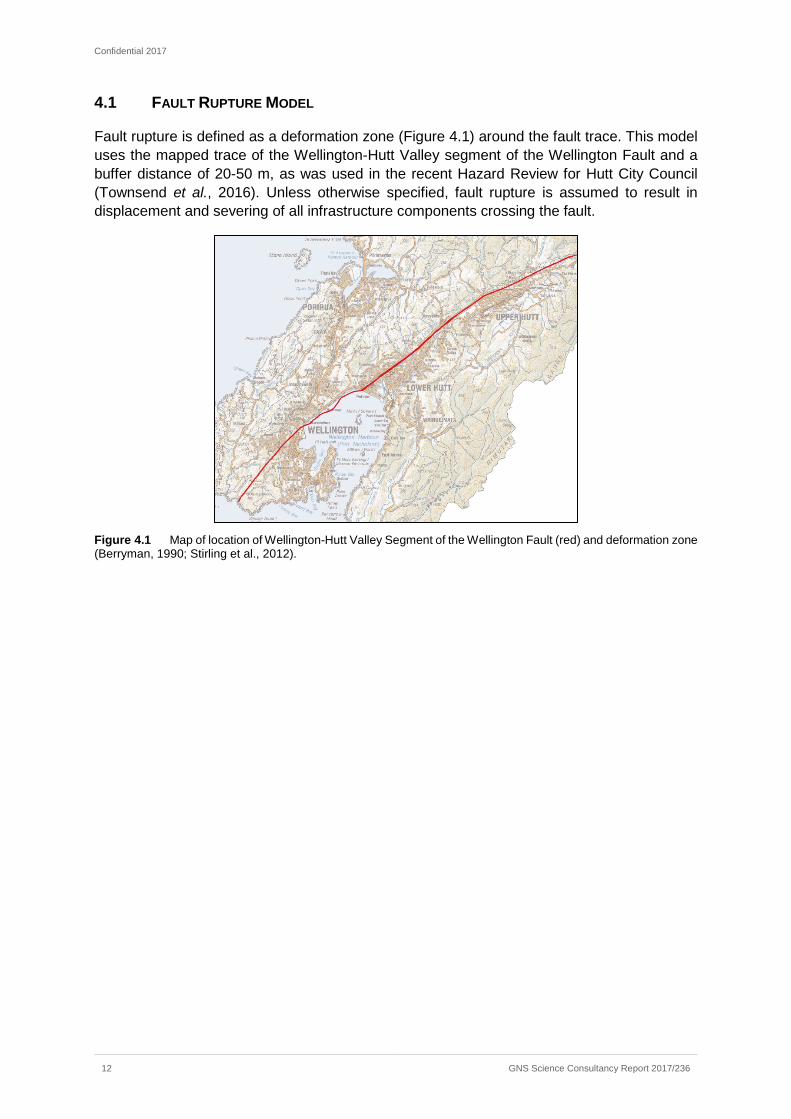
Confidential 2017
12 GNS Science Consultancy Report 2017/236
4.1 FAULT RUPTURE MODEL
Fault rupture is defined as a deformation zone (Figure 4.1) around the fault trace. This model uses the mapped trace of the Wellington-Hutt Valley segment of the Wellington Fault and a buffer distance of 20-50 m, as was used in the recent Hazard Review for Hutt City Council (Townsend et al., 2016). Unless otherwise specified, fault rupture is assumed to result in displacement and severing of all infrastructure components crossing the fault.
Figure 4.1 Map of location of Wellington-Hutt Valley Segment of the Wellington Fault (red) and deformation zone (Berryman, 1990; Stirling et al., 2012).
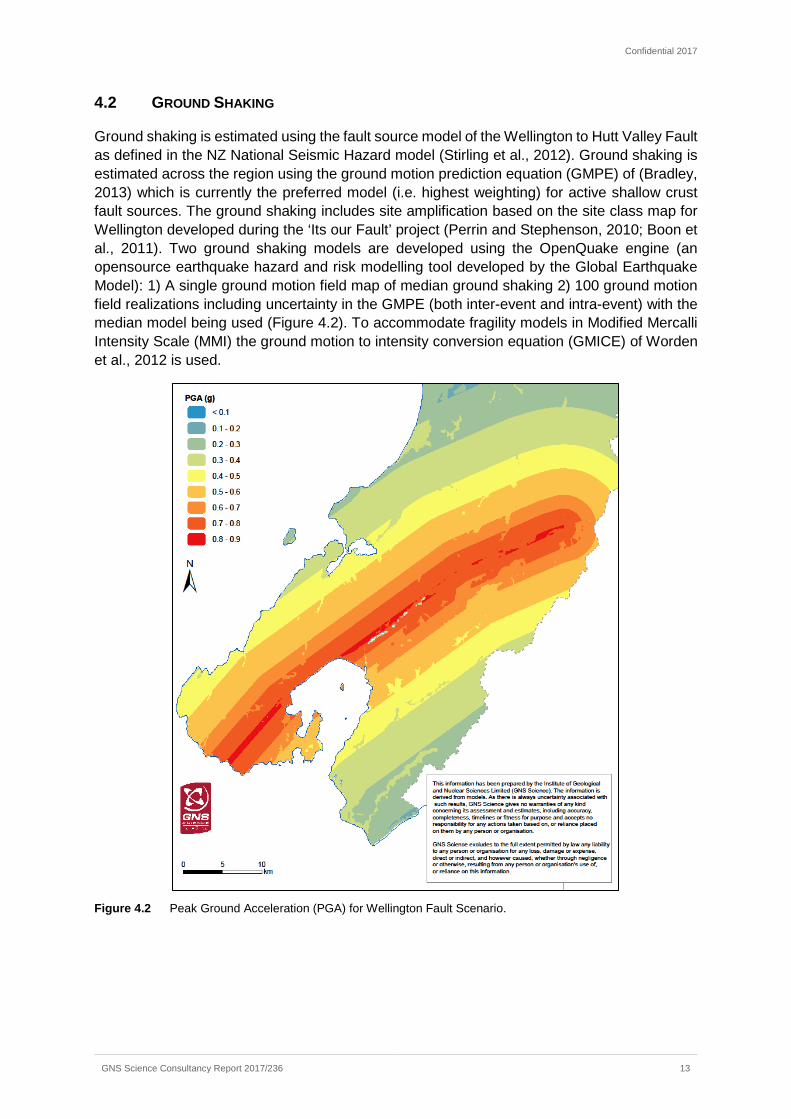
Confidential 2017
GNS Science Consultancy Report 2017/236 13
4.2 GROUND SHAKING
Ground shaking is estimated using the fault source model of the Wellington to Hutt Valley Fault as defined in the NZ National Seismic Hazard model (Stirling et al., 2012). Ground shaking is estimated across the region using the ground motion prediction equation (GMPE) of (Bradley, 2013) which is currently the preferred model (i.e. highest weighting) for active shallow crust fault sources. The ground shaking includes site amplification based on the site class map for Wellington developed during the ‘Its our Fault’ project (Perrin and Stephenson, 2010; Boon et al., 2011). Two ground shaking models are developed using the OpenQuake engine (an opensource earthquake hazard and risk modelling tool developed by the Global Earthquake Model): 1) A single ground motion field map of median ground shaking 2) 100 ground motion field realizations including uncertainty in the GMPE (both inter-event and intra-event) with the median model being used (Figure 4.2). To accommodate fragility models in Modified Mercalli Intensity Scale (MMI) the ground motion to intensity conversion equation (GMICE) of Worden et al., 2012 is used.
Figure 4.2 Peak Ground Acceleration (PGA) for Wellington Fault Scenario.
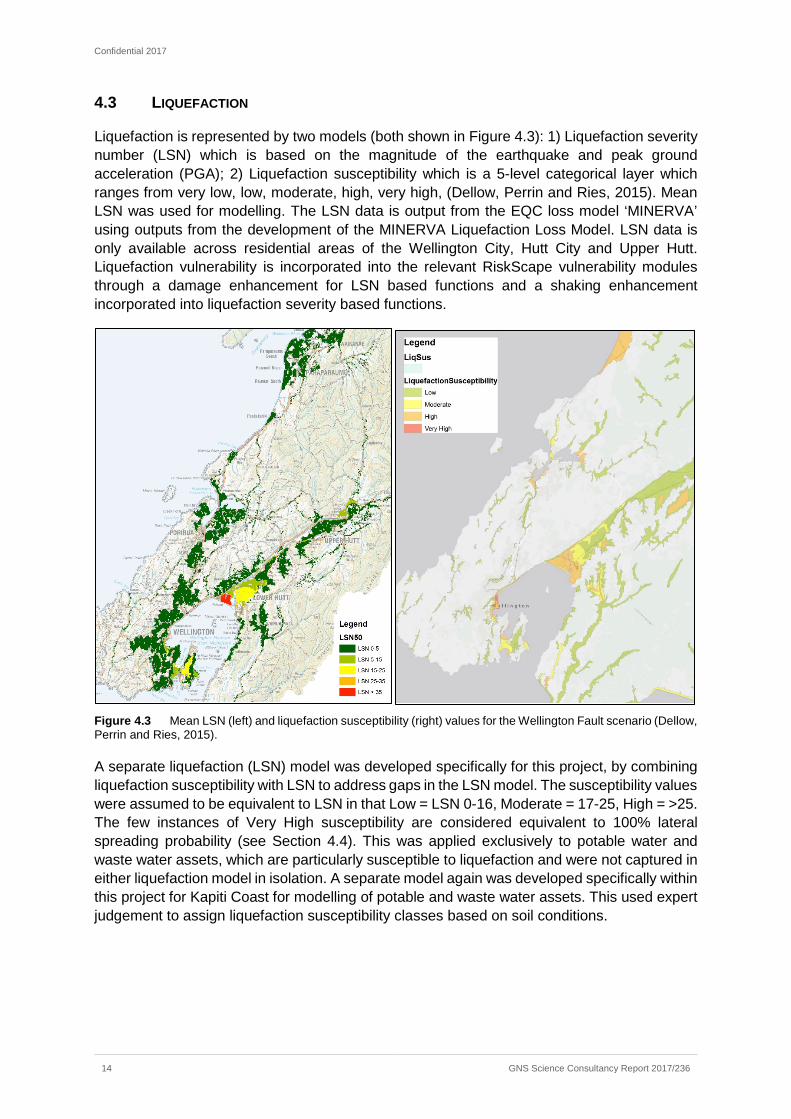
Confidential 2017
14 GNS Science Consultancy Report 2017/236
4.3 LIQUEFACTION
Liquefaction is represented by two models (both shown in Figure 4.3): 1) Liquefaction severity number (LSN) which is based on the magnitude of the earthquake and peak ground acceleration (PGA); 2) Liquefaction susceptibility which is a 5-level categorical layer which ranges from very low, low, moderate, high, very high, (Dellow, Perrin and Ries, 2015). Mean LSN was used for modelling. The LSN data is output from the EQC loss model ‘MINERVA’ using outputs from the development of the MINERVA Liquefaction Loss Model. LSN data is only available across residential areas of the Wellington City, Hutt City and Upper Hutt. Liquefaction vulnerability is incorporated into the relevant RiskScape vulnerability modules through a damage enhancement for LSN based functions and a shaking enhancement incorporated into liquefaction severity based functions.
Figure 4.3 Mean LSN (left) and liquefaction susceptibility (right) values for the Wellington Fault scenario (Dellow, Perrin and Ries, 2015).
A separate liquefaction (LSN) model was developed specifically for this project, by combining liquefaction susceptibility with LSN to address gaps in the LSN model. The susceptibility values were assumed to be equivalent to LSN in that Low = LSN 0-16, Moderate = 17-25, High = >25. The few instances of Very High susceptibility are considered equivalent to 100% lateral spreading probability (see Section 4.4). This was applied exclusively to potable water and waste water assets, which are particularly susceptible to liquefaction and were not captured in either liquefaction model in isolation. A separate model again was developed specifically within this project for Kapiti Coast for modelling of potable and waste water assets. This used expert judgement to assign liquefaction susceptibility classes based on soil conditions.
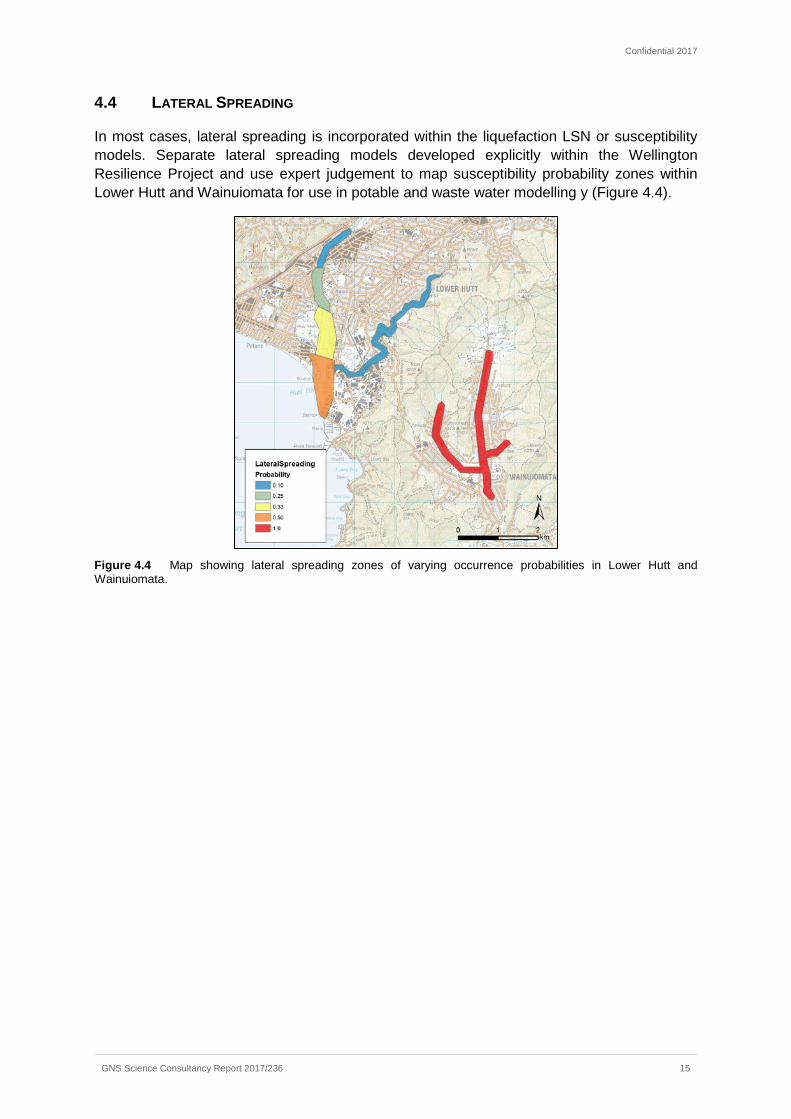
Confidential 2017
GNS Science Consultancy Report 2017/236 15
4.4 LATERAL SPREADING
In most cases, lateral spreading is incorporated within the liquefaction LSN or susceptibility models. Separate lateral spreading models developed explicitly within the Wellington Resilience Project and use expert judgement to map susceptibility probability zones within Lower Hutt and Wainuiomata for use in potable and waste water modelling y (Figure 4.4).
Figure 4.4 Map showing lateral spreading zones of varying occurrence probabilities in Lower Hutt and Wainuiomata.
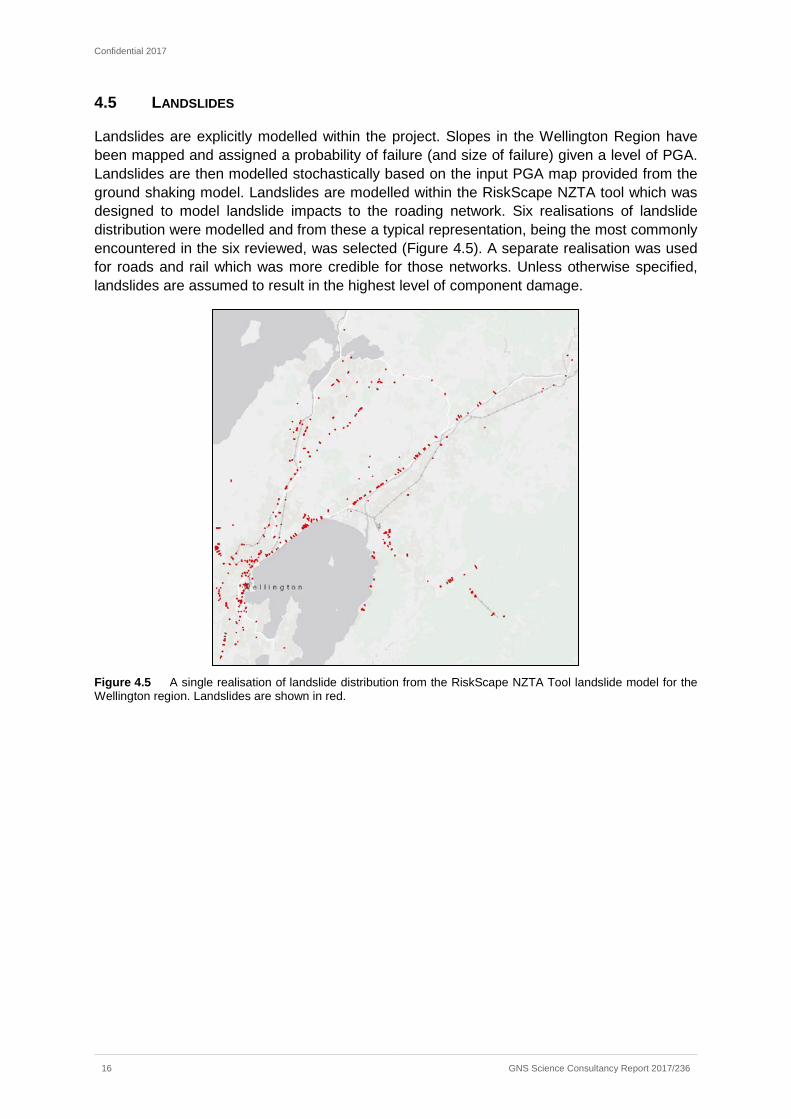
Confidential 2017
16 GNS Science Consultancy Report 2017/236
4.5 LANDSLIDES
Landslides are explicitly modelled within the project. Slopes in the Wellington Region have been mapped and assigned a probability of failure (and size of failure) given a level of PGA. Landslides are then modelled stochastically based on the input PGA map provided from the ground shaking model. Landslides are modelled within the RiskScape NZTA tool which was designed to model landslide impacts to the roading network. Six realisations of landslide distribution were modelled and from these a typical representation, being the most commonly encountered in the six reviewed, was selected (Figure 4.5). A separate realisation was used for roads and rail which was more credible for those networks. Unless otherwise specified, landslides are assumed to result in the highest level of component damage.
Figure 4.5 A single realisation of landslide distribution from the RiskScape NZTA Tool landslide model for the Wellington region. Landslides are shown in red.
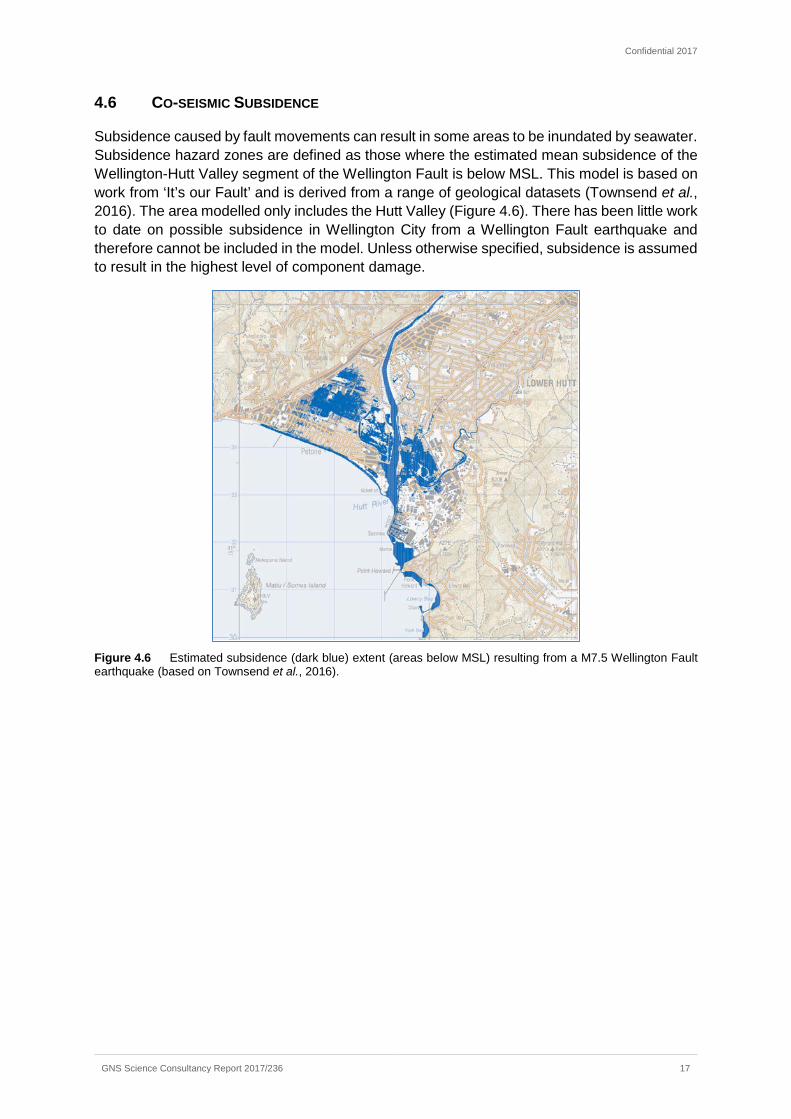
Confidential 2017
GNS Science Consultancy Report 2017/236 17
4.6 CO-SEISMIC SUBSIDENCE
Subsidence caused by fault movements can result in some areas to be inundated by seawater. Subsidence hazard zones are defined as those where the estimated mean subsidence of the Wellington-Hutt Valley segment of the Wellington Fault is below MSL. This model is based on work from ‘It’s our Fault’ and is derived from a range of geological datasets (Townsend et al., 2016). The area modelled only includes the Hutt Valley (Figure 4.6). There has been little work to date on possible subsidence in Wellington City from a Wellington Fault earthquake and therefore cannot be included in the model. Unless otherwise specified, subsidence is assumed to result in the highest level of component damage.
Figure 4.6 Estimated subsidence (dark blue) extent (areas below MSL) resulting from a M7.5 Wellington Fault earthquake (based on Townsend et al., 2016).

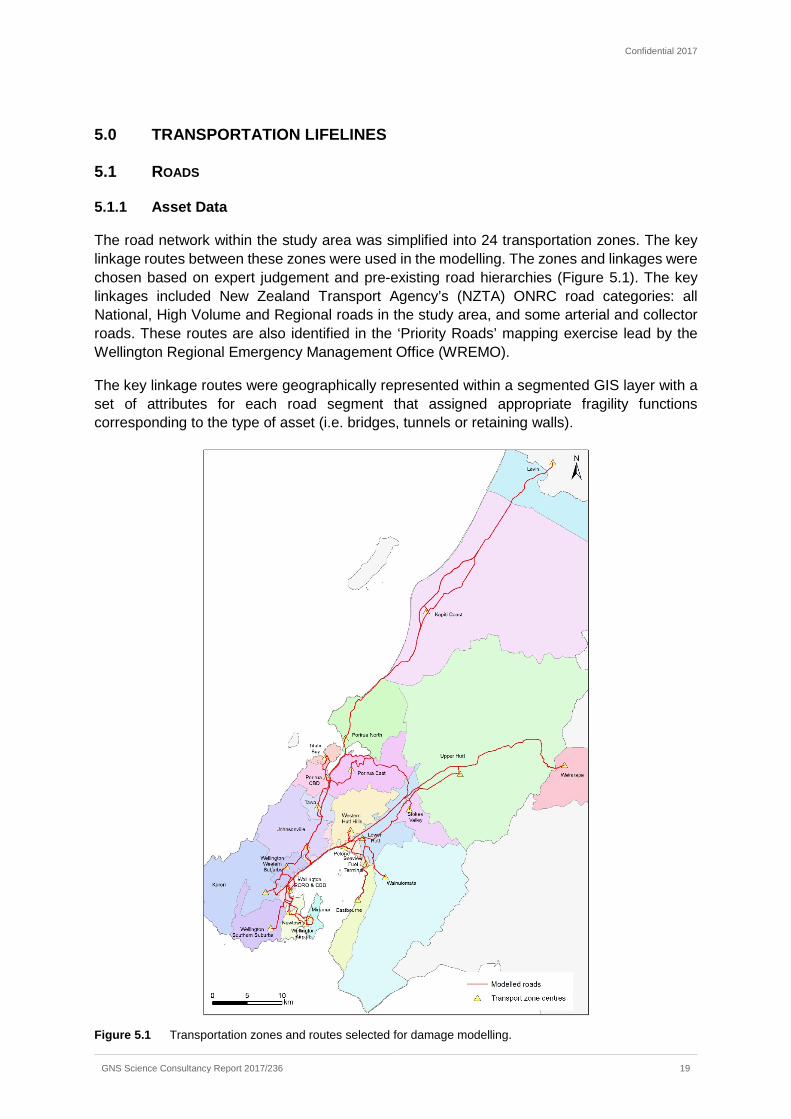
Confidential 2017
GNS Science Consultancy Report 2017/236 19
5.0 TRANSPORTATION LIFELINES
5.1 ROADS
5.1.1 Asset Data
The road network within the study area was simplified into 24 transportation zones. The key linkage routes between these zones were used in the modelling. The zones and linkages were chosen based on expert judgement and pre-existing road hierarchies (Figure 5.1). The key linkages included New Zealand Transport Agency’s (NZTA) ONRC road categories: all National, High Volume and Regional roads in the study area, and some arterial and collector roads. These routes are also identified in the ‘Priority Roads’ mapping exercise lead by the Wellington Regional Emergency Management Office (WREMO).
The key linkage routes were geographically represented within a segmented GIS layer with a set of attributes for each road segment that assigned appropriate fragility functions corresponding to the type of asset (i.e. bridges, tunnels or retaining walls).
Figure 5.1 Transportation zones and routes selected for damage modelling.
Confidential 2017
20 GNS Science Consultancy Report 2017/236
5.1.2 Vulnerability and Impact Modelling
Impacts of the Wellington Fault earthquake on the road network was estimated using vulnerability models incorporated within the GNS-NZTA Road Risk Evaluation Tool (Sadashiva, King and Matcham, 2017). Past and recent earthquakes have shown that bridges, tunnels and retaining walls are the common road structures that are vulnerable to ground shaking, while significant damage to the road itself are also evident due to ground failure (e.g. liquefaction and surface fault rupture). Therefore, the above road assets (roads, bridges, retaining walls) were selected for damage modelling, and fragility functions previously developed (King et. al. 2015) were applied for such assets along the selected routes for this study. Where additional / detailed information on the assets were made available by the roading managers such information was also used for damage modelling.
Damage to one or more assets due to an earthquake can result in disruption to the normal traffic flow at any road segment. Table 5.1 outlines the Service Disruption Levels (SDL) adopted for this project. Figure 5.2 shows the road disruption map for the earthquake event considered for this project. The map shows the critical SDL for each road segment. For example, consider a road segment with a bridge and a tunnel; if the SDL due to bridge damage = 3, SDL due to tunnel damage is 2 and SDL due to damage to road itself is 4 (note these are critical SDL as a result of damages due to all considered perils associated with the event for each asset), then the final SDL reported for the road segment is the maximum SDL (= 4 in this example).
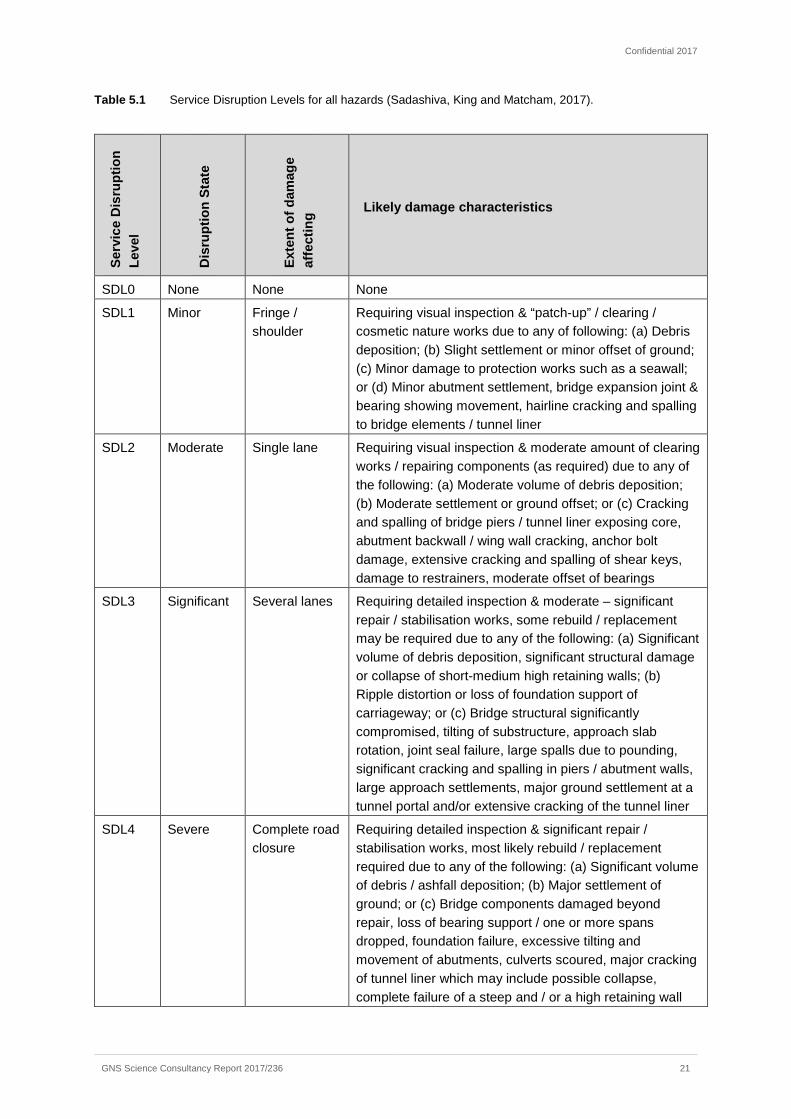
Confidential 2017
GNS Science Consultancy Report 2017/236 21
Table 5.1 Service Disruption Levels for all hazards (Sadashiva, King and Matcham, 2017). Se
rvic
e D
isru
ptio
n Le
vel
Dis
rupt
ion
Stat
e
Exte
nt o
f dam
age
affe
ctin
g Likely damage characteristics
SDL0 None None None
SDL1 Minor Fringe / shoulder
Requiring visual inspection & “patch-up” / clearing / cosmetic nature works due to any of following: (a) Debris deposition; (b) Slight settlement or minor offset of ground; (c) Minor damage to protection works such as a seawall; or (d) Minor abutment settlement, bridge expansion joint & bearing showing movement, hairline cracking and spalling to bridge elements / tunnel liner
SDL2 Moderate Single lane Requiring visual inspection & moderate amount of clearing works / repairing components (as required) due to any of the following: (a) Moderate volume of debris deposition; (b) Moderate settlement or ground offset; or (c) Cracking and spalling of bridge piers / tunnel liner exposing core, abutment backwall / wing wall cracking, anchor bolt damage, extensive cracking and spalling of shear keys, damage to restrainers, moderate offset of bearings
SDL3 Significant Several lanes Requiring detailed inspection & moderate – significant repair / stabilisation works, some rebuild / replacement may be required due to any of the following: (a) Significant volume of debris deposition, significant structural damage or collapse of short-medium high retaining walls; (b) Ripple distortion or loss of foundation support of carriageway; or (c) Bridge structural significantly compromised, tilting of substructure, approach slab rotation, joint seal failure, large spalls due to pounding, significant cracking and spalling in piers / abutment walls, large approach settlements, major ground settlement at a tunnel portal and/or extensive cracking of the tunnel liner
SDL4 Severe Complete road closure
Requiring detailed inspection & significant repair / stabilisation works, most likely rebuild / replacement required due to any of the following: (a) Significant volume of debris / ashfall deposition; (b) Major settlement of ground; or (c) Bridge components damaged beyond repair, loss of bearing support / one or more spans dropped, foundation failure, excessive tilting and movement of abutments, culverts scoured, major cracking of tunnel liner which may include possible collapse, complete failure of a steep and / or a high retaining wall
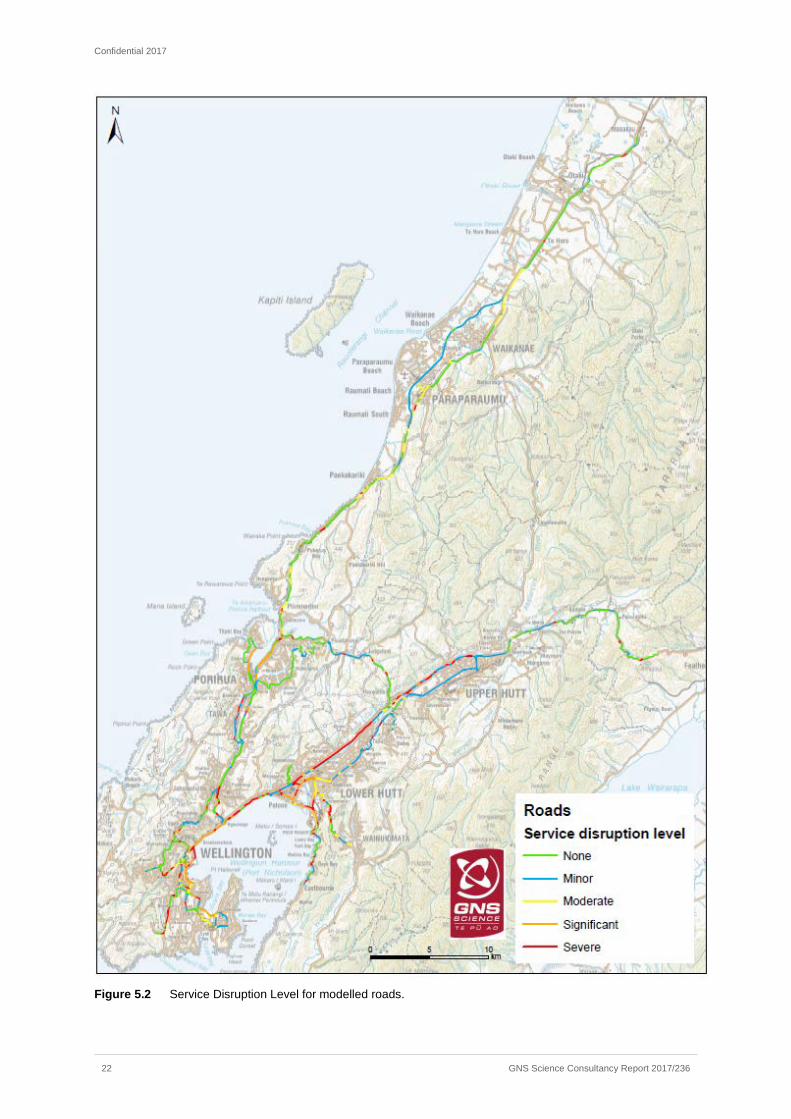
Confidential 2017
22 GNS Science Consultancy Report 2017/236
Figure 5.2 Service Disruption Level for modelled roads.
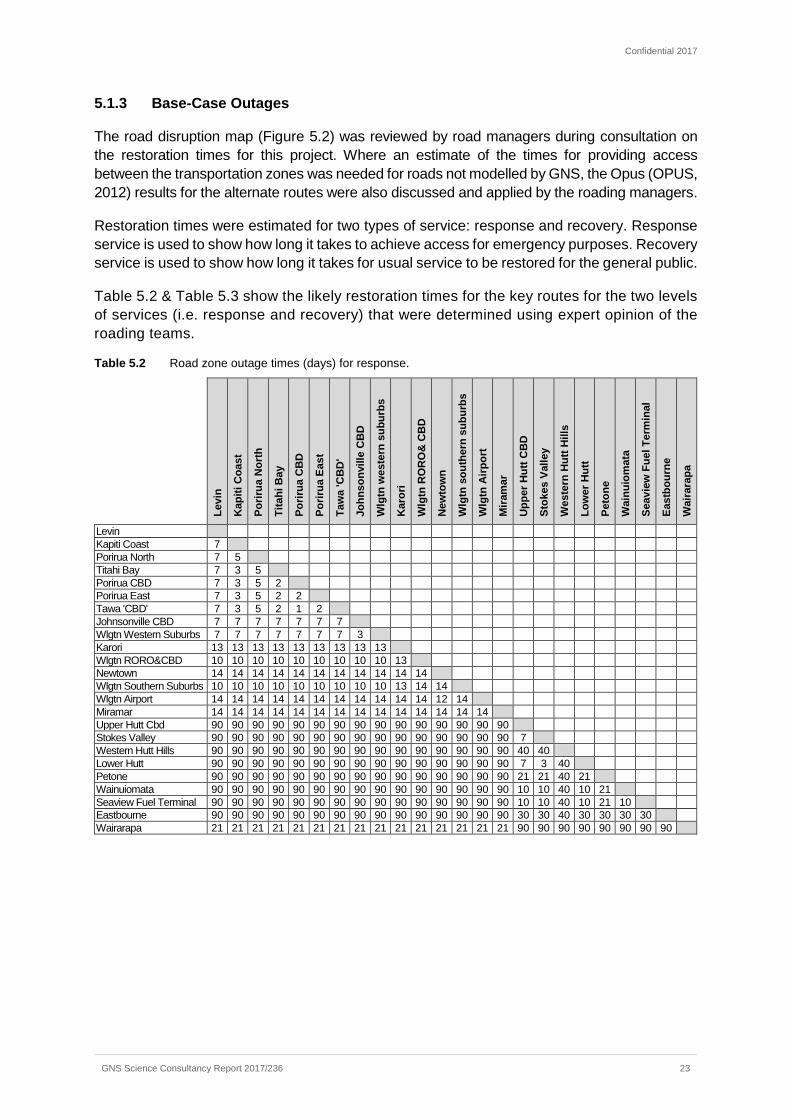
Confidential 2017
GNS Science Consultancy Report 2017/236 23
5.1.3 Base-Case Outages
The road disruption map (Figure 5.2) was reviewed by road managers during consultation on the restoration times for this project. Where an estimate of the times for providing access between the transportation zones was needed for roads not modelled by GNS, the Opus (OPUS, 2012) results for the alternate routes were also discussed and applied by the roading managers.
Restoration times were estimated for two types of service: response and recovery. Response service is used to show how long it takes to achieve access for emergency purposes. Recovery service is used to show how long it takes for usual service to be restored for the general public.
Table 5.2 & Table 5.3 show the likely restoration times for the key routes for the two levels of services (i.e. response and recovery) that were determined using expert opinion of the roading teams.
Table 5.2 Road zone outage times (days) for response.
Levi
n
Kap
iti C
oast
Porir
ua N
orth
Tita
hi B
ay
Porir
ua C
BD
Porir
ua E
ast
Taw
a 'C
BD'
John
sonv
ille
CB
D
Wlg
tn w
este
rn s
ubur
bs
Kar
ori
Wlg
tn R
ORO
& CB
D
New
tow
n
Wlg
tn s
outh
ern
subu
rbs
Wlg
tn A
irpor
t
Mira
mar
Uppe
r Hut
t CBD
Stok
es V
alle
y
Wes
tern
Hut
t Hill
s
Low
er H
utt
Peto
ne
Wai
nuio
mat
a
Seav
iew
Fue
l Ter
min
al
East
bour
ne
Wai
rara
pa
Levin Kapiti Coast 7 Porirua North 7 5 Titahi Bay 7 3 5 Porirua CBD 7 3 5 2 Porirua East 7 3 5 2 2 Tawa 'CBD' 7 3 5 2 1 2 Johnsonville CBD 7 7 7 7 7 7 7 Wlgtn Western Suburbs 7 7 7 7 7 7 7 3 Karori 13 13 13 13 13 13 13 13 13 Wlgtn RORO&CBD 10 10 10 10 10 10 10 10 10 13 Newtown 14 14 14 14 14 14 14 14 14 14 14 Wlgtn Southern Suburbs 10 10 10 10 10 10 10 10 10 13 14 14 Wlgtn Airport 14 14 14 14 14 14 14 14 14 14 14 12 14 Miramar 14 14 14 14 14 14 14 14 14 14 14 14 14 14 Upper Hutt Cbd 90 90 90 90 90 90 90 90 90 90 90 90 90 90 90 Stokes Valley 90 90 90 90 90 90 90 90 90 90 90 90 90 90 90 7 Western Hutt Hills 90 90 90 90 90 90 90 90 90 90 90 90 90 90 90 40 40 Lower Hutt 90 90 90 90 90 90 90 90 90 90 90 90 90 90 90 7 3 40 Petone 90 90 90 90 90 90 90 90 90 90 90 90 90 90 90 21 21 40 21 Wainuiomata 90 90 90 90 90 90 90 90 90 90 90 90 90 90 90 10 10 40 10 21 Seaview Fuel Terminal 90 90 90 90 90 90 90 90 90 90 90 90 90 90 90 10 10 40 10 21 10 Eastbourne 90 90 90 90 90 90 90 90 90 90 90 90 90 90 90 30 30 40 30 30 30 30 Wairarapa 21 21 21 21 21 21 21 21 21 21 21 21 21 21 21 90 90 90 90 90 90 90 90
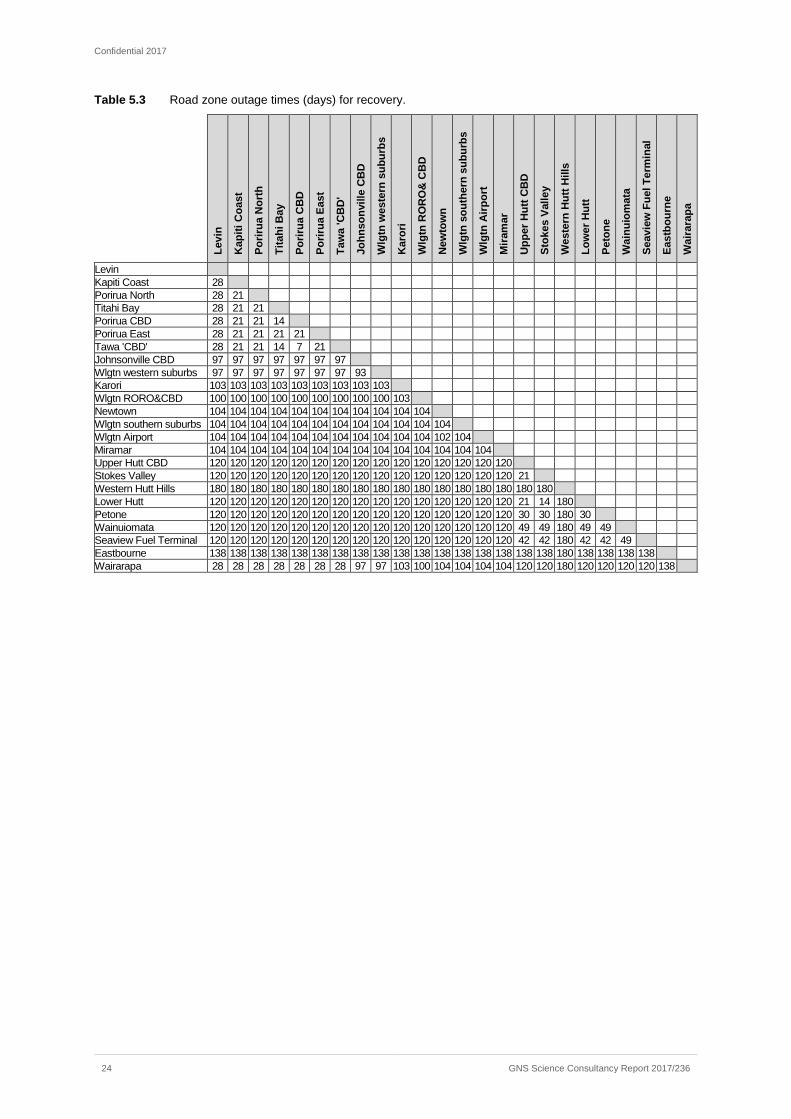
Confidential 2017
24 GNS Science Consultancy Report 2017/236
Table 5.3 Road zone outage times (days) for recovery.
Levi
n
Kap
iti C
oast
Porir
ua N
orth
Tita
hi B
ay
Porir
ua C
BD
Porir
ua E
ast
Taw
a 'C
BD
'
John
sonv
ille
CB
D
Wlg
tn w
este
rn s
ubur
bs
Kar
ori
Wlg
tn R
OR
O&
CB
D
New
tow
n
Wlg
tn s
outh
ern
subu
rbs
Wlg
tn A
irpor
t
Mira
mar
Upp
er H
utt C
BD
Stok
es V
alle
y
Wes
tern
Hut
t Hill
s
Low
er H
utt
Peto
ne
Wai
nuio
mat
a
Seav
iew
Fue
l Ter
min
al
East
bour
ne
Wai
rara
pa
Levin Kapiti Coast 28 Porirua North 28 21 Titahi Bay 28 21 21 Porirua CBD 28 21 21 14 Porirua East 28 21 21 21 21 Tawa 'CBD' 28 21 21 14 7 21 Johnsonville CBD 97 97 97 97 97 97 97 Wlgtn western suburbs 97 97 97 97 97 97 97 93 Karori 103 103 103 103 103 103 103 103 103 Wlgtn RORO&CBD 100 100 100 100 100 100 100 100 100 103 Newtown 104 104 104 104 104 104 104 104 104 104 104 Wlgtn southern suburbs 104 104 104 104 104 104 104 104 104 104 104 104 Wlgtn Airport 104 104 104 104 104 104 104 104 104 104 104 102 104 Miramar 104 104 104 104 104 104 104 104 104 104 104 104 104 104 Upper Hutt CBD 120 120 120 120 120 120 120 120 120 120 120 120 120 120 120 Stokes Valley 120 120 120 120 120 120 120 120 120 120 120 120 120 120 120 21 Western Hutt Hills 180 180 180 180 180 180 180 180 180 180 180 180 180 180 180 180 180 Lower Hutt 120 120 120 120 120 120 120 120 120 120 120 120 120 120 120 21 14 180 Petone 120 120 120 120 120 120 120 120 120 120 120 120 120 120 120 30 30 180 30 Wainuiomata 120 120 120 120 120 120 120 120 120 120 120 120 120 120 120 49 49 180 49 49 Seaview Fuel Terminal 120 120 120 120 120 120 120 120 120 120 120 120 120 120 120 42 42 180 42 42 49 Eastbourne 138 138 138 138 138 138 138 138 138 138 138 138 138 138 138 138 138 180 138 138 138 138 Wairarapa 28 28 28 28 28 28 28 97 97 103 100 104 104 104 104 120 120 180 120 120 120 120 138
Confidential 2017
GNS Science Consultancy Report 2017/236 25
5.1.4 Intervention outages
Due to the nature of the intervention projects selected for this project (see below) it was decided after consultation with the respective roading teams that no explicit damage modelling of these projects was necessary. It was assumed that the proposed works will undergo detailed engineering assessments, geotechnical investigations, meet current standard requirements etc., and risks identified will be addressed accordingly.
Intervention projects: Wadestown to Johnsonville route - strengthening of supporting retaining walls and some engineering of major uphill slopes results in a reduction of outage time Middleton Road retaining walls upgrade – this link is not included in damage modelling and therefore has no effect on outage time for roads Clifton Terrace On-ramp bridge slope stabilisation - this link is not included in damage modelling and therefore has no effect on outage time for roads Ngauranga Gorge Accelerated Resilience – some slopes are proposed to be stabilised (minor works only), therefore this has no effect on outage time for roads Ngauranga to Petone Shared Pathway and realign rail - It was assumed that this initiative would not provide an access that would provide an economically viable access, so was not considered for input to the response or recovery matrices and therefore has no effect on outage times for roads SH58 Haywards seismic upgrades from TG to Hutt Valley - slope stabilisations of slopes above SH58 at Haywards Hill result in a reduction of outage times for respective zones Taita Gorge Access Strengthening – strengthening of a retaining wall (supporting the road) - results in a reduction of outage time Hutt River Bridges Strengthening – project already completed and strengthening works are not expected to withstand a Wellington fault rupture and therefore has no effect on road outage time East West Link – a new route including a new bridge across the Hutt river so resulting in a reduction to outage time Petone to Grenada - a new route resulting in a reduction to outage time RORO better engineered road links to port – some strengthening works to road network near port facility that is expected to result in a reduction to outage time Improve resilience of airport connectivity to city networks via Newtown – strengthening results in a reduction to road outage times
The intervention projects had been arranged into two programmes. The effects to road outages from the two intervention programmes is summarised in Table 5.4 & Table 5.5.
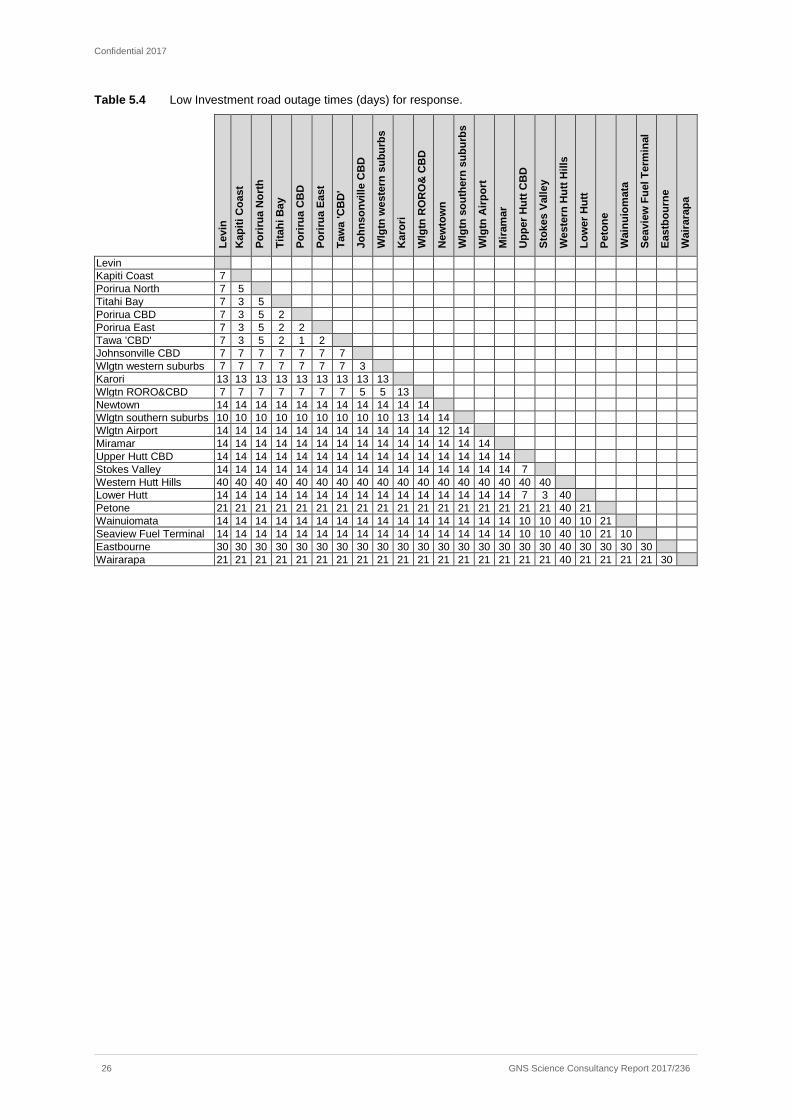
Confidential 2017
26 GNS Science Consultancy Report 2017/236
Table 5.4 Low Investment road outage times (days) for response.
Levi
n K
apiti
Coa
st
Porir
ua N
orth
Tita
hi B
ay
Porir
ua C
BD
Porir
ua E
ast
Taw
a 'C
BD
'
John
sonv
ille
CB
D
Wlg
tn w
este
rn s
ubur
bs
Kar
ori
Wlg
tn R
OR
O&
CB
D
New
tow
n
Wlg
tn s
outh
ern
subu
rbs
Wlg
tn A
irpor
t
Mira
mar
Upp
er H
utt C
BD
Stok
es V
alle
y
Wes
tern
Hut
t Hill
s
Low
er H
utt
Peto
ne
Wai
nuio
mat
a
Seav
iew
Fue
l Ter
min
al
East
bour
ne
Wai
rara
pa
Levin Kapiti Coast 7 Porirua North 7 5 Titahi Bay 7 3 5 Porirua CBD 7 3 5 2 Porirua East 7 3 5 2 2 Tawa 'CBD' 7 3 5 2 1 2 Johnsonville CBD 7 7 7 7 7 7 7 Wlgtn western suburbs 7 7 7 7 7 7 7 3 Karori 13 13 13 13 13 13 13 13 13 Wlgtn RORO&CBD 7 7 7 7 7 7 7 5 5 13 Newtown 14 14 14 14 14 14 14 14 14 14 14 Wlgtn southern suburbs 10 10 10 10 10 10 10 10 10 13 14 14 Wlgtn Airport 14 14 14 14 14 14 14 14 14 14 14 12 14 Miramar 14 14 14 14 14 14 14 14 14 14 14 14 14 14 Upper Hutt CBD 14 14 14 14 14 14 14 14 14 14 14 14 14 14 14 Stokes Valley 14 14 14 14 14 14 14 14 14 14 14 14 14 14 14 7 Western Hutt Hills 40 40 40 40 40 40 40 40 40 40 40 40 40 40 40 40 40 Lower Hutt 14 14 14 14 14 14 14 14 14 14 14 14 14 14 14 7 3 40 Petone 21 21 21 21 21 21 21 21 21 21 21 21 21 21 21 21 21 40 21 Wainuiomata 14 14 14 14 14 14 14 14 14 14 14 14 14 14 14 10 10 40 10 21 Seaview Fuel Terminal 14 14 14 14 14 14 14 14 14 14 14 14 14 14 14 10 10 40 10 21 10 Eastbourne 30 30 30 30 30 30 30 30 30 30 30 30 30 30 30 30 30 40 30 30 30 30 Wairarapa 21 21 21 21 21 21 21 21 21 21 21 21 21 21 21 21 21 40 21 21 21 21 30
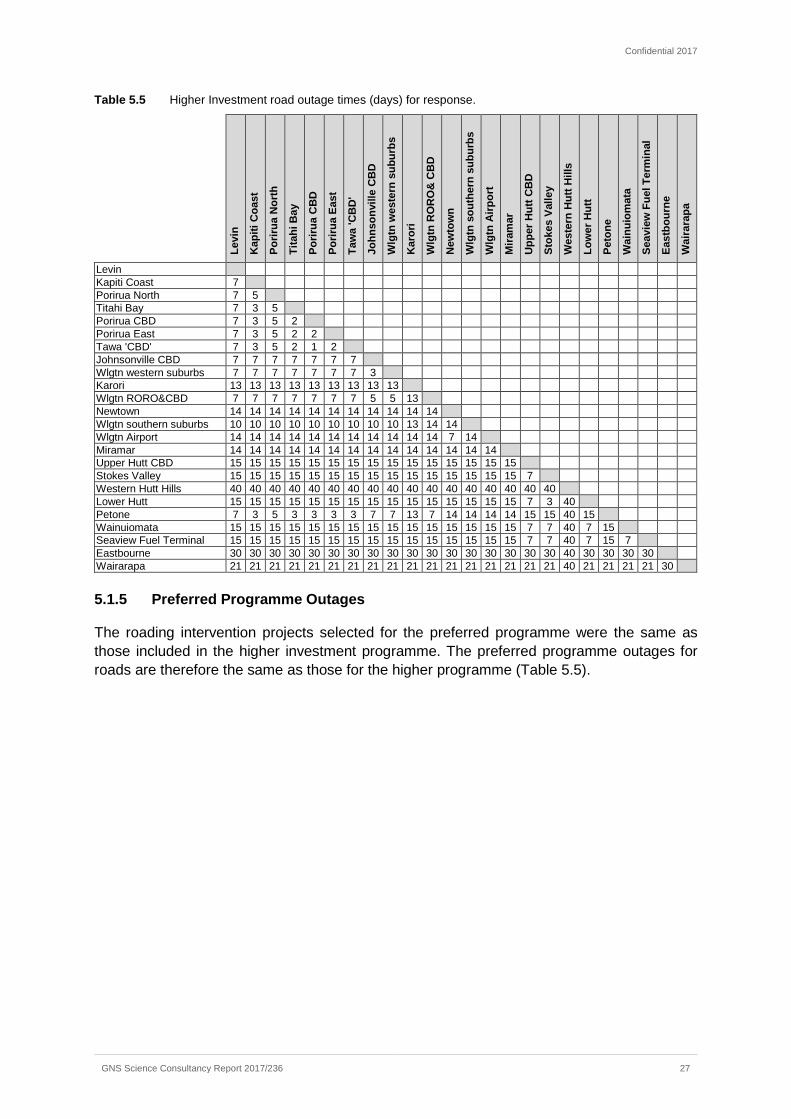
Confidential 2017
GNS Science Consultancy Report 2017/236 27
Table 5.5 Higher Investment road outage times (days) for response.
Levi
n
Kap
iti C
oast
Porir
ua N
orth
Tita
hi B
ay
Porir
ua C
BD
Porir
ua E
ast
Taw
a 'C
BD
'
John
sonv
ille
CB
D
Wlg
tn w
este
rn s
ubur
bs
Kar
ori
Wlg
tn R
OR
O&
CB
D
New
tow
n
Wlg
tn s
outh
ern
subu
rbs
Wlg
tn A
irpor
t
Mira
mar
Upp
er H
utt C
BD
Stok
es V
alle
y
Wes
tern
Hut
t Hill
s
Low
er H
utt
Peto
ne
Wai
nuio
mat
a
Seav
iew
Fue
l Ter
min
al
East
bour
ne
Wai
rara
pa
Levin Kapiti Coast 7 Porirua North 7 5 Titahi Bay 7 3 5 Porirua CBD 7 3 5 2 Porirua East 7 3 5 2 2 Tawa 'CBD' 7 3 5 2 1 2 Johnsonville CBD 7 7 7 7 7 7 7 Wlgtn western suburbs 7 7 7 7 7 7 7 3 Karori 13 13 13 13 13 13 13 13 13 Wlgtn RORO&CBD 7 7 7 7 7 7 7 5 5 13 Newtown 14 14 14 14 14 14 14 14 14 14 14 Wlgtn southern suburbs 10 10 10 10 10 10 10 10 10 13 14 14 Wlgtn Airport 14 14 14 14 14 14 14 14 14 14 14 7 14 Miramar 14 14 14 14 14 14 14 14 14 14 14 14 14 14 Upper Hutt CBD 15 15 15 15 15 15 15 15 15 15 15 15 15 15 15 Stokes Valley 15 15 15 15 15 15 15 15 15 15 15 15 15 15 15 7 Western Hutt Hills 40 40 40 40 40 40 40 40 40 40 40 40 40 40 40 40 40 Lower Hutt 15 15 15 15 15 15 15 15 15 15 15 15 15 15 15 7 3 40 Petone 7 3 5 3 3 3 3 7 7 13 7 14 14 14 14 15 15 40 15 Wainuiomata 15 15 15 15 15 15 15 15 15 15 15 15 15 15 15 7 7 40 7 15 Seaview Fuel Terminal 15 15 15 15 15 15 15 15 15 15 15 15 15 15 15 7 7 40 7 15 7 Eastbourne 30 30 30 30 30 30 30 30 30 30 30 30 30 30 30 30 30 40 30 30 30 30 Wairarapa 21 21 21 21 21 21 21 21 21 21 21 21 21 21 21 21 21 40 21 21 21 21 30
5.1.5 Preferred Programme Outages
The roading intervention projects selected for the preferred programme were the same as those included in the higher investment programme. The preferred programme outages for roads are therefore the same as those for the higher programme (Table 5.5).
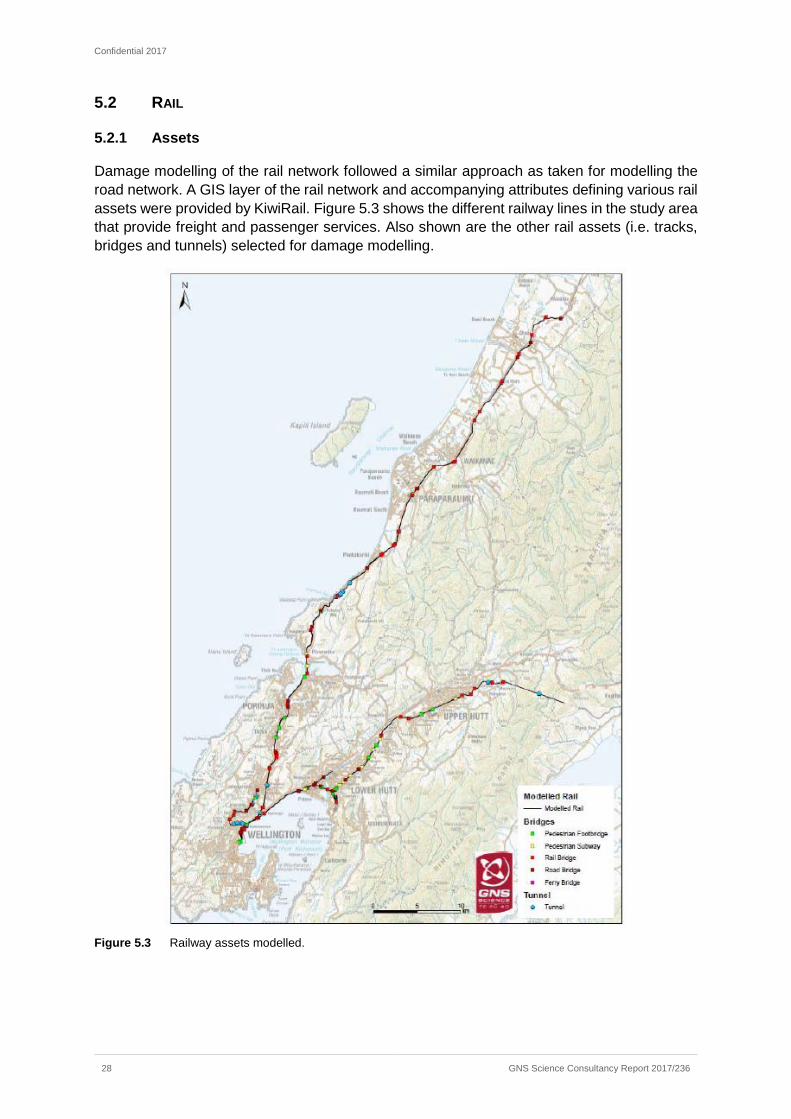
Confidential 2017
28 GNS Science Consultancy Report 2017/236
5.2 RAIL
5.2.1 Assets
Damage modelling of the rail network followed a similar approach as taken for modelling the road network. A GIS layer of the rail network and accompanying attributes defining various rail assets were provided by KiwiRail. Figure 5.3 shows the different railway lines in the study area that provide freight and passenger services. Also shown are the other rail assets (i.e. tracks, bridges and tunnels) selected for damage modelling.
Figure 5.3 Railway assets modelled.
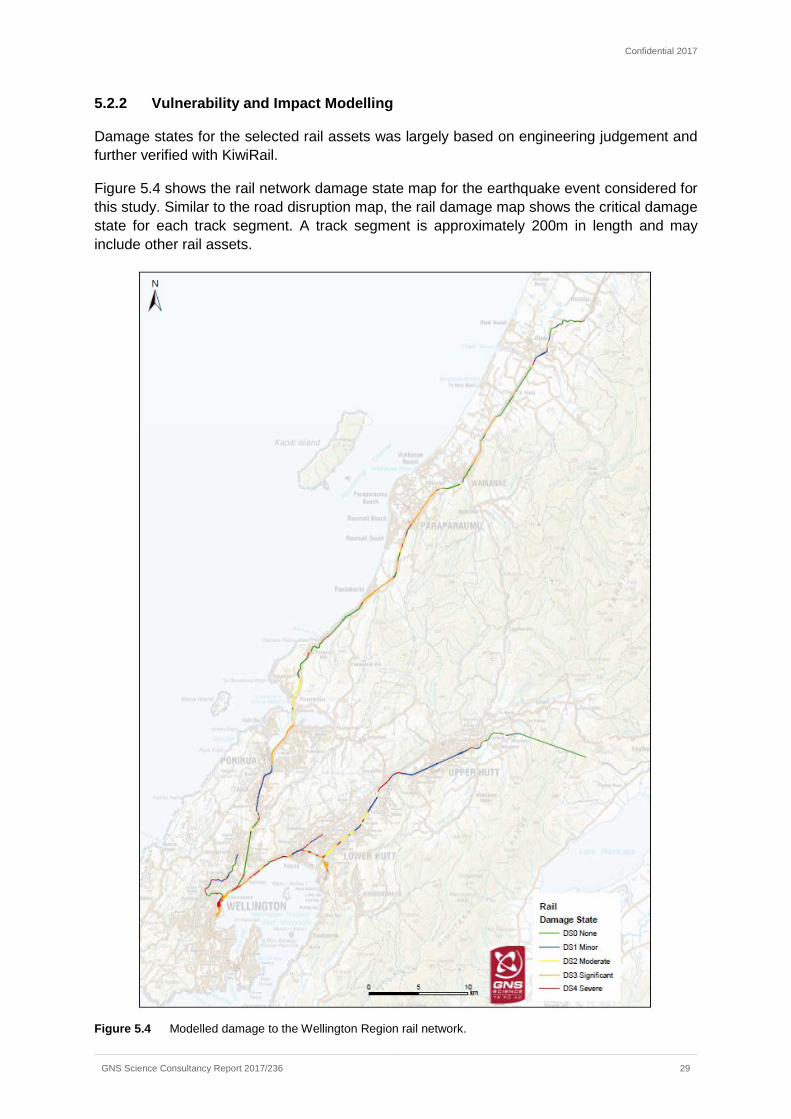
Confidential 2017
GNS Science Consultancy Report 2017/236 29
5.2.2 Vulnerability and Impact Modelling
Damage states for the selected rail assets was largely based on engineering judgement and further verified with KiwiRail.
Figure 5.4 shows the rail network damage state map for the earthquake event considered for this study. Similar to the road disruption map, the rail damage map shows the critical damage state for each track segment. A track segment is approximately 200m in length and may include other rail assets.
Figure 5.4 Modelled damage to the Wellington Region rail network.
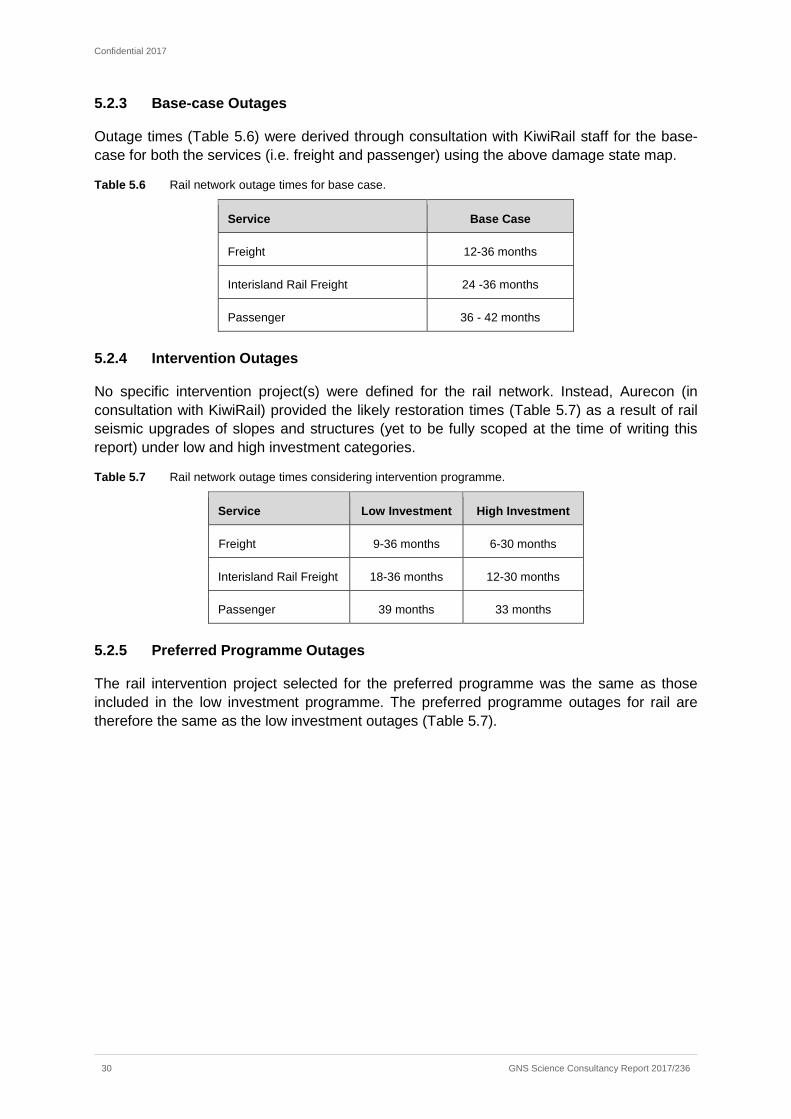
Confidential 2017
30 GNS Science Consultancy Report 2017/236
5.2.3 Base-case Outages
Outage times (Table 5.6) were derived through consultation with KiwiRail staff for the base-case for both the services (i.e. freight and passenger) using the above damage state map.
Table 5.6 Rail network outage times for base case.
Service Base Case
Freight 12-36 months
Interisland Rail Freight 24 -36 months
Passenger 36 - 42 months
5.2.4 Intervention Outages
No specific intervention project(s) were defined for the rail network. Instead, Aurecon (in consultation with KiwiRail) provided the likely restoration times (Table 5.7) as a result of rail seismic upgrades of slopes and structures (yet to be fully scoped at the time of writing this report) under low and high investment categories.
Table 5.7 Rail network outage times considering intervention programme.
Service Low Investment High Investment
Freight 9-36 months 6-30 months
Interisland Rail Freight 18-36 months 12-30 months
Passenger 39 months 33 months
5.2.5 Preferred Programme Outages
The rail intervention project selected for the preferred programme was the same as those included in the low investment programme. The preferred programme outages for rail are therefore the same as the low investment outages (Table 5.7).
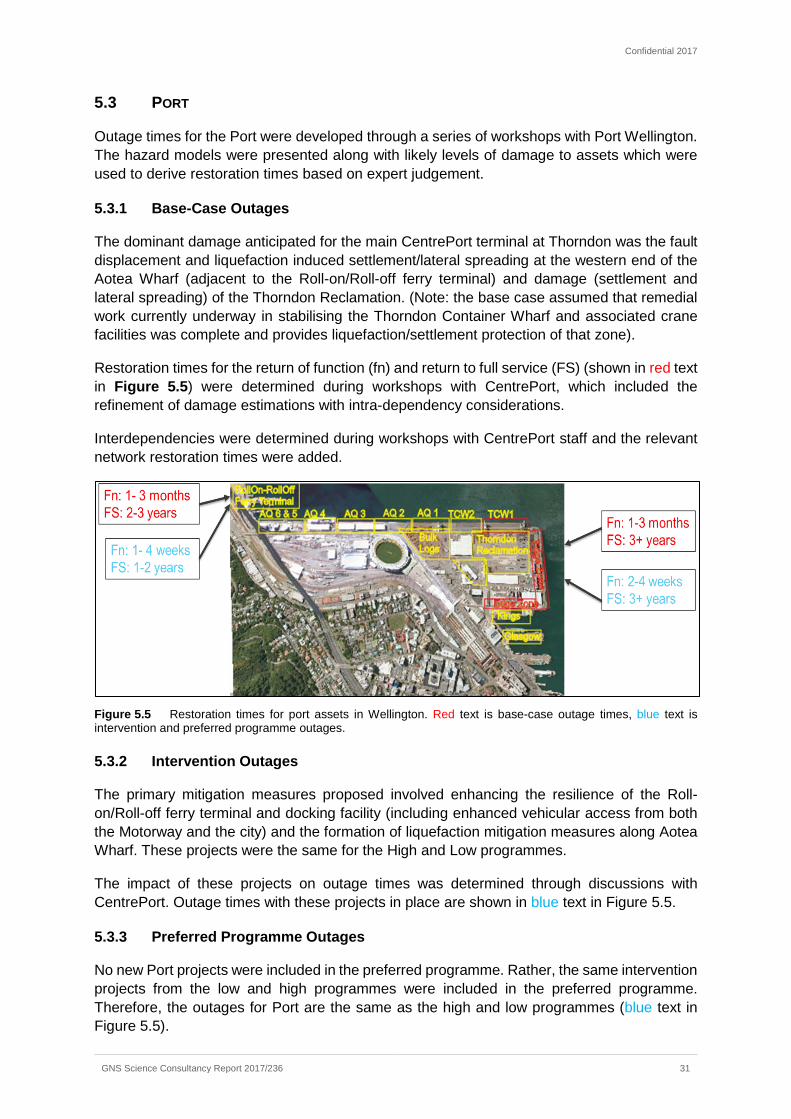
Confidential 2017
GNS Science Consultancy Report 2017/236 31
5.3 PORT
Outage times for the Port were developed through a series of workshops with Port Wellington. The hazard models were presented along with likely levels of damage to assets which were used to derive restoration times based on expert judgement.
5.3.1 Base-Case Outages
The dominant damage anticipated for the main CentrePort terminal at Thorndon was the fault displacement and liquefaction induced settlement/lateral spreading at the western end of the Aotea Wharf (adjacent to the Roll-on/Roll-off ferry terminal) and damage (settlement and lateral spreading) of the Thorndon Reclamation. (Note: the base case assumed that remedial work currently underway in stabilising the Thorndon Container Wharf and associated crane facilities was complete and provides liquefaction/settlement protection of that zone).
Restoration times for the return of function (fn) and return to full service (FS) (shown in red text in Figure 5.5) were determined during workshops with CentrePort, which included the refinement of damage estimations with intra-dependency considerations.
Interdependencies were determined during workshops with CentrePort staff and the relevant network restoration times were added.
Figure 5.5 Restoration times for port assets in Wellington. Red text is base-case outage times, blue text is intervention and preferred programme outages.
5.3.2 Intervention Outages
The primary mitigation measures proposed involved enhancing the resilience of the Roll-on/Roll-off ferry terminal and docking facility (including enhanced vehicular access from both the Motorway and the city) and the formation of liquefaction mitigation measures along Aotea Wharf. These projects were the same for the High and Low programmes.
The impact of these projects on outage times was determined through discussions with CentrePort. Outage times with these projects in place are shown in blue text in Figure 5.5.
5.3.3 Preferred Programme Outages
No new Port projects were included in the preferred programme. Rather, the same intervention projects from the low and high programmes were included in the preferred programme. Therefore, the outages for Port are the same as the high and low programmes (blue text in Figure 5.5).
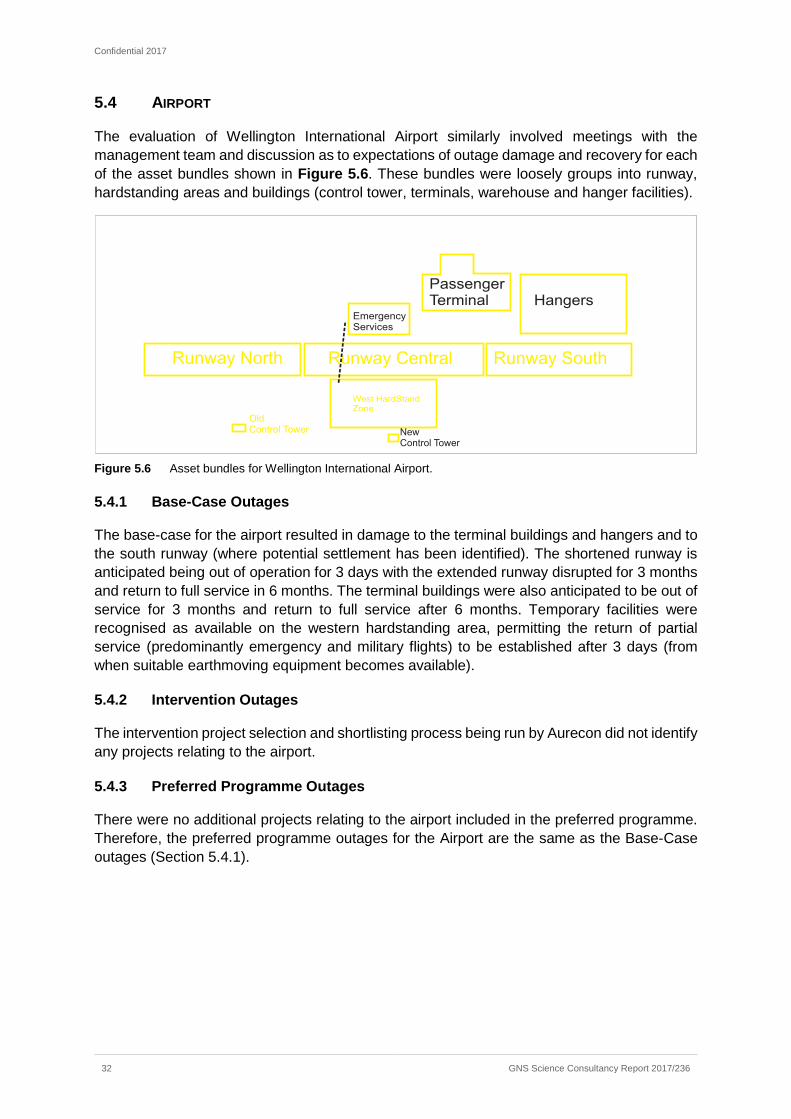
Confidential 2017
32 GNS Science Consultancy Report 2017/236
5.4 AIRPORT
The evaluation of Wellington International Airport similarly involved meetings with the management team and discussion as to expectations of outage damage and recovery for each of the asset bundles shown in Figure 5.6. These bundles were loosely groups into runway, hardstanding areas and buildings (control tower, terminals, warehouse and hanger facilities).
Figure 5.6 Asset bundles for Wellington International Airport.
5.4.1 Base-Case Outages
The base-case for the airport resulted in damage to the terminal buildings and hangers and to the south runway (where potential settlement has been identified). The shortened runway is anticipated being out of operation for 3 days with the extended runway disrupted for 3 months and return to full service in 6 months. The terminal buildings were also anticipated to be out of service for 3 months and return to full service after 6 months. Temporary facilities were recognised as available on the western hardstanding area, permitting the return of partial service (predominantly emergency and military flights) to be established after 3 days (from when suitable earthmoving equipment becomes available).
5.4.2 Intervention Outages
The intervention project selection and shortlisting process being run by Aurecon did not identify any projects relating to the airport.
5.4.3 Preferred Programme Outages
There were no additional projects relating to the airport included in the preferred programme. Therefore, the preferred programme outages for the Airport are the same as the Base-Case outages (Section 5.4.1).
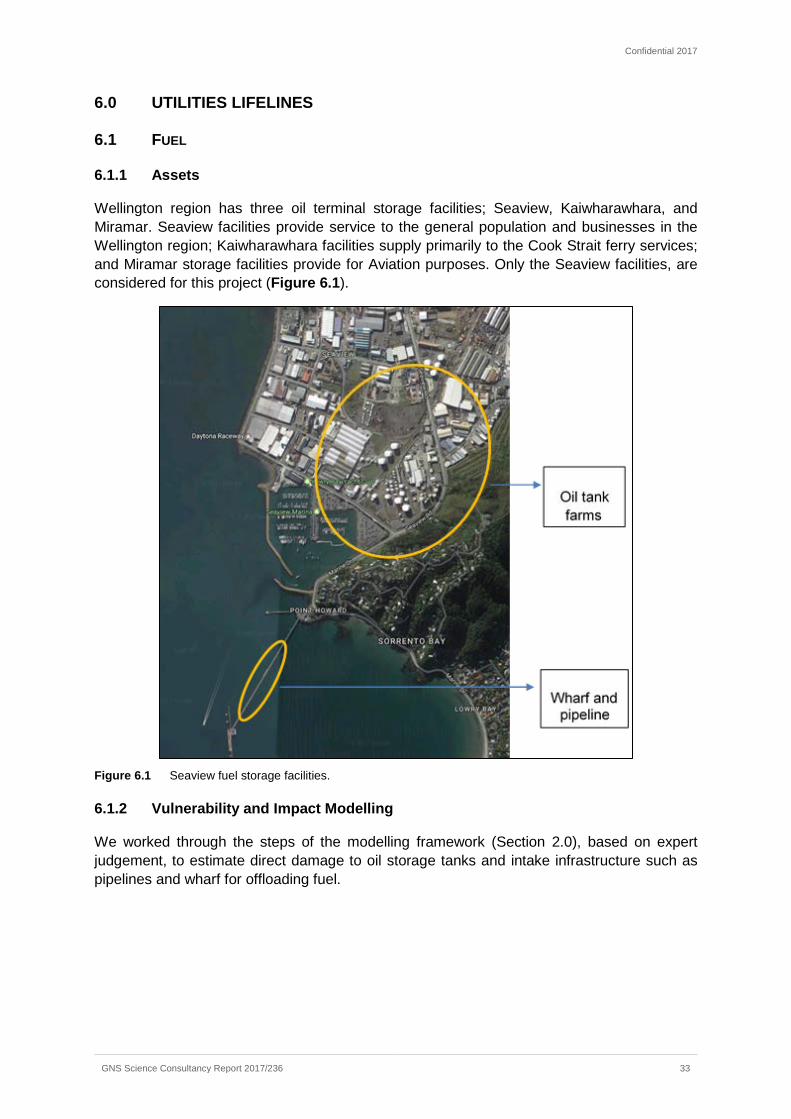
Confidential 2017
GNS Science Consultancy Report 2017/236 33
6.0 UTILITIES LIFELINES
6.1 FUEL
6.1.1 Assets
Wellington region has three oil terminal storage facilities; Seaview, Kaiwharawhara, and Miramar. Seaview facilities provide service to the general population and businesses in the Wellington region; Kaiwharawhara facilities supply primarily to the Cook Strait ferry services; and Miramar storage facilities provide for Aviation purposes. Only the Seaview facilities, are considered for this project (Figure 6.1).
Figure 6.1 Seaview fuel storage facilities.
6.1.2 Vulnerability and Impact Modelling
We worked through the steps of the modelling framework (Section 2.0), based on expert judgement, to estimate direct damage to oil storage tanks and intake infrastructure such as pipelines and wharf for offloading fuel.
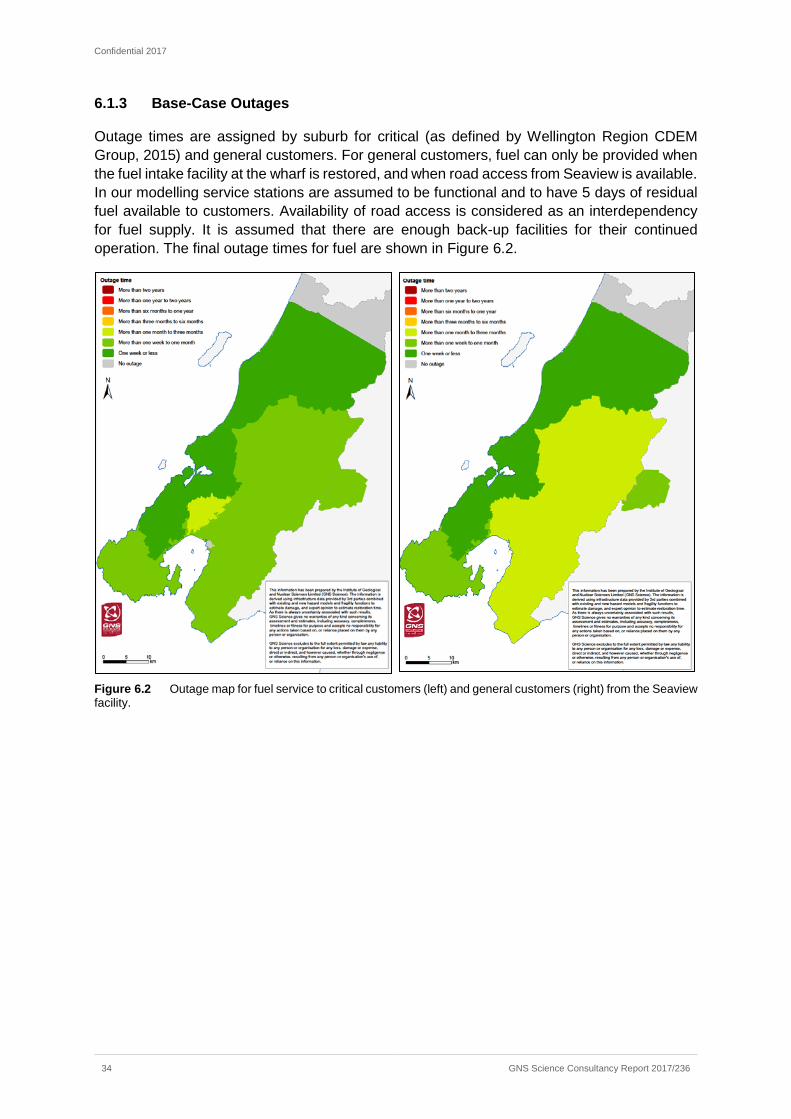
Confidential 2017
34 GNS Science Consultancy Report 2017/236
6.1.3 Base-Case Outages
Outage times are assigned by suburb for critical (as defined by Wellington Region CDEM Group, 2015) and general customers. For general customers, fuel can only be provided when the fuel intake facility at the wharf is restored, and when road access from Seaview is available. In our modelling service stations are assumed to be functional and to have 5 days of residual fuel available to customers. Availability of road access is considered as an interdependency for fuel supply. It is assumed that there are enough back-up facilities for their continued operation. The final outage times for fuel are shown in Figure 6.2.
Figure 6.2 Outage map for fuel service to critical customers (left) and general customers (right) from the Seaview facility.
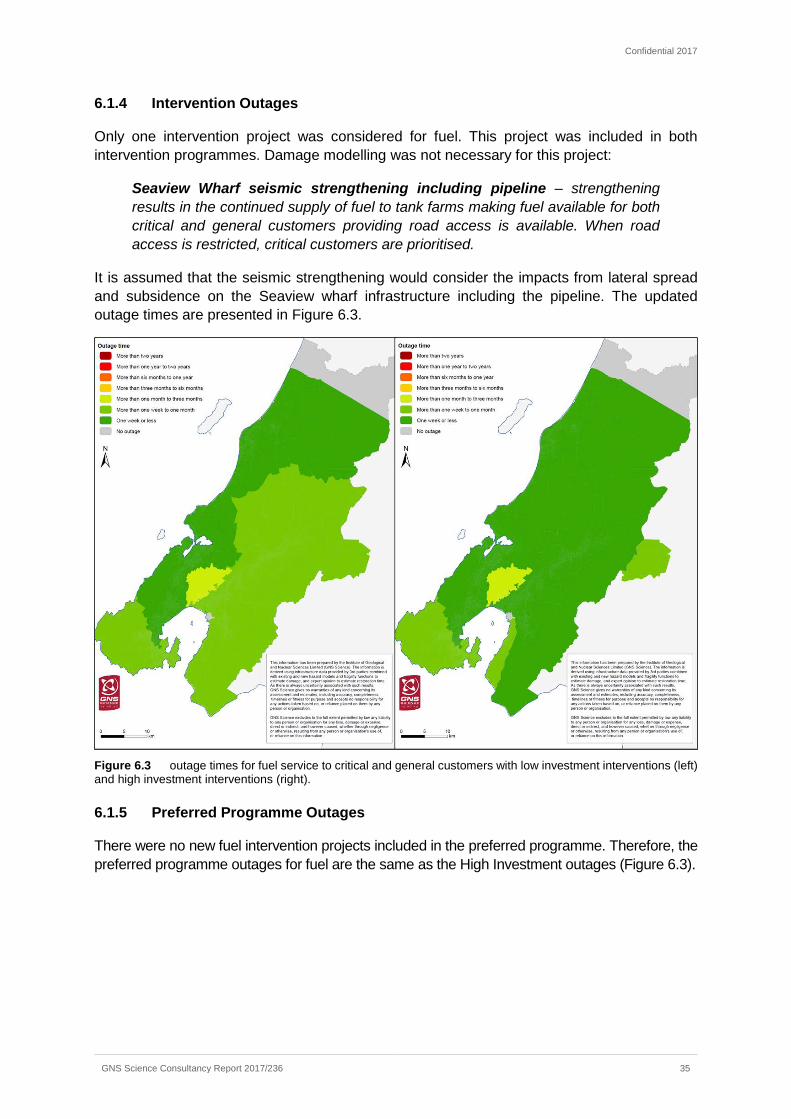
Confidential 2017
GNS Science Consultancy Report 2017/236 35
6.1.4 Intervention Outages
Only one intervention project was considered for fuel. This project was included in both intervention programmes. Damage modelling was not necessary for this project:
Seaview Wharf seismic strengthening including pipeline – strengthening results in the continued supply of fuel to tank farms making fuel available for both critical and general customers providing road access is available. When road access is restricted, critical customers are prioritised.
It is assumed that the seismic strengthening would consider the impacts from lateral spread and subsidence on the Seaview wharf infrastructure including the pipeline. The updated outage times are presented in Figure 6.3.
Figure 6.3 outage times for fuel service to critical and general customers with low investment interventions (left) and high investment interventions (right).
6.1.5 Preferred Programme Outages
There were no new fuel intervention projects included in the preferred programme. Therefore, the preferred programme outages for fuel are the same as the High Investment outages (Figure 6.3).
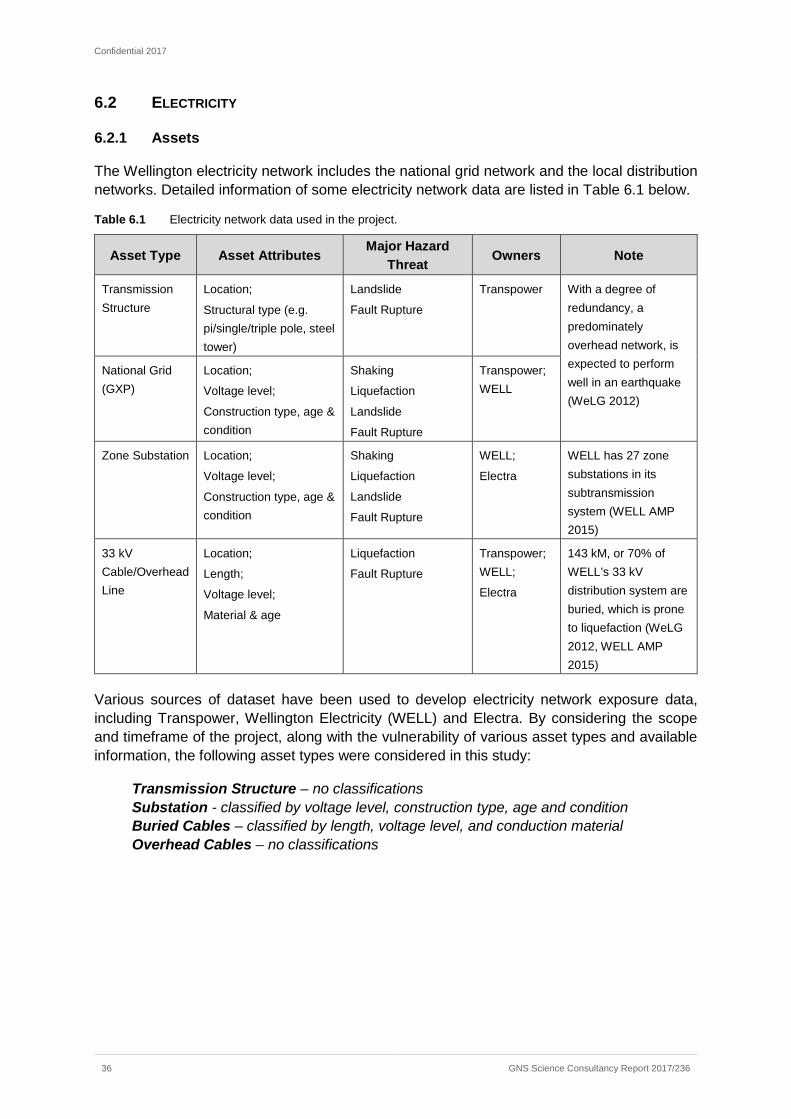
Confidential 2017
36 GNS Science Consultancy Report 2017/236
6.2 ELECTRICITY
6.2.1 Assets
The Wellington electricity network includes the national grid network and the local distribution networks. Detailed information of some electricity network data are listed in Table 6.1 below.
Table 6.1 Electricity network data used in the project.
Asset Type Asset Attributes Major Hazard Threat Owners Note
Transmission Structure
Location;
Structural type (e.g. pi/single/triple pole, steel tower)
Landslide
Fault Rupture
Transpower With a degree of redundancy, a predominately overhead network, is expected to perform well in an earthquake (WeLG 2012)
National Grid (GXP)
Location;
Voltage level;
Construction type, age & condition
Shaking
Liquefaction
Landslide
Fault Rupture
Transpower; WELL
Zone Substation Location;
Voltage level;
Construction type, age & condition
Shaking
Liquefaction
Landslide
Fault Rupture
WELL;
Electra
WELL has 27 zone substations in its subtransmission system (WELL AMP 2015)
33 kV Cable/Overhead Line
Location;
Length;
Voltage level;
Material & age
Liquefaction
Fault Rupture
Transpower; WELL;
Electra
143 kM, or 70% of WELL’s 33 kV distribution system are buried, which is prone to liquefaction (WeLG 2012, WELL AMP 2015)
Various sources of dataset have been used to develop electricity network exposure data, including Transpower, Wellington Electricity (WELL) and Electra. By considering the scope and timeframe of the project, along with the vulnerability of various asset types and available information, the following asset types were considered in this study:
Transmission Structure – no classifications Substation - classified by voltage level, construction type, age and condition Buried Cables – classified by length, voltage level, and conduction material Overhead Cables – no classifications
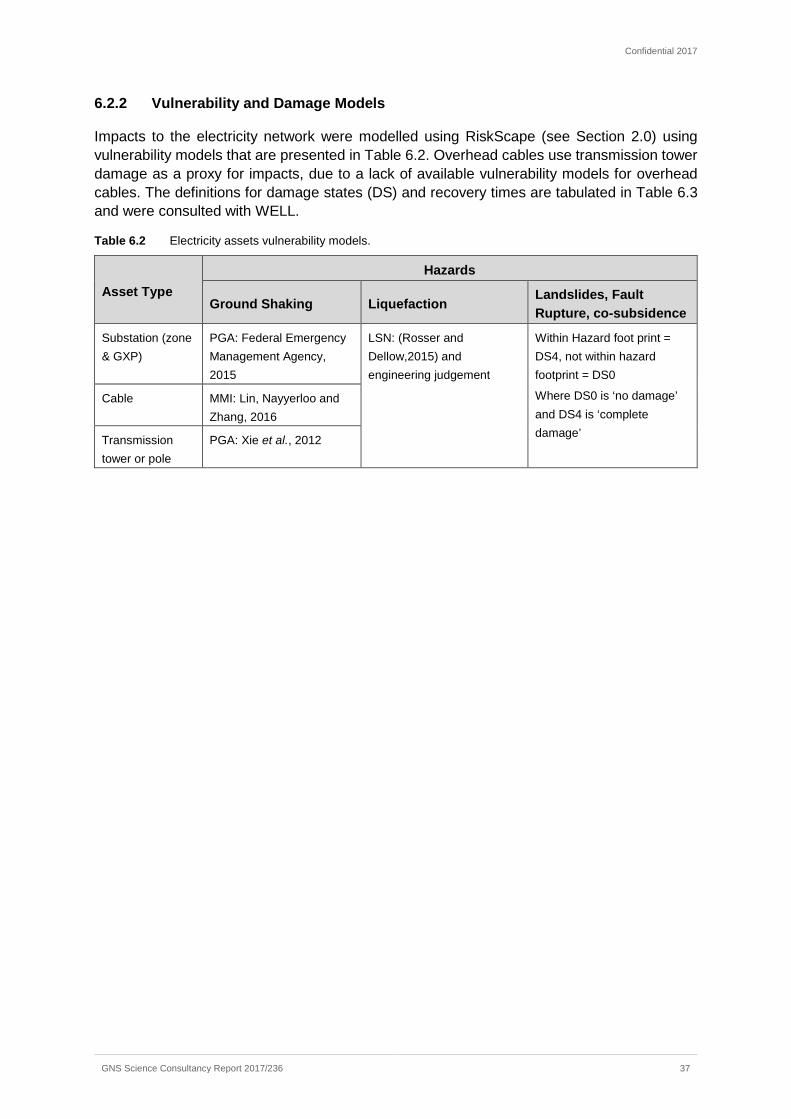
Confidential 2017
GNS Science Consultancy Report 2017/236 37
6.2.2 Vulnerability and Damage Models
Impacts to the electricity network were modelled using RiskScape (see Section 2.0) using vulnerability models that are presented in Table 6.2. Overhead cables use transmission tower damage as a proxy for impacts, due to a lack of available vulnerability models for overhead cables. The definitions for damage states (DS) and recovery times are tabulated in Table 6.3 and were consulted with WELL.
Table 6.2 Electricity assets vulnerability models.
Asset Type Hazards
Ground Shaking Liquefaction Landslides, Fault Rupture, co-subsidence
Substation (zone & GXP)
PGA: Federal Emergency Management Agency, 2015
LSN: (Rosser and Dellow,2015) and engineering judgement
Within Hazard foot print = DS4, not within hazard footprint = DS0
Where DS0 is ‘no damage’ and DS4 is ‘complete damage’
Cable MMI: Lin, Nayyerloo and Zhang, 2016
Transmission tower or pole
PGA: Xie et al., 2012
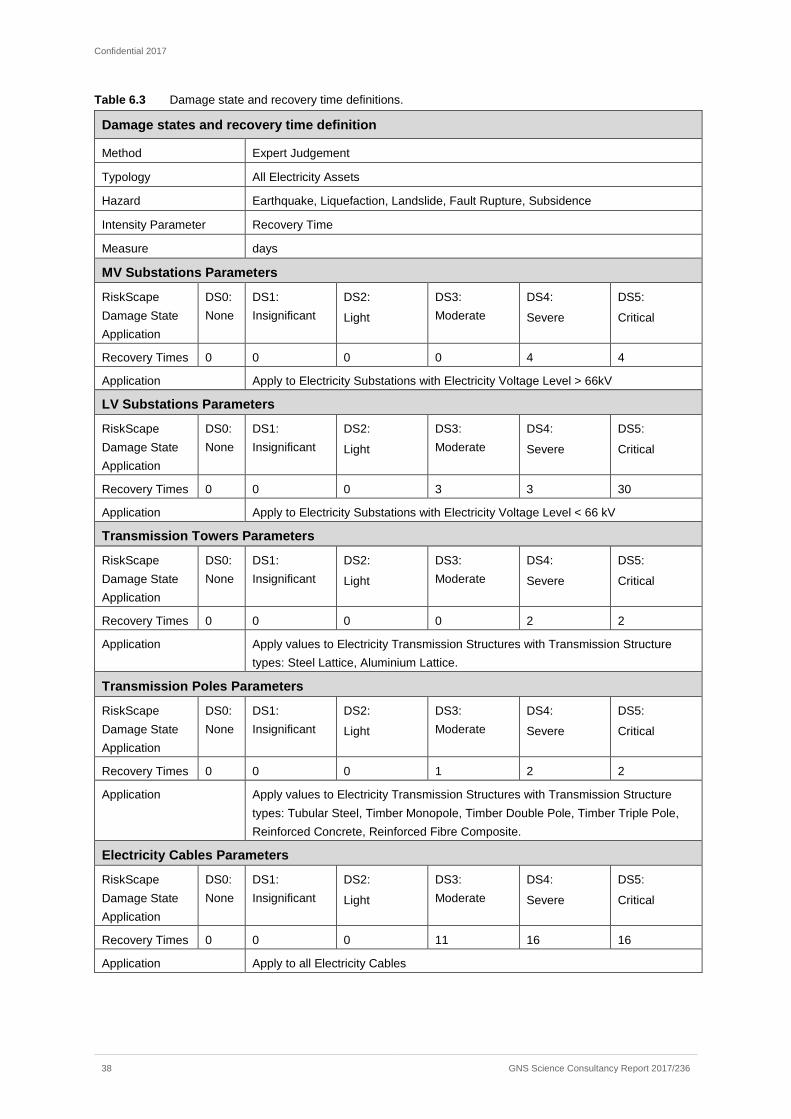
Confidential 2017
38 GNS Science Consultancy Report 2017/236
Table 6.3 Damage state and recovery time definitions.
Damage states and recovery time definition
Method Expert Judgement
Typology All Electricity Assets
Hazard Earthquake, Liquefaction, Landslide, Fault Rupture, Subsidence
Intensity Parameter Recovery Time
Measure days
MV Substations Parameters
RiskScape Damage State Application
DS0: None
DS1: Insignificant
DS2:
Light
DS3: Moderate
DS4:
Severe
DS5:
Critical
Recovery Times 0 0 0 0 4 4
Application Apply to Electricity Substations with Electricity Voltage Level > 66kV
LV Substations Parameters
RiskScape Damage State Application
DS0: None
DS1: Insignificant
DS2:
Light
DS3: Moderate
DS4:
Severe
DS5:
Critical
Recovery Times 0 0 0 3 3 30
Application Apply to Electricity Substations with Electricity Voltage Level < 66 kV
Transmission Towers Parameters
RiskScape Damage State Application
DS0: None
DS1: Insignificant
DS2:
Light
DS3: Moderate
DS4:
Severe
DS5:
Critical
Recovery Times 0 0 0 0 2 2
Application Apply values to Electricity Transmission Structures with Transmission Structure types: Steel Lattice, Aluminium Lattice.
Transmission Poles Parameters
RiskScape Damage State Application
DS0: None
DS1: Insignificant
DS2:
Light
DS3: Moderate
DS4:
Severe
DS5:
Critical
Recovery Times 0 0 0 1 2 2
Application Apply values to Electricity Transmission Structures with Transmission Structure types: Tubular Steel, Timber Monopole, Timber Double Pole, Timber Triple Pole, Reinforced Concrete, Reinforced Fibre Composite.
Electricity Cables Parameters
RiskScape Damage State Application
DS0: None
DS1: Insignificant
DS2:
Light
DS3: Moderate
DS4:
Severe
DS5:
Critical
Recovery Times 0 0 0 11 16 16
Application Apply to all Electricity Cables
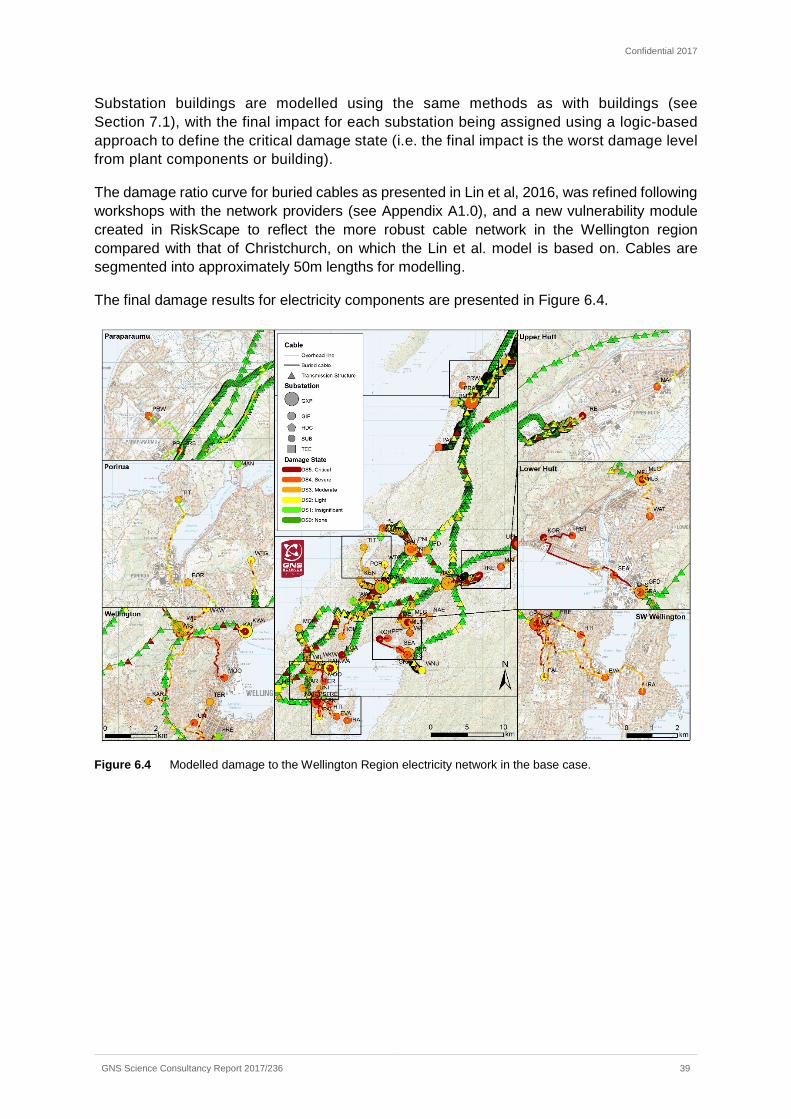
Confidential 2017
GNS Science Consultancy Report 2017/236 39
Substation buildings are modelled using the same methods as with buildings (see Section 7.1), with the final impact for each substation being assigned using a logic-based approach to define the critical damage state (i.e. the final impact is the worst damage level from plant components or building).
The damage ratio curve for buried cables as presented in Lin et al, 2016, was refined following workshops with the network providers (see Appendix A1.0), and a new vulnerability module created in RiskScape to reflect the more robust cable network in the Wellington region compared with that of Christchurch, on which the Lin et al. model is based on. Cables are segmented into approximately 50m lengths for modelling.
The final damage results for electricity components are presented in Figure 6.4.
Figure 6.4 Modelled damage to the Wellington Region electricity network in the base case.
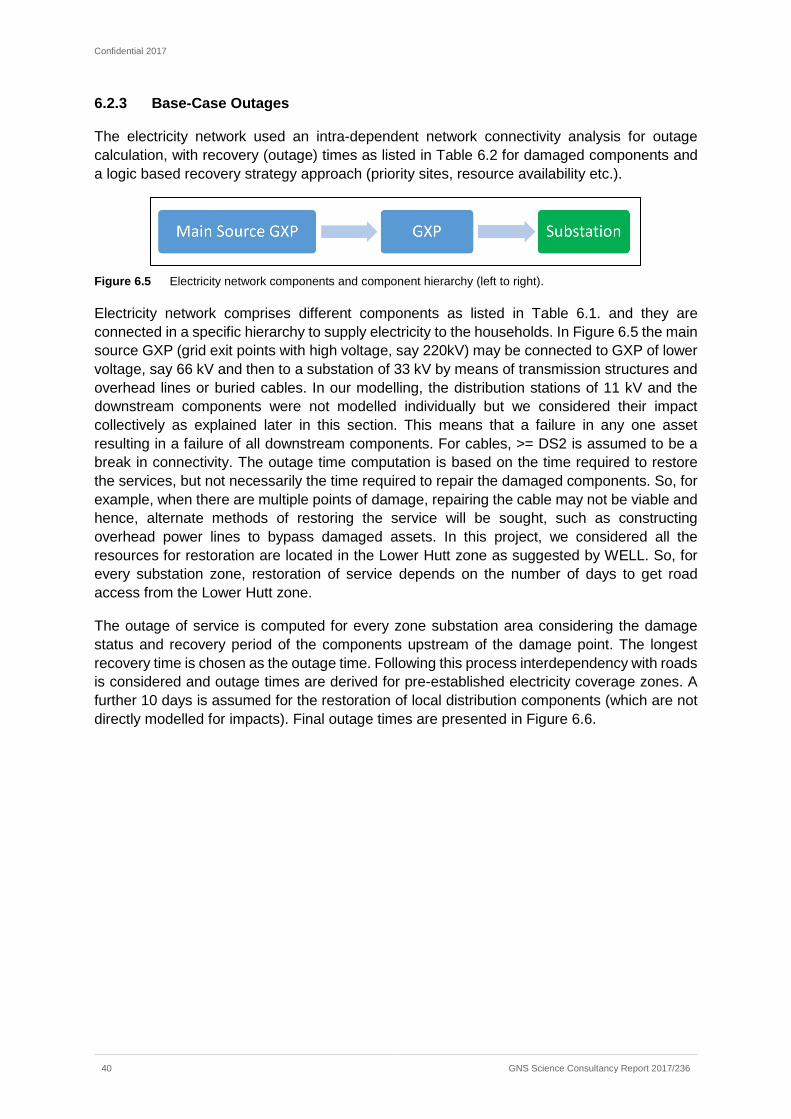
Confidential 2017
40 GNS Science Consultancy Report 2017/236
6.2.3 Base-Case Outages
The electricity network used an intra-dependent network connectivity analysis for outage calculation, with recovery (outage) times as listed in Table 6.2 for damaged components and a logic based recovery strategy approach (priority sites, resource availability etc.).
Figure 6.5 Electricity network components and component hierarchy (left to right).
Electricity network comprises different components as listed in Table 6.1. and they are connected in a specific hierarchy to supply electricity to the households. In Figure 6.5 the main source GXP (grid exit points with high voltage, say 220kV) may be connected to GXP of lower voltage, say 66 kV and then to a substation of 33 kV by means of transmission structures and overhead lines or buried cables. In our modelling, the distribution stations of 11 kV and the downstream components were not modelled individually but we considered their impact collectively as explained later in this section. This means that a failure in any one asset resulting in a failure of all downstream components. For cables, >= DS2 is assumed to be a break in connectivity. The outage time computation is based on the time required to restore the services, but not necessarily the time required to repair the damaged components. So, for example, when there are multiple points of damage, repairing the cable may not be viable and hence, alternate methods of restoring the service will be sought, such as constructing overhead power lines to bypass damaged assets. In this project, we considered all the resources for restoration are located in the Lower Hutt zone as suggested by WELL. So, for every substation zone, restoration of service depends on the number of days to get road access from the Lower Hutt zone.
The outage of service is computed for every zone substation area considering the damage status and recovery period of the components upstream of the damage point. The longest recovery time is chosen as the outage time. Following this process interdependency with roads is considered and outage times are derived for pre-established electricity coverage zones. A further 10 days is assumed for the restoration of local distribution components (which are not directly modelled for impacts). Final outage times are presented in Figure 6.6.
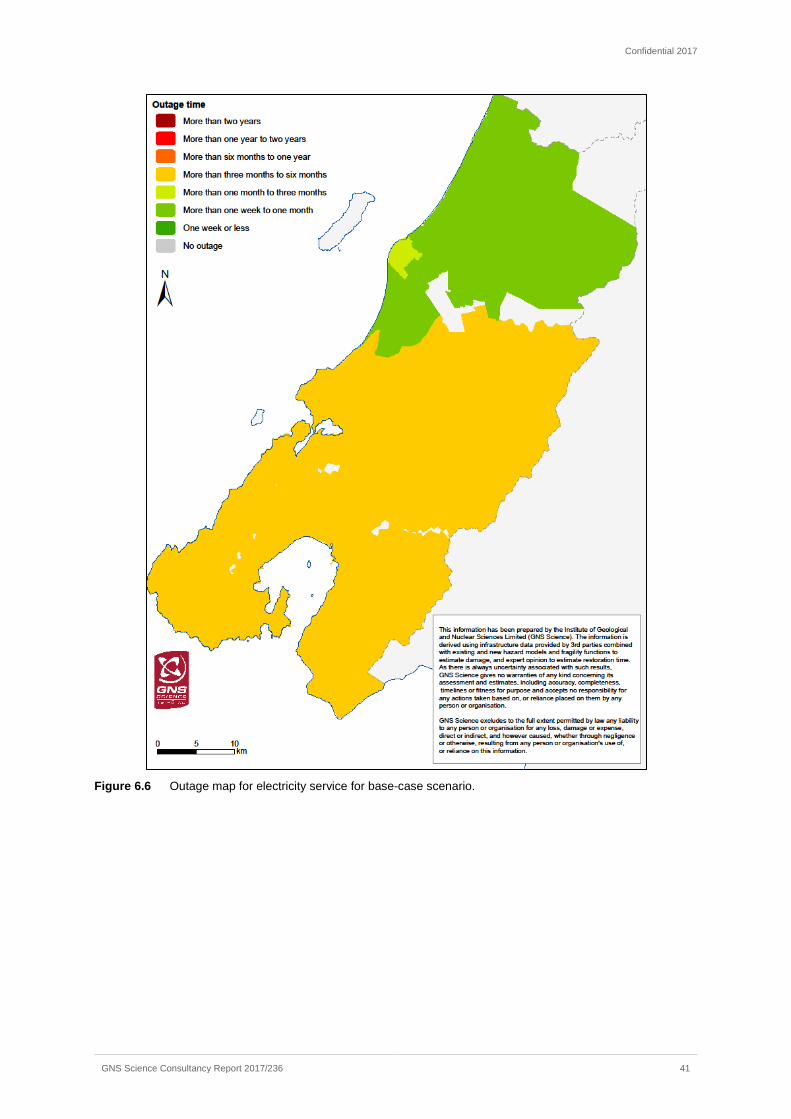
Confidential 2017
GNS Science Consultancy Report 2017/236 41
Figure 6.6 Outage map for electricity service for base-case scenario.
Confidential 2017
42 GNS Science Consultancy Report 2017/236
6.2.4 Intervention Outages
Intervention programmes for the electricity network were as follows:
Central Park Substation improved resilience - New connection (cable) added to a new substation which is assumed to be designed to withstand damage associated with the modelled earthquake scenario. Emergency overhead powerlines - Does not affect BAU assets and is therefore not modelled for damage. However, this does affect restoration and therefore outage time Increase 160MW interconnectedness between substations - New lines are added between affected substations. They are assumed to be constructed with XLPE conduction material. Phase 2 modelling used a secondary damage curve specifically for XLPE cables. This was to reflect a lower rate of damage for a more resistant material type. BAU modelling did not use this for existing XLPE cables. Seismic upgrade of 33kV buried cables - New cables, and therefore connections, are established in East Wellington and in Lower Hutt. Everything is assumed to be constructed with XLPE conduction material, and therefore use the new damage curve associated with this material type. CPK - Frederick St cables replaced under ongoing cable replacement programme - New cables added between CPK and Frederic St. Everything assumed to be constructed with XLPE conduction material, and therefore use the new damage curve for this material type. Replacement of all fluid filled cables in network - All buried cables in the network are assumed to be upgraded to XLPE conduction material type, if not already. Therefore, all cables use the new damage curve for this material type.
With the consideration of these intervention programmes, updated network outage times are presented for low and high investment packages in Figure 6.7.
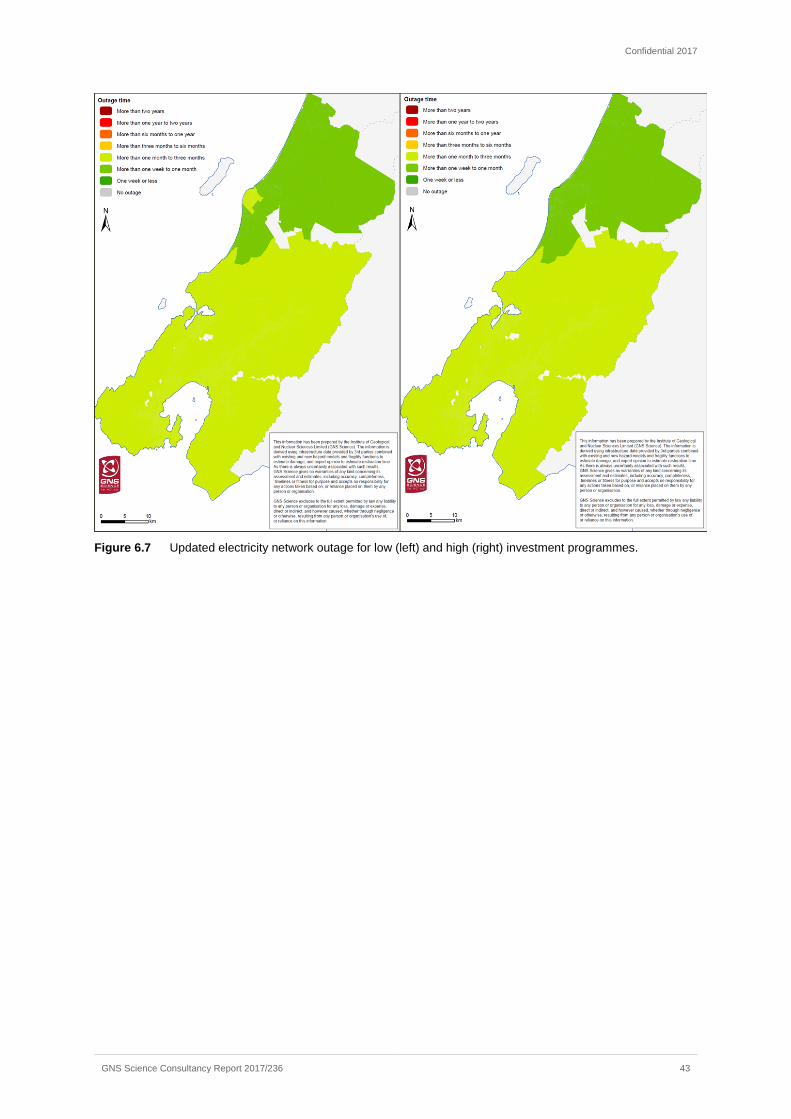
Confidential 2017
GNS Science Consultancy Report 2017/236 43
Figure 6.7 Updated electricity network outage for low (left) and high (right) investment programmes.
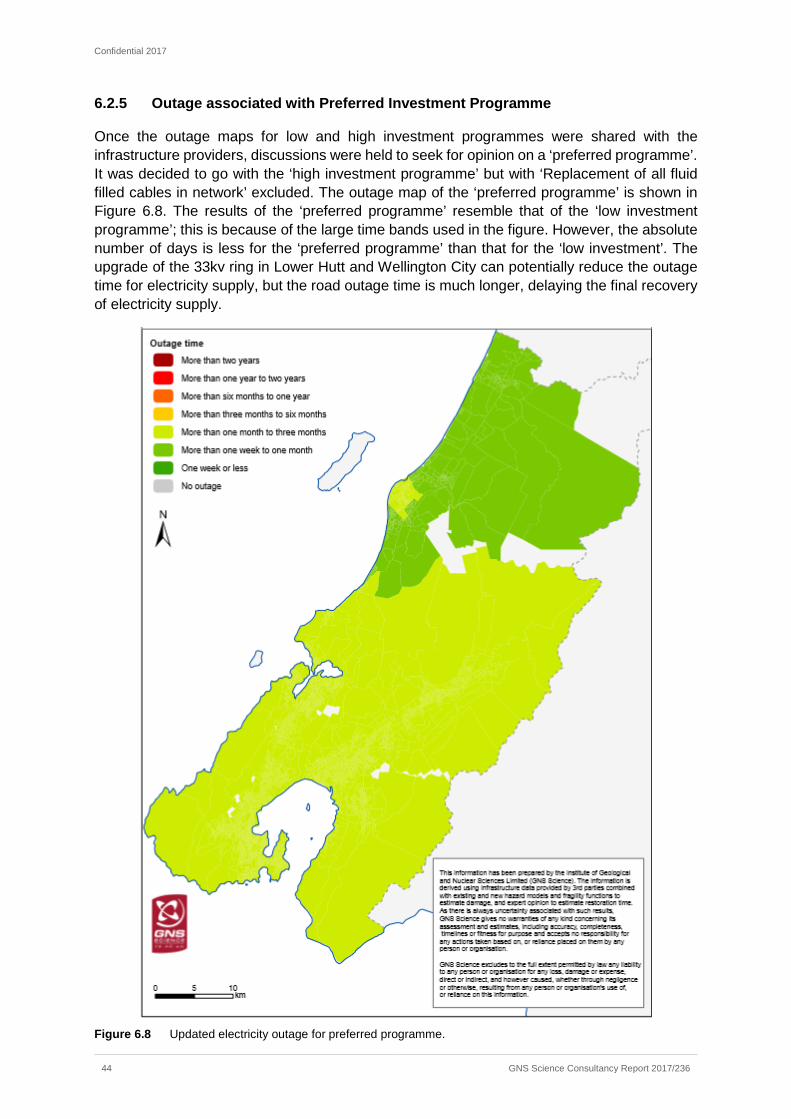
Confidential 2017
44 GNS Science Consultancy Report 2017/236
6.2.5 Outage associated with Preferred Investment Programme
Once the outage maps for low and high investment programmes were shared with the infrastructure providers, discussions were held to seek for opinion on a ‘preferred programme’. It was decided to go with the ‘high investment programme’ but with ‘Replacement of all fluid filled cables in network’ excluded. The outage map of the ‘preferred programme’ is shown in Figure 6.8. The results of the ‘preferred programme’ resemble that of the ‘low investment programme’; this is because of the large time bands used in the figure. However, the absolute number of days is less for the ‘preferred programme’ than that for the ‘low investment’. The upgrade of the 33kv ring in Lower Hutt and Wellington City can potentially reduce the outage time for electricity supply, but the road outage time is much longer, delaying the final recovery of electricity supply.
Figure 6.8 Updated electricity outage for preferred programme.
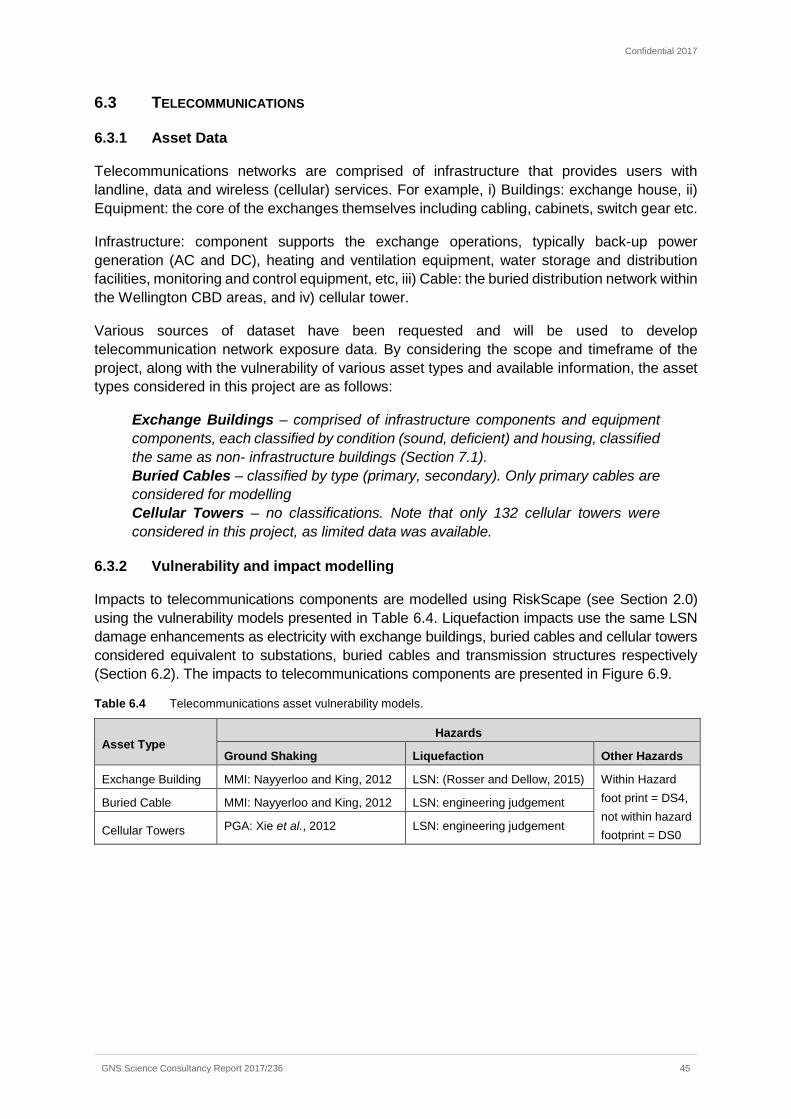
Confidential 2017
GNS Science Consultancy Report 2017/236 45
6.3 TELECOMMUNICATIONS
6.3.1 Asset Data
Telecommunications networks are comprised of infrastructure that provides users with landline, data and wireless (cellular) services. For example, i) Buildings: exchange house, ii) Equipment: the core of the exchanges themselves including cabling, cabinets, switch gear etc.
Infrastructure: component supports the exchange operations, typically back-up power generation (AC and DC), heating and ventilation equipment, water storage and distribution facilities, monitoring and control equipment, etc, iii) Cable: the buried distribution network within the Wellington CBD areas, and iv) cellular tower.
Various sources of dataset have been requested and will be used to develop telecommunication network exposure data. By considering the scope and timeframe of the project, along with the vulnerability of various asset types and available information, the asset types considered in this project are as follows:
Exchange Buildings – comprised of infrastructure components and equipment components, each classified by condition (sound, deficient) and housing, classified the same as non- infrastructure buildings (Section 7.1). Buried Cables – classified by type (primary, secondary). Only primary cables are considered for modelling Cellular Towers – no classifications. Note that only 132 cellular towers were considered in this project, as limited data was available.
6.3.2 Vulnerability and impact modelling
Impacts to telecommunications components are modelled using RiskScape (see Section 2.0) using the vulnerability models presented in Table 6.4. Liquefaction impacts use the same LSN damage enhancements as electricity with exchange buildings, buried cables and cellular towers considered equivalent to substations, buried cables and transmission structures respectively (Section 6.2). The impacts to telecommunications components are presented in Figure 6.9.
Table 6.4 Telecommunications asset vulnerability models.
Asset Type Hazards
Ground Shaking Liquefaction Other Hazards
Exchange Building MMI: Nayyerloo and King, 2012 LSN: (Rosser and Dellow, 2015) Within Hazard foot print = DS4, not within hazard footprint = DS0
Buried Cable MMI: Nayyerloo and King, 2012 LSN: engineering judgement
Cellular Towers PGA: Xie et al., 2012 LSN: engineering judgement
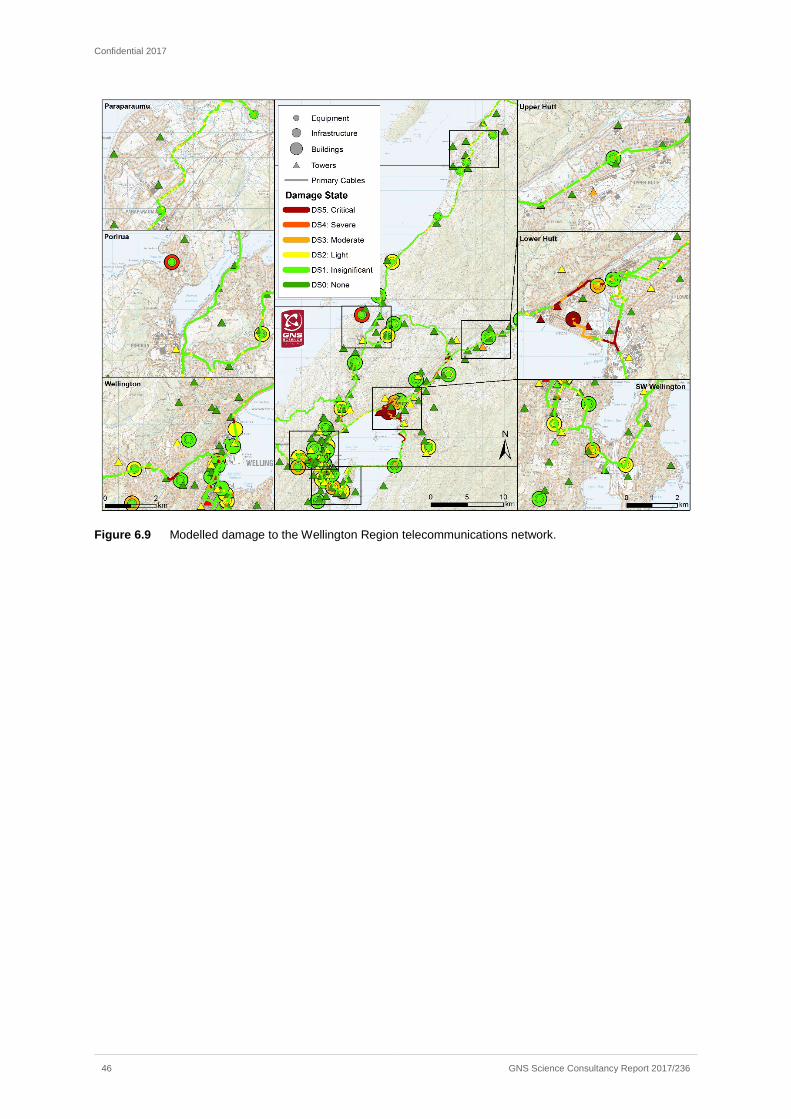
Confidential 2017
46 GNS Science Consultancy Report 2017/236
Figure 6.9 Modelled damage to the Wellington Region telecommunications network.
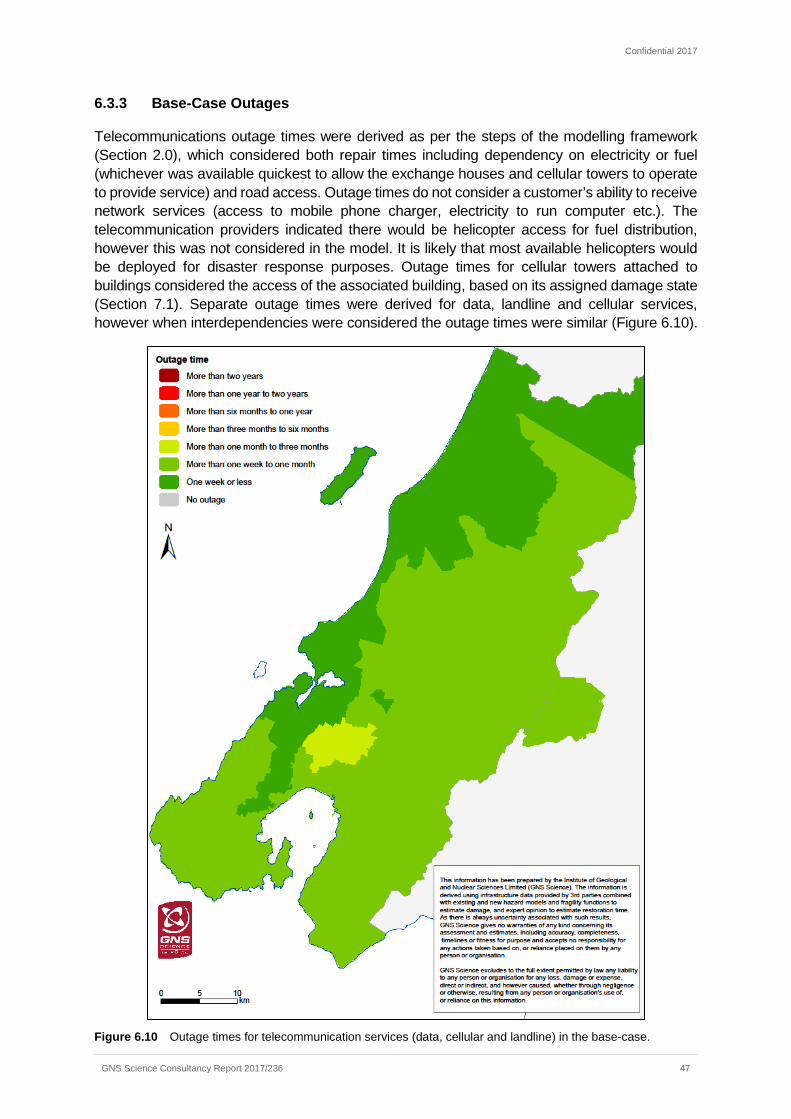
Confidential 2017
GNS Science Consultancy Report 2017/236 47
6.3.3 Base-Case Outages
Telecommunications outage times were derived as per the steps of the modelling framework (Section 2.0), which considered both repair times including dependency on electricity or fuel (whichever was available quickest to allow the exchange houses and cellular towers to operate to provide service) and road access. Outage times do not consider a customer’s ability to receive network services (access to mobile phone charger, electricity to run computer etc.). The telecommunication providers indicated there would be helicopter access for fuel distribution, however this was not considered in the model. It is likely that most available helicopters would be deployed for disaster response purposes. Outage times for cellular towers attached to buildings considered the access of the associated building, based on its assigned damage state (Section 7.1). Separate outage times were derived for data, landline and cellular services, however when interdependencies were considered the outage times were similar (Figure 6.10).
Figure 6.10 Outage times for telecommunication services (data, cellular and landline) in the base-case.
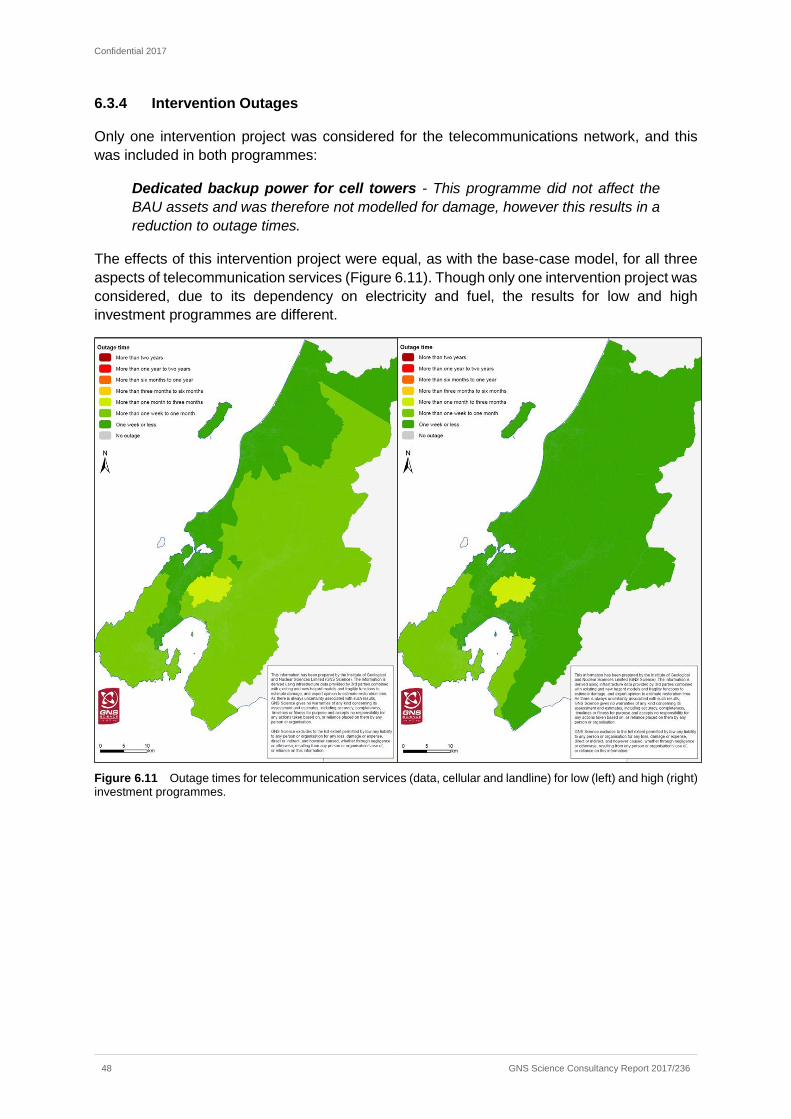
Confidential 2017
48 GNS Science Consultancy Report 2017/236
6.3.4 Intervention Outages
Only one intervention project was considered for the telecommunications network, and this was included in both programmes:
Dedicated backup power for cell towers - This programme did not affect the BAU assets and was therefore not modelled for damage, however this results in a reduction to outage times.
The effects of this intervention project were equal, as with the base-case model, for all three aspects of telecommunication services (Figure 6.11). Though only one intervention project was considered, due to its dependency on electricity and fuel, the results for low and high investment programmes are different.
Figure 6.11 Outage times for telecommunication services (data, cellular and landline) for low (left) and high (right) investment programmes.
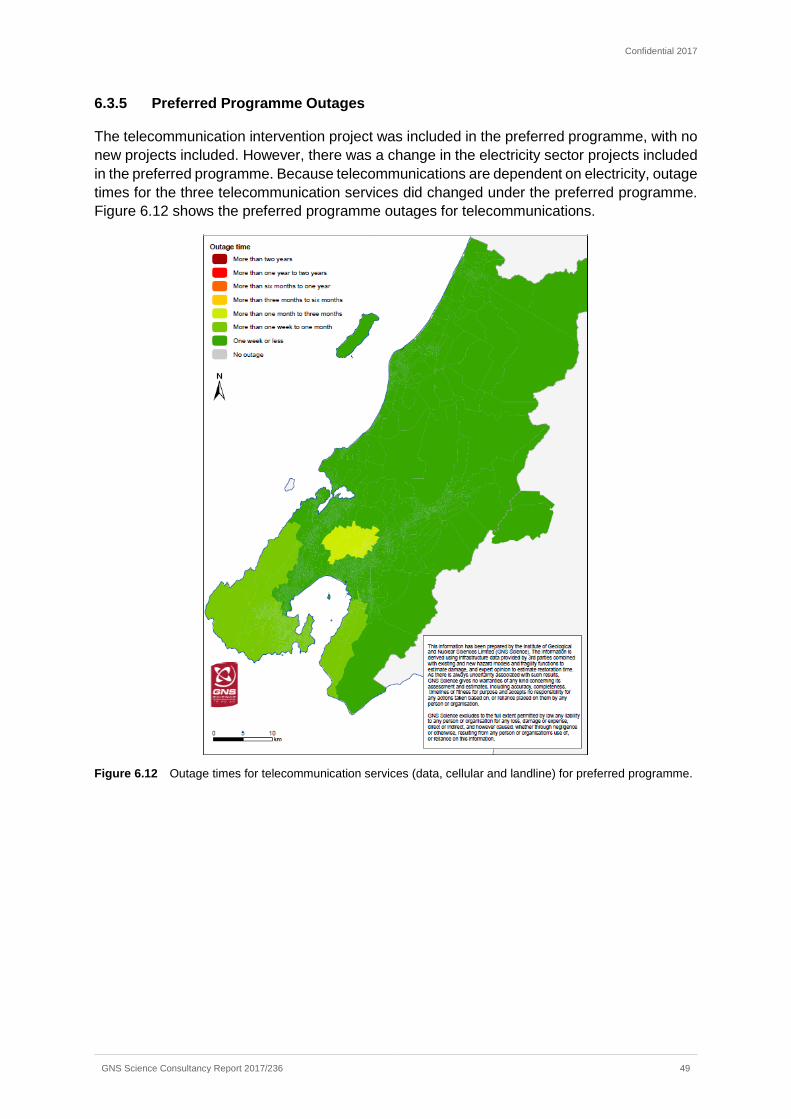
Confidential 2017
GNS Science Consultancy Report 2017/236 49
6.3.5 Preferred Programme Outages
The telecommunication intervention project was included in the preferred programme, with no new projects included. However, there was a change in the electricity sector projects included in the preferred programme. Because telecommunications are dependent on electricity, outage times for the three telecommunication services did changed under the preferred programme. Figure 6.12 shows the preferred programme outages for telecommunications.
Figure 6.12 Outage times for telecommunication services (data, cellular and landline) for preferred programme.
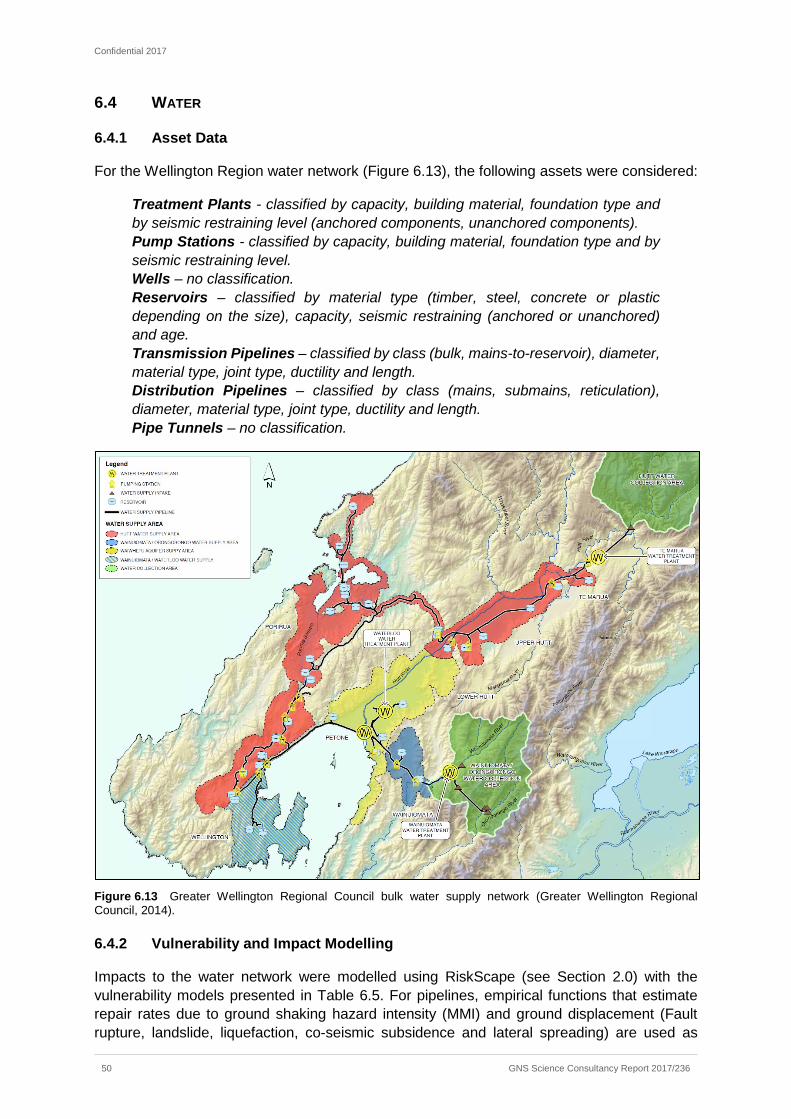
Confidential 2017
50 GNS Science Consultancy Report 2017/236
6.4 WATER
6.4.1 Asset Data
For the Wellington Region water network (Figure 6.13), the following assets were considered:
Treatment Plants - classified by capacity, building material, foundation type and by seismic restraining level (anchored components, unanchored components). Pump Stations - classified by capacity, building material, foundation type and by seismic restraining level. Wells – no classification. Reservoirs – classified by material type (timber, steel, concrete or plastic depending on the size), capacity, seismic restraining (anchored or unanchored) and age. Transmission Pipelines – classified by class (bulk, mains-to-reservoir), diameter, material type, joint type, ductility and length. Distribution Pipelines – classified by class (mains, submains, reticulation), diameter, material type, joint type, ductility and length. Pipe Tunnels – no classification.
Figure 6.13 Greater Wellington Regional Council bulk water supply network (Greater Wellington Regional Council, 2014).
6.4.2 Vulnerability and Impact Modelling
Impacts to the water network were modelled using RiskScape (see Section 2.0) with the vulnerability models presented in Table 6.5. For pipelines, empirical functions that estimate repair rates due to ground shaking hazard intensity (MMI) and ground displacement (Fault rupture, landslide, liquefaction, co-seismic subsidence and lateral spreading) are used as
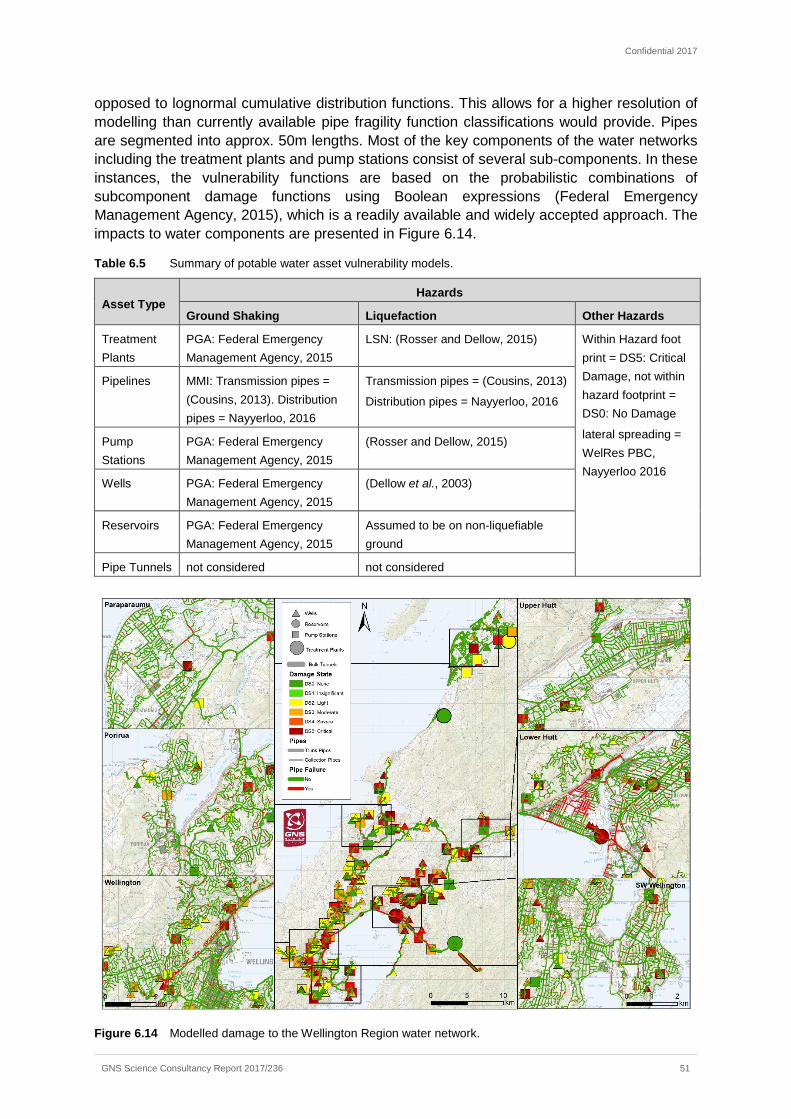
Confidential 2017
GNS Science Consultancy Report 2017/236 51
opposed to lognormal cumulative distribution functions. This allows for a higher resolution of modelling than currently available pipe fragility function classifications would provide. Pipes are segmented into approx. 50m lengths. Most of the key components of the water networks including the treatment plants and pump stations consist of several sub-components. In these instances, the vulnerability functions are based on the probabilistic combinations of subcomponent damage functions using Boolean expressions (Federal Emergency Management Agency, 2015), which is a readily available and widely accepted approach. The impacts to water components are presented in Figure 6.14.
Table 6.5 Summary of potable water asset vulnerability models.
Asset Type Hazards
Ground Shaking Liquefaction Other Hazards
Treatment Plants
PGA: Federal Emergency Management Agency, 2015
LSN: (Rosser and Dellow, 2015) Within Hazard foot print = DS5: Critical Damage, not within hazard footprint = DS0: No Damage
lateral spreading = WelRes PBC, Nayyerloo 2016
Pipelines MMI: Transmission pipes = (Cousins, 2013). Distribution pipes = Nayyerloo, 2016
Transmission pipes = (Cousins, 2013)
Distribution pipes = Nayyerloo, 2016
Pump Stations
PGA: Federal Emergency Management Agency, 2015
(Rosser and Dellow, 2015)
Wells PGA: Federal Emergency Management Agency, 2015
(Dellow et al., 2003)
Reservoirs PGA: Federal Emergency Management Agency, 2015
Assumed to be on non-liquefiable ground
Pipe Tunnels not considered not considered
Figure 6.14 Modelled damage to the Wellington Region water network.
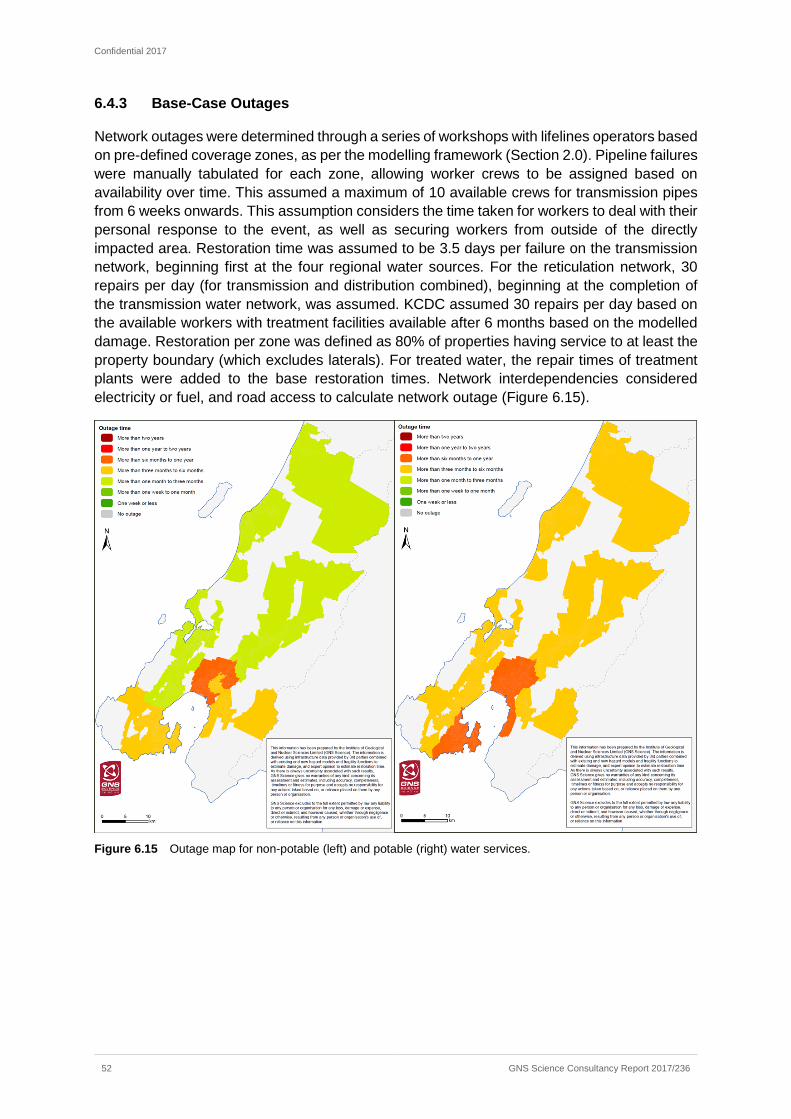
Confidential 2017
52 GNS Science Consultancy Report 2017/236
6.4.3 Base-Case Outages
Network outages were determined through a series of workshops with lifelines operators based on pre-defined coverage zones, as per the modelling framework (Section 2.0). Pipeline failures were manually tabulated for each zone, allowing worker crews to be assigned based on availability over time. This assumed a maximum of 10 available crews for transmission pipes from 6 weeks onwards. This assumption considers the time taken for workers to deal with their personal response to the event, as well as securing workers from outside of the directly impacted area. Restoration time was assumed to be 3.5 days per failure on the transmission network, beginning first at the four regional water sources. For the reticulation network, 30 repairs per day (for transmission and distribution combined), beginning at the completion of the transmission water network, was assumed. KCDC assumed 30 repairs per day based on the available workers with treatment facilities available after 6 months based on the modelled damage. Restoration per zone was defined as 80% of properties having service to at least the property boundary (which excludes laterals). For treated water, the repair times of treatment plants were added to the base restoration times. Network interdependencies considered electricity or fuel, and road access to calculate network outage (Figure 6.15).
Figure 6.15 Outage map for non-potable (left) and potable (right) water services.
Confidential 2017
GNS Science Consultancy Report 2017/236 53
6.4.4 Intervention Outages
Intervention projects for the Water network were as follows:
Cross Harbour Pipeline – new pipeline connection assumed to extend inland just south of the Waterloo Treatment Plant. The pipe is assumed to be designed to withstand damage from a Wellington Fault event and therefore no damage modelling was required. Prince of Wales and Bell Road Reservoir Upgrade - assumed to be designed to withstand damage in the given scenario and no damage modelling was done. This programme is necessary for the functionality of the cross harbour pipeline programme. Carmichael to Johnsonville and Karori Pipeline - new transmission pipeline is added connecting Karori, Carmichael and Johnsonville. This pipe was assumed to be designed to withstand damage from a Wellington Fault event and was therefore not modelled for damage. General Water Supply Toughening - a ‘critical’ network of pipes was defined, made up of predominantly mains and mains – to – reservoirs. These were all assumed to be upgraded to ductile pipes, if not already, for damage modelling. Porirua Branch Replacement & Emergency Water Treatment Facility - new pipeline connection is added which is assumed to be designed to withstand any damage from this scenario and was therefore not modelled for damage. The emergency treatment plant has no spatial data, but is also assumed to designed to withstand damage from this scenario and would be operational immediately after the event, therefore, no damage was modelled for this asset. The emergency treatment plant had no effect on non-potable outage time, but meant that potable water was available as soon as the pipes are repaired to supply the area. Elsdon Reservoir Upgrade - This programme was not modelled in Phase 2, but is necessary for the Porirua branch replacement and emergency water treatment facility programme. Waterloo Pump Station Extension - this assumed that the Waterloo Treatment Facility would be operational immediately after the given event. This was not modelled for damage as the extension is assumed to be designed to withstand damage during this scenario. This had no effect on outage time for non-potable water, however it meant that potable water is available immediately after pipes are restored. New Pipeline from Waterloo to Haywards – a new pipe is added for bulk supply between Waterloo treatment plant and Haywards. This pipe was assumed to be designed to withstand damage in the given scenario and is therefore not modelled for damage. Waterloo Water Treatment Plant Liquefaction Mitigation Project – this is assumed to be designed to withstand the effects of a Wellington Fault event, therefore no damage modelling is necessary. This results in a reduction of outage time for potable water. Silverstream Bridge Pipeline Replacement Project – new pipe assumed to be designed to withstand the effects of a Wellington Fault event, therefore damage modelling is not necessary.
All these projects were included in both intervention programmes.
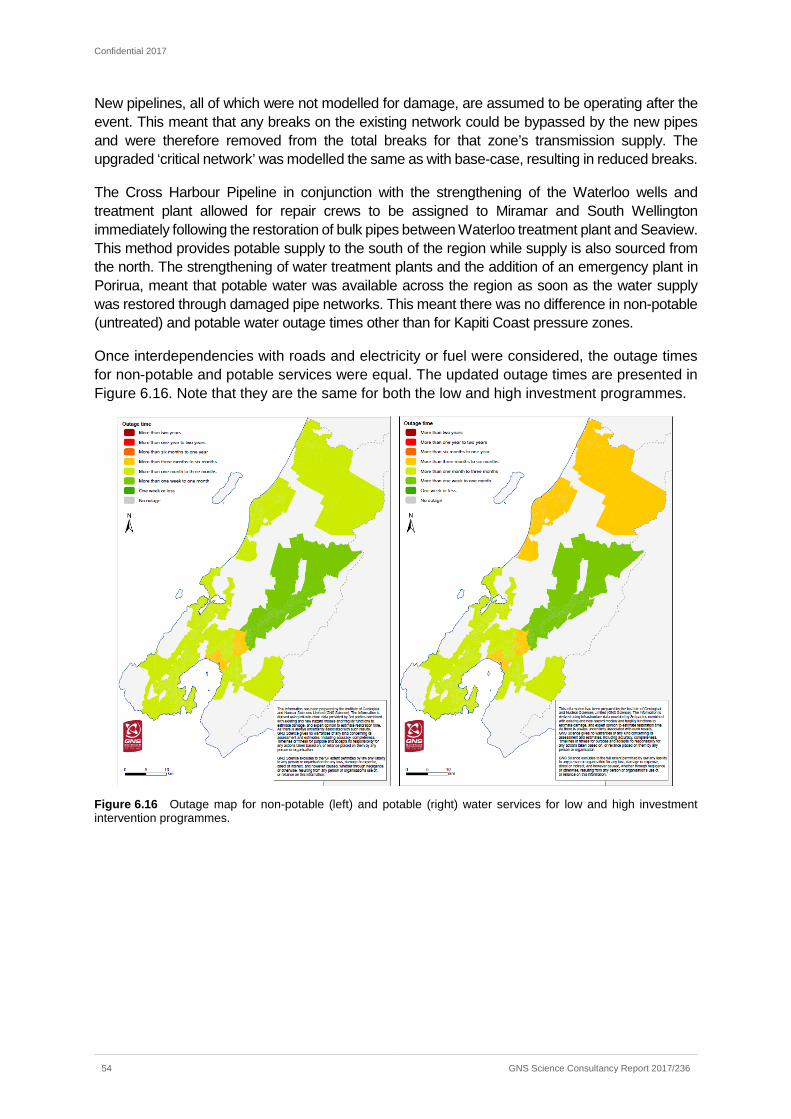
Confidential 2017
54 GNS Science Consultancy Report 2017/236
New pipelines, all of which were not modelled for damage, are assumed to be operating after the event. This meant that any breaks on the existing network could be bypassed by the new pipes and were therefore removed from the total breaks for that zone’s transmission supply. The upgraded ‘critical network’ was modelled the same as with base-case, resulting in reduced breaks.
The Cross Harbour Pipeline in conjunction with the strengthening of the Waterloo wells and treatment plant allowed for repair crews to be assigned to Miramar and South Wellington immediately following the restoration of bulk pipes between Waterloo treatment plant and Seaview. This method provides potable supply to the south of the region while supply is also sourced from the north. The strengthening of water treatment plants and the addition of an emergency plant in Porirua, meant that potable water was available across the region as soon as the water supply was restored through damaged pipe networks. This meant there was no difference in non-potable (untreated) and potable water outage times other than for Kapiti Coast pressure zones.
Once interdependencies with roads and electricity or fuel were considered, the outage times for non-potable and potable services were equal. The updated outage times are presented in Figure 6.16. Note that they are the same for both the low and high investment programmes.
Figure 6.16 Outage map for non-potable (left) and potable (right) water services for low and high investment intervention programmes.
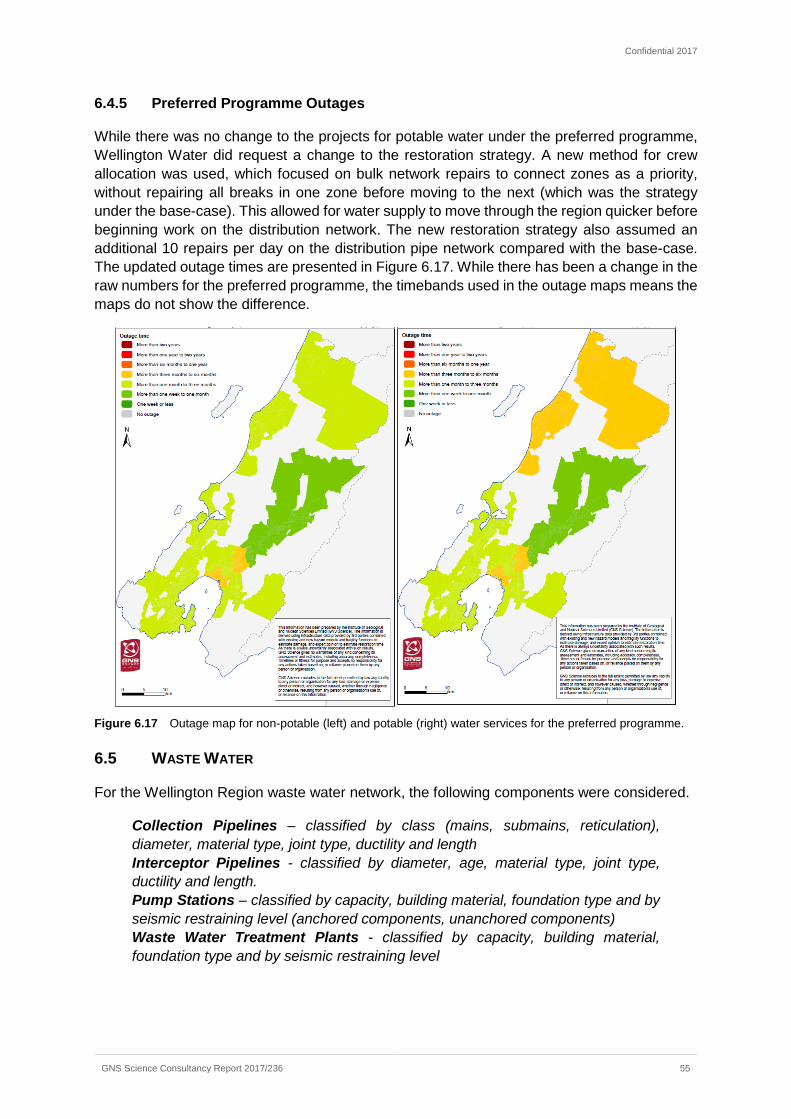
Confidential 2017
GNS Science Consultancy Report 2017/236 55
6.4.5 Preferred Programme Outages
While there was no change to the projects for potable water under the preferred programme, Wellington Water did request a change to the restoration strategy. A new method for crew allocation was used, which focused on bulk network repairs to connect zones as a priority, without repairing all breaks in one zone before moving to the next (which was the strategy under the base-case). This allowed for water supply to move through the region quicker before beginning work on the distribution network. The new restoration strategy also assumed an additional 10 repairs per day on the distribution pipe network compared with the base-case. The updated outage times are presented in Figure 6.17. While there has been a change in the raw numbers for the preferred programme, the timebands used in the outage maps means the maps do not show the difference.
Figure 6.17 Outage map for non-potable (left) and potable (right) water services for the preferred programme.
6.5 WASTE WATER
For the Wellington Region waste water network, the following components were considered.
Collection Pipelines – classified by class (mains, submains, reticulation), diameter, material type, joint type, ductility and length Interceptor Pipelines - classified by diameter, age, material type, joint type, ductility and length. Pump Stations – classified by capacity, building material, foundation type and by seismic restraining level (anchored components, unanchored components) Waste Water Treatment Plants - classified by capacity, building material, foundation type and by seismic restraining level
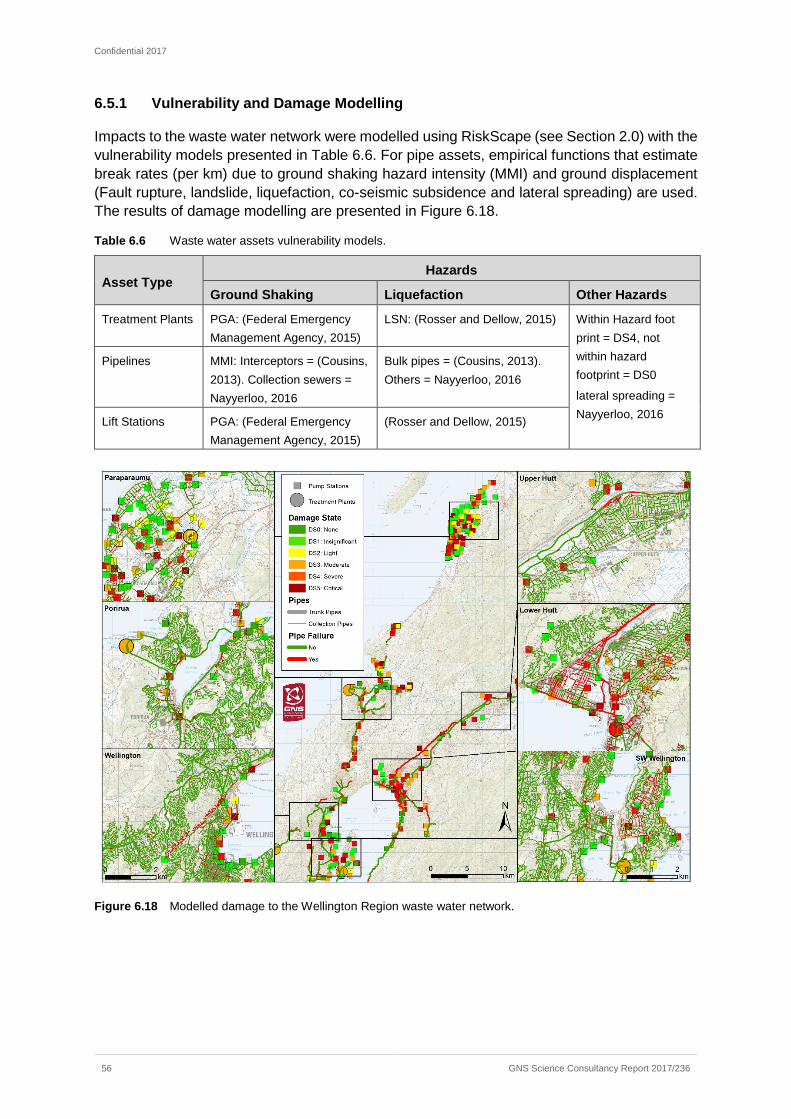
Confidential 2017
56 GNS Science Consultancy Report 2017/236
6.5.1 Vulnerability and Damage Modelling
Impacts to the waste water network were modelled using RiskScape (see Section 2.0) with the vulnerability models presented in Table 6.6. For pipe assets, empirical functions that estimate break rates (per km) due to ground shaking hazard intensity (MMI) and ground displacement (Fault rupture, landslide, liquefaction, co-seismic subsidence and lateral spreading) are used. The results of damage modelling are presented in Figure 6.18.
Table 6.6 Waste water assets vulnerability models.
Asset Type Hazards
Ground Shaking Liquefaction Other Hazards
Treatment Plants PGA: (Federal Emergency Management Agency, 2015)
LSN: (Rosser and Dellow, 2015) Within Hazard foot print = DS4, not within hazard footprint = DS0
lateral spreading = Nayyerloo, 2016
Pipelines MMI: Interceptors = (Cousins, 2013). Collection sewers = Nayyerloo, 2016
Bulk pipes = (Cousins, 2013). Others = Nayyerloo, 2016
Lift Stations PGA: (Federal Emergency Management Agency, 2015)
(Rosser and Dellow, 2015)
Figure 6.18 Modelled damage to the Wellington Region waste water network.
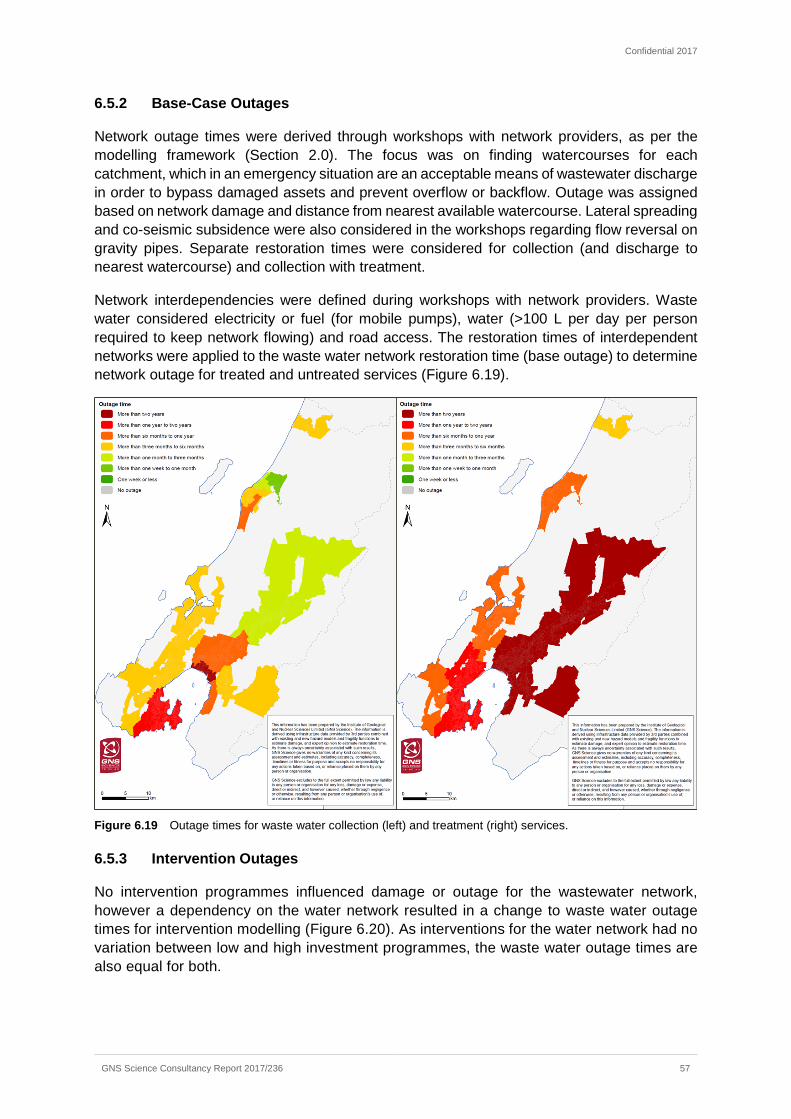
Confidential 2017
GNS Science Consultancy Report 2017/236 57
6.5.2 Base-Case Outages
Network outage times were derived through workshops with network providers, as per the modelling framework (Section 2.0). The focus was on finding watercourses for each catchment, which in an emergency situation are an acceptable means of wastewater discharge in order to bypass damaged assets and prevent overflow or backflow. Outage was assigned based on network damage and distance from nearest available watercourse. Lateral spreading and co-seismic subsidence were also considered in the workshops regarding flow reversal on gravity pipes. Separate restoration times were considered for collection (and discharge to nearest watercourse) and collection with treatment.
Network interdependencies were defined during workshops with network providers. Waste water considered electricity or fuel (for mobile pumps), water (>100 L per day per person required to keep network flowing) and road access. The restoration times of interdependent networks were applied to the waste water network restoration time (base outage) to determine network outage for treated and untreated services (Figure 6.19).
Figure 6.19 Outage times for waste water collection (left) and treatment (right) services.
6.5.3 Intervention Outages
No intervention programmes influenced damage or outage for the wastewater network, however a dependency on the water network resulted in a change to waste water outage times for intervention modelling (Figure 6.20). As interventions for the water network had no variation between low and high investment programmes, the waste water outage times are also equal for both.
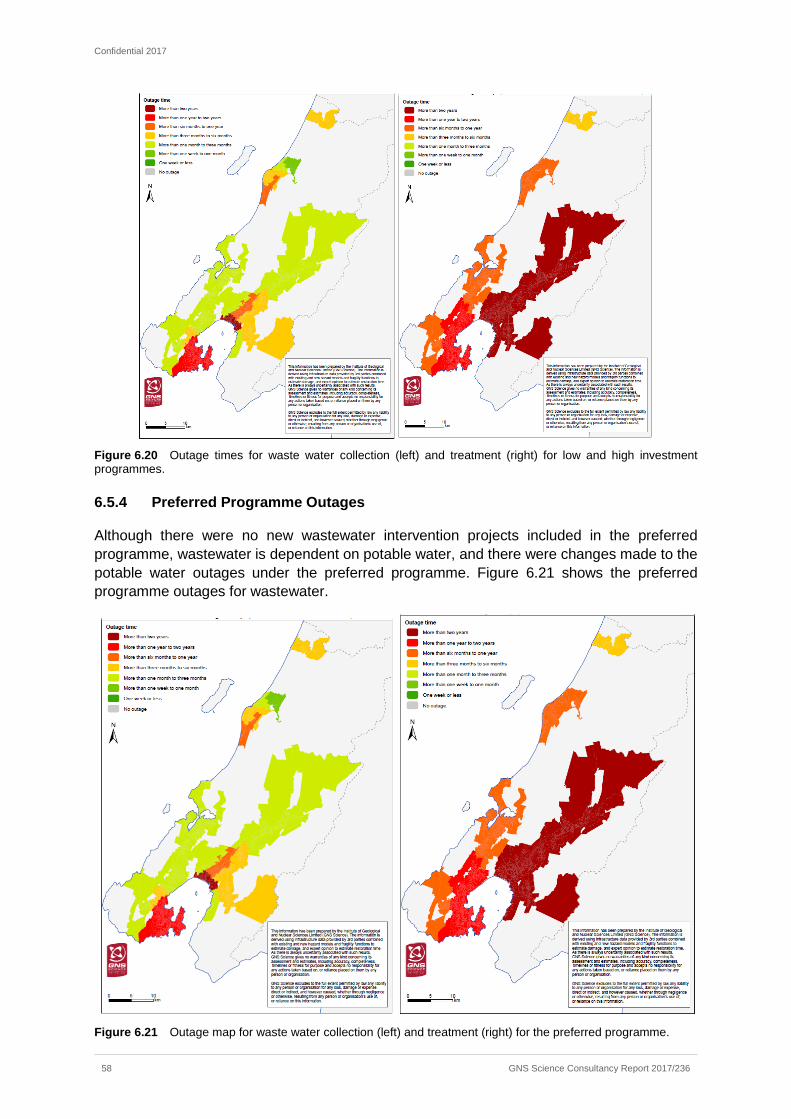
Confidential 2017
58 GNS Science Consultancy Report 2017/236
Figure 6.20 Outage times for waste water collection (left) and treatment (right) for low and high investment programmes.
6.5.4 Preferred Programme Outages
Although there were no new wastewater intervention projects included in the preferred programme, wastewater is dependent on potable water, and there were changes made to the potable water outages under the preferred programme. Figure 6.21 shows the preferred programme outages for wastewater.
Figure 6.21 Outage map for waste water collection (left) and treatment (right) for the preferred programme.
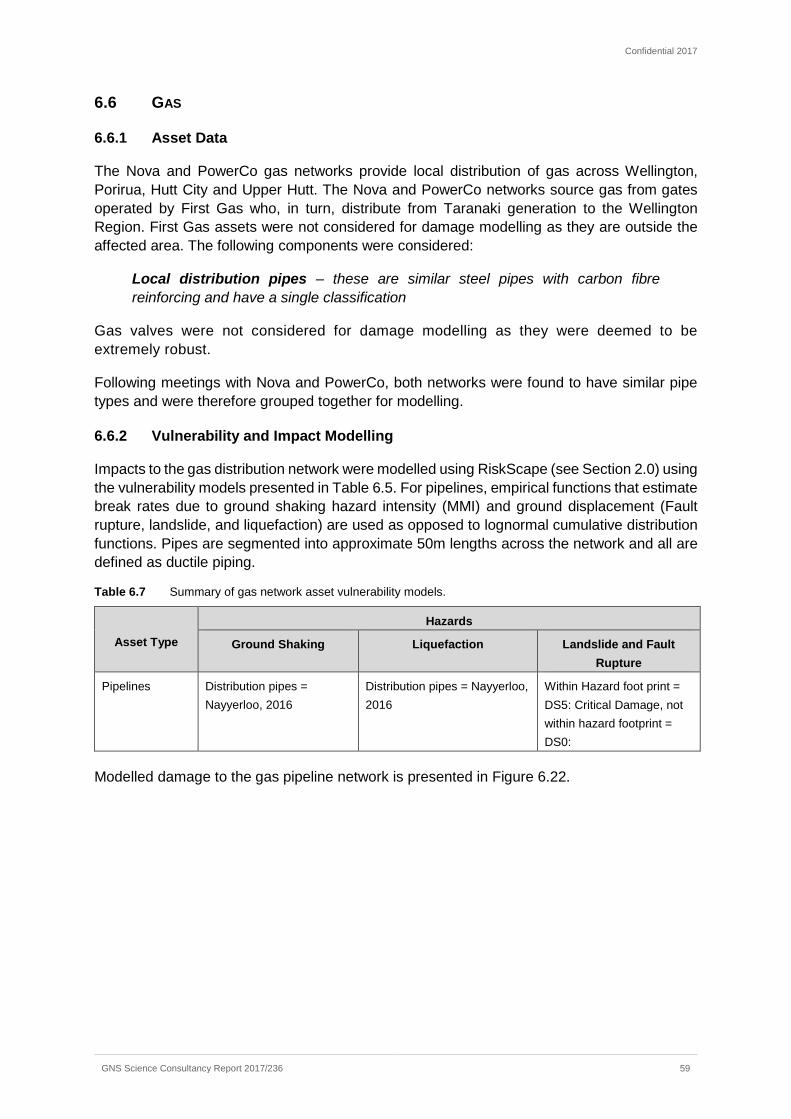
Confidential 2017
GNS Science Consultancy Report 2017/236 59
6.6 GAS
6.6.1 Asset Data
The Nova and PowerCo gas networks provide local distribution of gas across Wellington, Porirua, Hutt City and Upper Hutt. The Nova and PowerCo networks source gas from gates operated by First Gas who, in turn, distribute from Taranaki generation to the Wellington Region. First Gas assets were not considered for damage modelling as they are outside the affected area. The following components were considered:
Local distribution pipes – these are similar steel pipes with carbon fibre reinforcing and have a single classification
Gas valves were not considered for damage modelling as they were deemed to be extremely robust.
Following meetings with Nova and PowerCo, both networks were found to have similar pipe types and were therefore grouped together for modelling.
6.6.2 Vulnerability and Impact Modelling
Impacts to the gas distribution network were modelled using RiskScape (see Section 2.0) using the vulnerability models presented in Table 6.5. For pipelines, empirical functions that estimate break rates due to ground shaking hazard intensity (MMI) and ground displacement (Fault rupture, landslide, and liquefaction) are used as opposed to lognormal cumulative distribution functions. Pipes are segmented into approximate 50m lengths across the network and all are defined as ductile piping.
Table 6.7 Summary of gas network asset vulnerability models.
Asset Type Hazards
Ground Shaking Liquefaction Landslide and Fault Rupture
Pipelines Distribution pipes = Nayyerloo, 2016
Distribution pipes = Nayyerloo, 2016
Within Hazard foot print = DS5: Critical Damage, not within hazard footprint = DS0:
Modelled damage to the gas pipeline network is presented in Figure 6.22.
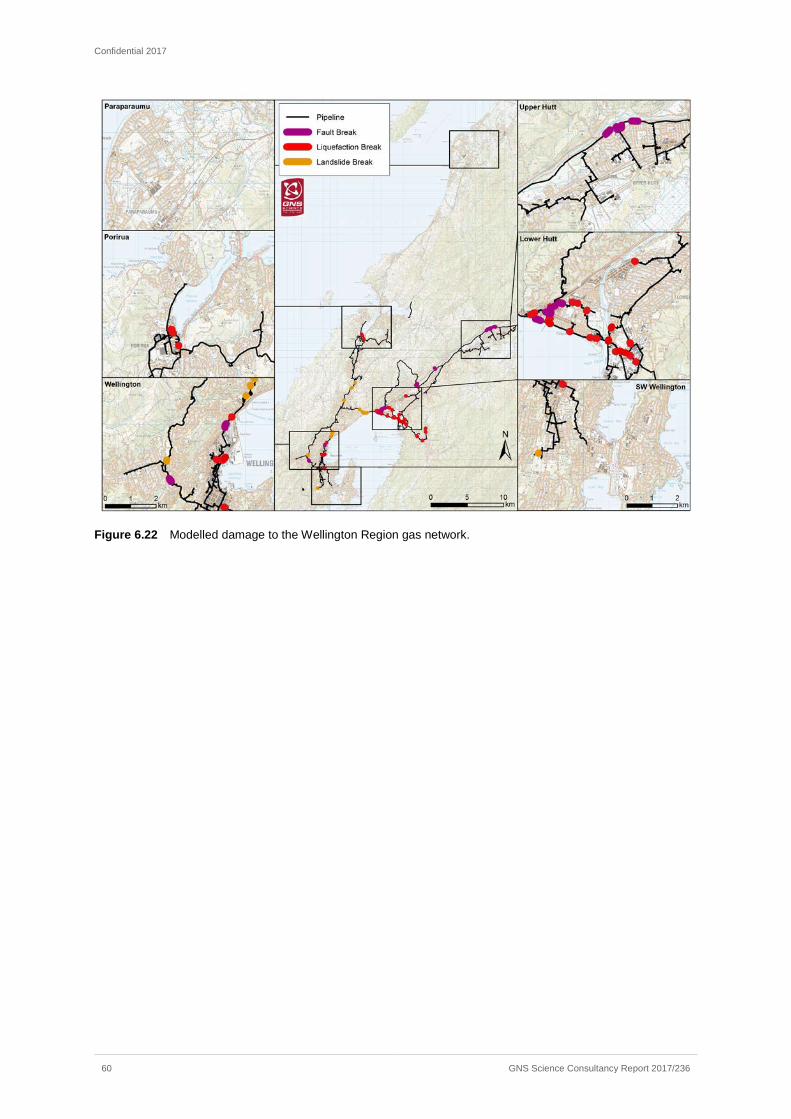
Confidential 2017
60 GNS Science Consultancy Report 2017/236
Figure 6.22 Modelled damage to the Wellington Region gas network.
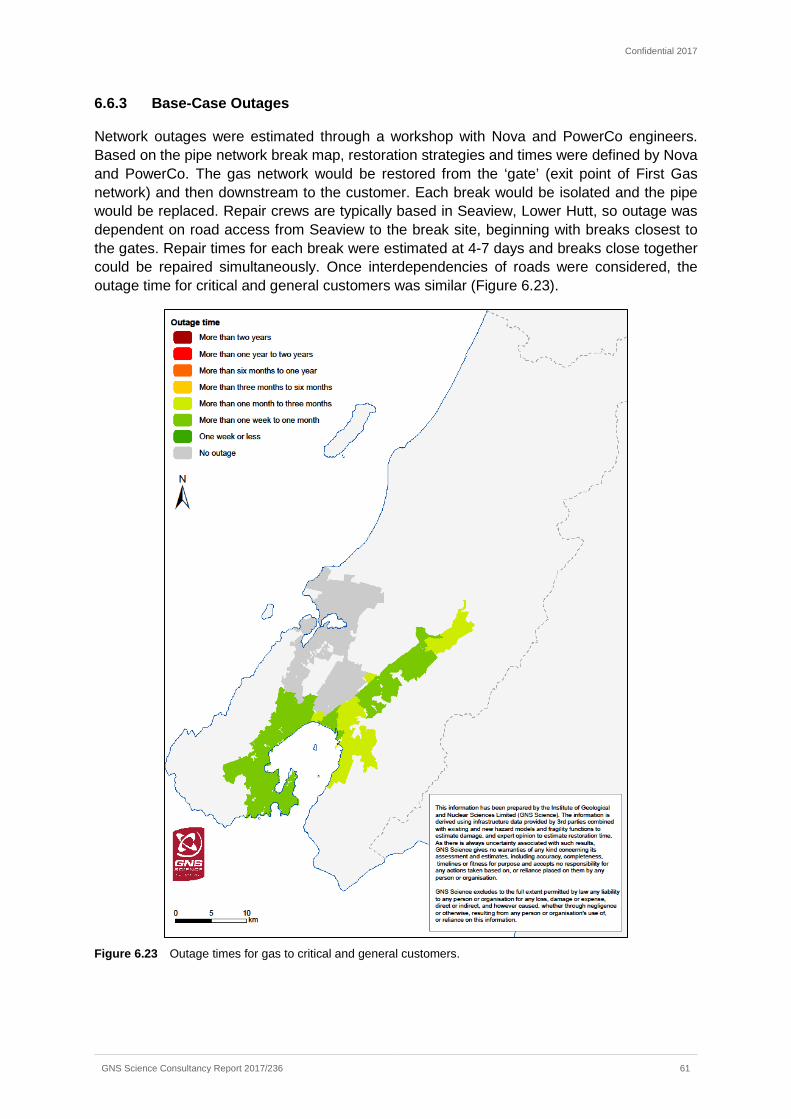
Confidential 2017
GNS Science Consultancy Report 2017/236 61
6.6.3 Base-Case Outages
Network outages were estimated through a workshop with Nova and PowerCo engineers. Based on the pipe network break map, restoration strategies and times were defined by Nova and PowerCo. The gas network would be restored from the ‘gate’ (exit point of First Gas network) and then downstream to the customer. Each break would be isolated and the pipe would be replaced. Repair crews are typically based in Seaview, Lower Hutt, so outage was dependent on road access from Seaview to the break site, beginning with breaks closest to the gates. Repair times for each break were estimated at 4-7 days and breaks close together could be repaired simultaneously. Once interdependencies of roads were considered, the outage time for critical and general customers was similar (Figure 6.23).
Figure 6.23 Outage times for gas to critical and general customers.
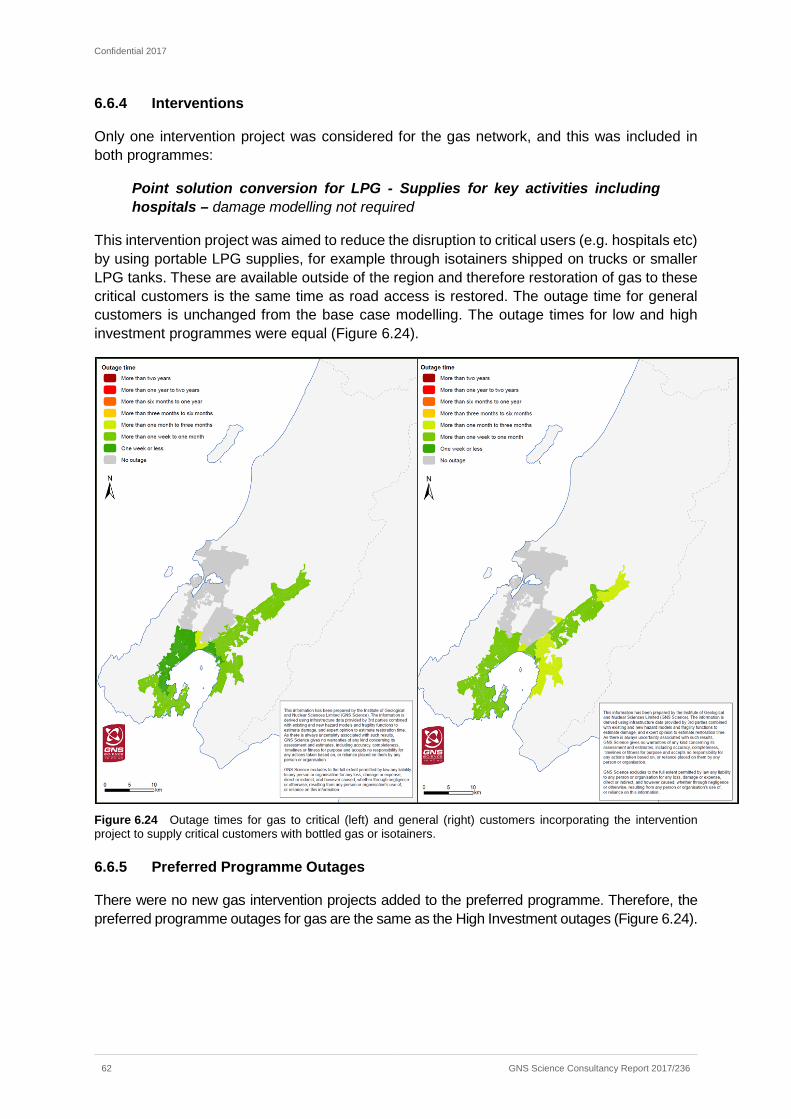
Confidential 2017
62 GNS Science Consultancy Report 2017/236
6.6.4 Interventions
Only one intervention project was considered for the gas network, and this was included in both programmes:
Point solution conversion for LPG - Supplies for key activities including hospitals – damage modelling not required
This intervention project was aimed to reduce the disruption to critical users (e.g. hospitals etc) by using portable LPG supplies, for example through isotainers shipped on trucks or smaller LPG tanks. These are available outside of the region and therefore restoration of gas to these critical customers is the same time as road access is restored. The outage time for general customers is unchanged from the base case modelling. The outage times for low and high investment programmes were equal (Figure 6.24).
Figure 6.24 Outage times for gas to critical (left) and general (right) customers incorporating the intervention project to supply critical customers with bottled gas or isotainers.
6.6.5 Preferred Programme Outages
There were no new gas intervention projects added to the preferred programme. Therefore, the preferred programme outages for gas are the same as the High Investment outages (Figure 6.24).
Confidential 2017
GNS Science Consultancy Report 2017/236 63
7.0 NON-INFRASTRUCTURE
7.1 BUILDINGS
Buildings are generally considered the end-point of most infrastructure distribution networks. Building assets can also easily be linked to occupancy and economic value based on council rateable values and national census data. This provides the crucial link between the built and social environments which is a key input for MERIT economic loss modelling (see Section 1.2) in this project. In addition to direct losses, the MERIT-RiskScape linked economic loss model also requires outage times which, in the case of buildings, are defined by functional down-time (i.e. the number of days a building is not functional following the given hazard scenario).
7.1.1 Asset Data
In the case of this project, all occupied buildings in the Wellington Region were assumed to be included in the RiskScape asset repository. This includes residential, commercial, industrial, educational, utility, community, government, religious and emergency operations buildings. This database was unaltered for the study area. Buildings are classified by use category, earning potential, replacement cost, contents value, storeys, floor area, footprint area, occupancy, vehicle value, vehicles.
7.1.2 Impact modelling
Utilising RiskScape’s vulnerability module for earthquakes and the Wellington Region buildings repository, direct impacts to building assets were modelled including the direct economic losses associated with building damage. The level of damage to structural and non-structural components of a building is described by one of five damage states: DS0: None (no damage), DS1: Insignificant (minor non-structural damage), DS2: Light (non-structural damage only), DS3: Moderate (repairable structural damage), DS4: Severe (irreparable structural damage), and DS5: Critical (structural integrity fails). The model was run for 10 scenario realisations at both night and day time scenarios, allowing for variations in population distribution. The direct impact results were provided for damage state (Figure 7.1), human displacement, human susceptibility, human losses and reinstatement costs.
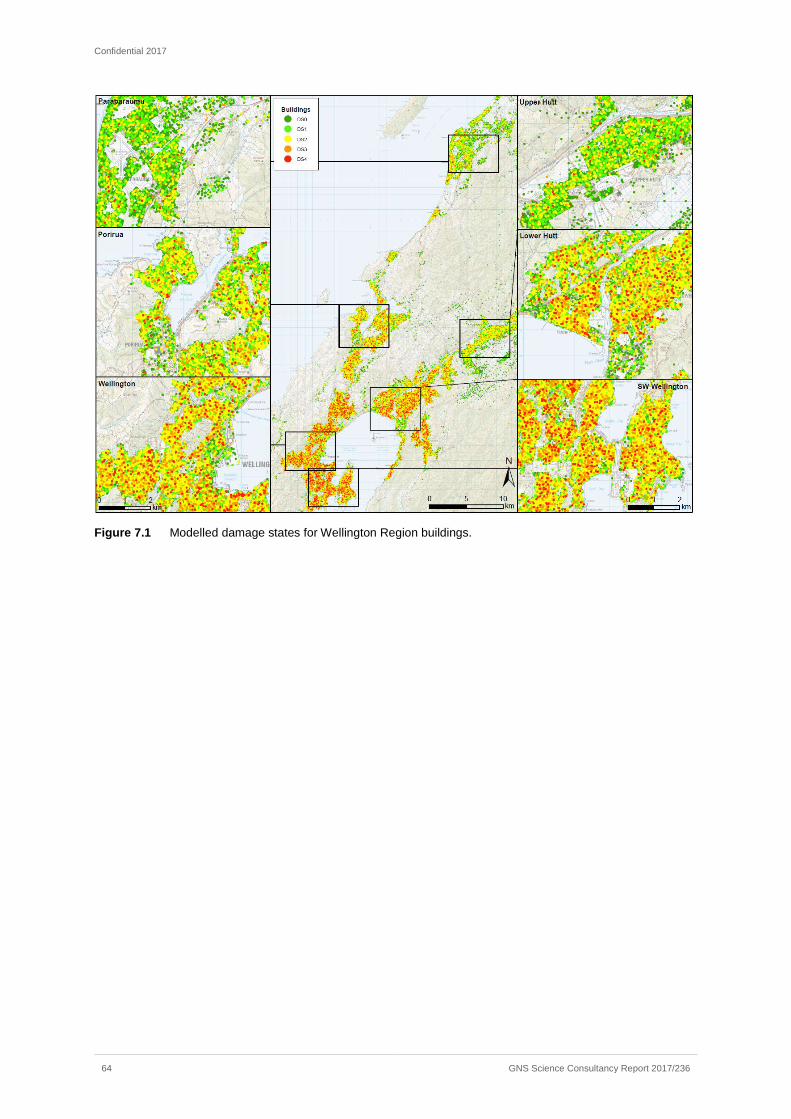
Confidential 2017
64 GNS Science Consultancy Report 2017/236
Figure 7.1 Modelled damage states for Wellington Region buildings.
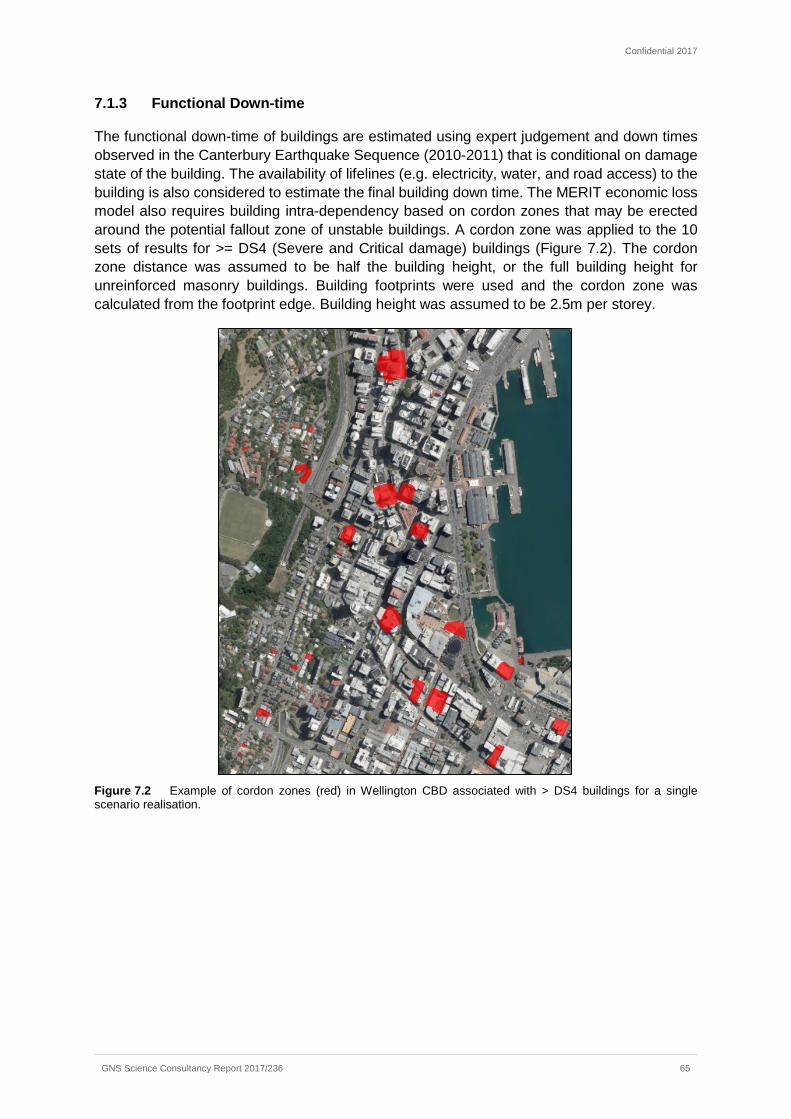
Confidential 2017
GNS Science Consultancy Report 2017/236 65
7.1.3 Functional Down-time
The functional down-time of buildings are estimated using expert judgement and down times observed in the Canterbury Earthquake Sequence (2010-2011) that is conditional on damage state of the building. The availability of lifelines (e.g. electricity, water, and road access) to the building is also considered to estimate the final building down time. The MERIT economic loss model also requires building intra-dependency based on cordon zones that may be erected around the potential fallout zone of unstable buildings. A cordon zone was applied to the 10 sets of results for >= DS4 (Severe and Critical damage) buildings (Figure 7.2). The cordon zone distance was assumed to be half the building height, or the full building height for unreinforced masonry buildings. Building footprints were used and the cordon zone was calculated from the footprint edge. Building height was assumed to be 2.5m per storey.
Figure 7.2 Example of cordon zones (red) in Wellington CBD associated with > DS4 buildings for a single scenario realisation.

Confidential 2017
GNS Science Consultancy Report 2017/236 67
8.0 SUMMARY
Three stages of infrastructure damage and economic disruption modelling have been undertaken to provide an evidence-base for the assessment of infrastructure investment programmes identified by the Wellington Lifelines Group. The modelling process has produced a series of temporal service outage maps that show the time to restoration of full service following a Mw7.5 Wellington Fault earthquake event and associated perils (fault rupture, ground shaking, liquefaction, landslides, lateral spreading, subsidence), as well as economic disruption information, including figures for loss in GDP out to five years following the event. This information is to be used by Aurecon in a Programme Business Case for investment in the resilience of Wellington’s infrastructure.
The outputs from the modelling process have been specifically produced for the Programme Business Case assessment, and are not necessarily appropriate for other uses by the lifeline organisations involved. However, the work done in this project can be built on, to produce appropriate information for more specific purposes, such as detailed analysis of network vulnerabilities or the impact of the staging of intervention projects on reducing GPD losses. Another positive outcome of the project is that further modelling can now be undertaken more efficiently than was possible before this project due to advances in modelling techniques developed as part of the project and supported by research funding.

Confidential 2017
GNS Science Consultancy Report 2017/236 69
9.0 ACKNOWLEDGMENTS
We would like to sincerely thank the lifeline organisations who contributed data, time and expertise to this project. We would like to thank the Richard Mowll for this facilitation and expert knowledge. And we would like to thank the Project Steering Group for providing valuable guidance and feedback on the modelling process.
We would like to thank Aurecon for their collaboration on this project.
We would like to thank Finn Scheele, Kelvin Berryman, and Michele Daly for their reviews of this report.

Confidential 2017
GNS Science Consultancy Report 2017/236 71
10.0 REFERENCES Allard J, Kenworthy C. 2017. Programme business case for infrastructure investment to ensure the
Wellington Region can rebound after a major earthquake. Wellington (NZ): Aurecon New Zealand Limited.
Berryman KR. 1990. Late Quaternary movement on the Wellington Fault in the Upper Hutt area. New Zealand Journal of Geology and Geophysics. 33(2):257–270.
Boon, D. Perrin ND, Dellow GD, Van Dissen RJ, Lukovic B. 2011. NZS1170.5:2004 site subsoil classification of Lower Hutt. In: Ninth Pacific Conference on Earthquake Engineering: Building an earthquake resilient society; 2011 Apr 14-16; Auckland, New Zealand. Auckland (NZ): 9PCEE. paper 013.
Bradley BA. 2013. A New Zealand-specific pseudospectral acceleration ground-motion prediction equation for active shallow crustal earthquakes based on foreign models. Bulletin of the Seismological Society of America. 103(3):1801–1822. doi:10.1785/0120120021.
Brown C, Seville E. 2017. Wellington Lifelines Resilience project programme business case: Business Behaviours Workshops, April 2017. Christchurch (NZ): Resilient Organisations.
Cousins WJ, Thomas G, Heron DW, Smith WD. 2012. Probabilistic modeling of post-earthquake fire in Wellington, New Zealand. Earthquake Spectra. 28(2):553-571. doi:10.1193/1.4000002.
Cousins WJ. 2013. Wellington without water: impacts of large earthquakes. Lower Hutt (NZ): GNS Science. 124 p. (GNS Science report; 2012/30).
Dellow GD, Perrin ND, Ries WF. 2015. Liquefaction hazard in the Wellington Region. Lower Hutt (NZ): GNS Science. 71 p. (GNS Science report; 2014/16).
Dellow GD, Barker PR, Beetham RD, Heron DW. 2003. A deterministic method for assessing the liquefaction susceptibility of the Heretaunga Plains, Hawke's Bay, NZ. In: Crawford S, Baunton P, Hargraves S. Geotechnics on the volcanic edge; 2003 Mar; Tauranga, New Zealand. Wellington (NZ): Institution of Professional Engineers New Zealand. p. 111-120. (Proceedings of technical groups; 30(1 GM)).
Federal Emergency Management Agency. 2015. Hazus–MH 2.1 technical manual : earthquake model. Washington (DC): Federal Emergency Management Agency Mitigation Division. 718 p. [accessed 2018 Mar 27]. https://www.fema.gov/media-library-data/20130726-1820-25045-6286/hzmh2_1_eq_tm.pdf.
Greater Wellington Regional Council. 2014. Wellington (NZ): Greater Wellington Regional Council; [accessed 2013 April 01]. http://www.gw.govt.nz/.
Lin S-L, Nayyerloo M, Zhang H. 2016. Seismic performance of buried cables during the Canterbury Earthquake Sequence. In: Australasian Earthquake Engineering Society Conference; 2016 Nov 25-27; Melbourne, Australia. Melbourne (AU): Australian Earthquake Engineering Society. paper 372.
Nayyerloo M, King AB. 2012. Assessment of earthquake risk: Chorus NZ. Lower Hutt (NZ): GNS Science. 37 p. (GNS Science consultancy report, 2012/247).
Perrin ND, Stephenson WR. 2010. Site class determinations (NZS 1170.5) in Wellington using borehole data and microtremor techniques. In: Earthquake prone buildings: how ready are we? 2010 NZEE Conference; 2010 Mar 26-28; Wellington, New Zealand. Wellington (NZ): New Zealand Society for Earthquake Engineering. paper 22, Figure 1.
Confidential 2017
72 GNS Science Consultancy Report 2017/236
Rosser BJ, Dellow GD. 2015. Assessment of liquefaction risk in the Hawke’s Bay. Lower Hutt (NZ): GNS Science. 77 p. (GNS Science consultancy report; 2015/186).
Sadashiva VK, King AB, Matcham I. 2017. Exploring a risk evaluation tool for New Zealand State Highway Network National Resilience Project. In: 16th World Conference on Earthquake Engineering, 16WCEE; 2017 Jan 9-13; Santiago, Chile. Tokyo (JP): International Association for Earthquake Engineering. paper 3957.
Smith N, Brown C, McDonald G, Seville E, Ayers M, Kim J. 2017. Wellington Resilience Programme business case: Modelling the Economics of Resilient Infrastructure Tool (MERIT) assumptions report. Christchurch (NZ): Resilient Organisations.
Stirling MW, McVerry GH, Gerstenberger MC, Litchfield NJ, Van Dissen RJ, Berryman KR, Barnes P, Wallace LM, Villamor P, Langridge RM, et al. 2012. National seismic hazard model for New Zealand: 2010 update. Bulletin of the Seismological Society of America. 102(4):1514-1542. doi:10.1785/0120110170.
Townsend DB, Begg JG, Van Dissen RJ, Rhoades DA, Saunders WSA, Little TA. 2016. Estimating co-seismic subsidence in the Hutt Valley associated with rupture of the Wellington Fault. Bulletin of the New Zealand Society for Earthquake Engineering. 49(3):283-291.
Wellington Region CDEM Group. 2015. Wellington Region CDEM Group Fuel Plan 2015. Wellington (NZ): WREMO.
Worden CB, Wald DJ, Rhoades DA. 2012. Probabilistic relationships between ground-motion parameters and modified mercalli intensity in California. Bulletin of the Seismological Society of America. 102(1):204–221. doi:10.1785/0120110156.
Xie L, Tang J, Tang H, Xie Q, Xue S. 2012. Seismic fragility assessment of transmission towers via performance-based analysis. In: 15th World Conference on Earthquake Engineering (15WCEE); 2012 Sep 24-28; Lisbon, Portugal. Kanpur (IN): NICEE. 10 p.

APPENDICES

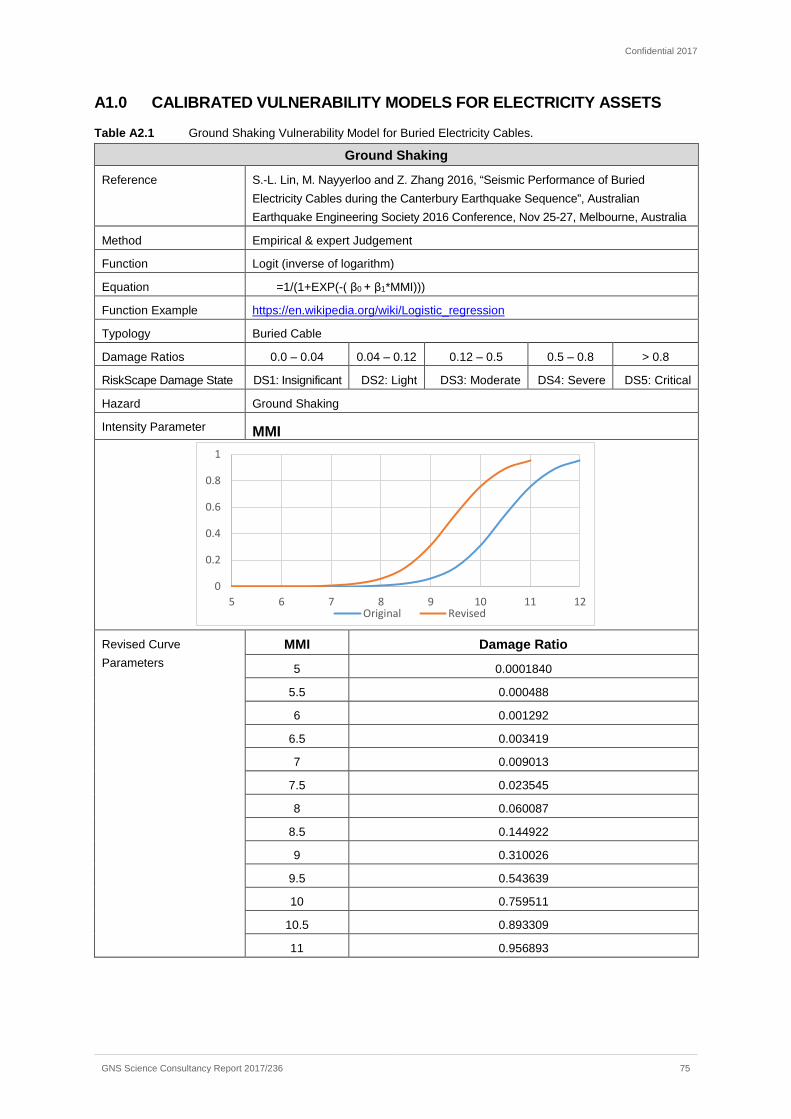
Confidential 2017
GNS Science Consultancy Report 2017/236 75
A1.0 CALIBRATED VULNERABILITY MODELS FOR ELECTRICITY ASSETS
Table A2.1 Ground Shaking Vulnerability Model for Buried Electricity Cables.
Ground Shaking
Reference S.-L. Lin, M. Nayyerloo and Z. Zhang 2016, “Seismic Performance of Buried Electricity Cables during the Canterbury Earthquake Sequence”, Australian Earthquake Engineering Society 2016 Conference, Nov 25-27, Melbourne, Australia
Method Empirical & expert Judgement
Function Logit (inverse of logarithm)
Equation =1/(1+EXP(-( β0 + β1*MMI)))
Function Example https://en.wikipedia.org/wiki/Logistic_regression
Typology Buried Cable
Damage Ratios 0.0 – 0.04 0.04 – 0.12 0.12 – 0.5 0.5 – 0.8 > 0.8
RiskScape Damage State DS1: Insignificant DS2: Light DS3: Moderate DS4: Severe DS5: Critical
Hazard Ground Shaking
Intensity Parameter MMI
Revised Curve Parameters
MMI Damage Ratio
5 0.0001840
5.5 0.000488
6 0.001292
6.5 0.003419
7 0.009013
7.5 0.023545
8 0.060087
8.5 0.144922
9 0.310026
9.5 0.543639
10 0.759511
10.5 0.893309
11 0.956893
0
0.2
0.4
0.6
0.8
1
5 6 7 8 9 10 11 12Original Revised

1 Fairway Drive
Avalon
PO Box 30368
Lower Hutt
New Zealand
T +64-4-570 1444
F +64-4-570 4600
Dunedin Research Centre
764 Cumberland Street
Private Bag 1930
Dunedin
New Zealand
T +64-3-477 4050
F +64-3-477 5232
Wairakei Research Centre
114 Karetoto Road
Wairakei
Private Bag 2000, Taupo
New Zealand
T +64-7-374 8211
F +64-7-374 8199
National Isotope Centre
30 Gracefield Road
PO Box 31312
Lower Hutt
New Zealand
T +64-4-570 1444
F +64-4-570 4657
Principal Location
www.gns.cri.nz
Other Locations
Appendix LModelling the Economics of Resilient Infrastructure Tool (MERIT) Assumptions Report
Wellington Resilience Wellington Resilience Wellington Resilience Wellington Resilience
Programme Business CaseProgramme Business CaseProgramme Business CaseProgramme Business Case Modelling the Economics of Resilient
Infrastructure Tool (MERIT)
Assumptions Report
5th December 2017
Date of this version: 05/12/2017
Report author(s): Nicola Smith, Charlotte Brown, Garry McDonald, Erica Seville, Morag Ayers, John Kim
www.me.co.nzwww.me.co.nzwww.me.co.nzwww.me.co.nz
Disclaimer: Although every effort has been made to ensure accuracy and reliability of the information
contained in this report, neither Market Economics Limited or Resilient Organisations Limited or any of its
employees shall be held liable for the information, opinions and forecasts expressed in this report.
Wellington Resilience Wellington Resilience Wellington Resilience Wellington Resilience
Programme Business CaseProgramme Business CaseProgramme Business CaseProgramme Business Case
Modelling the Economics of Resilient
Infrastructure Tool (MERIT)
Assumptions Report
Prepared for Prepared for Prepared for Prepared for
Wellington Lifelines Group
ContentsContentsContentsContents GLOSSARYGLOSSARYGLOSSARYGLOSSARY ............................................................................................................................................................................................................................................................................................................................................................................................................................................................................................................................................ 1111
1111 INTRODUCTIONINTRODUCTIONINTRODUCTIONINTRODUCTION ................................................................................................................................................................................................................................................................................................................................................................................................................................................ 2222
2222 MODELLING THMODELLING THMODELLING THMODELLING THE ECONOMICS OF RESILE ECONOMICS OF RESILE ECONOMICS OF RESILE ECONOMICS OF RESILIENT INFRASTRUCTURE IENT INFRASTRUCTURE IENT INFRASTRUCTURE IENT INFRASTRUCTURE TOOL (MERIT)TOOL (MERIT)TOOL (MERIT)TOOL (MERIT) ................................................................ 3333
3333 APPLYING MERIT TO WEAPPLYING MERIT TO WEAPPLYING MERIT TO WEAPPLYING MERIT TO WELLINGTONLLINGTONLLINGTONLLINGTON ................................................................................................................................................................................................................................................................................................................................ 5555
4444 MODEL LINKAGES AND AMODEL LINKAGES AND AMODEL LINKAGES AND AMODEL LINKAGES AND ASSUMPTIONSSSUMPTIONSSSUMPTIONSSSUMPTIONS ........................................................................................................................................................................................................................................................................................................ 6666
4.1 RISKSCAPE ....................................................................................................................... 8
4.2 CORDON ANALYSIS ............................................................................................................ 9
4.3 TOURISM ANALYSIS ........................................................................................................... 9
4.4 POPULATION RELOCATION MODULE .................................................................................... 12
4.5 BUSINESS BEHAVIOURS MODEL .......................................................................................... 22
4.6 TRANSPORT ANALYSIS ...................................................................................................... 33
5555 REFERENCESREFERENCESREFERENCESREFERENCES ............................................................................................................................................................................................................................................................................................................................................................................................................................................................ 41414141
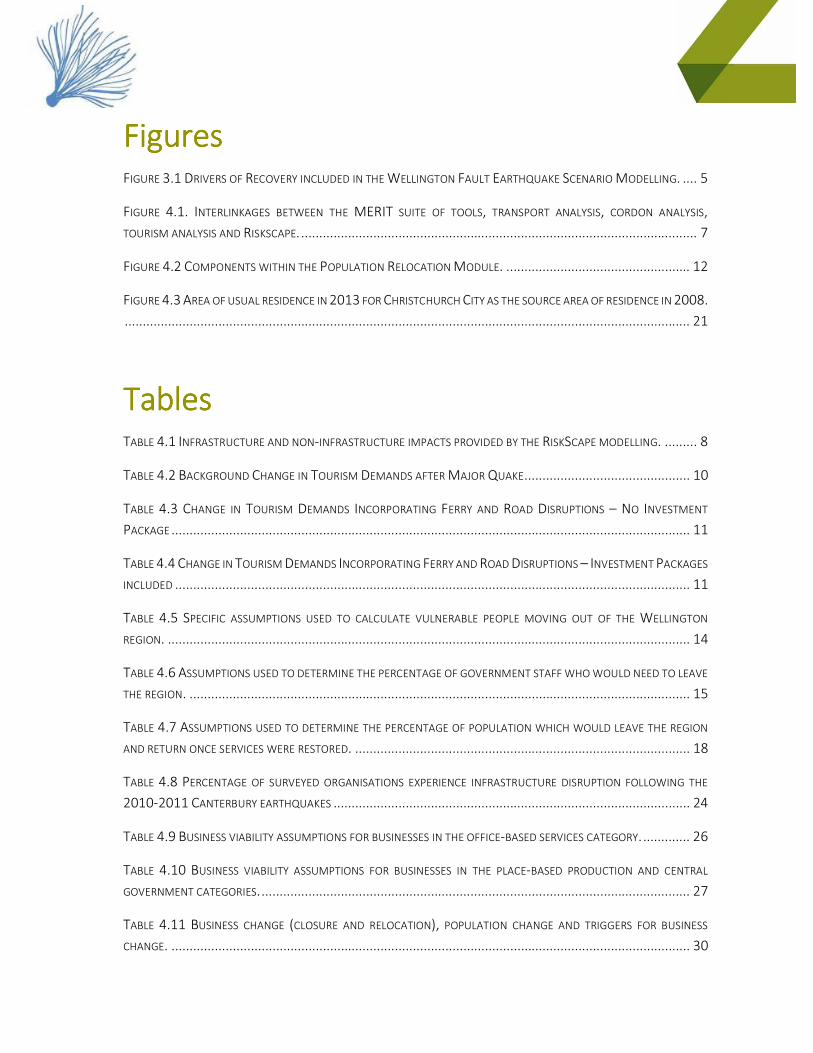
FiguresFiguresFiguresFigures FIGURE 3.1 DRIVERS OF RECOVERY INCLUDED IN THE WELLINGTON FAULT EARTHQUAKE SCENARIO MODELLING. .... 5
FIGURE 4.1. INTERLINKAGES BETWEEN THE MERIT SUITE OF TOOLS, TRANSPORT ANALYSIS, CORDON ANALYSIS,
TOURISM ANALYSIS AND RISKSCAPE. .............................................................................................................. 7
FIGURE 4.2 COMPONENTS WITHIN THE POPULATION RELOCATION MODULE. ................................................... 12
FIGURE 4.3 AREA OF USUAL RESIDENCE IN 2013 FOR CHRISTCHURCH CITY AS THE SOURCE AREA OF RESIDENCE IN 2008.
............................................................................................................................................................. 21
TablesTablesTablesTables TABLE 4.1 INFRASTRUCTURE AND NON-INFRASTRUCTURE IMPACTS PROVIDED BY THE RISKSCAPE MODELLING. ......... 8
TABLE 4.2 BACKGROUND CHANGE IN TOURISM DEMANDS AFTER MAJOR QUAKE .............................................. 10
TABLE 4.3 CHANGE IN TOURISM DEMANDS INCORPORATING FERRY AND ROAD DISRUPTIONS – NO INVESTMENT
PACKAGE ................................................................................................................................................ 11
TABLE 4.4 CHANGE IN TOURISM DEMANDS INCORPORATING FERRY AND ROAD DISRUPTIONS – INVESTMENT PACKAGES
INCLUDED ............................................................................................................................................... 11
TABLE 4.5 SPECIFIC ASSUMPTIONS USED TO CALCULATE VULNERABLE PEOPLE MOVING OUT OF THE WELLINGTON
REGION. ................................................................................................................................................. 14
TABLE 4.6 ASSUMPTIONS USED TO DETERMINE THE PERCENTAGE OF GOVERNMENT STAFF WHO WOULD NEED TO LEAVE
THE REGION. ........................................................................................................................................... 15
TABLE 4.7 ASSUMPTIONS USED TO DETERMINE THE PERCENTAGE OF POPULATION WHICH WOULD LEAVE THE REGION
AND RETURN ONCE SERVICES WERE RESTORED. ............................................................................................. 18
TABLE 4.8 PERCENTAGE OF SURVEYED ORGANISATIONS EXPERIENCE INFRASTRUCTURE DISRUPTION FOLLOWING THE
2010-2011 CANTERBURY EARTHQUAKES ................................................................................................... 24
TABLE 4.9 BUSINESS VIABILITY ASSUMPTIONS FOR BUSINESSES IN THE OFFICE-BASED SERVICES CATEGORY. ............. 26
TABLE 4.10 BUSINESS VIABILITY ASSUMPTIONS FOR BUSINESSES IN THE PLACE-BASED PRODUCTION AND CENTRAL
GOVERNMENT CATEGORIES. ....................................................................................................................... 27
TABLE 4.11 BUSINESS CHANGE (CLOSURE AND RELOCATION), POPULATION CHANGE AND TRIGGERS FOR BUSINESS
CHANGE. ................................................................................................................................................ 30
Page | 1
GlossaryGlossaryGlossaryGlossary CBD: CBD: CBD: CBD: Central Business District.
Census Area UnitCensus Area UnitCensus Area UnitCensus Area Unit (CAU): A geographic unit from Statistics New Zealand Census Area Unit Boundaries. The
CAU is constructed by combining meshblocks and generally coincide with main or secondary urban areas.
On average, CAUs within urban and rural areas normally contain a population of 3,000 to 5,000 and 500 to
2,000 respectively.
Computable General EquilibriumComputable General EquilibriumComputable General EquilibriumComputable General Equilibrium (CGE): A class of applied economic models typically used to illustrate an
economy’s responses to changes in policy, technology or other external shocks. Typically, CGE models
recognise several types of economic agents (usually different types of industries, households and
government), conceptualised as either profit or utility maximisers. Optimisation algorithms are employed
to determine the set of prices for all commodities and factors of production that would prevail subject to
selected constraints (e.g. all commodity and factor markets clear, and total income equals total expenditure
for all agents).
GDP: GDP: GDP: GDP: Gross Domestic Product.
HouseholdsHouseholdsHouseholdsHouseholds: New Zealand resident individuals and families, and Private Non-Profit Organisation (PNPO)
serving households.
MeshblockMeshblockMeshblockMeshblock: The smallest geographic unit for which statistical data is collected by SNZ. These vary in size
depending on population. Rural meshblocks generally having a population of around 60 people, while urban
meshblocks are roughly the size of a city block with approximately 110 people.
SAM: SAM: SAM: SAM: Social Accounting Matrices.
System DynamicsSystem DynamicsSystem DynamicsSystem Dynamics: A methodology for understanding certain kinds of dynamic systems. The methodology
concentrates on mapping the feedback relationships between different components or relationships within
a system, and simulating changes in systems over time.
TATATATA: Territorial Local Authority.
Page | 2
1111 IntroductionIntroductionIntroductionIntroduction As part of the Wellington Resilience Programme Business case, economic impact modelling was carried out
to assess packaged infrastructure options for improving Wellington’s resilience to a 7.5 magnitude
earthquake on the Wellington Fault. Specifically, the modelling assessed the disruption impacts to the
economy associated with the quake. Our analysis is deliberately narrowed to economic disruption rather
than consideration of losses of life or physical asset damage.1 This reflects the desire of stakeholders for an
economic analysis to support development of a resilience Programme Business Case (PBC). Importantly,
the stakeholders, through a facilitated Intervention Logic Mapping (ILM) workshop, selected net changes
in GDP2 associated with a preferred investment programme as a key PBC assessment metric – giving it a
65% weighting. Our modelling used ‘MERIT’ (MMMModelling the EEEEconomics of RRRResilient IIIInfrastructure TTTTool)
developed in the 2012-16 MBIE funded Economics of Resilient Infrastructure (ERI) research programme.3
The purpose of this report is to describe the economic modelling and assumptions made during the
analysis. The report is structured as follows:
Section 2Section 2Section 2Section 2 provides a brief description of the MERIT toolkit,
Section 3Section 3Section 3Section 3 describes how MERIT was applied to Wellington, and
Section 4Section 4Section 4Section 4 details the sub-models and key assumptions applied in the analysis.
1 The latter two however have been estimated by GNS Science. 2 As measured against a business-as-usual counterfactual scenario.
3 https://www.naturalhazards.org.nz/NHRP/Hazard-themes/Societal-Resilience/EoRI.
Page | 3
2222 Modelling the Economics of Resilient Modelling the Economics of Resilient Modelling the Economics of Resilient Modelling the Economics of Resilient
Infrastructure Tool (MERIT)Infrastructure Tool (MERIT)Infrastructure Tool (MERIT)Infrastructure Tool (MERIT) MERIT is an integrated spatial decision support system that enables a high-resolution assessment across
space and through time of the economic consequences of infrastructure failure, business response, and
recovery options.
Central to MERIT is a multi-sectoral, multi-regional and fully dynamic economic model, intentionally
designed to imitate the core features of a Computable General Equilibrium (CGE) model. CGE models tend
to be the favoured approach and ‘state-of-art’ in modelling of regional and national-level economic
impacts. Among the advantages of these types of models are the whole-of-economy coverage, the capture
of not only indirect (i.e. so-called upstream and downstream multiplier effects generated through supply
chains) and induced (i.e. as generated through household consumption) impacts, but also the ‘general
equilibrium’ impacts (i.e. price changes, factor substitution and transformation).
Although MERIT incorporates the core features of a CGE model, it is important to note that it differs from
a standard CGE model in that it is formulated as a System Dynamics model using finite difference equations.
This is an innovative extension to economic modelling undertaken in part to improve our ability to capture
the impacts of events over time. Standard economic models are ‘equilibrium’ models that describe
conditions of demand for all commodities and factors when a set of pre-determined conditions are met i.e.
supply equates to demand for commodities and factors, and income equates to expenditure for all
economic agents. MERIT however is a simulation model, acknowledging that in meeting these constraints
there is a transition pathway through which the economy must pass. MERIT is particularly useful when
dealing with natural hazard events as it can directly account for out-of-equilibrium dynamics that often
emerge in a disrupted economy.
Once information is transformed into appropriate inputs and MERIT is run, it can produce a variety of
indicators to help us assess economic impacts of an infrastructure outage in aggregate and by industry. The
model can thus not only be used to assess the economic consequence of a natural hazard event resulting
from infrastructure failure, but also to inform on resilience-building and investment initiatives. The steps
that are required to transform information on physical disruptions into appropriate input parameters can
vary can from application-to-application, depending on the types of physical information provided, as well
as the extent and nature of impacts arising out of the disruption event. Much of this report concentrates
on describing the steps and assumptions that were necessary to model the specific Wellington 7.5
magnitude earthquake scenarios.
Details on how the suite of MERIT tools was developed, how it works, and previous applications are also
provided in the following reports:
• Buxton, R.; Wright, K.C.; Daly, M.C.; Timar, L.; Mieler, D. (2014) Single Infrastructure Failures:
capturing outage information for MERIT - Modelling the Economics of Resilient Infrastructure
Tool. Economics of Resilient Infrastructure Research Report 2014/01. 56p.
Page | 4
• Seville, E., Stevenson, J., Brown, C., Giovinazzi, S., Vargo, J. (2014) Disruption and Resilience: How
Organisations coped with the Canterbury Earthquakes. Economics of Resilient Infrastructure
Research Report 2014/02, 45p.
• Smith, N.J., Zhang, Y., Cardwell, R., McDonald, G.W., Kim, J.-H., and Murray, C.F. (2015).
Development of a Social Accounting Framework for New Zealand. Economics of Resilient
Infrastructure Research Report 2015/01. 71p.
• Brown, C., Giovinazzi, S., Seville, E., Vargo, J., Stevenson, J.R. (2015) Developing the Business
Behaviours Module within MERIT. Economics of Resilient Infrastructure Research Report
2015/02. 71p.- addendum added January 2016.
• Hatton, T., Seville, E., Brown, C., Stevenson, J.R. (2016) Businesses and the Canterbury
earthquakes: how do their experiences translate to other contexts? Economics of Resilient
Infrastructure Research Report 2016/01.
• Deligne, N.I.; Blake, D.M.; Davies, A.J.; Grace, E.S.; Hayes, J.; Potter, S.; Stewart, C.; Wilson, G.;
Wilson, T.M. 2015. Economics of Resilient Infrastructure Auckland Volcanic Field Scenario,
Economics of Resilient Infrastructure Research Report 2015/03. 151 p.
• Smith, N.J., Kim, J-H., and McDonald, G.W. (2016). Auckland Water Outage Scenario: Modelling
the Economic Consequences of Interruptions in Infrastructure Service using MERIT. Economics of
Resilient Infrastructure Research Report 2016/02. 23p. 4
• Kim, J-H., Smith, N.J., and McDonald, G.W. (2016). Auckland Electricity Outage Scenario:
Modelling the Economic Consequences of Interruptions in Infrastructure Service using MERIT
Economics of Resilient Infrastructure Research Report 2016/04. 30p.
• Cardwell, R.C., McDonald, G.W., and Smith, N.J. (2016). Economic Impacts of a Hypothetical
Lyttleton Port Outage: A confidential report prepared for Lyttleton Port Company under the
Economics of Resilient Infrastructure Research Programme. Takapuna, Market Economics Ltd.
• Smith, N.J.; McDonald, G.W.; Kim, J-H. (2016). Economic Impacts of the State Highway 4 Outage
– June 2015, Economics of Resilient Infrastructure Research Report 2016/03. 15 p.
• Kim, J.-H.; N.J. Smith; G.W. McDonald (2016). Economics of Resilient Infrastructure, Economics of
Resilient Infrastructure Research Report 2016/04. 30 p.
• Smith, N.J., Harvey, E., and McDonald, G.W. (2016). Dynamic Economic Model. A technical
report. Economics of Resilient Infrastructure Research Report 2017/02. 109p.
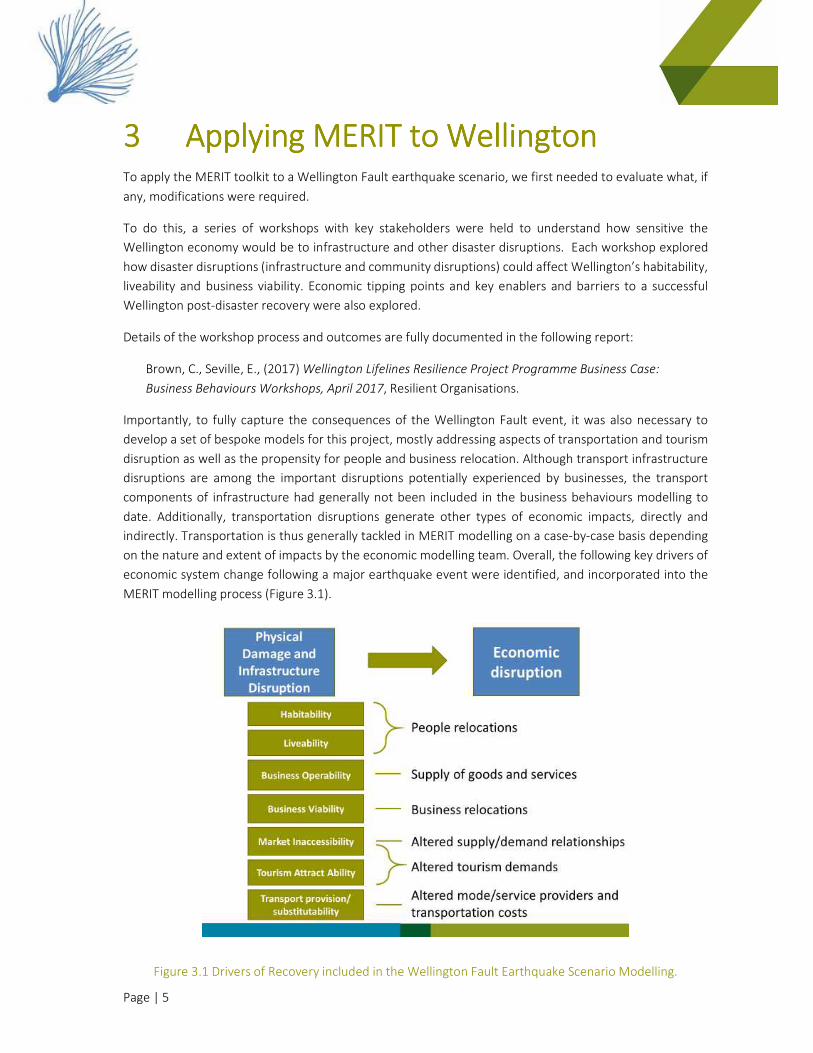
Page | 5
3333 Applying MERIT to WellingtonApplying MERIT to WellingtonApplying MERIT to WellingtonApplying MERIT to Wellington To apply the MERIT toolkit to a Wellington Fault earthquake scenario, we first needed to evaluate what, if
any, modifications were required.
To do this, a series of workshops with key stakeholders were held to understand how sensitive the
Wellington economy would be to infrastructure and other disaster disruptions. Each workshop explored
how disaster disruptions (infrastructure and community disruptions) could affect Wellington’s habitability,
liveability and business viability. Economic tipping points and key enablers and barriers to a successful
Wellington post-disaster recovery were also explored.
Details of the workshop process and outcomes are fully documented in the following report:
Brown, C., Seville, E., (2017) Wellington Lifelines Resilience Project Programme Business Case:
Business Behaviours Workshops, April 2017, Resilient Organisations.
Importantly, to fully capture the consequences of the Wellington Fault event, it was also necessary to
develop a set of bespoke models for this project, mostly addressing aspects of transportation and tourism
disruption as well as the propensity for people and business relocation. Although transport infrastructure
disruptions are among the important disruptions potentially experienced by businesses, the transport
components of infrastructure had generally not been included in the business behaviours modelling to
date. Additionally, transportation disruptions generate other types of economic impacts, directly and
indirectly. Transportation is thus generally tackled in MERIT modelling on a case-by-case basis depending
on the nature and extent of impacts by the economic modelling team. Overall, the following key drivers of
economic system change following a major earthquake event were identified, and incorporated into the
MERIT modelling process (Figure 3.1).
Figure 3.1 Drivers of Recovery included in the Wellington Fault Earthquake Scenario Modelling.
Page | 6
4444 Model Linkages and AssumptionsModel Linkages and AssumptionsModel Linkages and AssumptionsModel Linkages and Assumptions The core task faced in undertaking the MERIT modelling is to translate descriptions of infrastructure
damage and other forms of physical disruption, derived for the Wellington Fault earthquake scenario, into
estimates of economic impacts. Here, the descriptions of infrastructure damage and other forms of physical
disruption are provided by the RiskScape modelling team. For the most part this information could not be
applied directly as inputs to the economic model. Instead, a variety of additional modelling steps, typically
incorporating further information and assumptions are first undertaken to provide a set of time-dependent
parameters (i.e. GIS maps) that could be used directly as inputs to the economic model.
Figure 4.1 provides an overall scheme of the MERIT modelling process. To assist in the conceptualisation,
the mathematical procedures that make up the modelling process have been grouped into a series of
‘models’, some of which have underlying sub-components or ‘modules’. For example, the Dynamic
Economic Model is the core economic model constructed within the System Dynamics modelling language,
and it is underpinned by several modules that cover Enterprises, Factors, Capital, Labour, and so on (see
also Smith et al. (2016)). The Business Behaviours Model and Population Relocation Model are the other
two modules that make up the core components of the MERIT toolkit. The key sets of information that flow
between these models is also depicted in Figure 4.1. For example, the Business Behaviours Model (Brown
et al., 2015) calculated the ‘operability’ of different economic industries, across time, and given differing
combinations of infrastructure service and other types of disruption. Once calculated, the industry
operability parameters were incorporated directly within the Dynamic Economic Model, to modify the ‘as
normal’ levels of productivity within each economic industry.
In the following sections of this report we set out the key assumptions underpinning each model, and the
derivation of the information that flows between each model. Please note that the entire modelling process
was relatively complex with many steps, we concentrated only on describing aspects that were not already
covered by the technical reports listed above.
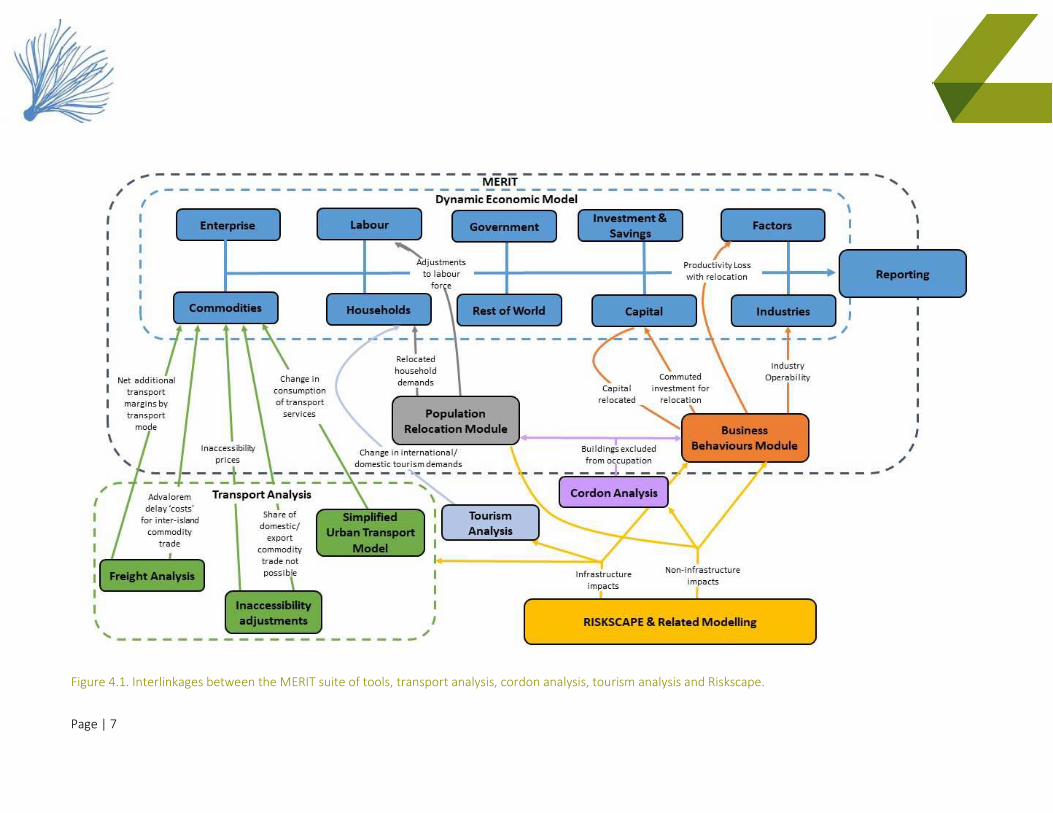
Page | 7
Figure 4.1. Interlinkages between the MERIT suite of tools, transport analysis, cordon analysis, tourism analysis and Riskscape.
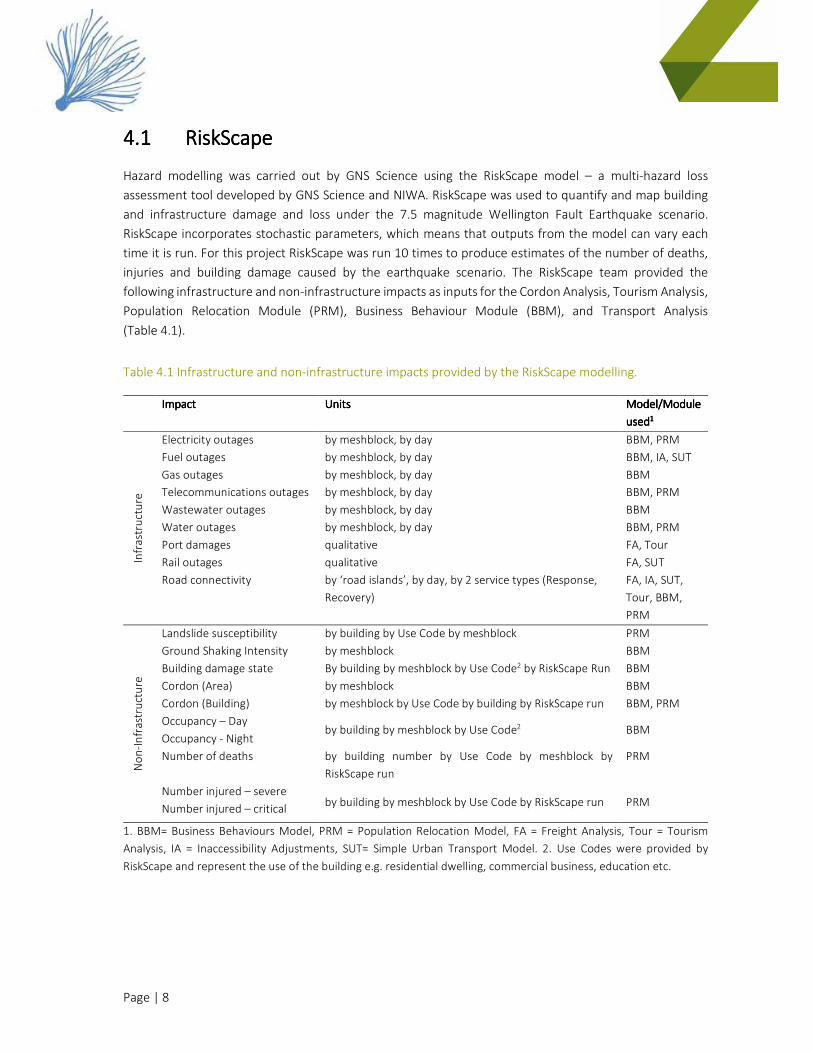
Page | 8
4.14.14.14.1 RiskScapeRiskScapeRiskScapeRiskScape
Hazard modelling was carried out by GNS Science using the RiskScape model – a multi-hazard loss
assessment tool developed by GNS Science and NIWA. RiskScape was used to quantify and map building
and infrastructure damage and loss under the 7.5 magnitude Wellington Fault Earthquake scenario.
RiskScape incorporates stochastic parameters, which means that outputs from the model can vary each
time it is run. For this project RiskScape was run 10 times to produce estimates of the number of deaths,
injuries and building damage caused by the earthquake scenario. The RiskScape team provided the
following infrastructure and non-infrastructure impacts as inputs for the Cordon Analysis, Tourism Analysis,
Population Relocation Module (PRM), Business Behaviour Module (BBM), and Transport Analysis
(Table 4.1).
Table 4.1 Infrastructure and non-infrastructure impacts provided by the RiskScape modelling.
ImpactImpactImpactImpact UnitsUnitsUnitsUnits Model/Model/Model/Model/MoMoMoModule dule dule dule
usedusedusedused1111
Infr
ast
ruct
ure
Electricity outages by meshblock, by day BBM, PRM
Fuel outages by meshblock, by day BBM, IA, SUT
Gas outages by meshblock, by day BBM
Telecommunications outages by meshblock, by day BBM, PRM
Wastewater outages by meshblock, by day BBM
Water outages
Port damages
Rail outages
Road connectivity
by meshblock, by day
qualitative
qualitative
by ‘road islands’, by day, by 2 service types (Response,
Recovery)
BBM, PRM
FA, Tour
FA, SUT
FA, IA, SUT,
Tour, BBM,
PRM
No
n-I
nfr
ast
ruct
ure
Landslide susceptibility by building by Use Code by meshblock PRM
Ground Shaking Intensity by meshblock BBM
Building damage state By building by meshblock by Use Code2 by RiskScape Run BBM
Cordon (Area) by meshblock BBM
Cordon (Building) by meshblock by Use Code by building by RiskScape run BBM, PRM
Occupancy – Day
Occupancy - Night by building by meshblock by Use Code2 BBM
Number of deaths by building number by Use Code by meshblock by
RiskScape run
PRM
Number injured – severe
Number injured – critical by building by meshblock by Use Code by RiskScape run PRM
1. BBM= Business Behaviours Model, PRM = Population Relocation Model, FA = Freight Analysis, Tour = Tourism
Analysis, IA = Inaccessibility Adjustments, SUT= Simple Urban Transport Model. 2. Use Codes were provided by
RiskScape and represent the use of the building e.g. residential dwelling, commercial business, education etc.
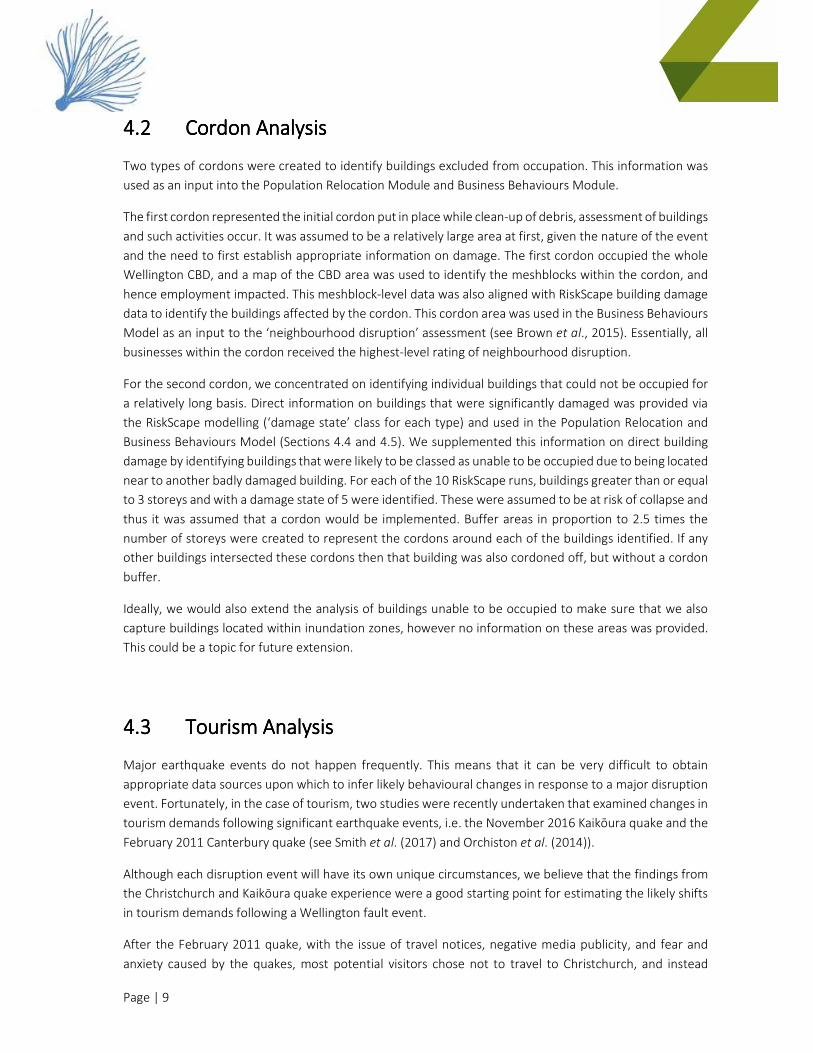
Page | 9
4.24.24.24.2 Cordon AnalysisCordon AnalysisCordon AnalysisCordon Analysis
Two types of cordons were created to identify buildings excluded from occupation. This information was
used as an input into the Population Relocation Module and Business Behaviours Module.
The first cordon represented the initial cordon put in place while clean-up of debris, assessment of buildings
and such activities occur. It was assumed to be a relatively large area at first, given the nature of the event
and the need to first establish appropriate information on damage. The first cordon occupied the whole
Wellington CBD, and a map of the CBD area was used to identify the meshblocks within the cordon, and
hence employment impacted. This meshblock-level data was also aligned with RiskScape building damage
data to identify the buildings affected by the cordon. This cordon area was used in the Business Behaviours
Model as an input to the ‘neighbourhood disruption’ assessment (see Brown et al., 2015). Essentially, all
businesses within the cordon received the highest-level rating of neighbourhood disruption.
For the second cordon, we concentrated on identifying individual buildings that could not be occupied for
a relatively long basis. Direct information on buildings that were significantly damaged was provided via
the RiskScape modelling (‘damage state’ class for each type) and used in the Population Relocation and
Business Behaviours Model (Sections 4.4 and 4.5). We supplemented this information on direct building
damage by identifying buildings that were likely to be classed as unable to be occupied due to being located
near to another badly damaged building. For each of the 10 RiskScape runs, buildings greater than or equal
to 3 storeys and with a damage state of 5 were identified. These were assumed to be at risk of collapse and
thus it was assumed that a cordon would be implemented. Buffer areas in proportion to 2.5 times the
number of storeys were created to represent the cordons around each of the buildings identified. If any
other buildings intersected these cordons then that building was also cordoned off, but without a cordon
buffer.
Ideally, we would also extend the analysis of buildings unable to be occupied to make sure that we also
capture buildings located within inundation zones, however no information on these areas was provided.
This could be a topic for future extension.
4.34.34.34.3 Tourism AnalysisTourism AnalysisTourism AnalysisTourism Analysis
Major earthquake events do not happen frequently. This means that it can be very difficult to obtain
appropriate data sources upon which to infer likely behavioural changes in response to a major disruption
event. Fortunately, in the case of tourism, two studies were recently undertaken that examined changes in
tourism demands following significant earthquake events, i.e. the November 2016 Kaikōura quake and the
February 2011 Canterbury quake (see Smith et al. (2017) and Orchiston et al. (2014)).
Although each disruption event will have its own unique circumstances, we believe that the findings from
the Christchurch and Kaikōura quake experience were a good starting point for estimating the likely shifts
in tourism demands following a Wellington fault event.
After the February 2011 quake, with the issue of travel notices, negative media publicity, and fear and
anxiety caused by the quakes, most potential visitors chose not to travel to Christchurch, and instead
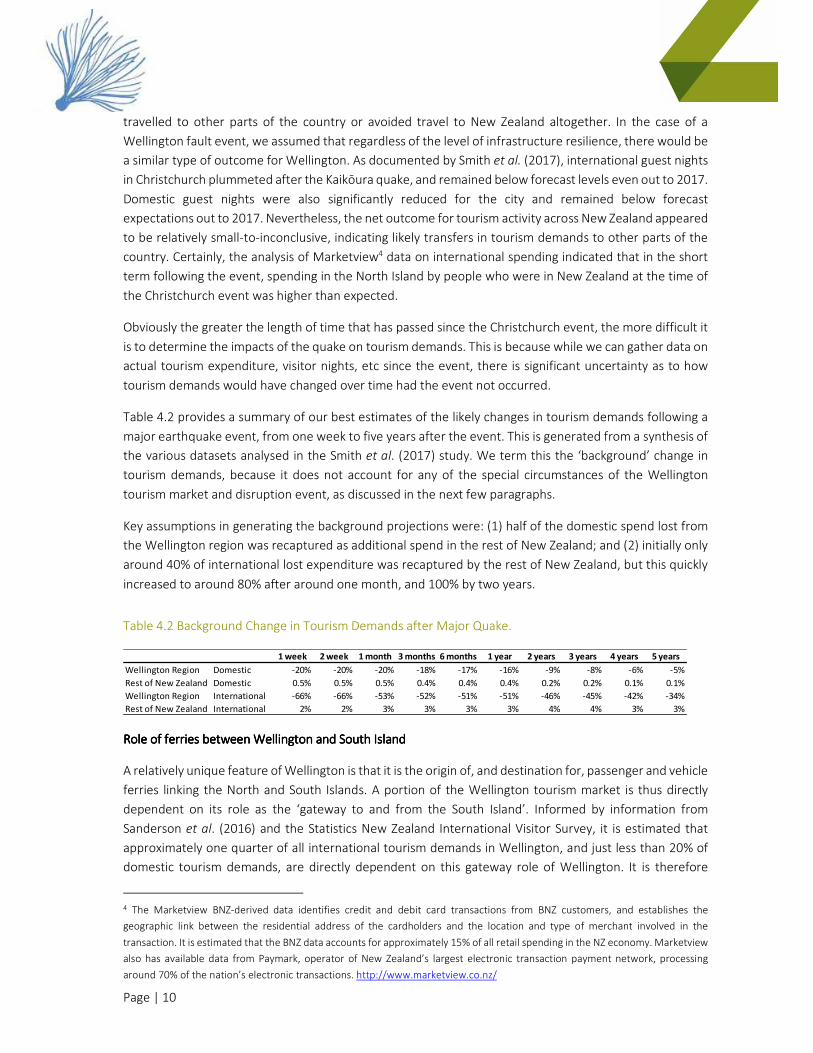
Page | 10
travelled to other parts of the country or avoided travel to New Zealand altogether. In the case of a
Wellington fault event, we assumed that regardless of the level of infrastructure resilience, there would be
a similar type of outcome for Wellington. As documented by Smith et al. (2017), international guest nights
in Christchurch plummeted after the Kaikōura quake, and remained below forecast levels even out to 2017.
Domestic guest nights were also significantly reduced for the city and remained below forecast
expectations out to 2017. Nevertheless, the net outcome for tourism activity across New Zealand appeared
to be relatively small-to-inconclusive, indicating likely transfers in tourism demands to other parts of the
country. Certainly, the analysis of Marketview4 data on international spending indicated that in the short
term following the event, spending in the North Island by people who were in New Zealand at the time of
the Christchurch event was higher than expected.
Obviously the greater the length of time that has passed since the Christchurch event, the more difficult it
is to determine the impacts of the quake on tourism demands. This is because while we can gather data on
actual tourism expenditure, visitor nights, etc since the event, there is significant uncertainty as to how
tourism demands would have changed over time had the event not occurred.
Table 4.2 provides a summary of our best estimates of the likely changes in tourism demands following a
major earthquake event, from one week to five years after the event. This is generated from a synthesis of
the various datasets analysed in the Smith et al. (2017) study. We term this the ‘background’ change in
tourism demands, because it does not account for any of the special circumstances of the Wellington
tourism market and disruption event, as discussed in the next few paragraphs.
Key assumptions in generating the background projections were: (1) half of the domestic spend lost from
the Wellington region was recaptured as additional spend in the rest of New Zealand; and (2) initially only
around 40% of international lost expenditure was recaptured by the rest of New Zealand, but this quickly
increased to around 80% after around one month, and 100% by two years.
Table 4.2 Background Change in Tourism Demands after Major Quake.
Role of ferries Role of ferries Role of ferries Role of ferries between Wellington and South Islandbetween Wellington and South Islandbetween Wellington and South Islandbetween Wellington and South Island
A relatively unique feature of Wellington is that it is the origin of, and destination for, passenger and vehicle
ferries linking the North and South Islands. A portion of the Wellington tourism market is thus directly
dependent on its role as the ‘gateway to and from the South Island’. Informed by information from
Sanderson et al. (2016) and the Statistics New Zealand International Visitor Survey, it is estimated that
approximately one quarter of all international tourism demands in Wellington, and just less than 20% of
domestic tourism demands, are directly dependent on this gateway role of Wellington. It is therefore
4 The Marketview BNZ-derived data identifies credit and debit card transactions from BNZ customers, and establishes the
geographic link between the residential address of the cardholders and the location and type of merchant involved in the
transaction. It is estimated that the BNZ data accounts for approximately 15% of all retail spending in the NZ economy. Marketview
also has available data from Paymark, operator of New Zealand’s largest electronic transaction payment network, processing
around 70% of the nation’s electronic transactions. http://www.marketview.co.nz/
1 week 2 week 1 month 3 months 6 months 1 year 2 years 3 years 4 years 5 years
Wellington Region Domestic -20% -20% -20% -18% -17% -16% -9% -8% -6% -5%
Rest of New Zealand Domestic 0.5% 0.5% 0.5% 0.4% 0.4% 0.4% 0.2% 0.2% 0.1% 0.1%
Wellington Region International -66% -66% -53% -52% -51% -51% -46% -45% -42% -34%
Rest of New Zealand International 2% 2% 3% 3% 3% 3% 4% 4% 3% 3%
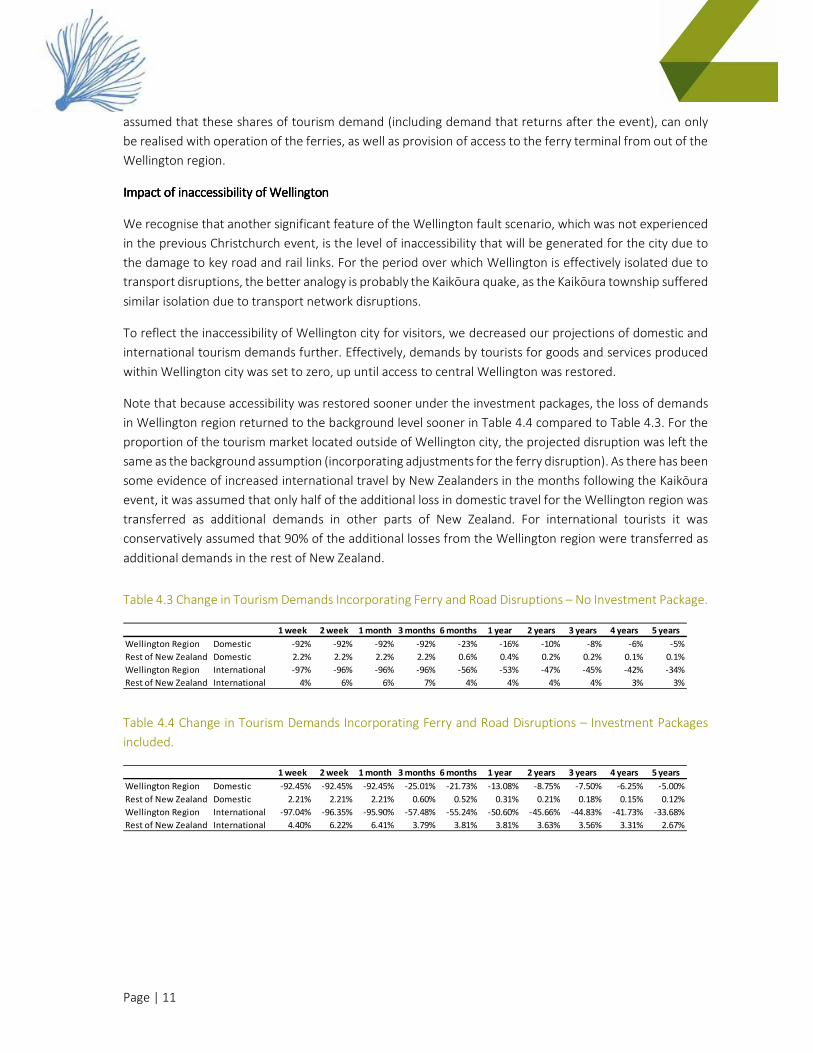
Page | 11
assumed that these shares of tourism demand (including demand that returns after the event), can only
be realised with operation of the ferries, as well as provision of access to the ferry terminal from out of the
Wellington region.
Impact of inaccessibility of WellingtonImpact of inaccessibility of WellingtonImpact of inaccessibility of WellingtonImpact of inaccessibility of Wellington
We recognise that another significant feature of the Wellington fault scenario, which was not experienced
in the previous Christchurch event, is the level of inaccessibility that will be generated for the city due to
the damage to key road and rail links. For the period over which Wellington is effectively isolated due to
transport disruptions, the better analogy is probably the Kaikōura quake, as the Kaikōura township suffered
similar isolation due to transport network disruptions.
To reflect the inaccessibility of Wellington city for visitors, we decreased our projections of domestic and
international tourism demands further. Effectively, demands by tourists for goods and services produced
within Wellington city was set to zero, up until access to central Wellington was restored.
Note that because accessibility was restored sooner under the investment packages, the loss of demands
in Wellington region returned to the background level sooner in Table 4.4 compared to Table 4.3. For the
proportion of the tourism market located outside of Wellington city, the projected disruption was left the
same as the background assumption (incorporating adjustments for the ferry disruption). As there has been
some evidence of increased international travel by New Zealanders in the months following the Kaikōura
event, it was assumed that only half of the additional loss in domestic travel for the Wellington region was
transferred as additional demands in other parts of New Zealand. For international tourists it was
conservatively assumed that 90% of the additional losses from the Wellington region were transferred as
additional demands in the rest of New Zealand.
Table 4.3 Change in Tourism Demands Incorporating Ferry and Road Disruptions – No Investment Package.
Table 4.4 Change in Tourism Demands Incorporating Ferry and Road Disruptions – Investment Packages
included.
1 week 2 week 1 month 3 months 6 months 1 year 2 years 3 years 4 years 5 years
Wellington Region Domestic -92% -92% -92% -92% -23% -16% -10% -8% -6% -5%
Rest of New Zealand Domestic 2.2% 2.2% 2.2% 2.2% 0.6% 0.4% 0.2% 0.2% 0.1% 0.1%
Wellington Region International -97% -96% -96% -96% -56% -53% -47% -45% -42% -34%
Rest of New Zealand International 4% 6% 6% 7% 4% 4% 4% 4% 3% 3%
1 week 2 week 1 month 3 months 6 months 1 year 2 years 3 years 4 years 5 years
Wellington Region Domestic -92.45% -92.45% -92.45% -25.01% -21.73% -13.08% -8.75% -7.50% -6.25% -5.00%
Rest of New Zealand Domestic 2.21% 2.21% 2.21% 0.60% 0.52% 0.31% 0.21% 0.18% 0.15% 0.12%
Wellington Region International -97.04% -96.35% -95.90% -57.48% -55.24% -50.60% -45.66% -44.83% -41.73% -33.68%
Rest of New Zealand International 4.40% 6.22% 6.41% 3.79% 3.81% 3.81% 3.63% 3.56% 3.31% 2.67%
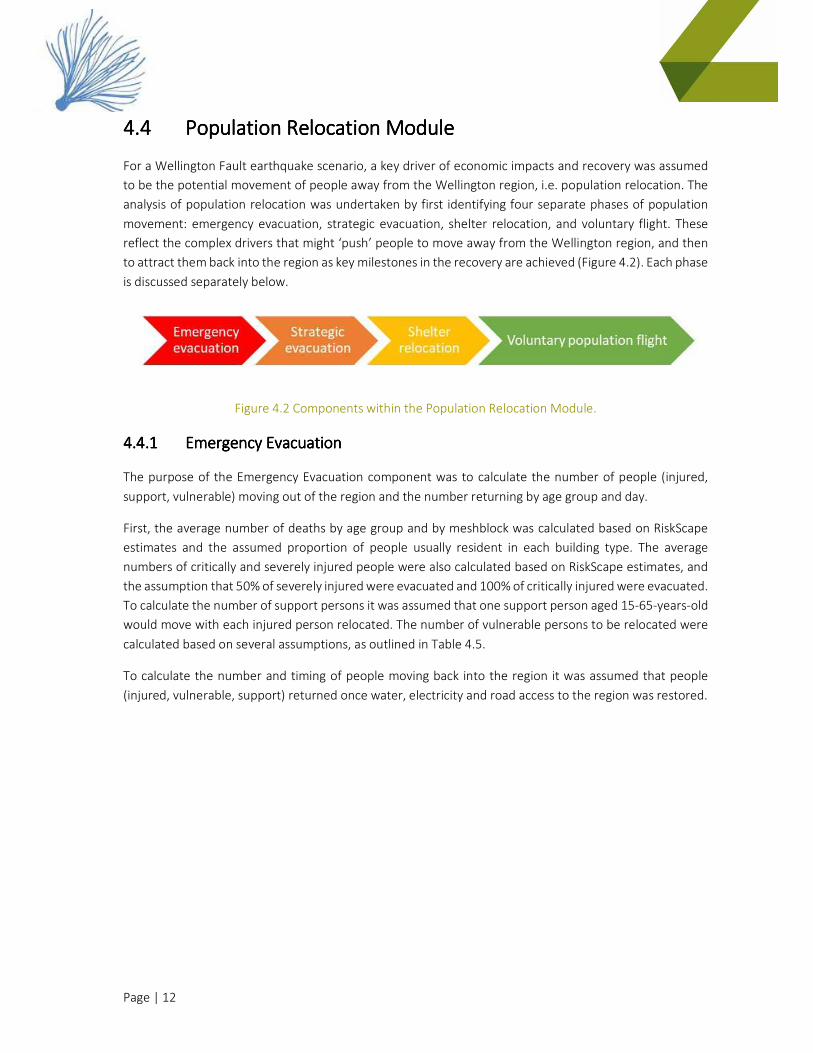
Page | 12
4.44.44.44.4 Population Relocation ModulePopulation Relocation ModulePopulation Relocation ModulePopulation Relocation Module
For a Wellington Fault earthquake scenario, a key driver of economic impacts and recovery was assumed
to be the potential movement of people away from the Wellington region, i.e. population relocation. The
analysis of population relocation was undertaken by first identifying four separate phases of population
movement: emergency evacuation, strategic evacuation, shelter relocation, and voluntary flight. These
reflect the complex drivers that might ‘push’ people to move away from the Wellington region, and then
to attract them back into the region as key milestones in the recovery are achieved (Figure 4.2). Each phase
is discussed separately below.
Figure 4.2 Components within the Population Relocation Module.
4.4.14.4.14.4.14.4.1 EmergencyEmergencyEmergencyEmergency EvacuationEvacuationEvacuationEvacuation
The purpose of the Emergency Evacuation component was to calculate the number of people (injured,
support, vulnerable) moving out of the region and the number returning by age group and day.
First, the average number of deaths by age group and by meshblock was calculated based on RiskScape
estimates and the assumed proportion of people usually resident in each building type. The average
numbers of critically and severely injured people were also calculated based on RiskScape estimates, and
the assumption that 50% of severely injured were evacuated and 100% of critically injured were evacuated.
To calculate the number of support persons it was assumed that one support person aged 15-65-years-old
would move with each injured person relocated. The number of vulnerable persons to be relocated were
calculated based on several assumptions, as outlined in Table 4.5.
To calculate the number and timing of people moving back into the region it was assumed that people
(injured, vulnerable, support) returned once water, electricity and road access to the region was restored.
Page | 13
Evidence to support vulnerable person evacuation assumptions
The Ministry of Civil Defence and Emergency Management (MCDEM) Mass Evacuation Guidelines
(MCDEM, 2008) identify these groups as vulnerable during a mass evacuation event.
• Māori communities;
• ethnic communities (non-English speakers/English as a second language);
• remote/isolated communities;
• aged and/or infirm;
• people with disabilities;
• tourists;
• people in prisons or residential institutions; and
• schools.
For the purposes of this modelling we assumed that only the aged, infirm, people with disabilities, people in
prisons and tourists needed to be evacuated due to disruption to critical infrastructure and other essential
services (e.g. food, shelter etc).
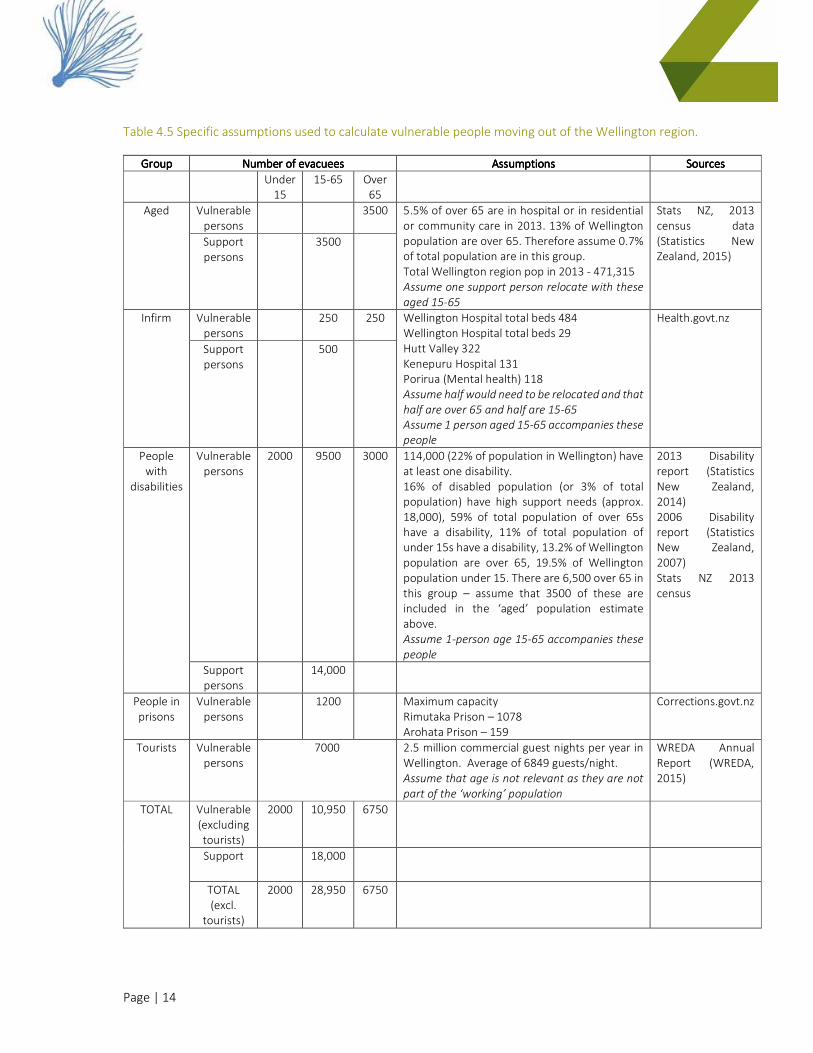
Page | 14
Table 4.5 Specific assumptions used to calculate vulnerable people moving out of the Wellington region.
GroupGroupGroupGroup Number of evacueesNumber of evacueesNumber of evacueesNumber of evacuees AssumptionsAssumptionsAssumptionsAssumptions SourcesSourcesSourcesSources
Under
15
15-65 Over
65
Aged Vulnerable
persons
3500 5.5% of over 65 are in hospital or in residential
or community care in 2013. 13% of Wellington
population are over 65. Therefore assume 0.7%
of total population are in this group.
Total Wellington region pop in 2013 - 471,315
Assume one support person relocate with these
aged 15-65
Stats NZ, 2013
census data
(Statistics New
Zealand, 2015)
Support
persons
3500
Infirm Vulnerable
persons
250 250 Wellington Hospital total beds 484
Wellington Hospital total beds 29
Hutt Valley 322
Kenepuru Hospital 131
Porirua (Mental health) 118
Assume half would need to be relocated and that
half are over 65 and half are 15-65
Assume 1 person aged 15-65 accompanies these
people
Health.govt.nz
Support
persons
500
People
with
disabilities
Vulnerable
persons
2000 9500 3000 114,000 (22% of population in Wellington) have
at least one disability.
16% of disabled population (or 3% of total
population) have high support needs (approx.
18,000), 59% of total population of over 65s
have a disability, 11% of total population of
under 15s have a disability, 13.2% of Wellington
population are over 65, 19.5% of Wellington
population under 15. There are 6,500 over 65 in
this group – assume that 3500 of these are
included in the ‘aged’ population estimate
above.
Assume 1-person age 15-65 accompanies these
people
2013 Disability
report (Statistics
New Zealand,
2014)
2006 Disability
report (Statistics
New Zealand,
2007)
Stats NZ 2013
census
Support
persons
14,000
People in
prisons
Vulnerable
persons
1200 Maximum capacity
Rimutaka Prison – 1078
Arohata Prison – 159
Corrections.govt.nz
Tourists Vulnerable
persons
7000 2.5 million commercial guest nights per year in
Wellington. Average of 6849 guests/night.
Assume that age is not relevant as they are not
part of the ‘working’ population
WREDA Annual
Report (WREDA,
2015)
TOTAL Vulnerable
(excluding
tourists)
2000 10,950 6750
Support 18,000
TOTAL
(excl.
tourists)
2000 28,950 6750
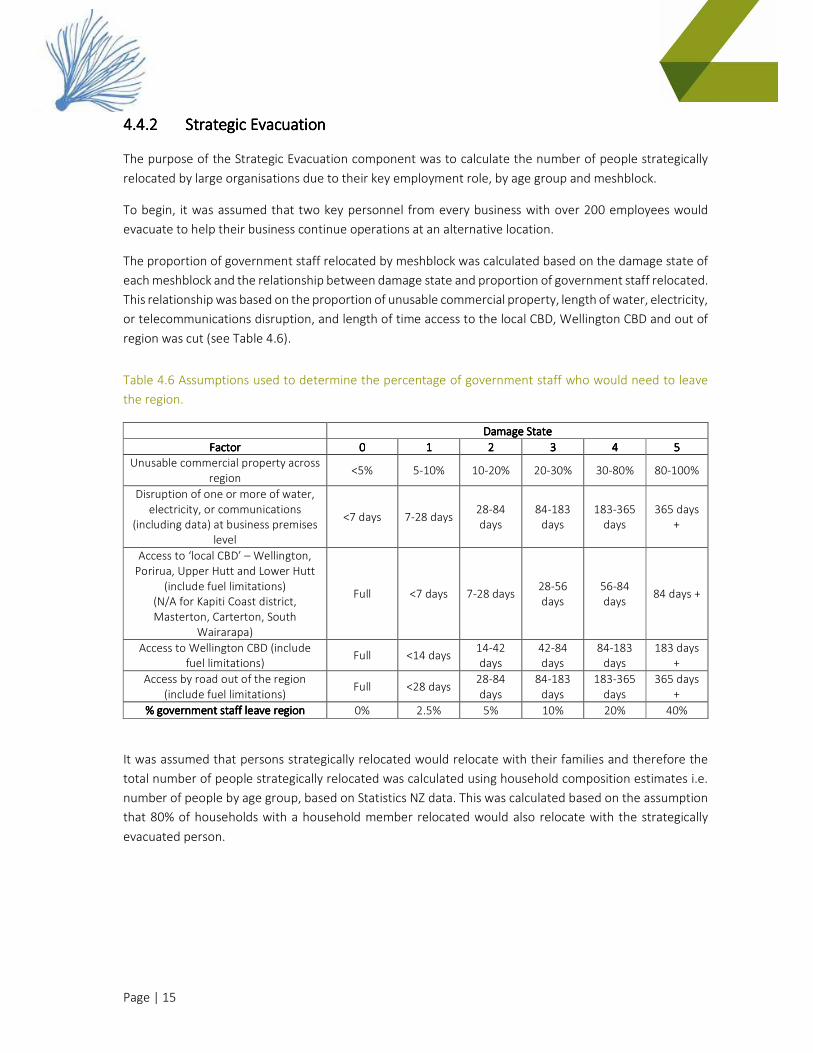
Page | 15
4.4.24.4.24.4.24.4.2 Strategic EvacuationStrategic EvacuationStrategic EvacuationStrategic Evacuation
The purpose of the Strategic Evacuation component was to calculate the number of people strategically
relocated by large organisations due to their key employment role, by age group and meshblock.
To begin, it was assumed that two key personnel from every business with over 200 employees would
evacuate to help their business continue operations at an alternative location.
The proportion of government staff relocated by meshblock was calculated based on the damage state of
each meshblock and the relationship between damage state and proportion of government staff relocated.
This relationship was based on the proportion of unusable commercial property, length of water, electricity,
or telecommunications disruption, and length of time access to the local CBD, Wellington CBD and out of
region was cut (see Table 4.6).
Table 4.6 Assumptions used to determine the percentage of government staff who would need to leave
the region.
Damage StateDamage StateDamage StateDamage State
FactorFactorFactorFactor 0000 1111 2222 3333 4444 5555
Unusable commercial property across
region <5% 5-10% 10-20% 20-30% 30-80% 80-100%
Disruption of one or more of water,
electricity, or communications
(including data) at business premises
level
<7 days 7-28 days 28-84
days
84-183
days
183-365
days
365 days
+
Access to ‘local CBD’ – Wellington,
Porirua, Upper Hutt and Lower Hutt
(include fuel limitations)
(N/A for Kapiti Coast district,
Masterton, Carterton, South
Wairarapa)
Full <7 days 7-28 days 28-56
days
56-84
days 84 days +
Access to Wellington CBD (include
fuel limitations) Full <14 days
14-42
days
42-84
days
84-183
days
183 days
+
Access by road out of the region
(include fuel limitations) Full <28 days
28-84
days
84-183
days
183-365
days
365 days
+
% government staff leave region% government staff leave region% government staff leave region% government staff leave region 0% 2.5% 5% 10% 20% 40%
It was assumed that persons strategically relocated would relocate with their families and therefore the
total number of people strategically relocated was calculated using household composition estimates i.e.
number of people by age group, based on Statistics NZ data. This was calculated based on the assumption
that 80% of households with a household member relocated would also relocate with the strategically
evacuated person.
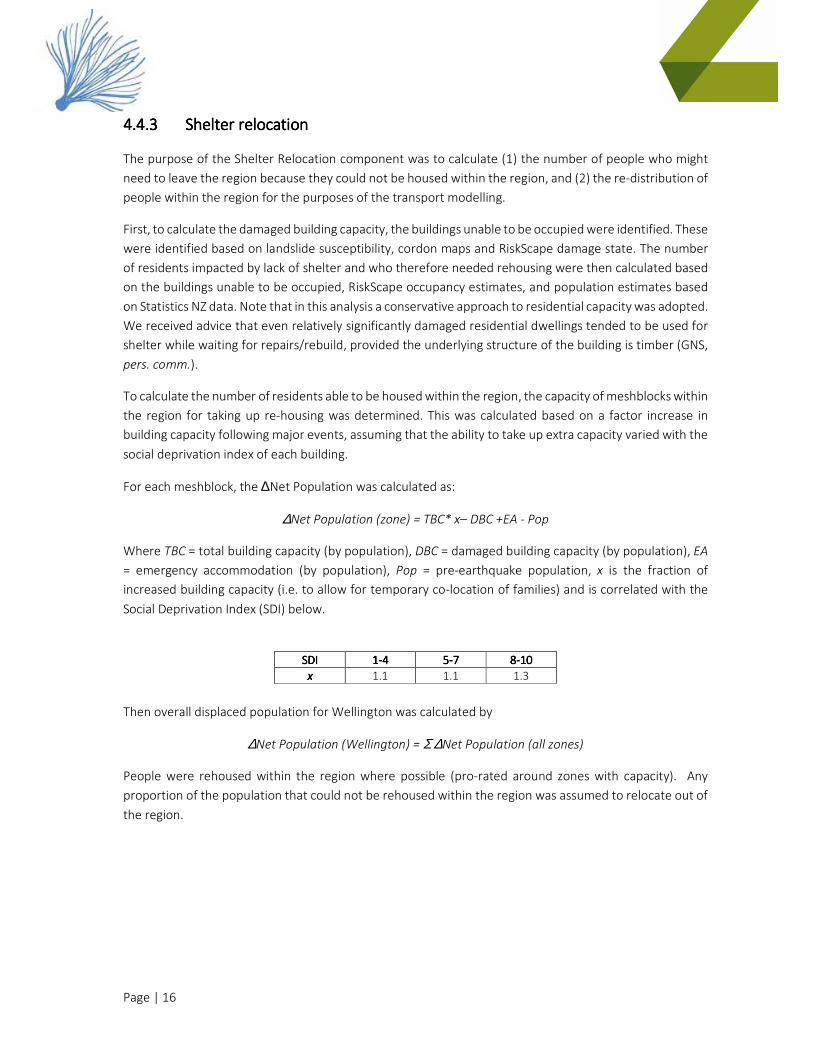
Page | 16
4.4.34.4.34.4.34.4.3 ShelterShelterShelterShelter relocationrelocationrelocationrelocation
The purpose of the Shelter Relocation component was to calculate (1) the number of people who might
need to leave the region because they could not be housed within the region, and (2) the re-distribution of
people within the region for the purposes of the transport modelling.
First, to calculate the damaged building capacity, the buildings unable to be occupied were identified. These
were identified based on landslide susceptibility, cordon maps and RiskScape damage state. The number
of residents impacted by lack of shelter and who therefore needed rehousing were then calculated based
on the buildings unable to be occupied, RiskScape occupancy estimates, and population estimates based
on Statistics NZ data. Note that in this analysis a conservative approach to residential capacity was adopted.
We received advice that even relatively significantly damaged residential dwellings tended to be used for
shelter while waiting for repairs/rebuild, provided the underlying structure of the building is timber (GNS,
pers. comm.).
To calculate the number of residents able to be housed within the region, the capacity of meshblocks within
the region for taking up re-housing was determined. This was calculated based on a factor increase in
building capacity following major events, assuming that the ability to take up extra capacity varied with the
social deprivation index of each building.
For each meshblock, the ∆Net Population was calculated as:
∆Net Population (zone) = TBC* x– DBC +EA - Pop
Where TBC = total building capacity (by population), DBC = damaged building capacity (by population), EA
= emergency accommodation (by population), Pop = pre-earthquake population, x is the fraction of
increased building capacity (i.e. to allow for temporary co-location of families) and is correlated with the
Social Deprivation Index (SDI) below.
SDISDISDISDI 1111----4444 5555----7777 8888----10101010
xxxx 1.1 1.1 1.3
Then overall displaced population for Wellington was calculated by
∆Net Population (Wellington) = Σ ∆Net Population (all zones)
People were rehoused within the region where possible (pro-rated around zones with capacity). Any
proportion of the population that could not be rehoused within the region was assumed to relocate out of
the region.
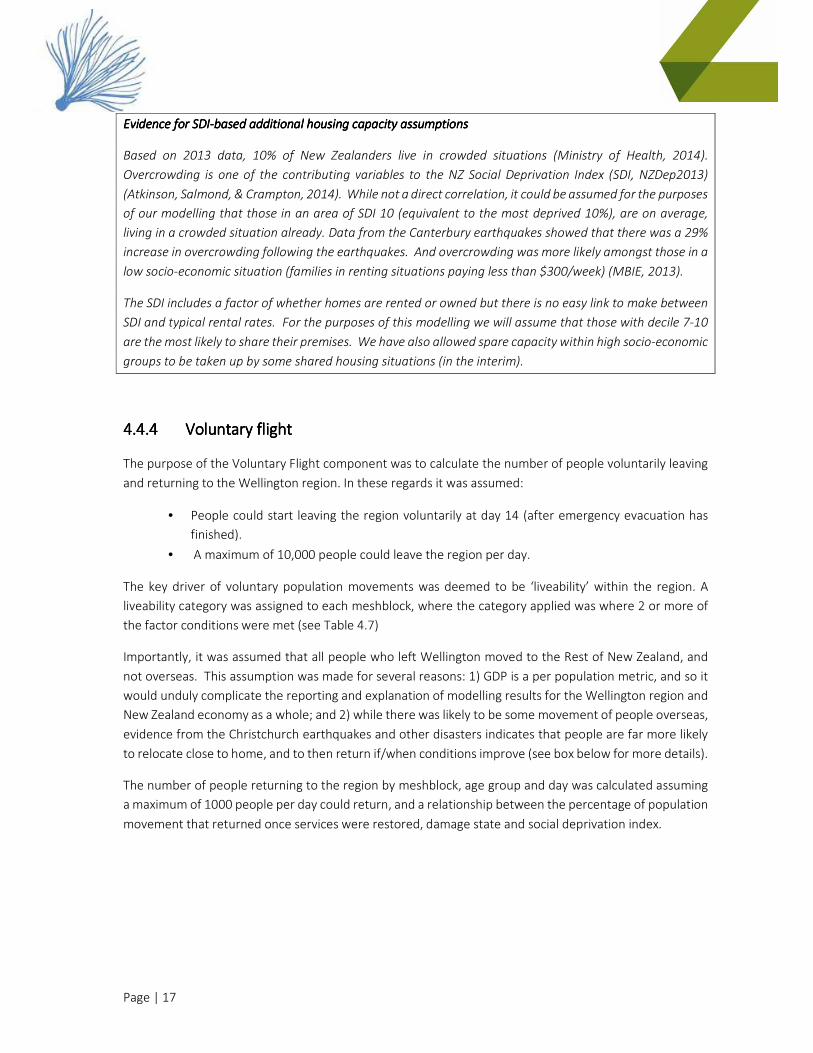
Page | 17
Evidence for SDIEvidence for SDIEvidence for SDIEvidence for SDI----based additional housing capacity assumptionsbased additional housing capacity assumptionsbased additional housing capacity assumptionsbased additional housing capacity assumptions
Based on 2013 data, 10% of New Zealanders live in crowded situations (Ministry of Health, 2014).
Overcrowding is one of the contributing variables to the NZ Social Deprivation Index (SDI, NZDep2013)
(Atkinson, Salmond, & Crampton, 2014). While not a direct correlation, it could be assumed for the purposes
of our modelling that those in an area of SDI 10 (equivalent to the most deprived 10%), are on average,
living in a crowded situation already. Data from the Canterbury earthquakes showed that there was a 29%
increase in overcrowding following the earthquakes. And overcrowding was more likely amongst those in a
low socio-economic situation (families in renting situations paying less than $300/week) (MBIE, 2013).
The SDI includes a factor of whether homes are rented or owned but there is no easy link to make between
SDI and typical rental rates. For the purposes of this modelling we will assume that those with decile 7-10
are the most likely to share their premises. We have also allowed spare capacity within high socio-economic
groups to be taken up by some shared housing situations (in the interim).
4.4.44.4.44.4.44.4.4 Voluntary flightVoluntary flightVoluntary flightVoluntary flight
The purpose of the Voluntary Flight component was to calculate the number of people voluntarily leaving
and returning to the Wellington region. In these regards it was assumed:
• People could start leaving the region voluntarily at day 14 (after emergency evacuation has
finished).
• A maximum of 10,000 people could leave the region per day.
The key driver of voluntary population movements was deemed to be ‘liveability’ within the region. A
liveability category was assigned to each meshblock, where the category applied was where 2 or more of
the factor conditions were met (see Table 4.7)
Importantly, it was assumed that all people who left Wellington moved to the Rest of New Zealand, and
not overseas. This assumption was made for several reasons: 1) GDP is a per population metric, and so it
would unduly complicate the reporting and explanation of modelling results for the Wellington region and
New Zealand economy as a whole; and 2) while there was likely to be some movement of people overseas,
evidence from the Christchurch earthquakes and other disasters indicates that people are far more likely
to relocate close to home, and to then return if/when conditions improve (see box below for more details).
The number of people returning to the region by meshblock, age group and day was calculated assuming
a maximum of 1000 people per day could return, and a relationship between the percentage of population
movement that returned once services were restored, damage state and social deprivation index.
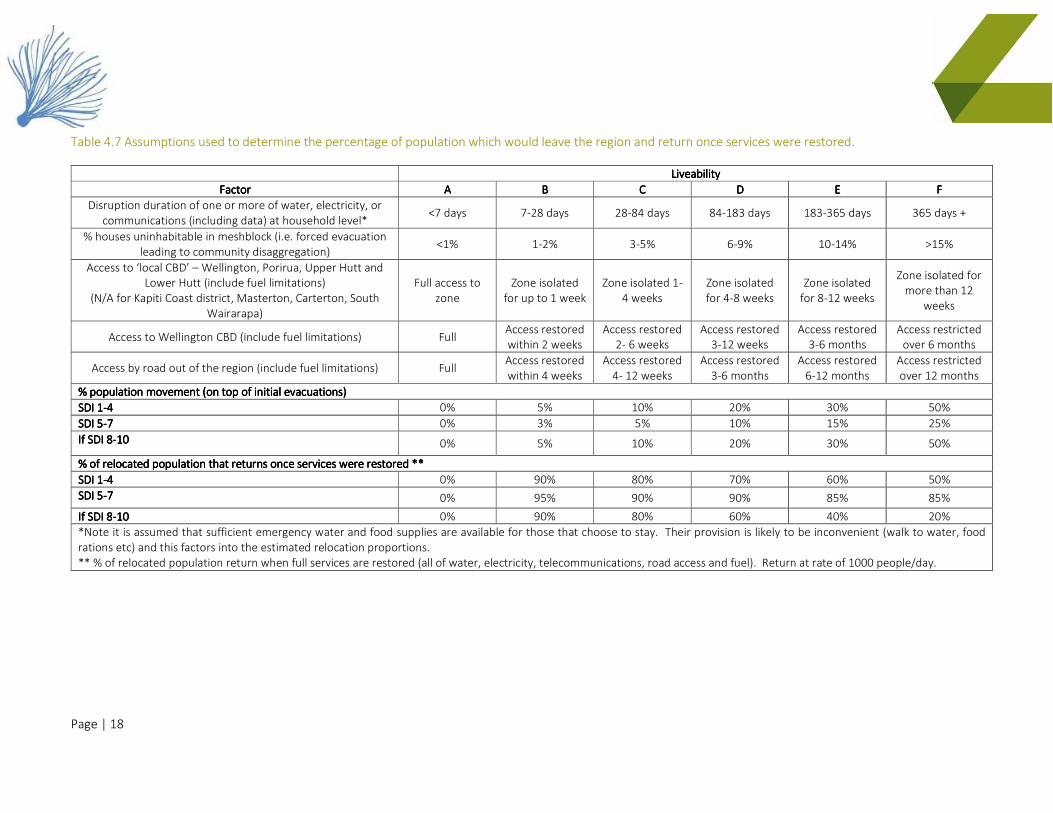
Page | 18
Table 4.7 Assumptions used to determine the percentage of population which would leave the region and return once services were restored.
LiveabilityLiveabilityLiveabilityLiveability
FactorFactorFactorFactor AAAA BBBB CCCC DDDD EEEE FFFF
Disruption duration of one or more of water, electricity, or
communications (including data) at household level* <7 days 7-28 days 28-84 days 84-183 days 183-365 days 365 days +
% houses uninhabitable in meshblock (i.e. forced evacuation
leading to community disaggregation) <1% 1-2% 3-5% 6-9% 10-14% >15%
Access to ‘local CBD’ – Wellington, Porirua, Upper Hutt and
Lower Hutt (include fuel limitations)
(N/A for Kapiti Coast district, Masterton, Carterton, South
Wairarapa)
Full access to
zone
Zone isolated
for up to 1 week
Zone isolated 1-
4 weeks
Zone isolated
for 4-8 weeks
Zone isolated
for 8-12 weeks
Zone isolated for
more than 12
weeks
Access to Wellington CBD (include fuel limitations) Full Access restored
within 2 weeks
Access restored
2- 6 weeks
Access restored
3-12 weeks
Access restored
3-6 months
Access restricted
over 6 months
Access by road out of the region (include fuel limitations) Full Access restored
within 4 weeks
Access restored
4- 12 weeks
Access restored
3-6 months
Access restored
6-12 months
Access restricted
over 12 months
% population movement (on top of initial evacuations)% population movement (on top of initial evacuations)% population movement (on top of initial evacuations)% population movement (on top of initial evacuations)
SDI 1SDI 1SDI 1SDI 1----4444 0% 5% 10% 20% 30% 50%
SDI 5SDI 5SDI 5SDI 5----7777 0% 3% 5% 10% 15% 25%
If SDI 8If SDI 8If SDI 8If SDI 8----10101010 0% 5% 10% 20% 30% 50%
% of relocated population that returns once services % of relocated population that returns once services % of relocated population that returns once services % of relocated population that returns once services wewewewere restored **re restored **re restored **re restored **
SDI 1SDI 1SDI 1SDI 1----4444 0% 90% 80% 70% 60% 50%
SDI 5SDI 5SDI 5SDI 5----7777 0% 95% 90% 90% 85% 85%
If SDI 8If SDI 8If SDI 8If SDI 8----10101010 0% 90% 80% 60% 40% 20%
*Note it is assumed that sufficient emergency water and food supplies are available for those that choose to stay. Their provision is likely to be inconvenient (walk to water, food
rations etc) and this factors into the estimated relocation proportions.
** % of relocated population return when full services are restored (all of water, electricity, telecommunications, road access and fuel). Return at rate of 1000 people/day.
Page | 19
Aspects that Aspects that Aspects that Aspects that were not were not were not were not includedincludedincludedincluded in the Voluntary Flight component in the Voluntary Flight component in the Voluntary Flight component in the Voluntary Flight component
The availability or quality of schooling in the region was not included as a factor (even though this came
through strongly in the workshops as a key factor likely to drive people’s decision making). This was
because there was significant uncertainty around the triggers for school closures – dependent on damage
and Ministry for Education decisions. Also, to some extent, school closures would be correlated with
community disaggregation.
Food availability, while essential, was not modelled. It was assumed that sufficient emergency rations
would be made available through Civil Defence arrangements. Although it may be costly to provide
emergency rations under some scenarios compared to others (i.e. because lack of vehicle access), the
financial costs of emergency provision were not modelled. ‘Full’ food supplies were assumed to be available
to a meshblock once access out of the region was restored.
Fear, while likely to be a considerable driver in the decision for individuals and families to leave the region,
was not incorporated as it is challenging to define at a spatial level and will be highly correlated to other
disruptions.
Evidence for relocation assumptionsEvidence for relocation assumptionsEvidence for relocation assumptionsEvidence for relocation assumptions
In San Francisco, the city has set several resilience targets for post-earthquake performance. That is, they
have set minimum levels of service for some infrastructure. One indicator they have set is level of housing
damage. San Francisco have set a 95% habitability rate of housing stock post-disaster to prevent tip-
out/out-migration of residents (and therefore associated economic losses). They have gathered evidence
from several different disaster events and looked at the correlation between housing damage and out-
migration. Below is data from the case studies used to support their case (SPUR, 2012).
An equivalent set of recovery targets has been created for lifeline services. However, the evidence and
process for establishing these targets is not supported with the evidence provided for the housing stock
(SPUR, 2009)
The Social Deprivation index has been included in the criteria for voluntary flight as several previous studies
have indicated that socio-economic status of community, and in particular, poverty has been associated
with the slow pace at which people are able to return and rebuild (Xiao & Van Zandt, 2011; Le Sage et al.,
2011). Post-Hurricane Katrina, Xiao and Van Zandt (2011) found that income negatively correlated with
population return; households with higher incomes were less dependent of low waged service industry jobs,
and are therefore more likely to be professionally and financially mobile. In contrast, low wage householders
were more likely to remain in damaged housing, with fewer alternative options available to them. Longer
term, if low wage households do not own property, they are more likely to relocate if living expenses increase
or job opportunities reduce (SPUR, 2012).
Based on this evidence, we have stratified population movements in our model into three SDI levels to
represent low, middle and high socio-economic groups. High socio-economic groups (SDI1-4) are assumed
to have high rates of immediate temporary relocation due to their capacity to find alternative
accommodation in the short term – rentals, holiday homes or relocation out of the region. Longer term we
have assumed a moderate rate of return as many in this group will likely to be able to afford to leave a
Page | 20
region, even if there is capital loss on their property. They are also likely to be highly employable. Low socio-
economic groups (SDI 8-10) are assumed to be more heavily dependent on emergency shelters and are more
likely to leave the region. Long term, it is assumed they are less likely to return, particularly if there are
housing and job shortages. For middle socio-economic groups (SDI5-7) we have assumed they are the least
mobile group. Those in this group that own property may not be able to leave their, likely, primary asset,
and may be reluctant to relocate without guaranteed employment.
It is important to note that research indicates that there are other under-lying factors that impact
populations’ capacity and desire to relocate including social capital (Aldrich, 2012) and existing population
growth/decline trajectories (Aldrich, 2011; Matanle, 2011). These factors are not currently included in our
model but are an area for future exploration
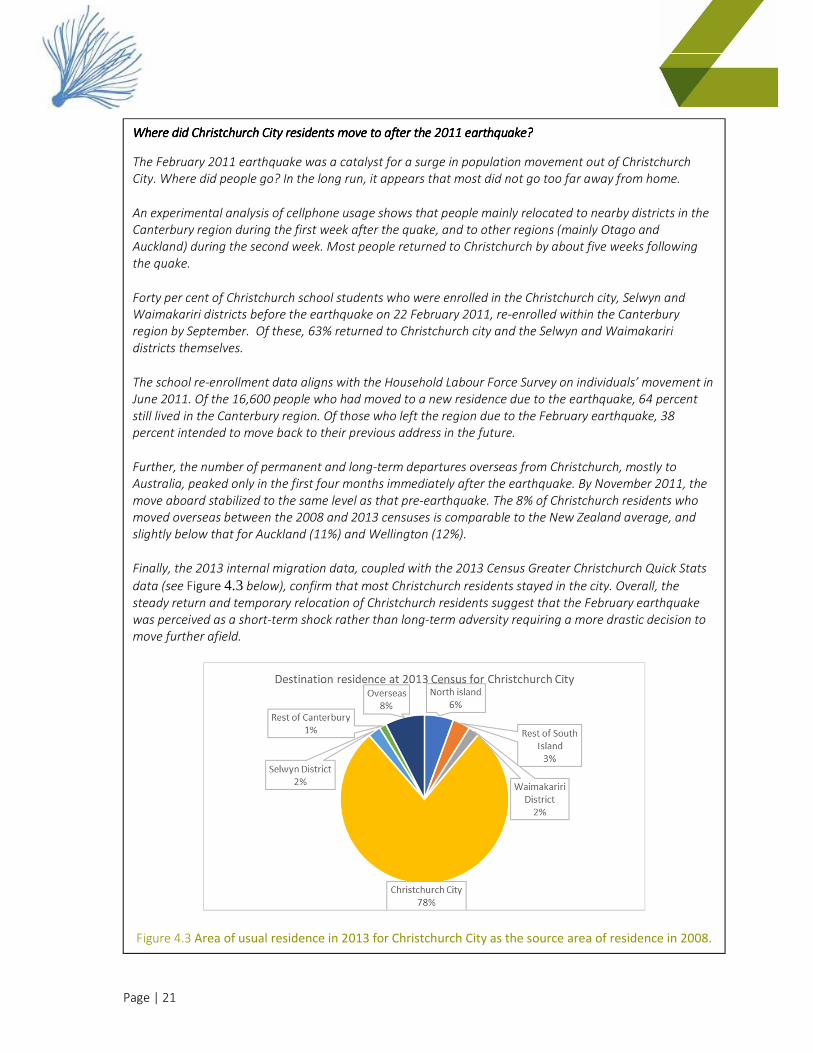
Page | 21
Where did ChristcWhere did ChristcWhere did ChristcWhere did Christchurch City residents move to after the 2011 earthquake?hurch City residents move to after the 2011 earthquake?hurch City residents move to after the 2011 earthquake?hurch City residents move to after the 2011 earthquake?
The February 2011 earthquake was a catalyst for a surge in population movement out of Christchurch
City. Where did people go? In the long run, it appears that most did not go too far away from home.
An experimental analysis of cellphone usage shows that people mainly relocated to nearby districts in the
Canterbury region during the first week after the quake, and to other regions (mainly Otago and
Auckland) during the second week. Most people returned to Christchurch by about five weeks following
the quake.
Forty per cent of Christchurch school students who were enrolled in the Christchurch city, Selwyn and
Waimakariri districts before the earthquake on 22 February 2011, re-enrolled within the Canterbury
region by September. Of these, 63% returned to Christchurch city and the Selwyn and Waimakariri
districts themselves.
The school re-enrollment data aligns with the Household Labour Force Survey on individuals’ movement in
June 2011. Of the 16,600 people who had moved to a new residence due to the earthquake, 64 percent
still lived in the Canterbury region. Of those who left the region due to the February earthquake, 38
percent intended to move back to their previous address in the future.
Further, the number of permanent and long-term departures overseas from Christchurch, mostly to
Australia, peaked only in the first four months immediately after the earthquake. By November 2011, the
move aboard stabilized to the same level as that pre-earthquake. The 8% of Christchurch residents who
moved overseas between the 2008 and 2013 censuses is comparable to the New Zealand average, and
slightly below that for Auckland (11%) and Wellington (12%).
Finally, the 2013 internal migration data, coupled with the 2013 Census Greater Christchurch Quick Stats
data (see Figure 4.3 below), confirm that most Christchurch residents stayed in the city. Overall, the
steady return and temporary relocation of Christchurch residents suggest that the February earthquake
was perceived as a short-term shock rather than long-term adversity requiring a more drastic decision to
move further afield.
Figure 4.3 Area of usual residence in 2013 for Christchurch City as the source area of residence in 2008.
Page | 22
4.4.54.4.54.4.54.4.5 Incorporating Population Relocation in the Economic ModelIncorporating Population Relocation in the Economic ModelIncorporating Population Relocation in the Economic ModelIncorporating Population Relocation in the Economic Model
For the economic modelling, the primary outcome of changes in population was changes in the location of
labour resources and changes in the distribution of demands for goods and services.
In terms of labour force changes, note that the Dynamic Economic Model incorporated two economic
regions: Wellington and Rest of New Zealand. To incorporate the change in labour force between these
regions the following further assumptions were made:
• After relocating from Wellington to the rest of New Zealand, many people were not able to
enter the workforce immediately due to the need to organise transportation, housing, set up
networks, and so on. The entry of a new person to the workforce was therefore staggered over
time, starting at least one week after the person left Wellington, and up to two months.
• For those persons who returned to Wellington once liveability improved, there was also a lag
before re-entry to the labour force. Given the likely existence of more established networks,
this was assumed to be shorter, ranging from one week to one months.
To ensure that the movement of people between regions immediately resulted in a change in the
distribution of demands for goods and services, a portion of the household income account for Wellington
region was relocated to the rest of New Zealand household income account. This was undertaken simply
on a per-capita basis assuming that all residents in Wellington had an equal share in the household income
account at the time of relocation. Once residents moved to a new region, they took on the demand
behaviours of resident’s in their new location.
4.54.54.54.5 Business BehaviourBusiness BehaviourBusiness BehaviourBusiness Behaviourssss ModelModelModelModel
Resilient Organisation’s original Business Behaviours model is described in the report:
Brown, C., Giovinazzi, S., Seville, E., Vargo, J., Stevenson, J.R. (2015) Developing the Business
Behaviours Module within MERIT. Economics of Resilient Infrastructure Research Report 2015/02.
71p.- addendum added January 2016.
As already explained, the original modelling was based largely on data arising out of the 2011 Canterbury
Earthquake event. At the commencement of the project a review was undertaken to determine the types
of modifications that would be necessary to the original model, to allow for the differences in the nature
and extent of impacts faced under the Wellington Fault earthquake event. One set of changes was to
incorporate a new Population Relocation Model, as already explained above. In terms of the Business
Behaviour’s Model, two principal additions were made: (1) modification of the original ‘operability’ curves,
and (2) inclusion of business relocations (for reasoning and assumptions behind each of these two topics
of see sections 4.5.1, 4.5.2 and 4.5.3). As a start point, however, the modelling and assumptions for the
extensions both relied on classifying business/industries into a set of subcategories, to reflect the different
infrastructure needs and capacities for adaption of different industry groups. The following industry groups
were identified:
Page | 23
1. Place-based people services
Businesses in this group were predominantly ‘non-moveable’ because of an in-region
customer base. Sectors considered to fall into this category included Health care and Social
assistance, Education and Training, and Local Government Administration.
2. Moveable discretionary spend services
This group was predominantly place-based, serving customers who choose to visit or reside
at a locality. Demands for services that these activities provided would potentially relocate
should customers choose to relocate. Sectors considered to fall into this category included
Retail, Accommodation and Food Services, and Art and Recreational Services.
3. Office-based services
This group was generally moveable, with working from home often a viable option. The
customer base could be either in or out of region. Sectors considered to fall into this
category included Professional, Scientific and Technical services, Information Media and
Telecommunications, and Financial and Insurance Services.
4. Manufacturing
Sectors considered to fall into this category included Food Manufacturing, Transport,
Equipment and Machinery Manufacturing, and Wood and Chemical Product
Manufacturing.
5. Place-based activities
Sectors considered to fall into this category included Construction, Electricity Generation
and Supply, Water, Sewerage, Drainage and Waste services, and Rental and Real Estate
Services.
6. Central Government
7. Primary
Included agricultural and mining sectors.
4.5.14.5.14.5.14.5.1 Business OperabilityBusiness OperabilityBusiness OperabilityBusiness Operability
The Business Behaviours Model took information on infrastructure and non-infrastructure disruptions, and
calculated the level of ‘operability’ achieved by each business/industry compared to as-usual operability.
To reflect that businesses are adaptive to situations, full operability generally returns over time, however
the more severe the level of disruption, and the longer the duration, the greater the initial fall in operability
and the longer the recovery period. The generated operability curves described the rate at which normal
levels of productivity in an industry fell, and then returned to normal.
The business behaviours model was originally developed using data on business recovery following the
2010-2011 Canterbury earthquakes (Table 4.8). Following the Canterbury earthquakes infrastructure
systems were not sufficiently disrupted to tip businesses into different behaviour (e.g. closure, relocation
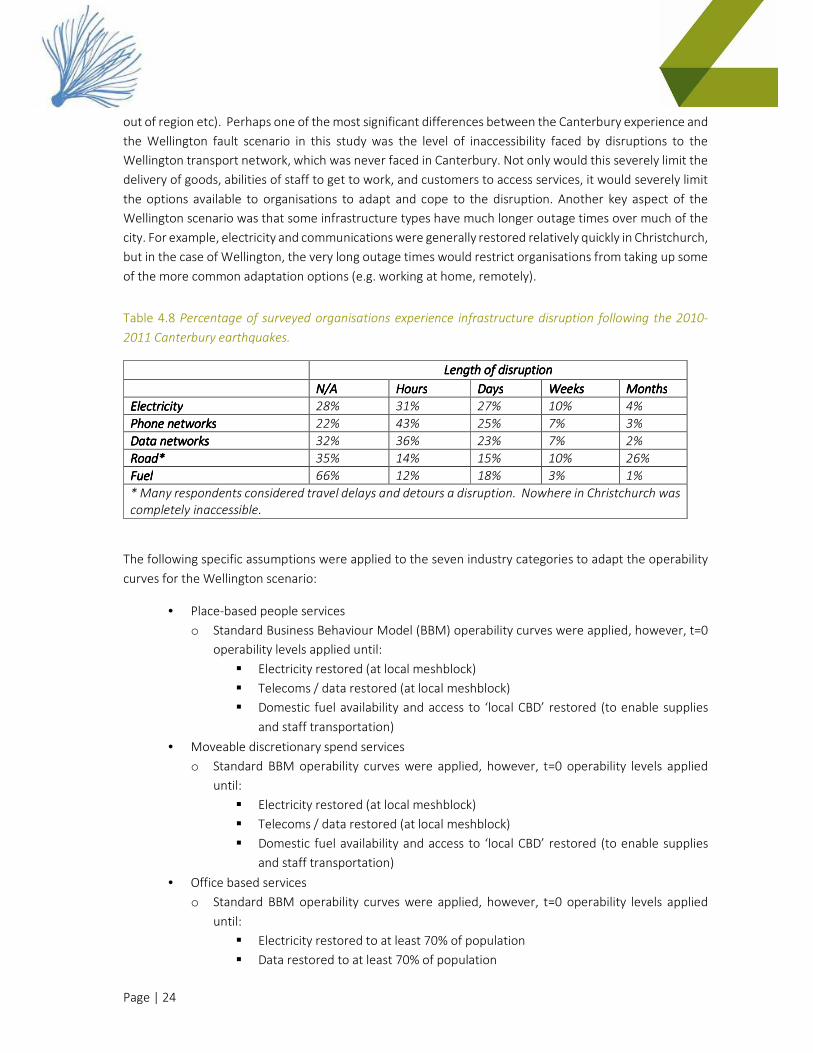
Page | 24
out of region etc). Perhaps one of the most significant differences between the Canterbury experience and
the Wellington fault scenario in this study was the level of inaccessibility faced by disruptions to the
Wellington transport network, which was never faced in Canterbury. Not only would this severely limit the
delivery of goods, abilities of staff to get to work, and customers to access services, it would severely limit
the options available to organisations to adapt and cope to the disruption. Another key aspect of the
Wellington scenario was that some infrastructure types have much longer outage times over much of the
city. For example, electricity and communications were generally restored relatively quickly in Christchurch,
but in the case of Wellington, the very long outage times would restrict organisations from taking up some
of the more common adaptation options (e.g. working at home, remotely).
Table 4.8 Percentage of surveyed organisations experience infrastructure disruption following the 2010-
2011 Canterbury earthquakes.
Length of disruptionLength of disruptionLength of disruptionLength of disruption
N/AN/AN/AN/A HoursHoursHoursHours DaysDaysDaysDays WeeksWeeksWeeksWeeks MonthsMonthsMonthsMonths
ElectricityElectricityElectricityElectricity 28% 31% 27% 10% 4%
Phone networksPhone networksPhone networksPhone networks 22% 43% 25% 7% 3%
Data networksData networksData networksData networks 32% 36% 23% 7% 2%
Road*Road*Road*Road* 35% 14% 15% 10% 26%
FuelFuelFuelFuel 66% 12% 18% 3% 1%
* Many respondents considered travel delays and detours a disruption. Nowhere in Christchurch was
completely inaccessible.
The following specific assumptions were applied to the seven industry categories to adapt the operability
curves for the Wellington scenario:
• Place-based people services
o Standard Business Behaviour Model (BBM) operability curves were applied, however, t=0
operability levels applied until:
� Electricity restored (at local meshblock)
� Telecoms / data restored (at local meshblock)
� Domestic fuel availability and access to ‘local CBD’ restored (to enable supplies
and staff transportation)
• Moveable discretionary spend services
o Standard BBM operability curves were applied, however, t=0 operability levels applied
until:
� Electricity restored (at local meshblock)
� Telecoms / data restored (at local meshblock)
� Domestic fuel availability and access to ‘local CBD’ restored (to enable supplies
and staff transportation)
• Office based services
o Standard BBM operability curves were applied, however, t=0 operability levels applied
until:
� Electricity restored to at least 70% of population
� Data restored to at least 70% of population
Page | 25
o Note that many within this grouping could work from home. These conditions enable
working from home. Road disruptions were not included as this is less important for those
that can work from home.
• Manufacturing
o Standard BBM operability curves were applied, however, t=0 operability levels applied
until:
� Electricity restored (at local meshblock)
� Telecoms / data restored (at local meshblock)
� Access in and out of region restored (to allow movements of supplies)
• Place-based activities
o Standard BBM operability curves were applied
• Government
o Standard BBM operability curves were applied, however, t=0 operability levels applied
until:
� Electricity restored (at local meshblock)
� Telecoms / data restored (at local meshblock)
� Domestic fuel availability and access to ‘local CBD’ restored (to enable supplies
and staff transportation)
• Primary industries
o Standard BBM operability curves were applied, however, t=0 operability levels applied
until:
� Access to central Wellington restored
Note: each criterion only applied where the infrastructure was disrupted for 3 or more days. If the
disruption was less than 3 days, then standard operability applied.
4.5.24.5.24.5.24.5.2 Business Business Business Business RelocationRelocationRelocationRelocation
The Business Relocation component models the relocation of businesses from the region (over and above
adjustments made due to reduced demand due to the population movements described above). This
reflects the assumption that some businesses chose to relocate some, or all, of their operations to outside
of the Wellington Region. This relocation of businesses triggered a shift of capital to outside the region.
First, for each industry category, a set of business viability factors were listed, reflecting decision drivers
for:
• could they move,
• would they move,
• why would they move.
The factors were primarily based on a series of expert workshops held in March 2017 with key industry
representatives. Based on these factors an estimated percent of the industry was assumed to leave the
region, taking their capital with them.
Business relocations were only considered for the groups ‘office-based services’, ‘manufacturing’, and
‘central government’. These were the industry groups considered most able to move their capital base
(perhaps only in part) to an alternative location. Nevertheless, we should recognise that movements of
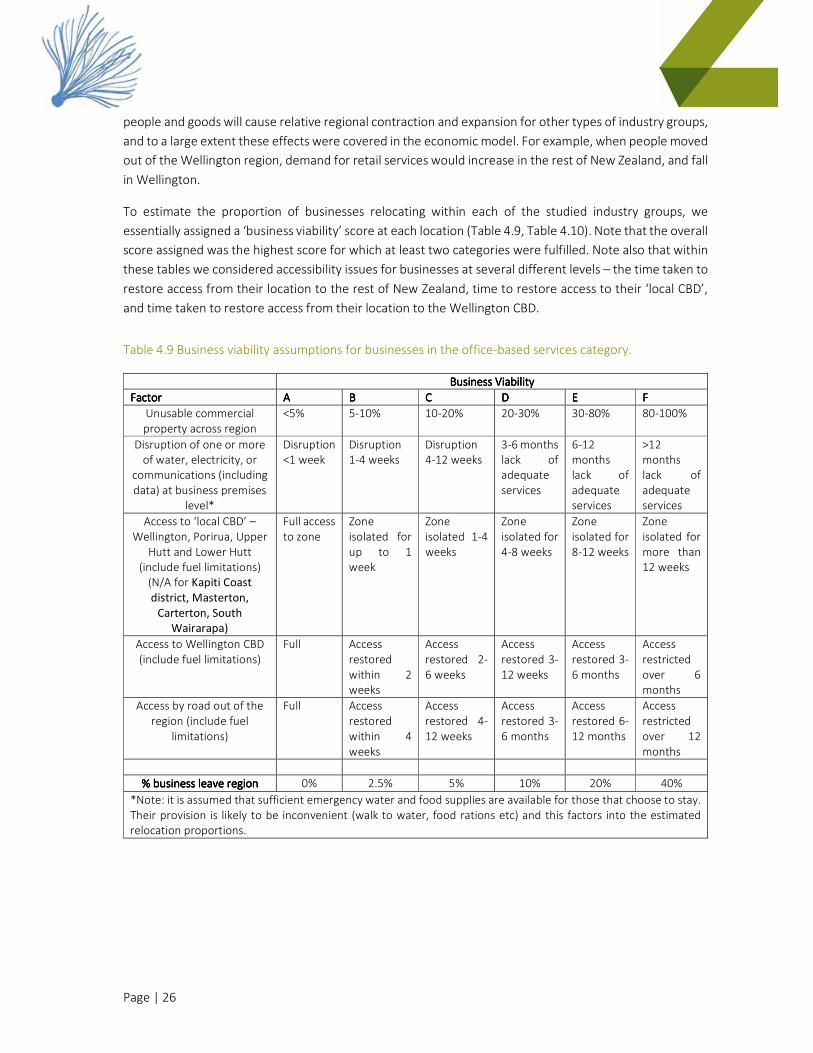
Page | 26
people and goods will cause relative regional contraction and expansion for other types of industry groups,
and to a large extent these effects were covered in the economic model. For example, when people moved
out of the Wellington region, demand for retail services would increase in the rest of New Zealand, and fall
in Wellington.
To estimate the proportion of businesses relocating within each of the studied industry groups, we
essentially assigned a ‘business viability’ score at each location (Table 4.9, Table 4.10). Note that the overall
score assigned was the highest score for which at least two categories were fulfilled. Note also that within
these tables we considered accessibility issues for businesses at several different levels – the time taken to
restore access from their location to the rest of New Zealand, time to restore access to their ‘local CBD’,
and time taken to restore access from their location to the Wellington CBD.
Table 4.9 Business viability assumptions for businesses in the office-based services category.
Business Business Business Business ViabilityViabilityViabilityViability
FactorFactorFactorFactor AAAA BBBB CCCC DDDD EEEE FFFF
Unusable commercial
property across region
<5% 5-10% 10-20% 20-30% 30-80% 80-100%
Disruption of one or more
of water, electricity, or
communications (including
data) at business premises
level*
Disruption
<1 week
Disruption
1-4 weeks
Disruption
4-12 weeks
3-6 months
lack of
adequate
services
6-12
months
lack of
adequate
services
>12
months
lack of
adequate
services
Access to ‘local CBD’ –
Wellington, Porirua, Upper
Hutt and Lower Hutt
(include fuel limitations)
(N/A for Kapiti Coast
district, Masterton,
Carterton, South
Wairarapa)
Full access
to zone
Zone
isolated for
up to 1
week
Zone
isolated 1-4
weeks
Zone
isolated for
4-8 weeks
Zone
isolated for
8-12 weeks
Zone
isolated for
more than
12 weeks
Access to Wellington CBD
(include fuel limitations)
Full Access
restored
within 2
weeks
Access
restored 2-
6 weeks
Access
restored 3-
12 weeks
Access
restored 3-
6 months
Access
restricted
over 6
months
Access by road out of the
region (include fuel
limitations)
Full Access
restored
within 4
weeks
Access
restored 4-
12 weeks
Access
restored 3-
6 months
Access
restored 6-
12 months
Access
restricted
over 12
months
% business leave region% business leave region% business leave region% business leave region 0% 2.5% 5% 10% 20% 40%
*Note: it is assumed that sufficient emergency water and food supplies are available for those that choose to stay.
Their provision is likely to be inconvenient (walk to water, food rations etc) and this factors into the estimated
relocation proportions.
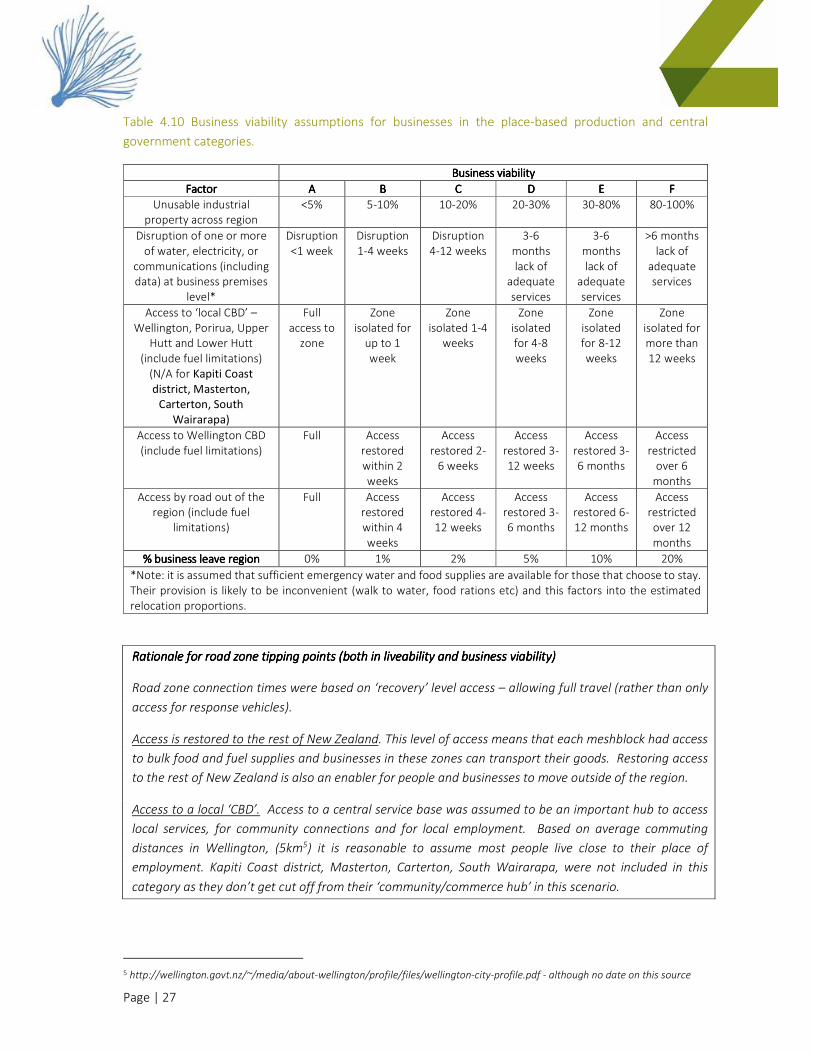
Page | 27
Table 4.10 Business viability assumptions for businesses in the place-based production and central
government categories.
Business viabilityBusiness viabilityBusiness viabilityBusiness viability
FactorFactorFactorFactor AAAA BBBB CCCC DDDD EEEE FFFF
Unusable industrial
property across region
<5% 5-10% 10-20% 20-30% 30-80% 80-100%
Disruption of one or more
of water, electricity, or
communications (including
data) at business premises
level*
Disruption
<1 week
Disruption
1-4 weeks
Disruption
4-12 weeks
3-6
months
lack of
adequate
services
3-6
months
lack of
adequate
services
>6 months
lack of
adequate
services
Access to ‘local CBD’ –
Wellington, Porirua, Upper
Hutt and Lower Hutt
(include fuel limitations)
(N/A for Kapiti Coast
district, Masterton,
Carterton, South
Wairarapa)
Full
access to
zone
Zone
isolated for
up to 1
week
Zone
isolated 1-4
weeks
Zone
isolated
for 4-8
weeks
Zone
isolated
for 8-12
weeks
Zone
isolated for
more than
12 weeks
Access to Wellington CBD
(include fuel limitations)
Full Access
restored
within 2
weeks
Access
restored 2-
6 weeks
Access
restored 3-
12 weeks
Access
restored 3-
6 months
Access
restricted
over 6
months
Access by road out of the
region (include fuel
limitations)
Full Access
restored
within 4
weeks
Access
restored 4-
12 weeks
Access
restored 3-
6 months
Access
restored 6-
12 months
Access
restricted
over 12
months
% business leave region% business leave region% business leave region% business leave region 0% 1% 2% 5% 10% 20%
*Note: it is assumed that sufficient emergency water and food supplies are available for those that choose to stay.
Their provision is likely to be inconvenient (walk to water, food rations etc) and this factors into the estimated
relocation proportions.
Rationale for road zone tipping points (both in liveability and business viability)Rationale for road zone tipping points (both in liveability and business viability)Rationale for road zone tipping points (both in liveability and business viability)Rationale for road zone tipping points (both in liveability and business viability)
Road zone connection times were based on ‘recovery’ level access – allowing full travel (rather than only
access for response vehicles).
Access is restored to the rest of New Zealand. This level of access means that each meshblock had access
to bulk food and fuel supplies and businesses in these zones can transport their goods. Restoring access
to the rest of New Zealand is also an enabler for people and businesses to move outside of the region.
Access to a local ‘CBD’. Access to a central service base was assumed to be an important hub to access
local services, for community connections and for local employment. Based on average commuting
distances in Wellington, (5km5) it is reasonable to assume most people live close to their place of
employment. Kapiti Coast district, Masterton, Carterton, South Wairarapa, were not included in this
category as they don’t get cut off from their ‘community/commerce hub’ in this scenario.
5 http://wellington.govt.nz/~/media/about-wellington/profile/files/wellington-city-profile.pdf - although no date on this source
Page | 28
Access to Wellington CBD. Wellington CBD is the source of roll-on/roll-off services and employment6. Even
if there was no central city and businesses relocated within the region – it would be a reasonable
assumption that businesses would only relocate to a location that was connected to the CBD (i.e. they
wouldn’t move to somewhere more isolated).
Aspects that Aspects that Aspects that Aspects that were not were not were not were not included in the included in the included in the included in the Business Relocation Business Relocation Business Relocation Business Relocation componcomponcomponcomponent ent ent ent
Business confidence was assumed to be a significant factor in whether businesses remained in the region
or relocated. However, we have not included this here as it was challenging to define and was likely to be
highly correlated with other disruptions.
Health and Safety legislation may have played a part in how able and willing businesses were to operate in
a disrupted environment. Our approach assumed that a pragmatic approach to health and sanitation and
other safety issues was taken by regulatory authorities and would not be a significant driver for businesses.
Evidence for business relocationEvidence for business relocationEvidence for business relocationEvidence for business relocation
There is limited literature on both business closure and relocation following disaster events. Sydnor et al.’s
(2017) study is one of a limited number that measures permanent business closure because of a natural
disaster. They found that 10% of the small businesses (0-74 employees) that were in operation prior to
Hurricane Katrina, had closed immediately and permanently after the event; this figure had grown to 25%
some 8 years on. Sydnor et al. (2016) found that age and health of the business played an important and
substantial role in the recovery. Business sector was also relevant, with service sector businesses less likely
to close when compared to other sectors. Older businesses bring more experience to problem solving, while
larger firms are likely to have greater human and financial capital required to ride the wave of recovery.
None the less, the extent of damage cannot be overlooked, since catastrophic damage to assets was also a
significant predictor of failure to resume business, irrespective of size of the organisation.
Wasileski et al. (2010) compared the impact of natural disaster on the continuity (and survival) of businesses
following the Loma Prieta earthquake in Santa Cruz US in 1989, with Hurricane Andrew which occurred in
1992 in South Dade County in Florida. Wasileski et al. (2010) found that in the case of the Loma Prieta
earthquake 6.7% of businesses either closed or relocated permanently following the event. Loss of lifeline
services (i.e. electricity, phone, water) and non-ownership of the business building contributed to a greater
likelihood of closure. In the case of Hurricane Andrew, an estimated 12.5% of businesses relocated, though
no data was available from businesses that entirely ceased to operate. Business closure in both cases
disproportionally impacted the retail and wholesale sector (Wasileski et al., 2010).
In Table 4.11, we have compiled statistics on business change (closure and relocation) and compared that
with statistics on population movement following the same event to determine a) whether there is likely to
6http://www.stats.govt.nz/Census/2013-census/profile-and-summary-reports/commuting-patterns-wtn/working-in-
wellington.aspx
Page | 29
be additional business changes aside from those drive by population changes, b) the identified triggers for
closure or relocation and c) the scale of closures/relocations.
Note that we have included data on both business closure and relocation because the current literature does
not give definitive descriptions as to what happens to businesses when they ‘close’. Some studies assume
businesses are closed when they are not in their original location; however, businesses often adapt and work
from alternative locations, so these studies will over-estimate closure. Similarly, data on where businesses
relocate too is often not provided. With these limitations in mind, this data is primarily useful for identifying
patterns in behaviour and magnitude changes in business operation.
The data indicates that business closure and/or relocation rates vary significantly between events, location
and across time. With the limited data available, and a complex range of geographical, socio-economic,
political and other variables to consider, it is difficult to draw robust conclusions around the drivers, and
extent, of business relocation following a different earthquake event.
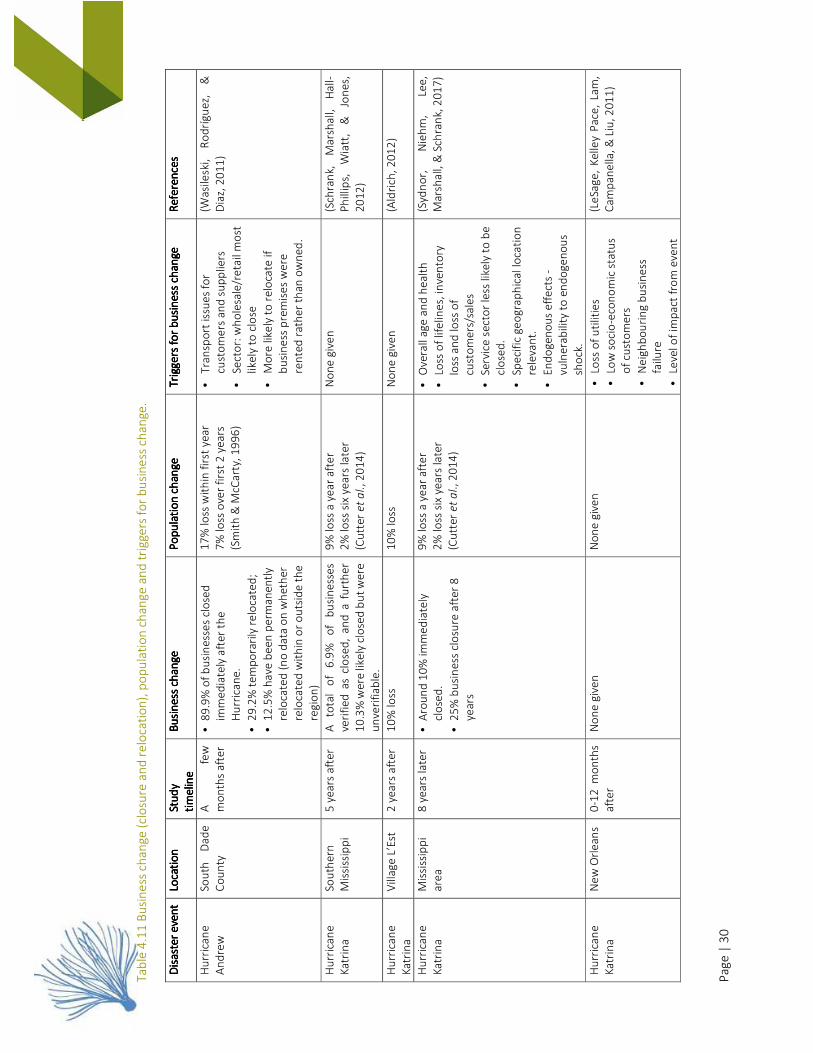
Pa
ge
| 3
0
Ta
ble
4.1
1 B
usi
ne
ss c
ha
ng
e (
clo
sure
an
d r
elo
cati
on
), p
op
ula
tio
n c
ha
ng
e a
nd
tri
gge
rs f
or
bu
sin
ess
ch
an
ge.
Dis
ast
er
eve
nt
Dis
ast
er
eve
nt
Dis
ast
er
eve
nt
Dis
ast
er
eve
nt
Loca
tio
nLo
cati
on
Loca
tio
nLo
cati
on
St
ud
y St
ud
y St
ud
y St
ud
y
tim
elin
eti
me
line
tim
elin
eti
me
line
Bu
sin
ess
ch
an
ge
Bu
sin
ess
ch
an
ge
Bu
sin
ess
ch
an
ge
Bu
sin
ess
ch
an
ge
P
op
ula
tio
n c
han
ge
Po
pu
lati
on
ch
ang
eP
op
ula
tio
n c
han
ge
Po
pu
lati
on
ch
ang
e
Tri
gge
rs f
or
bu
sin
ess
ch
an
geT
rigg
ers
fo
r b
usi
ne
ss c
ha
nge
Tri
gge
rs f
or
bu
sin
ess
ch
an
geT
rigg
ers
fo
r b
usi
ne
ss c
ha
nge
R
efe
ren
ces
Re
fere
nce
sR
efe
ren
ces
Re
fere
nce
s
Hu
rric
an
e
An
dre
w
Sou
th
Da
de
Co
un
ty
A
few
mo
nth
s a
fte
r
• 8
9.9
% o
f b
usi
ne
sse
s cl
ose
d
imm
ed
iate
ly a
fte
r th
e
Hu
rric
an
e.
• 2
9.2
% t
em
po
rari
ly r
elo
cate
d;
• 1
2.5
% h
ave
be
en
pe
rma
ne
ntl
y
relo
cate
d (
no
da
ta o
n w
he
the
r
relo
cate
d w
ith
in o
r o
uts
ide
th
e
reg
ion
)
17
% lo
ss w
ith
in f
irst
ye
ar
7%
loss
ove
r fi
rst
2 y
ea
rs
(Sm
ith
& M
cCa
rty,
19
96
)
• T
ran
spo
rt is
sue
s fo
r
cust
om
ers
an
d s
up
plie
rs
• Se
cto
r: w
ho
lesa
le/r
eta
il m
ost
like
ly t
o c
lose
• M
ore
like
ly t
o r
elo
cate
if
bu
sin
ess
pre
mis
es
we
re
ren
ted
ra
the
r th
an
ow
ne
d.
(Wa
sile
ski,
R
od
ríg
ue
z,
&
Dia
z, 2
01
1)
Hu
rric
an
e
Ka
trin
a
Sou
the
rn
Mis
siss
ipp
i
5 y
ea
rs a
fte
r A
to
tal
of
6.9
%
of
bu
sin
ess
es
veri
fie
d a
s cl
ose
d,
an
d a
fu
rth
er
10
.3%
we
re li
kely
clo
sed
bu
t w
ere
un
veri
fia
ble
.
9%
loss
a y
ea
r a
fte
r
2%
loss
six
ye
ars
late
r
(Cu
tte
r e
t a
l.,
20
14
)
No
ne
giv
en
(S
chra
nk,
M
ars
ha
ll,
Ha
ll-
Ph
illip
s,
Wia
tt,
&
Jon
es,
20
12
)
Hu
rric
an
e
Ka
trin
a
Vill
ag
e L
’Est
2
ye
ars
aft
er
10
% lo
ss
10
% lo
ss
No
ne
giv
en
(A
ldri
ch,
20
12
)
Hu
rric
an
e
Ka
trin
a
Mis
siss
ipp
i
are
a
8 y
ea
rs la
ter
• A
rou
nd
10
% im
me
dia
tely
clo
sed
.
• 2
5%
bu
sin
ess
clo
sure
aft
er
8
yea
rs
9%
loss
a y
ea
r a
fte
r
2%
loss
six
ye
ars
late
r
(Cu
tte
r e
t a
l.,
20
14
)
• O
vera
ll a
ge
an
d h
ea
lth
• Lo
ss o
f lif
elin
es,
inve
nto
ry
loss
an
d lo
ss o
f
cust
om
ers
/sa
les
• Se
rvic
e s
ect
or
less
like
ly t
o b
e
clo
sed
.
• Sp
eci
fic
ge
og
rap
hic
al l
oca
tio
n
rele
van
t.
• E
nd
og
en
ou
s e
ffe
cts
-
vuln
era
bili
ty t
o e
nd
og
en
ou
s
sho
ck.
(Syd
no
r,
Nie
hm
, Le
e,
Ma
rsh
all,
& S
chra
nk,
20
17
)
Hu
rric
an
e
Ka
trin
a
Ne
w O
rle
an
s 0
-12
mo
nth
s
aft
er
No
ne
giv
en
N
on
e g
ive
n
• Lo
ss o
f u
tilit
ies
• Lo
w s
oci
o-e
con
om
ic s
tatu
s
of
cust
om
ers
• N
eig
hb
ou
rin
g b
usi
ne
ss
failu
re
• Le
vel o
f im
pa
ct f
rom
eve
nt
(Le
Sag
e,
Ke
lley
Pa
ce,
Lam
,
Ca
mp
an
ella
, &
Liu
, 2
01
1)
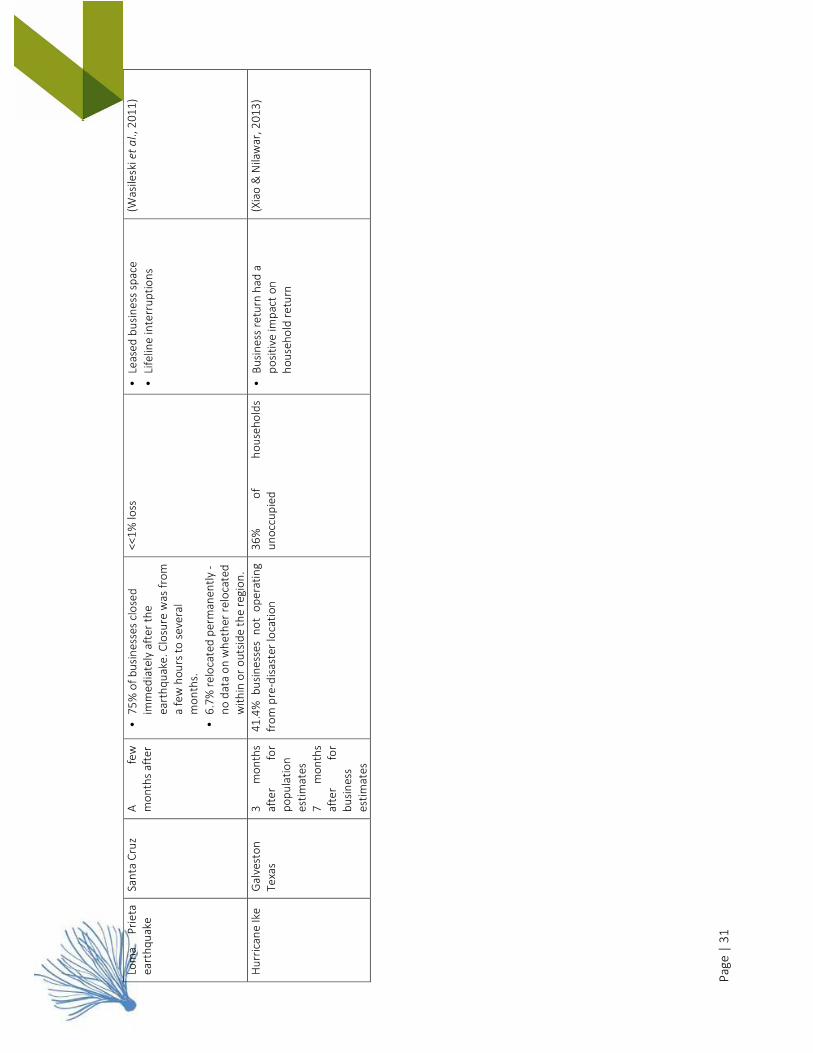
Pa
ge
| 3
1
Lom
a
Pri
eta
ea
rth
qu
ake
San
ta C
ruz
A
few
mo
nth
s a
fte
r
• 7
5%
of
bu
sin
ess
es
clo
sed
imm
ed
iate
ly a
fte
r th
e
ea
rth
qu
ake
. C
losu
re w
as
fro
m
a f
ew
ho
urs
to
se
vera
l
mo
nth
s.
• 6
.7%
re
loca
ted
pe
rman
en
tly
-
no
da
ta o
n w
he
the
r re
loca
ted
wit
hin
or
ou
tsid
e t
he
re
gio
n.
<<
1%
loss
•
Lea
sed
bu
sin
ess
sp
ace
• Li
felin
e in
terr
up
tio
ns
(Wa
sile
ski e
t a
l.,
20
11
)
Hu
rric
an
e I
ke
Ga
lve
sto
n
Te
xas
3
mo
nth
s
aft
er
for
po
pu
lati
on
est
ima
tes
7
mo
nth
s
aft
er
for
bu
sin
ess
est
ima
tes
41
.4%
b
usi
ne
sse
s n
ot
op
era
tin
g
fro
m p
re-d
isa
ste
r lo
cati
on
36
%
of
ho
use
ho
lds
un
occ
up
ied
• B
usi
ne
ss r
etu
rn h
ad
a
po
siti
ve im
pa
ct o
n
ho
use
ho
ld r
etu
rn
(Xia
o &
Nila
wa
r, 2
01
3)
Page | 32
4.5.34.5.34.5.34.5.3 Incorporating Business Behaviours in the Economic ModelIncorporating Business Behaviours in the Economic ModelIncorporating Business Behaviours in the Economic ModelIncorporating Business Behaviours in the Economic Model
OperabilityOperabilityOperabilityOperability
The method for calculating operability for industries was highly spatial, generating unique results for each
meshblock and 41 industry types. The economic model, however, utilised only two geographic regions,
Wellington and rest of New Zealand. It was therefore necessary to create overall operability curves for each
industry and economic region. To do this, we utilised the operability curves at each location as calculated
in Section 4.5.1, and weighted these by the relative number of employees at each location. The process
was undertaken twice, once for businesses that remained in the Wellington region, and once for those that
relocated outside of the region.
Importantly, for businesses that relocated to the rest of New Zealand, it was assumed that the original
operability curves, as would be generated following the method specified in Brown et al. (2015), were more
relevant, as the specific extensions for significant infrastructure disruption discussed in Section 4.5.1 were
not relevant in the non-disrupted rest of New Zealand region. However, a lag in recovery of approximately
1.5 months compared to the Brown et al. (2015) curves was considered an appropriate new adjustment to
reflect the extra disruptions likely to be faced by businesses setting up in an entirely new region.
For infrastructure services industries, ad-hoc adjustments to the operability curves were made. In short, it
was assumed that operability for these activities at any point in time would be directly proportional to the
share of normal infrastructure services in operation (i.e. as determined directly from the infrastructure
outage information provided by GNS Science).
Business RelocationBusiness RelocationBusiness RelocationBusiness Relocation
The principal method for implementing business relocations in the economic model was through adjusting
the capital stocks held by industries, the multifactor productivity of industries, and the functions that
determine the rates of investment in new capital. Key assumptions were as follows:
• The value of capital held by a business relocating was equivalent to that businesses’ share of total
employment in its industry group, multiplied by the value of capital held by that industry group at
the time of the quake.
• Not all capital held by businesses could be relocated. For example, stocks of buildings were
generally fixed at the original location. To estimate the proportion of total capital held by a business
relocating, we examined the Net Capital Stock data series from the national accounts and assigned
a proportion to each built capital type that is relocatable. This generated a range of relocatable
capital shares for different industry groups (e.g. 68% relocatable for Professional, Scientific,
Technical, Administrative and Support Services compared to 20% for Agriculture, Forestry and
Fishing)
• Capital that was left behind must be re-acquired by businesses. This was implemented in the
economic model by taking funds from the general investment pool to support the compulsory
investment in business relocation (i.e. for some months there was less funds available in the
national economy for normal investment activities).
• Businesses furthermore incur a one-off relocation set of costs which was implemented by
increasing the value of compulsory investment for relocation (point above) by 5%.
Page | 33
• Businesses would also likely face some reduction in productivity compared to productivity prior to
the quake, associated with loss of networks, goodwill and so on. This supports the inference that
decisions to relocate would not be taken lightly. This was implemented in the model through a one-
off drop in multifactor productivity of 5% for organisations relocating.
4.64.64.64.6 Transport AnalysisTransport AnalysisTransport AnalysisTransport Analysis
The transportation modelling covered three separate themes: freight, inaccessibility, and urban
transportation (Figure 4.1). These are discussed separately in the sub-sections below.
4.6.14.6.14.6.14.6.1 Freight AnalysisFreight AnalysisFreight AnalysisFreight Analysis
The freight analysis was undertaken in three separate components:
1.1.1.1. InterInterInterInter----island freight disruption island freight disruption island freight disruption island freight disruption –––– transport margins transport margins transport margins transport margins –––– the purpose of this part of the analysis was to
estimate the way in which changes in the operation of the inter-island ferries impacted on the costs
of transporting commodities around New Zealand. We concentrated only on domestic commodity
trade (i.e. where sources of supply and demand are both within New Zealand). In part this was due
to time and cost constraints in the modelling work. Additionally, we received advice in an expert
interview that, given the many ports in both the North and South Islands, and the very agile nature
of the logistics industry, export and import trade would be relatively quickly adapted to avoid inter-
island crossings in the transportation to/from ports (Mainfreight, pers. comm.).
A likely outcome of the loss of the roll-on-roll-off ferry service between the two islands was a shift
away from road and rail modes to coastal shipping while the ferry terminal was out of operation.
Furthermore, the costs incurred for transportation, per unit of commodity transferred, may have
changed because of the mode shifts and consequential increased competition for transportation
services (e.g. competition for space on ships).7 The analysis therefore provided estimates of the net
change in transport margins, by commodity type, and mode of transportation (road, rail, coastal
shipping).
First, estimates of the total expenditure on transportation of different types of commodities, by
transport mode utilised were developed. The estimates were derived by simply allocating the total
value of output of each of the freight transport service sectors to commodity types, according to
the total tonne km of transportation across New Zealand associated with each commodity and
transport model (see Ministry of Transport (2014)). Next, given time and information constraints,
we narrowed down the analysis to consider changes in transportation costs only for those
commodities where interisland trade is likely to be significant, i.e. horticulture and grain products,
limestone, cement, fertiliser and concrete, and general retail and manufactured goods (Ministry of
Transport, 2014).
7 Price changes resulting from increased demands compared to supply are addressed within the economic model itself. In this part
of the analysis we therefore use only current or constant prices.
Page | 34
For commodities with significant levels of trade between islands, it was necessary to estimate for
each dollar currently spent on road/rail transport between regions located in different islands, the
value that would need to be spent on coastal shipping instead.8 Fortunately as part of the
development of the MERIT model, M.E Research created a detailed set of economic accounts
known as Social Accounting Matrices (SAMs) for 16 New Zealand regions (Smith et al., 2014).9
These SAMs provided detailed information on the production and use of economic commodities in
New Zealand, and commodity trade between regions and other nations. The SAMS were a source
of information for estimating the proportion of domestic commodity trade by region impacted by
the interisland ferry and/or rail disruption.
An examination of the current value of transport service industries compared to the mass of
commodities transported indicated that generally coastal shipping and rail were relatively less
expensive than road for transportation on a per kg basis. This likely reflected the types of goods
currently transported by rail and coastal shipping, often bulk homogenous goods requiring
relatively little sorting and handling. It was assumed that costs (in constant dollar terms prior to the
quake) remained the same for transporting goods between islands by coastal shipping as by rail,
and thus the major impact was a shifting in demands for the type of transport service demanded.
When shifting from road transport to coastal shipping, however, it was assumed that the costs of
coastal shipping were only around half that of the original road transport costs, per kg of
commodity transported. Conservatively it was also assumed that 20% of the road service demands
per kg of commodity transported remained due to the need to transport goods to local ports.
2.2.2.2. InterInterInterInter----island Freight Disruption island Freight Disruption island Freight Disruption island Freight Disruption –––– Time Delay Costs Time Delay Costs Time Delay Costs Time Delay Costs
An interesting observation from the commodity transport margins analysis described above was
that while road freight was typically the most expensive choice of freight transportation, it was
often still the selected mode for freight transport. The likely explanation is that road transportation
was also the fastest mode, and thus an important consideration for consumers in addition to actual
financial costs. By implication, when the transport system was disrupted such that the
transportation of commodities between islands took longer, there was likely to be a range of
economic consequences associated with the time delays.
It was quite challenging to ascertain a suitable method for incorporating these delay costs in an
economy-wide model such as MERIT, given that the economic outcomes were likely to be quite
nuanced. For example, the impacts would vary according to the time of year, commodities
impacted, levels of inventories held, and so on. For the purposes of this study we adopted a method
common to CGE modelling where an ‘ad valorem’10 delay cost was added to the price of
commodities traded between islands. These per day delay costs for each commodity were sourced
8 Note that the method also seeks to calculate the changes in transport margins from rail to road over the period in which the
ferries are operating but the rail network is not.
9 For each region the accounts are broken down by 205 different commodity types, 106 different industry types and 5 additional
categories of final consumption for commodities (exports, household consumption, local government consumption, central
government consumption, and investment consumption). To derive the commodity flow accounts in the SAMS, estimates are made
of the total supply and demand for commodities by each region, and a gravity model is used to estimate the distribution of trade,
or in other words, how origin and destination of commodities are paired.
10 ‘Ad valorem’ are costs specified as a percentage of the value of the good.
Page | 35
from (Hertel et al., 2008) and enter the economic model essentially as ‘pseudo’ costs. That is, while
the costs were considered in the behaviour functions of economic agents, for example the
functions that determine whether domestic consumers chose to source goods from the domestic
market or from overseas, no actual money transfers were associated with the incurrence of these
costs.
Based on the study by Cenek et al. (2012), the magnitude of the additional delay associated with
shifting from road to coastal shipping for inter-island trade was assumed to be around one third of
a day. This was probably a conservative estimate for the Wellington Fault scenario given the Cenek
et al. study did not involve a situation where the transportation system was significantly impacted
causing increased competition for coastal shipping infrastructure. Significant further work would,
however, be required to develop time delay estimates more specific to this case study.
3.3.3.3. Port disruption Port disruption Port disruption Port disruption –––– In addition to the disruptions to ferry and inter -island freight movements, port
infrastructure disruption was assumed to alter the costs of transportation for import and export
trade. We used a method developed previously for analysis of the Kaikōura 2016 quake (Smith et
al., 2017) to estimate the net increase in export and import transport margins, by economic
commodity, associated with disruption to CentrePort. An important assumption was that all
commodities were re-routed through other New Zealand ports; particularly Napier Port and Port
of Tauranga. This generated additional demands for road transport services, per unit of
export/import commodity, and added to the effective price of the exports/imports.
4.6.24.6.24.6.24.6.2 Inaccessibility AdjustmentsInaccessibility AdjustmentsInaccessibility AdjustmentsInaccessibility Adjustments
The analysis of road impacts indicated that immediately following the earthquake event, damages to the
road network were likely to be severe, with the Wellington region separated into around twenty different
areas or ‘road islands’, with each generally isolated from others. Over time, with repairs and restoration to
the network, the isolated road islands were progressively linked back together, until eventually full access
was provided across the region. Not surprisingly, accessibility between road islands and accessibility in and
out of the region were generally restored faster under the investment package scenarios compared to the
baseline scenario without investments.
The level of inaccessibility experienced by road network damages was one of the most important aspects
of the Wellington fault scenario. Sections 4.4 and 4.5 have explained that accessibility has already been
taken into consideration in the estimation of the level of people and business movements out of the region.
Furthermore, accessibility impacted industry productivity, by potentially delaying the recovery of
operability following the event. In addition to this supply-side adjustment to the economic system, it was
also important to incorporate within the economic model demand-side adjustments in response to
inaccessibility. This prevented unrealistic price change responses in the model, and enabled demand-side
adaptations to inaccessibility to be better captured. 11 In particular, when faced with an inability to source
goods from Wellington suppliers, there was more chance that consumers looked to source goods from
alternative suppliers within New Zealand and elsewhere.
11 When only impacts on supply are modelled, prices in the economic model will adjust upwards, to reflect a shortage in supply
relative to demand. Disruptions to accessibility, however, create a unique situation where neither demand or supply can be realised
in the market.
Page | 36
Similar to the estimation of freight impacts, our analysis of inaccessibility first required an estimation of the
distribution of trade between Wellington and elsewhere. This time, however, we were interested in not
only physical commodities that were freighted between locations of supply and demand, but also service
commodities where inaccessibility acted as a barrier to consumption.
To estimate the origin and destination of commodities at detailed spatial units across New Zealand we
essentially disaggregated the commodity components of the regional SAMs (see section 4.6.1 above) into
individual accounts for each Census Area Unit (AU). This was undertaken in two steps. First, the regional
commodity accounts were disaggregated to account for each territorial authority (TA) and a gravity model
was used to estimate the level of trade within and between each TA (see Smith et al. (2014) for further
information on this approach). The TA accounts were then further disaggregated into AU accounts. At this
level it was assumed that commodity movements were distributed in direct proportion to the level of
population/employment within each AU. The principal data used for disaggregation were Statistics New
Zealand’s population and employment data by AU. Information on commodity imports and exports through
each New Zealand port (from the Harmonised System), also enabled the commodity accounts to be
extended to show the origin and destination of commodities to and from ports as a result of import/export
trade.
The census area accounts were then re-aggregated to match with the ‘road island’ spatial units used in the
road impact analysis. With this newly derived information on the levels of trade between road islands and
between road islands, the rest of New Zealand and abroad, and given the times at which accessibility was
regained between road islands12, it was possible to estimate the proportion of ‘as normal’ demand that
could not be satisfied at each day of our analysis.
Within the economic model, an extra ‘inaccessibility price’ was applied to the proportion of commodity
trade that was deemed inaccessible over and above normal costs including transportation.13 The
inaccessibility price was set at a very large $5 per kg. The exact magnitude of the price was not particularly
important; what was important was that the price was sufficiently large to induce the envisaged demand-
related behavioural responses. In these regards the economic model used tiered constant elasticity of
substitution (CES) demand functions, as is standard practice within computable general equilibrium models
(see Smith et al. (2016)). This means, for example, that when consumers located outside of the Wellington
region were faced with a very high price for goods produced within the Wellington region, they chose to
purchase instead more goods produced in parts of New Zealand outside of Wellington instead. These
12 Note that the road impact analysis provided two sets (i.e. matrices) of restoration times under each investment scenario: (1)
Response matrix and (2) Recovery matrix. It was assumed that day-to-day movements of people and goods and services would
only occur in the recovery phase, and thus for this modelling we have relied only on the restoration times provided by the Recovery
matrices.
13 Three categories of trade were considered: exports from Wellington region to rest of New Zealand, exports from rest of New
Zealand to Wellington, and exports from Wellington region to the rest of world. Although trade solely within the Wellington region
would also be impacted on accessibility, it was not considered that this method of accessibility pricing would be suitable for within-
Wellington trade. First, the method is based on calculations of ‘as normal’ proportions of trade impacted by inaccessibility and in
the case of Wellington the disruptions will be so significant, and the level of adaptations necessary also significant such that ‘as
normal’ shares will not relevant. Second, because many businesses will be highly isolated, the choices to purchase from an
alternative region (i.e. rest of NZ or rest of world) will also not be available and hence the CES substation options irrelevant. Third,
because many consumers in Wellington will also be impacted directly, the model already incorporates much of the necessary
demand-side adjustments.
Page | 37
effects also translated up the ‘CES’ demand tree, so that imported goods also became relatively more
desirable than domestic goods.
4.6.34.6.34.6.34.6.3 Simplified Urban Transportation ModelSimplified Urban Transportation ModelSimplified Urban Transportation ModelSimplified Urban Transportation Model
The final component of transport-related modelling was aimed at incorporating changes in transportation
costs faced by households, and the types of transport demanded by households, because of damages to
transportation infrastructure and household/business relocations.14 A typical method for calculating
changes in transportation costs, and mode choices, is by an urban four-stage transport model such as the
Wellington Transport Strategy Model (Opus, 2012a). This was, however, not a viable option for this project.
For one, transportation models are calibrated against ‘typical’ circumstances but in this project, we are
dealing with severe disruptions and changes to the whole system. Second, running a four-stage transport
model involves significant calculation times, additional consultant costs, and contracting of a third-party
organisation, all of which was beyond the scope of the current project. Overall, we recommend that this is
a suitable topic for further research and refinement.
In this project we adopted an intermediate approach whereby we attempted to take key components of
an urban transport model, and implemented these in a simplified manner. Probably the most important
limitation of the simplified transport model was that it concentrates principally on whether connections
between locations were available, and not the number and standard of connections. It thus provided
limited ability to quantify the costs of increased congestion and travel times, which were likely to be
relatively significant after the event. By implication our analysis did not fully capture the economic
consequences of the network outages and by implication the economic benefits of investments that
increased redundancies in the transport network (e.g. provision of a second resilient road link between
Porirua/Johnsonville and Lower Hutt). In short, the simplified transportation analysis was undertaken in
four key steps:
Step 1: GenerStep 1: GenerStep 1: GenerStep 1: Generate baseline household transport costs (i.e. without disruption)ate baseline household transport costs (i.e. without disruption)ate baseline household transport costs (i.e. without disruption)ate baseline household transport costs (i.e. without disruption)
First, the baseline transport costs incurred by Wellington region households were calculated on an annual
basis. Most of the necessary information/data was obtained directly from the 2013 release of the
Wellington Transport Strategy Model (Opus, 2012a), including input parameters specifically provided to us
on request. Inputs included:
• 2013 trip demand matrices for Wellington region transport zones (zone by three survey periods
(am peak, interpeak, pm peak), and by three modes (cars, public transport, heavy commercial
vehicles);
• 2013 time and distance matrices per trip (same matrix definitions as per (1));
• Distribution of regional trips by transport purpose (see Opus, 2012b, Table 2.2);
14 Although we recognise that changes in transportation costs and demand types will also be incurred by businesses (e.g. in day-
to-day movements of people who are required to travel for work, and moving goods around the Wellington region), it was
considered outside the scope of this project to develop a model to estimate such costs. Note also that freight cost changes resulting
from port, ferry and rail disruption are addressed separately.
Page | 38
• The regional mode shares (car, public transport, commercial vehicle) for each type of trip purpose
(see Opus, 2012b, Table 2.2).
• Scaling factors to translate the number of am, pm, and interpeak trips into the number of annual
trips (supplied by Greater Wellington)
To split the public transport mode trips among bus and train trips, annual bus and rail trips (origin-
destination) from the Wellington Transport Strategy Model (Opus, 2012a) were used. Bus and rail fares
from the Wellington Transport Strategy Model were used to assign costs to rail and bus trips.
It was also assumed that 100% of trips for ‘home-based work’ was incurred by households, 100% of ‘home-
based education’, and 70% of ‘other’ purpose trips. Furthermore, a cost of $20070.27 was assigned per km
of household travel by a private vehicle based on a Ministry of Transport estimate to run a medium-sized
car with an average travel distance of 14,000km per year and a petrol cost of $2.10 per litre.
Step 2: Generate trip generation functions from baStep 2: Generate trip generation functions from baStep 2: Generate trip generation functions from baStep 2: Generate trip generation functions from baselineselineselineseline
The next step was to generate functions that would allow us to estimate new trip generation matrices,
given revised information on employment (aggregated into four categories: manufacturing, retail/other
services, education, other) and population within transport zones. These functions were calibrated from
the baseline trip generation matrices received from the Wellington Transport Model, and the data we had
on population and employment, by transport zone.
Trip generation functions for each non-heavy commercial and heavy commercial transport modes between
transport zones was generated by running a non-negative coefficient linear regression using population
estimates, and four industry-employment types.
The time taken to get from zone to zone was calculated by running a non-negative least-squares regression
using the number of vehicle trips between transport zones and total number of regional vehicle trips.
Step 3: Estimate new trip generation statisticsStep 3: Estimate new trip generation statisticsStep 3: Estimate new trip generation statisticsStep 3: Estimate new trip generation statistics
Some information necessary to estimate changes in the distribution of people and business activities after
the quake was also relevant to the Business Behaviours and Population Relocation models, either as an
input to those models or as an output. For example, estimates of the number of people moving in and out
of the region were made in the Population Relocation Model. It can be noted, however, that the economic
model only operated at the total regional level, and thus did not require inputs that were defined spatially
across the Wellington region. To generate information suitable for the transport modelling, it was therefore
necessary to provide some ad-on features to both the Business Behaviours and Population Relocation
models, so that information on population and business activities became always defined spatially for the
Wellington region, i.e. by meshblock. It should also be noted that relatively little information was available
on how adaptations to infrastructure and building damage might occur in a heterogenous way across space,
for example through targeted business parks and emergency housing at specific locations. Therefore, the
approach taken for the transport modelling involved the application of relatively broad assumptions,
applied homogenously across the district. Further work could look more closely at likely locations for
permanent and temporary rehousing and capacities at these locations.
Key assumptions for the current modelling were:
Page | 39
Population
• The meshblock location of buildings where injuries and fatalities occurred was the same meshblock
location as the residency of persons injured/killed (note that the earthquake scenario occurred at
night and an adjustment was already made for the proportion of deaths and injuries of non-
residents).
• The number of vulnerable and support persons evacuated within a meshblock for a given age
group, out of the total regional number of vulnerable and support persons evacuated within that
age group was proportional to the meshblock’s share of regional population for that age group. If
these people returned, it was to the same meshblock from which they were evacuated.
• The residence location of employees (and their families) strategically evacuated was distributed
across meshblocks on a pro-rata basis according to each meshblock’s share of working age
population (note that only meshblocks within commuting distance from Wellington CBD were
considered).
• For buildings classified as ‘residential’ or ‘commercial’ use, the number of people displaced by
building damage or cordoning (i.e. ‘shelter’ displacement) was equal to the night occupancy of
those buildings.
• The capacity of remaining buildings to take up residents who were displaced was determined by
applying an ‘extra capacity factor’ to the current occupancy of those buildings. The factor was
assumed to be 10% for SDI categories 1-7 and 30% for SDI categories 8+. Displaced persons were
then distributed across meshblocks on a pro-rata basis according to the extra capacity available in
each meshblock, out of the total extra capacity available.
• As the voluntary flight components of the Population Relocation model were calculated at a
meshblock level, no further assumptions were required to determine how people leaving the
region under voluntary flight were distributed spatially. The people who were deemed to return to
the region were simply assumed to return to the same meshblock of origin (note more severely
degraded locations had a smaller share of people returning).
Employment
• In addition to population statistics, the trip generation functions relied on estimates of people
working in different industry groups, by meshblock, as a means of estimating likely trips originating
and destined for each meshblock. It was recognised, however, that while people may still be
employed, normal day-to-day trips may nevertheless be reduced due to the types of disruptions
experienced across the region. We therefore adjusted the employment statistics to generate
‘effective’ employment at each location. It was also considered reasonable to scale down
employment to an ‘effective level’ by taking around one third of the reduction in operability
calculated for each industry group within each meshblock.15
• The calculations of business/employee movements out of the region (based on levels of business
viability) were undertaken at a meshblock level.
• Employees who needed to evacuate due to building damage or cordoning but who remained in
the region were redistributed to meshblocks on a pro-rata basis according to each meshblocks’
15 It would overestimate impacts if we used the full reduction in operability to scale down employment levels. Operability changes
cover a range of circumstances including, for example, situations when an industry continues to use the same level of inputs and
by implication still requires the same number of staff to travel to work, but productivity losses mean the outputs generated reduce.
Page | 40
share of remaining occupancy. The redistribution was also undertaken separately for industrial
versus commercial activities, so that industrial activities were more likely to redistribute to areas
that are already high industrial, and vice versa.
Step 4: Estimate new household transport costs after quakeStep 4: Estimate new household transport costs after quakeStep 4: Estimate new household transport costs after quakeStep 4: Estimate new household transport costs after quake
Under the final step of the analysis, revised annual household transportation costs were generated,
iteratively for each day following the earthquake event. The revised transportation costs were then
compared to the baseline annual costs, to obtain a net change in annual transportation costs over time.
Note also that the costs were broken down according to commodities purchased by households (fuel,
vehicle repairs, rail transportation services, etc) so that the costs could be incorporated into the economic
model from both a demand and supply perspective.
First, armed with the functions derived under step 2, and the new population and employment statistics
generated under step 3, this step began with the calculation of revised annual trip generation matrices for
Wellington’s transport zones for each day of the analysis. Next, further revisions to the trip generation
matrices were made to incorporate damages to the road and rail network infrastructure, and the way in
which the networks were restored over time. Relevant assumptions were:
- Trips assigned to the rail network over the period in which the commuter rail was not operational were
assigned half to buses and half to private vehicles.
- Trips that could not be made simply because there was no connectivity between the relevant road
islands were redistributed from the origin road transport zone to new destination zones on a pro-rata
basis according to the remaining distribution of trips from that zone. The same process was then
undertaken but this time redistributing trips to new origin zones for a given destination zones. The
final matrices used were the average of the origin-based and destination-based matrices.
- Not all trips that could not be made because of lack of connectivity between road islands were
assumed to be redistributed for the first six months after the event. Initially, because the disruptions
were significant, and people and businesses were still developing adaptation strategies, it was
assumed that 0% of trips were redistributed. The proportion redistributed was however assumed to
reach 50% by day 100 and 100% by six months.
Page | 41
5555 ReferencesReferencesReferencesReferences Aldrich, D. P. (2011). The power of people: social capital’s role in recovery from the 1995 Kobe earthquake.
Natural Hazards, 56(3), 595–611.
Aldrich, D. P. (2012). Building resilience: Social capital in post-disaster recovery. Chicago: University of
Chicago Press.
Atkinson, J., Salmond, C., & Crampton, P. (2014). NZDep2013 Index of Deprivation. Wellington, New
Zealand.
Brown, C., Giovinazzi, S., Seville, E., Vargo, J., Stevenson, J.R. (2015) Developing the Business Behaviours
Module within MERIT. Economics of Resilient Infrastructure Research Report 2015/02. 71p.- addendum
added January 2016.
Cenek P.D., Kean, R.J., Kvatch, I.A., Jamieson, N.J. 2012. Freight transport efficiency: a comparative study
of coastal shipping, rail and road modes. NZTA research report 497.
CERA. (2011). Canterbury Economic Indicators June 2011. Retrieved from
http://cera.govt.nz/sites/default/files/common/canterbury-economic-indicators-june-2011.pdf
Corey, C., & Deitch, E. (2011). Factors Affecting Business Recovery Immediately after Hurricane Katrina.
Journal of Contingencies and Crisis Management, 19(3), 169–181.
Cutter, S. L., Emrich, C. T., Mitchell, J. T., Piegorsch, W. W., Smith, M. M., & Weber, L. (2014). Uneven
Recovery. In Hurricane Katrina and the Forgotten Coast of Mississippi (p. 68). New York: Cambridge
University Press.
Hertel, T. W., McDougall, R. A., Narayanan, B., Aguiar, A. H., Narayanan, G. B., Aguiar, A., & McDougall, R.
(2008). Global Trade, Assistance, and Production: The GTAP 7 Data Base. Center for Global Trade Analysis,
Purdue University, 18.
LeSage, J. P., Kelley Pace, R., Lam, N., Campanella, R., & Liu, X. (2011). New Orleans business recovery in
the aftermath of Hurricane Katrina. Journal of the Royal Statistical Society: Series A (Statistics in Society),
174(4), 1007–1027.
Matanle, P. (2011). The Great East Japan Earthquake, tsunami, and nuclear meltdown: towards the
(re)construction of a safe, sustainable, and compassionate society in Japan’s shrinking regions. Local
Environment, 16(9), 823–847.
MBIE. (2013). Housing pressures in Christchurch. A summary of the Evidence / 2013. Wellington, New
Zealand.
MCDEM. (2008). Mass Evacuation Planning. Director’s Guideline for Civil Defence Emergency Management
Groups DG 07/08. Wellington, New Zealand.
Ministry of Health. (2014). Analysis of Household Crowding. Based on Census 2013 data. Wellington, New
Zealand.
Page | 42
Ministry of Transport. (2014). National Freight Demand Study. Wellington, New Zealand
Newell, J., Beaven, S., & Johnston, D. M. (2012). Population movements following the 2010-2011 Canterbury
Earthquakes. Summary of research workshops November 2011 and current evidence.
Orchiston, C., Seville, E. and Vargo, J., 2014. Regional and sub-sector impacts of the Canterbury earthquake
sequence for tourism businesses. Australian Journal of Emergency Management, The, 29(4), p.32.
Opus, 2012a. Wellington Transport Models. Model Development Report. Technical Report 00, Wellington,
New Zealand.
Opus, 2012b. Wellington Transport Models. Input Parameters. Technical Report 15, Wellington, New
Zealand.
Sanderson, K., Nana, G. and Dixon, H. 2016. Economic Impact of CentrePort on Central New Zealand 2016.
Berl, Wellington.
Schrank, H., Marshall, M. I., Hall-Phillips, A., Wiatt, R., & Jones, N. (2012). Small-business demise and
recovery after Katrina: rate of survival and demise. Natural Hazards Review, 65(3), 2353–2374.
Smith, N.J., Harvey, E., and McDonald, G.W. (2016). Dynamic Economic Model. A technical report.
Economics of Resilient Infrastructure Research Report 2017/02. 109p.
Smith, N, McDonald, G, Ayers, M, Kim, J, Harvey, E. (2017). Economic impact of the 2016 Kaikōura
earthquake. A report prepared for the Ministry of Transport, New Zealand.
Smith, S. K., & McCarty, C. (1996). Demographic Effects Of Natural Disasters: A Case Study Of Hurricane
Andrew. Demography, 33(2), 265–275.
SPUR. (2009). Lifelines: Upgrading infrastructure to enhance San Francisco’s Earthquake Resilience. San
Francisco. Retrieved from https://www.spur.org/sites/default/files/publications_pdfs/SPUR_Lifelines.pdf
SPUR. (2012). Safe Enough to Stay. San Francisco. Retrieved from http://www.spur.org/publications/spur-
report/2012-02-01/safe-enough-stay
Statistics New Zealand. (2007). 2006 Disability Survey. Wellington, New Zealand.
Statistics New Zealand. (2014). Disability Survey 2013. Wellington, New Zealand.
Statistics New Zealand. (2015). 2013 QuickStats About people aged 65 and over. Wellington, New Zealand.
Sydnor, S., Niehm, L., Lee, Y., Marshall, M., & Schrank, H. (2017). Analysis of post-disaster damage and
disruptive impacts on the operating status of small businesses after Hurricane Katrina. Natural Hazards,
85(3), 1637–1663.
Wasileski, G., Rodríguez, H., & Diaz, W. (2011). Business closure and relocation: a comparative analysis of
the Loma Prieta earthquake and Hurricane Andrew. Disasters, 35(1), 102–129. Retrieved from
Webb, G. R., Tierney, K. J., & Dahlhamer, J. M. (2002). Predicting long-term business recovery from disaster:
A comparison of the Loma Prieta earthquake and Hurricane Andrew. Environmental Hazards, 4(2–3), 45–
58.

Page | 43
WREDA. (2015). Annual Report 2015. Wellington, New Zealand.
Xiao, Y., & Nilawar, U. (2013). Winners and losers: analysing post-disaster spatial economic demand shift.
Disasters, 37(4), 646–668.
s
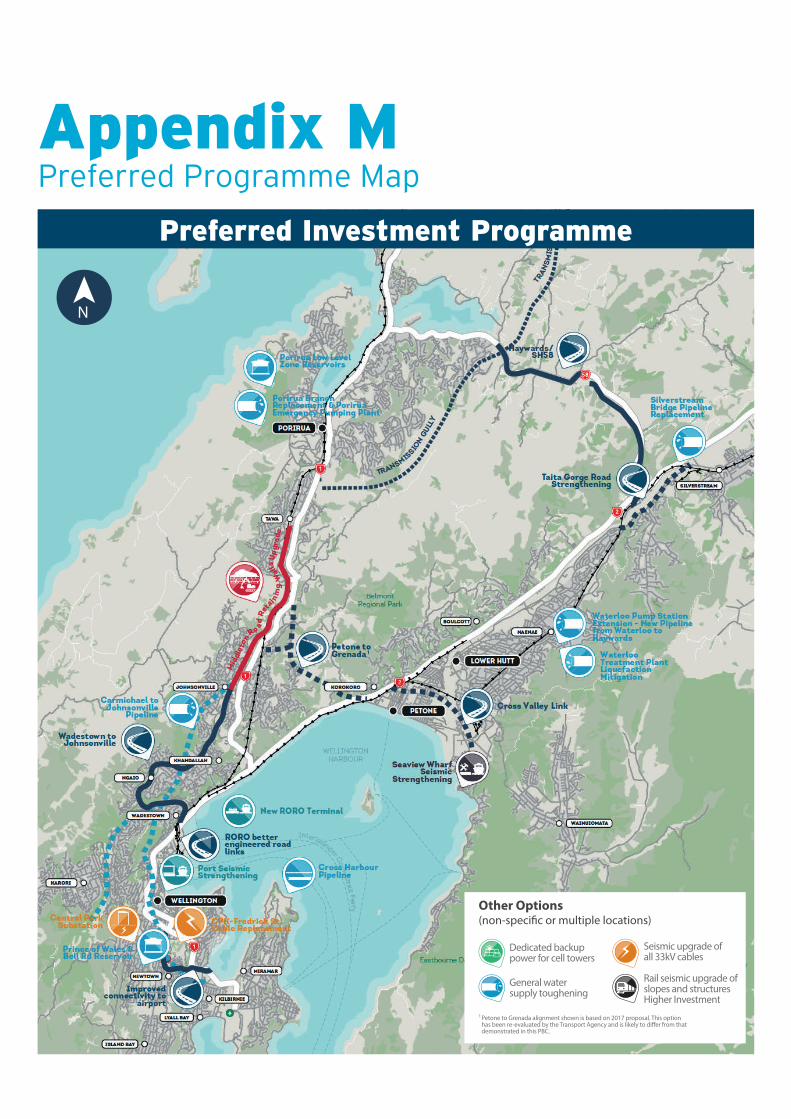
Appendix MPreferred Programme Map
Preferred Investment Programme
Other Options (non-specific or multiple locations)
Dedicated backup power for cell towers
Rail seismic upgrade of slopes and structures Higher Investment
General water supply toughening
N
Seismic upgrade of all 33kV cables
1 Petone to Grenada alignment shown is based on 2017 proposal. This option has been re-evaluated by the Transport Agency and is likely to differ from that demonstrated in this PBC.
1
Appendix NWellington Lifelines Project Financial Case, EY, September 2019
Wellington Lifelines Project – Financial Case
24 September 2019
Wellington Lifelines Project – Financial Case EY 4
Table of contents
1. Introduction .................................................................................................................. 5
1.1 Background & Context .............................................................................................. 5
1.2 The Business Case ................................................................................................... 5
1.3 The Financial Case ................................................................................................... 8
1.4 The Initiatives .......................................................................................................... 8
1.5 The Financial Model ............................................................................................... 16
2. Phase 1 Summary........................................................................................................ 18
3. Revenue ..................................................................................................................... 21
3.1 Revenue Summary ................................................................................................. 21
4. Costs .......................................................................................................................... 22
4.1 Cost Summary ....................................................................................................... 22
4.2 Implementation Costs ............................................................................................ 24
4.3 Initial Capital Expenditure ....................................................................................... 24
4.4 Lifecycle Costs ...................................................................................................... 25
4.5 Operating & Maintenance Costs ............................................................................... 25
4.6 Other Operating Costs ............................................................................................ 26
4.7 Overhead Costs ..................................................................................................... 26
5. Financial Impact .......................................................................................................... 28
5.1 Present Values ...................................................................................................... 28
6. Funding ...................................................................................................................... 29
6.1 Committed Funding ................................................................................................ 29
6.2 Contingent Funding ................................................................................................ 30
6.3 Funding Summary .................................................................................................. 32
7. Overall affordability ..................................................................................................... 34
7.1 Present Values ...................................................................................................... 35
8. Sensitivity Analysis ...................................................................................................... 37
9. Conclusions and Recommendations ............................................................................... 40
9.1 The Need for Central Government Ownership ................... Error! Bookmark not defined.
Appendix A Unaccelerated Scenario .................................................................................... 41
Appendix B Sources ........................................................................................................... 47
Wellington Lifelines Project – Financial Case EY 5
1. Introduction
1.1 Background & Context
The probability of a major earthquake hitting New Zealand’s capital city of Wellington is widely accepted, and the disastrous effects of major earthquakes have been demonstrated in the 2010/11 Christchurch Earthquakes as well as the 2016 Kaikoura Earthquake. In recent years, local councils have worked on increasing household resilience and have tightened building codes to protect lives in such an occurrence, but this focus on readiness has not been reflected across the board. Saving lives is paramount, but the survivors of a major disaster also need to be able to function in a working economy after the event. In the case of Wellington, the need for economic resilience is critical not only for the half a million people who live in the region, but also for the nation.
Wellington’s economy contributes 13.5% of New Zealand’s GDP, but this figure does not tell the entire story of why Wellington’s economy is important. Not only is it the seat of Government and the transport hub between the North and South Islands, but its large knowledge sector also has New Zealand’s fastest growth in digital businesses1. This concentration of services, financial and technology sectors makes it vulnerable to loss of firms who rely on intellectual capital and have the ability to move quickly to another place – not necessarily in New Zealand – should their current location become unsustainable.
To ensure the fastest possible economic recovery following a major earthquake, it is imperative that core infrastructure is as resilient as possible. In order to move towards this level of resilience, the Wellington Lifelines Group began the first stage of the Wellington Lifelines Programme Business Case (the ‘Business Case’). The Business Case has two major components:
► Analysing the economic cost of not being prepared and the consequent savings to the nation if we had infrastructure that was ready for a major earthquake and sufficiently resilient to be able to maintain services or recover rapidly. This stage of the Business Case is comprised of the Strategic and Economic Cases. ► The Strategic Case makes the argument for change ► The Economic Case determines value for money
► The development of the financial case (this report).
1.2 The Business Case
This business case is the first of this size and complexity ever undertaken in New Zealand2. It considers the interdependencies of 16 infrastructure providers in order to identify a step-change improvement to the Wellington Region’s resilience to a large earthquake.
The Strategic and Economic Cases are comprised of six key components:
1. Identification of significant benefits from improving Wellington and NZ’s infrastructure resilience to earthquake events
The strategic and economic cases detail how investing in infrastructure resilience will reduce the national economic impact of a large Wellington earthquake by more than $6 billion. In addition to the avoided economic losses, there will be significant social benefits achieved through Wellington’s communities surviving and thriving after a major seismic event.
Many of the resilience projects are already on long term asset plans and have funding earmarked. The business case identifies that if the interdependent resilience projects are delivered in a priority
1 Wellington Lifelines Project. Protecting Wellington’s Economy Through Accelerated Infrastructure Investment Programme
Business Case. Stage 1 – Demonstration of Benefits.2018.p.iii 2 Wellington Lifelines Project. Protecting Wellington’s Economy Through Accelerated Infrastructure Investment Programme
Business Case. Stage 1 – Demonstration of Benefits.2018. p.iv
Wellington Lifelines Project – Financial Case EY 6
order and accelerated, there will be significant benefits to Wellington and New Zealand’s economy when a major earthquake occurs.
2. Wellington is vital to New Zealand’s economy but is currently very vulnerable to large seismic events
Wellington is a vibrant and growing capital city and a key contributor to the New Zealand economy. It is the seat of Government, has high concentrations of professional and value-added services, is a centre for arts and innovation, a key tourist destination and also fulfils a role as a vital transport link between North and South Island. Wellington contributes 13.5% to New Zealand’s gross domestic product (GDP), which is second only to Auckland and is the highest GDP per capita in the country. Wellington also has a significant place in the national identity, and is home to more than 400,000 people.
Wellington’s vulnerability to a major earthquake is well-known, and it is not a question of if, but when the ‘big one’ will occur. The imminent questions are:
► How big will the economic and social impact be when the earthquake happens? ► What can be proactively done to reduce this impact?
To give confidence to Wellington residents and the people of New Zealand, as well as international investors, insurers and visitors, a credible plan must be in place to minimise the potentially devastating impact of a disaster in Wellington.
The recent Kaikoura and Canterbury earthquakes demonstrated the need to build resilient infrastructure in our cities. Evidence from our domestic experience and recent international disasters has shown that communal infrastructure is critical to habitability and, when it fails, cities can quickly become unliveable. When key infrastructure is out or operating at degraded levels of service, people leave, productivity drops and communities, and the economy suffer as a result.
Lifeline infrastructure organisations (Lifelines) are entities that provide essential infrastructure services to the community such as water, transport, energy and telecommunications and include ports, roads and power stations. Lifelines are key service providers to our cities and regions, and have a major role to play in minimising the impacts of hazard events.
Lifeline organisations have historically planned their resilience investments independently and over long periods of time. The drawback of this approach is that planning can become disaggregated and projects delayed due to a lack of centrally driven urgency, and/or internal competition from other priority projects. Even more compellingly, a city’s overall resilience is inherently interdependent across lifelines. For example, there is limited benefit in building a resilient water network, if the electricity network is not equally resilient such that pumping stations can function after an earthquake. Lack of co-ordination in planning resilience projects will result in suboptimal investment outcomes.
3. Integrated infrastructure approach to understand and model Wellington’s economic resilience
The Business Case draws on the expert knowledge held by Wellington Lifeline Infrastructure providers. Each Lifeline organisation helped identify infrastructure projects that would increase resilience and support faster economic recovery in the Wellington Region in the aftermath of a 7.5 magnitude earthquake.
A preferred programme of infrastructure projects was identified and modelled to understand potential economic benefits flowing from pre-earthquake investment, and to provide insights into the nationwide economic impacts of any large natural disaster.
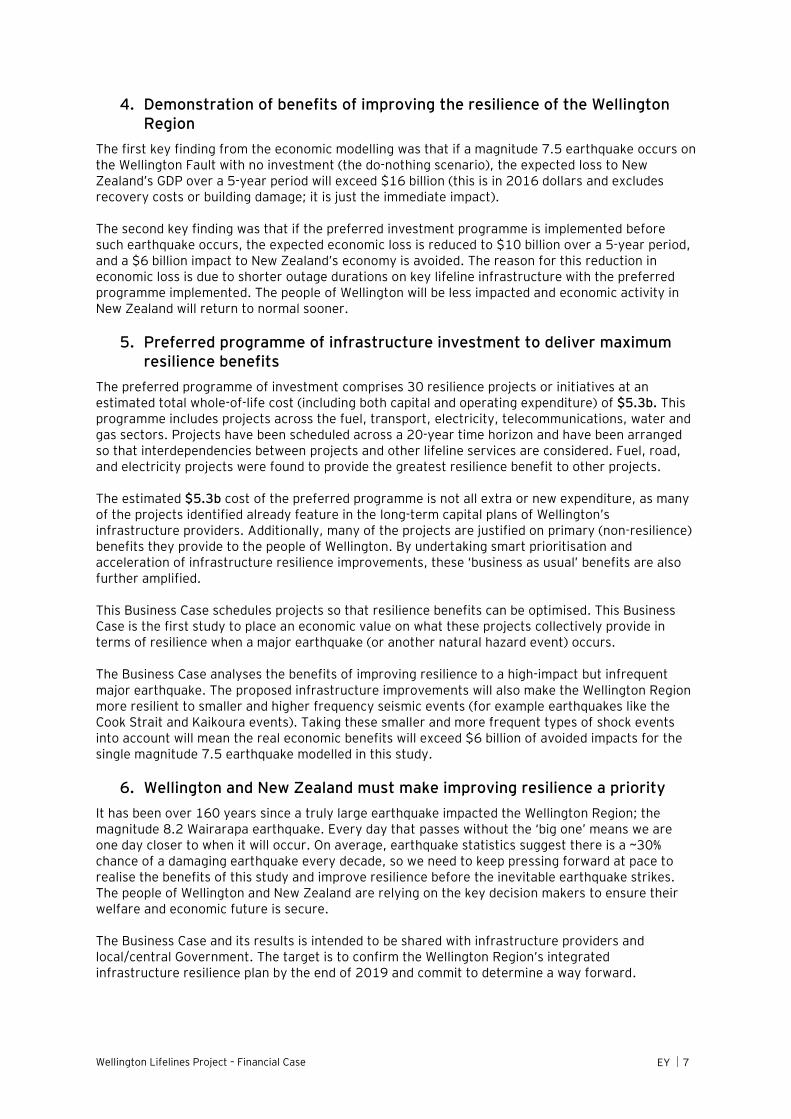
Wellington Lifelines Project – Financial Case EY 7
4. Demonstration of benefits of improving the resilience of the Wellington Region
The first key finding from the economic modelling was that if a magnitude 7.5 earthquake occurs on the Wellington Fault with no investment (the do-nothing scenario), the expected loss to New Zealand’s GDP over a 5-year period will exceed $16 billion (this is in 2016 dollars and excludes recovery costs or building damage; it is just the immediate impact).
The second key finding was that if the preferred investment programme is implemented before such earthquake occurs, the expected economic loss is reduced to $10 billion over a 5-year period, and a $6 billion impact to New Zealand’s economy is avoided. The reason for this reduction in economic loss is due to shorter outage durations on key lifeline infrastructure with the preferred programme implemented. The people of Wellington will be less impacted and economic activity in New Zealand will return to normal sooner.
5. Preferred programme of infrastructure investment to deliver maximum resilience benefits
The preferred programme of investment comprises 30 resilience projects or initiatives at an estimated total whole-of-life cost (including both capital and operating expenditure) of $5.3b. This programme includes projects across the fuel, transport, electricity, telecommunications, water and gas sectors. Projects have been scheduled across a 20-year time horizon and have been arranged so that interdependencies between projects and other lifeline services are considered. Fuel, road, and electricity projects were found to provide the greatest resilience benefit to other projects.
The estimated $5.3b cost of the preferred programme is not all extra or new expenditure, as many of the projects identified already feature in the long-term capital plans of Wellington’s infrastructure providers. Additionally, many of the projects are justified on primary (non-resilience) benefits they provide to the people of Wellington. By undertaking smart prioritisation and acceleration of infrastructure resilience improvements, these ‘business as usual’ benefits are also further amplified.
This Business Case schedules projects so that resilience benefits can be optimised. This Business Case is the first study to place an economic value on what these projects collectively provide in terms of resilience when a major earthquake (or another natural hazard event) occurs.
The Business Case analyses the benefits of improving resilience to a high-impact but infrequent major earthquake. The proposed infrastructure improvements will also make the Wellington Region more resilient to smaller and higher frequency seismic events (for example earthquakes like the Cook Strait and Kaikoura events). Taking these smaller and more frequent types of shock events into account will mean the real economic benefits will exceed $6 billion of avoided impacts for the single magnitude 7.5 earthquake modelled in this study.
6. Wellington and New Zealand must make improving resilience a priority
It has been over 160 years since a truly large earthquake impacted the Wellington Region; the magnitude 8.2 Wairarapa earthquake. Every day that passes without the ‘big one’ means we are one day closer to when it will occur. On average, earthquake statistics suggest there is a ~30% chance of a damaging earthquake every decade, so we need to keep pressing forward at pace to realise the benefits of this study and improve resilience before the inevitable earthquake strikes. The people of Wellington and New Zealand are relying on the key decision makers to ensure their welfare and economic future is secure.
The Business Case and its results is intended to be shared with infrastructure providers and local/central Government. The target is to confirm the Wellington Region’s integrated infrastructure resilience plan by the end of 2019 and commit to determine a way forward.
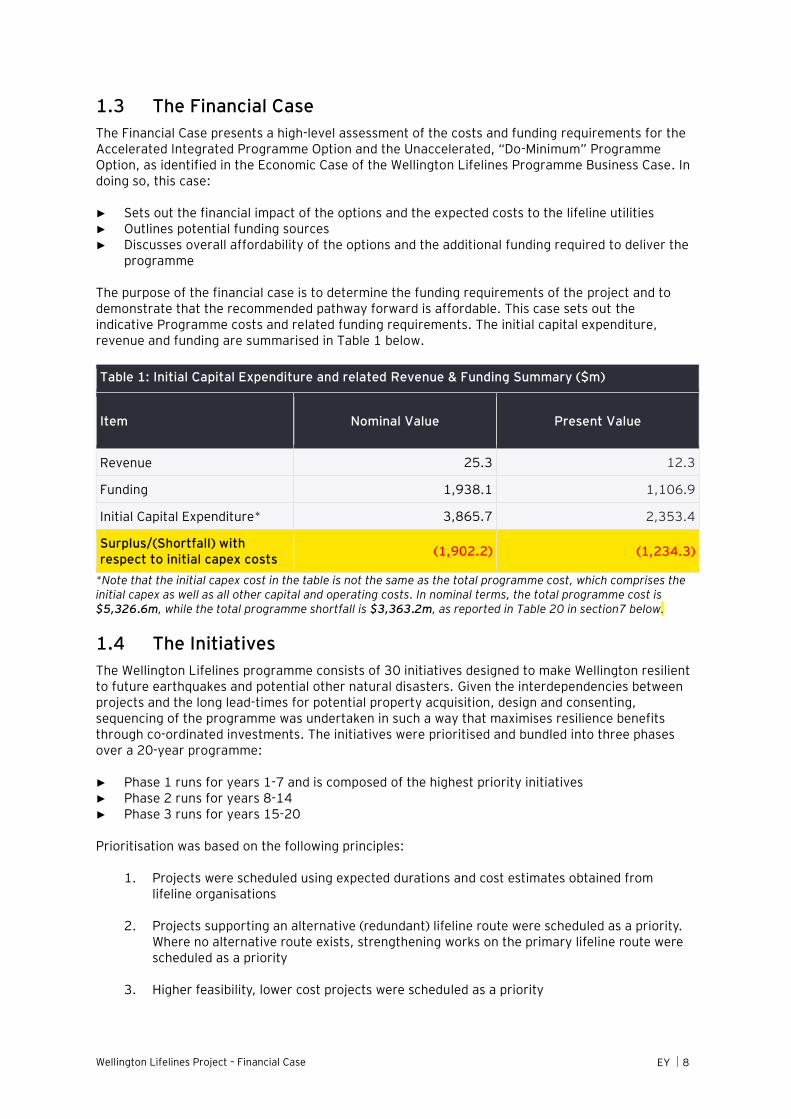
Wellington Lifelines Project – Financial Case EY 8
1.3 The Financial Case
The Financial Case presents a high-level assessment of the costs and funding requirements for the Accelerated Integrated Programme Option and the Unaccelerated, “Do-Minimum” Programme Option, as identified in the Economic Case of the Wellington Lifelines Programme Business Case. In doing so, this case:
► Sets out the financial impact of the options and the expected costs to the lifeline utilities ► Outlines potential funding sources ► Discusses overall affordability of the options and the additional funding required to deliver the
programme
The purpose of the financial case is to determine the funding requirements of the project and to demonstrate that the recommended pathway forward is affordable. This case sets out the indicative Programme costs and related funding requirements. The initial capital expenditure, revenue and funding are summarised in Table 1 below.
Table 1: Initial Capital Expenditure and related Revenue & Funding Summary ($m)
Item Nominal Value Present Value
Revenue 25.3 12.3
Funding 1,938.1 1,106.9
Initial Capital Expenditure* 3,865.7 2,353.4
Surplus/(Shortfall) with respect to initial capex costs
(1,902.2) (1,234.3)
*Note that the initial capex cost in the table is not the same as the total programme cost, which comprises the initial capex as well as all other capital and operating costs. In nominal terms, the total programme cost is $5,326.6m, while the total programme shortfall is $3,363.2m, as reported in Table 20 in section7 below.
1.4 The Initiatives
The Wellington Lifelines programme consists of 30 initiatives designed to make Wellington resilient to future earthquakes and potential other natural disasters. Given the interdependencies between projects and the long lead-times for potential property acquisition, design and consenting, sequencing of the programme was undertaken in such a way that maximises resilience benefits through co-ordinated investments. The initiatives were prioritised and bundled into three phases over a 20-year programme:
► Phase 1 runs for years 1-7 and is composed of the highest priority initiatives ► Phase 2 runs for years 8-14 ► Phase 3 runs for years 15-20
Prioritisation was based on the following principles:
1. Projects were scheduled using expected durations and cost estimates obtained from lifeline organisations
2. Projects supporting an alternative (redundant) lifeline route were scheduled as a priority. Where no alternative route exists, strengthening works on the primary lifeline route were scheduled as a priority
3. Higher feasibility, lower cost projects were scheduled as a priority

Wellington Lifelines Project – Financial Case EY 9
4. Fuel, road and electricity projects were scheduled as a priority since other initiatives were heavily dependent on them
5. Projects with a high complexity and cost were scheduled later in the programme to allow for appropriate planning
6. General strengthening works on the electricity and water distribution networks were phased evenly across the 20-year programme.
Each phase is further split into groups based on the lifeline (e.g. road, electricity etc.) they fall under. The phases and groups are summarised in Table 2 below.
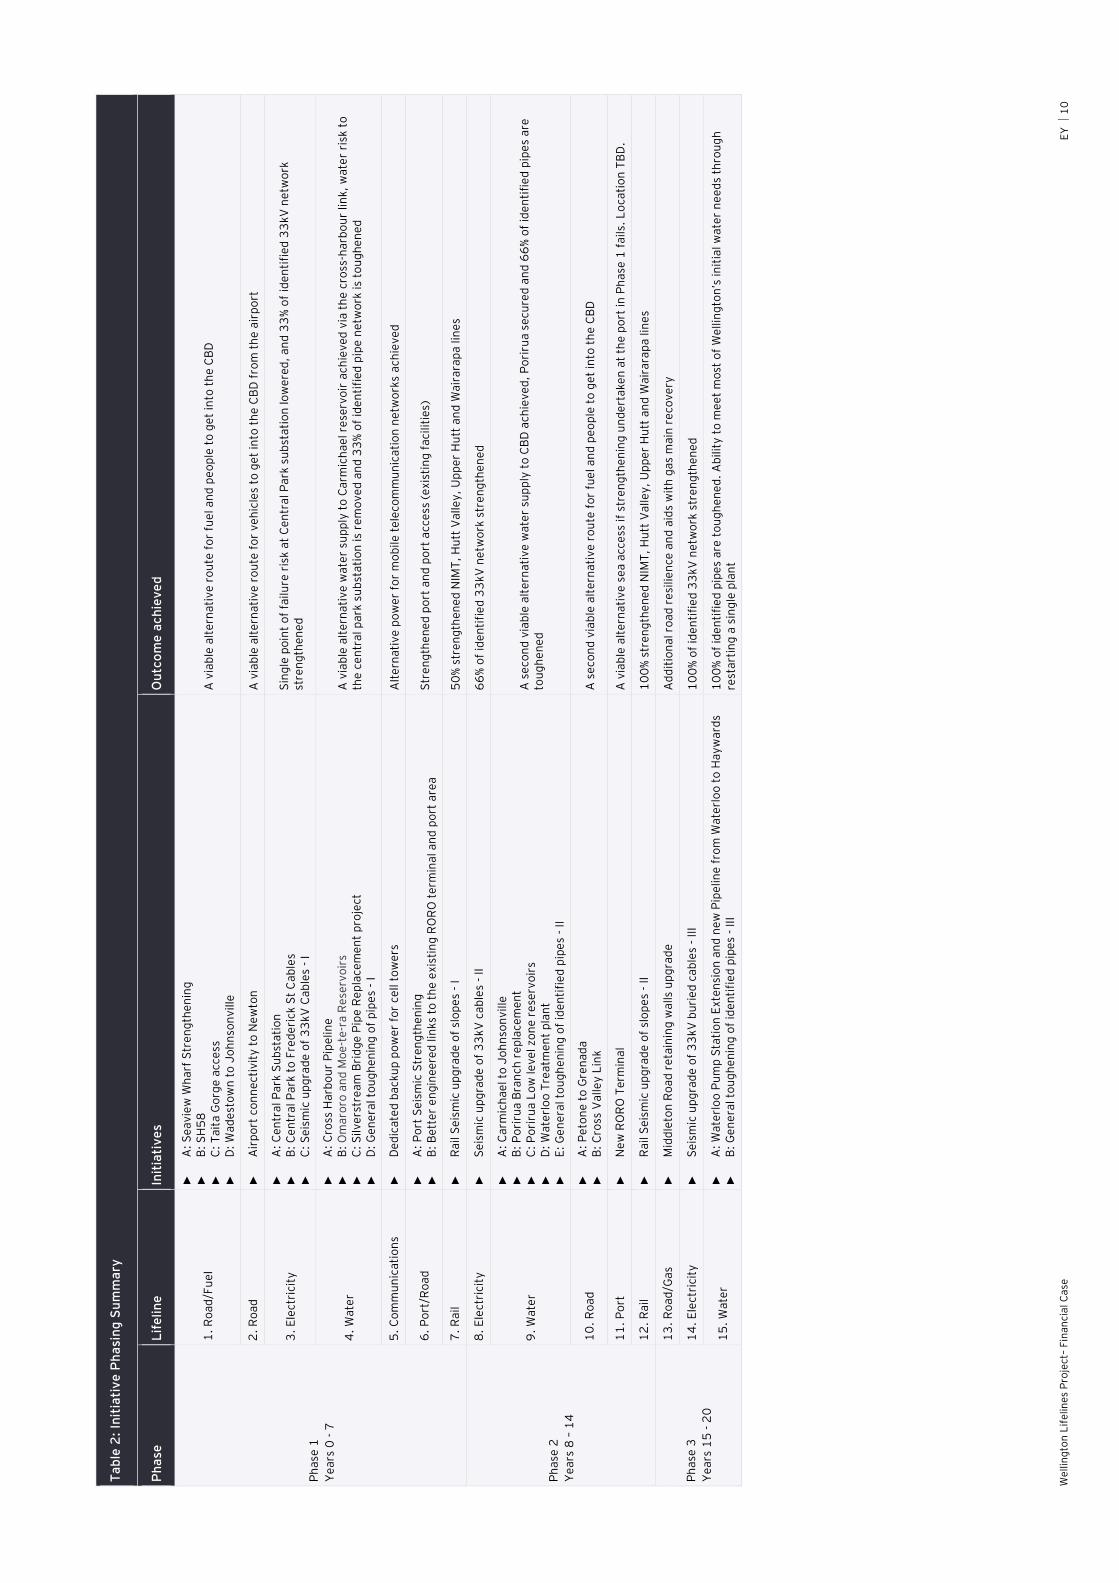
We
llin
gto
n L
ife
line
s P
roje
ct–
Fin
an
cia
l C
ase
E
Y
1
0
Ta
ble
2:
Init
iati
ve
Ph
asi
ng
Su
mm
ary
Ph
ase
L
ife
lin
e
Init
iati
ve
s
Ou
tco
me
ach
iev
ed
Ph
ase
1
Ye
ars
0 -
7
1.
Ro
ad
/Fu
el
►
A:
Se
av
iew
Wh
arf
Str
en
gth
en
ing
►
B
: S
H5
8
►
C:
Ta
ita
Go
rge
acc
ess
►
D
: W
ad
est
ow
n t
o J
oh
nso
nv
ille
A v
iab
le a
lte
rna
tiv
e r
ou
te f
or
fue
l a
nd
pe
op
le t
o g
et
into
th
e C
BD
2.
Ro
ad
►
A
irp
ort
co
nn
ect
ivit
y t
o N
ew
ton
A
via
ble
alt
ern
ati
ve
ro
ute
fo
r v
eh
icle
s to
ge
t in
to t
he
CB
D f
rom
th
e a
irp
ort
3.
Ele
ctri
city
►
A
: C
en
tra
l P
ark
Su
bst
ati
on
►
B
: C
en
tra
l P
ark
to
Fre
de
rick
St
Ca
ble
s ►
C
: S
eis
mic
up
gra
de
of
33
kV
Ca
ble
s -
I
Sin
gle
po
int
of
failu
re r
isk a
t C
en
tra
l P
ark
su
bst
ati
on
lo
we
red
, a
nd
33
% o
f id
en
tifi
ed
33
kV
ne
two
rk
stre
ng
the
ne
d
4.
Wa
ter
►
A:
Cro
ss H
arb
ou
r P
ipe
lin
e
►
B:
Om
aro
ro a
nd
Mo
e-t
e-r
a R
ese
rvo
irs
►
C:
Silv
ers
tre
am
Bri
dg
e P
ipe
Re
pla
cem
en
t p
roje
ct
►
D:
Ge
ne
ral to
ug
he
nin
g o
f p
ipe
s -
I
A v
iab
le a
lte
rna
tiv
e w
ate
r su
pp
ly t
o C
arm
ich
ae
l re
serv
oir
ach
iev
ed
via
th
e c
ross
-ha
rbo
ur
lin
k,
wa
ter
risk
to
th
e c
en
tra
l p
ark
su
bst
ati
on
is
rem
ov
ed
an
d 3
3%
of
ide
nti
fie
d p
ipe
ne
two
rk is
tou
gh
en
ed
5.
Co
mm
un
ica
tio
ns
►
De
dic
ate
d b
ack
up
po
we
r fo
r ce
ll t
ow
ers
A
lte
rna
tiv
e p
ow
er
for
mo
bile
te
leco
mm
un
ica
tio
n n
etw
ork
s a
chie
ve
d
6.
Po
rt/R
oa
d
►
A:
Po
rt S
eis
mic
Str
en
gth
en
ing
►
B
: B
ett
er
en
gin
ee
red
lin
ks
to t
he
exis
tin
g R
OR
O t
erm
ina
l a
nd
po
rt a
rea
S
tre
ng
the
ne
d p
ort
an
d p
ort
acc
ess
(e
xis
tin
g f
aci
liti
es)
7.
Ra
il
►
Ra
il S
eis
mic
up
gra
de
of
slo
pe
s -
I 5
0%
str
en
gth
en
ed
NIM
T,
Hu
tt V
alle
y,
Up
pe
r H
utt
an
d W
air
ara
pa
lin
es
Ph
ase
2
Ye
ars
8 –
14
8.
Ele
ctri
city
►
S
eis
mic
up
gra
de
of
33
kV
ca
ble
s -
II
66
% o
f id
en
tifi
ed
33
kV
ne
two
rk s
tre
ng
the
ne
d
9.
Wa
ter
►
A:
Ca
rmic
ha
el to
Jo
hn
son
ville
►
B
: P
ori
rua
Bra
nch
re
pla
cem
en
t ►
C
: P
ori
rua
Lo
w le
ve
l zo
ne
re
serv
oir
s ►
D
: W
ate
rlo
o T
rea
tme
nt
pla
nt
►
E:
Ge
ne
ral to
ug
he
nin
g o
f id
en
tifi
ed
pip
es
- II
A s
eco
nd
via
ble
alt
ern
ati
ve
wa
ter
sup
ply
to
CB
D a
chie
ve
d,
Po
riru
a s
ecu
red
an
d 6
6%
of
ide
nti
fie
d p
ipe
s a
re
tou
gh
en
ed
10
. R
oa
d
►
A:
Pe
ton
e t
o G
ren
ad
a
►
B:
Cro
ss V
alle
y L
ink
A s
eco
nd
via
ble
alt
ern
ati
ve
ro
ute
fo
r fu
el a
nd
pe
op
le t
o g
et
into
th
e C
BD
11
. P
ort
►
N
ew
RO
RO
Te
rmin
al
A v
iab
le a
lte
rna
tiv
e s
ea
acc
ess
if
stre
ng
the
nin
g u
nd
ert
ake
n a
t th
e p
ort
in
Ph
ase
1 f
ails.
Lo
cati
on
TB
D.
12
. R
ail
►
Ra
il S
eis
mic
up
gra
de
of
slo
pe
s -
II
10
0%
str
en
gth
en
ed
NIM
T,
Hu
tt V
alle
y,
Up
pe
r H
utt
an
d W
air
ara
pa
lin
es
Ph
ase
3
Ye
ars
15
- 2
0
13
. R
oa
d/G
as
►
Mid
dle
ton
Ro
ad
re
tain
ing
wa
lls u
pg
rad
e
Ad
dit
ion
al ro
ad
re
silie
nce
an
d a
ids
wit
h g
as
ma
in r
eco
ve
ry
14
. E
lect
rici
ty
►
Se
ism
ic u
pg
rad
e o
f 3
3kV
bu
rie
d c
ab
les
- II
I 1
00
% o
f id
en
tifi
ed
33
kV
ne
two
rk s
tre
ng
the
ne
d
15
. W
ate
r ►
A
: W
ate
rlo
o P
um
p S
tati
on
Exte
nsi
on
an
d n
ew
Pip
elin
e f
rom
Wa
terl
oo
to
Ha
yw
ard
s
►
B:
Ge
ne
ral to
ug
he
nin
g o
f id
en
tifi
ed
pip
es
- II
I 1
00
% o
f id
en
tifi
ed
pip
es
are
to
ug
he
ne
d.
Ab
ilit
y t
o m
ee
t m
ost
of
We
llin
gto
n’s
in
itia
l w
ate
r n
ee
ds
thro
ug
h
rest
art
ing
a s
ing
le p
lan
t
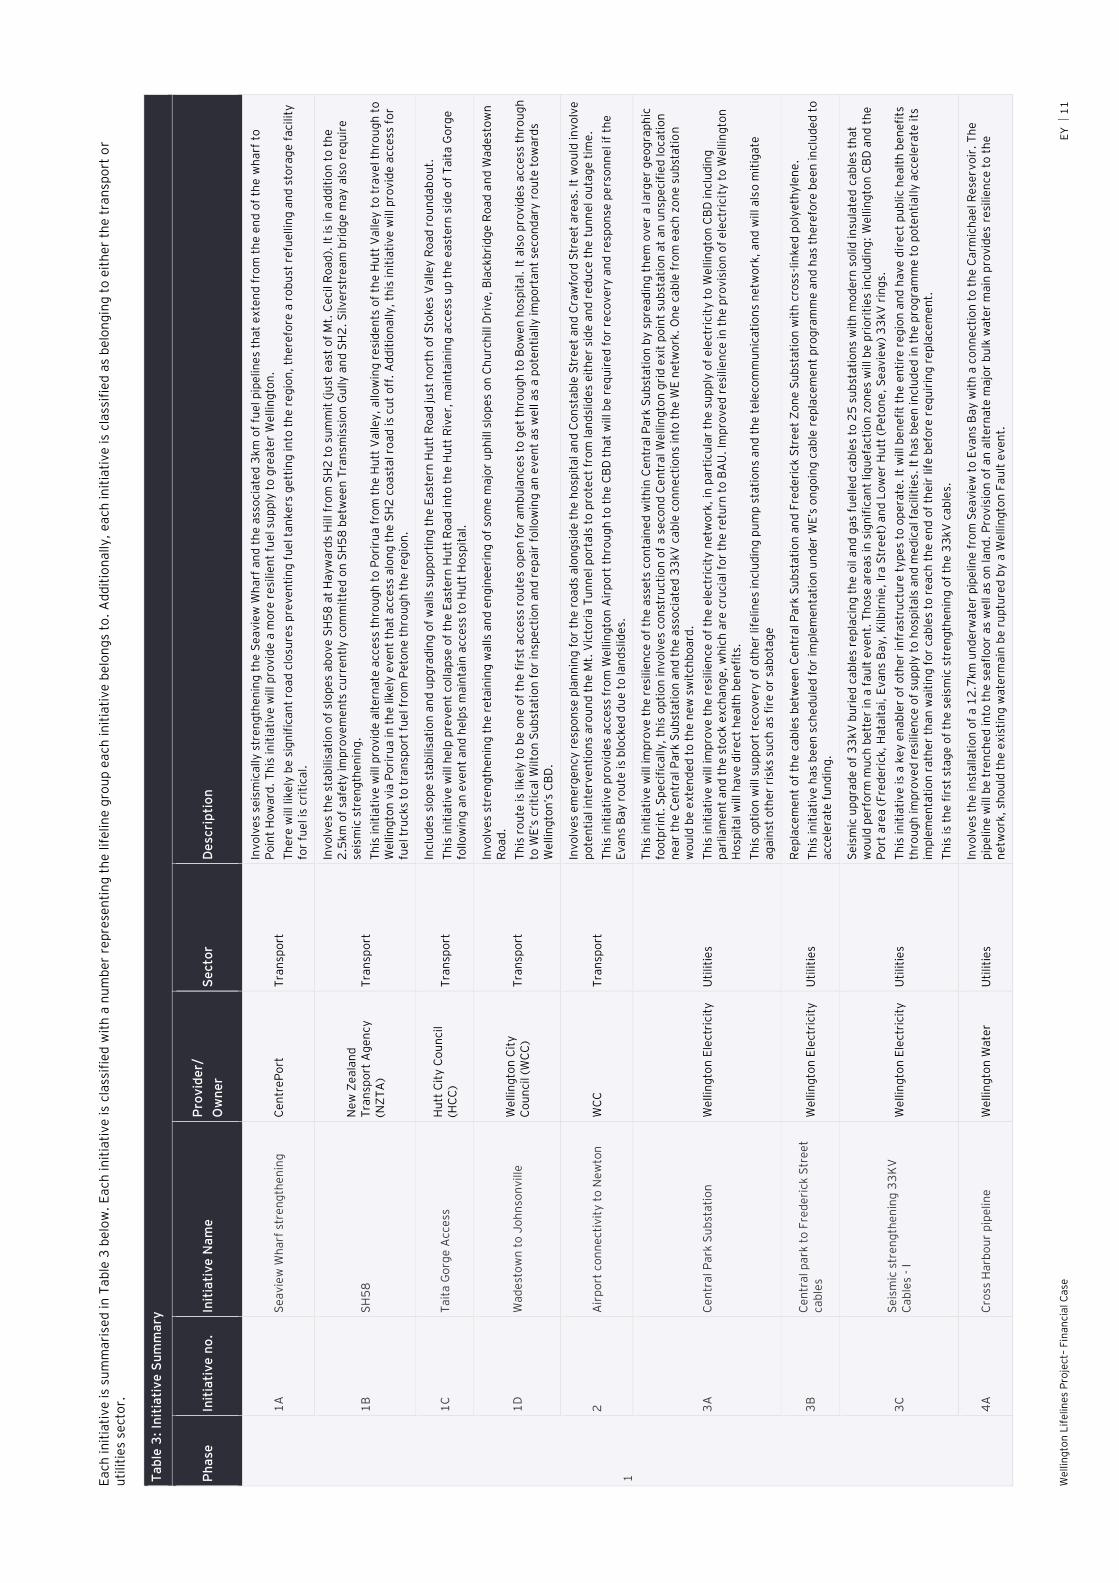
We
llin
gto
n L
ife
line
s P
roje
ct–
Fin
an
cia
l C
ase
E
Y
1
1
Ea
ch in
itia
tive
is
sum
ma
rise
d in
Ta
ble
3 b
elo
w.
Ea
ch i
nit
iati
ve
is
cla
ssif
ied
wit
h a
nu
mb
er
rep
rese
nti
ng
th
e lif
elin
e g
rou
p e
ach
in
itia
tive
be
lon
gs
to.
Ad
dit
ion
ally
, e
ach
in
itia
tive
is
cla
ssif
ied
as
be
lon
gin
g t
o e
ith
er
the
tra
nsp
ort
or
uti
liti
es
sect
or.
Ta
ble
3:
Init
iati
ve
Su
mm
ary
Ph
ase
In
itia
tiv
e n
o.
Init
iati
ve
Na
me
P
rov
ide
r/
Ow
ne
r S
ecto
r D
escri
pti
on
1
1A
S
ea
vie
w W
ha
rf s
tre
ng
the
nin
g
Ce
ntr
eP
ort
T
ran
spo
rt
Inv
olv
es
seis
mic
ally
str
en
gth
en
ing
th
e S
ea
vie
w W
ha
rf a
nd
th
e a
sso
cia
ted
3km
of
fue
l p
ipe
lin
es
tha
t e
xte
nd
fro
m t
he
en
d o
f th
e w
ha
rf t
o
Po
int
Ho
wa
rd.
Th
is in
itia
tiv
e w
ill p
rov
ide
a m
ore
re
silie
nt
fue
l su
pp
ly t
o g
rea
ter
We
llin
gto
n.
Th
ere
will like
ly b
e s
ign
ific
an
t ro
ad
clo
sure
s p
rev
en
tin
g f
ue
l ta
nke
rs g
ett
ing
in
to t
he
re
gio
n,
the
refo
re a
ro
bu
st r
efu
ellin
g a
nd
sto
rag
e f
aci
lity
fo
r fu
el is
cri
tica
l.
1B
S
H5
8
Ne
w Z
ea
lan
d
Tra
nsp
ort
Ag
en
cy
(NZ
TA
) T
ran
spo
rt
Inv
olv
es
the
sta
bilis
ati
on
of
slo
pe
s a
bo
ve
SH
58
at
Ha
yw
ard
s H
ill fr
om
SH
2 t
o s
um
mit
(ju
st e
ast
of
Mt.
Ce
cil R
oa
d).
It
is in
ad
dit
ion
to
th
e
2.5
km
of
safe
ty im
pro
ve
me
nts
cu
rre
ntl
y c
om
mit
ted
on
SH
58
be
twe
en
Tra
nsm
issi
on
Gu
lly a
nd
SH
2.
Silv
ers
tre
am
bri
dg
e m
ay
als
o r
eq
uir
e
seis
mic
str
en
gth
en
ing
.
Th
is in
itia
tiv
e w
ill p
rov
ide
alt
ern
ate
acc
ess
th
rou
gh
to
Po
riru
a f
rom
th
e H
utt
Va
lle
y,
allo
win
g r
esi
de
nts
of
the
Hu
tt V
alle
y t
o t
rav
el th
rou
gh
to
W
ellin
gto
n v
ia P
ori
rua
in
th
e lik
ely
ev
en
t th
at
acc
ess
alo
ng
th
e S
H2
co
ast
al ro
ad
is
cut
off
. A
dd
itio
na
lly
, th
is in
itia
tiv
e w
ill p
rov
ide
acc
ess
fo
r fu
el tr
uck
s to
tra
nsp
ort
fu
el fr
om
Pe
ton
e t
hro
ug
h t
he
re
gio
n.
1C
T
ait
a G
org
e A
cce
ss
Hu
tt C
ity
Co
un
cil
(HC
C)
Tra
nsp
ort
Incl
ud
es
slo
pe
sta
bilis
ati
on
an
d u
pg
rad
ing
of
wa
lls
sup
po
rtin
g t
he
Ea
ste
rn H
utt
Ro
ad
ju
st n
ort
h o
f S
toke
s V
alle
y R
oa
d r
ou
nd
ab
ou
t.
Th
is in
itia
tiv
e w
ill h
elp
pre
ve
nt
colla
pse
of
the
Ea
ste
rn H
utt
Ro
ad
in
to t
he
Hu
tt R
ive
r, m
ain
tain
ing
acc
ess
up
th
e e
ast
ern
sid
e o
f T
ait
a G
org
e
follo
win
g a
n e
ve
nt
an
d h
elp
s m
ain
tain
acc
ess
to
Hu
tt H
osp
ita
l.
1D
W
ad
est
ow
n t
o J
oh
nso
nv
ille
W
ellin
gto
n C
ity
C
ou
nci
l (W
CC
) T
ran
spo
rt
Inv
olv
es
stre
ng
the
nin
g t
he
re
tain
ing
wa
lls
an
d e
ng
ine
eri
ng
of
som
e m
ajo
r u
ph
ill sl
op
es
on
Ch
urc
hill D
riv
e,
Bla
ckb
rid
ge
Ro
ad
an
d W
ad
est
ow
n
Ro
ad
.
Th
is r
ou
te is
like
ly t
o b
e o
ne
of
the
fir
st a
cce
ss r
ou
tes
op
en
fo
r a
mb
ula
nce
s to
ge
t th
rou
gh
to
Bo
we
n h
osp
ita
l. I
t a
lso
pro
vid
es
acc
ess
th
rou
gh
to
WE
’s c
riti
cal W
ilto
n S
ub
sta
tio
n f
or
insp
ect
ion
an
d r
ep
air
fo
llo
win
g a
n e
ve
nt
as
we
ll a
s a
po
ten
tia
lly
im
po
rta
nt
seco
nd
ary
ro
ute
to
wa
rds
We
llin
gto
n’s
CB
D.
2
Air
po
rt c
on
ne
ctiv
ity
to
Ne
wto
n
WC
C
Tra
nsp
ort
Inv
olv
es
em
erg
en
cy r
esp
on
se p
lan
nin
g f
or
the
ro
ad
s a
lon
gsi
de
th
e h
osp
ita
l a
nd
Co
nst
ab
le S
tre
et
an
d C
raw
ford
Str
ee
t a
rea
s. It
wo
uld
in
vo
lve
p
ote
nti
al in
terv
en
tio
ns
aro
un
d t
he
Mt.
Vic
tori
a T
un
ne
l p
ort
als
to
pro
tect
fro
m la
nd
slid
es
eit
he
r si
de
an
d r
ed
uce
th
e t
un
ne
l o
uta
ge
tim
e.
Th
is in
itia
tiv
e p
rov
ide
s a
cce
ss f
rom
We
llin
gto
n A
irp
ort
th
rou
gh
to
th
e C
BD
th
at
will b
e r
eq
uir
ed
fo
r re
cov
ery
an
d r
esp
on
se p
ers
on
ne
l if
th
e
Ev
an
s B
ay
ro
ute
is
blo
cke
d d
ue
to
la
nd
slid
es.
3A
C
en
tra
l P
ark
Su
bst
ati
on
W
ellin
gto
n E
lect
rici
ty
Uti
liti
es
Th
is in
itia
tiv
e w
ill im
pro
ve
th
e r
esi
lie
nce
of
the
ass
ets
co
nta
ine
d w
ith
in C
en
tra
l P
ark
Su
bst
ati
on
by
sp
rea
din
g t
he
m o
ve
r a
la
rge
r g
eo
gra
ph
ic
foo
tpri
nt.
Sp
eci
fica
lly
, th
is o
pti
on
in
vo
lve
s co
nst
ruct
ion
of
a s
eco
nd
Ce
ntr
al W
ellin
gto
n g
rid
exit
po
int
sub
sta
tio
n a
t a
n u
nsp
eci
fie
d lo
cati
on
n
ea
r th
e C
en
tra
l P
ark
Su
bst
ati
on
an
d t
he
ass
oci
ate
d 3
3kV
ca
ble
co
nn
ect
ion
s in
to t
he
WE
ne
two
rk.
On
e c
ab
le f
rom
ea
ch z
on
e s
ub
sta
tio
n
wo
uld
be
exte
nd
ed
to
th
e n
ew
sw
itch
bo
ard
.
Th
is in
itia
tiv
e w
ill im
pro
ve
th
e r
esi
lie
nce
of
the
ele
ctri
city
ne
two
rk,
in p
art
icu
lar
the
su
pp
ly o
f e
lect
rici
ty t
o W
ellin
gto
n C
BD
in
clu
din
g
pa
rlia
me
nt
an
d t
he
sto
ck e
xch
an
ge
, w
hic
h a
re c
ruci
al fo
r th
e r
etu
rn t
o B
AU
. Im
pro
ve
d r
esi
lie
nce
in
th
e p
rov
isio
n o
f e
lect
rici
ty t
o W
ellin
gto
n
Ho
spit
al w
ill h
av
e d
ire
ct h
ea
lth
be
ne
fits
.
Th
is o
pti
on
will su
pp
ort
re
cov
ery
of
oth
er
life
lin
es
incl
ud
ing
pu
mp
sta
tio
ns
an
d t
he
te
leco
mm
un
ica
tio
ns
ne
two
rk,
an
d w
ill a
lso
mit
iga
te
ag
ain
st o
the
r ri
sks
such
as
fire
or
sab
ota
ge
3B
C
en
tra
l p
ark
to
Fre
de
rick
Str
ee
t ca
ble
s W
ellin
gto
n E
lect
rici
ty
Uti
liti
es
Re
pla
cem
en
t o
f th
e c
ab
les
be
twe
en
Ce
ntr
al P
ark
Su
bst
ati
on
an
d F
red
eri
ck S
tre
et
Zo
ne
Su
bst
ati
on
wit
h c
ross
-lin
ke
d p
oly
eth
yle
ne
.
Th
is in
itia
tiv
e h
as
be
en
sch
ed
ule
d f
or
imp
lem
en
tati
on
un
de
r W
E’s
on
go
ing
ca
ble
re
pla
cem
en
t p
rog
ram
me
an
d h
as
the
refo
re b
ee
n in
clu
de
d t
o
acc
ele
rate
fu
nd
ing
.
3C
S
eis
mic
str
en
gth
en
ing
33
KV
C
ab
les
- I
We
llin
gto
n E
lect
rici
ty
Uti
liti
es
Se
ism
ic u
pg
rad
e o
f 3
3kV
bu
rie
d c
ab
les
rep
laci
ng
th
e o
il a
nd
ga
s fu
elle
d c
ab
les
to 2
5 s
ub
sta
tio
ns
wit
h m
od
ern
so
lid
in
sula
ted
ca
ble
s th
at
wo
uld
pe
rfo
rm m
uch
be
tte
r in
a f
au
lt e
ve
nt.
Th
ose
are
as
in s
ign
ific
an
t liq
ue
fact
ion
zo
ne
s w
ill b
e p
rio
riti
es
incl
ud
ing
: W
ellin
gto
n C
BD
an
d t
he
P
ort
are
a (
Fre
de
rick
, H
ata
ita
i, E
va
ns
Ba
y,
Kilb
irn
ie,
Ira
Str
ee
t) a
nd
Lo
we
r H
utt
(P
eto
ne
, S
ea
vie
w)
33
kV
rin
gs.
Th
is in
itia
tiv
e is
a k
ey
en
ab
ler
of
oth
er
infr
ast
ruct
ure
ty
pe
s to
op
era
te.
It w
ill b
en
efi
t th
e e
nti
re r
eg
ion
an
d h
av
e d
ire
ct p
ub
lic
he
alt
h b
en
efi
ts
thro
ug
h im
pro
ve
d r
esi
lien
ce o
f su
pp
ly t
o h
osp
ita
ls a
nd
me
dic
al fa
ciliti
es.
It
ha
s b
ee
n in
clu
de
d in
th
e p
rog
ram
me
to
po
ten
tia
lly
acc
ele
rate
its
im
ple
me
nta
tio
n r
ath
er
tha
n w
ait
ing
fo
r ca
ble
s to
re
ach
th
e e
nd
of
the
ir lif
e b
efo
re r
eq
uir
ing
re
pla
cem
en
t.
Th
is is
the
fir
st s
tag
e o
f th
e s
eis
mic
str
en
gth
en
ing
of
the
33
kV
ca
ble
s.
4A
C
ross
Ha
rbo
ur
pip
elin
e
We
llin
gto
n W
ate
r U
tiliti
es
Inv
olv
es
the
in
sta
lla
tio
n o
f a
12
.7km
un
de
rwa
ter
pip
elin
e f
rom
Se
av
iew
to
Ev
an
s B
ay
wit
h a
co
nn
ect
ion
to
th
e C
arm
ich
ae
l R
ese
rvo
ir.
Th
e
pip
elin
e w
ill b
e t
ren
che
d in
to t
he
se
afl
oo
r a
s w
ell a
s o
n la
nd
. P
rov
isio
n o
f a
n a
lte
rna
te m
ajo
r b
ulk
wa
ter
ma
in p
rov
ide
s re
silie
nce
to
th
e
ne
two
rk,
sho
uld
th
e e
xis
tin
g w
ate
rma
in b
e r
up
ture
d b
y a
We
llin
gto
n F
au
lt e
ve
nt.
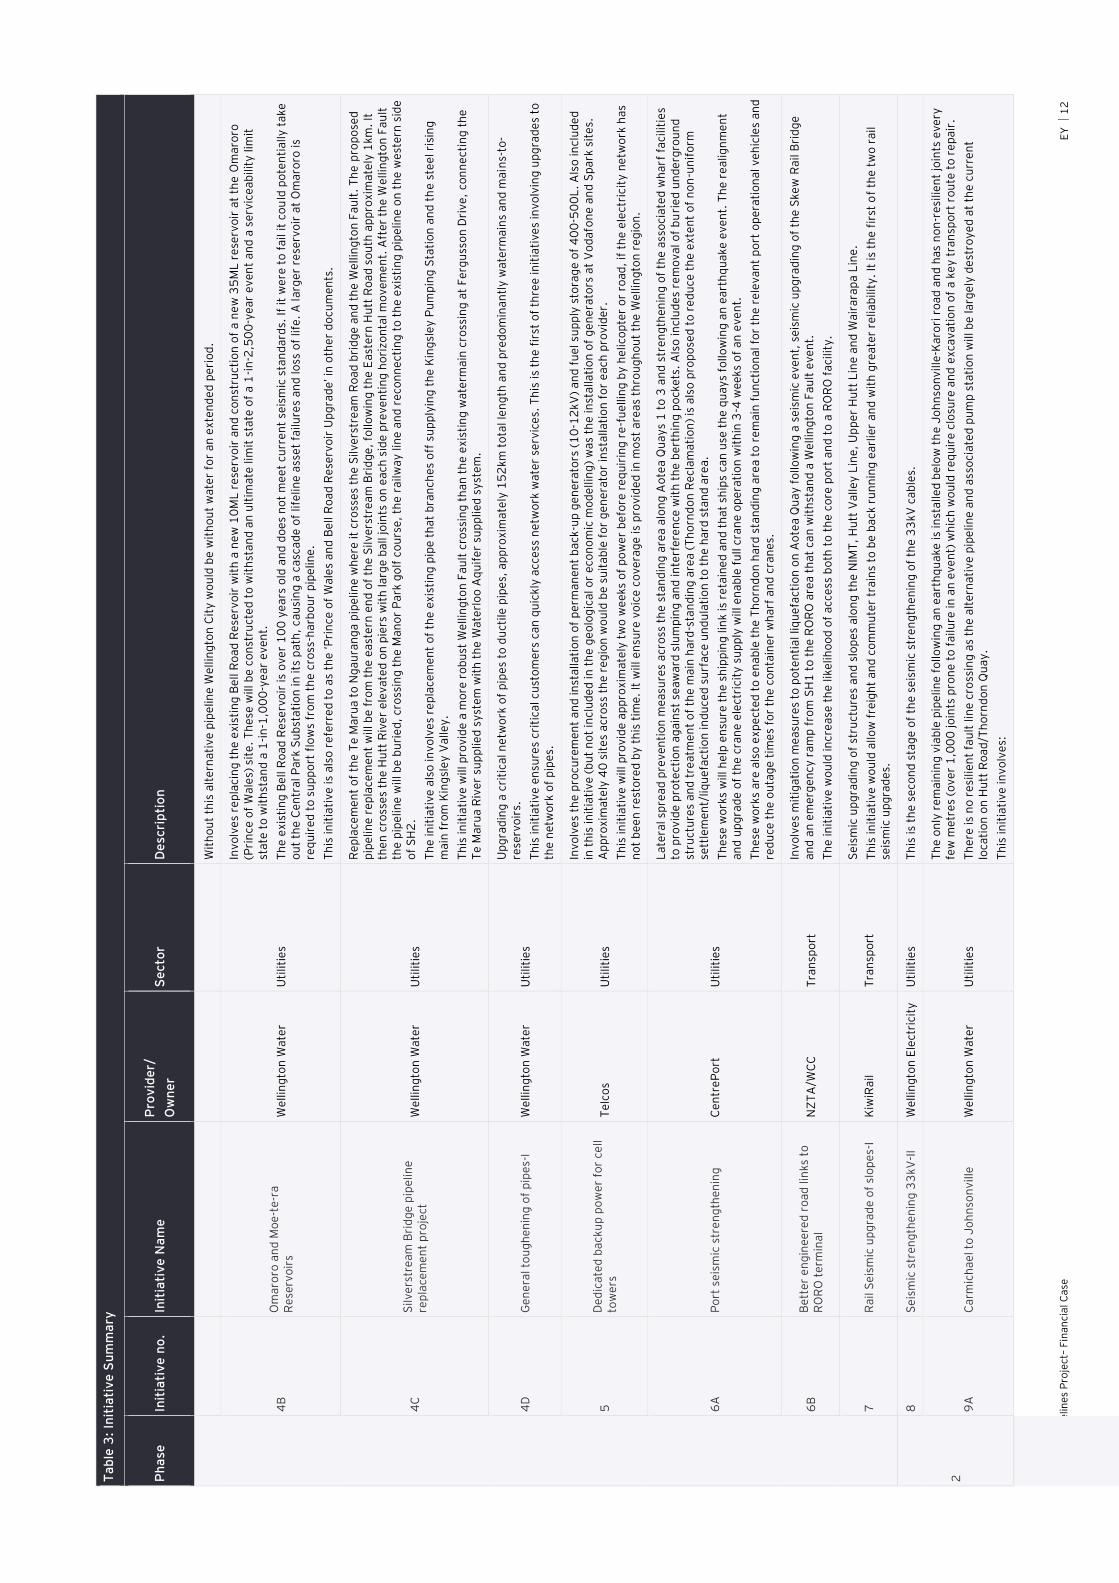
We
llin
gto
n L
ife
line
s P
roje
ct–
Fin
an
cia
l C
ase
E
Y
1
2
Ta
ble
3:
Init
iati
ve
Su
mm
ary
Ph
ase
In
itia
tiv
e n
o.
Init
iati
ve
Na
me
P
rov
ide
r/
Ow
ne
r S
ecto
r D
escri
pti
on
Wit
ho
ut
this
alt
ern
ati
ve
pip
elin
e W
ellin
gto
n C
ity
wo
uld
be
wit
ho
ut
wa
ter
for
an
exte
nd
ed
pe
rio
d.
4B
O
ma
roro
an
d M
oe
-te
-ra
R
ese
rvo
irs
We
llin
gto
n W
ate
r U
tiliti
es
Inv
olv
es
rep
laci
ng
th
e e
xist
ing
Be
ll R
oa
d R
ese
rvo
ir w
ith
a n
ew
10
ML
re
serv
oir
an
d c
on
stru
ctio
n o
f a
ne
w 3
5M
L r
ese
rvo
ir a
t th
e O
ma
roro
(P
rin
ce o
f W
ale
s) s
ite
. T
he
se w
ill b
e c
on
stru
cte
d t
o w
ith
sta
nd
an
ult
ima
te lim
it s
tate
of
a 1
-in
-2,5
00
-ye
ar
ev
en
t a
nd
a s
erv
ice
ab
ilit
y lim
it
sta
te t
o w
ith
sta
nd
a 1
-in
-1,0
00
-ye
ar
ev
en
t.
Th
e e
xis
tin
g B
ell R
oa
d R
ese
rvo
ir is
ov
er
10
0 y
ea
rs o
ld a
nd
do
es
no
t m
ee
t cu
rre
nt
seis
mic
sta
nd
ard
s. I
f it
we
re t
o f
ail it
cou
ld p
ote
nti
ally
ta
ke
o
ut
the
Ce
ntr
al P
ark
Su
bst
ati
on
in
its
pa
th,
ca
usi
ng
a c
asc
ad
e o
f life
lin
e a
sse
t fa
ilu
res
an
d lo
ss o
f life
. A
la
rge
r re
serv
oir
at
Om
aro
ro is
req
uir
ed
to
su
pp
ort
flo
ws
fro
m t
he
cro
ss-h
arb
ou
r p
ipe
lin
e.
Th
is in
itia
tiv
e is
als
o r
efe
rre
d t
o a
s th
e ‘P
rin
ce o
f W
ale
s a
nd
Be
ll R
oa
d R
ese
rvo
ir U
pg
rad
e’ in
oth
er
do
cum
en
ts.
4C
S
ilv
ers
tre
am
Bri
dg
e p
ipe
line
re
pla
cem
en
t p
roje
ct
We
llin
gto
n W
ate
r U
tiliti
es
Re
pla
cem
en
t o
f th
e T
e M
aru
a t
o N
ga
ura
ng
a p
ipe
lin
e w
he
re it
cro
sse
s th
e S
ilv
ers
tre
am
Ro
ad
bri
dg
e a
nd
th
e W
ellin
gto
n F
au
lt.
Th
e p
rop
ose
d
pip
elin
e r
ep
lace
me
nt
will b
e f
rom
th
e e
ast
ern
en
d o
f th
e S
ilv
ers
tre
am
Bri
dg
e,
follo
win
g t
he
Ea
ste
rn H
utt
Ro
ad
so
uth
ap
pro
xim
ate
ly 1
km.
It
the
n c
ross
es
the
Hu
tt R
ive
r e
lev
ate
d o
n p
iers
wit
h la
rge
ba
ll jo
ints
on
ea
ch s
ide
pre
ve
nti
ng
ho
rizo
nta
l m
ov
em
en
t. A
fte
r th
e W
ellin
gto
n F
au
lt
the
pip
elin
e w
ill b
e b
uri
ed
, cr
oss
ing
th
e M
an
or
Pa
rk g
olf
co
urs
e,
the
ra
ilw
ay
lin
e a
nd
re
con
ne
ctin
g t
o t
he
exis
tin
g p
ipe
lin
e o
n t
he
we
ste
rn s
ide
o
f S
H2
.
Th
e in
itia
tive
als
o in
vo
lve
s re
pla
cem
en
t o
f th
e e
xis
tin
g p
ipe
th
at
bra
nch
es
off
su
pp
lyin
g t
he
Kin
gsl
ey
Pu
mp
ing
Sta
tio
n a
nd
th
e s
tee
l ri
sin
g
ma
in f
rom
Kin
gsl
ey
Va
lle
y.
Th
is in
itia
tiv
e w
ill p
rov
ide
a m
ore
ro
bu
st W
ellin
gto
n F
au
lt c
ross
ing
th
an
th
e e
xis
tin
g w
ate
rma
in c
ross
ing
at
Fe
rgu
sso
n D
riv
e,
con
ne
ctin
g t
he
T
e M
aru
a R
ive
r su
pp
lied
sy
ste
m w
ith
th
e W
ate
rlo
o A
qu
ife
r su
pp
lie
d s
yst
em
.
4D
G
en
era
l to
ug
he
nin
g o
f p
ipe
s-I
We
llin
gto
n W
ate
r U
tiliti
es
Up
gra
din
g a
cri
tica
l n
etw
ork
of
pip
es
to d
uct
ile
pip
es,
ap
pro
xim
ate
ly 1
52
km t
ota
l le
ng
th a
nd
pre
do
min
an
tly
wa
term
ain
s a
nd
ma
ins-
to-
rese
rvo
irs.
Th
is in
itia
tiv
e e
nsu
res
crit
ica
l cu
sto
me
rs c
an
qu
ickly
acc
ess
ne
two
rk w
ate
r se
rvic
es.
Th
is i
s th
e f
irst
of
thre
e in
itia
tive
s in
vo
lvin
g u
pg
rad
es
to
the
ne
two
rk o
f p
ipe
s.
5
De
dic
ate
d b
ack
up
po
we
r fo
r ce
ll
tow
ers
T
elc
os
Uti
liti
es
Inv
olv
es
the
pro
cure
me
nt
an
d in
sta
lla
tio
n o
f p
erm
an
en
t b
ack
-up
ge
ne
rato
rs (
10
-12
kV
) a
nd
fu
el su
pp
ly s
tora
ge
of
40
0-5
00
L.
Als
o in
clu
de
d
in t
his
in
itia
tiv
e (
bu
t n
ot
incl
ud
ed
in
th
e g
eo
log
ica
l o
r e
con
om
ic m
od
ellin
g)
wa
s th
e in
sta
llati
on
of
ge
ne
rato
rs a
t V
od
afo
ne
an
d S
pa
rk s
ite
s.
Ap
pro
xim
ate
ly 4
0 s
ite
s a
cro
ss t
he
re
gio
n w
ou
ld b
e s
uit
ab
le f
or
ge
ne
rato
r in
sta
lla
tio
n f
or
ea
ch p
rov
ide
r.
Th
is in
itia
tiv
e w
ill p
rov
ide
ap
pro
xim
ate
ly t
wo
we
eks
of
po
we
r b
efo
re r
eq
uir
ing
re
-fu
elli
ng
by
he
lico
pte
r o
r ro
ad
, if
th
e e
lect
ricit
y n
etw
ork
ha
s n
ot
be
en
re
sto
red
by
th
is t
ime
. It
will e
nsu
re v
oic
e c
ov
era
ge
is
pro
vid
ed
in
mo
st a
rea
s th
rou
gh
ou
t th
e W
ellin
gto
n r
eg
ion
.
6A
P
ort
se
ism
ic s
tre
ng
the
nin
g
Ce
ntr
eP
ort
U
tiliti
es
La
tera
l sp
rea
d p
rev
en
tio
n m
ea
sure
s a
cro
ss t
he
sta
nd
ing
are
a a
lon
g A
ote
a Q
ua
ys
1 t
o 3
an
d s
tre
ng
the
nin
g o
f th
e a
sso
cia
ted
wh
arf
fa
ciliti
es
to p
rov
ide
pro
tect
ion
ag
ain
st s
ea
wa
rd s
lum
pin
g a
nd
in
terf
ere
nce
wit
h t
he
be
rth
ing
po
cke
ts.
Als
o in
clu
de
s re
mo
va
l o
f b
uri
ed
un
de
rgro
un
d
stru
ctu
res
an
d t
rea
tme
nt
of
the
ma
in h
ard
-sta
nd
ing
are
a (
Th
orn
do
n R
ecl
am
ati
on
) is
als
o p
rop
ose
d t
o r
ed
uce
th
e e
xte
nt
of
no
n-u
nif
orm
se
ttle
me
nt/
liq
ue
fact
ion
in
du
ced
su
rfa
ce u
nd
ula
tio
n t
o t
he
ha
rd s
tan
d a
rea
.
Th
ese
wo
rks
will
he
lp e
nsu
re t
he
sh
ipp
ing
lin
k is
reta
ine
d a
nd
th
at
ship
s ca
n u
se t
he
qu
ay
s fo
llo
win
g a
n e
art
hq
ua
ke
ev
en
t. T
he
re
alig
nm
en
t a
nd
up
gra
de
of
the
cra
ne
ele
ctri
city
su
pp
ly w
ill e
na
ble
fu
ll c
ran
e o
pe
rati
on
wit
hin
3-4
we
eks
of
an
ev
en
t.
Th
ese
wo
rks
are
als
o e
xp
ect
ed
to
en
ab
le t
he
Th
orn
do
n h
ard
sta
nd
ing
are
a t
o r
em
ain
fu
nct
ion
al fo
r th
e r
ele
va
nt
po
rt o
pe
rati
on
al v
eh
icle
s a
nd
re
du
ce t
he
ou
tag
e t
ime
s fo
r th
e c
on
tain
er
wh
arf
an
d c
ran
es.
6B
B
ett
er
en
gin
ee
red
ro
ad
lin
ks
to
RO
RO
te
rmin
al
NZ
TA
/WC
C
Tra
nsp
ort
Inv
olv
es
mit
iga
tio
n m
ea
sure
s to
po
ten
tia
l liq
ue
fact
ion
on
Ao
tea
Qu
ay
fo
llo
win
g a
se
ism
ic e
ve
nt,
se
ism
ic u
pg
rad
ing
of
the
Ske
w R
ail B
rid
ge
a
nd
an
em
erg
en
cy r
am
p f
rom
SH
1 t
o t
he
RO
RO
are
a t
ha
t ca
n w
ith
sta
nd
a W
ellin
gto
n F
au
lt e
ve
nt.
Th
e in
itia
tive
wo
uld
in
cre
ase
th
e lik
elih
oo
d o
f a
cce
ss b
oth
to
th
e c
ore
po
rt a
nd
to
a R
OR
O f
aci
lity
.
7
Ra
il S
eis
mic
up
gra
de
of
slo
pe
s-I
Kiw
iRa
il
Tra
nsp
ort
Se
ism
ic u
pg
rad
ing
of
stru
ctu
res
an
d s
lop
es
alo
ng
th
e N
IMT
, H
utt
Va
lle
y L
ine
, U
pp
er
Hu
tt L
ine
an
d W
air
ara
pa
Lin
e.
Th
is in
itia
tiv
e w
ou
ld a
llo
w f
reig
ht
an
d c
om
mu
ter
tra
ins
to b
e b
ack
ru
nn
ing
ea
rlie
r a
nd
wit
h g
rea
ter
relia
bili
ty.
It is
the
fir
st o
f th
e t
wo
ra
il
seis
mic
up
gra
de
s.
2
8
Se
ism
ic s
tre
ng
the
nin
g 3
3kV
-II
We
llin
gto
n E
lect
rici
ty
Uti
liti
es
Th
is is
the
se
con
d s
tag
e o
f th
e s
eis
mic
str
en
gth
en
ing
of
the
33
kV
ca
ble
s.
9A
C
arm
ich
ae
l to
Jo
hn
son
ville
W
ellin
gto
n W
ate
r U
tiliti
es
Th
e o
nly
re
ma
inin
g v
iab
le p
ipe
lin
e f
ollo
win
g a
n e
art
hq
ua
ke is
inst
alle
d b
elo
w t
he
Jo
hn
son
ville
-Ka
rori
ro
ad
an
d h
as
no
n-r
esi
lien
t jo
ints
eve
ry
few
me
tre
s (o
ve
r 1
,00
0 jo
ints
pro
ne
to
fa
ilu
re in
an
ev
en
t) w
hic
h w
ou
ld r
eq
uir
e c
losu
re a
nd
exca
va
tio
n o
f a
ke
y t
ran
spo
rt r
ou
te t
o r
ep
air
.
Th
ere
is
no
re
silie
nt
fau
lt lin
e c
ross
ing
as
the
alt
ern
ati
ve
pip
elin
e a
nd
ass
oci
ate
d p
um
p s
tati
on
will b
e la
rge
ly d
est
roy
ed
at
the
cu
rre
nt
loca
tio
n o
n H
utt
Ro
ad
/Th
orn
do
n Q
ua
y.
Th
is in
itia
tiv
e in
vo
lve
s:
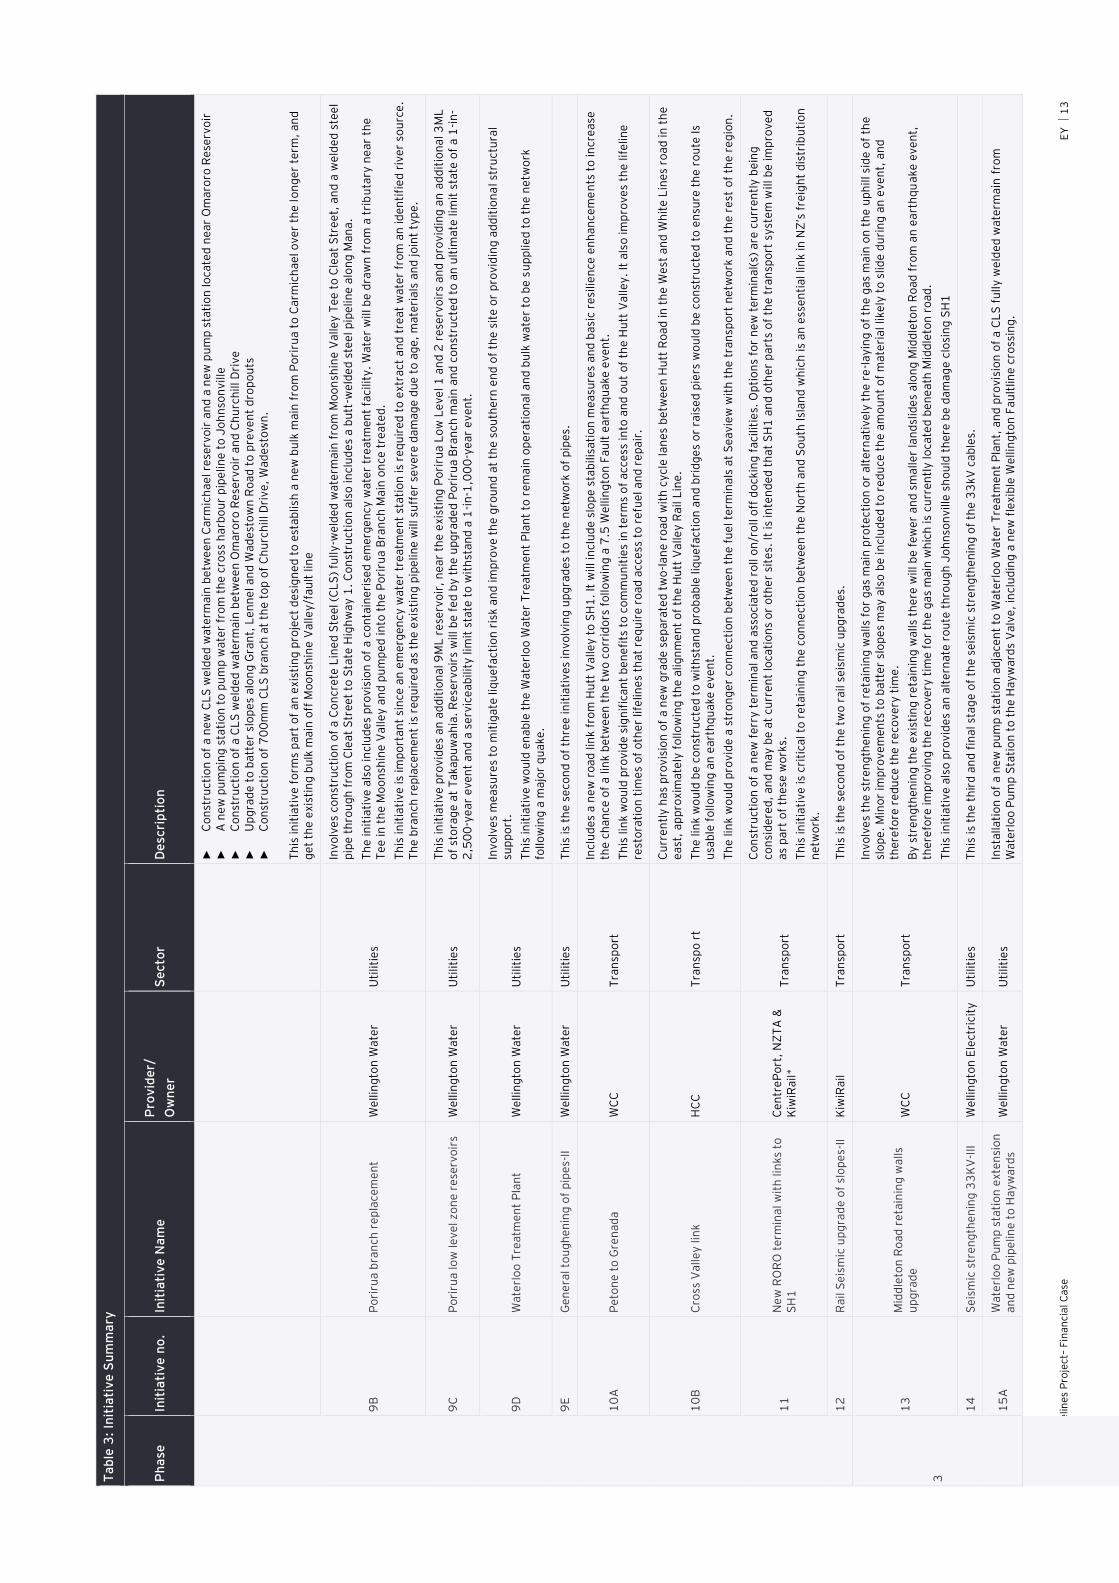
We
llin
gto
n L
ife
line
s P
roje
ct–
Fin
an
cia
l C
ase
E
Y
1
3
Ta
ble
3:
Init
iati
ve
Su
mm
ary
Ph
ase
In
itia
tiv
e n
o.
Init
iati
ve
Na
me
P
rov
ide
r/
Ow
ne
r S
ecto
r D
escri
pti
on
►
Co
nst
ruct
ion
of
a n
ew
CL
S w
eld
ed
wa
term
ain
be
twe
en
Ca
rmic
ha
el re
serv
oir
an
d a
ne
w p
um
p s
tati
on
lo
cate
d n
ea
r O
ma
roro
Re
serv
oir
►
A
ne
w p
um
pin
g s
tati
on
to
pu
mp
wa
ter
fro
m t
he
cro
ss h
arb
ou
r p
ipe
lin
e t
o J
oh
nso
nv
ille
►
C
on
stru
ctio
n o
f a
CL
S w
eld
ed
wa
term
ain
be
twe
en
Om
aro
ro R
ese
rvo
ir a
nd
Ch
urc
hill D
riv
e
►
Up
gra
de
to
ba
tte
r sl
op
es
alo
ng
Gra
nt,
Le
nn
el a
nd
Wa
de
sto
wn
Ro
ad
to
pre
ve
nt
dro
po
uts
►
C
on
stru
ctio
n o
f 7
00
mm
CL
S b
ran
ch a
t th
e t
op
of
Ch
urc
hill D
riv
e,
Wa
de
sto
wn
.
Th
is in
itia
tiv
e f
orm
s p
art
of
an
exis
tin
g p
roje
ct d
esi
gn
ed
to
est
ab
lish
a n
ew
bu
lk m
ain
fro
m P
ori
rua
to
Ca
rmic
ha
el o
ve
r th
e l
on
ge
r te
rm,
an
d
ge
t th
e e
xist
ing
bu
lk m
ain
off
Mo
on
shin
e V
alle
y/f
au
lt lin
e
9B
P
ori
rua
bra
nch
re
pla
cem
en
t W
ellin
gto
n W
ate
r U
tiliti
es
Inv
olv
es
con
stru
ctio
n o
f a
Co
ncr
ete
Lin
ed
Ste
el (C
LS
) fu
lly
-we
lde
d w
ate
rma
in f
rom
Mo
on
shin
e V
alle
y T
ee
to
Cle
at
Str
ee
t, a
nd
a w
eld
ed
ste
el
pip
e t
hro
ug
h f
rom
Cle
at
Str
ee
t to
Sta
te H
igh
wa
y 1
. C
on
stru
ctio
n a
lso
in
clu
de
s a
bu
tt-w
eld
ed
ste
el p
ipe
lin
e a
lon
g M
an
a.
Th
e in
itia
tive
als
o in
clu
de
s p
rov
isio
n o
f a
co
nta
ine
rise
d e
me
rge
ncy
wa
ter
tre
atm
en
t fa
cility
. W
ate
r w
ill b
e d
raw
n f
rom
a t
rib
uta
ry n
ea
r th
e
Te
e in
th
e M
oo
nsh
ine
Va
lle
y a
nd
pu
mp
ed
in
to t
he
Po
riru
a B
ran
ch M
ain
on
ce t
rea
ted
.
Th
is in
itia
tiv
e is
imp
ort
an
t si
nce
an
em
erg
en
cy w
ate
r tr
ea
tme
nt
sta
tio
n is
req
uir
ed
to
extr
act
an
d t
rea
t w
ate
r fr
om
an
id
en
tifi
ed
riv
er
sou
rce
. T
he
bra
nch
re
pla
cem
en
t is
re
qu
ire
d a
s th
e e
xis
tin
g p
ipe
lin
e w
ill su
ffe
r se
ve
re d
am
ag
e d
ue
to
ag
e,
ma
teri
als
an
d jo
int
typ
e.
9C
P
ori
rua
lo
w le
ve
l zo
ne
re
serv
oir
s W
ellin
gto
n W
ate
r U
tiliti
es
Th
is in
itia
tiv
e p
rov
ide
s a
n a
dd
itio
na
l 9
ML
re
serv
oir
, n
ea
r th
e e
xis
tin
g P
ori
rua
Lo
w L
ev
el 1
an
d 2
re
serv
oir
s a
nd
pro
vid
ing
an
ad
dit
ion
al 3
ML
o
f st
ora
ge
at
Ta
ka
pu
wa
hia
. R
ese
rvo
irs
will
be
fe
d b
y t
he
up
gra
de
d P
ori
rua
Bra
nch
ma
in a
nd
co
nst
ruct
ed
to
an
ult
ima
te lim
it s
tate
of
a 1
-in
-2
,50
0-y
ea
r e
ve
nt
an
d a
se
rvic
ea
bilit
y lim
it s
tate
to
wit
hst
an
d a
1-i
n-1
,00
0-y
ea
r e
ve
nt.
9D
W
ate
rlo
o T
rea
tme
nt
Pla
nt
We
llin
gto
n W
ate
r U
tiliti
es
Inv
olv
es
me
asu
res
to m
itig
ate
liq
ue
fact
ion
ris
k a
nd
im
pro
ve
th
e g
rou
nd
at
the
so
uth
ern
en
d o
f th
e s
ite
or
pro
vid
ing
ad
dit
ion
al st
ruct
ura
l su
pp
ort
.
Th
is in
itia
tiv
e w
ou
ld e
na
ble
th
e W
ate
rlo
o W
ate
r T
rea
tme
nt
Pla
nt
to r
em
ain
op
era
tio
na
l a
nd
bu
lk w
ate
r to
be
su
pp
lie
d t
o t
he
ne
two
rk
follo
win
g a
ma
jor
qu
ake
.
9E
G
en
era
l to
ug
he
nin
g o
f p
ipe
s-II
W
ellin
gto
n W
ate
r U
tiliti
es
Th
is is
the
se
con
d o
f th
ree
in
itia
tiv
es
inv
olv
ing
up
gra
de
s to
th
e n
etw
ork
of
pip
es.
10
A
Pe
ton
e t
o G
ren
ad
a
WC
C
Tra
nsp
ort
Incl
ud
es
a n
ew
ro
ad
lin
k f
rom
Hu
tt V
alle
y t
o S
H1
. It
will in
clu
de
slo
pe
sta
bilis
ati
on
me
asu
res
an
d b
asi
c re
silie
nce
en
ha
nce
me
nts
to
in
cre
ase
th
e c
ha
nce
of
a lin
k b
etw
ee
n t
he
tw
o c
orr
ido
rs f
ollo
win
g a
7.5
We
llin
gto
n F
au
lt e
art
hq
ua
ke e
ve
nt.
Th
is lin
k w
ou
ld p
rov
ide
sig
nif
ica
nt
be
ne
fits
to
co
mm
un
itie
s in
te
rms
of
acc
ess
in
to a
nd
ou
t o
f th
e H
utt
Va
lle
y.
It a
lso
im
pro
ve
s th
e lif
elin
e
rest
ora
tio
n t
ime
s o
f o
the
r lif
elin
es
tha
t re
qu
ire
ro
ad
acc
ess
to
re
fue
l a
nd
re
pa
ir.
10
B
Cro
ss V
alle
y lin
k
HC
C
Tra
nsp
o r
t
Cu
rre
ntl
y h
as
pro
vis
ion
of
a n
ew
gra
de
se
pa
rate
d t
wo
-la
ne
ro
ad
wit
h c
ycl
e la
ne
s b
etw
ee
n H
utt
Ro
ad
in
th
e W
est
an
d W
hit
e L
ine
s ro
ad
in
th
e
ea
st,
ap
pro
xim
ate
ly f
ollo
win
g t
he
alig
nm
en
t o
f th
e H
utt
Va
lle
y R
ail L
ine
.
Th
e lin
k w
ou
ld b
e c
on
stru
cte
d t
o w
ith
sta
nd
pro
ba
ble
liq
ue
fact
ion
an
d b
rid
ge
s o
r ra
ise
d p
iers
wo
uld
be
co
nst
ruct
ed
to
en
sure
th
e r
ou
te Is
usa
ble
fo
llo
win
g a
n e
art
hq
ua
ke e
ve
nt.
Th
e lin
k w
ou
ld p
rov
ide
a s
tro
ng
er
con
ne
ctio
n b
etw
ee
n t
he
fu
el te
rmin
als
at
Se
av
iew
wit
h t
he
tra
nsp
ort
ne
two
rk a
nd
th
e r
est
of
the
re
gio
n.
11
N
ew
RO
RO
te
rmin
al w
ith
lin
ks
to
SH
1
Ce
ntr
eP
ort
, N
ZT
A &
K
iwiR
ail*
Tra
nsp
ort
Co
nst
ruct
ion
of
a n
ew
fe
rry
te
rmin
al a
nd
ass
oci
ate
d r
oll o
n/r
oll o
ff d
ock
ing
fa
ciliti
es.
Op
tio
ns
for
ne
w t
erm
ina
l(s)
are
cu
rre
ntl
y b
ein
g
con
sid
ere
d,
an
d m
ay
be
at
curr
en
t lo
cati
on
s o
r o
the
r si
tes.
It
is in
ten
de
d t
ha
t S
H1
an
d o
the
r p
art
s o
f th
e t
ran
spo
rt s
yst
em
will b
e im
pro
ve
d
as
pa
rt o
f th
ese
wo
rks.
Th
is in
itia
tiv
e is
crit
ica
l to
re
tain
ing
th
e c
on
ne
ctio
n b
etw
ee
n t
he
No
rth
an
d S
ou
th I
sla
nd
wh
ich
is
an
ess
en
tia
l lin
k in
NZ
’s f
reig
ht
dis
trib
uti
on
n
etw
ork
.
12
R
ail S
eis
mic
up
gra
de
of
slo
pe
s-II
K
iwiR
ail
Tra
nsp
ort
T
his
is
the
se
con
d o
f th
e t
wo
ra
il s
eis
mic
up
gra
de
s.
3
13
M
idd
leto
n R
oa
d r
eta
inin
g w
alls
u
pg
rad
e
WC
C
Tra
nsp
ort
Inv
olv
es
the
str
en
gth
en
ing
of
reta
inin
g w
alls
for
ga
s m
ain
pro
tect
ion
or
alt
ern
ati
ve
ly t
he
re
-la
yin
g o
f th
e g
as
ma
in o
n t
he
up
hill si
de
of
the
sl
op
e.
Min
or
imp
rov
em
en
ts t
o b
att
er
slo
pe
s m
ay
als
o b
e i
ncl
ud
ed
to
re
du
ce t
he
am
ou
nt
of
ma
teri
al like
ly t
o s
lid
e d
uri
ng
an
ev
en
t, a
nd
th
ere
fore
re
du
ce t
he
re
cov
ery
tim
e.
By
str
en
gth
en
ing
th
e e
xis
tin
g r
eta
inin
g w
alls
the
re w
ill b
e f
ew
er
an
d s
ma
lle
r la
nd
slid
es
alo
ng
Mid
dle
ton
Ro
ad
fro
m a
n e
art
hq
ua
ke
ev
en
t,
the
refo
re im
pro
vin
g t
he
re
cove
ry t
ime
fo
r th
e g
as
ma
in w
hic
h is
curr
en
tly
lo
cate
d b
en
ea
th M
idd
leto
n r
oa
d.
Th
is in
itia
tiv
e a
lso
pro
vid
es
an
alt
ern
ate
ro
ute
th
rou
gh
Jo
hn
son
ville
sh
ou
ld t
he
re b
e d
am
ag
e c
losi
ng
SH
1
14
S
eis
mic
str
en
gth
en
ing
33
KV
-III
W
ellin
gto
n E
lect
rici
ty
Uti
liti
es
Th
is is
the
th
ird
an
d f
ina
l st
ag
e o
f th
e s
eis
mic
str
en
gth
en
ing
of
the
33
kV
ca
ble
s.
15
A
Wa
terl
oo
Pu
mp
sta
tio
n e
xte
nsi
on
a
nd
ne
w p
ipe
line
to
Ha
yw
ard
s W
ellin
gto
n W
ate
r U
tiliti
es
Inst
alla
tio
n o
f a
ne
w p
um
p s
tati
on
ad
jace
nt
to W
ate
rlo
o W
ate
r T
rea
tme
nt
Pla
nt,
an
d p
rov
isio
n o
f a
CL
S f
ully
we
lde
d w
ate
rma
in f
rom
W
ate
rlo
o P
um
p S
tati
on
to
th
e H
ay
wa
rds
Va
lve
, in
clu
din
g a
ne
w f
lexib
le W
ellin
gto
n F
au
ltlin
e c
ross
ing
.
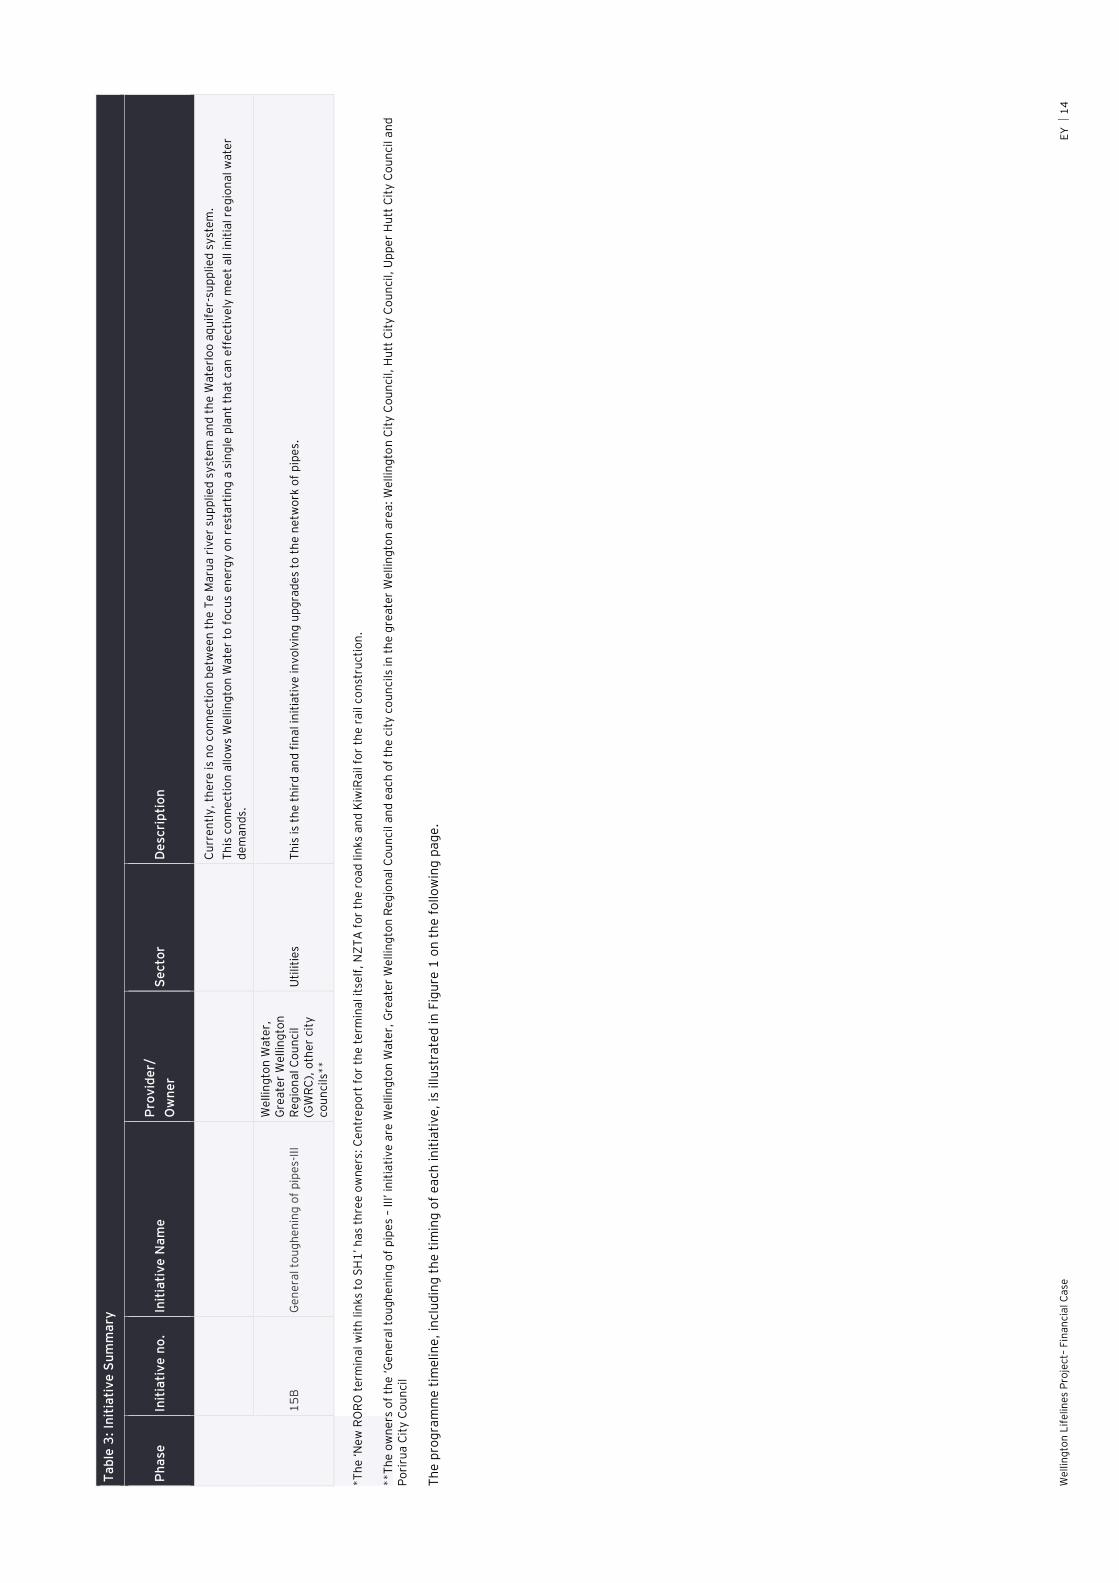
We
llin
gto
n L
ife
line
s P
roje
ct–
Fin
an
cia
l C
ase
E
Y
1
4
Ta
ble
3:
Init
iati
ve
Su
mm
ary
Ph
ase
In
itia
tiv
e n
o.
Init
iati
ve
Na
me
P
rov
ide
r/
Ow
ne
r S
ecto
r D
escri
pti
on
Cu
rre
ntl
y,
the
re is
no
co
nn
ect
ion
be
twe
en
th
e T
e M
aru
a r
ive
r su
pp
lied
sy
ste
m a
nd
th
e W
ate
rlo
o a
qu
ife
r-su
pp
lie
d s
yst
em
.
Th
is c
on
ne
ctio
n a
llo
ws
We
llin
gto
n W
ate
r to
fo
cus
en
erg
y o
n r
est
art
ing
a s
ing
le p
lan
t th
at
can
eff
ect
ive
ly m
ee
t a
ll in
itia
l re
gio
na
l w
ate
r d
em
an
ds.
15
B
Ge
ne
ral to
ug
he
nin
g o
f p
ipe
s-II
I
We
llin
gto
n W
ate
r,
Gre
ate
r W
ellin
gto
n
Re
gio
na
l C
ou
nci
l (G
WR
C),
oth
er
city
co
un
cils
**
Uti
liti
es
Th
is is
the
th
ird
an
d f
ina
l in
itia
tiv
e in
vo
lvin
g u
pg
rad
es
to t
he
ne
two
rk o
f p
ipe
s.
*T
he
‘N
ew
RO
RO
te
rmin
al w
ith
lin
ks
to S
H1
’ h
as
thre
e o
wn
ers
: C
en
tre
po
rt f
or
the
te
rmin
al it
self
, N
ZT
A f
or
the
ro
ad
lin
ks
an
d K
iwiR
ail f
or
the
ra
il c
on
stru
ctio
n.
**T
he
ow
ne
rs o
f th
e ‘G
en
era
l to
ug
he
nin
g o
f p
ipe
s –
III’
in
itia
tiv
e a
re W
ellin
gto
n W
ate
r, G
rea
ter
We
llin
gto
n R
eg
ion
al C
ou
nci
l a
nd
ea
ch o
f th
e c
ity
co
un
cils
in
th
e g
rea
ter
We
llin
gto
n a
rea
: W
ellin
gto
n C
ity
Co
un
cil,
Hu
tt C
ity
Co
un
cil,
Up
pe
r H
utt
Cit
y C
ou
nci
l a
nd
P
ori
rua
Cit
y C
ou
nci
l
Th
e p
rog
ram
me
tim
elin
e,
incl
ud
ing
th
e t
imin
g o
f e
ach
in
itia
tive
, is
illu
stra
ted
in
Fig
ure
1 o
n t
he
fo
llo
win
g p
ag
e.
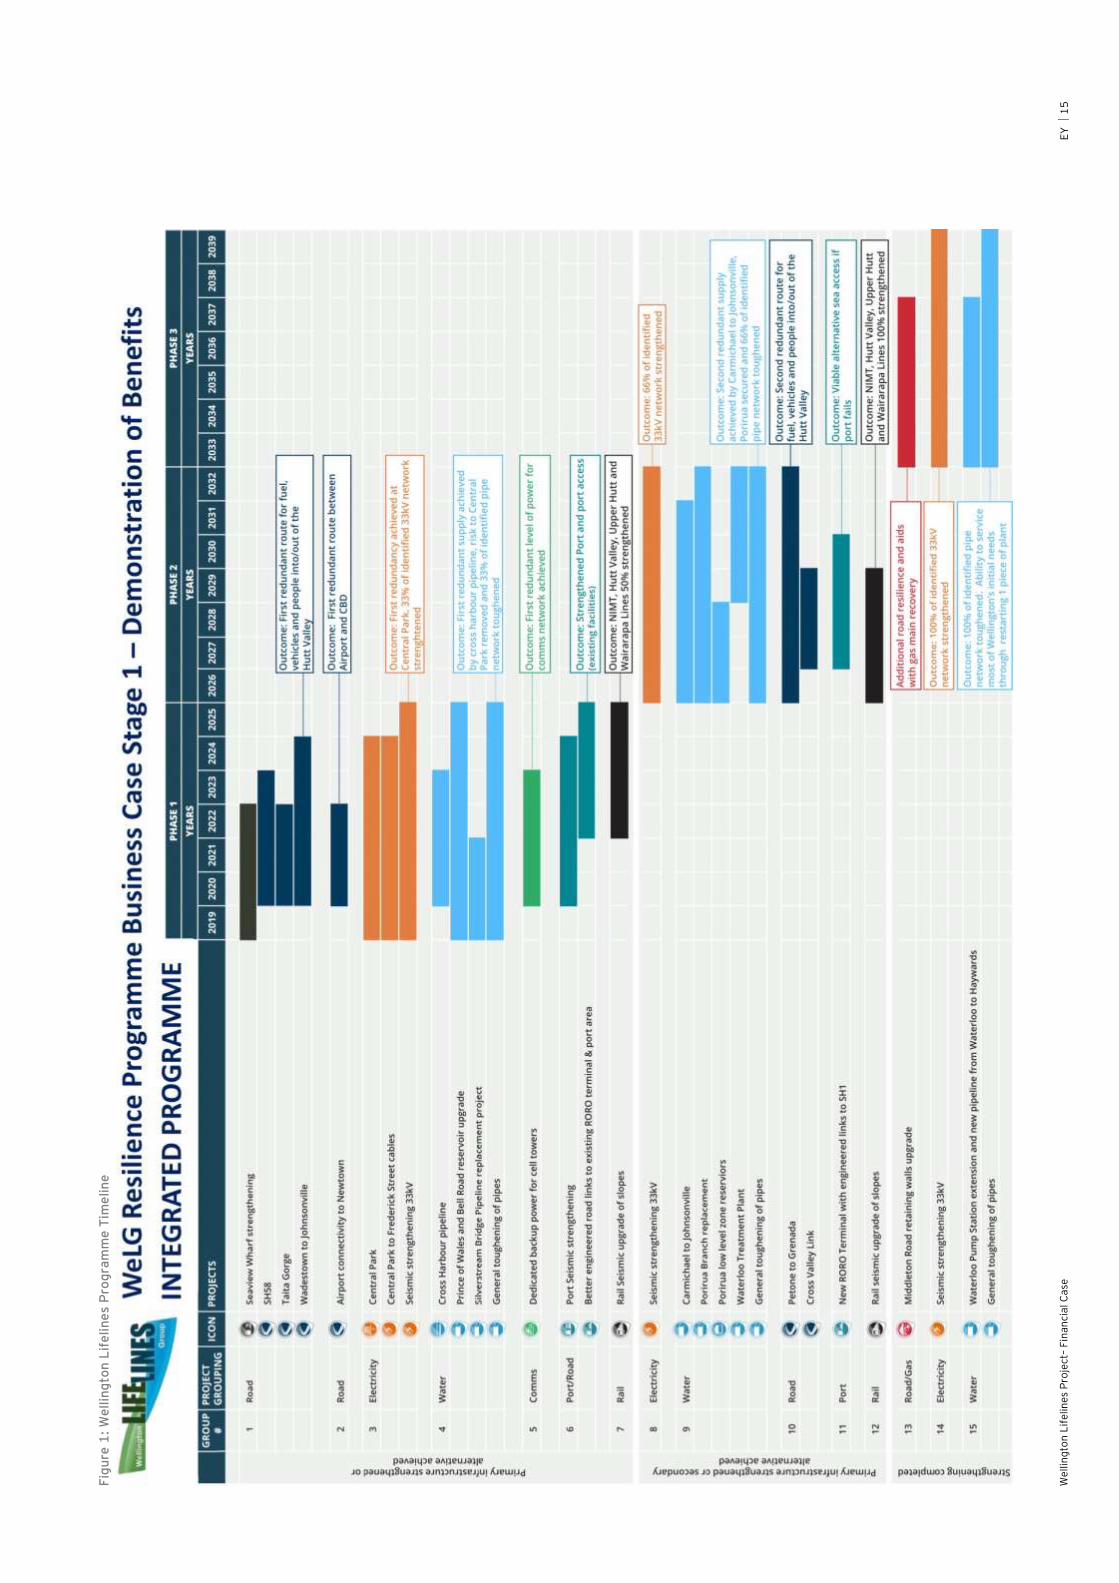
We
llin
gto
n L
ife
line
s P
roje
ct–
Fin
an
cia
l C
ase
E
Y
1
5
Fig
ure
1:
We
llin
gto
n L
ife
lin
es P
rog
ram
me
Tim
elin
e
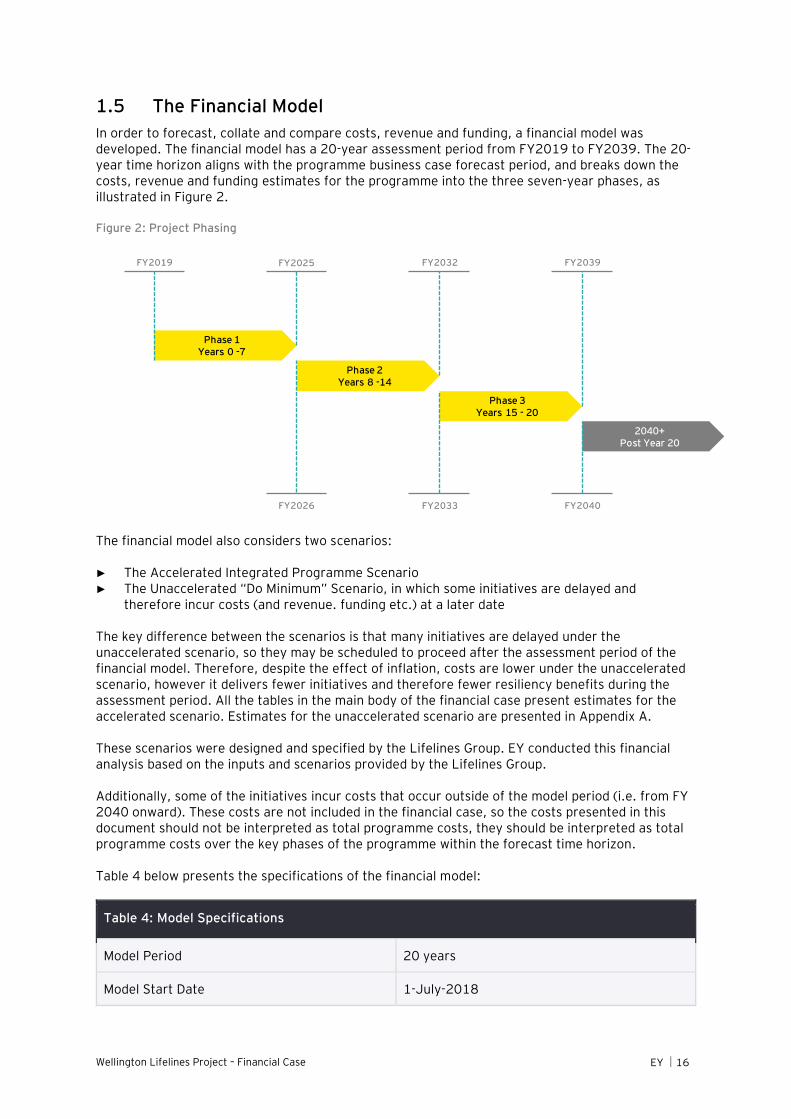
Wellington Lifelines Project – Financial Case EY 16
1.5 The Financial Model
In order to forecast, collate and compare costs, revenue and funding, a financial model was developed. The financial model has a 20-year assessment period from FY2019 to FY2039. The 20-year time horizon aligns with the programme business case forecast period, and breaks down the costs, revenue and funding estimates for the programme into the three seven-year phases, as illustrated in Figure 2.
Figure 2: Project Phasing
The financial model also considers two scenarios:
► The Accelerated Integrated Programme Scenario ► The Unaccelerated “Do Minimum” Scenario, in which some initiatives are delayed and
therefore incur costs (and revenue. funding etc.) at a later date
The key difference between the scenarios is that many initiatives are delayed under the unaccelerated scenario, so they may be scheduled to proceed after the assessment period of the financial model. Therefore, despite the effect of inflation, costs are lower under the unaccelerated scenario, however it delivers fewer initiatives and therefore fewer resiliency benefits during the assessment period. All the tables in the main body of the financial case present estimates for the accelerated scenario. Estimates for the unaccelerated scenario are presented in Appendix A.
These scenarios were designed and specified by the Lifelines Group. EY conducted this financial analysis based on the inputs and scenarios provided by the Lifelines Group.
Additionally, some of the initiatives incur costs that occur outside of the model period (i.e. from FY 2040 onward). These costs are not included in the financial case, so the costs presented in this document should not be interpreted as total programme costs, they should be interpreted as total programme costs over the key phases of the programme within the forecast time horizon.
Table 4 below presents the specifications of the financial model:
Table 4: Model Specifications
Model Period 20 years
Model Start Date 1-July-2018
Phase 1Years 0 -7
2040+Post Year 20
Phase 3Years 15 - 20
Phase 2Years 8 -14
FY2019 FY2039FY2032
FY2026 FY2033 FY2040
FY2025
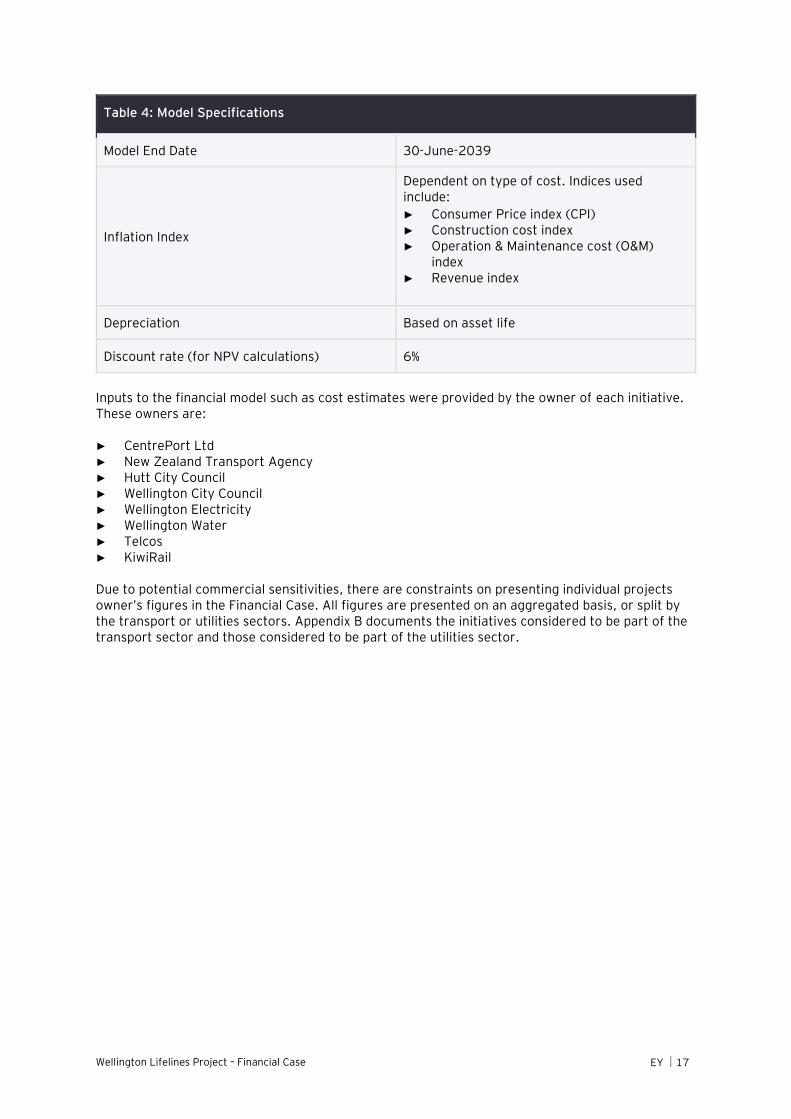
Wellington Lifelines Project – Financial Case EY 17
Table 4: Model Specifications
Model End Date 30-June-2039
Inflation Index
Dependent on type of cost. Indices used include:
► Consumer Price index (CPI) ► Construction cost index ► Operation & Maintenance cost (O&M)
index ► Revenue index
Depreciation Based on asset life
Discount rate (for NPV calculations) 6%
Inputs to the financial model such as cost estimates were provided by the owner of each initiative. These owners are:
► CentrePort Ltd ► New Zealand Transport Agency ► Hutt City Council ► Wellington City Council ► Wellington Electricity ► Wellington Water ► Telcos ► KiwiRail
Due to potential commercial sensitivities, there are constraints on presenting individual projects owner’s figures in the Financial Case. All figures are presented on an aggregated basis, or split by the transport or utilities sectors. Appendix B documents the initiatives considered to be part of the transport sector and those considered to be part of the utilities sector.
Wellington Lifelines Project – Financial Case EY 18
2. Phase 1 Summary
Phase 1 of the programme runs for the first seven years of the programme, from FY2019 to FY2025. It comprises the highest priority initiatives that support alternative (redundant) lifeline routes. These initiatives are generally higher feasibility, lower cost initiatives from the fuel, road and electricity sectors. The initiatives included in Phase 1 are:
► 1A Seaview Wharf Strengthening ► 1B SH58 ► 1C Taita Gorge Access ► 1D Wadestown to Johnsonville ► 2 Airport connectivity to Newton ► 3A Central Park Substation ► 3B Central park to Frederick Street cables ► 3C Seismic strengthening 33KV-I ► 4A Cross Harbour pipeline ► 4B Omaroro and Moe-te-ra Reservoirs ► 4C Silverstream Bridge pipeline replacement project ► 4D General toughening of pipes-I ► 5 Dedicated backup power for cell towers ► 6A Port seismic strengthening ► 6B Better engineered road links to RORO terminal ► 7 Rail Seismic upgrade of slopes-I
The summary results of Phase 1 of the programme are displayed in Table 5 below.
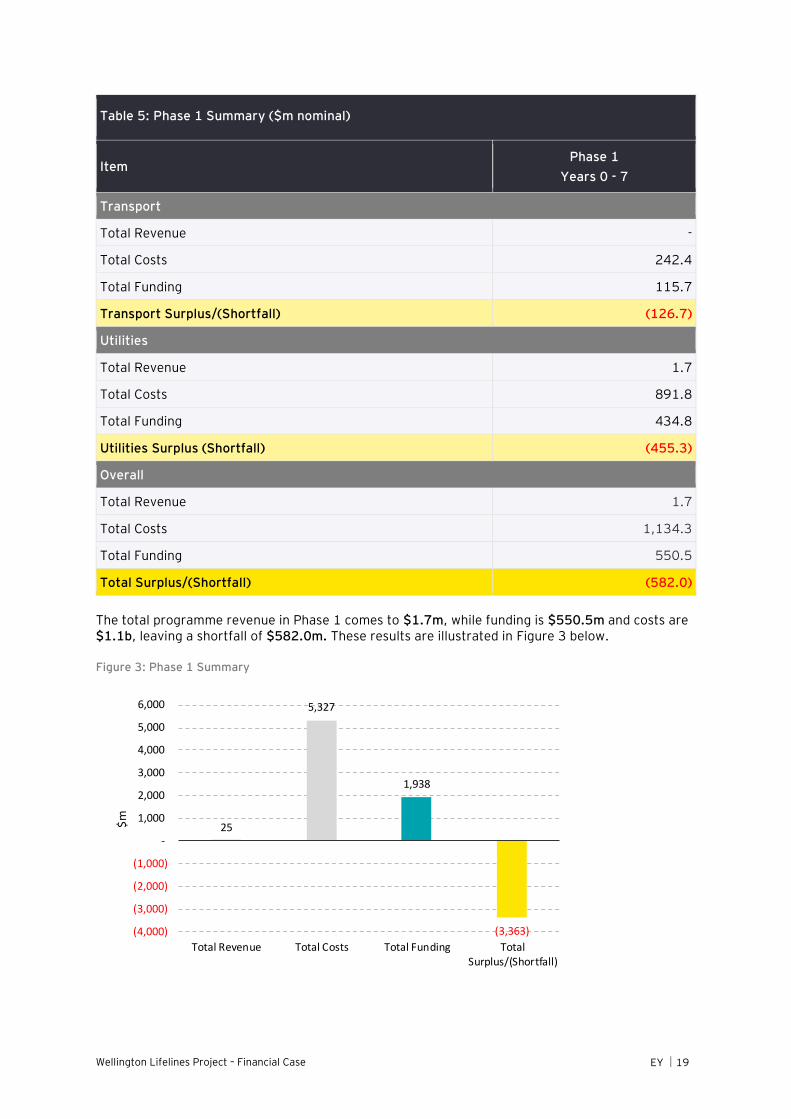
Wellington Lifelines Project – Financial Case EY 19
Table 5: Phase 1 Summary ($m nominal)
Item Phase 1
Years 0 - 7
Transport
Total Revenue -
Total Costs 242.4
Total Funding 115.7
Transport Surplus/(Shortfall) (126.7)
Utilities
Total Revenue 1.7
Total Costs 891.8
Total Funding 434.8
Utilities Surplus (Shortfall) (455.3)
Overall
Total Revenue 1.7
Total Costs 1,134.3
Total Funding 550.5
Total Surplus/(Shortfall) (582.0)
The total programme revenue in Phase 1 comes to $1.7m, while funding is $550.5m and costs are $1.1b, leaving a shortfall of $582.0m. These results are illustrated in Figure 3 below.
Figure 3: Phase 1 Summary
25
5,327
1,938
(3,363)(4,000)
(3,000)
(2,000)
(1,000)
-
1,000
2,000
3,000
4,000
5,000
6,000
Total Revenue Total Costs Total Funding TotalSurplus/(Shortfall)
$m

Wellington Lifelines Project – Financial Case EY 20
In Phase 1, the funding shortfall is largest in the utilities sector, with $455.3m (78.2%) of the $582.0m total shortfall coming from utilities initiatives and $126.7m from transport initiatives.
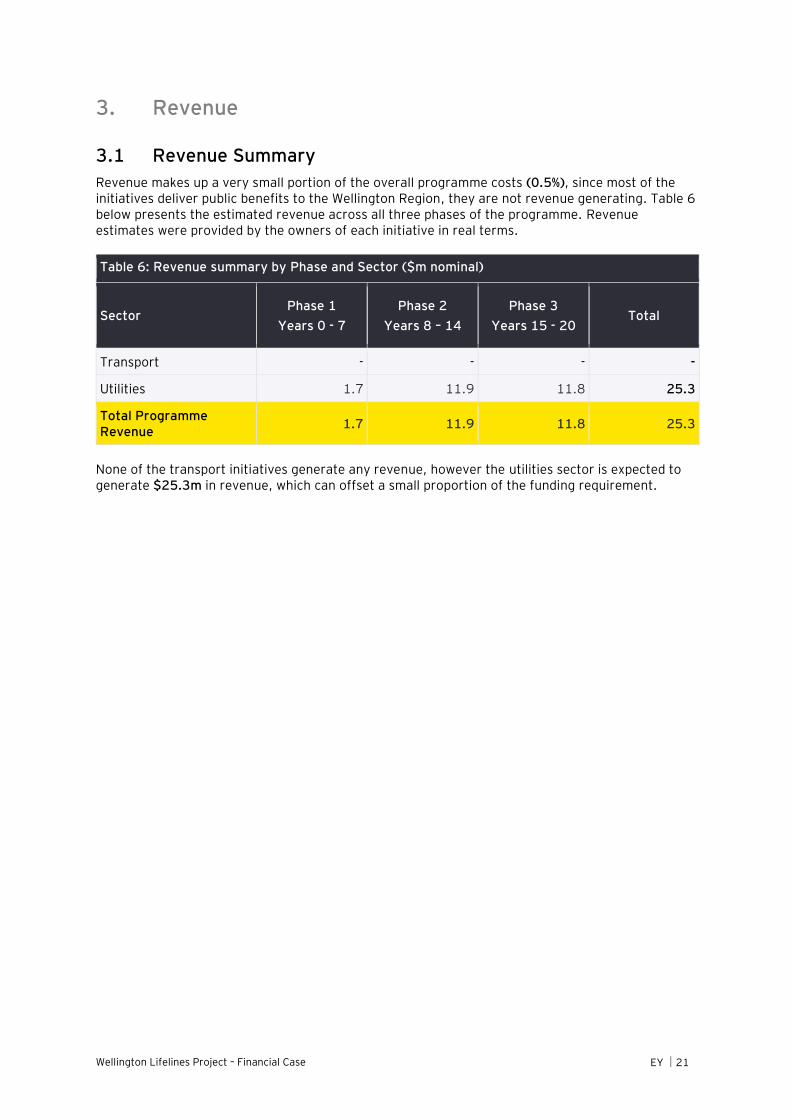
Wellington Lifelines Project – Financial Case EY 21
3. Revenue
3.1 Revenue Summary
Revenue makes up a very small portion of the overall programme costs (0.5%), since most of the initiatives deliver public benefits to the Wellington Region, they are not revenue generating. Table 6 below presents the estimated revenue across all three phases of the programme. Revenue estimates were provided by the owners of each initiative in real terms.
Table 6: Revenue summary by Phase and Sector ($m nominal)
Sector Phase 1
Years 0 - 7
Phase 2
Years 8 – 14
Phase 3
Years 15 - 20 Total
Transport - - - -
Utilities 1.7 11.9 11.8 25.3
Total Programme Revenue
1.7 11.9 11.8 25.3
None of the transport initiatives generate any revenue, however the utilities sector is expected to generate $25.3m in revenue, which can offset a small proportion of the funding requirement.
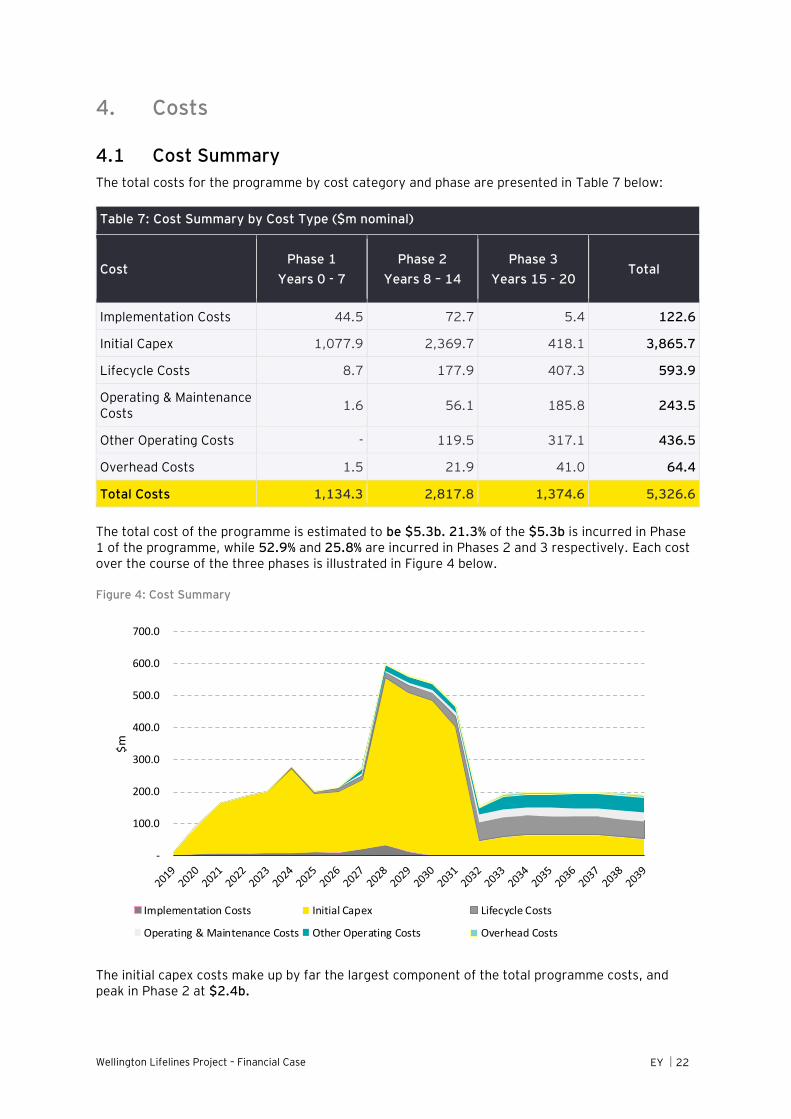
Wellington Lifelines Project – Financial Case EY 22
4. Costs
4.1 Cost Summary
The total costs for the programme by cost category and phase are presented in Table 7 below:
Table 7: Cost Summary by Cost Type ($m nominal)
Cost Phase 1
Years 0 - 7
Phase 2
Years 8 – 14
Phase 3
Years 15 - 20 Total
Implementation Costs 44.5 72.7 5.4 122.6
Initial Capex 1,077.9 2,369.7 418.1 3,865.7
Lifecycle Costs 8.7 177.9 407.3 593.9
Operating & Maintenance Costs
1.6 56.1 185.8 243.5
Other Operating Costs - 119.5 317.1 436.5
Overhead Costs 1.5 21.9 41.0 64.4
Total Costs 1,134.3 2,817.8 1,374.6 5,326.6
The total cost of the programme is estimated to be $5.3b. 21.3% of the $5.3b is incurred in Phase 1 of the programme, while 52.9% and 25.8% are incurred in Phases 2 and 3 respectively. Each cost over the course of the three phases is illustrated in Figure 4 below.
Figure 4: Cost Summary
The initial capex costs make up by far the largest component of the total programme costs, and peak in Phase 2 at $2.4b.
-
100.0
200.0
300.0
400.0
500.0
600.0
700.0
$m
Implementation Costs Initial Capex Lifecycle Costs
Operating & Maintenance Costs Other Operating Costs Overhead Costs
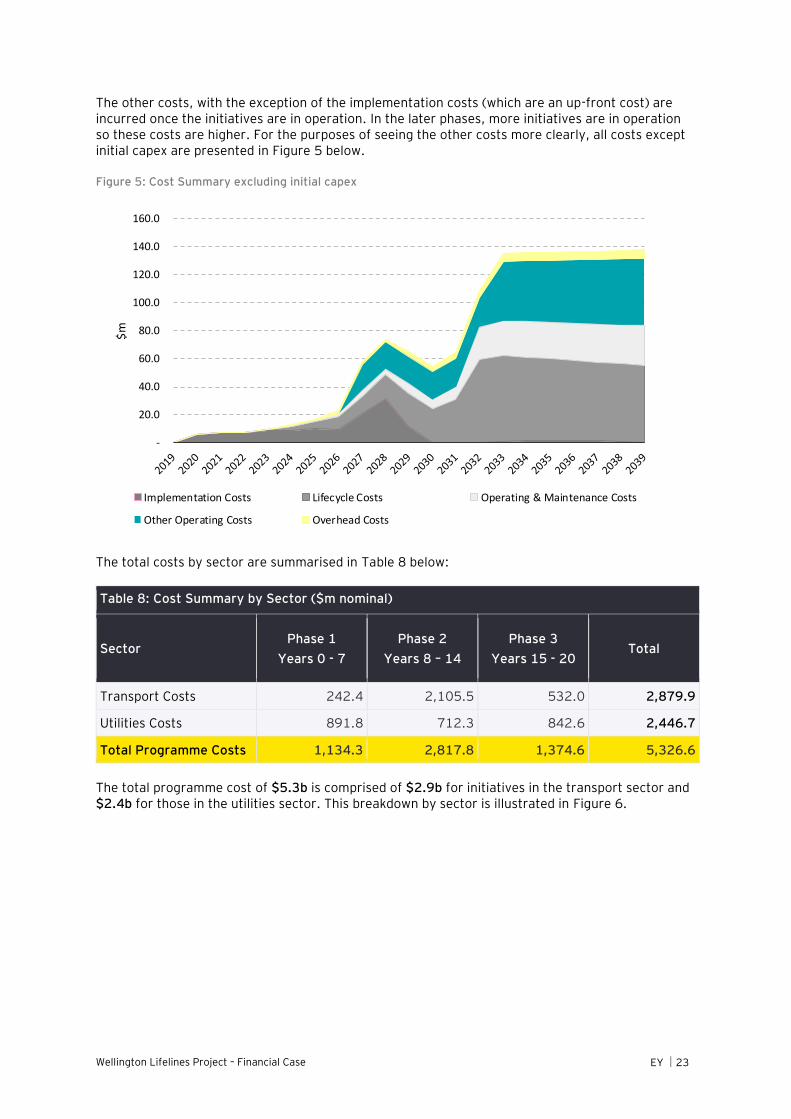
Wellington Lifelines Project – Financial Case EY 23
The other costs, with the exception of the implementation costs (which are an up-front cost) are incurred once the initiatives are in operation. In the later phases, more initiatives are in operation so these costs are higher. For the purposes of seeing the other costs more clearly, all costs except initial capex are presented in Figure 5 below.
Figure 5: Cost Summary excluding initial capex
The total costs by sector are summarised in Table 8 below:
Table 8: Cost Summary by Sector ($m nominal)
Sector Phase 1
Years 0 - 7
Phase 2
Years 8 – 14
Phase 3
Years 15 - 20 Total
Transport Costs 242.4 2,105.5 532.0 2,879.9
Utilities Costs 891.8 712.3 842.6 2,446.7
Total Programme Costs 1,134.3 2,817.8 1,374.6 5,326.6
The total programme cost of $5.3b is comprised of $2.9b for initiatives in the transport sector and $2.4b for those in the utilities sector. This breakdown by sector is illustrated in Figure 6.
-
20.0
40.0
60.0
80.0
100.0
120.0
140.0
160.0
$m
Implementation Costs Lifecycle Costs Operating & Maintenance Costs
Other Operating Costs Overhead Costs
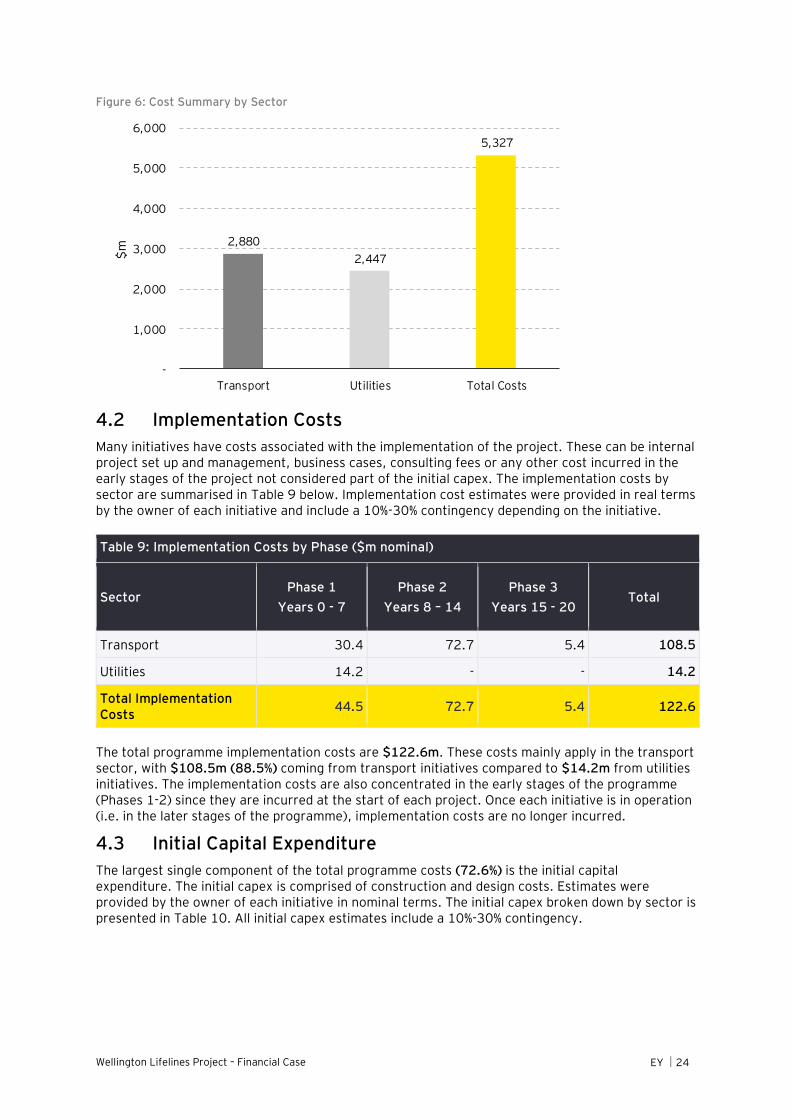
Wellington Lifelines Project – Financial Case EY 24
Figure 6: Cost Summary by Sector
4.2 Implementation Costs
Many initiatives have costs associated with the implementation of the project. These can be internal project set up and management, business cases, consulting fees or any other cost incurred in the early stages of the project not considered part of the initial capex. The implementation costs by sector are summarised in Table 9 below. Implementation cost estimates were provided in real terms by the owner of each initiative and include a 10%-30% contingency depending on the initiative.
Table 9: Implementation Costs by Phase ($m nominal)
Sector Phase 1
Years 0 - 7
Phase 2
Years 8 – 14
Phase 3
Years 15 - 20 Total
Transport 30.4 72.7 5.4 108.5
Utilities 14.2 - - 14.2
Total Implementation Costs
44.5 72.7 5.4 122.6
The total programme implementation costs are $122.6m. These costs mainly apply in the transport sector, with $108.5m (88.5%) coming from transport initiatives compared to $14.2m from utilities initiatives. The implementation costs are also concentrated in the early stages of the programme (Phases 1-2) since they are incurred at the start of each project. Once each initiative is in operation (i.e. in the later stages of the programme), implementation costs are no longer incurred.
4.3 Initial Capital Expenditure
The largest single component of the total programme costs (72.6%) is the initial capital expenditure. The initial capex is comprised of construction and design costs. Estimates were provided by the owner of each initiative in nominal terms. The initial capex broken down by sector is presented in Table 10. All initial capex estimates include a 10%-30% contingency.
2,880
2,447
5,327
-
1,000
2,000
3,000
4,000
5,000
6,000
Transport Utilities Total Costs
$m
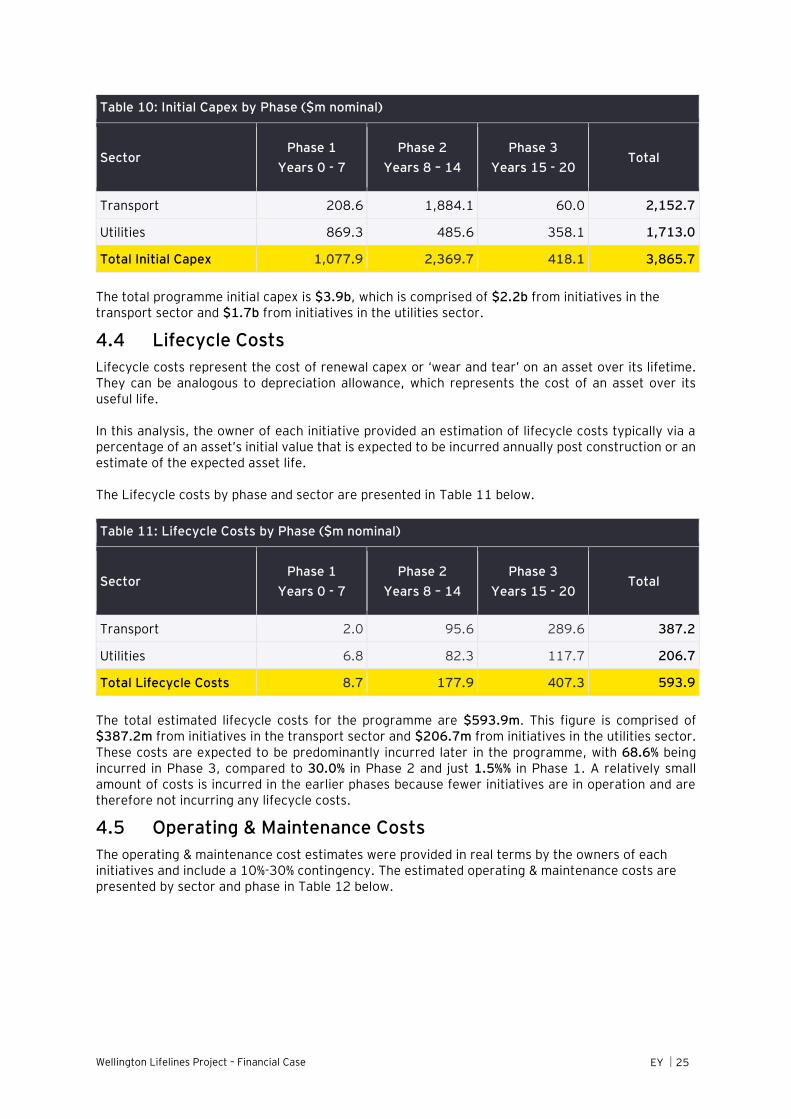
Wellington Lifelines Project – Financial Case EY 25
Table 10: Initial Capex by Phase ($m nominal)
Sector Phase 1
Years 0 - 7
Phase 2
Years 8 – 14
Phase 3
Years 15 - 20 Total
Transport 208.6 1,884.1 60.0 2,152.7
Utilities 869.3 485.6 358.1 1,713.0
Total Initial Capex 1,077.9 2,369.7 418.1 3,865.7
The total programme initial capex is $3.9b, which is comprised of $2.2b from initiatives in the transport sector and $1.7b from initiatives in the utilities sector.
4.4 Lifecycle Costs
Lifecycle costs represent the cost of renewal capex or ‘wear and tear’ on an asset over its lifetime. They can be analogous to depreciation allowance, which represents the cost of an asset over its useful life.
In this analysis, the owner of each initiative provided an estimation of lifecycle costs typically via a percentage of an asset’s initial value that is expected to be incurred annually post construction or an estimate of the expected asset life.
The Lifecycle costs by phase and sector are presented in Table 11 below.
Table 11: Lifecycle Costs by Phase ($m nominal)
Sector Phase 1
Years 0 - 7
Phase 2
Years 8 – 14
Phase 3
Years 15 - 20 Total
Transport 2.0 95.6 289.6 387.2
Utilities 6.8 82.3 117.7 206.7
Total Lifecycle Costs 8.7 177.9 407.3 593.9
The total estimated lifecycle costs for the programme are $593.9m. This figure is comprised of $387.2m from initiatives in the transport sector and $206.7m from initiatives in the utilities sector. These costs are expected to be predominantly incurred later in the programme, with 68.6% being incurred in Phase 3, compared to 30.0% in Phase 2 and just 1.5%% in Phase 1. A relatively small amount of costs is incurred in the earlier phases because fewer initiatives are in operation and are therefore not incurring any lifecycle costs.
4.5 Operating & Maintenance Costs
The operating & maintenance cost estimates were provided in real terms by the owners of each initiatives and include a 10%-30% contingency. The estimated operating & maintenance costs are presented by sector and phase in Table 12 below.
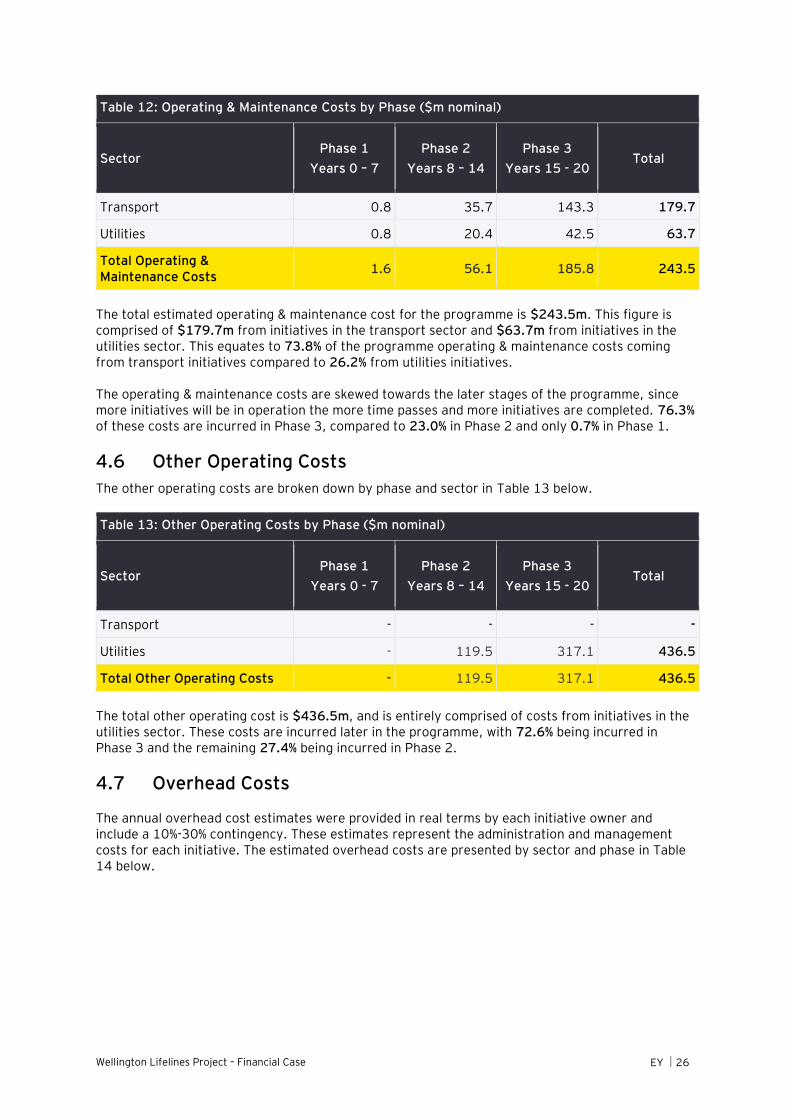
Wellington Lifelines Project – Financial Case EY 26
Table 12: Operating & Maintenance Costs by Phase ($m nominal)
Sector Phase 1
Years 0 – 7
Phase 2
Years 8 – 14
Phase 3
Years 15 - 20 Total
Transport 0.8 35.7 143.3 179.7
Utilities 0.8 20.4 42.5 63.7
Total Operating & Maintenance Costs
1.6 56.1 185.8 243.5
The total estimated operating & maintenance cost for the programme is $243.5m. This figure is comprised of $179.7m from initiatives in the transport sector and $63.7m from initiatives in the utilities sector. This equates to 73.8% of the programme operating & maintenance costs coming from transport initiatives compared to 26.2% from utilities initiatives.
The operating & maintenance costs are skewed towards the later stages of the programme, since more initiatives will be in operation the more time passes and more initiatives are completed. 76.3% of these costs are incurred in Phase 3, compared to 23.0% in Phase 2 and only 0.7% in Phase 1.
4.6 Other Operating Costs
The other operating costs are broken down by phase and sector in Table 13 below.
Table 13: Other Operating Costs by Phase ($m nominal)
Sector Phase 1
Years 0 - 7
Phase 2
Years 8 – 14
Phase 3
Years 15 - 20 Total
Transport - - - -
Utilities - 119.5 317.1 436.5
Total Other Operating Costs - 119.5 317.1 436.5
The total other operating cost is $436.5m, and is entirely comprised of costs from initiatives in the utilities sector. These costs are incurred later in the programme, with 72.6% being incurred in Phase 3 and the remaining 27.4% being incurred in Phase 2.
4.7 Overhead Costs
The annual overhead cost estimates were provided in real terms by each initiative owner and include a 10%-30% contingency. These estimates represent the administration and management costs for each initiative. The estimated overhead costs are presented by sector and phase in Table 14 below.
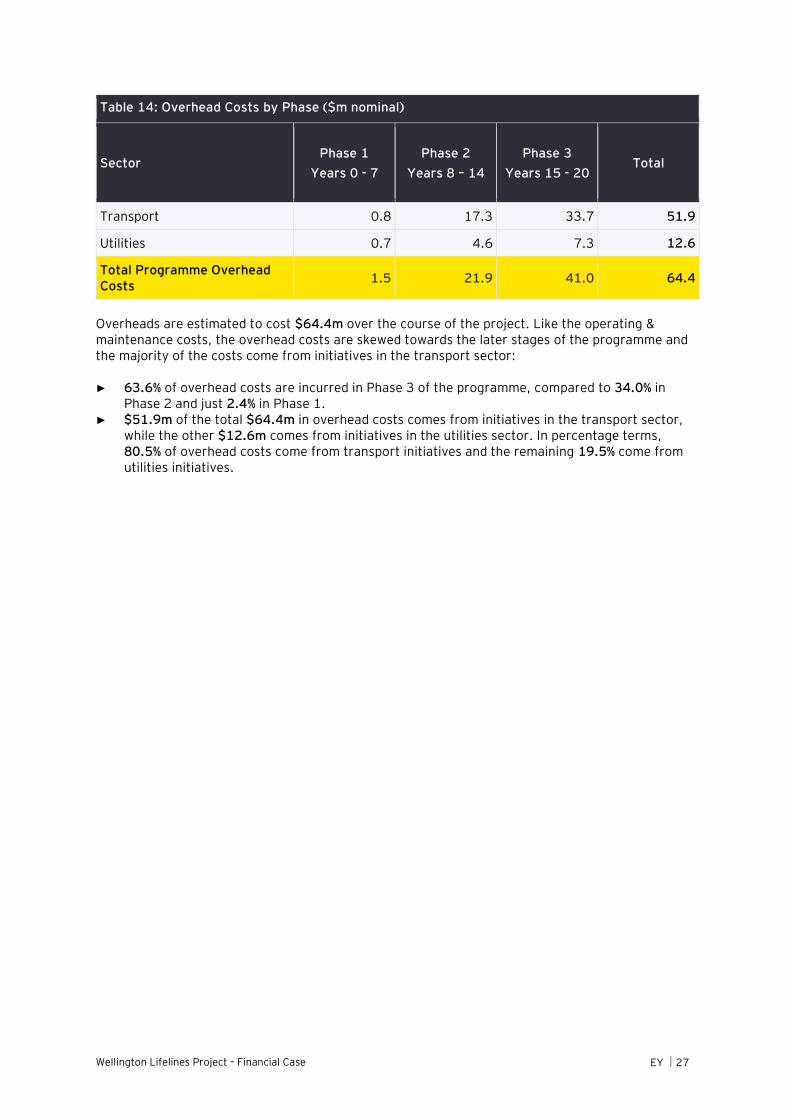
Wellington Lifelines Project – Financial Case EY 27
Table 14: Overhead Costs by Phase ($m nominal)
Sector Phase 1
Years 0 - 7
Phase 2
Years 8 – 14
Phase 3
Years 15 - 20 Total
Transport 0.8 17.3 33.7 51.9
Utilities 0.7 4.6 7.3 12.6
Total Programme Overhead Costs
1.5 21.9 41.0 64.4
Overheads are estimated to cost $64.4m over the course of the project. Like the operating & maintenance costs, the overhead costs are skewed towards the later stages of the programme and the majority of the costs come from initiatives in the transport sector:
► 63.6% of overhead costs are incurred in Phase 3 of the programme, compared to 34.0% in Phase 2 and just 2.4% in Phase 1.
► $51.9m of the total $64.4m in overhead costs comes from initiatives in the transport sector, while the other $12.6m comes from initiatives in the utilities sector. In percentage terms, 80.5% of overhead costs come from transport initiatives and the remaining 19.5% come from utilities initiatives.
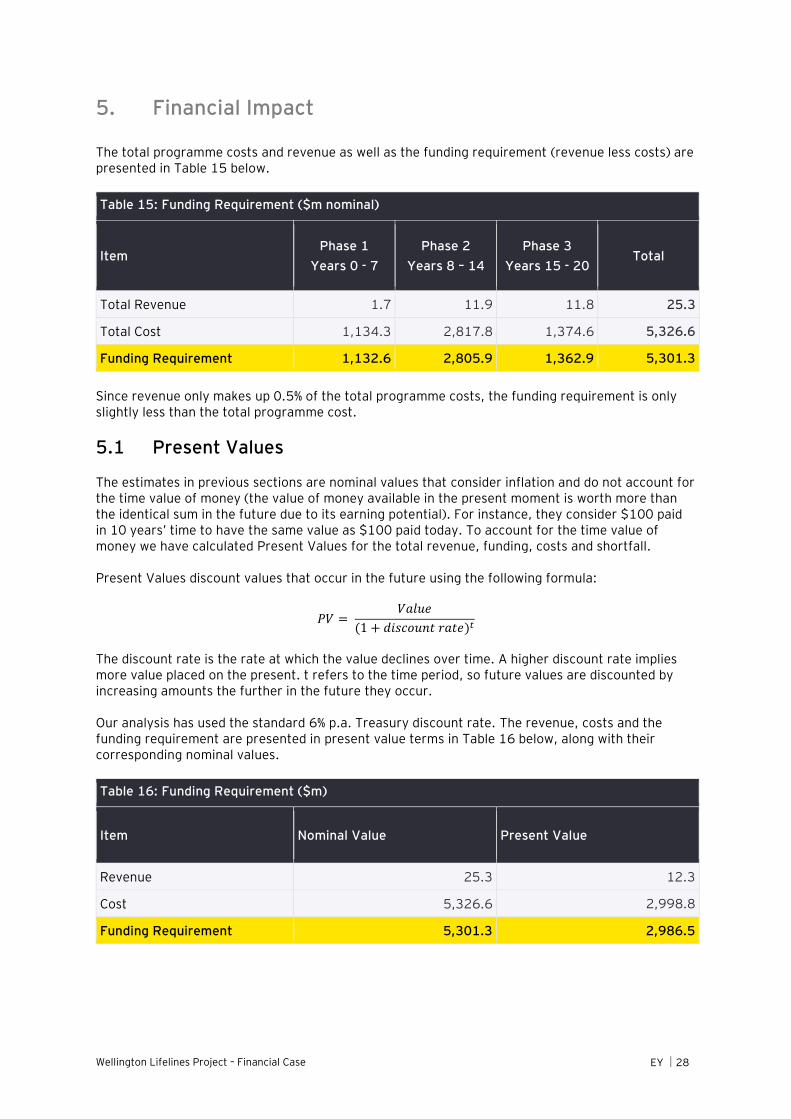
Wellington Lifelines Project – Financial Case EY 28
5. Financial Impact
The total programme costs and revenue as well as the funding requirement (revenue less costs) are presented in Table 15 below.
Table 15: Funding Requirement ($m nominal)
Item Phase 1
Years 0 - 7
Phase 2
Years 8 – 14
Phase 3
Years 15 - 20 Total
Total Revenue 1.7 11.9 11.8 25.3
Total Cost 1,134.3 2,817.8 1,374.6 5,326.6
Funding Requirement 1,132.6 2,805.9 1,362.9 5,301.3
Since revenue only makes up 0.5% of the total programme costs, the funding requirement is only slightly less than the total programme cost.
5.1 Present Values
The estimates in previous sections are nominal values that consider inflation and do not account for the time value of money (the value of money available in the present moment is worth more than the identical sum in the future due to its earning potential). For instance, they consider $100 paid in 10 years’ time to have the same value as $100 paid today. To account for the time value of money we have calculated Present Values for the total revenue, funding, costs and shortfall.
Present Values discount values that occur in the future using the following formula:
𝑃𝑉 = 𝑉𝑎𝑙𝑢𝑒
(1 + 𝑑𝑖𝑠𝑐𝑜𝑢𝑛𝑡 𝑟𝑎𝑡𝑒)𝑡
The discount rate is the rate at which the value declines over time. A higher discount rate implies more value placed on the present. t refers to the time period, so future values are discounted by increasing amounts the further in the future they occur.
Our analysis has used the standard 6% p.a. Treasury discount rate. The revenue, costs and the funding requirement are presented in present value terms in Table 16 below, along with their corresponding nominal values.
Table 16: Funding Requirement ($m)
Item Nominal Value Present Value
Revenue 25.3 12.3
Cost 5,326.6 2,998.8
Funding Requirement 5,301.3 2,986.5
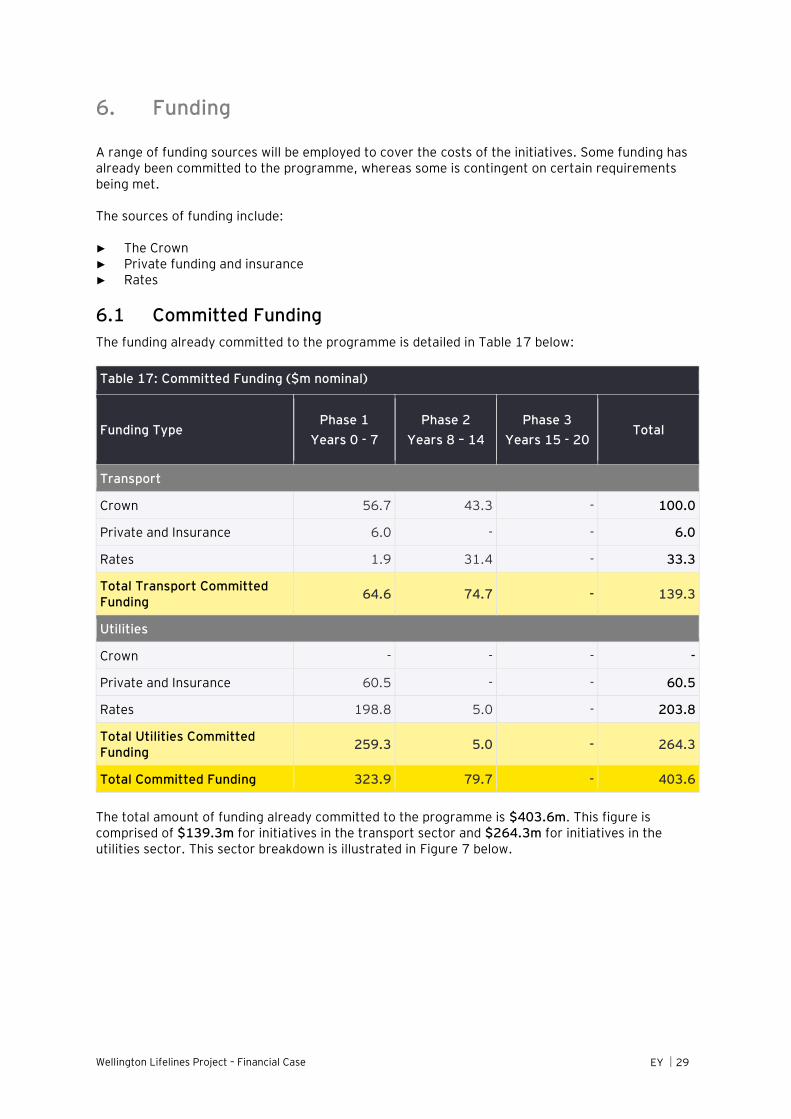
Wellington Lifelines Project – Financial Case EY 29
6. Funding
A range of funding sources will be employed to cover the costs of the initiatives. Some funding has already been committed to the programme, whereas some is contingent on certain requirements being met.
The sources of funding include:
► The Crown ► Private funding and insurance ► Rates
6.1 Committed Funding
The funding already committed to the programme is detailed in Table 17 below:
Table 17: Committed Funding ($m nominal)
Funding Type Phase 1
Years 0 - 7
Phase 2
Years 8 – 14
Phase 3
Years 15 - 20 Total
Transport
Crown 56.7 43.3 - 100.0
Private and Insurance 6.0 - - 6.0
Rates 1.9 31.4 - 33.3
Total Transport Committed Funding
64.6 74.7 - 139.3
Utilities
Crown - - - -
Private and Insurance 60.5 - - 60.5
Rates 198.8 5.0 - 203.8
Total Utilities Committed Funding
259.3 5.0 - 264.3
Total Committed Funding 323.9 79.7 - 403.6
The total amount of funding already committed to the programme is $403.6m. This figure is comprised of $139.3m for initiatives in the transport sector and $264.3m for initiatives in the utilities sector. This sector breakdown is illustrated in Figure 7 below.
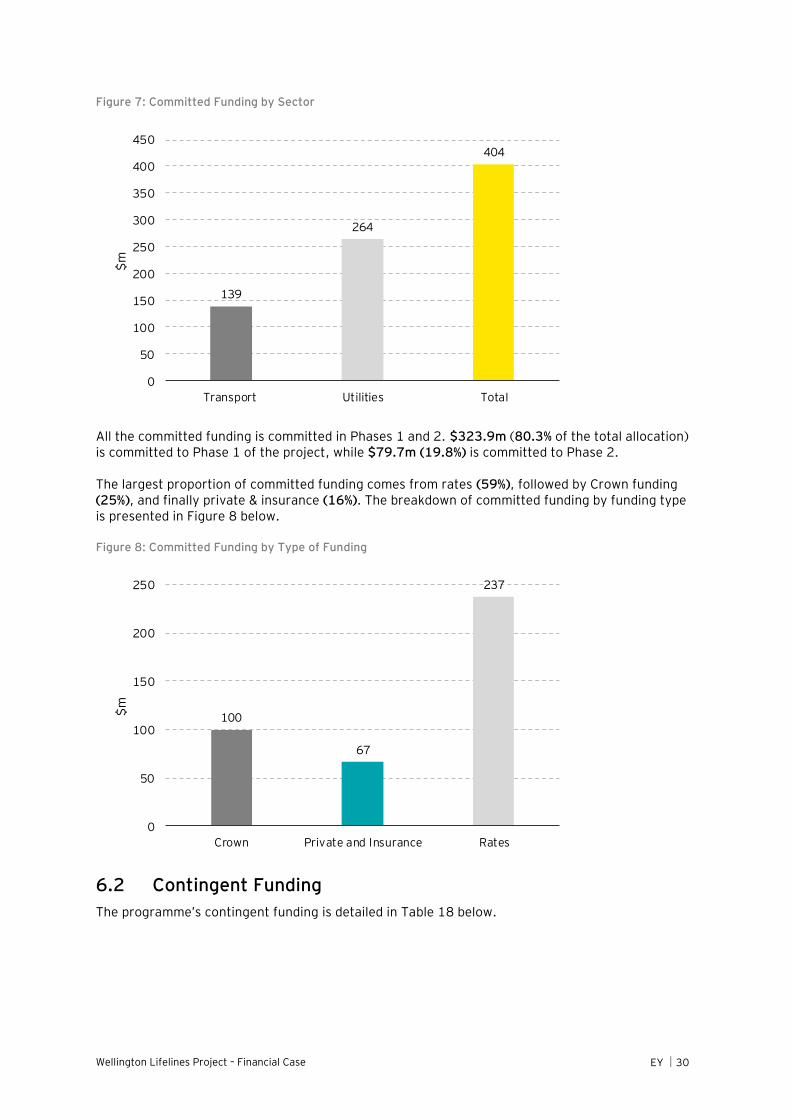
Wellington Lifelines Project – Financial Case EY 30
Figure 7: Committed Funding by Sector
All the committed funding is committed in Phases 1 and 2. $323.9m (80.3% of the total allocation) is committed to Phase 1 of the project, while $79.7m (19.8%) is committed to Phase 2.
The largest proportion of committed funding comes from rates (59%), followed by Crown funding (25%), and finally private & insurance (16%). The breakdown of committed funding by funding type is presented in Figure 8 below.
Figure 8: Committed Funding by Type of Funding
6.2 Contingent Funding
The programme’s contingent funding is detailed in Table 18 below.
139
264
404
0
50
100
150
200
250
300
350
400
450
Transport Utilities Total
$m
100
67
237
0
50
100
150
200
250
Crown Private and Insurance Rates
$m
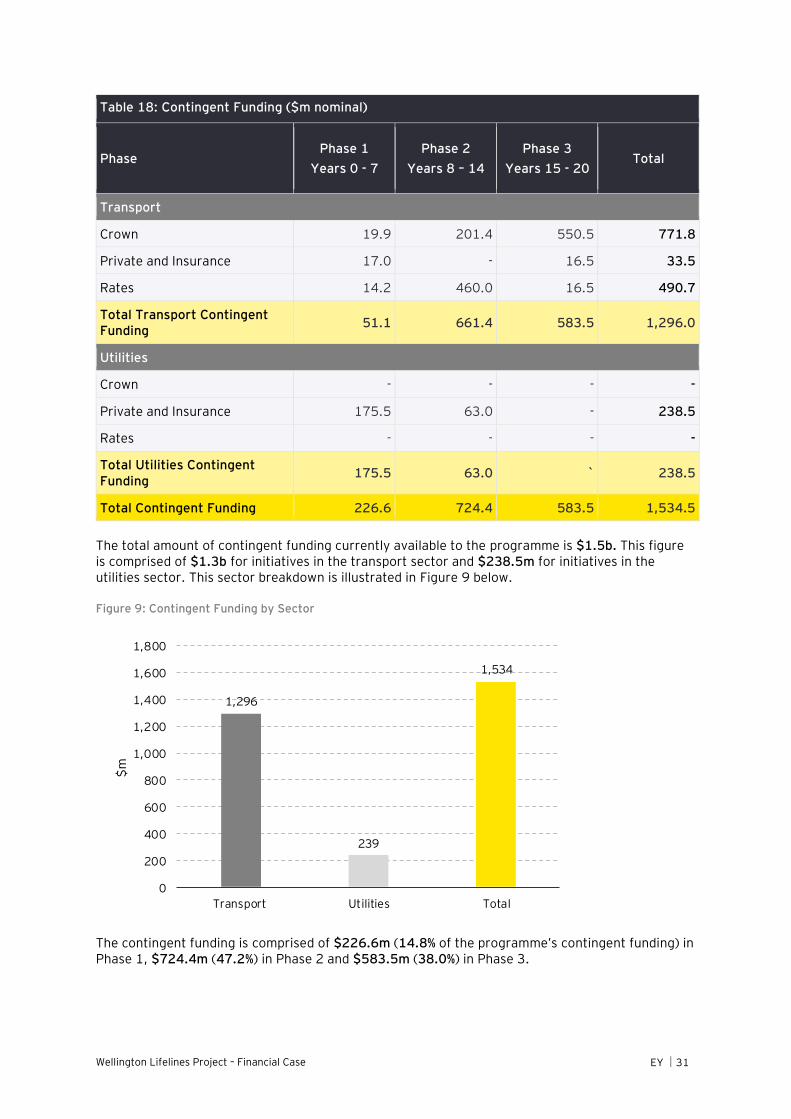
Wellington Lifelines Project – Financial Case EY 31
Table 18: Contingent Funding ($m nominal)
Phase Phase 1
Years 0 - 7
Phase 2
Years 8 – 14
Phase 3
Years 15 - 20 Total
Transport
Crown 19.9 201.4 550.5 771.8
Private and Insurance 17.0 - 16.5 33.5
Rates 14.2 460.0 16.5 490.7
Total Transport Contingent Funding
51.1 661.4 583.5 1,296.0
Utilities
Crown - - - -
Private and Insurance 175.5 63.0 - 238.5
Rates - - - -
Total Utilities Contingent Funding
175.5 63.0 ` 238.5
Total Contingent Funding 226.6 724.4 583.5 1,534.5
The total amount of contingent funding currently available to the programme is $1.5b. This figure is comprised of $1.3b for initiatives in the transport sector and $238.5m for initiatives in the utilities sector. This sector breakdown is illustrated in Figure 9 below.
Figure 9: Contingent Funding by Sector
The contingent funding is comprised of $226.6m (14.8% of the programme’s contingent funding) in Phase 1, $724.4m (47.2%) in Phase 2 and $583.5m (38.0%) in Phase 3.
1,296
239
1,534
0
200
400
600
800
1,000
1,200
1,400
1,600
1,800
Transport Utilities Total
$m
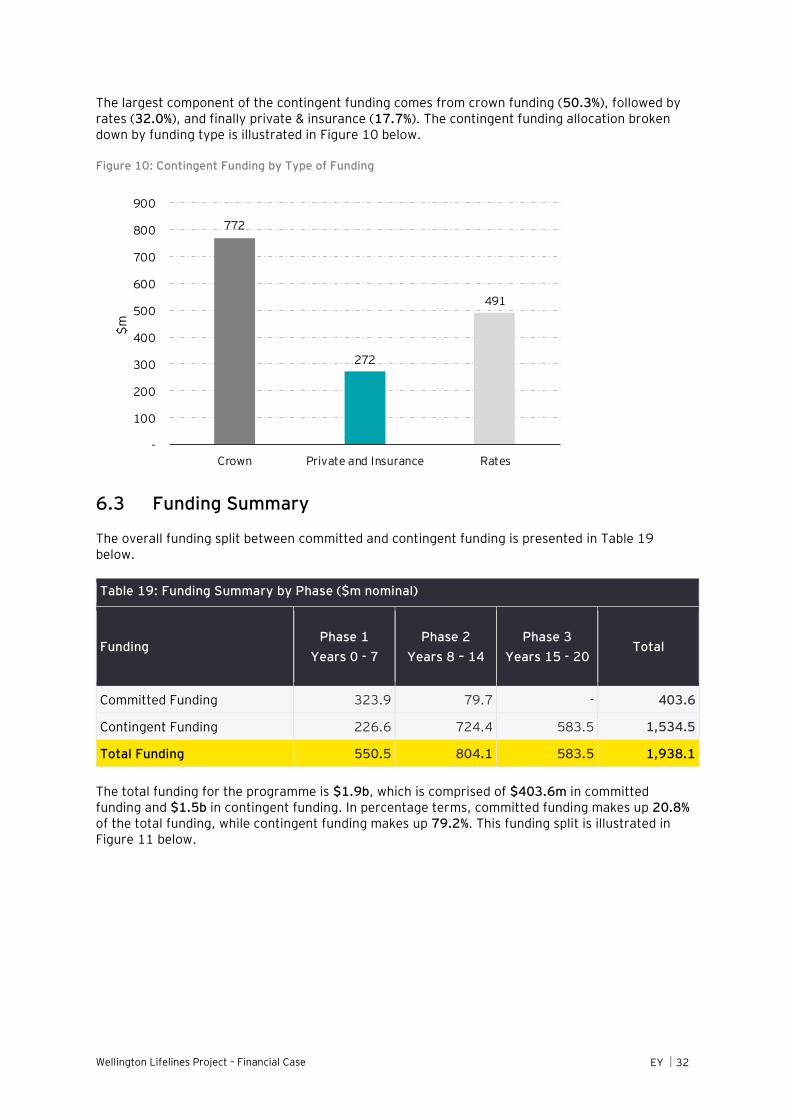
Wellington Lifelines Project – Financial Case EY 32
The largest component of the contingent funding comes from crown funding (50.3%), followed by rates (32.0%), and finally private & insurance (17.7%). The contingent funding allocation broken down by funding type is illustrated in Figure 10 below.
Figure 10: Contingent Funding by Type of Funding
6.3 Funding Summary
The overall funding split between committed and contingent funding is presented in Table 19 below.
Table 19: Funding Summary by Phase ($m nominal)
Funding Phase 1
Years 0 - 7
Phase 2
Years 8 – 14
Phase 3
Years 15 - 20 Total
Committed Funding 323.9 79.7 - 403.6
Contingent Funding 226.6 724.4 583.5 1,534.5
Total Funding 550.5 804.1 583.5 1,938.1
The total funding for the programme is $1.9b, which is comprised of $403.6m in committed funding and $1.5b in contingent funding. In percentage terms, committed funding makes up 20.8% of the total funding, while contingent funding makes up 79.2%. This funding split is illustrated in Figure 11 below.
772
272
491
-
100
200
300
400
500
600
700
800
900
Crown Private and Insurance Rates
$m
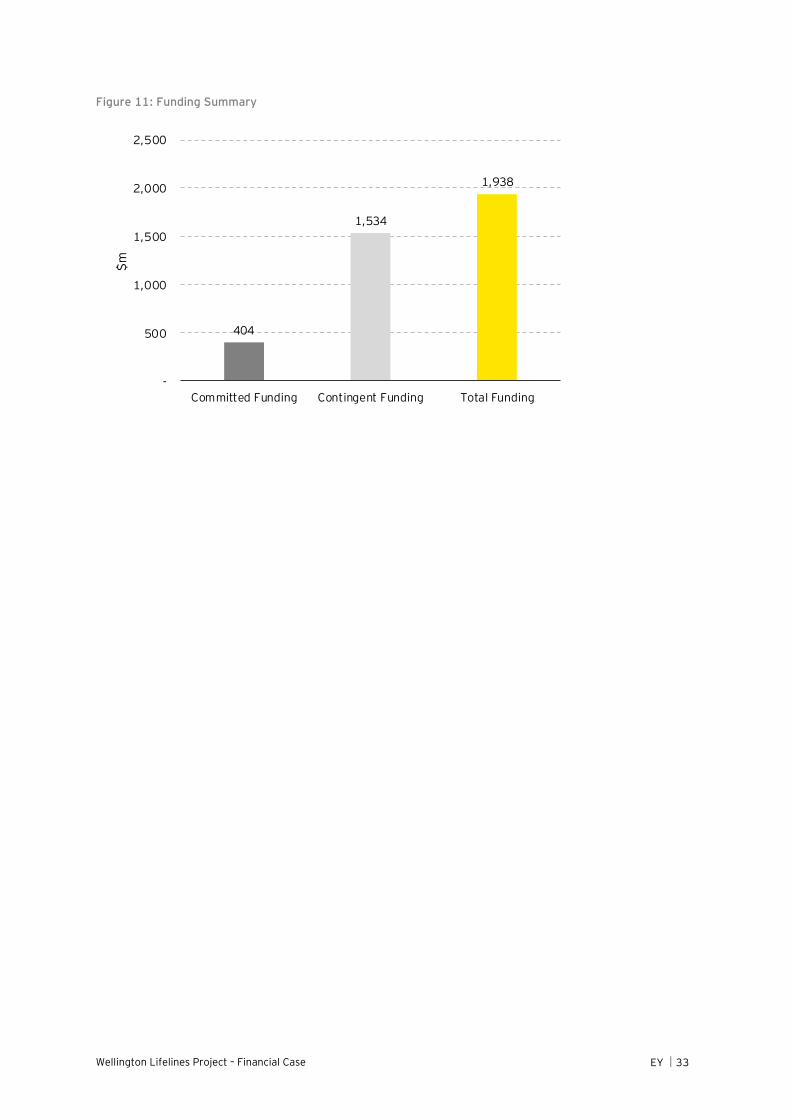
Wellington Lifelines Project – Financial Case EY 33
Figure 11: Funding Summary
404
1,534
1,938
-
500
1,000
1,500
2,000
2,500
Committed Funding Contingent Funding Total Funding
$m
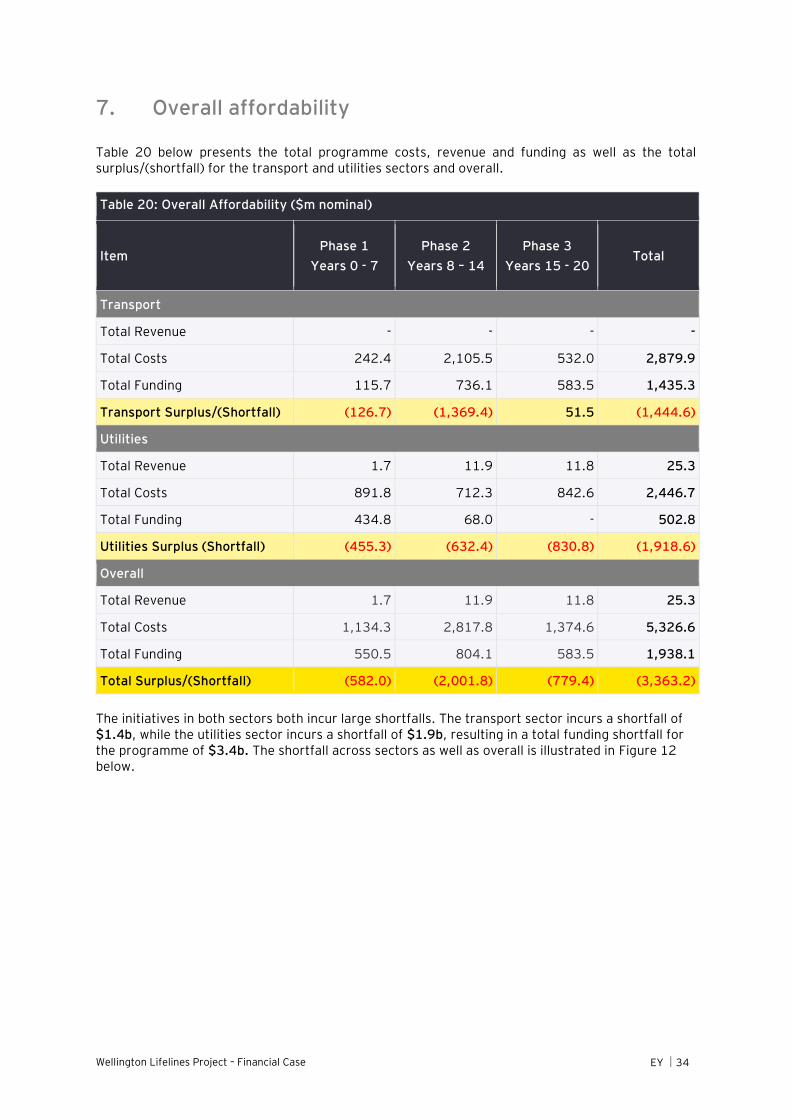
Wellington Lifelines Project – Financial Case EY 34
7. Overall affordability
Table 20 below presents the total programme costs, revenue and funding as well as the total surplus/(shortfall) for the transport and utilities sectors and overall.
Table 20: Overall Affordability ($m nominal)
Item Phase 1
Years 0 - 7
Phase 2
Years 8 – 14
Phase 3
Years 15 - 20 Total
Transport
Total Revenue - - - -
Total Costs 242.4 2,105.5 532.0 2,879.9
Total Funding 115.7 736.1 583.5 1,435.3
Transport Surplus/(Shortfall) (126.7) (1,369.4) 51.5 (1,444.6)
Utilities
Total Revenue 1.7 11.9 11.8 25.3
Total Costs 891.8 712.3 842.6 2,446.7
Total Funding 434.8 68.0 - 502.8
Utilities Surplus (Shortfall) (455.3) (632.4) (830.8) (1,918.6)
Overall
Total Revenue 1.7 11.9 11.8 25.3
Total Costs 1,134.3 2,817.8 1,374.6 5,326.6
Total Funding 550.5 804.1 583.5 1,938.1
Total Surplus/(Shortfall) (582.0) (2,001.8) (779.4) (3,363.2)
The initiatives in both sectors both incur large shortfalls. The transport sector incurs a shortfall of $1.4b, while the utilities sector incurs a shortfall of $1.9b, resulting in a total funding shortfall for the programme of $3.4b. The shortfall across sectors as well as overall is illustrated in Figure 12 below.
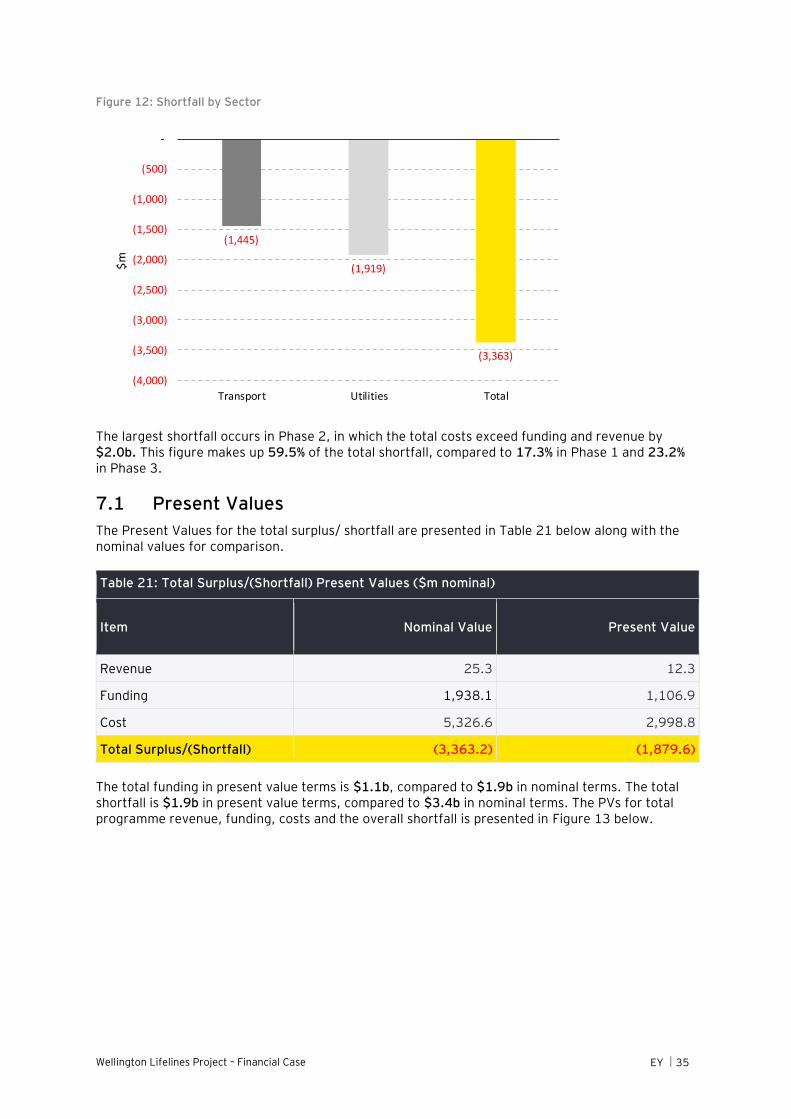
Wellington Lifelines Project – Financial Case EY 35
Figure 12: Shortfall by Sector
The largest shortfall occurs in Phase 2, in which the total costs exceed funding and revenue by $2.0b. This figure makes up 59.5% of the total shortfall, compared to 17.3% in Phase 1 and 23.2% in Phase 3.
7.1 Present Values
The Present Values for the total surplus/ shortfall are presented in Table 21 below along with the nominal values for comparison.
Table 21: Total Surplus/(Shortfall) Present Values ($m nominal)
Item Nominal Value Present Value
Revenue 25.3 12.3
Funding 1,938.1 1,106.9
Cost 5,326.6 2,998.8
Total Surplus/(Shortfall) (3,363.2) (1,879.6)
The total funding in present value terms is $1.1b, compared to $1.9b in nominal terms. The total shortfall is $1.9b in present value terms, compared to $3.4b in nominal terms. The PVs for total programme revenue, funding, costs and the overall shortfall is presented in Figure 13 below.
(1,445)
(1,919)
(3,363)
(4,000)
(3,500)
(3,000)
(2,500)
(2,000)
(1,500)
(1,000)
(500)
-
Transport Utilities Total
$m
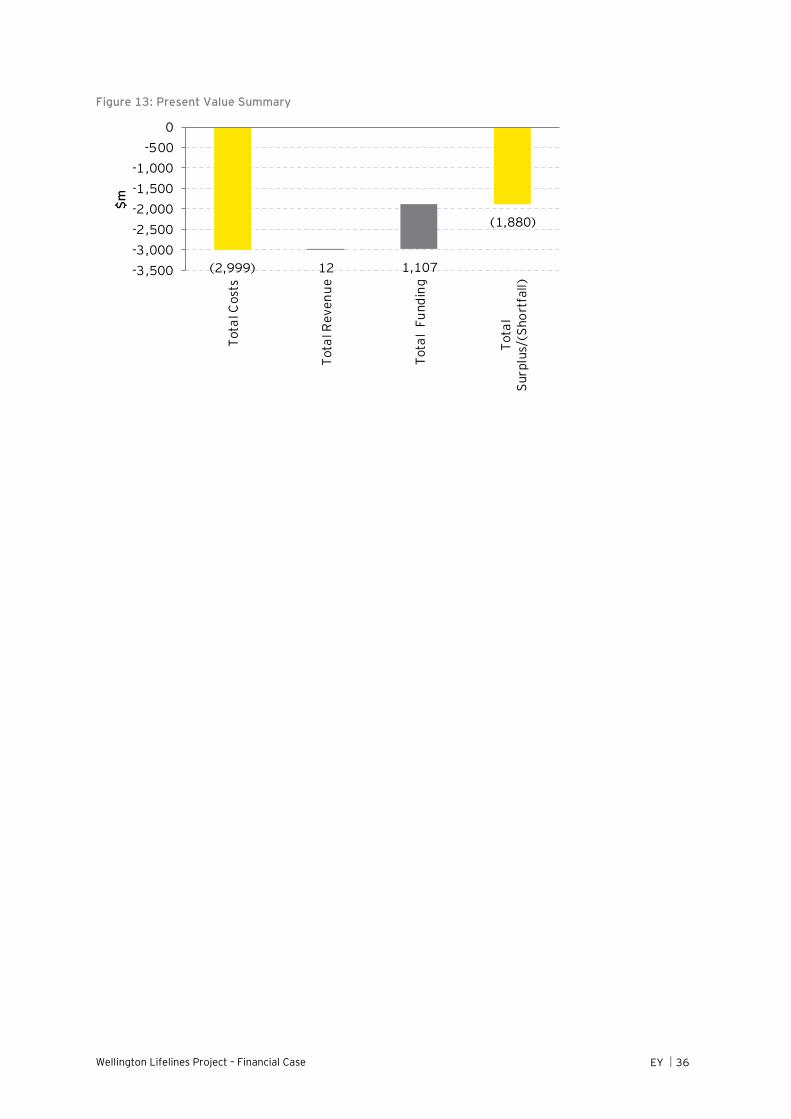
Wellington Lifelines Project – Financial Case EY 36
Figure 13: Present Value Summary
(2,999) 12 1,107
(1,880)
-3,500
-3,000
-2,500
-2,000
-1,500
-1,000
-500
0
To
tal C
ost
s
To
tal R
ev
en
ue
To
tal
Fu
nd
ing
To
tal
Su
rplu
s/(S
ho
rtfa
ll)
$m
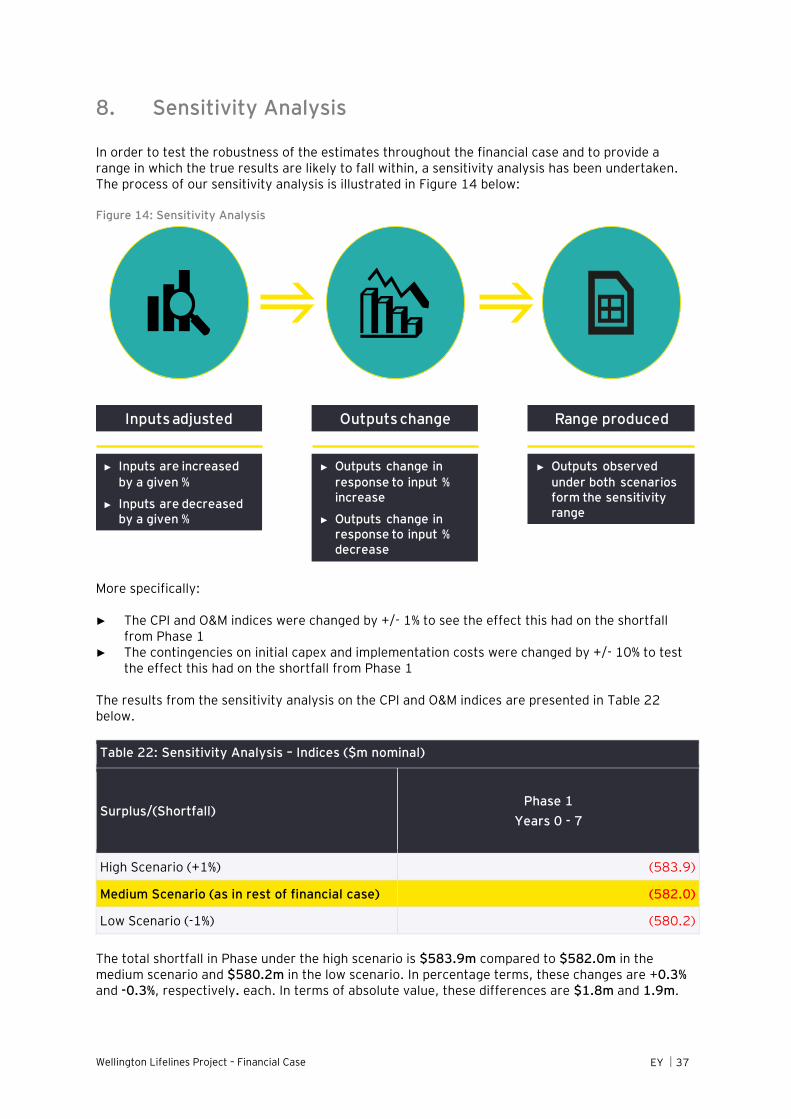
Wellington Lifelines Project – Financial Case EY 37
8. Sensitivity Analysis
In order to test the robustness of the estimates throughout the financial case and to provide a range in which the true results are likely to fall within, a sensitivity analysis has been undertaken. The process of our sensitivity analysis is illustrated in Figure 14 below:
Figure 14: Sensitivity Analysis
More specifically:
► The CPI and O&M indices were changed by +/- 1% to see the effect this had on the shortfall from Phase 1
► The contingencies on initial capex and implementation costs were changed by +/- 10% to test the effect this had on the shortfall from Phase 1
The results from the sensitivity analysis on the CPI and O&M indices are presented in Table 22 below.
Table 22: Sensitivity Analysis – Indices ($m nominal)
Surplus/(Shortfall) Phase 1
Years 0 - 7
High Scenario (+1%) (583.9)
Medium Scenario (as in rest of financial case) (582.0)
Low Scenario (-1%) (580.2)
The total shortfall in Phase under the high scenario is $583.9m compared to $582.0m in the medium scenario and $580.2m in the low scenario. In percentage terms, these changes are +0.3% and -0.3%, respectively. each. In terms of absolute value, these differences are $1.8m and 1.9m.
Inputs adjusted
► Inputs are increased
by a given %
► Inputs are decreased by a given %
Outputs change
► Outputs change in
response to input % increase
► Outputs change in response to input % decrease
Range produced
► Outputs observed
under both scenariosform the sensitivity range
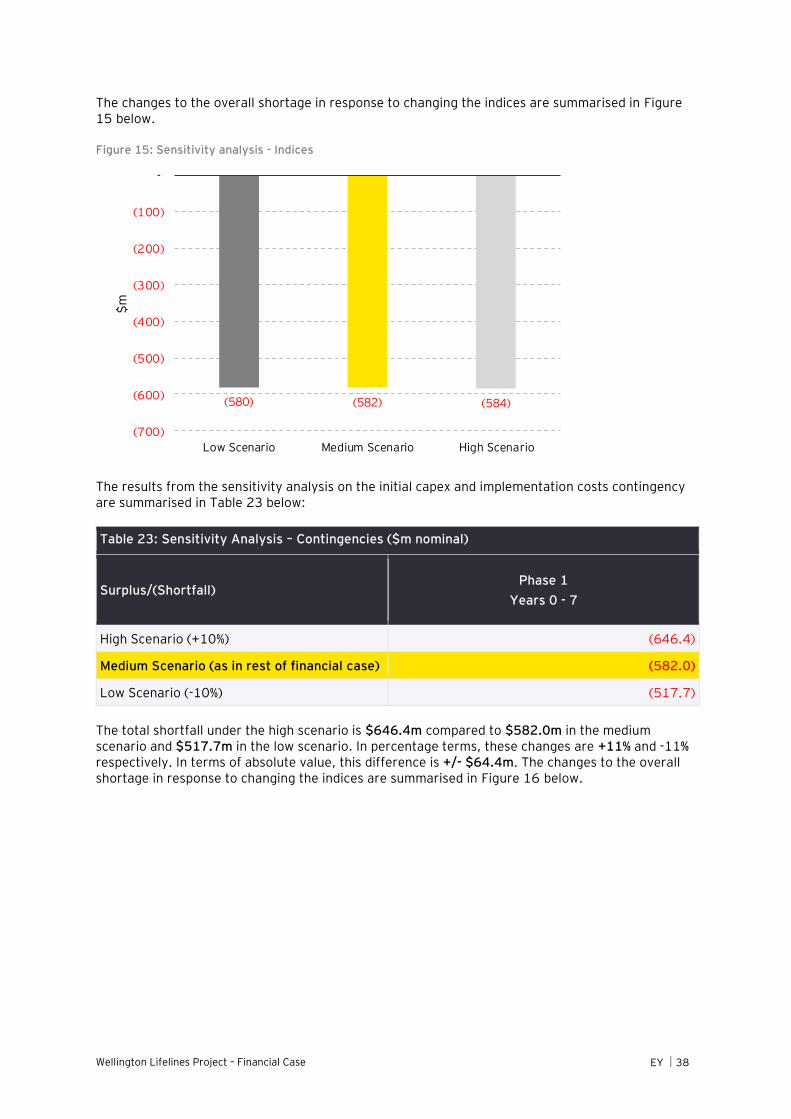
Wellington Lifelines Project – Financial Case EY 38
The changes to the overall shortage in response to changing the indices are summarised in Figure 15 below. Figure 15: Sensitivity analysis - Indices
The results from the sensitivity analysis on the initial capex and implementation costs contingency are summarised in Table 23 below:
Table 23: Sensitivity Analysis – Contingencies ($m nominal)
Surplus/(Shortfall) Phase 1
Years 0 - 7
High Scenario (+10%) (646.4)
Medium Scenario (as in rest of financial case) (582.0)
Low Scenario (-10%) (517.7)
The total shortfall under the high scenario is $646.4m compared to $582.0m in the medium scenario and $517.7m in the low scenario. In percentage terms, these changes are +11% and -11% respectively. In terms of absolute value, this difference is +/- $64.4m. The changes to the overall shortage in response to changing the indices are summarised in Figure 16 below.
(580) (582) (584)
(700)
(600)
(500)
(400)
(300)
(200)
(100)
-
Low Scenario Medium Scenario High Scenario
$m
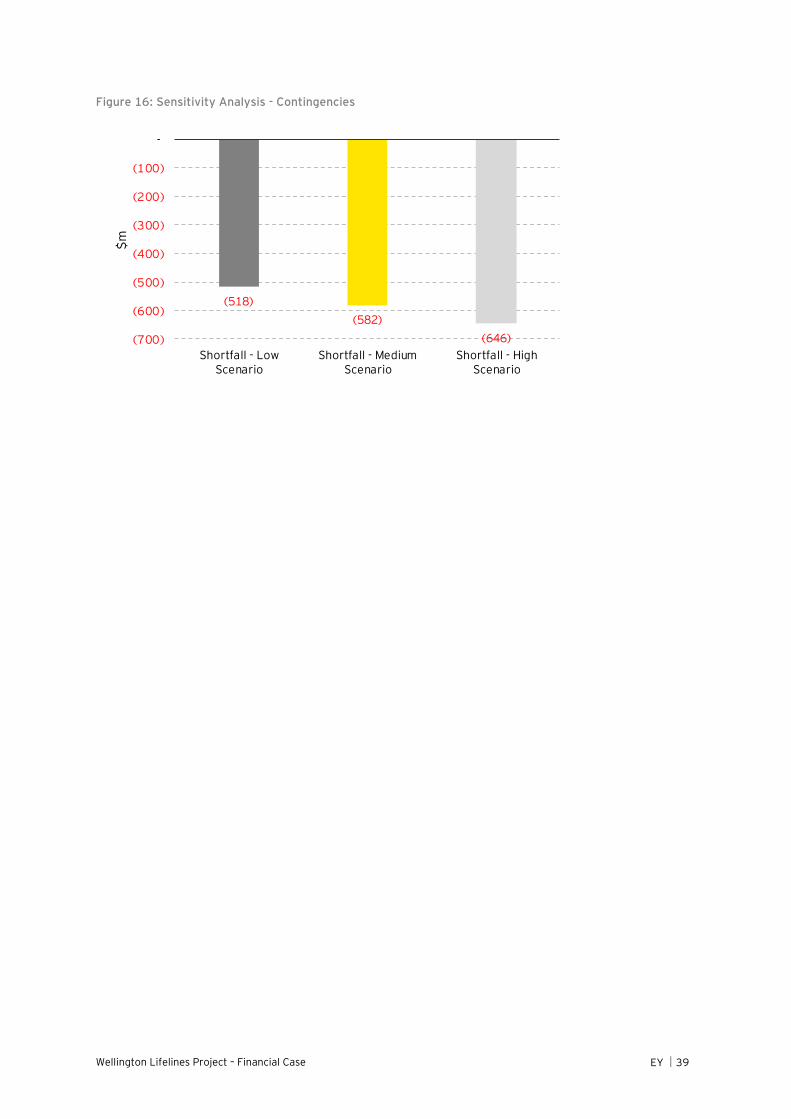
Wellington Lifelines Project – Financial Case EY 39
Figure 16: Sensitivity Analysis - Contingencies
(518)
(582)
(646)(700)
(600)
(500)
(400)
(300)
(200)
(100)
-
Shortfall - LowScenario
Shortfall - MediumScenario
Shortfall - HighScenario
$m
Wellington Lifelines Project – Financial Case EY 40
9. Conclusions and Recommendations
This Financial Case has demonstrated that a large amount of additional funding is required in order to implement the Lifelines Programme and realise the very large resiliency benefits. The key findings of the Financial Case are:
► The programme costs are estimated to be $5.3b. While this is a very large figure, it should be acknowledged that these are not all new costs, many of these initiatives already feature in the long-term capital plans of Wellington’s infrastructure providers
► Comfortably the largest single component of the programme cost is the initial capital expenditure of $3.9b, which represents 72.6% of the total cost
► The estimated revenue generated from the initiatives is small ($25.3m), and represents only 0.5% of the programme cost
► The estimated funding for the programme comes to $1.9b, which is 36.4% of the programme cost. However, only $403.6m of this amount is committed to the programme, while $1.5b is contingent on certain requirements being met. The committed funding makes up only 7.6% of the programme costs
► There is currently a significant funding shortfall of $3.4b, which represents 63.4% of the funding requirement. Therefore, only 36.6% of the funding required is allocated to the programme. If only committed funding is considered, this figure falls to only 7.6%
► In Phase 1 of the programme (the Phase containing the highest priority initiatives that deliver the greatest benefit and upon which other initiatives depend on), the funding shortfall is estimated to be $582.0m
► While the funding shortfall is large, many of the as yet unfunded projects are likely be funded through the crown, rates or user payment & insurance in the future
► The sensitivity analysis estimates the range within which the true shortfall amount for Phase 1 of the programme can be expected to fall, assuming that the cost estimates provided by the initiative owners are accurate. This range is $517.7m to $646.4m.
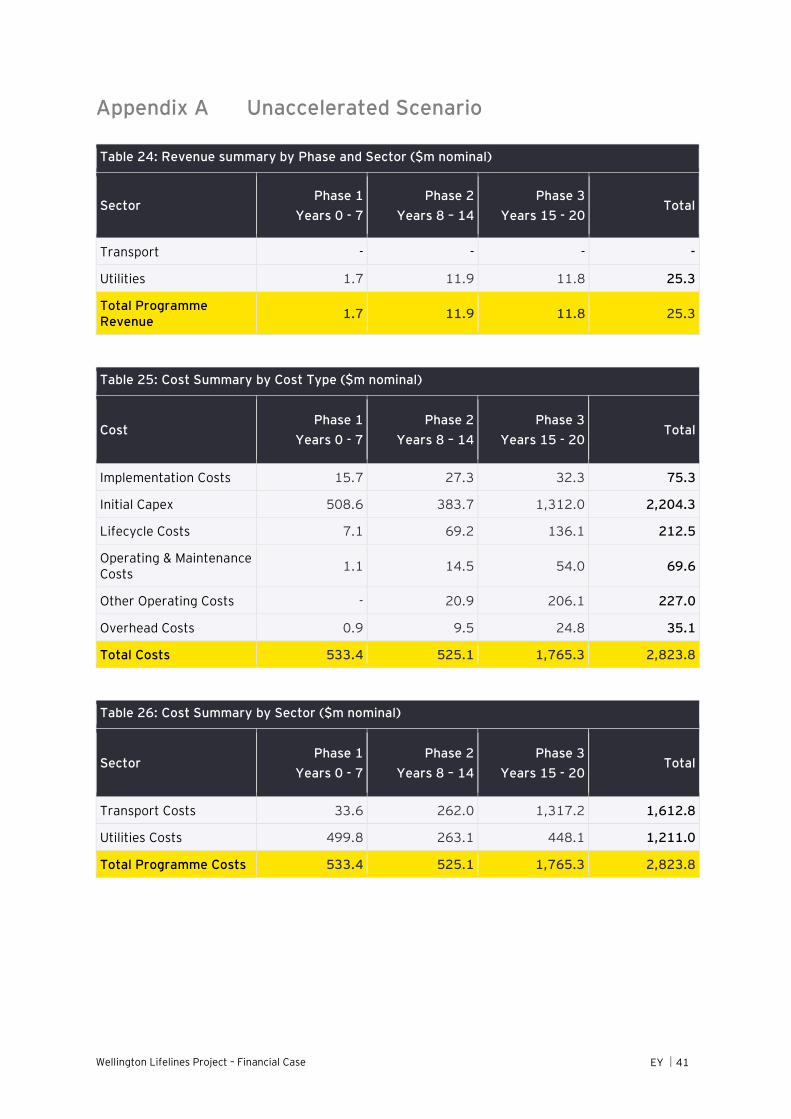
Wellington Lifelines Project – Financial Case EY 41
Appendix A Unaccelerated Scenario
Table 24: Revenue summary by Phase and Sector ($m nominal)
Sector Phase 1
Years 0 - 7
Phase 2
Years 8 – 14
Phase 3
Years 15 - 20 Total
Transport - - - -
Utilities 1.7 11.9 11.8 25.3
Total Programme Revenue
1.7 11.9 11.8 25.3
Table 25: Cost Summary by Cost Type ($m nominal)
Cost Phase 1
Years 0 - 7
Phase 2
Years 8 – 14
Phase 3
Years 15 - 20 Total
Implementation Costs 15.7 27.3 32.3 75.3
Initial Capex 508.6 383.7 1,312.0 2,204.3
Lifecycle Costs 7.1 69.2 136.1 212.5
Operating & Maintenance Costs
1.1 14.5 54.0 69.6
Other Operating Costs - 20.9 206.1 227.0
Overhead Costs 0.9 9.5 24.8 35.1
Total Costs 533.4 525.1 1,765.3 2,823.8
Table 26: Cost Summary by Sector ($m nominal)
Sector Phase 1
Years 0 - 7
Phase 2
Years 8 – 14
Phase 3
Years 15 - 20 Total
Transport Costs 33.6 262.0 1,317.2 1,612.8
Utilities Costs 499.8 263.1 448.1 1,211.0
Total Programme Costs 533.4 525.1 1,765.3 2,823.8
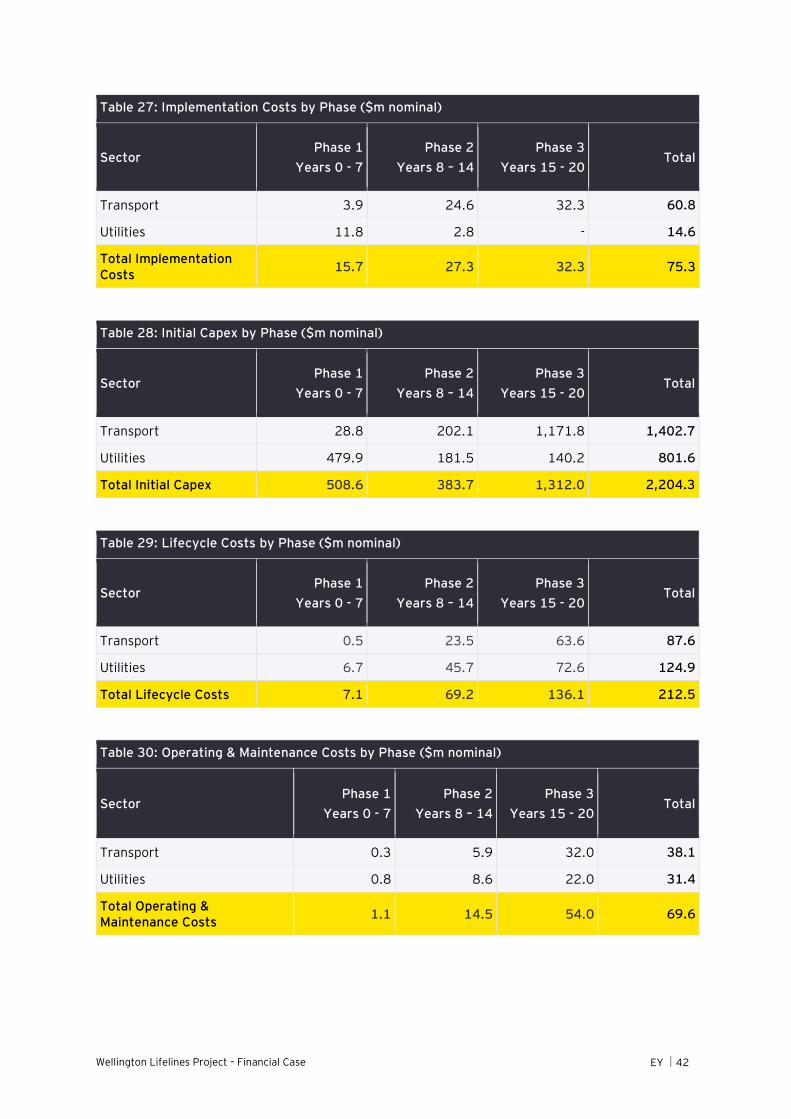
Wellington Lifelines Project – Financial Case EY 42
Table 27: Implementation Costs by Phase ($m nominal)
Sector Phase 1
Years 0 - 7
Phase 2
Years 8 – 14
Phase 3
Years 15 - 20 Total
Transport 3.9 24.6 32.3 60.8
Utilities 11.8 2.8 - 14.6
Total Implementation Costs
15.7 27.3 32.3 75.3
Table 28: Initial Capex by Phase ($m nominal)
Sector Phase 1
Years 0 - 7
Phase 2
Years 8 – 14
Phase 3
Years 15 - 20 Total
Transport 28.8 202.1 1,171.8 1,402.7
Utilities 479.9 181.5 140.2 801.6
Total Initial Capex 508.6 383.7 1,312.0 2,204.3
Table 29: Lifecycle Costs by Phase ($m nominal)
Sector Phase 1
Years 0 - 7
Phase 2
Years 8 – 14
Phase 3
Years 15 - 20 Total
Transport 0.5 23.5 63.6 87.6
Utilities 6.7 45.7 72.6 124.9
Total Lifecycle Costs 7.1 69.2 136.1 212.5
Table 30: Operating & Maintenance Costs by Phase ($m nominal)
Sector Phase 1
Years 0 - 7
Phase 2
Years 8 – 14
Phase 3
Years 15 - 20 Total
Transport 0.3 5.9 32.0 38.1
Utilities 0.8 8.6 22.0 31.4
Total Operating & Maintenance Costs
1.1 14.5 54.0 69.6
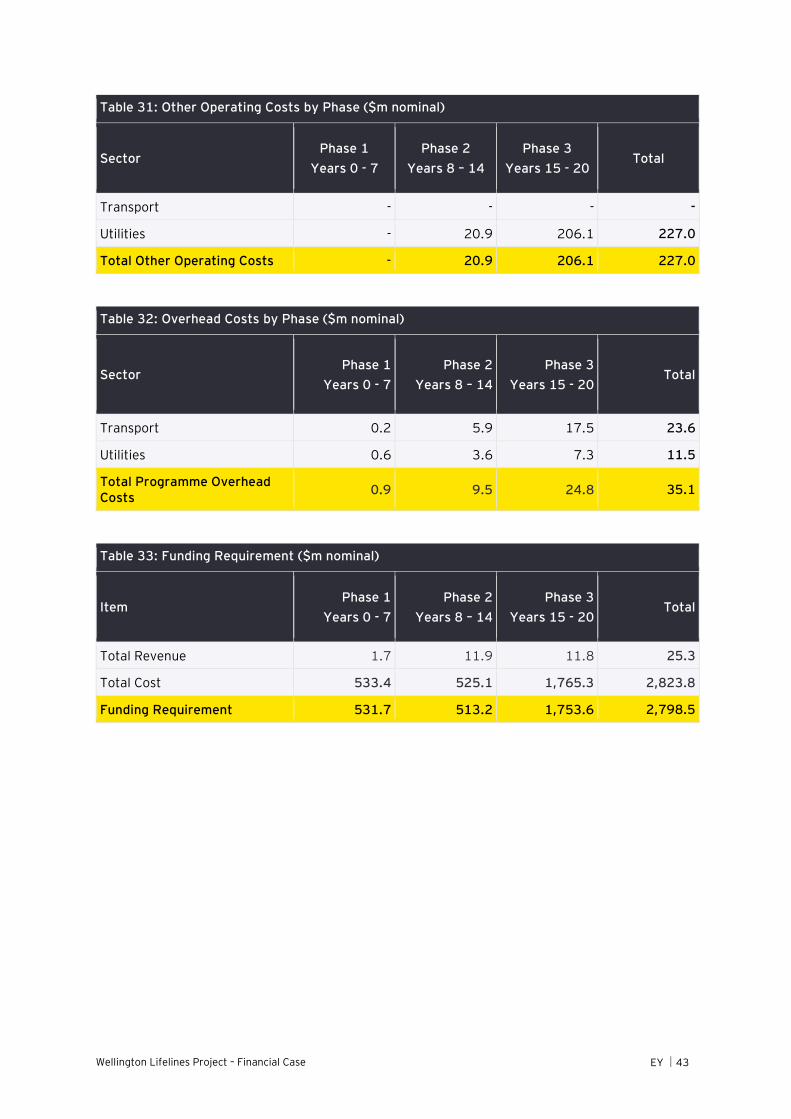
Wellington Lifelines Project – Financial Case EY 43
Table 31: Other Operating Costs by Phase ($m nominal)
Sector Phase 1
Years 0 - 7
Phase 2
Years 8 – 14
Phase 3
Years 15 - 20 Total
Transport - - - -
Utilities - 20.9 206.1 227.0
Total Other Operating Costs - 20.9 206.1 227.0
Table 32: Overhead Costs by Phase ($m nominal)
Sector Phase 1
Years 0 - 7
Phase 2
Years 8 – 14
Phase 3
Years 15 - 20 Total
Transport 0.2 5.9 17.5 23.6
Utilities 0.6 3.6 7.3 11.5
Total Programme Overhead Costs
0.9 9.5 24.8 35.1
Table 33: Funding Requirement ($m nominal)
Item Phase 1
Years 0 - 7
Phase 2
Years 8 – 14
Phase 3
Years 15 - 20 Total
Total Revenue 1.7 11.9 11.8 25.3
Total Cost 533.4 525.1 1,765.3 2,823.8
Funding Requirement 531.7 513.2 1,753.6 2,798.5
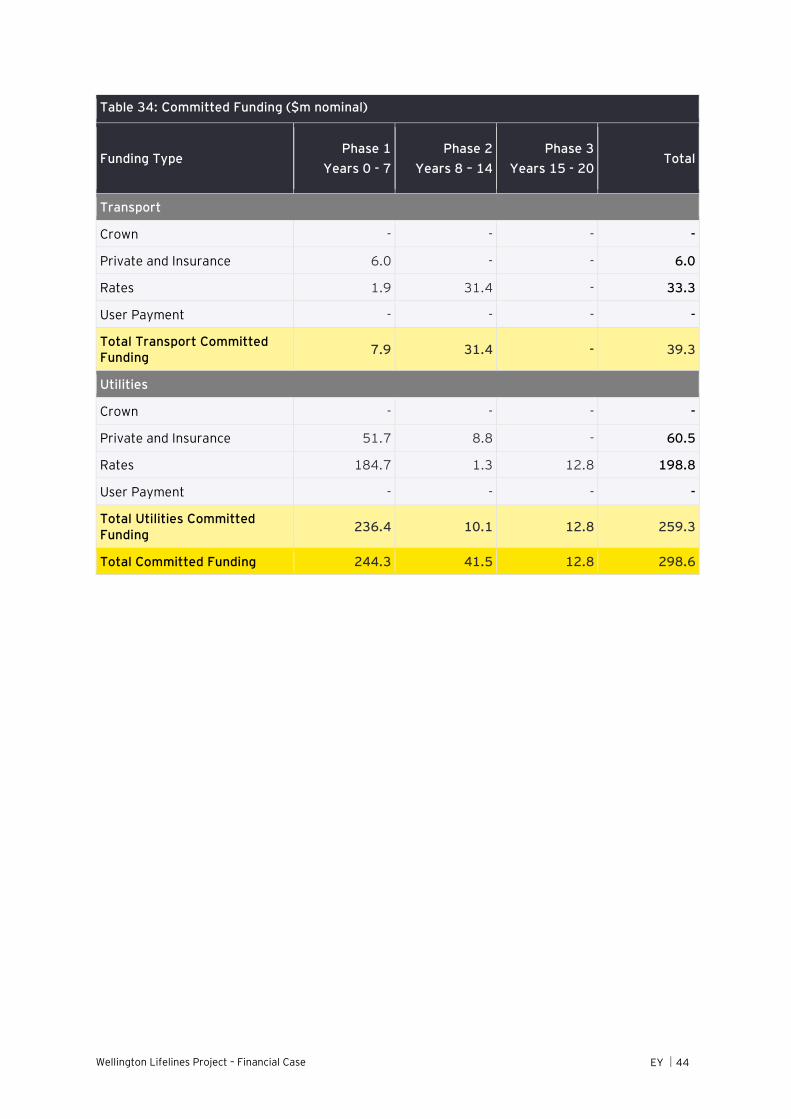
Wellington Lifelines Project – Financial Case EY 44
Table 34: Committed Funding ($m nominal)
Funding Type Phase 1
Years 0 - 7
Phase 2
Years 8 – 14
Phase 3
Years 15 - 20 Total
Transport
Crown - - - -
Private and Insurance 6.0 - - 6.0
Rates 1.9 31.4 - 33.3
User Payment - - - -
Total Transport Committed Funding
7.9 31.4 - 39.3
Utilities
Crown - - - -
Private and Insurance 51.7 8.8 - 60.5
Rates 184.7 1.3 12.8 198.8
User Payment - - - -
Total Utilities Committed Funding
236.4 10.1 12.8 259.3
Total Committed Funding 244.3 41.5 12.8 298.6
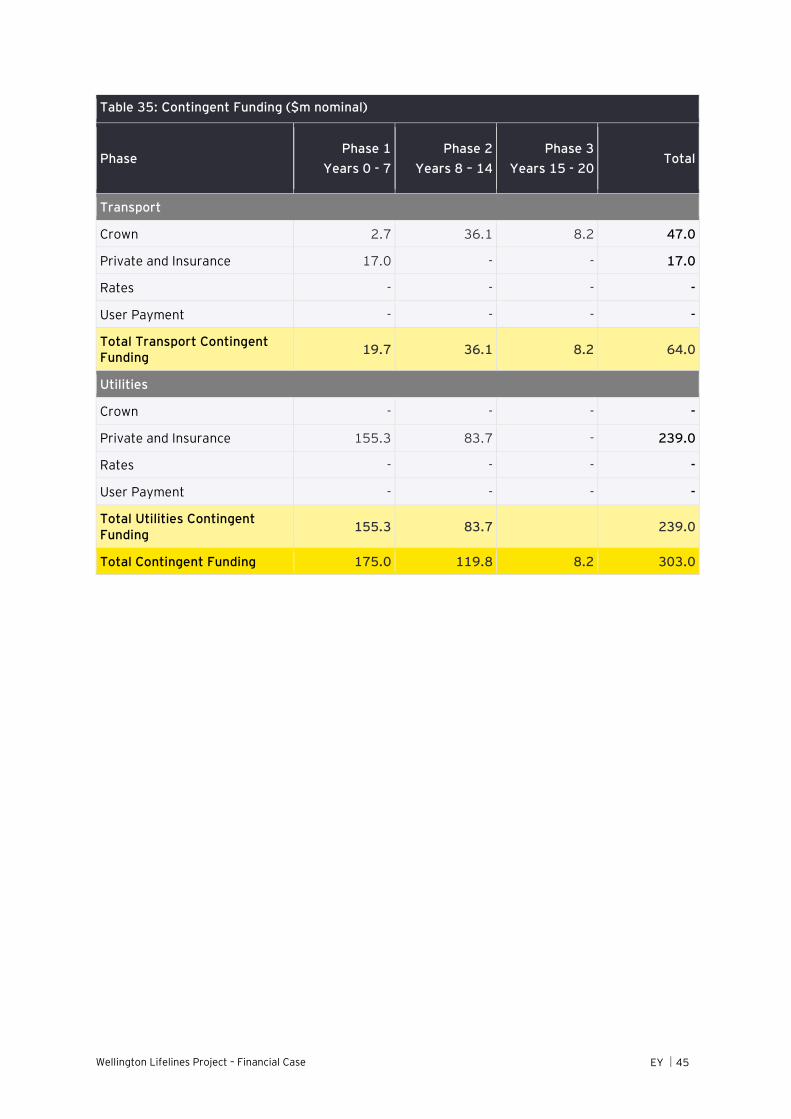
Wellington Lifelines Project – Financial Case EY 45
Table 35: Contingent Funding ($m nominal)
Phase Phase 1
Years 0 - 7
Phase 2
Years 8 – 14
Phase 3
Years 15 - 20 Total
Transport
Crown 2.7 36.1 8.2 47.0
Private and Insurance 17.0 - - 17.0
Rates - - - -
User Payment - - - -
Total Transport Contingent Funding
19.7 36.1 8.2 64.0
Utilities
Crown - - - -
Private and Insurance 155.3 83.7 - 239.0
Rates - - - -
User Payment - - - -
Total Utilities Contingent Funding
155.3 83.7 239.0
Total Contingent Funding 175.0 119.8 8.2 303.0
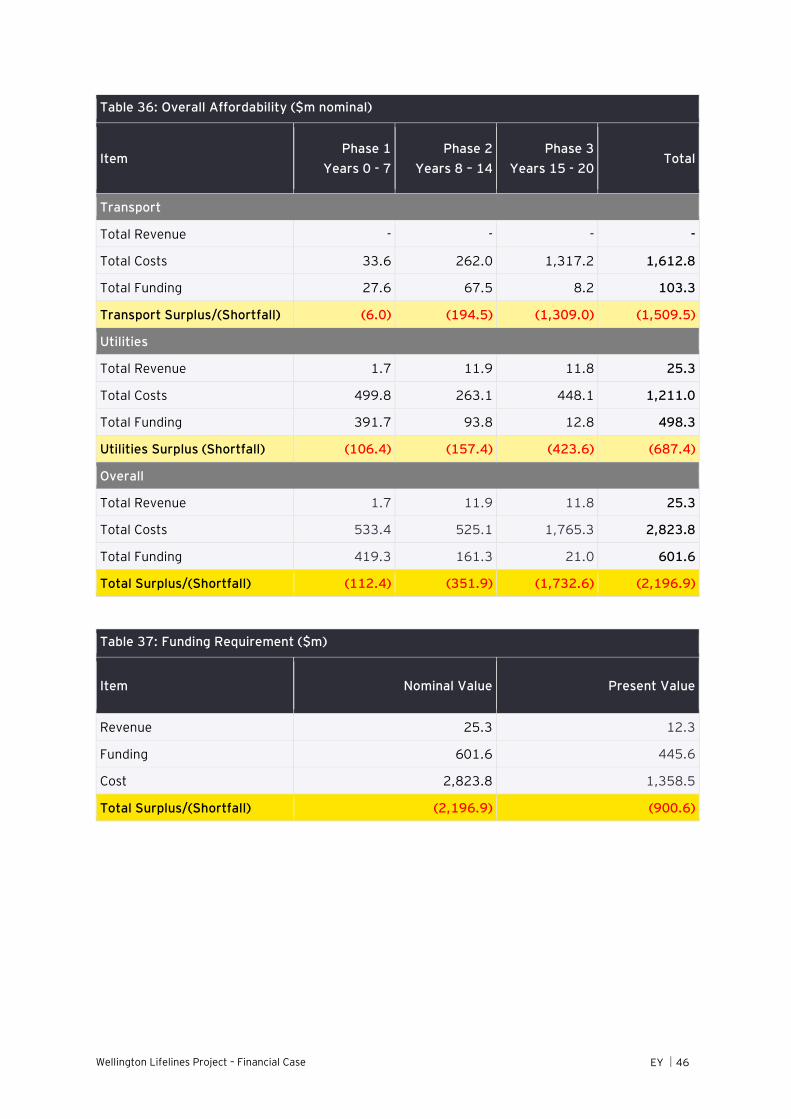
Wellington Lifelines Project – Financial Case EY 46
Table 36: Overall Affordability ($m nominal)
Item Phase 1
Years 0 - 7
Phase 2
Years 8 – 14
Phase 3
Years 15 - 20 Total
Transport
Total Revenue - - - -
Total Costs 33.6 262.0 1,317.2 1,612.8
Total Funding 27.6 67.5 8.2 103.3
Transport Surplus/(Shortfall) (6.0) (194.5) (1,309.0) (1,509.5)
Utilities
Total Revenue 1.7 11.9 11.8 25.3
Total Costs 499.8 263.1 448.1 1,211.0
Total Funding 391.7 93.8 12.8 498.3
Utilities Surplus (Shortfall) (106.4) (157.4) (423.6) (687.4)
Overall
Total Revenue 1.7 11.9 11.8 25.3
Total Costs 533.4 525.1 1,765.3 2,823.8
Total Funding 419.3 161.3 21.0 601.6
Total Surplus/(Shortfall) (112.4) (351.9) (1,732.6) (2,196.9)
Table 37: Funding Requirement ($m)
Item Nominal Value Present Value
Revenue 25.3 12.3
Funding 601.6 445.6
Cost 2,823.8 1,358.5
Total Surplus/(Shortfall) (2,196.9) (900.6)

Wellington Lifelines Project – Financial Case EY 47
Appendix B Sources
Wellington Lifelines Project. Protecting Wellington’s Economy Through Accelerated Infrastructure Investment Programme Business Case. Stage 1 – Demonstration of Benefits.2018.
Reserve Bank Bulletin, Vol 79, No.3. February 2016.
EY | Assurance | Tax | Transactions | Advisory About EY EY is a global leader in assurance, tax, transaction and advisory services. The insights and quality services we deliver help build trust and confidence in the capital markets and in economies the world over. We develop outstanding leaders who team to deliver on our promises to all of our stakeholders. In so doing, we play a critical role in building a better working world for our people, for our clients and for our communities.
EY refers to the global organization, and may refer to one or more, of the member firms of Ernst & Young Global Limited, each of which is a separate legal entity. Ernst & Young Global Limited, a UK company limited by guarantee, does not provide services to clients. Information about how EY collects and uses personal data and a description of the rights individuals have under data protection legislation is available via ey.com/privacy. For more information about our organization, please visit ey.com.
© 2019 Ernst & Young, New Zealand. All Rights Reserved. ED none
ey.com
REGIONAL RESILIENCE PROJECT
WELLINGTON LIFELINES


