Embed Size (px)
Citation preview
Western disturbances seen with AMSU-Band infrared sensors
Dileep M Puranik∗ and R N Karekar
Department of Atmospheric and Space Sciences, University of Pune, Pune 411 007, India.∗e-mail: [email protected]
Western disturbances (WD) of winter and pre-monsoon seasons are the important sources of rainfallin the Indo-Gangetic plains. WDs are troughs or circulations in the westerly winds modified bythe Himalayas. Operationally, WDs are monitored using infrared (IR) and water vapour (WV)images. Advanced Microwave Sounding Unit-B (AMSU-B), flying onboard the NOAA satellites,also allows WDs to be monitored in five microwave frequencies. Two are in water vapour window(89, 150 GHz) and three are absorption channels (centred at 183.31 GHz). Unlike the top of cloudview in IR or WV, AMSU-B radiances show the effect of moisture and hydrometeors in differentlayers.
Two cases of WD (17 April 2001 and 18–19 February 2003) are discussed using the microwavedata from AMSU-B and the IR and WV data from Meteosat-5. The aim here is to demonstrate theskill of AMSU-B in delineating structure of WDs. In particular, the cold intrusion and the moistconveyor belts are examined. It was found that the multi-channel view of the AMSU-B permits abetter understanding of the moist structures seen in the conveyor belts.
The a trous wavelet transform is used to clearly bring out mesoscale features in WDs. AMSU-Bbrings out intense convection as a large depression of BTs (>50K) at 150/176 GHz, cirrus andmoist bands at 180/182 GHz. Mesoscale convection lines within WDs that last short time are shownhere for the first time only in the AMSU-B images. Large-scale cirrus features are separated usingthe a trous wavelet transform.
Lastly, it is shown that there is a good likeness in the rain contours in the 3-h rain 3B42 (computedfrom TRMM and other data) to AMSU-B depressions in BT. Overall, AMSU-B shows better skillin delineating the structure of clouds and rain in WDs.
1. Introduction
1.1 Western disturbances (WDs)
The WDs (Rao and Srinivasan 1969) are themain source of precipitation in winter and pre-monsoon seasons over the Indo-Gangetic plains.During these seasons about 4–5 WDs occur permonth over NW India. They are baroclinic weathersystems (Holton 1992) moving within the westerlywind regime. The main component of these systemsis water vapour from the Arabian Sea rising alongisentropic surfaces. WDs are not extratropical
cyclones (Bader et al 1995) but are unique to theIndian subcontinent.
In an extratropical system, an anticyclonicallycurved warm conveyer belt brings in warm moistair to the centre of the system. The warm conveyorbelt (WCB, Browning 1986; Bader et al 1995) is anisentropic flow initiating in the planetary boundarylayer in the subtropics and moving upwards andtowards higher latitudes, almost parallel to the sur-face front. The realisation of such conveyor belts inthe satellite images has been termed atmosphericrivers of moisture. Such WCBs are many hun-dreds of kilometres long. This warm air is undercut
Keywords. Western disturbances; microwaves; infrared; AMSU-B; atmospheric sciences; remote sensing.
J. Earth Syst. Sci. 118, No. 1, February 2009, pp. 27–39© Printed in India. 27
28 Dileep M Puranik and R N Karekar
by (typically north-westerly) cold conveyor belt ofsimilar dimensions. At the boundary of the coldand dry conveyor belts, vertical circulations are setup, producing convection.
In contrast, a WD is smaller, of the order offive degrees latitude in size. It develops within anexisting trough in the belt of subtropical westerlywind and intensifies on passage across the Suleimanranges in Pakistan. Temperature and humidity gra-dients are not steep in WDs and therefore WDsdo not show fronts. In fact, given the weak tem-perature gradients over the (Indian) subtropicalregion, moist conveyor belts (MCB) (Bao et al2006; Knippertz and Martin 2007) occur insteadof WCB. Southwesterly wind ahead of the troughbrings in moisture from the Arabian Sea. Thewestern Himalayas lie almost normal to this moistwind ahead of the trough. WDs are retarded andmodified during their passage across the westernHimalayas. The Sub-Tropical Jet stream (STJ) isoften poised over these westerly troughs. Behindthe trough, the cold and dry upper troposphericwind crosses southwards. This is a cold air intru-sion into the WD. The STJ provides the neces-sary upper level divergence for the intensificationof the WD.
During the passage of a WD, the moist airascending over the western Himalayas producesthick and cold cirrus over the Himalayas which donot have significant rain or rain rates. Beneath thiscirrus canopy, short life mesoscale cloud structuresdevelop that produce significant rain. In both IRand WV images, the cold canopy leads to over-estimation of the raining areas (Kidder and VonderHaar 1995) in a WD.
1.2 Sensing WDs from satellites
Operationally, the WDs are monitored in ther-mal infrared (10.5–12.5µm, IR) and water vapourabsorption (6.7µm, WV) bands from geostationarysatellites such as INSAT and Meteosat-5. Thelatter had a high spatio-temporal sampling fre-quency (5 km, 30 min), permitting close monitoringof weather systems. However, only the cloud-topradiances are sensed in IR. In the WV band, radi-ances from the mid-tropospheric moist layer andcloud tops above the moist layer are visible.
The problem of not being able to see beneathcloud tops and not seeing moisture in variouslayers, faced by visible and infrared sensors,may be alleviated with microwaves. The ear-lier microwave sensors had coarse resolutions(25–60 km). Even with this limitation, the SpecialSensor Microwave/Imager was able to sense theMCBs (Bao et al 2006). Since 1998, with the launchof the Advanced Microwave Sounding Unit-B(AMSU-B), with a 16 km nadir resolution in five
channels, clouds and moisture can be sensed withhigher fidelity.
1.3 Problem statement
From the discussion above it is apparent that thearea of ascent in the MCB results in medium andhigh clouds. At the boundary of moist and dryair, instability occurs since the moisture and tem-perature gradients are large. Accurately locatingand finding the extent of various cloud-types isimportant for locating the latent heat releases thatdrive the disturbance and assessing the rain rates.These considerations lead to the first aim of thispaper.
• To compare the depiction of the cold intrusionsand MCBs in the five-channel AMSU-B data andthe IR or WV data (see section 4).
The other two complementary aims are as follows.
• To delineate mesoscale structures within theWDs with wavelet transform (WT) as an addi-tional tool (see section 5).
• To show that wavelet transformed AMSU-Bimages have better likelihood to the TRMM 3-hrain data for WD, than IR/WV images (seesection 6).
This paper is organised as follows. Data andits scale analysis are discussed in section 2. Forscale analysis we introduce a new variant of WTtermed the a trous WT (ATWT, Starck et al 1998;Puranik and Karekar 2004). We have selected twotypical cases for this study. In section 3, the syn-optic environment of two cases of WD (17 April2001, 19 February 2003) is discussed. A compar-ative study of conveyor belts using IR, WV andAMSU-B data, is made in section 4. Section 5brings out the advantage of AMSU-B (and the scaleanalysis of the AMSU-B data) for bringing outmesoscale features of WDs. Section 6 discusses rainin WDs. Section 7 has remarks on WD analysis andconcludes this work.
2. Data and scale analysis
2.1 Sensors
The IR and WV data are from the Meteosat-5.These have been radiometrically and geometricallycorrected by EUMETSAT. We have carried outgeo-location and conversion of digital counts toBTs. The range of BTs covered with a grey-scalein IR and WV data is between 318 K and 190 K.Each grey-shade corresponds to an 8 K interval.
The response of the WV band depends on thesensor bandwidth, the sensor zenith angle and the
Western disturbances in IR and microwaves 29
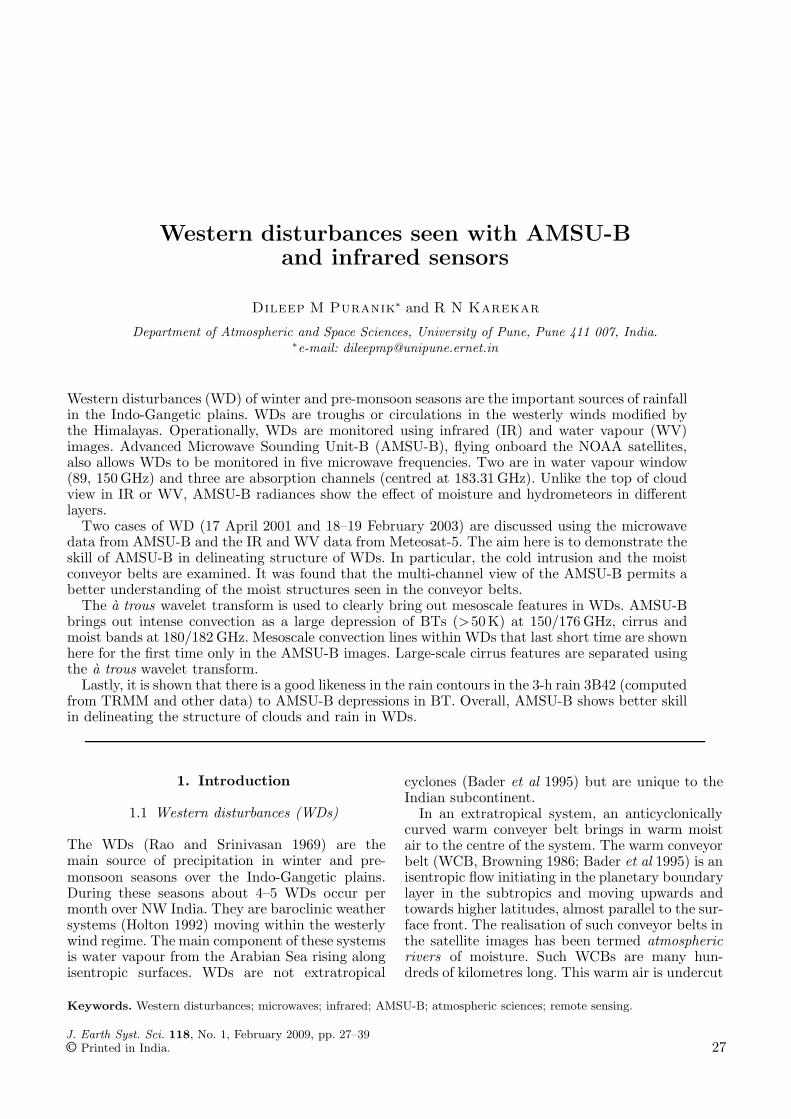
Figure 1. Synoptic situation at 0530 IST on 17 April 2001. (a) Upper winds and isotachs are seen at 700 hPa, (b) at300 hPa levels, (c) RH at 700 hPa and (d) at 300 hPa. The shapes of the regions of steep moisture gradient are similar butdisplaced by the dry air intrusion.
intervening atmosphere. In the case of Meteosat-5,the weighting function (Kidder and Vonder Haar1995) peaks between 350 and 400 hPa in mid-latitude summer atmospheres (Roca et al 2001).
The AMSU-B instrument flew or presently fliesonboard many NOAA satellites (N-15, 16, 17 and18). Each scan line has 90 pixels covering 2120 km(Goodrum et al 2000). Sensing channels are at89, 150, 183.3 ± 1, 183.3 ± 3 and 183.3 ± 7GHz.The latter three channels are referred to as 182,180 and 176 GHz. The first two channels, 89and 150 GHz are in atmospheric windows whilethe other three are in the 183 GHz absorptionband allowing an assessment of water vapour. The
AMSU-B digital counts are converted to BTs. The90 pixels in each scan line were re-sampled to136 pixels per line to correct the image distortion.The BTs are shown as images using a grey-scalewith 3 K intervals.
2.2 Data sources
Meteosat-5 IR and WV data at 5 km spatialand 30 min temporal resolution is obtained fromEUMETSAT archives. AMSU-B data is fromNOAA CLASS Archive. In section 6, three hourlyrain (in mm) data for 0.25◦ × 0.25◦ cells fromthe Tropical Rain Measuring Mission (TRMM)
30 Dileep M Puranik and R N Karekar
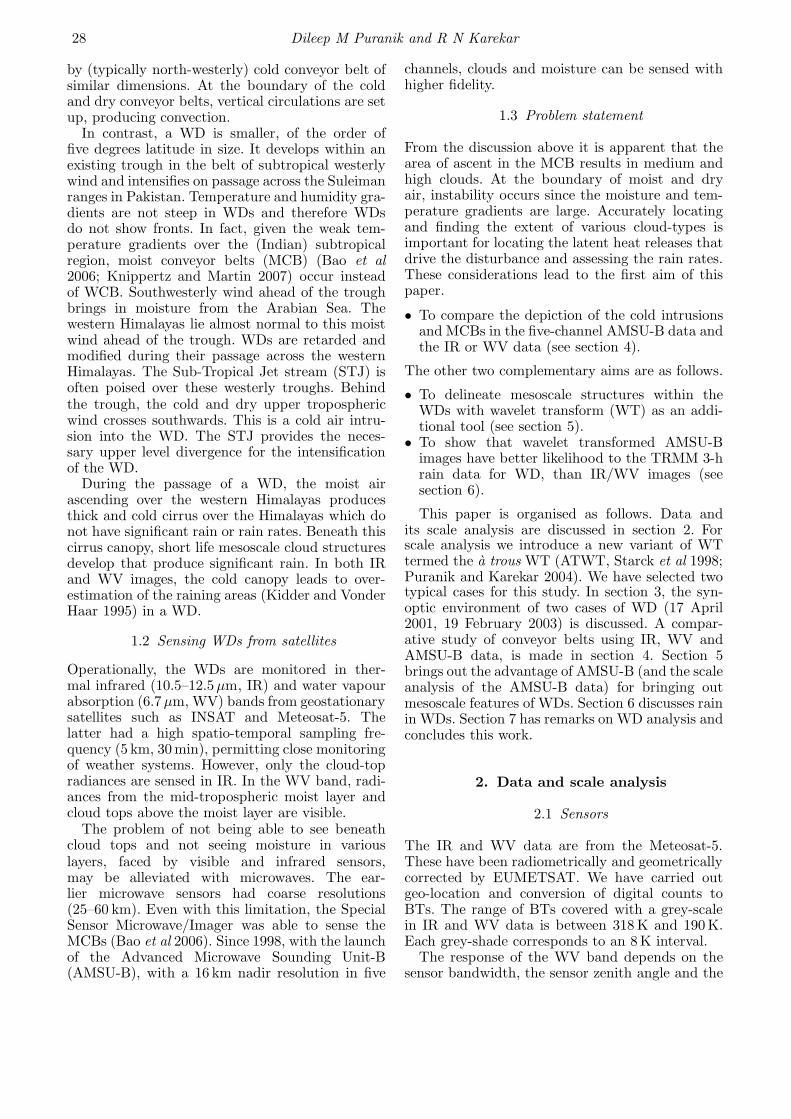
Figure 2. Synoptic situation at 700 hPa on 18 February 2003. (a) Upper winds and isotachs are seen at 0530 IST and(b) at 1730 IST. (c) and (d) show column precipitable water at 0530 IST and 1730 IST respectively. Advection of moistureinto Rajasthan is apparent.
3B 42 algorithm is used for comparison withAMSU-B.
2.3 Depression in BTs (dBT) due toclouds and cloud systems
The AMSU-B or infrared images show objectsagainst background radiances either from landor ocean. The background radiances are reduced(or depressed) very little in IR, significantly inWV and microwaves, by moisture. Significantclouds cause large reduction in radiance, i.e., alarge dBT.
The AMSU-B brightness temperature (BT) con-trast and size signatures for different cloud typesare caused by the distribution of water vapour andhydrometeors such as cloud droplets, raindrops,ice, graupel and hail resulting in absorption or scat-tering within the cloud. Reduced radiances showas lower BTs. Therefore, dBT is important in ouranalysis. Gheiby et al (2003) have used BT anddBT information in Artificial Neural Networks forcloud recognition purpose.
The BT at 89 and 150 GHz are related tosurface emission, absorption in the lower layersof atmosphere and scattering by water droplets
Western disturbances in IR and microwaves 31
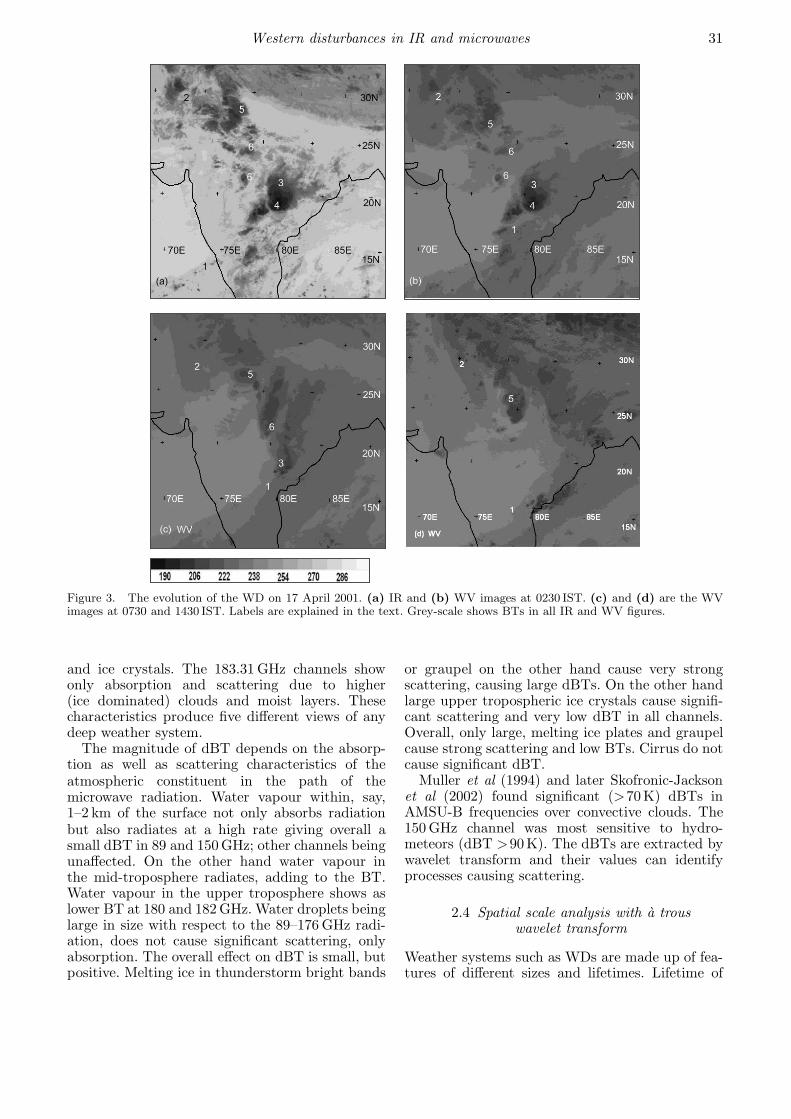
Figure 3. The evolution of the WD on 17 April 2001. (a) IR and (b) WV images at 0230 IST. (c) and (d) are the WVimages at 0730 and 1430 IST. Labels are explained in the text. Grey-scale shows BTs in all IR and WV figures.
and ice crystals. The 183.31 GHz channels showonly absorption and scattering due to higher(ice dominated) clouds and moist layers. Thesecharacteristics produce five different views of anydeep weather system.
The magnitude of dBT depends on the absorp-tion as well as scattering characteristics of theatmospheric constituent in the path of themicrowave radiation. Water vapour within, say,1–2 km of the surface not only absorbs radiationbut also radiates at a high rate giving overall asmall dBT in 89 and 150 GHz; other channels beingunaffected. On the other hand water vapour inthe mid-troposphere radiates, adding to the BT.Water vapour in the upper troposphere shows aslower BT at 180 and 182 GHz. Water droplets beinglarge in size with respect to the 89–176 GHz radi-ation, does not cause significant scattering, onlyabsorption. The overall effect on dBT is small, butpositive. Melting ice in thunderstorm bright bands
or graupel on the other hand cause very strongscattering, causing large dBTs. On the other handlarge upper tropospheric ice crystals cause signifi-cant scattering and very low dBT in all channels.Overall, only large, melting ice plates and graupelcause strong scattering and low BTs. Cirrus do notcause significant dBT.
Muller et al (1994) and later Skofronic-Jacksonet al (2002) found significant (>70K) dBTs inAMSU-B frequencies over convective clouds. The150 GHz channel was most sensitive to hydro-meteors (dBT >90K). The dBTs are extracted bywavelet transform and their values can identifyprocesses causing scattering.
2.4 Spatial scale analysis with a trouswavelet transform
Weather systems such as WDs are made up of fea-tures of different sizes and lifetimes. Lifetime of
32 Dileep M Puranik and R N Karekar
a feature is important for mesoscale forecasting.This, in turn, is related to its size through thegroup velocity. To extract features of WDs, offinite size and lifetime, multi-scale analysis such asthe wavelet transform (WT) is useful.
A special WT called a trous (ATWT, Shensa1992) is used in the present work. Unlike otherWT, it is non-decimating, i.e., the dimension of anywavelet component image is the same as that ofthe original data. Therefore, the ATWT output asscale k can be interpreted as the depression in BT(dBT) at scale k in the image with respect to scalek − 1. ATWT is discussed by Starck et al (1998).Puranik and Karekar (2004) have discussed itsimplementation specifically for the weather satel-lite images. To meet the requirement of having rea-sonably uniform background, 64 × 64 pixels, i.e.,1024 × 1024 km sub-images of the AMSU-B imagesare used when applying the a trous WT.
At every stage of the WT, the objects dou-bled in scale from the previous stage are succes-sively revealed. Since information is not lost indecimation, the equivalence of pixel values at eachscale with radiance is be maintained. A very briefoutline of the ATWT is given in Appendix. We nowutilise the data and analysis methods describedabove to discuss two typical WDs.
3. A synoptic view of the two WDs
As indicated in section 1.3 we have selected WDs of17 April 2001 and 18–19 February 2003 for detailedstudy. The Indian Daily Weather Summary for16 April 2001 reported a cyclonic circulation overPunjab till 5 km and an upper air trough with itsaxis at 9.5 km at 74◦E seen north of 15◦N. On17 April, the cyclonic circulation persisted. Theupper air trough reached 75◦E at 9.5 km. Duringthe day the upper air trough moved from 75◦E to78◦ E. On 18 April, the upper air trough moved to80◦E and weakened.
Prior to this event, there had been widespreadand intense convection south of 15◦N due to thepassage of an easterly wave. Moisture was raisedaloft and was moving northwards on 16 April.Dry air entered the region from northwest, behindthe trough and from north of the subtropical jeton 16 April. It spread south and eastward on 17April. Figures 1(a) and (b) show the winds at 700and 300 hPa respectively, at 0530 IST on 17 April.In both the figures the northerly wind directionbehind the trough is notable. Figures 1(c) and (d)show relative humidity at 0530 IST on 17 April at700 hPa and 300 hPa. Depending on the dry airdensity and wind speed, the moist regions are dif-ferentially displaced to east showing the relativehumidity at 700 and 300 hPa respectively.
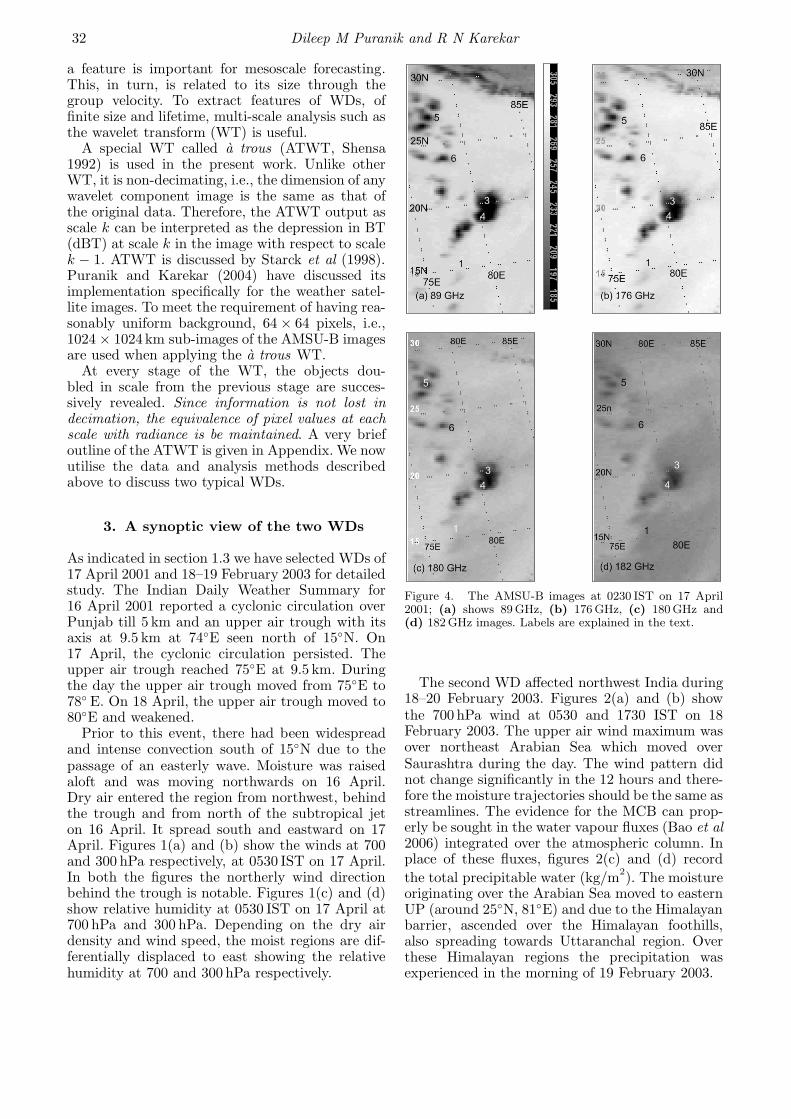
Figure 4. The AMSU-B images at 0230 IST on 17 April2001; (a) shows 89 GHz, (b) 176 GHz, (c) 180 GHz and(d) 182 GHz images. Labels are explained in the text.
The second WD affected northwest India during18–20 February 2003. Figures 2(a) and (b) showthe 700 hPa wind at 0530 and 1730 IST on 18February 2003. The upper air wind maximum wasover northeast Arabian Sea which moved overSaurashtra during the day. The wind pattern didnot change significantly in the 12 hours and there-fore the moisture trajectories should be the same asstreamlines. The evidence for the MCB can prop-erly be sought in the water vapour fluxes (Bao et al2006) integrated over the atmospheric column. Inplace of these fluxes, figures 2(c) and (d) recordthe total precipitable water (kg/m2). The moistureoriginating over the Arabian Sea moved to easternUP (around 25◦N, 81◦E) and due to the Himalayanbarrier, ascended over the Himalayan foothills,also spreading towards Uttaranchal region. Overthese Himalayan regions the precipitation wasexperienced in the morning of 19 February 2003.
Western disturbances in IR and microwaves 33
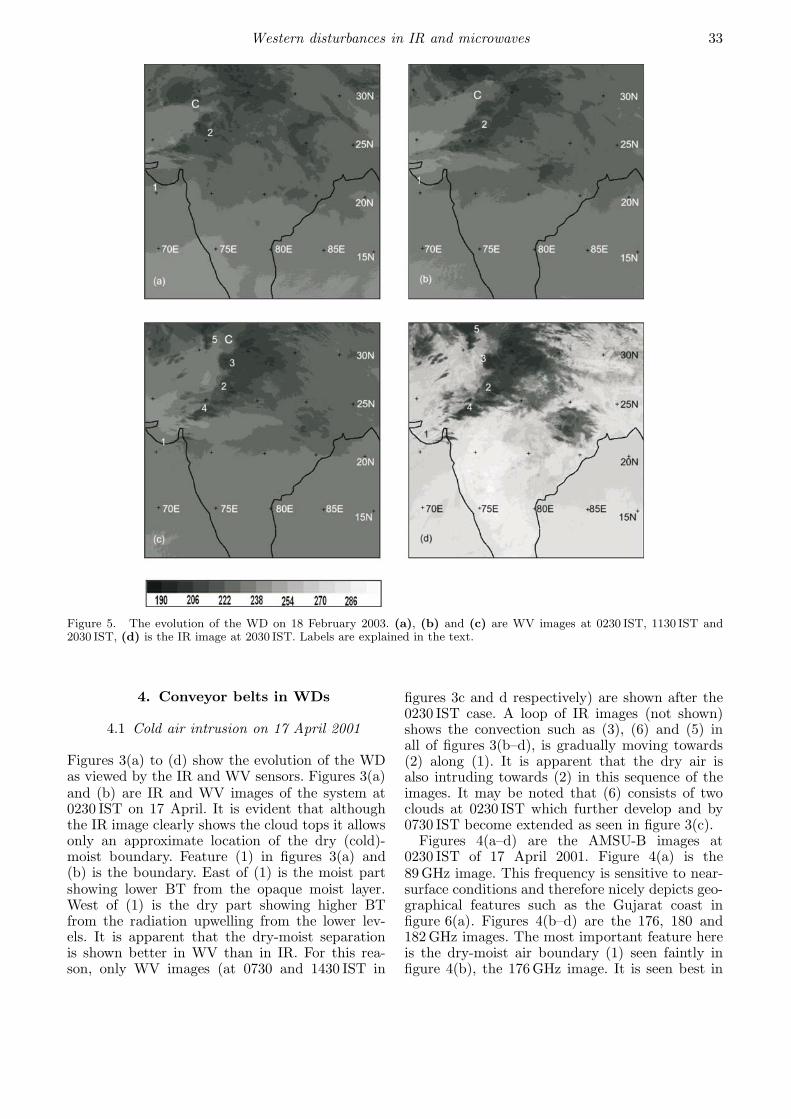
Figure 5. The evolution of the WD on 18 February 2003. (a), (b) and (c) are WV images at 0230 IST, 1130 IST and2030 IST, (d) is the IR image at 2030 IST. Labels are explained in the text.
4. Conveyor belts in WDs
4.1 Cold air intrusion on 17 April 2001
Figures 3(a) to (d) show the evolution of the WDas viewed by the IR and WV sensors. Figures 3(a)and (b) are IR and WV images of the system at0230 IST on 17 April. It is evident that althoughthe IR image clearly shows the cloud tops it allowsonly an approximate location of the dry (cold)-moist boundary. Feature (1) in figures 3(a) and(b) is the boundary. East of (1) is the moist partshowing lower BT from the opaque moist layer.West of (1) is the dry part showing higher BTfrom the radiation upwelling from the lower lev-els. It is apparent that the dry-moist separationis shown better in WV than in IR. For this rea-son, only WV images (at 0730 and 1430 IST in
figures 3c and d respectively) are shown after the0230 IST case. A loop of IR images (not shown)shows the convection such as (3), (6) and (5) inall of figures 3(b–d), is gradually moving towards(2) along (1). It is apparent that the dry air isalso intruding towards (2) in this sequence of theimages. It may be noted that (6) consists of twoclouds at 0230 IST which further develop and by0730 IST become extended as seen in figure 3(c).
Figures 4(a–d) are the AMSU-B images at0230 IST of 17 April 2001. Figure 4(a) is the89 GHz image. This frequency is sensitive to near-surface conditions and therefore nicely depicts geo-graphical features such as the Gujarat coast infigure 6(a). Figures 4(b–d) are the 176, 180 and182 GHz images. The most important feature hereis the dry-moist air boundary (1) seen faintly infigure 4(b), the 176 GHz image. It is seen best in
34 Dileep M Puranik and R N Karekar
figure 4(c) (180 GHz). In the 182 GHz image also,(1) is seen clearly. In figure 4(b), (3) lies on a brokenboundary (1) while in figures 4(c) and (d), (1) is tothe west of (3) showing that the moist layer extendsto the upper troposphere. As per figure 3(b) themoist layer top is close to 350 hPa while 182 GHzAMSU-B shows that the moisture extends to quitehigher levels.
It may be noted that the upper level winds (seefigure 1b) are mostly westerly, thus pushing thedry air (say between 20◦ and 25◦N) eastwards andnot advecting the moisture from lower latitudestowards northwest India where the axis of troughis located.
4.2 Moist conveyor belt seen on18 February 2003
The analysis of the MCB is similar to the earliersubsection. Figures 5(a)–(c) are the WV image at0230 IST, 0730 IST and 1130 IST on 18 February2003. Figure 5(d) is the IR image at 1130 IST. TheMCB is seen as low BT in the WV images, andoriginates (1) over the Arabian Sea. However, it ishard to accurately mark the extent of the conveyorbelt. Only when the MCB attains sufficient alti-tude does it show in IR and WV images as thincloud (2) and absorbing band (2) respectively. TheMCB is demarcated as the cloud boundary. TheMCB curves cyclonically at (C). The whole bandand (C) moves toward northeast with time as isevident from figures 5(a)–(c) (and d). Within thecurved structure, both MCB and the dry air toits left, move towards (C) where a circulation isdeveloping.
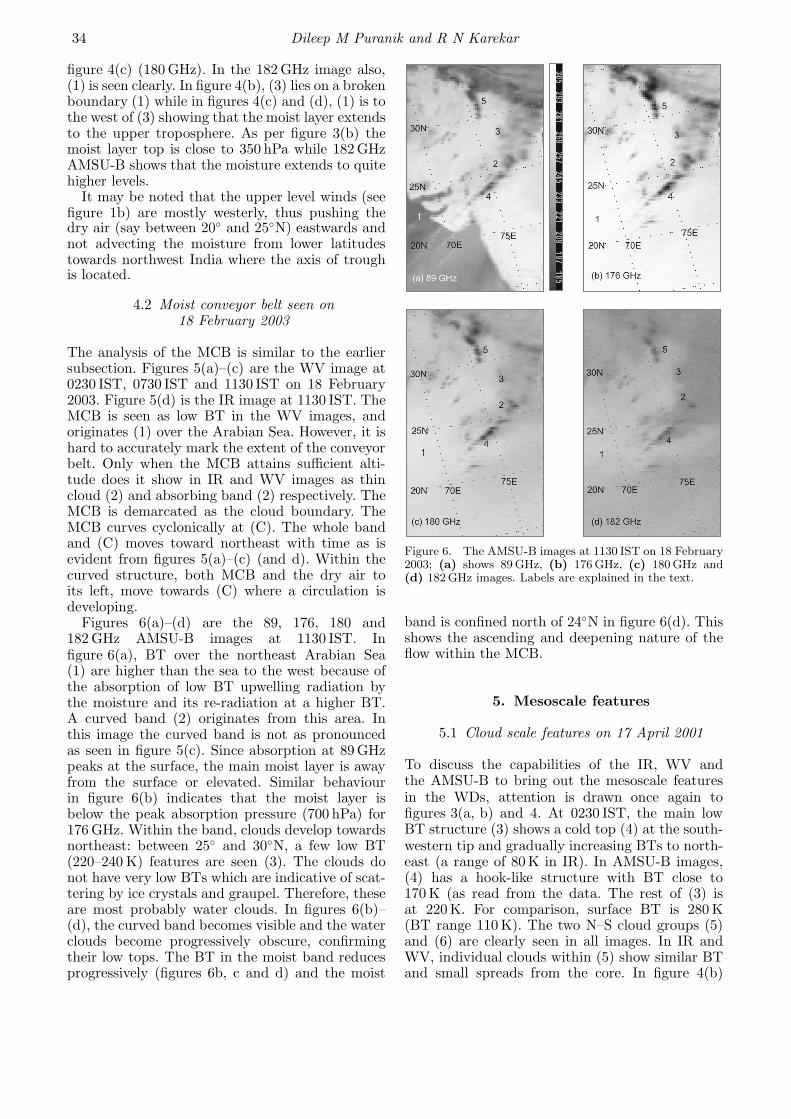
Figures 6(a)–(d) are the 89, 176, 180 and182 GHz AMSU-B images at 1130 IST. Infigure 6(a), BT over the northeast Arabian Sea(1) are higher than the sea to the west because ofthe absorption of low BT upwelling radiation bythe moisture and its re-radiation at a higher BT.A curved band (2) originates from this area. Inthis image the curved band is not as pronouncedas seen in figure 5(c). Since absorption at 89 GHzpeaks at the surface, the main moist layer is awayfrom the surface or elevated. Similar behaviourin figure 6(b) indicates that the moist layer isbelow the peak absorption pressure (700 hPa) for176 GHz. Within the band, clouds develop towardsnortheast: between 25◦ and 30◦N, a few low BT(220–240 K) features are seen (3). The clouds donot have very low BTs which are indicative of scat-tering by ice crystals and graupel. Therefore, theseare most probably water clouds. In figures 6(b)–(d), the curved band becomes visible and the waterclouds become progressively obscure, confirmingtheir low tops. The BT in the moist band reducesprogressively (figures 6b, c and d) and the moist
Figure 6. The AMSU-B images at 1130 IST on 18 February2003; (a) shows 89 GHz, (b) 176 GHz, (c) 180 GHz and(d) 182 GHz images. Labels are explained in the text.
band is confined north of 24◦N in figure 6(d). Thisshows the ascending and deepening nature of theflow within the MCB.
5. Mesoscale features
5.1 Cloud scale features on 17 April 2001
To discuss the capabilities of the IR, WV andthe AMSU-B to bring out the mesoscale featuresin the WDs, attention is drawn once again tofigures 3(a, b) and 4. At 0230 IST, the main lowBT structure (3) shows a cold top (4) at the south-western tip and gradually increasing BTs to north-east (a range of 80 K in IR). In AMSU-B images,(4) has a hook-like structure with BT close to170 K (as read from the data. The rest of (3) isat 220 K. For comparison, surface BT is 280 K(BT range 110 K). The two N–S cloud groups (5)and (6) are clearly seen in all images. In IR andWV, individual clouds within (5) show similar BTand small spreads from the core. In figure 4(b)
Western disturbances in IR and microwaves 35
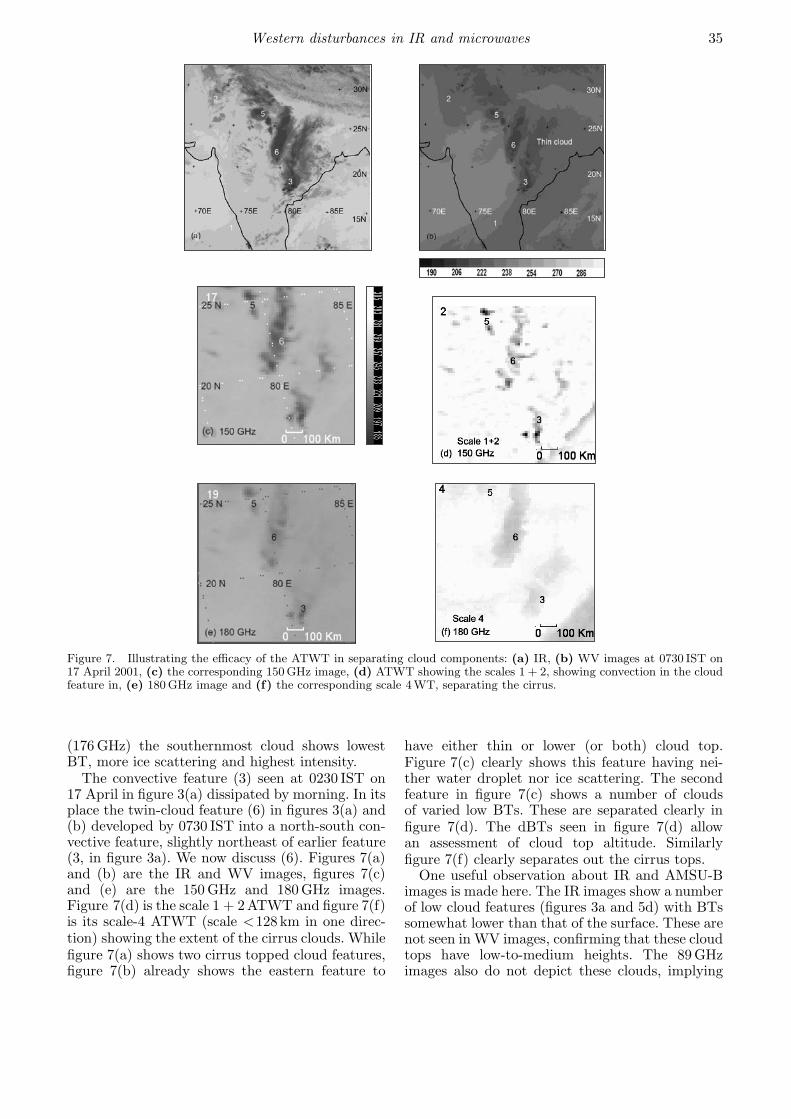
Figure 7. Illustrating the efficacy of the ATWT in separating cloud components: (a) IR, (b) WV images at 0730 IST on17 April 2001, (c) the corresponding 150 GHz image, (d) ATWT showing the scales 1 + 2, showing convection in the cloudfeature in, (e) 180 GHz image and (f) the corresponding scale 4WT, separating the cirrus.
(176 GHz) the southernmost cloud shows lowestBT, more ice scattering and highest intensity.
The convective feature (3) seen at 0230 IST on17 April in figure 3(a) dissipated by morning. In itsplace the twin-cloud feature (6) in figures 3(a) and(b) developed by 0730 IST into a north-south con-vective feature, slightly northeast of earlier feature(3, in figure 3a). We now discuss (6). Figures 7(a)and (b) are the IR and WV images, figures 7(c)and (e) are the 150 GHz and 180 GHz images.Figure 7(d) is the scale 1 + 2ATWT and figure 7(f)is its scale-4 ATWT (scale <128 km in one direc-tion) showing the extent of the cirrus clouds. Whilefigure 7(a) shows two cirrus topped cloud features,figure 7(b) already shows the eastern feature to
have either thin or lower (or both) cloud top.Figure 7(c) clearly shows this feature having nei-ther water droplet nor ice scattering. The secondfeature in figure 7(c) shows a number of cloudsof varied low BTs. These are separated clearly infigure 7(d). The dBTs seen in figure 7(d) allowan assessment of cloud top altitude. Similarlyfigure 7(f) clearly separates out the cirrus tops.
One useful observation about IR and AMSU-Bimages is made here. The IR images show a numberof low cloud features (figures 3a and 5d) with BTssomewhat lower than that of the surface. These arenot seen in WV images, confirming that these cloudtops have low-to-medium heights. The 89 GHzimages also do not depict these clouds, implying
36 Dileep M Puranik and R N Karekar
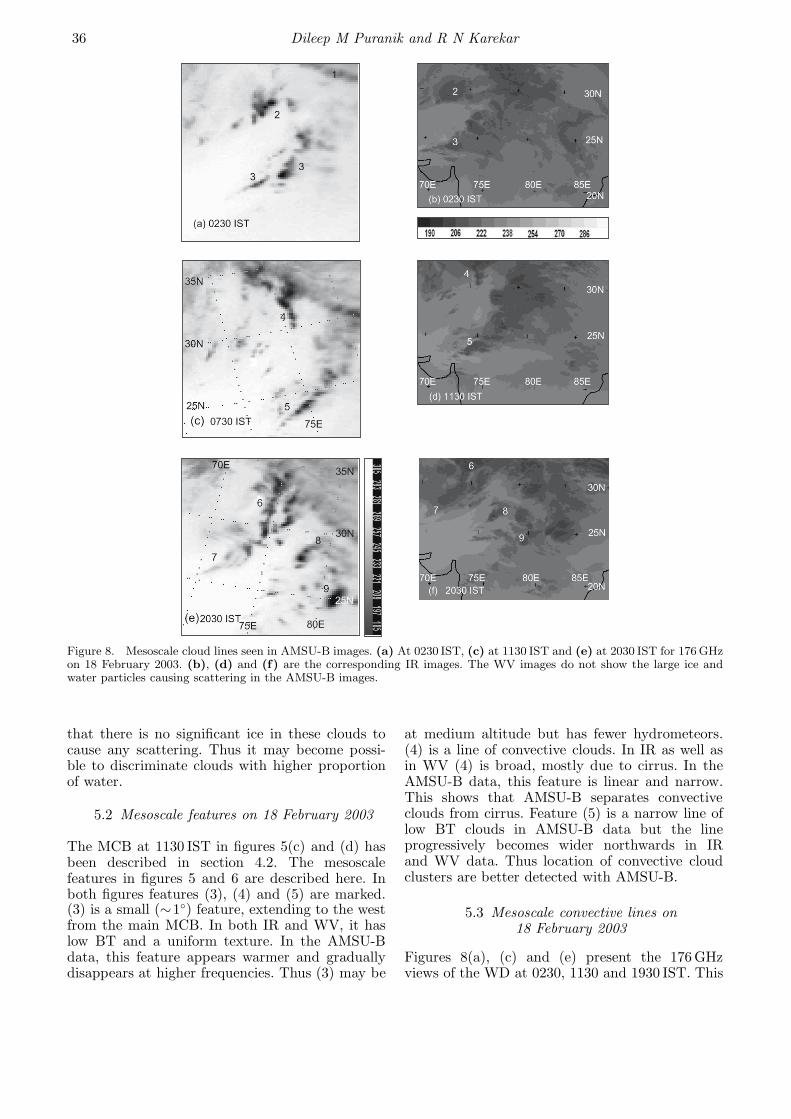
Figure 8. Mesoscale cloud lines seen in AMSU-B images. (a) At 0230 IST, (c) at 1130 IST and (e) at 2030 IST for 176 GHzon 18 February 2003. (b), (d) and (f) are the corresponding IR images. The WV images do not show the large ice andwater particles causing scattering in the AMSU-B images.
that there is no significant ice in these clouds tocause any scattering. Thus it may become possi-ble to discriminate clouds with higher proportionof water.
5.2 Mesoscale features on 18 February 2003
The MCB at 1130 IST in figures 5(c) and (d) hasbeen described in section 4.2. The mesoscalefeatures in figures 5 and 6 are described here. Inboth figures features (3), (4) and (5) are marked.(3) is a small (∼1◦) feature, extending to the westfrom the main MCB. In both IR and WV, it haslow BT and a uniform texture. In the AMSU-Bdata, this feature appears warmer and graduallydisappears at higher frequencies. Thus (3) may be
at medium altitude but has fewer hydrometeors.(4) is a line of convective clouds. In IR as well asin WV (4) is broad, mostly due to cirrus. In theAMSU-B data, this feature is linear and narrow.This shows that AMSU-B separates convectiveclouds from cirrus. Feature (5) is a narrow line oflow BT clouds in AMSU-B data but the lineprogressively becomes wider northwards in IRand WV data. Thus location of convective cloudclusters are better detected with AMSU-B.
5.3 Mesoscale convective lines on18 February 2003
Figures 8(a), (c) and (e) present the 176 GHzviews of the WD at 0230, 1130 and 1930 IST. This
Western disturbances in IR and microwaves 37
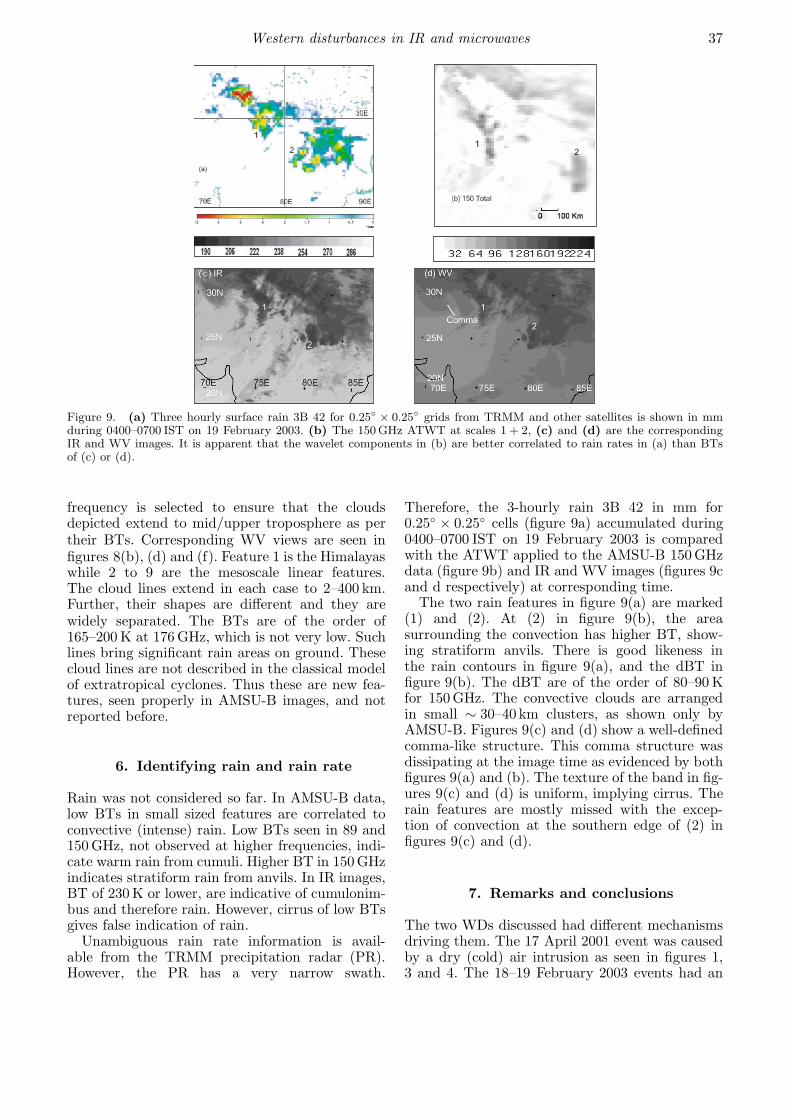
Figure 9. (a) Three hourly surface rain 3B 42 for 0.25◦ × 0.25◦ grids from TRMM and other satellites is shown in mmduring 0400–0700 IST on 19 February 2003. (b) The 150 GHz ATWT at scales 1 + 2, (c) and (d) are the correspondingIR and WV images. It is apparent that the wavelet components in (b) are better correlated to rain rates in (a) than BTsof (c) or (d).
frequency is selected to ensure that the cloudsdepicted extend to mid/upper troposphere as pertheir BTs. Corresponding WV views are seen infigures 8(b), (d) and (f). Feature 1 is the Himalayaswhile 2 to 9 are the mesoscale linear features.The cloud lines extend in each case to 2–400 km.Further, their shapes are different and they arewidely separated. The BTs are of the order of165–200 K at 176 GHz, which is not very low. Suchlines bring significant rain areas on ground. Thesecloud lines are not described in the classical modelof extratropical cyclones. Thus these are new fea-tures, seen properly in AMSU-B images, and notreported before.
6. Identifying rain and rain rate
Rain was not considered so far. In AMSU-B data,low BTs in small sized features are correlated toconvective (intense) rain. Low BTs seen in 89 and150 GHz, not observed at higher frequencies, indi-cate warm rain from cumuli. Higher BT in 150 GHzindicates stratiform rain from anvils. In IR images,BT of 230 K or lower, are indicative of cumulonim-bus and therefore rain. However, cirrus of low BTsgives false indication of rain.
Unambiguous rain rate information is avail-able from the TRMM precipitation radar (PR).However, the PR has a very narrow swath.
Therefore, the 3-hourly rain 3B 42 in mm for0.25◦ × 0.25◦ cells (figure 9a) accumulated during0400–0700 IST on 19 February 2003 is comparedwith the ATWT applied to the AMSU-B 150 GHzdata (figure 9b) and IR and WV images (figures 9cand d respectively) at corresponding time.
The two rain features in figure 9(a) are marked(1) and (2). At (2) in figure 9(b), the areasurrounding the convection has higher BT, show-ing stratiform anvils. There is good likeness inthe rain contours in figure 9(a), and the dBT infigure 9(b). The dBT are of the order of 80–90 Kfor 150 GHz. The convective clouds are arrangedin small ∼ 30–40 km clusters, as shown only byAMSU-B. Figures 9(c) and (d) show a well-definedcomma-like structure. This comma structure wasdissipating at the image time as evidenced by bothfigures 9(a) and (b). The texture of the band in fig-ures 9(c) and (d) is uniform, implying cirrus. Therain features are mostly missed with the excep-tion of convection at the southern edge of (2) infigures 9(c) and (d).
7. Remarks and conclusions
The two WDs discussed had different mechanismsdriving them. The 17 April 2001 event was causedby a dry (cold) air intrusion as seen in figures 1,3 and 4. The 18–19 February 2003 events had an
38 Dileep M Puranik and R N Karekar
MCB seen in figures 2, 5 and 6. The question to besettled is whether the IR/WV data or the AMSU-Bdata showed the dry-moist air boundary better.
The two IR images at figures 3(a) and 5(d) donot show any significant dry-moist boundary, par-ticularly over land. The WV images figures 3(b)and 5(c) do show the dry-moist boundary. How-ever this is seen only at the top of the moist layer,generally closer to 400 hPa (Bader et al 1995). Infigures 4 and 6, the 89 and 150 GHz channels depictwell the moist air and the developing warm clouds(with small or none ice scattering) are seen wellwhich are generally obscured in the higher (180,182 GHz) channels. Thus in comparison there ismore useful information on conveyor regions in theAMSU-B data. Only in one aspect the geostation-ary data is more valuable; i.e., its full spatial cover.The AMSU-B with its polar orbit and 2160 kmswath can miss on some parts of the passing WD.
The AMSU-B BT images are able to bring outthe (three dimensional) structure of the WDs bet-ter than the IR and WV images. The locations ofmesoscale cloud lines seen in the AMSU-B imagesand covered beneath the cirrus are one case ofimportance to weather analysis.
Comparison of the AMSU-B and TRMM based3-hourly rain data shows that large depressionsin BT in AMSU-B data (tentatively ∼ 80K) cor-responded to rain estimated by TRMM in the19 February 2003 early morning case. Further, cor-relation between the rain regions and the ATWT(of 150 GHz channel) was better than with the IRand WV images.
We conclude that AMSU-B and multi-scaleanalysis together give added advantages to theanalysis of weather produced by the geostationaryIR and WV data. We hope that in the nearfuture, MADRAS and Saphir (onboard Megha-Tropiques), AMSU-B and MHS would enrich thepractice of weather analysis.
Acknowledgements
Bhupendra Raut is acknowledged for his manyfaceted help. Level 1b AMSU-B data was obtainedfrom NOAA CLASS web archive. IR and WV digi-tal data were obtained from EUMETSAT archive.Figures 1 and 2 have been downloaded from theNOMADS3 server of NCEP, NOAA, USA. Thiswork was funded by ISRO grant GOI 419 atUniversity of Pune.
Appendix
A very brief description of the a trous transformis given below. Let C0(k) be the sampled dataset.Let a scaling function Φ(x) be a low pass filter.
The wavelet coefficients Wi(k) at scale i arefound using successive approximation:
Wi+1(k) = Ci(k) − Ci+1(k).
Cj are given by Cj(k) = Σlh(l)CJ−1(k + 2j−1l).In turn h(k) are derived from:
12Φ
(x
2
)= Σlh(l)Φ(x − l).
As i increases, the kth pixel is convolved withthose at the spacing of 2i−1. This in effect allowsthe larger spatial or temporal wavelengths to bebrought out and separated. Thus all Ci can beshown as graphs (or images in two dimensions).This is termed multi-resolution analysis.
C0(k) = CRem(k) + ΣjWj(k),
where CRem(k) is the smooth remainder signalarray.
The scaling function for the a trous analysisis selected for a good smoothing performance.The convolution mask used is given as hB3(l) ={0.0625, 0.25, 0.375, 0.25, 0.0625}. In case of atwo-dimensional image, the filter given above isused first on columns and then on the rows of theimage.
References
Bader M J, Forbes G S, Grant J R, Lilly R B E andWaters J 1995 Images in Weather Forecasting, CambridgeUniversity Press, 493 pp.
Bao J-W, Michelson S A, Neiman P J, Ralph F M andWilczak J M 2006 Interpretation of enhanced integratedwater vapor bands associated with extratropical cyclones:Their formation and connection to tropical moisture;Mon. Wea. Rev. 134(4) 1063–1080.
Browning K A 1986 Conceptual models of precipitationsystems; Wea. Forecasting 1 23–41.
Gheiby A, Sen P N, Puranik D M and Karekar R N 2003Thunderstorm identification from AMSU-B data using anartificial neural network; Met. Appl. 10(4) 329–336.
Goodrum G, Kidwell K B and Winston W 2000 The NOAAKLM users’ guide; NOAA US Department of CommerceNew York, NY, USA.
Holton J R 1992 An Introduction to Dynamic Meteorology,Academic Press.
Kidder S Q and Vonder Haar T H 1995 Satellite Meteo-rology: An Introduction; Academic Press, 466 pp.
Knippertz P and Martin J E 2007 A pacific moisture con-veyor belt and its relationship to a significant precipita-tion event in the semi-arid southwestern United States;Wea. Forecasting 22(1) 125–144.

Western disturbances in IR and microwaves 39
Kummerow C, Olson W S and Giglio L 1996 A simplifiedscheme for obtaining precipitation and vertical hydrome-teor profiles from passive microwave sensors; IEEE Trans.Geosci. Remote Sensing 34 1213.
Muller B M, Fuelberg H E and Xiang X W 1994 Simula-tion of the effect of water vapour, cloud liquid water andice on AMSU moisture channel brightness temperatures;J. Appl. Meteor. 33(10) 1133.
Puranik D M and Karekar R N 2004 Classification ofthunderstorms over India using multi-scale analysis ofAMSU-B images; J. Appl. Meteor. 43(4) 595.
Rao Y P and Srinivasan V 1969 Discussion of typicalweather situations: Winter western disturbances andtheir associated features; Forecasting Manual, IMD,India, Part III, I.1.
Roca R, Brogniez H, Picon L and Desbois M 2001 Highresolution observations of free tropospheric humidityfrom METEOSAT over the Indian Ocean, MEGHA-TROPIQUES 2nd Scientific Workshop, 2–6 July 2001,Paris, France.
Shensa M J 1992 Discrete wavelet transforms: Wedding the‘a trous’ and Mallat algorithms; IEEE Trans. Sig. Proc.40 2464.
Skofronick-Jackson G M, Gasiewski A J and Wang J R 2002Influence of microphysical cloud parameterisations onmicrowave brightness temperatures; IEEE Trans. Geosci.Rem. Sens. 40(1) 187.
Starck J-L, Murtagh F and Bijaoui A 1998 Image Proces-sing and Data Analysis; Cambridge University Press,284 pp.
MS received 1 April 2008; revised 7 October 2008; accepted 8 November 2008