Embed Size (px)
Citation preview

POLYMERS FOR ADVANCED TECHNOLOGIES
Polym. Adv. Technol. 2006; 17: 932–939
terscience.wiley.com). DOI: 10.1002/pat.778
Published online 11 September 2006 in Wiley InterScience (www.inWettability and spectroscopic characterization
of silylated wood samplesy
Ildiko Mohammed-Ziegler1,2*, Zoltan Horvolgyi3, Andras Toth4, Willis Forsling2 and
Allan Holmgren2
1Arany J. u. 28., H-2521 Csolnok, Hungary2Division of Chemistry, Lulea University of Technology, SE-97187 Lulea, Sweden3Department of Physical Chemistry, Budapest University of Technology and Economics, Budafoki ut 8., H-1521 Budapest, Hungary4Research Laboratory of Materials and Environmental Chemistry, Chemical Research Center of the Hungarian Academy of Sciences,
Pusztaszeri ut 59-67, H-1025 Budapest, Hungary
Received 2 December 2005; Revised 17 February 2006; Accepted 2 March 2006
*CorrespoQuality CHungaryE-mail: my8th InteTechnolo2005, Par
Surfaces of three European wood species (namely, English oak, Hungarian oak, and Scots pine) and
two tropical wood species (namely, teak and cloves) were silylated with dichlorodimethylsilane
(DDS), dichlorodiphenylsilane (DPS) and octadecyltrichlorosilane (OTS) in the first step, and with
chlorotrimethylsilane (CTMS) as a monofunctional reagent in a second step. Attenuated total
reflection-Fourier transform infrared (ATR-FT-IR) and electron spectroscopy for chemical analysis
(ESCA) measurements were performed in order to characterize the surface composition of the treated
samples. The progress of surface modification was also monitored by contact angle measurements of
different test liquids (water, formamide and diiodomethane). The water contact angles were found to
be in the range of 808 to 1458. The most hydrophobic surface was obtained by two-step silylation by
OTS and CTMS (water contact angles were between 1318 and 1408). Interestingly, the hydrophobicityof DDS-treated samples showed a significant decrease after additional silylation by CTMS. The
surface free energy values were evaluated in terms of the Lifshitz-van der Waals/acid-base theory.
The results obtained by the surface analytical methods (i.e. FT-IR and ESCA measurements) were
compared with the contact angle data. These results suggest that in the case of DDS-treated samples,
CTMS molecules substitute partly the DDS molecules, thus only physisorption of the silylating
agents is supposed at room temperature. Copyright # 2006 John Wiley & Sons, Ltd.
KEYWORDS: wood; silylation; ESCA/XPS; FT-IR
It is well-known that water is essential for life, including the
growth of micro-organisms, and that wood, an abundant
natural material, is ideal to feed many of these microbes. The
metabolism of these micro-organisms, however, leads to the
degradation of wood. Such a decay of wooden objects is not
desirable from an economical point of view. Therefore, the
application of various surface treatments against microbial
infection of wood has become more and more common. One
possibility to inhibit or slow down wood decay is to render
the wood surface hydrophobic, e.g. by silylation in order to
hinder the multiplication of fungi and bacteria. Increased
hydrophobicity decreases the amount of adsorbed water and
diminishes the adhesion of the microbial cells.
Various analytical methods are used to follow chemical
changes of wood and wood containing composites. FT-IR
spectroscopy is an efficient tool for the detection of changes
ndence to: I. Mohammed-Ziegler, Gedeon Richter Ltd,ontrol Department, Esztergomi ut 27, H-2510 Dorog,[email protected] Symposium on Polymers for Advancedgies 2005 (PAT 2005), Budapest, 13–16 September,t 2.
at the molecular level caused by mechanical effects,
irradiation by light, chemical modification or other treat-
ments of wood.1–17 X-ray photoelectron spectroscopy (XPS)/
electron spectroscopy for chemical analysis (ESCA) is also a
worldwide spread method to follow changes in surface
composition at the atomic level (see, for example, Refs. 1, 5, 6,
18–23). The results, obtained by analytical methods on
surface treated wood samples, often can be directly
correlated with the wetting properties of wood, as has been
established by many researchers.8,18,23–27 The mentioned
analytical techniques are also suitable to follow the process
and extent of silylation reaction, which is well-known and a
very efficient way of surface modification (see, for example,
Refs. 28–30). However, to the best of the authors’ knowledge
only a few papers have been reported on silylation of wood
so far.1,3,31–33
In a previous work, six European and six tropical wood
species were treated by three different silylating agents using
Copyright # 2006 John Wiley & Sons, Ltd.

Silylated wood samples 933
chloroform solutions of trimethylsilyl N,N-dimethylcarba-
mate, chlorotrimethylsilane (CTMS) and octadecyltrichlor-
osilane (OTS)31 and characterized by contact angle
measurements. The surface free energies were also deter-
mined analyzing the measured contact angles in order to
characterize the wettability of the samples. Further charac-
terization on selected samples was carried out by attenuated
total reflection-Fourier transform infrared (ATR-FT-IR)
spectroscopy and ESCA to obtain information about the
molecular composition of the treated surfaces and the
efficiency of the chemical modifications.1
In an attempt to increase the hydrophobicity of the
samples in the present study, additional silylating agents
were tested individually and in combination with each other,
using n-hexane as solvent and applying different time of
silylation. The surface modified samples were studied by
contact angle measurements, ATR-FT-IR and ESCA spectro-
scopic methods. In order to obtain a deeper understanding of
the wetting results, the surface free energies were also
determined by analyzing the contact angles in terms of the
Lifshitz-van der Waals/acid-base approach (LW-AB). The
results obtained in the present work were compared with
those of previous studies.1,31
EXPERIMENTAL
MaterialsThree European and two tropical wood samples were
studied. English oak (Quercus robur L.), and Scots pine
(Pinus sylvestris L.) were purchased from Sweden. Hungarian
oak (Quercus frainetto Ten. ) was obtained from Hungary.
Furthermore, two exotic wood samples, teak (Factona grandis)
and cloves tree (Eugenia aromatica) originating from Zanzi-
bar, Tanzania, were investigated. The African samples were
air dried for 6 weeks in Tanzania during the dry season and
posted to Hungary. Before the examinations they were
further air dried for at least 2 months. In order to ensure
comparability, the wood samples under study are identical
with earlier ones, reported in previous work.1–3,31 The wood
samples were cut into ca. 2mm thick plates parallel with the
fibres. Finally, each plate was successively polished in order
to obtain as smooth surface as possible using, in the last
stage, MX P320 waterproof silicon carbide polish paper
supplied by Struers.
The following chemicals were used. Silylating agents
included CTMS (Merck, �99%), OTS (Merck, �98%),
dichlorodiphenylsilane (DPS) (Fluka, �98.5%) and dichlor-
odimethylsilane (DDS) (Fluka, �98%). Wettability test
liquids included formamide (Aldrich, �99%), diiodo-
methane (Sigma, �99%), n-hexane (Merck, �99%), and ion
exchanged water (Millipore, 18.2MVcm).
Silanization in solutionThe treatment was adapted from the literature.34 Thus 1 vol%
n-hexane solutions of DDS, DPS and OTS were prepared.
Each wood sample (with an area of about 15 cm2) was kept in
the silanizing solution of 20ml under continuous stirring at
room temperature (in a fumehood) for 5min. Then the
samples were rinsed with pure n-hexane and air-dried. Some
of the samples were silanized again with the 1 vol% n-hexane
Copyright # 2006 John Wiley & Sons, Ltd.
solution of CTMS under identical conditions in order to
improve the silylation by silylating the (possibly polymer-
ized) precursors and the unreacted ligand groups.
ATR-FT-IR measurementsThese measurements were performed in order to obtain
information about the surface reaction and to assess semi-
qualitatively the amount of adsorbed reagents at the wood
surface. For the experiments a Perkin–Elmer System 2000 FT-
IR spectrometer equipped with a Specac (ATR) accessory
was used. Themeasurements were carried out at a resolution
of 4 cm�1, 128 scanswere accumulated using aKRS-5 internal
reflection element. The spectra were processed using Nicolet
Omnic software.
Contact angle measurementsDuring the sessile drop measurements, the wood plate was
placed horizontally in a chamber and monitored by a video-
microscope. About a 4-ml-droplet of the test liquid was
placed on thewood surface using amicro-syringe. Thewhole
process was recorded as a function of time and the contact
angles were determined by analyzing the drop contour. The
height and the maximum diameter of the droplet were
measured in steady-state circumstances at about the fifth
second of drop formation. The measurements were per-
formed only along the wood grains. Average contact angles
were calculated from the measurements of 5–10 droplets.
Wood is a porous material, therefore, the wetting process
can be divided into three periods.35 (1) The first stage is
characterized by an increase of the droplet diameter and
simultaneously the height of the droplet reduces which
results in a significant decrease of the contact angle. At the
end of this stage, temporary stabilization takes place and
the diameter becomes constant. (2) During the second
stage, the diameter of the droplet remains constant although
the height of the drop still decreases. Therefore, the contact
angle diminishes. Liptakova and Kudelka35 supposed that at
the end of this period all pores and holes in the surface layer
of wood is filled with liquid. (3) Finally, the liquid gradually
penetrates into the wood due to capillary forces and
consequently the diameter of the drop and the contact angle
decreases. Therefore, the contact angles are measured in the
stationary period of elapsed time (at the end of the first stage)
that corresponds to about the fifth seconds in the present
system. However, the contact angles should remain constant
or almost constant in higher contact angle range (>908)during the whole measurement, due to the hindered
imbibtion of the liquid.
The evaluation of the data is based on the LW-AB model
(for details see Refs. 30, 36, 37). The relations used for
calculations are the following:
ð1þ cos uÞg lv ¼ 2ffiffiffiffiffiffiffiffiffiffiffiffiffiffiffiffiffigLWsv gLWlv
qþ
ffiffiffiffiffiffiffiffiffiffiffiffiffigþsvg
�lv
qþ
ffiffiffiffiffiffiffiffiffiffiffiffiffig�svg
þlv
q� �(1)
gLWsv ¼ 0:25gLW
jv 1þ cos uj� �2
(2)
where g is the surface tension and u is the contact angle. The
subscripts s, l and v denote solid, liquid and vapour phases,
respectively. LW symbolizes the Lifshitz-van der Waals
component, gþ denotes the acidic (electron acceptor)
Polym. Adv. Technol. 2006; 17: 932–939
DOI: 10.1002/pat
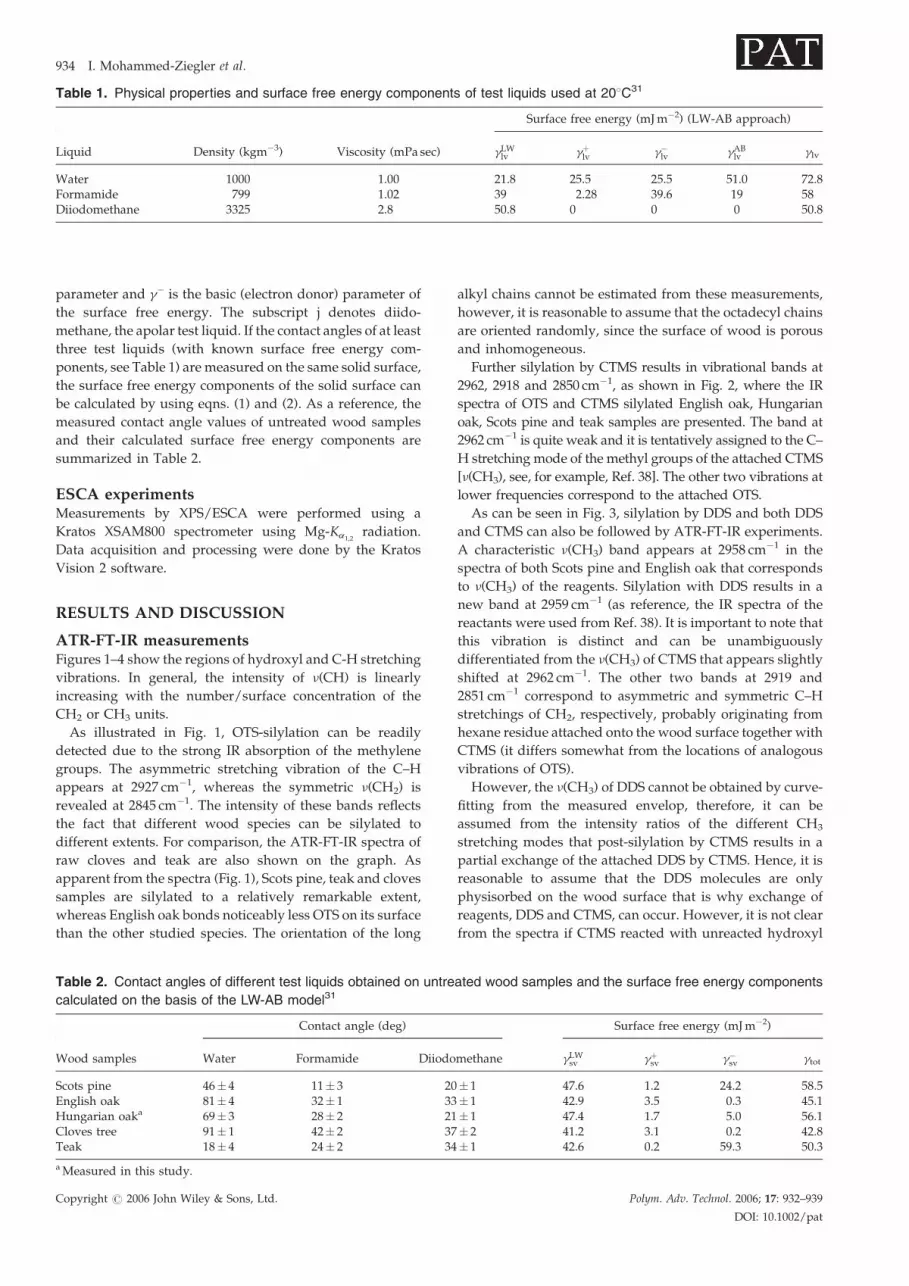
Table 1. Physical properties and surface free energy components of test liquids used at 208C31
Surface free energy (mJm�2) (LW-AB approach)
Liquid Density (kgm�3) Viscosity (mPa sec) gLWlv gþlv g�lv gABlv glv
Water 1000 1.00 21.8 25.5 25.5 51.0 72.8Formamide 799 1.02 39 2.28 39.6 19 58Diiodomethane 3325 2.8 50.8 0 0 0 50.8
934 I. Mohammed-Ziegler et al.
parameter and g� is the basic (electron donor) parameter of
the surface free energy. The subscript j denotes diido-
methane, the apolar test liquid. If the contact angles of at least
three test liquids (with known surface free energy com-
ponents, see Table 1) are measured on the same solid surface,
the surface free energy components of the solid surface can
be calculated by using eqns. (1) and (2). As a reference, the
measured contact angle values of untreated wood samples
and their calculated surface free energy components are
summarized in Table 2.
ESCA experimentsMeasurements by XPS/ESCA were performed using a
Kratos XSAM800 spectrometer using Mg-Ka1,2radiation.
Data acquisition and processing were done by the Kratos
Vision 2 software.
RESULTS AND DISCUSSION
ATR-FT-IR measurementsFigures 1–4 show the regions of hydroxyl and C-H stretching
vibrations. In general, the intensity of n(CH) is linearly
increasing with the number/surface concentration of the
CH2 or CH3 units.
As illustrated in Fig. 1, OTS-silylation can be readily
detected due to the strong IR absorption of the methylene
groups. The asymmetric stretching vibration of the C–H
appears at 2927 cm�1, whereas the symmetric n(CH2) is
revealed at 2845 cm�1. The intensity of these bands reflects
the fact that different wood species can be silylated to
different extents. For comparison, the ATR-FT-IR spectra of
raw cloves and teak are also shown on the graph. As
apparent from the spectra (Fig. 1), Scots pine, teak and cloves
samples are silylated to a relatively remarkable extent,
whereas English oak bonds noticeably less OTS on its surface
than the other studied species. The orientation of the long
Table 2. Contact angles of different test liquids obtained on untre
calculated on the basis of the LW-AB model31
Contact angle (deg)
Wood samples Water Formamide Diiodo
Scots pine 46� 4 11� 3 20English oak 81� 4 32� 1 33Hungarian oaka 69� 3 28� 2 21Cloves tree 91� 1 42� 2 37Teak 18� 4 24� 2 34
aMeasured in this study.
Copyright # 2006 John Wiley & Sons, Ltd.
alkyl chains cannot be estimated from these measurements,
however, it is reasonable to assume that the octadecyl chains
are oriented randomly, since the surface of wood is porous
and inhomogeneous.
Further silylation by CTMS results in vibrational bands at
2962, 2918 and 2850 cm�1, as shown in Fig. 2, where the IR
spectra of OTS and CTMS silylated English oak, Hungarian
oak, Scots pine and teak samples are presented. The band at
2962 cm�1 is quite weak and it is tentatively assigned to the C–
H stretching mode of the methyl groups of the attached CTMS
[n(CH3), see, for example, Ref. 38]. The other two vibrations at
lower frequencies correspond to the attached OTS.
As can be seen in Fig. 3, silylation by DDS and both DDS
and CTMS can also be followed by ATR-FT-IR experiments.
A characteristic n(CH3) band appears at 2958 cm�1 in the
spectra of both Scots pine and English oak that corresponds
to n(CH3) of the reagents. Silylation with DDS results in a
new band at 2959 cm�1 (as reference, the IR spectra of the
reactants were used from Ref. 38). It is important to note that
this vibration is distinct and can be unambiguously
differentiated from the n(CH3) of CTMS that appears slightly
shifted at 2962 cm�1. The other two bands at 2919 and
2851 cm�1 correspond to asymmetric and symmetric C–H
stretchings of CH2, respectively, probably originating from
hexane residue attached onto the wood surface together with
CTMS (it differs somewhat from the locations of analogous
vibrations of OTS).
However, the n(CH3) of DDS cannot be obtained by curve-
fitting from the measured envelop, therefore, it can be
assumed from the intensity ratios of the different CH3
stretching modes that post-silylation by CTMS results in a
partial exchange of the attached DDS by CTMS. Hence, it is
reasonable to assume that the DDS molecules are only
physisorbed on the wood surface that is why exchange of
reagents, DDS and CTMS, can occur. However, it is not clear
from the spectra if CTMS reacted with unreacted hydroxyl
ated wood samples and the surface free energy components
Surface free energy (mJm�2)
methane gLWsv gþsv g�sv gtot
� 1 47.6 1.2 24.2 58.5� 1 42.9 3.5 0.3 45.1� 1 47.4 1.7 5.0 56.1� 2 41.2 3.1 0.2 42.8� 1 42.6 0.2 59.3 50.3
Polym. Adv. Technol. 2006; 17: 932–939
DOI: 10.1002/pat

Figure 1. ATR-FT-IR spectra of OTS-silylated wood samples
(spectra are off-set for clarity).
Figure 3. ATR-FT-IR spectra of DDS and DDSþCTMS-sily-
lated Scots pine and English oak (spectra are off-set for
clarity).
Silylated wood samples 935
groups of the wood surface or CTMS simply substituted the
physisorbed DDS in part.
ATR-FT-IR spectra of some DPS-treated wood samples are
shown in Fig. 4. Aromatic C–H stretchings are located at
3072, 3049, 3023 and 2959 cm�1 (in good agreement with the
reference spectrum of neat DPS).38 The most characteristic
aromatic C–H stretching bands are marked by arrows in
Fig. 4. As apparent from the spectra, the different wood
species can be silylated by DPS to different extents. Solvent
residues are also detected on these wood samples, and the
locations of the aliphatic n(CH2) are at 2920 and 2851 cm�1.
Contact angle measurements
The role of silylation timeThe effect of the duration of silylation on surface properties
of wood has already been studied in the case of OTS and
CTMS.31 Therefore, only surface modification with DDS was
studied in this work. The water contact angle and the total
surface free energy data of the treated Scots pine sapwood
samples are shown in Fig. 5. The calculation is based on the
LW-AB theory. It is interesting to note that water contact
angles do not differ significantly if the sample is silylated for
Figure 2. ATR-FT-IR spectra of OTSþCTMS-silylated wood
samples (spectra are off-set for clarity).
Copyright # 2006 John Wiley & Sons, Ltd.
5min or for 15min, whereas, those increase remarkably after
a 30min or 60min silylation. The calculated surface free
energies, however, do not reflect this behavior. These values
decrease with time of silylation as expected but, surprisingly,
reach a minimum after a 30min reaction time and increase if
the sample is treated for an hour. Though it is not understood
clearly but one can suppose that extractable silylated (more
or less hydrophobic) small molecules migrate from the wood
sample into the organic test liquid decreasing the contact
angles significantly (see, for example, the extraordinary low
contact angles of diiodomethane in Tables 3 and 4). Hence,
the uncertainty of the determination of surface free energies
also becomes larger if the test liquid extracts some
components from the observed solid. Therefore, conclusions
must be drawn cautiously from contact angle measurements.
Water contact angles are more reliable since they do not
exhibit so pronounced changes during the measurements
and cannot dissolve easily the silylated organic wood
components.
The result of the one-step silylationAfter the time-dependence study, 5min was chosen as the
duration of silylation for further experiments in this study.
The observed contact angles and the calculated surface free
Figure 4. ATR-FT-IR spectra of DPS-silylated Scots pine,
English oak and cloves (spectra are off-set for clarity).
Polym. Adv. Technol. 2006; 17: 932–939
DOI: 10.1002/pat

Figure 5. Water contact angle (&) and total surface free
energy (*) on Scots pine sapwood samples treated with
DDS for different times obtained by the LW-AB approach.
936 I. Mohammed-Ziegler et al.
energy values are summarized in Table 3. As can be seen
from the water contact angle data, OTS renders the wood
surfaces more hydrophobic than DDS in line with expec-
tations, in most cases. The long alkyl chain of OTS can
certainly render the surface hydrophobic more effectively.
This also meets expectations even if polymerization of
precursors can occur.
Cloves wood differs from other wood samples. It was less
efficiently silylated by DDS than other samples. In line with
this, it exhibits relatively high surface free energy after the
treatment with DDS as compared with other studied
samples, mainly due to the extraordinary low diiodo-
methane contact angle. If cloves tree is treated with OTS,
the effect changes in an opposite way: the water contact angle
is somewhat lower than in the case of the other species,
whereas the surface free energy is lower than those of the
other OTS-treated wood samples under study. Con-
sequently, it is reasonable to assume that cloves mainly
have extractable small molecules by diiodomethane in case
of using DDS for silylation. This assumption is in good
agreement with earlier observations when chloroform
solutions of the silylating agents were applied for cloves
tree.31 The OTS-treated teak also show a strange behaviour
Table 3. Contact angles of different test liquids obtained on woo
components calculated on the basis of the LW-AB model
Contact angle (deg)
Wood samples Water Formamide Diiodomet
1% DDSScots pine 129� 3 104� 1 66� 2English oak 108� 3 92� 3 70� 3Hungarian oak 125� 2 101� 2 71� 1Cloves tree 124� 1 87� 2 38� 2Teak 129� 2 108� 2 72� 11% OTSScots pine 134� 2 113� 2 68� 2English oak 133� 2 97� 2 73� 1Hungarian oak 135� 1 102� 2 61� 1Cloves tree 127� 1 100� 2 81� 2Teak 132� 1 113� 1 25� 2
Copyright # 2006 John Wiley & Sons, Ltd.
concerning the surface free energy, which can also be
attributed to diiodomethane contact angles: its hydrophobi-
city is similar to that of the other samples but its calculated
surface free energy is remarkably higher than that of the
other samples (one step silylation) due to the extraordinary
low diiodomethane contact angles. This behavior cannot be
explained at present. Further investigation is necessary to
reveal the reason for the observed low diiodomethane
contact angles on this sample. This fact also underlines the
importance of surface free energy calculations. Apparently a
single contact angle value does not characterize the surface
properties and behavior unambiguously.
When DPS was used as silylating reagent, the diiodo-
methane contact angles were surprisingly low and practi-
cally complete wetting was observed in the case of
Hungarian oak. Therefore only water contact angles are
presented (Fig. 6). As evident from the data, silylation with
DPS results in moderate increase of hydrophobicity, with the
exception of Scots pine, which exhibits the average water
contact angle of 1458. That is comparable with values
obtained by silylation with OTS.
The result of the two-step silylationThe most important result here is that the consecutive
silylation with the different agents leads to an improved
water-repellent property of wood surfaces applying OTS in
the first step (Table 4). However, the post-silylation by
CTMS, in the case of DDS, deteriorates the hydrophobicity
that was reached in the first step. The resultant water contact
angles in this case are slightly higher than those obtained
only with silylation by CTMS31 (Fig. 7). The fact that DDS
could be partly exchanged with CTMS also suggests that the
silylating agents do not chemisorb on the wood surface. It
seems that at room temperature only physisorption occurs,
in similarity to silylation of silica.39 It is reasonable to assume
that OTS has higher affinity to the wood surface than DDS.
Therefore, the attached OTS cannot be exchanged or washed
off easily from the treated wood surface. It is also possible in
the case of pre-silylation with OTS that the long alkyl chains
sterically hinder the migration of CTMS molecules onto the
wood surface, and therefore OTS cannot be squeezed out
from the active sites of the surface. In Table 4, the
d samples treated in one step and the surface free energy
Surface free energy (mJm�2)
hane gLWsv gþsv g�sv gtot
25.11 (�)1.75 (�)0.41 2622.86 (�)0.32 1.26 2222.30 (�)0.71 (�)0.20 2240.56 (�)1.15 2.69 4421.75 (�)1.89 (�)0.07 22
23.97 (�)3.84 (�)0.13 2421.20 (�)0.00 (�)3.62 2127.97 (�)1.49 (�)2.43 3216.97 (�)0.00 (�)0.76 1746.12 (�)15.51 0.00 46
Polym. Adv. Technol. 2006; 17: 932–939
DOI: 10.1002/pat

Figure 6. Water contact angles obtained on DPS-treated
Scots pine, English oak, Hungarian oak, cloves tree and teak.
Figure 7. Water contact angles obtained on Scots pine,
English oak, cloves and teak treated by DDS and
DDSþCTMS (in this study), and by CTMS.31
Silylated wood samples 937
corresponding diiodomethane contact angles are extremely
low. It reflects that diiodomethane may dissolve the
adsorbed silylating agent.
Due to the very low hydrophobicity of the DPS treated
wood samples, post-silylation of these samples was not
carried out.
It is also necessary to mention the appearance of high
contact angle values (due to the surface roughness) and
anomalous surface free energy components obtained for
water-repellent surfaces in this study. These results confirm
the observations of other authors (see, for example, Refs. 36,
40). In the present study, the suggestion of de Meijer et al.36
has been applied, i.e. if a negative value was obtained during
the calculation of the surface free energy components, the
component was taken into account as a negative contribution
to the total surface free energy of the solid surface. This
assumption is necessary to use because the solution of the
linear equation system [derived from eqns. (1) and (2)]
results in square roots of the surface free energy components.
Theoretically, the surface free energy value can only be
positive (see, for example, Ref. 37), thus its square root can
also be only positive. In ref. 36 the appearance of the negative
Table 4. Contact angles of different test liquids obtained on woo
components calculated on the basis of the LW-AB model
Contact angle (deg)
Wood samples Water Formamide Diiodometh
1% DDSþ 1% CTMSScots pine 95� 3 42� 2 26� 1English oak 80� 3 28� 2 32� 1Hungarian oak 101� 4 34� 2 32� 1Cloves tree 107� 1 70� 2 38� 1Teak 103� 2 44� 2 34� 11% OTSþ 1% CTMSScots pine 140� 2 128� 3 94� 2English oak 131� 2 117� 2 67� 3Hungarian oak 135� 4 126� 2 81� 2Cloves tree 136� 1 118� 1 80� 2Teak 141� 2 125� 2 77� 1
Copyright # 2006 John Wiley & Sons, Ltd.
square roots was explained by the observed very high water
contact angle values obtained on the hydrophobic wood
samples. The high contact angle is connected to the surface
roughness of these samples. The application of ‘‘negative
contributions’’ results in realistic surface free energy values
for the treated wood surfaces. However, this phenomenon is
evenmore complex in the present case for samples with even
more hydrophobic character, e.g. in the case of the
consecutive application of OTS and CTMS. In these cases
even the application of ‘‘negative contributions’’ does not
make it possible to calculate the total surface free energy of
the solid surface.
It is necessary to underline the fact that in the case of wood
samples, the possible dissolution of some components in one
of the test liquids, as was mentioned earlier, may cause
extraordinary low contact angles in certain cases. In these
cases, eqns. (1) and (2) should not be used, since the dissolved
components modify the surface tension values summarized
in Table 1. However, finding non-polar test liquids that do
not extract components from the wood samples seems
impossible due to the great variety of wood extractives.
Hence, the basic reason for the found controversy is very
d samples treated in two steps and the surface free energy
Surface free energy (mJm�2)
ane gLWsv gþsv g�sv gtot
45.76 2.57 (�)1.44 4243.34 4.17 0.20 4443.34 (�)12.32 11.12 ?40.56 3.06 (�)0.60 3942.46 4.16 (�)5.77 ?
3.25 5.28 (�)5.08 ?(�)125.8 192.7 (�)1.00 ?(�)106.1 150.3 (�)0.35 ?(�)61.49 110.57 1.47 ?(�)120.7 174.44 (�)2.01 ?
Polym. Adv. Technol. 2006; 17: 932–939
DOI: 10.1002/pat

938 I. Mohammed-Ziegler et al.
likely the dissolution of some component(s) in some of the
test liquid(s).
Moreover, surface roughness, which can be the main
reason for high contact angles as was mentioned earlier, is
not taken into account by eqns. (1) and (2) that can also cause
the aforementioned controversies. From this point of view, it
would be necessary to use some additional equations to re-
calculate the surface tension values, determined on a rough
surface. For this calculation, however, it would be necessary
to know the ratio of the apparently wetted surface area to the
total surface area of the solid but this information is not
available presently.
It is worth mentioning, however, that the application of
LW-AB theory can also cause some uncertainties in the
analysis. Kwok,41 for instance, determined the surface free
energy of ideal solid surfaces [namely fluorocarbon,
polystyrene, and poly(methyl methacrylate)] by means of
the LW-AB theory and found that the results altered
significantly if the test liquid triplet changed. These
experiences can question the applicability of LW-AB theory
for the calculation of surface free energy components, though
it is widely used in the literature.
In any case, a more thorough explanation of the present
findings requires further experimental and theoretical efforts
in the future.
ESCA measurementsTable 5 reports the results of elemental analysis (in atom%)
for the variously silylated Scots pine and English oak
samples, together with the corresponding O/Si and C/Si
atomic ratios. Since Si is a marker element for the coating, the
Si-content and/or the Si/O and Si/C ratios could in principle
give indications of the efficiency of silylation. However, this
is complicated by the fact that the Si/C ratios of the silylating
agents themselves are different and also their numbers of
reactive functionalities are different. (The calculated Si/C
values for DDS, DPS, OTS and CTMS are 0.50, 0.08, 0.06 and
0.33, respectively, and the corresponding numbers of
reactive functional groups are 2, 2, 3 and 1.) The silylating
agent applied in the first step consumes at least one
functional group upon reacting with the substrate (or one
active site in case of physisorption). The remaining func-
tional group(s) hydrolyze, since no chlorine was detected by
ESCA. Table 5 reflects clearly that post-silylation by CTMS
changes the surface composition for both the Scots pine and
the English oak, regardless if CTMS is applied after DDS or
after OTS. Comparing the results obtained for samples
Table 5. Results of ESCA measurements on treated Scots
pine and English oak samples
Treatment
Scots pine English oak
O C Si Si/O Si/C O C Si Si/O Si/C
DDS 29.9 60.3 9.9 0.33 0.16 34.9 57.7 7.4 0.21 0.13DDSþCTMS 31.2 61.1 7.7 0.25 0.13 37.2 57.2 5.6 0.15 0.10DPS 19.7 73.8 6.6 0.34 0.09 22.2 69.5 8.3 0.37 0.12OTS 12.5 83.0 4.5 0.36 0.05 15.6 80.1 4.3 0.28 0.05OTSþCTMS 14.7 80.1 5.2 0.35 0.06 13.4 80.8 5.8 0.43 0.07
Copyright # 2006 John Wiley & Sons, Ltd.
treated by OTSþCTMS with those treated by OTS alone, it
can be seen that the Si-content increased and the Si/O ratio
either remained practically unchanged (Scots pine) or
increased (English oak). A similar comparison for samples
treated by DDSþCTMS with those treated by DDS alone,
however, shows a decrease in both the Si-content and the Si/
O ratio. This suggests that post-silylation by CTMS shows
basically different mechanisms after OTS or DDS: after OTS-
treatment the post-silylation proceeds mainly at the
unreacted sites of the substrate and/or of the attached
OTS, while after DDS the exchange of some DDS moieties
with CTMS occurs. Thus, the results obtained by ESCA are in
good agreement with those obtained by contact angle
measurements, according to which a consecutive silylation
byDDS andCTMS leads to a partial removal of DDS from the
wood surface.
AcknowledgmentsThis work was supported in part by the Hungarian National
Scientific Foundation for Research (OTKA T 049156 and
T 037643). The authors are grateful for the help of Zanzibar
Ministry of Agriculture in obtaining the tropical wood
samples. This project participates in the action of COST E41.
REFERENCES
1. Mohammed-Ziegler I, Marosi Gy, Matko Sz, Horvolgyi Z,Toth A. Polym. Adv. Technol. 2003; 14(11-12): 790–795.
2. Mohammed-Ziegler I. Adsorption of Pinosylvin onto the Struc-ture of Wood—Mechanism and Adsorption Parameters. Licenti-ate Thesis, Lulea University of Technology, Sweden, 2000.
3. Mohammed-Ziegler I, Horvolgyi Z, Forsling W, HolmgrenA. Wettability and spectroscopic Characterization of SurfaceModified Wood Samples Prepared by Different SilylatingAgents—Towards Protection of Wood. Proceedings of the 8thInternational Symposium on Polymers for Advanced Tech-nologies: Budapest, 2005.
4. Cretin NS, Ozmen N, Tingaut P, Sebe G. Eur. Polym. J. 2005;41(11): 2704–2710.
5. Tserki V, Zafeiropoulos NE, Simon F, Panayiotou C. Com-posites A: Appl. Sci. Manufact. 2005; 36(8): 1110–1118.
6. Gao ZH, Gu JY, Wang X-M, Li ZG, Bai XD. Pigment ResinTechnol. 2005; 34(5): 282–289.
7. Pandey KK. Polymer Degrad. Stab. 2005; 90(1): 9–20.8. Tingaut P, Weigenand O, Militz H, De Je B, Sebe G. Holz-
forschung 2005; 59(4): 397–404.9. Mononen K, Jaaskelainen A-S, Alvila L, Pakkanen TT,
Vuorinen T. Holzforschung 2005; 59(4): 381–388.10. AkerholmM, Salmen L. J. Appl. Polym. Sci. 2004; 94(5): 2032–
2040.11. Tolvaj L, Mitsui K. J. Wood Sci. 2005; 51(5): 468–473.12. Papp G, Barta E, Preklet E, Tolvaj L, Berkesi O, Nagy T,
Szatmari S. J. Photochem. Photobiol. A 2005; 173(2): 137–142.13. Mitsui K, Tolvaj L, Papp G, Bohus J, Szatmari S, Berkesi O.
Wood Res. 2005; 50(1): 1–8.14. Schwanninger M, Rodrigues JC, Pereira H, Hinterstoisser B.
Vibrat. Spectrosc. 2004; 36(1): 23–40.15. Yamauchi S, Sudiyani Y, Imamura Y, Doi S. J. Wood Sci. 2004;
50(5): 433–438.16. Stark NM,Matuana LM. Polym. Degrad. Stab. 2004; 86(1): 1–9.17. Rodrigues J, Faix O, Pereira H. Holzforschung 1998; 52(1):
46–50.18. Nzokou P, Kamdem DP. Surf. Interface Anal. 2005; 37(8):
689–694.19. Li K, Reeve DW. Cellulose Chem. Technol. 2004; 38(3-4):
197–210.20. Shchukarev A, Sundberg B, Mellerowicz E, Persson P. Surf.
Interface Anal. 2002; 34(1): 284–288.21. Risen J, Hulten AH, PaulssonM. J. Wood Chem. Technol. 2004;
24(4): 307–321.
Polym. Adv. Technol. 2006; 17: 932–939
DOI: 10.1002/pat

Silylated wood samples 939
22. Vladkova TG, Dineff PD, Gospodinova DN. J. Appl. Polym.Sci. 2004; 91(2): 883–889.
23. SernekM, Kamke FA, GlasserWG. Holzforschung 2004; 58(1):22–31.
24. Hakkou M, Petrissans M, Zoulalian A, Gerardin P. Polym.Degrad. Stab. 2005; 89(1): 1–5.
25. Koljonen K, Stenius P. Nordic Pulp and Paper Res. J. 2005;20(1): 107–113.
26. Gindl M, Reiterer A, Sinn G, Stanzl-Tschegg SE. Holz alsRoh - und Werkstoff 2004; 62(4): 273–280.
27. Kishino M, Nakano T. Holzforschung 2004; 58(5): 552–557.28. Thames SF, Gupta S. J. Appl. Polymer Sci. 2001; 81(3): 754–
761.29. Schmohl A. Charakterisierung silylterminierter Siliziumdioxido-
berflachen mit thermischer Desorptionsspektroskopie undoberflachensensitiven Analysemethoden. Ph.D. Dissertation,Ruprecht-Karls-Universitat, Heidelberg, 2004.
30. Anna P, Zimonyi E, Marton A, Szep A, Matko Sz, Keszei S,Bertalan Gy, Marosi Gy. Surface treated cellulose fibres in
Copyright # 2006 John Wiley & Sons, Ltd.
flame retarded PP composites. Macromol. Symp. 2003; 202:245–254.
31. Mohammed-Ziegler I, Oszlanczi A, Somfai B, Horvolgyi Z,Paszli I, Holmgren A, Forsling W. J. Adhesion Sci. Technol.2004; 18(6): 687–713.
32. Zollfrank C, Wegener G. Holzforschung 2002; 56(1): 39–42.33. Zollfrank C. Wood Sci. Technol. 2001; 35: 183–189.34. Horvolgyi Z, Kiss E, Pinter J. Magy. Kem. Foly. 1986; 92(11–
12): 488–494 (in Hungarian).35. Liptakova E, Kudelka J. Holzforschung 1994; 48(2): 139–144.36. deMeijerM,Haemers S, CobbenW,Militz H. Langmuir 2000;
16: 9352–9359.37. Lyklema J. Fundamentals of Interface and Colloid Science, vol. III.
Academic Press: San Diego, CA, 2000; chapter 1.38. Database of the National Institute of Standards and
Technology, http://webbook.nist.gov/chemistry/39. Tripp CP, Hair ML. Langmuir 1992; 8: 1961–1967.40. Barsberg S, Thygesen LG. J. Colloid Interface Sci. 2001; 234: 59–67.41. Kwok DY. Colloid Surfaces A 1999; 156(1–3): 191–200.
Polym. Adv. Technol. 2006; 17: 932–939
DOI: 10.1002/pat


