Embed Size (px)
Citation preview

Contents1 What Investors Should know about the US Current
Account Deficit.
2 Chapter 1: Why the World Needs a ReserveCurrency ...And Why It Is the US$
5 Chapter 2: The US Current Account Deficit:a Provider of Constant GlobalLiquidity
7 Chapter 3: The Deterioration in the USCurrent Account Deficit – A DirectResult of the Asian Crisis
10 Chapter 4: Asia Rebounds, the US$ Falls ...and the US Current Account DeficitContinues to Deteriorate!
14 Chapter 5: On the Other Side of the USCurrent Account Deficit – China
17 Chapter 6: On the Other Side of the USCurrent Account Deficit – Japan
20 Chapter 7: On the Other Side of the USCurrent Account Deficit – Asiaex Japan, ex China
25 Chapter 8: The Growth in Reserves is TooRapid
30 Chapter 9: Prevalent Concerns About the USCurrent Account Deficit – A Wordof Caution
34 Chapter 10: The US$ and the US CurrentAccount Deficit
36 Chapter 11: Conclusion

1
INTRODUCTION:
At the beginning of a long letter, Churchill would usually apologize: “forgive me for the length of thisletter; but I did not have the time to write you a short one”.
Keeping things short and sweet is indeed a true art form. And we usually strive towards that goal.
However, the subject that we have decided to tackle, namely whether the US current account deficitis as much of a problem as presented in the financial media and the main reason the US$ will stayweak for the foreseeable future is, we believe, impossible to articulately and efficiently cover in just afew pages.
As such, like Churchill, we will ask for our reader’s forgiveness. The following pages are somewhatdry. But the topic at hand is, we believe, important enough to ask for your attention over the followingpages.
At the end of this essay, we hope you will not be angry at us for diverging from our usual presentationstyle.

Chapter 1
2
Chapter 1: Why the World Needs a Reserve Currency ...And Why It Is the US$In order to trade, the world needs money.
And for a “money” to be accepted by market participants, it needs to present three characteristics:
1- A Mean of Exchange
2- A Standard of Value
3- A Store of Value
One could therefore conclude that any currency managed by a competent central bank, or gold,could be used for international trade. But yet, the US$ is still today the currency of world trade, andthe reserve currency of choice. Why?
The Old Monetary Systems ... And Why They CollapsedThe goals of any international monetary system should be:
a)To provide enough liquidity for the normal growth of international trade to take place, whateverthat is.
b)To offer a mechanism that allows for random shocks, (i.e.: oil price increases, financial crisis...) tobe absorbed without too much pain.
The gold exchange standard and the dollar/gold exchange standard failed on both accounts for thefollowing reasons:
Reason #1: There is no reason to expect the physical discoveries of gold to be correlated to theexpansion of world trade. As such, in a gold system, we either face an overabundance in the means ofpayments (Europe after the discovery of Latin American gold), or a cruel lack of money (world tradein the 19th century or in the 1930s). This unnatural over-supply/under-supply situation leads theglobal economy into huge booms and busts.
Reason #2: Countries that accumulated large inventories of gold were usually very reluctant to moveinto a balance of payments deficit and allow those who had a problem to return to equilibrium. As aresult, the system ran with a deflationary bias; the countries with a deficit were forced to move to avery restrictive policy because the ones with the surplus were neutral at best.
So historically, international monetary orders, such as the Bretton Woods order which prevailed between1945 and 1973, have collapsed because of a built-in lack of flexibility. And this brings us to today: theage of the US$ as a reserve currency.
The US$: The Default Reserve CurrencyA country does not decide that its currency will become a reserve currency. A currency is elected to bea reserve currency by its peers. And to be elected, the country issuing the currency has to present a setof fixed attributes.
Attribute #1: the issuing country must be dominant militarily. And here the logic is simple: oneholds a reserve currency for random crisis events. Wars are random crisis events. One wants to ensurethat, in case of a war, one is able to buy the best possible weapons... and be sure that the weapons willbe delivered.
Attribute #2: the issuing country must be dominant technologically (see above)

Chapter 1
3
Attribute #3: the issuing country must be dominant agriculturally so that in case of a random crisis,reserves can be morphed into food to feed local populations.
Attribute #4: the issuing country must be mature financially (i.e: have developed financial markets)so that in a “random crisis”, the afflicted country has the ability to raise money in the financialmarkets.
Adding up the four separate attributes, and cross-checking with the main currencies of the world(US$, Euro, Yen, RMB, CHF, GBP etc...), we find that the only currency that meets all four is theUS$, with the Euro running a distant second, mostly because of its lack of military power (i.e.: ifChina ever invades Taiwan, Taiwan will be hard pressed to get delivery of any weapons they orderfrom Europe...meanwhile, weapons bought in the US will be delivered by the 6th Pacific Fleet).
The reserve currency of the world is the US$. And we do not see any other emerging in the foreseeablefuture.
The Privilege of a Reserve CurrencyThe privilege of a reserve currency is that the issuing country does not know any foreign trade constraint;it settles its debt in its own currency. As a result, unlike any other country, the US does not need totighten monetary policy when it moves into a current account deficit.
This means that the central bank that issues the reserve currency (i.e.: the Fed) can force other centralbanks to either increase their reserves of its own currency, or suffer from a massive re-evaluation.Other central banks are in a de-facto subservient position. Or, in Orwellian terms, all central banksare equal, but one is more equal than the others.
This privilege, and this unlimited power to dictate monetary policy to others, had Charles de Gaulleall worked up. So worked up in fact, that he decided to “call the US bluff” and withdraw France’s goldfrom the Fed’s vaults. But to his dismay, the long-term effects on US monetary power were probablysimilar to Cyrus’ order to have the sea whiped after a bad storm thwarted his attempts to invadeGreece!
The New System & Dealing With Random ShocksSince 1973, and the emergence of the new monetary order (or shall we say creative disorder), we haveexperienced quite a few “random shocks” (Oil crisis, Gulf Wars, 1987 crash, 1995 Mexican crisis,1997 Asian crisis, 1998 Russian meltdown...). Each of these shocks required a huge infusion of US$to alleviate what was, in fact, a massive shortage of liquidity. Every time, the United States obliged, byallowing its current account deficit to deteriorate massively.
In the first oil shock, monetized by the Fed, the US current account deficit deteriorated by two pointsof GDP.
In the second oil shock (not monetized by the Fed), the change to a restrictive monetary policy by MrVolcker led to the collapse of borrowers in Latin America (and, very nearly to the collapse of those inEurope and the United States who had lent to the Latin Americans). The US current account deficitthen deteriorated to 3% of US GDP.
The third shock was not oil induced but was a result of excess borrowing in Asia. The US currentaccount deficit deteriorated by another 2% of GDP to reach 5% of GDP. This allowed the indebtedAsian nations to repay their US$ debt.

Chapter 1
4
So, we can safely say that the “new international monetary order” has dealt remarkably efficientlywith the kind of random shocks that had destroyed its predecessors.
T h e U S CA De f i c i t a s a So l u t i o n USA Current Account & 2 years Moving Average
Current Account Deficit as a % of GDP 0 Two Years Moving Average
72 73 74 75 76 77 78 79 80 81 82 83 84 85 86 87 88 89 90 91 92 93 94 95 96 97 98 99 00 01 02 03 04 05
as
a %
of G
DP
-6
-5
-4
-3
-2
-1
0
1
2
L AT I N A M ERI CA N CRI S I S
A SI A N CRI S I S
FI RST OI L SH OCK
Where to From Here?Having dealt with the world’s random shocks, the current US$ based international monetary systemis believed by consensus to be showing serious strain. To some investors, the past two year’s fall in theUS$ is but a prelude of a global, extremely painful adjustment set to unleash itself. But is such anadjustment likely? And if so, what would it mean for investors? These are some of the question we aimto answer in the coming pages.
Important conclusions from Chapter 1:a) Global trade is mostly denominated in US$.
b) The US$ is the world’s reserve currency.
c) When a shock hits the system, the US provide liquidity to the world through the US currentaccount deficit.
d) The US current account deficit now stands at 5% of US GDP.

Chapter 2
5
Chapter 2: The US Current Account Deficit: a Provider ofConstant Global LiquidityCentral bankers are paid to be cautious. And one of the many things they have to be cautious aboutis keeping enough reserves “in the bank” to pay for at least three, and usually six, months of imports.
Since most of world trade is denominated in US$, most countries imports (oil, gas, copper, steel,semiconductors...) will usually be priced in US$. So, in order to meet their trade requirements, domesticcentral banks are forced to keep most of their foreign currency reserves in US$.
And this is where it gets interesting. Thanks to outsourcing, globalization etc..., we should witness acontinued rapid acceleration in global trade over the coming years.
OECD Exports of Goods and Services, Volume, sa
OECD Exports of goods and services, Volume, sa [c.o.p 4]OECD Imports of goods and services, Volume, sa [c.o.p 4]
96 97 98 99 00 01 02 03 04
YoY
%C
hang
e
-5.0
-2.5
0.0
2.5
5.0
7.5
10.0
12.5
15.0
OECD trade growing by 6.5% per annumin the past decade
And in turn, this growth in global trade implies a higher need for US$ reserves. In a world withexpanding trade flows, the only way to reconcile the central banks’ needs for reserves, and the trade’sneeds for US$, is for the US to accept to run a perpetual current account deficit.
The important question is therefore not whether the US has a current account deficit (the worldneeds for the US to have one), but what the optimum current account deficit should be? And whathappens when it is too small? Or too large...
Illustrating this point is the fact that, every significant improvement in the US current account deficithas led to an international financial crisis. And this makes perfect sense: a smaller US current accountdeficit means that getting a hold of US$ is difficult; and when that happens, a marginal user of US$somewhere around the world gets cut off...and goes belly up.

Chapter 2
6
When the US Current Account Deficit Improves, Someone Goes Bust
Annual Increase/Decrease in US Current Account Deficit inverted
80 81 82 83 84 85 86 87 88 89 90 91 92 93 94 95 96 97 98 99 00 01 02 03 04
-40000
-30000
-20000
-10000
0
10000
20000
30000
40000
StocksMexicoCrash
Mexico Asi a
S&L
Japan bust starts
Arg entinaTurkeyTMT
If the US current account deficit is the main source of liquidity for the world, and if most of that newliquidity is absorbed by the working capital needs of world trade, then, over the long term, we shouldhave a certain stability between central bank reserves and world trade.
Conveniently, we do.
OECD Impor ts & Cent ral Bank Reserves Deposi ted at the Fed
OECD Imports of goods and services, Volume, AR, sa [index 1995]
OECD Imports of goods and services, Volume, sa [index 1995]
Central Bank Reserves in Real Terms [index 1995] Ratio Base 100 in 1995 [index 1995] Ratio Base 100 in 1995 [index 1995]
80 81 82 83 84 85 86 87 88 89 90 91 92 93 94 95 96 97 98 99 00 01 02 03 04
19
95
=1
0 0
25
50
100
200
Ra
tio
70
120
170
220
270
L inear Trend
320
Important conclusions from Chapter 2:e) Prudence dictates that central banks like to keep between 3 and 6 months worth of imports in
US$ reserves.
f) Global trade is accelerating fast, hereby forcing central banks to keep higher reserves.
g) The US current account deficit is a necessity to ensure that the world has enough US$ tofinance both global trade and central bank reserves. The important question is not whetherwe should have a US current account deficit, but what its optimum size is?
h) When the US current account deficit improves, someone, somewhere gets cut off from the US$stream and goes belly-up.

Chapter 3
7
Chapter 3: The Deterioration in the US Current Account Deficit –A Direct Result of the Asian Crisis
The Deterioration in the US Current Account DeficitFor the sake of simplification and generalization, we will divide the world into six main trade blocks:NAFTA (US, Canada, Mexico), Japan, China, Asia ex-Japan & ex-China (AEJEC), Europe, andOPEC/Oil Producers (Middle-East, Russia, Venezuela, Nigeria...).
In the previous large run-up in the US current account deficits (1985-87), much of the imbalance wasmatched by current account surpluses in the economies of the EU and Japan (in 1987, when the USran a US$161bn deficit, the EU and Japan ran surpluses of US$28bn and US$85bn respectively).
In the recent run-up in the US current account deficit, we have not witnessed an improvement in theEuropean current account surpluses. Instead, we have witnessed a 30% increase in the Japanese currentaccount surplus and a big expansion in Asian trades. Asian countries (including China) have increasedtheir share of US trade from 16% a decade ago to over 28% today.
Table 1: Breaking Down the Deterioration in the US Current Account Deficit
1997 2004 Change
1 US -136 -631 -495
2 Euro zone +99 +72 -27
3 Japan +97 +159 +62
4 Other OECD (ex Korea) +23 +28 +5
5 Asian NIEs (inc Korea) -2 +106 +108
6 China +37 +38 +1
7 Developing Asia (ex China, N -27 +31 +58
8 Middle East +8 +104 +96
9 Latin America -67 +9 +76
10 CIS (inc Russia) -9 +61 +70
11 Africa, C. Europe and other EMs -27 -41 -14
12 Errors and omissions +5 +98 +93
13 Asia (inc Japan, China) +105 +334 +229
14 Asia plus E&O +110 +432 +322
15 Mid East and CIS -1 +165 +166
16 Latin Am -67 +9 +76
Source: IMF
Looking at the above table, two easy conclusions can be drawn:
a) the deterioration in the US current account deficit occurred between 1997 and 2004
b) the deterioration was mostly against Asia
Needless to say, the fact that Asia experienced a massive financial crisis in 1997 is not coincidental.

Chapter 3
8
The Asian CrisisNumerous books have been written on the causes of the Asian Crisis. And various commentatorsusually find different evils (a culture of cronyism, the lack of productivity gains, financial manipulationby speculators etc...) to explain the sudden meltdown that occurred across the continent.
As we look at it, the crisis in Asia was a direct result of the Asian governments’ decision to peg theircurrencies to the US$. As a result of the currency pegs, investors in Thailand, Korea, Malaysia,Indonesia... were led to believe that they could borrow at 5% in US$ and invest in their local economies(usually real estate) for double digit returns.
This worked for a while. Until growing current account deficits led foreign banks and investors to shyaway from renewing US$ loans. At this point, the whole edifice built on leverage collapsed abruptly.
When the currencies collapsed, the borrowers were left with debt in US$, almost worthless and illiquidassets (at least for a while), and meager local currencies income that often did not cover the interestpayments on the US$ debt contracted just months before.
On the other side of that trade were either the local banking systems (which were devastated) and theOECD banking system.
If the fellows in Asia had defaulted on their debts (i.e.: a la Argentina, or a la Russia), the OECDbanking systems could have gone up in flames... So, as far as OECD countries were concerned, theonly practical solution was to allow the nearly bankrupt countries to earn the US$ they needed torepay the previously contracted debt.
And this is exactly what happened...the US current account deficit went “through the roof” in 1998,1999 and 2000, to accommodate the new demand for US$. The Asian Crisis marked an unprecedentedtransfer of wealth from the Asian consumer to the Western consumer, and from the Western producerto the Asian producer. This transfer of wealth permitted the leveraged Asian producer to repay hisUS$ debt.
And how was this result achieved? Simple: by a market movement in relative exchange rates.
Real Ef fect ive Exchange Rates: US Dol lar & As ia
USA J.P. Morgan Broad Real Eff. Exchange Rate index [index 1992:1]
USA J.P. Morgan Broad Real Eff. Exchange Rate index [index 1992:1]
Asian Arithmetical Average without China & Japan [index 1992:1]
78 79 80 81 82 83 84 85 86 87 88 89 90 91 92 93 94 95 96 97 98 99 00 01 02 03 04
19
92
:01
=1
00
70
80
90
100
110
120
130
140
Main Reasons Behind the US CA Def ic i t
In the chart above, the red line is the US$ trade-weighted index. The black line is the average of thetrade weighted indices of five Asian currencies: the Korean Won, the HK$, the Singapore $, theMalaysian Ringgit, and the New Taiwan $.

Chapter 3
9
There is little doubt in our minds that the collapse in Asian currencies triggered the big expansion inthe US current account deficit. This point is proved by the next chart which shows the ratio of thetrade weighted currency indices between the US and Asia. This ratio leads the US current accountdeficit by two years with a correlation of 0.94!
US Current Account Movements & Var iat ions in the TW Rates
Current Account Deficit as a % of GDP: 4 Quarters Average Quarterly Ratio of Trade Weighted Exchange Rates (ex China & Japan) pushed forward two years RHS
72 73 74 75 76 77 78 79 80 81 82 83 84 85 86 87 88 89 90 91 92 93 94 95 96 97 98 99 00 01 02 03 04 05 06 -6
-5
-4
-3
-2
-1
0
1
2
3
4 0.4
0.5
0.6
0.7
0.8
0.9
1.0
1.1
1.2
R=.94 SINCE 1975 ! ! !
??
Important conclusions from Chapter 3:i) We will consider that there are six main players in global trade: NAFTA, China, Japan,
Europe, Asia ex Japan ex China, Oil producing nations.
j) The deterioration in the US current account deficit since 1997 has been a direct result of theAsian Crisis, and the subsequent collapse in Asian currencies.
k) Any serious study of the US current account deficit therefore needs to focus on the US-Japan,US China, US Asia ex Japan, ex China trade flows.

Chapter 4
10
Chapter 4: Asia Rebounds, the US$ Falls ... and the US CurrentAccount Deficit Continues to Deteriorate!Over the past two and half years, the US$ has fallen against most currencies. So much so that, on atrade weighted basis the US$ is now down -13% against a broad index and -25% against the world’sbiggest currencies.
USA Trade Weighted Exchange Index
USA Trade Weighted Exchange index Broad [index 2002:2]USA Trade Weighted G-10/G-6 index [index 2002:2]
73 74 75 76 77 78 79 80 81 82 83 84 85 86 87 88 89 90 91 92 93 94 95 96 97 98 99 00 01 02 03 04
Inde
x10
00in
Feb
ruar
y20
02
20
30
40
50
60
70
80
90
100
110
120
130
140
US$ is down -13% against a broad index
and down -25% against the G10
On past historical correlation, one would have expected this fall in the US$ to trigger a markedimprovement in the US trade balance.
Trade Weighted Dollar & USA Trade Balance with or without China
USA Trade Weighted Exchange Real index Major Currencies [lag 18]Trade Balance as a % of GDPTrade Balance ex China as a % of GDP
87 88 89 90 91 92 93 94 95 96 97 98 99 00 01 02 03 04 05 06
Tra
deW
eigh
ted
Dol
lar
Inve
rted
70
140
asa
%of
GD
P
-4.5
-4.0
-3.5
-3.0
-2.5
-2.0
-1.5
-1.0
-0.5
0.0
0.5
1.0
1.5
The Trade weighted US$ leadsthe current account ex China by 18 mths
But instead, the opposite happened. And this odd fact raises some important questions:

Chapter 4
11
Is the US Industrial System Obsolete? Or Are US Exports Under-Counted?As illustrated in the chart below, US exports as a % of OECD exports stand today at a twenty yearlow. The last time US exports were this weak was during the mid-1980s spike in the US$ (when1US$=1GBP=10FF and every other American invaded Paris, London and the Riviera for the summer).
US Exports as a % of OECD Exports
Trade Weighted Dollar, Inverted, and pushed forward a yearUS Exports as a % of OECD Exports
72 73 74 75 76 77 78 79 80 81 82 83 84 85 86 87 88 89 90 91 92 93 94 95 96 97 98 99 00 01 02 03 04 05 06
Inde
xB
ase
100
in20
01
80
85
90
95
100
105
110
115
120
125
130
???
So does the US simply not produce anything that the world may want to buy? Even at a cheaper price?Anecdotal evidence does point that way. As the old joke goes: “Joe Smith started the day early, havingset his alarm clock (MADE IN JAPAN) for 6 a.m. While his coffeepot (MADE IN CHINA) wasperking, he shaved with his electric razor (MADE IN HONG KONG). He put on a dress shirt(MADE IN SRI LANKA), designer jeans (MADE IN SINGAPORE) and tennis shoes (MADE INKOREA). After cooking his breakfast in his new electric skillet (MADE IN INDIA) he sat down withhis calculator (MADE IN MEXICO) to see how much he could spend today. After setting his watch(MADE IN TAIWAN) to the radio (MADE IN PHILIPINES) he got in his car (MADE INGERMANY) and continued his search for a good paying AMERICAN JOB. At the end of yet anotherdiscouraging and fruitless day, Joe decided to relax for a while. He put on his sandals (MADE INBRAZIL) poured himself a glass of wine (MADE IN FRANCE) and turned on his TV (MADE INMALYSIA), and then wondered why he can’t find a good job in the USA.....”
As in most jokes, there is an underlying element of reality in the above story. And this reality is thatthe US is no longer very competitive in the production of most industrial goods (cars, consumerelectronics, machine-tools...).
But the more important reality is that it is very easy to count what the US imports (cars, TVs, tennisshoes...) but much more challenging to count what the US exports. What the joke above does not sayis that, in all likelihood, the financing of most of the above international production (except theFrench wines, of course!) had been done by banks, MADE IN AMERICA. Indeed, the off-shoot ofthe integration in the global system of production has been the amazing concentration of the globalfinancial system around American banks. But how does one include that in trade numbers?
Today, the biggest US exports are most likely a) university educations, b) banking and consultingservices, c) legal and accounting services, d) software... How does one account for a computer programdownloaded from a California-based server, through the internet, on a HK based PC, using a Visacard? Undeniably, it is a US export. But does it come up as such? And is it really US$ sensitive?

Chapter 4
12
Is the US Experimenting with a New Business Model?In the capitalist world (i.e.: not Japan), companies are flexible, and the organizational models thatthey follow can change massively over time. For example, in the last fifty years, we have seen theemergence of numerous multi-national companies. Each of them started as a purely domestic company,and eventually started to produce everywhere to sell everywhere. This was yesterday.
Following the recent union of globalization with fast and cheap information, we have witnessed theemergence of a new business model: companies that do not produce anything but yet sell everywhere.These companies know where the clients are, where the producers are, and they simply organize theordering by the clients and the delivery by the producers (and the placing of their logo on the productjust before delivery). These companies usually keep the high added-value parts of research, developmentand marketing in-house, and farm out all the rest to external producers. The archetypal example ofsuch a “platform company” is of course Dell. But others exist including IKEA, Wal-Mart, Li & Fungand maybe even E*Bay...
In micro-economic terms, this model makes plenty of sense and, if executed properly, makes for veryhigh returns on invested capital. But more importantly for us, it also has important macro-economicimplications.
The first implication is that countries where a number of companies start to use the “platform model”will run big trade deficits for the simple reason that what matters to trade numbers is “sales”, not“profits”. For example, if all Dell computers sold in the US are made in Mexico, Dell will have veryhigh earnings, and the US will have a big trade deficit.
The second implication is that the US economy will become far less cyclical, and the Mexican economywill be far more cyclical. Why? For the simple reason that industrial production is by far the mostcyclical part of any economy. Having out-sourced that part, the US economy will remain quite stable,while the Mexican economy will have added the US cyclicality to its own!
The third implication is that “industrial jobs” (those close to the hearts of politicians) will disappearin the “creative world” to reappear in Mexico, China etc... As unpalatable as it may seem to mosteconomists (who seem to believe that if you are not bringing a lunch-box and a hard-hat with you towork, you’re not really working), the job market in the developed economies will move to a minorityof very creative individuals working for themselves, and a majority of fellows working in the serviceindustry for the creative minds and/or the tourists coming in from the industrial world.
The fourth implication is that the excess trade balances earned by the “industrial world” will havelittle choice but be reinvested in the assets of the “creative world”. The pension funds of the “industrialworld” will buy the companies which give their countries work. The successful individuals in the“industrial world” will also buy real estate in the “creative world” (because it also happens to be the“fun world”). This implies that the assets in the “creative world”, and especially the prestige assets willalways border on the overvalued. Similarly, given the ability to change a producer if he becomes alittle bit too demanding, asset prices in the industrial world will remain a little bit undervalued at alltimes...
In a sense, don’t the above patterns also fit the traditional intra-country capital flows to which we arealready familiar? For example, New York has always had a trade deficit with Michigan. And Londonwith the rest of Europe. Or Hong Kong with the rest of China... And yet, looking at changes in theNY trade deficit has never been a great forecasting indicator of the city’s future.

Chapter 4
13
As our economies become increasingly service-based, should we not expect the correlation betweenthe current account deficits and the value of the currency to weaken?
Important conclusions from Chapter 4:l) Although the US$ has been falling over the past two and half years, the US current account
deficit has yet to improve.
m) Does this lack of improvement show that the US industrial base is obsolete? We do not thinkso.
n) Instead, we believe that, as the US economy evolves from an industrial economy to a servicebased economy, measuring US exports is a lot more challenging. Moreover, exports of USservices are less sensitive to changes in the US$ than industrial exports...

Chapter 5
14
Chapter 5: On the Other Side of the US Current AccountDeficit – ChinaAnother explanation to the fact that the US current account deficit continues to deteriorate is that,while the US$ has fallen, it has not fallen against the currencies on the other side of the deficit. Andchief amongst those countries is China and its fixed RMB exchange rate.
Excluding China, the US current account deficit appears to be in the process of bottoming out. Infact, on the above figures, one could argue that the past 18 months deterioration is more or less alllinked to the growth of US imports from China.
Will China Revalue?So should we conclude that a RMB revaluation is an immediate necessity as government economistshave been wont to do?
We do not think so. And this for a very simple reason; as Frederic Bastiat so brilliantly demonstrated,in economics there is always “ce qu’on voit et ce qu’on ne voit pas” (what you see and what you don’tsee). And the things that government economists see today are China’s current excessive exports to theUS relative to its imports. They then de facto assume that, to correct this discrepancy, Chinese exportsmust be curtailed (after all, that would be the aim of any revaluation). But another option exists: asharp increase in Chinese imports. And already, we are witnessing this second option.
As of today, Chinese imports are doubling in value every four years or so. And as a direct result,China’s trade surplus is actually shrinking.

Chapter 5
15
China Exports & Imports
China Exports China Imports Trade Balance0
82 83 84 85 86 87 88 89 90 91 92 93 94 95 96 97 98 99 00 01 02 03 04
US
D (
billi
ons)
1500
3000
6000
12000
24000
48000
-2500
2500
7500
12500
China accepted in WTO
Breaking down the Chinese trade surplus, one finds that China currently has a big surplus with theUS, and a deficit with the rest of the world! Which then begs the question of why would the Chineseleadership care to revalue?
Chinese Trade Balance Trade Balance with the US 0 Chinese Trade Balance ex US
93 94 95 96 97 98 99 00 01 02 03 04-10000
-7500
-5000
-2500
0
2500
5000
7500
China Global Trade Balance & US Trade Balance
The fact is, of course, that they don’t. And that the hordes of money managers willing to bet on aRMB revaluation will most likely be disappointed.

Chapter 5
16
Indeed, while we agree that today, the RMB is very undervalued against almost any major currency,we believe that this undervaluation need not be resolved through a currency revaluation. It can just aswell be resolved by a constant grind down of the currency’s value through inflation. And, right now,it appears that this is the preferred course of the Chinese authorities (note that Chinese CPI has gonefrom -2% to +5% in the past two years).
More importantly, it is hard to see what will make the Chinese leadership change its course; by takingcare of the overvaluation through inflation, the process is gradual, painless and face-saving. All aspectsthat a revaluation of the RMB does not offer!
As we look at it, an RMB revaluation is hardly a one-way trade (just like betting on a Ringgit or Bahtrevaluation in 1995-96 proved to be costly). Betting on a steady increase in Chinese inflation is, webelieve, a safer-bet!
So Does This Mean That China Will Simply Hog Reserves?In the past four years, Chinese reserves have grown by an impressive US$325bn. And, in turn, thisimpressive growth has led many commentators to conclude that China was draining capital from therest of the world. And wasting it.
However, as highlighted in the chart below, as a % of imports, Chinese reserves are lower than wherethey were in 1998. In other words, while reserves have grown rapidly, Chinese imports have growneven faster. As such, China is not having a recessionary influence on the world. Quite the contrary!
China Imports, Central Bank Reserves & Ratio
Six Months of Imports China Total reserves minus gold Ratio i
82 83 84 85 86 87 88 89 90 91 92 93 94 95 96 97 98 99 00 01 02 03 04500
1000
2000
4000
8000
16000
32000
64000
128000
256000
512000
0.25
0.50
0.75
1.00
1.25
1.50
1.75
2.00
2.25
2.50
2.75
3.00
3.25
3.50
3.75
4.00
4.25
4.50
4.75
5.00
China has a huge cushion, but its
imports are growing very, very fast
Devaluation
>six months of imports: danger zone
< six months of imports: PBoC relaxed
$ M
illio
ns
Important conclusions from Chapter 5:o) A large part of the deterioration in the US current account deficit is linked to trade with
China.
p) China has been able to boost its competitive position by maintaining an undervalued RMB.
q) A revaluation of the RMB is, we believe, rather unlikely in the coming years. Instead, theundervaluation of the RMB will be eroded by accelerating Chinese inflation.
r) As a result, the improvement in the US-China trade balance will most likely be a slow, steadyaffair, rather than a one time brutal adjustment.

Chapter 6
17
Chapter 6: On the Other Side of the US Current AccountDeficit – JapanEvery fund manager has his own “graveyard”, a stock, a market or an asset class to which he/she hasreturned several times, only to get his pocket picked.
For us, over the past decade, our graveyard has been Japan. We have felt on several occasions thatfundamentals were improving (i.e.: in 1994, in 1997, in 2001...) and that valuations were becomingmore attractive, only to be killed by an unpredictable, and unimaginably stupid change in policy.
So we turn to Japan with dread and reluctance, confident of just one thing: that if there is a chance forJapanese policy makers to make a bad situation worse, they will jump on the chance with both feet.
Indeed, the various Japanese governments’ mistakes have been diverse, and often unexpected (fromraising taxes at the beginning of an economic recovery, hiking interest rates at the wrong time, spendingpublic money in useless public works...). But in the bad economic decision sphere, one policy hasbeen constant since 1995: the decision to prevent the Yen from rising too much, at all cost.
In preventing the Yen’s rise, Japanese authorities believe that they are protecting the Japanese producer.Of course, all they are accomplishing is distorting capital allocation in Japan and preventing theJapanese consumer from reaping the rewards that are justly his.
Today, the Japanese Yen is more or less at the same level as in the beginning of the 1990s. And as weview things, this makes precious little economic sense.
Japan Exchange rate USD/JPY
Japan Exchange rate USD/JPY, close daily
Jul 94 Jul 95 Jul 96 Jul 97 Jul 98 Jul 99 Jul 00 Jul 01 Jul 02 Jul 03 Jul 04 Jul
US
D/J
PY
80
90
100
110
120
130
140
150
Since 1993, the Yen has mostly stayed
between Y105 & Y125 / US$
On the other side of this apparently stable Yen, one finds a massive increase in the BoJ’s reserves. Since1993, Japanese reserves have grown a mind-boggling US$740bn (from US$60bn to the currentUS$800bn today)!

Chapter 6
18
Japan Central Bank Reserves and Exchange Rate
Japan Foreign currency reserves Japan Exchange rate USD/JPY
92 93 94 95 96 97 98 99 00 01 02 03 04
In B
illio
ns o
f US
Dol
lars
50
100
200
400
800
Yen
Per
Dol
lar
80
110
140
170
200
230
260
290
The BoJ SterilizesWhen a central bank intervenes in the foreign exchange markets to prevent its currency from rising(as the BoJ has been doing), it finds itself in front of a dilemma: the interventions lead to the creationex nihilo of huge amounts of local currency (the monetary base shoots up).
For a central bank, this poses the question of whether to sterilize the intervention (i.e: destroy themoney just created) or not?
Sterilizing is not that hard. All the central bank needs to do is to sell the government bonds it has inits portfolio against the amount of money it created to intervene in the FX markets. What the centralbank gives with its right hand, it takes back with its left!
The easy way to find out whether a central bank is sterilizing is to look at the differences between themonetary base and the foreign exchange reserves. If the reserves are growing faster than the base, thenthe central bank is sterilizing (the contrary also being true). If we smooth over three years the differencesbetween the reserves and the base, we have a pretty good idea of what a central bank’s “structural bias”is.
We would argue that, in Japan, the central bank’s bias the wrong one!
Since 1992, every time the Japanese economy was starting to recover, the Yen started to rise. This ledthe central bank to intervene on the forex markets. And every time, if the economy felt strong enough,the BOJ started to sterilize its interventions aggressively.
The BoJ sterilization prevented any boom in consumption (which would have followed a rising exchangerate), or any increase in asset prices (since money supply was prevented from expanding).
Judging by its behavior since the implosion of the Japanese bubble, the BOJ appears to be mercantilistand monetarist at the same time; a deadly combination which reminds us of the Fed in the 1930s.Needless to say, it leads to economic stagnation and the collapse of the banking system carrying everfalling asset prices on its balance sheet.
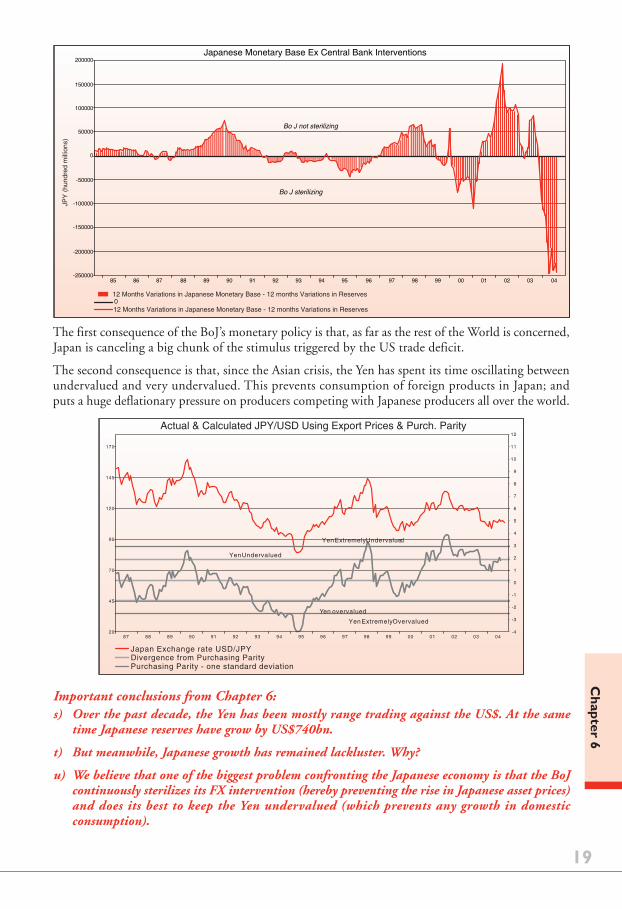
Today, the BOJ is at it again. Indeed, while the Japanese trade surplus keeps on expanding, theJapanese money supply growth rate is decelerating rapidly. This is a very deflationary policy for Japan,and for the world.
Chapter 6
19
0
85 86 87 88 89 90 91 92 93 94 95 96 97 98 99 00 01 02 03 04-250000
-200000
-150000
-100000
-50000
0
50000
100000
150000
200000JP
Y (
hund
red
mill
ions
)
Japanese Monetary Base Ex Central Bank Interventions
Bo J not sterilizing
Bo J sterilizing
12 Months Variations in Japanese Monetary Base - 12 months Variations in Reserves
12 Months Variations in Japanese Monetary Base - 12 months Variations in Reserves
The first consequence of the BoJ’s monetary policy is that, as far as the rest of the World is concerned,Japan is canceling a big chunk of the stimulus triggered by the US trade deficit.
The second consequence is that, since the Asian crisis, the Yen has spent its time oscillating betweenundervalued and very undervalued. This prevents consumption of foreign products in Japan; andputs a huge deflationary pressure on producers competing with Japanese producers all over the world.
Actual & Calculated JPY/USD Using Export Prices & Purch. Parity
Japan Exchange rate USD/JPYDivergence from Purchasing ParityPurchasing Parity - one standard deviation
87 88 89 90 91 92 93 94 95 96 97 98 99 00 01 02 03 0420
45
70
95
120
145
170
-4
-3
-2
-1
0
1
2
3
4
5
6
7
8
9
10
11
12
Yen overvalued
Yen Undervalued
Yen Extremely Undervalued
Yen Extremely Overvalued
Important conclusions from Chapter 6:s) Over the past decade, the Yen has been mostly range trading against the US$. At the same
time Japanese reserves have grow by US$740bn.
t) But meanwhile, Japanese growth has remained lackluster. Why?
u) We believe that one of the biggest problem confronting the Japanese economy is that the BoJcontinuously sterilizes its FX intervention (hereby preventing the rise in Japanese asset prices)and does its best to keep the Yen undervalued (which prevents any growth in domesticconsumption).

Chapter 7
20
Chapter 7: On the Other Side of the US Current AccountDeficit – Asia ex-Japan, ex ChinaThe big increase in the US current account deficit was triggered by the Asian crisis of 1997. Between1991 and 1997, Asian countries ran meager current account surpluses; sometimes even slipping intodeficits (mis 1995, mid 1996). But since the Asian Crisis, Asia ex Japan, ex-China’s current accountsurpluses have been impressive.
Asian Current Accounts
Sum of Asian Current Account Balances
91 92 93 94 95 96 97 98 99 00 01 02 03 04
In U
S$
Bn
-10
0
10
20
30
40
50
60
0
1
2
3
4
5
6
7
8
9
10
One of the reasons behind this, of course, is that the region is exporting more to the US than everbefore. But also that the region is exporting more to China than even the wildest wide-eyed Chinaoptimists could have imagined. For example: today, Korea exports 70% more to China than to theUS.
Taiwan & Korea: Ratio Between Exports to China & USA
Korea Exports to China & HK/Korea Exports to USA in Value Taiwan Exports to HK/Taiwan Exports to USA in Value 100
91 92 93 94 95 96 97 98 99 00 01 02 03 04
%
25
50
75
100
125
150
175
200
Taiwan & Korea now export more to China
than to the US!
Thanks to the growth of free trade, the implementation of the WTO and bilateral tarde agreements(i.e.: Japan-Singapore, China-Australia...), Asian companies are increasingly putting up factories inlocation different from their own countries.

Chapter 7
21
Let’s take Samsung as an example and a hypothetcial announcement to build a multi-billion dollarcell-phone factory on the Chinese Mainland.
In the first step, Samsung builds the factory by buying machine tools, most likely from Korea. Firstresult: Korea registers a large current account surplus with China (export of machine-tools).
In the second step, the Chinese factories produce cell-phones, a large number of which are sold eitherdomestically (China is the biggest cell-phone market) or to the US. Second result: the US registers acurrent account deficit with China.
In the third step, the Chinese factory registers profits (hopefully...after all, this is a Chinese companywith Korean management) and these profits are repatriated to Korea to boost Samsung’s bottom line.Third result: the Korean current account surplus with China is given a further boost.
If the above description corresponds to reality (and we believe that to some extent it does), then weshould expect:
a)Asia ex China (including Japan) to run large current account surpluses with China
b)China to run current account surpluses with the Western World
c)Reserves of Asian central banks to be accelerating rapidly
d)Asian currencies (ex RMB) to be the strongest in the world and the Western currencies to be theweakest.
Now is this not what is happening today?
As our longer-term readers know, this has been our premise for some time. And so far, one couldargue that the first three out of the four developments hav occurred. Indeed, from around the samelevel in 1998, Asian central bank reserves now stand at nearly four times the reserves of the ECB.
Asia Ex Japan Central Bank Reserves & ECB Reserves
Sum of Asian Foreign Exchange Reserves Excluding HK ECB Foreign Exchange Reserves
97 98 99 00 01 02 03 04
Tot
al R
eser
ves
in U
S D
olla
rs B
illio
ns
150
200
250
300
350
400
450
500
550
600
0
1
2
3
4
5
6
7
8
9
10
Given the above, we tend to believe that the big distortion in the US current account deficit is notcaused as much by the RMB peg, or even by the narrow mindness of the BoJ, but by the fact thatAsian currencies are stupidly undervalued today.

Chapter 7
22
Average of Asian Exchange Rates vs US$ & Euro
Average of the Five Asian Currencies Used vs the Euro [index 1996-12-31] Average of the Five Asian Currencies Used vs the US$ [index 1996-12-31]
93 94 95 96 97 98 99 00 01 02 03 04 05
Bas
e 10
0 D
ecem
ber
31 1
996
60
65
70
75
80
85
90
95
100
105
110
Asian currencies are close to 1997 level
But in that respect, and to retake the Kerry-Edwards slogan (une fois n’est pas coutume): Hope is onthe way! Indeed, Asian currencies are on the rise...
The Stealth Rise of Asian CurrenciesWhen it comes to Asian currencies, most investors and traders have been focused on two possibilities:1) Asian currencies will wait for the RMB to rise before revaluing, or 2) Asian currencies will wait forthe Yen to rise before revaluing. However, we think a third possibility might be in the works. Namelythat Asian currencies are rising now, without waiting.
Consider recent developments in Korea: South Korean foreign exchange reserves stayed flat at US$174.5in mid-October, compared with the end of September. And the Bank of Korea’s intervention in thelast fortnight only amounted to a meager US$45 million. Meanwhile, since the beginning of the year,the Won has been rising sharply (+6%). So unlike last year, it seems that some of the Asian centralbanks have decided to no longer stand in the way of their rising currencies. At least, that’s the messageone could draw from the recent rise of the Korean Won.
Indeed, in a year with a) very poor performance from semiconductor companies and falling Dramprices, b) a weak performance from the Yen (at least until recently), c) a sharp increase in oil prices, d)a Korean central bank that cut interest rates while almost every central bank interest rates rose rates,one would have typically expected the Korean Won to be the world’s worst performing currency.Instead, it is amongst the best.
Chapter 7
23
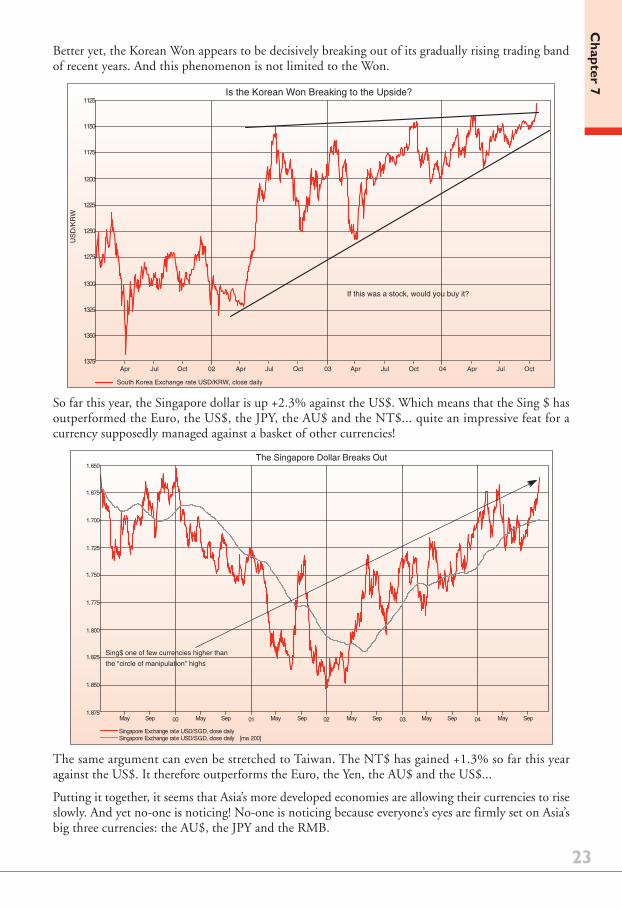
Better yet, the Korean Won appears to be decisively breaking out of its gradually rising trading bandof recent years. And this phenomenon is not limited to the Won.
Is the Korean Won Breaking to the Upside?
Apr Jul Oct 02 Apr Jul Oct 03 Apr Jul Oct 04 Apr Jul Oct
1125
1150
1175
1200
1225
1250
1275
1300
1325
1350
1375
If this was a stock, would you buy it?
US
D/K
RW
South Korea Exchange rate USD/KRW, close daily
So far this year, the Singapore dollar is up +2.3% against the US$. Which means that the Sing $ hasoutperformed the Euro, the US$, the JPY, the AU$ and the NT$... quite an impressive feat for acurrency supposedly managed against a basket of other currencies!
Singapore Exchange rate USD/SGD, close daily Singapore Exchange rate USD/SGD, close daily [ma 200]
May Sep 00 May Sep 01 May Sep 02 May Sep 03 May Sep 04 May Sep
1.650
1.675
1.700
1.725
1.750
1.775
1.800
1.825
1.850
1.875
The Singapore Dollar Breaks Out
Sing$ one of few currencies higher than
the "circle of manipulation" highs
The same argument can even be stretched to Taiwan. The NT$ has gained +1.3% so far this yearagainst the US$. It therefore outperforms the Euro, the Yen, the AU$ and the US$...
Putting it together, it seems that Asia’s more developed economies are allowing their currencies to riseslowly. And yet no-one is noticing! No-one is noticing because everyone’s eyes are firmly set on Asia’sbig three currencies: the AU$, the JPY and the RMB.

Chapter 7
24
This stealth increase of Asian currencies makes sense. It allows Korea, Singapore, Taiwan to cushionthe oil price increase. And it allows them to keep in check a recent pick-up in inflationary pressures(some of which is also imported from China and could accelerate – see China Misconceptions). Thestealth increase also boosts local consumption and makes perfect economic sense: on the OECDabsolute purchasing parity analysis, the Korean Won is undervalued by 40% against the USD (whileJapan is overvalued by 20% and the Euro is overvalued by 1%). Manufacturing labour cost comparisonsare even more spectacular: against the US$, the Won is undervalued by 50%, Taiwan by 70% andSingapore by 60%, while Japan and the EU (apart from Germany) are within 10% of the US$.
These findings are confirmed by our own export-prices, purchasing parity calculations. And by ourexperience: try as we may (and we have even been there with our wives!), we simply can not spendmoney in places like Singapore, Seoul or KL.
Singapore $ vs US$ Purchasing Parity
Singapore Exchange rate USD/SGD, close daily
82 83 84 85 86 87 88 89 90 91 92 93 94 95 96 97 98 99 00 01 02 03 04 050.4
0.7
1.0
1.3
1.6
1.9
2.2
2.5
-3
-1
2
4
6
8
10
Sing $ Overvalued
Sing $ Undervalued
Sing $ Extremely Overvalued
Sing $ Extremely Undervalued
US
D/S
GD
Nor
mal
ised
Pur
chas
ing
Par
ity
Normalized Deviation from PP
The Sing $ should be at 1.5 to the US $
Having said this, we would not be surprised if the stealth increase in Asia’s smaller currencies remainedunnoticed by the broader financial markets until some kind of news grabbing headlines (our bet fornews grabbing headline: a revaluation of the Malaysian Ringgit in the next twelve months) make themarkets realize that Asia’s developed economies have a separate life from China, Japan and the UnitedStates!
In similar circumstances, in the early 1970s in Europe, some countries chose to revalue (Switzerland,Germany...) while other countries chose inflation and demand led economic management (France,Italy, the UK...). A decade later, the results for investors were plain enough. Anyone who had favoredGermany and Switzerland did very well. Others lost their jobs.
Today, Korea, Singapore and possibly Taiwan are going down the Swiss way. China is going down theItaly/France way. Japan remains more of an enigma. We know where we would rather be invested!
Important conclusions from Chapter 7:v) Asian currencies are today massively undervalued. And this undervaluation goes a long way
in explaining the US current account deficit.
w) However, while everyone is busy getting worried about the US current account deficit, Asiancurrencies are starting to rise. This implies that the US current account deficit should abate.
x) In their large majority, investors have so far failed to notice the stealth rise in Asian currencies...But it is an extremely important development that announces a transfer (back?) of wealthfrom the Western consumer to the Asian consumer.

25
Chapter 8
Chapter 8: The Growth in Reserves is Too RapidAs we have tried to show above, the US current account deficit is the main source of liquidity for thegrowth in world trade. Except when it is too big. At which time the excess US$ provided by the UScurrent account deficit find their way into the coffers of foreign central banks.
In a typical year, if the US current account deficit increases by US$100bn, we would expect some ofthat money to be used for the purchase, or storage, of US$ priced goods (oil, copper, Drams...) andsome to be saved. The part that is saved either goes into the US capital account as foreign direct orportfolio investment or (if the world’s private investors don’t want to own extra dollar assets) ends upas reserves held at the Fed for foreign central banks.
Interestingly, a neat correlation has developed over time between the US current account deficit, andthe growth in reserves; usually, reserves grow by approximately a third of the US current accountdeficit.
Forex Reserves & US Cumulative Current Accounts
Cumulative Sum of the US current Account Deficits [lag 6] Central Bank Reserves Deposited at the Fed Regression on foreignreserves from US current Account Deficits [lag 6]
85 86 87 88 89 90 91 92 93 94 95 96 97 98 99 00 01 02 03 04
US
D (
billi
ons)
75
150
300
600
1200
2400
4800
R2=.95, Lead time 6 Months, X1: 0.33
And we can come up with the following equation whereas: US current account deficit = workingcapital needs of world trade + changes in foreign private investment + changes in foreign centralbanks reserves.
Over the past twenty-four months we have witnessed: a) an impressive boom in world trade (spurredmostly by growth in Asia), and b) a big rise in oil, commodity and freight prices. So, logically, onewould assume that the world’s working capital needs had gone up markedly. And with the increase inthe world’s working capital needs, central bank reserves should have grown a lot slower than the UScurrent account deficit.
At the same time, turning to private investment in US$ assets, it is a little-known but important factthat foreign holdings of US assets have been rising steadily even in the recent period of dollar weakness.Indeed, according to the Federal Reserve’s quarterly flow of funds figures total assets held in the US(excluding foreign official holdings of Treasury and agency bonds) at the end of 2003 were $6746billion. This was an increase of $550 billion from the end of 2002.
So even while newspapers and brokers were reporting a mad exit of foreign capital from the US, thefacts (as reported by the Fed) were the other way round. Every category of foreign investment in theUS, including bonds, equities and direct investment, was actually rising. And this makes intuitive

26
Chapter 8
sense. If foreigners had been leaving in droves, how could every asset class in the US from equities tojunk bonds, from real estate to government bonds have gone up so much in 2003 and either stayedsteady (Treasuries) or risen mildly (corporate bonds, equities) in 2004?
What about American holdings of assets abroad? Were US investors fleeing in droves from the US$?Again the answer is a surprising “no”. According to the same flow of funds figures, US holdings offoreign assets actually fell slightly, from $3700 billion at the end of 2002 to $3500 billion at the endof 2003. Putting the assets and liabilities together it seems that US capital flows were actually verypositive – i.e. investors were putting more money into US$ – to the tune of roughly $700 billion in2003.
Combining the big inflow of private capital with the increase in the world’s working capital needs, itwould seem that the world demand for US$ should easily have been sufficient to offset the increase inthe current account deficit. So central bank reserves at the Fed should have been pretty flat, or at leastgrown a lot slower than the US current account deficit.
But this is where it gets amusing: instead of growing slower, the increase in central bank reserves overthe past 12 months has been an unprecedented US$315bn; that’s nearly two thirds of the size of theUS current account deficit!
So how can we explain the sharp acceleration in central bank reserves?
Answer #1 – An Impressive Increase in LeverageThe last time we witnessed a large divergence between the US current account deficit and the growthin reserves was in 1995 and 1996. And the cause at the time was excessive borrowing from Asia.
As mentioned above, Asia spent the better part of the early 1990s borrowing US$ cheaply to invest inrapidly growing domestic economies. When interest rates fell in 1995 (following the Mexican crisis),the US$ borrowing only accelerated.
At the time, most investors were convinced that, by borrowing in US$ and investing in Malaysia,Indonesia, Thailand or Korea, they could only make money. First of all, the carry-trade was massivelypositive. And secondly, Asian currencies (especially the THB & MYR) were widely expected to revalue.
Forex Reserves and US Cumulative Current Accounts
Lat Two Years Cumulative current account deficit for the US [lag 6] Last Two Years Variations in Central Bank Reserves Deposited at the Fed Last Two Years Differences [lag 6]
80 81 82 83 84 85 86 87 88 89 90 91 92 93 94 95 96 97 98 99 00 01 02 03 04 05
US
D (
billi
ons)
-500
-400
-300
-200
-100
0
100
200
300
400
500
-200
-150
-100
-50
0
50
100
150
200
250
300
350
400
LeveragingDeleveraging
Asian Crisis
Leveraging

27
Chapter 8
With hindsight, we now know that events did not unfold quite as planned. And that many a fortunewas lost (as an aside, extensive use of leverage is usually the safest way to lose a fortune).
Looking at the past couple of years, a lot of similarities exist between 1995 and today:
a) the artificially low interest rate environment
b)the stampede into China (in 1995 it was Asia)
c) the conviction that the RMB will revalue (in 1995 it was the THB and the MYR)
But as the French saying goes, “comparaison n’est pas raison”. And there is another important factorbesides an impressive growth in US$ borrowing that explain the dichotomy between the growth inthe US current account deficit and central bank reserves.
Answer #2 – A Game of Massive Double-Counting is Under WayAs mentioned in the second chapter, central banks like to keep enough US$ at hand to cover at thevery least three months worth of imports, and usually six. Once that is achieved, then local governmentdebt denominated in foreign currencies usually starts to get repaid (i.e.: Thailand, Indonesia, Malaysia...1998-2001). Once both the reserves are secure, and foreign currency debts have been repaid, thecentral bank will then usually look at the countries against which it runs a current account deficit, andstart accumulating reserves in that currency.
To take an example: once the People’s Bank of China is secure with its US$ holdings, it will mostlikely decide to start buying some Yen (to cover the cost of its imports from Japan).
Usually, those reserves are deposited at the central bank of the surplus country (Japan, in our exampleabove) and appear as liabilities in the balance sheet of that central bank (assets held at the BoJ for theaccount of foreign central banks).
Which then implies that the country at the receiving end of these transfers (i.e.: Japan) now has twokinds of reserves:
a)The “earned reserves”, which are more or less equal to the sum of the current account surpluses overthe year. These reserves are, by their very nature, very stable.
b)The “unearned reserves”, which are the sum of the net private and public (central banks) capitalflows. These reserves are, by their very nature far more unstable.
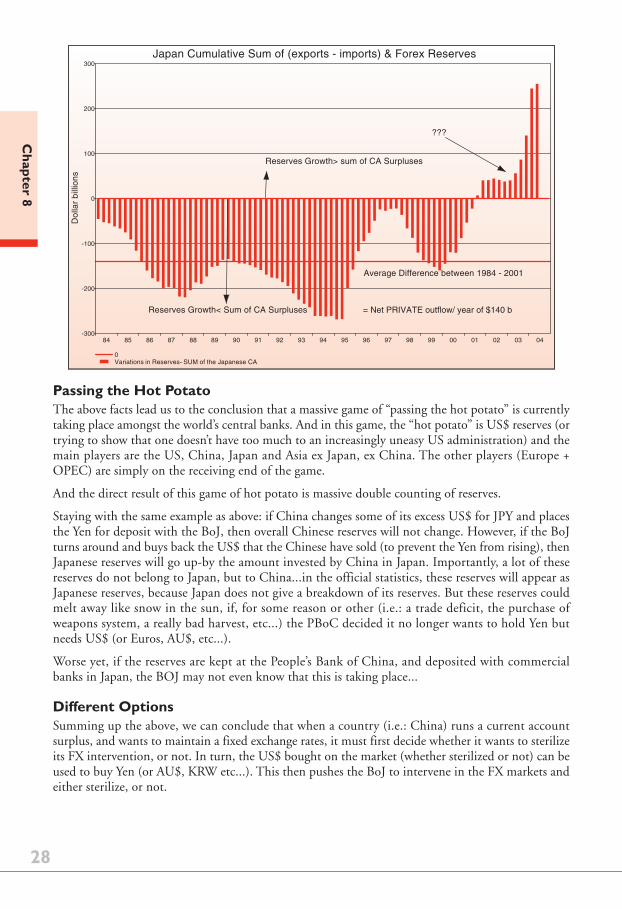
And unfortunately, it seems that most of the growth in reserves over the past couple of years has beenof the latter, unstable kind. As highlighted in the chart below, while historically the difference betweenJapan’s current account surplus and its annual growth in reserves has been a negative US$140bn, inthe past year, it has grown to a positive US$200bn!
28
Chapter 8
Japan Cumulative Sum of (exports - imports) & Forex Reserves
0 Variations in Reserves- SUM of the Japanese CA
84 85 86 87 88 89 90 91 92 93 94 95 96 97 98 99 00 01 02 03 04
Dol
lar
billi
ons
-300
-200
-100
0
100
200
300
Reserves Growth< Sum of CA Surpluses
Reserves Growth> sum of CA Surpluses
Average Difference between 1984 - 2001
???
= Net PRIVATE outflow/ year of $140 b
Passing the Hot PotatoThe above facts lead us to the conclusion that a massive game of “passing the hot potato” is currentlytaking place amongst the world’s central banks. And in this game, the “hot potato” is US$ reserves (ortrying to show that one doesn’t have too much to an increasingly uneasy US administration) and themain players are the US, China, Japan and Asia ex Japan, ex China. The other players (Europe +OPEC) are simply on the receiving end of the game.
And the direct result of this game of hot potato is massive double counting of reserves.
Staying with the same example as above: if China changes some of its excess US$ for JPY and placesthe Yen for deposit with the BoJ, then overall Chinese reserves will not change. However, if the BoJturns around and buys back the US$ that the Chinese have sold (to prevent the Yen from rising), thenJapanese reserves will go up-by the amount invested by China in Japan. Importantly, a lot of thesereserves do not belong to Japan, but to China...in the official statistics, these reserves will appear asJapanese reserves, because Japan does not give a breakdown of its reserves. But these reserves couldmelt away like snow in the sun, if, for some reason or other (i.e.: a trade deficit, the purchase ofweapons system, a really bad harvest, etc...) the PBoC decided it no longer wants to hold Yen butneeds US$ (or Euros, AU$, etc...).
Worse yet, if the reserves are kept at the People’s Bank of China, and deposited with commercialbanks in Japan, the BOJ may not even know that this is taking place...
Different OptionsSumming up the above, we can conclude that when a country (i.e.: China) runs a current accountsurplus, and wants to maintain a fixed exchange rates, it must first decide whether it wants to sterilizeits FX intervention, or not. In turn, the US$ bought on the market (whether sterilized or not) can beused to buy Yen (or AU$, KRW etc...). This then pushes the BoJ to intervene in the FX markets andeither sterilize, or not.

29
Chapter 8
We therefore have four possibilities:
1- China sterilizes and Japan sterilizes (2002 and early 2003, see An Important Change in China onthe GaveKal website): this is very deflationary for the world and very positive for US Treasuries.
2- China sterilizes, Japan does not: this is most unlikely but would lead to a rapid fall in the Yen andan out-performance of Japanese equity markets.
3- China does not sterilize, but Japan does (situation prevalent today): the Yen rise and Japaneseequities underperform.
4- Nobody sterilizes and money supplies accelerate rapidly: asset prices go through the roof (this iswhat happened in 2003).
In any event, we would like to reiterate that the current situation is highly unstable. The impressivegrowth in reserves shows that there either exists a massive short US$ position in the system, or thatcentral banks around the world, but especially in Asia, have been double counting their reserves.When reserves start to shrink, central banks will first liquidate their third party currencies (mostly Yenand possibly AU$). And this could add volatility in the financial markets at the worst possible time.
Important conclusions from Chapter 8:y) Everyone and their dog seem to agree that the US current account deficit is a very worrying
imbalance in the global financial system.
z) We are far more worried about the imbalance between the (modest) growth in the US currentaccount deficit and the (massive) growth in foreign exchange reserves.
aa) This imbalance could be the result of excessive US$ borrowing.
bb) Or it could the result of double counting from central banks.
cc) Either way, it could lead to a sharp contraction in money supply growth in countries such asJapan, Australia or Europe (if the double counting is taking place on the balance sheets of theBoJ, the RBA or the ECB...).

Chapter 9
30
Chapter 9: Prevalent Concerns About the US Current AccountDeficit – A Word of CautionIn recent weeks, various Fed officials have come out to announce that, unless the US$ fell a lot more,the US current account deficit will remain a major problem. Such statements make us very nervous.And one of the reasons for the nervousness is the Fed’s previous track record.
The Fed and Bubble ThinkingIn any good bubble, there are usually three distinct phases: initial scepticism, followed by confidenceand then absolute certainty, as the last sceptics capitulate and the bubble enters its final phase.
And, like most institutions, the Fed was a well-documented case of “bubble-thinking” in the late1990s. Consider the following statements from Chairman Greenspan:
September 24, 1996: “I recognise there is a stock market bubble problem at this point”;
December 6, 1996: “How do we know when irrational exuberance has unduly escalated asset values?”
September 4, 1998 “Is there a new economy? The economic performance of the United States in thepast five years has in certain respects been unprecedented”.
February 17, 2000: “It is becoming increasingly hard to deny that something fundamental has changed.This expansion is quite different from other post-war cycles.”
Nasdaq and Greenspan
USA Nasdaq Composite index, close daily [ma 20]Source: Ecowin
May Sep 96 May Sep 97 May Sep 98 May Sep 99 May Sep 00 May Sep500
1000
1500
2000
2500
3000
3500
4000
4500
5000
Scepticism Confid ence Certainty
"Irrational exuberance""Bubble problem"
"Something fundamental has changed"
"Is there a New Economy?"
In the same vein, consider the Fed’s declarations on deflation in the spring of 2003...just as inflationwas already re-accelerating in Asia and around the world!
So should we take the Fed’s new found concern about the size of the US current account deficit as asign that we should not worry about it? That’s what History suggests! As one of our older clients putsit: “when the Fed starts worrying a problem, I start thinking about something else”.

Chapter 9
31
An Interesting Article from our Friend Hunt TaylorOur friend and client Hunt Taylor (of Hartz Trading) recently wrote the following article in Hedgeworld(full article on http://www.hedgeworld.com/news/read_news.cgi?section=dail&story=dail11175.html).And we believe that applying some of Hunt’s conclusions to the problem of the US current accountdeficit makes for some interesting possibilities.
****
“Someone once told me Myron Scholes said the folks at Long-Term Capital Management thought they hadtheir risk buttoned down. In their minds, they were walking down Madison Avenue, eyes trained on thetops of the buildings, looking for falling safes, when they were suddenly struck at an oblique angle by acomet.
To understand what Dr. Scholes meant by a comet, I think one first has to understand the differencebetween risk and uncertainty. Risk is the chance that some unwanted but quite conceivable outcome occurs.You’re in the casino. You bet on black. It comes up red. Uncertainty, on the other hand, is the chance you’reaffected by some unwanted outcome you’ve never even considered. You’re leaving the casino with your winningswhen suddenly you’re hit by ... a comet.
The markets-in fact, societies-have a long and infamous history of death by comet. 1994 was full of them.We had them in emerging markets, currencies and interest rates. That year started with the Fed raisingrates, ending a long cycle of aggressive easing, the monetary policy response to the recession of 1991 and1992. In the eyes of many observers at the time, the logic was that that was a way for the Fed to createliquidity for ailing commercial banks and California Savings & Loans. They were afraid of having to gothrough another RTC debacle if the California housing market went south. The answer: Drop short rates,let the banks borrow short term at low rates, invest the money longer term at higher rates and, pretty soon,their balance sheets would look a whole lot better. Your basic carry trade.
The problem was that banks weren’t the only one doing it. Hedge funds, ever quick to spot a marketanomaly, were all over it, in size, with leverage. So, when the Fed announced its first quarter-point ratehike, 11 enormous, levered hedge funds and 19 massive prop desks thought to themselves, “Perhaps weshould unwind a billion or two,” all within roughly 10 minutes of each other. The ensuing massacre leftbanks in distress, hedge funds with double-digit drawdowns and Orange County broke. David Askin, themortgage-backed trader, was next. And you didn’t even need a telescope to see that comet coming.
Taking a quick tour back through the years, we had 9/11 in ’01, the bursting of the dot-com bubble in ’00,LTCM in ’98, the Asian Contagion in ’97, the carry trade and the Peso crisis in ’94-and that’s just 10years. We had the Hunt brothers in ’81, the LDC crisis in ’82, the crash of ’87, the S&L crisis in ’89.Anyone see a pattern here?
Market shocks are roughly as predictable as the buses on Madison Avenue. More so, according to most NewYorkers.
One thing all those past debacles had in common was a sudden, mass liquidation. No one ever went broketrying to get into a position, Pets.com notwithstanding.
The incomparable Edward O. Wilson noted in his wonderful book, “Consilience,” that Immanuel Kant, in1784, had observed that “man’s rational dispositions are destined to express themselves in the species as awhole, not in the individual.” I find this largely to be true, unless of course, mankind is using leverage.Leverage is like an echo chamber to the emotions of the investor, and leverage has been a culprit in morethan one of these bloodlettings.
Perhaps more to the point is the herdlike behavior of crowds. Investors have shown, time and again, thatthey prefer the company of others. It’s reassuring, particularly when we are invested in markets we might notunderstand as well as we should. The company of others, expressed in a chosen security, tends to make theprice go up, creating profits for the investors, who all too often use them to buy more of the aforementioned

Chapter 9
32
security, extending the cycle. And because this feels good, we tend to keep doing it. We tend to climb theproverbial “wall of worry” in packs, then herds. The stampedes come on the way out.
Steve Waite, in his book Quantum Investing, distinguishes between exogenous risk, which is risk that comesfrom outside events, and endogenous risk, which is risk that has built up internally. The terrible events of 9/11 were exogenous. The crash of ’87 was endogenous. I find most market shocks are from endogenous risk.No one yells fire in the movie theater. It just gets too crowded. The tipping point tips. Someone moves towardthe door, and suddenly it’s too late.
The final dynamic is the almost unanimous opinion that exists prior to the event. Even when most of usknow better, we tend not to act. Stocks in ’87 and ’99, the carry trade in ’94-we knew these markets weren’tgoing to go on forever, but, lemminglike, we marched steadfastly cliffward.
So, what conditions exist today? Which markets could be setting themselves up for a dislocation?
If I am coldly rational, I am actually more sanguine about prospects when I apply the criteria mentionedabove. Some friends had an interesting dinner conversation recently. They asked whether the markets werecurrently being driven by fear, greed or uncertainty. The decision was uncertainty. Iraq and the electionwere enough to keep most investors on the fences.
Uncertainly does not create unanimity of opinion. Are we so comfortably long with either stocks or bondsthat they are now prone to sudden mass liquidation? Probably not. At least not here and now.
How about leverage? Not really. Margins debt is not extreme in equities relative to where it has been, andbonds have had two years of sideways action. Greenspan has raised the short end 0.75% while the long endhas traded back down to a 4% yield, gently deflating the carry trade.
There are areas that concern me, though. The first is credit. I can’t find anyone who’s worried about it. EvenI can’t find a good reason to worry about it, and that’s got me nervous. Spreads are as tight as they have beenin years, and complacency is rampant. I know corporate balance sheets are in great shape, but I’ve seencredit sliced and diced and repackaged in more ways than Oscar Meyer has meat products and there wouldbe hell to pay if spreads went south.
Then there is the consumer. I’ve seen all the new metrics about household net worth relative to debt service.I also know that the U.S. consumer has not retrenched in 12 years. That’s a long time. And no one is reallylooking for it.
Housing also meets my checklist. Everybody’s long (including me), everybody’s levered (including me), and ifhousing ever turns down, The Wall Street Journal will read like a Stephen King novel.
Finally, there are hedge funds. I’ve written about that in the past. I believe there are structural and leverageissues that could become problems under the wrong circumstances. And the thing about hedge funds is thatthey don’t tolerate outflows very well.
Am I predicting a market shock in one of these areas? Not necessarily, but I’ll make book we’ll see a systematicshock someplace, and I’ll give odds it will be in the next 18 months. By then, we’ll be well into the first termof the new presidential cycle and lots of bad stuff tends to happen then. And while I’m not smart enough totell you what asset or investment class is going to get hit, my strong suspicion is that it will be one we are notfocused on.
****
A Useful FrameworkSummarizing the above article we can say that there exists two kinds of crisis: a) exogenous crisis (i.e.:a bomb devastates the centre of NY) and b) endogenous crisis (i.e.: because of too much speculationin Chinese real estate, a number of developers go bust).

Chapter 9
33
Trying to buffer a portfolio against an exogenous crisis is a thankless task. But trying to buffer portfoliosagainst endogenous crisis should be the major concern of money managers.
Endogenous shocks are usually the result of excess leverage and a sudden and simultaneous “rush forthe exit” by over-extended investors. They also follow a long period in which, to use Hunt’s words “analmost unanimous opinion exists prior to the event. Even when most of us know better, we tend not toact...”.
Hunt concludes his article by saying that, based on his years of experience of investing, he is growingnervous about the possibility of an endogenous crisis. His main problem however is that he can’tidentify it. He sees leverage all around him...but doesn’t see how the leverage will be squeezed out. Healso struggles to find a unanimity of opinion on any subject.
And this is where we would diverge with Hunt. Indeed, we do find a unanimity of opinion in themarket today. And this unanimity is that the US$ can only go down because of the US currentaccount deficit.
We also find that a lot of money has been borrowed (see Chapter 8) to invest on this very premise.
We also find that most very talented foreign exchange managers are struggling to make money thisyear (just like in 1999, most equity managers had a miserable year while the market powered ahead).
And finally the Fed is now on board...
Time to wake up and smell the coffee: the US current account deficit is not the big problem that it ispresented to be... As Ronald Reagan famously said, the deficit is big enough, and old enough, to takecare of itself!
And an improving US current account deficit is rarely good news for global financial markets. Ifnothing else, it implies a big rise in volatility.
Important conclusions from Chapter 9:dd)History suggests that, when the Fed starts worrying/talking about a problem, it is usually
time to worry about something else. Today, the Fed is making noise about the US currentaccount deficit...
ee) History also suggests that, when everyone in the financial markets agree about an issue, thenit is often prudent to take a step back and walk away.
ff) Today, everyone seems to agree that the US$ and the US current account deficit are intrinsicallylinked. But is this the case?
Chapter 10
34
Chapter 10: The US$ and the US Current Account DeficitThe prevalent belief in the market today is that, unless the US current account deficit improves, theUS$ will continue making new lows. But as we look at it, this is creating a correlation between twoevents that are not forcibly correlated.
After all, the US current account deficit deteriorated rapidly between 1997 and 2001, and the US$rose. It then continued to deteriorate between 2001 and 2003, and the US$ fell. It then deterioratedfurther in 2004, and the US$ mostly range-traded... In other words, the correlation between the UScurrent account deficit and the US$ has not been exactly rock-solid in recent years.
And the reason this correlation does not work is that the price of the US$ depends on the both thesupply of US$ and demand for US$. When the supply is too large, the US$ falls, and when the supplyis too low, the US$ rises. And the US current account deficit only makes up part of this supply of US$to the world; it is a small part of the overall equation.
The US$ Demand & SupplyAs we have tried to show above, the demand for US$ is heavily impacted by global trade. In 2001-2002, we had a slump in global trade (for the first time since 1974, the growth in OECD exports fellyear on year)... which in turn led to an oversupply of US$!
Another factor impacting the demand for US$ is the rate of return on invested capital in the US, andoutside of the US. When ROIC in the US accelerates, the US$ usually rises as foreign capital pours in(i.e.: between 1997 and 2000, the US$ rose sharply as returns on US equities were perceived by themarket to be very high).
Yet another factor on the price of the US$ is the repayment of previous US$ debt. For example, in1983-84, the US$ shot higher as European banks were forced to cover the bad (US$ denominated)loans they had been offering to various governments and companies in Latin and Central America...
For the world outside of the US, there are two main sources of US$: the US current account deficitand the ability/willingness to borrow US$. Today, there is little doubt that both are running at historicalhighs.
Putting it together, we can say that five main factors impact the price of the US$:
Demand Factor #1: The Health of World Trade
Demand Factor #2: The Rates of Return on Capital in the US Relative to the World
Demand Factor #3: The Repayment of Debt
Supply Factor #1: The US Current Account Deficit
Supply Factor #2: Ability/Willingness to Borrow US$
Given the above, we conclude that drawing a direct correlation between the US current accountdeficit and the price of the US$ is just too simplistic.
An Odd SituationThe above split might also help explain one of the past year’s mysteries: specifically why, with a fallingUS$, a widening US current account deficit and a widening US budget deficit have yields on USTreasuries remained so low? After all, if one where to believe the current consensus and accept that theUS$’ weakness is all linked to the US current account deficit, then we should also have expected USbond yields to rise over the past year. Instead they have fallen...

Chapter 10
35
And the reason that the US$ and bond yields have fallen together could be either that global trade waslacklustre for a couple of years (2001-2002), that the rates of return in the US ended up much smallerthan what was expected, or that the large amounts of US$ debt that had been contracted in the mid1990s had, by mid 2002, been repaid and, since the US$ short position no longer existed, the price ofthe US$, and the price of maintaining a short position (i.e.: the cost of borrowing) both fell...
As we look at it, any of the above possibilities explains the concomittent recent fall in the US$ and USTreasury yields more satisfactorily than pinning all the blame on the US current account deficit.
Important conclusions from Chapter 10:gg) The US current account deficit is not the only driver of the US$.
hh)The US$ demand and supply situation might not be as distressing as the large US currentaccount deficit suggests.

Chapter 11
36
Chapter 11: ConclusionBy this point, we hope that our reader will share our lack of overall concern about the direction of theUS current account deficit. Unlike too many commentators out there, we refuse to see the US currentaccount deficit as a profit and loss statement!
The world has been in an odd situation whereas:
a)Most of the growth in trade flows in the past five years have occurred between Asia, Japan, Chinaand Nafta.
b)The currencies of China, Japan, Asia have been massively undervalued and have been preventedfrom rising by government intervention.
c)As a result, the currencies of Europe which were overvalued against the US$, and very overvaluedagainst Asian currencies rose even further.
Undeniably, these are the trends of the past three years. But extrapolating them further into thefuture, as most investors are wont to do today, could prove very costly. If for no other reason that thesituation today is starting to look increasingly different to the situation of just one year ago.
Differences between Now, and Then...The first difference is that a number of Asian currencies (Korean Won, Singapore Dollar, TaiwanDollar) are creeping higher. In fact, even the Yen appears to be testing the Y105 level.
The second difference is that while the world experienced a US$ deleveraging phase between 1997and 2001, we now seem to be approaching the tail-end of a US$ leveraging period.
The third difference is that, while the whole of Asia was experiencing severe deflation in 1997-2002period, Asia is now witnessing accelerating rates of inflation nearly everywhere (except Japan). Needlessto say, deflation does not push central bankers to revalue...while inflation can (i.e.: Japan in the1970s).
And the list goes on...
We find that, when confronting a changing environment, it is usually more useful to draw a decisiontree than to extrapolate the recent past.
This is what we do below. And our decision tree has three variables
1)Will China revalue? We do not think so
2)Will Asia revalue? We believe it already happening
3)Will Japan revalue? We hope that the Yen will rise

Chapter 11
37
The Eight Different Scenarii – A Decision Tree
AsiaRevalues
ChinaRevalues
AsiaRevalues
Yes
Yes
Yes
Yes
Yes
Yes
Yes
No
No
No
No
No
No
No
JapanRevalues
JapanRevalues
JapanRevalues
JapanRevalues
Scenario 3: Very bullish for HKproperty stocks
Scenario 2: Very bullish for industrialand cyclical stocks everywhere
Scenario 1: Would most likely trigger ameltdown in US Treasury Market
Scenario 4: Very unlikely. Would mostlikely kill commodity prices
Scenario 5: this is the scenario webelieve in. Bullish Asian equity markets +commodities
Scenario 6: This is what is happeningtoday. Bullish Asian Bonds and AsianFinancials
Scenario 7: Bullish for JGBs
Scenario 8: Bullish for EuroGovernment Bonds
Impact on the Currency MarketsLooking around the world today, we continue to find currencies with positive fundamentals, attractivevaluations and positive technicals. These currencies are often in Asia (S$, KRW, NT$) or benefit fromAsian growth (CA$). And regardless of the scenarii above, we believe that there is every reason tomaintain overweight exposure to these currencies.
At the same time, we also continue to find currencies with deteriorating fundamentals (i.e.: largecurrent account deficits, falling returns on invested capital...), expensive valuations (i.e.: more thanone standard deviation away from purchasing parity) but very positive technicals (Euro, GBP, NZ$...).These currencies are, we believe, very dangerous to hold. These are the currencies that have risen as wewere stuck in the “No-No-No” scenario 8. Because Asian central banks did not let their currencies riseagainst the US$, the strain was taken by other currencies. As always, the markets did not behave asthey should, but as they could!
If we move away from scenario 8, the currencies that rose not on their own merit, but because theywere a “non-US$”, will stand to lose the most. And given the double counting in reserves, the fallscould be brutal and lead to severe contraction in domestic money supplies and falls in real estate(Australia? New Zealand? Britain? France?...).
Impact on the Fixed Income MarketsAs a result of the No-No-No scenario 8, real bond yields everywhere around the world are close tohistorical lows (because of the forced buying by central banks). A move away from scenario 8 toanother scenario should push bond yields higher across the board, but nowhere more so than in theUS.
At the same time, should we remain stuck in scenario 8, i.e.: Asia decides to continue to follow a“beggar thy neighbour” policy, then one of the core holdings of any portfolio should be Europeangovernment bonds.

Chapter 11
38
Impact on the Equity MarketsA revaluation of Asian currencies, especially the Yen and, to a lesser extent, the RMB, would allow fora consumption boom in Asia and an expansion in profit margins all over the world. In that contextone would want to own nothing but Asian consumer stocks and US/EMU exporters.
Should scenario 8 continue, then we can probably expect the European currencies to continue takingthe brunt of the adjustment and, with them, the European economy and European stock markets.
Putting it all togetherMore often than not, investing succesfully is not about picking winners, but about avoiding losers.And this is why we spend most of our time looking for investments that offer a profile of “Tails, I winand Heads, I don’t lose”.
In that respect, we believe that investing in Asian currencies, Asian bonds and Asian consumer stocksis a good case of Heads (scenarios 1 through 7) we win, and Tails (scenario 8), we don’t lose.
Looking around Europe, we fear that investing in the Euro could be a case of Tails (scenarios 1, 3, 5)we “lose big time”. At the same time, scenarios 1, 3, and 5 could prove very beneficial to EMUequities. Needless to say, the risk for Europe is that we stay in scenario 8 (in which case the Euroshould do well) and that European equities hit the wall very hard. A continuation of scenario 8, andpossibly even scenarios 4 and 7, would prove highlighy beneficial to European government bonds.
Turning to the US, there is no doubt in our minds that the US$ should continue to be sold againstalmost all Asian currencies. The only question is does one sell the US$ against European currencies?We believe that investors should not as the only way European currencies continue to rise is if weremain in scenario 8...and we might already be moving away from that scenario. By the same token,unless we remain in scenario 8, we believe that US equities will do well, and US Treasuries will dopoorly.


