Embed Size (px)
Citation preview
1
© Universal McCann 2008
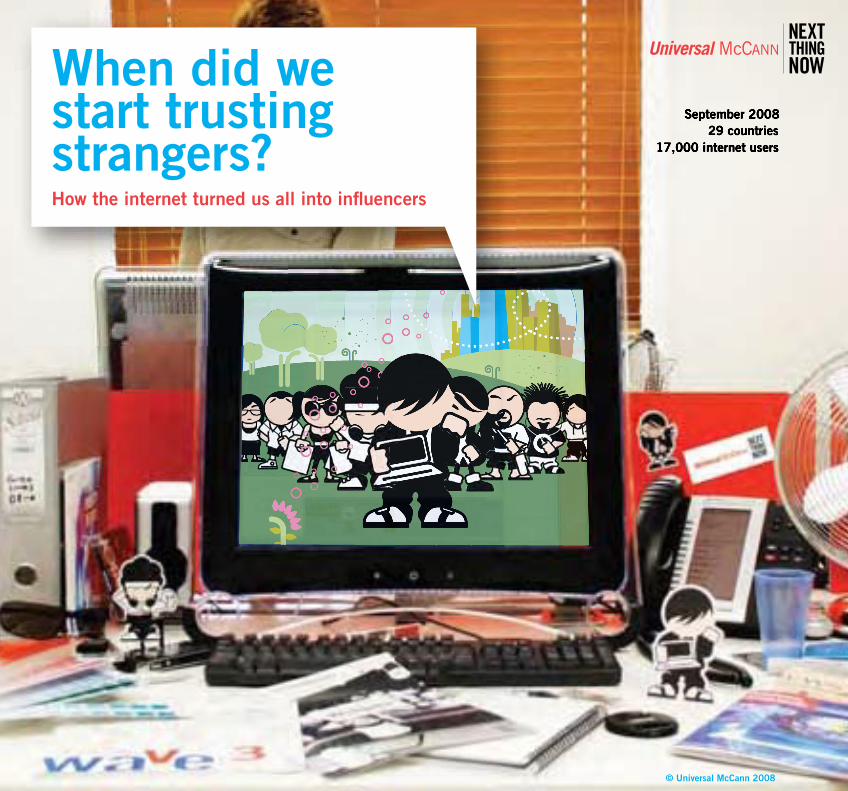
When did westart trustingstrangers?How the internet turned us all into influencers
3
Introduction No strangers anymore
Welcome to the new influence landscape
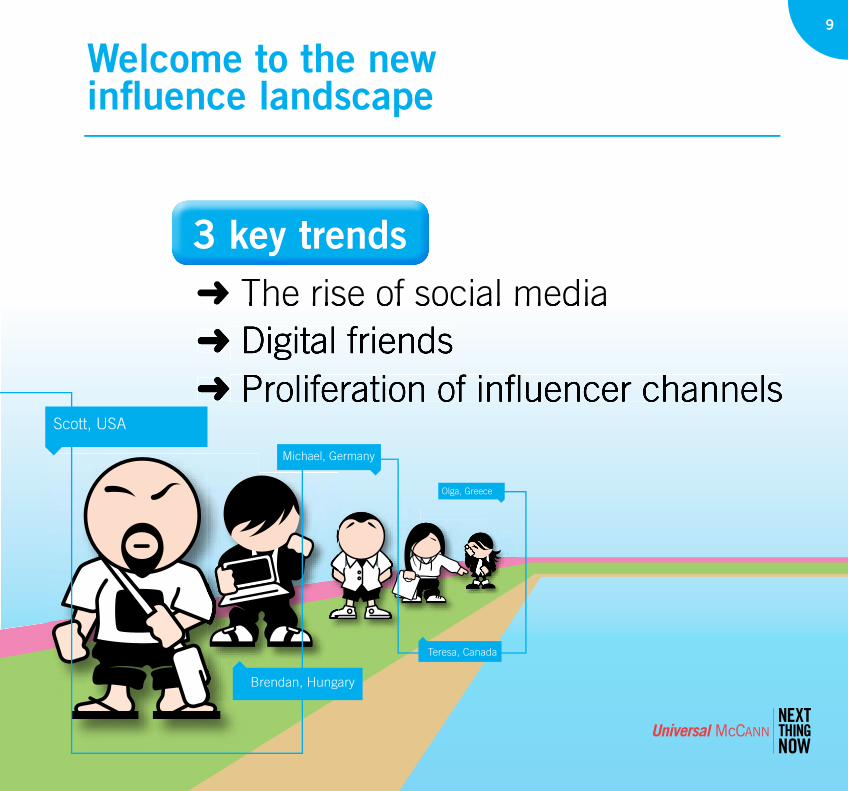
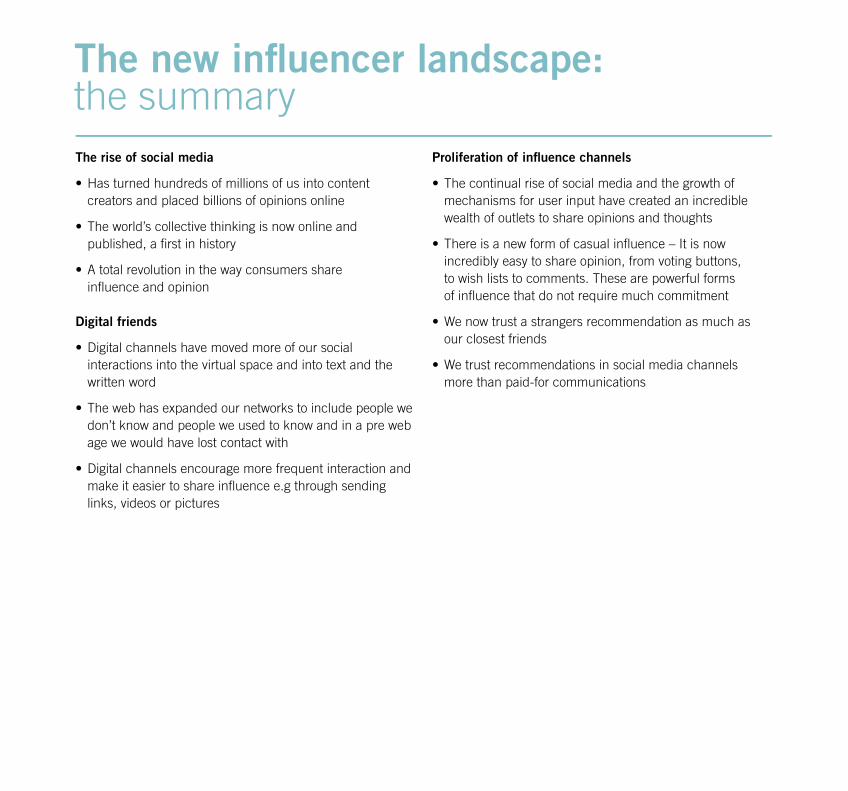
The rise of social media
Digital friends
Proliferation of influencer channels
The impactThe influence economy
The democratisation of influence
The new super influencers
Contents
5
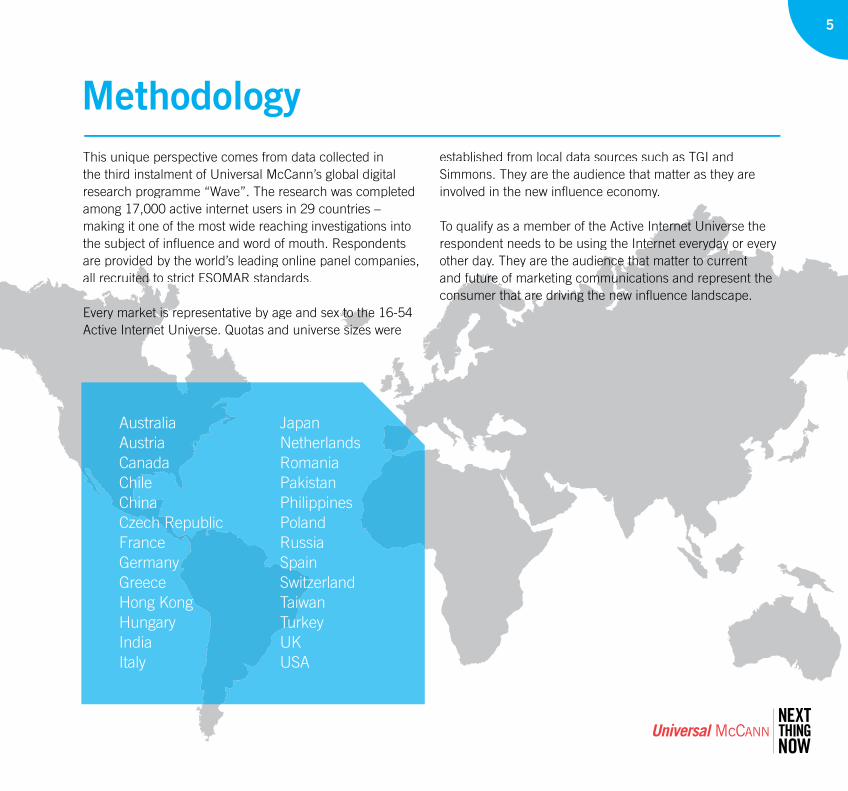
This unique perspective comes from data collected in the third instalment of Universal McCann’s global digitalresearch programme “Wave”. The research was completed among 17,000 active internet users in 29 countries –making it one of the most wide reaching investigations intothe subject of influence and word of mouth. Respondents are provided by the world’s leading online panel companies,eall recruited to strict ESOMAR standards.ed
t is representative by age and sex to the 16-54to theEvery market is rnet Universe. Quotas and universe sizes were sizeActive Internet Univ
established from local data sources such as TGI andSimmons. They are the audience that matter as they areinvolved in the new influence economy.
To qualify as a member of the Active Internet Universe the nternet Univerrespondent needs to be using the Internet everyday or everynternet everyday or eveother day. They are the audience that matter to current ence that matter to current and future of marketing commufuture of marketing communications and represent theconsumer that are driving the newonsumer that are driving the new influence landscape.
Methodology
Australia Austria Canada Chile China Czech Republic France Germany Greece Hong Kong Hungary India Italy
Japan Netherlands Romania Pakistan Philippines Poland Russia Spain Switzerland Taiwan Turkey UK USA
Long beforof informaMMouthth
co
er this er, the co
onsumer recommendation, readers’
shows wereradio shows were nt. s remained localised anPeer to peer interactions remainemained localised an
Then along came the web and a revolution begaalong cearly days, bulletin boards, chat rooms and home brew early websites allowed those technically in the know to project theithoughts and opinions. More recently social media such as blogs, social networks, photo or video sharing sites and wikisbl i l t k h t id h i it d ikihave opened the door to consumer publishing and hundreds of millions have embraced it.
p pdd
wiswiss s ere
sosoe sourcuuan wieldadaocial grou
eneenes we had wencencstayed insid
eded so many opinions and recommendations from so manyto so many opinions and recommendations from so many
danversational sparent, opesparent, open, convenv nan
d h t Th h t thi k th th t i fl ihaveand honest. They have to rethink the way that influence is d h t Th h t thi k th th t i fl iuted anddistributed and the role of marketing communications.
No Strangers Anymore
Agnes, FranceGraham, UK
Dmitri, Russia
Carlos, Brazil
7
No Strangers Anymore cont.
Yvonne, Switzerland
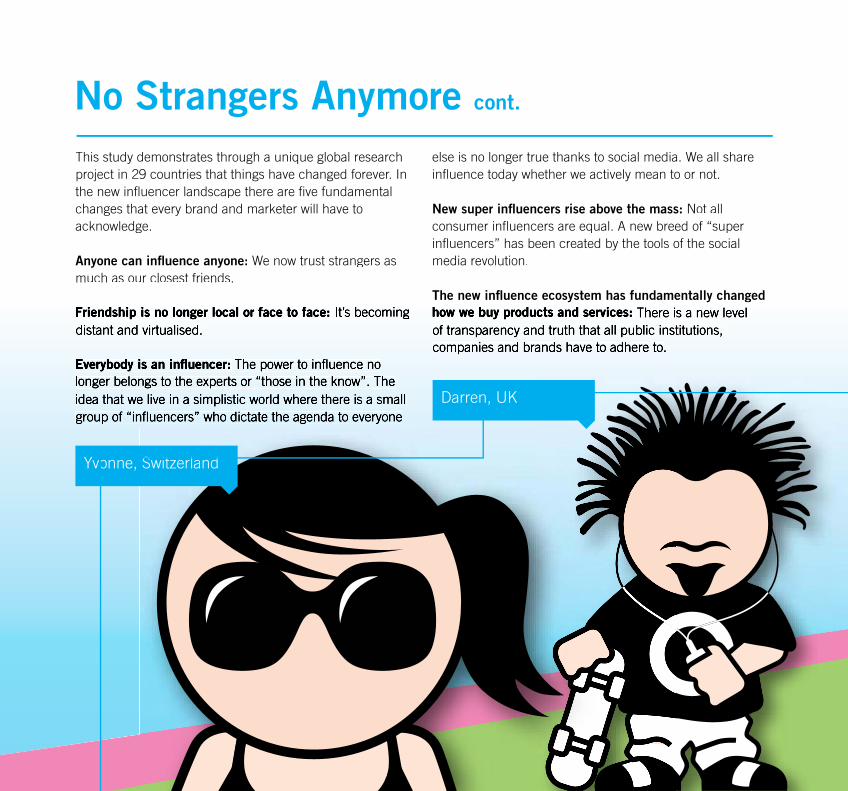
This study demonstrates through a unique global researchproject in 29 countries that things have changed forever. Inthe new influencer landscape there are five fundamental changes that every brand and marketer will have to acknowledge.
Anyone can influence anyone: We now trust strangers asmuch as our closest friends.
else is no longer true thanks to social media. We all share influence today whether we actively mean to or not.
New super influencers rise above the mass: Not all consumer influencers are equal. A new breed of “superinfluencers” has been created by the tools of the social media revolution.
The new influence ecosystem has fundamentally changed
Darren, UK
9
Welcome to the newinfluence landscape
The rise of social media
3 key trends
Scott, USA
Michael, Germany
Olga, Greece
Brendan, Hungary
Teresa, Canada
11
The rise of social mediaFrom its inception the internet has allowed consumers to create content in a manner that was never possible in the age of mass media where TV, radio and press belonged to the professionals. The web reduced the barriers to production and opened up the channels of distribution to anyone with a desire to create content or share their thoughts and opinions.
In the early days it required technical knowledge, experience and a substantial investment in computing and the impact was limited to the geek community. In the last few years these barriers have disappeared and consumer content and opinion has exploded due to the emergence of mass market social media platforms like YouTube, Blogger and MySpace.
These developments combined with the ever falling costs of computing and broadband have enabled a global revolution in consumers publishing their content and thinking.
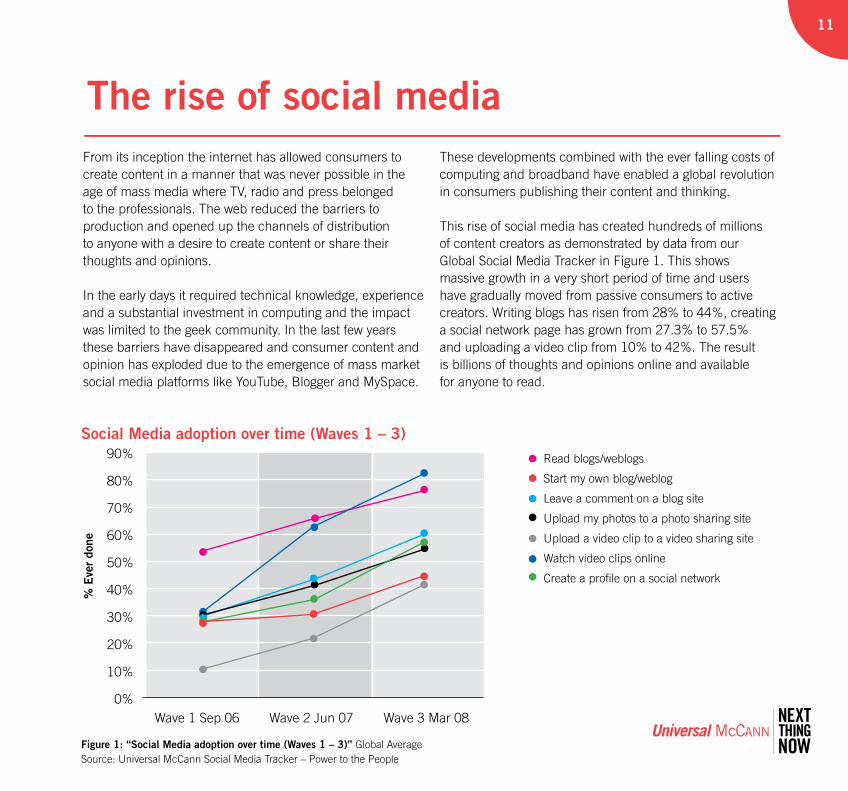
This rise of social media has created hundreds of millions of content creators as demonstrated by data from our Global Social Media Tracker in Figure 1. This shows massive growth in a very short period of time and users have gradually moved from passive consumers to active creators. Writing blogs has risen from 28% to 44%, creating a social network page has grown from 27.3% to 57.5% and uploading a video clip from 10% to 42%. The result is billions of thoughts and opinions online and available for anyone to read.
Figure 1: “Social Media adoption over time (Waves 1 – 3)” Global Average Source: Universal McCann Social Media Tracker – Power to the People
Social Media adoption over time (Waves 1 – 3)Read blogs/weblogs
Start my own blog/weblog
Leave a comment on a blog site
Upload my photos to a photo sharing site
Upload a video clip to a video sharing site
Watch video clips online
Create a profile on a social network
90%
80%
70%
60%
50%
40%
30%
20%
10%
0%Wave 1 Sep 06
% E
ver
done
Wave 2 Jun 07 Wave 3 Mar 08
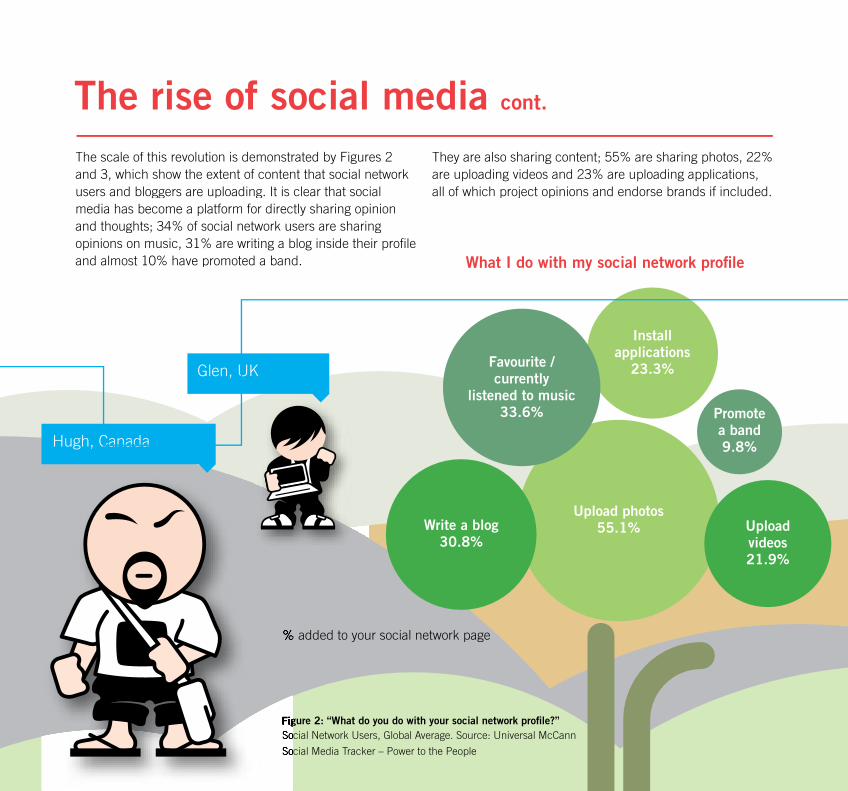
gure 2:gure 2: “What do you do with your social network profile?”“What do you do with your social network profile?”cial Network Users, Global Average. Source: Universal McCann cial Network Users, Global Average. Source: Universal McCann
cial Media Tracker – Power to the Peoplecial Media Tracker – Power to the People
% added to your social network page
Installapplications
23.3%
Upload photos55.1%Write a blog
30.8%Uploadvideos21.9%
Favourite /currently
listened to music33.6% Promote
a band9.8%
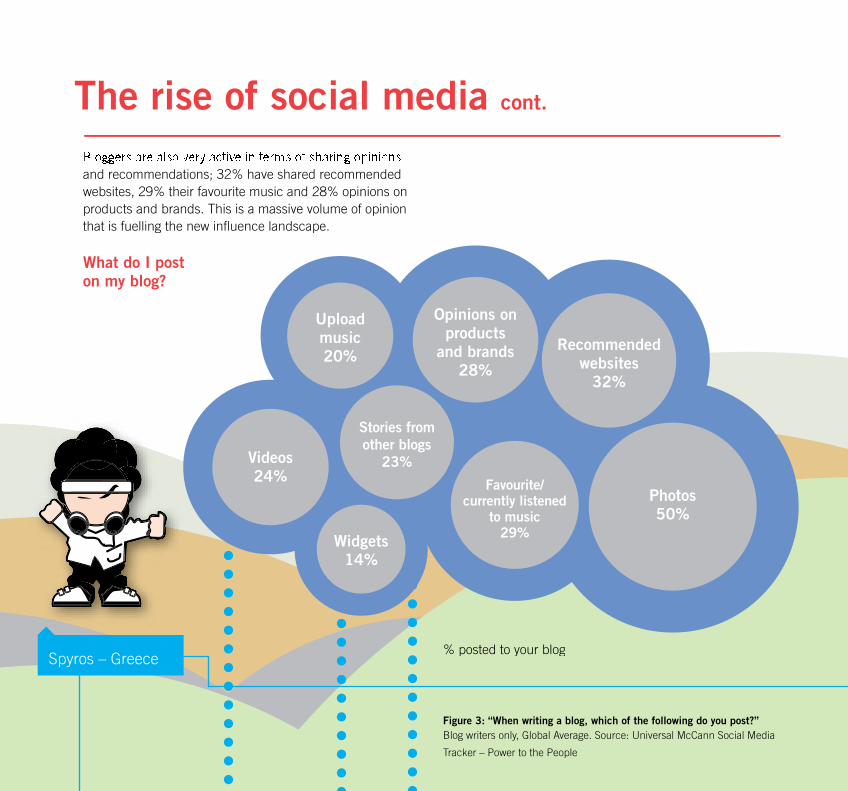
The scale of this revolution is demonstrated by Figures 2and 3, which show the extent of content that social networkusers and bloggers are uploading. It is clear that social media has become a platform for directly sharing opinionand thoughts; 34% of social network users are sharingopinions on music, 31% are writing a blog inside their profileand almost 10% have promoted a band.
They are also sharing content; 55% are sharing photos, 22% are uploading videos and 23% are uploading applications,all of which project opinions and endorse brands if included.
The rise of social media cont.
What I do with my social network profile
Glen, UK
Hugh, Canada
13
Monica, Spain
% posted to your blog
Figure 3: “When writing a blog, which of the following do you post?” Blog writers only, Global Average. Source: Universal McCann Social Media
Tracker – Power to the People
Videos24%
Recommendedwebsites
32%
Uploadmusic20%
Favourite/currently listened
to music29%
Opinions on products
and brands28%
Stories fromother blogs
23%
Widgets14%
Photos50%
and recommendations; 32% have shared recommended websites, 29% their favourite music and 28% opinions on products and brands. This is a massive volume of opinionthat is fuelling the new influence landscape.
The rise of social media cont.
Spyros – Greece
What do I post on my blog?
15
Have you seen the newUniversal McCann website? Check it outwww.universalmccann.com
15
Federico – Panama
Email99% Instant messenger
81.6%
Social network58%
VOIP51.3%
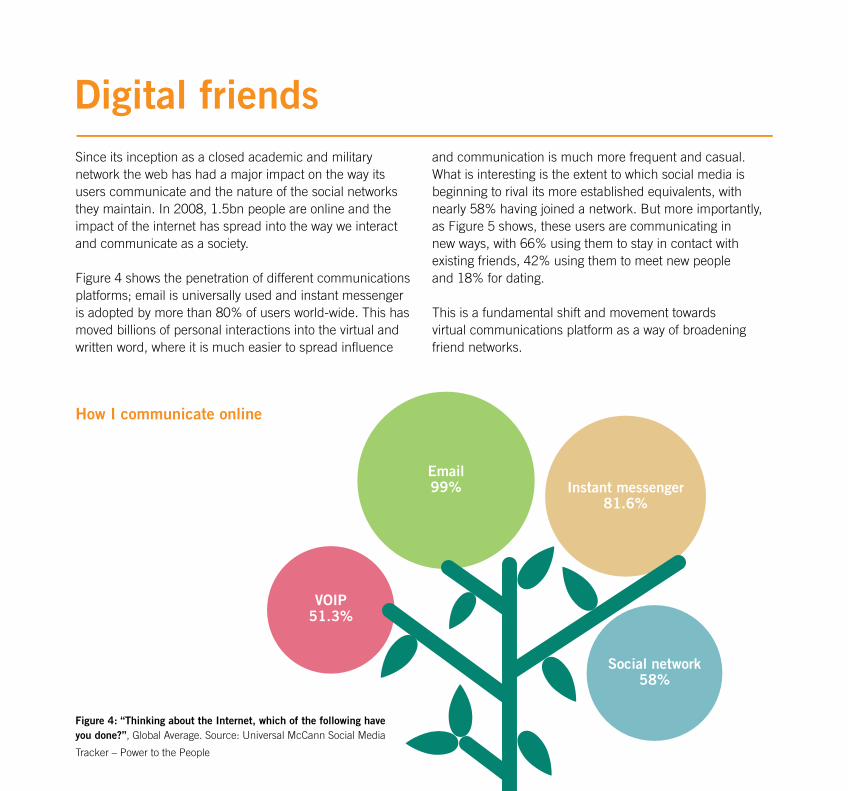
Digital friendsSince its inception as a closed academic and military network the web has had a major impact on the way its users communicate and the nature of the social networks they maintain. In 2008, 1.5bn people are online and the impact of the internet has spread into the way we interact and communicate as a society.
Figure 4 shows the penetration of different communications platforms; email is universally used and instant messenger is adopted by more than 80% of users world-wide. This has moved billions of personal interactions into the virtual and written word, where it is much easier to spread influence
and communication is much more frequent and casual. What is interesting is the extent to which social media is beginning to rival its more established equivalents, with nearly 58% having joined a network. But more importantly, as Figure 5 shows, these users are communicating in new ways, with 66% using them to stay in contact with existing friends, 42% using them to meet new people and 18% for dating.
This is a fundamental shift and movement towards virtual communications platform as a way of broadening friend networks.
Figure 4: “Thinking about the Internet, which of the following have you done?”, Global Average. Source: Universal McCann Social Media
Tracker – Power to the People
How I communicate online
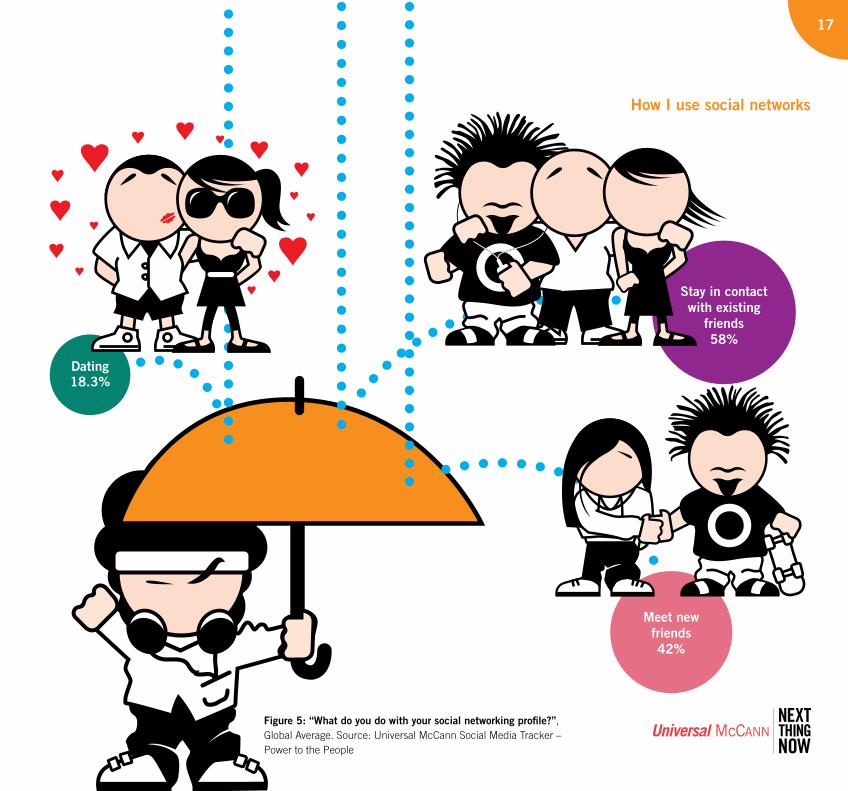
Figure 5: “What do you do with your social networking profile?”,Global Average. Source: Universal McCann Social Media Tracker – Power to the People
Dating18.3%
Meet new friends42%
Stay in contactwith existing
friends58%
17
How I use social networks
100
0
Fran
ce 4
8.6%
Pakist
an 6
7.7%
Turk
ey 4
3.6%
Brazil
61%
Mala
ysia
46.9
%
Taiw
an 6
4.4%
Spain
47.
5%
Italy
65.9
%
Hong K
ong 5
3.8%
Sout
h Kor
ea 5
7.3%
Mex
ico 7
2.9%
Philipp
ines 7
3.1%
China 6
0.1%
India
70.
2%
UK 25
.8%
% A
gree
Denm
ark 17
.6%
Austra
lia21
.8%
US 24
%
Canad
a 24.
3%
Austri
a 27.
7%
Hunga
ry 27
.9%
Germ
any 2
8.2%
Switz
erlan
d30
.8%
Poland
32.5
%
Japa
n 34
.9%
Russia
35%
Czech
36%
Greec
e 39.
4%
Nether
lands
14.
2%
Roman
ia 42
.3%
Digital friends cont.
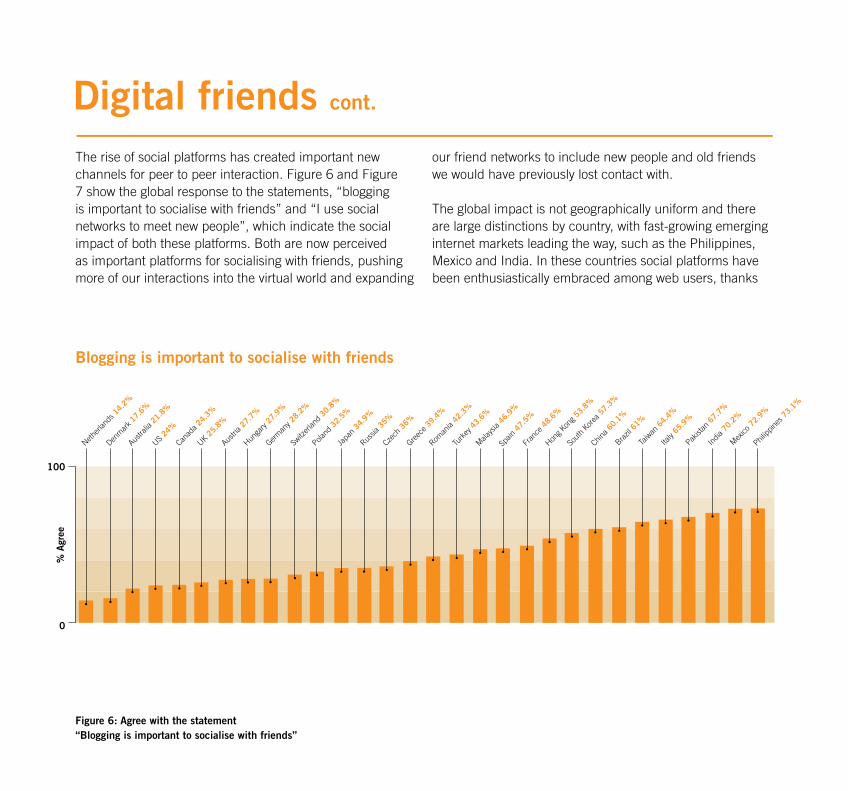
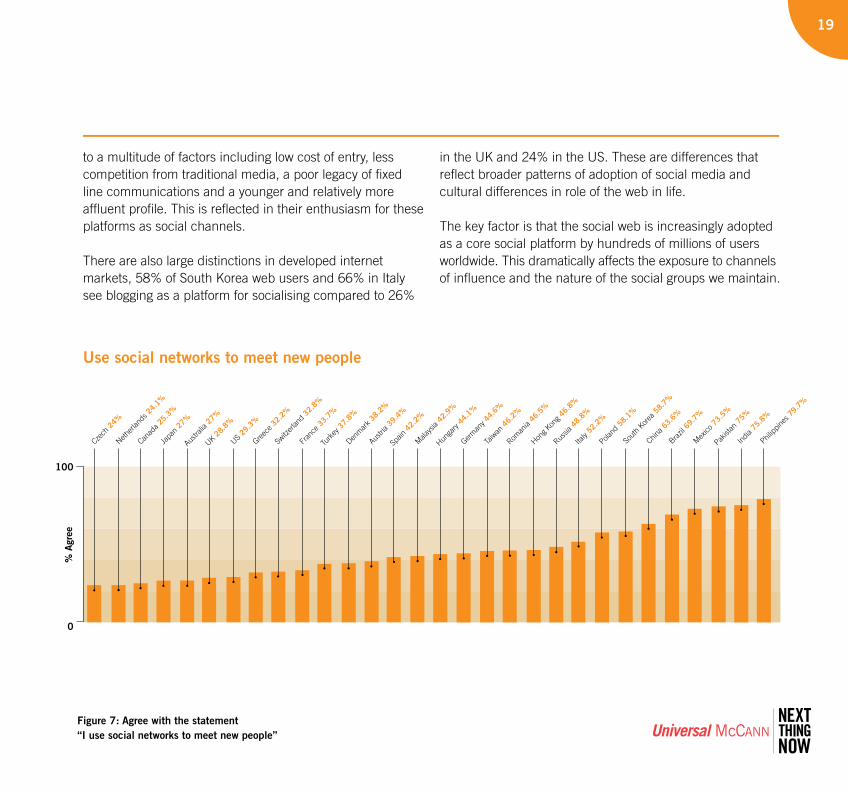
The rise of social platforms has created important new channels for peer to peer interaction. Figure 6 and Figure 7 show the global response to the statements, “blogging is important to socialise with friends” and “I use social networks to meet new people”, which indicate the social impact of both these platforms. Both are now perceived as important platforms for socialising with friends, pushing more of our interactions into the virtual world and expanding
our friend networks to include new people and old friends we would have previously lost contact with.
The global impact is not geographically uniform and there are large distinctions by country, with fast-growing emerging internet markets leading the way, such as the Philippines, Mexico and India. In these countries social platforms have been enthusiastically embraced among web users, thanks
Figure 6: Agree with the statement“Blogging is important to socialise with friends”
Blogging is important to socialise with friends
Use social networks to meet new people
Mex
ico 7
3.5%
Canad
a 25.
3%
Japa
n27
%
100
0
Hon
g Kon
g 46.
8%
Ger
man
y 44.
6%
Sou
th K
orea
58.
7%
Taiw
an 4
6.2%
Chin
a 63.
6%
Rom
ania
46.5
%
Bra
zil 6
9.7%
Rus
sia 4
8.8%
Italy
52.
2%
India
75.
8%
Phil
ippine
s 79.
7%
Pola
nd58
.1%
Pakist
an 7
5%
UK 28
.8%
% A
gree
Neth
erlan
ds 2
4.1%
Austra
lia 2
7%
Gre
ece 3
2.2%
Switz
erlan
d32
.8%
Fra
nce 3
3.7%
Turk
ey 3
7.8%
Den
mar
k 38.
2%
Aus
tria 39
.4%
Spain
42.
2%
Mala
ysia
42.9
%
Cze
ch 2
4%
Hunga
ry44
.1%
US 29
.3%
19
to a multitude of factors including low cost of entry, less competition from traditional media, a poor legacy of fixed line communications and a younger and relatively more affluent profile. This is reflected in their enthusiasm for these platforms as social channels.
There are also large distinctions in developed internet markets, 58% of South Korea web users and 66% in Italy see blogging as a platform for socialising compared to 26%
in the UK and 24% in the US. These are differences that reflect broader patterns of adoption of social media and cultural differences in role of the web in life.
The key factor is that the social web is increasingly adopted as a core social platform by hundreds of millions of users worldwide. This dramatically affects the exposure to channels of influence and the nature of the social groups we maintain.
Figure 7: Agree with the statement “I use social networks to meet new people”
Digital friends cont.
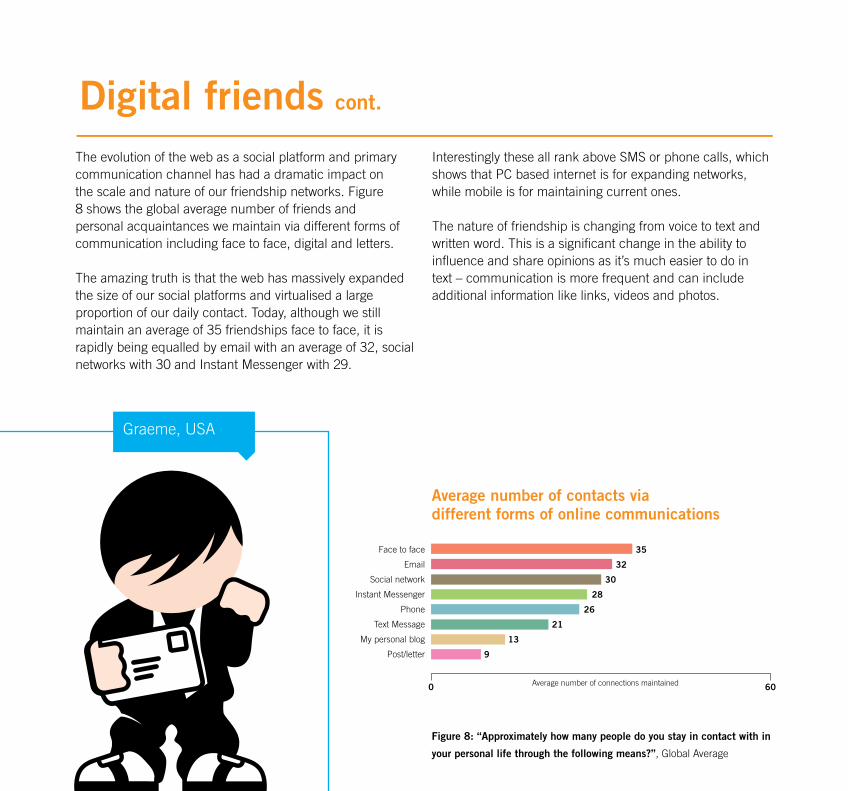
The evolution of the web as a social platform and primary communication channel has had a dramatic impact on the scale and nature of our friendship networks. Figure 8 shows the global average number of friends and personal acquaintances we maintain via different forms of communication including face to face, digital and letters.
The amazing truth is that the web has massively expanded the size of our social platforms and virtualised a large proportion of our daily contact. Today, although we still maintain an average of 35 friendships face to face, it is rapidly being equalled by email with an average of 32, social networks with 30 and Instant Messenger with 29.
Interestingly these all rank above SMS or phone calls, which shows that PC based internet is for expanding networks, while mobile is for maintaining current ones.
The nature of friendship is changing from voice to text and written word. This is a significant change in the ability to influence and share opinions as it’s much easier to do in text – communication is more frequent and can include additional information like links, videos and photos.
Figure 8: “Approximately how many people do you stay in contact with in
your personal life through the following means?”, Global Average
Average number of contacts via different forms of online communications
Face to face
Social network
Instant Messenger
Phone
Text Message
My personal blog
Post/letter
0 60Average number of connections maintained
35
32
30
28
26
21
13
9
Graeme, USA
21
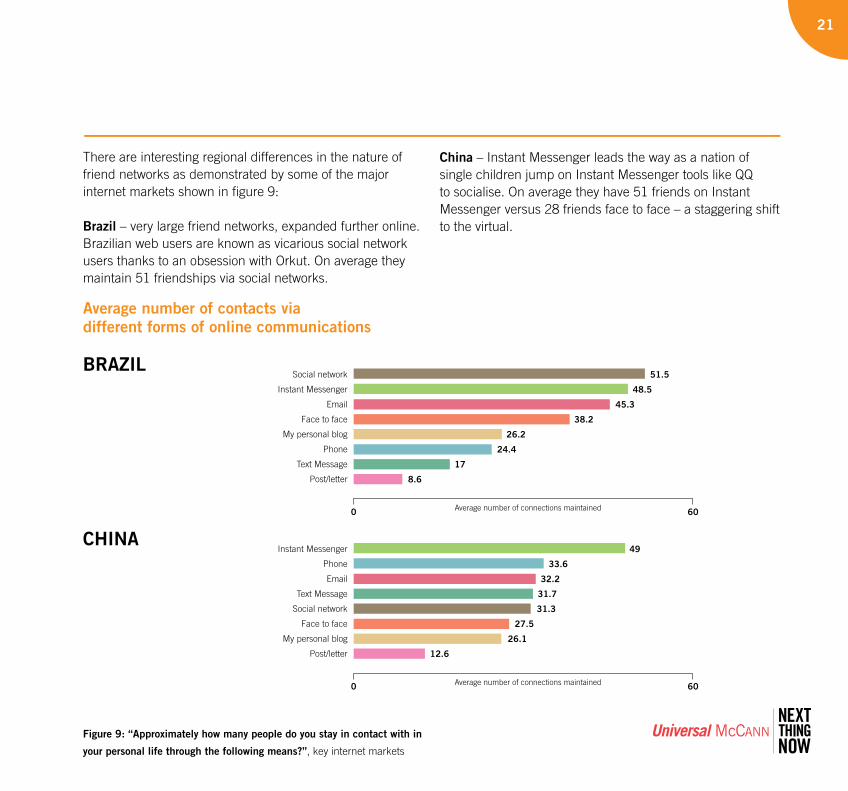
There are interesting regional differences in the nature of friend networks as demonstrated by some of the major internet markets shown in figure 9:
Brazil – very large friend networks, expanded further online. Brazilian web users are known as vicarious social network users thanks to an obsession with Orkut. On average they maintain 51 friendships via social networks.
China – Instant Messenger leads the way as a nation of single children jump on Instant Messenger tools like QQ to socialise. On average they have 51 friends on Instant Messenger versus 28 friends face to face – a staggering shift to the virtual.
Social network
Instant Messenger
Face to face
My personal blog
Phone
Text Message
Post/letter
0 60Average number of connections maintained
51.5
48.5
45.3
38.2
26.2
24.4
17
8.6
BRAZIL
Instant Messenger
Phone
Text Message
Social network
Face to face
My personal blog
Post/letter
0 60Average number of connections maintained
49
33.6
32.2
31.7
31.3
27.5
26.1
12.6
CHINA
Average number of contacts via different forms of online communications
Figure 9: “Approximately how many people do you stay in contact with in
your personal life through the following means?”, key internet markets
Digital friends cont.
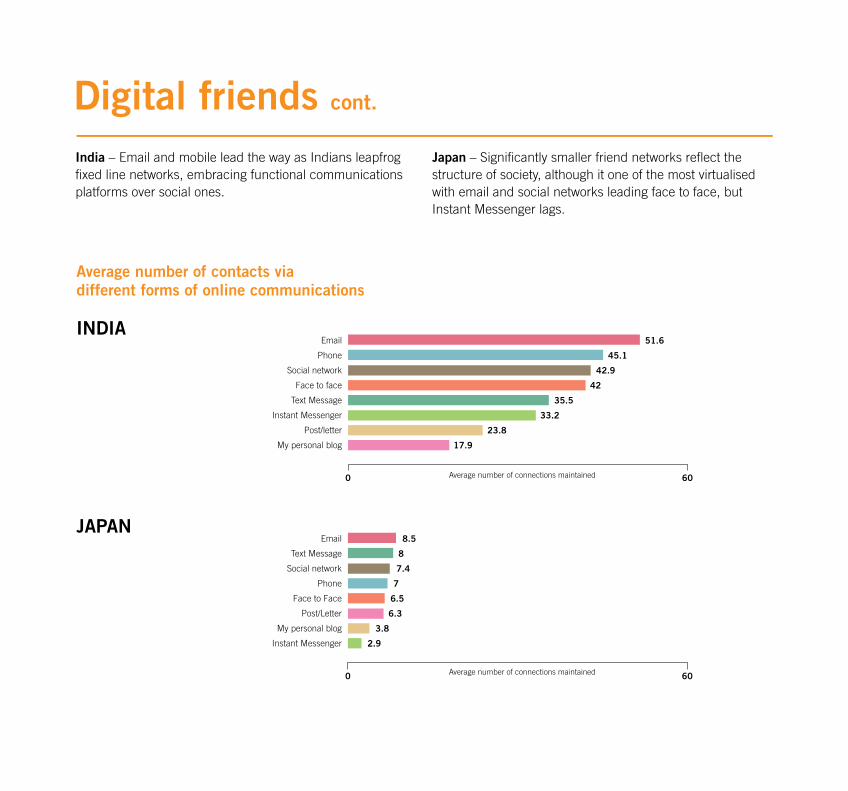
India – Email and mobile lead the way as Indians leapfrog fixed line networks, embracing functional communications platforms over social ones.
Japan – Significantly smaller friend networks reflect the structure of society, although it one of the most virtualised with email and social networks leading face to face, but Instant Messenger lags.
Phone
Social network
Face to face
Text Message
Instant Messenger
Post/letter
My personal blog
Average number of connections maintained0 60
51.6
45.1
42.9
42
35.5
33.2
23.8
17.9
INDIA
JAPANEmail
Text Message
Social network
Phone
Face to Face
Post/Letter
My personal blog
Instant Messenger
0 60Average number of connections maintained
8.5
8
7.4
7
6.5
6.3
3.8
2.9
Average number of contacts via different forms of online communications
23
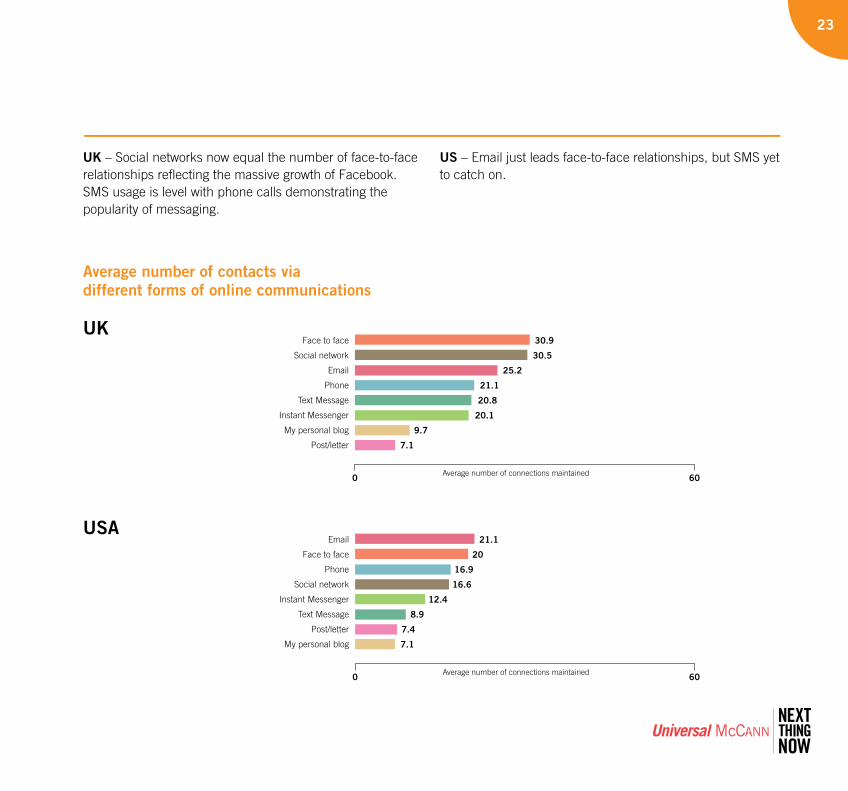
UK – Social networks now equal the number of face-to-face relationships reflecting the massive growth of Facebook. SMS usage is level with phone calls demonstrating the popularity of messaging.
US – Email just leads face-to-face relationships, but SMS yet to catch on.
UKFace to face
Social network
Phone
Text Message
Instant Messenger
My personal blog
Post/letter
Average number of connections maintained0 60
30.9
30.5
25.2
21.1
20.8
20.1
9.7
7.1
USA
Average number of connections maintained
Face to face
Phone
Social network
Instant Messenger
Text Message
Post/letter
My personal blog
0 60
21.1
20
16.9
16.6
12.4
8.9
7.4
7.1
Average number of contacts via different forms of online communications
Digital friends cont.
% stay in contact
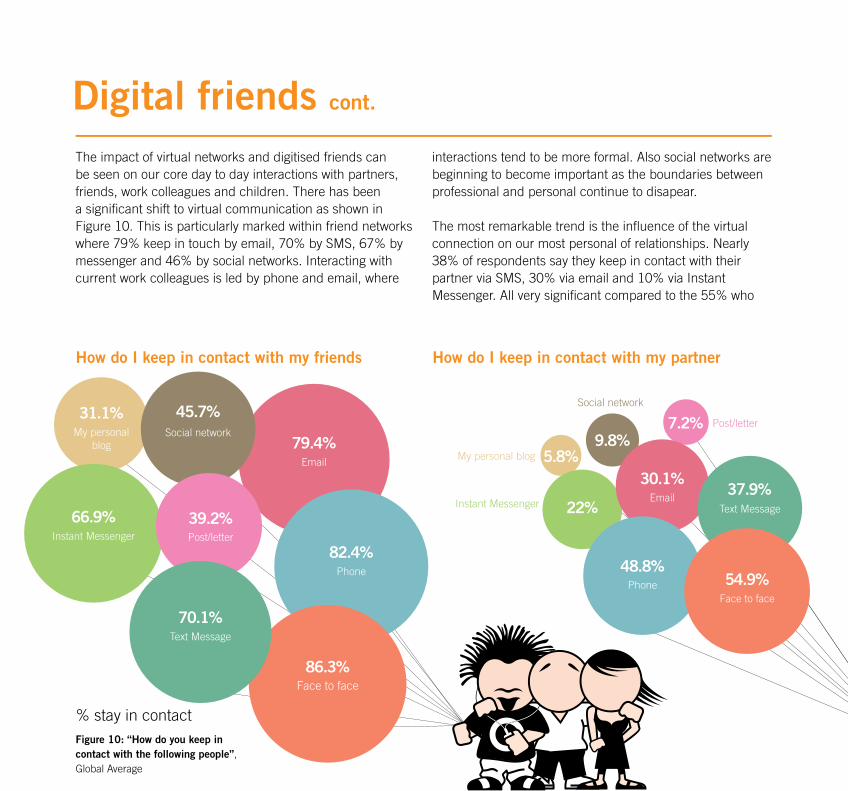
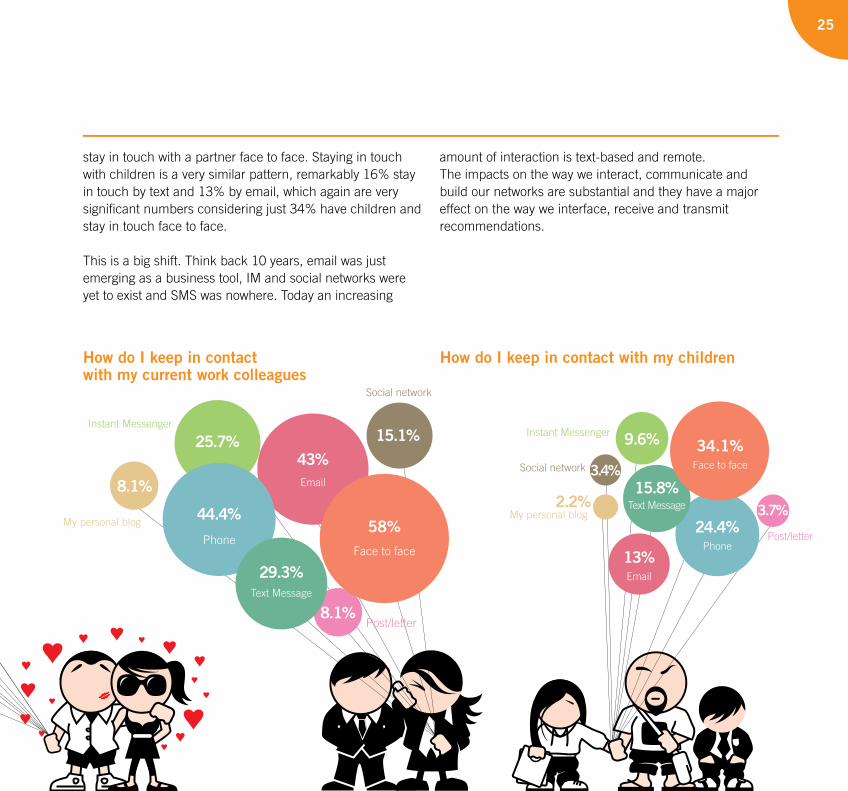
The impact of virtual networks and digitised friends can be seen on our core day to day interactions with partners, friends, work colleagues and children. There has been a significant shift to virtual communication as shown in Figure 10. This is particularly marked within friend networks where 79% keep in touch by email, 70% by SMS, 67% by messenger and 46% by social networks. Interacting with current work colleagues is led by phone and email, where
interactions tend to be more formal. Also social networks are beginning to become important as the boundaries between professional and personal continue to disapear.
The most remarkable trend is the influence of the virtual connection on our most personal of relationships. Nearly 38% of respondents say they keep in contact with their partner via SMS, 30% via email and 10% via Instant Messenger. All very significant compared to the 55% who
Figure 10: “How do you keep in contact with the following people”,Global Average
How do I keep in contact with my partnerHow do I keep in contact with my friends
86.3%Face to face
31.1%My personal
blog 79.4%Email
82.4%Phone
45.7%Social network
66.9% Instant Messenger
Social network
5.8%9.8%
7.2%
22%
30.1%Email
48.8%Phone 54.9%
Face to face
Post/letter
My personal blog
Text MessageInstant Messenger37.9%
39.2%Post/letter
70.1%Text Message
25
stay in touch with a partner face to face. Staying in touch with children is a very similar pattern, remarkably 16% stay in touch by text and 13% by email, which again are very significant numbers considering just 34% have children and stay in touch face to face.
This is a big shift. Think back 10 years, email was just emerging as a business tool, IM and social networks were yet to exist and SMS was nowhere. Today an increasing
amount of interaction is text-based and remote. The impacts on the way we interact, communicate and build our networks are substantial and they have a major effect on the way we interface, receive and transmit recommendations.
How do I keep in contact with my childrenHow do I keep in contactwith my current work colleagues
Post/letter
8.1%
25.7%43%
44.4%58%
15.1%
Social network
My personal blog
29.3%Text Message
Instant Messenger
Face to facePhone
8.1%
24.4%Phone
2.2% 3.7%
9.6%
13%Email
15.8%
34.1%Face to face
Post/letter
Social network
My personal blogText Message
Instant Messenger
3.4%
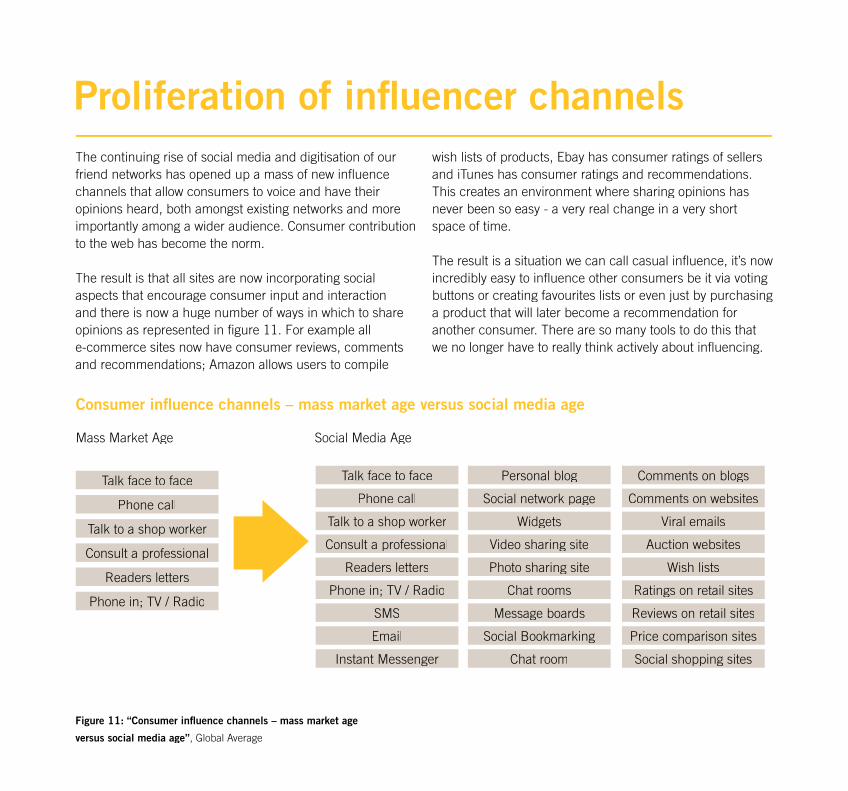
Proliferation of influencer channelsThe continuing rise of social media and digitisation of our friend networks has opened up a mass of new influencechannels that allow consumers to voice and have their opinions heard, both amongst existing networks and more importantly among a wider audience. Consumer contributionto the web has become the norm.
The result is that all sites are now incorporating social aspects that encourage consumer input and interaction and there is now a huge number of ways in which to share opinions as represented in figure 11. For example all e-commerce sites now have consumer reviews, comments and recommendations; Amazon allows users to compile
wish lists of products, Ebay has consumer ratings of sellers and iTunes has consumer ratings and recommendations.This creates an environment where sharing opinions has never been so easy - a very real change in a very shortspace of time.
The result is a situation we can call casual influence, it’s nowincredibly easy to influence other consumers be it via voting buttons or creating favourites lists or even just by purchasinga product that will later become a recommendation for another consumer. There are so many tools to do this thatwe no longer have to really think actively about influencing.
Figure 11: “Consumer influence channels – mass market age
versus social media age”, Global Average
Consumer influence channels – mass market age versus social media age
Mass Market Age Social Media Age
Talk face to face
Phone call
Talk to a shop worker
Consult a professional
Readers letters
Phone in; TV / Radio
Talk face to face Personal blog Comments on blogs
Phone call Social network page Comments on websites
Talk to a shop worker Widgets Viral emails
Consult a professional Video sharing site Auction websites
Readers letters Photo sharing site Wish lists
Phone in; TV / Radio Chat rooms Ratings on retail sites
SMS Message boards Reviews on retail sites
Email Social Bookmarking Price comparison sites
Instant Messenger Chat room Social shopping sites

27

Hi listairve oun this ama in ol hotel.ll sen you etails later.
29
Proliferation of influencer channels cont.
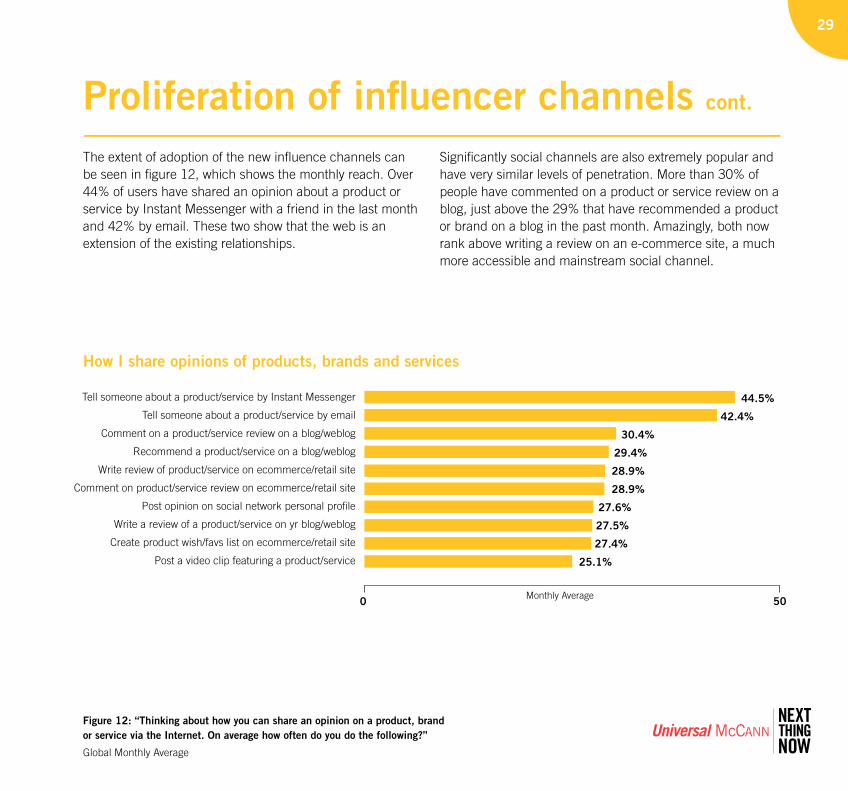
The extent of adoption of the new influence channels can be seen in figure 12, which shows the monthly reach. Over 44% of users have shared an opinion about a product or service by Instant Messenger with a friend in the last month and 42% by email. These two show that the web is an extension of the existing relationships.
Significantly social channels are also extremely popular and have very similar levels of penetration. More than 30% of people have commented on a product or service review on a blog, just above the 29% that have recommended a product or brand on a blog in the past month. Amazingly, both now rank above writing a review on an e-commerce site, a much more accessible and mainstream social channel.
Figure 12: “Thinking about how you can share an opinion on a product, brand or service via the Internet. On average how often do you do the following?”
Global Monthly Average
How I share opinions of products, brands and services
Tell someone about a product/service by Instant Messenger
Tell someone about a product/service by email
Comment on a product/service review on a blog/weblog
Recommend a product/service on a blog/weblog
Write review of product/service on ecommerce/retail site
Comment on product/service review on ecommerce/retail site
Post opinion on social network personal profile
Write a review of a product/service on yr blog/weblog
Create product wish/favs list on ecommerce/retail site
Post a video clip featuring a product/service
44.5%
42.4%
30.4%
29.4%
28.9%
28.9%
27.6%
27.5%
27.4%
25.1%
Monthly Average0 50
Proliferation of influencer channels cont.
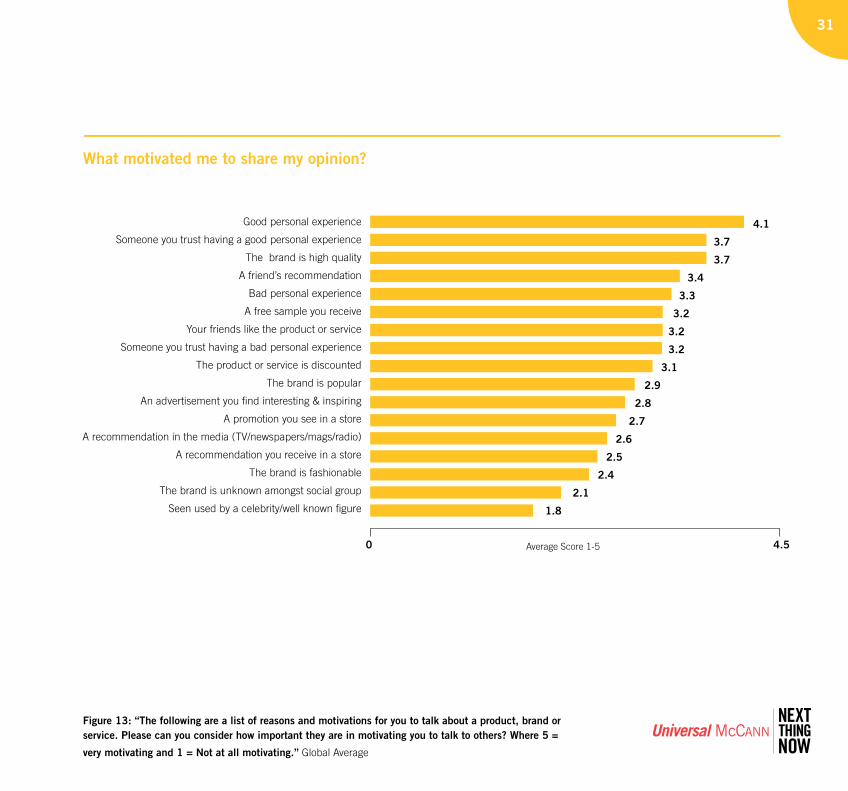
There are clear motivations for online users to share their opinions. When asked to rate different factors on a scale of 5 for importance a definitive pattern emerges among the mass market as Figure 13 shows. The most important factors being a good experience, a friend having a good experience and a quality product – demonstrating the importance in the new influence landscape of investing in a quality product. These both rank above negative experience, rebuffing the misconception that people just use the web to complain.
All aspects of personal experience and personal recommendations are stronger influences than any traditional paid for communications except sampling. A clear demonstration that being active in social media will become increasingly important for brands.
Interestingly for the mass market, a brand being fashionable or discovering an unknown brand is not a major driver to recommend and users would much rather comment and pass judgement on something that is already known and familiar. This is because we are more familiar with these products and we feel safer in recommending it. This shows that the majority of us do not want to dictate trends, but respond and evaluate what is already established.
These motivations indicate two things; firstly companies that invest in quality product will succeed and will get a much greater exposure through consumer content than their marketing budget allows; secondly it means that companies with a bad product or trying to cover up bad behaviour will suffer in the transparent world of the influencer economy.
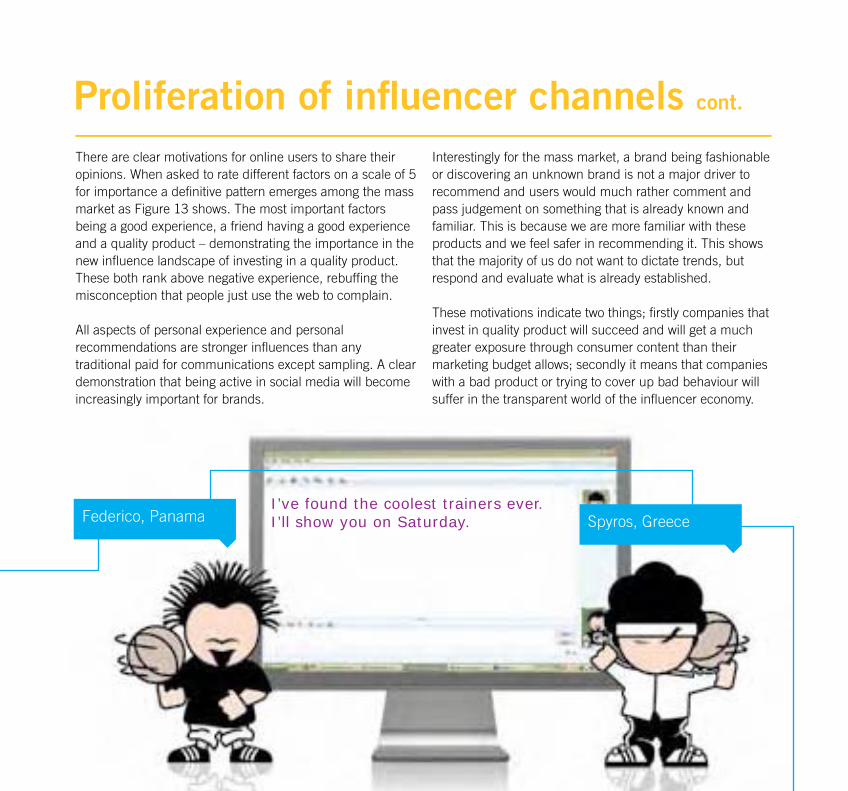
I’ve found the coolest trainers ever.I’ll show you on Saturday.Federico, Panama Spyros, Greece
31
Figure 13: “The following are a list of reasons and motivations for you to talk about a product, brand or service. Please can you consider how important they are in motivating you to talk to others? Where 5 =
very motivating and 1 = Not at all motivating.” Global Average
What motivated me to share my opinion?
Good personal experience
Someone you trust having a good personal experience
The brand is high quality
A friend’s recommendation
Bad personal experience
A free sample you receive
Your friends like the product or service
Someone you trust having a bad personal experience
The product or service is discounted
The brand is popular
An advertisement you find interesting & inspiring
A promotion you see in a store
A recommendation in the media (TV/newspapers/mags/radio)
A recommendation you receive in a store
The brand is fashionable
The brand is unknown amongst social group
Seen used by a celebrity/well known figure
4.1
3.7
3.7
3.4
3.3
3.2
3.2
3.2
3.1
2.9
2.8
2.7
2.6
2.5
2.4
2.1
1.8
Average Score 1-50 4.5
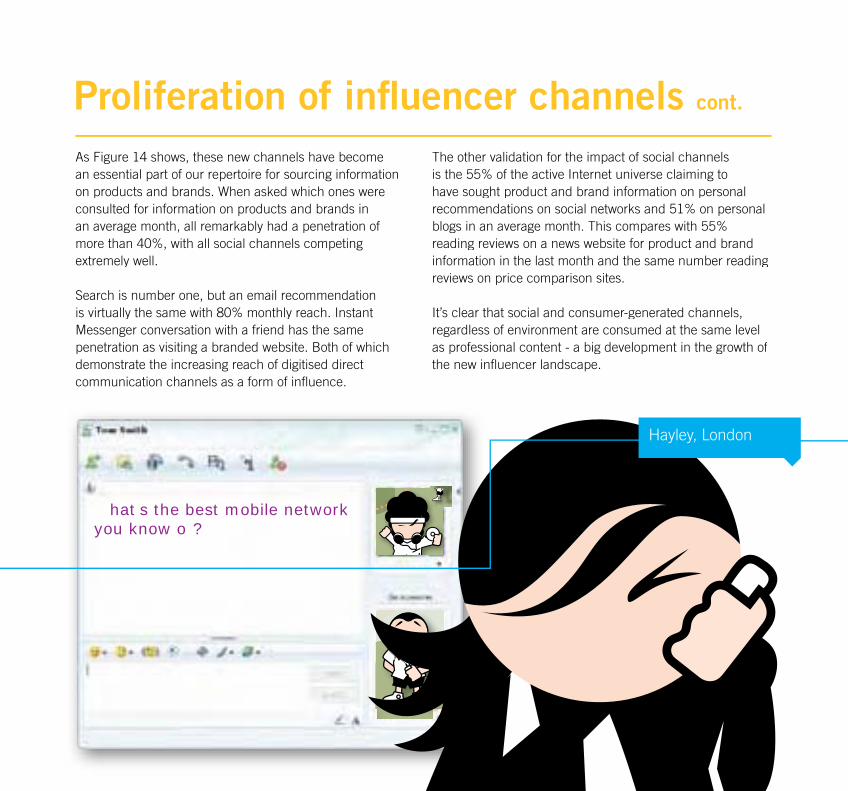
hat s the best mobile network you know o ?
Proliferation of influencer channels cont.
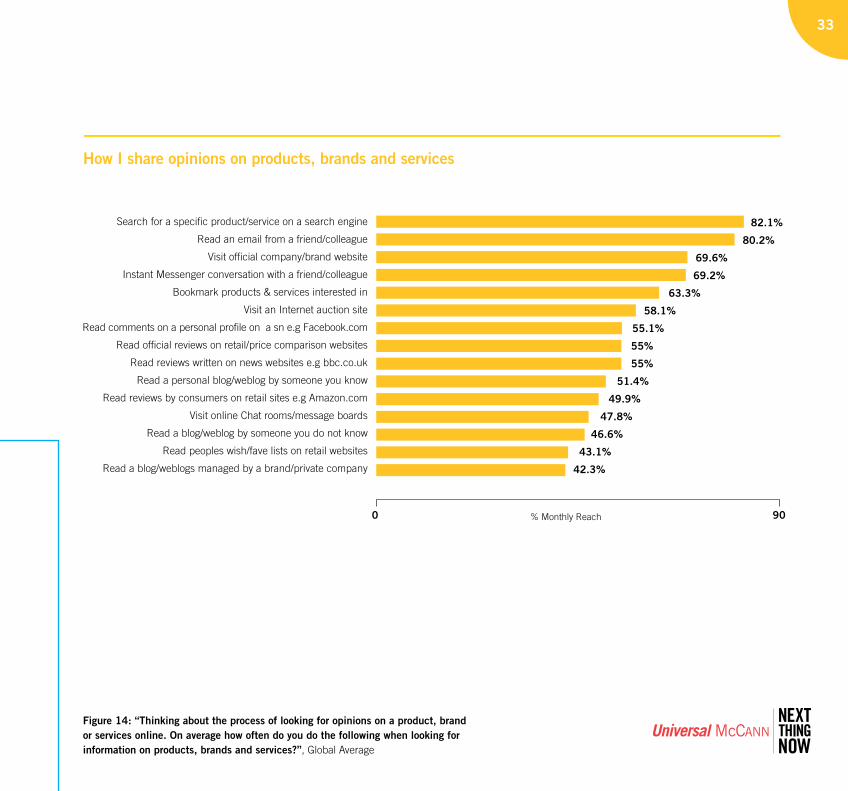
As Figure 14 shows, these new channels have become an essential part of our repertoire for sourcing informationon products and brands. When asked which ones wereconsulted for information on products and brands inan average month, all remarkably had a penetration ofmore than 40%, with all social channels competing extremely well.
Search is number one, but an email recommendation is virtually the same with 80% monthly reach. InstantMessenger conversation with a friend has the same penetration as visiting a branded website. Both of whichdemonstrate the increasing reach of digitised direct communication channels as a form of influence.
The other validation for the impact of social channelsis the 55% of the active Internet universe claiming to have sought product and brand information on personalrecommendations on social networks and 51% on personal blogs in an average month. This compares with 55% reading reviews on a news website for product and brand information in the last month and the same number readingreviews on price comparison sites.
It’s clear that social and consumer-generated channels,regardless of environment are consumed at the same level as professional content - a big development in the growth of the new influencer landscape.
Hayley, London
33
Figure 14: “Thinking about the process of looking for opinions on a product, brand or services online. On average how often do you do the following when looking for information on products, brands and services?”, Global Average
How I share opinions on products, brands and services
Search for a specific product/service on a search engine
Read an email from a friend/colleague
Visit official company/brand website
Instant Messenger conversation with a friend/colleague
Bookmark products & services interested in
Visit an Internet auction site
Read comments on a personal profile on a sn e.g Facebook.com
Read official reviews on retail/price comparison websites
Read reviews written on news websites e.g bbc.co.uk
Read a personal blog/weblog by someone you know
Read reviews by consumers on retail sites e.g Amazon.com
Visit online Chat rooms/message boards
Read a blog/weblog by someone you do not know
Read peoples wish/fave lists on retail websites
Read a blog/weblogs managed by a brand/private company
82.1%
80.2%
69.6%
69.2%
63.3%
58.1%
55.1%
55%
55%
51.4%
49.9%
47.8%
46.6%
43.1%
42.3%
% Monthly Reach0 90
Proliferation of influencer channels cont.
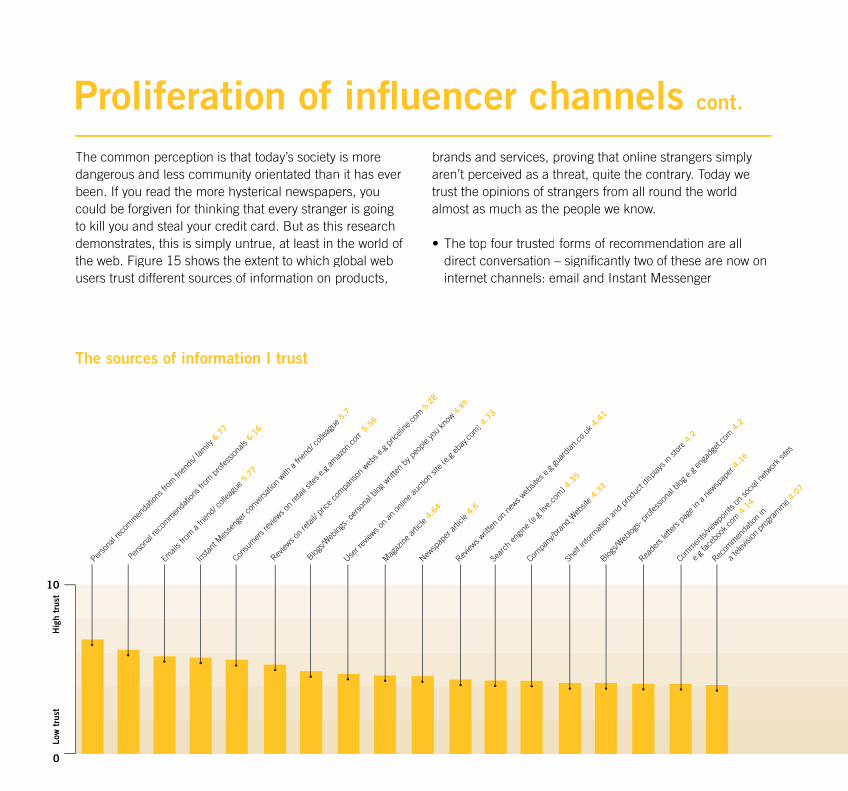
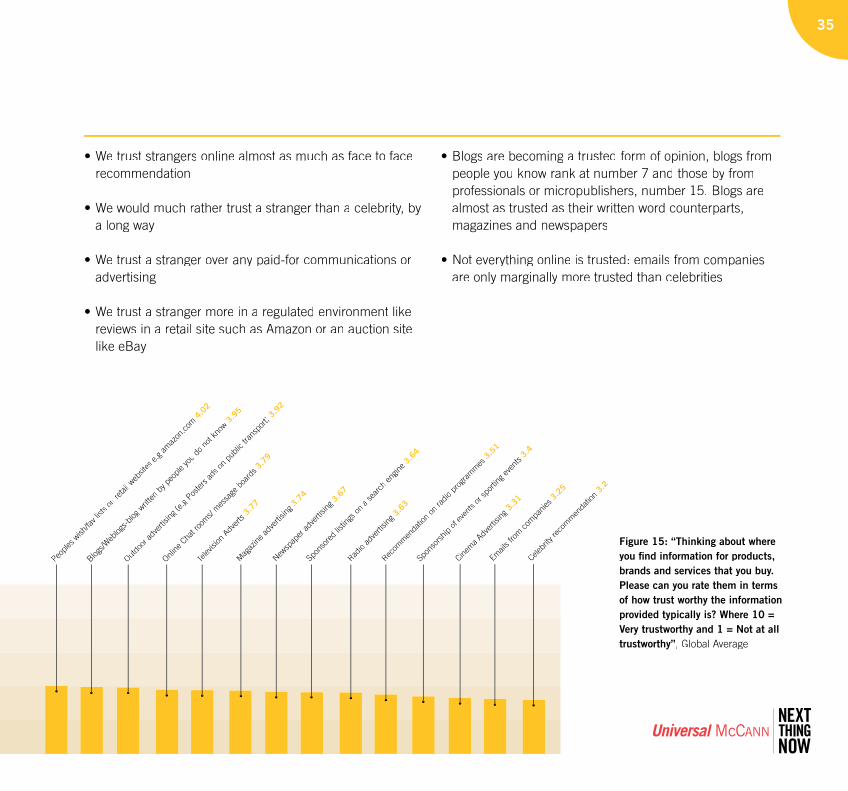
The common perception is that today’s society is more dangerous and less community orientated than it has ever been. If you read the more hysterical newspapers, you could be forgiven for thinking that every stranger is going to kill you and steal your credit card. But as this researchdemonstrates, this is simply untrue, at least in the world of the web. Figure 15 shows the extent to which global webusers trust different sources of information on products,
brands and services, proving that online strangers simplyaren’t perceived as a threat, quite the contrary. Today wetrust the opinions of strangers from all round the world almost as much as the people we know.
direct conversation – significantly two of these are now oninternet channels: email and Instant Messenger
The sources of information I trust
Mag
azine
artic
le 4.
64
s fro
m a
frien
d/ co
lleag
ue 5
.77
Insta
nt M
esse
nger
conv
ersa
tion
witha f
riend
/ coll
eagu
e 5.7
Consu
mer
s rev
iews o
n re
tail s
ites e
.g am
azon
.com 5
.56
Comm
ents/
viewpo
ints o
n so
cial n
etwor
k site
s
e
.g fac
eboo
k.com
4.1
4
Recom
men
datio
n in
a
telev
ision
pro
gram
me 4
.07
Review
s on
retai
l/ pric
e com
paris
on w
ebs e
.g pr
icelin
e.com
5.2
8
Perso
nal r
ecom
men
datio
ns fr
om p
rofes
siona
ls6.
16
User r
eview
s on
an on
line a
uctio
n sit
e (e.g
ebay
.com
) 4.73
Newsp
aper
artic
le 4.
6
Review
s writ
ten on
new
s web
sites
e.g gu
ardia
n.co
.uk 4
.41
Sear
ch en
gine (
e.g liv
e.com
) 4.3
5
Compa
ny/b
rand
Web
site 4
.33
Shelf
infor
mati
on an
d pr
oduc
t disp
lays i
n sto
re4.
2
Blogs/W
eblog
s- pr
ofess
ional
blog e
.g en
gadg
et.co
m 4
.2
Perso
nal r
ecom
men
datio
ns fr
om fr
iends
/ fam
ily 6
.77
Reade
rs let
ters p
age i
n a n
ewsp
aper
4.16
10
0
Blog
s/Web
logs-
perso
nal b
log w
ritten
by p
eople
you
know
4.8
9
Hig
h tr
ust
Low
tru
st
35
Figure 15: “Thinking about whereyou find information for products, brands and services that you buy.Please can you rate them in termsof how trust worthy the information provided typically is? Where 10 =Very trustworthy and 1 = Not at alltrustworthy”
3.6
3
3.9
5
3.7
4 3
.67
4.0
2
3.6
4
3.9
2
3.7
9 3.4
3.2
5
3.3
1 3
.2
3.7
7
3.5
1
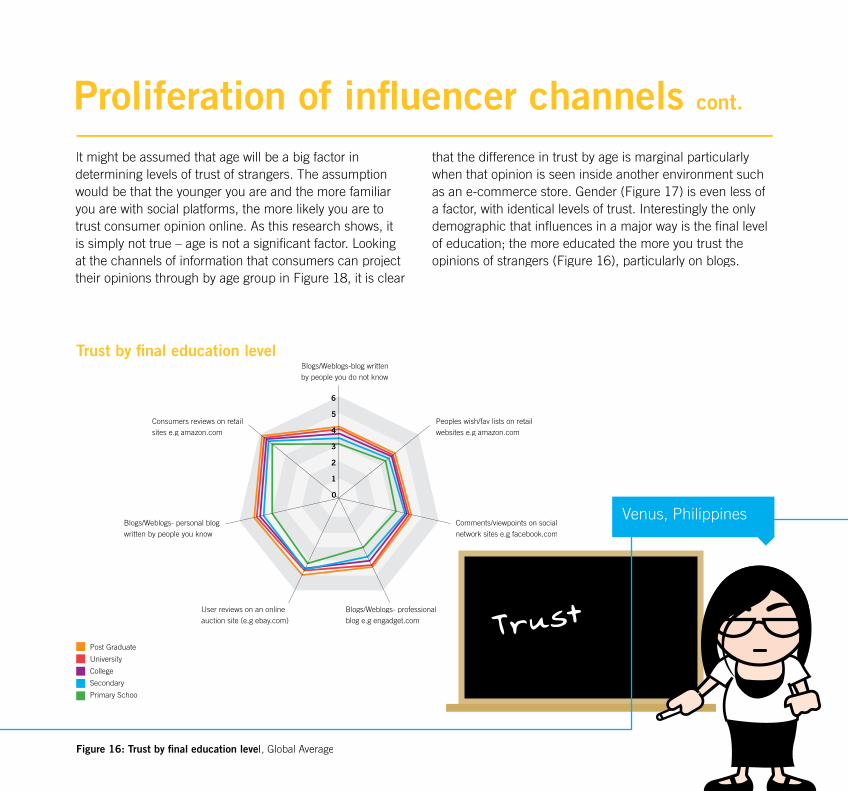
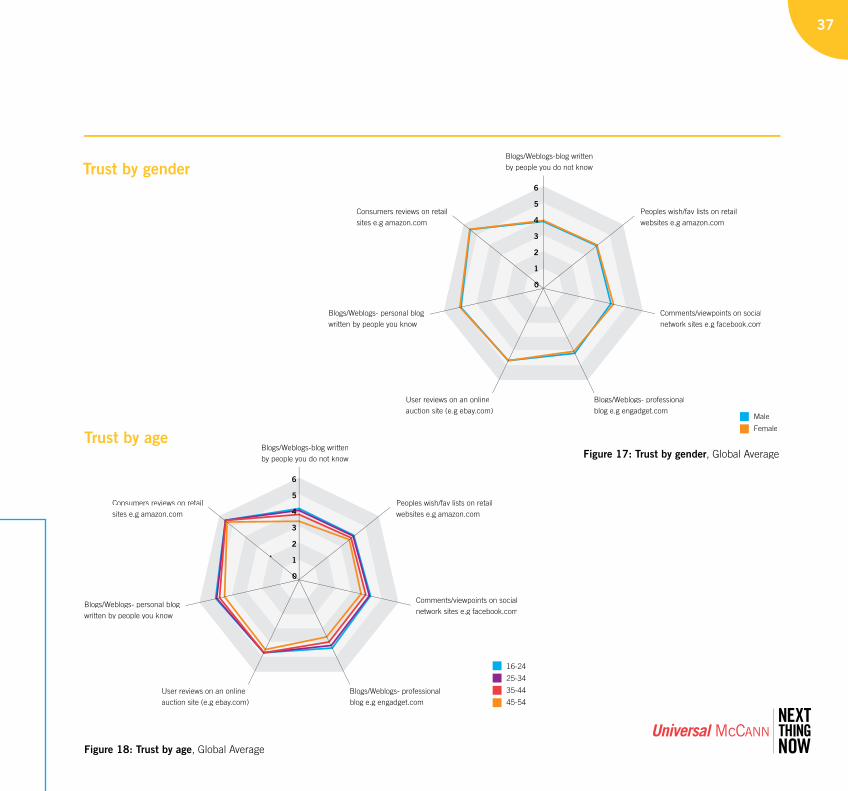
It might be assumed that age will be a big factor indetermining levels of trust of strangers. The assumptionwould be that the younger you are and the more familiar you are with social platforms, the more likely you are totrust consumer opinion online. As this research shows, it is simply not true – age is not a significant factor. Lookingat the channels of information that consumers can project their opinions through by age group in Figure 18, it is clear
that the difference in trust by age is marginal particularly when that opinion is seen inside another environment suchas an e-commerce store. Gender (Figure 17) is even less of a factor, with identical levels of trust. Interestingly the onlydemographic that influences in a major way is the final level of education; the more educated the more you trust the opinions of strangers (Figure 16), particularly on blogs.
Proliferation of influencer channels cont.
Figure 16: Trust by final education level, Global Average
Trust by final education levelBlogs/Weblogs-blog writtenby people you do not know
chart
6
4
5
2
1
3
0
Peoples wish/fav lists on retailwebsites e.g amazon.com
Consumers reviews on retailsites e.g amazon.com
Comments/viewpoints on socialnetwork sites e.g facebook.com
Blogs/Weblogs- personal blog written by people you know
Blogs/Weblogs- professionalblog e.g engadget.com
User reviews on an onlineauction site (e.g ebay.com)
00
Post Graduate
University
College
Secondary
Primary School
Venus, Philippines
37
Figure 17: Trust by gender, Global Average
Figure 18: Trust by age, Global Average
Trust by age
Trust by gender
Blogs/Weblogs-blog writtenby people you do not know
6
4
5
2
1
3
0
Peoples wish/fav lists on retailwebsites e.g amazon.com
Consumers reviews on retailsites e.g amazon.com
Comments/viewpoints on socialnetwork sites e.g facebook.com
Blogs/Weblogs- personal blog written by people you know
Blogs/Weblogs- professionalblog e.g engadget.com
User reviews on an onlineauction site (e.g ebay.com)
16-24
25-34
35-44
45-54
0
Blogs/Weblogs-blog writtenby people you do not know
chart
6
4
5
2
1
3
0
Peoples wish/fav lists on retailwebsites e.g amazon.com
Consumers reviews on retailsites e.g amazon.com
Comments/viewpoints on socialnetwork sites e.g facebook.com
Blogs/Weblogs- personal blog written by people you know
Blogs/Weblogs- professionalblog e.g engadget.com
User reviews on an onlineauction site (e.g ebay.com)
0
Male
Female
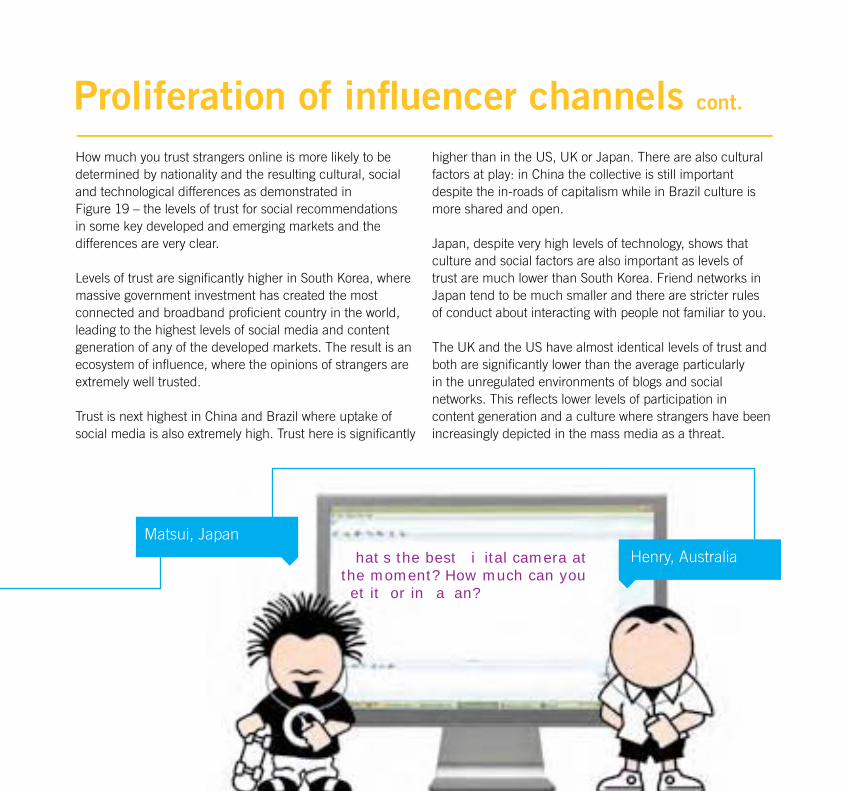
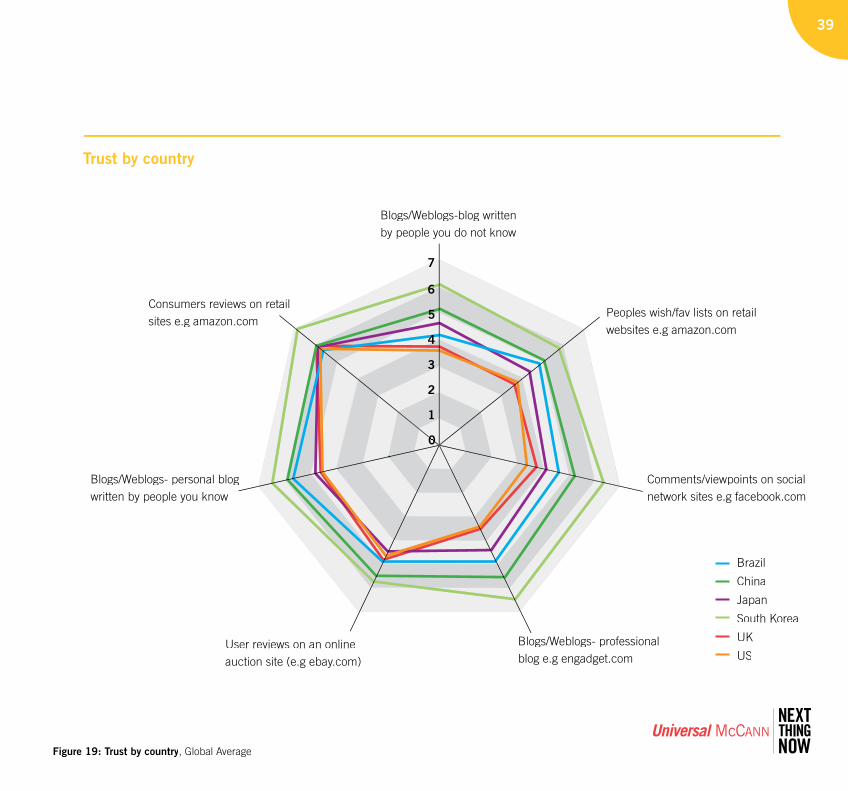
How much you trust strangers online is more likely to be determined by nationality and the resulting cultural, social and technological differences as demonstrated inFigure 19 – the levels of trust for social recommendations in some key developed and emerging markets and the differences are very clear.
Levels of trust are significantly higher in South Korea, where massive government investment has created the most connected and broadband proficient country in the world, leading to the highest levels of social media and content generation of any of the developed markets. The result is an ecosystem of influence, where the opinions of strangers are extremely well trusted.
Trust is next highest in China and Brazil where uptake of social media is also extremely high. Trust here is significantly
higher than in the US, UK or Japan. There are also cultural factors at play: in China the collective is still important despite the in-roads of capitalism while in Brazil culture is more shared and open.
Japan, despite very high levels of technology, shows that culture and social factors are also important as levels of trust are much lower than South Korea. Friend networks in Japan tend to be much smaller and there are stricter rules of conduct about interacting with people not familiar to you.
The UK and the US have almost identical levels of trust and both are significantly lower than the average particularly in the unregulated environments of blogs and social networks. This reflects lower levels of participation in content generation and a culture where strangers have been increasingly depicted in the mass media as a threat.
Proliferation of influencer channels cont.
hat s the best i ital camera at the moment? How much can you et it or in a an?
Matsui, JapanHenry, Australia
39
6
7
4
5
2
1
3
0
Figure 19: Trust by country, Global Average
Trust by country
Blogs/Weblogs-blog writtenby people you do not know
Peoples wish/fav lists on retailwebsites e.g amazon.com
Consumers reviews on retail sites e.g amazon.com
Comments/viewpoints on socialnetwork sites e.g facebook.com
Blogs/Weblogs- personal blog written by people you know
Blogs/Weblogs- professionalblog e.g engadget.com
User reviews on an onlineauction site (e.g ebay.com)
00
Brazil
China
Japan
South Korea
UK
US
The rise of social media
Digital friends
Proliferation of influence channels
The new influencer landscape:
41
al Son Ncon
pi
-Mang
o
www.stylehive.com www.this
www.wists.com www.osoyou.com
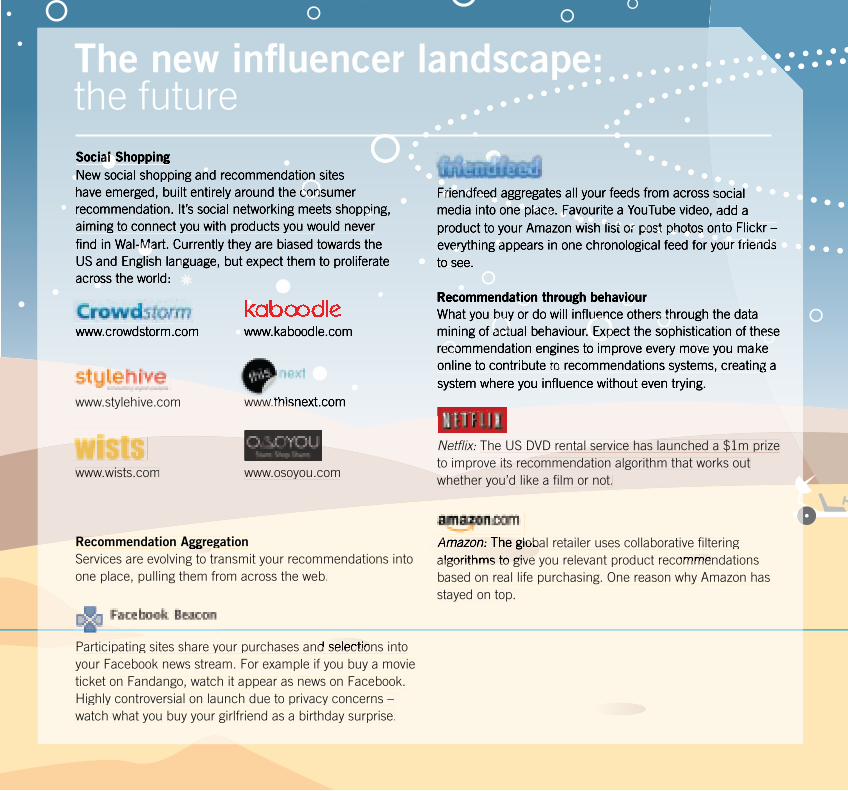
RRecommendation AggregationServices are evolving to transmit your recommendations intoone place, pulling them from across the web.
Participating sites share your purchases and selections intoPyour Facebook news stream. For example if you buy a movie ticket on Fandango, watch it appear as news on Facebook.Highly controversial on launch due to privacy concerns – watch what you buy your girlfriend as a birthday surprise.
endfeed lFrne place. Favou
list or post photosyour friendsaer
tio viobuy uen s thact . Exp ese
eco ve to
Netflix: The US DVD rental service hasrental service has launched a $1m prize to improve its recrove its recommendation algorithm that works out
hwhether you’d like a film or not.
Amaz The global retailer uses collaborative filtering algorithms to give you relevant product recommendations based on real life purchasing. One reason why Amazon has stayed on top.
The new influencer landscape:the future
4343
Shashi, India
Somyot, Thailand
Manpreet, China
Hayley, UK
The influence economy The democratisation of influenceThe new super influencers
The impact
Hugh, Canada
45
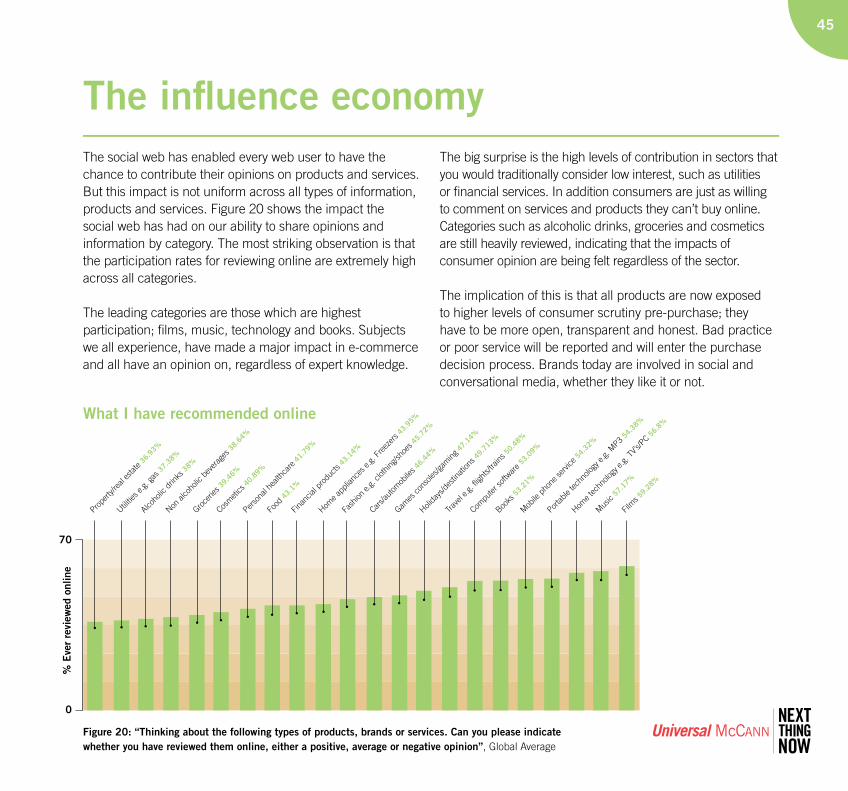
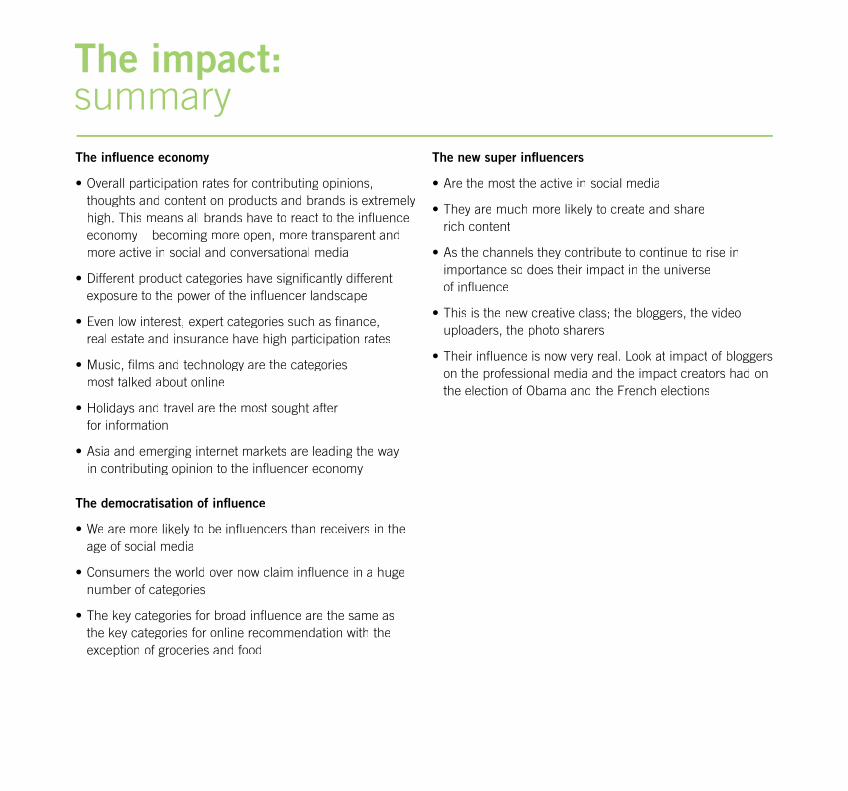
The influence economyThe social web has enabled every web user to have the chance to contribute their opinions on products and services. But this impact is not uniform across all types of information, products and services. Figure 20 shows the impact the social web has had on our ability to share opinions and information by category. The most striking observation is that the participation rates for reviewing online are extremely high across all categories.
The leading categories are those which are highest participation; films, music, technology and books. Subjects we all experience, have made a major impact in e-commerce and all have an opinion on, regardless of expert knowledge.
The big surprise is the high levels of contribution in sectors that you would traditionally consider low interest, such as utilities or financial services. In addition consumers are just as willing to comment on services and products they can’t buy online. Categories such as alcoholic drinks, groceries and cosmetics are still heavily reviewed, indicating that the impacts of consumer opinion are being felt regardless of the sector.
The implication of this is that all products are now exposed to higher levels of consumer scrutiny pre-purchase; they have to be more open, transparent and honest. Bad practice or poor service will be reported and will enter the purchase decision process. Brands today are involved in social and conversational media, whether they like it or not.
Figure 20: “Thinking about the following types of products, brands or services. Can you please indicate whether you have reviewed them online, either a positive, average or negative opinion”, Global Average
What I have recommended online
Utilitie
s e.g.
gas 3
7.38
%
Alcoho
lic d
rinks
38%
Non al
coho
lic b
ever
ages
38.
64%
Groce
ries 39
.46%
Perso
nal h
ealth
care
41.
79%
Food
43.1
%
Finan
cial p
rodu
cts 4
3.14
%
Home a
pplia
nces
e.g.
Free
zers
43.9
5%
Fash
ion e.
g. clo
thing
/shoe
s 45.
72%
Cars/a
utom
obile
s 46.4
4%
Games
cons
oles/g
aming
47.
14%
Holida
ys/d
estin
ation
s 49.7
13%
Compu
ter so
ftwar
e 53.
09%
Trave
l e.g.
fligh
ts/tra
ins 5
0.48
%
Books
53.2
1%
Mob
ile p
hone
servi
ce 5
4.32
%
Portab
le tec
hnolo
gy e.
g. M
P3 54
.38%
Home t
echn
ology
e.g.
TV’s/
PC 56.
8%
Mus
ic57
.17%
Film
s 59.2
8%
Prope
rty/re
al es
tate 3
6.93
%
Cosm
etics
40.8
9%
70
0
% E
ver
revi
ewed
onl
ine
The influence economy cont.
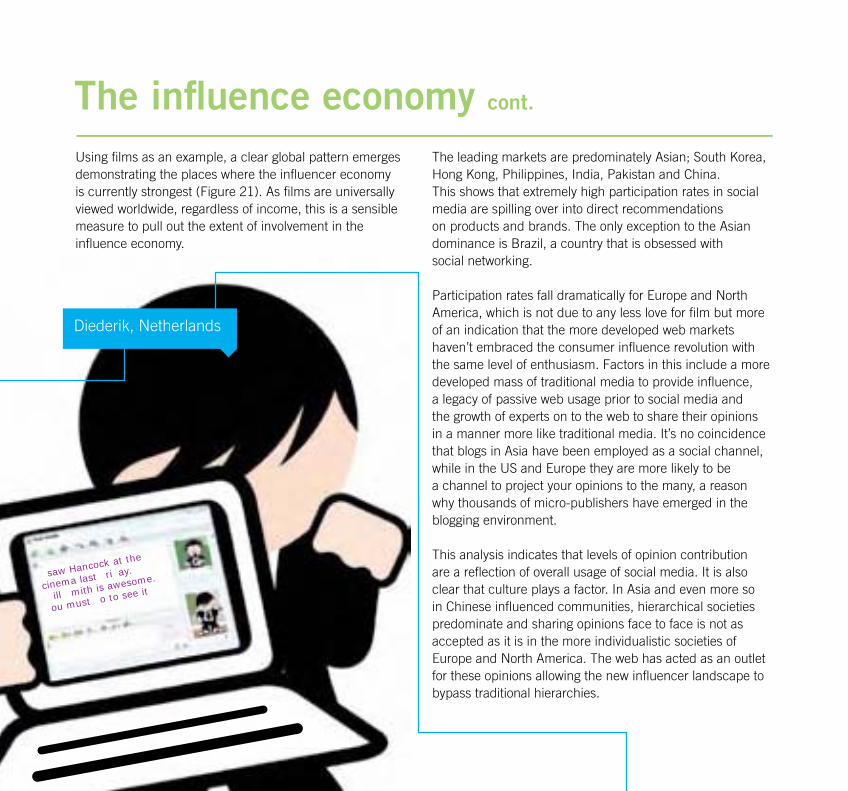
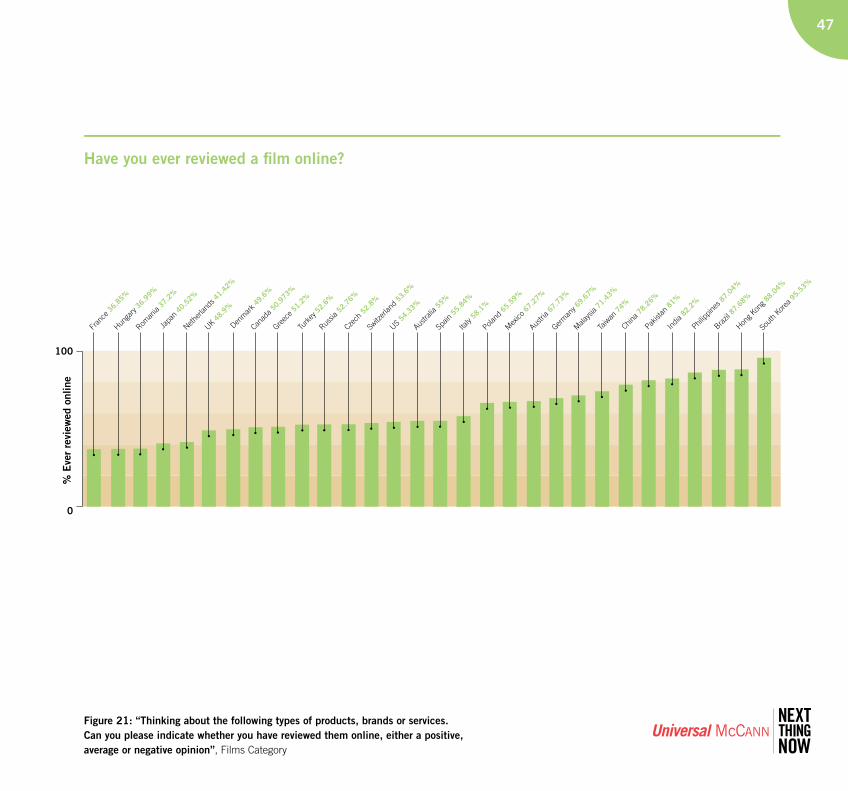
Using films as an example, a clear global pattern emerges demonstrating the places where the influencer economy is currently strongest (Figure 21). As films are universally viewed worldwide, regardless of income, this is a sensible measure to pull out the extent of involvement in the influence economy.
The leading markets are predominately Asian; South Korea, Hong Kong, Philippines, India, Pakistan and China.This shows that extremely high participation rates in social media are spilling over into direct recommendationson products and brands. The only exception to the Asian dominance is Brazil, a country that is obsessed withsocial networking.
Participation rates fall dramatically for Europe and North America, which is not due to any less love for film but more of an indication that the more developed web markets haven’t embraced the consumer influence revolution with the same level of enthusiasm. Factors in this include a more developed mass of traditional media to provide influence,a legacy of passive web usage prior to social media andthe growth of experts on to the web to share their opinions in a manner more like traditional media. It’s no coincidence that blogs in Asia have been employed as a social channel, while in the US and Europe they are more likely to bea channel to project your opinions to the many, a reason why thousands of micro-publishers have emerged in the blogging environment.
This analysis indicates that levels of opinion contribution are a reflection of overall usage of social media. It is also clear that culture plays a factor. In Asia and even more so in Chinese influenced communities, hierarchical societies predominate and sharing opinions face to face is not as accepted as it is in the more individualistic societies of Europe and North America. The web has acted as an outlet for these opinions allowing the new influencer landscape to bypass traditional hierarchies.
saw Hancock at the
cinema last ri ay.
ill mith is awesome.
ou must o to see it
Diederik, Netherlands
47
Figure 21: “Thinking about the following types of products, brands or services. Can you please indicate whether you have reviewed them online, either a positive, average or negative opinion”, Films Category
Have you ever reviewed a film online?
Philipp
ines 87
.04%
Greec
e 51.2
%
Roman
ia37
.2%
Japa
n 40
.52%
100
0
Austri
a 67.7
3%
Italy
58.1
%
China 78
.26%
Poland
65.5
9%
Pakist
an81
%
Mex
ico67
.27%
India
82.2
%
Germ
any 69
.67%
Mala
ysia
71.4
3%
Hong K
ong 8
8.04
%
Sout
h Kor
ea 9
5.53
%
Taiw
an 7
4%
Brazil
87.6
8%
UK48
.9%
Hunga
ry36
.99%
Nether
lands
41.4
2%
Canad
a 50.9
73%
Turk
ey 5
2.6%
Russia
52.7
6%
Czech
52.8
%
Switz
erlan
d53
.6%
US54
.33%
Austra
lia55
%
Fran
ce36
.85%
Spain
55.8
4%
Den
mar
k 49.
6%
% E
ver
revi
ewed
onl
ine
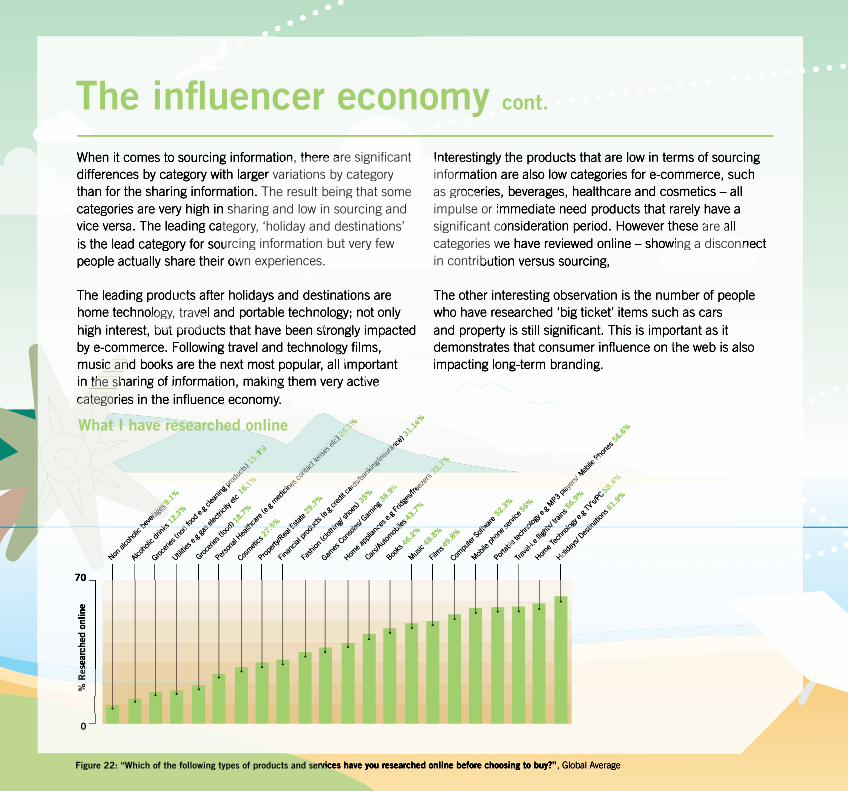
Figure 22: “Which of the following types of products and service
The influencer economy cont.
ion, there are significant e sigr variations by categoryy
n. The result being that somebesharing and low in sourcing and i
ategory, ‘holiday and destinations’anurcing information but very few o
own experiences. ce
uct eology, trave no
but produ stlog
imic antivekingation mthe sh
tecategor
Intinforas grocerieimpulse or im
are asignificant cowing a disconnecategories w
in contribu
flu thm
What I have researched online
ks
prod
ucucts)
nf
15.5
%
as
61%
od 75 l E
ards
/bann
king/i
nsur
anc
du hin ole
9%9%
ges
nce
eeze
rs339
.1%
bile
7%
% %%% Softw
pho
se
layer
s/ M
e P
ble
no
vel
hts
om
olog
58.4
%
Hol
tiner
ages
b
ines c
ontntac
t lens
es et
c)
lth
24.1
%
0
Res
%
49
Theresa, Azores
Tom, UK
The Azores are absolutely fantastic! I’ve seen some whales today...
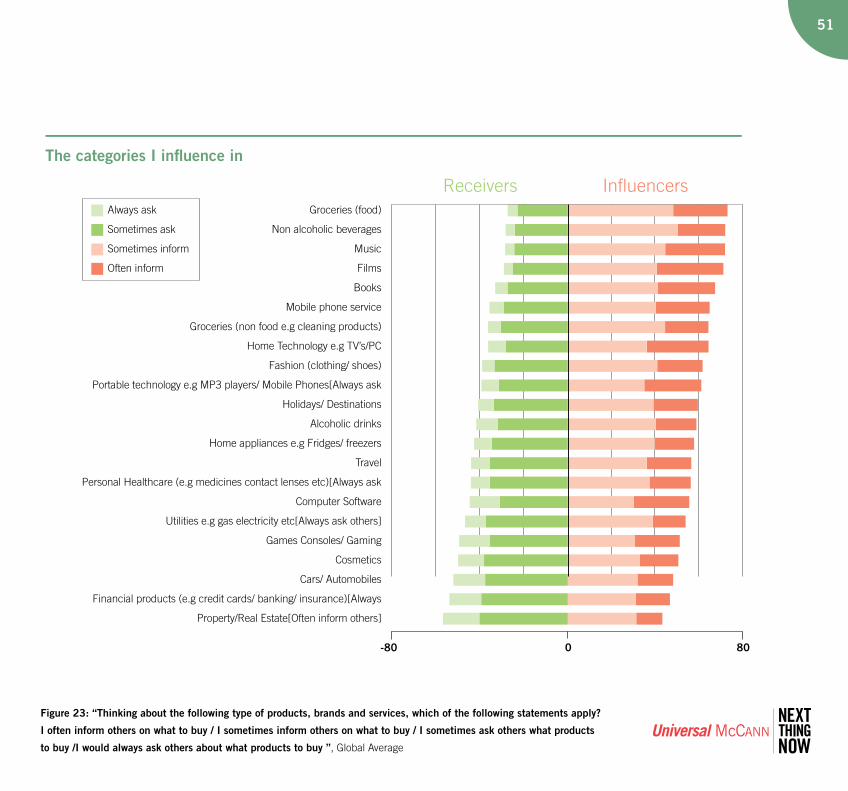
Democratisation of influenceFigure 23 shows the impact of the new influencer landscape– when asked whether we see ourselves as influencers or receivers on a number of product categories, we now claimto be influencers or receivers across a huge number of categories both on and offline.
Firstly the extent to which we consider ourselves influencersis much higher across all categories than would be expected and is now similar to the extent that we consider ourselves tobe receivers – this is a direct result of the ease of access for sharing influence. Secondly there is a correlation between the categories that are most popular for sharing informationonline and the ones that we now consider ourselves to be influencers in – music, film, books and technology. Theseare the categories most dependent on personal taste. This shows how important the web is in shaping the influenceeconomy.
Groceries and drinks prove the exception to the rule asthey are products that we are all knowledgeable about and consequently have always been rich in our verbalconversations, however they don’t fit into our online conversations, mainly because they are impulse products without a long purchase process.
Looking at the categories where we are predominately receivers, it is the categories that are less dictated by personal choice and more about in-depth knowledge. Theyare the fields that are traditionally low interest and dictatedby experts, such as property, finance, cars and cosmetics. However the impact of the new world of influence can even be seen here: although they rank last, they are still all over 40%; a reflection of a consumer who has accessto unprecedented volumes of knowledge, opinion and factonline. This will no doubt increase over time, eroding the power of the experts and bringing consumer influence into all categories.
Rolandas, Lithuania
51
Figure 23: “Thinking about the following type of products, brands and services, which of the following statements apply?
I often inform others on what to buy / I sometimes inform others on what to buy / I sometimes ask others what products
to buy /I would always ask others about what products to buy ”, Global Average
The categories I influence in
Receivers Influencers
-80 800
Groceries (food)
Non alcoholic beverages
Music
Films
Books
Mobile phone service
Groceries (non food e.g cleaning products)
Home Technology e.g TV’s/PC
Fashion (clothing/ shoes)
Portable technology e.g MP3 players/ Mobile Phones[Always ask
Holidays/ Destinations
Alcoholic drinks
Home appliances e.g Fridges/ freezers
Travel
Personal Healthcare (e.g medicines contact lenses etc)[Always ask
Computer Software
Utilities e.g gas electricity etc[Always ask others]
Games Consoles/ Gaming
Cosmetics
Cars/ Automobiles
Financial products (e.g credit cards/ banking/ insurance)[Always
Property/Real Estate[Often inform others]
Always ask
Sometimes ask
Sometimes inform
Often inform
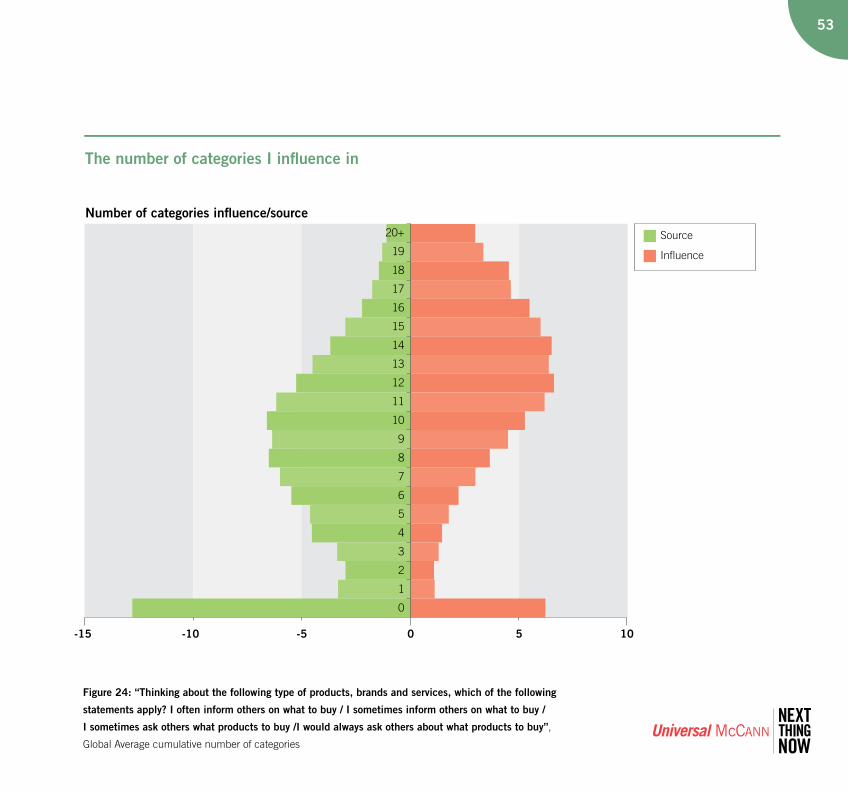
Democratisation of influence cont.
The true picture of the democratisation of influence can beseen in the number of categories that we claim to influence in. Figure 24 shows that we consider ourselves to beinfluencers across several categories. The peak of influence around 12-14 categories is much higher than would havebeen expected before the advent of the web. Visually it canbe seen that the pattern of influencers is top heavy, themajority influence in 10+ categories, which is much higherthan the mid point for sourcing information - we now claim to share more than we receive.
More importantly this contradicts the idea that we live in asimplistic world where there is a small group of “influencers” who dictate their agenda to everyone else. The truth is everybody influences and receives information across a huge number of categories and thanks to social media this trend has been amplified. The reality today is much more complicated.
Michael, Denmark Tara, USA
Arne-Inge, Norway
Riham, Egypt
Jennie, UK
Urban, Sweden
Mihai, Romania
Tadek, Poland
53
Figure 24: “Thinking about the following type of products, brands and services, which of the following
statements apply? I often inform others on what to buy / I sometimes inform others on what to buy /
I sometimes ask others what products to buy /I would always ask others about what products to buy”,
Global Average cumulative number of categories
The number of categories I influence in
Number of categories influence/source
-15 -10 -5 100 5
20+
19
18
17
16
15
14
13
12
11
10
9
8
7
6
5
4
3
2
1
0
Source
Influence
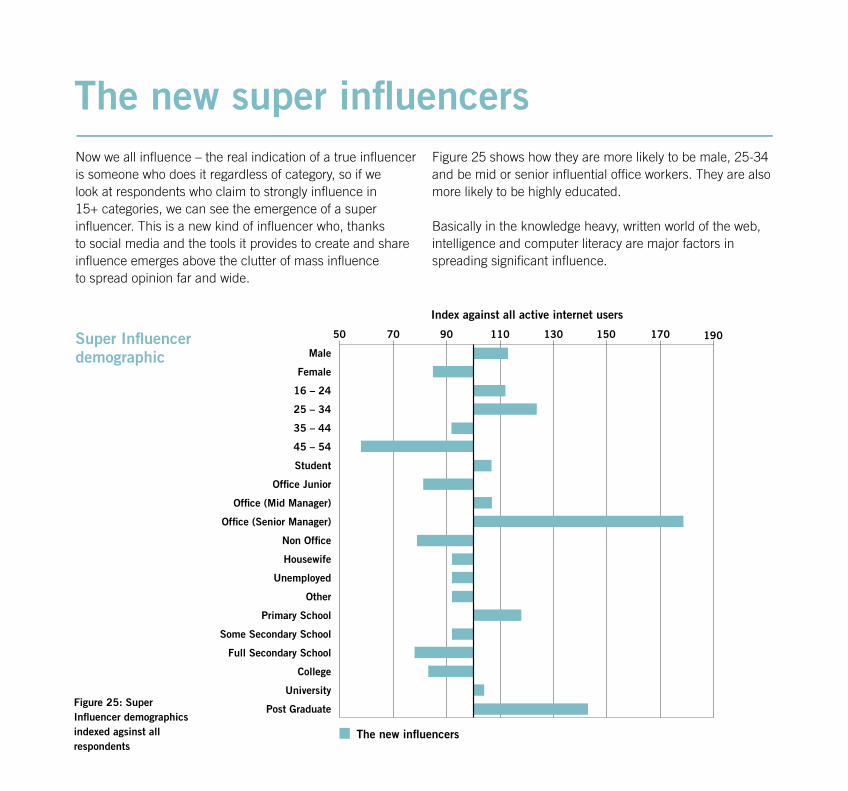
The new super influencersNow we all influence – the real indication of a true influencer is someone who does it regardless of category, so if we look at respondents who claim to strongly influence in 15+ categories, we can see the emergence of a super influencer. This is a new kind of influencer who, thanks to social media and the tools it provides to create and share influence emerges above the clutter of mass influence to spread opinion far and wide.
Figure 25 shows how they are more likely to be male, 25-34 and be mid or senior influential office workers. They are also more likely to be highly educated.
Basically in the knowledge heavy, written world of the web, intelligence and computer literacy are major factors in spreading significant influence.
Super Influencer demographic
Figure 25: Super Influencer demographics indexed agsinst all respondents
Index against all active internet users
The new influencers
50 70 90 110 130 150 170 190
Male
Female
16 – 24
25 – 34
35 – 44
45 – 54
Student
Office Junior
Office (Mid Manager)
Office (Senior Manager)
Non Office
Housewife
Unemployed
Other
Primary School
Some Secondary School
Full Secondary School
College
University
Post Graduate
Index aginst all active internet users
The new influencers
100 110 120 130 140 150 160
First amongst friends/family to try new products/services
I like taking risks
I spend a lot of time out and about with friends
When buying products, friends often ask my opinion
I pursue a life of challenge, novelty and change
Always looking for new products/services to try
I have a keen sense of adventure
I often do things on the spur of the moment
I want to get to the very top of my career
I seize opportunities when they arise
I try hard to stay in contact with friends/acquaintances
I’m an optimist
I’m interested in other cultures
People must take me as they find me
I enjoy good quality things
Important to keep well informed about things
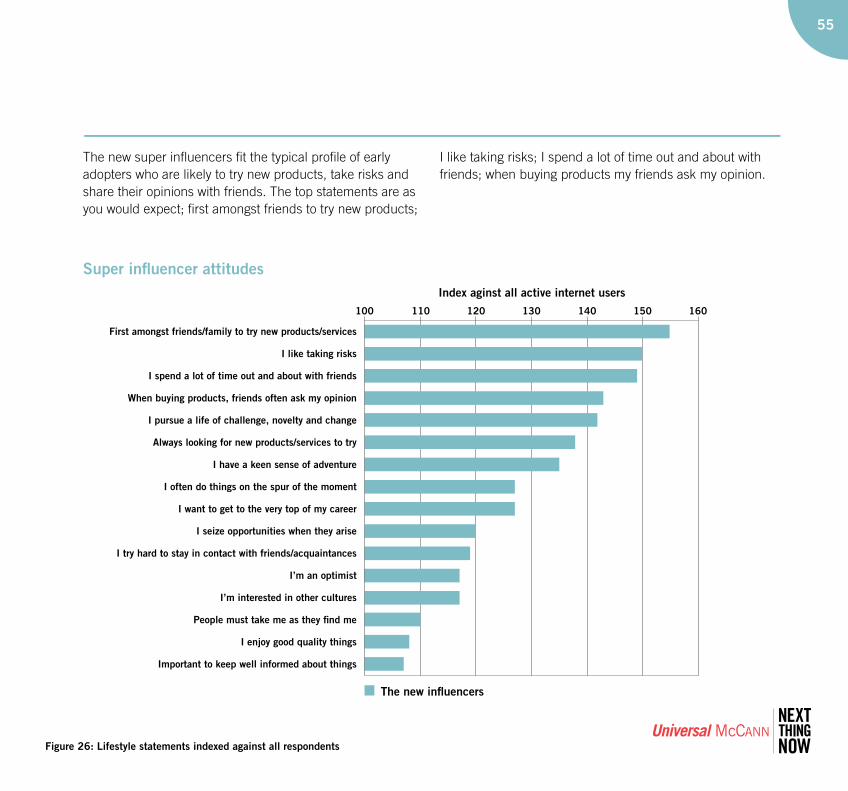
The new super influencers fit the typical profile of early adopters who are likely to try new products, take risks and share their opinions with friends. The top statements are as you would expect; first amongst friends to try new products;
I like taking risks; I spend a lot of time out and about with friends; when buying products my friends ask my opinion.
55
Figure 26: Lifestyle statements indexed against all respondents
Super influencer attitudes
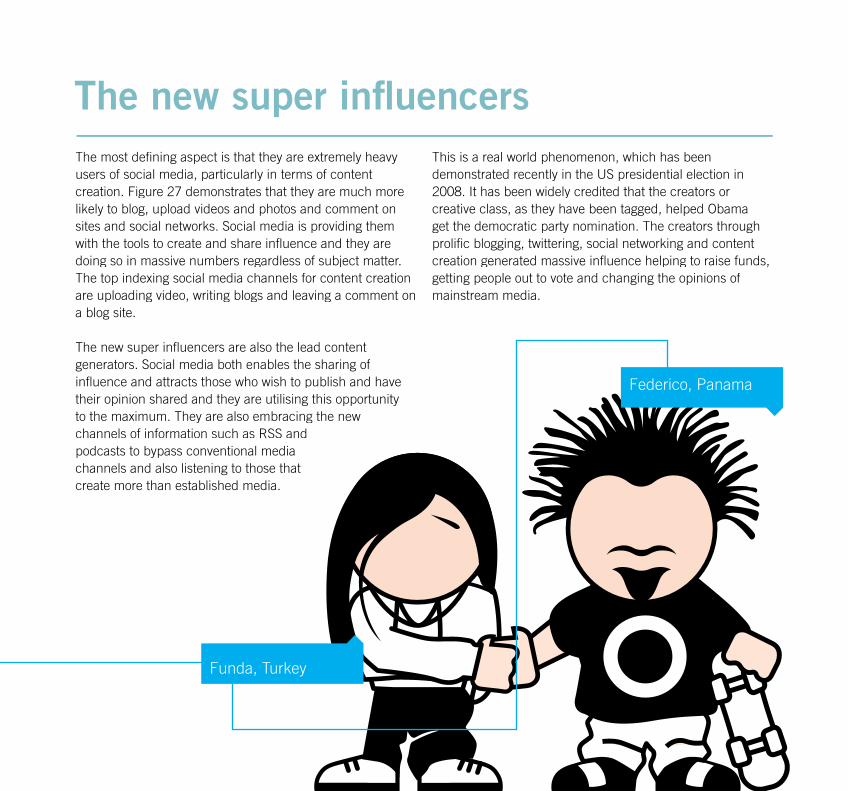
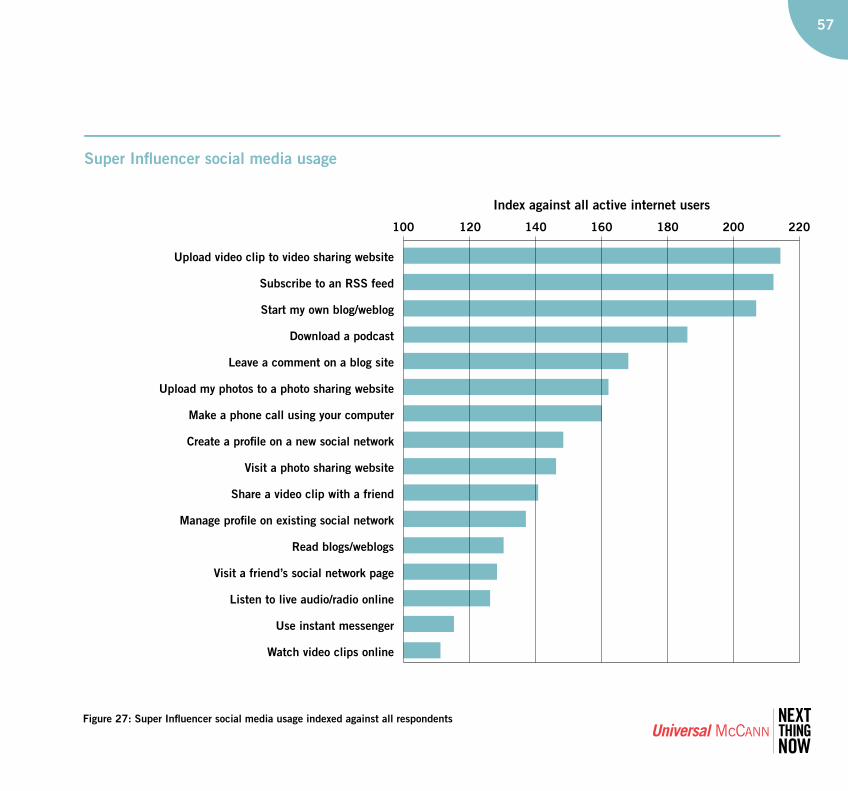
The new super influencersThe most defining aspect is that they are extremely heavy users of social media, particularly in terms of content creation. Figure 27 demonstrates that they are much morelikely to blog, upload videos and photos and comment on sites and social networks. Social media is providing them with the tools to create and share influence and they are doing so in massive numbers regardless of subject matter.The top indexing social media channels for content creationare uploading video, writing blogs and leaving a comment ona blog site.
The new super influencers are also the lead content generators. Social media both enables the sharing of influence and attracts those who wish to publish and havetheir opinion shared and they are utilising this opportunityto the maximum. They are also embracing the newchannels of information such as RSS and podcasts to bypass conventional media channels and also listening to those thatcreate more than established media.
This is a real world phenomenon, which has beendemonstrated recently in the US presidential election in 2008. It has been widely credited that the creators or creative class, as they have been tagged, helped Obama get the democratic party nomination. The creators throughprolific blogging, twittering, social networking and contentcreation generated massive influence helping to raise funds, getting people out to vote and changing the opinions of mainstream media.
Federico, Panama
Funda, Turkey
57
Super Influencer social media usage
Figure 27: Super Influencer social media usage indexed against all respondents
Index against all active internet users
100 120 140 160 180 200 220
Upload video clip to video sharing website
Subscribe to an RSS feed
Start my own blog/weblog
Download a podcast
Leave a comment on a blog site
Upload my photos to a photo sharing website
Make a phone call using your computer
Create a profile on a new social network
Visit a photo sharing website
Share a video clip with a friend
Manage profile on existing social network
Read blogs/weblogs
Visit a friend’s social network page
Listen to live audio/radio online
Use instant messenger
Watch video clips online
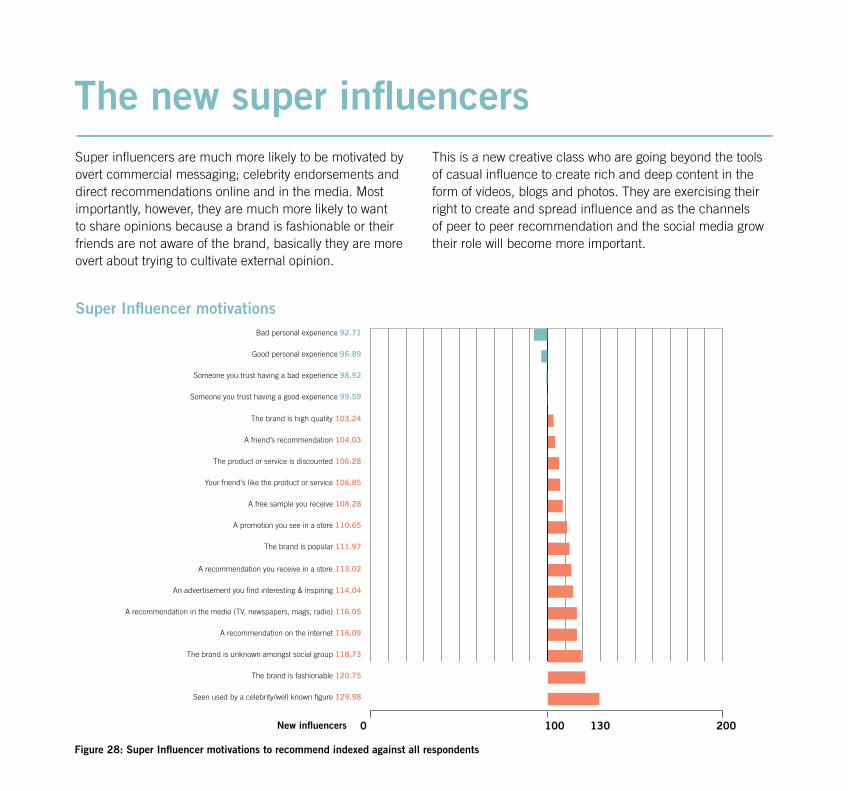
The new super influencersSuper influencers are much more likely to be motivated by overt commercial messaging; celebrity endorsements and direct recommendations online and in the media. Most importantly, however, they are much more likely to want to share opinions because a brand is fashionable or their friends are not aware of the brand, basically they are more overt about trying to cultivate external opinion.
This is a new creative class who are going beyond the tools of casual influence to create rich and deep content in the form of videos, blogs and photos. They are exercising their right to create and spread influence and as the channels of peer to peer recommendation and the social media grow their role will become more important.
Super Influencer motivations
0 200100
Bad personal experience 92.71
Good personal experience 96.89
Someone you trust having a bad experience 98.92
Someone you trust having a good experience 99.59
The brand is high quality 103.24
A friend’s recommendation 104.03
The product or service is discounted 106.28
Your friend’s like the product or service 106.85
A free sample you receive 108.28
A promotion you see in a store 110.65
The brand is popular 111.97
A recommendation you receive in a store 113.02
An advertisement you find interesting & inspiring 114.04
A recommendation in the media (TV, newspapers, mags, radio) 116.05
A recommendation on the internet 116.09
The brand is unknown amongst social group 118.73
The brand is fashionable 120.75
Seen used by a celebrity/well known figure 129.98
130
Figure 28: Super Influencer motivations to recommend indexed against all respondents
New influencers
59
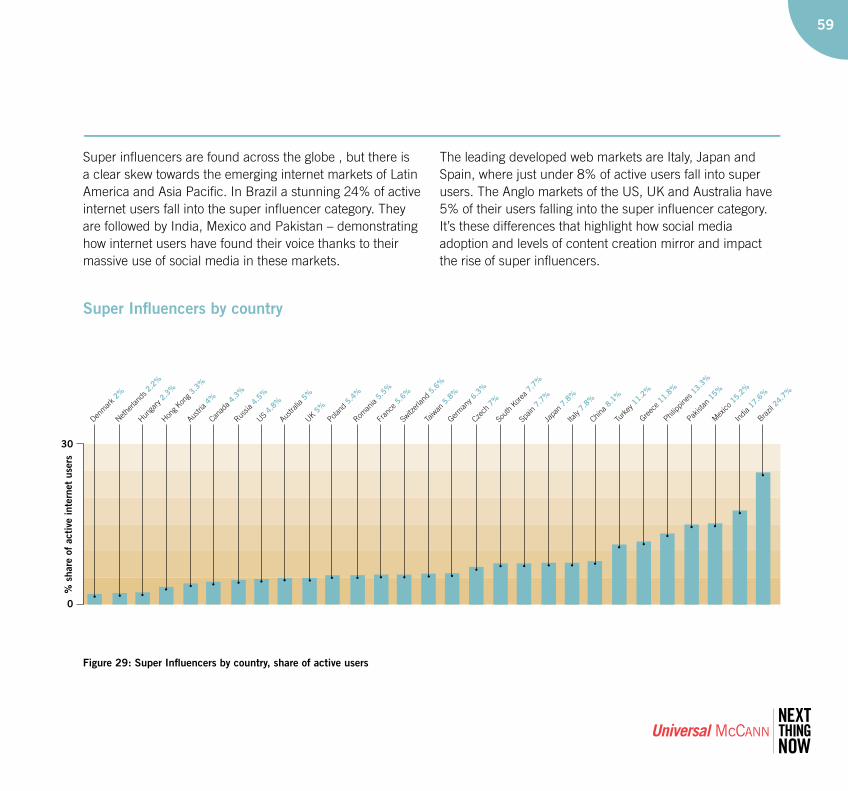
Super influencers are found across the globe , but there is a clear skew towards the emerging internet markets of Latin America and Asia Pacific. In Brazil a stunning 24% of active internet users fall into the super influencer category. They are followed by India, Mexico and Pakistan – demonstrating how internet users have found their voice thanks to their massive use of social media in these markets.
The leading developed web markets are Italy, Japan and Spain, where just under 8% of active users fall into super users. The Anglo markets of the US, UK and Australia have 5% of their users falling into the super influencer category. It’s these differences that highlight how social media adoption and levels of content creation mirror and impact the rise of super influencers.
Super Influencers by country
Figure 29: Super Influencers by country, share of active users
Japa
n7.
8%
Mex
ico15
.2%
Czech
7%
Greec
e 11.8
%
Sout
h Kor
ea7.
7%
Philipp
ines 13
.3%
Spain
7.7%
Pakist
an15
%
Italy
7.8%
China 8.
1%
Brazil
24.7
%
Turk
ey11
.2%
India
17.6
%
30
0
Canad
a 4.3%
% s
hare
of
acti
ve in
tern
et u
sers
Nether
lands
2.2%
Hunga
ry2.
3%
Hong K
ong 3.
3%
Austri
a 4%
Russia
4.5%
US4.
8%
Austra
lia5%
UK5%
Poland
5.4%
Roman
ia5.
5%
Fran
ce5.
6%
Switz
erlan
d5.
6%
Taiw
an5.
8%
Denm
ark 2%
Germ
any 6.
3%
The impact:summaryThe influence economy
The democratisation of influence
The new super influencers
61
Michelle, UK
Jai, Dubai
Charlotte, UK
Dorota, Poland
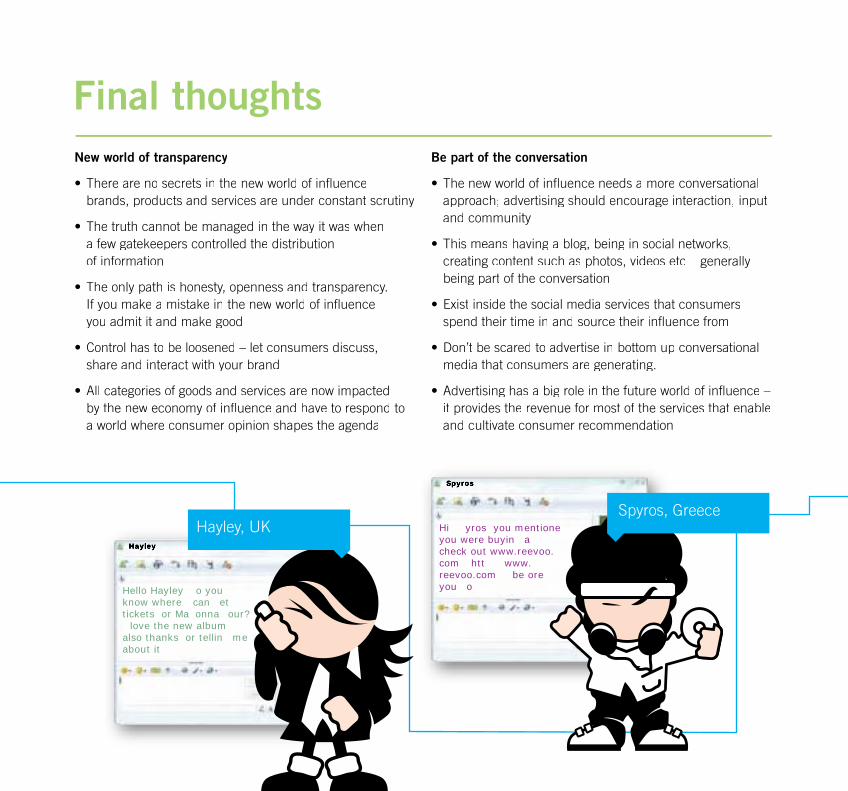
New world of transparency Be part of the conversation
Final thoughts
Hello Hayley o you know where can et tickets or Ma onna our? love the new album
also thanks or tellin me about it
Hi yros you mentione you were buyin a check out www.reevoo.com htt www.reevoo.com be ore you o
Hayley
Spyros
6363
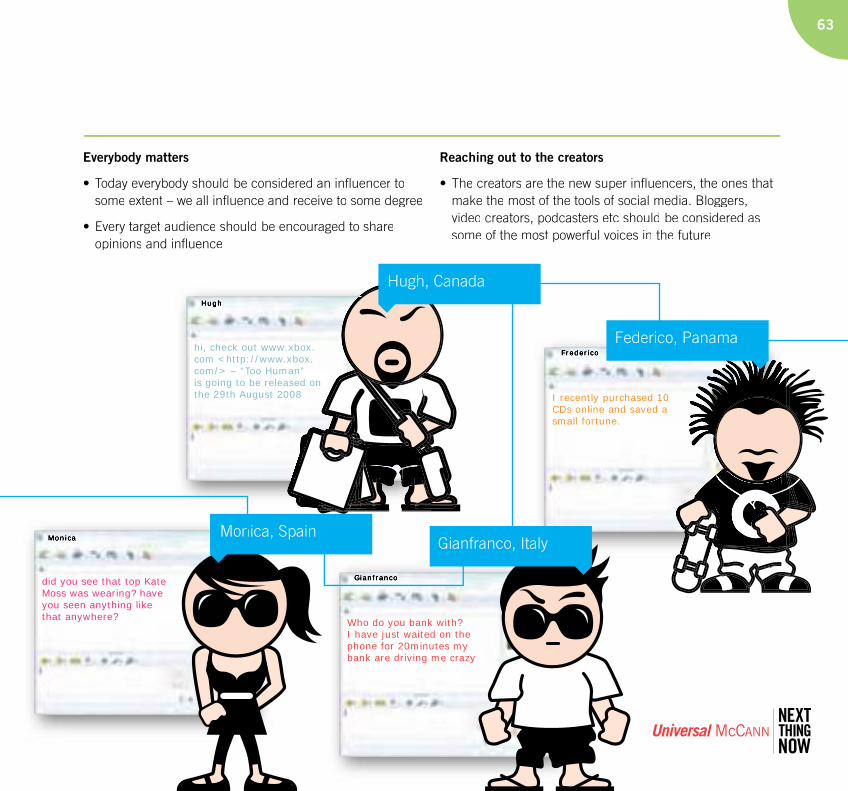
Everybody matters Reaching out to the creators
hi, check out www.xbox.com <http://www.xbox.com/> – “Too Human”is going to be released on the 29th August 2008 I recently purchased 10
CDs online and saved a small fortune.
did you see that top Kate Moss was wearing? have you seen anything like that anywhere? Who do you bank with?
I have just waited on the phone for 20minutes my bank are driving me crazy
Monica
Gianfranco
Hugh
Frederico
Moving forwardn did we start trusting strangers r en gersstrangersart trusting s
m an search prg global resr srex massive pacts of the mmin ogies.ns technoloogies.c o o
This is the seThis is the second in a series of in-depth studies. The firsts of in-ded in a seriesThiThis is the secome, Anypudy “Anytim yplace lo
emand forology, able techno emand foremay, in particular deolend the rooleand the rooles and the roand the role lee of advertising.
in-deptpth toppics we also run aa Social accesss the oongoing impact oongoing impac of social media.ocial media.rvey wwas re h 2released in March 22002008 and
uled foor qquarter 4 2008.
dd dorts canAll repaauniversawww.u
tions on the oty questn oouesty questFor anny questions on the nnch pleasresearc
Tom SmithHead of Consumer Futures EMEA
Sue, UK
65
Yvonne, SwitzerlandHanley, Czech Republic
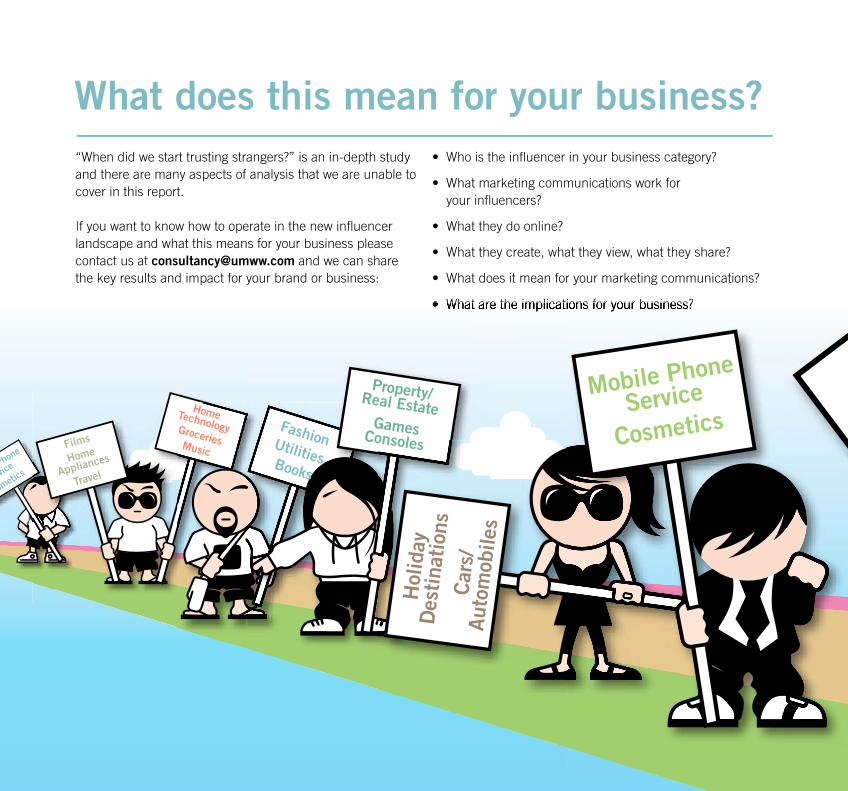
What does this mean for your business?“When did we start trusting strangers?” is an in-depth study and there are many aspects of analysis that we are unable tocover in this report.
If you want to know how to operate in the new influencerlandscape and what this means for your business please contact us at [email protected] and we can share the key results and impact for your brand or business:
your influencers?
HomeTechnologyGroceriesMusic
FashionUtilitiesBooks
Mobile Phone
Service
CosmeticsPhone
vice
smetic
s
Hol
iday
Des
tina
tion
sCar
s/Aut
omob
iles
Property/Real EstateGamesConsolesFilms
Home
Appliances
Travel
67
Personal
Healthcar
e
Computer
Software
Alcoholic
Drinks
Finan
cial
Produc
ts
Portab
le
Techn
ology
67

Universal McCann © 2008


