Embed Size (px)
Citation preview

School of Plant Science
UTAS An Investigation into the Influence of Variation in Controlled Environment Plant Research Facilities on Growth Responses.
Submitted in fulfilment of the requirements for the Degree of Master of Science
By
Ian Cummings BSc, Cert. Hort.
University of Tasmania (April, 2008)

This dissertation contains no material which has been accepted for the award of any degree or diploma by the University or any other institution, except by way of background information and duly acknowledged in the Thesis, and to the best of the candidate's knowledge and belief no material previously published or written by another person except where due acknowledgment is made in the text of the thesis.
This Thesis may be made available for loan and limited copying in accordance with the Copyright Act 1968.
(
Ian Cummings
April 2008

Abstract In this study, controlled environment plant growth facilities were examined through
both physical measurement and plant growth response studies in order to characterise
the degree of variation between environments and to identify those variations that may
influence experimental results. Plant growth facilities consist of greenhouses, where
temperature and light is influenced by seasonal variations, and growth chambers,
where temperature and light quantity is considered to be accurately controlled, but
where all light is artificial.
Natural light spectral properties were found to be quite consistent temporally and
seasonally, but quantity was highly variable and influenced by greenhouse design and
covering material. In winter, light quantity was found to influence plant morphology,
particularly in greenhouse areas with heavy structural components. Plants showed
increased shoot elongation relative to higher light areas under such conditions. Growth
chamber experiments that varied irradiance but not temperature confirmed shoot
length was closely associated with light quantity, with longest shoot lengths under
lowest irradiance and shortest shoot lengths under highest irradiance. Covering
material also had an influence. In a study of the spectral properties and growth
responses under glass and polycarbonate clad greenhouses with the same design,
orientation and temperature profiles, light quantity was always lower under
polycarbonate relative to glass. In spring, with longer day-length and higher irradiance
relative to winter, this had little influence on plant morphology or development. In
winter, however, plants under polycarbonate showed significant shoot elongation
relative to plants grown under glass. The minor differences in spectral properties
between glass and polycarbonate (polycarbonate had lower UV and blue, and higher
far-red proportions relative to glass and natural light) did not appear to be a significant
influence on results, as flowering node was not significantly different between
treatments. The UV reduction under polycarbonate and laminated glass relative to
natural light and horticultural glass also did not appear to be a significant influence on
plant morphology, as supplementing UV back to natural levels did not produce
significant differences between treatments.
Light quantity reductions in winter can be somewhat compensated for by
supplementary lighting. A range of high pressure sodium lamps were tested, and most
would be suitable for this purpose, including some non-plant specific brands.

Irradiances of 50- 100 pmol rn-2s-I over an 18h photoperiod produced dramatic growth
improvements in pea, with significantly increased leaf size, dry weight and yield.
Although high pressure sodium lamps have a high red to far-red ratio (R:FR), which
could be expected to delay flowering, there was no delay in flowering node relative to
18h extension lighting with a low R:FR. Diffusing covers over the lamps improved
light distribution, and there was no significant benefit from using a moving light
system relative to a fixed system.
Photoperiod control systems were examined, and the importance of total light
exclusion for day-length studies was confirmed. Inductive light levels for pea were
less than 0.1 pmol m-2s-1 . While traditional photoperiod extension is with incandescent
lamps because of their low R:FR, white, blue, red and far-red light were all inductive
to flowering for pea. The low R:FR of incandescent and far-red light induced typical
shade avoidance responses of increased shoot length and reduced leaf size, which the
other wavelengths did not.
Seasonally, both light quantity and temperature varied widely in the glasshouse
environments. Various shade methods are commonly employed in summer to reduce
radiant load, and a range of these were examined. All of the methods were found to be
spectrally neutral compared to unshaded conditions, and did not influence plant
morphology. Plants grown in summer had significantly reduced shoot length, leaf size,
flowering time and yield compared to plants grown in other seasons. Both growth
chamber and natural light experiments indicated these were primarily responses to
elevated temperature, particularly the reductions in yield.
For more accurate control over environmental parameters, plant growth chambers
are commonly used in.plant research. However, all of the light sources used were
found to have very different spectral properties to natural light, even when mixed to
broaden the spectrum. Thermal load was found to be significant with high intensity
discharge lamps even with a separately ventilated light loft, although the use of double
glass barriers and water filters reduced the impact. The addition of incandescent lamps
to the light mix in an attempt to mimic more natural R:FR ratios was found to be
ineffective and significantly increased thermal load. Plants showed clear signs of
temperature influence, with reduced shoot length, leaf size and yield, and did not
flower at a lower node as expected from reduced R:FR. However, far-red light
emitting diodes added to the light mix produced natural R:FR ratios without thermal

load influences, and plants responded as expected with increased shoot length and
reduced flowering node.
Spectral distribution and growth responses under fluorescent and mixed metal
halide/high pressure sodium lamps were quite similar at equal temperature and
irradiance. However, plants grown under metal halide flowered at a significantly
earlier node than the other sources, while under high pressure sodium lamps, shoot
length was significantly longer. Metal halide has high blue, and high pressure sodium
has low blue irradiance. Supplementation of high pressure sodium with blue light
induced reduced shoot length and flowering node. However, R:FR also varied
between light sources and natural light. The role of blue light was further investigated
using photo-selective shade screens, which were found to alter blue proportion but not
R:FR relative to natural light. Under red shade cloth (low blue, high red proportions)
shoot length was significantly increased and under blue shade cloth (high blue, low
red proportions) shoot length was significantly reduced relative to spectrally neutral
shade cloth. Blue light receptor cry] mutant plants did not respond to shade cloth
treatment, as shoot elongation was not significantly different in cry] mutant plants
grown under neutral, red or blue shade. This indicates a clear role of blue light
quantity in pea shoot length responses, and specifically, the cry] photoreceptor in
these changes.
This study has identified that light and temperature are the most important factors
that vary between controlled environments, and are a potential influence on results.
Taken together, the results from this study will allow future plant researchers, and
facility managers, to identify the equipment variations that may influence plant
responses.

Acknowledgments
Thanks to my supervisors (Jim Reid and Anthony Koutoulis) and staff at the School of Plant Science for assistance, encouragement and advice, particularly Eloise Foo, John Ross, Jim Weller, Mark Hovenden, Greg Jordan, Greg Symons, Corinne Jaeger, Tracey Winterbottom, and Michael Oates.
Thanks also to the many friends and colleagues at other plant research facilities, particularly Janyce Truett and Pam Rogers at the Department of Primary Industry, Knoxfield, Victoria for access to facilities and data records, and care of plants. Thanks to the following people and institutions for access, discussion, and advice:
Ursula Langridge and Robin Hoskins, University of Adelaide
Paul Ingram, SARDI
Tony Agostino, CSIRO Canberra
Sue Lyons, ANU
Stewart Crowley, Monash University
Brett Ferguson, University of Queensland
Christine Newman, University of Sydney
Muharrunid Masood, MacQuarie University
Kevin Stokes, University of Newcastle
Funding for these visits and this research came from a Vice Chancellor's award for
excellence and the School of Plant Science
Thanks most of all to my family, for patience and tolerance, and particularly to my
wife Elizabeth, who kept me going when the going got tough.
iv

Table of contents Abstract
Acknowledgments iv
Table of contents
Abbreviations ix
Table of figures
Chapter 1 Introduction 1
1.1 Temperature 2
1.2 Light 5
1.2.1 Light sources 8
1.2.1.1 Natural light 8
1.2.1.1.1 Shade 8
1.2.1.2 Artificial sources 10
1.3 Context 13
Chapter 2 Glasshouse environments 16
2.1 Introduction 16
2.2 Materials and methods 18
2.2.1 Glasshouse environments 18
2.2.2 Light measurements and analysis 19
2.2.3 Temperature, air velocity and CO2 measurements 20
2.2.4 Plant growth and measurements 20
2.3 Results 21
2.3.1 Spectral properties 21
2.3.1.1 Winter 21
2.3.1.2 Summer 23
2.3.2 Light quantity 27
2.3.2.1 Season 27
2.3.2.2 Winter 28
2.3.2.3 Summer 29
2.3.3 Temperature variation 30
2.3.4 CO2, Air velocity and Humidity variation 31
2.3.5 Growth responses 32
2.3.5.1 Winter 33

2.3.5.2 Summer 36
2.3.5.3 Season 38
2.3.6 Examining the reasons for growth response variations 40
2.3.6.1 Light quality (spectral properties) 40
2.3.6.2 Light quantity 41
2.3.6.2.1 Duration 41
2.3.6.2.2 Irradiance 44
2.3.6.3 Temperature 46
2.3.6.4 Air velocity, CO2 48
2.4 Discussion 49
2.4.1 Spectral properties 49
2.4.2 Light quantity 50
2.4.3 Temperature 53
2.4.4 Air velocity and CO2 54
2.4.5 Indicative plant responses 55
Chapter 3 Glass or Polycarbonate: influence of covering material 56
3.1 Introduction 56
3.2 Materials and methods 58
3.2.1 Greenhouse environments 58
3.2.2 Light measurements and analysis 59
3.2.3 Plant material and culture 60
3.2.4 Data collection and analysis 60
3.3 Results 61
3.3.1 Transmission and spectral properties 61
3.3.2 Growth responses 63
3.4 Discussion 68
Chapter 4 Supplementary lighting 71
4.1 Introduction 71
4.2 Materials and Methods 73
4.3 Results 75
4.3.1 Relative spectral properties of HPS light sources 75
4.3.2 Growth responses with supplementary lighting 80
4.3.3 Light distribution systems 82
4.4 Discussion 85
Chapter 5 Photoperiod control 89
vi

5.1 Introduction 89
5.2 Materials and methods 92
5.3 Results 93
5.3.1 Spectral properties of light sources 93
5.3.2 Inductive light level 94
5.3.3 Light leakage measurements 95
5.3.4 End of day R:FR ratio 95
5.3.5 Responses to photoperiod extension R:FR 96
5.3.6 Response to monochromatic photoperiod extensions 99
5.4 Discussion 100
Chapter 6 Growth Chambers 104
6.1 Introduction 104
6.2 Materials and methods 109
6.2.1 Growth chambers examined 109
6.2.2 Light sources and treatments 109
6.2.3 CO2 and humidity measurements 110
6.2.4 Light measurements 110
6.2.5 Air and temperature measurements 111
6.2.6 Plant growth and measurements: 111
6.3 Results 112
6.3.1 Air velocity, CO2 and humidity 112
6.3.2 Light measurement ranges and sensors 113
6.3.3 Light distribution 115
6.3.4 Comparison of cool white fluorescent tubes 115
6.3.5 Growth responses under fluorescent sources 119
6.3.6 Incandescent sources 120
6.3.7 HID Lamps 121
6.3.8 Growth responses under HID lamps 125
6.3.9 High irradiance influences, barrier types and water filters 127
6.3.9.1 Light measurements 127
6.3.9.2 Radiant temperature measurements 129
6.3.9.3 Growth responses 130
6.4 Discussion 132
Chapter 7 Red to far-red ratio correction in growth chambers 136
7.1 Introduction 136
vii

7.2 Materials and methods 137
7.2.1 Light measurements 137
7.2.2 Growth chambers and light sources 138
7.2.3 Temperature measurements 138
7.2.4 Plant growth and measurements 139
7.2.5 Experimental design 139
7.3 Results 140
7.3.1 Spectral distribution 140
7.3.2 Thermal load 144
7.3.3 Growth responses 146
7.4 Discussion 148
Chapter 8 The role of blue light 152
8.1 Introduction 152
8.2 Materials and methods 155
8.2.1 Plant material and growth conditions 155
8.2.2 Light measurements and treatments 156
8.2.2.1 Shade treatments 156
8.2.3 Plant growth measurement and analysis 158
8.3 Results 159
8.3.1 Shoot length and flowering node varied with light source 159
8.3.2 Blue supplementation reduced shoot length and flowering 161
8.3.3 Reduced irradiance increased shoot length and delays flowering 162
8.3.4 Blue irradiance influenced pea growth independently of R:FR 163
8.3.5 Examining the role of the cryptochrome photoreceptor in the shade cloth response 164
8.4 Discussion 165
Appendix: Indicative plant responses 169
References 170
viii

Abbreviations Blue light (400-500 nm)
B:R Quantum ratio of blue to red light
B:FR Quantum ratio of blue to far-red light
cry] A cryptochrome 1 defective mutant selection from L107 pea
CWF Cool white fluorescent lamps
DLI Daily light integral, the total PPF quantity of light received in a 24h period (mol m-2d-1 )
DW Shoot dry weight
FR Far-red light (700-800 run)
FT Flowering time from planting date
HPS High pressure sodium lamps
Inc Incandescent lamps
L107 Hobart line 107 pea, a selection from Pisum sativum L. `Torsdag'
L218 Hobart line 218 pea, a day neutral selection from Pisum sativurn L. `Torsdag'
L1-9 Length between nodes 1 to 9
LED Light emitting diodes
LL Leaflet length at node 9
LW Leaflet width at node 9
MH Metal halide lamps
NFI Node of flower initiation
PAR Photosynthetic active radiation (400-700 nm, W m -2)
PPF Photosynthetic photon flux (400-700 nm,
Red light (600-700 nm)
R:FR(b) Broad band quantum ratio or red (600-700 nm) to far-red (700-800 nm)
R:FR(n) Narrow band quantum ratio of red (655-666 nm) to far-red (725-735 nm) light
TL Total shoot length
TN Total number of nodes
UV Ultra-violet light (< 400 nm)
molm-2s-1)
ix

Table of figures Figure 2.1. Spectral distribution of the glasshouse environments under winter overcast conditions • 22
Figure 2.2. Waveband proportions (% 300-800nm) of sunny and overcast conditions, winter and summer, outside. 25
Figure 2.3. Irradiance measurements taken at 15 minute intervals inside a glasshouse on days (11 and 13 March 2007) with intermittent cloud cover 27
Figure 2.4. Spectral distribution of Sylvania (Tokyo, Japan) F36W/BLB-T8 Black light 41
Figure 2.5. Mean length, of nodes 1-9 for L107 pea grown concurrently in glasshouse conditions at air velocities of 0.3, 0.7 and 1.4 m s -1 . Different letters signify significant differences at P<0.01, n = 20. 48 Figure 3.1. Spectral distributions of sunlight, and in situ measurements of laminated glass, horticultural glass, and polycarbonate. Measurements were conducted in immediate succession, as described in Materials and Methods 61 Figure 3.2. Relative spectral distribution as a percentage of total irradiance (300-800 nm) for sunlight, polycarbonate, horticultural glass and laminated glass. 62
Figure 3.3. Spectral distributions of sunlight, and in situ measurements of horticultural glass, and polycarbonate in adjacent greenhouses. Measurements were conducted in immediate succession, as described in Materials and Methods 65
Figure 4.1. Spectral distribution of tested HPS light sources. Abbreviations: Lucagrow , GE Lucagrow; Planta, 0Sram Vialox Planta HPS; SON-T-Agro- Osram SON-T AGRO HPS; Sunmaster, Sunmaster 600W HPS Deluxe; SON-E, Osram Vialox NAV-E (SON-E) 400W; Thorn SON-E, SON-E GES Elliptical 400W 76
Figure 4.2. Natural light within the glasshouse during winter overcast conditions and with HPS supplement (Osram Vialox NAV-E (SON-E) High Pressure Sodium 400W in Philips (Australia) LL 400 Lowbay fitting, no cover 79 Figure 5.1. Spectral distribution of described blue, red and far-red LEDs 93
Figure 5.2. Spectral distribution of standard photoperiod extension using 3 x 40 watt L40 W/ 20S cool white fluorescent, (Osram) to 4 x 100w pearl incandescent (Thorn). 94
Figure 5.3. Measured wavelength ratios from 2 PM to after sunset (twilight), overcast conditions 96
Figure 6.1. Spectral distribution of measured fluorescent light sources. Full light details and measurement protocols are in Materials and Methods. 117
Figure 6.2. Spectral distribution of incandescent sources- 100W pearl incandescent globes, PAR38 floodlamp, and 12 volt quartz halogen. Full details are in Materials and Methods 121

Figure 6.3. Spectral distribution of GE Kolorarc MBID 400/T/H metal halide lamps, Vialox Planta T400W HPS lamps, and a mix of these two sources in a 2:1 ratio (M1-1/HPS). Full details are in Materials and Methods. 123
Figure 6.4. Spectral distribution of Thorn (India) MH 400W/C/U Metal Halide and Thorn (Romania) HPS 400W SON-E GES Elliptical in a 2:1 ratio measured through double layer toughened glass (top), and as above with a 4cm depth water barrier filter (bottom). 128
Figure 6.5. Relative spectral distribution of Thorn (India) MH 400W/C/U Metal Halide and Thorn (Romania) UPS 400W SON-E GES Elliptical through double layer toughened glass, with and without 4cm water barrier filter, as a percentage of total irradiance (300-800nm). 129
Figure 6.6. Mean (± SE) radiant temperature measurements inside growth chambers with separately ventilated light lofts with single glass (Glass), double glass (Dbl. glass) and double glass plus a 4 cm depth water filter (+ Water filter). Air temperature in all cases was 20 ° ± 0.2°C, distance is cm from the barrier. Measurements were taken with lights off (dark) and with lights on, PPF 425 Knol rr1-2 S-1 130 Figure. 7.1. Relative spectral distribution as a percentage of total irradiance over 300- 800nm for common growth chamber light sources compared to sunlight. Abbreviations- CWF — cool white fluorescent; INC- incandescent; MH- metal halide; HPS- high pressure sodium; full details in materials and methods. A) measured through the glass barrier in Thermoline growth chambers, R:FR ratios- CWF-6.7, INC- 0.6, MH- 2.4 and HPS-7.1. B) As above, measured in the same chambers with the full bank of incandescent added- 16x 37W CWF + 4 100W Inc, R:FR 1.6; 6x 400W MH + 5 100W Inc, R:FR 2.1; 4 x400W MH + 2 x 400W UPS + 5 100W Inc, R:FR 2.4 142 Figure 7.2. Spectral distribution (300-800nm) of 3 x 100W incandescent and approximately 30W (120) far red KL450-730GDDH LED (Shinkoh Electronics, Tokyo, Japan) 143
Figure 7.3. Mean (± SE) radiant temperature measurements inside growth chambers with separately ventilated light lofts. Air temperature in all cases was 20 °± 0.2 °C, distance is cm from the barrier, soil temperature was at 1 cm depth. Irradiance (PPF at 50 cm) : (A)- 220, (B)- 425, (C)- 220 1.1.mol tri 2s -1 . (C) was under metal halide with a R:FR of 1.2 achieved by adding incandescent lamps or far red LED. Abbreviations: CWF, cool white fluorescent; INC, incandescent; MH, metal halide; HID, mixed MH and high pressure sodium lamps; LED, far red light emitting diodes; full details in Materials and Methods 145
Figure 7.4. Mean node of flower initiation (NFI) ± SE, and length between nodes 1-9 (LI-9) ± SE at different R:FR ratios. Light sources for the ratios: 8.7- F36W/840 Luxline Plus cool white fluorescent (Sylvania, Munich, Germany); 6.7- FL 40SSCW/37-T8 cool white, (NEC, Tokyo, Japan) 1.9- FL 40SSCW/37-T8 cool white + 4x 100Wpearl incandescent bulbs (Thorn, Australia). All plants were grown under a 24h photoperiod, PPF was 150 [tmol rr1-2 s , temperature was 20 ± 0.2 °C, n = 20 146
Figure 8.1. Spectral distribution as a function of wavelength of sunlight, neutral and photoselective shade cloths. Red, Blue- ChromatiNet° 50% red & blue shade cloth, neutral- 50% green shade cloth 157
xi

Figure 8.2. Mean shoot length ± SE between nodes 1 and 9, and node of flower initiation (NFI) for pea L107 by R:FR (A, C) and blue irradiance (B, D), n = 20. Plants were grown at 220 iimol-m-2 s-I PPF, photoperiod 18 h, temperature 20° ± 0.2°C in Thermoline (Sydney, Australia) model 3540 growth chambers under combinations of cool white fluorescent tubes (CWF), incandescent globes (Inc), metal halide lamps (MH), and high pressure sodium lamps (HPS) to give the R:FR and blue irradiances specified. 160 Figure 8.3. Mean shoot length ± SE between nodes 1 and 9 for L107 pea grown under 100 [trnol r11-2 s-I high pressure sodium lamps, and with additional white or blue fluorescent irradiance of 20-45 Knol m -2
S-1
. Photoperiod 18 h, temperature 20 o ± 0.2 oC. Different letters signify significant differences at P < 0.01, n=10 162
Figure 8.4. Mean shoot length ± SE between nodes 1 and 17 for L107 pea grown under shaded and unshaded conditions. Neutral shade- 50% green shade cloth; Red, Blue shade- ChromatiNet® 50% red & blue shade cloth. Different letters signify significant differences at P < 0.01, n=20. 164
Figure 8.5. Mean shoot length ± SE between nodes 1 and 9 for L107 (WT) and cryl peas grown under the shade treatments as. Neutral- 50% green shade cloth; Red, Blue- ChromatiNet® 50% red & blue shade cloth. 165
xii

Chapter 1 Introduction
To survive, plants need only minerals, water, air and light (Spalding and Folta
2005). Plant development is influenced by environmental factors, such as light,
temperature, CO 2, humidity and nutrients (Moe and Heins 1990), as well as water
status (Hanan 1998). Water status and nutrients are largely controlled in protected
horticulture, and air movement is less variable than outside conditions (Downs and
Krizek 1997). Light and temperature are considered the major environmental
determinants (Cathey and Campbell 1977). In plant science research, it is important to
optimise these parameters, or at least minimise their possible influence, on the
environmental factor or factors being examined. Moe and Heins (1990) examined the
effects of light and temperature and found they had a similar influence for many
morphological characteristics in a wide range of plants. Red light (R) or high R to far-
red (FR) ratios suppressed shoot elongation and promoted lateral branching. Plants
grown with a lower day temperature than night temperature exhibited the same
morphology. FR light or low R:FR strongly enhanced shoot elongation and inhibited
lateral branching. Plants grown with a higher day temperature than night temperature
exhibited the same morphology. Thus, it is important to optimise control parameters
so that known variables are being examined.
Plants respond to their environment in a variety of ways. For example,
photoperiodic responses of species can be classified into 25 interactions of light and
temperature (Hanan 1998). These responses are generally examined in isolation; it is
rare for multiple influences to be examined together (Moe and Heins 1990). Even for
molecular and genetic studies, if there are multiple environmental influences, it would
be difficult to assign a cause to an observed effect. This is the basis for controlled
environment facilities- environmental variables can be controlled so that cause and
effect can be examined. For example, plant growth chambers with accurate
temperature and light control are used to examine temperature gradient effects under
the same light conditions or light effects under the same temperature conditions.
There are three classes of plant growth structures: greenhouses, where radiation is
supplied by the sun; phytotrons, which use solar radiation supplemented by artificial
1

sources; and growth chambers, where all radiation is artificial (Aldrich and White
1969). •
Greenhouses are largely concerned with modification of temperature by trapping
long wave radiation. Modification of the light environment is a consequence of the
choice of covering material (Hanan 1998). Structure, geometry and orientation all
influence the light environment inside the greenhouse (Mermier and Baille 1988).
Photoperiod studies in greenhouses involve the natural photoperiod being modified
by extension lighting and/or screening to exclude light. Screening in greenhouses can
modify the difference in temperature between short day (SD) and long day (LD) or
control plants and can lead to incorrect conclusions (Heins and Faust 1994).
Growth chambers provide accurate control of light and temperature, allowing
(theoretically) for uniform, reproducible conditions (Carlson and Giger 1978; Hammer
1978). However, the artificial light sources used have very different spectral
properties to sunlight (Runkle 2004), while thermal load from the lamps can be a
significant and often unmeasured component (Bubenheim et al. 1988).
Thus, the facilities used to control the environment may in themselves influence
plant responses. Characterisation of the experimental environment is the first step
required before quantifying plant responses (Sager etal. 1988). That is the intention of
this thesis. Through physical measurement of the variation in representative controlled
environment growth facilities, and by relating these to measured plant responses,
valuable insights can be gained into the influence of equipment variations that may
inadvertently influence experimental results.
1.1 Temperature Temperature influences plants at all stages of their development (Ormrod 1978b).
Rate of development is temperature dependent, rates increase up to a maximum,
which is the optimum temperature for that species, and above this optimum, growth
rapidly declines (Heins et al. 2000).
• Average day temperature influences rate of leaf and flower development in a wide
range of species in a near linear fashion over a set temperature range (usually 10 -
30oC). At lower and higher temperatures rates are reduced (Moe and Heins 1990). The
rate of flower development in particular is strongly influenced by temperature
(Kaczperski et al. 1991; Pramuk and Runkle 2005).
2

Temperature is also an important conditioning factor in germination with optimum
germination temperature varying with species. For example, for Sinapsis arvensis the
optimum is 15°C while in Plantago major it is between 25-30°C (Frankland 1981).
Some species, such as Rumex obtusifolia, are stimulated by fluctuating temperature
(Franldand 1981). Regular temperature changes can also entrain the endogenous clock
in the absence of light signals (Fankhauser and Staiger 2002). Many species show a
thermo periodic response, with improved growth when there is a daily temperature
fluctuation (Ormrod 1978b). Lower day than night temperature can reduce shoot
length (Moe and Heins 1990; Vogelezang 2000) through reduced gibberellin levels
(Grindal et al. 2000).
Optimum temperature also varies with developmental stage. Germination and
seedling optimum temperatures are often higher than later growth stages (Otifirod
1978b). Cooler temperatures during maturation increase yield in many crop species
(Heins et al. 2000) and yield and seed weight is negatively correlated with
temperature in pea (Chetia and Kumar 2005; Poggio et al. 2005).
Temperature extremes can be very damaging to plants. High temperatures increase
moisture stress within the plant and can damage cells, destroy proteins, and interfere
with enzyme activity (Ormrod 1978b). Low temperatures reduce growth rates, while
freezing temperatures physically damage cells from ice crystal formation and
desiccation (Ormrod 1978b). However, within the normal temperature range it is the
average temperature that influences plant development, not short term fluctuations
(Adams 2006; Cockshull et al. 2002).
Soil temperature also influences plant growth and development. Water and nutrient
availability is influenced by soil temperature (Ormrod 1978b), which can be
significantly increased from radiant heat in growth chambers, particularly in
individual pots (Hamasaki and Okada 2000). High root temperature impairs plant
growth by increasing respiration and reducing water and nutrient uptake, while root
cooling can partially offset growth reductions from high air temperature (Incrocci et
al. 2000).
Temperature also interacts with other factors, notably air velocity and light. High air
velocity and low humidity can have a cooling effect on leaves by increasing
transpiration rates, so that leaves can be cooler than ambient temperature (Ormrod
1978b). Absorbed radiation increases plant temperature, particularly at the shoot tip,
unless removed by transpiration, emission or convection (Faust and Heins 1997).
3

Flowering in many species is controlled by modulation of photoperiod and thermo
period, allowing for onset of flowering and seed set in favourable conditions
(Fankhauser and Staiger 2002). Plant phenology can be predicted by interactions of
light and temperature (Yan and Wallace 1998). Flowering delays from low light
quantity can be somewhat offset by higher temperature (Pramuk and Runkle 2005),
while low temperature exposure of imbibed seed (vernalization) can counteract short
day photoperiod flowering delays in sensitive species (Beveridge and Murfet 1996;
Yan and Wallace 1998; Inoue 2002). Photosynthesis continues over a wide
temperature range in most species (Salisbury and Ross 1992), but low temperature can
severely limit photosynthesis in cold sensitive species, such as soybean (Tambussi et
al. 2004).
Temperature in greenhouses is generally controlled by heating and cooling systems.
Ventilation rates, active cooling systems, and use of thermal screens all contribute to
temperature control but wide temperature ranges are common (Hanan 1998). Growth
chambers generally provide accurate temperature control, but thermal exchange needs
to be considered (Hicklenton and Heins 1997). A major source of thermal load is heat
from lamps (Hicklenton and Heins 1997). To reduce the influence of lamp heat, many
growth chambers have a separately ventilated light loft with a glass or plexiglass
barrier (Cathey and Campbell 1977). However, radiant heat load can still be
significant even with a barrier (Bubenheim etal. 1988; Hamasaki and Okada 2000).
McCree (1984) examined radiation from high intensity discharge lamps and found
high irradiance can be accompanied by an abnormally high thermal radiation load on
plants. Near infra red radiation is largely transmitted or reflected from leaves, but
incandescent and high intensity discharge lamps in particular emit large quantities of
far infrared radiation (Bubenheim et al. 1988; Faust and Heins 1997; Hicklenton and
Heins 1997; McCree 1984). Thus plants in growth chambers can be subject to far
greater thermal loads than in the natural environment (Hiciclenton and Heins 1997), 5-
10 times larger than on a sunny outdoor day (Hamasaki and Okada 2000).
Some light source influences on growth may also be related to temperature.
Increased growth of lettuce under high pressure sodium lamps compared to cool white
fluorescent tubes at equal irradiance was attributed to wavelength and temperature
contribution from wavelengths above 700nm (Koontz et al. 1987). Most studies that
demonstrate the value of photoperiod extension with incandescent lamps have not
established if the benefits are from a phytochrome ratio effect, the additional
4

photosynthetic contribution of 700-750 nm radiation, or a temperature effect on the
plants (Tibbitts et al. 1983). The radiant thermal effects need to be separated from
other environmental temperature effects (Sager et al. 1982).
1.2 Light For plants, light is the energy source and therefore of primary importance in plant
development, physiology and metabolism. Most aspects of plant life are influenced by
the qualities and quantities of light (Spalding and Folta 2005). Plant responses to light
can be categorised as photosynthetic or photomorphogenic (Sager etal. 1982).
Photosynthesis determines vegetative growth (Sager et al. 1982). Intact leaves
absorb more green than the isolated pigments used in studies as the carotenoids act in
a light harvesting capacity for photo systems 1 and 2, contributing to the high
quantum efficiency of photosynthesis over a wide spectral range (Barber etal. 1981).
Photosynthetic rates amongst species vary by nearly two orders of magnitude, even
under optimum conditions (ideal temperature, saturating light, normal oxygen and
CO2 levels, high humidity). C, species, such as corn, have the highest rates, fixing
CO 2 at up to twice the rate of C2 crop plants, such as pea (Salisbury and Ross 1992).
Interactions between exogenous and endogenous factors determine photosynthetic
rates and patterns, corresponding primarily with diurnal changes in air vapour-
pressure deficit and light quantity (Singsaas et al. 2000). Natural light quantity can be
highly variable, particularly when cloudy (Smith and Morgan 1981), but transferring
plants from high to low irradiance show acclimation responses are rapid, with rapid
changes in photosynthetic rate and chlorophyll a/b ratio (Chow and Anderson 1987a;
Walters and Horton 1994). Lower irradiance over longer periods stimulates an
increase in light harvesting complexes (Chow and Anderson 1987b). Chloroplasts
accumulate towards light under low fluence to maximise photosynthetic efficiency,
and relocate away from high fluence light to minimise photo-damage (Wada 2005).
Thus, plants adapt to the light environment through physiological responses (Walters
and Horton 1994).
Photomorphogenesis refers to the responses of plants to their light environment
(Kendrick and Weller 2003a). Light acting as information rather than an energy
source affects a wide range of photomorphogenic responses. These include
germination, seedling development, photosynthetic and photo-protective pigment
5

synthesis, and morphological development including shoot elongation and leaf
expansion, leaf movement, and flower initiation (Sager et al. 1982).
The ability of a plant to respond to the radiation environment depends on its
capacity to detect and respond to those changes. Photoreceptors detect the changes
and are involved in the translation of the environmental signal to a biological signal
(Smith 1981). Photomorphogenesis involves multiple photoreceptors and multiple
interacting signalling pathways, and depends on the environmental conditions and
developmental stage of the plant (lino and Haga 2005). Many light controlled
processes, based on modulation of gene activity, occur in response to changes in light
(Fankhauser and Staiger 2002). Light mediated responses range from within minutes,
such as de-etiolation, to hours or days, such as entrainment of circadian rhythms
(vonArnim and Deng 1996). Inductive responses can be induced by a pulse of light,
while other responses require long periods of light and can show increased response
with increased irradiance. Thus photoreceptors can act as a switch or as photon
counters (Kendrick and Weller 2003b).
Photoreceptors work through proteins, ions and hormones that form interacting and
branching signalling pathways so that a relatively simple input (light) creates a
complex output (Fankhauser and Staiger 2002). Phytochromes and cryptochromes
mediate many of the same physiological responses, and interactions may result in
relatively stable responses over a wide range of fluence rates and photoperiods
(Platten 2003). Examples include interaction between phyA and phyB in near
neighbour detection (shade avoidance); and cry2, phyB and phyA interactions in
flower initiation (Casal 2005).
Many responses are not all or none, but quantitative (vonAmim and Deng 1996).
Responses in the natural environment involve complex interactions of light and
hormones in response to environmental cues, as many light regulated responses also
respond to hormone application, notably auxin, ethylene, cytokinins and gibberellins
(vonArnim and Deng 1996). Light and gibberellin (GA) interactions occur in
germination, de-etiolation, stem growth, tuber formation, and flowering (Garcia-
Martinez and Gil 2001). Low R:FR and/or end of day FR treatments that increase
shoot elongation affect GA metabolism and/or responsiveness in many species.
Application experiments and phytochrome mutant studies suggest light quality alters
plant responses to GA (Garcia-Martinez and Gil 2001).
6
In controlled environments, and in horticulture, the problem of supply and
measurement of light for plant growth has long been known. Visible light to the
human eye (generally measured in lumens) is between 400-750 rim, with peak
luminosity at 555 nm (Canham 1966). Plants respond to wavelengths beyond these
limits, 300-800 nm is generally used to define the morphogenetic active range (Sager
and McFarlane 1997). Light between 500-600 nm, although bright to us, is of
relatively less importance to the plant (Canham 1966). Lamp manufacturers are
primarily concerned with human visibility (Ryer 1997), and thus with luminous flux
(a weighted measure of the overall stimulation to the average human eye from both
intensity and wavelength between 400 and 750 nm). Lamps are thus quoted in terms
of luminous flux (Ryer 1997). All of these measures are meaningless for plant growth.
Different lamp sources with the same luminous intensity produce quite different plant
relative dry weights (Canham 1966).
Most plant physiology literature quote the quantity of light in the 400-700nm range,
i.e. photosynthetically active radiation (PAR). McCree (1972a) examined definitions
of PAR by measuring the action spectrum, absorptance and spectral quantum yield of
22 crop plants in both growth chambers and the field. CO, uptake was measured over
350-750 nm in a wide range of conditions including leaf age, orientation, temperature
and CO, concentration (McCree 1972a). Regardless of the condition, all species
showed a quantum yield curve with 3 maxima: 2 broad maxima at 440 nm and 620
nm, as well as a shoulder at 670 nm. Average height of the blue peak was 70% of the
red peak, although data by Sager et al. (1982) suggest it is higher than this.
Photosynthetic activity occurs between 360-760 nm, but the tails below 400nm and
above 700nm are minimal (McCree 1972b). McCree (1972b) concludes that although
none of the definitions of the PAR range are strictly accurate, and that leaves do not
have a constant response rate between this range, it is still an acceptable definition if
measured in pmbles m 2s -1 (i.e. PPF- photosynthetic photon flux). However, there is
considerable variation between PPF and the biological responses when using narrow
spectrum lamps; PPF is only accurate for broad spectrum sources (Sager et al. 1982).
In addition, single number measurements, such as PAR or PPF, often ignore the
wavelength/energy per photon nature of light, as well as direction. Light may also be
polarized by reflecting surfaces in many experimental set ups. The time factor is also
often ignored- i.e. whether an instantaneous (e.g. fluence rate) or time integrated (e.g.
fluence) measurement is being given (Bjorn and Vogelmann 1994). Plants respond to
7

light quality as well as light quantity, so ideally a full description of light would
include information on spectral distribution and wavelength ratios using
spectroradiometer data, but this is rarely done (Bjorn and Vogelmann 1999).
At the very least, light descriptions should include information on the light sources
used for the study (Krizek and McFarlane 1983). This thesis includes comprehensive
spectroradiometer analysis of the light sources commonly used in plant research,
including relative spectral distribution and wavelength ratios. As such, it can be used
as a guide to the spectral properties of artificial lights, the influence of covering
materials and shade methods on the properties of natural light, and the influence these
may have on plant growth responses.
1.2.1 Light sources
1.2.1.1 Natural light Solar radiation is absorbed (by ozone, oxygen and water) and scattered (Raleigh and
Mie scattering) by the atmosphere (Smith and Morgan 1981). Daylight is the total
global radiation received at the earth's surface and is therefore the sum of the resulting
incident and diffuse light. Total irradiance (400-800nm) on clear days is above 1600
moles m 2s'. Fluence rate between 450-850 nm is quite uniform, but cloud cover and
dust haze produce some variations. Clouds reflect a portion of blue (400-500 nm)
wavelengths, but cause little alteration to longer wavelengths (600-800 nm); only
altering R:FR ratios by 5%. Dust reduces blue and increases the proportion of red
wavelengths. Aspect affects the daylight spectrum received, where plants may not be
irradiated by direct light for some time and are primarily lit by diffuse light, which is
higher in blue wavelengths (Smith and Morgan 1981).
At sunrise and sunset, when the solar elevation is less than 10 degrees, the spectrum
is relatively rich in blue and far red. The normal daylight R:FR ratio is quite constant
(655-665/725-735) at 1.1, rising from or dropping to about 0.7 at sunrise and sunset.
The duration of this change depends on latitude and solar declination, as well as being
affected by weather and dust haze (Smith and Morgan 1981).
1.2.1.1.1 Shade Radiation under canopies consists of unfiltered daylight that has passed through the
canopy; and filtered daylight modified by absorption, reflection and transmission.
Shade spectrums thus typically have troughs in the blue and red regions due to
8

absorption, a minor peak in green, and a major peak in far red from reflection. The
degree of shading corresponds to the R:FR ratio- the lower the ratio the greater the
degree of shading (Kendrick and Weller 2003a; Smith and Morgan 1981). Under
overcast skies the R:FR ratio within canopies is less markedly reduced due to the
diffusing nature of cloud cover and a larger proportion of diffuse radiation penetrates
canopy gaps. Shade spectrums are also affected by solar elevation and seasonal
change, as well as weather patterns, particularly wind gaps in vegetation cover and its
effect on sun flecks (Holmes 1981).
Shade responses are highly varied according to species and maturity, as well as
canopy architecture and soil fertility. Different parts of the plant experience different
degrees of shade, and many species have different strategies during juvenile and adult
phases (Grime 1981). Many shade tolerant species tend to be slower growing with
comparatively low respiratory rates even at higher irradiance. Responses to shade in
such species may be more physiological than morphogenic (Grime 1981). Shade
tolerant species have a lower response to spectral changes than shade intolerant
species, particularly for stem extension rates (Morgan 1981).
In competitive situations there is an adaptive advantage in rapid elongation
responses to reduced irradiance or low R:FR (Ballare etal. 1997). Phytochrome
perceives the spectral changes in FR. The decreased blue quantity in shade light can
affect plant growth independently of the R:FR ratio (Morgan 1981). As a canopy
grows, mutual shading triggers movement towards better lit areas. FR reflection from
neighbouring plants provides an early warning proximity detection mechanism
triggering anticipatory shade avoidance responses termed foraging for light. Projection
of shoots towards canopy gaps is mediated by blue light and negative phototropism to
reflected FR (Ballare et al. 1997).
Thus although sunlight is relatively constant, many plant species respond to the
reduced R:FR and blue quantity in shade light by increasing shoot elongation,
reducing leaf area, and earlier flowering, collectively called shade avoidance
(Kendrick and Weller 2003a). In contrast, high R:FR can signal non-competitive
conditions to the plant, resulting in reduced plant height, and later flowering in many
species (Runkle and Heins 2001). As such, any alteration in the spectral properties of
light by controlled environment equipment, such as covering material or artificial light
source, could have a significant impact on plant growth and development.
9

1.2.1.2 Artificial sources
Spectrally, sunlight is quite constant seasonally and temporally (Smith and Morgan
1981), but the artificial lights used in plant research and horticulture vary markedly.
There are many types and brands of lamps used in plant research, and lamp types are
often mixed to produce broader spectra. As plant responses can vary according to
wavelength, intensity and duration (Sager etal. 1982), it is important to understand
the properties of the light sources being used and to report those properties in correct
radiometric terms (Salisbury and Ross 1992).
The commonly used artificial light sources are incandescent globes, fluorescent
tubes, and, where higher irradiance is required, high intensity discharge lamps: metal
halide or high pressure sodium (Bubenheim et al. 1988). Although many different
kinds of fluorescent lamps have been developed, cool white fluorescent has been the
standard used for most horticultural and research applications, including in growth
chambers (Cathey and Campbell 1977). Metal halide and high pressure sodium lamps
have a higher luminous efficiency, but the greater heat radiation requires increased
ventilation, and the point source nature of globes rather than tubes must be managed
to avoid variation in uniformity at the plant level (Bubenheim etal. 1988; Cathey and
Campbell 1977).
Artificial light sources all have very different spectral properties to natural light.
Cool white fluorescent tubes, for example, have a much higher R:FR ratio (up to 8.8)
compared to sunlight (around 1.1). This can affect growth and development responses,
particularly of LD plants (Runkle 2004). Small changes in R:FR ratios between 0-2
can have significant effects, thus canopy shading, twilight, and light sources with
different light spectra will influence phytochrome photo equilibrium and thus shoot
elongation, lateral branching and flowering in many species. This has important
implications for plant research studies, particularly those involving artificial light
sources, either as the sole source or as a supplement to natural light (Moe and Heins
1990). Incandescent globes, unlike the other lamp types, are rich in far red
wavelengths, hence are often added to other sources to broaden the spectral mix or to
reduce R:FR. However, this is usually in insufficient quantities to reduce R:FR
meaningfully in growth chambers without significant thermal effects (Smith 1994), as
most of the output of incandescent globes is heat (McFarlane 1978).
Blue wavelengths may be involved in the perception of light quantity (Smith and
Morgan 1981). High pressure sodium lamps are relatively deficient in blue, while
10

metal halide lamps are rich in blue. Excess shoot elongation under high pressure
sodium has been attributed to low blue quantity (Tibbitts et al. 1983). In contrast,
more compact growth can occur under metal halide than natural light and high
pressure sodium (Yorio etal. 1995; Zheng etal. 2005). High UV levels are possible
from depleted ozone levels and can be found in some artificial light sources, such as
metal halide lamps, particularly on start up. High UV is associated with tissue
damage, shortened internodes, smaller and thicker leaves, increased branching, and
decreased biomass. However, the effects are modified by other wavelengths in the
PAR range, and plants can acclimate (Kakani etal. 2003; Nogues et al. 1999;
Teramura 1983).
Light source can influence flowering and shoot length even as a supplement or
extension to natural light. Flowering of many species is delayed by day length
extension with high R:FR sources such as fluorescent, compared to low R:FR sources,
such as incandescent (Lane et al. 1965). A combination of cool white fluorescent and
incandescent improves the flowering response in many LD species (Vince-Prue 1994).
R:FR close to the natural level of 1.1 is the most effective at flower induction for LD
plants without increasing elongation, which lower ratios (such as under incandescent
lighting) tend to induce (Runkle 2004). Irradiance can also affect flowering time of
many plants, increasing irradiance can reduce flowering time in some species
(Mattson and Erwin 2005).
Traditional photoperiod day length extension lighting is with incandescent, as it is
effective due to its low R:FR ratio, and inexpensive to install and run (Cathey and
Campbell 1977). However, incandescent lamps are inefficient for photosynthetic
(supplementary) lighting (McCree 1972b) and the low R:FR can increase shoot
elongation relative to other sources (Runkle and Heins 2001). Cool white fluorescent,
high pressure sodium, metal halide and incandescent lamps were compared for flower
induction through weak day extension in Campanula and Coreopsis. Irradiance above
1 umol m's - ' from any of the lamp sources was sufficient to induce flowering, and
shoot elongation was reduced compared to incandescent lighting (Whitman et al.
1998).
Light leakage is an important aspect of photoperiod control. Fluence rates as low as
0.2 p.moles m's' induced flowering in Campanula (Whitman et al. 1998). Light
leakage of high pressure sodium light was tested on neighbouring crops from a
greenhouse with a photoperiod extended morning and evening to provide 18 h.
11

Flowering was delayed in the short day plants (Chrysanthemum, Poinsettia) from
measured leakage levels of 0.05-0.2 innol m 2s PPF, and promoted in the long day
plants (Fuchsia and Callistephus chinensis) and cucumber elongation was reduced and
fruiting delayed (Bakker and Blacquiere 1992). Hence when studying photoperiod
sensitive species, any light from any source is a potential influence on results, and the
growth chambers or greenhouse areas used should exclude all external light.
Thus choice of light source can be a strong influence on results, even as a low level
extension to natural light. Low R:FR sources, such as incandescent, can accelerate
flowering but increase shoot length, that is, induce a shade avoidance response. High
R:FR sources, such as fluorescent, metal halide and high pressure sodium, can signal
non-competitive conditions and may relatively delay flowering compared to natural
light. Blue quantity may also influence morphology, with low blue sources such as
high pressure sodium associated with increased shoot length. However, at higher
irradiance wavelength differences between lamps may be less important, total blue
quantity increases and plants have more energy for growth, masking wavelength
effects (Cathey and Campbell 1977, Tibbitts et al. 1983; Walters and Horton 1994). In
addition, as a supplement to natural light, wavelength differences between lamps may
be less important (Moe 1997). What is needed when choosing light sources for plant
growth and experiments is assessment of the likely impacts, if any, of those choices on
plant development and morphology.
Natural light quantity is highly variable, but in growth chambers is usually constant.
It is common for plants in growth chambers to be given high irradiance to simulate
more 'natural' conditions (Bubenheim et al. 1988). Total photosynthesis depends on
irradiance and duration (Hanan 1998), and plants exposed to lower PPF for longer
periods generally accumulate more dry matter than those exposed to high PPF for
shorter periods (Warrington and Norton 1991). Many growth chambers are capable of
up to 1000 gmol 111-2S -1 of constant irradiance, which over a 16h photoperiod equates
to almost 58 mol m' dy -1 , well above peak summer daily light integrals. Such
abnormally high irradiance can produce abnormal growth (Warrington and Norton
1991). High PPF can produce photo bleaching while the radiant heat load can produce
desiccation (McFarlane 1978). Growth chamber guidelines (Sager and McFarlane
1997) point out that irradiances based on peak summer PPF values are unnecessary, 3-
400 [imol tri2s-1 are sufficient for 16 h photoperiods- around 17-23 mol
12

It is clear that light is a major influence on plant growth and development, and thus
it is important to understand the variation in the qualities and quantities of light in
controlled environment facilities for plant growth. PPF alone is not adequate for
determining the growth effects of various lamp types and filters (Bubenheim et al.
1988), as PPF gives information on light quantity but no information on light quality.
Thus data in non-photon units and that does not go beyond 700nm is limiting (Smith
and Morgan 1981). Quantum sensors weighted in the PPF range for plant physiology
give a reasonable approximation, but their limitations should be noted (Bjorn and
Vogelmann 1994). For these reasons, this thesis uses spectroradiometer analysis of the
commonly used light sources, and can be used as a reference to their relative spectral
properties. Growth responses under these sources are also presented, along with
analysis of the influence of spectral, quantity, and thermal differences.
1.3 Context Plants respond to their environment through a wide range of environmental cues,
and plant research frequently involves measurement of responses to one particular
environmental cue while attempting to keep other parameters constant. This is the
reason for using controlled environment plant growth facilities. Greenhouses modify
temperature, but do not completely control it. Glass enriches the PAR component
relative to sunlight, while many other materials enrich the far-red component relative
to sunlight, and UV is generally reduced. Shading and filtering of such structures can
also influence wavelength ratios. All of these factors can affect photosynthesis and
photomorphogenesis (Kittas et a/. 1999). Thus it is important to characterise these
parameters and the effects they may have.
Growth chambers provide accurate control over temperature and light quantity, but
the light sources used all vary markedly from sunlight. Photomorphogenic effects can
be induced by a wide range of wavelengths, well beyond the normal PAR range,
which is often the only light parameter measured. Some light quality influences may
be reduced at higher irradiance, but responses vary between and within species. There
may also be unmeasured radiant temperature effects from lamps. When using artificial
light sources, which will have different spectral properties to sunlight even when
mixed, it is important to characterise the full spectral distribution of the light sources
in use and to understand the effects they may have on the species being examined.
13

In addition to temperature and light, CO2, air velocity and exchange, and humidity
also vary within and between controlled environments. CO2 can become depleted in
close cultivation, or elevated from human activity without adequate ventilation (Peet
and Krizek 1997), and air velocity is much less variable than outside conditions
(Downs and Krizek 1997).
By measuring physical differences between controlled environments and examining
plant responses to these variations, insights into which parameters are important under
which circumstances can be gained. The controlled environment facilities at the
School of Plant Science, University of Tasmania, have evolved since the 1960s with
construction and/or purchase of phytotrons, glasshouses, and controlled environment.
plant growth chambers as need and funds allowed. The facilities now consist of 2
phytotron glasshouses, several glasshouses and shade houses, a multi chambered
controlled environment glasshouse, and 24 growth chambers of various age,
manufacture, design and lighting source. An overview of the facilities can be found at
vvww.utas.edu.au/glasshouse . Thus, there are a diverse range of glasshouse and
growth chamber environments. This allowed for study of the influence of physical
variation on growth responses. To study the influence of polycarbonate or glass, the
usual choices in greenhouse covering material, measurements and growth studies were
conducted at the Department of Primary Industry facility at Knoxfield, Victoria.
A number of other institutions' facilities were surveyed and examined, both to
determine the general relevance of this study and to identify common issues. From
this, it was found that most such facilities also have a diverse range of greenhouses
and growth chambers of various design, age and level of control. Many different light
sources were in use, and there was general uncertainty about the potential influence of
variations in equipment design and set-up on experimental results. Reports of
observed differences in plant responses in different growth chambers and greenhouses
were common, but the reasons for these differences were generally not known. While
most facilities routinely measured light quantity, none were measuring light quality.
The intention of this thesis is to analyse and characterise a wide range of controlled
environments and levels of control available for plant research in terms of light,
temperature, humidity, CO2 levels, air exchange rates and air velocity. These variables
will be related to their effects on plant morphogenesis, through analysis and
experimentation, with emphasis on the implications this may have for research
outcomes. How interchangeable controlled environments are will be examined,
14

particularly by experiments on pea parental lines, the major source of morphogenic
research mutants used at this facility. Pea was chosen as it is sensitive to light quality,
quantity, and temperature changes, thus a good indicator of the influence of variation
in these factors in controlled environment research.
Generally, controlled environment plant growth equipment is used to minimise
environmental variables to examine specific plant responses. This study takes a
different approach by using the plant responses to study variation in the controlled
environment equipment. To identify the variables of importance, initial chapters are
by necessity largely concerned with the physical variations and general plant
responses to these variations. In later chapters, a more focused approach could be
taken to examine specific responses in more detail.
It is hoped the information in this thesis will assist plant researchers with decisions
over experimental design, and controlled environment facility managers with
decisions on equipment design, set-up, and use. Thus, inadvertent influences on
experimental results from equipment differences can be avoided.
15

Chapter 2 Glasshouse environments
2.1 Introduction In this chapter, physical variation between glasshouses is measured. Plant responses
in the different environments are examined, and specific experiments are reported on
that examined the influence of the physical factors identified as important, notably
light quantity and temperature.
Under natural conditions, plants encounter considerable variation in light intensity,
quality and duration (Walters and Horton 1994), as well as in temperature, air
movement, nutrients, and water status (Hanan 1998; Khaoua et al. 2006; Moe and
Heins 1990). Greenhouses are largely concerned with modification of temperature by
trapping long wave radiation. Modification of the light environment is a consequence
of the choice of covering material (Hanan 1998). Structure, geometry and orientation
all influence the light environment inside the greenhouse (Mermier and Baille 1988).
For example, east-west orientation of the long axis improves light transmission in
autumn and winter compared to north-south, but reduces the uniformity of light
distribution within the greenhouse (Soriano et al. 2004).
Water status and nutrients are largely controlled in protected horticulture, and air
movement is less variable than outside conditions (Downs and Ksizek 1997). Air
movement influences include heat transfer, transpiration, and CO2 uptake, and thus
can influence leaf size, crop yield and shoot length (Downs and Krizek 1997).
Greenhouse ventilation is required to assist temperature and humidity control and
distribution, and for air exchange to maintain CO 2 levels in particular (Khaoua et al.
2006). Mechanical stress from high air velocity can reduce shoot elongation (Morrow
and Wheeler 1997), while low air velocity has been blamed for elongated shoots
(Downs and Krizek 1997). Generally in controlled environments air velocities
between 0.3-0.7 m s -1 are recommended (Downs and Krizek 1997). Plants and
infrastructure within the controlled environment can strongly influence air velocity
distribution and thus microclimate (Khaoua et al. 2006).
In regions with short day-length in winter, light is often the limiting factor for plant
growth in greenhouses, thus the covering material and greenhouse design become
important (Aldrich and White 1969). Typical responses to low light levels are smaller,
longer leaves, increased internode length, reduced chlorophyll concentration, and
lower dry weight at maturity (McFarlane 1978). The structural frame can reduce light
16

by up to 70% (Aldrich and White 1969); lightweight frames, larger panel size and
lower roof pitches can improve transmission (Aldrich and White 1969). Greenhouse
covering material also becomes more important at moderate to high latitudes with
glass providing the highest transmission (Aldrich and White 1969; Hanan 1998; Kittas
etal. 1999).
While in winter light can be limiting, in summer the radiation load needs to be
managed in greenhouses to reduce thermal load (Hanan 1998). Various methods are
employed, including whitewash, shade cloths and thermal screens. However, excess
shading can induce elongation (Potter et al. 1999) independently of wavelength
(Christophe et al. 2006; Gawronska etal. 1995). Spectral properties of shade methods
have been examined in sunny conditions and found to slightly alter wavelength
distribution (Kittas et al. 1999), but an examination in overcast conditions or
comparative growth responses have not been described.
Study of greenhouse transmission is complex. Transmission varies with material,
superstructure orientation, design, shape, slope and height as well as time of day,
season, latitude and climatic conditions (Hanan 1998). Greenhouse energy balance
involves measurement of global (300-3000nm) transmission. For plant physiology, in
situ measurements of PAR (400-700nm) and morphogenetically active radiation (300-
800nm) is more relevant, with information on the cryptochrome and phytochrome
related parameters included (Kittas et al. 1999). This study takes that approach.
However, such studies generally compare sunny summer conditions. Included here are
comparisons during light limiting conditions when transmission and wavelength
differences are likely to be of most importance. Hence sunny and overcast
measurements were made in summer and winter, as well as examining growth
responses in all seasons using garden pea as an indicator of temperature and light
variations.
Most aspects of plant life are influenced by the qualities and quantities of light
(Spalding and Folta 2005), while temperature is considered to be the major influence
on horticultural crops (Faust and Heins 1997; Hanan 1998). Greenhouses are generally
used to modify natural temperature variation for more even growth, but temperature
can still vary markedly. The rate of development is temperature dependent, with rates
increasing up to a maximum,.which is the optimum temperature for that species
(Heins et al. 2000). Cooler temperatures during maturation increase yield in many
crop species (Heins et al. 2000). Peas are particularly sensitive to water and
17

temperature stress during maturation (Roche et al. 1999). Net photosynthesis
decreases with increasing leaf temperature in pea (Haldimann and Feller 2005), and
yield and seed weight is negatively correlated with temperature in pea (Chetia and
Kumar 2005; Poggio et al. 2005). Peas are a cool season crop, hence well suited to the
study of the influence of even modefate temperature increases over summer.
The controlled environment facilities at the School of Plant Science, University of
Tasmania consist of a range of glasshouses of varying age, structure and orientation
allowing examination of glass type, structure and orientation influences on spectral
properties and light distribution, both seasonally and temporally. Both laminated glass
and horticultural glass are used. Winter light levels can be limiting at this location (42 °
S), while in summer, various shading methods are employed ranging from whitewash
through shade cloths and thermal shade screens. This allowed for study of the physical
variation between typical research glasshouses, and the influence these variations may
have on plant development and morphology.
Other sources of variation between greenhouses include heating and cooling
methods which will influence temperature distribution and air velocity. These factors
were also examined along with CO2 levels, which could be depleted with crowded
conditions in cool weather (vents closed). To further examine some observed plant
responses to measured environmental variations, a number of specific experiments
were conducted using garden pea.
2.2 Materials and methods
2.2.1 Glasshouse environments All the glasshouses examined are aluminium framed with similar orientation, but
vary in the type of glass covering and in summer shading method (Table 2.1). The
main phytotron is covered in laminated glass (Pilkington, Australia, 6.4mm), the top
phytotron by horticultural glass (Pilkington, Australia, 3mm). Summer shading
methods are also listed. Various shading methods were examined: whitewash
(Parosoline glasshouse paint, Plantecnic, Belgium), 70% shade cloth (Sarlon,
Australia) and internal and external thermal shade screens (XLS aluminium/polyester
60% thermal shade screen, Ludvig Svensson Ltd., Kinna, Sweden). Shade cloth
measurements were conducted in a small adjacent horticultural glasshouse. The two
phytotron glasshouses include a series of automatic plant trolleys on rails that can be
moved into climate controlled dark bays. The bays are used for photoperiod control
18

and can be dark or have extension lighting. The trolley system adds to the shading
influence of the structure and for this reason the main phytotron is divided into apron
area (the growing area without the trolleys) and bay area (with the trolleys) for much.
of the analysis.
Heating of the main phytotron glasshouses is provided by electric tubular heaters
activated below 15 °C; cooling by vents opening at 23 °C, gable extraction fans at 25 °C,
and evaporative cooling at 30 °C. The top phytotron is also heated by electric tubular
heaters activated below 15 °C and cooled by air conditioners activated at 25°C, hence
giving a smaller degree of temperature variation. The controlled environment
glasshouse is divided into 6 individually controllable cells with heating and cooling
provided by fan coil units and chilled water; temperature control is generally within 1-
2°C of set point. Temperature in all the glasshouses is continuously recorded and
controlled via Honeywell (Australia) TC205F17 sensors and EBI software.
This variation in glasshouse environments allowed for the examination of a number
of factors including the influence of glass type, degree of infrastructure shading, shade
method, and level of temperature control, in different seasons.
Table 2.1. Greenhouse environments examined at the Hobart site
Greenhouse Abbreviation Cover Orientation Shading method
Main phytotron Main apron Laminated glass E-W External Al screen
Main phytotron Main bays Laminated glass E-W External Al screen
Top phytotron Top Hort. Glass E-W Whitewash
Eucalypt house Euc Hort. Glass E-W Whitewash
Controlled env. Cell Laminated glass NE-SW Internal Al screen
2.2.2 Light measurements and analysis Light measurements were taken with a LI-1800 spectroradiometer (LI-COR,
Lincoln,.NB, USA) with a cosine corrected sensor. All natural light measurements
were taken unless otherwise stated at midday in stable conditions: clear sky for sunny
measurements, fully overcast for cloudy conditions. Comparative measurements,
including transmission percentages, were taken on the same day in the same
conditions in immediate succession. Growth chamber light measurements were at an
air temperature of 20 °C with external light excluded.
19

Spectral irradiance was downloaded in W r11-2 nm-1 and as quantum intergrade (umol 2
S-1 ) averaged over 3 scans in the range 300-800nm, following measurement and
reporting guidelines (Bjorn and Vogelmann 1994; Sager et al. 1982). Selected
measurements were also taken with an Apogee UV-PAR spectroradiometer (Apogee
Instuments Inc., Logan, UT, USA) to check for accuracy. Instrument agreement was
generally within 1% in all wavebands. For comparisons of waveband proportions at
different irradiances the percentage of quantum intergrade (300-800) was calculated
for PPF (photosynthetic photon flux, 400-700 nm) and for each 100nm band.
Wavelength ratios follow published methods (Kittas et al. 1999) and were calculated
from the quantum data as: R:FR narrow band (R:FRn) 655-665 nm1725-735 nm; R:FR
broad band (R:FRb) 600-700 nm/700-800 nm; blue to red (B:R) 400-500 nm/600-700
nm; B:FR 400-500 nm/700-800 nm. Figures quoted for R:FR are broad band unless
otherwise stated.
Light distribution measurements were taken using a LI-185B Quantum radiometer
with quantum sensor (LI-COR, Lincoln, NB., USA). Daily light integrals (DLI) are
given as mol r11-2 d-l and follow standard calculation methods (Faust 2003) from the
light measurement data. •
2.2.3 Temperature, air velocity and CO 2 measurements Air temperature in all the controlled environments is continuously recorded via
Honeywell (Australia) TC205F17 sensors and EBI software. This data was used for
temperature analysis. Temperature and air velocity distribution within the
environments were taken with a Kane-May Ltd (Welwyn, Herts, Great Britain) KM-
4000 thermo-anemometer in a range of external weather conditions. Soil temperature
was measured 1 cm below the pot surface at weekly intervals with a CPS Inc (Hialeah,
Florida, USA) Tempseeker T200 digital thermometer with silicon temperature
sensors. Three sensors were used per measurement with 10 pots per location. Surface
and leaf temperature measurements were taken with a CPS Inc (Florida, USA) infra
red thermometer. CO2 measurements were taken at weekly intervals with a LI-COR
LI-6400 portable photosynthesis system.
2.2.4 Plant growth and measurements To compare growth responses under the different environments peas (a selection of
Pisum sativum L. `Torsdag') were grown in the various environments. This line
(Hobart line 107, wild type to a range of photoperiod and shoot length mutants), is a
20

quantitative long day plant (Reid et al. 1996). Plants were sown 2 per pot using even
sized seed in 14 cm slimline pots in a 1:1 mixture of grade 3 vermiculite (Australian
Vermiculite and Perlite Co., Fairfield, Victoria, Australia) and 10 mm dolerite
aggregate (HBMI, Kingston, Tasmania, Australia) topped with 2-3 cm of a pasteurised
1:1 mix of peat moss (Te - Em, New Brunswick, Canada) and coarse river sand
(Island Resources, Scottsdale, Tasmania, Australia) with added macronutrients
(Osmocote 18N-2.6P-9.9K , Scotts-Sierra, Marysville, OH, USA) at 1 kg 111-3 , pH was
adjusted to 7 with dolomite lime and limestone. All plants were watered as needed and
fertilised with nutrient solution weekly consisting of Aquasol (Hortico, Australia),
N:P:K 23:4:18 at a rate of lg plus Iron Chelate (Kendon Chemicals, Sydney, NSW,
Australia) at 0.05g I -1 .
Plants were sown in the respective treatments and germination recorded. Stem
diameter (mid point between nodes 9 and 10), leaf width (LW) and leaf length (LL) of
1 leaflet per plant was measured at node 9 at the commencement of flowering for
selected treatments. During growth, node of flower initiation (NFI) and days from
planting to first open flower (FT) was recorded. At maturity (senescence) length of
intemodes 1-9 (L1-9), total shoot length (TL), number of nodes (TN); number of seed
(Seed) and number of pods (Pods) were measured. Dry weight was measured after air
drying of the harvested plants for at least 72 h.
Statistical analysis using JMP software (SAS Institute, Cary, NC, USA) included
ANOVA, Students t-test, Dunnetts method, and Tukeys test.
2.3 Results
2.3.1 Spectral properties Spectral properties can alter between summer and winter, mainly due to sun angle,
and with cloud cover, mainly due to Rayleigh scattering (Kittas etal. 1999). Thus
measurements were taken in winter (July) and summer (December) under sunny (clear
skies) and cloudy (fully overcast) conditions to quantify the spectral differences that
would be experienced by plants in the different glasshouses in different seasons.
2.3.1.1 Winter Figure 2.1 shows spectral distribution as a function of wavelength of the glasshouses
and outside under winter overcast conditions, when light parameters are likely to be
most important due to short days and low irradiance. The horticultural glass covered
21

Owrcast
Apron
— - • Bays
– – -Top
Wavelength (nm)
0.08 -
0.06 -
0.04 -
0.02 -
0.00 -r - ' 300 350 400
if '..•1
., • .- • -
• + 1, , - 4
450 500 550 600 650 700 750 800
top phytotron and the laminated glass main phytotron (apron and bays) are shown as
the measurements for the other glasshouses covered with the same materials were
similar (eucalypt glasshouse, horticultural glass; controlled environment glasshouse
cells, laminated glass). Hence this figure is representative of material and structural
influences.
Figure 2.1. Spectral distribution of the glasshouse environments under winter overcast conditions
Lower transmission in the phyotoron bay area relative to the other glasshouse areas
can also be seen (Bays, Fig. 2.1), showing the influence of heavier infrastructure
shading in this area. Spectral distribution was largely unaltered in any of the
glasshouses relative to natural light, apart from the reduced UV-B component through
the laminated glass covered apron and bays compared to the horticultural glass
covered top glasshouse (Fig. 2.1).
Spectral distribution on a proportional basis also shows this reduced UV-B
transmission through laminated glass compared to horticultural glass and natural light
under both sunny and overcast conditions (Table 2.2). Otherwise there was little
variation between the glasshouses under winter sunny or overcast conditions and
natural light (Table 2.2). However, the heavily shaded phytotron bays do show some
variation in sunny conditions, with slightly more UV (300-400 nm) and blue (400-500
nm), less red (600-700 nm) and less far red (700-800 nm) proportionally, similar
proportions to natural overcast conditions (Table 2.2). Wavelength ratios (Table 2.2)
also indicate the slightly higher blue proportion under overcast conditions, and in the
22

shaded phytotron bays under sunny conditions. Diffuse light is higher in blue
wavelengths proportionally (Smith and Morgan •1981), thus heavy infrastructure
produced some shade like light qualities even under sunny conditions. However, R:FR
was largely unaltered by sun conditions, glass type, or infrastructure shading.
2.3.1.2 Summer Spectral characteristics of the glasshouse environments were also examined in
summer and compared to winter (Fig. 2.2). The slightly higher blue (400-500 nm)
proportion in overcast conditions occurs during both summer and winter. In winter
sun, red (600-700 nm) and far red (700-800 nm) proportions are slightly higher than
summer, but red to far red ratio is unaltered (1.1 in winter and summer).
Spectral distribution and wavelength ratios are largely unaltered winter to summer,
outside or in the glasshouse environments, apart from the reduction in UV component
under laminated glass (Tables 2.2, 2.3).
In summer, various shade methods are employed to reduce thermal load (Table 2.1).
Shade cloth (70% green, Sarlon Australia) is used on some smaller glasshouses, or
within glasshouses for specific experiments, hence was included in the analysis. The
influence of these common shade methods on spectral properties was examined (Table
2.3).
The apron (main phytotron apron) is covered on the eastern side by aluminium
thermal screen. Measurements were taken on this side with the screen up, then rolled
down in immediate succession. Top (top phytotron glasshouse) is whitewashed with
strips of Parasoline glasshouse paint, applied with a roller. Measurements were taken
on adjacent whitewashed and un-whitewashed areas. The euc house (eucalypt
glasshouse) is also shaded by this method and spectral properties were no different to
the top phytotron. Shade cloth was measured before and after applying the screen to a
small glasshouse on site clad in 3mm horticultural glass, the same material as the top
phytotron and the euc house. Spectral properties of these 3 glasshouses uncovered was
the same, hence only the figures for the top phytotron are included in Table 2.3.
23

Table 2.2. Waveband proportions (% quantum intergrade 300-800nm) and wavelength ratios of the glasshouse environments under winter sunny and overcast conditions. Main and cell glasshouses are laminated glass, *top and euc glasshouses are horticultural glass.
Environment
Sunny
PPF
Wavelength proportion (% total irradiance)
300-400 400-500 500-600 600-700
UV Blue Green Red
700-800
Far-red R:FR
(n)
Wavelength ratios
R:FR (b) B:R B:FR
Outside 69.4 2.4 15.5 25.0 29.0 28.0 1.1 1 0.5 0.6
Main apron 72.9 0.9 16.9 26.9 29 26.1 1.1 1.1 0.6 0.7
Main bay 73.3 1.9 20.8 26.8 25.7 24.5 1 1 0.8 0.9
Cell 73.9 0.9 17.0 27.5 29.3 25.2 1.2 1.2 0.6 0.7
Top* 71.9 2.3 16.7 26.4 28.7 25.8 1.1 1.1 0.6 0.7
Euc* 69 2.5 15.9 24.7 28.3 28.5 1 1 0.6 0.7
Overcast
Outside 69.8 3.8 17.9 24.9 27 26.4 1.1 1 0.7 0.7
Main apron 74.1 1.2 19.6 27.2 27.3 24.7 1.1 1.1 0.7 0.8
Main bay 73.5 1.4 19.3 27.0 27.2 25.2 1.1 1.1 0.7 0.8
Cell 74.5 1.2 19.6 27.4 27.5 24.3 1.1 1.1 0.7 0.8
Top* 71.6 3.1 18.4 26.2 27.1 25.3 1.1 1.1 0.7 0.7
Euc* 71 3.2 18.3 25.8 26.9 25.7 1.1 1.1 0.7 0.7
24

300-400 400-500 500-600 600-700 700-800
Wavelength (nm)
o Wint. sun
• Sum. Sun
W. overcast
o S. overcast
Rela
tive
spec
tal d
istr
ibut
ion
(/o)
35
30 -
25 -
20 -
15 -
10 -
5 -
0
Figure 2.2. Waveband proportions (% 300-800nm) of sunny and overcast conditions, winter and summer, outside.
As for winter, there was little difference in spectral properties between the
glasshouses, apart from the UV reduction under laminated glass (main apron). None
of the shade methods employed significantly altered the spectral properties of sunlight
(Table 2.3), or of overcast conditions (data not shown). However, shading with
whitewash and thermal screens did slightly increase blue proportions and wavelength
ratios, although R:FR was largely unaltered by any of the shade methods (Table 2.3).
The shade cloth examined was wavelength and ratio neutral (Table 2.3), i.e. spectral
properties were not altered by shade cloth, only light quantity.
25

Table 2.3. Spectral distribution (% 300-800 nm) and wavelength ratios for glasshouse environments with and without shading. Abbreviations Apron- main phytotron apron area (laminated glass), Top- top phytotron apron area (horticultural glass), SS- aluminium thermal shade screen, WW- Parosoline glasshouse paint, SC- 70% green shade cloth
Environment
PPF Wavelength proportion (°/0 total irradiance) 300-400 400-500 500-600 600-700
UV Blue Green Red
700-800
Far-red R:FR
(n)
Wavelength ratios
R:FR (b) B:R B:FR
Outside 71.0 2.9 16.7 25.7 28.2 26.5 1.1 1.1 0.6 0.6 Apron sun 74.0 1.2 18.1 27.4 28.5 24.9 1.1 1.1 0.6 0.7 Apron SS 75.0 1.3 19.4 27.7 27.7 23.9 1.1 1.2 0.7 0.8 Top sun 71.0 2.6 16.8 26.1 28.2 26.3 1.1 1.1 0.6 0.6 Top VVW 72.0 3.1 18.3 26.6 27.0 25.1 1.1 1.1 0.7 0.7
SC 70.0 2.7 16.5 25.7 27.8 27:3 1 1 0.6 0.6
26

2.3.2 Light quantity Natural light quantity is affected by weather, season, cloud cover and day-length.
Under intermittent cloud cover, natural light quantity variation can be large (Fig. 2.3).
Sun angle variations, time of day and seasonal, also have an influence (Smith and
Morgan 1981). In greenhouses, covering material and superstructure also influence
light quantity and distribution (Hanan 1998).
Figure 2.3. Irradiance measurements taken at 15 minute intervals inside a glasshouse on days (11 and 13 March 2007) with intermittent cloud cover.
2.3.2.1 Season Seasonal light quantity figures for the main phyotoron 'apron were similar, mean
DLI was approximately 14, 11, 14 & 16 mol m -2d-1 for autumn, winter, spring and
summer (under a shade screen in summer) respectively. Photoperiod was maintained
27

at 18 h in all seasons, consisting of natural daylight extended morning and evening
with weak (10-20 gmol rd2s-1 , 0.5 mol ni2d-1 ) mixed fluorescent/incandescent
lighting with a R:FR of 0.8. Variation within and between glasshouses was examined
in more detail for winter and summer.
2.3.2.2 Winter In situ transmission percentages (Table 2.4) show the strong influence of
superstructure shading under sunny conditions in particular, as noted by a number of
authors (eg Hanan, 1998; Aldritch and White, 1969). Testing of glass materials ex situ
gave PPF transmission of 90% in sunlight for laminated glass and 82% for
horticultural glass, but inside glasshouse measurements show transmission of only
around 50%. The heavy infrastructure in the phytotron bays reduced transmission to
less than 14% at plant level in sunny conditions (Table 2.4). The controlled
environment glasshouse (Cell) has larger glass panels, smaller extension lighting
systems and the highest in situ transmission in sunlight, over 80% (Table 2.4). Under
overcast conditions, transmission percentages are much higher, over 90% of available
light is transmitted in the top phytotron, although in the phytotron bays transmission
percentages were still much lower (50-60%, Table 2.4). Under overcast conditions,
transmission was higher through horticultural glass (euc house, top phytotron)
compared to laminated glass (main glasshouse, controlled environment glasshouse),
the reverse of the sunny situation (Table 2.4).
Table 2.4. Transmission percentages (PPF) of the glasshouse environments under winter sunny and overcast conditions
Laminated glass Hort glass
Main apron Main bay Cell Top Euc
Sunny 53.6 14.4 81.5 47.2 47.6
Overcast 78.4 59.5 80.3 95.8 89.4
Light distribution measurements were taken at midday in winter in sunny and
overcast conditions. Measurements within the greenhouses under overcast conditions
were very even, although low, ranging from 100-160 gmol m -2 s-1 . Under sunny
conditions there were stark contrasts from structural shading, ranging from 140-820
gmol 111-2 s-1 . Under heavy cloud, light levels were very low, and there was large
variation in winter light levels (Table 2.5). Natural photoperiod averaged 9.6 h in
28
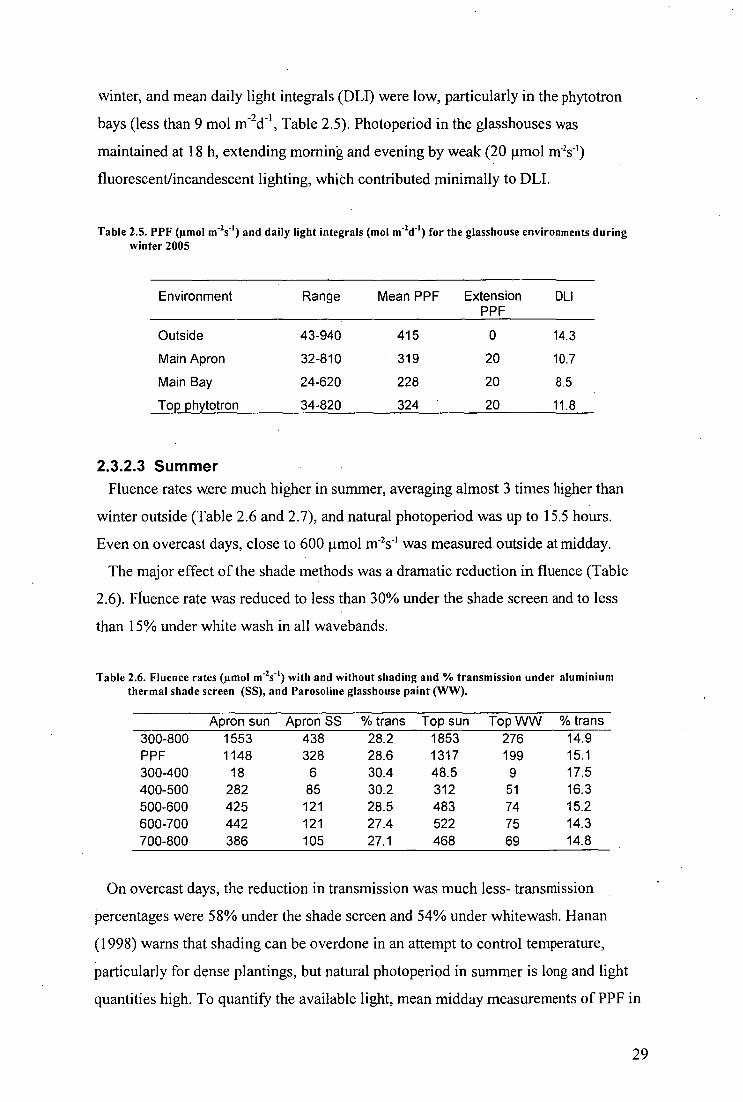
winter, and mean daily light integrals (DLI) were low, particularly in the phytotron
bays (less than 9 mol m -2d-I , Table 2.5). Photoperiod in the glasshouses was
maintained at 18 h, extending morning and evening by weak (20 pmol m 2s-1 )
fluorescent/incandescent lighting, which contributed minimally to DLI.
Table 2.5. PPF (p.mol nf 2s-1 ) and daily light integrals (mol m-2c1-1 ) for the glasshouse environments during winter 2005
Environment Range Mean PPF Extension DLI PPF
Outside 43-940 415 0 14.3
Main Apron 32-810 319 20 10.7
Main Bay 24-620 228 20 8.5
Top phytotron 34-820 324 20 11.8
2.3.2.3 Summer Fluence rates were much higher in summer, averaging almost 3 times higher than
winter outside (Table 2.6 and 2.7), and natural photoperiod was up to 15.5 hours.
Even on overcast days, close to 600 [imol m 2s-1 was measured outside at midday.
The major effect of the shade methods was a dramatic reduction in fluence (Table
2.6). Fluence rate was reduced to less than 30% under the shade screen and to less
than 15% under white wash in all wavebands.
Table 2.6. Fluence rates (pmol m -2s -1 ) with and without shading and % transmission under aluminium thermal shade screen (SS), and Parosoline glasshouse paint (WW).
Apron sun Apron SS % trans Top sun Top WW % trans 300-800 1553 438 28.2 1853 276 14.9 PPF 1148 328 28.6 1317 199 15.1 300-400 18 6 30.4 48.5 9 17.5 400-500 282 85 30.2 312 51 16.3 500-600 425 121 28.5 483 74 15.2 600-700 442 121 27.4 522 75 14.3 700-800 386 105 27.1 468 69 14.8
On overcast days, the reduction in transmission was much less- transmission
percentages were 58% under the shade screen and 54% under whitewash. Hanan
(1998) warns that shading can be overdone in an attempt to control temperature,
particularly for dense plantings, but natural photoperiod in summer is long and light
quantities high. To quantify the available light, mean midday measurements of PPF in
29

the glasshouses through summer 2005/6 were recorded and daily light integrals (DLI)
calculated (Table 2.7).
Table 2.7. Calculated PPF (p.mol m-2s-1) and daily light integrals (mol m -2d-l ) for the glasshouse environments during summer 2005/6
Environment Range Mean PPF Extension PPF
DLI
Outside 580-1710 1184 0 65.8
Apron 310-1260 850 20 47.7
Apron SS 180-360 286 20 16.3
Main Bay SS 130-280 217 20 12.3
Top phytotron 250-1110 576 20 30.6
The significant influence on light quantity of the shade screens can be seen,
reducing mean PPF by almost 70% on the apron. Added to the infrastructure shading
in the bays, DLI is reduced to 12.3 mol -2c1-1 compared to almost 48 mol -2d-1 on the
unshaded portion of the same glasshouse apron area (Table 2.7). However, all
measurements are within the 12-14 mol -2d- ' recommended for peak flowering by
Mattson and Erwin (2005). The top phytotron was painted with whitewash, which had
the lowest transmission % of around 15% compared to shade screen transmission of
30% (Table 2.6). The whitewash was applied in strips, however, rather than a blanket
application, and this method created a higher transmission level than shade screen of
around 36% of the uncovered glass. The striped nature also created a moving pattern
of light and shade rather than a blanket reduction, with no area in permanent sun or
shade. This affected distribution- under the shade screens light distribution was very
even, under the striped whitewash, stark contrasts were measured, as indicated by the
high range figures (Table 2.7). The net result was significantly higher light levels in
the whitewashed glasshouses than the shade screen areas (Table 2.7). Thus in summer,
there were large light quantity differences between the glasshouses according to shade
method or absence of shade.
2.3.3 Temperature variation Greenhouses are generally used to modify natural temperature variation, and the
climate modifying influence of the glasshouses examined compared to outside
conditions can be seen (Table 2.8). However, temperature ranges were still large, and
30

seasonal temperature variations even within the same glasshouse were significant,
with mean temperature ranges of 9-31 °C in the main phytotron glasshouse (Table 2.8).
These figures also demonstrate that the degree of temperature moderation depends on
the level of control equipment, as the evaporatively cooled main glasshouse was
appreciably more variable than the air conditioned top phytotron (Table 2.8), while the
chilled water fan coil units in the cell glasshouse produce mean temperature variations
of less than 2°C in all seasons (data not shown).
Thus effective temperature control in glasshouses is possible, but the control
equipment required is significant and costly, both to purchase and to operate. Most
research institutions examined had a similar range of greenhouses with varying levels
of control, with the bulk of plant material grown in areas with moderate temperature
control and smaller areas with high level temperature control for specific experiments.
As for light quantity, then, temperature variation seasonally is large for the bulk of
plant material in plant research facilities and a closer examination of the influence of
such variation is warranted. Further detail of the temperature variations experienced
by the plants seasonally are included in the growth response studies (Section 2.4).
Table 2.8. Mean day and night air temperatures and temperature ranges ( °C) by season in selected glasshouses compared to outside conditions.
Outside Main phytotron Top phytotron
Season Day Night Range Day Night Range Day Night Range
Autumn 15.6 10.9 3-29 20.3 14.5 11-28 19.3 13.8 10-24
Winter 12.5 8.3 2-19 18.2 12.8 9-23 18.1 13.6 10-22
Spring 16.8 11.0 4-31 21.4 14.6 10-31 21.9 14.7 10-27
Summer 21.5 16.2 9-30 24.9 18.5 15-31 22.8 17.4 13-26
2.3.4 CO 2, Air velocity and Humidity variation CO2 levels can become limiting in dense canopies and in controlled environments
without adequate ventilation (Hanan 1998; Peet and Krizek 1997). Levels can also be
enhanced from human activity in closed or poorly ventilated environments (Peet and
Krizek 1997). However, measurements taken in all the glasshouse environments in all
seasons and weather conditions did not show any significant variation from ambient
levels.
31

Air velocity can vary with greenhouse ventilation type and location, internal
structures and plant position, as well as being influenced by external weather
conditions (Khaoua et al. 2006). External measurements showed wide variation in air
velocity, but this was not reflected in the internal measurements. In winter, with vents
generally closed, air velocity ranged from 0.1-0.4 m s -1 and was generally evenly
distributed, although lowest readings were in the phytotron bays. In summer, with
vents generally open and active cooling on (evaporative coolers, air conditioning), air
velocity ranged from 0.1-0.6 m s -1 . Active cooling vents are all shielded with
perforated aluminium to reduce air velocity gradients. Distribution within the
greenhouses was again relatively even, although velocities as high as 1.4 m s-1 could
be measured at vent level during active cooling. In the top phytotron, the first plant
row had measurements above 0.7 m s -1 under such conditions.
Generally in controlled environments air velocities between 0.3-0.7 m s -1 are
recommended (Downs and Krizek 1997). While often below this, the results suggest
ventilation rates within the greenhouses were sufficient to maintain ambient CO2
levels, and that air velocity distribution was relatively even. Some plant rows adjacent
to active vents were above the recommended range.
Humidity influences plant transpiration rates through vapour pressure deficit.
Transpiration rate is influenced by temperature, air movement, irradiance, and soil
moisture (Spomer and Tibbitts 1997). In well watered plants, low humidity is unlikely
to cause desiccation. However, high humidity is associated with plant diseases and can
be an issue in controlled environments (Spomer and Tibbitts 1997). Humidity
monitoring by glasshouse sensors showed levels vary widely, ranging from 33-81%.
In the controlled environment glasshouse humidity was maintained at 60% or above,
values ranged from 62-83%. However, no evidence of plant desiccation from low
humidity or increased disease incidence at high humidity was observed.
2.3.5 Growth responses The glasshouse environments showed physical variations in light quality, quantity
and temperature, even in the same season, To examine the influences of these
variations, if any, a standard pea line known to be sensitive to temperature and light
variations (a selection from Pisum sativum L. `Torsdag', Hobart line 107) was grown
concurrently in representative glasshouses in the extreme seasons, winter and summer.
As well, seasonal variation influences were examined by comparing growth responses
32

of the same pea line in different seasons in the same glasshouse. Glasshouses used
were the laminated glass main phytotron apron and bay areas, which varied in light
quantity but not air temperature; and the top phytotron, which is clad in horticultural
glass.
2.3.5.1 Winter In winter, measured light levels were potentially limiting, particularly in the
phytotron bays, with a mean daily light integral (DLI) of less than 9 mol 111-2 (1-1 (Table
2.5). Light wavelength differences are likely to be more important at low irradiance
(Cathey and Campbell 1977), allowing for examination of any influence of the slight
spectral variations between the environments, such as the UV reduction under
laminated glass (main glasshouse) compared to under horticultural glass (top
glasshouse). Mean temperature parameters for the study period were similar in the
different environments (Table 2.9). As well as continuous monitoring results (mean
day/night temps), weekly midday measurements of air and soil temperature were
taken at each growing site (mid. air/soil temp, Table 2.9).
Table 2.9. Mean winter temperature parameters (°C) for the glasshouse environments during the study period (winter 2005)
Environment Midday air Midday soil Mean day Mean night temperature temperature temperature temperature
Outside 15.2 - 13.3 8.8
Main apron 21.6 19.8 18.5 13.3
Main bay 21.6 19.4 18.5 13.3
Top phytotron 22.4 19.8 18.6 13.4
Photoperiod in all the areas was 18 h, consisting of natural daylight (average 9.6 h)
extended morning and evening by weak (20 [moles 111-2 s-1 ) mixed fluorescent
incandescent lighting with a red to far-red ratio (R:FR) of 0.8. PPF and DLI
measurements over the study period (Table 2.5) show lowest light measurements were
in the main phytotron bays, averaging only 8.5 mol M-2 (1-1 , followed by the main apron
and top phytotron (10.7 and 11.8 mol m 2 &I). Thus the environments allow
comparison of growth parameters in a standard pea line under different light quantity
conditions. Plants were grown and analysed as described in Materials and Methods.
33

In the lowest light environment of the phytotron bays total shoot length (TL, Table
2.10) was significantly increased relative to the other environments. Flowering was
also delayed as node of flower initiation (NFI) and flowering time (FT) were
significantly (P<0.05) delayed compared to the phytotron apron and the top
glasshouse (Table 2.10), and stem diameter and leaf size (LW, LL) were significantly
(P<0.05) reduced. Yield (seed, pods) was also reduced in the bays relative to the other
environments, but not significantly so (Table 2.10). There were no significant
differences between the apron and top glasshouse (Table 2.10), apart from TL and FT,
which decreased with increased light quantity (r 2 0.74 and 0.89 respectively). Dry
weight was not significantly different between environments (Table 2.10) in spite of
the growth differences. For example, plants in the bays were taller but had smaller
stems and leaves, perhaps explaining the lack of significant difference in dry weight
relative to the other environments.
In summary, the results show there were significant differences in growth and
development parameters between the glasshouse environments during winter, and
there was a strong association with light quantity. Even within the same glasshouse
(i.e. the main phytotron apron and bays) large differences were observed. Plants
grown in the bays, with low light levels, showed increased shoot length and number of
nodes, delayed flowering, reduced stem diameter and leaf size.
34

Table 2.10. Winter and summer mean growth results (± SE) for L107 pea, n = 20. Different letters signify significant differences at P<0.05, letter plus asterisk (e.g. b*) significant at P<0.01. Daily light integrals: Winter- Bay, 8.5; Apron, 10.7; Top, 11.8; Summer- Bay, 12.3, Apron shaded, 16.3, Apron unshaded 47.7, Top, 30.6 mol nf 2 d4 . Abbreviations: Bay- main phytotron bay area, Apron- main phytotron apron area, Top- top phytotron apron area, Apron shaded- main phytotron apron area under thermal shade screen, L1-9- length between nodes 1-9, TL- total shoot length, TN- total no. of nodes, NFI- node of flower initiation, FT- flowering time from planting date, LW- leaflet width at node 9, LL- leaf let length at node 9, Dry W- shoot dry weight.
Winter L1-9(cm) TL(cm) TN NFI FT(days) Seed Pods Stem(mm) LW(mm) LL(mm) DryW (g)
Bay 57.1 191.5 20.8 16.9 55.3 17.4 4.9 2.6 29.0 35.5 6.9 ± 1.85 a ± 8.08 a ± 0.39 a* ± 0.23 a*. ± 0.69 a* ± 2.58 a ± 0.64 a ± 0 . 08a* ± 0.72 a ± 0.08 a* ± 0.70 a
Apron 62.1 169.9 19.4 16.1 50.3 21.0 5.4 3.2 30.8 40.4 6.4 ± 0.83 b ± 2.62 b* ± 0.16 b ± 0.05 b ± 0.37 b* ± 1:00 a ± 0.28 a ± 0.07 b ± 0.50 b ± 0.67 b ± 0.20 a
Top 55.0 148.2 19.5 16.1 47.0 18.4 5.1 3.2 31.6 42.5 6.9 ± 0.67 a ± 3.16 c* ± 0.17 b ± 0.06 b ± 0.40 c* ± 1.61 a ± 0.36 a ± 0.06 b 0.58b ± 0.80 b ± 0.39 a
Summer Bay 37.7 100.4 17.9 15.6 33.4 3.7 1.7 2.2 26.5 39.3 3.5
± 0.44 a ±2.20a ± 0.11 a ± 0.18 a ± 0.44 a ± 0.83 a ± 0.24 a ±0.06a ± 0.87 a ± 1.25 a ± 0.15 a Apron Shaded 34.7 92.4 17.7 15.8 34.9 3.4 1.7 2.3 26.7 39 3.2
± 0.83 b ± 2.68 a ± 0.29 a ± 0.24 a ± 0.45 a ± 0.63 a ± 0.19 a ± 0.06 a ± 0.95 a ± 1.04 a ± 0.20 a Apron 35.1 93.9 17.1 15.1 31.7 3.0 1.7 2.3 28.3 41 3.6
± 0.48 b ± 2.67 a ± 0.31 a ± 0.20 a ± 0.60 b*. ± 0.41 a ± 0.17 a ± 0.05 a ± 0.81 a ± 0.92 a ± 0.16 a Top 31.4 91.6 17.9 15.2 39.1 7.3 2.5 2.5 28.0 38.5 3.5
± 0.76 c* ± 2.13 a ± 0.26 a ± 0.25 a ± 0.90 c* ±0.71 b* ± 0.22 b ± 0.10 b ± 1.06 a ± 1.32 a ± 0.08 a
35

2.3.5.2 Summer As for winter, to compare growth responses under the different environments
described above, peas were grown concurrently in the same glasshouses. In summer,
shading methods were employed- whitewash in the top phytotron; shade screens in the
main phytotron (eastern side only). This also allowed for the examination of the
influence of shade method on growth responses, as plants were grown concurrently
under the non-shaded portion of the apron. Mean PPF and DLI for each environment
were very variable in the different environments, ranging from 12-48 mol m -2d-1 in
shaded and unshaded conditions respectively (Table 2.7). Photoperiod was maintained
at 18 h, consisting of natural daylight (averaging 15h over summer) extended morning
and evening by weak (20 imoles tri 2s-1 ) mixed fluorescent and incandescent lighting.
Plants were grown and analysed as described in Materials and Methods.
Temperature parameters were quite variable between the environments in summer
(Table 2.11). The main phytotron environments (apron unshaded, apron shaded and
bays) were comparable in mean and midday air temperature, but midday soil
temperature was significantly higher in non-shaded plants in this environment (Table
2.11). Temperatures were cooler on average in the air conditioned top phytotron than
the evaporatively cooled main phytotron, with midday air and soil temperatures up to
5°C cooler. This demonstrates the influence of cooling method on growing conditions.
Thus, unlike winter, there was significant temperature variation between the
environments.
Table 2.11. Mean summer temperature parameters (oC) for the glasshouse environments during the study period (summer 2005/6)
Environment Midday air Midday soil Mean day Mean night temperature temperature temperature temperature
Outside 26.6 21.5 16.2
Main apron SS 29,5 24.8 24.9 18.5
Apron no SS 29.5 28.9 24.9 18.5
Main bay 29.5 23.8 24.9 18.5
Top phyt. 25.9 23.8 22.8 17.4
Cell 3 20.4 19.6 20.5 19.8
36

PPF and DLI measurements (Table 2.7) were also variable. Lowest light
measurements were in the main phytotron bays, averaging 12.3 mol m 2 d1 , while
highest measurements were in the same glasshouse on the unshaded side, averaging
almost 48 mol m 'd - '. Shading dramatically reduced light levels (and soil
temperature), on the apron area to 16 mol m -2 d -1 . Light levels in the whitewashed top
phytotron were relatively high, over 30 mol m -2 d- ' (Table 2.7). Thus the glasshouses
examined for the growth response studies varied markedly in light quantity and
temperature.
Results (Table 2.10) suggest the major influence in summer was temperature, not
light quantity. Shoot length (L1-9, TL) was not significantly different on the unshaded
and shaded sides of the apron even though daily light integral was almost 3 times
higher, nor was stem diameter, leaf size and dry weight. While L1-9 was higher in the
relatively low light of the bays, all other parameters were not significantly different to
the shaded and unshaded portions of the apron. The exception was flowering time
(FT), which was not significantly different between the bays and shaded apron, but
significantly earlier (P<0.01) on the unshaded side, and significantly later (P<0.01) in
the top phytotron (Table 2.10). Seed number was also significantly higher (P<0.01) in
the top phytotron, but not significantly different in the other environments (Table
2.10). Dry weight was not significantly different between any of the environments.
Shade methods dramatically reduced light transmission (Table 2.6) and irradiance
(Table 2.7). In the main phytotron, the shade screen reduced DLI from around 48 to
16 mol The reduction in thermal load is reflected in a significant reduction in
mean midday soil temperature from 29 to 25°C (Table 2.11). However, there were no
significant differences for any of the growth and development parameters measured
between the shaded and unshaded sides of the apron, apart from earlier flowering time
on the unshaded side (Table 2.10).
Overall, the results show there was much less variation in growth responses between
the environments in summer compared to winter in spite of the large differences in
light quantity. This would suggest that light quantity in the lower light areas was still
sufficient for normal growth. Variation appears to be more related to temperature than
light in summer. There are large reductions in all growth parameters in the higher
temperatures of summer compared to winter, particularly in shoot length, flowering
time, and yield (Table 2.10), even in the phytotron bays where light levels were still
relatively low. Node of flower initiation (NFI) was relatively stable between the
37

environments and winter to summer, reducing by around 1 node in summer.
Reduction of DLI by shading had little influence on growth parameters, but in the
cooler top phytotron, plants had longer internodes, later flowering, and higher yields
and larger leaves (Table 2.10). However, this house also varied in covering material
(horticultural rather than laminated glass), and shade method (whitewash rather than
shade screen).
2.3.5.3 Season The influence of season was examined by comparing the growth of L107 pea on the
main glasshouse apron area in different seasons. In the same glasshouse environment
under the same photoperiod (18h) growth responses were variable between seasons,
particularly shoot length, flowering time and yield (Table 2.12). Summer figures are
from plants grown under the shade screen. As can be seen from Table 2.12, DLI
figures were relatively even between the seasons in this area, although lower in
winter. The major variations were in mean temperature (Table 2.12). Shoot length
decreased with increasing temperature between the seasons (TL r 2=0.76), and yield
figures reduce (seed r 2=0.65) (Table 2.12). Flowering node (NFI) was earlier in spring
and summer, but was relatively stable between seasons. Days to first open flower
(FT), i.e. the vegetative phase, was also influenced by temperature (r 2=0.89). The
vegetative phase was longest in the coolest seasons (50 days in winter) and reduced in
warmer periods (35 days in summer) (Table 2.12). Dry weight also decreased with
increasing temperature (Table 2.12). Late summer figures were included to examine
the influence of decreasing temperature- plants were maturing in autumn as
temperature was moderating. Shoot length figures were significantly increased relative
to spring (when temperatures were increasing) and summer, as were yield figures
(Table 2.12).
Late summer plants were also grown in the main glasshouse and outside in a shade
house to examine the influence of the lower average temperature outside, and of
decreasing temperature after flowering. Compared to glasshouse grown plants, plants
outside in the shade house had significantly (at P < 0.01) increased total shoot length,
flowering time (vegetative phase) and yield (Table 2.12). Plants were similar to winter
and autumn grown plants, when temperatures were cooler but DLI was less.
38

Table 2.12. Mean environmental and growth parameters (± SE, n = 20) for L107 pea grown on the main phytotron apron in different seasons. Late summer plants were also grown concurrently in a shade house (Late summer shade house). Different letters signify significant differences at P<0.05, letter plus asterisk (e.g. b*) significant at P<0.01. Abbreviations: L1-9- length between nodes 1-9, TL- total shoot length, FT- flowering time from planting date, NFI- node of flower initiation, LW- leaflet width at node 9, LL- leaflet length at node 9, DW-shoot dry weight.
Season Mean day temp
(C)
Mean DLI (mo1m -2d -1 )
L1-9 (cm)
TL (cm) FT (days)
NFI Seed Pods Stem (mm)
LW (mm) LL (mm) DW. (g)
Winter 18.2 10.7 62.1 ± 169.9± 50.3± 16.1 ± 21.0± 5.4± 3.2± 30.8± 40.4± 6.4± 0.83 a* 2.62 a* 0.37 a* 0.05 a 1.00 a* 0.28 a* 0.07 a* 0.50 a 0.67 a 0.20 a*
Autumn 20.3 14.2 37.7 ± 151 ± 45.3 ± 16.0 ± 18.2 ± 4.6 ± 2.6 ± 28.3 ± 39.4 ± 5.7 ± 0.66 b 2.20 b* 0.35 b* 0.13 ab 0.77 a* 0.18 a* 0.08 b 0.84 a 1.24 a 0.18 a*
Spring 21.4 14.4 39.4± 118.9± 36.4± 15.3± 10.2± 3.5± 2.7± 31.3± 44.9± 4.4± 0.92 b 4.00 c* 0.46 c* 0.14 b* 1.42 b* 0.28 b* 0.06 b* 0.68 a 0.86 b* 0.19 b*
Summer 24.9 16.3 34.7± 92.4± 34.9± 15.8± 3.4± 1.7± 2.3± 26.7± 39.0± 3.6± 0.83 b 2.68 d* 0.45 c* 0.24 ab 0.63 c* 0.19 c* . 0.06 c* 0.95 b* 1.04 a 0.16 c*
Late 22.2 15.6 42.6± 127.3± 36.1 ± 16.0± 11.9± 3.5± 2.7± 32.2± 42.5± 5.3± Summer 0.56 c 2.18 c* 0.67 c* 0.31 a 0.69 b* 0.20 b 0.06 b* 0.65 a 3.72 a 0.21 ab*
Late 21.1 15.6 39.6± 156.8± 43.6± 15.9± 14.1 ± 5.2± 3.3± 32.6± 43.8± 5.9± summer- shade house
0.78 b 6.63 a*b* 0.55 b* 0.17 a 1.09 b* 0.32 a* 0.07 a* 0.63 a 0.92 b 0.20 a*
39

2.3.6 Examining the reasons for growth response variations
2.3.6.1 Light quality (spectral properties) Spectral differences between the glasshouse environments were minor. The shading
methods examined did not significantly alter the spectral properties of sunlight (Table
2.3), and there were no significant differences between plants grown on the shaded
and unshaded sides of the apron apart from flowering time (Table 2.10). The largest
spectral difference was in the reduced UV-B component through laminated glass
compared to horticultural glass (Fig. 2.1). In winter, plants grown in the main
glasshouse (laminated glass) were significantly longer and days to first flower was
significantly later (L1-9, TL, FT, Table 2.10) than those grown concurrently in the top
glasshouse (horticultural glass), even though light and temperature profiles were
similar and photoperiod extension type was the same. In summer, plants had longer
L1-9 under horticultural glass, and flowering time and yield was increased (Table
2.10), but there were significant temperature differences (Table 2.11).
To examine the influence of UV, independently of temperature, L107 pea was
grown in the controlled environment glasshouse at 20 °C day, 18 °C night, ± 1 °C under
laminated glass. Supplementary UV was supplied to half the plants over the full 18 h
photoperiod by fluorescent black lights (Fig. 2.4) at a fluence rate of 6 umol m -2
This was to provide 0.4 mol T11-2 CI-1 UV, the calculated deficit from natural light UV
levels during the study period (autumn). Also gown was pea L218, a day neutral
selection from L107, to examine if there was any difference in response between a
photoperiodic and non photoperiodic line.
40

UV blacklight
300 350 400 450 500 550 600 650 700 750 80C
Wavelength (nm)
Figure 2.4. Spectral distribution of Sylvania (Tokyo, Japan) F36W/BLB-T8 Black light
Results (Table 2.13) show that for L107, there were no significant differences
between UV depleted and UV added plants, apart from a slight increase in number of
nodes (TN) without UV. For L218, total shoot length, number of seed and stem
diameter was significantly increased (P< 0.05, Table 2.13) with UV added. Other
parameters were not significantly different. There was no significant difference in
flowering parameters for either the photoperiodic (L107) or day neutral lines (L218).
2.3.6.2 Light quantity
2.3.6.2.1 Duration L107 pea is a quantitative long day photoperiodic line and wild type to a range of
photomorphogenic mutants (Weller et al. 2001) grown at the Hobart site. The
phytotron bay system (automated trolleys) allows for photoperiod control, and is
examined in Chapter 5. As a quantitative plant, L107 flowers later under short days,
(node 23 under 8h, Chapter 5, Table 5.4), and around node 16 under 18h (Table 2.12).
Standard photoperiod in the glasshouses is 18h. It was identified that in winter plants
were influenced by low light levels (Table 2.12), and one way of increasing light
quantity is to extend the photoperiod. Some species show improved growth under a
24h photoperiod, while others do not. For example, increasing photoperiod from 16 to
24 h with the same total daily light integral produced a 50% yield increase in lettuce
(Koontz et al. 1987). However, some species (e.g. radish and chrysanthemum) show
reduced leaf development and dry weight, and some growth abnormalities under
continuous light (Warrington and Norton 1991). The response of pea appears to have
41

not been described in these terms; hence the specific response of increasing
photoperiod from 18h to 24h was examined under controlled conditions.
To examine the growth response of pea to a 24h photoperiod, L107 was grown in
growth chambers under fluorescent/incandescent lighting at 20 °C at 18h and 24h.
Irradiance was 200 imoles m-2s4 under 18h and 150 moles m -2s-1 under 24h to give
equal total daily light integral of 13 mol m -2d-I , allowing for examination of the
difference in photoperiod without temperature or total light quantity differences.
Compared to 18h, plants under 24h at equal DLI showed significantly (P < 0.01)
reduced total shoot length, number of nodes, earlier flowering node and time, reduced
yield and dry weight (Table 2.14). Leaf size was not significantly different (Table
2.14).
42

Table 2.13. Mean growth parameters (± SE, n = 20) for lines 107 and 218 pea grown concurrently in a controlled environment laminated glass glasshouse (UV depleted) with and without 0.4 mol m -2 (14 UV-B supplement provided by Sylvania (Japan) F36W/BLB-T8 Black light. Photoperiod 18h consisting of natural light extended by high pressure sodium globes. Temperature 22 ° day, 18 ° night ±1 °C. Different letters signify significant differences at P<0.05, letter plus asterisk (e.g. b*) significant at P<0.01. Abbreviations: L1-9- length between nodes 1-9, TL- total shoot length, TN- total no. of nodes, NFI- node of flower initiation, FT- flowering time from planting date, LW- leaflet width at node 9, LL- leaflet length at node 9, Dry W- shoot dry weight.
L107 L1-9(cm) TL(cm) TN NFI FT(days) Seed Pods Stern(mm) LW(mm) LL(mm) Dry W (g)
- UV, 46.0 144.0 20.8 17.5 36.3 11.8 4.1 2.6 31.6 43.4 4.7 ±0.66a ±2.54a ±0.16a ±0.12a ±0.32a ±0.79a ±0.29a ± 0.07 a ± 0.59 a ± 0.73 a ± 0.12 a
+ UV 47.0 140.2 20.3 17.3 36.0 11.0 3.9 2.7 32.6 45.5 4.6 • ± 0.59 a ± 1.41 a ± 0.14 b ± 0.11 a ± 0.26 a ± 0.51 a ± 0.21 a ± 0.07 a ± 0.58 a ± 0.94 a ± 0.06 a
L218 L1-9(cm) TL(cm) TN NFI FT(days) Seed Pods Stem(mm) LW(mm) LL(mm) Dry W (9)
- UV 40.0 94.8 16.4 13.4 29.9 7.4 4.4 2.8 32.9 44.9 3.7 ± 0.56 a ± 2.00 a ± 0.23 a ± 0.17 a ± 0.39 a ± 0.65 a ± 0.31 a ± 0.04 a ± 0.39 a ± 0.67 a ± 0.07 a
+ UV 40.9 100.7 16.8 13.4 29.7 10.0 4.9 3.0 32.5 45.9 4.0 ± 0.38 a ± 1.24 b ± 0.17 a ± 0.22 a ± 0.54 a ± 0.69 b* ± 0.32 a ± 0.04 b* ± 0.41 a ± 0.46 a ± 0.17 a
Table 2.14. Mean environmental and growth parameters (± SE, n = 20) for L107 pea grown concurrently in controlled environment chambers under fluorescent/incandescent lighting at 20 °C at 18 and 24h. Irradiance was 200 moles in -2s4 under 18h and 150 moles rrf 2s-1 under 24h to give equal total daily light integral of 13 mol nf 2d -1 . * signifies significant differences at P.<0.05, ** significant at P<0.01. Abbreviations: L1-9- length between nodes 1-9, TL- total shoot length, TN- total no. of nodes, NFI- node of flower initiation, FT- flowering time from planting date, LW- leaflet width at node 9, LL- leaflet length at node 9, Dry W- shoot dry weight.
L1-9 (cm) TL (cm) TN NFI FT (days) Seed Pods Stem (mm) LW (mm) LL (mm) Dry W (g) 18h 31.4 131.5 23.3 18.1 35.4 19.9 7.8 2.8 35.0 46.3 5.7
± 0.58 ± 3.23 ± 0.33 ± 0.18 ± 0.44 ± 1.71 ± 0.70 ± 0.08 ± 1.02 ± 1.30 ± 0.16 24h 33.2 107.9 21.5 16.7 31.2 12.8 6.2 2.9 33.0 45.6 4.7
± 0.54* ± 2.0** ± 0.24** ± 0.15** ± 0.57** ± 0.93** ± 0.50 ns ± 0.07' ± 0.57 s ± 0.98 ns ± 0.16**
43

2.3.6.2.2 Irradiance •Most species have an optimum irradiance range for maximum growth rates. Dry
weight accumulation increases with irradiance for many species up to a threshold
(Mattson and Erwin 2005), but responses vary widely by species (Warrington and
Norton 1991). Maximum flowering for many crop species is between 12 and 14 mol
m-2d -1 (Mattson and Erwin 2005). Photosynthetic rates also vary with species, but
most C3 species reach light saturation by 600iimol rn-2s-1 (McCree 1972a). For peas,
maximum rates are at less than 500 pmol rn -2s-1 , photosynthetic rates reduce above
500 limol rri2s-1 (Chow and Anderson 1987a).
Low light levels can be a stress to plants. Peas typically respond to low light with
shoot elongation (Gawronska et al. 1995) and this appeared to be the case for winter
grown plants in the glasshouse bays (Table 2.10). Light levels in the glasshouse
environments varied widely between each other (e.g. 8.5-10.7 mol m -2d-1 in winter in
the main phytotron bays and apron, Table 2.6 ) and between seasons (eg 12.3-16.3
mol m-2d-1 for the same areas in summer, up to 47.7 mol m -2d-1 on the unshaded apron,
Table 2.7). However, temperature also varied (Table 2.12); hence the specific
response to irradiance was examined under controlled conditions.
To examine the growth response of pea to irradiance, L107 was grown in growth
chambers under fluorescent/incandescent lighting at 20°C under an 18h photoperiod.
Irradiance was 80, 150, 220 and 300 Innoles tri2s-1 PPF, giving total daily light
integrals of 5.2, 9.7, 14.3, and 19.4 mol m -2d-1 respectively.
Results show that at equal temperature, increased irradiance significantly (P <0.01)
reduced shoot length (Table 2.15). Length of nodes 1-9 was strongly correlated with
irradiance (r2=0.88), decreasing with increasing irradiance. Dry weights, however,
were not significantly different between treatments (Table 2.15). Optimum irradiance
appeared to be at 14 moles ni2d-1 , with earlier flowering time, highest yield and stem
diameter, and dramatically increased leaf size (Table 2.15).
44
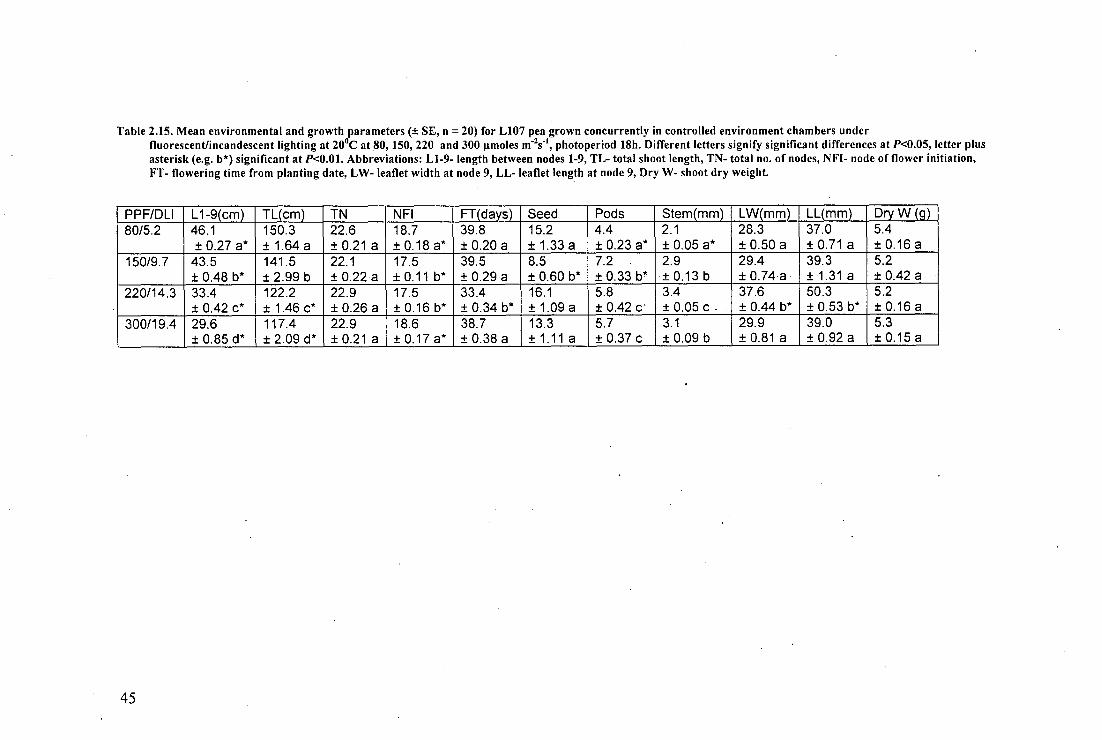
Table 2.15. Mean environmental and growth parameters (t SE, n = 20) for L107 pea grown concurrently in controlled environment chambers under fluorescent/incandescent lighting at 20 °C at 80, 150, 220 and 300 umoles photoperiod 18h. Different letters signify significant differences at P<0.05, letter plus asterisk (e.g. b*) significant at P<0.01. Abbreviations: L1-9- length between nodes 1-9, TL- total shoot length, TN- total no. of nodes, NFL- node of flower initiation, FT- flowering time from planting date, LW- leaflet width at node 9, LL- leaflet length at node 9, Dry W- shoot dry weight.
PPF/DLI L1-9(cm) TL(cm) TN NFI FT(days) Seed Pods Stem(mm) LW(mm) LL(mm) Dry W (g) 80/5.2 46.1 150.3 22.6 18.7 39.8 15.2 4.4 2.1 28.3 37.0 5.4
± 0.27 a* ± 1.64 a ± 0.21 a ± 0.18 a* ± 0.20 a ± 1.33 a ± 0.23 a* ± 0.05 a* ± 0.50 a ± 0.71 a ± 0.16 a 150/9.7 43.5 141.5 22.1 17.5 39.5 8.5 7.2 2.9 29.4 39.3 5.2
± 0.48 b* ± 2.99 b ± 0.22 a ± 0.11 b* ± 0.29 a ± 0.60 b* ± 0.33 b* ± 0.13 b ± 0.74 a ± 1.31 a ± 0.42 a 220/14.3 33.4 122.2 22.9 17.5 33.4 16.1 5.8 3.4 37.6 50.3 5.2
± 0.42 c* ± 1.46 c* ± 0.26 a ± 0.16 b* ± 0.34 b* ± 1.09 a ± 0.42 c• ± 0.05 c . ± 0.44 b* ± 0.53 b* ± 0.16 a 300/19.4 29.6 117.4 22.9 18.6 38.7 13.3 5.7 3.1 29.9 39.0 5.3
± 0.85 d* ± 2.09 d* ± 0.21 a ± 0.17 a* ± 0.38 a ± 1.11 a ± 0.37 c ± 0.09 b ± 0.81 a ± 0.92 a ± 0.15 a
45

2.3.6.3 Temperature The major differences in the glasshouse environments in summer appeared to be
temperature related, with reductions in shoot length, yield and flowering time in
particular associated with increased temperature (Table 2.12). To examine the
influence of temperature, independently of irradiance, L107 was grown in growth
chambers with fluorescent/incandescent lighting under an 18h photoperiod at 15, 20,
and 25 °C at optimum irradiance (shown above to be 220 timoles rn -2s -1 PPF, 14.3, mol
m-2d-1 ) Results (Table 2.16) show that at 15 °C, total shoot length, number of nodes,
flowering node, flowering time, yield and dry weight were significantly increased
relative to 20oC. At 25oC, shoot length, flowering time, yield, stem diameter, leaf size
and dry weight were significantly reduced relative to plants grown at 20 °C.
Development time was slower at lower and earlier at higher temperature, reflected in
flowering time (Table 2.16), but also in days to senescence (90 days at 15 0, 65 days at
20°, 60 days at 25 °C). Thus, relative to 20°C, lowering temperature increased yield
and biomass, but strongly delayed development time. Higher temperature reduced
yield and biomass significantly and slightly accelerated development time. At 20 °C,
leaf size was significantly (P < 0.01) . larger than at 15 and 25 °C, smallest leaf size was
• at the higher temperature (Table 2.16). Total shoot length, flowering time, yield, and
dry weight appear to be closely associated with temperature in these results (Table
2.16), with r2 values of 0.93, 0.98, 0.79 and 0.77 respectively. Node of flower
initiation (NFL Table 2.16) was least influenced by temperature (r 2=0.28).
To confirm these responses under natural light conditions, L107 plants were also
grown concurrently in adjacent controlled environment glasshouse cells. Temperature
was 20°C day 15 °C night and 25 °C day, 20 °C night, both ± 2°C. Results (Table 2.16)
also showed significantly (P < 0.05) reduced total shoot length, flowering time, yield,
stem diameter, leaf size and dry weight at 25 °C compared to 20 °C. Again NFI was not
significantly different (Table 2.16).
46

Table 2.16. Mean growth parameters (± SE, n = 20) for L107 pea grown concurrently in controlled environment chambers under fluorescent/incandescent lighting at 15, 20 and 25°C at 220 )(moles photoperiod 18h; and in adjacent controlled environment glasshouse cells under natural light with photoperiod extended to 18 h with high pressure sodium lamps at 20 and 25° ±2°C. Different letters signify significant differences at P<0.05, letter plus asterisk (e.g. b*) significant at P<0.01. Abbreviations: L1-9- length between nodes 1-9, TL- total shoot length, TN- total no. of nodes, NFL- node of flower initiation, FT- flowering time from planting date, LW- leaflet width at node 9, LL- leaflet length at node 9, Dry W- shoot dry weight.
Growth chambers uC L1-9(cm) TL(cm) TN NFI FT(days) Seed Pods Stem(mm) LW(mm) LL(mm) Dry W (g) 15 6.1
31.8 156.3 25.8 18.4 55.0 30.0 10.0 3.4 32.0 40.8 ± 0.40 a ± 1.49 a* ± 0.22 a* ± 0.13 a ± 0.46 a* ± 1.51 a* ± 0.51 a* ± 0.06 a ± 0.47 a* ± 0.48 a
±0.12 a* 20 33.4 122.2 22.9 17.5 33.4 16.1 5.8 3.4 37.6 50.3 5.2
± 0.42 b ± 1.46 b* ± 0.26 b ± 0.16 b* ± 0.34 b* ± 1.09 b* ± 0.42 b* ± 0.05 a ± 0.44 b* ± 0.53 b* ± 0.16 b* 25 27.9 93.7 22.3 18.2 27.7 6.6 3.8 2.5 26.0 38.9 3.7
± 0.41 c* ± 2.01 c" ± 0.34 b ± 0.12 a ± 0.21 c* ± 0.66 c* ± 0.34 c* ± 0.04 b* ± 0.64 c* ± 0.79 c ± 0.08 c* Controlled temperature glasshouse uC L1-9(cm) TL(cm) TN NFI FT(days) Seed Pods Stem(mm) LW(mm) LL(mm) Dry W (g) 20 32.5 121.4 20.7 17.0 40.0 15.2 5.3 3.5 37.4 48.8 5.7
±0.84a ±4.11 a ±0.41 a ± 0.24 a ±0.29a ±1.32a ±0.67a ±0.19a ± 1.15 a ± 1.66 a ±0.32a 25 33.1 97.3 20.0 17.4 30.8 11.1 3.7 2.7 28.4 40.6 3.3
± 0.82 a ± 4.74 b* ± 0.47 a ± 0.31 a ± 0.42 b* ± 1.04 b ± 0.54 b ± 0.11 b* 1.64 b* ± 1.62 b* ± 0.35 b*
47

500 - E
a.) 450
a) -o 2 400
a) w
•
350 - C
2 300
a
0.3 0.7 1.4
Air velocity (m s-1 )
2.3.6.4 Air velocity, CO2 In common with most research greenhouses, the glasshouses examined have staged
cooling. Initially vents open at 20 °C (passive cooling), and extraction fans or air
conditioning operating at 23-25 °C (active cooling). Air velocity measured in the
glasshouses was generally within the recommended range for controlled environments
of 0.3-0.7 m s -1 (Downs and Krizek 1997), even with active cooling. However, up to
1.4 m s -1 was measured close to vents during active cooling. To examine the influence
of air velocity, L107 was grown concurrently under glasshouse conditions at 0.1-0.3
m s -1 (i.e. the normal air velocity range measured in the ventilated glasshouse with
passive ventilation), and with air velocity increased with fans to 0.7 and 1.4 m s -1 (the
ranges measured with active cooling).
There were no significant differences between treatments for number of nodes,
flowering node, flowering time, yield, stem diameter, leaf size or dry weight.
However, length of nodes 1-4, 1-9 and total shoot length all showed significant (P <
0.01) reductions at 0.7 m s -1 compared to 0.3 m s -1 . Although shoot length was further
reduced at 1.4 m s -1 , the reductions were not significantly different (e.g. Fig. 2.5 for
L1-9). Thus increased air velocity reduced shoot length but not other growth
parameters.
Figure 2.5. Mean length of nodes 1-9 for L107 pea grown concurrently in glasshouse conditions at air velocities of 0.3, 0.7 and 1.4 m Different letters signify significant differences at P<0.01, n = 20.
48

2.4 Discussion
2.4.1 Spectral properties There was little difference in natural light spectral properties between winter and
summer either in sunny or overcast conditions (Fig. 2.2). In overcast conditions, blue
proportions are increased, but R:FR ratios are unaltered (Table 2.2). Increased blue
has been attributed to light scatter from cloud cover (Smith and Morgan 1981), and
also appears to be a property of scattered light in the glasshouses from structural
shading, as the phytotron bays showed similar increases in blue proportions, as did
areas under thermal shade screens. The light scattering properties of the heavy
infrastructure in the bays, and of the reflective aluminium shade screens may be
responsible. However, differences were minor with around a 1% increase in blue in
shaded conditions.
Apart from this difference in the bays, there was also little difference in spectral
properties in the glasshouses in any season, apart from the UV reduction under
laminated glass (main phytotron) compared to horticultural glass (top phytotron), (Fig.
2.1, Table 2.2). In winter, when these areas had similar temperature and light quantity
profiles, shoot length and flowering time was reduced in the top phytotron, but all
other growth parameters were the same (Table 2.10). In summer, shoot length was
also reduced but flowering time was later, and yield was increased in the top
phytotron (Table 2.10). However, it was markedly cooler in the top phytotron
compared to the apron over this period. To test if UV reduction had an influence, both
L107 and a day neutral pea line (L218) were grown at controlled temperature in a
laminated glass glasshouse with and without supplementary UV radiation. Results
(Table 2.13) showed no significant differences for L107, but slight increases in shoot
length and yield of L218 with UV added to restore ambient levels. There have been
numerous studies on the influence of above ambient UV levels: high UV can induce
tissue damage, stunting, reduced leaf area and increased thickness, and increased
branching. Stomata may close, photo protective pigments increase and chlorophyll
content reduces, thus photosynthesis is reduced (Beggs and Wellman 1994; Teramura
1983), including in pea (Nogues et al. 1999). However, these effects may be modified
by other wavelengths in the PAR range, and plants can acclimate (Kakani et al. 2003).
Although UV can be damaging, a lack of UV can reduce anthocyanin synthesis and
49

produces "weaker" plants (Hashimoto 1994). For pea, restoring UV to ambient levels
produced slight but not significant growth improvement, and the UV reduction under
laminated compared to horticultural glass is unlikely to be a significant influence on
growth responses.
None of the shade methods employed significantly altered the spectral properties of
sunlight (Table 2.3), unlike canopy shade where far red proportions in particular are
significantly enhanced (Morgan 1981; Smith and Morgan 1981). Both whitewash and
shade cloth can be considered wavelength neutral with respect to sunlight (Table 2.4).
Thermal shade screens are commonly used in research greenhouses, as they provide
insulation at night and shade during summer days. The thermal shade screen used in
the main phytotron over summer did induce a slight increase in R:FR, from 1.1 to 1.2,
and slightly higher blue proportion (Table 2.4). This was in agreement with previous
reports (Kittas et al. 1999), but growth responses were not examined. In this study,
there were no significant differences (apart from flowering time, which appeared to be
temperature related, Table 2.12) in growth parameters between plants grown under
shade screen and those with no shading (Table 2.10). This suggests the slight spectral
alterations under shade screens can also be considered spectrally neutral for plant •
responses, and that the common methods of artificial shade do not mimic the spectral
properties of the filtered light in plant canopies where R:FR ratio is reduced in
proportion to the degree of shading (Morgan 1981).
Spectral properties, then, showed little variation seasonally or between glasshouses,
were little influenced by shading methods, and the slight changes recorded did not
appear to influence the growth responses of a pea line known to be sensitive to such
changes.
2.4.2 Light quantity In contrast to spectral properties, light quantity was highly variable, both seasonally
and daily. Ranges in winter and summer (Tables 2.5, 2.7) showed large variation and
large quantity variations can also be found on an hourly basis with cloud cover (Fig.
2.3). In situ measurements showed the strong influence of greenhouse structures on
light quantity (Table 2.4). While glass transmitted up to 90% of sunlight, within the
glasshouse transmission was reduced to around 50%, and was under 15% amongst the
heavy infrastructure of the phytotron bays. In the controlled environment glasshouse,
with little structural shading, transmission was over 80%. Thus mean daily light
50
integrals (DLI) was very low in the phytotron bays in winter (Table 2.5), and plants
grown in this period showed significantly increased shoot length and flowering time,
with reduced stem diameter and leaf size (Table 2.10), characteristics of low light
responses (McFarlane 1978). The effect of infrastructure shading could also be
observed from light distribution measurements, particularly under sunny conditions
where midday measurements on the same day ranged from, for example, 140-820
ilmol m-2 s-I . Lower figures were under extension lights and stands on the phytotron
apron. However, with the earth's rotation, the sun position is not fixed relative to the
glasshouse, and there was no area of the glasshouses in permanent shade. Rather, there
was a moving pattern of light and shade within the glasshouses throughout the day,
and photosynthetic adaptation to light levels is rapid (Walters and Horton 1994).
While higher total crop yields are reported under diffused light, attributed to more
even light distribution (Hanan 1998; Aldritch and White 1969), these glasshouses are
not used for whole crops but for a series of small scale independent experiments.
Nevertheless, there was no evidence of improved growth under the diffusing nature of
the shade screens compared to unshaded conditions (Table 2.10).
Winter light levels can be limiting under diffusing materials and maximum
transmission needs to be considered (Aldritch and White 1969). Under overcast
conditions, winter light levels measured were at times very low, 5 times lower than
sunny conditions outside, even though transmission was relatively high under overcast
conditions (Table 2.4), and in winter plants were relatively elongated compared to
other seasons (Table 2.12). One way to increase daily light integral is to increase the
photoperiod, for example from 18 to 24h. Some species such as lettuce, show
improved growth under a 24h photoperiod (Koontz et al. 1987), while others do not
(Warrington and Norton 1991). To examine the response of pea to a 24h photoperiod,
L107 was grown in growth chambers at 18 and 24h but at equal total daily light
integral of 13 mol m -2d-I . Results (Table 2.14) showed the longer photoperiod was
detrimental to growth for pea, with reduced shoot length, yield and dry Weight
compared to 18h, but earlier flowering.
In contrast to winter, summer light levels were very high, 3 times higher than winter
outside (Tables 2.5, 2.7), and was highly variable between environments, ranging
from means of 12 mol 1112 d-I in the phytotron bays to almost 48 mol m 2 cl-I on the
unshaded main phytotron apron (Table 2.7). A common method for reducing thermal
load in greenhouses in summer is to use shading to reduce solar gain. The primary aim
51

of shading is not the creation of shade but to limit unacceptable temperature increases
from high solar irradiance (Hanan 1998). Whitewash is simple and cheap, but can
produce heavy shading and is considered inflexible (Connellan 1996). Retractable
shade screens offer the flexibility to be opened on overcast days, and closed when
needed. Shade screens with insulating properties (thermal screens) can be opened
during low light, closed during high light and at night to reduce heat loss (Connellan
1996; Hanan 1998). While measurements under whitewash confirmed the heavy
shading properties of this material (transmission of 15%, Table 2.6), there is flexibility
in how the material is applied. With striped application, summer light levels in the top
phytotron were relatively high, over 30 mol 111-2 d-1 , compared to 16 mol m 2 c1-1 under
shade screen (Table 2.7), even though shade screen transmission was close to 30%
(Table 2.6). The striped application method created a higher transmission level of
around 36% of the uncovered glass. The striped nature also created a moving pattern
of light and shade rather than a blanket reduction. This affected distribution- under the
shade screens light distribution was very even, under the striped whitewash, stark
contrasts could be found. However, as for uncovered glass, no area was in permanent
shade. The net result was significantly higher light levels in the whitewashed
glasshouses than the shade screen areas (Table 2.7). Photosynthetic adaptation to light
is rapid, as plants transferred from high to low light intensity show rapid changes in
photosynthetic rate and chlorophyll a/b ratio and an increase in light harvesting
complexes (Walters and Horton 1994). Peas also adapt rapidly, photosynthetic
capacity increased on transfer from low light (60 [tmoles m -2s-1 ) to high (390 [tmoles
M-2
S-1
) with no obvious lag phase, and both high and low light adapted plants showed
similar utilisation efficiency of low light (Chow and Anderson 1987a).
Use of shading maintained relative even light levels between seasons, yet growth
responses were highly variable (Table 2.12). In winter, with relatively even
temperature profiles in the glasshouses, shoot length and flowering time showed a
close association with light quantity (Table 2.10). In summer shoot length was not
significantly different on the unshaded and shaded sides of the apron (Table 2.10)
even though daily light integral was almost 3 times higher, although flowering time
was earlier under higher light. To further examine the role of light quantity, plants
were grown in growth chambers at equal temperature (20 °C) but different irradiances
(80, 150, 220 and 300 i_tmol 121-2 s-1 )• There were clear reductions in shoot length with
increasing irradiance (Table 2.15). Flowering time was not significantly different at
52

80, 150 and 300 innol 111-2 s-1 , but was significantly earlier at 220 gmol IT1-2 s-1 . This
irradiance (around 14 mol 111-2 d-1 ) appeared to be the optimum irradiance for pea
growth, with highest yield, stem diameter and leaf size (Table 2.15).
Overall, the results show that light quantities are highly variable and structural
shading can dramatically reduce light levels. In winter, plant responses suggested light
was limiting in the phytotron bays, with increased shoot length, known to be
associated with irradiance in pea (Gawronska et al. 1995). This was confirmed by
growth chamber experiments (Table 2.15). In summer, the much higher irradiance can
be managed with shading, and the commonly employed methods examined can be
considered as spectrally neutral, both physically and in terms of pea responses.
Although light quantity was substantially reduced by shading, light quantities were
still adequate for growth, and its use resulted in relatively even DLI between seasons
(Table 2.12). Peak irradiance for pea growth was around 14 mol m -2 d -1 .
2.4.3 Temperature Mean day temperature ranges were moderate between seasons, ranging from 18-
25 °C in the main phytotron (Table 2.8), but pea is a cool season crop strongly
influenced by temperature (Chetia and Kumar 2005). Temperature appeared to exert a
major influence, independently of irradiance. The seasonal results at relatively even
DLI (Table 2.12) suggest a strong influence of temperature on shoot length and yield
in pea, and the growth chamber experiments at equal irradiance confirmed this.
Seasonally, total shoot length, flowering time, seed number, and stem diameter
appeared to be closely associated with temperature, decreasing with increasing
temperature. Leaf size reduced, but was less variable between seasons. Node of flower
initiation was relatively stable between seasons. Plants grown in the cooler shade
house over summer were similar to winter and autumn grown plants, when
temperatures were cooler but DLI was less, suggesting the shoot length, yield and
flowering time reductions in spring and summer were related more to temperature
than light quantity.
Growth variation also appeared to be more related to temperature than irradiance in
summer. There were large reductions in all growth parameters in the higher
temperatures of summer compared to winter, particularly in shoot length, flowering
time, and yield (Table 2.10), even in the phytotron bays where light levels were still
relatively low. Node of flower initiation (NFI) was relatively stable between the
53

environments and winter to summer, reducing by around 1 node in summer. In the
main phytotron, the shade screen reduced DLI from around 48-16 mol -20 (Table
2.7). The reduction in thermal load was reflected in a significant reduction in mean
soil temperature from 29 to 25 °C, but air temperature was not altered (Table 2.11).
However, there were no significant differences for any of the growth and development
parameters measured between the shaded and unshaded sides of the apron apart from
earlier flowering time on the unshaded side (Table 2.14). The air conditioned top
phytotron was on average 2°C cooler in summer (Table 2.11), and plants had longer
internodes, later flowering, higher yields and larger leaves (Table 2.10). Most species
have an optimum temperature, above which growth and yield declines rapidly (Heins
et al. 2000), and under field conditions, yield has been negatively correlated with
increasing temperature for pea (Chetia and Kumar 2005; Poggio et al. 2005).
Under the same light source at equal irradiance in growth chambers, and under
natural light in a controlled environment glasshouse, the strong influence of
temperature on pea could be seen. Total shoot length, flowering time, yield, and dry
weight were closely related to temperature in these results (Table 2.16), while node of
flower initiation (NFI) was least influenced by temperature, (r 2 of 0.28). At 15 °C, total
shoot length, number of nodes, flowering node, flowering time, yield and dry weight
were significantly increased relative to 20 °C. At 25 °C, shoot length, flowering time,
yield, stem diameter, leaf size and dry weight were significantly reduced relative to
plants grown at 20°C. Development time was slower at lower and earlier at higher
temperature. Higher temperature reduced yield and biomass significantly and reduced
leaf size (Table 2.16).
2.4.4 Air velocity and CO 2 . Light quantity and temperature varied between environments and seasons, and had
significant influences on growth. However, the influence of air velocity, CO2 and
humidity was minor. While humidity was often variable, ranging from 40% to over
80%, there was no evidence of growth impacts on well watered plants. CO2 levels
showed little variation from ambient readings in any of the glasshouse environments.
Air velocity and distribution, while highly variable outside, was generally within the
0.3 to 0.7 m s -1 range recommended for controlled environments (Downs and Krizek
1997.). Increasing air velocity above this level did reduce shoot length (Fig. 2.5), but
all other growth measurements were not significantly different.
54

2.4.5 Indicative plant responses In L107 pea, shoot length was the most variable factor in response to environmental
variation. Shoot length was increased by low irradiance, and reduced by increased
temperature and high air velocity. Node of flower initiation was relatively stable at
different irradiances and temperature, but was reduced by a 24h photoperiod.
Flowering time was increased by low irradiance, but shows close association with
temperature, reducing as temperature increases, and a reflection of development time.
Yield (seed and pods) showed close correlation with temperature, reducing as
temperature increased, as did dry weight. However, dry weight, commonly used as a
biomass indicator, was not always representative of growth differences. For example,
in winter plants in the phytotron bays had significantly smaller leaves and stems
relative to the other environments, but dry weight was not significantly different, as
these plants also had increased shoot length. Stem diameter and leaf size was
relatively stable between environmental conditions, but was reduced at low irradiance
and by higher temperature. Optimum growing conditions for this pea line would
appear to be at 20°C under an 18h photoperiod at around 200 [tmol M-2S-1 , or 14 mol
111-2 d-1 , at air velocities below 0.7 m s -1 . Least favorable growing conditions would be
above 23 °C under a 24h photoperiod at less than 100 mmol ni 2s - 1 , or 9 mol m 2 d-1 , at
air velocities above 0.7 m s -1 .
55

Chapter 3 Glass or Polycarbonate: influence of covering material
3.1 Introduction A common decision in greenhouse design is the choice of covering material. Many
plastic films are available, but for long term structures, the choice is usually between
glass and polycarbonate (Lexan). In Australia in recent years, the choice has tended to
lean towards polycarbonate for research greenhouses, as its impact resistance more
easily meets containment regulations. In the commercial sector, the trend has been
towards glass because of its high light transmission and longevity. Surprisingly, given
the costs involved, there have been few studies on comparative growth responses
under these materials. In this section, spectral properties and growth responses of a
standard research pea line under glass and polycarbonate is examined.
In Chapter 2, the strong influence of glasshouse infrastructure on light quantity was
shown in sunny conditions (Fig. 2.1); the influence was less under overcast conditions
(Table 2.4). Shoot length of pea was influenced by light quantity, with reduced leaf
size and relatively increased shoot length at lower irradiance under both natural (Table
2.10) and controlled conditions (Table 2.15).
The spectral properties of natural light varied according to cloud cover, with
increased blue proportion relative to sunny conditions (Table 2.2), but little difference
by season (Fig. 2.2). Commonly used summer shading methods also did not influence
spectral properties appreciably (Table 2.3). Both laminated and horticultural glass did
not alter the spectral properties of natural light significantly, apart from the UV
reduction under laminated glass (Table 2.2). However, UV supplementation to natural
levels under laminated glass did not influence growth responses (Table 2.13).
At moderate to high latitudes, light is often the limiting factor for plant growth in
greenhouses during short winter days, thus type of covering material and greenhouse
design become more important (Aldrich and White 1969). Most studies confirm glass
provides the highest transmission of greenhouse covering materials; several types of
reinforced plastic materials had visible light transmission values 15-37% lower with
up to 20% further losses in transmission when aged for 5 years (Aldrich and White
1969). Double layer covers have higher absorption and, although energy efficient, can
limit growth in low light climates (Hanan 1998). Polycarbonate is 10 times lighter
56

than glass, thus requiring less supporting structure. Transmission is 7-14% less than
glass but even with less infrastructure, light transmission inside the greenhouse is
usually less than inside a glasshouse (Mermier and Baille 1988). Plastic films are
available in a wide range of chemical compositions and additives, mainly UV
stabilisers for durability and infrared absorbers to reduce thermal heat loss.
Transmission levels range from 75 to 90%, and the light weight requires less
supporting structure (Connellan 1998; Mermier and Baille 1988). Transmission
deteriorates with age, with longevity for plastic films estimated at 2-4 years, 7-12
years for polycarbonate, and 30-50 years for glass (Connellan•1998).
Transparency of covering material also has an influence. Transparent materials
provide sharp contrasts, while translucent materials provide more light scatter and thus
more even distribution (Aldrich and White 1969). Some studies report up to 25%
increase in dry weight under translucent coverings, even though light quantity was
lower. However, for many species examined, lower winter light levels under
fibreglass and reinforced plastics resulted in elongated stems and abnormal
development compared to glass grown plants (Aldrich and White 1969). Tomato plant
height was significantly higher under acrylic and polyethylene compared to glass
(Erhiomi et al. 2002). There are also temperature interactions. Growth and flowering
of snapdragon and stock was better under glass than double layer polyethylene film,
although dry weight was similar, attributed to the improved thermal properties under
the double layer film (Dansereau et al. 1998). Carnation and cucumbers had lower
yields and flowering was delayed by 1-4 days under double acrylic than under single
glass greenhouses with identical design and orientation (Reiersen and Sebesta 1981).
Heat loss was 50% less and light transmission 15% lower in the acrylic compared to
the glasshouse in this study (Sebesta and Reiersen 1981). While many of these papers
relate the observed growth differences to temperature and/or light quantity, rarely is
consideration given to alterations in light quality under the different covering
materials. Kittas et al. (1999) measured spectral differences between greenhouse
covering materials under clear sky conditions but did not examine plant responses.
While supplementary lighting tended to correct any growth anomalies under non- •
glass materials, suggesting a light quantity response (Erhioui et al. 2002; Hao and
Papadopoulos 1999), the influence of spectral properties is rarely described. Height
reduction by filtering far red light is well described (Cerny et al. 2003), as is growth
57

improvements by supplementing natural light with high pressure sodium lamps, which
can offset light quantity reductions (Moe 1997).
Kittas et al. (1999) examined the spectral properties of glass, plastic film,
polyethylene and fibreglass greenhouses with and without various shading methods.
They found for similar structures and dimensions, glass transmits the highest PAR,
although the lighter structure of the plastic film greenhouse allowed for higher total
transmission. There was no influence of covering material or shading method on
phytochrome related parameters, but blue wavelengths were reduced significantly
under all covers except glass. Glass also contributes to a relative enrichment of PAR
relative to total radiation, and is recommended for areas where light is limiting in
winter (Kittas etal. 1999). Transmission, spectral properties and growth responses
were examined at this location (Hobart, Tasmania, Australia, latitude 42 ° S) under
laminated and horticultural glass. Glass and polycarbonate properties and growth
responses were examined in more detail at the Department of Primary Industries at
Knoxfield, Victoria, Australia, which has parallel climate controlled glass and
polycarbonate greenhouses, allowing for a clear comparison of the influence of these
materials on light properties and plant responses.
3.2 Materials and methods
3.2.1 Greenhouse environments Glasshouses examined at the Hobart site are listed in Table 2.1. All glasshouses are
aluminium framed and clad in either laminated glass (Pilkington Australia, 6.38 mm)
or horticultural glass (Pilkington Australia, 3mm). Also on the Hobart site is a CSIRO
greenhouse framed with galvanised steel and clad in polycarbonate 8mm glazing sheet
(Allplastics Engineering, Sydney, Australia). Glass and polycarbonate properties and
growth responses were examined in more detail at the Department of Primary
Industries at Knoxfield, Victoria, which has parallel climate controlled horticultural
glass and polycarbonate greenhouses. This greenhouse complex was opened in 1994,
thus the covering materials were 12-13 years old at the time of the study. Each
greenhouse has the same design (galvanised steel frame clad in either horticultural
glass or polycarbonate), size (7 x 4 metres), control equipment (fan coil units and
evaporative cooling) and orientation (long axis north-south). Environments are
continuously monitored and controlled via a Nelan Industries (Melbourne, Victoria,
Australia) greenhouse control system.
58

3.2.2 Light measurements and analysis Light measurements were taken with a LI-1800 spectroradiometer (LI-COR,
Lincoln, NB, USA) and/or with an Apogee UV-PAR spectroradiometer (Apogee
Instruments Inc., Logan, Utah, USA), both with cosine corrected sensors.
Measurements at the Hobart site were taken of the isolated materials (horticultural
glass, laminated glass and polycarbonate sheeting) in sunny conditions by placing the
spectroradiometer in a box with the top cut at an angle of 60 ° (to simulate roof pitch)
and placing a sheet of the material over the top. Measurements were also taken in the
greenhouses in immediate succession under clear sky conditions. Greenhouses
measured were the main phytotron (laminated glass), top phytotron (horticultural
glass) and the CSIRO greenhouse (polycarbonate). This allowed for in situ
measurements of the materials under the same conditions.
Spectroradiometer measurements were taken under both sunny and overcast
conditions under horticultural glass and polycarbonate during the growth response
studies at DPI, Knoxfield, Victoria. Adjacent greenhouses with the same design and
orientation were used. This allowed for in situ comparisons under a range of light
conditions and at various times of the day. In addition, light quantity (in kilo lux) is
monitored and recorded at 15 min intervals in the DPI greenhouses. This data was
downloaded and analysed for the growth response study periods.
Comparative measurements, including transmission percentages, were taken on the
same day in the same conditions in immediate succession. Growth chamber light
measurements were at an air temperature of 20 0 C with external light excluded.
Spectral irradiance was downloaded in W rr1-2 nm-1 and as quantum intergrade
(i.tmol.m .2 .s -1 ) averaged over 3 scans in the range 300-800nm, following the
measurement and reporting recommendations of Sager et al. (1982) and Bjorn and
Vogelmann (1994). For comparisons of waveband proportions at different irradiances
the percentage of quantum intergrade (300-800) was calculated for PPF
(photosynthetic photon flux, 400-700 nm) and for each 100nm band.
Red to far-red ratios (R:FR) were calculated as narrow band (R:FR n): 655-665 /
725-735 nm; broad band (R:FR b) 600-700 / 700-800 nm. Blue to red ratios were
calculated as 400-500 / 600-700 nm (B: R); blue to far red as 400-500 / 700-800 nm
(B:FR). Ratio calculations follow the recommendations outlined in Kittas et al.
(1999).
59

Light distribution measurements were taken using a LI-185B Quantum radiometer
with quantum sensor (LI-COR, Lincoln, NB, USA). Daily light integrals (DLI) are
given as mol r11-2 d' and follow standard calculation methods (Faust 2003) from the
light measurement data.
3.2.3 Plant material and culture To compare growth responses under the different environments peas (a selection of
Pisum sativum L. `Torsdag') were grown concurrently in adjacent greenhouses clad
with either polycarbonate or horticultural glass in both spring (17/10-29/11/2006) and
winter (4/6-6/8/2007). This pea line (Hobart line 107) is a quantitative long day plant.
As no supplementary lighting was used for the study periods (so that only the
influence of covering material was being examined) a day neutral isoline of L107 was
also grown (Hobart line 218). This allowed for collection of flowering data under
short day conditions (winter), and also allowed for examination of any growth
differences between a photoperiodic and non-photoperiodic line under the different
covering materials. Plants were sown 2 per pot using a commercial pine bark based
potting mix with added macro and micro nutrients (Bio-Gro, Bayswater, Victoria,
Australia). Plant spacing was sufficient to avoid self shading.
Plants were watered with timed sprinklers for 10 min twice daily. Mean
temperatures for the study periods were spring- maximum 24.5 °C, minimum 12.6 °C
(glass), 24.4 °C and 13.0°C (poly); winter- maximum 21.7°C, minimum 10.2°C (glass)
21.6°C and 10.5 °C (poly). Thus temperatures were very even between the
environments and the major difference was the covering material.
3.2.4 Data collection and analysis At harvest, length of each internode from nodes 1 to 12 was recorded. Stem
diameter (mid point between nodes 9 and 10), leaf width (LW) and leaf length (LL) of
1 leaflet per plant was measured at node 9. Node of flower initiation (NFI) and days
from planting to first open flower (FT) was recorded during growth. Fresh weight of
harvested shoots was also recorded.
Statistical analysis using JMP software (SAS Institute, Cary, NC, USA) included
ANOVA, Students t-tests, Dunnetts method, and Tukeys test.
60

— - - Hort glass
Lam glass
— — — - Poly
Sun
Wavelength (nm)
1.8
1.6 -
'1 1.4-
1.2-
,G) 1- C 6° 0.8 -
0.6 -
-0 0.4 - r cci 0.2 -
0 •
300
r _
350 400 450 500 550 600 650 700 750 800
1'7
3.3 Results
3.3.1 Transmission and spectral properties Transmission percentages of the isolated materials were 68, 82 and 90% for
polycarbonate, horticultural glass and laminated glass, respectively, in the PPF (400-
700 nm) range. In the polycarbonate, horticultural glass and laminated glass
greenhouses at the Hobart site, however, there was little difference in transmission, all
were around 58% when measured in immediate succession. Figure 3.1 shows in situ
spectral distribution measurements in the greenhouses at the Hobart site, and it is clear
from this figure that the transmission losses are relatively even. This highlights that
differences in greenhouse design and orientation can influence light transmission.
Figure 3.1. Spectral distributions of sunlight, and in situ measurements of laminated glass, horticultural glass, and polycarbonate. Measurements were conducted in immediate succession, as described in Materials and Methods.
There is little difference in spectral distribution through any of the tested covering
materials and sunlight, apart from the elimination of UV-B radiation below 390 nm by
polycarbonate and laminated glass (Fig. 3.1). Wavelength ratios were largely
unaltered from sunlight ratios under any of the materials, although blue wavelengths
were slightly reduced (by 2%) and far-red proportions slightly increased (by 2-3%)
under polycarbonate (Fig. 3.2). The slight enhancement of PAR wavelengths reported
for glass (Kittas et al. 1999) can also be seen, particularly for laminated glass (Fig.
3.2). This conforms with previous reports (Young et al. 1994) for polycarbonate
(Lexan) and for polyethylene and fibreglass greenhouses (Kittas et al. 1999).
61

Blue (400-500) Red (600-700) Far red(700-800)
0 Sun
• Poly 0 Hort glass • Lam glass
Figure 3.2. Relative spectral distribution as a percentage of total irradiance (300-800 nm) for sunlight, polycarbonate, horticultural glass and laminated glass.
It is interesting to note that in situ measurements in the glasshouses were
comparable to those in the polycarbonate greenhouse at the Hobart site (Fig. 3.1).
However, design, orientation and internal structures of this house differed from the
glasshouses, which have more structural components than the polycarbonate house.
By comparison, transmission measurements in the controlled environment glasshouse,
which has larger panel size and less structural components than the other glasshouses,
were over 80% (Table 2.6), again highlighting the influence of design on light
properties. Thus further analysis was conducted at the DPI Knoxfield site, which has
adjacent greenhouses with the same design and orientation. This allowed for in situ
comparisons under a range of light conditions and at various times of the day.
Measurements were conducted in both spring and winter during the growth response
studies.
Analysis of spectral distribution seasonally and by time of day showed the same
relative spectral properties of the covering materials. The slightly reduced blue and
slightly enhanced far-red proportions of polycarbonate relative to glass and natural
light was observed at all times of the day and under both sunny and overcast
conditions (Table 3.1). Representative spectral distributions at different times of the
day and under sunny and overcast conditions are shown in Figure 3.3. Clear from
these figures, and confirmed by the continuous monitoring data, was that at all times
under all conditions, transmission was lower through polycarbonate compared to
glass. With lower sun angle in the morning and afternoon, and in overcast conditions,
62

transmission differences were less (Table 3.2). However, midday figures showed large
differences in transmission, particularly under sunny conditions (Fig. 3.3 A), in spring
and winter.
3.3.2 Growth responses Growth response studies were conducted in adjacent greenhouse cells in both spring
and winter, as described in Materials and Methods. In spring, growth differences
between plants grown under glass or polycarbonate were slight (Table 3.3). Shoot
length was slightly reduced under polycarbonate in both pea lines even though light
quantity was reduced under this material, suggesting light quantity was not a limiting
factor. Flowering measurements were not significantly different under glass and
polycarbonate for either line, suggesting light quality was not a significant factor as
NFI in particular is most influenced by light quality. Leaf size was reduced under
polycarbonate relative to glass in L218, and fresh weights were reduced. Overall,
while differences were small, plants under glass were taller, healthier plants in
appearance with higher fresh weights.
In winter, plants under polycarbonate showed clear responses to low light levels.
Compared to plants grown under glass, both L107 and L218 showed significant (P <
0.01) shoot elongation at all growth stages. L218 also had significantly reduced leaf
size and fresh weight compared to plants grown under glass (Table 3.3). Flowering
node was not significantly different between treatments for either line, suggesting
light quality differences were not a significant influence, but flowering time was
delayed under polycarbonate relative to glass.
63

Table 3.1. Waveband proportions (% quantum intergrade 300-800nm) and wavelength ratios of natural light and adjacent greenhouse environments under winter sunny and overcast conditions.
Environment Wavelength proportion (% total irradiance) Wavelength ratios
PPF -300-400 400-500 500-600 600-700 700-800 R:FR R:FR UV Blue Green Red . Far-red (n) (b) B:R B:FR
Sunny
Outside 70.5 5.1 19.1 25.1 26.2 24.6 1.1 1.1 0.7 0.8
Glass 72.4 3.5 18.6 26.4 27.2 24.2 1.1 1.1 0.7 0.8
Poly 72.4 0.8 17.0 26.5 28.8 27.0 1.1 1.1 0.6 0.6
Overcast
Outside 69.2 5.4 19.9 24.7 24.8 25.6 1.0 1.1 0.8 0.8
Glass 71.9 4.8 21.3 26.0 24.8 23.5 1.1 1.2 0.9 0.9
Poly 73.4 1.0 21.4 26.7 25.8 25.8 1.0 1.2 0.8 0.8
64

7E
-
9.0
.7: 8.0
7 . 0 ZE 6.0
A" 5.0
4.0
13t, 3.0
• 2.0
1.0
Sun
- Glass
- - Poly
300 350 400 450 500 550 600 650 700 750 800
Wavelength (nm)
300 350 400 450 500 550 600 650 700 750
Wavelength (nm)
800
E 4.0
• 3.5
E 3.0
k 2.5
2.0
1.5
1.0 II
0.5
S. 0.0
Sun
- Glass
- - -- Poly
300 350 400 450 500 550 600 650 700 750 800
Wavelength (nm)
Outside
-Glass
- • • - Poly
ç3.0
4.) 2.5
2.0
1.5
1.0
0.5
• 0.0
800 300 350 400 450 500 550 600 650 700 750
0.5
.7c 0.4
Outside
-Glass
- - • - Poly
0.3
0.0 co
Wavelength (nm)
A. 12 noon sunny, October 17 (spring) C. 12 noon overcast, June 4 (winter)
B. 4 pm sunny, October 17 (spring) D. 4 pm overcast, June 4 (winter)
Figure 3.3. Spectral distributions of sunlight, and in situ measurements of horticultural glass, and polycarbonate in adjacent greenhouses. Measurements were conducted in immediate succession, as described in Materials and Methods.
65

Table 3.2 Calculated transmission percentages of glass and polycarbonate greenhouses examined at selected times on a sunny spring day (17 October 2006) and a winter overcast day (4 June 2007).
Sunny, spring Transmission % by Wavelength (nm) Time Material
300-800 PPF 300-400 400-500 500-600 600-700 700-800 10 am Glass
73.1 75.3 62.5 76.3 76.0 73.6 69.3 10 am Poly
59.3 61.6 7.1 56.2 62.8 65.2 65.7 Noon Glass
82.2 84.4 57.5 80.2 86.5 85.5 81.0 Noon Poly
38.3 39.3 5.9 33.0 40.3 42.1 42.1 4 pm Glass
91.8 94.6 56.4 88.3 96.6 97.2 90.5 4 pm Poly
78.8 81.2 11.1 73.1 82.3 85.6 84.5 Cloudy, winter Transmission % by Wavelength (nm) Time Material
300-800 PPF 300-400 400-500 500-600 600-700 700-800 TO am Glass
59.1 51.9 43.7 60.9 65.2 66.9 59.1 10 am Poly
48.1 50.8 6.8 47.8 45.2 43.2 48.1 Noon Glass
64.3 65.8 79.3 74.6 65.3 58.8 54.6 Noon Poly
53.8 56.7 8.6 54.0 57.9 57.7 57.5 4 pm Glass
60.1 62.5 " 53.1 64.4 63.3 60.2 55.2 4 pm Poly
48.6 51.5 9.1 51.6 52.4 50.5 48.9
It is claimed light diffusing materials such as polycarbonate result in more even
plant growth, but plants under polycarbonate were not less variable than those under
glass, either in appearance or as indicated by standard error calculations (Table 3.3).
Overall, the results suggest that the observed light quantity reductions under
polycarbonate relative to glass were not significant during spring but resulted in shoot
elongation, reduced leaf size and lower fresh weight in winter.
66

Table 3.3. Mean growth parameters (± SE, n = 20) for lines 107 and 218 pea grown concurrently in controlled environment glass and polycarbonate greenhouses under natural light in spring and winter. Different letters signify significant differences at P<0.05, letter plus asterisk (e.g. b*) significant at P<0.01. Abbreviations: Ll-x-shoot length between nodes 1-x, NFI- node of flower initiation, FT- flowering time from planting date, LW- leaflet width at node 9, LL- leaflet length at node 9, FW-shoot fresh weight.
L107 Spring L1-4(mm) L1-9(mm) L1-12(mm) NFI FT(days) Stem(mm) LW(mm) LL(mm) FW (g)
Glass 60.4 271.2 427.3 16.2 34.2 2.4 25.4 34.5 5.3 ± 1.34 a ± 7.61 a ± 16.01 a ± 0.12 a ± 0.42 a ± 0.09 a ± 0.51 a ± 0.74 a ± 0.58 a
Poly 57.3 •235.8 387.2 16.3 33.9 2.4 26.5 35.1 3.4 ± 1.34 a ± 9.92 b* ± 21.24 a ± 0.16 a ± 0.46 a ± 0.05 a ±0.51 b ± 0.69 a ±0.51 a
L218 Spring L1-4(mm) L1-9(mm) L1-12(mm) NFI FT(days) Stem(mm) LW(mm) LL(mm) FW (g)
Glass 42.9 300.7 517.7 12.7 28.9 2.9 28.2 38.2 6.7 ± 1.16 a ± 7.24 a ± 12.64 a ± 0.14 a ± 0.59 a ± 0.14 a ± 0.65 a ± 0.74 a ± 1.16 a
Poly 46.8 286.6 445.7 13.1 29.3 2.7 24.5 33.7 • 4.5 ± 1.76 a ± 6.85 a ± 15.90 b* ± 0.18 a ± 0.56 a ± 0.08 a ± 0.72 b* ± 0.95 b* ± 0.47 b
L107 Winter L1-4(mm) L1-9(mm) L1-12(mm) NFI FT(days) Stem(mm) LW(mm) LL(mm) FW (g)
Glass 58.9 277.2 435.6 16.4 53.0 2.6 24.6 31.8 7.2 ± 1.88 a ± 5.27 a ±7.17a ± 0.20 a ±0.24a ± 0.07 a ± 0.64 a ±0.86a ± 0.44 a
Poly 77.3 316.9 503.1 16.7 55.0 2.6 24.3 32.2 6.7 ± 1.98 b* ± 7.03 b* ± 10.00 b* ± 0.20 a ± 0.44 b* ± 0.07 a ± 1.02 a ± 0.94 a ± 0.41 a
L218 Winter L1-4(mm) L1-9(mm) L1-12(mm) NFI FT(days) Stem(mm) LW(mm) LL(mm) FW (g)
Glass 61.9 311.9 515.0 12.4 42.4 2.9 27.6 36.1 9.6 ± 2.79 a ± 5.00 a ± 8.53 a ± 0.12 a ± 0.22 a ± 0.06 a ± 0.47 a ± 0.56 a ±0.41 a
Poly 81.3 338.8 541.3 12.6 46.7 2.8 25.3 33.2 7.4
± 1.07 b* ± 4.50 b* ± 7.01 b ± 0.11 a ± 0.25 b* ± 0.10 a ± 0.45 b* ± 0.65 b* ± 0.25 b*
67

3.4 Discussion When considering greenhouse design, covering material options need to be
examined. Although glass has the highest transmittance (Aldrich and White 1969), the
lower superstructure requirements, better diffusing properties and better insulating
properties of other materials such as polycarbonate (Connellan 1998; Mermier and
Baille 1988) should be considered. In Australia, new construction standards .
(Australian Standard 1288) requires sloping roofed glass structures, when being built
or modified, to be constructed of laminated or toughened glass. Containment
regulations (both quarantine and gene technology regulations) also require impact
resistant materials to be used. Thus re-development of existing glasshouses and
construction of new greenhouses requires a change from standard 3mm horticultural
glass to another material: acrylic, polycarbonate, laminated glass, or toughened glass.
Acrylics tested had relatively low light transmission (under 50%, data not shown).
Toughened glass required by regulation is thicker (8 mm) and heavier than laminated
glass (6mm), requiring heavier superstructure. Thus the choice, realistically, is
between laminated glass and polycarbonate, although greenhouses are still being
constructed using 4 mm horticultural glass.
Spectral properties of laminated and horticultural glass and polycarbonate were
examined in detail using both the isolated materials and in situ, as suggested by Kittas
et al. (1999), for possible photomorphogenic effects from altered wavelength ratios
(Fig. 3.1, 3.2). There was little difference in spectral distribution through any of the
tested covering materials and sunlight, apart from the elimination of UV radiation
below 390 nm by both polycarbonate and laminated glass. The influence of reduced
UV levels is unclear. High UV can be damaging to plants, increasing leaf thickness,
and reducing chlorophyll content and photosynthesis (Kakani et al. 2003; Teramura
1983). Filtering UV improved growth and yield of eggplant, and with UV eliminated
plants were 20% taller (Kittas et al. 2006), but responses may be species dependent
(Kittas et al. 2006). Cucumber and lettuce growth was inhibited by ambient UV levels
(Krizek etal. 1998;.Krizek etal. 1994), but tomato and radish growth was improved
by ambient UV levels (Tezuka etal. 1993). It has also been suggested that a lack of
UV can reduce anthocyanin synthesis and produces "weaker" plants (Hashimoto
1994). For pea, supplementation with UV to ambient levels under laminated glass
68

(which filters UV, unlike horticultural glass) did not alter growth and there were no
shoot length alterations (Table 2.13). Thus, the observed shoot length increases in
peas under polycarbonate (UV depleted) compared to horticultural glass in winter
(non- depleted) (Table 3.3), were unlikely to be an influence of UV levels. In addition,
shoot length differences were small in spring; plants grown under polycarbonate were
actually slightly reduced in shoot length relative to glass grown plants.
Another possible influence on shoot length is the slightly reduced blue and increased
far-red proportions of polycarbonate compared to glass and natural light (Fig. 3.2).
Both increased far-red and reduced blue were shown to increase shoot length in pea
(Chapters 7, 8: Figs. 7.4, 8.3). However, the alterations are slight, around 2%,
wavelength ratios were largely unaltered (Table 3.1), and again while shoot length
was increased in winter under polycarbonate, plants were slightly shorter in spring
under this material relative to glass. Flowering node for L107 was found to be
relatively stable across irradiance and temperature differences, but is influenced by
light quality (Table 2.16, Fig 7.4). For plants grown under glass and polycarbonate in
both seasons, flowering node was not significantly different. This suggests the
measured light quality differences between glass and polycarbonate were not a
significant influence on results. Interestingly, both a non-photoperiodic and a
photoperiodic line were grown as the later was not expected to flower under short day
conditions during the growth period. While no photoperiod extension lighting was
used in the greenhouses during the study, as only the influence of covering material
was to be examined, security lighting around the complex appeared to be sufficient to
induce a long day response in L107 pea. This highlights the importance of total light
exclusion for photoperiod studies, as previous studies have suggested light leakage
even at very low levels can be sufficient to induce a photoperiodic response (Bakker
and Blacquiere 1992), and the presence of flowering in L107 in winter during the
study period confirm this.
In greenhouses with different design and orientation, light quantity differences
between glass and polycarbonate were small (Fig. 3.1), highlighting the importance of
these factors in greenhouse design. However, transmission measurements through the
isolated materials, and in greenhouses with the same design and orientation, light
quantity was reduced by polycarbonate relative to glass (Fig. 3.3, Table 3.2). In
spring, with relatively longer days and higher overall irradiance, this reduction in light
quantity was not a significant influence on results (Table 3.3). In winter, however,
69

plants showed clear responses to low irradiance, with significantly increased shoot
length, smaller leaves, and reduced fresh weight under polycarbonate relative to glass
(Table 3.3). In controlled environment experiments, increased shoot length was
clearly associated with low irradiance (Table 2.15). Previous studies with pea have
also demonstrated elongation in response to reduced irradiance (Gawronska et al.
1995).
In summary, spectral differences between materials was not a significant influence
on results. Reduced light quantity by lower transmission through polycarbonate
relative to glass was not a significant influence on results except under light limiting
conditions (i.e. during short days in winter). It should be noted, however, that
supplementary lighting offers significant growth improvements under such conditions
(Table 4.3) and would be likely to correct any light quantity deficit responses under
polycarbonate.
70

Chapter 4 Supplementary lighting
4.1 Introduction Natural radiation is highly variable with cloud cover, dust and shading; varying from
as little as 70 pmoles M-2S-I under heavy cloud to over 2000 pmoles M-2S -I under clear
skies. Greenhouses typically only transmit 60% of the available light, and under short
winter days radiation is often deficient. Supplemental irradiation can provide
significant growth improvements where natural light is limiting, such as under short
winter days and overcast conditions (Hanan 1998; Hao and Papadopoulos 1999).
Despite the spectral variation, any of the artificial light sources can be used to grow
plants or to supplement natural radiation (Hanan 1998). Incandescent lamps have low
photosynthetic efficiency and are little used to supplement radiation. Fluorescent are
more efficient, but their size with reflectors produce considerable shading. High
pressure sodium (HPS) are the most efficient- fewer, smaller lamps are needed for the
same irradiance, thus reducing interference with natural light through shading (Hanan
1998). HPS are long life and have sufficiently high red levels to promote both growth
and flowering in many long day plants (Fisher et al. 2001). Metal halide (MH) are
also suitable for supplementary lighting, but compared to HPS have lower energy
efficiency and lower photosynthetic efficiency from the lower red component (Sager
etal. 1988) thus are little used in commercial greenhouses (Hanan 1998). For
example, HPS lighting required 25% less fixtures than MU to achieve the same PPF,
and produced more flowers per plant in roses at equal PPF (Menard and Dansereau
1995). Most crops show increased yield with HPS supplemental lighting of 40-80
[moles M-2 S-I to increase daily light integrals (Fisher et al. 2001). For example, 65
pmoles M-2S-I of HPS supplementing natural light for 16 h daily increased cucumber
yield 28% (Hao and Papadopoulos 1999). Sweet pepper growth rates, yield and dry
weight was substantially increased by HPS supplements of 75-125 VM101eS M-2S-I for
16 h (Demers et al. 1991). While unnecessary during sunny and/or long days, during
winter or overcast conditions, there is a near linear positive relationship between daily
light integral (DLI) increases up to 12 moles m-2d-1 and yield (Fisher et al. 2001).
Light distribution may be further enhanced by using a moving light system.
Stationary lights must be evenly spaced for even light distribution. While reflector
type or diffusing covers can even out distribution, there will still be patterns of light
and shade from other structures and the crop itself. There is some evidence that
71

pulsing supplementary lights can further improve net assimilation rates by avoiding
light saturation and allowing time for photosynthetic reactions (Hanan 1998). Under
HPS pulse lighting, geraniums had superior quality and more flowers in less time than
under non pulsed 1-[PS supplements (Tardif and Dansereau 1993). The moving system
can be used in this manner to produce a slow increase and decrease in light intensity at
the plant level as well as, in theory, allowing greater penetration of light into the
canopy by reducing self shading (Zheng et al. 2006). However, under fixed and
moving HPS supplementary lighting, growth of gerbera was reduced relative to the
fixed system (Zheng et al. 2006).
As described in Chapter 2, winter light levels can be limiting at the Hobart study
site, particularly in the phytotron bays, where DLI averaged less than 9 mol rr1-2 c1-1
(Table 2.5), and plants were relatively elongated in response (Table 2.10).
Supplemental irradiation with HPS is reported to provide significant growth
improvements under such conditions (Hanan 1998; Hao and Papadopoulos 1999), but
the primary lighting systems in use is traditional photoperiodic lighting using mixed
fluorescent/incandescent lamps. While such a mix promotes flowering in many LD
species (Vince-Prue 1994), such as pea, and only very low fluence rates are required
(Kendrick and Weller 2003a) photosynthetic efficiency is low. These have been
chosen for their low R:FR ratio to accelerate flowering (0.7-0.8), but have low
photosynthetic efficiency, and such low R:FR can increase shoot extension (Moe and
Heins 1990). However, high R:FR lighting such as HPS can signal non-competitive
conditions and relatively delay flowering in some species. While only low irradiance
extension lighting is required for photoperiod induction (Kendrick and Weller 2003a),
there would be some advantage to a higher irradiance photoperiodic lighting system
which could double as photosynthetic lighting when natural light levels are limiting,
and to provide more even seasonal daily light integrals. Spectral differences between
lamps, however, may be less important when used as a supplement to natural radiation
(Moe 1997), and photoperiod extension with weak HPS can produce an equivalent
flowering response with less shoot extension than incandescent lamps in some species
(Whitman et al. 1998).
There are a range of HPS lamps and reflectors available, many marketed as plant
specific. In this section, spectral properties and growth responses to supplementary
HPS lighting are examined, with particular emphasis on growth improvements, shoot
extension and flowering response relative to traditional fluorescent/incandescent
72

photoperiodic lighting. Also examined were light delivery systems, and specifically
whether a moving light system could deliver the claimed further growth
improvements relative to a fixed system.
4.2 Materials and Methods Photoperiodic lighting in the glasshouses examined is provided by mixed cool white
fluorescent (CWF) and 100W incandescent lamps. A range of plant specific HPS
lamps are available commercially, generally marketed as having higher blue, red and
far-red proportions than regular HPS globes. Several of these, with different housings,
were tested. Light measurements, plant growth and analysis were as previously
described in Materials and Methods (Sections 2.2.2 and 2.2.4). Measurements were
taken at night to exclude other light sources, except for daylight overcast supplemental
light measurements. All measurements were taken at 1.5 m from the light source.
The spectral properties of a range of HPS lamps were compared relative to sunlight,
traditional photoperiodic lighting (CWF, INC), and to each other. Plant specific HPS
tested were Lucagrow LU400/HO (GE Lighting, Budapest, Hungary); Vialox Planta-
T 400 (Osram, Munich, Germany); SON-T AGRO 400 (Philips, Brussels, Belgium);
and SL600W.U15.VRD Super HPS Deluxe (Sunmaster, Solon, OH, USA). Non plant
specific HPS tested were Vialox NAV-E (SON-E) 400W (Osram, Munich, Germany)
and SON-E GES Elliptical 400W (Thorn, Bucharest, Romania). Relative spectral
distribution as a percentage of total irradiance (300-800nm, quantum data) and
wavelength ratios of these HPS was also compared to photoperiod extension lighting
and to sunlight. Photoperiod extension lighting used was 40W L40 W/ 20S cool white,
(Osram, Munich, Germany) and 100W pearl incandescent (Thorn, Smithfield, NSW,
Australia), housed in aluminium reflectors that hold 3 x CWF and 4 x incandescent
lamps (spectral properties, Section 5.3.1). In addition, the influence of increasing the
far-red component by adding incandescent to the supplementary light mix in a 1:1
ratio (1 x 400W HPS, 1 x 100W incandescent) was examined.
Also tested were the spectral properties of supplementary light in daylight: i.e. does
supplementary lighting alter the spectral properties of sunlight, and thus potentially
influence growth responses. Spectroradiometer measurements were taken under both
sunny and overcast conditions at midday beneath Osram Vialox NAV-E (SON-E)
400W HPS at a distance of 1.5 m from the light source.
73

To examine the influence of supplementary light on growth responses, L107 pea
plants were grown and analysed as previously described (Section 2.2.4) concurrently
under glasshouse conditions in both winter and summer. Photoperiod was 18 h
consisting of natural daylight (average 9.6 h winter, 15.2 h summer) supplemented
and extended with either HPS or mixed fluorescent/incandescent lighting. HPS was
Vialox NAV-E (SON-E) High Pressure Sodium 400 W globes (Osram, Munich,
Germany) delivering approximately 100 tunol ni 2 S -1 at plant level; mixed fluorescent/
incandescent was 3 x 40 W L40 W/ 20S cool white to 4 x 100 W pearl incandescent
delivering approximately 20 turrol 111-2 s 1 . R:FR ratios measured were 4 and 0.8
respectively. Mean temperatures were winter, 18.6 °C day, 13.4°C night; summer
22.8 °C day 17.4°C night.
To aid light distribution, different housings and reflectors are available for
supplementary lighting. Some have diffusing covers or larger reflectors for more even
light distribution (manufacturers' data). Light distribution measurements were taken
beneath various housings and reflectors fitted with GE Lucagrow lamps using a LI-
185B quantum sensor (LI-COR, Lincoln, NB, USA). Tested were housings with
acrylic diffusing covers from Ruud Lighting (Sydney, NSW, Australia); and Pierlite
(Padstow, NSW, Australia) HL400HPSCG pendant mount fittings. Open reflectors
tested were LL 400 Lowbay fittings (Philips, Sydney, NSW, Australia), and Adjust-A-
Wings Avenger reflectors (Accent Hydroponics, NSW, Australia).
The influence of a moving light system on growth responses was examined by
growing L107 concurrently in growth chambers at 20 ° ± 0.5 °C with an 18 h
photoperiod. An automated light mover system (Nicoponics, Sydney, NSW,
Australia) was installed in one of the chambers. Lights are attached to small motors
that run along aluminium rails, length of travel is determined by length of rail and
adjustable stoppers. When the motor hits a stopper, it reverses direction. The claim is
that shaded spots are avoided, and combined with the pulsing of light intensity,
growth is improved (manufacturer's literature). SL600W.U15.VRD Super HPS
Deluxe (Sunmaster, Hungary) with Adjust-A-Wings Avenger reflector (Accent
Hydroponics, NSW, Australia) were attached to the light mover in one cabinet, the
same light source was fixed in position in the other cabinet. Irradiance (PPF) was 220
1.1rnol rn'2 s4 at pot level in each case directly beneath the lights, reducing to 150 1.tmol
rif2 S-I at the edges of the plant area. Twenty plants were grown per treatment with the
aim of determining if the moving system improved and provided more even growth.
74

4.3 Results
4.3.1 Relative spectral properties of HPS light sources UPS lamps are generally used for supplementary lighting because of the relatively
high red component and high light output (Fisher etal. 2001). There are many brands
and types of HPS available, some marketed as plant specific, with higher blue and red
proportions. However, of those tested, spectral distribution (Fig. 4.1) is very similar
between plant specific products (Lucagrow, Agro, Sunmaster) and regular HPS (SON-
- E). The low UV and blue, and high red components of HPS lighting relative to
sunlight is clear from these figures and Table 4.1. Relative spectral distribution and
wavelength ratios (Table 4.1), however, reveal that most of the spectral output is in
the 500-600 nm (green/yellow) range. Far-red proportions are also low in HPS lamps
relative to sunlight and photoperiod extension lighting, and hence R:FR ratios are high
(Table 4.1).
For plant growth, blue, red and far-red light are needed. Plant specific HPS are
marketed as having higher blue and far-red proportions to regular HPS, but of the
lamps tested, only the Lucagrow lamps met these claims (Table 4.1). UV and blue
proportions, however, are still very low compared to sunlight in all the lamps tested,
and R:FR remains high. In fact the next best lamp tested in terms of these wavelengths
was the non-plant specific Osram SON-E. Blue proportion was higher and R:FR lower
than the Lucagrow lamps, but red proportion was lower. The Planta lamps had very
high green/yellow, and low blue, red and far-red proportions (Table 4.1) and on this
basis would be the least suitable for plant growth, even though they are marketed as
such.
75
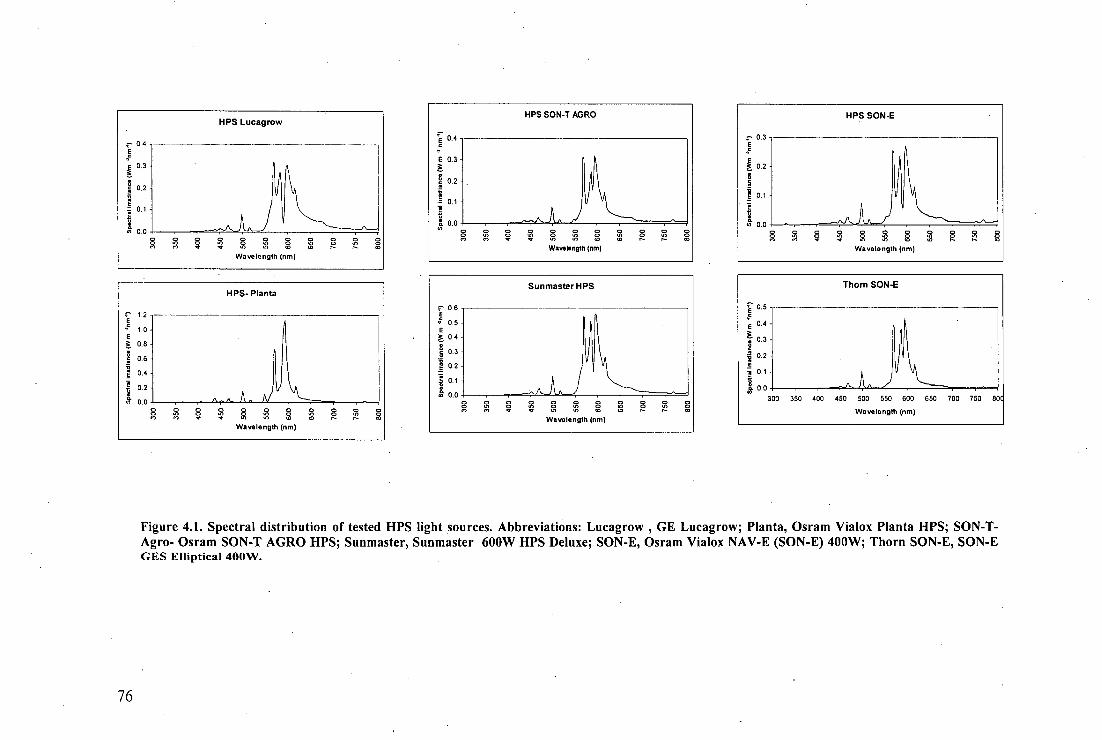
Thom SON-E
350 400 450 500 550 600 650 700 750 80(
Wavelength (nm)
I 0.0
300
0.5
0.4
0 3
0.2
0.1
Figure 4.1. Spectral distribution of tested HPS light sources. Abbreviations: Lucagrow , GE Lucagrow; Planta, Osram Vialox Planta HPS; SON-T- Agro- Osram SON-T AGRO HPS; Sunmaster, Sunmaster 600W HPS Deluxe; SON-E, Osram Vialox NAV-E (SON-E) 400W; Thorn SON-E, SON-E GES Elliptical 400W.
76

Table 4.1. Relative spectral distribution as the percentage of total irradiance (300-800 nm) and wavelength ratios of high pressure sodium (HPS) light sources, photoperiod extension lighting and natural light with and without HPS supplement. Fluorescent/ incandescent extension lighting and sunlight proportions and ratios are included for comparative purposes. Both plant specific (Lucagrow, Planta, Son-T Agro, Sunmaster) and non- plant specific (Osram, Thorn SON-E) HPS globes were compared. Sun+HPS and Overcast+HPS measurements used Osram SON-E. Full light details and measurement protocols are in Materials and Methods. Abbreviations: Lucagrow , GE Lucagrow; HPS+INC, 1 x GE Lucagrow (400W) and 1 x 100W Incandescent; Planta, Osram Vialox Planta HPS; Agro- Osram SON-T AGRO HPS; Sunmaster, Sunmaster 600W HPS Deluxe; Osram SON-E, Vialox NAV-E (SON-E) 400W; Thorn SON-E, SON-E GES Elliptical 400W; FI/Inc, 3x cool white fluorescent + 4x 100W incandescent; INC, 100W incandescent.
Light source
HPS
PPF
Wavelength proportion VA total irradiance)
300-400 400-500 500-600 600-700
UV Blue Green Red
700-800
Far-red R:FR (n)
Wavelength ratios
R:FR (b) B:R B:FR
Lucagrow 89.6 0.2 4.2 41.6 43.9 10.1 2.8 4.3 0.1 0.4
HPS+INC 88.8 0.1 4.1 40.3 44.5 11.0 2.6 4.0 0.1 0.4
Planta 96.5 0.2 5.3 68.1 23.1 3.3 3.5 7.1 0.2 1.6
Agro 92.2 0.1 5.1 51.0 36.2 7.8 2.8 4.7 0.1 0.7
Sunmaster 93.0 0.1 4.2 52.4 36.5 6.7 2.9 5.4 0.1 0.6
Osram SON-E 90.3 0.5 5.6 47.8 36.8 9.3 2.5 4.0 0.2 0.6
Thorn SON-E 96.2 0 5.5 61.6 29.1 3.7 3.7 7.8 0.2 1.5
Extensions
F!/Inc 64.5 0 8.1 26.6 29.8 35.5 0.8 0.8 0.3 0.2
Inc 45.7 0 2.0 12.0 31.0 55.0 0.7 0.6 0.1 0.04
Natural light
Sunlight 69.4 2.4 15.5 25.0 29.0 28.0 1.1 1 0.5 0.6
Sun+HPS 72.0 2.6 15.5 28.4 28.4 25.2 1.1 1.1 0.5 0.6
. Overcast 71 3.2 18.3 25.8 26.9 25.7 1.1 1.1 0.7 0.7
Overcast+HPS 75 3.0 16.7 29.1 28.9 22.4 1.2 1.3 0.6 0.8
77
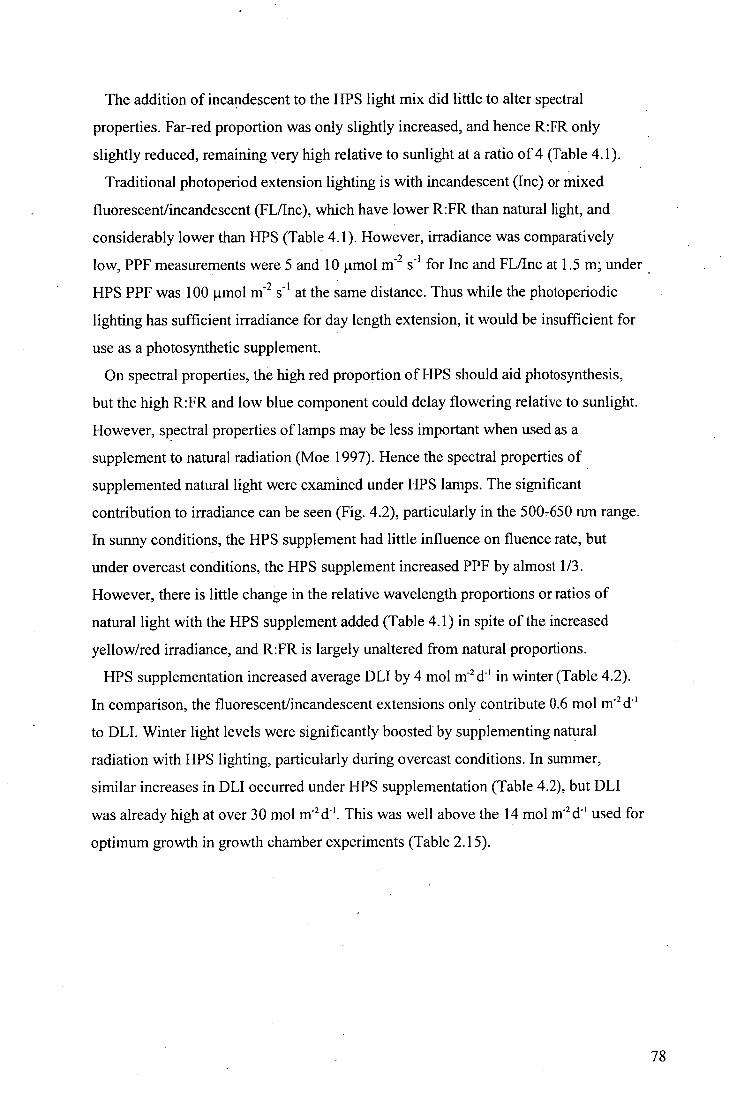
The addition of incandescent to the HPS light mix did little to alter spectral
properties. Far-red proportion was only slightly increased, and hence R:FR only
slightly reduced, remaining very high relative to sunlight at a ratio of 4 (Table 4.1).
Traditional photoperiod extension lighting is with incandescent (Inc) or mixed
fluorescent/incandescent (FL/Inc), which have lower R:FR than natural light, and
considerably lower than HPS (Table 4.1). However, irradiance was comparatively
low, PPF measurements were 5 and 10 p.mol m -2 s-I for Inc and FL/Inc at 1.5 m; under .
HPS PPF was 100 [tmol 111-2 s-I at the same distance. Thus while the photoperiodic
lighting has sufficient irradiance for day length extension, it would be insufficient for
use as a photosynthetic supplement.
On spectral properties, the high red proportion of HPS should aid photosynthesis,
but the high R:FR and low blue component could delay flowering relative to sunlight.
However, spectral properties of lamps may be less important when used as a
supplement to natural radiation (Moe 1997). Hence the spectral properties of
supplemented natural light were examined under HPS lamps. The significant
contribution to irradiance can be seen (Fig. 4.2), particularly in the 500-650 nm range.
In sunny conditions, the HPS supplement had little influence on fluence rate, but
under overcast conditions, the HPS supplement increased PPF by almost 1/3.
However, there is little change in the relative wavelength proportions or ratios of
natural light with the HPS supplement added (Table 4.1) in spite of the increased
yellow/red irradiance, and R:FR is largely unaltered from natural proportions.
HPS supplementation increased average DLI by 4 mol m 2 d- ' in winter (Table 4.2).
In comparison, the fluorescent/incandescent extensions only contribute 0.6 mol m 2 d-1
to DLI. Winter light levels were significantly boosted by supplementing natural
radiation with HPS lighting, particularly during overcast conditions. In summer,
similar increases in DLI occurred under HPS supplementation (Table 4.2), but DLI
was already high at over 30 mol M-2 d-1 . This was well above the 14 mol M-2 c1-1 used for
optimum growth in growth chamber experiments (Table 2.15).
78

300 350 400 450 500 550 600 650 700
Wavelength (nm)
750 800
0.30
0.25 -
E
a) c
ns 0.10
1-11 .
•
0 05
a 0.00
Overcast
+ HPS
Figure 4.2. Natural light within the glasshouse during winter overcast conditions and with HPS supplement (Osram Vialox NAV-E (SON-E) High Pressure Sodium 400W in Philips (Australia) LL 400 Lowbay fitting, no cover
Table 4.2. Winter and summer light quantities (PPF in 1.1M01 DLI in mol m -2d -I) under 18h HPS or mixed fluorescent/incandescent (FI/Inc)supplementation of natural light.
Winter
Supplement Range PPF Mean PPF Ext. PPF DLI
UPS 80-910 371 100 15.8
Fl/Inc 34-820 324 20 11.8
Summer
HPS. 360-1110 631 100 35.2
Fl/Inc 250-1080 576 20 30.6
79

4.3.2 Growth responses with supplementary lighting While HPS supplementation did not greatly alter the spectral properties of natural
light (Table 4.1), plants would be subjected to high R:FR after dark. In particular this
could delay flowering relative to low R:FR extension lighting. HPS also significantly
increased light quantity in winter, which can increase growth responses when light
may be limiting. To examine the influence of supplementary light on growth
responses, L107 pea plants were grown and analysed concurrently under glasshouse
conditions in both winter and summer as described in Materials and Methods.
Photoperiod was 18 h consisting of natural daylight (average 9.6 h winter, 15.2 h
summer) supplemented and extended with either 100 .t.rriol T11-2 s-I HPS or 20 Ilmol m-2
S-1 mixed fluorescent/incandescent lighting. R:FR ratios measured were 4 for HPS
and 0.8 for Fl/Inc. Light quantity was also increased. HPS supplementation increased
average DLI by 4-5 mol M-2 d-' (Table 4.2).
In winter, plants grown with HPS supplementation showed dramatic increases in
yield, almost double the number of pods and a 75% increase in seed compared to
plants grown under the Fl/Inc supplement (Table 4.3). Dry weight, stem diameter and
leaf size (LW and LL, Table 4.3) were also dramatically increased under HPS.
Internode length (L1-9) was reduced under HPS, but not total shoot length (TL, Table
4.3). Flowering time was earlier under HPS, but not flowering node (Table 4.3). Thus
in winter, HPS supplementation dramatically increased growth parameters relative to
Fl/Inc supplementation. Internode length was reduced as expected from high R:FR,
but increased irradiance also reduces shoot length in pea (Table 2.15). Flowering
node, however, was not delayed as could be expected from high R:FR (Table 4.3).
In summer, stem diameter, leaf size and dry weight were also increased under HPS
supplementation compared to Fl/Inc supplementation (Table 4.3), but the increases
were not so dramatic. Again flowering node was not delayed by the high R:FR of HPS
(Table 4.3). Shoot length was reduced, including total shoot length, and yield was
reduced relative to Fl/Inc supplementation. These factors (shoot length and yield)
were shown to be associated with increased temperature (Table 2.16) and radiant heat
from the higher wattage HPS lamps may be an influence in these results. Flowering
time was earlier under HPS in both winter and summer, which may also be associated
with temperature (Table 2.12, 2.16).
80

Table 4.3. Winter and summer mean growth parameters (± SE, n = 20) for L107 peas grown concurrently in glasshouse conditions under 18h photoperiod consisting of natural light supplemented with 100 gmoles in-2s-1 high pressure sodium lamps (HPS) or 20 gmoles 111 -2S-I fluorescent/incandescent (FI/Inc) lighting. Full details are in Materials and Methods. Different letters signify significant differences at P<0.05, letter plus asterisk (e.g. b*) significant at P<0.01.
Winter
L1-9(cm) TL(cm) TN NFI FT(days) Seed Pods Stem(mm) LW(mm) LL(mm) Dry W (g)
Fl/Inc 55.0 148.2 19.5 16.1 47.0 18.4 5.1 3.2 31.6 42.5 6.9
±0.67a ± 3.16 a ± 0.17 a ±0.06a ± 0.40 a ± 1.61 a ±0.36a ± 0.06 a ± 0.58 a ± 0.80 a ± 0.39 a
HPS 46.4 146.8 21.0 15.8 45.6 34.1 9.9 4.3 38.6 52.3 7.7
± 0.70 b* ± 2.27 a ± 0.21 b* ± 0.13 a ± 0.16 b* ± 2.49 b* ± 0.46 b* ± 0.07 b* ± 0.79 b* ± 0.93 b* ± 0.52 a
Summer .
Fl/Inc 31.4 91.6 17.9 15.2 39.1 7.3 2.5 2.5 28.0 38.5 3.5
± 0.76 a ± 2.13 a ± 0.26 a ± 0.25 a ± 0.90 a ± 0.71 a ± 0.22 a ± 0.10 a ± 1.06 a ± 1.32 a ± 0.08 a
HPS 29.4 76.0 17.6 15.3 34.1 5.9 2.5 3.1 29.1 43.8 4.0
± 0.84 a ± 3.05 b* ± 0.26 a ± 0.18 a ±0.61 b* ± 1.0 a ± 0.34 a ± 0.15 b* ± 1.26 a ± 2.18 b ± 0.20 b
81

4.3.3 Light distribution systems For even growth, even light distribution is important. Thus supplementary lighting
needs to be evenly distributed to avoid growth differences. To aid light distribution,
different housings and reflectors are available for supplementary lighting, usually with
diffusing covers or larger reflectors. Light distribution measurements were taken
beneath various housings and reflectors fitted with GE Lucagrow lamps using a LI-
185B quantum sensor. Tested were housings with acrylic covers, open lowbay
reflectors, and open winged reflectors as described in Materials and Methods.
Spectral distribution measurements were taken on the Lucagrow globes with and
without the acrylic diffusing cover (data not shown).There was little difference in
spectral distribution between the covered and uncovered Lucagrow globes. The major
effect of the acrylic covers was on light distribution. The diffusing nature of the
covers resulted in very even light distribution. With the lights placed 1.5m apart there
was little alteration in fluence rate measured between lights at 1.5m from the lights.
With the uncovered lights in the lowbay reflectors at the same spacing measured at the
same distance, fluence rate reduced by 35% between lights. While higher irradiance
was measured directly beneath the uncovered lights at a distance of 1 m, the diffusing
nature of the acrylic covers actually results in higher PPF measured at a distance of
1.5m from the lights, directly underneath (120 and 80 pimoles M-2S -1 , respectively).
The winged reflectors also produced very even light distribution with little alteration
in fluence rate between lights, and a much broader light distribution area from single
lights compared to the open lowbay reflectors. Thus, both diffusing covers and larger
reflectors aid light distribution, but the increased shading influence of larger reflectors
during daylight was noticeable.
Light distribution can also be improved by moving light systems. Light distribution
measurements undertaken on this system confirmed the slow increase/decrease in
fluence, and higher canopy penetration. Growth responses were compared under a
fixed or moving system using the same lamps and reflector type as described in
Materials and Methods. Results (Table 4.4) showed the moving system did improve
some growth responses relative to the fixed system, but development was delayed.
Seed number was increased, but flowering node and flowering time were delayed
relative to the same lights in a fixed system (Table 4.4). In fact the plants were slower
to develop under the moving system, as reflected in the later flowering time and
82

increased total shoot length (Table 4.4). Hence dry weight was significantly higher
under the moving system (Table 4.4), but this was a result of the increased shoot
length from slower development times. Harvest time was two weeks later under the
moving system. The moving system also did not result in more even growth between
the plants.
83

Table 4.4. Mean growth parameters (± SE, n = 20) for L107 peas grown concurrently in growth chambers at 20 ° ± 0.5°C under HPS lamps fixed in position or moving backwards and forwards across the plants. Photoperiod 18h, irradiance 220 moles iti 2s4 at the pot surface. Full details are in Materials and Methods. Different letters signify significant differences at P.<0.05, letter plus asterisk (e.g. b*) significant at P<0.01.
L1-9(cm) TL(cm) TN NFI FT(days) Seed Pods Stem(mm) LW(mm) LL(mm) Dry W (g)
Stationary 54.1 138.5 22.2 18 31.6 16.9 6.1 3.2 37.4 48.1 5.6
± 0.49 a ± 2.62 a ± 0.25 a ± 0.13 a ± 0.19 a ± 1.05 a ± 0.53 a ± 0.05 a ± 0.42 a ± 0.61 a ± 0.22 a
Moving 53.7 150.6 22.5 18.8 37.7 21.1 6.2 3.1 37 47.8 6.6
± 0.41 a ± 2.76 b* ± 0.26 a ± 0.10 b* ± 0.18 b* ± 1.17 b ± 0.42 a ± 0.06 a ± 0.63 a ±0.71 a ± 0.13 b*
84

4.4 Discussion All of the HPS sources tested have low blue and high red components compared to
sunlight and other sources (Fig. 4.1, Table 4.1). However, the highest proportional
output is in the 500-600 nm (green/yellow) range. This is in the peak range of the
human eye photopic response (Ryer 1997) and hence the lights *appear very bright to
humans. Photosynthesis, however, has peak responses to blue and red, with red
wavelengths the most efficient for photosynthesis (Sager et al. 1982).
The FR proportion from HPS sources is very low compared to sunlight and
traditional photoperiod extension lighting (Table 4.1), and hence R:FR is very high.
Addition of far red rich incandescent globes to HPS, however, had little effect, only
reducing R:FR by 0.2 (Table 4.1). HPS globes do contain some FR; in the plant
specific Lucagrow lamps it is relatively high at 9.3% compared to Osram Planta lamps
tested (3.3%, Table 4.1). These latter globes are also marketed as plant specific, with
higher blue and red proportions than regular HPS (manufacturers' data). While blue
levels are similar (both only 4-6%), the Lucagrow globes have 20% less green, 14%
more red and 6% more far red than the Planta globes, thus come closer to meeting the
plant specific claim. In fact, the non-plant specific Osram SON-E globes tested in this
section have less green, more red and more far red than Planta globes and thus come
closer to meeting the plant specific claim, even though they are not marketed as such
and are considerably less expensive. Overall, given the aim of supplementary lighting
to maximise photosynthesis (Hanan 1998) and red wavelengths having the highest
photosynthetic efficiency (Sager etal. 1988), the Lucagrow globes appear to be the
best choice of the globes tested for this purpose, followed by Osram SON-E, which
out-performed more expensive plant specific lamps, including Sunmaster and the
widely used SON-T-Agro lamps.
Far-red proportions are low in HPS lamps relative to sunlight, and hence R:FR ratios
are high (Table 4.1). High R:FR is known to reduce intemode extension and to delay
flowering in photoperiodic sensitive species (Runkle and Heins 2001). Low blue
proportion is also associated with later flowering and increased internode extension
(Runkle and Heins 2001, Eskins 1992, Wheeler et al. 1991). Hence on spectral
properties, the high red proportion of HPS should aid photosynthesis, but the high
R:FR and low blue component could delay flowering relative to sunlight. Shoot length
responses are less clear, as high R:FR can reduce shoot length but the low blue
85

proportion of HPS has been associated with increased intemode length (Wheeler et
al., 1991, Tibbitts et al. 1983), as is low irradiance (Gawronska et al. 1995). In
addition, in a natural light background, HPS provided significant contribution to total
irradiance (Table 4.2), but did not significantly alter wavelength ratios of natural light
(Table 4.1). There are numerous studies that report growth improvements under HPS
supplementation of natural light during winter (Bredmose 1995; Demers et al. 1991;
Dorais et al. 1991; Vezina et al. 1991), but the influence of HPS supplementation on
flowering node or intemode extension has received less attention.
Thus to examine the influence of altered wavelength properties and increased
irradiance, growth responses under HPS and fluorescent/incandescent supplementary
lighting were examined using a photoperiodic pea line (L107). In winter, compared to
Fl/Inc supplement, supplementary lighting with HPS significantly reduced L1-9 and
increased TN, but not TL significantly (i.e. intemode length was reduced, Table 4.3).
Flowering node was not significantly altered in spite of the high R:FR ratio of the
HPS lighting (R:FR 4), which could be expected to delay flowering (Whitman et al.
1998). Twilight R:FR ratios (such as in the Fl/Inc mix used in this study, R:FR 0.8)
can increase shoot extension (Moe and Heins 1990; Runkle and HeMs 2001), but so
can low irradiance in pea (Gawronska et al. 1995) and the observed intemode length
reductions in this study could be from high R:FR during the after dark extension
period or from the increased irradiance. While low R:FR promotes flowering in many
LD species (Vince-Prue 1994), such as pea, and only very low fluence rates are
required (Kendrick and Weller 2003a) photosynthetic efficiency is low. This was
reflected in the large increase in DLI with HPS supplement compared to Fl/Inc
supplementation (Table 4.2). Supplemental irradiation can provide significant growth
improvements where natural light is limiting, such as under short winter days and
overcast conditions (Hanan 1998; Hao and Papadopoulos 1999). In garden pea, yield
was dramatically increased, as was item diameter and leaf size under HPS
supplementary lighting during winter (Table 4.3). Thus the DLI increase from HPS
supplementary lighting dramatically improved growth and yield under winter
conditions, intemode length was reduced, and flowering unaltered.
In summer, supplementary light had less influence (Table 4.3). Light use efficiency
is highest at low PPF, thus supplementing light has a greater effect at low light levels
than high levels (de Koning 1997). Summer results also showed a temperature
influence, with reduced shoot length, yield and flowering time. Thermal radiation
86

from lamps can influence growth (Faust and Heins 1997; Graper and Healy 1991), and
L107 pea showed reduced shoot length, yield and flowering time with increased
temperature, both under natural light and in growth chamber experiments (Table
2.16).
Flowering node was again not delayed under HPS compared to Fl/Inc lighting in
summer (Table 4.3), in spite of the large difference in R:FR. Spectral differences
between lamps may be less important when used as a supplement to natural radiation
(Moe 1997), and ratio measurements (Table 4.1) confirm little influence of HPS on
natural ratios as a supplement. As well, flowering can be promoted by an increase in
photosynthesis supply and/or radiant heat from the lamps (Moe 1997), which may
counteract a ratio induced delay. It is interesting that when HPS lighting was applied
as an extension to photoperiod rather than over the full lighting period, NFI was
delayed relative to Fl/Inc extension. Under these conditions, L107 NFI was around
node 17 (Table 2.16) compared to node 15-16 under both continuous light period
supplementation with HPS or Fl/inc (Table 4.3) or with Fl/inc extension (Table 2.12).
In the growth chamber studies, plants under HPS lighting alone showed delayed
flowering node relative to natural light supplemented with HPS (around nodes 18 and
16 respectively, Tables 4.4, 4.3). Thus HPS lighting can delay flowering, but when
used as a supplement to natural light, these delays were not observed.
When ambient DLI is low, supplemental lighting at photosynthetic levels improves
quality and flowering (Pramuk and Runkle 2005). Results obtained for a standard line
pea plant support this, and if yield or biomass (as indicated by dry weight) increase is
the primary aim, significant growth improvements can be obtained in winter by
supplementing natural radiation with UPS lighting.
For even growth, even light distribution is important, thus the spacing and reflector
type is important with supplementary lighting. The high output and small size of UPS
allows for fewer lamps and less shading for a given light level compared to other light
sources, but light distribution must be managed- generally less than 30% variation
should be the. aim (Fisher etal. 2001). Higher wattage lamps with broad reflectors can
be mounted high in the greenhouse, or if head height does not allow this, a closer
spacing of lower wattage lamps is required (Fisher etal. 2001). Results with various
reflector types showed that acrylic covers improved light distribution and did not alter
the spectral properties of uncovered lamps. Larger reflectors also improved light
distribution, but increased infrastructure shading during natural light. The covered
87

housings also protect the lamps from moisture and sprays, and provide safety
protection from lamp breakage.
Moving light systems are claimed to improve and provide more even growth by
aiding light distribution and penetration into the canopy. While such a system did
produce some growth improvements (Table 4.4), development time was delayed
relative to a fixed system, and growth was not less variable. Under fixed and moving
HPS supplementary lighting, growth of gerbera was reduced relative to the fixed
system, even though photosynthetic capacity was increased, perhaps because of the
slower response time of photosynthesis compared to the rate of change in irradiance
(Zheng et al. 2006). Even light distribution under HPS can be achieved by adequate
spacing of lamps, particularly if diffusing covers are used. Most lighting
manufacturers provide a service to calculate the required lamp spacing for a given
irradiance over an area.
In summary, HPS supplements are an established method of improving growth rates
under light limiting conditions. A range of plant specific FIPS lamps are available and
of those tested GE Lucagrow globes best meet the manufacturers claims, although
some non-plant specific (and less expensive) HPS globes performed well. Winter
growth of pea was dramatically improved by the use of 80-100 [tmol 111-2S-1 HPS
supplementation of natural light, and flowering was not delayed relative to low R:FR
lighting. Diffusing acrylic covers or adjustable reflectors improve light distribution,
but the reflectors have a larger footprint and thus produce more infrastructure shading.
Light moving systems reduced self shading and increased canopy penetration, but
delayed development times relative to a fixed system. UPS lighting could also be used
as photoperiod lighting for more even seasonal daily light integrals, and did not delay
flowering when used as a continuous supplement over the full LD photoperiod.
88

Chapter 5 Photoperiod control
5.1 Introduction Photoperiod studies in greenhouses involve the natural photoperiod being modified
by extension lighting and/or screening to exclude light (Heins and Faust 1994).
Growth chambers are also useful for photoperiod studies, as the duration of the light
period can be controlled. Issues identified of concern in photoperiod control were
what types of lights can be used for photoperiod extension, the quantity of light
required and what level of light leakage can be inductive in sensitive species. This
Chapter examines those issues using the facilities at the School of Plant Science,
which include growth chambers in total light exclusion zones and phytotron
glasshouses with a series of automated plant trolleys and light proofed bays. This
allowed for examination of the influence of light extension type to natural daylight (eg
fluorescent or incandescent), examination of inductive light levels and the
quantification of light leakage in controlled environment equipment used for
photoperiod studies.
Photoperiod responses vary between species and even within cultivars of the same
species (Mattson and Erwin 2005). Garner and Allard (1920, cited in Cathey and
Campbell, 1977) characterised plant responses to photoperiod and classified plants
into four types- short day (SD), long day (LD), day length intermediate and day
neutral. Continuous light inhibits flowering and promotes vegetative growth in short
day plants, promotes flowering and vegetative growth in long day plants, reduces
flowering in intermediate plants, and has no effect on flowering but may increase
shoot length in day neutral plants. Long night photoperiodic responses (SD) depend
on the period of darkness exceeding some critical value, following a period of light. In
LD plants, long photoperiods of continuous light are required for flowering (Vince-
Prue 1981). In SD plants the duration of darkness is the primary determinant, as night
break experiments prevent flowering. Also important is when the night break occurs-
the night break response is a transient period of sensitivity related in time to the
beginning of the dark period. However, a preceding period of light is needed for the
dark period to be effective. Thus both light and dark are necessary components of the
photoperiodic mechanism in SD plants. Light quantity is also important, SD plants
will not flower if the photoperiod is very short or irradiance is very low. Although the
89

light requirement for induction in SD plants is not of photosynthetic levels, there may
be an interaction with photosynthesis in that photosynthate is required (Vince-Prue
1994).
Plants measure the length of darkness. In a number of LD plants, a night break of
light under short day conditions has the same effect as long day conditions. R is the
most effective wavelength and FR can reverse the effects. Since this is a phytochrome
mediated response, only low energy levels are needed to artificially extend
photoperiodic day length (Kendrick and Weller 2003a).
Traditional photoperiod extension lighting is with incandescent lamps, which have a
low R:FR ratio and low photosynthetic efficiency. Only very low fluence rates are
required for photoperiodic responses- less than 1iimole m -2s-1 can be inductive
(Whitman et al. 1998). Threshold illuminance values for responsive species vary by
two to three orders of magnitude, but between 1 and 50 lux of incandescent is
generally sufficient (Summerfield and Roberts 1987). Using the formulas and
conversion tables of Thimijan and Heins (1983), 50 lux of incandescent equates to 1
m-2s-I . Saturation irradiance (above which there is no increase in response) also
varies widely, from less than 10 lux for chickpea to over 1000 lux (201.1mol ni2s-1 ) in
lentil (Summerfield and Roberts 1987). Hence, accurate light exclusion is necessary to
effectively examine photoperiod responses.
Comparative photoperiod studies generally use a photosynthetic lighting level
followed by either dark or weak photoperiodic extension at a non photosynthetic level.
Incandescent for this purpose is simple to install, effective, and inexpensive (Cathey
and Campbell 1977; McCree 1972b; Whitman et al. 1998).
Many studies confuse photoperiod with daily light integral (DLI) when comparing
light duration effects (Adams and Langton 2005). LD photoperiod treatments include
high irradiance SD preceded and/or followed by low irradiance lighting (day
extension lighting); photosynthetic lighting of different photoperiods and intensity to
give the same DLI (equal integral lighting); and low irradiance lighting applied during
the dark period (night break lighting) (Adams and Langton 2005). LD treatments
frequently improve growth of plants compared to SD, even with equal DLL LD
commonly promotes leaf area and photosynthetic efficiency. Typically thinner, larger
shade type leaves are produced under such conditions, as plants appear to respond to
the average irradiance over the lit period. Such leaves are more photosynthetically
efficient, and due to the hyperbolic relationship between PAR and photosynthesis, it is
90
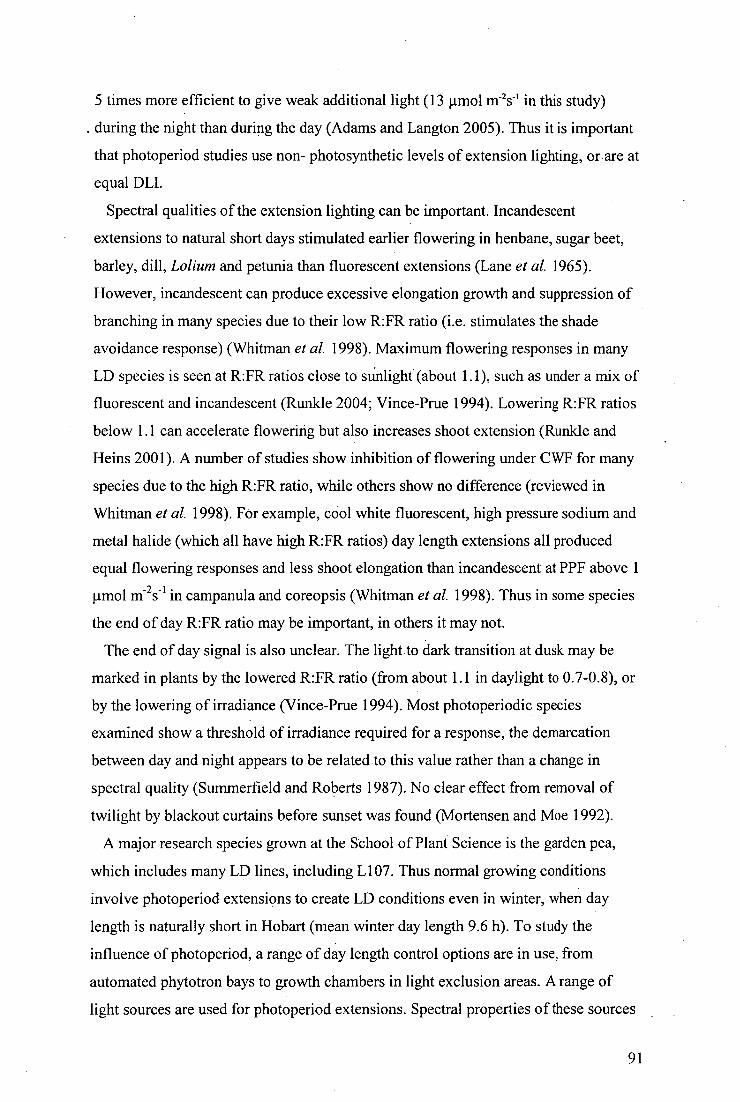
5 times more efficient to give weak additional light (13 urnol m 2s -1 in this study)
. during the night than during the day (Adams and Langton 2005). Thus it is important
that photoperiod studies use non- photosynthetic levels of extension lighting, or are at
equal DLI.
Spectral qualities of the extension lighting can be important. Incandescent
extensions to natural short days stimulated earlier flowering in henbane, sugar beet,
barley, dill, Lolium and petunia than fluorescent extensions (Lane et al. 1965).
However, incandescent can produce excessive elongation growth and suppression of
branching in many species due to their low R:FR ratio (i.e. stimulates the shade
avoidance response) (Whitman etal. 1998). Maximum flowering responses in many
LD species is seen at R:FR ratios close to sunlight (about 1.1), such as under a mix of
fluorescent and incandescent (Runkle 2004; Vince-Prue 1994). Lowering R:FR ratios
below 1.1 can accelerate flowering but also increases shoot extension (Runkle and
Heins 2001). A number of studies show inhibition of flowering under CWF for many
species due to the high R:FR ratio, while others show no difference (reviewed in
Whitman et al. 1998). For example, cool white fluorescent, high pressure sodium and
metal halide (which all have high R:FR ratios) day length extensions all produced
equal flowering responses and less shoot elongation than incandescent at PPF above 1
[tmol 111-2S - I in campanula and coreopsis (Whitman etal. 1998). Thus in some species
the end of day R:FR ratio may be important, in others it may not.
The end of day signal is also unclear. The light to dark transition at dusk may be
marked in plants by the lowered R:FR ratio (from about 1.1 in daylight to 0.7-0.8), or
by the lowering of irradiance (Vince-Prue 1994). Most photoperiodic species
examined show a threshold of irradiance required for a response, the demarcation
between day and night appears to be related to this value rather than a change in
spectral quality (Summerfield and Roberts 1987). No clear effect from removal of
twilight by blackout curtains before sunset was found (Mortensen and Moe 1992).
A major research species grown at the School of Plant Science is the garden pea,
which includes many LD lines, including L107. Thus normal growing conditions
involve photoperiod extensions to create LD conditions even in winter, when day
length is naturally short in Hobart (mean winter day length 9.6 h). To study the
influence of photoperiod, a range of day length control options are in use, from
automated phytotron bays to growth chambers in light exclusion areas. A range of
light sources are used for photoperiod extensions. Spectral properties of these sources
91

are examined, particularly R:FR ratios, and the likely implications for morphological
growth parameters in the garden pea. To examine the influence of photoperiod control
methods, L107 peas were grown under a range of conditions described below.
Specifically examined were inductive light levels, light leakage and effectiveness of
control methods, and the influence of photoperiod extension type.
5.2 Materials and methods Light measurements, plant growth and analysis were as previously described in
Materials and Methods (Sections 2.2.2 and 2.2.4).
Normal glasshouse conditions were an 18 h photoperiod consisting of natural light
•extended morning and evening by mixed fluorescent/incandescent lighting. This is a
mix of 3 x 40 watt L40 W/ 20S cool white fluorescent tubes (Osram, Munich,
Germany) to 4 x 100w pearl incandescent (Thorn, Smithfield, NSW, Australia) with
R:FR measured of 0.8.
Inductive light level was examined by growing L107 under natural light for 8 h
followed by 16 h low fluence incandescent extension or no light extension in light
proof dark bays. The extension was provided by a single 25W incandescent bulb
(Thorn Australia). Ten plants per treatment were placed at intervals from this light to
create a total irradiance gradient of 0.6, 0.3, 0.2 and 0.1 iimol 111-2S -1 , as measured with
the Li-Cor spectroradiometer. Mean day temperature for the study period was day,
23.2°C, night 16.0°C.
Light leakage levels were measured in closed dark bays and growth chambers
during daylight, and in growth cabinets grouped in a dark area with the lights on in an
adjacent chamber.
End of day light measurements were taken with both the Li-Cor and Apogee
spectroradiometers at 15 min intervals until after sunset under both overcast and clear
sky conditions.
To examine the effects of photoperiod extension type, plants were grown
concurrently in phytotron bays for 8 h photoperiods (natural daylight) extended by
either incandescent (25W pearl incandescent Thorn, Australia) or cool white
fluorescent (40 watt L40 W/ 20S cool white, Osram, Germany) for 16 h. Extension
fluences used were 5 limol al -2s (300-800 nm) in both cases. R:FR ratios were 0.7
and 5.6, respectively. Mean daytime PPF was 228 moles m -2s - ', DLI around 8 mol m -
2 d - '. The phytotron bays consist of a series of moveable trolleys and light proofed
92
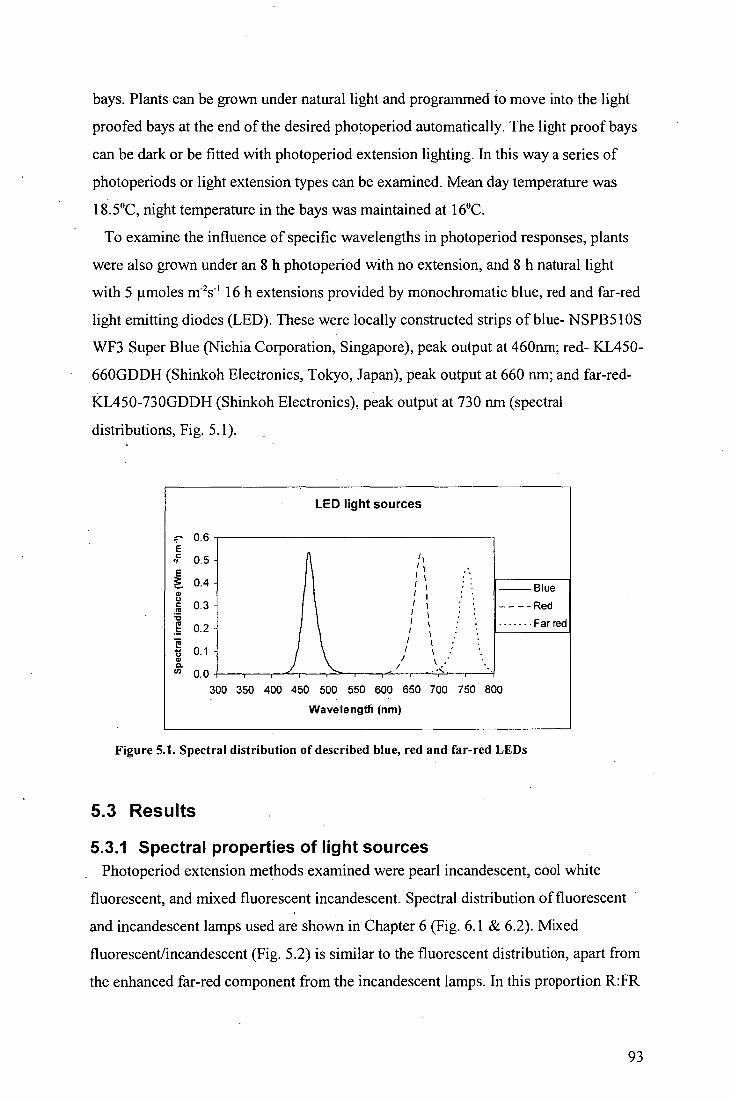
LED light sources
0.6
0.5 -
0.4 -
0.3 -
0.2 -
0.1 -
Spec
tral
Irra
dian
ce (W
m 4
nm-1)
■ a 0
Blue
— — - Red
Far red
300 350 400 450 500 550 600 650 700 750 800
Wavelength (nm)
bays. Plants can be grown under natural light and programmed to move into the light
proofed bays at the end of the desired photoperiod automatically. The light proof bays
can be dark or be fitted with photoperiod extension lighting. In this way a series of
photoperiods or light extension types can be examined. Mean day temperature was
18.5°C, night temperature in the bays was maintained at 16°C.
To examine the influence of specific wavelengths in photoperiod responses, plants
were also grown under an 8 h photoperiod with no extension, and 8 h natural light
with 5 pmoles rri 2s - I 16 h extensions provided by monochromatic blue, red and far-red
light emitting diodes (LED). These were locally constructed strips of blue- NSPB510S
WF3 Super Blue (Nichia Corporation, Singapore), peak output at 460nm; red- KL450-
660GDDH (Shinkoh Electronics, Tokyo, Japan), peak output at 660 nm; and far-red-
KL450-730GDDH (Shinkoh Electronics), peak output at 730 nm (spectral
distributions, Fig. 5.1).
Figure 5.1. Spectral distribution of described blue, red and far-red LEDs
5.3 Results
5.3.1 Spectral properties of light sources Photoperiod extension methods examined were pearl incandescent, cool white
fluorescent, and mixed fluorescent incandescent. Spectral distribution of fluorescent
and incandescent lamps used are shown in Chapter 6 (Fig. 6.1 & 6.2). Mixed
fluorescent/incandescent (Fig. 5.2) is similar to the fluorescent distribution, apart from
the enhanced far-red component from the incandescent lamps. In this proportion R:FR
93

Fl/inc extension lighting
0.02.
0 0 0 0 0 0 0 0 0 0 0 In 0 in 0 111 0 1.0 0 co 01- Lo In co co r- N. co
Wavelength (nm)
0.01 -
0.00 CD co co
is reduced from 5.6 (for fluorescent) to 0.8, which is equivalent to the natural light
twilight ratio (Smith and Morgan 1981).
Figure 5.2. Spectral distribution of standard photoperiod extension using 3 x 40 watt L40 W/ 205 cool white fluorescent, (Osram) to 4 x 100w pearl incandescent (Thorn).
Arrangement of this lighting in the phytotrons at the School of Plant Science
consists of one light bank over every second row of plants, set 2 m above ground
level. This gave measured light distribution ranges of 8-201.unol m-2s- ' at pot level.
This is above the range of threshold to saturation irradiance given for photoperiodic
responses by Summerfield and Roberts (1987), who also note that even distribution is
not as important for photoperiodic lighting, as long as levels are above thresholds.
5.3.2 Inductive light level To examine inductive light level, plants were grown under 8 h natural light with a
very weak light extension gradient (0.1 to 0.6 tunol m -2s- '), and with no extension, as
described in Materials and Methods. Results show that even an irradiance of 0.1 Innol
rn-2s-1 can be considered inductive for pea, as flowering node (NFI, Table 5.1) was
significantly earlier (P < 0.01) than no extension. At 0.2 and 0.3 pmol m 2s NFI was
not significantly different to 0.1 mmol m -2s-1 . At 0.6 lmoles NFI was
significantly earlier (P < 0.01) than 0.1 j.trnol ni2s- I and was not significantly different
to an extension irradiance of 5 1.1moles rn -2s- I used to compare extension light source
(Table 5.2). Thus, for L107 pea inductive irradiance was less than 0.1 imoles
while saturating irradiance was above 0.6 moles M-2S-I .
94

Table 5.1. Node of flower initiation (NFI)± SE, n = 10 for L107 pea grown under 8 h natural light with no extension, and with 16 h extensions of 0.1 to 0.6 !moles nf2s1 as described in Materials and Methods. • Different letters signify significant differences at P<0.05, letter plus asterisk (e.g. b*) significant at P<0.01.
Extension irradiance 0 0.1 0.2 0.3 0.6 (timoles
NFI 22.1 ± 17.2 ± 16.8 ± 16.7 ± 15.9 ± 0.21 a* 0.18 b 0.16 b 0.16 b 0.16 c*
5.3.3 Light leakage measurements Given the very low fluence required for inductive responses, growth chambers and
dark bays used for photoperiod studies were tested for light leakage levels, as plants
growing in SD conditions may be influenced by light leakage from natural light or
from adjacent growth chambers. In closed dark bays during daylight, light levels were
under 0.001 limol
In the phytotron bays and in growth chambers in a darkened area, light leakage was
below detectable levels. With lights on in an adjacent chamber, light levels in the dark
chamber were under 0.001 iimol m's - t. In dark cabinets not in a light proof area, light
levels measured were between 0.01 and 0.03 limol m 2s. L107 plants grown in this
chamber under SD conditions (8 h) flowered at node 25.2 ± 0.28, suggesting light
leakage at this level (0.01-0.03 vtmol Iv's') was not inductive.
5.3.4 End of day R:FR ratio R:FR ratio of the mixed fluorescent/incandescent photoperiod extension lighting
examined mimic twilight levels of 0.8. However, it is uncertain whether end of day
time measurement is a response to the lowering of R:FR ratio at twilight or to lowered
irradiance (Vince-Prue 1994), but appears to be marked by irradiance below threshold
levels (Moe 1997; Summerfield and Roberts 1987, Tibbitts et al. 1983).
Twilight ratios were measured under both clear sky and overcast conditions, both in
a glasshouse (through horticultural glass) and outside. To avoid light contamination,
all supplementary light sources were turned off for these measurements. It has
previously been reported (Smith and Morgan 1981) that daylight is remarkably
constant over the course of the day, but that R:FR drops to 0.8 during twilight. This
was confirmed for broad band R:FR (Fig. 5.3), with a lowering of R:FR to 0.8 at
95

LO LO CD (1) 0 In %- 'tzr Cri Cri 6 6 6 6
twilight due to an increase in far-red proportion. However, there was little alteration in
narrow band calculation. Also measured were blue ratios (Fig. 5.3). Blue proportion
increases dramatically at twilight, from 0.6 to 1.2 at sunset. Thus although far-red
does increase at twilight, the large change in spectral properties is in blue proportion.
There was no alteration in ratios through glass compared to open sky, and results were
similar under both clear and overcast conditions.
Figure 5.3. Measured wavelength ratios from 2 PM to after sunset (twilight), overcast conditions
The specific role of blue light at twilight appears to have not been investigated, but
screening to exclude twilight had no influence in previous studies (Mortensen and
Moe 1992). In addition, plants in the SD system at the School of Plant Science usually
enter the dark bays before twilight and do not receive the extension lighting. Such
plants therefore do not receive a twilight signal, but respond to the SD treatment,
suggesting lowered irradiance acts as an end of day signal, as well as or instead of a
twilight ratio.
5.3.5 Responses to photoperiod extension R:FR In Chapter 4, plants grown under high pressure sodium (high R:FR) did not flower
at a later node than plants grown under fluorescent/incandescent lighting (low R:FR),
as could be expected. However, since this comparison was not at equal DLI, there
• may have been no delay in flowering due to the extra photosynthate from increased
irradiance. A number of species show inhibition of flowering under fluorescent due to
96

the high R:FR, while others show little difference (Whitman et al. 1998). Lowering
R:FR below daylight levels of around 1.1 can accelerate flowering, but also increases
shoot extension as part of the shade avoidance response (Runkle and Heins 2001).
However, spectral differences between lamps may be less important when used as a
supplement to natural radiation (Moe 1997). To examine the influence of photoperiod
extension R:FR at equal DLI, L107 plants were grown concurrently under 8 h, and 8 h
+ 16 h weak photoperiod extension with either incandescent or fluorescent lamps.
R:FR ratios of the extensions were 0.7 and 5.6, respectively, allowing for examination
of the influence of low or high R:FR.
Results (Table 5.2) confirm the facultative LD response of L107 pea (Reid et
a/.1996): plants will flower under SD, but flowering is delayed by 6-7 nodes and 15-
20 days. Thus total shoot length (TL) and total nodes (TN) is significantly greater than
under inductive (long day) photoperiods. In spite of the very large difference in R:FR
between the incandescent and fluorescent extensions, however, NFI was not
significantly different, although slightly earlier under incandescent. Flowering time,
however, was significantly earlier under incandescent compared to fluorescent (Table
5.2).
97

Table 5.2. Photoperiod extension type mean growth results (± SE) for L107 pea, n = 20. Plants grown concurrently under 8 h natural light with no extension, or 16 h weak fluorescent or incandescent extension as described in Materials and Methods. Different letters signify significant differences at P<0.05, letter plus asterisk (e.g. b*) significant at P<0.01. Abbreviations: inc- incandescent, fl- fluorescent, L1-9- length between nodes 1-9, TL- total shoot length, TN- total no. of nodes, NFI- node of flower initiation, FT- flowering time from planting date, LW- leaflet width at node 9, LL- leaflet length at node 9, Dry W- shoot dry weight.
L1-9(cm) TL(cm) TN NFI FT(days) Seed Pods Stem(mm) LW(mm) LL(mm) Dry W (g)
8 h 31.5 189.8 30.8 22.7 69.3 15.5 10.3 2.5 25.3 34.5 6.1
± 1.09 a* ± 5.15 a* ± 0.60 a* ± 0.29 a* ± 1.29 a* ± 2.58 a* ± 0.99 a* ± 0.08 a ± 0.50 a* ± 0.58 a ± 0.28 a*
8 h + inc 58.2 147.5 18.0 16.0 48.7 8.3 2.6 2.5 26.3 33: 8 4.6
± 0.64 b* ± 2.64 b* ± 0.10 b ± 0.05 b ± 0.33 b* + 0.51 b ± 0.20 b ± 0.05 a ± 0.28 b ± 0.43 b* ± 0.24 b
8 h + fl 44.4 129.9 19.1 16.4 53.6 11.1 3.9 2.5 28.0 36.7 4.5
± 1.09 c* ± 2.78 c* ± 0.14 c ± 0.06 b ± 0.44 c* ± 1.13 b ± 0.36 b ± 0.07 a ± 0.59 c ± 0.75 c* ± 0.24 b
98

Shoot length was significantly increased relative to fluorescent extension under
incandescent. Internode length (L1-9) was significantly increased (by almost 14 cm)
as was total shoot length (TL). Total nodes (TN) was significantly decreased, and
leaflet size (LW and LL) was significantly decreased under incandescent. These are
typical shade avoidance responses to low R:FR ratio (Ballare etal. 1997). Yield (seed
and pods) was also reduced under incandescent extension. Thus extension type
(fluorescent or incandescent) significantly influenced morphology of a standard line
garden pea.
5.3.6 Response to monochromatic photoperiod extensions Flowering node (NFI, Table 5.2) was not significantly different under fluorescent or
incandescent extensions in spite of the large difference in R:FR. Other species have
also shown this lack of response, for example high R:FR day length extensions all
produced equal flowering responses and less shoot elongation than low R:FR
incandescent extensions in campanula and coreopsis (Whitman etal. 1998). To test
the response of pea, the experiment was repeated with the day length extension
provided by weak monochromatic blue, red and far-red LED lighting as described in
Materials and Methods. This allowed for examination of specific wavelengths on the
LD response, including blue light. While light sources such as fluorescent and high
pressure sodium have high R:FR, they still contain some far-red light. By using
monochromatic wavelengths as the photoperiod extension, the specific roles of red,
far-red and blue can be examined. The flowering response under the extension
wavelengths would also indicate if a far-red component is required for flowering, or
whether other wavelengths are also inductive.
Results show that any of the light extension wavelengths induce significantly earlier
flowering than SD conditions (Table 5.3), all were around the natural LD flowering
node for this pea line of node 16. Thus any of the wavelengths tested can be
considered inductive. However, plants flowered at a significantly later node under red ,
with significantly reduced internode lengths compared to blue and far-red extensions
(Table 5.3). The far-red extension induced significantly earlier flowering, increased
internode length and smaller leaves, typical shade avoidance responses to low R:FR.
Under blue, shoot length and leaf size was not significantly different to SD conditions,
but flowering was significantly earlier. The results suggest light of any wavelength is
99

effective at flower induction in pea as an extension to natural light, but high R:FR will
delay flowering and reduce shoot length, while low R:FR has the opposite effect. Blue
wavelengths were inductive for flowering without altering shoot length.
Table 5.3. Photoperiod extension type mean growth results (± SE) for L107 pea, n = 20. Plants grown concurrently under 8 h natural light with no extension, or 16 h weak blue, red or far-red light emitting diodes extension as described in Materials and Methods. Different letters signify significant differences at P<0.05, letter plus asterisk (e.g. b*) significant at P<0.01. Abbreviations:, L1-X- length between nodes 1-X, NFL- node of flower initiation, FT- flowering time from planting date, LW- leaflet width at node 9, LL- leaflet length at node 9.
L1-4 (cm) L1-9 (cm) L1-12 (cm) NFI FT (days) LW (mm) LL (mm)
8 h 10.9 44.8 73.2 23.6 66.3 20.4 28.1
± 0.26 a ± 0.36 a* ± 0.71 a* ± 0.28 a* ± 2.01 a* ± 0.56 a ± 0.63 a
8h + 11.5 46.0 72.4 15.9 46.1 19.7 27.3 Blue ± 0.17 a* ± 0.50 a* ± 0.66 a* ± 0.06 b* ± 0.23 b ± 0.33 a ± 0.41 a
8h + 9.3 40.2 61.9 16.8 45.5 21.4 29.5 Red ± 0.23 b* ± 1.05 b* ± 1.60 b* ± 0.18 c* ± 0.31 b ± 0.69 a ± 1.13 a
8h + 12.7 55.6 83.2 15.3 51.0 17.7 23.6 Far-red ± 0.36 c* ± 0.97 c* ± 1.43 c* ± 0.13 d* ± 0.34 c . ± 0.65 b ± 0.50 b*
5.4 Discussion Only very low fluence was required for an inductive response in L107 pea.
Inductive irradiance was less than 0.1 p.mol m's - ' while saturating irradiance was
above 0.6 [imol m's' (Table 5.1). This is in line with other results for photoperiod
sensitive species (Summerfield and Roberts 1987). Fluence rates as low as 0.2 [trnol
in-2s - ' induced flowering in Campanula (Whitman et al. 1998). This highlights that for
SD experiments to be effective, external light must be excluded, including from
adjacent areas. For example, light leakage of HPS light was tested on neighbouring
crops from a greenhouse with a photoperiod extended morning and evening to provide
18 h by Bakker and Blacquiere (1992). Flowering was delayed in the SD plants
(Chrysanthemum, Poinsettia) from measured leakage levels of 0.05 to 0.2 [tmol
PPF, and promoted in the LD plants (Fuchsia and Callistephus chinensis). Cucumber
elongation was reduced and fruiting delayed (Bakker and Blacquiere 1992). As part of
the study of glass and polycarbonate (Chapter 3), L107 was grown under non-
inductive Conditions in winter: short days without any photoperiod extension.
However, security lighting around the complex was sufficient to induce a LD
100

flowering response (Table 3.3). This again highlights the importance of light
exclusion for SD conditions.
For different photoperiods incorporating natural light, a system of phytotron bays is
in use at the School of Plant Science, Hobart. These consist of automatic trolleys that
run into a series of dark bays, which can be dark or contain photoperiod extensions.
The phytotron bays tested were effectively light proof, but other systems in common
use, such as photoperiod curtains, may not exclude all light.
Photoperiod control is also commonly conducted in growth chambers. As for natural
light systems, care must be taken to exclude all other light sources (such as light
leakage from other chambers through vents) if the photoperiod being examined is to
be relied upon. Testing of light leakage levels in chambers and the dark bays showed
that levels were very low, less than 0.03 p,mol M-2 s-I . Plants grown under SD
conditions with this level of light leakage did not show an inductive response,
suggesting light leakage was not an issue in the growth chambers examined.
Nevertheless, for added safety, light exclusion zones (including light proof vents) are
in place at the School of Plant Science around selected growth chambers, and the
phytotron bays can be considered light proof.
It is uncertain if the end of day signal is marked in plants by lowered R:FR (from
about 1.1 in daylight to 0.7-0.8), or by the lowering of irradiance (Vince-Prue 1994).
It has previously been reported (Smith and Morgan 1981) that daylight is remarkably
constant over the course of the day, but that R:FR drops to 0.8 during twilight.
Twilight ratios were measured (Fig. 5.3) and it was found that although broad band
R:FR does decrease, narrow band calculation did not. Blue proportion increased
dramatically at twilight, from 0.6 to 1.2 at sunset (Fig. 5.3). That light spectral
properties are relatively constant through the day was confirmed and there was no
alteration in ratios through glass compared to open sky, under both clear and overcast
conditions. The role of blue at twilight has not been investigated specifically, but
screening to exclude twilight had no influence in previous studies (Mortensen and
Moe 1992). The demarcation between day and night appears to be related to irradiance
dropping below threshold values rather than a change in spectral quality (Summerfield
and Roberts 1987). In addition to these studies, plants in the SD system at the School
of Plant Science usually enter the dark bays before twilight and do not receive any
extension lighting. Such plants therefore do not receive a twilight signal, but respond
101

to the SD treatment, suggesting lowered irradiance acts as an end of day signal, as
well as or instead of a twilight ratio.
The influence of extension lighting type on flowering is unclear. R:FR . has a clear
influence on plant responses, sensitive species show increased elongation, earlier
flowering and small leaf size in response to low R:FR (e.g. Ballare et al. 1997), and
relatively delayed flowering and reduced shoot length at high R:FR (e.g. RunIde and
HeMs 2001). However, as an extension to natural light, plant responses vary and
wavelength differences may be less important under such circumstances (Moe 1997).
Flowering in a range of species was relatively delayed under high R:FR fluorescent
compared to incandescent photoperiod extensions (Lane et aL 1965), and maximum
flowering response tends to be at natural R:FR (Vince-Prue 1981), thus traditional
photoperiod extensions use low R:FR lighting such as described in Figure 5.2.
However, other studies do not show inhibition of flowering at high R:FR. For
example, CWF, HPS and MH (which all have high R:FR) day length extensions all
produced equal flowering responses and less shoot elongation than incandescent at
PPF above 1 limo' 111-2 S-I in campanula and coreopsis (Whitman etal. 1998). R:FR
may be less important in the LD flowering response than the mere presence of light.
Any light from any wavelength can stimulate de-etiolation, for example (Kendrick and
Weller 2003b). Thus in some species the end of day R:FR ratio may be important, in
others it may not.
The response of pea was examined by comparing L107 growth with incandescent
(R:FR 0.7) and fluorescent (R:FR 5.6) at equal irradiance. Results (Table 5.2) showed
that for L107 pea, shoot length was significantly increased relative to fluorescent
extension under incandescent, with reduced leaf size and yield. These are typical
shade avoidance responses to low R:FR (Ballare etal. 1997). However, flowering
node was not significantly different. Further analysis using 8 h natural light plus weak
blue, red and far-red monochromatic extensions (Table 5.3) suggested light of any of
the tested wavelength is effective at flower induction in pea relative to SD conditions.
However, high R:FR will slightly delay flowering and reduce shoot length, while low
R:FR has the opposite effect. Blue wavelengths were inductive for flowering without
• altering shoot length.
Many studies that demonstrate the value of photoperiod extension with incandescent
have not established if the benefits are from a phytochrome ratio effect, the additional
photosynthetic contribution of 700-750 nm radiation, or a temperature effect on the
102

plants (Tibbitts et a/. 1983). Incandescent lamps have a high thermal component
(McFarlane 1978), and the radiant thermal effects need to be separated from other
environmental temperature effects (Sager etal. 1982). The low fluence rates, and high
distance to lights in the climate controlled phytotron bays helps to minimise these
effects, but the radiant influence of incandescent lamps in closer environments should
be considered. There was no evidence of thermal load influence on the L107 results
under either light source. Increased temperature reduced shoot length in pea (Table
2.16), as did the influence of thermal load from incandescent globes in growth
chambers (Chapter 7). L107 gown under the incandescent extension showed shoot
length increases relative to the fluorescent extension, as expected from lowered R:FR,
and under far-red LED, which provide far-red light without the thermal implications
of incandescent, the same typical shade avoidance responses of increased shoot
length, smaller leaves and earlier flowering were observed. Thus this response can be
considered to be a wavelength effect, not a thermal influence.
In summary, inductive light levels for photoperiodic sensitive species are very low,
and care should be taken to exclude all external light for SD studies. Any light from
any wavelength is likely to be inductive. Growth cabinets tested, however, did not
show light leakage above threshold levels. The end of day signal is likely to be
irradiance below threshold levels rather than a change in spectral properties at
twilight. Photoperiod extension R:FR can influence results- low R:FR can induce
shade avoidance responses, but high R:FR lighting and even monochromatic blue
lighting extension still produced a La response of earlier flowering.
103

Chapter 6 Growth Chambers
6.1 Introduction A range of growth chamber types are used at the School of Plant Science Controlled
Environment Facility, as in most such facilities. As research needs develop, growth
chambers are added, thus all facilities surveyed had a range of brands and types with
different light sources. Growth chambers are used for their ability to accurately
control environmental variables, notably temperature and light quantity. However,
there are many design and control method variations, and hence differences in air
velocity, direction and exchange rates, temperature distribution, and light. What
influence do 'these parameters have on plant development and morphology? How
comparable are results using different growth chambers? What is the influence of light
source on results? And even where the same light type is used (eg cool white
fluorescent), are there differences between the various brands and wattages used?
This chapter looks in detail at growth chamber issues by both physical measurement
and by examining growth responses of a standard pea line. The major difference
between growth chambers (and natural light) is light source. Spectral characteristics of
all the light sources used at the School of Plant Science facility are examined, which
are representative of the commonly used artificial lights used in plant research. The
interchangeability of sources, possible photomorphogenic effects of these sources, and
comparative growth responses are examined.
Under natural conditions, plants encounter considerable variation in light quantity,
quality and duration (Walters and Horton 1994). Temperature and other
environmental parameters also vary spatially and temporally (Carlson and Giger
1978). The variability of natural light environments was examined in Chapter 2, and
both descriptive (eg light quantity and temperature) and experimental (growth
responses of the garden pea in these environments) measurements showed significant
variation between environments and seasons. This makes comparisons of results
difficult unless plants are grown concurrently. Growth chambers can provide uniform
reproducible conditions for assessment of physiological and morphological
development (Carlson and Giger 1978). However, in growth chambers all radiation is
104

artificial (Aldrich and White 1969) and all artificial light sources have very different
spectral characteristics to sunlight (Deitzer 1994; Runkle 2004).
Plant responses vary according to wavelength, intensity and duration (Sager et al.
1988). Light source becomes particularly important in growth chambers where all
radiation is artificial (Aldrich and White 1969), and all artificial light sources have
very different spectral characteristics to sunlight (Runkle 2004). There may also be
some growth effects from the radiant component of artificial light sources above
700nm, either from the additional photosynthetic contribution, or a temperature effect
(Koontz etal. 1987; Tibbitts etal. 1983). Cool white fluorescent (CWF) are the
traditional light source in growth chambers, with or without incandescent (Cathey and
Campbell 1977). R: FR ratios as high as 8.8, with virtually no far-red (FR)
component, can be found in CWF, and this can inhibit flowering and shoot extension
in many species (Runkle 2004). R:FR ratios of natural light are generally not
replicated in growth chambers, even with the addition of incandescent lamps to the
light mix (Downs 1994).
Where high PPF levels are required, usually with the aim of simulating "natural"
conditions, fluorescent sources are considered inadequate, and high intensity
discharge (HID) lamps tend to be used (Bubenheim et al. 1988). Of the HID sources,
metal halide and high pressure sodium are the most common, due to their radiant
efficiency, long life and high output (Bubenheim etal. 1988). HID lamps can provide
higher PPF levels, but also increase short and long wave radiation, often to levels well
above those found in the natural environment (McCree 1984). This can affect leaf
temperature, increasing transpiration and reducing water use efficiency (Bubenheim et
al. 1988). Leaf temperatures 16 °C higher than air temperature have been measured
under HID lamps without filtering (McCree 1984). Hence growth chambers often
have separately ventilated, temperature controlled light lofts to reduce thermal load
and reduce output variation from temperature influences (Sager and McFarlane 1997).
Even with a barrier, management of heat load in the chamber is difficult, particularly
with lamps with a high thermal component such as HID and incandescent. Radiation
not reflected is absorbed and radiated as heat (Ormrod 1978a). Plexiglass
(polycarbonate) reduces the UV component more than glass; and both reduce
transmission of long wave radiation. Water barriers are the most effective long wave
radiation filters, reducing levels by a maximum of 51% at a depth of 40rnm yet
reducing PPF by less than 2% (Bubenheim et al. 1988). Unfortunately, water filters
105

increase design costs and maintenance so are often not practical (Downs 1994).
Differences in spectral output and light filtering methods (e.g. plexiglass, glass or
water barrier filters) may affect growth and development by causing differences in
photosynthesis, photomorphogenesis, and leaf and soil temperature (Tibbitts et al.
1983). At the School of Plant Science, growth chambers with no barrier, single and
double glass, and with water filters are in use. This allowed for study of the influence
of barrier type on both thermal load and growth responses.
There are many brands and types of lamps used in plant research, and they are often
mixed to produce broader spectra or specific light ratios (Sager et al. 1988). The lack
of conformity in lamp types and mixes makes comparison of results difficult (Tibbitts
et al. 1983). Spectral distribution, particularly in the far red region, has rarely been
considered in selection and use of growth chamber lighting systems (Downs 1994).
Phytochrome parameters have largely been ignored, with the addition of "token"
amounts of incandescent to provide limited far red proportions, well below sunlight
levels (Smith 1994). Equal wattage of incandescent has been recommended to provide
a far red component equivalent to sunlight proportions (Warrington 1978). However,
incandescent sources have peak output at 900nm, producing significant long wave
radiation. Consequently radiant heat load must be managed, and barrier type becomes
more important (Smith 1994). Although early recommendations for addition to
fluorescent lighting were 30% of the installed wattage, output of fluorescents has
improved (Downs 1994) and this figure appears to be inadequate, particularly for
higher output high intensity discharge lighting (Downs 1994; Warrington 1978).
In addition to photosynthesis, light also acts as environmental information for the
plant, affecting a wide range of photomorphogenic responses, including germination,
de-etiolation, elongation, leaf expansion, and flowering (Spalding and Folta 2005;
Weller 2004). The wavelengths most important for plant development are UV-blue
(350-500 nm), red (600-700 nm), and far-red (700-800 nm). The usual practice of
reporting PAR or PPF alone (i.e. 400-700 nm) are limiting (Downs 1979; Smith and
Morgan 1981). A full description of light should give the amount of light in each
waveband active in plant responses, 300-800nm, using spectroradiometer data
expressed in photometric terms in [tmol M-2 S-1 (Bjorn and Vogelmann 1994). Ratios of
blue to red (B:R), blue to far-red (B:FR), and R:FR should also be included for
possible photomorphogenic effects (Kittas et al. 1999).
106

Specific ratios can have specific effects. High R:FR generally signal a favourable
light environment, encouraging germination, de-etiolation, and flowering in many
species. Low R:FR signal competitive conditions and can encourage shade avoidance
responses- increased elongation, reduced leaf area, reduced branching and accelerated
flowering (Kendrick and Weller 2003a). Even very small changes in R:FR can induce
such responses (Casal 2005).
The importance of a far red component is well documented, particularly as an
incandescent addition to fluorescent sources, often increasing plant 'fresh weight, shoot
length and rate of flowering (Downs 1979). Less clear is the addition of incandescent
to HID sources. Addition of incandescent had little effect on mustard and wheat
growth, but increased soybean growth and accelerated flowering in Lolium (Downs
1994). Addition of incandescent in equal wattage to HID increased dry weight, plant
height and leaf area in tomato and sorghum when heat load was managed (Warrington
1978). The system described use water barrier filters and distance to reduce thermal
load effects, but most growth chambers do not have these options. Light mixes that
most closely resemble the natural spectrum produced the most "normal" plant growth
and development (Warrington et al. 1976), but growth chamber light sources have
very different spectral properties to natural light..
Blue light has been associated with light quantity/quality perception, as increasing
the blue component of white light is associated with shorter internodes (Thomas
1981), and the reduction of the blue component in canopy shade can induce elongation
(Ballare et al. 1997). Excess hypocotyl elongation in some species under high pressure
sodium (HPS) lamps has been attributed to the low blue component of this light
source (Tibbitts et al. 1983). HPS can produce excess elongation, while metal halide
(MH, relatively high blue component) induced less elongation than control plants
under high irradiance (Sager et al. 1982), and tomatoes grown under HPS were taller
than those grown under MH (Zheng et al. 2005). Soybean internode length under HPS
became progressively shorter with increasing blue supplementation or increased
irradiance, up to a blue level of 30 1.tmol 111-2S-I after which increasing blue had no
effect (Wheeler et al. 1991). Hypocotyl and petiole extension may be regulated by
light irradiance through blue light perception (Christophe et al. 2006; Walters and
Horton 1994), but inhibition of extension is also under phytochrome control (Walters
and Horton 1994). Large differences in shoot elongation may be seen under low
irradiance due to phytochrome responses, under high irradiance (above 300 [tmol rn -
• 107

2s-i ) with the same light source only small differences may be seen due to the
influence of blue receptors (Tibbitts etal. 1983). However, light quantity is also a
strong influence on shoot length (Gawronska et al. 1995), both blue quantity and
irradiance can influence plant morphology (Christophe et al. 2006). Plants grown
under higher irradiance have more energy available for growth, masking wavelength
effects (Walters and Horton 1994).
Other possible sources of variation between growth chambers include humidity, air
velocity, CO2 levels and temperature distribution. Generally in growth chambers air
velocities between 0.3-0.7 m s recommended for adequate air exchange and to
avoid CO2 depletion (Downs and Krizek 1997). A downward airflow creates more
even temperature gradients than upward and horizontal flow, but horizontal flow
better mimics natural conditions (Downs and Krizek 1997). Air velocity was
examined as an influence on growth in Chapter 2 and found to reduce shoot length at
velocities above this level (Fig. 2.5). Temperature profiles, air velocity and CO2 levels
were measured in the growth chambers during the growth response studies to
determine the range of variation and to identify any issues with these factors. Plants
were also grown in different chambers concurrently under the same light source,
irradiance, photoperiod and temperature to determine if there was any significant
growth chamber influence on results. Position of plants in the chambers was also
analysed for any such influence, such as edge effects.
However, the major difference in growth chambers is the light source, which can
exert an influence on photosynthetic, photomorphogenic and temperature responses.
The same model of growth chamber was used to study the influence of light source on
temperature and growth responses within the chamber. These chambers can be fitted
with fluorescent or HID lamps, with and without incandescent, allowing for a
comprehensive analysis of the influence of light source.
108

6.2 Materials and methods
6.2.1 Growth chambers examined Growth chambers used were Thermoline (Sydney, NSW, Australia) models 3540
and PG11.12.6.TD with externally ventilated light lofts separated from the growing
area by Pilkington (Dandenong, Victoria, Australia) 6TF 6 mm toughened glass
barriers with horizontal air flow; Conviron (Winipeg, Manatoba, Canada) model
EF7H with plexiglass barriers and upward airflow, locally constructed chambers (Tri-
Tec, Hobart, Tasmania, Australia) with double 6mm toughened glass light loft barriers
with and without 40 mm water filters beneath the light loft; and locally constructed
growth chambers with no light loft barrier and downward airflow.
6.2.2 Light sources and treatments Cool white fluorescent sources were L40 W/ 20S (Osram, Munich Germany), 36
W/W 41 (Thorn, Smithfield, NSW, Australia), 40SSCW/37-EXP (NEC, Tokyo,
Japan); F36W1840 Luxline Plus (Sylvania, Munich, Germany); 115W
F48T12/CWNHO (Sylvania, Danvers, MA, USA); and 37W HGX Quadphosphor
(NEC, Tokyo, Japan). Gro-Lux lamps were F36W GRO-T8 (Sylvania, Munich,
Germany).
Blue and red fluorescents were TLD 36W/15 Blue and TLD 36W/15 Red (Philips,
Eindhoven, Holland).
Fluorescent light source growth response studies were conducted in growth
chambers at an air temperature of 20 ° ± 0.2°C, under an 18 h photoperiod at 220 umol
m-2 s -1 PPF at the pot surface. Light sources used were L4OW/20S, 36W1W 41, and
36W/840 CWF, and Gro-Lux lamps.
High intensity discharge lamps used were metal halide: Kolorarc MBID 400/T/H
(GE Lighting, Budapest, Hungary), and MH 400W/C/U (Thorn, Mumbai, India); high
pressure sodium lamps were Vialox Planta T400W (Osram, Munich, Germany),
400W SON-E GES Elliptical (Thorn, Bucharest, Romania), and SL600W.U15.VRD
Super HPS Deluxe (Sunmaster, Solon, OH, USA).
Incandescent source used were 100W pearl incandescent lamps (Thorn, Smithfield,
NSW, Australia), MR16 12V 50W halogen, and 150W PAR38 (Mirabella,
Tullamarine, Victoria, Australia).
109

Comparative plant growth responses under growth chamber artificial light source
studies were conducted in the same model chambers (model 3540, Thermoline,
Sydney, Australia,) at equal irradiance (photosynthetic photon flux 220 Knot rI1-2 s at
the pot surface), photoperiod (18 h) and temperature (20 ° ± 0.2°0. These reach-in
chambers can accommodate high intensity discharge (HID) lamps (6 x 400W) and
•incandescent (5 x 100W) or fluorescent lamps (16 x 36W) and incandescent (4 x
• 100W). This allowed for study of all the light sources in the same growth chamber
type and model. Light sources used were cool white fluorescent- F36W/840 Luxline
Plus (Sylvania, Munich, Germany); incandescent globes- 100W pearl (Thorn,
Smithfield, NSW, Australia); metal halide lamps- 400W Kolorarc MBID 400/T/H
(GE Lighting, Budapest, Hungary); and high pressure sodium lamps- Vialox Planta
T400W (Osram, Munich, Germany).
All other experiments and measurements were conducted in the growth chambers
under an 18 h photoperiod at 220 or 425 pmol m -2 s at an air temperature of 20 °
± 0.2 °C.
6.2.3 CO 2 and humidity measurements CO2 and humidity were measured in a range of growth cabinets with a LI-6400
portable photosynthesis system (LI-COR, Inc., Lincoln, NB, USA) during selected
growth response studies.
6.2.4 Light measurements All light measurements were taken in controlled environment chambers with
external light excluded at an air temperature of 20 ° C using a LI1800
spectroradiometer (LI-COR, Inc., Lincoln, NB, USA) with a cosine corrected sensor.
Spectral irradiance was downloaded in W 111-2 nm-1 and as quantum intergrade (pmol
m-2 s -1 ) averaged over 3 scans in the range 300-800nm, following measurement and
reporting guidelines (Bjorn and Vogelmann 1994; Sager et al. 1982). Selected
measurements were also taken with an Apogee UV-PAR spectroradiometer (Apogee
Instuments Inc., Logan, UT, USA) to check for accuracy. Agreement between
instruments was generally within 1%. Figures and spectral distributions were checked
against data from the manufacturers, lists of spectral data (Deitzer 1994; Deitzer 2005)
and other published data using light source comparisons (Bubenheim et al. 1988;
Koontz etal. 1987; Sager etal. 1982; Tibbitts etal. 1983).
110

For comparisons of waveband proportions of a light source and/or between light
sources at different irradiances, the percentage of quantum intergrade (300-800 nm)
was calculated for PPF (photosynthetic photon flux, 400-700 nm) and for each 100nm
band. Wavelength ratios follow published methods (Kittas et al. 1999) and were
calculated from the quantum data as: R:FR narrow band (R:FRn) 655-665 nm1725-
735 nm; R:FR broad band (R:FRb) 600-700 nm1700-800 nm; blue to red (B:R) 400-
500 nm/600-700 nm; B:FR 400-500 nm/700-800 nm.
Light source details are as given by the manufacturer. As fluence rate can decrease
with lamp age, particularly in the first 100 h, all measurements were taken on sources
that had burned for 100 h or more. Light sources were measured a minimum of 1 h
after start up. Light distribution measurements in the growth chambers were taken
using a LI-COR LI-185B quantum radiometer with quantum sensor. This instrument
and an Apogee model QMSW quantum meter were also used to compare
measurement ranges and sensors.
6.2.5 Air and temperature measurements Air temperature measurements in the growth chambers were continuously monitored
and controlled by BrainChild (Taipei, Taiwan) BTC 9090 sensors (Thermoline
models) and by Honeywell (Sydney, NSW, Australia) customised software and
sensors (model TE205F17, Mamac Systems, Holden Hill, South Australia). Air
velocity was measured with a Kane-May Ltd (Welwyn, Hefts, UK) KM-4000 thermo-
anemometer. Radiant temperature in chambers was measured with a CPS Inc
(Hialeah, Florida, USA .) Tempseeker T200 digital thermometer with silicon
temperature sensors, 3 sensors were used per measurement, at 10 cm intervals from
the light loft barrier. Soil temperature was measured 1 cm below the surface using the
probe sensor of this instrument. Results given are means of hourly measurements over
three days. Surface and leaf temperature measurements were taken with a CPS Inc
(Hialeah, FL, USA) infra-red thermometer.
6.2.6 Plant growth and measurements: To compare growth responses under the light sources and in the growth chambers,
peas (a selection of Pisum sativum L. `Torsdag') were grown in the various
environments. This line (Hobart line 107) is a quantitative long day plant (Reid et al.
1996). Plants were grown in adjacent pots, 2 per 14 cm slimline pot in a 1:1 (v/v) mix
of vermiculite and dolerite chips topped with 2-3 cm of peat-sand potting mixture. All
111

plants were watered as needed and fertilised with nutrient solution weekly consisting
of Aquasol (Hortico, Sydney, NSW, Australia), N:P:K 23:4:18 at a rate of lg 1 -1 plus
Iron Chelate (Kendon Chemicals, Sydney, NSW, Australia) at 0.05g 1'. Relative
.humidity, while not controlled, ranged from 40-65% in all experiments. Twenty plants
were sown per treatment. During growth, stem diameter (mid point between nodes 9
and 10), leaf width (LW) and leaf length (LL) of 1 leaflet per plant was measured at
node 9 at the commencement of flowering, node of flower initiation (NFI) and days
from planting to first open flower (FT) were recorded. At maturity (senescence) length
of internodes 1-9 (L1-9), total shoot length (TL), number of nodes (TN); number of
seed (Seed) and number of pods (Pods) were measured. Shoot dry weight was
measured after air drying of the senesced plants for at least 72 h.
Statistical analysis using JMP software (SAS Institute, Cary, NC, USA) included
ANOVA, Students t-tests, Dunnetts method, and/or Tukeys test.
6.3 Results
6.3.1 Air velocity, CO2 and humidity A range of growth chamber types were used in these studies, with a range of air flow
directions. Generally in growth chambers air velocities between 0.3-0.7 m s -1 are
recommended for adequate air exchange and to avoid CO2 depletion (Downs and
Krizek 1997). Downward airflow creates more even temperature gradients than
upward and horizontal flow, but horizontal flow better mimics natural conditions
(Downs and Krizek 1997).
Results of measurements within the growth chambers tested showed that air
velocities ranged from 0.3 to 1.1 m s. Largest gradients were in the horizontal flow
chambers (Thermoline models), which ranged from 1.1 m at the fan inlet side to
0.5 m s -1 at the opposite wall. However, decrease in velocity was rapid, measuring
around 0.7 m sl within 10 cm of the inlet. Velocity between plants was reduced to
around 0.3 m s. Most even were the downward airflow models, with velocities
ranging from 0.5 to 0.6 m In the growth response studies (Fig. 2.5), air velocity
above 0.7 m s -1 was shown to reduce shoot length. However, during growth response
studies in the growth chambers, there was no significant variation in shoot length from
plant position in the chamber (data not shown). In addition, fluorescent growth
response studies were conducted in different chamber types, but there were no
112

significant differences in growth parameters. This would suggest air velocity within
the ranges measured was not a significant factor in growth responses.
CO2 levels can become limiting in dense canopies and in controlled environments
without adequate ventilation (Hanan 1998; Peet and Krizek 1997). Levels can be also
be enhanced from human activity in closed or poorly ventilated environments (Peet
and Krizek 1997). However, measurements taken in various growth cabinets during
growth did not show any significant variation from ambient levels, suggesting air
exchange rates were adequate and CO 2 was not a limiting factor.
Humidity influences plant transpiration rates through vapour pressure deficit.
Transpiration rate is influenced by temperature, air movement, irradiance, and soil
moisture (Spomer and Tibbitts 1997). In well watered plants, low humidity is unlikely
to cause desiccation. However, high humidity is associated with plant diseases and can
be an issue in controlled environments (Spomer and Tibbitts 1997). Humidity was not
controlled in the growth cabinets used, but monitoring showed levels varied much less
than ambient conditions, ranging from 55-70%. No evidence of plant desiccation from
low humidity or increased disease incidence at high humidity was observed.
6.3.2 Light measurement ranges and sensors As a guide, Table 6.1 lists fluence rates at the same distance from the light sources
in the growth chambers using both PPF meters (Li-Cor and Apogee) and
spectroradiometers (Li-Cor LI 1800 and Apogee) in the 400-700 nm PPF range. Also
included is fluence over 300-800 nm, the morphologically active radiation range,
measured with the spectroradiometers. All measurements were 80 cm from the light
source at 20° C. Table 6.1 illustrates a number of points. It shows how important it is
to use a calibrated, or at least the same, instrument to measure light parameters, as the
PPF meters give very different readings to the LI1800 spectroradiometer over the
same range. The PPF meters under register the PPF of CWF by 14%, and of HID
sources by 25%. Errors are larger with incandescent added, and the wider range
measurements illustrate the significant unmeasured contribution to irradiance of
longer wavelength sources- incandescent and HID. PPF meter readings vary according
to light source, calibration and weighting function, a more accurate measure of
quantum flux is a spectroradiometer, which totals the number of photons in each
waveband (Bjorn and Vogelmann 1994). Although the accepted PPF range is 400-
700nm, some photosynthetic activity occurs between 360-760 rim (McCree 1972a),
113

and the unmeasured photosynthetic contribution of longer wavelength light sources
can be significant (Tibbitts et al. 1983). Both PPF meters used in this study gave very
similar readings, as did the two spectroradiometers, hence this was not a calibration
issue, but an indication that the weighting function used in such meters under estimate
the actual fluence rate when calculated on an energy flux per nanometre basis.
However, PPF meters can be used as a guide to setting up equal PPF of the same light
source (e.g. CWF in several growth cabinets). Because of wavelength differences
between lamps, caution should be used when setting equal irradiance of different light
sources unless a spectroradiometer is used.
Wattage is not a guide to PPF, as the monochromatic sources illustrate (blue and red
tubes). Blue wavelengths have almost twice the energy of red (Salisbury and Ross
1992) and in this study red fluorescent tubes have only 1/3 of the output of blue tubes
of the same wattage. Similarly, the 115W high output (VHO) tubes (tested in the
Conviron chamber) did not produce higher irradiance than 40W CWF. A number of
authors point out the different photosynthetic efficiency of various lamp types, with
red wavelengths being the most efficient (e.g. Sager etal. 1982, Cathey and Campbell,
1977). Thus the actual spectral distribution of a lamp type is important, particularly at
lower fluence (Cathey and Campbell 1977; Tibbitts et al. 1983; Walters and Horton
1994). PPF meters give an indication of irradiance, but, unlike spectroradiometers, no
information on spectral distribution.
Table 6.1 also illustrates the high PPF levels achievable with HID lamps, over six
times the levels achievable with a full bank of CWF tubes in the same cabinets at the
same distance.
114

Table 6.1. Fluence rate measurements of various light sources in gmol m 2 s4 at 80 cm.
Light Source No. lamps PPF meter Spectro- Spectro- 400-700 nm radiometer radiometer
400-70 nm 300-800 nm
Blue fluorescent
6 x 36 W 23 27.9 30.1
Red fluorescent 6 x 36W 7 9.3 12.1 CWF. 16 x 40W 150 184.0 193.0 CWF + inc 16,4 x 100W 175 215.6 275.3 Inc 4 x 100W 25 27.1 78.4 CWF 8 x VHO 75 98.0 102.8 Thermolines
CWF 14 x 36W 75 S7.3 101.7 CWF + inc 14, 4 x 60W 85 112.8 145.4 HID 6 x 400W 390 521.4 606.8 HID + inc 6, 5 x 100W 410 552.9 671.2
6.3.3 Light distribution Light distribution measurements were taken in the growth cabinets under both
fluorescent and high intensity lighting. Growth cabinets are generally designed for
even light distribution, with white reflective walls and the entire growing area covered
by lighting. Fluorescent tubes run the full length of the growing area, and HID lighting
generally consists of more lower wattage lamps rather than fewer high wattage lamps
to produce more even distribution. Nevertheless there Was around 10-15% reduction
in irradiance towards the edges under both lighting types. Thus edge effects should be
considered in experimental design, or the very edges avoided. Light distribution
otherwise was very even.
6.3.4 Comparison of cool white fluorescent tubes The commonly used light source for plant research in both growth chambers and
greenhouses is CWF (Heo et al. 2002, Runlde 2004). Various CWF tubes are
available, many with claimed higher output.
115

Fluorescent tubes pass a current through mercury vapour to emit radiation. The inner
walls of the tubes are coated with phosphors that fluoresce when activated by the
radiation, broadening the spectral output. Thus spectral distribution depends on the
particular phosphors used (Sager and McFarlane 1997). Although broader spectrum
fluorescents are available (eg warm white) and specific plant fluorescents (Gro-Lux)
the additional phosphor coatings reduce lamp output, making them a less efficient
(and more expensive) option (Sager and McFarlane 1997). Comparative studies
generally show higher dry matter accumulation under CWF than warm whites and
Gro-Lux (Sager and McFarlane 1997). CWF emit light primarily in the PAR range,
and little far red radiation is produced contributing to the characteristically high R:FR
ratios (Sager and McFarlane 1997). This is confirmed by Fig. 6.1 and Table 6.2
below.
Fluorescent tubes are available in Australia mainly as 36W and 40W tubes, the latter
being the standard tube used at the School of Plant Science. However, 40W
fluorescent tubes are to be discontinued in Australia, and some of the more recent
growth chambers do not take these larger tubes. Higher output tubes are also
available, such as triphosphor 36W840 tubes. A comparison was made between CWF
light sources- spectral properties and fluence- to examine how interchangeable such
tubes are (what are the spectral differences and are there any differences in growth
responses as a consequence), and whether higher irradiances are achievable from the
fixed tube capacity of the growth chambers. In addition, spectral properties and
growth responses under plant specific Gro-Lux tubes were compared with standard
CWF. For comparative purposes, spectral distributions of representative fluorescent
lamps are shown in Fig. 6.1. Also examined were the various brands of 36W and 40W
cool white tubes. There were no significant differences between any of the brands
examined (Sylvania, Philips, Thorn and Osram, data not shown) of the same wattage.
A more detailed analysis of the quantum data using relative wavelength proportions
and quantum ratios (Table 6.2) allows for a better comparison of the CWF sources to
each other, and to natural light.
116

117
Figure 6.1. Spectral distribution of measured fluorescent light sources. Full light details and measurement protocols are in Materials and Methods.
40W cool white Fl
; 0.5
01
a 0.0
Wavelength (nm)
0
NEC 37W cool white
o o o o 0 tn o o 0 Wavelength (nm)
0 . 3
CI 0.2
.1
36W 840 CWF
r to
" 0.8
0.6
2 Wavelength (nm)

Table 6.2. Relative spectral distribution as the percentage of total irradiance (300-800 nm) and wavelength ratios of cool white fluorescent (CVVF), incandescent (INC) and natural light. Full light details and measurement protocols are in Materials and Methods.
Light source
CWF
PPF
Wavelength proportion (Y0 total irradiance)
300-400 400-500 500-600 600-700
UV Blue Green Red
700-800
Far-red R:FR
(n)
Wavelength ratios
R:FR (b) B:R B:FR
40W 96.6 0.6 16.5 52.3 27.8 3.0 5.6 9.3 0.6 5.5
36W/41 97.3 0.5 19.8 53.1 24.3 2.1 5.8 11.4 0.8 9.3 37W 96.6 0.5 19.4 53.8 23.7 2.1 6.5 11.2 0.8 9.2
VHO 97.3 0.3 15.5 54.3 27.4 2.5 6.1 11.2 0.6 6.3
36W/840 95.3 0.6 19.4 41.0 35.0 4.0 2.2 8.7 0.6 4.8 Quadphos. 95.8 0.5 20.0 41.2 34.6 3.7 2.2 9.5 0.6 5.5
Gro-Lux 94.7 0.7 22.5 16.7 55.5 4.6 4.4 12.2 0.4 4.9
INC
Inc 45.7 0 2.0 12.0 31.0 55.0 0.7 0.6 0.1 0.04
PAR38 49.1 0.6 3.7 14.0 31.5 50.3 0.7 0.6 0.1 0.06
QH 58.2 1 5.2 19.2 33.7 40.9 0.8 0.8 0.2 0.1
Natural light
Sunlight 69.4 - 2.4 15.5 25.0 29.0 28.0 1.1 1 0.5 0.6 Overcast 69.8 3.8 17.9 24.9 27 26.4 1.1 1 0.7 0.7
118

Results (Fig 6.1, Table 6.2) show the very low UV and far red output of CWF
relative to sunlight. Blue and red proportions are comparable to sunlight, but
green/yellow proportions (500-600 nm) are much higher. This is in the peak range of
the human eye photopic response (Ryer 1997) hence the lights appear bright to people,
but for photosynthesis blue and red wavelengths are the most efficient, green the least
efficient (McCree 1972a). Of the CWF sources tested, the triphosphor 36W/840 tubes
had highest red proportions and lowest R:FR, and on this basis are likely to be the
most suitable for plant growth. These tubes also produced approximately 15% more
light in the PPF range than the other sources, including VHO tubes. Recently released
quadphosphor tubes had a near identical spectral profile and a further 15% increase in
fluence. Otherwise, spectral differences between CWF tubes were minor. Plant
specific Gro-Lux lamps have high blue, low green and high red (Table 6.2), hence
should be more photosynthetically efficient at equal irradiance, but far-red proportions
are also very low. This is reflected in the wavelength ratios, all the fluorescent sources
have very high R:FR, which has been associated with delayed flowering and reduced
shoot extension (Runkle and Heins 2001).
6.3.5 Growth responses under fluorescent sources Fluorescent light source growth response studies were conducted using L107 peas
grown in growth chambers at an air temperature of 20 0 ± 0.2°C, under an 18 h
photoperiod at 220 innol 111-2 s -1 PPF at the pot surface. Light sources used were
L4OW/20S, 36W/W 41, 36W/840 CWF, and Gro-Lux lamps.
There were no significant growth differences between any of the sources used at
equal irradiance. Representative figures for growth under CWF are included in Table
6.4. Shoot length, flowering time, yield, leaf size and dry weight all showed no
significant differences from these means, nor did flowering node. However, flowering
node (means around node 18) show significant delays to natural light grown plants
(around node 16), reflecting the high R:FR of the fluorescent sources. The higher red
proportion of 36W840 tubes did not improve growth relative to. the other CWF
sources, and the lower R:FR did not result in a lower flowering node. R:FR was still
very high relative to sunlight at over 2 (Table 6.2). Conversely, the higher R:FR of the
other sources (all around 6) did not result in further delays in flowering node. Gro-Lux
tubes at equal irradiance did not improve growth of peas relative to CWF (data not
shown).
119

6.3.6 Incandescent sources Incandescence is the radiation created by a heated body, for incandescent bulbs this
is created by passing a current across a tungsten filament (Sager and McFarlane 1997).
Incandescent bulbs are used largely for photoperiod extensions as their high far red
component makes them highly suitable for this purpose (Hanan 1998). They are
commonly used either as the only light source for relatively weak photoperiod
extensions or mixed with other light sources in growth chambers to reduce the high
R:FR of these sources. The low R:FR of incandescent is clear (Table 6.2). Most of the
spectral output is in the far-red range, hence R:FR is lower than sunlight at 0.7, and
much lower than fluorescent sources (Table 3.2).
Incandescent sources have a continuous spectra (Fig. 6.2) rather than lined spectra
as found in most other light sources. Bulb wattage did not influence results- 25W,
40W and 60W incandescent bulbs all had the same spectral properties. A large
proportion of incandescent output is heat, and photosynthetic output is low. Other
incandescent sources, such as higher output PAR 38 floodlights and low voltage
quartz halogen, also have the same spectral properties (Fig. 6.2, Table 6.2). While
higher irradiance can be achieved with floodlights, most of the output is still in the far-
red and above (thermal) range.
The very low blue proportion of incandescent is reflected in the B:R and B:FR ratios
(Table 6.2). Most of the photosynthetic output is in the red portion of the spectrum,
and PPF is less than half of the output. The high proportion of far-red output and low
photosynthetic efficiency make incandescent globes suitable for photoperiod
extension but unsuitable for photosynthetic lighting. Incandescent globes are also a
useful source of additional far-red light for more efficient light sources such as CWF
and HID, but the thermal component is significant. The influence of adding
incandescent to the light mix in growth chambers is examined in detail in Chapter 7.
120

Par 38 floodlight
• 0.25
0.20
0.15 8
0.10
▪ 0.05
• 0.00 300 350 400 450 500 550 600 650 700 750 80C
Wavelength (nm)
12v QH
0.06
0.05
3
•
0.04
0.03
0.02
• 0.01
a- 0.00 300 350 400 450 500 550 600 650 700 750 80(
Wavelength (nm)
Figure 6.2. Spectral distribution of incandescent sources- 100W pearl incandescent globes, PAR38 floodlamp, and 12 volt quartz halogen. Full details are in Materials and Methods.
6.3.7 HID Lamps High intensity discharge (HID) lamps are used in growth chambers when higher
irradiances are required. In the same growth chamber type (Thermoline model 3540),
irradiance with the HID lamps were up to 6 x higher than the fluorescent bank of
lamps (Table 6.1). Fluence rates up to 600 limol m -2 s-1 (PPF) are achievable in these
chambers with the HID lamps. The lights are mounted in a separately ventilated light
loft to reduce thermal heat load, with a Pilkington (Australia) 6TF 6mm toughened
glass barrier. Light banks can be switched separately to control light source (eg HID
121

with or without INC) and intensity (eg half on, all on). Irradiance can also be altered
by adjustable height growing racks to move plants closer or further from the light
sources. These growth chambers also have a removable fluorescent/ incandescent
rack. This allowed for the same growth cabinet type to be used for the growth
response studies, thus minimising the possible influence of other sources of variation,
such as air exchange and velocity.
The commonly used HID sources are metal halide (MH) and high pressure sodium
(HPS). Spectral properties of HPS sources were described in Chapter 4
(supplementary light), but are also included here for comparative purposes (Fig. 6.3).
Relative spectral distribution and wavelength ratios of the light sources as a
percentage of total fluence (300-800 nm) are shown in Table 6.3. Fluorescent lights
and sunlight figures are included for comparative purposes. It can be seen from these
tables and figures that metal halide is a relatively broad spectrum light source, with
high blue, green and red proportions (Table 6.3). Unlike all the other light sources,
UV component (300-400 nm) is similar to sunlight. Blue component is higher than
sunlight, hence blue ratios are well above natural light levels (Table 6.3). Far-red
proportion is still low relative to sunlight, hence R:FR is high at over 2 (Table 6.3).
However, far-red component is higher than all of the artificial light sources tested,
apart from incandescent (Table 6.2).
HPS lamps have a low UV with high green/yellow and red components. Blue
proportion is very low, only 5.3% compared to 23.6% for Mil and 16-20% for
sunlight and CWF (Table 6.3). Far-red proportion is very low, hence R:FR is very
high. Mixed MH/HPS (2:1 ratio) produces blue proportions, and B:R ratio, similar to
sunlight, but green/yellow proportions remain high, and far-red very low compared to
sunlight (Table 6.3). All of these HID sources tested were plant specific products, but far-red content is
still very low, and most of the output is in the human photopic peak of 500-600 nm.
As all MH lamps provide high blue proportion and even plant specific HPS have low
blue proportion, in a mix of the two lamp types it may be unnecessary to use plant
specific lamps. Thus the spectral properties of non-plant specific lamps in the same
ratio (2 x 400W MH to 1 x 400W HPS) were tested. Lamps used were Thorn (India)
MH 400W/C/U Metal Halide and Thom (Romania) HPS 400W SON-E GES
Elliptical, both non-plant specific. However, analysis of Wavelength proportions
122

Spectral irradiance (Wm -2nm-') PPPPP
Cr) CO b 300
350 -
400
450
3 600 -
650 -
700 -
750 -
800 -
Spectral irradiance (W m n m )
PPPP N) A 01 CO a 1■3
300
350 -
400 -
450
F) 500 CD
(7 (2 550 5 3 600
650
700
750
800
qu e
ld - S
dH
Spectral irradiance (Wm -2 nm -1 ) oPPPP 7' 7' 7'
C') 3 -A 0) 03 0 f -A
proporti ons compared t o
the plan
t specifi c
(T able 6.3) show
s th e non plant s pecific
mix does ha v
e slightly lowe r blue and far-red

Table 6.3. Relative spectral distribution as the percentage of total irradiance (300-800 nm) and wavelength ratios of high intensity discharge (HID) lamps compared to sunlight and cool white fluorescent (CWF). Light sources were: metal halide (MH)- GE Kolorarc; high pressure sodium (HPS)- Osram Planta; mixed (MH+HPS) - 2x Kolorarc to 1 x Planta; mixed non-plant specific (MH+HPS*) Thorn MH 400W/C/U Metal Halide and Thorn HPS 400W SON-E GES Elliptical: CWF- Sylvania 36W1840. All lights were measured in Thermoline model 3540 growth chambers through 6mm toughened glass barrier with external light excluded. The same light sources and chambers were used in the growth response studies.
Light source
HID
PPF
Wavelength proportion (% total irradiance)
300-400 400-500 500-600 600-700
UV Blue Green Red
700-800
Far-red R:FR
(n)
Wavelength ratios
R:FR (b) B:R B:FR
MH 84.2 2.0 23.6 36.1 24.5 10.2 2.4 2.4 1.0 2.3 HPS 96.5 0.2 5.3 68.1 23.1 3.3 3.5 7.1 0.2 1.6
MH+HPS 91.4 0.9 16.5 49.6 25.3 7.7 3.3 3.3 0.7 2.2 MH+HPS* 95.4 1 12.0 58.0 25.3 3.6 3.4 7 0.5 3.3
CWF
36W/840 95.3 0.6 19.4 41.0 35.0 4.0 2.2 8.7 0.55 4.8 Natural light
Sunlight 69.4 2.4 15.5 25.0 29.0 28.0 1.1 1 . 0.5 0.6
124

6.3.8 Growth responses under HID lamps The high R:FR of HID and fluorescent lamps could result in delayed flowering and
reduced internode extension (Runkle 2004). Previous studies have also suggested the
low blue levels in HPS can induce shoot elongation, while the relatively high blue
levels in MH can inhibit elongation and produce more compact growth (Sager et al.
1982; Tibbitts etal. 1983; Zheng etal. 2005). To test the response to light source, a
photoperiodic pea line was grown under both HID and CWF at equal irradiance (220
[tmol r11-2 s-1 ), photoperiod (18 h) and temperature (20 ° ± 0.2 °C) in the same model
growth chambers (Thermoline model 3540). Thus the major difference was the light
source.
Results did vary with light source (Table 6.4), but growth responses under CWF,
MH, and mixed MH/HPS were quite consistent. Shoot length measurements were
similar under CWF, MH and mixed MH/HPS (Table 6.4). However, intemode length
was significantly longer under UPS compared to the other sources, flowering node
and flowering time was delayed, and dry weight was significantly higher (Table 6.4).
Under MH, plants flowered significantly earlier (FT) at a lower node (NFI, Table 6.4)
than the other light sources. Leaflets were significantly smaller (LW, Table 6.4) and
dry weight was significantly reduced relative to the other sources (Table 6.4). Yield
(seed and pods, Table 6.4) was similar for all the sources; although pod number was
higher under MH, total seed number was not (i.e. under MH plants produced more
pods but with fewer seeds per pod). Thus under CWF and mixed MH/HPS, growth
responses were similar at equal temperature and irradiance. However, plants under
MH showed earlier flowering, reduced leaf size and dry weight. Under HPS, plants
were significantly longer with delayed flowering relative to the other sources.
125
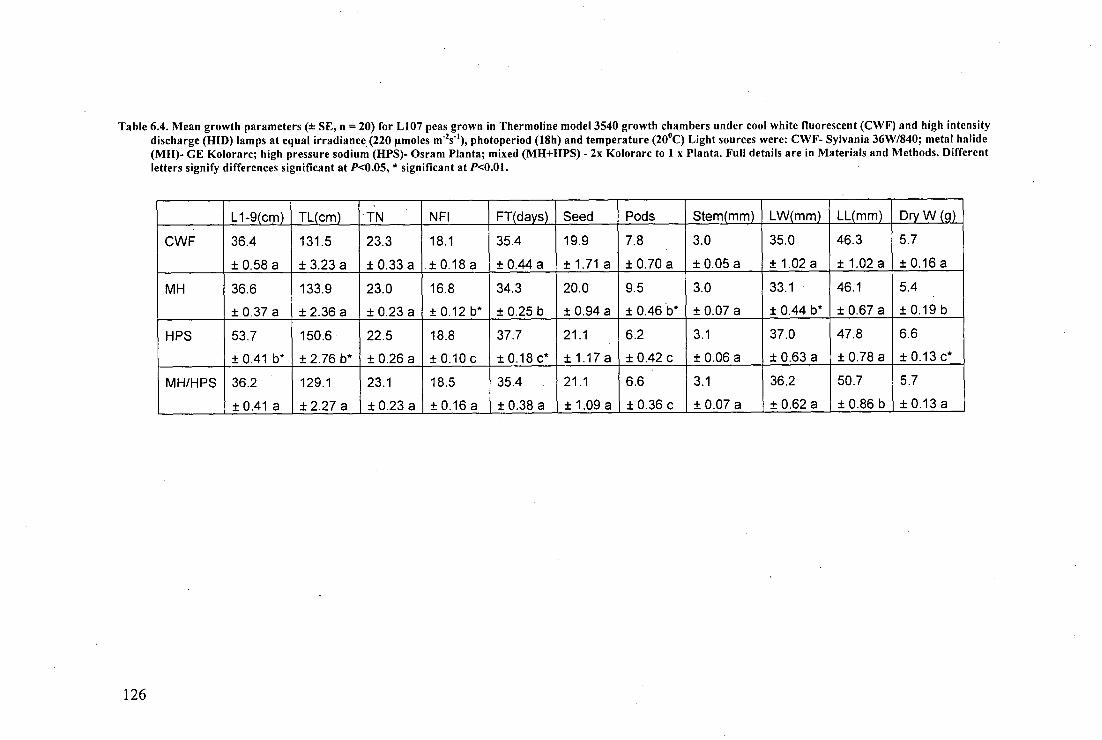
Table 6.4. Mean growth parameters (± SE, n = 20) for L107 peas grown in Thermoline model 3540 growth chambers under cool white fluorescent (CWF) and high intensity discharge (HID) lamps at equal irradiance (220 moles m -2s' 1 ), photoperiod (18h) and temperature (20 °C) Light sources were: CWF- Sylvania 36W/840; metal halide (MH)- GE Kolorarc; high pressure sodium (HPS)- Osram Planta; mixed (MH+HPS) - 2x Kolorarc to 1 x Planta. Full details are in Materials and Methods. Different letters signify differences significant at P<0.05, * significant at P<0.01.
L1-9(cm) TL(cm) TN NFI FT(days) Seed Pods Stem(mm) LW(mm) LL(mm) Dry W (g)
CWF 36.4 131.5 23.3 18.1 35.4 19.9 7.8 3.0 35.0 46.3 5.7
± 0.58 a ± 3.23 a ± 0.33 a ± 0.18 a ± 0.44 a ± 1.71 a ± 0.70 a ± 0.05 a ± 1.02 a ± 1.02 a ± 0.16 a
MH 36.6 133.9 23.0 16.8 34.3 20.0 9.5 3.0 33.1 46.1 5.4
± 0.37 a ± 2.36 a ± 0.23 a ± 0.12 b* ± 0.25 b ± 0.94 a ± 0.46 b* ± 0.07 a ± 0.44 b* ± 0.67 a ± 0.19 b
HPS 53.7 150.6 22.5 18.8 37.7 21.1 6.2 3.1 37.0 47.8 6.6
±0.41 b* ± 2.76 b* ± 0.26 a ± 0.10 c ± 0.18 c* ± 1.17 a ± 0.42 c ± 0.06 a ± 0.63 a ± 0.78 a ± 0.13 c*
MH/HPS 36.2 129.1 23.1 18.5 35.4 21.1 6.6 3.1 36.2 50.7 5.7
± 0.41 a ± 2.27 a ± 0.23 a ± 0.16 a ± 0.38 a ± 1.09 a ± 0.36 c ± 0.07 a ± 0.62 a ± 0.86 b ± 0.13 a
126

6.3.9 High irradiance influences, barriertypes and water filters Significantly higher irradiance is achievable with HID lamps compared to
fluorescent sources in the Thermoline model chambers (Table 6.1). However, HID
sources increase thermal load on the plants, particularly at high irradiance (McCree
1984) unless managed with the use of effective light loft barriers (Bubenheim etal.
1988). A 4 cm water barrier is reported to be an effective filter of up to 50% radiant
heat — i.e. the infra- red and above range, but not reduce the PAR range (Bubenheim et
al. 1988). Shallower depths are less effective, increasing depth a further 20cm only
provides an additional 2% radiant reduction (Bubenheim et al. 1988).
Thermal load and growth responses of L107 pea were measured under mixed
MH/HPS in the Thermoline chambers, with a single glass barrier, and in locally
constructed chambers (Tri-Tec Ltd) specifically designed to operate at high irradiance.
These latter chambers have a double glass barrier and 4cm removable water barrier
filters to further reduce lamp thermal load. This allowed for examination of barrier
type on thermal load, spectral properties and irradiance, and on growth responses.
L107 was shown to be sensitive to moderate temperature increases (Chapter 2), with
reduced shoot length, yield and flowering time (Table 2.17).
Plants were grown at an air temperature of 20 °C under an 18 h photoperiod at 425
[tmol rI1-2 s-1 PPF.
6.3.9.1 Light measurements Lamps used were Thorn (India) MH 400W/C/U Metal Halide and Thorn (Romania)
HPS 400W SON-E GES Elliptical in a ratio of 2 MH lamps to 1 HPS lamp.
Measurements with and without the water filter were taken 1 metre from the light
barriers at 20° C.
Spectral distribution of the light mix with and without the water barrier filter is
shown in Fig. 6.4. There is a reduction in UV wavelengths below 380 nm, and a slight
reduction in the far-red waveband above 720 nm with the water filter in place,
otherwise there is little difference in the spectral distribution with or without the water
filter. The LI-1800 spectroradiometer does not measure beyond 850 nm, so it is
difficult to assess the impact on infra red and beyond wavelengths (i.e. the thermal
load); however, low temperature performance of the cabinets is significantly improved
by addition of the water filter. A comprehensive analysis of global radiation
127

Full lights no water filter
4— 2.5
300 350 400 450 500 550 600 650 700 750 800 850
Wavelength (nm)
Full lights + water filter
Wavelength (nm) 300 350 400 450 500 550
V 600 650 700 750 800 850
characteristics of water barrier filters using similar light sources is provided by
Bubenheim etal. (1988).
Relative spectral distribution of the light mix with and without the water filter
confirms little alteration in spectral properties from the addition of a water filter (Fig.
6.5). Irradiance was not reduced in the PPF range by the water filter. For example,
measurements at 1 m from the lights were 485 nmol rri2s -1 without and 484 prnol
2S-1 with the 4 cm filter.
Figure 6.4. Spectral distribution of Thorn (India) MH 400W/C/U Metal Halide and Thorn (Romania) HPS 400W SON-E GES Elliptical in a 2:1 ratio measured through double layer toughened glass (top), and as above with a 4cm depth water barrier filter (bottom).
128

ri
— 100
• 90- i5
80- (a 2 70 -
• 60 - o • 50- .0
40- -o
• 30- U 0. • 20 - a) > 10 - a) rt 0
PPF 300-400 400-500 500-600 600-700 700-800
Wavelength (nm)
0 Full lights + water filter • Full lights NO water filter
Figure 6.5. Relative spectral distribution of Thorn (India) MH 400W/C/U Metal Halide and Thorn (Romania) HPS 400W SON-E GES Elliptical through double layer toughened glass, with and without 4cm water barrier filter, as a percentage of total irradiance (300-800nm).
6.3.9.2 Radiant temperature measurements • Radiant temperature was measured in the chambers with and without the 4 cm depth
water filter during the growth response studies. Irradiance at plant level was 425 p.mol
rri2s -1 ; air temperature in both chambers was 20 ° ± 0.5 °C. With lights off, radiant
temperature was close to air temperature (Fig. 6.6). With lights on, radiant
temperature in both chambers was above air temperature in both cases (Fig. 6.6). With
the water barrier in place, radiant temperature was 1-2.5 °C above air temperature;
through the double glass barrier alone, temperatures were 2-4 °C above air temperature
(Fig. 6.6). In the Thermoline chambers, with a single glass barrier, radiant
temperatures were consistently 4-5 °C above air temperature at this irradiance (Figure
6.6).
129

—o— Dark —o— Glass — — Dbl.glass —x— +Water filter
Figure 6.6. Mean (± SE) radiant temperature measurements inside growth chambers with separately ventilated light lofts with single glass (Glass), double glass (Dbl. glass) and double glass plus a 4 cm depth water filter (+ Water filter). Air temperature in all cases was 200 ± 0.2°C; distance is cm from the barrier. Measurements were taken with lights off (dark) and with lights on, PPF 425 gmol I11-2
6.3.9.3 Growth responses Compared to plants grown at 220 [tmol m-2s-1 (Table 6.5), plants grown at higher
irradiance under single glass (425 prmol ni2s-1 ) had significantly reduced shoot length,
yield, leaf size and dry weight. Plants were more compact with smaller leaves and
significantly thicker stems at higher irradiance in all categories (Table 6.5). Both
increased irradiance and temperature was shown to have these influences on pea
(Tables 2.16, 2.17). Under double glass and double glass with a 4 cm water filter,
radiant temperature was progressively reduced (Fig. 6.6), and total shoot length was
significantly increased relative to single glass at the higher irradiance. However,
although seed number was increased under the water filter, other growth parameters
were not significantly increased relative to double glass alone. Overall, the results
suggest higher irradiance produces more compact plants with smaller leaves, which is
slightly offset by reducing thermal load. Higher radiant temperature reduced seed
number, but the growth improvements from further radiant filtering by the use of a 4
cm water filter were slight compared to a double glass barrier alone.
130

Table 6.5. Mean growth parameters (± SE, n = 20) for L107 peas grown in growth chambers under mixed metal halide and high pressure sodium lighting at equal irradiance (425 'moles m4s-1), photoperiod (18h) and temperature (20 °C) Full details are in Materials and Methods. Different letters signify differences significant at P<0.05, *
significant at P<0.01.
L1-9(cm) TL(cm) TN NFI FT(days) Seed Pods Stem(mm) LW(mm) LL(mm) Dry W (g)
Single glass 22.5 93.7 22.8 18.2 35.7 17.2 6.2 3.6 27.8 42.3 4.7
± 0.36 a ± 1.62 a* ± 0.40 a ± 0.18 a ± 0.40 a ± 2.13 a ± 0.53 a ± 0.08 a ± 0.59 a ± 0.97 a ± 0.36 a
Dbl glass 22.7 99.7 22.6 17.9 34.8 16.9 6.2 3.5 27.7 42.7 5.3
± 0.22 a ± 1.67 b* ± 0.27 a ± 0.15 a ± 0.46 a ± 1.10 a ± 0.51 a ± 0.07 a ± 0.39 a ± 1.00 a ± 0.32 b
Dbl glass 23.0 103.0 23.6 17.9 36.5 21.0 7.1 4.2 29.1 43.2 5.4
+ water filter ± 0.29 a ± 2.03 b* ±0.41 a ± 0.15 a ± 0.16 a ± 2.01 b ± 0.64 a ± 0.10 b* ± 0.74 b ± 0.73 a ± 0.30 b
Single glass 36.2 129.1 23.1 18.5 35.4 21.1 6.6 3.1 36.2 50.7 5.7
220 pmol rn-2s-1 ± 0.41 b* ± 2.27 c* ± 0.23 a ± 0.16 a ± 0.38 a ± 1.09 b ± 0.36 a ± 0.07 c* ± 0.62 c* ± 0.86 c* ± 0.13 c
131

6.4 Discussion Growth chambers allow for accurate environmental control over light and temperature
regardless of season. Hence they are favoured to allow for reproducible experimental
conditions. A range of growth chamber types were tested and all had relatively low and
even air velocity, and humidity, with no evidence of CO2 limitation. However, the light
sources used have very different spectral properties to sunlight, and to each other.
The commonly used light source in growth chambers is cool White fluorescent (CWF),
which offer relatively broad spectral output and low heat output. Many brands and types
are available, including tri and quadphosphor tubes with claimed higher output. Of the
CWF tubes tested, spectral distribution was similar (Fig. 6.1, Table 6.2); altered growth
effects from substituting either the NEC 37W or triphosphor tubes for the standard 40W
or 36W cool white tubes on this basis would be unlikely. On a proportional basis, CWF
have similar blue and red levels to natural light, but high output in the 500-600nm range.
R:FR ratios are well above sunlight levels, reflecting the very low far-red component of
CWF. Ratios between tubes were similar. Output in the 600-700 nm band was higher for
the tri and quadphosphor tubes (36W840) and lower in the green 500-600nm band. The
higher red component of these tubes (Table 6.2) should also be advantageous for plant
growth, as should the high blue and red components of Gro-Lux tubes. However, growth
response studies did not show any significant differences for L107 peas under any of
these sources at equal irradiance and temperature, including Gro-Lux tubes. Previous
studies have shown no growth advantage from these plant specific tubes due to the lower
output (Sager and McFarlane 1997, Sager etal. 1988). In this study, even at equal
irradiance, growth of pea was not improved by Gro-Lux tubes relative to the considerably
less expensive CWF tubes tested.
Both the NEC and tri phosphor tubes (36W840) had a higher total fluence (15% and
17.5% respectively) than the other CWF tubes, which can be significant where light may
be limiting such as in a growth cabinet under short day conditions. Recently released
quadphosphor CWF produced a further 15% increase in irradiance (i.e. more than 30%
higher output in the PPF range than regular CWF of equal wattage). Thus while
wavelength differences between CWF tubes were relatively unimportant in terms of
growth responses, the higher irradiances achievable with tri and quad phosphor tubes are
132

an advantage when higher fluence rates are required. Using Standard CWF it was difficult
to maintain the identified peak irradiance of 14 mol m -2 d 1 for peas (plants had to be very
close to the canopy), while with the tri and quad phosphor tubes, this irradiance was
easily achieved. Under short day conditions, the higher irradiance achievable becomes
particularly important if adequate daily light integrals for normal growth are to be
achieved.
When higher irradiances are required, high intensity discharge (HID) lamps are often
used in growth cabinets. For example, in the same growth chamber type (Thermoline
model 3540), irradiance with the HID lamps was up to 6 x higher than the fluorescent
bank of lamps (Table 6.1). Such lamps have a high thermal component, however, and
need to be separated from the growing area by separately ventilated light lofts to manage
thermal load. However, high irradiance fluorescent growth cabinets are available, using
electronic ballasts and VHO and/or T5 fluorescents irradiances up to 1000 umol rrl-2 s-I
are claimed at 15cm from the lights. Tests on a Conviron model E15 were conducted;
irradiance averaged 875 timol m -2 s -1 at this distance.
Of the HID lamps in common use, metal halide (ME) provides the closest
approximation to sunlight where high PPF levels are required, but the spectral properties
remain very different to sunlight. R: FR and blue proportions are very high relative to
natural light. High pressure sodium (HPS) have a high green and red component, and red
wavelengths are the most effective for photosynthesis (Sager et al. 1982), but blue
content is very low. The MH+HPS mix (2:1 ratio) reduces the blue proportion to close to
sunlight levels, but R: FR remains very high relative to natural light (Table 6.3).
When grown at equal temperature and irradiance, plants under CWF and mixed
MH/HPS, had similar growth responses. However, plants under MH showed earlier
flowering, reduced leaf size and dry weight. Under HPS, plants were significantly longer
with delayed flowering relative to the other sources (Table 6.4). Thus at equal irradiance
and temperature in the same growth chamber type, growth results for L107 pea varied
with light source. Under MH, which has the highest blue proportion, flowering was
significantly earlier than under the other light sources, while under HPS, which has a low
blue proportion, flowering was delayed and shoot length increased relative to the other
sources. All of the light sources have low far-red content, hence high R: FR ratios, and
133

flowering was delayed relative to natural long day conditions (Table 2.13, around node 16
for L107). Flowering node was found to be relatively stable across light quantity and
temperature variations (Chapter 2), and a good indicator of light quality. Thus delayed
flowering node under the high R:FR of artificial light sources was expected. However,
flowering node under (node 16.8) was significantly earlier than the other sources
even though R:FR was high, and less than one node later than under natural light. These
results suggest that light quality influences shoot length and flowering node, but overall
growth (number of nodes, yield, stem diameter, leaf size and dry weight) were relatively
uninfluenced by light quality.
It could be expected that sources rich in blue and red would produce improved growth,
as these wavelengths are the most efficient for photosynthesis, while light in the 500-
600nm band is less efficient (Sager etal. 1982). Artificial light sources are primarily
developed for luminous intensity (i.e. for human visibility), which is maximal in the green
waveband (Canham 1966). Hence most artificial light sources have peak output in this
500-600nm band, as this corresponds with the human eye peak photopic response (Ryer
1997), and even plant specific HID products tested here retain peak output in this band
(Table 3.3). However, under Gro-Lux tubes, which would appear to have the ideal profile
for plant growth with high blue and red and low yellow-green proportions, growth was
not improved relative to CWF. This confirms previous studies that did not find growth
improvements under these lights. Under MH, which is rich in blue, growth was reduced
relative to CWF, and under HPS, which are high in red wavelengths, shoot length was
increased (possibly from the low blue component) but yield and leaf size were not
significantly increased. While light in the vicinity of the absorption peaks of chlorophylls
a and b (662 and 642 nm) is the most efficient (Tamulaitis et al. 2005), the carotenoids
act in a light harvesting capacity for photo systems 1 and 2 contributing to the high
quantum efficiency of photosynthesis over a wide spectral range (Barber et al. 1981).
Even under near monochromatic yellow low pressure sodium lamps, tested plants grew
adequately (Cathey and Campbell 1977). There has been little study on the influence of
green wavelengths on groWth, but addition of 24% green to red and blue LED improved
lettuce growth and colour (Kim et al. 2004). Thus it would appear that for general growth
134

what is required is sufficient light in the PPF range of 400-700nm, but sources low in blue
can result in increased shoot length and further delays to flowering.
Under mixed MH/HPS at higher irradiance (425 limol m -2 s -1 ) plants were more
compact with thicker stems and smaller leaves. Radiant temperature was appreciably
increased relative to air temperature by HID lighting, even with the lights separated from
the growth area with ventilated light lofts. With a single glass barrier, radiant temperature
was 4-5 °C higher than air temperature, with double glass 2-4 °C higher, and with the
addition of a 4 cm depth water filter, 1-2.5 °C higher. Thus further separation of the light
loft by double glass and/or water filters reduced thermal load in the growth chambers.
The observed shoot length reduction in the plants was slightly offset by reducing thermal
load by the use of a double glass barrier and/or a 4 cm depth water filter. Higher radiant
temperature reduced seed number, but the growth improvements from further radiant
filtering by the use of a water filter were slight compared to a double glass barrier alone.
Thus as for the irradiance and temperature studies under CWF (Table 2.17), high
irradiance and temperature reduces shoot length and leaf size while high temperature
reduces yield.
135

Chapter 7 Red to far-red ratio correction in growth chambers
Note: The contents of this chapter have largely been published (Cummings I, Reid JB, Koutoulis A (2007) Red: Far-Red Ratio Correction in Plant Growth Chambers - Growth Responses and Influence of Thermal Load on Garden Pea. Physiologia Plantarum 131, 171-179).
7.1 Introduction For long day (LD) plants a red to far red ratio (R:FR) close to the natural level of
around 1 is considered the most effective at flower induction (Vince-Prue 1981). Most
growth chamber light sources have high R:FR (greater than 2), which can produce
responses different from those observed in the natural environment, including delayed
flowering in photoperiodic sensitive species, and inhibited internode extension (Runkle
2004; Runkle and Heins 2001; Whitman etal. 1998). For example, as R:FR increased
(i.e. relatively more R) shoot extension progressively decreased and flowering was
inhibited in five LD species tested (Runkle 2004). Hence far red rich incandescent lamps
are frequently added to the light mix in growth chambers to reduce R:FR, but usually in
insufficient quantities to correct the far-red deficit (Smith 1994). The high thermal
component of incandescent sources can lead to heat load problems from adding sufficient
FR (Smith 1994). To reduce the influence of heat from lamps, many growth chambers
have a separately ventilated light loft with a glass or plexiglass barrier (Cathey and
Campbell 1977). However, radiant heat load can still be significant even with a barrier
(Bubenheim etal. 1988; Hamasaki and Okada 2000). McCree (1984) examined radiation
from high intensity discharge (HID) lamps and found high irradiance can be accompanied
by an abnormally high thermal radiation load on plants. Near infra red radiation is largely
transmitted or reflected from leaves, but incandescent and HID lamps in particular emit
large quantities of far infrared radiation (Bubenheim etal. 1988; Faust and Heins 1997;
Hicklenton and Heins 1997; McCree 1984). Thus plants in growth chambers can be
subject to far greater thermal loads than in the natural environment (Hicklenton and Heins
1997), 5-10 times larger than on a sunny outdoor day (Hamasaki and Okada 2000).
Absorbed radiation increases plant temperature, particularly at the shoot tip, unless
136

removed by transpiration, emission or convection (Faust and Heins 1997). While air
temperature in growth chambers is generally closely monitored and controlled, giving the
user confidence in their accuracy, the thermal load from lamps may be an un-monitored
influence on results. The common practice of adding incandescent lamps to the light mix
to increase the far-red component may not reduce R:FR meaningfully in the proportions
provided, but may well add to thermal load.
This section examines the spectral properties of common growth chamber light sources,
with and without incandescent lamps, and examines the growth responses of a
photoperiodic garden pea line (Pisum sativum L. cv. Torsdag) under these sources. The
shoot length and flowering response of this pea line to a R:FR gradient was examined.
Commonly used growth chamber light sources (fluorescent, metal halide and high
pressure sodium) were measured with and without incandescent in the same brand and
model of growth chambers, allowing a comparative analysis of the spectral properties. An
analysis of radiant temperature under these light sources in the cabinets is also presented.
Growth responses of pea were examined under the light sources, focusing on the
influence of adding incandescent lamps. This suggested thermal load to be a major
influence with HID lamps and supplementary incandescent sources. Hence the influence
of increased temperature on pea was examined. An alternative low heat method of
correcting for far red deficiency using light emitting diodes (LED) was examined.
7.2 Materials and methods
7.2.1 Light measurements To ensure the light source comparisons were at equal irradiance, all light measurements
were taken in controlled environment chambers with external light excluded at an air
temperature of 20° C using a LI1800 spectroradiometer (LI-COR, Inc., Lincoln, NB,
USA) with a cosine corrected sensor. Spectral irradiance was downloaded in W M-2 nm 1
and as quantum intergrade (gmol m -2 s-1 ) averaged over 3 scans in the range 300-800nm,
following measurement and reporting guidelines (Bjorn and Vogelmann 1994; Sager et al. 1982). Selected measurements were also taken with an Apogee UV-PAR
spectroradiometer (Apogee Instuments Inc., Logan, Utah, USA) to check for accuracy.
Agreement between instruments was generally within 1%. Figures and spectral
137

distributions were checked against data from the manufacturers, lists of spectral data
(Deitzer 1994; Deitzer 2005) and other published data for light source comparisons. For
comparisons of waveband proportions of a light source and/or between light sources at
different irradiances, the percentage of quantum intergrade (300-800 nm) was calculated
for PPF (photosynthetic photon flux, 400-700 nm) and for each 100nm band. Ratio
calculations follow published methods (Kittas etal. 1999): R:FR as narrow band (R:FR n)
655-665 / 725-735 nm; broad band (R:FR b) 600-700 / 700-800 nm. Figures quoted for
R:FR are broad band unless otherwise stated.
Light source details are as given by the manufacturer. As fluence rate can decrease with
tube or globe age, particularly in the first 100 h, all measurements were taken on sources
that had burned for 100 h or more. Light sources were measured a minimum of 1 h after
start up.
7.2.2 Growth chambers and light sources Growth chambers used were Thermoline (Sydney, NSW, Australia) model 3540 with
externally ventilated light lofts separated from the growing area by Pilkington
(Dandenong, Victoria, Australia) 6TF 6 mm toughened glass barriers. These reach-in
chambers can accommodate high intensity discharge (HID) lamps (6 x 400W) and
incandescent (5 x 100W) or fluorescent lamps (16 x 36W) and incandescent (4 x 100W).
This allowed for study of all the light sources in the same growth chamber type and
model.
7.2.3 Temperature measurements Air temperature measurements in the growth chambers were continuously monitored
and controlled by BrainChild (Taipei, Taiwan) BTC 9090 sensors. Air temperature and
velocity were checked with a Kane-May Ltd (Welwyn, Herts, UK) KM-4000 thermo-
anemometer. Radiant temperature in chambers was measured with a CPS Inc (Hialeah,
FL, USA) Tempseeker T200 digital thermometer with silicon temperature sensors, 3
sensors were used per measurement, at 10cm intervals from the light loft barrier. Soil
temperature was measured 1 cm below the surface using the probe sensor of this
instrument. Results given are means of hourly measurements over three days. Surface and
138

leaf temperature measurements were taken with a CPS Inc (Hialeah, Florida, USA) infra-
red thermometer.
7.2.4 Plant growth and measurements To compare growth responses under the light sources, peas (a selection of Pisum
sativum L. cv. Torsdag) were grown in the various environments. This line (Hobart line
107) is a quantitative long day plant (Reid et al. 1996). Plants were grown in adjacent
pots, 2 per 14 cm slimline pot in a 1:1 (v/v) mix of vermiculite and dolerite chips topped
with 2-3 cm of peat-sand potting mixture. All plants were watered as needed and
fertilised with nutrient solution weekly consisting of Aquasol (Hortico, Sydney, NSW,
Australia), N:P:K 23:4:18 at a rate of 1g I -1 plus Iron Chelate (Kendon Chemicals,
Sydney, NSW, Australia) at 0.05g 1 -1 . Relative humidity, while not controlled, ranged
from 40-65% in all experiments. Twenty plants were sown per treatment. During growth,
stem diameter (mid point between nodes 9 and 10), leaf width (LW) and leaf length (LL)
of 1 leaflet per plant was measured at node 9 at the commencement of flowering, node of
flower initiation (NFI) and days from planting to first open flower (FT) were recorded. At
maturity (senescence) length of internodes 1-9 (L1-9), total shoot length (TL), number of
nodes (TN); number of seed (Seed) and number of pods (Pods) were measured. Shoot dry
weight was measured after air drying of the senesced plants for at least 72 h.
Statistical analysis using JMP software (SAS Institute, Cary, NC, USA) included
ANOVA , Students t-tests, Dunnetts method, and/or Tukeys test.
7.2.5 Experimental design For consistency, all measurements and growth response studies were conducted in the
same model growth chambers- Thermoline Pty. Ltd., (Sydney, NSW, Australia) model
3540, except for one experiment on temperature responses under natural light conditions.
This was conducted in adjacent controlled environment glasshouse cells under an 18 h
photoperiod consisting of natural light extended morning and evening by approximately
100 ilmol fr1-2 S. 1 high pressure sodium lamps (GE Lighting, Budapest, Hungary). Mean
daily light integral (DLI) was approximately 16 mol m -2 d 1 . Air temperatures were 20° ±
20 and 25 0 ± 2°C respectively. Response to R:FR was examined in the growth chambers at
a constant 20° ± 0.2°C under a 24 h photoperiod at a PPF of 150 limol m -2 5 -1 . Light
139

sources were: R:FR 8.7- F36W/840 Luxline Plus cool white fluorescent (Sylvania,
Munich, Germany); R:FR 6.7- 40SSCW/37-EXP cool white fluorescent (NEC, Tokyo,
Japan); R:FR 1.9- 40SSCW/37-EXP cool white fluorescent tubes + 100W pearl
incandescent lamps (Thorn, Smithfield, NSW, Australia). All other experiments and
measurements were conducted in the growth chambers under an 18 h photoperiod at 220
or 425 gmol M -2 s -1 PPF, at an air temperature of 20 0 ± 0.2°C. Light sources used were
40SSCW/37-EXP cool white fluorescent; 100W pearl incandescent; Kolorarc MBID
400/T/H metal halide lamps (GE Lighting; Budapest, Hungary) and Vialox Planta T400W
high pressure sodium lamps (Osram, Munich, Germany). LED sources were locally
constructed 40 cm strips of 120 far red KL450-730GDDH (Shinkoh Electronics, Tokyo,
Japan) mounted on velo board 10 mm apart in 3 rows and encased in polycarbonate tubes.
7.3 Results
7.3.1 Spectral distribution Spectral distributions of cool white fluorescent (CWF), metal halide (MH), high
pressure sodium (HPS) and incandescent globes (INC) relative to sunlight are illustrated
in Fig. 7.1A. Because the light sources were at different irradiances to sunlight,
percentage distribution of each waveband is shown to allow for direct comparison. The
very different spectral properties of these common growth chamber light sources can be
seen, both in relation to each other and in particular to sunlight. While cool white
fluorescent and metal halide are relatively broad spectrum, both have a higher green (500-
600 nm) and lower red (600-700 nm) fraction than sunlight. Metal halide also has a
higher blue (400-500 nm) proportion. High pressure sodium has very little blue, but a
very high proportion of green. All of these sources are deficient in far red (700-800 nm),
with broad band R:FR ratios of 6.7, 2.4 and 7.1, respectively, compared to the sunlight
ratio measured of 1.1. Incandescent is blue and green deficient with high red and
particularly far red proportions, with a R:FR of 0.6. Thus, based on R:FR, cool white
fluorescent, metal halide and high pressure sodium should delay flowering in long day
(LD) plants and inhibit internode extension, while incandescent would have the opposite
effects (Runkle 2004; Runkle and Heins 2001; Whitman et al. 1998).
140

It is clear why incandescent lamps are often mixed with other sources in growth
chambers, and most chambers have provision for this. However, the quantities are usually
insufficient to correct the far-red deficit (Smith 1994). This is demonstrated in this study
(Fig. 7.113). For cool white fluorescent, R:FR is reduced from 6.7 to 1.6, with metal halide
from 2.4 to 2.1 and with mixed metal halide/high pressure sodium from 3.3 to 2.4 with
the addition of the full bank of 500W of incandescent in these chambers.
All these R:FR ratios are still above the natural light ratio of 1.1. To achieve a R:FR
close to natural light levels, it was necessary to add higher than equal proportions of
incandescent (as suggested by Warrington, 1978). For example, 1100W of incandescent
to 800W of metal halide produced a R:FR of 1.2 at 220 i_tmol t11 -2 S-1 PPF. Using far- red
light emitting diodes (LED) it was possible to achieve the same ratio with a single LED
strip (30W) added to 800W of metal halide. The monochromatic nature of this light
source compared to incandescent is also clear (Fig. 7.2). Using far-red LED R:FR ratios
as low as 0.1 has been measured with cool white fluorescent at 150 gmol m -2 s-1 . By
varying the number of LED strips and the power input, R:FR can be manipulated to the
desired level with an adequate photosynthetic level of light and without significant
thermal load influences.
141

Wavelength (nm) A
Sun
CWF
— — INC
—- — - — M H
—— — — HPS
70
60 -
50 -
40 -
30 -
20 -
10 -
0
300-400 400-500 500-600 600-700 700-800
0
Fr,
To ' s- r) 42.1 0- U)
CO (1)
60
• 50
2 I in .3 40
:1:75
IT 30 - 4)
•
To co 20 - > co 10 -
. •
0
...-
I I
/ • • 1/4 /
I / . • • • •
• 0 • ••
Sun
CWF+Inc
- - - MH-4-Inc
- - - - MH/HPS+Inc
300-400 400-500 500-600 600-700 700-800
Wavelength (nm)
Figure. 7.1. Relative spectral distribution as a percentage of total irradiance over 300-800nm for common growth chamber light sources compared to sunlight. Abbreviations- CWF — cool white fluorescent; INC- incandescent; Mil- metal halide; HPS- high pressure sodium; full details in materials and methods. A) measured through the glass barrier in Thermoline growth chambers, R:FR ratios- CWF-6.7, INC- 0.6, MH- 2.4 and HPS-7.1. B) As above, measured in the same chambers with the full bank of incandescent added- 16x 37W CWF + 4 100W Inc, R:FR 1.6; 6x 400W MH + 5 100W Inc, R:FR 2.1; 4 x400W MH + 2 x 400W HPS + 5 100W Inc, R:FR 2.4
142

INC
FR LED
0.14
0.12 -
0.10 -
0.08
0.06 -
0.04
0.02 - co
0.00
300 350 400 450 500 550 600 650 700 750 800
Wavelength (nm)
Figure 7.2. Spectral distribution (300-800nm) of 3 x 100W incandescent and approximately 30W (120) far red KL450-730GDDH LED (Shinkoh Electronics, Tokyo, Japan).
The spectral variation between the plants growing in the chambers was also examined,
as radiation under canopies consists of unfiltered light that has passed through gaps in the
canopy and filtered light modified by absorption, reflection and transmission (Holmes
1981). Natural shade spectrums thus typically have troughs in the blue and red regions
due to absorption, a minor peak in green, and a major peak in far red from reflection
(Smith and Morgan 1981). The degree of shading corresponds to R:FR; the lower the
ratio the greater the degree of shading (Kendrick and Weller 2003a; Smith and Morgan
1981). As growing conditions are often crowded in growth chambers, the possibility of
corresponding variations in spectral properties was investigated. Slight reductions were
found in blue (400-500nm) and red (600-700nm) regions and increases in green (500-600
nm) and far red (700-800 nm) regions. However, with the white reflective walls of the
growth chambers, the within canopy variations were minor, in the order of 1-2%, with
R:FR reductions of 0.1-0.5. For example, the highest R:FR reduction was under mixed
metal halide, high pressure sodium and incandescent, with a reduction from 2.4 above
canopy to 1.9 below. Under cool white fluorescent and incandescent, the reduction in
R:FR under the canopy was 0.1.
143
7.3.2 Thermal load Radiant temperature measurements were taken in the chambers at 10cm intervals from
the light loft barrier at 220 (Fig. 7.3A) and 425 pmol rr1-2 s 1 PPF (Fig. 7.38) during the
growth studies. Soil temperature at lcm depth was also measured. Under cool white
fluorescent, temperature variation was +1 °C or less. However, adding 400W of
incandescent increased the radiant temperature at 10cm from the barrier by 4 °C. By
50cm, the variation was less than +1 °C (Fig. 7.3A).
At the same irradiance using high intensity discharge (HID) lamps (metal halide and
high pressure sodium) temperature was up to 3 °C higher than cool white fluorescent (Fig.
7.3A). Adding incandescent to the HID lamps did not appreciably increase temperature,
but did elevate mean soil temperature by close to 3 °C (Fig. 7.3A). Under HID at 425
rn -2s-I (Fig. 7.3B) radiant temperature was consistently 3-4 °C higher than air
temperature. With the incandescent bank turned on (500W) and at the same irradiance,
temperature variation was 4-5 °C higher than air temperature, with soil temperature more
than 4°C above air temperature. With incandescent added, R:FR was reduced from 3.3 to
2.4, still well above the natural ratio of 1.1.
Under metal halide, with a R:FR of 1.2 achieved by the addition of sufficient
incandescent or far red LED, radiant temperature measurements (Fig. 7.3C) show both
chambers were above the air temperature of 20°C. However, under incandescent radiant
temperature was 2-3 °C higher than under far red LED.
Leaf temperatures in the various environments were not significantly different from the
air temperature (data not shown), as expected for well watered plants, as transpiration has
a cooling effect. However, leaves within 10cm of the barrier under high irradiance and
with incandescent added were 1-2°C above the ambient air temperature. Growth chamber
internal surface temperatures were also similarly elevated when incandescent light was
added. At the higher irradiance, the under surface of the light loft barrier was well over
40°C, 7-8 °C higher than without incandescent at the same irradiance.
144

A
• - - A- - - HID
– - – HID+ INC
Distance from barrier (cm)
10 20 30 40 50 Soil
— 24 -
23
26
S--) 25 -
18
10 20 30 40 50 Soil
Distance from barrier (cm)
MH+ INC
MH+ LED
Figure 7.3. Mean (± SE) radiant temperature measurements inside growth chambers with separately ventilated light lofts. Air temperature in all cases was 20± 0.2 °C, distance is cm from the barrier, soil temperature was at 1 cm depth. Irradiance (PPF at 50 cm) : (A)- 220, (B)- 425, (C)- 220 gmol nf2s -1 . (C) was under metal halide with a R:FR of 1.2 achieved by adding incandescent lamps or far red LED. Abbreviations: CWF, cool white fluorescent; INC, incandescent; MIL metal halide; HID, mixed MH and high pressure sodium lamps; LED, far red light emitting diodes; full details in Materials and Methods.
145

17.5 50
—15.5
15 8.7 1.9 6.7
R:FR
—17
L1 9 NFI
45
C.) 0, 40
- J
35
30
7.3.3 Growth responses To examine the influence of increasing R:FR, the photoperiodic pea line (L107) was
grown under a R:FR gradient generated using cool white fluorescent and incandescent
lamps (R:FR 1.9) and different brands of cool white fluorescent (R:FR 6.7 and 8.7).
Intemode length was significantly (P < 0.01) inhibited and flowering significantly (P <
0.01) delayed with increasing R:FR (Fig. 7.4).
Figure 7.4. Mean node of flower initiation (NFL) ± SE, and shoot length between nodes 1-9 (L1-9) SE at different R:FR ratios. Light sources for the ratios: 8.7- F36W/840 Luxline Plus cool white
fluorescent (Sylvania, Munich, Germany); 6.7- FL 4OSSCW/37-T8 cool white, (NEC, Tokyo, Japan) 1.9- FL 40SSCW/37-T8 cool white + 4x 100Wpearl incandescent bulbs (Thorn, Australia). All plants were grown under a 24h photoperiod, PPF was 150 jurnol m -2 s-1 , temperature was 20 ± 0.2 °C, n = 20.
Growth re§pOnses under high intensity discharge lamps (mixed metal halide, high
pressure sodium) with and without incandescent lamps are shown in Table 7.1. At the
same irradiance in the same growth chamber type the plants show significant (P < 0.01)
reductions in shoot length (L1-9, TL), yield (seed, pods), stem diameter and leaflet size
(LW, LL) with incandescent added in spite of the R:FR reduction. At 220 iimol m 2 s',
flowering node (node of flower initiation, NFI) was not significantly different with the
R:FR reduction from 3.3 to 2.1. At higher irradiance (425 pmol m 2 s)flowering node
was earlier (from 18.2 to 17.5), as was flowering time (FT) with incandescent added.
146

However, under natural LD light in the glasshouse this pea line flowers at node 16 (mean
16.1 ± 0.12, n=100), so flowering node is still delayed compared to natural conditions.
Table 7.1. Mean (± SE) growth measurements of pea 1107 grown in growth chambers with separately ventilated light lofts. Air temperature in all cases was 20 ± 0.2°C, photoperiod 18h. Light source metal halide/high pressure sodium (MH/HPS) in a 2:1 ratio. Irradiance was PPF at 50 cm, 220 pmol ni2 s4 and 425 pmol 111-2
S -1 both ± 500W incandescent, R:FR ratios 3.3 (no inc), 2.1 (+inc). Abbreviations- L1-9- length between nodes 1-9; TL- total shoot length; FT- flowering time; NH- node of flower initiation; LW- leaflet width; LL- leaflet length, full details in materials and methods. Significance **P<0.01,*P< 0.05, ns- not significant, n=20.
L1-9
(cm)
TL
(cm)
FT (days)
NFL Seed Pods Stem (mm)
LW (mm)
LL (mm)
220 36.2 129.1 35.4 18.5 21.1 6.6 3.1 36.2 50.7
-INC ± 0.41 ±2.27 +0.38 ±0.20 ± 1.09 ±0.36 ±0.07 ±0.62 ±0.86
220 32.9 112.4 36.6 18.3 15.6 4.9 2.5 30.2 40.7
+ INC ± 0.53** ± 3.03** ± 0.43* ± 0.3 ns ± 1137** + 0.47** ± 0.08** ± 0.93** ± 1.34**
L1-9 TL FT NFL Seed Pods Stem LW LL
(cm) (cm) (days) (mm) (mm) (mm)
425 22.5 93.7 35.7 18.2 17.2 6.2 3.6 27.8 42.3
_ rc ± 0.36 ± 1.62 ±0.4 ±0.18 ±2.13 ±0.53 ±0.08 ±0.59 +0.97
425 18.6 64.8 34.0 17.5 8.0 2.9 2.5 20.3 . 28
+ INC ± 0.37** ±1.57** ± 0.30** ±0.17* ± 0.8** + 0.3** ± 0.07** ± 0.55** ± 0.69**
These responses mimic the results for temperature increase both in the glasshouse and
growth chamber environments (Table 2.16). In growth chambers, increasing air
temperature from 20 to 25 °C at the same irradiance (18 h photoperiod, 220 mol
14.4 mol IT1-2 d-I ) produced similar significant reductions in shoot length, yield, stem
diameter and leaflet size (Table 2.16). Plants also showed significant (P < 0.01)
reductions in shoot dry weight and flowering time at higher temperature, although the
flowering node was delayed at the higher temperature. L107 plants grown in adjacent
controlled environment glasshouse cells show significantly reduced (P < 0.01) total
length, yield, stem diameter and leaflet size at 25 °C compared to 20°C (Table 2.16). Shoot
dry weight and flowering time were also significantly (P < 0.01) reduced, from means of
5.7 to 3.3 g and 40 to 30.8 days respectively. However the flowering node was only
slightly delayed. At the higher temperature plants showed faster development, hence
147
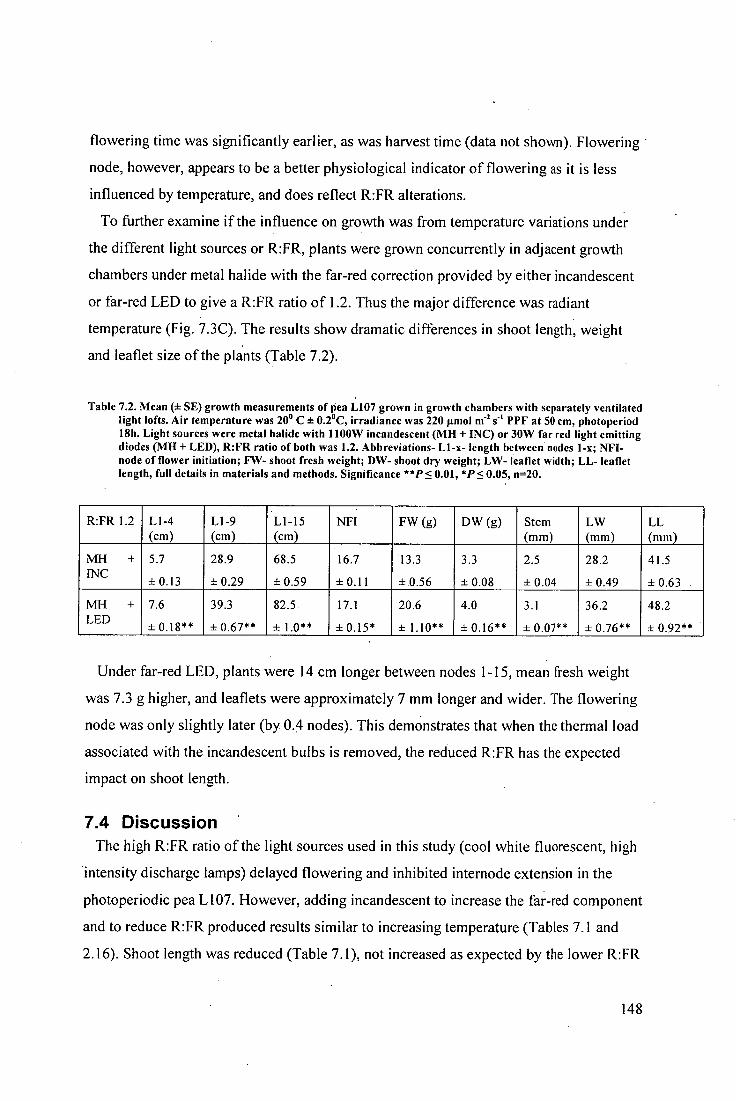
flowering time was significantly earlier, as was harvest time (data not shown). Flowering -
node, however, appears to be a better physiological indicator of flowering as it is less
influenced by temperature, and does reflect R:FR alterations.
To further examine if the influence on growth was from temperature variations under
the different light sources or R:FR, plants were grown concurrently in adjacent growth
chambers under metal halide with the far-red correction provided by either incandescent
or far-red LED to give a R:FR ratio of 1.2. Thus the major difference was radiant
temperature (Fig. 7.3C). The results show dramatic differences in shoot length, weight
and leaflet size of the plants (Table 7.2).
Table 7.2. Mean (± SE) growth measurements of pea L107 grown in growth chambers with separately ventilated light lofts. Air temperature was 20° C ± 0.2°C, irradiance was 220 !tmol ni2 s -1 PPF at 50 cm, photoperiod 18h. Light sources were metal halide with 1100W incandescent (MH + INC) or 30W far red light emitting diodes (MH + LED), R:FR ratio of both was 1.2. Abbreviations- L1-x- length between nodes 1-x; NFL- node of flower initiation; FVV- shoot fresh weight; DW- shoot dry weight; LW- leaflet width; LL- leaflet length, full details in materials and methods. Significance **P< 0.01, *P< 0.05, n=20.
R:FR 1.2 L1-4 (cm)
L1-9 (cm)
L1-15 (cm)
NFL FW (g) DW (g) Stem (mm)
LW (mm)
LL (mm)
MH + 5.7 28.9 68.5 16.7 13.3 3.3 2.5 28.2 41.5 INC ±0.13 ±0.29 ±0.59 ±0.11 ±0.56 ±0.08 ±0.04 ±0.49 ±0.63
MH + 7.6 39.3 82.5 17.1 20.6 4.0 3.1 36.2 48.2 LED ±0.18** ±0.67** ± 1.0** ±0.15* ± 1.10** ±0.16 ± 0.07** ± 0.76** ±0.92**
Under far-red LED, plants were 14 cm longer between nodes 1-15, mean fresh weight
was 7.3 g higher, and leaflets were approximately 7 mm longer and wider. The flowering
node was only slightly later (by 0.4 nodes). This demonstrates that when the thermal load
associated with the incandescent bulbs is removed, the reduced R:FR has the expected
impact on shoot length.
7.4 Discussion The high R:FR ratio of the light sources used in this study (cool white fluorescent, high
intensity discharge lamps) delayed flowering and inhibited intemode extension in the
photoperiodic pea L107. However, adding incandescent to increase the far-red component
and to reduce R:FR produced results similar to increasing temperature (Tables 7.1 and
2.16). Shoot length was reduced (Table 7.1), not increased as expected by the lower R:FR
148

(Runkle 2004), and yield, leaf size and shoot dry weight were significantly reduced.
These responses are normally seen in pea as temperature is increased, both in growth
chamber and natural light conditions (Table 2.16). Correcting the far-red deficit with far-
red LED, a low heat source of far-red light, reduced the radiant load (Fig. 7.3C) and
dramatically increased shoot length and leaflet size compared to plants grown with the
ratio correction provided by incandescent lighting (Table 7.2). Yield in particular
appeared to be closely related to temperature in these results. Cooler temperatures during
maturation increase yield in many crop species (Heins et al. 2000) and yield and seed
weight is negatively correlated with temperature in pea (Chetia and Kumar 2005; Poggio
et al. 2005).
This pea line does respond to R:FR, although the response is not large (Weller et al.
2001). Under cool white fluorescent, reducing R:FR from 6.7 (no incandescent) to 1.9
(with incandescent) significantly (P < 0.01) increased intemode length and reduced the
node of flower initiation (NFI) in L107 (Fig. 7.4). Temperature differences were not large
under this source (Fig. 7.3A), and adding incandescent was relatively effective at
reducing R:FR, although irradiance achievable was relatively low. Under high intensity
discharge light sources (metal halide, high pressure sodium), reducing R:FR by adding
incandescent reduced intemode length and had little influence on NFI (Table 7.1). Thus,
if the aim of adding incandescent is to modify shoot length reduction and the delayed
flowering resulting from high R:FR, it was not achieved. Increasing light quantity had
similar effects under high intensity lamps- reduced shoot length, yield, leaflet size and dry
weight (Table 7.1). Again these responses are similar to those observed as temperature is
increased (Table 2.16).
While temperature differences were only in the order of 2-3 °C in most cases, the
differences were sustained over the entire photoperiod of 18h. Within the normal
temperature range it is average temperature that influences plant development, not short
term fluctuations (Adams 2006; Cockshull et al. 2002) and peas are particularly sensitive
to water and temperature stress during maturation (Roche etal. 1999). Once temperature
rises above a species optimum, growth responses can reduce rapidly (Heins et al. 2000).
While light loft barriers can reduce thermal load by up to 75% they do not completely
remove it. The relatively low air speed (0.1-0.4 m s -1 ) of most chambers can exacerbate
149

this residual thermal load on plants (McCree 1984). Air velocities measured in the
chambers in our study ranged from 0.3-0.6 m Increasing air velocity decreases the
difference between leaf and air temperature, but high velocities can reduce growth from
mechanical stress (Salisbury 197§). Higher temperatures can also increase moisture stress
within the plant (Ormrod 1978b). Pallas and Michel (1971) examined infrared radiation
on leaf temperature and growth on warm and cool weather species, including pea. While
leaf temperature was similar due to transpiration, growth of the cool weather species was
significantly better in the low radiation chamber, and "strikingly better" for pea (Pallas
and Michel 1971). We measured leaf temperature in the various environments and
generally did not find significant differences, as expected in well watered plants.
However, growth chamber surface temperatures were significantly higher with
incandescent added, and at high irradiance the under surface of the light loft barrier was
well over 40°C. Leaves within 20cm of the barrier were 1-2°C above ambient under the
high irradiance sources with or without incandescent added.
Soil temperature can be significantly increased from the radiant load in growth
chambers, particularly in individual pots (Hamasaki and Okada 2000). In this study, while
air temperatures were often similarly elevated with or without incandescent, soil
temperature was always higher (Fig. 7.3). For example, under high intensity discharge
lamps at 425 ilmol rn -2 s air temperature was similarly elevated but soil temperature
was 2°C higher with incandescent added (Fig. 7.3B) and significantly reduced growth
parameters (Table 7.1). Growth parameters were also significantly reduced with the
increase in irradiance from 220 to 425 grnol m -2 s-I .
R:FR correction in growth chambers without additional thermal load influences is
achievable by using far-red LEDs. Under metal halide, a R:FR of 1.2 was achieved with
1100W of incandescent or approximately 30W of far red LED. Radiant temperature was
2-3 °C less under LED (Fig. 7.3C) and plants were significantly longer with larger leaflets
and higher weights (Table 7.3), similar to autumn and spring grown glasshouse plants
(Table 2.12). With incandescent added, the plants were more like plants grown in the
glasshouse over summer (Table 2.12). Most of the output of incandescent lamps is
infrared radiation (McFarlane 1978). The narrow band specific wavelength of LED and
low heat output make them useful for plant research and growth (Bula et al. 1991). R:FR
150

ratios as low as 0.1 can be achieved using far-red LED supplementation of photosynthetic
levels of fluorescent lighting, a useful feature for studies on canopy shading.
The results suggest that caution should be used when using incandescent lamps in
growth chambers and/or high intensity discharge lamps at relatively high irradiance.
Although air temperatures were maintained throughout these experiments at 20°C, radiant
temperature was significantly higher up to 50cm from the light loft barriers and strongly
influenced results. Addition of incandescent in the normal proportions provided in growth
chambers did not correct R:FR sufficiently to mimic natural light (flowering node was
still delayed) and increased radiant heat problems (reduced shoot length, yield, leaflet
size, shoot dry weight). Higher than equal wattage was required to reproduce sunlight
R:FR, which produced greater heat load and hence growth effects. However,
supplementary far-red LED can produce sunlight or even deep canopy shade R:FR ratios
without the significant growth inhibiting thermal influences.
151

Chapter 8 The role of blue light
8.1 Introduction The ratio of red to far-red light (R:FR), which is perceived by the phytochrome
photoreceptors, is the most intensively studied of the light quality changes that influence
plant growth (Franklin and Whitelam 2005; Rajapakse et al. 1999). Due to the absorption
of red light by photosynthetic tissue, canopy shade has a higher far-red proportion, and
this can stimulate increased intemode length, reduced leaf area, increased apical
dominance, and accelerated flowering, collectively called shade avoidance (Kendrick and
Weller 2003a). In contrast, high R:FR can signal non-competitive conditions and reduce
plant height, as well as delay flowering in many species (Runkle and Heins 2001). In
addition to low R:FR, canopy shade also has reduced levels of blue light and an overall
reduction in light quantity, which can play a role in shade avoidance (Pierik et al. 2004),
although the role of these factors has received considerably less attention (Chrisiophe et
al. 2006; Franklin and Whitelam 2005).
In growth chambers the commonly used light sources (fluorescent, metal halide, high
pressure sodium) all have a R:FR above 2, well above the natural R:FR of approximately
1, which can reduce shoot length and delay flowering (Cummings etal. 2007; Moe and
Heins 1990; Runkle 2004). Far-red rich incandescent globes are often added to the light
mix in growth chambers, but this is usually in insufficient quantities to reduce R:FR
significantly (Cummings et al. 2007; Smith 1994). All of these light sources vary not only
in R:FR (from sunlight and each other), but also in blue irradiance. Artificial light sources
deficient in blue, such as high pressure sodium (HPS) can induce elongation (Tibbitts et
al. 1983), while sources high in blue, such as metal halide, can reduce height (Zheng et
al. 2005) even though both sources have high R:FR. Increasing the blue component of
HPS by supplementation or increasing irradiance reduced intemode length in soybean
(Wheeler etal. 1991), and blue supplementation of HPS reduced shoot length in
cucumber and tomato (Menard etal. 2006). However, the role of blue light may be
species dependent (Dougher and Bugbee 2001; Hirai et al. 2006), and the role of blue
152

light needs to be examined independently of both R:FR and irradiance alterations, which
also influence shoot length (Christophe etal. 2006; Gawronska et al. 1995).
For horticultural crops, shoot height control through manipulation of wavelength ratios
is receiving increasing interest, as it allows manipulation of plant height without long-
term breeding programs or the use of chemical growth regulators (Rajapakse etal. 1999).
Most research has focused on manipulating R:FR, particularly shoot height reduction by
filtering far-red light (thus increasing R:FR) with plastic greenhouse films (Cerny et al.
2003; Fletcher etal. 2005; Li etal. 2003; van Haeringen etal. 1998). Shoot height
reduction through copper sulphate filters has also been attributed to reduced far red
(Bachman and McMahon 2006; Rajapakse and Kelly 1992; Rajapakse etal. 1999).
However, height reduction by increasing R:FR can also have the potentially negative
effect of delaying flowering (Runkle and Heins 2002; Runkle and Heins 2003). In
contrast, manipulation of blue light to alter plant height has not been widely explored,
even though filtering blue light can induce elongation (Maas 1992; Mortensen and Moe
1992) independently of R:FR (Runkle and Heins 2001), and increasing the blue
component of white light may be associated with shorter internodes (Thomas 1981).
Photo selective shade cloths have recently been developed with the aim of providing
crop protection and manipulation of plant growth (Shahak et al. 2004). However, reduced
irradiance due to spectrally neutral shading can induce elongation and reduced leaf area
(Christophe etal. 2006; Dougher and Bugbee 2001; Gawronska etal. 1995). Red and
blue photo selective shade cloths reportedly enhance or reduce specific wavelengths,
particularly in the blue and red regions; while R:FR is largely unaltered (Shahak et al.
2004). Blue shade cloth reduced and red shade cloth increased shoot length in
Pittosporum variegatum (Oren-Shamir etal. 2001), chrysanthemum height was reduced
under blue shade cloth (Kobayashi 2005) and Dracaena height increased under red shade
cloth (Kobayashi etal. 2006). However, the mechanism of action of these shade cloths
has not been fully explored and their potential use to examine photomorphogenic
responses has not been described. It is unclear whether the growth responses are to altered
red or blue wavelengths, or both.
One way to distinguish this is by examining the role of specific photoreceptors.
Phytochromes mediate red and far red and some blue responses, while cryptochromes are
153

exclusively involved in blue responses (Neff and Chory 1998{Platten, 2005 #184; Platten
et a/. 2005; Weller etal. 2001). In pea a range of photoreceptor mutants are available,
including a cryptochrome 1 (cry]) mutant with specifically altered blue light response
(Platten et al. 2005). For example, cry] mutant seedlings grown under blue light are
longer than wild type plants as the CRY1 protein is required to suppress shoot elongation
in response to blue light (Platten etal., 2005). As the CRY1 photoreceptor only absorbs
light in the blue region of the spectrum (Ahmad et a/. 2002), a change in the response of
cry] mutants to red and/or blue shade cloths would indicate that the shade cloths modify
plant growth due to changes in the proportion of blue rather than red light.
In this section, the role of blue light is explored using pea growth responses through to
maturity. A range of methods were used to specifically examine the role of blue light.
Shoot length and flowering in particular were examined under artificial light sources
which varied in both R:FR and blue irradiance. The role of blue light was further
examined by supplementation experiments under high pressure sodium lamps, which are
blue deficient. To examine the role of blue light under natural light conditions, the
spectral properties and growth responses under photo selective shade cloths were
analysed. This allowed for the examination of the role of blue independently of R:FR, as
well as the influence of light quantity. In addition to using a wild-type selection of pea, a
mutant deficient in cryptochrome 1 (cry]) was used to determine if changes in blue light
were responsible for the differences observed under the shade cloth treatments.
154

8.2 Materials and methods
8.2.1 Plant material and growth conditions Pea (Pisum sativum L.) lines used were a quantitative long day wild type selection of
cv. Torsdag, L107 (Reid et al. 1996), and the cryl mutant on this genetic background
(Platten et al. 2005). Plants were sown two per pot using even sized seed in 14 cm
slimline pots in a 1:1 mixture of grade three vermiculite (Australian Vermiculite and
Perlite Co., Fairfield, Victoria, Australia) and 10 mm dolerite aggregate (HBMI,
Kingston, Tasmania, Australia) topped with two cm of a pasteurised 1:1 mix of peat moss
(Te - Em, New Brunswick, Canada) and coarse river sand (Island Resources, Scottsdale,
Tasmania, Australia) with added macronutrients (Osmocote 18N-2.6P-9.9K, Scotts-
Sierra, Marysville, OH, USA) at 1 kg m 3 ; pH was adjusted to 7 with dolomite lime and
limestone. All plants were watered as needed and fertilised with nutrient solution weekly
consisting of Aquasol (Hortico, Sydney, NSW, Australia), N:P:K 23:4:18 at a rate of lg
'plus Iron Chelate (Kendon Chemicals, Sydney, NSW, Australia) at 0.05g1 -1 .
Growth chamber artificial light source studies were conducted in the same model
chambers (model 3540, Thermoline, Sydney, Australia,) at equal irradiance
(photosynthetic photon flux 220 ilmol m -2 S-1 at the pot surface), photoperiod (18h) and
temperature (20 ° ± 0.2°C). Light sources used were cool white fluorescent- F36W/840
Luxline Plus (Sylvania, Munich, Germany); incandescent globes- 100W pearl (Thom,
Smithfield, NSW, Australia); metal halide lamps- 400W Kolorarc MBID 400/T/H (GE
Lighting, Budapest, Hungary); and high pressure sodium, lamps- Vialox Planta T400W
(Osram, Munich, Germany).
Blue and white light supplementation of high pressure sodium studies were conducted
in locally constructed chambers (Tri-Tec, Hobart, Tasmania, Australia) under an 18h
photoperiod and air temperature of 20° ± 0.2°C. Plants were grown under 400W SON-E
GES Elliptical (Thorn, Bucharest, Romania) high pressure sodium lamps at an irradiance
of 100 limol m -2 s-1 , which provided a blue proportion of 5 .irnol m -2 s -1 and a R:FR of 7.8.
To examine the influence of blue quantity, monochromatic blue was added to this level of
HPS by suspending blue fluorescent tubes (TLD 36W/15 Blue, Philips, Eindhoven,
155

Holland) in the chamber, which created a gradient from 5-70 wol 131 -2 sl additional blue.
To examine if any observed growth responses were due to blue wavelength or simply
increased irradiance, the experiment was repeated with a white fluorescent gradient
(F36W/840 Luxline Plus, Sylvania, Munich, Germany) in the range of interest: 20-45
larnol rn -2 s-i . The additional blue irradiance of the white fluorescent treatment was 4-9
Knot 111 -2
Shade treatment plants were grown in a glasshouse, average temperatures for the study
period (late spring) were day 23.9°C, night 16.6°C. Photoperiod was 18 h, consisting of
natural daylight (average 14 h) extended morning and evening by weak (51=01 r11-2 sl )
incandescent lighting. Repeats were conducted in autumn and early spring in the same
glasshouse, average temperatures were day 20.1 and 22.4°C, night 13.5 and 13.8°C,
respectively.
8.2.2 Light measurements and treatments Light measurements were taken with a LI-1800 spectroradiometer (LI-COR, Lincoln,
NB, USA) with a cosine corrected sensor following measurement and reporting
guidelines (Bjorn and Vogelmann 1994; Sager etal. 1982). For comparisons of waveband
proportions the percentage of total irradiance (quantum intergrade 300-800 nm) was
calculated for PPF (photosynthetic photon flux, 400-700 nm) and for each 100nm band.
Quantum ratios were calculated using described methods (Kittas et a/. 1999): Red to far
red narrow band (R:FR n) 655-665 / 725-735 nm; red to far red broad band (R:FR b) 600-
700 / 700-800 nm; blue to red (B: R) 400-500 / 600-700 nm; blue to far red (B:FR) 400-
500 / 700-800 nm. Light distribution measurements were taken using a LI-185B quantum
radiometer with quantum sensor (LI-COR, Lincoln, NB, USA). All natural light
measurements were taken on the same day in the same conditions in immediate
succession. Growth chamber measurements were at an air temperature of 20 0 C with
external light excluded.
8.2.2.1 Shade treatments Shade treatment plants were grown in a climate modified glasshouse clad with 3mrn
horticultural glass (Pilkington, Dandenong, Victoria, Australia), which the spectral
measurements showed to be effectively visible light wavelength neutral with respect to
156

Sun Neutral
Blue — — - Red
Wavelength (nm)
0.45 c
•
0.40 -4,- E 0 ' 35
0.30 - a o 0.25 - c
0.20 - -a E 0.15 - L.. is 0.10 -
0.05 - O.
Cl) 0.00 300
r 6
350 400 450 500 550 600 650 700 750 800
sunlight (Table 3.3.1). Plants were grown unshaded and under 50% shade cloths: green
(Sarlon, Moonee Ponds, Victoria, Australia); red and blue (ChromatiNet, Polysack
Industries, Negev, Israel). Green shade cloth (neutral shade) was also wavelength neutral
with respect to sunlight (Table 8.1). In contrast, the red and blue photo selective shade
cloths dramatically altered spectral distribution. Blue shade cloth enhanced blue (400-500
nm) and reduced red (600-700nm) proportions; while red shade cloth reduced blue and
green/yellow (500-600 nm) proportions and enhanced red and far-red (Table 8.1, Fig.
8.1). Thus green shade cloth was used to examine the effects of light quantity (neutral
shade), while red and blue shade cloths were used to examine the effects of blue and red
light proportions largely independently of R:FR. Although broad band R:FR was reduced
under blue shade cloth (0.8, Table 8.1), narrow.band R:FR was not and neither calculation
range is altered under green or red shade cloth. Photosynthetically active radiation (PAR,
400-700nm) measurements taken with a quantum sensor under the v.arious treatments
during the growth response studies were consistently equal. Typical values were 950
prnol 111-2 s-1 on sunny days in un-shaded conditions, 450 [tmol m-2 s-1 under each shade
treatment. Thus although PAR was the same for each shade treatment, spectral
distribution varied markedly (Fig. 8.1).
Figure 8.1. Spectral distribution as a function of wavelength of sunlight, neutral and photo selective shade cloths. Red, Blue- ChromatiNet ® 50% red & blue shade cloth, neutral- 50% green shade cloth.
157

Table 8.1. Relative spectral distribution (% total irradiance 300-800 nm) and wavelength ratios for sun, glass and shade methods. Abbreviations SC- 50% green shade cloth; Red, Blue- ChromatiNet ® 50% red & blue photo selective shade cloth.
Sun Glass SC Red Blue
Wavelength
PAR 71 72 70 70 71
300-400 2.9 2.6 2.7 2.1 2.3
400-500 16.7 16.8 16.5 9.4 23.8 500-600 25.7 26.1 25.7 13.9 25.3 600-700 28.2 28.2 27.8 36.8 21.5 700-800 26.5 26.3 27.3 37.8 27.1 Ratios
R:FR (N) 1.1 1.1 1 1 1.1 R:FR (B) 1.1 1.1 1 1 0.8 B:R 0.6 0.6 0.6 0.3 1.1 B:FR 0.6 0.6 0.6 0.3 0.9
8.2.3 Plant growth measurement and analysis Under each treatment, stem diameter, and leaflet width and length were measured at
node 9 at the commencement of flowering. Node of flower initiation (NFL) and days from
planting to first open flower (FT) were recorded. At harvest, length of internodes, total
shoot length, number of nodes, and seed and pod number were measured. Shoot dry
weight was measured after air drying of senesced plants for 72 h. Statistical analysis
using JMP software (SAS Institute, Cary, NC, USA) included ANOVA, Students t-tests,
Dunnetts method, and/or Tukeys test.
158

8.3 Results
8.3.1 Shoot length and flowering node varied with light source To examine the influence of light source, L107 pea was grown under mixtures of
fluorescent, metal halide, high pressure sodium and incandescent lamps. The same model
growth chambers were used at equal irradiance (220 mol M-2 s -1 ), photoperiod (18 h) and
temperature (20 ± 0.2 °C).
Both internode length and flowering node varied with light source (Fig. 8.2). L107 does
responds to reduced R:FR with delayed flowering and reduced shoot length (Cummings
et al. 2007; Weller et al. 2001). However, under the light sources used, a response based
on R:FR was not clear (Fig. 8.2A, C). Shoot length did not decrease with increasing R:FR
as expected (Fig. 8.2A). However, ranking the light sources by blue irradiance suggested
a correlation of shoot length with blue quantity (Fig. 8.2B). Plants displayed the longest
intemodes under the lowest blue irradiance (9 [tmol m 2s 1 , HPS). Light sources with
higher blue irradiance had significantly shorter intemodes and above 30 !mot ni 2s-1 of
blue no further reduction in shoot length was observed. Node of flower initiation (NF1)
was significantly earlier (P < 0.01) under metal halide than the other light sources even
though R:FR was high (Fig. 8.2C). Ranking the light sources by total blue (400-500 nm)
irradiance (Fig. 8.2D) suggested earlier flowering at a blue irradiance above 40 limo' rn -2
S-1
.
159

2.9 3 3.3
R:FR (n) A
1.4 1.8
9 52 30 36 40
Blue irradiance (pmol m 4s-1 )
HPS 550 -
SOO -
450 -
400
350 -
300
250 -
200
Mea
n le
ngth
no
des
1-9
(mm
)
MH MH/HPS CWF/Inc MI-1/HPS/Inc
MH/HPS/Inc MH/HPS CWF/Inc MH
? 550
E 500
450
-0 400
350
c 300 -
c 250
g 200
HPS
19.5
19 -
18.5 -
18 -
17.5 -
17 -
16.5 -
16
15.5
CWF/Inc
1.4 1.8 2.9 3 3.3
. R:FR (n)
HPS 19.5
19 - MH/HPS/Inc MH/HPS
MH/HPS/Inc
I. HPS
MH
MH/HPS
18.5 -
18 - CWF/Inc
T. 17.5 - z 17
16.5
16
15.5
MH
30 36 40
Blue irradiance (pmol m's')
52 9
Figure 8.2. Mean shoot length ± SE between nodes 1 and 9, and node of flower initiation (NFI) for pea L107 by R:FR (A, C) and blue irradiance (B, D), n = 20. Plants were grown at 220 ;mot m 2 s1 PPF, photoperiod 18 h, temperature 20 ± 0.2 °C in Thermoline (Sydney, Australia) model 3540 growth chambers under combinations of cool white fluorescent tubes (CWF), incandescent globes (Inc), metal halide lamps (MH), and high pressure sodium lamps (HPS) to give the R:FR and blue irradiances specified.
160

8.3.2 Blue supplementation reduced shoot length and flowering To examine this blue response in more detail L107 was grown under high pressure
sodium lamps, the light source with lowest blue fraction but high R:FR. To this
background was added a monochromatic blue light gradient from 5-70 gmol I11-2 s-1 .
Significant shoot length reductions (P < 0.05 at 20 and P < 0.01 at 30 Imo' 111-2 S -1 ,
11=10) occurred at additional irradiance of 20-30 iimol m -2 s-1 blue compared to
additional irradiance of 5 - 15 ;mot r11-2 s-1 blue. As for the light source experiments
(Fig. 8.2), no further significant reduction in shoot length was observed above 30
wnol 111-2 s-1 of blue.
To examine if this was simply an effect of the additional irradiance, the experiment
was repeated with a white fluorescent gradient in the range of interest (20-45 pmol m -
2 s -1 ). The additional blue irradiance of the white fluorescents was 4-9 Imo' 111-2 s-1 .
Under high pressure sodium with white supplementation, shoot length did not
significantly differ. In contrast, the equivalent blue irradiance significantly reduced
shoot length (Fig. 8.3, P < 0.01).
Node of flower initiation (NFI) was progressively lower under increasing blue
irradiance, from means of 17.6 ± 0.24 with 5 1..tmol r11-2 S-1 additional blue to 16.3 ±
0.21 with 45 limo' M-2 s-1 additional blue (significant at P < 0.01, n=10). The results
suggest a blue light specific effect on flowering, as increasing irradiance with the
white fluorescent gradient had no effect on NFI; and NFI was reduced under light
sources with a higher blue proportion (Fig. 8.2D). In addition, when grown under
monochromatic blue L107 NFI was node 15.9 (± 0.10, n=20); under monochromatic
red NFI was node 18.3 (± 0.39, n=20).
161

0
20 30
45
Mea
n le
ng
t h n
ode
s 1-
9 ( m
m)
500 -
475 -
450
425 -
400 -
375 -
350
a a a a
N
Additional irradiance (Irmo' ni2s-1 )
o White Blue
Figure 8.3. Mean shoot length ± SE between nodes 1 and 9 for L107 pea grown under 100 gmol m -2 s-1 high pressure sodium lamps, and with additional white or blue fluorescent irradiance of 20-45 gmol m -2 s -1 . Photoperiod 18 h, temperature 20 ± 0.2 °C. Different letters signify significant differences at P < 0.01, n=10.
8.3.3 Reduced irradiance increased shoot length and delayed flowering
To further examine the influence of light quantity, L107 pea was grown under
spectrally neutral shade cloth and unshaded in the glasshouse. PAR was reduced by
approximately 50% under neutral shade but light quality relative to sunlight was not
affected (Table 8.1). Compared to neutral shade plants, unshaded plants had
significantly reduced shoot length throughout the experiments (Fig. 8.4, P < 0.01).
Leaf size was not affected by light quantity, but stem diameter was significantly larger
in unshaded plants (data not shown, P < 0.01). Shoot dry weight was significantly
higher for unshaded plants (Table 8.2, P < 0.01). Unshaded plants also flowered
significantly earlier and at a lower node (FT, NFL Table 8.2, P < 0.01), with
significantly higher yield (seed, and pods, Table 8.2, P < 0.01) compared to plants
under neutral shade. Thus reducing PAR by 50% without altering light quality
produced taller, thinner plants with longer internodes, reduced dry weight and reduced
yield.
162

Table 8.2. Mean flowering node and time, yield (seed, pods) and shoot dry weight ± SE for L107 peas grown under neutral, photo selective shade cloths and unshaded treatments as described in Materials and Methods. Significance comparisons used Dunnetts method with neutral shade as the control group. Different letters signify differences significant at P<0.05, * significant at P<0.01, n=20. Abbreviations: NFI, node of flower initiation; FT, flowering time.
Treatment NFL FT(days) Seed Pods Dry w (g)
Neutral 16.5 42.5 9.4 3.2 4.2
+0.11 a +0.18a ±0.87a ±0.20a +0.11 a
Blue 16.1 42.3 10.3 3.9 5.9
±0.10 b ±0.22 a ±0.52 a ±0.18 b ±0.07 b*
Red 16.1 41.1 10.0 3.2 5.3
±0.13 a ±0.09 b* ±0.92 a +0.25 a ±0.10 c*
Unshaded 15.5 39.3 17.6 4.8 5.4
±0.14 c* ±0.18 c* +1.36 b* ±0.33 c* ±0.32 0'
8.3.4 Blue irradiance influenced pea growth independently of R:FR The artificial light studies have both altered blue quantity and R:FR. In contrast, the
photo selective shade cloths had altered blue irradiance but largely unaltered R:FR
(Table 8.1, Fig. 8.1), and are thus a useful tool to further examine the role of blue
light, independently of R:FR. Each shade cloth treatment reduced PAR by
approximately 50%.
Compared to neutral shade, L107 peas under blue shade cloth were significantly
shorter and under red shade cloth significantly taller, respectively, at all growth stages.
For example, length between internodes 1-17 was significantly longer under red and
significantly shorter under blue shade cloth (Fig. 8.4, P < 0.01). Under red shade,
R:FR was the same as neutral shade and unshaded treatments but blue quantity was
reduced and red quantity enhanced (Table 8.1). Under blue shade broad band R:FR
was actually reduced relative to other treatments, which would be expected to increase
internode length, but length was actually reduced, presumably due to the enhanced
blue quantity (Table 8.1). Repeats of the experiments in different seasons (spring and
autumn) consistently produced significantly shorter plants under blue and significantly
taller plants under red shade cloths (data not shown, P < 0.01).
Node of flower initiation (NFI) and flowering time (FT) were slightly earlier under
both red and blue coloured shade cloths compared to neutral shade (Table 8.2).
163

2000
E 1800
1600 a)
-o o 1400
rm 1200
g 1000 a) 2
a
800 Unshaded Neutral shade Red shade Blue shade
Leaflets and stems were slightly larger under both red and blue shade compared to
neutral shade, and leaflets were significantly longer under blue shade (data not shown,
P < 0.05). Yield was also increased under blue shade compared to neutral shade (Pod
number, Table 8.2). More importantly, both blue and red shaded plants had
significantly higher dry weights than neutral grown plants (Table 8.2, P < 0.01).
Figure 8.4. Mean shoot length ± SE between nodes 1 and 17 for L107 pea grown under shaded and unshaded conditions. Neutral shade- 50% green shade cloth; Red, Blue shade-ChromatiNet® 50% red & blue shade cloth. Different letters signify significant differences at P < 0.01, n=20.
8.3.5 Examining the role of the cryptochrome photoreceptor in the shade cloth response
While R:FR was largely unaltered by all three shade cloth treatments examined, the
red and blue shade cloths result in substantial changes in the proportions of both red
and blue light when compared to sun and neutral shade (Table 8.1, Fig. 8.1). However,
it was still unclear if the observed shoot elongation under red shade and shoot length
reductions under blue shade relative to neutral shade (Fig. 8.4) were due to changes in
the proportion of red light or blue light or both. Thus the response of the blue light
receptor mutant cry] of pea to neutral, blue and red shade cloths was examined to
determine if it was changes in blue light under these treatments that modify growth.
As observed in previous experiments (Fig. 8.4), compared to neutral shade wild type
(L107) pea plants exhibited significantly increased elongation under red shade and
significantly reduced shoot elongation under blue shade (Fig. 8.5, P < 0.05). In
contrast, cryl mutant plants did not respond to either shade cloth treatment, as shoot
164

elongation was not significantly different in cry] mutant plants grown under neutral,
red or blue shade (Fig. 8.5). This indicates a clear role of blue light quantity in pea
shoot length responses, and specifically, the CRY1 photoreceptor in these changes.
I I Neutral 11 Red =I Blue
cryl
Figure 8.5. Mean shoot length ± SE between nodes 1 and 9 for L107 (WT) and cryl peas grown under the shade treatments as. Neutral- 50% green shade cloth; Red, Blue-ChromatiNet® 50% red & blue shade cloth.
8.4 Discussion In this study, blue irradiance had clear effects on shoot length and flowering in pea
independently of R:FR, in a range of conditions. Under different artificial light
sources, shoot length and flowering was associated with blue quantity as well as
R:FR, and blue supplementation reduced shoot length and flowering node
independently of the increased irradiance. Using a novel method for varying blue
quantity under natural light, it has been shown that blue light mediated alteration in
shoot length was at least partially mediated by the CRY1 photoreceptor in pea.
Like many photoperiodic species, L107 pea has reduced shoot length and delayed
flowering with increased R:FR (Weller et al. 2001). The commonly used artificial
light sources used in growth chambers (fluorescent, metal halide, high pressure
sodium) all have high R:FR. However, when grown under these sources at equal
irradiance, wild type peas did not show clear correlations between increasing R:FR
and shoot length or flowering, but were influenced by the blue irradiance (Fig. 8.2).
Low blue irradiance was associated with increased shoot length even at high R:FR.
This highlights the impact light source can have on plant growth and indicates that
165

care should be taken with which light sources are selected for growth chamber
experiments.
Previous studies in soybean have associated shoot length with the low blue
irradiance of high pressure sodium lamps, as increasing irradiance to provide a
minimum blue light threshold of 30 pmol 111-2 s -1 reduced shoot length (Wheeler et al.
1991). This single study has been used as a guideline to avoid increased elongation in
growth chamber studies under artificial light (Sager and McFarlane 1997). However,
increasing irradiance in itself influences shoot length (Christophe et al. 2006),
particularly of pea (Gawronska et al. 1995). It is clear examination of such a threshold
in other species is required, and for pea it would appear this threshold of 30 !mot rI1-2 -1 s also applies. Under HPS, shoot length was significantly longer than the other light
sources at equal irradiance, all of which had a blue proportion above 30 urnol IT1-2 s -1
(Fig. 8.2). Furthermore, blue light supplementation of HPS above 30 p.mol IT1-2 s -1
significantly reduced pea shoot length, whereas supplementation with white
fluorescent light of equal irradiance did not, presumably because the blue fraction did
not meet this apparent threshold (Fig. 8.3), and providing a clear indication that blue
quantity can influence shoot length, not just increased irradiance.
High blue irradiance also influenced flowering. In WT plants, flowering node was
reduced when blue irradiance was above 45 pmol m -2 s-I , but was not significantly
different when the additional irradiance was supplied by white fluorescent. Under
monochromatic blue, flowering was at a similar node to light grown glasshouse plants
(node 16), and under blue shade cloth, flowering was earlier than neutral shade (Table
8.2). In Arabidopsis, blue irradiance can influence flowering even when R:FR is high
through CRY2 (Casal 2005; Mockler etal. 2003), and in mixtures of red, blue and far
red light, flowering was in direct relation to blue irradiance (Eslcins 1992). However,
the role of blue light in regulating flowering in pea is less clear. The promotion of
flowering in pea is mediated by phyA under high R:FR; under low R:FR promotion is
via a reduction in phyB mediated inhibition, but blue may also promote flowering
(Weller et al. 2001). Pea cryl (blue light receptor) mutants still retain a blue induced
promotion of flowering, suggesting the role of additional blue receptors in this
response in pea, possibly cry2 (Platten et al. 2005).
The artificial light sources that were studied not only have altered blue irradiance,
but different R:FR, and are well above the sunlight R:FR of 1.1. In studies under
natural light, height reduction by filtering far red light is well documented (e.g.
166

Rajapakse et al. 1999) but the role of blue light has received less attention. Thus photo
selective shade cloths with altered blue irradiance (Oren-Shamir et al. 2001) were
examined as a potential research tool. Blue shade cloth increased and red shade cloth
decreased the blue proportion respectively relative to natural light and neutral shade,
but R: FR was largely unaltered (Table 8.1, Fig. 8.1). This allowed for a novel method
of examining the influence of blue light, and of light quantity, independently from
R:FR, and on large adult plants.
Under blue shade cloth, shoot length was significantly reduced relative to neutral
shade (Fig. 8.4). In fact, blue shade cloth had slightly reduced broad band R:FR (0.8),
which may be expected to induce elongation, yet plants were significantly reduced in
height. Plants grown under red shade cloth showed significant elongation relative to
neutral shade (Fig. 8.4) although R:FR was unaltered. Thus it would appear that the
shoot length alterations under red and blue shade cloths were due to alterations in blue
or red irradiance, or both. To resolve this problem, L107 (WT) and a mutant blue light
receptor line (cry]) were used to clarify the influence of blue light in the shade cloth
response. In contrast to WT plants, there were no significant shoot length differences
in the cry] mutant plants between the shade treatments (Fig. 8.5). CRY1 only absorbs
in the blue spectrum (Ahmad et al. 2002), confirming the shoot length modifications
under blue and red shade cloths are due to the alterations in blue proportion, not red
proportion, and that CRY1 is the photoreceptor mediating this response.
Photosynthetically active radiation (PAR) level is also implicated in plant
morphogenesis (Christophe et al. 2006; Dougher and Bugbee 2001) and in this study
increased irradiance reduced shoot length in pea with no change in wavelength
proportions compared to neutral shade (Fig. 8.4). In Trifolium, both blue and PAR •
reductions contributed to petiole elongation (Christophe et al. 2006). In the shade
treatments, PAR was similar yet there were shoot length reductions under blue and
shoot length increases under red shade cloths (Fig. 8.4), clearly regulated by blue
light. While blue shade grown plants were taller than un-shaded plants, they were
significantly shorter than plants under neutral shade. This indicates that photo
selective shade cloths could have potential horticultural applications. Protection of
horticultural crops by shading is common to reduce radiant heat load, but reducing
PAR by shading can induce elongation and reduce yield (Hanan 1998).
Chemical growth regulators are also commonly used to manipulate height of
horticultural crops, and there is considerable interest in photo selective filters to
167

reduce chemical use (Rajapalcse et al. 1999). Height reduction by filtering far red light
(i.e. increasing R:FR) can have the potentially negative effect of delaying flowering
(RunIde and Heins 2001; Runkle and Heins 2002). Blue shade cloth may be a
potentially beneficial form of shading compared to neutral shaded plants. Pea plants
grown under blue shade cloth were significantly shorter, had higher shoot dry weight,
higher yield and earlier flowering, all potentially beneficial growth responses (Table
8.2).
Thus the photo selective shade cloths examined have potential for examining the
influence of blue irradiance on photomorphogenic responses in adult plants and, in
species with a strong response to blue irradiance, have horticultural potential for
manipulating height and flowering whilst offering crop protection.
In conclusion, a clear role for blue light in shoot elongation and flowering in mature
pea plants has been defined. The significant impact of blue irradiance on pea
development appears to act independently of R:FR, and indicates blue may be an
important component of the shade avoidance response of this species. Under the
artificial light sources commonly used in growth chambers, both R:FR and blue
irradiance can influence shoot length and flowering, indicating that the choice of light
source should be carefully considered. Photo selective shade cloths have both
horticultural and photomorphogenic research potential. Using this novel method, it has
been shown that under sunlight R:FR, both irradiance and blue light fraction
influences shoot length and flowering in garden pea, with shoot length at least
partially mediated by the CRY1 photoreceptor.
168

Appendix: Indicative plant responses The following table has been compiled from indicative responses of peas in the
different experimental environments. By using the plants' responses as indicators of
their environment, management decisions can be made based on such information and
the growing conditions of the plants. Thus if, for example, the plant response is long
intemodes, it could be from low light, low blue or low R:FR. If the plants are in
relatively short days and/or if the PPF is low, increasing irradiance and/or the DLI
should correct the problem. If the plants are under HPS, it is probably from low blue
irradiance, so increasing blue (eg add some MH to the light mix) should correct this.
The third option is unlikely in growth chambers as R:FR is usually high, but possible
from incandescent photoperiod extensions, in which case one could add/switch to
Fluorescent for the extension. In this way the plant responses can be used as a
management tool.
Symptom Causes Solutions
Long intemodes Low light T irradiance
Low blue 1 blue
Low R:FR i red, I, far red
Short intemodes High temp. 4. temp.
High light 4 irradiance
High blue I red, I blue
High R:FR I far red, 4 red
Small leaves High light 4. irradiance
High temp. 4, temp.
Low R:FR T red, 4. far red
Late flowering High R:FR I far red, 4 red, I blue
Early flowering Low R:FR I red, 4 far red
Low yield High temp. I. temp.
High light 4 irradiance
Low R:FR I red, 4, far red
169

References Adams SR (2006) Maximising the savings from temperature integration. The Commercial Greenhouse Grower October, 2006, 33-36.
Adams SR, Langton FA (2005) Photoperiod and plant growth: a review. Journal of Horticultural Science & Biotechnology 80, 2-10.
Ahmad M, Grancher N, Heil M, Black RC, Giovani B, Galland P, Lardemer D (2002) Action spectrum for cryptochrome-dependent hypocotyl growth inhibition in Arabidopsis. Plant Physiology 129, 774-785.
Aldrich RA, White JW (1969) Solar radiation and plant growth in greenhouses. Transactions of the ASAE 12, 90-93.
Bachman GR, McMahon MJ (2006) Day and night temperature differential (DIF) or the absence of far-red light alters cell elongation in 'Celebrity White' Petunia. Journal of the American Society for Horticultural Science 131, 309-312.
Bakker JA, Blacquiere T (1992) Reflected supplementary lighting can affect the crops of neighbours. Acta Horticulturae 327, 95.
Ballare CL, Scopel AL, Sanchez RA (1997) Foraging for light: Photosensory ecology and agricultural implications. Plant Cell and Environment 20, 820-825.
Barber J, Horler DNH, Chapman DJ (1981) Photosynthetic pigments and efficiency in relation to the spectral quality of absorbed light. In 'Plants and the daylight spectrum'. (Ed. H Smith) pp. 341-354. (Academic Press Inc: London)
Beggs CJ, Wellman E (1994) Photocontrol of flavonoid biosynthesis. In 'Photomorphogenesis in Plants'. (Eds RE Kendrick and GHM Kronenberg) pp. 733- 751. (Kluwer Academic Publishers: Dordrecht)
Beveridge CA, Murfet IC (1996) The gigas mutant in pea is deficient in the floral stimulus. Physiologia Plantarum 96, 637-645.
Bjorn LA, Vogelmann TC (1994) Quantification of light. In 'Photomorphogenesis in Plants'. (Eds RE Kendrick and GHM Kronenberg) pp. 17-25. (Kluwer Academic Publishers: Dordrecht)
170

Bredmose N (1995) High Utilization Ratio of Supplementary Light by Cut Roses at All Times of the Year. Gartenbauwissenschaft 60, 125-131.
Bubenheim DL, Bugbee B, Salisbury FB (1988) Radiation in controlled environments: influence of lamp type and filter material. Journal of the American Society for Horticultural Science 113, 468-474.
Bula RJ, Morrow RC, Tibbitts TW, Barta DJ, Ignatius RW, Martin TS (1991) Light-emitting diodes as a radiation source for plants. HortScience 26, 203-205.
Canham AE (1966) 'Artificial Light in Horticulture.' (Centrex Publishing Co.: Eindhoven, Netherlands)
• Carlson WH, Giger W (1978) A gradient approach to conducting research on plant response to radient energy. Phytotronic Newsletter 19, 67-73.
Casal JJ (2005) Convergence of phytochrome and cryptochrome signalling. In 'Light Sensing in Plants'. (Eds M Wada, K Shimazaki and M lino) pp. 285-292. (Springer-Verlag: Tokyo)
Cathey HM, Campbell LE (1977) Plant Productivity: New approaches to efficient • sources and environmental control. Transactions of the ASAE 20, 360-366.
Cerny TA, Faust JE, Layne DR, Rajapakse NC (2003) Influence of photoselective films and growing season on stem growth and flowering of six plant species. Journal of the American Society for Horticultural Science 128, 486-491.
Chetia SK, Kumar R (2005) Temperature and photoperiod effect on pea (Pisum sativum L.). Legume research 28, 111-114.
Chow WS, Anderson JM (1987a) Photosynthetic Responses of Pisum sativum to an Increase in Irradiance during Growth 1. Photosynthetic Activities. Australian Journal of Plant Physiology 14, 1-8.
Chow WS, Anderson JM (1987b) Photosynthetic Responses of Pisum sativum to an Increase in Irradiance during Growth 2. Thylakoid Membrane Components. Australian Journal of Plant Physiology 14, 9-19.
171

Christophe A, Moulia B, Varlet-Grancher C (2006) Quantitative contribution of blue light and PAR to the photocontrol of plant morphogenesis in Trifolium repens (L.). Journal of Experimental Botany 57, 2379-2390.
Cockshull KE, Adams SR, Plackett C (2002) Smart temperature control (using temperature integration to save energy). Grower 3 October 2002, 20-21.
Connellan G (1996) Greenhouse designs for optimum production environments. In 'International Symposium on Plant Production in Closed Ecosystems'. Narita, Japan. (Ed. T Kozai) pp. 159-164. (International Society for Horticultural Science- Acta Horticulturae)
Connellan G (1998) Greenhouse coverings- properties and selection. In 'The National Protected Cropping Expo'. NSW pp. 30-37. (NSW Agriculture)
Cummings I, Reid JB, Koutoulis A (2007) Red: Far-Red Ratio Correction in Plant Growth Chambers - Growth Responses and Influence of Thermal Load on Garden Pea. Physiologia Plantarum 131, 171-179.
Dansereau B, Zhang P, Gagnon S (1998) Stock and Snapdragon as Influenced by Greenhouse Covering Materials and Supplemental Light. HortScience 33, 668-671.
de Koning JCM (1997) Modelling the effect of supplementary lighting on production and light utilization efficiency of greenhouse crops. Acta Horticulturae 418, 65-71.
Deitzer G (1994) Spectral comparisons of sunlight and different lamps. In 'International Lighting in Controlled Environments Workshop'. (Ed. TW Tibbitts) pp. 197-199. (NASA (USA) Publication No. CP-95-3309)
Deitzer G (2005) Excel file of spectral analysis of light sources. In. (http://ncr101.montana.edu/)
Demers DA, Charbonneau J, Gosselin A (1991) Effects of Supplementary Lighting on the Growth and Productivity of Greenhouse Sweet-Pepper. Canadian Journal of Plant Science 71, 587-594.
Dorais M, Gosselin A, Trudel MJ (1991) Annual Greenhouse Tomato Production under a Sequential Intercropping System Using Supplemental Light. Scientia Horticulturae 45, 225-234.
172
Dougher TAO, Bugbee B (2001) Differences in the response of wheat, soybean and lettuce to reduced blue radiation. Photochemistry and Photobiology 73, 199-207.
Downs RJ (1994) History and applications in controlled environments. In 'International Lighting in Controlled Environments Workshop'. (Ed. TW Tibbitts). (NASA-CP-95-3309)
Downs RJ, Krizek DT (1997) Air Movement. In 'Controlled Environment Guidelines'. (Eds RW Langhans and TW Tibbitts) pp. 87-104. (NCR 101- North Central Regional Research Publication No. 340)
Downs RW (1979) Radiation: Critique 1. In 'Controlled Environment Guidlines for Plant Research'. (Eds TW Tibbitts and TT Kozlowski) pp. 29-45. (Academic Press: New York)
Erhioui BM, Gosselin A, Hao X, Papadopoulos AP, Dorais M (2002) Greenhouse covering materials and supplemental lighting affect growth, yield, photosynthesis. and leaf carbohydrate synthesis of tomato plants. Journal of the American Society for Horticultural Science 127, 819-824.
Eskins K (1992) Light-quality effects on Arabidopsis development. Red, blue and far-red regulation of flowering and morphology. Physiologia Plantarum 86, 439-444.
Fankhauser C, Staiger D (2002) Photoreceptors in Arabidopsis thaliana: light • perception, signal transduction and entrainment of the endogenous clock. Planta 216,
1-16.
Faust J (2003) Light management in greenhouses. In. (Floriculture Industry Research and Scholarship Trust
Faust JE, Heins RD (1997) Quantifying the influence of high pressure sodium lighting on shoot tip temperature. Acta Horticulturae 418, 85-91.
Fisher . P, Donnelly C, Faust J (2001) Evaluating supplemental light for your greenhouse. Ohio Florists Association Bulletin, 1-6.
Fletcher JM, Tatsiopoulou A, Mpezamihigo M, Carew JG, Henbest RGC, Hadley P (2005) Far-red light filtering by plastic film, greenhouse-cladding materials: effects on growth and flowering in Petunia and Impatiens. Journal of Horticultural Science & Biotechnology 80, 303-306.
173

Franldand B (1981) Germination in Shade. In 'Plants and the daylight spectrum'. (Ed. H Smith) pp. 187-204. (Academic Press Inc.: London)
Franklin KA, Whitelam GC (2005) Phytochromes and shade avoidance responses in plants. Annals of Botany 96, 169-175.
Garcia-Martinez JL, Gil J (2001) Light regulation of gibberellin biosynthesis and mode of action. Journal of Plant Growth Regulation 20, 354-368.
Gawronska H, Young-Yell Y, Furukawa K, Kendrick RE, Takahashi N, Kamiya Y (1995) Effects of low irradiance stress on gibberellin levels in pea seedlings. Plant Cell Physiology 36, 1361-1367.
Graper DF, Healy W (1991) High-Pressure Sodium Irradiation and Infrared Radiation Accelerate Petunia Seedling Growth. Journal of the American Society for Horticultural Science 116, 435-438.
Grime JP (1981) Plant strategies in shade. In 'Plants and the daylight spectrum'. (Ed. H Smith) pp. 159-186. (Academic Press Inc.: London)
Grindal G, Moe R, Junttila 0 (2000) The Role of Gibberellin and Phytochrome in DIF-Mediated Stem Elongation. Acta Horticulturae 514, 205-211.
Haldimann P, Feller U (2005) Growth at moderately elevated temperature alters the physiological response of the photosynthetic apparatus to heat stress in pea (Pisum sativum L.) leaves. Plant Cell and Environment 28, 302-317.
Hamasalci T, Okada M (2000) Thermal radiation load on temperature regimes in plant growth chambers. Biotronics 29, 57-69.
Hammer PA (1978) Reproducibility in Growth Chamber Research. Phytotronic Newsletter 19, 28-32.
Hanan JJ (1998) 'Greenhouses- Advanced Technology for Protected Horticulture.' (CRC Press LLC: Boca Raton)
Hao X, Papadopoulos AP (1999) Effects of supplemental lighting and cover materials on growth, photosynthesis, biomass partitioning, early yield and quality of greenhouse cucumber. Scientia Horticulturae 80, 1-18.
174
Hashimoto T (1994) Requirements of blue, UV-A, and UV-B light for normal growth of higher plants, as assessed by action spectra for growth and related phenomena. In 'International Lighting in Controlled Environments Workshop'. (Ed. TW Tibbitts). (NASA-CP-95-3309)
Heins RD, Faust J (1994) Radiant cooling leads to cooler temperatures under black cloth. HortScience 29, 503.
Heins RD, Liu B, Runkle ES (2000) Regulation of Crop Growth and Development Based on Environmental Factors. Acta Horticulturae 516, 13-22.
Heo J, Lee C, Chalcrabarty D, Paek K (2002) Growth responses of marigold and salvia bedding plants as affected by monochromic or mixture radiation provided by a Light-Emitting Diode (LED). Plant Growth Regulation 38, 225-230.
Hicklenton PR, Heins R (1997) Temperature. In 'Plant Growth Chamber Hanndbook'. (Eds RW Langhans and TW Tibbitts) pp. 31-42. (NCR 101- North Central Regional Research Publication No. 340, Iowa State University, Iowa)
Hirai T, Amaki W, Watanabe H (2006) Action of blue or red monochromatic light on stem internodal growth depends on plant species. Acta Horticulturae 711, 345-349.
Holmes MG (1981) Spectral distribution of radiation within plant canopies. In 'Plants and the daylight spectrum'. (Ed. .H Smith) pp. 147-158. (Academic Press Inc.: London)
lino M, Haga K (2005) Roles played by auxin in phototropism and photomorphogenesis. In 'Light Sensing in Plants'. (Eds M Wada, K Shimazaki and M lino) pp. 269-276. (Springer-Verlag: Tokyo)
Incrocci L, Pardossi A, Vernieri P, Tognoni F (2000) Effects of heat stress and hypoxia on growth, water relations and ABA levels in bean (Phaeseolus vulgaris L.) seedlings. Acta Horticulturae 516, 31-39.
Inoue T (2002) Effects of seed vernalization and photoperiod on flower bud initiation of summer, spring, and winter flowering types of sweet pea (Lathyrus odoratus L.). Journal of the Japanese Society for Horticultural Science 71, 127-132.
175

Kaczperski MP, Carlson WH, Karlsson MG (1991) Growth and Development of Petunia Xhybrida as a Function of Temperature and Irradiance. Journal of the American Society for Horticultural Science 116, 232-237.
Kakani VG, Reddy KR, Zhao D, Sailaja K (2003) Field crop responses to ultraviolet-B radiation: a review. Agricultural and Forest Meteorology 120, 191-218.
Kendrick RE, Weller J (2003a) Photomorphogenesis. In 'Encyclopedia of Applied Plant Sciences'. (Eds B Thomas, D Murphy and B Murray) pp. 1069-1076. (Academic Press: London)
Kendrick RE, Weller J (2003b) Phytochromes and other photoreceptors. In 'Encyclopedia of Applied Plant Sciences'. (Eds B Thomas, D Murphy and B Murray) pp. 1063-1069. (Academic Press: London)
Khaoua SA, Bournet PE, Migeon C, Boulard T, Chasseriaux G (2006) Analysis of greenhouse ventilation efficiency based on computational fluid dynamics. Biosystems Engineering 95, 83-98.
Kim HH, Goins GD, Wheeler RM, Sager JC (2004) Green-light supplementation for enhanced lettuce growth under red- and blue-light-emitting diodes. Hortscience 39, 1617-1622.
Kittas C, Baille A, Giaglaras P (1999) Influence of covering material and shading on the spectral distribution of light in greenhouses. Journal Agricultural Engineering Research 73, 341-351.
Kittas C, Tchamitchian M, Katsoulas N, Kapaiskou P, Papaioannou C (2006) Effect of two UV-absorbing greenhouse-covering films on growth and yield of a soilless eggplant crop. Scientia Horticulturae 110, 30-37.
Kobayashi KD (2005) Effects of photoselective shadecloths on growth and flowering of potted chrysanthemum. HortScience 40, 1012.
Kobayashi KD, Kawabata AF, Lichty JS (2006) Effects of photoselective shadecloths on potted Dracaena and Anthurium plants. HortScience 41, 1053-1054.
Koontz HV, Prince RP, Koontz RF (1987) Comparison of fluorescent and high pressure sodium lamps on growth of leaf lettuce. HortScience 22, 424-425.
Krizek DT, Britz SJ, Mirecki RM (1998) Inhibitory effects of ambient
176

levels of solar UV-A and UV-B radiation on growth of cv. New red fire
lettuce. Physiologia Plantarum 103, 1-7.
Krizek DT, McFarlane JC (1983) Controlled environment guidelines. HortScience 18, 662-664.
Krizek DT, Mirecici RM, Kramer GF (1994) Growth Analysis of Uv-B-Irradiated Cucumber Seedlings as Influenced by Photosynthetic Photon Flux Source and Cultivar. Physiologia Plantarum 90, 593-599.
Lane HC, Cathey HM, Evans'LT (1965) The Dependence of Flowering in Several Long-Day Plants on the Spectral Composition of Light Extending the Photoperiod. American Journal of Botany 52, 1006-1014.
Li SM, Rajapakse NC, Young RE (2003) Far-red light absorbing photoselective plastic films affect growth and flowering of chrysanthemum cultivars. Hortscience 38, 284-287.
Maas FM (1992) Photomorphogenesis in roses. Acta Horticulturae 305, 109-113.
Mattson NS, Erwin JE (2005) The impact of photoperiod and irradiance on flowering of several herbaceous ornamentals. Scientia Horticulturae 104, 275-292.
McCree KJ (1972a) The action spectrum, absorptance and quantum yield of photosynthesis in crop plants. Agricultural Meteorology 9, 191-216.
McCree KJ (1972b) Test of current definitions of photosynthetically active radiation against leaf photosynthesis data. Agricultural Meteorology 10, 443-453. •
McCree KJ (1972a) The action spectrum, absorptance and quantum yield of photosynthesis in crop plants. Agricultural Meteorology 9, 191-216.
McCree KJ (1972b) Test of current definitions of photosynthetically active radiation against leaf photosynthesis data. Agricultural Meteorology 10, 443-453.
McCree KJ (1984) Radiation levels in growth chambers fitted with high intensity discharge lamps, with or without thermal barriers. Crop Science 24, 816-819.
177

McFarlane JC (1978) Light. In 'A Growth Chamber Manual: environmental control for plants'. (Ed. RW Langhans) pp. 15-44. (Comstock Pub. Associates: Ithaca, N.Y.)
Menard C, Dansereau B (1995) Differential Responses of Rose Cultivars to Light-Source and Nitrogen-Fertilization. Scientia Horticulturae 64, 117-132.
Menard C, Dorais M, Hovi T, Gosselin A (2006) Developmental and physiological responses of tomato and cucumber to additional blue light. Acta Horticulturae 711, 291-296.
Mermier M, Baille A (1988) The optical properties of plastic materials for greenhouses and screens. Plasticulture 77, 11-24.
Mockler T, Yang HY, Yu XH, Parikh D, Cheng YC, Dolan S, Lin CT (2003) Regulation of photoperiodic flowering by Arabidopsis photoreceptors. Proceedings of the National Academy of Sciences of the United States of America 100, 2140-2145.
Moe R (1997) Physiological aspects of supplementary lighting in horticulture. Acta Horticulturae 418, 17-24.
Moe R, Heins R (1990) Control of plant morphogenesis and flowering by light quality and temperature. Acta Horticulturae 272, 81-89.
Morgan DC (1981) Shadelight quality effects on plant growth. In 'Plants and the daylight spectrum'. (Ed. H Smith) pp. 203-221. (Academic Press Inc: London)
Morrow RC, Wheeler RM (1997) Plant Physiological Disorders. In 'Controlled Environment Guidelines'. (Eds RW Langhans and TW Tibbitts) pp. 133-142. (NCR 101- North Central Regional Research Publication No. 340)
Mortensen LV, Moe R (1992) Effects of selective screening of the daylight spectrum, and of twilight on plant growth in greenhouses. Acta Horticulturae 305, 103-108.
Neff MM, Chory J (1998) Genetic interactions between phytochrome A, phytochrome B, and cryptochrome 1 during Arabidopsis development. *Plant Physiology 118, 27-35.
Nogues S, Allen DJ, Morison JIL, Baker NR (1999) Characterization of stomatal closure caused by ultraviolet-B radiation. Plant Physiology 121, 489-496.
178

Oren-Shamir M, Gussakovslcy EE, Shpiegel E, Nissim-Levi A, Ratner K, Ovadia R, Giller YE, Shahak Y (2001) Coloured shade nets improve the yield and quality of green decorative branches of Pittosporum variegatum. Journal of Horticultural Science & Biotechnology 76, 353-361.
Ormrod DP (1978a) Environmental stresses in controlled environments. Phytotronic Newsletter 19, 41-45.
Ormrod DP (1978b) Temperature. In 'A Growth Chamber Manual: environmental control for plants'. (Ed. RW Langhans) pp. 45-56. (Comstock Pub. Associates: Ithaca, N.Y.)
Pallas JE, Michel BE (1971) Infrared energy as a factor in controlled environments. Physiologia Plantarum 25, 165-168.
Peet MM, Krizek DT (1997) Carbon Dioxide. In 'Controlled Environment Guidelines'. (Eds RW Langhans and TW Tibbitts) pp. 65-80. (NCR 101- North Central Regional Research Publication No. 340)
Pierik R, Whitelam GC, Voesenek LACJ, de Kroon H, Visser EJW (2004) Canopy studies on ethylene-insensitive tobacco identify ethylene as a novel element in blue light and plant-plant signalling. The Plant Journal 38, 310-319.
Platten JD (2003) Blue-light photoreceptors and development of the garden pea. PhD thesis, University of Tasmania.
Platten JD, Foo E, Elliott RC, Hecht V, Reid JB, Weller J (2005) Cryptochrome 1 contributes to blue light sensing in Pea. Plant Physiology 139, 1472-1482.
Poggio SL, Satorre EH, Denthiou S, Gonzalo GM (2005) Pod and seed numbers as a function of photothermal quotient during the seed set period of field pea (Pisum sativum) crops. European Journal of Agronomy 22, 55-69.
Potter T, Rood SB, Zanewich KP (1999) Light intensity, gibberellin content and the resolution of shoot growth in Brassica. Planta 207, 505-511.
Pramuk LA, Runkle ES (2005) Photosynthetic Daily Light Integral During the Seedling Stage Influences Subsequent Growth and Flowering of Celosia, Impatiens, Salvia, Tagetes, and Viola. HortScience 40, 1136-1139.
179

Rajapakse NC, Kelly JW (1992) Regulation of Chrysanthemum growth by spectral filters. Journal of the American Society for Horticultural Science 117, 481-485.
Rajapakse NC, Young RE, McMahon MJ, Oi R (1999) Plant height control by photoselective filters: current status and future prospects. Horttechnology 9, 618-624.
Reid JB, Murfet IC, Singer SR, Weller JL, Taylor SA (1996) Physiological-genetics of flowering in Pisum. Seminars in Cell & Developmental Biology 7, 455-463.
Reiersen D, Sebesta Z (1981) A comparison of the effect of single glass and double acrylic sheating on plant growth and development. Acta Horticulturae 115, 401-408.
Roche R, Jeuffroy MH, Ney B (1999) Comparison of different models predicting the • date of beginning of flowering in pea (Pisum sativum L.). Ecological Modelling 118,
213-226.
Runkle ES (2004) Role of far red light in flowering and stem extension of plants. In 'International Controlled Environment Meeting'. Brisbane, Australia pp. 49-50. (ACEWG)
Runlde ES, HeMs RD (2001) Specific functions of red, far red, and blue light in flowering and stem extension of long day plants. Journal of the American Society for Horticultural Science 126, 275-282.
Runkle ES, Heins RD (2002) Stem extension and subsequent flowering of seedlings grown under a film creating a far-red deficient environment. Scientia Horticulturae 96, 257-265.
Runkle ES, Heins RD (2003) Photocontrol of flowering and extension growth in the long day plant Pansy. Journal of the American Society for Horticultural Science 128, 479-485.
Ryer A (1997) 'The light measurement handbook.' International Light, Newburyport, MA.
Sager JC, Edwards JL, Klein WH (1982) Light energy utilization efficiency for photosynthesis. Transactions of the ASAE 25, 1737-1746.
Sager JC, McFarlane JC (1997) Radiation. In 'Controlled Environment Guidelines'. (Eds RW Langhans and TW Tibbitts) pp. 1-30. (NCR 101- North Central Regional Research Publication No. 340)
180

Sager JC, Smith WO, Edwards IL, Cyr KL (1988) Photosynthetic efficiency and phytochrome photoequilibria determination using spectral data. Transactions of the ASAE 31, 1882-1889.
Salisbury FB (1979) Temperature. In 'Controlled Environment Guidlines for Plant Research'. (Eds TW Tibbitts and TT Kozlowski) pp. 75-116. (Academic Press: New York)
Salisbury FB, Ross CW (1992) 'Plant Physiology.' (Wadsworth Publishing Company: Belmont)
Sebesta Z, Reiersen D (1981) A comparison of single glass and double acrylic sheating with respect to heat loss and effects on plant environment. Acta Horticulturae 115, 409-412.
Shahak Y, Gussakovsky EE, Gal E, Ganelevin R (2004) ColorNets: crop protection and light-quality manipulation in one technology. Acta Horticulturae 659, 143-151.
Singsaas EL, Ort DR, DeLucia EH (2000) Diurnal regulation of photosynthesis in understory saplings. New Phytologist 145, 39-49.
Smith H (1981) Function, evolution and action of plant photosensors. In 'Plants and the daylight spectrum'. (Ed. H Smith) pp. 499-508. (Academic Press Inc: London)
Smith H (1994) Phytochrome-mediated responses: Implications for controlled environment research facilities. In 'International Lighting in Controlled Environments Workshop'. (Ed. TW Tibbitts) pp. 57-67. (NASA-CP-95-3309)
Smith H, Morgan DC (1981) The spectral characteristics of the visible radiation incident upon the surface of the earth. In 'Plants and the daylight spectrum'. (Ed. H Smith) pp. 3-20. (Academic Press Inc.: London)
Soriano T, Hernandez J, Morales MI, Escobar I, Castilla N (2004) Radiation Transmission Differences in East-West Oriented Plastic Greenhouses. Acta Horticulturae 633, 91-97.
Spalding EP, Folta KM (2005) Illuminating topics in plant photobiology. Plant Cell and Environment 28, 39-53.
181

Spomer LA, Tibbitts TW (1997) Humidity. In 'Controlled Environment Guidelines'. (Eds RW Langhans and TW Tibbitts) pp. 43-64. (NCR 101- North Central Regional Research Publication No. 340)
Summerfield RJ, Roberts EH (1987) Effects of illuminance on flowering in long- and short-day grain legumes: a reappraisal and unifying model. In 'Manipulation of Flowering'. (Ed. JG Atherton). (Butterworths: London)
Tambussi EA, Bartoli CG, Guiamet JJ, Beltran° J, Araus JL (2004) Oxidative stress and photodamage at low temperatures in soybean (Glycine max L. Merr.) leaves. Plant Science 167, 19-26.
Tamulaitis G, Duchovskis P. Bliznikas Z, Breive K, Ulinskaite R, Brazaityte A, Novickovas A, Zukauskas A (2005) High-power light-emitting diode based facility for plant cultivation. Journal of Physics D-Applied Physics 38, 3182-3187.
Tardif M, Dansereau B (1993) High R/Fr Hps-Pulses Enhance Earliness of Flowering of Exacum (Exacum-Affine Balf F) and Geranium (Pelargonium X Hortorum Bailey,L.H.). Canadian Journal of Plant Science 73, 1163-1167.
Teramura AH (1983) Effects of ultraviolet-B radiation on the growth and yield of crop plants. Physiologia Plantarum 58, 415-427.
Tezuka T, Hotta T, Watanabe I (1993) Growth promotion of tomato and radish plants by solar UV radiation reaching the Earth's surface. Journal of Photochemistry and Photobiology B: Biol. 19, 61-63.
Thomas B (1981) Specific effects of blue light on plant growth and development. In 'Plants and the daylight spectrum'. (Ed. H Smith) pp. 443-459. (Academic Press Inc: London)
Tibbitts TW, Morgan DC, Warrington IJ (1983) Growth of lettuce, spinach, mustard and wheat plants under four combinations of high-pressure sodium, metal halide and tungsten halogen lamps at equal PPFD. Journal of the American Society of Horticultural Science 108, 622-630.
van Haeringen CJ, West JS, Davis FJ, Gilbert A, Hadley P, Pearson S, Wheldon AE, Henbest RGC (1998) The development of solid spectral filters for the regulation of plant growth. Photochemistry and Photobiology 67, 407-413.
182

Vezina F, Trudel MJ, Gosselin A (1991) Influence of Various Supplemental Lighting Treatments on the Productivity and Physiology of Greenhouse Tomato. Canadian Journal of Plant Science 71, 923-932.
Vince-Prue D (1981) Daylight and photoperiodism. In 'Plants and the daylight spectrum'. (Ed. H Smith) pp. 223-242. (Academic Press Inc: London)
Vince-Prue D (1994) The duration of light and photoperiodic responses. In 'Photomorphogenesis in Plants'. (Eds RE Kendrick and GHM Kronenberg) pp. 447- 490. (Kluwer Academic Publishers: Dordrecht)
Vogelezang JVM (2000) Improvement of Plant Quality by Integrated Control of Light, Temperature and DIF-Strategy. Acta Horticulturae 515, 83-90.
vonArnim A, Deng XW (1996) Light control of seedling development. Annual Review of Plant Physiology and Plant Molecular Biology 47, 215-243.
Wada M (2005) Chloroplast photorelocation movement. In 'Light Sensing in Plants'. (Eds M Wada, K Shimazaki and M lino) pp. 193-199. (Springer-Verlag: Tokyo)
Walters RG, Horton P (1994) Acclimation of Arabidopsis-Thaliana to the Light Environment - Changes in Composition of the Photosynthetic Apparatus. Planta 195, 248-256.
Warrington IJ (1978) Controlled environment lighting- high pressure discharge lamp . based systems. Phytotronic Newsletter 19, 15-26.
Warrington IJ, Mitchell CA, Halligan G (1976) Comparisons of Plant Growth Under Four Different Lamp Combinations and Various Temperature and Irradiance Levels. Agricultural Meteorology 16, 231-245.
Warrington IJ, Norton RA (1991) An Evaluation of Plant-Growth and Development under Various Daily Quantum Integrals. Journal of the American Society for Horticultural Science 116, 544-551.
Weller J (2004) Phytochrome and cryptochrome functions in crop plants. In 'Encyclopedia of Plant and Crop Science'. (Ed. RM Goodman) pp. 920-923. (Marcel Dekker, Inc.: New York)
183

Weller JL, Beauchamp N, Kerckhoffs LHJ, Platten JD, Reid JB (2001) Interactions of phytochromes A and B in the control of de-etiolation and flowering in pea. The Plant Journal 26, 283-294.
Wheeler RM, Mackowiak CL, Sager JC (1991) Soybean Stem Growth under High-Pressure Sodium with Supplemental Blue Lighting. Agronomy Journal 83, 903-906.
Whitman CM, Heins RD, Cameron AC, Carlson WH (1998) Lamp type and irradiance level for daylength extensions influence flowering of Campanula carpatica 'Blue clips', Coreopsis grandiflora 'Early Sunrise', and Coreopsis verticillata 'Moonbeam'. Journal of the American Society for Horticultural Science 123, 802-807.
Yan WK, Wallace DH (1998) Simulation and prediction of plant phenology for five crops based on photoperiod x temperature interaction. Annals of Botany 81, 705-716.
Yorio NC, Mackowiak CL, Wheeler RM, Sager JC (1995) Vegetative Growth of Potato under High-Pressure Sodium, High-Pressure Sodium Son-Agro, and Metal Halide Lamps. Hortscience 30, 374-376.
Young RE, McMahon MJ, Rajapakse NC, Decoteau DR (1994) Spectral filtering for plant production. In 'International Lighting in Controlled Environments Workshop'. (Ed. TW Tibbitts). (NASA-CP-95-3309)
Zheng Y, Blom T, Dixon M (2006) Moving lamps increase leaf photosynthetic capacity but not the growth of potted gerbera. Scientia Horticulturae 107, 380-385.
Zheng YB, Zhang P. Dixon M (2005) Evaluation of four lamp types for the production of tomato plants in controlled environments. Horttechnology 15, 646-652.
184


![Sharing Your Work in Open Access [Open Access for Researchers, Module 5]](https://img.pdfslide.net/doc/110x75/632bae8e194458cd430896b4/sharing-your-work-in-open-access-open-access-for-researchers-module-5.jpg)

