Embed Size (px)
Citation preview
Athens Journal of Education May 2014
101
Why are we here? An Investigation of Academic,
Employability and Social Facets of Business
Undergraduates’ Motivation Using Thurstone
Scaling
By John Buglear
In the UK employability is a key university performance measure.
This reflects both the tightening graduate employment market and
the demands on the sector for greater accountability. The literature
on employability considers the implications for institutions and the
student motivation literature examines students’ intrinsic and
extrinsic goal orientations. This exploratory study complements both
areas of work by considering employability, currently deemed an all-
pervasive extrinsic goal, as far as students’ motivation is concerned
relative to the more conventional drivers of decisions to enter higher
education; achieving academic success and social fulfilment. It aims
to establish both the significance of employability as a motivating
factor and ascertain the degree of association with the academic and
social factors as well as profile variables. The research design
applies Thurstone attitude scaling. Several hundred business
undergraduates were asked to encapsulate why they were on their
course. The responses were collated and scored by a set of judges
against scales of academic, employability and social motivation. The
judges’ scores were used to determine the most appropriate
statements to use in the research instrument, which was then used to
survey the attitudes of 75 students. The results suggest that
employability is a significant aspect of students’ motivation and is
associated with the academic and social aspects of motivation. This
significance of employability suggests effective learning support
strategies are likely to be those that are based on experiential and
skill-driven learning alongside more tightly drawn cognitive
approaches. The balance of motivational aspects can also inform
institutions’ student recruitment.
Head of the Management Division, Nottingham Business School, Nottingham Trent
University, UK.
Vol. 1, No. 2 Buglear: Why are we here? …
102
Introduction
‘Employability’ has long been an implicit outcome of the UK higher
education sector. Yorke traces the association between higher education and
labour market outcomes back to 1963 (2004: 409). Knight and Yorke argue
that ‘UK higher education institutions […] are now charged with promoting
graduate employability - contributing directly to the stock of human capital –
and their performances are monitored’ (2003: 3) and Tomlinson notes that
degrees ‘have been presented as crucial for economic development’ (2008: 49).
From September 2012 English institutions must provide publicly accessible
Key Information Sets (KIS) for potential applicants. These will contain data
about employment, including occupational status six months after graduation,
the proportion of graduates in ‘graduate jobs’ and pay levels (Department for
Business Innovation & Skills, 2011: 28-29).
Employability and Student Motivation
Notwithstanding the current emphasis on employability there is no clear
consensus about its meaning. Pool and Sewell (2007: 277) refer to ‘this elusive
concept of employability’ and Tymon (2011: 2) records the ‘lack of coherence
about what is meant by the term’. After noting the ‘various definitions’
Saunders and Zuzel (2010) adopt Yorke’s formulation of employability as ‘a
set of achievements – skills, understandings and personal attributes - that
makes graduates more likely to gain employment and be successful in their
chosen occupations, which benefits themselves, the workforce, the community
and the economy’ (2006: 8). This is student-focussed, epitomising what
Wilton describes as ‘the policy emphasis on the supply-side of the labour
market’ (2008: 18) and anticipates employability being aligned with student
motivation. It follows that the significance of employability within students’
disposition to enter higher education is key.
In his study of 350 management students Adcroft employs the
psychological dichotomy of extrinsic and intrinsic motivation. He contrasts the
extrinsic, study as a means to an end, with the intrinsic, study for its own sake
(2010: 12). Rolfe (2001: 2) found in her interviews with 70 lecturers at four
UK universities that the balance between the extrinsic and intrinsic had
changed during her respondents’ careers. They felt that a ‘higher proportion of
current students go to university for career reasons than in the past’ and that
‘students are less interested in their subject and are more interested in
vocational aspects of their studies’. This contrasts somewhat with the findings
from the survey of 300 marketing students at a Malaysian institution by Ting
and Lee (2011: 12). They explored the rationales students deployed in choosing
options. They found that ‘perceived exposure to future career skills is not the
most important attributes for students in choosing elective subjects’. In their
literature review they note that although there is some congruence between
criteria applied for option choice and selection of institution and course ‘most
Athens Journal of Education May 2014
103
of the criteria used to choose their electives do not seem to concur with the
goal of choosing an institution which offers a quality education that would
ultimately help secure potential career opportunities’ (2011: 2).
Kember et al. interviewed 36 undergraduates at Hong Kong universities to
explore their motivation (2008: 316). They applied the notion of ‘orientation’
to encapsulate the mix of student motivations (2010: 264) and regarded
motivation as ‘a multifaceted phenomenon’ (2010: 265). Their ‘motivational
orientation framework’ consisted of six continua including career, which may
be considered to align with employability, interest, suggesting a focus on the
academic dimension of the student experience, and ‘university lifestyle’ and
‘sense of belonging’, both reflecting the social dimension of it (2010: 265). As
far as the career dimension was concerned they identified two aspects, ‘it was
common to see a degree as a prerequisite to a reasonable career [but] most
students were also guided in their choice of […] programme […] by career
prospects’ (2010: 275). Their findings on the academic aspect were that
although ‘some students thought little about going to university, for others
there was a strongly expressed personal goal of taking their education as far
as they could’ (2010: 275). One of their social aspects, ‘university lifestyle’,
constituted ‘a motivation for students to attend university through the social
life universities offered’ (2010: 275).
The social dimension emerged as a significant factor in Clewes’ interviews
with ten students on a UK MBA programme. She found that ‘student-to-
student interaction was seen as a particularly satisfying aspect […] by the
majority of the informants’ (2003: 80). This finding confirmed other studies
she cited as highlighting ‘the importance of student interaction and the social
climate’ (2003: 83).
The academic components of the Kember et al. model (2010: 265) and the
work of Clewes (2003) echo the model advanced by Tinto in his influential
work on student retention. In this he identified congruence with the academic
and social domains of their institution as crucial to student persistence (1975:
94).
The themes outlined above provide the foundation for the work reported
here. The research questions that it seeks to address are:
1. How strong is employability as an aspect of student motivation to
enter higher education?
2. How does the employability aspect of motivation vary by gender,
course mode and whether or not English is the student’s first
language? This last variable is used as a loose proxy of
international versus home students, although it is conceded that
language is not the sole discriminating factor between home and
international students.
3. To what extent and how is the employability aspect of motivation
related to the academic and social aspects of motivation?
Vol. 1, No. 2 Buglear: Why are we here? …
104
Research Methods
The departure points for the literature on employability have been
governmental (Knight and Yorke, 2003: 3), supra-governmental (Yorke, 2004:
410) and the three perspectives listed by Tymon; employer, student and
institution (2011: 2). Tymon concentrates on the nature of employability from
the student perspective (2011: 12).
This study was undertaken in the business school at Nottingham Trent
University, a UK institution with approximately 25,000 students on a wide
variety of courses. It adopts a broad, grounded basis (Fisher, 2010: 137),
applying a ‘bottom-up’ rather than ‘top-down’ approach by starting with
students’ rationales for entering higher education. In May 2011, 282 business
undergraduates were asked to state in a single sentence why they had come to
university. A total of 386 statements were submitted, some students writing
down more than one. These were the raw materials for the research instrument.
The statements were categorised into ‘academic’ e.g. ‘I wanted to get a
university education’, ‘employability’ e.g. ‘I want to improve my job prospects
for the future’ and ‘social’ e.g. ‘I came here for the good night life’.
Approximately 30% of the statements were academic, 53% employability and
17% social.
Actual or close duplicates were removed and the remaining statements
listed in three files, one each for the academic, the employability and the social.
Following Thurstone’s method of equal appearing intervals (Trochim, 2002),
developed as a way of measuring psychological value (Thurstone, 1929: 157)
and commended by Oppenheim as an appropriate method of studying
differences between groups (1992: 189), these statements constituted the ‘pool
of items’ for rating by judges (Oppenheim, 1992: 190). The dozen judges used
in the study included tutors, academic support staff and students. Each was
asked to rate each statement on a scale from the least positive (1) reason for
going to university to the most positive (11). This process was repeated for the
three files.
The central tendency and spread of the judges’ scores for each statement
were used to select a set of statements for the instrument. Following
Oppenheim (1992: 194) the statements were grouped by average score and the
one among the several with the same average having the least spread was
selected as the statement reflecting that point on the scale. For five of the 87
academic statements the median of the judges’ scores was 1. Of these five the
one with the least spread of judges’ scores was ‘I am on this course because it
was the easiest option’ so this statement was selected for the instrument to
reflect the point 1, the least positive on the scale for the academic aspect of
motivation to enter higher education. The same process resulted in ‘I am on
this course because I find the constant evolution of business and the new
concepts fascinating’ being chosen to reflect the other end of this scale, in this
case 10 as no statement achieved a median judges’ score of 11.
The equivalent polar statements for employability were ‘I am on this
course because I want to be a millionaire’ (1) and ‘I am on this course for a
Athens Journal of Education May 2014
105
solid grounding to proceed with my future career and learn new skills I will
benefit from for the rest of my life’ (10). For the social aspect they were ‘I
didn’t really want to go to university but my teachers pushed me into it’ (1) and
‘’I came here because being at university is a life experience’ (10).
Ten statements for each aspect were sifted from each of the three original
sets. Collectively the ten constitute the calibrations on a 10-point scale. For the
instrument, the sequence of the statements in each of the three sets of ten was
randomised. The final instrument consisted of three profile questions, on
gender, mode of study (full-time or sandwich) and whether or not English was
the respondent’s first language, followed by the thirty selected statements.
Respondents were asked to tick only those statements with which they agreed.
This pilot study was a convenience sample survey of second year business
undergraduates conducted by direct elicitation which yielded 75 useable
responses. The data from these were entered into the Minitab package. The
responses to the profile questions were analysed directly. The responses to the
statements were used to generate an average score for each of the three
motivational aspects by adding the score for each statement with which a
respondent had agreed and dividing by the number of statements with which
they had agreed, following Trochim (2002). To illustrate, one respondent, a
female on a full-time courses whose first language was not English agreed with
the academic aspect statement rated 2, the two employability aspect statements
rated 6 and 8, and the three social aspect statements rated 6, 8 and 10. These
yield an average academic aspect score of 2, an employability aspect score of 7
and a social aspect score of 8.
Oppenheim contends that the reliability of Thurstone scales ‘tends to be
adequate’, and offers a similar qualified endorsement of their validity (1992:
194-5). The robustness of the method rests substantially on the a priori
objectivity afforded by the role of the judges.
Findings
Of the 75 respondents, 31 (41.3%) were female, 50 (66.7%) were on a
sandwich course and 35 (46.6%) did not have English as their first language.
Contingency analysis showed no significant association between Gender and
Mode (p = 0.097) but significant association between Gender and English as a
first language (p = 0.033); a higher than expected number of males and a lower
than expected number of females having English as their first language. Mode
and English as the first language were very significantly associated (p = 0.000)
with more sandwich and fewer full-time students than expected having English
as their first language.
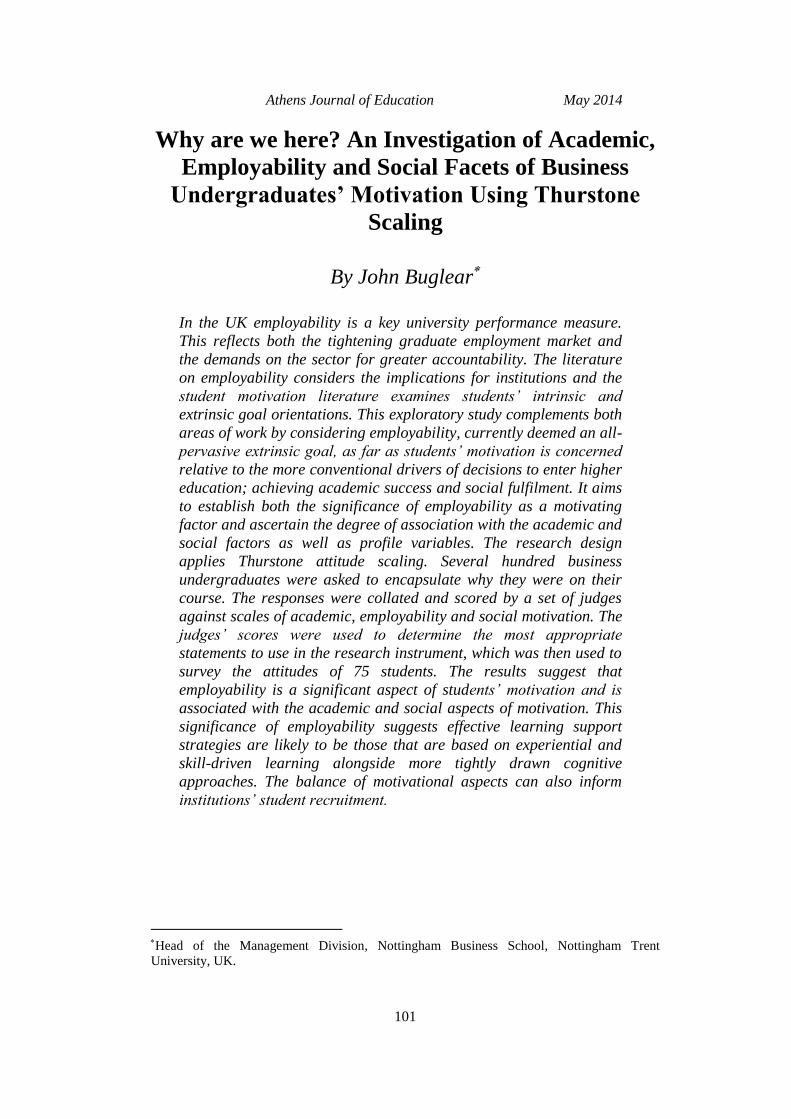
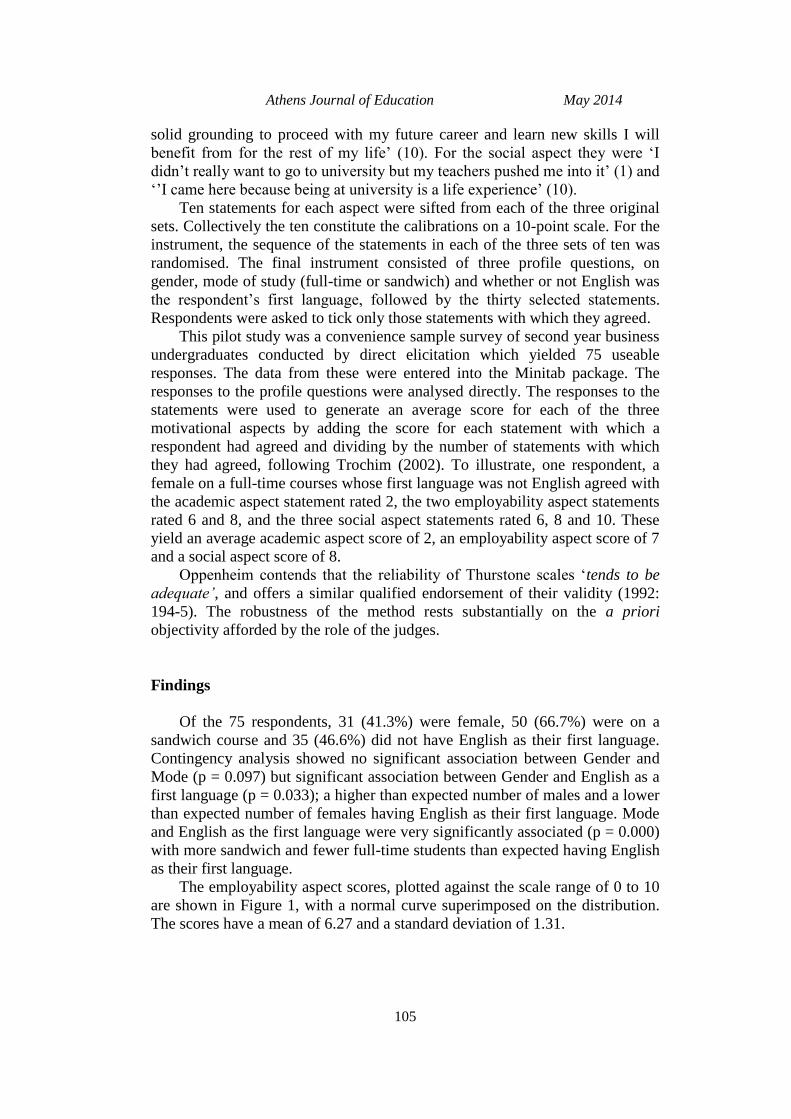
The employability aspect scores, plotted against the scale range of 0 to 10
are shown in Figure 1, with a normal curve superimposed on the distribution.
The scores have a mean of 6.27 and a standard deviation of 1.31.
Vol. 1, No. 2 Buglear: Why are we here? …
106
1086420
25
20
15
10
5
0
Score
Freq
uenc
y
Figure 1: Histogram of Employability aspect scores
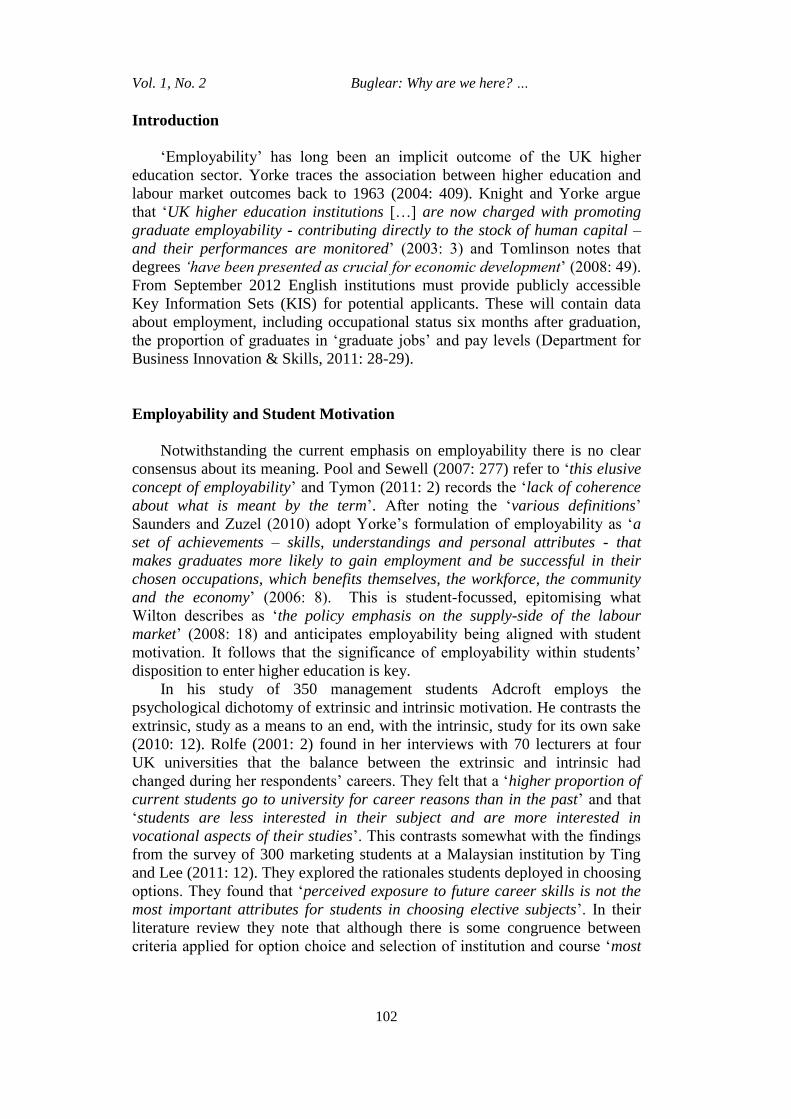
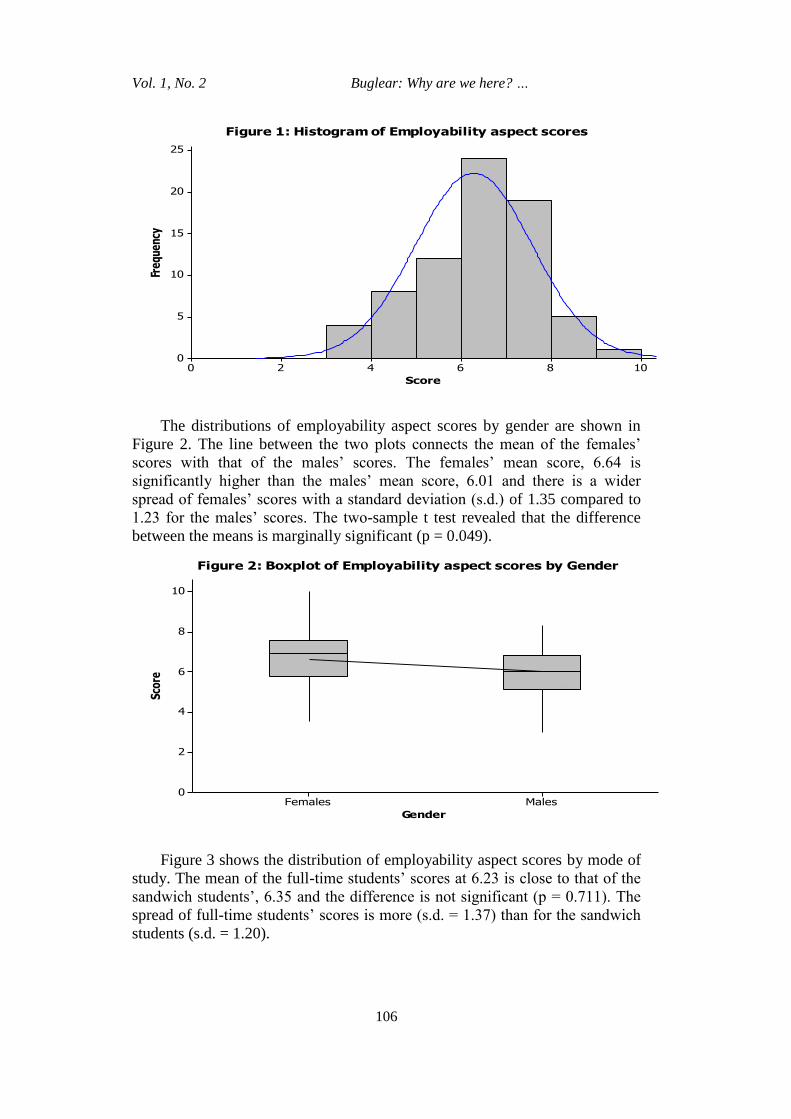
The distributions of employability aspect scores by gender are shown in
Figure 2. The line between the two plots connects the mean of the females’
scores with that of the males’ scores. The females’ mean score, 6.64 is
significantly higher than the males’ mean score, 6.01 and there is a wider
spread of females’ scores with a standard deviation (s.d.) of 1.35 compared to
1.23 for the males’ scores. The two-sample t test revealed that the difference
between the means is marginally significant (p = 0.049).
MalesFemales
10
8
6
4
2
0
Gender
Scor
e
Figure 2: Boxplot of Employability aspect scores by Gender
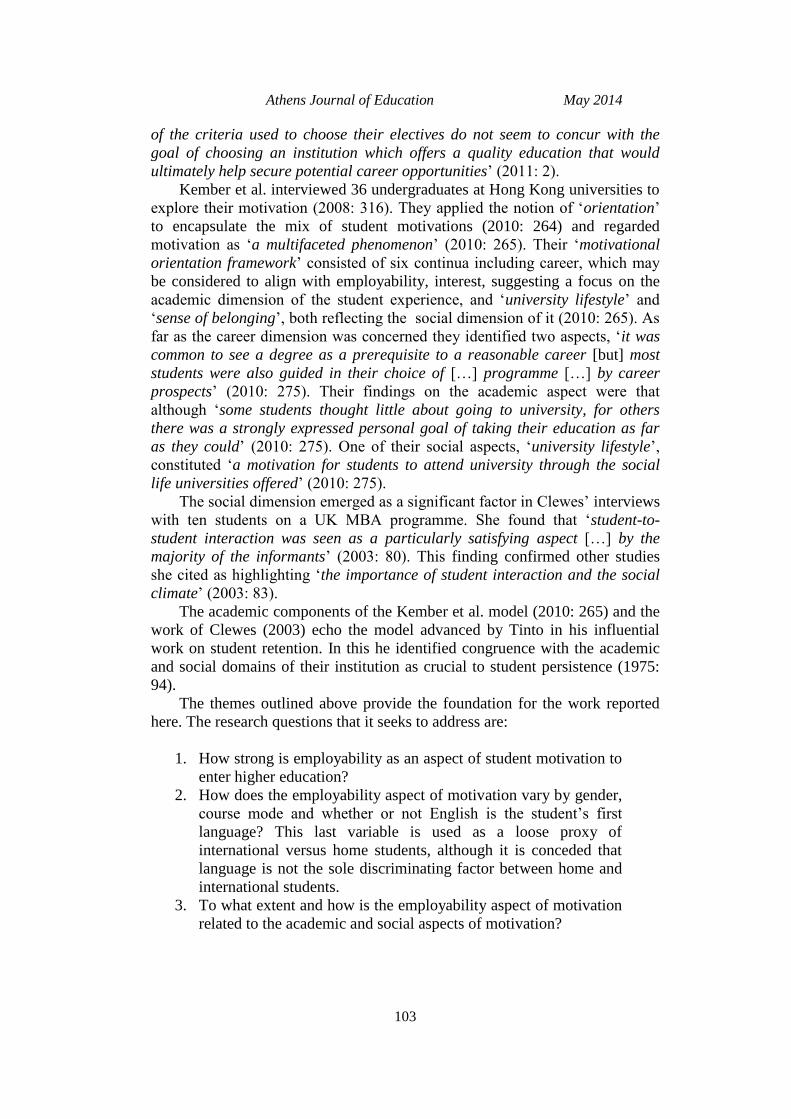
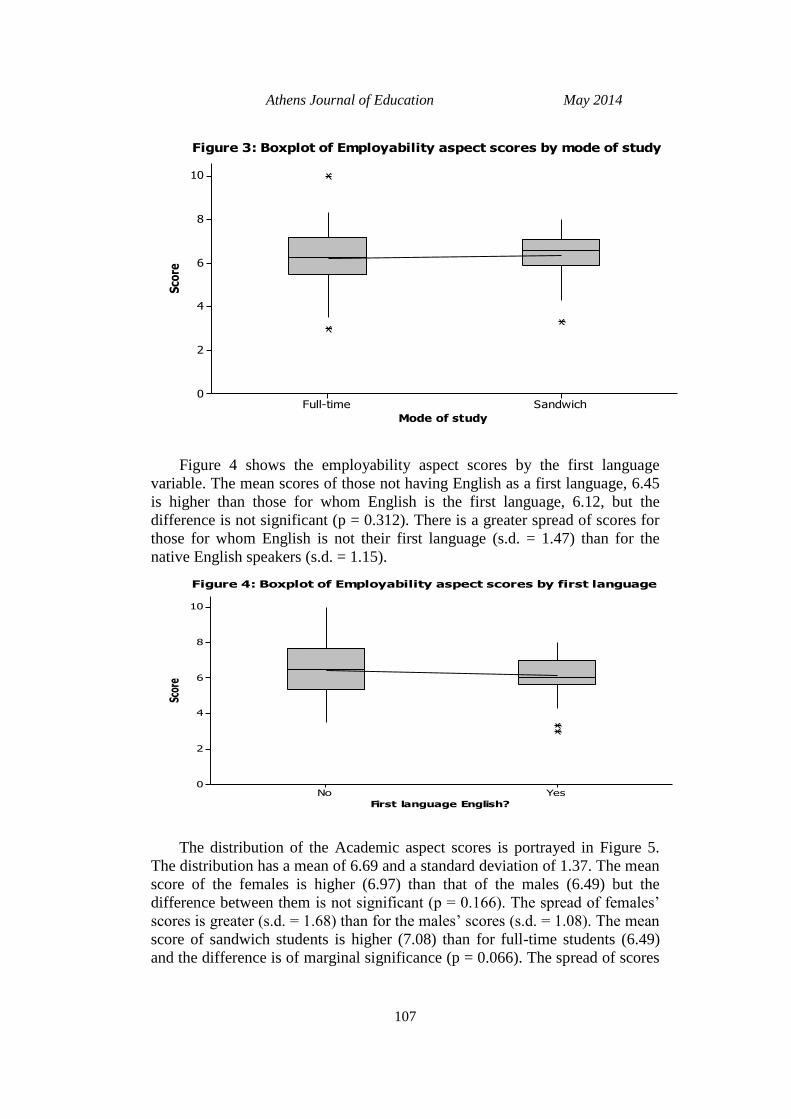
Figure 3 shows the distribution of employability aspect scores by mode of
study. The mean of the full-time students’ scores at 6.23 is close to that of the
sandwich students’, 6.35 and the difference is not significant (p = 0.711). The
spread of full-time students’ scores is more (s.d. = 1.37) than for the sandwich
students (s.d. = 1.20).
Athens Journal of Education May 2014
107
SandwichFull-time
10
8
6
4
2
0
Mode of study
Sco
re
Figure 3: Boxplot of Employability aspect scores by mode of study
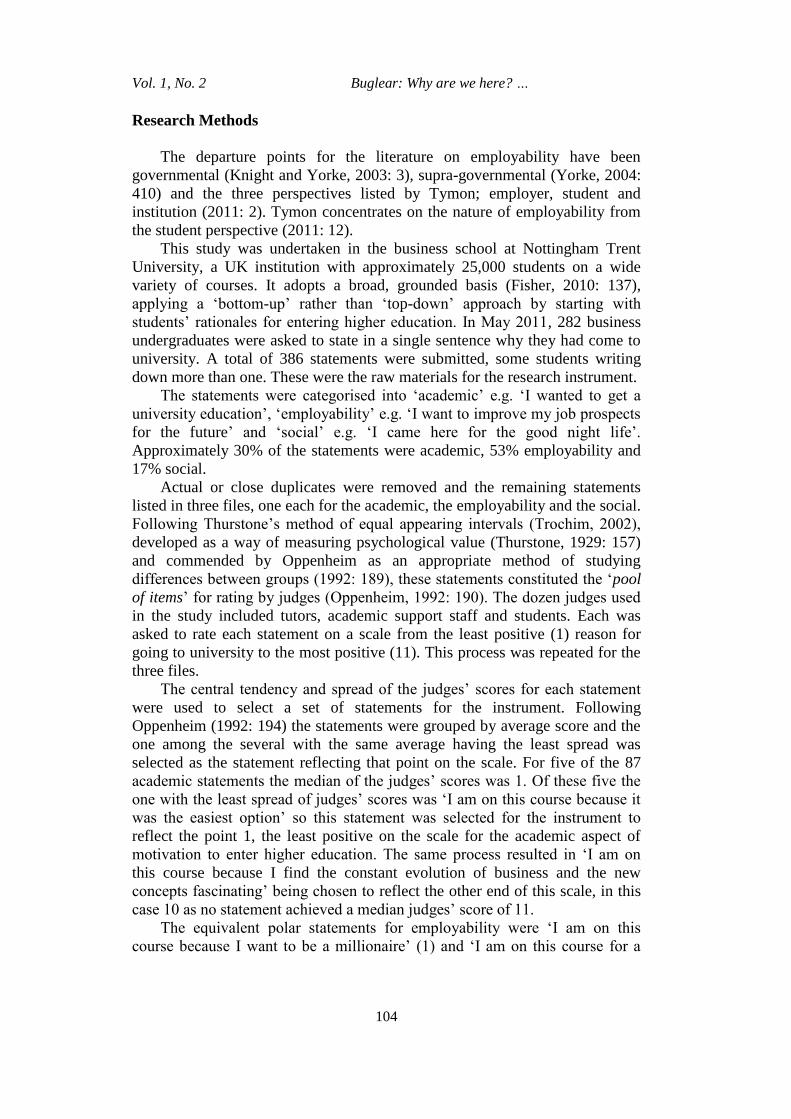
Figure 4 shows the employability aspect scores by the first language
variable. The mean scores of those not having English as a first language, 6.45
is higher than those for whom English is the first language, 6.12, but the
difference is not significant (p = 0.312). There is a greater spread of scores for
those for whom English is not their first language (s.d. = 1.47) than for the
native English speakers (s.d. = 1.15).
YesNo
10
8
6
4
2
0
First language English?
Scor
e
Figure 4: Boxplot of Employability aspect scores by first language
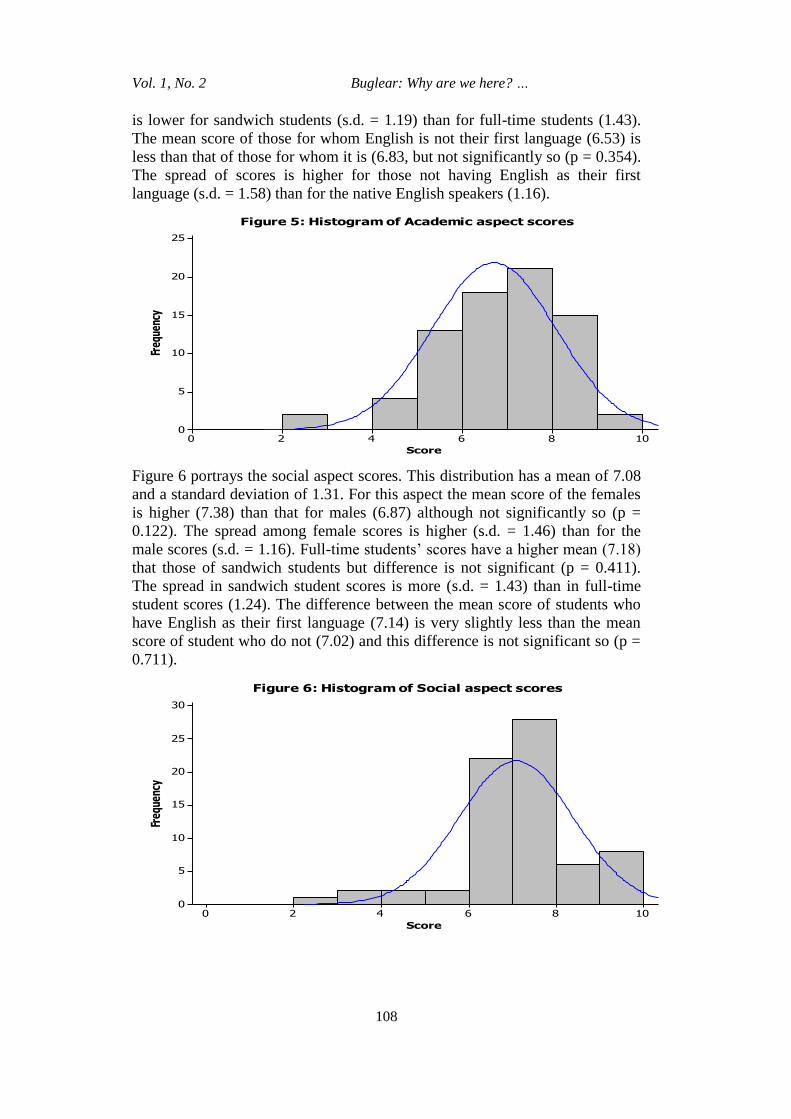
The distribution of the Academic aspect scores is portrayed in Figure 5.
The distribution has a mean of 6.69 and a standard deviation of 1.37. The mean
score of the females is higher (6.97) than that of the males (6.49) but the
difference between them is not significant (p = 0.166). The spread of females’
scores is greater (s.d. = 1.68) than for the males’ scores (s.d. = 1.08). The mean
score of sandwich students is higher (7.08) than for full-time students (6.49)
and the difference is of marginal significance (p = 0.066). The spread of scores
Vol. 1, No. 2 Buglear: Why are we here? …
108
is lower for sandwich students (s.d. = 1.19) than for full-time students (1.43).
The mean score of those for whom English is not their first language (6.53) is
less than that of those for whom it is (6.83, but not significantly so (p = 0.354).
The spread of scores is higher for those not having English as their first
language (s.d. = 1.58) than for the native English speakers (1.16).
1086420
25
20
15
10
5
0
Score
Freq
uenc
y
Figure 5: Histogram of Academic aspect scores
Figure 6 portrays the social aspect scores. This distribution has a mean of 7.08
and a standard deviation of 1.31. For this aspect the mean score of the females
is higher (7.38) than that for males (6.87) although not significantly so (p =
0.122). The spread among female scores is higher (s.d. = 1.46) than for the
male scores (s.d. = 1.16). Full-time students’ scores have a higher mean (7.18)
that those of sandwich students but difference is not significant (p = 0.411).
The spread in sandwich student scores is more (s.d. = 1.43) than in full-time
student scores (1.24). The difference between the mean score of students who
have English as their first language (7.14) is very slightly less than the mean
score of student who do not (7.02) and this difference is not significant so (p =
0.711).
1086420
30
25
20
15
10
5
0
Score
Freq
uenc
y
Figure 6: Histogram of Social aspect scores
Athens Journal of Education May 2014
109
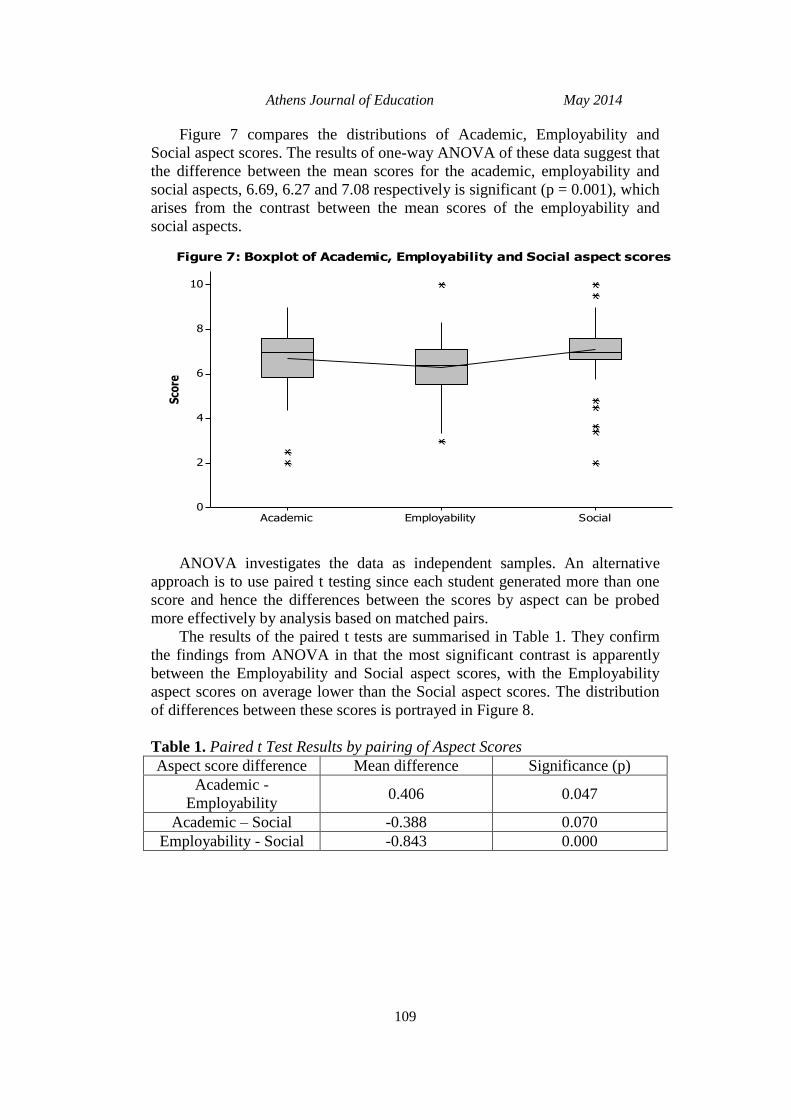
Figure 7 compares the distributions of Academic, Employability and
Social aspect scores. The results of one-way ANOVA of these data suggest that
the difference between the mean scores for the academic, employability and
social aspects, 6.69, 6.27 and 7.08 respectively is significant (p = 0.001), which
arises from the contrast between the mean scores of the employability and
social aspects.
SocialEmployabilityAcademic
10
8
6
4
2
0
Sco
re
Figure 7: Boxplot of Academic, Employability and Social aspect scores
ANOVA investigates the data as independent samples. An alternative
approach is to use paired t testing since each student generated more than one
score and hence the differences between the scores by aspect can be probed
more effectively by analysis based on matched pairs.
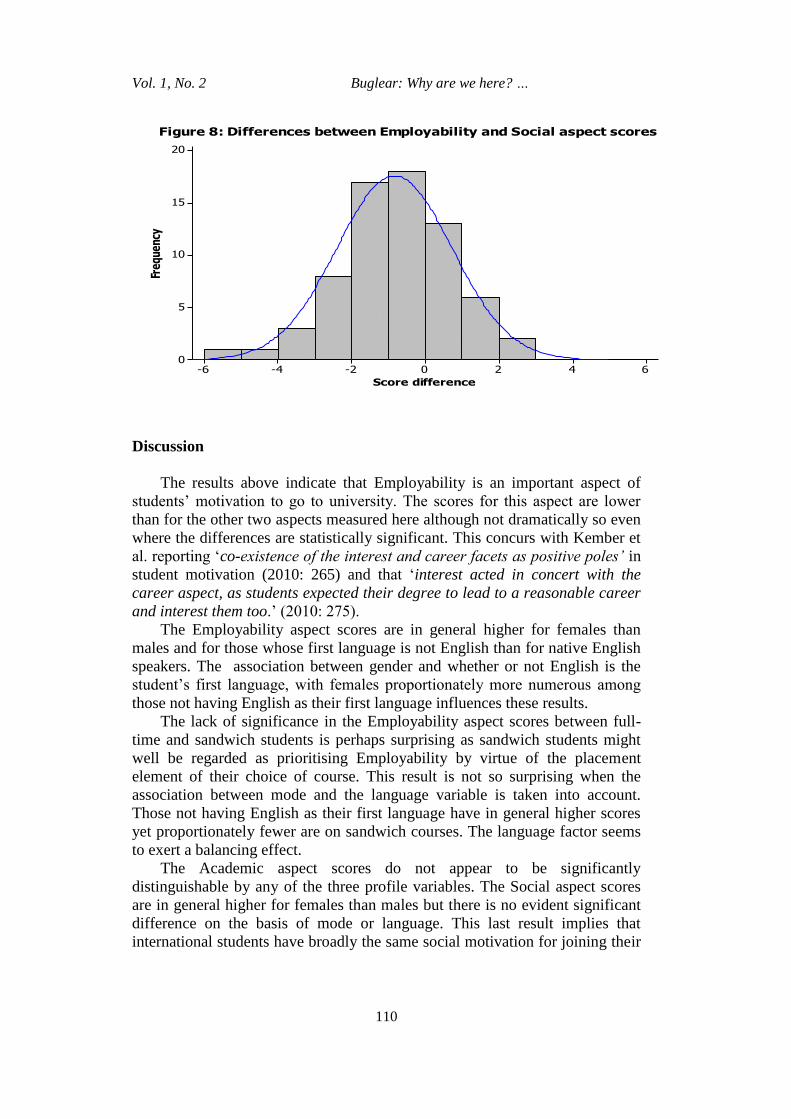
The results of the paired t tests are summarised in Table 1. They confirm
the findings from ANOVA in that the most significant contrast is apparently
between the Employability and Social aspect scores, with the Employability
aspect scores on average lower than the Social aspect scores. The distribution
of differences between these scores is portrayed in Figure 8.
Table 1. Paired t Test Results by pairing of Aspect Scores
Aspect score difference Mean difference Significance (p)
Academic -
Employability 0.406 0.047
Academic – Social -0.388 0.070
Employability - Social -0.843 0.000
Vol. 1, No. 2 Buglear: Why are we here? …
110
6420-2-4-6
20
15
10
5
0
Score difference
Freq
uenc
y
Figure 8: Differences between Employability and Social aspect scores
Discussion
The results above indicate that Employability is an important aspect of
students’ motivation to go to university. The scores for this aspect are lower
than for the other two aspects measured here although not dramatically so even
where the differences are statistically significant. This concurs with Kember et
al. reporting ‘co-existence of the interest and career facets as positive poles’ in
student motivation (2010: 265) and that ‘interest acted in concert with the
career aspect, as students expected their degree to lead to a reasonable career
and interest them too.’ (2010: 275).
The Employability aspect scores are in general higher for females than
males and for those whose first language is not English than for native English
speakers. The association between gender and whether or not English is the
student’s first language, with females proportionately more numerous among
those not having English as their first language influences these results.
The lack of significance in the Employability aspect scores between full-
time and sandwich students is perhaps surprising as sandwich students might
well be regarded as prioritising Employability by virtue of the placement
element of their choice of course. This result is not so surprising when the
association between mode and the language variable is taken into account.
Those not having English as their first language have in general higher scores
yet proportionately fewer are on sandwich courses. The language factor seems
to exert a balancing effect.
The Academic aspect scores do not appear to be significantly
distinguishable by any of the three profile variables. The Social aspect scores
are in general higher for females than males but there is no evident significant
difference on the basis of mode or language. This last result implies that
international students have broadly the same social motivation for joining their
Athens Journal of Education May 2014
111
course. Whether or not their aspirations in this respect are fulfilled is of course
another matter.
There are some important caveats that should be attached to the
consideration of these results. These concern the instrument design, the
empirical process and the analysis.
The three aspects measured here are composite in nature, and this is
especially so in terms of the Social aspect. This affected how the judges scored
the statements for this aspect. The Academic aspect contains within it strands
of interest in the subject as well as academic performance and fulfilment of
potential. The Employability aspect embraces both aspiration for specific
career paths and the hope of finding career paths. These disparities did not
impact on the judges’ scoring process as much as was the case for their scoring
of the Social aspect statements. There was in general a wider variation in the
judges’ scores for the statements associated with this aspect, and this reflected
fundamental differences on what constituted legitimate social components of
life at university. This was sharpest in the rating of statements about the
seeking of personal relationships, with some judges considering such activities
to be very negative and others that it was very positive, in the sense that it
could bring stability to a student’s university work and focus ambition. The
effect of this disparity of view was that none of the statements about personal
relationships attracted sufficiently consistent scores to be used in the
instrument.
The questionnaire was distributed in seminars for one second-year
undergraduate module by the seminar tutor, completed during the seminar and
returned to the tutor. There are three empirical complications that arise from
this. The first is that in using tutors for elicitation, students’ responses may be
shaped by wishing to report what they believe the tutor wants them to say
rather than what they actually think.
The second issue arises because not all students belonging to the seminar
groups attended the seminars at the questionnaires were distributed. This is
arguably a form of non-response that may inject bias into the findings. As
Moser and Kalton contend, ‘non-response is a problem because of the
likelihood – repeatedly confirmed in practice - that people who do not return
questionnaires differ from those who do’ (1993: 267-268). The insight that
Moser & Kalton suggest might be gleaned about non-respondents from the
likelihood of their responses being closer in nature to those of respondents
replying to a follow-up, as against the initial request (1993: 267) which was not
available in this case as there was only one round of elicitation. It is reasonable
to surmise that the inevitable lack of response from non-attenders does give
rise to bias as their absence may well reflect a lower motivation on their part. If
this were the case the distributions of scores for the motivational aspects are
likely to be different from those that would have occurred had all target
respondents been reached. Arguably the average Academic aspect score may
have been lower, although the average Social score might have been higher. It
Vol. 1, No. 2 Buglear: Why are we here? …
112
is difficult to conjecture what impact a 100% response would have had on the
average Employability aspect score.
The third empirical issue arises from the survey being of second-year
undergraduates. These, it might be argued have already experienced a year of
higher education during which by peer pressure and institutional socialisation
they have absorbed institutional and tutor perspectives that impact on their own
motivational dispositions. This could render a compression effect on the
distributions of scores resulting in tighter distributions than might arise from a
survey of first-year students, especially as by the second year of study, students
with lower motivation may well be among those who have left voluntarily or
by virtue of inadequate academic performance.
The analysis of the scores reported above relies on parametric statistical
summary measures, the mean and the standard deviation. The scores data are
measured on a relative rather than an absolute scales such as those used to
measure time or distance, making them ordinal in nature and thus in strict
terms analysed more appropriately non-parametric methods (Blumberg et al.,
2005: 276). The deviation from that orthodoxy is conventionally excused by
virtue of the power of parametric methods being generally greater than as non-
parametric methods (Blumberg et al., 2005: 276) and hence the fact that
‘researchers frequently ‘bend the rules’ in order to be able to use parametric
techniques’ (Oppenheim, 1992:.158). It might also be argued that the wider
understanding of parametric methods and the relative obscurity of non-
parametric methods also influences this practice. The adoption of it here is
undertaken in line with Kerlinger’s advice that ‘the best practice would seem to
be to treat ordinal measurements as though they were interval measurements
but to be constantly alert to the possibility of gross inequality of intervals’
(quoted in Blumberg et al., 2005, p.376).
These caveats are important qualifications in determining how far
generalisation is possible from the results of this study. A further limitation
arises from the sampling method used, convenience sampling. This is a
generally simple and quick approach to adopt in an exploratory study (Buglear,
2012: 340) but generalising from sample results to the population is not as
robust as that achieved by the use of samples selected by a random process
(Bryman and Bell, 2011: 185). It does not mean the samples are inevitably
unrepresentative, which can occur with random samples, but that what
Blumberg et al. call ‘estimates of precision’ cannot be obtained (2005: 208).
The implication is that any inference drawn from the sample results can be no
more than speculative and illustrative. In addition the survey was undertaken at
specific points in time, like those of Adcroft, ‘a series of snapshots of student
motivation rather than a moving picture of student motivation’ (2012: 19). It is
reasonable to speculate that student motivation may be influenced by the stage
of the academic year and extraneous factors such as personal difficulties or
financial problems.
Taking these issues into account, the scope for generalisation is confined
to regarding this study as a single case illustrating a specific feature of the
student experience. Silverman argues that such a case, where the context itself
Athens Journal of Education May 2014
113
is broad is of interest (2005: 134) and Mabry contends that it offers the
possibility of what he terms ‘petite generalisation’ (2008: 223).
Conclusion
As Adcroft argues, ’motivation is an important influence on student
learning’ (2010:12), and that the ‘diversity of motivation’ means that there is a
challenge in meeting ‘the expectations of students whose primary motivation is
curiosity and interest, as well as meeting the expectations of those students
with a more instrumental mindset’ (2010: 19). The results here suggest that the
diversity of the academic, employability and social aspects of motivation is
reasonably homogenous, with relatively few students recording scores at the
extremes of the scales.
The findings suggest there does seem to be a general alignment of student
motivation with the employability purpose now prominently imputed to UK
higher education. It should however be emphasised that the respondents were
business students undertaking a course with a vocational focus, being more
study for business than study of business. As such it might well be assumed
that their motivation for university study will align with the employability
agenda.
This research offers insights into the achievement of the effective blending
of the learning experience. The rating of the employability motivation aspect as
almost on a par with the academic suggests that the ideal for the students
surveyed would be the unity of theory and practice that is typically sought in
business education, and especially where an experiential component is
available. For student recruitment, the evidence presented here suggests that
the inclination of students is be attracted to courses that offer both academic
challenge and enhancement of career prospects.
References
Adcroft, A. (2010). ‘The motivations to study of undergraduate students in
management: The impact of degree programme and level of study.’ International
Journal of Management Education 9(1): 11-20
Blumberg, B., D.R. Cooper & P.S. Schindler (2005). Business research methods.
Maidenhead: McGraw-Hill Education
Bryman, A. & E. Bell (2011). Business research methods. 3rd
ed. Oxford: Oxford
University Press
Buglear, J. (2012). Quantitative methods for business and management. Harlow:
Pearson
Clewes, D. (2003). A student-centred conceptual model of service quality in higher
education.’ Quality in Higher Education 9(1): 69-85
Department for Business Innovation & Skills (2011). ‘Higher Education: Students at
the heart of the system. London: The Stationary Office
Vol. 1, No. 2 Buglear: Why are we here? …
114
Fisher, C. (2010). Researching and writing a dissertation. 3rd
ed. Harlow: Pearson
Education
Kember, D., A. Ho & C. Hong (2010). ‘Initial motivational orientation of students
enrolling in undergraduate degrees.’ Studies in Higher Education 35(3): 263-276
Kember, D., C. Hong & A. Ho (2008). ‘Characterising the motivational orientation of
students in higher education: A naturalistic study in three Hong Kong
universities.’ British Journal of Educational Psychology 78: 313-329
Knight, P. & M. Yorke (2003). ‘Employability and good learning in higher education.’
Teaching in Higher Education 8(1): 3-16
Mabry, L. (2008). ‘Case study in social research.’ In P. Alasuutari, L. Bickman and J.
Brannen (eds.), The SAGE Handbook of Social Research Methods, 214-227.
London: Sage
Moser, C.A. & G. Kalton (1993). Survey methods in social investigation. 2nd
ed.
Aldershot: Ashgate
Oppenheim, A. N. (1992). Questionnaire design, interviewing and attitude
measurement. London: Continuum
Pool, L.D. & P. Sewell (2007). ‘The key to employability: Developing a practical
model of graduate employability.’ Education + Training 49(4): 277-289
Rolfe, H. (2001). ‘The effects of tuition fees on students’ demands and expectations:
evidence from case studies of four universities.’ Discussion Paper 190, London:
National Institute of Economic and Social Research
Saunders, V. & K. Zuzel (2010). ‘Evaluating employability skills: Employer and
student perspectives.’ Bioscience Education DOI:10.3108/beej.15.2
Silverman, D. (2005). Doing qualitative research. London: Sage
Thurstone, L. L. (1929). The measurement of psychological value. In: T. V. Smith and
W. K. Wright (eds.), Essays in Philosophy by Seventeen Doctors of Philosophy of
the University of Chicago. Chicago: Open Court, 157-174.
Ting, D. H. & C. W. K. Lee (2011). ‘Understanding students’ choice of electives and
its implications.’ Studies in Higher Education DOI:10.1080/03075079.
2010.512383: 1-17
Tinto, V. (1975). ‘Dropout from higher education: A theoretical synthesis of recent
research. Review of Educational Research 45(1): 89-125.
Tomlinson, M. (2008). ‘The degree is not enough: students’ perception of the role of
higher education credentials for graduate work and employability.’ British
Journal of Sociology of Education 29(1): 49-61
Trochim, W. M. K. (2002). Thurstone scaling. Available at http://www.socialresearch
methods.net/kb/scalthur.htm [15 April 2012]
Tymon, A. (2011). ‘The student perspective on employability’ Studies in Higher
Education DOI:10.1080/03075079.2011.604408: 1-16
Yorke, M. (2006). Employability in higher education: What it is – What it is not.
York: Higher Education Academy
Yorke, M. (2004). ‘Employability in the undergraduate curriculum: Some student
perspectives.’ European Journal of Education 39(4): 409-427


