Embed Size (px)
Citation preview

AGRICULTURALECONOMICS
Agricultural Economics 46 (2015) 53–67
Will cotton make a comeback in Mali?
Jeanne Y. Coulibalya,∗, John H. Sandersb, Paul V. Preckelb, Timothy G. Bakerb
aWorld Agroforestry Center, United Nations Avenue, PO Box 30677, Nairobi, 00100, KenyabDepartment of Agricultural Economics, Purdue University, West Lafayette, IN, USA
Received 2 May 2013; received in revised form 24 June 2014; accepted 30 July 2014
Abstract
With the decline of cotton especially in the marginal cotton areas, farmers have been using more of the cotton-financed inputs on the cereals.The cotton para-statal company (CMDT) has made a virtue out of this recommending diversification for these regions. Following the world pricespike in 2010, the Malian government responded with a substantial price increase for cotton in 2011 of 38% to rejuvenate the Malian sector. Thisarticle looks at the impact of this price policy in the cotton economy and the potential of new cereal technology and marketing strategy to raiseincomes and facilitate the diversification. Given the importance of the marketing decision of selling later after the recovery of cereal prices from theharvest collapse, a discrete stochastic programming model was developed for three-stage decision making. Then, the recent changes in the cottoneconomy and government fertilizer subsidies were analyzed along with the introduction of the new technology marketing of sorghum. Cotton andmaize continue to dominate the economy but the combined sorghum technology marketing increases farmers’ incomes by 16% to 21% and easesthe return to normal cotton prices, after the 2011 price spike, as well as the removal of the fertilizer subsidies.
JEL classifications: D81, O38, Q13, Q16, Q18
Keywords: Agricultural technology; Cotton; Sorghum; Marketing strategies; Government policy; Discrete stochastic model; Farm income; Mali
1. Introduction
Since the 1950s, cotton has been the main foreign ex-change earner of Mali and several other West African countries(Burkina Faso, Chad, and Benin). Cotton has been called“white gold.” However, in Mali, real cotton prices have declinedin the 21st Century. As a result, cotton area and production havealso declined steadily in the cotton areas especially outside theprime production regions. There, the combination of both de-clining cotton prices and cotton yields has encouraged Malianfarmers to shift from cotton to cereal production.
Over the decade of 2000–2010, farmers diversified awayfrom cotton and increased land area and inputs (Fig. 1) al-located to the cereals. An increasing fraction of fertilizer allo-cated as credit for cotton has been diverted to cereals, especiallymaize but also including sorghum. The Malian para-statal cot-ton company, “Compagnie Malienne pour le Developpementdu Textile” (CMDT; CMDT, 2011 ), responsible for the cotton
∗Corresponding author. Tel.: +25-420-722-4028; fax: +25-420-722-4001.E-mail address: [email protected] (J. Y. Coulibaly).
Data Appendix Available OnlineA data appendix to replicate main results is available in the online version ofthis article.
sector has been touting these shifts as successes in encouragingdiversification. However, a fundamental problem with cerealproduction in sub-Saharan Africa is the price collapses at har-vest and in good weather. Those price collapses reduce theprofitability of intensification. Strategic marketing especiallyavoiding harvest sales with storage can improve the incomeprospects for cereals.
The choice facing Malian policy makers is whether to attemptto recover cotton area and arrest the yield declines in cotton orto facilitate the shift to improved cereal technologies associatedwith strategic marketing or both. Facilitating diversification canalso mean not giving targeted subsidies or other preferentialtreatments to cotton. Typically, the primary commodity hasbuilt up its own domestic, and in this case international lobbywith substantial influence over supporting agricultural policy(Bingen, 1998). The historic success of a primary crop is sim-ilar to the Dutch disease in that it can encourage governmentsto neglect potential income-enhancing opportunities providedby diversification into new technology for alternative activitiesand to continue preferential and expensive policy measures tomaintain the dominance of the primary crop. Investments innew agricultural technologies provide opportunities to considera broad range of crop alternatives rather than maintaining afocus on supportive policy for cotton.
C© 2014 International Association of Agricultural Economists DOI: 10.1111/agec.12140

54 J.Y. Coulibaly et al./Agricultural Economics 46 (2015) 53–67
0
20000
40000
60000
80000
100000
120000
Area
pla
nted
in h
a
Years
Millet Sorghum Maize
Source: Adapted from the Malian Ministry of Agriculture, 2010 in Coulibaly, 2011, p. 9.
Fig. 1. Area planted to sorghum, millet, and maize from 1998 to 2008 in the Koutiala region.
The objective of this article is to provide an assessment of theefficacy of alternative government policies to increase house-hold incomes in southern Mali including the introduction ofnew production technology and marketing strategies for cerealsand the recent introduction of fertilizer subsidies.
The article is structured as follows. We discuss new cerealalternatives in the cotton sector including the new sorghumtechnology and marketing as well as maize marketing. Then,we develop a farm household model to compare the incomeeffects of the policy measures including these new activities.This section is followed by a discussion of the model results.Finally, the conclusions and policy implications are presentedin a final section.
2. Decline of cotton with the rise of cereal technology andmarketing innovations
The predominant cropping system in the prime cotton zoneof Mali is a rotation of cotton–maize–sorghum with most ofthe purchased inputs applied to the cotton and maize and withsorghum obtaining some residual carryover effect from the fer-tilization. In the more marginal cotton regions, sorghum has alarger crop area than maize due to sorghum’s greater toleranceof low rainfall and poor soil fertility (Fig. 1).
In the last decade, cotton area in the Koutiala region hasdeclined dramatically by 80%, in sharp contrast with the area
increase for cereals (Fig. 2). These changes have been attributedto poor soil fertility and delayed payments to farmers for cotton,but primarily to the declining cotton prices (Baquedano et al.2010). The decline in cotton prices has been triggered by alack of competitiveness in the international market with Bttransgenic cotton due to higher costs of insect control (Vitaleet al., 2007) and the competition with synthetic fibers (Droy,2008). With the floods in China in 2010, the international pricefor cotton increased by 80%. The subsequent domestic responsein Mali was to increase the domestic cotton price by 38% in2011.1 So, we will be considering what happens as cotton pricesdecline from their 2011–2013 peak in Mali.
New cultivars of sorghum have been produced on researchstations in the region over the past two decades. The princi-pal physical constraint impeding the more rapid diffusion ofthe new sorghum cultivars has been low soil fertility (Vitaleand Sanders, 2005). Besides the soil fertility problem, anothersubstantial problem is the price collapse at harvest and in goodand sometimes even normal rainfall (for further discussions, seeOuendeba, 2003 and Abdoulaye and Sanders, 2006). By em-ploying storage, farming associations and sale after the posthar-vest price recovery, farmers can increase the profitability of the
1 In 2011, the Malian cotton price was increased to 255 F CFA/kg from the185 F CFA/kg in 2010. The exchange rate then (May 2011) was 452 F CFA/$.Note that world cotton prices quickly fell again in 2012. Mali kept the nominalprices Mali only lowering the farm gate cotton to 250 F CFA/kg in 2013, a 2%decline (USDA, 2013).

J.Y. Coulibaly et al./Agricultural Economics 46 (2015) 53–67 55
-
5,000
10,000
15,000
20,000
25,000
30,000
35,000
40,000Pr
oduc
�on
in to
ns a
nd a
rea
plan
ted
in h
a
Years
Produc�on Area
Source: Adapted from the Malian Ministry of Agriculture, 2010 in Coulibaly, 2011, p. 8.
Fig. 2. Cotton area and production in the Koutiala region (Mali) from 1998 to 2008.
increased expenditures on fertilizer (Coulibaly, 2011; see theseasonal price variation for different years in Fig. 3).
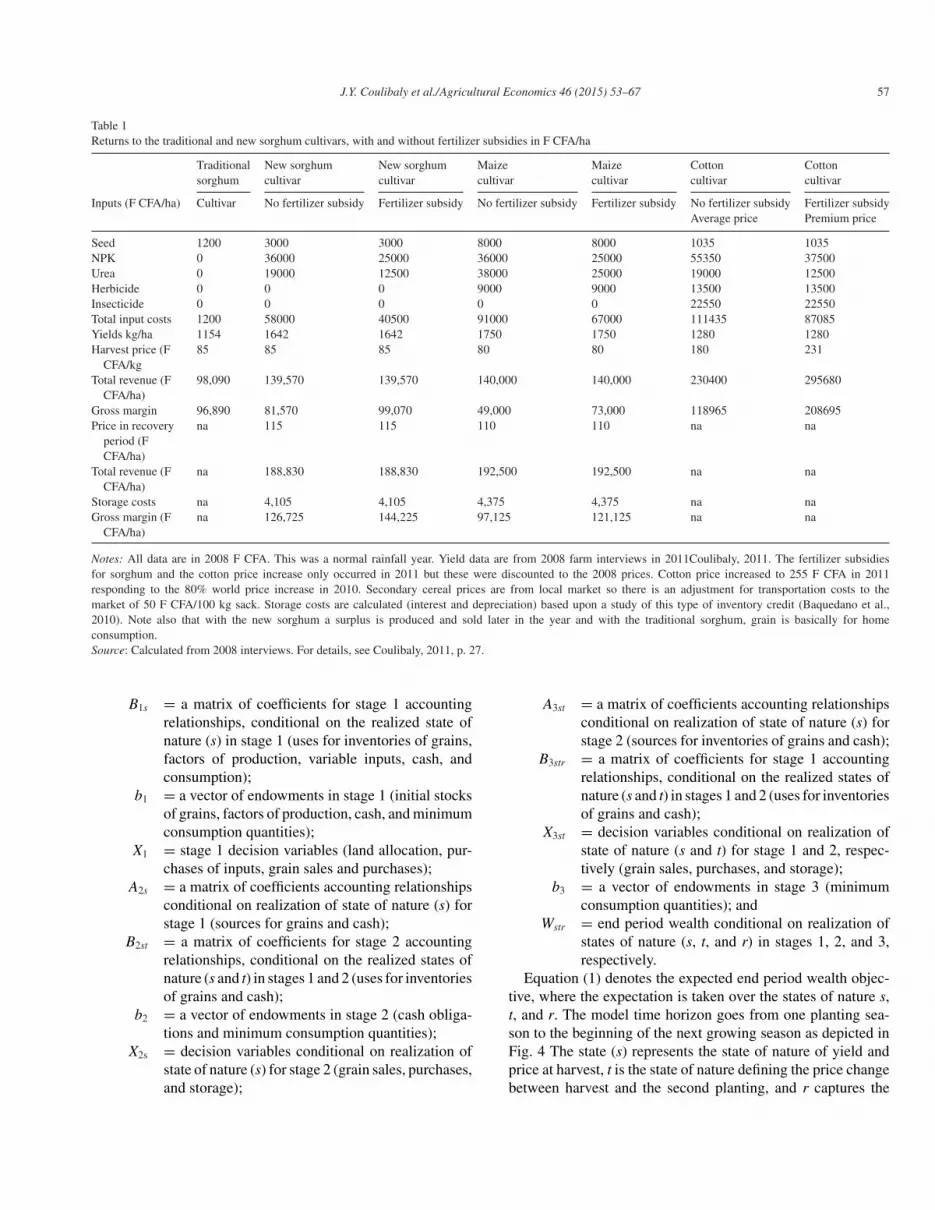
If the grain from the new sorghum technology with fertiliza-tion is sold at harvest, there is no income gain compared withthe traditional sorghum variety and low input use (Table 1).Even with the fertilizer subsidy, this new activity sold at har-vest is only slightly more profitable than the traditional activity.However, if the new sorghum technology with its higher yieldsis sold later, then substantially more profit is earned than withthe traditional sorghum technology.2
Then, the profitability of the other two principal crops, cottonand maize, is calculated with and without the fertilizer subsidies.For cotton, two prices are considered, the very high price in2011 and the expected price after the spike using an averageof the cotton prices from 2006 to 2010 adjusted for inflation.Cotton prices are set by the government at around the start ofthe crop year. Cereal prices are market-determined. The maizeprice tends to be slightly less than the sorghum price.
Sorghum without the fertilizer subsidy but with improvedmarketing is more profitable than maize either with or withoutthe maize fertilizer subsidies. The maize input costs are muchhigher than those of sorghum as the fertility demands are greaterfor maize. The cotton activity still dominates the cereals evenwithout fertilizer subsidies for cotton (Table 1). However, note
2 With the lower yields, the traditional sorghum technology only provides forhome consumption. With the new technology, the later sales, storage, and salesthrough a farmers’ association become important.
that the omission of labor costs in the gross margin estimationbiases these results. Cotton is by far the most labor-intensivewith repeated sprayings and large harvest labor requirements.So, we need to make comparisons of these activities in a frame-work which takes into account labor costs (family and hired)such as a programming model.
3. Modeling the technology-marketing decisionsat the farm
Evaluating new technologies in a risky environment has gen-erally been approached with some variation of an expectedutility model (Abdoulaye and Sanders, 2006; Ghadim andPannell, 1999; Marra and Carlson, 1990). In these models, mul-tiple states of nature and the incorporation of the risk aversioncharacteristics of the decision maker have been a central fo-cus. Decisions are made at one point of time (typically plant-ing time), and there has been a focus on yields and weatherrisks.
The marketing decisions, especially the response to the pricecollapse at harvest, are important for profitability of the sorghumtechnology. Hence, the model used here focuses on decisionsat several points in time during the crop season, and reflects thedynamic relationships between the yields and prices.
The Discrete Stochastic Programming (DSP) model hasbeen used for analyzing farmers’ sequential decision mak-ing under uncertainty. Cocks (1968) developed a multistage

56 J.Y. Coulibaly et al./Agricultural Economics 46 (2015) 53–67
0
50
100
150
200
250
Nor
mal
ized
pric
es
2003-2004 2004-2005 2005-2006
2006-2007 2007-2008 2008-2009
Source: Coulibaly, 2011, p. 32.
Fig. 3. Sorghum prices in Koutiala, 2003–2009.
farming model in which labor requirements and gross marginare stochastic decision variables with discrete probability distri-butions. Rae (1971) further elaborated the capability of DSP insolving problems with sequential decisions under uncertainty.Adesina and Sanders (1991) and Shapiro et al. (1993) used thismodel to show that peasant farmers in Niger have the abilityto adapt cropping and resource management strategies to therainfall pattern. Lopez-Pereira et al. (1994) determined the in-come effects of soil conservation strategies and seed–fertilizertechnologies in Honduras by employing a discrete stochasticmodel. More recently, Maatman et al. (2002) applied a se-quential programming approach to describe farmers’ decisionmaking in Burkina Faso regarding grain consumption, sales,storage, and purchases throughout the growing and postharvestseasons. A common feature across these studies is that rainfalland/or yields were the only random variables influencing farm-ers’ decisions. The models did not incorporate randomness inprices. Yet, variability of harvest and postharvest prices are alsoimportant sources of uncertainty influencing farmers’ decisionmaking.
This study takes into account dynamic price uncertainties aswell as yield variability in analyzing farmers’ production, in-ventory, and marketing decisions over time. Conditional strate-gies allow future decisions to be influenced by past decisions(Preckel, 2008). Moreover, randomness in the constraint pa-rameters is also incorporated.
The timeline that illustrates the process of farmers’ decisionmaking is represented in Fig. 4
Our model is presented below in algebraic notation
Max E[W ] =∑
s
∑t
∑rρstrWstr (1)
subject to
− A1X1 + B1sX2s ≤ b1 (2)
− A2sX2s + B2stX3st ≤ b2 (3)
− A3stX3st + B3strWstr ≤ b3 (4)
X1, X2s , X3st,Wstr ≥ 0 (5)
where:s, t, and r = the states of nature in stage 1, 2, and 3, respec-
tively;ρstr = the joint probability of states s, t, and r occurring
in stages 1, 2, and 3, respectively;A1 = a matrix of coefficients for stage 1 accounting
relationships (sources for grains, factors of produc-tion, variable inputs, and cash);
J.Y. Coulibaly et al./Agricultural Economics 46 (2015) 53–67 57
Table 1Returns to the traditional and new sorghum cultivars, with and without fertilizer subsidies in F CFA/ha
Traditional New sorghum New sorghum Maize Maize Cotton Cottonsorghum cultivar cultivar cultivar cultivar cultivar cultivar
Inputs (F CFA/ha) Cultivar No fertilizer subsidy Fertilizer subsidy No fertilizer subsidy Fertilizer subsidy No fertilizer subsidy Fertilizer subsidyAverage price Premium price
Seed 1200 3000 3000 8000 8000 1035 1035NPK 0 36000 25000 36000 25000 55350 37500Urea 0 19000 12500 38000 25000 19000 12500Herbicide 0 0 0 9000 9000 13500 13500Insecticide 0 0 0 0 0 22550 22550Total input costs 1200 58000 40500 91000 67000 111435 87085Yields kg/ha 1154 1642 1642 1750 1750 1280 1280Harvest price (F
CFA/kg85 85 85 80 80 180 231
Total revenue (FCFA/ha)
98,090 139,570 139,570 140,000 140,000 230400 295680
Gross margin 96,890 81,570 99,070 49,000 73,000 118965 208695Price in recovery
period (FCFA/ha)
na 115 115 110 110 na na
Total revenue (FCFA/ha)
na 188,830 188,830 192,500 192,500 na na
Storage costs na 4,105 4,105 4,375 4,375 na naGross margin (F
CFA/ha)na 126,725 144,225 97,125 121,125 na na
Notes: All data are in 2008 F CFA. This was a normal rainfall year. Yield data are from 2008 farm interviews in 2011Coulibaly, 2011. The fertilizer subsidiesfor sorghum and the cotton price increase only occurred in 2011 but these were discounted to the 2008 prices. Cotton price increased to 255 F CFA in 2011responding to the 80% world price increase in 2010. Secondary cereal prices are from local market so there is an adjustment for transportation costs to themarket of 50 F CFA/100 kg sack. Storage costs are calculated (interest and depreciation) based upon a study of this type of inventory credit (Baquedano et al.,2010). Note also that with the new sorghum a surplus is produced and sold later in the year and with the traditional sorghum, grain is basically for homeconsumption.Source: Calculated from 2008 interviews. For details, see Coulibaly, 2011, p. 27.
B1s = a matrix of coefficients for stage 1 accountingrelationships, conditional on the realized state ofnature (s) in stage 1 (uses for inventories of grains,factors of production, variable inputs, cash, andconsumption);
b1 = a vector of endowments in stage 1 (initial stocksof grains, factors of production, cash, and minimumconsumption quantities);
X1 = stage 1 decision variables (land allocation, pur-chases of inputs, grain sales and purchases);
A2s = a matrix of coefficients accounting relationshipsconditional on realization of state of nature (s) forstage 1 (sources for grains and cash);
B2st = a matrix of coefficients for stage 2 accountingrelationships, conditional on the realized states ofnature (s and t) in stages 1 and 2 (uses for inventoriesof grains and cash);
b2 = a vector of endowments in stage 2 (cash obliga-tions and minimum consumption quantities);
X2s = decision variables conditional on realization ofstate of nature (s) for stage 2 (grain sales, purchases,and storage);
A3st = a matrix of coefficients accounting relationshipsconditional on realization of state of nature (s) forstage 2 (sources for inventories of grains and cash);
B3str = a matrix of coefficients for stage 1 accountingrelationships, conditional on the realized states ofnature (s and t) in stages 1 and 2 (uses for inventoriesof grains and cash);
X3st = decision variables conditional on realization ofstate of nature (s and t) for stage 1 and 2, respec-tively (grain sales, purchases, and storage);
b3 = a vector of endowments in stage 3 (minimumconsumption quantities); and
Wstr = end period wealth conditional on realization ofstates of nature (s, t, and r) in stages 1, 2, and 3,respectively.
Equation (1) denotes the expected end period wealth objec-tive, where the expectation is taken over the states of nature s,t, and r. The model time horizon goes from one planting sea-son to the beginning of the next growing season as depicted inFig. 4 The state (s) represents the state of nature of yield andprice at harvest, t is the state of nature defining the price changebetween harvest and the second planting, and r captures the

58 J.Y. Coulibaly et al./Agricultural Economics 46 (2015) 53–67
Decisions at planting time: X : crop 1
mix, sales, purchases, grain and cash transfer to the next period
Stage 1: Growing season
Realization of post-harvest prices and
yields
Realization of price movement during the price recovery season P2st
Realization ofprice movement during the lean season: P3str
Decisions at the end ofharvest period:X2s Output Sales, consumption,
purchases, inventories for the recoveryseason
Decisions at the end ofrecovery period:X3st Output sales, consumption,
purchases, inventories for the hungryseason
End Period Wealth Wstr
Stage 2: Price recovery season
Stage 3: Lean season
Fig. 4. Timeline of the discrete stochastic model for farmers’ decision making in Mali.
state of nature defining the change in prices between the sec-ond and third stages. Equation (2) denotes stage 1 constraintsthat account for sources and uses (conditional on state [s] toaccount for potential variation in the use of inventories in thenext stage) of resources (land, labor, purchased inputs, grain
stocks, and cash). Stage 1 starts at the beginning of the firstgrowing season in June, and ends at harvest in December. Stage1 decisions encompass land area allocation for crops (maize,cotton, sorghum ,and millet), quantity of fertilizer and seedsto use, amount of labor to hire, grain consumption, quantity of

J.Y. Coulibaly et al./Agricultural Economics 46 (2015) 53–67 59
grains purchased and sold, and cash retained for next period.These decisions are constrained by resource availability as wellas the future needs for cash and consumption. Initial capitalcomes from the earnings of the previous season from cereals,cotton, and other enterprises.
Equation (3) denotes stage 2 constraints, conditional on states(s and t) that account for sources and uses of resources (grainstocks and cash). These constraints include a minimum con-sumption requirement for the three main grains, sorghum, mil-let, and maize, with a total of 5,103 kg in the initial stage. This isobserved consumption during the farm household interviews in2008, a normal crop year, and is constant across states of nature.
The second stage spans the months of January through May.At the end of the growing season, January, the crop yields andgrain prices are known. These outcomes will help determine theconsumption and expenditure decisions at harvest conditionalon the realized yields and harvest time prices, and based onconditional distributions of the further evolution of prices overtime.
Thus, conditional on the yield and price outcomes and theirknowledge of the future, farmers decide on the amount of cropsto sell at harvest. Farmers also have the alternative to storecereals for consumption, and buy/sell later in the year afterthe storage has taken place. These decisions are constrained bythe state of nature of crop production determining the amountof grain that they have in storage. At that point, the value ofcotton production is used to reimburse the in-kind fertilizercredit received from the cotton para-statal company.3
These constraints also reflect a harvest income constraint.Farmers need to insure that at harvest there is sufficient incometo pay for a series of obligations traditionally incurred then.These expenditures include paying the costs incurred during theplanting season for hired and family labor, schooling costs, costsof naming ceremonies and weddings, and deferred medical andhousing expenditures. The cash constraint at harvest insuresthat there is enough cash from sales of crops at harvest to coverthose expenditures.4 Again, as in the first stage, the quantityof grain consumption (of sorghum, millet, and maize) has beencollected during the household interviews and is estimated at3,645 kg for the second stage.
Equation (4) denotes stage 3 constraints, conditional on reali-zation of states s, t, and r, that account for sources and uses ofresources (grain stocks and cash). The third stage extends fromthe planting in June of the second growing season to Septem-ber.5 At the end of the price recovery season, farmers knowpostharvest grain prices. At this point, they make decisions re-garding grain sales and purchases with knowledge of currentgrain inventories and prices (both conditional on past actions
3 In the last five years, CMDT has made loans for maize and sorghum inputcredits with the provision that the loans must be repaid in cotton.
4 Cotton revenues are received several months after harvest when the cotton ispicked up. Moreover, in recent years there have been delays of cotton paymentsinto the summer, another reason for farmer dissatisfaction.
5 Note that this second planting decision is not modeled. In this third stageanother marketing decision is made and we estimated end period wealth.
and realizations of yields and harvest time prices), and withknowledge of the conditional distribution of future price move-ments (see Appendix A).
At the end of the time period, farmers sell all remainingstocks of grain, valued at the realized grain prices at the end ofthe planning horizon. Constraints include the grain consump-tion requirement for the third stage estimated at 2,916 kg fromfield interviews. Constraints include an accounting relationshipfor the net returns earned from the activities performed acrossperiods under the joint events (states of nature s, t, and r) and thevalue of the remaining stocks at the end of the planning horizon.The Wstr is equal to the end period wealth, the expected valueof which is maximized in the objective function.
Finally, Eq. (5) represents the non-negativity constraints onthe decision variables.
Within the model, we are treating risk aversion the way farm-ers say that they behave (Coulibaly, 2010). Rather than usingthe conventional method of introducing a utility function reflect-ing risk aversion, our technique is to identify farmers’ statedobjectives and to use them as the constraints before maximiz-ing expected income. Two constraints are frequently stated byfarmers (Baquedano et al., 2010) and utilized here. The firstrequirement is that harvest time income is sufficient to payfor a series of obligations traditionally incurred then. Second,farmers are required to put aside sufficient grain for consump-tion during at least part of the rest of the year.6 At all decisionpoints, a fixed subsistence constraint specifying a minimumgrain consumption quantity has been defined. This minimumgrain consumption requirement is met either by own productionor by purchases from the market. These two requirements forhousehold income at harvest and for subsistence are primarymethods of farmers for coping with the riskiness of their pro-duction and marketing environment; Farmers are modeled asmaximizers of their net income subject to first satisfying theseconstraints on required harvest time expenditures and homeconsumption.
4. Estimation of the stochastic process
A fundamental step in a DSP model is to develop a model ofthe stochastic process governing yields and prices over time. Inthe DSP, decisions are made at three different points of time:planting, harvest, and sale several months after the harvest timeprice collapse (see Fig. 4).
The sequential nature of the decisions in the DSP model takesinto account the random variables that have been realized in thepast, the decisions that have been made in the past, and theconditional distribution of random variables whose outcomeswill be realized in the future. For example, at harvest cropyields and prices have been realized but the changes in pricesduring the storage period have not been realized—only theirconditional distributions are known.
6 Due to storage problems, such as insects or lack of storage capacity, farmersoften do not attempt to store cereals until the next harvest.

60 J.Y. Coulibaly et al./Agricultural Economics 46 (2015) 53–67
The joint distribution of yields is implemented via an empir-ical distribution. This distribution is representative of the entiresample of yields and prices and gives an equal probability ofoccurrence to each element or state of nature in the sample. So,this distribution retains the full information in the sample re-garding not only the means and covariances between yields, butalso the higher-order moments (skewness, kurtosis, etc.). Foryields, 29 states of nature are captured in the empirical distribu-tion with a probability of realization of 1/29 for each state. Analternative distribution could have been the normal distributionbut the normality of yields has been challenged by numerousstudies (Just and Weninger, 1999; Nelson and Preckel, 1989;Ramirez et al., 2003).
Because the yield time series data has a longer sequence ofobservations than the price time series, a direct empirical jointdistribution is not available. To deal with this, harvest prices(i.e., prices that are realized in tandem with yields) are re-gressed on yields using ordinary least squares. These predictiveequations are used to obtain a mean level for the price of eachcommodity at harvest. To obtain a joint distribution of harvestprices conditional on realized yields, the empirical distributionof errors from these regressions is used to construct states ofnature for realized harvest prices with equal probability of re-alization.
Similarly, the distributions of prices for the later periods in themodel (where grain may be sold after storage) are regressed onthe previous period’s prices. Again, the regression models pro-vide the means for the distributions of prices. The residuals fromthe estimations are added to those means to obtain conditionaldistributions of prices, given the realizations of past prices andyields. Details of the estimations of the price dynamics modelsand for the yield distributions are found in Appendices A andB, respectively.
5. Data
Close to the beginning of the growing season, the yearlyprice of cotton at which the cotton company will buy cottonfrom farmers is announced. Input credits for cotton and fer-tilizers for the cereals are received from the para-statal cottoncompany to be repaid in cotton. Other mean harvest time pricesare estimated as functions of yields for the cereals. Then, meanprices in succeeding periods are estimated as functions of pricesin the previous period (see Appendix A). As indicated in theprevious section, the distributions of errors from the regres-sions are added to the estimated conditional means to obtainconditional distributions of prices.
The data used to build the model were assembled from a com-bination of primary and secondary sources. Primary data havebeen collected from field surveys conducted in 2008 and sup-plemented by additional field research in June and July 2010 inthe village of Garasso of the Koutiala District (Coulibaly, 2011).A random sample of 67 farmers of comparable assets and en-dowments were interviewed and the average of this sample was
selected to be a representative farm for the analysis. Primarydata collected included household expenditures, grain con-sumption requirements, stocks of grain at the beginning ofthe growing season, initial capital available for the agricul-tural activities, land available for cultivation, available farmfamily labor, costs and quantity of purchased inputs (fertilizer,pesticides, insecticides, seeds) necessary for the crop activities.These data were used as exogenous factors to specify the modelparameters and the resource constraints that enter into Eqs. (2)–(4) The values of all these parameters are reported in Coulibaly(2011).
Secondary data were obtained at an aggregate level (i.e., col-lected at the district level) and include rainfall observations,yields, and prices for the crops analyzed (sorghum, millet, cot-ton, and maize). Yields were annual observations from 1998to 2008 gathered at the Ministry of Agriculture in Mali andthe CMDT. Rainfall observations in Koutiala for the time spanof 1980 to 2009 have been collected from the Malian Depart-ment of Meteorology. Yield observations were utilized for thedistribution of the yield states of nature (s) and the stochas-tic resource requirement mentioned in Eq. (3) Since yield datawere only available for a set of 10 years and we needed a longertime frame for the estimated empirical distribution, the rainfallobservations were used to predict yields for the years 1980 to2009 (see Appendix B and Table B1). One year of observa-tion (1984) was dropped because of inconsistency in the data.Hence, a total set of 29 observations composed of predicted andreal aggregate yield served in the estimation of the probabilitydistribution of yields. Yields for each crop were also incorpo-rated in the model to estimate total production based on areaallocation.
Price data for the grain crops maize, millet, and sorghum ofthe model were primarily over 1998 to 2008 and were obtainedfrom the National Market Watch in Mali (see Tables A1–A3).These retail prices were adjusted by subtracting transportationcosts to estimate farm gate prices over time with the assumptionof constant margins. Farmers also sell in local and regionalmarkets. Those prices have been deflated using a GDP indexobtained from the International Monetary Fund. Nominal cottonprices were obtained from the CMDT and were converted toreal prices (Table B1) using the GDP index.
6. Results
This is an agricultural system traditionally dominated bycotton so the reaction to the 2010 world price spike of cotton isshown. Then, the income effects of the new sorghum technologyand marketing are estimated. Finally, as the cotton price returnsto normal levels and the fertilizer subsidies are removed, theincome effects and the role of new sorghum technology areevaluated.
In the present system, traditional sorghum production is thepredominant activity as cotton prices have been falling over thelast decade and maize needs high fertilization levels (base case;

J.Y. Coulibaly et al./Agricultural Economics 46 (2015) 53–67 61
Table 2Farm incomes and crop allocations with normal and peak cotton prices with farmers’ sorghum technologies presently in the field and the improved marketingstrategies for cereals
Base case Scenario 1 Scenario 2Base cotton price Peak cotton price Peak cotton priceSale of cereal at harvest Sale of cereal at harvest Storage and late sale
Cotton price (CFA/kg) 185 231 231Cotton area (ha) 3.84 5.48 5.48
43% 43%Maize area (ha) 1.28 5.68 5.68
344% 344%Traditional sorghum (ha) 6.9 0.84 0.84
−88% −88%Millet area (ha) 3 3 3Total area 15 15 15Income (×1000 CFA) 635 1,118 1,169
76% 84%
Notes: Income is end period wealth in this model. Fertilizer subsides on cotton, maize, and sorghum.Exchange rate: $US1 = 452.61 F CFA on April 18, 2011 at www.oanda.com.Millet area has been fixed at 3 ha since millet is usually grown on the lower soil fertility areas of the farm.Source: Calculated from Coulibaly, 2011.
Table 2). In 2011, CMDT responded to the increased worldcotton prices of 2010 with a 38% price increase. Cotton andmaize areas substantially increased with incomes increasing76% (scenario 1, Table 2). When cotton prices are higher, farm-ers can obtain more input credits especially for inorganic fertil-izers and farmers often use some of this fertilizer on the cereals.Note that maize area increases as traditional sorghum area col-lapses. If the maize is stored and sold later, there is a furtherincrease in incomes and maize area (scenario 2, Table 2).
Now, we introduce the improved sorghum technology con-sisting of a higher-yielding cultivar of sorghum, use of moderatelevels of inorganic fertilizer, and improved agronomic meth-ods.7 The estimated sorghum yield increase was 42% from the1,154 kg/ha of traditional sorghum (with the residual fertilizereffect from fertilizing cotton) to 1,642 kg/ha (see Table 1).8
In 2011, besides the high price for cotton there were alsofertilizer subsidies on cotton, maize, and sorghum;9 so this isthe base case for Table 3. With the new sorghum technolo-gies, income is increased by 10% (scenario 2, Table 3). Tradi-tional sorghum disappears and maize area is substantially de-creased. Even cotton area slightly decreases. Adding strategicmarketing (scenario 3) raises incomes a further 11% (Table 3).
7 The moderate inorganic fertilizer dose utilized in the fieldwork was two50 kg sacks of NPK and one sack of urea. The improved agronomy includedorganic fertilizer, ridging, side-dressing, the split application of fertilizer andthinning. After 2008, the recommended fertilizer dose has become one sack ofDAP and one sack of urea. This reduces the input costs and concentrates on thecommon deficiencies of N and P in semiarid sub-Saharan Africa.
8 There were 50 farmers following these improved practices in the farm-levelwork of Garasso. A total of 35 farmers were interviewed and these are the meanyields for the new cultivar of sorghum and the traditional sorghum on theirfarms. Crop cut average yields for the target group were 1.96 tons/ha and thehighest yield was 3.4 tons/ha (See Coulibaly, 2011, p. 3).
9 In 2011, the Malian government expanded the fertilizer subsidy to bothsorghum and millet for certain regions. Regional changes are now madeannually.
Nevertheless, at this very high cotton price (231 F CFA/kg),cotton remains the dominant activity and helps both cereals bymaking input credits available (which are repaid in cotton).10
Storage and later sale of grains (before the next planting) resultin a 26% increase in prices from the harvest price (Fig. 4). Withthe later sales, there is a shift to cotton as the adverse effect ofpoor rainfall on maize yields offsets the higher profit potentialof increased maize area (scenario 3, Table 3).
Whereas world prices came down rapidly during 2012–2013,Malian nominal prices for cotton stayed at the same nominallevels. The Malian cotton price increase of 2011 was only one-half the world price increase of 2010. Thereafter, world cottonprices fell to $1/lb and $0.88/lb, respectively, in 2012 and 2013as compared to $1.65/lb in 2010. Hence, some continued de-cline in the Malian real cotton prices is expected. The inflation-adjusted mean price of the five years prior to 2011 for the priceof cotton is then employed in the model as the adjusted cottonprice after the decline.
Maintaining the fertilizer subsidies for all three major activi-ties, the income decline from the return to normal cotton priceswas only 8%. So, the sorghum technology-marketing introduc-tion moderates this income decline (compare Tables 2 and 4).Moreover, here there is a net return increase of $0.73 to $1.44for each one-dollar release of the credit constraint on the newsorghum activity. So, there is substantial encouragement forexpansion of the new sorghum activity by making more creditavailable.
The fertilizer subsidies are a primary policy issue presentlyin Malian agriculture. The Malian fertilizer price peak wasespecially dramatic in 2008 but was followed one year laterby a decline in the urea price and the subsidized prices for
10 Since 2010, input credits have been made for the new sorghum technologyin the Koutiala region with repayment in sorghum to the large merchants andin cash by the merchants to the BNDA (development bank).

62 J.Y. Coulibaly et al./Agricultural Economics 46 (2015) 53–67
Table 3Farm income and crop alternatives with new sorghum technologies (with fertilizer subsidy), peak cotton prices, and marketing strategy
Base case Scenario 2 Scenario 3Technologies presently New sorghum New sorghumadopted Technology TechnologyHarvest sale cereal Harvest sale cereal Storage & late sales
Peak cotton price (CFA/kg) 231 231 231Cotton area (ha) 5.48 5.26 5.26
−4% −4%Maize area (ha) 5.68 2.75 2.75
−52% −52%Traditional sorghum (ha) 0.84 . .Millet area (ha) 3 3 3Improved sorghum (ha) 0 4 4Income (×1000 CFA) 1,118 1,233 1,294
10% 16%Marginal value of the improved sorghum credit constraint 0 0.43 0.66
Notes: Income is end period wealth in this model. Fertilizer subsides on cotton, maize, and sorghum. Exchange rate: $US1 = 452.61 F CFA on April 18, 2011 at.The cotlook index of world cotton price in 2010 was estimated at 164 cents/pound.Source: Calculated from Coulibaly, 2011.
Table 4Farm incomes and crop choices with normal cotton prices and alternative subsidy programs for fertilizer
Base case Scenario 4 Scenario 5 Scenario 6 Scenario 7Normal cotton price Normal cotton price Normal cotton price
Peak cotton price Normal cotton price Storage & late sales Storage & late sales Harvest salesStorage & late sales Storage & late sales Removal fertilizer Subsidy only for maize Subsidy only for maizeFertilizer subsidy Fertilizer subsidy subsidy and cotton and cotton
Cotton price (CFA/kg) 231 212 212 212 212Cotton area (ha) 5.26 4.57 4.74 4.97 5.42
−13% −10% −6% 3%Maize area (ha) 2.75 3.43 2.38 4.01 4.78
25% −13% 46% 74%Traditional sorghum (ha) . 0 1.86 0 1.79Millet area (ha) 3 3 3 3 3Improved sorghum (ha) 4 4 3.01 3.01 .
0 −25% −25%Income (×1000 CFA) 1,294 1,191 948 1,118 1,002
−8% −27% −14% −23%Marginal value of the
improved sorghumcredit constraint
0.66 0.73 0.5 0.3 .
Notes: Income is end period wealth in this model. Fertilizer subsidies on cotton, maize, and sorghum. Exchange rate: $US1 = 452.61 F CFA on April 18, 2011 atwww.oanda.com. The improved sorghum area ceiling of 4 ha is due to the limit on the credit amount provided to farmers. This credit can only allow them to grow amaximum of 4 ha. The normal price of 212 CFA/kg is the mean of real cotton prices (2008 base) for the last years (2006–2010) before the cotton spike.Source: Calculated from Coulibaly, 2011.
the compound fertilizer and the urea made available by CMDT(Fig. 5). After a dip in fertilizer price in 2010 from the 2008high, fertilizer prices again increased to 2008 levels in 2011.So, the subsidies have been very important in prices availableto farmers.
The fertilizer price spikes could represent either temporarydemand shifts11 or long-term structural changes (Fig. 4, alsoHeffer and Prod’homme, 2011, 2012; Ott, 2012, p. 14). In the
11 The observed price spikes are especially noticeable after bad weather yearsin major producers and in association with the push to use maize as biofuel inthe United States.
first case, the present high fertilizer prices result from poorweather conditions in major agricultural regions in the worldand from the biofuel demand shift in the United States. Inthis case, the subsidized fertilizer prices are expected to ap-proximate the long-run normal prices. Hence, cotton, maize,and new-technology sorghum retain an important place in thecrop mix and incomes only decline by 8%, also including thereturn of cotton to its long-run expected prices (scenario 4,Table 4).
For the second case of a long-term structural shift with fertil-izer prices at the high levels after 2008 and fertilizer subsidiesremoved, incomes fall 27% (scenario 5, Table 4). Traditional

J.Y. Coulibaly et al./Agricultural Economics 46 (2015) 53–67 63
-
2,000
4,000
6,000
8,000
10,000
12,000
14,000
16,000
18,000
20,000
2002 2004 2006 2008 2010 2012
Fer�
lizer
pric
es (F
CFA/
bag)
Years
NPK market
Urea market
NPK CMDT
Urea CMDT
Source: Estimated from CMDT, 2011.Notes: After 2008, the subsidized prices of the compound fertilizer (NPKBS) and urea were identical. NPKBSrefers to the chemical composition of the fertilizer with the macronutrients of nitrogen, phosphorous, and potassiumand the micronutrients of boron and sulfur. The CMDT subsidizes the prices of fertilizer for cotton and maize andfor sorghum and millet in certain regions of Mali in 2011.
Fig. 5. Market and CMDT prices for cotton fertilizer (NPKBS and urea) in Mali from 2002 to 2011.
sorghum experiences a sharp decline in area while the otherfertilized activities of cotton, maize, and improved sorghum areless affected.
If the fertilizer subsidies are only allowed for cotton andmaize but not for sorghum as was the case prior to 2011, incomesonly decline by 14% with the fall in the cotton price. Notethat when the fertilizer subsidy for sorghum is withdrawn, theimproved sorghum area declines to 3 ha from 4 ha but retainsan important role in the crop mix. Only when there is no storagefor later sales does the new sorghum activity drop out of thecrop mix (scenario 7, Table 4). Thus, the improved marketinghas a larger area increase effect on the new sorghum technologythan adding the fertilizer subsidy on sorghum. Cotton stays akey component of the crop mix even with lower prices andremoving the fertilizer subsidies, but so does the new sorghumactivity as long as better marketing is encouraged (Table 4).
7. Conclusion
With the abrupt decline of the cotton sector in the moremarginal cotton zones during the last decade, the cotton para-statal (CMDT) and the government have been trying to encour-age diversification focusing primarily on maize. Here, we haveshown the potential of new sorghum technologies, includingimproved marketing, to provide moderate income gains evenwith the return of cotton to normal price levels and the removalof the fertilizer subsidies.
New sorghum technologies and strategic marketing facilitatesome diversification away from cotton. This diversification alsomoderates income declines as the cotton price returns to normallevels and the fertilizer subsidies are eliminated. Nevertheless,
these are small adjustments with the sorghum technology moreof an addition to the cotton–maize system rather than a substi-tution of the cereals for cotton. However, it still seems also veryimportant to proceed with diversification as Mali is expected tocontinue to lose export share to the cotton exporters utilizingBt technologies (Vitale et al., 2007).
There are important learning by doing aspects of getting themoderate fertilizer levels employed and the rest of the agro-nomic practices12 right to accompany the improved sorghumcultivar. Moreover, the subsidized fertilizer prices are proba-bly closer to the long-run expected fertilizer prices13 than thepeak or spiked prices in Mali of 2008 and 2011 after adverseweather conditions in major production regions the previousyears.14
In the Malian south, even in these more marginal cottonzones returns are higher for inorganic fertilizer on the cerealsthan in most of the country due to the higher rainfall. Hence,more progress could be made with cereals toward food secu-rity and for supplying the quantity of cereals necessary infeed for chickens and dairy cattle and substituting for millet
12 This fertilizer needs to be side-dressed rather than broadcast and a series ofagronomic practices need to be adopted. So, these changes have to be masteredby farmers to insure a high return to moderate fertilization (Coulibaly et al.,2011).
13 This assumes that the fertilizer industry does not have the ability to maintainprices high even after the demand peak conditions. With all the new constructiongoing on in the fertilizer industry, market power is not expected to be operatedthis way (Heffer and Prud’homme, 2011, 2012).
14 We have already noted the Chinese floods in 2010 (also Pakistan) and therewere adverse weather conditions in 2007 in Texas. Moreover, in the UnitedStates, this was the period of rapid expansion of maize for biofuel. So, thesefactors contributed to fertilizer demand shifts.

64 J.Y. Coulibaly et al./Agricultural Economics 46 (2015) 53–67
during adverse rainfall years in the production of processedfoods.
In 2013, the new sorghum cultivar, Grinkan, with the othertechnology components discussed, has been moving across theKoutiala region and has also been introduced into the cottonzones of Burkina Faso and the higher rainfall region of Niger,Gaya. In Mali, in 2013, the Development Bank (BNDA) pro-vided loans for fertilizer purchases for 8,000 ha in the Koutialaregion for the new technology-marketing sorghum activitiesmodeled here. Besides bank loans the farmers’ associationshave been able to get contracts with large merchants bypass-ing local and nearby town merchants and thereby enablingthe farmers’ associations to obtain larger shares of the mar-keting margins (Jean-Francois Guay, former director of theIICEM program in Mali, personal communication). In BurkinaFaso, the Ministry of Agriculture promoted the introduction of1,000 ha of Grinkan combined with fertilizer in 2013 provid-ing small quantities of both for farmers in the cotton zone. InGarasso, Mali where the new sorghum cultivar, Grinkan, wasintroduced in 2008 as part of the technology-marketing pack-age discussed here, surrounding villages called the cultivar “thecotton of Garasso.”
Appendix A: Price determination and states of nature
Econometric techniques using time series data were em-ployed to estimate the postharvest conditional price distribu-tions. The yearly time series data covers the period 1998 to2008. OLS regressions on grain prices to reflect their con-ditionality nature with time series price observations across10 years are estimated.
Harvest prices are influenced by yield outcomes. The firstset of regressions estimated indicates the dependence betweenyearly harvest prices and yields for the grains sorghum, maize,and millet (Eqs. (A.1)–(A.3). The relationships between ownharvest prices and yields from 1998 to 2007 are
Pst1 = 336.94 − 0.24yst1 (A.1)(58.88) (0.09) Rsquare = 0.40
Pmt2 = 305.62 − 0.20ymt2 (A.2)(132.57) (0.14) Rsquare = 0.12
PMt2 = 178.20 − 0.05yMt2 (A.3)(52.04) (0.03) Rsquare = 0.22
(Standard errors are reported in parentheses),where, Pst1, Pmt1, PMt1 are, respectively, harvest prices forsorghum, millet, and maize in year t; and yst1, ymt1, and yMt1represent the yields for sorghum, millet, and maize in year t.
In the second set of regressions, prices for sorghum, millet,and maize in the recovery season have been regressed against
Table A1Harvest time prices (F CFA/kg) for grains
Years Millet Sorghum Maize
1998 153 119 961999 94 80 642000 82 65 672001 128 114 982002 170 157 1302003 83 56 492004 109 90 842005 115 96 872006 82 69 622007 87 82 832008 104 80 86
Table A2Recovery time prices (F CFA/kg) for grains
Years Millet Sorghum Maize
1998 131 135 1131999 69 73 642000 140 117 1142001 185 185 1572002 175 157 1302003 74 65 602004 164 158 1492005 126 108 962006 85 73 712007 103 90 1012008 123 109 113
Table A3Hungry time prices (F CFA/kg) for grains
Years Millet Sorghum Maize
1998 119 124 1001999 70 65 632000 167 153 1202001 204 202 1672002 153 115 792003 80 72 732004 210 196 1482005 128 103 772006 93 93 882007 137 120 1362008 156 138 120
own harvest prices. Three sets of OLS regressions have beenperformed (Eqs. (A.4)–(A.6). A weighted average is used forharvest prices to reflect adequately the timing of the marketingdecisions. Based on empirical observations, the largest part ofthe grains sold at harvest occurs in the month of December.So, upon field reports and technicians’ advice, we attributed aweight of 20% to the grain prices for the month of October andNovember and a weight of 60% for the month of December.Prices in the recovery period are represented by the average

J.Y. Coulibaly et al./Agricultural Economics 46 (2015) 53–67 65
price of April and May. Farmers’ objective is to sell their stockof grains during those months as prices often experience sizableincrease. But farmers need income for input purchases beforethe next planting season. The following regressions were esti-mated between harvest prices and prices in the recovery period:
Pstp = 24.38 + 0.99Pstp−1 (A.4)(32.85) (0.34) Rsquare = 0.46
Pmtp = 28.53 + 0.88Pmtp−1 (A.5)(40.40) (0.35) Rsquare = 0.36
PMtp = 21.34 + 1.03PMtp−1 (A.6)(31.42) (0.37) Rsquare = 0.43
where standard errors are reported in parentheses; Pstp, Pmtp,and PMtp are, respectively, the prices of sorghum, millet, andmaize in year t and marketing period p (April, May); andPstp−1, Pmtp−1, and PMtp−1 stand for the prices of sorghum,millet, and maize in year t in the lag marketing period Pp−1
(harvest).In the third set of regressions (Eqs. (A.7)–(A.9), prices in
the lean season are estimated as a function of harvest pricesand prices in the recovery period for each of the commoditiesmentioned previously. Here, prices in the lean season are char-acterized by the average price of August and September whichare the months with the highest prices for the hungry season.The strong relationships between prices in the lean season andprices in the two preceding periods are reported below:
Pstp = 48.50 + 1.52Pstp−1 − 1.08Pstp−2
(13.11) (0.14) (0.19) Rsquare = 0.94
(A.7)
Pmtp = 42.24 + 1.43Pmtp−1 − 0.77Pmtp−2
(14.26) (0.12) (0.16) Rsquare = 0.96
(A.8)
PMtp = 50.78 + 1.29PMtp−1 − 0.99PMtp−2
(22.04) (0.24) (0.35) Rsquare = 0.81
(A.9)
where standard errors are reported in parentheses; Pstp, Pmtp,and PMtp are, respectively, the prices of sorghum, millet, andmaize in year t and marketing period p (August, September);Pstp−1, Pmtp−1, and PMtp−1 stand for the prices of sorghum,millet, and maize in year t in the first lag marketing period Pp−1(April, May); and Pstp−2, Pmtp−2, and PMtp−2 stand for theprices of sorghum, millet, and maize in year t in the second lagmarketing period Pp−2 (harvest).
The values of the error terms in the grain price regressionequations for each marketing period were used to construct
the probability distribution of prices in each marketing period.Since observations for prices are only available for 10 years,an empirical distribution was used to define the states of natureand their associated probabilities. Thus, 10 states of nature weredefined for prices in each marketing period with a probabilityof occurrence of one event equals to 1/10.
At the end of the year, the total number of states of natureis the product of the events that were obtained in each decisionperiod. This product is equal to 17,000 that is 17 × 10 × 10× 10. The probability of the end period states of nature is alsoobtained by multiplying the probabilities of the outcomes thatunfold in each time period. As we can notice, the size of the DSPincreases exponentially with the number of stages and states ofnature but the modeling of number of states of nature achievedis feasible with current computer capacity.
Appendix B
Real aggregate yield observations and monthly prices wereonly available for a 10-year period going from 1998 to 2007.However, to be able to fit any appropriate distribution to thedata, a larger number of observations are required. Given thattraditional crop yields in the study area are mainly influenced byrainfall, observations on rainfall from 1980 to 2009 were usedto simulate crop yields for the missing years of observations thatmeans from 1980 to 1997 and from 2007 to 2009. In the studyregion, the likelihood of excess rainfall in the months of Augustand September makes flooding sometimes a constraint to ade-quate plant maturation and good crop yields. Thus, a quadraticterm in rainfall was added in the regressions to characterize thedecreasing crop yield with excess of rainfall. So, the grain yieldregression equations are described as follows:
ymt = −1062.51 + 31.59Xt − 0.12X2t
(463.89) (7.69) (0.03) Rsquare = 0.75
(B.1)
yst = −1809.86 + 45.01Xt − 0.18X2t
(528.50) (8.76) (0.04) Rsquare = 0.77
(B.2)
yMt = −3505.93 + 80.52Xt − 0.30X2t
(1976.90) (32.76) (0.13) Rsquare = 0.58
(B.3)
where ymt , yst , and yMt are, respectively, yield for millet,sorghum, and maize in year t; and Xtand X2
t are, respectively,the rainfall observation and the quadratic term for rainfall inyear t.
For cotton, in addition to rainfall, exogenous cotton prices setby the para-statal company at the beginning of the agriculturalseason are expected to impact the allocation of land to cotton

66 J.Y. Coulibaly et al./Agricultural Economics 46 (2015) 53–67
Table B1Yield in kg/ha, rainfall in mm, and real cotton price (CFA/kg) from 1980 to 2009
Years Millet Traditional sorghum Improved sorghum Maize Cotton Rainfall Real cotton price
1980 951 1005 1642 1715 939 108 2121981 994 1051 1688 1846 1043 121 2301982 1005 1070 1707 1870 1058 119 2271983 951 1005 1642 1715 958 108 2181985 988 1048 1685 1824 970 117 2071986 1001 1056 1693 1871 987 125 2111987 913 958 1595 1606 893 101 2141988 1022 1082 1719 1931 1028 129 2151989 830 846 1483 1383 778 93 2191990 968 976 1613 1841 906 151 2211991 1001 1061 1698 1866 1070 122 2351992 882 914 1551 1523 826 99 2091993 918 962 1599 1621 957 103 2331994 716 713 1350 1364 1028 190 2191995 996 1059 1696 1843 1046 117 2271996 954 1005 1642 1727 1145 111 2781997 995 1026 1663 1893 1053 143 2471998 1007 971 1608 1823 1031 148 2621999 1039 1090 1727 1903 953 123 2142000 931 978 1615 1538 1009 105 2242001 1006 1056 1693 1868 1111 112 2522002 785 798 1435 1207 777 91 2352003 958 1059 1696 1800 1145 136 2552004 921 994 1631 1804 1063 98 2552005 983 989 1626 1773 798 113 1882006 979.4 991 1628 1896 767 152 1842007 1000 1095 1732 2040 1005 138 1742008 901 939 1500 1578 825 102 2002009 1026 1088 1800 1941 875 129 164
Note: Observed yields are from 1998 to 2007. Predicted yields are from 1980 to 1997 and from 2008 to 2009 following the above regression equations. For theimproved sorghum, we had only three years of field observations (2007 to 2009), so we computed first the difference in the average yield between the traditionalcultivar and the improved one during those years. Then, we found the yields of the improved sorghum for the 26 years with missing observations by adding thisaverage value to the yields of the traditional sorghum variety.
and influence significantly cotton yield. Therefore, cotton pricesfrom 1980 to 2009 were added in the cotton yield regressionequation as shown below:
yct = −3050.75 + 53.59Xt − 0.21X2t + 3.15Pct
(1166.40) (18.47) (0.07) (0.89) Rsquare = 0.63
(B.4)
where yct is the cotton yield in year t, Pct is the cotton price inyear t.
In total, instead of 10 years of observations, the expandedsample for crop yields contains 29 observations including bothreal yield data and simulated yields.
References
Abdoulaye, T., Sanders, J.H., 2006. New technologies, marketing strategiesand public policy for traditional food crops: Millet in Niger. Agric. Syst. 90,272–292.
Adesina, A.A., Sanders, J.H., 1991. Peasant farmer behavior and cereal tech-nologies: Stochastic programming analysis in Niger. Agric. Syst. 5, 21–38.
Baquedano, F., Sanders, J.H., Vitale, J., 2010. Increasing incomes of cottonfarmers in Mali: Is elimination of U.S. subsidies the only solution? Agric.Syst. 103, 418–432.
Bingen, R.J., 1998. Cotton, democracy, and development in Mali. J. Mod. Afr.Stud. 36(2), 265–285.
CMDT (Compagnie Malienne du developpement des Textiles). 2011. Statisticsof agricultural production 1980–2010, Bamako, Mali.
Cocks, K.D., 1968. Discrete stochastic programming. Manage. Sci. 15(1),72–79.
Coulibaly, Y.J., 2010. Evaluation des technologies de production et decommercialisation du sorgho et du mil dans le Cadre du Projet IER-INTSORMIL/MALI, USAID. Bulletin IER- INTSORMIL n° 10.
Coulibaly, Y.J., 2011. Diversification or cotton recovery in the Malian cottonzone: Effects on households and women. Unpublished Ph D Dissertation.Purdue University, Department of Agricultural Economics, West Lafayette,IN.
Droy, I., 2008. Le coton bio-equitable au Mali : Un facteur de transformationsociale. Working paper. IRD-UMR C3 ED.
Ghadim, A.K.A., Pannell, D.J., 1999. A conceptual framework of adoption ofan agricultural innovation. Agric. Econ. 21, 145–154.
Heffer, P., Prod’homme, M., 2011. Short-Term Fertilizer Outlook, 2011–2012,International Fertilizer Industry Association, Mimeo, 7 pages
Heffer, P., Prod’homme, M., 2012. Fertilizer Outlook, 2012–2016, InternationalFertilizer Industry Association, Mimeo, 7 pages.
Just, R.E., Weninger, Q., 1999. Are crop yields normally distributed? Am. J.Agric. Econ. 81(2), 287–304.

J.Y. Coulibaly et al./Agricultural Economics 46 (2015) 53–67 67
Lopez-Pereira, M.A., Sanders, J.H., Baker, T.G., Preckel, P.V., 1994. Economicsof erosion-control and seed-fertilizer technologies for hillside farming inHonduras. Agric. Econ. 11, 271–288.
Maatman, A.C., Schweigman, C., Ruijs, A., Van der Vlerk, M.H., 2002. Mod-eling farmers’ response to uncertain rainfall in Burkina Faso: A stochasticprogramming approach. Oper. Res. 50(3), 399–414.
Malian Ministry of Agriculture. 2010. Statistics of agricultural production1998–2008. Ministere de l’Agriculture, Bamako, Mali.
Marra, M., Carlson, G.A., 1990. The decision to double crop: An applicationof expected utility theory using Stein’s theorem? Am. J. Agric. Econ. 72(2),337–345.
Nelson, C.H., Preckel. P.V., 1989. The conditional beta distribution as a stochas-tic production function. Am. J. Agric. Econ. 71, 370–378.
Ott, H., 2012. Fertilier markets and their interplay with commodity and foodprices, Report EUR 25392 EN, European Commission Joint Research Cen-ter, Seville, Spain, 65 pages.
Ouendeba, B., 2003. Market improvement and new food crop technologies inthe Sahel. Intsormil Report. INTSORMIL, Niamey, Niger, 50 pages.
Preckel, V.P., 2008. Quantitative economic analysis via mathematical pro-gramming. Department of Agricultural Economics, Purdue University, WestLafayette, IN.
Rae, A.N., 1971. An empirical application and evaluation of discrete stochasticprogramming in farm management. Am. J. Agric. Econ. 53(4), 625–638.
Ramirez, O.A., Misra, S., Field, J., 2003. Crop yield distributions revisited.Am. J. Agric. Econ. 85(1), 108–120.
Shapiro, B.I., Sanders, J.H., Reddy, K.C., 1983. Evaluating and adapting newtechnologies in a high-risk agricultural system, Niger. Agric. Syst. 42(1–2),153–171.
USDA, 2013. Global agricultural information network. Gain report. USDAForeign Agricultural Services, Washington, DC, 10 pages.
Vitale, J.D., Sanders, J.H., 2005. New markets and technological change for thetraditional cereals in semi-arid sub-Saharan Africa: The Malian case. Agric.Econ. 32, 111–129.
Vitale, J.D., Boyer, T., Uaiene, R., Sanders, J.H., 2007. The economic impactsof introducing Bt technology in smallholder cotton production systems ofWest Africa: A case study from Mali. AgBioForum 10(2), 71–84.


![LAJ6AJNGUE ]fRAN~AI~E AU MALI](https://img.pdfslide.net/doc/110x75/6325a479cedd78c2b50cb051/laj6ajngue-franaie-au-mali.jpg)


