Embed Size (px)
Citation preview

- Master Thesis Report -
WILL DUTCH LIBRARY
COLLECTIONS FLOAT? An Evaluation of Implementing a Floating Library Collection
Concept v^thin the Dutch Public Library Sector using a Systems Engineering Approach into Improving the Transport of Interiibrary
Loan using Discrete Event Simulation Modeling
Nick van der Nuofdaa
•"' 'fm
Student number: 1198491 TIL5060 - TIL Master Thesis Project
Delft University of Technology Master Transport, Infrastructure and Logistics
June 22, 2011
k w i n k . TU Delft groep

TU Delft Delft University of Technology
FACULTY TECHNOLOGY, POLICY AND MANAGEMENT
Systems Engineering Department
Visit
Phone Fax Web
Jaffalaan 5 2e28BX Den
The Netherlands P/0 Box 5015 NL-2600GA Delft The Netherlands t31 (0)15-2788380 •31 (0)15-2783429 www.sk.tbm.tudelft.nl
WILL DUTCH LIBRARY COLLECTIONS FLOAT? An Evaluation of Implementing a Floating Library Collection Concept within the Dutch
Public Library Sector using a Systems Engineering Approach into Improving the Transport of Interiibrary Loan using Discrete Event Simulation Modeling
Master Thesis Report
Author Nicholas von der Noordoa BSc
Student registration number: 1198491
Degree Master of Science
Graduation Date July 6 2011
University Delft University of Technology
Faculty Technology. Policy 8. M a n a g e m e n t
Program Transport, Infrastructure a n d Logistics
Department Systems Engineering
Company Kwink Groep B.V.
Graduation Committee
Professor Systems Engineering
First Supervisor Systems Engineering
Second Supervisor Mar ine a n d Transport Technology
External Supervisor 1 Kwink Groep B.V.
External Supervisor 2 Kwink Groep B.V.
Prof.dr.ir A. Verbraeck
Dr. M. Seek
Dr. R. R. Negenbom
ir B. van Mil
Bertiene Dunning MSc

kwink. groep
PREFACE
During the past eight months I per formed my master thesis project at the consul tancy
firm Kwink Groep B.V. in the Hague. This thesis is the final project of my master
Transport, Infrastructure a n d Logistics at Delft University of Technology, Faculty of
Technology, Policy a n d Managemen t .
This project has been per formed based on a assignment I have designed together
vyith Kwink Groep B.V. a n d Ronald Spanier w h o is manag ing the Pilot Distributie
project commissioned by the Stichting Bibliotheek.nl. This assignment was set up
based on comp lemen t ing the Pilot Distributie with addi t ional research into improving
the transportation of interiibrary loan in the Netherlands. The project has resulted in
preliminary results of the effects of implement ing a f loat ing col lect ion c o n c e p t within
the publ ic library secto i . Several library organisations within the sector are exploring
the c o n c e p t a n d the results from this project cou ld b e valuable in assessing the
possibilities of implement ing a f loat ing col lect ion.
Making this thesis valuable for the Delft University of Technology a n d va luable for bo th
Kwink Groep B.V. a n d the Dutch library sector wou ld not have been possible without
supervision a n d great support. I wou ld like to thank all the consultants and trainees at
Kwink Groep B.V. that he lped me a n d a b o v e all my supervisors Bill van Mill a n d
Bertiene Dunning. I wou ld also like to thank Ronald Spanier from the Servicecentrum
Flevolandse Bibliotheken, also on behal f of Kwink Groep B.V., for the opportuni ty to
perform this project. Without his help, va luab le input a n d the joyful con tac t moments,
the project wou ld not have been successful. Thanks to Ronald I had the c h a n c e to
meet several important peop le in the library sector w h o have been very helpful for
me in understanding the sector a n d its situation regarding interiibrary loan. A special
thanks to all the interviewees a n d their t ime.
Both my supervisors f rom TU Delft, M a m a d o u Seek a n d Rudy Negenbom, also desen^e
a g rand thank you : they he lped me , cha l lenged me , kept me on the right pa th a n d
reassured m e at times when I n e e d e d it the most. I wou ld also like to thank Alexander
Verbraeck for his important adv i ce at the crucial moments during the project and for
aga in being my professor during the conclusion of yet another degree at this faculty.
I personally wou ld like to thank bo th my parents for their moral support during my
extensive student ca ree r for not giving up on m e a n d finally fheir valuable input as
external readers during this project .
And of course, thanks to all those other peop le that supported me, listened to me
a n d bel ieved in m e during the course of my studies, wi th special thanks to Floor!
Nict van der Noordoa
Amsterdam, June 2011
• fu Delft
kwink. g">ep
EXECUTIVE SUMMARY
One of the provincial organizations that will have to dea l wi th less funding in the
coming years are the Provincial Service Organizations (PSO|. PSOs are the regional
facilitators that faci l i tate Dutch public libraries within a province. Amongst other
activities they faci l i tate the libraries with ICT services a n d transportation of library
materials be tween the libraries within a provincial service area. Due to recent budge t
cuts, these PSOs will have to find means to reduce costs and opera te more efficient.
The focus in this project is on reducing costs of the transportation of library materials
be tween public libraries. This service prov ided to the end-user is ca l led inlerlibray loan
(ILL). The launch of the nat ional library ca ta logue (NBC) is expec ted to increase the
use of this service a n d therefore the d e m a n d for transportat ion. Due to this increase,
several provincial transportation service providers (PSOs) are foreseeing severe
problems with their capac i t y . The consequences of this issue have an effect on the
library sector itself a n d finally have an effect on the end-user of the library. The limited
capac i t y of the transportation services lead to longer turnaround times of library
materials and therefore longer wai t ing times for the end-users. The relevance of a
g o o d transportation network be tween libraries is of social impor tance. The public
library sector is a publicly funded sector a n d finding ways in where the public funds
c a n be used more efficient is a great opportuni ty as is a better library service towards
the end-users.
This project focuses on reorganizing the distribution of interiibrary loan (ILL) to reduce
costs in the future. A relatively new a n d innovative c o n c e p t within the library sectors
throughout the wor id is implement ing a n d maintaining so ca l led f loating collections.
With floating collections, the library materials that are lent out d o not return to the
owning library but remain at the locat ion of its former request. The biggest a d v a n t a g e
of implement ing this c o n c e p t is the immed ia te reduct ion of return movements of the
library materials. In theory this reduct ion c a n reach a 50% reduct ion of transportation
movements. Potential negat ive side effects are: empty ing out the smaller libraries
a n d capac i t y problems in the b igger libraries due to the increase of f loating materials
in their libraries: ownership issues due to libraries purchasing the materials, but once
f loat ing, "lose" their mater ia l to the f loating col lect ion. Focus within this project is on
the logistics of implement ing a f loating col lect ion within the library sector in the
Netheriands. The ob ject ive of this project is to eva luate the potent ia l of implement ing
a f loating col lect ion c o n c e p t in the Dutch publ ic library sector, considering an
expec ted growth in d e m a n d for interiibrary loan, l imited budge t for the transportation
services of the PSOs a n d considering the needs a n d requirements of all involved
stakeholdeis. The research question that is answered in this project is:
Does imp/emenf ing o floating collection in the public library sector in the
Netherlands improve the transportation service of interiibrary loan
considering the expected growth in demand and limited budget for the
intertibrary ban service in the future?
The focus is to limit the costs due the budge t cuts en fo rced in the publ ic library sector.
However, with solving the perce ived issues by the stakeholders a n d to keep the
stakeholder satisfied, extra capac i t y is n e e d e d to implement the f loating col lect ion in
the coming three years. It c a n b e conc luded from analysis that with no
TU Delft

kwink. roep
implementation of the floating collection concept, the capacity of the current system is absolutely not sufficient which is proved by simulation. When deciding not to implement such a system, other measures must be taken to limit the increase in demand. In terms of growth in demand, the implementation of a floating collection does handle the increase of transportation needed without the necessity of increasing the capacity and therefore investing in resources. However, limiting the issues and keeping the stakeholders satisfied means that extra capacity is needed to overcome the increase in demand in order to ensure the waiting times of the end-users remain on the same level as in the current situation.
The configuration of the library sector in the Netheriands is the main reason why the research question is hard to answer. There ore several reasons to call the library sector in the Netherlands unsuitable for implementation of the floating coHection; this sector involves many stakeholders with the same goals and ambitions towards the end-user but with different ideas on how to reach these goals and the history of the library sector in the Netheriands shows local origination of Nbraries that have grown to large provincial organizations. The goal for the future is one national organization and one library collection (the Collectie Nederfcind). However, the library sector has only recently started organizing institutions on a national level. That why it is too early to implement a ftoating collection on this level due to the immaturity of the national library sector. Now is a good moment to test the floating collection concept on a lower level. After successful testing and the successful implementation of the NBC, the floating concept can be implemented on a national level.
To obtain more detailed information and increase the quality of the knowledge of the library sector relevant to the implementation of a floating collection, a research team should be set up. This research team should research the following using the Collaborative Business Engineering approach; include all involved stakeholders in the project actively and upgrade the model with increasing the number of libraries and PSOs with the new information obtained; the model should play a central role and include clear and transparent communication about this model. Include validation of the input variables using information from ttie field.
Successful implementation of the ftoating collection concept within other lit)raty organizations in other nations should be investigated. Focusing on lessons learned, the advantages and cutbacks from methods used should give high quality insight in the process steps of implementing a floating collection concept in the field. Also, the possibilities of lessons learned from other sectors in developing redistribution plans should be investigated. The algorithms used in the private sector could be adapted in the library sector by redefining the algorithms to fit this cose. These models are sophisticated and have high potential in optimizing the redistribution based on a number of constraints, for example, nninimizing costs. The following steps should lead to a successful implementation of a floating collection: First test the ftoating collection with a complete simulation model of o provincial service area. Second, test the floating collection in practice on a provincial level. And finally, implement the floating collection in practice on a national level.
•fu Delft
k w i n k . poep
TABLE OF CONTENTS
Preface
Executive Summary
Table of contents
1 Introduction
I. I Background Information
1.2 Research Scope
1.3 Research Questions
1.4 Research Approach
1.5 Research Plan
1.5.1 STATE THE PROBLEM: Interlbrary Loan System Analysis
1.5.2 INVESTIGATE ALTERNATIVE: Floating Collection Concept
1.5.3 MODEL THE SYSTEM: Modeling the Interiibrary Loan System
1.5.4 MODEL THE SYSTEM: Evaluation of the Simulation Results
1.5.5 RE-EVALUATE: Conclusions and Recommendations
1.6 Outline of Project
1
I
3
5
6
8
9
10
10
11
11
12
2 Interiibrary Loan System Analysis 13
2.1 Scope of the Problem Area 13
2.2 Library Sector Analysis 14
2.2.1 Stichting PSO Nederiand 14
2.2.2 StakehokJer Networic 14
2.2.3 Stakeholder Needs and Requirements within Interiibrary Loan ) 8
2.3 Current Interiibrary Loan Concept 19
2.3.1 Definition of Interlibray Loan 19
2.3.2 Categorization of ILL Materials by use of Long Tail Theory possible? 21
2.3.3 Current Organization 22
2.3.4 SWOT Analysis of the Current Interiibrary Loan Concept 24
2.4 Interiibrary Loan System Model 24
2.4.1 Causal Relafionships within the Interiibrary Loan System 25
2.4.2 A Complete Overview of the Interiibrary Loan System 25
2.5 Interiibrary Loan System Requirements 27
•fu Delft

kwink. groep
3 Floating Col lect ion Concep t 29
3.1 Future Interiibrary Loan Situation 29
3.2 Floating Col lect ion C o n c e p t 30
3.2.1 Concep t of Floating Library Collections 31
3.2.2 Possible Issues after Implementat ion of the Floating Col lect ion Concep t 34
3.2.3 Possible Solutions for the Perceived Issues 35
3.2.4 Evaluation 37
4 Model ing of the interiibrary Loan System 39
4.1 Conceptual izat ion 39
4.1.1 Description of the conceptua l izat ion steps 39
4.1.2 Identi f icat ion of the Key Performance Indicators 40
4.2 Specif icat ion 43
4.3 Verif ication a n d Val idat ion 44
5 Evaluation of the Simulation Results 47
5.1 Results from the Simulation Runs 47
5.1.1 Current Situation 47
5.1.2 Future Situation 49
5.1.3 Implement ing the Floating Col lect ion 51
5.1.4 Adap t ing the Floating Col lect ion Concep t 56
5.2 Evaluation of the System Requirements 62
5.2.1 Costs 62
5.2.2 Service 63
5.2.3 Capac i t y 63
6 Conclusions and Recommendat ions 65
6.1 Conclusions of the Project 65
6.2 Conclusion of the Research Question 69
6.3 Evaluation of the used Methods a n d the Results 70
6.4 ümitations of the Project 73
6.5 Recommendat ions for the Future of Interiibrary Loan in the Netherlands 73
Glossary 77
Table of Figures a n d Tables 78
References 81
ru Delft
k w i n k .
Appendices 87
Appendix A: Goa l M e a n Diagram of the Stichting PSO Neder land 87
Appendix B: Formal Chart of the Stakeholder Network 90
Appendix C: Interests, Goals a n d Problem Perceptions of the Stakeholders 93
Appendix D: Inferdependencies of the Stakeholders within the Network 98
Appendix E: The Setup of the Pilot Distribufie 101
Appendix F: The Causal Relationship Diagram of the Interiibrary Loan System 103
Appendix G: Questionnaire 105
Appendix H: Ob jec t Model ing using UML 123
Appendix I: Process Or iented Model ing using IDEFO Diagrams 125
Appendix J: Flow Chart Model ing 130
Appendix K: Setup of the Discrete Simulation Mode l in Arena 132
Appendix L: Data Col lect ion 136
Appendix M: Simulation Run Setup 139
Appendix N: Assumptions M a d e during Design of Simulation Mode l 141
Appendix O: Val idat ion of Simulation Model 143
Appendix P: Results of the Simulation Runs 145
Appendix Q: Results Test Simulation runs wi th triple c a p a c i t y 149
ru Delft

1 INTRODUCTION
The first chapter of this thesis report includes an introduct ion on the library sector, the
prob lem it is fac ing with interiibrary loan a n d the scope of the project, leoding to the
research questions. Based on these questions, a project a p p r o a c h is described a n d
a rgued . The chdpter finishes with the genera l outl ine of the project.
During the past year, several provincial governments a n d municipalities in the
Netherlands have a n n o u n c e d the implementat ion of mild to severe budge t cuts in
their organizations. This directly comes from the not ional government , whose nat ional
pol icy is to empower severe budge t cuts in all sections of the nat ional , regional a n d
local governments. The provincial governments have a n n o u n c e d that all the
provinces c o m b i n e d will b e cu t 400 million Euros f rom their budgets. 290 million will b e
reduced from the their budge t in the year 2011. These cuts are of ten bigger than the
budge t cuts the provinces endure f rom the nat ional government ( I ) . This stresses the
fact that less money is avai lab le in the coming years for several provincial
organizations.
The Provincial Service Organizations (PSO) are one of the provincial organizations that
will have to dea l wi th less funding in the com ing years. Every province in the
Netherlonds has its o w n PSO. PSOs are the regional facilitators that assist Dutch public
libraries in their businesses within provincial boundaries. The activities o l the PSOs
consist of faci l i tat ing publ ic libraries within fheir service area with digital sen^ices, ICT
sen/ices, innovat ion a n d project deve lopment , a n d transportation of library materials
be tween libraries a n d similar organizations. Due to recent budge t cuts dll PSOs have
to find means to reduce costs a n d ope ra te more efficient (2).
One of the most important services the PSOs provide to the libraries in their province is
the transportation of library materials. All the libraries in the region d e p e n d on this
service to transport their materials to other libraries that request the materials a n d to
return the materials to the owner of the materials. Every library has a different
col lect ion a n d because of this transportat ion service it is possible for end-users to
request materials that are not avai lab le at their o w n library. With the use of an ICT
system mainta ined by the PSO, the end-user c a n order, for example a book, directly
from a library that has the book avai lab le a n d the PSO transports the materials from
the requested library to the local library of the end-user. When the end-user returns
the book, the PSO returns it to the owning library. Next to transporting library materials
be tween libraries, the PSO transports exchange col lections to schools a n d care
institutions (3).
This service of transporting library materials b e t w e e n libraries is ca l led Interiibrary loan
(ILL). Cuirently in the Netherlands there are t w o types of ILL, OBL (Onderiing
bibl iothecair leenverkeer) a n d IBL (InterbibBothecair leenvertceer]. The ILL be tween
libraries within the same prov ince is ca l led OBL. The ILL be tween Bbraries of different
PSO service areas is ca l led IBL (4).
The budge t cuts in the library sector will shape the future organizat ion of the PSOs. The
impac t is expec ted to b e significant (2). Due to the budge t cuts from the
•fu Delft
kwink. gro«P
municipolities, several smaller libraries are e x p e c t e d to close their doors (5). Local
libraries are e x p e c t e d to opera te wi th less budge t in the future a n d therefore posses
less buying power, mean ing that libraries will buy less new materials than before a n d
the collections will not expand (2). Due to these developments, the transportation
volumes of ILL materials are e x p e c t e d to rise in the coming years because end-users
will choose to borrow materials from other Hbraries more of ten than currently.
On a nat ional level, innovat ion in the library sector is taking shape. The Stichting
Bilbiotheek.nl |BNL) is a foundat ion that contributes to expand ing a n d maintaining the
nat ional digital library. They wort< for the joint publ ic libraries in the Netherlands. One
of the main objectives of the BNL is to implement a n d operate the National Library
Cata logue (NBC). The NBC is a nat ional online ca ta logue that should have been
launched at the e n d of 2010' (6), End-users c a n order materials using this online
ca ta logue and pick up these materials at their local library, even if their local library
does not have the mater ia l in their col lect ion. The mater ia l is then ordered from a
library somewhere in ttie Netheriands that does have the material avai lable and the
material is deBvered to the local library by the local PSO. The launch of this national
ca ta logue is expec ted to increase the use of the transport service of the PSOs (7).
The logistics of transporting library materials crossing the provincial borders (IBL) is not
yet organized on a nat ional scale. When a mater ia l is requested from a library in a
different province, the Bbroty does not send the mater id i with the transport service of
the PSO. The library sends the mater ia l in a n enve lope to the requesting library using
the nat ional mail service from PostNL. This w a y of transporting the materials on a
nat ional scale is very costly and needs to b e r e d u c e d in the future. The Slichting
Bilbiotheek.nl has started a pilot project wi th the goa l to improve the distribution of IBL
a n d save costs (8). This pilot project uses the PSO transport sen/ice in every provincial
service area as a hub a n d use TNT Innight that distributes the ILL materials be tween
the hubs every night. This pik)l project aims to reduce the costs of transporting
materials over the provincial borders (8).
Currently, every PSO has its own transport service. There are many differences
be tween these services a m o n g PSOs, but there are also many similarities. Every PSO
operates their service within the boundaries of the province a n d they operate from
the cap i ta l of this p rov ince ' . Depend ing on the size of the province a n d the number
of libraries within the province, the PSO operates several routes within the province.
On these routes, the libraries are served by the PSO in be tween two to five times per
week. Dependent on the different service levels (days pet week serviced by the PSO),
most of the libraries have to pay a yeariy fee . The routes are ope ra ted by a so ca l led
loop system. The PSO calls on the main library of a Library Organization (LO), and then
cal l on the different library locations of this LO to distribute the ILL materials be tween
the branches. A LO consists of more library locat ions a n d a h e a d off ice. The loop
closes by call ing on h e a d off ice of the LO. After call ing several LOs and fheir
locations, a route is c o m p l e t e d a n d the service returns to the PSO headquarteis (9). In
Figure 1-1: Example of a route within a provincial service area ope ra ted bY a pso an
example is given of a route of the PSO transport service.
' At the moment the launch date is unclear due to allot of issues remaining in the implementation process (Ml ^ Except for the provinces North and South Holland. The PSO ProBiblio operates within both provinces
•fu Delft

kwink. groep
FIGURE 1 - 1 : EXAMfLE OF A ROUTE WITHIN A PROVINCIAL SERVICE AREA OPERATED BY A PSO
Several transportation services of PSOs are foreseeing problems with their capacity (9). In the past year the transport volumes have risen to a level where the PSO is having trouble distributing the ILL materials in an efficient manner. With the expected increase of transport volume, this becomes a larger issue. Especially because of the budget cuts, the funding will not increase in the coming years in order to be able to invest in new resources and capacity (10). The current routes that are driven by the service are historically developed and are static. They do not change when the demand for ILL changes due to the service level they have to provide to the libraries. Small changes in the routes do occur, but these are based on the demand of their customers, the library organizations and not to make the routes more efficient.
The consequences of these issues have effect on the whole library sector and finally have effect on the end-user. The inefficient use of resources leads to longer turnaround times of library materials being lent out and therefore waiting times for the end-users become longer. The relevance of a good distribution networtc between libraries is of social importance. The public library sectors is an important part of the culture of the Netherlands. To unsure the continuity of the library sector, a significant amount of public funds is invested in this sector. To find a way in where the public funding can be spend in o more efficient way is a great opportunity as is a better library sen/ice towards the end-users.
This project focuses on the distribution networks of the eleven PSOs combined. "The Pilot Distributie" project organizes a service between the transportation service hubs, and this project focuses on the distribution of materials within the provincial service areas. As described above, the library sector has less funding dvailable to invest in a new distribution system and therefore this project aims to research the provincial distribution network considering an increase in volume while maintaining similar resources.
This project is executed is commissioned by the national collaboration of the PSOs, Ihe SticWing PSO Nederland (SPN). The SPN is determined to work together with the
•fij Delft
kwink. groep
local PSOs to support the public libraries in this form of collaboration. The SPN aims to shape future innovation in the library sector and the development of their services and products ( I I ) . The public library sector is in a situarion of change due to the recent innovative projects that have been implemented in the sector and the most important development is the digitalizafion of information. The focus of this project is on the national distribution network that is jointly operated by the members of the SPN, the PSOs.
This project focuses on reorganizing the distribution of ILL in order to save costs in the future. A relatively new and innovative concept within the library sectors throughout the world is implementing and maintaining so called floating collections. The basic concept of a floating collection is that several organizations maintaining a collection of materials share their collections among each other in a network. The members can lend materials from this collective collection and after returning the materials, the materials enter the collection of the requesting library. The materials v/ithin this collective collection "float" among the physical locations, repeatedly being requested and transported from organization to organization. The collective collection of materials are a "fioating collection" (12). In Rgure 1-2 the difference between Ihe original organization and the floating collection is presented graphically.
Floating Collection
# - -
0 .
\
- •
w
Current Situation
o . ^
T<^ \N ©—-«—
= ^ A :r ^ ©
i
FIGURE 1-2: DIFFERENCE IN TRANSPORT MOVEMENTS BETWEEN THE CURRENT SITUATION AND AFTER
IMPLEMENTING A FLOAriNG COLLECTION
The biggest advantage of implementing a floating collection concept is the immediate reduction of transportafion movements that return the library materials to the location of origin. In theory this concept can reach a 50% reduction of transportafion. Possible negative side effects that are expected: smaller libraries empty out and the bigger libraries have no capacity to support the increase of floating materials in their libraries. Issues are also expected due to the ownership of the materials. Libraries purchase materials but once floating "lose" their material to the floating collection j 12).
The logistics of transporting the materials are the highest costs of ILL and due to the budget cuts in the future this is the area of interest to research. The question is if saving costs on transporting ILL is possible by implementing a floating collection
TU Delft

kwink. groep
concept. This project discusses the organizational aspects and consequences of implementing o fioating collection but focuses on the effects on costs and service to the end-user.
i .3 p'i:>t>kC ' i '• ', •.--':.•'!•!;.
The objective of this project is to evaluate the potential of innplemenflng a floating collection concept in the Dutch pubKc library sector, considering an expected growth in demand for interiibrary loan, limited budget for ttie transportation services of the PSOs and considering the needs dnd requirements of all stakeholders involved. This project has setup a research question and sub questions in order to reach this goal.
The research question that is answered in this project is as follows:
o Does implementing a floating collection in the public library sector in the Netherlands improve the transportation service of interiibrary loan considering fhe expected growth in demand and limited budget for the intertibrary loan service in the future?
The following sub reseorch questions enable answering the main research question.
1. How is the current system of distribution of ILL materials between libraries in Ihe Netheriands organized and who are the relevant stakeholders involved?
a. What is the scope of the system? b. Who are the involved stakeholders and what are their goals and
interests in the distribution of ILL materials between the libraries? c. How is the distribution of inleriibrory loan within the Netheriands
organized by the PSOs? d. What are the system requirements of implementing a floating
collection system?
2. How can the floating collection be implemented to meet the requirements of fhe involved stakeholders and future growth of ILL in the library sector?
a. What is the future situation of the interiibrary loan, considering future trends within the library sector?
b. What is the floating collection concept and what are the benefits and cutbacks of implementing a floating collection within the Ubrary Sector in the Netherlands?
c. What possible solutions to the identified issues can be designed to minimize the negative impact of inplementation of a floating collection?
3. What is the impact on fhe key perfornnance indicators of the system when implementing the ftoating collection using a simulation model of the inferiitirary loan system?
a. What design of a model can represent Ihe ILL system in the Netherlands?
b. What information and data are necessary to design an ILL model?
•fij Delft
kwink. ro«t>
c. Is the ILL model valid to be an effective representation of the ILL system in the Netherlands?
4. What conclusions can be made from the results from ttie simulation of the current situation, the future situation, the implementafion of the floating collection and the implementation of the designed solutions to minimize the negative effects of the floating collection?
5. What are fhe next steps in implementing the floating collection in the Pibrary sector in the Netheriands from an organizational point of view?
Next to the abovementioned questions focusing on evaluation of implementing a floating collection in the Netherlands, the next questions focus on the ajapficability of the fools used and research pertormed during this project:
1. Can the floating collection concept be implemented in other sectors than the ibrary sector?
2. Can the model designed in INs project be applied in other fields? 3. What can be learned from the results from this project that can be used in
other sectois? 4. What is learned from fhe use of the reseorch approach within this project?
The research approach of the project is elaborated on in this section. Rrst the methodology behind the chosen research method is argued dnd second, the research approach is detailed based on the sub questions stated in the former chapter.
Considering the complexity of the distribution system described in the former chapters, there are many organizations interrelated with ILL in the Netheriands with contradictory interests. The dynamic environment of the library sector within the Netheriands, with on the one hand the innovations in the sector and the other the budget cuts that Hmit certain opportunities, a "complete and holistic system approach" is needed. In order to find solutions in the library sector, one must make sure that all the components of the system, e.g. the logistics, library organizations and people within the sector, work together in order to provide that the system worics efficiently. The methodology that fits these arguments is a systems engineering approach (13).
Thinking in systems promotes a holistic view to problems (14). One definition states:
"The systems engineering method recognizes each system is an integrated whole even though composed of diverse, specialized structures and sub-functions. It further recognizes that any system has a number of objectives and that the balance betv/een them may differ widely from system to system. The methods seek to optimize the overall system functions according fo fhe weighted objecfives and fo achieve maximum compatibility of its parts. "(15).
•fu Delft

kwink. groep
System deve lopment of ten requires contr ibut ion from diverse techn ica l disciplines
(16). As also the case wi th finding solutions within the descr ibed system in this project,
several disciplines are assessed to find a suitable solution to the prob lem f a c e d by the
col laborat ion of fhe PSOs. Using systems engineering has been partly the doma in of
fhe technica l communi ty . Except in fhe last years more a n d more nontechnica l
practit ioners are using systems thinking as a guidel ine into solving issues within leading
projects. Terry Bahill (17) states that "systems' thinking is a disciple for seeing wholes". It
is a framework for seeing interrelationships rather than static snapshots. He also states
that "systems thinking forces peop le to gather all possible processes a n d
interrelationships into a n organized structure."
Within the field of systems engineering there are several approaches a project c o n
use in order to use an outl ine to reach the goals identi f ied in the introduct ion. There is
a systems engineer ing a p p r o a c h that claims that if extracts all similarities be tween the
different approaches within the systems engineering field. The person behind this
a p p r o a c h is Terry Bahill a n d he d e v e l o p e d the SIMILAR a p p r o a c h together wi th Bruce
Gissing (17).
Bahill and Gissing incorporate two systems engineer ing methodologies into the
SIMILAR a p p r o a c h : the Requirements Discovery Process a n d the Systems Designs
Process. Both of these approaches fit this project for the fol lowing reasons:
• Due to the complexi ty of the many stakeholders involved, discovering the
requirements of the future system is difficult a n d of significant impor tance.
• Due to an implementat ion of the f loating col lect ion c o n c e p t significant
changes to the current system ore needed . This needs a design a p p r o a c h into
designing the new systems that is eva lua ted at the end of the project.
The main focus of this a p p r o a c h is the constant f eedback to the needs and
expectat ions of the relevant stakeholders in the system. After every step in fhe
SIMILAR process, the needs a n d expectat ions are eva lua ted on the p roceed ing of
the project in order to stay in line with the involved stakeholders. This methodo logy fits
with fhe n e e d of co l laborat ion with many different stakeholders within the ILL
organization within the library sector in the Netherlands.
The process steps as descr ibed by Bahill are d e p i c t e d in Figure 1-3.
•fu Delft
kwink. groep
FIGURE 1-3: THE SIMILAR APPROACH (17)
These seven steps c a n be summarized with the ac ronym SIMILAR: State, Investigate,
Mode l , Integrate, Launch, Assess, a n d Reevaluate. This project adapts four stages
(lined in blue) f rom the SIMILAR a p p r o a c h : State the Problem, Investigate Alternatives,
Mode l the System a n d Re-evaluate. The reason for selecting only half of the process
steps is because Bahill a n d Gissing d e v e l o p e d the me thod for comp le te field projects
including implementat ion a n d integrat ion of the designed system (17). In this project
a preliminary study into the implementat ion of a f loating col lect ion concep t is
per formed wh ich disenables the use of fhe last three steps in the SIMILAR process. The
selected process steps are e labo ra ted in more detai l within the next paragraph.
1 C P t^CaPr -H P I .IKi
In the fol lowing, fhe research p lan of fhe project is descr ibed, wh ich is an adap ta t ion
of the systems engineering a p p r o a c h , SIMILAR, descr ibed in fhe former paragraph.
An important part of the project is the analysis of the current situation. Due to the
complexi ty of the library sector a n d the many autonomous stakeholders involved in
ILL, fhe analysis of the current situation has a large role in understanding the system
a n d identifying the needs and requirements from the stakeholders a n d the system in
order to successfully implement a f loating col lect ion in the library sector in fhe
Netheriands. The chap te r that describes the f loating col lect ion describes the
changes needed within the c o n c e p t a n d the possibilities of adop t i ng the distribution
c o n c e p t of the ILL.
In the following paragraphs the steps of the project are descr ibed more in detai l :
•fij Delft

kwink. groep
Bahill States that the problem statement starts with a description of the top-level function that the system must perform or the deficiency that must be ameliorated. This problem statement must include all of fhe requirements that the system must satisfy and inputs should come fi-om all Involved stakeholders (17). Following Bahill's step, the current top level system of ILL In the Netherlands is analyzed. This is done to gain more insight and knowledge about the library sector and the distribution network that organizes the ILL. The first step in this SIMILAR step is lo define the scope of the system. In the scope, the boundaries of the system are identified as are the involved stakeholders.
The second step is to perform a thorough stakehoWer analysis on all the relevant stakeholders that are part of organizing the ILL in fhe Netheriands. The goal is to gain insight in the interests, goals, influence and power of the stakeholders involved. The needs and expectations of the stakeholders involved are analyzed. To gain this information several interviews with relevant stakehoklers are held. The anolysis results in an overview of fhe networtc of stakeholders invofved and identity critical stakeholders in the system that are crucial to the system and have the power to adapt the system to solve the issues described in this chapter. All these actors ore described in detail.
The interviews contribute to the gathering of information regarding the orgdnization of fhe distribution network. In the next step fhe current distribution is analyzed. First focusing on the definition of ILL. The current ILL concept will be analyzed second based on information gathered ft^om several sources, including Ihe inten/iews held and internet resources. Third, attention is on the current organization of the logistics and the service level offered to the end-users. The analysis on the current concept identifies fhe systems' capabilties and analyze the logistical operations of fhe current sriuation.
All the above mentioned steps within this phase are incorporated in the system diagram of the current system which present fhe architecture of the system. The base of fhe system diagram is a conceptual model. In this conceptual model fhe system factors are identified as are fhe relationship between these factors. Factors that influence the system from outside the system are identified and the means of the problem owner to influence and change the factors of the system are determined. The output of this phase forms a system diagram which gives an overview of the complete ILL in the Netheriands.
In the concluding paragraph the stakeholder needs and system requirements are stated. These needs and requirements are the basis for fhe evaluation of the future situation and fhe implementation of the floating collection. These needs and requirements determine fhe chosen key performance indicators during the evaluation of the modeling phase.
•fu Delft
k w i n k . gro^
In this chapter the future situation of the ILL in the library sector in the Netheriands is investigated in detail. There dre several external factors identitied in Ihe former steps that shape the future of ILL. In this paragraph a future situation is sketched to set a yardstick fof fhe floating collection concept during the evaluation phase. The next step is to analyze the floating collection concept in more detail. In this paragraph information from a questionnaire is used to assess the possibilities and cutbacks from implementafion of a floating collection. A SWOT Analysis puts fhe concept in perspective of a possible implementation. The most significant issues that con be investigated within the scope of this project are identified.
Based on the perceived issues of the stakeholders identified, solutions ore designed to minimize these issues after implementation. While designing the solutions, a closer look info other sectors that are or have faced similar problems in their field are taken. From these lessons learned, solutions are designed for the perceived issues and these solutions are investigated using system modeling in the following chapter.
Bahill states that in the business environment, models and simulations are run to analyze the process and find the as is and, through analysis, determine the to be (17). In order to find the as is and determine the to be, models of the olternalives to optimize the distribution of ILL within the Netheriands are designed in this chapter. A model is "o simplified description, especially a mathematical one, of a system or process, to assist calculations and predictions" according to the Oxford Dictionary (18). In this project three simplified models dre designed that are the base of the evaluation of the three situations that are assessed on their performance. The current and future situation as well as fhe implemented floating collection concept are evaluated on their pertormance by using discrete event simulation modeling. Using discrete event simukaflon modeling enables o detailed comparison between the current and future situation with the implementation of a floating collection.
The following arguments lead fo the conclusion that discrete event simulation modeling fit the goals of the project (19):
• Library materials are discrete entities that flow through the system one by one. The materials flow through the system through processes and resources. This enables discrete analyses.
• The identification of queues is possible with discrete simulation. This enables locating bottlenecks in the distribution process, waiting times of the end-user and delays in delivery.
• Simulation can handle various stochastic variables in the system and evaluate the system in time with varying the variables. There are many stochastic variables within this system.
• Dynamic modeling is possible with simulation. In this project dynamics ore needed due to the increase of transport flow over time.
In this project a simplified model of a set of libraries is used that is similar to reality and inspired by reality. This method is called exploratory modeling and analysis. Exploratory modeling and analysis can be used fo exptore the influence of
•fu Delft

kwink. groep
uncertainties and to test the effectiveness and robustness of designs given all these uncertainties (20). The use of this method is ideal in this project because of the uncertainties of implementing such a design in the Dutch library sector, this project evaluates fhe effects on a smaller scale and extrapolate the results to a larger scale in order fo find a more clear direction of a design with fewer uncertainties in the future.
The set ol libraries in the exploratory model contain similar characteristics as libraries in the real world have and the number of materials flowing through the system are determined through data analysis. Due to the unpredictability of Ihe outcome (of the implementation of a floating collection concept), this exploratory model shows the preliminary results of implementation in the Netherlands.
The first step is concepfualizotion of fhe system. During the conceptualization phase, models are made that identify the objects, the processes and fhe decisions made by the models. The output of the conceptualization is a set of key pertormance indicators on which the performance of the models are evaluated. During the specification phase, data is collected through various sources: through interviews vrith the stakeholders involved, internet sources and the library of the Technical University of Delft. During this phase any assumptions made in designing this model are clarified and argued. The next phases included the set-up of the evaluation and the verificdtion and validation of the model.
1.5.4 M!:)DrL THL :>v^':?-.,v [vAii iAiiON Ol i r i S,MIH AH- 'N RisiH f. In this phase all the results from the simulation runs are assessed. An overview of the effects on the key performance indicators is provided. To conclude, the results are evaluated on the system requirements.
i..S.'-) R L L V A L U A ^ L . - ,•!•!., i l i : )K , ;N i . iMi . : Pr A i . J M M I ; - j | ) ,M 'A 'h
Bahill states that the Re-evaluation step is arguably the most important of these steps. Re-evaluation should be a continual process with many parallel loops and it means observing fhe output and using this information to modify the system input, and or the product, and or the process (17). During the course of the project and otter every step an evaluation takes place in order to observe the output of that step in respect to the needs and requirements of the stakeholders.
In the final phase the conclusions and recommendations are presented. The research questions stated in the introduction of this project are answered and next steps are identified for implementing a floating collection in the library sector.
ê
a i
ru Delft
kwink. groep
1 .6 OlJlLINbOF P R C J E C T
Introduction
Background Information Research Scope Research Questions Research Approach Research Plan
Scope of the Problem Area Library Sector Analysis Curfent Interiibrary Loan Concept InteriibraiY Loan System Model Interiibrary Loan System Requirements
INVESTIGATE ALTERNATIVES:
Future Interiibrary Loan Situation Floating Collection Concept
' MODEL THE SYSTEM:
,^^odeling the Intertibra"
Conceptuolizotion Specification Verification and Validation
Results from fhe Simulation Runs Evaluation of the System Requirements
T3
ê
Conclusions of the F'rojecl Conclusion of the Research Question fcvaluation of the used Methods and Results Limitations of the Project Recommendations
FIGURE 1 -4: OUTUNE OF THE PROJECT
a
f 12 ^U Delft

kwink. roep
2 INTERLIBRARY LOAN SYSTEM ANALYSIS
In this phase of the project the current interiibrary loan (ILL) within the Netheriands is analyzed. The following steps analyze the system to get a complete overview and understanding of how the ILL is organized and which stakehokJers are involved in the processes. Rrst the scope of fhe system is determined. Next, fhe network of stakeholders within this scope is analyzed. After that, the critical actors in the system ore identitied, and the logistical concept of ILL is assessed. All the above mentioned analyses form the input of the system diagram which enables fhe identification of the architecture of the system and the requirements of the system.
The first step of a problem statement is to determine fhe boundaries and fhe scope as to what part of the system is and what elements are out of the control of the relevant involved stakeholders concerning fhe issues stated in Ihe introduction of the project. First, the physical boundaries of fhe system are set and second the relevant stakeholders are identified.
This project will focus on both the OBL (ILL within provincial service area) and fhe IBL (ILL in between provincial service areas) transportation flows In the library sector within the provincial services areas in the Netherlands. Every element that is directly and indirectly involved in the organization and execution ol the transport of ILL materials is included in Ihe scope of this project. The focus is on Ihe logistics and the logisticol operations that facilitate fhe movement of ILL materials.
The implementation of the NBC in the ibrary sector is taken into account. Effects from this implementation are assessed and evaluated throughout the project. Also Ihe provincial catalogues that have the same purpose as fhe NBC, but contained within the provincial service areas ore within the scope of this project. Data from these provincial catalogues are used as input tor the project.
Table 2-1 includes all the relevant stakeholders that are included in Ihe stakeholder network analysis:
Ubraiy Organballons GovMMlwnlal
Noltonol Stichting PSO Nedefk»id (S»9 Vereniging Openbare Bibliotheken (VOJ) Stichting Uil i||iillii|ij|t|il((IHl governments SectorinstltuitllpiMil .flWDMMoni .' . ^ Bibliothekeri (SlOBf .j^ifcdy of Onderw» % Centrale Discotheek :'1MiK»«l CentroOlllBlllllMI M Rotterdam (CDR) ' i m j j i ' l op lOCW) (C«l £ UW|K«*UB'S) 2:
'•- •.:,. ., , • . n Local . ' " ' . - . j2 Provincial Service Organtzalioilt (PJOf ^ Plus Libraries (CG Librar/) - -, -: . | Libreiry Organizations ILO) 9 UbmiYLoogltgntaa '•: A ,: ., . , g
TABLE 2-1: INVOLVED STAKEHOLDERS VHTHIH THE SCOPE OF THIS PROJECT ü
^U Delft
kwink. poep
In the system scope relevant stakeholders were identified fhdf dre relevant to this project. In this step of the problem statement, these stakeholders dre analyzed more into depth. Several steps are part of this analysis and first, the problem owner of the project is assessed, the Stichting PSO Nederiand. The second step is to analyze the network of stakeholders. The stakeholder analysis obtains insight in the goals, interests and positions of the stakehokders regarding the issues stated in fhe introduction of this project.
The goal of this paragraph is to gain insight in the goals and means of the SPN in which the SPN can Influence fhe system and determine a good implementdtion of a fkjating collection. There are links to be identified between the goals of the SPN organization and the means of fhe SPN to reach these goals. In order to analyze these aspects, a goal mean diagram is designed. The goal mean tree diagram of the SPN and the explanatory description of the didgram can be viewed in Appendix A: Goal Mean Diagram of the S.
The individual PSOs are part of the collaboration SPN and are focused on their own sen/ice area and transportation service. However, the SPN is focused on sharing the knowledge between the PSOs. The task of the SPN is to communicate the benetits of knowledge and skill sharing to the individual PSOs. Otherwise the PSO will not see the gain and will not colkjborate in the way fhe SPN would like fo see it. In the diagram in Appendix A is shown that the services of importance in this project are both the ICT sen/ices and the logistical services. The correlation is clear: Ihe ICT system houses the digital cataloging of the materials and fhe order system so the end-user can order materials from other libraries. When tooking at a national level, the ICT system should be compatible with all provincial sen/ice areas. At this moment fhe ICT system of provinces differ.
The fdsk of a single PSO is to collaborate with library organizations within its area, fhe "client" of this PSO. If new policy is set on national level, it is the task of the individual PSO fo communicate fhe cfianges to the library level. If they do not do this in a correct way, the library organizations might not cooperate in the way they would want it. Focusing on implementing a floating collection, the tasks of most importance are the tasks to collaborate with fhe library organizations. Collaboration is significant for the successful implementafion of fhe floating collection concept and it is identified as one of fhe clear goals and tasks of the SPN. In order to understand the needs and requirements of fhe stakeholders involved with implementing a floating collection in the library sector, a stakeholder analysis is performed in the following paragraph.
The Stichting PSO Nederland operates in a network of stakeholders in the library sector. Many of the stakeholders In this network are directly involved with the distribution of librdry materials and several stakeholders are indirectly involved. The SPN therefore must rely on a selection of stakeholders in the network to achieve their goals In optimizing the distribution of materials between libraries. It is important for fhe
• fu Delft

kwink. groep
SPN to be aware of the network of stakeholders and their goals and interests in the current dnd future situation of the distribution. The stakeholders that are of importance fo fhe SPN are stakeholders that are directly involved with the distribution, for example, the PSO in the provincial sen/ice area that is attected by fhe possible solutions and outcome of this project. It also includes stakeholders thai possess means that have the power to help optimize the transportation of library materials.
In order to create this awareness for the SPN, a stakeholder network dnalysis is performed (21). This analysis leads fo a qualitative better understanding of the network of actors involved in the distribution of library materials between libraries. The analysis mops the relationships between the different stdkeholders and this provides insight in the opportunities and threats for the approach of fhe future situation and leads fo a more legitimate analysis of the network. The network analysis recognizes the position of fhe involved stakeholders and that leads fo a better collaboration between the stakeholders in the dttempt to solve fhe issues of the future.
To pertorm the stakeholder network analysis, several steps need fo be made. After identifying all the involved stakeholders, the stakeholders are mapped in a formal chart wherein the formal relationships between the stakeholders ore indentified as ore the formal tasks, competencies and current laws and regulations. The interests, goals and problem perceptions of all the involved stakeholders are identified next as are the inferdependencies of the stakeholders. These are identified by the resources available by the stakeholders and their subjective involvement in the situation. After performing all the steps necessary the implications of the findings ore identified. To obtain the necessary information needed to pertorm the detaiied analyses two techniques are used. To start, a desk study is performed fo analyze initial information available. After the desk study several interviews are performed to analyze the stakeholders more in depth. In fhe following paragraphs the steps and conclusions of the stakeholder dnalysis are discussed.
2 2.2.1 Ot-'.ii"i ';;i '.;:- : !wc;A-;iEiTK.^r-* A^' -JCIIJ^:- .A i-< ^•«'•tHijAJi:^ •;• A ' / .TA
The first step in the stakeholder analysis is identifying the formal relationships between the involved stakeholders by using a formal chart. All the stakeholders in the network are connected with each other and the formal map is presented in Appendix B: Formal Chart of the Stakeholder Network.
All the library organizations have similar goals fo fhe issues faced with the implementation of a floating collection concept. All the organizations have goals to assist the library sector to be successful and support the organizations that need guidance to achieve the continuation of fhe library sector as a part of cultivation of fhe Netheriands. The sector orgonizdfions on a notional scale ore young: the SPN, the Sector Instituut Openbare Bibliotheken (SIOB) and Bibliotheek.nl (BNL) are set up in the beginning of 2010 in context of the library innovation. The projects initiated by these notional sector organizations might not have fhe full support of fhe local organizations due to their notional agenda. The library sector is historically a regional and autonomous organized being and is starting to be organized from a national perspective. The national organizations must fake into account the local and regional
•fu Delft
k w i n k . groep
needs of the library organizations in order fo successfully organize projects on a national scale.
? 7 / . ? pi.fc- : ' ' !• iC'-J> C'i P!•A>!^I.F>A •^ï •:•
kwink. groep
Appendix D: Inferdependencies of the Stakeholders within the Networtc. The output of fhe analysis is used in fhe next pdrdgraph.
All the important information on all fhe involved stakeholders in Ihe distribution of moferials between libraries in the Netheriands is identified. The last step is to categorize the stakeholders in their power and involvement in ILL and to determine which stdkehokJers must be taken into account in planning future alternatives within ILL. To do this a power versus interest grid is made. This grid consists of two dimensions: the interest of fhe stakeholder in the problem and the power the stakeholders has within fhe scope of fhe project. These two dimensions are put on fhe axes of the grid and result in identifying four cotegories of stakeholders:
• Players Players have both a high interest in the jaroblem and have enough power to influence the outcome of the project: these players must be taken into account
• Subjects These stakeholders have a high stake in the problem, but when it comes to influencing the outcome they have little decision power for major influence.
• Context setters The setters of context in ILL are stakeholders that have the political power to make changes and influence other stakeholders but have less interest than the players within ILL
• Crowd The stakeholders thdf form the crowd have less power and less interest than the rest and ore not taken into account further
The grid shown in Table 2-2 helps to highlight possible coalitions fo be encouraged or discouraged and the grid provides information on how to convince certain stakeholders to change fheir views within the problem to help achieve possible „ solutions in the future. >•
o c
Power-> < . . ^ E
CDR BNL
Library Locations
SPN c PSO o
Plus Libraries ^ • . T LO S _ End-user n
I I 'c I • CWDWI '^MM'MkM £ ^ VOB i
SIOR ^ 3PL's (e.g. TNT) . , ,•.• ,^
NBDBibllon „ Municipolities
CB Provincial Governments i g Ministry OC&W ; o
TABLE 2-2: POWER INTEREST GRID INVOLVED STAKEHOLDERS
ru Delft
k w i n k . pvep
The players in implementing the floating collection are the stakeholders that are directly involved with ILL. fhe SPN, the PSOs and the LOs including the Plus Libraries. These stakeholders possess the collections of library materials that float among each other and it is of significant importance that the needs and requirements of these ployers are met fo ensure the success of such a change within these organizations.
The stakehokiers directly involved with fhe players are the stakeholders thdf need to cooperate in order to make this incremental change effective. Requirements from this corner ore needed to be considered and discussed, but If stdkeholders in this category stand in the way of success they could easily not participate and the plan does not tail. The crowd is only of interest whenever the project needs the stakeholders categorized in this corner. The context setters are background stakeholders and in the cose of fhe Library sector important national organizations that deliver Ihe funds. These context setters state the boundaries in where the project can be executed,
In this paragraph conclusions are presented on the performed stakeholder network analysis and the needs and requirements of the stakeholders concerning ILL are stated. These needs dnd requirements form a significant part of the remaining phases of the project. The SIMILAR approach (see 1.4) states that after every phase in the project, the needs and requirements of fhe stdkeholders need to be ossessed. Stakehokier needs in implementing a floating collection concept:
• Customer satisfaction. The biggest need of all stakeholders is to ultimately serve the end-user with fhe best service the library sector can provide, the following needs are derived ft'om this need.
• Innovation To hold on the end-users, there is a need for innovation within the sector. The last years and organizational changes within the sector have shown that innovation in the sector has a significant positive ettect.
• Availability. The availability of library materials is of essence. The goal of ILL and the implementation of the NBC are fo increase the accessibility of library materials to the public. A high availability of materials is a significant need of all the stakeholders involved in ILL.
There are three main stakeholder requirements for implementing the floating collection concept:
• Customer service. The requirements focus mainly on serving fhe end-user with the best service the stakeholders con provide. Among this is to make sure that the costs of Implementing a floating collection are to the minimum,
• Waiting time. The waiting time for end-users that need to waif for materials to arrive at the location they have chosen must not increase after implementafion of fhe floating collection.
• No negative effect». Many stakeholders involved in ILL are skeptical about the floating collection concept. Some stakeholders predict certain negative effects offer implementation to take place. The minimization of these negative effects is an important requirement for the implementation of o floating collection concept. The expected negative effects are discussed in 3.2.
•fu Delft

kwink. groep
2.3 CuRWbNl ItTTERLIBR.A.RT LOAN CONCfcPf
In this paragraph the current concept of the interiibrary loon system in the Netheriands is analyzed. This is done by elaborating on the definition, characteristics and behavior of interiibrary loan. The next step is in depth on how the transportation services are organized and fhe service level. This is done by explaining the logistic organization and the service level provided to the end-user.
2.3.1 DfiiNii l >l l ...i i:-:!i A„iB-<AV LCJAN The definition of interiibrary loan is:
"ILL is a service whereby a user of one library can borrow books or receive photocopies of documents that are owned by another library," (22)
The user mokes a request with their local library, which, acting as an intermediary, identifies owners of the desired item, places the request, receives fhe item, makes it available to the user, and arranges for its return. Although books and journal articles are the most frequently requested items, the Centrale Discotheek Rotterdam (CDR) lends audio recordings, video recordings, maps, sheet music, and microforms of all kinds. In many cases, nominal fees accompany interiibrary loan services reaching up to a couple of Euros per request.
Like stated in fhe introduction, there are two categories of interiibrary loan systems operating in fhe Netherlands:
• OBL (Onderling Bibliothecair Leenverkeer) This service contains the lending of materials between libraries within fhe provincial senrice area of a PSO. This is supported by an ICT system within this service area and the transportation service of the PSO.
• IBL (Interbibliothecair Leenverkeer). This service is a nationwide service which goes beyond the borders of fhe provincial service areas. There is still no ICT catalogue system running to support this service but there will be one in the near future. This national catalogue (the NBC) will support the IBL (and fhe OBL) in fhe future. The transportation system currently used is the mail service of PostNL. However, like stated in fhe introduction, the Pilot Distributie has started using the service of TNT Innight to transport IBL materials between PSOs using the PSO headquarters as transportation hubs and the PSO transportation services to deliver the materiols to the library organizations within the provincial service area.
ILL materials con in theory be every piece of material available in the collection of libraries today (23). In the current situation libraries hove fo select ports of fheir own collection to be available for either OBL or IBL use or for both. There ore also cases that a port of the collection of a library is only available for viewing from a distance using the internet and not available for lending (23). Like sold before, in theory an ILL material con be every material in a library available for lending. But the question that Is significant for this research is, con one categorize ILL materials within the Netherlands? A possible categorization of ILL materials could enable the distribution
•fu Delft
k w i n k . groep
of ILL to be more efficient. Reolizing categorization could create more insight in what kind of moferials are lent between libraries and with categorization, a more focused logistical operation could be possible. With categorization, ILL materials could be stored and distributed centrally instead of amongst the other materials. Finding logistical solutions to the distribution issue could be easier.
To answer the question of categorization is possible it is necessary to find out why materials are lend out to other libraries. This is explained by: the requesting library do not have the material In its collection and there is another library that has the material in stock. The true question is why certain libraries do not hove certain materials in their own collection. There is a true difference in type of collections in fhe libraries in the Netheriands. There are certain educational levels identified of fhe materiols in librdry collections, as presented in Table 2-3.
Royal Library WO level
University Libraries WO level
Plus Libraries HBO level
Ubrary Organizations Secondary school level Library Locations
TABLE 2-3: CATEGORIZATION OF LIBRARIES IN THE NETHERLANDS
It can be assumed that the position of fhe libraries within the list stated above is the educational level in which the highest educational level are supplied by the Royal Library and the lowest educational level ore supplied by fhe library locations. It is also safe to assume that the largest libraries, which have the most materials in fheir collections and the rarest materials within their collections, are also on fhe top of the list. Concluded from these assumptions, it is safe to say that the lowest libraries are the libraries that request OBL and IBL materials from the higher libraries and therefore fhe higher ranked libraries are the supplying libraries (7). The next question is to what kind of materials do the higher libraries have that the lower libraries do not have in fheir collections.
Very popular titles like adult fiction con be ruled out. It is very likely that even the smaller libraries have these books within fheir collections. Some libraries even exclude the popular titles (or a selection) from OBL and/or IBL to supply fheir own end-users first, given o certain time period (23). Other libraries say that it is not because of fhe popularity of fhe material that defines it to be lent out to other libraries, but more fhe rarity of the material (23). It is likely that a book that focuses on a frog that only lives in the northern part of the Netheriands will be available in the library of Sneek, but will not be o part of fhe collection in the Royal Library in The Hague. There might be a person in The Hague that is interested in this frog and will request the book via the IBL system. Other libraries say that the nature of ILL materials ore scientific for the same reasons that the extra materials owned by the higher libraries are of more scientific nature and will be requested by the lower libraries (23). The most interesting distinction that stakeholders within the sector moke between normal materials and ILL materials
•fu Delft

kwink. poep
is by using the Long Tail Theory (7). In the next paragraph the Long Toil theory is explained and then the application within the library sector is tested.
The Long Tail Theory refers fo the statistical property thai a larger share ol population rests within the foil of a probabiHly distribution than observed under a 'normal' distribution. A long fail distortion arises with the inclusion of some unusually high (or low) values which increase (decrease) the mean, skewing fhe distribution fo fhe right. This con be seen in Figure 2-1 (24).
The term Long Toil has gained popularity in recent times as describing the retailing strategy of selling a large number of unique items in relatively small quantifies, usually In addition to selling fewer popular items in large quantities. The Long Tail was popularized by Chris Anderson in an October 2004 Wired magazine article, in which he mentioned Amazon.com and Nettlix as examples of businesses applying this strategy (25). The Long Tail distribution is illustrated in the Figure 2-1.
FIGURE 2-1: THE I O N 6 TAIL THEORY FROM ANDERSON
If the long tail theory is applied on ILL in the library sector, one might assume that the more populai materials or Ihe more available materials are in the 'head' of the long tail distribution and the unpopular or rare materials are in the 'tail' of fhe long tail distribution. Immediately fhe question is raised if one can define ILL materials as materials that appear in the long tail of Ihe distribution.
The theory states that in the tail of the distribution an endless amount of products, for example ILL materials, ore stored that are not lent very often. Within theory about the long toil theory applied to the library sector, the Online Computer Library Center (OCLC) states that 10% of the library collection represents 90% of the usage by the end-user (26). This is very comparable to the theory stated by Anderson that states that 80% of the products recite in the tail while 80% of the popularity recites in the
ru Delft
kwink. roep
head of fhe distribution (25). The OCLC finally performed a study in requested ILL materials in 2005 and found out thai actually 75% of the ILL requests were of materials that recite in the head of f he distribution instead of in fhe tail (26).
This lost research done by the OCLC disproves the theory that categorization of ILL materials is possible using Andersons theory of the Long Tail distribution. To conclude this sidestep within this project, it is not possible to categorize the materials that flow as ILL and this makes fhe implementation of a floating collection more challenging.
The concept of ILL is investigated in the former section and in fhe next step the organizational aspects of ILL is analyzed. In the current distribution concept, the materials that enter the ILL system are owned by fhe library organizations. Like sated dbove, fhe LOs themselves decide whether o material is entered into the ILL system. The origin of an ILL material is the location ol the owning LO and the materials ore distributed from this location and returned bock. If is notable that the origin of the materials is not digitally registered in the current situation but will be after the Introduction of Ihe NBC.
When on ILL material leaves its origin due fo a request, it is transported to the requesting location. The requesting location is held responsible for the return of the material. This return movement is therefore initiated by the requesting location when, for example, the end-user of fhe requesting location has finished reading fhe book |7).
The means of transportafion are different with both the OBL and the IBL. With OBL requests, the materials are sent with the transportation sen/ice of fhe PSO using the standard crates delivered by the PSO. The LOs that are signed with the transportafion service pay the PSO a yeariy fee to be part of one of the routes of the transportation service. This fee is of a public nature which results in a fairiy low rote if you compare the fee to private logistic company's fees. Being part of the transportation sen/ice of the PSO brings several side benefits for fhe libraries like lending out other materials between library locations, tor example beamers against no extra costs (10).
The Pilot Distributie has started a different classification of IBL distribution. Before the Pilot, the IBL materials were send using envelops and the regukar mail delivery service from PostNL. Now they have started fo use the TNT Innight service to transport the IBL materials from PSO to PSO, using the PSO headquarters as transportation hubs in every provincial service area. Instead of sending the IBL materials with the regular PostNL postal service using envelops, it is now send with the PSO transportation service. At the PSO headquarters, the IBL and OBL materials are split and the IBL materials ore put in special TNT Innight boxes to be picked up by TNT Innight at night. TNT Innight sorts the IBL materials at night and deliver the IBL materials fhe next ddy to fhe PSO in the provincial area of the requesting library location. The return movement is done in the some way. Due to fhe recent start of fhe Pilot, it is not clear as fo what fhe prices will be per IBL material to transport the materials using this service. In Appendix E: The Setup of fhe Pilot Distributie the goal of the project, prices and sen/ice of the Pilot can be viewed.
"fu Delft

kwink. groep
Next of focus is fhe number of logistical hubs currently operating, the number of sen/ice points in the system [read: library locations), transportation between hubs and between hubs and service locations, sorting activities and routing of fhe transporfation. This can be seen in Table 2-4,
The number of hubs and their locations
There ore 11 central hubs, one per provincial service area. The PSO headquarters are the hubs within a provincial service area.
The number of library organizations and their library locations Transportation between hubs
There are 171 library organizations and 1031 library location in the Netherlands (27)
The transportation between the hub locations is outsourced to a 3PL: TNT Innight
Transportation between hub The transportation between ttie hub loccrtions and the and service points library locations is organized by the transportation
sen/ices of fhe individual PSO organizations
Sorting activities
Routing possibilities
Sorting in the transportation vehicle In fhe current situation fhe transportafion service employees of the PSOs sort the ILL materials in the truck. This means less capacity in the vehicle due fo space necessity for the sorting activities. Advantage is that less sorting is needed df the hub and that materials that have a destination within the current route can be delivered within the same ddy.
Sorting at the hub In fhe current situation several PSOs have sorting activities at their hub location. Sorting is done in order to prepare the routes of fhe next day.
One loop per day sen/icing an amount of sen/ice points that can be serviced in a day
One loop with smaller inner loops connecting the Library Organizations with their incorporated library locations within on inner loop. This routing principle must include sorting activities within the truck to be feasible.
TABLE 2-4: CURRENT LOGISTICAL OPERATIONS OF ILL
The number of locations as to where fhe end-user cdn pick up and return its materials is stated above. The means to order material and accessibility is elaborated on next. Ubrary end-users need to visit fhe library which they have a membership to loan materials they desire. Within their library they can take material directly from fhe shelves of the library but they can also login fo a local computer fo log in fo the provincial catalogue fo check if the material they requested is dvailable at another library when the library does not possess a copy. Within the same internet environment, the end-user con request this material and the end-user receives an
D h Ï
'U Delft 23
kwink. groep
email at the moment he can pick up his requested materials. Picking up the materials must be done at the library he requested the mdferials. Returning fhe materials fakes place at the same library.
It is concluded that categorization of ILL materials is not possible with the current research done on ILL. In theory every material within the collections of the libraries in the Netherlands can be an ILL material. However, certain educational level differences exist which can cause problems with fhe implementation of a floating concept. This is because the collections of local libraries hove no demand for materials with a high educational level. These libraries do not desire a certain percent of fheir collection to be of a high educational level without demand for these materials. A SWOT analysis is presented on the current organization of ILL in the Netheriands in Table 2-5.
Strengths
• Due to the Fétol) foimüla iofttte Dutch libraries it is a strength that the users are forced to visit the library fo pick up and return their requested ILL materials (App. Gj
• The visits have social benefits; people can use the library as a meeting point /App. Gj
' J. • ' -, '
Opportunities
• Development of libraries as cultural centers by forcing the members fo visit the libraries [App. G)
» Funding for culture is continuous. but need for spending this funding is necessary (7)
Weaknesses
• Ttie local transportation services ore the bottlenecks of the current situation (national focus) due to their limited service levels towards the smaller library locations (9)
• These limited service levels cannot guarantee certain delivery times to fhe end-user (10)
• Opening hours of the library. Wortting people cannot visit fhe libraries fo pickup or return materials (App. G)
• Distance to the libraries is in some cases too far for the user to travel {App. Gj
Threats
• The current capacities of the transportation service of the PSOs are low (9)
• The transportation flow of fhe future is expected to increase (7)
• A decrease of number of litxaries fApp. G;
• Continue fo lose members at the same rate if no changes are made jApp. Gj
• Budget cuts ensures that small libraries will need fo close their doors towards the end-users. ^App. Gj
TABLE 2-5: SIWOT ANALYSIS OF THE CURRENT ORGANISATION OF ILL IN THE NETHERLANDS
The next step is combining all the previous steps and designing a system diagram in which the complete ILL system is illustrated. The final step towards the completed system diagram is fhe design of a causal relationship diagram. Within this diagram the individual elements of fhe ILL system ore set in relation to each other. The final system diagram is used to identify the external factors that influence the future of the ILL in
• fu Delft

kwink. groep
the Netheriands and that identify fhe system requirements. This is presented in the concluding paragraph.
In this paragraph fhe causal relationship diagram is used to gain more insight in the relationships between the different elements within fhe system. Ihe relationships between Ihe elements are bidirectional which creates reactions within the system whenever one of the elements changes. In the diagram several loops are identified which identify critical relafionships within ILL (28). These loops and their effects ore described in this paragraph. The causal relationship diagram and a more detailed description ore presented in Appendix F: The Causdl Relationship Diagram.
The largest loop in the system has fhe service level of the transportafion service as the center. Whenever the service level of the library organizations in fhe provincial service area is changed, the complete system is affected. The most important effect within this loop is the delivery time of the ILL materials. These can only be determined by altering the service level of the LOs. If fhe delivery time is decreased, the delivery time affects the end-users which will then, as a resutt, use the ILL system more, which in the end will result in more volume of ILL materials being transported through the system. This then will decrease the service level.
An important factor that is identified is the popukirity of fhe new NBC. It is notable that the popularity is mainly influenced by outside factors, meaning, that the SPN does not have full control of the popularity. When the popularity increases significantly, fhe results are severe on the need for transportation and Ihe necessity for capacity.
The goal of this paragraph is to define fhe system dnd Its borders fo identify what is port of fhe system and what factors do not betong within the system but are part of fhe environment of fhe system. Another goal of the system diagram is to define the structure and relationships within the system and fo define fhe output of the system and identify the criteria of the problem owner. These criteria form the basis for the search for possible solutions. The knowledge gained trom the system diagram con be used to define possible solutions and identify relevant environmental factors that influence Ihe system but cannot be influenced by fhe SPN.
•fu Delft
k w i n k . r « p
The system didgram consists of the foltowing components:
. .>ysfe,'n an,'! tKnjnt.ifjiie^ ol I'lt' sy;lerr) The identified system that fits in the boundaries set by the problem and the problem owner is formed by fhe use of a causal relationship diagram. This diagram is elaborated in fhe former paragraph. This diagram forms the basic component of fhe system diagram. From tWs diagram all the other components ore identified and emphasized in the system didgrdm.
. ('n,".'(i'r'i)pfif fa*.for: From the causal relationship diagram the control elements are identified which the problem owner directly has the power to influence fhe system with. These factors are placed on the top side of fhe system diagram
. f r)v/^)nniefilrji f\n-Kvs The elements that are not part of the system and cannot be influenced by the problem owner are environmental factors. The relevant factors that influence the system ore identified in the causal relationship diagram and ore illustrated in the system diagram on the left hand side of the diagram.
. Sy:'tf:-n-i f.:rilef/o The most important outcome of this analysis is fhe identitication of fhe system criteria. These criteria will be the basis of fhe search for possible solutions fo achieve Ihe objectives set by the SPN in the context of fhe distribution of materials between the libraries in fhe Netherlands. The system criteria are placed on the right hand side of fhe diagram.
The most important factors identified:
FIGURE 2-2: SYSTEM DIAGRAIN OF THE ILL SYSTEM
•fu Delft

kwink. 2..5 iNltRLlBRAkV L . ÏANSrSr tM RtQUIRfcMbNlS
In fhe last paragraph, the concluding remarks are made of the system analysis. In this paragraph the system requirements are presented that are derived from the stakeholder requirements and the system analysis. After processing the needs and requirements of the involved stakeholders, the system requirements can be set using the system analysis and model from 2.4. There are three categories of system requirements identified:
;. Cosf;.
The costs per shipment of OBL/IBL (ILL) may not increase while implementing fhe floating collection concept The costs of resources used to transport the ILL materials may not increase while implementing floating collection
2. Service
• The waiting times for the end-user may not increase due to the implementafion of o floofing collection
3. Copacify
• The capacity of fhe transport service cannot increase in the coming years • The capacity of fhe Library shelves must be met • The number of scientific materials within the local library collections must be
limited
The system requirements identified in this section are used as input in the next chapter and for the setting of the key pertormance indicators for the simulation model.
.a-o
n 1
0)
o
ru Delft 27
kwink.
.2-O
1
.5
28 fu Delft

kwink. greep
3 FLOATING COLLECTION C O N C E P T
In the former chapter the system of ILL in the Netheriands is analyzed. From this
ondlysis the system requirements are identi f ied. In the fol lowing section fhe
implementat ion of fhe ftoating c o n c e p t in the Netheriands is discussed. This is done in
three steps. First the future situation of the system is discussed. This is done based on
Ihe environmental factors ident i f ied in the system d iag ram in the former chapter . The
second step is discuss fhe floating col lect ion c o n c e p t .
In fhe introduct ion of this project the cause of the e x p e c t e d problems of fhe future
are stated. Due to b o t h the increasing use of the OBL a n d IBL system in the
Netheriands a n d the implementat ion of the NBC in the near future, the transportation
d e m a n d for ILL will drastically increase in the com ing years a n d l imited budge t will be
dvai lable tor the transportation sen/ice to handle this increase. To determine how
much the d e m a n d will increase, this pa rag raph first assesses the environmental
factors from the system analysis to identify the cdLJses of fhe increase in d e m a n d a n d
second, a source is used fo determine the growth rate of d e m a n d per year.
In the former chap te r the fol lowing relevant environmental factors are identi f ied:
• Éxlernal fa<'tors ri ^ loted to Ihe implenier i la t ion of the NBC:
o Popularity of the NBC a m o n g the end-users
o The number of libraries c o n n e c t e d to the NBC
o Share of library materials in tocal col lections o p e n to fhe NBC
. hunding frorii gt-vernrnenlol tfodles l o reoc i l o tt ie e x p e c t e d growtt i of
d e m a n d
If is expec ted that fhe d e m d n d for ILL materials wik increase. The main reason for this
expecta t ion is the steady incredse of fhe use of OBL (ILL within a provincial service
area) in the past years (9). In the past years the library organizations have increased
the accessibility of the materials within the province. In some provincial service areas
if is free of cha rge for an end-user to request on i tem within the borders of the
provincial service area. This measure has increased the d e m o n d significantly (29). The
next reason why the d e m a n d wiU increase in the coming years is fhe introduction of
the NBC (National library catatogue). This nat iona l c a t a l o g u e will increase the
accessibility to a higher deg ree than is seen in fhe current situation (6).
The rise in d e m a n d is d e p e n d e n t on fhe popular i ty of the NBC. The increase of
d e m a n d Is a n ef fect tha i is n e e d e d lo give the end-users d higher accessibility is an
important question. The rise in d e m a n d is also d e p e n d e n t on the number of libraries
that ore c o n n e c t e d to the NBC a n d Ihe selection of their loca l col lect ion to enter in
the NBC. The ac tua l g rowth in d e m a n d in the future is hard to predict , but is
expec ted to b e significant. To determine a g o o d estimation on the future d e m a n d ,
the growth of the last years are assessed.
•fu Delft
k w i n k .
n
Q
I 30
In the monthly digest of the Stichting BibBotheek.nl (BNL) t t ie Figures of the yeariy
growth are given a n d these Figures are presented in
Table 3-1.
Year
2 0 M
200*
2010
RequMto
92627
154885
236241
Raqimb
69840
111662
173998
Nothonond
21623
41243
59824
Xhonamd
77%
73%
75%
Inptoceu
1164
1980
2419
TAME 3-1: RGUREJ ON THE GROWTH Of REQUESTS IN THE ONUNE TOOL AANVRAGEN (29)
II is shown in Ihe Table that the growth of requests ("Aanvragen") increased with 67%
in 2009 a n d 53% in 2010. These growth rates are very high. However, during the
interview with Ronald Spanier, the expert on ILL f rom BNL, ment ioned these rates to
be put in perspect ive (7). The Figures in this Table are from t f ie tool "Aanvragen" . This
tool is not national ly a d a p t e d by all provincial service areas. The increase in
percentages is including the newly c o n n e c t e d libraries to the fool Aanvragen. The
absolute total numbers per year cannot b e c o m p a r e d . Mr. Spanier ment ioned that a
part of this growth is due fo the increase of fhe d e m a n d for ILL. He estimates a growth
of 30% per year in the last 3 years (7).
During the same interview Ronald Spanier is asked if he cou ld estimate the future
growth of the tota l ILL d e m a n d in the next three years. After check ing with fhe right
peop le in his organization, the est imate growth for the coming years is presented in
Table 3-2
year growlh/year
2010 30%
2011 35%
2^ 2012 45%
8 2013 55% o U C TABLE 3-2: GROWTH ESTIMATION FOR THE ILL IN THE COMING YEARS O
^ These figures are Wgh a n d will cause severe issues with fhe current capac i t y of the
0 transportation services of the PSOs. These growth tigures in d e m d n d dre used in the
01 simulation model .
^ The next step is l o anat /ze the floating col lect ion c o n c e p t in more detai l . In this
S pa ragraph former experiences wi th implementat ion of a floating col lect ion concep t
IJ are assessed a n d information ft^om a questionnaire ore used to assess the possibilities
b a n d cutbacks from implementat ion of a floating col lect ion. A SWOT Analysis is
presented to pu t the c o n c e p t in perspect ive for possible implementat ion. The most
significant issues that c a n b e invest igated within fhe scope of this project are
identi f ied a n d possible solutions fo these issues are presented.
ru Delft

kwink. groep
3.'2.1 CONCEPl O! F i : •AIING LiBRAkY C O L L E C I I O N ;
The c o n c e p t of floating library col lect ion Is similar to fhe current situation as is
descr ibed in section 2.3. There is only one cruciol pdrt c h a n g e d . The basis of fhe
c o n c e p t Is to el iminate the return movement of ILL materials a n d store the ILL
materials at fhe locat ion where if is last requested a n d returned. When a mater ia l is
requested after it is stored at the last locat ion, it is directly transported to the locat ion
of the new request. In theory, this eliminates up to 50% of transportation movements
because the mater ial , in theory, never has to return to the locat ion of origin. This has
major consequences fo the organizat ion of ownership a n d responsibility of the
material . There are some measures that n e e d to b e taken in order to implement this
c o n c e p t successfully.
The first question that is raised is whether w h o is go ing to pay for fhe organization of a
floating col lect ion. In the current situation libraries have their own materials in their
o w n library col lect ion. Issues c a n be raised that libraries d o not wan t their materials in
the possession of other libraries where they canno t have on eye on their possessions
or the knowledge of the whereabouts of fheir o w n e d materials. Like stated before in
pa ragraph 2.3, Ihe locations of the ILL materials are not t racked of the current
moment . The requesting party is responsible for the return movement . With no
a u t o m a t e d locat ion determinat ion, the materials c o n get lost or libraries can dec ide
fo keep the materials (23).
One c a n dec ide fo shift the ownership of fhe f loat ing ILL materials to a centra l
organization, but the question then is wh ich organizat ion a n d is this organization ore
willing to pay for fhe preservation of a f loating col lect ion. Next, the natural mixing of
fhe collections is of part icular interest. One c a n v iew the c h a n g e of col lect ion in time
as a positive ef fect fo fhe col lect ion of a library locat ion, but if also poses many
threats. For example , the movements of ILL materials cou ld dominanf ly g o in one
direct ion instead of bidirect ional a n d c rea te bo th emp ty bookshelves in one library
a n d lock of space in another. Other libraries state that they wou ld not won t rare ILL
materials on their shelves that are of no interest of the majority of fhe end-users (23).
It Is ment ioned before that innovat ion is part of a new strategy in the library sector in
fhe last years (30). On several areas within the sector innovat ion is imp lemented to
c reo te awdreness that the library sector is new a n d innovat ive in its operations a n d
services. The c o n c e p t of f loat ing col lections is a very innovat ive a n d an un-
conservative w a y of organizing collections of library organizations. It is very rare in the
wor ld and the coses where a f loat ing col lect ion is imp lemented ore limited. The idea
of the c o n c e p t is new a n d this is fhe mdin reason for the number of imp lemented
concepts be ing scarce. One of fhe successful implementat ions of a f loating
col lect ion is at the Sarasota Country Libraries in Sarasota, Florida,
The Sarasota Country Libraries have eight libraries in the Sarasota County a n d had
capac i t y problems wi th their ILL transport service. The d e m a n d was rising after the
moment they had in t roduced an ICT Col lect ion system a n d m a d e it accessible for
the public. The board of the Sarasota Country Libraries d e c i d e d to implement the
f loat ing col lect ion c o n c e p t in 2007. On fheir websi te they p romo ted the f loat ing
col lect ion c o n c e p t a n d m a d e a presentat ion avai lab le with their implementat ion
• fu Delft
kwink. groep
process. The most important facts from their implementat ion process ore presented
here in Table 3-3 (12).
Main reasons lor floating
Preparation process
Results
• Capac i t y issues of the ILL transport service • The desire for one col lect ion instead of eight
separate collections
1, Setup of a project implementat ion t e a m 2, Setup of ICT systems that were needed fo
support the f loat ing col lect ion 3. Testing of the ICT system 4. Training of Staff in fhe new processes
Collection: . April 2008: • June 2008: • August 2008: . Oc tober 2008:
Transportation: . September 2007: • April 2008: • June 2008:
20% Floating 45% Floating 70% Floating 90% Floating
2100 crates transported 1700 crates transported 1300 crates transported
Issues
Positive feedback
Lessons learned:
Disappoint ing adop t ion by fhe librory sfdff '•' Budgetary problems Unbalance of the shelves Regular clients were angry wi th empty shelves of their library
More efficient More variety in col lect ion Staff liked fhe chal lenge a n d c h a n g e in organizat ion
To c rea te a rebalance/reposi t ioning p lan To better c o m m u n i c a t e Standardize even more
TABLE 3-3: RESULTS SARASOTA FLOATING COLLECTION
There ore significant difterences b e t w e e n fhe cose descr ibed a b o v e a n d the case of
the Netherlands a n d wrihin a provincial service area. The area of implementat ion of
the Sarasota Libraries is signiflcontly smaller than a regular provincial service area in
the Netherlands. Another major di f ference is fhe ownership of fhe col lect ion. The
Sarasota Libraries possess the comp le te col lect ion. In a provincial sen/ice area there
are many owners of col lections (the library organizations) within the area. This c a n
c rea te major issues after implement ing a f loating col lect ion in the Netherlands.
During fhe course of this project a questionnaire, presented in Appendix G:
Questionnaire , is h a n d e d out fo several library organizations involved in ILL within the
TU Delft

kwink. groep
Netheriands. The questions include valuable information about the floating collection concept. From this questionnaire the SWOT Analysis of the implementation of the Floating Collection, presented in Table 3-4 is derived,
Strengths
faiDiiiitfi)'imw|ihi. • No direct return movements in the
system. Major effects on logistical cost. These effects could up lo 50% reduction in nnovements and coufcl •vt^JCillMiportation costs.
• P o t o r t ^ ^ M i r delivery due to Mw decred^^lrtswerage (Monte*
CoflecMon sirengttu: • A natural changing varkation in th«
collections of the libraries due to ft» natural «»t<*i6nolr
Che<]pBiJifliifcational adaptatioM
Wcaknetset
' i l l p M i i i M N M H H a ^ • ligfewntral admlnisfration dl the tU
meÉlHtats available at this moment. ThKiasponsMKtiïis are of reeiuesting «in«| j»ee^4ng ibrary
• SlBBSnot to fit with the retell fonnuta « t i i l b r a r i e s today
• SWiOf Issues are expected with ownership. Library organizations purchase their own collections and tmplementing a floating collection means that their purchases leove ttieir IliiK)» iiwithout knowing when the nMiitkJL return and who is responsible
• StÜétTffl^ c iöTöcreÜSWcs of 16L today can give strange collections and untjqlpnced collections In «me
Opportunities
lopporfunWes: The ltl l | |üll i i ' l tation of a floating collection is consistent with the Innovations within the library sector being implemented at t t » r
I II I i lBlf i' 'li jkiKa«rf«B4iiMJHMB*
lOBWpcagljBPorHinBWW I h e r t w M p i r i transportation mov«^|f i te$on increase the cun'ent capacity without lrK»aail«Q.i|Mi«Qili tor resources. the increase of capacity has the potential to overcome the increase of demarslipitoe near ftrture
tnthreofs; • y^tHt^s can decrease the
|É(«i(jUfemenl of rare and unpopular WWfèilgls, they can easily obtain tore
rjhrough the ILL floating on (capacity problems due to an
expected unbolarKe between ttie size of original collections and tt»e
~ 'ifci'iiii-ii II . ^ ^1.'J. .'i »•.*.'• I M I ^ ^ M J I - . . .
' 'IMMPMil^^^TnQMiiaiMnwiCnM o O
M o u a>
TABLE 3-4: SWOT ANALYSIS FOR IMPLEMENTATION OF FIOATING COLLECTION CONCeT IN THE NETHERLANDS (APPENDIX G: QUESTIONNAIRE)
The weaknesses a n d threats ident i f ied through the questionnaire a n d d e d u c t e d from
interviews are further analyzed in fhe next pa rag raph . One of the goals of this project
is to a t tempt to minimize the possible issues that c a n occur after implementaf ion of
the f loating col lect ion. By further analysis of these issues, possible solutions to these
issues c a n b e designed fo a t t emp t to minimize them.
ru Delft
k w i n k .
The most relevant issues from the SWOT analysis presented in the former paragraph ore analyzed in this paragraph. The following issues are of significant importance to the involved stakeholders:
. AM iiriwrinleti Mii:<tuiP of iibioiv motf^riciis williin o lihrnry due- to the Hooting ol rjll innleriols
o Mixture of owner of materials o Mixture of type content of materials
. Siielvw capacity problems due lo the unrioluial iiribalan.:-e ot rnoleriais CiriiOhOSi l lb'OrtO'.
o An overcapacity at libraries that hove more requesting members than materials requested by other libraries
o An under capacity at libraries that hove less requesting members than materials requested by other libraries
. Knovvleclge |L">r..j|)lcT'i'. otioul the wfifc.-rc-oL'v'Ut::. arid rri::)nie!'t iif lolLJrr: ol iibioiy rrioloiials
MIXfüfr= >f rriiiff.-cinf:. After implementing a floating collection concept in the library sector in the Netherlands, a shift of library materials is very likely fo occur. Library materials do not return to their original location immediately and thus a mixture of library materials in the current collections occurs. As stated in fhe SWOT analysis in the former paragraph, this phenomenon has both positive and negative effects. Focusing on the negative eftects: the libraries participating in the floating collection concept could perceive the mixture in their collection as unwanted by the organization of that library and especiolly unwanted or undesired by fhe end-user population of that library. There are two types of mixtures identified in this study, a mixture of heritage of the materials (mixture of ownership) and o mixture of content of the materials. Although these two types ore correlated, content of the materials is often related to the location of fhe library (e.g. a smaller library in fhe country side will have special books about fhe area] (23).
Research done on the desires of a librdry, regarding fhe mixture ot content of the materials, shows that the majority ol fhe collection should be owned by the library itself. Retracting this information means that o library collection should have more than 50% of their collection formed by their own materials (7), Numbers on the desired content for the collection is still to be discussed. One con argue that the desired content is dependent on the desires from their members, but it is the members that ore demanding the material in fhe first place. If there is a shift in content, H is because of the members themselves.
Shelve co/:i:i<.fty Another issue that is expected after implementafion, and has occurred at fhe Sarasota Libraries in Fiorido, is the unbalance in number of materials at the libraries after a certain period. This unbdiance can be created due to more users requesting
•fu Delft

kwink. groep
materials in one library than are requested at this library by other libraries. This causes this library fo hove an overcapacity in a certain period making other libraries having on undercopacity of materials (23).
Research has shown that libraries can house 10% more materials than the number of materials in fheir own collection (7). If the number of materials exceeds the 10% on overage, than there is no space left to display the materials on available shelves within the libraries. Research showed that libraries do not desire an under capacity In fear of losing satisfaction of their members. Libraries could handle a discharge ot materials of up to 20% in a certain time period, but not more (7).
KrKiwIedge problems Feedback on the questionnaire showed that issues are expected fo the tracking and tracing of the library materials and issues relevant to the return ddte of their moferials. In theory there is no return date within a floating collection, but to keep stakeholders satisfied, the organization might find it a good initiative to implement o return date to make sure stakeholders see fheir possessions return within a certain time period.
Issues surrounding trdcking and tracing are not fo be expected due to the tracking and tracing being available within fhe NBC (31).
111!-! ' o ' ' • : r i h \ I Iv'i I'l ISSIIP.
In fhe former paragraph issues that can occur after implementing o floating collection are identified. In this paragraph solutions are designed to minimize these issues. To find solutions the first step is learning from other sectors that hove similar situations and similar problems. What solutions are being implemented in these coses and con these solutions be designed in such a way that it could minimize the issues that might occur after implementation of the floating collection concept?
There are two sectors identified that have similar situations and similar issues:
• The distribution of empty iTiaritime containers • The repositioning of rental cars within a service area
In the next sections o closer look is taken info both cases and an assessment is made on what can be learned from these cases in order to design solutions for the issues in the library sector.
Empty niaritirne containers The maritime container sector has similar problems as the library sector could have after implementation of a floating collection. Next to transporting maritime containers containing goods for demanding customers, container shippers need to manage their fleet of containers while considering the empty container flows. Due to natural unbalance in supply and demand throughout the world, there is an unbalance in the storage of empty containers within seaports. These empty containers need fo be transported fo locations with demand for empties. This so-called "repositioning" is a major port in the container fleet management of container shippers (32).
The fleet management relies on mathematical algorithms to solve and optimize the repositioning problems of fhe distribution of empty containers. In this sector,
•fu Delft
k w i n k . groep
algorithms were designed in fhe 1970s and nowadays are highly improved. The algorithms toddy depend on the forecast made on fhe demand and supply flows of containers worldwide, the costs of transporting and storage of empties and the Cdpacity available for transportation ot empties. The optimization of fhe repositioning plan is cost driven. As transporting empties does not odd value to the shipper, the costs must be absolutely minimum (33) (34).
Implementing a rebalance plan within the floating collection concept could be o good solution fo solving the issues discussed above. But adopting on algorithm directly from a container shipping company could be problematic. There are mony differences between the sectors. The models involving empty containers rely on advanced forecasting models which do not exist in the library sector. Forecasting is primarily done with historical data and the transportation services of the PSOs nowaddys do not have this data available for forecasting (10). This could be possible in d couple of years. The container sector is cost driven, which is also sought after in this project, however, fhe container industry is a sector that is also profit driven. The library sector is not profit driven, but service based and therefore the algorithms used in the container sectors would need significant adaptations. The container shippers also handle one big "collection" (read: fleet) of containers. In fhe case of fhe libraries, there are many "fleets" and like said eoriier, issues ore expected from mixing the "fleets".
Car rental service The cor renfdl sector also possesses similar distribution concepts to the library sector. Wrihin car rental companies fhe user often can choose fo rent a car for a round trip, in where the user returns the cor at the location it has picked up the car earlier, or he con choose fo rent fhe car for a single trip and drop the car at another location than where he picked up the vehicle. This second option mokes if necessary for car rental companies to manage their fleet in similar ways as fhe container shippers. Due to fhe stochastic nature of the single trips, an unbalanced fleet of cars occurs throughout the companies' locations. To balance the fleet, car rental companies have repositioning strategies and these are also based on algorithms (35),
As the case with the container shippers, fhe algorithms used by car rental companies ore highly sophisticated and depend even more on forecasting models. Cor rental fleet planners must forecast demand beforehand fo be able to supply the demand on every location. The some as with containers, the car rental company is a cost driven market with a main focus on generating high profit (35).
When designing a rebalance or repositioning plan for the floating collection ot the libraries in the Netheriands, the same issues as with the cor rental service case are present. Car rental companies operate one collection and oil the locations ore managed by one headquarter who manage the fleet planning. When the floating collection is implemented and matured enough to generate good statistical historic data to provide data for advanced forecasting models, the algorithms used by Cdr rental companies could be very useful for the library sector.
•fu Delft
kwink. groep
3.0 .-. IrVAlUAllO'J
Looking at t)Oth cases, designing a rebalance or repositioning p lan seems a g o o d
solution to all fhe issues that are e x p e c t e d by implement ing o floating col lect ion in
the Netheriands. When designing o retK3lance plan a lot c o n be teamed from both
coses. However, a t this s tage of time, fhe algorithms used by the bo th the container
shipping compan ies a n d car rental compan ies are far too sophist icated d n d have
different goals than the library sector fo a d a p t these algorithms at this level.
When model ing the system in the com ing chapters a rebalanc ing plan must be
designed that satisfies oil fhe requirements of the stakeholders involved in the system.
Based on this pa rag raph , a reba lance p lan has the potent ia l to solve the issues
descr ibed in the fonner paragraphs. When designing a p lan that periodically
redistributes library materials fo locations where , for example , there is o shortage of
materials, the issues might b e p reven ted . While reba lanc ing library materials, more
transportation is n e e d e d fo perform the reba lance . The extra movements necessary
to reposition the materials decrease the potent ia l a d v a n t a g e gd ined by
implementing a f loat ing collection concept, but ttie question is, by how much .
• fu Delft
u
•5 u ? 1 w-0 0 i r
h •^ .c
a
i 37
kwink.
• u c o U
o o
S 6 h
38 T U Delft
kwink. groep
4 MODELING OF THE INTERLIBRARY LOAN SYSTEM In this chapter the current system a n d the implementat ion of fhe floating col lect ion is
mode led . Based on the discrete event model ing techniques the current situation is
conceptua l ized in several graphica l models. This is done fo ga in insight into fhe
processes of the PSO transportation service a n d the commun ica t ion be tween these
processes. From these concep tua l models the key per to rmance indicators are
determined fo eva luate the implementat ion of the f loat ing col lect ion concep t . After
the conceptual izat ion, the details of the simulation models are assessed by specifying
the d a t a n e e d e d dnd clarifying the assumptions that need fo b e m a d e in order to
c reo te a mode l that represents reality. The fol lowing steps are fo verify the
correctness of the models a n d va l idate fhe m o d e l using an expert within the library
sector to check if the mode l behaves correctly.
4 . 1 C O N C E P T U A L I Z A I i O N
Wrihin this pa ragraph the conceptual izat ion phases is e labora ted on. The more
deta i led descriptions into the conceptual izat ion models are presented in Appendix H-
J. In this pa rag raph a summary is presented a n d the ident i f ied key per formance
indicators are ment ioned.
4.1 .1 Dl:^CK!PTI'';N • • MH- ,, . . l iv icef ' l l i.AI i/.AIiQN SIEP'S
The flrst model ing techn ique used in the conceptua l izat ion phase is ob jec t model ing.
In this analysis all the relevant objects in the system, der ived from the causal
relationship d iag ram from pa rag raph 2.4.1, are assessed by using ob jec t model ing in
the Unified Model ing Language. This is done fo ga in insight in fhe objects a n d their
characteristics as wel l their relationship be tween other objects. Using UML enables a
clear and static v iew of fhe ILL system a n d that identities o comp le te view of fhe
structure of the mode led ILL system of a specific time (36). The ob jec t mode l focuses
on a particular set of ob ject instances a n d attributes, a n d the links be tween fhe
instances. A corre la ted set of sub models provides insight into how on arbitrary v iew
of a system is expec ted to evolve over time (37). The ident i f ied objects a n d their
relationships are complex within the ILL system. There are objects with over iapping
characteristics a n d objects belonging to several classes wh ich moke o clear overview
of fhe objects ditflculf. To enab le the ob jec t mode l fo b e less complex several objects
ore a d d e d fo the object mode l . This techn ique has enab led the project to gain a
clear insight in the archi tectural blueprint of the ILL system including the stakeholders,
fheir activities a n d fheir business processes. The ob jec t mode l of the ILL objects a n d
deta i led descript ion con be v iewed in Appendix H: Ob jec t Model ing.
The next step of the conceptual izat ion phase is to p lace the objects from the ob jec t
mode l in sequence. Followed by designing a process-oriented description of all the
processes ope ra ted by the transport service of a PSO. The techn ique used in this step
Is IDEFO-diogroms (38). This techn ique gives insight in the process steps, the information
a n d resources n e e d e d per process step a n d fhe necessary input fo c reate fhe
relevant output ob ject . The models show that the system has three decomposi t ion
levels. A third decomposi t ion was n e e d e d in order to gain enough insight in the
processes fo be ab le to conceptual ize the ILL system. The individual tasks of resources
are Identif ied in the third decomposi t ion a n d fhe a l locat ion of fhe information is
•fu Delft
k w i n k . groep
ident i t ied. The complexi ty of the processes a n d its functions ore simplified and put in
sequence using this technique wh ich enables easier model ing in the next
paragraphs. The IDEFO-diogroms of the ILL processes a n d o more deta i led description
on the use of the IDEFO diagrams c a n be v iewed in Appendix 1: Process Oriented
Model ing.
In order to understand fhe individual decisions that n e e d to be m o d e by the relevant
employees of the transport service of fhe PSO, a f low chart mode l is m a d e as the
fol lowing step. In this analysis a flow chart mode l is used fo visudlize the decisions of
the directly involved stakeholders within fhe processes of transporting library materials
(39). Within the processes identi f ied in the process or iented models in Appendix 1. the
ident i t ied organizational units ore the user, the library a n d the PSO. The f low within the
f low chart starts wi th the order of on ILL material a n d flows through the system until
the moteriol is back at the library of origin. The most information is ga ined on the side
of the PSO. This mode l enab led a clearer overview of processes a n d the decisions
n e e d e d by fhe relevant entities in fhe system. Using a flow chart mode l enables the
conceptual izat ion to b e more comprehensive. Tasks ident i t ied in the process oriented
model ing in append ix I are set in sequence ot decision and f low using the flow chart
mode l ing . This creates on insight in the responsibilities of the stakeholders involved
directly with fhe transportaf ion of ILL materials. Particular bott lenecks a n d flows in the
f low of fhe system were not identi f ied. The f low char t mode l a n d de ta i led description
of the use of fhe mode l c a n b e v iewed in Appendix J: Flow Chart Model ing
-': ! .2 inFMriL- A ilOW ) MH l r V Pl-fM,;)|;-|,,iA^' I IN IJ I : .u\:s>-
The ILL system is conceptua l i zed so that a simulation mode l c a n b e specif ied d n d
buitt. The goa l of simulating the ILL system is to assess the possible alternatives against
the current situation a n d rote the per fo rmance of the alternatives. In order to rate the
per formance, the per fo rmance must be measured by selecting key per tormance
indicators (<PI), Accordingly, choosing fhe right KPIs is reliant upon having a g o o d
understanding of w h a t is important to the organization. Because of the need fo
deve lop a g o o d understanding of what is important , per fo rmance indicotor selection
is of ten closely associated with the use of various techniques to assess the present
state ot the business, a n d its key activities (40). The key activities identif ied within this
project are the system requirements identif ied in pa rag raph 2.5.
The KPIs enable the assessment of the system's per to rmance by simulating the models
in the next chapter . The KPIs identi f ied use the some categor ies as fhe identif ied
system requirements, namely costs, service a n d capac i t y .
•fu Delft

kwink.
Costs
KPI unit calculation
malerla6< by the PSO
The number of materials distributed by the PSO
The average cycle time ol a library
# library materials
#dayt
. Counting the nu«iMjNtfibMa|rFiiclterlals "Ml I'B "TilMffiil .» -| f^r t^ i i 'S i I '1 I ' "^l" '
Counting the number of library materials that exit the PSO headquarters
CalctjIaHng the interval in days ttraf a Ubraiy material retums to its original
TABLE 4-1: COST KPIS
The system requirements stated in 2.5.2 state that the costs of shipping a single library material should not increase after implementation of the floating collection concept . and fhe costs of resources should not increase after implementafion. After fhe conceptualization of fhe system of ILL the KPIs stated in Table 4-1 are identitied. The costs of sNpping library materials and fhe use of resources are measured using the number of transported materials in the system. After determining fhe number of transported mdferials of fhe different simulation models, one con compare fhe differences between the numbers of transported materials and justify fhe differences in costs of shipment and resources. The average cycle time ot Ihe library materials is the time it takes in on interval to return to fhe library of origin. This KPI is an important cost estimate for the library organizations because a materials out of fhe collection does not generate income. When returned, fhe materials ore accessible for end-users to be lent. After implementing a floating collection, fhe cycle time increases. The amount of increase is an important KPI for the implementation and the communication towards Ihe stakeholders.
The cost KPIs ore important performance measures fo answer the research question because the KPIs determine in port fhe success of this project. The research question raises fhe question if the implementation of a floating collection improves the transportafion of ILL considering budget limitations. Measuring the costs using cost KPIs partly answers this question.
Sen/ice
KPI unit
The average WQlinstinwoigl
calculation
Calculating th€: toys ttie end-user needs to wo: _ end-u!«r mode an order until the end- twréw» pick up Ihe ubrary material.
TABLE 4-2: SERVICE KPIS
fu Delft
kwink. r « p
The system requirements state that the waiting times of the end-user for receiving the ordered materials may not increase after implementation of fhe floating collection concept. The KPI that measures fhe waiting time is stated above. Calculation of the waiting time using the simulation method in the next chapter is not complicated. The time it takes for an end-user to receive its order is measured and assessed in paragraph 5.1.
The waiting times of the end-user ore of importance in answering the research question because the research question asks if the implementation of a floating collection improves the transportation of ILL considering the expected growth in demand. A growth in demand without a growth in capacity increases fhe wolfing times of the end-users. Measuring Ihe waiting times shows when the growth in demand of the ILL can be handled by the transportation sen/ice after implementation of the floating collection concept.
Capacity
KPI unit calculation
Mixture of Nbrory Xo(ownft)rary ITiis is calculated t ^ determining the nxrierlals wllhin a rucrterials within the origin of the library materials within Hi* , Mbtory eoHecWoB ca»«dk>n collection
Library shelve % The number of library materials in cun^ent capacHy collection divided by the originol number
of materials within the collection
TABLE 4-3: CAPACITY KPIS
The system requirements state that three terms of capaci ty should be met. First the capaci ty of the transport service cannot increase in fhe coming years due to budget constraints. The capac i ty of the transport system is not a KPI in this system because it is an input variable. Within the model the capaci ty remains the same. Second, fhe mixture of library materials must be contained. Library organizations need a large portion of their collection, more than 50%, fo be fheir own. Third, the capaci ty of the library shelves must be met. This means that the increase in number of materials in a certain library may not increase with more than 10% because of limited shelve space. The decrease in number of materials in libraries may not decrease more than 10% of fheir originol capacity.
The importance of Ihe capaci ty KPIs regarding fhe project are because of fhe stakeholders needs and position in fhe system. As identified in fhe library sector analysis (2.2), the negative effects that might occur after implementafion of a floating collection need to be minimized. Measuring these KPIs identify the negative effects of implementation and rate the pertormance of possible solutions to these negative effects.
• fu Delft

kwink. groep
4.2 SPECIFiCAHON
In this paragraph the details of the simulation model ore determined. All the necessary steps to specify the simulation model thot have been performed are described more in detail in Appendix K, Appendix L and Appendix M. In this paragraph a summary is provided to gain insight in the steps mode to specify the model.
The first step in fhe specification phase is fo build the simulation model. The simuldfion model is built in Rockwell Automation's Arena (41). This is a software fool to enable the simulation of discrete event simuldfion modeling. Using Arena, the models from the conceptualization phase ore translated into a simulation model that can be run in a certain time period to assess the processes and objects of fhe system and measure the performance of the system. In designing the Arena model the Handboek Arena is used (42). A more detailed description of fhe setup of fhe simulation model in Arena is presented in Appendix K: Setup of the Discrete Simulation Model.
A small representation of the exploratory network of library is shown in Figure 4-1:
FIGURE 4-1: SETUP OF THE SIMULATION MODEL BUILD IN ARENA
In Figure 4-1 fhe setup of fhe expbrofory model built in Arena is presented. In this small representation of a provincial sen/ice area and the libraries operating in this area the choice is made to use a set ot four libraries of different sizes in this model. All the relevant categories of libraries in the Netheriands are represented in the model.
• PSO • Plus Library (Library B) • Library Organization (Library A) • Library Locations (Libraries X and Y)
•fu Delft
k w i n k . groep
Each library has o different size of collection available for ILL and a different amount of members requesting ILL materials. In this model the PSO collects ond distributes the IBL dnd ILL from oil the libraries.
The next step is to collect the relevant data needed as input for the simulation model. The data is collected by performing interviews with relevant stakeholders and various internet sources. The nature of the public library sector in the Netheriands enables public ddfa sharing so all fhe relevant data are available without barriers. The data used in fhe simulation model can be viewed in Appendix L.
The tinal step is the setup of the simulation runs. In this step the length of the simulation njn is set; fhe length of fhe simulation run is one year. The main reason for choosing one year is fhe availability of the data collected. The data collected is in periods of calendar years which mokes the data easier for comparison reasons when fhe model is run for one year. More details on the simulation run setup can be viewed in Appendix M: Simulation Run Setup
During the former steps in specifying the simulation model, various assumptions have been made. These assumptions ore very important to clarify. Every model is a near representation of reality and simplified to creote a more cleor understanding of fhe situation. The assumptions made in this chapter limited the model in its performance in representing fhe real situation. All the assumptions made in during fhe design and specification can be viewed in Appendix N: Assumptions.
4.3 VERIFICATION AND V A I lOATii.):-:
During the verificdtion phase it is checked if the model is coded correctly and if fhe model is tronslafed correctly form the conceptualization phase fo the specification phase. During fhe specitication the input variables are determined and the calculation rules of the output variable determined. In this ppragraph if is checked if the translation is performed correctly. This is done by both a dynamic verification and static verification (43).
First the dynamic verification is performed. Dynamic verification is performed during the execution of software, and if dynamically checks its behavior. It is commonly known as the test phase (43). If is important if the model logic is coded correctly. At this point a trace of commands is mode in one simulation run. After several tests and adjustments, the model seems to be coded correctly. Next to the code, the model is walked through thoroughly and checked for structural errors. Second, the model has been checked if fhe output variables ore calculated correctly. This is called the static veriflcation. Static verification is the process of checking that fhe software meets the requirements by doing a physical inspection of if (43). The model is checked how much entities ore created, how much entities end up in queues and how much entities leave the system. In fhe lost model this is all acceptable.
The final step in completing the design of fhe simulation model is to validate the model. Validation means that the model is conrectly representing reality. The validation phase knows two steps. The first phase is the face validation by o library expert and the second phase is the structural validation of the simulation model.
•fu Delft

kwink. groep
The face validation phase is condLJcted with an expert within ttie library sector and a manager of a PSO transportation service (7). Face validity is fhe validity of d test at face value. In other words, a test can be said fo hove face validity if it "looks like" it is going to measure what if is supposed to measure. In simutation, the first goal of the simukjfion analyst is fo construct a model that appears reasonable on its face fo model users and others who are knowledgeable about the real system fcieing simulated (19), During the expert meeting, all the inputs, processes and outputs of the model were discussed. Also, the behavior after changing several input variables is discussed and after several adaptations to the model, the model was face validated.
The next validation step lets Ihe model undergo several structural tests to check if the model behaves as expected fo fhe changes in input parameters. This is necessary because it needs fo undergo experiments in a kjfer stage in fhe project. With these tests, some input variables are changed Into extreme values and checked how the model responds lo these changes (44), Three tests have been done and the results of the tests can be viewed in Appendix O: Validation and fhe summary is given bebw.
• Capacity ol a shipnie/if In this test the capacity of a shipment is kjwered to a minimum, instead of allowing 45 materials (3 crates) per library per pickup day, the variable is changed to 15 materials (1 crate). As con be seen in the appendix, the model behaves like expected. The majority of the library materials are not collected by the PSO dnd do end up in long queues. This delays fhe wait tor materials for fhe end-user dramatically. This is as expected because the capacity of the current situation is just sufficient to transport the materials.
• Percentage ot users requesting mrj(ena/s In this test the distribution of the requests over the libraries is changed. In the current situation the library users from Bbrary A request materials with the ^ distribution of 70% fo library X and 30% from library Y. This distribution is >-reversed. The expected effect occurs. Library Y receives too many orders and c with the current service level cannot provide this servtee. Also the librory o coHection is too small to handle the requests resulting in the emptying of fhe £-collection. This can be seen in Appendix O. ^
a . the speed (•! itK- collection ond distribution of library rriateriats £
In this lest fhe speed of collection and distribution of the PSO transport service ^ is varied. The current speed in the model is halt a day fo reach the PSO and 'g half a day to reach the destination k>cation. In Appendix O the results dre o> presented and fhe effects of ttie waiting times are as expected. When o dropping fhe time fo 0 days, the waiting times of the end-users decreases and o when the speed is changed to 3 days, the waiting times increase. ^
.52 D
ru Delft 4.5
kwink.
o o
E
o O)
T3 o 5
~ "fu Delft

kwink. groep
5 EVALUATION OF THE SIMULATION RESULTS
In fhe former chapter a simulation model has been designed fo evaluate the floating collection concept by implemenflng this concept in the model ot the current situation. The simulation model has been designed and validated by sources within fhe library sector. In this chapter the simulation models are run for the period of one year and the results ore presented in the first paragraph. Atter assessing the results, the results ore evaluated on the key performance indicators identified in the former chapter.
5.1 RESULTS FROM THE SIMULATION RUNS
The key performance indicators identified in paragraph 4.1.4 are measured using fhe simulation models designed in the former chapter. The KPIs are as followed:
. The numi-jer of library materials transported by fhe PSO o The number of materials collected by the PSO o The number of materials distributed by the PSO
• Averoge cycle time of lit'jrory tnatenals • Average waiting times for fhe end-users • The composilion of ihe lihiaiy collections
o Mixture of library materials within a library collection o Library shelve capacity
In fhe following sections fhe results on the KPIs ore presented using tables and graphs, and fhe results ore discussed. First the current situation is presented followed by the future situation of the ILL in the next three years and finally followed by fhe results from fhe implemented floating collection. The final results from the adaptations made to the models regarding the redistribution plan are set up to minimize the negative effects of implementing the floating collection.
.5.1 .1 CURkFNl SiflJAIr.iK
The simulation results for the cun-ent situation ore presented below for all the KPIs:
Materials Collected
Materials Distributed
Total
materials
5817
5701
11518
crates
1939
1900
3839
I
Materials transporten lyy PSO B
E
o 3 i
TABLE 5-1: CURRENT SITUATION: MATERIALS TRANSPORTED » .
O
As shown in Table 5-1, in the current system 11.518 materials ore being transported by § the PSO. The difference in Ihe numbers of collected materials and distributed S materials are the materials still handled by fhe PSO at the moment that the simulation S run has been stopped. Note that the number of transported materials is done with the n capacity of 3 crates per library and that a crate can handle IS materials. u
ru Delft
D
47
kwink. groep
Average cycle time of library materials
days
Average cycle tinne of a library material 18,0
TABLE S-2: CURRENT SITUATION: CYCLE tiME
The average cycle time, fhe time it fakes for a library material to be back at the library ot origin is 18 days. This number is more dependent on the time if takes the user to use fhe material than the transportation service operated by the PSO. The time fhe user uses the material is determined by a triangular distribution of minimum 3 days, on average 7 days and a maximum of 18 days. If the overage waiting time (see below) is subtracted twice (two trips) from 18 ddys, 10 days remain as the time it takes for a user to return the material effectively. This is unexpected. One would expect 7 days fo be the average time it takes the user to use the materials. It takes the material 3 days longer than overage to return to the library. Due fo the different service levels (Plus Library 5 days I LibA 3 days / LtbX 2 days / LibY I day) of fhe libraries, the materials take longer, on average, to return to the owning library. This accounts for fhe extra cycle time of the library materials.
Averoge wailing times end-user
days
Average watting times of the end-user 3.8
TABLE S-3: CURRENT STTUATION: WAITING TIMES
The average waiting time of an end-user is 3.8 days. This number is validated in fhe previous chapter using fhe experts' opinion and is fhe overall overage in the current situation. Note that due to fhe different service levels of the libraries the waiting times are dependent on the service level (the number of times per week the PSO serves fhe library) provided by the PSO. Also note that in the simulations weekends ore excluded from the simulation time. The days used in this chapter ore weekdays.
The composition of the library cotteclion:^
The composition of the library collection in the current situation is static. Every library possesses its own materials which is presented in Tdble 5-4.
Materials
Plus
LO
LLX
LLY
CoHecffons Plus
100%
0%
1 0%
0%
LO
0%
100%
0%
0%
LLX
0%
0%
100%
0%
LLY
0%
0%
0%
100%
TABLE 5-4: CURRENT SITUATION: COMPOSITIONS OF COLLECTIONS
•fu Delft

kwink. groep
These values are e x p e c t e d because all the used ILL materials returned by the end-
user return to the library of fhe owner by the transportation service of fhe PSO. These
presented resuHs of the current sriuation are fhe yardstick with wh ich fhe next models
(the future situation and the floating collection) are c o m p a r e d .
.;, i .'/ '-\:HIK\ Sli l • ON
In the future situation the simuk3tk>n models ore t>eing a d o p t e d to fit the p red ic ted
future scenarios. As discussed in pa rag raph 3.1, the d e m a n d for ILL increases
dramat ical ly . The fo l lowing increase presented in Table 5-5 is p red ic ted b y Mr. Spanier
(7):
Year Growth In demand/year
TAUE S-S; GROWTH IN DEMAND FOR lit
These growth rotes have b e e n a d a p t e d in the d e m a n d of the mode l a n d fhe
fol lowing results ore from the simulation runs indicat ing the values for the KPIs in the
future situation.
Moferials trai^sporled by PSO
T393I
-Total Libirary Materials Transported
2010 2011 2012 2013
FIGURE 5-1: FUTURE StTUATION: MATERIAtS ItANSPOntO
The g raph in Figure 5-1 indicates the g rowth in materials t je ing t ransported by the PSO
transport service. The e x p e c t e d growth rates of t t ie t ransported materials a re similar
to fhe growth rotes as in
Table 5-5, but this does not occur. The reason for the decl ine in growth of the
transported library materials is the stationary capac i t y of the trucks of the PSO
transportation sen/ice. The capac i t y reaches its max imum after 2010 and simply
canno t handle the extra d e m a n d in ILL. The remain ing I txory materials remain within
the queues at the library wai t ing l o b e p i cked u p t t ie next t ime the PSO services the
ru Delft
kwink. groep
library. These queues increase exponential ly through time. It is arguable that the
results presented in Figure 5-1 ore representing the real future situation. Whenever the
wai t ing times of ILL grow exponential ly, the users use the ILL system less, creat ing a
drop in d e m a n d . This elastictty of d e m a n d is not mode led in these simulations and the
results a b o v e stipukate the react ion of Ihe system fo the exponential ly increase of the
d e m a n d for ILL.
Another reoson for the d e c i n e in growth o l materials t ransported is the raise of
number of materials wai t ing in the queues. Due to the exponential ly growth ot
number of materials in queues, fhe number of materials within fhe library col lect ion
drop fo zero, wh ich disenables users requesting orders to order a n d these users a n d
requests exit the system without the orders be ing honored.
A.veiacjf^ cycle time of tibiary inaterials
VH,5
- A v e r a g e Cyc le Time Library Materials (in days)
FKÏURE 5-2: FUTURE SITUATION; CYCLE TIME
The overage cyc le time of a library material increases through the years. As said
before, the cyc le t ime is dependen t on the time it takes fhe users to use the materials,
but in Ihe case of growing d e m a n d , the wai t ing times within the queues for the PSO
transport seroice take over as fhe main driver for the cyc le Hme a n d fhe cyc le t ime
grows up to 134.5 days in Ihe year 2013. When subtract ing the average wait ing times
of the users in 2013 (see below) (52,8 days) a n d the average usage t ime of a library
material (14 days) from the cyc le t ime, 68 days is left wha t represents the average
wai t ing t ime within bo th fhe queues at the library, at fhe col lect ion for p ickup a n d at
the col lect ion for return, fl takes fhe PSO so long fo pick up a library material at a
library because ot the l imited capac i t y avai lable (see above) . All these figures are
aga in arguable because of fhe drastic increase in wai t ing times it is quest ionable if
the end-users will still use t t ie system a n d if the d e m a n d will stil increase with the same
rate as used in this project.
ru Delft

kwink. groep
Average waiting times end-user
60,0
500
40,0
300
20,0
10,0
0,0
2010
52,8
-Average Waiting Times End-User in days
2013
FIGURE 5-3: FUTURE SITUATION: WAITING TIMES
As expected from the former results shown above, fhe waiting times rise to the extreme in the coming years due fo fhe increase in demand for ILL. The average waiting times increase up to 10 weeks. If is an understdfement that these waiting times are unacceptable for the end-users. It is argued before whether the end-users will wait this long for their materials. As a result of the increasing waiting times, the demand drops after several months. This indirect effect, the elasticity of the demand, is not modeled in this project in order to objectively compare the future situation with implementing the floating collection concept.
When evaluating the results of the future situation without the option to implement a floating collection concept, one can argue fhe severity of the future sifuotion of ILL. When the growth rates are to increase as expected by the expert, fhe library sector involved with ILL has a serious problem. With the current capacity, the increase in demand can never be handled by fhe PSOs and wrih no funds available for increase in capacity, the sector should find serious solutions fo decrease the increase in demand for fhe future,
The cornr">osifion of the library collectioiY:. The composition of fhe library collections of fhe libraries in the future situation remain fhe some as in the current situation.
5.1 .3 I M P I I M F N U N G it i ' E,rjAiiNf,^ ContCf iON At this point the simulation model used in the lost two paragraphs is addpfed more thorough. Adaptations are made in order to simulate the situation in which library materials are returned and not transported back to the origin library. The materials enter the library collection of fhe user who lost used fhe library material. The results from fhe simulations through the coming three years are presented in the section below.
ru Delft
k w i n k . groep
/Materials transported by PSO
18000
16000
14000
12000
10000
8000
6000
4000
12.983
^-"""^ 11.518
^„.^l.'JO,^
5.345
2010 2011
13.683
-—r / / /
10.624,6
2012
16.419,1
/ / / ' i ^
13,931
2013
FIGURE 5-4: FLOATING COLLECTION: MATERIALS TRANSPORTED
In Figure 5-4, the number of transported materials through the years is presented for the future situation and after the implementation of the floating collection concept. It is clear that due to the implementation of the floating collection in the year 2010, the number of materials tronsported decrease with 50%. Due fo the materials not returning to their origin, a major decrease in movements is realized. This effect has on effect on the capacity of the transport service. The capacity of the transportation service double in respect to the demand for transport after implementing the floating collection concept. The figure in year 2010 drops more than 50%. This is caused by the minor adaptations to fhe model. Because within fhe exploratory model, due to its size, the materials requested by fhe end-users are sometimes located at fheir own library which disables the need for transportation. This minor change in the model is justifiable because offer implementing a floating collection, fhe user will first use fhe ILL system before checking fhe shelf of fhe library for this material (7). Even while considering this effect, the frdnsportofion drops near 50%, which is expected.
This effect In year 2010 was expected, but the results in the next years are more interesting. The question was if the implementafion of the floating collection can intercept fhe demand for ILL with the some capacity. Due to the abovementioned incredse in capacity of the transport service, the increase in demand for ILL in fhe future can be handled by the PSO (when looking of fhe stable waiting times of fhe end-users below). The increase In transportation follows the some growth as the growth of demand. This means no increase in waiting times for the users and no unnecessary waiting times of materials to be handled by the PSO. The results in 2013 of the floating collection compared to the future situation ore unexpected at first, but considering the unwanted modeling effects caused by the exponentially increase of queues in the future situation, the model of fhe floating collection con handle fhe increase of demand, whereas the model of the future situation cannot. This causes the number of transported materials to increase in the year 2013 compared to fhe
•fu Delft

kwink. groep
future situation. This makes the two models non-comparab le in the future years (2011 -
2013). However, positive results for the implementat ion of a fioating col lect ion c a n be
der ived.
Aveiagt? cycle time of library materials
FIGURE 5-5: FLOATING COLLECTION: CYCLE n M i
The graph stating the cyc le t ime shows tha i the cyc le times of Nbrory materials
increase more than 8 times. This is e x p e c t e d due to the fdc t that the materials d o not
return fo the origin directly. Interesting to know is that, on ave rage , the library
materials d o return to their origin, a n d within 32 weeks in the cose of this small
exploratory mode l . However, one c a n argue these resutts w h e n looking at reality. The
simulation mode l is a small network of libraries, a n d increasing the number ot libraries
within the nefwori< will increase the cyc le t ime of the materials.
Average waiting times er
60,0
50,0
40,0
1 30,0 20.0
10,0
FIGU
• Future Situation
• Floating Collection
RE 5-4: FIOATING COUECTIi
d-user
2010
3,8
2,9
ON: WAniNG IMRe
2011
20,5
2,9
!
1 1 1 L 2012
42,0
2,8
. _
1 1 1 I L 2013
52,8
3,0
3
2
'i7) 0)
O c o
1 LU
_o
S Ö
u
s i
ru Delft 53
kwink. Following fhe expecta t ion of the increase of number of materials transported, t t ie
wai t ing times of the end-users d o not increase significantiy in the coming years with
the implementat ion ot the floating col lect ion.
These results ore very c lear in identifying d positive resutt for the implementaf ion of
f loat ing col lect ion in fhe situation of the Dutch library sector. However, the negat ive
effects expec ted by the stakeholders n e e d to b e invest igated. The fol lowing KPIs on
the composit ion of fhe library col lections try to g ive a c lear indicat ion on the results of
the negat ive effects offer implement ing t t ie floating col lect ion concep t .
CofT)/,)ositi'oii of Colleclioni irt fhe year 20I'S
FIGURE 5-7: HOADNG COUfCnON: COMPOSITION OF THE COLLECTIONS
FIGURf 5-*: HOAIING COUECTION: COMrOSmOM OF THE COLLECTIONS
The flrst discussed issue offer implementaf lon of the f loat ing col lect ion in fhe former
chap te r is the mixture of library materials in the library col lect ions. As illustrated In the
ru Delft

kwink. groep
Figure 5-7, the library collections are mixed. The Plus library (LibB) has a less mixed
library col lect ion than the others. This was e x p e c t e d because the materials avai lab le
for ILL of fhe Plus library within this system are of scientitic level. The d e m a n d for the
scientific materials is lower than for the regular materials (for a more deta i led
description on the d e m a n d patterns a n d assumptions see Appendix L a n d Appendix
N) d n d therefore the materials from the plus library ore not spread out over the other
libraries. One c a n see a c lear distribution in the mixture of materials within the
collections. This is as e x p e c t e d due to the distribution of the d e m a n d depend ing on
the size of the library collections. The assumption is that the materials within this
exploratory mode l are without categor izat ion of any sort. Recall ing paragraph 2.3.2,
categor izat ion of ILL was not possible. Other categorizations (e.g. origin) are left out
ot this model . Within this mode l the smallest library col lect ion (library locat ion Y) loses
most of its materials. When reflect ing on the real situation, this might not h a p p e n .
Small libraries hove special collections wh ich might not be of interest in the larger
libraries. Assuming equa l categor ies of materials, this does occur.
As discussed in pa rag raph 3.2.2, w h e n libraries lose more than 50% of fheir own
col lect ion it is u n a c c e p t a b l e for the library organizations. In the Figure 5-7 it is clear
that this p h e n o m e n o n occurs tor three out of four libraries. As discussed in paragraph
3.2.3, a redistribution p lan needs to be designed in order to minimize this unwan ted
ef fect . In pa ragraph 5.1.4, the redistribution p lan is designed a n d a d o p t e d in the
mode l to genera te resutts a n d determine whether this p lan still favors fhe f loating
col lect ion as a suitable al ternat ive to the issues s ta ted in this report.
The next issue expec ted by the involved stakeholders is the unba lance in number of
materials within the library collections. In fhe Figure 5-8 is shown that this issue does not
occur within this simulation mode l w h e n c o m p a r e d to the inriial values of the library
col lect ion stated in Appendix L. As is shown in Figure 5-8, the libraries have the similar
amount of materials in the processes a n d no significant unba lance is identi f ied. After
analysis if b e c a m e clear that the assumptions m o d e in the former chapter ore fhe
reason for the per tect ba lance in the library collections. To recall fhe da ta col lect ion
paragraph , 4.2.2, fhe number of requests per requesting library is proport ional to the
size of the library col lect ion. In the interview with Mr. Spanier he clearly stated that
one c a n assume this distribution of requests (7). One c a n argue if this is fhe case in the
real wor id. It is however difficult to simulate random values in this part of the simulation
mode l . Test runs have been per formed where the distribution is subjected to random
distribution functions. However, due to fhe necessary replications, on average
towards the stated distribution occurs. Unless fhe proport ional distribution of requests
a n d size of library col lect ion differs, the b a l a n c e in library col lections remains in
ba lance .
In combinat ion with the issue of mixed library collections a n d the stakeholder
requirements to decrease the cyc le time of materials once f loat ing, o redistribution
p lan is designed a n d imp lemented in fhe f loating col lect ion simulation model . The
design and the results dre presented in the fol lowing pa rag raph .
• fu Delft
kwink. groep
5.1.4 ADAPTING IHL- FLOATING COLLECTION CONCEPI
in this pa ragraph the issues occurr ing during implementat ion of the floating
col lect ion, as discussed in the former chapter , ore a t t e m p t e d to be minimized. This is
done by adop t ing the f loat ing col lect ion simulation mode l with a redistribution p lan.
Several options are avai lable for a redistribution p lon to b e designed, dnd these
options are discussed first.
The first subject that needs to b e de termined is the number of materials that need to
b e redistributed to the rightful libraries. By determining these numbers, o closer look is
token into fhe composit ion as simulated in the former paragraph . By determining a
w a n t e d composi t ion a n d subtract ing the current composi t ion from this desired
situation, one gets the percentages of the col lect ion that need to b e redistributed
a n d the locations where to redistribute the library materials. In the following tables the
desired situation is presented as is fhe subtract ion from the current situation. This all
resulting in the redistribution p lan,
CoMecffons
Materials Plus LO LLX LLY
Plus
LO
LLX
LLY
70%
10%
10%
10%
10X
70%
10%
10%
10%
10%
70%
10%
tox
10%
10%
70%
TABLE 5-S: DESIRED COMPOSItiON OF COLLECTIONS AFTER REDISTRIBUtiON
After the interview wtth Mr. Spanier, ft b e c a m e clear that the libraries would not
o c c e p t losing more than 50% of fheir col lect ion while part ic ipat ing with the f loating
col lect ion (7). To c rea te a safety margin for the redistributions, 20% is a d d e d to the
initial stakeholder requirement, creat ing a n e e d for 70% of the own col lect ion to be
part of the col lect ion otter redistribution. Following f rom this desired situation the
fol lowing redistribution p idn is m d d e by subtract ing fhe desired composi t ion from the
current composi t ion. In Tables 5-7 fill 5-9 fhe calcu lat ion c o n be fo l lowed.
Materials
Plus
LO
LLX
LLY
Collecffons
Plus
93%
4%
2%
1%
LO
12%
47%
27%
13%
LLX
11%
48%
27%
14%
LLY
11%
48%
27%
14%
TABLE 5-7: CURRENT COMPOSITION UBRARY COLLECTIONS
TU Delft
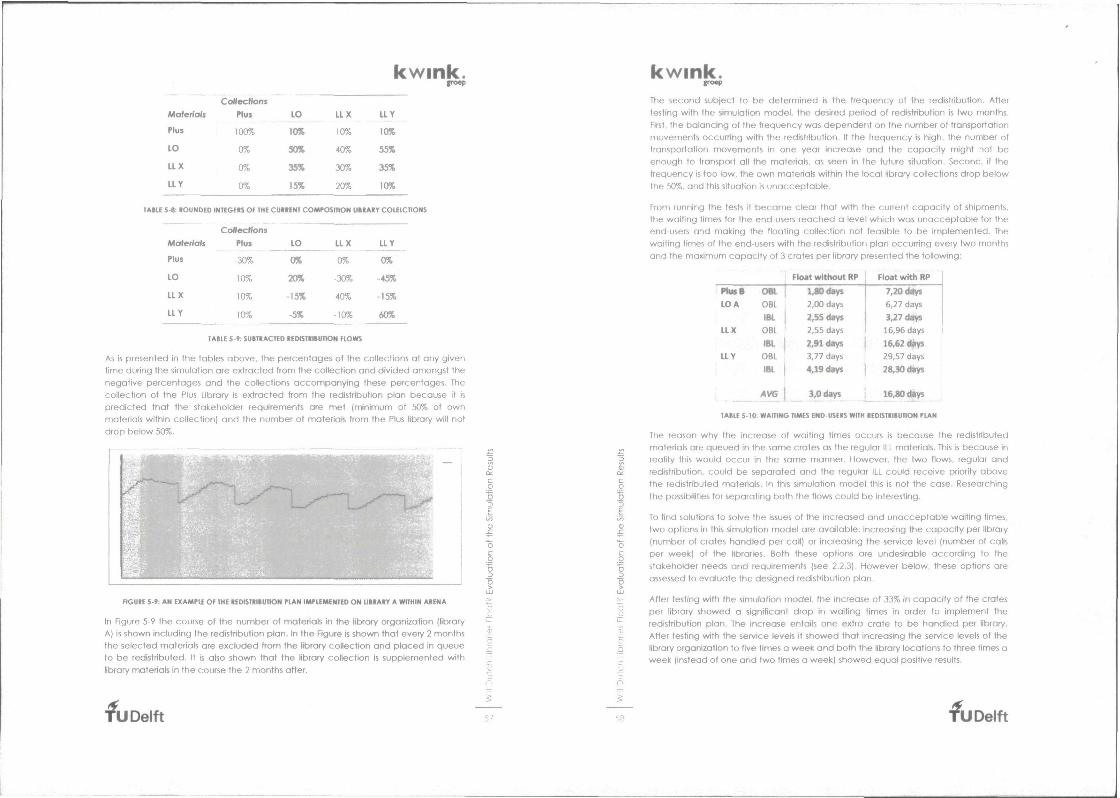
kwink. groep
Materials
Plus
LO
LLX
LLY
CoNecHons
Plus
100%
0%
0%
0%
LO
lOK
30%
35%
1S%
LLX
10%
40%
30%
20%
UY
10%
55%
35%
10%
TABLE 5-a: ROUNDED INTEGERS OF THE CURRENT COMPOSITION UIRARY COLEICTIONS
Moferfals
Plus
LO
LLX
LLY
CoffecHbns
Plus
-30%
10%
10%
10%
LO
0%
20%
-1S%
-5%
LLX
0%
-30%
40%
-10%
LLY
0%
-4S%
-15%
40%
TABLE S-f: SUBTRACTED REDSTRIIUTION FLOWS
As is presented in the tables above, the percentages of the collections at any given time during Ihe simuldtion ore extracted from Ihe collection and divided amongst the negative percentages and the collections accompanying these percentages. The collection of the Plus Library is extracted from the redistribution plan because if is predicted that the stakeholder requirements dre met (minimum of 50% of own materials wrthin collection) and the number ot materials from the Plus library will not drop below 50%.
FIGURE 5-9: AN EXAMPLE OF THE REDISTRIiUTION PLAN IMTIEMENTED ON UBRARY A WnHIN ARENA
In Figure 5-9 the course of fhe number of materials in the library organization (library A) is shown including the redistribution plan. In the Figure is shown that every 2 months the selected materials ore excluded from the library collection and placed in queue to be redistributed. It is also shown that the library collection Is supplemented with library materials in the course the 2 months after.
•fu Delft
k w i n k . g™p
The second subject to be determined is fhe frequency of the redistribution. After testing with the simulation model, the desired period of redistribution is two months. First, the balancing of fhe frequency was dependent on the number of transportafion movements occurring with the redistribution. If the frequency is high, the number of transportation movements in one year increase and the capacity might not be enough to transport all the materials, as seen in the future situation. Second, if fhe frequency is too low, the own materials within fhe local library collections drop below fhe 50%. and this situation is unacceptable.
From running the tests it became clear that with fhe current capacity of shipments. the waiting times for the end-users reached a level which was unacceptable for the end-users and making the floating collection not feasible to be implemented. The waiting times of fhe end-users with fhe redistribution plan occurring every two months and the maximum capacity of 3 crates per library presented the following:
i n n . * LOA
! LLX
LLY [
DM. OBL
m. OBL Wl OBL
«(.
AV6
xm«»»t 2,00 days
2,SSdiiys
2,55 days
Wi*iys 3,77 days
4 . U d a y t
l ^ d ^ r s
Float with RP
7,20 «hi»» 6,27 days
3,27 days
16,96 days
16,62 #ys 29,57 days
28,30 dns
iejo#ys
TABLE 5-10: WAITING TIMES END-USERS WITH REDISTRIBUTION PLAN
The reason why fhe increase of waiting times occurs is because fhe redistributed materials ate queued in the same crates as the regular ILL materials. This is because in reoltty this would occur in the same manner. However, the two flows, regular and redistribution, could be separated and the regular ILL could receive priority above fhe redistributed materials. In this simulation model this is not the case. Researching the possibilities for separating both the flows could be interesting.
To tind solutions lo solve the issues of fhe increased and unacceptable waiting times, two options in this simulation model are available: increasing the capacity per library (number of crates handled per call) or increasing the service level (number of calls per week) of the libraries. Both these options are undesirable according to fhe stakeholder needs and requirements (see 2.2.3). However below, these options ore assessed to evaluate the designed redistribution plan.
After testing with the simulation model, fhe increase of 33% in capacity of the crates per library showed a significant drop in waiting times in order to implement the redistribution plan. The increase entails one extra crate fo be handled per library. After testing with the service levels it showed that increasing the sen/ice levels of the library organization to tive times a week and both the library locations to three times a week (instead of one and two times a week) showed equal positive results.
•fu Delft

kwink. groep
The cho ice is m o d e fo handle one cra te more per library instead of increasing the
service levels. This is m o d e because increasing the service levels has a higher impac t
on the number of resources n e e d e d for the transportaf ion service of fhe PSO. After
ca lcu lat ion, increasing the service level needs four crates per week more than
increasing fhe number of crates hand led per library. Also looking of fhe routes
ope ra ted by fhe PSOs, increasing the number of crates per library is more efficient
than add ing locations fo the existing routes.
To conc lude , a redistribution p lan is designed wi th the fol lov^ng characteristics:
• Frecjuency: 2 months
• PSO ("apoci ty increase: I c ra te per library
The results of the simulation runs including the redistribution p lan are dep i c ted in the
lol lowing section.
Materials transported by P.50
25000
15000
10000
5000
2010 2011 2012 2013
i Current Situation • Floating Collection
25000
2010 2011 2012 2013
I Redistribution Ptan with extra capacity
FIGURE 5-10: FLOATING COLLECTION COMPARED WITH REDISTRIBUTION PLAN: MATERIAU TRANSPORTED
The compar ison of the results f rom 2010 a n d 2011 show that that the number of
transported materials with a f loating col lect ion including fhe distribution plan is higher
than without fhe redistribution p lan . This is as e x p e c t e d due to the increase in
transportafion because of the extra transport movements genera ted by the
redistribution. It is olso showed thdf the number of t ransported materials is less than
the current sttuofion, wh ich indicates that an improvement in number of transported
materials is c rea ted a n d extra capac i t y is gene ra ted c o m p a r e d to the current
situation.
The results in years 2012 a n d 2013 ot fhe number of t ransported materials are un-
c o m p a r o b l e due fo the extra c a p a c i t y imp lemen ted wtthin the m o d e l including the
redistribution p lan. The extra c a p a c i t y is used in these years wh ich disenables the
compar ison be tween the results. However it is positive that the extra capac i t y is used
'U Delft
kwink. in the yea5 2012 a n d 2013. This shows that wtth the growth in d e m a n d , the extra
capac i t y Is n e e d e d .
Average f:yc/e time of library materials
180,0
160,0
140,0
120,0
100,0
80,0
60,0
40,0
20,0
156,2
18,0
2010
• Current Situation • FkDoting Collection
180,0
160,0
140,0
120,0
100,0
80,0
60,0
40,0
20,0
117,0
2010
• Redistribution Plan witti extra capacity
FIGURE 5-11: REDISTRIBUTION PLAN: CYCLE tiME
Looking of fhe results of fhe cyc le times of the materials including the redistribution
p lan, the cyc le times decrease. However, the decrease in cyc le time (of 25%) is not
signiticant c o m p a r e d to the f loating col lect ion wrihout redistribution p lan.
Average waiting times- end-user
2010 2011 2012 2013
M Future Situation • Floating Collection
2010 2011 2012 2013
• Redistribution Plan
FIGURE 5-12: REDISTRIBUTION PLAN: WAITING TIMES
The overage wai t ing times show promising results. However the wai t ing times d o
increase due to the increase in traffic within the mode l . On the one hand , one c o n
argue if fhe Increase in transportation moves is signiticant or even troubling for the
end-users. On the other hand , the n e e d for copac t t y increase might disencouroge
fu Delft

kwink. the stakeholders to consider the option. This because increase in capacity does not even lower the waiting times for the endusers.
These resutts ore very positive for the implementation of the floating collection concept. Including a redistribution plan with a frequency of 2 months, the future demand ot ILL can be transporofed by the PSO with only a small Increase in capacity per library. The use of a redistribution plan attempts to minimize the negative effects for the involved stakeholders. If these effects ore indeed minimized is shown in fhe next section.
CoiripC'^ition of Collections
FIGURE 5-13: REDiSTRIBUnON PLAN: COMPOSITION OF COLLECTIONS
As seen in Figure 5-13, fhe redistribution plan meets the requirements from the stakehokiers. On average the requirements are met. tt is shown from the animations used in the simulation modeling that, lor example, the collection of LL Y drops to 47% a couple of days before the redistiibution. This must be taken info account when communicating to fhe stakehokiers, but might not be significant as fhe average is significantly above fhe 50% (74%).
•fu Delft
k w i n k .
FIGURE 5-14: REDISTRIBUTION PLAN: COMPOSITION OF COLLECTIONS
As seen from Figure 5-14, the balance of the collection remains. This is as expected due to fhe proportion between the requests and the size of ttie libraries.
In this paragraph the resuHs from the former paragraph ore evaluated against the stakehokjer requirements and the system requirements based on the resutts of the KPIs presented. This evaluation is done in the three identified categories: costs, service and capacity.
Deriving the direct costs ot implementing the ftoating collection is complicated wtthin this project. The simulation model models the KPI: number of transport movements per material. The number of movements could be translated into currency, however, Ihe historical data does not provide this information, and neither is this model capable of calculating the costs in o significant fashion. The evaluation on costs are assessed based on the percentage difference between the alternatives.
The main cost drivers of fhe transportation service of the PSO are the necessary resources like trucks and truck drivers. Within the simulation model ot the current sriuation a dear picture is shown ot an exploratory situation in which the capacity is neariy sufficient. This is also the case wtthin the real worid. Any changes to this system cause the capacity fo be more than enough or absolutely not sufficient. To know this, one must look of the average waiting fimes of the end-user. When the waiting times increase, this is due fo the limited capacity available.
WWIe designing the redistribution plan, a choice is made fo increase fhe copactty. This is not conform Ihe stakeholders' needs or reqtjirennents, txit is tested to show the results. Not increasing the copactty shows that with a redistribution plan, fhe floating collection concept is not a leasible concept tor implementation in the case of the example model. Increasing fhe copactty leads to additional investments, but ttie
5 62 ru Delft

kwink. groep
question is how much. This is not on easy question to answer. The capacity is increased by 33%. But this does not mean that when owned 3 trucks, fhe PSO should invest in I extra truck. There ore numerous factors influencing the need for an extra truck.
The conclusion here is that when after implementing the floating collection concept including fhe redistribution plan, the PSO must manage the capacity closely. The results show that in year 2012, the extra copactty is needed: so immediate necessity for extra capacity is not required. This gives the transport service of the PSO some room to grow into the expected incredse of demand.
5,?'^ SFRVTF
Evaluating the service towards the end-user is done based on Ihe averoge waiting times. This is the time an end-user needs fo wait before it con pick-up its material from the library. Assessing the results gives a positive feedback for the waiting fimes otter implementing the floating collection. Even after implementing the redistribution plan info the floating collection concept confirms that the waiting times are not signiticantly larger than accepted.
The waiting times do increase after implementing the redistribution plon, but not to an unacceptable level. Whether to know if the former statement is true, tt is necessary to communicate the waiting times to the stakeholders.
5 2.;» (~»'"AC!iy The category of capacity deals with three subjects;
• The capacity of the transport sen/ice • The capacity of the library shelves • The contiguration of library materials within the library collection
The capacity of the transport service is discussed in paragraph 5.2.1.
The capacity of library shelves proved to be of no concern within this project. Due to the proportional distribution of the requests from the requesting libraries and the size of fhe library collections, fhe capacities of the shelves within the libraries in the model remained intact. There were no libraries under-shelved and no libraries with on under capacity. However, in the real worid, this is most likely not to occur. The real worid is not as pertect as the model in this project. As seen in Sarasota, fhe unbalance between libraries participating in o floating collection does occur and implementing a redistribution plan should solve this issue. The redistribution plan in this project does not rebalance the libraries, but minor changes in the model enable this when needed.
The configuration ot the library collections generated issues like expected in the fonner chapter. With the implementafion of fhe redistribution plan, the issues ore resolved.
•fu Delft
k w i n k .
2
3
64 ru Delft

kwink. groep
6 CONCLUSIONS AND RECOMMENDATIONS In this chapter fhe project is concluded. First the sub research questions slated in the introduction are answered. The next step is fo evaluate fhe project and answer the main research question of this project. The Hmitations of this project ore discussed next and the last step is to present recommendations to the Stichting PSO Nederiand for further steps into implementing a floating collection in the library sector in the Netherlands.
1. How is the current system of distribution ol materials belween libraries in the Netheriands organized and who ore the relevant slakeholders involved?
To answer this question several aspects of this question were answered first. First fhe problem owner, the Stichting PSO Nederiand, was investigated and after that the library sector and its stakeholders were analyzed, using desk research, inten/iews etc. Outcome of this analysis is a set of stakeholder needs dnd requirements in where the demands of the stakeholders in the process of implementing o fioating collection were determined:
The following stakeholder needs hove been determined:
• A need for Innovation within the sector to meet the requirements of the end-users.
• The availability of library materials is of essence to increase Ihe sen/ice for fhe end-user.
Stakeholder requirements for implementing the ftoating collection concept ore to moke sure that the costs of implementing o floating collection are to the minimum: to moke sure that the waiting time for end-users not increase after implementation of the floating collection; and to ensure Ihe minimization of negative effects after implementation of the fioating collection concept.
Concluding from the stakeholder analysis one con argue that fhe network of stakeholders is very large wtth many individual stakeholders with different agendas. The reason for this is fhe historical development of the sector. Implementing a floating collection on a national scale considering fhe complexity of many stakeholders implicates fhe difficutty in realizing the possible implementation. The notional organizations in Ihe sector must not underestimate the need for collaboration on the lower level of the sector in order to achieve innovative national agendds such as implementing o floating collection concept.
Second, fhe organization of interiibrary loan (ILL) was analyzed more into depth to creote insight in the business of transporting library materials wrthin the network of libraries. The possibility to categorize the ILL materials in respect to fhe total collection is investigated with no success by using the long foil theory of Anderson (see 2.3.2). The current organization is analyzed including the logistics of fhe transport service and the level of service provided towards the end-user. The outcome of this phase is a SWOT analysis of the current organization which is shown in paragraph 2.3.4. The strengths and opportuntties of Ihe current situation are the retail formula of fhe
•fu Delft
k w i n k . poep
libraries which forces the end-users to travel to the library lor their materials which enables people fo meet in libraries and be tempted lo participate In cutturol events organized by fhe libraries. This feature has the opportunity to create cultural centers around libraries in the cities. Negative aspects of the current situation are the opening hours and distances to the libraries. These aspects limit certain population groups' access to the libraries and their collections. Implementing the notional catalogue in combination with a floating collection concept might improve the accessibility for these population groups.
Third, fhe system requirements are identified using the input from fhe former analyses and constructing a causal relationship diagram of the ILL system. This didgram creates a complete overview of fhe discrete element factors of fhe system and their direct causal relationships between each other. The diagram identitied fhe instruments of fhe system that can be influenced by the Stichting PSO Nederiand, the environmental factors which were the input in analyzing future trends and the criteria factors which followed into fhe system requirements. The system requirements ore as followed;
• The costs per shipment of ILL may not increase while implementing floating collection
• The number of resources used fo transport fhe ILL materials may not increase while implementing the floating collection concept
. The waiting times for the end-user may not increase due to the implementation of o floating collection
. The capacity of the transport service cannot increase in the coming years
. The capacity of fhe Library shelves must be met
. The number of scientific materials in the collections must be limited
2. In what woy con Ihe ftoating collection be imp/emented fo meet fhe requirements of fhe involved stakeholders and future growth of ILL in fhe library sector?
The steps Into answering this question are as follows. To analyze fhe future situation of the ILL in the Netherlands fhe environmental factors from the causal relationship diagram were the input for investigating the future trends. The main driver for fhe future is fhe increase in demand for ILL caused by the future introduction of the NBC. After desk resedrch and discussions with an expert, the growth rates of the ILL demand in Ihe coming years were predicted lor 2011-2013 respectively 35%, 45% and 55%.
The second step was fo analyze the floating collection concept. First this was done by handing out a questionnaire to relevant stakeholders within the library sector. The output of the questionnaire was analyzed and complemented with a cose study on the successful implementation of a floating collection in Sarasota, Florida. The outcome ol this chapter was summarized in a SWOT analysis and fhe outcome of fhe analysis was that the possibilities of fhe flooflng collection concept could solve the issues of limited transport capacity due to budget cuts in the future by reducing fhe transportation flows up fo 50%. The floating collection concept is also on innovative concept which tits into fhe innovative business plans ot the library sector. Negative
•fu Delft

kwink. groep
aspects of the floating collection concept are the mixture of library materials in the library collections, the possible unbalance in the number of materials wtthin the library collections and the knowledge problems of the whereabouts of the materials by the library organizations.
The negative eftects described were analyzed to design solutions fo these issues expected by the stakeholders otter implementation of a floating collection concept. Solutions were investigated by analyzing fhe empty maritime container business and fhe cor rental business. These sectors experience similar issues as the library sector could endure offer implementation of the floating collection concept. The outcome of this analysis was fo design a redistribution plan within the floating collection concept in order fo minimize fhe mixture of library materials in the library collections, fhe possible unbalance in the number of materials within the library collections and the knowledge problems of fhe library organizations expected fo occur. The redistribution plan is designed and tested using the simulation models in chapter 5.
3. What is the impact on fhe key performance indicators of the system when I'mp/emenfing the floating collection using a simulation model of fhe interiibrary loan system?
The first step was to conceptualize fhe ILL using process, object and decision modeling. From this step, the key pertormance indicators were indentified using the system requirements identified in research question 1. The KPIs are categorized in the some three categories as the system requirements: costs, service and capacity.
The second step was lo specify and design the simulation model based on the conceptualization models. Wtthin this step data was collected from several sources, such OS desk research, o questionnaire and interviews wtth stakeholders. In this step fhe model is set up and the assumptions that needed claritication in order to design the simulation models were elaborated on. The models for all the sttuations (current and future situation / floating collection situation) were then veritied and validated g using face validation with on expert within the library sector. The simulation models o were verified and validated successfully and could be used for the evaluation. g
E The last step was fo run the simulations according fo fhe determined set-up. The E results of the simulation runs are extensively elaborated in chapter 5. Main conclusions }jj from the resutts are described below: ^
c Main conclusions on fhe Future situation without adaptations: „,
c o
. The number of transported materials increases as the demand for ILL rises. 'S However, fhe number of transported materials does not increase as much as c the demand due to the limtted capacity of the transportation system. u
• The cycle time of library materials increases dramatically due to library £: materials not being transported. Requested materials cannot be transported o due to fhe limited capacity of fhe transport system. g
• The waiting time for end-users increase dramatically. This increase in waiting g time is not desired by the stakeholdeis involved in the system Q
ru Delft 67
k w i n k . groep
Main conclusions on fhe implementation of fhe floating collection concept:
. After implementation the number of materials transported decreases with 50% in the tirst year, as expected. Due fo fhe demand growth In the following years, the number of materials transported increases.
. The cycle fimes of fhe library materials are six fimes higher than in fhe current sttuofion. This is expected since the materials do not directly return to their origin.
• The v/aiting times for the end-users do not increase when demand rises. This means that the flooflng collection creates enough added capacity for the transportafion system: the transport service con handle the increase in demand in the next three years.
« As expected in paragraph 3.2.2, the library collections contain a mixed amount of library materials from all libraries connected with the floating collections. The requirement that a library collection should contain more than 50% of its own materials is met for half of the libraries in this model.
. The expected unbdidnce in fhe number of librory materials within the library collections as expected in paragraph 3.2.2 does not occur.
In order to decrease fhe negative effects of implementing the floating collection, a redistribution plan was put in place. The main conclusions from this Floating collection concept including the redistribution plan;
• The number of materials transported is higher than without the redistribution plon. The number of materials transported increase more than the current sttuofion because of the increase in capacity needed for the redistribution plon.
. The average cycle time of the library materials is lower than without the redistribution plan, but tt is unknown if these cycle times are desired by the involved stakeholders.
. The average waiting times are longer than without redistribution plan, but do not increase significantly like in the years 2012 and 2013 in the current situation. Question is again if the increase of the waiting times is acceptable when increasing the capacity of fhe transport service.
. The amount ol own materials wtthin the collection of a library, on average, does not drop below 50%. The stakeholder requirements ore met.
. As wtthout the redistribution plan, the balance in number of materials is in balance.
The impact on the key performance indicators ore assessed in paragraph 5.2. A summary is given below;
Costs;
The evaluation on costs has been assessed based on fhe difference between number of transported materials within the atternatives in percentages. While designing the redistribution plan, a choice is made to increase fhe copactty. This is not conform the slakeholders' needs or requirements, but is tested fo create preliminary results on the redistribution plan. The conclusion is that after implementing the floating collection concept including the redistribution plan, the PSO should manage the capacity
ru Delft

kwink. poep
closely. The results show that in year 2012, the extra capacity is needed. So, the immediate need for extra capacity is not required. This gives the transport sen/ice of the PSO some room to grow into the expected increase of demand.
Service:
Evaluating the service towards fhe end-user is done based on the overage watting times. Assessing the results show a positive result for the wolfing times after implementafion of fhe floating collection. Even offer implementing the redistribution plan into fhe floating collection concept, the waiting times ore nol longer than accepted.
Capacity:
The capacity of library shelves proved fo be of no concern within this project. The redistribution plan in this project does not rebalance the number of materials within the local library collections, but minor changes in the model would enable this option to be available when needed. The mixture of materials within fhe library collections did create issues like expected. With the implementation of the redistribution plan, these issues were solved.
In this paragraph on answer is given on the main research question:
o Does implementing a floating collection in the public Htirary sector in the Netherlonds improve fhe fransporfotton service of interiitxary loan considering fhe expected growth in demand and limited budget for the intertbrary loan service in the future?
The answer to this question is given in three ports. First, on answer is given whether the Dutch library sector is suitable for a floating collection concept. Second, on answer is given if Ihe floating collection concept improves the distribution of interiibrary loon materials in terms of costs and third. If Ihe ftoating collection can handle the expected growth of ILL in the future.
There are several reasons to coll Ihe ibrary sector in Ihe Nefheriond unsuitable for implementation of the floating collection:. This sector involves many slakeholders with the some goals and ambitions towards the end-user but with different ideas on how fo reach these goals. The history of the library sector in the Netheriands tells o story of local origination of libraries thai in the years have grown to large organizations on a provincial level, library organizations tend to work together wtth a central organization that supports these libraries on o provincial level, the Provincial Service Organization (PSO). The focus of the future is a notional organization and one notional library collection (the Collectie Nederiand). But this point is far beyond reach. The library sector has just started organizing institutions on o notional level (VOB, SIOB, BNL and the SPN) and is at the start of becoming organized on this level playing field. Implementing a floating collection at this stage in the setup of o notional organization might be too eariy. A better moment lo consider implementation is offer o successful introduction of the digitdl notional library collection (NBC) and il the "Collectie Nederiand" is in sighl. In Ihe meantime, the ftoating collection concept can be tested
•fu Delft
k w i n k . g™^
in practice on a lower level. Based on the development of the provincial sen/ices managed on fhe provincial level, the PSOs ore suitable to start testing floating collections in practice.
In terms of costs, the results from this project ore limited like stdted eoriier (see 6.1). The focus of this project is to keep the costs at the same level due the budget cuts enforced in the public library sector. However, with solving the expected issues perceived by the stdkehokiers and fo keep the stakeholder sdtisfled, extra cdpocify is needed fo implement the floating collection in fhe coming three years. The capacity is increased in oil years during the simukation runs, but as mentioned earlier: the copactty does not need lo be increased before year 2012. One could argue that wtth no implementation of fhe floating collection concept, the capacity of fhe current system is absolutely not sufficient which is proved by simuldfion. When deciding not to implement such a system, other measures must be token to limit the increase in demand. Other measures could be to limit fhe use of ILL to prevent the demand for transportation to rise to fhe expected levels by ctrarging fhe use of ILL or fo promote new and Innovative digital atternatives to offer materials to end-users without the need to physically transport the requested mdferials.
In terms of growth in demand, the implementafion of a floating collection does handle the increase of transportation needed without the necessity of increosing the cdpdctty and therefore fhe need to invest in resources. However, keeping the stakeholders satisfied nneans that extra capacity is needed to overcome the increase in demand in order to ensure fhe wolfing fimes of the end-users to remain on fhe some level as in the current situation.
Next fo the abovementioned questions focusing on evaluation of implementing a floating collection in the Netheriands, the next questions ore focused on the dpplicability of fhe tools and research performed during this project.
i. Con fhe floating collection concept be imptemenfed in other sectors than the library sector?
During this project, research is done in two other sectors that experience similar issues to the issues perceived by the stakeholders after implementing o floating collection concept. These sectors ore maritime container sector and cor rental sector. These sectors hove similar issues but these sectors already handle "floating collections". To answer this question, one must look at simitar circumstances to fhe library sector in the Netherlands. The main characteristics that shape fhe difficulties of implementation in the Netheriands ore:
1. Several individudi collections, not owned by one stakeholder If one collection existed among several tocafions, like seen in the other sectors discussed in this project a lot of difficulties would not exist
2. The individudi coltection consists of unique rtems 3. The stakeholders lend materials to each other
•fu Delft

kwink. groep
The reason for lending out the materials in the Ubrary sector is based on g o o d
will and not for profit reasons. In the cases used in this project, the cost
reduction is performed for profit maximization
4. Transportation flows be tween these individual collections
5, The library sector is a Publicly f unded sector
This sector is not profit driven
Finding o sector wtth similor characteristics is comp l i ca ted . One cou ld conc lude that
this sector a n d the ILL within this sector are unique a n d that the solutions presented in
this report are special ly a d o p t e d for the library sector in the Netheriands. This makes
easy appl ica t ion in other sectors difficutt. By looking at the two examples used in this
project the characteristics do not m a t c h . For bo th examples, the only characteristics
that m a t c h are characterist ic 4 a n d less characterist ic 3. Number 3 entails that
individual collections lend materials fo e a c h other, wh ich in the two examples is not
really fhe cose. In franchises, this might h a p p e n , but probably still is m a n a g e d through
direct orders from headquarters.
This project c o n easily app ly for other library sectors in other countries with similar
characteristics as in the Netherlands. The results in this project should b e eva lua ted
before investigating the possibilities in these countries.
2. Can fhe model designed in this project be applied in other fields?
Following from the question answered a b o v e regarding implementat ion of a f loat ing
col lect ion in other tields than the library sector, if such a sector wou ld be identi t ied, it
might be possible fo use Ihe same simulation mode l fo explore fhe first results of
implement ing a tiooting col lect ion.
When looking of other library sectors, the mode l c o n b e used to dssess the
per formance of their distribution networks. In this cose not only foreign library sectors
cou ld be eva lua ted but also smaller library organizations here in fhe Netheriands who g
might dec ide to implement a f loating col lect ion on a local scale. For example , a •§
library organization wi th several library locations. ^ CD
The mode l used in this project is an exploratory mode l wh ich entails that its purpose is £
to c reate generic results. This makes it easier to a d o p t such o mode l fo other cases 8
like ment ioned above . n:
c 3. What can be learned from the results from this project that can be used in b
other sectors? g
The results from the simulation runs cou ld be used in other sectors thdf dec ide to o c
investigate fhe possibilities in implement ing the f loating col lect ion concep t . Like o ment ioned before, fhe characteristics of these other sectors need fo be similor in ».
order to va l idate the results from this project. g
The results after implement ing a f loating col lect ion wi thout redistribution p lan show S
how such a system cou ld react to an implementat ion. Special results include the shift 5
of materials from different owners within the local collections. It is shown that the n
materials shift in the same distribution as the distribution in d e m a n d . The distribution in u
d e m a n d is assumed similar to fhe distribution of col lections b e t w e e n the locations. R
*U Delft
kwink. groep
This means that the smaller locations wtth smaller col lections lose their own materials
In exchange for a b igger shore of materials originating from fhe locations with much
bigger collections. The b igger locations exper ience the opposite effect, making this
result signiticant for all sectors.
The results of unba lanc ing fhe number of materials wtthin the local collections in this
project were limited due fo the abovemen t i oned similarity in distribution of d e m o n d
a n d size of local col lect ions. In this project this distribution is assumed similar, but in fhe
real wor id this is highly unlikely. After test njns, if showed that tamper ing with the
distribution functions resulted in an unba lance in number of materials of the local
collections. Significant resutts on the b a l a n c e of number of materials can only be
ob ta ined by testing in prac t ice . When this phenomenon does occur in pract ice, a
redistribution p lan wou ld b e sufficient fo ba lance the collections.
4. What is learned from the use of the research approach within this project?
In the introduction of this project a cho ice has been m o d e to use fhe systems
engineering a p p r o a c h SIMILAR from Bahill a n d Gissing. Arguments were set out why
the SIMILAR a p p r o a c h should fit within the object ive of this project a n d why this
a p p r o a c h would enab le the answering of fhe research questions. The question here is
wha t is learned from using the selection of this a p p r o a c h and what can be done
better in future research using this a p p r o a c h .
The main focus of Bahill a n d Gissing was the continuous f eedback of the project steps
on the needs a n d requirements of stakeholders. Within this project on extensive
stakeholder analysis was per tormed resulting in the needs a n d requirements.
However, these needs a n d requirements are a capture ot fhe moment . A more
dynamic stakeholder involvement wou ld improve fhe feedback during the project
steps a n d therefore the use of SIMILAR. During this project tt was difficutt to involve the
stakeholders directly, but for future research it is advised to d o so.
The combinot ion of the requirements discovery process a n d system design process by
Bahill a n d Gissing within SIMILAR is used wi th success in this project. The link be tween
the library sector analysis a n d system analysis resulting in fhe comp le te system
requirements forming the input for the design phase of the project is c o n d u c t e d with
ease. Using the steps designed by Bahill enab led this project to focus on these
discovery processes before starting fhe design phase. O n c e the reauirements were
identi f ied the design phase cou ld b e started wtth comp le te knowledge of the system.
To conc lude , using d systems engineering a p p r o a c h within this project was needed
a n d m o d e this project to a success. The many stakeholders involved a n d the various
disciplines used in this project required a holistic a p p r o a c h wh ich enab led a
comp le te overview after every step of the project . After every step, fhe ma tch with
the stakeholders was sought a n d w h e n in line, fhe project cou ld p roceed . Using only
four steps in the SIMILAR a p p r o a c h disabled fhe real life implementat ion, but as o
preliminary study into implement ing a f loat ing col lect ion c o n c e p t in fhe public library
sector in the Netherlands the SIMILAR m e t h o d was very useful.
• fu Delft

kwink. groep
MIT.M1CI-,
Some limitations hove in f luenced the results a n d o u t c o m e of this project a n d these
limttotions ore discussed in this pa rag raph . Some input a n d information are based on
assumptions a n d selections of d a t a from the field (see Appendix N). These
dssumpfions have ef fect on the quality a n d the effectiveness of the simulation mode l
used in this report. However, the mode l c a n b e a d o p t e d a n d upg raded by using
more d d t d a n d information from the field.
There ore Hmitations based on the numtier of sources used from the library sector.
Several interviews were held wtth different stakehokiers, but the network o l fhe Dutch
library sector Is so comp lex a n d k i rge that more information from more different
stakeholders will improve the quality a n d judgment of fhe results presented in this
report. This project was not inrtiated by fhe Stichting PSO Neder iand d n d no budge t or
investment from their side was n e e d e d fo comp le te ttiis project. This meant that the
commi tment of several stakeholders during this project c o n be improved.
f: 5 "^' f-OOMM'-- . . , : , ' • ; • ? ! . tO(< • - - F!.i'Ui.:t C-t- irJiE-l- :HK- •• ' L..'-Jri II', ' -
" j j i H E K i j - f . • :
In this pa ragraph , recommendat ions addressing the Stichting PSO Neder land ore
m o d e . The recommendat ions conta in recommendat ions based on necessary further
research to c rea te more insight in relevant steps in the imptemenfot ion process of the
floating col lect ion c o n c e p t .
RC'Corumertdationi I^A fuithei research
To obtain more de ta i led informat ion a n d increase the quoirty of the knowledge of the
library sector relevant to the implementat ion ot a floating col tect ion, o research t e a m
should b e setup. This research t e a m shoukt research the fol lowing: „ c o
• Use the Col laborat ive Business Engineering a p p r o a c h fo setup the research. '3
This a p p r o a c h will inc lude all involved stakehokiers in the project actively. By Y
the use of interact ive workshops, oil involved stdkeholders will par t ic ipate in g
the research a n d fhe commun ica t ion will b e intense. Only by including the £
involved stakeholders act ively in d e process the future Imptementot ion will be u
a success. Memtiers in this t e a m shouW b e Ihe foNowing stakeholders: ">=
o The SPN c
o All the PSOs (1 lx) g
o All Plus Libraries (14x) .2
o A de lega te from the VOB w h o will speak on behatt of fhe Ubrary -^
Organizations q
o A de lega te from fhe VNG
o A de lega te from the SIOB
o A de lega te f rom the BNL
Wtth new information ob ta ined the simulation m o d e l coukt b e upg raded for
more libraries a n d eventual ly more PSOs.
U
ru Delft
.5! O
73
groep
• The mode l should p lay a centra l rote In further research. This includes clear
a n d transparent commun ica t ion abou t the mode l o n d the input variables
should b e va l ida ted using information from the field
. More successful implementat ions of the floating coltect ion c o n c e p t wtthin
other library organization in other nations should be invest igdted. Focusing on
lessons learned d n d fhe advan tages a n d cutbacks from methods used should
give high qual i ty insight in the process steps of implement ing a f loating
col lect ion c o n c e p t in the field.
• More research in the devetopment of a redistribution pk in within the cose of
the Dutch ibrary sector is n e e d e d . Focus areas of reseorch should be
dynamic redistribution. Dynamic in fhe sense that the momen t a n d volume of
fhe redistribution should be invest igated in relation to the ac tua l need for
redistribution of that t ime in the process a n d fhe avai lable capac i t y in the
trucks at that g iven moment .
. Research into separat ing the redistribution flows from the regular ILL flows
could improve the redistribution p lan. Research is n e e d e d in using special
resources for redistributing the materials next fhe regular transportafion or
giving Ihe regular ILL materials priority over the redistribution flows.
• The possibilities of lessons learned from other sectors in deve lop ing a
redistribution p lon should b e further invest igated. From analysis in this project it
b e c a m e clear that the algorithms used in the private sector cou ld b e
a d o p t e d in the library sector by redefining the digorithms lo fit this case. These
algorithms hove not b e e n a d o p t e d fo this exploratory research but these
models ore sophist icated a n d hove high potent ia l in optimizing the
redistribution bosed on a number of constraints, for example, minimizing costs.
. AHemofive options not ment ioned in this project to minimize the costs of ILL
a n d l o b e p repa red for the luture g rowth of Ihe d e m a n d for ILL cou ld be
invest igated. A l lemol ive options, d iscovered during fhe process of this project
ore distribution of ILL from one centra l locat ion using a centra l storage and
logistical operations.
. The future of the service of ILL should be investigated a n d assessed. Questions
that n e e d to b e answered:
0 Is ILL n e e d e d in fhe future?
c What t ime f rame? 5-10 years?
0 After a successful digitalizafion of library materials, will there be o
necesstty for transporting library materials?
o What is fhe potent ia l of e-readers a n d printing on d e m a n d in respect
to ILL?
•fu Delft

kwink. Next steps of successful impj/ementation
Test floating collection
on Q provincial level with simulation.
Test the floating collection
on a provincial level in practice
lest the floating collection
on a notional level in practic
o u
3
ru Delft 75
k w i n k .
o •o
o u
76 ru Delft

kwink. groep
GLOSSARY
ILL Interiibrary loan. This is the term that entails fhe lending o l library
materials b e t w e e n libraries
IBL Interbibliothecair leenvervoer; Inlertibrory loon crossing the borders of
the provincial service areas
OBL Onderi ing bibl iothecair teenvervoer; Interiibrary toon transported within
one provincial service area
NBC Nat ionale Bibliotheek Cata logues: Nat ional library ca ta logue that will
b e in t roduced of the end of this yeor
Plus Ubraries Larger library organizations wi th addi t ional educa t iona l tasks. The
col lections of the Plus Ubraries are larger a n d conta in more
educa t iona l materials f f ion library organizations. There are 14 Plus
Ubraries in the Netheriands a n d dre l oca ted in the larger cities of the
Netheriands
LO Ubrary organizat ion {Basts Bibliotfieek): on organizat ion of libraries
(originally within one munic ipa l ly ) wi th several library locations Ihot
owns a n d operates one centra l col lect ion of library materials. There
ore approx imate ly 171 (2009) library organizations
LL Ubrary locat ion; A Nbrory tha i is port ot a library organizat ion. There ore
approximately 1031 (2009) Nbrory locations
SPN Stichting PSO Neder land: Not ional Col laborat ion of PSOs in fhe
Netheriands
PSO Provincial service orgonizattons that support Nbraries within a provincial
service a rea . The focus in this project Is the support in ICT operations
a n d the transportat ion of interibrory loon materials within the network
of libraries
BNL Stichting Bilbiotheek.ni; The nat ional organization that is responsible for
designing the digttol innovat ion ot the library sector
SIOB Secforinstituut openba re bibNotheken; fhe sector organization of the
ibrary sector. The main tasks ore to imptement pol icy from the Ministry
ofOCW
VOB Vereniging von Openbare BibNotheken: the notional association of public libraries in tiet Netheriands. The VOB represent oil the library organizations in the Netheriands
OCW The ministry of Education, Curture and Science of the Netheriands
VNG the association of Dutch municipalities
•fu Delft
k w i n k . roep
TABLE OF FIGURES AND TABLES
Figure 1-1: Exampte of a route within a provincial service area ope ra ted by a PSO 3
Figure I -2; Difference in transport movements b e t w e e n Ihe current sttuofion a n d dfter
implement ing a f loat ing coBection 4
Figure 1-3; The SIMILAR a p p r o a c h 8
Figure 1-4: OutNne of fhe Project 12
Figure 2-1; The long Toil theory from Anderson 21
Figure 2-2: System d iag ram of the ILL System 26
Figure 4-1; Setup of the Simulation Mode l bui ld In Arena 43
Figure 5-1; FUTURE SITUATION: Materials transported 49
Figure 5-2; FUTURE SITUATION: Cycle Time 50
Figure 5-3; FUTURE SITUATION; Wait ing times 51
Figure 5-4; FLOATING COaECTION; Materials transported 52
Figure 5-5; FLOATING COLLECTION; Cycle time 53
Figure 5-6; FLOATING COLLECTION; Wait ing times 53
Figure 5-7: FLOATING COLLECTION: Composit ion of the Collecttons 54
Figure 5-8; FLOATING COLLECTION; Composit ion of the Collecttons 54
Figure 5-9: An Exampte of the Redistribution Plan imp lemented on Library A within
Arena 57
Figure 5-10: Floating Col lect ion C o m p a r e d wi th Redistribution Plan: Materials
transported 59
Figure 5-11; REDISTRIBUTION PLAN: Cycle Time 60
Figure 5-12; REDISTRIBUTION PLAN; Wait ing times 60
Figure 5-13; REDISTRIBUTK)N PLAN; Composit ion of CoNections 61
Rgure 5-14; REDISTRIBUTION PLAN; Composit ion of Collections 62
Figure I ; the goa l MEANS d iag ram of fhe stichting pso neder iand 87
Figure 2; The formal chart of the Nbrory sector involving interiibrary loon 90
Figure 3; Transport flows in the Pitot Distributie 102
Figure 4; Causal Relationship Diagram of the ILL System in the Nethertands 103
Figure 5; Object Mode l of the transport service PSO 123
Figure 6; IDEFO Processes AO 125
Figure 7; IDEFO processes A I -A6 126
Figure 8; IDEFO Diagram of process o l 128
Figure 9; IDEFO Diagram of process a2 128
Figure 10; IDEFO Diagram of process a3 128
Figure 11; IDEFO Diagram of process a4 129
Figure 12; IDEFO Diagram ot process a5 129
Figure 13; IDEFO Diagram of process a6 129
Figure 14; Flow Chart Mode l transport service PSO 130
Figure 15; SETUP OF THE SIMULATION MODEL BUILD IN ARENA 132
Figure 16: Library Organisation (LibA) mode ted in Arena 134
Figure 17; The PSO Mode led in Arena 135
•fu Delft

kwink. groep
Figure 18; Capacity of Shipment 143 Figure 19: Percentage of users requesting materials 144 Rgure 20; The speed of fhe collection and distribution ot library materials 144
Table 2-1: Involved stakeholders wtthin the scope of this project 13 Table 2-2: Power interest grid involved stakeholders 17 Table 2-3: categorization of libraries in the netheriands 20 Table 2-4; Current logistical operations of ILL 23 Table 2-5; SWOT analysis of the current organisation of ILL in fhe Netheriands 24
Table 3-1; Rgures on the growth of requests in fhe online fool Aanvragen (29) 30 Table 3-2; growth estimation for the ILL in the coming years 30 Table 3-3; Resutts Sarasota Floating Collection 32 Table 3-4; SWOT Analysis for Implementation of Floating Collection Concept in the Netherlands 33
Tabte 4-1: Cost KPIs 41 Table 4-2: Service KPIs 41 Tabte 4-3: Capacity KPIs 42
Table 5-1; CURRENT SITUATION; Materials Transported 47 Table 5-2; CURRENT SITUATION; Cycte Time 48 Table 5-3; CURRENT SITUATION; Waiting times 48 Table 5-4; CURRENT SITUATION; Compositions of Coltections 48 Table 5-5; Growth in Demand for ILL 49 Table 5-6; Desired Composttion of Collections after redistribution 56 Table 5-7; Current Composttion Ubrary Collections 56 Table 5-8; Rounded Integers of the current Composition Ubrary Colelctions 57 Table 5-9: Subtracted Redistribution Flows 57 Table 5-10: Wolfing times End-users wtth Redistribution Plan 58
Table 1; Determination of orders IBL (48) 136 Table 2; Determination of orders OBL (10) (7) 136 Table 3; Current and Future situation Orders for OBL and IBL and Ubrary Collection sizes 137 Table 4; Floating Collection Orders for OBL and IBL and Library Collection sizes 138
kwink. groep
I
IT 'S <D 2 Ö
n
D
"^ "fu Delft

kwink. froep
REFERENCES
1. Vos, André de. Behoedzaam bezuinigen. Binnelonds Bestuur. 9 7 2010, p. 3.
2. KasperkovHi beMdsondenoek en odvlet. EEN KRIMPEND PERSPECVEF Gemeentelijke bezuinigingen op openbaart)ibltotheekwerk in de periode 2010-2013. Amersfoort : sn, 2010.
3. Zeeuwse BIbflofheek, Provinciate Service Organisatie. Zeeuwse BibSotheek. jOnine] [Citaat van; 28 04 2011.) htfp;//www.zeeuwsebiblotheek.nl/provinciate_service/.
4. Probibflo. ProBNo Vervoersdienst. Probibfo. lOnüne) [Citaat van: 05 11 2010.) http;//www.problblio.nl/produclen-cliensten/v 1 ervoer-alanbod/vervoersdienst.aspx?educalie=8.lezen=8.informafie=S,icf=8.hr=8.mari(eting= &logistiek=&fd=8.frefwoord=&doelgroepen=&thema=&producfType=.
5. Trouw. 'Één op de drie biblotheken verdwijnt'. Trouw. 23 10 2010, p. 1.
6. ANP. BibNotheken werken aan onNne nationale catalogus, nu.n/. 14 7 2010, p. 1.
7. Spanier, Ronald. Managing Director JFB. pnterv.j Nick von der Noordao. 1805 2011.
8. Sftehting BNblotheek.nl. Pilot Distributie stort op I februari 2011. Sffchting Bi/biotheek.n/. [Online) 12 10 2010. hffp;//www.stichtingbibliotheek.nl/Nieuws_Pitot%20distributie.htm.
9. Stakenburg. Hans. Manager Logistiek Probibïo. Hooriem, 02 12 2010.
10. Bosma, Jeroen. Manager Bedn^oering B/SC. Utrecht, 01 12 2010.
11. VOB. Oprichting van de Stichting PSO Nederiand. Vereniging Openbare Bilb/iofheken. 6 1 2010, p. 2.
12. Sarasota County Libraries. Ftoating CoBection Information. Sarasota County ubraries. [OnNne) 6 May 2009. (a tool von: 27 04 2011.) http://www.scNbs.net/CMS/Media/Docs/Floating/Staff_lntro_to_Ftoating_Mar2008.pdf
13. Sage, Andrew en Arrmlrong, James I. Jr. Infroduct/on fo Systems Engineering, si: John Wiley & Sons, 2000.
14. Checkland. P. Systems thinking. Systems Procftce. Chichester: Wiley, 1993.
15. Chestnut, Harold. Systems Engineering Tools, si; Wiley, 1965.
16. Ramo, Simon en St.Ckilr, Robin K. The Systems Approoch: Fresh Solutions fo Complex Problems Through Combining Science and Practical Common Sense. Anaheim. CA : sn, 1998.
17. Re-eva/uoting Systems Engineering Concepts Using Systems Thinking. BoliNI, Terry A. en GInlng. Bruce. 1998, IEEE TRANSACTIONS ON SYSTEMS, MAN, AND CYBERNETICS—PART C; APPLICATIONS AND REVIEWS, pp, 516-527.
•fu Delft
k w i n k . 18. Oxford Dictionaries, model. Oxford Dictionaries; The wortd's most trusted dicffonories. [OnBne] [Citaat von: 21 05 2011.) http;//www.oxforddictionaries.com/definition/model?view=uk.
19. Jerry Banks, John Canon, Barry Nelson and David Nkrol. Discrete-event system simulation. Upper Saddle River, NJ ; Prentice Hall, 2005.
20. Using Smalt Models for Big Issues; Exptoratory System Dynamics Modelling and Anatysis for Insightful Crisis Management Pruyl, ErMc. Seoul, Korea : Proceedings of the I8fh International Conference of the System, 2010.
21. Enserink, B. en al.. ef. Policy Analysis of Multi-Actor Systems. Den Hoog : LEMMA, 2010.
22. Wlklpedki. Intertibrary toon, vy/kiped/a. (Online] 06 04 2011. (Citaat van: 25 05 201 l.j http;//en.wikipedid.org/wiki/lnfertibrary_loan.
23. Boon, Hs, ct al. Questionnaire ILL Thesis, Appendix G. 25 03 2011. Appendix G.
24. Levlne. David M., el al. Sfdfistics for Managers using Microsoft Excel; 3rd Edition, si; Prentice Hall, 2002.
25. Anderson, Chris. The Long Tail. Wired. [OnNne] October 2004. |Citaat van: 12 April 2011.] http;//www.wired.com/wired/archlve/12.10/tail.hfml.
26. The tale of the library tong foil; space, collections, and ftie network. OCLC Research. 2007. p. 23.
27. SIOB. SIOB BibNofheekmonitor. Secforinst/tuuf Openbare Bibliotheken. [Online] [Citaat von: 24 02 2011.] http;//www.srob.nl/bibNotheekmonitor/trends-bibBofheken/organisattes-en-vestigingen/spreiding-bibNothekervover-hef-Iand/item28.
28. Matsachuseffs Iratlfute of Technology. Rood Maps; A Guide fo Learning System Dynamics. Boston : MIT, 2005.
29. SttehMng BIbUotheek.nl. Aanvragen berichten. Stichting BibJotheek.nl. [Online] 11 Januari 2011. [Citaat van; 24 5 2011.]
30. VNG; IPO; OCW. Biblotheekchorter 2010-2012. Den Haag : sn, 2009.
31. Sttehling Blbllolheek.nl. NBC en Open Index; wat is het? Bibliotheek.ni helpt bibfofheken innoveren. [OnNne] [Citaat van; 02 05 2011.] http;//www stichtingbibNotheek.nl/NBC .htm.
32. Cralnic, Tcodor Gabriel en Kim. Kap Hwan. Intermodol Transportation, [boekauf.] C. Bomhort en G. Laporte. Hondbook in OR & MS. si: Elsevier, 2007.
33. U, JIng-An. Altocofion ot empty containers between mutti-ports. European Journal of Operational Research. 182, 2007, 1, pp. 400-412.
•fu Delft

kwink. groep
34. Shintania, Kolchl. The container shipping network design problem with empty container repositioning. Transportation Research Port E: Logistics and Transportation Review. 1, 2007, Vol. 43, 39-59.
35. LI, Zhaolln en Too, Feng. On determining optimal fleet size and vehicle transfer policy for a cor rental company. Computers & Operattons Research. 2, 2010, Vol. 37, 341-350.
36. Grady Booch, Ivor Jacobson & Jim Rumbaugh. OMG Unitied Modeling Language Specificotion. Version 1.3 , 2000, Vol. Retrieved 12 August 2008, Rrst Edttion.
37. MIshra, Satlsh. Visual Modeling & Unitied Modeling Language (UML) ; Introduction fo UML. [OnNne] Rational Software Corporation. [Cttaof van; 9 11 2008.] hftp://www2.informatik.hu-beriin.de/~hs/Lehre/2004-WS_SWQS/20050l07_Ex_UML.ppt.
38. Materials Laboratory, Air Force Wright Aeronautical Laboratories, Mi Force Systems Command. ICAM Architecture Part ll-Votume IV- Function Modeling Manual (IDEFOj. Ohio ; Wright-Pofterson Air Force Base, 1981. 45433.
39. Farrell, Joyce. Programming Logic and Design, 5fh ed. si; Comprehensive, 2008.
40. Flti-Glbbon, Carol Taylor. Performance indicators, si; BERA Dialogues, 1990. 9781853590924.
41. Rockwell Automation. Overview. Arena Simulation Software. [Online] 2011. [Citaat van; 30 05 2011.] http;//www.arenasimulation.com/Products_Basic_Edition.aspx.
42. Beerens, Gransjean, van Kaam and Verbraeck. Handbook Arena. Delft ; TU Delft, 2002.
43. Carlo GhezzI, Mehdl Jazayerl, Dlno Mandrloll. Fundamentals of Software Engineering, si: Prentice Hall. 0-13-099183-X.
44. Qudraf-Ullah, Hassan. STRUCTURAL VALIDAVON OF SYSTEM DYNAMICS AND AGENTBASED SIMULATION MODELS. Toronto, ON ; ECMS, 2005.
45. VOB. Over de VOB. Vereniging Openbare Bibliotheken. (Online) 2011 03 2011. [Cttaof von: 02 04 2011.] http;//www.debibliofheken.nl/over-de-vob.html.
46. Stichting BIbUotheek.nl. Over ons. Stichting Bibliotheek.nl. [Online] [Citaat von: 12 05 2011.] http;//www.stichfingbibBotheek.nl/Over%20ons.hfm.
47. SIOB. waf we doen. secforinstifuuf openbare bibliotheken. [Online] [Cttoat van; 21 01 2011.] http;//www.siob.nl/over-ons/wat-we-doen/tteml47.
48. Plusblbllotheken. Plusbibliofheken. Plus+ bibliotheken. [Online] [Citaat von: 02 03 2011.] hHp;//www,plusbibliotheken,nl/index.php?id=20.
49. OBA. Over de OBA. Openbdre Bliotheek Amsterdam. [Online] 2011. [Ciloat von: 02 02 2011.1htfp://www.oba.nl/index.cfm/t/Over_de_OBA/vid/04IBIC3C-17A4-A597-D933022A56908CD6.
f u Delft
k w i n k . groep
50. NBD Blbllon. NBD/BibNon voor alle bibliotheken en scholen. NBD/Biblion. [OnNne] 2011. [Citaat van: 05 03 2011.] hftp;//vvvvw.nbdbiblion.nl/?pagina=8&.
51. Centraal Boekhuls. Historie. Centraal Boekhuis. [OnNne] 2011. [Citaat van: 05 02 2011.] hftps;//portal.boekhuis.nl/cbonNne/over-ons/over-cb/historie.
52. Bohl, Rynn. Tools for Structured and Object-Oriented Design, si; Prentice Hall, 2007.
53. Ho, William en Emrouznejad, All. Multi-criteria logistics distribution network design using SAS/OR. si: Elsevier, 2008.
54. ElseH, H. A. en Sandblom, Carl-Louis. Operations Research A Model-Based Approach, si; Springer Berlin Heidelberg, 2010.
55. SImchl-Levl. David, Chen, Xln en Bramel, Jullen. The Logic of Logistics: Theory, Algorithms, and Applications for Logistics and Supply Chain Management, si; Springer New York, 2005.
56. Dhlllon, B. S. Human Reliability and Error in Transportation Systems. London : Springer, 2007.
57. Sörensen, Kenneth, et al. Mefoheuristics in fhe Service Industry. Beriin Heidelberg ; Springer, 2009.
58. Merkuryev, Yuri, el al. SimulaftbrvSased Cose Studies in Logistics: Education and Applied Research. London ; Springer. 2009.
59. Gudehus, TImm en Kotzab, Herbert. Comprehensive Logistics. Berlin ; Springer, 2009.
60. Zapte, Günther, Braune, Roland en Bögl, Michael. Metaheuristic Search Concepts: A Tutorial with Applications to Production and Logistics. Beriin ; Springer, 2010.
61. Nunen, Jo A.E.E.. Grazia Speranza. M. en Bertazzl. Luca. Innovations in Distribution Logistics. Berlin : Springer, 2009.
62. Llndert, Marcel te. Samensmelten von supply chains levert schaalvoordeel op. Logistiek.nL 5 2 2009, p. 2.
63. Hlller en Lleberman. Introduction fo Operations Research: Eighth Edition. New York : McGraw-Hill, 2005.
64. BIbllotheekblad. Bibliofheek.nl mookf planning implementatie. Sib/iotheekblod.nl. [OnNne] 31 01 2011. [Citaat von: 03 02 2011.] htfp://www.bibliotheekblad.nl/nieuws/nieuwsarchief/berichf/1000000528.
65. Verbraeck, Alexander en Valentin, Edwin. Discrete Modellen: Deel II Discrete Simulatie. Delft : TU Delft, 2006.
66. Department ol Defense - System Management College. SYSTEMS ENGINEERING FUNDAMENTALS. FORT BELVOIR, VIRGINIA ; DEFENSE ACQUISITION UNIVERSITY PRESS, 2001.22060-5565.
•fu Delft

kwink. groep
67. Missile Defense Agency. Department of Defense Documentation of Veriffcaftbn, Validation & Accreditation fW&AJ for/Vloctels and Simuioh'ons. 2008.
o 0 h
ru Delft 85
kwink.
0) •c g
Q
" ^ •fu Delft

ï s S a
I I 8 -i e 5

kwink. To combine the objectives of fhe problem owner, the Stichting PSO Nederiand, and the means of fhe SPN fo influence Ihe sttuotion, a means-end objective network is mode in this appendix. The diagram in this analysis Nnks fhe means of the SPN with the corresponding objectives. The means that teod fo achieving on objective ore identified and schematically IHusfrafed in the diagram. The diagram is usually used for two different redsons. The flrst reason is to use the diagram as o tool fo scope the problem area and fo choose fhe appropriate objective level of the project. The second reason for analyzing fhe objectives and means of fhe problem owner using this tool is to be able to reason the objectives schematically In retafion fo the means and to create a wide range of strategies and resources that could contribute to the realization otthe objectives (21). Conclusions from means-ends objectives network:
• The higher goals in the diagram are of the coltaboration of PSOs, fhe Stichting PSO Nederiand and fhe means at the bottom of fhe scheme belong fo fhe individual PSOs. The means ore at operational level and fhe goals in fhe upper area ore more strategic tevel.
• The goals are split in serving fhe ibrories with services and products to support fhe Nbraries in products that benefit from scaling and in the collaboration goals that con moke the body of oil fhe PSOs stronger. The spNf In goals is noteworthy because fhe difference in gools is clear. The individual PSO is focused within their area and trdnsportotion service and fhe SPN is focused on sharing fhe knowledge between the PSOs. The task of the SPN is to communicate the benefits of knowledge and skill sharing to fhe individudi PSOs. Otherwise fhe PSO does not see the goin and does not coltaborole in the way the SPN desires necessary (11).
• Presented in the didgram ore fhe services of importance in this study, the ICT service and the logistical service. The correlation is clear; the ICT system houses fhe digital catatoging of the materials and the order systems so that the end-user cdn order materials from outside their own Bbrary. When looking on a notional level, this ICT system should be compatible with all the provinces. At the moment the ICT systems of several provinces differ from others. The most common ICT system that is used is the BICAT system (9).
• Several means are identified thdf dt the moment are not used and therefore fhe goals ore not met. There are three means that focus on forecasting transportation volume. Forecasting is nol done of the moment and could increase the knowtedge of the PSOs in order to improve the logistics service. It has to be noted that there ore two different type of forecasting identified. The forecasting of fhe material that is transported within Ihe province and on the other hand fhe material that comes from outside the province, the notional transport from the NBD and the IBL (10).
• The task of the PSO is to coNoborote with fhe Nbrory organizations, the "cBenI" of the PSO. If is they who fhe serve and moke SLAs (service level agreements) with. If new poficy is set on o notional level, it is the task of the individudi PSO to communicate fhe changes lo the ibrary level. If they do not do this in o right way, the libraries might not cooperate In the way they would want if (9).
ru Delft
kwink. groep
nCUie 2: THE KMMAl CHAIT OF THE UUAtY SECTOI INVOLVING INTEIUUAIY lOAN
All relationships and (inter-) connections between stakehokiers hove formal and informal sides. Knowledge about both sides is needed to undersfdnd Ihe stakeholders and their environment. The formal mop is a mean for orientation in that sense. Obvious lo soy that low and regulations hove o major impact on fhe network of slakeholders and therelore these ore identified and the impacts of fhe low and regutations ore determined and analyzed.
Formal positions The formal positions of fhe stakeholders dre subdivided in three segments. First the Bbrary sector organizations ore identified. These associations ore advocacy organizations for their members. The important sector organizations are fhe problem owner, fhe Stichting PSO Nederland (SPO), representing all Ihe PSOs in the Netheriands; the Vereniging von Openbare BibNotheken (VOB), the association of all oftiNoted pubNc Nbraries thol ore o member ot the VOB; and fhe Secforinstifuuf Openbare BibNotheken (SIOB), the organization which is o poNcy extension of fhe ministry of OCW. The Stichting BibNotheek.nl (BNL) is a sector organization that is run
•fu Delft

kwink. groep
individually wtth individual tasks but is monitored by both the VOB and the SIOB which take port in the advisory boord of fhe BNL.
The second identified segment is the Nbrary organizations. In this segment all the differenl librdry organizations that ore directly involved wtth libraries ore classified. These include the basic libraries, the Plus libraries the PSO's and fhe scientitic libraries.
The third segment is the external parties that hove relationships with the former two segments. These include the govemmenfoi organizations, fhe private organizations and the end-users.
Mutual relationships Specifying the relationships between the involved stakeholders starts with the SPN. The SPN ploys o central role in the network of stakeholders that ore involved with the distribution of materials between the Bbraries. All the PSOs in the Netherlands ore member of fhe SPN and the SPN is a lobbyist for the PSOs towards the national government and fhe SIOB. The individual PSOs ore the organizations that organize fhe transport service to all the affiliated libraries, this including fhe library organizations (LOs) and fhe Plus Libraries in their region. The individual PSOs ore rewarded subsidy from the provincial governments in their region and ore held accountable for certain guideBnes set by the provincial governments under provincial cuttural policy. The municipalities also use cultural policy to grant libraries in their region with subsidy. These grants go directly to the library organizations and the library organizations determine final destinations for subsidies among their Bbrary locations (LLs).
The ministry of OCW provides subsidy to the library sector via their sector instftute, the SIOB. The ministry sets policy guideBnes for fhe notional Bbrary poBcy and fhe policy is executed by the SIOB. The SIOB also has a seat in the advisory board ol the BNL is where the digttol library poBcy is executed on a national scale. From BNL the NBC is organized and promoted as the projects that improves the national distribution of materials belween libraries.
The end-users mostly visit the different libraries to lend fheir mdferials. The assumption is mode that end-users go to the nearest library from fheir home or work location.
Law and regulations The most important regulation that influences this project is the Bibliolheekchorler 2010-2012 (30). In this charter the role oBocotion of the different organizations that are involved in the library sector innovation is set up and agreed by the important stakeholders in the network. The role ollocotion gives all the organizations their tasks and responsibilities wtthin the network.
• fu Delft
kwink.
0) u '•ü c 1) Q. a <
b
92 'U Delft

Stakeholder Interests Goals (desired situation) Issue Gap (unwanted/cuirent sHuoHen)
Cause
Ubrary Organfzoffons Noffonol
VOB
SIOB
Good collaborcrtion bstvueen PSOsonlCT ami Logistics fwtiNioiks (rv): S«gKifi«tMérM^tn 9br0rf 0i^f0fiBO^&nt
Regtonol and local interests in Nbraries: faster and cheaper transport of materials between libraries, a larger coltection and more lending of moteriols
'•mtniK
Notional interests in fhe goals of Libraries as on extension of the Ministry of OCW
Coordlnote long kisting, ^ructurol and sofd •uppol to ttie Bbraries h the Nethertands (t1)
Look otter the shared interests of the public library sector (45)
. ''£tM»nMtiMii»'anci
manageméi* ofnii-<Wpah*«#*» mitioncri (É^kttCiKrt (46) Coordindte all plans from the Ministry of OC&W aimed to renew and strengthen the library sector (47);
Ttie increase of Werprovlnckjl transport e* materials, more notional transport of materials; CapocBy of fctinsport servkas or* Kety not incraGBe Tronsportalion of materiols is expensive and hove long lead times; threat of losing members and number of todns
tong lead fimat ititiite uring t4ailenaf TKmsport ter future tafö; High cost WMI» USina PostNL tor IBL It» cuwwrt transport
Long lead fimes while using National Transport for future NBC: High cost while using PostNL for IBL in current transport
The inflroductkx) of ttie N8C;budeMcutr«f protAKial gomwnmanls
No cost efficient and tost notional kigistlcol netiwork for materials: services like bol.com with cheop materials with tost delivery and 2"" hand materiols
N& CO^[^tÊB^9^Pfi0 Km f^njuflW.mpiHMp,' TlÊlH01MlL'Wiitll0l^0^:'
No cost efficient and fast notional logistical network for materials
UKB (KB+UB'i)
ftovs kntamst in alcBter rXMOIKi JOSPBCQI
Less interest in NBC because of own GGC.
realization of on information architecture including a shared digital infrastructure and the need to intensify fhe cooperation with third parties (links to national, academic and public Nbraries). (47); control BitHiotheek.nl To be a nottonal lerKfng (X^ fO fd lmur i c
UKB aims to promote notional scientitic information by; cooperation between the member libraries and UKB interests of governments and of the VSNU.
LAodtknes for delvMies ouliidas ttie provindol boRMs dw too h ^ end ttw costs con be k3w<«r
TTie noHenol ItMlWDWrtdt meiieridkktotfeilw baoaus«fit
and PSO natweMB
local
Plus Libraries
'" MOW 'iSMÉ^Uyi.f'.IIX: ftw ' ''ies ftsidf'mGiiiEals
Cheaper transportation of IBL to the BB's
f© d90r'lilfhJIliiit •"' logistical support to libraries and sip*)r organizations In ftsrtr catchment areo f«) The foundation aims, through coordination, cooperation and innovation, the scientific
tf^eir ccrtcfMYMnt «rad on» Increasing; Rw^dratxirt capaati «M not M ^ increase The use of PostNL to transport the IBL materials fo fhe BB is too costly
•'"Oi Wl'PBp^^BfSSI Dr :"'' mcrtotlniiiliiifi^-increoM in tiw M U M du«toiH*l«éf$i)m
Lack of a cost efficient transportation network for IBL: fhe use of PostNL is expensive

Ubraiy Organization
Library Location
Cheaper transportation of IBL from Plus Libraries; A good and fast OLV network of the PSO transport service
A fast and cheap logistical network to exchange materials with libraries
support function fo maintain, develop and promote. This would contribute fo the Plus Libraries a national library and information network (48). The LO offers the dynamic society free access to information, knowledge dnd culture for all by providing high quoBty library ser/ices lo education, participation, meeting and cuttural experience (49). A good and complete range of materials to offer their users. This includes materials from the city, province or notional
The use of PostNL to transport the IBL mati from and fo the Plus Library is too costly
The IBL sen/Ice lead times ore long; The OLV lead fimes could be shorter
Lack of a cost efficierif: transportation netwOrii;,.; for IBL; the use of Postfc|;: is expensive
Lack of a cost efficient transportation netiwork for IBL; the use of PostNL is expensive
Governmental Organizations MunicipaMies Good use of
municipaltty frjnds put in fhe libraries to achieve to (abstract) goals set by fhe municipalities; Interest in a good functioning of the library sector to enhance cultural development in region .
Responsible for the executive work of the physical library and the local component of the notional digital library, for local networks and the connection with provincial and ndtional nehvorics (30)
The libraries have fo achieve fheir duties yjjlfi less funding than in ttie past
Due fo budget cuts, thé municipality has pass on cuts in fhe grants ot libraries
Provincial Governments
• Ministry OC&W
Good use ot provincial funds put in the PSOs to achieve to (abstract) goals set by fhe provincial government: Interest in a good functioning of the library sector to enhance cultural development in region Is responsible for the design of a national library network, build up by local and provincial networks, port of this is the national digital infrastructure: Interest in a good functioning of the library sector to enhance cultural development in region
Responsible for the support of the executive work of the plus library, for the provincial network, for fhe connection to the national network and the implementation ol the national digttol library (30) Has a system responsibility for the public library sector and for giving the SIOB assignments in implementing these responsibilrties (30)
The libraries hove to achieve their duties with less funding than in the post
Due fo budget cuts, the provincial government has pass on cuts in the grants of libraries
Private Organizations 3PL's (PostNL)
NBD Blbllon
In ottering service to PSOs/LO to transport materials to and from libraries
Have no interest in taking the notional distribution of materials on their distribution of new materials
To make a profil in offing services to parties that need distribution services in order to maintain continuity in business The NBD is a non-profit company that tries optimize the course of materials in the libraries by delivering materials for lending purposes to Bbrories (50)
TNT Innight is involved in fhe Pilot Distribution BNL
Their involvement is because of their Innight sen/ice

CB
Non organized inl»r»st
Might have interest to include the distribution of Public libraries in their system
In having tfieir motsiiai tfie desire for as cttaqp and as fast as po iüM evcioljle
To be the biggest logistical service provider concerning materials in the Netheriands (51).
To read mateikiis and have tli« motaffals tfiey desire ovoloiste ot tfwk Ibrary around ttie comer
Having to request certain materials, one must order tfiem of the Ubrary most of the time and hav« fo watt up to a couple of days befor« ttteir HKiterid ontves at the *«qu>s*»ddw«na»pw
The current ICT systwm and distributtoniystiillll orgoniiedinfh* : »; Nettierionds ; /.!':
Stakeholder Resources SubstihifabUfy Dependency on Stakeholder
Citlicai Stakeholder
Ubrary Organizations Itoflonai m i VOB
^•:' »OB
,. 1-. • i • :• '.•.
UKB
.telrwdtorcet; Lobby Joined forces; Lobby: vole in BNL KWQ>i*ttlBB and ««MMfhtOfNtC Extended formal powers; vote in BNL
Fti^teM)i30onin «tMbuAsn Joined forces; Lobby; collection of (WSF) materials
krvpkiceabte irreplaceable
irreplaceable
ig#ploccflbie
irreplaceable
Motor Moderate
Mcfor
Moderate
Mclor
Low
Yes No
No
No
No
local vaiKfiifiSrigieammé tnpBacMM» Motor
Plus Libraries (CG Ubrary]
VB»
Library Locations
Governmental OroanizaMons
; : 'dlMcHlen Participation in distribution; collection of (WSF) materials Par«^se«onln (M^(M9n; cdkKHon of mdNwt* collection of materials
Irreplaceable
repkaceoble
replaceable
Major
Motor
High
FaniBÉ flfiHRMB* ftMHisI^ IVÉAÉbcet^ÉM-i^Mn w*
Y*5
Yes
Yes
Yes
Y#$

l^^mHimm^mW: Irreplacedble (within term) Irreplaceable (wtthin term)
replaceable
Yes Provincial Governments
'Ministry OC&W
Private Organiixiilons 3PL's (e.g. PostNL)
NBD Blbllon
CB
Non organized interesf groups
S End-user (sub-groups)
j -
resources Formal powers: financial resources Formal powers in SIOB; financial resources
Advanced distribution networks and systems: Knowledge and expertise of distribution Advanced disfribufion networks and systems: Knowledge and expertise of distribution Advanced distribution networks and systems; Knowledge and expertise of distribution
FiBng complaints; Lending materials: membership librory
replaceable
replaceable
replaceable
High
High
Moderate
Moderate
No
No
No
No
mmm-
Moderate No

kwink. |ro«p
A r - - | ,-..r/. [:• J.^r \f-l\' , ; r THF p i l QF DlSTSlPiJfiF
Kostenbesparing en kortere doorlooptijd Het doel van de pilot Distributie is om de kosten van het interprovinciaal transport tussen bibliotheken te veriagen en de doorlooptijd van het landelijk transport te versnellen.
Met de pilot distributie wordt het gecombineerde gebruik getest van de provinciale distributienetwerken en nachtdistributie voor het vervoer van boeken (interbibliothecair leenverkeer) en cd's (Centrale Discotheek Rotterdam) over provinciale grenzen heen. Per zending wordt tijdens de pilot een zeer gunstig tarief gerekend, dat in elk geval fors lager zal liggen dan de standaard portokosten voor het verzenden van een boek (€ 6,-).
Tijdens de pilot krijgen basisbibliotheken IBL-leveringen aangeboden door het provinciaal transport. Retourzendingen kunnen door basisbibliotheken gewoon weer worden meegeven met het provinciaal transport. Dat is gemakkelijk en het levert lagere kosten op. De pilot distributie wordt in opdracht van Stichting Bibliotheek.ni ontwikkeld. De pilot gaat op 7 maart 2011 van start.
Achtergrond Plusbibliotheken versturen jaariijks veel boeken in het kader van het Interbibliothecair Leenverkeer (IBL) per TNT post naar basisbibliotheken. Basisbibliotheken sturen deze boeken weer retour per TNT post. De kosten die hiermee gepaard gaan zijn al jaren onderwerp van discussieerde Centrale Discotheek Rotterdam is eveneens een van de leveranciers die gebruik maakt van de landelijke pilot Distributie. Leners kunnen op de gebruikelijke manier cd's lenen via de dienst Aanvragen binnen hun bibliotheeksysteem. Zodra CDR als leverancier gaat optreden kunnen leners dankzij de pilot Distributie eerder over de gevraagde cd's beschikken dan voorheen. Ook retourneren via de pilot Distributie zorgt ervoor dat de Cd's weer sneller beschikbaar zijn. Overigens is de verwachting dat met de komst van de Nationale Bibliotheekcatalogus (NBC) het gebruik van collecties over de provinciegrenzen heen zal toenemen. Goedkoop en snel interprovinciaal transport wordt daarmee noodzakelijk.
Doelstellingen • Reduceren van de transportkosten voor interprovinciaal leenverkeer in de
pilot. Na de pilot komen deze kosten nog lager te liggen. De kosten voor de CDR mogen niet hoger worden dan de huidige kosten.
• Versnellen van interprovinciaal leenverkeer (t.o.v. landelijk NBD-transport) naar 2 tot 7 dagen.
• Inzicht krijgen in volume, dooriooptijd en kosten interprovinciaal leenverkeer
Uitvoering Tijdens de pilot bezoeken de PSO's vijf keer per week de deelnemende Plusbibliotheken en de CDR. Aan het einde van de middag zetten de PSO's de boeken en cd's die naar de andere provincies getransporteerd moeten worden klaar voor TNT Innight. TNT Innight brengt alles naar haar sorteercentrum in Nieuwegein en sorteert daar alles uit. 's Nachts wordt alles weer getransporteerd
•fu Delft
kwink. naar de PSO's. Deze zendingen kunnen door de PSO's weer meegenomen worden in de routes van de vervoersdienst.
HGVM 3: nANSKMn FIOWS M THt MLOT DKreiMHE
De retourzending vertoopt volgens in omgekeerde volgorde. De basisbibliotheek stuurt het boek retour via het regulier transport van haar eigen PSO. TNT Innight haalt het hier op en levert het af bij de PSO van de Plusbibiiotheek. Deze levert het boek uiteindelijk af bij de Plusbibliotheek.
Mijlpalen 18 oktober 2010 Start nulmeting bij deelnemende Plusbibliotheken 1 november 2010 Start acceptatietest wijzigingen CBS van Plusbibliotheken 1 maart 2011 Start pilot 31 augustus 2011 Einde pilot 30 september 2011 Besluitvorming over vervolg pilot
Na het einde van de pilot zal de distributiewijze van de pilot worden gehandhaafd, totdat een besluit is genomen over het vervolg. Hiervoor vnorden afspraken gemaakt met de deelnemers.
ru Delft

nCURE 4: CAUSM IClAnONSHIP OIACKAM OF THE l i l I v n i M )N THE NETHEUANDl
The c a u s a l re lat ionship d i a g r a m is bu f ld u p ou t of several e lements . The system tactors b e i n g the circles a n d the relaf ionships b e t w e e n
these fac tors b e i n g t h e arrows. I h e arrows h o v e on ly o n e d i rec t ion a n d s tand tor t he c a u s a l re lat ionship t>e tween t w o fac tors . The a r row
has a n e g a t i v e or a posi t ive c a u s a l re lat ionship w i th o n e l e m e n t . If o n e fac to r increases, a posi t ive relat ionship increases the fac to r
c o n n e c t e d w i th a posit ive a r row.
Within the system o l ILL several sub systems o re i den t# ied . The subsystems a t e e n c l o s e d by the d o t t e d boxes. I h e tac to i s o re
c a t e g o r i z e d ; s o m e fac tors h a v e a spec ia l t u n c t b n in respec t to t h e p r o b l e m o w n e r o l this p ro jec t , t he St icht ing PSO N e d e r l a n d . There
a r e e n v i r o n m e n t a l tac tors w h i c h o re fac to rs t h a t t h e SPN c a n n o t i n f l uence o n d a r e d e p e n d e n t o n . Instrument tac tors a r e to b e
i n f l u e n c e d b y the SPN a n d c o n b e used by the SPN fo in f l uence the system in its I k i n g . The iden t i f i ed system cr i ter ia a r e the o u t p u t
factors of t he system a n d o r e the fac tors w h i c h measure the p e r t o i m o n c e of t he ILL system.
Uke s ta ted in 2.4.1. there are several loops t o b e ident i f ied wi th in t h e ILL system. C losed loops in a c a u s a l relat ionship d i a g r a m a re of
interest w h e n r r o d e B n g o system using this m e t h o d b e c o u s e of t h e b e h a v i o r o l a l o o p . A l o o p c a n ei ther h a v e a posi t ive e f f ec t , w h i c h
m e a n s tho t a l o o p cont inues t o increase o n c e o n e factcM is i nc reased . Tho e f f e c t c o u l d ei t t ier t i e w a n t e d or u n w a n t e d . N e g a t i v e loops
also exist. Ttie most impo r t an t loops o re discussed in 2.4.1.
The m e t h o d s a n d techn iques used in this p a r a g r a p h a r e d e r i v e d f rom the R o a d M a p s t o learn ing System Dynamics t rom MIT (28).

kwink.
During the course of this project a questionnaire was designed in order to gain insight
in the interiibrary loan system In fhe Netheriands. The questionnaire is designed In
Dutch and contains basic questions concern ing the definit ion of ILL and fhe ILL
material . Next to the basic questions, addi t ional questions are raised focusing on
future concepts wtthin fhe organizat ion of ILL. The comp le te list ot concepts within the
questionnaire is not used in fhe project. Within the project a clear focus is set on the
f loating col lect ion c o n c e p t .
The feedback of fhe questionnaire is used in pa rag raph 2.3 a n d 3.2. The opinions of
fhe employees that rece ived the questionnaire ore important input in the SWOT
analyses on fhe current ILL organizat ion a n d fhe floating col lect ion concep t . The
perce ived issues that arise from implement ing a floating col lect ion wtthin the library
sector are c o m e forth f rom these questionnaires.
Interbibliothecair Leenverkeer Vragenlijst - Feedback Afstudeeronderzoek Nick van der Noordao van de TU Delft naar de IBL Distributie in hef /coder van de Pilot Distributie
Deze vragenl^st is gemaakt naar aantekSng van de geplande w o r k t o p op 9 rrxaort 20ï 1 in liet kader van liet afstudeeronderzoek van Nick van dor Noordao van de TU (Delft. De geplande workshop is deel van het afstudeeronderzoek van rr^ dat Is gestort in het kader van de PItot Distributie van tnterbiblott>ecalr leenverlceer (IBL). De pflot Is op 7 moort van start gegaan. All© genodigden voor deze workshc^ ontvangen deze vragenBjst en aan allen wordt vriendel^ verzocht om het in te vullen naar eigen mening en expertise en het te retourneren. De vragen die in deze vragenlijst staan zouden tijdens de eerste workshop worden behandeld. Omdat de woricshc^ van 9 maart niet door kon gaan. is deze vragenlijst opgestekj. De input van de betrokkenen in cJ ,-,_ onderzoek is van groot bek^ng voor het realseren van realistische en significante resultaten.
Deze vragenlijst zal: o dieper ingaan op het onderzoek o per vraag een toefichting geven over de context
^U Delft ~
o
kwink.
Mijn onderzoek is gestart na oonleldlng van het starten van de Plfc>t Distributie. Ik heb sdmen met Ronald Spanier een opc*acht op>gesteki die de distributie van media binnen de provtnciegreniren zal orxierzoeken. M^n aanpak is een zogenaamde "bottunvup" IserKidering. Na de distributie binnen de provincie grenzen te hebben onderzocht zal ik mijn resultatwi generaliseren op atte provinciale gebieden en het onderzoek op het IcvKlel^ niveou dooflrekhen.
0 0 inferessante v a n ^ z e Twoeae srap B cftaT WTSÖöiST föpSffeK© «tóncépfènltf oeZè^ap rrfSHF. i p c u s is op mogelijke dienstverleningconcepten op landelijk niveau. Belangrijk hierbij is het 'out-•riif-the-box' denken. Ik tieb vanuit nnijn opleidng Technische Bestuurskunde in Delft een werkwijz
aangenomen woartwj samenwerking met alle betro^cken partijen een cruciaal onderdeel vc mijn onderzoek vormt. Omdat er veel verschillende partijen betrokken zijn bij de distributie, ze op provinciaal als op tandel^k niveau, ben ik van ptan om deze partijen mee te laten denken in
Het meest betangrijke element van m^n onderzoek is de lectuur dat door bibBotheken onderBng wordt uitgewisseld, het IBL verkeer. Door het creèren van de NBC wordt verwacht dat het IBt vartceer zal toenemen. In n^jn ondwzoek is het van ^ o o t belang om een goede definitie •» bepalen van het begrip tBL-boek. Wat is precies een IBL boek en waarom is hei een IBL boek? In d e
.JwoKshop wibe ik een korte brainstorm organiseren waarbij een hoop ideeën over de definitie van Wm^ IBL boek boven tafel zouden komen. Ik zou graag alsnog deze input van u willen ontvangen In
onderstaande tekstblok. Met deze input zou ik een betere categorisatie kunnen nnaken van het IBL boek.
a a
E/s Boon - &bliotheek Drachten
Een IBL boek is een boek dat tussen bibNotheken onderlng getransporteerd wordt met het doet uitgeleefKl te worden aan een \e2&r van een bibSotheek die Mlf r^et in het t>ezit is van deze titel.
In principe zijn dit alle boeken (en ook ofKJere media) die binnen Nederland aanwezig zijn in alle bibliotheken maar er :ijn (delen van) collecties die niet uitgeleend worden maar slechts ter irïzage aar^geboden worden. Boeken uit dte collecties JXiUen vanzelfsprekend geen IBL boeken worden.
Willy Karel - Bibliotheek Eindhoven
IBL staat voor Interbibliothecair leenverlceer. Een IBL boek is daarom een boek/ of arxier nrwteriaal zoals cd . Dvd. etc. wat aan orKler biblotheken buiten de eigen organisatie wordt uitgeleend. De bibliotheek bepaalt welke materialen voor Ibl ter beschikking worden gestekJ. Zo kunnen zogenaamde sprinters of titels die recenter zijn dan 3 nraanden, door een bibliotheek uitgestoten worden voor IBL.
O'
f lOó rUDelft

kwink. «roep
' Rob Kiehgeld - Mijn Eigen Bibliotheek
J Een IBL-boek is een boek dot door bibliotheek X naar bibliotheek Y wordt verzonden omdat Y het ' niet in de eigen collectie heeft, er binnen Y wel vraag naar is, en X geen bezwaar heeft het tijdelijk ' af te staan. Dit houdt in dat elk boek in principe een iBL-boek is of kan worden. In principe, want in I de praktijk Is er wel enig onderscheid te maken.
' Rek3ties met de hoeveelheid uitleningen per jaar of de populariteit van een boek zijn er in die zin, I dat hoe meer vraag er is naar een bepaalde titel (dus hoe populairder hij is), des te groter de kans I is dat die titel in elke bibliotheek aanwezig is en dus niet gouw via IBL aangevraagd hoeft te , worden.
I Voorbeeld: 'Komt een vrouw bij de dokter' van Kluun zal niet gauw via IBL aangevraagd hoeven , worden, omdat die titel in vrijwel elke bibliotheek aanwezig zal zijn. 'Van tufsteen tot spitsboog' ] (over de Petrus- en Pouluskerk in Loppersum) is wel een typisch voorbeeld van een IBL-boek, omdat ' van zo'n titel niet ven^vocht mag worden dat die tot de eerste aanschafkeus van de meeste I bibliotheken behoort, en er toch (incidenteel) vraag naar zal zijn.
Fred Kolman - OBA
Een IBL boek - het lijkt me beter om de term IBL titel te gebruiken - is een titel die door de ene bibliotheek (vragende bibliotheek] wordt aangevraagd bij een andere bibliotheek (leverende bibliotheek). IBL titels worden verzonden per (intem)transport of de post; in een enkel geval per mail als het een electronische publicatie betreft.
In prindpe zou elke titel die in een ultleencollectie staat een IBL boek kunnen zijn. Vaak heeft het helemaal niets met populariteit te maken, maar juist met het fa t dat de titel zetozoam is (tong tail}.
[ Rene van der Hove - OBD
[ Een Inter Bibliothecair Leenverkeer {IBL)boek is boek dat wordt uitgeleend aan een andere [ bibliotheek in plaats van aan een ingeschreven eigen lener.
! Sommigen maken onderscheid tussen OBL en IBL leenverkeer. Het OBL leenverkeer is dan het [ leenverkeer tussen bibliotheken die behoren tot hetzelfde netwerk met meerdere vestigingen in [ meerdere plaatsen. Het overige leenverkeer wordt dan aangeduid als IBL verkeer.
J Overijlen:, betreft hei iB:_ ni-t;
[ in Nederland zijn er collecties die bedoeld zijn om vanuit efficiency ovenwegingen andere [ bibliotheken te ondersteunen met literatuur . Voor een deel zijn dit collecties waar het publiek ' geen rechtstreekse toegang toe heeft maar wel kan aanvragen mits hij/zij lid is van een andere I bibliotheek. Het gevraagde wordt niet uitgeleend aan een persoon moor oen een bibliotheek I waar het gevraagde kan worden afgehaald. Deze collecties worden vaak aangeduid als 1 sa menwerkingscollectie. Afhankelijk van het collectiedeel gaat het over het algemeen om minder J populaire werken maar dat verschilt per samenwerklngsvalxand. V ^ ,
.s o .Q '—1
JZ
u o
•fu Delft " ^
nxateriaaljcoileri oai.'C rmj^iefcd.
kwink. groep
Lieke de Veer - Mijn Eigen Bibliotheek
Definitie:
Een IBL boek is een boek dat vlo het Inter Bibliotecair Leenverkeer (IBL) geleend wordt. Het boek komt dus uit een andere bibliotheekcollectie dan die waar de lener ingeschreven staat. In Groningen spreken we alleen van Inter Bibliothecair Leenverkeer als de aanvraag buiten de eigen organisatie (lees: provincie) gehonoreerd is. Bij openbare bibliotheken binnen de provincie spreken we van onderling leenverkeer (aanvragen en reserveringen)
Van het totaal aantal uitleningen in de provincie Groningen zal niet meer dan 5% bestaan uit IBL aanvragen, schat ik.
Wat betreft leveringen: in principe levert alleen de OB Groningen aan het landelijk IBL Het gaat In feite om HBO+ materiaal. Populaire titels worden binnen de provinciegrenzen geleverd.
Zie WSF-IBL statistiek voor gedetailleerde info.
Het aantal IBL boek aanvragen (landelijk, inclusief UB-en etc) doolt jaarlijks met ongeveer 5%.
Heerenveen
Elk bibliotheekboek kan een IBL-boek zijn, tenzij de bibliotheek geen boeken uitleent aan andere bibliotheken of het boek een nostagexemptaar is (kwetsbaar, onmisbaar, te oud). Verder heeft een IBL-boek geen bijzondere kenmerken. IBL betekent volgens mij alleen maar dat het boek door de ene bibliotheek aan de andere uitgeleend wordt t.b.v. een lener van die bibliotheek.
Het aantal uitleningen speelt hierin geen rol, dat kan variëren van 1 tot vele tientallen. Hetzelfde geldt voor populariteit. Openbare bibliotheken hebben de populairste titels vaak zelf In de collectie; juist voor de minder gangbare titels valt men terug op de collecties van WSF of U ni versi teltsbibliotheken.
t Friesland - Noordoost
' IBL boek:
[ Een boek dot door de ene (universiteits)bibliotheek can de andere bibliotheek uitgeleend wordt ' tbv van aanvraag klant..
! Dit kan een populair boek zijn, het kan een specifieke titel zijn enz.
I Grote en wetenschappelijke bibliotheken zijn vaak de leverende bibliotheken en de kleine [ bibliotheken de vragende bibliotheken.
^ ^ ^ ^ ^ ] Friesland Zuidwest
\ In principe kan het ieder boek ^jn, dat niet in onze provinciale catatogus beschikbaar Is.
•fu Delft
kwink. Bort Unssen - Biblk>theek Maastricht
Materialen van bibliotheken die door een l d van een andere blMotheek (of door een andere bibltotheek) worden aangevraagd
Je hebt het eigenlijk in de hele enquête over boeken. IBL is echter ook kopieën, avm, btadmuzlek.
Hons Stokenburg - Pro8/b/io
Voor ons Is een IBL boek een boek wat aar>gevraagd wordt bij de plus bibliotheek of Universiteit en/of hogeschool of onder soort Instellng.(b,v, bedrijfsbiblotheek)
Het boek is dan ook vaak een gespedaBseerd boek.
Deze materialen worden tondelQk aangeboden en vers tu i f .
Merendeel van de aanvragen/reservering gaan via ons eigen network (Bteat), deze reserveringen bedragen op dit n'wment zo'n 1.500.000 boeken
Wij noemen dit OBL Onderling (KbBotheek) Leenverkeer.
Deze reservering blijven in ons werkgebied.
Als deel van mijn onderzoek zal ik dienstverteningconcepten onderzoeken cfie betrekking hebben op het distribueren van IBL boeken in en tussen de provincies. Ik heb voor aanvang van de v«xkshop al onderzoek gedaan naar verschillende soorten dienstverleningsconcepten en Ik heb deze in de vragenlijst op genomen. Er zijn concepten ingedeeld vanuit het perspectief van de bibliotheek en er zijn concepten die ingedeeki zijn vanuit het perspectief van de eindgebruiker. Ik heb per concept een korte toelichting gegeven om duidelijker te maken vraaruit het concept bestaat en wat het doel van het concept ts. Ik zou graag een zo gedetailleerd mogelijke reactiO,,,, van u willen ontvangen per concept. Met uw commentaar en opmericingen kan Ik een meer ' gedegen onderzoek kunr>en verrichten naar deze verschillende concepten en kon Ik deze concepten beter evalueren op basis van toekomstige scenario's. Na commentaar te hebtsen gegeven op de verschillemde dienstvei leningsconcepten vraag ik u ven/olgens om een top 3 van de meest haolbare concepten te maken en deze top 3 te onderfcxiuv^'en.
Het idee van dit concept is om de gecategoriseerde IBL boek centraal op te slaan in I of meerdere centi^ale punten. Het distiibueren van het IBL boek zal vanuit dit centinie punt v«xden georganiseerd. Gebruikers kunnetn aangeven dat ze een IBL boek willen ler>en. Een order bij het centrale punt zal ervoor zorgen dot het boek binnen enkele dagen de bibliotheek of het uitgiftepunt naar wens zal bereiken. Dit concept zorgt ervoor dat de IBL boeken snel en goedkoop beschikbaar ain voor het comolete tandeliike netwerk.
ru Delft 109
kwink. Els Boon - Bibliotheek Drachten
Een ^cht (dee. De cenfrote punten bestaan al lang, daf z^n nameH^ de bibliotheken. Ik denk rvet dat het veel tijdwinst optevert en er moet een spectote collectie aangelegd worden, wat alt^d een hoop gekj gaat kosten.
Willy Karel - &blK>ttieek Eindhoven
Je krijgt volgens mij een errorme «ïHectie ergens cenhoal. Poputaire titels zullen in grote getale aanwezig nxjeten z^n, anders kan de kfcint niet bediend worden.
Een centi-ale distributie Ijkt me wel zinvc^ voor ouder materiaal. Nu wordt er veel oud nnateriaal afgesctireven en de vraag is of er nog een bibiotheek In tsledertarKl deze titel nog in de coltectie heeft. Een centraal depot voor oudere materialen Ijkt me zeer zinvol.
Rob Kleingeld - Mijn Eigen BJbltofheek
In feite Is d t de huicSge praktijk, mits " lof meerdere centrale punten" breed opgevat nxig worden: in de meeste provincies fungeren V^F- en/of Universlteitsblbfiottieek als centraal punt.
Landelijk één centraal punt - in een ver verleden als eens overwogen - Ijkt me tametijk irieffiaënt en om die reden niet te verkiezen. Provinciale spreicfing van collecties over WSF- en universiteitsbiblottiek^i geeft veel meer mogelijkheden tot direct gebruik door veel meer leners, en gwïereert okjus een fioger rer>dwTient. En ook uit deze collecties kun je titels aanvragen. Bij een hogere omloopsnelheid is de kans om bij een IBL-oanvroag te stuiten op een uitgeleend exemptaar wel groter, maar een goed georganiseerd verdeel- en doorstuursysteem naar andere centrale punten kan dit probleem ondervangen. Ook dit is de huidige praktijk: elke aanvraag die niet door de eerste nrogelijke leverander geleverd kon worden wordt thans automatisch doorgestuurd.
Eigenlijk een ideale situatie (al zijn er rK>g we! enige vert>eterpunten denkbaar)
Fred Kolman - OBA
Voordeet: makkeSjk te organiseren
Nadeel: van wie ts die collectie. Ik kan me voorstelen dat je van aKe aangeboden titels een aantal exempteiren koopt en zo goot verspr^den. De financiering zou je dan via een famule kunnen verdelen over de deelnemers. Maar wat doe Je dan met de aanvragen voor zeldzame werken . Dan zouden alle samenv^erkende oiganlsaties zouden ook hun mogaajncollecties moeten afstaan. Ik vraag me of of dat haalbaar is. Decentale organisatie heeft ook als voordeel dot je bij een catamltelt niet je volledige leenverkeer kvi^t bent.
ru Delft

kwink. groep
Rene van der Have - OBD
Huidige situatie
Er wordt reeds gewerkt met zwaartepunt- en samenwerklngscollecties. Veetal zijn deze provinciaal georganiseerd. Dat komt onder meer door de (provinciale) subsidiëring en het uitgangspunt dat bijzondere collecties raadpleegbaar zijn voor studiedoeleinden op niet te grote afstand voor de lener.
Een tandelijke collectie heeft de volgende vo<xdelen:
- efficiënter door minder overiap
- door nDossaliteit efficiëntere werkprocessen
- kigistiek efficiënter In te regelen
Nadelen:
-Vevii werk / btdciel .J n.ijnite orri op 1 plek voor lier h'^::\e land aori i 7 "cnaffen en U}; oeheren.. i" nu ingebed b'j beskjai'd-^i: \\'e'^.zo•:}rr\\••e•.'i^}•.'\
-fysieke raadpleging van collectie door bezoekers door grotere afstand moeizaam
- minder affectie met regionale literatuur- en historische boeken
- minder kennis van tokale collecties
- bij een catastrofe is I landelijke collectie kwetsbaar N _ ^ ______ _ ^ _^ _ ^ ___ _ ^ _ ^ _ ^ _ ^ ^ _ ^ _ ^ _ ^ _ ^ _ ^ _ ^ ___ _ ^ _ ^ _ ^ _ ^ ___ _ ^ ___ _ ^ _ ^ ___ _ ^ _ ^ _ ^ _ ^ _ ^ _ ^ ^ ^ ^ ^ ^ ^ ^ ^ ^ _ ^ _ ^ _ ^ _ ^ _ ^ _ ^ _ ^ _ ^ _ ^ _ ^ _ ^ ______ _ ^ ___ _^
Üeke de Veer - Mijn Eigen Bibliotheek
Wanneer 100% bekend is om welke boeken het goot, is dit mogelijk een aantrekkelijk model. De praktijk is echter griIBger. Ervaring leert dot boeken die op deze manier opgestagen worden en 'wachten' tot er een vraag komt, een tage uitleen frequentie kennen. In Groningen is (ol ver voor de fusie) gekozen om de magazijncollectie onder te brengen in de open uitlening van de Bibliotheek Groningen zodat leveren nog steeds mogelijk is, maar de collectie ook beschikbaar is voor klanten in de bibliotheek. Hiermee zijn veel titels ontdubbeld en dus kosten bespaard.
Als we kunnen gaan leveren vanuit printing on demand is centrale distributie wel een aantrekkelijk perspectief.
•ö c & a <
a
ru Delft
kwink. groep
Heerenveen
Dit concept goot er van uit dot van tevoren bekend is welke boeken aangevraagd zullen worden. Dat is kennis die niemand t>ezit. Populaire titels waar veel vraag naar zal ajn worden door elke bibliotheek sowieso aangeschaft. In het centrale punt zou men deze titels don in veelvoud moeten aanschaffen, aangezien het niet bij 1 aanvraag per 3 weken blijft en de wachttijd oploopt bij veel belangstelling. Juist voor de minder populaire titels vallen openbare bibliotheken terug op grotere vestigingen of wetenschappelijk bibliotheken. Het zou er dus op neerkomen dat dit centrale punt olie titels zou moeten aanschaffen die er verschijnen en de meeste van deze boeken staan vervolgens te verstoffen in het magazijn, om zo nu en don op aanvraag de kost uit te komen. De boeken kunnen beter in bibliotheken op de planken staan, zodat de bezoekers die tangs de kasten topen op hun bestaan gewezen worden en ze meer kans hebben uit die kasten te komen.
Dit neemt niet weg dat er landelijk overlegd zou moeten worden wie een bepaalde titel in de collectie opneemt, zodat er geen titels gemist worden.
Wet een goed idee: een soort 'pluscollectie' per - bijvoorbeeld - provincie, als eerste bevoorrodingspunt van openbare bibliotheken. Hierin geen boeken die te populair ajn en ook niet té specialistisch.
Friesland ~ Noordoost
Dit concept kon snel en goedkoop zijn.
Dot zijn ook tevens de voordelen: de aanvraag kon direkt naar een centraal punt gestuurd worden, dus besparing in tijd en daarmee ook in kosten en kan binnen korte tijd dus geleverd worden.
Een nadeel kon zijn dot dit concept zichzelf kan tegenwerken in kosten, omdat een veel grotere hoeveelheid boeken aanweag moet zijn: de omloop is sneller en groter.
Friesland Zuidwest
Niet haalbaar en ook niet wenselijk.
Uitleningen worden alleen gegenereerd naar aanvragen, collectie is verder een dood bezit en niet toegankelijk en zichtbaar voor openbaar gebruik.
Sart Unssen - Bibliotheek Maastricht
Een centrale plek voor ibl materialen lijkt ons niet wenselijk. Want waar go je die materialen dan plaatsen? Zijn ze don alleen beschikbaar voor IBL en niet voor de open uitleen? Wie bekostigd deze materialen? De Plusbibliotheken zouden natuurlijk wel onderling kunnen afspreken wat de zwaartepunten in hun collecties zijn en of ze hun saneerbeleid aanpassen aan de andere collecties. Door een goede centrale catalogus (bijv. de toekomstige nbc of de 13onderlknop catatogus) is het duidelijk waar een materiaal zich bevindt en kan het evt. aangevraagd worden.
f i i Delft

kwink. froep
Hans Stakenburg - ProBiblk»
Ik vind dit een goed concept,
Het zal voor duidelijkheid zorgen,.
Er worden nu bij alle biblotheken plus biblottTeken discussies gevoerd over de finandën van het aanbieden van IBL, Grote bibBotheek plus blblottwken voelen zich niet geroepen om alle IBL aanvragen te honoreren dit i.v.m. de keften.
Distributie van de IBL materialen kan vanuit één punt ook beter en ^>eller.
Het concept van een fkxtting collectie klinkt misschien bekend in de oren. Bij dit concept zullen de gecategoriseerde IBL boeken <ie uitgeleend worden aan andere bibliotheken niet direct teruggestuurd worden naar ide oorspronkeijke collectie, nrxaor op de locatie blijven waar het boek is aangevraagd. De volgende lezer die het boek w/il lezen en reserveert, zal het boek vanuit deze bibliotheek toegestuurd krijgen. Met cfit concept worden onnodige k>gtstieke bewegingen besDoard en daarn^ee wordt het ti-onsoort van IBL boeken een stuk aoedkooer.
Els Boon - Bibliotheek Drachten
Dit kJee Is beter dan het vorige. >^leen: wie betoott deze boeken?? En iectere blbfiotheek kan besluiten de boeken te houden, een lastig punt.
Willy Karel - &blk>theek Eindhoven
In feite heb je don 1 bibiotheek met 1 coHectie.
Ik denk dat cflt idee zijn t ^ ver vooruit Is. Per orgonisatie wordt een collectie toch als eigendom gezien en Is in eerste instantie aangeschaft voor de eigen, soms zeer spedfieke leden.
Veel IBL materiaal aangevraagd door onze ktanten, wordt geleverd door universiteiten. Ik denk niet dat het voor onze collectie zinvol is om een 1 x geleende universitaire titel bij ons op de plank te hebben stoan. Stel je zet deze titels in een o p ^ g , dan moet daar weer ruimte voor vrijgemaakt vwxden
Rob K/eingeW - Mijn Eigen Bibliotheek
Het concept is me beker>d, althans op papier. Woarschlir>l}k z^n er geen technische beletselen om dit te organiseren, en ral er in zo'n geval inderdaad sprake zijn van minder transportkosten (retourzenden is er don immers niet meer bij). Ik heb werkefijk geen idee of zo'n concept In de praktijk ook gaat werken, het gaat nu wel érg uit van het Idee van een 'Collectie Nedertand' (ob gezamenlijk be^t van één 'Bibliotheek Nedertand'), en die bestaat gewoon niet.
Een praktijkproef zou duidel^kheid moeten brengen in de voors en tegens, ik zou er op dit moment geen zinnig woord over kunnen zeggen.
•fu Delft
&
u
Q
i ]]3
kwink. groep
Fred Kolman - OBA
Voordeel: Besparing van leenverkeer
Nadeel: aanvragen van wetenschappeijke fiterotuur door leden van openbare bibliotheken gaat zorgen voor" vreemde" coHectles.
Rene van der Have ~ OBD
Nadelen:
-geen uniform beheer
- boeken kunnen makkefijk zoelaoken/worden afgeschreven enz.
- past niet bij winketformule tokale bibBotheken
-bij nieuwe oanvroag nrx)et het boek toch via centraal punt vanwege centiaol punt
Voordelen VU .T lb ;
-geen
Lieke de Veer - Mijn Eigen Bibliotheek
D e ^ vorm bespaart aanzienlek op de transportkosten. We overwegen dit nnodel (op tarr^jn) voor de aanvragen binnen de provir>ciegrenzen. Er zijn echter nog wat hobbels te nemen. Het automatiseringssysteem is Nertoe nog niet voldoende uitgerust. Managers zijn van mening dat de gemeen tesubsicBe voor de collectie voor de kjkole gemeenschap bedoeto is en niet voor andere gemeenten. Er is vrees voor kaalslag (alsof materialen maar één kont op gaan). En hoe weet je nou hoe jouw collectie rendeert als het materiaal voortdurende elders Is.
Vooral In combinatie me\ het winkefcortcept (retail), levert dit nog de nodige vraagtekens op. Op tondelijke schaal (binnen de OB weréiö. of In Ql vertxand?) zal dat niet veel anders zijn.
Heerenveen
Het kiee van een 'fkxating' collectie Is niet K> gek, maar de praktische uitvoering fijkt mij problematisch. Wie bet>eert (en betoolt!} een fkxiting collectie? Elke bibliotheek heeft zijn eigen budget en zal niet bij zijn als de «gen boeken na uitlenen nooit meer terugkomen. Biblotheken zullen bovendien niet altijd betang hebben bij exemptoren uit een floating collectie die niet in hun eigen collectie passen. In - vooral - openbare bibliotheken is het publek heel divers en er zijn veel ti'tels cfie slechts eennxaal aangevraagd worden en waar verder niemand van de klantenkring interesse voor zal hebben.
Wil je alleen poputaire titels in een fkxating collectie opnemen, dan zullen de boeken zich op een gegeven moment ook ophopen in bibBotheken waarin veel actieve aanvragers in het ledenbestand zitten.
Kortom, tiet Idee is niet zo gek, moor de uitwerkir>g Ijkt mij op veel praktische problemen te stuiten.
•fu Delft

kwink. groep
Friesland - Noordoost
Dit concept werkt voor de kleinere (vragende)bibliotheken nadelig. Administratief vraagt dit voor die bibliotheken tijd en geld. Immers zij komen met een grote hoeveelheid nog uit te leveren boeken te zitten.
Friesland Zuidwest
In principe wel een goede gedachte, maar je krijgt daarmee titels dien niet goed in de eigen collectie passen qua niveau, onderwerp, gebruikersgroep enz.
Voordeel: kortere routes
Bart Linssen - Bibliotheek Maastricht
Het is zeker een voordeel dat er minder transport hoeft plaats te vinden. We kunnen ons voorstellen dof er een soort v*flsselcollectie is bestaande uit materialen die HBO plus niveau hebben. Deze collectie wordt dan bekostigd vanuit de PLUS bibliotheken. De wisselcollectie dient te worden verspreid over de PLUS bibfiotheken woamo het aanvragen er voor zorgt dat de collectie vanzelf per bibliotheek goot fluctueren. M.o.w. door waar de vraag is gaat de collectie naar toe. Nadelen:
- Bibfiotheken waar de leden veel aanvragen ontvangen veel nrraterialen die daar don blijven staan. M.o.w. gevaar voor ruimtegebrek. - Bibfiotheken die veel aanvragen gaan ontvangen moeten naderhand ook meer gaan versturen. Wie goot dot betalen? Gezamenlijke pot? - Inwerken materialen? Hoe wordt geregistreerd welke materialen bij welke bibliotheek ï jn? Kon dit automatisch of dient de cotalogiseerafdefing veel extra werk te verrichten?
Hons Stakenburg - ProBiblio
Kfinkt interessant, is bij ons ook een discussie voor het OBL.
Wij tapen nu tegen het feit dot alle bibliotheken hun eigen bezit toch graag in hun eigen bibliotheken terug willen hebben.
Een tweede probleem is de automatiseringssystemen.
A. EFK ''OFNAi^-iF VAN S-'^•>/tCFPl; HTFM \WAAi^ n-.-yPKf:'J FVf^NHJPfl vOOR'^>^ BF:^'ri:.li^
Bij dit concept ligt de focus op de afstand die de gebruiker aflegt om zijn of haar boek op te halen en te retourneren. Op het moment kon de lezer alleen boeken ophalen en retoumeren bij de bibliotheken. Dit concept heeft het idee om deze 'servicepunten' in aantal te vergroten en de afstond tussen de lezer en zijn of haar boek te verkleinen. Er moet don gedacht worden dot er 'servicepunten' georganiseerd kunnen worden in v^nkels zoals een supermarkt bij de lezer in de buurt. De boeken worden in combinatie van een van de eerder genoemde concepten gedistribueerd onder de service punten.
^ J *
•fu Delft
kwink. groep
Els Boon - ^bliotheek Drachten
Dit vind ik een slecht idee. Stuur ze dan rechtstreeks naar de aanvrager, dat is pas service. Op deze manier is het een halfslachtige dienstverlening met als nadeel dat de klont nog niet in de blbfiotheek komt en dus ook niet geneigd is om eens iets anders te lenen of te gebruiken.
Wi7/y Karet - Bibliotheek Eindhoven
Dit Bjkt me een gewetaig concept voor de toekomst. Bibfiotheken zullen in de toekomst misschien toch vaker een servicepunt openen in ptaots van een volledige vestiging open te houden. Makkelijk te bereiken punten zoals een supermarktketen lijkt me een gewetaig alta'notief.
IBL materialen meesturen met levering van goederen vlo de bij de keten behorend transport?
Snackbar concept. In de winkel staan een soort automaten waar de op te halen boeken in worden gelegd. Klant ontvangt per mail een code om het voor hem bestemde kluisje
te openen. Voor inlevering staat er een speciale bak, die zo omgeruild kon worden door het personeel van de venkel of de chauffeur (brievenbus idee]
Rob Kleingeld - Mijn Eigen Bibliotheek
Leuk idee, ol zou ik niet weten hoe je dit organisatorisch rond zou moeten krijgen. Afgezien daarvan: ik heb nog nooit als bezwaar horen noemen dat klanten hun IBL-aanvragen bij de bibliotheek moeten afhalen. In de meeste gevallen goon ze door immers ook heen om ze in te dienen, en don is dot kennelijk ook geen probleem. Of willen we de mogelijkheid creëren om aanvragen ook bij de sigorenboer of de Kiloknaller in te kunnen dienen? Mooie voorbeelden van out-of-the-box denken, vooral doen, moor eerlijk gezegd zie ik alleen moor problemen i.p.v. nieuwe mogelijkheden.
Fred Kolman - OBA
Voordeel: heel gebruiksvriendelijk
Nadeel: Supermarkten zullen er ook wat aan v/illen verdienen; dus wellicht hogere IBL tarieven
Rene van der Have - OBD
Uitbreiding servicepunten is aantrekkelijk (denk ook aan benanestotlons) doordat door bezuinigingen de spreiding van bibliotheken verslechterd.
Nadeel
Controle, beheer 6n r-eiournering ;nb. je wer' 't ook 'ryr/\ exi'^rnplofs-n die onderrr-ans eigöncjorr; zijn!
^nefficiêrite verzending; (af en ioe een e.-.ert-ipiaor naor het servicepunt en weer lerugj
inning boete- en leengefcJen lastig
•fu Delft

kwink. groep
Lieke de Veer - Mijn Eigen Bibliotheek
Bij dit concept Is het niet alleen van belang dat de afstond voor de klant beperkt Is, moor ook dot de afhaal- en inlevertijden ruimer zijn don bv de openingstijden van de (kleinere) bibliotheek. Nadeel is dat het klantcontact ptaots vindt op een plek waar je er als bibliotheek geen zicht op hebt. Je kunt niet reageren op vragen en je mist daardoor ook 'informatie' over de ktant. Foutkons is groter en herstelkans kleiner. Een netwerk van distributiepunten onderhouden kon arbeidslntensief zijn. En dus duur.
Het idee is wel sympathiek, zeker in kleine dorpen (nrraor daar is don weer geen supermorkt). Sanrtenwerken met dorpsbetangen e.d. behoort tot de nrxjgelijkheden om uit te zoeken. Of ook een commerciële variant als Kkata ingezet kan worden, zol afhangen van vrat de ktant ervoor over heeft.
Heerenveen
Vooral handig in dorpen en buurten woor de bibBotheek ver weg Is. Volgens mij wordt dit hier en daar al gedaan in den lande, In ieder geval Wj Biebsearch in het middelbaar onderA^js.
Voordeel is duideBjk: mirxier reisafstar>d voor de kkint. Nadeel is ook dutde^k: ook als er maar 1 boek aangevraagd is moet het naar het afhoo^unt gebracht worden, want anders wordt de wachttijd te tar>g. Dit vraagt r>ogal wat van de biblotheken (ariaetdsuren, benzinekosten e.d.).
FriestarxJ Noordoost
Dit concept is vanuit service voor de gebruiker prima. Tijd- en kostenbesparend.
Friéstond Zuidwest
Voordelen: dk:htbii de klant. Levert voor een beperkt aantal ktanten een voordeel op in plaftekjr)dssituaties.
Nadelen: fctonf krijgt zo we in^ biry:iing met de bk>Satt>eek, reta9 gedachte is zoek.
B/Wtofheek ts ook een onfmoefJhgspkxrti zorgt voor socksie co/ies» op hef pkjffetond.
Sort Unssen - ab/bfheek Maastricht
Vanwege het sluiten van veel bibliotheekvestigingen een interessante optie. En het is uiteraard ktantvriendeljk omdat onze leden wellicht minder afstonden hoeven of te leggen of op andere tijdstippen de materialen kunnen goon ophalen. Nadelen: - waarschijnlijk hogere kosten door ruimtes te huren, zelftDecfier^ngskostjes, personeel (bijv van een postagentschap) die exti-o betaald nnoet worden voor de afhandelingen. Willen de ktanten dit opbrengen of.... Een orxiere nrrariier van firKinciering?
[ Hans Stakenburg - ProBiblio
I Ik vind <St concept te ver gaan, er mag toch van een lezer best wel verwacht worden dot deze I naar de bibiotheek gaat.
I Tevens worden de kosten wel erg hoog
u D Q
•fu Delft ~
kwink.
Bi) dit concept is het idee om de boeken bij de lezer thuis te bezorgen en weer op te halen. Dit verkleint de afstand tussen de lezer en zijn of hoor boek. De boeken zullen in combinatie van een van de distributie concepten worden gedistribueerd onder de gebruikers.
a a <
g
I I 18
Els Boon - awiofheek Drachten
Een moQlie service nrwar erg duur en het nadeel is dot de ktant de biblott>eek kan vermeden, fysiek gesproken. Moer voor wie fink in de buidel wil tasten nrK)et dit moge^k z^n.
Willy Karel - Bibliotheek Eindhoven
Gemakservice.
Veel duurder concept om per ktant I titel te versturen en af te leva^en bij een hutsa<*es. Veel mensen zijn niet thuis. Hoe vaak bied je Iets aan? Wat als er nooit iemand thuis is, ook de buren niet.?
Afhalen bij een servicepunt?
Rob Kleingeld - Mijn Eigen Bibliotheek
Thuisbezor0ng zou vrat rrA\ betreft zeker onderdeel van een praktijkproef mogen zijn, al liggen ook hier de (praktische) bezwaren voor de hand (leners overdag nooit ttiuis, beide ouders werken, etc).
's Avonds opnieuw tongskomen zal waorschijnl^k wel erg duur worden, de spullen dan nraar of taten halen op een afgesproken plek (Postkantoor? BlbÜotheek?) is het paard achter de wagen spannen.
Vooralsnog zijn er veel leveranciers van IBL-aanvragen (met name uit UB-kring) die hun nxiteriaal alleen willen afstaan aan derden ob er een (openbare) Wblotheek tussen Ét als intermediair, en cfie verantwoordelijk is voor de veilge retoumering. Ook in dit geval zou ik zeggen; probeer het oHemoai eens uit In de praktijk, al is het voor mij de vraag of alle voordelen wel zo opwegen tegen de bezwaren.
Fred Kolman - OBA
Voordeel: Over dit corx:ept denken wij ook na voor onze takale reserveringen. Is natuurlek heel publieksvriendeijk.
Nadeel: tn een stad ob Amsterdam is het lastig te organiseren vanwege verkeersopstoppingen. Wij overwegen meeliften met een bezorgdierwt (TNT, V&D) maar dot zal het reserveren van boeken zeker duurder maken voor de ktant. Moor je ZDK) dan met twee tarieven kunnen werken: thuis bezorgen en zelf oftralen bf) de bibiotheek.
Rene van der Have - 06D
Er z|n proeven gedaan. Uitkomst: kkinten van de blbfiotheek vinden taog of O tarief zwaarder wegen don sr>elle en gebruiksvriendeflke levering.
Een goede regeing waarbij biblotheken partij zijn b^ de verspreiding van Ebooks heeft de voorkeur.
ru Delft

kwink. groep
Lieke de Veer - Mijn Eigen &bliotheek
Eveneens de moeite woord, mits flexibel ten aanzien van de ophaal- en levertijden. Je moet er niet voor thuis hoeven bfijven en de kosten moeten beperkt zijn (voor de klant én de bibliotheek).
Zetten we hiervoor vrijwilfigers in of een koerierdienst?
Heerenveen
Dit is het meest gebnjiksvriendelijke concept en er zullen lezers zijn die hier graag extra voor willen betalen. Dat is volgens mij wel een voorwaarde; het kon niet gratis. Daarvoor zijn de kosten voor de bibliotheken gewoon te hoog en leners zullen hier ongetwijfeld begrip voor hebben. Je zou de keuze kunnen geven; voor een laag bedrag (of gratis) aonwogen en afhalen bij de bibliotheek of afhoolpunt, of thuis afleveren voor een extra bijdrage in de kosten. Hierbij moet je ook nog bekijken of de boeken weer opgehaald worden of dat ze ingeleverd moeten worden bij de bibliotheek of een afhoolpunt.
Frie^and - Noordoost
Dit concept is nog beter, door de lezer persoonlijker benaderd wordt.
Friesland Zuidwest
Nadeel: zie A. en te duur.
Voordeel: zie A.
Bart Linssen - Bibliotheek Maastricht
De ideale situatie. Zie de voordelen van hierboven + nog meer tijdsbesparing en gemak voor de klanten Nadelen: - Hogere kosten door het rechtstreeks bij de klant afleveren (door bibliotheek of bijv. TNT?) - Hoe verwerk je / registratie ? - Wat als de ktant niet thuis is? Abnog ophalen bij een servicepunt / blbfiotheek? Of...
Hans Stakenburg - ProBiblio
Zie antwoord bij o
N p -R •=-ER:]FECIIEF
Els Boon - Bibliotheek Drachten
0) o '•o c
2L Concepten vanuit het perspectief van de Bibliotheek:
G e w o o n vanuit bibl iotheken uit lenen a a n elkaar, zoals gebruikelijk, maar met een g o e d e
Concepten vanuit het perspectief van de lezer:
Thuisbezorging. Gemak dient de mens.
fl U Delft
• i
119
kwink. groep
Wjlly Karel - Bibliotheek Eindhoven _ _
Concepten vanuit het perspectief van de Bibliotheek:
Concepten vanuit het perspectief van de lezer
2A
Rob Kleingeld - Mjjn Eigen Bibliotheek
Concepten vanuit het perspectief van de Bibliotheek:
IA
Concep ten vanuit et perspectief van de lezer:
2B
Vanuit het perspectief van de bibliotheek: IA ligt het dichtst bij de huidige situatie, en die is zoals gezegd helemaal zo gek nog niet. Veel 'centi^ale punten' betekent: volledig gebruikergerichf, geeft de gebruiker de mogelijkheid zelf collecties te raadplegen, en - desgewenst - materialen eventueel elders aan te wogen.
Vanuit hef concept van de lezer: thuisbezorging wordt al veel langer gepropageerd, en nxag vrat mij betreft gouw een keer onderdeel van een proef worden. Afhalen bij de bibliotheek kfinkt inderdaad weinig 2011, maar maakt het allemaal daarentegen wel erg eenvoudig. Bovendien bieden de meeste bibliotheken vondaog de dog de mogelijkheid om aangevraagde boeken in een andere vestiging/flfiaal op te halen, dus of het nu voor veel mensen bezwaariijk is Maar de roep om thuisbezorging Is niet te stuiten, dus gouw maar eens uitproberen svp!
Fred_Ko/mo_n_--_OBA
Concepten vanuit het perspectief van de Bibliotheek:
Floating col lect ie
Concepten vanuit het perspectief van de lezer.
Thuis bezorgen
Gekozen voor floating collection, onvdot je dit concept nog zou kunnen aanpassen; bijv. aanvragen uit openbare bibfiotheken in je collectie taten staan en uit de UKB tenjgsturen.
Gekozen voor thuisbezorgen; dot is voor de klont uiteindelijk veel meer service don naar de supermarkt gaan (don kun je net zo goed even doorlopen naar de bibliotheek).
Rene van der Have - OBD
ru Delft
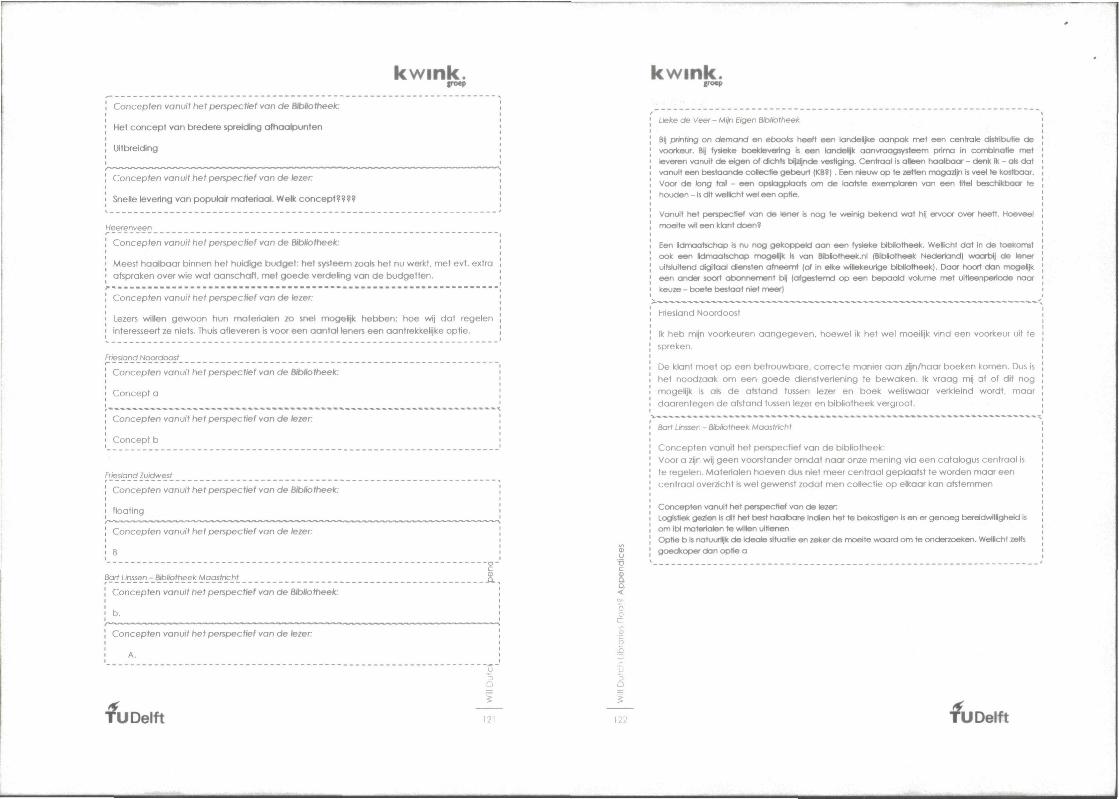
kwink. iroep
Concep ten vanuit het perspectief van de BH^Hotheek:
Het c o n c e p t van bredere spreiding o fhao lpun ten
Uitbreiding
Concep ten vanuit het perspectief van de lezer.
Snelle levering van populoir mater iaal . W e k concep t???? V
Heerenveen r — — — — — • • • .
C o n c e p t e n vanuit het perspectief van de ft'b/iothee/t:
Meest haa l t x ia r binnen het huidige budge t : het systeem zoals het nu werkt, met evt. extra
afspraken over wie wa t aanschaf t , met g o e d e verdel ing van d e budge t ten .
^ • - - - - - - - - - - - - - - - - - - - - - - - - - - - - - - - - - - - - - - - - - - - - - - - - - - - - - - - - - - - - - - '
C o n c e p t e n vanuit het perspectief van de lezer:
Lezers willen g e w o o n hun mater ia len zo snel mogelijk hebben ; hoe wij da t regelen
interesseert ze niets. Thuis af leveren is voor een aan ta l leners een aantrekkelijke opt ie .
Friesland Noordoost
Concepten vanuit tiet perspect ief van d e B/bfe)tt)ee)t: i
Concep t a ]
Concepten vanuit het perspectief van de lezer
Concep t b
Friesland ZuKlwest
Concepten vanuit t>et perspectief van de BibSottieek:
fkDOting
Concep ten vanuit ttet perspectief van de lezer
e
Bart Unssen - Bibfofheek Moostricht
Concep ten vanuit he t perspectief van de BibHottieek:
b.
Concep ten vanuit het perspectief van de lezer
A.
c
1
fu Delft ~
kw ink . groep
Üefce de Veer - Mijn Eigen &bliofheek
Bij print(r>g on demand en ebooks heeft een londeBjke aanpak met een cenhxile distributie de voorkeur. Bij fysieke boektevering is een landelijk aonvraogsysteem prima in comWnatle met leveren vanuit de eigen of dichts bijzijnde vestiging. Centraal is alleen haalbaar - denk ik - ab dat vanuit een bestaande collectie gebeurt (KB?) . Een nieuw op te zetten nxagozijn Is veel te kosttxior. Voor de k>r)g tail - een opstagptaats om de taotste exemptaren van een titel beschikbaar te houden - is dit wetBcht wei een optie.
Vanuit het perspectief van de lener is nog te wreinig bekend vrat hij ervoor over heeft. Hoeveel moeite wil een ktant doen?
Een lidmoatsctKip is nu nog gekoppeto oon een fysieke bibBotheek. WeHIcht dat in de toekomst ook een Bdmaotschop mogelijk b van Blbfiotheek.nl (BibBotheek Nederland) waarbij de ler>er uitsluitend c^gitool diensten afneemt (of In elke willekeurige bibliotheek). Daar hoort don mogeljk een ander soort abonnement bij (afgestemd op een bepaald volume met ultieenperiode naar keuze - boete bestaat niet meer)
I Friesland Noordoost ,
] Ik heb mijn voorkeuren a a n g e g e v e n , hoewel ik l iet we l moeilijk vind een vooriceur uit te '
I spreken. '
! De klant moet op een bet rouwbare, cor rec te manier a a n z ^ / h a a r boeken komen. Dus is ]
I f iet noodzaak o m een g o e d e dienstverlening te b e w a k e n . Ik v raag my af of dit nog \
I mogelijk is als d e afstand tussen lezer en boek weliswaar verkleind wordt , maar |
I daa ren tegen d e afstand tussen lezer en bibl iotheek vergroot. |
V * * - * * * • ^ • » * * - - - * * * * * * * * * * * * * - * • - - • - • • - • • - - • - - • - - • - - • - • * • - • * * * » * * * * * * • * - ^ - ^ •-•-^-^ * - - - • - • -^ • - • • - • * " * * * * *
I Bart Unssen - Sfts/iofheek Maastncht i
] Concep ten vanuit het perspectief van d e bibl iott ieek: "
I Voor a zijn wij g e e n voorstander omda t naar onze mening via een catalogus centraal is i
j te regelen. Mater ia len hoeven dus niet meer cent raa l geplaatst te worden maar een "
i cen t raa l overzicht Is we l gewenst zodat men col lect ie o p eflcaar kan afstemmen "
' Concepten vanuit t>et perspectief van de lezer i I Logistiek gezien is dit tiet best haalbare Indien het te bekostigen is en er genoeg bereidwlllgheld te i I om Ibl materialen te vw'llen uitlenen [ ! Optie b is notuuriijk de ideale situatie en zeker de moeite waard om te onderzoeken. Wellicht zelfs [ ! goedkopw dan optie o '
•fu Delft

kwink. jroep
ApKtHDix H: O B irC i M O D E U P - K , U S ' N C UML
FIGUIE 5: OBJECT MODEl OF THE TaANSrODT SERVICE PSO
in the first step of the conceptualization phase of the modeling of the ILL system, an object diagram is used. An object diagram is classified as a structure diagram in the Unified Modeling Language (UML|. This diagram is a diagram that shows a complete or partial view of the structure of a modeled system at a specific time (36). An object diagram focuses on some particular set of object instances and attributes, and the links between the instances. A correlated set of object diagrams provides insight into how an arbitrary view of a system is expected fo evolve over time.
Within this project fhe object model is used to identify fhe objects within the ILL system and the relationships between these objects. The relationships are of aggregation or composition. The objects are part ot another object or contain within other objects. Within the ILL system four sub systems ore identified. The identified objects and fheir relationships are complex within this system. There are a lot of objects with overiapping characteristics and objects belonging fo several classes which makes a clear overview of the objects difficult. To enable fhe object model to be less complex
•fu Delft
kw ink . groep
several objects are added to fhe object model. The classes RequestingLibrary and RequestedLibrary are added to define a library in its function towards a ILL order. Another clarification is to split the ILL crates in two categories. In the real worid there is only one type of crate. To simplify the object model the crates are subdivided in two categories (37).
This modeling techniques has enabled the project to gain a clear insight in the architectural blueprint of the ILL system including the stakeholders, their activities and their business processes. This manner of modeling enables a static view of the objects of fhe system in relationship to each other. In the next steps the dynamic properties of the ILL are modeled.
•fu Delft

kwink. roep
APPb'-JDix I: P R O C E S S O K I E M I E D M O D E L I N G U . S I N G ". G K A M S
The IDEFO Functional Model ing m e t h o d is des igned to mode l the decisions, actions,
a n d activities of an organizat ion or system. In its original form, IDEFO includes bo th a
definition of a graphica l model ing language a n d a description of a comprehensive
methodo logy for deve lop ing IDEFO should assist in organizing system analysis a n d
p romote effect ive commun ica t i on . IDEFO is used to analyze fhe functions fhe system
performs a n d to record fhe mechanisms by wh i ch these are done . The result of
apply ing IDEFO to this system is a mode l that consists of a hierarchical series of
diagrams, text, a n d glossary cross-referenced to e a c h other. The two primary
model ing components are functions (represented on a d i ag ram by boxes) a n d the
d a t a and objects that inter-relate those functions (represented by arrows). (38).
The IDEFO models d isplayed In this paragraph ore tx jsed on simple syntax. Each
activi ty is descr ibed by a verb based lalaei p l a c e d in a box. Inputs are shown as
arrows entering the left side of fhe act iv i ty box while output are shown as exiting
arrows on the right side of the box. Controls are displayed as arrows entering the top
of the box a n d mechanisms are displayed as arrows enter ing from the bo t t om of the
box. Inputs, Controls, Outputs, a n d MectKinlsnns are all referred f o as concep ts (38).
- Route Information NBC
- F*rovincial Service Area Catalogue - Stack Location Crates at Requested Library - ILL Material Destination . Route Number - Navigational System - IBL Crates Location at PSO - Crate Destinoton Information - Stack Location Crates at Requesting Library - Library Memt3efst>lp - Cost per ReQuested ILL Material
-User - IBL Moteriol on Stielf
- IBL Crate - OBL Moteriol on Sfielf
- OBL Crate - lei Crotes from TNT Innigtif
— • Ptovinctdl ^ SefvjceArea ,
~r - Transportation Mode - Requesting Library ICT System - Requesting Ltorory Computer - Lïxorien -PSO Driver - PSO Truck - Adrrwwtration system
RGURf t: IDEFO PROCESSES AO
Requested Uoteriot bock on Shell - IBL Crate to TNT Innight -User
• fu Delft

kwink. groep
' ROulV IrtfOnTKAort
il O) o tl
.c
F
Ol 0 Q
X
r 0 U
r c c o
fl) o y-<i)
u o
o o ï <1)
> (fi
(U
o
n
n
0)
ri
u
• o c O 0)
ii H < E -I n O- P 5 a
E H) o £
a E o
:n c j) o
O
5 o ? . O) o i D
^ 3 • £ Sr. UJ D . Q O • 0 j^- ïf £
0)
V U
i i Q. c c o ~ o m
as E . c o ._ u £ : <ü O) •o •=; ^ c X ' J) o; CU O )
£ S £ § ^ £ S S o > s 5) O) 11) o c 8
Q. O ë
CD i i ^ O)
• O Q-
o S a (D E £
- o w o " ° 0) -O 13
5 £ 3; £
o ^ T3
ï y
lU .!£} -ü C c 0) OJ .2 5 b S .5» c o "- o E - " ° 1 É •a -S .£
>• o
£ u o s
>• £ o
o
o !
O) 3 > o ra .3!
£• o <u
lU E o
2 dJ
E f £ o
E £
ra ,« . 2 0) •D y o D L^ o LU c;i a <u
o —
a c 5 .2 o o 'S S dj Q-
6 ë
^ ibav L_Sfej
I fronsportotlon |
• mLOmv
I • btxofWn
a o
i : O 0) - o
£ c ._ o
u E o •=; Q. 2> (1) o
- E o . £ a C X ra J o a r E u o 'o oj
l) ,.; -^ D •D Q. S> 3 XI o
°? <" o £ . E 9 CD ra j= D *"
P ö
FIGURE 8: IDEFO DIAGRAM OF PROCESS Al
FIGURE 9: IDEFO DIAGRAM OF PROCESS A2
2 -d
u ••ö
< co. O O IE
b X3
FIGURE 10: IDER) DIAGRAM OF PROCESS A3
128 *U Delft

kwink.
FIGURE 11: IDEFO DIAGRAM OF PROCESS A4
FIGUIE 12: WEFO DIAGRAM OF PROCESS AS
a <
.2 O
h
FIGURE 13: IOH« DIAGRAM OF PROCESS M
^U Delft 129
kwink. ,A"KtfJLJI.< J. FuüvN Cr<,A-;l M O D t t NG
A flowchart is a type of diagram that represents a process, showing the steps as boxes of various kinds, and their order by connecting these with arrows. This diagrammatic representation can give a step-by-step solution to a given problem. Processes are represented in these boxes, and arrows connecting them represent flow of control (52).
Flowcharts are used in designing complex processes. Like other types of diagram, they help visualize what is going on and thereby help the viewer to understand a process and find flows and bottlenecks. The two most common types of boxes in a flowchart are:
. a processing step, and denoted as a rectangular box • a decision, usually denoted as a diamond.
A flowchart is described as "cross-functional" when the page is divided info different swim lanes describing fhe control of different organizational units. A symbol appearing in a particular "lane" is within the control of that organizational unit. This technique allows fhe location of fhe responsibility for performing an action or making a decision correctly, showing fhe responsibility of each organizational unit for different parts of a single process (39).
nCURE 14: FLOW CHART MODEl TRANSPORT SERVICE PSO
ru Delft

kwink. groep
In Figure 14 the flow chart model of the ILL is shown. Within the processes identified in the process oriented models in Appendix 1, the identified organizational units are the user, the library and the PSO. These three organizational swim lanes are identified in fhe model in Figure 14. The flow within fhe flow chart starts with the order of an ILL material and flows through fhe system in till the material is back at the library of origin. The most information is gained on the side of the PSO. The processes understood by fhe project before the flow chart model was designed was more complex than shown in the figure above. This model enabled a more clear overview of processes and the decisions needed by the relevant entities in fhe system.
Using a flow chart model enables fhe conceptualization to be more comprehensive. Tasks identified in the process oriented modeling in appendix I are set in sequence of decision and flow using the flow chart modeling. This creates an insights in the responsibilities of the stakeholders involved directly with the transportation of ILL materials. Particular bottlenecks and flaws in fhe flow of the system were not identified.
•fu Delft
k w i n k .
APPENDIX K: SETUP OF THE DISCRETE SIMULATION MODEL IN ARENA
The simulation model is build is Rockwell Automation's Arena (41). This is a software tool to enable the simulation of discrete event simulation modeling. Using Arena, the models from the conceptualization phase are translated info a simulation model that can be run in a certain time period to assess the processes and objects of the system and measure the performance of the system. While setting up the simulation model, the "Handbook Arena" by Beerens, Gransjean, van Kaam and Verbraeck is used (42).
A representation of fhe exploratory network of libraries from the Arena software is shown below;
UkavA-UtmiO^rttMKi
UmyK.UtairLccagDn
FIGURE 15: SETUP OF THE SIMUUTION MODEL BUILD IN ARENA
In Figure 4-1 the setup of the exploratory model build in Arena is presented, in this small representation of a provincial service area and the libraries operating in this area the choice is made to use a set of four libraries of different size in this model. All the relevant categories of libraries in the Netheriands are represented in the model:
. PSO • Plus Library (Ubrary B) . Ubrary Organization (Ubrary A) . Ubrary Locations (Libraries X and Y)
Each librar/ has a different size of collection available for ILL and a different amount of members requesting ILL materials. In this model the PSO collects and distributes the IBL and ILL from all the libraries.
ru Delft

m.ti iJiw"" '.ijip. • ^ f W " ^?mi:^'r
kwink. groep
The next step is to bui ld the individual locations a n d fhe operations a n d processes
that are part of the subsystem. All the libraries are m o d e l e d fhe same in Arena. Below,
in Figure 16, library A is shown mode led in Arena.
ru Delft
. 0
a <
2 a
'—I
sz u
I ?
]33
C O
» c < 0 ,
O
< 2r| h •n
§ 1
Ï
B
o
o
0)
n P
c ^ :g .2 ? -g 1 D E
^ o XI 2 B S 5 ^ .2
ë 3 8 » t3 - £ 0 0 •D t <o
^8ï o
^ 0 o — — CD HI n
CD t 5
S -o S § ^ -o £ n P o
— o
? o
•CI
== (J
1 p
— o z ; <D
- «i) o ^
iS
0 s
<D
V iS 0
a *:; s C
£ 0 0) .c .:ü l ) > & .2
CD
j : c
^ o
fillip ü l i l l !
? | 5
° § I
b Ü ^
(1) ^ O
Hi 1 1 0 o u H) E 0, g
— rr
III
S u a . ë a £ S Ï ? O) D n
. pE is c: I ~ .5 .2
CD cl> " ö
->. a
i ° a o Q- £ < ^ 1
CJ
£ £ 'S t CD O £ 12
CD $ ' S -3=
^ E ~ o c o
3 8 E :
ö I -H . I l l E^i: o . | ? .E I S ? U D
5 B - I E Ï S 3 2 r
£ £ B jz e -
0 ^
ë P 5 £ -s
CD
3 Ï •° c Ti .0
i3
E .12 T3
• T3 C D
<D 3)
¥ u
^1

kwink. groep
PSO
a- :
FIGURE 17: THE PSO MODELED IN ARENA
The next e lement in the simulation mode l is the PSO. The PSO collects the materials
a n d transports the materials to the PSO headquarters. O n c e co l l ec ted the materials
are sorted in the crates of the destination of the materials. The library materials stay
overnight (or longer, d e p e n d a n t on fhe service level of that part icular library) a n d are
distributed to fhe destination library on the next day.
Next to the models. Arena a n d its inter face are used to measure the KPIs and create
dynamic graphs fo monitor the behavior of fhe simulation mode l .
I) o T3 c 0) a a. < c» D O
V .fi b
'U Delft 135
kwink. groep
A P P F N D I X I : D.4TA C o i i rcTiOM
While collecring fhe relevant data that is used fo specify the simulation model, the
data was collected in several spreadsheets. The spreadsheets are shown below in
Tables 0-4. All the information is derived from interviews with PSOs and the use of
internet. The library sector is a public funded sectors, so all the data was available for
free.
In Table 2 and Table 4 various assumptions are made. The assumptions are explained
in detail in Appendix N.
Plus Ubraries sends 33.000 IBL materials to libraries:
. i-^.600 Shipments to ta l per year
196 per year/l ibrary
0,8 per day
0,1 per hour
0-1: DETERMINATION OF ORDERS IBL (48)
BISC Utrectit (OBL)
•S 147.933
2959
11.4
1.4
Ubraries
Requests per year per library to ta l
per year/l ibrary
per day / library
per hour / library
SFB Flevoland (OBL)
10
8000
800
3,1
0.4
Ubraries
Requests per year per library total
per year/ l ibrary
per day / library
per hour / library
Average
0.9 per hour / library
TABLE 2: DETERMINATION OF ORDERS OBL (10) (7)
'U Delft
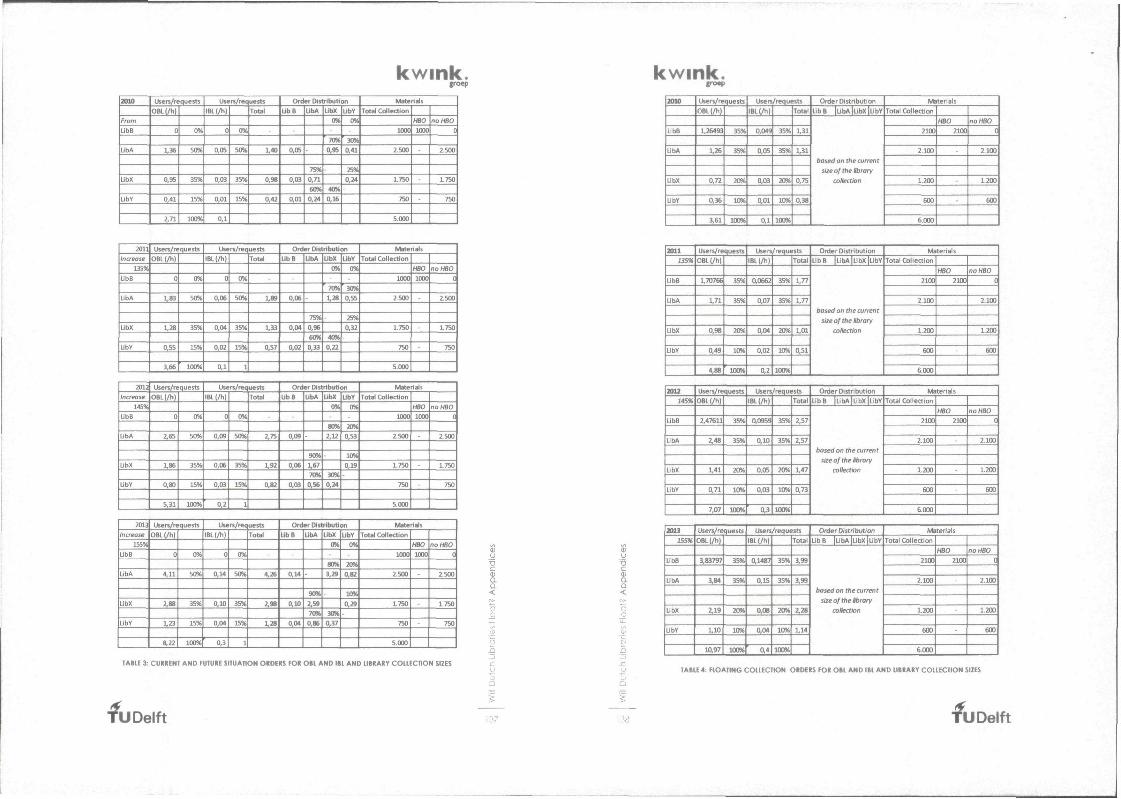
kwink. groep
2010
From
UbB
UbA
UbX
UbY
Usen/requests
0B l ( / l l
0
1,36
0.95
0,41
2,71
0%
5054
35%
15%
100%
Uxn/na lBl(/h)
0
0,05
0,03
0,01
0,1
0%
50%
35%
15%
uests Tool
1,«
0,98
0,42
Order DIstrIbutfcHl UbB
0,05
0,03
0,01
UbA
75% 0,71
60% 0,24
UbX
0%
70%
0,95
40% 0,16
UbY 0%
30% 0,41
25% 0,24
Materials |
Total Collection
1000
2500
1750
750
5.000
HBO 1000
no HBO
d 2500
1.750
750
20U
Increase
135%
UbB
UbA
UbX
UbY
Userï/requests OBL l/h
0
1,0
1,28
0,55
3,66
0%
50%
35%
15%
100%
Users/req
IBL (/f,
0
0,06
0,04
0,02
0,1
0%
50%
35%
15%
1
uests
Total
1,89
1.33
0,57
Order Distribution UbB
0,06
0,04
0,02
UbA
-75%
0,96
60%
0,33
UbX
0%
70% 1,28
40%
0,22
UbY
0%
30% 0,55
25% 0,32
Materials j Total Collec^on
1000
2500
1.7S0
750
5.000
HBO
1000 no HBO
d 2500
1.750
750
2012
Increase
145%
UbB
UbA
UbX
UbY
Users/requests
OBL (/Il
0
2,65
1,86
0,80
5,31
0%
50%
35%
15%
100%
Users/ieq IBL(/h)
ffl 0,09
0,06
0,03
0,2
0%
50%
35%
15%
1
uests
Total
2,75
1,92
0,82
Order Distribution
UbB
0,09
0,06
0,(B
UbA
90% 1,67 70%
0,56
UbX
0%
80%
2,12
30%
0,24
UbY
0%
20%
0,53
10%
0,19
Materials 1 Total Collection
1000
2.500
1.750
750
5.000
HBO
lOOO no HBO
d 2500
1750
750
2013 Increase
155%
UbB
UbA
UbX
UbY
Users/requests OBL(/h
0
4,11
2,88
1,23
8^22
0%
50%
35%
15%
100%
Users/req IBL(/h
0
0,14
0,10
0,04
0,3
0%
50%
35%
15%
1
uests
Total
4,26
2.98
1,28
Order Distribution UbB
0,14
0,10
0,04
UbA
90%
2,59
70% 0,86
UbX
0%
80%
',»
30% 0,37
UbY 0%
20%
0,82
10%
0,29
Materials 1
Total Collection
1000
2500
L750
750
5.000
HBO
ICOO no HBO 1
d 2500
1.750
750
TABLE 3: CURRENT AND FUTURE SITUATION ORDERS FOR OBL AND I t l AND UBRARY COLLECTION SIZES
•fu Delft
k w i n k . 2010
UbB
UbA
UbX
UbY
Users/requests
OBl(/h)
1,264M
1,26
0,72
0,36
3,61
35%
35%
20%
10%
mm
Users/requests
IBL (/I,)
0,049
0,05
0,03
0,01
0,1
35%
35%
20%
10%
100%
Tota
1,31
1,31
0,75
0,38
Order Distribution
UbB jUbAJUbxiubY
based on the current
size of the ibrary
collection
Materials I
Total Collection
21X
2.100
1.200
600
6.000
H80
21X
no HBO
ol 2.IO0I
1.200
600
mil 135%
UbB
UbA
UbX
UbY
Users/requests OBL(/h
1,70766
1,71
0,98
0,49
4,88
35%
35%
20%
10%
100%
Users/requests IBl( /h
0,0662
0,07
0,04
0.02
0,2
35%
35%
20%
10%
100%
Tota
1,77
1,77
1,01
0,51
Order Distribution
Ube iubAJUbXJUbY
based on the current
size of the Ibrary
collection
Materials | Total Collection
2100
2.100
1.200
600
6.000
HBO 2100
no HBO
ol 2 1 X
1200
600
1012
145%
UbB
UbA
UbX
UbY
Users/requests 08L(/h)
2,47611
2,48
1,41
0,71
7,07
35%
35%
20%
10%
100%
Users
IBL (/h
0,0959
0,10
0,05
0,03
0,3
/requests
35%
35%
20%
10%
100%
Tota
2,57
2,57
1,47
0,73
Order Distribution UbB jUbAJUbXiUbY
bosed on the current
size of the library
collection
Materials I
Total Collection
2100
2.100
1.200
600
6.000
HBO
2100
-
no HBO
d 2100
1.2001
600
2013 155%
UbB
UbA
UbX
UbY
Users/requests
OBM/h
3,83797
3,84
2,19
1,10
10,97
35%
35%
20%
10%
100%
Users/requests
IBt(/h)
0,1487
0,15
0,08
ao4
0,4
35%
35%
20%
10%
100%
Tota
3,99
3,99
2,28
1.14
Order Distribution
UbB jUbAlubXJUbY
bosed on the current
size of the library
collection
Materials |
Total Collection
2100
2.100
1.200
eoo
6.000
HBO
2100
no HBO
d 2.100
1200
600
TABLE 4: FIOATING COLLECTION ORDERS FOR OBL AND IBL AND UBRARY COLLECTION SIZES
•fu Delft

k w i n k . groep
APPENDI.X M: SIMLH* HON RUN SERIP
The simulation run setup is an important step in determining the length and number of replications to be used while simulation the alternatives. Long simulation and many replications cause extreme long waiting times for an analyst but very accurate results (19). In order to find a tradeoff between long waiting times and accurate results from the simulation runs: the startup time, the length of a simulation run and fhe number of replications are calculated below.
The startup time is based on fhe number of materials within a collection that needs to be in an equilibrium after a certain period. By visual conformation if showed that all the library collections where in a state of equilibrium after 2 months. To be certain, fhe 2 months must be calculated by minimum of three to have a correct startup time (19).
in order to double check, the cycle time of o library material is determined. In the model without floating, the cycle time is 18 hours. With floating, the cycle time is 157 hours. Both these numbers are in order and within the eoriier determined 6 months startup time.
A test run is done with a startup time of 6 months and several key pertormance indicators are tested on their standard deviation. With a correct startup time, the standard deviation should not differ significantly from each other (19). After looking at the results, it showed that this was indeed the case.
The startup time is determined:
• Without floating: 1040 hours equals 6 months . With floating: 1040 hours equals 6 months
iL'-JGTHOi-SlMULAIION üUN Within Bferature it states that fhe length of a simulation run should be at least 3 times fhe longest cycle time of a material within the system (19). In this case that would be 54 hours without floating and 471 hours with floating.
In this case a simulation run of 1 year (2080 hours) is chosen. The main reason of the increase in needed simulation time is fhe historical data that is used and no fluctuations within the year exist. The data provided by the stakeholders are of one ,o calendar year and simulating one year enables a possible comparison. Also, after .2 testing, the duration of a simulation run (without animations) tended to be short c enough tor the analyst. Q.
< NUMBER OF «EPuCAnows £
Ö The number of repBcations that need to be determined need fo be cdlculdted. The 3 reason to use multiple replications is because the model uses stochastic variables. j ; While using multiple replications, the stochastic outcome of the variables are evened b out with a low standard deviation to the results are reliable and conclusions can be S drawn from these results (19). Negative aspects ot using multiple replications is the .c computational time. 3
ru Delft 139
k w i n k .
After testing fhe simulation model with 5 replications, fhe reliability of fhe model was 97,5-98,4%. This is a very high reliability. Because the simulation model is not large, a test has been made with 10 replications resulting in better reliability and a remaining small computational time. The choice has been made to use 10 replications.
n c a <
CO-
o o
IT
.2 2 n
140 "fu Delft
A Pt-
• • •
•
•
•
•
•
•
•
•
•
•
•
•
kwink. grotp
NDix N: A•Mi^APl•ONS M A D E OUPINO DESIC.N ot- SIMULAHON
MODEL
The sizes of the collections of the libraries is tictive but validated by on expert The sizes of the members of the libraries is Active but volldated by an expert The relationship between number of end-users and number of orders is to be assumed similar, validated by an expert The relationship between the size ot collection and the number of end-users is assun-ied to be similar, validated by an expert
The library materials handled in the system are materials that are ordered for ILL. The collections are based ot materials tof ILL and the other materials that do not receive order do not exist in tWs system The number of orders generated for IBL is assumed to be an average of orders of one Plus Library. This is calculated by the total number of IBL order divided by the number of Plus Libraries in the l^lefhertands The number of orders for OBL is derived from two provincial service areas in the Netheriands, Utrecht and Flevoteind. Ttie average of both the provincial service areas is taken as the order generation ot OBL in fhe system Within fhe model it is assumed that the distribution of orders over the different libraries is dependent on fhe size of the librory collection on that moment. The theory behind this assumption is that fhe chance a user orders a materials at a bigger collection is higher than in a srraSer collection it is assumed that fhe end-users order their materials at random. No categorization is done in fhe matedafe and dennand tor certain categories Is not avallable in this model If Is assumed that the end-user always picks up the material it has ordered. Only when the material fhe end-user tries to request is not available wrill the end-user leave the system without using a Ubrary material. It is assumed that once a rrraferial is requested, it is not avaifcible for another user to request. it is assumed that an end-user uses library materials with a triangular distribution with a mean of 7 days, a minimum of 3 days and a maximum of 21 day. Tfiis is validated by an expert.
For the exploratory model is assumed ttiat one network ot libraries contains: o 1 Plus Library o 1 Library Organization (LO) 0 2 Library Locations (both of different size of collection and size of end-
users) Assumed is that the libraries are open 5 days a week and 8 hours per day. Assumed is that fhe libraries are closed in the weekend. The following service levels are assumed In ttie model. Ttiese are validated by an expert to be near reality:
o Plus Library: 5 times a week O LO: 3 times a week
•fu Delft
% ^ ^ Co-
O u_
^ SI
Q
s 14!
kwink. tr°V
0 LL X: 2 fimes a week o LL Y: 1 time a week
• Assumed for fhe current situation is that the Plus Library does not order Ubrary materials, in the tkxiflng collection the Plus library participates. This is validated by an expert.
• If is assumed that Ihe materials from the Plus Ubrary are of scientific nature (>HBO Level)
• It is assumed that fhe capacity of the transportation service is 3 crates per library of each 15 materials. This is calculated using simulation runs. The nearest to reality is the capacity is just sufficient to handle all the materials. This is cateulated fo be 45 materials per day per library. See # for more details. This is validated by an expert to tie near fo reality. However, the real number ot crates per Nbrary is not determined by number, but by demand.
• It is assumed that the trucks on route pick up materials and bring fhe materials to fhe PSO first before distributing them to the destination In the real worid the materials with a destination on the same route are delivered immediately. Because the model is so small compared to reality, this is not done.
• It is assumed that the NBC is introduced and that the end-user order their ILL materials ttwoLigh this system
•fu Delft

kwink. groep
APPENDIX O: VALIDAITON OFSI/V^ULATION MODEL
in the validation stage, the model must undergo several structural tests to check if the model behaves as expected to the changes in input parameters. This is necessary because it needs to undergo experiments in a later stage in the project. With these tests, some input variables are changed into extreme values and checked how the model responds to these changes. Three tests have been done and the results of the tests can be viewed below.
. Copacify of a shipment In this test the capacity of a shipment is lowered to a minimum. Instead of allowing 45 materials (3 crates) per library per pickup day, the variable is changed to 15 materials (1 crate). As can be seen in the appendix, the model behaves like expected. The majority of the library materials are not collected by the PSO and do end up in long queues. This delays the wait tor materials tor fhe end-user dramatically. This is as expected because the capacity at fhe current situation is just sufficient to transport the materials.
Capacity of the Truck
number of crates per
pickup day
Waiting times Current
Waiting times Float
A X Y
B A X
Y
45
hours 32,0 29,7
34,8
15,3 14,7 19,7
28,3
days 4,0 3,7 4,4
1,9 1,8 2,5
3,5
15
hours 856,62 791,37
681,19
56,17 59,5
55,43
28,52
days 107,1 98,9 85,1
7,0 7,4
6,9 3,6
Difference
2578% 2563% 1856%
267% 305% 182%
1%
FIGURE 18: CAPACIIY OF SHIPMENT
• Percentage of users requesting materials In this test the distribution of the requests over the libraries is changed. In the current situation the library users from library A request materials with the distribution of 70% to library X and 30% from library Y. This distribution Is reversed. The expected effect occurs. Library Y receives too many orders and fhe current sen/ice level cannot provide this service. Also the library collection is too small fo handle the requests resulting in the emptying of the collection. This can be seen in the appendix.
• fu Delft
kwink. Collections
Current situation B A
x Y
User from
Ubrary A:
X |70%)/ y(30«)
989,61 2370,25
1598,31
647,93
User from
Ubrary A:
X (30%)/ Y(70%)
985,65 2237,41
1580,73
62,72
Difference
0% -6%
- 1 %
-90%
FIGURE 19: PERCENTAGE OF USERS REQUESTING MATERIALS
• The speed of the collection and distribution of library materials In this test the speed of collection and distribution of the PSO transport service is varied. The cun^ent speed in the model is half a day to reach the PSO and half a day to reach the destination location. In fhe appendix the results are presented and the effects of the waiting times are as expected. When dropping the time to 0 days, the waiting times of the end-users decreases and when the speed is changed to 3 days, the waiting times increase.
Speed of Delivery
Speed
Waiting times Current situation
Waiting times Floating Collection
A
x Y
B A
x Y
0,5
hours 32,0 29,7 34,8
15,3 14,7 19,7 28,3
days days
4,0 3,7 4,4
1,9 1,8 2,5 3,5
0
hours 26,75 24,21 30,88
9,4 10,65 14,16 23,92
days days
3,3 3,0 3,9
1,2 1,3 1,8 3,0
Difference
-16% -19% -11%
-39% •28% -28% •16%
3
hours 70,63 66,65 72,43
39,54 42,64
51,76 65,55
days days
8,8 8,3
9,1
4,9 5,3
5,5 8,2
Difference
121% 124% 108%
159% 190% 163%
132%
FIGURE 20: THE SPEED OF THE COLLECTION AND DISTRIBUTION OF LIBRARY MATERIALS
'U Delft

m
V
~r 'U
si
urn r mm \i lllI
N 1 UI<UI>I \t\
1ITFPPPI i » 2 S
\MmM
\ \T\T\T\
II
M i !
i
r °™
«rlTr 4
'n n
T 1 -riT jwH
É T
I I .
t,
T
"SI
f f r 1-is|H i 11
H y p
!«l<lxl>l UI
1 r i l i l 1 r nrm ' y^M^H
T T T
II V p
-
'
<
m
f
i
<
1
X
5
> •
ï
^
i 1 i
I I T ' I
T i r
Lipi!
pkk
f t
"F "!1
il
i
T
r
i
1
il
•<
!|§
l^ï
ii
1
pi
r
h
mm \^ mMM^
\i P É É j ï
iT T T
1 1<I UI \>.\ 1
11
M M
i l l ? 'S
i
1 T
\m T r
UJ pi
LUUUl 1
-
'
<
'
*\M*\ mm
T T
t t
a | _
si
si
Itrn r iWrn r
N 1 jBl<ixl>.| U i
J a d d a d M
» S J l l
T T T T
1 UI Ui ui 1
1
il
i t t i
'É&
is
r
r r LM
1 uu
rrl
11
1
rl 1
f T d^id
r i
T i l l
I t
ii
i iiW 1 1
|ü|l«| l(it|K(
amdddda^l
J^wJarJ
ssLiLyJll
1 s
< H I
fflt •51 1
ls^^ij:j|ll*!
mrr FJ*J*JBJI
JiiU 11
1 I f 1 Fl
ITT < T T
ip <«
li.JJ:
J f 1 PI JlTI
ITT PTH
i l
ii
i l l T l 1
f f f ^^BIS^^N'-rJ'^
wip» ys<yjiLy
£
SIP f
a £ 2 >
flllfl IITT T l T •mlT
f rl r T
l i l
. T T
mm T T
<l 1 1
Éphy
1 Jj
f
J il
I I I I
\\m 111111
LUUUI 1
WPP
p p f¥l
fflf I I P
1
H
n
m
1 1 l«UI
1 111
1 KUI I
1 mf\*f\ flcj J«^iJajds|
m i m m
T T T
UUJ UI UI 1
II **''* I1«lill»fl
l|i ||i|i]l -p|i|li
Il [1111 \\vT\i 1 1 uuuui 1 uuuui 1
T rPI
Jl T U\ \m
< 1 1 I
i \m
il LIJ 1
Tf Lr T 4 ¥ <l 1 1
-TT 3
>
mm
J?T ydiep
y>!piy
iLLLL
fill - T T
T n i l
N iT
iLLLL
! 1

I r 1 5 " I s a SS 1
1 - __ iiiêii
il li .... 1
- -- uu JPll 7ï 3 "" piP :i Pi 7
; s 1
si '^ 1 " s __ - a 3 - -
<«
ii
H
; ?
JÉi«
Ji^* ^ËSÉ'*
fllE?
I . 4 . .
I I
SI
If
mn s
sgisiï-1 I IP
1
J
5
1
si 5 l
$i
,]
l 1
1 • a
1
1
! «
3
i
c
B
1
i
1 3'
§
s
j p p
jmt
A
1824.2
;
58,5
7
29,0
3
1379
.73
3'
ÏJiSJ
t t ^ t
/ S Ï S
1 iS «ie
3
mn I l ! i ! |
K « | (
üglCi!
5
l I H ; ^ l i 5 « |
I S I S ^ I E
<
3
i l i i l
i l i f
__?l?ï
üf l?
J ï i ?
* " < - >
^mij
^JJH
j i i i
1 . . , .
« ï ï i
? ? | 1 !
<
j m
ï .o < K >
I I II 1
• LI 1

kwink. irotp
APPLNDIX Q : Rtsuiis TESTSIMULAHON RUNS WITI-I TRIPLL c.^p,Acnr
2013 NBC (triple capacity)
Collected
Distribute
17805 17674
Total
35479 2a8K
1
1
8 A
X
Y
AV6
uur
129,6
141,8
139,6
157,3
142,1
dag
16,2
17,7
17,4
19,7
17,8
OK
- 1 *
- 1 *
- 2 *
- 1 *
B
A
X
Y
OBL
OBL
IBL
OBL
IBL
OBL
IBL
AV6
uur
32,2
21,3
29,4
24,4
33,1
32,9
28,9
dag
4,0
2,7
3,7
3,1 4,1
4,1 3,6
-3% -2%
- 3 *
-4X -6%
-3X
9 15
crates per Library materials per crate
B
A
X
Y
Initial
1000
2500
1750
750
Average
964,01 2087,03
1278,81
444,78
In process
35,99 412,97
471,19
305,22
4K
17%
27%
41%
B
A
X
Y 1.193,66
B
964,01
0
0
0 964,01
A
0
2087,03
0
0 2087,03
X
0
0
1278,81
0 1278,81
Y
0
0
0
444,78 444,78
B
A
X Y
8
100%
0%
0% 0%
A
0%
100%
0%
0%
X
0%
0%
100%
0%
Y
0%
0%
0% 100%
0>
T3
ru Delft
o
I
4