Embed Size (px)
Citation preview
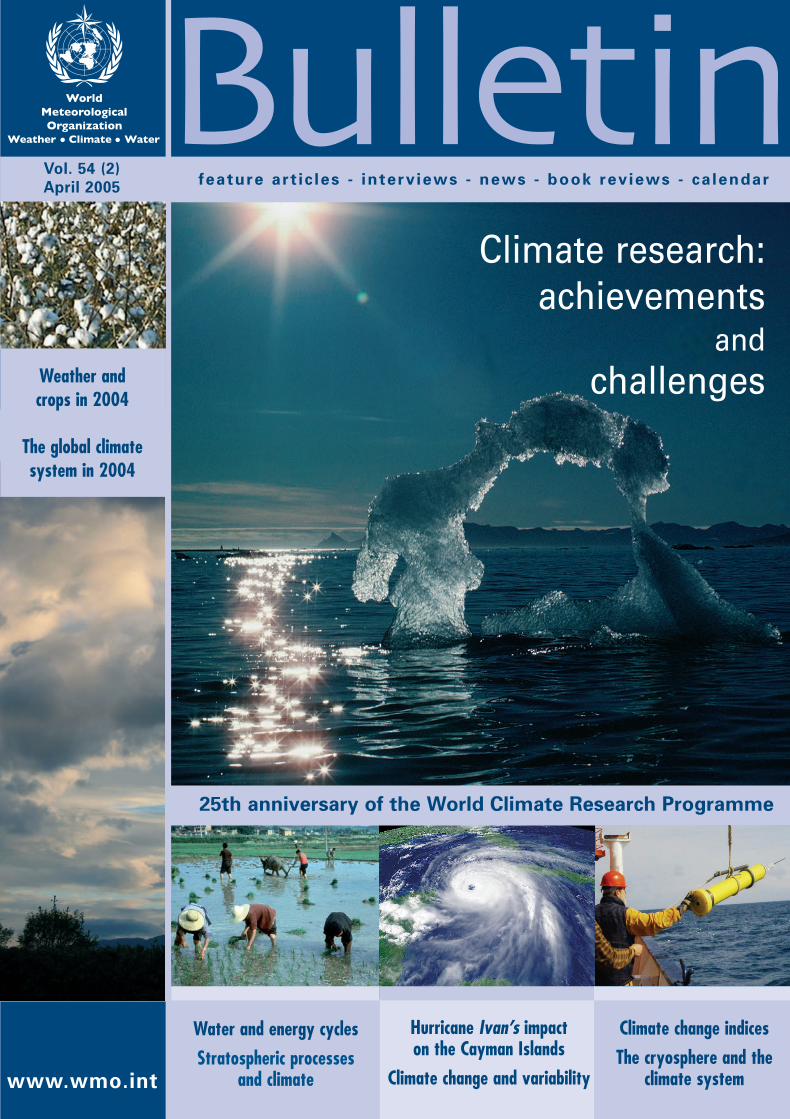
Hurricane Ivan’s impact on the Cayman Islands
Climate change and variability
Climate change indicesThe cryosphere and the
climate system
Water and energy cyclesStratospheric processes
and climate
Vol. 54 (2) April 2005
www.wmo.int
feature art ic les - interviews - news - book reviews - calendar
25th anniversary of the World Climate Research Programme
Weather and crops in 2004
The global climate system in 2004
World Meteorological Organization 7bis, avenue de la PaixCase postale No. 2300CH-1211 Geneva 2, SwitzerlandTel: + 41 22 730 81 11Fax: + 41 22 730 81 81E-mail: [email protected]: http://www.wmo.int ISSN 0042-9767
Climate research:achievements
and challenges
WM
O B
ULL
ET
INV
olu
me
54 N
o. 2
A
pri
l 200
5
Cover(final)GB+dos 4mm.qxd(8) 17/06/05 12:24 Page a1
WMO is a specialized agency of theUnited Nations.Its purposes are:
� To facilitate worldwide cooperation in theestablishment of networks of stationsfor the making of meteorological obser-vations as well as hydrological and othergeophysical observations related tometeorology, and to promote the estab-lishment and maintenance of centrescharged with the provision of meteoro-logical and related services;
� To promote the establishment and main-tenance of systems for the rapidexchange of meteorological and relatedinformation;
� To promote standardization of meteoro-logical and related observations and toensure the uniform publication of obser-vations and statistics;
� To further the application of meteorologyto aviation, shipping, water problems,agriculture and other human activities;
� To promote activities in operationalhydrology and to further close coopera-tion between Meteorological andHydrological Services;
� To encourage research and training inmeteorology and, as appropriate, inrelated fields, and to assist incoordinating the international aspects ofsuch research and training.
The World MeteorologicalCongress
is the supreme body of the Organization. Itbrings together delegates of all Membersonce every four years to determine generalpolicies for the fulfilment of the purposesof the Organization.
The Executive Council
is composed of 37 directors of NationalMeteorological or HydrometeorologicalServices serving in an individual capacity; itmeets at least once a year to supervise theprogrammes approved by Congress.
The six regional associations
are each composed of Members whosetask it is to coordinate meteorological,hydrological and related activities withintheir respective Regions.
The eight technical commissions
are composed of experts designated byMembers and are responsible for studyingmeteorological and hydrological operationalsystems, applications and research.
Executive Council
PresidentA.I. Bedritsky (Russian Federation)
First Vice-PresidentA.M. Noorian (Islamic Republic of Iran)
Second Vice-PresidentT.W. Sutherland (British Caribbean Territories)
Third Vice-PresidentM.A. Rabiolo (Argentina)
Ex officio members of theExecutive Council (presidents ofregional associations)
Africa (Region I)M.S. Mhita (United Republic of Tanzania)Asia (Region II)A.M.H. Isa (Bahrain)South America (Region III)R. Michelini (Uruguay) (acting)
North America, Central America and theCaribbean (Region IV)C. Fuller (Belize)South-West Pacific (Region V)Woon Shih Lai (Singapore)Europe (Region VI)D.K. Keuerleber-Burk (Switzerland) (acting)
Elected members of the ExecutiveCouncil
M.L. Bah (Guinea)J.-P. Beysson (France)Q.-uz-Z. Chaudhry (Pakistan)Chow Kok Kee (Malaysia)M.D. Everell (Canada)U. Gärtner (Germany)B. Kassahun (Ethiopia)J.J. Kelly (United States of America)R.D.J. Lengoasa (South Africa)G.B. Love (Australia) (acting)J. Lumsden (New Zealand)F.P. Mote (Ghana)A.D. Moura (Brazil) (acting)J.R. Mukabana (Kenya)K. Nagasaka (Japan) (acting)I. Obrusnik (Czech Republic) (acting)H.H. Oliva (Chile)Qin Dahe (China)J.K. Rabadi (Jordan) (acting)D. Rogers (United Kingdom) (acting)B.T. Sekoli (Lesotho)R. Sorani (Italy)S.K. Srivastav (India)
(four seats vacant)
Presidents of technicalcommissions
Aeronautical MeteorologyN.D. GordonAgricultural MeteorologyR.P. MothaAtmospheric SciencesA. EliassenBasic SystemsA.I. Gusev ClimatologyY. BoodhooHydrologyB. StewartInstruments and Methods of ObservationR.P. Canterford (acting)Oceanography and Marine MeteorologyJ. Guddal and S. Narayanan
The WorldMeteorologicalOrganization(WMO)Weather • Climate • Water
WMO Headquarters building
The CD-Rom contains (in pdf format in bothhigh and low resolution):
• WMO Bulletin 54 (2) – April 2005
• MeteoWorld – April 2005
• Weather, climate, water and sustainable development (WMO-No. 974) (Brochure for World Meteorological Day 2005)
• Saving paradise, ensuring sustainabledevelopment (WMO-No. 973)
The CD-Rom also contains (in pdf format in low resolution) :
• World Climate Research Programme: 25 years ofscience serving society (Brochure)
• Global Energy and Water Cycle Experiment—Phase I(Brochure)
• Nine WCRP flyers
CD-ROM
Cover(final)GB+dos 4mm.qxd(8) 17/06/05 12:24 Page a2
Secretary-General Michel JARRAUD
Deputy Secretary-General Hong YAN
Assistant Secretary-General Vacant
Subscription ratesSurface mail Air mail
1 year CHF 60 CHF 852 years CHF 110 CHF 1503 years CHF 145 CHF 195
Published quarterly (January, April, July,October) in English, French, Russian andSpanish editions.
Opinions expressed in signed articles or inadvertisements appearing in the WMO Bulletinare the author's or advertiser's opinions and donot necessarily reflect those of WMO. Themention of specific companies or products inarticles or advertisements does not imply thatthey are endorsed or recommended by WMO inpreference to others of a similar nature whichare not mentioned or advertised. Extracts fromunsigned (or initialled) articles in the journal maybe reproduced provided the customary acknowl-edgement is made. Requests to publish signedarticles (in part or in whole) should be addressedto the Editor.
Editor: Hong YanAssociate Editor: Judith C.C. Torres
E-mail: [email protected].: (+41) 22 730.84.78Fax: (+41) 22 730.80.24
Contents
In this issue . . . . . . . . . . . . . . . . . . . . . . . . . . . . . . . . . . . . . . . . . . . . . 50
Climate change and variability—what can we predict? . . . . . . . . . . . 51
Water and energy cycles: investigating the links . . . . . . . . . . . . . . . . 58
From ozone hole to chemical climate prediction . . . . . . . . . . . . . . . . 65
Frozen assets: the cryosphere’s role in the climate system . . . . . . . . 75
Climate change indices . . . . . . . . . . . . . . . . . . . . . . . . . . . . . . . . . . . . 83
The global climate system in 2004 . . . . . . . . . . . . . . . . . . . . . . . . . . . 87
Weather and global crop production in 2004 . . . . . . . . . . . . . . . . . . . 92
Hurricane Ivan’s impact on the Cayman Islands . . . . . . . . . . . . . . . . . 97
Visits of the Secretary-General . . . . . . . . . . . . . . . . . . . . . . . . . . . . . . 101
Book reviews . . . . . . . . . . . . . . . . . . . . . . . . . . . . . . . . . . . . . . . . . . . . 105
New books received . . . . . . . . . . . . . . . . . . . . . . . . . . . . . . . . . . . . . . . 107
Recently issued . . . . . . . . . . . . . . . . . . . . . . . . . . . . . . . . . . . . . . . . . . 108
Staff news . . . . . . . . . . . . . . . . . . . . . . . . . . . . . . . . . . . . . . . . . . . . . . 109
Obituaries . . . . . . . . . . . . . . . . . . . . . . . . . . . . . . . . . . . . . . . . . . . . . . . 111
Calendar . . . . . . . . . . . . . . . . . . . . . . . . . . . . . . . . . . . . . . . . . . . . . . . . 112
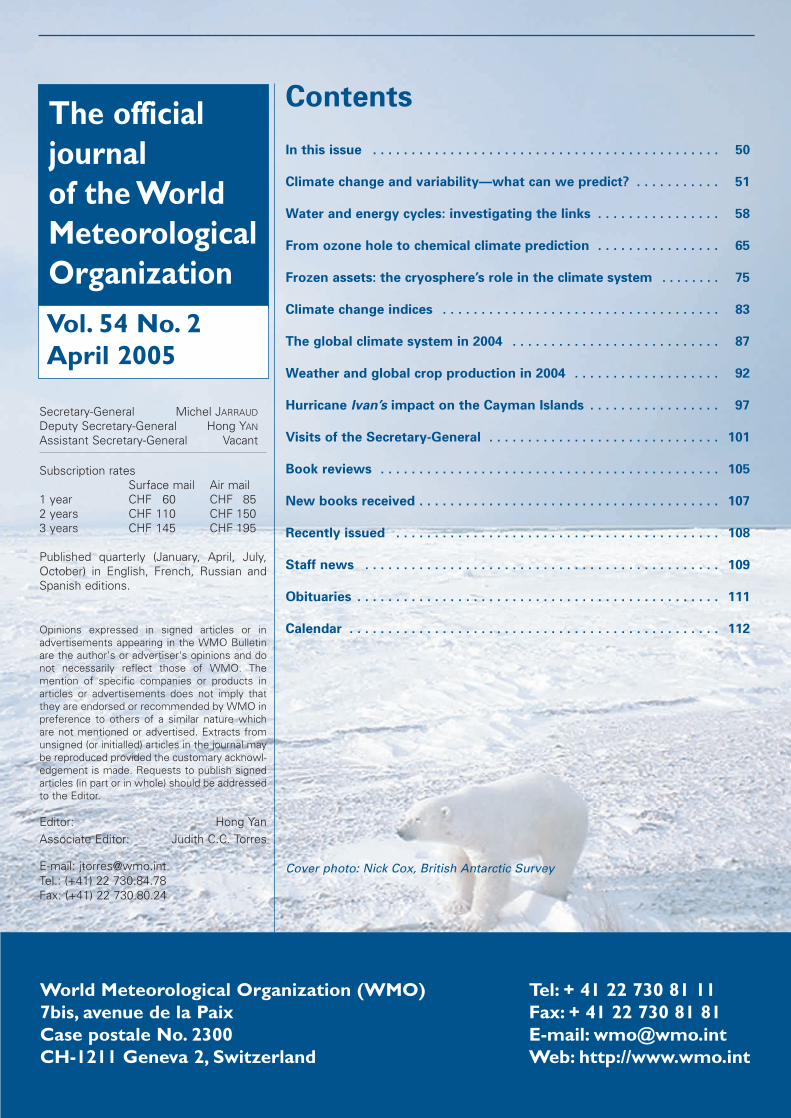
Cover photo: Nick Cox, British Antarctic Survey
The officialjournal of the WorldMeteorologicalOrganizationVol. 54 No. 2April 2005
World Meteorological Organization (WMO) Tel: + 41 22 730 81 117bis, avenue de la Paix Fax: + 41 22 730 81 81Case postale No. 2300 E-mail: [email protected] Geneva 2, Switzerland Web: http://www.wmo.int
BLTN 54/2 13/06/05 17:27 Page 49
This issue of the Bulletin celebrates25 years of climate research by WMOand the World Climate ResearchProgramme (WCRP), sponsored byWMO, the International Council forScience and the IntergovernmentalOceanographic Commission ofUNESCO. The main objectives set forthe WCRP at its inception in 1980remain valid today and for the foresee-able future: to determine thepredictability of climate and the extentof human influence on climate.
The WCRP has made enormousadvances in understanding specificcomponents (ocean, land, atmos-phere, cryosphere) of the climatesystem and created many new oppor-tunities and challenges for researchand its applications of the results forthe benefit of society. The WCRP has
been implemented mainly through asmall number of “core projects” andrelated activities. Some have alreadybeen successfully concluded and leftsignificant scientific, technical andpractical legacies, in particular: theTropical Ocean and GlobalAtmosphere project (TOGA, 1985-1994); the World Ocean CirculationExperiment (WOCE, 1982-2002); andthe Arctic Climate System Study(ACSYS, 1994-2003). Today, theWCRP consists of four major coreprojects and various cross-cutting andco-sponsored activities. This issuecontains articles on each of these coreprojects.
“Climate change and variability—what can we predict?” introducesand illustrates the wide and challeng-ing remit of the Climate Variability andPredictability (CLIVAR) project, build-ing on the legacies of itspredecessors, TOGA and WOCE.CLIVAR research is aimed at develop-ing more useful predictions of climatevariability and change through the useof improved climate models andobservations.
The Global Energy and Water CycleExperiment (GEWEX) carries outinvestigations of the atmosphere, itsglobal water cycle and energybudget, and how they might affect,and adjust to, climate change.“Water and energy cycles: investi-gating the links” recognizes GEWEXachievements to date and also high-lights the ever-challenging objectivescurrently being addressed.
“From ozone hole to chemical climateprediction” is testimony to thestrengths and value of internationalcoordination, collaboration, andcommitment in research as demon-strated by the achievements of theStratospheric Processes and their Rolein Climate (SPARC) project. Such
collaboration resulted in an interna-tional team of SPARC scientistsreceiving WMO’s Nobert GerbierMUMM International Award in 2003.
“Frozen assets: the cryosphere’s role inthe climate system” traces WCRP’sinitiatives in promoting cryosphericresearch from the achievements of theregionally focused ACSYS to the devel-opment and introduction of WCRP’snewest core project, Climate andCryosphere (CliC), which recognizes thefull global extent of the cryosphere’spresence and influence. WCRP’s maincontributions to the International PolarYear 2007-2008 will be channelledthrough CliC.
These projects have benefited fromWMO’s major Programmes and thedata provided by the observingnetworks operated by the NationalMeteorological and HydrologicalServices.
Another feature article is one whichdescribes the importance of regionalworkshops to produce indices ofclimate change for certain countriesand regions where data have hithertobeen lacking. They are also a goodbeginning for regional cooperation.
The North Atlantic hurricane seasonwas a record-breaking one in terms ofnumbers, proximity and severity. Ivancaused death and destruction acrossthe Caribbean. An article describingIvan’s impact on the Cayman Islandsshows the importance of internationalcooperation and of preparednessmeasures to reduce loss of life andproperty, promoted by WMO.
Other articles in this issue are “Theglobal climate system in 2004” and“Weather and global crop productionin 2004”.
50
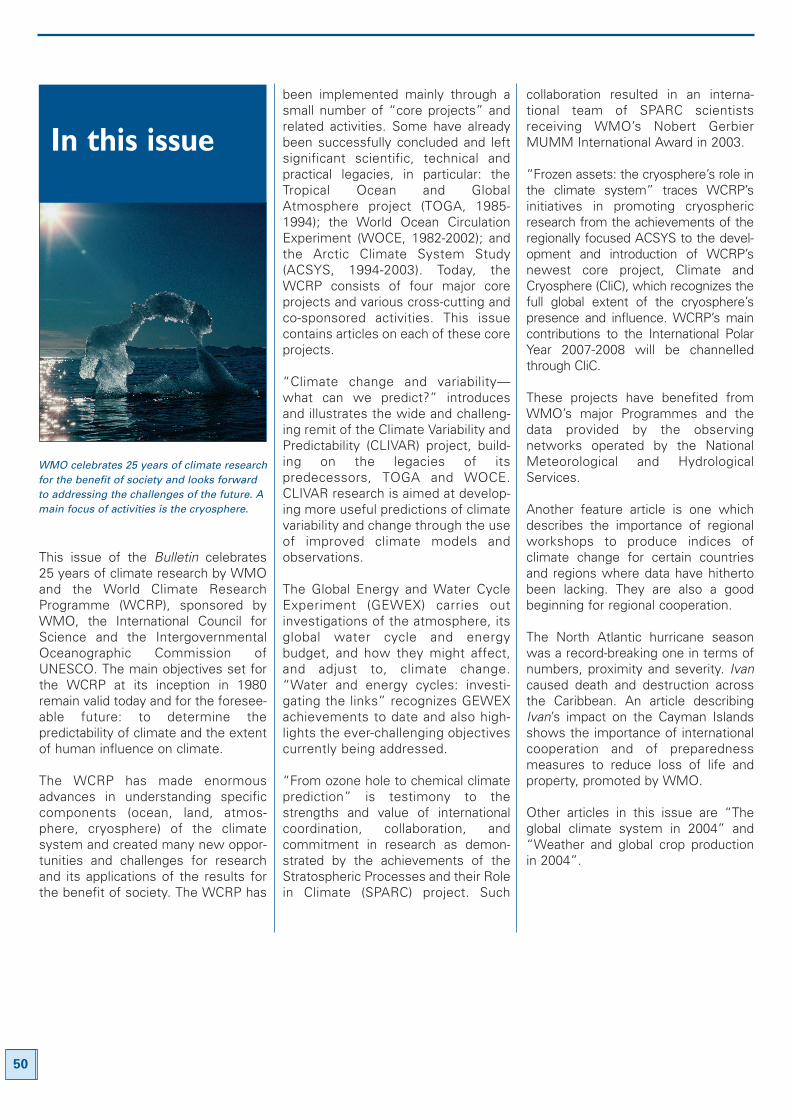
In this issue
WMO celebrates 25 years of climate researchfor the benefit of society and looks forwardto addressing the challenges of the future. Amain focus of activities is the cryosphere.
BLTN 54/2 13/06/05 17:27 Page 50
By Antonio Busalacchi1, David Legler2,
Howard Cattle3, Tim Palmer4 and
John Gould5
Introduction
The impacts of climate variability andthe threat of future climate change arenow key issues that are brought to ourattention on an almost daily basis.Obtaining a better understanding ofclimate variability, predictability andchange lies at the heart of the missionof the Climate Variability andPredictability project, CLIVAR, of theWorld Climate Research Programme(WCRP). Ocean-atmosphere interac-tions form a particular focus for
CLIVAR, reflecting the legacy fromtwo previous WCRP projects, theTropical Ocean-Global AtmosphereProject (TOGA) and the World OceanCirculation Experiment (WOCE).Indeed, CLIVAR is now the WCRPspearhead for research on the globalocean, its interactions with the atmos-phere and its key role in climatevariability and change. The first part ofthis article briefly summarizes theoverall legacy of TOGA and WOCEthat CLIVAR now builds on. In thesecond part, we summarize some ofthe key contributions from CLIVARsince its inception, drawing on theoutputs of the First InternationalCLIVAR Science Conference held in2004.
TOGA and WOCE—the legacy
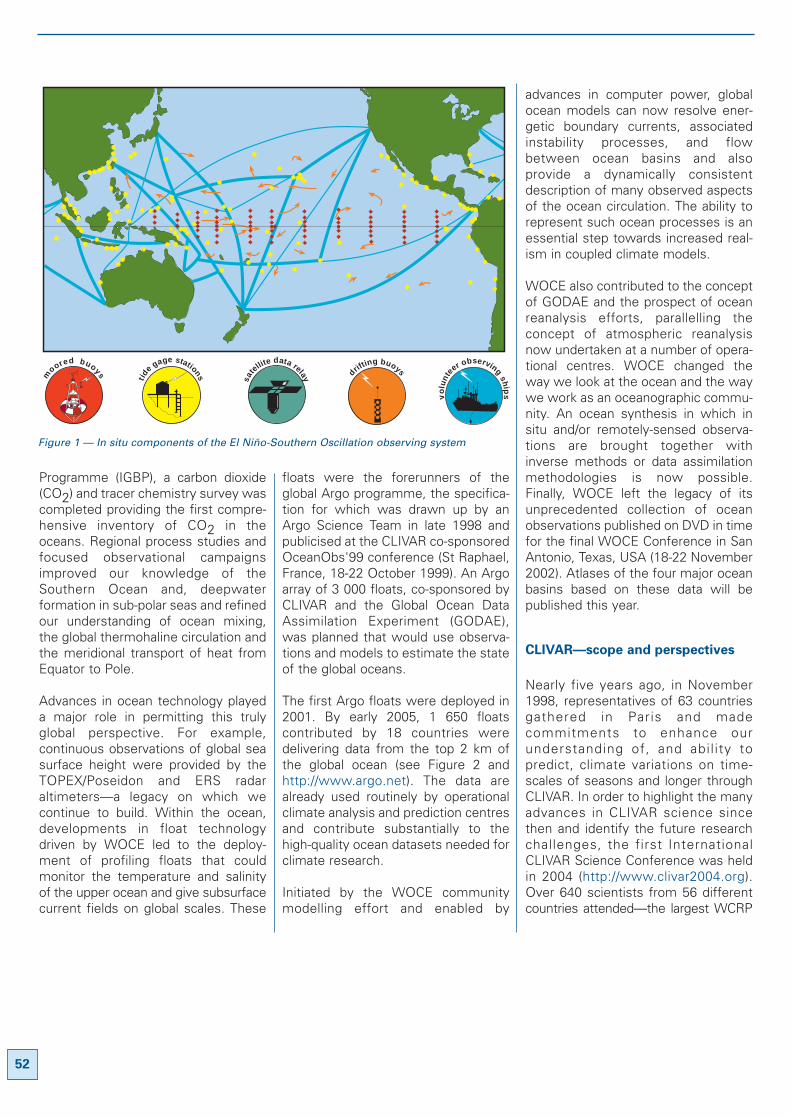
The TOGA decade (1985-1994)provided, for the first time, aconcerted international effort inobserving and predicting a majorcomponent of the variability of thecoupled climate system—the El Niño-Southern Oscillation (ENSO)—and itsimpact on the global atmosphere.During TOGA, routine observations ofthe air-sea interface and upper-oceanthermal structure in the tropical PacificOcean were provided in real-time bythe Tropical Atmosphere-Ocean (TAO)array. These mooring observationshave since been sustained in thePacific (Figure 1) and, under the spon-sorship of CLIVAR, extended to theAtlantic and now to the Indian Ocean.
Other enhancements to the atmos-phere and ocean observing systemscritical to ENSO prediction were alsomade, whilst, at the same time,
coupled ocean-atmosphere predictionmodels were established and imple-mented at many of the world’s majorprediction centres. Ocean data assimi-lation proved to be a key element inthe initialization of seasonal-to-interannual climate forecast systems.In addition, the overall approach toclimate science evolved during TOGA.Prior to TOGA, in the early to mid-1980s,oceanographers and meteorologistswere often in separate and distinctcommunities. As part of TOGA, thesecommunities came together to form anew breed of climate scientist whowas dedicated to exploring modes ofvariability that occur in the coupledocean-atmosphere system and that donot exist in the uncoupled ocean oratmosphere.
In a similar manner, WOCE (1982-2002) left a significant imprint on ourknowledge of, and ability to model, theglobal oceans. It introduced innovativetechnology, and made changes to ourscientific method. WOCE provided aglobal perspective on the temporalvariability and mean state of theworld's oceans, from top to bottom. Itestablished a baseline against whichto assess past and future changes andevaluate anthropogenic effects on theglobal ocean circulation, a key activitybeing carried forward within CLIVAR.In partnership with the Joint GlobalOcean Flux Study (JGOFS) of theInternational Geosphere-Biosphere
51
Climatechange andvariability—what can wepredict?
1 Director, Earth System Science Interdisciplinary Center, University of Maryland, USA2 Director, US CLIVAR Project Office, Washington, USA3 Director, International CLIVAR Project Office, Southampton, United Kingdom4 European Centre for Medium-Range Weather Forecasts, Reading, United Kingdom5 Commonwealth Scientific and Industrial Research Organisation, Hobart, Australia
International CLIVAR Project Office,Southampton, United KingdomE-mail: [email protected]: http://www.clivar.org
BLTN 54/2 13/06/05 17:27 Page 51
Programme (IGBP), a carbon dioxide(CO2) and tracer chemistry survey wascompleted providing the first compre-hensive inventory of CO2 in theoceans. Regional process studies andfocused observational campaignsimproved our knowledge of theSouthern Ocean and, deepwaterformation in sub-polar seas and refinedour understanding of ocean mixing,the global thermohaline circulation andthe meridional transport of heat fromEquator to Pole.
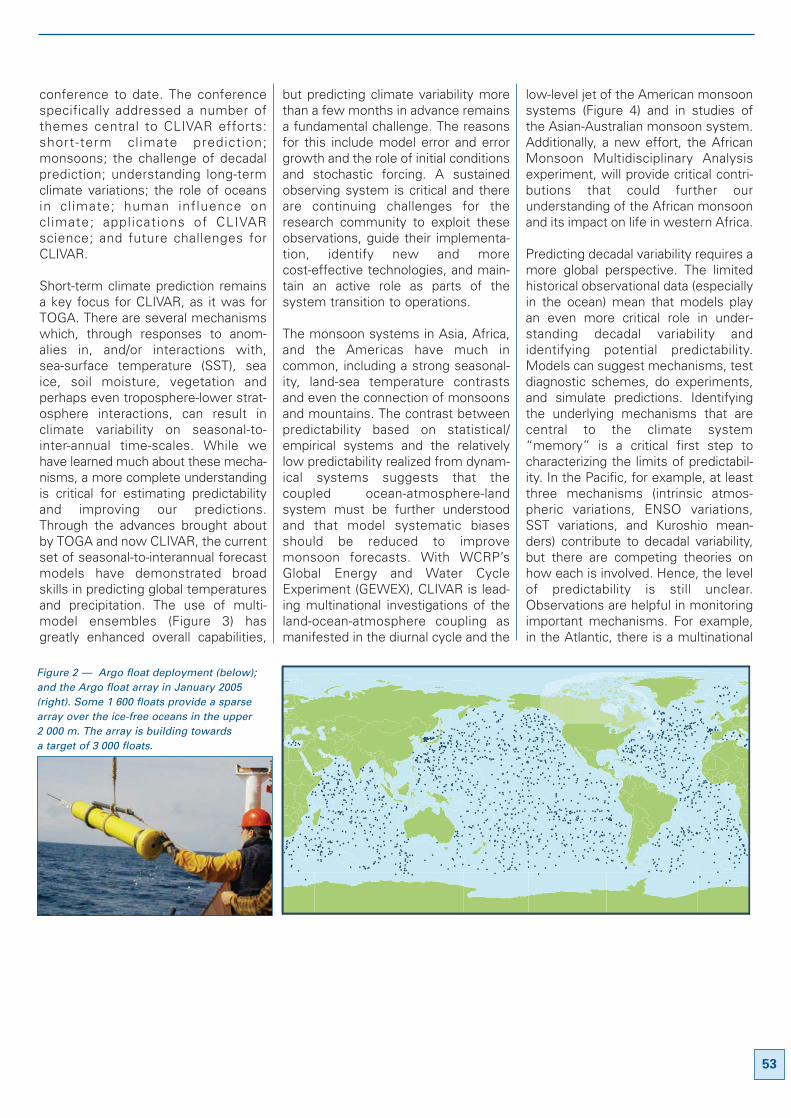
Advances in ocean technology playeda major role in permitting this trulyglobal perspective. For example,continuous observations of global seasurface height were provided by theTOPEX/Poseidon and ERS radaraltimeters—a legacy on which wecontinue to build. Within the ocean,developments in float technologydriven by WOCE led to the deploy-ment of profiling floats that couldmonitor the temperature and salinityof the upper ocean and give subsurfacecurrent fields on global scales. These
floats were the forerunners of theglobal Argo programme, the specifica-tion for which was drawn up by anArgo Science Team in late 1998 andpublicised at the CLIVAR co-sponsoredOceanObs'99 conference (St Raphael,France, 18-22 October 1999). An Argoarray of 3 000 floats, co-sponsored byCLIVAR and the Global Ocean DataAssimilation Experiment (GODAE),was planned that would use observa-tions and models to estimate the stateof the global oceans.
The first Argo floats were deployed in2001. By early 2005, 1 650 floatscontributed by 18 countries weredelivering data from the top 2 km ofthe global ocean (see Figure 2 andhttp://www.argo.net). The data arealready used routinely by operationalclimate analysis and prediction centresand contribute substantially to thehigh-quality ocean datasets needed forclimate research.
Initiated by the WOCE communitymodelling effort and enabled by
advances in computer power, globalocean models can now resolve ener-getic boundary currents, associatedinstability processes, and flowbetween ocean basins and alsoprovide a dynamically consistentdescription of many observed aspectsof the ocean circulation. The ability torepresent such ocean processes is anessential step towards increased real-ism in coupled climate models.
WOCE also contributed to the conceptof GODAE and the prospect of oceanreanalysis efforts, parallelling theconcept of atmospheric reanalysisnow undertaken at a number of opera-tional centres. WOCE changed theway we look at the ocean and the waywe work as an oceanographic commu-nity. An ocean synthesis in which insitu and/or remotely-sensed observa-tions are brought together withinverse methods or data assimilationmethodologies is now possible.Finally, WOCE left the legacy of itsunprecedented collection of oceanobservations published on DVD in timefor the final WOCE Conference in SanAntonio, Texas, USA (18-22 November2002). Atlases of the four major oceanbasins based on these data will bepublished this year.
CLIVAR—scope and perspectives
Nearly five years ago, in November1998, representatives of 63 countriesgathered in Paris and madecommitments to enhance ourunderstanding of, and abil ity topredict, climate variations on time-scales of seasons and longer throughCLIVAR. In order to highlight the manyadvances in CLIVAR science sincethen and identify the future researchchallenges, the first InternationalCLIVAR Science Conference was heldin 2004 (http://www.clivar2004.org).Over 640 scientists from 56 differentcountries attended—the largest WCRP
52
m
oored buoys
vo
lunt
eer observing
ship
s
drifting buoys
tide
gage stations
sate
llitedata relay
Figure 1 — In situ components of the El Niño-Southern Oscillation observing system
BLTN 54/2 13/06/05 17:27 Page 52
conference to date. The conferencespecifically addressed a number ofthemes central to CLIVAR efforts:short-term climate prediction;monsoons; the challenge of decadalprediction; understanding long-termclimate variations; the role of oceansin cl imate; human influence onclimate; applications of CLIVARscience; and future challenges forCLIVAR.
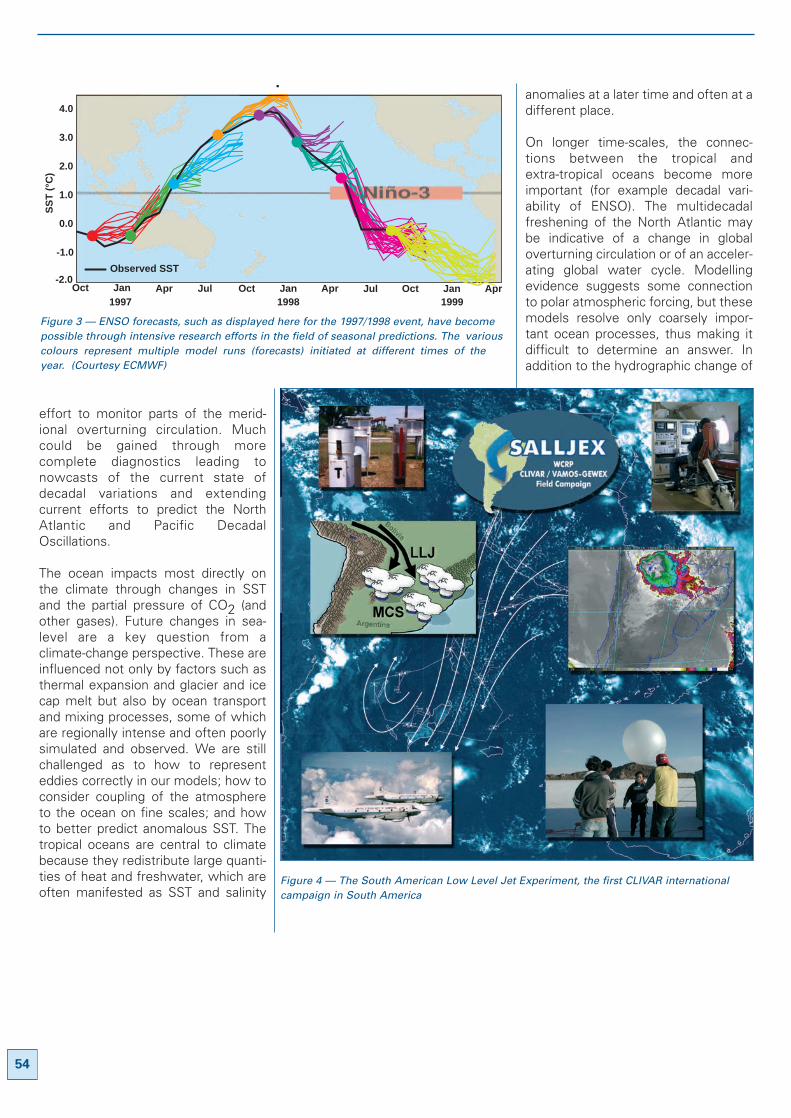
Short-term climate prediction remainsa key focus for CLIVAR, as it was forTOGA. There are several mechanismswhich, through responses to anom-alies in, and/or interactions with,sea-surface temperature (SST), seaice, soil moisture, vegetation andperhaps even troposphere-lower strat-osphere interactions, can result inclimate variability on seasonal-to-inter-annual time-scales. While wehave learned much about these mecha-nisms, a more complete understandingis critical for estimating predictabilityand improving our predictions.Through the advances brought aboutby TOGA and now CLIVAR, the currentset of seasonal-to-interannual forecastmodels have demonstrated broadskills in predicting global temperaturesand precipitation. The use of multi-model ensembles (Figure 3) hasgreatly enhanced overall capabilities,
but predicting climate variability morethan a few months in advance remainsa fundamental challenge. The reasonsfor this include model error and errorgrowth and the role of initial conditionsand stochastic forcing. A sustainedobserving system is critical and thereare continuing challenges for theresearch community to exploit theseobservations, guide their implementa-tion, identify new and morecost-effective technologies, and main-tain an active role as parts of thesystem transition to operations.
The monsoon systems in Asia, Africa,and the Americas have much incommon, including a strong seasonal-ity, land-sea temperature contrastsand even the connection of monsoonsand mountains. The contrast betweenpredictability based on statistical/empirical systems and the relativelylow predictability realized from dynam-ical systems suggests that thecoupled ocean-atmosphere-landsystem must be further understoodand that model systematic biasesshould be reduced to improvemonsoon forecasts. With WCRP’sGlobal Energy and Water CycleExperiment (GEWEX), CLIVAR is lead-ing multinational investigations of theland-ocean-atmosphere coupling asmanifested in the diurnal cycle and the
low-level jet of the American monsoonsystems (Figure 4) and in studies ofthe Asian-Australian monsoon system.Additionally, a new effort, the AfricanMonsoon Multidisciplinary Analysisexperiment, will provide critical contri-butions that could further ourunderstanding of the African monsoonand its impact on life in western Africa.
Predicting decadal variability requires amore global perspective. The limitedhistorical observational data (especiallyin the ocean) mean that models playan even more critical role in under-standing decadal variability andidentifying potential predictability.Models can suggest mechanisms, testdiagnostic schemes, do experiments,and simulate predictions. Identifyingthe underlying mechanisms that arecentral to the climate system“memory” is a critical first step tocharacterizing the limits of predictabil-ity. In the Pacific, for example, at leastthree mechanisms (intrinsic atmos-pheric variations, ENSO variations,SST variations, and Kuroshio mean-ders) contribute to decadal variability,but there are competing theories onhow each is involved. Hence, the levelof predictability is still unclear.Observations are helpful in monitoringimportant mechanisms. For example,in the Atlantic, there is a multinational
53
Figure 2 — Argo float deployment (below);and the Argo float array in January 2005(right). Some 1 600 floats provide a sparsearray over the ice-free oceans in the upper2 000 m. The array is building towardsa target of 3 000 floats.
BLTN 54/2 13/06/05 17:27 Page 53
effort to monitor parts of the merid-ional overturning circulation. Muchcould be gained through morecomplete diagnostics leading tonowcasts of the current state ofdecadal variations and extendingcurrent efforts to predict the NorthAtlantic and Pacific DecadalOscillations.
The ocean impacts most directly onthe climate through changes in SSTand the partial pressure of CO2 (andother gases). Future changes in sea-level are a key question from aclimate-change perspective. These areinfluenced not only by factors such asthermal expansion and glacier and icecap melt but also by ocean transportand mixing processes, some of whichare regionally intense and often poorlysimulated and observed. We are stillchallenged as to how to representeddies correctly in our models; how toconsider coupling of the atmosphereto the ocean on fine scales; and howto better predict anomalous SST. Thetropical oceans are central to climatebecause they redistribute large quanti-ties of heat and freshwater, which areoften manifested as SST and salinity
anomalies at a later time and often at adifferent place.
On longer time-scales, the connec-tions between the tropical andextra-tropical oceans become moreimportant (for example decadal vari-ability of ENSO). The multidecadalfreshening of the North Atlantic maybe indicative of a change in globaloverturning circulation or of an acceler-ating global water cycle. Modellingevidence suggests some connectionto polar atmospheric forcing, but thesemodels resolve only coarsely impor-tant ocean processes, thus making itdifficult to determine an answer. Inaddition to the hydrographic change of
54
Apr Jul Oct Jan Apr Jul Oct Jan AprOct Jan
-1.0
-2.0
0.0
1.0
2.0
3.0
4.0
SS
T (
°C)
Observed SST
1997 1998 1999
p
Figure 3 — ENSO forecasts, such as displayed here for the 1997/1998 event, have becomepossible through intensive research efforts in the field of seasonal predictions. The variouscolours represent multiple model runs (forecasts) initiated at different times of theyear. (Courtesy ECMWF)
Figure 4 — The South American Low Level Jet Experiment, the first CLIVAR internationalcampaign in South America
BLTN 54/2 13/06/05 17:28 Page 54
water properties, ocean circulationsmay be changing (as suggested by alti-metric and in situ observations), whichcould enhance sea-level rise regionally.
These changes could have globalimpacts on ocean temperature, mixingrates, and CO2 uptake rates.Characterizing the distribution andtime variations of salinity is critical forboth extra-topical and tropical oceans.Improved diagnostics of the globalthermohaline circulation are needed.The Southern Ocean is also importantin the global climate context. Itconnects the upper and lower limbs ofthe global overturning circulation,stores 60 per cent of the total anthro-pogenic carbon, may have an annularmode, has been linked to ENSO, andis likely to be sensitive to globalclimate variations.
Palaeoclimate records are critical forexploring longer time-scale climatevariations, i.e. on time-scales ofcenturies and longer. When comparingmultiple reconstructions based onpalaeo-proxy data, proper scaling andcalibration are critical. Many of thedifferences between reconstructionscan be attributed to the calibrationsthat are often based on data in differ-ent seasons and regions. None-theless, the observed late 20thcentury warming is anomalous whencompared to proxy reconstructionsand models (over the past 2 000years).
The recent increased melting of theGreenland Ice Sheet is not (accordingto palaeo-records) unprecedented but,if projected temperature changesunder increased greenhouse-gasconcentrations are realized, sea-levelrise could be faster than anticipated.Finally, palaeoclimate models haveimproved and can provide some addi-tional insight to climate variations (e.g.ENSO) and how their forcings andtheir evolution may have changed.
There are many scientific challengesregarding human influence on climate, including the linkagesbetween natural climate variations andanthropogenically-induced changes.CLIVAR provides input into the Inter-governmental Panel on ClimateChange (IPCC) by helping to meetthese challenges through stimulatingefforts on climate change predictionand detection. Thus, US CLIVARClimate Process Teams, which areattracting international participation,are targeting major areas of uncertain-ties in IPCC-class models, whilstCLIVAR helped to lead efforts in theassessment of the model integrationsfor the Fourth IPCC AssessmentReport (AR4), with a major workshopin March 2005.
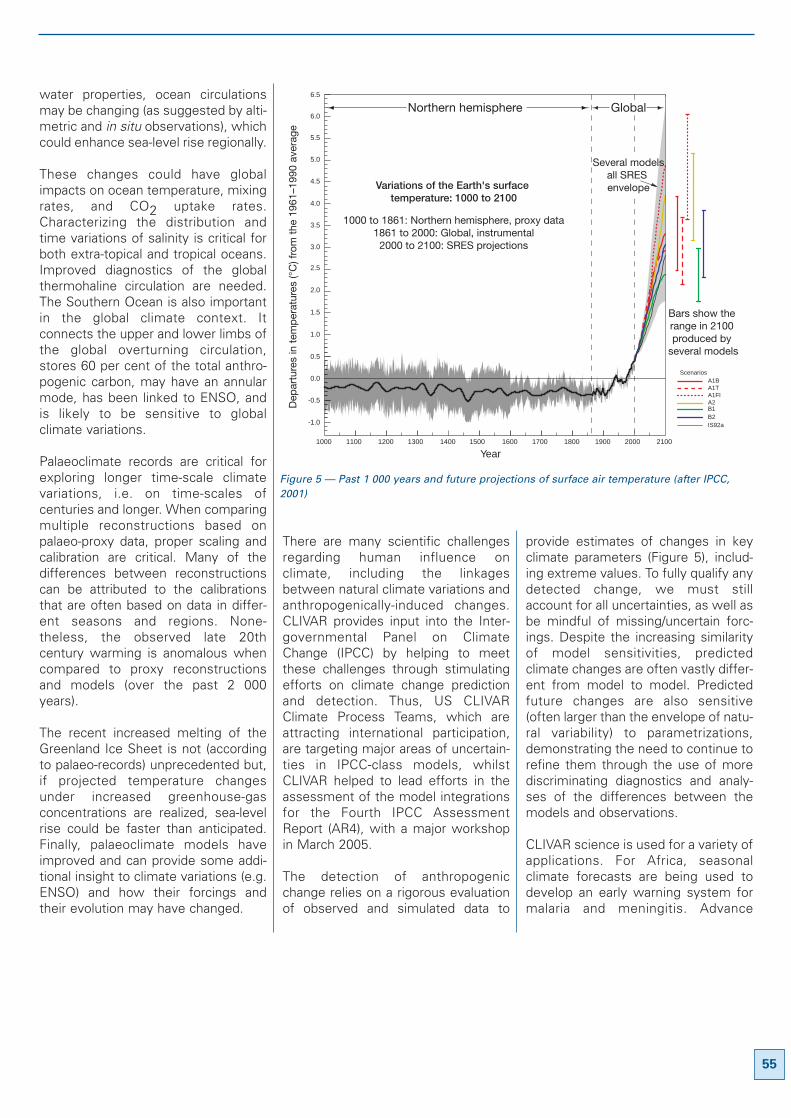
The detection of anthropogenicchange relies on a rigorous evaluationof observed and simulated data to
provide estimates of changes in keyclimate parameters (Figure 5), includ-ing extreme values. To fully qualify anydetected change, we must stillaccount for all uncertainties, as well asbe mindful of missing/uncertain forc-ings. Despite the increasing similarityof model sensitivities, predictedclimate changes are often vastly differ-ent from model to model. Predictedfuture changes are also sensitive(often larger than the envelope of natu-ral variability) to parametrizations,demonstrating the need to continue torefine them through the use of morediscriminating diagnostics and analy-ses of the differences between themodels and observations.
CLIVAR science is used for a variety ofapplications. For Africa, seasonalclimate forecasts are being used todevelop an early warning system formalaria and meningitis. Advance
1000 1200 1400 1600 1800 200019001700150013001100 2100
Year
-1.0
-0.5
0.0
0.5
1.0
1.5
2.0
2.5
3.0
3.5
4.0
4.5
5.0
5.5
6.0
6.5
A1BScenarios
A1TA1FIA2B1B2IS92a
Bars show the range in 2100 produced by
several models
Dep
artu
res
in t
emp
erat
ures
(°C
) fro
m t
he 1
961–
1990
ave
rage
Northern hemisphere Global
Variations of the Earth's surface temperature: 1000 to 2100
1000 to 1861: Northern hemisphere, proxy data1861 to 2000: Global, instrumental
2000 to 2100: SRES projections
Several modelsall SRES envelope
Figure 5 — Past 1 000 years and future projections of surface air temperature (after IPCC,2001)
55
BLTN 54/2 13/06/05 17:28 Page 55
predictions of a range of variablessuch as precipitation (including totals,onset and ending dates) and environ-mental conditions (e.g. dust, humidity)are a necessary first step, but predic-tion systems have difficulty producingforecasts of these variables and thevalidation and monitoring observa-tions are often inadequate. Lengthyhistories of hindcasts are useful indemonstrating the value of seasonalforecasts and have led to their furtheroperational use. CLIVAR and GEWEXare working together to improve thesimulation and predictions ofmonsoons and intraseasonal-to-inter-annual forecasts that are valuablefor water-resource managers. Seasonalforecasts have proved useful forhydroelectric power management.Some of the most notable applica-tions of CLIVAR science have been inagriculture.
Studies on adaptation and utilization ofclimate forecasts by, for example, theClimate Prediction and Agriculture(CLIMAG) project of the GlobalChange SysTem for Analysis,Research and Training (START) and byothers have been very valuable. It isimportant to develop region-specificadvice; involve farmers early and havethem test recommended strategies;and finally communicate risk factors toavoid calamitous losses.
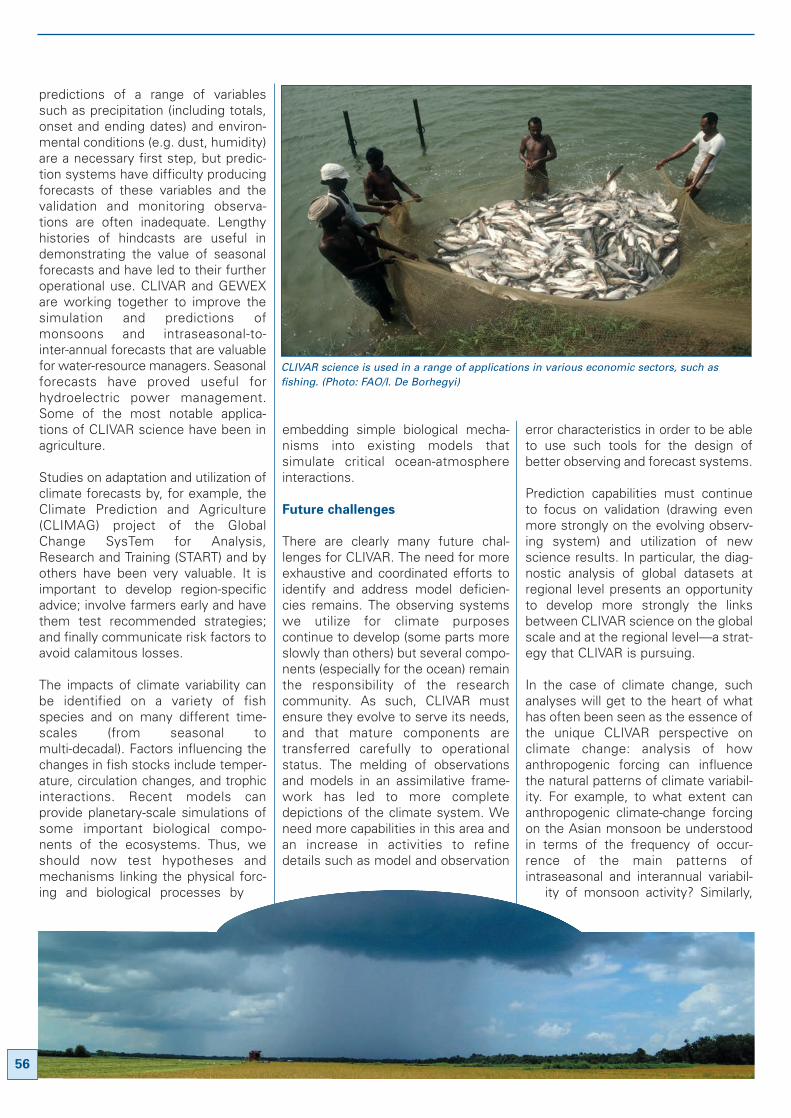
The impacts of climate variability canbe identified on a variety of fishspecies and on many different time-scales (from seasonal tomulti-decadal). Factors influencing thechanges in fish stocks include temper-ature, circulation changes, and trophicinteractions. Recent models canprovide planetary-scale simulations ofsome important biological compo-nents of the ecosystems. Thus, weshould now test hypotheses andmechanisms linking the physical forc-ing and biological processes by
embedding simple biological mecha-nisms into existing models thatsimulate critical ocean-atmosphereinteractions.
Future challenges
There are clearly many future chal-lenges for CLIVAR. The need for moreexhaustive and coordinated efforts toidentify and address model deficien-cies remains. The observing systemswe utilize for climate purposescontinue to develop (some parts moreslowly than others) but several compo-nents (especially for the ocean) remainthe responsibility of the researchcommunity. As such, CLIVAR mustensure they evolve to serve its needs,and that mature components aretransferred carefully to operationalstatus. The melding of observationsand models in an assimilative frame-work has led to more completedepictions of the climate system. Weneed more capabilities in this area andan increase in activities to refinedetails such as model and observation
error characteristics in order to be ableto use such tools for the design ofbetter observing and forecast systems.
Prediction capabilities must continueto focus on validation (drawing evenmore strongly on the evolving observ-ing system) and utilization of newscience results. In particular, the diag-nostic analysis of global datasets atregional level presents an opportunityto develop more strongly the linksbetween CLIVAR science on the globalscale and at the regional level—a strat-egy that CLIVAR is pursuing.
In the case of climate change, suchanalyses will get to the heart of whathas often been seen as the essence ofthe unique CLIVAR perspective onclimate change: analysis of howanthropogenic forcing can influencethe natural patterns of climate variabil-ity. For example, to what extent cananthropogenic climate-change forcingon the Asian monsoon be understoodin terms of the frequency of occur-rence of the main patterns ofintraseasonal and interannual variabil-
ity of monsoon activity? Similarly,
CLIVAR science is used in a range of applications in various economic sectors, such asfishing. (Photo: FAO/I. De Borhegyi)
56
BLTN 54/2 13/06/05 17:28 Page 56
how is the decadal mode associatedwith the Sahel drought influenced byanthropogenic forcing? To what extentdo the models to be used in IPCC AR4describe satisfactorily the coupleddynamics of ENSO and how will thefrequency of ENSO be influenced byanthropogenic forcing?
In addition, for prediction of longertime-scale (e.g. decadal) variability,more systematic numerical diagnos-tics and experimentation are requiredwhile we also develop nowcasts andexplore experimental predictions ofimportant indices. The ocean contin-ues to be an important focus ofCLIVAR. We must exploit fully thedeveloping observation system andpush forward with improved modelsand coupled systems to characterizemore fully the changes in ocean circu-lation, climate-critical processes,ocean intransitivity, changes in carbonuptake, and sea level. Differences inmodel feedbacks in climate-changeintegrations are a significant limitingfactor in developing improved coupledclimate models. The fidelity of keyprocesses leading to these differencesneeds to be addressed. Finally, while itis gratifying to note the many applica-tions of CLIVAR research, it isapparent that integrating climatepredictions into decision-makingsystems is a key to more success inthis area.
57
BLTN 54/2 13/06/05 17:28 Page 57
By S. Sorooshian1, R. Lawford2,
P. Try2, W. Rossow3, J. Roads4,
J. Polcher5, G. Sommeria6, R. Schiffer2
Introduction
The Earth’s climate fluctuates andchanges both regionally and globally.Inevitably, this is reflected in the vari-ability and change of Earth's waterbudget and its complex and dynamicenergy balance with the Sun. Pro-cesses controlling the transports,transformations and exchanges ofheat and water in the climate system
are inextricably intertwined over alarge range of space- and time-scalesfrom boundary-layer turbulence toglobal climate change. Recognizingthe pressing requirement to betterunderstand and predict these complexprocesses and their interactions, theWorld Climate Research Programme(WCRP) launched the Global Energyand Water Cycle Experiment (GEWEX)in 1990. GEWEX leads WCRP’s stud-ies of the dynamics and thermo-dynamics of the atmosphere, theatmosphere’s interactions with theEarth’s surface (especially over land),and the global water cycle. By virtue ofthis central role, GEWEX connectswith other WCRP projects, includingthe Climate Variability and Predicta-bility (CLIVAR) project, the Strato-spheric Processes and their Role inClimate project, and the Climate andCryosphere (CliC) project. Further-more, WCRP’s co-sponsors, WMO,the International Council for Scienceand the Intergovernmental Oceano-graphic Commission of UNESCO,provide GEWEX access to researchersin both the academic and governmen-tal sectors.
GEWEX: Phases I and II
The first phase of GEWEX (1990-2002)focused on the development ofanalysis tools and models, usingoperational and research satellites,regional analyses of continental scalebasins, and process studies to supportthe development of parameterizationsof feedback processes (relating toclouds and land) for global climatemodels. During Phase I, more than1 500 scientists from over 35 countries
participated in GEWEX activities andmore than 20 special issues ofrefereed papers were produced.
Understanding the role of water in theclimate system is a priority for WCRPand GEWEX. As vapour, water is theEarth’s strongest and most plentifulgreenhouse gas. Clouds also have animportant feedback role in the climatesystem and, depending on theircomposition, spatial distribution andaltitude, may enhance or diminishclimate-change effects. Feedbackinfluences also come from land-surface states determined by soilmoisture and vegetation, whichcontrols the partitioning of incomingsolar radiation into radiative, sensible,latent (evaporation) and ground-heatfluxes and precipitation into runoff andinfiltration. The cycle is closed byevapotranspiration from the land andevaporation from the ocean. Under-standing, characterizing and closingboth the global water and energy
58
Water andenergy cycles:investigatingthe links
International GEWEX Project Office, Silver Spring, Maryland, USA E-mail: [email protected]: http://www.gewex.org/igpo.html
GEWEX Phases I and II
GEWEX Phase II (2003-2013)emphasizes the full exploitation ofthe understanding and tools fromPhase I (1990-2002), along withincreased reliance on upgradedmodels and assimilation systemsand new environmental satellitesystems to produce even greatercontributions to climate science.
1 University of California, Irvine, USA2 International GEWEX Project Office, Silver Spring, USA3 NASA Goddard Institute for Space Studies, New York, USA4 University of California, San Diego, USA5 Laboratoire de météorologie dynamique du Centre national de la recherche scien-
tifique (CNRS), Paris, France6 WMO/WCRP
BLTN 54/2 13/06/05 17:28 Page 58
budgets have been a major focus forGEWEX research.
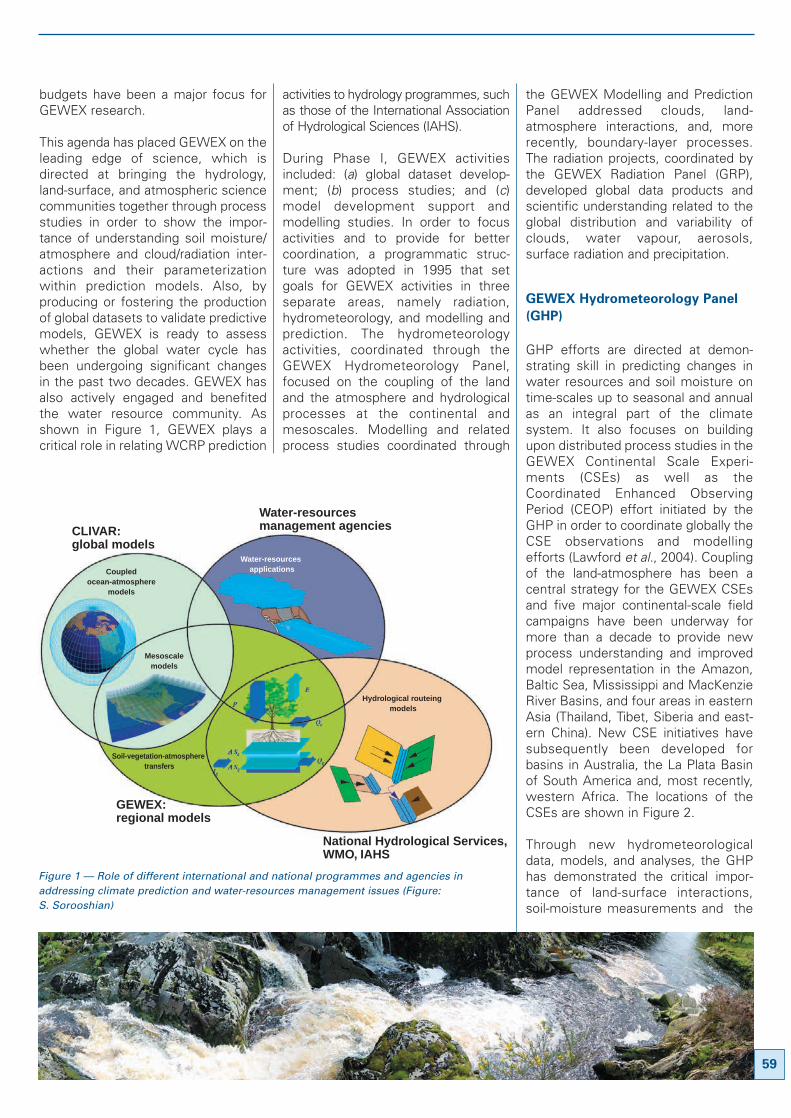
This agenda has placed GEWEX on theleading edge of science, which isdirected at bringing the hydrology,land-surface, and atmospheric sciencecommunities together through processstudies in order to show the impor-tance of understanding soil moisture/atmosphere and cloud/radiation inter-actions and their parameterizationwithin prediction models. Also, byproducing or fostering the productionof global datasets to validate predictivemodels, GEWEX is ready to assesswhether the global water cycle hasbeen undergoing significant changesin the past two decades. GEWEX hasalso actively engaged and benefitedthe water resource community. Asshown in Figure 1, GEWEX plays a critical role in relating WCRP prediction
activities to hydrology programmes, suchas those of the International Associationof Hydrological Sciences (IAHS).
During Phase I, GEWEX activitiesincluded: (a) global dataset develop-ment; (b) process studies; and (c)model development support andmodelling studies. In order to focusactivities and to provide for bettercoordination, a programmatic struc-ture was adopted in 1995 that setgoals for GEWEX activities in threeseparate areas, namely radiation,hydrometeorology, and modelling andprediction. The hydrometeorologyactivities, coordinated through theGEWEX Hydrometeorology Panel,focused on the coupling of the landand the atmosphere and hydrologicalprocesses at the continental andmesoscales. Modelling and relatedprocess studies coordinated through
the GEWEX Modelling and PredictionPanel addressed clouds, land-atmosphere interactions, and, morerecently, boundary-layer processes.The radiation projects, coordinated bythe GEWEX Radiation Panel (GRP),developed global data products andscientific understanding related to theglobal distribution and variability ofclouds, water vapour, aerosols,surface radiation and precipitation.
GEWEX Hydrometeorology Panel
(GHP)
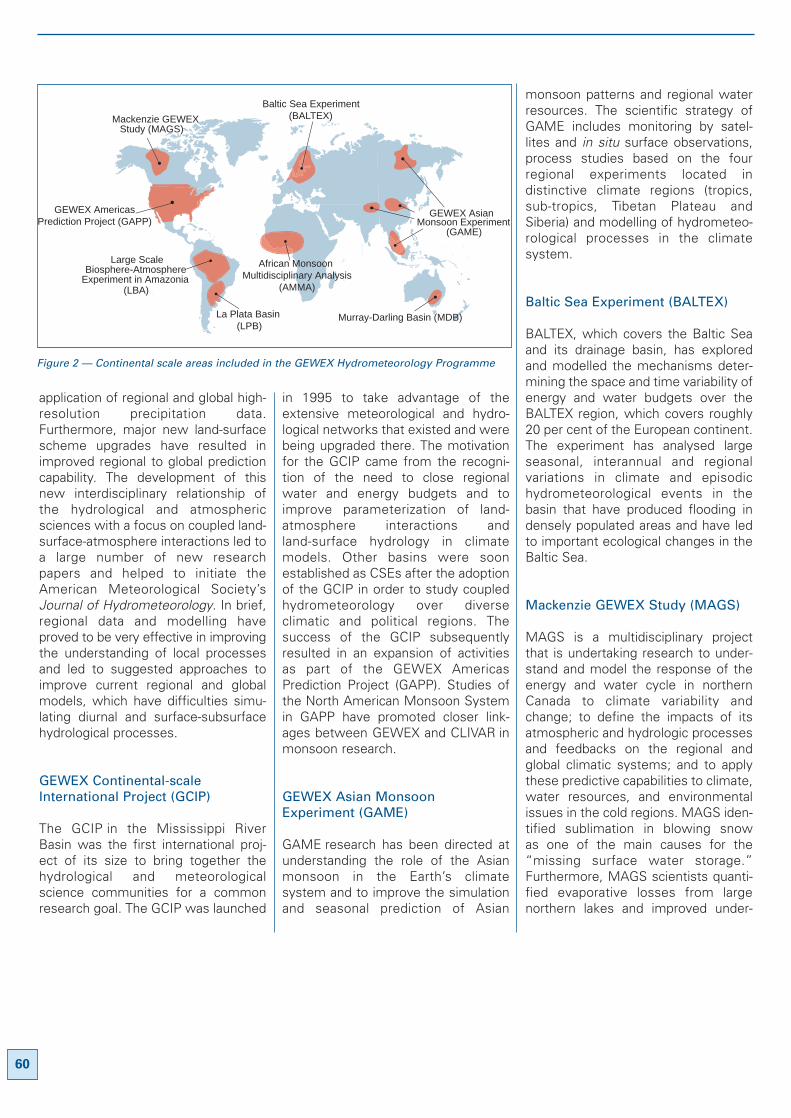
GHP efforts are directed at demon-strating skill in predicting changes inwater resources and soil moisture ontime-scales up to seasonal and annualas an integral part of the climatesystem. It also focuses on buildingupon distributed process studies in theGEWEX Continental Scale Experi-ments (CSEs) as well as theCoordinated Enhanced ObservingPeriod (CEOP) effort initiated by theGHP in order to coordinate globally theCSE observations and modellingefforts (Lawford et al., 2004). Couplingof the land-atmosphere has been acentral strategy for the GEWEX CSEsand five major continental-scale fieldcampaigns have been underway formore than a decade to provide newprocess understanding and improvedmodel representation in the Amazon,Baltic Sea, Mississippi and MacKenzieRiver Basins, and four areas in easternAsia (Thailand, Tibet, Siberia and east-ern China). New CSE initiatives havesubsequently been developed forbasins in Australia, the La Plata Basinof South America and, most recently,western Africa. The locations of theCSEs are shown in Figure 2.
Through new hydrometeorologicaldata, models, and analyses, the GHPhas demonstrated the critical impor-tance of land-surface interactions,soil-moisture measurements and the
Water-resources applicationsCoupled
ocean-atmospheremodels
Mesoscalemodels
Soil-vegetation-atmosphere transfers
Hydrological routeing models
CLIVAR:global models
Water-resourcesmanagement agencies
National Hydrological Services,WMO, IAHS
GEWEX:regional models
Figure 1 — Role of different international and national programmes and agencies inaddressing climate prediction and water-resources management issues (Figure:S. Sorooshian)
59
BLTN 54/2 13/06/05 17:28 Page 59
application of regional and global high-resolution precipitation data.Furthermore, major new land-surfacescheme upgrades have resulted inimproved regional to global predictioncapability. The development of thisnew interdisciplinary relationship ofthe hydrological and atmosphericsciences with a focus on coupled land-surface-atmosphere interactions led toa large number of new researchpapers and helped to initiate theAmerican Meteorological Society’sJournal of Hydrometeorology. In brief,regional data and modelling haveproved to be very effective in improvingthe understanding of local processesand led to suggested approaches toimprove current regional and globalmodels, which have difficulties simu-lating diurnal and surface-subsurfacehydrological processes.
GEWEX Continental-scaleInternational Project (GCIP)
The GCIP in the Mississippi RiverBasin was the first international proj-ect of its size to bring together thehydrological and meteorologicalscience communities for a commonresearch goal. The GCIP was launched
in 1995 to take advantage of theextensive meteorological and hydro-logical networks that existed and werebeing upgraded there. The motivationfor the GCIP came from the recogni-tion of the need to close regionalwater and energy budgets and toimprove parameterization of land-atmosphere interactions andland-surface hydrology in climatemodels. Other basins were soonestablished as CSEs after the adoptionof the GCIP in order to study coupledhydrometeorology over diverseclimatic and political regions. Thesuccess of the GCIP subsequentlyresulted in an expansion of activitiesas part of the GEWEX AmericasPrediction Project (GAPP). Studies ofthe North American Monsoon Systemin GAPP have promoted closer link-ages between GEWEX and CLIVAR inmonsoon research.
GEWEX Asian MonsoonExperiment (GAME)
GAME research has been directed atunderstanding the role of the Asianmonsoon in the Earth’s climatesystem and to improve the simulationand seasonal prediction of Asian
monsoon patterns and regional waterresources. The scientific strategy ofGAME includes monitoring by satel-lites and in situ surface observations,process studies based on the fourregional experiments located indistinctive climate regions (tropics,sub-tropics, Tibetan Plateau andSiberia) and modelling of hydrometeo-rological processes in the climatesystem.
Baltic Sea Experiment (BALTEX)
BALTEX, which covers the Baltic Seaand its drainage basin, has exploredand modelled the mechanisms deter-mining the space and time variability ofenergy and water budgets over theBALTEX region, which covers roughly20 per cent of the European continent.The experiment has analysed largeseasonal, interannual and regional variations in climate and episodichydrometeorological events in thebasin that have produced flooding indensely populated areas and have ledto important ecological changes in theBaltic Sea.
Mackenzie GEWEX Study (MAGS)
MAGS is a multidisciplinary projectthat is undertaking research to under-stand and model the response of theenergy and water cycle in northernCanada to climate variability andchange; to define the impacts of itsatmospheric and hydrologic processesand feedbacks on the regional andglobal climatic systems; and to applythese predictive capabilities to climate,water resources, and environmentalissues in the cold regions. MAGS iden-tified sublimation in blowing snow as one of the main causes for the“missing surface water storage.”Furthermore, MAGS scientists quanti-fied evaporative losses from largenorthern lakes and improved under-
60
Mackenzie GEWEXStudy (MAGS)
Baltic Sea Experiment(BALTEX)
GEWEX AsianMonsoon Experiment
(GAME)
Murray-Darling Basin (MDB) La Plata Basin (LPB)
African Monsoon Multidisciplinary Analysis
(AMMA)
Large ScaleBiosphere-Atmosphere
Experiment in Amazonia(LBA)
GEWEX AmericasPrediction Project (GAPP)
Figure 2 — Continental scale areas included in the GEWEX Hydrometeorology Programme
BLTN 54/2 13/06/05 17:28 Page 60
standing and model representation ofrunoff processes in the northernregions. Along with GAME-Siberia,MAGS has strengthened the linksbetween GEWEX and CliC.
Large Scale Biosphere-AtmosphereExperiment in Amazonia (LBA)
The hydrometeorological aspects ofLBA have been directed at under-standing the role of tropical forestsand the consequences of deforesta-tion for regional energy and waterbudgets. Phase I field experiments,modelling, and analyses showed a44 per cent imbalance of the watercycle in the Amazon basin. Amongstthe many important findings, LBAstudies determined the transport ofmoisture from Amazonia to southernBrazil via the low-level jet east of theAndes and quantified the interannualvariability of the Amazon Basin as asource/sink of carbon dioxide andmoisture based on an assessment ofcarbon sequestration in tropical forestenvironments during ENSO events.
International Satellite Land SurfaceClimatology Project (ISLSCP)
ISLSCP initially focused on field exper-iments but more recently hasundertaken the development of inter-disciplinary datasets. These fieldexperiments included the First ISLSCPField Experiment (FIFE) and the Boreal Ecosystems-Atmosphere Study(BOREAS). Subsequently, ISLSCPlaunched two interdisciplinary datacollections to develop co-registeredinterdisciplinary Earth science landdatasets for variables needed bymodellers for coupled land-atmos-phere modelling. The first co-located1 × 1° observational datasets covereda two-year period and have been usedwidely in research and education.The second data collection
initiative (ISLSCP II) produced datasetsat spatial resolution of 1° to 0.5° and0.25° for the period 1986-1995.
GHP has mounted several global proj-ects that integrate studies andactivities in all the CSEs. These activi-ties include the Water and EnergyBudget Studies (WEBS) and the WaterResources Applications Project(WRAP). GHP also coordinatesGEWEX-related research with globalprojects, including the CoordinatedEnhanced Observing Period (CEOP)and the International Association ofHydrologic Sciences Project forUngauged Basins, global data centres,including the Global PrecipitationClimatology Centre and the GlobalRunoff Data Centre, and internationalagencies, including the InternationalAtomic Energy Agency. Its activitieshelp to coordinate and disseminatehydrological results to the internationalhydrological community.
GEWEX Modelling and Prediction
Panel (GMPP)
GMPP contributes to the globalmodelling of the processes thatcontrol the global energy and waterbudget and demonstrates the valueof predicting the variability of thiscycle and its response to climate forc-ing with a particular emphasis oncloud and land-surface process repre-sentation. The goal of GMPP researchis to demonstrate the capability topredict water storage and runoff overcontinental regions, as an element ofseasonal-to-interannual climate pre-dictability, and to demonstrate thecapability to predict the radiationbudget and fluxes as an element ofdecadal-to-centennial climate variabilityand response to changes in externalforcing factors (Chahine, 1997).
Phase I components
The principal Phase I components ofGMPP include the GEWEX CloudStudy System and Global Land-Atmosphere System Study with itsprimary subprojects: the Project forIntercomparison of Land-SurfaceParameterization Schemes and theGlobal Soil Wetness Project. GMPPstudies have reduced uncertainties inthe understanding and simulation ofkey water-cycle variables through theapplication of Phase I observations andland-surface and cloud-process para-meterizations derived through regionalstudies and model intercomparisons.
The GEWEX Atmospheric BoundaryLayer Study was formed in 1999 tostudy how the interactions of the landsurface and the boundary cloud layerare mediated through the atmosphericboundary layer.
GEWEX Cloud Study System(GCSS)
GCSS has carried out studies thatsupport the development of new physically-based cloud parameteriza-tions using cloud-resolving models ofdifferent cloud system types fornumerical weather prediction andclimate models: marine boundary-layerclouds, Cirrus, extra-tropical layerclouds, tropical deep convection andpolar clouds. GCSS investigates thesecloud types with a combined analysisof a wide range of models: from turbulent-eddy-resolving models tocloud-resolving and regional-scalemodels to single-column and generalcirculation models used for weatherforecasting and climate in addition to awide range of in situ, surface, andsatellite remote-sensing observations.
Tools for conducting these studies havebeen gathered on a linked set of
Websites, the main one being
61
BLTN 54/2 13/06/05 17:28 Page 61
the GCSS Data Integration for ModelEvaluation. These activities are leadingnot only to improved cloud parameteri-zations but also to the implementation ofnew, more focused field experimentsand advances in the use of combinedsets of surface and satellite-based activesensors.
GCSS study results have supportedimproved understanding of the effectsof the three-dimensional structure ofclouds on radiative fluxes, the interac-tion of clouds with the marine surfaceand atmospheric boundary layer, theorganization and distribution of precip-itation in tropical convective com-plexes, and the character and evolu-tion of Cirrus and polar clouds.
Global Land-Atmosphere SystemStudy (GLASS)
GLASS seeks to improve our under-standing of, and capability to simulate,surface processes from the plot scaleto the global scale by multi-institutionalexperiments of both stand-alone land-surface models (LSMs) and coupledland-atmosphere models on both thelocal (point, plot and catchment) andlarge (continental to global) scales.Through multi-model experiments,GLASS confronts the hypothesis underwhich the LSMs have been developedand thus advance the community’sknowledge of their capabilities. Thegoal of GLASS is to incorporateimproved understanding of the physi-cal processes at the land surface intoglobal models and to identify andunderstand the important componentsof land-atmosphere interaction.
Project for Land-SurfaceParameterization Schemes andGlobal Soil Wetness Project
Initially through the Project forIntercomparison of Land-Surface
Parameterization Schemes (PILPS) andnow through GLASS, the developmentof improved land-surface models hasbeen coordinated at the process level.Subsequently, the Global Soil WetnessProject (GSWP) carried out intercom-parisons of land-surface models on theglobal scale. More generally, GLASSinitiated within the community the tran-sition for land-surface parameterizationsbound to an atmospheric model to land-surface models. PILPS and GLASS haveled to the accelerated development ofLSMs by model and data intercompar-isons for different climate regimes.
The evaluation of simulated soilwetness and precipitation predictionsin ensembles of models within GSWPand the Global Land AtmosphereCoupling Experiment has raised theawareness of the community to theintrinsic limitation of LSMs to produceobservable quantities. For example,coupled LSMs and global climatemodels have been assessed in termsof their sensitivity to soil moisture andocean sea-surface temperatures,which can greatly affect their ability tosimulate climate predictability. GLASSalso developed a critical set of stan-dards for the exchange of forcing datato facilitate modelling studies usingland-surface models.
The GMPP facilitates the transfer of knowledge about models and model-ling techniques to operations through an annual joint meeting with the WMO Commission for AtmosphericScience/Joint Scientific CommitteeWorking Group on NumericalExperimentation.
GEWEX Radiation Panel (GRP)
Efforts of the GRP are directedtowards determining the diabatic heat-ing of the atmosphere and surface byradiative, sensible and latent energyexchanges with accuracy sufficient todiagnose the processes influencingvariations of the surface and atmos-phere from weather to decadal climatescales. GRP projects analyse long-term, global satellite observations thatare supported by key, high-quality,long-term, in situ measurements thatare used to diagnose the causes offorced and unforced climate variations(Rossow et al., 2005). The GRP stud-ies foster improvements in radiativetransfer models used in weather andclimate models and in the analysis ofsatellite- and surface-based remote-sensing observations.
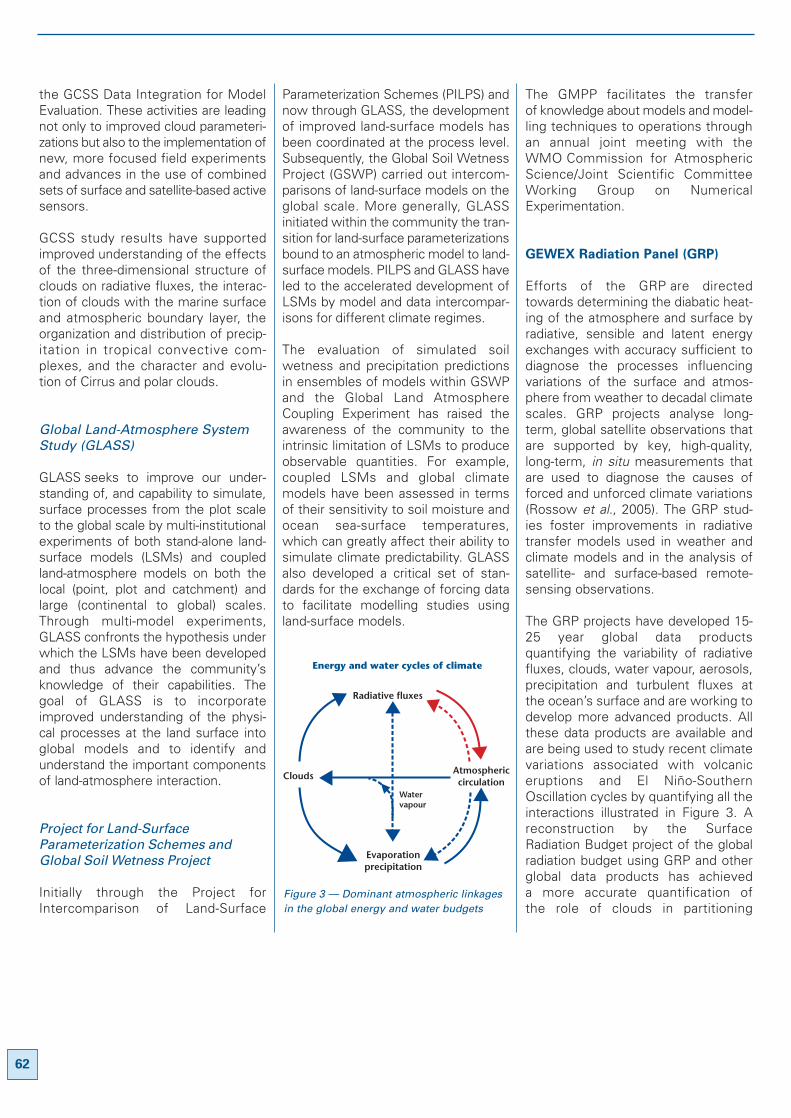
The GRP projects have developed 15-25 year global data productsquantifying the variability of radiativefluxes, clouds, water vapour, aerosols,precipitation and turbulent fluxes atthe ocean’s surface and are working todevelop more advanced products. Allthese data products are available andare being used to study recent climatevariations associated with volcaniceruptions and El Niño-SouthernOscillation cycles by quantifying all theinteractions illustrated in Figure 3. Areconstruction by the SurfaceRadiation Budget project of the globalradiation budget using GRP and otherglobal data products has achieved a more accurate quantification of the role of clouds in partitioning
62
Figure 3 — Dominant atmospheric linkagesin the global energy and water budgets
Energy and water cycles of climate
Radiative fluxes
Atmosphericcirculation
Clouds
Evaporationprecipitation
Watervapour
BLTN 54/2 13/06/05 17:28 Page 62
the planetary radiation budget amongthe atmosphere, ocean, land andcryosphere.
The International Satellite CloudClimatology Project has pioneered thecross-calibration, analysis and mergerof measurements from the inter-national constellation of weathersatellites to produce the first globalquantitative description of the physicalproperties of clouds resolving diurnal-to-decadal variations.
The Global Precipitation ClimatologyProject has produced the first globallycomplete determination of precipita-tion resolving five-day-to-decadalvariations by the analysis and mergerof measurements from the interna-tional constellation of weathersatellites and in situ measurements.
The Global Water Vapour Projectconducted a pilot study that pioneeredthe merger of water-vapour measure-ments from the internationalconstellation of weather satellites andin situ atmospheric soundings to
produce a detailed description of theglobal distribution of atmosphericwater-vapour profiles resolving daily-to-decadal variations.
The Global Aerosol ClimatologyProject recently completed a system-atic analysis of year-to-year variationsof aerosols that is now being mergedwith an analysis of the associated variations of cloud microphysical properties. In addition, the firstcomprehensive compilation of in situocean surface flux measurements wasproduced by the SeaFlux project.
These efforts have fostered improve-ments in global satellite-basedproducts, providing turbulent fluxes ofheat, water, and momentum resolvingdaily-to-decadal variations. The globalsatellite observation analysis projectsare supported by reference networksestablished by GRP and data centres.For example, the development of theBaseline Surface Radiation Networkhas led to reductions in measurementuncertainties of more than a factor of two. The Global Precipitation
Climatology Centre, a data centre that is linked with GRP precipitationstudies, has compiled an extensivecollection of surface precipitation gaugedata and analyses. Both these initiativesare key elements of the Global ClimateObserving System.
In preparation for Phase II of GEWEX,the GRP has an ongoing project,known as the Intercomparison ofRadiation Codes in Climate Models, tofoster significant development ofradiative transfer codes in all atmos-pheric general circulation models and aworking group to develop a coordi-nated approach for the reduction andanalysis of combinations of atmos-pheric profiling instruments (radars,lidars and sodars) from a worldwidenetwork of long-term monitoring sites.In addition, the GRP is working withother GEWEX activities to develop anadvanced, comprehensive analysis ofthe fluxes of energy and waterbetween the land and atmosphere.
Challenges
To achieve its objectives in Phase II(see box overleaf), GEWEX willdevelop and apply a wide range ofmodelling tools ranging from globalclimate models to regional andmesoscale models, and will evaluatedownscaling methods suitable for thesmaller spatial and temporal scalesgenerally associated with hydrologicalmodels used in local water-resourcemanagement.
Another primary element of Phase II isthe Coordinated Enhanced ObservingPeriod (CEOP). The first phase of thisexperiment (CEOP I) is described inKoike (2004). CEOP II will focus on thedevelopment of a two-year dataset ofin situ, satellite and model data for theperiod of 2003-2004 to supportresearch objectives in the climateprediction and monsoon systemstudies. GEWEX also takes the lead on
63
60˚ 90˚ 120˚ 150˚ 180˚ 210˚ 240˚ 270˚ 300˚ 330˚ 30˚ 60˚
-90˚
-60˚
-30˚
0˚
30˚
60˚
90˚60 90 120 150 180 210 240 270 300 330 0 30 60˚
-90
-60
-30
0
30
60
90
(mm/year)0 500 1 000 1 500 2 000 2 500 3 000 3 500
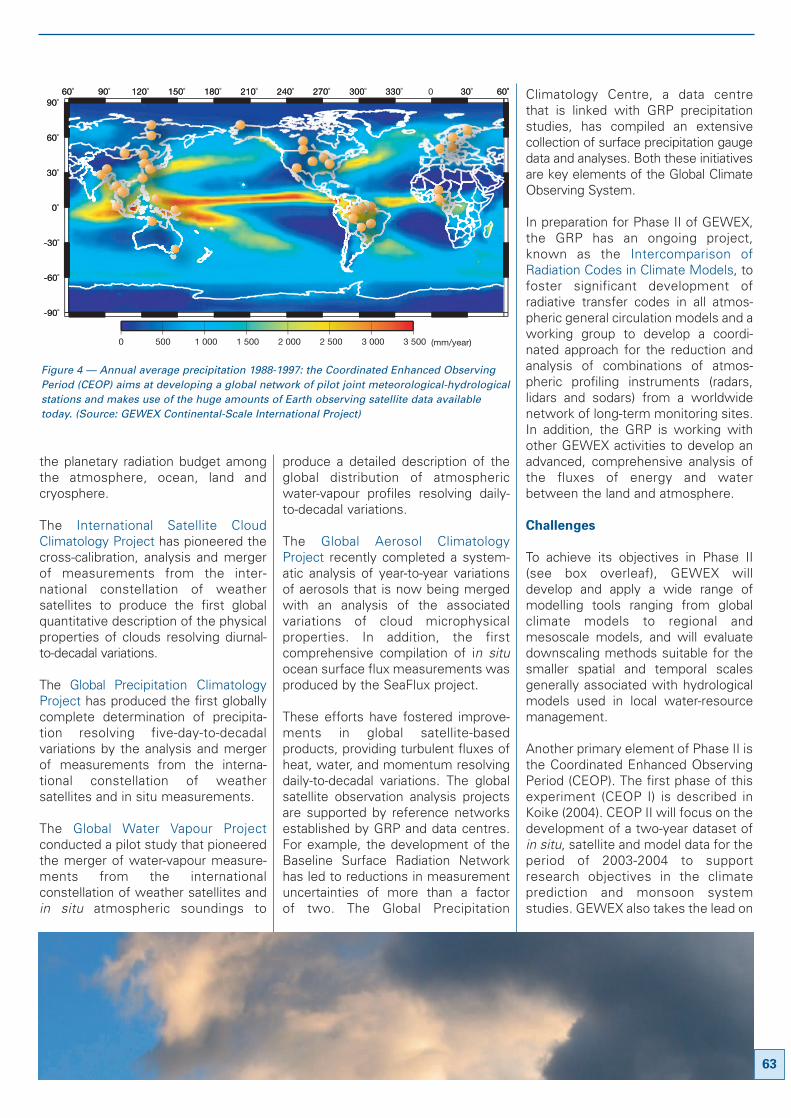
Figure 4 — Annual average precipitation 1988-1997: the Coordinated Enhanced ObservingPeriod (CEOP) aims at developing a global network of pilot joint meteorological-hydrologicalstations and makes use of the huge amounts of Earth observing satellite data availabletoday. (Source: GEWEX Continental-Scale International Project)
BLTN 54/2 13/06/05 17:28 Page 63
behalf of WCRP in the IntegratedGlobal Water Cycle Observationstheme of the Integrated GlobalObserving Strategy Partnership. In thatregard, CEOP has been endorsed asthe first element of the new IntegratedGlobal Water Cycle Observationtheme. GEWEX also will contribute tothe Global Water System Projectwithin the Earth System SciencePartnership framework. In addition,research projects in GEWEX Phase IIwill be supportive of WCRP’s newstrategy, the Coordinated Observationand Prediction of the Earth System.Readers wishing to follow the progressof GEWEX or to access the wide rangeof data and data products available areinvited to visit the GEWEX home page(www.gewex.org).
Acknowledgements
The successes and progress reported herewould not have been possible without themajor contributions and data services of theUS National Aeronautics and SpaceAdministration, the US National Oceanic andAtmospheric Administration, the JapanAerospace Exploration Agency, the GermanAssociation of Natural Resources, theEuropean Space Agency, the EuropeanOrganisation for the Exploitation ofMeteorological Satellites, the EuropeanCommission, the Meteorological Service ofCanada, and the Natural Sciences andEngineering Research Council of Canada.A number of other national and internationalagencies and programmes have alsocontributed data and infrastructure to theproject. Also, the authors would like to thankDr Bisher Imam, Ms Dawn Erlich and MsCarolyn Serey for their help in preparing thefigures and finalizing the text for this article.
References:
CHAHINE, M.J., 1997: GEWEX strategiesand goals are affirmed by the JointScience Committee, GEWEXNewsletter, 7 (3), p.2.
KOIKE, T., 2004: The CoordinatedEnhanced Observing Period—an initialstep for integrated global water cycleobservation. WMO Bulletin 53 (2).
LAWFORD, R.G., R. STEWART, J. ROADS,H.-J. ISEMER, M. MANTON, J. MARENGO,T. YASUNARI, S. BENEDICT, T. KOIKE andS. WILLIAMS, 2004: Advancing globaland continental scale hydrometeorol-ogy: Contributions of the GEWEXHydrometeorology Panel, Bulletin ofthe American Meteorological Society,85 (12).
ROSSOW, W.B., B.E. CARLSON,P.W. STACKHOUSE, B.A. WIELICKI andY-C ZHANG, 2005: Implications andopportunities suggested by long-termchanges of radiative fluxes at thesurface and top of the atmosphere.(Submitted to the Bulletin of theAmerican Meteorological Society inOctober 2004).
64
GEWEX Phase IIobjectives
• Produce consistent researchquality data sets complete witherror descriptions of the Earth’senergy budget and water cycleand their variability and trendson interannual to decadal timescales, and for use in climatesystem analysis and modeldevelopment and validation
• Enhance the understanding ofhow energy and water cycleprocesses function and quantifytheir contribution to climatefeedbacks
• Determine the geographicaland seasonal characteristics ofthe predictability of key waterand energy cycle variables overland areas and through collabo-rations with the wider WCRPcommunity determine thepredictabiity of energy andwater cycles on a global basis
• Develop better seasonal predic-tions of water and energy cyclevariability through improvedparameterizations encapsulatinghydrometeorological processesand feedbacks for atmosphericcirculation models
• Undertake joint activities withoperational hydrometeorologi-cal services and hydrologicalresearch programmes todemonstrate the value of newGEWEX prediction capabilities,datasets and tools for assessingthe consequences of globalchange
BLTN 54/2 13/06/05 17:28 Page 64
By N. McFarlane (SPARC International
Project Office), A. Ravishankara
(NOAA Aeronomy Laboratory,
Boulder, USA) and A O'Neill
(University of Reading, UK)
Stratospheric Processes and their
Role in Climate (SPARC) Project—
a short history
The SPARC project came about over aperiod of years through the efforts of acommunity of scientists, first toformulate its central goals and then tohave it accepted by the main interna-tional scientific organizations. Anumber of scientists were involved inthe long process which led to therecognition of SPARC as a project ofthe World Climate Research
Programme (WCRP). The major effortsof M. Geller and M.-L. Chanin, the firstCo-Chairs of the SPARC Project, werecritical to final success.
Although depletion of ozone in thestratosphere had been an issue ofinterest in research for more than adecade, discovery of the Antarcticozone hole in 1985 added enormousimpetus to this field of investigation.Understanding the chemistry anddynamics of the ozone hole, and ofstratospheric ozone more generally,was recognized as a scientifically chal-lenging issue, as well as one of greatconcern for human health. In hisBanquet response for the Nobel Prizein Chemistry (see SPARC NewsletterNo.6. on the SPARC Website(http://www.atmosp.physics.utoronto.ca/SPARC), Prof. F Sherwood Rowlanddrew attention to the signing of theMontreal Protocol in 1989 as recogni-tion of the great importance to beattached to monitoring and control ofgaseous emissions to the atmos-phere. Many important nationalprogrammes were set up in responseto this.
Although depletion of stratosphericozone was, at first, considered asbeing somewhat distinct from climate-change issues, it had become increas-ingly clear that the future evolution ofthe ozone layer and its eventual recov-ery were part of the broader story ofclimate change associated withincreasing concentrations of radiativelyand chemically active substances inthe atmosphere as a result of humanactivities. The critical role of suchsubstances in the chemistry of ozonein the Antarctic stratospheric winterpolar vortex, remote from their sourceregions, is in itself indicative of theimportance of transport and exchangebetween the troposphere and strato-sphere on time- scales ranging fromweeks to years. It was becomingevident, however, that this dynamical
coupling could influence the tropo-sphere as well. In addition, recognitionthat the signal of climate change wassensitive to the composition and struc-ture of the upper-troposphere/lower-stratosphere region underlined theneed for a programme of researchdirected toward understanding therole of the stratosphere in the climatesystem. It was also clear that, to besuccessful, this programme wouldhave to combine a wide range of disci-plines and expertise and fullyrecognize the key role of atmospheric
65
From ozonehole tochemicalclimateprediction
We now know that ozone is
subject to transformation by
long-lived chemicals, both
natural and man-made,
released at the Earth's
surface, and substantial
reductions in its
concentration could have a
strongly deleterious effect
upon mankind and upon the
rest of the biosphere.
(F. Sherwood Rowland,
Nobel Prizewinner for
Chemistry, 1995)
SPARC Office, Toronto, Ontario, CanadaE-mail: [email protected]: http://www.atmosp.physics.utoronto.ca/SPARC/
BLTN 54/2 13/06/05 17:28 Page 65
chemistry in climate change. By theearly 1990s, this had already receivedfull recognition within the InternationalGlobal Atmospheric Chemistry (IGAC)Project of the International Geosphere-Biosphere Programme (IGBP). Theissues covered by IGAC, however,dealt exclusively with the troposphereand did not include the complex interac-tions of chemistry, radiation and
dynamics, which characterize thetropopause region and the stratosphere.
Two main organizations prepared theway for the recognition of the role ofthe stratosphere in the climate. TheScientific Committee on Solar-Terrestrial Physics (SCOSTEP)included in its programme a topic enti-tled “Middle atmosphere response
from above and below”. The relevantWorking Panel led by M. Geller andM.-L. Chanin had a large influence onthe scientific content of SPARC. Itincluded the issue of “Solar variabilityeffects on the environment” under theleadership of K. Labitzke. This issuewas picked up later by SPARC and hasremained a theme of joint interestbetween SCOSTEP and SPARC.
During the same period, the role of theInternational Union of Geodesy andGeophysics (IUGG) in the IGBP wasbeing discussed. As a member of thefirst SSC of IGBP, M.-L. Chanin under-took the task of finding a way toinclude the stratosphere in the IGBPProgramme. Although these effortsdid not succeed as planned, they wereeventually rewarded with the accept-ance of the SPARC project as part ofthe WCRP in March 1992.
The first main meeting of the SPARCProject took place in September 1992in Carqueiranne, France, as a NATOAdvanced Study Institute. It was organ-ised by M.-L. Chanin and included agroup of lecturers who played a majorrole in the definition of SPARC priorities(Initial Review of Objectives andScientific Issues, 1993).
Achievements
The SPARC project has played a majorrole in highlighting the importance ofstratospheric processes in the climatesystem. This has been achieved by anapproach which has been: firstly, to beresponsive to the need for scientificinput to international scientific assess-ments; secondly, to identify manageableprojects where coordination at interna-tional level can make a difference; andthirdly, to have clear deliverables foreach project, such as scientific reviewswhich summarize the state of knowl-edge and facilitate and stimulate newdirections for research.
66
Major foci of the early SPARC Programme
Stratospheric indicators of climate change
Goal: to detect trends in stratospheric constituents, physical properties andprocesses, and included particular emphasis on the following topics:
• Detection of stratospheric temperature trends
• Detection of trends in the vertical distribution of ozone
• Compilation of a water-vapour climatology and detection of long-termchanges
• Stratospheric aerosol climatology and trend
Stratospheric processes and their relation to climate This initiative dealt with key physical, chemical, and dynamical processes ofimportance for understanding and modelling the role of the stratosphere inthe climate system. These were dealt with under the following topics:
• Stratosphere-troposphere exchange and dynamics and transport in thelower stratosphere and upper troposphere
• The Quasi-biennial Oscillation and its possible role in coupling thestratosphere and troposphere
• Gravity-wave processes and their parametrization
• Chemistry and microphysics in the lower stratosphere and uppertroposphere
Modelling stratospheric processes and trends and their effects onclimateThis initiative emphasizes large-scale modelling and comparison of modelswith observations. Two components of this initiative which have producedkey achievements and ongoing activities are GRIPS (GCM-RealityIntercomparison Project for SPARC) project and Compilation of aStratospheric Reference Climatology.
BLTN 54/2 13/06/05 17:28 Page 66
The early SPARC programme
The early SPARC programme wasorganized around three major foci:stratospheric indicators of climatechange; stratospheric processes andtheir relation to climate; and themodelling of stratospheric processesand trends and their effects on climate(see box).
Space does not permit a detaileddiscussion, but there have been manynotable achievements within each ofthese foci and it is worthwhile drawingattention to some that have broadlyinfluenced thinking and research in
regard to stratospheric processes and,potentially, also public awareness andpolicy in important ways.
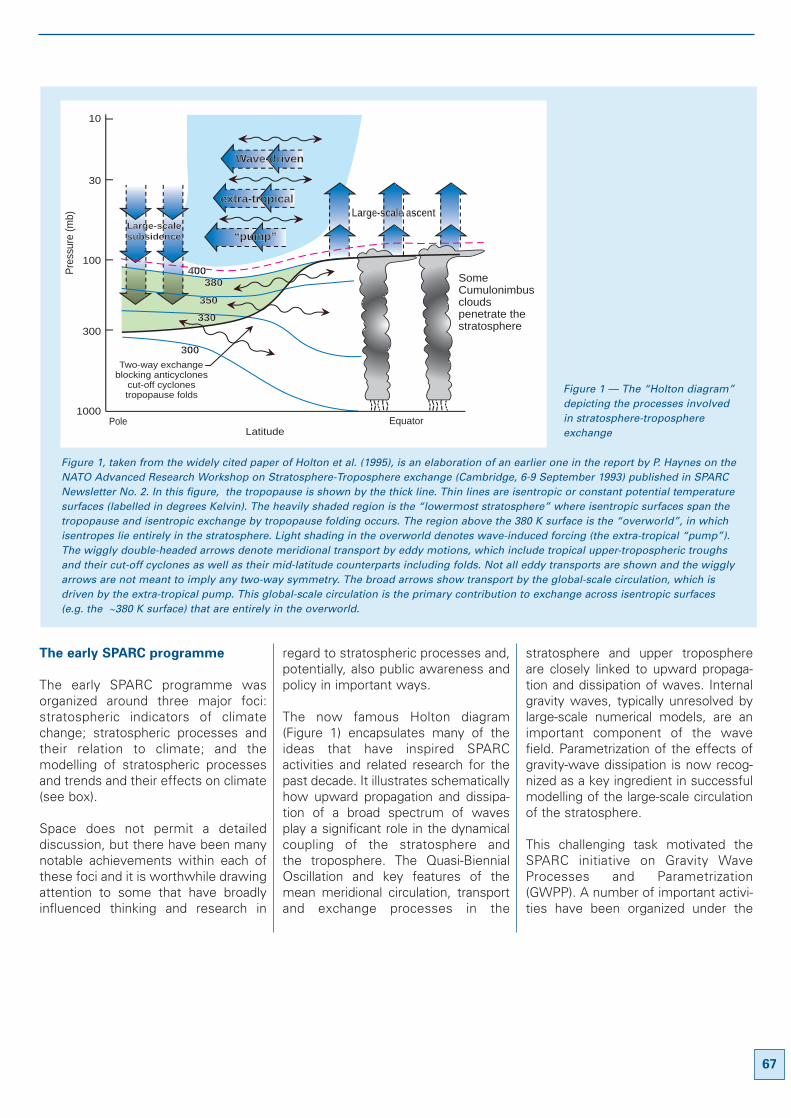
The now famous Holton diagram(Figure 1) encapsulates many of theideas that have inspired SPARC activities and related research for thepast decade. It illustrates schematicallyhow upward propagation and dissipa-tion of a broad spectrum of waves play a significant role in the dynamicalcoupling of the stratosphere and the troposphere. The Quasi-BiennialOscillation and key features of themean meridional circulation, transportand exchange processes in the
stratosphere and upper troposphereare closely linked to upward propaga-tion and dissipation of waves. Internalgravity waves, typically unresolved bylarge-scale numerical models, are animportant component of the wavefield. Parametrization of the effects ofgravity-wave dissipation is now recog-nized as a key ingredient in successfulmodelling of the large-scale circulationof the stratosphere.
This challenging task motivated theSPARC initiative on Gravity WaveProcesses and Parametrization(GWPP). A number of important activi-ties have been organized under the
67
SomeCumulonimbuscloudspenetrate thestratosphere
EquatorLatitude
Large-scale ascent
Wave-driven
extra-tropical
“pump”
400380
350
330
300
Large-scalesubsidence
Two-way exchangeblocking anticyclones
cut-off cyclonestropopause folds
Pole
10
30
100
300
1000
Pre
ssur
e (m
b)
Figure 1 — The “Holton diagram”depicting the processes involvedin stratosphere-troposphereexchange
Figure 1, taken from the widely cited paper of Holton et al. (1995), is an elaboration of an earlier one in the report by P. Haynes on theNATO Advanced Research Workshop on Stratosphere-Troposphere exchange (Cambridge, 6-9 September 1993) published in SPARCNewsletter No. 2. In this figure, the tropopause is shown by the thick line. Thin lines are isentropic or constant potential temperaturesurfaces (labelled in degrees Kelvin). The heavily shaded region is the “lowermost stratosphere” where isentropic surfaces span thetropopause and isentropic exchange by tropopause folding occurs. The region above the 380 K surface is the “overworld”, in whichisentropes lie entirely in the stratosphere. Light shading in the overworld denotes wave-induced forcing (the extra-tropical “pump”).The wiggly double-headed arrows denote meridional transport by eddy motions, which include tropical upper-tropospheric troughsand their cut-off cyclones as well as their mid-latitude counterparts including folds. Not all eddy transports are shown and the wigglyarrows are not meant to imply any two-way symmetry. The broad arrows show transport by the global-scale circulation, which isdriven by the extra-tropical pump. This global-scale circulation is the primary contribution to exchange across isentropic surfaces(e.g. the ~380 K surface) that are entirely in the overworld.
BLTN 54/2 13/06/05 17:28 Page 67
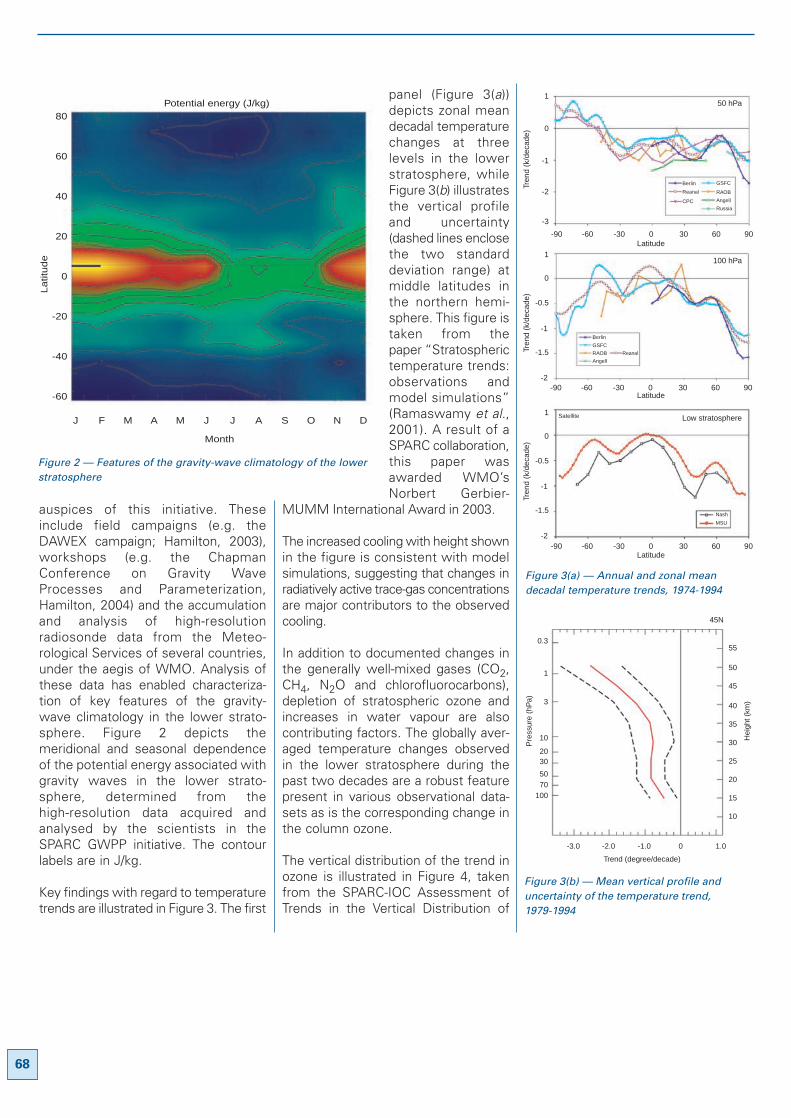
auspices of this initiative. Theseinclude field campaigns (e.g. theDAWEX campaign; Hamilton, 2003),workshops (e.g. the ChapmanConference on Gravity WaveProcesses and Parameterization,Hamilton, 2004) and the accumulationand analysis of high-resolutionradiosonde data from the Meteo-rological Services of several countries,under the aegis of WMO. Analysis ofthese data has enabled characteriza-tion of key features of the gravity-wave climatology in the lower strato-sphere. Figure 2 depicts themeridional and seasonal dependenceof the potential energy associated withgravity waves in the lower strato-sphere, determined from thehigh-resolution data acquired andanalysed by the scientists in theSPARC GWPP initiative. The contourlabels are in J/kg.
Key findings with regard to temperaturetrends are illustrated in Figure 3. The first
panel (Figure 3(a))depicts zonal meandecadal temperaturechanges at threelevels in the lowerstratosphere, whileFigure 3(b) illustratesthe vertical profileand uncertainty(dashed lines enclosethe two standarddeviation range) atmiddle latitudes inthe northern hemi-sphere. This figure istaken from the paper “Stratospherictemperature trends:observations andmodel simulations”(Ramaswamy et al.,2001). A result of aSPARC collaboration,this paper wasawarded WMO’sNorbert Gerbier-
MUMM International Award in 2003.
The increased cooling with height shownin the figure is consistent with modelsimulations, suggesting that changes inradiatively active trace-gas concentrationsare major contributors to the observedcooling.
In addition to documented changes inthe generally well-mixed gases (CO2,CH4, N2O and chlorofluorocarbons),depletion of stratospheric ozone andincreases in water vapour are alsocontributing factors. The globally aver-aged temperature changes observedin the lower stratosphere during thepast two decades are a robust featurepresent in various observational data-sets as is the corresponding change inthe column ozone.
The vertical distribution of the trend inozone is illustrated in Figure 4, takenfrom the SPARC-IOC Assessment ofTrends in the Vertical Distribution of
68
J F M A M J J A S O N D
80
60
40
20
0
-20
-40
-60
Latit
ude
Month
Potential energy (J/kg)
Figure 2 — Features of the gravity-wave climatology of the lowerstratosphere
Figure 3(b) — Mean vertical profile anduncertainty of the temperature trend, 1979-1994
Figure 3(a) — Annual and zonal meandecadal temperature trends, 1974-1994
-90 -30 60 90300-60
-90 -30 60 90300-60
-90 -30 60 90300-60
1
0
-1
-0.5
-1.5
-2
1
0
-1
-2
-3
1
0
-1
-0.5
-1.5
-2Tr
end
(k/d
ecad
e)Tr
end
(k/d
ecad
e)Tr
end
(k/d
ecad
e)
50 hPa
100 hPa
Low stratosphereSatellite
Latitude
Latitude
Latitude
Berlin
Berlin
Reanal
Reanal
CPC
GSFC
GSFC
RAOB
RAOB
Angell
Angell
Russia
Nash
MSU
45N
55
50
45
40
35
30
25
20
15
10
0 1.0-1.0-2.0-3.0
0.3
1
3
10
2030
5070
100
Pre
ssur
e (h
Pa)
Hei
ght (
km)
Trend (degree/decade)
BLTN 54/2 13/06/05 17:28 Page 68
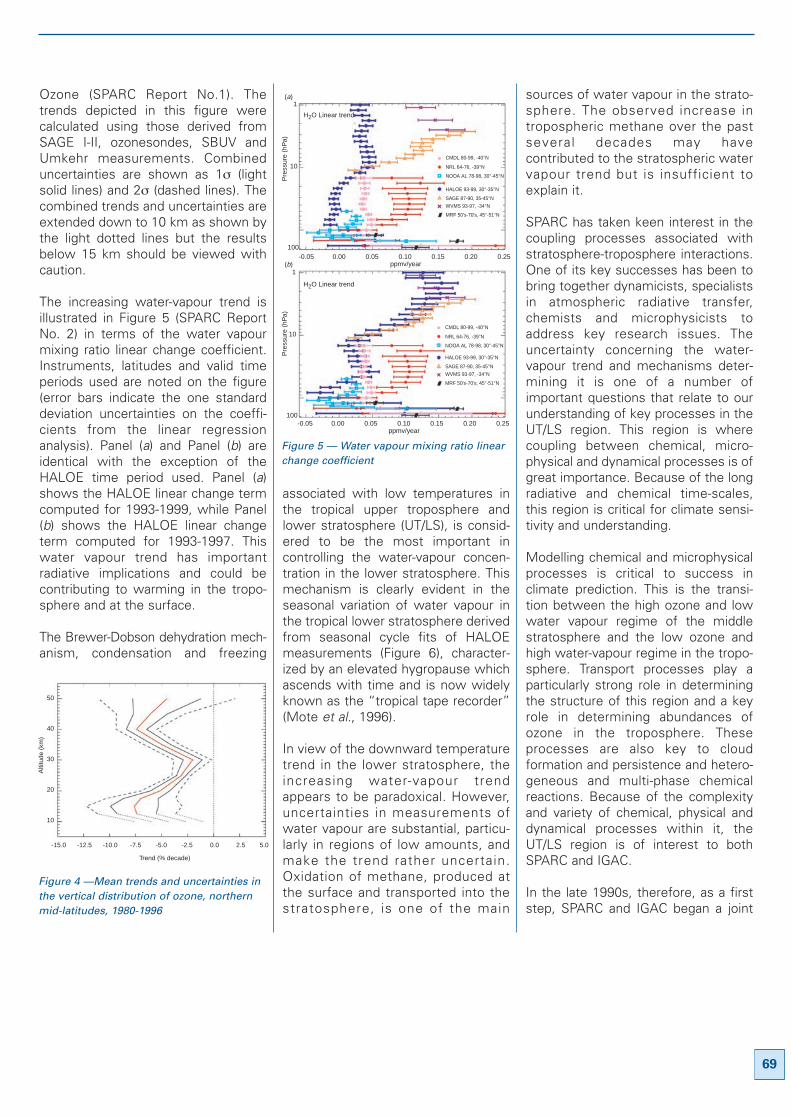
Ozone (SPARC Report No.1). Thetrends depicted in this figure werecalculated using those derived fromSAGE I-II, ozonesondes, SBUV andUmkehr measurements. Combineduncertainties are shown as 1σ (lightsolid lines) and 2σ (dashed lines). Thecombined trends and uncertainties areextended down to 10 km as shown bythe light dotted lines but the resultsbelow 15 km should be viewed withcaution.
The increasing water-vapour trend isillustrated in Figure 5 (SPARC ReportNo. 2) in terms of the water vapourmixing ratio linear change coefficient.Instruments, latitudes and valid timeperiods used are noted on the figure(error bars indicate the one standarddeviation uncertainties on the coeffi-cients from the linear regressionanalysis). Panel (a) and Panel (b) areidentical with the exception of theHALOE time period used. Panel (a)shows the HALOE linear change termcomputed for 1993-1999, while Panel(b) shows the HALOE linear changeterm computed for 1993-1997. Thiswater vapour trend has importantradiative implications and could becontributing to warming in the tropo-sphere and at the surface.
The Brewer-Dobson dehydration mech-anism, condensation and freezing
associated with low temperatures inthe tropical upper troposphere andlower stratosphere (UT/LS), is consid-ered to be the most important incontrolling the water-vapour concen-tration in the lower stratosphere. Thismechanism is clearly evident in theseasonal variation of water vapour inthe tropical lower stratosphere derivedfrom seasonal cycle fits of HALOEmeasurements (Figure 6), character-ized by an elevated hygropause whichascends with time and is now widelyknown as the “tropical tape recorder”(Mote et al., 1996).
In view of the downward temperaturetrend in the lower stratosphere, theincreasing water-vapour trendappears to be paradoxical. However,uncertainties in measurements ofwater vapour are substantial, particu-larly in regions of low amounts, andmake the trend rather uncertain.Oxidation of methane, produced atthe surface and transported into thestratosphere, is one of the main
sources of water vapour in the strato-sphere. The observed increase intropospheric methane over the pastseveral decades may havecontributed to the stratospheric watervapour trend but is insufficient toexplain it.
SPARC has taken keen interest in thecoupling processes associated withstratosphere-troposphere interactions.One of its key successes has been tobring together dynamicists, specialistsin atmospheric radiative transfer,chemists and microphysicists toaddress key research issues. Theuncertainty concerning the water-vapour trend and mechanisms deter-mining it is one of a number ofimportant questions that relate to ourunderstanding of key processes in theUT/LS region. This region is wherecoupling between chemical, micro-physical and dynamical processes is ofgreat importance. Because of the longradiative and chemical time-scales,this region is critical for climate sensi-tivity and understanding.
Modelling chemical and microphysicalprocesses is critical to success inclimate prediction. This is the transi-tion between the high ozone and lowwater vapour regime of the middlestratosphere and the low ozone andhigh water-vapour regime in the tropo-sphere. Transport processes play aparticularly strong role in determiningthe structure of this region and a keyrole in determining abundances ofozone in the troposphere. Theseprocesses are also key to cloud formation and persistence and hetero-geneous and multi-phase chemicalreactions. Because of the complexityand variety of chemical, physical anddynamical processes within it, theUT/LS region is of interest to bothSPARC and IGAC.
In the late 1990s, therefore, as a firststep, SPARC and IGAC began a joint
69
50
40
30
20
10
-10.0 -7.5 -5.0 -2.5 0.0 2.5 5.0-15.0 -12.5
Alti
tude
(km
)
Trend (% decade)
Figure 4 —Mean trends and uncertainties inthe vertical distribution of ozone, northernmid-latitudes, 1980-1996
CMDL 80-99, -40°N
NRL 64-76, -39°N
NOOA AL 78-98, 30°-45°N
HALOE 93-99, 30°-35°N
SAGE 87-90, 35-45°N
WVMS 93-97, -34°N
MRF 50's-70's, 45°-51°N
CMDL 80-99, -40°N
NRL 64-76, -39°N
NOOA AL 78-98, 30°-45°N
HALOE 93-99, 30°-35°N
SAGE 87-90, 35-45°N
WVMS 93-97, -34°N
MRF 50's-70's, 45°-51°N
1
10
100
1
10
100
0.00 0.05 0.10 0.15 0.20 0.25-0.05
0.00 0.05 0.10 0.15 0.20 0.25-0.05
Pre
ssur
e (h
Pa)
Pre
ssur
e (h
Pa)
ppmv/year
ppmv/year
H2O Linear trend
H2O Linear trend
(a)
(b)
Figure 5 — Water vapour mixing ratio linearchange coefficient
BLTN 54/2 13/06/05 17:28 Page 69
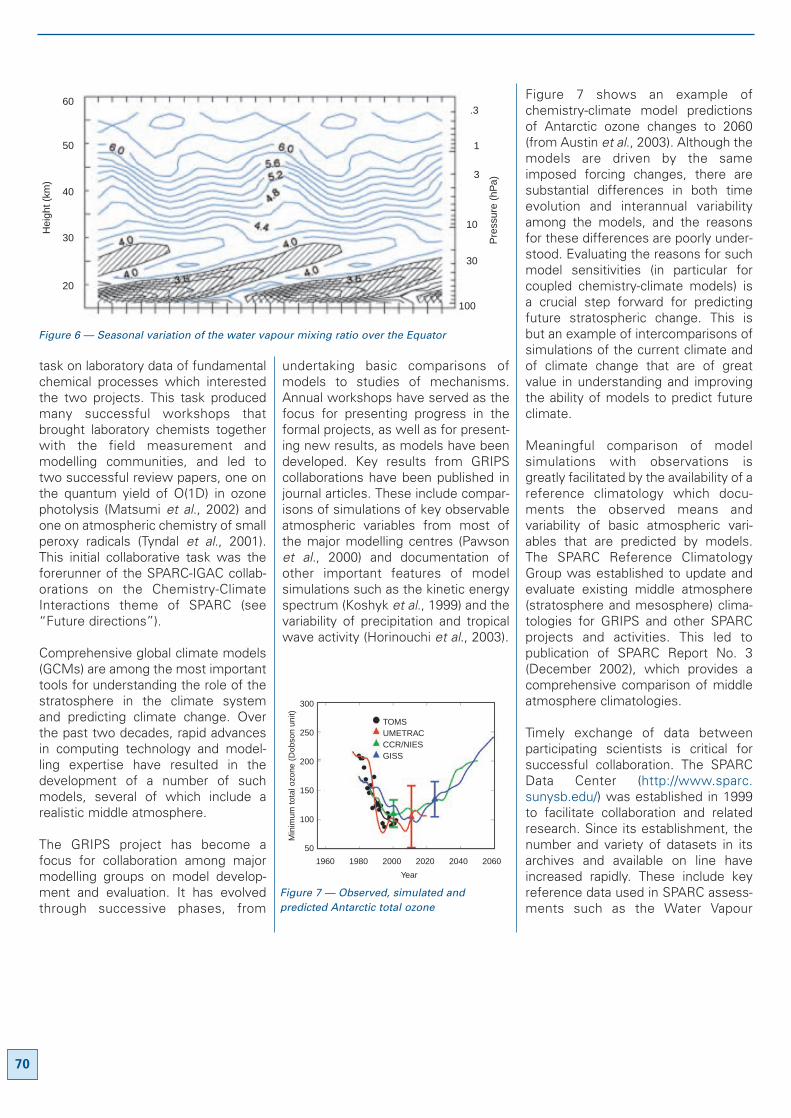
task on laboratory data of fundamentalchemical processes which interestedthe two projects. This task producedmany successful workshops thatbrought laboratory chemists togetherwith the field measurement andmodelling communities, and led totwo successful review papers, one onthe quantum yield of O(1D) in ozonephotolysis (Matsumi et al., 2002) andone on atmospheric chemistry of smallperoxy radicals (Tyndal et al., 2001).This initial collaborative task was theforerunner of the SPARC-IGAC collab-orations on the Chemistry-ClimateInteractions theme of SPARC (see“Future directions”).
Comprehensive global climate models(GCMs) are among the most importanttools for understanding the role of thestratosphere in the climate systemand predicting climate change. Overthe past two decades, rapid advancesin computing technology and model-ling expertise have resulted in thedevelopment of a number of suchmodels, several of which include arealistic middle atmosphere.
The GRIPS project has become afocus for collaboration among majormodelling groups on model develop-ment and evaluation. It has evolvedthrough successive phases, from
undertaking basic comparisons ofmodels to studies of mechanisms.Annual workshops have served as thefocus for presenting progress in theformal projects, as well as for present-ing new results, as models have beendeveloped. Key results from GRIPScollaborations have been published injournal articles. These include compar-isons of simulations of key observableatmospheric variables from most ofthe major modelling centres (Pawsonet al., 2000) and documentation ofother important features of modelsimulations such as the kinetic energyspectrum (Koshyk et al., 1999) and thevariability of precipitation and tropicalwave activity (Horinouchi et al., 2003).
Figure 7 shows an example of chemistry-climate model predictionsof Antarctic ozone changes to 2060(from Austin et al., 2003). Although themodels are driven by the sameimposed forcing changes, there aresubstantial differences in both timeevolution and interannual variabilityamong the models, and the reasonsfor these differences are poorly under-stood. Evaluating the reasons for suchmodel sensitivities (in particular forcoupled chemistry-climate models) isa crucial step forward for predictingfuture stratospheric change. This isbut an example of intercomparisons ofsimulations of the current climate andof climate change that are of greatvalue in understanding and improvingthe ability of models to predict futureclimate.
Meaningful comparison of modelsimulations with observations isgreatly facilitated by the availability of areference climatology which docu-ments the observed means andvariability of basic atmospheric vari-ables that are predicted by models.The SPARC Reference ClimatologyGroup was established to update andevaluate existing middle atmosphere(stratosphere and mesosphere) clima-tologies for GRIPS and other SPARCprojects and activities. This led topublication of SPARC Report No. 3(December 2002), which provides acomprehensive comparison of middleatmosphere climatologies.
Timely exchange of data betweenparticipating scientists is critical forsuccessful collaboration. The SPARCData Center (http://www.sparc.sunysb.edu/) was established in 1999to facilitate collaboration and relatedresearch. Since its establishment, thenumber and variety of datasets in itsarchives and available on line haveincreased rapidly. These include keyreference data used in SPARC assess-ments such as the Water Vapour
70
60
20
30
40
50
100
30
10
3
1
.3
Hei
ght (
km)
Pre
ssur
e (h
Pa)
Figure 6 — Seasonal variation of the water vapour mixing ratio over the Equator
250
300
200
150
100
50
1960 1980 2000 2020 2040 2060
TOMSUMETRACCCR/NIESGISS
Year
Min
imum
tota
l ozo
ne (
Dob
son
unit)
Figure 7 — Observed, simulated andpredicted Antarctic total ozone
BLTN 54/2 13/06/05 17:31 Page 70
Assessment (WAVAS), as well asother data such as high-resolutiontemperature and wind data fromradiosondes for selected years.
One of the hallmarks of SPARC hasbeen the anticipation of the needs ofinternational assessments such as theWMO ozone assessment and theassessments of the Intergovern-mental Panel on Climate Change(IPCC). This has been done throughtimely workshops, development ofkey issues before the assessments(review articles and collaborative proj-ects) and providing the expertise(participation of SPARC scientists asco-authors, lead-authors, contributingauthors and reviewers). This service isexpected to continue in the future.
Future directions
The progress of research and knowl-edge regarding stratosphericprocesses in the past decade, to asignificant degree under the auspicesof SPARC collaborations, has drawnattention to a number of issues thatneed to be addressed by collaborativeresearch activities in the near future.In view of this, new themes andperspectives for the SPARC projecthave been developed and havereceived the support of the WCRP.Collaboration with other internationalprojects is essential for promotingSPARC science within these themes.To this end, the Joint ScientificCommittee of the WCRP has recog-nized that SPARC must play a leadingrole in achieving a number of specificobjectives: (a) to lead a collaborationon chemistry-climate interactions withthe IGAC project; (b) to focus onissues raised by recent studies of theArctic Oscillation (AO); (c) to liaisewith SCOSTEP on solar radiative forc-ing and temperature trends; (d) towork with WMO’s GlobalAtmosphere Watch (GAW)
project on the penetration of ultravio-let radiation; and (e) to contribute tointernational planning and missionplanning. The above list is merely asubset of possible areas of collabora-tion. For instance, much stronger linkswith the WCRP’s CLIVAR project areessential on long-term climate variabil-ity and predictability.
Recently, SPARC has organized itsactivities under three interlinkedthemes to consolidate its contribu-tions to climate prediction and tomake effective points of contact withother WCRP projects. The associatedquestions posed within each theme,though certainly not exhaustive, aimto identify primary foci for SPARCactivities, at least in the immediatefuture.
Detection, attribution andprediction of stratosphericchanges
� What are the past changes and vari-ations in the stratosphere?
� How well can we explain pastchanges in terms of natural andanthropogenic effects?
� How do we expect the strato-sphere to evolve in the future, andwhat confidence do we have inthose predictions?
This theme is a continuation, synthe-sis and extension of earlier SPARCthemes on long-term variability andtrends in the stratosphere. Futurework will emphasize attribution andprediction. This will require aconcerted, collaborative researchprogramme involving, in manyinstances, coupled chemistry-climatemodels.
Determining the magnitude of naturalvariability of key variables in key regions is critical to detection and attribution oflong-term change. In many instances,the available observational record is notsufficiently long to evaluate the rangeof natural variability. For example, themajor wintertime warming thatoccurred in the Antarctic stratospherein 2002 (WMO, 2002) was the firstrecorded and abruptly reversed thetrend toward a colder longer-lastingpolar vortex, clearly evident in theprevious 20 years of observations(Baldwin et al., 2003). In contrast,wintertime warmings in the Arcticstratosphere are observed relativelyfrequently. The observing of this rareevent in the Antarctic for the first timeunderlines the difficulty of evaluatingthe full range of natural variability fromthe observational record alone.
Evaluating the probability of such rareevents with the aid of ensembles oflong simulations using global climatemodels is a possibility (Taguchi andYoden, 2002). Confidence in predictionand attribution will demand statisticallysignificant results based on largeensembles of integrations with numer-ical models (or approaches that can beshown to be statistically equivalent).The experience gained within theGRIPS project is a basis for a futurerole of SPARC in coordinating experi-ments by different groups to facilitatemeaningful comparison of results.
Stratospheric chemistry andclimate
� How will stratospheric ozone andother constituents evolve?
� How will changes in stratosphericcomposition affect climate?
� What are the links between changesin stratospheric ozone, UV radiation
and tropospheric chemistry?
71
BLTN 54/2 13/06/05 17:31 Page 71
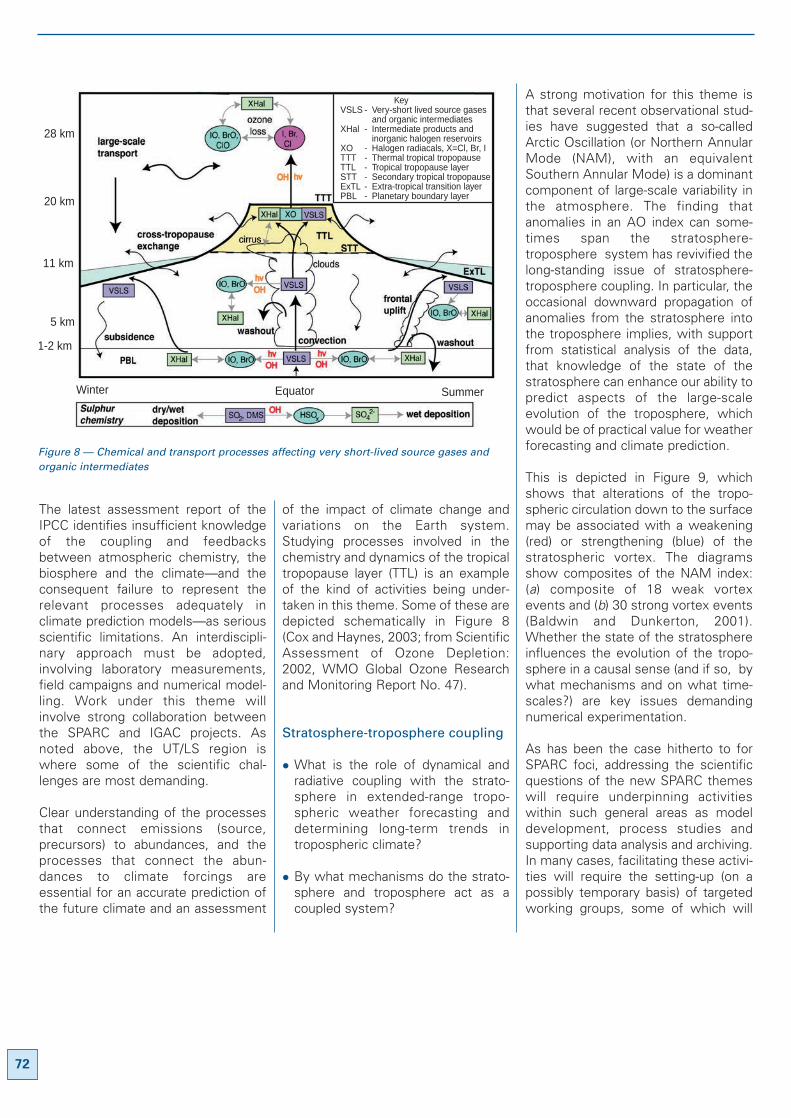
The latest assessment report of theIPCC identifies insufficient knowledgeof the coupling and feedbacksbetween atmospheric chemistry, thebiosphere and the climate—and theconsequent failure to represent therelevant processes adequately inclimate prediction models—as seriousscientific limitations. An interdiscipli-nary approach must be adopted,involving laboratory measurements,field campaigns and numerical model-ling. Work under this theme willinvolve strong collaboration betweenthe SPARC and IGAC projects. Asnoted above, the UT/LS region iswhere some of the scientific chal-lenges are most demanding.
Clear understanding of the processesthat connect emissions (source,precursors) to abundances, and theprocesses that connect the abun-dances to climate forcings areessential for an accurate prediction ofthe future climate and an assessment
of the impact of climate change andvariations on the Earth system.Studying processes involved in thechemistry and dynamics of the tropicaltropopause layer (TTL) is an exampleof the kind of activities being under-taken in this theme. Some of these aredepicted schematically in Figure 8(Cox and Haynes, 2003; from ScientificAssessment of Ozone Depletion:2002, WMO Global Ozone Researchand Monitoring Report No. 47).
Stratosphere-troposphere coupling
� What is the role of dynamical andradiative coupling with the strato-sphere in extended-range tropo-spheric weather forecasting anddetermining long-term trends intropospheric climate?
� By what mechanisms do the strato-sphere and troposphere act as acoupled system?
A strong motivation for this theme isthat several recent observational stud-ies have suggested that a so-calledArctic Oscillation (or Northern AnnularMode (NAM), with an equivalentSouthern Annular Mode) is a dominantcomponent of large-scale variability inthe atmosphere. The finding thatanomalies in an AO index can some-times span the stratosphere-troposphere system has revivified thelong-standing issue of stratosphere-troposphere coupling. In particular, theoccasional downward propagation ofanomalies from the stratosphere intothe troposphere implies, with supportfrom statistical analysis of the data,that knowledge of the state of thestratosphere can enhance our ability topredict aspects of the large-scaleevolution of the troposphere, whichwould be of practical value for weatherforecasting and climate prediction.
This is depicted in Figure 9, whichshows that alterations of the tropo-spheric circulation down to the surfacemay be associated with a weakening(red) or strengthening (blue) of thestratospheric vortex. The diagramsshow composites of the NAM index:(a) composite of 18 weak vortexevents and (b) 30 strong vortex events(Baldwin and Dunkerton, 2001).Whether the state of the stratosphereinfluences the evolution of the tropo-sphere in a causal sense (and if so, bywhat mechanisms and on what time-scales?) are key issues demandingnumerical experimentation.
As has been the case hitherto to forSPARC foci, addressing the scientificquestions of the new SPARC themeswill require underpinning activitieswithin such general areas as modeldevelopment, process studies andsupporting data analysis and archiving.In many cases, facilitating these activi-ties will require the setting-up (on apossibly temporary basis) of targetedworking groups, some of which will
72
28 km
20 km
11 km
5 km
1-2 km
Winter Equator Summer
KeyVSLS - Very-short lived source gases
and organic intermediatesXHal - Intermediate products and
inorganic halogen reservoirsXO - Halogen radiacals, X=Cl, Br, ITTT - Thermal tropical tropopauseTTL - Tropical tropopause layerSTT - Secondary tropical tropopauseExTL - Extra-tropical transition layerPBL - Planetary boundary layer
Figure 8 — Chemical and transport processes affecting very short-lived source gases andorganic intermediates
BLTN 54/2 13/06/05 17:31 Page 72
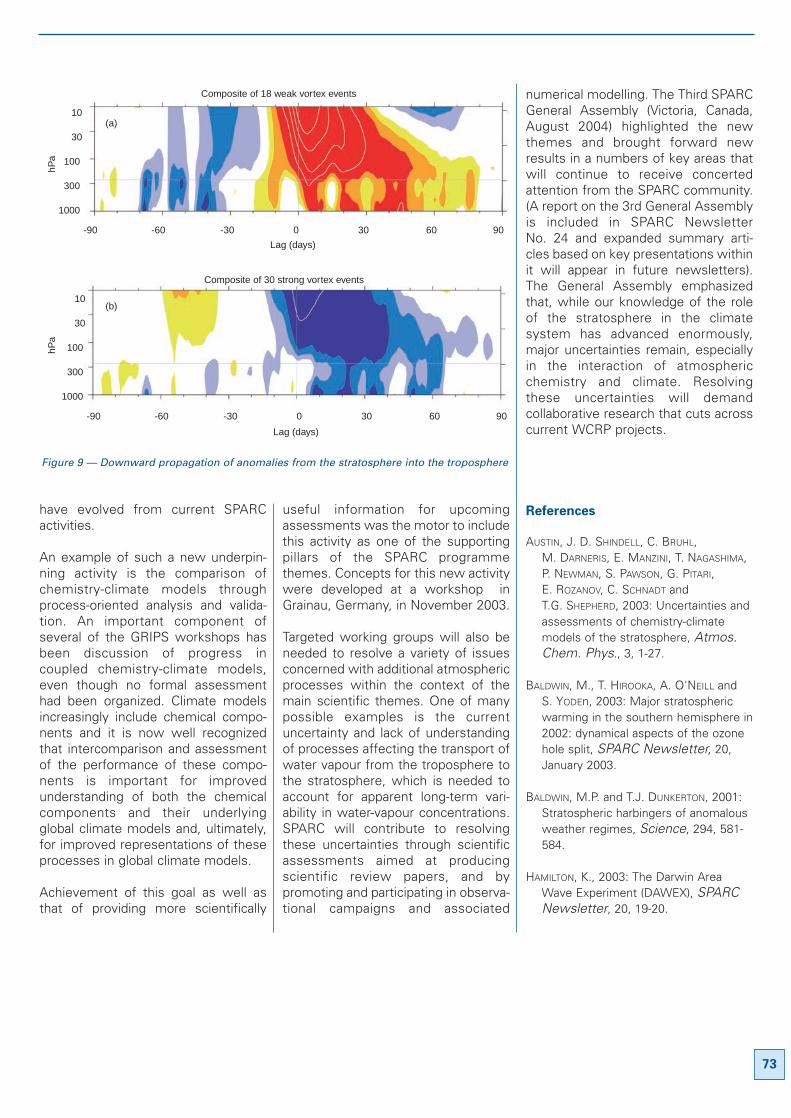
have evolved from current SPARCactivities.
An example of such a new underpin-ning activity is the comparison ofchemistry-climate models throughprocess-oriented analysis and valida-tion. An important component ofseveral of the GRIPS workshops hasbeen discussion of progress incoupled chemistry-climate models,even though no formal assessmenthad been organized. Climate modelsincreasingly include chemical compo-nents and it is now well recognizedthat intercomparison and assessmentof the performance of these compo-nents is important for improvedunderstanding of both the chemicalcomponents and their underlyingglobal climate models and, ultimately,for improved representations of theseprocesses in global climate models.
Achievement of this goal as well asthat of providing more scientifically
useful information for upcomingassessments was the motor to includethis activity as one of the supportingpillars of the SPARC programmethemes. Concepts for this new activitywere developed at a workshop inGrainau, Germany, in November 2003.
Targeted working groups will also beneeded to resolve a variety of issuesconcerned with additional atmosphericprocesses within the context of themain scientific themes. One of manypossible examples is the currentuncertainty and lack of understandingof processes affecting the transport ofwater vapour from the troposphere tothe stratosphere, which is needed toaccount for apparent long-term vari-ability in water-vapour concentrations.SPARC will contribute to resolvingthese uncertainties through scientificassessments aimed at producingscientific review papers, and bypromoting and participating in observa-tional campaigns and associated
numerical modelling. The Third SPARCGeneral Assembly (Victoria, Canada,August 2004) highlighted the newthemes and brought forward newresults in a numbers of key areas thatwill continue to receive concertedattention from the SPARC community.(A report on the 3rd General Assemblyis included in SPARC NewsletterNo. 24 and expanded summary arti-cles based on key presentations withinit will appear in future newsletters).The General Assembly emphasizedthat, while our knowledge of the roleof the stratosphere in the climatesystem has advanced enormously,major uncertainties remain, especiallyin the interaction of atmosphericchemistry and climate. Resolvingthese uncertainties will demandcollaborative research that cuts acrosscurrent WCRP projects.
References
AUSTIN, J. D. SHINDELL, C. BRUHL,M. DARNERIS, E. MANZINI, T. NAGASHIMA,P. NEWMAN, S. PAWSON, G. PITARI,E. ROZANOV, C. SCHNADT andT.G. SHEPHERD, 2003: Uncertainties andassessments of chemistry-climatemodels of the stratosphere, Atmos.Chem. Phys., 3, 1-27.
BALDWIN, M., T. HIROOKA, A. O'NEILL andS. YODEn, 2003: Major stratosphericwarming in the southern hemisphere in2002: dynamical aspects of the ozonehole split, SPARC Newsletter, 20,January 2003.
BALDWIN, M.P. and T.J. DUNKERTON, 2001:Stratospheric harbingers of anomalousweather regimes, Science, 294, 581-584.
HAMILTON, K., 2003: The Darwin AreaWave Experiment (DAWEX), SPARCNewsletter, 20, 19-20.
73
10
30
100
300
1000
-60 -30 0 30 60 90-90
3
2
Lag (days)
Composite of 18 weak vortex events
10
30
100
300
1000
-60 -30 0 30 60 90-90
Lag (days)
Composite of 30 strong vortex events
(a)
(b)
hPa
hPa
Figure 9 — Downward propagation of anomalies from the stratosphere into the troposphere
BLTN 54/2 13/06/05 17:31 Page 73
HAMILTON, K., 2004: Report on theChapman Conference on Gravity WaveProcesses and Parameterization,SPARC Newsletter, 23, 15-16.
HOLTON, J.R., P.H. HAYNES, M.E. MCINTYRE,A.R. DOUGLASS, R.B. ROOD and L. PFISTER,1995: Stratosphere-troposphereexchange, Rev. Geophys., 33, 403-439.
HORINOUCHI, T., S. PAWSON, K. SHIBATA,U. LANGEMATZ, E. MANZINI, M.A. GIORGETTA,F. SASSI, R.J. WILSON, K. HAMILTON, J. DE
GRANPRÉ and A.A. SCAIFE, 2003: Tropicalcumulus convection and upward propa-gating waves in middle atmosphericGCMs, J. Atmos. Sci., 60, 2765-2782.
KOSHYK, J.N., B.A. BOVILLE, K. HAMILTON,E. MANZINI and K. SHIBATA, 1999: Thekinetic energy spectrum of horizontalmotions in middle-atmosphere models,J. Geophys. Res., 104, 27177-27190
MATSUMI, Y., F.J. COMES, G. HANCOCK,A. HOFZUMAHAUS, A.J. HYNES, M. KAWASAKI
and A.R. RAVISHANKARA, 2002: J. Geophys.Res., 107, oid: 10.1029/2001JD000510.
MOTE, P.W., K.H. ROSENLOF, M.E. MCINTYRE,et al., 1996: An atmospheric taperecorder: The imprint of tropical tropo-pause temperatures on stratosphericwater vapour, J. Geophys.Res., 103,(D8), 8651-8666.
PAWSON, S., K. KODERA, K. HAMILTON,T.G. SHEPHERD, S.R. BEAGLEY, B.A. BOVILLE,J.D. FARRARA, T.D.A. FAIRLIE, A. KITOH,W.A. LAHOZ, U. LANGEMATZ, E. MANZINI,D.H. RIND, A.A. SCAIFE, K. SHIBATA, P. SIMON,R. SWINBANK, L. TAKACS, R.J. WILSON,J.A. AL-SAADI, M. AMODEI, M. CHIBA,L. COY, J. DE GRANDPRÉ, R.S. ECKMAN,M. FIORINO, W.L. GROSE, H. KIODE,J.N. KOSHYK, D. LI, J. LERNER,J.D. MAHLMAN, N.A. MCFARLANE,C.R. MECHOO, A. MOLOD, A. O’NEILL,R.B. PIERCE, W.J. RANDEL, R.B. ROOD
and F. WU, 2000: The GCM-RealityInteromparison Project for SPARC(GRIPS): Scientific Issues and Initial
Results, Bull. Am. Met. Soc., 81, 781-796.
RAMASWAMY, V. M-L. CHANIN et.al., 2001:Stratospheric temperature trends:observations and model simulations,Reviews of Geophysics, 39, 71-122.
TAGUCHI, M. and S. YODEN, 2002: Internalinterannual variations of the tropo-sphere-stratosphere coupled system ina simple global circulation model. PartII: Millenium integrations. J. Atmos.Sci., 59, 3037-3050.
TYNDALL, G. S., R. A. COX, C.GRANIER,R. LESCLAUX, G.K. MOORTGAT,M.J. PILLING, A.R. RAVISHANKARA andT.J. WALLINGTON, 2001: AtmosphericChemistry of small organic peroxy radi-cals, J. Geophys. Res., 106,12157-12182.
WMO, 2002: Antarctic ozone hole splits intwo. Press Release No. 681.
74
BLTN 54/2 13/06/05 17:31 Page 74
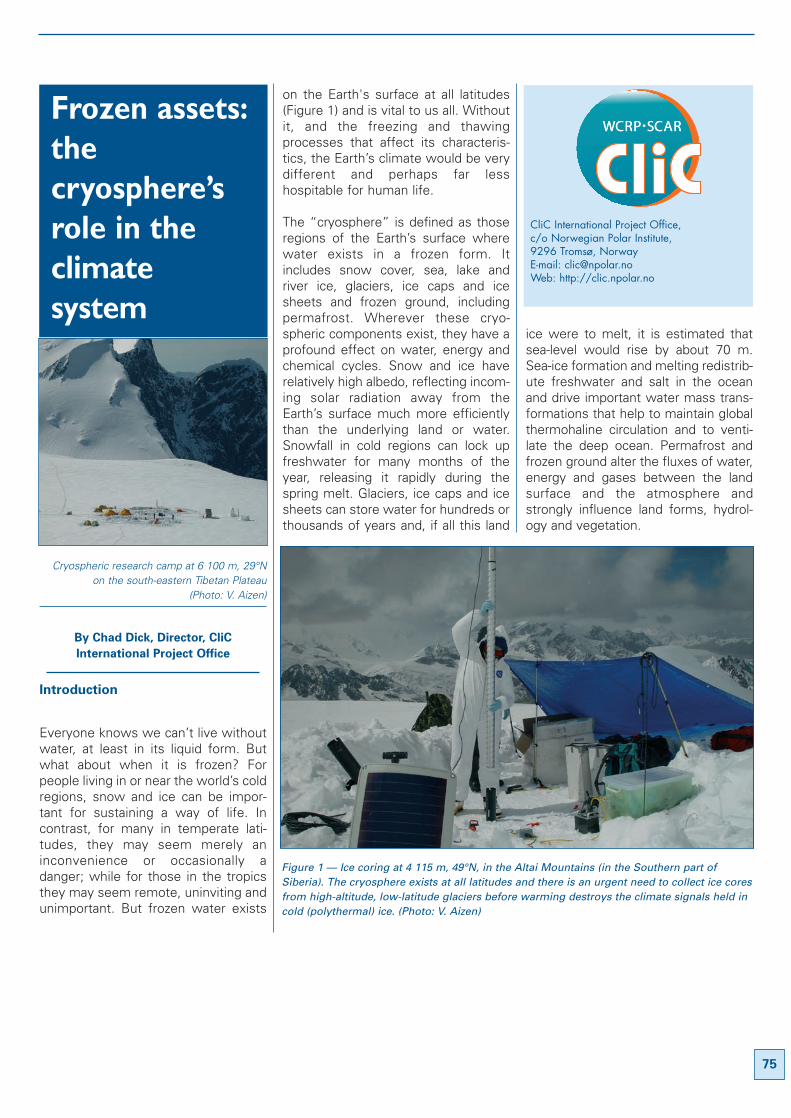
Cryospheric research camp at 6 100 m, 29°Non the south-eastern Tibetan Plateau
(Photo: V. Aizen)
By Chad Dick, Director, CliC
International Project Office
Introduction
Everyone knows we can’t live withoutwater, at least in its liquid form. Butwhat about when it is frozen? Forpeople living in or near the world’s coldregions, snow and ice can be impor-tant for sustaining a way of life. Incontrast, for many in temperate lati-tudes, they may seem merely aninconvenience or occasionally adanger; while for those in the tropicsthey may seem remote, uninviting andunimportant. But frozen water exists
on the Earth's surface at all latitudes(Figure 1) and is vital to us all. Withoutit, and the freezing and thawingprocesses that affect its characteris-tics, the Earth’s climate would be verydifferent and perhaps far lesshospitable for human life.
The “cryosphere” is defined as thoseregions of the Earth’s surface wherewater exists in a frozen form. Itincludes snow cover, sea, lake andriver ice, glaciers, ice caps and icesheets and frozen ground, includingpermafrost. Wherever these cryo-spheric components exist, they have aprofound effect on water, energy andchemical cycles. Snow and ice haverelatively high albedo, reflecting incom-ing solar radiation away from theEarth’s surface much more efficientlythan the underlying land or water.Snowfall in cold regions can lock upfreshwater for many months of theyear, releasing it rapidly during thespring melt. Glaciers, ice caps and icesheets can store water for hundreds orthousands of years and, if all this land
ice were to melt, it is estimated thatsea-level would rise by about 70 m.Sea-ice formation and melting redistrib-ute freshwater and salt in the oceanand drive important water mass trans-formations that help to maintain globalthermohaline circulation and to venti-late the deep ocean. Permafrost andfrozen ground alter the fluxes of water,energy and gases between the landsurface and the atmosphere andstrongly influence land forms, hydrol-ogy and vegetation.
75
Frozen assets:thecryosphere’srole in theclimatesystem
CliC International Project Office, c/o Norwegian Polar Institute,9296 Tromsø, NorwayE-mail: [email protected]: http://clic.npolar.no
Figure 1 — Ice coring at 4 115 m, 49°N, in the Altai Mountains (in the Southern part ofSiberia). The cryosphere exists at all latitudes and there is an urgent need to collect ice coresfrom high-altitude, low-latitude glaciers before warming destroys the climate signals held incold (polythermal) ice. (Photo: V. Aizen)
BLTN 54/2 13/06/05 17:31 Page 75
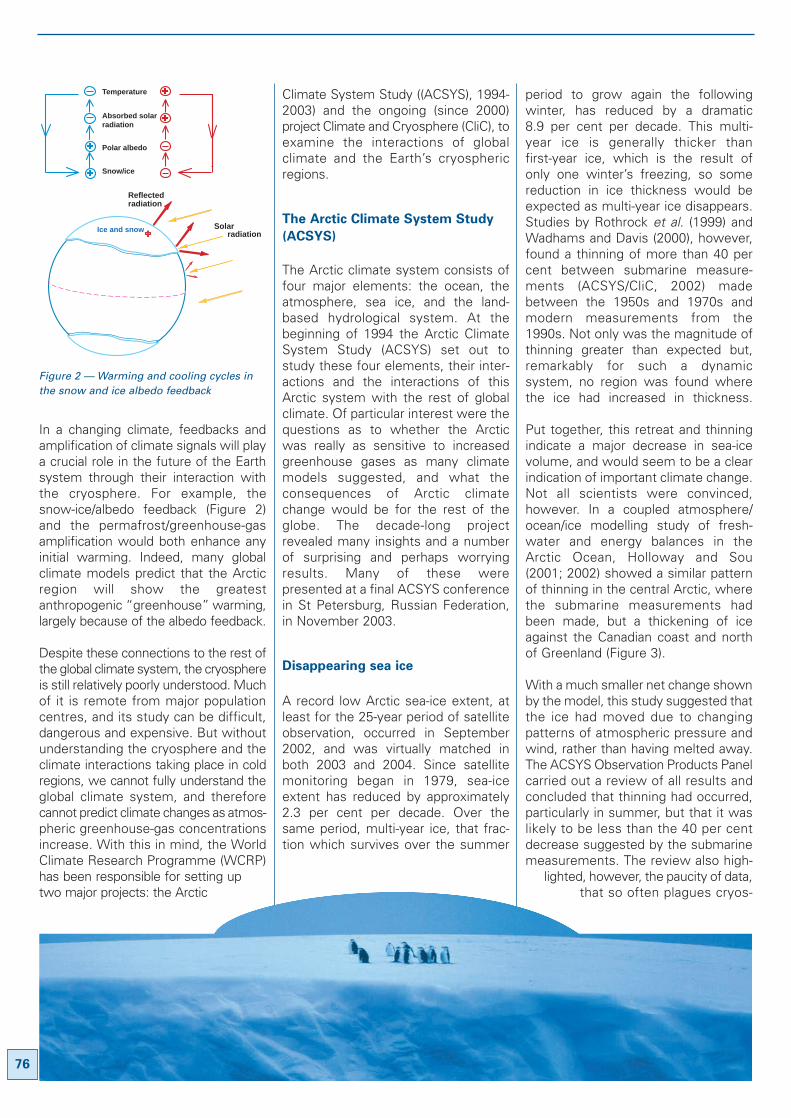
In a changing climate, feedbacks andamplification of climate signals will playa crucial role in the future of the Earthsystem through their interaction withthe cryosphere. For example, thesnow-ice/albedo feedback (Figure 2)and the permafrost/greenhouse-gasamplification would both enhance anyinitial warming. Indeed, many globalclimate models predict that the Arcticregion will show the greatestanthropogenic “greenhouse” warming,largely because of the albedo feedback.
Despite these connections to the rest ofthe global climate system, the cryosphereis still relatively poorly understood. Muchof it is remote from major populationcentres, and its study can be difficult,dangerous and expensive. But withoutunderstanding the cryosphere and theclimate interactions taking place in coldregions, we cannot fully understand theglobal climate system, and thereforecannot predict climate changes as atmos-pheric greenhouse-gas concentrationsincrease. With this in mind, the WorldClimate Research Programme (WCRP)has been responsible for setting uptwo major projects: the Arctic
Climate System Study ((ACSYS), 1994-2003) and the ongoing (since 2000)project Climate and Cryosphere (CliC), toexamine the interactions of globalclimate and the Earth’s cryosphericregions.
The Arctic Climate System Study
(ACSYS)
The Arctic climate system consists offour major elements: the ocean, theatmosphere, sea ice, and the land-based hydrological system. At thebeginning of 1994 the Arctic ClimateSystem Study (ACSYS) set out tostudy these four elements, their inter-actions and the interactions of thisArctic system with the rest of globalclimate. Of particular interest were thequestions as to whether the Arcticwas really as sensitive to increasedgreenhouse gases as many climatemodels suggested, and what theconsequences of Arctic climatechange would be for the rest of theglobe. The decade-long projectrevealed many insights and a numberof surprising and perhaps worryingresults. Many of these werepresented at a final ACSYS conferencein St Petersburg, Russian Federation,in November 2003.
Disappearing sea ice
A record low Arctic sea-ice extent, atleast for the 25-year period of satelliteobservation, occurred in September2002, and was virtually matched inboth 2003 and 2004. Since satellitemonitoring began in 1979, sea-iceextent has reduced by approximately2.3 per cent per decade. Over thesame period, multi-year ice, that frac-tion which survives over the summer
period to grow again the followingwinter, has reduced by a dramatic8.9 per cent per decade. This multi-year ice is generally thicker thanfirst-year ice, which is the result ofonly one winter’s freezing, so somereduction in ice thickness would beexpected as multi-year ice disappears.Studies by Rothrock et al. (1999) andWadhams and Davis (2000), however,found a thinning of more than 40 percent between submarine measure-ments (ACSYS/CliC, 2002) madebetween the 1950s and 1970s andmodern measurements from the1990s. Not only was the magnitude ofthinning greater than expected but,remarkably for such a dynamicsystem, no region was found wherethe ice had increased in thickness.
Put together, this retreat and thinningindicate a major decrease in sea-icevolume, and would seem to be a clearindication of important climate change.Not all scientists were convinced,however. In a coupled atmosphere/ocean/ice modelling study of fresh-water and energy balances in theArctic Ocean, Holloway and Sou(2001; 2002) showed a similar patternof thinning in the central Arctic, wherethe submarine measurements hadbeen made, but a thickening of iceagainst the Canadian coast and northof Greenland (Figure 3).
With a much smaller net change shownby the model, this study suggested thatthe ice had moved due to changingpatterns of atmospheric pressure andwind, rather than having melted away.The ACSYS Observation Products Panelcarried out a review of all results andconcluded that thinning had occurred,particularly in summer, but that it waslikely to be less than the 40 per centdecrease suggested by the submarinemeasurements. The review also high-
lighted, however, the paucity of data,that so often plagues cryos-
Ice and snow Solarradiation
Reflectedradiation
Snow/ice
Polar albedo
Absorbed solar radiation
Temperature
++
Figure 2 — Warming and cooling cycles inthe snow and ice albedo feedback
76
BLTN 54/2 13/06/05 17:31 Page 76
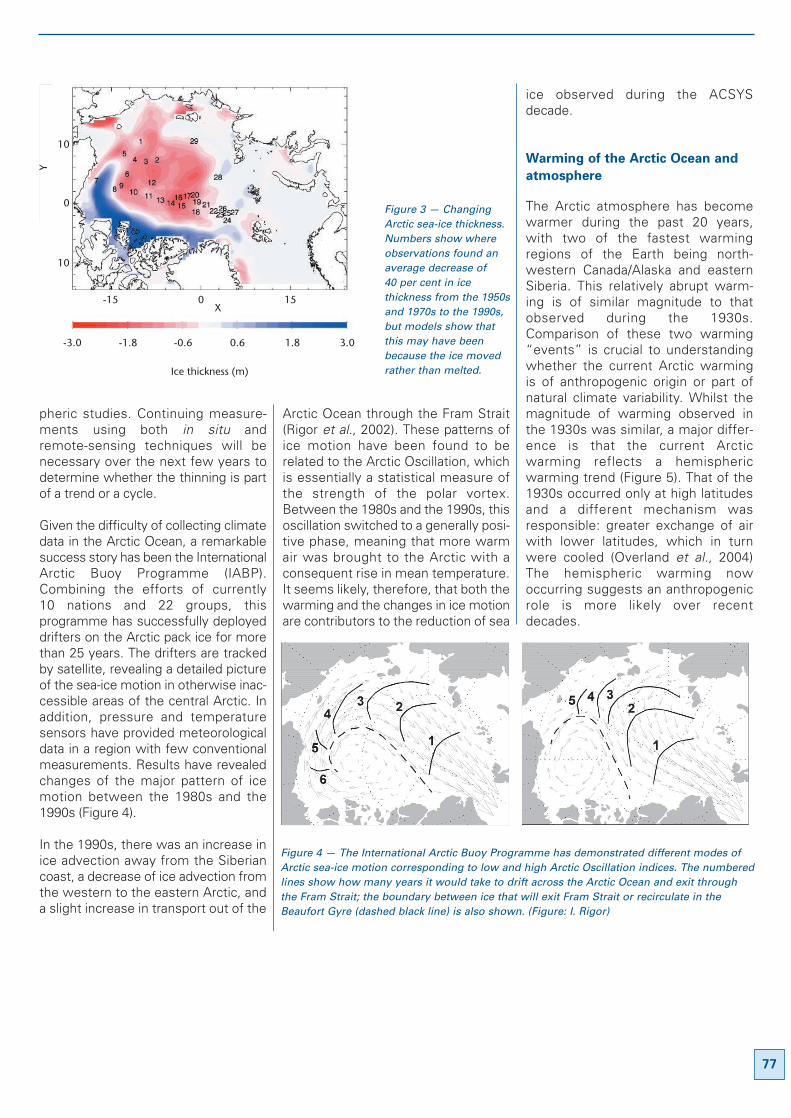
pheric studies. Continuing measure-ments using both in situ andremote-sensing techniques will benecessary over the next few years todetermine whether the thinning is partof a trend or a cycle.
Given the difficulty of collecting climatedata in the Arctic Ocean, a remarkablesuccess story has been the InternationalArctic Buoy Programme (IABP).Combining the efforts of currently10 nations and 22 groups, thisprogramme has successfully deployeddrifters on the Arctic pack ice for morethan 25 years. The drifters are trackedby satellite, revealing a detailed pictureof the sea-ice motion in otherwise inac-cessible areas of the central Arctic. Inaddition, pressure and temperaturesensors have provided meteorologicaldata in a region with few conventionalmeasurements. Results have revealedchanges of the major pattern of icemotion between the 1980s and the1990s (Figure 4).
In the 1990s, there was an increase inice advection away from the Siberiancoast, a decrease of ice advection fromthe western to the eastern Arctic, anda slight increase in transport out of the
Arctic Ocean through the Fram Strait(Rigor et al., 2002). These patterns ofice motion have been found to berelated to the Arctic Oscillation, whichis essentially a statistical measure ofthe strength of the polar vortex.Between the 1980s and the 1990s, thisoscillation switched to a generally posi-tive phase, meaning that more warmair was brought to the Arctic with aconsequent rise in mean temperature.It seems likely, therefore, that both thewarming and the changes in ice motionare contributors to the reduction of sea
ice observed during the ACSYSdecade.
Warming of the Arctic Ocean and
atmosphere
The Arctic atmosphere has becomewarmer during the past 20 years,with two of the fastest warmingregions of the Earth being north-western Canada/Alaska and easternSiberia. This relatively abrupt warm-ing is of similar magnitude to thatobserved during the 1930s.Comparison of these two warming“events” is crucial to understandingwhether the current Arctic warmingis of anthropogenic origin or part ofnatural climate variability. Whilst themagnitude of warming observed inthe 1930s was similar, a major differ-ence is that the current Arcticwarming reflects a hemisphericwarming trend (Figure 5). That of the1930s occurred only at high latitudesand a different mechanism wasresponsible: greater exchange of airwith lower latitudes, which in turnwere cooled (Overland et al., 2004)The hemispheric warming nowoccurring suggests an anthropogenicrole is more likely over recentdecades.
10
0
10
-15 0 15
-3.0 -1.8 -0.6 0.6 1.8 3.0
Y
X
Ice thickness (m)
Figure 3 — ChangingArctic sea-ice thickness.Numbers show whereobservations found anaverage decrease of40 per cent in icethickness from the 1950sand 1970s to the 1990s,but models show thatthis may have beenbecause the ice movedrather than melted.
Figure 4 — The International Arctic Buoy Programme has demonstrated different modes ofArctic sea-ice motion corresponding to low and high Arctic Oscillation indices. The numberedlines show how many years it would take to drift across the Arctic Ocean and exit throughthe Fram Strait; the boundary between ice that will exit Fram Strait or recirculate in theBeaufort Gyre (dashed black line) is also shown. (Figure: I. Rigor)
77
BLTN 54/2 17/06/05 12:42 Page 77
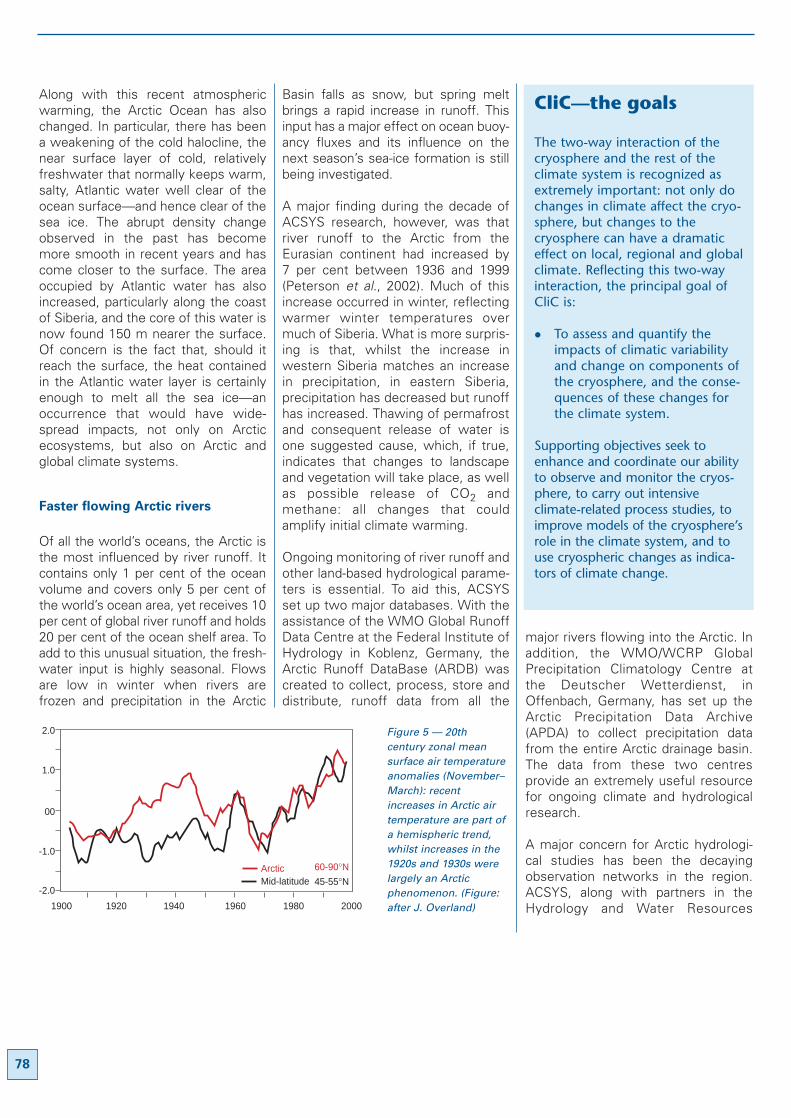
Along with this recent atmosphericwarming, the Arctic Ocean has alsochanged. In particular, there has beena weakening of the cold halocline, thenear surface layer of cold, relativelyfreshwater that normally keeps warm,salty, Atlantic water well clear of theocean surface—and hence clear of thesea ice. The abrupt density changeobserved in the past has becomemore smooth in recent years and hascome closer to the surface. The areaoccupied by Atlantic water has alsoincreased, particularly along the coastof Siberia, and the core of this water isnow found 150 m nearer the surface.Of concern is the fact that, should itreach the surface, the heat containedin the Atlantic water layer is certainlyenough to melt all the sea ice—anoccurrence that would have wide-spread impacts, not only on Arcticecosystems, but also on Arctic andglobal climate systems.
Faster flowing Arctic rivers
Of all the world’s oceans, the Arctic isthe most influenced by river runoff. Itcontains only 1 per cent of the oceanvolume and covers only 5 per cent ofthe world’s ocean area, yet receives 10per cent of global river runoff and holds20 per cent of the ocean shelf area. Toadd to this unusual situation, the fresh-water input is highly seasonal. Flowsare low in winter when rivers arefrozen and precipitation in the Arctic
Basin falls as snow, but spring meltbrings a rapid increase in runoff. Thisinput has a major effect on ocean buoy-ancy fluxes and its influence on thenext season’s sea-ice formation is stillbeing investigated.
A major finding during the decade ofACSYS research, however, was thatriver runoff to the Arctic from theEurasian continent had increased by7 per cent between 1936 and 1999(Peterson et al., 2002). Much of thisincrease occurred in winter, reflectingwarmer winter temperatures overmuch of Siberia. What is more surpris-ing is that, whilst the increase inwestern Siberia matches an increasein precipitation, in eastern Siberia,precipitation has decreased but runoffhas increased. Thawing of permafrostand consequent release of water isone suggested cause, which, if true,indicates that changes to landscapeand vegetation will take place, as wellas possible release of CO2 andmethane: all changes that couldamplify initial climate warming.
Ongoing monitoring of river runoff andother land-based hydrological parame-ters is essential. To aid this, ACSYSset up two major databases. With theassistance of the WMO Global RunoffData Centre at the Federal Institute ofHydrology in Koblenz, Germany, theArctic Runoff DataBase (ARDB) wascreated to collect, process, store anddistribute, runoff data from all the
major rivers flowing into the Arctic. Inaddition, the WMO/WCRP GlobalPrecipitation Climatology Centre atthe Deutscher Wetterdienst, inOffenbach, Germany, has set up theArctic Precipitation Data Archive(APDA) to collect precipitation datafrom the entire Arctic drainage basin.The data from these two centresprovide an extremely useful resourcefor ongoing climate and hydrologicalresearch.
A major concern for Arctic hydrologi-cal studies has been the decayingobservation networks in the region.ACSYS, along with partners in theHydrology and Water Resources
78
ArcticMid-latitude
60-90°N45-55°N
2.0
1.0
00
-1.0
-2.0
1900 1920 1940 1960 1980 2000
Figure 5 — 20thcentury zonal meansurface air temperatureanomalies (November–March): recentincreases in Arctic airtemperature are part ofa hemispheric trend,whilst increases in the1920s and 1930s werelargely an Arcticphenomenon. (Figure:after J. Overland)
CliC—the goals
The two-way interaction of thecryosphere and the rest of theclimate system is recognized asextremely important: not only dochanges in climate affect the cryo-sphere, but changes to thecryosphere can have a dramaticeffect on local, regional and globalclimate. Reflecting this two-wayinteraction, the principal goal ofCliC is:
� To assess and quantify theimpacts of climatic variabilityand change on components ofthe cryosphere, and the conse-quences of these changes forthe climate system.
Supporting objectives seek toenhance and coordinate our abilityto observe and monitor the cryos-phere, to carry out intensiveclimate-related process studies, toimprove models of the cryosphere’srole in the climate system, and touse cryospheric changes as indica-tors of climate change.
BLTN 54/2 13/06/05 17:31 Page 78
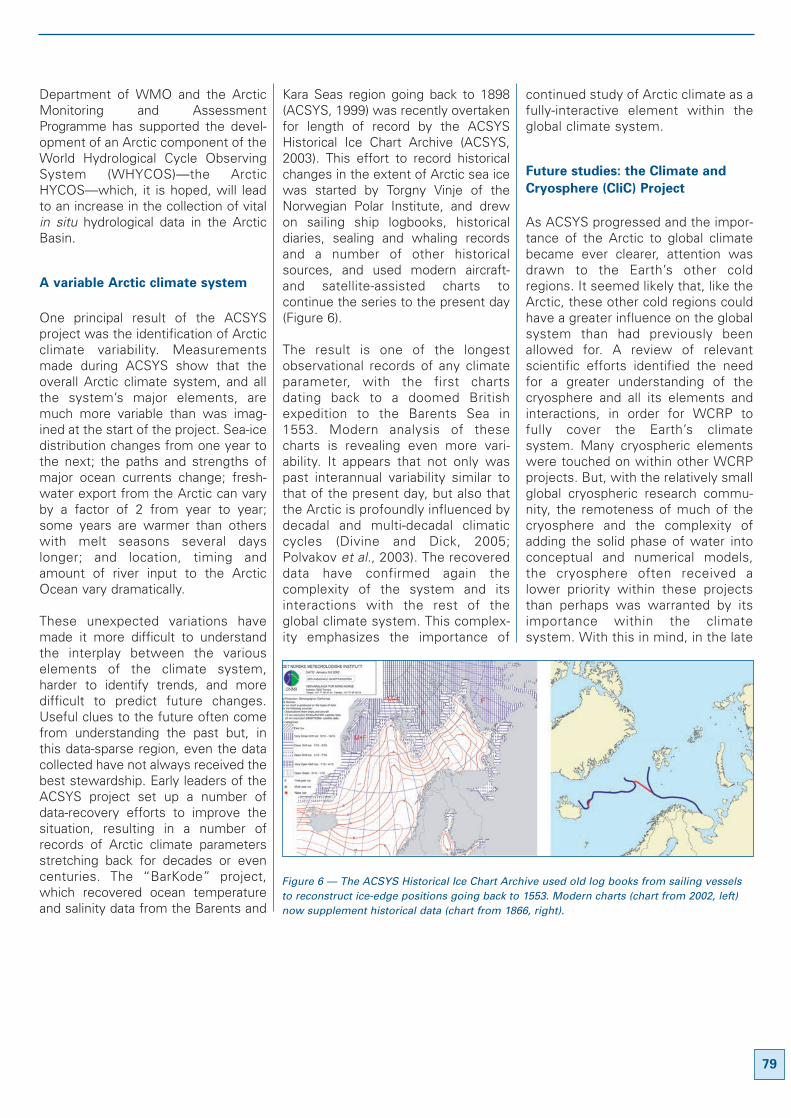
Department of WMO and the ArcticMonitoring and AssessmentProgramme has supported the devel-opment of an Arctic component of theWorld Hydrological Cycle ObservingSystem (WHYCOS)—the ArcticHYCOS—which, it is hoped, will leadto an increase in the collection of vitalin situ hydrological data in the ArcticBasin.
A variable Arctic climate system
One principal result of the ACSYSproject was the identification of Arcticclimate variability. Measurementsmade during ACSYS show that theoverall Arctic climate system, and allthe system’s major elements, aremuch more variable than was imag-ined at the start of the project. Sea-icedistribution changes from one year tothe next; the paths and strengths ofmajor ocean currents change; fresh-water export from the Arctic can varyby a factor of 2 from year to year;some years are warmer than otherswith melt seasons several dayslonger; and location, timing andamount of river input to the ArcticOcean vary dramatically.
These unexpected variations havemade it more difficult to understandthe interplay between the variouselements of the climate system,harder to identify trends, and moredifficult to predict future changes.Useful clues to the future often comefrom understanding the past but, inthis data-sparse region, even the datacollected have not always received thebest stewardship. Early leaders of theACSYS project set up a number ofdata-recovery efforts to improve thesituation, resulting in a number ofrecords of Arctic climate parametersstretching back for decades or evencenturies. The “BarKode” project,which recovered ocean temperatureand salinity data from the Barents and
Kara Seas region going back to 1898(ACSYS, 1999) was recently overtakenfor length of record by the ACSYSHistorical Ice Chart Archive (ACSYS,2003). This effort to record historicalchanges in the extent of Arctic sea icewas started by Torgny Vinje of theNorwegian Polar Institute, and drewon sailing ship logbooks, historicaldiaries, sealing and whaling recordsand a number of other historicalsources, and used modern aircraft-and satellite-assisted charts tocontinue the series to the present day(Figure 6).
The result is one of the longestobservational records of any climateparameter, with the first chartsdating back to a doomed Britishexpedition to the Barents Sea in1553. Modern analysis of thesecharts is revealing even more vari-ability. It appears that not only waspast interannual variability similar tothat of the present day, but also thatthe Arctic is profoundly influenced bydecadal and multi-decadal climaticcycles (Divine and Dick, 2005;Polvakov et al., 2003). The recovereddata have confirmed again thecomplexity of the system and itsinteractions with the rest of theglobal climate system. This complex-ity emphasizes the importance of
continued study of Arctic climate as afully-interactive element within theglobal climate system.
Future studies: the Climate and
Cryosphere (CliC) Project
As ACSYS progressed and the impor-tance of the Arctic to global climatebecame ever clearer, attention wasdrawn to the Earth’s other coldregions. It seemed likely that, like theArctic, these other cold regions couldhave a greater influence on the globalsystem than had previously beenallowed for. A review of relevantscientific efforts identified the needfor a greater understanding of thecryosphere and all its elements andinteractions, in order for WCRP tofully cover the Earth’s climatesystem. Many cryospheric elementswere touched on within other WCRPprojects. But, with the relatively smallglobal cryospheric research commu-nity, the remoteness of much of thecryosphere and the complexity ofadding the solid phase of water intoconceptual and numerical models,the cryosphere often received alower priority within these projectsthan perhaps was warranted by itsimportance within the climatesystem. With this in mind, in the late
79
Figure 6 — The ACSYS Historical Ice Chart Archive used old log books from sailing vesselsto reconstruct ice-edge positions going back to 1553. Modern charts (chart from 2002, left)now supplement historical data (chart from 1866, right).
BLTN 54/2 13/06/05 17:31 Page 79
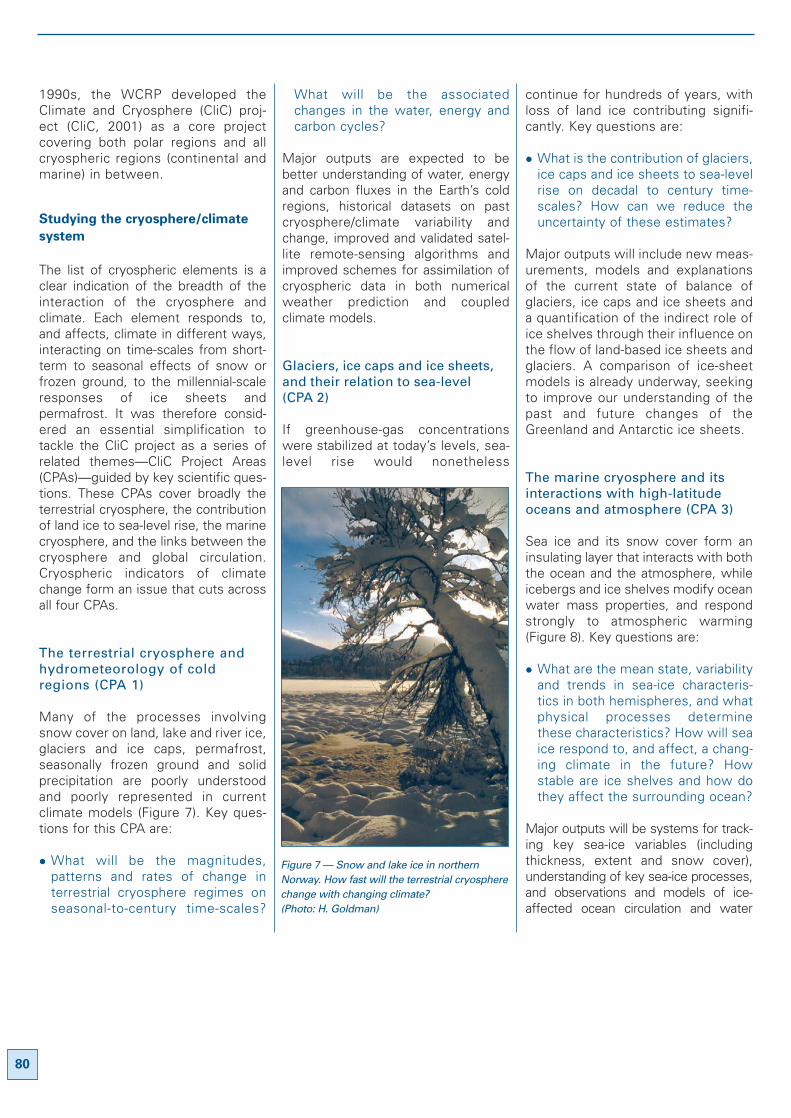
1990s, the WCRP developed theClimate and Cryosphere (CliC) proj-ect (CliC, 2001) as a core projectcovering both polar regions and allcryospheric regions (continental andmarine) in between.
Studying the cryosphere/climate
system
The list of cryospheric elements is aclear indication of the breadth of theinteraction of the cryosphere andclimate. Each element responds to,and affects, climate in different ways,interacting on time-scales from short-term to seasonal effects of snow orfrozen ground, to the millennial-scaleresponses of ice sheets andpermafrost. It was therefore consid-ered an essential simplification totackle the CliC project as a series ofrelated themes—CliC Project Areas(CPAs)—guided by key scientific ques-tions. These CPAs cover broadly theterrestrial cryosphere, the contributionof land ice to sea-level rise, the marinecryosphere, and the links between thecryosphere and global circulation.Cryospheric indicators of climatechange form an issue that cuts acrossall four CPAs.
The terrestrial cryosphere andhydrometeorology of coldregions (CPA 1)
Many of the processes involvingsnow cover on land, lake and river ice,glaciers and ice caps, permafrost,seasonally frozen ground and solidprecipitation are poorly understoodand poorly represented in currentclimate models (Figure 7). Key ques-tions for this CPA are:
� What will be the magnitudes,patterns and rates of change interrestrial cryosphere regimes onseasonal-to-century time-scales?
What will be the associatedchanges in the water, energy andcarbon cycles?
Major outputs are expected to bebetter understanding of water, energyand carbon fluxes in the Earth’s coldregions, historical datasets on pastcryosphere/climate variability andchange, improved and validated satel-lite remote-sensing algorithms andimproved schemes for assimilation ofcryospheric data in both numericalweather prediction and coupledclimate models.
Glaciers, ice caps and ice sheets,and their relation to sea-level(CPA 2)
If greenhouse-gas concentrationswere stabilized at today’s levels, sea-level rise would nonetheless
continue for hundreds of years, withloss of land ice contributing signifi-cantly. Key questions are:
� What is the contribution of glaciers,ice caps and ice sheets to sea-levelrise on decadal to century time-scales? How can we reduce theuncertainty of these estimates?
Major outputs will include new meas-urements, models and explanationsof the current state of balance ofglaciers, ice caps and ice sheets anda quantification of the indirect role ofice shelves through their influence onthe flow of land-based ice sheets andglaciers. A comparison of ice-sheetmodels is already underway, seekingto improve our understanding of thepast and future changes of theGreenland and Antarctic ice sheets.
The marine cryosphere and itsinteractions with high-latitudeoceans and atmosphere (CPA 3)
Sea ice and its snow cover form aninsulating layer that interacts with boththe ocean and the atmosphere, whileicebergs and ice shelves modify oceanwater mass properties, and respondstrongly to atmospheric warming(Figure 8). Key questions are:
� What are the mean state, variabilityand trends in sea-ice characteris-tics in both hemispheres, and whatphysical processes determinethese characteristics? How will seaice respond to, and affect, a chang-ing climate in the future? Howstable are ice shelves and how dothey affect the surrounding ocean?
Major outputs will be systems for track-ing key sea-ice variables (includingthickness, extent and snow cover),understanding of key sea-ice processes,and observations and models of ice-affected ocean circulation and water
80
Figure 7 — Snow and lake ice in northernNorway. How fast will the terrestrial cryospherechange with changing climate? (Photo: H. Goldman)
BLTN 54/2 13/06/05 17:31 Page 80
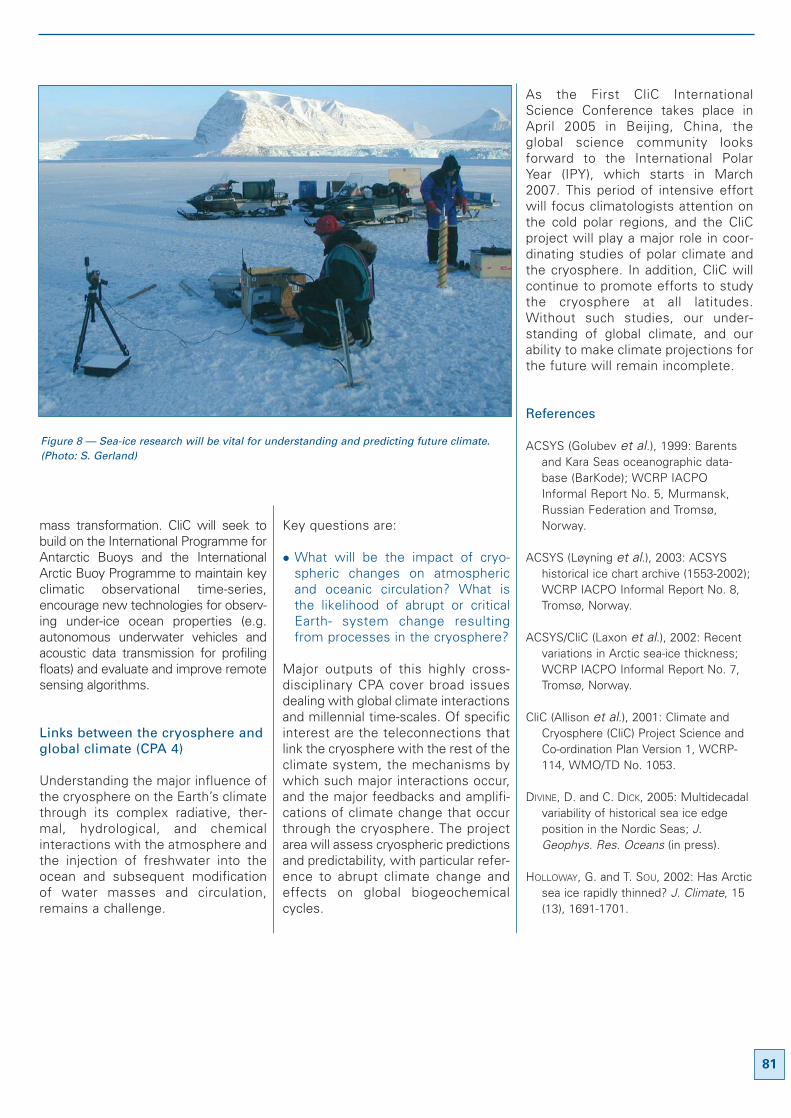
mass transformation. CliC will seek tobuild on the International Programme forAntarctic Buoys and the InternationalArctic Buoy Programme to maintain keyclimatic observational time-series,encourage new technologies for observ-ing under-ice ocean properties (e.g.autonomous underwater vehicles andacoustic data transmission for profilingfloats) and evaluate and improve remotesensing algorithms.
Links between the cryosphere andglobal climate (CPA 4)
Understanding the major influence ofthe cryosphere on the Earth’s climatethrough its complex radiative, ther-mal, hydrological, and chemicalinteractions with the atmosphere andthe injection of freshwater into theocean and subsequent modificationof water masses and circulation,remains a challenge.
Key questions are:
� What will be the impact of cryo-spheric changes on atmosphericand oceanic circulation? What isthe likelihood of abrupt or criticalEarth- system change resultingfrom processes in the cryosphere?
Major outputs of this highly cross-disciplinary CPA cover broad issuesdealing with global climate interactionsand millennial time-scales. Of specificinterest are the teleconnections thatlink the cryosphere with the rest of theclimate system, the mechanisms bywhich such major interactions occur,and the major feedbacks and amplifi-cations of climate change that occurthrough the cryosphere. The projectarea will assess cryospheric predictionsand predictability, with particular refer-ence to abrupt climate change andeffects on global biogeochemicalcycles.
As the First CliC InternationalScience Conference takes place inApril 2005 in Beijing, China, theglobal science community looksforward to the International PolarYear (IPY), which starts in March2007. This period of intensive effortwill focus climatologists attention onthe cold polar regions, and the CliCproject will play a major role in coor-dinating studies of polar climate andthe cryosphere. In addition, CliC willcontinue to promote efforts to studythe cryosphere at all latitudes.Without such studies, our under-standing of global climate, and ourability to make climate projections forthe future will remain incomplete.
References
ACSYS (Golubev et al.), 1999: Barentsand Kara Seas oceanographic data-base (BarKode); WCRP IACPOInformal Report No. 5, Murmansk,Russian Federation and Tromsø,Norway.
ACSYS (Løyning et al.), 2003: ACSYShistorical ice chart archive (1553-2002);WCRP IACPO Informal Report No. 8,Tromsø, Norway.
ACSYS/CliC (Laxon et al.), 2002: Recentvariations in Arctic sea-ice thickness;WCRP IACPO Informal Report No. 7,Tromsø, Norway.
CliC (Allison et al.), 2001: Climate andCryosphere (CliC) Project Science andCo-ordination Plan Version 1, WCRP-114, WMO/TD No. 1053.
DIVINE, D. and C. DICK, 2005: Multidecadalvariability of historical sea ice edgeposition in the Nordic Seas; J.Geophys. Res. Oceans (in press).
HOLLOWAY, G. and T. SOU, 2002: Has Arcticsea ice rapidly thinned? J. Climate, 15(13), 1691-1701.
81
Figure 8 — Sea-ice research will be vital for understanding and predicting future climate.(Photo: S. Gerland)
BLTN 54/2 13/06/05 17:31 Page 81
HOLLOWAY, G. and T. SOU, 2001: Is Arcticsea ice rapidly thinning? Ice andClimate News, 1. (ACSYS/CliCNewsletter).
OVERLAND, J.E., M.C. SPILLANE,D.B. PERCIVAL, M. WANG and H.O.MOFJELD, 2004: Seasonal and regionalvariation of pan-Arctic surface airtemperature over the instrumentalrecord. J. Climate, 17 (17), 3263-3282.
PETERSON, B.J., R.M. HOLMES,J.W. MCCLELLAND, C.J. VOROSMARTY,R.B. LAMMERS, A.I. SHIKLOMANOV,I.A. SHIKLOMANOV and S. RAHMSTORF,2002: Increasing river discharge to theArctic Ocean. Science, 298 (5601),2171-2173.
POLYAKOV I.V., R.V. BEKRYAEV, G.V. ALEKSEEV,U.S. BHATT, R.L. COLONY, M.A. JOHNSON,A.P. MASKSHTAS and D. WALSH, 2003:Variability and trends of air temperatureand pressure in the maritime Arctic,1875-2000. J. Climate, 16 (12), 2067-2077.
RIGOR, I., J.M. WALLACE and R.L. COLONY,2002: On the response of sea ice tothe Arctic Oscillation. J. Climate, 15(18), 2648 - 2668.
ROTHROCK, D.A., Y. YU and G.A. MAYKUT,1999: Thinning of the Arctic sea-icecover. Geophys. Res. Lett., 26 (23),3469-3472.
WADHAMS, P. and N.R. DAVIS, 2000: Furtherevidence of ice thinning in the ArcticOcean. Geophys. Res. Lett., 27 (24),.3973-3975.
82
BLTN 54/2 13/06/05 17:31 Page 82
Thomas C. Peterson,
National Climatic Data Center, National
Oceanic and Atmospheric
Administration, Asheville, North
Carolina, USA, and Chair, WMO
Commission for Climatology Open
Programme Area Group on the
Monitoring and Analysis of Climate
Variability and Change
Introduction
For decades, most analyses of long-term global climate change usingobservational data have focused onchanges in mean values. Several well-respected datasets of monthly stationtemperature and precipitation dataprovide quite good coverage acrossthe globe. Analysing changes inextremes (e.g. the number of daysexceeding the 90th percentile of mini-mum temperature observations),however, requires long-term digital
daily data. Unfortunately, such data arenot readily available internationally forlarge portions of the world. In the 2002“global” analysis by Frich et al. (2002),almost no analysis of extremes waspossible for most of Central and SouthAmerica, Africa and southern Asia.However, a concerted series of effortsto remedy that situation is underway.
Role of an international expert
team (ET)
Two complementary efforts to enableglobal analysis of extremes are beingcoordinated by the joint WMOCommission for Climatology (CCl)/World Climate Research Programme(WCRP) Climate Variability andPredictability (CLIVAR) project’s ExpertTeam on Climate Change Detection,Monitoring and Indices (ETCCDMI).Detailed information on the ET is available at http://www.clivar.org/organization/etccd. Members of theExpert Team come from all continentsand encompass a wide range ofexpertise in the field of climatechange. The author is not a member ofthe ET but works closely with it aschair of the CCl Open ProgrammeArea Group (OPAG) on the Monitoringand Analysis of Climate Variability andChange to which the ET belongs. Asall ET members are volunteers withfull-time jobs, the focus of their workmust be on what they can coordinate,recommend or inspire, rather than dothemselves.
One of the ET’s activities is interna-tional coordination of a suite of climate-change indices derived from daily datawhich focus primarily on extremes. Thedevelopment of the indices involvesnot only ET members but also numer-ous other scientists working with dailyclimate data. By setting an exactformula for each index, analyses donein different countries or differentregions can fit together seamlessly.
A total of 27 indices are considered tobe core indices. They are based on dailytemperature values or daily precipita-tion amount. Some are based on fixedthresholds that are of relevance toparticular applications. In these cases,thresholds are the same for all stations.
Other indices are based on thresholdsthat vary from location to location. Inthese cases, thresholds are typicallydefined as a percentile of the relevantdata series. The definitions of the27 indices and the formulas for calcu-lating them are available fromhttp://cccma.seos.uvic.ca/ETCCDMI.This Website also provides theFORTRAN code for calculating theindices from daily data and a user-friendly software package to calculatethe indices. This software package,called RClimDex, uses the free soft-ware R (see http://www.r-project.orgfor more information), which is alanguage and an environment for statis-tical computing and graphics.
Analysis software does not, however,perform without data. In many parts ofthe world, enough daily data havebeen digitized to contribute to ananalysis but institutions are reluctantto share them. This is a difficult prob-lem to address. The solution proposedby the ETCCDMI’s predecessor was tohold regional climate-change work-shops modelled after the Asia PacificNetwork workshops (Manton et al.,2000; Peterson et al., 2001). Two wereheld in 2001 and, in view of the expe-rience gained, the ETCCDMI decidedto hold a series of other such work-shops to cover all areas of the globe.
Regional workshop concept
The workshops bring together partici-pants from as many countries aspossible across an area for a combina-tion of seminars and hands-onanalyses of the daily data they bring
83
Climatechange indices
BLTN 54/2 13/06/05 17:31 Page 83
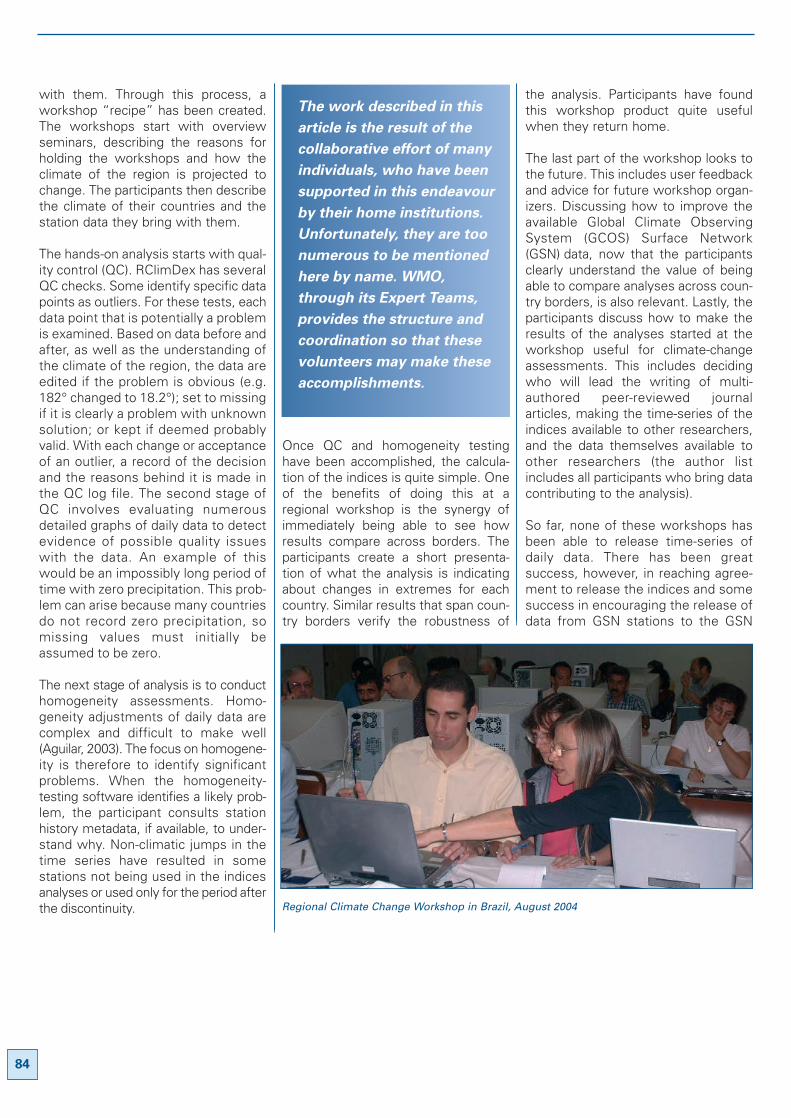
with them. Through this process, aworkshop “recipe” has been created.The workshops start with overviewseminars, describing the reasons forholding the workshops and how theclimate of the region is projected tochange. The participants then describethe climate of their countries and thestation data they bring with them.
The hands-on analysis starts with qual-ity control (QC). RClimDex has severalQC checks. Some identify specific datapoints as outliers. For these tests, eachdata point that is potentially a problemis examined. Based on data before andafter, as well as the understanding ofthe climate of the region, the data areedited if the problem is obvious (e.g.182° changed to 18.2°); set to missingif it is clearly a problem with unknownsolution; or kept if deemed probablyvalid. With each change or acceptanceof an outlier, a record of the decisionand the reasons behind it is made inthe QC log file. The second stage ofQC involves evaluating numerousdetailed graphs of daily data to detectevidence of possible quality issueswith the data. An example of thiswould be an impossibly long period oftime with zero precipitation. This prob-lem can arise because many countriesdo not record zero precipitation, somissing values must initially beassumed to be zero.
The next stage of analysis is to conducthomogeneity assessments. Homo-geneity adjustments of daily data arecomplex and difficult to make well(Aguilar, 2003). The focus on homogene-ity is therefore to identify significantproblems. When the homogeneity-testing software identifies a likely prob-lem, the participant consults stationhistory metadata, if available, to under-stand why. Non-climatic jumps in thetime series have resulted in somestations not being used in the indicesanalyses or used only for the period afterthe discontinuity.
Once QC and homogeneity testinghave been accomplished, the calcula-tion of the indices is quite simple. Oneof the benefits of doing this at aregional workshop is the synergy ofimmediately being able to see howresults compare across borders. Theparticipants create a short presenta-tion of what the analysis is indicatingabout changes in extremes for eachcountry. Similar results that span coun-try borders verify the robustness of
the analysis. Participants have foundthis workshop product quite usefulwhen they return home.
The last part of the workshop looks tothe future. This includes user feedbackand advice for future workshop organ-izers. Discussing how to improve theavailable Global Climate ObservingSystem (GCOS) Surface Network(GSN) data, now that the participantsclearly understand the value of beingable to compare analyses across coun-try borders, is also relevant. Lastly, theparticipants discuss how to make theresults of the analyses started at theworkshop useful for climate-changeassessments. This includes decidingwho will lead the writing of multi-authored peer-reviewed journalarticles, making the time-series of theindices available to other researchers,and the data themselves available toother researchers (the author listincludes all participants who bring datacontributing to the analysis).
So far, none of these workshops hasbeen able to release time-series ofdaily data. There has been greatsuccess, however, in reaching agree-ment to release the indices and somesuccess in encouraging the release ofdata from GSN stations to the GSN
84
The work described in this
article is the result of the
collaborative effort of many
individuals, who have been
supported in this endeavour
by their home institutions.
Unfortunately, they are too
numerous to be mentioned
here by name. WMO,
through its Expert Teams,
provides the structure and
coordination so that these
volunteers may make these
accomplishments.
Regional Climate Change Workshop in Brazil, August 2004
BLTN 54/2 13/06/05 17:31 Page 84
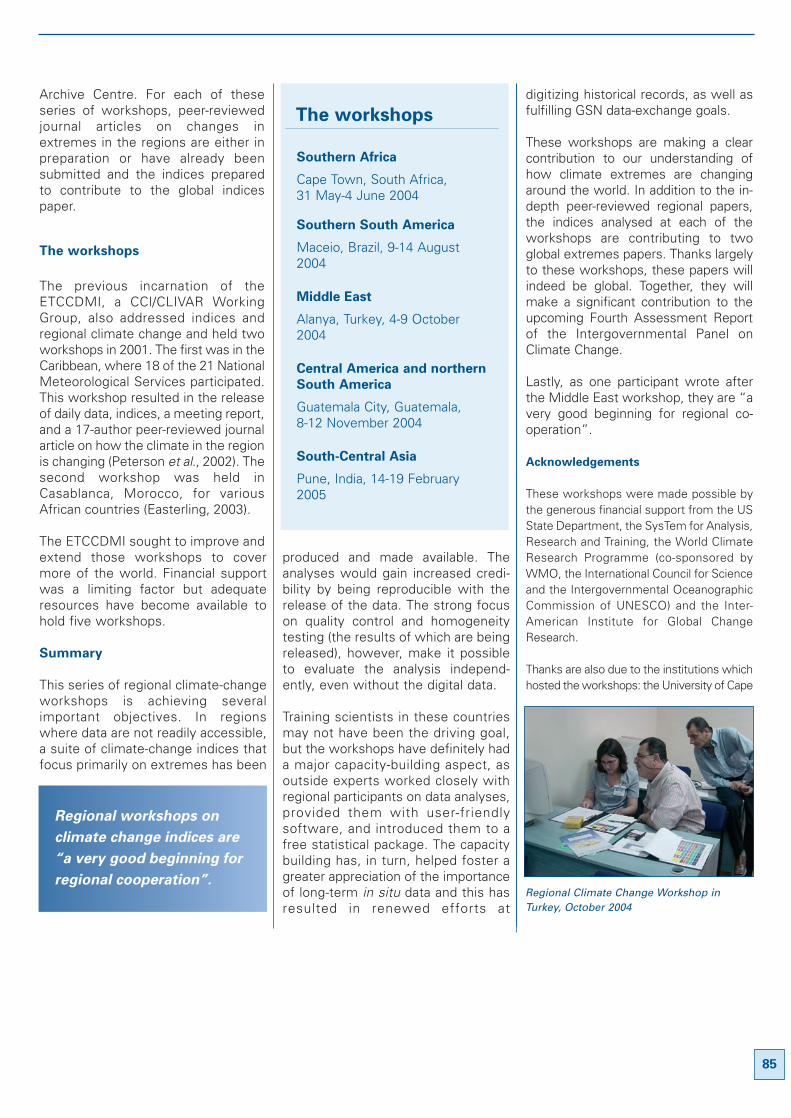
Archive Centre. For each of theseseries of workshops, peer-reviewedjournal articles on changes inextremes in the regions are either inpreparation or have already beensubmitted and the indices preparedto contribute to the global indicespaper.
The workshops
The previous incarnation of theETCCDMI, a CCl/CLIVAR WorkingGroup, also addressed indices andregional climate change and held twoworkshops in 2001. The first was in theCaribbean, where 18 of the 21 NationalMeteorological Services participated.This workshop resulted in the releaseof daily data, indices, a meeting report,and a 17-author peer-reviewed journalarticle on how the climate in the regionis changing (Peterson et al., 2002). Thesecond workshop was held inCasablanca, Morocco, for variousAfrican countries (Easterling, 2003).
The ETCCDMI sought to improve andextend those workshops to covermore of the world. Financial supportwas a limiting factor but adequateresources have become available tohold five workshops.
Summary
This series of regional climate-changeworkshops is achieving severalimportant objectives. In regionswhere data are not readily accessible,a suite of climate-change indices thatfocus primarily on extremes has been
produced and made available. Theanalyses would gain increased credi-bility by being reproducible with therelease of the data. The strong focuson quality control and homogeneitytesting (the results of which are beingreleased), however, make it possibleto evaluate the analysis independ-ently, even without the digital data.
Training scientists in these countriesmay not have been the driving goal,but the workshops have definitely hada major capacity-building aspect, asoutside experts worked closely withregional participants on data analyses,provided them with user-friendlysoftware, and introduced them to afree statistical package. The capacitybuilding has, in turn, helped foster agreater appreciation of the importanceof long-term in situ data and this hasresulted in renewed efforts at
digitizing historical records, as well asfulfilling GSN data-exchange goals.
These workshops are making a clearcontribution to our understanding ofhow climate extremes are changingaround the world. In addition to the in-depth peer-reviewed regional papers,the indices analysed at each of theworkshops are contributing to twoglobal extremes papers. Thanks largelyto these workshops, these papers willindeed be global. Together, they willmake a significant contribution to theupcoming Fourth Assessment Reportof the Intergovernmental Panel onClimate Change.
Lastly, as one participant wrote afterthe Middle East workshop, they are “avery good beginning for regional co-operation”.
Acknowledgements
These workshops were made possible bythe generous financial support from the USState Department, the SysTem for Analysis,Research and Training, the World ClimateResearch Programme (co-sponsored byWMO, the International Council for Scienceand the Intergovernmental OceanographicCommission of UNESCO) and the Inter-American Institute for Global ChangeResearch.
Thanks are also due to the institutions whichhosted the workshops: the University of Cape
85
Southern Africa
Cape Town, South Africa, 31 May-4 June 2004
Southern South America
Maceio, Brazil, 9-14 August2004
Middle East
Alanya, Turkey, 4-9 October2004
Central America and northern
South America
Guatemala City, Guatemala, 8-12 November 2004
South-Central Asia
Pune, India, 14-19 February2005
The workshops
Regional workshops on
climate change indices are
“a very good beginning for
regional cooperation”.Regional Climate Change Workshop inTurkey, October 2004
BLTN 54/2 13/06/05 17:31 Page 85
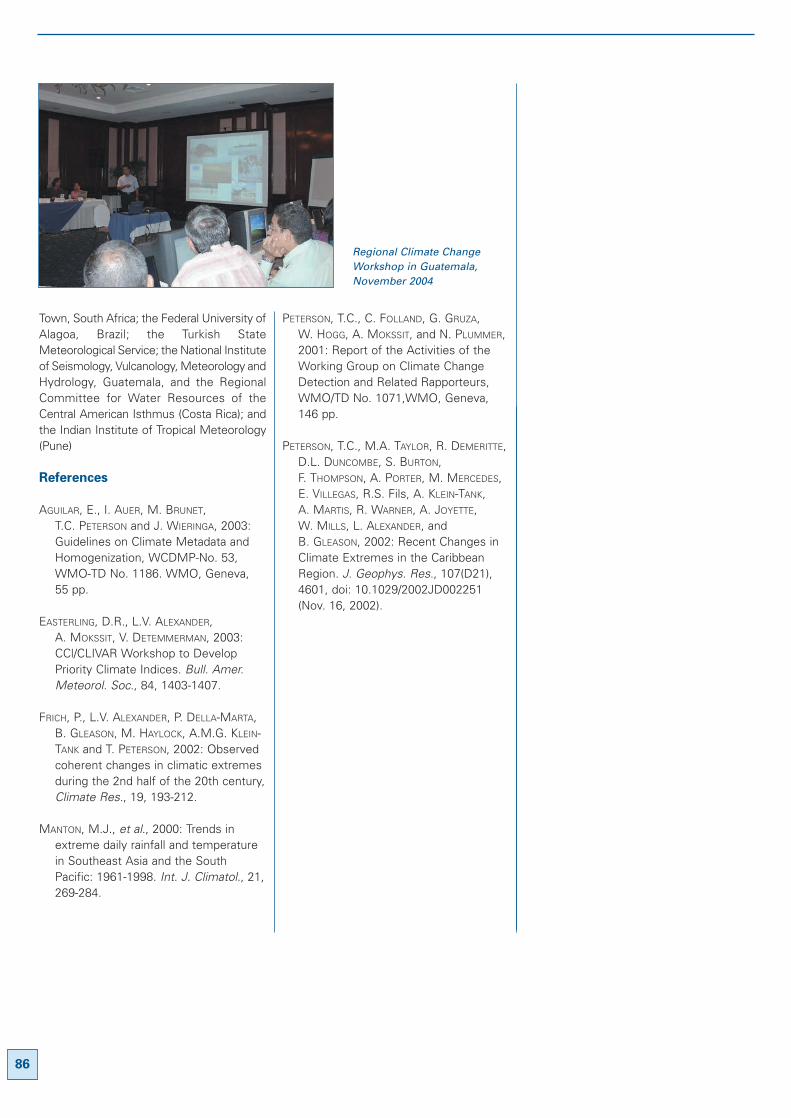
Town, South Africa; the Federal University ofAlagoa, Brazil; the Turkish StateMeteorological Service; the National Instituteof Seismology, Vulcanology, Meteorology andHydrology, Guatemala, and the RegionalCommittee for Water Resources of theCentral American Isthmus (Costa Rica); andthe Indian Institute of Tropical Meteorology(Pune)
References
AGUILAR, E., I. AUER, M. BRUNET,T.C. PETERSON and J. WIERINGA, 2003:Guidelines on Climate Metadata andHomogenization, WCDMP-No. 53,WMO-TD No. 1186. WMO, Geneva,55 pp.
EASTERLING, D.R., L.V. ALEXANDER,A. MOKSSIT, V. DETEMMERMAN, 2003:CCl/CLIVAR Workshop to DevelopPriority Climate Indices. Bull. Amer.Meteorol. Soc., 84, 1403-1407.
FRICH, P., L.V. ALEXANDER, P. DELLA-MARTA,B. GLEASON, M. HAYLOCK, A.M.G. KLEIN-TANK and T. PETERSON, 2002: Observedcoherent changes in climatic extremesduring the 2nd half of the 20th century,Climate Res., 19, 193-212.
MANTON, M.J., et al., 2000: Trends inextreme daily rainfall and temperaturein Southeast Asia and the SouthPacific: 1961-1998. Int. J. Climatol., 21,269-284.
PETERSON, T.C., C. FOLLAND, G. GRUZA,W. HOGG, A. MOKSSIT, and N. PLUMMER,2001: Report of the Activities of theWorking Group on Climate ChangeDetection and Related Rapporteurs,WMO/TD No. 1071,WMO, Geneva,146 pp.
PETERSON, T.C., M.A. TAYLOR, R. DEMERITTE,D.L. DUNCOMBE, S. BURTON,F. THOMPSON, A. PORTER, M. MERCEDES,E. VILLEGAS, R.S. Fils, A. KLEIN-TANK,A. MARTIS, R. WARNER, A. JOYETTE,W. MILLS, L. ALEXANDER, andB. GLEASON, 2002: Recent Changes inClimate Extremes in the CaribbeanRegion. J. Geophys. Res., 107(D21),4601, doi: 10.1029/2002JD002251(Nov. 16, 2002).
86
Regional Climate ChangeWorkshop in Guatemala,November 2004
BLTN 54/2 13/06/05 17:31 Page 86
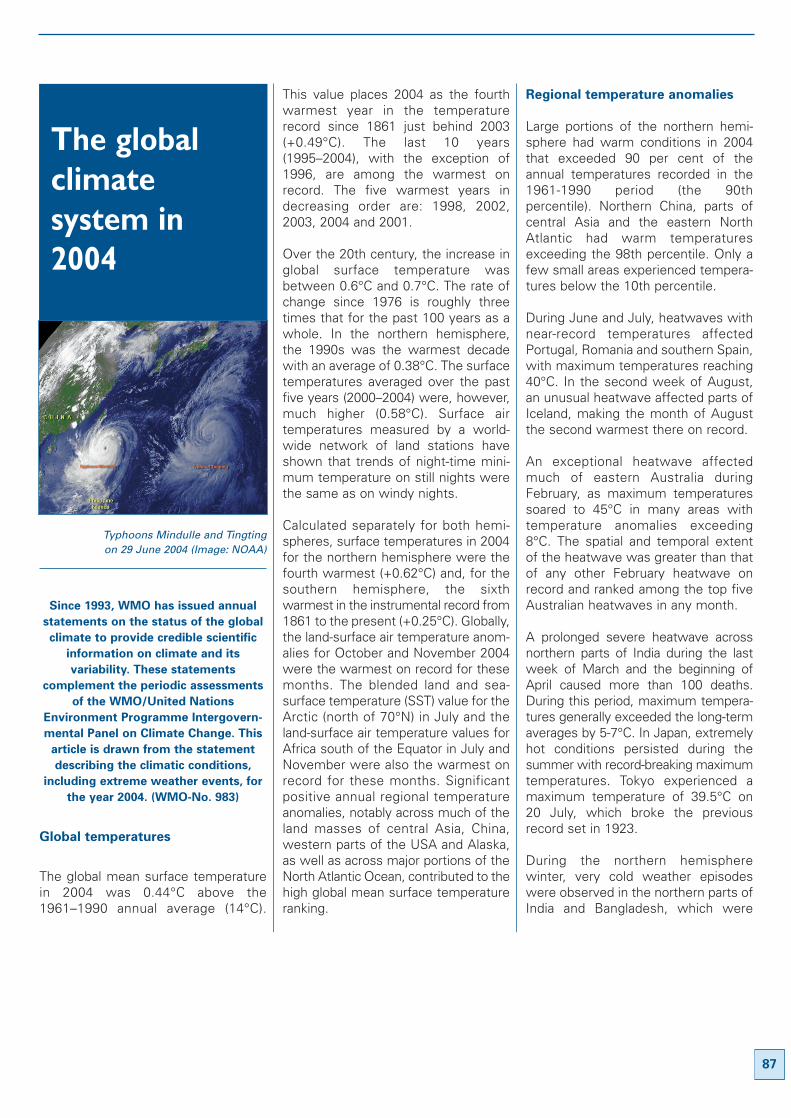
Typhoons Mindulle and Tingting on 29 June 2004 (Image: NOAA)
Since 1993, WMO has issued annual
statements on the status of the global
climate to provide credible scientific
information on climate and its
variability. These statements
complement the periodic assessments
of the WMO/United Nations
Environment Programme Intergovern-
mental Panel on Climate Change. This
article is drawn from the statement
describing the climatic conditions,
including extreme weather events, for
the year 2004. (WMO-No. 983)
Global temperatures
The global mean surface temperaturein 2004 was 0.44°C above the1961–1990 annual average (14°C).
This value places 2004 as the fourthwarmest year in the temperaturerecord since 1861 just behind 2003(+0.49°C). The last 10 years(1995–2004), with the exception of1996, are among the warmest onrecord. The five warmest years indecreasing order are: 1998, 2002,2003, 2004 and 2001.
Over the 20th century, the increase inglobal surface temperature wasbetween 0.6°C and 0.7°C. The rate ofchange since 1976 is roughly threetimes that for the past 100 years as awhole. In the northern hemisphere,the 1990s was the warmest decadewith an average of 0.38°C. The surfacetemperatures averaged over the pastfive years (2000–2004) were, however,much higher (0.58°C). Surface airtemperatures measured by a world-wide network of land stations haveshown that trends of night-time mini-mum temperature on still nights werethe same as on windy nights.
Calculated separately for both hemi-spheres, surface temperatures in 2004for the northern hemisphere were thefourth warmest (+0.62°C) and, for thesouthern hemisphere, the sixthwarmest in the instrumental record from1861 to the present (+0.25°C). Globally,the land-surface air temperature anom-alies for October and November 2004were the warmest on record for thesemonths. The blended land and sea-surface temperature (SST) value for theArctic (north of 70°N) in July and theland-surface air temperature values forAfrica south of the Equator in July andNovember were also the warmest onrecord for these months. Significantpositive annual regional temperatureanomalies, notably across much of theland masses of central Asia, China,western parts of the USA and Alaska,as well as across major portions of theNorth Atlantic Ocean, contributed to thehigh global mean surface temperatureranking.
Regional temperature anomalies
Large portions of the northern hemi-sphere had warm conditions in 2004that exceeded 90 per cent of theannual temperatures recorded in the1961-1990 period (the 90thpercentile). Northern China, parts ofcentral Asia and the eastern NorthAtlantic had warm temperaturesexceeding the 98th percentile. Only afew small areas experienced tempera-tures below the 10th percentile.
During June and July, heatwaves withnear-record temperatures affectedPortugal, Romania and southern Spain,with maximum temperatures reaching40°C. In the second week of August,an unusual heatwave affected parts ofIceland, making the month of Augustthe second warmest there on record.
An exceptional heatwave affectedmuch of eastern Australia duringFebruary, as maximum temperaturessoared to 45°C in many areas withtemperature anomalies exceeding8°C. The spatial and temporal extentof the heatwave was greater than thatof any other February heatwave onrecord and ranked among the top fiveAustralian heatwaves in any month.
A prolonged severe heatwave acrossnorthern parts of India during the lastweek of March and the beginning ofApril caused more than 100 deaths.During this period, maximum tempera-tures generally exceeded the long-termaverages by 5-7°C. In Japan, extremelyhot conditions persisted during thesummer with record-breaking maximumtemperatures. Tokyo experienced amaximum temperature of 39.5°C on20 July, which broke the previousrecord set in 1923.
During the northern hemispherewinter, very cold weather episodeswere observed in the northern parts ofIndia and Bangladesh, which were
87
The globalclimatesystem in2004
BLTN 54/2 13/06/05 17:31 Page 87
blamed for as many as 600 deaths.Maximum and minimum temperatureswere 6-10°C below normal. During theaustral winter, abnormally cold condi-tions in the high-altitude areas of theAndes in southern Peru reportedlykilled 92 people and more than100 000 farm animals.
Prolonged drought in some regions
In early 2004, drought conditionscontinued to affect parts of easternSouth Africa, Mozambique, Lesothoand Swaziland. However, enhancedprecipitation in the last half of the rainyseason (November to March) providedsome benefit to crops in southernAfrica. Rainfall during both the long(March to June) and short (October toNovember) rainy seasons of 2004 waswell below normal across parts of theGreater Horn of Africa, resulting in acontinuation of multi-season drought.Isolated regions in the southern sectorand portions of Uganda experienceddriest conditions on record since 1961.In Kenya, a premature end to the 2004long rains exacerbated the droughtconditions resulting from several yearsof poor rainfall in many areas. Foodproduction in Kenya was projected atapproximately 40 per cent belownormal. In spite of abundant rainfall in2004, multi-year drought conditionsalso continued in Somalia, threateningagriculture and food security in theregion. In Eritrea, struggling fromnearly four years of drought, poor rainsduring the March-May rains exacer-bated drinking-water shortages.
In India, the 2004 seasonal rainfallduring the south-west monsoonseason (June-September) over thecountry as a whole was 13 per centbelow normal with 18 per cent of thecountry experiencing moderatedrought conditions. Rainfall deficiencywas the highest over north-west India,where only 78 per cent of normal rain-
88
The 2004 tropical cyclone seasonover the North Atlantic and thenorth-west Pacific saw some of themost deadly hurricanes andtyphoons responsible for more than6 000 deaths and heavy damage toinfrastructure. The 2004 cycloneseason was the second costliestcyclone season after 1992 and thenumber of deaths due to tropicalcyclones was the highest since2000.
During the Atlantic hurricaneseason, 15 named tropical stormsdeveloped; the average is around10. During August, eight tropicalstorms formed, which is a recordfor the most named storms for anymonth of August. Since 1995, therehas been a marked increase in theannual number of tropical storms inthe Atlantic Basin, which is coinci-dent with the active phase of theAtlantic multi-decadal signal. Nineof the named storms were classifiedas hurricanes. Six of those were“major” hurricanes (category threeor higher on the Saffir-Simpsonscale). Hurricane Ivan was the mostpowerful storm to affect theCaribbean in 10 years. HurricaneCharley was the strongest and mostdestructive hurricane to strike theUSA since Andrew in 1992. In all,nine named storms impacted theUSA, causing extensive damageestimated at more than US$ 43billion and making 2004 the costli-est hurricane season in the USA onrecord. Atlantic tropical cycloneswere directly responsible for morethan 3 000 deaths in 2004; the vastmajority were in Haiti due to floodsfrom Hurricane Jeanne.
Conversely, in the eastern NorthPacific, tropical cyclone activity wasbelow average. Only 12 namedstorms developed during the year,compared to an average of 16. Outof those 12 storms, six reachedhurricane strength and threereached “major” status. None ofthe cyclones made landfall as atropical storm or hurricane.
In the South Atlantic Ocean, sea-surface and atmospheric conditionsdo not favour the formation ofhurricanes. During March 2004,however, the first documentedhurricane since geostationary satel-lite records began in 1966developed. Unofficially namedCatarina, it made landfall along thesouthern coast of Brazil (in the stateof Santa Catarina) on 28 March2004, causing great damage toproperty and some loss of life.
In the north-west Pacific, 29 namedstorms developed; the average isaround 27. Nineteen of themreached typhoon intensity, whichwas slightly more than the long-term average. On an average, threetropical cyclones make landfall inJapan. However, in 2004, 10 tropi-cal cyclones made landfall, breakingthe previous record of six, estab-lished in 1990. Typhoon Tokage wasthe deadliest typhoon to affectJapan since 1979. Two hundredand nine people were killed inJapan by floods, landslides, strongwind and storm surge caused bythe tropical cyclones. They alsocaused damage to infrastructureworth around US$ 10 billion.Typhoon Rananim, which was themost severe typhoon affectingZhejiang, China, since 1956,claimed 169 fatalities and causeddamage worth over US$ 2 billion.
The South-West Indian Oceancyclone season was also active withan above normal number of tropi-cal storms. Tropical cyclone Gafilo,which was responsible for 237deaths, was the strongest to affectMadagascar in 10 years. Tropicalstorm 02B made landfall on thecoast of Myanmar on 19 May, caus-ing 200 fatalities. However, tropicalcyclone activity over the SouthPacific/Australian region wassuppressed.
A disastrous cyclone season
BLTN 54/2 13/06/05 17:31 Page 88
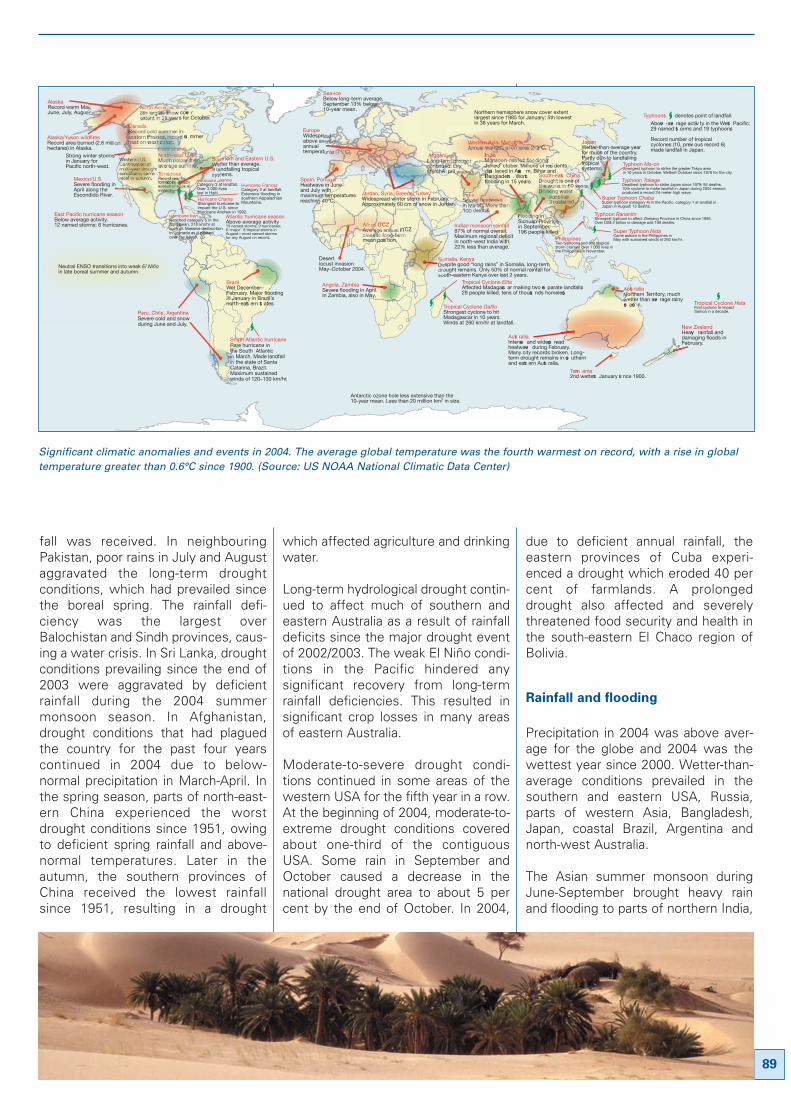
fall was received. In neighbouringPakistan, poor rains in July and Augustaggravated the long-term droughtconditions, which had prevailed sincethe boreal spring. The rainfall defi-ciency was the largest overBalochistan and Sindh provinces, caus-ing a water crisis. In Sri Lanka, droughtconditions prevailing since the end of2003 were aggravated by deficientrainfall during the 2004 summermonsoon season. In Afghanistan,drought conditions that had plaguedthe country for the past four yearscontinued in 2004 due to below-normal precipitation in March-April. Inthe spring season, parts of north-east-ern China experienced the worstdrought conditions since 1951, owingto deficient spring rainfall and above-normal temperatures. Later in theautumn, the southern provinces ofChina received the lowest rainfallsince 1951, resulting in a drought
which affected agriculture and drinkingwater.
Long-term hydrological drought contin-ued to affect much of southern andeastern Australia as a result of rainfalldeficits since the major drought eventof 2002/2003. The weak El Niño condi-tions in the Pacific hindered anysignificant recovery from long-termrainfall deficiencies. This resulted insignificant crop losses in many areasof eastern Australia.
Moderate-to-severe drought condi-tions continued in some areas of thewestern USA for the fifth year in a row.At the beginning of 2004, moderate-to-extreme drought conditions coveredabout one-third of the contiguousUSA. Some rain in September andOctober caused a decrease in thenational drought area to about 5 percent by the end of October. In 2004,
due to deficient annual rainfall, theeastern provinces of Cuba experi-enced a drought which eroded 40 percent of farmlands. A prolongeddrought also affected and severelythreatened food security and health inthe south-eastern El Chaco region ofBolivia.
Rainfall and flooding
Precipitation in 2004 was above aver-age for the globe and 2004 was thewettest year since 2000. Wetter-than-average conditions prevailed in thesouthern and eastern USA, Russia,parts of western Asia, Bangladesh,Japan, coastal Brazil, Argentina andnorth-west Australia.
The Asian summer monsoon duringJune-September brought heavy rainand flooding to parts of northern India,
89
Significant climatic anomalies and events in 2004. The average global temperature was the fourth warmest on record, with a rise in globaltemperature greater than 0.6°C since 1900. (Source: US NOAA National Climatic Data Center)
S o u t h ern an d E as t ern U . S .W et t er t h an av erag e.9 l an d f al l i n g t ro p i c als ys t ems .
E u ro p eW i d es p readab o v e av erag ean n u al t emp erat u res (+ 1° C ).
H u rri c an e FrancesC at eg o ry 2 at l an d f al l .E x t en s i v e f l o o d i n g i n s o u t h ern A p p al ac h i anM o u n t ai n s .
H u rri c an e JeanneC at eg o ry 3 at l an d f al l .O v er 3 000 l i v esl o s t i n H ai t i .
A t l an t i c h u rri c an e s eas o n A b o v e-av erag e ac t i v i t y15 n amed s t o rms ; 9 h u rri c an es ;6 ‘ maj o r’ . 8 t ro p i c al s t o rms i nA u g u s t — mo s t n amed s t o rmsf o r an y A u g u s t o n rec o rd .
A l as k a/Y u k o n w i l d f i resR ec o rd area b u rn ed (2. 6 mi l l i o n h ec t ares ) i n A l as k a.
N eu t ral E N S O t ran s i t i o n s i n t o w eak El Niño i n l at e b o real s u mmer an d au t u mn .
A l as k aR ec o rd w arm M ay, J u n e, J u l y, A u g u s t .
S o mal i a, K en yaD es p i t e g o o d “ l o n g rai n s ” i n S o mal i a, l o n g -t erm d ro u g h t remai n s . O n l y 50% o f n o rmal rai n f al l f o r s o u t h -eas t ern K en ya o v er l as t 2 years .
T ro p i c al C yc l o n e Elita A f f ec t ed M ad ag asc ar mak i n g t w o se p arat e l an d f al l s. 29 p eo p l e k i l l ed , t en s o f t h o u sa n d s h o mel ess.
T ro p i c al C yc l o n e Gafilo S t ro n g es t c yc l o n e t o h i t M ad ag as c ar i n 10 years . W i n d s at 260 k m/h r at l an d f al l .
N o rt h ern h emi s p h ere s n o w c o v er ex t en t l arg es t s i n c e 1985 f o r J an u ary; 5t h l o w es t i n 38 years f o r M arc h .
A n t arc t i c o z o n e h o l e l es s ex t en s i v e t h an t h e 10-year mean . L es s t h an 20 mi l l i o n k m2 i n s i z e.
H u rri c an e IvanR eac h ed c at eg o ry 5 i n t h eC ari b b ean . 210 k m/h r at l an d f al l . M as s i v e d es t ru c t i o ni n G ren ad a as i t p as s edo v er t h e i s l an d .
E as t P ac i f i c h u rri c an e s eas o nB el o w av erag e ac t i v i t y.12 n amed s t o rms ; 6 h u rri c an es . I n d i an mo n s o o n rai n f al l
87% o f n o rmal o v eral l . M ax i mu m reg i o n al d ef i c i t i n n o rt h -w es t I n d i a w i t h 22% l es s t h an av erag e.
P eru , C h i l e, A rg en t i n aS ev ere c o l d an d s n o w d u ri n g J u n e an d J u l y.
T yp h o o n TokageD ead l i es t t yp h o o n t o s t ri k e J ap an s i n c e 1979; 94 d eat h s . 10t h c yc l o n e t o mak e l an d f al l i n J ap an d u ri n g 2004 s eas o n ; p ro d u c ed a rec o rd 24-met er h i g h w av e.
T yp h o o n s:
C h i n aF l o o d i n g i nS i c h u an P ro vi n c ei n S ep t emb er.196 p eo p l e k i l l ed .
S o u t h -east C h i n aD ro u g h t i s o n e o ft h e w o rst i n 50 years.D ri n k i n g w at er su p p l i es t h reat en ed .
A f g h an i st anL o n g -t erm d ro u g h tc o n t i n u ed . D ryM arc h –A p ri l se aso n .
I n d i aS eve re h eat w avei n M arc h . M o re t h an100 d eat h s.
W es t ern U . S .C o n t i n u at i o n o fmu l t i -year d ro u g h tc o n d i t i o n s , s o merel i ef i n au t u mn .
I n d i aM o n so o n -rel at ed f l o o d i o n gJ u n e–O c t o b er. M i l l i o n s o f resi d en t sd i sp l ac ed i n A ssa m, B i h ar an dB an g l ad esh . W o rstf l o o d i n g i n 15 years.
T o n ad o esR ec o rd year f o rt o rn ad o es . M o s t l ya res u l t o f t ro p i c als ys t ems .
C en t ral an dN o rt h -east U . S .M u c h c o l d er-t h an -ave rag e su mmer.
C an ad aR ec o rd c o l d su mmer i neast ern P rai ri es, rec o rd su mmerh eat o n w est c o ast .
N o rt h A meri c a8t h l arg est sn o w c o ve rex t en t i n 38 years f o r O c t o b er.
A f ri c a I T C ZA ve rag e an n u al I T C Zc l o se t o l o n g -t ermmean p o si t i o n .
W est ern A si a, M o n g o l i aA n n u al w armt h , an o mal i es 2–3 ° C .
S p ai n , P o rt u g alH eat w av e i n J u n ean d J u l y w i t hmax i mu m t emp erat u resreac h i n g 40° C .
A b o ve -ave rag e ac t i vi t y i n t h e W est P ac i f i c ;29 n amed st o rms an d 19 t yp h o o n s.
R ec o rd n u mb er o f t ro p i c al c yc l o n es (10, p revi o u s rec o rd 6) mad e l an d f al l i n J ap an .
A u st ral i aI n t en se an d w i d esp read h eat w ave d u ri n g F eb ru ary. M an y c i t y rec o rd s b ro k en . L o n g -t erm d ro u g h t remai n s i n so u t h ern an d east ern A u st ral i a.
B raz i lW et D ec emb er–F eb ru ary. M aj o r f l o o d i n gi n J an u ary i n B raz i l ’ sn o rt h -east ern st at es.
H u rri c an e CharleyS t ro n g es t h u rri c an e t oi mp ac t t h e U . S . s i n c eH u rri c an e Andrew i n 1992.
T asm an i a2n d w et t est J an u ary si n c e 1900.
T ro p i c al C yc l o n e HetaF i rs t c yc l o n e t o i mp ac t S amo a i n a d ec ad e.
S t ro n g w i n t er s t o rms i n J an u ary f o r P ac i f i c n o rt h -w es t .
J o rd an , S yri a, G reec e, T u rk eyW i d es p read w i n t er s t o rm i n F eb ru ary. A p p ro x i mat el y 60 c m o f s n o w i n J o rd an .
S o u t h A t l an t i c h u rri c an eR are h u rri c an e i nt h e S o u t h A t l an t i ci n M arc h . M ad e l an d f al l i n t h e s t at e o f S an t aC at ari n a, B raz i l .M ax i mu m s u s t ai n edw i n d s o f 120– 130 k m/h r.
M ex i c o /U . S .S ev ere f l o o d i n g i nA p ri l al o n g t h eE s c o n d i d o R i v er.
A n g o l a, Z amb i aS ev ere f l o o d i n g i n A p ri l .I n Z amb i a, al s o i n M ay.
D es ertl o c u s t i n v as i o nM ay– O c t o b er 2004.
S u p er T yp h o o n NidaC ame as h o re i n t h e P h i l i p p i n es i n M ay w i t h s u s t ai n ed w i n d s o f 260 k m/h r.
T yp h o o n RananimS t ro n g es t t yp h o o n t o af f ec t Z h ej i an g P ro v i n c e i n C h i n a s i n c e 1956. O v er U S $ 2 b i l l i o n i n d amag e an d 169 d eat h s .
S u p er T yp h o o n ChabaS u p er-t yp h o o n (c at eg o ry 4) i n t h e P ac i f i c , c at eg o ry 1 at l an d f al l i nJ ap an i n A u g u s t ; 13 d eat h s .
J ap anW et t er-t h an -av erag e yearf o r mu c h o f t h e c o u n t ry. P art l y d u e t o l an d f al l i n gt ro p i c als ys t ems .
A u st ral i aN o rt h ern T erri t o ry, mu c h w et t er t h an ave rag e rai n y se aso n .
N ew Z eal an dH eavy rai n f al l an d d amag i n g f l o o d s i n F eb ru ary.
S ea-i c eB el o w l o n g -t erm av erag e.S ep t emb er 13% b el o w10-year mean .
P h i l i p p i n esT w o t yp h o o n s an d o n e t ro p i c als t o rm c l ai med o v er 1 000 l i v es i nt h e P h i l i p p i n es i n N o v emb er.
d en o t es p o i n t o f l an d f al l .
T yp h o o n Ma-onS t ro n g es t t yp h o o n t o s t ri k e t h e g reat er T o k yo areai n 10 years i n O c t o b er. W et t es t O c t o b er s i n c e 1876 f o r t h e c i t y.
BLTN 54/2 17/06/05 12:42 Page 89
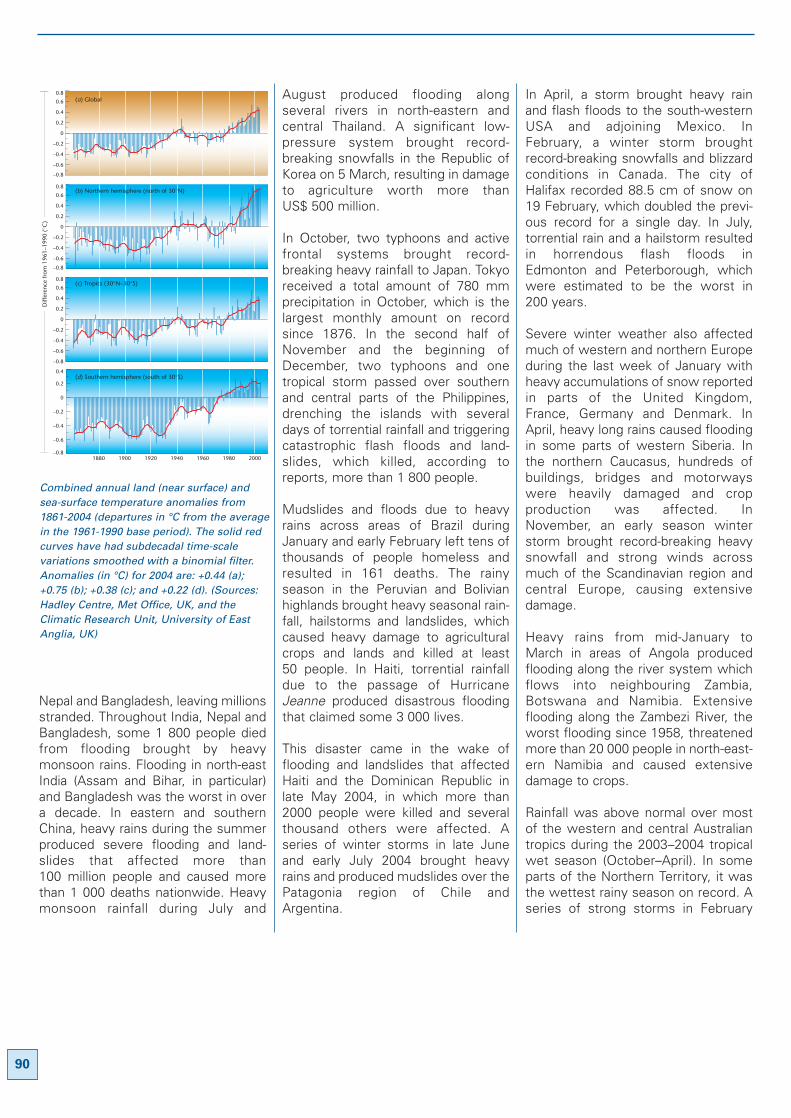
Nepal and Bangladesh, leaving millionsstranded. Throughout India, Nepal andBangladesh, some 1 800 people diedfrom flooding brought by heavymonsoon rains. Flooding in north-eastIndia (Assam and Bihar, in particular)and Bangladesh was the worst in overa decade. In eastern and southernChina, heavy rains during the summerproduced severe flooding and land-slides that affected more than100 million people and caused morethan 1 000 deaths nationwide. Heavymonsoon rainfall during July and
August produced flooding alongseveral rivers in north-eastern andcentral Thailand. A significant low-pressure system brought record-breaking snowfalls in the Republic ofKorea on 5 March, resulting in damageto agriculture worth more thanUS$ 500 million.
In October, two typhoons and activefrontal systems brought record-breaking heavy rainfall to Japan. Tokyoreceived a total amount of 780 mmprecipitation in October, which is thelargest monthly amount on recordsince 1876. In the second half ofNovember and the beginning ofDecember, two typhoons and onetropical storm passed over southernand central parts of the Philippines,drenching the islands with severaldays of torrential rainfall and triggeringcatastrophic flash floods and land-slides, which killed, according toreports, more than 1 800 people.
Mudslides and floods due to heavyrains across areas of Brazil duringJanuary and early February left tens ofthousands of people homeless andresulted in 161 deaths. The rainyseason in the Peruvian and Bolivianhighlands brought heavy seasonal rain-fall, hailstorms and landslides, whichcaused heavy damage to agriculturalcrops and lands and killed at least50 people. In Haiti, torrential rainfalldue to the passage of HurricaneJeanne produced disastrous floodingthat claimed some 3 000 lives.
This disaster came in the wake offlooding and landslides that affectedHaiti and the Dominican Republic inlate May 2004, in which more than2000 people were killed and severalthousand others were affected. Aseries of winter storms in late Juneand early July 2004 brought heavyrains and produced mudslides over thePatagonia region of Chile andArgentina.
In April, a storm brought heavy rainand flash floods to the south-westernUSA and adjoining Mexico. InFebruary, a winter storm broughtrecord-breaking snowfalls and blizzardconditions in Canada. The city ofHalifax recorded 88.5 cm of snow on19 February, which doubled the previ-ous record for a single day. In July,torrential rain and a hailstorm resultedin horrendous flash floods inEdmonton and Peterborough, whichwere estimated to be the worst in200 years.
Severe winter weather also affectedmuch of western and northern Europeduring the last week of January withheavy accumulations of snow reportedin parts of the United Kingdom,France, Germany and Denmark. InApril, heavy long rains caused floodingin some parts of western Siberia. Inthe northern Caucasus, hundreds ofbuildings, bridges and motorwayswere heavily damaged and cropproduction was affected. InNovember, an early season winterstorm brought record-breaking heavysnowfall and strong winds acrossmuch of the Scandinavian region andcentral Europe, causing extensivedamage.
Heavy rains from mid-January toMarch in areas of Angola producedflooding along the river system whichflows into neighbouring Zambia,Botswana and Namibia. Extensiveflooding along the Zambezi River, theworst flooding since 1958, threatenedmore than 20 000 people in north-east-ern Namibia and caused extensivedamage to crops.
Rainfall was above normal over mostof the western and central Australiantropics during the 2003–2004 tropicalwet season (October–April). In someparts of the Northern Territory, it wasthe wettest rainy season on record. Aseries of strong storms in February
90
1880 1900 1920 1940 1960 1980 2000
(d) Southern hemisphere (south of 30°S)
(a) Global
Diff
eren
ce fr
om 1
961–
1990
(°C
)
(b) Northern hemisphere (north of 30°N)
–0.8
–0.6
–0.4
–0.2
0
0.2
0.4
–0.8
–0.6
–0.4
–0.2
0
0.2
0.4
0.6
0.8
–0.8
–0.6
–0.4
–0.2
0
0.2
0.4
0.6
0.8
–0.8
–0.6
–0.4
–0.2
0
0.2
0.4
0.6
0.8(c) Tropics (30°N–30°S)
Combined annual land (near surface) andsea-surface temperature anomalies from1861-2004 (departures in °C from the averagein the 1961-1990 base period). The solid redcurves have had subdecadal time-scalevariations smoothed with a binomial filter.Anomalies (in °C) for 2004 are: +0.44 (a);+0.75 (b); +0.38 (c); and +0.22 (d). (Sources:Hadley Centre, Met Office, UK, and theClimatic Research Unit, University of EastAnglia, UK)
BLTN 54/2 13/06/05 17:31 Page 90
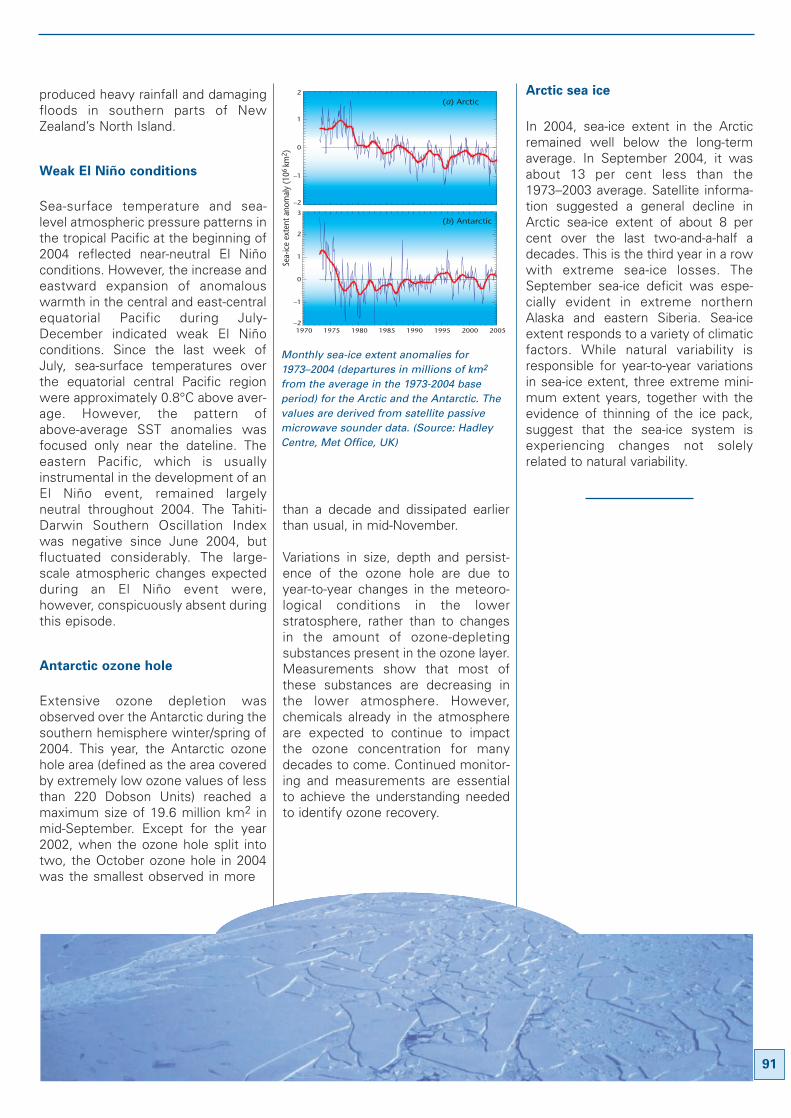
produced heavy rainfall and damagingfloods in southern parts of NewZealand’s North Island.
Weak El Niño conditions
Sea-surface temperature and sea-level atmospheric pressure patterns inthe tropical Pacific at the beginning of2004 reflected near-neutral El Niñoconditions. However, the increase andeastward expansion of anomalouswarmth in the central and east-centralequatorial Pacific during July-December indicated weak El Niñoconditions. Since the last week ofJuly, sea-surface temperatures overthe equatorial central Pacific regionwere approximately 0.8°C above aver-age. However, the pattern ofabove-average SST anomalies wasfocused only near the dateline. Theeastern Pacific, which is usuallyinstrumental in the development of anEl Niño event, remained largelyneutral throughout 2004. The Tahiti-Darwin Southern Oscillation Indexwas negative since June 2004, butfluctuated considerably. The large-scale atmospheric changes expectedduring an El Niño event were,however, conspicuously absent duringthis episode.
Antarctic ozone hole
Extensive ozone depletion wasobserved over the Antarctic during thesouthern hemisphere winter/spring of2004. This year, the Antarctic ozonehole area (defined as the area coveredby extremely low ozone values of lessthan 220 Dobson Units) reached amaximum size of 19.6 million km2 inmid-September. Except for the year2002, when the ozone hole split intotwo, the October ozone hole in 2004was the smallest observed in more
than a decade and dissipated earlierthan usual, in mid-November.
Variations in size, depth and persist-ence of the ozone hole are due toyear-to-year changes in the meteoro-logical conditions in the lowerstratosphere, rather than to changesin the amount of ozone-depletingsubstances present in the ozone layer.Measurements show that most ofthese substances are decreasing inthe lower atmosphere. However,chemicals already in the atmosphereare expected to continue to impactthe ozone concentration for manydecades to come. Continued monitor-ing and measurements are essentialto achieve the understanding neededto identify ozone recovery.
Arctic sea ice
In 2004, sea-ice extent in the Arcticremained well below the long-termaverage. In September 2004, it wasabout 13 per cent less than the1973–2003 average. Satellite informa-tion suggested a general decline inArctic sea-ice extent of about 8 percent over the last two-and-a-half adecades. This is the third year in a rowwith extreme sea-ice losses. TheSeptember sea-ice deficit was espe-cially evident in extreme northernAlaska and eastern Siberia. Sea-iceextent responds to a variety of climaticfactors. While natural variability isresponsible for year-to-year variationsin sea-ice extent, three extreme mini-mum extent years, together with theevidence of thinning of the ice pack,suggest that the sea-ice system isexperiencing changes not solelyrelated to natural variability.
91
Sea-
ice
exte
nt a
nom
aly
(106
km
2 )
(a) Arctic
(b) Antarctic
Monthly sea-ice extent anomalies for1973–2004 (departures in millions of km2
from the average in the 1973-2004 baseperiod) for the Arctic and the Antarctic. Thevalues are derived from satellite passivemicrowave sounder data. (Source: HadleyCentre, Met Office, UK)
BLTN 54/2 13/06/05 17:31 Page 91
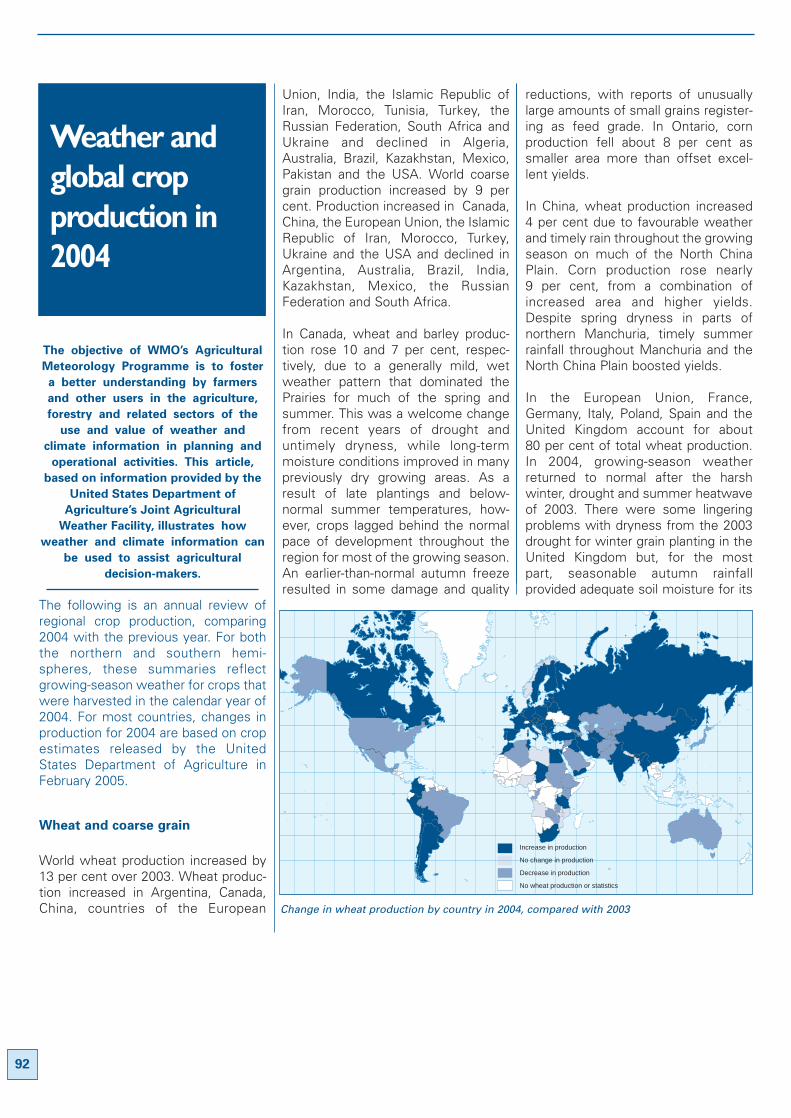
The objective of WMO’s Agricultural
Meteorology Programme is to foster
a better understanding by farmers
and other users in the agriculture,
forestry and related sectors of the
use and value of weather and
climate information in planning and
operational activities. This article,
based on information provided by the
United States Department of
Agriculture’s Joint Agricultural
Weather Facility, illustrates how
weather and climate information can
be used to assist agricultural
decision-makers.
The following is an annual review ofregional crop production, comparing2004 with the previous year. For boththe northern and southern hemi-spheres, these summaries reflectgrowing-season weather for crops thatwere harvested in the calendar year of2004. For most countries, changes inproduction for 2004 are based on cropestimates released by the UnitedStates Department of Agriculture inFebruary 2005.
Wheat and coarse grain
World wheat production increased by13 per cent over 2003. Wheat produc-tion increased in Argentina, Canada,China, countries of the European
Union, India, the Islamic Republic ofIran, Morocco, Tunisia, Turkey, theRussian Federation, South Africa andUkraine and declined in Algeria,Australia, Brazil, Kazakhstan, Mexico,Pakistan and the USA. World coarsegrain production increased by 9 percent. Production increased in Canada,China, the European Union, the IslamicRepublic of Iran, Morocco, Turkey,Ukraine and the USA and declined inArgentina, Australia, Brazil, India,Kazakhstan, Mexico, the RussianFederation and South Africa.
In Canada, wheat and barley produc-tion rose 10 and 7 per cent, respec-tively, due to a generally mild, wetweather pattern that dominated thePrairies for much of the spring andsummer. This was a welcome changefrom recent years of drought anduntimely dryness, while long-termmoisture conditions improved in manypreviously dry growing areas. As aresult of late plantings and below-normal summer temperatures, how-ever, crops lagged behind the normalpace of development throughout theregion for most of the growing season.An earlier-than-normal autumn freezeresulted in some damage and quality
reductions, with reports of unusuallylarge amounts of small grains register-ing as feed grade. In Ontario, cornproduction fell about 8 per cent assmaller area more than offset excel-lent yields.
In China, wheat production increased4 per cent due to favourable weatherand timely rain throughout the growingseason on much of the North ChinaPlain. Corn production rose nearly9 per cent, from a combination ofincreased area and higher yields.Despite spring dryness in parts ofnorthern Manchuria, timely summerrainfall throughout Manchuria and theNorth China Plain boosted yields.
In the European Union, France,Germany, Italy, Poland, Spain and theUnited Kingdom account for about80 per cent of total wheat production.In 2004, growing-season weatherreturned to normal after the harshwinter, drought and summer heatwaveof 2003. There were some lingeringproblems with dryness from the 2003drought for winter grain planting in theUnited Kingdom but, for the most part, seasonable autumn rainfallprovided adequate soil moisture for its
92
Weather andglobal cropproduction in2004
Increase in production
No change in production
Decrease in production
No wheat production or statistics
Change in wheat production by country in 2004, compared with 2003
BLTN 54/2 13/06/05 17:31 Page 92
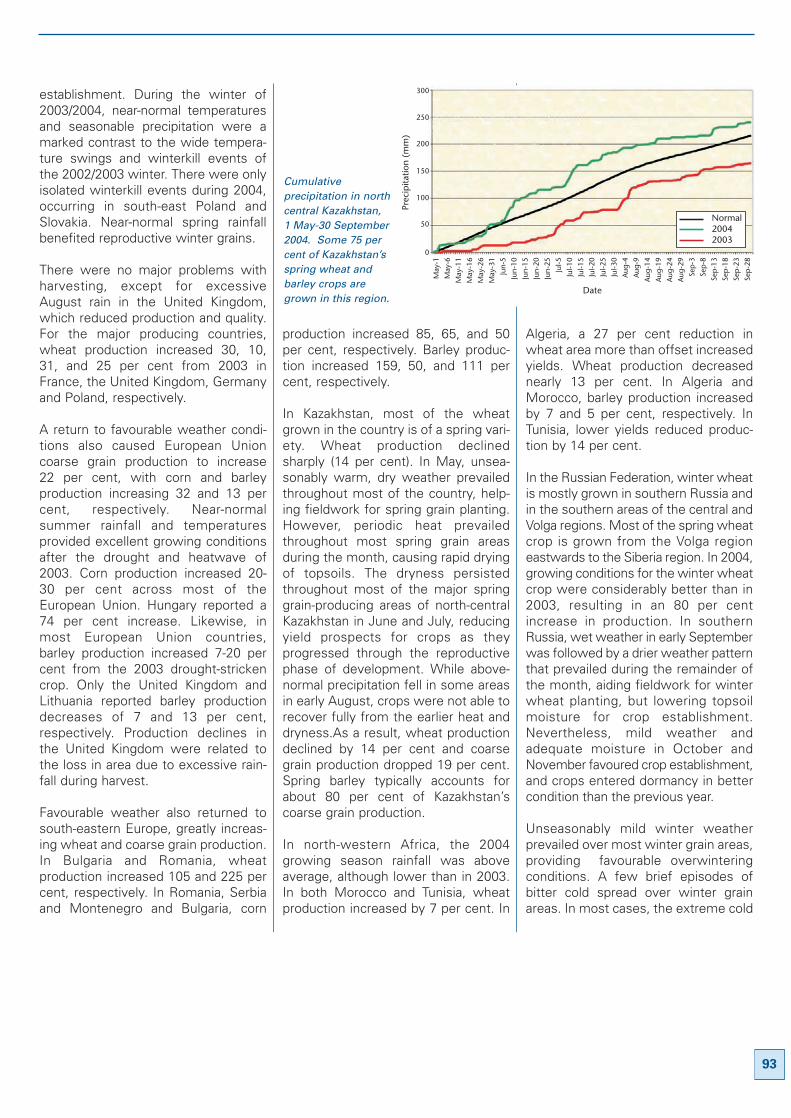
establishment. During the winter of2003/2004, near-normal temperaturesand seasonable precipitation were amarked contrast to the wide tempera-ture swings and winterkill events ofthe 2002/2003 winter. There were onlyisolated winterkill events during 2004,occurring in south-east Poland andSlovakia. Near-normal spring rainfallbenefited reproductive winter grains.
There were no major problems withharvesting, except for excessiveAugust rain in the United Kingdom,which reduced production and quality.For the major producing countries,wheat production increased 30, 10,31, and 25 per cent from 2003 inFrance, the United Kingdom, Germanyand Poland, respectively.
A return to favourable weather condi-tions also caused European Unioncoarse grain production to increase22 per cent, with corn and barleyproduction increasing 32 and 13 percent, respectively. Near-normalsummer rainfall and temperaturesprovided excellent growing conditionsafter the drought and heatwave of2003. Corn production increased 20-30 per cent across most of theEuropean Union. Hungary reported a74 per cent increase. Likewise, inmost European Union countries,barley production increased 7-20 percent from the 2003 drought-strickencrop. Only the United Kingdom andLithuania reported barley productiondecreases of 7 and 13 per cent,respectively. Production declines inthe United Kingdom were related tothe loss in area due to excessive rain-fall during harvest.
Favourable weather also returned tosouth-eastern Europe, greatly increas-ing wheat and coarse grain production.In Bulgaria and Romania, wheatproduction increased 105 and 225 percent, respectively. In Romania, Serbiaand Montenegro and Bulgaria, corn
production increased 85, 65, and 50per cent, respectively. Barley produc-tion increased 159, 50, and 111 percent, respectively.
In Kazakhstan, most of the wheatgrown in the country is of a spring vari-ety. Wheat production declinedsharply (14 per cent). In May, unsea-sonably warm, dry weather prevailedthroughout most of the country, help-ing fieldwork for spring grain planting.However, periodic heat prevailedthroughout most spring grain areasduring the month, causing rapid dryingof topsoils. The dryness persistedthroughout most of the major springgrain-producing areas of north-centralKazakhstan in June and July, reducingyield prospects for crops as theyprogressed through the reproductivephase of development. While above-normal precipitation fell in some areasin early August, crops were not able torecover fully from the earlier heat anddryness.As a result, wheat productiondeclined by 14 per cent and coarsegrain production dropped 19 per cent.Spring barley typically accounts forabout 80 per cent of Kazakhstan’scoarse grain production.
In north-western Africa, the 2004growing season rainfall was aboveaverage, although lower than in 2003.In both Morocco and Tunisia, wheatproduction increased by 7 per cent. In
Algeria, a 27 per cent reduction inwheat area more than offset increasedyields. Wheat production decreasednearly 13 per cent. In Algeria andMorocco, barley production increasedby 7 and 5 per cent, respectively. InTunisia, lower yields reduced produc-tion by 14 per cent.
In the Russian Federation, winter wheatis mostly grown in southern Russia andin the southern areas of the central andVolga regions. Most of the spring wheatcrop is grown from the Volga regioneastwards to the Siberia region. In 2004,growing conditions for the winter wheatcrop were considerably better than in2003, resulting in an 80 per centincrease in production. In southernRussia, wet weather in early Septemberwas followed by a drier weather patternthat prevailed during the remainder ofthe month, aiding fieldwork for winterwheat planting, but lowering topsoilmoisture for crop establishment.Nevertheless, mild weather andadequate moisture in October andNovember favoured crop establishment,and crops entered dormancy in bettercondition than the previous year.
Unseasonably mild winter weatherprevailed over most winter grain areas,providing favourable overwinteringconditions. A few brief episodes ofbitter cold spread over winter grainareas. In most cases, the extreme cold
93
300
250
200
150
100
0
50
May
-1M
ay-6
May
-11
May
-16
May
-26
May
-31
Jun-
5Ju
n-10
Jun-
15Ju
n-20
Jun-
25Ju
l-5Ju
l-10
Jul-1
5Ju
l-20
Jul-2
5Ju
l-30
Aug
-4A
ug-9
Aug
-14
Aug
-19
Aug
-24
Aug
-29
Sep-
3Se
p-8
Sep-
13Se
p-18
Sep-
23Se
p-28
Prec
ipita
tion
(mm
)
Date
Normal20042003
Cumulativeprecipitation in northcentral Kazakhstan,1 May-30 September2004. Some 75 percent of Kazakhstan’sspring wheat andbarley crops aregrown in this region.
BLTN 54/2 13/06/05 17:31 Page 93
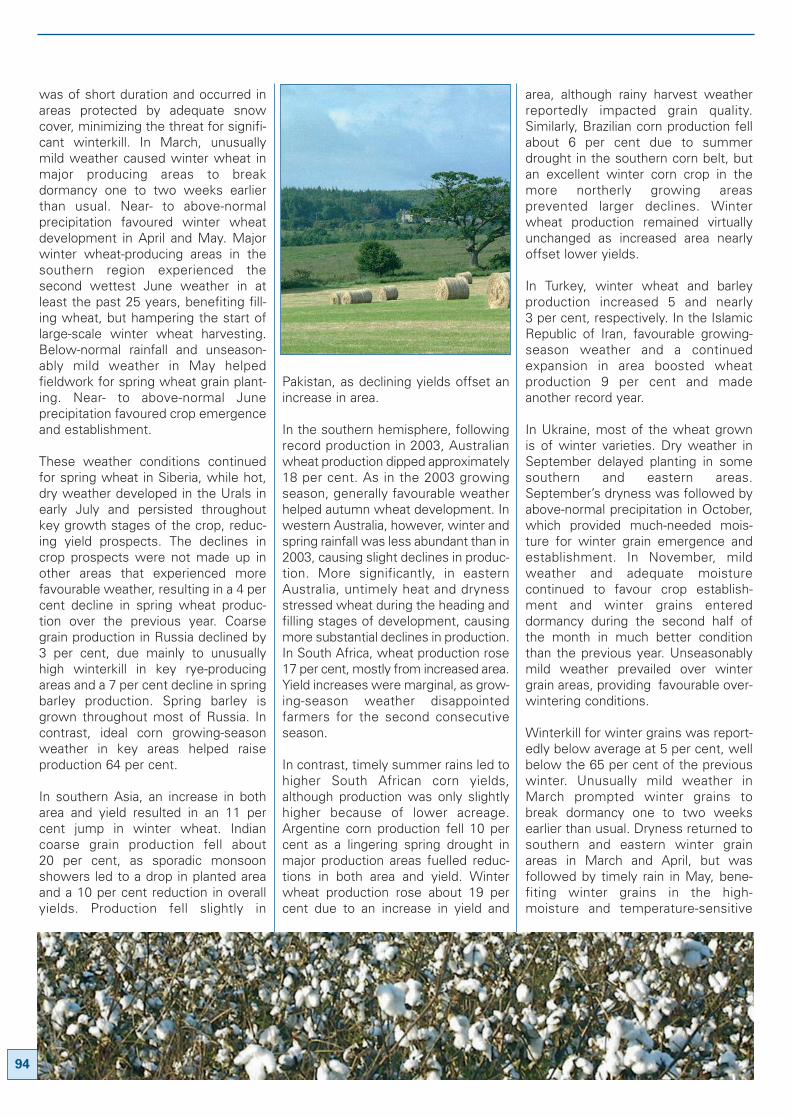
was of short duration and occurred inareas protected by adequate snowcover, minimizing the threat for signifi-cant winterkill. In March, unusuallymild weather caused winter wheat inmajor producing areas to breakdormancy one to two weeks earlierthan usual. Near- to above-normalprecipitation favoured winter wheatdevelopment in April and May. Majorwinter wheat-producing areas in thesouthern region experienced thesecond wettest June weather in atleast the past 25 years, benefiting fill-ing wheat, but hampering the start oflarge-scale winter wheat harvesting.Below-normal rainfall and unseason-ably mild weather in May helpedfieldwork for spring wheat grain plant-ing. Near- to above-normal Juneprecipitation favoured crop emergenceand establishment.
These weather conditions continuedfor spring wheat in Siberia, while hot,dry weather developed in the Urals inearly July and persisted throughoutkey growth stages of the crop, reduc-ing yield prospects. The declines incrop prospects were not made up inother areas that experienced morefavourable weather, resulting in a 4 percent decline in spring wheat produc-tion over the previous year. Coarsegrain production in Russia declined by3 per cent, due mainly to unusuallyhigh winterkill in key rye-producingareas and a 7 per cent decline in springbarley production. Spring barley isgrown throughout most of Russia. Incontrast, ideal corn growing-seasonweather in key areas helped raiseproduction 64 per cent.
In southern Asia, an increase in botharea and yield resulted in an 11 percent jump in winter wheat. Indiancoarse grain production fell about20 per cent, as sporadic monsoonshowers led to a drop in planted areaand a 10 per cent reduction in overallyields. Production fell slightly in
Pakistan, as declining yields offset anincrease in area.
In the southern hemisphere, followingrecord production in 2003, Australianwheat production dipped approximately18 per cent. As in the 2003 growingseason, generally favourable weatherhelped autumn wheat development. Inwestern Australia, however, winter andspring rainfall was less abundant than in2003, causing slight declines in produc-tion. More significantly, in easternAustralia, untimely heat and drynessstressed wheat during the heading andfilling stages of development, causingmore substantial declines in production.In South Africa, wheat production rose17 per cent, mostly from increased area.Yield increases were marginal, as grow-ing-season weather disappointedfarmers for the second consecutiveseason.
In contrast, timely summer rains led tohigher South African corn yields,although production was only slightlyhigher because of lower acreage.Argentine corn production fell 10 percent as a lingering spring drought inmajor production areas fuelled reduc-tions in both area and yield. Winterwheat production rose about 19 percent due to an increase in yield and
area, although rainy harvest weatherreportedly impacted grain quality.Similarly, Brazilian corn production fellabout 6 per cent due to summerdrought in the southern corn belt, butan excellent winter corn crop in themore northerly growing areasprevented larger declines. Winterwheat production remained virtuallyunchanged as increased area nearlyoffset lower yields.
In Turkey, winter wheat and barleyproduction increased 5 and nearly3 per cent, respectively. In the IslamicRepublic of Iran, favourable growing-season weather and a continuedexpansion in area boosted wheatproduction 9 per cent and madeanother record year.
In Ukraine, most of the wheat grownis of winter varieties. Dry weather inSeptember delayed planting in somesouthern and eastern areas.September’s dryness was followed byabove-normal precipitation in October,which provided much-needed mois-ture for winter grain emergence andestablishment. In November, mildweather and adequate moisturecontinued to favour crop establish-ment and winter grains entereddormancy during the second half ofthe month in much better conditionthan the previous year. Unseasonablymild weather prevailed over wintergrain areas, providing favourable over-wintering conditions.
Winterkill for winter grains was report-edly below average at 5 per cent, wellbelow the 65 per cent of the previouswinter. Unusually mild weather inMarch prompted winter grains tobreak dormancy one to two weeksearlier than usual. Dryness returned tosouthern and eastern winter grainareas in March and April, but wasfollowed by timely rain in May, bene-fiting winter grains in the high-moisture and temperature-sensitive
94
BLTN 54/2 13/06/05 17:31 Page 94
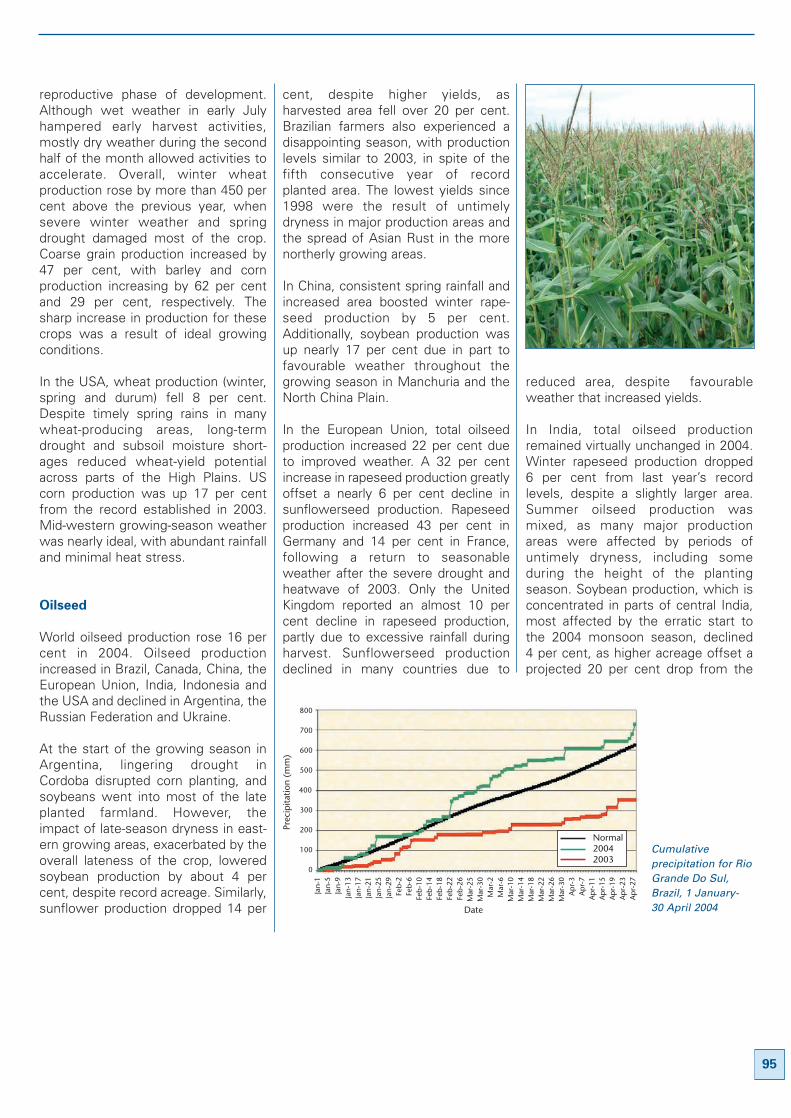
reproductive phase of development.Although wet weather in early Julyhampered early harvest activities,mostly dry weather during the secondhalf of the month allowed activities toaccelerate. Overall, winter wheatproduction rose by more than 450 percent above the previous year, whensevere winter weather and springdrought damaged most of the crop.Coarse grain production increased by47 per cent, with barley and cornproduction increasing by 62 per centand 29 per cent, respectively. Thesharp increase in production for thesecrops was a result of ideal growingconditions.
In the USA, wheat production (winter,spring and durum) fell 8 per cent.Despite timely spring rains in manywheat-producing areas, long-termdrought and subsoil moisture short-ages reduced wheat-yield potentialacross parts of the High Plains. UScorn production was up 17 per centfrom the record established in 2003.Mid-western growing-season weatherwas nearly ideal, with abundant rainfalland minimal heat stress.
Oilseed
World oilseed production rose 16 percent in 2004. Oilseed productionincreased in Brazil, Canada, China, theEuropean Union, India, Indonesia andthe USA and declined in Argentina, theRussian Federation and Ukraine.
At the start of the growing season inArgentina, lingering drought inCordoba disrupted corn planting, andsoybeans went into most of the lateplanted farmland. However, theimpact of late-season dryness in east-ern growing areas, exacerbated by theoverall lateness of the crop, loweredsoybean production by about 4 percent, despite record acreage. Similarly,sunflower production dropped 14 per
cent, despite higher yields, asharvested area fell over 20 per cent.Brazilian farmers also experienced adisappointing season, with productionlevels similar to 2003, in spite of thefifth consecutive year of recordplanted area. The lowest yields since1998 were the result of untimelydryness in major production areas andthe spread of Asian Rust in the morenortherly growing areas.
In China, consistent spring rainfall andincreased area boosted winter rape-seed production by 5 per cent.Additionally, soybean production wasup nearly 17 per cent due in part tofavourable weather throughout thegrowing season in Manchuria and theNorth China Plain.
In the European Union, total oilseedproduction increased 22 per cent dueto improved weather. A 32 per centincrease in rapeseed production greatlyoffset a nearly 6 per cent decline insunflowerseed production. Rapeseedproduction increased 43 per cent inGermany and 14 per cent in France,following a return to seasonableweather after the severe drought andheatwave of 2003. Only the UnitedKingdom reported an almost 10 percent decline in rapeseed production,partly due to excessive rainfall duringharvest. Sunflowerseed productiondeclined in many countries due to
reduced area, despite favourableweather that increased yields.
In India, total oilseed productionremained virtually unchanged in 2004.Winter rapeseed production dropped6 per cent from last year’s recordlevels, despite a slightly larger area.Summer oilseed production wasmixed, as many major productionareas were affected by periods ofuntimely dryness, including someduring the height of the plantingseason. Soybean production, which isconcentrated in parts of central India,most affected by the erratic start tothe 2004 monsoon season, declined4 per cent, as higher acreage offset aprojected 20 per cent drop from the
95
800
700
600
500
400
300
0
200
100
Jan-
1Ja
n-5
Jan-
9Ja
n-13
Jan-
17Ja
n-21
Jan-
25Ja
n-29
Feb-
2Fe
b-6
Feb-
10Fe
b-14
Feb-
18Fe
b-22
Feb-
26M
ar-2
5M
ar-3
0M
ar-2
Mar
-6M
ar-1
0M
ar-1
4M
ar-1
8M
ar-2
2M
ar-2
6M
ar-3
0A
pr-3
Apr
-7A
pr-1
1A
pr-1
5A
pr-1
9A
pr-2
3A
pr-2
7
Prec
ipita
tion
(mm
)
Date
Normal20042003
Cumulativeprecipitation for RioGrande Do Sul,Brazil, 1 January-30 April 2004
BLTN 54/2 17/06/05 12:42 Page 95
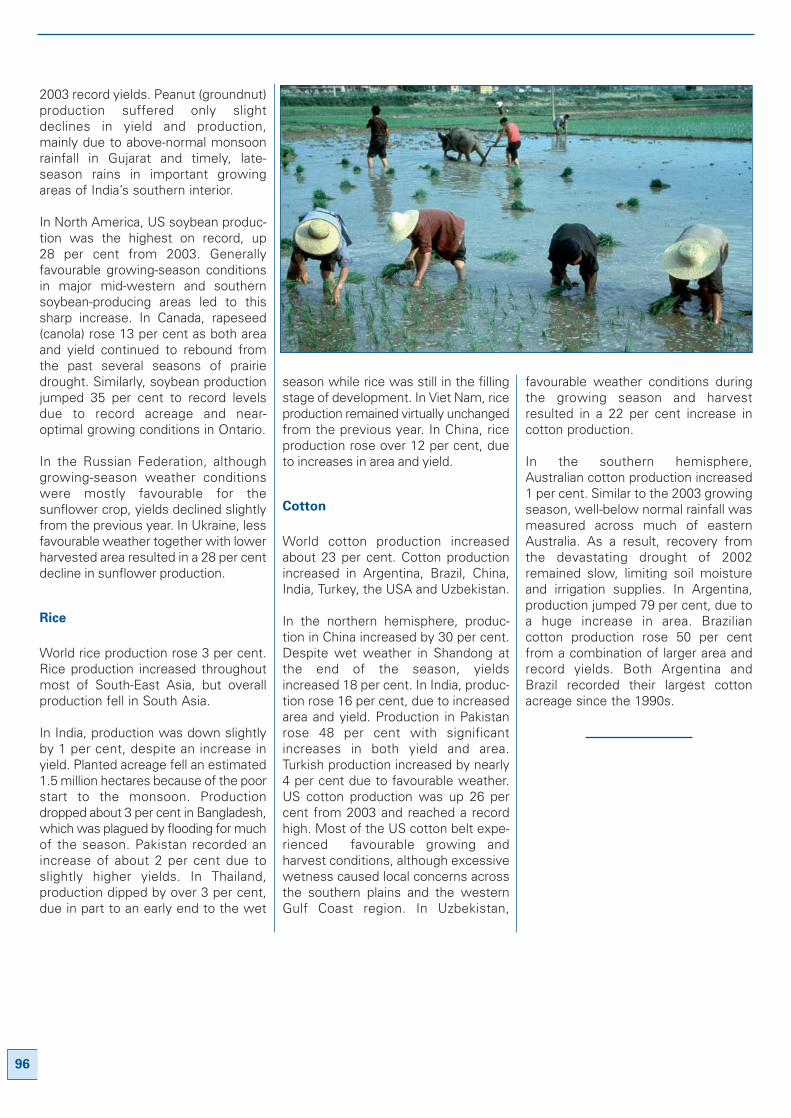
96
2003 record yields. Peanut (groundnut)production suffered only slightdeclines in yield and production,mainly due to above-normal monsoonrainfall in Gujarat and timely, late-season rains in important growingareas of India’s southern interior.
In North America, US soybean produc-tion was the highest on record, up28 per cent from 2003. Generallyfavourable growing-season conditionsin major mid-western and southernsoybean-producing areas led to thissharp increase. In Canada, rapeseed(canola) rose 13 per cent as both areaand yield continued to rebound fromthe past several seasons of prairiedrought. Similarly, soybean productionjumped 35 per cent to record levelsdue to record acreage and near-optimal growing conditions in Ontario.
In the Russian Federation, althoughgrowing-season weather conditionswere mostly favourable for thesunflower crop, yields declined slightlyfrom the previous year. In Ukraine, lessfavourable weather together with lowerharvested area resulted in a 28 per centdecline in sunflower production.
Rice
World rice production rose 3 per cent.Rice production increased throughoutmost of South-East Asia, but overallproduction fell in South Asia.
In India, production was down slightlyby 1 per cent, despite an increase inyield. Planted acreage fell an estimated1.5 million hectares because of the poorstart to the monsoon. Productiondropped about 3 per cent in Bangladesh,which was plagued by flooding for muchof the season. Pakistan recorded anincrease of about 2 per cent due toslightly higher yields. In Thailand,production dipped by over 3 per cent,due in part to an early end to the wet
season while rice was still in the fillingstage of development. In Viet Nam, riceproduction remained virtually unchangedfrom the previous year. In China, riceproduction rose over 12 per cent, dueto increases in area and yield.
Cotton
World cotton production increasedabout 23 per cent. Cotton productionincreased in Argentina, Brazil, China,India, Turkey, the USA and Uzbekistan.
In the northern hemisphere, produc-tion in China increased by 30 per cent.Despite wet weather in Shandong atthe end of the season, yieldsincreased 18 per cent. In India, produc-tion rose 16 per cent, due to increasedarea and yield. Production in Pakistanrose 48 per cent with significantincreases in both yield and area.Turkish production increased by nearly4 per cent due to favourable weather.US cotton production was up 26 percent from 2003 and reached a recordhigh. Most of the US cotton belt expe-rienced favourable growing andharvest conditions, although excessivewetness caused local concerns acrossthe southern plains and the westernGulf Coast region. In Uzbekistan,
favourable weather conditions duringthe growing season and harvestresulted in a 22 per cent increase incotton production.
In the southern hemisphere,Australian cotton production increased1 per cent. Similar to the 2003 growingseason, well-below normal rainfall wasmeasured across much of easternAustralia. As a result, recovery fromthe devastating drought of 2002remained slow, limiting soil moistureand irrigation supplies. In Argentina,production jumped 79 per cent, due toa huge increase in area. Braziliancotton production rose 50 per centfrom a combination of larger area andrecord yields. Both Argentina andBrazil recorded their largest cottonacreage since the 1990s.
BLTN 54/2 13/06/05 17:31 Page 96
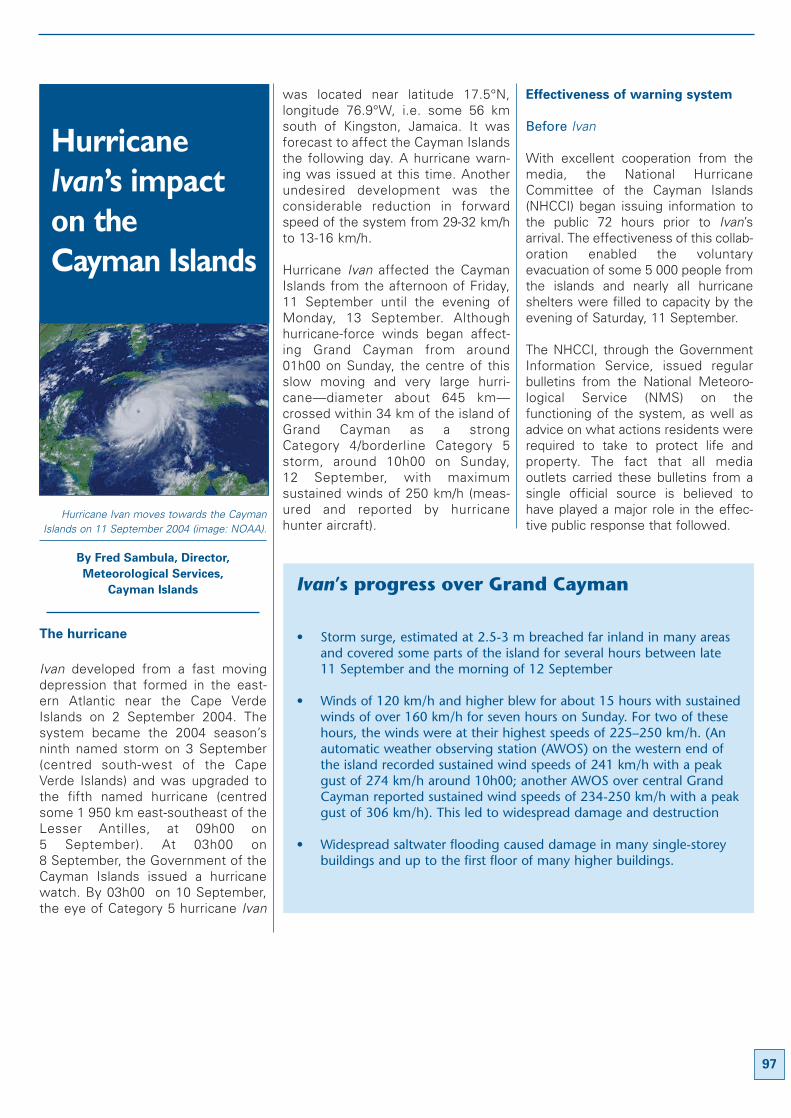
Hurricane Ivan moves towards the CaymanIslands on 11 September 2004 (image: NOAA).
By Fred Sambula, Director,
Meteorological Services,
Cayman Islands
The hurricane
Ivan developed from a fast movingdepression that formed in the east-ern Atlantic near the Cape VerdeIslands on 2 September 2004. Thesystem became the 2004 season’sninth named storm on 3 September(centred south-west of the CapeVerde Islands) and was upgraded tothe fifth named hurricane (centredsome 1 950 km east-southeast of theLesser Antilles, at 09h00 on5 September). At 03h00 on8 September, the Government of theCayman Islands issued a hurricanewatch. By 03h00 on 10 September,the eye of Category 5 hurricane Ivan
was located near latitude 17.5°N,longitude 76.9°W, i.e. some 56 kmsouth of Kingston, Jamaica. It wasforecast to affect the Cayman Islandsthe following day. A hurricane warn-ing was issued at this time. Anotherundesired development was theconsiderable reduction in forwardspeed of the system from 29-32 km/hto 13-16 km/h.
Hurricane Ivan affected the CaymanIslands from the afternoon of Friday,11 September until the evening ofMonday, 13 September. Althoughhurricane-force winds began affect-ing Grand Cayman from around01h00 on Sunday, the centre of thisslow moving and very large hurri-cane—diameter about 645 km—crossed within 34 km of the island ofGrand Cayman as a strongCategory 4/borderline Category 5storm, around 10h00 on Sunday,12 September, with maximumsustained winds of 250 km/h (meas-ured and reported by hurricanehunter aircraft).
Effectiveness of warning system
Before Ivan
With excellent cooperation from themedia, the National HurricaneCommittee of the Cayman Islands(NHCCI) began issuing information tothe public 72 hours prior to Ivan’sarrival. The effectiveness of this collab-oration enabled the voluntaryevacuation of some 5 000 people fromthe islands and nearly all hurricaneshelters were filled to capacity by theevening of Saturday, 11 September.
The NHCCI, through the GovernmentInformation Service, issued regularbulletins from the National Meteoro-logical Service (NMS) on thefunctioning of the system, as well asadvice on what actions residents wererequired to take to protect life andproperty. The fact that all mediaoutlets carried these bulletins from asingle official source is believed tohave played a major role in the effec-tive public response that followed.
97
HurricaneIvan’s impacton the Cayman Islands
Ivan’s progress over Grand Cayman
• Storm surge, estimated at 2.5-3 m breached far inland in many areasand covered some parts of the island for several hours between late11 September and the morning of 12 September
• Winds of 120 km/h and higher blew for about 15 hours with sustainedwinds of over 160 km/h for seven hours on Sunday. For two of thesehours, the winds were at their highest speeds of 225–250 km/h. (Anautomatic weather observing station (AWOS) on the western end ofthe island recorded sustained wind speeds of 241 km/h with a peakgust of 274 km/h around 10h00; another AWOS over central GrandCayman reported sustained wind speeds of 234-250 km/h with a peakgust of 306 km/h). This led to widespread damage and destruction
• Widespread saltwater flooding caused damage in many single-storeybuildings and up to the first floor of many higher buildings.
BLTN 54/2 13/06/05 17:31 Page 97
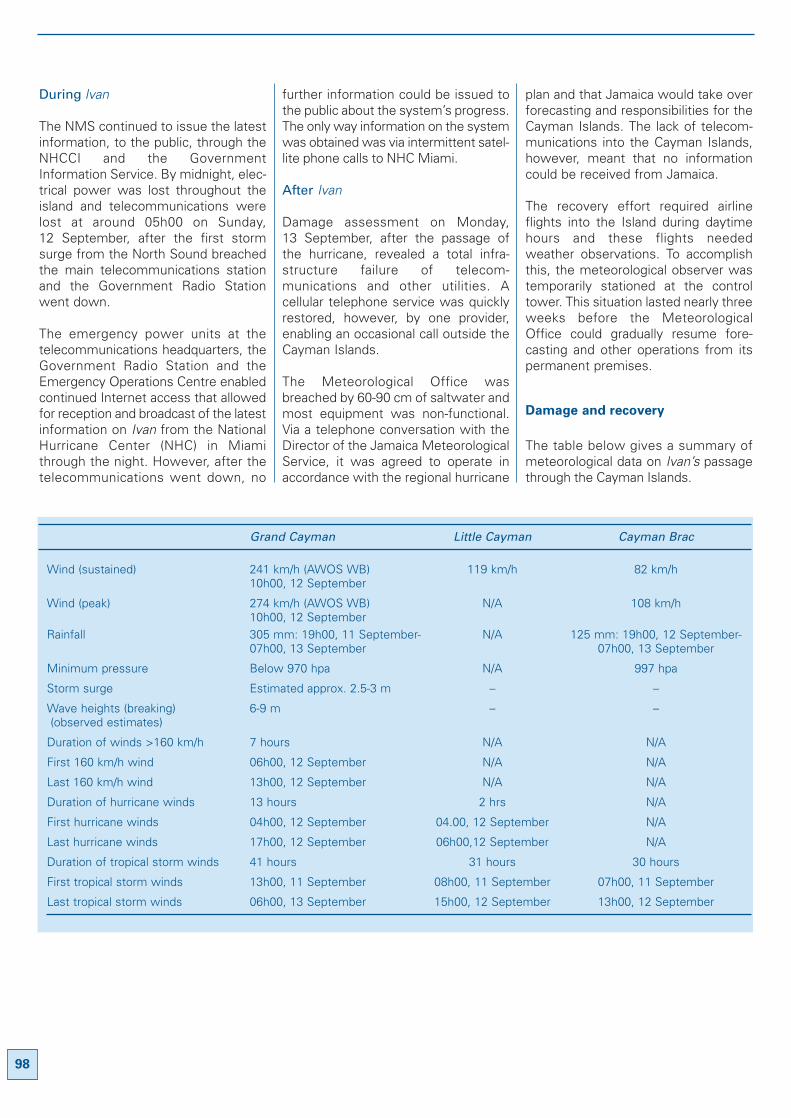
During Ivan
The NMS continued to issue the latestinformation, to the public, through theNHCCI and the GovernmentInformation Service. By midnight, elec-trical power was lost throughout theisland and telecommunications werelost at around 05h00 on Sunday,12 September, after the first stormsurge from the North Sound breachedthe main telecommunications stationand the Government Radio Stationwent down.
The emergency power units at thetelecommunications headquarters, theGovernment Radio Station and theEmergency Operations Centre enabledcontinued Internet access that allowedfor reception and broadcast of the latestinformation on Ivan from the NationalHurricane Center (NHC) in Miamithrough the night. However, after thetelecommunications went down, no
further information could be issued tothe public about the system’s progress.The only way information on the systemwas obtained was via intermittent satel-lite phone calls to NHC Miami.
After Ivan
Damage assessment on Monday,13 September, after the passage ofthe hurricane, revealed a total infra-structure failure of telecom-munications and other utilities. Acellular telephone service was quicklyrestored, however, by one provider,enabling an occasional call outside theCayman Islands.
The Meteorological Office wasbreached by 60-90 cm of saltwater andmost equipment was non-functional.Via a telephone conversation with theDirector of the Jamaica MeteorologicalService, it was agreed to operate inaccordance with the regional hurricane
plan and that Jamaica would take overforecasting and responsibilities for theCayman Islands. The lack of telecom-munications into the Cayman Islands,however, meant that no informationcould be received from Jamaica.
The recovery effort required airlineflights into the Island during daytimehours and these flights neededweather observations. To accomplishthis, the meteorological observer wastemporarily stationed at the controltower. This situation lasted nearly threeweeks before the MeteorologicalOffice could gradually resume fore-casting and other operations from itspermanent premises.
Damage and recovery
The table below gives a summary ofmeteorological data on Ivan’s passagethrough the Cayman Islands.
98
Grand Cayman Little Cayman Cayman Brac
Wind (sustained) 241 km/h (AWOS WB) 119 km/h 82 km/h10h00, 12 September
Wind (peak) 274 km/h (AWOS WB) N/A 108 km/h10h00, 12 September
Rainfall 305 mm: 19h00, 11 September- N/A 125 mm: 19h00, 12 September-07h00, 13 September 07h00, 13 September
Minimum pressure Below 970 hpa N/A 997 hpa
Storm surge Estimated approx. 2.5-3 m – –
Wave heights (breaking) 6-9 m – –(observed estimates)
Duration of winds >160 km/h 7 hours N/A N/A
First 160 km/h wind 06h00, 12 September N/A N/A
Last 160 km/h wind 13h00, 12 September N/A N/A
Duration of hurricane winds 13 hours 2 hrs N/A
First hurricane winds 04h00, 12 September 04.00, 12 September N/A
Last hurricane winds 17h00, 12 September 06h00,12 September N/A
Duration of tropical storm winds 41 hours 31 hours 30 hours
First tropical storm winds 13h00, 11 September 08h00, 11 September 07h00, 11 September
Last tropical storm winds 06h00, 13 September 15h00, 12 September 13h00, 12 September
BLTN 54/2 13/06/05 17:31 Page 98
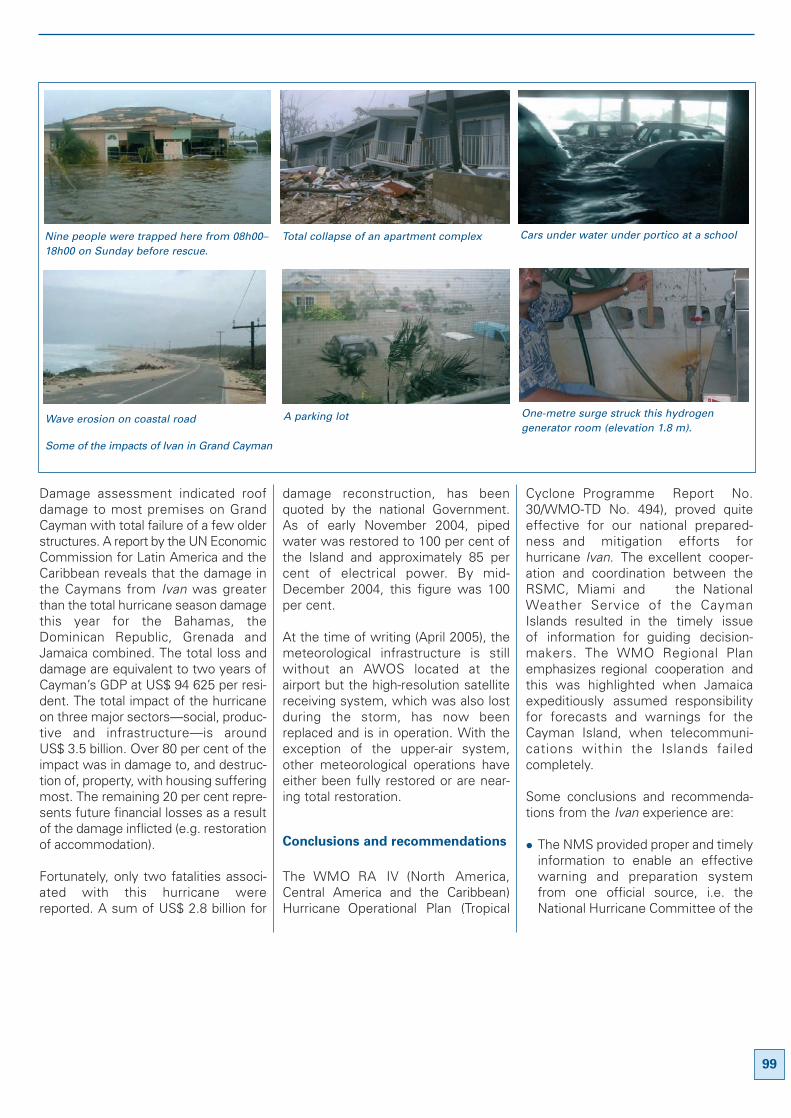
Damage assessment indicated roofdamage to most premises on GrandCayman with total failure of a few olderstructures. A report by the UN EconomicCommission for Latin America and theCaribbean reveals that the damage inthe Caymans from Ivan was greaterthan the total hurricane season damagethis year for the Bahamas, theDominican Republic, Grenada andJamaica combined. The total loss anddamage are equivalent to two years ofCayman’s GDP at US$ 94 625 per resi-dent. The total impact of the hurricaneon three major sectors—social, produc-tive and infrastructure—is aroundUS$ 3.5 billion. Over 80 per cent of theimpact was in damage to, and destruc-tion of, property, with housing sufferingmost. The remaining 20 per cent repre-sents future financial losses as a resultof the damage inflicted (e.g. restorationof accommodation).
Fortunately, only two fatalities associ-ated with this hurricane werereported. A sum of US$ 2.8 billion for
damage reconstruction, has beenquoted by the national Government.As of early November 2004, pipedwater was restored to 100 per cent ofthe Island and approximately 85 percent of electrical power. By mid-December 2004, this figure was 100per cent.
At the time of writing (April 2005), themeteorological infrastructure is stillwithout an AWOS located at theairport but the high-resolution satellitereceiving system, which was also lostduring the storm, has now beenreplaced and is in operation. With theexception of the upper-air system,other meteorological operations haveeither been fully restored or are near-ing total restoration.
Conclusions and recommendations
The WMO RA IV (North America,Central America and the Caribbean)Hurricane Operational Plan (Tropical
Cyclone Programme Report No.30/WMO-TD No. 494), proved quiteeffective for our national prepared-ness and mitigation efforts forhurricane Ivan. The excellent cooper-ation and coordination between theRSMC, Miami and the NationalWeather Service of the CaymanIslands resulted in the timely issueof information for guiding decision-makers. The WMO Regional Planemphasizes regional cooperation andthis was highlighted when Jamaicaexpeditiously assumed responsibilityfor forecasts and warnings for theCayman Island, when telecommuni-cations within the Islands failedcompletely.
Some conclusions and recommenda-tions from the Ivan experience are:
� The NMS provided proper and timelyinformation to enable an effectivewarning and preparation systemfrom one official source, i.e. theNational Hurricane Committee of the
99
Nine people were trapped here from 08h00–18h00 on Sunday before rescue.
Total collapse of an apartment complex Cars under water under portico at a school
Wave erosion on coastal road A parking lot One-metre surge struck this hydrogengenerator room (elevation 1.8 m).
Some of the impacts of Ivan in Grand Cayman
BLTN 54/2 13/06/05 17:31 Page 99
Cayman Islands (NHCCI). Coupledwith excellent media collaboration,the message reached the public,who prepared accordingly and onlytwo lives were lost.
� There is a need for a purpose-builtmeteorological facility and to reinforcethe supporting infrastructure, suchthat failure of this function is kept toan extreme minimum.
� Two of the most effective and reli-able tools in hurricane tracking andforecasting, i.e. a weather radar anda storm-surge model, were notice-ably absent from our preparednessand mitigation arsenal. Every effortmust be made to obtain these asthey will significantly improve thequality of warning informationprovided by the NMS for decision-making for preparedness and mitigation.
� This event proved that the NMS iscapable of offering effective earlywarnings on severe weather to thenation.
� There is a need to have a robusttelecommunications and informationcommunication and technologynetwork capable of affording reliableoperations before, during and afterstorm events.
� The Government should be encour-aged to take a more active role inensuring the health and sustainabil-ity of weather services for thenation. In hurricane-prone countries,such as the Cayman Islands, there isa need to ensure that early warningsof natural disasters become an inte-gral part of government policy andthat they form an effective instru-ment for preventive strategies.
100
BLTN 54/2 13/06/05 17:52 Page 100
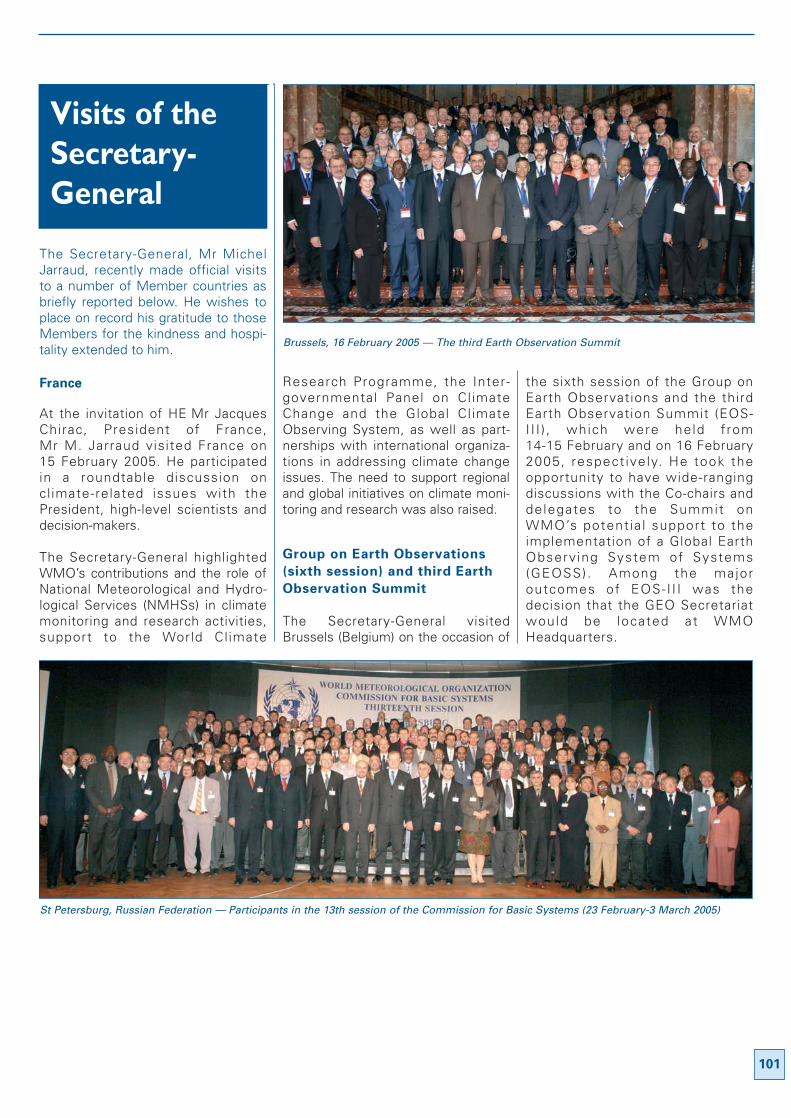
101
The Secretary-General, Mr MichelJarraud, recently made official visitsto a number of Member countries asbriefly reported below. He wishes toplace on record his gratitude to thoseMembers for the kindness and hospi-tality extended to him.
France
At the invitation of HE Mr JacquesChirac, President of France, Mr M. Jarraud visited France on15 February 2005. He participated in a roundtable discussion on cl imate-related issues with the President, high-level scientists anddecision-makers.
The Secretary-General highlightedWMO’s contributions and the role ofNational Meteorological and Hydro-logical Services (NMHSs) in climatemonitoring and research activities,support to the World Cl imate
Research Programme, the Inter-governmental Panel on ClimateChange and the Global Cl imateObserving System, as well as part-nerships with international organiza-tions in addressing climate changeissues. The need to support regionaland global initiatives on climate moni-toring and research was also raised.
Group on Earth Observations
(sixth session) and third Earth
Observation Summit
The Secretary-General visited Brussels (Belgium) on the occasion of
the sixth session of the Group onEarth Observations and the thirdEarth Observation Summit (EOS-I I I ) , which were held f rom14-15 February and on 16 February2005, respect ively. He took theopportunity to have wide-rangingdiscussions with the Co-chairs anddelegates to the Summit onWMO’s potent ia l support to theimplementation of a Global EarthObserv ing System of Systems(GEOSS). Among the majoroutcomes of EOS-I I I was thedecision that the GEO Secretariatwould be located at WMOHeadquarters.
Visits of theSecretary-General
Brussels, 16 February 2005 — The third Earth Observation Summit
St Petersburg, Russian Federation — Participants in the 13th session of the Commission for Basic Systems (23 February-3 March 2005)
BLTN 54/2 13/06/05 17:52 Page 101
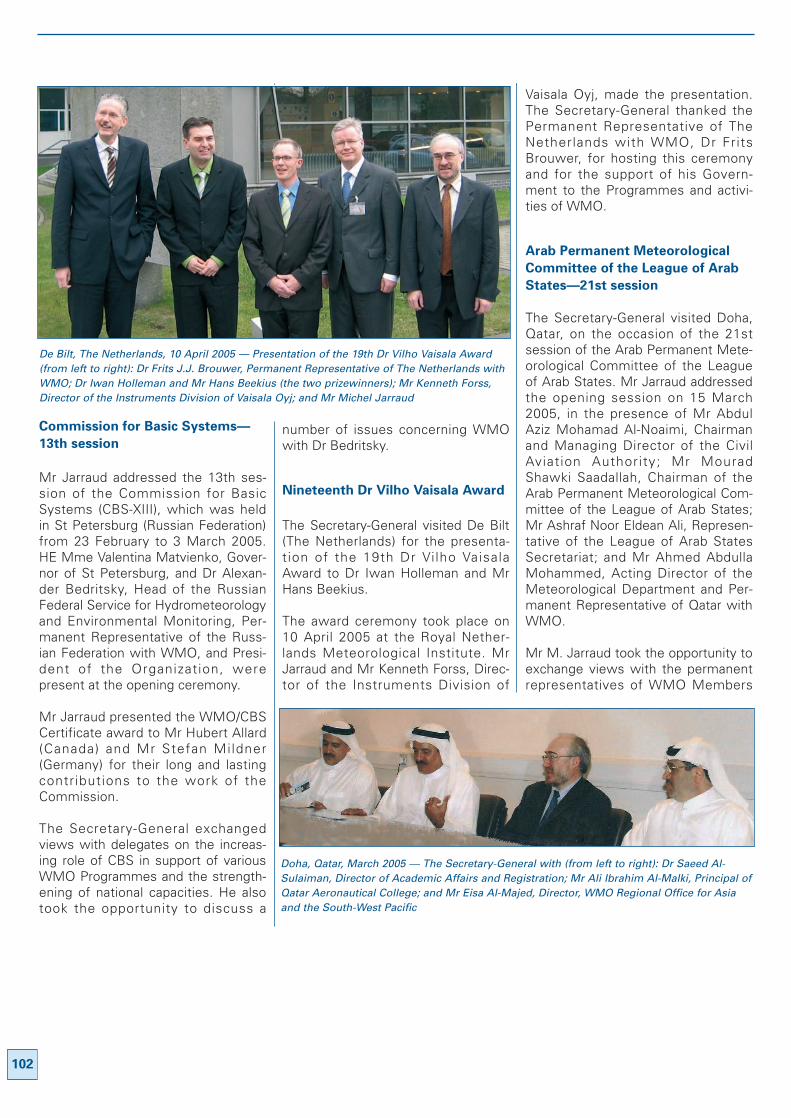
102
Commission for Basic Systems—
13th session
Mr Jarraud addressed the 13th ses-sion of the Commission for BasicSystems (CBS-XIII), which was heldin St Petersburg (Russian Federation)from 23 February to 3 March 2005.HE Mme Valentina Matvienko, Gover-nor of St Petersburg, and Dr Alexan-der Bedritsky, Head of the RussianFederal Service for Hydrometeorologyand Environmental Monitoring, Per-manent Representative of the Russ-ian Federation with WMO, and Presi-dent of the Organization, werepresent at the opening ceremony.
Mr Jarraud presented the WMO/CBSCertificate award to Mr Hubert Allard(Canada) and Mr Stefan Mildner(Germany) for their long and lastingcontributions to the work of theCommission.
The Secretary-General exchangedviews with delegates on the increas-ing role of CBS in support of variousWMO Programmes and the strength-ening of national capacities. He alsotook the opportunity to discuss a
number of issues concerning WMOwith Dr Bedritsky.
Nineteenth Dr Vilho Vaisala Award
The Secretary-General visited De Bilt(The Netherlands) for the presenta-t ion of the 19th Dr Vi lho VaisalaAward to Dr Iwan Holleman and MrHans Beekius.
The award ceremony took place on10 April 2005 at the Royal Nether-lands Meteorological Institute. MrJarraud and Mr Kenneth Forss, Direc-tor of the Instruments Division of
Vaisala Oyj, made the presentation.The Secretary-General thanked thePermanent Representative of TheNetherlands with WMO, Dr FritsBrouwer, for hosting this ceremonyand for the support of his Govern-ment to the Programmes and activi-ties of WMO.
Arab Permanent Meteorological
Committee of the League of Arab
States—21st session
The Secretary-General visited Doha,Qatar, on the occasion of the 21stsession of the Arab Permanent Mete-orological Committee of the Leagueof Arab States. Mr Jarraud addressedthe opening session on 15 March2005, in the presence of Mr AbdulAziz Mohamad Al-Noaimi, Chairmanand Managing Director of the CivilAviation Authority; Mr MouradShawki Saadallah, Chairman of theArab Permanent Meteorological Com-mittee of the League of Arab States;Mr Ashraf Noor Eldean Ali, Represen-tative of the League of Arab StatesSecretariat; and Mr Ahmed AbdullaMohammed, Acting Director of theMeteorological Department and Per-manent Representative of Qatar withWMO.
Mr M. Jarraud took the opportunity toexchange views with the permanentrepresentatives of WMO Members
De Bilt, The Netherlands, 10 April 2005 — Presentation of the 19th Dr Vilho Vaisala Award(from left to right): Dr Frits J.J. Brouwer, Permanent Representative of The Netherlands withWMO; Dr Iwan Holleman and Mr Hans Beekius (the two prizewinners); Mr Kenneth Forss,Director of the Instruments Division of Vaisala Oyj; and Mr Michel Jarraud
Doha, Qatar, March 2005 — The Secretary-General with (from left to right): Dr Saeed Al-Sulaiman, Director of Academic Affairs and Registration; Mr Ali Ibrahim Al-Malki, Principal ofQatar Aeronautical College; and Mr Eisa Al-Majed, Director, WMO Regional Office for Asiaand the South-West Pacific
BLTN 54/2 13/06/05 17:52 Page 102
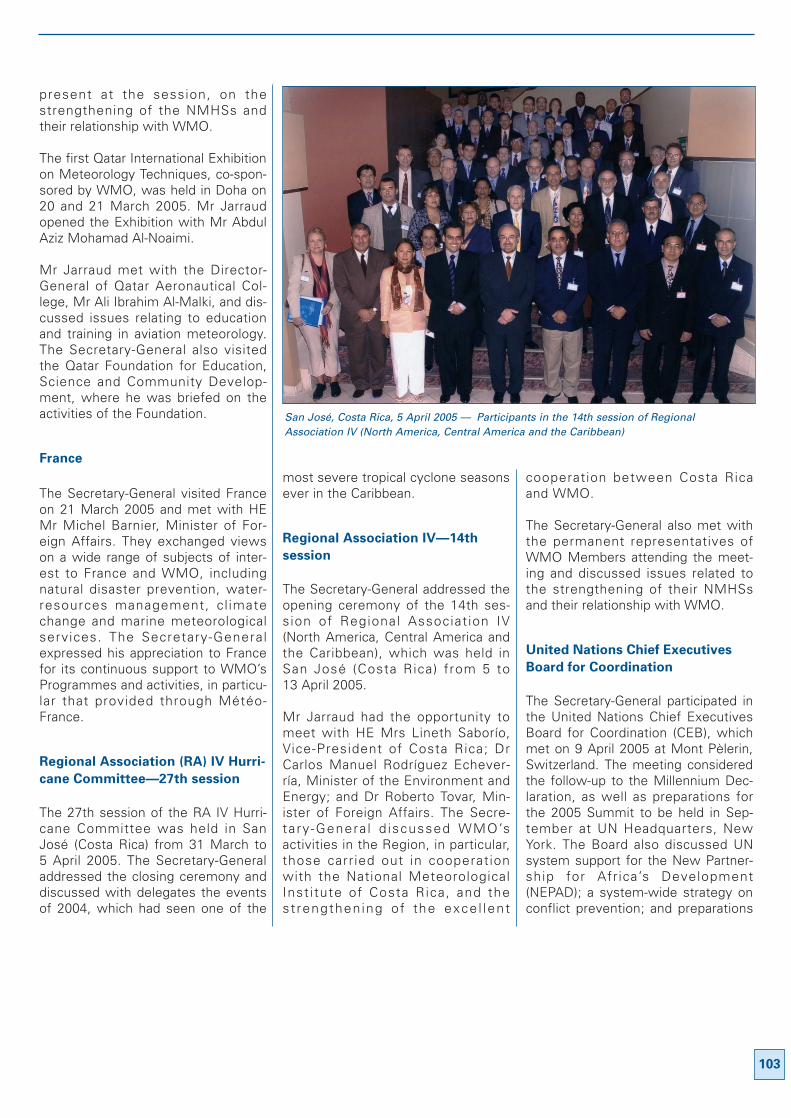
103
present at the session, on thestrengthening of the NMHSs andtheir relationship with WMO.
The first Qatar International Exhibitionon Meteorology Techniques, co-spon-sored by WMO, was held in Doha on20 and 21 March 2005. Mr Jarraudopened the Exhibition with Mr AbdulAziz Mohamad Al-Noaimi.
Mr Jarraud met with the Director-General of Qatar Aeronautical Col-lege, Mr Ali Ibrahim Al-Malki, and dis-cussed issues relating to educationand training in aviation meteorology.The Secretary-General also visitedthe Qatar Foundation for Education,Science and Community Develop-ment, where he was briefed on theactivities of the Foundation.
France
The Secretary-General visited Franceon 21 March 2005 and met with HEMr Michel Barnier, Minister of For-eign Affairs. They exchanged viewson a wide range of subjects of inter-est to France and WMO, includingnatural disaster prevention, water-resources management, cl imatechange and marine meteorologicalservices. The Secretary-Generalexpressed his appreciation to Francefor its continuous support to WMO’sProgrammes and activities, in particu-lar that provided through Météo-France.
Regional Association (RA) IV Hurri-
cane Committee—27th session
The 27th session of the RA IV Hurri-cane Committee was held in SanJosé (Costa Rica) from 31 March to5 April 2005. The Secretary-Generaladdressed the closing ceremony anddiscussed with delegates the eventsof 2004, which had seen one of the
most severe tropical cyclone seasonsever in the Caribbean.
Regional Association IV—14th
session
The Secretary-General addressed theopening ceremony of the 14th ses-sion of Regional Associat ion IV(North America, Central America andthe Caribbean), which was held inSan José (Costa Rica) from 5 to13 April 2005.
Mr Jarraud had the opportunity tomeet with HE Mrs Lineth Saborío,Vice-President of Costa Rica; DrCarlos Manuel Rodríguez Echever-ría, Minister of the Environment andEnergy; and Dr Roberto Tovar, Min-ister of Foreign Affairs. The Secre-tary -Genera l d iscussed WMO’sactivities in the Region, in particular,those carried out in cooperationwith the National MeteorologicalInst i tute of Costa Rica, and thestrengthening of the exce l lent
cooperation between Costa Ricaand WMO.
The Secretary-General also met withthe permanent representatives ofWMO Members attending the meet-ing and discussed issues related tothe strengthening of their NMHSsand their relationship with WMO.
United Nations Chief Executives
Board for Coordination
The Secretary-General participated inthe United Nations Chief ExecutivesBoard for Coordination (CEB), whichmet on 9 April 2005 at Mont Pèlerin,Switzerland. The meeting consideredthe follow-up to the Millennium Dec-laration, as well as preparations forthe 2005 Summit to be held in Sep-tember at UN Headquarters, NewYork. The Board also discussed UNsystem support for the New Partner-ship for Africa’s Development(NEPAD); a system-wide strategy onconflict prevention; and preparations
San José, Costa Rica, 5 April 2005 — Participants in the 14th session of RegionalAssociation IV (North America, Central America and the Caribbean)
BLTN 54/2 13/06/05 17:52 Page 103
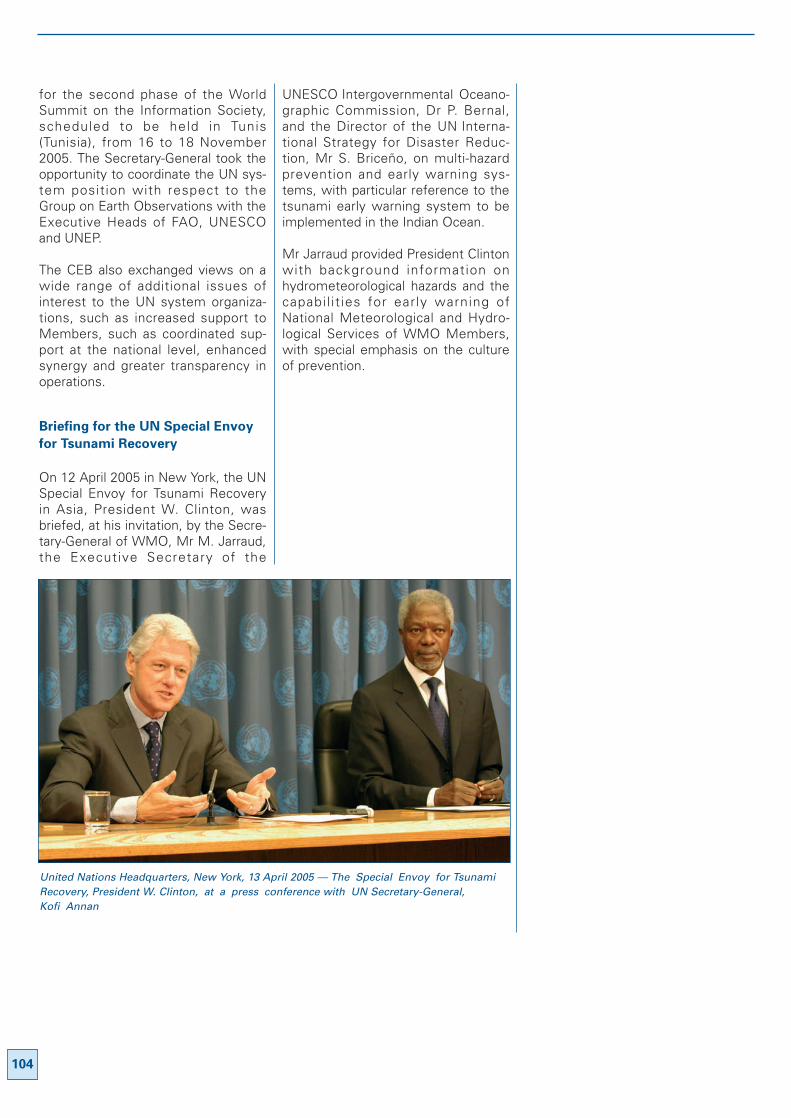
for the second phase of the WorldSummit on the Information Society,scheduled to be held in Tunis(Tunisia), from 16 to 18 November2005. The Secretary-General took theopportunity to coordinate the UN sys-tem position with respect to theGroup on Earth Observations with theExecutive Heads of FAO, UNESCOand UNEP.
The CEB also exchanged views on awide range of additional issues ofinterest to the UN system organiza-tions, such as increased support toMembers, such as coordinated sup-port at the national level, enhancedsynergy and greater transparency inoperations.
Briefing for the UN Special Envoy
for Tsunami Recovery
On 12 April 2005 in New York, the UNSpecial Envoy for Tsunami Recoveryin Asia, President W. Clinton, wasbriefed, at his invitation, by the Secre-tary-General of WMO, Mr M. Jarraud,the Executive Secretary of the
UNESCO Intergovernmental Oceano-graphic Commission, Dr P. Bernal,and the Director of the UN Interna-tional Strategy for Disaster Reduc-tion, Mr S. Briceño, on multi-hazardprevention and early warning sys-tems, with particular reference to thetsunami early warning system to beimplemented in the Indian Ocean.
Mr Jarraud provided President Clintonwith background information onhydrometeorological hazards and thecapabil it ies for early warning ofNational Meteorological and Hydro-logical Services of WMO Members,with special emphasis on the cultureof prevention.
United Nations Headquarters, New York, 13 April 2005 — The Special Envoy for TsunamiRecovery, President W. Clinton, at a press conference with UN Secretary-General, Kofi Annan
104
BLTN 54/2 13/06/05 17:52 Page 104
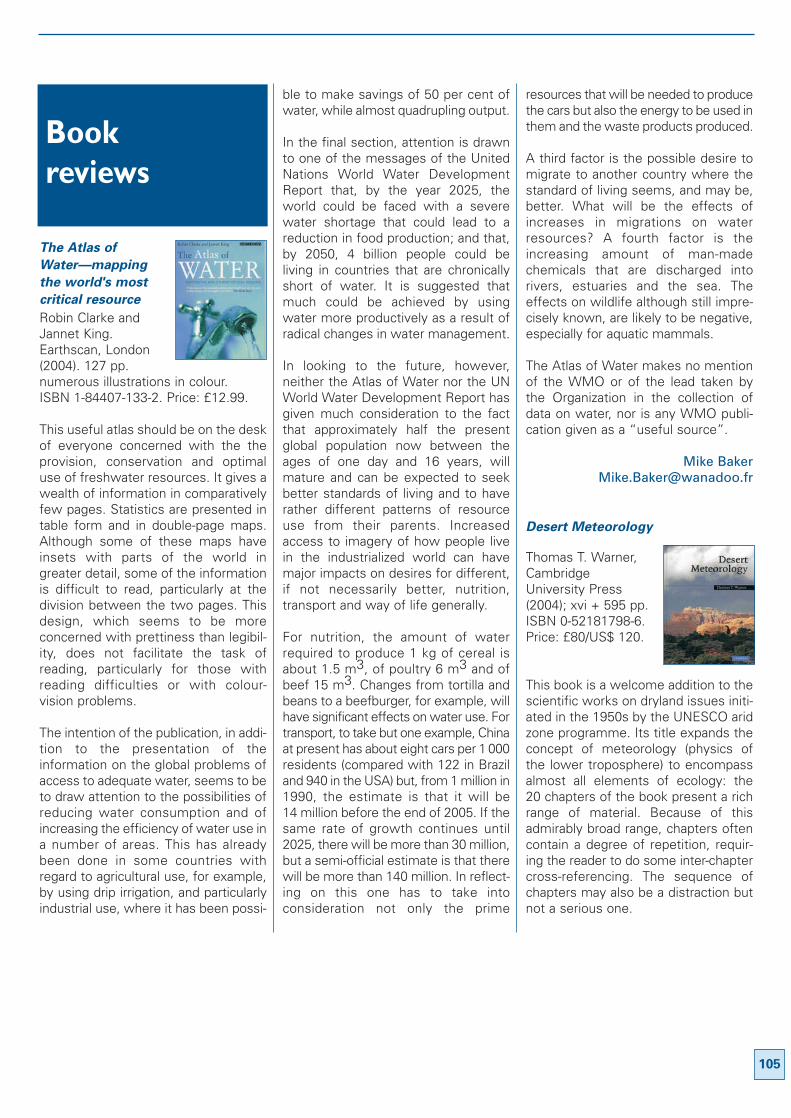
The Atlas of
Water—mapping
the world's most
critical resource
Robin Clarke andJannet King.Earthscan, London(2004). 127 pp.numerous illustrations in colour. ISBN 1-84407-133-2. Price: £12.99.
This useful atlas should be on the deskof everyone concerned with the theprovision, conservation and optimaluse of freshwater resources. It gives awealth of information in comparativelyfew pages. Statistics are presented intable form and in double-page maps.Although some of these maps haveinsets with parts of the world ingreater detail, some of the informationis difficult to read, particularly at thedivision between the two pages. Thisdesign, which seems to be moreconcerned with prettiness than legibil-ity, does not facilitate the task ofreading, particularly for those withreading difficulties or with colour-vision problems.
The intention of the publication, in addi-tion to the presentation of theinformation on the global problems ofaccess to adequate water, seems to beto draw attention to the possibilities ofreducing water consumption and ofincreasing the efficiency of water use ina number of areas. This has alreadybeen done in some countries withregard to agricultural use, for example,by using drip irrigation, and particularlyindustrial use, where it has been possi-
ble to make savings of 50 per cent ofwater, while almost quadrupling output.
In the final section, attention is drawnto one of the messages of the UnitedNations World Water DevelopmentReport that, by the year 2025, theworld could be faced with a severewater shortage that could lead to areduction in food production; and that,by 2050, 4 billion people could beliving in countries that are chronicallyshort of water. It is suggested thatmuch could be achieved by usingwater more productively as a result ofradical changes in water management.
In looking to the future, however,neither the Atlas of Water nor the UNWorld Water Development Report hasgiven much consideration to the factthat approximately half the presentglobal population now between theages of one day and 16 years, willmature and can be expected to seekbetter standards of living and to haverather different patterns of resourceuse from their parents. Increasedaccess to imagery of how people livein the industrialized world can havemajor impacts on desires for different,if not necessarily better, nutrition,transport and way of life generally.
For nutrition, the amount of waterrequired to produce 1 kg of cereal isabout 1.5 m3, of poultry 6 m3 and ofbeef 15 m3. Changes from tortilla andbeans to a beefburger, for example, willhave significant effects on water use. Fortransport, to take but one example, Chinaat present has about eight cars per 1 000residents (compared with 122 in Braziland 940 in the USA) but, from 1 million in1990, the estimate is that it will be14 million before the end of 2005. If thesame rate of growth continues until2025, there will be more than 30 million,but a semi-official estimate is that therewill be more than 140 million. In reflect-ing on this one has to take intoconsideration not only the prime
resources that will be needed to producethe cars but also the energy to be used inthem and the waste products produced.
A third factor is the possible desire tomigrate to another country where thestandard of living seems, and may be,better. What will be the effects ofincreases in migrations on waterresources? A fourth factor is theincreasing amount of man-madechemicals that are discharged intorivers, estuaries and the sea. Theeffects on wildlife although still impre-cisely known, are likely to be negative,especially for aquatic mammals.
The Atlas of Water makes no mentionof the WMO or of the lead taken bythe Organization in the collection ofdata on water, nor is any WMO publi-cation given as a “useful source”.
Mike [email protected]
Desert Meteorology
Thomas T. Warner,CambridgeUniversity Press(2004); xvi + 595 pp.ISBN 0-52181798-6.Price: £80/US$ 120.
This book is a welcome addition to thescientific works on dryland issues initi-ated in the 1950s by the UNESCO aridzone programme. Its title expands theconcept of meteorology (physics ofthe lower troposphere) to encompassalmost all elements of ecology: the20 chapters of the book present a richrange of material. Because of thisadmirably broad range, chapters oftencontain a degree of repetition, requir-ing the reader to do some inter-chaptercross-referencing. The sequence ofchapters may also be a distraction butnot a serious one.
Book reviews
105
BLTN 54/2 13/06/05 17:52 Page 105
The three principal areas covered are:
• The physics of atmospheric dynam-ics that relate to microscale(interface between air and surfaceand subsurface features of theground), meso- and macroscalecontinental or ecogeographical units
• Ecological interactions of biota,including human beings, with theelements of the desert system
• Impacts of desert processes onglobal climate and the worldwidegeography of deserts.
The geography of climatic aridity(causes) is explained and forces thatmay drive climate change are reviewed,as are likely impacts of desert environ-ment, particularly dust, on atmosphericprocesses. This is a comprehensivecoverage.
The global dimension of impacts ofdeserts and processes of drylanddegradation (desertification) causedprimarily by human overexploitation,has relevance to issues of internationalgovernance of global environmentalissues. When the WorldBank/UNDP/UNEP envisaged theestablishment of a Global EnvironmentFacility (GEF) in 1991 as a financialmechanism in support of schemes for
managing global environment issues,desertification was not considered tobe a global environment issue to beincluded with protecting the ozonelayer; limiting emission of greenhousegases; protection of biodiversity; andprotection of international waters. Theposition of GEF towards desertificationhas mellowed since 2002. Some chap-ters of this book explain the scientificbasis for this change in attitude.
Two chapters address issues of inter-actions of vegetation with, andimpacts of humans on, drylandecosystems. Advanced students ofdesert ecology will find here sourcesof ideas. One chapter addresses thequestion of human adaptation to adesert environment that is dry andaustere.
Two chapters deal with desert rainfall:a climatic feature that controls theecological features of deserts. Paucityand wide-scale variability make waterresources poor and non-predictable.Excess may cause floods that can bedestructive: this is the dilemma ofdesert inhabitants and desert biota.Recurrent drought is the most damag-ing environmental menace forinhabitants of the world’s drylands.
The text is based on solid science andthe author presents his diverse material
in a commendable style of clear and well-illustrated text. Because climate studiesdepend on the science of physics, thepresentation includes mathematicalequations (and models) but the authorhandles this in a way that keeps thebook accessible for a broad readership,which is an added merit.
A set of appendices adds to the utilityof the text. The list of references,though rich, misses several useful andrelevant publications, examples:Interactions of Desertification andClimate, by M.A.J. Williams and R.-C.Balling, 1996, WMO/UNEP; Atlas ofAfrican Rainfall and its InterannualVariability, by S.E. Nicholson, J. Kimand J. Hoopingarner, 1988, FloridaState University.
This is a reference book that deservesacclaim. It does indeed present an “in-depth review of [desert] meteorologyand climate … desert geomorphology,desert hydrologic systems, and desertthermal energy budget”. It providesexcellent text and teaching material:each chapter ends with “questions forreview” and “problems and exer-cises”, as well as hints to solvingsome of the problems and exercises.
106
BLTN 54/2 13/06/05 17:52 Page 106
The basis of civilization—Water
science?
John C. Rodda andLucio Ubertini (Eds.).InternationalAssociation ofHydrological Sciences.IAHS Publication 286.ISBN 1-901502-57-0x + 342 pp.Price: £58.50.
The introduction explores the linkagesbetween hydrology and societythroughout history and outlines theslow development of water technol-ogy and the even slower developmentof water science. Other authorsprovide specific examples of the riseof understanding of water science.
The impact of water resources devel-opment and management on societyis discussed from political, economicand cultural viewpoints. Theapproaches to risk and conflict involv-ing water are considered in detail:intellectual and philosophical inspira-tion and discursive politics in thechanging role of risk awareness arecentral to any analysis of how futurewater policy-making will be made.Issues of governance, past and pres-ent are also reviewed.
Primer on climate
change and
sustainable
development—facts,
policy analysis and
applications
Mohan Munasingheand Rob Swart.Cambridge University Press (2005).ISBN 0-521-00888-3. xii + 445 pp.Price: £30.
This Primer on climate change andsustainable development gives an up-to-date, comprehensive and accessibleoverview of the links between climatechange and sustainable development.Building on the main findings of thelast series of Intergovernmental Panelon Climate Change (IPCC) assessmentreports, in which both authors wereinvolved, the book summarizes thelatest research linking the two. Ourcurrent knowledge of the basicscience of climate change isdescribed, before moving on to thefuture scenarios of developmentwithin the context of climate change.The authors identify opportunities forsynergies and resolving potentialtrade-offs. Discussing theory, policyanalysis and applications, they analyseeffective implementation of climatepolicy at scales ranging from global tothe local.
Marine
turbulence—theories,
observations and
models (Results of
the CARTUM Project)
Helmut Z. Baumert,John H. Simpson andJürgen Sündermann(Eds.). Cambridge University Press(2005). ISBN 0-521-83789-8. Price:£175/US$ 275.
This books gives a comprehensiveoverview of measurement techniquesand theories for marine turbulence andmixing of greenhouse gases, nutrients,
trace elements, and hazardoussubstances in our oceans and shelfseas—from local to planetary scales.These processes buffer climatechanges and are centrally importantfor regional to global ecosystemdynamics.
The book is divided into eight parts,covering turbulence in relation to strat-ification, waves and intermittence;observational techniques for field stud-ies; selected computural means for thestudy of turbulence, boundary layers;practical case-studies in estuaries,fjords, lakes and shelf seas, and at theshelf edge; small scale three-dimen-sional turbulence and quasi-two-dimensional turbulence occurringon the planetary scale, and anoverview of comprehensive data setsand models codes.
107
New booksreceived
BLTN 54/2 17/06/05 12:42 Page 107
108
For the full WMO catalogue of publica-tions and how to order these and otherpublications, see:http://www.wmo.ch/web/catalogue/
WMOStatement onthe Status ofthe GlobalClimate in 2004(WMO-No. 983)[E] - [F] – [R] - [S]12 pp.Price: CHF 15.
This year’s statement (WMO-No. 983)describes the climatic conditions,including extreme weather events, forthe year 2004 and provides a historicalperspective of some of the variabilityand trends that have occurred sincethe 19th century. The statementplaces 2004 as the fourth warmestyear in the temperature record since1861 and indicates that there has beena rise in global temperature greaterthan 0.6°C since 1900.
World ClimateResearchProgramme: 25 years of scienceserving society[E]24 pp.
This brochure was issued to mark the25th anniversary of the World ClimateResearch Programme. It can also beviewed in pdf form and downloadedfrom the WCRP Website: http://www.wmo.ch/web/wcrp/news.htm
WMO IntegratedGlobal ObservingSystem (WMO-IOS)[E]8 pp.
The WMO-IOS takesEarth observations,processes them tobuild products and tools which helpdecision-makers respond to the needsof users. It is a core component of theGlobal Earth Observation System ofSystems (GEOSS). This brochureexplains what the Integrated GlobalObserving System is and how it cancontribute effectively to activities inalmost all sectors of human endeav-our. The brochure is useful fordecision-makers, the media and thepublic.
Seehttp://www.wmo.ch/news/news.htmland click on the icon for the pdfversion. Hard copies are available uponrequest from the WMO Secretariat.
Regional Association II (Asia),Thirteenth session—Abridged finalreport with resolutions (2004)(WMO-No. 981)116 pp.[A] - [C] - [E] - [F] - [R]Price: CHF 25.
Applications of Climate Forecastsfor Agriculture. Proceedings of anExpert GroupMeeting forRegionalAssociation I(Africa)(WMO/TD-1223, AGM-7)198 pp.[E]Price: CHF 30,
Servicios de Información yPredicción del Clima (SIPC) yAplicaciones Agrometeorológicaspara los Países Andinos: Actas de
la Reunión Técnica(Proceedings of theThird RegionalTechnical meetingon CLIPS andAgrometeorologicalApplications for theAndean Countries)(WMO/TD No. 1234,AGM-6)iii + 221pp.[S]Price: CHF 30.
Recentlyissued
WMO STATEMENT ON THE STATUS OFTHE GLOBAL CLIMATE IN 2004
World Meteorological OrganizationWeather • Climate • Water
WMO-No. 983
World Meteorological OrganizationIntegrated Global Observing System (WMO-IOS)a core component of the Global Earth Observation System of Systems (GEOSS)
WMO-IOS
takes Earth
observations,
processes them
together to
build products and
deliver tools
to decision makers
for helping
to make informed
decisions
for the needs
of society.
The Integrated Global Observing System of WMO,decades of experience and services integrating:Observations: space, atmosphere, land, and oceansData: a wide variety of operational and research platformsPlatforms: in situ and in spaceTime: past and present to help understand our future.
WMO
World ClimateResearch Programme:
25 years of scienceserving society
BLTN 54/2 13/06/05 17:52 Page 108

Appointments
Philippe Dupraz:Assistant PrintingOperator/Handyman inthe Printing andElectronic PublicationsSection of theConferences, Printingand Distribution
Department on 1 January 2005
Christian Giroud:Offset Operator in thePrinting and ElectronicPublications Section ofthe Conferences,Printing andDistributionDepartment on
1 January 2005
Yvon Staub: StockClerk in the PublicationsSales and DistributionUnit of the Printing andElectronic PublicationsSection of theConferences, Printingand Distribution
Department on 1 January 2005
Datius G. Rutashobya:Scientific Officer in theHydrology Division ofthe Hydrology andWater ResourcesDepartment on10 January 2005
Robert J. Stefanski:Scientific Officer in theAgriculturalMeteorology Division ofthe World ClimateProgramme Departmenton 17 January 2005
Xiaoxia (Anny) Zhang:Head of the Payroll andPension Unit in theHuman ResourcesDivision of theResource ManagementDepartment on24 January 2005
Edgard E. Cabrera:Chief of the OceanAffairs Division in theApplications ProgrammeDepartment on31 January 2005
Herbert Lanz: AssistantWebmaster,Information SystemsDivision, ResourceManagementDepartment on1 February 2005
Stuart J. Baldwin:Treasurer in the FinanceDivision, ResourceManagementDepartment on1 February 2005
Isabelle Rüedi:ProgrammeCoordination Officer,World Weather WatchDepartment, on1 February 2005
Nina Maslina: Editor(Russian language) inthe Linguistic Servicesand PublicationsDepartment on17 February 2005
Robert Maire:Maintenance Assistantin the CommonServices Division of theResource ManagementDepartment on 1 April2005
Slobodan NickovicScientific Officer in theEnvironment Division ofthe AtmosphericResearch andEnvironmentDepartment on 17 April2005
Transfers
Nelly Conforty-Ferreux, Interpreter/Translator in theLinguistic Services andPublicationsDepartment, was trans-ferred to theConferences Services ofthe Conferences, Printing and Distri-bution Department on 1 February 2005.
109
Staff news
BLTN 54/2 17/06/05 12:42 Page 109

Marc Peeters, formerlyHuman ResourcesOfficer, ResourceManagementDepartment, was trans-ferred to theConferences Servicesof the Conferences,
Printing and Distribution Department on1 February 2005.
Michel Jardon wasappointed to the post ofHuman ResourcesAssistant in theEntitlements andAdministration Unit ofthe Human ResourcesDivision, ResourceManagement Department, by transferfrom the post of Human ResourcesClerk in the Recruitment and TrainingUnit of the same Division on 1 March2005.
Joanna Drake-Stewartwas transferred fromthe post of Library Clerkin the Technical Libraryof the AtmosphericResearch andEnvironmentProgramme Department
to the post of Process Control Clerk inthe Printing and Electronic PublicationsSection of the Conferences, Printingand Distribution Department on1 March 2005.
Departure
Maria Kheir retiredfrom her post ofSenior Secretary in theCabinet and ExternalRelations Office of theSecretary-General’sOffice on 31 January2005.
Anniversary
Lucia Bertizzolo,Procurement Assistantin the Procurement andTravel Office of theResource ManagementDepartment: 30 yearson 4 March 2005
110
BLTN 54/2 13/06/05 17:52 Page 110
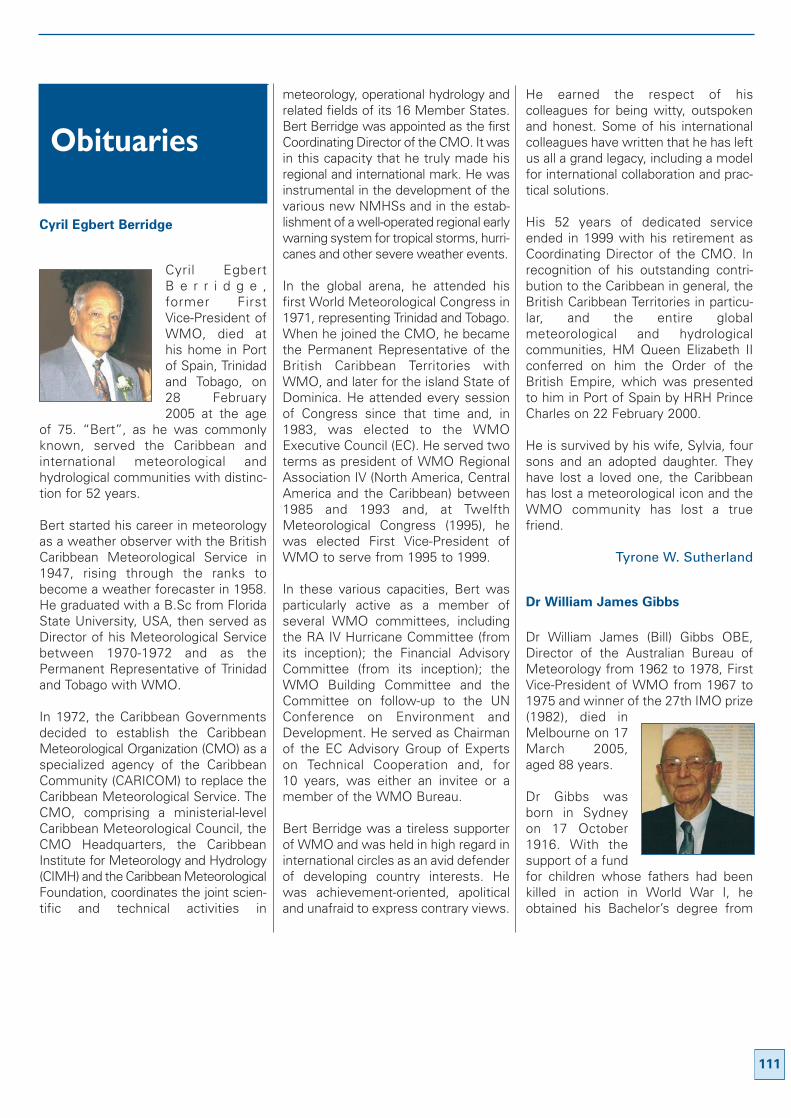
111
Cyril Egbert Berridge
Cyril EgbertB e r r i d g e ,former FirstVice-President ofWMO, died athis home in Portof Spain, Trinidadand Tobago, on28 February2005 at the age
of 75. “Bert”, as he was commonlyknown, served the Caribbean andinternational meteorological andhydrological communities with distinc-tion for 52 years.
Bert started his career in meteorologyas a weather observer with the BritishCaribbean Meteorological Service in1947, rising through the ranks tobecome a weather forecaster in 1958.He graduated with a B.Sc from FloridaState University, USA, then served asDirector of his Meteorological Servicebetween 1970-1972 and as thePermanent Representative of Trinidadand Tobago with WMO.
In 1972, the Caribbean Governmentsdecided to establish the CaribbeanMeteorological Organization (CMO) as aspecialized agency of the CaribbeanCommunity (CARICOM) to replace theCaribbean Meteorological Service. TheCMO, comprising a ministerial-levelCaribbean Meteorological Council, theCMO Headquarters, the CaribbeanInstitute for Meteorology and Hydrology(CIMH) and the Caribbean MeteorologicalFoundation, coordinates the joint scien-tific and technical activities in
meteorology, operational hydrology andrelated fields of its 16 Member States.Bert Berridge was appointed as the firstCoordinating Director of the CMO. It wasin this capacity that he truly made hisregional and international mark. He wasinstrumental in the development of thevarious new NMHSs and in the estab-lishment of a well-operated regional earlywarning system for tropical storms, hurri-canes and other severe weather events.
In the global arena, he attended hisfirst World Meteorological Congress in1971, representing Trinidad and Tobago.When he joined the CMO, he becamethe Permanent Representative of theBritish Caribbean Territories withWMO, and later for the island State ofDominica. He attended every sessionof Congress since that time and, in1983, was elected to the WMOExecutive Council (EC). He served twoterms as president of WMO RegionalAssociation IV (North America, CentralAmerica and the Caribbean) between1985 and 1993 and, at TwelfthMeteorological Congress (1995), hewas elected First Vice-President ofWMO to serve from 1995 to 1999.
In these various capacities, Bert wasparticularly active as a member ofseveral WMO committees, includingthe RA IV Hurricane Committee (fromits inception); the Financial AdvisoryCommittee (from its inception); theWMO Building Committee and theCommittee on follow-up to the UNConference on Environment andDevelopment. He served as Chairmanof the EC Advisory Group of Expertson Technical Cooperation and, for10 years, was either an invitee or amember of the WMO Bureau.
Bert Berridge was a tireless supporterof WMO and was held in high regard ininternational circles as an avid defenderof developing country interests. Hewas achievement-oriented, apoliticaland unafraid to express contrary views.
He earned the respect of hiscolleagues for being witty, outspokenand honest. Some of his internationalcolleagues have written that he has leftus all a grand legacy, including a modelfor international collaboration and prac-tical solutions.
His 52 years of dedicated serviceended in 1999 with his retirement asCoordinating Director of the CMO. Inrecognition of his outstanding contri-bution to the Caribbean in general, theBritish Caribbean Territories in particu-lar, and the entire globalmeteorological and hydrologicalcommunities, HM Queen Elizabeth IIconferred on him the Order of theBritish Empire, which was presentedto him in Port of Spain by HRH PrinceCharles on 22 February 2000.
He is survived by his wife, Sylvia, foursons and an adopted daughter. Theyhave lost a loved one, the Caribbeanhas lost a meteorological icon and theWMO community has lost a truefriend.
Tyrone W. Sutherland
Dr William James Gibbs
Dr William James (Bill) Gibbs OBE,Director of the Australian Bureau ofMeteorology from 1962 to 1978, FirstVice-President of WMO from 1967 to1975 and winner of the 27th IMO prize(1982), died inMelbourne on 17March 2005,aged 88 years.
Dr Gibbs wasborn in Sydneyon 17 October1916. With thesupport of a fundfor children whose fathers had beenkilled in action in World War I, heobtained his Bachelor’s degree from
Obituaries
BLTN 54/2 13/06/05 17:52 Page 111
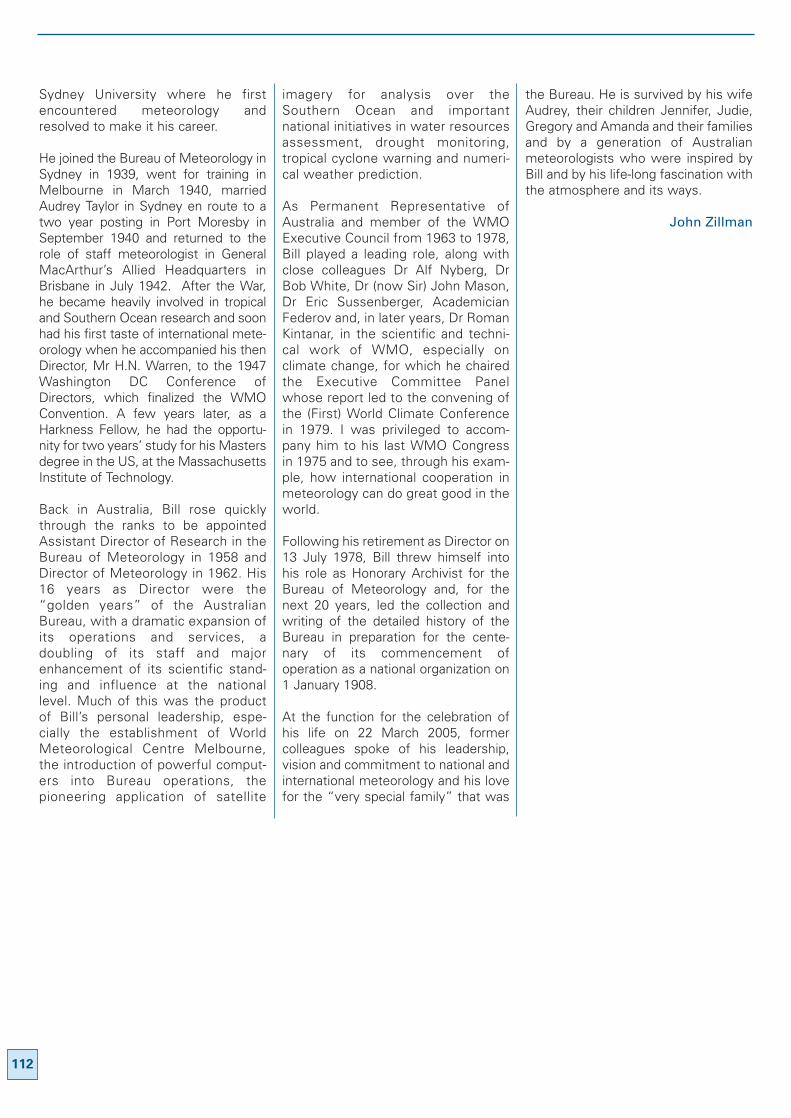
Sydney University where he firstencountered meteorology andresolved to make it his career.
He joined the Bureau of Meteorology inSydney in 1939, went for training inMelbourne in March 1940, marriedAudrey Taylor in Sydney en route to atwo year posting in Port Moresby inSeptember 1940 and returned to therole of staff meteorologist in GeneralMacArthur’s Allied Headquarters inBrisbane in July 1942. After the War,he became heavily involved in tropicaland Southern Ocean research and soonhad his first taste of international mete-orology when he accompanied his thenDirector, Mr H.N. Warren, to the 1947Washington DC Conference ofDirectors, which finalized the WMOConvention. A few years later, as aHarkness Fellow, he had the opportu-nity for two years’ study for his Mastersdegree in the US, at the MassachusettsInstitute of Technology.
Back in Australia, Bill rose quicklythrough the ranks to be appointedAssistant Director of Research in theBureau of Meteorology in 1958 andDirector of Meteorology in 1962. His16 years as Director were the“golden years” of the AustralianBureau, with a dramatic expansion ofits operations and services, adoubling of its staff and majorenhancement of its scientific stand-ing and influence at the nationallevel. Much of this was the productof Bill’s personal leadership, espe-cially the establishment of WorldMeteorological Centre Melbourne,the introduction of powerful comput-ers into Bureau operations, thepioneering application of satellite
imagery for analysis over theSouthern Ocean and importantnational initiatives in water resourcesassessment, drought monitoring,tropical cyclone warning and numeri-cal weather prediction.
As Permanent Representative ofAustralia and member of the WMOExecutive Council from 1963 to 1978,Bill played a leading role, along withclose colleagues Dr Alf Nyberg, DrBob White, Dr (now Sir) John Mason,Dr Eric Sussenberger, AcademicianFederov and, in later years, Dr RomanKintanar, in the scientific and techni-cal work of WMO, especially onclimate change, for which he chairedthe Executive Committee Panelwhose report led to the convening ofthe (First) World Climate Conferencein 1979. I was privileged to accom-pany him to his last WMO Congressin 1975 and to see, through his exam-ple, how international cooperation inmeteorology can do great good in theworld.
Following his retirement as Director on13 July 1978, Bill threw himself intohis role as Honorary Archivist for theBureau of Meteorology and, for thenext 20 years, led the collection andwriting of the detailed history of theBureau in preparation for the cente-nary of its commencement ofoperation as a national organization on1 January 1908.
At the function for the celebration ofhis life on 22 March 2005, formercolleagues spoke of his leadership,vision and commitment to national andinternational meteorology and his lovefor the “very special family” that was
the Bureau. He is survived by his wifeAudrey, their children Jennifer, Judie,Gregory and Amanda and their familiesand by a generation of Australianmeteorologists who were inspired byBill and by his life-long fascination withthe atmosphere and its ways.
John Zillman
112
BLTN 54/2 13/06/05 17:52 Page 112
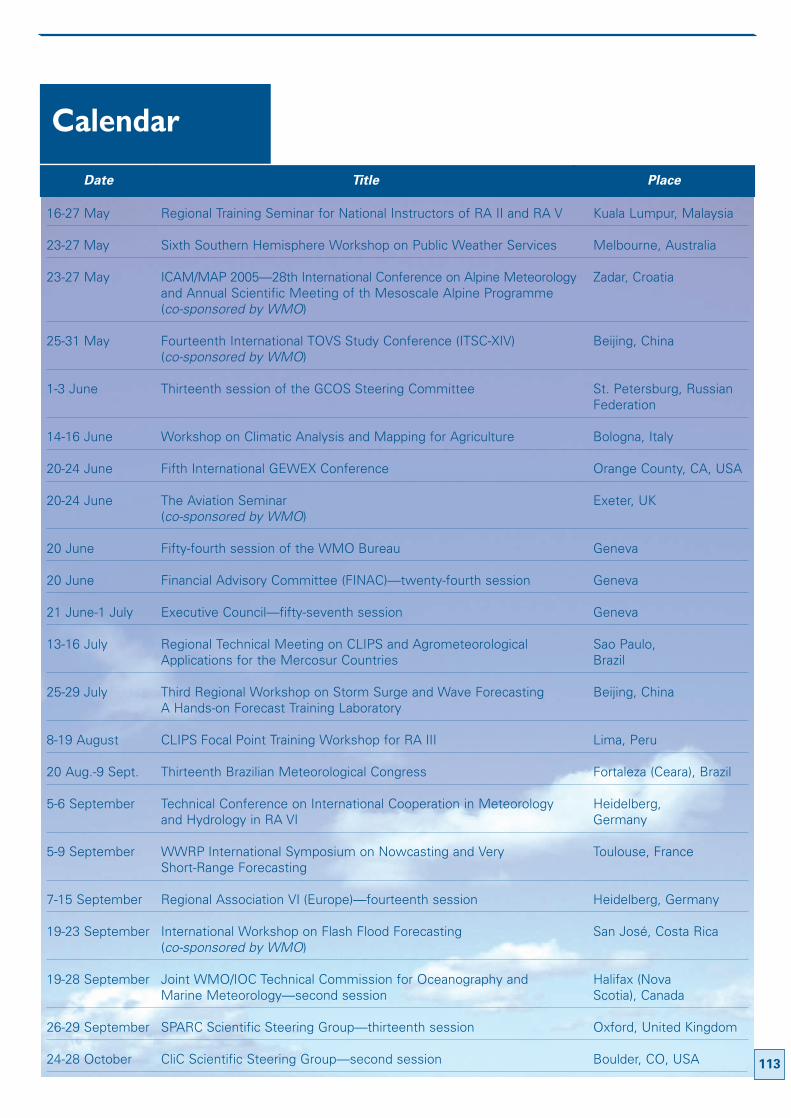
Calendar
Date Title Place
16-27 May Regional Training Seminar for National Instructors of RA II and RA V Kuala Lumpur, Malaysia
23-27 May Sixth Southern Hemisphere Workshop on Public Weather Services Melbourne, Australia
23-27 May ICAM/MAP 2005—28th International Conference on Alpine Meteorology Zadar, Croatiaand Annual Scientific Meeting of th Mesoscale Alpine Programme(co-sponsored by WMO)
25-31 May Fourteenth International TOVS Study Conference (ITSC-XIV) Beijing, China(co-sponsored by WMO)
1-3 June Thirteenth session of the GCOS Steering Committee St. Petersburg, RussianFederation
14-16 June Workshop on Climatic Analysis and Mapping for Agriculture Bologna, Italy
20-24 June Fifth International GEWEX Conference Orange County, CA, USA
20-24 June The Aviation Seminar Exeter, UK(co-sponsored by WMO)
20 June Fifty-fourth session of the WMO Bureau Geneva
20 June Financial Advisory Committee (FINAC)—twenty-fourth session Geneva
21 June-1 July Executive Council—fifty-seventh session Geneva
13-16 July Regional Technical Meeting on CLIPS and Agrometeorological Sao Paulo, Applications for the Mercosur Countries Brazil
25-29 July Third Regional Workshop on Storm Surge and Wave Forecasting Beijing, China A Hands-on Forecast Training Laboratory
8-19 August CLIPS Focal Point Training Workshop for RA III Lima, Peru
20 Aug.-9 Sept. Thirteenth Brazilian Meteorological Congress Fortaleza (Ceara), Brazil
5-6 September Technical Conference on International Cooperation in Meteorology Heidelberg, and Hydrology in RA VI Germany
5-9 September WWRP International Symposium on Nowcasting and Very Toulouse, FranceShort-Range Forecasting
7-15 September Regional Association VI (Europe)—fourteenth session Heidelberg, Germany
19-23 September International Workshop on Flash Flood Forecasting San José, Costa Rica(co-sponsored by WMO)
19-28 September Joint WMO/IOC Technical Commission for Oceanography and Halifax (Nova Marine Meteorology—second session Scotia), Canada
26-29 September SPARC Scientific Steering Group—thirteenth session Oxford, United Kingdom
24-28 October CliC Scientific Steering Group—second session Boulder, CO, USA 113
BLTN 54/2 13/06/05 17:52 Page 113
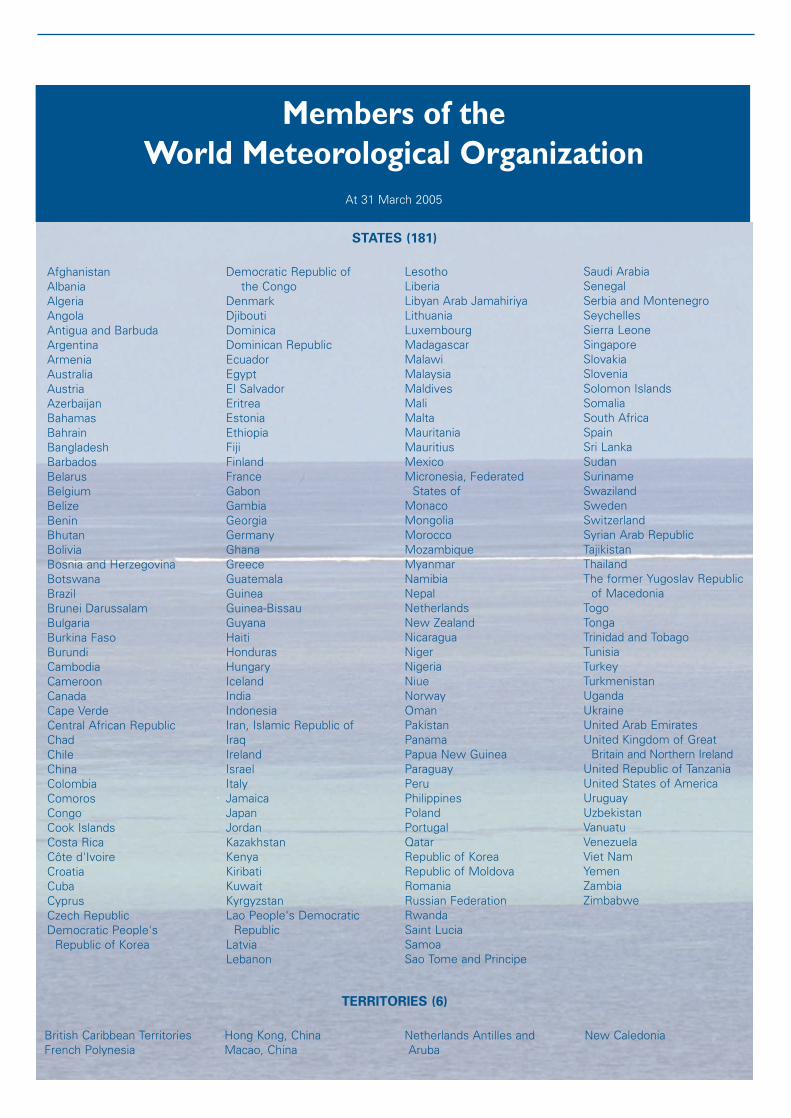
AfghanistanAlbaniaAlgeriaAngolaAntigua and BarbudaArgentinaArmeniaAustraliaAustriaAzerbaijanBahamasBahrainBangladeshBarbadosBelarusBelgiumBelizeBeninBhutanBoliviaBosnia and HerzegovinaBotswanaBrazilBrunei DarussalamBulgariaBurkina FasoBurundiCambodiaCameroonCanadaCape VerdeCentral African RepublicChadChileChinaColombiaComorosCongoCook IslandsCosta RicaCôte d'IvoireCroatiaCubaCyprusCzech RepublicDemocratic People's
Republic of Korea
Democratic Republic ofthe Congo
DenmarkDjiboutiDominicaDominican RepublicEcuadorEgyptEl SalvadorEritreaEstoniaEthiopiaFijiFinlandFranceGabonGambiaGeorgiaGermanyGhanaGreeceGuatemalaGuineaGuinea-BissauGuyanaHaitiHondurasHungaryIcelandIndiaIndonesiaIran, Islamic Republic ofIraqIrelandIsraelItalyJamaicaJapanJordanKazakhstanKenyaKiribatiKuwaitKyrgyzstanLao People's Democratic
RepublicLatviaLebanon
LesothoLiberiaLibyan Arab JamahiriyaLithuaniaLuxembourgMadagascarMalawiMalaysiaMaldivesMaliMaltaMauritaniaMauritiusMexicoMicronesia, Federated
States ofMonacoMongoliaMoroccoMozambiqueMyanmarNamibiaNepalNetherlandsNew ZealandNicaraguaNigerNigeriaNiueNorwayOmanPakistanPanamaPapua New GuineaParaguayPeruPhilippinesPolandPortugalQatarRepublic of KoreaRepublic of MoldovaRomaniaRussian FederationRwandaSaint LuciaSamoaSao Tome and Principe
Saudi ArabiaSenegalSerbia and MontenegroSeychellesSierra LeoneSingaporeSlovakiaSloveniaSolomon IslandsSomaliaSouth AfricaSpainSri LankaSudanSurinameSwazilandSwedenSwitzerlandSyrian Arab RepublicTajikistanThailandThe former Yugoslav Republic
of MacedoniaTogoTongaTrinidad and TobagoTunisiaTurkeyTurkmenistanUgandaUkraineUnited Arab EmiratesUnited Kingdom of Great
Britain and Northern IrelandUnited Republic of TanzaniaUnited States of AmericaUruguayUzbekistanVanuatuVenezuelaViet NamYemenZambiaZimbabwe
Members of the World Meteorological Organization
At 31 March 2005
STATES (181)
TERRITORIES (6)
British Caribbean TerritoriesFrench Polynesia
Hong Kong, ChinaMacao, China
Netherlands Antilles andAruba
New Caledonia
BLTN 54/2 13/06/05 17:52 Page 114

BLTN 54/2 13/06/05 17:52 Page 115

BLTN 54/2 17/06/05 12:42 Page 116

www.rst .vcs.de
Remote Sensing Technology
VCS Aktiengesellschaft · Borgmannstraße 2 · 44894 Bochum · Germany · www.vcs.de
RS
T05
05
The VCS MTSAT user station is ready for reception ofLRIT and HRIT data being transmitted by the new MTSAT 1R satellite
Based on the well-known 2met!¤ concept, VCS is yourreliable partner for the complete range of next generationremote sensing systems and technologies. Beside sophisticated application features, 2met!¤ is now ready toreceive LRIT and HRIT data being transmitted by the newgeo-stationary MTSAT satellite.
Ask us about your solutionby emailing [email protected] by calling +49 234 9258-112
get in touch with MTSAT.
BLTN 54/2 13/06/05 17:52 Page 117
BLTN 54/2 13/06/05 17:52 Page 118
BLTN 54/2 13/06/05 17:52 Page 119

BLTN 54/2 13/06/05 17:52 Page 120
WMO is a specialized agency of theUnited Nations.Its purposes are:
� To facilitate worldwide cooperation in theestablishment of networks of stationsfor the making of meteorological obser-vations as well as hydrological and othergeophysical observations related tometeorology, and to promote the estab-lishment and maintenance of centrescharged with the provision of meteoro-logical and related services;
� To promote the establishment and main-tenance of systems for the rapidexchange of meteorological and relatedinformation;
� To promote standardization of meteoro-logical and related observations and toensure the uniform publication of obser-vations and statistics;
� To further the application of meteorologyto aviation, shipping, water problems,agriculture and other human activities;
� To promote activities in operationalhydrology and to further close coopera-tion between Meteorological andHydrological Services;
� To encourage research and training inmeteorology and, as appropriate, inrelated fields, and to assist incoordinating the international aspects ofsuch research and training.
The World MeteorologicalCongress
is the supreme body of the Organization. Itbrings together delegates of all Membersonce every four years to determine generalpolicies for the fulfilment of the purposesof the Organization.
The Executive Council
is composed of 37 directors of NationalMeteorological or HydrometeorologicalServices serving in an individual capacity; itmeets at least once a year to supervise theprogrammes approved by Congress.
The six regional associations
are each composed of Members whosetask it is to coordinate meteorological,hydrological and related activities withintheir respective Regions.
The eight technical commissions
are composed of experts designated byMembers and are responsible for studyingmeteorological and hydrological operationalsystems, applications and research.
Executive Council
PresidentA.I. Bedritsky (Russian Federation)
First Vice-PresidentA.M. Noorian (Islamic Republic of Iran)
Second Vice-PresidentT.W. Sutherland (British Caribbean Territories)
Third Vice-PresidentM.A. Rabiolo (Argentina)
Ex officio members of theExecutive Council (presidents ofregional associations)
Africa (Region I)M.S. Mhita (United Republic of Tanzania)Asia (Region II)A.M.H. Isa (Bahrain)South America (Region III)R. Michelini (Uruguay) (acting)
North America, Central America and theCaribbean (Region IV)C. Fuller (Belize)South-West Pacific (Region V)Woon Shih Lai (Singapore)Europe (Region VI)D.K. Keuerleber-Burk (Switzerland) (acting)
Elected members of the ExecutiveCouncil
M.L. Bah (Guinea)J.-P. Beysson (France)Q.-uz-Z. Chaudhry (Pakistan)Chow Kok Kee (Malaysia)M.D. Everell (Canada)U. Gärtner (Germany)B. Kassahun (Ethiopia)J.J. Kelly (United States of America)R.D.J. Lengoasa (South Africa)G.B. Love (Australia) (acting)J. Lumsden (New Zealand)F.P. Mote (Ghana)A.D. Moura (Brazil) (acting)J.R. Mukabana (Kenya)K. Nagasaka (Japan) (acting)I. Obrusnik (Czech Republic) (acting)H.H. Oliva (Chile)Qin Dahe (China)J.K. Rabadi (Jordan) (acting)D. Rogers (United Kingdom) (acting)B.T. Sekoli (Lesotho)R. Sorani (Italy)S.K. Srivastav (India)
(four seats vacant)
Presidents of technicalcommissions
Aeronautical MeteorologyN.D. GordonAgricultural MeteorologyR.P. MothaAtmospheric SciencesA. EliassenBasic SystemsA.I. Gusev ClimatologyY. BoodhooHydrologyB. StewartInstruments and Methods of ObservationR.P. Canterford (acting)Oceanography and Marine MeteorologyJ. Guddal and S. Narayanan
The WorldMeteorologicalOrganization(WMO)Weather • Climate • Water
WMO Headquarters building
The CD-Rom contains (in pdf format in bothhigh and low resolution):
• WMO Bulletin 54 (2) – April 2005
• MeteoWorld – April 2005
• Weather, climate, water and sustainable development (WMO-No. 974) (Brochure for World Meteorological Day 2005)
• Saving paradise, ensuring sustainabledevelopment (WMO-No. 973)
The CD-Rom also contains (in pdf format in low resolution) :
• World Climate Research Programme: 25 years ofscience serving society (Brochure)
• Global Energy and Water Cycle Experiment—Phase I(Brochure)
• Nine WCRP flyers
CD-ROM
Cover(final)GB+dos 4mm.qxd(8) 17/06/05 12:24 Page a2

Hurricane Ivan’s impact on the Cayman Islands
Climate change and variability
Climate change indicesThe cryosphere and the
climate system
Water and energy cyclesStratospheric processes
and climate
Vol. 54 (2) April 2005
www.wmo.int
feature art ic les - interviews - news - book reviews - calendar
25th anniversary of the World Climate Research Programme
Weather and crops in 2004
The global climate system in 2004
World Meteorological Organization 7bis, avenue de la PaixCase postale No. 2300CH-1211 Geneva 2, SwitzerlandTel: + 41 22 730 81 11Fax: + 41 22 730 81 81E-mail: [email protected]: http://www.wmo.int ISSN 0042-9767
Climate research:achievements
and challenges
WM
O B
ULL
ET
INV
olu
me
54 N
o. 2
A
pri
l 200
5
Cover(final)GB+dos 4mm.qxd(8) 17/06/05 12:24 Page a1


