Embed Size (px)
Citation preview
Workplace Discrimination and Depressive Symptoms: A Studyof Multi-Ethnic Hospital Employees
Wizdom Powell Hammond,Gillings School of Global Public Health, Department of Health Behavior and Health Education,Lineberger Comprehensive Cancer Center, University of North Carolina at Chapel Hill, 334BRosenau Hall, CB #7440, Chapel Hill, NC 27599, USA
Marion Gillen, andCenter for Occupational and Environmental Health, School of Public Health, EHS, University ofCalifornia, Berkeley, 50 University Hall, #7360, Berkeley, CA 94720-7360, USA
Irene H. YenDepartment of Medicine, Division of General Internal Medicine, University of California, SanFrancisco, 3333 California Street, Suite 335, Box 0856, San Francisco, CA 94143-0856, USAWizdom Powell Hammond: [email protected]
AbstractWorkplace discrimination reports have recently increased in the U.S. Few studies have examinedracial/ethnic differences and the mental health consequences of this exposure. We examined theassociation between self-reported workplace discrimination and depressive symptoms among amulti-ethnic sample of hospital employees. Data came from the prospective case–controlGradients of Occupational Health in Hospital Workers (GROW) study (N = 664). We used theCenter for Epidemiological Studies Depression Scale (CES-D) to assess depressive symptoms andmeasured the occurrence, types, and frequency of workplace discrimination. African Americanswere more likely than other racial/ethnic employees to report frequent and multiple types ofdiscrimination exposure. Multivariate relationships were examined while controlling for socio-demographic factors, job strain, and general social stressors. After adjustment, workplacediscrimination occurrence and frequency were positively associated with depressive symptoms.The positive association between workplace discrimination and depressive symptoms was similaracross racial and ethnic groups. Reducing workplace discrimination may improve psychosocialfunctioning among racial/ethnic minority hospital employees at greatest risk of exposure.
KeywordsDiscrimination; Workplace; Depression; Job strain; Race/ethnicity
IntroductionWorkplace discrimination is a persistent problem in the U.S., despite legislation designed toprohibit and discourage these practices. According to the Equal Employment OpportunityCommission, 33,937 charges of race-based workplace discrimination, 24,582 age-based,28,372 sex-based, and 10,601 charges related to national origin were filed in the 2008 fiscalyear (EEOC 2009). These U.S. estimates mark a record high in formal complaints and a15% increase over those filed in 2007(EEOC 2009). However, these statistics likely
Correspondence to: Wizdom Powell Hammond, [email protected].
NIH Public AccessAuthor ManuscriptRace Soc Probl. Author manuscript; available in PMC 2010 May 11.
Published in final edited form as:Race Soc Probl. 2010 March 1; 2(1): 19–30. doi:10.1007/s12552-010-9024-0.
NIH
-PA Author Manuscript
NIH
-PA Author Manuscript
NIH
-PA Author Manuscript
underestimate such occurrences because minority group members often minimize theseexperiences (Ruggiero and Taylor 1997), and are notably reluctant to file formal charges(Hirsh and Kornrich 2008). Workplace discrimination has been examined in a variety ofracial and ethnic groups (e.g., whites, African Americans, Hispanic Americans, FilipinoAmericans, etc.) (Asakura et al. 2008; Bhui et al. 2005; de Castro et al. 2008; Deitch et al.2003; Jackson et al. 1995; Mays et al. 1996; Pavalko et al. 2003; Roberts et al. 2004;Rospenda et al. 2008; Wadsworth et al. 2007; Yen et al. 1999). In general, researchers foundthat members of gender, racial, or ethnic minority groups report workplace discriminationmore often, and the consequences of this exposure are distinguishable from effects producedby other psychosocial features (e.g., decision-making control and performance expectations)of their occupations (Pavalko et al. 2003; Roberts et al. 2004; Wadsworth et al. 2007).
In common day-to-day interactions, being treated unfairly because of one’s personalcharacteristics produces wide-ranging deleterious impacts on mental and physical healthsuch as anxiety, psychological distress, various cardiovascular effects, poor self-reportedhealth status, and low birth weight in infants of mothers experiencing discrimination (Barneset al. 2008; Clark et al. 1999; Gee et al. 2006; Kessler et al. 1999; Krieger 1990; Lewis et al.2006; Rospenda et al. 2008; Schulz et al. 2006; Williams et al. 2003a, b; Williams et al.1997; Yuan 2007). The most consistently described negative mental health consequence ofdiscrimination is increased depressive symptomatology (Finch et al. 2000; Noh et al. 1999;Schulz et al. 2006; Williams et al. 2003a, b). Exposure to workplace discrimination hassimilarly been found to harm mental health from diminished psychological well-being,increased risk of psychological distress, and pronounced depressive symptoms (Bhui et al.2005; Jackson et al. 1995; Roberts et al. 2004; Rospenda et al. 2008; Wadsworth et al.2007).
While discrimination occurs in a variety of workplace environments, certain organizationsmay be structured in ways that increase the likelihood of biased treatment and subordinationof employees occupying lower social status positions. Hospitals are complex hierarchicalorganizations with potential inequities in employee power distribution. Employeesoccupying lower status positions in these settings may also face especially high emotionaldemands (Landsbergis 1988). Workplace environments characterized by high emotionaldemands and low control, a combination referred to as “job strain,” have also beenassociated with poor physical and psychological well-being (Markovitz et al. 2004;Netterstrom et al. 2008; Williams et al. 1997). Since job strain is marked by diminishedcontrol, it may further contribute to employees’ perceptions of unfair treatment in theworkplace. Employees may also enter the workplace with stressors unrelated to features oftheir occupations. Thus, it is important to account for the contribution made by more generalsocial stress exposures to the discrimination–mental health relationship (Taylor and Turner2002; Wheaton et al. 1994). General social stress reflects exposures that are more normativeand unrelated to individual characteristics (e.g., race and age) but that also increase the riskof depressive symptoms of employees.
A few studies have examined workplace discrimination among hospital employees or haveconsidered how job strain and general stress might affect the workplace discrimination–mental health relationship. Studies on work-place discrimination have also focused primarilyon black–white differences or discrimination experiences of a single racial/ethnic minoritygroup. However, with an increasingly diverse workforce, we need additional studies thatdocument workplace discrimination among minority groups. We address these empiric gapsin our study of workplace discrimination and depressive symptoms in a multi-ethnic sampleof hospital workers.
Hammond et al. Page 2
Race Soc Probl. Author manuscript; available in PMC 2010 May 11.
NIH
-PA Author Manuscript
NIH
-PA Author Manuscript
NIH
-PA Author Manuscript
We build on general stress-and-coping frameworks (Folkman 1984; Folkman and Lazarus1986; Folkman et al. 2000; Lazarus 1995), which have been commonly employed ininvestigations of discrimination, occupational stress, and mental health. We conceptualizeworkplace discrimination as a biopsychosocial stressor (Clark et al. 1999) and a product ofperson–environment transactions that can lead to negative psychological outcomes whenthey are appraised as demanding, threatening, and uncontrollable. Specifically, wehypothesized that reports of workplace discrimination, number of types, and frequency ofthese experiences would be positively associated with depressive symptoms. Further, wehypothesized that the positive association between workplace discrimination would bestrongest among employees from racial/ethnic minority groups. Following the lead ofprevious researchers, (Pavalko et al. 2003; Wheaton et al. 1994) we also assessed otherpsychosocial aspects of the work environment (e.g., job strain) and general social stressexposures.
MethodsParticipants
Study participants (n = 644; 166 cases and 498 controls) were recruited for a prospectivecase–control study, Gradients of Occupational Health in Hospital Workers (GROW),(Rugulies et al. 2004) of musculoskeletal injuries among hospital workers fromapproximately 6,000 employees of two healthcare institutions in northern California. Caseswere recruited at the occupational health clinic where employees sought care for a work-related injury, defined as a new presentation of an acute or cumulative work-relatedmusculoskeletal injury, and determined to be work-related. Controls were selected from alist obtained from each hospital’s human resources department and were matched by jobgroup, shift length, or at random, yielding a 3:1 ratio to cases. Personal identifiers weredeleted from the interview responses accessible to study investigators for data analysis. Noother individuals had access to individual level responses, even once purged of suchpersonal identifiers. Supervisors could have been aware that employees participated in thestudy but not their injury status nor the nature of their responses. Employees did not receiveany incentive for participation. Physicians were excluded from the eligible participant pooldue to varying employee status among this group. Specifically, physicians were excludedfrom participation because most would have only been temporarily assigned to each hospitalsetting, resulting in a large number of exclusions at the outset. Additional information on thestudy sample has been reported elsewhere (Gillen et al. 2007; Rugulies et al. 2004). Thepresent study analyzes data from the baseline wave, which included the full sample (n =644; 166 cases and 498 controls) of hospital employees.
Study MeasuresStudy participants were administered a structured telephone-based questionnaire designed toassess the role of both physical and psychosocial workplace exposures in musculoskeletalinjuries.
Workplace DiscriminationWorkplace discrimination was assessed in three ways. First, participants were asked ascreening question, “During the past year, have you been treated unfairly by coworkers orsupervisors because of your race or ethnicity, nationality, gender, sexual orientation, or age.”Possible responses to this question were “yes” or “no.” Participants who responded “yes”were coded as having experienced discrimination by co-workers or supervisors. Those whoresponded “yes” to the initial screening question were asked 11 additional questions.Responses to the first six items, which asked participants to indicate the “types” (race,ethnicity, nationality, sex, sexual orientation, or age-based) of workplace discrimination they
Hammond et al. Page 3
Race Soc Probl. Author manuscript; available in PMC 2010 May 11.
NIH
-PA Author Manuscript
NIH
-PA Author Manuscript
NIH
-PA Author Manuscript
experienced, were used to create the second measure of discrimination. Possible responsesto these items were “yes” or “no.” Yes (=1) responses to each type of discrimination werecounted (potential range of 0–6). Due to a skewed distribution, these responses were re-categorized into three groups, “none,” “only one,” and “multiple.” Individuals who reportedexperiencing no discrimination of any type, as well as individuals assigned a value of “0” onthe basis of the initial screening question, were assigned to the “none” category. The “onlyone” category included those who reported experiencing one type of workplacediscrimination. All others were assigned to the “multiple” category. The remaining fiveitems, which addressed the frequency with which participants experienced discrimination indifferent aspects of work, (e.g., hiring, evaluation, work assignment, promotion, and day-to-day work interactions) were used to create the third measure. Participants responded to thesequestions on a six-point scale that ranged from “never” (coded as 0) to “very often” (codedas 5). Responses to these questions were re-categorized into three groups, “never,”“sometimes,” and “often.” Individuals who reported no discrimination were assigned to the“never” category; those who responded that they had experienced discrimination “onlyonce,” “a few times,” or “occasionally” to the “sometimes” group; and those who reportedexperiencing discrimination “often” or “very often” to the “often” group.
General Social StressorsGeneral social stress exposure was assessed with the 4-item version of the Perceived StressScale (Cohen et al. 1983). This scale measures an individual’s appraisal of general stressors(i.e., “In the past month, have you felt that you were unable to control the important thingsin your life?” and “In the past month, have you felt confident about your ability to handleyour personal problems?”) using a four-point response scale from “never” (coded as 0) to“very often” (coded as 4). This measure has been widely used in studies investigating mentaland physical health outcomes among ethnic minority populations (Cohen 1988; Flores et al.2008; Kopp 2010; Sharp et al. 2007; Siqueira Reis et al. 2010). The Perceived Stress Scale isused to assess the amount of global stress in an individual’s life, as opposed to their responseto specific stressors. Previous studies among psychiatric (Hewitt et al. 1992; Pbert et al.1992) and non-psychiatric (Cohen 1988; Cohen et al. 1983; Flores et al. 2008; Siqueira Reiset al. 2010) samples demonstrate good validity (i.e., predictive, discriminant, andconcurrent), as well as test–retest reliability. Responses were summed to create a score(potential range 0–16). Internal consistency measured by Cronbach’s alpha was 0.66 amongstudy participants.
Job StrainThe 14-item version of the Job Content Questionnaire (JCQ) (Karasek et al. 1998) was usedto evaluate job strain, including five questions on psychological demands and nine on jobcontrol (i.e., six items on skill latitude and three on decision authority). The JCQ hasdemonstrated good concurrent, predictive, factorial, and discriminant validity across avariety of populations (Karasek et al. 1998; Theorell and Karasek 1996). All responses were4-point scales ranging from “strongly agree” to “strongly disagree.” Consistent with priorstudies using the JCQ (Landsbergis et al. 2000), we dichotomized the “demands” and“control” scales at their medians. Those who experienced high demands and low controlwere assigned a score of 1 (high job strain), while all others were coded as 0 (low jobstrain). The Cronbach’s alpha for our sample was 0.77.
Depressive SymptomsThe Center for Epidemiological Studies Depression Scale (CES-D), (Radloff 1977) a 20-item, self-report scale developed for the general population, was used to measure depressivesymptoms. The measure has been widely used and validated among a variety of racial/ethnicgroups (Koji et al. 2007; Radloff 1977; Stahl et al. 2008). The CES-D has also demonstrated
Hammond et al. Page 4
Race Soc Probl. Author manuscript; available in PMC 2010 May 11.
NIH
-PA Author Manuscript
NIH
-PA Author Manuscript
NIH
-PA Author Manuscript
good construct, discriminant, and predictive validity in more recent studies examiningassociations between psychosocial features of the workplace and depressive symptoms(Ertel et al. 2008; Inoue et al. 2010; Netterstrom et al. 2008). Overall scores range from 0 to60 with higher scores indicating more depressive symptomatology (Weissman et al. 1977).We computed a summed score for each participant per scoring instructions. The Cronbach’salpha for our sample was 0.85.
Demographic VariablesAge, sex, educational attainment (categorized as no college, associate, bachelor, or post-graduate degree), annual household income (ascertained in $20,000 and $40,000 incrementsup to a category of $120,000 and greater), and nativity status (U.S. vs. foreign-born) wereassessed. Individuals were asked to report their racial/ethnic background (white, AsianPacific Islander, Latino, and African American) and to indicate whether they consideredthemselves to be of more than one race. These latter responses were classified as “Mixedand other.”
Occupational CategoriesWe first created 13 occupational categories determined by status in the organization,education/licensing, amount and type of patient contact, and amount and type of physicallabor. We further collapsed these categories into six groups: administrator and professional,nursing, other clinical, clerical (e.g., admissions and data entry clerks), technical (e.g.,radiology and laboratory technologists), and support positions (e.g., physical plant andhousekeeping staff). The “other clinical” occupations category included 34% mental health,29% nursing-related, and 15% rehabilitation occupations.
All study procedures were approved by the (University of California, San Francisco)Institutional Review Board.
Data AnalysisWe conducted simple (unadjusted) univariate (Chi-square) analyses to describe samplecharacteristics. We applied Yates’ (Yates 1934) corrections for continuity to chi-square testsperformed on cells that failed to meet the expected frequency assumption (Camilli andHopkins 1978) (i.e., that have expected frequencies smaller than 5). We performed one-wayanalyses of variance to assess the relationship between three workplace discriminationmeasures and mean CES-D scores. We used linear regression models to analyze theassociation between workplace discrimination and depressive symptoms (Hypothesis 1). Wetested a basic model that included race/ethnicity only (adjusted for age, sex, education,income, and occupation) (Model 1). Next, we tested a model that included reportedworkplace discrimination as a predictor (Model 2) and then added the covariates, generalsocial stress (Model 3), and job strain (Model 4). Finally, we tested a model that includedthe demographic variables, workplace discrimination, general stress, and job strain (Model5). Further, we used linear regression models to analyze the association between the typesand frequency of workplace discrimination experiences and depressive symptoms. We testedmodels that included the number of types and the frequency of work-place discriminationexperiences as predictors (adjusted model for race/ethnicity, age, sex, education, income,and occupation) (Models 6), general social stress (Models 7), and job strain (Model 8). InModel 9, we included the demographic variables, the frequency and types of work-placediscrimination, general social stress, and job strain. We also tested interactions betweenrace/ethnicity and workplace discrimination to evaluate whether this association wasstronger among racial/ethnic minority employees (Hypothesis 2). For the interaction models,we also adjusted for age, sex, education, income, and occupation. We assessed
Hammond et al. Page 5
Race Soc Probl. Author manuscript; available in PMC 2010 May 11.
NIH
-PA Author Manuscript
NIH
-PA Author Manuscript
NIH
-PA Author Manuscript
multicollinearity and found variance inflation factors that ranged from 1.04 to 2.06suggesting that multicollinearity was not a concern in our models. Continuous measureswere mean centered in our multivariate analyses. Statistical analyses were performed withStatistical Package for Social Sciences “SPSS for Windows Release 16” (2007).
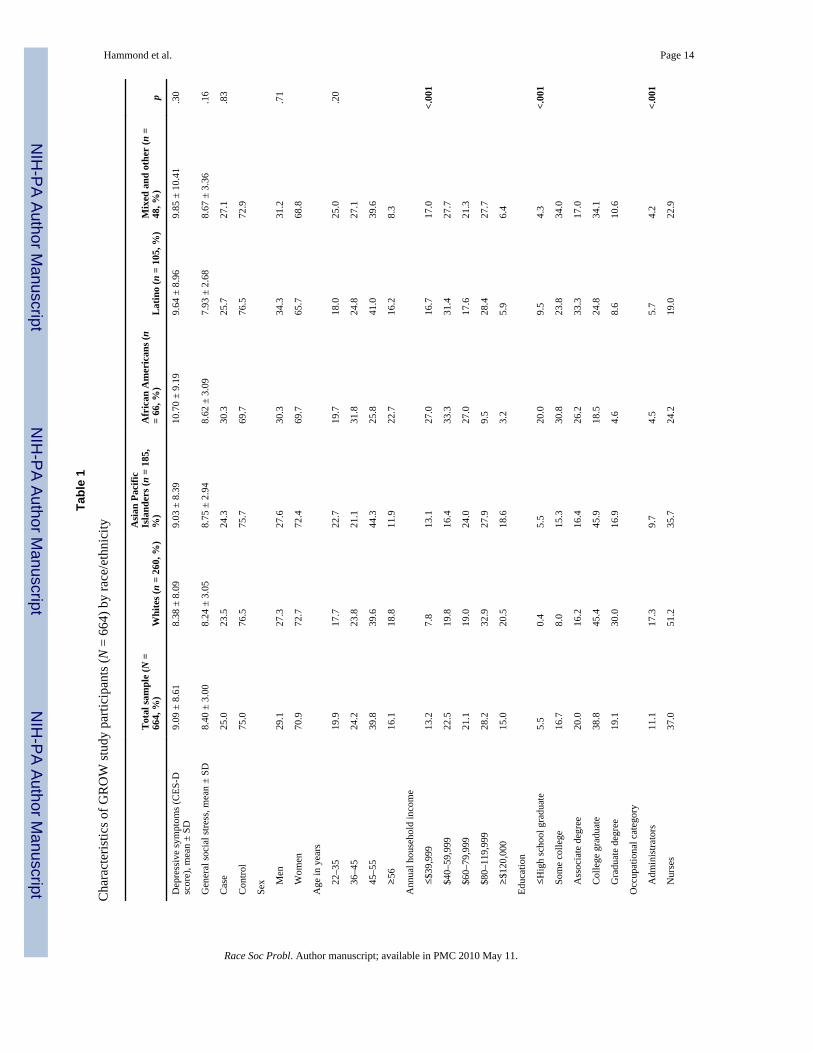
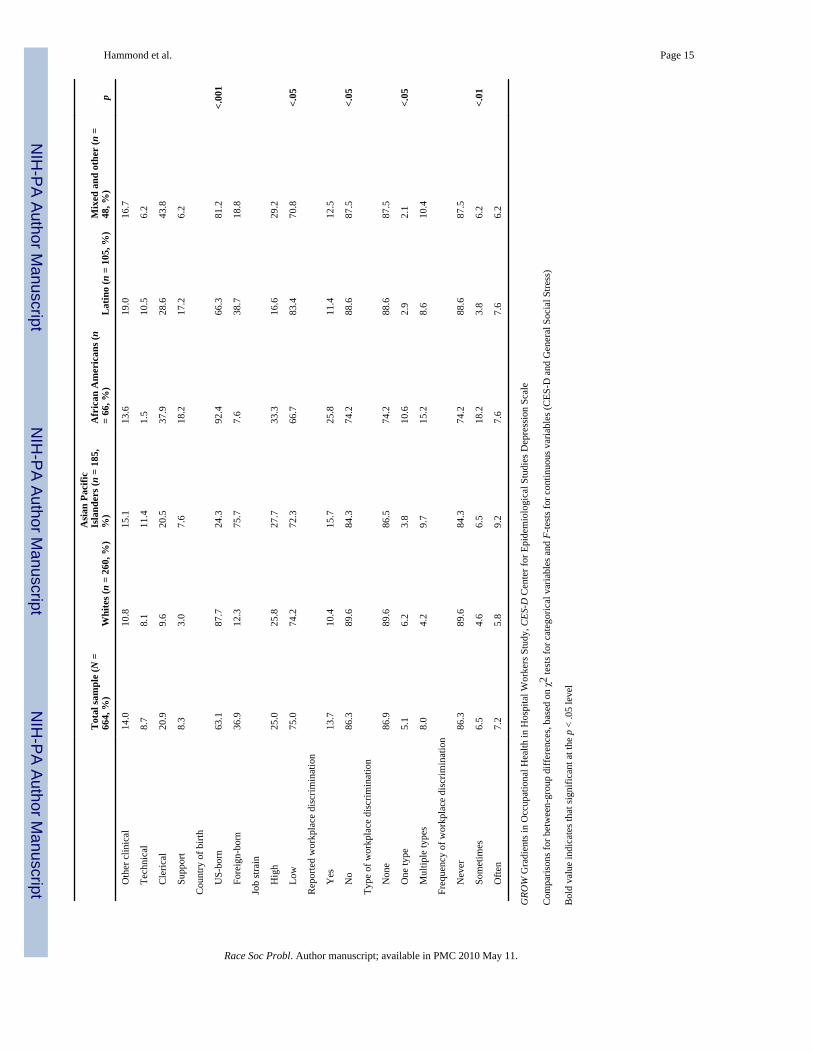
ResultsIn Table 1, we display the characteristics of the study sample stratified by race/ethnicity.Our sample was comprised of 260 non-Hispanic whites, 185 Asian Pacific Islanders, 66African Americans, 105 Latinos, and 48 individuals of “Mixed and other” race. Themajority of the sample was women, between the ages of 45–55, had an annual householdincome of $80,000–$119,000, were nurses, college graduates, and born in the U.S. (seeTable 1). There were no differences by race/ethnicity in mean CES-D or general social stressscores. Whites reported higher income and education levels compared to all other racial/ethnic groups. African Americans and Latinos reported lower levels of education andincome than Asian Pacific Islanders. African Americans, Latinos, and individuals classifiedas “Mixed and other” were more likely than whites to occupy clerical or support positions.Asian Pacific Islanders and Latinos were more likely to be foreign-born than other groups.More Asian Pacific Islanders than whites, Latinos, and African Americans reported “low”job strain. Our analysis (table not shown) revealed no differences between cases andcontrols on most of our key socio-demographic variables (age, sex, income, education, andcountry of birth). However, cases were more likely to be nurses. This finding is likely anartifact of our sample, which contained a greater percentage of nurses (37%). We did findthat cases had higher CES-D, job strain, and general social stress scores.
Fourteen percent of the participants reported experiencing workplace discrimination in thepast year (Table 1). Reports of workplace discrimination did not differ by case status, sex,age, education, occupation, or country of birth. African Americans were more likely thanemployees of other racial/ethnic groups to report experiencing workplace discrimination andmultiple types of discrimination and to categorize these experiences as occurring“sometimes.”
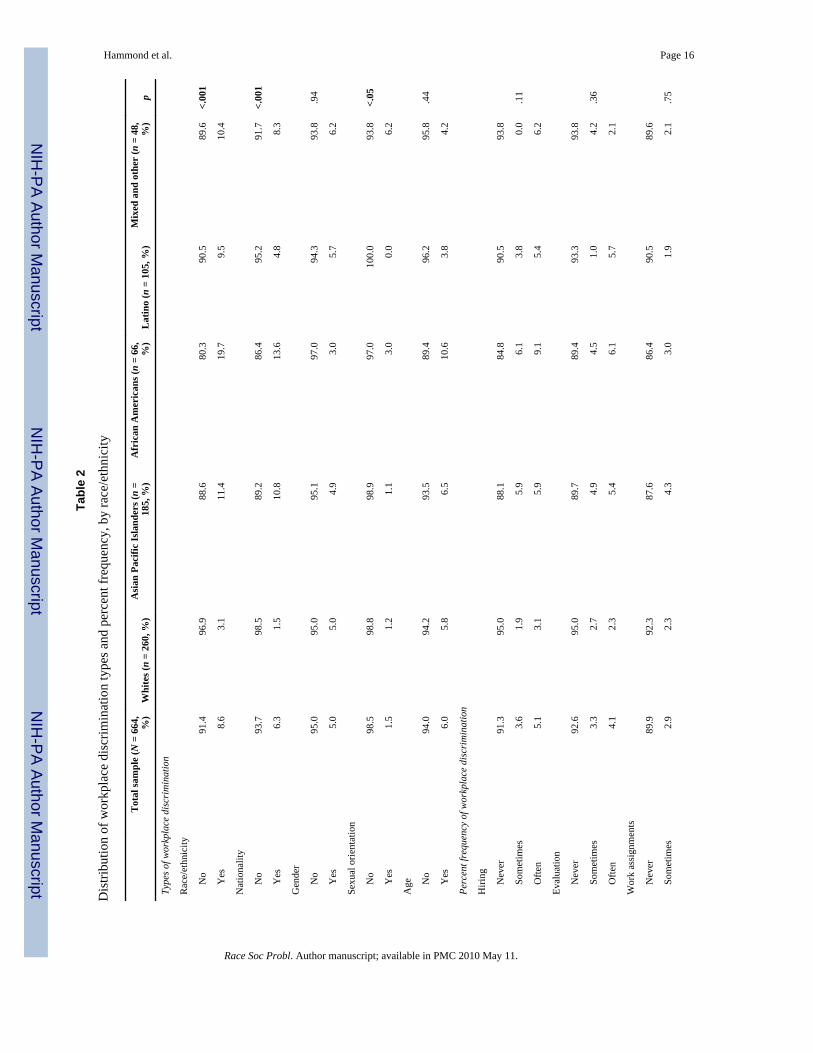
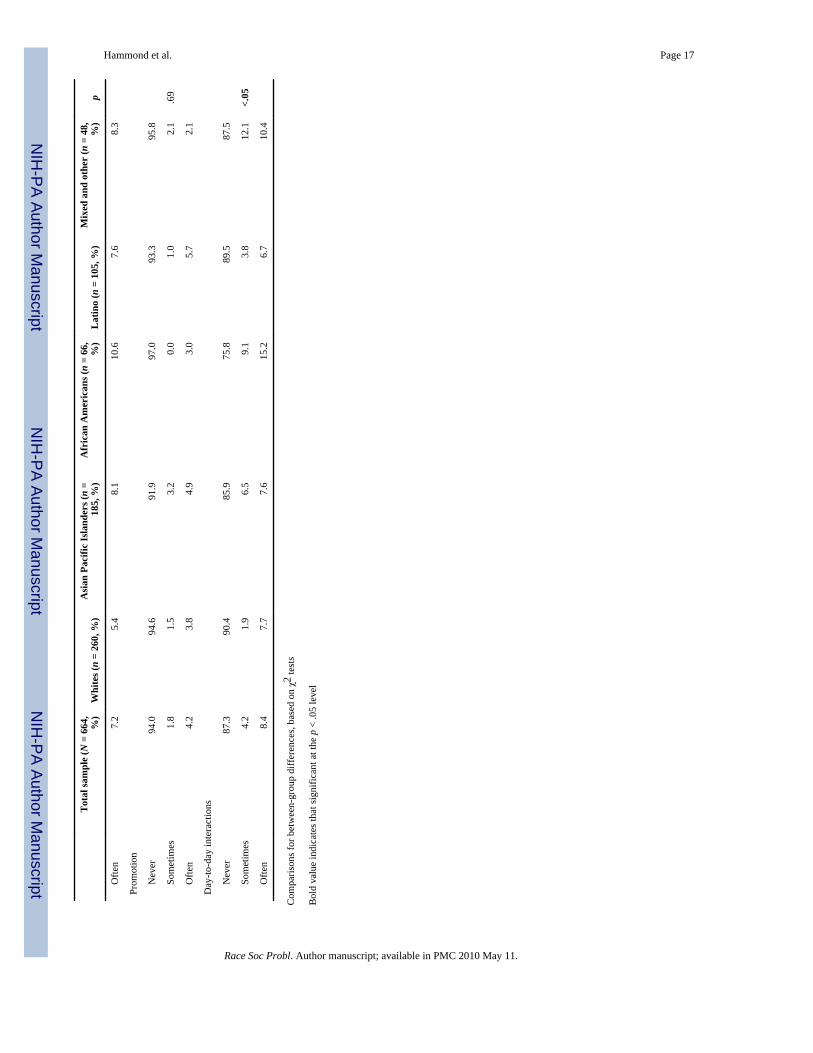
Fifty-seven percent of those reporting workplace discrimination attributed these events torace/ethnicity (Table 2). However, more African Americans noted this type ofdiscrimination compared to other groups. A greater number of Asian Pacific Islanders andAfrican Americans reported workplace discrimination based on nationality. There were noracial or ethnic differences in the frequency of reported discrimination in hiring, evaluation,work assignments, or promotion. However, more African Americans reported experiencingdiscrimination in day-to-day work-place interactions.
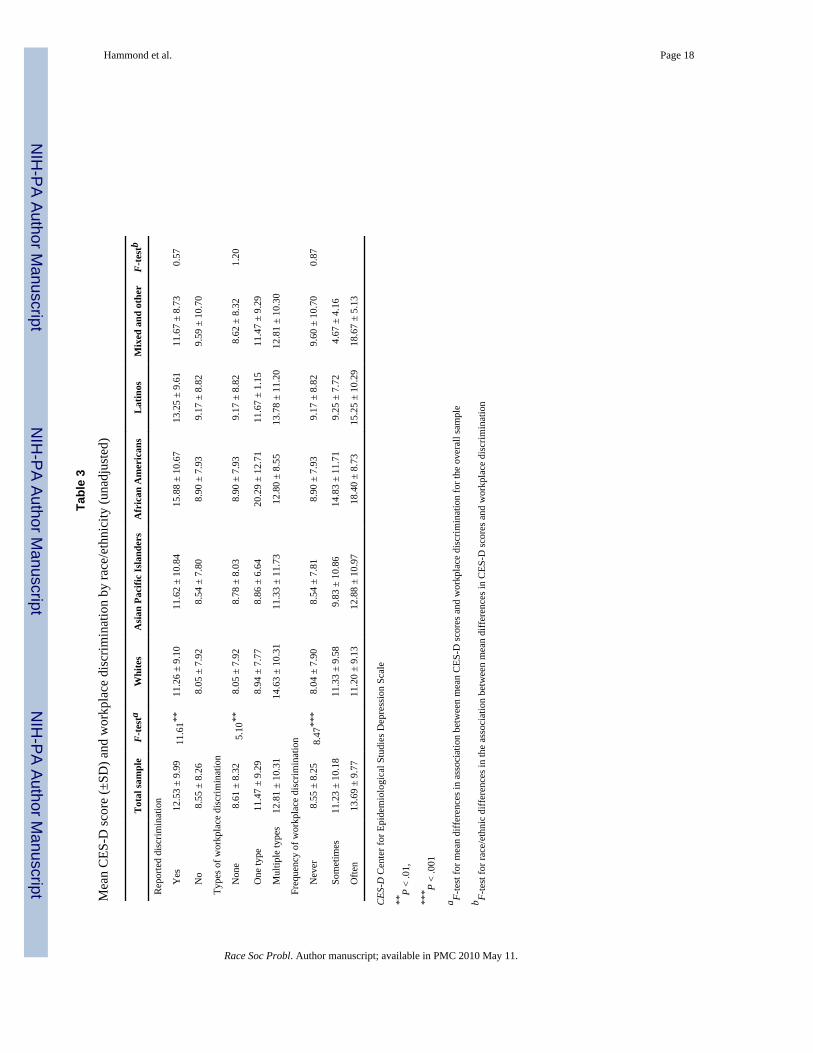
Each of our three measures of workplace discrimination was positively, significantlyassociated with higher mean CES-D scores (Table 3). Post-hoc comparisons revealed thisassociation was primarily driven by differences in mean CES-D scores between individualsin the lowest (e.g., none and never) and highest (e.g., multiple and often) discriminationtypes and frequency groups. There were no racial/ethnic differences in bivariate associationsbetween workplace discrimination and mean CES-D scores.
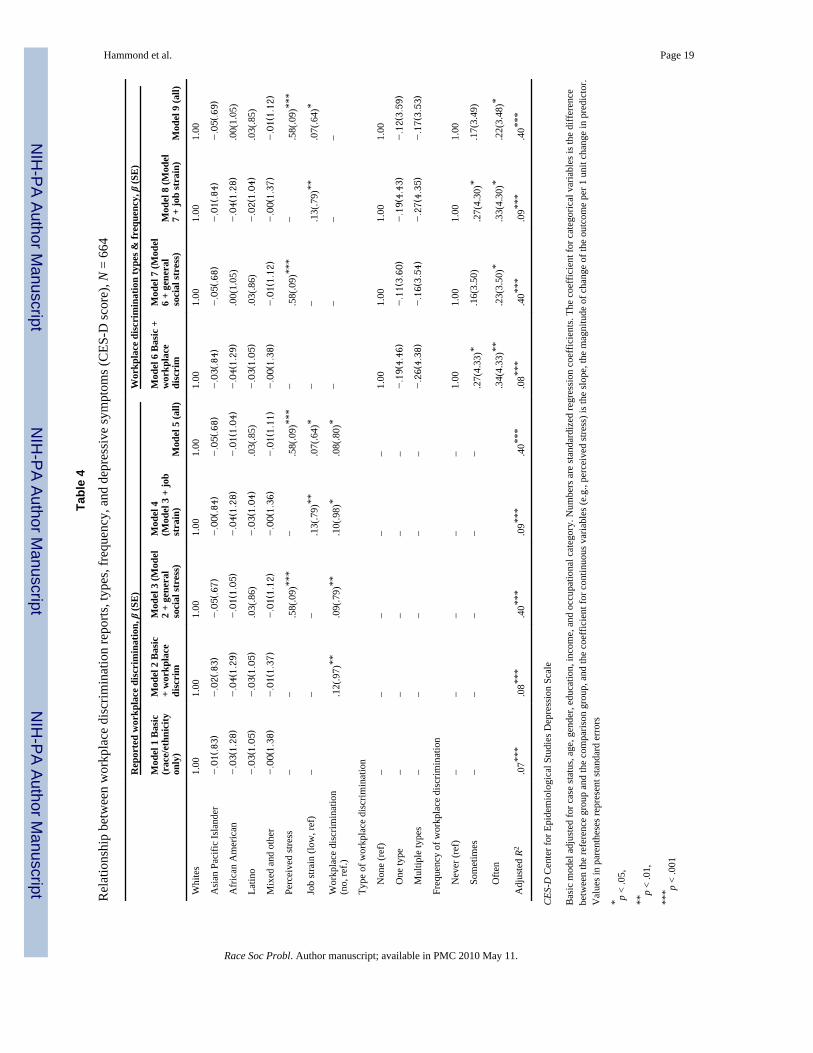
Table 4 displays results from the linear regression analyses investigating the multivariateassociation between three measures of workplace discrimination and depressive symptomsadjusted for case status, age, sex, education, income, and occupational category. Weconducted the multivariate analysis with and without case status included as a covariate, andour results were virtually unchanged. Thus, we report the results with case status included asa covariate. Race/ethnicity was not a significant predictor of depressive symptoms (Model
Hammond et al. Page 6
Race Soc Probl. Author manuscript; available in PMC 2010 May 11.
NIH
-PA Author Manuscript
NIH
-PA Author Manuscript
NIH
-PA Author Manuscript
1). Reported workplace discrimination (Models 2–5) and discrimination frequency (Models6–9) were associated with more depressive symptoms. The positive association betweenworkplace discrimination frequency and depressive symptoms was strongest and mostconsistent for individuals who experienced discrimination “often” (Models 6–8). There wasno significant association between the number of discrimination types and depressivesymptoms. General social stress (Models 3 and 7) and job strain (Models 4 and 8) were bothstatistically significantly associated with depressive symptoms, but adding these factors tothe models did not eliminate the positive association between workplace discriminationfrequency and depressive symptoms. In the final models (Model 5 and 9), general socialstress exposure, job strain, and workplace discrimination frequency were all associated withgreater depressive symptomatology.
Our tests for interactions between race/ethnicity and workplace discrimination were non-significant. Thus, we did not find support for our hypothesis that the association betweenworkplace discrimination and depressive symptoms would be more pronounced amongracial or ethnic minorities.
DiscussionThis analysis represents one of a few multi-ethnic investigations of the association betweenthe occurrence, types, and frequency of workplace discrimination and depressivesymptomatology. Fourteen percent of our hospital employee sample reported experiencingworkplace discrimination in the past year, a proportion similar to the 12 and 16% reported ina frequently cited study of workplace discrimination (Pavalko et al. 2003). Consistent withrecent EEOC data (EEOC 2008), more of our sample attributed workplace discrimination torace/ethnicity than to any other personal characteristic. African American employees wereespecially likely to view their race/ethnicity as a source of unfair treatment in the workplace,which was not surprising given that other researchers have reported similar results (Pavalkoet al. 2003).
Our multivariate findings generally support our study hypotheses. Specifically amonghospital employees, we found that workplace discrimination occurrence, types, andfrequency are associated with depressive symptomatology above and beyond job strain andgeneral social stress. Thus, our study confirms and extends previous research (Pavalko et al.2003; Roberts et al. 2004; Wadsworth et al. 2007) by documenting that the impact ofworkplace discrimination on mental health is distinguishable from that produced by otherpsychosocial and occupational stressors. Workplace discrimination accounts for anadditional 1% of the variance over the controls and race. Building on arguments made byothers (Prentice and Miller 1992), we offer a slightly different interpretation of this “smalleffect.” These authors state: “showing that an effect holds even under the most unlikelycircumstances possible can be as impressive as (or, in some cases, perhaps even moreimpressive than) showing that it accounts for a great deal of variance (p. 163).” The strengthof our finding lies in the fact that workplace discrimination maintained an effect in thepresence of socio-demographic controls and after general stress and job strain were added tothe models.
Our findings are consistent with the burgeoning body of research linking workplacediscrimination to poor mental health status (Pavalko et al. 2003; Roberts et al. 2004;Rospenda et al. 2008) and a higher prevalence of discrimination exposure among AfricanAmericans (Kessler et al. 1999). It is notable in the context of these findings that AfricanAmericans (as were Latinos) were also more likely to occupy clerical and support positionsthan whites and Asian Pacific Islanders. Thus, it is plausible that occupying these relativelysubordinate positions in the hospital hierarchy may place this group at additional risk of
Hammond et al. Page 7
Race Soc Probl. Author manuscript; available in PMC 2010 May 11.
NIH
-PA Author Manuscript
NIH
-PA Author Manuscript
NIH
-PA Author Manuscript
workplace discrimination and associated depressive symptoms. We offer this interpretationsince low job control—a hallmark of job strain—is associated with lower occupationalstatus (Marmot et al. 1997). Future studies should explore whether interactions betweenworkplace discrimination and job strain explain racial/ethnic differences in depressivesymptoms.
The association between workplace discrimination occurrence or types and depressivesymptoms did not differ by race/ethnicity, which suggests that these aspects ofdiscrimination exposure produced universally negative effects on the mental health of oursample. Differences in the way we asked about these aspects of workplace discriminationcould have also contributed to these findings. Cumulative models of discrimination(Geronimus 1992) provide another possible explanation for these findings as they posit morepronounced negative health outcomes among individuals who experience frequentdiscrimination exposure. Our investigation indicates that single indicators might obscureimportant race/ethnic differences and thus highlights the importance of assessing multipledimensions of workplace discrimination exposure.
Our study had limitations. We assessed self-reported workplace discrimination. Thus, it ispossible that biases in report and recall exist. Attributional biases may have contributed tomore vigilance or reports of discrimination. However, the likelihood of this effect isdiminished in light of the “minimization hypothesis” (Ruggiero and Taylor 1997), whichsuggests that minority group individuals are more likely to downplay the discrimination theyexperience. The tendency to minimize or downplay experiences of discrimination may havebeen exacerbated if employees felt that their identity could have become known. Asindicated earlier, personal identifiers were removed from the interview data, and employersdid not know who the study participants were. However, it is likely that some employeesmay have felt less comfortable disclosing information about their workplace experiences. Inthis case, it is plausible that our study underestimates the effect of workplace discriminationon the mental health of our study population. Since our data are cross-sectional, depressivesymptomatology could have led some individuals to report more discrimination. Studiesdocumenting increased depressive symptoms over time as a consequence of general andworkplace discrimination exposure (Pavalko et al. 2003; Schulz et al. 2006) suggest that thisreporting bias is less probable. Nonetheless, it will be important to employ longitudinaldesigns in future investigations into workplace discrimination to rule out this possibility.
We assessed workplace discrimination as a major event. Research suggests that assessmentof ‘microaggressions” in the workplace may provide a better estimate of discriminationexposure (Deitch et al. 2003). Indeed, African Americans in our sample were more likely toreport frequent exposure to workplace discrimination in their day-to-day interactions thanemployees from other groups. Future studies will want to include more robust measures of“microaggressions” in the workplace, as well as those that assess discrimination in moregeneral life domains. Although it is possible that we underestimated the mental healthimpacts of workplace discrimination, using only a single aspect of mental health status,depression has been shown to be the most frequently described psychological consequenceof workplace discrimination (Rospenda et al. 2008).
It is also useful to note that discrimination does not produce uniformly pathogenic mentalhealth effects since some individuals may be buffered by identity factors, self-esteem, andcoping resources (Fischer and Shaw 1999; Sellers and Shelton 2003). Future studies shoulddetermine whether these individual differences alter the association between exposure toworkplace discrimination and depressive symptoms.
Hammond et al. Page 8
Race Soc Probl. Author manuscript; available in PMC 2010 May 11.
NIH
-PA Author Manuscript
NIH
-PA Author Manuscript
NIH
-PA Author Manuscript
Notable strengths of our study include our use of a multi-ethnic sample, focus on hospitalemployees, and assessment of multiple psychosocial and occupational stressors. We wereable to demonstrate that experiencing discrimination based on multiple personalcharacteristics is associated with more depressive symptoms. To our knowledge, this findinghas not been previously reported.
The documented increase in official reports of workplace discrimination to the EEOC(2009) suggests that gaining an understanding of its ensuing mental health consequences forracial and ethnic minority employees is both timely and critical. The psychological costs ofexposure to workplace discrimination are especially important in hospital employees sinceincreases in mental health issues correlate highly with absenteeism, reduced productivity,and occupational errors, (Kessler and Frank 1997; Kessler et al. 2008; Kouzis and Eaton1994) factors that can all compromise patient safety. When such declines in occupationalfunctioning occur among hospital employees, the healthcare delivery system may bedisrupted in ways that diminish its capacity to respond to patient needs. Since longitudinaldata suggest that the negative psychological effects of workplace discrimination persist andreduce the quality of labor force participation over time (Pavalko et al. 2003), increasingresearch and structural intervention efforts aimed at eliminating risks of this occupationalexposure is a public health priority. Nowhere else is this need more pressing than amongracial and ethnic minority employees who face compounded exposure to discrimination inthe social and workplace environment.
AcknowledgmentsThis study was supported by the National Institute of Arthritis and Musculoskeletal and Skin Diseases, (Grant R01AR47798-01). The first author is supported by the National Center for Minority Health and Health Disparities(Award 1L60MD002605-01), the National Cancer Institute (Grant 3U01CA114629-04S2), and the University ofNorth Carolina at Chapel Hill Cancer Research Fund. The authors would like to thank Drs. Noel Brewer, Edwin B.Fisher, and Brenda DeVellis for their comments on earlier versions of this manuscript. The authors would also liketo thank Dr. Nestor Lopez-Duran for statistical consultation.
ReferencesAsakura T, Gee GC, Nakayama K, Niwa S. Returning to the “Homeland”: Work-related ethnic
discrimination and the health of Japanese Brazilians in Japan. American Journal of Public Health.2008; 98(4):743–750. [PubMed: 18309126]
Barnes LL, de Leon CFM, Lewis TT, Bienias JL, Wilson RS, Evans DA. Perceived discrimination andmortality in a population-based study of older adults. American Journal of Public Health. 2008;98(7):1241–1247. [PubMed: 18511732]
Bhui K, Stansfeld S, McKenzie K, Karlsen S, Nazroo J, Weich S. Racial/ethnic discrimination andcommon mental disorders among workers: findings from the EMPIRIC study of ethnic minoritygroups in the United Kingdom. American Journal of Public Health. 2005; 95(3):496–501. [PubMed:15727983]
Camilli G, Hopkins KD. Applicability of chi-square to 2 × 2 contingency tables with small expectedcell frequencies. Psychological Bulletin. 1978; 85(1):163–167.
Clark R, Anderson NB, Clark VR, Williams DR. Racism as a stressor for African Americans. Abiopsychosocial model. American Psychologist. 1999; 54(10):805–816. [PubMed: 10540593]
Cohen, S. Perceived stress in a probability sample of the United States. In: Shirlynn, SS.; Stuart, O.,editors. The social psychology of health. Thousand Oaks, CA: Sage Publications, Inc; 1988. p.31-67.
Cohen S, Kamarck T, Mermelstein R. A global measure of perceived stress. Journal of Health andSocial Behavior. 1983; 24(4):385–396. [PubMed: 6668417]
de Castro AB, Gee GC, Takeuchi DT. Workplace discrimination and health among Filipinos in theUnited States. American Journal of Public Health. 2008; 98(3):520–526. [PubMed: 18235069]
Hammond et al. Page 9
Race Soc Probl. Author manuscript; available in PMC 2010 May 11.
NIH
-PA Author Manuscript
NIH
-PA Author Manuscript
NIH
-PA Author Manuscript
Deitch EA, Barsky A, Butz RM, Chan S, Brief AP, Bradley JC. Subtle yet significant: The existenceand impact of everyday racial discrimination in the workplace. Human Relations. 2003; 56(11):1299–1324.
EEOC. Race-based charges: FY 1999–FY 2007. 2008. Retrieved May 20, 2008, fromhttp://www.eeoc.gov/stats/race.html
EEOC. Charge statistics FY 1997 through FY 2008. 2009. Retrieved May 2, 2009, fromhttp://www.eeoc.gov/stats/charges.html
Ertel KA, Koenen KC, Berkman LF. Incorporating home demands into models of job strain: Findingsfrom the work, family, and health network. Journal of Occupational and Environmental Medicine.2008; 50(11):1244–1252. 1210.1097/JOM.1240b1013e31818c31308d. [PubMed: 19001950]
Finch BK, Kolody B, Vega WA. Perceived discrimination and depression among Mexican-originadults in California. Journal of Health and Social Behavior. 2000; 41(3):295–313. [PubMed:11011506]
Fischer AR, Shaw CM. African Americans’ mental health and perceptions of racist discrimination:The moderating effects of racial socialization experiences and self-esteem. Journal of CounselingPsychology. 1999; 46(3):395–407.
Flores E, Tschann JM, Dimas JM, Bachen EA, Pasch LA, de Groat CL. Perceived discrimination,perceived stress, and mental and physical health among Mexican-origin adults. Hispanic Journal ofBehavioral Sciences. 2008; 30(4):401–424.
Folkman S. Personal control and stress and coping processes: A theoretical analysis. Journal ofPersonality and Social Psychology. 1984; 46(4):839–852. [PubMed: 6737195]
Folkman S, Lazarus RS. Stress processes and depressive symptomatology. Journal of AbnormalPsychology. 1986; 95(2):107–113. [PubMed: 3711433]
Folkman, S.; Lazarus, RS.; Dunkel-Schetter, C.; DeLongis, A.; Gruen, RJ.; Higgins, ET., et al.Motivational science: Social and personality perspectives. New York: Psychology Press; 2000.The dynamics of a stressful encounter; p. 111-127.
Gee GC, Ryan A, Laflamme DJ, Holt J. Self-reported discrimination and mental health status amongAfrican descendants, Mexican Americans, and other Latinos in the New Hampshire REACH 2010initiative: The added dimension of immigration. American Journal of Public Health. 2006; 96(10):1821–1828. [PubMed: 17008579]
Geronimus AT. The weathering hypothesis and the health of African-American women and infants:Evidence and speculations. Ethnicity and Disease. 1992; 2(3):207–221. [PubMed: 1467758]
Gillen M, Yen IH, Trupin L, Swig L, Rugulies R, Mullen K, et al. The association of socioeconomicstatus and psychosocial and physical workplace factors with musculoskeletal injury in hospitalworkers. American Journal of Industrial Medicine. 2007; 50(4):245–260. [PubMed: 17311255]
Hewitt PL, Flett GL, Mosher SW. The perceived stress scale: Factor structure and relation todepression symptoms in a psychiatric sample. Journal of Psychopathology and BehavioralAssessment. 1992; 14(3):247–257.
Hirsh CE, Kornrich S. The context of discrimination: Workplace conditions, institutionalenvironments, and sex and race discrimination charges. American Journal of Sociology. 2008;113(5):1394–1432.
Inoue A, Kawakami N, Haratani T, Kobayashi F, Ishizaki M, Hayashi T, et al. Job stressors and long-term sick leave due to depressive disorders among Japanese male employees: Findings from theJapan work stress and health cohort study. Journal of Epidemiology and Community Health. 2010;64(3):229–235. [PubMed: 19679702]
Jackson PB, Thoits PA, Taylor HF. Composition of the workplace and psychological well-being: Theeffects of Tokenism on America’s Black Elite. Social Forces. 1995; 74(2):543–557.
Karasek R, Brisson C, Kawakami N, Houtman I, Bongers P, Amick B. The job content questionnaire(JCQ): An instrument for internationally comparative assessments of psychosocial jobcharacteristics. Journal of Occupational Health Psychology. 1998; 3(4):322–355. [PubMed:9805280]
Kessler RC, Frank RG. The impact of psychiatric disorders on work loss days. PsychologicalMedicine. 1997; 27(4):861–873. [PubMed: 9234464]
Hammond et al. Page 10
Race Soc Probl. Author manuscript; available in PMC 2010 May 11.
NIH
-PA Author Manuscript
NIH
-PA Author Manuscript
NIH
-PA Author Manuscript
Kessler RC, Merikangas KR, Wang PS. The prevalence and correlates of workplace depression in thenational comorbidity survey replication. Journal of Occupational and Environmental Medicine.2008; 50(4):381–390. [PubMed: 18404010]
Kessler RC, Mickelson KD, Williams DR. The prevalence, distribution, and mental health correlatesof perceived discrimination in the United States. Journal of Health and Social Behavior. 1999;40(3):208–230. [PubMed: 10513145]
Koji W, Katsutoshi T, Gilles T, Toshihiko S, Masaru M, Hitoshi M, et al. Validity of the center forepidemiologic studies depression scale as a screening instrument of major depressive disorderamong Japanese workers. American Journal of Industrial Medicine. 2007; 50(1):8–12. [PubMed:17096372]
Kopp MS, Thege BK, Balog P, Stauder A, Salavecz G, Rózsa S, et al. Measures of stress inepidemiological research. Journal of Psychosomatic Research. 2010 In Press, Corrected Proof.
Kouzis AC, Eaton WW. Emotional disability days: Prevalence and predictors. American Journal ofPublic Health. 1994; 84(8):1304–1307. [PubMed: 8059890]
Krieger N. Racial and gender discrimination: Risk factors for high blood pressure? Social Science andMedicine. 1990; 30(12):1273–1281. [PubMed: 2367873]
Landsbergis PA. Occupational stress among health care workers: A test of the job demands-controlmodel. Journal of Organizational Behavior. 1988; 9(3):217–239.
Landsbergis PA, Theorell T, Schwartz J, Greiner BA, Krause N. Measurement of psychosocialworkplace exposure variables. Occupational Medicine. 2000; 15(1):163–188. [PubMed:10620790]
Lazarus, RS. Psychological stress in the workplace. In: Crandall, R.; Perrewe, PL., editors.Occupational stress: A handbook. Philadelphia, PA: Taylor & Francis; 1995. p. 3-14.
Lewis TT, Everson-Rose SA, Powell LH, Matthews KA, Brown C, Karavolos K, et al. Chronicexposure to everyday discrimination and coronary artery calcification in African-Americanwomen: The SWAN heart study. Psychosomatic Medicine. 2006; 68(3):362–368. [PubMed:16738065]
Markovitz JH, Matthews KA, Whooley M, Lewis CE, Greenlund KJ. Increases in job strain areassociated with incident hypertension in the CARDIA study. Annals of Behavioral Medicine.2004; 28(1):4–9. [PubMed: 15249254]
Marmot MG, Bosma H, Hemingway H, Brunner E, Stansfield S. Contribution of job control and otherrisk factors to social variations in coronary heart disease incidence. The Lancet. 1997; 350(9073):235.
Mays VM, Coleman LM, Jackson JS. Perceived race-based discrimination, employment status, and jobstress in a national sample of black women: Implications for health outcomes. Journal ofOccupational Health Psychology. 1996; 1:319–329. [PubMed: 9547054]
Netterstrom B, Conrad N, Bech P, Fink P, Olsen O, Rugulies R, et al. The relation between work-related psychosocial factors and the development of depression. Epidemiologic Reviews. 2008;30(1):118–132. [PubMed: 18587142]
Noh S, Beiser M, Kaspar V, Hou F, Rummens J. Perceived racial discrimination, depression, andcoping: A study of Southeast Asian refugees in Canada. Journal of Health and Social Behavior.1999; 40(3):193–207. [PubMed: 10513144]
Pavalko EK, Mossakowski KN, Hamilton VJ. Does perceived discrimination affect health?longitudinal relationships between work discrimination and women’s physical and emotionalhealth. Journal of Health and Social Behavior. 2003; 44(1):18–33. [PubMed: 12751308]
Pbert L, Doerfler LA, DeCosimo D. An evaluation of the perceived stress scale in two clinicalpopulations. Journal of Psychopathology and Behavioral Assessment. 1992; 14(4):363–375.
Prentice DA, Miller DT. When small effects are impressive. Psychological Bulletin. 1992; 112(1):160–164.
Radloff LS. The CES-D scale: A self-report depression scale for research in the general population.Applied Psychological Measurement. 1977; 1(3):385–401.
Roberts RK, Swanson NG, Murphy LR. Discrimination and occupational mental health. Journal ofMental Health. 2004; 13(2):129–142.
Hammond et al. Page 11
Race Soc Probl. Author manuscript; available in PMC 2010 May 11.
NIH
-PA Author Manuscript
NIH
-PA Author Manuscript
NIH
-PA Author Manuscript
Rospenda KM, Richman JA, Shannon CA. Prevalence and mental health correlates of harassment anddiscrimination in the workplace: Results from a national study. Journal of Interpersonal Violence.2008 0886260508317182.
Ruggiero KM, Taylor DM. Why minority group members perceive or do not perceive thediscrimination that confronts them: The role of self-esteem and perceived control. Journal ofPersonality and Social Psychology. 1997; 72(2):373–389. [PubMed: 9107006]
Rugulies R, Braff J, Frank JW, Aust B, Gillen M, Yen IH, et al. The psychosocial work environmentand musculoskeletal disorders: Design of a comprehensive interviewer-administeredquestionnaire. American Journal of Industrial Medicine. 2004; 45(5):428–439. [PubMed:15095425]
Schulz AJ, Gravlee CC, Williams DR, Israel BA, Mentz G, Rowe Z. Discrimination, symptoms ofdepression, and self-rated health among African American women in Detroit: Results from alongitudinal analysis. American Journal of Public Health. 2006; 96(7):1265–1270. [PubMed:16735638]
Sellers RM, Shelton JN. The role of racial identity in perceived racial discrimination. Journal ofPersonality and Social Psychology. 2003; 84(5):1079–1092. [PubMed: 12757150]
Sharp LK, Kimmel LG, Kee R, Saltoun C, Chang CH. Assessing the perceived stress scale for AfricanAmerican adults with asthma and low literacy. Journal of Asthma. 2007; 44(4):311–316.[PubMed: 17530531]
Siqueira Reis R, Ferreira Hino AA, Romelio Rodriguez Anez C. Perceived stress scale: Reliability andvalidity study in Brazil. Journal of Health and Psychology. 2010; 15(1):107–114.
SPSS for Windows Release 16. Chicago, IL: SPSS, Inc; 2007.Stahl D, Sum CF, Lum SS, Liow PH, Chan YH, Verma S, et al. Screening for depressive symptoms:
Validation of the center for epidemiologic studies depression scale (CES-D) in a multiethnic groupof patients with diabetes in Singapore. Diabetes Care. 2008; 31(6):1118–1119. [PubMed:18337303]
Taylor J, Turner RJ. Perceived discrimination, social stress, and depression in the transition toadulthood: Racial contrasts. Social Psychology Quarterly. 2002; 65(3):213–225.
Theorell T, Karasek RA. Current issues relating to psychosocial job strain and cardiovascular diseaseresearch. Journal of Occupational Health Psychology. 1996; 1(1):9–26. [PubMed: 9547038]
Wadsworth E, Dhillon K, Shaw C, Bhui K, Stansfeld S, Smith A. Racial discrimination, ethnicity andwork stress. Occupational Medicine. 2007; 57(1):18–24. [PubMed: 16928781]
Weissman MM, Sholomskas D, Pottenger M, Prusoff BA, Locke BZ. Assessing depressive symptomsin five psychiatric populations: A validation study. American Journal of Epidemiology. 1977;106(3):203–214. [PubMed: 900119]
Wheaton, B.; Avison, WR.; Gotlib, IH. Stress and mental health: Contemporary issues and prospectsfor the future. New York: Plenum Press; 1994. Sampling the stress universe; p. 77-114.
Williams RB, Barefoot JC, Blumenthal JA, Helms MJ. Psychosocial correlates of job strain in asample of working women. Archives of General Psychiatry. 1997a; 54(6):543–548. [PubMed:9193195]
Williams DR, Neighbors HW, Jackson JS. Racial/ethnic discrimination and health: Findings fromcommunity studies. American Journal of Public Health. 2003a; 93(2):200–208. [PubMed:12554570]
Williams DR, Neighbors HW, Jackson JS. Racial/ethnic discrimination and health: Findings fromcommunity studies. American Journal of Public Health. 2003b; 93(2):200–208. [PubMed:12554570]
Williams DR, Yan Y, Jackson JS, Anderson NB. Racial differences in physical and mental health:Socio-economic status, stress and discrimination. Journal of Health Psychology. 1997b; 2(3):335–351.
Yates F. Contingency table involving smal numbers and the χ2 test. Journal of the Royal StatisticalSociety (Supplement). 1934; 1(2):217–235.
Yen IH, Ragland DR, Greiner BA, Fisher JM. Workplace discrimination and alcohol consumption:Findings from the San Francisco Muni health and safety study. Ethnicity and Disease. 1999; 9(1):70–80. [PubMed: 10355476]
Hammond et al. Page 12
Race Soc Probl. Author manuscript; available in PMC 2010 May 11.
NIH
-PA Author Manuscript
NIH
-PA Author Manuscript
NIH
-PA Author Manuscript
Yuan ASV. Perceived age discrimination and mental health. Social Forces. 2007; 86(1):291–311.
Hammond et al. Page 13
Race Soc Probl. Author manuscript; available in PMC 2010 May 11.
NIH
-PA Author Manuscript
NIH
-PA Author Manuscript
NIH
-PA Author Manuscript
NIH
-PA Author Manuscript
NIH
-PA Author Manuscript
NIH
-PA Author Manuscript
Hammond et al. Page 14
Tabl
e 1
Cha
ract
eris
tics o
f GR
OW
stud
y pa
rtici
pant
s (N
= 6
64) b
y ra
ce/e
thni
city
Tot
al sa
mpl
e (N
=66
4, %
)W
hite
s (n
= 26
0, %
)
Asi
an P
acifi
cIs
land
ers (
n =
185,
%)
Afr
ican
Am
eric
ans (
n=
66, %
)L
atin
o (n
= 1
05, %
)M
ixed
and
oth
er (n
=48
, %)
p
Dep
ress
ive
sym
ptom
s (C
ES-D
scor
e), m
ean
± SD
9.09
± 8
.61
8.38
± 8
.09
9.03
± 8
.39
10.7
0 ±
9.19
9.64
± 8
.96
9.85
± 1
0.41
.30
Gen
eral
soci
al st
ress
, mea
n ±
SD8.
40 ±
3.0
08.
24 ±
3.0
58.
75 ±
2.9
48.
62 ±
3.0
97.
93 ±
2.6
88.
67 ±
3.3
6.1
6
Cas
e25
.023
.524
.330
.325
.727
.1.8
3
Con
trol
75.0
76.5
75.7
69.7
76.5
72.9
Sex
M
en29
.127
.327
.630
.334
.331
.2.7
1
W
omen
70.9
72.7
72.4
69.7
65.7
68.8
Age
in y
ears
22
–35
19.9
17.7
22.7
19.7
18.0
25.0
.20
36
–45
24.2
23.8
21.1
31.8
24.8
27.1
45
–55
39.8
39.6
44.3
25.8
41.0
39.6
≥
5616
.118
.811
.922
.716
.28.
3
Ann
ual h
ouse
hold
inco
me
≤$
39,9
9913
.27.
813
.127
.016
.717
.0<.
001
$4
0–59
,999
22.5
19.8
16.4
33.3
31.4
27.7
$6
0–79
,999
21.1
19.0
24.0
27.0
17.6
21.3
$8
0–11
9,99
928
.232
.927
.99.
528
.427
.7
≥
$120
,000
15.0
20.5
18.6
3.2
5.9
6.4
Educ
atio
n
≤H
igh
scho
ol g
radu
ate
5.5
0.4
5.5
20.0
9.5
4.3
<.00
1
So
me
colle
ge16
.78.
015
.330
.823
.834
.0
A
ssoc
iate
deg
ree
20.0
16.2
16.4
26.2
33.3
17.0
C
olle
ge g
radu
ate
38.8
45.4
45.9
18.5
24.8
34.1
G
radu
ate
degr
ee19
.130
.016
.94.
68.
610
.6
Occ
upat
iona
l cat
egor
y
A
dmin
istra
tors
11.1
17.3
9.7
4.5
5.7
4.2
<.00
1
N
urse
s37
.051
.235
.724
.219
.022
.9
Race Soc Probl. Author manuscript; available in PMC 2010 May 11.
NIH
-PA Author Manuscript
NIH
-PA Author Manuscript
NIH
-PA Author Manuscript
Hammond et al. Page 15
Tot
al sa
mpl
e (N
=66
4, %
)W
hite
s (n
= 26
0, %
)
Asi
an P
acifi
cIs
land
ers (
n =
185,
%)
Afr
ican
Am
eric
ans (
n=
66, %
)L
atin
o (n
= 1
05, %
)M
ixed
and
oth
er (n
=48
, %)
p
O
ther
clin
ical
14.0
10.8
15.1
13.6
19.0
16.7
Te
chni
cal
8.7
8.1
11.4
1.5
10.5
6.2
C
leric
al20
.99.
620
.537
.928
.643
.8
Su
ppor
t8.
33.
07.
618
.217
.26.
2
Cou
ntry
of b
irth
U
S-bo
rn63
.187
.724
.392
.466
.381
.2<.
001
Fo
reig
n-bo
rn36
.912
.375
.77.
638
.718
.8
Job
stra
in
H
igh
25.0
25.8
27.7
33.3
16.6
29.2
Lo
w75
.074
.272
.366
.783
.470
.8<.
05
Rep
orte
d w
orkp
lace
dis
crim
inat
ion
Y
es13
.710
.415
.725
.811
.412
.5
N
o86
.389
.684
.374
.288
.687
.5<.
05
Type
of w
orkp
lace
dis
crim
inat
ion
N
one
86.9
89.6
86.5
74.2
88.6
87.5
O
ne ty
pe5.
16.
23.
810
.62.
92.
1<.
05
M
ultip
le ty
pes
8.0
4.2
9.7
15.2
8.6
10.4
Freq
uenc
y of
wor
kpla
ce d
iscr
imin
atio
n
N
ever
86.3
89.6
84.3
74.2
88.6
87.5
So
met
imes
6.5
4.6
6.5
18.2
3.8
6.2
<.01
O
ften
7.2
5.8
9.2
7.6
7.6
6.2
GRO
W G
radi
ents
in O
ccup
atio
nal H
ealth
in H
ospi
tal W
orke
rs S
tudy
, CES
-D C
ente
r for
Epi
dem
iolo
gica
l Stu
dies
Dep
ress
ion
Scal
e
Com
paris
ons f
or b
etw
een-
grou
p di
ffer
ence
s, ba
sed
on χ
2 te
sts f
or c
ateg
oric
al v
aria
bles
and
F-te
sts f
or c
ontin
uous
var
iabl
es (C
ES-D
and
Gen
eral
Soc
ial S
tress
)
Bol
d va
lue
indi
cate
s tha
t sig
nific
ant a
t the
p <
.05
leve
l
Race Soc Probl. Author manuscript; available in PMC 2010 May 11.
NIH
-PA Author Manuscript
NIH
-PA Author Manuscript
NIH
-PA Author Manuscript
Hammond et al. Page 16
Tabl
e 2
Dis
tribu
tion
of w
orkp
lace
dis
crim
inat
ion
type
s and
per
cent
freq
uenc
y, b
y ra
ce/e
thni
city
Tot
al sa
mpl
e (N
= 6
64,
%)
Whi
tes (
n =
260,
%)
Asi
an P
acifi
c Is
land
ers (
n =
185,
%)
Afr
ican
Am
eric
ans (
n =
66,
%)
Lat
ino
(n =
105
, %)
Mix
ed a
nd o
ther
(n =
48, %)
p
Type
s of w
orkp
lace
dis
crim
inat
ion
Rac
e/et
hnic
ity
N
o91
.496
.988
.680
.390
.589
.6<.
001
Y
es8.
63.
111
.419
.79.
510
.4
Nat
iona
lity
N
o93
.798
.589
.286
.495
.291
.7<.
001
Y
es6.
31.
510
.813
.64.
88.
3
Gen
der
N
o95
.095
.095
.197
.094
.393
.8.9
4
Y
es5.
05.
04.
93.
05.
76.
2
Sexu
al o
rient
atio
n
N
o98
.598
.898
.997
.010
0.0
93.8
<.05
Y
es1.
51.
21.
13.
00.
06.
2
Age
N
o94
.094
.293
.589
.496
.295
.8.4
4
Y
es6.
05.
86.
510
.63.
84.
2
Perc
ent f
requ
ency
of w
orkp
lace
dis
crim
inat
ion
Hiri
ng
N
ever
91.3
95.0
88.1
84.8
90.5
93.8
So
met
imes
3.6
1.9
5.9
6.1
3.8
0.0
.11
O
ften
5.1
3.1
5.9
9.1
5.4
6.2
Eval
uatio
n
N
ever
92.6
95.0
89.7
89.4
93.3
93.8
So
met
imes
3.3
2.7
4.9
4.5
1.0
4.2
.36
O
ften
4.1
2.3
5.4
6.1
5.7
2.1
Wor
k as
sign
men
ts
N
ever
89.9
92.3
87.6
86.4
90.5
89.6
So
met
imes
2.9
2.3
4.3
3.0
1.9
2.1
.75
Race Soc Probl. Author manuscript; available in PMC 2010 May 11.
NIH
-PA Author Manuscript
NIH
-PA Author Manuscript
NIH
-PA Author Manuscript
Hammond et al. Page 17
Tot
al sa
mpl
e (N
= 6
64,
%)
Whi
tes (
n =
260,
%)
Asi
an P
acifi
c Is
land
ers (
n =
185,
%)
Afr
ican
Am
eric
ans (
n =
66,
%)
Lat
ino
(n =
105
, %)
Mix
ed a
nd o
ther
(n =
48, %)
p
O
ften
7.2
5.4
8.1
10.6
7.6
8.3
Prom
otio
n
N
ever
94.0
94.6
91.9
97.0
93.3
95.8
So
met
imes
1.8
1.5
3.2
0.0
1.0
2.1
.69
O
ften
4.2
3.8
4.9
3.0
5.7
2.1
Day
-to-d
ay in
tera
ctio
ns
N
ever
87.3
90.4
85.9
75.8
89.5
87.5
So
met
imes
4.2
1.9
6.5
9.1
3.8
12.1
<.05
O
ften
8.4
7.7
7.6
15.2
6.7
10.4
Com
paris
ons f
or b
etw
een-
grou
p di
ffer
ence
s, ba
sed
on χ
2 te
sts
Bol
d va
lue
indi
cate
s tha
t sig
nific
ant a
t the
p <
.05
leve
l
Race Soc Probl. Author manuscript; available in PMC 2010 May 11.
NIH
-PA Author Manuscript
NIH
-PA Author Manuscript
NIH
-PA Author Manuscript
Hammond et al. Page 18
Tabl
e 3
Mea
n C
ES-D
scor
e (±
SD) a
nd w
orkp
lace
dis
crim
inat
ion
by ra
ce/e
thni
city
(una
djus
ted)
Tot
al sa
mpl
eF-
test
aW
hite
sA
sian
Pac
ific
Isla
nder
sA
fric
an A
mer
ican
sL
atin
osM
ixed
and
oth
erF-
test
b
Rep
orte
d di
scrim
inat
ion
Y
es12
.53
± 9.
9911
.61*
*11
.26
± 9.
1011
.62
± 10
.84
15.8
8 ±
10.6
713
.25
± 9.
6111
.67
± 8.
730.
57
N
o8.
55 ±
8.2
68.
05 ±
7.9
28.
54 ±
7.8
08.
90 ±
7.9
39.
17 ±
8.8
29.
59 ±
10.
70
Type
s of w
orkp
lace
dis
crim
inat
ion
N
one
8.61
± 8
.32
5.10
**8.
05 ±
7.9
28.
78 ±
8.0
38.
90 ±
7.9
39.
17 ±
8.8
28.
62 ±
8.3
21.
20
O
ne ty
pe11
.47
± 9.
298.
94 ±
7.7
78.
86 ±
6.6
420
.29
± 12
.71
11.6
7 ±
1.15
11.4
7 ±
9.29
M
ultip
le ty
pes
12.8
1 ±
10.3
114
.63
± 10
.31
11.3
3 ±
11.7
312
.80
± 8.
5513
.78
± 11
.20
12.8
1 ±
10.3
0
Freq
uenc
y of
wor
kpla
ce d
iscr
imin
atio
n
N
ever
8.55
± 8
.25
8.47
***
8.04
± 7
.90
8.54
± 7
.81
8.90
± 7
.93
9.17
± 8
.82
9.60
± 1
0.70
0.87
So
met
imes
11.2
3 ±
10.1
811
.33
± 9.
589.
83 ±
10.
8614
.83
± 11
.71
9.25
± 7
.72
4.67
± 4
.16
O
ften
13.6
9 ±
9.77
11.2
0 ±
9.13
12.8
8 ±
10.9
718
.40
± 8.
7315
.25
± 10
.29
18.6
7 ±
5.13
CES
-D C
ente
r for
Epi
dem
iolo
gica
l Stu
dies
Dep
ress
ion
Scal
e
**P
< .0
1,
*** P
< .0
01
a F-te
st fo
r mea
n di
ffer
ence
s in
asso
ciat
ion
betw
een
mea
n C
ES-D
scor
es a
nd w
orkp
lace
dis
crim
inat
ion
for t
he o
vera
ll sa
mpl
e
b F-te
st fo
r rac
e/et
hnic
diff
eren
ces i
n th
e as
soci
atio
n be
twee
n m
ean
diff
eren
ces i
n C
ES-D
scor
es a
nd w
orkp
lace
dis
crim
inat
ion
Race Soc Probl. Author manuscript; available in PMC 2010 May 11.
NIH
-PA Author Manuscript
NIH
-PA Author Manuscript
NIH
-PA Author Manuscript
Hammond et al. Page 19
Tabl
e 4
Rel
atio
nshi
p be
twee
n w
orkp
lace
dis
crim
inat
ion
repo
rts, t
ypes
, fre
quen
cy, a
nd d
epre
ssiv
e sy
mpt
oms (
CES
-D sc
ore)
, N =
664
Rep
orte
d w
orkp
lace
dis
crim
inat
ion,
β (S
E)
Wor
kpla
ce d
iscr
imin
atio
n ty
pes &
freq
uenc
y, β
(SE
)
Mod
el 1
Bas
ic(r
ace/
ethn
icity
only
)
Mod
el 2
Bas
ic+
wor
kpla
cedi
scri
m
Mod
el 3
(Mod
el2
+ ge
nera
lso
cial
stre
ss)
Mod
el 4
(Mod
el 3
+ jo
bst
rain
)M
odel
5 (a
ll)
Mod
el 6
Bas
ic +
wor
kpla
cedi
scri
m
Mod
el 7
(Mod
el6
+ ge
nera
lso
cial
stre
ss)
Mod
el 8
(Mod
el7
+ jo
b st
rain
)M
odel
9 (a
ll)
Whi
tes
1.00
1.00
1.00
1.00
1.00
1.00
1.00
1.00
1.00
Asi
an P
acifi
c Is
land
er−.01(.83)
−.02(.83)
−.05(.67)
−.00(.84)
−.05(.68)
−.03(.84)
−.05(.68)
−.01(.84)
−.05(.69)
Afr
ican
Am
eric
an−.03(1.28)
−.04(1.29)
−.01(1.05)
−.04(1.28)
−.01(1.04)
−.04(1.29)
.00(
1.05
)−.04(1.28)
.00(
1.05
)
Latin
o−.03(1.05)
−.03(1.05)
.03(
.86)
−.03(1.04)
.03(
.85)
−.03(1.05)
.03(
.86)
−.02(1.04)
.03(
.85)
Mix
ed a
nd o
ther
−.00(1.38)
−.01(1.37)
−.01(1.12)
−.00(1.36)
−.01(1.11)
−.00(1.38)
−.01(1.12)
−.00(1.37)
−.01(1.12)
Perc
eive
d st
ress
––
.58(
.09)
***
–.5
8(.0
9)**
*–
.58(
.09)
***
–.5
8(.0
9)**
*
Job
stra
in (l
ow, r
ef)
––
–.1
3(.7
9)**
.07(
.64)
*–
–.1
3(.7
9)**
.07(
.64)
*
Wor
kpla
ce d
iscr
imin
atio
n(n
o, re
f.).1
2(.9
7)**
.09(
.79)
**.1
0(.9
8)*
.08(
.80)
*–
––
–
Type
of w
orkp
lace
dis
crim
inat
ion
N
one
(ref
)–
––
––
1.00
1.00
1.00
1.00
O
ne ty
pe–
––
––
−.19(4.46)
−.11(3.60)
−.19(4.43)
−.12(3.59)
M
ultip
le ty
pes
––
––
–−.26(4.38)
−.16(3.54)
−.27(4.35)
−.17(3.53)
Freq
uenc
y of
wor
kpla
ce d
iscr
imin
atio
n
N
ever
(ref
)–
––
––
1.00
1.00
1.00
1.00
So
met
imes
––
––
–.2
7(4.
33)*
.16(
3.50
).2
7(4.
30)*
.17(
3.49
)
O
ften
.34(
4.33
)**
.23(
3.50
)*.3
3(4.
30)*
.22(
3.48
)*
Adj
uste
d R2
.07*
**.0
8***
.40*
**.0
9***
.40*
**.0
8***
.40*
**.0
9***
.40*
**
CES
-D C
ente
r for
Epi
dem
iolo
gica
l Stu
dies
Dep
ress
ion
Scal
e
Bas
ic m
odel
adj
uste
d fo
r cas
e st
atus
, age
, gen
der,
educ
atio
n, in
com
e, a
nd o
ccup
atio
nal c
ateg
ory.
Num
bers
are
stan
dard
ized
regr
essi
on c
oeff
icie
nts.
The
coef
ficie
nt fo
r cat
egor
ical
var
iabl
es is
the
diff
eren
cebe
twee
n th
e re
fere
nce
grou
p an
d th
e co
mpa
rison
gro
up, a
nd th
e co
effic
ient
for c
ontin
uous
var
iabl
es (e
.g.,
perc
eive
d st
ress
) is t
he sl
ope,
the
mag
nitu
de o
f cha
nge
of th
e ou
tcom
e pe
r 1 u
nit c
hang
e in
pre
dict
or.
Val
ues i
n pa
rent
hese
s rep
rese
nt st
anda
rd e
rror
s
* p <
.05,
**p
< .0
1,
*** p
< .0
01
Race Soc Probl. Author manuscript; available in PMC 2010 May 11.


