Embed Size (px)
Citation preview
TECHNICAL UNIVERSITY IN BRNO
&CZECH TECHNICAL UNIVERSITY IN PRAGUE
INIS-mf—14791
WORKSHOP 96BRNO, JANUARY 22-24, 1996
27 fe 1 5
PART II.
Engineering Mechanics - Theory of Construction - Materials Science inMechanical Engineering - Materials Science in Electrical, Chemical andCivil Engineering - Power Systems and Electrical Engineering - Electronics,
Measuring and Communication Engineering
TECHNICAL UNIVERSITY IN BRNO
&
CZECH.TECHNICAL UNIVERSITY IN PRAGUE
WORKSHOP 96BRNO, JANUARY 22-24, 1996
PART II.
Engineering Mechanics - Theory of Construction - Materials Science inMechanical Engineering - Materials Science in Electrical, Chemical andCivil Engineering - Power Systems and Electrical Engineering - Electronics,
Measuring and Communication Engineering
These ate the Proceedings of the Fifth Annual university-wide seminar WORKSHOP 30which will take place at the Technical University in Brno from 22-24 January, 1996.
The aim of the seminar is to present and discuss the latest results obtained by researchersespecially at the Czech Technical Universiiy in Prague, Technical University in Brno and atcollaborating institutions.
The organizing committee has selected a total of 494 contributions divided into 22 differentareas of interest.
Part II has contributions in the areas of:
• engineering mechanics
• theory of construction
• materials science in mechanical engineering
• materials science in electrical, chemical and civil engineering
• power systems and electrical engineering
• electronics, measuring and communication engineering
Organizing committee:
Chairman: P. ChmelaCo-chairman: M. KalalMembers: J. BaUte, V. Brabec, M. Buchta, P. Hazdra, M. Hobza, J. Jan, M. Krai,
J. Matousek, J. Mici'n, P. Ondracka, L. Pribyl, I. Ruller, A. Strejc,M. Zahradkova, D. Zabokrtska
Prague, December 1995
This book was prepared with UTgpC from the input files supplied by the authors. AH partialarticles were prepared with W96 - a special-purpose IffgX-based environment. Program-ming W96, general style, typographic corrections and the final composition of this book isby A. Strejc (CTU Computing Centre).
Published by the Czech Technical University in Prague. Printed by CTU Publishing House.Unsalable publication.
WORKSHOP 96 CONTENTS
CONTENTS
7. ENGINEERING MECHANICS
PVM PARALLELIZATION OF EXPLICIT FINITE ELEMENT PROGRAMS 417P. Krysl
TRIANGULATION OF 3D SURFACES BY THE ADVANCING FRONTTECHNIQUE 419D. Rypl
RATE DEPENDENT ANALYSIS OF CONCRETE STRUCTURES 421J. Mdca
DYNAMIC CONDENSATION 423Z. Bittnar, J. Kruis
NONLINEAR ANALYSIS OF CONCRETE STRUCTURES 425B. Paizdk, Z. Bitlnar
ANALYSIS OF STRUCTURES USING TRANSFORMATION FIELD ANALYSIS . . . 427P. Prochdzka, J, Sejnoha
TUNNEL LINING IMPROVEMENT BY OPTIMIZED ANCHORING 429J. Sejnoha, P. Prochdzka
LARGE DISPLACEMENT ANALYSES OF SHELLS 431P. Fajman
EVOLUTION AND STRUCTURAL SHAPE OPTIMIZATION 433J. Bocko, J. Miller
FATIGUE LIFE OF BRIDGE 435J. Culik
STATIC ANALYSIS OF CABLE-STAYED BRIDGE SYSTEMS 437J. Kadlcdk, J. Kytyr
CRACK GROWTH SIMULATION 439P. Broz
DESIGN OF NON-UNIFORM STRUTS 441M. Tochdctk
FAILURE HISTORY OF SLOPES WITH PREDESTINATED SLIP SURFACE 443J. Vacek, E. Westman
COUPLING OF PHYSICAL AND MATHEMATICAL MODELS INGEOTECHNICS 445V. Dolezel, P. Prochdzka
403
WORKSHOP 96 CONTENTS
MICROMECHANICAL MODELLING IN THEORY OF COMPOSITEMATERIALS 447B. Novotny
DAMAGE IN KEVLAR/EPOXY COMPOSITES 449M. Cerny
CYCLE MODELING OF RECIPROCATING AIR COMPRESSOR 451B. Sekanina
A NUMERICAL SOLVER FOR ELASTOHYDRODYNAMICALLYLUBRICATED LINE CONTACTS 453J. Cermdk
A BALL-PLATE MACHINE FOR MEASURING ANT1WEAR FILMS INCONCENTRATED CONTACTS 455/. Kfupka, M. Haril
RIGID-PLASTIC SIMULATION OF FORMING PROCESSES BY FINITEELEMENTS 457J. PetruSka
MODEL OF INTERACTION BETWEEN FLEXIBLE STRUCTURE ANDFLUID 459K. Dedouch
ACOUSTICAL INTERACTION OF A PLATE WITH FLUID 461/. Zolotarev
SIMULATION OF SYSTEMS WITH n-DEGREE OF FREEDOM 463J. Vondfich, S. Jirki, J. Hobzik, V. Kula
IDENTIFICATION OF FEM AND EXPERIMENTAL DYNAMIC MODELS 465r. "-ich, D. Hovdek, J. Housa
GROUND HOOK FOR SEMI-ACTIVE DAMPING OF TRUCK'S SUSPENSION.... 467M. Valdsek, M. Novak
INVESTIGATION OF THE RAIL VEHICLE GUIDING PROPERTIES 469J. Siba, T. Htptner, J. Koldf
8. THEORY OF CONSTRUCTION
RELATION BETWEEN THE BUILDING CONSTRUCTIONS AND THEINDOOR ENVIRONMENT 473J. Chybik
LONG-TERM BEHAVIOUR OF ONE-WAY COMPOSITE REINFORCEDCONCRETE SLABS 475J. Navrdtil, M. Lavicky
404
WORKSHOP 96 CONTENTS
STRESS DEVELOPMENT IN SEQUENTIALLY CONSTRUCTED HIGH-RISEBUILDINGS 477J. L. ViUk, V. Knsttk
STIFFNESS AND DEFLECTIONS OF STIFFENING CORES OF HIGH-RISEBUILDINGS 479K. Bauer, V. KHstck
FAILURE OF CONNECTION OF COMPOSITE BEAMS 481J. L. Vitek
MODELLING OF THE BEHAVIOUR OF CONCRETE - INFLUENCE OFCRACKS 483J. Prochdzka, J. Krdtky, V. Kfistek, J. L, Viiek, K. Trtik, J. Filipovd
STRESS-STRAIN DIAGRAM OF CONCRETE IN COMPRESSION 485P. Bouska, 0. Lowitovd, P. Konvulinka
INFLUENCE OF DIFFERENT KINDS OF STEEL FIBRES ON SOMEPROPERTIES OF CONCRETE 487A. Almasani
REINFORCEMENT BEAMS STRENGTHENED BY UNBONDEDREINFORCEMENT 489T. Vanek, J. Bulvas, L. Podolka
EXCESSIVE DEFLECTIONS OF PRESTRESSED CONCRETE BRIDGES 491J. L. Vitek, V. KHstek
ENVIRONMENTAL EFFECTS ON CONCRETE ELEMENTS 493J. L. Vitek, V. KHstek
DESIGN TOOL FOR RC STRUCTURES: OBJECT-ORIENTED APPROACH 495R. Chudoba, Z. Bittnar
ULTIMATE LIMIT STATE OF PRESTRESSED CONCRETE BEAMS -COMPUTER CODE 497P. Vitek, J. L. Vitek
COMPARING PREDICTED AND MEASURED INDOOR AIR TEMPERATURE... 499D. Vytlacil
SOIL IMPROVEMENT BY GRAVEL PILES 501P. Kuklik, J. Kuklikovd
ON THE CALIBRATION OF THE NEW CZECH PAVEMENT DESIGNMETHOD 503B. Novotny
DESIGN AND MANUFACTURING OF AN ULTRALIGHT AEROPLANE 505A. Pistek
405
WORKSHOP 96 CONTENTS
BOUNDARY LAYER WIND TUNNEL AT VZLU LETNANY - PROGRESSREPORT 507J. Krai, M. Jirsdk, 0. Sutncr, M. Tochdcek, 0. Lowilovd
STIFFNESS OPTIMIZATION OF MACHINE STRUCTURES 509K. Vitek, S. Hohj, M. Spaniel
OPERATING RELIABILITY OF HARMONIC DRIVE UNITS 511L. Jancik, Z. Bauer, V. Dynybyl, J. Kanaval, R. Nemec
EMBEDDED COLUMN BASE EXPERIMENTS 513J. Pertold, F. Wald, Z. Sokol
MATHEMATICAL MODELLING OF BUCKLING BEHAVIOR OF SLENDERSTEEL WEBS 515M. Novak, 0. Lowitovd
DESIGNING STEEL CONSTRUCTIONS BY FEM METHOD 517F. Cihdk
COMPOSITE STRUCTURES: THE PERFORATED BAND AS A SHEARCONNECTOR 519J. Machdcek, J. Studnicka
9. MATERIALS SCIENCE IN MECHANICAL ENGINEERING
APPLICATION OF IMAGE ANALYSIS ON THE EVALUATION OFSTRUCTURES OF Ni-SUPERALLOYS, STEEL AND CERAMICS 523J. Krejci, J. Krejcova, J. Bfezina, J. Smutnd, D. Janovd
THE PREPARATION OF THIN FOILS FOR TRANSMISSION ELECTRONMICROSCOPY BY ION MILLING 525Z. Vojtkuldkovd, J. Krejci
CONTRIBUTION TO THE STUDY OF GUINIER-PRESTON ZONES BYMEANS OF HIGH RESOLUTION ELECTRON MICROSCOPY 527M. Karlik, B. Jouffrey
UPGRADE OF SEM ANALYTIC COMPLEX BY POSSIBILITY OFADVANCED NUMERICAL DATA PROCESSING 529D. Janovd, J. Svejcar
DEVELOPMENTS IN ROBUST SURFACE RECONSTRUCTION FROMSTEREO SEM IMAGES 531D. Janovd, J. Jan
DIFFRACTION ANALYSIS OF MATRIX PHASES IN ELECTRON BEAMWELDS OF A STAINLESS MARAGING STEEL 533K. Macek, P. Lvkds, J. Janovcc, P. Mikula, R. Ihsdk
COMPUTER PROCESSING OF NDT INDICATION 535L. Ptdcck, M. Drttckmuller, Z. Kukla
406
WORKSHOP 96 CONTENTS
USE OF SCANNING TUNNELING MICROSCOPY IN MATERIALS SCIENCEAND ENGINEERING 537J. Svejcar, L. Benes, J. Man, Z. Vojtkuldkovd, M. Ccpera
DEGRADATIONS ACTING DURING SERVICE EXPOSURE OF STEAMTURBINE PARTS AND THEIR INFLUENCE ON REMAINING LIFE 539R. Foret, A. Buchal, J. Krejci
REMAINING STRENGTH OF CORRODED TRANSIT GAS PIPELINES 541F. Valenta, M. Sochor, J. Michalec, M. Spaniel, M. Ruzicka
CREEP RUPTURE STRENGTH OF A STAINLESS MARAGING STEEL 543Z. Koufil, K. Macek, J. Sasko
PHASE TRANSITIONS IN Ni-Cr-Al ALLOYS AND NiCr-Al COUPLE 545J. Krejci, J. Bfezina, J. Smutnd, A. Buchal, J. Svejcar
METALLURGY OF Mg-Li ALLOYS 547L. Ptdcek, L. Zemcik, V. Ustohal, J. Michdlek
INTERMETALLIC PHASES IN AN Al-Li-Cu-Zr ALLOY 549V. Stary, K. Macek
DIFFRACTION ANALYSIS OF ALUMINIUM SPECIMENS AFTER PLASTICEXTENSION 551/. Kraus, G. Gosmanovd, N. Ganev, L. Berka
STRUCTURE OF 7010 Al-ALLOY AND FATIGUE CRACK PROPAGATION 553J. Kxmz, J. Siegl, P. Kopfiva, I. Ncdbal
THEORETICAL PREDICTION OF THE FATIGUE CRACK GROWTH RATE 555V. Oliva, L. Cse'plo, R. Hartman, A. Materna
FATIGUE CRACK SURFACE PICTURES: A RANDOM FIELD ANALYSIS(COMPUTER AIDED FRACTOGRAPHY) 557H. Lauschmann, P. Cusan
THE FATIGUE DURABILITY OF NITRIDED GEARS 559J, Handk, I. Dvorak ,
FATIGUE PROPERTIES OF UHSLA POLDI STEEL 561L. Bartik, J. Pokluda
HIGH AND LOW CYCLE FATIGUE OF AUSTEMPERED DUCTILE IRON 5635. Vechet, J. Poldk, K. Obrtlik, E. Dorazil, J. Svejcar, B. Skrbek
INCREASING OF UTILITY PROPERTIES OF FERRITIC DUCTILE CASTIRON DETERMINED FOR WORK UNDER LOW TEMPERATURES 565R. Hudec, B. Vlach, L. Vdlka, B. Pacal, G. Papdnkovd
STUDY OF PHASE TRANSFORMATIONS IN HEAT TREATED MODELCAST STEEL Fe-C-Si-Ni-Nb 567B. Pacal, E. Dorazil, R. Hudec, T. Podrdbsky, A. Buchal, Z. Vojtkuldkovd
407
WORKSHOP 96 CONTENTS
CAST MOLYBDENUM HIGH-SPEED STEELS FOR CUTTING TOOLS 568T. Podrdbsky, J. Svejcar
THE LABORATORY OF CERAMIC MATERIALS MECHANICALPROPERTIES TESTING 571B. Vlach, M. Reinisch, M. Trunec, J. Krejci, R. Hudcc
THE INFLUENCE OF Cr AND Ti ON THE ALUMINA SINGLE CRYSTAL ATHIGH TEMPERATURES 573K. Maca, Z. Cochndr
PRODUCTION TECHNOLOGY VS. STRUCTURE AND MECHANICALPROPERTIES OF ADVANCED PLASTICS 575E. Mollikovd, B. Vlach, B. Kandus
COLD-ROLLING OF POLYMERS PART I: TENSILE PROPERTIES 577J. Stcidl
PRELIMINARY TEM STUDY OF CARBON/CARBON COMPOSITE 579F. Hnilica, P. Glogar, V. Stary
THE INFLUENCE OF HYGROTHERMAL AGING ON IMPACTPROPERTIES OF KEVLAR-EPOXY COMPOSITE 581Z. KoHnek
ADHESION STUDY BY SCRATCH TEST AND VIBRATIONALSPECTROSCOPY 583P. Mach
COATINGS ON DEEPLY CURVATURED SURFACES 585/. Kvasnicka, R. Novak, D. Novdkovd
PARTICLE SCATTERING ON SOLID SURFACES 587T. Sikola, P. Dub, J. Jiruse A. Nebojsa, J. Ildjek, R. Ccskn,
ION BEAM MODIFICATION OF CERAMIC SURFACES AND DEPOSITIONOF THIN FILMS , 589T. Sikola, J. Spousta, L. Dittrichovd, F. Matejka, D. Janovd, A. Nebojsa,A. Buchal, R. Ceska, I. Kustcra, J. Stefka
ANALYSIS OF RESIDUAL STRESS STATE DUE TO CUTTING 591JV. Gancv, I. Kraus, G. Gosmanovd
OPTIMIZATION OF HEAT TREATMENT USING A NUMERICAL MODEL 593F. Kavicka, J. Hlousek, J. Stetina
INFLUENCE OF LASER HEAT TREATMENT ON SURFACE PROPERTIESOF HIGH-SPEED STEEL TYPE 6-5-2 595J. Cejp, P. Jurci
MECHANICAL PROPERTIES AND STRUCTURE OF METALS ANDALLOYS SUBJECTED TO HIGH STRAIN-RATE DEFORMATION 597J. Krejci, J. Breiina, J, Smutnd, J. Svejcar, M. Forejt, B. Vlach
408
WORKSHOP 96 CONTENTS
JOINING OF DISSIMILAR MATERIALS 599V. Ustohal, M. Klicnik, J. Dupdk, P. Skoda
10. MATERIALS SCIENCE IN ELECTRICAL, CHEMICALAND CIVIL ENGINEERING
STRUCTURAL RELAXATION IN SPLAT COOLED 75Ce-25Al ALLOY 603R. Fiedler
CONDUCTANCE CHANGES AND PREMATURE CAPACITY LOSS INPOSITIVE LEAD-ACID BATTERY PLATES 605M. Caldbck, K. Micka, V. Smarda, P. Baca, P. Kfivdk
ELECTRICAL PROPERTIES OF CARBON FIBER-EPOXY COMPOSITES INRADIOFREQUENCY RANGE 100 MHz - 1.8GHz 607V. Kfesdlek
CHECKING OF QUALITY AND POSSIBILITY OF USE OF RECYCLEDBUILDING MATERIALS 609B. Novotny, J. Addmek, J. Novak
DEVELOPMENT OF NEW MATERIALS MAITENENCE OF CONCRETE 611R. Drochytka
MAGNETIC ANISOTROPY: A NEW BASE FOR ANALYSIS OFSTRUCTURAL PROPERTIES OF BUILDING MATERIALS? 613/. Ter:ijski, F. Hrouda, J. WoMgcmuth, J. Handk
USING MICROWAVES FOR BUILDING CERAMICS MOISTUREDETERMINATION IN MANUFACTURE 615/. Moudry, V. Bozek, M. Novotny
BOND OF EPOXY-COATED REINFORCEMENT 617P. Bouska, M. Ilrabdnek, M. Novak, O. Sutner
SELECTED PHYSICAL AND MECHANICAL PROPERTIES OF SULPHURCONCRETE 619J. Dohndlek
INFLUENCE OF DISPERSION REINFORCEMENT BY POLYPROPYLENEFIBERS ON RESTRAIN SHR1KAGE OF CONCRETE 621J. h'olisko, T. Klccka
STRAIN RATE DEPENDENT CONCRETE FRACTURE ENERGY 623P. Rencha
COMPRESSIVE STRAIN-SOFTENING IN CONCRETE 625P. Konvalinka
STRUCTURE OF THE Na(H,D)Y ZEOLITES WITH CHEMISORBEDMOLECULES BY NEUTRON DIFFRACTION 627S. Vratislav, M. Dlouhd, V. Bosdcek, D. Jancba
409
WORKSHOP 96 CONTENTS
A METHOD FOR EVALUATING THE WATER-REPELLENT PROPERTIESOF COATING MATERIALS 629J. Drchalovd, R. Cerny
AN ANALYSIS OF WATER-VAPOR DIFFUSION PROPERTIES OFCOATING MATERIALS ON EXTERNAL LININGS 631S. Hoskovd, J. Toman, R. Cerny
MONITORING OF AGEING PROCESS OF INSULATING VARNISHES 633J. Kuba, V. Papez
GROWING OF LEAD IODIDE CRYSTALS 635M. Matuchovd, J. Tomdsko, J. Eckstein, K. W. Benz, J. Maixner
MODIFICATION OF LiNbO3 OPTICAL PROPERTIES BY He+IMPLANTATION 637/. Hrubd, J. Krdl
DETECTION SENSITIVITY OF ULTRASONIC PULSE VELOCITY METHODTO INTERNAL VOIDS IN CONCRETE 639V. Kadlecek, S. Modry
MATERIAL PROBLEMS OF CASTOR 440 CASK PACKAGE 641J. Pokorny, J. Novak
NONDESTRUCTIVE EVALUATION OF TIMBER STRUCTURES 643P. Kuklik, J. Dolejs, A. Kuklikovd
NONDESTRUCTIVE TESTING OF STRUCTURAL TIMBER 645J. Dolejs, M. Togni, P. Kuktik, A. Kuklikovd, K. Togelovd
11. POWER SYSTEMS & ELECTRICAL ENGINEERING
GENETIC ALGORITHM USED FOR ELECTROMECHANICAL SYSTEMIDENTIFICATION 649C. Ondrusek, T. Brezina, F. Veselka
CONTROLLED REACTOR FOR A SYMETRIZATION OF LOAD 651X Pavelka
3-PHASE VOLTAGE STIFF INVERTER WITH PWM 653M. Bfichdc, J. Dolezal, M. Klecka
PWM RECTIFIERS 655K, Kunzel, S. Seborsky, J. 2ditk
A NEURAL CURRENT CONTROL OF THYRISTOR RECTIFIERS 657J. Skalicky
EMI AND ELECTRICAL APPARATUSES 659P. Mindl
410
WORKSHOP 96 CONTENTS
CONVERTERS FOR GENERATORS IN WIND STATIONS 661J. Janousek, J. Pavelka, P. Vozenilek
IDENTIFICATION OF INDUCTION MOTOR PARAMETERS 663J. Javurek, J. Gcrlich
MODERN TRACTION DRIVE? HERE COMES OUR SOLUTION 665P. Laciga, V. Lizdk
TRANSIENT STUDY OF A LINEAR ELECTRICAL MOTOR 667J. Kajka
RELIABILITY OF POWER EQUIPMENT INSULATING SYSTEMS 669F. Wohlmuth
DIELECTRIC ABSORBTION OF HYDROGENERATORS 671J. Petr, J. Kuba, F. Antfeist
THE INTELLIGENT ELECTRIC DRIVES WITH SWITCHED RELUCTANCEMOTORS 673J. Koldcny, M. Patocka, P. Ilutdk, L. Chalupa, R. Visinka, P. Osmera,I. Simonik
RADIATION TRANSFER IN ELECTRIC ARC PLASMAS 675V. Aubrecld, M. Bartlovd, B. Gross, L. Peska
PROCESSING OF THE RESULTS OF HOLOGRAPHIC INTERFEROMETRY 677L. Peska, A. Houska, B. Gross
MODELLING OF THE ARC IN THE CURRENT ZERO REGION 679J. Bartl, B. Gross, L. Peska, V. Aubrecht
HOLOGRAPHIC DIAGNOSTICS OF AN ARC FED BY DC CURRENT 681L. Peska, A. Houska, B. Gross
TEMPERATURE DISTRIBUTION IN NON-STATIONARY PLASMA 683V. Zdrazil, B. Gross, L. Peska
ON USING FRESNEL MIRRORS IN SOLAR SYSTEMS TO CONCENTRATEENERGY 685J. Grcgor, L. Havelka, I. Jakubovd
SYSTEM FOR CHECKING OF AUTOMATIC INSTRUMENTTRANSFORMER TEST SET TETTEX 2767 687K. Draxler, R. Styblikovd, M. Simunek
THE NEW INTEGRAL CHARACTERISTICS 689J. Habel, T. Straka, T. Veselka, A. Joanidis J. Koci, R. Kaloc
THE CONNECTION OF POWER ENERGY SYSTEMS 691J. Tuma
411
WORKSHOP 96 CONTENTS
USING RULE-BASED EXPERT SYSTEM FOR EVALUATION OFDIAGNOSTIC MEASUREMENT OF POWER-ENGINEERING SYSTEMS G93K. Zdlis
CLASSIFICATION OF DISCHARGES IN HV INSULATING SYSTEMS USINGA NEURAL EXPERT SYSTEM G95J. Mrkvicka
HIERARCHICAL FUZZY CONTROL FOR POWER ENERGY SYSTEMS 697P. Hordcek, J. Brabec, J. Fuka, B. Slddek
12. ELECTRONICS, MEASURING AND COMMUNICATIONENGINEERING
NEW RESULTS IN THE NONLINEAR DYNAMICAL SYSTEM MODELLING 701J. Pospisit, J. Brzobohaty, Z. Kolka
THE RECONSTRUCTION OF A GAP BANDPASS SIGNAL 703J. Havlik, V. Sebesta
GENERALIZED CANONIC STRUCTURESOF THE LTI-DISCRETE SYSTEMFOR DIGITAL SIGNAL PROCESSORS 705Z. Smekal
SPEECH SPECTRUM CODING USING MULTIGRAM SEGMENTATION 707J. Cernocky
TRACKING OF A MOVING BODY BY CCD CAMERA 709J. Honec, M. Richter, P. Valenta, F. Sole
ACTIVE RC FILTERS IN CURRENT MODE 711T. Dosldl
NEW CURRENT-MODE FILTER STRUCTURES 713P. Martinek, J. Rudolf
FILTERS WITH TRANSIMPEDANCE OPERATIONAL AMPLIFIERS 715V. Zeman, K. Vrba
CONTRIBUTION TO THE DIRECT SYNTHESIS OF SC CIRCUITS 717J. Bicdk, L. Divis
VIDEO PARALLEL PROCESSOR VERIFICATION BY ITS MODELING 719P. Vitek, E. KoHdl
EMPLOYMENT OF 2x2 SWITCHING ELEMENTS IN ATM SWITCHINGNETWORKS 721L. Valiskovi
NOISE CANCELLATION SYSTEMS 723P. Sovka, P. Polldk, V. Davidek, J. Uhlif
412
WORKSHOP 96 CONTENTS
NEW MULTIMEDIA TECHNOLOGIES AT THE DEPARTMENT OFTELECOMMUNICATIONS AT FEE-CTU IN PRAGUE 725J. Svoboda, B. Simdk, T. Zeman, J. Hrad
FUZZY SIGNAL PROCESSING 727J. Podlesdk, P. Sitina, R. Abu Zummar, M. Renda, J. Prochdzka
USE OF GPS TECHNIQUE IN EDUCATION AND PRACTICE AT TU BRNO 729J. Weigel, 0. Svdbensky, M. Svec, J. Vitdsek, F. Soukup, L. Pldnka,V. Hanzl, V. Ricny, K. Hanousek
PRACTICAL TRAINING IN EMC 731J. Svacina
OPTIMIZATION OF THE SYSTEM FOR EXTRACTION OF CERAMICBINDERS 733L. Bejcck
AN AUTOMATED OPTICAL MEASURING SYSTEM 735L. Bejcek, M. Liska
OFF-LINE IMPROVING QUALITY OF FFT SPECTRUM MEASUREMENT 737M. Sedldcek, J. Matijovsky
PROPAGATION EXPERIMENT TRANSMITTER DESIGN 739P. Zldmal
AUTOMATIC MEASUREMENT OF INELASTIC ELECTRON TUNNELLINGSPECTRA 741P. Mach, M. Kvbecka, M. Ku'ska
CONTACTLESS CURRENT MEASUREMENT 743P. Ripka, P. Kejik, P. Kaspar, K. Draxler
DYNAMIC TESTING OF A/D PLUG-IN BOARDS 745M. Pokorny, V. Haasz, J. Rozlocil
PRESSURE INDICATOR WITH RESONANT SENSOR 747K. Draxler, F. Mazdnek, J. Verts
SYSTEM FOR ULTRASONIC RAILS TESTING AND ONE YEAR'SUTILISATION CONCLUSION 749R. Bdlek, P. Janousek, J. Krejca
THE SATELLITE LASER RANGEFINDER FOR REMOTE SENSING OF THEEARTH 751A. Novotny, M. Cech, K. Hamal, II. Jelinkovd, I. Prochdzka, M. Tawadrous,H. Deebes
THE EXPERIMENTAL INTEGRATED GPS/GLONASS RECEIVER 753M. Broum, Z. Bilek, J. Fiier, P. Keller, P. Kovdf, L. Seidl, F. Vejrazka,J. Zapotolny
413
WORKSHOP 96 ; CONTENTS
INFLUENCE OF THE CONSTRUCTION OF THE RADIOFREQUENCYPART OF THE NAVIGATION RECEIVER ON THE INTERFERENCEIMMUNITY 755P. Kovdr, J. Fiser, F. Vejrazka
THE PROPAGATION OF ELECTROMAGNETIC WAVES FOR CMR AND P C S . . . 757P. Pechai, M. Mazdnck
ANALYSIS OF SLOTLINE DISCONTINUITIES AND RESONATORS 759J. Machac, J. Zehentner
THE 37 GHz SHORT DISTANCE EXPERIMENT 761H. Bdrtik, M. Mazdnek
THE COMPUTATION OF THE SCATTERED FUNCTION FOR THECOMPLEX PERMITIVITY OF RAIN WATER AT 37GHz 763L. Balant
THE MATERIAL DIELECTRIC CHARACTERISTIC MEASUREMENT 765M. Mazdnek, Z. Brychta, K. Hoffmann, I\. Novotny, P. Pcchac
414

Section 7
ENGINEERING MECHANICS
NEXT PA6E(S)left
WORKSHOP 96 ENGINEERING MECHANICS
PVM PARALLELIZATION OF EXPLICITFINITE ELEMENT PROGRAMS
P. Krysl
CTU, Fac. of Civil Eng., Dcpt. of Structural MechanicsThakurova 7, 166 29 Praha 6,
currently on leave at the Department of Civil Engineering,Northwestern University, Evanston, IL, U.S.A.
Key words: parallelization, PVM, finite elements, explicit integration
Explicit finite element programs for non-linear dynamics arc of rather simple logicalstructure. If the inherent characteristics of this logic are exploited in the design and imple-mentation, an "object-oriented" programming style leads to elegant, extendible and main-tainable programs. Firstly, a high-level representation for the explicit time integrators isformulated. The parallel algorithm is then stated, and it is shown that the star-shapedconfiguration of a "master" program communicating with a number of "workers" is wellsuited to the parallel formulation. Finally, it is shown how to create different versions ofthe integrator, which correspond either to the master or to the worker.
There are several formulations of the explicit central difference (CD) integration scheme.In order to be able to use the advantages of the time stepping scheme (in particular thefact, that no matrix inversions arc necessary), two variants can be considered most efficient:(i) the Newmark variant resulting from the well-known implicit /3 method for 7 = | and/? = 0, and (ii) the Nystroem variant constructed from a finite difference approximation tothe first and second time derivative.
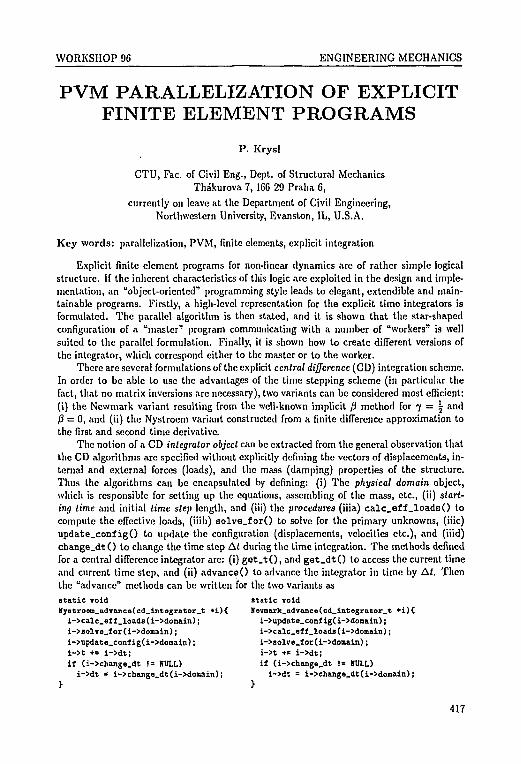
The notion of a CD integrator object can be extracted from the general observation thatthe CD algorithms are specified without explicitly defining the vectors of displacements, in-ternal and external forces (loads), and the mass (damping) properties of the structure.Thus the algorithms can be encapsuliited by defining: (i) The physical domain object,which is responsible for setting up the equations, assembling of the mass, etc., (ii) starl-ing lime and initial time step length, and (iii) the procedures (iiia) ca l c . e f f . l oads 0 tocompute the effective loads, (iiib) solve_for() to solve for the primary unknowns, (iiic)update.configO to update the configuration (displacements, velocities etc.), and (iiid)change_dt() to change the time step At during the time integration. The methods definedfor a central difference integrator are: (i) ge t_ t ( ) , and got_dt() to access the current timeand current time step, and (ii) advanceO to advance the integrator in time by A(. Thenthe "advance" methods can be written for the two variants asstatic void static voidNyBtroem_advance(cd_integrator_t *i)< Nevmark_advance(cd_integrator_t •iH
i->calc_efl-loads(i->domain); i->updato_config(i->domain);i->solve_for(i->domain); i->calc_eM_loads(i->domain);i->update_config(i->domain); i->solve_for(i->domain);l->t += i->dt; i->t += i->dt;ii (i->change.dt != HULL) it (i->change_dt != HULL)i->dt = i->chango_dt(i->donain); i->dt = i->chaag«_dt(i->domain);
417
WORKSHOP 96 ENGINEERING MECHANICS
The parallel version of the explicit finite element program is based on the followingsimple idea: Split the original mesh and assign the partitions to the processors (workers).Define interfaces as such nodes which are shared by two or more partitions. Then for eachtimf step compute the solution for the partitions in parallel, assemble the nodal forcesfor the nodes at the interfaces between partitions globally at the master, and distributethem to workers. (The actual implementation could be rather complicated by dynamic loadbalancing. This is an active area of on-going research, for which no simple solutions exist.Only the case of static problem decomposition was considered here.) The computation isthus distributed between the master (it is responsible for starting up the workers, and forthe assembly and distribution of the interface forces), and the workers (they are workingon the partitions as if they were serial programs, with the exception of the assembly ofthe effective forces at the interface, which must be sent to the master and then retrievedin their globalized form). The actual implementation was done by defining macros andconditional compilation units in the serial code. Thus it is possible to maintain only a singleversion of the program and to generate either the serial program, or the PVM-based parallelprograms (master or worker). We can demonstrate the implementation on a code fragment,which corresponds to the worker's computation of the initial time step by running a loopover all elements of the partition, computing the time step and sending it to the master.Master collects this information from all workers, and then broadcasts the global minimum.Workers receive the time step and return it just as a serial version of the program would.(The PVM functions were hidden by macros to ease maintenance of the code.)doubleWD_comput8_dt(Vfcdonain_t *d) {.
double dt = ISFIHITY;ELEH.LOOPCdt = nin(dt, VE.suggested.tine.stepCthoELEH)));IHITSEHDO;PACK(double, tdt);SEHD(theHASTER, TIME.STEP.AHSWER.TAG);RECEIVE(theMASTER, TIHE_STEP_AKSVER_TAa);UBP>.CK(doublo, tdt);return dt;
There is not enough space here to discuss additional issues such as the computation ofthe inertial properties of the interface nodes, or of the energy balance. The reader is referredto the technical report [1],
The parallel version of the explicit finite element program proved to be easily maintain-able. The main difficulty is a need for automatic partitioning of the finite element domain,which should minimize the communication bandwidth, and at the same time balance theworker load.
References:
[1] KRYSL, P.: Parallelizing explicit structural dynamics with PVM. Technical report,Northwestern University, Evanston, 1995.
This research has been conducted at the Department of Structural Mechanics as part ofthe research project "Material Models for Concrete ..." and has been supported by GACRgrant No. 103/93/1175.
418
WORKSHOP 96 ENGINEERING MECHANICS
TRIANGULATION OF 3D SURFACES BYTHE ADVANCING FRONT TECHNIQUE
D. Rypl
CTU, Fac. of Civil Eng., Dept. of Structural MechanicsThakurova 7, 166 29 Praha 6
Key words: triangulation, 3D surface, advancing front
This article is directly related to the paper presented in the last year workshop [1].The originally proposed approach for triangulation of spatial surfaces utilizes the bijectivemapping between the tensor product polynomial surface and its parametric space. Theactual triangulation is performed in the parametric space, using the local mesh controlfunction, and the obtained mesh is then mapped onto the original surface. Although thismethodology proved, in most cases, to provide quite satisfactory results several drawbackshave been identified. Firstly, there is a tendency to generate at most two triangles sharingthe corner of the parametric space even if this is a reentrant corner on the original surface.This results apparently in badly shaped triangles around this corner. Secondly, the mappingis generally not affine. This implies presence of element distortion and stretching whenmapped between the real and the parametric spaces and requires a special treatment todeal with singular cases [2] introduced by degenerated or badly parameterized surfaces.
In the approach presented in this paper, the meshing algorithm is constrained directlyto the physical surface and the parametric space is used only to enhance the efficiency of thealgorithm [3]. A widely known advancing front technique with some modifications allowingfor surface curvature is employed. Firstly, the initial front consisting of edges constitutingthe boundary of the surface (including inner loops) is established. Once the initial fronthas been set up the mesh generation continues on the bases of the edge removal algorithmaccording to the following steps until the front becomes empty:
• the first available edge AB is pulled from the front» the position of "ideal" point P (forming the new AABP) is calculated taking into
account local surface curvature and mesh size variation• the projection P' of point P to the surface is evaluated• the local neighbourhood of point P' is established• the neighbourhood is searched for the most suitable candidate C to form a new AABC• the intersection check is carried out to avoid overlapping of the created triangle with
an already existing one in the neighbourhood• the front is updated to account for newly formed &ABC
To make the algorithm applicable to a wide variety of surfaces with a reasonable levelof complexity the family of tensor product polynomial surfaces (e.g. Rational Bezier sur-face, B-spline surface, NURBS, etc.) is considered in the presented study. This brings inseveral advantages. Since these surfaces are widely used in CAD and modeling systems anatural and consistent interface between the modeler and the mesh generator is ensured.
419
WORKSHOP 96 ENGINEERING MECHANICS
All these surfaces enable relatively simple evaluation of surface normal and gradients at dis-crete locations on the surface which are the only quantities required during the generation.And finally, the parametric space of these surfaces allows for some procedures (namely theintersection checks) to be performed more efficiently than in 3D.
The spatial localization for the intersection checking and the front management, interms of edge selection and searching, are considered to be the general bottlenecks of theadvancing front procedure. Both aspects are addressed in the presented approach. Thespatial localization is implemented using the octree which is built around the surface (ordomain) to be discretized. This exhibits the O(logd) computational complexity which be-comes nearly constant for reasonable octree depth d. The octree is also used to control theelement size gradation. To ensure the gradual variation of element size the maximum oneoctree level difference of octants sharing an edge is enforced. This avoids the necessity toimplement special algorithm to pull an edge from the front and therefore the simplest ap-proach was chosen which always uses the first edge in the front. This obviously leads to theconstant computational complexity. The remaining procedures are similar to the conven-tional advancing front method and thus the overall computational complexity approachesO(n) with n being the number of elements, which makes the proposed methodology verycompetitive for practical use.
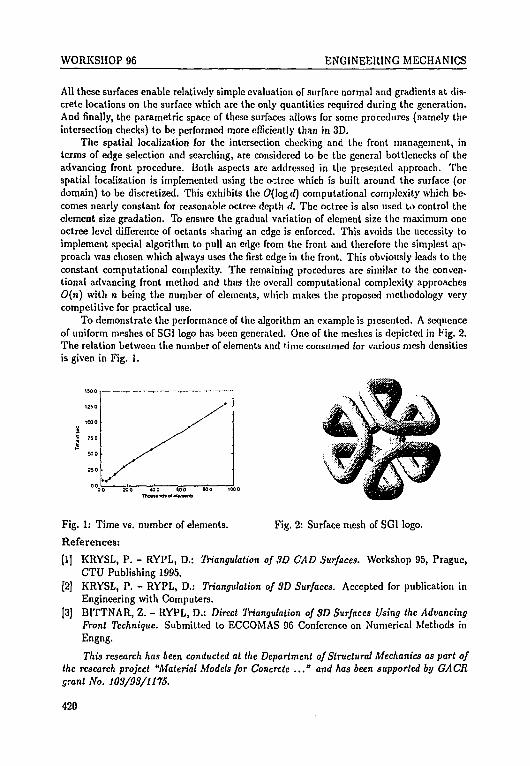
To demonstrate the performance of the algorithm an example is piesented. A sequenceof uniform meshes of SGI logo has been generated. One of the meshes is depicted in Fig. 2.The relation between the number of elements and time consumed for various mesh densitiesis given in Fig. 1.
Fig. 1: Time vs. number of elements. Fig. 2: Surface mesh of SGI logo.
References:
[1] KRYSL, P. - RYPL, D.: Triangulation of 3D CAD Surfaces. Workshop 95, Prague,CTU Publishing 1995.
[2] KRYSL, P. - RYPL, D.: Triangulation of 3D Surfaces. Accepted for publication inEngineering with Computers.
[3] BITTNAR, Z. - RYPL, D.: Direct Triangulation of 3D Surfaces Using the AdvancingFront Technique. Submitted to ECCOMAS 96 Conference on Numerical Methods inEngng.
This research has been conducted at the Department of Structural Mechanics as part ofthe research project "Material Models for Concrete ..." and has been supported by GACRgrant No. 103/93/1175.
420
WORKSHOP 96 ENGINEERING MECHANICS
RATE DEPENDENT ANALYSISOF CONCRETE STRUCTURES
J . Maca
CTU, Fac. of Civil Eng., Djpt. of Structural MechanicsThakurova 7, 166 29 Praha 6
Key words: dynamic analysis, elasto-plasticity, strain rate, concrete, numerical modelling
Despite relatively scare experimental data, there is a clear experimental evidence ofstress or strain rate dependence of behaviour of concrete and similar materials. The mostprominent features are:
a) the significa nt increase of strength parameters as the average rate of straining i;_ .xBasesfrom the quasi-static rate (approx. 10"5 sec"1) to the higher strain rates associatedwith a seismic excitation (approx. lO^-lO"1 sec"1) and especially to very high strainrates under impact loads (approx. lO'sec"1);
b) the increase of Young's modulus of elasticity with increasing strain rate.
It is generally known from the experimental study (e.g. [4]) that the strain rate effectof concrete is more sensitive for tension than for compression. Going to the extreme loadingconditions concrete can exhibit near doubling of its strength, a factor that cannot be ignoredin any realistic analysis. An increase of the modulus of elasticity is not so significant, e.g.for the strain rate 10 sec"1 it is approximately 10-15%. On the other hand it is necessaryto say that there is no important property of concrete which decreases its value with higherstrain rates. From a designers's point of view this is quite a positive feature. The increaseof strength is sometimes only a few percent which may not be considered in some loadingconditions - e.g. traffic and gass explosions.
Strain rate dependency of the material properties can be included in the numericalmodel by the following three fundamental ways: a) elasto-plasticity, b) elasto-viscoplasticity,and c) fracture mechanics models.
In this project the rate effects are included into the elasto-ptastic model. Mohr Coulombsurface , for example, can be uniquely defined by the uniaxial compressive and tensilestrength values, i.e. fm and ft. Rate hardening models lead to an instantaneous breathingsurface (they may expand or shrink depending on the rate of process), as both /„, and ftare made strain rate dependent and expressed as
fi = f'cu * HRC&H) . ft = / , ' • HKT&U)
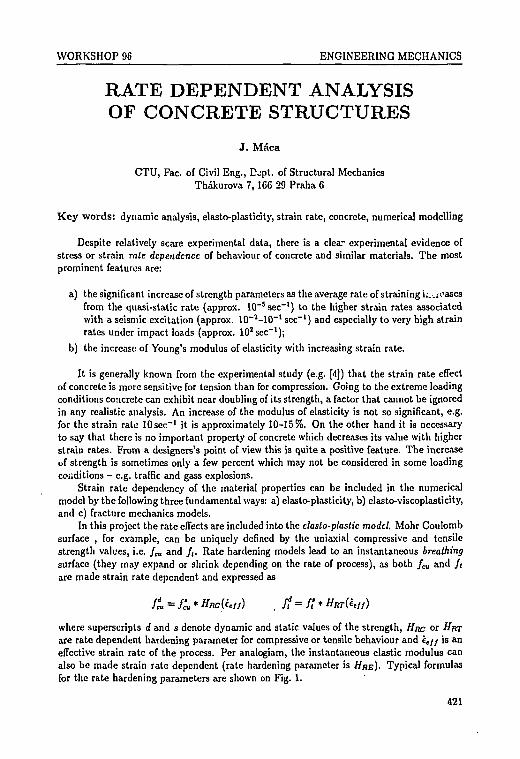
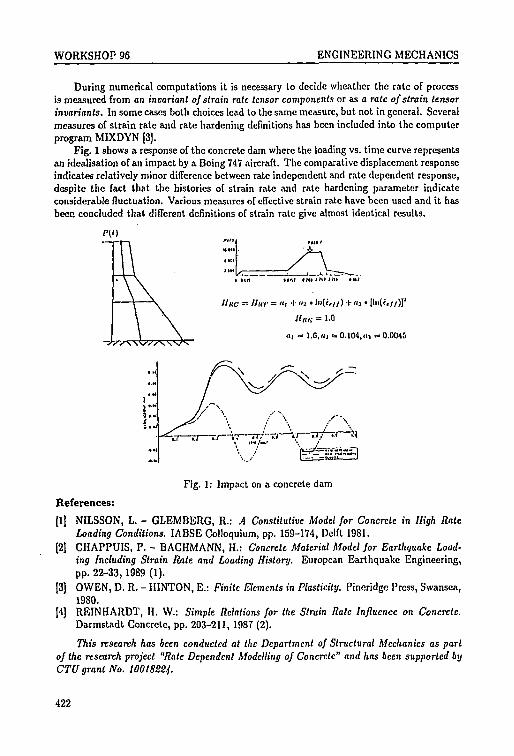
where superscripts d and s denote dynamic and static values of the strength, Hue or HKTare rate dependent hardening parameter for compressive or tensile behaviour and tcj/ is aneffective strain rate of the process. Per analogiam, the instantaneous elastic modulus canalso be made strain rate dependent (rate hardening parameter is HUE). Typical formulasfor the rate hardening parameters are shown on Fig. 1.
421
WORKSHOP 96 ENGINEERING MECHANICS
During numerical computations it is necessary to decide whcather the rate of processis measured from an invariant of strain rate tensor components or as a rate of strain tensorinvariants. In some cases both choices lead to the same measure, but not in general. Severalmeasures of strain rate and rate hardening definitions has been included into the computerprogram MIXDYN [3].
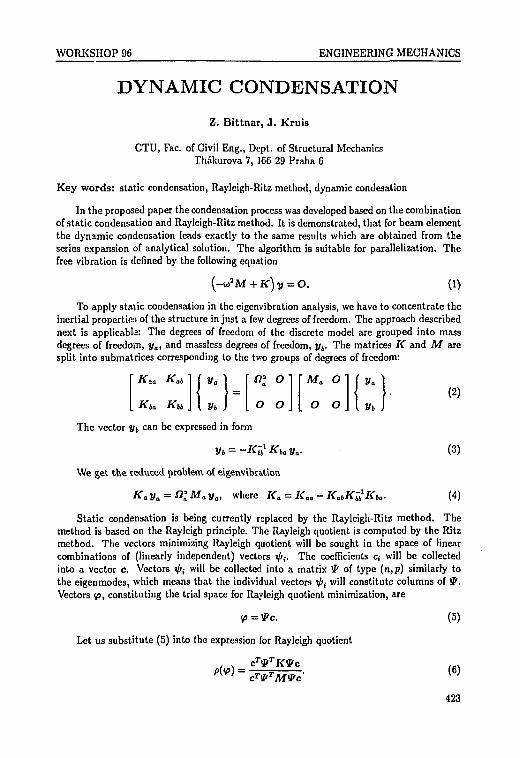
Fig. 1 shows a response of the concrete dam where the loading vs. time curve representsan idealisation of an impact by a Boing 747 aircraft. The comparative displacement responseindicates relatively minor difference between rate independent and rate dependent response,despite the fact that the histories of strain rate and rate hardening parameter indicateconsiderable fluctuation. Various measures of effective strain rate have been used and it hasbeer, concluded that different definitions of strain rate give almost identical results.
line = Hia- = "i + "i ' !»('<•//) + "i • l'i'(<.//)]'
///IB = 1.0
«i = 1.0,'ii = 0.104, <n = 0.004S
Fig. 1: Impact on a concrete dam
References:
[1] NILSSON, L. - GLEMBERG, R.: A Constitutive Model for Concrete in High RateLoading Conditions. IABSE Colloquium, pp. 159-174, Delft 1981.
[2] CHAPPUIS, P. - BACHMANN, H.: Concrete Material Model for Earthquake Load-ing Including Strain Rate and Loading History. European Earthquake Engineering,pp. 22-33, 1989 (1).
[3] OWEN, D. R. - HINTON, E.: Finite Elements in Plasticity. Pineridge Press, Swansea,1980.
[4] REINHARDT, H. W.: Simple Relations for the Strain Rate Influence on Concrete.Darmstadt Concrete, pp. 203-211, 1987 (2).
This research has been conducted at the Department of Structural Mechanics as partof the research project "Rate Dependent Modelling of Concrete" and has been supported byCTU grant No. 10018S24.
422
WORKSHOP 96 ENGINEERING MECHANICS
DYNAMIC CONDENSATION
Z. Bittnar, J . Kruis
CTU, Fac. of Civil Eng., Dept. of Structural MechanicsThakurova 7, 166 29 Praha 6
Key words: static condensation, Rayleigh-Ritz method, dynamic condesation
In the proposed paper the condensation process was developed based on the combinationof static condensation and Rayleigh-Ritz method. It is demonstrated, that for beam elementthe dynamic condensation leads exactly to the same results which are obtained from theseries expansion of analytical solution. The algorithm is suitable for parallelization. Thefree vibration is defined by the following equation
( - u > J M + K ) y = O. (1)
To apply static condensation in the eigenvibration analysis, we have to concentrate theinertial properties of the structure in just a few degrees of freedom. The approach describednext is applicable: The degrees of freedom of the discrete model are grouped into massdegrees of freedom, ya, and massless degrees of freedom, yb. The matrices K and M aresplit into submatrices corresponding to the two groups of degrees of freedom:
] ( ) [ 1 (u K»\\v>\ [ O O J [ O O J 1 y
The vector yb can be expressed in form
yb = -K^KiaVa. (3)
We get the reduced problem of eigenvibntion
Kaya = niMaya, where Ka = Kaa-K^K^K^. (4)
Static condensation is being currently replaced by the Rayleigh-Ritz method. Themethod is based on the Rayleigh principle. The Rayleigh quotient is computed by the Ritzmethod. The vectors minimizing Rayleigh quotient will be sought in the space of linearcombinations of (linearly independent) vectors V1;. The coefficients a will be collectedinto a vector c. Vectors rj>{ will be collected into a matrix 9 of type (n,p) similarly tothe eigenmodes, which means that the individual vectors ij>i will constitute columns of <?.Vectors (p, constituting the trial space for Rayleigh quotient minimization, are
f> = 9c. (5)
Let us substitute (5) into the expression for Rayleigh quotient
423
WORKSHOP 96 ENGINEERING MECHANICS
Because dp/dc = O, we get from (6) a condition for c in the form of a system of linearhomogeneous equations
Kc = pMc. (7)
That means that by the Ritz method we have reduced the original problem with ndegrees of freedom into an eigenvalue problem with p degrees of freedom.
Let us show here that the static condensation method with the Raylcigh-Ritz methodyields a consistent approach to the condensation of the mass matrix. Starting from equation(3), we can write
{I: }-[-*£«. ]*•-•»•• (8)
which is analogous to (5). However, ya and J/J are not here mass and massless degrees offreedom. This transformation can be written for the whole structure, substructure, or foran isolated element.
Thus, using (8), the matrices K and M will be transformed from the generalizedcoordinates ya , yb into the generalized coordinates yn. We get
R" = 9rK9, M' = 9TM 9. (9)
Substitution of (8) into the first relation of (9) leads to K' = Ka (!<"„ from equation (4)).The numerical implementation of the condensation process can be advantageously based
on these two alternative ways:
1. Condensation of the stiffness matrix is carried out by the Gaussian elimination.
2. Condensation is carried out unknown-by-unknown. Therefore, it is sufficient to for-mulate the algorithm for a single degree of freedom. In that case the transformationmatrix can be written as
where t is a vector of Gauss multipliers, which are needed for zeroing of a singlecolumn.
Substituting (10) into the second relation (9) we get
+ MabtT + tAf6i,t
T. (11)
My, is a scalar for the condensation of the single degree of freedom. The describedapproach is sometimes called the Guyan reduction.
References:
[1] BITTNAR Z. - SEJNOHA J.: Nxtmericke melody mechaniky 1, CTU Publishing 1992.
This research has been conducted at the Department of Structural Mechanics as part ofthe research project "Material Models for Concrete ...". GACR grant No. 103/93/1175.
424
WORKSHOP 96 ENGINEERING MECHANICS
NONLINEAR ANALYSIS OFCONCRETE STRUCTURES
B. Patzak, Z. Bittnar
CTU, Fac. of Civil Eng., Dcpt. of Structural MechanicsThakurova 7, 166 29 Praha 6
Key words: concrete, plasticity, cracking.
The long-time changes of mechanical properties of structures made of reinforced con-crete should significantly change reliability and durability of such structures. The attentionwas focused on relatively new cooling towers situated in Nuclear power plant Dukovany,which are now strongly damaged due to aggressive environment conditions. In order to beable to design effective reconstruction, the software for numerical analysis of shells struc-tures made of reinforced concrete was developed. The computational model includes suchimportant effects like plasticity, cracking and creep. The algorithm used at material level toconsistently describe plasticity and cracking in quasi-brittle materials like mortar or concreteis shortly presented in this paper.
Incremental plasticity approach witli generally non-associate normality and arbitraryhardening rule is implemented. This approach agrees with experimental evidence and iswidely used in most applications. The material model describing crack behavior must bephysically realistic and suitable for numerical implementation. Currently, two approachesare widely used to model crack behavior: the discrete and smeared approach. The smearedmodel, which is computationally much more simpler then the discrete one, has been used.Such model does not require topology changes during solution process. Concrete damageis simulated as a system of parallel cracks smeared over the whole finite element. Beforecracking, the material is assumed to be isotropic, linearly elastic. When principal stressviolates tension strength criterion, crack is introduced with direction normal to the cor-responding principal stress. Crack is modeled by switching from isotropic to orthotropicbehavior, reducing material stiffness in the direction of normal.
In its original form (proposed by Rashid 196S), the smeared approach assumes the slopeof softening branch to be a material property. This model coupled with simple strengthcriterion leads to results dependent on the mesh size. Such approach also cannot model thesize-effect. In this paper we will follow the crack band model proposed in [1], which is threeparametric (tensile strength, fracture energy and size of the fracture process zone). Suchmodel provides mesh-independent results and can model size effect. In this paper, attentionis focused on the development of consistent incremental material stiffness matrix, takinginto account both plasticity and concrete cracking. Approach presented here can be easilyenhanced to incorporate such effects as creep and shrinkage. The basic assumption of ourtreatment is that the total strain rate vector k is decomposed into concrete strain rate kc°and several crack strain rates denoted as k , E " , etc. Finally it follows
k = kc° + k" + k°, where e " = k' + k" and e " = {e ; , e" , - - -} (1)
The strain rate e° is the stress independent part of strain rate (for example caused bythermal dilatation or shrinkage). Further is assumed that e° = o.
425
WORKSHOP 96 ENGINEERING MECHANICS
For 3D stress state the crack can be imagined as a crack plane with local coordinatesystem, where local x-axis is normal to the crack plane and axes y and z are lying in thecrack plane. Then only 3 of total 6 components of local crack strain rate are nonzero (thenormal one and two shears in crack plane). Local crack strain rate vector has the form&7 — i^xi "l"y> 7x«}T> Global crack strain rate is a sum of contribution of all local crackstrain rates transformed to global coordinate system.
(2)
The local non vanishing crack strain rates are assumed to be related to stress rate vector viaa = Z?crecr. Matrix Dcr in general case allows coupling between normal and shear strains.Now we proceed to derivation of a general form of incremental constitutive matrix, takinginto account possible plasticity and cracking in multiple directions. We have
(3)
( « , \ T•S— I and NT we obtain two equations. By some math,O<T )
we finally obtain:
D"-- (4)
with-D'7 = D'-D'NA-XNTD' and A'x = [D"+ NTD'N]-K Structure of this matrixis similar to well known elasto-plastic incremental tangent stiffness, but Dc* is used insteadJD", which considers possible cracking in various directions.
Material model presented here, is implemented in pilot version of OOFEM program.This program, written in object-oriented language, is designed to be general purpose finiteelement prototype code and has been shortly described in [3].
References:[1] BAZANT, Z. P. - OH, B. H.: Crack band theory for fracture of concrete, pp. 155-177.
RILEM Materials and Structures 16, 1983.[2] DE BORST, R.: Smeared cracking, plasticity, creep, and thermal loading - a unified
approach, pp. 89-110. Computer Methods in Applied Mechanics and Engineering 62,North Holland 1987.
[3] KRUIS, J. - PATZAK, B.: Analysis of structures using object-oriented approach.pp. 363-365. Workshop 95, Prague 1995.
This research has been conducted at the Department of Structural Mechanics as part ofthe research project "Numerickd simulace vlivu poSkozeni vclkych chladicich vezi" and hasbeen supported by CTU grant No. 10018SS6 and GACR grant No. 103/93/1175.
426
WORKSHOP 96 ENGINEERING MECHANICS
ANALYSIS OF STRUCTURES USINGTRANSFORMATION FIELD ANALYSIS
P. Prochazka, J . Sejnoha
CTU, Fac. of Civil Eng., Dept. of Structural MechanicsThakurova 7, 166 20 Praha 6
Key words: transformation field analysis, composite materials, bounded domain
In recent years some papers have been devoted to homogenization of composite or lami-nated materials, [3j. In the present paper we concentrate our attention on homogenization ofnonhomogeneous bodies by means of a special treatment proposed by Dvorak, [1], and applyit to the solution of composite structures . The main idea consists in separating the mutualeffect, o{ eigensUains ji,j (eigensttesses a,j) from one inclusion (internal cell) to another.One of the most suitable techniques dealing with homogenization is the boundary elementmethod (BEM). The influence functions maybe computed at each point of the internal cellswith high accuracy, nonlinearities in inclusions and matrix can easily be introduced and areeffectively computed.
The influence functions enable one, according to the paper [1], to solve the elastic-plasticand viscoplastic composite systems based on a. change of eigenstrains or eigenstresses, whilethe other quantities remain unchanged during the iteration process. The procedures of thiskind suite very effectively to applications in sense of BEM.
We extend the Hashin-Shtrikman variational principle, [4], by introducing both eigen-strain and eigenstress fields into the formulation. Assume that no body forces are present.
An equivalent formulation may be obtained by variation of the extended functional
with respect to the fields T,-,- (stress polarisation) and gy, where A/y,t LT,u = /yM, £ijn isthe stiffness matrix. We have denoted
and the quantities with superimposed 0 belong to homogeneous body, primed quantities aredifferencies between real and homogeneous bDdy. For details see [2J.
It can be proved that the stationary value U' of the functional U is equal to the actualpotential strain energy stored in the anisotropic and heterogeneous body.
After variating V we get the integral equation
where the starred quantities are known kernels.Differentiating the last equation with respect to £,• we arrive at the expression
where C is the convected term.
427
WORKSHOP 96 ENGINEERING MECHANICS
Willis, [3], proved that the last relation is a positive definite and symmetric integraloperator in the standard norm.
Our goal now is to derive the relation between the strains and the eigenstresses of theform
e = Ae°+F\,
where A and F are the influence function matrices (A is mostly referred to as the mechanicalconcentration function matrix). Note that once computed, these matrices do not changetheir values during iteration processes for nonlinear solution of plasticity, optimization,etc. They completely depend only on the shape of the body under study and its materialproperties in the initial stage of the iteration.
After discretization of the boundary and after discretization of the domain fi intointernal cells, the integral equations take the form
UP'-E'E-E\ = 0, £' = / / p ' - * ' £ - < P A ,
where U is a square matrix (3N * 3JV) and 3/V is a number of degrees of freedom on theboundary, p' is the vector of discretized tractions at nodal points of boundary P, E, E'are the matrices (ZN * 6M) of influences of the strains and eigenstrains in the discretizeddomain, H is a (6M * 3N) matrix and, finally, <I> and W are square matrices (6M * GM).
As the regular matrix U may be inverted, elimination of ;>' gives
Se = e° +TX, S = 1 + *' -HU~l E', T = -tf + HU~l E.
Obviously, S is a regular (GM*6M) matrix, as for a given A,j, (t, j being fixed) a uniqueresponse e may be expected. The searched influence function matrix F is equal to S"1 Twhile S~l is the mechanical concentration function matrix A.
In this short contribution we have presented only the fundamental idea of the pro-posed approach to nonhomogencous and anisotropic bodies. Based on the extended Hashin-Shtrikman theorem in combination with the BEM it is possible to obtain the strain influencematrices relating the strains £,j,£(y and the eigenstrains/eigenstresses.
References:
[1] DVORAK, G. .).: Transformation field analysis of inelastic composite materials, Proc.R. Soc. Lond. A 437, 311-327, 1992.
[2] PROCHAZKA, P. - SEJNOHA, J.: Behavior of composites on bounded domain, ac-cepted for publishing in Boundary Element Communications.
[3] WILLIS, J. R.: Bounds and self-consistent estimates for the overall properties ofanisotropic composites, J. Mech. Phys. Solids, 25, 185-202, 1977
[4] HASHIN, Z. - SHTRIKMAN, S.: On some variational principles in anisotropic andhomogeneous elasticity, J. Mech. Phys. Solids, 10, 335-342, 1962.
This research has been conducted at the Department of Structural Mechanics as partof the research projects "Optimization of Structures using Transformation Field Analysis"and "Fuzzy-probabilistic Concept of Time Dependent Structural Reliability" and has beensupported by GA CR grant No. 103/95/1S66 and No. 103/94/0137.
428
WORKSHOP 96 ENGINEERING MECHANICS
TUNNEL LINING IMPROVEMENTBY OPTIMIZED ANCHORING
J . Sejnoha, P. Prochazka
CTU, Fac. of Civil Eng., Dept. of Structural MechanicsThakurova 7, 166 29 Praha 6
Key words: tunnel lining, anchoring, bearing capacity
In previous papers [1, 2], the authors have formulated an effective approach to theanalysis of nonhomogencous bodies and have used the transformation field analysis forrelating the components of stress or strain tensors and the components of eigenstrains oreigenstresses. Mathematical background of this approach can be found in [3]. This paperdeals with an extended dual variational principle for bounded nonhornogeneous bodies.By means of internal parameters, eigenstrains py and/or eigenstresses <T,J- it is possible toincrease the bearing capacity of structures, or to minimize the stress excesses. The BEM isused as a powerful tool for a numerical solution to the problem of optimal prestraining ofanchors in the rock surrounding a tunnel. The basic results are briefly summarized in thispaper and the theory is applied to the optimization of prestress in the anchors.
An analysis of heterogeneous bodies in general may be based on extended dual Hashin-Shtrikman variational principle
where variations are considered with respect to the fields "fa (polarizations) and a\y Wehave denoted
°'=\L *&£*d n = \ L M^ dn
and the quantities with superscript 0 are responses of the homogeneous body while primedquantitites are differencies between real and homogeneous bodies. Myu is the compliencetensor.
It can be proved that the stationary value U" of the functional £/" is equal to the actualcomplementary energy stored in the anisotropic and heterogeneous body.
Performing a variation of U', integrating by parts, and setting the fundamental solutionfor the variation of a'tj, we get
Using the kinematic and the constitutive equations, we derive
k(x, f)ui(*) dT(x)
where the starred quantities are known kernels. The converted term C arises at the internalpoint £ e ft by the exchange of the order of integration and differentiation.
429
WORKSHOP 96 ENGINEERING MECHANICS
After discretization of the boundary into boundary elements as well as of the domaininto internal cells with constant stress and eigenstrain distributions we get
Pu'-S'<7-Sn = 0, CT' = - B U ' + £'<T + S / I ,
As the regular matrix P may be inverted, elimination of u' gives
Obviously, V is a regular matrix. The influence function matrix is equal to V"1 Z whileV"1 is the mechanical concentration function matrix.
As, for the sake of simplicity, we assume that in each cell constant distributions ofboth stress and eigenstrain fields are prescribed, the relation between stresses ok in thesubdomains Uk,k = \,...,m, and the eigenstrains it1,1 = l,...,n, reads
(*)* = E E (*«)" («?)' + t, t,(Gii)H («)',* = 1,.»,6, * = 1 "ij=l 1=1 J=I /=!
where B — V"1 and G = V"1 Z. The stresses (of)* are known quantities.A natural requirement is to assure that the stresses be as small as possible. This means
that the variance
Vi=i *=i /
Differentiation of / with respect to (/io)" leads to a system of linear algebraic equationsfor unknown (ftj)'
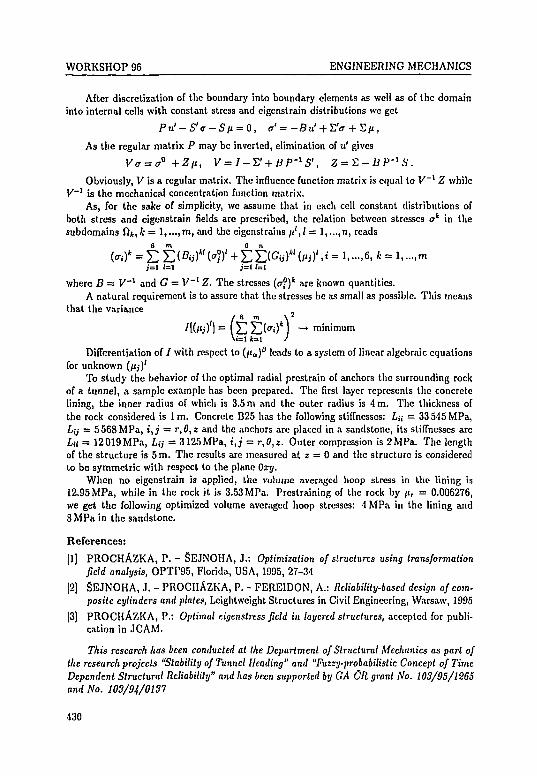
To study the behavior of the optimal radial prestrain of anchors the surrounding rockof a tunnel, a sample example has been prepared. The first layer represents the concretelining, the inner radius of which is 3.5 m and the outer radius is 4 m. The thickness ofthe rock considered is lm, Concrete B25 has the following stiffnesses: La = 33545MPa,Lij = 5568MPa, i,j = r,0,z and the anchors are placed in a sandstone, its stiffnesses areL« = 12019MPa, Lij = 3125MPa, i,j = r,0,z. Outer compression is 2MPa. The lengthof the structure is 5 m. The results are measured at z = 0 and the structure is consideredto be symmetric with respect to the plane Oiy.
When no eigenstrain is applied, the volume averaged hoop stress in the lining is12.95 MPa, while in the rock it is 3.53MPa. Prestraining of the rock by ^ r = 0.006276,we get the following optimized volume averaged hoop stresses: 4 MPa in the lining and8 MPa in the sandstone.
References:
[1] PROCHAZKA, P. - SEJNOHA, J.: Optimization of structures using transformationfield analysis, OPTI'95, Florida, USA, 1995, 27-34
[2] SEJNOHA, J. - PROCHAZKA, P. - FEREIDON, A.: Reliability-based design of com-posite cylinders and plates, Leightweight Structures in Civil Engineering, Warsaw, 1995
[3] PROCHAZKA, P.: Optimal cigenstress field in layered structures, accepted for publi-cation in JCAM.
This research has been conducted at the Department of Structural Mechanics as part ofthe research projects "Stability of Tunnel Heading" and "Fuzzy-probabilistic Concept of TimeDependent Structural Reliability" and has been supported by GA CR grant No. 103/95/1265and No. 103/94/0137
430
WORKSHOP 96 ENGINEERING MECHANICS
LARGE DISPLACEMENT ANALYSESOF SHELLS
P. Fajman
CTU, Fac. of Civil Eng., Dept. of Structural MechanicsThakurova 7, 166 29 Praha 6
Key words: unbalanced, incremental, shell
Different possibilities of computation of unbalanced forces are described in this paper.Assumptions are small strains and medium rotations. The updated Lagrangian formulationand the constant arc-length incremental method are used [1]. The stiffness matrix is basedon the Green-Lagrange strain tensor. In an incremental form this tensor is decomposedinto linear and nonlinear parts. The discretization of the linearized principle of virtualdisplacements can bo written as
([KL ]) {Ar} = {AR} - {AFr} = {Sr}
where [Ki], [KNL] a r e the linear and non linear parts of stiffness matrix respectively, {Ar}is the incremental displacement vector and {gr} represents the unbalanced force vector.
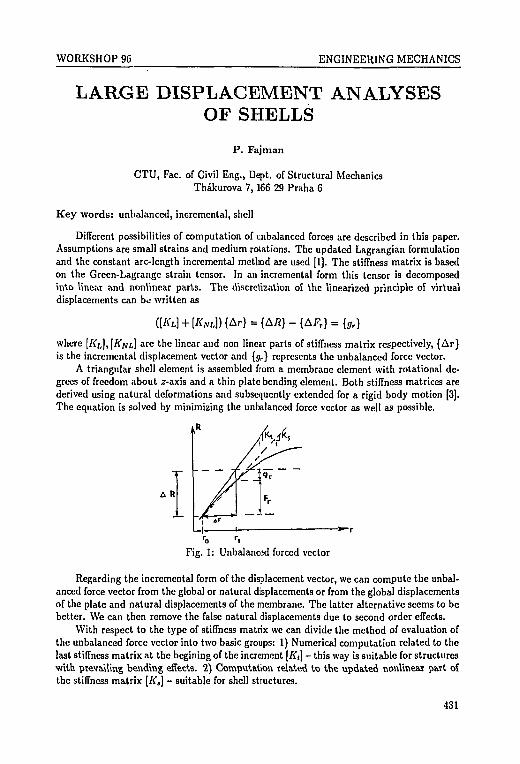
A triangular shell element is assembled from a membrane element with rotational de-grees of freedom about z-axis and a thin plate bending element. Both stiffness matrices arederived using natural deformations and subsequently extended for a rigid body motion [3].The equation is solved by minimizing the unbalanced force vector as well as possible.
Fig. 1: Unbalanced forced vector
Regarding the incremental form of the displacement vector, we can compute the unbal-anced force vector from the global or natural displacements or from the global displacementsof the plate and natural displacements of the membrane. The latter alternative seems to bebetter. We can then remove the false natural displacements due to second order effects.
With respect to the type of stiffness matrix we can divide the method of evaluation ofthe unbalanced force vector into two basic groups: 1) Numerical computation related to thelast stiffness matrix at the begining of the increment [Kt] - this way is suitable for structureswith prevailing bending effects. 2) Computation related to the updated nonlinear part ofthe stiffness matrix [K,] - suitable for shell structures.
431
WORKSHOP 96 ENGINEERING MECHANICS
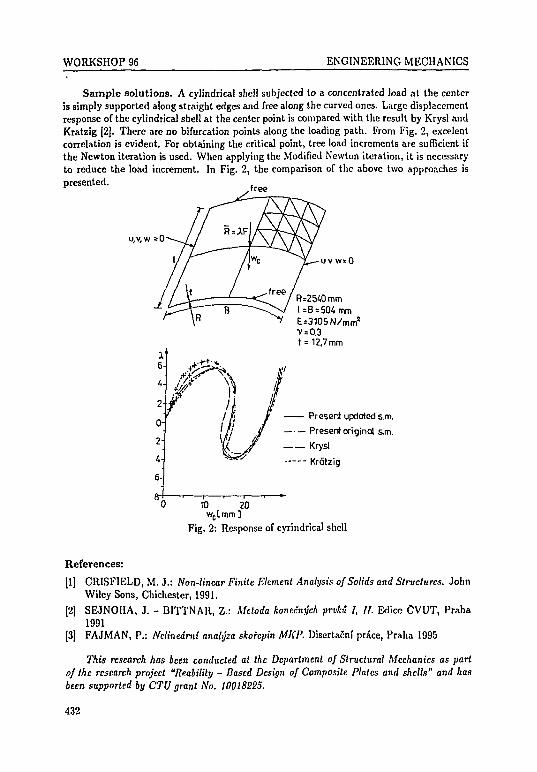
Sample solutions. A cylindrical shell subjected to a concentrated load at the centeris simply supported along straight edges and free along the curved ones. Liirge displacementresponse of the cylindrical shell at the center point is compared with the result by Krysl andKratzig [2]. There are no bifurcation points along the loading path. From Fig. 2, excelentcorrelation is evident. For obtaining the critical point, tree load increments are sufficient ifthe Newton iteration is used. When applying the Modified Newton iteration, it is necessaryto reduce the load increment. In Fig. 2, the comparison of the above two approaches ispresented. f r e e
u, v, w = 0
Present updated s.m.
Present original s.m.
Krysl
Krdtzig
10 20wc[ mm ]
Fig. 2: Response of cylindrical shell
References:
[1] CRISF1ELD, M. J.: Non-linear Finite Element Analysis of Solids and Structures. JohnWiley Sons, Chichester, 1991.
[2] SEJNOHA, J. - BITTNAR, Z.: Mctoda kontcnych prvku I, II. Edice CVUT, Praha1991
[3] FAJMAN, P.: Nelinedrni analy'za skofepin MKP. Disertacni price, Praha 1995
This research has been conducted at the Department of Structural Mechanics as partof the research project "Reabilily - Based Design of Composite Plates and shells" and hasbeen supported by CTU grant No. 10018225.
432
WORKSHOP 96 ENGINEERING MECHANICS
EVOLUTION AND STRUCTURALSHAPE OPTIMIZATION
J. Bocko, J. Miiller*
TU Kosice, Fac. of Mechanical Eng., Dept. of Tech. Mech. & ElasticityLetna 9, 041 00 Kosice, Slovakia
*TU Kosice, Fac. of Civil Eng., Dept. of Civil Eng. Mech.Moyzesova 34, 042 00 Kosice, Slovakia
Key words: optimization, finite elements
The process of structural optimization implies producing the best possible design fora structure under prescribed loading conditions. The process of optimization has manyaspects, but as a rule, in structural optimization we deal only with parameters which havedirect influence on mechanical behaviour of the structure. We do not include the tech-nological aspects. Anyway, this reduced understanding of optimization can be also verycomplicated, especially in multicritcria structural optimization. In all cases the formulationof optimization task have to be provided very carefully.
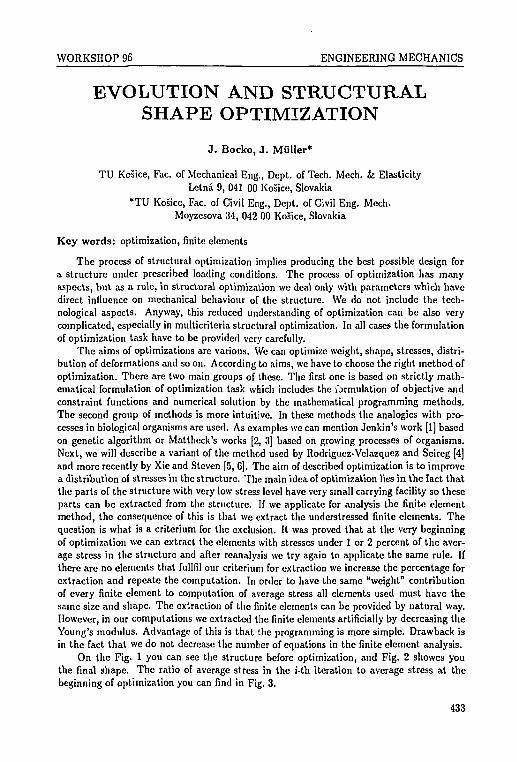
The aims of optimizations arc various. We can optimize weight, shape, stresses, distri-bution of deformations and so on. According to aims, we have to choose the right method ofoptimization. There are two main groups of these. The first one is based on strictly math-ematical formulation of optimization task which includes the i'jrmulation of objective andconstraint functions and numerical solution by the mathematical programming methods.The second group of methods is more intuitive. In these methods the analogies with pro-cesses in biological organisms are used. As examples we can mention Jenkin's work [1] basedon genetic algorithm or Mattheck's works [2, 3] based on growing processes of organisms.Next, we will describe a variant of the method used by Rodriguez-Velazquez and Seireg [4]and more recently by Xie and Steven [5, 6]. The aim of described optimization is to improvea distribution of stresses in the structure. The main idea of optimization lies in the fact thatthe parts of the structure with very low stress level have very small carrying facility so theseparts can be extracted from the structure. If we applicate for analysis the finite elementmethod, the consequence of this is that we extract the undepressed finite elements. Thequestion is what is a criterium for the exclusion. It was proved that at the very beginningof optimization we can extract the elements with stresses under 1 or 2 percent of the aver-age stress in the structure and after reanalysis we try again to applicate the same rule. Ifthere are no elements that fullfil our criterium for extraction we increase the percentage forextraction and repeate the computation. In order to have the same "weight" contributionof every finite element to computation of average stress all elements used must have thesame size and shape. The extraction of the finite elements can be provided by natural way.However, in our computations we extracted the finite elements artificially by decreasing theYoung's modulus. Advantage of this is that the programming is more simple. Drawback isin the fact that we do not decrease the number of equations in the finite element analysis.
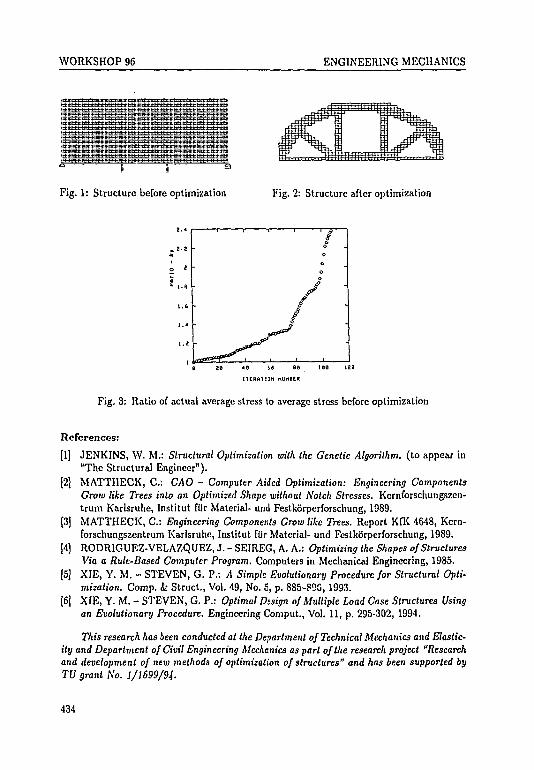
On the Fig. 1 you can see the structure before optimization, and Fig. 2 showes youthe final shape. The ratio of average stress in the i-th iteration to average stress at thebeginning of optimization you can find in Fig. 3.
433
WORKSHOP 96 ENGINEERING MECHANICS
Fig. 1: Structure before optimization Fig. 2: Structure after optimization
IICRRTian rtunBCS
Fig. 3: Ratio of actual average stress to average stress before optimization
References:
[1] JENKINS, W. M.: Structural Optimization with the Genetic Algorithm, (to appear in"The Structural Engineer").
[2] MATTHECK, C: CAO - Computer Aided Optimization: Engineering ComponentsGrow like Trees into an Optimized Shape without Notch Stresses. Kernforschungszen-trum Karlsruhe, Institut fur Material- und Festkorperforschung, 1989.
[3j MATTHECK, C: Engineering Components Grow like Trees. Report KfK 4648, Kern-forschungszentrum Karlsruhe, Institut fur Material- und Festkorperforschung, 1989.
[4] RODRIGUEZ-VELAZQUEZ, J. - SEIREG, A. A.: Optimizing the Shapes of StructuresVia a Rule-Based Computer Program. Computers in Mechanical Engineering, 1985.
[5] XIE, Y. M. - STEVEN, G. P.: A Simple Evolutionary Procedure for Structural Opti-mization. Comp. t Struct., Vol. 49, No. 5, p. 885-890, 1993.
[6] XFE, Y. M. - STEVEN, G. P.: Optimal Design of Multiple Load Case Structures Usingan Evolutionary Procedure. Engineering Comput., Vol. 11, p. 295-302, 1994.
This research has been conducted at the Department of Technical Mechanics and Elastic-ity and Department of Civil Engineering Mechanics as part of the research project "Researchand development of new methods of optimization of structures" and has been supported byTV grant No. 1/1699/94.
434
WORKSHOP 96 ENGINEERING MECHANICS
FATIGUE LIFE OF BRIDGE
J . Culik
CTU, Fac. of Civil Eng., Dept. of Structural MechanicsThakurova 7, 166 29 Praha 6
Key words: simulation, fatigue life, service life, crack prediction, fracture mechanics, Woh-ler curve, PREFFAS model, ONERA model, CORPUS model
The EVA (Enabling Vibration Analysis) system was developed by Culik at the de-partment of Structural Mechanics in the Faculty of Civil Engineering at the Czech technicalUniversity in Prague. The system makes it possible to simulate on a computer the evolutionof stress in time for some part of a structure during the passage of road or railway vehiclesalong a bridge.
The simulation model has two parts, the model of bridge vibration and the modelof vehicle vibration which influence each other. The whole model makes it possible todetermine the evolution of stress in time for some part of a structure for various velocitiesand roadway surface unevennes, some arrangement of vehicles, some distance between thevehicles etc.
The traffic reconnaissance should have already made known the traffic density at theplace where the bridge will be designed, and this means that the average numbers of vehiclesper time unit, divided according to vehicles types, will be known.
We divided the all vehicles to simulation experiments. Each simulation experiment hasa type of vehicle or some arrangement of vehicles, velocity, roadway surface unevennes etc.The result of each simulation experiment is the evolution of stress in time for the observedpart of the structure.
The evolution of a stress is decomposed into the basic harmonic modes and the effecton the material fatigue life is watched. The material fatigue life can be determined usingthe concept of Wohler curves, or, alternatively, crack growth based on linear elastic fracturemechanics.
If the bridge material fatigue life is observed then two simulation stages have to becomputed: the crack initiation stage and the crack growth stage. The second stage isdecisive. The concept of Wohler curves considers the both stages. The concept of linearelastic fracture mechanics can be used if the initial lenght of crack is known or if a smallinitial crack is supposed in a newly built structure.
The EVA system makes it possible to determine a fatigue life according to Wohlercurves or according to fracture mechanics.
If the concept of Wohler curves is used the evolution of stress is decomposed by therain flow method into basic harmonic modes. The number of periods up to the time ofcritical crack lenght Af,- for each harmonic mode is computed according to the formulaswhich was published at Czech standard CSN 736205, CSN 731401 or PENV 1994-1-1 (newCzech standard CSN 731401).
The oscillation is not harmonic, therefore the Palmgren-Miner hypothesis will be usedm TV-
£ £ = i (i)435
WORKSHOP 96 ENGINEERING MECHANICS
where T is the fatigue life and r; is a number of periods in each group (the number ofvehicles coresponding to the experiment type). The fatigue life is calculated from (1).
If the concept of linear elastic fracture mechanics is used then the crack growth issimulated from the initial lenght till the critical lenght and coresponding time is summarizedaccording to Paris law
The following alternative formula can be used
^ = A((AKHf - AK
/ / = / " , P = - + 1, 7 = 0.714A<r
where a is the crack lenght, N is the number of periods, AAT is the range of intensity stressfactor, A/Co is threshold stress intensity factor, cr0 is average stress, Ac is stress range andC,n,A,f),a are material constants.
The above described methods don't consider the stress history and the result can benot correct.
The PREFFAS, ONERA and CORPUS models calculate maximum and minimum ofthe stress intensity factors at each stress cycle. The models calculate the opening stressintensity factor and then they calculate for the effective range of stiess intensity factor(maximum minus opening value) the crack lenght difference according to the Paris law (2).The calculation algorithms of opening stress intensity factors arc different for the PREFFAS,ONERA and CORPUS models. This models give more correct results because the stresshistory is respected.
The PREFFAS model considers the opening stress intensity factor Kop as a maximum of
K«pj,k = Kmazj — I A + B .,"""' ] [Kmaxj ~ Kmin,k)\ ' » m a t j /
for j = 1 to i — 1 and for all k 6 (j,i), where A,B are material constants.The ONERA model considers that the crack is opened if the stress forms a new plastic
zone.The CORPUS stress opening model is based on a loss of connection during the crack
opening at the highest place of a crack surface.
References:
[1] CULlK, J.: The Fatigue Life of a Steel Structure. Engineering Mechanics, Vol. 2, No. 4,pp. 247-254. Association for Engineering Mechanics, Brno 1995.
[2] PADMADINATA, U. H.: Investigation of Crack Closure Prediction Models for Fatiguein Aluminium Alloy Sheet under Fright-Simulation Loading. Report LR-619, TU, Uni-versity of Technology, Delft 1990.
This research has been conducted at the Department of Structure Mechanics as part ofthe research project "Search of service life of bridge by simulation" and has been supportedby CTU grant No. 1051,.
436
WORKSHOP 96 ENGINEERING MECHANICS
STATIC ANALYSIS OF CABLE-STAYEDBRIDGE SYSTEMS
J . Kadldak, J . Kytyr
Technical Univ. of Brno, Fac. of Civil Engineering, Dept. of Structural MechanicsVevefi 95, 662 37 Brno, Czech Republic
Key words: bridges, statics, theory, automation, stiffening girder, cable, towers, suspen-sions
Recently, modern aesthetic and economically very advantageous cable-stayed bridgesand cable footbridges for pedestrians have been used for bridging wide vales and rivers morefrequently. For static analysis of cable-stayed bridge systems a new method based on thesecond order theory has been derived which ia Mly computer automated. By means of thismethod, safe and economical design of basic carrying elements of the system can be carriedout.
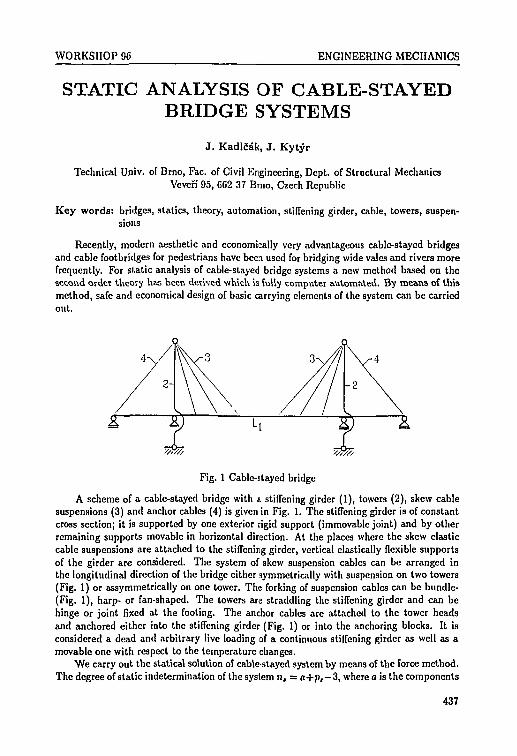
Fig. 1 Cable-stayed bridge
A scheme of a cable-stayed bridge with a. stiffening girder (1), towers (2), skew cablesuspensions (3) and anchor cables (4) is given in Fig. 1. The stiffening girder is of constantcross section; it is supported by one exterior rigid support (immovable joint) and by otherremaining supports movable in horizontal direction. At the places where the skew elasticcable suspensions are attached to the stiffening girder, vertical elastically flexible supportsof the girder are considered. The system of skew suspension cables can be arranged inthe longitudinal direction of the bridge either symmetrically with suspension on two towers(Fig. 1) or assynimetrically on one tower. The forking of suspension cables can be bundle-(Fig. 1), harp- or fan-shaped. The towers are straddling the stiffening girder and can behinge or joint fixed at the footing. The anchor cables are attached to the tower headsand anchored either into the stiffening girder (Fig. 1) or into the anchoring blocks. It isconsidered a dead and arbitrary live loading of a continuous stiffening girder as well as amovable one with respect to the temperature changes.
We carry out the statical solution of caMestayed system by means of the force method.The degree of static indetermination of the system n, = a+pz—3, where a is the components
437
WORKSHOP 96 ENGINEERING MECHANICS
number of the reactions of exterior supports of the stiffening girder and ps is the numberof cable suspensions. As statically indeterminate magnitudes x; (i = 1,2,..., n3) we choosethe bending moments of the stiffening girder over exterior supports and at attachmentplaces of suspension cables to the girder. The basic statically defined system is formedby simple girders, the number of which equals the number of continuous girder spans onelastic supports. The support moments over the exterior supports and at places of cablesuspensions are solved from a system of n, five-moment equations. From the known supportmoments, the remaining statical magnitudes of stiffening girder can be determined, inclusiveof the reactions in its exterior attachments and in elastically flexible supports, as well. Itis possible to determine the tensile axial forces in suspension cables by means of thesemagnitudes and then we can determine from them the normal forces in anchor cables andcompressing forces of the towers.
We solve the influence of movable loading on the continuous stiffening girder by meansof influence lines using the combination of kinematic method (the shape of an influence line)with the analytical method (determining of the ordinates). By means of the computationalprogramm BRIDGES it is possible to construct the influence lines of statical magnitudes,basic carrying elements of cable-stayed bridge system. From the calculated ordinates eachinfluence line can be drawn and its evaluating for uniform loading can be carried out.
References:
[1] KADLCAK, J.: Statics of Carrying Cables of Suspended Roofs (in Czech), p. 156,Studie CSAV, Academia Praha, No. 10, 1990.
[2] KADLCAK, J.: Statics of Suspension Cahlc Roofs, p. 316, A. A. Balkema, Netherlands-USA, 1995.
This research has been conducted at the Department of Structural Mechanics as part ofthe research project "Static Analysis of Suspension and Cable-Stayed Bridge Systems" andhas been supported by TU of Brno grant No. FU 350024.
438
WORKSHOP 96 ENGINEERING MECHANICS
CRACK GROWTH SIMULATION
P. Broz
CTU, Klokner Institute, Dept. of Engineering StructuresSolinova 7, 166 OS Praha 6
Key words: energy release rate, equivalent modes, maximum circumferential stress theory,notch analysis, propagation laws
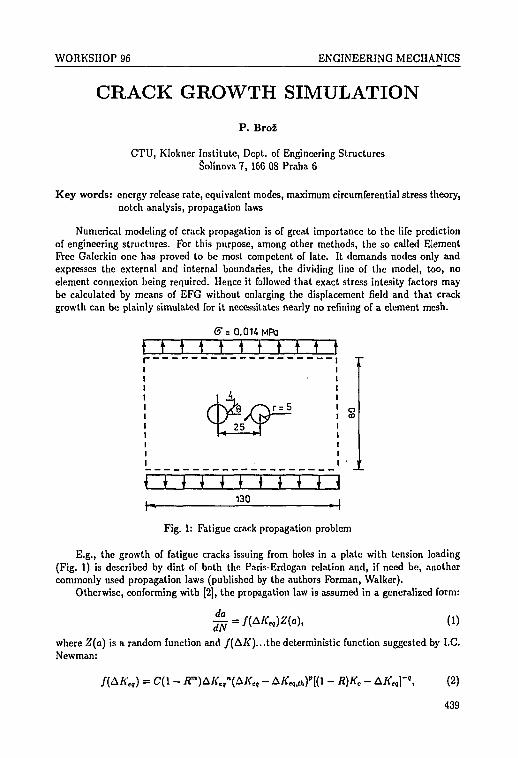
Numerical modeling of crack propagation is of great importance to the life predictionof engineering structures. For this purpose, among other methods, the so called ElementFree Galerkin one has proved to be most competent of late. It demands nodes only andexpresses the external and internal boundaries, the dividing line of the model, too, noelement connexion being required. Hence it followed that exact stress intesity factors maybe calculated by means of EFG without enlarging the displacement field and that crackgrowth can be plainly simulated for it necessitates nearly no refining of a element mesh.
<5" = 0.01AMR3
i • t 1 t \ \ \ t T^
• * * *130
Fig. 1: Fatigue crack propagation problem
E.g., the growth of fatigue cracks issuing from holes in a plate with tension loading(Fig. 1) is described by dint of both the Paris-Erdogan relation and, if need be, anothercommonly used propagation laws (published by the authors Forman, Walker).
Otherwise, conforming with [2], the propagation law is assumed in a generalized form:
where Z(a) is a random function and /(AX)...the deterministic function suggested by I.C.Newman:
- R)KC - (2)
439
WORKSHOP 96 ENGINEERING MECHANICS
C,m,n,p and q being material dependent parameters and AA' t,... the range of equivalentmode I stress intensity factors:
&Ktq = Kt,m'*-Kt,
mia, (3)
where /<£,""" and if,,"101 are the minimum and maximum equivalent mode I stress intensityfactors.
According to [1], to simulate mixed-mode behaviour, fatigue phenomena are expressedby the equation for AKcq, as follows
'<„ = A/C;COS3| - 2 —sin—, (4)
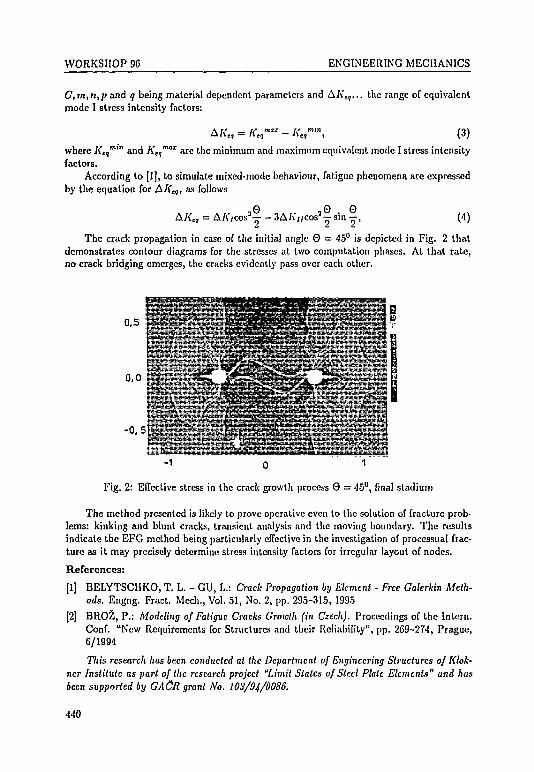
The crack propagation in case of the initial angle 0 = 45° is depicted in Fig. 2 thatdemonstrates contour diagrams for the stresses at two computation phases. At that rate,no crack bridging emerges, the cracks evidently pass over each other.
o,s
0,0
-0,5•KM
-1 0 . 1
Fig. 2: Effective stress in the crack growth process 9 = 45°, final stadium
The method presented is likely to prove operative even to the solution of fracture prob-lems: kinking and blunt cracks, transient analysis and the moving boundary. The resultsindicate the EFG method being particularly effective in the investigation of proccssual frac-ture as it may precisely determine stress intensity factors for irregular layout of nodes.
References:
[1] BELYTSCHKO, T. L. - GU, L.: Crack Propagation by Element - Free Galerkin Meth-ods. Engng. Fract. Mech., Vol. 51, No. 2, pp. 295-315, 1995
[2] BROZ, P.: Modeling of Fatigue Cracks Growth (in Czech). Proceedings of the Intern.Conf. "New Requirements for Structures and their Reliability", pp. 269-274, Prague,6/1994
This research has been conducted at the Department of Engineering Structures of Klok-ner Institute as part of the research project ''Limit States of Steel Plale Elements" and hasbeen supported by GACR grant No. 103/94/0086.
440
WORKSHOP 96 ENGINEERING MECHANICS
DESIGN OF NON-UNIFORM STRUTS
M. Tochacek
CTU, Klokner Institute, Dept. of Engineering StructuresSolinova 7, 165 08 Praha 6,
Key words: steel structures, buckling, non-uniform struts
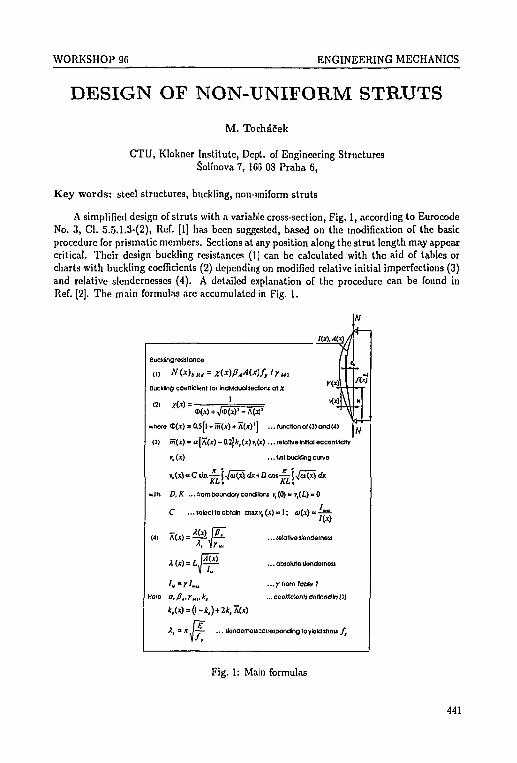
A simplified design of struts with a variable cross-section, Fig. 1, according to EurocodeNo. 3, Cl. 5.5.1.3-(2), Rcf. [1] has been suggested, based on the modification of the basicprocedure for prismatic members. Sections at any position along the strut length may appearcritical. Their design buckling resistances (1) can be calculated with the aid of tables orcharts with buckling coefficients (2) depending on modified relative initial imperfections (3)and relative slcndernesses (4). A detailed explanation of the procedure can be found inRef. [2]. The main formulas are accumulated in Fig. 1.
Duckling roilslance
Buckling coefficient lor individual lecJoni at x
(2) * W = '
where <t>(jr) = 0.5[l + m(jf)+ A(x)1] ...functionof(3)and(4)
(3) H W » a | A W - 0 . 2 j t , W v , ( i ) ...rotative Initial eccontrlclty
v, (*) ...first buckling cuve
wilh D,K ...tiomboundaryconditbnt n(0)» »,(i) = 0
C ...ielecttoobtaln maxy,( j i ; ) - l ; ( u ^ J e - ^ 2 -
l\X)
,i(.t)-ip^
...leblivoilendemoa
.,. absolute tlondemeu
...yttom Table J
... coorndontt doflnodln (!)
-— ... ilondornoucorfejpondingtoytolditfou fr
Fig. 1: Main formulas
441
WORKSHOP 96 ENGINEERING MECHANICS
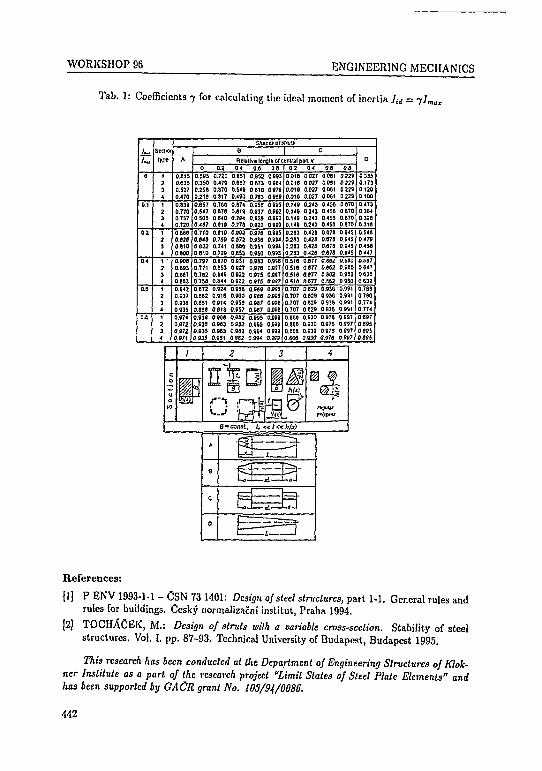
Tab. 1: Coefficients 7 for calculating the ideal moment of inertia ]id = yJmar
0.8150.6390.5270.4700.8390.7700.7370.720
0.620ID
0.0000.00aO.B930.BB70.8630.0420.0370.530
0350,8740.9720.9720.671
Relative length of ceOS
0.595 0.7200.350 0.4790.255 0.3700.21 B 0.317
0.651 0.052 0.0910.08? 0.873 0BB40.549 0.S10 0.9760.400 0.763 0,858
0,657 0.76B0.S47 0.6700 500 0.0400.407 0.010
O.B74O.fltftO.7B40.77ft
0.059 0.0050.937 0.9620.025 0.0000.922 0,090
0.710 0,0100.045 0.7500.622 0.741Q.B10 0.7290.707 0.6700.771 0.6530.762 0.6*80.758 0.B44
0.0030.8720.8S00.BS30.0310.0270.9220.022
0.076 0.6950.0 56 0.9040.951 0.0940.050 O.Q«0.SB3 O.BSB0.076 0.8970.075 0.0970.873 O.P97
0.872 0.B240.B62 0.9100.BS1 0.9140.858 0.913
O.OSB0.9C00.0530.957
0.8B9 0.0030.058 0.9090.637 0.098O.9B7 0.058
0.939 0.068O.MS 0.0030.935 0.9630.935 0.961
0,0920.6620.0620.9S2
0.995 O.0S90.095 0.9090.994 O.0990,994 O.9B3
02 0.4 0.9 OS0.016 0.027 0061 0229
[0 0.027 0.031 02293 0.027 0.061 0229'6 0.027 0.061 0 228!0 0.243 0.456 IId 0.243 0.456 I19 0.243 0.456 II9 Q.243 0.456 I
0.2830.2830,2830.2B3
0.428 0.678 '0.42B 0.678 '0.428 0,676 '0.418 0.670 1
0.5160.5190.5J4
0.677 0.8SZ '0.677 0.662 I0.677 0662 I0677 0-862 '
0.7070.7070.7070.707
0.8660.6660.B660.666
o.eia.629 0 930.829 0.93S629 0.936
.030 0.9760.030 0.9760.030 007S0.930 0,978
0.636
0.632
0.7BB0 7B00.7740 774
0.897
0.695
References:
[1] P ENV 1993-1-1 - CSN 73 1401: Design of steel structures, part 1-1. General rules and
rules for buildings. Cesky normalizacni institut, Praha 1994.
[2] T O C H A C E K J M.: Design of struts with a variable cross-section. Stability of steelstructures. Vol. I. pp. 87-93. Technical University of Budapest, Budapest 1995.
This research has been conducted at the Department of Engineering Structures of Klok-ner Institute as a part of the research project "Limit States of Steel Plate Elements" andhas been supported by GAOR grant No. 103/94/0086.
442
WORKSHOP 96 ENGINEERING MECHANICS
FAILURE HISTORY OF SLOPESWITH PREDESTINATED
SLIP SURFACE
J . Vacek, E. Westman*
CTU, Klokner Institute, Dept. of Engineering StructuresSolfnova 7, 166 08 Praha 6,
*U.S.D.L, B.O.M.,Denver Research Center, Dept. of MinesDenver, Colorado 80 225
Key words: slope stability, failure history, mechanics, predestinated slip surface
In the framework of experimental study the laboratory has been completed by apparatsthat enable one a continual record of tailings deformations.
New material has been developed, based on epoxy resin, that simulates a slip at the tail-ings bottom. This slip layer will make it possible the movement of the tailings body. Threemodels has been build up and the deformation of the slopes has been observed, including thecracks development. The cracks has been created in the originally homogeneous material ofthe tailings when tilting the stand by 10 or 15 degrees. At the toe of the tailings a pile hasbeen bored, instrumented with strain gages, for observing pile reactions (the forces, that isdeveloped by the pile when restraining the slope movement). Photogrammetric evaluationof tailing movements was made at department of geodesy at CTU Prague.
A numerical modeling study was initiated using both UDEC and FLAC distinct elementmodeling codes. Previous numerical modeling had been performed on the project, howeverit had used finite element modeling. It is resulting in accuracy only to the point of initiationof failure. Distinct element modeling allows large displacements to occur within the model,more accurately simulating real world and physical modeling results. Initial studies wereperformed with UDEC, however FLAC was subsequently chosen because it more accuratelysimulates soil mechanics such as those encountered in the studies tailings deposits.
A sequence of studies was completed using material properties and model geometrywhich matched the physical model - a sloped tailings deposit located above a dipping shearsurface. The body was modeled in an unreinforced state as well as a reinforced condition.The physical models reinforce the toe of the slope with a pile; such reinforcement was notavailable in the numerical modeling, however a plate on the surface of the slope tied backwith a cable into the slope simulated the pile well. A effect of reinforcement strength wasstudied by varying the yield strength and cross-sectional area of the cable.
Attached figures show some typical results.
This research has been conducted at the Department of Engineering Structures, KloknerInstitute CTU and Denver Research Center and is based on work sponsored by the U.S.-Czcchoslovak Science and Technology Joint Fund in cooperation with MPO CR and BOMUSA, as part of the research project "Depot Capacity", No. 94 028 (No. CTU 1671001).
443
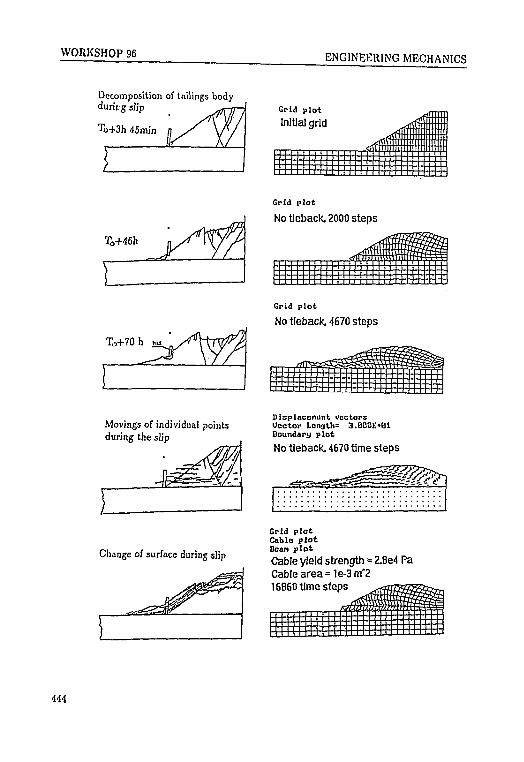
WORKSHOP 96 ENGINEERING MECHANICS
Decomposition of tailings bodydurkg slip
45min
Grid plotInitial grid
Grid platNo tieback, 2000 steps
To+70 h
Grid plotNo tieback. 4670 steps
Movings of individual pointsduring the slip
Change of surface during slip
Displacement vectorsVector Length: 3.Q00E-B1Boundary plot
No tleback. 4670 time steps
Grid plotCablo plotScan plot
Cable yield strength = 2.8e4 PaCable area =1e-3m*216860 time steps
444
WORKSHOP 96 ENGINEERING MECHANICS
COUPLING OF PHYSICALAND MATHEMATICAL MODELS
IN GEOTECHNICS
V. Dolezel, P. Prochazka*
CTU, Fac. of Civil Eng., Scientific & Innovation CentreThakurova 7, 166 29 Praha 6
*CTU, Fac. of Civil Eng., Dcpt. of Structural MechanicsThakurova 7, 166 29 Praha 6
Key words: tunnel heading, boundary element method, physical modeling, coupled mod-eling, material properties of rock
In the paper we discuss a possible solution of the stability of an opening (e.g. tunnel)in a rock continuum under assumption that the mechanical behavior of the continuum isapproximately known from the physical model. The stability of the opening is studied bymeans of the BEM, being formulated as a contact problem. By virtue of this technology, thelimit state analysis is carried out. The mathematical model involves the Uzawa's algorithmssolving the classical problem of the generalized Coulomb's friction model. The distributionof material properties is simulated as a pararr.etrical study in the mathematical model.
This procedure was successfully applied to an assessment of behavior of the rock massin vicinity of an opening excavated in mine area near the town of Ostrava. The paper bringsabout some results following this study.
Principles of new design methods of underground construction works in soft rocks canbe formulated on the basis of results from extensive tests on physical models, as well as frommathematical models, and, eventually, from comparison of results from both the models.Properties of those rocks differ from site to site. Rocks are frequently separated by discon-tinuity planes. These planes and the weakening zones cause disintegration or susceptibilityto disintegration of the rock mass into structural units of various forms, size and properties.Their properties change also with the stress mode and depend on the stressing force towhich the rock was exposed in the past.
It results from the above mentioned facts that the properties of the rock environmentcannot be measured neither on small rock samples nor by the isolated sporadic tests insite. In the first case, we cannot evaluate the effect of weakening planes, and in the otherone the dispersion variance caused by inhomogeneities of the rock mass. In both cases, thenecessary conditions of the physical similitude are usually not observed. These conditionswould require to measure the rock properties under stress conditions equal to stressingforce to which they are exposed during construction and after completion of constructionworks. These requirements can very easily be observed on physical models from equivalentmaterials.
Results from laboratory tests can directly be used as input data to mathematical solu-tion provided tlie constitutive relation between the stress tensor and strains is known andprovided the relative homogeneity and isotropy are assumed.
445
WORKSHOP 96 ENGINEERING MECHANICS
On the other hand the stresses are difficult to obtain from the physical modeling. Thisis the moment when the mathematical model can help and coupling of both models canapproximate the real state of the rock continuum and the underground structure (e.g. lining).
A very important conclusion results from some selected rock mechanics problems, bythe method of physical and mathematical modeling, and from their mutual comparison. Itis possible, by means of a test on the physical model, to establish conditions which are of pri-mary interest for us (e.g. when the resistance of internal forces against failure is minimum).For conditions thus established, the deformation and stress of the rock environment in theneighborhood of the underground opening are determined by the boundary element method(used here) or with the aid of the FEM or by combination of FEM Sz BEM. A part of theproblem can therefore be resolved by tests on the physical model and the results obtainedcan be used as input values for final solution by some numerical method. In this way, bothprocedures can be adequately combined and completed, advantages and drawbacks of bothof them acting complementarily.
A stability study concerning an influence of the backfill of the opening was carried outin 2D (longitudinal direction of the opening was preferred), based on the BEM computation.The domain above the tunnel heading was split into two parts (two subdomains F| and Fr)and along the boundaries of these parts the surface forces were computed from Uzawa'salgorithm. They simulate an admissible relative displacement distribution along the bound-ary between these parts. Another forces were simulating the influence of the third directionand were applied along the faces at the bottom and at the roof of the opening. These forceswere expressed by virtue of a kind of Winkler's coefficient k [MPa/m]. Material constantsof the domain had the following values: E = 55 000 MPa, v = 0.29. The capacity s of thefictitious contact line is expressed by the relation:
s = j l 0 0 %
where /0 is the length of the part where [u]( ^ 0 and / is the total length of the contactbetween F; and F r . [u]t is the difference between tangential displacements with respect toTi and F r .
Other studies were carried out by the authors and in the future, this model shouldimprove the information on the mechanic behavior of the system studied.
References:
[1] CEA, J.: Optimization, Theorie el Algorithmes, Dunod, Paris, 1971: 175.
[2] DOLEZEL, V. - PROCHAZKA, P.: Application of mathematical and physical modelsin continuum mechanics (in Czech), 9th Conf. on Foundation Engng., Brno, 1981,51-56.
[3] PROCHAZKA, P. - DOLEZEL, V.: Global stability of tunnel heading, 9th DanubianEC SMFE Budapest, 1990, 335-3-12.
[4] PROCHAZKA, P. - DOLEZEL, V.: On a coupling of physical and mathematical mod-eling in contact problems of gcotcchnics, submitted to Acta Polytechnica.
This research has been conducted at the Department of Structural Mechanics as part ofthe research project "Stability of Tunnel Heading" and has been supported by GA CR grantNo. 103/95/1265.
440
WORKSHOP 96 ENGINEERING MECHANICS
MICROMECHANICAL MODELLING INTHEORY OF COMPOSITE MATERIALS
B. Novotny
CTU, Klokner Institute, Dept. of Composite Materials & StructuresSolinova 7, 166 08 Praha 6,
Key words: micromechanics, method of cells, microstrains, microstresses, engineering con-stants
The micromechanical analysis has emerged as a critical research area investigating pro-perties of composite materials by modelling the behaviour of its constituents, their geometricproperties (shape and packing), interface conditions, internal damage initiation and accu-mulation mechanisms.
The micromechanical modelling experienced considerable qualitative advancement frommodels based on classical solutions to complex models requiring application of fast compu-ters with large capacity and advanced software. Among such micromechanical models, theAboudi's model |1] has a specific position, being based on simple geometric modelling ofthe phases (in form of rectangular blocks) and simple approximation of the microvariablesallowing the fulfillment of the microcontinuity (microtransfer) conditions in the "micro-integral" sense only. From the educational point of wiev, all this features are in favour ofthe adoption of this method in the learning process.
The original version of the method can be easily generalized by considering multivolumerepresentative cell {01,02,0:3}; cr; = l , . . . ,p , ; with pi cell volume subdividions in eachcoordinate direction. In each subcell (c»i 02 03), a local coordinate system x ; ' ' is introduced,in which the subcell interfaces are defined as x>"'' = dbjA,^. The microdisplacements arethen modelled as
U;O1OJO3» = u){'"O2Oj) + ^ i J o ' ) ^ l O I O 3 ) . (1)
and from the conditions of displacement continuity we can derive relations between micro-and macro-displacements (denoted as to,-)
2-, hi* Vij =Jii~ar > ni~l^ hi* > (*)*=i ax> *=i
to, = »}"•""»> (i,j,/= 1,2,3; ft = * if l = j ,
ft = l Pi if
Additional equations are provided by the interface microstress transfer conditions
_(O|«2Ol) _ (ft 02 ft) / • • f. _ , « n l (n\
ctj = \,2,...,pj-\; ft- = o i+i;at = l,2,...,pk , Pk-ak if k^j;
447
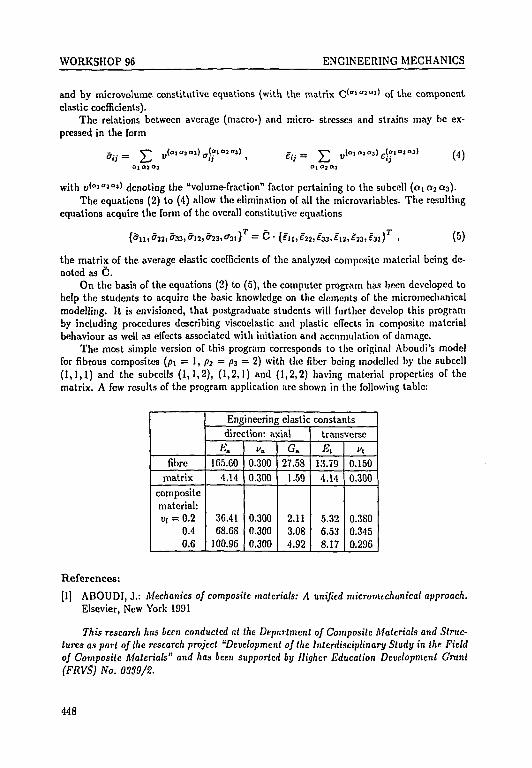
WORKSHOP 96 ENGINEERING MECHANICS
and by microvoluine constitutive equations (with the matrix C1""'1'*31 of the componentelastic coefficients).
The relations between average (macro-) and micro- stresses and strains may be ex-pressed in the form
- _"ij — (4)
with vl"1"2"') denoting the "volume-fraction" factor pertaining to the subcell (The equations (2) to (4) allow the elimination of all the microvariables. The resulting
equations acquire the form of the overall constitutive equations
; \T (5)
the matrix of the average elastic coefficients of the analyzed composite material being de-noted as C.
On the basis of the equations (2) to (5), the computer program has been developed tohelp the students to acquire the basic knowledge on the elements of the micromechanicalmodelling. It is envisioned, that postgraduate students will further develop this programby including procedures describing viscoelastic and plastic effects in composite materialbehaviour as well as effects associated with initiation and accumulation of damage.
The most simple version of this program corresponds to the original Aboudi's modelfor fibrous composites (p\ = 1, p% = ps = 2) with the fiber being modelled by the subcell(1,1,1) and the subcells (1,1,2), (1,2,1) and (1,2,2) having material properties of thematrix. A few results of the program application are shown in the following table:
fibrematrix
compositematerial:vt = 0.2
0.40.6
Engineering elastic constantsdirection: axial
E.165.60
4.14
36.4168.68
100.96
0.300
0.300
0.3000.3000.300
G.27.58
1.59
2.113.084.92
transverse
Et
13.794.14
5.326.538.17
0.1500.300
0.3800.3450.296
References:
[1] ABOUDI, J.: Mechanics of composite materials: A unified micromcchanical approach.Elsevier, New York 1991
This research has been conducted at the Department of Composite Materials and Struc-tures as part of the research project "Development of the Interdisciplinary Study in the Fieldof Composite Materials" and has been supported by Higher Education Development Grant(FRVS) No. 0339/2.
448
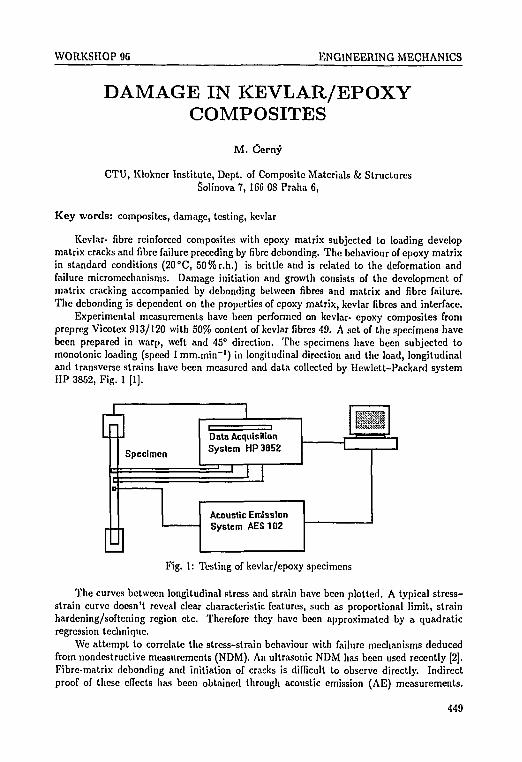
WORKSHOP 9G ENGINEERING MECHANICS
DAMAGE IN KEVLAR/EPOXYCOMPOSITES
M. Cerny
CTU, Klokner Institute, Dept. of Composite Materials & StructuresSoh'nova 7, 16G OS Praha 6,
Key words: composites, damage, testing, kevlar
Kevlar- fibre reinforced composites with epoxy matrix subjected to loading developmatrix cracks and fibre failure preceding by fibre debonding. The behaviour of epoxy matrixin standard conditions (20°C, 50%r.h.) is brittle and is related to the deformation andfailure micromcchanisms. Damage initiation and growth consists of the development ofmatrix cracking accompanied by debonding between fibres and matrix and fibre failure.The debonding is dependent on the properties of epoxy matrix, kevlar fibres and interface.
Experimental measurements have been performed on kevlar- epoxy composites fromprepreg Vicotex 913/120 with 50% content of kevlar fibres 49. A set of the specimens havebeen prepared in warp, weft and 45° direction. The specimens have been subjected tomonotonic loading (speed 1 mm.min"1) in longitudinal direction and the load, longitudinaland transverse strains have been measured and data collected by Hewlett-Packard systemHP 3852, Fig. 1 [1].
Specimen
Data AcquisitionSystem HP385Z
Acoustic EmissionSystem AES102
Fig. 1: Testing of kcvlar/epoxy specimens
The curves between longitudinal stress and strain have been plotted. A typical stress-strain curve doesn't reveal clear characteristic features, such as proportional limit, strainhardening/softening region etc. Therefore they have been approximated by a quadraticregression technique.
We attempt to correlate the stress-strain behaviour with failure mechanisms deducedfrom nondestructive measurements (NDM). An ultrasonic NDM has been used recently [2].Fibre-matrix debonding and initiation of cracks is difficult to observe directly. Indirectproof of these effects has been obtained through acoustic emission (AE) measurements.
449
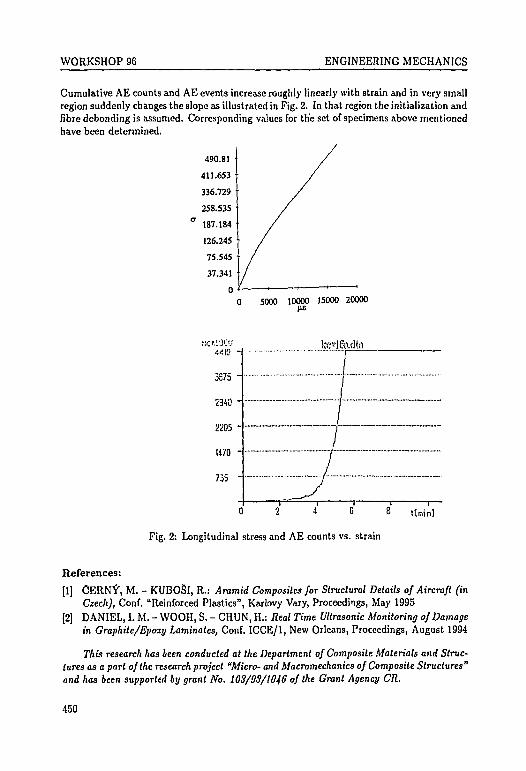
WORKSHOP 96 ENGINEERING MECHANICS
Cumulative AE counts and AE events increase roughly linearly with strain and in very smallregion suddenly changes the slope as illustrated in Fig. 2. In that region the initialization andfibre debonding is assumed. Corresponding values for the set of specimens above mentionedhave been determined.
490.81
411.653
336.729
258.535
187.184
126.245
75.545
37.341
05000 10000 15000 20000
r.c'l'X'J
•MB! -
3575 "
2340 -
2205 "
1470 -
735 -
2 1 G B
Fig. 2: Longitudinal stress and AE counts vs. strain
References:
[1] CERN?, M. - KUBOSI, R.: Aramid Composites for Structural Details of Aircraft (inCzech), Conf, "Reinforced Plastics", Karlovy Vary, Proceedings, May 1995
[2] DANIEL, I. M. - WOOH, S. - CHUN, H.: Real Time Ultrasonic Monitoring of Damagein Graphite/Epoxy Laminates, Conf. ICCE/1, New Orleans, Proceedings, August 1994
This research has been conducted at the Department of Composite Materials and Struc-tures as a part of the research project "Micro- and Macromechanics of Composite Structures"and has been supported by grant No. 103/93/1046 of the Grant Agency CR.
450
WORKSHOP 96 ENGINEERING MECHANICS
CYCLE MODELING OFRECIPROCATING AIR COMPRESSOR
B. Sekanina
TU, Fac. of Mechanical Eng., Dept. of ThermodynamicsTechnicka 2, 616 69 Brno
Key words: reciprocating compressor, cycle modeling, computer program, pressure andtemperature diagrams, polytropic exponent
Working cycle of compressors and pneumatic mashines consists of operations which workduring an aproximate constant pressure but ire not represented as isobaric thermodynamicoperations and of operations which are usually seen as polytropic operations with a constantpolytropic exponent. For air compressors, for example, its value is given in the range of1.20-1.50.
Today's availibility corresponding with a computer technique allows to try to reacha more detailed evaluated solutions of operations which go on in the pneumatic cylinderoriginating at the first law of thermodynamics application by an open or closed system and ofheat transfer laws. The starting series of computation during the course of gas compressionand expanssion having a constant velocity of the piston came up from a differential equationof the first law of thermodynamics for a closed system and an ideal gas complimented by aNewton law of heat transfer by convection. Runge-Kutte method of the 4th degree has beenused for its solution. Because the working action has been aimed more to the problematicsof reciprocating compressors, the next stage has derived the elementary energy balanceequations of evaluation of four basic parts of compressor cycle which come out from atime discreditation of action and allow to solve more common cases after some adjustmentsincluding changes of boundary conditions and physical properties of gas during one cycle.A sinus course of piston velocity at the constant angular velocity with regard to the infinitelenght of the connecting rod has already been taken into account in all perfomed calculations.
The course of compression and expanssion in all individual time intervals is a result ofsystem solution of two linear equations - equation of state of an ideal gas and an equationof elementary energy balance for a closed thermodynamic system where heat transfer byconvection is expressed by dependance on immediate area of inner heat transfer surface of thecylinder, heat-transfer coefficient from gas to the inner walls and an immediate temperaturedifference between gas and inner walls of the cylinder. Solution of discharge and suctionarises from assumption of an unsteady process in an open thermodynamic system havinga constant pressure, including the enthalpy flow of gas input or its output. A quadraticequation for gas temperature at its final point is obtained in each time interval.
System of computed programs have been used for basic oricntational computation ofcompressive and expanssion courses in cylinders of reciprocating compressors with a goalin mind to get first insight of courses and influences of some basic parameters (slimness ofa cylinder, average piston velocity, compression ratio, relative size of an clearance space).Computed interactions and dependancy p-V, T-s, values of total heat transfering, wastedand performed work and corresponding total polytropic exponent from the starting andending state of gas have been also obtained. By now it can be said, that the calculated
451
WORKSHOP 96 ENGINEERING MECHANICS
values of the total polytropic exponents, even in case of limited values of usual parameters,shows to be higher than usualy presented in the literature.
A programe for basic quantities calculations of the whole reciprocating compressor hasbeen set up from partial programes of elementary energy evaluations. First alternativecame up as a result of probable constant temperature of the cylinder's inner wall during thewhole cycle. This doesn't take into account the physical heat quantities of the compressor'scylinder part and any conditions for a heat transfer from the cylinder into the space around(cooling). The second alternative is an effort to include basic parts of the cylinder into agiven thermodynamic system under much simplified conditions (infinitelly high heat con-ductivity of the material the cylinder is made of, the same conditions for heat transfer forall its parts). The result of some of the calculation of the reciprocating air compressor cyclemodel with the overall heat transfer through the cylinder walls are marked on into diagramsp,T-FI (crank's angle). Consideration has been given to the simplification mentioned aboveas well as to the lack of detailed evidence as to the conditions of heat transfer inside ofthe cylinder. It is possible to make a conclussion only to the quality characteristics. Thefollowing conclusions dealing with the temperature and pressure during its course of workfrom the research of air compressors working in the usual range shows:
• The temperature of the cylinder wall is almost constant and its value ranges in thedependance on the compression ratio and cooling of the cylinder within 30-80°C.
• With the same values of the input gass mass, the slimness of the cylinder is not reallya decisine factor.
• Influence of the average piston velocity as to the increase or decrease of gas temperatureduring compression or cxpanssion is important only during an intensive cooling of thecompressor's cylinder. Otherwise the course of compression and cxpanssion is almostadiabatic.
• Obtained results of calculations dealing with probable values of the heat-transfer coef-ficient inside of the cylinder, corresponding total polytropic exponents in case of com-pression 1.32-1.40 and in case of expanssion 1.40-1.42, are in agreement. Exponentof expanssion shows always to be higher than the compression exponent. During thesuction temperature of 20 °C, the air temperature at the end of compression reachesupto 350°C - values that are much higher than temperature in the oil lubricatedcylinders of air compressors usually allowed.
With regard to the lack of literary facts about the conditions of heat transfer from gasto the cylinder walls, comparison as to the more precise calculations with a given experimentis necessary. Indication of an air compressor 2JSK-75-S is being prepared with a mutualcooperation of VKDI Compressors Orlik.
References:
(1] CHLUMSK?, V.: Pistove kompresory. SNTL, Praha 1958, pp. 28-53.(2] CHLUMSKV', V. - LISKA, A.: Kompresory. SNTL-ALFA, Praha 1977, pp. 18-44.[3] BOUCHE, C. - WINTTEItUN, K.: Kolbenverdichter. Springer-Verlag, Berlin 1968,
pp. 7-34.
This research has been conducted at the Department of Thermodynamics as part of theresearch project "Modeling of compression and cxpanssion in the pneumatic cylinders" andhas been supported by TU Brno grant No. FP S59JB8.
452
WORKSHOP 96 ENGINEERING MECHANICS
A NUMERICAL SOLVER FORELASTOHYDRODYNAMICALLYLUBRICATED LINE CONTACTS
J . Cermak
TU of Brno, Fac. of Mech. Engineering, Dept. of ThermomechanicsTechnicka 2, Brno, Czech Republic.
Key words: elastohydrodynamics, line contact, numerical solution, control volumes
This paper describes a developed numerical solver (computer program) for solution ofpressure distribution in heavy loaded line contacts. A constant temperature is assumed,i.e. only small slip occurs within the contact. Solids of the contact are assumed to beelastically deformable and the deformations are essential. A fluid is not expected to flowacross the contact within line contact. Because of very large changes of pressure up to threegigapascals, viscosity and density can be no longer assumed to be constant. Surfaces ofsolids in the contact area are supposed to be smooth. The contact is working under steadystate conditions.
The fluid flow in narrow gap between the surfaces is described by one-dimensionalReynolds equation. The equation is derived from Navier-Stokes equations. Mass inertiaforces are neglected. Boundary conditions of zero pressures in the inlet and outlet are ap-plied. Moreover, a cavitation condition, i.e. only positive or zero pressure values are allowed.The deformation of the contact solids is evaluated via Timoshenko's integral formula. Thefilm thickness is determined as a sum of geometric separation of non-deformated contactsurfaces and the elastic deformation of them. A Roelands' viscosity pressure dependence isused. The density changes are approximated by Dowson and Higginson's formula. To dealwith this problem, one have to solve a non-linear integro-differential boundary value prob-lem. The position of the outlet boundary condition is unknown, because of the cavitationcondition.
A control volume approach described in [4], is used to perform a discretization. It resultsto a system of non-linear algebraical equations. For the calculation of first "conductive"term in Reynolds equation a central discretization is used. The second "convective" termis calculated via upstream discretization. For the film thickness evaluation, it is supposed,that the pressure is constant over the control volume.
Because of a strong nonlinearity of viscosity, a robust method has to be use to reachhigh loads. It was found in [2], that the simple Gauss Seidel's iterative method is acceptablefor moderate loads only. This solver is based on a Gauss Seidel's relaxation combined withone-dimensional method of cuttings. The method used in [3] is similar, but they used a one-dimensional Newton's method and the derivation has been performed analytically instead ofnumerically. That is not suitable for testing different discretization schemes. This methodis sufficient for high loads (up to 3 GPa of Hertzian pressure). An underrelaxation factorabout 0.25 is commonly used. Nodes are visited from the inlet to the outlet during thesweep. Algebraical equations are supposed to be satisfied, when a maximal residue is smallerthan 10"9.
453
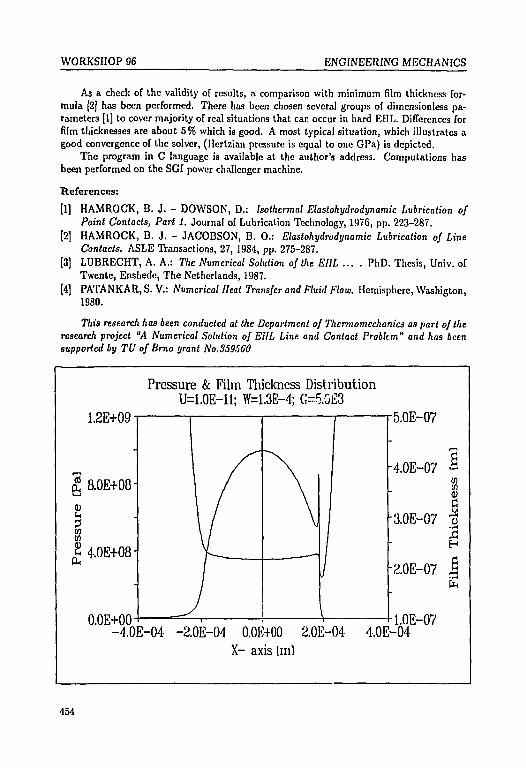
WORKSHOP 96 ENGINEERING MECHANICS
As a check of the validity of results, a comparison with minimum film thickness for-mula [2] has been performed. There has been chosen several groups of dimensionless pa-rameters [1] to cover majority of real situations that can occur in hard EIIL. Differences forfilm thicknesses are about 5 % which is good. A most typical situation, which illustrates agood convergence of the solver, (Hertzian pressure is equal to one GPa) is depicted.
The program in C language is available at the author's address. Computations hasbeen performed on the SGI power challenger machine.
References:
[1] HAMROCK, B. J. - DOWSON, D.: Isothermal Elastohydrodynamic Lubrication ofPoint Contacts, Part 1. Journal of Lubrication Technology, 1976, pp. 223-287.
[2] HAMROCK, B. J. - JACOBSON, B. 0.: Elastohydrodynamic Lubrication of LineContacts. ASLE Transactions, 27, 1984, pp. 275-287.
[3] LUBRECHT, A. A.: The Numerical Solution of the EIIL . . . . PhD. Thesis, Univ. ofTwente, Enshede, The Netherlands, 1987.
[4] PATANKAR, S. V.: Numerical Heat Transfer and Fluid Flow. Hemisphere, Washigton,1980.
This research has been conducted at the Department of Thcrmomeckanics as part of theresearch project "A Numerical Solution of EIIL Line and Contact Problem" and has beensupported by TU of Brno grant No.359560
&
inen2
1.2E+09-
8.0E+08-
-
4.0E+08-
Pressure & Film Thickness DistributionU=1.0E-ll; W=1.3E-4; G=5.0fi3
\r\ /
J
\\\
(j.UL+(JU •-4.0E-04 -2.0E-04 O.OE+00 2.0E-04
X- axis [ml
- K f\v (YiO.UJi (Jr
-4.0E-07
-3.0E-07
•
•2.0E-07
4.0E-04
%
lickr
P
Fil
rr
454
WORKSHOP 96 ENGINEERING MECHANICS
A BALL-PLATE MACHINEFOR MEASURING ANTIWEAR FILMS
IN CONCENTRATED CONTACTS
I. Kfupka, M. HartI
TU, Fac. of Mechanical Eng., Institute of DesignTechnicka 2, 616 69 Brno
Key words: elastohydrodynamic lubrication, experimental equipment, antiwear films
Both the partial elastohydrodynamic and boundary lubrication are mostly used typesof lubrication of rubbing surfaces and at the same time one of the most developing region ofthe tribology. Once the load is applied to the contact bodies the surface asperities start tocontact one another. After that the lubrication film cannot do its main function i.e. reductionof friction and wear of the rubbing surfaces. To diminish friction and wear losses ZDDPantiwear additives are added to lubricating oils. These multifunction additives react withrubbed metals to form (on rubbing surfaces) antiwear surface films. Neither processes offorming antiwear additive films on rubbing surfaces have been understood thoroughly yetnor the thickness of these additive films have been meassured correctly. The estimated valuesof the thickness of these additive films depend on used physical methods (transmission orscanning electror, microscopy, reflection infrared spectroscopy; X-ray fluorescence; X-rayspectroscopy; ellipsometry...). These values are cited from that of monomolecular layers upto some hundred nanometers. The determination of the thickness of these additive filmsis one of the main factors in understanding of mechanisms of wear reduction. Antiwearadditive films of the thickness about tenths nanometers reduce wear and friction throughreduction of the modulus and yield stress of metals of the rubbing surfaces. While that ofthickness of hundrets nanometers do not allow the surface asperities to contact one anotherat all. Optical inteferometry (chromatic and monochromatic) is one of the most significantmethods in measurement of the thickness of ZDDP additive films.
The aim of our research is to consider the validity of the hypotheses of function of an-tiwear ZDDP additive films forming on rubbing surfaces during partial EHD and boundarylubrications. It is possible then to evaluate the processes which lead to a scuffing of rubbingsurfaces. The research of the behaviour of ZDDP additive films in different operating con-ditions includes determination of the thickness of the lubricating film between the rubbingsurfaces, determination of the thickness of the additive antiwear film on the rubbing surfacesand measurement of the friction coefficient.
The first step of this research was the construction of experimental equipment so-called ball-plate machine. This experimental equipment (Fig. 1) enables the observationof the lubrication film and rubbing surfaces in the whole visible and infrared region of theelectromagnetic spectrum and in a wide range of operating conditions (load, temperature,speed of rubbing surfaces, geometry and material of rubbing surfaces, lubricant, etc.). Itsbasic element is a couple of friction elements, consisting of a monocrystalline saphire diskof 20 mm in diameter, and of a shaped cylinder of 25.4 mm in diameter made of bearingsteel 14209. The shaped cylinder driven through the shaft by DC servomotor (pure sliding)
455
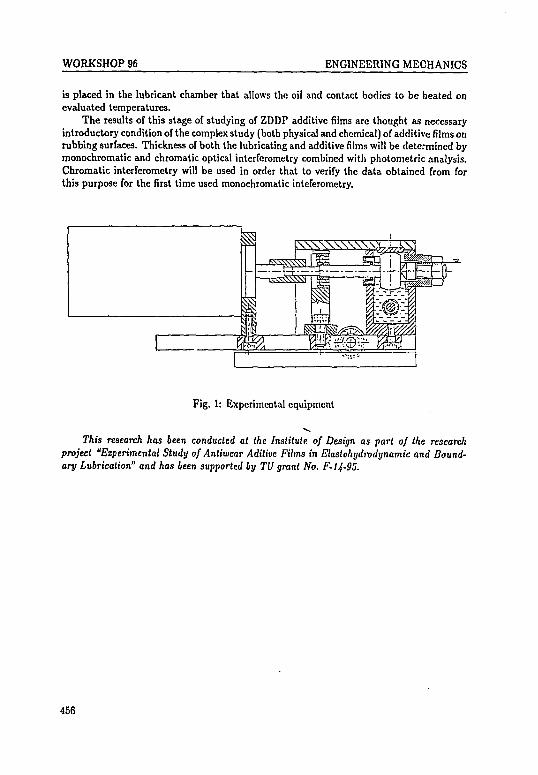
WORKSHOP 96 ENGINEERING MECHANICS
is placed in the lubricant chamber that allows the oil and contact bodies to be heated onevaluated temperatures.
The results of this stage of studying of ZDDP additive films are thought as necessaryintroductory condition of the complex study (both physical and chemical) of additive films onrubbing surfaces. Thickness of both the lubricating and additive films will be determined bymonochromatic and chromatic optical interferometry combined with photometric analysis.Chromatic interferometry will be used in order that to verify the data obtained from forthis purpose for the first time used monochromatic inteferometry.
Fig. 1: Experimental equipment
This research has been conducted at the Institute of Design as part of the researchproject "Experimental Study of Antiwear Adilive Films in Elastohydrodynamic and Bound-ary Lubrication" and has been supported by TU grant No. F-lj-95.
456
WORKSHOP 96 ENGINEERING MECHANICS
RIGID-PLASTIC SIMULATIONOF FORMING PROCESSES
BY FINITE ELEMENTS
J . Petruska
TU, Fac. of Mechanical Eng., Institute of Solid MechanicsTechnicka 2, 616 69 Brno
Key words: forming simulation, flow formulation, rigid-plastic material, finite elementmethod, rolling
Rigid-plastic model of material has a long tradition in the theory of forming. Its ap-plication simplifies substantially many practical forming problems, providing results withacceptable level of precision, as the neglected components of elastic strain constitute hereonly a tiny fraction of the total strain. The same reason is behind the effort to formulateand use a rigid-plastic algorithm in finite element codes, which are specialized in the areaof forming simulation.
One of such algorithms was in the last time formulated at the department of SolidMechanics TU Brno. Its objective was to enable analysis of practical forming problemson a standard PC 386/486 computer. Basic constitutive relation of our formulation is theLevy-Mises equation of rigid-plastic flow, which relates the deviatoric stress sy to strainrate e,y according to
2a.»U = 3^0-
where a and t are equivalent stress and strain rate. Several types of flow stress curve a =/(£,£, T) can be prescribed: strain hardening material, viscoplastic or thermo-viscoplasticone. The last model is the most demandig one as it requires simultaneous solution of acoupled problem of unsteady thermal conduction in the material. Nevertheless, for 2Dproblems, even this coupled thermal-deformational analysis can be run on the PC.
Besides the constitutive equation, appropriate kinematic relations, incomressibility con-dition and principle of virtual power present the set of field equations constituting the basisof so called flow formulation, for which the primary unknown variable is the velocity. Theincompressibility condition is introduced by the penalty method via parameter A, in thiscase the virtual power principle reads
/ SijSejjdv + X I ijjSeudv — I piSvids = 0
where v,-, p; are velocity and external surface load. Standard finite element discretization ofthe presented relations leads to a set of algebraic equations
KV = F
457
WORKSHOP 96 ENGINEERING MECHANICS
solved with respect to the nodal velocity matrix V. General solution strategy is theincremental-iterative Newton-Raphson procedure with geometry updating at the end ofeach increment.
Programs using the presented algorithm are generally applicable in many areas of for-ming. Of course, there are also some limitations. Neglecting the elastic part of deformation,the solution is not able to provide the information concerning rezidual stress at the endof the simulated process. That is why the flow formulation is more frequently used in thearea of bulk forming than sheet metal forming, where the elastic spring back representsan important aspect of the simulation. Also the correct prediction of boundary betweenthe elastic and plastic zone can be difficult in situations, where only a part of the body isplastically deformed.
Applicability of the algorithm will be illustrated on the simulation of flat productsrolling, modelled as two dimensional (plane strain) or three dimensional case. Createdprograms ROL2D and ROL3D can solve such problems on PC as nonstationary ones, i.e.including the end effects of material entering/leaving the roll gap. The rolls are supposed tobe rigid with friction between roll and material. The two dimensional model can be solvedas a coupled thermal-deformational one, with dissipated deformational energy entering theheat balance equation and appropriate boundary conditions: convection in contact withthe roll and convection with radiation on the free surface. Reliability of the programs wasverified by a number of hot rolling simulations. Some will be presented at the Workshop,among them for instance the edge rolling simulation with successive vertical and horizontalmill passes.
References:
[1] HARTLEY, P. - PILLINGER, I. - STURGESS, C : Numerical modelling of materialdeformation processes. Springer-Verlag, Berlin, 1992.
[2] PETRUSKA, J: An unsteady finite element simulation of plane strain hot rolling. Me-tallurgy and Foundry, pp. 547-556, No. 4, Vol. 18, (1992).
[3] PETRUSKA, J: Three dimensional simulation of rolling by Finite Elements. Proc.
"Metallurgy East-West'93", pp. 242-246, October 11-14, Stara Lesna, Slovakia, 1993.
[4] PETRUSKA, J: Simulation of Forming by Finite Elements - Commercial and SpeciallyDeveloped Software. Formability'94, Ostrava 24.-27.10.1994.
[5] PETRUSKA, J: Rigid-plastic model of edge rolling. Proc. of Engineering Mechanics'95,Svratka 15.-18.5.95, pp. 403-408 (in Czech).
This research has been conducted at the Institute of Solid Mechanics as part of theresearch project "Rigid-plastic simulation of forming process by finite elements" and hasbeen supported by TU grant No. F-12-94.
458
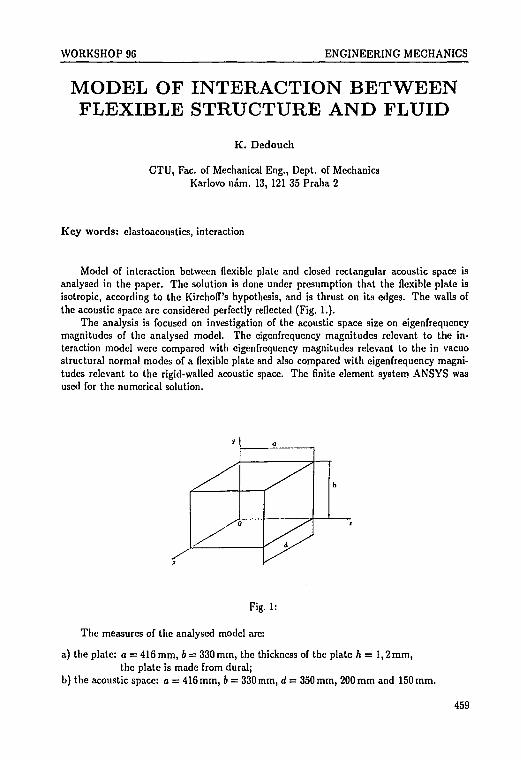
WORKSHOP 96 ENGINEERING MECHANICS
MODEL OF INTERACTION BETWEENFLEXIBLE STRUCTURE AND FLUID
K. Dedouch
CTU, Fac. of Mechanical Eng., Dept. of MechanicsKarlovo nam. 13, 121 35 Praha 2
Key words: elastoacoustics, interaction
Model of interaction between flexible plate and closed rectangular acoustic space isanalysed in the paper. The solution is done under presumption that the flexible plate isisotropic, according to the Kirchoff's hypothesis, and is thrust on its edges. The walls ofthe acoustic space are considered perfectly reflected (Fig. 1.).
The analysis is focused on investigation of the acoustic space size on eigenfrequencymagnitudes of the analysed model. The eigenfrequency magnitudes relevant to the in-teraction model were compared with eigenfrequency magnitudes relevant to the in vacuostructural normal modes of a flexible plate and also compared with eigenfrequency magni-tudes relevant to the rigid-walled acoustic space. The finite element system ANSYS wasused for the numerical solution.
3 a
Fig. 1:
The measures of the analysed model are:
a) the plate: a = 416 mm, 6 = 330 mm, the thickness of the plate h = 1,2 mm,the plate is made from dural;
b) the acoustic space: a = 416 mm, 6 = 330 mm, d = 350 mm, 200 mm and 150 mm.
459
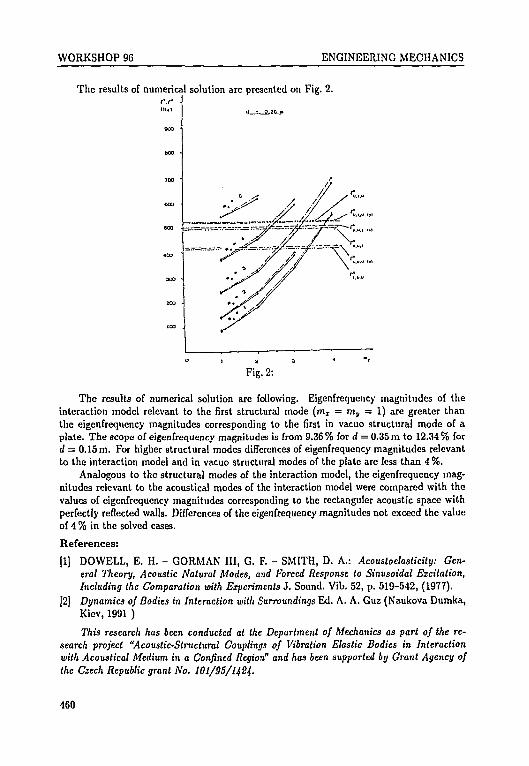
WORKSHOP 96 ENGINEERING MECHANICS
The results of numerical solution are presented on Fig. 2.\
Fig. 2:
The results of numerical solution are following. Eigenfrequency magnitudes of theinteraction model relevant to the first structural mode (m r = mv = 1) are greater thanthe eigenfrequency magnitudes corresponding to the first in vacuo structural mode of aplate. The scope of eigenfrequency magnitudes is from 9.36 % for d = 0.35 m to 12.34 % ford = 0.15 m. For higher structural modes differences of eigenfrequency magnitudes relevantto the interaction model and in vacuo structural modes of the plate are less than 4 %.
Analogous to the structural modes of the interaction model, the eigenfrequency mag-nitudes relevant to the acoustical modes of the interaction model were compared with thevalues of eigenfrequency magnitudes corresponding to the rectanguler acoustic space withperfectly reflected walls. Differences of the eigenfrequency magnitudes not exceed the valueof 4 % in the solved cases.
References:
[1] DOWELL, E. H. - GORMAN III, G. F. - SMITH, D. A.: Acoustoelasticity: Gen-eral Theory, Acoustic Natural Modes, and Forced Response to Sinusoidal Excitation,Including the Comparation with Experiments 3. Sound. Vib. 52, p. 519-542, (1977).
[2] Dynamics of Bodies in Interaction with Surroundings Ed. A. A. Guz (Naukova Dumka,Kiev, 1991 )
This research has been conducted at the Department of Mechanics as part of the re-search project "Acoustic-Structural Couplings of Vibration Elastic Bodies in Interactionwith Acoustical Medium in a Confined Region" and has been supported by Grant Agency ofthe Czech Republic grant No. 101/95/US4.
460
WORKSHOP 96 ENGINEERING MECHANICS
ACOUSTICAL INTERACTION OFA PLATE WITH FLUID
I. Zolotarev
Intitute of Thermomechanics, Academy of Sciences of the Czech RepublicDolejskova 5, 182 00 Praha 8
Key words: vibration, plate, compressible fluid, coupling, natural frequency
An aeroelastic system consisting of a thin elastic plate that is supported by an array ofsprings (kj) and iiubjected to a longitudinal tension 77X > 0 along with flowing compressibleinviscid fluid limited by rigid wall is studied. The equation describing natural vibrationsof a plate of thickness h and material properties E,p,,v and fluid of density pi and soundvelocity c0 for its coupling in 2D channel of height H0 could be written (according [1, 2, 4])in the form
The linear potential flow theory for inviscid fluid is used. Then the perturbation fluidpressure p(z) is related to the velocity potential $ by means of p(z) = — /><ff. The velocitypotential of the fluid is to satisfy the following set of conditions on the surface of the elasticplate: f U o = $f and on the rigid wall: f,_ ^ = 0.
We can get the characteristic equation for natural frequencies w of the coupled plate-fluid system ([2, 3, 5])
Da* + 77X53 + kj- p.hu2 - Pt<J • W) = 0,
where *(/3) denoted the function
Dispersion characteristic of simply supported still plate (Lo length of plate) interactingwith air in cannel for dimensionless parameters of system: p = 0.128 • 10~3; c = 0.066;v = 0.34; H = 10; L = Lo/h = n/a was studied by using ANSYS finite element code. Asa result of this calculation some dispersion characteristics and fluid pressure distribution inthe cannel were obtained. A sample of these calculations is presented in the Fig. a) and b).The curves corresponding to the structural (plate) modes of vibration and those related tothe acoustical resonance of air in the cannel could be observed and distinguished.
A sample of the dimensionless frequencies $1 of the pre-stressed plate interacting withthe compressed air contained in the channel was calculated for the following parameters:p = 0.01; c = 0.066; v = 0.34; H = 10; Nx = 0.5; K = 15.6 • 10"s. The first three branchesof the solution fi for the coupled system are depicted in part c). The solutions ft0 and na,n
for the uncoupled systems (p = 0) are plotted in the same figure as dashed lines. We can seethe region of strong acoustic-structural coupling, i.e. the field where the structural naturalfrequencies (fi0) and acoustic resonance frequencies (ttafi) are very close (for a = 0.14 and
461
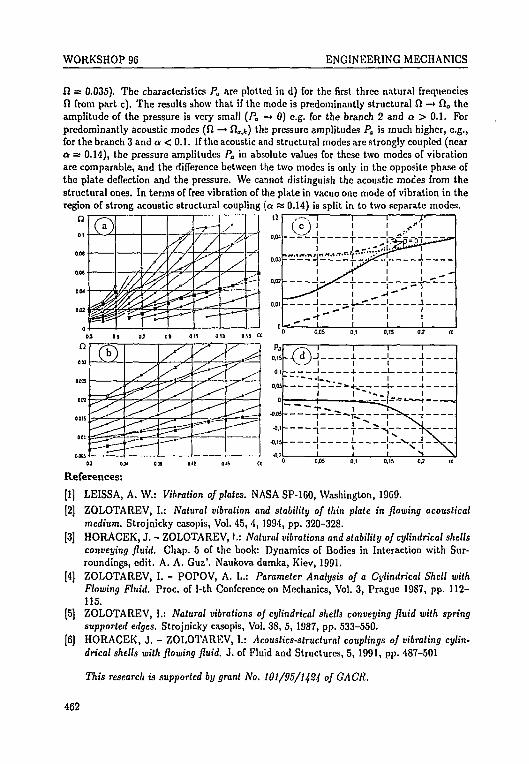
WORKSHOP 96 ENGINEERING MECHANICS
f) = 0.035). The characteristics Pa are plotted in d) for the first three natural frequenciesft from part c). The results show that if the mode is predominantly structural ft —> Qo theamplitude of the pressure is very small (/"„ -» 0) e.g. for the branch 2 and a > 0.1. Forpredominantly acoustic modes (fi —» {!„,&) the pressure amplitudes Po is much higher, e.g.,for the branch 3 and a < 0.1. If the acoustic and structural modes are strongly coupled (neara = 0.14), the pressure amplitudes Pa in absolute values for these two modes of vibrationare comparable, and the difference between the two modes is only in the opposite phase ofthe plate deflection and the pressure. We cannot distinguish the acoustic modes from thestructural ones. In terms of free vibration of the plate in vacuo one mode of vibration in theregion of strong acoustic structural coupling {a ss 0.14) is split in to two separate modes.
00
References:
[1] LEISSA, A. W.: Vibration of plates. NASA SP-160, Washington, 1969.
[2] ZOLOTAREV, I.: Natural vibration and stability of thin plate in flowing acousticalmedium. Strojnicky casopis, Vol. 45, 4, 1994, pp. 320-328.
[3] HORACEK, J. - ZOLOTAREV,!.: Natural vibrations and stability of cylindrical shellsconveying fluid. Chap. 5 of the book: Dynamics of Bodies in Interaction with Sur-roundings, edit. A. A. Guz'. Naukova dtimka, Kiev, 1991.
[4] ZOLOTAREV, I. - POPOV, A. L.: Parameter Analysis of a Cylindrical Shell withFlowing Fluid. Proc. of I-th Conference on Mechanics, Vol. 3, Prague 1987, pp. 112-115.
[5] ZOLOTAREV, I.: Natural vibrations oj cylindrical shells conveying fluid with springsupported edges. Strojnicky casopis, Vol. 38, 5, 1987, pp. 533-550.
[6] HORACEK, J. - ZOLOTAREV, I.: Acoustics-structural couplings of vibrating cylin-drical shells with flowing fluid. J. of Fluid and Structures, 5, 1991, pp. 487-501
This research is supported by grant No. 101/95/1424 of GACR.
462
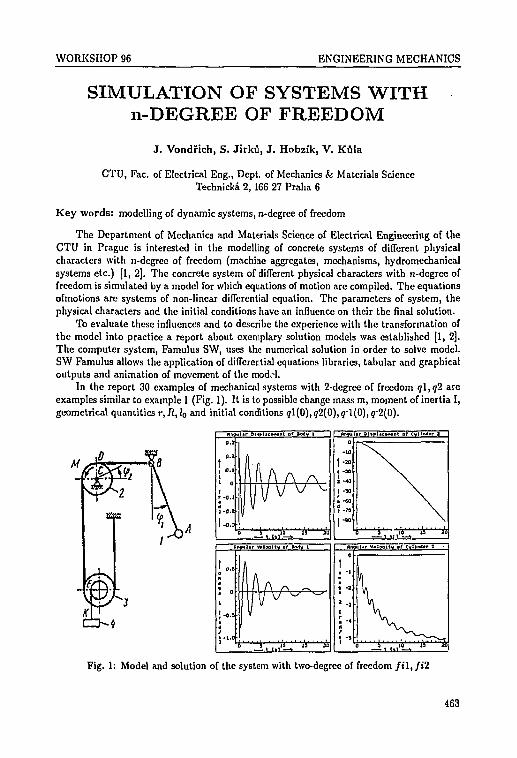
WORKSHOP 96 ENGINEERING MECHANICS
SIMULATION OF SYSTEMS WITHn-DEGREE OF FREEDOM
J. Vondfich, S. Jirku, J . Hobzik, V. Kfila
CTU, Fac. of Electrical Eng., Dept. of Mechanics & Materials ScienceTechnicka 2, 166 27 Praha 6
Key words: modelling of dynamic systems, n-degree of freedom
The Department of Mechanics and Materials Science of Electrical Engineering of theCTU in Prague is interested in the modelling of concrete systems of different physicalcharacters with n-degree of freedom (machine aggregates, mechanisms, hydromechanicalsystems etc.) [1, 2]. The concrete system of different physical characters with n-degree offreedom is simulated by a model for which equations of motion are compiled. The equationsofmotions are systems of non-linear differential equation. The parameters of system, thephysical characters and the initial conditions have an influence on their the final solution.
To evaluate these influences and to describe the experience with the transformation ofthe model into practice a report about exemplary solution models was established [1, 2].The computer system, Famulus SW, uses the numerical solution in order to solve model.SW Famulus allows the application of differential equations libraries, tabular and graphicaloutputs and animation of movement of the modd.
In the report 30 examples of mechanical systems with 2-degrce of freedom ql,q2 areexamples similar to example 1 (Fig. 1). It is to possible change mass m, moment of inertia I,geometrical quantities r,Jl, Jo and initial conditions q\{0),q2(0),ql(0),q'2(0).
Fig. 1: Model and solution of the system with two-degree of freedom / t l , / i 2
463
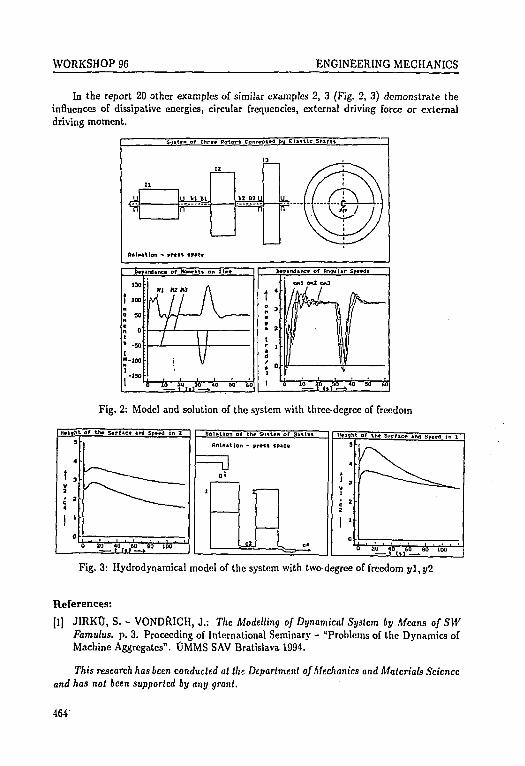
WORKSHOP 96 ENGINEERING MECHANICS
In the report 20 other examples of similar examples 2, 3 (Fig. 2, 3) demonstrate theinfluences of dissipative energies, circular frequencies, external driving force or externaldriving moment.
o/ Thrrr ttotort Conwcttd by Elastic SMfts
Ant»*lion - prtit
Fig. 2: Model and solution of the system with three-degree of freedom
) of tb»&iUtn.of
Antmtlon - press SP*C»
*0 60 81) 100
Fig. 3: Hydrodynamical model of the system with two-degree of freedom j/1, yi
References:
[1] JIRK0, S. - VONDRICH, J.: The Modelling of Dynamical System by Means of SWFamulus, p. 3. Proceeding of International Seminary - "Problems of the Dynamics ofMachine Aggregates". OMMS SAV Bratislava 1994.
This research has been conducted at the Department of Mechanics and Materials Scienceand has not been supported by any grant.
464'
WORKSHOP 96 ENGINEERING MECHANICS
IDENTIFICATION OF FEM ANDEXPERIMENTAL DYNAMIC MODELS
P. Bach, D. Houdek, J . Housa
CTU, Fac. of Mechanical Eng., Dept. of Machines & Equipment for Eng. ProductionHorska 3, 128 00 Praha 2
Key words: identification, mode shapes, FEM
Machine tool structure design is nowadays often preceded with FEM modeling. If aprototype is available it is possible to compare (identify) FEM model and experimentalmodal model. A FEM model, however, does not represent a structure fully, because ofnecessary simplifications due to economic and technical capacities. As an example theSUUCVUTC is assumed Vo be linear and undamped, which is far from reaiity dealing withcomplicated structures with joints or shells. Apart from that, geometric simplifications arealso necessary. It is not, for instance, possible to include all details as holes, radii etc. Thesesimplifications result in differences between computational analytical experimental models.
The goal of identification is to update the analytical model to match the reality. If themodal parameters of both models are at the end of the process close, the models are referredto as identified. Only identified analytical model can be used for futher comptutations assimulation of various configurations etc.
Serious problems in FEM modeling present various types of joints. In this project,simple structures are identified at the begining (plate,beam) step-by-step moving to morecomplicated parts and finally complete machine structures.
An example of a more complicated part (but still monolite) is a "brake drum". Itconsists of a grooved hub, a big operation ring and a connecting "bottom" with holes.
In order to obtain mode shapes and natural frequencies, impact hammer, dual channelFFT analyser B&K 2034 and modal software VTK ADASH have been used . Experimentalmodel consists of 168 excited DOFs. A response reference pick-up has been situated onthe inner surface of the ring in radial direction. The structure has been suspended on afoam rubber block. The analytical model has been created in an FEM program LUSAS. Itconsists of 846 thin-shcll-type parabolic elements producing 2612 nodes. "Free" suspensionhas been assumed also.
Natural frequencies of both models are for the identified mode shapes listed in thetable be low. Having considered the relative simplicity of the structure and low modecoupling, it has not been necessary to compute the correlation numbers. The identificationhas been performed visually in mode shape animation. The deviations (listed in the table)are relative to the experimental model. Due to the fact that the structure can be consideredas rotation symmetric shell, most natural frequencies are double, which means that twoortogonal mode shapes have the same natural frequency. Both mode shapes have beenfound in the analytical model, only one in the experiment. Shell type elements performdouble frequency split due to discrepancies in symmetry. The frequencies are very close,trough. These close frequencies are also listed in the table.
In both models the vibrations of 3 fundamental substructures of the drum have been ob-served: big operation ring, hub and bottom. Individual mode shapes performed oscillations
465
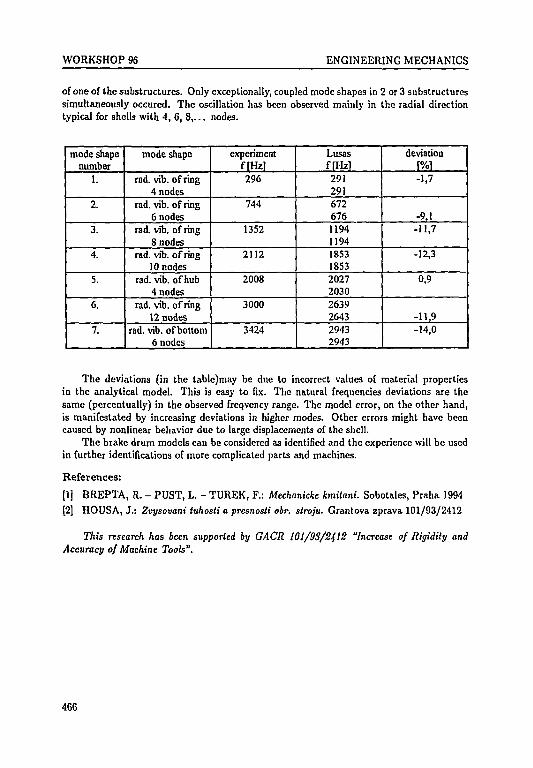
WORKSHOP 96 ENGINEERING MECHANICS
of one of the substructures. Only exceptionally, coupled mode shapes in 2 or 3 substructuressimultaneously occured. The oscillation has been observed mainly in the radial directiontypical for shells with 4, 6, 8,. . . nodes.
mode shapenumber
1.
2.
3.
4.
5.
6.
7.
mode shape
rad. vib. of ring4 nodes
rad. vib. of ring6 nodes
rad. vib. of ring8 nodes
rad. vib. of ring10 nodes
rad. vib. of hub4 nodes
rad. vib. of ring12 nodes
rad. vib. of bottom6 nodes
experimentffHzl296
744
1352
2112
2008
3000
3424
LusasfFHzi2912916726761194119418531853202720302639264329432943
deviationF%1-1,7
-9,1-11,7
-12,3
0,9
-11,9-14,0
The deviations (in the table)may be due to incorrect values of material propertiesin the analytical model. This is easy to fix. The natural frequencies deviations are thesame (percentually) in the observed freqvency range. The model error, on the other hand,is manifestated by increasing deviations in higher modes. Other errors might have beencaused by nonlinear behavior due to large displacements of the shell.
The brake drum models can be considered as identified and the experience will be usedin further identifications of more complicated parts and machines.
References:
[1] BREPTA, R. - PUST, L. - TUREK, F.: Mechanicke kmitani. Sobotales, Praha 1994
[2] HOUSA, J.: Zvysovani tuhosti a presnosli obr. stroju. Grantova zprava 101/93/2412
This research has been supported by GACR 101/93/2412 "Increase of Rigidity andAccuracy of Machine Tools".
466
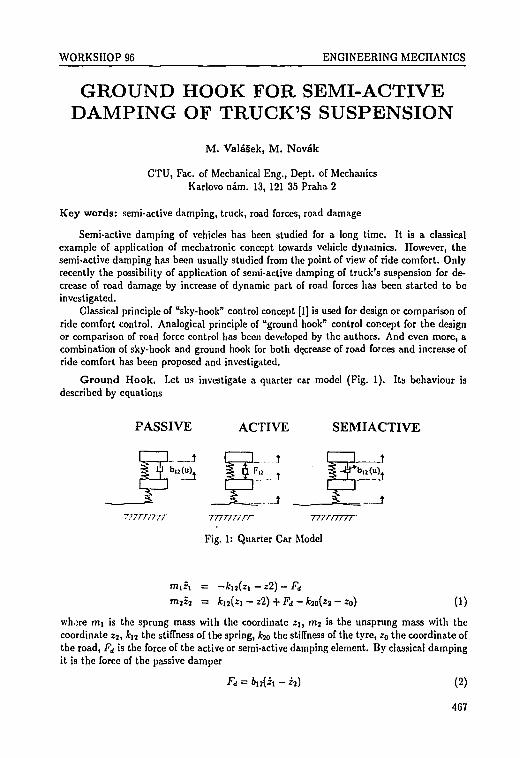
WORKSHOP 96 ENGINEERING MECHANICS
GROUND HOOK FOR SEMI-ACTIVEDAMPING OF TRUCK'S SUSPENSION
M. ValaSek, M. Novak
CTU, Fac. of Mechanical Eng., Dept. of MechanicsKarlovo nam. 13, 121 35 Praha 2
Key words: semi-active damping, truck, road forces, road damage
Semi-active damping of vehicles has been studied for a long time. It is a classicalexample of application of mechatronic concept towards vehicle dynamics. However, thesemi-active damping has been usually studied from the point of view of ride comfort. Onlyrecently the possibility of application of semi-active damping of truck's suspension for de-crease of road damage by increase of dynamic part of road forces has been started to beinvestigated.
Classical principle of "sky-hook" control concept [1] is used for design or comparison ofride comfort control. Analogical principle of "ground hook" control concept for the designor comparison of road force control has been developed by the authors. And even more, acombination of sky-hook and ground hook for both decrease of road foi ces and increase ofride comfort has been proposed and investigated.
Ground Hook. Let us investigate a quarter car model (Fig. 1). Its behaviour isdescribed by equations
PASSIVE ACTIVE
-inrm/r Trrrrr/rr T^rrmTT^
Fig. 1: Quarter Car Model
= - M * i - z2) - Fd
= fcij(zi — z2) + Fd — fc2o(zj — zo) (1)
wh;re mi is the sprung mass with the coordinate Zi, mj is the unsprung mass with thecoordinate z2, fci j the stiffness of the spring, ijo the stiffness of the tyre, z0 the coordinate ofthe road, Fj is the force of the active or semi-active damping element. By classical dampingit is the force of the passive damper
Fd = M * i - *s (2)
467
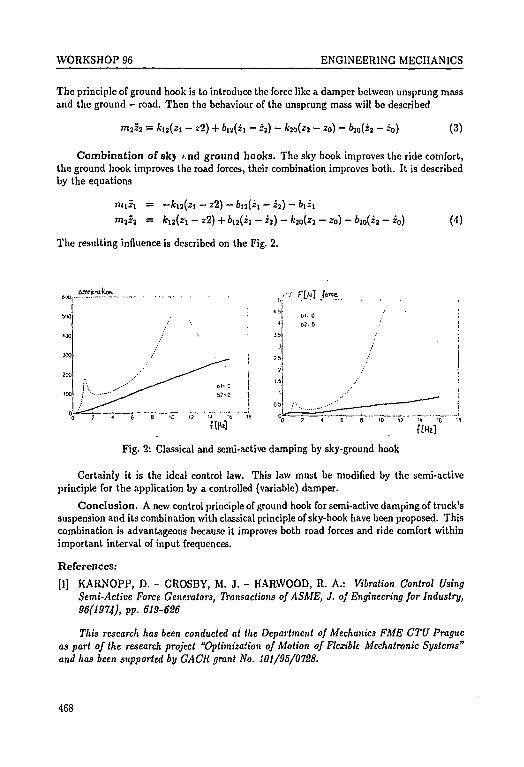
WORKSHOP 96 ENGINEERING MECHANICS
The principle of ground hook is to introduce the force like a damper between unsprung massand the ground - road. Then the behaviour of the unsprung mass will be described
= 12(21 - 22) + &u(ii - ij) - - *o) - 620(22 - z0) (3)
Combination of skj >.nd ground hooks. The sky hook improves the ride comfort,the ground hook improves the road forces, their combination improves both. It is describedby the equations
= -fcn(zi - z2) - 612(2! - z2) - 61^
1712*2 = kl2{zi - z2) + 6u(zi - z2) - k20(z2 - z0) - 620(22 - 20) (4)
The resulting influence is described on the Fig. 2.
•'-'' F[N] {one.
Fig. 2: Classical and semi-active damping by sky-ground hook
Certainly it is the ideal control law. This law must be modified by the semi-activeprinciple for the application by a controlled (variable) damper.
Conclusion. A new control principle of ground hook for semi-active damping of truck'ssuspension and its combination with classical principle of sky-hook have been proposed. Thiscombination is advantageous because it improves both road forces and ride comfort withinimportant interval of input frequences.
References:
[1] KARNOPP, D. - CROSBY, M. J. - HARWOOD, R. A.: Vibration Control UsingSemi-Active Force Generators, Transactions of ASME, J. of Engineering for Industry,96(1974), pp. 619-626
This research has been conducted al the Department of Mechanics FME CTU Pragueas part of the research project "Optimization of Motion of Flexible Mechatronic Systems"and has been supported by GACR grant No. 101/95/0728.
468
WORKSHOP 96 ENGINEERING MECHANICS
INVESTIGATION OF THE RAILVEHICLE GUIDING PROPERTIES
J . Siba, T. Heptner, J . Kola?
CTU, Fac. of Mechanical Eng., Dept. of Automobiles, ICE & Railway VehiclesTechnicka 4, 166 07 Praha 6
Key words: rail vehicle, truck, wheelset, track, riding safety, mathematical model, rollerrig (testing stand), vehicle-track interaction
Vehicle guiding properties as a theoretical problem consists in two concurrent areas -operation in straight and/or curved parts of track. While in the first case problems of truckmotion stability are investigated, in the second case antiderailment safety, track geometrystability and wear of wheel and rails are the main viewpoints.
The present utate of the theory of rail vehicle guiding characteristics makes it possibleto determine the basic property of behaviour of conventional truck types in usual opera-tion conditions. Linearised mathematical models are mostly used to describe those cases;in fact the principle of these proceses is deeply non-linear and even main parameters arestochastical.
Therefore it is not possible to extrapolate the used mathematical models and theirresults to the new unconventional types of trucks. For that reason some significant nonlinearconnections have been analysed within the framework of the project (relations between creepcharacteristics and geometry of rail-wheel contact, real conditions - both of truck and trackparts.)
Recently some of these partial influences (creep characteristics, geometry of wheel-railcontact, real wheel and rail properties) were evaluated, basic models of the unconventionaltruck types were created (self steered axle boggies with the passive and active control ele-ments). Problems connected with the questions of the train operation speed increase wereespecially investigated. The antiderailment safety and the passenger comfort improved bymeans of tilting car body are the most important of them. These results have been referredto at the recent Workshop discussions.
Layout, design and construction of the 1/3-scale roller testing rig (Fig. 1) are theprincipal content of the present stage of the project. The aim of the roller rig is to verifyand demonstrate the results of theoretical investigations. The testing equipment consists ofthe main parts - four rollers and the investigated two-axle bogie model. The roller rig isdriven by two DC electric motors (drive units MEZOM ATIC-K). A pair of rollers at one sideis driven by one motor by means of the toothed belt FLENNOR. Distance between rolleraxes may be changed. Each motor is independently fed from its own converter. Motor speedsare independently controlled. While during the straigt track simulation the speed of bothmotors must be controlled at the identical constant value, during the curving simulation, thedifferent speeds have to be controled with high accuracy. Theoretically, it is also possible tosimulate passing transient curve by means of time-variable speed difference. Two air springsbetween the rigid cross beam (part of the main frame) and the bogie model produce verticalload.
469
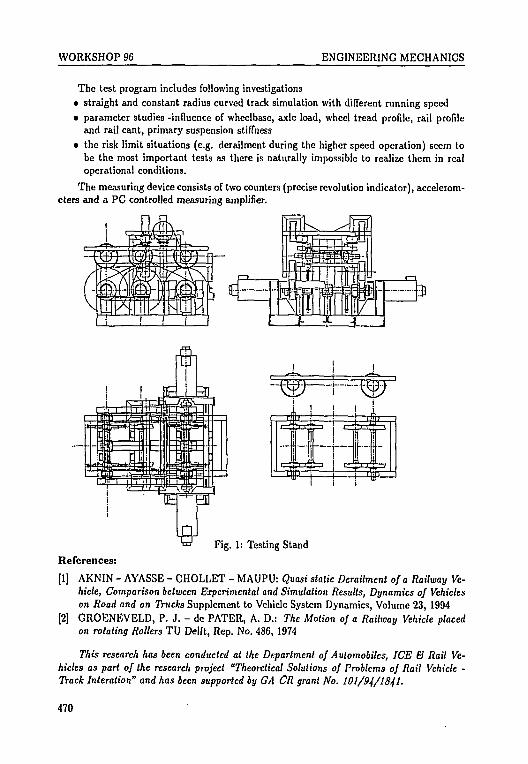
WORKSHOP 96 ENGINEERING MECHANICS
The test program includes following investigations• straight and constant radius curved track simulation with different running speed• parameter studies -influence of wheelbase, axle load, wheel tread profile, rail profile
and rail cant, primary suspension stiffness• the risk limit situations (e.g. derailment during the higher speed operation) seem to
be the most important tests as there is naturally impossible to realize them in realoperational conditions.
The measuring device consists of two counters (precise revolution indicator), accelerom-eters and a PC controlled measuring amplifier.
Fig. 1: Testing Stand
References:
[1] AKNIN - AYASSE - CHOLLET - MAUPU: Quasi static Derailment of a Railway Ve-hicle, Comparison between Experimental and Simulation Results, Dynamics of Vehicleson Road and on Trucks Supplement to Vehicle System Dynamics, Volume 23, 1994
[2] GROENEVELD, P. J. - de PATER, A. D.: The Motion of a Railway Vehicle placedon rotating Rollers TV Delft, Rep. No. 486, 1974
This research has been conducted at the Department of Automobiles, ICE & Rail Ve-hicles as part of the research project "Theoretical Solutions of Problems of Rail Vehicle -Track Interation" and has been supported by GA CR grant No. 101/94/1841.
470

Section 8
THEORY OF CONSTRUCTION
NEXT PAQE(S)left BLAK&
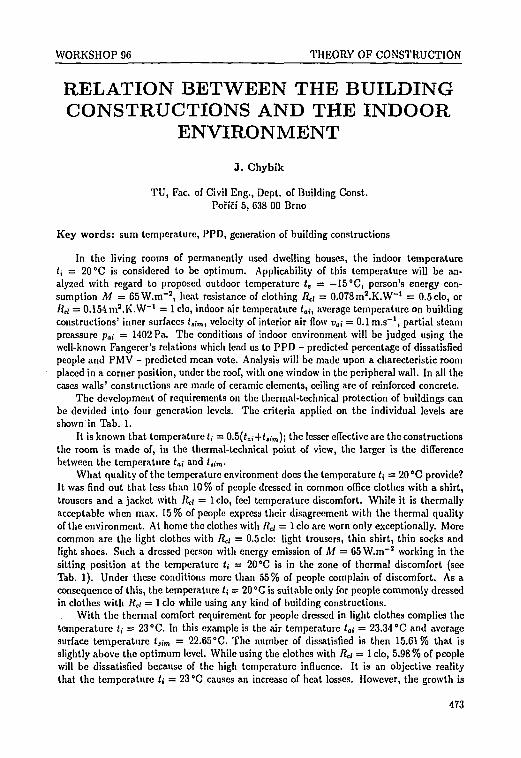
WORKSHOP 96 THEORY OF CONSTRUCTION
RELATION BETWEEN THE BUILDINGCONSTRUCTIONS AND THE INDOOR
ENVIRONMENT
J. Chybik
TU, Fac. of Civil Eng., Dept. of Building Const.Pori'ci 5, 638 00 Brno
Key words: sum temperature, PPD, generation of building construction!!
In the living rooms of permanently used dwelling houses, the indoor temperature(,• = 20 °C is considered to be optimum. Applicability of this temperature will be an-alyzed with regard to proposed outdoor temperature te = —15°C, person's energy con-sumption M = 65W.m"2, heat resistance of clothing Rd = 0.078 m2.K.W~' = 0.5 clo, orRcl = 0.154 m'.K.W"1 = 1 clo, indoor air temperature {„;, average temperature on buildingconstructions' inner surfaces <„•„,, velocity of interior air flow vai = 0.1 m.s"1, partial steampreassure pa; = 1402 Pa. The conditions of indoor environment will be judged using thewell-known Fangerer's relations which lead us to PPD - predicted percentage of dissatisfiedpeople and PMV - predicted mean vote. Analysis will be made upon a characteristic roomplaced in a corner position, under the roof, with one window in the peripheral wall. In all thecases walls' constructions are made of ceramic elements, ceiling are of reinforced concrete.
The development of requirements on the thermal-technical protection of buildings canbe devided into four generation levels. The criteria applied on the individual levels areshown in Tab. 1.
It is known that temperature (,- = 0.5(<ol+(,,m); the lesser effective are the constructionsthe room is made of, in the thermal-technical point of view, the larger is the differencebetween the temperature tai and t,,m.
What quality of the temperature environment does the temperature U = 20 °C provide?It was find out that less than 10% of people dressed in common office clothes with a shirt,trousers and a jacket with Rci = 1 clo, feel temperature discomfort. While it is thermallyacceptable when max. 15% of people express their disagreement with the thermal qualityof the environment. At home the clothes with Rci = 1 clo are worn only exceptionally. Morecommon are the light clothes with Rd = 0.5 clo: light trousers, thin shirt, thin socks andlight shoes. Such a dressed person with energy emission of M = 65 W.m~J working in thesitting position at the temperature U = 20 °C is in the zone of thermal discomfort (seeTab. 1). Under these conditions more than 55% of people complain of discomfort. As aconsequence of this, the temperature <; = 20 °C is suitable only for people commonly dressedin clothes with Rci = 1 clo while using any kind of building constructions.
With the thermal comfort requirement for people dressed in light clothes complies thetemperature (; = 23 °C. In this example is the air temperature ta{ — 23.34 °C and averagesurface temperature i,im = 22.65 °C. The number of dissatisfied is then 15.61% that isslightly above the optimum level. While using the clothes with Rci = 1 clo, 5.98 % of peoplewill be dissatisfied because of the high temperature influence. It is an objective realitythat the temperature U = 23 °C causes an increase of heat losses. However, the growth is
473
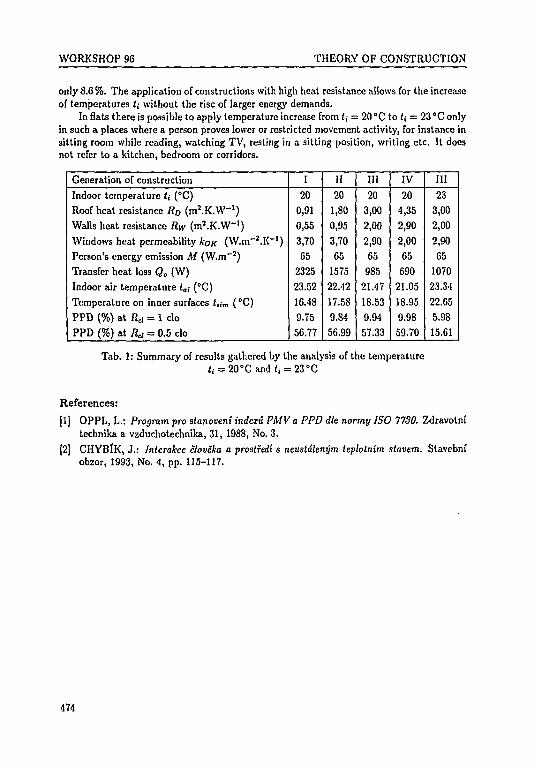
WORKSHOP 96 THEORY OF CONSTRUCTION
only 8.6 %. The application of constructions with high heat resistance allows for the increaseof temperatures i; without the rise of larger energy demands.
In flats there is possible to apply temperature increase from <j = 20 °C to i; = 23 °C onlyin such a places where a person proves lower or restricted movement activity, for instance insitting room while reading, watching TV, resting in a sitting position, writing etc. It doesnot refer to a kitchen, bedroom or corridors.
Generation of construction
Indoor temperature <,- (°C)
Roof heat resistance RD (m'.K.W"1)
Walls heat resistance Rw (n^ .K.W 1 )
Windows heat permeability koK (W.rrf'.K"')
Person's energy emission M (W.m~2)
Transfer heat loss Qo (W)
Indoor air temperature <„; (°C)
Temperature on inner surfaces t,;m (°C)
PPD (%) at Rcl = 1 clo
PPD (%) at Rd = 0.5 clo
I20
0,91
0,55
3,70
65
2325
23.52
16.48
9.75
56.77
II
20
1,80
0,95
3,70
65
1575
22.42
17.58
9.84
56.99
III
20
3,00
2,00
2,9065
985
21.47
18.53
9.94
57.33
IV
20
4,35
2,90
2,00
65
690
21.05
18.95
9.98
59.70
III
23
3,00
2,00
2,90
65
1070
23.34
22.65
5.98
15.61
Tab. 1: Summary of results gathered by the analysis of the temperature«, = 20°Cand t, = 231>C
References:
|1] OPPL, L.: Program pro stanoveni indexi PMV a PPD die normy ISO 7730. Zdravotni'technika a vzduchotechnika, 31, 1988, No. 3.
[2] CHYBlK, J.: Interakce cloveka a prostfedi s neustdknym leplotnim stavem. Stavebniobzor, 1993, No. 4, pp. 115-117.
474
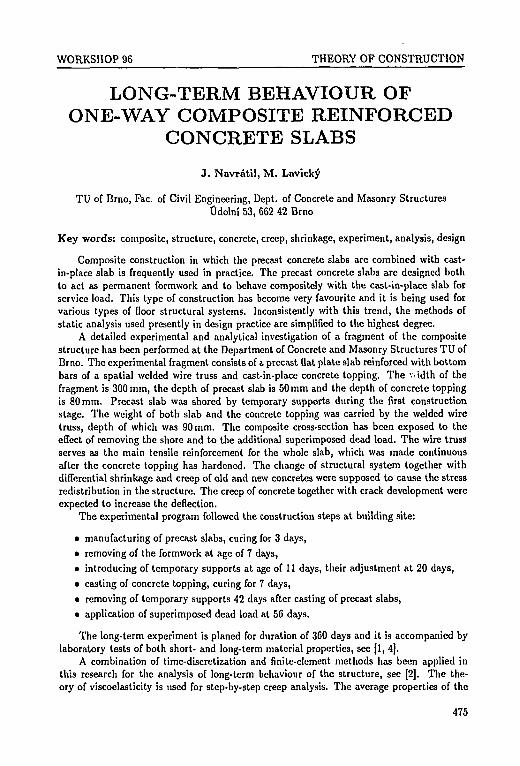
WORKSHOP 96 THEORY OF CONSTRUCTION
LONG-TERM BEHAVIOUR OFONE-WAY COMPOSITE REINFORCED
CONCRETE SLABS
3. Navratil, M. Lavicky
TU of Brno, Fac. of Civil Engineering, Dept. of Concrete and Masonry StructuresCdolni 53, 662 42 Brno
Key words: composite, structure, concrete, creep, shrinkage, experiment, analysis, design
Composite construction in which the precast concrete slabs are combined with cast-in-place slab is frequently used in practice. The precast concrete slabs are designed bothto act as permanent formwork and to behave compositely with the cast-in-place slab forservice load. This type of construction has become very favourite and it is being used forvarious types of floor structural systems. Inconsistently with this trend, the methods ofstatic analysis used presently in design practice are simplified to the highest degree.
A detailed experimental and analytical investigation of a fragment of the compositestructure has been performed at the Department of Concrete and Masonry Structures TU ofBrno. The experimental fragment consists of a precast flat plate slab reinforced with bottombars of a spatial welded wire truss and cast-in-place concrete topping. The vidth of thefragment is 300 mm, the depth of precast slab is 50 mm and the depth of concrete toppingis 80 mm. Precast slab was shored by temporary supports during the first constructionstage. The weight of both slab and the concrete topping was carried by the welded wiretruss, depth of which was 90 mm. The composite cross-section has been exposed to theeffect of removing the shore and to the additional superimposed dead load. The wire trussserves as the main tensile reinforcement for the whole slab, which was made continuousafter the concrete topping has hardened. The change of structural system together withdifferential shrinkage and creep of old and new concretes were supposed to cause the stressredistribution in the structure. The creep of concrete together with crack development wereexpected to increase the deflection.
The experimental program followed the construction steps at building site:
• manufacturing of precast slabs, curing for 3 days,
• removing of the formwork at age of 7 days,
• introducing of temporary supports at age of 11 days, their adjustment at 20 days,
• casting of concrete topping, curing for 7 days,
• removing of temporary supports 42 days after casting of precast slabs,
• application of superimposed dead load at 56 days.
The long-term experiment is planed for duration of 360 days and it is accompanied bylaboratory tests of both short- and long-term material properties, see [1, 4].
A combination of time-discretization and finite-element methods has been applied inthis research for the analysis of long-term behaviour of the structure, see [2]. The the-ory of viscoelasticity is used for step-by-step creep analysis. The average properties of the
475

WORKSHOP S6 THEORY OF CONSTRUCTION
cross-section with respect to drying axe considered for creep and shrinkage calculations.A sophisticated creep model UB3", see [3], is used, including updating creep and shrinkagepredictions based on short-time measurements. The reduction of the stiffness of experimen-tal fragment caused by cracks is modelled in a simplified way using reduced modulus ofelasticity. The finite-element analysis is performed at each time step. Various parts of thecross-section are modelled using eccentric frame elements, e.g. precast slab, cast in placetopping, and reinforcement. The history of construction steps is fully respected. The meth-ods used for the analysis are compared with the methods traditionally used in practice andthey are verified by results of the experiment.
Based on the results obtained till present lime we may conclude:
• There is no reliable relationship between the strength and elastic modulus of concrete.
• Modulus of elasticity of cast-in-place concrete is usually lower than expected.
• The application of compliance function describing total deformation is strongly rec-ommended with the possibility of updating of the predictions based on short-timemeasurements.
• The simplification in reduction of stiffness due to cracks is doubtful and it is notapplicable in general case.
• The research contributed to the verification of the methods.
• The methods traditionally used in practice for the analysis of relevant problem areinsufficient.
• The behaviour of temporary timber supports (drying up, creeping) is of decisive im-portance for the total deflection of the structure.
References:
[1] NAVRATIL, J. - LAVICKY, M.: Analyza icinku dotvarovdni a smrsfavdni betonufragmentu spfazene zelezobetonove deskove konstrukce. Spfazene konstrukce beton-beton, pp. 57-60, CBS CSSI, CNK F1P a CVUT Praha, Praha, 1995.
[2] NAVRATIL, J.: Casovi zdvisld analyza rdmovych konstrukci. Stavebnicky casopis,pp. 429-451, 7 (40), Slovak Academic Press, Bratislava, 1992.
[3] RILEM RECOMMENDATION: Creep and Shrinkage Prediction Model for Analysisand Design of Concrete Structures - Model B3. Committee TC 107, 1995.
[4] NAVRATIL, J. - LAVICKY, J.: Structural Performance of Composite Reinforced Con-crete Slabs with Respect to Creep and Shrinkage of Concrete. Workshop 95, pp. 389-390,CVUT Praha, VUT Brno, 1995.
This research has been conducted at the Department of Concrete and Masonry Struc-tures as part of the research project "Structural Analysis of Composite Reinforced ConcreteSlabs with Respect to Shrinkage and Creep of Concrete" and has been jointly funded by theTechnical University of Brno under Grant No. B 17/9f and FU 250005, by Stamont BrnoJSC, and by Hottingtr Baldwin Messtechnik VUT-FS centre.
476
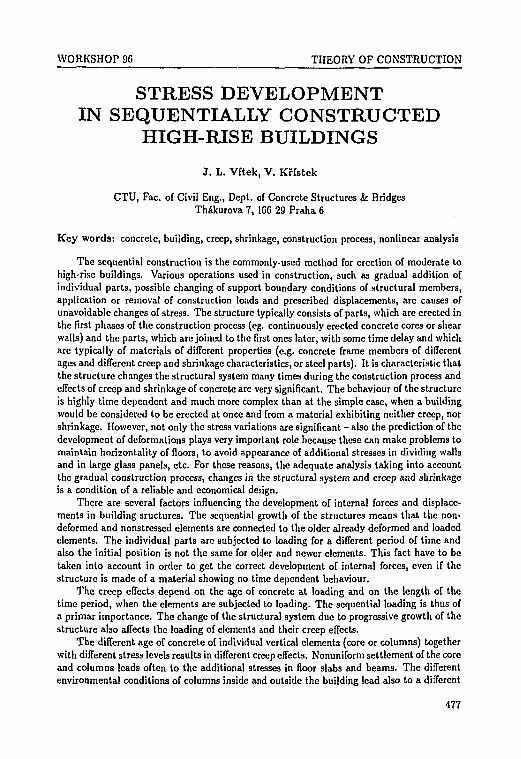
WORKSHOP 96 THEORY OF CONSTRUCTION
STRESS DEVELOPMENTIN SEQUENTIALLY CONSTRUCTED
HIGH-RISE BUILDINGS
J. L. Vftek, V. Krfstek
CTU, Fac. of Civil Eng., Dept. of Concrete Structures & BridgesThakurova 7, 166 29 Praha 6
Key words: concrete, building, creep, shrinkage, construction process, nonlinear analysis
The sequential construction is the commonly-used method for erection of moderate tohigh-rise buildings. Various operations used in construction, such as gradual addition ofindividual parts, possible changing of support boundary conditions of structural members,application or removal of construction loads and prescribed displacements, are causes ofunavoidable changes of stress. The structure typically consists of parts, which are erected inthe first phases of the construction process (eg. continuously erected concrete cores or shearwalls) and the parts, which are joined to the first ones later, with some time delay and whichare typically of materials of different properties (e.g. concrete frame members of differentages and different creep and shrinkage characteristics, or steel parts). It is characteristic thatthe structure changes the structural system many times during the construction process andeffects of creep and shrinkage of concrete are very significant. The behaviour of the structureis highly time dependent and much more complex than at the simple case, when a buildingwould be considered to be erected at once and from a material exhibiting neither creep, norshrinkage. However, not only the stress variations are significant - also the prediction of thedevelopment of deformations plays very important role because these can make problems tomaintain horizontality of floors, to avoid appearance of additional stresses in dividing wallsand in large glass panels, etc. For these reasons, the adequate analysis taking into accountthe gradual construction process, changes in the structural system and creep and shrinkageis a condition of a reliable and economical design.
There are several factors influencing the development of internal forces and displace-ments in building sructures. The sequential growth of the structures means that the non-deformed and nonstressed elements are connected to the older already deformed and loadedelements. The individual parts are subjected to loading for a different period of time andalso the initial position is not the same for older and newer elements. This fact have to betaken into account in order to get the correct development of internal forces, even if thestructure is made of a material showing no time dependent behaviour.
The creep effects depend on the age of concrete at loading and on the length of thetime period, when the elements are subjected to loading. The sequential loading is thus ofa primar importance. The change of the structural system due to progressive growth of thestructure also affects the loading of elements and their creep effects.
The different age of concrete of individual vertical elements (core or columns) togetherwith different stress levels results in different creep effects. Nonuniform settlement of the coreand columns leads often to the additional stresses in floor slabs and beams. The differentenvironmental conditions of columns inside and outside the building lead also to a different
477
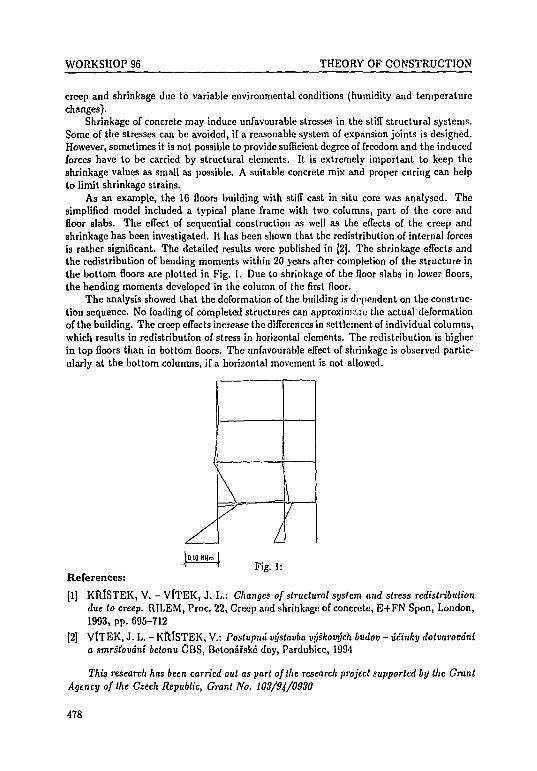
WORKSHOP 96 THEORY OF CONSTRUCTION
creep and shrinkage due to variable environmental conditions (humidity and temperaturechanges).
Shrinkage of concrete may induce unfavourable stresses in the stiff structural systems.Some of the stresses can be avoided, if a reasonable system of expansion joints is designed.However, sometimes it is not possible to provide sufficient degree of freedom and the inducedforces have to be carried by structural elements. It is extremely important to keep theshrinkage values as small as possible. A suitable concrete mix and proper curing can helpto limit shrinkage strains.
As an example, the 16 floors building with stiff cast in situ core was analysed. Thesimplified model included a typical plane frame with two columns, part of the core andfloor slabs. The effect of sequential construction as well as the effects of the creep andshrinkage has been investigated. It has been shown that the redistribution of internal forcesis rather significant. The detailed results were published in [2). The shrinkage effects andthe redistribution of bending moments within 20 years after completion of the structure inthe bottom floors are plotted in Fig. 1. Due to shrinkage of the door slabs in lower floors,the bending moments developed in the column of the first floor.
The analysis showed that the deformation of the building is drpendent on the construc-tion sequence. No loading of completed structures can approximate the actual deformationof the building. The creep effects increase the differences in settlement of individual columns,which results in redistribution of stress in horizontal elements. The redistribution is higherin top floors than in bottom floors. The unfavourable effect of shrinkage is observed partic-ularly at the bottom columns, if a horizontal movement is not allowed.
Fig. 1:References:
[1] KRlSTEK, V. - VlTEK, J. L.: Changes of structural system and stress redistributiondue to creep. RILEM, Proc. 22, Creep and shrinkage of concrete, E+FN Spon, London,1993, pp. 695-712
[2] VlTEK, J. L. - KRlSTEK, V.: Postupnd vystavba vyskovych budov - ucinky dotvarovdnia smrsfovdni betonu CBS, Betonafske dny, Pardubice, 1994
This research has been carried out as part of the research project supported by the GrantAgency of the Czech Republic, Grant No. 103/9^/0930
478
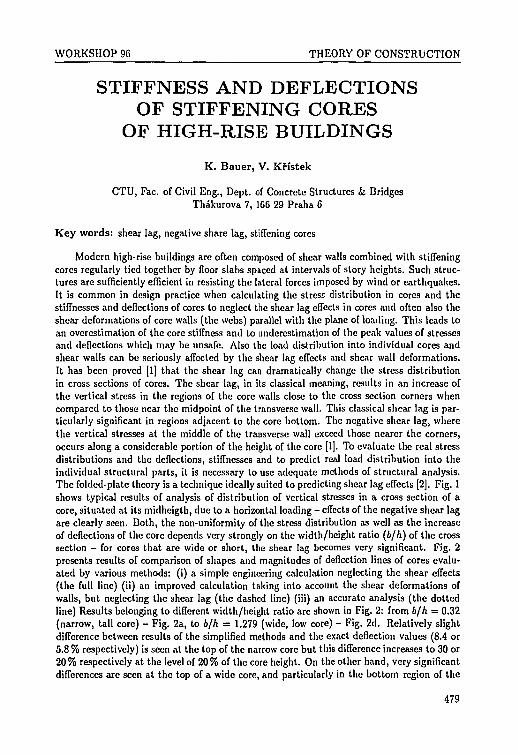
WORKSHOP 96 THEORY OF CONSTRUCTION
STIFFNESS AND DEFLECTIONSOF STIFFENING CORES
OF HIGH-RISE BUILDINGS
K. Bauer, V. Kristek
CTU, Fac. of Civil Eng., Dept. of Concrete Structures & BridgesThakurova 7, 166 29 Praha 6
Key words: shear lag, negative share lag, stiffening cores
Modern high-rise buildings are often composed of shear walls combined with stiffeningcores regularly tied together by floor slabs spaced at intervals of story heights. Such struc-tures are sufficiently efficient in resisting the lateral forces imposed by wind or earthquakes.It is common in design practice when calculating the stress distribution in cores and thestiffnesses and deflections of cores to neglect the shear lag effects in cores and often also theshear deformations of core walls (the webs) parallel with the plane of loading. This leads toan overestimation of the core stiffness and to underestimation of the peak values of stressesand deflections which may be unsafe. Also the load distribution into individual cores andshear walls can be seriously affected by the shear lag effects and shear wall deformations.It has been proved [1] that the shear lag can dramatically change the stress distributionin cross sections of cores. The shear lag, in its classical meaning, results in an increase ofthe vertical stress in the regions of the core walls close to the cross section corners whencompared to those near the midpoint of the transverse wall. This classical shear lag is par-ticularly significant in regions adjacent to the core bottom. The negative shear lag, wherethe vertical stresses at the middle of the transverse wall exceed those nearer the corners,occurs along a considerable portion of the height of the core [1]. To evaluate the real stressdistributions and the deflections, stiffnesses and to predict real load distribution into theindividual structural parts, it is necessary to use adequate methods of structural analysis.The folded-plate theory is a technique ideally suited to predicting shear lag effects [2]. Fig. 1shows typical results of analysis of distribution of vertical stresses in a cross section of acore, situated at its midheigth, due to a horizontal loading - effects of the negative shear lagare clearly seen. Both, the non-uniformity of the stress distribution as well as the increaseof deflections of the core depends very strongly on the width/height ratio (b/h) of the crosssection - for cores that are wide or short, the shear lag becomes very significant. Fig. 2presents results of comparison of shapes and magnitudes of deflection lines of cores evalu-ated by various methods: (i) a simple engineering calculation neglecting the shear effects(the full line) (ii) an improved calculation taking into account the shear deformations ofwalls, but neglecting the shear lag (the dashed line) (iii) an accurate analysis (the dottedline) Results belonging to different width/height ratio are shown in Fig. 2: from b/h = 0.32(narrow, tall core) - Fig. 2a, to b/h = 1.279 (wide, low core) - Fig. 2d. Relatively slightdifference between results of the simplified methods and the exact deflection values (8.4 or5.8% respectively) is seen at the top of the narrow core but this difference increases to 30 or20% respectively at the level of 20% of the core height. On the other hand, very significantdifferences are seen at the top of a wide core, and particularly in the bottom region of the
479
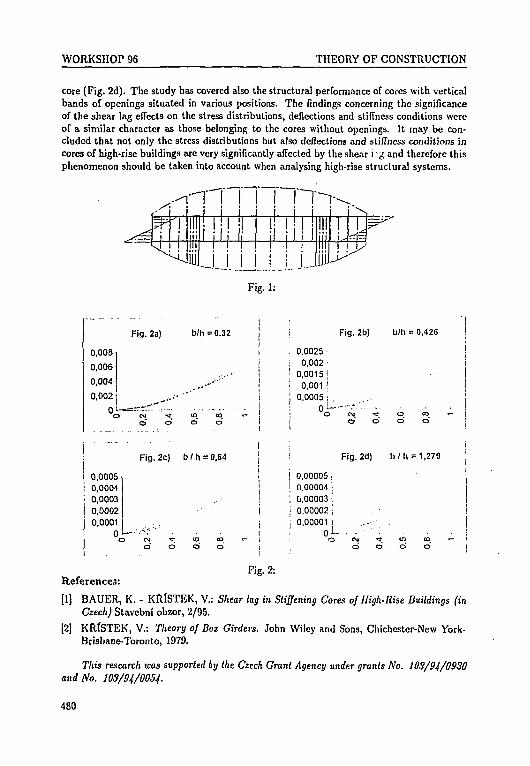
WORKSHOP 96 THEORY OF CONSTRUCTION
core (Fig. 2d). The study has covered also the structural performance of cores with verticalbands of openings situated in various positions. The findings concerning the significanceof the shear lag effects on the stress distributions, deflections and stiffness conditions wereof a similar character as those belonging to the cores without openings. It may be con-cluded that not only the stress distributions but also deflections and stiffness conditions incores of high-rise buildings are very significantly affected by the shear Kg and therefore thisphenomenon should be taken into account when analysing high-rise structural systems.
,.-1-1
Fig. 1:
Fig.2a)
0.008
0,006
0,004
0,002 j __...••
0 ** ......
b/h = 0.32
. . . . . . . . .
• Fig. 2b) bin = 0,426
0.0025-1 0,002:
| 0,0015]i 0,001 !j 0,0005 \ .i 0 -— •*
j 0,0005! 0,0004! 0,0003I 0,0002i 0,0001
Fig. 2c) 1 = 0,64
CO « -
Fig. 2d) b / h = 1,279
| 0,00005,| 0,00004 iI 0,00003;i 0,00002 |: 0.00001 I
CO CO ^
Fig. 2:References:
[1] BAUER, K. - KRlSTEK, V.: Shear lag in Stiffening Cores of High-Rise Buildings (inCzech) Stavebni obzor, 2/95.
[2] KRfSTEK, V.: Theory of Box Girders. John Wiley and Sons, Chichestcr-New York-Brisbane-Toronto, 1979.
This research was supported by the Czech Grant Agency under grants No. 103/94/0930and No. 103/94/005^.
480
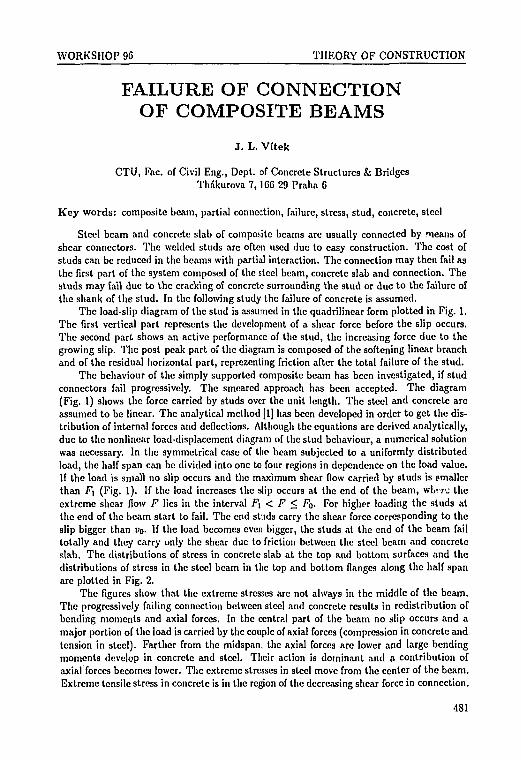
WORKSHOP 96 THEORY OF CONSTRUCTION
FAILURE OF CONNECTIONOF COMPOSITE BEAMS
J. L. Vftek
CTU, Fac. of Civil Eng., Dept. of Concrete Structures k BridgesThakurova 7, 166 29 Praha 6
Key words: composite beam, partial connection, failure, stress, stud, concrete, steel
Steel beam and concrete slab of composite beams are usually connected by means ofshear connectors. The welded studs are often used due to easy construction. The cost ofstuds can be reduced in the beams with partial interaction. The connection may then fail asthe first part of the system composed of the steel beam, concrete slab and connection. Thesluds may fail due to the cracking of concrete surrounding the stud or due to the failure ofthe shank of the stud. In the following study the failure of concrete is assumed.
The load-slip diagram of the stud is assumed in the quadrilinear form plotted in Fig. 1.The first vertical part represents the development of a shear force before the slip occurs.The second part shows an active performance of the stud, the increasing force due to thegrowing slip. The post peak part of the diagram is composed of the softening linear branchand of the residual horizontal part, rcprezenting friction after the total failure of the stud.
The behaviour of the simply supported composite beam has been investigated, if studconnectors fail progressively. The smeared approach has been accepted. The diagram(Fig. 1) shows the force carried by studs over the unit length. The steel and concrete areassumed to be linear. The analytical method [1] has been developed in order to get the dis-tribution of internal forces and deflections. Although the equations are derived analytically,due to the nonlinear load-displacement diagram of the stud behaviour, a numerical solutionwas necessary. In the symmetrical case of the beam subjected to a uniformly distributedload, the half span can be divided into one to four regions in dependence on the load value.If the load is small no slip occurs and the mnximum shear flow carried by studs is smallerthan F\ (Fig. 1). If the load increases the slip occurs at the end of the beam, WLWJ theextreme shear flow F lies in the interval Fx < F < Fo. For higher loading the studs atthe end of the beam start to fail. The end studs carry the shear force corresponding to theslip bigger than VQ. If the load becomes even bigger, the studs at the end of the beam failtotally and they carry only the shear due to friction between the steel beam and concreteslab. The distributions of stress in concrete slab at the top and bottom surfaces and thedistributions of stress in the steel beam in the top and bottom flanges along the half spanare plotted in Fig. 2.
The figures show that the extreme stresses are not always in the middle of the beam.The progressively failing connection between steel and concrete results in redistribution ofbending moments and axial forces. In the central part of the beam no slip occurs and amajor portion of the load is carried by the couple of axial forces (compression in concrete andtension in steel). Farther from the midspan, the axial forces are lower and large bendingmoments develop in concrete and steel. Their action is dominant and a contribution ofaxial forces becomes lower. The extreme stresses in steel move from the center of the beam.Extreme tensile stress in concrete is in the region of the decreasing shear force in connection.
481
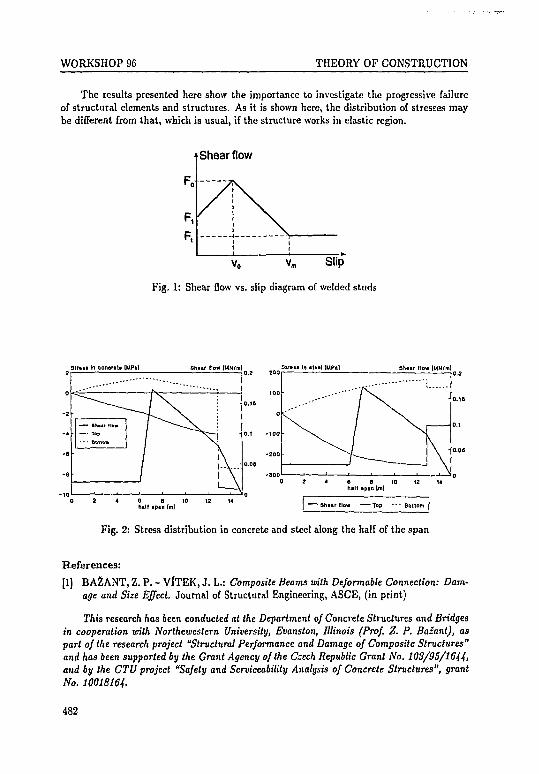
WORKSHOP 96 THEORY OF CONSTRUCTION
The results presented here show the importance to investigate the progressive failureof structural elements and structures. As it is shown here, the distribution of stresses maybe different from that, which is usual, if the structure works in elastic region.
Shear flow
Fig. 1: Shear flow vs. slip diagram of welded studs
— sw.• Top
- - • Bottom
0 2
ow
4
/ X—sJ\/ \ ^/
/J8 a iohalf .Pin (ml
\
12
\
\
1—r\14
0,16
0.1
O.OS
100
0
-too
-200
•300
flow iMN/m]
half apan [m]10 12 14
-Sh»»Mlow Top - • • Bottom
Fig. 2: Stress distribution in concrete and steel along the half of the span
References:
[1] BAZANT, Z. P. - ViTEK, J. L.: Composite Beams with Deformable Connection: Dam-age and Size Effect. Journal of Structural Engineering, ASCE, (in print)
This research has been conducted at the Department of Concrete Structures and Bridgesin cooperation with Northeweslern University, Evanston, Illinois (Prof. Z. P. Bazant), aspart of the research project "Structural Performance and Damage of Composite Structures"and has been supported by the Grant Agency of the Czech Republic Grant No. 103/95/1644,and by the CTU project "Safety and Serviceability Analysis of Concrete Structures", grantNo. 10018164.
482
WORKSHOP 96 THEORY OF CONSTRUCTION
MODELLING OF THE BEHAVIOUROF CONCRETE
- INFLUENCE OF CRACKSJ. Prochazka, J. Kratky, V. Kffstek,
J. L. Vitek, K. Trtfk, J. Filipova
CTU, Fac. of Civil Eng., Dept. of Concrete Structures k BridgesThakurova 7, 166 29 Praha 6
Key words: concrete structures, structural design, cracks, crack types, crack width, dura-bility, load-bearing capacity, impermeability, static behaviour, prevention ofcrack, limitation of crack, crack repair
The question of the significance of cracks on the durability and function of concretestructures has in certain cases led to many discussions and sometimes to expensive remedialactions. The research team came to the conclusion, that there is a necessity to write ahandbook on crack problems in concrete structures. In this handbook there are resultsreceived in this research program. The theses of this handbook are presented in this paper.
Structural cracks are caused by dead loads, applied forces and other external influences.Intristic cracks are more important than structural cracks (see [1, 2[), therefore there aregiven: the classification of the various type of intristic cracks (three main types: plastic -appear in first hours; early thermal contraction - appear one day to two/three weeks; long-term drying shrinkage - appears after several weeks or even months); the description of theirsymptoms and discussing the main influences. Some cracking may involve combinations ofvarious types. Knowledge of this should enable designers and contractors to take measureswhich will either prevent or control intristic cracks. Cracks which are caused e.g. excessiveuse of calcium chloride, microcracking, etc. are mentioned briefly. Principles which governthe formation of crack in plastic and hardened concrete are very important.
Guidance about the circumstances under which some form of crack-limitation require-ments need be stipulated at the design stage. The requirements differ depending on theenvironment and load type. Furthermore, crack-limitation requirements must sometimesbe stipulated to limit deformations and wear, to achieve an adequate impermeability andsound insulation and, in certain cases, to satisfy hygienic and aesthetic requirements. Rec-ommend-r :oi on the crack width that may be accepted from the durability point of view incases in win h a concrete structure has cracked in an undesirable way. However, apart fromcomplexity, there are in some cases reasons why it is not always realistic to determine crackwidths rigorously. Intristic cracks are sometimes unpredictable, but they can be minimisedand controlled by careful attention to design details and construction techniques.
Failure mechanism and failure theories aie described. The width of the crack are influ-enced by the geometry and fixity of the part of the structure affected and by the concretequality and reinforcement. There is no reliable methods for calculating crack widths in un-reinforced concrete(see [3]). Various relationships for crack width were proposed based onan inventory of cracks. The crack distributing properties of the reinforcement are modelledusing empiiical formuiae. The quantity of reinforcement that achieves the crack distribution
483
WORKSHOP 96 THEORY OF CONSTRUCTION
shall have the tensile force capacity that is as large as the concretes capacity immediatelybefore the crack occurs.
The significance of crack on the durability of reinforcement is discussed in detail. Thedurability could be affected by frost, aggregate reactions, lime leaching. Impermeabilitydrops with increasing crack width. If the flow through a crack is assumed to be laminar, itincreases as the cube of the crack width.
For practice there are important prevention and limitation of cracks. Non-structuralcracks: - prevention of plastic settlement cracks: reduction of settlement, reduction of re-straint, revibration, of plastic shrinkage cracks - curing, mix design, use fibres; - preventionof early thermal contraction cracks: aggregate with lower coefficients of thermal expan-sion, blended cements, distribution of reinforcement, no sudden changes of cross section,no high concentrations of reinforcement, providing movement joints, minimised delayingthe removal of formwork, the use of insulation; prevention of long-term shrinkage cracks:concrete mix, temperature history, curing, relative humidity, ratio of volume to exposedsurface. Structural cracks - prevention: strength class of concrete, reinforcement, thermaljoints, etc.
Cracks may be separated into two classes for the purpose of deciding upon the typeof repair. 1. Dormant cracks (open, close or extend further): fine, wide, fractures. 2. Livecracks (subjected to further movement). Cracks may be injected with various materialseither to rebond the substrate or to act as void fillers. Dormant cracks: cement grouts,epoxy resin, polyester resin, synthetic latex; live cracks: polyurethane resin, acrylic gels,flexible epoxy resin.
In many cases it is possible to prevent cracking by the simple mentioned measurements.Cracking problem - balance between the function of the structure and the cost of limitingcracking. The handbook will be devoted to a wide range of civil engineers in research, indesign and on the site.
References:
[1] Technical Report, N. 22.: Non-slructurai crack in concrete. Nakladatelstvi The Con-crete Society, Great Britain, 1992, pp. 2-45.
[2] Concrete report, N. 3.: Crack in concrete structures - specialy thermal crack. SvenskaBetongforeningen, Stockholm, Sweden, 1995.
[3] DBV - Merkblat: Begrenzung der Rissbildung im Stahlbeton - und Spannbeton. pp.19-30, Deutschcr Beton - Verein E. V., Wiesbaden, 1985.
[4] PROCHAZKA, J.: Vznik trhlin vyvolanych tepelnymi zmenami v belonovych kon-strxtkeich. Monoliticke stavby, Vojenske stavby - Praha, 1995.
This research has been conducted at the Department of Concrete structures and bridgesas part of the research project "Modelling of the structural performance" and has beensupported by CTU grant No. 10018227.
484
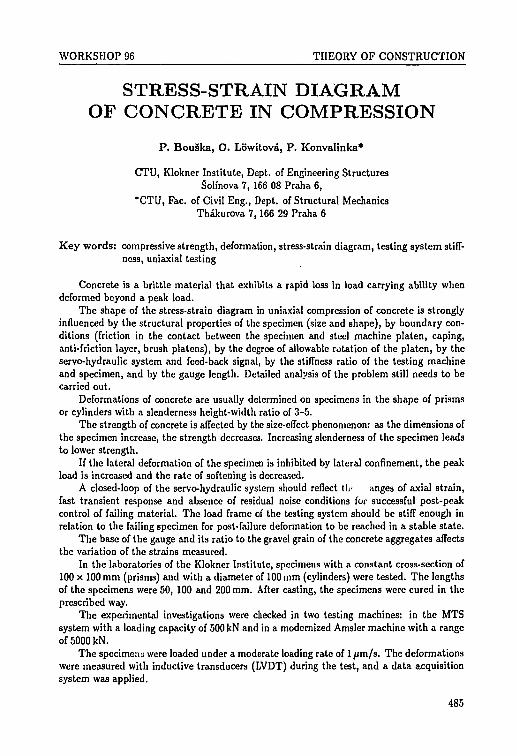
WORKSHOP 96 THEORY OF CONSTRUCTION
STRESS-STRAIN DIAGRAMOF CONCRETE IN COMPRESSION
P. BouSka, O. Lowitova, P. Konvalinka*
CTU, Klokner Institute, Dept. of Engineering StructuresSoh'nova 7, 166 08 Praha 6,
*CTU, Fac. of Civil Eng., Dept. of Structural MechanicsThakurova 7,166 29 Praha 6
Key words: compressive strength, deformation, stress-strain diagram, testing system stiff-ness, uniaxial testing
Concrete is a brittle material that exhibits a rapid loss in load carrying ability whendeformed beyond a peak load.
The shape of the stress-strain diagram in uniaxial compression of concrete is stronglyinfluenced by the structural properties of the specimen (size and shape), by boundary con-ditions (friction in the contact between the specimen and steel machine platen, caping,anti-friction layer, brush platens), by the degree of allowable rotation of the platen, by theservo-hydraulic system and feed-back signal, by the stiffness ratio of the testing machineand specimen, and by the gauge length. Detailed analysis of the problem still needs to becarried out.
Deformations of concrete are usually determined on specimens in the shape of prismsor cylinders with a slenderness height-width ratio of 3-5.
The strength of concrete is affected by the size-effect phenomenon: as the dimensions ofthe specimen increase, the strength decreases. Increasing slenderness of the specimen leadsto lower strength.
If the lateral deformation of the specimen is inhibited by lateral confinement, the peakload is increased and the rate of softening is decreased.
A closed-loop of the servo-hydraulic system should reflect th< anges of axial strain,fast transient response and absence of residual noise conditions for successful post-peakcontrol of failing material. The load frame of the testing system should be stiff enough inrelation to the failing specimen for post-failure deformation to be reached in a stable state.
The base of the gauge and its ratio to the gravel grain of the concrete aggregates affectsthe variation of the strains measured.
In the laboratories of the Klokner Institute, specimens with a constant cross-section of100 x 100 mm (prisms) and with a diameter of 100 mm (cylinders) were tested. The lengthsof the specimens were 50, 100 and 200 mm. After casting, the specimens were cured in theprescribed way.
The experimental investigations were checked in two testing machines: in the MTSsystem with a loading capacity of 500 kN and in a modernized Amsler machine with a rangeof 5000 kN.
The specimens were loaded under a moderate loading rate of 1 fim/s. The deformationswere measured with inductive transducers (LVDT) during the test, and a data acquisitionsystem was applied.
485
WORKSHOP 96 THEORY OF CONSTRUCTION
It had earlier been proved, following Karpcnko that the stress-strain diagram can beapproximated by most lifelike numerical expression.
Fig. 1: Specimen in the testing machine
References:
[1] VONK, R. A.: A Micromcchanical Investigation of Softening of Concrete Loaded inCompression. Heron, Delft, 1993
[2] OKUBO, S. Y.: Uniazial Compression Testing Using a Linear Combination of Stressand Strain as the Control Variable, Int. J. Rock Mech. Min Sci. and Gcomech. Abstr.Vol. 22, No. 5
[3] CPC12: Measurements of Deformation of Concrete under Comprcssivc Load, RILEMTechnical Recommendations for the Testing and Use of Construction Materials, RILEM,1994
[4] KOTSOVOS, M. D.: Effect of Testing Techniques on the Post-Ultimate Behaviour ofConcrete in Compression, Materials and Structure, Vol. 16, No. 139, 1991
[5] RILEM Commitee 148: Strain Softening of Concrete, proposal for round robin test,Delft University of Technology, 1993
[6] KARPENKO, N. I.: K poslrojcniu obobscennoj zavisimosti dlja diagramy deformi-rovanija bclona, ISiA, Minsk, 1983
This research has been conducted at the Department of Engineering Structures of Klok-ner Insitute as part of the research project "Experimental Analysis of Compressive Strain-Softening in Concrete" and has been supported by CTU grant No. 101J8151.
486
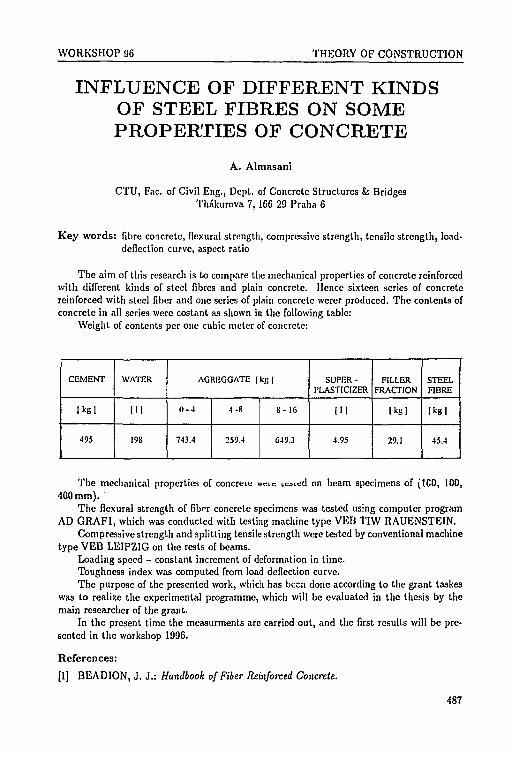
WORKSHOP 96 THEORY OF CONSTRUCTION
INFLUENCE OF DIFFERENT KINDSOF STEEL FIBRES ON SOMEPROPERTIES OF CONCRETE
A. Almnsani
CTU, Fac. of Civil Eng., Dept. of Concrete Structures & BridgesThakurova 7, 166 29 Praha 6
Key words: fibre concrete, flexural strength, compressive strength, tensile strength, load-deflection curve, aspect ratio
The aim of this research is to compare the mechanical properties of concrete reinforcedwith different kinds of steel fibres and plain concrete. Hence sixteen series of concretereinforced with steel fiber and one series of plain concrete werer produced. The contents ofconcrete in all series were costant as shown in the following table:
Weight of contents per one cubic meter of concrete:
CEMENT
[ k g l
495
WATER
HI
198
AGREGGATE (kg)
0-4
743.4
4-8
259.4
8 - 16
649.3
SUPER -PLASTICIZER
['I
4.95
FILLERFRACTION
[kg l
29.1
STEELFIBRE
[kg]
45.4
The mechanical properties of concrete wcic iconid on beam specimens of (ICO, 100,400 mm).
The flexural strength of fibor concrete specimens was tested using computer programAD GRAF1, which was conducted with testing machine type VEB TIW RAUENSTEIN.
Compressive strength and splitting tensile strength were tested by conventional machinetype VEB LEIPZIG on the rests of beams.
Loading speed - constant increment of deformation in time.Toughness index was computed from load deflection curve.The purpose of the presented work, which has been done according to the grant taskes
was to realize the experimental programme, which will be evaluated in the thesis by themain researcher of the grant.
In the present time the measurments are carried out, and the first results will be pre-sented in the workshop 1996.
References:
[1] BEADION, J. J.: Handbook of Fiber Reinforced Concrete.
487

WORKSHOP % THEORY OF CONSTRUCTION
[2] KRATKY, J. - TRTIK, K. - VODICKA, J.: Betony vyzluzene rozptylenou vyztuzi.
[3] HOFF, G. C : Fibre Reinforced Concrete. International Symposium, 1984.
This research has been conducted at the Department of Concrete Structures and Bridgesas part of the research project "Influence of Different Kinds of Steel Fibre on Some Prop-erties of Concrete" and has been supported by CTU grant No. 10018228.
488
WORKSHOP 96 THEORY OF CONSTRUCTION
REINFORCEMENT BEAMSSTRENGTHENED
BY UNBONDED REINFORCEMENT
T. Vangk, J. Bulvas, L. Podolka
CTU, Fac. of Civil Eng., Dept. of Concrete Structures & BridgesThakurova 7, :66 29 Praha 6
Key words: analysis, concrete, reinforcement, prestressing, strengthening, failure, rolledsection
Strengthening of reinforced concrete beams in reconstructed buildings has become veryactual and this trend is going to continue for many years. For a wider practical use it isnecessery to develop and verify the new meihods of strengthening of reinforced concretebeams. One of the possibilities to increase the load carrying capacity is to strengthen themby unbonded reinforcement. The reinforcement rolled sections or prestrcsscd reinforcementis placed on the bottom side or on the bottom part of the web.
For the thesis five alternatives of strengthening by unbonded reinforcement were selectedand tested at the CTU laboratories. The alternatives differ in the way of strengtheningof the bottom part of the beam. In 1995 alternative A was tested. The scheme of thestrengthened beam and the cross section are in the Fig. 1. The beam, that has been testedand was already used, was strengthened by rolled section (angles at each edge of the beam).Anchoring of these profiles is easily provided by welding them to steel plates fixed at theends of the beam. The shear is carried by skew steel strips on the right side. On the leftside the shear is carried by vertical steel strips that replace the stirrups Fig. 1.
Each alternative was tested on three identical beams that were loaded up to the to-tal failure. The measurements values were compered with the calculated results using theprogram VOK 2 (for prestressed structures) developed at the Department of Conctre Struc-tures and Bridges (prof. Kristek, doc. Vi'tek, dr. Ing. Vi'tek) Fig. 2. In the program thebeam is divided into several layers and the ordinery and both the prestressed reinforcementwith bond and without bond are considered. The different between the theoretical andexperimental results is very small.
Due to restricted finantial means only the alternative A was tested and calculated inthis year. The additional reinforcement can be free or covered by mortar.
By now four alternatives have been tested and calculated. The last one will be testednext year. The particulars of the desing, testing and experince gained in practice will bewritten in the thesis Ing. L. Podolka.
References:
[1] ALKHA1RI, F. M. - NAAMAN, A. E.: Analysis of Beams Prestressed with Un-bonded Internal or External Tendons, Journal of structural engineering, Vol. 119, No. 9,September, 1993.
[2] VANEK, T. - BULVAS, J. - PODOLKA, L.: Strengthening of Beams for Shear andBend by Glueing Steel Strips with Epoxy Resin 1, Stavcbni obzor 5/95.
489
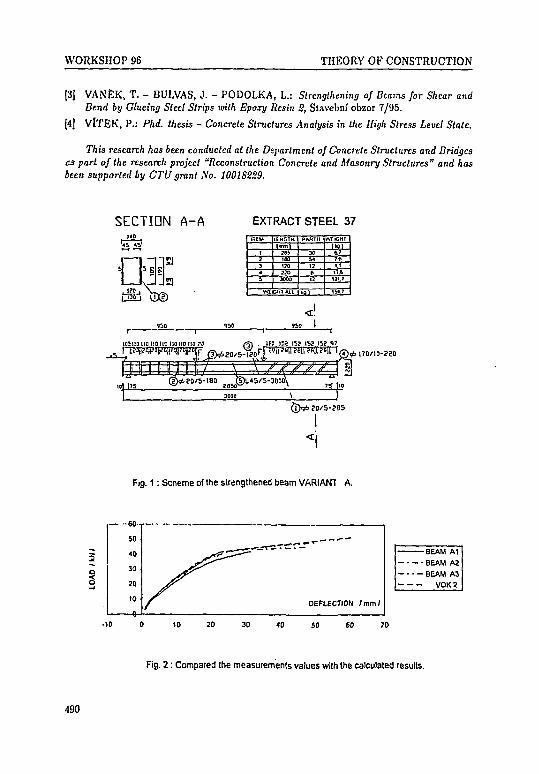
WORKSHOP 96 THEORY OF CONSTRUCTION
[3] VANEK, T. - BULVAS, J. - PODOLKA, L.: Strengthening of Beams for Shear andBend by Glueing Steel Strips with Bpoxy Resin S, Stavebni obzor 7/95.
[4] VlTEK, P.: Phd. thesis - Concrete Structures Analysis in the High Stress Level State.
This research has been conducted at the Department of Concrete Structures and Bridgesas part of the research project "Reconstruction Concrete and Masonry Structures" and hasbeen supported by CTU grant No. 10018229.
SECTION A-A
H~3-t-iaisJJa
EXTRACT STEEL 37
HEM
t734b
LENGTH
W>
1JO2203000
PAATH
30
12612
WKGHJ A i l U o l
WElGMl
tut67
i.tiT.t
1217
1M7
ICillDllOllOno UOII0110?3
-f 1
Til»1111 Jl I —\— x
160
1 "'i5 :
if
15? 15? 15? S?" I I 1 ^, ,70/10-JSO
IOU
(t)il> S0/5-2BS
Fig. 1 : Scheme o( the strengthened beam VARIANT A.
a
s
60-.
5040
30
20
to f DEFLECTION Imml
BEAM A1
BEAM A2
BEAM A3
VOK 2
20 60 70
Fig. 2 : Compared the measurements values with the calculated results.
490
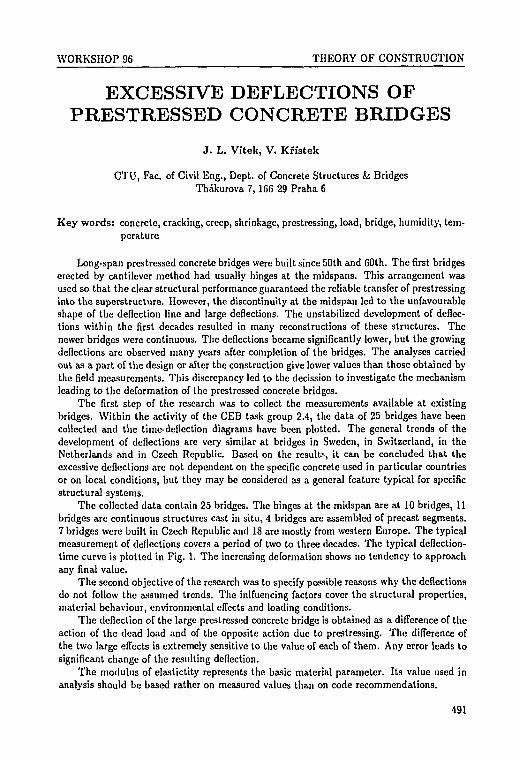
WORKSHOP 96 THEORY OF CONSTRUCTION
EXCESSIVE DEFLECTIONS OFPRESTRESSED CONCRETE BRIDGES
J . L. Vitek, V. Kfistek
CTU, Fac. of Civil Eng., Dept. of Concrete Structures k BridgesThakurova 7, 166 29 Praha 6
Key words: concrete, cracking, creep, shrinkage, prestressing, load, bridge, humidity, tem-perature
Long-span prcstressed concrete bridges were built since 50th and 60th. The first bridgeserected by cantilever method had usually hinges at the midspans. This arrangement wasused so that the clear structural performance guaranteed the reliable transfer of prestressinginto the superstructure. However, the discontinuity at the midspan led to the unfavourableshape of the deflection line and large deflections. The unstabilized development of deflec-tions within the first decades resulted in many reconstructions of these structures. Thenewer bridges were continuous. The deflections became significantly lower, but the growingdeflections are observed many years after completion of the bridges. The analyses carriedout as a part of the design or after the construction give lower values than those obtained bythe field measurements. This discrepancy led to the decission to investigate the mechanismleading to the deformation of the prestressed concrete bridges.
The first step of the research was to collect the measurements available at existingbridges. Within the activity of the CEB task group 2.4, the data of 25 bridges have beencollected and the time-deflection diagrams have been plotted. The general trends of thedevelopment of deflections are very similar at bridges in Sweden, in Switzerland, in theNetherlands and in Czech Republic. Based on the results, it can be concluded that theexcessive deflections are not dependent on the specific concrete used in particular countriesor on local conditions, but they may be considered as a general feature typical for specificstructural systems.
The collected data contain 25 bridges. The hinges at the midspan are at 10 bridges, 11bridges are continuous structures cast in situ, 4 bridges are assembled of precast segments.7 bridges were built in Czech Republic and 18 are mostly from western Europe. The typicalmeasurement of deflections covers a period of two to three decades. The typical deflection-time curve is plotted in Fig. 1. The increasing deformation shows no tendency to approachany final value.
The second objective of the research was to specify possible reasons why the deflectionsdo not follow the assumed trends. The inlfuencing factors cover the structural properties,material behaviour, environmental effects and loading conditions.
The deflection of the large prestressed concrete bridge is obtained as a difference of theaction of the dead load and of the opposite action due to prestressing. The difference ofthe two large effects is extremely sensitive to the value of each of them. Any error leads tosignificant change of the resulting deflection.
The modulus of elastictity represents the basic material parameter. Its value used inanalysis should be based rather on measured values than on code recommendations.
491
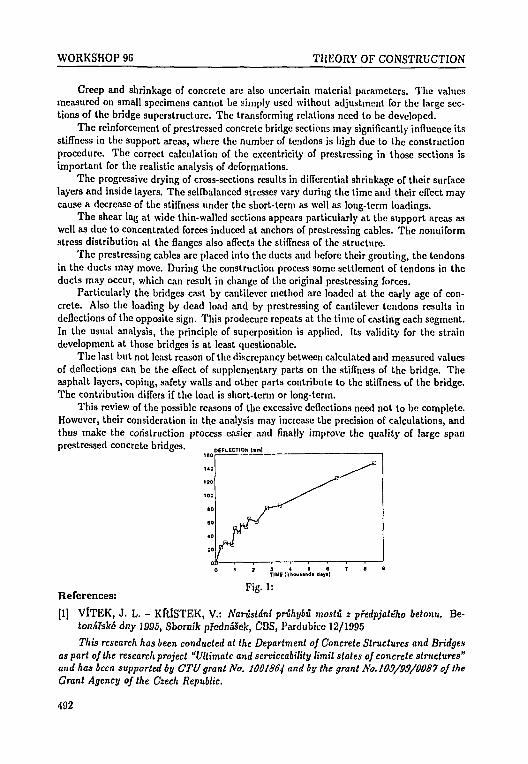
WORKSHOP 96 THEORY OF CONSTRUCTION
Creep and shrinkage of concrete are also uncertain material parameters. The valuesmeasured on small specimens cannot be simply used without adjustment for the large sec-tions of the bridge superstructure. The transforming relations need to be developed.
The reinforcement of prestressed concrete bridge sections may significantly influence itsstiffness in the support areas, where the number of tendons is high due to the constructionprocedure. The correct calculation of the excentricity of prestressing in those sections isimportant for the realistic analysis of deformations.
The progressive drying of cross-sections results in differential shrinkage of their surfacelayers and inside layers. The selfbalanced stresses vary during the time and their effect maycause a decrease of the stiffness under the short-term as well as long-term loadings.
The shear lag at wide thin-walled sections appears particularly at the support areas aswell as due to concentrated forces induced at anchors of prestressing cables. The nonuiformstress distribution at the flanges also affects the stiffness of the structure.
The prestressing cables are placed into the ducts and before their grouting, the tendonsin the ducts may move. During the construction process some settlement of tendons in theducts may occur, which can result in change of the original prestressing forces.
Particularly the bridges cast by cantilever method are loaded at the early age of con-crete. Also the loading by dead load and by prestressing of cantilever tendons results indeflections of the opposite sign. This prodecure repeats at the time of casting each segment.In the usual analysis, the principle of superposition is applied. Its validity for the straindevelopment at those bridges is at least questionable.
The last but not least reason of the discrepancy between calculated and measured valuesof deflections can be the effect of supplementary parts on the stiffness of the bridge. Theasphalt layers, coping, safety walls and other parts contribute to the stiffness of the bridge.The contribution differs if the load is short-term or long-term.
This review of the possible reasons of the excessive deflections need not to be complete.However, their consideration in the analysis may increase the precision of calculations, andthus make the construction process easier and finally improve the quality of large spanprestressed concrete bridges. 0EFLECTKW , „ „ ,
TIMEiihotJMndt dayil
F'S- 1:References:
[1] ViTEK, J. L. - KRlSTEK, V.: Nariistdnl prihybu mosti z pfedpjateho betonu. Be-tonarske dny 1995, Sbornfk prednasek, CBS, Pardubice 12/1995
This research has been conducted at the Department of Concrete Structures and Bridgesas part of the research project "Ultimate and serviceability limit states of concrete structures"and has been supported by CTU grant No. 1001864 and by the grant No. 103/93/0087 of theGrant Agency of the Czech Republic.
492
WORKSHOP 96 THEORY OF CONSTRUCTION
ENVIRONMENTAL EFFECTSON CONCRETE ELEMENTS
J . L. Vitek, V. Kffstek
CTU, Fac. of Civil Eng., Dept. of Concrete Structures & BridgesThakurova 7, 166 29 Praha 6
Key words: concrete, creep, humidity, cracking, temperature, softening, nonlinear analy-sis, shrinkage
Concrete elements are usually subjected to progressive drying. After casting the con-crete element is wet and the pores are filled with water. If the surface is exposed to drying,the thin surface layer dries rather fast, but the inside portions of the section dry much slower.The nonuniform drying results in differential shrinkage in the surface layers and inside thesection. In the initial stage (in dependence on the drying conditions and on the size of theelement), the surface layers tend to shrink more than the core of the section. However,the compatibility of the section have to be maintained, which results in the development ofstress, although the specimen is not loaded. The tensile stress at the surface is balancedby the compression in the core. If the drying is significant the tensile stresses exceed thestrength of concrete and cracks appear on the surface of the specimen.
After some period the compression stress inside the section causes the shortening ofconcrete, while the tensile stress causes the elongation of surface areas. The stress distri-bution changes so that the core is subjected to tension and surface areas are compressed.If there are cracks on the surface, they close. If they cannot close fully, the nonuniformdistribution of the stress becomes more pronounced.
If an element is subjected to temperature changes, additional stresses due to the nonuni-form thermal expansion accross the thickness of the element originate and then they cansignificantly influence the stress distribution induced by nonuniform shrinkage.
Drying process is rather slow. It takes some months or years, until the slab elementdries completely. The development of strain is therefore also slow and creep effects canreduce the stresses. On the other hand the temperature changes are much faster. Thecomplete heating or cooling of the slab elements takes place within days. The reduction ofstresses due to creep becomes much smaller. The most important phenomena influencingthe stress development are cracking and the modulus of elasticity. The elastic modulusshould be replaced by compliance function, which can much better express the stiffness ofconcrete at short-term (and long-term) loading.
The stresses are in equilibrium, however, due to the nonlinearity in tension (and dueto cracking), they cannot be simply superimposed to the stresses induced by loading of theelement. The complete analysis taking into account the environmental effects and externalloading is necessary, if the correct stresses are to be calculated. Such process is usually toocomplex for the use in design practice. However, also if an usual analysis is applied thedesigners have to bear in mind, that the stress distribution may differ from that, that theyobtained from their design calculations. The additional reinforcement should be added, toget a reserve capable to carry the mentioned stresses.
493
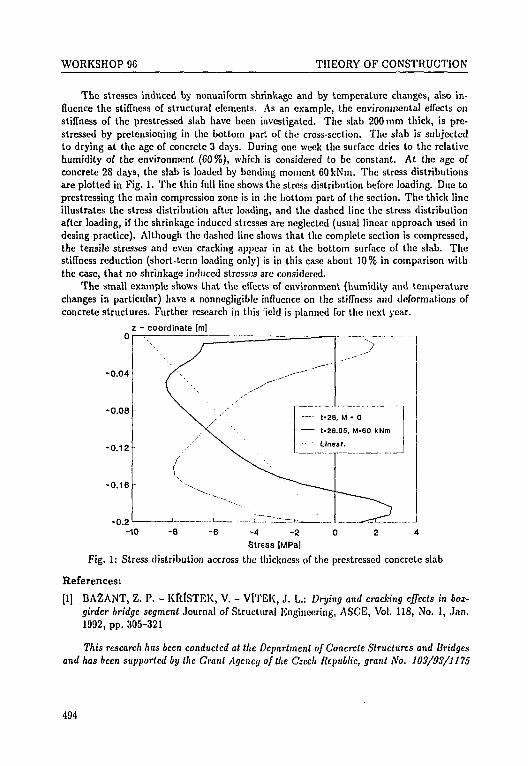
WORKSHOP 96 THEORY OF CONSTRUCTION
The stresses induced by nonuniform shrinkage and by temperature changes, also in-fluence the stiffness of structural elements. As an example, the environmental effects onstiffness of the prestressed slab have been investigated. The slab 200 mm thick, is pre-stressed by pretensioning in the bottom part of the cross-section. The slab is subjectedto drying at the age of concrete 3 days. During one week the surface dries to the relativehumidity of the environment (60%), which is considered to be constant. At the age ofconcrete 28 days, the slab is loaded by bending moment 60kNm. The stress distributionsare plotted in Fig. 1. The thin full line shows the stress distribution before loading. Due toprestressing the main compression zone is in the bottom part of the section. The thick lineillustrates the stress distribution after loading, and the dashed line the stress distributionafter loading, if the shrinkage induced stresses are neglected (usual linear approach used indesing practice). Although the dashed line shows that the complete section is compressed,the tensile stresses and even cracking appear in at the bottom surface of the slab. Thestiffness reduction (short-term loading only) is in this case about 10% in comparison withthe case, that no shrinkage induced stresses are considered.
The small example shows that the effects of environment (humidity and temperaturechanges in particular) have a nonnegligible influence on the stiffness and deformations ofconcrete structures. Further research in this field is planned for the next year.
z - coordinate |m]
-0.04
t-28, M - 0
t-28.05, M-60 kNm
— Linear.
-4 -2Stress IMPal
Fig. 1: Stress distribution accross the thickness of the prestrcsscd concrete slab
References:
[1] BAZANT, Z. P. - KRlSTEK, V. - ViTEK, J. L.: Drying and cracking effects in box-girder bridge segment Journal of Structural Engineering, ASCE, Vol. 118, No. 1, Jan.1992, pp. 305-321
This research has been conducted at the Department of Concrete Structures and Bridgesand has been supported by the Grant Agency of the Czech Republic, grant No. 103/03/1175
494

WORKSHOP 96 THEORY OF CONSTRUCTION
DESIGN TOOL FOR RC STRUCTURES:OBJECT-ORIENTED APPROACH
R. Chudoba, Z. Bi t tnar
CTU, Fac. of Civil Eng., Dept. of Structural MechanicsThakurova 7, 166 29 Praha 6
Key words: concrete, plasticity, sensitivity analysis, object-oriented methods.
The state of computerization of the structural design process is characterized by adisturbing disparity between analysis proper and the full design process. Most of the presentspecifications and codes have been historically calibrated in a manual design environment inwhich reanalysis was prohibitively expensive. In such environment the design was consideredsatisfactory when a few key members were at thcii allowable limit in one loading condition.The position of the analysis in the design process has changed considerably in the last decade.The analysis time and error have been drastically reduced. This increasingly motivates theresearch in the area of computerizing the design-oriented activities.
The developed design tool for RC framed structure is an example of the extendedcomputer support throughout the development of the structure. The salient features of thesystem include:
• Easy transition of the structure model between the evaluation schemes (representedby both analysis and design algorithms) which arc applicable in different stages of thedesign process and for different design members.
• Simple insertion of the new type of the design member into the system by providingsuitable interface for the inclusion of design related objects.
• Support for preliminary design stages. For RC framed structures the rigid-plasticoptimization scheme is a suitable tool for this task.
• Efficient algorithm for sensitivity calculation of the history-dependent response of RCframed structure. This item is necessary to provide the support for redesign decisionsby identifying portions of the structure that need to be modified to achieve the intendedfunction.
• Optional decomposition of the environment into several modules with an automateddefinition of the communication protocols.
The program represents the pilot application focused on the narrowed area of the prob-lem domain. The use the conceptual support of the object-oriented paradigm for a smallscale problem alleviates the difficulties with future extensions of the system. If the directionsin which the system is expected to grow are concerned and enforced through correspondingabstractions during the object-oriented analysis, the support for these extensions is pre-served in the produced system. As a result, the pilot application may be constructed for anarrow region of the considered problem domain. Once the overall system architecture isestablished and examined on a. narrowed problem domain involving also the structure designactivities, further functionality may be included at relatively low implementation cost.
495
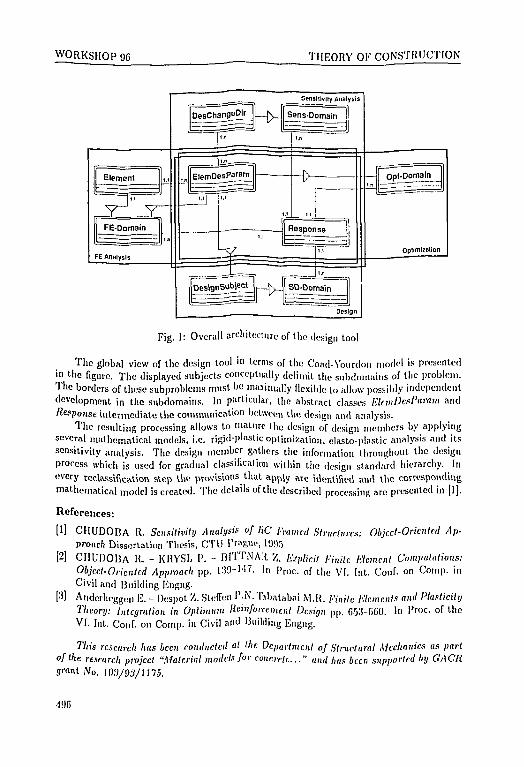
WORKSHOP 96 THEORY OF CONSTRUCTION
II FE-Domain
FE Analysis
Sensitivity Analysis
iDesignSubieot^ L
Design
Opl-Domain
Optlmizmion
Fig. 1: Overall architecture of the design tool
The global view of the design tool in terms of the Coiid-Yourdon model is presentedi" the figure. The displayed subjects conceptually delimit the siibdomains of the problem.The borders of these subproblcins must be maximally flexible to allow possibly independentdevelopment in the subdomains. In particular, the abstract classes EkmDcsParam andResponse intermediate the communication between the design and analysis.
The resulting processing allows to mature the design of design members by applyingseveral mathematical models, i.e. rigid-plastic optimization, elasto-plastic analysis and itssensitivity analysis. The design member gathers the information throughout the designprocess which is used for gradual classification within the design standard hierarchy. In"very rcclassificaVjon step Use provisions that apply Me identified and the correspondingmathematical model is created. The details of the described processing are presented in [1].
References:
[1] CHUDOBA R. Sensitivity Analysis of RC Framed Structures: Object-Oriented Ap-proach Dissertation Thesis, CTU l'rague, 1995
[2] CHUDOBA It. - KRYSL P. - UlTTNAll Z. Explicit Finite Element Computations:Object-Oriented Approach pp. 139-M7. In prOc. of the VI. Int. Conf. on Comp. inCivil and Building Engng.
[3] Anderheggeii E. - Despot Z. Stefan I'-N. Tabatabai M.R. Finite Elements and PlasticityTheory: Integration in Optimum llcinfonenicnl Design pp. G5:(-6G0. In l'roc. of theVI. Int. Conf. on Comp. in Civil and Building Engng.
This research has been conducted «' "'c Department of Structural Mechanics as partof the rescarcli project "Material models for concrete..." and has been supported by GACIigrant JV0. ! 03/93/1)7,5.
496
WORKSHOP 96 THEORY OF CONSTRUCTION
ULTIMATE LIMIT STATEOF PRESTRESSED CONCRETE
BEAMS - COMPUTER CODE
P . Vitek, J . L. Vftek
CTU, Fac. of Civil Eng., Dept. of Concrete Structures & BridgesThakurova 7, 166 29 Praha 6
Key -words: analysis, concrete, bond, tendon, failure, reinforcement, numerical solution,ultimate limit state
The safety of structures is assumed to be proven, if the cross-sections show higherload carrying capacity than the load effects calculated mostly under the assumption of theelasticity. The possible redistribution of internal forces due to softening of cross-sections at ahigh stress level is often neglected or assumed in a very simple way. At prestressed structures,particularly if the unbonded tendons are used, the nonlinear behaviour of concrete and steelshould be taken into account, so that the more realistic view of Mie failure in ultimate limitstate would be obtained. In order to make the nonlinear analysis of continuous beams easier,the computer code VOK-2 has been written by the authors of the paper.
The program is based on the finite element method. The beam elements are connectedin nodes. The nodes are placed in the locations of supports, under the point loads and atthe points, where the prestressing tendons change their shape. The elements are dividedinto concrete layers. Mild reinforcement is also included as a part of the cross-section.
The material behaviour of concrete, steel and prestressing steel is described by non-linear stress-strain diagrams. Concrete in compression has curved loading branch andstraight unloading branch. Concrete in tension has linear loading branch and linear soften-ing branch. Unloading is simplified by a straight line connecting the unloading point withthe origin of coordinates. The concrete stress-strain diagram may be modified so that it issuitable as well as for modelling of fibre reinforced concrete. The softening branch is thencomposed of the two lines. Mild steel behaviour is modelled by elastic-plastic diagram withor without hardening. Unloading branch is again linear. Prestressing steel has only curvedbranch in tension with linear unloading.
Bonded tendons are aproximated by a polygon. They are connected with the concretebeam at all nodes along their length. The prcstressing can vary in each segment of thetendon. The bonded prestressing can be assumed as pretensioned or posttensioned.
Unbonded tendons are again of a polygonal shape. However, they are connected tothe concrete beam only in specific points. Their connection at deviators can be eitherfree, i.e. no friction is assumed, or fixed, i.e. infinite friction does not allow the tendon tomove at the deviator. These cases represent the boundaries of the realistic behaviour. Inthe serviceability limit state no movement appears at deviators, but in the ultimate limitstate a movement may be expected. To model the movement at the deviators would be asignificant complication of the analysis. During the loading process, the slips might occur ina sequence, which is dependent on the loading process. An increase of the precision seems
497
WORKSHOP 96 . THEORY OF CONSTRUCTION
to be inadequate to the effort necessary for the development of a sophisticated numericalprocedure.
Loading of the beam is assumed in different stages. In the first stage the beam issubjected to dead load and prestressing by bonded tendons. This takes into account theinitial stage if the prestressing starts to act on the undeformed beam.
In the second stage, the unbonded tendons are prestresscd on the beam, which hasalready been deformed. It makes it possible, to model the construction of precast bridges,where the tendons are stressed after the assembly of beam elements. If necessary, theprestressing can be activated in one stage by omitting of the first stage.
In the third stage the beam is loaded by a set of forces representing the live load orby the imposed displacement of the node. If the beam is loaded in the serviceability limitstate, the stresses obtained after the third stage of loading may be compared with allowablevalues.
The ultimate limit state is reached, if the set of forces representing live load in the thirdstage is increased, until the failure of the beam at any section occurs. The Newton Raphsonmethod is used in order to approximate the behaviour of the beam until failure is reached.The failure occurs due to crushing of concrete in compression or due to exceeding of thelimit tensile strain in steel. The load is automatically adjusted, so that it corresponds toits maximum value at the failure. If the displacement of the node is assumed as a controlparameter, the load is increased up to the peak load and then decreased due to softening ofthe beam. More than one section may fail, until the kinematic mechanism is created.
The general procedure gives a good opprotunity of establishing the ultimate load car-rying capacity of continuous beams. The question under discussion is, what parametersshould be taken as an input for the diagrams describing the material behaviour. It may beexpected that the values recommended by codes based on limit states would provide toosmall stiffnesses and load carrying capacity of the beam. The other opinion, which seemsto be more realistic, suggests to use the average strengths of materials. The problems areconnected with the design philosophy and the safety concepts. They are under discussionin international associations like CEB or RILEM, but the final decision has not still beenadopted.
References:
[1] VlTEK, J. L. - VlTEK, P.: Prestressed concrete beams - Serviceability and ultimatelimit states. In External prcstressing in structures, AFPC, 1993, pp. 123-132
[2] VlTEK, P.: Analyza betonovych konstrukci pfi vysokc urovni namdhdni. Doktorskadisertacnf prace, Stavebni fakulta CVUT, Praha 1995
This research has been conducted at the Department of Concrete Structures and bridgesas part of the research project "The effects of random initial imperfections" and has beensupported by Grant Agency of the Czech Republic, grant No. 103/93/0087 and by CTU grantNo. 10018164
498
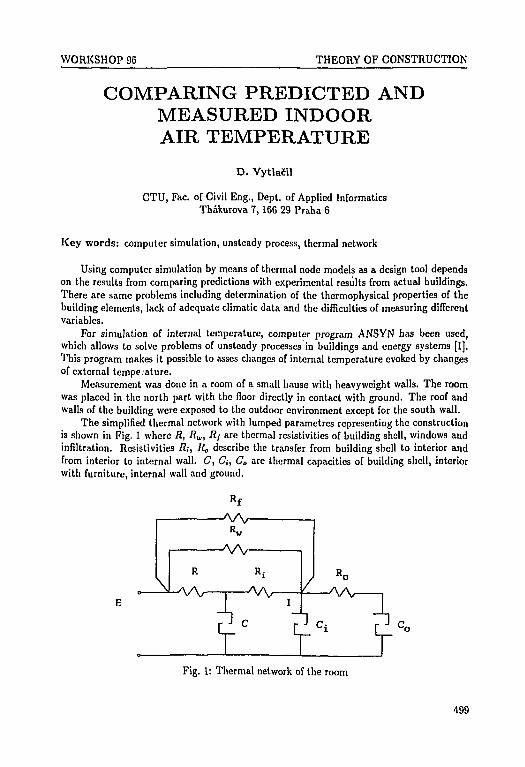
WORKSHOP 96 THEORY OF CONSTRUCTION
COMPARING PREDICTED ANDMEASURED INDOORAIR TEMPERATURE
D. VytlaCU
CTU, Fac. of Civil Eng., Dept. of Applied InformaticsThakurova 7,166 29 Praha 6
Key words: computer simulation, unsteady process, thermal network
Using computer simulation by means of thermal node models as a design tool dependson the results from comparing predictions with experimental results from actual buildings.There are same problems including determination of the thermophysical properties of thebuilding elements, lack of adequate climatic data and the difficulties of measuring differentvariables.
For simulation of internal temperature, computer program ANSYN has been used,which allows to solve problems of unsteady processes in buildings and energy systems [1].This program makes it possible to asses changes of internal temperature evoked by changesof external tempe.ature.
Measurement was done in a room of a small hause with heavyweight walls. The roomwas placed in the north part with the floor directly in contact with ground. The roof andwalls of the building were exposed to the outdoor environment except for the south wall.
The simplified thermal network with lumped parametres representing the constructionis shown in Fig. 1 where R, Rw, Rj are thermal resistivities of building shell, windows andinfiltration. Resistivities Ri, Ro describe the transfer from building shell to interior andfrom interior to internal wall. C, C,-, Co are thermal capacities of building shell, interiorwith furniture, internal wall and ground.
R f
W« W
R,-
r rFig. 1: Thermal network of the room
499
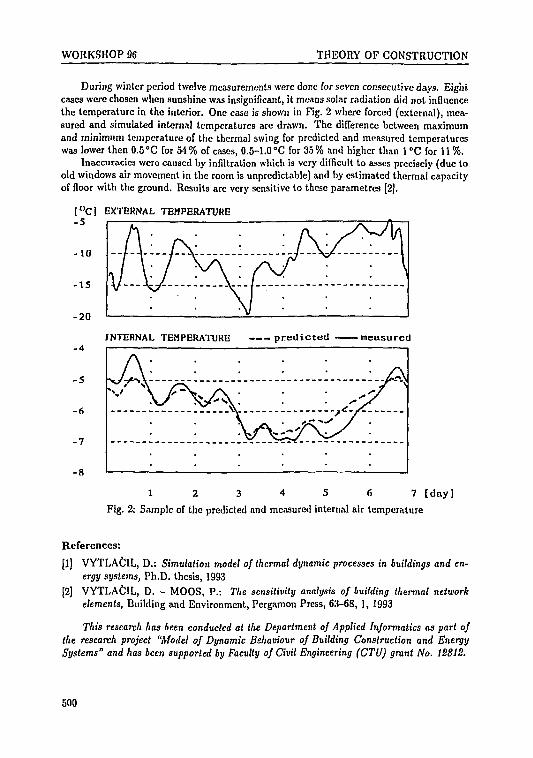
WORKSHOP 96 THEORY OF CONSTRUCTION
During winter period twelve measurements were done for seven consecutive days. Eightcases were chosen when sunshine was insignificant, it means solar radiation did not influencethe temperature in the interior. One case is shown in Fig. 2 where forced (external), mea-sured and simulated internal temperatures are drawn. The difference between maximumand minimum temperature of the thermal swing for predicted and measured temperatureswas lower then 0.5°C for 54% of cases, 0.5-1.0°C for 35% and higher than 1°C for 11%.
Inaccuracies were caused by infiltration which is very difficult to asses precisely (due toold windows air movement in the room is unpredictable) and by estimated thermal capacityof floor with the ground. Results are very sensitive to these parametrcs [2].
[°C] EXTERNAL TEMPERATURE-5
- to
- I S
- 2 0
-4
- 5
-6
- 7
-8
INTERNAL TEMPERATURE — - p r e d i c t e d measured
1 2 3 4 5 6 7 [daylFig. 2: Sample of the predicted and measured internal air temperature
References:
[1] VYTLACIL, D.: Simulation model of thermal dynamic processes in buildings and en-ergy systems, Ph.D. thesis, 1993
[2] VYTLACIL, D. - MOOS, P.: The sensitivity analysis of building thermal networkelements. Building and Environment, Pergamon Press, 63-68, 1, 1993
This research has been conducted at the Department of Applied Informatics as part ofthe research project "Model of Dynamic Behaviour of Building Construction and EnergySystems" and has been supported by Faculty of Civil Engineering (CTU) grant No. 12812.
500
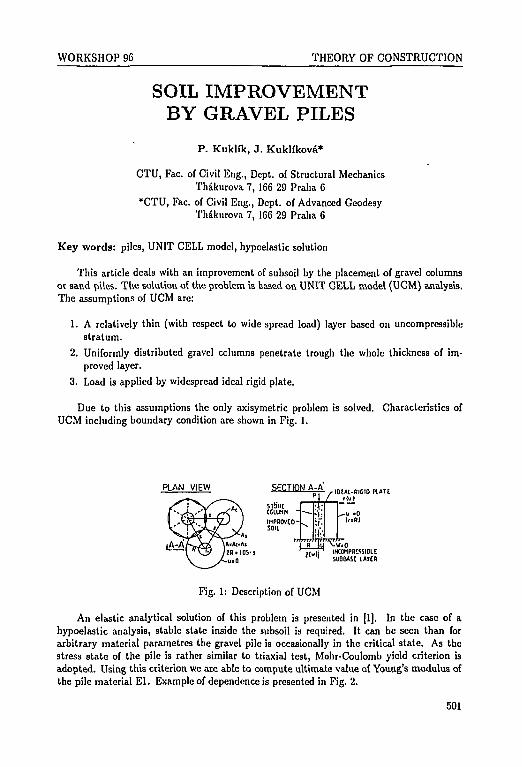
WORKSHOP 96 THEORY OF CONSTRUCTION
SOIL IMPROVEMENTBY GRAVEL PILES
P. Kukh'k, J . Kuklikova*
CTU, Fac. of Civil Eng., Dept. of Structural MechanicsThakurova 7, 166 29 Praha 6
*CTU, Fac. of Civil Eng., Dept. of Advanced GeodesyThakurova 7, 166 29 Praha 6
Key words: piles, UNIT CELL model, hypoelastic solution
This article deals with an improvement of subsoil by the placement of gravel columnsor sand piles. The solution of the problem is based on UNIT CELL model (UCM) analysis.The assumptions of UCM are:
1. A relatively thin (with respect to wide spread load) layer based on uncompressiblestratum.
2. Uniformly distributed gravel columns penetrate trough the whole thickness of im-proved layer.
3. Load is applied by widespread ideal rigid plate.
Due to this assumptions the only axisymetric problem is solved. Characteristics ofUCM including boundary condition are shown in Fig. 1.
SECTION A-A IOCAL-RIGID r u n(111 I
Fig. 1: Description of UCM
An elastic analytical solution of this problem is presented in [1]. In the case of ahypoelastic analysis, stable state inside the subsoil is required. It can be seen than forarbitrary material parametres the gravel pile is occasionally in the critical state. As thestress state of the pile is rather similar to triaxial test, Mohr-Coulomb yield criterion isadopted. Using this criterion we are able to compute ultimate value of Young's modulus ofthe pile material El . Example of dependence is presented in Fig. 2.
501
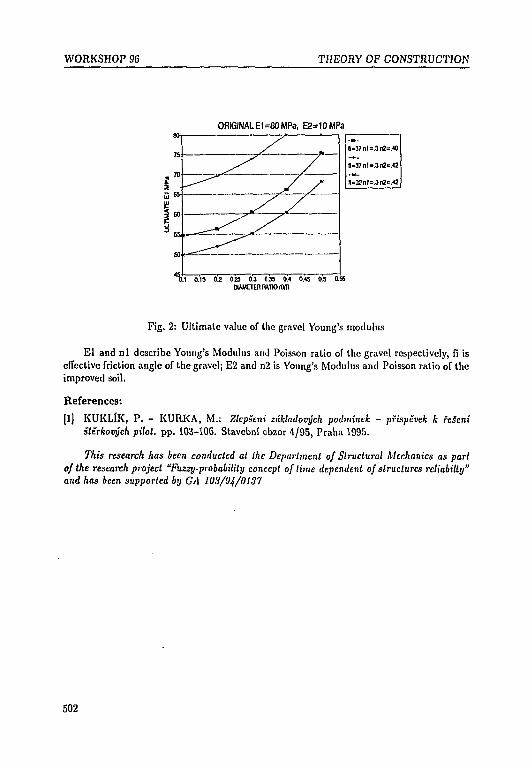
WORKSHOP 96 THEORY OF CONSTRUCTION
ORIGINAL Et =80 MPa, E2=10MPa
01 015 0 2 0.25 0 3 0,35 0.4 0.45 0.5 0.55DIAMETER HMIOrOm
Fig. 2: Ultimate value of the gravel Young's modulus
El and nl describe Young's Modulus and Poisson ratio of the gravel respectively, fi iseffective friction angle of the gravel; E2 and n2 is Young's Modulus and Poisson ratio of theimproved soil.
References:
[1] KUKLlK, P. - KURKA, M.: Zlepseni zdkladovych podminck - pfispevek k fesenisttrkovych pilot, pp. 103-106. Stavebni obzor 4/95, Praha 1995.
This research has been conducted at the Department of Structural Mechanics as partof the research project "Fuzzy-probability concept of lime dependent of structures rcliabilty"and has been supported by CA 103/94/0137
502
WORKSHOP 96 THEORY OF CONSTRUCTION
ON THE CALIBRATION OF THE NEWCZECH PAVEMENT DESIGN METHOD
B. Novotny
CTU, Klokner Institute, Dept. of Composite Materials & StructuresSolinova 7, 166 08 Praha 6,
Key words: flexible pavement, deflection testing, deflectograph, reliability of pavementdesign, calibration
The new Czech design procedure for flexible pavements is based on principles andrequirements for safety and serviceability of road structures. The fundamental structuralcriterion of the method makes use of the Miner law for pavement damage accumulation.By applying results of the Eurocode discussion on fatigue phenomenon [2], the pavementfatigue criterion may be formulated as
S,(a,B,n,,e,)<Soh,Do), (1)
with the quantity Sj representing a measure of the pavement damage accumulated duringthe "model" fatigue process
SJ(a,B,n.,e,) = n,'£(W''e.i)B , (2)i=i
that distinguishes four seasons of the year with relative durations TJ and correspondingfatigue material parameters a,-, the additional fatigue parameter B being thermally inde-pendent. The traffic induced pavement loading process is modelled here as a standard axleload application repetitive process, n, denoting the total number of load applications, eachload application causing the pavement strains £,j.
The expression So(i,Do) from the right side of (1) comprises partial factors to assessdifferent aspects of the reliability of our pavement modelling effort
SB(t,D0) = D0ydjD, (3)
with 7,( being the partial factor of the pavement mathematical response model reliability(indicating the accuracy of the pavement strains e,j calculation). The Do factor representsthe critical value for the damage ratio, it describes in a quantitative way the fact that theMiner rule does not take "sequence" effect of the traffic load into account. Finally, the fofactor deals with the consequences of pavement failure (in terms of riding comfort levels).The factors Do, 7J , ID form a set of control parameters to be determined in such a way thatthe desired level of the pavement structure reliability is reached under all design situations.
In order to calibrate the design procedure, the outcome of its application to the pave-ment structures, that are representative of construction tradition, should be analysed. Tab. 1presents Sf(a,B,n.,£,) values pertaining to the selected catalogue pavement structures[3] (taken from the catalogue pages NN 1-1 and NN 1-2 with fo = 1). In calculating5y(a,B,n,,£j), the values of parameters ay, B were taken from [1] and n, was set to 2,5-107.
503
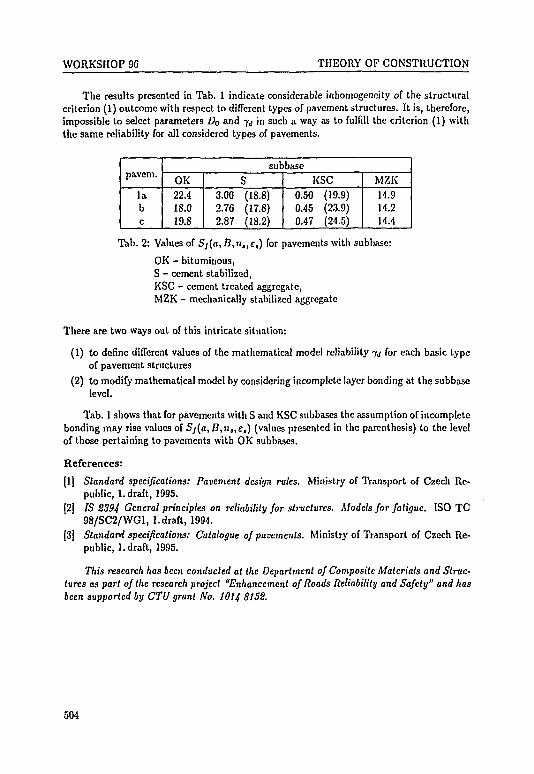
WORKSHOP 96 THEORY OF CONSTRUCTION
The results presented in Tab. 1 indicate considerable inhomogeneity of the structuralcriterion (1) outcome with respect to different types of pavement structures. It is, therefore,impossible to select parameters Da and -fj in such a way as to fulfill the criterion (1) withthe same reliability for all considered types of pavements.
labc
OK22.418.019.8
3.002.762.87
subbase
S(18.8)(17.8)(18.2)
KSC0.500.450.47
(19.9)(23.9)(24.5)
MZK
14.914.214.4
Tab. 2: Values of Sf(a,B,n,,e,) for pavements with subbase:
OK - bituminous,S - cement stabilized,KSC - cement treated aggregate,MZK - mechanically stabilized aggregate
There are two ways out of this intricate situation:
(1) to define different values of the mathematical model reliability JJ for each basic typeof pavement structures
(2) to modify mathematical model by considering incomplete layer bonding at the subbaselevel.
Tab. 1 shows that for pavements with S and KSC subbases the assumption of incompletebonding may rise values of Sj(a,B,n,,e,) (values presented in the parenthesis) to the levelof those pertaining to pavements with OK subbascs.
References:
[1] Standard specifications: Pavement design rules. Ministry of Transport of Czech Re-public, 1. draft, 1995.
[2j IS 2394 Genera! principles on reliability for structures. Models for fatigue. ISO TC98/SC2/WG1, 1.draft, 1994.
[3] Standard specifications: Catalogue of pavements. Ministry of Transport of Czech Re-public, 1. draft, 1995.
This research has been conducted at the Department of Composite Materials and Struc-tures as part of the research project "Enhancement of Roads Reliability and Safety" and hasbeen supported by CTU grant No. 1014 8152.
504
WORKSHOP 95 THEORY OF CONSTRUCTION
DESIGN AND MANUFACTURINGOF AN ULTRALIGHT AEROPLANE
A. Pfst6k
Tl), Fac. of Mechanical Eng., Institute of Aerospace EngineeringTechnicka. 2, 616 69 Brno, CR
Key words: aircraft design, aircraft manufacturing, very light aeroplane, ultralight aero-plane
The current period in aviation of Czech Republic can be characterised by a certaindecrease in production amounts caused by the new economic conditions after November1989 and by changes in the former traditional markets. In the field of sports flying on thecontrary the activities have risen significantly which has brought a production boom in the"ultralight" aeroplane category. In Czech Republic more than 450 such aeroplanes wereproduced within few years and their total number is still increasing.
The Institute of Aerospace Engineering (IAE) of the Faculty of Mechanical Engineeringat Technical University Brno has always been involved in any actual activity — at aircraftindustry and design offices as well as at the Czech Amateur Flight Association, private oramateur producers. The professional level of IAE staff supported by its hardware and soft-ware equipment brought an idea to design and manufacture own ultralight aeroplane. Thedesign stage should enable the students to apply their knowledge of lectures and practicalcourses in framework of aircraft design. In the production stage the students should directlyparticipate in manufacturing and in testing of the aeroplane in the Aircraft Test Laboratory.The design and development work at the project of ultralight aeroplane should result in anaeroplane for amateur flying of the students of the IAE.
The manufacturing costs of a modern ultralight aeroplane are very high and cannot becovered either from the budget of the IAE or the Faculty alone. A partner was searchedfor to assist the 1AE — an agreement was finally signed with the company KAPPA Jihlavawhich agreed to cover production costs. To have additional support for the project, a grantapplication was submitted at the Faculty of Mechanical Engineering TU Brno. The objectivewas to support the project in area of theoretical analysis, material tests, structure designas well as the verification of the flight characteristics and design conception by a preciselyscaled radio-controlled model.
A modern conception of the aeroplane has been chosen. The result is the aeroplanewhich get over the standard design practices in many aspects. The aeroplane has beendesigned in accordance with the European Aviation Requiremnets for very light aeroplanesJAR-VLA and the Czech ones L8/S and UL-2. It is a two-seat, low-wing, all-metal aeroplanewith a retractable undercarriage. The power plant is the ROTAX 618 engine with a propellerdesigned at the IAE. The airfoil of the wing and the tail were optimised with respect to themaximum performance of the aeroplane and the minimum stalling speed.
The most important designs features are as follows: The aeroplane is equipped with aretractable undercarriage enabling to increase the maximum speed. In order to provide morecomfort while decreasing the maximum width of the fuselage, the seats are set over in thelongitudinal direction. The aeroplane has integral fuel tanks enabling the flight range over
505
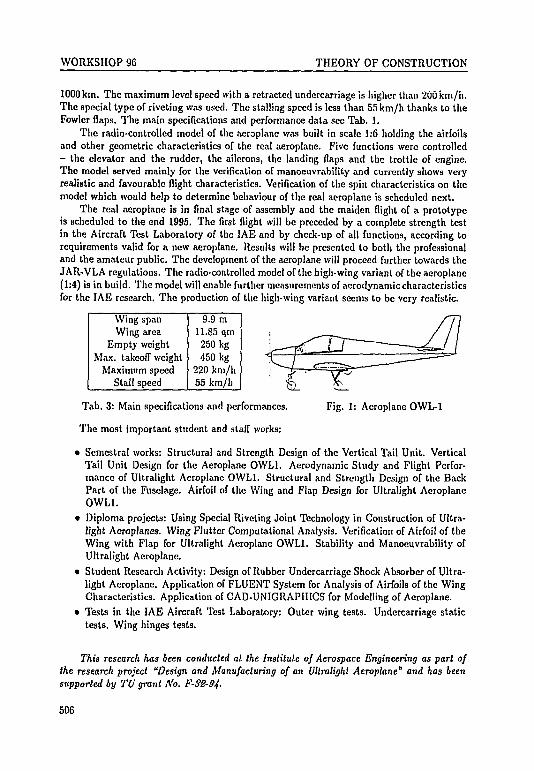
WORKSHOP 96 THEORY OF CONSTRUCTION
1000 km. The maximum level speed with a retracted undercarriage is higher than 200 km/'h.The special type of riveting was used. The stalling speed is less than 55 km/h thanks to theFowler flaps. The main specifications and performance data see Tab. 1.
The radio-controlled model of the aeroplane was built in scale 1:6 holding the airfoilsand other geometric characteristics of the real aeroplane. Five functions were controlled- the elevator and the rudder, the ailerons, the landing flaps and the trottle of engine.The model served mainly for the verification of manoeuvrability and currently shows veryrealistic and favourable flight characteristics. Verification of the spin characteristics on themodel which would help to determine behaviour of the real aeroplane is scheduled next.
The real aeroplane is in final stage of assembly and the maiden flight of a prototypeis scheduled to the end 1995. The first flight will be preceded by a complete strength testin the Aircraft Test Laboratory of the IAE and by check-up of all functions, according torequirements valid for a new aeroplane. Results will be presented to both the professionaland the amateur public. The development of the aeroplane will proceed further towards theJAR-VLA regulations. The radio-controlled model of the high-wing variant of the aeroplane(1:4) is in build. The model will enable further measurements of aerodynamic characteristicsfor the IAE research. The production of the high-wing variant seems to be very realistic.
Wing spanWing area
Empty weightMax. takeoff weight
Maximum speedStall speed
9.9 m11.85 qm250 kg450 kg
220 km/h55 km/h
Tab. 3: Main specifications and performances.
The most important student and staff works:
Fig. 1: Aeroplane OWL-1
• Semestral works: Structural and Strength Design of the Vertical Tail Unit. VerticalTail Unit Design for the Aeroplane 0WL1. Aerodynamic Study and Flight Perfor-mance of Ultralight Aeroplane OWL1. Structural and Strength Design of the BackPart of the Fuselage. Airfoil of the Wing and Flap Design for Ultralight AeroplaneOWL1.
• Diploma projects: Using Special Riveting Joint Technology in Construction of Ultra-light Aeroplanes. Wing Flutter Computational Analysis. Verification of Airfoil of theWing with Flap for Ultralight Aeroplane 0WL1. Stability and Manoeuvrability ofUltralight Aeroplane.
• Student Research Activity: Design of Rubber Undercarriage Shock Absorber of Ultra-light Aeroplane. Application of FLUENT System for Analysis of Airfoils of the WingCharacteristics. Application of CAD-UNIGRAPIIICS for Modelling of Aeroplane.
• Tests in the IAE Aircraft Test Laboratory: Outer wing tests. Undercarriage statictests. Wing hinges tests.
This research has been conducted at the Institute of Aerospace Engineering as part ofthe research project "Design and Manufacturing of on Ultralight Aeroplane" and has beensupported by TU grant No. F-SS-94-
506
WORKSHOP 96 THEORY OF CONSTRUCTION
BOUNDARY LAYER WIND TUNNELAT VZLU LETftANY - PROGRESS
REPORTJ. Krai, M. Jirsak*, O. Sut.ner,
M. Tochacek, O. Lowitova
CTU, Klokner Institute, Dept. of Engineering MechanicsSolmova 7, 166 08 Praha 6,
*Thc Aeronautical Research and Testing Institute, (VZLU a.s.)Beranovych 130, 199 05 Praha 9 - Letfiany
Key words: boundary layer wind tunnel, wind engineering
A boundary layer wind tunnel has been under construction by KU CVUT and VZLUsince October 1993. This project is supported by a GA CR grant. UTAM AV CR isparticipating in the project as a consultant.
A description of the project can be found in [1,2]. The outlet parts of the tunnel behindthe test section, including a fan, were assembled and set in operation at the end of 1994.
In 1995, production and assembly of the 13.6 m long development part (in which theboundary layer is developed) was completed. The inlet part of the tunnel - consistingof a dust filter, an input segment and a nozzle - has been designed, manufactured andassembled. The inlet part is detachable. It can be moved to a special place in the tunnelhall, where it will have no influence on the return air flow in the case of the operation ofa second wind tunnel. Because elements of dust can damage wire anemometers, a dust filteris used. This filter is in front of the input segment, which an air flow turns by 45 degreesto the horizontal direction by two cascades of the blades. Then the air flow cross section isreduced by 2.6 times in the nozzle.
A test section was completed in November 1995. Parts of the construction of a smallroom for staff have been prepared. The room will be completed after installation of a testsection at VZLU. The production of adjustable ceiling panels and mechanisms for thedevelopment and testing sections are nearing completion. The assembly of all these partsshould be completed by the end of 1995.
A first version of a field of blocks (more than 12 m long) for developing an "openterrain" boundary layer type has been installed in the tunnel. The remaining parts of thedevelopment equipment (spires) are in production.
Some problems that have arisen have been discussed with specialists in Germany. Twoimportant changes in the tunnel design were made on the basis of joint discussions. Firstly,one segment of the development section was installed behind the test section to reducepressure fluctuations. The spectra of the pressure fluctuations were analysed for differentfan speeds. To remove undesirable peaks of the spectra, modifications were made to theshape of the motor frame parts. Pressure fluctuation spectra were analysed again, and newmodifications were made. These tests are being continued.
Secondly, we decided to install an adjustable ceiling along the development and testingsections. Some ceiling panels are made of wood, the others of hard aluminium sheets.
507
WORKSHOP 96 THEORY OF CONSTRUCTION
The rigid wooden panels are ligh-weight and will to be installed in the development part.They will be adjustable in the vertical direction by a mechanism driven by a transportableelectrical adapter. Metal panels will be installed in the test section. The elasticity of thesepanels is utilized for smoothing cross section changes. The vertical position of the panelsis remote controlled. Panel couplings involve axial movement and angular displacementbetween the panels. This equipment should form a boundary layer flow with constant staticpressure.
The test section is a complicated part of the tunnel. It is separated from the tunnelsections to reduce undesirable vibration. It can be fixed to the ground or separated byvibration dampers. The turntable with a diameter of 1.5 m has a ball bearing.
A 3D positioner is prepared for production. The positioner will be remote controlledby PC. Because of long delivery times for some parts, the positioner will not be ready foruse before January 1996.
New measurement equipment for differential pressure measurements is being tested. Itconsists of 32 small pressure sensors with amplifiers, an I/O card for PC, and universalsoftware for measurement control and analysis of results.
We would like to thank all co-workers from VZL0 and I<0 CVUT for their inventivecollaboration during boundary layer wind tunnel design, production and assembly.
References:
[1] JIRSAK, M. - KRAL, J.: New Wind Tunnel VZLO. Proceedings EECWE 94, Warsava1994.
[2] KRAL, J.: Atmospheric Boundary Layer Wind Tunnel for Testing Building Structures.Workshop 95, CVUT, Praha 1995.
This research has been conducted at the Klokner Institute CVUT as part of the researchproject "Boundary Layer Wind Tunnel Building up for Testing Dynamic Effects on Buildingsand Structures" and has been supported by GA CR grant No. 103/93/0765.
508
WORKSHOP 96 THEORY OF CONSTRUCTION
STIFFNESS OPTIMIZATION OFMACHINE STRUCTURES
K. Vitek, S. Holy, M. Spaniel
CTU, Fac. of Mechanical Eng., Dept. of Elasticity & Strength of MaterialsTechnicka 4, 166 07 Praha 6
Key words: optimum structure design
When modernizing of mashines the designer is often limited, in cosequence of originalconception, by requirement that some machine parts may or must remain unchangeable asthey must fit to the present design.
Fig. 1 shows a part of a machine designated to an inovation. This is the arm of anX-radiator rotating around its horizontal axis being supported with the bearings Z. Theradiator itself is located in the protective covering having the big mass and connected withthe arm in the position C where it can further rotate, supported with the bearings H.A basic constructional limitation appears to be the determined footing with the bearingsZ; the original design of the radiator covering attachment C; the modification of the armmanufacturing technology (from the casting to the welding process) and the maintaining ofa free space between the radiator and the rotation axis Z. The arm stiffness in the point Crelated to the footing Z was chosen to be the principal optimization criterion because owingto the requirement of its multiple increase was the inovation of this subset carried out.Objective function and a set of constraints represent in the optimizing process very strictrequirements with regard to computational systems. There had been necessary to appliedcalculations of the structure repeated many times using 3D FEM but such an approachwas not bearable (profitable) both from time and financial standpoints. From that reasona computational difference of less accurate models of the structure in ID (in respect to3D) were estimated and the optimizing, many times repeated, calculations were applied tothe ID models of the structure. A detailed stiffness analysis showed that the demandedstiffness parameters can not be attained in the original design and thus the optimizingmodel of the structure was extended by using further possible design variations. First ofall, the lengths x, y were gradually changed using the cross section A = const and finallythe support H was altered as well. The resulting structure shape in Fig. 2 was, after thecomputional analysis executed in ID, verified by applying the 3D model at several loadingvariations when rotating in the gravitational field. It appeared thate according to obtainedexperience it wa possible to estimate the computational difference of the ID model comparedwith the 3D model with a high accuracy and in this manner carry out the optimizingprocess. Necessary design alternations of the decisive component led to new proposals ofother original apparatuses that had not been originally taken into account. In order to obtainthe inovation optimum, i.e. objective function of the stiffness, the alternations, representingthe optimizing constraint reduction in the solution process, were necessary.
509
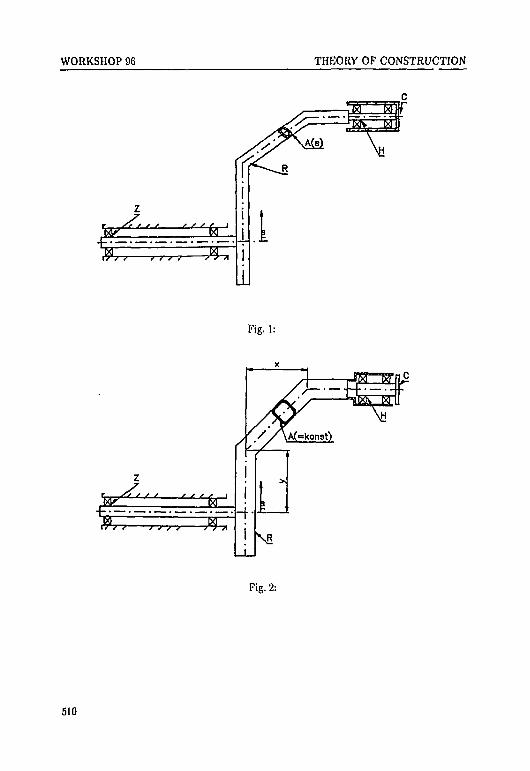
WORKSHOP 96 THEORY OF CONSTRUCTION
z
•M-
1.i
1
Fig. 1:
ba
Fig. 2:
510
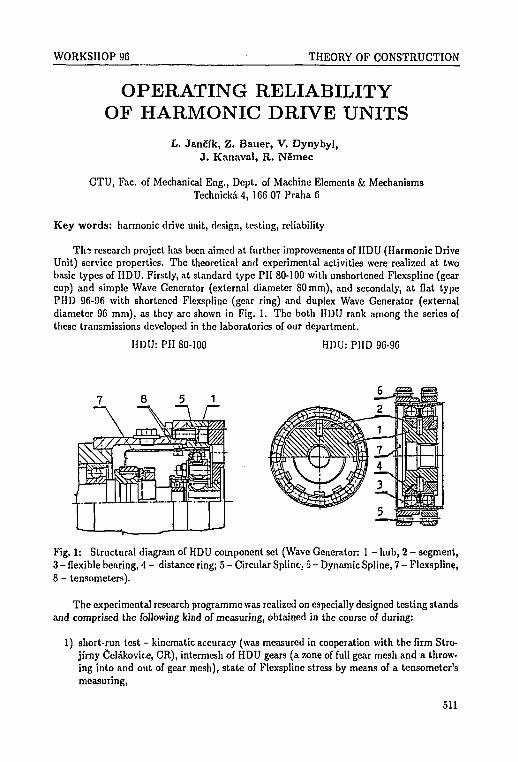
WORKSHOP 96 THEORY OF CONSTRUCTION
OPERATING RELIABILITYOF HARMONIC DRIVE UNITS
L. Jancfk, Z. Bauer, V. Dynybyl,J . Kanaval, R. Nemec
CTU, Fac. of Mechanical Eng., Dept. of Machine Elements & MechanismsTechnicka 4, 166 07 Praha fi
Key words: harmonic drive unit, design, testing, reliability
Thr: research project has been aimed at further improvements of HDU (Harmonic DriveUnit) service properties. The theoretical and experimental activities were realized at twobasic types of HDU. Firstly, at standard type PII 80-100 with unshortened Flexspline (gearcup) and simple Wave Generator (external diameter 80mm), and secondaly, at flat typePHD 96-96 with shortened Flexspline (gear ring) and duplex Wave Generator (externaldiameter 96 mm), as they are shown in Fig. 1. The both HDU rank among the series ofthese transmissions developed in the laboratories of our department.
HDU: PH 80-100 HDU: PHD 96-96
7
"A8
, "A
rgZZZrisz
i\
1\ rm%r—•pc,
P
Fig. 1: Structural diagram of HDU component set (Wave Generator: 1 - hub, 2 - segment,3 - flexible bearing, 4 - distance ring; 5 - Circular Splint., 3 - Dynamic Spline, 7 - Flexspline,8 - tensometers).
The experimental research programme was realized on especially designed testing standsand comprised the following kind of measuring, obtained in the course of during:
1) short-run test - kinematic accuracy (was measured in cooperation with the firm Stro-jirny Celakovice, CR), intermesh of HDU gears (a zone of full gear mesh and a throw-ing into and out of gear mesh), state of Flexspline stress by means of a tensometer'smeasuring,
511
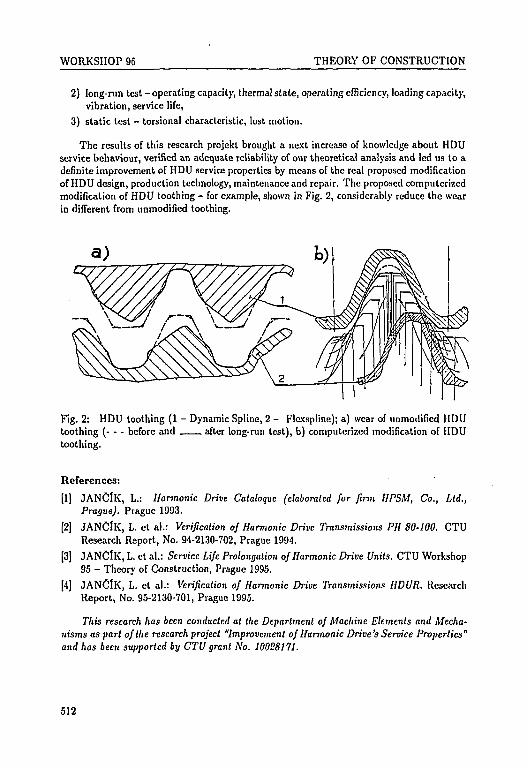
WORKSHOP 96 THEORY OP CONSTRUCTION
2) long-run test - operating capacity, thermal state, operating efficiency, loading capacity,vibration, service life,
3) static test - torsional characteristic, lost motion.
The results of this research projckt brought a next increase of knowledge about HDUservice behaviour, verified an adequate reliability of our theoretical analysis and led us to adefinite improvement of HDU service properties by means of the real proposed modificationof HDU design, production technology, maintenance and repair. The proposed computerizedmodification of HDU toothing - for example, shown in Fig. 2, considerably reduce the wearin different from unmodified toothing.
Fig. 2: HDU toothing (1 - Dynamic Spline, 2 - Flexspline); a) wear of unmodified HDUtoothing (- - - before and after long-run test), b) computerized modification of HDUtoothing.
References:
[1] JANClK, L.: Harmonic Drive Catalogue (elaborated for firm UPSM, Co., Ltd.,Prague). Prague 1993.
[2] JANCfK, L. et al.: Verification of Harmonic Drive Transmissions PH 80-100. CTUResearch Report, No. 94-2130-702, Prague 1994.
[3] JANCfK, L. et al.: Service Life Prolongation of Harmonic Drive Units. CTU Workshop95 - Theory of Construction, Prague 1995.
[4] JANCfK, L. et al.: Verification of Harmonic Drive Transmissions HDUR. ResearchReport, No. 95-2130-701, Prague 1995.
This research has been conducted at the Department of Machine Elements and Mecha-nisms as part of the research project "Improvement of Harmonic Drive's Service Properties"and has been supported by CTU grant No. 10028171.
512
WORKSHOP 96 THEORY OF CONSTRUCTION
EMBEDDED COLUMN BASEEXPERIMENTS
J. Pertold, F. Wald, Z. Sokol
CTU, Fac. of Civil Eng., Dcpt. of Steel StructuresThakurova 7, 166 29 Praha 6
Key words: Embedded, Structural design, column base, steel concrete connection, exper-iments
This paper presents an experimental research concerning embedded column bases. Thepreliminary analytical research is also included.
The main advantage of an embedded column base is the high stiffness of its steel-conciete connection. Compared to the base plate with anchor boils, during the constructionof an embedded column base there are not difficulties with the accuracy of the anchor boltplacements and assuring of the contact surface between the base plate and the concretebase. One disadvantage of this column base can be the difficulties involved in erection ofthe column, for it is necessary to fix the column into its final position until the concrete ofthe base begins lo support the column's weight.
Nine specimens were tested in the laboratory of Czech Technical University, Civil En-gineering Faculty during the year 1995. The experiments could be sorted into three sets.Each set was designed to separate the basic responses of the column base to the load. Thevertical and horizontal displacement of the specimens were measured with respect to theincreasing axial force, sheer force and bending moment.
On the first set of experiments (see Fig. lb) the bonding between the steel column (weband the flanges) and the concrete was measured.
To contrast, the bonding was excluded by use of oil on the second set of specimens (seeFig. lc) The resistance of the bottom of the concrete block against punching was examined.
The third set of specimens (see Fig. la) was loaded by a moment only, with the normalforce excluded. The deformation of the surface was measured (using strain gauges), as wellas the horizontal displacement of the column and the concrete base.
The design bending resistance model of the embedded column in the concrete foundationcan be calculated from the equilibrium between the internal concrete forces and the externalloading forces. A simplified plastic stress distribution in concrete of approximated height of0.8'Z is taken into account.
The collapse can occur by steel failure in shear or by concrete failure in bending. Theexperiments show the ways of improving a prediction model; The internal column flange iscontributing highly to the transmission of stress from steel to concrete. This occurs due tothe existence of the concrete cantilever closed between the column flanges and the columnweb. For a calculation of the concrete bearing strength in the horizontal direction, theconcentration factor could be estimated as 1.3.
A numerical simulation using the Finite Element Method is being made in progressto provide a wide sensitivity study of the main parameters of influence. The final findingshould lead to the production of a simplified method of prediction of the necessary embeddeddepth.
513
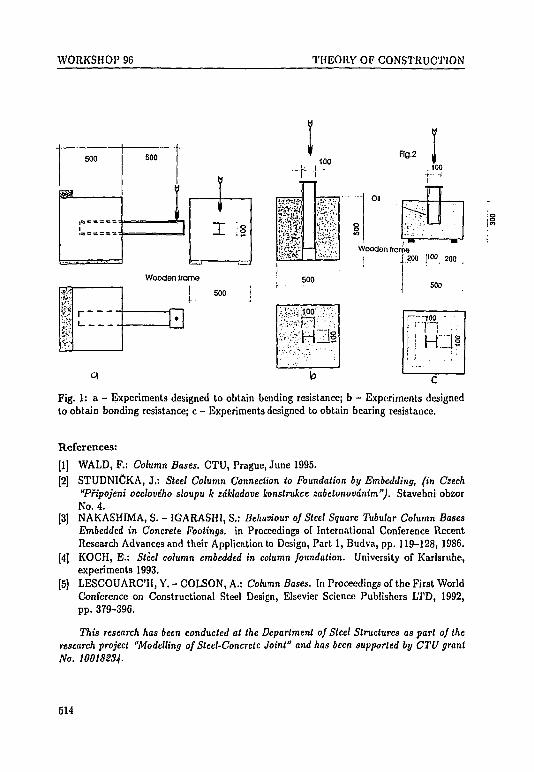
WORKSHOP 96 THEORY OF CONSTRUCTION
500
pa
]
soo
1
.,1
Wooden frame
500
100
y**y :• ' ;•.
500
Rg.2
s
on
Wooden (ra
aFig. 1: a - Experiments designed to obtain bending resistance; b - Experiments designedto obtain bonding resistance; c - Experiments designed to obtain bearing resistance.
References:
[1] WALD, F.: Column Bases. CTU, Prague, June 1995.
[2] STUDNICKA, J.: Steel Column Connection to Foundation by Embedding, (in Czech"Pripojeni ocehveho sloupu k zdkladove konstrukce zabelonovinim"). Stavebni obzorNo. 4.
[3] NAKASHIMA, S. - IGARASHI, S.: Behaviour of Steel Square Tubular Column BasesEmbedded in Concrete Footings, in Proceedings of International Conference RecentResearch Advances and their Application to Design, Part 1, Budva, pp. 119-128, 1986.
[4] KOCH, E.t Steel column embedded in column foundation. University of Karlsruhe,experiments 1993.
[5] LESCOUARC'H, Y. - COLSON, A.: Column Bases. In Proceedings of the First WorldConference on Constructional Steel Design, Elsevier Science Publishers LTD, 1992,pp. 379-396.
This research has been conducted at the Department of Steel Structures as part of theresearch project "Modelling of Steel-Concrete Joint" and has been supported by CTU grantNo. 10018S31
514
WORKSHOP 96 THEORY OF CONSTRUCTION
MATHEMATICAL MODELLING OFBUCKLING BEHAVIOR
OF SLENDER STEEL WEBS
M. Novak, O. Lowitova*
CTU, Klokner Institute, Dept. of Engineering MechanicsSolinova 7, 166 08 Praha 6,
*CTU, Klokner Institute, Dept. of Engineering StructuresSolinova 7, 166 08 Praha 6
Key words: post-buckling, repeated loading, numerical simulation, fatigue crack, patchload, FEM computer system FEAT, shape mode, imperfections
The objective of this investigation is to determine the stress state of webs subjectedto shear and operating in the post-buckled range. The study has been performed in theframework of Prague research on the "breathing" of slender webs under repeated loading.
It is well known that the post-buckling capacity of plated structures is very remarkable,and the exploitation of this feature is quite important from the point of view of the cost ofstructures. Studies of buckling and post-buckling behavior under monotonic loading havebeen performed for years in many laboratories. However, the task is far more complicatedif the loading is not monotonic. The aim of the numerical analysis was:
a) to study buckling shapes,
b) to make a numerical simulation of structural response during the experiment, in orderto determine
- the stress state, in the case of monotonic loading, and— the stress conditions in the zones of expected fatigue cracks.
Testing Specimens and Mathematical model. The investigations concerned steelgirders, as shown in Fig. 1. The web was modelled by triangular shell elements, the flangesand stiffeners by means of beams. The finite element computer system FEAT was used. Spe-cial improvements to its geometrically nonlinear analysis part were made in order to achievebetter convergeney properties and accuracy. The principal features of the calculations areas follows:
Triangular three node shell finite element with 3 displacements and 3 rotations in eachnode. DKT (Discrete Kirchhoff Theory) finite element for the plate, special finite wallelement with rotation around the axis perpendicular to the element plane (Fajman [2]).
Beam element with the same degrees of freedom in the node as the shell element.Combination of the Newton-Raphson and Arc-Length methods for the nonlinear solu-
tion procedure.Calculation of the initial stress matrix from membrane stress and axial forces in each
iteration for determination of unbalanced forces.
Numerical results. Linear buckling shape modes were computed as essential results.The critical value of the loading provides an estimation of the beginning of the "post-critical" state of the structure. In our case this first shape mode was between 41 % and
515

WORKSHOP 96 THEORY OF CONSTRUCTION
48% of the experimentally obtained bearing capacity. In the numerical modelling, the mainproblem came - as usual - from the imperfections. They influence the behavior of thestructure very strongly, namely at low levels of loading. The shape of the imperfection isalso very important. Because the displacements in the post-critical state are larger than theimperfections, the structure behaves "ordinarily" if the shape of the imperfection is smooth.However, in the case of an imperfection of complicated shape, thestructural response iscompletely different and bifurcation points can be found. Local imperfections, though notleading to buckling of the web as a whole, produce local gradients of stresses and initiatecracks or plastic zones.
In otder to gain more information about these phenomena, the response of the struc-ture to various shapes of imperfection has been modelled. The comparison of the load-displacement diagrams is shown in Fig. 2.
Fig. 1: FEM model
References:Fig. 2: Load-perpendicular displacement diagram
[1] NOVAK, M. - LOWITOVA, 0.: FEM Analysis of the Post-Buckling Behavior of SteelSlender Wtbs in Shear. Stability of Steel Structures, International Colloquium Euro-pean Session, Budapest, Hungary, September 1995, pp. 257-262.
[2] FAJMAN, P.: Geom. Nonlinear Analysis of Shells. Dissertation 1995, CTU Prague
This research has been conducted at the Department of Engineering Structures, KloknerInstitute CTU a3 part of the research project "Limit States of Steel Plate Elements Subjectto Various Regimes of Loading" and has been supported by GACR grant No. 1314 2005.
516
WORKSHOP 96 THEORY OF CONSTRUCTION
DESIGNING STEEL CONSTRUCTIONSBY FEM METHOD
P. Cihak
CTU, Fac. of Civil Eng., Dept. of HydrotechnicsThakurova 7, 166 29 Praha 6
Key words: FEM method, ANSYS, modelling
In building construction and water management practice some constructions occurwhose design represents certain problems. This applies to namely designing details withincreased spatial complexity and solution of constructions which are exposed to dynamicloads. In some cases impact load is in question, e.g. by a falling load. By applying classicaltheoretic mechanics such tasks may be solved only with difficulties. Then, there are twopossibilities left: either to construct a physical model acquiring results for the real construc-tion on the basis of mechanical similarity or to create a mathematical model. Mathematicalmodelling of constructions has gone through a marked development lately mainly becauseof its relatively fast solutions available and for economical reasons. From mathematicalmodels the most common one has become that of modelling by using a method of finalizedelements. One of the largest programme systems for the solution of these problems is rep-resented by ANSYS system which has now reached its 5.2 version. ANSYS programme isbuilt on a module basis consisting of three basic modules. These are a preprocessor by whichthe construction set-up data is developed, the proper processor with computation modules(SOLVERS) and a postprocessor; on these components a complete modern computer systemis based.
For solving dynamically loaded constructions a DYNA 3D module is applied, where 3Dstands for three dimensional modelling by using three dimensional finalized elements. Thesystem allows to solve contact problems with mutual interaction of two structural elements,e.g. two or more walls.
By using a system with DYNA 3D module Ls tasks may be solved as well in which theconstruction has suffered a rupture and it is necessary to deal with a state which will occurafter the slip limit has been exhausted.
Within the framework of a grant project we have dealt with problems of contact betweentwo or three walls and of impact stress of constructions. This problem consisted in impactload affecting a simple beam by a falling load and the impact of the fall on this load. Tomake the conditions for solving the task more difficult, the body was modelled in a shape ofa hollow vessel with several lids. The lids were screwed to the vessel's jacket. The subject ofthe solution was to establish the ultimate strength of screw connections when subjected todynamic stress during the fall of the vessel first on a solid base, later on an elastic cushion.The reaction of the elastic cushion was modelled as well by using a FED method.
The result of the modelling is the determination of ultimate load of an elastic beamsubjected to stress by a falling load and the impact of the reaction of base on the defor-mation of the vessel. The design also resulted in the determination of ultimate load of thedynamically stressed screw connections between the solid boards of the vessel's lid and itsjacket.
517

WORKSHOP 96 THEORY OF CONSTRUCTION
The most interesting result is the solution of the contact of three lids. Theoretically thisrepresents a contact problem where it is necessary to change the density and the distributionof finalized elements in the contact area. During modelling of this problem such promisingresults have been obtained which confirm a possibility of finding a solution to this or similarcontact problems as well.
This research has been conducted at the Department of Hijdrotechnics and has beensupported by CTU grant No. 10018238
518
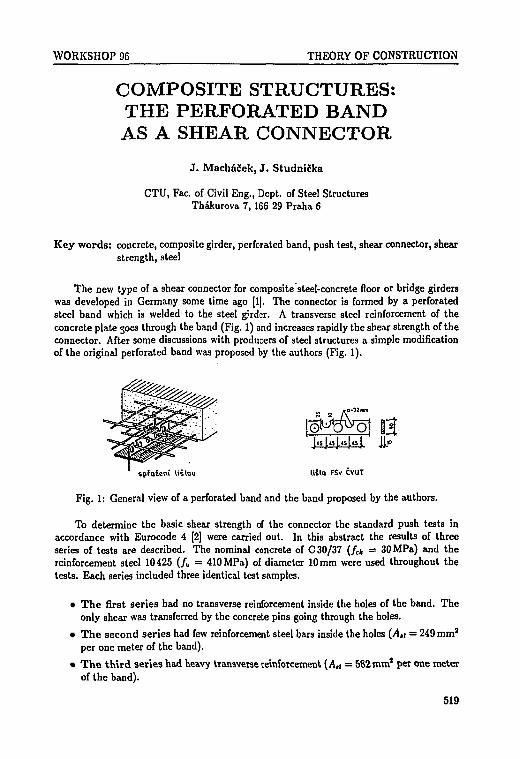
WORKSHOP 96 THEORY OF CONSTRUCTION
COMPOSITE STRUCTURES:THE PERFORATED BANDAS A SHEAR CONNECTOR
J . Machacek, J . StudniJka
CTU, Fac. of Civil Eng., Dept. of Steel StructuresThakurova 7, 1S6 29 Praha 6
Key words: concrete, composite girder, perforated band, push test, shear connector, shearstrength, steel
The new type of a shear connector for composite steel-concrete floor or bridge girderswas developed in Germany some time ago [1|. The connector is formed by a perforatedsteel band which is welded to the steel girder. A transverse steel reinforcement of theconcrete plate joes through the band (Fig. 1) and increases rapidly the shear strength of theconnector. After some discussions with producers of steel structures a simple modificationof the original perforated band was proposed by the authors (Fig. 1).
spfoieni Uitou Uilo FSv CVUT
Fig. 1: General view of a perforated band and the band proposed by the authors.
To determine the basic shear strength of the connector the standard push tests inaccordance with Eurocode 4 [2] were carried out. In this abstract the results of threeseries of tests are described. The nominal concrete of C 30/37 (/c* = 30 MPa) and thereinforcement steel 10425 (/„ = 410 MPa) of diameter 10 mm were used throughout thetests. Each series included three identical test samples.
• T h e first series had no transverse reinforcement inside the holes of the band. Theonly shear was transferred by the concrete pins going through the holes.
• The second series had few reinforcement steel bars inside the holes (A,t = 249 mm2
per one meter of the band).
• T h e th i rd series had heavy transverse reinforcement (A,t = 582 mm1 per one meterof the band).
519
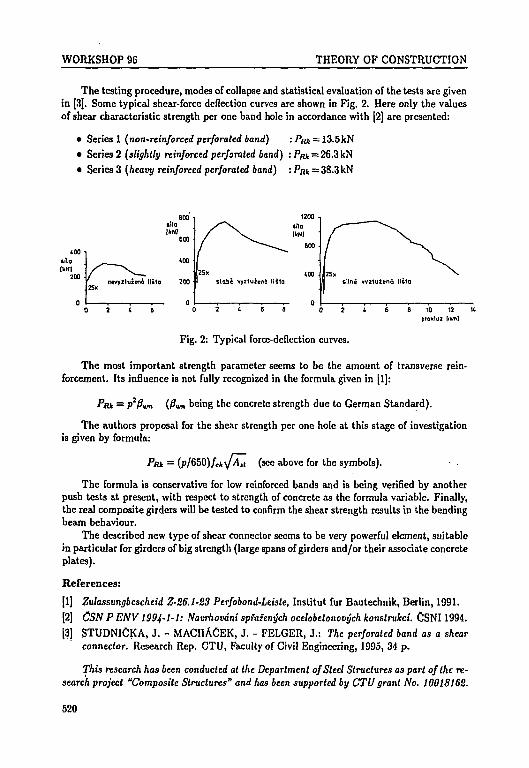
WORKSHOP 96 THEORY OF CONSTRUCTION
The testing procedure, modes of collapse and statistical evaluation of the tests arc givenin [3], Some typical shear-force deflection curves are shown in Fig. 2. Here only the valuesof shear characteristic strength per one band hole in accordance with [2] are presented:
• Series 1 (non-reinforced perforated band) :/>fi* = 1
• Series 2 (slightly reinforced perforated band) : P w = 2
• Series 3 (heavy reinforced perforated band) : Put, = 38.3 kN
8 10 12 V.proktuz Imml
Fig. 2: Typical force-deflection curves.
The most important strength parameter seems to be the amount of transverse rein-forcement. Its influence is not fully recognized in the formula given in [1]:
•PR* = p2/?um (/?<«> being the concrete strength due to German Standard).
The authors proposal for the shear strength per one hole at this stage of investigationis given by formula:
•PR* = (p/650)fck\jA,t (see above for the symbols). • .
The formula is conservative for low reinforced bands and is being verified by anotherpush tests at present, with respect to strength of concrete as the formula variable. Finally,the real composite girders will be tested to confirm the shear strength results in the bendingbeam behaviour.
The described new type of shear connector seems to be very powerful element, suitablein particular for girders of big strength (large spans of girders and/or their associate concreteplates).
References:
[1] Zulassungbescheid Z-S6.1-23 Perfobond-Leiste, Institut fur Bautechnik, Berlin, 1991.[2] CSN P ENV1994-1-1: Navrhovani spfazenych ocelobetonovych konstrukci. CSNI1994.[3] STUDNICKA, J. - MACHACEK, J. - FELGER, J.: The perforated band as a shear
connector. Research Rep. CTU, Faculty of Civil Engineering, 1995, 34 p.
This research has been conducted at the Department of Steel Structures as part of the re-search project "Composite Structures" and has been supported by CTU grant No. 1001816S.
520

Section 9
MATERIALS SCIENCE
IN MECHANICAL ENGINEERING
NEXT PAGBfS)
WORKSHOP 96 MATERIALS SCIENCE IN MECHANICAL ENGINEERING
APPLICATION OF IMAGE ANALYSISON THE EVALUATION OF
STRUCTURES OF Ni-SUPERALLOYS,STEEL AND CERAMICS
J. KrejJi, J. Krejfova*, J. Bfezina**,J. Smutna**, D. Janova
TU, Fac. of Mechanical Eng., Institute of Materials EngineeringTechnicka 2, 616 69 Brno
*TU, Fac. of Mechanical Eng., Institute of TechnologyTechnicka 2, 616 69 Brno
"Institute of Physics of Materials,Zizkova 22, 616 62 Brno
Key words: image analysis, structure, Ni, superalloys, steel, ceramics
The project was proposed for ona year with the aim to introduce the image analysis asvaluable tool in structure evaluation and measurement. The materials and procedures werechosen so that the results can be used in other research projects and teaching. The softwareused was the ScreenMeasurement provided by LIM.
The materials used were Ni-Cr-Al alloys, Ni-Cr plasma coatings on Al substrate, Ni2oCrpowder used for plasma spraying, Ni based superalloys CMSX-3, and various ceramic coat-ings plasma sprayed on steel substrates. The study of the structures of ferritic steels isanticipated. Both, on-line evaluation from light microscope Zeiss Neophot 32 and off-lineevaluation from micrographs obtained in SEM and TEM, were employed. The applicationof image analysis for assessment of selected area electron diffrac tion patterns is being devel-oped. The image analysis is also used to measure the shape change of Taylor test specimens.These specimens are impacted onto the rigid anvil and their final dimensions and shape areused to determine the dynamic mechanical properties. Common problem accompanying theapplication of image analysis regardless of material, is specimen preparation. Especially,when different materials comprise one specimen, metallography preparation is crucial. Thepreparation of metallography specimens from plasma sprayed coatings require special pro-cedure for each pair of materials. [1]. Some material combinations cannot be manually, andtesting different condition for automatic specimen preparation is time consuming. Nonethe-less, relatively "easy" materials like Ni-based superalloy or Ni-Cr-Al alloys may also posesome problems. Transmission electron micrographs of the structure containing 7 and 7'phases are difficult to obtain with uniform contrast. In some cases, 7 — 7' interface cannotbe resolved under ordinary imaging conditions, and suitable dark field must be find.
In all instances, evaluated recently, both manual count and semi — or full automaticimage analysis were used. The aim was to compare results and find the limits were image au-tomatic analysis could be treacherous. We are glad to report that all results coincide withinthe experimental errors. The measurement was done on 7' phase particles in superalloy, 7'phase particles in Ni-Cr-Al alloy with varying size and shape (subjected to different heat
523

WORKSHOP 96 MATERIALS SCIENCE IN MECHANICAL ENGINEERING
treatments), porosity in thermal spray coatings (NiCr, Mo, hydroxyapatite, Ni etc. on steelsubstrates), and NiCr powder used for plasma spraying. Electron diffraction patterns couldbe evaluated in two ways, namely, by the direct measurement of length (spot position) andangles, or by comparison with previously indexed patterns. The second method requiresgradual building of the library of typical diffraction patterns. The length changes and shapeof impacted specimens (Taylor test) are basic data necessary for determination of dynamicyield stress. The final shape of specimen is mushroom-like and usually is determined bymanual measurement. The software makes possible not only the measurement on the screenbut also the suitable image storage and transfer of the results to other software packages.The results acquired in the frame of the project are used for teaching and in many otherresearch projects.
References:
[1] Advanced Materials k Processes 148 (1995) No.l.
[2] KREJCOVA, J.: Vyuziti obrazove analijzy Screen Measurement pfi hodnoceni porozitypovlaku zdrovych materildli. Seminar LIM 1995, Praha 1.6.1995
This research has been conducted at the Institute of Material Engineering as part ofthe research project "Application of Image Analysis on the Evaluation of Structures of NiSuperalloys, Steels, and Ceramics" and has been supported by TU grant No. FMES59577.
524
WORKSHOP 96 MATERIALS SCIENCE IN MECHANICAL ENGINEERING
THE PREPARATION OF THIN FOILSFOR TRANSMISSION ELECTRONMICROSCOPY BY ION MILLING
Z. Vojtkulakova, J . Krejfi
TU, Fac. of Mechanical Eng., Institute of Materials EngineeringTechnicka 2, 616 69 Brno
Key words: thin foils, ion gun, phase identification, specimen preparation, ion sputtering,ion source, incident angle, transmission electron microscopy
Transmission electron microscopy is powerful tool of material science. It allows thestructure studies, phase identification, microanalysis, etc. The specimen preparation is es-sential for reliable results. It has to satisfy to requirements: transparency and unchangingof structure originally present in the material, For metals and alloys electrolytic thinning ismost popular method. For nonconductive materials, many techniques were tried (ultrami-crotome, cleavage, etc) but it seems that only ion bom bardment meet both conditions. Evenwhen conductive materials are concerned, there are many instances when electrolytic thin-ning is not suitable. For example composite materials, specimens containing two differentmaterials joined. The difficulties always arise when we attempt to thin material containingconstituents differing considerably in conductivity, hardness, chemical properties etc. Thusfor some materials (ceramics, composites, high speed steels, gray cast irons, especially withnodular graphite, explosive weldments, thermal spray coatings) the ion sputtering is theonly possible method for the last stage of foil preparation. The objective of the project hasbeen the development of methods for thin foil preparation these materials with ion gun IV3.
The process of thinning in the ion gun depend on a number of parameters: acceler-ating voltage, vacuum quality, current, gas pressure, angle of ion beam incidence etc. Itshowed it is impossible to operate relatively obsolete apparatus 1V3 so that it can be usedfor routine thin foil preparation. During the second year of the project, necessary fixingand modifications of the apparatus were performed. The vacuum system was checked andsealed and the apparatus became at last operational. Nevertheless, the apparatus embodyvacuum system with pumping speed around 351/s and this capacity showed insufficient forour purposes. For full operation, the ion milling apparatus would require around 1501/s.The results, therefore, were not satisfactory although experiments were extensive. Otherapplic ations, like cleaning of the surface of ceramics yielded satisfying results. To gainsome experience and to start to produce transparent thin foils for other research projects,experiments have been done simultaneously on new equipment (Edwards) installed at theInstitute of Physics of Materials. Two types of specimens were used. First we prepared thinfoils from explosive weldment of copper and carbon steel. After some labouring the optimalconditions were found to be: ion source voltage: 6 kV; ion source current: 1 rnA; specimencurrent: 50 fim; incident angle 20° (5 hours) and 5" (1.5 hour). These foils were examinedin a Philips CM12 STEM with EDAX 9900 ultra thin window X-ray microanalyzer. Anexample of the structure in mixed zone is in Fig. 1. This micrograph correspond to theregion containing nonequilibrium alloy Cu+Fe (Fig. 2)
525
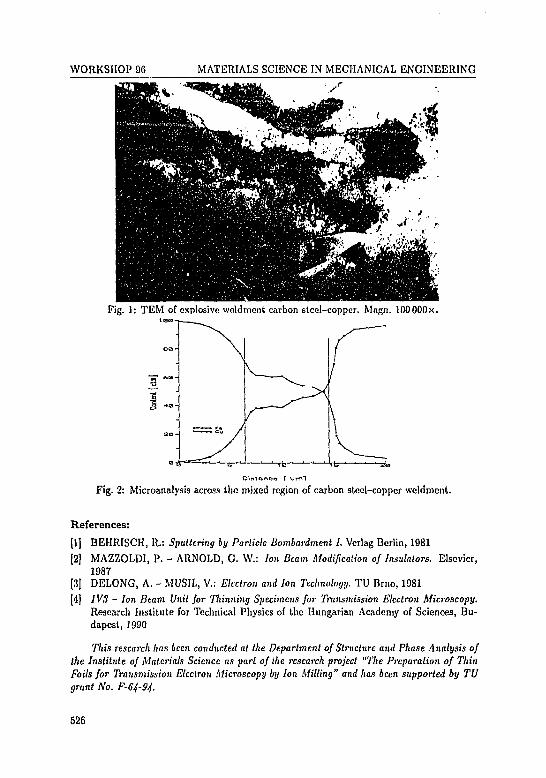
WORKSHOP 96 MATERIALS SCIENCE IN MECHANICAL ENGINEERING
Fig. 1: TEM of explosive; weldment carbon steel-copper. Magn. lOOOOOx.
Distance T umi
Fig. 2: Microanalysis across the mixed region of carbon steel-copper weldment.
References:
[1] BEHRISCH, R.: Sputtering by Particle Bombardment I. Verlag Berlin, 1981
[2] MAZZOLDI, P. - ARNOLD, G. W.: Ion Beam Modification of Insulators. Elsevier,1987
[3] DELONG, A. - MUSIL, V.: Electron and Ion Technology. TU Brno, 1981
[4] IV3 - Ion Beam Unit for Thinning Specimens for Transmission Electron Microscopy.Research Institute for Technical Physics of the Hungarian Academy of Sciences, Bu-dapest, J990
This research has been conducted at the Department of Structure and Phase Analysis ofthe Institute of Materials Science as part of the research project "The Preparation of ThinFoils for Transmission Electron Microscopy by Ion Milling" and has been supported by TUgrant No. F-6J-9J.
526
WORKSHOP 96 MATERIALS SCIENCE IN MECHANICAL ENGINEERING
CONTRIBUTION TO THE STUDY OFGUINIER-PRESTON ZONES
BY MEANS OF HIGH RESOLUTIONELECTRON MICROSCOPY
M. Karlfk, B. Jouffrey*
CTU, Fac. of Nucl. Sci. & Phys. Eng., Dcpt. of MaterialsTrojanova 13, 120 00 Praha 2, Czech Republic
*Ecole Centrale Paris, LMSS-Mat92295 Chatenay-Malabry, France
Key words: Al-Cu alloy, Al-Cu-Mg-Mn alloy, GP zones, electron microscopy, contrast,multislice simulations, tomographic atom probe, solid solution
Guinier-Preston (GP1) zones, small clusters of alloying elements, are known to form inthe first stages of lh.e decomposition of solid solution. They are disc shaped in the Al-Cubased alloys, being only one atomic layer thick in the majority of cases.
We studied these GP1 zones in the model alloy Al-Cu Avit.% and in the industrial alloyAl-Cu4.4-Mgl.5-Mn0.6 wt.% (AA 2024) by means of high resolution electron microscopy.The experimental images in [100] and [110] crystal axes are interpreted using multislicesimulations [1].
A local analysis of the Cu content in the GP1 zones by means of X ray emission excitedby a nanoprobe of electrons from field emission gun was made. We used a simple modelto interpret the results. The copper concentration turned out to be 50-100%. A three-dimensional cartography of the distribution of copper atoms in the binary alloy has beenobtained by means of the tomographic atom probe [2].
The majority of the GP1 zones in the Al-Cu4wt.% alloy aged at 373 K for 10 hoursconsist of atomic monolayers, the disc diameter ranging from 4 to 10 nm. In the same alloywe found also double layer GP1 zones. The GP1 zones in the industrial alloy Al-Cu-Mg-Mn(AA 2024) in the T3 temper (solution annealed, quenched, pre-strained 2 % and naturallyaged for more than 2 years) have the same form as those observed in the binary alloy.
The contrast of the GP1 zones is strongly dependent on their size, on the foil thickness,on the defocus of the objective lens (Fig. 1) and less sensitive to their internal structure (Cucontent) and to the position of the GP1 zone in the depth of the foil. In certain conditions,we observed also a very strong contrast of the GP1 zones. This contrast is explained bythe channelling of electrons along the copper rich columns in the GP1 zone. The heavycopper atoms collect, due to their stronger electrostatical potential, more electrons from theincident beam than the light aluminum atoms in the adjacent matrix.
We observed, in the [110] zone axis orientation, shearing of a GP1 zone by a dislocation.We propose a simple model of strengthening by the GP1 zones, related to the yield stress,
The results obtained by means of the tomographic atom probe show that the matrixsurrounding GP1 zones is still rich in copper. The distribution of Cu atoms in the solutionis not homogeneous. In the vicinity of the GP1 zones (several angstroems), the matrix is
527
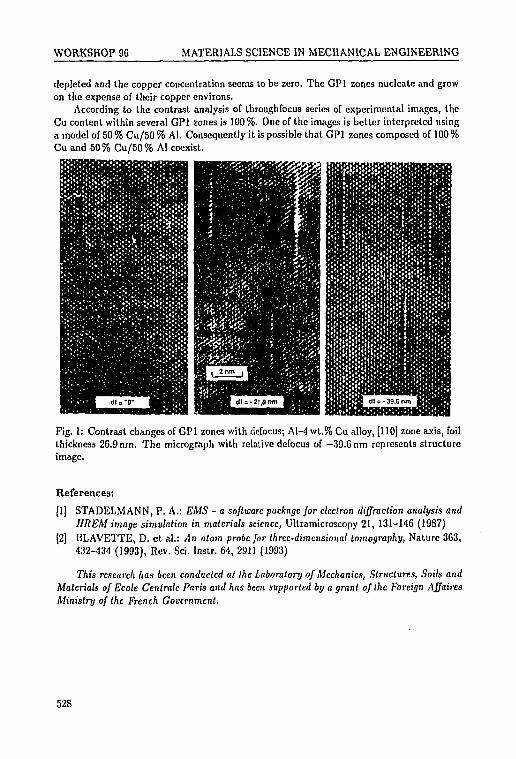
WORKSHOP 96 MATERIALS SCIENCE IN MECHANICAL ENGINEERING
depleted and the copper concentration seems to be zero. The GP1 zones nucleate and growon the expense of their copper environs.
According to the contrast analysis of throughfocus series of experimental images, theCu content within several GPl zones is 100 %. One of the images is better interpreted usinga model of 50 % Cu/50 % Al. Consequently it is possible that GPl zones composed of 100 %Cu and 50 % Cu/50 % AI coexist.
Fig. 1: Contrast changes of GPl zones with dcfocus; Al-4 wt.% Cu alloy, [110] zone axis, foilthickness 26.9 nm. The micrograph with relative defocus of -39.6 nm represents structureimage.
References:
[1] STADELMANN, P. A.: EMS - a software package for electron diffraction analysis andHREM image simulation in materials science, Ultramicroscopy 21, 131-146 (1987)
[2] BLAVETTE, D. et al.: An atom probe for three-dimensional tomography, Nature 363,432-434 (1993), Rev. Sci. Instr. 64, 291] (1993)
This research has been conducted al the Laboratory of Mechanics, Structures, Soils andMaterials of Ecole Centralc Paris and has been supported by a grant of the Foreign AffairesMinistry of the French Government.
528
WORKSHOP 96 MATERIALS SCIENCE IN MECHANICAL ENGINEERING
UPGRADE OF SEM ANALYTICCOMPLEX BY POSSIBILITY
OF ADVANCED NUMERICALDATA PROCESSING
D. Janova, J . Svejcar
TU Brno, Faculty of Mechanical Engineering, Institute of Material ScienceTechnicka. 2, 616 69 Brno
Key words: scanning electron microscopy, curve fitting, digital image processing, imagepresentation, surface reconstruction
The project "Increase of cxploitability of the SEM analytic complex JXA 840 A" wasaimed generally at improving the measurement data analysis by providing a link betweenthe microscopic complex and a PC-type computer and at applying modern numerical dataprocessing methods. The main problems met and solved in frame of the project were: 1)format conversion of data from the LINK format used by the measuring complex into the MS-DOS format, 2) hardware configuration selection and installation, 3) program developmentor selection of suitable software packages for analysis and presentation of the particulartypes of measurement data, 4) routinely usable implementation of the surface calculation,based on couples of stereo images.
As for providing the link between the measuring complex and the PC computer, theonly feasible way turned out to be the data transfer via external media. Nevertheless, theLINK data format is not compatible with MS-DOS format; after consulting many differentsources, a functioning data conversion program has been provided [4],
The initial equipment available consisted of a 386/20 MHz/4 Mbyte computer in 1994.A substantial upgrade was made in frame of cooperation with the Faculty of El. Eng. andComp. Sci. [9] turning the computer into a 486/66 MHz/20 Mbyte machine and providinga high resolution HP-LJ4P laser printer. This equipment provided sufficient power to solvesome data processing tasks as needed e.g. in the projects [5-8] as well as to implement asimpler version of stereo analysis programmed in the Borland PASCAL language. Neverthe-less, implementing the stereo analysis package in MATLAB environment was at the edge ofpossibilities of the system without providing sufficient space for further development. Theprice/performance analysis showed that the PC-based hardware is for the given purposepresently advantageous over workstations; joining the means of this and other projects, itwas possible to exchange the hardware for a new Pentium/90 MHz/32 Mbyte system in 1995.
The initial program development in frame of the project has been done in the BorlandPASCAL environment. In 1994 it has been decided to switch to the MATLAB environmentutilizing both its general purpose core and the available specialized toolboxes. So far, thecore MATLAB package has been provided. Concerning the hardcopy presentation of images,a way [10] of a reasonable quality image print has been verified.
The main part of the work in frame of the project has been devoted to implementingthe original approach to stereo analysis, as described in [1, 2], enabling to calculate the
529

WORKSHOP 96 MATERIALS SCIENCE IN MECHANICAL ENGINEERING
surface of microscopic samples on the basis of stereo couples of images. Nine versions of thePASCAL based program systems have been worked out, gradually improving both the speedand reliability of surface determination as well as the friendliness of the user interface. Thelast version includes also the automatic measurement geometry identification in a simplifiedform. All the versions worked with image data matrices of 256 x 256 pixels obtained bydecimating the original data. The height data provided are substantially more reliable thanthe results of the firmware that provides totally chaotic results under common conditions.
In 1995, most of the work on this implementation was devoted to switching to MATLABenvironment which enabled working with the original image matrices 512 x 512 pixels. Inthis frame, a set of specialized procedures has been developed, namely for testing differenttypes and modifications of disparity analysis (5 versions), for deriving parametric images,procedures for surface calculation and for statistical identification of the measurement ge-ometry based on histogram of the directional disparity field. Even difficult images withlarge areas of low variance could be successfully analyzed. Presently, a user friendly versionof the program package is being prepared.
References:
[1] JANOVA, D. - JAN, J.: Improvements in surface reconstruction from stereo pairs ofimages provided by scanning electron microscope. Proc. of Japan-Central Europe JointWorkshop on Advanced Computing in Engineering, (in print), Polish Ac. Sci., Pultusk(Poland) 1994.
(2] JANOVA, D. - JAN, J.: Robust Surface Reconstruction from Stereo SEM Images. In:V. Hlavac, R. Sara (eds.): Lecture Notes in Computer Science no. 970 (Proc. CAIP'95),Springer Verlag 1995, pp. 900-905.
[3] JANOVA, D. - JAN, J.: Robust surface reconstruction based on electron scanning mi-croscope stereo images. Proc. MEASUREMENT'95, Slovak Ac. Sci., Smolenice (Slo-vakia) 1995, p. 104
[4] Firm SOFO: Personal communication.
[5] Project COST No. 504
[6] SVEJCAR, J. - JANOVA, D. - ZEMAN, J. - CEPERA, M.: Struktura ZrO2 povlakutepetnych barter ajeji zmeny v prubehu cyklickeho ohrevu. Proc. of seminar Prostorovemodely struktury a mikromechanika lomu (TU Brno k Slovak Ac. Sci.), Brno 1995
[7] JANOVA, D.: Instability of electron beam current and compensation of its influenceon quantitative analysis. Proc. MCEM'93 (Multinational Congress on Electron Mi-croscopy), Parma (Italy) 1993.
[8] JANOVA, D.: Kompensace nestability proudu primarniho svazku v elektronovem ras-trovacim mikroskopu. Hutnicke listy No. 7-8, 1994, pp. 71-77
[9] VACLAVIK, V.: Personal Communication.
[10] KILIAN, P.: Personal Communication.
The project was supported by the grant No. FP359438 of the Faculty of MechanicalEngineering, TU Brno and partly also by the grant No. C-9J/2S (FUS5009) of the rector'sgrant agency of the Technical University Brno.
530
WORKSHOP 96 MATERIALS SCIENCE IN MECHANICAL ENGINEERING
DEVELOPMENTS IN ROBUSTSURFACE RECONSTRUCTIONFROM STEREO SEM IMAGES
D. Janova, J. Jan*
TU Brno, Faculty of Mechanical Engineering, Institute of Material ScienceTechnicka 2, 616 69 Brno
*TU Brno, Fac. of Electrical Eng. and Comp. Science, Dept. of Biomedical EngineeringPurkynova 91a, 612 00 Brno
Key words: scanning electron microscopy, stereo vision, disparity analysis, surface recon-struction
The last year developments in a robust method providing quantitative surface descrip-tion of microscopic samples from scanning electron microscope based on disparity analysisin stereoscopic couples of microscopic images are described. The new contributions are:disparity analysis using vector grey level registration based on vector angle minimisation(rather than on correlation or distance minimisation) in comparison with a feature matchingapproach, the effective implementation of the disparity map calculation and the identifica-tion of measuring geometry based on statistical processing of the disparity matrices. Thepresented approach is distinguished from most current stereo work by not imposing anyconstraints concerning the computed surface while still keeping the computational demandsat a reasonable level for the application.
After the previous work, there remained two main problems in SEM stereo analysis. Thedisparity analysis had to be sufficiently robust to cope with often unfavourable conditionsin SEM imaging. With respect to the high variety oC the analysed scenes, it was undesirableto impose any a priori constraints to the calculated surface shapes which excluded manyotherwise useful simplifications. The second problem concerned the real geometry of aparticular measurement the identification of which can only be based on noisy disparitymatrices as the real situation differs substantially from the expected one due to mechanicalimperfections of the support working in micrometer domain.
An extensive experimental comparison of different criteria, as applied to SEM stereoimages, has been made. Both basic groups of the '.riteria, i.e. grey level and featurebased matching were tried. No better criterion has been found in the first group comparingdefined image areas than to minimise the angle between the multidimensional vectors a andb, describing the two areas by ordered sets of pixel values, or to maximise its cosine
a&/[|a||6|). (1)
The advantage of the criterion is its insensitivity to different intensity and contrast ofboth images but even in well exposed couples it gave definitely the least error rate amongall the more common criteria including correlation and covariance or Euclidean and otherdistances.
531
WORKSHOP 96 MATERIALS SCIENCE IN MECHANICAL ENGINEERING
In the group of feature based criteria, particular attention has been devoted to thecombined criterion described in [1] that obviously worked well in practical tasks and issubstantially less demanding computationally but until now the achieved error rate was toohigh.
Unfortunately, the criterion (1) is rather demanding so that a well organized compu-tation is needed to achieve reasonable computing times. The basic idea is to start witha sparse "layer" of possibly not too precise but reliable pairs of points and to proceed tomore dense "layers" based on the previous ones as estimates. The influence of sequencesof the layer parameters was in a greater detail estimated in [3]. There is unfortunately noformalised clue to an optimum design so that only intuitive experimental approach was usedto determine a reasonable sequence of the "layers" with appropriate parameters. In this waydetermined sequence has led to cutting the computing time by more than one decimal order.
As already mentioned, the tilt axis is both shifted and rotated with respect to itsexpected position. There are no direct means to determine the real axis position so thatit must be estimated from the vector field of disparity. In the previous work [2] the axiswas interactively placed to the line with maximum zero disparity vectors. In practical casessuch an estimate may be unreliable; therefore a new formalized method to identify themeasurement geometry has been introduced. It is based on statistical analysis of 2-D fieldof "rectified" disparity direction as described in detail in [5].
After implementing the mentioned improvements, the analysis became usable routinelyand its processing time is already in the acceptable range comparable with the time requiredto gather the microscopic image data. Also, the location of the tilt axis is determined fullyautomatically thus removing the last interactive step.
References:
[1] PAAR, G.: Robust Disparity Estimation in Terrain Modelling for Spacecraft Naviga-tion. Proc. 11th Intern. Conf. on Pattern Recognition, I APR 1992.
[2] JANOVA, J.: Reliable Surface Reconstruction from Stereo Pairs of Images Providedby Scanning Electron Microscope. Czech Journal of Physics, Vol. 44 (1994), No. 3,pp. 255-260.
[3] JANOVA, D. - JAN, J.: Improvements in surface reconstruction from stereo pairs ofimages provided by scanning electron microscope. Proc. of Japan-Central Europe JointWorkshop on Advanced Computing in Engineering (in print), Polish Ac. Sci., Pultusk(Poland) 1994.
[4] JANOVA, D. - JAN, J.: Robust surface reconstruction based on electron scanning mi-croscope stereo images. Proc. MEASUREMENT'95, Slovak Ac. Sci., Smolenice (Slo-vakia) 1995, pp. 104.
[5] JANOVA, D. - JAN, J.: Robust Surface Reconstruction from Stereo SEM Images. In:Hlavac V., Sara R. (eds.): Lecture Notes in Computer Science No. 970 (Proc. CAIP'95),Springer-Verlag 1995, pp. 900-905.
[6] JANOVA, D. - JAN, J.: Robust surface reconstruction from stereo SEM images. Proc.of MCEM'95 (multinational congress on electron microscopy), High Tatras (Slovakia)1995, pp. 223-224.This project was supported by the grant no. C-94/SS (FU 35009) of the rector's grant
agency of the Technical University Brno and partly also by the grant No. 102/94/0374 ofthe Grant Agency of the Czech Republic.
532
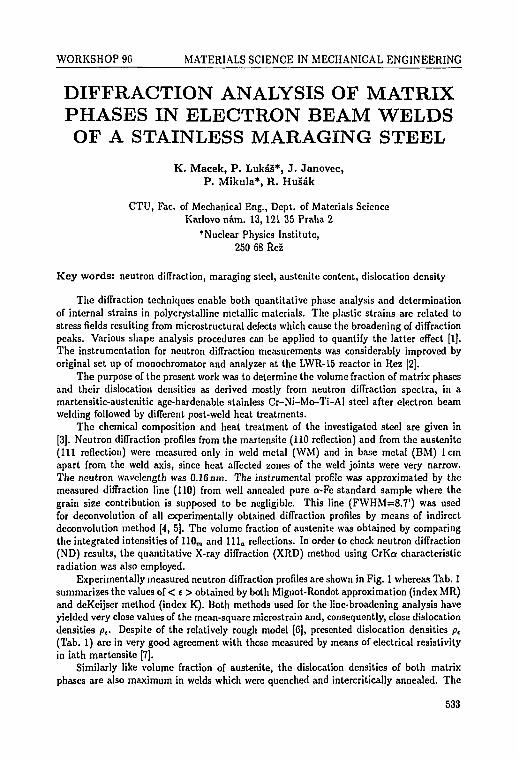
WORKSHOP 96 MATERIALS SCIENCE IN MECHANICAL ENGINEERING
DIFFRACTION ANALYSIS OF MATRIXPHASES IN ELECTRON BEAM WELDSOF A STAINLESS MARAGING STEEL
K. Macek, P . Luka§*, J . Janovec,P . Mikula*, R. HuSak
CTU, Fac. of Mechanical Eng., Dept. of Materials ScienceKarlovo nam. 13, 121 35 Praha 2
*Nuclear Physics Institute,250 68 Rez
Key words: neutron diffraction, maraging steel, austenite content, dislocation density
The diffraction techniques enable both quantitative phase analysis and determinationof internal strains in polycrystalline metallic materials. The plastic strains are related tostress fields resulting from microstructural defects which cause the broadening of diffractionpeaks. Various shape analysis procedures can be applied to quantify the latter effect [1].The instrumentation for neutron diffraction measurements was considerably improved byoriginal set up of monochromator and analyzer at the LWR-15 reactor in Rez [2].
The purpose of the present work was to determine the volume fraction of matrix phasesand their dislocation densities as derived mostly from neutron diffraction spectra, in amartensitic-austenitic age-hardenable stainless Cr-Ni-Mo-Ti-Al steel after electron beamwelding followed by different post-weld heat treatments.
The chemical composition and heat treatment of the investigated steel are given in[3]. Neutron diffraction profiles from the martensite (110 reflection) and from the austenitc(111 reflection) were measured only in weld metal (WM) and in base metal (BM) lcmapart from the weld axis, since heat affected zones of the weld joints were very narrow.The neutron wavelength was 0.16 nm. The instrumental profile was approximated by themeasured diffraction line (110) from well annealed pure a-Fe standard sample where thegrain size contribution is supposed to be negligible. This line (FWHM=8.7') was usedfor deconvolution of all experimentally obtained diffraction profiles by means of indirectdeconvolution method [4, 5]. The volume fraction of austenite was obtained by comparingthe integrated intensities of 110m and l l l a reflections. In order to check neutron diffraction(ND) results, the quantitative X-ray diffraction (XRD) method using CrKa characteristicradiation was also employed.
Experimentally measured neutron diffraction profiles are shown in Fig. 1 whereas Tab. 1summarizes the values of < £ > obtained by both Mignot-Rondot approximation (index MR)and deKeijser method (index K). Both methods used for the line-broadening analysis haveyielded very close values of the mean-square microstrain and, consequently, close dislocationdensities pc. Despite of the relatively rough model [6], presented dislocation densities p,(Tab. 1) are in very good agreement with those measured by means of electrical resistivityin lath martensite [7].
Similarly like volume fraction of austenite, the dislocation densities of both matrixphases are also maximum in welds which were quenched and intercritically annealed. The
533
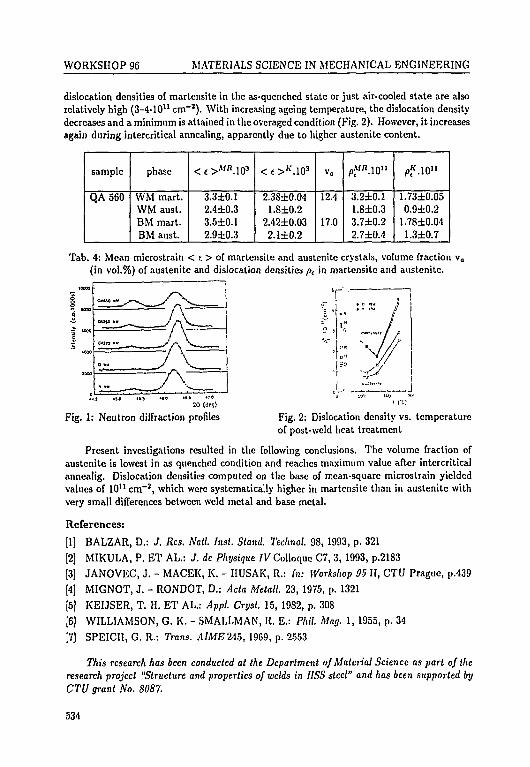
WORKSHOP 96 MATERIALS SCIENCE IN MECHANICAL ENGINEERING
dislocation densities of martensite in the as-quenched state or just air-cooled state are alsorelatively high (3-4-1011 cm"2). With increasing ageing temperature, the dislocation densitydecreases and a minimum is attained in the overaged condition (Fig. 2). However, it increasesagain during intercritical annealing, apparently due to higher austenite content.
sample
QA560
phase
WM mart.WM aust.BM mart.BM aust.
< e >M f i .103
3.3±0.12.4±0.33.5±0.12.9±0.3
< c >K.1O3
2.38±0.041.8±0.2
2.42±0.032.1 ±0.2
v«
12.4
17.0
pJf/l.10n
3.2±0.11.8±0.33.7±0.22.7±0.4
/>*.10"
1.73±0.050.9±0.2
1.78±0.041.3±0.7
Tab. 4: Mean microstrain < e > of martensite and austenitc crystals, volume fraction va
(in vol.%) of austenite and dislocation densities p , in martensite and austenitc.
I s»
* L i20 (detj)
Fig. 1: Neutron diffraction profiles Fig, 2: Dislocation density vs. temperatureof post-weld heat treatment
Present investigations resulted in the following conclusions. The volume fraction ofaustenite is lowest in as quenched condition and reaches maximum value after intercriticalannealig. Dislocation densities computed on the base of mean-square microstrain yieldedvalues of 10" cm"3, which were systematically higher in martensite than in austenite withvery small differences between weld metal and base metal.
References:
[1] BALZAR, D.: J. Res. Natl. Inst. Stand. Technol. 98, 1993, p. 321
[2] MIKULA, P. ET AL.: J. de Physique IV Colloque C7, 3, 1993, p.2183
[3] JANOVEC, J. - MACEK, K. - HUSAK, R.: In: Workshop 95II, CTU Prague, p.439
[4) MIGNOT, J. - RONDOT, D.: Ada Metall. 23, 1975, p. 1321
[5] KEIJSER, T. H. ET AL.: Appl. Cryst. 15, 1982, p. 308
[6] WILLIAMSON, G. K. - SMALLMAN, R. E.: Phil. Mag. 1, 1955, p. 34
[7] SPEICH, G. R.: Trons. AIME245, 1969, p. 2553
This research has been conducted at the Department of Material Science as part of theresearch project "Structure and properties of welds in IISS steel" and has been supported byCTU grant No. 8087.
534

WORKSHOP 96 MATERIALS SCIENCE IN MECHANICAL ENGINEERING
COMPUTER PROCESSINGOF NDT INDICATION
L. Ptacek, M. Druckmuller*, Z. Kukla
TU of Brno, Fac. of Mechanical Eng., Dept. of Materials Eng.Technicka 2, 616 69 Brno
*TU of Brno, Fac. of Mechanical Eng., Dept. of MathematicsTechnicka 2, 616 69 Brno
Key words: something, anything, nothing
The development of radiological methods in the field of NDT is greatly affected byefforts to limit as much as possible the application, of radiogt&phic methods and to replaceX-ray indication (on a film) by a new, qualitatively higher form of recording. Doing awaywith the film recording of an X-Ray image brings some important advantages:
1. There is no lengthy negative process or defects that may appear in the course of thenegative process (artefacts in radiographs).
2. The possibility of real-time radiological testing.
3. A marked improvement in the economy of testing (there are no expenses on films,baths, dark-room operator, documentation and storing of test results are simpler).
4. The process of testing is made faster.
Most promising in the development of film-free indication seem to be skiascopic methodswith a highly sensitive system of recording. It should be noted that such facilities arecommercially available from leading manufacturers of X-ray devices, mostly supplied inthe form of single-purpose units. The skiascopic image is taken, amplified, converted toelectronic form and either recorded by means of a TV monitor or processed by a CCDmatrix [1], or digitalized and processed on a powerful computer.
Solution of assigned project Project F-60-94 was divided into two tasks:
1. To set up a radioscopic device assembly with digital output (digital image processor,image memory, control unit)
2. To write a (or adapt an existing) program for quantitative analysis of radioscopicimage that would make it possible to solve problems of testing various machine parts(metals, ceramics, plastics).
The aim of the present work is to introduce methods of computer-processing a radio-scopic image in order to enhance the sensitivity of the method, resolvability and overallassesibility of material defects. It can be expected that the quality of an X-ray signal eval-uated in this way will exceed the quality of Tadiographic methods, especially in cases whenvery thick walls are to be X-rayed.
535

WORKSHOP 96 MATERIALS SCIENCE IN MECHANICAL ENGINEERING
Device assembly and its function. The device assembly was proposed and imple-mented in keeping with the schematic diagram. The X-ray source releases a homogeneousbeam of radiation which will pass through the object under irradiation. Due to the in-teraction between radiation and substance an intensive relief is formed in the beam. Thismodified (no longer homogeneous) beam impinges on a fluorescent screen, where the X-rayradiation gets modulated to the region of visible spectrum. Subsequently the radiation in-tensity can be amplified as much as 10 000 times in a two-stage brightness amplifier. Thisamplified visible image is taken by a camera and converted to an electric signal. The electricsignal is applied to the input of a computer (486 DX 40), where it is digitnlized to be readyfor further processing (a VIDEO PLUS digitalization card is used). The evaluation programis based on the DIPS 4.0 program of the SOFO Company, which is used e.g. for image anal-ysis in metallography or in astronomy. Scanning the X-ray image is done by SLOWSCAN,which provides for slow scanning of static images and thus ensures their high quality. It canalso be used for scanning at extremely low illumination levels or in the photometric analysisof images.
The DIPS program enables:
• photometric analysis
• combining images (algebraic, statistical and logical operations)
• filtering the image by using matrix convolutions
• generating the image, magnifying its parts and adjusting the pseudocolours
• measuring in the image (coordinates of objects, distances and angles between them)
• counting the objects
• analyzing the shape of objects
• classifying the objects.
The two-monitor version makes it possible to follow continuously on one (black andwhite) monitor the image scanned, and to carry out the analysis on the other (colour)monitor. DIPS's internal programming language makes it possible for DIPS to adapt tothe needs of evaluating radiograms, writing an algorithm of image analysis, and comparingthe results of analysis with the classification conditions as set by evaluating standards. Animportant advantage consists in the possibility of storing the results (both the image andthe record of its evaluation) on a magnetic or optical disc, which provides for an easy andcheap method of keeping records of the results of testing.
References:
[1] NETUSIL, T. - ZAVAVADIL, Z. - NIKEROV, V.: Some Properties of RadioscopicSystem with CCD Matrix, (in Czech) Proc. 'Defektoskopie 93' (1993).
[2] POCHMAN, J. - SPUNDA, J. - KAMENEC, J.: Fast Image Processor for Radioscopy,(in Czech). Proc. 'Digitalni zpracovani obrazu 88' TESLA VUST, Praha 1988.
This research has been conducted at the Department of Materials Engineering as partof the research project "Computer Processing of NDT Indication." and has been supportedby TU of Brno grant No. F-60-9J{.
536
WORKSHOP 96 MATERIALS SCIENCE IN MECHANICAL ENGINEERING
USE OF SCANNINGTUNNELING MICROSCOPY IN
MATERIALS SCIENCE ANDENGINEERING
J . Svejcar, L. Benes, J . Man,Z. Vojtkulakova, M. Cepera*
TU, Fac. of Mechanical Eng., Institute of Material EngineeringTechnicka. 2, 616 69 Brno
*Military Technical Institute of Protection,Rybkova 2, 602 00 Brno
Key words: scanning tunneling microscopy, surface topography, fatigue, thin solid films
Due to its parameters, especially its very high lateral and vertical resolution, scanningtunneling microscopy (STM) is an outstanding experimental instrument. Until now, mostof the published information refer to its applications in theoretical and applied physics,especially surface science. STM can, however, be also very useful for solving problems thatare of "engineering nature". These STM applications often do not utilize fully the limits of itspossibilities. In material science and engineering (MSE), it is used when required informationcannot be obtained by other techniques. Frequently, lower magnifications are used, withSTM only complementing or substituting traditional methods such as optical microscopy,scanning and transmission electron microscopy when these methods fail or when they mustbe stretched to their limits. Unfortunately, STM can be usually used in the microstructureevaluation of several metals and alloys only [1, 2]. Due to the serious absorption and surfaceoxidat ion, it is difficult to investigate easily oxidizing materials. It is almost impossibleto study the microstructure of industrial alloys, such as steels, with STM unless propersurface protection is applied. Very nice examples of such surface protection (by coveringit with a layer of glycerol) during the study of bainitic microstructure of an austemperedFe-lC-4Cr-2Si steel have been published recently [2].
Excellent examples of these STM applications are given, e.g., by Opielka et al. [3],who studied the morphology of 7'-phase in a nickel alloy. He used STM to determine thevolume fraction of 7'-phase when conventional metallographic examination yields erroneousresults due to inaccurate image representation of the phase. Similar examples is the studyof dispersed particles and carbides in Ni-and Fe-base alloys, the study of PVD layer of TiNon high-speed steel, etc. Pischow et al. [4], studied, among other, carbonitrides in steel.They also a comparison of the laboriousness and reliability of conventional techniques (suchas carbon replicas in TEM) and of STM, revealing the advantages and great possibilitiesof STM. Several examples of our own results obtained on STM 3130 (TESCAN) built intoSEM 2SS (JEOL), follow.
One of our first attempts was the study of the "just-initiated" fatigue cracks in theearliest stage of the fatigue process. Cylindrical specimens of stainless austenitic steel 316LTHYSSEN were. Small area of the surface was electrolytically polished. After short loading
537
WORKSHOP 96 MATERIALS SCIENCE IN MECHANICAL ENGINEERING
(N = 7500 cycles, which represents cca 5 % of fatigue life) a slab containing the polishedarea was cut out and sputtered with Au. These specimens were examined in STM. Cyclic-plastic deformation is reveal itself in surface extrusions and intrusions created by persistentslip bands.
Another issue is the analysis of Pd coatings with different thicknesses (250-2200 nm)formed by reactive diode sputtering on various substrates (single crystal Si(l l l) , Si(100),glass). The subject of study was the effect of the coating thickness and the type of substrateon the surface quality of a sputtered layer. It showed, for example, that the layer on Si(100)has a tendency to copy the morphology of a substrate surface [1],
The last example refers to nanostructural and amorphous thin coatings, namely Ti,Ti-14% Cr, Ti-50% Cu, prepared by magnetron sputtering on a glass substrate. BothSTM and TEM allowed to verify the proposed model. The structure of both surfaces ofPVD coating (i.e., free surface and surface adjacent to glass), and the coating fracture werestudied by means of STM. It was found that the microstructure of specimens was in goodagreement with the Thornton model [5], that takes into account the effect of substratetemperature and argon pressure on the coating microstructure. The surfaces images clearlyshow the columnar growth structures, that are characteristic for low thermal mobility of ionsand low mobility of particles growing perpendicular to the substrate surface. At greatermagnification, the micrographs of coating fracture surfaces show columnar structure ofthe individual fibres. Image of the free surface confirm a very low roughness but showa well-defined crystalline structure, while the "glass" side exhibit nanostructure of the firstdeposited layer. Nanostructure can be attributed to the cooling rate of impinging particles,and to the transfer of heat after the impingement.
References:
[1] SVEJCAR, J. et al.: Applying Scanning Tunneling Microscopy to Physical Metallurgy.Proc. of Intern. Conference on Advanced Materials and Technologies, Plzefi, 1995.
[2] WANG, J. J. et al.: Use of Scanning Tunneling Microscopy in Metallography. MaterialsCharacterization 33 (1994) pp. 163-174.
[3] OPIELKA, H. - McKAY, P.: STM for the Microstructural Examination of Metallo-graphic Specimens. Prac. Metallography, 30 (1993) pp. 399-411.
[4] PISCHOW, K. A. - HARALDSEN, A. K. - KORHONEN, A.: Materials Characteri-zation 2 (1993) p.69.
[5] THORNTON, J. A. - HOFFMAN, D. W.: Stress-related effects in thin films. ThinSolid Films 171 (1989) pp. 5-31.
This research has been conducted at the Institute of Material Engineering as part of theresearch project "Application of Scanning Tunneling Microscopy" and has been supportedby TV grant No. C 26/94.
538
WORKSHOP 96 MATERIALS SCIENCE IN MECHANICAL ENGINEERING
DEGRADATIONS ACTING DURINGSERVICE EXPOSURE OF
STEAM TURBINE PARTS AND THEIRINFLUENCE ON REMAINING LIFE
R. Foret, A. Buchal, J . KrejSf
TU Brno, Fac. of Mechanical Eng., Dept. of Materials Eng.Technicka 2, 616 69 Brno
Key words: low-alloyed, heat-resistant CrMoV and CrMoVW steels, long-time service,degradation mechanisms, stability of microstructure, carbide reactions, re-maining life
The influence of long-term service on the microstructure and mechanical properties oftwenty-five steam turbine casings, which were cast from steels of grades 42 2740, 42 2745,42 2747 and 42 2834, has been described in [1] and [2]. The results of these works can besummarised as follows:
• Long-term service resulted in the embrittlement of casings, which was linked with adecrease in relative notch toughness and yield stress in more than 50% of casings.
• An enrichement of the coexisting carbides (M4C3, M^Ce, M7C3 and M3C ) by Cr, Mo,V and W was observed and it was more pronounced at the hot end of the casings andafter a longer period of exposure. The thermodynamic stability of carbides, whichwas evaluated by the quasi-eguilibrium constant K of the carbidic reactions of the"integral" carbide MnC [2], was greater at the hot end.
The results of the subsequent more detailed experimental work (ATEM, SEM, AES,EDS and XRD; miciochemical and phase analysis of all carbides were realized in carbonextraction replicas and on carbides prepared by anodic isolation), which has partly beendescribed in [3], [4] and [5], can be summarised as follows:
• The ernbrittlement of especially the hot end of casings was poportional to the inter-granular decohesion (ID) mode fracture followed austenite (steels 42 2740, 42 2747- bainite) or ferrite (steel 42 2834 - ferrite) grain boundaries. Casings with the IDfracture mode greater than 50% of fracture surfaces had the transition temperature t,-above the room temperature.
• Carbide coarsening contributes to the to the embrittlement at the hot end of casings- carbide-induced embrittlement.
• One of the degradation mechanisms leading to the embrittlement of casings is temperor segregation embrittlement due to the segregation of P, Sn and Cu to austenitic orferritic grain boundaries [3]. This type of segregation embrittlement probably fits themodel proposed by Qu and McMahon [6].
539

WORKSHOP 96 MATERIALS SCIENCE IN MECHANICAL ENGINEERING
• Changes in types of carbides can be observed during long-time service (dissolutionof carbides M3C, M33C6 - in grade 42 2740 steel and precipitation of carbides MjCand Me,C; precipitation sequences were found to be in general agreement with that ofSenior [7]).
• Increasing time and temperature of service had little effect on the chemical compositionof carbides M4C3, M2C and M6C, but in type M3C, MjaCe and M7C3 carbides anincreasing content of Cr, Mo and V was observed.
• Phase and chemical composition of coexisting carbides,or changes in their thermo-dynamical stability quantified by their quasi-equilibrium constant K, can be used toestimate the time-temperature history of important steam turbine parts.
• The degradation of microstructure (particle coarsening, precipitation sequence, re-distribution of alloying elements between carbides and ferritc matrix, segregation ofimpurities) is rather more difficult to quantify. At present it is not clear, whetherthese "metalographic methods" will be sufficiently sensitive and reproducible. Thesemethods are useful for preliminary assessment of life in that they supply supportingevidence for other methods.
References:
[1] FORET, R. - STRANSK?, K. - KRUMPOS, J.: Degradation of properties of HPsteam turbine casings during long-term service exposure. Materials Engineering, Vol. 1(1994), No. 2, pp. 1-17 (in Czech)
[2] FORET, R. - STRANSKY, K.: Influence of long-term service exposure on microstruc-ture and mechanical properties of steam turbine casings. Proc. of EUROMAT 94,Balatonszeplak 1994, pp. 550-554
[3] FORET, R. - SUBA, J.: Intergranular brittleness of steam turbine casings after long-term service. Proc. of International conference of fractography, Stara Lesna 1994,pp.106-109
[i] FORET, R. - JANOVA, D. - SUBA, J.: Degradation mechanisms acting during serviceexpozure of steam turbine parts and their influence on remaining life. Research report,TU Brno 1993
[5] FORET, R. - JANOVA, D.: ibbid Research report, TU Brno, 1994
[6] QU, Z. - McMAHON, C. J.: The effects of tempering reaction on temper enbrittlementof alloy steels. Metallurgical Transactions, Vol. 14A (1983), No. 6, pp. 1101-1108
[7] SENIOR, B. A.: A critical review of precipitation behaviour in ICr-Mo-V rotor steels.Materials Science and Engineering, Vol. A103 (1988), pp. 263-271
This research has been conducted at the Institute of Materials Engineering and has beensupported by TU Brno, Faculty grant No. F-57-9S.
540
WORKSHOP 9G MATERIALS SCIENCE IN MECHANICAL ENGINEERING
REMAINING STRENGTH OFCORRODED TRANSIT GAS PIPELINES
F. Valenta, M. Sochor, J . Michalec,M. Spaniel, M. R&zic'ka
CTU, Fac. of Mechanical Eng., Dept. of Elasticity & Strength of MaterialsTechnicka 4, 166 07 Pralia 6
Key words: gas pipeline, corrosion defects, limit analysis
Gas transmission pipelines can be affected by a range of corrosion mechanisms whichmay lead to reduction in structural integrity and eventual failure. The economic conse-quences of reduced operating pressure, or lost production, repair or replacement are severe.Engineering assessment methods are therefore applied to assess the fitness-for-purpose ofoperating pipelines containing corrosion. The existing widely accepted criterion, the 'B31GCriterion', is semi-empirical, and is conservative mainly when being applied on higher gradematerial. At the Dept. of Elasticity & Strength of Materials, CTU - Fac. of Mech. Eng.,research was designed ten years ago to assess a guidance derived from theoretical analysis,validated through a carefully designed programme of experimental analysis enabling thecontinued safe and economic operation of corroded pipelines. In 1995 the research pro-gramme continued focusing on two main objectives: 1) The continuation of the theoreticaland experimental analysis of the problem; and 2) the application of results achieved to datefocused on urgent problems arising from the transit gas pipelines operation.
First of all, carried out was evaluation of the theoretical and experimental results ob-tained so far, concerning machined (determined) defects of the surface corrosion type. Anew programme was designed aiming at the assessment of the residual life, reliability andsafety of gas pipelines having natural defects.
The theoretical approach has been amplified by taking into account a geometricallynonlinear formulation of the problem. However, this more accurate mathematical approachhas thrown up the necessity to define newstate parameters for the assessment of the cor-roded pipe limit load carrying capacity (LLCC). Observing an interesting phenomenon,which being the conservation of the location of the extreme local values of the pipe radialdisplacement, the relative plastic area length (with respect to the pipe parameters) basedon that exteme, is used for this purpose. From the experimental standpoint, we set out,subsequent upon newly encountered problems, to assess the limit state of pipe having nat-ural defects and also to simulate the corrosion process propagation and its influence on thepipe LLCC over an interval of two years, i.e. the regular inspection period. A methodol-ogy serving for the surface corrosion defect assessment based on both the numerical andexperimental analyses was projected. Substantial progress has been achieved in this field.The proposed methodology has been gradually compared and validated with internationalstandards. For the next two years an extensive programme concerning both the theoreticaland experimental analyses has been proposed. This will be focused on the numerical assess-ment of natural defect topology using optical methods directly enabling their applicationsin the field. Based on this, a preparation of the project on the automatic FEM meshing ofnatural defects has been in progress. Finally, the creation of the link between the numerical
541
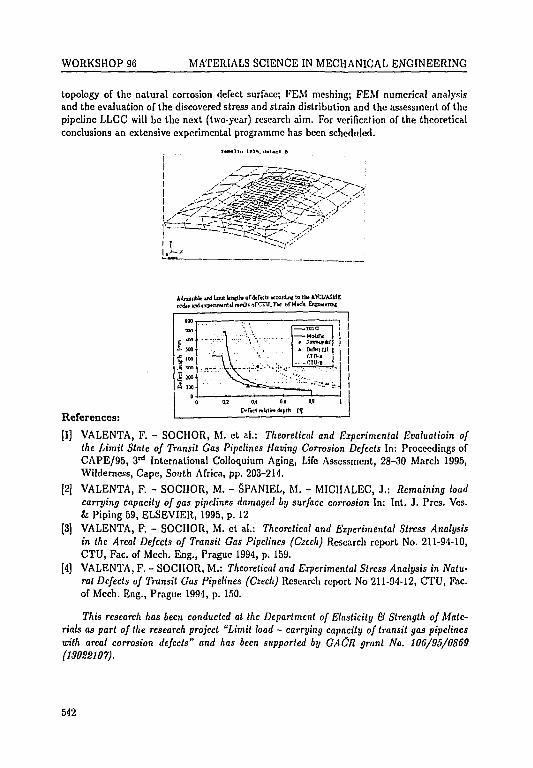
WORKSHOP 96 MATERIALS SCIENCE IN MECHANICAL ENGINEERING
topology of the natural corrosion defect surface; FEM meshing; FEM numerical analysisand the evaluation of the discovered stress and strain distribution and the assessment of thepipeline LLCC will be the next (two-year) research aim. For verification of the theoreticalconclusions an extensive experimental programme has been scheduled.
MAW u4 luwt knctlu o f defccli i ccorfu* lo the AHCI/ASMEl l f C r U F c o f M t c h E
References:
[1] VALENTA, F. - SOCHOR, M. et al.: Theoretical and Experimental Evaluatioin ofthe Limit State of Transit Gas Pipelines Having Corrosion Defects In: Proceedings ofCAPE/95, 3rd International Colloquium Aging, Life Assessment, 28-30 March 1995,Wilderness, Cape, South Africa, pp. 203-214.
[2] VALENTA, F. - SOCHOR, M. - SPANIEL, M. - MICHALEC, J.: Remaining loadcarrying capacity of gas pipelines damaged by surface corrosion In: Int. J. Pros. Ves.& Piping 59, ELSEVIER, 1995, p. 12
[3] VALENTA, F. - SOCHOR, M. et al.: Theoretical and Experimental Stress Analysisin the Areal Defects of Transit Gas Pipelines (Czech) Research report No. 211-94-10,CTU, Fac. of Mech. Eng., Prague 1994, p. 159.
[4] VALENTA, F. - SOCHOR, M.: Theoretical and Experimental Stress Analysis in Natu-ral Defects of Transit Gas Pipelines (Czech) Research report No 211-94-12, CTU, Fac.of Mech. Eng., Prague 1994, p. 150.
This research has been conducted at the Department of Elasticity & Strength of Mate-rials as part of the research project "Limit load - carrying capacity of transit gas pipelineswith area/ corrosion defects" and has been supported by GACR grant No. 106/95/0869(1303S107).
542
WORKSHOP 96 MATERIALS SCIENCE IN MECHANICAL ENGINEERING
CREEP RUPTURE STRENGTHOF A STAINLESS MARAGING STEEL
Z. Koufil, K. Macek, J . Sasko
CTU, Fac. of Mechanical Eng., Dept. of Materials ScienceKarlovo nam. 13, 121 35 Praha 2
Key words: creep, rupture stength, stainless maraging steel, Larson-Miller parametr
Mechanical properties particularly the yield strength and ultimate strength at roomtemperature of the stainless martensitic-austenitic age hardenable steel 10%Cr-10%Ni-2%Mo-Ti-Al do not attain corresponding properties of the classical ultra-high strengthmaraging steels. However, the former steel has excellent corrosion resistance and also betterpreserves its strength at elevated temperatures (up to 550 °C) due to higher reaustenitizationtemperature [1] as compared with the latter steels.
Previous investigations [2] were focused on the mechanical behaviour of the steel 10-10-2 at elevated temperatures in dependence on its heat treatment. It has been pointed outthat the influence of heat treatment on short-time tensile strength decreases with increasingtesting temperature. The values of yield strength and ultimate strength at the highesttesting temperature 480 °C were nearly independent on the temperature of preceding heattreatment (from 520 °C to 650 °C). The influence of the temperature of heat treatment maybe illustrated in the following way: after ageing at 520 °C in order to obtain the peak-hardened state, both the high hardness and strength decreased with increasing temperatureof the short-time tensile test, whereas after intercritical annealing at 650 "C both the lowhardeness and strength were almost unaffected by the testing temperature within the rangeof 400-480 CC.
The present paper reports a further study of the effect of prior heat treatment on creeprupture tensile strength of wrought steel of the type 10-10-2.
Two heats No. 25 and No. 26 of the steel were used for these experiments. Chemicalcomposition of the heat No. 25 was as follows (in wt. %): 0.011 % C-0.21 % Mn-0.16 % Si-0.016 % P-0.014 % S-10.41 % Cr-9.96 % Ni-2.32 % Mo-1.03 % Ti-0.47 % Al-0.026 % Co-0.06 % Cu-0.007 % N-0.003 % 0 . The heats were produced in a vacuum induction furnaceand cast into ingots of 11 weight. The ingots were forged and rolled into rods of 20 mmin diameter. Specimens of 6 mm in diameter with threaded ends were turned from testblanks quenched from 930 °C, 1 h in water. Then the specimens were either aged for 3 hat 520 °C or 560 °C, or intercritically annealed at 650 °C and air cooled. Creep rupturetests were carried out in electrical resistance furnaces on air, where the temperatures weremeasured using chromel-alumel thermocouples. The testing temperatures ranged between500 and 540 °C. The testing procedure met the standardized requirements according to CSN42 0351. The mickrostructures were investigated by means of light or transmission electronmickroscopy of plastic replicas in the longitudinal sections both in the threated ends and inthe vicinity of fracture of the tested specimen.
The results of creep tests were evaluated using Larson-Miller's parameter
(1)
543
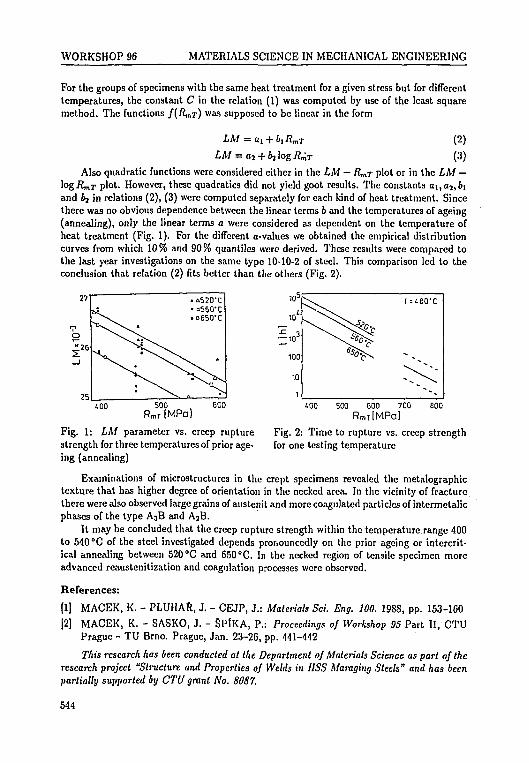
WORKSHOP 96 MATERIALS SCIENCE IN MECHANICAL ENGINEERING
For the groups of specimens with the same heat treatment for a given stress but for differenttemperatures, the constant C in the relation (1) was computed by use of the least squaremethod. The functions f(RmT) was supposed to be linear in the form
(2)
(3)
Also quadratic functions were considered either in the LM — Rmr plot or in the LM —plot. However, these quadratics did not yield goot results. The constants ai,a2 ,6i
and 4j in relations (2), (3) were computed separately for each kind of heat treatment. Sincethere was no obvious dependence between the linear terms b and the temperatures of ageing(annealing), only the linear terms a were considered as dependent on the temperature ofheat treatment (Fig. 1). For the different a-values we obtained the empirical distributioncurves from which 10% and 90% quantiles were derived. These results were compared tothe last year investigations on the same type 10-10-2 of steel. This comparison led to theconclusion that relation (2) fits better than the others (Fig. 2).
25400 600 too 500 600 700
RmT |MPa)800
Fig. 2: Time to rupture vs. creep strengthfor one testing temperature
Fig. 1: LM parameter vs. creep rupturestrength for three temperatures of prior age-ing (annealing)
Examinations of microstructurcs in the crept specimens revealed the metalographictexture that has higher degree of orientation in the necked area. In the vicinity of fracture,there were also observed large grains of austenit and more coagulated particles of intermetalicphases of the type A3B and AjB.
It may be concluded that the creep rupture strength within the temperature range 400to 540 "C of the steel investigated depends pronouncedly on the prior ageing or intercrit-ical annealing between 520 °C and 650°C. In the necked region of tensile specimen moreadvanced reaustenitization and coagulation processes were observed.
References:
[1] MACEK, K. - PLUHAR, J. - CEJP, J.: Materials Set. Eng. 100. 1988, pp. 153-160[2] MACEK, K. - SASKO, J. - SPlKA, P.: Proceedings of Workshop 95 Part II, CTU
Prague - TU Brno. Prague, Jan. 23-26, pp. 441-442
This research has been conducted at the Department of Materials Science as part of theresearch project "Structure and Properties of Welds in IISS Maraging Steels" and has beenpartially supported by CTU grant No. 8087.
544
WORKSHOP 96 MATERIALS SCIENCE IN MECHANICAL ENGINEERING
PHASE TRANSITIONS IN Ni-Cr-AlALLOYS AND NiCr-Al COUPLE
3. Krejci, J . Bfezina*, J . Smutna*,A. Buchal, J . Svejcar
TU, Fac. of Mechanical Eng., Institute of Material EngineeringTechnicka 2, G16 69 Brno
•Institute of Physics of Materials, ASCR,2izkova 22, 616 62 Brno
Key words: phase transformations, structure, order, TEM, microanalysis
The interest in Ni-Cr-Al ternary system increases due to new technologies and appli-cations. Ni-Cr-based thermal barrier coatings, functionally graded materials, intermetallicmatrix composites [2], resistors, etc., add to the primary interest in Ni-based superalloyswhere these three elements play essential role. The Ni-Cr-Al system was used as a model tosimplify the complex chemistry of most Ni-base superalloys. Although more than 40 yearselapsed since first comprehensive study of the Ni-Cr-Al system was undertaken [1], theternary phase diagram is not yet known in detail. The experimental data are limited bothin concentrations and temperatures; sometimes the published results are confusing. Thephases appearing in the ternary diagram [1] are: 7 - Ni rich primary solid solution (FCC),7' ordered intermetallic phase WizAl (based on FCC), Q - Cr rich primary solid solution(BCC) and /? ordered intermetallic phase NiAl (B2, CsCl type). Ni-rich region of the phasediagram contains single pha se 7 field (higher temperatures) or 7 and 7 + 7' fields (lowertemperatures). Alloys containing i=sl7at.%Cr and 11 at% Al exhibited in as quenched and850°C annealing condition cuboidal particles of Ni3AI. Authors found near the 1000°Cfour-phase plane (/3 + 7 < = > a + 7'). Recent compendium on ternary phase diagrams [2]make mainly use of these results with some minor correction. The experimental data shouldbe therefore supplied including the medium annealing temperatures as the final productspass through this temperature range repeatedly. Other problems are the grain boundaryinstigated phase transformation and the influence of interstitial impurity atoms, especiallyfrequently present carbon.
Ni20Crl3Al alloys with 0.02 wt. %C and without (very low content of) carbon werechosen for experiments because 13 at. %A1 are "safely" in the 7 '+ 7 phase field and totalalloying element content correspond to earlier experiments [3, 4] on Ni-Cr binary systemaround the NijCr superstructure stoichiometry. Melting under Ar atmosphere was followedby chill cast (cooling rate «500°C/s). The slabs were annealed for 10, 100 and 500 hrsat 800°C and 600°C in evacuated silica ampoules. Annealing was terminated by waterquenching. Annealed slabs were prepared in usual manner for light, scanning and transmis-sion electron microscopy. These specimens were also used for X-ray phase analysis. In duecourse, the layered specimens containing Al 99.999 % substrate and Ni20Cr plasma sprayedcoating were prepared. These specimens were studied, after annealing at 600 °C, by lightand scanning electron microscopy. The preparation of thin foils for transmission electronmicroscopy from coated specimens is under way.
545
WORKSHOP 96 MATERIALS SCIENCE IN MECHANICAL ENGINEERING
All literature data assume the presence of only two phases, 7 and 7', at temperature andcomposition used in our experiments. At high temperatures only 7 phase is considered to bein thermodynamic equilibrium. Nevertheless, we encountered 7' phase in as cast specimens.Its volume fraction, size, shape and composition change during the annealing at 800 °C.The volume fraction decreases while the particle size increases. The shape changes fromalmost circular to rectangular with aspect ratio 2:1. Majority of these changes takes placein the first 10 hours of annealing. The Al content in 7' particles gradually increases withannealing time from «13% in as cast specimens to «17%. These values are valid for in-grainparticles. Grain boundaries (GB) are a different story. Irregular angular 7 ' particles appearon GB during the annealing, their Al content is Rs25 %. Contrary to the literature data,BCC a-phase Cr rich particles show at grain boundaries (Cr content 90 % and more) aftershort annealing. These particles appear usually close to the coarse 7'. Longer annealingleads to the precipitation of needle-like a phase inside the grains as well. The sum of Aland Cr nominal contents is higher than 25at.%, and despite the precipitation of Cr-richphase, the Cr atoms enter both sublattices. Therefore, with exception of GB particles, theAl content in 7' phase is relatively low, although the degree of long range order increaseswith annealing time as proved by X-ray and electron diffractions. In as-cast specimens, theinterface between matrix and circular 7' particles is not well defined and the particles are faroff the equilibrium as they change after short annealing. NijAl particles attain rectangularshape similar to that in Ni based superalloys, with sides parallel to (100) planes. Thisshape does not change during the further annealing and suggest that the misfit (i.e., strainenergy) between lattice parameters is decisive factor. The presence of carbon is apparentafter long annealing times when Cr carbides nucleate at grain boundaries or Cr rich particles.Their volume fraction is very low and they were observed only in TEM (X-ray diffractiondid not show their presence) [5]. The coated specimen preparation posed some problems.These problems include adhesion of coating, diffusion across the interface, metallographypreparation of specimen containing two very different materials. Preliminary assessmentsof structures on coated couples were then done. The examination of the coated specimensrevealed that no mixing of elements takes place during the plasma spraying, while annealingat 600 °C starts the diffusion of Al and Cr.
References:
[1] TAYLOR, A. - FLOYD, R. W.: The constitution of nickel-rich alloys of the nickel-chromium-aluminium system. Journal of the Institute of Metals (1952) 81, 451-464.
[2] PETZOW, G. - EFFENBERG, G. - (EDS.): Ternary Alloys. ASM International, USA,4,400-415.
[3] KARMAZIN, L. - KREJCl, J. - ZEMAN, J.: Gamma phase and NhCr-type long rangeorder in Ni-rich Ni-Cr-Mo alloys. Mater, Sci. Engng A183 (1994), 103-109.
[4] KREJCf, J. - KARMAZIN, L: Phase Transformation and Recrystallization in NiSSCrAlloy. Mater. Sci. Engng A188 (1994), 185-191.
[5] KREJCl, J.-BUCHAL, A.-SVEJCAR,J.-SVOBODA,M.: Structure ofNi20Crl3Alwith and without carbon annealed at 800°C. To be published in Mater. Sci. Engng.
This research has been conducted at the Institute of Material Engineering as part of theresearch project "Ni-Cr-Al-alloying base for advanced high tematerature structural materi-als" and has been supported by TU grant No, FU350037.
546
WORKSHOP 96 MATERIALS SCIENCE IN MECHANICAL ENGINEERING
METALLURGY OF Mg-Li ALLOYS
L. Pta£ek, L. ZemCik*, V. Ustohal, J . Michalek
TU of Brno, Fac. of Mechanical Eng., Dept. of Materials ScienceTechnicka 2, 616 69 Brno
*TUof Brno, Fac. of Mechanical Eng., Dept. of Casting Techn.Technicka. 2, 616 69 Brno
Key words: something, anything, nothing
Magnesium alloys are extremely light alloys with a very favourable strength-to-densityratio. They are therefore specially suited for the construction of means of transport, espe-cially aircraft and rockets. The density of these alloys can be further reduced by additionsof lithium. An unfavourable property of magnesium is its easy inflammability in air. Theinflammability of magnesium alloys in molten state poses some special metallurgical prob-lems. The melt must be covered permanently with suitable slag or it must be protectedwith a protective atmosphere. The melting of Mg-Li alloys is further complicated by lithiumreacting with oxygen, nitrogen and hydrogen, as well as by the great differences in meltingtemperature and density of the two metals. Both metals are also characterized by compara-tively low boiling temperatures. Mg-Li alloys are prone to explosion when the melt gets intocontact with water or moisture. Type IS2/I HERAUS vacuum induction furnace was usedfor the preparation of Mg-Li alloys, which solved the problem of Mg ignition, and the possi-bility of explosion in case lithium got into contact with moisture was excluded. The meltingof Mg alloys in vacuum is rendered difficult by the high pressure of saturated vapours ofthe base metal, which at the melting temperature amounts to 359 Pa. With the pressurein the furnace space at 1 Pa, the melt might start boiling and incontrollable changes in thecomposition of molten alloys might set in. Thus after evacuation the furnace was filled withargon to a pressure of 5 000 Pa in order to suppress the boiling reliably even in the case themelt got overheated in the course of melting. Several heats of Mg-Li alloys with differentLi contents were prepared in this way. Chemical composition of these experimental heats isgiven in Table 1.
Tab. 1: Chemical composition of experimental heats [weight %]
Heat No.
95195295219522
Content of alloying elements in alloysAl
5.405.255.225.33
Mn0.1390.1610.1040.133
Fc0.0080.0080.0490.016
Zn2.582.552.482.55
Li12.614.312.612.9
As part of experimental work the application of protective gas SF0 (sulphur hexafluo-ride) was verified in suppressing the ignition of Mg alloys during the melting and pouring inair. An electric resistance furnace was used for melting. The alloy was melted in a crucibleof type 18/8 chrome-nickel steel. Prior to melting the crucible was rinsed and filled withprotective gas. This gas is of ca six times the density of air, it falls to the bottom of crucible
547
WORKSHOP 96 MATERIALS SCIENCE IN MECHANICAL ENGINEERING
and drives air out of the crucible. According to [1, 2] the protective effect of this gas ispresent even at concentrations of 0.5-1.5% in a mixture with air. After melting the meltwas poured into a cast-iron mould which had been rinsed with protective gas. The chemicalcomposition of remelted heats is given in Table 1 under Ncs 9521, 9522. It turned out thatthe protective gas SF6 was reliable in protecting the Mg-Li alloys from ignition during bothmelting and pouring. The surface of the specimens cast was smooth and of metallic lus-tre. Thanks to their specific properties, especially the favourable rigidity-to-density ratio,Mg-Li alloys can be used with advantage as matrices in composite materials with metallicmatrix. The production of composites by way of casting was tested experimentally. Used asstrengthening phases were SiC whiskers. With regard to the reactiviity of Mg and especiallyLi the compatibility of the hardening phase and the matrix Mg-Li alloy deserves attention.Several methods of introduccing SiC whiskers into the melt were proposed and tested. It isevident from the metallographic analysis that the hardening phase used is compatible withthe matrix Mg-Li alloy. These favourable results point to a possible direction of furtherdevelopment.
The same as the metallurgy, the preparation of metallurgical specimens from Mg-Lialloys, too, is rendered complicated due to the properties of the two elements. Complicationsappear already while taking (cutting) samples when, in the absence of intensive cooling at thepoint of cutting, burning develops. Etching the samples presents another complication. Anumber of etching agents and methods were tested on alloy specimens for light microscopy.When the FUSS etching agent was used, the specimen of Mg +14 % Li showed signs ofoveretching after a short period. The procedure given in [4] (etching by the Vilella-Bainsolution, i.e. 50 ml HCL, l g picric acid, 100 ml water) was tested but with negative result.A more favourable result was obtained when using a solution of oxalic acid. It is clear,however, that this solution will not be final.
References:
[1] Giesserei Giesserei 62, No. 3, (1975), pp. 59.
[2] FINK, R.: Gisserei Gisserei-Praxis No. 9, pp. 120.
[3] PTACEK, L. - ZEMClK, L.: Metallurgy, Properties and Structure of Mg-Li Alloys.
Proc. of Ninth Int. Metallographic Symposium., Tatranska. Lomnica, 1995, pp. 323-326.
[4] USTOHAL, V. - KOZUMPLlKOVA, J.: Mg-Li Alloys, the Lighesl Metallic StructureMaterials (in Czech) Hutnicke listy, No. 1, 1989, pp. 57-59.
This research has been conducted at the Department of Materials Engineering as partof the research project "Metallurgy of Mg-Li Alloys" and has been supported by TU of Brnogrant No. F-61-94.
548
WORKSHOP 96 MATERIALS SCIENCE IN MECHANICAL ENGINEERING
INTERMETALLIC PHASESIN AN AI-Li-Cu-Zr ALLOY
V. Stary, K. Macek
CTU, Fac. of Mechanical Eng., Dept. of Materials ScienceKarlovo nam. 13, 121 35 Praha 2
Key words: electron probe, microanalysis, Al-Li alloys, primary and secondary phases
Electron Probe X-ray Microanalysis (EPMA) is a method which makes it possible toconnect the direct definition of chemical composition to the electron microscopical imagein a given place in the sample. In recent years, EPMA has been widely used in materialscience. The principles of the method, i.e. analysis in a very small interaction volume, makelocal chemical analysis possible. The main application has thus been in the study of volume(lateral and depth) inhomogeneities. This study concerns the chemical composition andsize distribution of primary and secondary particles of intermetalic phases in Al-Cu-Li-Zralloys.
EPMA measurement was carried out at SEM (TESLA BS 300) equipped with an EDSdetector (Be window) and LINK system AN10/85S. The average chemical composition (inwt.%) of the investigated aluminium alloy was 3.3% Cu, 1.9% Li, 0.1% Zr and low leveltraces of Mg, Fe, Mn, Na, Si, Ti and Ca [1], We studied two types of sample: the first wasin as cast condition (only low temperature annealing was used), the second was preparedby extrusion at 460°C followed by thermal treatment. The surface was polished in thestandard way (finally using a diamond size 1/0). Optical microscopy showed several phasesat the grain boundaries and some phase inside the grains. The complete results of opticalmicroscopy analysis are given in [2]. For approximate quantitative analysis we used LINKZAF. Size distribution and the simultaneous chemical composition was quantified by LINKprograms DIGISCAN and DIGIPAD.
By the scanning electron microscopy, basically two types of particles (bright ones (BR)and dark ones (DK)) were revealed in the image. The dark and the bright particles areassumed to contain Li and heavier elements, respectively. We divided them into classesaccording to their composition: Cu(BR), Cu(DK), CuTi, CuFe, CuCaZr and CuCaSc. Ofcourse, all the particles contained Alj some of them may have contained Li, which is notmeasureble by EPMA. In the cast sample, there are two groups, containing only Cu (inaddition to Al and possible Li) - the first group (BR) with a larger concentration of Cu,the second group (DK) with a lower concentration of Cu. Moreover, it was also possibleto divide the particles according to their shape. The rod-shape particles (length 2-4 /jm)were bright and usually of Cu or CuFe type. The observed particle size was limited inthe program to about 0.1 /im. The size distributions of several types of the particles areillustrated in Figs. 1 and 2.
In the literature, the soluble phases AbLi, AljCuLi, Al2Cu, AljCuMg are reported, thenext possible phase is AbCujFe [3]. Insoluble particles such as AUfFe.Mn) and Al6(Fe,Cu)are also mentioned [4]. In the cast sample, most of the extra elements were in the relativelylarge areas (bright in the SEM image) at the boundaries of the dendrites. In the round-shape particles with a large Cu content (probably AljCu), Ca, Zr and Ti were relatively
549
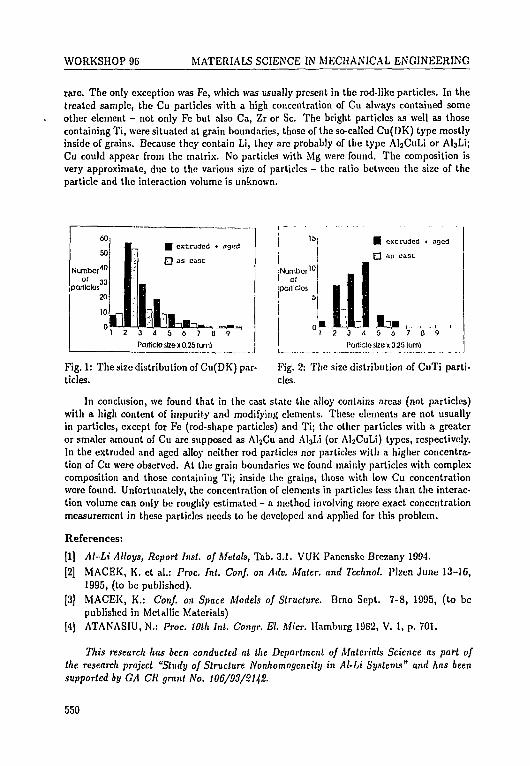
WORKSHOP 96 MATERIALS SCIENCE IN MECHANICAL ENGINEERING
rare. The only exception was Fe, which was usually present in the rod-like particles. In thetreated sample, the Cu particles with a high concentration of Cu always contained someother element - not only Fe but also Ca, Zr or Sc. The bright particles as well as thosecontaining Ti, were situated at grain boundaries, those of the so-called Cu(DK) type mostlyinside of grains. Because they contain Li, they are probably of the type Al2CuLi or AfoLi;Cu could appear from the matrix. No particles with Mg were found. The composition isvery approximate, due to the various size of particles - the ratio between the size of theparticle and the interaction volume is unknown.
particles
11
extruded + aged
as cast
3 4 5 6 7 8
Particle size x 0.25 lum]
extruded « aged
ciu cast
1 2 3 4 5 6 7 8 9
Particle sizox 0.25 lum)
Fig. 1: The size distribution of Cu(DK) par-ticles.
Fig. 2: The size distribution of CuTi parti-cles.
In conclusion, we found that in the cast state the alloy contains areas (not particles)with a high content of impurity and modifying elements. These elements are not usuallyin particles, except for Fe (rod-shape particles) and Ti; the other particles with a greateror smaler amount of Cu are supposed as AljCu and AI3W (or AI2CuLi) types, respectively.In the extruded and aged alloy neither rod particles nor particles with a higher concentra-tion of Cu were observed. At the grain boundaries we found mainly particles with complexcomposition and those containing Ti; inside the grains, those with low Cu concentrationwere found. Unfortunately, the concentration of elements in particles less than the interac-tion volume can only be roughly estimated - a method involving more exact concentrationmeasurement in these particles needs to be developed and applied for this problem.
References:
[1] Al-Li Alloys, Report Inst. of Metals, Tab. 3.1. VUK Pancnske Brezany 1994.
[2] MACEK, K. et al.: Proc. Int. Conf. on Adv. Mater, and Technol. Plzen June 13-16,1995, (to be published).
[3] MACEK, K.: Conf. on Space Models of Structure. Drno Sept. 7-8, 1995, (to bepublished in Metallic Materials)
[4] ATANASIU, N.: Proc. tOth Int. Congr. El. Micr. Hamburg 1982, V. 1, p. 701.
This research has been conducted at the Department of Materials Science as part ofthe research project "Study of Structure Nonhomogeneity in Al-Li Systems" and has beensupported by GA CR grant No. 106/93/3142.
550
WORKSHOP 9G MATERIALS SCIENCE IN MECHANICAL ENGINEERING
DIFFRACTION ANALYSISOF ALUMINIUM SPECIMENSAFTER PLASTIC EXTENSION
I. Kraus, G. Gosmanova, N. Ganev, L. Berka*
CTU, Fac. of Nucl. Sci. & Phys. Eng., Dept. of Solid State EngineeringV Holesovickach 2, 180 00 Praha 8
*CTU, Fac. of Civil Eng., Central LaboratoriesThakurova 7, 166 29 Praha 6
Key words: aluminium, residual stress, plastic deformation, diffraction analysis
The aim of investigation was to identify residual stresses by diffraction methods in pureAl (99.85 %) samples after tensile deformation.
Samples investigated, a) Flat specimens with dimensions 10 x 150 x 2 mm3. Sam-ple 1: strain value £ = 5%, strain rate v = 5mm/min. Sample 2: c = 5%, v = 2mm/min.b) Flat specimens with dimensions 10 x 50 x 2 mm3. Sample 3: e = 5%, v = 0.5mm/min.Sample 4: e — 10%, v = 0.5mm/min.
Experimental methods and techniques. 1. The Debye-Schcrrer back-reflectionmethod with photographic registration of CuKa radiation was used for qualitative visualestimation of crystallite size on samples 1, 2 and diffraction line {511}/{333} was analysed.2. The X-ray tensometric "sin2tp" method was applied on sections (10 x 22 x 2 mm3) of de-formed specimens 1, 2. An fi-goniometer DRON UM-1 with scintillation detection of CuKaradiation was used to measure {422} diffraction line profile in step-scane mode (A20 = 0.1°,const, time exposition 15 sec). The XEC l/2aj22 = 19.07 x 10"6 M I V 1 [1] was used forstress evaluation. Powder standard Al was measured under the same conditions. 3. Linebroadening analysis for microstrains estimation was carried out on samples 1, 2. Owingto spotty lines reversal motion (±5 mm) of specimens was applied. 4. Analysis of latticestrains by means of neutron diffraction methods was carried out on samples 3, 4.
Results of experiments.
a) The character of spotty lines for samples 1, 2 was qualitatively the same both beforeand after deformation.
b) 10 vs sin^ij) plots obtained for sample 1 in longitudinal (1L) and transversal ( IT)directions of measurements and for Al powder are given in Fig. 1 (including "max-imum" error bar 2A20). The following values of macroscopic stresses <rv have beencalculated:
sample 1: <sL = -5.17 ±5.35 MPa, aT = -0.47 ± 5.88 MPa;
sample 2: aL = -6.53 ±5.73MPa, aT = -3.32 ± 4.70 MPa.
c) Profiles of diffraction line {422} obtained at t/> = 0° for Al standard and deformedsamples are shown in Fig. 2. From the comparable shapes of profiles (especially fromthe clearly resolved doublets Kai.j) and the very small values of breadths for the
551
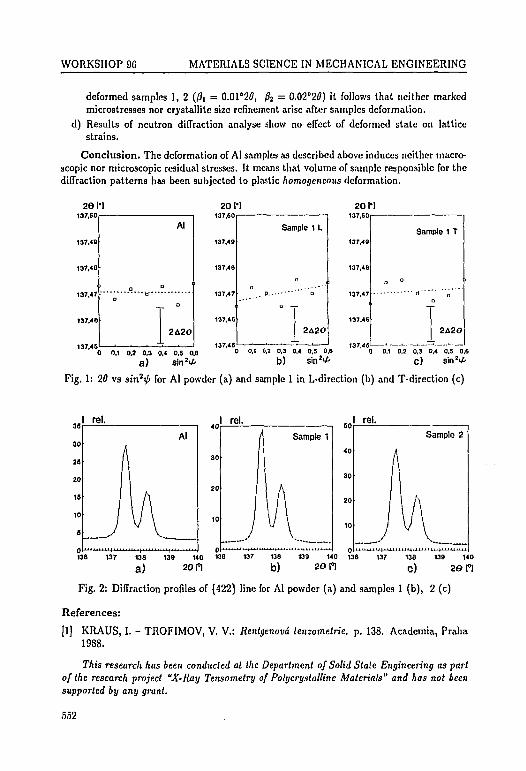
WORKSHOP 96 MATERIALS SCIENCE IN MECHANICAL ENGINEERING
deformed samples 1, 2 (ft = O.O1°20, ft = O.O2°20) it follows that neither markedmicrostresses nor crystallite size refinement arise after samples deformation,
d) Results of neutron diffraction analyse show no effect of deformed state on latticestrains.
Conclusion. The deformation of Al samples as described above induces neither macro-scopic nor microscopic residual stresses. It means that volume of sample responsible for thediffraction patterns has been subjected to plastic homogeneous deformation.
29CI137,501
137,49
137,48
137.47
137,46
Sample 1 T
2A2O
0 0.1 0,2 0,3 0.4 0.5 0.6
a) sinV-0 0,1 0,2 0,3 0,4 0,5 0,6
c) sinz<£
Fig. 1: 20 vs siv?xj> for Al powder (a) and sample 1 in L-direction (b) and T-direction (c)
I rel. I rel. I rel.
Sample 1 Sample 2
138 137 138 139 140 '36 137 138 139 140 136 137 138 139 140
a) 29l°i b) 2Gi°i c ) 2et°l
Fig. 2: Diffraction profiles of {422} line for Al powder (a) and samples 1 (b), 2 (c)
References:
[1] KRAUS, I. - TROFIMOV, V. V.: Rentgcnovd lenzomelrie. p. 138. Academia, Praha1988.
This research has been conducted at the Department of Solid Stale Engineering as partof the research project "X-Ray Tensometry of Polycrystalline Materials" and has not beensupported by any grant.
552
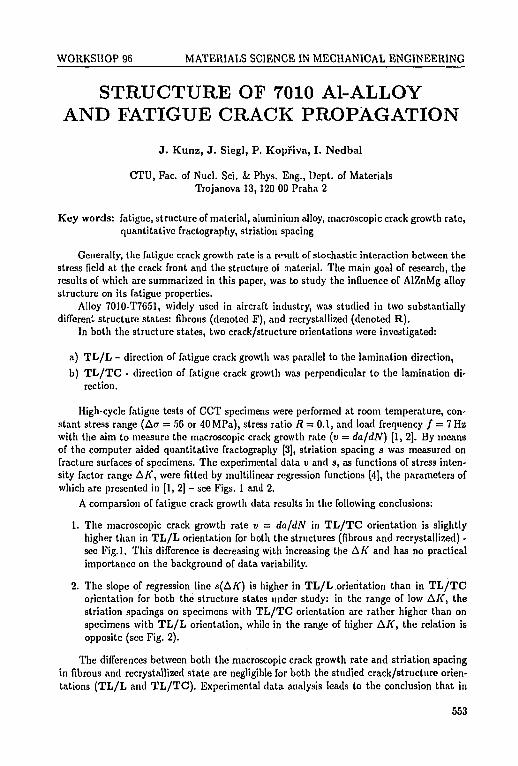
WORKSHOP 96 MATERIALS SCIENCE IN MECHANICAL ENGINEERING
STRUCTURE OF T010 Al-ALLOYAND FATIGUE CRACK PROPAGATION
J. Kunz, J. Siegl, P. Kopriva, I. Nedbal
CTU, Fac. of Nucl. Sci. & Phys. Eng., Dept. of MaterialsTrojanova 13, 120 00 Praha 2
Key words: fatigue, structure of material, aluminium alloy, macroscopic crack growth rate,quantitative fractography, striation spacing
Generally, the fatigue crack growth rate is a remit of stochastic interaction between thestress field at the crack front and the structure of material. The main goal of research, theresults of which are summarized in this paper, was to study the influence of AlZnMg alloystructure on its fatigue properties.
Alloy 7010-T7651, widely used in aircraft industry, was studied in two substantiallydifferent structure states: fibrous (denoted F), and recrystallized (denoted R).
In both the structure states, two crack/structure orientations were investigated:
a) TL/L - direction of fatigue crack growth was parallel to the lamination direction,
b) TL/TC - direction of fatigue crack growth was perpendicular to the lamination di-rection.
High-cycle fatigue tests of CCT specimens were performed at room temperature, con-stant stress range (ACT = 56 or 40MPa), stress ratio R = 0.1, and load frequency / = 7 Hzwith the aim to measure the macroscopic crack growth rate (u = da/dN) (1, 2], By meansof the computer aided quantitative fractography [3], striation spacing s was measured onfracture surfaces of specimens. The experimental data v and s, as functions of stress inten-sity factor range AK, were fitted by multilinear regression functions [4], the parameters ofwhich are presented in [ 1 , 2 ] - see Figs. 1 and 2.
A comparsion of fatigue crack growth data results in the following conclusions:
1. The macroscopic crack growth rate v = da/dN in TL/TC orientation is slightlyhigher than in TL/L orientation for both the structures (fibrous and recrystallized) -see Fig.l. This difference is decreasing with increasing the AK and has no practicalimportance on the background of data variability.
2. The slope of regression line s(AK) is higher in TL/L orientation than in TL/TCorientation for both the structure states under study: in the range of low AK, thestriation spacings on specimens with T L / T C orientation are rather higher than onspecimens with TL/L orientation, while in the range of higher AK, the relation isopposite (see Fig. 2).
The differences between both the macroscopic crack growth rate and striation spacingin fibrous and recrystallized state are negligible for both the studied crack/structure orien-tations (TL/L and TL/TC). Experimental data analysis leads to the conclusion that in
553
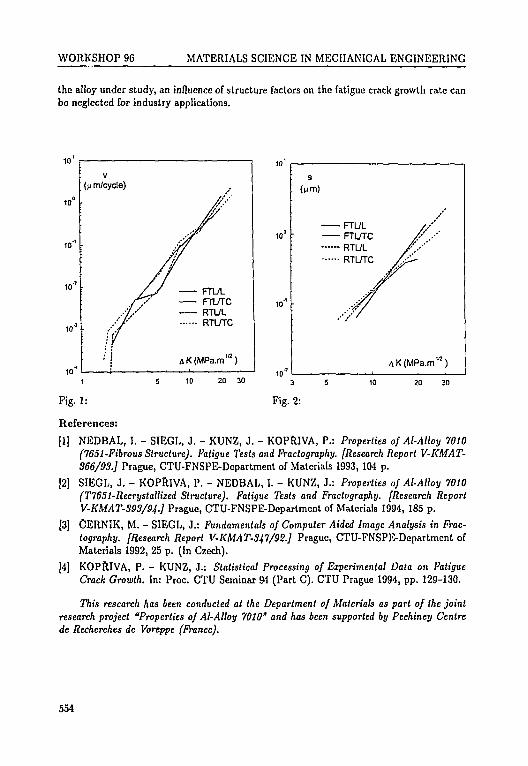
WORKSHOP 96 MATERIALS SCIENCE IN MECHANICAL ENGINEERING
the alloy under study, an influence of structure factors on the fatigue crack growth rate canbe neglected for industry applications.
u
10°
10-
io-!
10J
in"*
V
(nm/cycle)
, / r'
• - 7if
fFTULFTUTCRTULRTUTC
A K<MPW*>
10'
10AK(MPa.m
3
Fig. 2:
20 30
Fig. 1:
References:
[1] NEDBAL, I. - SIEGL, J. - KUNZ, J. - KOPRIVA, P.: Properties of Al-Alloy 7010(7651-Fibrous Structure). Fatigue Tests and Fractography. [Research Report V-KMAT-366/93.] Prague, CTU-FNSPE-Department of Materials 1993, 104 p.
[2] SIEGL, J. - KOPRIVA, P. - NEDBAL, I. - KUNZ, J.: Properties of Al-Alloy 7010(T7651-Recrystallized Structure). Fatigue Tests and Fractography. [Research ReportV-KMAT-S93/94.] Prague, CTU-FNSPE-Department of Materials 1994, 185 p.
[3] CERNIK, M. - SIEGL, J.: Fundamentals of Computer Aided Image Analysis in Frac-tography. [Research Report V-KMAT-347/9S.] Prague, CTU-FNSPE-Department ofMaterials 1992, 25 p. (In Czech).
[4] KOPRIVA, P. - KUNZ, J.: Statistical Processing of Experimental Data on FatigueCrack Growth. In: Proc. CTU Seminar 94 (Part C). CTU Prague 1994, pp. 129-130.
This research has been conducted at the Department of Materials as part of the jointresearch project "Properties of Al-Alloy 7010" and has been supported by Pechiney Centrede Recherches de Voreppe (France).
554
WORKSHOP 96 MATERIALS SCIENCE IN MECHANICAL ENGINEERING
THEORETICAL PREDICTION OF THEFATIGUE CRACK GROWTH RATE
V. Oliva, L. Cseplo, R. Hartman, A. Materna
CTU, Fac. of Nucl. Sci. & Phys. Eng., Dept. of MaterialsTrojanova 13, 120 00 Praha 2
Key words: material damage, fatigue, fatigue crack, crack rate, fracture criteria, finiteelement method
Recently some special FEM techniques were developed for the mathematical modellingof cyclic plasticity around a growing fatigue crack [1]. An important question is: cansuch detailed numerical stress-strain analysis also provide a direct theoretical estimationof the crack growth rate? A series of FEM simulations of edge fatigue crack growth inspecimens of Al alloys were described in reports [2-5]. The resulting theoretical crack ratesare summarized in Tab. 1 together with the corresponding experimental values. The mainconclusions drawn from these calculations are summarized below.
Let's assume a material element A in front of the fatigue crack tip in the small distanceAa. According to a critical strain-to-fracture model, the crack tip will extend to A duringAN cycles satisfying the Manson-Coffin relation A£pAAr"=ec in A. Denote Atp the plasticstrain range in the loading direction. According to Sih's energetic hypothesis, the crack willextend by an amount Aa after AN cycles, during which a critical amount of strain energydensity Ac is reached in element A. Parameters /?, cc or Xc are obtained from common low-cycle fatigue tests and the immediate crack rate can be estimated as Aa/AN. The resultspresented in Table 1 show that both "local low-cycle fatigue" criteria give very good resultsfor thin-walled bodies (plane stress). In practice, the energetic criterion has proved to workbetter. It is not very sensitive to finite element mesh density around the crack tip.
The so called global/local theory [6] describes the fatigue crack propagation process atboth continuum and micro-mechanics levels in terms of internal energy in static plastic zone.The fatigue crack rate is expressed as (A — $)/(F — J) where A is the rate of plastic work,$ is the heat generated during one cycle, V is the increase in fracture energy within zone perunit crack advance and J is the well known J integral. As a first approximation for the term(A — $) the plastic work dissipated in the cyclic plastic zone only was estimated from FEMsolution [7]. From the experimentally obtained crack rate, in AlZn6Mg2Cu2-plate with aunit thickness V = 16mJ/mm2. Further calculations, however, must be carried out in orderto decide whether P is a material constant and also whether the above presented generalrelationship is applicable for theoretical predictions of the real crack rate.
The theoretical estimation of the fatigue crack rate in thick-walled bodies remains anopen question. It is mainly the real stress-strain state along the crack front that is not fullyunderstood. If plane strain is assumed, the cyclic plasticity at the crack tip is mild andpredicted crack mouth displacement as well as the crack rate are unrealistically low (seethe last three rows in Tab. 1). On the other hand, if plane stress conditions are prescribed,the theoretical crack opening load is too high when compared with the experiment. Theunderlying cause of the contradiction might be in the different fracture mechanism underplane strain condition. In order for the local fracture criteria above to remain valid, the
555
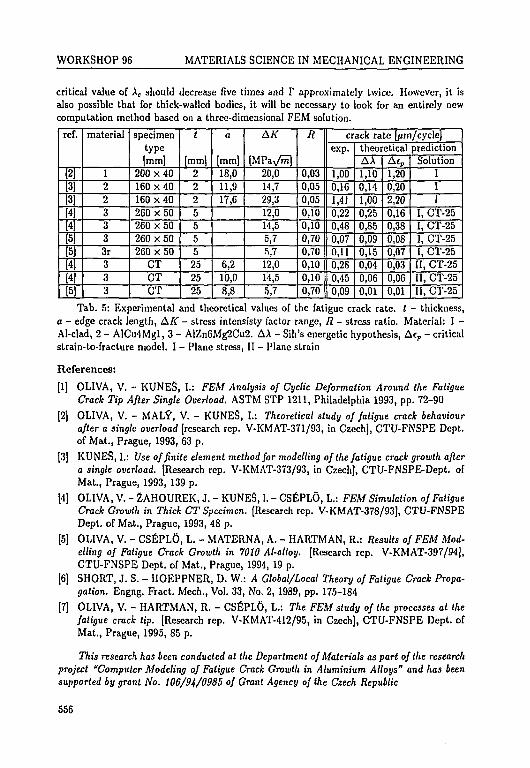
WORKSHOP 96 MATERIALS SCIENCE IN MECHANICAL ENGINEERING
critical value of Ac should decrease five times and V approximately twice. However, it isalso possible that for thick-walled bodies, it will be necessary to look for an entirely newcomputation method based on a three-dimensional FEM solution.
Ief.
12)33445
I5J1445
material
1223333r333
specimentype[mm]
200 x 40160 x 40160 x 40260 x 50260 x 50260 x 50260 x 50
CTCTCT
t
[mm]2225555252525
a
[mm]18,011,917,6
6,210,08,8
A/f
[MPavH20,014,729,312,014,55,75,712,014,55,7
H
0,030,050,050,100,100,700,700,100,100,70
crack rate [/im/cyclc]exp.
1,000,161,410,220,480,070,110,280,450,09
theoretical predictionAA1,100,141,000,250,850,090,150,040,060,01
Ac,1,200,202,200,160,380,080,070,030,060,01
SolutionIII
I, CT-25I, CT-25I, CT-25I, CT-25II, CT-25II, CT-25II, CT-25
Tab. 5: Experimental and theoretical values of the fatigue crack rate, t - thickness,a - edge crack length, AK - stress intensisty factor range, R - stress ratio. Material: 1 -Al-clad, 2 - AlCu4Mgl, 3 - AlZn6Mg2Cu2. AA - Sih's energetic hypothesis, Aep - criticalstrain-to-fracture model. I - Plane stress, II - Plane strain
References:
[1] OLIVA, V. - KUNES, I.: FEM Analysis of Cyclic Deformation Around the FatigueCrack Tip After Single Overload. ASTM STP 1211, Philadelphia 1993, pp. 72-90
[2] OLIVA, V. - MALV, V. - KUNES, I.: Theoretical study of fatigue crack behaviourafter a single overload [research rep. V-KMAT-371/93, in Czech], CTU-FNSPE Dept.of Mat., Prague, 1993, 63 p.
[3] KUNES, I.: Use of finite element method for modelling of the fatigue crack growth aftera single overload. [Research rep. V-KMAT-373/93, in Czech], CTU-FNSPE-Dept. ofMat., Prague, 1993, 139 p.
[4] OLIVA, V. - 2AHOUREK, J. - KUNES, I. - CSEPLO, L.: FEM Simulation of FatigueCrack Growth in Thick CT Specimen. [Research rep. V-KMAT-378/93], CTU-FNSPEDept. of Mat., Prague, 1993, 48 p.
[5] OLIVA, V. - CSEPLO, L. - MATERNA, A. - HARTMAN, R.: Results of FEM Mod-elling of Fatigue Crack Growth in 7010 Al-alloy. [Research rep. V-KMAT-397/94],CTU-FNSPE Dept. of Mat., Prague, 1994, 19 p.
[6] SHORT, J. S. - HOEPPNER, D. W.: A Global/Local Theory of Fatigue Crack Propa-gation. Engng. Fract. Mech., Vol. 33, No. 2, 1989, pp. 175-184
[7] OLIVA, V. - HARTMAN, R. - CSEPL6, L.: The FEM study of the processes at thefatigue crack lip. [Research rep. V-KMAT-412/95, in Czech], CTU-FNSPE Dept. ofMat., Prague, 1995, 85 p.
This research has been conducted at the Department of Materials as part of the researchproject "Computer Modeling of Fatigue Crack Growth in Aluminium Alloys" and has beensupported by grant No. 106/94/0985 of Grant Agency of the Czech Republic
556
WORKSHOP 96 MATERIALS SCIENCE IN MECHANICAL ENGINEERING
FATIGUE CRACK SURFACE PICTURES:A RANDOM FIELD ANALYSIS
(COMPUTER AIDED FRACTOGRAPHY)
H. Lauschmann, P. Cusan
CTU, Fac. of Nucl. Sci. k Phys. Eng., Dept. of MaterialsTrojanova 13, 120 00 Praha 2
Key words: fatigue fracture, picture analysis, random field
For incorporating automatical computational methods into practical fractog-raphy, 1) image features correlated to the crack growth rate (magnitude and/or direction)must be defined, 2) computer procedures must be constructed for indentifying and analysingthese features.
In the conservative fractographic practice the individual occurrences of the given frac-tographic feature are recognised and measured. To receive a representative information, arather long time of both the operator and the scanning electron microscope must be in-vested. A significant lowering of costs is expected from automatic methods through increaseof the operational efficiency.
However, the most important contributor of picture processing in fractography consistsin extending the information sources. The concept of fractographic feature is no morelimited to localised, geometrically precisely defined structures, but also integral statisticalcharacteristics of greater areas may be used.
A new fractographic feature has been looked for in connection with fatigue fracturesurfaces affected by corrosion. The usual information source - striations - is damaged.The remaining surface relief can be studied under low magnification from 100 to 500. Thepicture resembles a mountain landscape: a significant part of information is contained inareas of continuously changing brightness. Image elements cannot be defined by using theusual geometrical structures as fibres or closed areas.
Several attempts have been made in the past to use the dimensions of striation patchesas a new fractographic feature [1, 2] (in a striation patch the striations had been laidcontinuously before they were damaged). These patches are present in the picture mostlynot as areas of constant brightness, but as "smooth slopes", often with a changing gradient.That is why no objective algorithm has been found yet to determine the striation patchesborders.
The general nature of the picture is a random field with significant anisotropy. Therelief is oriented along the crack growth direction. It is distinct in visual evaluation thatcharacteristic dimensions of the random field change with the crack growth rate. While thedependence of "longitude" of the relief in the direction of crack growth is complicated, the"width" of the relief perpendicular to the crack growth direction is monotonously increasingwith the crack growth rate. It follows that some characteristic of the random field correlationproperties in this direction may be taken as the demanded fractographic feature.
557
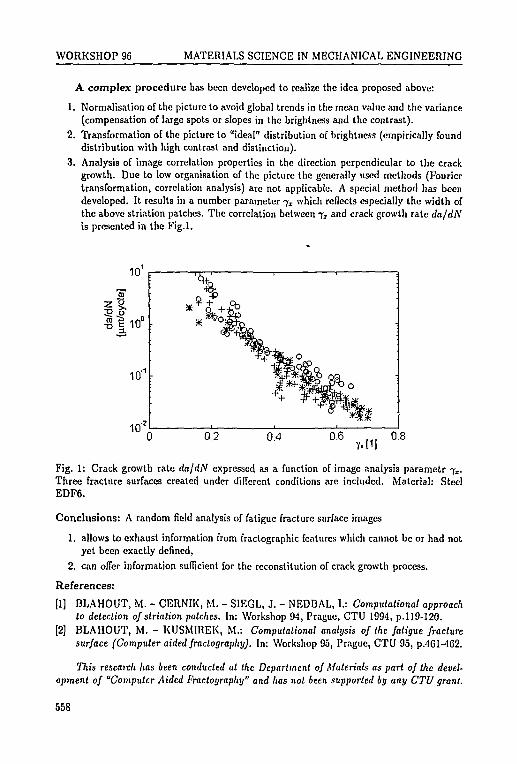
WORKSHOP 96 MATERIALS SCIENCE IN MECHANICAL ENGINEERING
A complex procedure has been developed to realize the idea proposed above:
1. Normalisation of the picture to avoid global trends in the mean value and the variance(compensation of large spots or slopes in the brightness and the contrast).
2. Transformation of the picture to "ideal" distribution of brightness (empirically founddistribution with high contrast and distinction).
3. Analysis of image correlation properties in the direction perpendicular to the crackgrowth. Due to low organisation of the picture the generally used methods (Fouriertransformation, correlation analysis) are not applicable. A special method has beendeveloped. It results in a number parameter fx which reflects especially the width ofthe above striation patches. The correlation between fT and crack growth rate da/dNis presented in the Fig.l.
0.6 . . . O.iYx[1]
Fig. 1: Crack growth rate da/dN expressed as a function of image analysis parametr j z .Three fracture surfaces created under different conditions are included. Material: SteelEDF6.
Conclusions: A random field analysis of fatigue fracture surface images
1. allows to exhaust information from fractographic features which cannot be or had notyet been exactly defined,
2. can offer information sufficient for the reconstitution of crack growth process.
References:
|1] BLAHOUT, M. - CERN1K, M. - SIEGL, J. - NEDBAL, 1.: Computational approachto detection of striation patches. In: Workshop 94, Prague, CTU 1994, p.119-120.
[2] BLAHOUT, M. - KUSMIREK, M.: Computational analysis of the fatigue fracturesurface (Computer aided fractography). In: Workshop 95, Prague, CTU 95, p.461-462.
This research has been conducted at the Department of Materials as part of Ike devel-opment of "Computer Aided Fractography" and has not been supported by any CTU grant.
558
WORKSHOP 96 MATERIALS SCIENCE IN MECHANICAL ENGINEERING
THE FATIGUE DURABILITY OFNITRIDED GEARS
J . Hanak, I. Dvorak
Military Academy in Brno, Fac. of Military Engineering, Dept. of Mecli. and Mach.Design, Dept. of Materials and Technology of Product.
Kounicova 65, 612 00 Brno
Key words: fatigue, durability, gears, fatigue testing methodology, fatigue crack propaga-tion
Fatigue failure is the final result of degradation processes, taking place in metallic mate-rials as a consequence of repeated, cyclic loadings with combination of several other effects.This way of loading is the principal otie for practically all constructions, and especially forthe automotive nnd power engineering equipments. One of the fatigue stage is the periodof a fatigue crack propagation, which may produce a defect of the critical length, initiatinga sudden, brittle fracture.
The reliability and operational ability of a gear are limited by loading capacity of gear,specially in bending. The most dangerous failure is the fracture of the tooth, usually as theresult of cumulative fatigue degradation process, caused by a cyclic external loading.
The decisive stages of fatigue degradation process (initiation and short crack prop-agation) are situated into the surface (active) layer. This is why the technologies, thatstrengthen the surface layer of a machine part favourably influence its fatigue strength.Marked high effects have been found for nitriding or ion-nitriding technologies; many ex-periments have proved the significant increases in fatigue limits of nitrided specimens andmachine parts as well.
The benefits of nitriding, however, are not conformable for the region of time limitedfatigue strength. Explanation of these phenomena requires more detailed study of indi-vidual stages o{ fatigue process in nitrided ma.teria.ls, including tl\c determination and theevaluation of external factors, which controls the fatigue mechanism.
The surface hardened, mainly nitrided spur gears were tested on hydraulic fatiguemachine ZDM 10 Mp. Using the up and down testing procedure, the fatigue limits anddurabilities for different applied loads were obtained and statistically evaluated and theequations of S-N curves were calculated for typical gear materials.
The nitriding CSN steel 15330 (comparable with DIN 30CrMoV9) was studied morein details. In addition to the above mentioned experiments, the fatigue crack propagationparametres, including the threshold values, were measured. The CT specimens and themethodology according ASTM E 647 Standard were used.
Conclusions, resulting from experimets are the following:
a) Experiments and theirs results (statistically evaluated values of fatigue limits, S-Ncurves) supply the principal material characteristics being necessary for the strengthcalculations of gears.
b) The fatigue durability and the ability of overloading of each material could be ex-pressed by means of the slope coefficient of S-N curve.
559

WORKSHOP 96 MATERIALS SCIENCE IN MECHANICAL ENGINEERING
c) The variance of fatigue limits of experimental materials, being treated with individualparameters of nitriding technology, as well as the different values of the slope coefficientexpress the important effect of internal factors (chemical composition, microstructureof material).
d) The location of fatigue fracture nucleation either under the nitrided layer or in itsbottom part could explain the following facts:
- the higher level of fatigue crack propagation threshold value of nitrided layer withrespect to the base material
- more effective role of fine, more dense segregated complex carbonitrides, that actas the barrier against the short fatigue crack growth
- the existence of microscopic and macroscopic internal stresses in the nitridedlayer
The action of individual mentioned factors are complex and additive.
e) The analyses of fracturing process in nitrided parts and results of crack-rate exper-iments have enabled the approximative quantification of individual stages of fatigueprocess with the following conclusions:
- the stage of long fatigue crack propagation covers relatively short and constantperiod of the total life (up to 20 %). This is valid both for tested specimens andgears.
- the different durability of individual tested specimens and teeth could be likelyrelated to the duration of the nucleation and the short crack propagation stages.
- the exact analysis needs the better understanding to the physical nature of men-tioned processes and more adequate quantification of the initial stages of fatigueprocess.
References:
[1] HANAK, J. - DVORAK, I.: Analysis of some factors, influencing the fatigue durabilityof nitrided machine parts. Res. Rep. G9/93, Military Academy in Brno (In Czech).
This research has been conducted at the Department of Mechanics and Machine Designand at the Department of Materials and Technolgy of Production Constructions as part ofthe research project "Fatigue Strength and Durability of Nitrided Machine Parts" and hasbeen supported by Military Academy in Brno by grant No. G9/93.
560
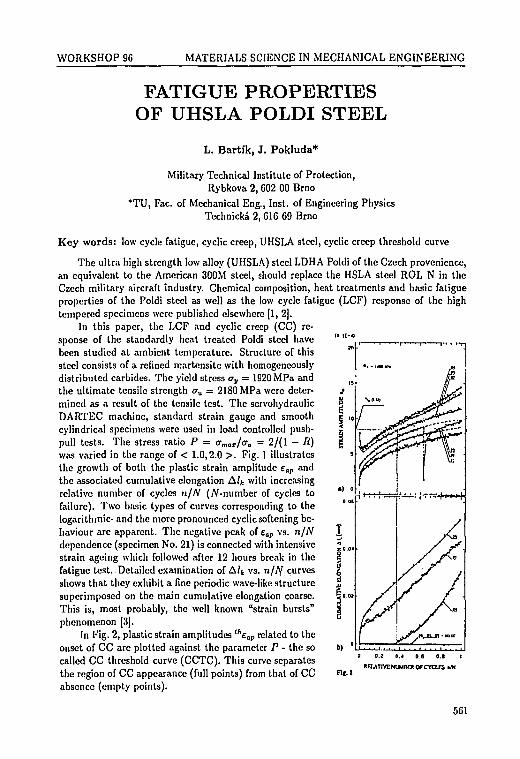
WORKSHOP 96 MATERIALS SCIENCE IN MECHANICAL ENGINEERING
FATIGUE PROPERTIESOF UHSLA POLDI STEEL
curve
L. Bartfk, J. Pokluda*
Military Technical Institute of Protection,Rybkova 2, 602 00 Brno
*TU, Fac. of Mechanical Eng., Inst. of Engineering PhysicsTechnicka 2, 616 69 Brno
Key words: low cycle fatigue, cyclic creep, UHSLA steel, cyclic creep threshold
The ultra high strength low alloy (UHSLA) steel LDHA Poldi of the Czech provenience,an equivalent to the American 300M steel, should replace the HSLA steel ROL N in theCzech military aircraft industry. Chemical composition, heat treatments and basic fatigueproperties of the Poldi steel as well as the low cycle fatigue (LCF) response of the hightempered specimens were published elsewhere [1, 2].
In this paper, the LCF and cyclic creep (CC) re-sponse of the standardly heat treated Poldi steel havebeen studied at ambient temperature. Structure of thissteel consists of a refined martensite with homogeneouslydistributed carbides. The yield stress <ry = 1S20 MPa andthe ultimate tensile strength <ru = 2180 MPa were deter-mined as a result of the tensile test. The servohydraulicDARTEC machine, standard strain gauge and smoothcylindrical specimens were used in load controlled push-pull tests. The stress ratio P = amal/ca = 2/(1 - R)was varied in the range of < 1.0,2.0 >. Fig. 1 illustratesthe growth of both the plastic strain amplitude eap andthe associated cumulative elongation A/jt with increasingrelative number of cycles n/N (TV-number of cycles tofailure). Two basic types of curves corresponding to thelogarithmic- and the more pronounced cyclic softening be-haviour are apparent. The negative peak of £ap vs. n/Ndependence (specimen No. 21) is connected with intensivestrain ageing which followed after 12 hours break in thefatigue test. Detailed examination of A/* vs. n/N curvesshows that they exhibit a fine periodic wave-like structuresuperimposed on the main cumulative elongation coarse.This is, most probably, the well known "strain bursts"phenomenon [3].
In Fig. 2, plastic strain amplitudes theap related to theonset of CC are plotted against the parameter P • the socalled CC threshold curve (CCTC). This curve separatesthe region of CC appearance (full points) from that of CCabsence (empty points).
F1f.I
561
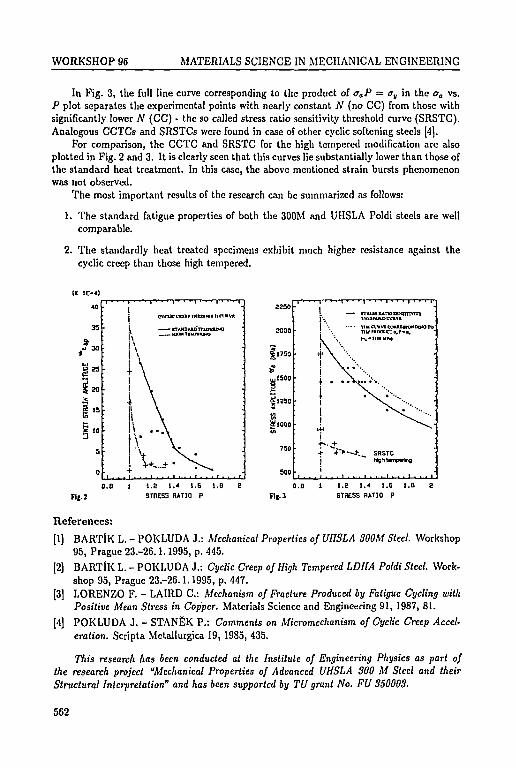
WORKSHOP 96 MATERIALS SCIENCE IN MECHANICAL ENGINEERING
In Fig. 3, the full line curve corresponding to the product of aaP = <?„ in the aa vs.P plot separates the experimental points with nearly constant N (no CC) from those withsignificantly lower N (CC) - the so called stress ratio sensitivity threshold curve (SRSTC).Analogous CCTCs and SRSTCs were found in case of other cyclic softening steels [4].
For comparison, the CCTC and SRSTC for the high tempered modification are alsoplotted in Fig. 2 and 3. It is clearly seen that this curves lie substantially lower than those ofthe standard heat treatment. In this case, the above mentioned strain bursts phenomenonwas not observed.
The most important results of the research can be summarized as follows:
1. The standard fatigue properties of both the 300M and UHSLA Poldi steels are wellcomparable.
2. The standardly heat treated specimens exhibit much higher resistance against thecyclic creep than those high tempered.
(X IE-4)
40 1j CVflJ
I .—i \ ——i \
\\
1 \+ \1 \
\\V A
• \ \
! V.._+
1
STAMOAIDTTMmUNOKlOHTlljnUNO
•
•
| l 7 5 0 •
Flf. 2
1.2 1.4 1.6 l .D
STBE53 RATIO P
500
Flj. 3
— tnaMwnoitNmrvTTY
liltClVVlCtNUtUrONKNOTO
+ * * • ? > — * . _ SRSTCj high tampering
1.2 1.4 1.6 1 .0
STRESS RATIO P
References:
[1] BARTlK L. - POKLUDA J.: Mechanical Properties of UHSLA 300M Steel. Workshop95, Prague 23.-26.1.1995, p. 445.
[2] BARTlK L. - POKLUDA J.: Cyclic Creep of High Tempered LDHA Poldi Steel. Work-shop 95, Prague 23.-26.1.1995, p. 447.LORENZO F. - LAIRD C: Mechanism of Fracture Produced by Fatigue Cycling withPositive Mean Stress in Copper. Materials Science and Engineering 91, 1987, 81.POKLUDA J. - STANEK P.: Comments on Micromechanism of Cyclic Creep Accel-eration. Scripta Metallurgica 19, 1985, 435.
[3]
This research has been conducted at the Institute of Engineering Physics as part ofthe research project "Mechanical Properties of Advanced UHSLA 300 M Steel and theirStructural Interpretation" and has been supported by TU grant No. FU 350003.
562
WORKSHOP 96 MATERIALS SCIENCE IN MECHANICAL ENGINEERING
HIGH AND LOW CYCLE FATIGUEOF AUSTEMPERED DUCTILE IRON
S. Vechet, J . Polak*, K. Obrtlik*,E. Dorazil, J . Svejcar, B . Skrbek**
TU of Brno, Fac. of Mechanical Eng., Pisek Inst. of Materials Eng.Technicka2 616 69 Brno
*Academy of Sciences of Czech Republic, Institute of Physics of MaterialsZiikova 22 602 00 Brno
**LIAZ Jablonec,Belgicka 400, 466 05 Jablonec nad Nisou
Key words: austempered ductile cast iron - ADI, upper and lower bainite structure, me-chanical fatigue properties, Woehler and Manson-Coffin curves, fatigue limit
Because of its good physical, technological and mechanical properties, ductile iron findsan ever wider range of application in a number of industries. Its main advantage is the verywide spectrum of possible heat treatment alternatives, which is conditional upon favourablegraphite shape. One such possibility, which in technical practice is today often made useof, is austempering. The present paper deals with the effect of this type of heat treatmenton the fatigue properties of ductile iron.
Used in the experiments were 2 heats of unalloyed and alloyed ductile cast irons. Isother-mal heat treatment in order to obtain a bainitic structure was carried out in electric cruciblefurnaces with salt baths. In all the cases austenitization temperature was 900 "C and theholding time at this temperature was 1 h. The time of isothermal transformation was forindividual heats determined experimentally on the basis of optimum mechanical properties,characterized by maximum elongation, in intervals from 2 s to 25 h.
Haigh cycle fatigue properties were assessed on the basis of determining the Woehlercurves and the fatigue limit values. Fatigue tests were carried out under symmetric loadingcycle or under repeated tension on an Amsler high-frequency resonance pulsator at roomtemperature. The Woehler curves were determined on a set of 12 to 15 cylindrical testspecimens with threaded heads, the working part of the specimen was of dia 7 mm.
The Woehler curves were evaluated mathematically by the least square method withthe aid of three-parameter non-linear function. The fatigue limit values were determinedfor the basic number of cycles N = 107.
Low cycle fatigue tests were performed using cylindrical specimens with 8 mm in di-ameter. Specimens were cycled in a computer controlled electrohydraulic testing machineMTS. Constant total strain amplitude cycling with the srain rate 3 • 10"3s"1 was adopted.Hysteresis loops were digitally recorded for selected number of cycles and stress amplitude,strain amplitude, plastic strain amplitude and the area of the hysteresis loop were evaluated.
The fatigue life curves were plotted as Manson-Coffin curves and derived Woehler curvesusing values of the plastic strain amplitude and stress amplitude at half-life.
The surface of the gauge Ienth after cycling and fracture surfaces were examined in ascanning electron microscope Philips 505.
563
WORKSHOP 96 MATERIALS SCIENCE IN MECHANICAL ENGINEERING
The stady of fatigue properties of austempered ductile cast irons has brought followingresults:
• In ADI the most favourable fatigue properties can be found with upper-bainite struc-tures as opposed to transition bainite and, especially, lower-bainite structures. Thisbehaviour is affected neither by the type of loading (tension-compression, tension,bending) nor by the loading cycle asymmetry.
• With bainitic structures the increase in ultimate strength due to changes in heattreatment conditions (lower transformation temperature) is not accompanied by anincrease in fatigue limit; on the contrary, the fatigue limit decreases with increasingultimate strength.
• With ADI the dependence of the loading cycle amplitude on the mean cycle stressduring tension-compression loading is hyperbolic.
• Upper and lower bainite showed rapid initial hardening and saturated behaviour duringthe whole fatigue life.
• The fatigue resistance of the materials depends on the structure of the matrix but alsoon the criteria used for life evaluation and is different when stress amplitude or plasticstrain amplitude is applied.
• When the crack is initiated from a large initial defect, the stage of short crack growthis diminished and the fatigue life is reduced.
References:
[1] DORAZIL, E.: High Strength Austempered Ductile Cast Iron. Academia, Praha (1991),pp. 73-129.
[2] VECHET, S.: Behavior of, Ductile Cast Iron in Conditions of Fatigue Loading(in Czech). PhD dissertation, TU of Brno, 1989.
[3] JOHANSSON, M. - VESANEN, A. - RETTING, H.: Anlriebstechnik. Antrienstechnik,15, 1976, pp. 593-600.
[4] JOHANSSON, M.: Properties and Applications of Austempered Austenitic-Bainitic
Ductile Iron. Proc. of Itnernational Foundry Congress 45, Budapest, 1978.
[5] HORUNG, K.: Heat Treatment of Metals. PP AMsterodam, 1986, pp. 87.
[6] KUHN, G. - REUTER, H.: Konstruieren und Giessen VDI, Dusseldorf, 1976.
This research has been conducted at the Department of materials Engineering as partof the research project "High And Low Cycle Fatigue Of Austempered Ductile Iron" and hasbeen supported by TU of Brno grant No. F-59-94-
564
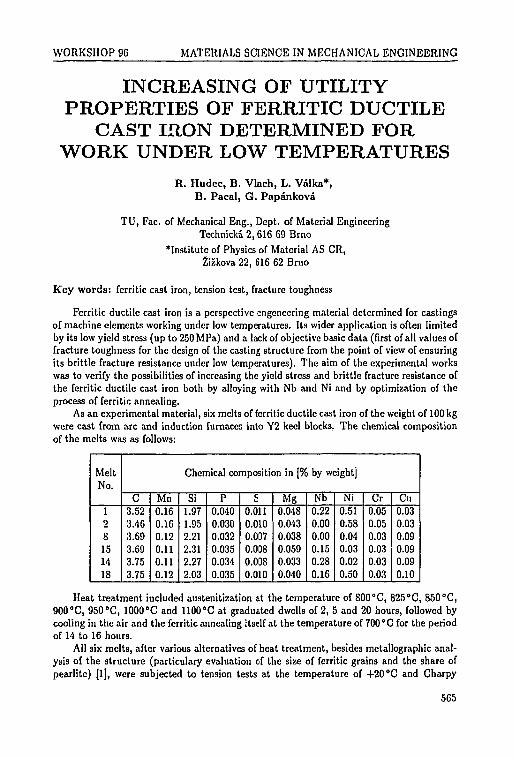
WORKSHOP 96 MATERIALS SCIENCE IN MECHANICAL ENGINEERING
INCREASING OF UTILITYPROPERTIES OF FERRITIC DUCTILE
CAST IRON DETERMINED FORWORK UNDER LOW TEMPERATURES
R. Hudec, B. Vlach, L. Valka*,B. Pacal, G. Papankova
TU, Fac. of Mechanical Eng., Dept. of Material EngineeringTechnicka. 2, 616 69 Brno
institute of Physics of Material AS CR,Zizkova 22, 616 62 Brno
Key words: ferritic cast iron, tension test, fracture toughness
Ferritic ductile cast iron is a perspective engencering material determined for castingsof machine elements working under low temperatures. Its wider application is often limitedby its low yield stress (up to 250 MPa) and a lack of objective basic data (first of all values offracture toughness for the design of the casting structure from the point of view of ensuringits brittle fracture resistance under low temperatures). The aim of the experimental workswas to verify the possibilities of increasing the yield stress and brittle fracture resistance ofthe ferritic ductile cast iron both by alloying with Nb and Ni and by optimization of theprocess of ferritic annealing.
As an experimental material, six melts of ferritic ductile cast iron of the weight of 100 kgwere cast from arc and induction furnaces into Y2 keel blocks. The chemical compositionof the melts was as follows:
MeltNo.
128151418
C3.523.463.693.693.753.75
Mn0.160.160.120.110.110.12
Chemical composition in [9
Si1.971.952.212.312.272.03
P0.0400.0300.0320.0350.0340.035
S0.0110.0100.0D70.0D80.0080.010
Mg0.0480.0430.0380.0590.0330.040
by weight]
Nb0.220.000.000.150.280.16
Ni0.510.580.040.030.020.50
Cr0.050.050.030.030.030.03
Cu0.030.030.090.090.090.10
Heat treatment included austenitization at the temperature of 800°C, 825°C, 850°C,900°C, 950°C, 1000°C and 1100°C at graduated dwells of 2, 5 and 20 hours, followed bycooling in the air and the ferritic annealing itself at the temperature of 700 °C for the periodof 14 to 16 hours.
All six melts, after various alternatives of heat treatment, besides metallographic anal-ysis of the structure (particulary evaluation of the size of ferritic grains and the share ofpearlite) [1], were subjected to tension tests at the temperature of +20°C and Charpy
565
WORKSHOP 96 MATERIALS SCIENCE IN MECHANICAL ENGINEERING
V-notch toughness tests at the temperature of 0°C to — 40"C. For melts No. 1 and 2,dependences of the temperature and stress rate on the strength properties, reached at ten-sion tests and the temperature dependences of the Chr-rpy V-notch toughness and dynamicfracture toughness were found out in addition [2].
Optimization of the heat treatment showed that the smallest fcrritic grain and thereforethe most advantageous combination of mechanical properties was achieved for all the meltsafter the austenitization at the temperature of 825°C up to 850°C after the dwell of 2 and5 hours. At lower austenitization temperatures a significant drop of the Charpy V-notchtoughness due to the presence of the sub-grains boundary structure occurred. At auste-nitization at the temperatures above 850 °C the size of austcnitic and subsequently ferriticgrain grows. It results in a significant drop of yield stress in particular. A similar influenceto that of the high austenitizing temperature is caused also by a long time of austenitization(20 hours) [3].
After an optimum cycle of the heat treating the best brittle fracture resistance wasachieved with the melt No. 8 (i.e. unalloyed) which had the Charpy V-notch toughnessmore than 22 J.cm"J even at the temperature of -40°C, with the yield stress at the 20°Cof approx. 300 MPa. The highest yield stress (350 MPa) was achieved with the ferritic ductilecast iron of the melt No. 14. alloyed by 0.2S%Nb, but with Charpy V-notch thoughncss att he -20°C under 12 J.cm-2.
The most suitable combination of the strength properties {Re = 330 MPa) and theCharpy V-notch toughness (at — 40 °C 18 J.cm"2) was proved by the cast iron alloyed by acombination of Ni and Nb (melt No. 18), cast from an arc furnace. A similar cast iron (meltNo. 1) from an inductive furnace, however, had rather worse mechanical properties, due toother structure after casting [3].
In addition to the optimalization of the heat treatment and the chemical composition,also the applicability of the Hall-Petch relation [2] and the possibility of mathematicalexpression of the dependence of the true stress on the true strain in the sphere of uniformplastic strain was proved with the ferritic ductile cast iron during the project solution[4J. The experimental works made showed the possibility of significant improvement ofthe mechanical properties of the ferritic ductile iron by the option of suitable chemicalcomposition and the heat treatment process.
References:
[1] HUDEC, R. - VLACH, B. - PACAL, B.:: Properties of Ferritic Cast Iron Determinedfor Work under Low Temperatures. VIII. Micdzynarodove sympozjum naukove, Jas-zowiec 1994, 93-97.
[2] PAPANKOVA, G.: Diplom work. VUT-FS Brno, 1995.
[3] HUDEC, R. et al.: Increasing of Utility Properties of Ferritic Ductile Cast Iron Deter-mined for Work under Low Temperatures. VUT-FS Brno, 1995.
[4] ZAKLOPALOVA, K.: Diplom work. VUT-FS Brno, 1995.
This research has been conducted at the Department of Material Engineering as partof the research project "Increasing of Utility Properties of Ferrilic Ductile Cast Iron Deter-mined for Work under Low Temperatures" andhas been supported by TU grant No. F 49-94.
566

WORKSHOP 96 MATERIALS SCIENCE IN MECHANICAL ENGINEERING
STUDY OF PHASETRANSFORMATIONS
IN HEAT TREATED MODELCAST STEEL Fe-C-Si-Ni-Nb
B. Pacal, E. Dorazil, R. Hudec,T. Podrabsky, A. Buchal, Z. Vojtkulakova
TU of Brno, Fac. of Mechanical Eng., Pisek Inst. of Materials Eng.Technicka 2, 616 69 Brno
Key words: nodular grey cast iron, low alloy silicon steel, chemical microheterogenity,ferritic annealing, transitic behaviour
The long term research task was aimed at a more detailed study of the defined propertiesof the ferritic cast irons with nodular graphite, the materials designed for low temperatureapplication. Because of the structurally intricate relationships of the low alloy cast ironbrittle-fracture behaviour and their heterogeneity, the phase transformations and the pre-cipitation processes, the attention was focussed at the study of model alloys. These alloyswere the cast silicon steels with nickel and niobium additions, the chemical composition ofwhich corresponded to the cast irons matrix but the alloys were structurally more simple.
The aim of the grant project was:
• to propose and optimize the chemical composition and the heat treatment regimes ofsteels,
• to study the influence of chemical heterogeneity in as cast state on phase transforma-tions during heat treatment,
• to carry out the structural analyses of original states, the states after individual stagesof treatment and of the final optimized structural states,
• to study the structural processes using anisothermal methods of annealing in thegamma-alpha region,
• to obtain the optimum combination of mechanical properties, that means yieldstrength and tensile strength as high as possible preserving the high level of brittle-fracture behaviour properties in the region of low temperature practical applications.
The solution of the grant project was performed on six experimental melts of siliconsteels with graduated contents of niobium and of carbon. Initial work was aimed at thestructural analyses of cast state and the study of chemical microhetcrogeneity. There wereverified different heat treatment regimes consisting of annealing without phase changes ofthe cast states, normalizing with consequent annealing under temperatures Ac\ or quenchhardening in combination with high temperature tempering. The aim of experiments wasto get ferritic matrix of cast irons and to trace the kinetics of the passing phase transfor-mations with special regard to precipitation processes and to obtaining of very fine grainedhomogeneous ferritic matrix.
567
WORKSHOP 96 MATERIALS SCIENCE IN MECHANICAL ENGINEERING
The optimized structural states were used at the heat treatment of specimen for the de-termination of the basic mechanical properties and for the verification of transitic behaviourof cast silicon steels.
The study of phase transformations performed with model silicon steels has broughtfollowing results:
• Primary carbides with niobium content are present in the structure of all melts andare formed already in liquid steel. Directional segregation of silicon into the regionsof grain boundaries of primary austenitic grains takes place during solidification.
• Pearlitic-ferritic structure of cast state is not possible to be transformed fully into fer-rite and graphite by an anneling below Aci because the pearlitic cementite is stabilizedby the carbide forming elements.
During austenitization the precipitation of carbides or niobium carbonitrides of thetype of Nbx(C,N)v takes place. The carbides are concentrated into the region of grainboundaries of secondary austenitic grains and prevent their coarsening. This processtakes place also at lower niobium content in cast steel.
• The intensity of precipitation is influenced by the condition of austenitization andin less degree also by the tempering temperature at the decomposition of martensite.The original carbon content in steel determines the range of the graphitization processduring annealing and in less degree also the amount of the present carbide precipitates.
• The degree of decomposition of the pearlitic cementitc is determined by the transfor-mation conditions and by the degree of cementite saturation especially by chromium.
The resulting grain size of ferrite at given melts, the substitutional strengthening offerrite and the extent of precipitation process are the main reason of the reached values ofthe strength characteristics of the cast silicon steels. In comparison to the nodular grey castirons the transitive curves are shifted to the right and to more higher temperatures.
References:
[1] IRWINE, K. J. - PICKERING, F. B.: JISI November 1963, pp. 944-959.
[2] SHARMA, R. C. - LAKSHMANAM, V. K. - KIRKELDY, J. S.: Metallurgical Trans-actions A. 1985, vol. 15A, pp. 545-556
[3] EMENIKE, C. 0 . - BILLINGTON, J. C: Materials Science and Technology. January1991, vol. 7, pp. 83-84.
[4] PARK, S. H. - YUE, S. - JONAS, J. J.: Metallurgical Transctins A. 1992, vol. 23A,pp. 1641-1651.
This research has been conducted at the Department of Materials Science of PisckInstitute of Materials Engineering as part of the research project "Study of Phase Transfor-mations in Heat Treated Model Cast Steel Fe-C-Si-Ni-Nb" and has been supported by TUgrant No. F-50-9J.
568
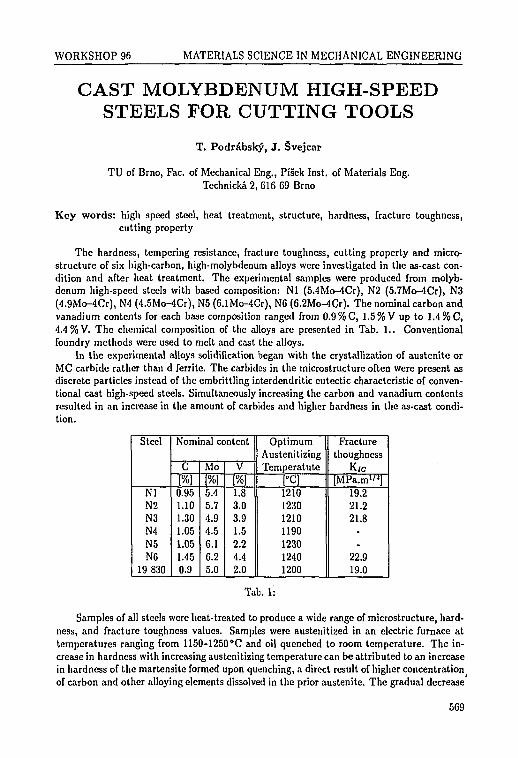
WORKSHOP 96 MATERIALS SCIENCE IN MECHANICAL ENGINEERING
CAST MOLYBDENUM HIGH-SPEEDSTEELS FOR CUTTING TOOLS
T. Podrabsky, J. Svejcar
TU of Brno, Fac. of Mechanical Eng., Pt'sek Inst. of Materials Eng.Technicka 2, 616 69 Brno
Key words: high speed steel, heat treatment, structure, hardness, fracture toughness,cutting property
The hardness, tempering resistance, fracture toughness, cutting property and micro-structure of six high-carbon, high-molybdenum alloys were investigated in the as-cast con-dition and after heat treatment. The experimental samples were produced from molyb-denum high-speed steels with based composition: Nl (5.4Mo-4Cr), N2 (5.7Mo-4Cr), N3(4.9Mo-4Cr), N4 (4.5Mo-4Cr), N5 (6.lMo-4Cr), N6 (6.2Mo-4Cr). The nominal carbon andvanadium contents for each base composition ranged from 0.9 %C, 1.5 %V up to 1.4 %C,4.4%V. The chemical composition of the alloys are presented in Tab. 1.. Conventionalfoundry methods were used to melt and cast the alloys.
In the experimental alloys solidification began with the crystallization of austenite orMC carbide rather than d ferrite. The carbides in the microstructure often were present asdiscrete particles instead of the embrittling interdendritic eutcctic characteristic of conven-tional cast high-speed steels. Simultaneously increasing the carbon and vanadium contentsresulted in an increase in the amount of carbides and higher hardness in the as-cast condi-tion.
Steel
NlN2N3N4N5N6
19 830
Nominal content
C[%]0.951.101.301.051.051.450.9
Mo(%)5.45.74.94.56.16.25.0
V[%]1.83.03.91.52.24.42.0
OptimumAustenitizingTemperatute
[°C]1210123012101190123012401200
Fracturethoughness
K/c[MPa.m1/*]
19.221.221.8
22.919.0
Tab. 1:
Samples of all steels were heat-treated to produce a wide range of microstructure, hard-ness, and fracture toughness values. Samples were austcnitized in an electric furnace attemperatures ranging from 1150-1250°C and oil quenched to room temperature. The in-crease in hardness with increasing austenitizing temperature can be attributed to an increasein hardness of the martensite formed upon quenching, a direct result of higher concentrationof carbon and other alloying elements dissolved in the prior austenite. The gradual decrease
569
WORKSHOP 96 MATERIALS SCIENCE IN MECHANICAL ENGINEERING
in hardness observed is due to an increase in retained austenite resulting from higher con-centrations of carbon and other alloying elements in solution, and consequently, a reductionin M, temperature.
Double tempered at a temperature of about 550 "C produced the maximum secondaryhardening effect (HRC 65). These alloys have higher tempering resistance than forgededhigh-speed steel CSN 19 830.
The fracture toughness specimens used for the experimrnts were of the three-point bendtype. The results of these experiments are given in Tab. 1. The morphologie of Vanadium-carbides in the high-speed steels have a direct effect on fracture toughness. As seen, valuesof fracture toughness of new steels are higher than forgeded high-speed steel CSN 19 830.
The price of molybdenum cast high-speed steels is lower than that of the steel.
References:
[1] FREMUNT, P. - PACAL, B. - VARHANiCEK, J.: Alloys with Higher Vanadium andCarbon Intended for Cast Cutting Tools. BISI, 1978.
This research has been conducted at the Department of Materials Engineering as partof the research project "Cast Molybdenum High-speed Steel for Cutting Tools" and has beensupported by TV of Brno grant No. F-47-94-
570

WORKSHOP 96 MATERIALS SCIENCE IN MECHANICAL ENGINEERING
THE LABORATORY OF CERAMICMATERIALS MECHANICAL
PROPERTIES TESTINGB. Vlach, M. Reinisch, M. Trunec,
J. Krejci, R. Hudec
TU, Fac. of Mechanical Eng., Institute of Material EngineeringTechnicka. 2, 616 69 Brno
Key words: ceramics, glass, mechanical testing, fracture, toughness
The aim of the project "Mechanical Properties and Fracture Behaviour of AdvancedCeramics" was to built the Laboratory that will make it possible to evaluate mechanicalproperties of ceramic materials. The realization of the project was planned for two years,namely 1994 and 1995.
During the first year, the measurement of two fundamental mechanical characteristics,strength and fracture toughness, was mastered. For fracture toughness measurement, weintended to find the method close to the ASTM E399 Standard. This stanc:jd requiresthe crack of defined shape to be introduced in the specimen. For three-point bendingspecimen we used the technique known as "bridge indentation". First experience showsthat this method is relatively reliable but not universal. Some structures of aluminiumoxide (corundum) ceramics and glasses defy the attempts to introduce a crack. Thus, forbending tests, it was necessary to modify the Chevron V-notch method (ASTM E1304). Onaluminium oxide ceramics, where both methods could be used, the values of Ktc measuredby both methods were acquired; it was found that the differences between the methods ofmeasurement are negligible [1, 2], During the project first year, we also tried to unearthfinancial resources for modern testing machine suitable for test of ceramics, eventually ofplastics.
Second year was dedicated to the solution of two problems:
a) the relation between mechanical properties and the structure of materials,
b) the surface preparation both for test specimen and for the microstructure evaluation(ceramography, thin foils for TEM).
In the course of the study of relationship between mechanical properties and structure,following publications were prepared:
- The methods for strength and fracture toughness measurement of ceramics were testedon aluminium oxide. Raw material for test pieces was prepared by injection mouldingfrom powders of different origin. Data acquired during the measurement methodsevaluation and results concerning the effects of grain size on strength and toughnesswere accepted for publication in the journal Kovove materialy [3]
571
WORKSHOP 96 MATERIALS SCIENCE IN MECHANICAL ENGINEERING
- The fracture behaviour of borosilicate glass hardened by vanadium and molybdenumparticles was studied in collaboration with Institute of Physics of Materials ASCRand School of Metallurgy and Materials, University of Birmingham. The results werepresented on International Conference in Plzcfi [4] and they are being prepared forpublication [5].
- Mechanical properties of new generation zirconia ceramic material were comparedfor two ceramics production technologies. The technologies were isostatic pressing(CIP) in widespread use, and injection moulding. The experiments were completed,at present the results are evaluated. It is necessary to prove that the ceramics structureis that of tetragonal polycrystalline zirconia (TZP), and thus, the preparation of thinfoils for TEM is under way.
In the first year, we had to rely on colleagues from DIAS Turnov for specimen surfacepreparation and ceramographic polishing for structure study. During the second year, wesucceeded in fitting our metallographic laboratory for these purposes.
Due to financial support provided by Grant Agency of Ministry of Education and grantsupport of Faculty of Mechanical Engineering TU Brno, it was possible to equip the Labo-ratory with modern testing machine fy ZWICK with loading up to 20 kN. The machine willbe delivered at the end of 1995 year.
The Laboratory for Mechanical Testing and Structure Evaluation of advanced ceramicmaterial was established at Faculty of Mechanical Engineering of TU Brno. It is used for re-search primarily by Department of Ceramics of the Institute of Material Engineering, of TUfor study of advanced ceramic materials. In due course, it is utilized both by undergraduateand graduate students of the Material Engineering specialization.
References:
[1] VLACH, B. et al.: Strength of Ceramics. Workshop 95, Prague, January 23-26, 1995.
[2] REINISCH, M. - VLACH, B. - TRUNEC, M.: Pevnost a tomovd houzevnalost kon-strukeni keramiky. Seminar: Prostorove modely struktury a mikromechanika lomu. FSVUT Brno 7.-8. zan 1995.
[3] REINISCH, M. - VLACH, B. - TRUNEC, M.: Hodnoceni pevnosti a lomove houzev-natosti injekcnS vstfikovane korundove' keramiky. Kovove materialy 1995, No. 6.
[4] REINISCH, M. - DLOUHt, I. - VLACH, B.: Experiences with the use of chevron-notchthree point bend specimens for the fracture toughness determination. InternationalConference on Advanced Materials and Technologies, Plzeii, June 13-16, 1995.
[5] DLOUH?, I. - REINISCH, M. - BOCCACCINI, A.: Fracture Characterization ofBorosilicate Glass Reinforced by Ductile Metallic Particles, to be published.
This research has been conducted at the Institute of Material Engineering as part ofthe research project "Mechanical Properties and Fracture Behaviour of Advanced Ceramics"and has been supported by TU grant No. C27/9J.
572
WORKSHOP 9fi MATERIALS SCIENCE IN MECHANICAL ENGINEERING
THE INFLUENCE OF Cr AND TiON THE ALUMINA SINGLE CRYSTAL
AT HIGH TEMPERATURES
K. Maca, Z. Cochnar
TU of Brno, Fac. of Mechanical Eng., Dept. of CeramicsTechnicka 2, 616 69 Brno
Key words: ceramics-metal interaction, chromium, titanium, alumina
The problems associated with the application of directional crystallization of modernheat resistant alloys stems from the reaction between the components of the alloy and theceramic mould and core at high temperatures [1, 2]. Results from previous experiments[3, 4] confirmed that the attacking species were primarily chromium and titanium in nickelbase superalloys.
Due to the lack of available thermodynamic data on real complex alloys, it is difficultto establish a theoretical description of the reaction processes involved in the system. Forthis reason, a simpler arrangement of the reaction model system was devised. This involvedusing single crystal alumina of defined crystal orientation and replacing the complex alloywith ternary and binary alloys of specific composition and with pure metals.
It was revealed that the initial step of the interaction between the alloys, Ni-20Cr andNi-20Cr-5Ti, and the alumina ceramic is redox of the following type:
2Cr + A12O3 <—> 2A1 + Cr2O3
2Ti + A12O3 <—• 2A1 + Ti2O3
The structure of the reaction products are considerably different: the formation ofa solid solution of Al203xCr203 against a sharply bordered layer of Ti203- The growthkinetics of the reaction layers is controlled by diffusion of trivalent metal cations throughthe product layers. The diffusion coefficient of Cr3+ through Al2O3xCr2O3 was calculatedto be 10~12 cm2/s and the diffusion coefficient of Ti3+ was calculated to be 10~9 cm2/s at1600°C.
Activities of the reactive elements have a remarkable influence in the described mech-anism. But the activities are not known in general even for binary or ternary alloys. Theeffect of the reaction is different when dealing with pure metallic constituents (activity = 1)and single crystal alumina. The reaction of the pure metallic elements (Cr and Ti) arepossible in the liquid or solid state. Because of the high melting points of pure chromiumand titanium (1857°C and 1660°C respectively) high temperatures are required to achievethe liquid state. The pure metals were superheated 50 °C above their corresponding meltingpoints. Results from such experiments showed that even after a short period of time ofinteraction (25 mins) the reaction was very intensive leading to the destruction of the singlecrystal alumina such that determining kinetics parameters was very difficult.
The study of the reaction of pure metals with alumina was more conveniently done at1600 °C, which is the highest temperature used during unidirectional solidification. Bothmetals are in the solid state at this temperature.
573
WORKSHOP 96 MATERIALS SCIENCE IN MECHANICAL ENGINEERING
Perfect contact of the metal with the ceramic can be achieved by sputtering or steamingof the metal. The sputtering was preferred due to its higher purity. Thin layers (tenthsof /im) of chromium and titanium were successfully sputtered on single crystal alumina byusing of two broad beam Kaufman ion sources [5]. The study of kinetics required temper-ature dwells of the order of tens of hours. The performed experiment showed that for longtemprature dwells, it is important to sputter thicker layers of the order of 10 or 100/im,thus compensating for the loss of metal due to evaporation at high temperatures even withthe use of an inert gas over-pressure.
For completion of the interfacial behaviour between the O/AI2O3 sandwich, interac-tions were also investigated between the CrjOa/AljOj sandwich.
References:
[1] CIHLAfl, J. - MACA, K. - C O C H N A R , Z.: Ceramic shell mould behaviour at contactwith Ni alloy melts, Proceedings of PRECAST '91, pp. 80-97, Uherske Hradistc, 1991
[2] MACA, K. - HRBACOVA, J. - ClHLAfl, J.: Interaction f-tlwcen alumina ceramicsand Ni alloys, Proceeding of Junior-Euromat 1992, pp. 420-121, Lausanne, 1992
[3] MACA, K. - CIHLAR, J.: Alumina shell moulds and cores for directional solidification
of Ni-attoys, Proceedings of 8th CIMTEC, World Ceramics Congress, Florence, 1994
[4] MACA, K. - CIHLAR, J.: The surface bchaviur of ceramic moulds and cores duringunidirectional solidification ofNi-base alloys, Mechanical behaviour of materials at hightemperature, Lisbon, 1995
[5] SlKOLA, T.: Design, construction and application of the equipment based on the broadbeam Kaufman ion source, Postgraduate theses, Technical University of Brno, 1993
This research has been conducted at the Department of Ceramics as part of the researchproject "The study of high temperature processes involved between Cr rcsp. Ti and singlecrystal alumina" and has been supported by TU grant No. FU350038.
574
WORKSHOP 96 MATERIALS SCIENCE IN MECHANICAL ENGINEERING
PRODUCTION TECHNOLOGYVS. STRUCTURE
AND MECHANICAL PROPERTIESOF ADVANCED PLASTICS
E. Mollikova, B. Vlach, B. Kandus*
TU, Fac. of Mechanical Eng., Dept. of Materials ScienceTechnicka 2 616 69 Brno
*TU, Fac. of Mechanical Eng., Dept. of TechnologyTechnicka 2 616 69 Brno
Key words: composite, polypropylene, magnesium hydroxide, degree of filling, filler grainsize, filler grains' surface modification, mechanical properties, impact tough-
In the modern macromolecular chemistry research a much greater effort is devotedto the improvement of the already existing material properties than to the developementof completely new polymeric materials [1]. From this point of view an important way isto process composite materials filled with mineral grained particles [2]. One of the bestfillers seems to be magnesium hydroxide, originally used as an agent capable to lower theflammability of plastics. In the adition to self-extinguishability or non-flammability thecomposite materials with polyolephine matrix filled with 40-60 % of magnesium hydroxidepresent excellent mechanical properties, especially toughness, as well [3]. For this reasonthe researchers struggle hard in order to optimize the constitution of these compositesfor different applications. This optimization is based on the scientific explanation of therelationship between structure and properties.
The aim of the grant project named "Relationship between Production Technology,Structure and Mechanical Properties of Advanced Plastics" which has been solved at theFaculty of Mechanical Engineering, Technical University Brno, in the years 1994 [4] and 1995has been to improve the knowledge of the influence of two kinds of commercial magnesiumhydroxide as filler on the structure and mechanical properties of the polymeric compositewith polypropylen matrix, with special respect to the various filler grain size of the sameshape, of the surface modification of the filler grains, and to the degreee of filling. Havingcombined these factors we have obtained 10 kinds of experimental materials. The sampleswere manufactured by means of injection moulding machine BATTENFELD BA 750/220in Polymer Institute, LTD, Brno.
All materials were subjected to tensile tests (ISO 527:1993) under the temperaturefrom —50 °C to +110 °C and the speed of loading 50 mm.min"1. Temperature dependencesof Young's modulus, yield stress, tensile strength and tensile strain at tensile strength havebeen obtained.
Moreover the dependences of the named stress and strain characteristics on the speedof loading under constant temperature +23 °C were examined. The speed of testing wasfrom O.lmm.min"1 to lOOmm.min"1.
575
WORKSHOP 96 MATERIALS SCIENCE IN MECHANICAL ENGINEERING
The resistance of materials to impact loading was examined by instrumented Charpyimpact tester. The relevant samples notched with type A notch (ISO 179:1993) were testedunder the temperature from -30 °C to +70 °C.
Our research results will be presented at the international conference in January 1996and are prepared for publication.
During solving the project we have gained knowledge of methods for the evaluation ofmechanical properties and structure of the plastics. This means a contribution to the furtherrelevant research and to teaching the students in the under- and post-graduate degree.
References:
[1] HALPIN, J. C : Polym. Eng. Sci., 15,132, 1975
[2) Plastics Compounding. Redbook 1985/86.
[3] PETRUJ, J.: Polyolcphines modified with anorganical fillers. Research Report 404,VUMCH Brno 1986.
[4] MOLLIKOVA, E. - VLACH, B. - KANDUS, B.: Relationship between ProductionTechnology, Structure and Mechanical Properties of Advanced Plastics. Report aboutsolving grant project F-65-94 in the year 1994. TU Brno, Fac. of Mechanical Eng.,Dept. of Materials Science. 1995.
This research has been conducted al the Department of Mateiiats Sciences as part ofthe research project "Relationship between Production Technology, Structure and MechanicalProperties of Advanced Plastics" and has been supported by TU of Brno grant No. F-94-95.
576
WORKSHOP 96 MATERIALS SCIENCE IN MECHANICAL ENGINEERING
COLD-ROLLING OF POLYMERSPART I: TENSILE PROPERTIES
J. Stcidl
CTU, Fac. of Mechanical Eng., Dept. of Materials ScienceKarlovo nam. 13, 121 35 Praha 2
Key words: cold-rolling, engeneering polymers, tensile deformation
Introduction. It is well known that orientation processes in polymeric materials cansignificantly enhance the mechanical properties of the final product. In the past, much efforthas been directed to solid state deformation of polyethylene and polypropylene and respec-tive technologies as drawing, extrusion, rolling and forging [1]. However, due to the low heatdistortion temperature of these polymers, their practical use as highly oriented polymers islimitod. Hence, particular focus has to be directed towards the polymer group designatedas engineering polymers. This will push up the useful range for the oriented structures tohigher temperatures, well beyond 100 °C. Furthemore, most of solid-state forming processeshave been generally performed at relatively high temperatures. It requires additional heat-ing of materials. On the other hand, little information is available about cold-rolling ofengineering polymers at ambient temperature. Accordingly, selected types of engineeringpolymers have been tested with respect to cold-rolling ability and produced profiles havebeen characterized from the mechanical points of view.
Experimental. Based upon the foregoing examinations, two engineering polymers,substantially different in their structure and tensile behaviour, have been chosen for thisstudy. The materials used were polycarbonate MAKROLON (Bayer) and polyoxymethy-lene KEMATAL (Hoechst). Polycarbonate has amorphous structure with the glass transi-tion temperature of 150 "C. It is characterized by very good toughness, distinct and • !'arpyielding, typically initiated by shear band mechanism. More particularly, it exhibit;- -da-tively high drawability as a result of neck formation. It is, therefore, to be understood thatpolycarbonate can be considered as a model amorphous polymer for plasticity and orienta-tion studies. Notably, some of the typical amorphous polymers exhibit crazing mechanismand brittle behaviour (PS). By contrast, polyoxymethylene is a higly crystalline polymerwith the melting temperature of 180 °C. Polyoxymethylene used in the present work breaksin the stage of neck development and its tensile strain at break is low. At this point, it is alsonoted that the semicrystalline polymers usually achieve high draw ratio (PE, PP). Two-rollmachine with different rolls speed (asymmetrical rolling) has been used for the cold-rollingof injection molded dumb-bell shaped standard ISO specimens. The temperature of therolls was 20°C. That is, due to the asymmetrical rolling, the shear plastic defromationwas very intensive. The mechanical properties, in the tensile mode, were measured usingconventional tensile tester at room temperature. The distance between the grips has beenadjusted according to the draw ratio of rolled specimens.
Results. It is to be observed from Fig. 1 that the cold-rolling apparently changes theshape of the stress-strain curves. In general, both polymers examined behave in differentmanners. The tensile deformation of cold-rolled polycarbonate is homogenous up to break,necking docs not occur as compared to the original material. Importantly, the stress-strain
577
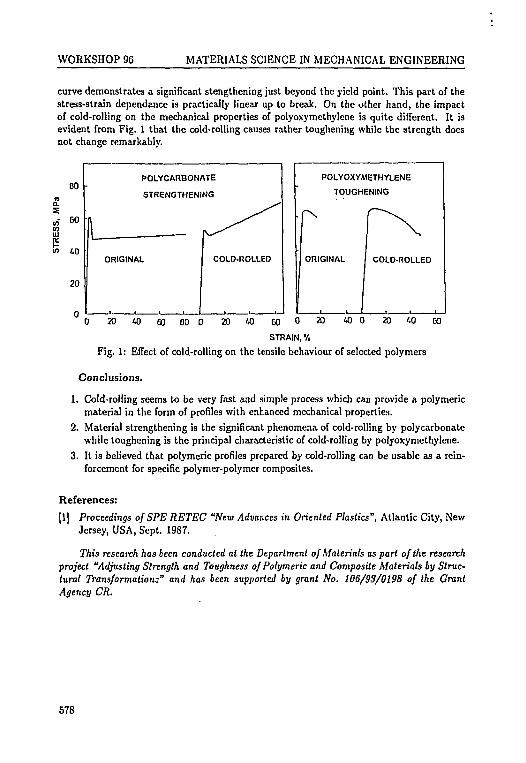
WORKSHOP 96 MATERIALS SCIENCE IN MECHANICAL ENGINEERING
curve demonstrates a significant stengthening just beyond the yield point. This part of thestress-strain dependence is practically linear up to break. On the other hand, the impactof cold-rolling on the mechanical properties of polyoxymethylene is quite different. It isevident from Fig. 1 that the cold-rolling causes rather toughening while the strength doesnot change remarkably.
80OCL
<nui
S 40
20
POLYCARBONATE
STRENGTHENING
ORIGINAL COLD-ROLLED
POLYOXYMETHYLENE
TOUGHENING
ORIGINAL COLD-ROLLED
0 2 0 4 0 6 0 6 0 0 2 0 4 0 6 0 0 2 0 4 0 0 2 0 4 0 6 0
S T R A I N , %
Fig. 1: Effect of cold-rolling on the tensile behaviour of selected polymers
Conclusions.
1. Cold-rolling seems to be very fast and simple process which can provide a polymericmaterial in the form of profiles with enhanced mechanical properties.
2. Material strengthening is the significant phenomena of cold-rolling by polycarbonatewhile toughening is the principal characteristic of cold-rolling by polyoxymethylene.
3. It is believed that polymeric profiles prepared by cold-rolling can be usable as a rein-forcement for specific polymer-polymer composites.
References:
[1] Proceedings of SPE RETEC "New Advances in Oriented Plastics", Atlantic City, NewJersey, USA, Sept. 1987.
This research has been conducted at the Department of Materials as part of the researchproject "Adjusting Strength and Toughness of Polymeric and Composite Materials by Struc-tural Transformations" and has been supported by grant No. 106/93/0198 of the GrantAgency CR.
578
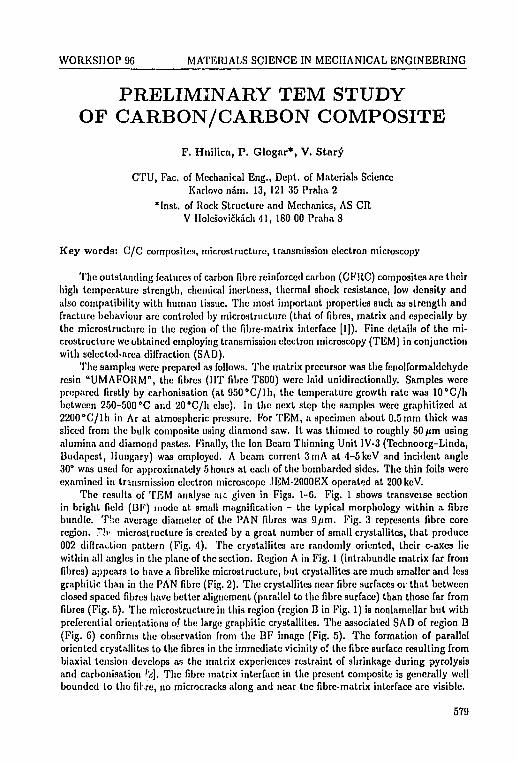
WORKSHOP 96 MATERIALS SCIENCE IN MECHANICAL ENGINEERING
PRELIMINARY TEM STUDYOF CARBON/CARBON COMPOSITE
F. Hnilicn, P . Glogar*, V. Stnry
CTU, Fac. of Mechanical Eng., Dept. of Materials ScienceKarlovo nam. 13, 121 35 Praha 2
*Inst. of Rock Structure and Mechanics, AS CRV Holesovickach 41, 180 00 Praha 8
Key words: C/C composites, microstruclurc, transmission electron microscopy
The outstanding features of carbon fibre reinforced carbon (CFRC) composites are theirhigh temperature strength, chemical inertness, thermal shock resistance, low density andalso compatibility with human tissue. The most important properties such as strength andfracture behaviour are controlcd by microstructurc (that of fibres, matrix and especially bythe microstructure in the region of the fibre-matrix interface [1]). Fine details of the mi-crostructurc we obtained employing transmission electron microscopy (TEM) in conjunctionwith selected-area diffraction (SAD).
The samples were prepared as follows. The matrix precursor was the fenolformaldehyderesin "UMAFORM", the fibres (IIT fibre T800) were laid unidircctionally. Samples wereprepared firstly by carbonisation (at 950°C/lh, the temperature growth rate was 10°C/hbetween 250-500 °C and 20°C/h else). In the next step the samples were graphitized at2200°C/lh in Ar at atmospheric pressure. For TEM, a specimen about 0.5mm thick wassliced from the bulk composite using diamond saw. It was thinned to roughly 50/im usingalumina and diamond pastes. Finally, the Ion Beam Thinning Unit IV-3 (Tcchnoorg-Linda,Budapest, Hungary) was employed. A beam current 3 mA at 4-5 kcV and incident angle30° was used for approximately 5 hours at each of the bombarded sides. The thin foils wereexamined in transmission electron microscope 1EM-2000EX operated at 200 keV.
The results of TEM analyse aic given in Figs. 1-6. Fig. 1 shows tranBVcise sectionin bright field (BF) mode at small magnification - the typical morphology within a fibrebundle. T!:o average diameter of the PAN fibres was 9/<m. Fig. 3 represents fibre coreregion. "!v microstructurc is created by a great number of small crystallites, that produce002 diffraction pattern (Fig. <1). The crystallites are randomly oriented, their c-axes liewithin all angles in the plane of the section. Region A in Fig. 1 (intrabundle matrix far fromfibres) appears to have a fibrelikc microstructure, but crystallites are much smaller and lessgraphitic than in the PAN fibre (Fig. 2). The crystallites near fibre surfaces or that betweenclosed spaced fibres have better aligncmcnt (parallel to the fibre surface) than those far fromfibres (Fig. 5). The microstruclurein this region (region B in Fig. 1) is nonlamellar but withpreferential orientations of the large graphitic crystallites. The associated SAD of region B(Fig. 6) confirms the observation from the BF image (Fig. 5). The formation of paralleloriented crystallites to the fibres in the immediate vicinity of the fibre surface resulting frombiaxial tension develops as the matrix experiences restraint of shrinkage during pyrolysisand carbonisation {'/]. The fibre matrix interface in the present composite is generally wellbounded to the fir.re, no microcracks along and near the fibre-matrix interface are visible.
579
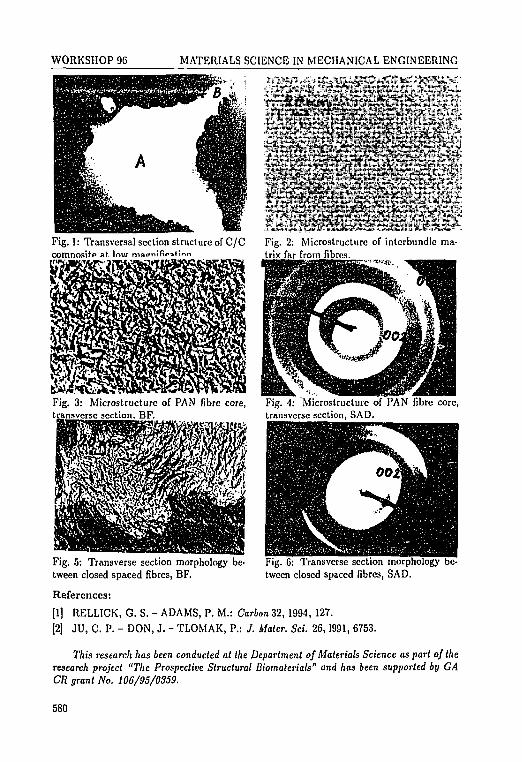
WORKSHOP 96 MATERIALS SCIENCE IN MECHANICAL ENGINEERING
Fig. 1: Transversal section structure of C/C Fig. 2: Microstructurc of interbundle ma-COmnosit.P at. lnw trix far from fibres.
Fig. 3: Microstructure of PAN fibre core, Fig. 4: Microstructme of PAN fibre core,transverse section. BF. transverse section, SAD.
Fig. 5: Transverse section morphology be- Fig. 6: Transverse section morphology be-tween closed spaced fibres, BF. tween closed spaced fibres, SAD.
References:
[1] RELLICK, G. S. - ADAMS, P. M.: Carbon 32, 1994, 127.
[2] JU, C. P. - DON, J. - TLOMAK, P.: J. Mater. Sci. 26,1991, 6753.
This research has been conducted at the Department of Materials Science as part of theresearch project "The Prospective Structural Biomatcrials" and has been supported by GACR grant No. 106/95/0359.
580
WORKSHOP 96 MATERIALS SCIENCE IN MECHANICAL ENGINEERING
THE INFLUENCE OF HYGROTHERMALAGING ON IMPACT PROPERTIESOF KEVLAR-EPOXY COMPOSITE
Z. Koffnek
CTU, Fac. of Mechanical Eng., Dept. of Materials ScienceKarlovo nam. 13, 121 35 Praha 2
Key words: composite materials, impact properties, hygrothermal aging
Para-aramide fibre reinforced cpoxy resins are used for aircraft fusselage panels whereboth good impact resistance and radiotransparency are required. Our previous investiga-tion has revealed that hygrothermal aging of para-aramidc composite, manufactured fromprepreg VICOTEX 913, results in irreversible increasing of water diffusivity and mechanicaldamping [1]. This abstract summarizes results of evaluation of composite impact behaviourinfluenced by the hygrothermal aging. The Charpy impact test was used to determineenergy absorbing characteristics of the composite. Using an instrumented Charpy pendu-lum hammer, differences in load histories among original, wet and dried specimens wereevaluated.
Experimental procedure. Composite panel was fabricated using VICOTEX 913/50/K120 prepreg manufactured by Brochier, France. The prepreg contains Kevlar 49plain fabric impregnated with tetrafunctional epoxy resin (tetraglycidylmethylendianiline- TGDMA) cured with dicyandiamine (DICY) and substituted urea as an accelerator. Atwelve-ply composite panel with a stacking sequence of plies [0] * i treated using the stan-dard vacuum-bagging procedure and a platen press molding proc The rectangular un-notched specimens (1.6 x 10 x 55 mm) were machined from a composite panel. The first setof specimens was impact tested in the original condition. The second set of specimens wasexposed to distilled water at a temperature of 65 °C until near complete water saturation(70 days) and then tested. The third set of specimens underwent the same treatment butwas dried until achieving the initial weight prior to being tested.
The instrumented Charpy testing machine CEAST (impact velocity 3.7 m/s, energy7.5 J, span between the specimen anvils 30 mm) has a strain gage attached to the strikerwhich allows to record the load-time history. Load resolution is determined by the ana-log/digital converter Advantech with a 100 kHz frequency. Data collection is triggered by aphotodetector. Collected signal can be digitally filtered to reduce high frequency oscillations(ringing) using a moving average procedure. Further analysis of load-time signals is madeusing a personal computer and a spreedsheat program.
Results. Fi^. 1 shows load-deflection and energy-deflection curves obtained in aninstrumented impact test of an original and a hygrothermally aged Kevlar 49-epoxy speci-mens. A comparison of total Charpy impact energies and ductility indexes for an originalcomposite, a wet composite and a composite dried after hygrothermal exposure is shown inFigs. 2, 3.
581
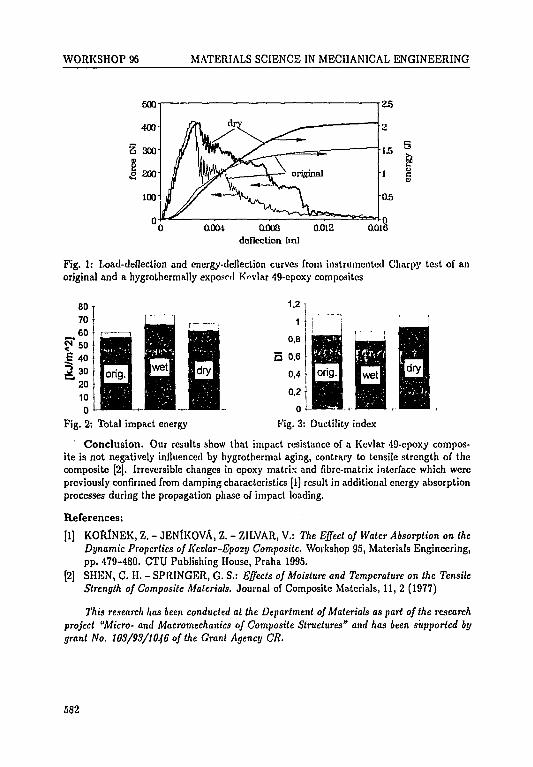
WORKSHOP 96
g
1
500-
400"
300-
200-
100
MATERIALS SCIENCE
a yy V ^L 'V_
) o.oo4 aooadeflection tml
IN MECHANICAL
, —
=«r
pnnl
25
2
15
1
05
0.012 0.016
ENGINEERING
Sh
ener
i
Fig. 1: Load-de8ection and energy-deflection curves from instrumented Charpy test of anoriginal and a hygrothermally exposerl Kfvlar 49-epoxy composites
EI
80706050403020100
Fig. 2:
r" "i
B W H BSBHIljBHj ^wBJorigJ j H J
Total impact energy Fig. 3: Ductility index
Conclusion. Our results show that impact resistance of a Kevlar 49-epoxy compos-ite is not negatively influenced by hygrothermal aging, contrary to tensile strength of thecomposite [2]. Irreversible changes in epoxy matrbc and fibre-matrix interface which werepreviously confirmed from damping characteristics [1] result in additional energy absorptionprocesses during the propagation phase of impact loading.
References:
[1] KORlNEK, Z. - JENlKOVA, Z. - ZILVAR, V.: The Effect of Water Absorption on theDynamic Properties of Kevlar-Epoxy Composite. Workshop 95, Materials Engineering,pp. 479-480. CTU Publishing House, Praha 1995.
[2] SHEN, C. H. - SPRINGER, G. S.: Effects of Moisture and Temperature on the TensileStrength of Composite Materials. Journal of Composite Materials, 11, 2 (1977)
This research has been conduckd at the Department of Materials as part of the researchproject "Micro- and Macromechanics of Composite Structures" and has been supported bygrant No. 103/93/1046 of the Grant Agency CR.
582
WORKSHOP 96 MATERIALS SCIENCE IN MECHANICAL ENGINEERING
ADHESION STUDY BY SCRATCH TESTAND VIBRATIONAL SPECTROSCOPY
P. Mach
CTU, Fac. of Electrical Eng., Dept. of ElectrotechnologyTechnicka 2, 1G6 27 Praha 6
Key words: adhesion measurement, scratch test, IR spectroscopy
Adhesion is a very significant nonelectric property of insulating coatings. It influencesmany other electric and nonelectric properties. Therefore the study of adhesion is very oftenjoined with the study of electrical and nonelectrical properties of coatings. The substanceof adhesion is given by physical, and/or chemical bonds created between a substrate and acoating.
There are many methods of adhesion measurement. According to the National standardthe adhesion test is described as follows: a grating of mutually perpendicular lines (usually5 x 5 lines) is scratched using a proper tip. The distance between neighboring lines is givenby the standard. Then the number of squares in the grating which have dropped out duringthe scratching is calculated. The adhesion of the coating is evaluated with regard to thisnumber. This test is good for an industrial use, however, its sensitivity is not sufficientfor a deeper adhesion analysis. Therefore we have used a "scratch" test for the adhesionmeasurement. This test is based on the evaluation of a track after scratching of the coatingby the tip of defined radius and is described elsewhere [1]. Using this type of test we haveevaluated adhesion of different electric insulating varnishes.
We have found that the thickness .of the coating that is recommended by producer ofvarnish is usually too thick for the scratch adhesion measurement (the maximum load ofthe tip has been ION, the tip radius has been 300/jm). Therefore the specimens have beenprepared of a diluted varnish. The layer thickness proper for the measurement has beendifferent for different varnishes. The coating have been prepared on Cu and Al substrates.The specimens have been aged thermally at the temperature higher than the temperatureof the class (the varnishes of the classes B, F, H and C have been investigated). The scratchadhesion measurement is also influenced by the hardness, persistence and thickness of thelayer. All these properties including adhesion change during the ageing. Therefore the valueof adhesion force only (not adhesion) can be obtained as a result of the scratch measurementafter measured data evaluation.
We have found that the adhesion decreases during the varnish ageing in the most cases.Results of adhesion investigation of the varnish S 1942 and the varnish Isola have beenvery interesting. The adhesion of layers prepared on the Al substrates has been very goodduring all the ageing time whereas the adhesion of layers prepared on the Cu substrates hasdecreased to the zero after three weeks of ageing and the varnish has been full destroyed.We suppose a chemical reaction between Cu and these types of varnishes. This reaction isprobably accelerated by the temperature.
The adhesion investigation described previously makes the adhesion force measurementpossible but it does not make the analysis of a cause of adhesion possible. This informationis necessary for varnishes producers because they have to analyze the substance of adhesion
583
WORKSHOP 96 MATERIALS SCIENCE IN MECHANICAL ENGINEERING
forces with regard to the chemical composition of material. Therefore we have also testedthe possibilities of IR and IETS spectroscopies for this analysis. However, there is verydifficult to analyze the substance of adhesion forces because the spectra are given by manybands that are caused by chemical bonds and groups in material. The number of thesebonds is usually very high whereas the number of bonds that are given by the bonding ofthe coating on the substrate is substantially lower. Therefore the intensity of spectral bandscaused by the adhesion is usually very low in comparison with the intensity of other bandsand often is smoothed by these bands.
A possible way how to analyze the adhesion bonds by the use of IR spectroscopy isto prepare special specimens. These specimens are prepared by the dropping of the liquidmaterial of the prepared layer (an insulating layer is e.g. the layer of an electric insulatingvarnish and therefore this form of layer preparation is the most usual) on the substrate.The substrate is located on the separator and an excess of dropped material is spun offimmediately after dropping. Then the concentration of the dilution is decreased by anadding of a proper thinner and the process is repeated. The line of specimens with the lowerand lower thickness of the layer is prepared by this way. The spectra of these specimens haveto be measured by an IR spectrometer with the good sensitivity. If the coating is bondedon the substrate by the chemisorption the bands caused by chemical bonds could be usuallyfound in the spectra of layers with the thickness near to the monomolccular ones. A moreprobable situation is that some spectral bands of the basic material will be shifted becausetheir vibrational frequency is influenced by the adhesion forces. We have used this methodfor the study of principle of adhesion of insulating varnish S 5001. The new spectral bandshave not been found and the shift of bonds of basic coating material has been very low.
An other type of vibrational spectroscopy for the adhesion bonds analysis is IET spec-troscopy. The preparation of specimens is more difficult in this case but the layer under testis very thin and therefore the analysis of adhesion bonds is more convenient. The compar-ison of IR spectra of the varnish and its IET spectra can also help in this analysis thoughnot only IR bands are presented in the tunnelling spectra. The results of adhesion analysisof four different types of electric insulating varnishes will be presented.
References:
[1] SCHORNIKOVA, M. - MACH, P.: Adhesion of electric insulating varnish, pp. 96-101.18th International Spring Seminar on Electronic Technology, Tcmcsvar, 1995.
[2] CHALKER, H. K. - BULL, S. J. - RICHERBY, D. S.: A review of the methodsfor the evaluation of coating-substrate adhesion, pp. 583-592. Material Science andEngineering, A 140, 1991.
[3] TSUKAMOTO, Y. - KURODA, H. - SATO, A. - YAMAGUCHI, H.: Microindentationadhesion tester and its application to thin films, pp. 220-225. Thin Solid Films, 213,1992.
research has been conducted at the Department of Electrotcchnology as part of theresearch project "Evaluation of Electric Insulating Varnishes" and has been supported byGACR grant No. 10S/94/1480.
584
WORKSHOP 96 MATERIALS SCIENCE IN MECHANICAL ENGINEERING
COATINGS ON DEEPLYCURVATURED SURFACES
I. Kvasnitfka, R. Novak*, D. Novakova*
CTU, Fac. of Mechanical Eng., Dept. of Machining & Process PlanningTechnicka 4, 16C 07 Praha 6
*CTU, Fac. of Mechanical Eng., Dept. of PhysicsTechnicka 4, 166 07 Praha 6
Key words: internal stress, internal stress relaxation, coatings, thin films
The mechanical properties of coatings deposited on deeply curvatured surfaces are ofgreat importance also in the design, -fabrication and use of wear resistant coatings on theedges of cutting and forming tools. Stress computing for this type of coating using commonmethods and also the elastic constants values, which are valid for bulk materials, cannotprovide the right conclusions concerning the behaviour of the coatings. The reason is thatthe coatings are growing on the edges under the conditions which are very far from thethermodynamic equilibrium. In particular, in the case of plasma assisted deposition meth-ods, the edges are exposed to an intensive ion bombardment which brings a considerableamount of energy into the coating. Under this circumstances the relaxation of the growthinduced stress cannot proceed and it shows in the high internal stress and in the fact thatthere are substantial differences in the elastic constants values in comparison both with thebulk material and with the coating deposited on the planar or only shallowly curvaturedsubstrates.
In comparison with coatings deposited on planar substrates, for coatings on deeplycurvatured surfaces the typical feature is the presence of the radial stress perpendicular tothe coating-substrate interface. The direction of this stress is very important, because itcan affect substantially the coating adhesion. It can be easily shown that:
• In the case of the tangential tensile stress in the coating on a convex surface, the radialcompressive stress is present. In the opposite case, the compressive tangential stressgenerates a tensile stress, which tries to tear off the coating from the substrate.
• On the concave surfaces all stresses have the same sign, i.e. the tensile stresses actagainst the adhesion of the coating.
It is also important to consider the fact that the presence of a radial stress due tosome external reasons (e.g. due to its rigidity, the substrates prevent the coating shrinkageduring cooling) can induce the tangential stress, which affects the state of stress in thesubstrate-coating interface and also the coating adhesion.
The state of stress in the coatings depends on the ratio of coating thickness and radiusof curvature. For shallow curvature, when the radius of curvature is substantially largerthan the coating thickness, the influence of the substrate rigidity on the state of stress inthe coating is negligible. For deep curvature, which is typical for the tools edges, whenthe radius of curvature and the coating thickness are comparable, the state of stress inthe coating is complex and the radial stresses can play an important role. Simultaneously
585

WORKSHOP 96 MATERIALS SCIENCE IN MECHANICAL ENGINEERING
also the substrate deformations could be significant, and the state of the system substrate-coating depends also on the ratios of Young's modules and Poisson's constants. Stress inthe coating can also create some plastic deformations. Analytical solution is possible onlyin the case of spherical surfaces, in the remaining cases an experimental investigation isnecesary.
The experimental evaluation of the internal stresses is usually performed by bend de-flection measuring of a thin elastic cantilever beam with the coating deposited on one ofits surfaces. The width and depth of the beam are comparable with the coating thickness.These micromachined structures are made by means of procedures common in microelec-tronics (masking, underetching etc.). That is why the beams are usually made on siliconwafers. The tests are performed by means of micromanipulators in vacuum chambers ofscanning electron microscopes and both the spontaneous bending of the beam and the forceversus deflection graphs are measured. Recently a new experimental procedure was devel-oped [1] by which a complete elastoplastic stress-strain characterization of thin coatings oncantilever beams can be performed. Also the effects of residual stresses and stresses inducedby external forces can be recognized. These experimental data provide important informa-tion about the state of stress in the coatings un tool edges and the results can be used forthe optimalization of the deposition process parameters.
References:
[1] SHWEITZ, J. A.: A new and simple micromechanical approach to the stress-straincharacterization of thin coatings. J. Micromech. Microeng., 1, 10 (1991)
This research has been conducted at the Department of Physics, the Department of Ma-chining and the Department of Material Sciencies of the Faculty of Mechanical Engineeringas part of the research project "Behaviour study of the PVD deposited metal coating onedges of machine paris"and has been supported by GA CR grant No. 106/95/1397.
586
WORKSHOP 96 MATERIALS SCIENCE IN MECHANICAL ENGINEERING
PARTICLE SCATTERINGON SOLID SURFACES
T. Sikola, P . Dub , J . JiruseA. Nebojsa*, J . Hajek, R. Ceika,
TU, Fac. of Mechanical Eng., Inst. of Phys. Eng.Technicka 2, 616 69 Brno
*MU, Fac. of. Sci., Dept. of Solid State PhysicsKotlafska2, 611 37 Brno
Key words: particle scattering, kinematical and dynamical theory of diffraction, surfaces,sputtering, TRIM
Physical processes taking place at bombardment of solid surfaces by electron and ionbeams are interesting not only from the physical point of view, but they find growing applica-tion both in technological and analytical areas. Detailed understanding of these phenomenais thus vitally important for their application in surface and thin films engineering.
The primary physical process determining numerous secondary phenomena during bom-bardment of a solid surface is scattering of the particle on the target atom. The wavelengthof the electrons within the energy range of 102 eV falls into the interval of inter-atomic dis-tances (as 10° A). Therefore, the scattering event must be treated by quantum mechanicalmethods [1]. The direct consequence of the elastic scattering of electrons on the surfaceis for example diffraction of electrons on periodic solid surfaces. On the other hand, thewavelength of ions is at least in three orders of magnitude lower than in the case of electronof the same energy. Scattering of the ions with the energy higher than 102 eV on surfaceatoms can thus be described as a collision of particles fully governed by the laws of classicalphysics. For the application purposes one of the most important phenomena induced byscattering of ions is sputtering of the target atoms.
Diffraction of electrons is used for determination of surface structure of solids. To findprecise positions of the atoms in the crystal lattice, the experimental dependence of diffrac-tion spot intensities on electron energy, obtained from the LEED experiment, is comparedwith that obtained theoretically for a supposed model of the structure. The theoreticaldependence of the intensity is found using numerical calculations based on the dynamicaltheory of diffraction.
In the above procedure we have used a kinematical model of diffraction for findingchanges of the surface structure of Ni(100) with respect to the bulk Ni-structure. The exper-imental curves of this material were measured at Aarhus university [2]. As it was expected,the kinematical model, taking into account only single scattering events, did not providethe perfect agreement between the theoretical and experimental dependencies of intensities.The lowest difference between areas bounded by both curves was 14%. For comparison,calculations carried out on the base of dynamical theory of scattering approached valuesbetween 1.5-3 % [2\. However, the positions of corresponding intensity peak maxima foundfrom the theory and experiment were in a very good agreement. The structural model givingthe best accordance between the curves (i.e. 14 %) supposed the distance between the 1st
587
WORKSHOP 96 MATERIALS SCIENCE IN MECHANICAL ENGINEERING
and 2nd layer 1.78A, whereas the distances between lower layers were 1.76 A(relaxation).The vibration amplitudes of atoms in the 1st, 2nd and lower layers were 0.17, 0.09 and0.07 A, respectively.
Regarding the interaction of ions with a surface, a kinetic model of the argon ion beamcleaning of the copper surface from carbon atoms was developed. The model is based onthe kinetic equation for a time development of the layer thickness of carbon on the coppersurface. The equation describes the competition between the growth of the carbon-basedlayers (due to the adsorption of carbon containing molecules) and the ion sputtering ofthese layers. The sticking (adsorption) coefficient of carbon atoms on the Cu-surface wasfor simplicity taken independent on the thickness of the carbon containing layer and waschosen as Sc = n, where n is the average number of carbon atoms in hydrocarbon molecules(n R3 2) [3J. The sputtering yield of carbon (copper) from the carbon layer on the coppersubstrate for the energy corresponding to the experiment (600 eV) was calculated by meansof the static TRIM 92 [4] as a function of the thickness of the carbon layer for the normaland 60° angle of ion beam incidence. Dependence of the sputtering yield on the angle ofincidence is discussed in [3] in detail. The equation was solved numerically.
The simulation revealed that to increase the efficiency of the cleaning process, thesputtering should be carried out at higher angles of incidence (60°-70°). Such arrangementincreases the sputtering yield and reduces the penetration of carbon into the material tobe studied. Further increase of the angle of incidence above this range would lead to asubstantial decrease of the sputtering yield and so the growth of carbon on the surface,instead of its etching, could be initiated. Further, the energy of the ion beam should bekept as low as possible to reduce a penetration of recoil carbon atoms into copper (at leastduring the final phase of sputtering process). On the other hand, the sputtering yieldcorresponding to too low ion energies may not be high enough to keep going on the etchingprocess. Thus the energy of 500-600 eV seems to be a reasonable compromise between thesetwo opposite requirements.
References:
[1] LUTH, H.: Surfaces and Interfaces of Solids, Springer-Verlag, Berlin, 1993, p. 429.
[2] NIELSEN, M.: private communication
[3] SIKOLA, T. et al.: Cleaning of Metal Surfaces Using the Broad Beam Ion Source,9th Int. Conf. on Surface Modification of Metals by Ion Beams, San Sebastian 1995,accepted for publication in Surface & Coatings Technology.
[4] MOLLER, W.: Thin Solid Films 228 (1993) 319.
This research has been conducted in the Institute of Physical Engineering as part ofthe research project "Particle Scattering on Solide Surfaces" and has been supported by thegrant of Fac. of Mechanical Eng., TU, No. FP359551.
588
WORKSHOP 96 MATERIALS SCIENCE IN MECHANICAL ENGINEERING
ION BEAM MODIFICATIONOF CERAMIC SURFACES ANDDEPOSITION OF THIN FILMS
T. Sikola, J . Spousta, L. Dittrichova, F. Matgjka*,D. Janova**, A. Nebojsa***, A. Buchal**,
R. Ceska, I. Kustera, J . Stefka
TU, Fac. of Mechanical Eng., Inst. of Phys. Eng.Technicka 2, 616 69 Brno
*TU, Fac. of Electrical Eng., Dept. of Microelectronics
Odolni 53, 602 00 Brno
**TU, Fac. of Mechanical Eng., Inst. of Material Eng.Technicka 2, 616 69 Brno
***MU, Fac. of Sci., Dept. of Solid State PhysicsKotlafska2, 611 37 Brno
Key words: surfaces and thin films, ion beam technologies, ceramics
Ion beams have become widely used tool for modification of surfaces and depositionof thin films. The apparatus based on this technique was designed in our group [1]. Theprimary ion beam source with a grid diameter of 150 mm was applied to modification ofthe ceramic samples and sputtering of the ceramic and metallic targets. The secondary ionsource with a grid diameter of 75 mm was used to a simultaneous bombardment of growingthin films in order to modify their properties. The energy of the argon primary ion beamwas 600 eV, the secondary ion source was run with the ion energy 100-600 eV.
In this study mainly the role of the energy of ions bombarding simultaneously the grow-ing thin films in changes of their composition, structure, morphology, mechanical, opticaland electrical properties was investigated. The ions transfer their energy to the neighbouringatoms of the surface layers creating here a localized thermodynamically unbalanced area.From the general point of view this makes it possible to generate metastable compounds andstructures which are not attainable at balanced conditions [2-4]. The techniques used forthe analyses and measurements of the above properties were e.g. RBS, XRD, STM, SEM,profilometry, microhardness and ellipsometry.
In our experiments ceramic materials were treated in two steps. The first step of thistreatment involved surface modification and sputtering of ceramic samples as AI2O3 andhydroxyapatite Caio (Po^s (OH)j. An influence of the ion beam parameters (ion energy,angle of ion beam incidence) on modification and sputtering of the ceramic surface wasstudied. The second step was aimed at the application of the sputtering effect of the ceramicsto deposition of thin films. Targets sputtered by the ion beam in order to deposit thin filmswere A12O3 and ZrOj - base ceramics (98% and 99.97%). Thin films were deposited ondifferent substrates such as a mirror polished single crystal Si(100), polycrystalline Mo andstainless steel, ceramics (AljO3) ZrO:) and hydroxiapatite, glass and quartz.
Modification of ceramic surfaces by ion beam bombardment showed some interestingeffects depending on the energy and direction of the ion beam (e.g. compositional changes
589

WORKSHOP 96 MATERIALS SCIENCE IN MECHANICAL ENGINEERING
and texture formation). AI2O3 and ZrOj thin films prepared by ion beam sputtering revealedthe chemical composition close to the stoichiometric values and good optical properties,however, the positive role of the ions bombarding films during their growth was not clearlyobserved [5]. Therefore, additional experiments, e.g. X-ray reflection method for a study offilm density changes must still be carried out.
The metallic targets sputtered were Mo (99.6 %), Ti (99.95 %), and Al (99.995 %). Thinfilms were deposited on different substrates such as a mirror polished single crystal Si(lOO),polycrystalline Mo, AljO3-base ceramic, glass and quartz. The concentration of Mo (Al) inthe thin films was decreasing (increasing) with ion energy as the Ar-content was increasing(decreasing). The RBS spectra of molybdenum thin films possess only molybdenum in thefilms at lower energies. At higher energies (400 and 600 eV) Mo content was decreased to90 % due to Ar-atoms penetrated into Mo-layers. The content of Ti was below 35 % for allion energies. Depending on the ion energy, the aluminium content in Al-thin film growsfrom about 85 to 99 %.
In contrast to the films mentioned above, titanium in the films prepared by sputteringof a titanium target is not a major element and its concentration is below 35% for allion energies. This is caused by a high ability of titanium to bind chemically oxygen andother reactive elements. For all ion energies up to 400 eV oxygen was the major elementaccommodated in the films. The ratio O/Ti was close to the stoichiometric value of 2 forall ion energies up to 400 eV. Higher ion beam energies and doses led to higher values of theindex of refraction for Al and Ti-thin films, most probably due to densification of the films.Further, it was found that increasing energy of ions caused a decrease of the deposition ratesof all films due to re-sputtering of the thin film atoms and in the case of Al-thin films itintensified amorphisation processes in the Al/Si structure [6].
References:
[1] SlKOLA, T. et al.: Equipment for Modification, Etching and Deposition of Thin FilmsBased on a Broad Beam Ion Source, Scripta Fac. Sci. Nat. Univ. Masaryk. Brun. 2(1992) 119.
[2] SCHEWEBEL, C. et al.: 34th AVS Nat. Symposium Anaheim 1987.
[3] RABALAIS, J. W. et al.: Nuclear Instr. Meth. B 67 (1992) 287.
[4] COLLIGAN, J. S.: Materials Science & Engineering, A139 (1991) 199-206.
[5] SPOUSTA, J. et al.: Low Energy Ion Beam Treatment of Ceramics, accepted for pub-lication in the Proceedings of the 6th European Conference on Applications of Surfaceand Interface Analysis, Montreux, October 1995, John Wiley.
[6] SlKOLA, T. et al.: Dual Ion Beam Deposition of Metallic Thin Films, 9th Int. Conf.on Surface Modification of Metals by Ion Beams, San Sebastian 1995, accepted forpublication in Surface & Coatings Technology.
This research has been conducted in the Institute of Physical Engineering as part ofthe research project Ton Beam Modification of Ceramic Surfaces and Deposition of ThinFilms" and has been supported by the grant of Fac. of Mechanical Eng., TV, No. FP359417.
590
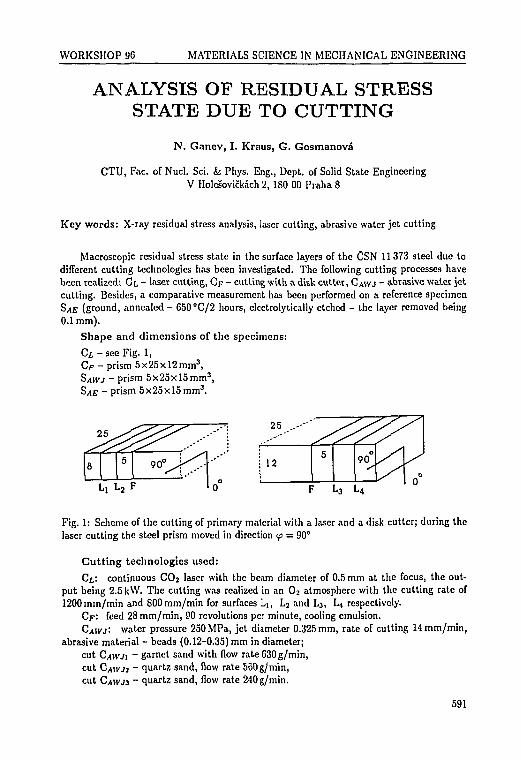
WORKSHOP 96 MATERIALS SCIENCE IN MECHANICAL ENGINEERING
ANALYSIS OF RESIDUAL STRESSSTATE DUE TO CUTTING
N. Ganev, I. Kraus, G. Gosmanova
CTU, Fac. of Nucl. Sci. k Phys. Eng., Dept. of Solid State EngineeringV Holesovickach 2, ISO 00 Praha 8
Key words: X-ray residual stress analysis, laser cutting, abrasive water jet cutting
Macroscopic residual stress state in the surface layers of the CSN 11373 steel due todifferent cutting technologies has been investigated. The following cutting processes havebeen realized: CL - laser cutting, C F - cutting with a disk cutter, CAWJ - abrasive wa.ter jetcutting. Besides, a comparative measurement has been performed on a reference specimenSAE (ground, annealed - 650 °C/2 hours, electrolytically etched - the layer removed being0.1 mm).
Shape and dimensions of the specimens:
C i - s e e Fig. 1,C F - prism 5x25xl2mm3 ,SAWJ - prism 5x25xl5mm3 ,SAE - prism 5x25xl5mm3 .
25
L, L2 F
Fig. 1: Scheme of the cutting of primary material with a laser and a disk cutter; during thelaser cutting the steel prism moved in direction f = 90°
Cut t ing technologies used:
CL: continuous CO2 laser with the beam diameter of 0.5 mm at the focus, the out-put being 2.5 kW. The cutting was realized in an O2 atmosphere with the cutting rate of1200mm/min and 800mm/min for surfaces Li, L2 and L3, L4 respectively.
C F : feed 28 mm/min, 90 revolutions per minute, cooling emulsion.CAWJ'- water pressure 250MPa, jet diameter 0.325 mm, rate of cutting 14 mm/min,
abrasive material - beads (0.12-0.35) mm in diameter;cut CAWJ\ - garnet sand with flow rate 630 g/min,cut CAWJ2 ~ quartz sand, Bow rate 550g/min,cut CAWJ3 ~ quartz sand, flow rate 240 g/min.
591

WORKSHOP 96 MATERIALS SCIENCE IN MECHANICAL ENGINEERING
Diffraction techniques used:
• Phase analysis of cutting surfaces Li, L2, L3, Lt and F (Fig. 1); CoKa radiation wasused to measure the diffraction patterns within 20 = 10° -f-135".
• Tensometric method sivPrp was performed on an u-goniometer SIEMENS using CrKaradiation; diffraction line {211} a-Fe was measured for 20 = 149°-162° with a step scan0.2" and time of acquisition t = 30s for Lj, L2, L3l L4, t = 10s and 20 = 149° -r-162°for specimens CAWJ and F. The peak position 20211 was determined as a centroid of{211} Ka diffraction line of ferrite crystallites in all azimuths of measurement.
Results of measurements
1) Crystallites of a-Fe are present on the cutting surfaces F, Li, L2, L3, L4. In additionto austenite, sections Lj, L2, L3, L4 contain wustit FeO (Li, L2, L3), hematite Fe2Os(L2, L3), and magnetite Fe3O4 (L :, L2, L3).
2) Macroscopic stresses a (MPa) obtained from surfaces Li, L2, L3, L4 depend on thedirection of measurement (Tab. 1).
Cut
L,L4
L2
L3
v> = o°-293 ± 7-374 ± 12-222 ±11-313 ±14
VJ = 90°
-203 ± 7-159 ± 8-263 ± 25-255 ± 19
Tab. 6: Stresses a (MPa) on the L1-T-L4 in azimuths ip = 0° and <p = 90°
3) The surface of the reference specimen SAE is free of stresses, i.e. a = 0 MPa.
20211(Kai) = 156.10°.
4) The triaxial residual stress state characterized by component <rn(0) = CT22(0) == —532.1 MPa and gradients </n = j 2 2 = 32.4MPa./im"1 and 333 = ll . lMPa./im"1
[1] was found in the surface layer of Cp.
5) In the surface layer CAWJI "n(0) = CT22(0) = -144.2MPa,S11 = ff22 = -13.5MPa./im-' and 533 = 10.2MPa./jm-'.
6) The biaxial stress state was indicated on the surfaces of samples C^IVJJ, CAVVJ3I a n ^c(CAWj2) = -275 MPa, a(CAWJ3) = -335 MPa.
7) The width of diffractiom line {211} Ko, found for \j> = 0° is the same for any directionof measurement tp and it varies with the cutting technologies applied:
C F ( 1 . 4 6 ° ) , L,(3.80°), L2(3.70°), L3(4.00°), L4(4.09°),0 ( ° ) , and S(0.42°).
References:
[1] KRAUS, I.: X-ray Analysis of Non-uniform Stress Fields. Academia, Prague 1990.
This research has been conducted at the Department of Solid State Engineering as partof the research project "Analysis of Residual Stress State Due to Cutting" and has beensupported by CTU grant No. 10048890.
592

WORKSHOP 96 MATERIALS SCIENCE IN MECHANICAL ENGINEERING
OPTIMIZATION OF HEAT TREATMENTUSING A NUMERICAL MODEL
F. Kavidka, J . HlouSek, J . StStina
TU, Fac. of Mechanical Eng., Dept. of Termodynamics and Nuclear EnergeticTechnicka 2, Brno 616 69
Key words: heat treatment, Fourier's equation, optimization, numerical model
During heating and cooling of heavy and massive castings there is the danger of creatingconsiderable temperature gradients with consequent development of strong heat stresses thatmay be a cause of internal crackings. For this reason it is necessary to pay considerableattention to maintaining optimum heating rates, introducing an appropriate number ofequalizing pauses and cooling rates, especially if the question is a cooling medium such asoil or even water.
It is therefore appropriate, for castings which are very demanding technologically as wellas financially, to complexly analyze the temperature field during heat treatment at the startof their production. At present, in order to determine the temperature fields, experimentalmeasurement is conducted on several castings which frequently leads to their destruction.Furthermore, the measurement is also very time consuming and it is influenced by manyexternal factors (accuracy and service life of thermocouples, contact of thermocouple mea-suring ends with the furnace atmosphere etc.) and by random influences.
The original three-dimensional mathematical model of unsteady heat transfer in solidi-fying castings can, after modification, be applied to the calculation of the temperature fieldduring its heat treatment. It is necessary to define different boundary and initial conditionswhile heating and cooling.
The presented numerical solution to the temperature field of castings during heat treat-ment is, according to all available information, the only one of its kind. The test piece wasa complex low-alloy steel casting with significant differences in wall thickness. The wholecasting was continually measured.
Heating of the casting in a furnace and subsequent cooling by quenching in a water bathis, from the viewpoint of the theory of heat transfer, a case of unsteady spatial (i.e. three-dimensional) heat transfer. In the casting itself the unsteady heat conduction takes placein accordance with the partial differential Fourier equation that mathematically representsthe description of time variation of temperature t at indifferent points of the object causedby resultant heat transfer and by the effect of heat sources. Here, the internal heat sourcesare the latent heats during characteristic structure transformations Aci and Ac3.
An elegant method for the simulation of the release of latent heat (generally latent heatduring characteristic structure transformations or during changes of state) was used. Theenthalpy function was introduced. Therefore, the explicit differential method was selectedfor the calculation.
The solution of the Fourier equation must also conform to the initial and boundaryconditions of the solution.
While solving, it is necessary to simulate the supply (while heating) or the release (whilecooling) of latent heat that accompanies the structural changes. Therefore, an explicit
593
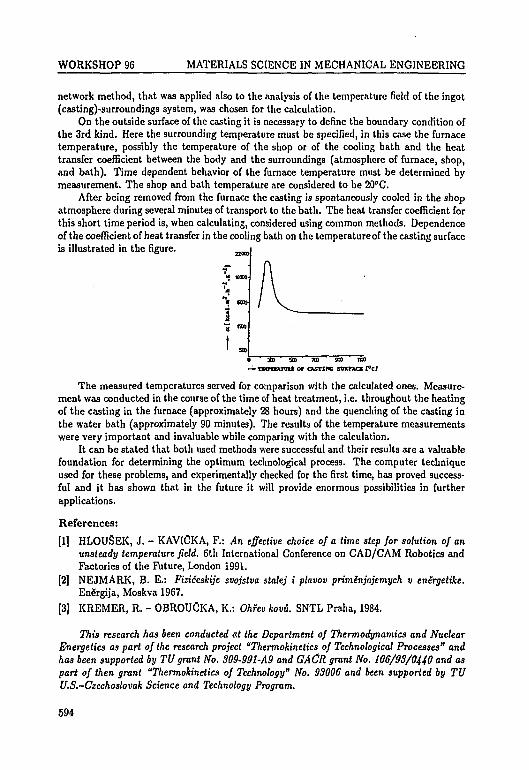
WORKSHOP 96 MATERIALS SCIENCE IN MECHANICAL ENGINEERING
network method, that was applied also to the analysis of the temperature field of the ingot(casting)-surroundings system, was chosen for the calculation.
On the outside surface of the casting it is necessary to define the boundary condition ofthe 3rd kind. Here the surrounding temperature must be specified, in this case the furnacetemperature, possibly the temperature of the shop or of the cooling bath and the heattransfer coefficient between the body and the surroundings (atmosphere of furnace, shop,and bath). Time dependent behavior of the furnace temperature must be determined bymeasurement. The shop and bath temperature are considered to be 20°C.
After being removed from the furnace the casting is spontaneously cooled in the shopatmosphere during several minutes of transport to the bath. The heat transfer coefficient forthis short time period is, when calculating, considered using common methods. Dependenceof the coefficient of heat transfer in the cooling bath on the temperature of the casting surfaceis illustrated in the figure.
55 ra 900 tooor c A s n n c SOXTACK t°cl
The measured temperatures served for comparison with the calculated ones. Measure-ment was conducted in the course of the time of heat treatment, i.e. throughout the heatingof the casting in the furnace (approximately 28 hours) and the quenching of the casting inthe water bath (approximately 90 minutes). The results of the temperature measurementswere very important and invaluable while comparing with the calculation.
It can be stated that both used methods were successful and their results are a valuablefoundation for determining the optimum technological process. The computer techniqueused for these problems, and experimentally checked for the first time, has proved success-ful and it has shown that in the future it will provide enormous possibilities in furtherapplications.
References:
[1] HLOUSEK, J. - KAVICKA, F.: An effective choice of a time step for solution of anunsteady temperature field. 6th International Conference on CAD/CAM Robotics andFactories of the Future, London 1991.
[2] NEJMARK, B. E.: Fiziceskije svojstva stalej i plavov primenjajemych v enSrgetike.Energija, Moskva 1967.
[3] KREMER, R. - OBROUCKA, K.: Ohfev kovu. SNTL Praha, 1984.
This research has been conducted at the Department of Thermodynamics and NuclearEnergetics as part of the research project "Thermokinetics of Technological Processes" andhas been supported by TU grant No. 309-991-A9 and GACR grant No. 106/93/0440 and aspart of then grant "Thermokinetics of Technology" No. 93006 and been supported by TUU.S.-Czechoslovak Science and Technology Program.
594
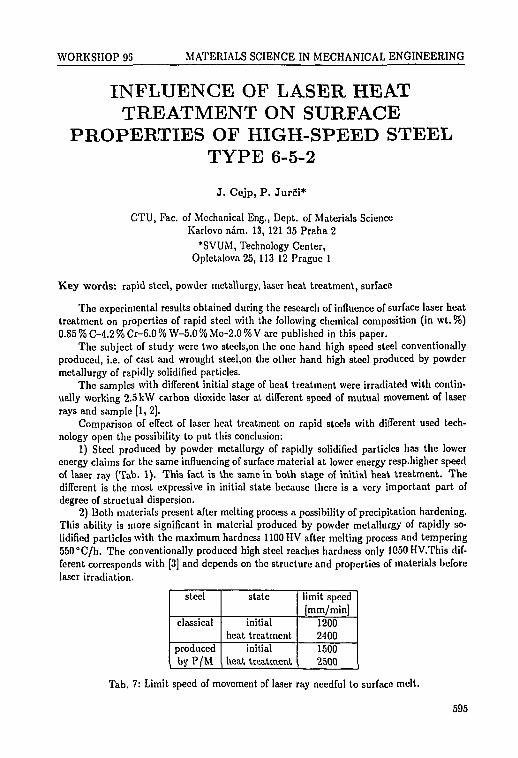
WORKSHOP 96 MATERIALS SCIENCE IN MECHANICAL ENGINEERING
INFLUENCE OF LASER HEATTREATMENT ON SURFACE
PROPERTIES OF HIGH-SPEED STEELTYPE 6-5-2
J. Cejp, P. Jurci*
CTU, Fac. of Mechanical Eng., Dept. of Materials ScienceKarlovo nam. 13, 121 35 Praha 2
*SVUM, Technology Center,Opletalova 25, 113 12 Prague 1
Key -words: rapid steel, powder metallurgy, laser heat treatment, surface
The experimental results obtained during the research of influence of surface laser heattreatment on properties of rapid steel with the following chemical composition (in wt. %)0.85% C-4.2 % Cr-6.0 % W-5.0 % Mo-2.0 % V are published in this paper.
The subject of study were two steels,on the one hand high speed steel conventionallyproduced, i.e. of cast and wrought steel,on the other hand high steel produced by powdermetallurgy of rapidly solidified particles.
The samples with different initial stage of heat treatment were irradiated with contin-ually working 2.5 kW carbon dioxide laser at different speed of mutual movement of laserrays and sample [1, 2].
Comparison of effect of laser heat treatment on rapid steels with different used tech-nology open the possibility to put this conclusion:
1) Steel produced by powder metallurgy of rapidly solidified particles has the lowerenergy claims for the same influencing of surface material at lower energy resp.higher speedof laser Tay (Tab. 1). This fact is the same in both stage of initial heat treatment. Thedifferent is the most expressive in initial state because there is a very important part ofdegree of structual dispersion.
2) Both materials present after melting process a possibility of precipitation hardening.This ability is more significant in material produced by powder metallurgy of rapidly so-lidified particles with the maximum hardness 1100 HV after melting process and tempering550°C/h. The conventionally produced high steel reaches hardness only 1050 HV.This dif-ferent corresponds with [3] and depends on the structure and properties of materials beforelaser irradiation.
steel
classical
producedbyP/M
state
initialheat treatment
initialheat treatment
limit speed[mm/min]
1200240015002500
Tab. 7: Limit speed of movement of laser ray needful to surface melt.
595
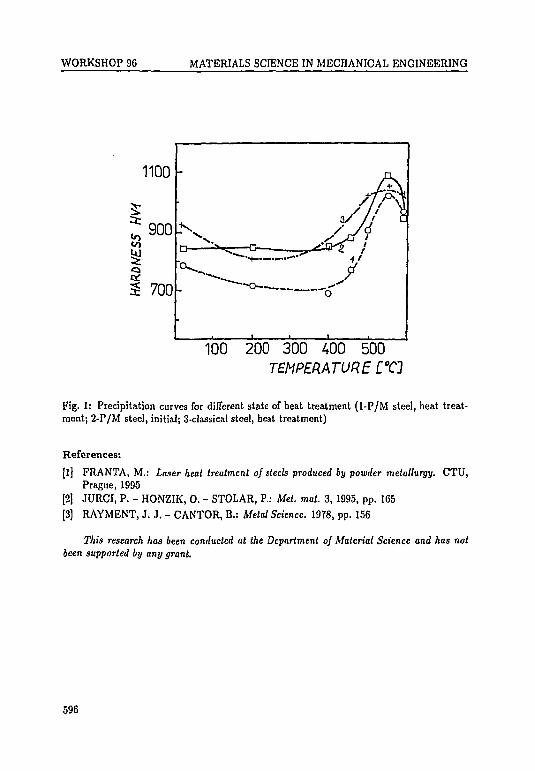
WORKSHOP 96 MATERIALS SCIENCE IN MECHANICAL ENGINEERING
100 200 300 400 500TEMPERATURE C°C]
Fig. 1: Precipitation curves for different state of heat treatment (1-P/M steel, heat treat-ment; 2-P/M steel, initial; 3-classical steel, heat treatment)
References:
[1] PRANTA, M.: Laser heat treatment of steels produced by powder metallurgy. CTU,Prague, 1995
[2] JURCI, P. - HONZIK, O. - STOLAR, P.: Met. mat. 3,1995, pp. 165
[3] RAYMENT, J. J. - CANTOR, B.: Metal Science. 1978, pp. 156
This research has been conducted at the Department of Material Science and has notbeen supported by any grant.
596
WORKSHOP 96 MATERIALS SCIENCE IN MECHANICAL ENGINEERING
MECHANICAL PROPERTIES ANDSTRUCTURE OF METALS AND ALLOYS
SUBJECTED TO HIGH STRAIN-RATEDEFORMATION
J . Krejcf, J . Bfezina*, J . Smutna*,J . Svejcar, M. Forejt**, B. Vlach
TU, Fac. of Mechanical Eng., Institute of Material EngineeringTechnicka 2, 616 69 Brno
•Institute of Physics of Materials, ASCR,Zizkova 22, 616 62 Brno
**TU, Fac. of Mechanical Eng., Institute of TechnologyTechnicka 2, 616 69 Brno
Key words: mechanical properties, structure, strain-rate, deformation, metals, alloys
The understanding of deformation behaviour of metal materials at high strain rates is ofimmense value for wide range of applications. The values of dynamic mechanical propertiesare necessary for quantitative description of armour penetration, new technologies that usethe energy of the explosives and, for that matter, for most forming technologies. The demandfor these values arises in thermal spraying, crashworthiness, safety problems of nuclearfacilities, etc. The number of experimental techniques was devised to ascertain material'sresponse to the high strain rate deformation. One of these methods, used especially for theiv-jessment of dynamic strength of ductile materials, is Taylor test. The Taylor test involvesthe impact of cylindrical projectile on the non-deforming (rigid) target at normal incidence.The impact causes specimen's permanent deformation. Resulting specimen shape is usually"mushroom-like".
The specimens were prepared from different FCC and BCC materials (single crystal andpolycrystalline copper, Cu3Al and Cu30Zn alloys, Al, 18/8 austenitic steel, plain carbonsteel (0.5 %C) quenched from 950 °C and tempered at different temperatures. Cylindri-cal specimens 25 mm long and 5 mm in diameter were accelerated by compressed air gunto velocities up to 300 ms"1. Few specimens 50 mm long were also used. The measuredparameters were: Initial and final length of the specimen. Initial and final profile of thespecimen on all specimens. The critical impact velocity (i.e., the highest velocity that doesnot induce permanent deformation) was determined. Some specimens were cut axially andhardness along the specimen axis was measured and structure assessed by light microscopyand scanning electron microscopy (SEM); Thin foils for transmission electron microscopy(TEM) were prepared from selected specimens. The substructure was studied and whenpossible the sub-grain size was measured along the specimen axis. In addition, "inverse"experiments were performed. In this case, the specimen is the immovable target and itsresponse on the impact of the projectile was evaluated. The shape, hardness and structurewere followed in relation to impact velocity and specimen's thickness.
597
WORKSHOP 96 MATERIALS SCIENCE IN MECHANICAL ENGINEERING
We have not observed undeformed regions in the specimens. Wherever the comparisonbetween dynamic and quasistatic yield stresses is possible, it shows that critical velocityvalues of yield stress equal or surpass the quasistatic tensile strength. The fundamentaldifference between quasistatic and impact loading is that quasistatic loading "deforms"whole affected volume in the same time while impact loading instigates plastic deformationthat spread across the specimen. Therefore, there is a question whether the strain ratedependence of quasistatic and "impact" stress characteristics should lie on a smooth curve.Specimen profiles and hardness variation can be generally described as follows: near theimpact surface the drop in both characteristics takes place. Its position depends on thelength of the specimen. Possible explanation is that this "tooth" arises from the interactionof propagating plastic front (compression) and reflected elastic tensile stress wave. The droprepresents local softening (tensile deformation). The variation of diameter near the free endof specimens (often the diameter less than the original is encountered) could be assigned tothe mechanism that under different circumstances (higher loading rates, larger specimens)leads to the spalling. In these specimens decrease (softening) on the hardness course can beobserved in this region.
The transmission electron microscopy shows expected dependence of the structure onthe stacking lault energy. Near impact surface, a region of heavy deformation appears athigher impact velocity. This region is similar to the regions adjacent to the adiabatic shea.1
bands observed in low SFE materials. The easiness of dislocation movement (value of SFE)does not seem to be the decisive parameter of the material's response to the high strain ratedeformation. The initial dislocation density (cold worked versus annealed copper), grain sizeand particles presented (plain carbon steel) appear to be more substantial parameters. Theplateau (or low slope) on the dependence of cell size vs. distance from impact surface suggeststhat the region of almost constant plastic wave front propagation rate (and amplitude) doexist but only in the central part of the specimen. The results are being complementedcontinuously with the aim to obtain relatively comprehensive set of data that would allowfurther theoretical evaluation.
The project is designed for two years. First task, was making the experimental equip-ment fully operative after it was moved from the Institute of Physics of Materials. In duecourse the test apparatus was improved, so that the velocity measurement is more preciseand velocities well above 300 m/s were achieved. New experiments (e.g., flyer plate, softtarget, displacement of free surface) are being prepared. The structure evaluation of the al-ready exposed specimens continues. The results obtained were used in following conferencecontributions [1, 2] (two papers for international journals are being prepared).
References:
[1] KREJCf, J. - FOREJT, M. - BUCHAR, J. - SVEJCAR, J.: Structural Aspects of HighStrain Rate Deformation with Emphasis on Forming and Explosive Welding. Interna-tional Conference on Advanced Materials, Plzefi, June 1995.
[2] FOREJT, M. - KREJCf, J. - BUCHAR, J.: High Strain Phenomena in Metal Forming.Fourth International Conference on Teaching and Education in Fatigue and Fracture(TEFF-4), Vienna, Austria, TU Vienna, Institute of Mechanics, July 13-14, 1995.
This research has been conducted at the Institute of Material Engineering as part of theresearch project "Structure and Mechanical Properties under High Strain Rates" and hasbeen supported by TU grant No. FP359578.
598

WORKSHOP 96 MATERIALS SCIENCE IN MECHANICAL ENGINEERING
JOINING OF DISSIMILAR MATERIALS
V. Ustohal, M. Kh'cnik, J . Dupak*, P . Skoda*
TU of Brno, Fac. of Mechanical Eng., Institute of Materials EngineeringTechnicka 2, 616 69 Brno
*Academy of Sciences of Czech Republic, Institute of Scientific InstrumentsKralovopolska 147, 612 00 Brno
Key words: joint, dissimilar materials, electron beam welds, reactive solders, intermetalliccompounds, terminal solid solutions
Instruments and apparatuses for unconventional fuction need very often not only un-usual solution of their construction but also uncommon combinations of dissimilar materialsconnected by undismatling joints. Necessity of development of vacuum tight joints of alu-minium or aluminium alloys with titanium, titanium alloys and corrosion resistant steelsappear to be very actual. These material combinations are considered to be unweldable bycommon methods of fusion welding because of the formation of very brittle intermetalliccompounds in weld metal [1].
Research work in frames of the grant project F-63-94 was aimed at the possibility of suchtype of joint, in which undesirable formation of continuous layers or zones of intermetalidesdoes not take place at all or is minimalised. Experimental materials were aluminium 42 4002and corrosion resistant steel 17 246. Two possible ways of their mutual joining have beentested:
1. Melting of aluminium only in very narrow zone adjacent to solid steel. Only theformation of terminal solid solution takes place. This method was previously verifiedby us with success for the combination of aluminium-titanium [2].
2. Joining by reactive solders of the eutcctics type. For the given materials combinationa thin layer of silver with or without underlayer of nickel has been verified. Silverreacts with aluminium during the process of contact melting resulting in a formationof an eutectics solder.
Experiments were performed with pipes of the outer diameter 38 mm and the wallthickness 1.6 mm. Joints were tested for vacuum tightness by a helium leak detector. Soundjoints were heated to 300 °C, kept at this temperature for 20 minutes, then cooled in free airto the room temperature and then undercooled to very low temperature in liquid nitrogen.Such drastic heat treatment was repeated five times altogether for each specimen. Then thejoints were tested again for vacuum tightness. There were tested 6 pipe specimen altogether,all having superb final vacuum tightness.
Structure of joints was evaluated by mctallographical analysis. For each structuralpart the microhardness was determined. Qualitative and quantitative X-Ray microanalysiswas applied for the determination of chemical composition of all structural parts. Tensileand bend strengths were verified by simple mechanical testing of strips cut from the pipespecimens.
599

WORKSHOP 96 MATERIALS SCIENCE IN MECHANICAL ENGINEERING
Conclusion: The results obtained have shown that it is possible to prepare vacuumtight, mechanically strong enough joints between aluminium and titanium, nickel or cor-rosion resistant steel. Following research programme will be aimed at the optimization ofconditions and parameters of joining in order to eliminate possible but undesirable localoverheating of materials during their joining.
References:
[1] DUPAK, J. - MICHALICKA, P. - VRESTAL, J. - KAPOUNEK, P.: Novy zpusobsvafovdni kombinovanych spoji Al-Ti elektronovym paprskem. (New Method of Weldingof Combined Joints Al-Ti by Electron Beam). Zvaranie, 43, (1994), No. 1, pp. 13-16.
[2] USTOHAL, V. - DUPAK, J.: Svarove spoje riznorodych materiali elektronovym pa-prskem. (Weld Joints of Dissimilar Materials by Electron Beam). VUT FS, OMI aOPT AV CR, Brno, 1994.
This research has been conducted at the Department of Materials Engineering as partof the research project "Joining of Dissimilar Materials " and has been supported by TUgrant No. F-63-94.
600

Section 10
MATERIALS SCIENCE
IN ELECTRICAL, CHEMICAL
AND CIVIL ENGINEERING
NEXT PAGEIS1left BLAKK
WORKSHOP 96 MATERIALS SCIENCE IN ELECTRICAL, CHEM. fe CIVIL ENG.
STRUCTURAL RELAXATIONIN SPLAT COOLED 75Ce-25Al ALLOY
R. Fiedler
TU, Fac. of Electrical Eng. and Computer Sci., Dept. of MicroelectronicsOdolni 53, Brno
Key words: crystal structure, diffraction, intermetallic compound, kinetic coefficient, me-tallic glass, preferred orientation, structural relaxation
The aim of this paper is to describe the process of the structural relaxation of splatcooled 75Ce-25Al alloy. Intermetallic compound CeaAl attracted attention as a heavyfermion with antiferromagnetic ordering at temperatures bellow 115K [1]. The Ce3Al com-pound exists in three allotropic modifications. The alpha phase having hexagonal structureNo. 194 of NisSn type [2] is stable in the temperature range 115-523 K.
The process of structural relaxation in splat cooled 75Ce-25Al alloy samples was investi-gated by measurement of the diffraction intensities of the hexagonal intermetallic compoundCesAl, which arose from the non-crystalline state during isothermal annealing in a diffrac-tion chamber. Annealing 90°C/5 h/argon did not affect the X-ray diffraction pattern of themetallic glass structure. Structural relaxation started at temperature Tg = 100 °C.
At the beginning of the first stadium of structural relaxation, the diffraction 002 was oneorder of intensity higher than the 201 diffraction which has the highest intensity of a stable,ordered crystalline compound. Both the computing of diffraction intensities for ordered anddisordered Ce3Al and the measurement of preferred orientation for partly relaxed structureproved that the observed intensity of 002 diffraction is due to the creating of very thin plateshaving (001) orientation and thickness d < 100 nm.
Annealing for 39 hrs at 100 °C in a diffraction chamber enabled the determination ofthe kinetic coefficients k and n in Avrami equation [3]. The transformed volumes of materialfor the Avrami equation were determined from the relative intensities of diffractions.
The values of kinetic coefficients n = 0.5, k = 0.57 for diffraction 002 and n = 0.5, k =0.37 for diffraction 201 were computed from the Avrami equation applied to experimentaldiffraction intensities. The value of kinetic coefficient n = 0.5 has confirmed (see [3]) therole of thin plates in the first stadium of structural relaxation. Extrapolation of kineticcurves for different rate constants k made it possible to assess time necessary for completeordering. Plates oriented along the basal plane of the stable crystal structure were builtup at temperature 100 °C in 80 hrs. Transformation from the non-crystalline phase to thecrystalline chemically ordered alpha Ce3Al phase at temperature 100°C would be finishedin 400 hrs.
The experiments and their analysis proved that the first stadium of structural relaxationdid not started by a topological ordering in local 3D micro-volumes of sample, but by thelong range ordering of atoms in the volume of very thin plates having the orientation ofthe basal plane (001) of hexagonal structure of alpha Ce3Al phase. During the diffusioncontrolled thickening, topological and chemical ordering took place simultaneously.
603
WORKSHOP 96 MATERIALS SCIENCE IN ELECTRICAL, CHEM. fc CIVIL ENG.
Measurement of the preferred orientation by a texture X-ray difFractometer proved thatthe plate-like shape of analysed samples did not influence the orientation of new grains whichwere transformed from the glassy stale.
Author expresses his thanks to Rudolfphus W.A. Hendrikx from Kamerlingh OnnesLaboratorium, Rijks Universiteit, Leiden (NL) for splat cooled samples and to Ing. JiriZeman, DrSc. from Brno Military Technical Institute for texture measurements.
References:
[1] LAWSON, A. C. - LAWRENCE, J. M. - THOMSON, J. D. - WILLIAMS, A.: PhysicaB163, 1990, pp. 587-590.
[2] VILLARS, P. - CALVERT, I. D.: Pearson's Handbook of Cryslallographic Data forIntermetallic Phases. 2. ed. Materials Park, Ohio, ASM 1991.
[3] CHRISTIAN, J. W.: The Theory of Transformations in Metals and Alloys. 2. ed.Oxford, Pergamon Press 1985.
This research has been conducted at the Department of Microehctronics as part of theresearch project and has been supported by GACR grant No. 106/95/0310.
604
WORKSHOP 96 MATERIALS SCIENCE IN ELECTRICAL, CHEM. fc CIVIL ENG.
CONDUCTANCE CHANGESAND PREMATURE CAPACITY LOSS
IN POSITIVE LEAD-ACIDBATTERY PLATES
M. Calabek, K. Micka*, V. Smarda,P. Baca, P. Krivak
TU Brno, Fac. of Electrical Eng. and Informatics,Antom'nska, 1, 662 09 Brno
*J. Heyrovsky Institute of Physical Chemistry,Dolejskova 3, 182 23 Praha
Key words: lead-acid batteries, cnllector-active mass interface, contact resistance, activemass resistance, grid alloys, premature capacity loss
Our research work has been devoted to identification of processes that cause prematurecapacity loss (PCL) in lead-acid batteries. Special attention has been paid to the conduc-tance of the active material Gm and to the conductance of the interphase between the activematerial and the lead grid Gk in positive electrodes.
Test electrodes were pasted on grids made of pure lead and seven different grid alloys,both antimonial and antimony-free (with calcium), and with different tin contents. The areafor pasting was 55 x 20 mm, the thickness was 7 mm. The paste had a typical industrialformulation (from Baren Batterie, Austria). The test cells contained a large excess of bothelectrolyte and negative active material. The negative electrodes were placed at either sideof the test electrode at a distance of about 25 mm. No separators were used. The plateswere formed in the usual way.
The test electrodes were arranged into two groups (eight electrodes each); one groupwas cycled under a "bad" regime and the other under a "good" one [2]. In the bad regime,the charging current was adjusted so that the charge passed after 18 h be equal to 150%of that obtained after discharge in the preceding cycle. In the good regime, the electrodeswere charged more rapidly with a current corresponding to the discharge time of four hours(in our case 0.5 A) until the cell voltage reached 2.4 V, and then with a current of half thepreceding value so that the total charge be 125% of that obtained during the discharge.The electrodes were discharged daily at about one-hour discharge rate to a cut-off voltageof 1.6V (100% DOD).
The results of the measurements were obtained in the form of the dependences of theinterphase conductances Gk and of the active mass conductances Gm together with thedischarge capacity G on the number of cycles. The conductance measurements were carriedout by means of our original method [1]. The conspicuous decrease of the capacity, thatwas observed, is obviously a manifestation of the PCL effect.
Under the bad cycling regime, a close resemblance between the curves of the capacityand of the active material conductance can be observed. The capacity increases linearly withthe specific conductance of the (charged) active material up to the value of Gm <=s 200 S.cm"1
605
WORKSHOP 96 MATERIALS SCIENCE IN ELECTRICAL, CHEM. & CIVIL ENG.
and then it remains almost constant. This is particularly true for electrodes with Pb-Ca0.09, Pb-Ca 0.09-Sn 0.32, Pb-Ca 0.09-Sn 0.70 and Pb-Sb 1.61-Ca 0.37 grids (numbersindicate the component contents per cent).
Similar dependences were obtained for electrodes cycled under the good regime, buttheir life was appreciably longer, except for the electrode with Pb-Ca grid, which brokedown after several cycles. For antimony-free collectors under the bad regime, the cyclelife decreases with increasing tin content, while for antimonial lead collectors the cycle lifeincreases with the content of antimony. With respect to 100 % DOD, the electrodes attaineda rather high cycle life. Shedding of the active material, but no deterioration of the currentcollector was observed at the end of the test.
Electrodes with pure lead grids broke down before finishing the six conditioning cycles.Their capacity fell in parallel with the conductances, Gk and Gm. These results stronglysuggest the presence of some form of passivation of the lead grid. Further evidence ofpassivation was obtained from voltage-lime curves which were of usual shape, but shiftedto lower voltage values. Such behaviour is typical for passivation due to the formation ofhigh-resistance layers close to the grid [3, 4]. Generally, a fall in the discharge capacity wasaccompanied by a decrease in the conductance of the active material, whereas no correlationwith the interphase conductance (except, perhaps, for electrodes with the pure lead grid)was found. Under the bad regime, the Gk values usually began to fall when the end of cyclelife (i.e. | of Co) was attained; and under the good regime, the changes of Gk values wererelatively small or, with antimonial lead grids, even negligible.
The decrease in capacity under the bad cycling regime is a typical manifestation ofthe PCL effect, although, as anticipated, the rate of capacity loss was lower for antimo-nial lead grids. The clear correlation with the active material conductance is in line withactive-material-based causes of capacity loss, such as described by the model proposed byWinsel et al. [2). (Experiments carried out under the good cycling regime led to a similarcorrelation.) A theory of the effect of active material resistance on the discharge capacitywas elaborated by Bouet and Pompon [5], who concluded that the loss of capacity is largelydue to an increase in the resistance of intergranular contacts and not to a decrease in theelectrochemical activity of lead dioxide.
References:
[1] CALABEK, M. - MICKA, K.: Eleclrochim. Ada 37, p. 1805 (1992)
[2] WINSEL, A. - VOSS, E. - HULLMEINE, U.: J. Power Sources 30, p. 209 (1990)
[3] DORING, H. - GARCHE, J. - DIETZ, H. - WIESENER, K.: J. Power Sources 30,p. 41 (1990)
[4] GARCHE, J. - ANASTASIJEVIC, N. - WIESENER, K.: Eleclrochim. Ada 26, p.1363(1981)
[5] BOUET, J. - POMPON, J. P.: Electrochim. Ada 26, p. 1477 (1981)
This research has been conducted at the Department of Electrotechnology of TU Brno aspart of the research project "Studies of the Collector/Active Mass Interface in the Lead-AcidBatteries" and has been supported by TU in Brno (Grant No. 0053/95) and by the AdvancedLead-Acid Battery Consortium (Project No. AMC 00SA), a program of the InternationalLead Zinc Research Organization, Research Triangle Park, NC, USA.
606
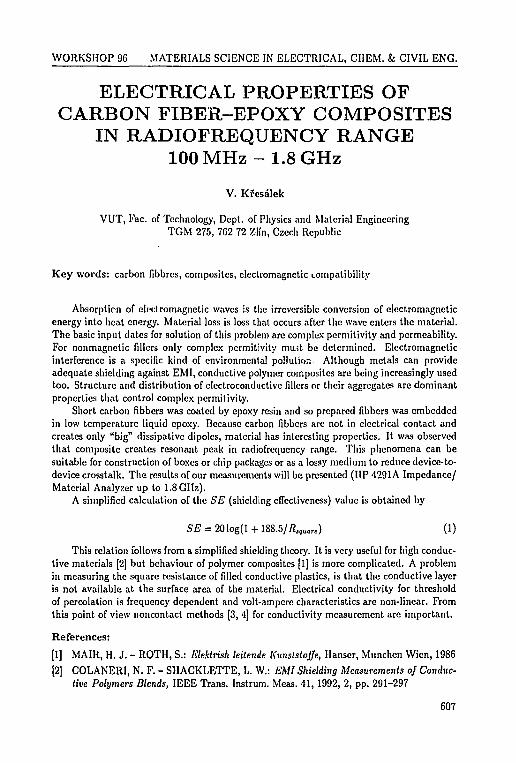
WORKSHOP 96 MATERIALS SCIENCE IN ELECTRICAL, CHEM. fc CIVIL ENG.
ELECTRICAL PROPERTIES OFCARBON FIBER-EPOXY COMPOSITES
IN RADIOFREQUENCY RANGE100 MHz-1.8 GHz
V. Kfcsalek
VUT, Fac. of Technology, Dept. of Physics and Material EngineeringTGM 275, 762 72 Zlfn, Czech Republic
Key words: carbon fibbrcs, composites, electromagnetic uimpatibility
Absorption of electromagnetic waves is the irreversible conversion of electromagneticenergy into heat energy. Material loss is loss that occurs after the wave enters the material.The basic input dates for solution of this problem are complex permitivity and permeability.For nonmagnetic fillers only complex permitivity must be determined. Electromagneticinterference is a specific kind of environmental pollution Although metals can provideadequate shielding against EMI, conductive polymer composites are being increasingly usedtoo. Structure and distribution of electroconductive fillers or their aggregates arc dominantproperties that control complex permitivity.
Short carbon fibbers was coated by epoxy resin and so prepared fibbers was embeddedin low temperature liquid epoxy. Because carbon fibbers are not in electrical contact andcreates only "big" dissipative dipoles, material has interesting properties. It was observedthat composite creates resonant peak in radiofrequency range. This phenomena can besuitable for construction of boxes or chip packages or as a lossy medium to reduce device-to-device crosstalk. The results of our measurements will be presented (HP 4291A Impedance/Material Analyzer up to 1.8 GHz).
A simplified calculation of the SE (shielding effectiveness) value is obtained by
S £ = 201og(l +188.5/7J,,Ua«) (1)
This relation follows from a simplified shielding theory. It is very useful for high conduc-tive materials [2] but behaviour of polymer composites [1] is more complicated. A problemin measuring the square resistance of filled conductive plastics, is that the conductive layeris not available at the surface area of the material. Electrical conductivity for thresholdof percolation is frequency dependent and volt-ampere characteristics are non-linear. Fromthis point of view noncontact methods [3, 4] for conductivity measurement are important.
References:
[1] MAIR, H. J. - ROTH, S.: Elektrish leitende Kunststoffe, Hanser, Munchen Wien, 1986[2] COLANERI, N. F. - SHACKLETTE, L. W.: EMI Shielding Measurements of Conduc-
tive Polymers Blends, IEEE Trans. Instrum. Meas. 41, 1992, 2, pp. 291-297
607
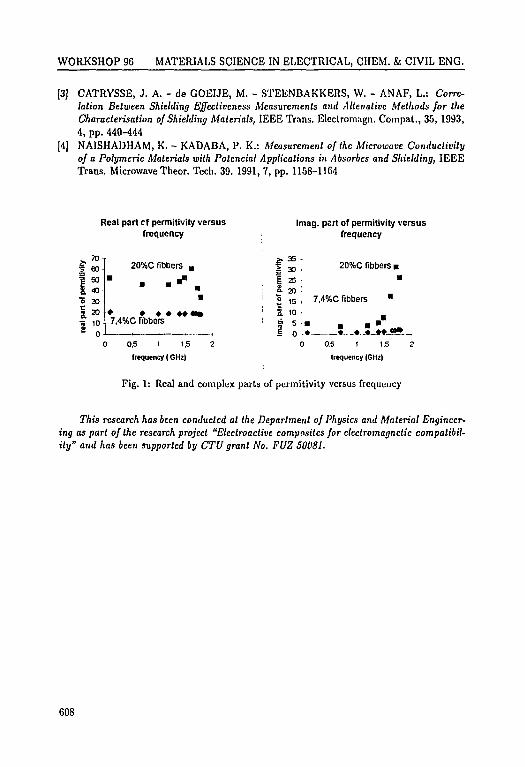
WORKSHOP 96 MATERIALS SCIENCE IN ELECTRICAL, CHEM. fc CIVIL ENG.
[3] CATRYSSE, J. A. - de GOEIJE, M. - STEENBAKKERS, W. - ANAF, L.: Corre-lation Betwten Shielding Effectiveness Measurements and Allenativc Methods for theCharacterisation of Shielding Materials, IEEE Trans. Electromagn. Compat., 35, 1993,4, pp. 440-444
[4] NAISHADHAM, K. - KADABA, P. K.: Measurement of the Microwave Conductivityof a Polymeric Materials with Potencial Applications in Absorbes and Shielding, IEEETrans. Microwave Theor. Tech. 39. 1991, 7, pp. 1158-1164
Real part c.f permitivity versus Imag. pert of permitivity versusfrequency frequency
*i t ,
> 60 20%C fibbers B I" x [ 20%C fibbers •
" • • • " _ I 2 5 ;• • s. 20 •
• ° 15 , 7.4%C fibbers •• * * * * * * * ; I 10 •7,4%C fibbers ; g> s • • a •
, , , • 1 o - • " . . - • . - • _ # • - < • • .0 0,5 I 1.5 2 ; 0 0.5 I 1.5 2
frequency (GHz) j frequency (GHz)
Fig. 1: Real and complex parts of permitivity versus frequency
This research has been conducted at the Deparlment of Physics and Material Engineer-ing as part of the research project "Electroactive composites for electromagnetic compatibil-ity" and has been supported by CTU grant No. FUZ 50081.
608
WORKSHOP 96 MATERIALS SCIENCE IN ELECTRICAL, CHEM. k CIVIL ENG.
CHECKING OF QUALITY ANDPOSSIBILITY OF USE OF RECYCLED
BUILDING MATERIALS
B. Novotny, J. Adamek*, J. Novak
TU of Brno, Fac. of Civil Eng., Dept. of Building Materials and Testing MethodsOdolni 53, 602 00 Brno
Key words: building, materials, recycling, their, properties, testing, and, use, brick, con-crete, recyclates
At the reconstructions and demolitions of buildings a great amount of waste arises thathas been used so far only a little. For the possibility of further use of recycled buildidngmaterials, it is necessary to pay attention to both the quality and properties of the originalmaterial and the way of secondary processing and the finding out of special requirements forpreparing, treatment of prepared mixtures and finding out physico-mechanical and chemicalproperties of products created from the recyclates for their further use.
The finding out of physico-mechanical properties was at first done on the brick andconcrete recyclates, obtained from the mobile crushing machine equipped by the RCL-1232-EV impact pulverizer of the SBM Wageneder Company in Austria. The machine is operatedby the Dufoner s.r.o Company at the spoil heap in Brno-Cernovice and it produces fractionsof 0-16 mm, 16-32 mm and 32-80 mm. Individual grains can be described as slighly rounded,with the shape index 1.5-2. The grain size, done by a standardized series of sieves, showedthe continuous granulometry, corresponding to the grain size curve with a higher proportionof fine particles to 2 mm, especially in the brick recyclate.
The volume mass of the brick recyclate was up to 1950 kg.m"3 and of the concreterecyclate around 2200 kg.m"3. The absorption capacity of the brick recyclate was up to23% and of the concrete recyclate up to 10%.
The compacting capacity of the brick recyclate fraction 0-16 mm, when used as theback filling material, found out by the Proctor test, can be done at the moisture content of6-7 natural moisture. By the measurement of the mass activity the limit of Ra 120 Bq.m"1
was not exceeded.On the basis of these and other found-out properties we checked experimentally the
possibilities of the use of brick recyclate in practice - for the production of unburnt com-pressed bricks 300 x 150 x 100 mm from the mixture of recyclate and soil 40/60% with the10% admixture of cement CEM II/B-S 22.5 and without cement. With the cement admix-ture we achieved the compression strength of 6.7 MPa and without cement 3.3 MPa, after14 days of free drying in the air. The bricks were used for building a garage in Prerov inthe way of monolithic bricklaying.
By crushing arises a large amount of fine fractions. These can be used as the filler formortars for bricklaying with a higher thermal resistance than that of natural aggregate. Thelower volume mass of the brick crushed materil improves the thermal-insulating properties.
Our aim is the use of the brick recyclate for the production of construction and con-struction elements, for example brick-concrete. Basic tests were performed on the mistures
609

WORKSHOP 96 MATERIALS SCIENCE IN ELECTRICAL, CHEM. & CIVIL ENG.
of various compositons with the cement CEM II/B-S 22.5 and brick crushed material 0-16 mm. The performed experiments showed that the resulting proporties are influenced bythe properties of the original materil. The compession strength was between 13 and 20 MPa.The elasticity modulus is in comparison with the concrete with natural aggregates lower byas 50 %. The air shrinkage and increase in volume is highter by as much as 20 % in com-parison with the concrete of natural aggregates of similar strenghts. The higher absorptioncapacity shows that the brick-concretes will not be frostproof. It is necessary to say thenthat for the use of the brick-concrete in contact with water and temperatures below zero itwill be necessary to take certain measures.
On the other hand it seems to be quite natural to use the recycled concrete as thereplacement of natural aggregates for the production of construction concrete. However,great attention must be payed to its faultlessnes and to the harmful substance content. Thecomparison tests, done by Doc. J. Filous, CSc, (TU Brno), showed that the recycled concreteinfluences neqatively the concrete mixture consistency, while the strengths are comparable(max. 15 % lower than in the case of use of natural aggregate), the elasticity moduls is lowerby approx. 15-20 %, the creep coefficient higher by as much as 50 % and the shrinkage by20-40%.
If we know these data and take them in account, the use of concrete recydate as theaggregates for concrete can be quite advantageous.
References:
[1] MOLNAR, L.: Recyklace stavebni suti. Zpracovani stavebnich odpadu - RECYCLING,Prerov 1992
[2] VACEK, V.: Moznosti recyklace cihelne stavebni suli, jejiho pouziti jako plniva staveb-nich smesi. Kandidatska prace, Praha 1994
[3] NOVOTNY, B. - FOJTIK, J.: Vlastnosli a pouziti recyklovanych bcionu. Odbornyseminar 5841, Sekurkon, Brno 1995
This research has been conducted at the Depatrment of Building Materials and TestingMethods as part of the research project "Checking of quality and possibility of use of recycledmaterials" and has been supported by TU in Brno grant No. FU 250025.
610

WORKSHOP 96 MATERIALS SCIENCE IN ELECTRICAL, CHEM. fc CIVIL ENG.
DEVELOPMENT OF NEW MATERIALSMAITENENCE OF CONCRETE
R. Drochytka
TU, Fac. of Civil Eng., of Technology of Building Materials and ComponentsGorkeho 7, 662 38 Brno
Key words: new building materials, concrete, maitenence, durability, fly ash
Increased applicability of existing deteriorated concrete constructions stresses require-ments for better maitenance of the concrete. The aim of maitenance has to be first of allto stop corrosion ofthe inside reinforcement, to prevent condensed water from getting intoparts below the surface of concrete and to stop or at least maximally slow down the processof carbonization.
Increased numbers of excellent maintenance materials are being used nowdays. Maite-nance materials used for constructions can be divided into four or three types:
a) materials aimed at protection of the reinforcement (conservation)
b) adhesive bridge (penetration of concrete)
c) correction (reprofilation) material
d) secundary surface protection (impregnation, paint)
Requirements for correction materials together with paint we can summarize into thefollowing points:
• good coherence with the base (min 1.5MPa in simple tension)
• compression strength or tensile strength in bend equal or slightly better than that ofthe base concrete.
• modulus of elasticity lower than that of the base concrete
• frostresistance minimum at T 50
• minimal changes of volume resulting from changes in humidity as well as temperature
• low absorption
• shrinkage cracking totally eliminated
• good watertightness
• alternative difussion resistance to the penetration of water vapour according to theconstruction (for instance in cooling towers low on the outside but on the inside of thecasing.
• high difusion resistance to the penetration of carbon dioxide, sulpher dioxide and otheracid-forming gases in the given enviroment.
611
WORKSHOP 96 MATERIALS SCIENCE IN ELECTRICAL, CHEM. & CIVIL ENG.
The aim of our internal task was within the development of new correction materials wasto find the most suitable way of processing fly ash. Because here we discuss a very wide area,the aim was narrowed to the development of fine grained mortars and smoothing materialstogether with a binding agent based on Portland cement ."Cid opoxy resins. Several types offly ashes, differently treated (for instance Melni'k power plant, Chvaleticc, Zdas Zdar n. S.)have been used together with only Czech binding agents. In its qualities this material shouldbe comparable with the qualities of reprofilation materials on our market.
For the purpose of use as a fine grained mortar and smoothing material several recepiesof mixtures with binding agent based on acrylate were developed in the first stage. The aimwas to find the maximal filling weight rate of cement to fly ashes. For the said requirementsthe most advantageous rate is 1:3. Higher rates of filling are not interesting for this purpose.Generally we can say that adding of dispersions increases bending strength, elasticity ofmixtures, improves the forming property of compositions and adhession to the base. Thedanger is in the foaming of "Socrat" when stirring which decreases volume weight, increasesporosity and causes that total strength is lower. Dry fly ash can be produced only as asingle-component composition. In case of agglomerated fly ash it is possible to producemulti-component mixtures. The reason is 30 % humidity which acts as a negative factor inpremature hydration of cement.
Based on the above stated results and tests with PCC mortars in acordance withmethodology we have made tests with different fly ashes as the filling agent for PCC. Thephysical and chemical parametrcs of both types of ashes are different. The required parame-tres under the same technologic conditions are different. This sort of filling agents is waterdiluteable, that is - it hardens after it is mixed with a hardener in the presence or water.This 13 a very advantageous fact from the technology point of view, as it is possible touse damp filling agents and there will be no cost for its drying. Consistence of mixturescan be changed by batching water and cement can be added as another part of the fillingagent which can hydrate in damp medium. Resins, on the contrary, which harden only indry medium, reach higher strength are being used for hydroinsulation cannot be used incombination with mortars. For testing of PC mortars we have chosen normally availableCHS EPOXY 516, which was filled in suitabe rates 1:2 to 1:6 with fly ashes. The bestresults we have obtained with rate 1:2 and this mixture was suggested for production as asingle-component with process flow sheet.
All the factors influencing prices are generally known, that is price of raw materials,transportation costs, machinery costs, productivity and so forth. The suggested prices aredramatically lower than prices of maitenance materials produced under the same principleabroad that are available on the Czech market.
References:
[1] DROCHY7.'KA, R.: Zkouseni sanacnich hmot a nateru. Sbornik Sanace betonovychkonstrakci, Brno 1995.
This research has been conducted at the Department of Technology of Building Mate-rials and Components as part of the research project "Development of new materials formaitenence of concrete" and has been supported by TU grant No. FU 250027.
612

WORKSHOP 96 MATERIALS SCIENCE IN ELECTRICAL, CHEM. fc CIVIL ENG.
MAGNETIC ANISOTROPY:A NEW BASE FOR ANALYSIS
OF STRUCTURAL PROPERTIESOF BUILDING MATERIALS?
I. Terzijski, F. Hrouda*, J . Wohlgemuth*, J . Hanak**
TU of Brno, Fac. of Civil Eng., Dept. of Concrete and Masonry StructuresOdolni 53, 662 42 Brno*AGICO spol. s r.o.,
Je£na 29a, 612 46 Brno•*GEOFYZIKA a.s.,
•Jecna 29a, 612 46 Brno
Key words: building materials, structural properties, magnetic anisotropy, measuringpractice, ceramics, ferrofluid
We report on new developments in the analysis of structure properties of ceramic build-ing materials using the measurement of magnetic anisotropy.
Functional properties of building materials are mostly predetermined by their structure.That is why searching for new methods and techniques of analysis of structural properties ofbuilding materials is all the time very important. Analysis of magnetic anisotropy is efficienttechnique in the study of the fabrics of rocks in geology and geophysics (e.g. Hrouda, 1982,Tarling and Hrouda, 1992). The possible use of magnetic anisotropy data for identifyingbuilding material structure is the fundamental idea of this project.
The magnetic anisotropy was measured in low magnetic field with the KLY-2 Kap-pabridge (Jelinek, 1973, 1980) and evaluated using AN1SO software (Jelinelt, 1977). Withthis instrument we have measured samples of ceramic (brick) material (cubes 2 cm in edge)in two steps.
First, the magnetic anisotropy was measured on three ceramic specimens in natural stateto obtain information concerning preferred orientation of magnetite, hematite and/or othercarrier of magnetism. Second, the magnetic anisotropy was investigated on these specimensafter saturation by the magnetic liquid to find the existence of an oriented system of cracksand pores. These studies of fabric of solid particles and of pore space were completed bythe density measurement of ceramic material.
We present comparison of results from the measurement of the magnetic anisotropyof ceramic materials before their saturation by the magnetic liquid and after the satura-tion. The specimens had shapes of rods with quadrate base. The specimens for measuringmagnetic anisotropy were made in an oriented way with respect to the rod axis. The mag-netic susceptibility of dry materials is relatively high (0.86 • 10"3 to 1.1 • 10"3 SI Units)which indicates relatively high content of magnetic materials. The magnetic anisotropy ofthe investigated materials is characterized by relatively low variability from specimen tospecimen.
613

WORKSHOP 96 MATERIALS SCIENCE IN ELECTRICAL, CHEM. fc CIVIL ENG.
The degree of magnetic anisotropy is moderate, indicating clear and well measurable(but not extremely strong) preferred orientation of magnetic materials in the specimensinvestigated. The susceptibility ellipsoids are almost perfectly rotational prolate, indicatinglinear preferred orientation of the magnetic materials (preferred orientation of rod-like par-ticles and/or zonal orientation of cake-like particles). The axes of maximum susceptibility(the rotational axes of susceptibility ellipsoids) are parallel to the rod axes of the specimens(within the error interval for the specimen cutting and magnetic anisotropy determination).
This magnetic fabric evidently reflects the technique of the specimen preparation (ax-ially symmetric protrusion of the specimen). The magnetic susceptibility of the specimenswith pores saturated by ferrofluids is almost three orders of magnitude higher (7 • 10"1 SIUnits). Therefore, the anisotropy of susceptibility indicates in this case the preferred ori-entation of pores filled in the ferrofluid. This susceptibility increase corresponds to theporosity of 33-38 %. The anisotropy degree is again moderate, but slightly higher than thatof dry specimens. This indicates that the pores are anisometric and show some degree ofpreferred orientation. The susceptibility ellipsoid is again near the prolate spheroid, butnot as near as that of the dry specimens. The maximum axis is parallel to the rod axis ofthe specimens. It means that the pores were made in an oriented way during the processof material formation. One can deduce that in the process of material formation the solidparticles were oriented preferably and the pores were oriented in the same way as the solidparticles, i.e. parallel to the rod axis.
References:
[1] TARLING, D. H. - HROUDA, F.: The Magnetic Anisotropy of Rocks. Chapmann kHall, London, 1992.
[2] HROUDA, P.: Magnetic Anisotropy of Rocks and Its Application in Geology and Geo-physics. Geophys. Surv. No. 5, 1982, pp. 37-82.
[3] HROUDA, P. - JELlNEK, V. - HRUSKOVA, L.: A Package of Programs for StatisticalEvaluation of Magnetic Anisotropy Data Using IBM-PC Computers. EOS Trans. Am.Geophys. Union, Fall Meet, 1990, p. 147.
[4] JELlNEK, V.: Precision A. C. Bridge Set for Measuring Magnetic Susceptibility ofRocks and Its Anisotropy. Stud. Geophys. Good., 1973, No. 17, pp. 36-48.
[5] JELfNEK, V.: Kappabridge KLY-S. A Precision Laboratory Bridge for MeasuringMagnetic Susceptibility of Rocks. Leaflet, Geofyzika, Brno, 1980, p. 4
This research has been conducted at the Department of Concrete and Masonry Struc-tures as part of the research project "Verifying of the Possibility to Use the MagneticAnisotropy Data for Determination of the Texture and Pore Structure of Building Mate-rials." and has been supported by TU grant No. 0026.
614
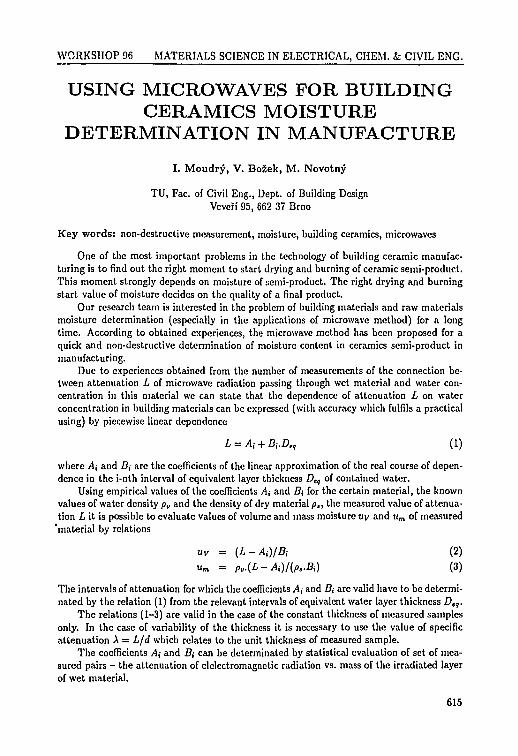
WORKSHOP 06 MATERIALS SCIENCE IN ELECTRICAL, CHEM. fc CIVIL ENG.
USING MICROWAVES FOR BUILDINGCERAMICS MOISTURE
DETERMINATION IN MANUFACTURE
I. Moudry, V. Bozek, M. Novotny
TU, Fac. of Civil Eng., Dept. of Building DesignVevefi 95, 662 37 Brno
Key words: non-destructive measurement, moisture, building ceramics, microwaves
One of the most important problems in the technology of building ceramic manufac-turing is to find out the right moment to start drying and burning of ceramic semi-product.This moment strongly depends on moisture of semi-product. The right drying and burningstart value of moisture decides on the quality of a final product.
Our research team is interested in the problem of building materials and raw materialsmoisture determination (especially in the applications of microwave method) for a longtime. According to obtained experiences, the microwave method has been proposed for aquick and non-destructive determination of moisture content in ceramics semi-product inmanufacturing.
Due to experiences obtained from the number of measurements of the connection be-tween attenuation L of microwave radiation passing through wet material and water con-centration in this material we can state that the dependence of attenuation L on waterconcentration in building materials can be expressed (with accuracy which fulfils a practicalusing) by piecewise linear dependence
L = Ai + Bt.Dcq (1)
where At and B; are the coefficients of the linear approximation of the real course of depen-dence in the i-nth interval of equivalent layer thickness Dtq of contained water.
Using empirical values of the coefficients At and 2?; for the certain material, the knownvalues of water density />„ and the density of dry material p,, the measured value of attenua-tion L it is possible to evaluate values of volume and mass moisture Uv and um of measured
"material by relations
uv = (L-A;)/Bt (2)
«m = Pv.(L-Ai)/(p,.Bi) (3)
The intervals of attenuation for which the coefficients /I; and /?; are valid have to be determi-nated by the relation (1) from the relevant intervals of equivalent water layer thickness Dcq.
The relations (1-3) are valid in the case of the constant thickness of measured samplesonly. In the case of variability of the thickness it is necessary to use the value of specificattenuation A = L/d which relates to the unit thickness of measured sample.
The coefficients A{ and Bf can be determinated by statistical evaluation of set of mea-sured pairs - the attenuation of elelectromagnetic radiation vs. mass of the irradiated layerof wet material.
615
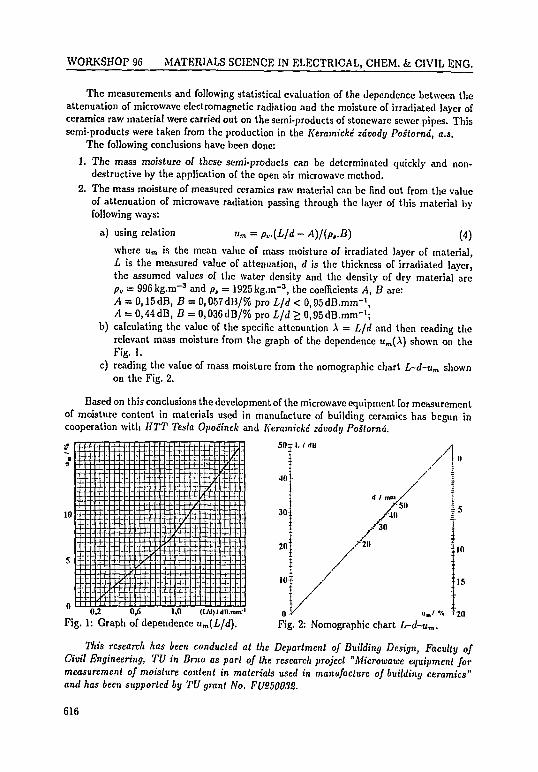
WORKSHOP 96 MATERIALS SCIENCE IN ELECTRICAL, CHEM. fc CIVIL ENG.
The measurements and following statistical evaluation of the dependence between theattenuation of microwave electromagnetic radiation and the moisture of irradiated layer ofceramics raw material were carried out on the semi-products of stoneware sewer pipes. Thissemi-products were taken from the production in the Keramicke zavody Postornd, a.s.
The following conclusions have been done:
1. The mass moisture of these semi-products can be determinated quickly and non-destructive by the application of the open air microwave method.
2. The mass moisture of measured ceramics raw material can be find out from the valueof attenuation of microwave radiation passing through the layer of this material byfollowing ways:
a) using relation um = pv.{L/d - A)/(p,.B) (4)
where um is the mean value of mass moisture of irradiated layer of material,L is the measured value of attenuation, d is the thickness of irradiated layer,the assumed values of the water density and the density of dry material arepu = 996kg.m"3 and p, = 1925 kg.m"3, the coefficients A, B are:A = 0,15dB, B = 0,057dB/% pro L/d < O.QSdB.mm-1,A = 0,44dB, B = 0,036dB/% pro L/d > O.gsdB.mm"1;
b) calculating the value of the specific attenuation A = L/d and then reading therelevant mass moisture from the graph of the dependence um(A) shown on theFig. 1.
c) reading the value of mass moisture from the nomographic chart L-d-um shownon the Fig. 2.
Based on this conclusions the development of the microwave equipment for measurementof moisture content in materials used in manufacture of building ceramics has begun incooperation with HTT Testa Opoanek and Keramicke sdvody Postornd.
IE!10
0,2 0,6 1,0 (Udj/dB-mm1
Fig. 1: Graph of dependence um{L/d). Fig. 2: Nomographic chart L-d-un
This research has been conducted at the Department of Building Design, Faculty ofCivil Engineering, TV in Brno as part of the research project "Microwawe equipment formeasurement of moisture content in materials used in manufacture of building ceramics"and has been supported by TU grant No. FU250032.
616
WORKSHOP 9C MATERIALS SCIENCE IN ELECTRICAL, CHEM. fc CIVIL ENG.
BOND OF EPOXY-COATEDREINFORCEMENT
P. Bouska, M. Hrabanek, M. Novak*, O. Sutner**
CTU, Klokner Institute, Dept. of Engineering StructuresSoli'nova 7, 166 08 Praha 6,
*CTU, Klokner Institute, Dept. of Theor. and Appl. Mech.Solinova 7,166 08 Praha 6,
**CTU, Klokner Institute, Dept. of Exper. MechanicsSoh'nova 7, 166 08 Praha 6
Key words: assocative plastic flow law, bond of reinforcement, testing, numerical mod-elling
In a natural way, reinforcing bars in concrete are protected against corrosion by theircomparatively high alkalinity. In healthy concrete and on the surface of the insert thereis merely a thin layer of ferric oxide that forms, protecting it, together with the alkalinesurroundings, against further corrosion. If there is a change in the material property of theconcrete surrounding the reinforcements, under the influence of the environment (e.g. aerialcarbon dioxide or an aggressive atmosphere), the beginning of corrosion of the reinforcingbars may take place. The layer of the corrosion product on the reinforcing bars is severaltimes higher in volume than the original volume of the iron; this may cause inner stress inthe concrete, leading to the deterioration of its surface. Extensive attention is now beinggiven to structures damaged by reinforcement corrosion.
Several methods for protecting reinforcing bars have been applied, the most efficientbeing to coat them. In the developed countries a coated reinforcement is used in structuresexposed to an aggressive environment.
The Nova hut' metallurgical plant in Ostrava, in cooperation with the State ResearchInstitute of Material Protection in Prague, has been engaged on these problems. Reinforce-ments covered by protective coats, produced by the powder plastification technique, havealready been manufactured and tested.
The thickness of the coat is very important; a considerable thickness gives better pro-tection against corrosion, but the bond with the concrete needed for the static function ofthe reinforcement becomes weaker.
A system for bond testing for reinforcing steel and concrete, the so-called Pull-out Test,was developed at the Klokner Institute in the past, in accordance with the CEB-RILEMRecommendation. This system has now been modernized, using the new efficient MTSloading system combined with the INOVA hydraulic system.
Mathematical modelling of the experiments has been performed on two levels:
• The behavior of a single bar being pulled-out from the concrete. This was calculatedas an axisymmetric problem. The contact between steel and concrete was modelled bymeans of contact elements. The plastic mathematical model of the properties of thecontact in terms of shear stress and compressive stress perpendicular to contact plane
617
WORKSHOP 96 MATERIALS SCIENCE IN ELECTRICAL, CHEM. fc CIVIL ENG.
was applied. The associative plastic flow rule (isotropic hardening) results in couplingbetween shear and compressive deformation. Calculations with various hardeningfunctions were performed to provide information about its influence on the failuremechanism.
• The response of a beam with reinforcement taking into account the bond effect. Theconstitutive law for bond effect is taken in terms of the relations between shear stressand deformation. In order to determine this relation previous results were used. Manynumerical difficulties occur because of coupling of cracking of concrete in the tensilezone and bond failure.
The objective of the project is to extend our knowledge of the failure process in thebond between concrete and reinforcement. The load carrying capacity and mechanism ofconcrete failure are being investigated experimentally and by numerical modeling.
References:
[1] CEB: Bond Action and Bond Behaviour of Reinforcement, No. 151, 1989
[2] CEB: Protection Systems for Reinforcement, No. 211, 1992
[3] URBAN, V. - ROZEHNAL, J.: Low Cycle Fatigue of Bond, In.: Bond in concrete,
International Conference CEB, RTU Riga, Latvia, 1992
[4] PESAT, V. - SOKENIK, P. - URBAN, V.: Moznosti povrchove ochrany betondfske
oceli, Vyzk. zprava NH VZU Ostrava, 1993
[5] BOUSKA, P.: Vyzkum soudrznosli povlakovych vyztuzi, In.: Nove materialy a tech-nologie, VS banska, Ostrava, 1995
[6] BAZANT, Z. P. - CEDOLIN, L.: Stability of Structures, Oxford University Press, NewYork, 1991
This research has been conducted at the Klokner Insitute of CTU as a part of the re-search project "Bond of Coated Concrete Reinforcement", and has been supported by GACRgrant No. 10S/95/0550.
618
WORKSHOP 96 MATERIALS SCIENCE IN ELECTRICAL, CHEM. k CIVIL ENG.
SELECTED PHYSICALAND MECHANICAL PROPERTIES
OF SULPHUR CONCRETE
J. Dolinalek
CTU, Klokner Institute, Dept. of Technology of ConcreteSoh'nova 7, 166 08 Praha 6,
Key words: sulphur, sulphur concrete, physical and mechanical properties, corrosion re-sistance
Sulphur concrete is a material where elementary sulphur is used as a binder of inertparticles of the aggregate. Sulphur thus replaces the mixture of cement and water which isused as a binder in classical concrete. Sulphur concrete is formulated by heating sulphur tothe liquefying temperature of about 140°C, when it may be mixed with any type of aggre-gate. After cooling, this mixture turns to a firm matter with good mechanical propertiesand very high resistance to a variety of aggresive materials.
The 1995 experiments are a follow up on previous results (1). Sulphur concrete formulawas further improved to enable its placing in layers 40 to 60 mm thick and to maximallysuppress its volume changes and to avoid shrinkage induced cracks. To this end, the dicy-clopentadiene (DCPD) dose was increased and polypropylene fibres 6 mm long were addedto the fomula. All these modifications were supposed to suppress volume changes and toavoid shrinkage induced cracks. The resulting formula consisted of:
• sulphur 225 kg
• 0/4 fraction aggregate 650 kg
• 4/8 fraction aggregate 310 kg
• ash 50 kg
• DCPD 10 kg
• polypropylene fibres 2 kg
Sample prisms of 40 x 40 x 160 mm were made of this optimized mixture. Thermalexpansivity coefficient was to be assessed in a temperature interval of +20 to +80 °C bothin dry and aqueous environment. Repeated measurements showed that this formula ofsulphure concrete displays thermal expansivity coefficient in the interval of 9.48 • 10"6 K"1 to12,21 -lO"6 K"1. These values come under the average thermal expansivity area of structuralconcrete, which typically equals to 10-10"8 K"1. This implies that sulphur concrete anchoredto a concrete base would, if heated from one side, dilate only as a result of the respectivetemperature drop and not as a result of different thermal expansivity coefficients.
The sample prisms were further used for establishing statistic and dynamic elasticitymodules for sulphur concrete. The statistic elasticity module was established in keeping withthe CSN ISO 6784, dynamic elasticity modules were established by means of the ultrasoundpulse method after the CSN 73 1371 and also by means of the resonance method afterCSN 73 1372.
619

WORKSHOP 96 MATERIALS SCIENCE IN ELECTRICAL, CHEM. fc CIVIL ENG.
The average static elasticity module established from 6 partial results was 31.84 GPa.The average dynamic elasticity module established by the resonance method was 36.72 GPaand the ultrasound method resulted in 39.37GPa. Thus, the dynamic elasticity modulesshow 15 do 20 % higher values than the static module values. This is a typical differenceestablished for various types of concrete, stemming from different principles used for estab-lishing the elasticity module by the individual testing methods.
Simultaneously, long-term sulphur concrete corrosion tests were performed, using 65%nitric acid, 85% phosphoric acid and 25% aqueous solution of amonia. The testing prismsof 40 x 40 x 160 mm were first weighed to 0.01 g accuracy. 12 samples were placed into eachmedium, 12 samples were kept for comparison, exposed only to lab ambience. The testswere performed after 7, 28 and 90 days of exposure. Three samples were removed from eachmedium, thoroughly rinsed with water, surface dried and weighed to 0.01 g accuracy. Sampleappearance was checked, together with a simple scratch test for surface hardness. Then theexposed samples and the control samples were subjected to tensile bending strength andcompression strength tests.
The average sample mass after the 90 days exposure in the individual aggressive mediadid not merely drop, it grew in average by 0.13 %. This corresponds to the average saturationlevel of the corrosion solution in porous system of sulphur concrete.
Similarly, tensile bending strength compared with compression strength in samplesunder test and control samples showed insignificant differences between individual proups,possibly arising from usual statistical fluctuations. Average tensile bending strength ofcontrol samples after 90 days was 9.81 MPa and compression strength was 43.84 MPa.
The corrosion tests thus imply that sulphur concrete exposed to nitric acid, phosphoricacid and aqueous ammonia will neither be damaged, nor will its basic mechanical propertiesdeteriorate.
Based on these results and in cooperation with Chemisol company practical applicationof sulphur concrete in situ was performed. A layer of sulphur concrete was put onto aretaining tank walls in Autobaterie in Ceska Li'pa. Formulation of larger quantities ofsulphur concrete is technologically difficult, thorough homogenization of large quantities isneeded, including its uniform heating to a required temperature in the range from 130 °Cto 140 °C. This is a challenge, but not an unfeasible one.
Performed experiments clearly showed suitability and practicability of sulphur concreteas a special building and insulation material, its physical and mechanical properties com-parable with high quality concrete, and on top of that with excellent corrosion resistanceespecially towards inorganic acids.
This research has been conducted at the Department of Technology of Concrete of theKlokner Institute, CTU Prague as part of the research project "Sulphur concrete" and hasbeen supported by the Fund for Development of Universities, grant No. 8218.
620
WORKSHOP 96 MATERIALS SCIENCE IN ELECTRICAL, CHEM. fc CIVIL ENG.
INFLUENCE OF DISPERSIONREINFORCEMENT
BY POLYPROPYLENE FIBERS ONRESTRAIN SHRIKAGE OF CONCRETE
J . Kolfsko, T. Klefka
CTU, Klokner Institute, Dept. of Exper. MechanicsSolinova 7, 166 08 Praha 6,
Key words: polypropylene fibers, concrete, free shrinkage, restrain shrinkage, toughness
Shrinkage and cracking (if the shrinkage is restrained) is a major concern for concrete,especially for flat structures as a pavement (highway pavement), slabs (parking garages),walls. One of the methods to reduce the adverse efects of shrinkage cracking is to reinforceconcrete with short randomly distributed fibers. The efficiency of polypropylene fibers toarresting cracks in concrete was studied.
Polypropylene fibers are low modulus fibers (modulus of elasticity varies from 4 to8 GPa). There are two types of fibers (according to a way of manufacturing) which can beused as a dispersion reinforcement:
- monofilament polypropylene fibers,- fibrillated polypropylene fibers.
Main difference between these types of fibers is cross section an surface of fibers.Monofilament fibers have circle cross section (diameter varies from 15 to 200 /<m) and smoothsurface. Fibrillated fibers have irregular cross section (thickness varies from 50 to 250 /im),sharp edges and uneven surface.
For purposes of evaluation of fiber reinforced concrete materials (FRC), toughness inthe form of energy absorbtion in bending, so-called "flexural toughness" is most widelyused. Flexural toughness can be expressed in energy terms as absolute values. In Czechrepublic there is no standard for testing and evaluation of flextural toughness. Accordingto the RILEM recommendation [5] energy absorbtion is defined as the area under the load-deflection curve (deflection measured at load point). The tests were carried out accordingto that RILEM recommendation. The testing notched beams (100 x 100 x 400 mm, notch33 mm in the middle of beam) were prepared and were subjected to third-point load. Therewere tested two types of mixtures. Plain concrete and the same type of mixture with dosageof monofilament polypropylene fibers FIBRREX (dosage of 0.1 % by volume = 0.9 kg/m3,length 12 mm) with special surface treatment (lubrication) to improve water wettability.Dosage of chosen fibers (0.1 % by volume = 0.9 kg/m3) was specified as an optimum duringthe tests which were carried out during the years 1992-94 [1-4]. The test were done on threespeciments for plain and three speciments for FRC after 28 days of hardening of concretein wet condition (humidity higher than 95%). During the tests the load-deflection curvewas obtained. From that curve the "first crack flexural toughness" (first crack strenght =max. load) and "total flexural toughness" (whole load-deflection curve) was calculated. Theresult is that in comparison the "first crack flexural toughness" is about 25% higher for
621
WORKSHOP 96 MATERIALS SCIENCE IN ELECTRICAL, CHEM. fc CIVIL ENG.
FRC than for plain concrete and "total flexural toughness" is about 50 % higher for FRCthan for plain concrete.
The compresive tests were carried out too. There was no significant difference betweenFRC an plain concrete. Compresive strenght (test speciments were three cubes 150 x 150 x150 mm) was for FRC 28.9 MPa and for plain concrete 28.6 MPa.
For restrained shrinkage cracking test, a ring type speciment was developed. The specialformwork was made with inner steel ring (diameter 300 mm, wall 30 mm thick) and outtersteel mould. Both of these rings were placed centrically on steel plate so that annulus spacebetween them could be filled with a concrete. There were again two mixtures investigated.FRC and plain concrete. Cracking in restrained speciments was investigated between 1 and60 days (after casting). The first crack appeared in plain concrete speciment after 20 daysin FRC speciment after 48 days. After 60 days there were two craks (in different places)through whole body of plain concrete ring with total width about 0.4-0.5 mm and one crackin body of FRC ring with width about 0.1-0.15 mm. To get more experimental data andvalidate resultates from the tests mentioned above is necessery to continue experimentalwork.
To see effectiveness of reinforcement by polypropylene fibers results of reinforced spec-iments were compared with the control speciments from the plain concrete of the same mixproportions. From this comparison it is seen that reinforcement by monofilament polypropy-lene fibers FIBRREX has significant positive influence on energy absorbtion of concrete andis very effective in controlling restrained shrinkage cracking in hardened concrete.
References:
[1] KOLlSKO, J. - KLECKA, T.: Vliv polypropyle'nove disperzni mikrovyztuze na lo-movou houzevnatost betonu pp. 188-192. sborm'k V. mezinarodnf sympozium Sanacebetonovych konstrukci, Brno kveten 1995
[2] KOLtSKO, J. - P'JMPR, V.: Pouliti PP vldken v cementovych maltdch a betonech.SILIKA casopis pro silikatovy prumysl, pp. 173-177, No. 4, 1993.
[3] KOLlSKO, J.: Aplikace PP vldken v maltdch a betonech. sborm'k prednasek IV. mez-inarodni sympoyium Sanace betonovych konstrukci, pp. 224-229, Brno kveten 1994.
[4] KLECKA, T. - DOHNALEK, J. - HORK?, B. - KOLfSKO, J.: Influence of componetson properties of shotcrete. CTU SEMINAR 94, part C, pp. 161-162, Prague, January17-20, 1994
[5] RILEM: Determination of the fracture energy of mortar and concrete by means ofthree-point bend tests on notched beams, RILEM Draft Recommendation. Materialsand Constructions, Julliet-Aout 1985, No. 106, pp. 285-296.
[6] KASPERKIEVVCZ, J. - SKARENDAHL, A.: Toughness estimation in FRC compos-ites. Swedish Cement and Concrete Research Institute, 100 44 STOCKHOLM CBIReport 4:90, ISRN CBI R-90/4-SE.
[7] SARIGAPHUTI, M. - SPAH, S. P. - VINSON, K. D.: Shrinkage cracking and Dura-bility characteristics of Cellulose Fiber Reinforced Concrete. ACI Materials Journal,July-August 1993, Vol. 90, No. 4, pp. 309-318.
This research has been conducted at the Department of Engineering Structures as partof the research project "Influence of Dispersion Reinforcement by Polypropylene Fibers onProperties of Concrete" and has been supported by CTU grant No. 101 j 8303.
622
WORKSHOP 96 MATERIALS SCIENCE IN ELECTRICAL, CHEM. k CIVIL ENG.
STRAIN RATE DEPENDENTCONCRETE FRACTURE ENERGY
P. Reficha
CTU, Fac. of Civil Eng., Dept. of Structural MechanicsThakurova 7, 166 29 Praha 6
Key words: concrete, strain rate, fracture energy
Transient dynamic events in RC structures are considerably affected by concrete fractureenergy. The energy absorbed in concrete may increase the limit load in these circumstances(although the static limit load is nearly independent of the fracture energy). Unfortunately,standard fracture mechanics (either linear or nonlinear) is not directly applicable to rein-forced concrete members with common reinforcement ratios since the cracks are arrested byreinforcement bars and relatively dense system of cracks develops instead of a singular crackin plain concrete. This has two consequences for computational modeling. First, discretecracks models are not applicable (too dense cracks), second, the strain softening in smearedcracks models becomes position dependent (crack density decreases with the distance froma reinforcement bar). The latter phenomenon requires a crack pattern to be assumed in thebar vicinity. A smeared cracks model for reinforced concrete based on fracture mechanicsconcepts was suggested [2]. Smooth transition to the well established crack band concept forplain concrete is guaranteed in this model. The strain rate depedence of several parametersis to be determined experimentally. Published results are scarce and cannot be incorporatedin constitutive equations [1]. Original tests were therefore designed and partially carried outfor this purpose. The strain rate effects in cracking reinforced concrete can systematicallybe explored when the above material model is accepted. In the first step, the rate sensitivityof the fracture energy G/ was assessed. The specimen, a concrete cylinder reinforced by anaxial reinforcement bar was subjected to fast axial tension. If the relative stiffness of thebar to that of the surrounding concrete is sufficient then a uniform strain can be assumedalong the bar and the total elongation of the specimen need be measured. The specimen sizeand strain distribution allow for average strain rates of the order 10s"1. The actual strainrates depend on the loading device. The arrangement also was used for static tension tests.The same tests were carried out with bare reinforcing bars, too. The difference betweenthe reinforced concrete and bare steel bars curves allows for the concrete fracture (or strainsoftening) share of the specimen stiffness and energy to be determined. For the fast tensiontests the results are shown in Fig. 1. The scatter of tests with concrete cylinders is dueto parasitic bending effects introduced by insufficient specimen precision. From the areabetween bare bars and concrete (average) curves in Fig. 1 the concrete fracture energy Gjcan be found by means of a calibration curve. The calibration curve is derived by numer-ical evaluation of the above material model for each actual case of the specimen and testarrangement. The first series of tests indicates that fracture energy decreases with growingstrain rate but the result is not yet sufficiently reliable. Next specimen series will be givenspecial care in order to avoid the parasitic strains and narrow the scatter of results. Twospecial devices were designed and built for the experimental part of the project. One of
623
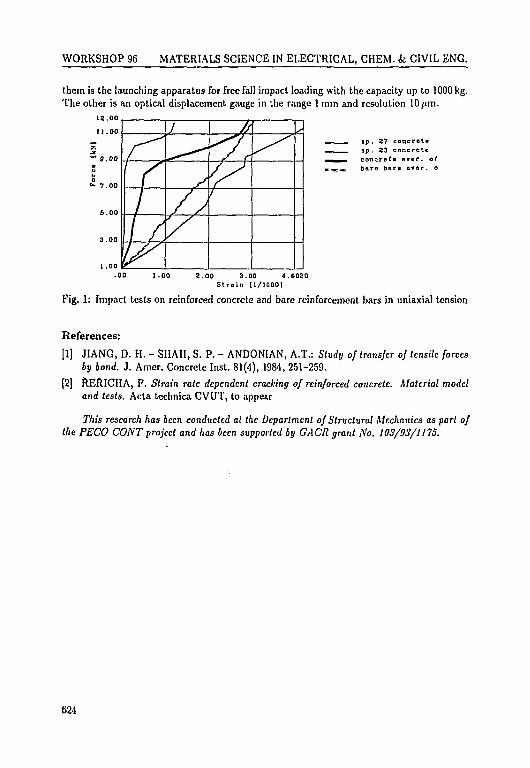
WORKSHOP 96 MATERIALS SCIENCE IN ELECTRICAL, CHEM. fc CIVIL ENG.
them is the launching apparatus for free fall impact loading with the capacity up to 1000 kg.The other is an optical displacement gauge in the range 1 mm and resolution 10 /im.
is.oo11.00
/
IS'
1
/ /
V
sp. 27 concretesp. 23 concreteconcrete aver, ofbare bara aver, o
3.00
• 00 1.00 2.00 3.00 4.S020Strain (1/10001
Fig. 1: Impact tests on reinforced concrete and bare reinforcement bars in uniaxial tension
References:
[1] JIANG, D. H. - SHAH, S. P. - ANDONIAN, A.T.: Study of transfer of tensile forcesby bond. J. Amer. Concrete Inst. 81(4), 1984, 251-259.
[2] RERICHA, P. Strain rate dependent cracking of reinforced concrete. Material modeland tests. Acta technica CVUT, to appear
This research has been conducted at the Department of Structural Mechanics as part ofthe PECO CONT project and has been supported by GACR grant No. 103/93/1173.
624
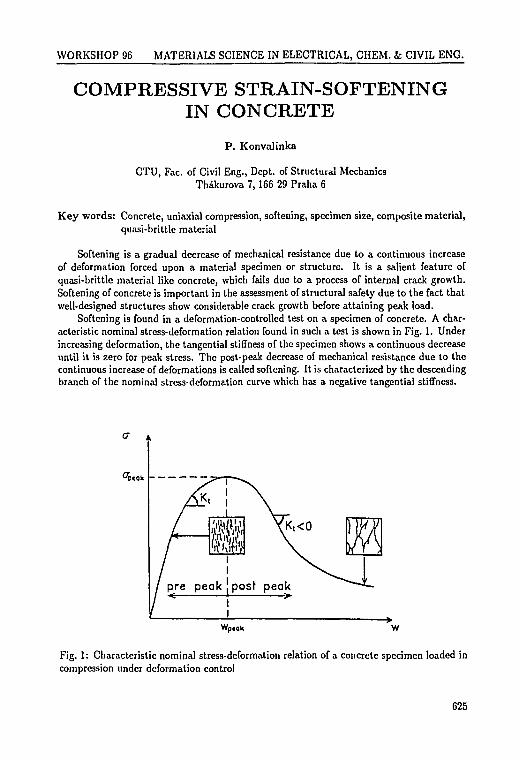
WORKSHOP 96 MATERIALS SCIENCE IN ELECTRICAL, CHEM. fc CIVIL ENG.
COMPRESSIVE STRAIN-SOFTENINGIN CONCRETE
P. Konvalinka
CTU, Fac. of Civil Eng., Dept. of Structural MechanicsThakurova 7, 166 29 Praha 6
Key words: Concrete, uniaxial compression, softening, specimen size, composite material,quasi-brittle material
Softening is a gradual decrease of mechanical resistance due to a continuous increaseof deformation forced upon a material specimen or structure. It is a salient feature ofquasi-brittle material like concrete, which fails due to a process of internal crack growth.Softening of concrete is important in the assessment of structural safety due to the fact thatwell-designed structures show considerable crack growth before attaining peak load.
Softening is found in a deformation-controlled test on a specimen of concrete. A char-acteristic nominal stress-deformation relation found in such a test is shown in Fig. 1. Underincreasing deformation, the tangential stiffness of the specimen shows a continuous decreaseuntil it is zero for peak stress. The post-peak decrease of mechanical resistance due to thecontinuous increase of deformations is called softening. It is characterized by the descendingbranch of the nominal stress-deformation curve which has a negative tangential stiffness.
Fig. 1: Characteristic nominal stress-deformation relation of a concrete specimen loaded incompression under deformation control
625
WORKSHOP 96 MATERIALS SCIENCE IN ELECTRICAL, CHEM. & CIVIL ENG.
Concrete is a heterogeneous material comprising hardener-cement paste, aggregates andvoids. Internal stiffness and strenght show significant variation. Initial stress and cracks arealready present before loading. This causes a progressive crack growth found in a concretespecimen when it is subjected to a progressive deformation. Especially the weak interfacebetween the large aggregates and the mortar play an important role in this process of crackgrowth. The material is gradually weakened because a continuously diminishing numberof internal bonds is capable of opposing the externally applied deformation. This finallyresults in softening of the specimen.
References:
[1] VAN MIER, J. G.: Muliiazial Strain Softening of Concrete. Material and Structures,Vol. 19, No. I l l , 1986, pp. 179-200
[2] KONVALINKA, P. - BITTNAR, Z.: Experimental Analysis of Compresssive Strain-Softening in Concrete. CTU Prague, Workshop 1995, pp. 343-344.
This research has been conducted at the Department of Structural Mechanics as part ofthe research project "Experimental Analysis of Compressive Strain-Softening in Concrete"and has been supported by CTU grant No. 10018151.
626
WORKSHOP 96 MATERIALS SCIENCE IN ELECTRICAL, CHEM. fc CIVIL ENG.
STRUCTURE OF THE Na(H,D)YZEOLITES WITH CHEMISORBED
MOLECULES BY NEUTRONDIFFRACTION
S. Vratislav, M. Dlouha, V. Bosacek*, D. Janeba
CTU, Fac. of Nucl. Sci. & Phys. Eng., Dept. of Solid State EngineeringV Holesovickach 2, 180 00 Praha 8
inst i tu te of Physical Chemistry, Czech Acad. Sci.,Dolejskova 3, 182 23 Praha 8
Key words: neutron diffraction, zeolites, Rietveld analysis
The continued interest in the structure investigation of zeolites is stimulated by theirpotential for the practical use in the chemical technology. It is generally expected thatcatalysts based on zeolites would be able to approximate the properties of very effectivebiological catalysts-enzymes. Zeolites exibited regular, but easily modifiable structure, areimportant pretenders of this type catalysts. The basic condition for succesful preparationof well defined structures is to manage suitable and precise methods for characterization ofthe synthesized structures. Spectroscopic method (mainly IR, NMR) together with neutrondiffraction are suitable for this purpose.
Our conclusions on the distribution of protons and cations in NaH,Y zeolites [1] werefully confirmed and found very wide responses[2]. Therefore, we started to continue our in-vestigations on the NaY and NaX type of zeolites with chemisorbed methyl groups(13CD3I, 13CH3I) during 1994 year. Results of our structure investigations of the NaYand NaX zeolites were presented on the EPDIC IV Conference [3].
The period of the 1995 year was concerned with the low temperature diffraction exper-iments and on the determination of the position of the chemisorbed groups. The powdersamples (NaX, NaY, NaY+CHsI and NaY+CD3I) for neutron diffraction experiments wereprepared in the J. Heyrovsky Institute of Physical Chemistry CAS. The materials were de-composed in a vacuum of 10"5Torr at 400 °C (10-12 hours) and sealed under vacuum incylindrical glass with an inner diameter of 12mm (glass thickness was 0.4mm). The heightof the column of powder was about 50 mm. The sorntion of CH3I groups was carried out invacuum at 80 K and then the sample was mixed up in the course of 60 minutes at 160°C.
Powder neutron diffraction experiments were performed on the KSN-2 diffractometrinstalled at the 15 MW research reactor LVR-15 in Rez near Prague. The wavelenght ofthe monochromatic beam was 0.1362 nm. The diffractometer is equipped by the close cyclerefrigerator system Mod. CP-62-ST/1.
The diffraction patterns recorded were refined using the Rietveld profile method (codeRIET-N : it was modified from the original Petten version by our laboratory). We used therange of the sin(0)/A from 0.025 to 0.360, i.e. 10 = 3°-57°. We note, however, that at higherangles the pattern becomes featureless even at reasonable resolution due to rapid decreaseof the diffracted intensities of Y-zeolites with 20. A total of 283 diffraction lines was used
627
WORKSHOP 96 MATERIALS SCIENCE IN ELECTRICAL, CHEM. k CIVIL ENG.
in the refinement process. The scattering lengths used were taken from the "Neutron News,3 (1992) 28-37". We reached the values from 7.9 to 11.1 % for the discrepancy factor Rwpand confirmed cubic symmetry in the space group Fd3m.
Our structural results gave us the possibility to determine the cation distribution (5/ , Srand Sn positions) and the position of the methyl groups with respect to the lattice oxygenatoms inside the cavities of the basic structural framework of the NaY type zeolite. Withrespect to the determined structural parameters we can conclude:
• the shift of the cation positions with respect to the zeolite state without chemisorption
• the position parameters of methoxyl groups were obtained
• the exhange H by D showed the same change of the occupation numbers of the Si, Srand S/j seats and the better condition of the refinement process of powder diagrams
• we continue our work on the NaX type zeolites with chemisorbed CH3I and CD3Igroups
The structural investigations of chemisorbed zeolites by neutron diffraction togetherwith the 13C MAS NMR experiments is a basic tool for the identification and location ofthe catalytic active sites, knowledge of which is extremely important for the better under-standing of catalytic processes.
References:
[1] JIRAK, Z. - VRATISLAV, S. - BOSACEK, V.: J. Phys. Chem. Solids, 41 (1980)p. 1089
[2] MORTIER, W. J. - SCHOONHEYDT, R. H.: Progress in Solid State Chem. 16,(1985) 1
[3] VRATISLAV, S. - DLOUHA, M. - BOSACEK, V. - JANEBA, D.: Proc. of the EPDIKIV Conference, Chester, England (1995) p. 33
This research has been conducted at the Department of Solid State Engineering as partof the research project "Neutronographic Structure and Texture Analysis" and has been sup-ported by CTU grant No. 8216.
628
WORKSHOP 96 MATERIALS SCIENCE IN ELECTRICAL, CHEM. fc CIVIL ENG.
A METHOD FOR EVALUATINGTHE WATER-REPELLENT PROPERTIES
OF COATING MATERIALS
J . Drchalova, R. Cerny
CTU, Faculty of Civil Engineering, Department of PhysicsThdkurova 7, 166 29 Praha 6
Key words: coating, external lining, water-repellent, integral capillarity
The water-proofness quality of coating materials can be evaluated by various methods.A first look into the evaluation process can provide the knowledge of the material parame-ter which is most characteristic for the moisture transport in porous materials, namely thedifTusivity of liquid moisture K. However, this parameter may not be known in some casesbecause K measuring is very difficult for materials containing small pores only, and in addi-tion K itself does not tell anything about the influence of coating thickness and about theproperties of the contact surface between the coating and the substrate. Therefore, directtesting of the coating-substrate system is more desirable.
One of the physical quantities characterizing the behavior of capillary-porous materialsin contact with water is the height of capillary rise, i.e., the maximum height AmM of thewater column in the material above the main water level. However, the measurements ofAmu are very lengthy and, in the main, inaccurate [1].
As a more suitable quantity for evaluating the water-proofness quality can be consideredthe capillarity C defined by the relation
r- l d m n \c-slt' (1)
where 5 is the surface of the specimen which is in contact with water, m is the mass ofthe moistened specimen, / is the time. As a matter of fact, the capillarity defined by (1) isidentical with the water flux in the material.
The value of C is an instantaneous quantity which does not provide any information onthe history of the moistening process. Therefore, it appears reasonable to define the integralcapillarity Cint (see, e.g., [2])
n i s i . "»(*)-n»d . .O(r)dT = 5 , (2)
o owhere m is the mass of the moist specimen, ma is the mass of the dried specimen.
The integral capillarity is capable to express not only the absolute amount of water inthe specimen but also the time history of the moistening process which is particularly usefulin comparing the effectiveness of various coatings on a specified substrate. Therefore, weemploy the C;M(T) function as the main parameter in evaluating the water-proofness qualityof coating materials throughout this paper.
In a practical application of the evaluation of water-repellent properties of coatingmaterials, we have chosen the coatings used in building constructions for protecting the
629
t=Jo
WORKSHOP 96 MATERIALS SCIENCE IN ELECTRICAL, CHEM. k CIVIL ENG.
external linings. We studied four lining materials, Dekalux 5, Dekalux 12, Dekalit P6,Dekalit P10, and three types of the surface treatment, Rudicolor, Aquafob and Rudicolor-Aquafob combination (Rudicolor on the face, Aquafob on the back). The experiments werealso performed with the lining materials without any surface treatment in order to evaluatethe effect of the coatings in a direct comparison with the basic material.
The influence of Rudicolor (a thin-layered plaster material) on the water-proofnessof the lining was qualitatively very similar for all the lining materials we studied. TheRudicolor layer was effective only for short-time water influence, typically one hour. Therelative integral capillarities
C r e ,= ; ~ 1 0 0 [%]
achieved 30-50% after 1.5 hours and after 8.5 hours already 80-90%. The quantitativeeffect of the Rudicolor coating on the studied lining materials differed significantly. Wehave observed that this effect increases with the increasing volume mass of the lining, whichis more pronounced for longer times.
The possible explanation lies in the fact that the adhesive properties of the plasterto the materials with higher porosity (Dekalit P, for instance) are better since the plasterpenetrates easier into the porous structure. Consequently, the moisture transfer coefficientis higher and the moisture content reaches relatively high values already after a short time- 90% of the maximum moisture content, umM, in 8-10 hours for Dekalit P6. On the otherhand, the heavier materials such as Dekalux 5 reach comparable values after more than 48hours. It should be noted, however, that after several days both Dekalux and Dekalit Pachieved 100 % um»x despite the presence of Rudicolor coating.
The hydrophobic coating material Aquafob exhibited water-proofness much better thanRudicolor - the moisture maxima after 4.5 days were in the range of 50% to 80% um,x.However, the effectiveness of Aquafob increased with the decreasing volume mass of thebasic material.
The probable reason of this fact was that also here the coating penetrated deeper intothe material with lower volume mass but due to its water-repellent properties the largercontact area acted in an opposite way than in the case of the plaster material Rudicolor.
The Aquafob coating on the back side of the specimen in the Rudicolor-Aquafob com-bination was observed not to have any additional water-proofness effect compared to thespecimens with Rudicolor only.
References:
[1] MRLiK, F.: Moisture-Induced Problems of Building Materials and Constructions (inSlovak), Bratislava, Alfa, 1985.
[2] HANSEN, K. K. - BUNCH-NIELSEN, T.: Capillary Rise of Water in Insulating Ma-terials and in Gravel and Stone, Proceedings of the 3rd Symposium "Building Physicsin the Nordic Countries", Vol. 2., B. Saxhof (ed.), Copenhagen, 1993, p. 761.
This research has been conducted at the Department of Physics and has been supportedby the grants of the Grant Agency of the Czech Republic No. 103/94/0140 and 103/94/0595,and by the grant of the Faculty of Civil Engineering No. 1001.
630
WORKSHOP 96 MATERIALS SCIENCE IN ELECTRICAL, CHEM. fc CIVIL ENG.
AN ANALYSIS OF WATER-VAPORDIFFUSION PROPERTIESOF COATING MATERIALSON EXTERNAL LININGS
S. Hoskova, J . Toman, R. Cerny
CTU, Faculty of Civil Engineering, Department of PhysicsThakurova 7, 166 29 Praha 6
Key words: water vapor, diffusion, coating, lining
Diffusion of water vapor through coating materials on external linings can be evaluatedby several methods. One of them is described in the general Czech standard for coatingmaterials CSN 673093 [1] where the coating is analyzed separately from the basis. This iscertainly a method which is physically correct and objective but its application for coatingson porous building materials can often lead to some misunderstandings as the coating caneasily penetrate into the porous structure of the basis and its real thickness may not beknown with a sufficient precision. Therefore, from the point of view of practical usefulnessit is more appropriate to analyze the diffusion properties of a coating just on the materialwhich will form its basis in the construction.
In modeling the water vapor diffusion in porous materials, two main phenomenologicalrelations for the flux of water vapor j are used, j — — Dgrad/>c, j = —6gradpv, wherepc is the mass of water vapor per unit volume of the porous material, D is the diffusioncoefficient of water vapor in the porous material, pv is the partial pressure of water vapor, Sis the water vapor permeability. Besides D and S, several other coefficients are introducedin building physics for the sake of better clarity for the building practice. Among them, thevapor diffusion resistance number fi (e.g., [2]), the water vapor resistance Z (e.g., [3]) or thediffusion thickness So (e.g., [4]) belong to the most frequently used.
In measuring the diffusion of water vapor in coating-lining systems, as a matter offact, we do not determine exactly the diffusion material parameters but only their effectivevalues for a two-layer system. However, knowing the diffusion parameters of the basic liningmaterials and the thickness of the coating, we can calculate the diffusion parameters of thecoating materials using the water-vapor resistance Z. In an analogous way as with theelectric resistances, the water-vapor resistance of a series of elements can be expressed as
Therefore, we have
6, 4 oc
where d is the thickness, the indices s,b,c denote the system, the basis and the coating,resp. From Eq. (2) it follows that
631
WORKSHOP 96 MATERIALS SCIENCE IN ELECTRICAL, CHEM. k CIVIL ENG.
For measuring the diffusion coefficient of water vapor D we have chosen a steady-state method, commonly used for experimental work on other materials. The measuringapparatus (see [5], for details) consists of two airtight glass chambers separated by the sampleof the measured material, which is typically board-type. In the first chamber, a state nearto 100% relative humidity is kept (achieved with the help of a cup of water), while in thesecond one a state close to 0% relative humidity (set up using some absorption material, suchas silica gel). After certain time, the measurement is interrupted, and the changes of themass of water in the cup, Am, , and of the silica gel, Am,, during the chosen time interval[0,r] are determined. If |Amw | = |Am4|, i.e., if the steady state is established within themeasuring system, the experiment is terminated. Otherwise, the measurement continues inthe same way as before. The experiment is carried out under isothermal conditions.
In a practical application of the proposed method of analysis of the diffusion prop-erties of coating-lining systems, we studied four lining materials, Dekalux 5, Dekalux 12,Dekalit P6, Dekalit P10, and three types of the surface treatment, Rudicolor, Aquafob andRudicolor-Aquafob combination (Rudicolor on the face, Aquafob on the back). The experi-ments were also performed with the lining materials without any surface treatment in orderto evaluate the effect of the coatings in a direct comparison with the basic material.
The results of measurements have shown that the influence of both Rudicolor andAquafob on the diffusion properties of the coating-lining systems was relatively small,20-30 % in average.
This is a favorable feature from the point of view of the water balance of the externalwalls since the main flux of water vapor is usually in the direction from the interior to theexterior.
The approximate values of diffusion parameters of the coatings themselves calculatedusing Eq. (3) have shown that this positive effect was not due to the low thickness of thecoatings but due to the fact that the diffusion coefficients of both Rudicolor and Aquafobwere only several times lower than those of the studied lining materials.
References:
[1] CSN 673093 Stanoveni propustnosli volneho ndterovcho filmu pro vodni pdru.[2] KRISCHER, 0.: Die wissenlschaftlichcn Grundlagen der Trocknungslcchnik, Springer
Verlag, Berlin 1963.
[3] VILLADSEN, J. - HANSEN, K.K. - WADSO, L.: Water Vapour Transtnission Prop-erties of Wood Determined by the Cup Method, Proc. of the 3rd Symposium BuildingPhysics in the Nordic Countries Vol. 2, B. Saxhof (ed.), Copenhagen, 1993, p. 685.
[4] ROBERY, P. C : Requirements of Coatings, JOCCA 71 (1988), 403.
[5] CERNY, R. - HOSKOVA, S. - TOMAN, J.: A Transient Method for Measuring theWater Vapor Diffusion in Porous Building Materials, Proc. of International Symposiumon Moisture Problems in Building Walls, V. P. dc Freitas, V. Abrantcs (cds.), p. 137,Univ. of Porto, 1995.
This research has been conducted at the Department of Physics and has been supportedby the grants of the Grant Agency of the Czech Republic No. 103/94/0140 and 103/94/0595,and by the grant of the Faculty of Civil Engineering No. 1001.
632
WORKSHOP 96 MATERIALS SCIENCE IN ELECTRICAL, CHEM. fc CIVIL ENG.
MONITORING OF AGEING PROCESSOF INSULATING VARNISHES
J . Kuba, V. Pape i
CTU, Fac. of Electrical Eng., Dept. of ElectrotechnologyTechnicka 2, 166 27 Praha 6
Key words: dielectric parameters, insulating varnishes, complex permitivity measure-ments, quality testing
Insulating varnishes are v.sed for impregnating of windings, insulation of wires and forsurface insulation of printed circuit boards, too.
Temperature, humidity, radiation and the other enviromental influences cause ageingof insulating varnishes and this fact can be observed as a change of some their electricproperties. The aim of our experiments was:
• monitoring of ageing process of the selected insulation varnishes by the measurementsof relative permitivity and dissipation factor at wide frequency range from 50 Hz to50 MHz,
• to determine of the information ability level of these dielectric parameter measure-ments and the possibility of '. leir utilisation at quality testing of the insulating var-nishes.
Dielectric parameters of insulating varnishes type S 5001 and S 1942 were measuredformerly [1] and the informations about the other two varnishes are given in this paper.Relative permitivity and dissipation factor have been measured on:
• electric insulating varnish used for deep impregnation of windings, type S 1901, insu-lating class B (130 °C), made in CZ, chemical basis of the varnish is fenolic resin andxylen [2]
• electric insulating varnish used for deep impregnation of windings, type Izola-220 T,insulating class F (155 °C),made in Italy (firm Roolizola).
The films for dielectric parameter measurements were prepared from these varnisheson 0.18 mm thick cooper sheets. For evaluation of the influence of ageing, tested filmswere subject to artifically accelerated ageing in several cycles. Each cycle (A, B, C, D)is represented a 60-hours exposition in oven at the temperature of 155 °C (S 1901) and at180°C (Izola). The same measuring equipments and methods have been used as in [1]. Themeasured frequency dependences of the relative permitivity and dissipation factor of thevarnishes S 1901 and Izola-220 T during ageing (curves A, B, C, D) are shown in Fig. 1.,Fig. 2. and Fig. 3., Fig. 4.
633
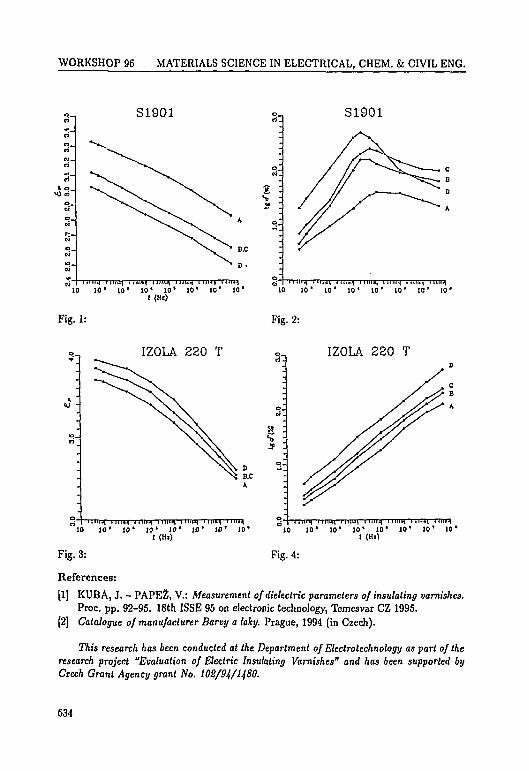
WORKSHOP 96 MATERIALS SCIENCE IN ELECTRICAL, CHEM. k CIVIL ENG.
s-
S1901
| I I I I ILI m i n i j <i)«n uiiiai l i iuH IIII .IH mi i i . |10 1 0 ' 10* 1 0 * 10* 1 0 ' 1 0 ' 10*
I (Hz)
Fig. 1:
£s
S1901
10 10" 10" 10 ' 1 0 ' 10* 10 ' 10'
Fig. 2:
IZOLA 220 T
10 10" 10' 10*I (Hi)
10' 10 '
s -
IZOLA 220 T
10' 10'1 (Hi)
Fig. 4:Fig. 3:
References:
[1] KUBA, J. - PAPEZ, V.: Measurement of dielectric parameters of insulating varnishes.Proc. pp. 92-95. 18th ISSE 95 on electronic technology, Temesvar CZ 1995.
[2] Catalogue of manufacturer Barvy a laky. Prague, 1994 (in Czech).
This research has been conducted at the Department of Electrotechnology as part of theresearch project "Evaluation of Electric Insulating Varnishes" and has been supported byCzech Grant Agency grant No. 102/9^/1480.
634
WORKSHOP 96 MATERIALS SCIENCE IN ELECTRICAL, CHEM. k CIVIL ENG.
GROWING OF LEAD IODIDECRYSTALS
M. Matuchova, J . Tomdsko, J . Eckstein*,K. W. BenZ*, J . Maixner**
CTU, Fac. of Electrical Eng., Dept. of Mechanics & Materials ScienceTechnicka 2, 166 27 Praha 6
*Albert-Ludwigs-University, Institute of CrystallographyHebelstr. 25, 79104 Freiburg, Germany
**Institute of Chemical Technology, Central Lab. 85Technicka 5, 166 28 Praha 6
Key words: lead iodide, X-ray detectors, semiconductors, zone melting, growing crystals
Interest in room temperature semiconductor detector materials has increased [1] signif-icantly in the last two decades. Mercuric iodide (Hglj) and lead iodide (Pbl2) are two mostpromising materials [2, 3] besides the well known classical materials (e.g. CdTe, CdSe,GaAs,GaSb, InP) for such applications. Unlike Hgl2 which is a well studied material, Pblj is muchless mentioned in the literature and the technique of growing high quality bulk crystals fromthis material has still to be worked out in detail.
Pblj is a suitable material for uncooled solid state efficient detectors that can operateover a wide temperature range up to 130 °C. Detectors of this type are ideal for applicationin medical and enviromental engineering to improve diagnostic methods.
Two important physical properties distinguish Pblj for detector applications. These areits lower vapour pressure [4] and its higher chemical stability. The polytypism of Tbh seemsto be one significant property of this material, which can cause the change of characteristicelectrical and optical properties.
The main stages of preparation of high quality bulk Pb^ crystals consist of preparationof stoichiometric lead iodide, its purification by zone melting and growing crystals. Ourresearch focuses on an analysis of all steps in the manufacturing process. The results of thecrystal manufacture are characterized by stoichiometry, spectral and X-ray analysis.
The input Pbl2 material for purification by zone melting was prepared by precipitationfrom Pb(NO3)2 with KI, using an excess of KI; the concentration of both solutions was0.5 M. The temperature was held between 22 and 25 °C, and the solution was constantlystirred. The starting material for purification was found to have a stoichiometric ratio thatonly varied at the third decimal place.
Zone melting [5] is an excellent purification method. The purity of final productdepends on the efficiency of the solid-liquid separation step. The impurity content (Ag, Fe,Ca, Mg, Al, Cu, Si) of the zone-refined Pbl2 material after 20 passes was analyzed to be inthe ppm range by atomic absorption. To obtain a constant stoichiometry ratio, zone-refinedPbl2 was iodized with methylene iodide in a quartz glass ampule.
635
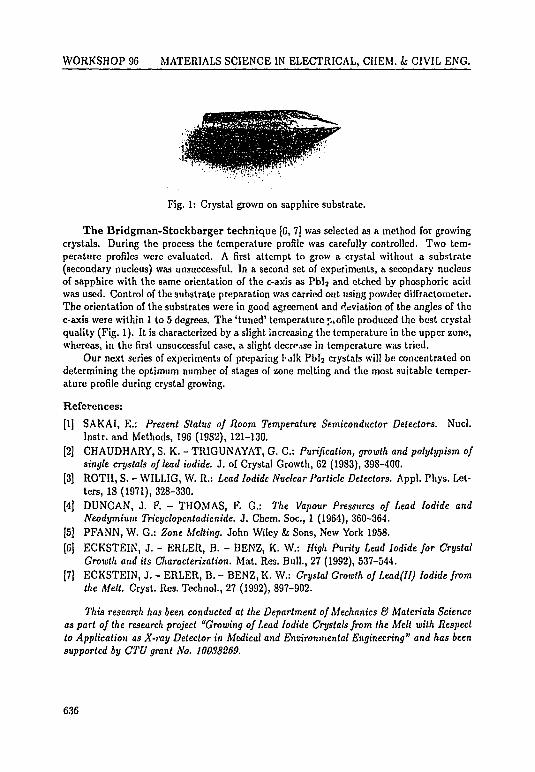
WORKSHOP 96 MATERIALS SCIENCE IN ELECTRICAL, CHEM. k CIVIL ENG.
Fig. 1: Crystal grown on sapphire substrate.
The Bridgman-Stockbarger technique [6, 7] was selected as a method for growingcrystals. During the process the temperature profile was carefully controlled. Two tem-perature profiles were evaluated. A first attempt to grow a crystal without a substrate(secondary nucleus) was unsuccessful. In a second set of experiments, a secondary nucleusof sapphire with the same orientation of the c-axis as Pbl2 and etched by phosphoric acidwas used. Control of the substrate preparation was carried out using powder diffractometer.The orientation of the substrates were in good agreement and deviation of the angles of thec-axis were within 1 to 5 degrees. The 'tuned' temperature piofilc produced the best crystalquality (Fig. 1). It is characterized by a slight increasing the temperature in the upper zone,whereas, in the first unsuccessful case, a slight decrctse in temperature was tried.
Our next series of experiments of preparing hulk Pbl2 crystals will be concentrated ondetermining the optimum number of stages of zone melting and the most suitable temper-ature profile during crystal growing.
References:
[1] SAKAI, E.: Present Status of Room Temperature Semiconductor Detectors. Nucl.Instr. and Methods, 196 (1982), 121-130.
[2] CHAUDHARY, S. K. - TRIGUNAYAT, G. C : Purification, growth and polylypism ofsingle crystals of lead iodide. J. of Crystal Growth, 62 (1983), 398-400.
[3] ROTH, S. - WILLIG, W. R.: Lead Iodide Nuclear Particle Detectors. Appl. Phys. Let-ters, 18 (1971), 328-330.
[4] DUNCAN, J. F. - THOMAS, F. G.: The Vapour Pressures of Lead Iodide andNeodymium Tricychpentadienide. J. Chem. Soc, 1 (1964), 360-364.
[5] PFANN, W. G.: Zone Melting. John Wiley & Sons, New York 1958.
[6] ECKSTEIN, J. - ERLER, B. - BENZ, K. W.: High Purity Lead Iodide for CrystalGrowth and its Characterization. Mat. Res. Bull., 27 (1992), 537-544.
[7] ECKSTEIN, J. - ERLER, B. - BENZ, K. W.: Crystal GroiDth of Lead(II) Iodide fromthe Melt. Cryst. Res. Technol., 27 (1992), 897-902.
This research has been conducted at the Department of Mechanics & Materials Scienceas part of the research project "Growing of Lead Iodide Crystals from tke Melt with Respectto Application as X-ray Detector in Medical and Environmental Engineering" and has beensupported by CTU grant No. 10038S69.
636
WORKSHOP 96 MATERIALS SCIENCE IN ELECTRICAL, CHEM. fc CIVIL ENG.
MODIFICATION OF LiNbO3 OPTICALPROPERTIES BY He+ IMPLANTATION
I. Hruba, J. Krai
CTU, Fac. of Nucl. Sci. k Phys. Eng., Dept. of Physical ElectronicsV Holesovickach 2, 180 00 Praha 8
Key words: ion implantation, LiNbOa, refractive index, absorption coefficient
Recently, massive application of optical waveguide elements has taken place to increasethe information transmission rate. In the field of itegrated optics, namely the LiNbO3 com-ponents are commercially employed. To prepare a waveguide based on LiNbOa, it is possibleto take advantage of the refractive index change caused by the radiation modification of amaterial under ion implantation.
By the means of ion implantation it is possible to create either a waveguide channelby increasing the refractive index under a surface or to make an optical barrier in depth ofseveral microns by decreasing the refractive index in the layer where high energy ions stop.
During the ion penetration into a material, two types of energy losses occur. Theydepend on the ion velocity. When the velocity of an ion is high enough - in the MeV energyregion - an essential part of the ion kinetic energy is transmitted to electron excitations,ionizations, and it also results in the breakdown of chemical bonds. Since the electron-holepairs arc created, it can be expected that both color vacancy F centers and intersticialII centers appear. All these effects have strong influence on the absorption. When an ionis slowed down, nuclear collisions are much more pronounced. As it was shown in [1], therefractive index change depends on the density of energy deposited in nuclear collisionswhich result in material structure defects. These defects accumulate in dependence on thedose of implanted ions and even the amorphisation connected with a volume expansion mayoccur. This can be one of the reasons of the refractive index decrease generated by the ionimplantation. Strong correlation between the changes of refractive index and the materialdensity (volume) changes is expressed by Wei [2] correction of Lorentz-Lorentz equation:
An 1 , 2 , . , j- = ^ ( n ' - l ) ( n 2 +
n - refractive indexa - polarizibilityV - volumeK - influence on the local field
The implantation depth depends besides other features, on the kind and energy of anincomming ion. The development of the radiation demagealso depends on the temperatureduring the implantation process.
Waveguides suitable for technical applications are at least 4/im thick. To create sucha waveguide, it is necessary to use He+ ion beam with energy at least 2 MeV. In a LiNbO3crystal the different changes for ordinary and extraordinary refractive indices are inducedby the ion implantation. The extraordinary refractive index is slightly increased in the
637
WORKSHOP 96 MATERIALS SCIENCE IN ELECTRICAL, CHEM. fc CIVIL ENG.
region just bellow the surface. However, at the end of the ion path both the ordinary andextraordinary indices are decreased proportionaly to the ion dose.
The experiments are performed on ion beam modification of LiNbOa optical properties.Thin plates of LiNbO3 cut perpendiculary to the crystalographic axis are polished from oneside and left ground from the other side. He ions are implanted with energy 100 keV at aboutroom temperature into the polished plane. The ion beam is scanned over the target withthe average current 3- 10"r A/cm2. The surface of the implanted sample is covered by a thinMo gauze to supress possible charging. The distribution of implanted ions, simulated byTRIM 90 [4], shows the mean projected range value Rp = 0.62/im and standart deviationRp = 0.15 fim. So, the surface implanted layer in our experiments can approximate theburried He layer (optical barrier) implanted with MeV energies in a depth of several /im.
The ellipsometry is applied to measure the refractive index in the barrier. The polariza-tor-compensator sample-analysator ellipsometer is used and from the measured data thecomplex refractive index N is evaluated. Its real part gives the ratio of the light velocity ina vacuum and a material, the imaginary part of N defines the absorption coeficient. Thereal part of the measured refractive index has been in good agreement with the previouslypublished results [3]. Moreover, we have evaluated the absorption coefficient which in x andy planes rises with the dose.
We have also measured the effective thickness of the modified layer and its dependenceon the ion dose. The growing thickness of the layer may be due to an expansion of theimplanted volume. We intend to investigate changes in optical properties of fotorefractivematerials under various parameters of ion implantation with the aim to produce an opticalwaveguide with special parameters.
The authors would like to thank Dr. Hrdina and Dr. Chvostova from the Institute ofPhysics of Czech Academy of Science for their help with the ellipsometric measurementsand the evaluation of the ellipsometric data.
References;
[1] TOWNSEND, P.: Optical Effects of Ion Implantation, 1994
[2] WEI, D. T. - LEE, W. W.: Appl.Phys.Lelt.,25(1974)
[3] GOTZ, G.: Optoelectronic materials, in Ion Beam Modification of Insulators (edit, byP. Mazzoldi), Elsevier 1987.
[4] ZIEGLER, J. - BIERSACK, J. P. - LITTMARK, U.: The Stopping Range of Ions inSolids, Vol. 1, Pergamon Press, New York 1985
This research has been conducted at the Department of Physical Electronic as part ofthe research project "Modification of optical materials properties by ion beams" and hasbeen supported by CTU grant No. 10048295
638
WORKSHOP 96 MATERIALS SCIENCE IN ELECTRICAL, CHEM. fc CIVIL ENG.
DETECTION SENSITIVITY OFULTRASONIC PULSE VELOCITYMETHOD TO INTERNAL VOIDS
IN CONCRETE
V. Kadlecek, S. Modry
CTU, Klokner Institute, Dept. of Concrete TechnologySoh'nova 7, 166 08 Praha 6
Key words: ultrasonic pulse velocity method, detection sensitivity, internal voids
The ultrasonic pulse testing method is recommended for estimation of uniformity andquality of concrete and also for detection of internal voids or cracks in concrete. The realcapabilities of this method have been examined in the frame of the special experimentalproject [1]. Among other the effect of modelled "hidden" faults like internal voids andcracks has been investigated. Prismatic specimens made of cement mortar or concrete haddimensions 100 x 100 x 400 mm. In the central part of some tested specimens modelledfaults of different sizes have been created with the aid of the foam polystyrene plates ofsizes as follows: 20 x 20, 50 x 50, 80 x 80 mm at a constant thickness of 30 mm.
The effect of the modelled faults has been tested by direct method of measurements ofultrasonic pulse velocity. Transducers have been placed on the both sides of test specimens(in longitudinal or transversal directions). Simultaneously, the influence of the magnitudeof the working frequency of the transmitter as well as the influence of the procedure of thereading of time have been examined.
From the experimental results follows that the diagnostic capability of ultrasonic pulsevelocity measurements for identification of modelled faults in the test specimens is very lowin comparison with results of the other tests. Specimens with the largest modelled fault haveshown decrease of maximum pulse velocity 2 to 3 % approx. in longitudinal and 6 to 7.5 %approx. in transversal direction only. However, at the same time the generally acceptedmean value of the coefficient of variation of the ultrasonic pulse velocity has been 1.5%approx. (e.g. [2]). On the contrary, maximum decrease of the values of dynamic moduli ofelasticity estimated by resonance method has shown 42 to 53 % resp.
The central part of the test specimens has also been examined for compressive strenght,flexural strenght, direct tensile strenght and splitting straight. In the last case the mostpronounced decrease in strenght has been about 85% for both tested materials, i.e. cementmortar and concrete.
The results indicate that the ultrasonic pulse velocity method provides a very lowdetection sensitivity for assessment of the internal voids in concrete, respectively none (seee.g. [3]). This reveals that in concrete the ultrasonic pulses does not propagate rcctilinearly,but reflect multiplicatively on surfaces of aggregates grains. This is probably why, that theinterpretation of obtained results is not easy. In order to obtain reliable data, it is necessaryto carry out the pulse velocity tests under strict supervision and by experienced operators.
639

WORKSHOP 96 MATERIALS SCIENCE IN ELECTRICAL, CHEM. fc CIVIL ENG.
The interpretation of data should be done by competent experts to avoid nondesirablefallacies.
References:
[1] KADLECEK, V. - DOHNALEK, J.: Conditions of objective use of ultrasonic pulsevelocity method for quality assessment of concrete and for diagnostic of concrete struc-tures. Research report (in Czech), KtJ CVUT, Prague, 1985
[2] POPOVICS, S. - ROSE, J. L. - POPOVICS, J. S.: The behavior of ultrasonic pulsesin concrete. Cement and Concrete Research, 20, 1984, 99
[3] SCHICKERT, G.: Critical reflections on non-destructive testing of concrete. Materialsand Structures, 17, 1984, 99
This research has been conducted at the Department of Concrete Technology and hasnot been supported by any grant.
640
WORKSHOP 96 MATERIALS SCIENCE IN ELECTRICAL, CHEM. fc CIVIL ENG.
MATERIAL PROBLEMSOF CASTOR 440 CASK PACKAGE
J. Pokorny, J. Novak*
CTU, Fac. of Mechanical Eng., Dept. of Materials ScienceKarlovo nam. 13, 121 35 Praha 2
Key words: CASTOR 440, cask body, IAEA, regulations testing
CASTOR 440 is a transport and storage cask for spent fuel assemblies from reactorsof the VVER type employed in the Czech Republic. It is manufactured by GNB Essencompany; a part of the production is performed by Skoda PIzen company. The cask isdesigned for 84 spent fuel assemblies. The cask is to meet essential safety criteria summarizedas follows:
• shielding• criticality safety• leak tightness
The construction conception of the package and materials used guarantee the observanceof these general requirements under normal operating conditions as well as after assumedaccidents. From the mechanical point of view the cask is a massive thick-wall can withflat bottom and double lid equipped at the side walls with four trunnions for the handling.Radial fins at the outer side wall of the cask body enlarge the heat transfer surface. Thethermal power of the cask after loading burn-up fuel elements is up to 20 kW. The maximalthermal power mentioned reduces in the course of time. In lengthwise holes in the caskbody, circular moderator rods out of polyethylene are arranged. The spent fuel elementsare accommodated in the cask cavity in a honeycombed basket, which ensures the residualheat transfer and critically-safe fuel arrangement within the basket. The cask cavity is filledwith helium with underpressure of 20kPa. The leak tightness of the cask monitoring isperformed by means of pressure measuring between the primary and secondary lid. Thecask is during the transport equipped with add-on impact limiters installed at the two caskends. They consist of ortogonally set wooden prismoids enclosed partly in steel plate shells.Metal cover protects the impact limiters from outer side.
Main material groups used in the cask design:• Cask Body - massive cask (over 100 t) out of ductile cask iron of the GGG 40 type.
Minimal mechanical values quaranteed: iJpO,2 = 200MPa, Rm = 250MPa, A5 = 6%.The structure is made out of ferit (at least 80%); the rest is made of perlit. The anti-defectcontrol of the body is performed completely with ultrasound. The cask interior is nickel-plated in an cloctroplating method. The design of the cask does not permit the pressure inthe side wall of the cask to exceed 21 MPa.
• Lids, Trunnions, Screws - made cf maraging stainless forge steel X5CrNi 134.Allowable limit values: Rm = 780-980 MPa, RpQ,2 = > 635MPa, A5 > = 15%. The anti-defect control of the lids and the trunnions is performed by means of capillar and ultrasoundtests. Under the strains of normal operating conditions the values are considerably belowthe allowable limit values testified by high safety coefficients (indexes).
641

WORKSHOP 96 MATERIALS SCIENCE IN ELECTRICAL, CHEM. & CIVIL ENG.
• Basket - serves for inner arrangement of burn-up fuel elements, heat transfer andpartial absorption of fast-moving neutrons. It is made out of corrosion-resistant boratedsteel. The heat transfer is performed by heat conducting plates of A199,5W7, which are notstrained.
• IAEA regulations testing. In addition to normal operating conditions, the caskmust also comply with IAEA regulations concerning accident situations.
• Drop from a 9 m height onto a flat impact plate. Impact limiters installedat the two cask ends serve for reducing the impact effecting. The impact deceleration isdependent on the angle of incidence; nevertheless the 100 g value is not exceeded. Theseresults proved a drop test of a cask with similar design. All parts of the cask resist thesedynamic powers.
• 1 m drop on the pin with 150 mm diameter, length 200 mm.• Impact with the lid surface - two steel plates (60 and 30 mm) are installed in the
impact limiters. Experiments and calculations prove that these plates absorb all energy.• Impact with the side wall line - both the test calculation and the experiment
were performed in Japan CASTOR. The maximum stress in the inner side wall of the caskis only 86.9 MPa.
• 200 m water immersion test - the outside pressure 2 MPa increases the stress inthe cask side wall only by 8.04 MPa.
• Thermal test - the cask has the 30min. resistance to the outside temp, of 800 °C.All manufacturing processes concerning the cask are performed in ISO 9001 quality.
Resume. Considering possible application of the CASTOR cask package in the CzechRepublic, the Faculty of Mechanical Engineering of CVUT was entrusted with the taskof assessing the cask from the point of view of material used and mechanical strain. Alltests were based on information from manufacturer. The cask had to be modified, partlyalso in accordance with our comments. Only the third modification fulfilled prescribedrequirements. The modifications concerned strengthening of the inner basket, changes inseveral screw tightening moments and explaining questions about assumed fragile damage.Several computations had to be defined more precisely and clearly.
Short-term changes of mechanical values of material used in the cask construction arepredictable. We propose, however, to put inside the cask several test bodies, so that couldbe possible to examine assumed time-depended changes of structure, firmness, ductility andpersistence. After future deposition of burnt-up fuel into permanent place, this will makeeasier the decision concerning further possible employment of the cask.
References:
[1] NOVAK, J. - POKORN?, J.: Castor U0 Cask Package - Material Problems. IAEAWorkshop, Safety Assesment for Spent Fuel Storage Facilities for NPPs, Rez, May 1995.
[2] Documentation of Company GNB. Essen, Germany. 1994.
[3] WIESSER, K. E. et al: Gusseisen mit Kugelgraphit als Werkstoff fuer Transport undLagcrbehalter bestrahlter Brennelemente, Sonderdruck BAM. Berlin. Mart 1985.
This research has been conducted at the Department of Materials Science Fac. of Me-chanical Eng., CTU, Prahafor SOJB Praha.
642
WORKSHOP 96 MATERIALS SCIENCE IN ELECTRICAL, CHEM. fc CIVIL ENG.
NONDESTRUCTIVE EVALUATION OFTIMBER STRUCTURES
P. Kuklik, J. Dolejg, A. Kuklfkova
CTU, Fac. of Civil Eng., Dept. of Steel StructuresThakurova 7, 166 29 Praha 6
Key words: timber, wood-based panels, timber structures, test methods
The contribution deals with the use of modal analysis for the investigation of dynamicalproperties of timber structures.
Modal analysis involves the determination of modal parameters for components andstructures. Modal parameters are essentially dynamic characteristics of an element deter-mined by the mechanical interaction of structural geometry and material. An element willfreely vibrate at one or more of its natural frequencies when subjected to some form of ex-ternal triggering force. At each natural frequency the element forms a certain shape calleda "mode shape". The mode shape formed may be predicted by computer models but stillrequires measurement to determine accurately the modal frequency and amplitudes. Vibra-tion can be caused by any number of external sources. Should the fundamental frequency ofthe external source coincide with any of the natural frequencies (particularly those with themost significant amplitudes) large amplitudes of vibration can occur. This phenomenon,known as resonance, results in large amplitudes that can have destructive effects on compo-nents and structures. In some cases this causes the deterioration of members, in general thiscontributes to increased fatigue of the specimen. Study in this area falls into the categoryof structural dynamics.
This examination is directed towards the modal analysis of thin-flanged beams. Thiswork can be generally divided into sections.
1) Experimental analysis: A large part of this work involves taking field measurementsof thin-flanged beams and an analysis of the obtained results.
2) Finite elen.cnt analysis: The derivation of modal parameters and hence mode shapesusing analytical models utilising a special finite element package capable of performingdynamic analysis on a model. In addition to this static load cases can be examinedon models already validated with dynamic correlation between experimental and an-alytical results.
Trough the use of relatively inexpensive equipment it is possible to correlate analyticalmodels and experimental data. Using this technique more accurate models can be con-structed, which in term imitates dynamic behaviour. These models can be used to analysepossible alterations to the structure. These modifications involve increasing the structuremass or stiffness to affect directly the frequency at which resonance occurs. This meansthat it is possible to:
1) evaluate a component and a structure,
2) adjust the mathematical model to represent the component and the structure in situ,and
643
WORKSHOP 96 MATERIALS SCIENCE IN ELECTRICAL, CHEM. k CIVIL ENG.
3) perform modifications on the component and the structure without physically alteringthe existing component and the structure.
By using this method problem frequencies and mode shapes can be identified andconsidered in any modifications. The most efficient practical solution can be implementedfollowing trial runs of possible feasible solutions using finite element analysis.
The spectrum analyser used for measurements was a four channel Tektronix. Four chan-nels enable the dynamicist to have one accelerometer measuring the force input and threemeasuring the structural response, which is a common technique for checking the recorderdata simply using measurement comparisons. Measurement checking should be practicedwhere possible to help to eliminate the possible recording and processing of extraneousdata. The spectrum analyser performs Fast Fourier Transforms (FFT) on the measureddata creating a continuous curve by joining the discrete measured points with the use of amathematical series.
The impact hammer used for all these investigations has been specially developed duringthe recent few years. Essentially the impact hammer has the character of a hammer of amass about 3 kg. The drop height of the hammer is about 15-20 cm.
Test elements of thin-flanged beams were made of spruce wood and water resistantspruce plywood. The ribs and the reinforcement of thin-flanged beams were connected bynails.
During the measuring the responses were simultaneously recorded with the help of acomputer which at the same time decided if the magnitude of the imparted impulses waskept within tolerable limits. The panels were tested on both sides.
It is obvious from the results of experimental testing of thin-flanged beams and theirsubsequent modelling by means of the Finite Element Method that modal analysis is aconvenient method for the verification of computation models. Models verified by modalanalysis can furher be solved in detail by means of the Finite Element Method. In this waya very good reliability of the obtained results can be expected.
References:
[1] BATA, M. - PLACHtf, V. - TRAVNICEK, F.: Dynamika stavebnich konstrukci. Praha1987.
[2] BATA, M. - PLACH'?, V.: Vysetfovdni dynamickych icinki na slavebni konstrukce.Praha 1978.
[3] BITTNAR, Z. - SEJNOHA, J.: Numericke melody mechaniky 1 a 2. Praha 1992.[4] KOLAR, V. - KRATOCHVlL, J. - LEITNER, F. - 2EN1SEK, A.: VypoSet plosnych
a prostorovych konstrukci metodou konecnych prvku. Praha 1979.[5] KUFNER, A. - KADLEC, J.: Fourier series. Prague 1971.[6] VEIT, J.: Integral™ transformace. Praha 1979.
This research has been conducted at the Department of Steel Structures as part of theresearch project "COST 508" and has been supported by CTU grant No. 1S422/10018SSO.
644
WORKSHOP 96 MATERIALS SCIENCE IN ELECTRICAL, CHEM. fc CIVIL ENG.
NONDESTRUCTIVE TESTING OFSTRUCTURAL TIMBER
J . DolejS, M. Togni*, P . Kukh'k,A. Kuklikova, K. Tdgelova
CTU, Fac. of Civil Eng., Dept. of Steel StructuresThakurova 7, 166 29 Praha 6
* University of Florence, Inst. for Forest Management and TechnologyVia S .Bonaventura, 13-1-50145 Firenze
Key words: timber, timber grading, timber structures, nondestructive testing, vibrationtechnique, ultrasound technique
Wood is genarally known as a structural material with strongly orthotropic elastic prop-erties. Furthermore, it is a material susceptible to creep under long-term loading, and it ischaracterized as having significantly variable strength and stiffness properties. The conse-quent need for nondestructive testing-grading-of structural timber has been recognized formany years. The fundamental hypothesis for nondestructive testing of wood materials wasinitiated by Jayne in 1959. He proposed that the energy storage and dissipation properties ofwood materials, which can be measured nondestructively by using a number of techniques,are controlled by the same mechanisms that determine the static behavior of such material.As a consequence, useful mathematical relationships between these properties and staticelastic and strength behavior should be attainable through statistical regression analysis.
Two main methods for such grading are widely used today; visual grading and machinestress grading. Both methods have certain limitations as well as disadvantages. Improve-ments or alternatives should be wellcomed.
For grading is possible to use vibration techniques. A part of energy, added to a bodyby a touch (stroke, hammer blow) is transformed into vibrations. First of all these vibrationsare very complicated and are dependent on the way and the violence of the blow and alsoon the physical and geometrical properties of the body. If the body is supported, naturalvibrations will be produced after a short time. Depending on the kind of supports and thedirection of the excitation bending vibrations of different modes can be produced as wellas longitudinal or torsional vibrations. The GOULD-oscilloscope records the vibrationstransduced by means of an accelerometer with amplifier. Good results are obtained bysupporting of the vibrating body under the desired vibration nodes. The excitation by astroke has to be effected in direction of the vibration. The approximate solution of thedifferential motion equation of bending (longitudinal, torsional loading) is given by Euleror Timoshenko theory. The modulus of elasticity can be calculated using the observedfrequency.
The ultrasound technique was developed on the basis of the correlation between thephysical properties - such as the stiffness properties and the density - and the velocity of theultrasonic waves; the ultrasound propagation can be used to determine the mechanical prop-erties of wood (stiffness and strength) to grade the sawn timber. The testing apparatus wasthe PROCEQ CONCRETE TESTER CCT 4, a device conceived for testing concrete; thisapparatus measures the time employed by the ultrasonic wave - generated by a piezo-electric
645
WORKSHOP 96 MATERIALS SCIENCE IN ELECTRICAL, CHEM. k CIVIL ENG.
transducer up to recording transducer, end-to-end through the specimen. The distance be-tween the transducers (which is the length of the specimen) allowed to calculate the velocityof the wave. Thanks to the simplified equation the dynamic modulus of elasticity can becomputed.
Works on determining of mechanical properties (modulus of elasticity, strength) ofstructural timber (spruce) by means of nondestructive metods have been started. Visualgrading was also performed. Every beam (nominal size 100 x 120 x 2900 mm) was deter-mined a knot ratio, slope of grain, annual ring width and wane, decay and reaction woodpresence according to DIN 4074. The sample of 43 beams has been graded into 4 classes.Transverse vibration, longitudinal stress wave and ultrasound techniques have been carriedon to determine elastic moduli. The first natural frequency from "free-free" bending vibra-tion was evaluated both flatwise and edgewise position. The bending stiffness will not beunderestimated with more than 5% when the nodal points distance is not below 10 timesthe beam depth by using Euler theory.
For the vibration technique in longitudinal direction soft supports were used to simulate"free-free" conditions.
The ultrasound measurements were performed along two edges of each specimen.Results of all these methods will be compared. After nondestructive tests will be
carried out destructive tests. Relationships between nondestructive parameters (modulusof elasticity predicted by means of every up-mentioned technique, annual ring width, knotratio, slope of grain etc.) and strength values will be derived.
References:
[1] PERSTORPER, M.: Dynamic modal tesls of timber 9th Int. Symposium of Nond. Test.
of Wood, Madison USA, 1993
[2] GORLACHER, R.: A Dynamic method for Determining Elastic Properties of WoodFirenze, September 1989
[3] ROSS, R. J. - PELLERIN, R. F.: Nondestructive Testing for Assessing Wood Membersin Structures General Tech. Report, Madison, USA 1991
[4] NAKAI, T. - TANAKA, T. - NAGAO, H.: Comparison of Non-Destructive Tests forMeasuring Modulus of Elasticity as a Parameter for Grading Sawn Tim&er Tokyo, 1990
[5] S ANDOZ, J. L.: Grading of Construction Timber by Ultrasound Wood Sci. and Techno].23: 95-108 (1989)
This research has been conducted at the Department of Steeel Structures as part of theresearch project "COST 508" and has been supported by CTU grant No. 134S8/10018S32"
646

Section 11
POWER SYSTEMS AND
ELECTRICAL ENGINEERING
NEXT PAGIE(S)left BLAK3C
WORKSHOP 96 POWER SYSTEMS & ELECTRICAL ENGINEERING
GENETIC ALGORITHM USEDFOR ELECTROMECHANICAL SYSTEM
IDENTIFICATION
C. OndrtiSek, T. Bfezina*, F. Veselka
TU, Fac. of Electrical Eng. & Comp. Sci., Dept. of Electrical Machines & Apparatustidolni 19, 602 00 Brno
*TU, Fac. of Mechanical Eng.,Tcchnicka 2, 616 19 Brno
Key words: genetic algorithm, optimization, mechatronics, electromechanical systems
Introduct ion. Some technical problems can be solved via computational techniqueswhich are essentially inspired by living nature. One of these is the class of genetic algorithm.It is based on random search and optimisation with selection of the best members from awide set of stochastically generated and updated vectors. Genetic algorithms are inspiredby the theory of evolution based on Darwinian evolution theory. The mathematical modelworks with terms that are similar to the terms in nature. The set of generated solutionsis called the population. The solutions that best fit the optimization criteria are knownas the best members of the population. New members of the population are derived fromthese best members by the procedure called recombination, method of recombinationcannotreach the global optimum, stochastic changes, called mutations, are made in the populationto get probably better solutions. The worst members are destroyed during the computationto make space for better solutions. Each member of the population is formed from a setof elements similar to natural genes. These genes forms a genetic string which works as amember of the population. These genes can be elements of the input vectors that producean input to the optimization function. The initial population is created as a random set ofgenes in the members of the population. The genetic algorithm is then divided into foursteps that are repeated until an optimal solution to the optimization problem is found.
1. Evaluation, - the computation of the optimization criteria (cost function) for all mem-bers of population.
2. Selection - the finding and orderring of the best numbers in the processed population.
3. Recombination, a subset on the best members are combined to get new members ofthe population.
4. Mutation - the method of producing slightly different members in the population.
Paramete rs optimisation. Parameters of equivalent circuit diagram of an inductionmotor with single cage is in [5]. The parameters Rl, R2, R3, XI, X2, X3 represent the genes.In the proces of optimisation it is necessary first of all to set an actual range of parametersR and X. The advantage of genetic algorithm is that the actual range of parameters couldbe extremely large and therefore no detailed information about parameters is required.
649

WORKSHOP 96 POWER SYSTEMS fc ELECTRICAL ENGINEERING
Static characteristics M = f(s), I = f(s) and cosy> = f(s) can be calculated fromcircuit diagrams. The calculated characteristics are compared with the measured (or ob-tained from design procedure) and genetic algorithm procedure is repeated until a certaincost function is satisfied. The parameters obtained for the best solution are the optimizedparameters requred. The parameter optimisation was performed on motors of the powerrange from 3.6 kW up to 1 MW, nominal voltage 380 V and 6kV, single-cage or double-cage.
Conclusions. Parameters optimisation of induction motors in the power-range 3.6 kWup to 1 MW by means of genetic algorithm was performed. The results proved the usefull-ness of that algorithm used. The advantages of genetic algorithm are computer stability,high probability to find the global optimum and reduction of programmers time. The dis-advantage is relatively large computer-time.
References:
[1] VALSA, J.: Modely trojfazoveho indukcniho stroje pro simulaci dynamickych stavu.FEI VUT v Brne, Brno 1991.
[2] KRAL, J. - BREZINA, T.: Genetic Algori. ims in Solving of Engineering Problems.Inzenyrska mechanika, c. 5, 1993.
[3] SLAMA, L. - KRAL, J.: Gcneticky algoritmvs a jeho vyuziti v reseni nloh optimalizacea identifikace. Brno 1995.
[4] MALY, J.: Identifikace parametnt elektrickych stroju nestandardnimi metodami. DPUESP FEI VUT v Brne, Brno 1993.
[5] KUCHYNKOVA, H.: Identifikace parametru pro simulacni modely asynchrpnnichstroju. UESP FEI VUT v Brne, Brno 1993.
This research has been conducted at the Department of Electrical Machines and Appa-ratus and has been supported by TU grant No. FUJ50058.
650
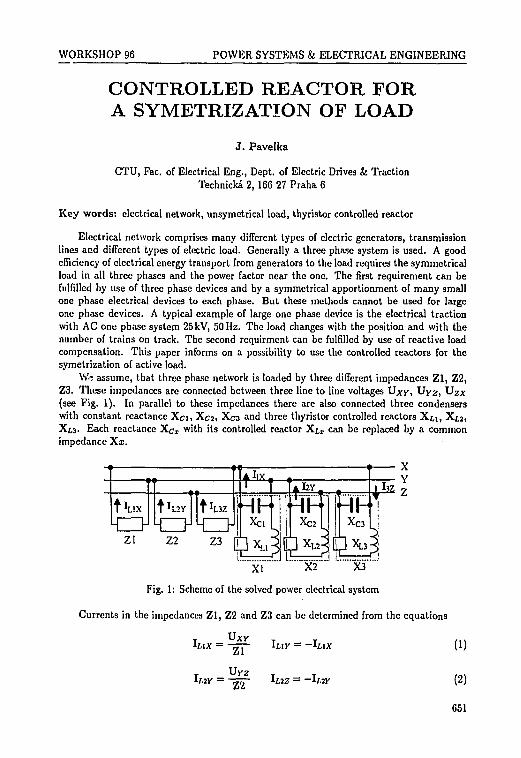
WORKSHOP 96 POWER SYSTEMS & ELECTRICAL ENGINEERING
CONTROLLED REACTOR FORA SYMETRIZATION OF LOAD
J . Pavelka
CTU, Fac. of Electrical Eng., Dept. of Electric Drives & TractionTechnicka 2, 166 27 Praha 6
Key words: electrical network, unsymetrical load, thyristor controlled reactor
Electrical network comprises many different types of electric generators, transmissionlines and different types of electric load. Generally a three phase system is used. A goodefficiency of electrical energy transport from generators to the load requires the symmetricalload in all three phases and the power factor near the one. The first requirement can befulfilled by use of three phase devices and by a symmetrical apportionment of many smallone phase electrical devices to each phase. But these methods cannot be used for largeone phase devices. A typical example of large one phase device is the electrical tractionwith AC one phase system 25 kV, 50 Hz. The load changes with the position and with thenumber of trains on track. The second requirment can be fulfilled by use of reactive loadcompensation. This paper informs on a possibility to use the controlled reactors for thesymetrization of active load.
W? assume, that three phase network is loaded by three different impedances Zl , Z2,Z3. These impedances are connected between three line to line voltages VXY, Vyz, Uzx(see Fig. 1). In parallel to these impedances there are also connected three condenserswith constant reactance Xei, Xc2, Xc3 and three thyristor controlled reactors X^i, Xt2,Xt3- Each reactance Xcx with its controlled reactor Xj, r can be replaced by a commonimpedance X i .
XI X2 X3
Fig. 1: Scheme of the solved power electrical system
Currents in the impedances Zl , Z2 and Z3 can be determined from the equations
= -luxZl
VYZ
Z2
(1)
(2)
651
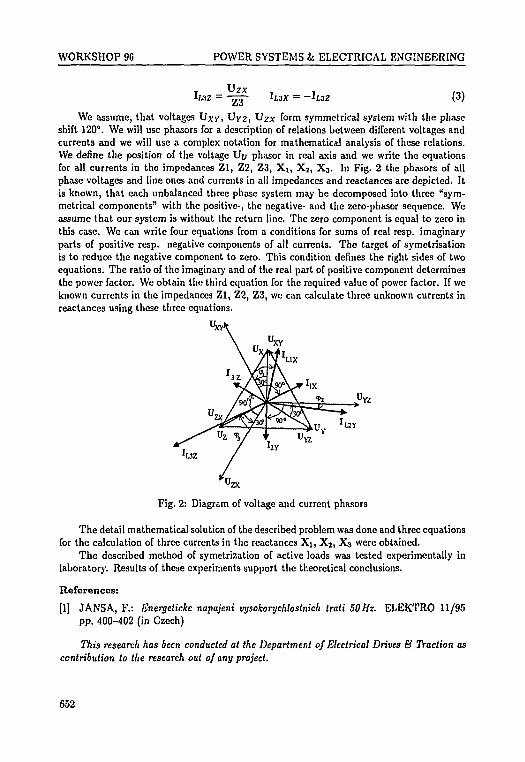
WORKSHOP 96 POWER SYSTEMS & ELECTRICAL ENGINEERING
VzxZ3 IL3X = -I (3)
We assume, that voltages VXY, UYZ, ^ZX form symmetrical system with the phaseshift 120°. We will use phasors for a description of relations between different voltages andcurrents and we will use a complex notation for mathematical analysis of these relations.We define the position of the voltage Uy phasor in real axis and we write the equationsfor all currents in the impedances Zl, Z2, Z3, Xj , X2, X3 . In Fig. 2 the phasors of allphase voltages and line ones and currents in all impedances and reactances are depicted. Itis known, that each unbalanced three phase system may be decomposed into three "sym-metrical components" with the positive-, the negative- and the zero-phasor sequence. Weassume that our system is without the return line. The zero component is equal to zero inthis case. We can write four equations from a conditions for sums of real resp. imaginaryparts of positive resp. negative components of all currents. The target of symetrisationis to reduce the negative component to zero. This condition defines the right sides of twoequations. The ratio of the imaginary and of the real part of positive component determinesthe power factor. We obtain the third equation for the required value of power factor. If weknown currents in the impedances Zl, Z2, Z3, we can calculate three unknown currents inreactances using these three equations.
Fig. 2: Diagram of voltage and current phasors
The detail mathematical solution of the described problem was done and three equationsfor the calculation of three currents in the reactances Xi, Xj , X3 were obtained.
The described method of symetrization of active loads was tested experimentally inlaboratory. Results of these experiments support the theoretical conclusions.
References:
[1] JANSA, F.: Energeticke napajeni vysokorychlostnich trati 50Hz. ELEKTRO 11/95pp. 400-402 (in Czech)
This research has been conducted at the Department of Electrical Drives & Traction ascontribution to the research out of any project.
652
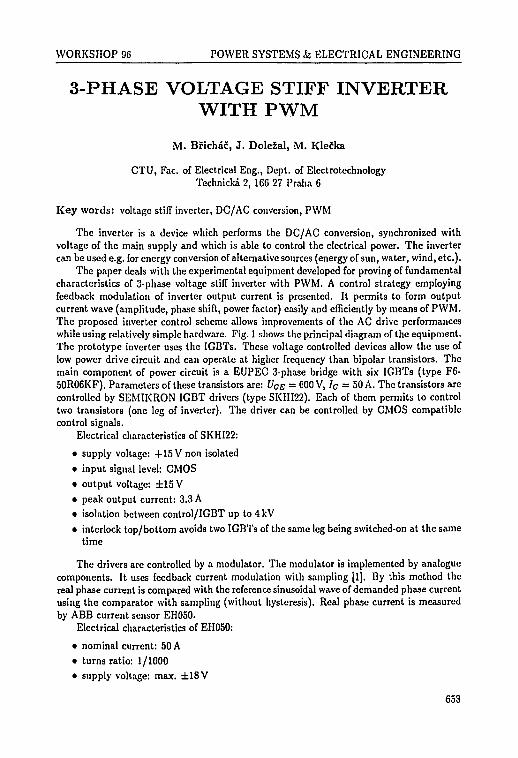
WORKSHOP 96 POWER SYSTEMS fc ELECTRICAL ENGINEERING
3-PHASE VOLTAGE STIFF INVERTERWITH PWM
M. Bfichac, J . DoleSal, M. Kledka
CTU, Fac. of Electrical Eng., Dept. of ElectrotechnologyTechnicka 2, 166 27 Praha 6
Key words: voltage stiff inverter, DC/AC conversion, PWM
The inverter is a device which performs the DC/AC conversion, synchronized withvoltage of the main supply and which is able to control the electrical power. The invertercan be used e.g. for energy conversion of alternative sources (energy of sun, water, wind, etc.).
The paper deals with the experimental equipment developed for proving of fundamentalcharacteristics of 3-phase voltage stiff inverter with PWM. A control strategy employingfeedback modulation of inverter output current is presented. It permits to form outputcurrent wave (amplitude, phase shift, power factor) easily and efficiently by means of PWM.The proposed inverter control scheme allows improvements of the AC drive performanceswhile using relatively simple hardware. Fig. 1 shows the principal diagram of the equipment.The prototype inverter uses the IGBTs. These voltage controlled devices allow the use oflow power drive circuit and can operate at higher frequency than bipolar transistors. Themain component of power circuit is a EUPEC 3-phase bridge with six IGBTs (type F6-50R06KF). Parameters of these transistors are: UCE = COOV, Ic = 50 A. The transistors arecontrolled by SEMIKRON IGBT drivers (type SKHI22). Each of them permits to controltwo transistors (one leg of inverter). The driver can be controlled by CMOS compatiblecontrol signals.
Electrical characteristics of SKHI22:
• supply voltage: +15 V non isolated
• input signal level: CMOS
• output voltage: ±15 V
• peak output current: 3.3 A• isolation between control/IGBT up to 4 kV
• interlock top/bottom avoids two IGBTs of the same leg being switched-on at the sametime
The drivers are controlled by a modulator. The modulator is implemented by analoguecomponents. It uses feedback current modulation with sampling [1]. By this method thereal phase current is compared with the reference sinusoidal wave of demanded phase currentusing the comparator with sampling (without hysteresis). Real phase current is measuredby ABB current sensor EH050.
Electrical characteristics of EH050:
• nominal current: 50 A
• turns ratio: 1/1000• supply voltage: max. ±18 V
653
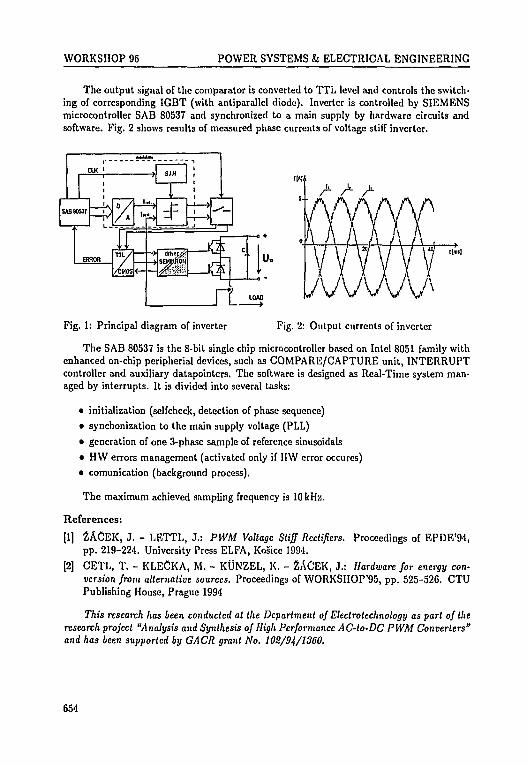
WORKSHOP 96 POWER SYSTEMS & ELECTRICAL ENGINEERING
The output signal of the comparator is converted to TTL level and controls the switch-ing of corresponding IGBT (with antiparallel diode). Inverter is controlled by SIEMENSmicrocontroller SAB 80537 and synchronized to a main supply by liardware circuits andsoftware. Fig. 2 shows results of measured phase currents of voltage stiff inverter.
A
Fig. 1: Principal diagram of inverter
IMAM/Fig. 2: Output currents of inverter
The SAB 80537 is the 8-bit single chip microcontroller based on Intel 8051 family withenhanced on-chip peripherial devices, such as COMPARE/CAPTURE unit, INTERRUPTcontroller and auxiliary datapointers. The software is designed as Real-Time system man-aged by interrupts. It is divided into several tasks:
• initialization (selfcheck, detection of phase sequence)
• synchonization to the main supply voltage (PLL)
• generation of one 3-phase sample of reference sinusoidals
• HW errors management (activated only if HW error occures)
• comunication (background process).
The maximum achieved sampling frequency is 10 kHz.
References:
[1] 2ACEK, J. - LETTL, J.: PWM Voltage Stiff Rectifiers. Proceedings of EPDE'94,pp. 219-224. University Press ELFA, Kosice 1994.
[2] CETL, T. - KLECKA, M. - KUNZEL, K. - ZACEK, J.: Hardware for energy con-version from alternative sources. Proceedings of WORKSHOP'95, pp. 525-526. CTUPublishing House, Prague 1994
This research has been conducted at the Department of Electrotechnology as part of theresearch project "Analysis and Synthesis of High Performance AC-to-DC PWM Converters"and has been supported by GACR grant No. 10S/94/1360.
654
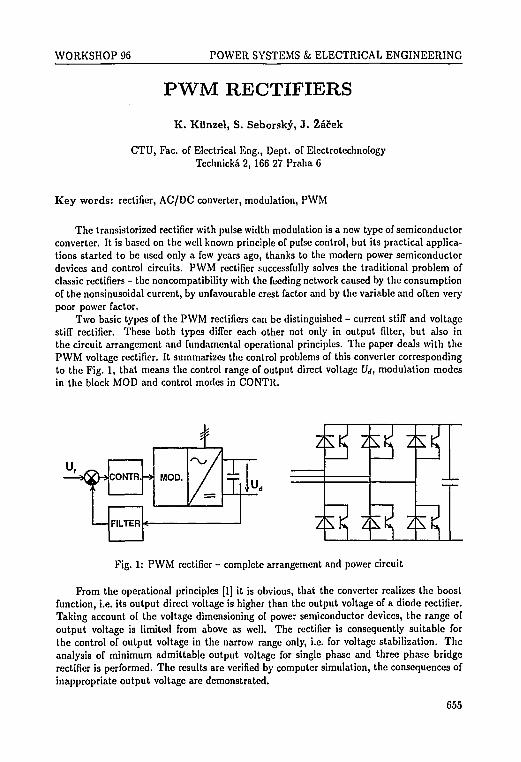
WORKSHOP 96 POWER SYSTEMS & ELECTRICAL ENGINEERING
PWM RECTIFIERS
K. Kiinzel, S. Seborsky, J . 2acek
CTU, Fac. of Electrical Eng., Dept. of ElectrotechnologyTechnicka 2, 166 27 Praha 6
Key words: rectifier, AC/DC converter, modulation, PWM
The transistorized rectifier with pulse width modulation is a new type of semiconductorconverter. It is based on the well known principle of pulse control, but its practical applica-tions started to be used only a few years ago, thanks to the modern power semiconductordevices and control circuits. PWM rectifier successfully solves the traditional problem ofclassic rectifiers - the noncompatibility with the feeding network caused by the consumptionof the nonsinusoidal current, by unfavourable crest factor and by the variable and often verypoor power factor.
Two basic types of the PWM rectifiers can be distinguished - current stiff and voltagestiff rectifier. These both types differ each other not only in output filter, but also inthe circuit arrangement and fundamental operational principles. The paper deals with thePWM voltage rectifier. It summarizes the control problems of this converter correspondingto the Fig. 1, that means the control range of output direct voltage Uj, modulation modesin the block MOD and control modes in CONTR.
CONTR.
FILTER
-» MOD. 7 1T
u
Fig. 1: PWM rectifier - complete arrangement and power circuit
From the operational principles [1] it is obvious, that the converter realizes the boostfunction, i.e. its output direct voltage is higher than the output voltage of a diode rectifier.Taking account of the voltage dimensioning of power semiconductor devices, the range ofoutput voltage is limited from above as well. The rectifier is consequently suitable forthe control of output voltage in the narrow range only, i.e. for voltage stabilization. Theanalysis of minimum admittable output voltage for single phase and three phase bridgerectifier is performed. The results are verified by computer simulation, the consequences ofinappropriate output voltage are demonstrated.
655
WORKSHOP 96 POWER SYSTEMS k ELECTRICAL ENGINEERING
The fundamental characteristics of the rectifier are substantially influenced by the mod-ulation mode, i.e. by the switching algorithm of the converter branches. The goal of it is thesinusoidal shape of input phase currents with demanded (zero) phase shift according to thephase voltages. The analysis of the principal modulation modes of ac current or voltage isperformed. The limit of switching dynamics of power semiconductor devices is taken into ac-count. The harmonic analysis of simulated phase currents is realized. The computer modelis used for the comparing of the rectifier dynamic behavior with different modulation modes.The fundamental principles and characteristics of space vector control are mentioned. Theobtained results serve for comparing of the performed modulation modes.
The controller of the rectifier ensures the demanded constant value of the output directvoltage, i.e. it eliminates the effect of disturbances (input voltage, output current). Thetransient functions of the controlled system, used for the design of controller parameters,are stated from the power balance equations of the converter for both directions of powertransport. The filter of direct voltage feedback signal is discussed. The analyzed variants ofthe control algorithm are proved by computer simulation of control or disturbance effects.Sensing of the main disturbance - output current - seems to be very effective.
The above mentioned analyses are verified by computer simulation of the convertersystem considering the real transformer parameters and modulating algorithm; the powersemiconductor devices are modelled as ideal switches. Two programms processing the blockdiagram of the simulated system have been applied - PSI/c (Delft Univ. of Technology- BOZA) and MATLAB & SIMULINK (Mathworks). The second one was used also forharmonic analysis of the results.
The conclusions of the submitted paper suggest, that PWM voltage rectifier representsa progressive AC/DC converter with high compatibility. It can be used as an input converterin AC/AC indirect converters, in on-line uninterruptible power sources, etc. The performedanalysis is used for following experimental works.
References:
[1] LETTL, J. - 2ACEK, J.: PWM Voltage Stiff Rectifiers. Intern. Conf. on El. Drives
and Power Electronics EDPE'9<1, Kosice 1994, pp. 219-224.
[2] LETTL, J. - 2ACEK, J.: Zdkladni vlastnosti usmernovacu s sifkove pulsni modulaci.
XXIV. celostat. konf. o el. pohonech, Plzen 1995, str. 191-196.
[3] KLECKA, M. - KUNZEL, K.: ttcgulace usmernovace s sifkovc pulsni modulaci. XXIV.
celostat. konf. o el. pohonech, Plzcn 1995, str. 167-172.
[4] LETTL, J. - 2ACEK, J.: Usmernovace s sifkove pulsni modulaci. ELEKTRO 10,Praha 1995, str. 347-350.This research has been conducted at the Department of Elcclrotcchnology as part of the
research project "Analysis and Synthesis of High Performance AC-to-DC PWM Converters"and has been supported by GACR grant No. 102/94/1360.
656
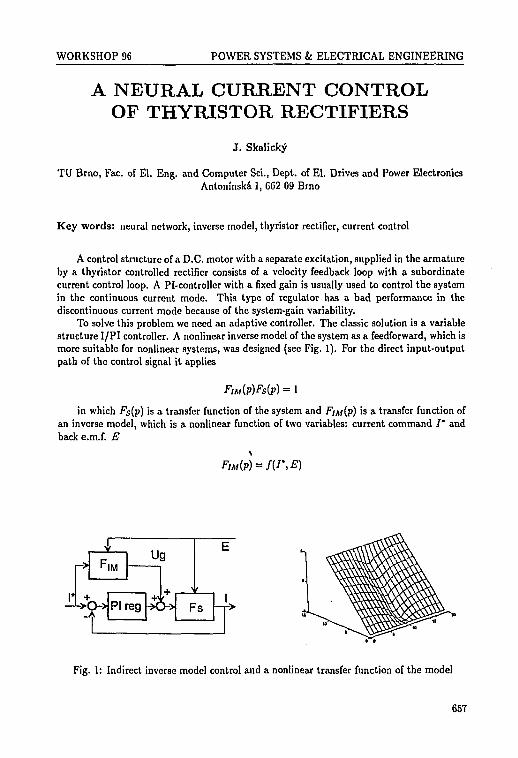
WORKSHOP 96 POWER SYSTEMS & ELECTRICAL ENGINEERING
A NEURAL CURRENT CONTROLOF THYRISTOR RECTIFIERS
J . Skalicky
TU Brno, Fac. of El. Eng. and Computer Sci., Dept. of El. Drives and Power ElectronicsAntoninska 1, 662 09 Brno
Key words: neural network, inverse model, thyristor rectifier, current control
A control structure of a D.C. motor with a separate excitation, supplied in the armatureby a thyristor controlled rectifier consists of a velocity feedback loop with a subordinatecurrent control loop. A Pi-controller with a fixed gain is usually used to control the systemin the continuous current mode. This type of regulator has a bad performance in thediscontinuous current mode because of the system-gain variability.
To solve this problem we need an adaptive controller. The classic solution is a variablestructure I/PI controller. A nonlinear inverse model of the system as a feedforward, which ismore suitable for nonlinear systems, was designed (see Fig. 1). For the direct input-outputpath of the control signal it applies
FIM(P)FS(P) = 1
in which Fs(p) is a transfer function of the system and FIM(p) is a transfer function ofan inverse model, which is a nonlinear function of two variables: current command /* andback e.m.f. E
Fig. 1: Indirect inverse model control and a nonlinear transfer function of the model
657
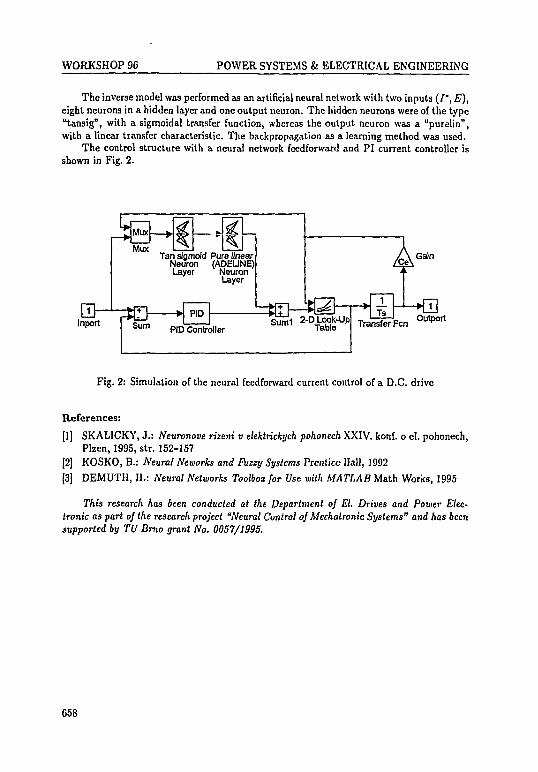
WORKSHOP 96 POWER SYSTEMS & ELECTRICAL ENGINEERING
The inverse model was performed as an artificial neural network with two inputs (/", E),eight neurons in a hidden layer and one output neuron. The hidden neurons were of the type"tansig", with a sigmoidal transfer function, whereas the output neuron was a "purelin",with a linear transfer characteristic. The backpropagation as a learning method was used.
The control structure with a neural network feedforward and PI current controller isshown in Fig. 2.
MuxMux Tan sigmoid Pure linear
Neuron (ADELINE)Layer Neuron
Layer
Gain
Fig. 2: Simulation of the neural feedforward current control of a D.C. drive
References:
[1] SKALICKY, J.: Neuronove rizeni v elektrickych pohonech XXIV. konf. o el. pohonech,PIzen, 1995, str. 152-157
[2] KOSKO, B.: Neural Neworks and Fuzzy Systems Prentice Hall, 1992
[3] DEMUTH, H.: Neural Networks Toolbox for Use with MATLAB Math Works, 1995
This research has been conducted at the Department of El. Drives and Power Elec-tronic as part of the research project "Neural Control of Mechatronic Systems" and has beensupported by TV Brno grant No. 0057/1995.
658
WORKSHOP 96 POWER SYSTEMS fc ELECTRICAL ENGINEERING
EMI AND ELECTRICAL APPARATUSES
P. Mindl
CTU, Fac. of Electrical Eng., Dept. of Electric Drives & TractionTechnicka. 2,166 27 Praha 6
Key words: electrical apparatus, electromagnetic interference, electronic components,overvoltage protection
Electronic components are important parts of many electrical apparatuses in low volt-age mains distributors. Electrical apparatuses with electronic elements provide wider opera-tional possibilities in comparison with traditional arrangements. However, such apparatusesmust be very good protected against overvoltages and voltage peaks superimposed on mainsvoltage to respect their sensitivity on voltage peaks and other types of electromagnetic in-terferences (EMI).
There are used three typical ways to reduce mains AC voltage for feeding electronicparts of apparatuses:
1. transformer with insulated secondary winding (12-24 V)
2. serial capacitor
3. serial resistor
Feeding transformer is very good not only from the point of view of efficiency, but alsowith the respect to the influence of EMI. Insulation and low capacitance between primaryand secondary windings are very effective protection against EMI penetration. Negativeproperty of this solution are high costs for transformer mass production.
AC digital time delay relays, time switches and similar apparatuses use serial capacitorto reduce the mains voltage to 12 or 24 V. The voltage is rectified and stabilized on thislevel. This supply operates without problems when EMI does not occure in mains voltage.But for high frequency and voltage impulses is the used serial capacitance to low. Highamplitudes of current impulses penetrate into recifier and destroy them. This is given byhigh-pass frequency characteristics of this arrangement. Therefore additional overvoltagearrestor must be applied. However, the use of serial capacitor with respect to EMI effectscannot be in principle recommended.
Serial nonlinear resistor for voltage reduction is the best arrangement for low-con-sumption apparatuses. Such solution is acceptable in time delay relays, time switches etc.based on CMOS integrated circuits. For feeding of this circuits it is possible to use low-pass R-C filter with high damping effects for EMI. Switch "power relay" is then feeded byintegrated circuit controlled chopper having input rectified voltage (310 V DC).
This solution has advantages given by low costs and EMI resistance. It also enables widerange of supply voltages, typically from 24 to 240 V AC or DC. This conclusions were madeon the basis of defect-analyses of many apparatuses, used in mains industrial distributors.
659

WORKSHOP 96 POWER SYSTEMS k ELECTRICAL ENGINEERING
References:
[1] MINDL, P. - MARIK, P.: Frequency properties of power transformers, pp. 541-542.WORKSHOP 95, CTU, Praha 1995.
This research has not been supported by any grant.
660
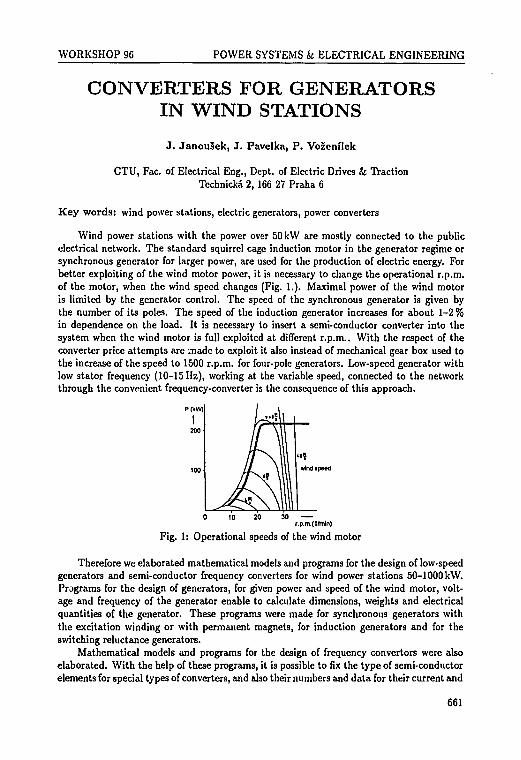
WORKSHOP 96 POWER SYSTEMS & ELECTRICAL ENGINEERING
CONVERTERS FOR GENERATORSIN WIND STATIONS
J . JanouSek, J . Pavelka, P . Vozenilek
CTU, Fac. of Electrical Eng., Dept. of Electric Drives & TractionTechnicka 2, 166 27 Praha 6
Key words: wind power stations, electric generators, power converters
Wind power stations with the power over 50 kW are mostly connected to the publicelectrical network. The standard squirrel cage induction motor in the generator regime orsynchronous generator for larger power, are used for the production of electric energy. Forbetter exploiting of the wind motor power, it is necessary to change the operational r.p.m.of the motor, when the wind speed changes (Fig. 1.). Maximal power of the wind motoris limited by the generator control. The speed of the synchronous generator is given bythe number of its poles. The speed of the induction generator increases for about 1-2 %in dependence on the load. It is necessary to insert a semi-conductor converter into thesystem when the wind motor is full exploited at different r.p.m.. With the respect of theconverter price attempts are made to exploit it also instead of mechanical gear box used tothe increase of the speed to 1500 r.p.m. for four-pole generators. Low-speed generator withlow stator frequency (10-15 Hz), working at the variable speed, connected to the networkthrough the convenient frequency-converter is the consequence of this approach.
P(VW)
r.p.m.(1/mln)
Fig. 1: Operational speeds of the wind motor
Therefore we elaborated mathematical models and programs for the design of low-speedgenerators and semi-conductor frequency converters for wind power stations 50-1000 kW.Programs for the design of generators, for given power and speed of the wind motor, volt-age and frequency of the generator enable to calculate dimensions, weights and electricalquantities of the generator. These programs were made for synchronous generators withthe excitation winding or with permanent magnets, for induction generators and for theswitching reluctance generators.
Mathematical models and programs for the design of frequency convertors were alsoelaborated. With the help of these programs, it is possible to fix the type of semi-conductorelements for special types of converters, and also their numbers and data for their current and
661
WORKSHOP 96 POWER SYSTEMS k ELECTRICAL ENGINEERING
voltage dimensioning. It is posible to use these programs for the design of these converterswith the rectifier connected to the generator and with the invertor connected to the network:
• Diode bridge rectifier, DC inductance and thyristor inverter. The scheme is usefulfor the synchronous generator, with good magnetical and electrical performance load.Inverter consumes reactive power from the network, and therefore a compensationdevice must be added to the system.
• Thyristor bridge rectifier, the other elements of the converter are the same. Thisscheme of the converter enables the synchronous machine to work as a motor for therun up of the wind motor rotor.
• Diode bridge rectifier, capacitor is added into the DC-circuit, switched semi-conductorelements, controlled by the PWM are used in the inverter, to pass the active powerfrom the DC-circuit to the network. The generator posses full electrical load, but fullmagnetical load occurs only for the low speed control zone. It is possible to use thisconverter also for the induction generator.
• The DC voltage converter is added to the rectifier and inverter from the previousscheme. DC voltage converter lowers the rectifier voltage to a value proper for theinverter. The independence of the generator voltage on its speed is an advantage. Theconverter can be used also for the induction generator.
• Cykloconverter is used for low speed generators with frequences of w 10 Hz. A largenumber of thyristors and consumption of the reactive power from the network areobvious disadvantages. Power factor is very low when an induction generator is used.
• Converter for the switched reluctance generator. This generator cannot work withoutconverter.
Created programs enable complex design of low speed generator and converter for bigpower wind power station working on the network. We can also get the price comparisonof useful combinations of generators and converters when the information about the actualprices of semi-conductor elements are given.
Voltages, currents, efficience, power-factor, torque and electric power curves can bedetermined in dependence on the frequency control by other related programs. In this waywe get the compherensive program complex, which enables to verify the correctness of eachsolution of combinations of the electric generator and of the converter including detailedinformation on the influence of the converter on the generator and on the network. Thisenables the proper choice of the drive type and therefore the reliable base for the consultationactivity and for the propagation of wind power stations.
References:
[1] JANOUSEK, J. - VOZENILEK, P.: Electric Generators for Wind Power Stations.Proc. of annual workshop, Fac. of Electrical Eng., Part II, CTU Prague, pp. 527-528.
[2] DE HAAN, S. W. - JANOUSEK, J. et al.: A High Efficiency Electrical Conversion Sys-tem with Variable Reluctance Generator for Variable Speed Wind Turbines. Researchreport of The Netherlands Energy Research Foundation ECN, May 1995.
This research has been conducted al the Department of Electric Drives and Traction aspart of the research project "Generators and Invertors of Wind Power Stations for Condi-tions in Czech Republic" and has been supported by CTU grant No. 38186.
662
WORKSHOP 96 POWER SYSTEMS fc ELECTRICAL ENGINEERING
IDENTIFICATION OF INDUCTIONMOTOR PARAMETERS
J . Javurek, J . Gerlich
CTU, Fac. of Electrical Eng., Dept. of Electric Drives & TractionTechnicka 2, 166 27 Praha C
Key words: AC drives, microprocessor control, parameter identification, system self-com-missioning
The control method used for high performance applications with induction drives usu-ally utilize the field oriented approach techniques. Core of these methods is in the mathe-matical model of induction motor. As model inputs could be taken the terminal quantities(like currents and shaft revolutions), the produced output is the information of magneticfield inside the machine. Based on this knowledge the control method could work as classicaldc machine control - the independent managing of torque and magnetic field.
Besides the benefits of using the maintenance-free machine there are also disadvantages.One of the main drawback of that commonly applied indirect vector control schemes isthe requirement of correct adjusting the parameters used in internal computation model.The analysis in [?] shown that inaccurate machine model parameters deteriorate boththe transient and steady state performance. Unfortunately, the machine parameters aren'tconstant, but vary with temperature and magnetic flux level and are affected by skin-effect.
To help to find the correct equivalent model parameters the new method, suitable formicroprocessor controlled drives, has been developed. Equivalent scheme of the inductionmotor drive takes various types of descriptions ('T'-fonn, T'-form, T " " - form, etc.). Iden-tification method is based on the fact that the equivalent scheme of induction motor couldbe taken as frequency dependent impedance circuit. By controlling the voltage inverterswitches in a special mode the induction motor could be fed by one phase voltage with con-stant (but changeable) frequency. The phase current and the line voltage vector act as inputsignals for computing procedure. Output of this is the first estimation of system parameters.Induction motor behaviour under these conditions is the same as in lock-rotor test (like thetransformer with shorted secondary winding). If the supplied frequency is low (below 1 Hz),the imaginary part of equivalent impedance is close the value of magnetizing inductance.If the supplied frequency is higher (approx. 20 Hz), the imaginary part come close to theleakage inductance (see Fig. 1). The real part of impedance has also similar behaviour -for low frequency the real part is near the value of rotor resistance. Equivalent inductance(£e, in Fig. 1) alter from value of magnetizing inductance to value of the leakage inductanceaccording the changes of frequency . Varying the input frequency from low to high valuethe phase and amplitude frequency characteristics is recorded. Final procedure approximatethe measured data and calculate the parameters of equivalent scheme of induction motor.
Proposed method has been proved on the testing drive with voltage fed GTO inverter(switch frequency 300 Hz), controllled by two microprocessor boards with Intel '196 KCcontroller. One of them perform the pulse width modulation task, the second realize theidentification procedure. Communication between the boards is done by dual-port HAM.All algorithms are written in low-level programming language because of requirements of
663
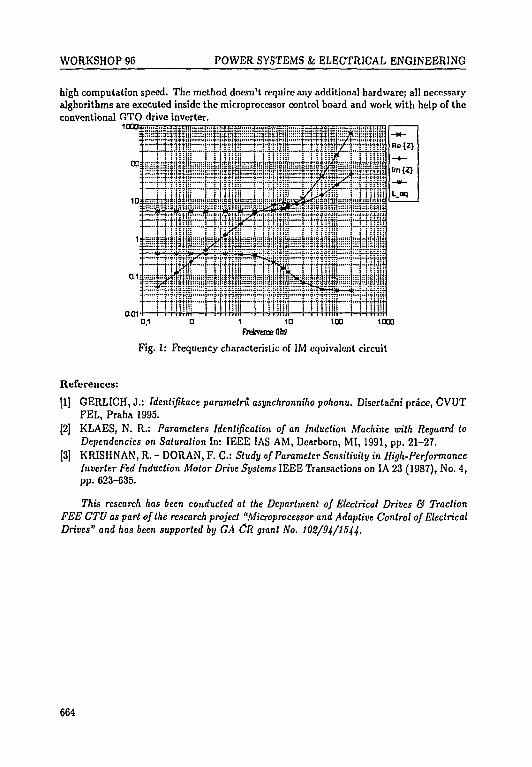
WORKSHOP 96 POWER SYSTEMS & ELECTRICAL ENGINEERING
high computation speed. The method doesn't require any additional hardware; all necessaryalghorithms are executed inside the microprocessor control board and work with help of theconventional GTO drive inverter.
10003"
03:
10:
0.1=
act
3 . ! } mm i t i t ! it" t i n inn r jus i r i n i imp— •» * » i-ttiii t » w m i *r t 11 M-HI 1- + <->>I-»I / t i i «-i IM~ { 4 4 J44-III f * j f * f *» ~ 4 ~[ I I I«-IH *• 4 1 44H>f / j I I 41 JH
I l l t t t
0.1
Fig. 1: Frequency characteristic of IM equivalent circuit
References:
[1] GERLICH, J.: Identifikace parameiru asynchronniho pohonu. Disertacnf prace, CVUTFEL, Praha 1995.
[2] KLAES, N. R.: Parameters Identification of an Induction Machine with Regaard toDependencies on Saturation In: IEEE IAS AM, Dearborn, MI, 1991, pp. 21-27.
[3] KRISHNAN, R. - DORAN, F. C : Study of Parameter Sensitivity in High-PerformanceInverter Fed Induction Motor Drive Systems IEEE Transactions on IA 23 (1987), No. 4,pp. 623-635.
This research has been conducted at the Department of Electrical Drives & TractionFEE CTU as part of the research project "Microprocessor and Adaptive Control of ElectricalDrives" and has been supported by GA CR grant No. 10S/94/1544.
664

WORKSHOP 96 POWER SYSTEMS k ELECTRICAL ENGINEERING
MODERN TRACTION DRIVE?HERE COMES OUR SOLUTION
P. Laciga, V. Lizak
CTU, Fac. of Electrical Eng., Dept. of Electric Drives & TractionTechnicka. 2, 166 27 Praha 6
Key words: traction AC drives, digital signal processor, field oriented control
The aim of our work was the complex solution of control system of AC traction driveaccording to CKD Trakce development programme. The traction drive is developed foruse in electrical city transportation systems for tramway vehicles, trolley-buses and subwayvehicles, usually supplied from power net of nominal voltage of 600, resp. 750 V.
The analysis of global features leads to the following conclusions:
• traction drive is fed by trolley wire net with rapid disturbations of source parameters(eg. voltage, impedance);
• traction drive should fulfill the correct and safety response to the operational stages -like overtravel of the trolley section, temporary disconection of the overhead collector;
• dynamic regenerative brake is the operating braking system, stand-by rheostatic brake;
• operation of EDB (electrodynamic brake) independent on supply voltage;
• drive should operate also on reduced voltage (passage through a washing machine);
Power circuits were developed in CKD Trakce as the voltage inverter based on IGBTdevices. The inverter supplies two parallel induction motors (nominal values 470V/75Hz,85 kW (114 HP)) in one boogie. Top frequency of output voltage is 145 Hz - which corre-sponds to velocity of 80km.h~' (50mph). The modulation frequency has been set to 2 kHz(we suppose step up to 4 kHz).
Because of the requirement mentioned above we use full digital control of the drivebased on field oriented control technique. The control board is equiped by digital signalprocessor and completed with additional devices (glue logic, generation of firing impulses,protection circuits). Connection to the power part provide fibre optic cables, the terminalvalues of currents and voltage are measured by sensors based on Hall-effect. The revolutionof motors are scanned by incremental speed sensors.
Field oriented control algorithm uses current-based reference model of induction ma-chine, magnetic flux linkage of rotor is calculated in 62.5 ps repetition period. This way ofdetermination of magnetic flux and its space angle seems to be robust in various states of op-eration of the drive. The computation of reference model runs continously and independetlyon other tasks.
Control algorithm uses the results of reference model. The repetition period of computa-tion of control tasks is the same as period of modulation. The control structure of controlledflux operation region is given in Fig. 1, the one of flux weakening region in Fig. 2. Bothstructures arc developped in order to provide as fast response to supply net disturbationsas possible.
665
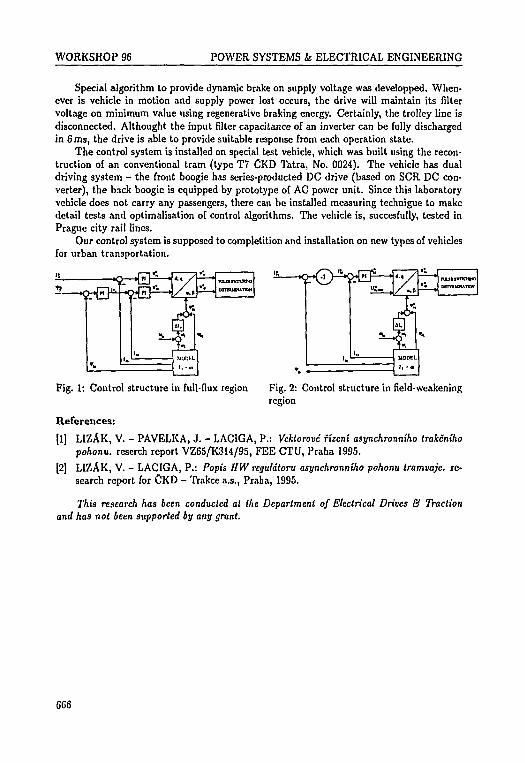
WORKSHOP 96 POWER SYSTEMS & ELECTRICAL ENGINEERING
Special algorithm to provide dynamic brake on supply voltage was developped. When-ever is vehicle in motion and supply power lost occurs, the drive will maintain its filtervoltage on minimum value using regenerative braking energy. Certainly, the trolley line isdisconnected. Althought the input filter capacitance of an inverter can be fully dischargedin 6 ms, the drive is able to provide suitable response from each operation state.
The control system is installed on special test vehicle, which was built using the recon-truction of an conventional tram (type T7 CKD Tatra, No. 0024). The vehicle has dualdriving system - the front boogie has series-producted DC drive (based on SCR DC con-verter), the back boogie is equipped by prototype of AC power unit. Since this laboratoryvehicle does not carry any passengers, there can be installed measuring technigue to makedetail tests and optimalisation of control algorithms. The vehicle is, succesfully, tested inPrague city rail lines.
Our control system is supposed to completition and installation on new types of vehiclesfor urban transportation.
Fig. 1: Control structure in full-flux region Fig. 2: Control structure in field-weakeningregion
References:
[1] LIZAK, V. - PAVELKA, J. - LACIGA, P.: Vektorove Hzeni asynchronniho trakcnihopohontt. reserch report VZ65/K314/95, FEE CTU, Praha 1995.
[2] LIZAK, V. - LACIGA, P.: Popis HW reguldtoru asynchronniho pohonu tramvaje. re-search report for CKD - Trakce a.s., Praha, 1995.
This research has been conducted at the Department of Electrical Drives & Tractionand has not been supported by any grant.
666
WORKSHOP 96 POWER SYSTEMS & ELECTRICAL ENGINEERING
TRANSIENT STUDYOF A LINEAR ELECTRICAL MOTOR
J. Kafka
CTU, Fac. of Nucl. Sci. & Phys. Eng., Dept. of MathematicsTrojanova 13,120 00 Praha 2
Key words: linear partial differential equations, equations of parabolic type, numericalsolution, two-dimensional case, quasistationary electromagnetic field, tran-sient eddy currents, linear electrical motor, rail vehicles, vehicles supportedby magnetic cushion
The paper presented constitutes a continuation of author's contribution presented at theComputational Physics '90 meeting in Amsterdam in 1990 (written jointly with Nguyen VanNhac) as well as at CTU Workshops '92, '93 and '95. The simplification of a linear motor toa two-dimensional case has been described in author's contribution at CTU Workshop '95.The method used to calculate the electromagnetic field in the linear motor can be calledas "half-way between the finite element method and the finite difference method". Weunderline that the time is discrete and the winding of the linear motor can be fed bycurrents of arbitrary waveform. In this way we can follow the effects of feeding the windingof the linear motor by the output of arbitrarily complicated thyristor control circuits. Weare not bound by the usual three-phase system. The number of coils of the winding canbe arbitrary and the successive coils can be fed by a "current wave", propagating along thebody of the linear motor.
References:
[1] LAITHWA1TE: Linear electrical motors. (Czech translation of the book published bySNTL, Praha, 1972, exists)
This research has been conducted at the Department of Mathematics of the Faculty ofNuclear Science and Physical Engineering of CTU and has not been supported by any grant.
N E X T P A G E I S )toft BLAH** fl 667
WORKSHOP 96 POWER SYSTEMS fc ELECTRICAL ENGINEERING
RELIABILITY OF POWER EQUIPMENTINSULATING SYSTEMS
F. Wohlmuth
CTU, Fac. of Electrical Eng., Dept. of Power Engineering (HVL)Technicka. 2, 166 27 Praha 6
Key words: reliability, diagnostics, measurement, testing, detection, monitoring, data pro-cessing, partial discharges, distortion, transformer, winding, computer sup-porting
In this research, Department of Physics, Department of Electrotechnology, Departmentof Electrical Drives and Traction and Department of Power Engineering - mainly HighVoltage Laboratory (HVL) of this Department - have taken part.
We have continued in fulfilling the team project aim which have dealt with researchand development of the headlined topic. This paper presents only the summary of activitiesand results achieved in 1995. The internal research reports complete the information andseveral other papers [1-6] have also been presented in 1995.
The HVL - Dept. of Physics group proved the possibility of PD-detection and measur-ing in oil-insulated transformers by ultrasound using new acoustoelectric converters with abuilt-in preamplifiers. These transducers are both broad-band and highly sensitive and allowmultisensor detection and the comparison of time delays between transducers. The initialmeasurements were performed on the model arrangement (a small spark gap connected inRC-circuit and placed in the oil tank). Most problems caused by inadequate shielding ofelectrical field must have been solved.
The analysis of PD-activity measurements with respect to the possibility of on-linemeasurement and expert-deciding technique, respectively, was conducted by HVL in coop-eration with other institutes. As a result, processing and saving data from both (on-lineand off-line diagnostical measurements was solved by a new expert system which has beendeveloped in other cooperation and support.
The growing extent of testing activities in the EMC branch induced the HVL teamto make first experiments with short-time overcurrent testing of low voltage power- andtelecommunication-equipments. A proper technique and conditions for takeover of speci-mens to testing have been proved. The tests are provided with respect to the IEE 801-5Standard. Overvoltage arresters can be tested as well.
A new approach to the mathematical evaluation of overvoltages caused by ferromagneticresonance has been studied by the Dept. of Power Engineering, and applied to real conditionsof this overvoltage type.
Authors of the frequency characteristic method (for detection of winding distortions orother changes) provided in situ transformer winding state measurements with respect to therepeatability of results. They found that long cables between measuring equipment and alarge transformer represent a limitation for the repeatability because of their capacity whichcan not be neglected. Thus, an optical fibre waveguide system was used for measuring signalstranslation. A new program for verifying the repeatability of measurements on transformersin power plants and switchgears has been prepared in the HVL.
669

WORKSHOP 96 POWER SYSTEMS fc ELECTRICAL ENGINEERING
The Dept. of Electrotechnology group has continued in verifying the pulse-frequencytechnique for detection of turn short-circuits and insulation system changes, the correlationbetween changes of the frequency characteristic, and changes of other parameters measuredby other methods. Further, the time rates of both absorption- and rcsorplion-currents havebeen measured on two hydroalternators and the results have been related to the changes ofthe loss factor characteristic.
The Dept. of Electrical Drives and Traction research group has designed and realized(in a model) a new system for complex measuring time rates of currents, voltages, vibrationsand noise on transformers. The system is supported by a computer which enables recordingand off-line processing of above mentioned quantities. The goal of the new method lies in adiagnosis of the actual mechanical state of a transformer from measuring the four mentionedquantities during transformer switching on.
References;
[1] UCiK, T. - WOHLMUTH, R: Akustickd detckce cdstccnych vyboju (in Czech; Acous-tical Detection of Partial Discharges). In: Internat. Conference DIAGNOSTIKA '95,West Bohemia University in Pilsen, St'ahlavice by Pilsen, Sept. 1995, p. 81.
[2] UClK, T. - WOHLMUTH, F.: Ullrazvukovd lokatizacc edstecnych vyboju (in Czech;Ultrasound Localization of Partial Discharges in Transformers). In: See [1], p. 8G.
[3] HASMAN, T. - KVASNICKA, V.: Diagnoslika transformdtoru v hydroclcklrdrndch (inCzech; Diagnostics of Transformers in Hydro Power Plants). See [1], p. 155.
[4] ZALlS, K. - MRKVlCKA, J.: Pocitacovd podpora vyhodnocovdni vybojove finnosti(in Czech; Computer Assistance by Discharge Activity Evaluation). In: ConferenceVSB-Technical University of Ostrava. Ostrava, Sept. 1995, p. 49.
[5] ZALlS, K.: Dielectric Diagnostics in Service -from Databases to Expert Systems. In:STOCKHOLM POWER TECH (High Voltage Technology), ref. SPT HV 01-07-00898.Stockholm, June 1995, p. 34.
[6] KUBA, J. - PETR, J.: Monitoring for Transformers Using Pulse Frequency Technique.In: Workshop "Parameter Identification and Computer Aided Diagnostics of ElectricalMachines", Budapest 1995, p. 22.
This research has been conducted at the Department of Power Engineering (and otherdepartments mentioned over) as part of the research project "Reliability of Power EquipmentInsulating Systems" and has been supported by CACR grant No. 10S/94/1358.
670
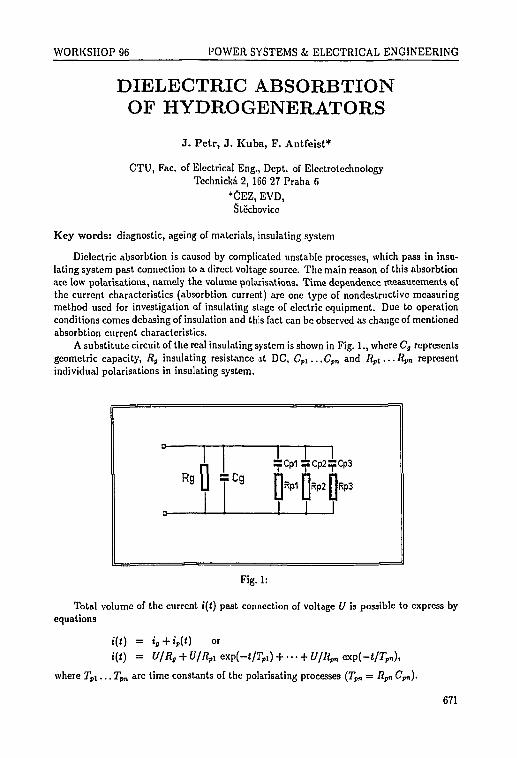
WORKSHOP 96 POWER SYSTEMS & ELECTRICAL ENGINEERING
DIELECTRIC ABSORBTIONOF HYDROGENERATORS
J . Petr , J . Kuba, F. Antfeist*
CTU, Fac. of Electrical Eng., Dept. of ElectrotechnologyTechnicka 2, 166 27 Praha 6
*CEZ, EVD,Stechovice
Key words: diagnostic, ageing of materials, insulating system
Dielectric absorbtion is caused by complicated unstable processes, which pass in insu-lating system past connection to a direct voltage source. The main reason of this absorbtionarc low polarisations, namely the volume polarisations. Time dependence measurements ofthe current characteristics (absorbtion current) are one type of nondestructive measuringmethod used for investigation of insulating stage of electric equipment. Due to operationconditions comes debasing of insulation and this fact can be observed as change of mentionedabsorbtion current characteristics.
A substitute circuit of the real insulating system is shown in Fig. 1., where C3 representsgeometric capacity, R3 insulating resistance at DC, Cp\...Cpn and Rvi...Rvn representindividual polarisations in insulating system.
Fig. 1:
Total volume of the current i(t) past connection of voltage U is possible to express byequations
»(t) = U/Rg + 17/71,, e x p H / r , , ) + •.. + U/Rpn exp(-«/rp n) ,
where Tp\... Tpn are time constants of the polarisating processes (Tpn = Rpn (?,,„).
671
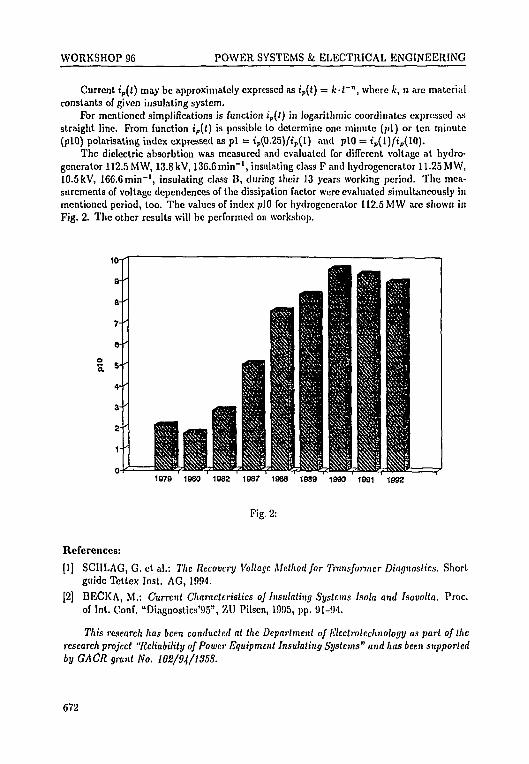
WORKSHOP 96 POWER SYSTEMS & ELECTRICAL ENGINEERING
Current ip(t) may be approximately expressed as i'p(() = k-t~", where k, n arc materialconstants of given insulating system.
For mentioned simplifications is function ip(t) in logarithmic coordinates expressed asstraight line. From function ir(t) is possible to determine one minute (pi) or ten minute(plO) polarisating index expressed as pi = i'p(Q.25)/i'p(l) and plO = ip(l)/tp(10).
The dielectric absorbtion was measured and evaluated for different voltage at hydro-generator 112.5 MW, 13.8 kV, 136.6 min"1, insulating class F and hydrogenerator 11.25 MW,10.5kV, 166.6min"1, insulating class B, during their 13 years working period. The mea-surements of voltage dependences of the dissipation factor were evaluated simultaneously inmentioned period, too. The values of index plO for hydrogenerator 112.5MW are shown inFig. 2. The other results will be performed on workshop.
1S79 1980 1982 1987 1983 1989 1990 1991 1992
Fig. 2:
References:
[1] SCHLAG, G. ct al.: The Recovery Voltage Method for Transformer Diagnostics. Short
guide Tettex Inst. AG, 1994.
[2] BECKA, M.: Current Characteristics of Insulating Systems Isola and Isovolta. Proc.of Int. Conf. "Diagnostics'95", ZU Pilsen, 1995, pp. 91-9-1.
This research has been conducted at the Department of Electrotcchnology as part of theresearch project "Reliability of Power Equipment Insulating Systems" and has been supportedby GACR grant No. 102/94/1358.
672
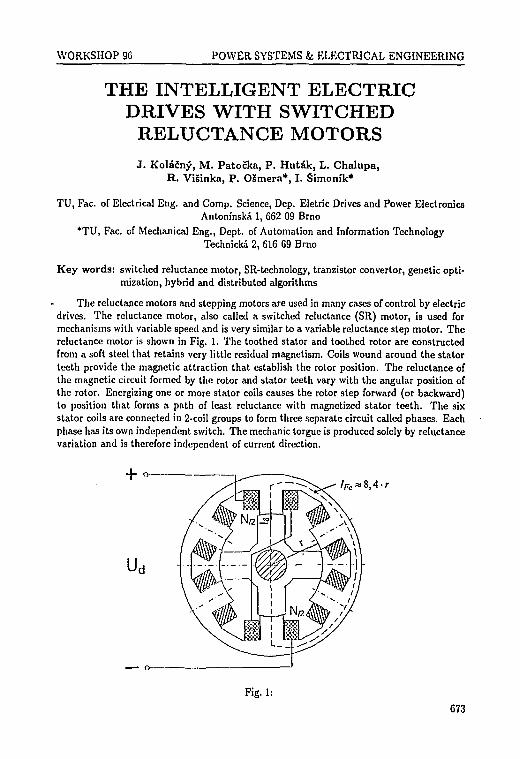
WORKSHOP 96 POWER SYSTEMS & ELECTRICAL ENGINEERING
THE INTELLIGENT ELECTRICDRIVES WITH SWITCHED
RELUCTANCE MOTORSJ . Koladny, M. Patocka, P. Hutak, L. Chalupa,
R. Visinka, P . OSmera*, I. Simonik*
TU, Fac. of Electrical Eng. and Comp. Science, Dep. Eletric Drives and Power ElectronicsAntoni'nska 1, 662 09 Brno
*TU, Fac. of Mechanical Eng., Dept. of Automation and Information TechnologyTechnicka. 2, 616 69 Brno
Key words: switched reluctance motor, SR-technology, tranzistor convertor, genetic opti-mization, hybrid and distributed algorithms
The reluctance motors and stepping motors are used in many cases of control by electricdrives. The reluctance motor, also called a switched reluctance (SR) motor, is used formechanisms with variable speed and is very similar to a variable reluctance step motor. Thereluctance motor is shown in Fig. 1. The toothed stator and toothed rotor are constructedfrom a soft steel that retains very little residual magnetism. Coils wound around the statorteeth provide the magnetic attraction that establish the rotor position. The reluctance ofthe magnetic circuit formed by the rotor and stator teeth vary with the angular position ofthe rotor. Energizing one or more stator coils causes the rotor step forward (or backward)to position that forms a path of least reluctance with magnetized stator teeth. The sixstator coils are connected in 2-coil groups to form three separate circuit called phases. Eachphase has its own independent switch. The mechanic torgue is produced solely by reluctancevariation and is therefore independent of current direction.
Fig. 1:
673

WORKSHOP 96 POWER SYSTEMS fc ELECTRICAL ENGINEERING
The common grant (first stage) was solved by workers and student of doctoral degreeof both departments at VUT Brno. Every of participated group is doing its research,where parts of this problem are dealing with all structures of the coir.:«lex intelligent drives(in the power and control fields). The functional prototype of motor was designed andused. This motor was tested to gain the parameters of mathematical model using nonlineartheory. Our goal is to explane the basic principal of motor torgue. The measurementsalone were concentrated to get torgue dependancy on the speed of circulation of the rotor.By experiment the characteristics of magnetic flux were received. This are very importantvalues for selection of strategy switching of power tranzistor of convertor. In the second partthe collection of power part of convertor were created to suply every phase of motor. Thesystem was design as three separated two-quadrant convertor. The device has six tranzistorstoghether with operated voltage about 300 V and current 40 A. There are 6 tranzitors andtheir cooling, three sensors of current, pulse source to excite 6 circuits in the unit. Thereis of cource very fast current eletronic protection. Switches can operate up to 10 kHz/20 A.For lower values of current, it is possible to work with frequency of 20 kHz.
The flexibility of the SR motor drive i noteworthy and so is its high efficiency at partialloads. It is both easy and inexpensive to modify the switching angles to give a varietyof different torgue-spced characteristics. The parameters of electronic control system isprepared to be optimized by genetic algorithms (GA). We use the GA for optimization thesignal in electric drive. The trend to digital computer control is evident in application withthe reluctance mototors.
A genetic algorithm is an optimization algorithm based on the mechanics of naturalselection. The GA contains three basic operators - reproduction, crossover, and mutation.To increase the efficiency of a genetic algorithms the the influence of migration in hybridand distributed GA is tested. The second stage of grant will continue next year.
References:
[1] KOLACN1?, J.: Elektricke pohony se spinanymi reluctacnimi motory, Elcktrotechnicky
magazi'n, pp. 21-23, ETM Brno
[2] KOLACNf, J. - OSMERA, P.: The optimization of reluctance motore by the geneticalgorithms, The 1st International Conference on Genetic Algorithms, pp. 59-64, Brno1995
[3] PATOCKA, M.: Jednoduchy model zapinaciho a vypinaciho deje tranzistoru IGBT,Celostatni konference EPVE 95, Brno, pp. 99-103
[4] VRBA, J.: Pohon s linearizovanym spinanym rctuklacnim motorem, mezinarodnivedecka konference, Ostrava 95, pp. 143-148
[5] CHALUPA, L.: Pohon se spinanym rehklanc'nim motorcm, diplomova prace, VUT FEIBrno, 1994
This research has been conducted at the Department of Electric drives and power elec-tronics as part of the research project "Intdigentni elektricky pohon se spinanym reluk-tancnim motorem" and has been supported by TV grant No. FU 450052.
674

WORKSHOP 96 POWER SYSTEMS fc ELECTRICAL ENGINEERING
RADIATION TRANSFERIN ELECTRIC ARC PLASMAS
V. Aubrecht, M. Bartlova*, B. Gross, L. PeSka
TU, Fac. of Electrical Eng. and Comp. Sci., Dept. of Electrical Machines and Apparatustidolni 19, 602 00 Brno
*TU, Fac. of Electrical Eng. and Comp. Sci., Dept. of Special Electrical Eng. and QualityBozetechova 2, 602 00 Brno
Key words: plasma radiation, radiation transfer, electric arc
One of the most intractable problems of plasma physics has been the calculation ofenergy transfer due to radiation. It is generally accepted that radiative transport of energyplays an important role in the design of many engineering applications. Radiation transfer •is a significant energy exchange process in high pressure arc plasmas having temperaturesof greater than 15 000 K and pressures of 0.1 MPa or more.
Typical radiation quantities of interest: radiation intensity, radiation flux and diver-gence of radiation flux are calculated from integrals over the radiation frequency and angles.Values of radiation flux at a given point depend on the temperature distribution of the entirevolume of plasma. Description of the radiation field in the arc plasmas is a very difficultproblem since integration over frequency and angles must be carried out simultaneously.Radiation wavelengths span the far infrared to the short ultraviolet spectrum regions. Bothcontinuum and line radiation with hundreds of spectral lines have to be taken under con-sideration. Furthermore in some regions of the plasma there is radiation emission, but inother regions there is usually a net absorption of radiation due to ultra violet radiation fromhot regions of plasma being absorbed in cold regions. Exact calculations, though possible inprinciple, are usually impossible in practice, even with modern computers, due t.j she largecomputation times required. Several approximation methods for prediction of radiationtransfer in plasmas have been investigated.
We have used the approximate method of partial characteristics as formulated by Sev-ast'yanenko [1, 2] for prediction of radiation intensities, radiation fluxes and the divergenceof radiation fluxes for specified temperature profiles of SF0 arc plasmas.
In the method of partial characteristics, integrations over frequencies and angles are sep-arate operations. The most time consuming frequency integration is carried out in advanceto create tables of the two functions Som and ASim.
Solution of the radiation transfer equation for the radiation intensity in any directioninvolves the quantity exp(-T), where r = / Kudx, Kv is the absorption coefficient andi is distance along a particular line segment. The essence of the approximation is that inperforming the integral in the exponential, it is assumed that the temperature variation islinear between the two end temperatures. Although r varies by over 5 orders of magnitudewith different radiation frequencies, the exponential is fairly insensitive to r . For all valuesof T less than 0.2, the exponential is between 0.8 and 1, and for all values of r greater than1.6, the exponential is less than 0.2.
For arc plasmas, we characterize each component line segment of the calculation byits length x = \X — Y\ and two end temperatures Tx, and Ty. The two functions, partial
675
WORKSHOP 96 POWER SYSTEMS & ELECTRICAL ENGINEERING
sink ASim and source Som, as formulated in [1], are functions of the macroparamctcrs Tx,Ty and x:
Y
exp - / Kv(x)dx j dv, (1)V x
/ Y \
- / Kv(x)dx j dv,V x I
oo / Y \
ASim(TX,TY,Y - X) = J \BW(X) - BV(Y))KV(X] KV{Y) exp - / K{n)dn) dv,o . \ X I
(2)
where />, Bu and /C are radiation frequency, Planck function and absorption coefficientrespectively.
Calculations of radiation flux density or of its divergence are possible by the summationof components from representative line segments and directions to integrate over all solidangles. Absorption coefficients of SF6 plasmas were calculated as a function of temperatureand radiation frequency [3].
We have calculated [4] tables of Som and ASim functions for SFo plasmas. Thetemperatures Ty are specified with a step of ATy = 1000 K from 2000 K to 35 000 K. Thetemperatures Tx are given for 300 K, 500 K and from 1000 K to 35 000 K with a step ofATjf = 1000 K. Geometric dimensions x (in cm) are given in logarithmic scale from —2.0 to2.0, which corresponds to dimensions from 0.01 cm to 100 cm. Tables for 0.1, 0.5 and 1 MPahave been calculated. Complete tables of SFe partial characteristics stored on floppy discscan be obtained from the authors of the paper.
Furthermore the method of partial characteristics has been used to evaluate net emissionof radiation, as a function of position, in an algorithm to predict temperature profiles ofwall stabilized arcs at any given current. A comparison with experimental results is madeof predicted electric field strengths and central arc temperatures as a function of current forSFe arcs of radius 0.25 cm at a pressure of 1 bar. The method gives agreement with exactcalculations of flux density to within 20% with a reduction in computation time of aboutfour orders of magnitude.
References:
[1] SEVAST'YANENKO, V. G.: Radiation Transfer In a Real Spectrum. Integration OverFrequency. Journal of Engineering Physics, Vol. 36, No. 2, pp. 138-148, 1979.
[2] SEVAST'YANENKO, V. G.: Radiation Transfer In a Real Spectrum. Integration WithRespect To the Frequency and Angles. Journal of Engineering Physics, Vol. 38, No. 2,pp. 173-179, 1980.
[3] AUBRECHT, V. - GROSS, B.: Net Emission Coefficient of Radiation in SF6 ArcPlasmas. Journal of Physics D.: Appl. Phys., Vol. 27, pp. 95-100, 1994.
[4] AUBRECHT, V. - LOWKE, J. J.: Calculations of Radiation Transfer in SF6 Plas-mas Using the Method of Partial Characteristics. Journal of Physics D.: Appl. Phys.,Vol. 27, pp. 2066-2073, 1994.
This research has been conducted at the Department of Electrical Machines and Appa-ratus as part of the research project "Radiation Transfer In An Switching Arc Plasma AndIts Influence On Energy Balance." and has been supported by TU grant No. FU450048.
676

WORKSHOP 96 POWER SYSTEMS & ELECTRICAL ENGINEERING
PROCESSING OF THE RESULTSOF HOLOGRAPHIC INTERFEROMETRY
L. Peska, A. Houska*, B . Gross
TU, Fac. of Electrical Eng. & Comp. Sci., Dept. of Electrical Machines & ApparatusOdolni 19, 602 00 Brno
*TU, Fac. of Mechanical Eng., Dept. of Physical Eng.Technicka 2, 619 16 Brno
Key words: optical diagnostics, holographic interferometry, electric arc, temperature, nu-merical processing of images
Introduction. The measurements were carried out on an arc burning between verticalcarbon electrodes. This configuration guarantees an optical symmetry of the plasma whichis necessary for the application of the employed holographic method. Since the arc was fedby AC current, it was necessary to select sufficiently short time intervals with regard to theduration of one period of the feed current in order to be able to presume that in the selectedinterval the measured temperature field is constant in time.
Theory. The implementation of a sufficiently short time interval was made possibleby a stroboscopic device formed by a slot in a disk rotating at synchronous speed, wherebyone revolution corresponded to the duration of one period of the feed current. The exposureperiod of the recording material was defined by the width of the slot, the position of theslot was indicated by a pulse transmitted at a time when it allowed exposure. The pulsewas recorded oscilographically together with the time waveform of the current feeding thearc. The time instant of the exposure with regard to the time waveform of the current,determined by the position of the slot, could be varied by skewing the small synchronousmotor driving the stroboscopic device.
The measuring apparatus was the Mach-Zehnder interferometer described in [1].The measured hologram is created in two steps. In the first one is created on the
recording material a hologram without the arc discharge and after developing it is accuratelyadjusted into the location where it was formed. The measured thermal field of the arcmani? -its itself in the form of interference fringes formed by the interference of tha arcradiab a aud the hologram obtained without the arc. The interfering radiation of the arc issuppressed by optical filtration and the overall structure is exposed onto the photographicemulsion.
The structure of the interference fringes is determined by changes of the refractive indexof light for the air heated by the arc plasma, the recording of which can be evaluated byclassical photometric^ and equidensitometrical methods. These allow the obtainment ofaccurate results, but with great demands onto time; in our case they have been employedas a control of the results.
The resulta which we are publishing have been obtained by a method which allowsgreater comfort during the work, a large shortening of the time required for processing andthe obtainment of almost the same accuracy. We have utilized the possibilityof digitizingthe image by scaning in with a CCD camera.
677

WORKSHOP 96 POWER SYSTEMS fc ELECTRICAL ENGINEERING
Since the arc plasma in cylindrically symmetrical, for its description in the selectedtime is sufficient only a single interferogram obtained by computer processing using theDIPS program.
During the evaluation is determined from the system of interference fringes the mag-nitude of the refractive index in relation to the distance from the arc plasma axis, and bycomparison with the known dependence of the refractive index on temperature in determinedthe sought temperature.
Employing the Gladstone-Dale dependence of the refractive index on temperature isobtained after rearrangement for the calculation of temperature
TR\fd\AS(y)} 1Cp-K J ay /y' r'
(i)
For a known atmospheric pressure and a known ambient temperature this equationis solved by a numerical approximation while taking into account the course of the phasechanges in the transversal section by the least squares method.
Conclusion. In the paper is presented the application of holographic methods uponthe determination of temperature and its time waveforms in the vicinity of the electricarc fed by an AC current and the evaluation of the interference recordings of the studiedenvironment, their digitization and processing by numerical methods [2, 3], The describedprocedure is applicable also outside the laboratory. The errors of measurement are smallerthan for spectroscopic methods where the error is 10%.
References:
[1] AUBRECHT, V. - GROSS, B. - PESKA, L. - HOUSKA, A.: Evaluation of Interfer-ograms of an Electric Arc Discharge Proc. Xth Symp. on "Physics of Switching Arc",TV Brno, pp. 99-105, Tri studne, 1992.
(2] PESKA, L. et al.: Diagnostics of the Temperature Field of an AC Arc Discharge. Proc.Xth Symp. on "Physics of Switching Arc", TU Brno, pp. 182-185, Slapanice, 1994.
(3] PESKA, L. - AUBRECHT, V. - GROSS, B. - HOUSKA, A.: Holographic Interfer-ometry of A.C. Arcs. Proc. 40. Int. Wissenschaft. Kolloquium, TU Ilmenau, Vol. 1,pp. 720-724, 1995.
This research has been conducted at the Department of Electrical Machines & Apparatusas part of the research project "Methods of Intcrferomelric Diagnostics of the Arc Plasma"supported by TU in Brno grant No. FU 450054 and project "Optical methods of Arc PlasmaDiagnostics" supported by GACR grant No. 102/95/0059.
678
WORKSHOP 96 POWER SYSTEMS fe ELECTRICAL ENGINEERING
MODELLING OF THE ARCIN THE CURRENT ZERO REGION
J. Bartl, B. Gross, L. PeSka, V. Aubrecht
TU, Fac. of Electrical Eng. & Comp. Sci., Dept. of Electrical Machines & Apparatustjdolnf 19, 602 00 Brno
Key words: electric arc, terminal model of the arc, modelling of the arc
Introduction. The behaviour of the arc in the current zero region determines thecourse of the rupturing process, its successful mastering allows the determination of therupturing limit without machanical damage to the circuit breaker. The parameters influ-encing the rupturing process can be obtained upon rupturing relatively small powers by ananalysis of the oscilographic recording of the rupturing process.
Theory. The arc is considered according to Griitz [1] as an electric dipole, with theinstantaneous electrical conductivity (dynamic) g varying with time and the static conduc-tivity G which depends on the current and as a consequence of fluctuations in the arc ontime. The electrical conductivity approaches at the time ( at a rate of dg/dt the steady-statevalue which is proportional to the difference of the static and dynamic conductivity. Theproportionality constant is the reciprocal value of time, for which would have to be sup-plied into the arc the power required for its maintenance, so that the electrical conductivitychanges in the ratio 1 : e. This time is identical with the time constant T introduced byMayr. The static conductivity corresponds to the electrical conductivity which is set upin the plasma of an arc which is burning for a sufficiently long time and its magnitude isdetermined by replacing the static characteristics of the arc with the positive branch of ahyperbola which is almost equiaxial.
Taking into account these assumptions the starting differential lation can be derivedin the form
ft-r(WB-S) (1)
which represents one of the forms of the Mayr equation.The numerical integration of equation (1) allows the determination of the parameters
which influence the quenching of the arc. One of the three quantities: time constant, rup-tured current, voltage feeding the ruptured circuit can be arbitrarily selected as a parameter.
From the plot of the solution of the equation can be unambiguously determined, atwhat value of the parameters the rupturing arc will be quenched.
It is thus possible for a known r and No to determine in a defined circuit the rupturinglimit of the circuit breaker. The calculation starts out from equation (1), in which is ap-pearing apart from i he sought quantities the electrical conductivity and its time derivation.
The procedure is relativaly simple, the greatest difficulty presents the numerical deter-mination of the time waveform of the electrical conductivity of the plasma, since a smallrandom change of conductivity leads to large changes in the course of the derivation, butnevertheless it provides in the majority of cases applicable results. We have been using this
679

WORKSHOP 96 POWER SYSTEMS & ELECTRICAL ENGINEERING
procedure with very good results in the analysis of experimentaly determined VA charac-teristics of fuses [2, 3].
Conclusions. The paper describes the possibility of utilizing a mathematical arcmodel for determing the rupturing limits of a circuit breaker by a non-destructive method.The switch is tested while rupturing a much smaller power than is its nominal rupturingperformance. From the oscillographic recording of the ruptured current and the relevantvoltage are determined the parameters for the determination of the rupturing limit of theswitch under test.
References:
[1] GRUTZ, A.: Iiechnerische Untersuchung von Leislungssclialtcrn mit Hilfe eincr veral-gemeinten Lichtbogenlhtorie. Disertation Aachen.
[2] MAYR, 0.: Beitraege zur Theorie des slatischen und dynamischen Lichtbogens..Archiv fuer Elektrotechnik No. 37, p. 588, 1943.
[3] GROSS, B. - PAUKERT, J. - GOF.THANSOVA, '&.: Modelling of the VA Characteris-tics of Low-voltage Power Fus cs of the Switch. Arc 5, p. 125, FE VUT Brno,1953, (in Czech).
7%is research has been conducted at the Department of Electrical Machines & Apparatusas part of the research project "Methods of Interferometric Diagnostics of the Arc Plasma"supported by TU in Brno grant No. FU 450054 and project "Optical Methods of Arc PlasmaDiagnostics" supported by CACR NO. 102/95/0059.
680
WORKSHOP 96 POWER SYSTEMS fc ELECTRICAL ENGINEERING
HOLOGRAPHIC DIAGNOSTICSOF AN ARC FED BY DC CURRENT
L. Peska, A. Houska*, B . Gross
TU, Fac. of Electrical Eng. & Comp. Sci., Dept. of Electrical Machines & ApparatusUdolni 19, 602 00 Brno
*TU, Fac. of Mechanical Eng., Dept. of Physical Eng.Technicka 2, 616 19 Brno
Key words: optical diagnostics, holographic interferometry, electric arc, temperature
Introduction. In the paper is described the application of holographic diagnostics forthe determination of radial temperature waveform in the inmediate vicinity of the electricarc plasma fed by DC current.
Under the assumption that the discharge path is short, the formed thermal field inrotationally symmetrical and for its accurate description one interfcrogram is sufficient. Forthe recording of the latter a modified Mach-Zehnder interferometer was used [1].
Theory. The interference fringes, the position and density of which corresponds tochanges of the magniture of the refractive index of the environment, are obtained by doubleexposure. During the first one is created on the photographic material a hologram of theenvironment without the burning arc and after placing it into the location where it wastaken, is created on the second negative is system of interference fringes which allows thedetermination of the sought quantity.
The position of the interference fringes is measured photometrically in the selectedsections. Since we proceed point after point, this procedure requires a lot of time. Forspeeding up, enhancing the accuracy but mainly for automating the procedure has beenused the equidensitometer designad and assembled at the Institute of Electric Machinesand Apparatus FEI VUT in Brno which allows the accurate and effective evaluation ofphotographs, their digitization, processing by numerical methods and storage in the form offiles in the memory medium of the computer. The digitization accuracy of this instrumentis large, its resolution is limited only by the grain of the employed photographic material.
The theoretical foundation for the determination of the sought temperature are basedon a change of the optical path of the ray in the studied cross-section. For a change of theinterference order holds true
| /L (1)
where AS(y) is the change of the interference order by 1 and A is the wavelength.Taking into consideration the rotational symmetry of the measured environment, then
after rearrangement is obtained
681

WORKSHOP 96 POWER SYSTEMS k ELECTRICAL ENGINEERING
After talcing into account the dependence of the magnitude of the refractive indexon temperature, at a known pressure, gas composition of the measured environment andambient temperature, it is possible after the evaluation of the integral on the right-handside to determine the sought temperature [2, 3].
The actual evaluation was carried out by a computer program. The optical recordingwas after digitization by the equidensitometer inserted into the program and after balancingit by numerical methods the latter computed the sought temperature.
Conclusions. Holographic interferometry allows a determination of a change of themagnitude of the refractive index of a transparent environment set up by a physical influ-encing of the environment with a substantial reduction of the demands onto the quality ofthe optical elements employed in classical interferometry.
References:
[1] AUBRECHT, V. - GROSS, B. - PESKA, L. - HOUSKA, A.: Evaluation Of Intcrfero-grams Of An Electric Arc Discharge . Proc. Xth Symp. on "Physics of Switching Arc",
pp. 99-105, Tfi studne, 1992.
[2] PESKA, L. - et. al.: Processing of Inierferograms of an Electric Arc Discharge. Proc.
EOS Annual Meetings Digest, Vol. 3, pp. 135-136, Zaragoza, 1993.
[3) PESKA, L. - et.al.: Merferometry of an Electric Arc Discharge Acta Physica Univer-sitatis Comenianae, Vol. XXXVI, pp. 89-95, Bratislava, 1995.
This research has been conducted at the Department of Electrical Machines and Ap-paratus as part of the research project "Methods of Interferometric Diagnostics of the ArcPlasma" supported by TU t'n Brno grant No. FU J5005J and project "Optical Methods ofArc Plasma Diagnostics", supported by GACR grant No. 102/95/0059.
682
WORKSHOP 96 POWER SYSTEMS fc ELECTRICAL ENGINEERING
TEMPERATURE DISTRIBUTIONIN NON-STATIONARY PLASMA
V. Zdraii l , B . Gross*, L. PeSka*
TU, Fac. of Electrical Eng. & Comp. Sci., Dept. of PhysicsTechnicka 2, 619 16 Brno
*TU, Fac. of Electrical Eng. & Comp. Sci., Dept. of Electrical Machines & Apparatustfdolni 19, 602 00 Brno
Key words: optical diagnostics, electric arc, non-homogeneous plasma, non-stationaryplasma
Introduct ion. The spectral lines irradiated by the arc plasma pass as a consequenceof its non-homogeneity through locations with a different temperature. The ray emergingfrom the vicinity of the arc axis is partly absorbed in locations with a lower temperature,the relevant spectrl line has a characteristic profile which is called self-reversal. From theprofile of the line can be determined the temperature. The latter is calculated from themarginal intensities, i.e. the intensities emitted in the immediate vicinity of the self-reversalminimum. Bartels limits this procedure by the elimination of the resonace lines. For thesethe described procedure can be utilized only when widening of the line is caused by collisionswith electrons.
The procedure is relatively simple and requires the measurement of the marginal inten-sity only on one observation ray. The knowlegde of further determining quantities is notrequired and thus the results are given with a minimum of assumptions.
Theory. It is assumed for the measured plasma that in it a thermic equilibrium existsand that the states sum can be replaced by the statistic weight of the basic state. By acalculation taking into account ionization and the higher terms of the states sum can beproved that a 10% concentration of the ions does not influence the results; thus the higherterms of the states sum can be neglected.
The described method is theoretically derived on the basis of papers of Bartels [1, 2].The temperature is determined by the measurement of intensity on lines which indicate anobservable self-reversal. Tile maxima surrounding the self-reversal minimum are denoted asreversal peaks, the intensity emitted in them is called peak intensity, from which the soughttemperature can be determined.
For the determination of the temperature is used the relationship
^ ^ ' ( 1 )
where Ta is the Wien temperature given by the relationship
hv
where h is the Planck constant, fc the Boltzmann constant, /„ the peak intensity, v thefrequency of the line under consideration, &wh(v) is an auxiliary quantity.
683

WORKSHOP 96 POWER SYSTEMS & ELECTRICAL ENGINEERING
x(fj) is a, relatively complicated function of the excitation voltage of the upper term ofthe considered line and of the ionization voltage of the element with emits the employedspectral line.
The equation (1) is the first approximation in a complicated iterative procedure. Fortemperatures up to 7000 K this first step is sufficiently accurate.
At higher temperatures several iterations arc used, upon computer processing thiscauses no great difficulties.
The described method has hitherto been employed for temperature measurements of astationary non-homohenous plasma and in this work we have extended it into the measure-ment of the temperature of a non-stationary arc plasma fed by AC current.
During the measurements stroboscopic equipment was used which allowed the pho-tographing of the arc spectrum in short time intervals. The relevant line of the spectrumwas photometered in selected locations of the transversal section of the measured arc.
The cylindrical symmetry of the measured arc plasma was guaranteed by the verticalarc burning between the copper and carbon electrode. With tha aid of two mirrors and anoptical system the arc was displayed onto the slot of the spectrograph, so that the axis ofthe arc image was perpendicular to it.
Conclusion. In the paper is applied the Bartels method of measurement of the radialtemperature distribution in the electric arc plasma. The method utilizes spectral lines witha self-reversal and is suitable for temperature measurements of a non-homogenous plasma.The subject of the paper in the measurement of the radial temperature distribution of anon-homgenous plasma in a non-stationary state.
References:
[1] BARTELS, H. et al.: Eine neue Methode zur Temperaturmessung an hochtemperiertenBogensaulen I. ZfPh No. 127. p. 243, 1950.
[2] BARTELS, H.: Eine neue Methode zur Temperaturmessung an hochtemperierten Bo-gensaulen II. ZfPh No. 128, p. 108, 1950.
This research has been conducted at the Department of Electrical Machines & Apparatusas part of the research project "Methods of Inierferomelric Diagnostics of the Arc Plasma",supported by TU in Brno grant No. FU 450054 and project "Optical Methods of Arc PlasmaDiagnostics" supported by GACR grant No. 102/95/0059.
684
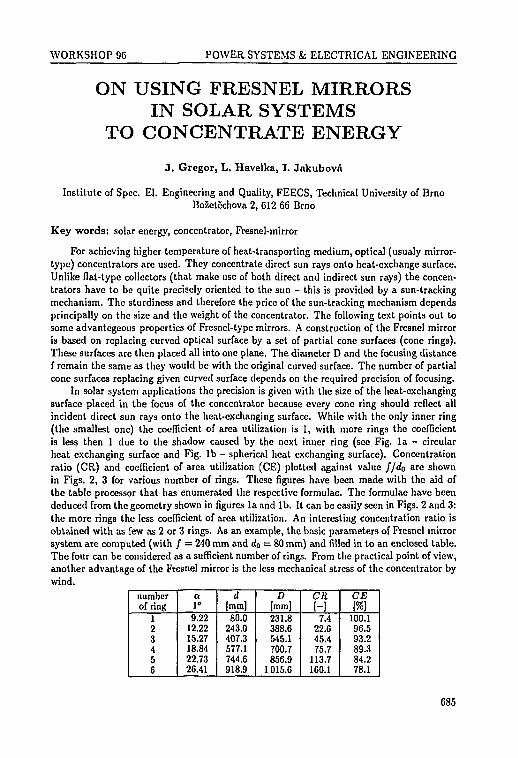
WORKSHOP 9G POWER SYSTEMS k ELECTRICAL ENGINEERING
ON USING FRESNEL MIRRORSIN SOLAR SYSTEMS
TO CONCENTRATE ENERGY
J. Gregor, L. Havelka, I. Jakubova
Institute of Spec. El. Engineering and Quality, FEECS, Technical University of BrnoBozetechova 2, C12 66 Brno
Key words: solar energy, concentrator, Fresnel-mirror
For achieving higher temperature of heat-transporting medium, optical (usualy mirror-type) concentrators are used. They concentrate direct sun rays onto heat-exchange surface.Unlike flat-type collectors (that make use of both direct and indirect sun rays) the concen-trators have to be quite precisely oriented to the sun - this is provided by a sun-trackingmechanism. The sturdiness and therefore the price of the sun-tracking mechanism dependsprincipally on the size and the weight of the concentrator. The following text points out tosome advantegeous properties of Fresnel-type mirrors. A construction of the Fresnel mirroris based on replacing curved optical surface by a set of partial cone surfaces (cone rings).These surfaces are then placed all into one plane. The diameter D and the focusing distancef remain the same as they would be with the original curved surface. The number of partialcone surfaces replacing given curved surface depends on the required precision of focusing.
In solar system applications the precision is given with the size of the heat-exchangingsurface placed in the focus of the concentrator because every cone ring should reflect allincident direct sun rays onto the heat-exchanging surface. While with the only inner ring(the smallest one) the coefficient of area utilization is 1, with more rings the coefficientis less then 1 due to the shadow caused by the next inner ring (see Fig. la - circularheat exchanging surface and Fig. lb - spherical heat exchanging surface). Concentrationratio (CR) and coefficient of area utilization (CE) plotted against value //do are shownin Figs. 2, 3 for various number of rings. These figures have been made with the aid ofthe table processor that has enumerated the respective formulae. The formulae have beendeduced from the geometry shown in figures la and lb. It can be easily seen in Figs. 2 and 3:the more rings the less coefficient of area utilization. An interesting concentration ratio isobtained with as few as 2 or 3 rings. As an example, the basic parameters of Fresnel mirrorsystem are computed (with / = 240 mm and d0 = 80 mm) and filled in to an enclosed table.The four can be considered as a sufficient number of rings. From the practical point of view,another advantage of the Fresnel mirror is the less mechanical stress of the concentrator bywind.
numberof ring
123456
a1"9.22
12.2215.2718.8422.7326.41
d[mm]80.0
243.0407.3577.1744.6918.9
D[mm]231.8388.6545.1700.7856.9
1015.6
CRH
7.422.645.475.7
113.7160.1
CE[%]
100.196.593.289.384.278.1
685
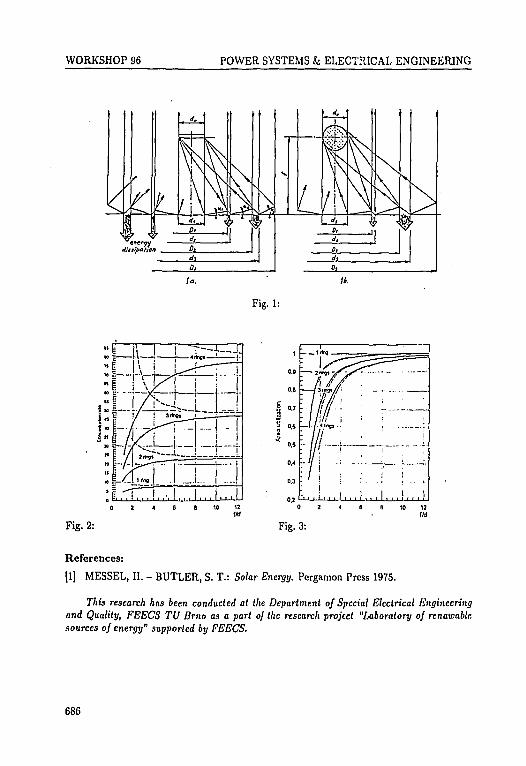
WORKSHOP 96 POWER SYSTEMS k ELECTRICAL ENGINEERING
la.
Fig. 1:
0.0
0.8
0,7
»••
o ,
0.4
0.3
0.2
W\" / 1 '
: i
i
; j i
. . 1 . . . 1 . . . ! . . . 1
Fig. 2: Fig. 3:
References:
[1] MESSEL, II. - BUTLER, S. T.: Solar Energy. Pergamon Press 1975.
This research has been conducted at the Department of Special Electrical Engineeringand Quality, FEECS TV Brno as a part of the research project "Laboratory of renawabtesources of energy" supported by FEECS.
686
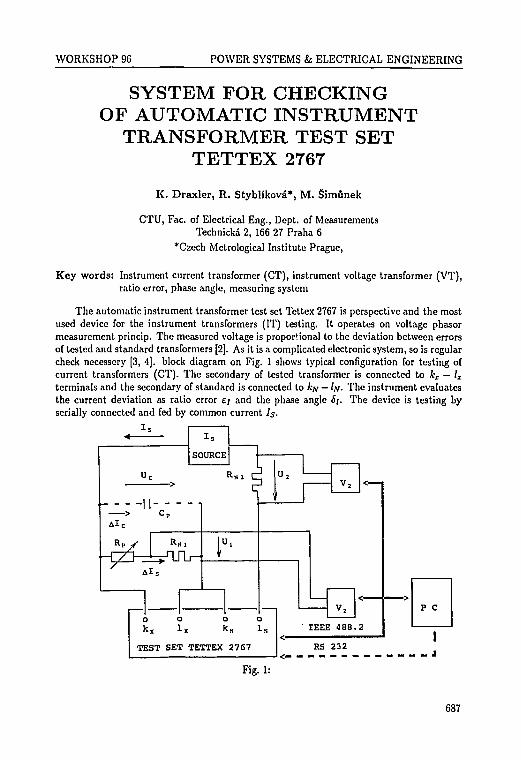
WORKSHOP 96 POWER SYSTEMS & ELECTRICAL ENGINEERING
SYSTEM FOR CHECKINGOF AUTOMATIC INSTRUMENT
TRANSFORMER TEST SETTETTEX 2767
K. Draxler, R. Styblikova*, M. Simunek
CTU, Fac. of Electrical Eng., Dept. of MeasurementsTechnicka 2, 166 27 Praha 6
*Czech Metrological Institute Prague,
Key words: Instrument current transformer (CT), instrument voltage transformer (VT),ratio error, phase angle, measuring system
The automatic instrument transformer test set Tettex 2767 is perspective and the mostused device for the instrument transformers (IT) testing. It operates on voltage phasormeasurement princip. The measured voltage is proportional to the deviation between errorsof tested and standard transformers [2]. As it is a complicated electronic system, so is regularcheck necessery [3, 4]. block diagram on Fig. 1 shows typical configuration for testing ofcurrent transformers (CT). The secondary of tested transformer is connected to kx — lx
terminals and the secondary of standard is connected to kn — IN- The instrument evaluatesthe current deviation as ratio error £; and the phase angle £/. The device is testing byserially connected and fed by common current Is.
SOURCE
&N 2
Ale
O O O O
kx lx k» 1»
TEST SET TETTEX 2767
Fig. 1:
' IEEE 488.2
P C
RS 232
687

WORKSHOP 96 POWER SYSTEMS k ELECTRICAL ENGINEERING
The ratio error, given by the formula
AIS U, • RN, * n , . ,ets = _ _ _ = _ _ _ Sls = 0 (I)
can be simulated by means of resistors Rp and fl/vi connected in parallel. The phase angle,given by the formula
r , A/C UC-RS2-U-CP - ,„,Sis = arctan -7— = - arctan ^ , as = 0 (2)
JS 1/2
can be simulated analogically by means of capacitance Cp (in Fig. 1 dashed).The voltages U\, Ui and Uc are measured by voltmeters V\ and V2 usign the PC
controlled system according to Fig. 1. The data transfer to the PC is realized by meansof IEEE 488 bus. The informations about the ratio error £;m and the phase angle £;m
measured by means of system Tettex 2767 are transfered by IEEE 488 or RS 232 bus. Thetrue value of ratio error e and phase angle 6 is calculated according to relations (1) and(2). The described method allows the simulation of errors of one polarity and of limitedrange. The whole error range can be simulated by means of additional current source Aj,connected to kx — lx terminals. The source should allow adjustment of amplitude in range0-20 % Is and phase in range 0-360°. The value of phase angle 6 = 0 will be set on the testset by pliase adjustment and the value of ratio error e will be checked and the other wayround. The currents Is and A/s will be determined from the voltage drops on the serialresistors. The true values of ratio error e and phase angle 6 will be calculated according torelations (1) and (2). The testing method for the VT checking is similar. The errors aresimulated by serial resistor or capacitance, respectively by additional voltage source.
References:
[1] Tettex Instrument General catalog
[2] BRAUN - KOHLER: Meseirichtung fur die automatische Fchlerbcstimung an Strom-und Spannungswandlern. Sonder druck aus ETZ Bd 99 (1978) Heft 2.
[3] STYBLiKOVA - DRAXLER: The New Instrument Transformer Test Sets and theirChecking. ELEKTRO 1994/11, pp. 355-360.
[4] STYBLfKOVA - DRAXLER: The Developement of Instruments Transformers andHigh DC Currents Metrology. The Bulletin CM I No. 3360, Prague 1995
This work has been supported by the Grant Agency of the Czech Republic (grant num&er102/93/1197).
688

WORKSHOP 96 POWER SYSTEMS fc ELECTRICAL ENGINEERING
THE NEW INTEGRALCHARACTERISTICS
J. Habel, T. Straka, T. Veselka, A. JoanidisJ. Kocf, R. Kaloc
CTU, Fac. of Electrical Eng., Dept. of ElectroenergeticsTechnicka 2, 166 27 Praha 6
Key words: illumination system, integral characteristics, mean spherical illumination,mean cylindrical illumination, mean cubic illumination, working plane, kon-trast rendering factor, glare discomfort
The illumination of the horizontal working plane surface is still usually used for thequality evaluation of a lighting system. This characteristic only describes illumination ofplanes and not three dimensional things. Watched details are usually three dimensional inmost of illuminated areas, so it is necessary to use characteristics that objectively describespace quality lighting. The integral characteristic is in general equal to the mean value ofthe basic model of the illumination receiver so far mostly used are the ball (the averagespherical illumination E^) or cylinder (the average cylindrical illumination Ec).
During resolving the project we have taken attention to the possibility of using the cubeas the model receiver and the practical application of newly propposed values.
It is mostly illumination of all six surfaces of the cube (the cubic illumination JEOO),eventually illumination of four, usually vertical, walls of elementary cube (£(*).
We calculated some values in the model room with diameters 6 x 7.2 m. Five varioustypes of luminaries (with its various distribution curves) were step by step installed in thisroom. Illuminating system was created according to the valid Czech norm CSN 360450which demands 500 lx on the working place. Than we took away 20 to 30 percent luminaries.Than we compared all various situation.
We analysed the average spherical illumination (Etx), the illumination of the planesurface (77/i), the average cylindrical illumination [Ec), the direction of the flow of light (c),the cubic illumination (Eos) illumination of four vertical walls of the cube (JEM), luminanceof ceiling, walls and working plane, contrast rendering factor, system efficiency and glarediscomfort was checked there.
The analysis showed that according to watched parameters the illumination systemwith semi-direct luminaries was the best used variant. On the opposite the luminaries withdiffuse cover showed a lighting environment as the worse. This illumination system haddouble energy consumption in comparison to the others.
Subjective evaluation of the lighting system was done at the Warsaw university and ingeneral the results were the same as the computed.
Evaluation of illuminated systems with various luminaries optical systems shows theanalogous distribution of both values E^x and Eos as well as Ec and £o<.
The calculus of direct and indirect part of the mean cylindrical illumination Eoa is notcomplicated, because it deals with the illumination of planes.
Simultaneously the calculation and the measurement of the average cubic illuminationoffers both the value of the illumination of the horizontal plane and one of four vertical planes
689

WORKSHOP 96 POWER SYSTEMS k ELECTRICAL ENGINEERING
and also the projective of the direction of the light flow vector into a given co-ordinate axis,signifying the difference of illumination of the cubic's opposite walls. Difficulties of designcalculation decrease significantly.
It is not necessary to use a special cells extension (as it is needed for Et, and Ec) formeasuring, but it is used cosine-corrected photometer from the common luxmeter.
Our team constructed a prototype of device that sets the photocell into all six wantedpositions, collects and computes the data.
As we tried to suggest the recommended values Eoo, which should be recommended forcertain lighting systems, we found out that it is possible to proceed from the values E^ inthe Czech norm (part for residential rooms) that could be taken as a starting point. It willbe necessary to make data more exact especially from the time point of view. Target valuesof the average cylindrical illumination Ec is not at disposal in the Czech norm yet.
Obtained evaluation (in spite of fact that the number of lighting system was limited)confirms the hypotheses that instead of value t/E^ can be practically used c/Eos and alsot/Eot instead of e/Ec.
Further research about this problems should be done.
References:
[1] CUTTLE, C : Beyond The Working Plane. Washington, 1967
[2] HABEL, J.: Average Cubic Illumination. International Light Engineering Seminar,Moscow 1992
[3] HABEL, J. - STRAKA, T.: Evaluation Of Space Quality Lighting Through A NewIntegral Characteristic. Symposium Lighting Engineering 1995, Maribor - Slovenia
[4] HABEL, J. - STRAKA, T. - VESELKA, T.: The Mean Cubic Illumination. ColocviumDepartaments of Electroenergetics In Czech and Slovak Republics, TU Kosice, Slovakia1993
This research has been conducted at the Department of Power Engineering as a partof the research project "The New Integral Characteristics" and has been supported by grantNo. 10038S71 of the Czech Technical University.
690

WORKSHOP 96 POWER SYSTEMS fc ELECTRICAL ENGINEERING
THE CONNECTION OF POWERENERGY SYSTEMS
J . T ima
CTU, Fac. of Electrical Eng., Dept. of ElectroenergeticsTechnicka 2, 166 27 Praha 6
Key words: reliability of power energy system, ecological impact to environment, diagnos-tic expert systems, fuzzy logic, control of power energy system
The state of the power energy system is defined by means of operation parameters of thepower energy system and its devices. The character of the operation parameters determinesvarious states of power energy systems (PES):
• normal state,t alert state,t state of disturbances,t state after disturbances.
The research activities were carried out for emergency states, i.e. states occuring duringmajor disturbances with great interruption of electric energy supply to industrial sector andto inhabitans, often with a long time duration. These studies are very important for theinterconnection of the Czech PES with UCPTE and for the control of lower lewels of powertransmission and distribution systems.
The application of artificial intelligence to the control of PES (expert systems, neuralnetwork, fuzzy logic) is given by effort to use also the human operational experience andoperational opinions. The aim is to:
• decrease the demand of the dispatchers, the reduction of activities in preparing theoperation of the PES,
• standardise the fast action,• decrease time for restoration of energy supply,• prevent the failure of the dispatcher,t use the experience of experts for training of dispatchers.
The results of research activities were presented in following fields - the mathematicalmodel of PES reliability, the expert system for diagnostic task of electrical devices (enginesand transformers), the basis of fuzzy regulation, the use of fuzzy logic for control of flickerin supply of electric energy and for control of the power system in emergency states.
The control of PES in emergency states is realised by means of modules:
• control module provides the control of the whole system. The control is performed byhelp of other computer programs, simulation programs etc,
• failure module gives the advice during failures in the PES. It is not active in thenormal state,
691

WORKSHOP 96 POWER SYSTEMS k ELECTRICAL ENGINEERING
• operational module provides all normal manipulations in the PES, control of produc-tion, demand, regulation U/Q, regulation of P, control of energy exchange etc,
• information module provides the connection with the dispatcher and the fulfilementof the information base. An important part of that module is a filter of the data. Thismodule is very important, because the operation of the PES depends on the qualityof informations.
We studied at first the fuzzy control in the application of the failure module. We haveused the Linquistic Model Processing System (LMPS). For this empty expert system it wasnecessary to define:
• the model of the PES,
• fuzzy variables and their word values,
• fuzzy sets of variables,
• description of relationships between variables.
The control system was proved in the energy region in South Bohemia.Emergency states can arise also from smog situations. Therefore we want to use the
fuzzy logic for solving of these situation in the PES.The results of scientific activities were presented during 1995 five times at conferences
and seminars, and six papers in international conferences were called for.
References:[1] TOMA, J. - HOVORKA, J.: Study of the use of fuzzy logic for control of PES in
emergency stales, 3rd Zittau Fuzzy-Colloquy, September 1995.
This research has been conducted at the Department of Electroenergelics as part of theresearch project "The Connection of Power Energy Systems" and has been supported byCTU grant No. 10038198.
692
WORKSHOP 96 POWER SYSTEMS fe ELECTRICAL ENGINEERING
USING RULE-BASED EXPERT SYSTEMFOR EVALUATION
OF DIAGNOSTIC MEASUREMENTOF POWER-ENGINEERING SYSTEMS
K. Zalis
CTU, Fac. of Electrical Eng., Dept. of Power EngineeringTechnicka 2, 166 27 Praha 6
Key words: expert system, rule-based expert system, dielectric diagnosis, diagnostics,predictive maintenance, insulation, reliability, evaluation, electrical machine,alternator, transformer, insulating oil
The insulation of high-voltage (HV) machines and equipment in operation is regularlytested with special diagnostic methods and its real state is evaluated. Based on the results ofthese diagnostic tests, it is possible to determine the reliability of machines and equipment insubsequent service, to prolong the inspection periods or to reduce the number of inspections.
Diagnostic measurement data was formerly gathered in database systems, which wereoriented for recording results and for storing operational equipment data. However, a com-prehensive view of a specific subject from the point of view of its future reliability in servicemay be ensured only by an expert system which evaluates the individual diagnostic meth-ods, provides expert propositions, makes correlations between different methods. Expertsystems are based on the principle of passing the knowledge of an human expert onto thesystem and using it with the same results as consulting the expert. Expert systems can bea very efficient tool for fast, high-quality decision-making but cannot fully replace humansand cannot solve non-standard situations. The statement of an expert system correspondswith conclusions and recommendations of a colloquy of top experts in the field whose advicecan either be taken or ignored.
There are several different types of expert systems which are based singularly on pro-duction rules, neural networks, genetic algorithms, etc. as well as expert systems of a mixedtype. Most experts in the field of dielectric diagnosis decide according to directives, limitvalues and rules of the IF-THEN type. For processing information of the type jassumptionj,jhypothesis£, production rule-based expert systems provide the best solutions. That is whythe rule-based expert system was chosen in this case.
The staff of the High Voltage Laboratory (HVL) of the Czech Technical University(CTU) in Prague collaborated with several top workplaces in this field on the construction ofa rule-based expert system for dielectric diagnosis. This group consists of universities (CTUPrague, VSB Ostrava, VUT Brno, WBU Pilsen), research institutes and laboratories (R&DBechovice, Skoda Pilsen, ZCE),individual companies (Czech Power Company, ORGREZ,private companies, etc.) and other experts interested in this area. The empty rule-basedexpert system SPEL-EXPERT (a modification of the FEL-EXPERT expert system [1],created at the Department of Control Technology of the CTU) was chosen. In this rule-basedexpert system any uncertainty in the knowledge is represented with the help of Bayesian
693
WORKSHOP 96 POWER SYSTEMS fc ELECTRICAL ENGINEERING
conditional probability. A weight factor is associated with each rule, representing the degreeof certainty of an expert about the given statement. The consultation results in a gradingof final hypotheses, which is carried out by means of weighing the influence of supportingand rejecting rules. Upon first consultation with the expert system, each rule is associatedwith an a priori probability which expresses the rate of validity of the rule without takinginto account any additional knowledge supplied during the consultation.
The created rule-based expert system for dielectric diagnostics was named IZOLEX[2] and the sources used for its creation were chiefly Czech (CSN) and international (ISO)standards, operational regulations (Czech Power Company, ORGREZ), consultations withexperts, and domestic and international scientific literature. The IZOLEX expert systemevaluates diagnostic measurements from 37 commonly used diagnostic methods for evalu-ating the state of HV insulation of rotating machines (16 methods), non-rotating machines(10 methods) and insulating oils (11 methods). The current knowledge base of the expertsystem consists of 628 nodes, 783 rules, 65 context connection rules, 282 priority connec-tions, 107 goals and 3 taxonomies. The biggest advantage of the IZOLEX expert systemis the fact that this expert system enables even a non-expert user to determine the risks offurther operation of a HV device without having to consult top experts. Wide use of thisexpert system is expected in practice, for example, at the workplaces of servicemen.
Results of the work of and information about the IZOLEX expert system were publishedby the staff of HVL at the IEEE SPT Conference in Stockholm [3], at the ISH'95 Conferencein Graz [4] and at 8 other conferences in 1995. Three articles were also published in scientificjournals in 1995.
References:
[1] MARlK, V. - VLCEK, T.: Expertni system FEL-EXPERT, verze 3.S (in Czech; ExpertSystem FEL-EXPERT, version 3.S). CVUT-FEL, 1991.
[2] ZALIS, K. - HOVORKA, M. - BRAZDIL, J.: IZOLEX - Expertni system pro diagnos-tiku vn izolaci elektrickych stroju (in Czech; IZOLEX - Expert System for HV InsulationDiagnostics of Electrical Machines). In: Elektro, 5 (1995), No. 6, pp. 220-224. ISSN1210-0889.
[3] ZALIS, K.: Dielectric Diagnostics in Service - from Databases to Expert Systems. In:STOCKHOLM POWER TECH (High Voltage technology), ref. SPT HV 01-07-00898.Stockholm, June 1995, pp. 34-38.
[4] ZALIS, K.: Database and Expert Systems for Dielectric Diagnosis. In: 9th Interna-tional Symposium on High Voltage Engineering, ref. 5593. Graz, August 1995.
This research has been conducted at the Department of Power Engineering as a part ofthe research project "The Expert System for Diagnostics of HV Electrical Machines" andhas been supported by GACR grant No. 102/94/1481.
694
WORKSHOP 96 POWER SYSTEMS k ELECTRICAL ENGINEERING
CLASSIFICATION OF DISCHARGESIN HV INSULATING SYSTEMS
USING A NEURAL EXPERT SYSTEM
J . MrkviJka
CTU, Fac. of Electrical Eng., Dept. of Power EngineerigTechnicka 2, 166 27 Praha 6
Key words: insulation, high-voltage, monitoring, discharge activity, reliability, measure-ment, recognition, partial discharges, expert system, neural network
Detection of discharge activity is an important means of testing the reliability of in-sulatnig systems of high-voltage (HV) equipment. Therefore many successful methods fordetection, location and evaluation of partial discharge (PD) have been developed for thispurpose. Several discharge quantities used for standard diagnostics do not predict the life-time of the insulation systems, they give us information about its quality. The aim of ourresearch is to determine the actual stage of the HV insulation and to estimate the safetyin operation and the reliability of HV equipment. The results of this project will help toincrease the reliability of diagnostics of power equipment (alternators, transformers etc.)used in the power system of the Czech Republic.
Measurement of PD is a modern non-destructive method for HV insulation diagnostics[1]. Measurement of PD in eletrical insulation is provided by the global method of PD-measurements [2], which was developed for this purpose in the high-voltage laboratory(HVL) of the Dept. of Power Engineering, CTU Prague. This method is advantageous for:1s (.i'iTolctcness, high sensitivity and relatively short measuring and evaluating times. This's. v'h./.t can be used not only for off-line diagnostics, but also in on-line monitoring of stageinsulating systems.
Each defect in electrical insulation has its own particular degradation mechanism. Itis important to know the correlation between discharge patterns and the kind of defect.Recognition of internal discharges and their correlation with the kind of defect is becomingicreasingly important in the quality control of insulating systems. For purposes of describingthe characteristics of PD, discharge quantities have been divided into three groups [3]:
• Basic quantities, which are observed by the classic PD mesuring unit
• Deduced quantities, which are integrated characteristics of basic quantities
• Statistical operators on basic and deduced quantities
For measuring PD characteristics and evaluating PD quantities a measuring systemfor analyzing PD pattern was developed [4]. The measuring system consists of a classicPD-measuring unit, which can output non-processed data (real-time PD characteristics),and of a computer, where data is processed and PD quantities and statistical parametersaie evaluated. Data from PD-measuring unit is transferred to the computer via an. I/OPC card with a 16-bit A/D converter. In this unit, detected analog signals arc digitized
695
WORKSHOP 96 POWER SYSTEMS k ELECTRICAL ENGINEERING
and prepared for processing in the computer. Evaluated parameters are input vectors for aneural network classifier.
Neural networks (NN) have promissing capabilities as automatic discriminators andintelligent alarm processors [5, 6]. They have the ability to learn from examples withoutknowledge of explicit rules, to recognize input patterns which are different from learnedpatterns, and to adapt to differing pieces of equipment and they require only minimalcustomization. The expert system used in this project is based on an empty neural expertsystem called NEUREX which was developed at the Dept. of Computers, TU Ostrava [8].The knowledge base of this expert system (the training set for neural network) consists ofcharacteristics and parameters mesured on models or on insulating systems with well-knowndefects which are used as input parameters and of output results of stage HV insulation andkinds of detected defects [9].
The next steps of research activity in this project are to build a real knowledge basefor the expert system and to test this system on real HV equipment in the power system ofthe Czech Republic.
References:
[1] KELEN, A.: Diagnostic ofHV Insulation - From Inspection to Continuous Monitoring.Ref. 1020-05, CIGRE Symposium 05-87, Vienna 1987.
[2] VEVERKA, A. - ZALIS, K.: Global Method for Measuring Partial Discharges. Elek-trotechnicky obzor, 70, 1981, No. 12, pp. 675-679.
[3] MRKVICKA, J.: Diagnostics of Measurement of Discharge Activity. Diploma Work,CTU in Prague 1993.
[4] GULSKI, E. - KREUGER, F. H.: Computer-aided Recognition of Discharge Sources.IEEE Transactions of Electrical Insulation, Vol. 27, No. 3, June 1992, pp. 82-92.
[5] SUZUKI, H. - ENDOH, T.: Pattern Recognition of Partial Discharge in XLPE CablesUsing a Neural Network. IEEE Transactions of Electrical Insulation Vol. 27, No. 3,June 1992, pp. 543-549.
[6] TOU, J. - GONZALES, R.: Pattern Recognition Principles. Addison-Wesley, 1974.
[7] CIMBALA, R.: Utilization of Pattern Recognition Principles for Diagnostic Purposes.Elektrotechnicky casopis, 45, No. 8, 1994, pp. 315-317.
[8] VONDRAK, I.: Neurex 4.0. Expert System Based on Neural Network. TU Ostrava,1993.
[9] MRKVICKA, J.: Classification of Discharge Acivity Using a Neural Expert System.Poster '95, Conference of Student Research Activity, CTU in Prague 1995.
This research has been conducted at the Department of Power Engineering as part of theresearch project "The Expert System for Diagnostics of High Voltage Electrical Machines"and has been supported by GA CR grant No. 102/94/1481.
696
WORKSHOP 96 POWER SYSTEMS fc ELECTRICAL ENGINEERING
HIERARCHICAL FUZZY CONTROLFOR POWER ENERGY SYSTEMS
P. Horaeek, J . Brabec, J . Fuka, B. Sladek
CTU, Fac. of Electrical Eng., Dept. of Control EngineeringKarlovo nam. 13, 121 35 Praha 2
Key words: Fuzzy control, fuzzy inputs, neural networks, hierarchical control
Presented work aims at development of a hierarchically distributed nonlinear controllersfor the use in Networked Electric Power Systems. The controller is internally implementedas interconnected fuzzy systems described by Horacek and Binder (1995). Fuzzy LogicControllers (FLC) with hierarchically structured rule base are static, generally nonlinearfunctions, mapping numerical inputs to numerical outputs. Static mapping or rather itsparameters, basically reference fuzzy set Membership Functions (MF) and rules, can bedesigned (i) purely manually, (ii) by automatic learning scheme processing input/outputpairs of data representing the reference behavior of the FLC or (iii) combined scheme wheremanual design is used for presetting rules and MFs with fine tuning of selected MFs andrule weights using reference training data.
Single Stage Decision Making. Minimal realization of a fuzzy system can be achievedby implementing layered rule base (Horacek and Binder, 1995). This structure is basedon the idea of exception handling. The nonlinear control map which works satisfactorilyalmost in all situations, process states, is generated using large granularity. Note that thebackground strategy is linear in number of practical cases. The union of support of fuzzysets representing the rules of the background strategy is equal to the input space. Exceptionsfrom the background strategy are realized by additional, rather locally invoked rules. Theglobal strategy should be gradually disabled when the more specific rules are activated.No chaining of rules is done. The resulting layered structure of decision rules is shown inFig. la.
Multi Stage Decision Making. Chaining the rules might be required when rules playdifferent role in the control system. A typical example is a FLC with a rule based, measuredsignal preprocessor and a controller shown in Fig. lb. It is well known that the humanoperator is not able to cope with the amount of detail information available in the computercontrol of a complex system like the power distribution network. The information describingthe state of the process has to be preprocessed and as an aggregate presented to the operatorwho reacts to it more efficiently. The output of the preprocessor is a fuzzy set or sets. Thecontroller processes fuzzy values provided by the preprocessor and not the crisp values givenby all the particular sensors. A FLNN is extended to the multi-stage decision case whererules are grouped and groups are chained in order to get a hierarchy of decisions as proposedby Horacek and Binder (1995).
The two hierarchically structured fuzzy logic controllers lead to simplification in theFLC design and tuning as the dimensionality of the design problem is reduced and trans-parency of the input/output reasoning is improved. A reference data driven fine tuning ofpart of a nonlinear function of a FLC, implemented as a hierarchically structured FuzzyLogic Neural Network, has been developed. However, manual design of FLNN topology
697

WORKSHOP 96 POWER SYSTEMS k ELECTRICAL ENGINEERING
Fig. 1: a) Single-stage hierarchical FLC, b) Multi-stage hierarchical FLC
and its parameters in the form of a rule base and membership functions dominates in theengineering practice at present. The main reason is that bad reference data may lead toincorrect FLC tuning as is often the case in training of conventional neural networks. Toprevent this a designer prefers using rather his experience for primary setting of parame-ters of preprocessor and leaving few parameters of the final decision part of a hierarchicallyorganized FLC for automatic tuning by reference data driven algorithms.
References:
[1] BRABEC, J. - HORACEK, P.: Learning Algorithms for Fuzzy Neural Control: AProcess Control Application. In: Proceedings of International Workshop on FuzzyTechnologies in Automation and Intelligent Systems, pp. 212-221, Duisburg, Germany1994.
[2] HORACEK, P. - BINDER, Z.: Hierarchical Fuzzy Controllers. In: Proceedings of 4th1FAC Symposium on Low Cost Automation, pp. 1-9, Buenos Aires, Argentina 1995
[3] HORACE!^ P.: Design Techniques for Fuzzy Control. In: Proceedings of InternationalWorkshop on Intelligent Robotic Systems IRS'94, pp. 80-93, INPG/IMAG Grenoble,1994
[4] HORACEK, P. - BRABEC, J.: An Implementation of Genetic Algorithms for FuzzyLogic Control. In: Proceedings of CTU Prague - TU Brno Workshop 95, pp. 135-136,Prague 1995
[5] HORACEK, P. - BRABEC, J.: Nonlinear Controller Design Based on Fuzzy Modelling.
In: Proceedings of CTU Prague - TU Brno Workshop 95, pp. 137-138, Prague 1995
[6] HORACEK, P.: Fuzzy Modelling and Control. In: H.H. Adelsberger, J. Lazansky,V. Mafik (eds.): Information Management in Computer Integrated Manufacturing,Lecture Notes in Computer Science, pp. 257-288, Springer-Verlag, Berlin-Heidelberg1995This research has been conducted at the Department of Control Engineering as part of
the research project "The Connection of Power Energy Systems" and has been supported byIGS CTU grant No. 10038198.
698
WORKSHOP 96 POWER SYSTEMS fc ELECTRICAL ENGINEERING
FUZZY TECHNIC AND FLICKER
J . Dolegal, J . Tlusty
CTU, Fac. of Electrical Eng., Dept. of ElectroenergeticsTechnicka 2, 166 27 Praha 6
Key words: fuzzy, flicker, time elay
This paper deals with sources of flicker in power distribution systems. The limits offlicker regulation are developed and presented graphically. It is shown that in the frequencyband from 1-15 Hz, classical methods are capable of suppressing flicker in power systems,but that the classical methods are not sufficient for suppressing higher flicker frequencies.In this paper, the improvemet of flicker regulation for all frequencies by fuzzy technology isdescribed.
Electrical equipment with non-linear characteristics is a source of disturbance by har-monics, interharmonics, voltage fluctuations, voltage dips, supply interruptions, and voltageimbalances. This paper concerns voltage fluctuations in supply systems. Generally, sincevoltage fluctuations have an amplitude not exceeding 10 %, most equipment is not disturbedby them. The main disadvantage which can be attributed to them is flicker, the fluctuationof luminosity of incandescent lamps. This phenomenon is only important as a source ofdiscomfort to individuals. The physiological discomfort associated with this phenomenondepends on the amplitude of the fluctuations of the component frequencies, the rate ofrepetition for voltage changes, and the duration of the disturbance.
From the physical point of view, flicker can be compared to the amplitude modulationprocess when the supply voltage at angular frequency 50 Hz is modulated by a voltagefluctuation in the band from 0.5 to 30 Hz.
Electrical arc furnaces are the most complicated sources of voltage fluctuations withchaotic character. Fluctuations of current in electric arc furnaces cause voltage fluctuationsin the supply network. To reduce these fluctuations, we use a Static Var Compensator thatoperates on the principle of indirect compensation of reactive power. This SVC is composed,of a thyristor-controlled reactor and a fixed capacitor bank.
The aim of the regulation of flicker is to limit the fluctuation of voltage and reactivepower in the frequency spectrum from 2 Hz to 30 Hz. One of the dynamic parameters thatdecreases the possibility of elimination of flicker is time delay in the measurement andcalculation of reactive power. This time delay can take as long as 25 milliseconds.
When we analyze the envelope of reactive power and voltage, we can see a good corre-lation between them. For this reason we can study the influence of SVC in limiting voltagefluctuations in the sub-harmonic band. We know from the theory of the calculation of elec-trical networks that drops in voltage in the distribution network areapproximately equal tothe change in reactive power. For this reason, the target for regulating flicker is determinedby the value of reactive power. In order to determine the quality of regulation, we expressthe Flicker Suppression Factor
When we consider the accuracy of the amplitude, the time of delay corresponds to thetime it takes for the phasor to shift 60 electrical degrees. It follows that to reduce flicker to25 Hz, the time delay must be less than 6 milliseconds. It is impossible to reduce time delay
699

WORKSHOP 96 POWER SYSTEMS fe ELECTRICAL ENGINEERING
because it occurs in the process of measurement of voltage and current and the calculationof reactive power. Because flicker cannot be regulated efficiently by a standard regulator,we have used a regulating procedure with a predictor to limit flicker in all bands of thespectrum.
For this procedure, we use our knowledge of typical frequency spectra from electricalarc furnaces. The model can be derived from ANFIS or GENFIS, which are fuzzy logictools in the MATLAB computer program. The procedure uses the learning ability of neuralnetworks and uses fuzzy logic to compose rules. In order to confirm the fuzzy predictionwe erase from the rules the assumption that the system is based on the history of themeasurement of the real process in the real environment. Prediction will be a response tothe average value of the system and will be less accurate when the system deviates from theaverage.
The prediction limits the time of delay. The regulator can be modified so that theoutput from the predictor can be used to respond as if the time delay did not exist. Thefilter output is connected to the predictor, which uses a neural network and fuzzy logic tocalculate the future value of the controlled variable for compensation of the time of delay.
The simulation proposes that the time delay is a multiple of the data collection period.The history of data can be divided into blocks. One represented value can be determinedfrom each block by local filtration. In our case, we use two blocks, input 1 and input 2.When teaching the predictor, we form a prediction surface for our sample with the help ofANFIS and GENFIS. In the control process the same value passes through the predictionsurface and we receive a prediction of output.
Conclusion. From an analysis of flicker it follows that its regulation has a limit dueto time delay in the regulation loop. Flicker of the electric arc furnace cannot be limited inall bands by classical regulators. For limiting high frequencies of flicker, we try to use fuzzytechnology. Our experience shows that teaching a fuzzy predictor enables the prediction offuture values with a high degree of accuracy and allows better conrol of flicker than fromclassical regulators, particularly for high frequencies. Because the spectrum of flicker isunstable all the time, we propose using an adaptation of the prediction surface to changethe character of input.
References:
[1] DOLEZAL, J. - TLUSTY, J.: Fuzzy control of Flicker in Power Systems. 3rd ZittauFuzzy-Colloquy, September 1995
This research has been conducted at the Department of Electroenergetics as part of theresearch project "Propojovani etektrizacnich soustav" and has been supported by CTU grantNo. 10038198.
700

Section 12
ELECTRONICS,
MEASURING AND
COMMUNICATION
ENGINEERING
NEXT PAGE(S)left
WORKSHOP 96 ELECTRONICS, MEASURING fc COMMUNICATION ENG.
NEW RESULTS IN THE NONLINEARDYNAMICAL SYSTEM MODELLING
J. PospfSil, J. Brzobohaty*, Z. Kolka
TU, Fac. of Electrical Eng. & Comp. Sci., Dept. of RadioelectronicsAntonfnska 1, 662 09 Brno
*TU, Fac. of Electrical Eng. & Comp. Sci., Dept. of MicroelectronicsCdolni 53, 602 00 Brno
Key words: dynamical systems, modelling, piecewise-linear approach, chaos
New canonical state models of chua's circuit family. The third-order piecewise-linear (PWL) dynamical systems are intensively studied as the simplest autonomous systemswhich can exhibit chaotic behaviour. Such systems belong to the Class Co! vector field in.ft3 [4] and can be described by the general matrix form
dx/dt = Ax + bh(w), w = aTx, AeR?*3, iGii3, « e i ? .
The simple memoryless PWL function h{w) = (|u>+l| — |tu —1|) is continuous, odd-symmetric, partitioning iJ3 by two parallel planes into one inner (Do) and two outer re-gions (/?+i,D_i). The dynamical behaviour of such systems is given by two sets of threeeigenvalues determining two char, polynomials associated with the corresponding regions
Do : det(sl - Ao) = s3 -p^s1 +pjs -pa D+1,D-i : det(sl -A) = s3 - qt32 + ?2s - 73
where Ao = A + baT and 1 is the unity matrix. State matrix A determines equivalenteigenvalue parameters 91,92,93 while matrix Ao determines coefficients pj,pj,P3. Someof the known systems topologically conjugate to Class C (e.g. Chua's universal circuit orChua's oscillator) are canonical with respect to all possible behaviour of the associatedvector field, and with respect to the number of necessary parameters. They are not canonical,however, with respect to the relation between these parameters and the equivalent eigenvalueparameters. Such a property is useful especially for the study of chaos. New elementarycanonical state equations have the following forms:
1st form: 2nd form:dxi/dt = 91X1 - ij + (pi - 9i)A(ii) dxi/dt = qixt + q2x2 + 93X3 + Hw)dxj/dt = 92X! - 13 + (j>2 - 9i)Mii) dxi/dt = - i j dx3/dt = -Xjdx3/dt = 93X1 + (P3 - 93)A(xi) u> = (pi -
The corresponding circuit models consist of three ideal integrators, three summators,and one PWL element. Both structures contain the known canonical forms of the third-order nonautonomous linear system (AC and FLF networks) and a nonlinear feedback blockdescribed by a simple memoryless PWL function h(w). In the modified structures (oneadditional summator) the equivalent eigenvalue parameters 91,92,93 and pi,ft ,ft directlydetermine the summator gains. References - [1, 2].
703
WORKSHOP 96 ELECTRONICS, MEASURING fc COMMUNICATION ENG.
Piecewise-linear modelling and circuit design. Piecewise-linear models are suit-able especially for strongly nonlinear systems. The decomposed implicit state model hasthe form
x = Cu + Dj+g, 0 = Mwhere x € R™, y € i f are input and output model variables and u, j e Rk are statevariables satisfying the linear complementary condition u > 0, j > 0, uTj = 0 . The designof such a model is a very difficult mathematical problem the general solution of which is notknown so far. New two different algorithms for the 1-D case have been developed, the exactand the numerical one. The exact algorithm covers continuous PWL relations in generalcase. The numerical algorithm based on optimization procedure allows to design the statemodel with less state variables than that designed by the exact algorithm.
The implicit models are also suitable for PWL circuit realizations. The circuit thenconsists of a linear multiport corresponding to the linear model equations and a loadingblock of ideal diodes corresponding to the orthogonal state variables. Method of the resistivemultiport design that has been developed is based on multiple D/A converters integrated onone chip in CMOS technology. Besides higher accuracy and time invariability the system canbe controlled via a standard digital interface. A grounded four-port operating in the voltage-mode has been implemented having each port driven by a summing voltage amplifier withdigitally adjustable gains using octal D/A converter DAC-8840. The gain values are derivedfrom parameters of an arbitrary four-port network matrix. It has been built especially forthe realization of the elementary canonical state models of Chua circuit family mentionedabove. This 3-region symmetric PWL system contains three capacitors and two antiparalleldiodes connected to the individual ports of the resistive four-port. Special software packageincluding a driver for converter progamming and an optimization module (stability andoptimum parasitic poles) has been written. References - [3-5].
References:
[1] POSPlSlL, J. - BRZOBOHATt, J. - KOLKA, Z.: Elementary Canonical State Mod-els of the Third-Order Autonomous Piecewise-Linear Dynamical Systems. In: Proc.ECCTD'95, Istanbul, 1995, pp. 463-466
J2] POSPlSlL, J.: Elementary Canonical State Models of Autonomous Piecewise-LinearDynamical Systems Linearly Conjugate to Chua's Circuit Family. Radioengineering,Vol. 5, 1996 (will be published)
[3] POSPfSlL, J. - KOLKA, Z.: Algorithms for the Automatic Design of the DecomposedState Model of a One-Dimensional Piecewise-Linear System. In: Proc. ISCAS'94, Lon-don, 1994, Vol. 6, pp. 45-48.
[4] KOLKA, Z.: Universal Digitally Controlled Multiport. In: Proc. ECCTD'95, Istanbul,1995, Vol. 2.
[5] POSPlSIL, J. - KOLKA, Z. - BRZOBOHAT?, J.: Decomposed Parametric State Modelof a Piecewise-Linear System with a Fully Independent One-Dimensional Mapping. In:Proc. ECCTD'95, Istanbul, 1995, Vol. 2, pp. 1175-1177
This research has been conducted at the Department of Radioelectronics as part of theresearch project "Modelling of Special Phenomena in Nonlinear Dynamical Systems" andhas been supported by TU grant No. FU 450055.
704
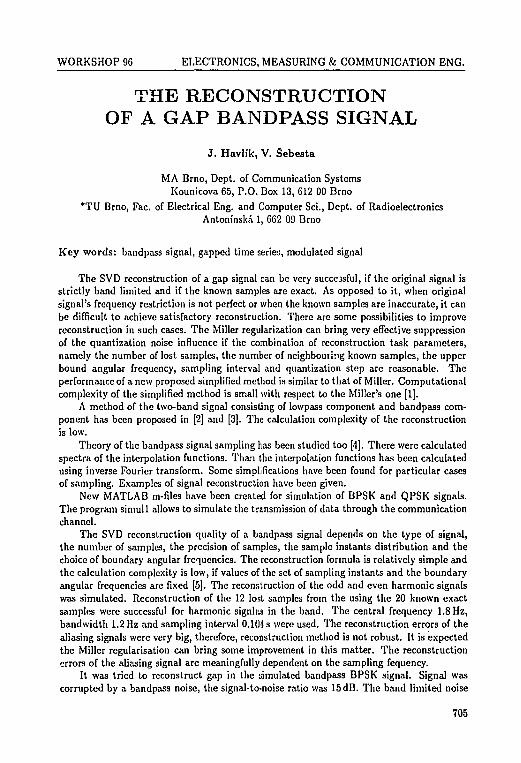
WORKSHOP 96 ELECTRONICS, MEASURING & COMMUNICATION ENG.
THE RECONSTRUCTIONOF A GAP BANDPASS SIGNAL
J . Havlfk, V. Sebesta
MA Brno, Dept. of Communication SystemsKounicova 65, P.O. Box 13, 612 00 Brno
*TU Brno, Fac. of Electrical Eng. and Computer Sci., Dept. of RadioelectronicsAntoninska 1, 662 09 Brno
Key words: bandpass signal, gapped time series, modulated signal
The SVD reconstruction of a gap signal can be very successful, if the original signal isstrictly band limited and if the known samples are exact. As opposed to it, when originalsignal's frequency restriction is not perfect or when the known samples are inaccurate, it canbe difficult to achieve satisfactory reconstruction. There are some possibilities to improvereconstruction in such cases. The Miller regularization can bring very effective suppressionof the quantization noise influence if the combination of reconstruction task parameters,namely the number of lost samples, the number of neighbouring known samples, the upperbound angular frequency, sampling interval and quantization step are reasonable. Theperformance of a new proposed simplified method is similar to that of Miller. Computationalcomplexity of the simplified method is small with respect to the Miller's one [1].
A method of the two-band signal consisting of lowpass component and bandpass com-ponent has been proposed in [2] and [3]. The calculation complexity of the reconstructionis low.
Theory of the bandpass signal sampling has been studied too [4]. There were calculatedspectra of the interpolation functions. Than the interpolation functions has been calculatedusing inverse Fourier transform. Some simplifications have been found for particular casesof sampling. Examples of signal reconstruction have been given.
New MATLAB m-files have been created for simulation of BPSK and QPSK signals.The program simull allows to simulate the transmission of data through the communicationchannel.
The SVD reconstruction quality of a bandpass signal depends on the type of signal,the number of samples, the precision of samples, the sample instants distribution and thechoice of boundary angular frequencies. The reconstruction formula is relatively simple andthe calculation complexity is low, if values of the set of sampling instants and the boundaryangular frequencies are fixed [5]. The reconstruction of the odd and even harmonic signalswas simulated. Reconstruction of the 12 lost samples from the using the 20 known exactsamples were successful for harmonic signlf-s in the band. The central frequency 1.8 Hz,bandwidth 1.2Hz and sampling interval 0.104s were used. The reconstruction errors of thealiasing signals were very big, therefore, reconstruction method is not robust. It is expectedthe Miller regularisation can bring some improvement in this matter. The reconstructionerrors of the aliasing signal arc meaningfully dependent on the sampling fequency.
It was tried to reconstruct gap in the simulated bandpass BPSK signal. Signal wascorrupted by a bandpass noise, the signal-to-noise ratio was 15 dB. The band limited noise
705
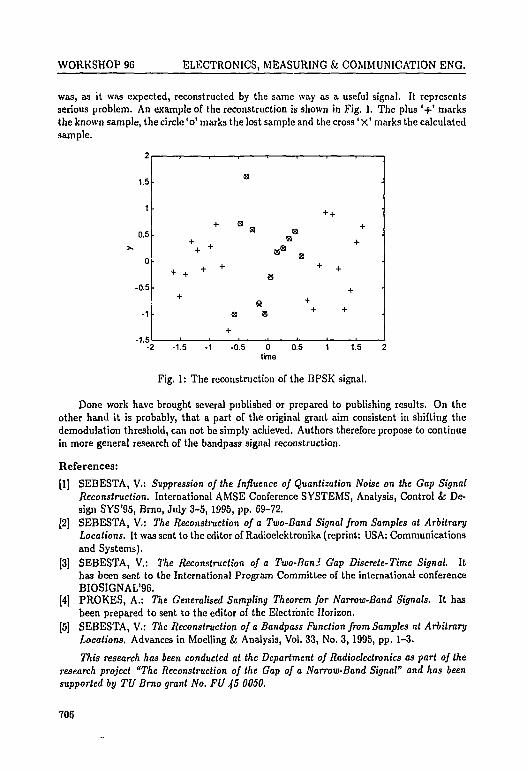
WORKSHOP 96 ELECTRONICS, MEASURING & COMMUNICATION ENG.
was, as it was expected, reconstructed by the same way as a useful signal. It representsserious problem. An example of the reconstruction is shown in Fig. 1. The plus ' + ' marksthe known sample, the circle 'o ' marks the lost sample and the cross' x ' marks the calculatedsample.
1.5
1
0.5
0
-0.5
-1
-1.5
(8
8 B
+ + B® B
+ + «
8 8
+
+
+
+ +
+
+ +
-2 -1.5 -1 -0.5 0 0.5 1 1.5 2time
Fig. 1: The reconstruction of the BPSK signal.
Done work have brought several published or prepared to publishing results. On theother hand it is probably, that a part of the original grant aim consistent in shifting thedemodulation threshold, can not be simply achieved. Authors therefore propose to continuein more general research of the bandpass signal reconstruction.
References:
[1] SEBESTA, V.: Suppression of the Influence of Quantization Noise on the Gap SignalReconstruction. International AMSE Conference SYSTEMS, Analysis, Control & De-sign SYS'95, Brno, July 3-5, 1995, pp. 69-72.
[2] SEBESTA, V.: The Reconstruction of a Two-Band Signal from Samples at ArbitraryLocations. It was sent to the editor of Radioelektronika (reprint: USA: Communicationsand Systems).
[3] SEBESTA, V.: The Reconstruction of a Two-Ban?. Gap Discrete-Time Signal. Ithas been sent to the International Program Committee of the international conferenceBIOSIGNAL'96.
[4] PROKES, A.: The Generalised Sampling Theorem for Narrow-Band Signals. It hasbeen prepared to sent to the editor of the Electronic Horizon.
[5] SEBESTA, V.: The Reconstruction of a Bandpass Function from Samples at ArbitraryLocations, Advances in Moelling & Analysis, Vol. 33, No. 3, 1995, pp. 1-3.
This research has been conducted at the Department of Radioeleclronics as part of theresearch project "The Reconstruction of the Gap of a Narrow-Band Signal" and has beensupported by TV Brno grant No. FU 45 0050.
706
WORKSHOP 9C ELECTRONICS, MEASURING fc COMMUNICATION ENG.
GENERALIZED CANONIC STRUCTURESOF THE LTI-DISCRETE SYSTEM
FOR DIGITAL SIGNAL PROCESSORS
Z. Smekal
TU, Fac. of Electrical Eng., Dept. of TelecommunicationAntoninska. 1, 662 09 Brno
Key words: Digital signal processor, digital filter structure, zero input response
The digital signal processor (DSP) architecture has been designed to maximize through-put in data-intensive DSP applications. The architecture of the DSP is mostly the Harvardarchitecture. The linear time invariant (LTI) discrete system is implemented with finite ac-curacy using typically fixed- or floating-point arithmetic. The most popular representationof negative numbers is two's complement convention. The recursive frequency digitalfilter can be realized as a cascade of partial sections. It is well-known, that a parallel orcascade connection of the partial sections of the first and the second order is less sensitiveto finite wordlength effects than the direct canonic forms of the sth order. If it is supposed,that the discrete system is stable and has the real coefficients of the system transfer function,then the modul of the system poles will be less than one and will exist at real axis in com-plex plane or in complex conjugate pairs. In this case the maximum value of coefficients canbe less than two, but it may be permitted only the maximum one. This is the reason whyboth generalized canonic models are modified with basic condition not to change the systemtransfer function. Modified generalized models for the canonic form 1, resp. 2 (CF1 resp.CF2) of the i-th second partial section are described by these difference equations
v„• (n) = i - t* (0) S (n) + 2 [g-i,- („ - 1) - ^y; (n - 1)] ,
vu(n) = i-vll
»i(n) = 2 [£*< (") + $""• H -
CF2
an
CF1
The symbols j/,(n) and i;(n) are the output and input signals, respectively, and u;(n)is the state variable of the i-th section. In speech processing the partial section involves, asusual, lat t ice s t ructures with two or four multipliers. Fig. 1 shows the block diagram ofthe lattice structure.
707
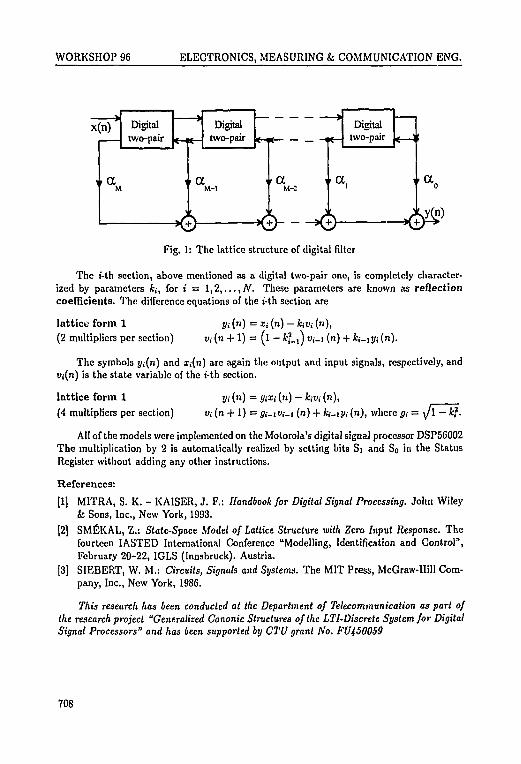
WORKSHOP 96 ELECTRONICS, MEASURING & COMMUNICATION ENG.
1 • aM
Digitaltwo-pair
MA
• a
Digitaltwo-pair
M-l
Digitaltwo-pair
a
{+)
Fig. 1: The lattice structure of digital filter
The t'-th section, above mentioned as a digital two-pair one, is completely character-ized by parameters kj, for i = 1,2,...,N. These parameters are known as reflectioncoefficients. The difference equations of the i-th section are
lattice form 1(2 multipliers per section)
m («) = xt (n) - kvi (n),Vi (n + 1) = (l - *:?_,) «,-_, (n) + k,.iyi (n).
The symbols jft(n) and ii(n) are again the output and input signals, respectively, andVt(n) is the state variable of the i-th section.
lattice form 1
(4 multipliers per section)
j/i (n) = fffXj (n) - kiv; (n),
i>,-(n + 1) = ft-if.-i (n) + Av-iJ/i (n), where gi = v/l -
All of the models were implemented on the Motorola's digital signal processor DSP56002The multiplication by 2 is automatically realized by setting bits Si and So in the StatusRegister without adding any other instructions.
References:
[1] MITRA, S. K. - KAISER, J. F.: Handbook for Digital Signal Processing. John Wileyk Sons, Inc., New York, 1993.
[2] SMfiKAL, Z.: State-Space Model of Lattice Structure with Zero Input Response. Thefourteen IASTED International Conference "Modelling, Identification and Control",February 20-22, IGLS (Innsbruck). Austria.
[3] SIEBERT, W. M.: Circuits, Signals and Systems. The MIT Press, McGraw-Hill Com-pany, Inc., New York, 1986.
This research has been conducted at the Department of Telecommunication as part ofthe research project "Generalized Canonic Structures of the LTI-Discrete System for DigitalSignal Processors" and has been supported by CTU grant No. FU450059
708
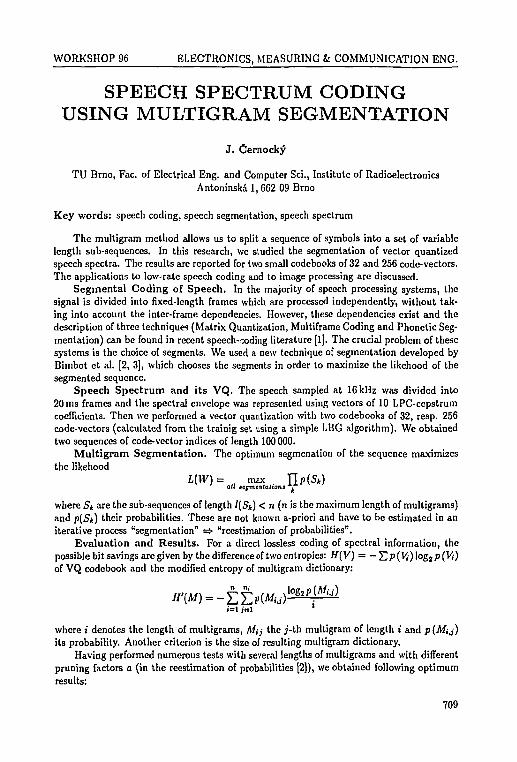
WORKSHOP 96 ELECTRONICS, MEASURING fe COMMUNICATION ENG.
SPEECH SPECTRUM CODINGUSING MULTIGRAM SEGMENTATION
J . Cernocky
TU Brno, Fac. of Electrical Eng. and Computer Sci., Institute of RadioelectronicsAntoninska 1, 662 09 Brno
Key words: speech coding, speech segmentation, speech spectrum
The multigram method allows us to split a sequence of symbols into a set of variablelength sub-sequences. In this research, we studied the segmentation of vector quantizedspeech spectra. The results are reported for two small codebooks of 32 and 256 code-vectors.The applications to low-rate speech coding and to image processing are discussed.
Segmental Coding of Speech. In the majority of speech processing systems, thesignal is divided into fixed-length frames which are processed independently, without tak-ing into account the inter-frame dependencies. However, these dependencies exist and thedescription of three techniques (Matrix Quantization, Multiframe Coding and Phonetic Seg-mentation) can be found in recent speech-coding literature [1]. The crucial problem of thesesystems is the choice of segments. We used a new technique of segmentation developed byBimbot et al. [2, 3], which chooses the segments in order to maximize the likehood of thesegmented sequence.
Speech Spectrum and its VQ. The speech sampled at 16kHz was divided into20 ms frames and the spectral envelope was represented using vectors of 10 LPC-cepstrumcoefficients. Then we performed a vector quantization with two codebooks of 32, resp. 256code-vectors (calculated from the trainig set using a simple LBG algorithm). We obtainedtwo sequences of code-vector indices of length 100 000.
Mult igram Segmentation. The optimum segmenation of the sequence maximizesthe likehood
L(W)= max . J[p(Sk)all segmentations "V*
where Sk are the sub-sequences of length l(Sk) < n (n is the maximum length of multigrams)and p(Sk) their probabilities. These are not known a-priori and have to be estimated in aniterative process "segmentation" =*• "reestimation of probabilities".
Evaluation and Results . For a direct lossless coding of spectral information, thepossible bit savings are given by the difference of two entropies: H(V) = — T,p(Vi)\og2p(Vi)of VQ codebook and the modified entropy of multigram dictionary:
where i denotes the length of multigrams, M,j the j - th multigram of length t andits probability. Another criterion is the size of resulting multigram dictionary.
Having performed numerous tests with several lengths of multigrams and with differentpruning factors o (in the reestimation of probabilities [2]), we obtained following optimumresults:
709
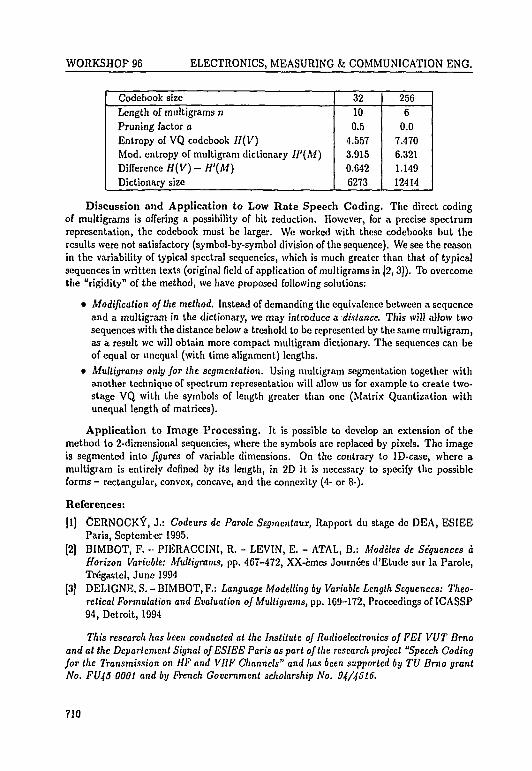
WORKSHOP 96 ELECTRONICS, MEASURING & COMMUNICATION ENG.
Codebook sizeLength of multigrams nPruning factor aEntropy of VQ codebook //(V)Mod. entropy of multigram dictionary H'(M)Difference H(V) - H'(M)Dictionary size
32100.5
4.5573.9150.6426273
2566
0.07.4706.3211.14912414
Discussion and Application to Low Ra te Speech Coding. The direct codingof multigrams is offering a possibility of bit reduction. However, for a precise spectrumrepresentation, the codebook must be larger. We worked with these codebooks but theresults were not satisfactory (symbol-by-symbol division of the sequence). We see the reasonin the variability of typical spectral sequencies, which is much greater than that of typicalsequences in written texts (original field of application of multigrams in [2, 3]). To overcomethe "rigidity" of the method, we have proposed following solutions:
• Modification of the method. Instead of demanding the equivalence between a sequenceand a multigram in the dictionary, we may introduce a. distance. This will allow twosequences with the distance below a trcshold to be represented by the same multigram,as a result we will obtain more compact multigram dictionary. The sequences can beof equal or unequal (with time alignment) lengths.
• Multigrams only for the segmentation. Using multigram segmentation together withanother technique of spectrum representation will allow us for example to create two-stage VQ with the symbols of length greater than one (Matrix Quantization withunequal length of matrices).
Application to Image Processing. It is possible to develop an extension of themethod to 2-dimensional sequencies, where the symbols are replaced by pixels. The imageis segmented into figures of variable dimensions. On the contrary to ID-case, where amultigram is entirely defined by its length, in 2D it is necessary to specify the possibleforms - rectangular, convex, concave, and the connexity (4- or 8-).
References:
[1] CERNOCKt, J.: Codeurs de Parole Segmcntaux, Rapport du stage de DEA, ESIEEParis, September 1995.
[2] BIMBOT, F. -- PIERACCINI, R. - LEVIN, E. - ATAL, B.: Modeles de Sequences aHorizon Variable: Muttigrams, pp. 467-472, XX-emes Journees d'Etude sur la Parole,Tregastel, June 1994
[3] DELIGNE. S. - BIMBOT, F.: Language Modelling by Variable Length Sequences: Theo-retical Formulation and Evaluation of Multigrams, pp. 169-172, Proceedings of ICASSP94, Detroit, 1994
This research has been conducted at the Institute of Radioelectronics of FEI VUT Brnoand at the Deparlemcnl Signal of ESIEE Paris as part of the research project "Speech Codingfor the Transmission on HF and VIIF Channels" and has been supported by TV Brno grantNo. FU45 0001 and by French Government scholarship No. 94/4516.
710

WORKSHOP 96 ELECTRONICS, MEASURING k COMMUNICATION ENG.
TRACKING OF A MOVING BODYBY CCD CAMERA
J. Honec, M. Richter, P. Valenta, F. Sole
TU, Fac. of El. Eng. & Comp. Sci., Dept. of Automatic Control & InstrumentationBozetechova 2, 612 66 Brno
Key words: robot control, stereofotogrammetrie, CCD camera, position detection, Kalmanfiltering, camera calibration
According to development of robot control algorithms for fast detection and trackingof objects with CCD cameras has been analyzed.
We have solved two common tasks:
• 2D task: if object is moving in working plane, it is enough to find only two coordi-nates, the third one is defined by working plane. The orientation of working plane accordingto camera is fixed. The parameters of rules to transform object coordinates in the sceneto coorinate system coupled with working plane of robot could be done by finding definedfixed points of working plane.
An accuracy of location computation based on resolution of camera and fixed points onworking plane. With TV camera with standard CCD chips by SONY ICX 039 (resolution752(H)x287x2(V)) and pixel oriented digitizer for optically well defined object could befind place with accuracy up to 3 mm vertically and up to 1.5 mm horizontally (if cameraruns in non interlaced mode).
The values are valid if object is scaned with angle higher than 60 degrees and robot'sworking plane is 1000 x 750 mm. The accuracj of coordination definition could be improvedby smaller working area or by using subpixel values. The knowledge of inner coordinates ofcamera, for coordinates corection, is assumed.
• 3D task: the object could be situated anywhere in the working area. In this case itis necessary to find all object coorinates by some of stereofotogrammetrics methods. Duerelatively easierst of mathematic apparat (requirements of high speed processing) we havechoosen system with couple of cameras with fixed base. In this case both cameras arescanning objects with aproximatelly the same angle. It makes easier to find stereocou-ples in sequence of stereo images. Analyses of accuracy of stereofotogrammetrically findedcoordinates is relativelly difficult task.
Routhly we can start with information that coordinates in object plane could be findwith accuracy equal to step of base ratio. For example if the width of object plane is 1 mand base is 0.3 m and with CCD camera with ICX 039 chip could be reached resolutionapproximately 1.5 mm without using subpixel methods. Accuracy of computation of objectdistance from camera is in this case 3 mm.
The accuracy of object coordinates calculation depends on accuracy of outer and in-ner cameras orientations. The most important items of inner camera orientation includesprincipal point, camera constant and distortion of lenses. We have develope method to findnonlinear objectiv distortion and principal point.
711

WORKSHOP 96 ELECTRONICS, MEASURING fc COMMUNICATION ENG.
To describe the objective distorsion we can use formula rn = r o ( l + o r 0 ) . The values r0,rn are real and measured distances of testing point from the principal point. The value c isthe only calculated parameter. Described method allowes correction of objectiv distorsionsat corners of image under one pixel. The same results as with classical methots could bereached by this solution.
To calculate of outer cameras orientation were used classical stereofotogrammetricalmethods, which were modified to convergate even for relativelly roughtly digitized image.
To detect and calculate the object coordinates in the image were used corelation meth-ods. As corelation pattern was used idealized image of object or its edges. After objectdetection was used Kalman's filter with prediction to follow the trajectory. The predictedvalues allows to find an object area which has to be searched in next step and then cutdown computation time.
We have assembled the stereofotogrammetrical pair CCD cameras with fix base equalto 300 mm with pixel oriented digitizer and with software. Algorithms for object trajectorytracking were implementea in 32 bits DSP TMS320C30. Measured coordinates were usedto move arm of robot to object.
Robot control with CCD camera has some restrictions due to properties of CCD cam-era. The resolution of common CCD cameras, in case when the whole working area istaken, allows rought position detection. For accurate positioning of robot we must use nextcamera coupled with robot for detail image. Computational expensive algorithms could becalculated by using simple board with DSP. The object trajectory in the picture is possibleto find with step under 0.1 s.
This research has been conducted at the Department of Automatic Control and Instru-mentation as part of the research project "Advanced Schemes of Robot Control" and hasbeen supported by GACR grant No. 101/93/S435.
712
WORKSHOP 96 ELECTRONICS, MEASURING fc COMMUNICATION ENG.
ACTIVE RC FILTERSIN CURRENT MODE
T. Dostal
TU, Fac. of Electrical Eng. & Comp. Sci., Dept. of RadioelectronicsAntoninska 1, 662 09 Brno
Key words: analoque filters, active RC biquads, voltage current and hybride modes, cur-rent conveyors, transimpedance and current amplifiers
Active RC filters are well-known and popular. There is a voltage signal processingin classical voltage mode, using a conventional opamps. Unfortunately parasitic inherentfeatures of the real opamp play there more characeristic role, specially in high frequencyregion [1]. For this reason an adjoint current mode has been developed, where the currentsignal processing is used.
From principle of methodology we would recommend to distinguish more hybrid modetoo, next to basic mentioned voltage and current one, namely voltage-current or current-voltage respectively, if certain subcircuit (usually an active element) operates in the oppositemode. Note that the conventional opamp operates in voltage mode, while the currentconveyor and the transimpedance amplifier in current one respectively.
At first, several modes in simple ARC single amplifier, second order filters have beenanalyzed, compared and experimentally tested in detail. Specially the Huelsman highpassARC filter was studied [1] in voltage, current and hybrid current-voltage mode respectively.Computer experimental results ware given to numerically compare performances of themodes, assuming a limited frequency response of the real opamp, modelling conventionalLM 741 in program Microcap.
Furthermore migration of poles and zeros of this circuit was studied, using programsCOCO and LINO. In all, the hybrid current-voltage and specially full current modes arecloser to the ideal case. There are much wider bandwith, high gain, lower noise, largelinearity and high slew rate, than in the corresponding classical voltage mode.
The current mode version can be simply obtained from the known voltage filter, as aprototype, using the concept of adjoint networks, namely interchanging the input and outputof active elements (nullator and norator of the opamp) and reversing the input output portsof the overall filter.
New high performance ARC biquadratic filters, using commercially available tran-simpedance opamps have been given in [2] in all mentioned modes. These circuits are theredesigned from already known double-ladder multiple-loop feedback conventional opampstructure, operating in voltage mode, using adjoint transformation and special modifica-tion for the transimpedance opamp respectively. The papers [2] and [6] demonstrate thattransimpedance opamp, including a compensation pin, are much more versatile and betterthan other opamps, specially in high frequency range, what was supported by computermodelling and experiments. There is given an equivalent circuit of the real transimpedanceopamp, modelling its parasitic properties, using voltage and current controlled sources. Pa-rameters are named for commercially available AD 844 (Analog Devices). Furthermore, in[2] are given some comments on the Fabre's paper from IEE Proc. G 1993, No. 5, too.
713
WORKSHOP 96 ELECTRONICS, MEASURING k COMMUNICATION ENG.
Simple implementations of functional blocks (voltage and current followers, derivators,integrators, immitance convertors and invertors) and synthetic elements-inductors and fre-quency dependent negative resistors, using transimpedance opamps are given in [7].
A true current operational amplifier in monolithic integrated form was proposed byMucha [8], in two versions, namely a differential input-single output one and a complemen-tary single input-differential output, respectively. Specially second one is more suitable forthe full current mode filter applications, adjoint to the voltage prototypes, what was shownin [4]. Biquadratic elliptic low-pass ARC filter using single input-differential output currentoperational amplifier was proposed in [3]. This full current mode filter was ingeniously trans-formed from the known voltage mode prototype as an adjoint counterpart. Both circuitsware compared in detail by computer modelling.
The other current and hybrid mode filters using current operational amplifiers, second-generation current conveyors (CC II) and transimpedance opamps are given in [5-7], too.
References:
[1] DOSTAL, T. - RYBIN, A.: Comparison of several modes in simple ARC second-orderfilter. Radioengineering, No. 3, 1994, pp. 17-21
[2] DOSTAL, T.: Insensitive voltage-mode and currend-mode filters from transimpedanceop. amps. IEE Proc. Cir. Dev. Syst. No. 2, 1995, pp. 140-144
[3] DOSTAL, T. - SENK, L. - PROKOP, R.: Eliptickd dolni propust ARC s proudovymzesilovacem. In: Elektro'95, EF VSD, Zilina, s. 77-80
[4] DOSTAL, T. - SENK, L. - PROKOP, R.: Pfidruieni obvody s proudovymi zesilovaci.In: Radioelektronika 95, FEI VUT Brno, s. 42-45
[5] DOSTAL, T. •- SENK, L.: Integrators using current op. amplifiers. Accepted for con-ference Radioelektronika 96.
[6] DOSTAL, T. - PROKOP, R.: ARC filters using single transimpedance amplifier. Ac-cepted for conference Radioelektronika 96.
[7] DOSTAL, T. - SARMAN, R.: Functional blocks and synthetic elements from tran-simpedance opamps. Accepted for conference Radioelektronika 96.
[8] MUCHA, I.: Towards a true current operational amplifier. In: ISCAS 94, London,1994, pp. 389-392
This research has been conducted at the Department of Radioelectronics as part of theresearch project "Filter Synthesis in Current Mode" and has been supported by TU grantNo. 0064-1995.
714
WORKSHOP 96 ELECTRONICS, MEASURING fc COMMUNICATION ENG.
NEW CURRENT-MODEFILTER STRUCTURES
P . Martinek, J. Rudolf
CTU, Fac. of Electrical Eng., Dept. of Circuit TheoryTechnicka 2,166 27 Praha 6
Key words: current-mode filters, SC filters
In Ref.[l] we have introduced new lossless non-reciprocal structures suitable for high-quality filter implementation. An efficient synthesis algorithm was developed and testedand a behaviour of designed filters was investigated. To improve dynamic properties and todecrease influence of Op-Amp imperfections, the transformation to the current-mode wasstudied. Two ways were tested to obtain desired structures:
• Direct synthesis procedure arising from the re-arrangement of fundamental buildingblock. This way leads to the modified form of synthesis algorithm under "current-mode" starting conditions.
• Adjoint transformation of a voltage-mode counterpart.
Both the ways have been found to be efficient and together with the new improved formof synthesis algorithm lead to the flexible design of current-mode all-pole LP, BP and HPfilters. The design flexibility allovcs to choose the type of loading immitances and workingimmitances, which, in the end, make possible to adapt final structure to the technologicalconstraints flowing from the implementation technique.
Because the design procedure is based on an application of two-port transmission (chain)parameters, a problem of the derivation of starting parameters arises. The solution is trivial,when single-terminated circuit is considered. In the case of both-port terminated circuitwas necessary to find a new solution because of non-reciprocal character of the synthetisedcircuit. For this purpose a generalized form of Feldtkeller's equation was derived and usedin the evaluation procedure of transmissiom two-port parameters. This work was presentedin Proceedings of the conference ECCTD'95 [2].
To get a global information about a behaviour of different filter realizations, followingtopics were observed:
• An influence of synthesis procedure (particularly the order of transfer zeroes realiza-tion) to the spread of values of circuit elements,
• an influence of Op-Amp non-idealities, especially influence of the ratio of Op-AmpGBW-product to fitter cut-off frequency,
• dynamic properties of structures designed.
As reference LP-filters were used Cauer's 4th and 6th-order filters of the type C 04a 35 25and C 06b 68 25 designed in the all possible modifications. In global, 16 different circuitstructures were compared. The results showed wery low sensitivity of current-mode struc-tures to OP-Amp gain-bandwidth product and excellent dynamic properties. On the otherhand, the dynamic properties strongly depended on an arrangement of loading immitances,which was found as a critical point of the optimal design.
715
WORKSHOP 96 ELECTRONICS, MEASURING fc COMMUNICATION ENG.
A detail comparison of current-mode LP designs to their voltage-mode counterpartswas made in [3].
Another part of our work was oriented to the development of filter structures, basedon generalized divider configuration. A synthesis of these filters arises from the directrealization of the coefficients of given transfer function, and, from this point of view, suchcircuits are able to serve as equalizers or basic structures of analog adaptive filters. Anoriginal structure using generalized immitance converters (GIC) was developed and testedin its voltage-mode and current-mode form, A behaviour of the mentioned structures wasstudied. A comparative study performed in the frame of diploma-thesis [4] was devoted tothe evaluation of a set of the 2nd and 4th-order filters and a detail investigation of theirproperties. Especially the influence of Op-Amp inaccuracies to the transfer poles and zeroeslocation was analysed. In this case current-mode structures were found as insensitive in thewide extent of Op-Amp's GBW and trajectories of pole- and zero-shifts caused by GBW-changes were oriented along the direction of minimal sensitivity of the circuit frequencyresponse. These results were presented at the conference RADIOELEKTRONIKA 95 [5].
Simultaneously discrete-time SC structures, derived from the above mentioned basiccontinuous-time prototype have been investigated. To minimize a number of Op-Ampsused, a simplified type of SC-GIC was developed by using "negative SC-resistor effect". Inconnection with the detail description of SC-GIC, the influence of SC-resistor implemen-tation to the circuit behaviour was studied. On this occasion new properties of studiedcircuits were found. The obtained results led to the optimum switch-phasing design and, ingeneral, made possible to decrease the total capacitance of the final circuit.
The presented structures seem to be prospective in a wide area of applications. Forexample, the second-order blocks based on generalized-divider structure could serve as anuniversal building blocks of tunable filter or equalizer structures. An application of thementioned structures will be a topic of the future investigations.
References:
[1] MARTINEK, P.: Low-Sensitivity Non-Reciprocal Lossless Filters. Proc. of the Work-shop 95, Part II, p. 577, CVUT, Prague, 1995
[2] MARTINEK, P. - MATZNER, I.: Current-Mode Non-Reciprocal Lossless Filters. Proc.of the ECCTD'95 Istanbul, Vol. 2, pp. 801-804, Istanbul Technical University, Turkey,1995
[3] RUDOLF, J.: A Comparison of Current-Mode and Voltage-Mode GIC Filters. Proc. ofthe Czech-Polish-Hungarian Workshop on Circuit Theory and Applications, Kazimierz,Poland, pp. 58-63, Warsaw University of Technology, Poland, 1995.
[4] ADAMKOVA, M.: Design Algorithms of SC Adaptive Filters. Diploma Thesis, CVUTFEL, K331, Prague 1995
[5] MARTINEK, P. - ADAMKOVA, M.: A Contribution to Filter Design Based on Princi-ple of Generalized Divider (in Czech). Proc. of the RADIOELEKTRONIKA 95, Part III(supplement), pp. 5-8, VUT-FEI Brno, 1995.
This research has been conducted at the Department of Circuit Theory as part of theresearch project "Current-Mode Analog Circuits" and has been supported by CTU grantNo. 10038274.
716
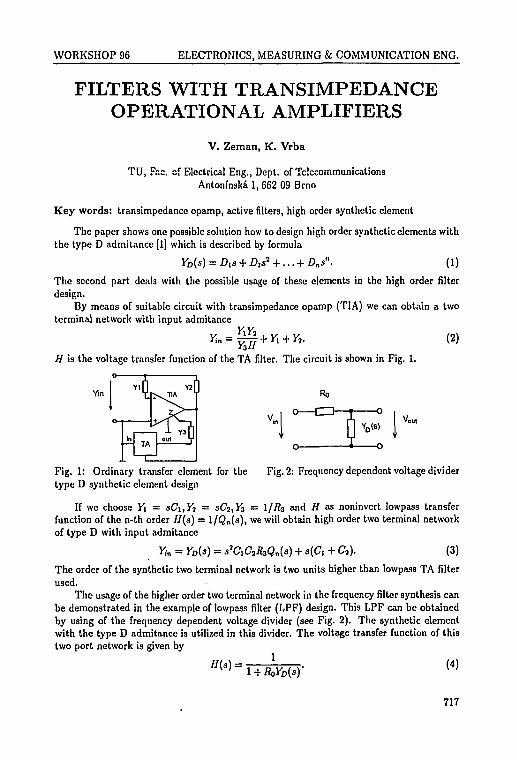
WORKSHOP 96 ELECTRONICS, MEASURING & COMMUNICATION ENG.
FILTERS WITH TRANSIMPEDANCEOPERATIONAL AMPLIFIERS
V. Zeman, K. Vrba
TU, Fac. of Electrical Eng., Dept. of TelecommunicationsAntom'nska 1, 662 09 Brno
Key words: transimpedance opamp, active filters, high order synthetic element
The paper shows one possible solution how to design high order synthetic elements with
the type D admitance [1] which is described by formula
The second part deals with the possible usage of these elements in the high order filterdesign.
By means of suitable circuit with transimpedance opamp (TIA) we can obtain a twoterminal network with input admitance
VV1 2 (2)
H is the voltage transfer function of the TA filter. The circuit is shown in Fig. 1.
Ro
Fig. 1: Ordinary transfer element for the Fig. 2: Frequency dependent voltage dividertype D synthetic element design
If we choose Y\ = aC\,Yi = sCi,Yi = l /#3 and H as noninvert lowpass transferfunction of the n-th order H(s) = 1/Qn(s), we will obtain high order two terminal networkof type D with input admitance
Yin = YD(s)=s'ClC2R3Qn(s) + s(Ci+C,). (3)
The order of the synthetic two terminal network is two units higher than lowpass TA filterused.
The usage of the higher order two terminal network in the frequency filter synthesis canbe demonstrated in the example of lowpass filter (LPF) design. This LPF can be obtainedby using of the frequency dependent voltage divider (see Fig. 2). The synthetic elementwith the type D admitance is utilized in this divider. The voltage transfer function of thistwo port network is given by
717
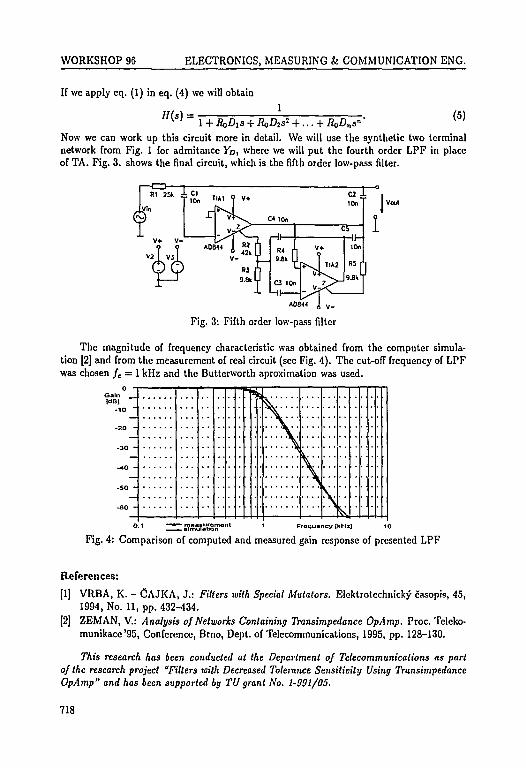
WORKSHOP 96 ELECTRONICS, MEASURING & COMMUNICATION ENG.
If we apply eq. (1) in eq. (4) we will obtain
H(s) =1
Now we can work up this circuit more in detail. We will use the synthetic two terminalnetwork from Fig. 1 for admitance YD, where we will put the fourth order LPF in placeof TA. Fig. 3. shows the final circuit, which is the fifth order low-pass filter.
Fig. 3: Fifth order low-pass filter
The magnitude of frequency characteristic was obtained from the computer simula-tion [2] and from the measurement of real circuit (see Fig. 4). The cut-off frequency of LPFwas chosen fc = 1 kHz and the Butterworth aproximation was used.
GainIdBJ
-20 -
-30 -
-40 -
-50 -
-60 -
K
\ . . .
\
\
\
\
Vs.s
O.I *~*F~ «?mufaUonnOnl 1 Frequency JkHzJ 10
Fig. 4: Comparison of computed and measured gain response of presented LPF
References:
[1] VRBA, K. - CAJKA, J.: Fillers wilh Special Mutaiors. Elektrotechnicky casopis, 45,1994, No. 11, pp. 432-434.
[2] ZEMAN, V.: Analysis of Networks Containing Transimpedance OpAmp. Proc. Teleko-munikace'95, Conference, Brno, Dept. of Telecommunications, 1995, pp. 128-130.
7"Ais research has been conducted at the Department of Telecommunications as partof the research project "Filters with Decreased Tolerance Sensitivity Using TransimpedanccOpAmp" and has been supported by TU grant No. 1-991/05.
718
WORKSHOP 96 ELECTRONICS, MEASURING fc COMMUNICATION ENG.
CONTRIBUTION TO THE DIRECTSYNTHESIS OF SC CIRCUITS
J . Bic"ak, L. DiviS
CTU, Fac. of Electrical Eng., Dept. of Circuit TheoryTechnicka 2, 166 27 Praha 6
Key words: circuit theory, SC filters, synthesis of discrete-time filters
The internal CTU grant No. 10038274 backed the investigation of the SC structures,which were based on a new analog nonreciprocal lossless prototype, published in [1]. Theprocedure of an effective Z-domain design, analogical to the chain parameters partial re-moval procedure for the continuous-time prototype, described in [2], was searched for thesestructures.
The formulation of such design procedure consists of two steps:
1. Formulation of multiphase 2-domain chain parameters.
2. Adapting the individual analog procedure steps in the Z-domain,
which is briefly mentioned in the following paper with a couple of more detailed references.The multiphase SC chain parameters based on the [3] were formulated for the particular
kind of two-phase circuits in the form of:
(5W where V . ^ U ^ f ' " «« ) etc. (1)
The solution using algebraic cofactor was formulated for these parameters. This ap-proach was successfully tested by means of mathematical software MAPLE. Relations to re-maining SC transfer functions, namely to four basic voltage and charge transfers (K and H),came out as
An = A""1 . „ / K« Kt
which are the generalized analogies of the well-known continuous-lime relations, see [4].The above mentioned chain parameters were then applied to carry out the 2-domain
design procedure analogically to the continuous-time prototype. To complete this objectivesuccessfully, three main topic had to be performed, what is briefly described as follows:
• Analysis of ^-domain loads.
• Decomposition of K(z) to au(z) and 012(2).
• The removal step.
719
WORKSHOP 96 ELECTRONICS, MEASURING k COMMUNICATION ENG.
As it was established in [5], the multiphase structure of An and An is simplifiedby strays insensitive resistor simulation under the condition that an appropriate switchesphasing is used. In that case the design procedure can be performed separately for Ktc (evento even) transfer function; in the odd phase the load has no influence on the circuit function.
The analogy of the even-odd part separation (in order to establish an and an necessaryfor the removal procedure) was developed in the second step. The reciprocal and antirecip-rocal polynomials were established as counterparts of even and odd part of the function ins-domain respectively. This separation is not unambiguous in the Z-domain and depends onused 3 *-* z transformation. For the strays-insensitive structures the following relations arevalid (where nj and nj are the reciprocal and antireciprocal parts of the transfer functionnumerator, respectively):
The rules for removement of one second order building block were formulated in thelast step of the design procedure. Taking into account that the chain matrix of the buildingblock is the 4 x 4 matrix, the removal formula can be written in the form:
A>=(°n 0 an ayi \(4)
where an and a n are the above mentioned chain parameters and Ag\ is the inverse chainmatrix of the removed block. The conditions of a,, = 0 and dij = anz'i necessary for thesuccessful removement are valid for specific switches phasing again which can be formulatedfor an individual structure unambiguously.
The entire procedure was successfully tested on the fourth-order elliptic filter of type A,the strays-insensitive resistor simulation was used. The results are summarized in [5], a con-tribution for a foreign journal is now being prepared. Since the structures discussed in [2]have their current-mode counterparts we are going to apply the above mentioned designapproach for this class of circuits as well.
References:
[1] MARTINEK, P. - MATZNER, I.: Active Filters Based on Lossless Nonreciprocat Struc-tures. Proceedings of the ECCTD '93, Davos, Elsevier, Amsterdam, 1993, Part I,pp. 745-750
[2] KOUDELKA, D.: Effective SC Filter Design. Ing. Thesis, CTU, Fac. of ElectricalEng., Dept. of Circuit Theory, Praha 1992 (in Czech).
[3] KURTH, C. F. - MOSCHYTZ, G. S.: Two-Port Analysis of Suiitched-Capacitor Net-works Using Four-Port Equivalent Circuits in the Z-domain. IEEE Transection onCircuits and Systems, Vol. CAS/26, No, 3, March 1979, pp. 166-180.
[4] DIVlS, L. - BICAK, J.: Charge Transfer Functions And Chain Parameters of SCEquivalents. Radioengineering, Vol. 4, No. 2, June 1995, pp. 1-7.
[5] DIVIS, L.: Analysis and Synthesis of SC Circuits. PhD Thesis, CTU, Fac. of ElectricalEng., Dept. of Circuit Theory, Praha 1995.
This research has been conducted at the Department of Circuits Theory as part of theresearch project "Current Mode Analog Circuits" and has been supported by CTU grantNo. 10038371
720
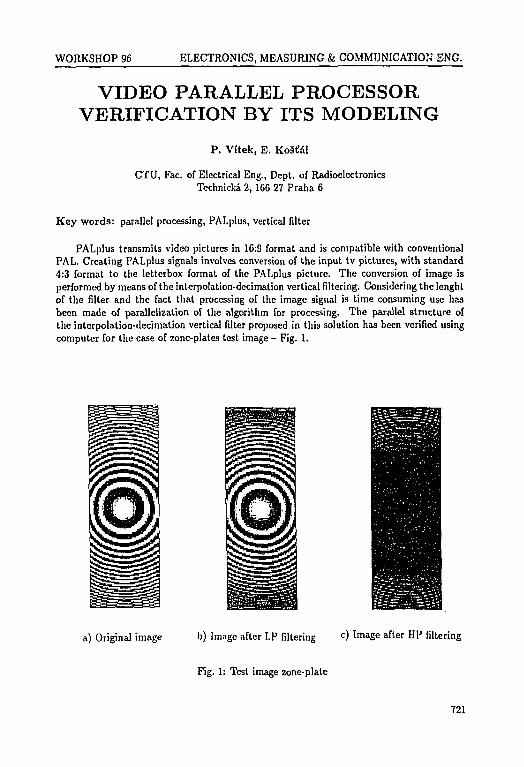
WORKSHOP 96 ELECTRONICS, MEASURING & COMMUNICATION ENG.
VIDEO PARALLEL PROCESSORVERIFICATION BY ITS MODELING
P. Vitek, E. KoitJal
CTU, Fac. of Electrical Eng., Dept. of RadioelectronicsTechnicka 2, 166 27 Praha 6
Key words: parallel processing, PALplus, vertical filter
PALplus transmits video pictures in 16:9 format and is compatible with conventionalPAL. Creating PALplus signals involves conversion of the input tv pictures, with standard4:3 format to the letterbox format of the PALplus picture. The conversion of image isperformed by means of the interpolation-decimation vertical filtering. Considering the lenghtof the filter and the fact that processing of the image signal is time consuming use hasbeen made of parallelization of the algorithm for processing. The parallel structure ofthe interpolation-decimation vertical filter proposed in this solution has been verified usingcomputer for the case of zone-plates test image - Fig. 1.
a) Original image b) Image after LP filtering c) Imag<= after HP filtering
Fig. 1: Test image zone-plate
721

WORKSHOP 96 ELECTRONICS, MEASURING & COMMUNICATION ENG.
Parallel processing achieved using 9 partial processors, which have 78% utilization. Eachof them contains an elementary processor for multiplication and addition as well as videoline memory. In comparision with serial processing which has an effeciency comparablewith that of a single partial processors in the parallel structure, the parallel procesor isapproximately 50 time faster.
The coding scheme discussed above requires vertical filtering of two types. The wholefilter has two outputs. Using the first filter is possible to take out the low frequency com-ponent of the function spektra associated with the original image (as a signal) with thesecond filter generating the remaining high frequency part of the spectra. This arrangementforms the basis of the modern coding method used in PALplus system. The results obtainedduring the research for the computer simulation of this arrangement are illustrated on theFig. 1. In this diagram Fig. lb and Fig. lc corespond to the input image show the effect ofthe filter on the reproduced image.
The first version of the filter is modelled in terms an electronic parallel processor. Thisstudy also takes heed of the optical realization of this operation. This supposes the use ofspatial light modulators, optical Fourier transform systems and image sensors in performingthe required functions. The concept of the specified image sensor has been worked out andthe timing diagram of its operational regime for said two pass vertical filter calculated.
References:
[1] VITEK, P.: Present state of implementation of optical methods in parallel optical pro-cessing. CTU, Prague 1993.
[2] HENTSCHEL, C. - SCHOENFELDER, H.: Probleme des Formatwecksels bei zukuen-ftigen verbesserten PAL-Verfahren. FKT, No. 11, 1991.
[3] VITEK, P. - BERNAS, M. - KOSTAL, E.: Parallel optical video processor simulation.Proc. of Photonics '95 conference, Topics 6, Praque, 1995.
[4] VITEK, P. - KOSTAL, E.: Parallel video processor PALplus for interpolation-decimation vertical filtering. Proc. of Radioelectronics '95, Brno, 1995.
This research has been conducted at the Department of Radioelectronics as part of theresearch project "Tools for systems of the fast processing of image information" and hasbeen supported by CTU Prague grant No. 100S8S85.
722
WORKSHOP 96 ELECTRONICS, MEASURING fc COMMUNICATION ENG.
EMPLOYMENT OF 2x2 SWITCHINGELEMENTS IN ATM SWITCHING
NETWORKS
L. ValaSkova
CTU, Fac. of Electrical Eng., Dept. of Telecommunications EngineeringTechnicka 2, 166 27 Praha 6
Key words: multistage interconnection network, self-routing, throughput
ATM (Asynchronous Transfer Mode) was chosen by the CCITT to serve as a base forthe future Broadband Integrated Services Digital Network. The main challenge in ATMswitching is to build fast packet switches which can handle data rates ranging from 150 to600Mb/s per input line.
A switching network N x N combines two functional components: buffer memory tostore the cells and an interconnection mechanism to transfer them from the inputs to selectedoutputs. A number of switching network architectures has been proposed. According to theinterconnection principle used, three basic types of ATM switching networks are identified:the shared-memory type, the shared-medium type, and the space-division type (switchingnetworks combining these principles can be met as well). Generally, in switching networksbased on shared-memory and shared-medium, traffic from all input lines is multiplexedinto a single stream of bandwidth equal to N times the bandwidth of a single line. Thisrepresents a great difficulty for large N since such switching networks become very complexand expensive.
Although space-division switching networks present problems of their own, intercon-nection networks based on identical small switching elements seem to be very attractive. Inthis article we will concentrate on switching networks built with 2 x 2 switching elements.Switching networks N x N where N = 2" (n = 2,3,.. .) can be built with nN/2 switchingelements arranged in n stages. A class of such networks is usually referred to as banyannetworks although it encompasses networks of various topologies (e.g. flip network, omeganetwork, delta network, shuffle-exchange network). Regardless of the particular form theytake, all of the above N x N multistage interconnection networks possess the followingproperties. There exists a single path which connects an input line to an output line. Theestablishment of such a path may be accomplished in a distributed fashion, using a self-routing procedure. If the outputs of such an interconnection network are numbered from 0to N and expressed by a binary word (of the length of n) then switching elements are ableto configure themselves by considering one bit of the destination address of routed cells.
The networks possess a regular structure which is particularly suitable for VLSI im-plementation; furthermore their structure is modular allowing the construction of largenetworks from smaller ones without the need for modification in the physical layout or inthe algorithms needed for their operation. All these features have made these interconnec-tion networks among the most desirable building blocks for fast packet switches. But aserious shortcoming of these architectures is internal blocking, i.e. even if all cells at inputsare destined to different outputs (there are BO output conflicts) several cells may contend
723
WORKSHOP 96 ELECTRONICS, MEASURING & COMMUNICATION ENG.
for an internal link. This induces throughput limitations, and so additional techniques areused to relieve the internal blocking.
The first solution to mention is placing buffers at the points of conflicts. It is known asthe buffered-banyan switching network. For uniform input traffic pattern a buffer of about4 cells at each switching element can improve the capacity (throughput when offered loadequals to 1) of the switching network above 0.6. Nevertheless in case of bursty traffic severecongestions can occur. One solution may be to operate internal links at a higher rate thanexternal lines. From a hardware implementation point of view this is not very convenient.Another possibility is to randomize the traffic at the input so as to distribute it across theentire network and break the unpleasant effects of long bursts. For this purpose additionalstages may be included to switching networks which provide for each input/output pairseveral paths (e.g. Benes networks).
Another approach to internal conflicts is implementation of a sorting network whichpasses to a banyan network only cells free of both output and internal conflicts. Of coursesuch a solution implies a more sophisticated architecture dealing with recycling of unsuccess-ful cells and resequencing them at the outputs. Combining this idea with the one mentionedabove (increasing the number of possible paths for input/output pairs, for example by usingseveral parallel banyan networks) very satisfactory results can be obtained.
Yet another solution using multiple banyan networks consists of placing the banyannetworks in tandem. Upon a conflict between two cells at some switching element, one ofthe two cells is routed according to its destination, while the other :s derouted and marked assuch. At the output of the first banyan, successful cells are extracted to output port buffers,while those which appear at the wrong outputs are unmarked and start a new round withlesser chances for conflicts this time. It can be shown that for uniform traffic six banyannetworks in tandem result in the network capacity very close to 1.0.
A high switch capacity can be obtained also with pure banyan networks where buffersare placed at outputs as well as at inputs. Cells which would cause output conflicts arestored in the input buffers waiting to be switched at a later time. This means that the samenumber of output lines remains idle (so called head-of-the-line blocking) while behind theseHOL cells, cells destined to the idle outputs might be placed. To avoid this, bypass queuesare implemented, i.e. during one time slot, w cells from each input buffers are given chanceto contend for idle outputs. This requires a slightly higher internal rate. In [4] it is shownthat with the window depth to = 4 and four parallel banyan networks, capacity around 0.9can be obtained.
References:
[1] TOBAGI, F. A.: Fast Packet Switch Architectures For Broadband Integrated ServicesDigital Networks, pp. 133-167. Proceedings of the IEEE, Vol. 78, No. 1, January 1990.
|2] WU, C. - FENG, T.: On a Class of Multistage Interconnection Networks, pp. 694-702,IEEE Transactions on Computers, Vol. C-29, No. 8, August 1980.
[3] KIM, II. S. - LEON-GARCIA, A.: A Self-Routing Multistage Switching Network forBroadband ISDN. pp. 459-466, IEEE Journal on Selected Areas in Communications,Vol. 8, No. 3, April 1990.
[4] SU, Y. - HUANG, J.: Throughput Analysis and Optimal Design of Banyan Switcheswith Bypass Queues, pp. 2781-2784, IEEE Transactions on Communications, Vol. 42,No. 10, October 1994.
724

WORKSHOP 96 ELECTRONICS, MEASURING fc COMMUNICATION ENG.
NOISE CANCELLATION SYSTEMS
P. Sovka, P. Pollak, V. Davidek, J. Uhlif
CTU, Fac. of Electrical Eng., Dept. of Circuit TheoryTechnicka 2, 166 27 Praha 6
Key words: noise suppression, microphone array, voice activity detector, time delay esti-mation
Continuing our work on noise cancellation systems, we have investigated algorithms fortime delay estimation, voice activity detection and noise suppression. These algorithms areimportant parts of noise cancellation systems.
The objectives of the research were:
• To analyze and compare methods for time delay estimation and compensation. Specialattention was paid to use of higher order spectra.
• To analyze and compare methods of voice activity detection. Emphasis was put on thedevelopment of reliable speech activity detectors suitable for real-time implementation.
• To implement a chosen noise suppression method on a signal processor.
• To test the implemented noise canceller under real noisy conditions in a running car.
Noise suppression systems are widely used in various speech processing systems, e.g.speech recognition, hands-free mobile telephony, aids for hearing-impaired, etc. We focusedon the mobile telephony application. Our final goal was to implement a low-cost simpleand reliable algorithm for the real time suppression of additive car noises. That is why weused the spectral subtraction algorithm. We tested this algorithm for one microphone andmultimicrophone noise cancellation systems. We have found that the one microphone systemperformance is heavy dependent on the proper detection of speech activity segments, whilethe performace of the multimicrophone system is influenced by the time delay estimationalgorithm. Owing to our hardware configuration we focused on the implementation of thespectral subtraction system using one and two microphones.
Delay estimation and compensation. Multimicrophone noise cancellation systemsare based on the assumption that an additive noise is a diffusive signal while speech isa coherent signal. These assumptions are valid if the distances between microphones aregreater than 30 cm. Inspite of the microphone configuration the speech signals picking upby microphones have different time delays. Prior tc the spectral subtraction is applied thesedelays had to be compensated. Second order spectra (SOS) and higher order spectra (HOS)can be used. HOS require the gaussianity of car noises. We have found this assumptionis not valid for many types of car noises. Inspite this fact HOS outperform SOS when thecrosscorrelation of noises is large and signal to noise ratio (SNR) is low. On the other handHOS are more sensitive to the parameters selection than SOS. Further details and resultscan be found in [1].
Spectral subtraction. Spectral subtraction subtracts an estimation of the back-ground noise spectrum from the input signal spectrum. The difference between one mi-crophone spectral subtraction and multimicrophone spectral subtraction lies in the way of
725
WORKSHOP 96 ELECTRONICS, MEASURING fc COMMUNICATION ENG.
getting the estimation of the background noise spectrum. For one input signal this estima-tion has to be done in nonspeech segments. This approach requires a reliable voice activitydetector (VAD). For more input signals the background noise estimation is got from thesubtraction of input signals. Before the subtraction the delays between signals have to becompensated. This compensation also requires a VAD. If the ideal voice detection is usedthe average figure in the noise suppression varies from 6 to 12 dB depending on the rate ofsignal parameters changes.
One microphone spectral subtraction was implemented on the floating point signalprocessor TMS320C30. Details and results are in [2].
Voice activity detector. As describes in the preceding text the VAD is the commonpart of noise suppression methods. We suggested several VADs based on spectrum, cepstrumand coherence, which are suitable for the real-time processing. These detectors exhibit highreliability even for low SNR (about -6 dB). The description, implementation requirementsand achieved results are described in [3-8].
References:
[1] MASA, P. - SOVKA, P.: Odhady iasoveho zpozdeni a vicekanalovych signdlu feci. InRadioelektronika 95. V. celostatni vedecka konference, pp. 315-318. Brno, duben 1995.
[2] DAVlDEK, V. - SOVKA, P. - SlKA, J.: Real-Time Implementation of Spectral Sub-traction Algorithm for Suppression of Acoustic Noise in Speech. In EUROSPEECH'95,4th European Conference on Speech Communication and Technology, pp. 141-144.Madrid, Spain, Sept., 1995.
[3] KRfZ, B. - SOVKA, P.: Sludie koheren6niho detektoru rei/pausa. In Radioelektronika95. V. celostatni vgdecka konference, pp. 152-155. Brno, duben 1995.
[4] KOHOUTOVA, L. - UHLlft, J.: Detektor feci v sumu realizovany neuronovou siti. InRadioelektronika 95. V. celostatni v<Sdecka konference, pp. 156-159. Brno, duben 1995.
[5] KRlZ, B. - SOVKA, P.: Neural Network Based Enhancement of Coherence DetectorSpeech-Pause. In Proceedings of the Polish-Czech-Hungarian Workshop on CircuitTheory and Applications, pp. 41-46. Warsav University of technology, Institute ofElectronics Fundamentals, Sept., 1995.
[6] Pollak, P. - SOVKA, P. - UHLlJl, J.: Cepstral Speech/Pause Detectors. In Proceedingsof IEEE Workshop on Nonlinear Signal and Image Processing, pp. 388-391. NeosMarmas, Greece, June, 1995.
[7] SOVKA, P. - POLLAK, P.: The Study of Speech/Pause Detectors for Speech Enhance-ment Methods. In EUROSPEECH'95; 4th European Conference on Speech Communi-cation and Technology, pp. 1575-1578. Madrid, Spain, Sept., 1995.
[8] SOVKA, P. - DAVfDEK, V. - POLLAK, P. - UHLfR, J.: Speech/Pause Detection forReal-Time Implementation of Spectral Subtraction Algorithm. In ICSPAT'95, the 6thInternational Conference on Signal Processing Applications and Technology, pp. 1955-1958. Boston, MA, USA, Oct., 1995.
This research has been conducted at the Department of Circuit Theory, Faculty of Elec-trical Engineering, CTU in Prague, as part of the research project "Speech EnhancementSystems" and has been supported by CTU grant No. 100S8B75.
726
WORKSHOP 96 ELECTRONICS, MEASURING fc COMMUNICATION ENG.
NEW MULTIMEDIA TECHNOLOGIESAT THE DEPARTMENT
OF TELECOMMUNICATIONSAT FEE-CTU IN PRAGUE
J . Svoboda, B. Simak, T. Zeman, J . Hrad
CTU, Fac. of Electrical Eng., Dept. of Telecommunications EngineeringTechnicka 2, 166 27 Praha 6
Key words: multimedia technology, telecommunication, video compression, MPEG, JPEG
At present time, the term "multimedia" is used very frequently, although its definitionis ambiguous and various branches of industry understand it in different ways of technicaland technological solutions.
The initial approach to multimedia technology at our department was stimulated bydemand for better effectiveness of the teaching process.
In the first period (between the years 1989-1990), the technological equipment wasquite meagre (computers based on I80286 processor, software like Basic, Pascal etc.). Usageof graphical subsystems was limited, while that of sound or moving picture was simplyimpossible.
Later on (1992-1993), within the TEMPUS project, the department obtained an au-thoring system - Authorware Professional for Windows, which made the development ofnew teachware much easier. This enabled the authors to concentrate on educational aims,with the advantage of using graphics, animations, and especially sounds. The mentionedsystem is used for teachware development up to the present day; and more than ten mul-timedia educational programmes have been prepared; their topics concern especially datacommunications (signal converters, packet communications), electromagnetic compatibility(measuring, EMC of a personal computer), telematics (document telegraphy), and often thecommon problems of communications (the OSI model).
Since 1994 we have been exploring another approaches to more effective preparationof teachware. Thanks to the grant of MSMT (Czech Ministry of Education, Youth andPhysical Culture) we were able to equip a new workplace for designing videoprogrammesand to update the workplace for multimedia programmes preparation. We learned aboutthe possibilities of recording our own CD-ROMs and, in context, of modern compressiontechnologies application. In 1995, building of a new multimedia presentation laboratory hasstarted, and a multimedia presentation workstation is being equipped. The full operationshould start in the next year (1996).
Nowadays, the main struggle is focused on creating an original authoring system, whichforms a part of an extensive project called "The Telecommunications Engineering Ency-clopaedia". The mentioned system will enable to compile a large amount of informationconcerning telecommunications to the form of encyclopaedia, while the information carriershould be CD-ROM.
727
WORKSHOP 96 ELECTRONICS, MEASURING k COMMUNICATION ENG.
The basis of our multimedia workplace is a PC with Pentium processor (running at90MHz), equipped with 16MB RAM, PCI and ISA internal bus, SCSI-2 interface adapter.Besides the common peripherals, the colour scanner HP3c, a 1 MB hard disk, removablemedia hard disk drive SyQuest 270 MB and a quad-speed CD-ROM drive are the additionaldevices.
The functions of input, sampling, recording, playback and output of sound are suppliedby a sound card Monterey that have a wavetable sound synthesis and a MIDI interfaceintegrated on it. Thus, it is possible for any audio device to act as a peripheral of thesound subsystem, which is supplemented with an electronic musical instrument with MIDIinterface and with an amplifier with a pair of loudspeakers.
The video subsystem constitutes the set FPS60, that is capable of digitising S-VHSvideo, compression to M-JPEG format and storing to hard disk, and playback of the video(from M-JPEG or MPEG-1 format) on the SVGA monitor. The input peripherals areS-VHS devices (professional videorecorder Panasonic AG-5700 and camcorder PanasonicNV-MS4E).
In future, we want to focus on solving various problems concerning:
• Real-time compression and decompression of video;
• Connecting the "terminal" multimedia systems with multimedia/multifunction/ISDN/computer networks;
• Finishing the preparation of the new authoring system;
• "The Telecommunications Engineering Encyclopaedia" project;
• The building of the teaching laboratory.
References:
[1] SVOBODA, J. - SIMAK, B. - VONDRAK, M. - ZEMAN, T.: New Educational Waysfor Engineers of Telecommunications. EAEEIE Annual Conference, Reims, France,1994
[2] SVOBODA, J. - SIMAK, B. - ZEMAN, T.: Development of the Teaching and Coopera-tion with the Industry at the Department of Telecommunications Engineering. EAEEIEAnnual Conference, Bologna, Italy, 1995
This research has been conducted at the Department of Telecommunications Engineeringas a part of the research project "Multimedia" and it has not been supported by CTU.
728
WORKSHOP 96 ELECTRONICS, MEASURING fe COMMUNICATION ENG.
FUZZY SIGNAL PROCESSING
3. Podle5ak, P . Sitina, R. Abu Zummar ,M. Renda, J. Prochazka
CTU, Fac. of Electrical Eng., Dept. of RadioelectronicsTechnicka 2, 166 27 Praha 6
Key words: fuzzy logic, fuzzy signal processing, fuzzy clustering, fuzzy control, fuzzy sets,neural networks, fuzzy-neural networks, fuzzy associative memories, fuzzyfilters, signal filtering and prediction, nonlinear filters, biomedical diagnostics
The new technique of digital signal processing known as "Fuzzy Signal Processing", isdeveloping at a rather slower rate than other Fuzzy logic applications. In the area of signalprocessing, fuzzy logic finds its applications in nonlinear filtering (e.g. for nonstationary sig-nals) with the possibility of utilizing adaptive algorithms, in the estimation of parameters ofnonstationary signals, in speech and image encoding and in signal identification/recognition.
Our work involves two areas of applications: medical diagnostics and radiolocation.Although these areas are completely distinct, they share a similar methodology of digitalsignal processing. Our work is focused on nonstandard cases of signal processing, where wesubstitute nonlinear filters (often based on neural networks or the radial function) by fuzzyfilters and in the case of parameter estimation, or tracking, by "Fuzzy Kalman filters". Ourwork can be roughly divided into the following three areas. The first area is focused on thesole utilization of fuzzy cluster analysis of input data, which allows the achievement of abetter characterization of the actual signal than using analogous statistical methods. Thismethod was used e.g. for better detection of a signal in noise. The second area attemptsto implement IF-THEN rules into the design process, which allows a substantial increasein the accuracy of conditions for signal processing. Such a type of filter is capable ofsubstituting existing nonlinear filters, and with suitably set conditions, achieving betterresults. An equalizer in a nonlinear channel may serve as an example. The third area ofour work combines the advantages of fuzzy processing of data and neural networks. Thiscombination allows us to make use of the advantages of both techniques. The methodologysuch as learning and adaptation, already developed in the field of artificial neural networks,may be utilized. Within the framework of the project, properties of selected nonlinear filterswere verified by computer simulation, and it was ascertained that with "fuzzy filtering",qualitatively better results may be achieved than using standard filtering techniques.
References:
[1] PODLESAK, J.: Fuzzy Logic Approach to Multiradar Targed Tracking Internal Reportof the Department of Radioelectronics CTU Prague (in Czech), 1995
[2] SlTINA, P.: Fuzzy neural networks Internal report of the Department of Radioelec-tronics CTU Prague (in Czech), 1994
[3] ABU ZUMMAR, R.: Computerized Electrocardiogram Analysis Internal report of theDepartment of Radioelectronics CTU Prague, 1995
[4] TERANO, T. - ASAI, K. - SUGENO, M.: Fuzzy Systems Theory and its ApplicationsAcademic Press, Inc., 1992
729
WORKSHOP 96 ELECTRONICS, MEASURING fc COMMUNICATION ENG.
[5] KOSKO, B.: Neural Networks and Fuzzy Systems Prentice-Hall International, Inc., 1992
[6] TERANO, T. - ASAI, K. - SUGENO, M.: Applied Fuzzy Systems AP Professional,Inc., 1994
[7] GUPTA, M. M. - RAO, D. H.: On the Principals of Fuzzy Neural Networks Fuzzy Setsand Systems, 61: 1-18, 1994
[8] ARAKAWA, K. - ARAKAWA, Y.: Digital Signal Processing Using Fuzzy ClusteringIEICE Transaction, 74(11): 3554-3558, 1991
[9] LIN, C. T. - GEORGE, C. S.: Neural-networks-based Fuzzy Logic Control and DicisionSystem IEEE Transaction on Computers, 40(12): 1320-1336, December 1991
[10] LIN, C. T. - LEE, C. S.: Reinforcement Structure/parameter Learning for Neural-network-based Fuzzy Logic Control Systems IEEE Transaction on Fuzzy Systems, 2(1),1994
[11] BAGLIO, S. - FORTUNA, L. - LO PRESTI, M. - VINCI, C : IIR and FIR FuzzyFilters Proceedings of the 36th Midwest Symposium on Circuits and Systems, 832-835,1993
[12] TOUMAZOU, C. - LANDE, T.: Building Bloks for Fuzzy Processors IEEE Circuitsand Devices Magazine, 10(4): 48-50, July, 1994
[13] SAADE, J. J. - SCHWARZLANDER, H.: Application of Fuzzy Hypothesis Testing toSignal Detection under Uncertainty Fuzzy Sets and Systems, 62: 9-19, 1994
[14] WANG, L. - MENDEL, M.: Fuzzy Adaptive Filters, with Application to NonlinearChannel Equalization IEEE Transactions on Fuzzy Systems, 1(3), 1993
[15] HORACEK, P. - BRABEC, J.: Learning Algorithms for Fuzzy Neural Control ProcessControl Application, Department of Control Engineering CTU Prague, 1994
[16] PROCHAZKA, J.: System with Vague Logic ST, 42(2): 70-72 (in Czech), 1994
This research has been conducted at the Department of Radioelectronics as part of theresearch project "The Fuzzy Adaptive Signal Processing" and has been supported by CTUPrague grant No. 10038283.
730
WORKSHOP 96 ELECTRONICS, MEASURING fc COMMUNICATION ENG.
USE OF GPS TECHNIQUEIN EDUCATION AND PRACTICE
AT TU BRNO
J. Weigel, O. Svabensky, M. Svec, J. Vitasek, F. Soukup,L. Planka, V. Hanzl, V. ftigny*, K. Hanousek*
TU Brno, Fac. of Civil Eng., Dept. of GeodesyVeveri 95, 662 37 Brno
*TU Brno, Fac. of Electrical Eng. and Comp. Sc, Dept. of RadioelectronicsAntoni'nska 1, 662 09 Brno
Key words: GPS, geodesy, navigation, education
The Navigation Satellite Timing and Ranging (NAVSTAR) Global Positioning Sys-tem (GPS) under development by the US Department of Defense will soon provide newopportunities for surveyors and their profession.
Department of Geodesy, FCE TU Brno purchased in last two years two GPS receiversWILD System 200 of the swiss firm LEICA, belonging to the class of highest precision. To-gether with the receivers the SKI (Static Kinematic software) GPS processing software wasalso purchased. In October 1995 the third GPS receiver WILD System 300 was obtained bycourtesy of Swiss government (Agreeme1 t between Swiss and Czech governments accordingto the project of Czech Office for Surveying and Cadastre from June 1995).
In the beginning of 1995 the building of research and training GPS laboratory at Depart-ment of Geodesy, TU Brno started. The laboratory will be used also by other departmentsof FCE, other faculties, and other universities in Brno. The main part of the laboratory isthe GPS reference station, which will be employed in international, national and regionalGPS measuring campaigns. The station is placed on the roof of building "B" of FCE andit was named "TUBO" (TU BrnO). It is monumented by a steel pillar in centre of previousastronomical observatory. The station "TUBO" was included in the national control net-work of reference points (densification of zero-order network over the whole czech territory- DOPNUL campaign).
One of the experiments had to test the possibility of continuous GPS data collection withhelp of special software WILD BASE. Another task was to solve the problem of permanentmonitoring and storing of meteorological parameters (in cooperation with meteo-station ofFCE). In present time the reference station "TUBO" is able to serve as a permanent 24 hoursstation for campaigns lasting several days. For the purpose the connection to INTERNETnetwork was accomplished. The station was equipped with necessary computer techniqueenabling the data collection and data processing at laboratory and also in field conditions.Main activities at this research station in 1995:
• data collection at "TUBO" in May-June 1995 for international geodynamic projectCERGOP (Central European Regional Geodynamics Project) which is being realized byjoint effort of ten European countries within the frame of the section C-Geodesy of theEarth Science Committee, Working Group on Science and Technology of the CEI.
731
WORKSHOP 96 ELECTRONICS, MEASURING & COMMUNICATION ENG.
• preparation and measurements in the national geodynamical control network (GEO-DYN 95-2 campaign in October 1995). In preparation phase the laboratory cooperatedwith Research Institute of Geodesy, Topography and Cartography in Zdiby on testing thepossibility of simultaneous measurements with various types of GPS receivers (PEBRMIXcampaign in February 1995) together with test epoch measurements (GEODYN 95-1 cam-paign in April 1995).
• GPS measurements for the research grant "Monitoring of Displacements of Supra-Crustal Blocks on Border of Czech Massif and Alpine-Carpathian System With Help ofGPS" (MORAVA campaign in October 1995) covering the inclusion of "TUBO" stationinto this project, including preliminary, exploratory and test measurements.
• continuous GPS measurements in local geodynamic network "Sneznik" (1995 epoch).This experimental geodynamic network was established in 1992 by TU Brno and UA Wro-claw in "Sneznik" mountain region. The network covers an area on both sides of the Czech-Polish border.
• experiments with combinations of various types of GPS receivers and with variousGPS post-processing software products (TRIMBLE - VUGTK Zdiby, ASHTECH - GeovapPardubice, TOPCON - Geodis Brno).
In pedagogic sphere the GPS was included in several subjects in geodesy and car-tography studies at TU Brno, FCE (subjects "Geodetic Astronomy and Space Geodesy","Theoretical Geodesy", "Positioning Systems" and special GPS Seminar). At FECS theGPS problematics were included mainly in subject "Navigation". The Department of Ra-dioelectronics, FECS intends to purchase one GPS receiver in near future. Department ofGeodesy, TU Brno is making efforts to obtain the BERNESE GPS software for precise GPSpost-processing.
GPS is also included in post-graduate studies at both faculties, and in themes of diplomaworks. In 1995 a text-book on GPS problematics was released at FCE. Students of the5th course of geodesy and cartography studies visited in October 1995 the Leica factoryin Switzerland where GPS equipment is manufactured. The GPS laboratory served as aconsulting and lecturing centre for external GPS users and for students of other universitiesin Brno. Laboratory specialists participated in many international and national conferences,workshops and seminars on GPS problematics.
GPS practical applications were studied in detail in 1995, for example in field of cre-ation and densification of local geodetic networks (problems connected with transformationsbetween WGS 84 and S-JTSK coordinate systems in neighbourhood of "TUBO" station,employment of GPS for control points establishment in photogrammetry, use of GPS forobjectivisation of geodetic measuremets in undermined areas of the Ostrava region, estab-lishment of local networks for engineering projects - e.g. highway tunnel in Brno etc.)
References:
[1] SVABENSKY, O. et al.: Measurements in geodynamic network Sneznik Int.Meeting on
Cooperation of the Central European Initiative, Kocovce 1994
[2] SVABENSKY, 0 . - FIXEL, J. - WEIGEL, J.: Fundamentals of GPS and practicalaplications VUT Brno, 1995. 120 p.
This research has been conducted at the Department of Geodesy as part of the researchproject "Use of GPS Technique in Education and Practice at TU Brno" and has been sup-ported by TU Brno" grant No. FU 250028.
732
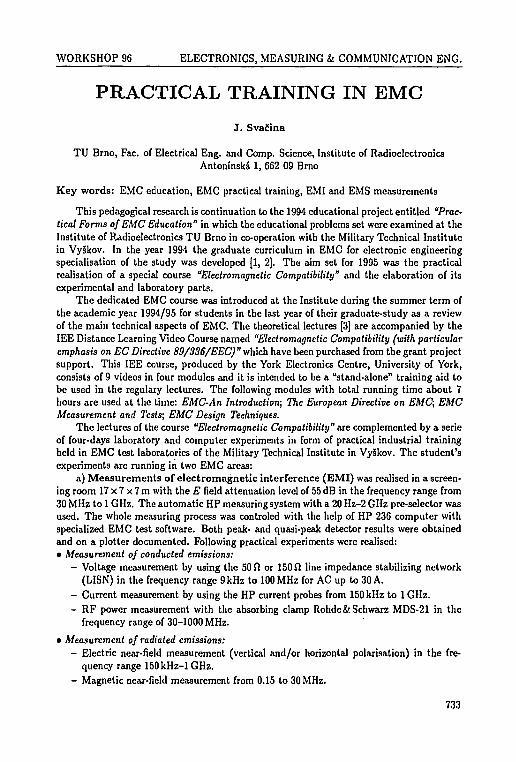
WORKSHOP 96 ELECTRONICS, MEASURING k COMMUNICATION ENG.
PRACTICAL TRAINING IN EMC
J . SvaEina
TU Brno, Fac. of Electrical Eng. and Comp. Science, Institute of RadioelectronicsAntoninska 1, 662 09 Brno
Key words: EMC education, EMC practical training, EMI and EMS measurements
This pedagogical research is continuation to the 1994 educational project entitled "Prac-tical Forms of EMC Education" in which the educational problems set were examined at theInstitute of Radioelectronics TU Brno in co-operation with the Military Technical Institutein Vyskov. In the year 1994 the graduate curriculum in EMC for electronic engineeringspecialisation of the study was developed [1, 2]. The aim set for 1995 was the practicalrealisation of a special course "Electromagnetic Compatibility" and the elaboration of itsexperimental and laboratory parts.
The dedicated EMC course was introduced at the Institute during the summer term ofthe academic year 1994/95 for students in the last year of their graduate-study as a reviewof the main technical aspects of EMC. The theoretical lectures [3] are accompanied by theIEE Distance Learning Video Course named "Electromagnetic Compatibility (with particularemphasis on EC Directive 89/336/EEC) " which have been purchased from the grant projectsupport. This IEE course, produced by the York Electronics Centre, University of York,consists of 9 videos in four modules and it is intended to be a "stand-alone" training aid tobe used in the regulary lectures. The following modules with total running time about 7hours are used at the time: EMC-An Introduction; The European Directive on EMO, EMCMeasurement and Tests; EMC Design Techniques.
The lectures of the course "Electromagnetic Compatibility" are complemented by a serieof four-days laboratory and computer experiments in form of practical industrial trainingheld in EMC test laboratories of the Military Technical Institute in Vyskov. The student'sexperiments are running in two EMC areas:
a) Measurements of electromagnetic interference (EMI) was realised in a screen-ing room 17 x 7 x 7 m with the E field attenuation level of 55 dB in the frequency range from30 MHz to 1 GHz. The automatic HP measuring system with a 20 Hz-2 GHz pre-selector wasused. The whole measuring process was controled with the help of HP 236 computer withspecialized EMC test software. Both peak- and quasi-peak detector results were obtainedand on a plotter documented. Following practical experiments were realised:• Measurement of conducted emissions:
- Voltage measurement by using the 50 ft or 150 il line impedance stabilizing network(LISN) in the frequency range 9 kHz to 100 MHz for AC up to 30 A.
- Current measurement by using the HP current probes from 150 kHz to 1 GHz.- RF power measurement with the absorbing clamp Rohde & Schwarz MDS-21 in the
frequency range of 30-1000 MHz.
• Measurement of radiated emissions:- Electric near-field measurement (vertical and/or horizontal polarisation) in the fre-
quency range 150kHz-lGHz.- Magnetic near-field measurement from 0.15 to 30 MHz.
733
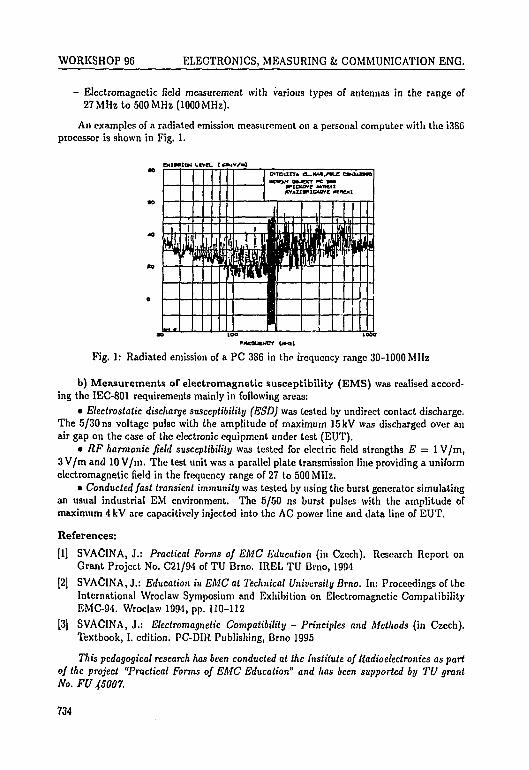
WORKSHOP 96 ELECTRONICS, MEASURING k COMMUNICATION ENG.
- Electromagnetic field measurement with various types of antennas in the range of27 MHz to 500 MHz (1000 MHz).
An examples of a radiated emission measurement on a personal computer with the i386processor is shown in Fig. 1.
CMIM1W U V A [ *
1
MCMMf MJCXT PC * M
Iai SB I,
JLI y
1
111 N
!ii»
Jala LL
% 4
Fig. 1: Radiated emission of a PC 386 in the frequency range 30-1000 MHz
b) Measurements of electromagnetic susceptibility (EMS) was realised accord-ing the IEC-801 requirements mainly in following areas:
• Electrostatic discharge susceptibility (ESD) was tested by undirect contact discharge.The 5/30 ns voltage pulse with (he amplitude of maximum 15 kV was discharged over anair gap on the case of the electronic equipment under test (EUT).
• RF harmonic field susceptibility was tested for electric field strengths E = 1 V/m,3 V/m and 10 V/m. The test unit was a parallel plate transmission line providing a uniformelectromagnetic field in the frequency range of 27 to 500 MHz.
• Conducted fast transient immunity was tested by using the burst generator simulatingan usual industrial EM environment. The 5/50 ns burst pulses with the amplitude ofmaximum 4 kV are capacitively injected into the AC power line and data line of EUT.
References:
[1] SVACINA, J.: Practical Forms of EMC Education (in Czech). Research Report onGrant Project No. C21/94 of TU Brno. IREL TU Brno, 1994
[2] SVACINA, J.: Education in EMC at Technical University Brno. In: Proceedings of theInternational Wroclaw Symposium and Exhibition on Electromagnetic CompatibilityEMC-94. Wroclaw 1994, pp. 110-112
[3] SVACINA, J.: Electromagnetic Compatibility - Principles and Methods (in Czech).Textbook, I. edition. PC-DIR Publishing, Brno 1995
This pedagogical research has been conducted at the Institute of Radioelectronics as partof the project "Practical Forms of EMC Education" and has been supported by TU grantNo. FU 45007.
734
WORKSHOP 96 ELECTRONICS, MEASURING & COMMUNICATION ENG.
OPTIMIZATION OF THE SYSTEM FOREXTRACTION OF CERAMIC BINDERS
L. Bejcek
TU, Fac. of Electrical Eng., Dept. of Automation and MeasurementsBozetechova 2, 612 66 Brno
Key words: ceramics mixture, extraction, experimental system sensors, measurements,experiment regulation, process optimization
Extraction processes enable substantial quality improvement of production processes.However, multiparameter systems are concerned where it is rather difficult to maintainprecisely defined and reproducible working conditions. Within the framework of VUT B4Project it has been proved that such a system can be regulated. The final stage of theproject was based on theoretical and practical experience gained in the previous years. Theaim was the modification and optimization of the entire process, including the software,and expansion of the system to enable study and complete regulation of the process ofthermal extraction of organic polymere ceramic binders, and further to make it adaptableto similar technological processes caried out at the Department of the Faculty of MechanicalEngineering. In practice, the construction of the upper part of extraction furnace had tobe changed to achieve a better distribution of temperature, and to exchange the utilizedbalance module. The previous module from the laboratory balance Mettler, model College244 DR didn't suit our purposes and had to be substituted with module B303 from thesame manufacturer. A simple exchange was impossible because of differences in connectionand dimensions. Moreover, it was necessary to devise another system of sample lock andthermal protection (shielding) of the upper part of extraction furnace. In addition thetemperature measurement using the thermccell PtRh-Pt was improved - all measuringchannels were equipped with converters located in close vicinity of the place of measurement.The regulation algorithm was adapted to suit the changed parameters of extraction furnace,and to achieve a better regulation dynamics and to minimize the deviations from the requiredvalue. At the time when this abstract was written, verifying experimental measurementswere carried out at the Department of Mechanical Engineering. The results and conclusionswill be presented at WORKSHOP 96. Nevertheless, it can be stated now that all therequired properties will be achieved, and that all tasks will be fulfilled.
References:[1] BEJCEK, L.: Measurement, processing and evaluation of experimental process. In.:
Workshop 95, Praha 1995[2] BEJCEK, L.: Automation of extract process. In: International scientific conference
ISC 95. Ostrava 1995
This research has been conducted at the Department of Automation and MeasurementEngineering as part of the research project "Optimization of the System for Extraction ofCeramic Binders" and has been supported by TU oj Brno, Grant No. FU450061.
NEXT PAGE(S)left B
WORKSHOP 96 ELECTRONICS, MEASURING k COMMUNICATION ENG.
AN AUTOMATED OPTICALMEASURING SYSTEM
L. Bejcek, M. LiSka
TU, Fac. of Electrical Eng., Dept. of Automation and Measurement EngineeringBozetechova 2, 612 66 Brno
*TU, Fac. of Mechanical Eng., Dept. of PhysicsTechnicka 2, 612 66 Brno
Key words: source of optical radiation, monochromator, radiation bandwith, synchronousdetector, fibre optics, optical power, wavelenght, index of optical refraction,optical attenuation
Optoelectronics, as a rapidly developing field, has various technical and scientific ap-plications, and therefore technical university students should be well acquainted with thisbranch of science. Being aware of the fact that the equipment necessary for work in this fieldrequires substantial financial support, we have launched a project within the framework ofwhich an integrated workplace would be established in cooperation between the Faculty ofMechanical Engineering and the Faculty of Electrical Engineering. There is no such equip-ment available either at Technical University or at Masaryk University in Brno. It is anoptical computer-controlled system for measurement of the basic parameters (properties)of optical fibres (multimode stepindex PCS, both gradient and single-mode), fibre opticscomponents, and namely light-conducting sensors. The basic version of the system shouldenable measurement of optical power in dependence on time and wavelength (in the rangefrom 250 to 2000 nm), colorimetric measurement, measurement of numerical aperture (indexof refraction), and polarization measurement.
The PC-controlled optical system is modular, with great variability, which is an advan-tage considering the different character of measurements carried out at both workplaces in-volved (an adjustable source of incoherent radiation, a coherent source of radiation, spectralanalyzer, and other configurations). The research was aimed at realization and installation(for pedagogical and research purposes) of a unique, fully automated,
PC-IBM-controlled measuring optical system for measurement, evaluation, and furtherprocessing of the characteristic properties of optical fibres, both with the step change ofrefractive index, and gradient, eventually single-mode properties (optical attenuation, wave-length, numerical aperture, refractive index, etc.). During the first year of the project up tothe date of writing this abstract, the Department of Automation and Measurement Engi-neering in cooperation with the company MIKROKOM Prague have developed a PC-IBM-controlled optical measuring system for automated measurement, data processing (evalua-tion) and storage.
The system features:
• automation of spectral and time measurements of radiation intensity
• optical input Cor a loose beam of optical tadiation or optical connector
• dynamic range 10-115dBm for Si detector (10mm)
* 737

WORKSHOP 96 ELECTRONICS, MEASURING fc COMMUNICATION ENG.
• wavelength range 250-2000 nm with Si and Ge detectors for bandwith of approx. 20 nm
• measurement precision of 3 %
• automatic equalization of the dc component of optical signal
• optical detector transimpedance 1-109 V/A
• frequency range 1-5.10* Hz• basic sensitivity of synchronous amplifier of 50 mV at adjustable attenuation 1-106,
resolution of 19 bits at signal/noise ratio of over - 20 dB and time constant in therange 25 ms to 25 s
• programmable generation of phase lock samples in the range 5-5 000 Hz
• step drives control (measuring sensor with TTL inputs)
• optical modulator stability of 4 % (lamp source of optical radiation or an externalsource according to requirements.
Currently under way are verifying measurements of all the system parameters, testingand completing the control software and of hardware according to the requirements of bothteams.
References:
[1] Opticky merici system OMS-S.l. Firemni rnalerialy spolecnosti MIKROKOM s.r.o.Praha, 1995
This research has been conducted at the Department of Automation and MeasurementEngineering and Department of Physics as part of the research project "An AutomatedOptical Measuring System" and has been supported by TU of Brno, Grant No. FU45006S.
738
WORKSHOP 96 ELECTRONICS, MEASURING fc COMMUNICATION ENG.
OFF-LINE IMPROVING QUALITYOF FFT SPECTRUM MEASUREMENT
M. SedlaJek, J . Matejovsky
CTU, Fac. of Electrical Eng., Dept. of MeasurementsTechnicka 2, 166 27 Praha 6
Key words: digital spectrum analysis, errors of measurement, digital signal processing
When measuring frequency spectra of periodical waveforms using FFT it is necessaryto take into account errors caused by signal quantization. Errors caused by imperfections ofthe ADC used, by possible jitter of sampling period, possible aliasing and spectral leakagehave to be also analysed [1].
In case of noncoherent sampling (sampling not synchronised with measured periodicalsignal) the most important source of errors is usually the spectral leakage. It causes spec-trum deformation in cases when periodical extension of the measured part of signal hasdiscontinuities at the ends of repeated intervals. One possible way of leakage reduction isusing tapered windows applied on signal. Disadvantage of this method is that applying awindow on signal (in time domain or frequency domain) causes deformation of both signaland its spectrum. This is due to the convolution of signal spectrum with spectrum of thewindow used. For error reduction some interpolation in frequency domain is usually needed,since the frequencies for which spectral lines are found do not correspond in case of nonco-herent sampling with the maximum of the main lobe and with the minima of the side lobesof the spectrum of the used window [2].
An alternative method of spectral error reduction for the case of noncoherent samplingwas suggested and experimentally verified. More than one period of periodical measuredsignal is sampled and stored in computer memory. Afterwards its period time is found andone period (or some integer number of periods) is interpolated. (Linear, polynomial andspline interpolation were used for this purpose.) The interpolated waveform is resampled sothat there be exactly N = 2m (m - positive integer, N - number of FFT points) samplesper period or per integer number of periods. Applying FFT on the resampled signal resultsin large error reduction.
Experiments were carried out both on sinusoidal waveforms and more complicatedperiodical waveforms. For example, a harmonic signal with 10 V amplitude was sampled sothat FFT yields the basic component of error spectrum of about 4 V. This component wasreduced to about 0.02 V when polynomial interpolation and the above described resamplingwere used.
Complete information concerning error of measurement of frequency spectrum is pro-vided by the error spectrum, defined as the difference between ideal spectrum and measuredspectrum of a signal. Expressing an over-all error of measurement of amplitude spectrum bya simple numerical error is easy in case of a harmonic signal - SNR or THD can be used forthe purpose. In case of a general periodical signal a similar approach can be used. The ratioof the RMS value of the error signal to the RMS value of the signal expressed in percent andcalled total relative error (TRE) was used by us. Both RMS values were computed in thefrequency domain. The above described method of error reduction has lead to pronounced
739
WORKSHOP 96 ELECTRONICS, MEASURING k COMMUNICATION ENG.
error falling: e.g. the TRE was changed from 43% to 0.3% or from 94% to 0.6% if theNational Instruments PC plug-in board was used for signal sampling and quantization.
Finding the signal period time is of basic importance for this method. In case ofcomplicated periodical signals with several zero crossings during period this is not a simpletask. An overview of methods which can be used for that purpose is presented togetherwith numerical results in [3]. The work [3] was performed within the same project as wasthe reduction in error spectra described in this contribution.
References:
[1] SEDLACEK, M. - MATEJOVSKt, J. - PLEVA, J.: Frequency Spectra MeasurementUsing FFT and PC PlugOin Boards - Errors and Error Reduction. Proc. 7th Symp.IMEKO TC4, "Modern Electrical and Magnetic Measurement", Prague 1995, pp. 497-501
[2] ANDRIA, G. - SAVINO, M. - TROTTA, A.: Windows and Interpolation Algorithmsto Improve Electrical Measurement Accuracy IEEE Trans. Instr. and Meas., Vol. 38,No. 4, pp. 856-863
[3] STADLER, P. - HAASZ, v.: Determination Of Period For Pulse Waveforms WithSeveral Zero Crossings During One Period Proc. of ISIE'95, Athens, 1995, Vol. 2,pp. 622-627
This research has been conducted at the Department of Measurement as part of theresearch project "Investigation of Algoritms for Dynamic Measurement and the Specificationof Methods for Estimation of Errors of these Measurments by the Use of PC Plug-in BoardSystems" and has been supported by GACR grant No. 102/93/0907.
740
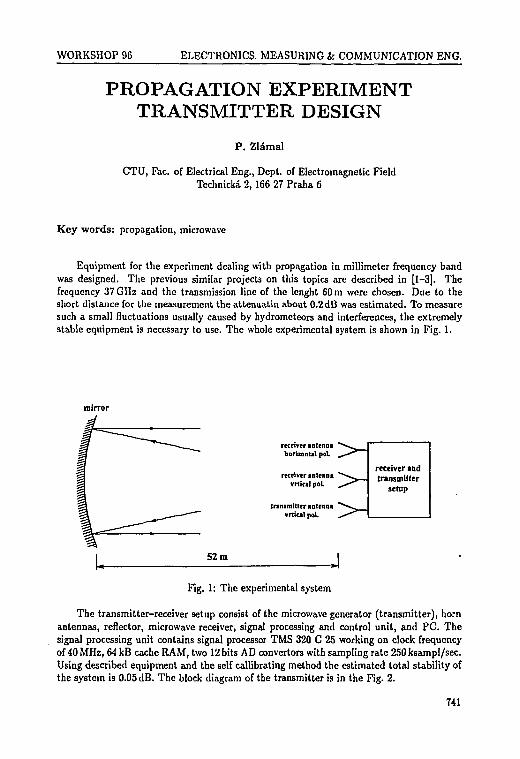
WORKSHOP 96 ELECTRONICS, MEASURING & COMMUNICATION ENG.
PROPAGATION EXPERIMENTTRANSMITTER DESIGN
P . Zlamal
CTU, Fac. of Electrical Eng., Dept. of Electromagnetic FieldTechnicka 2, 166 27 Praha 6
Key words: propagation, microwave
Equipment for the experiment dealing with propagation in millimeter frequency bandwas designed. The previous similar projects on this topics are described in [1-3]. Thefrequency 37 GHz and the transmission line of the lenght 60 m were chosen. Due to theshort distance for the measurement the attenuatin about 0.2 dB was estimated. To measuresuch a small fluctuations usually caused by hydrometeors and interferences, the extremelystable equipment is necessary to use. The whole experimental system is shown in Fig. 1.
mirror
receiver antennahorizontal poL
receiver antennavrtlcil poL
transmitter antennavrttcal pol.
receiver andtransmitter
setup
52 m
Fig. 1: The experimental system
The transmitter-receiver setup consist of the microwave generator (transmitter), hornantennas, reflector, microwave receiver, signal processing and control unit, and PC. Thesignal processing unit contains signal processor TMS 320 C 25 working on clock frequencyof 40 MHz, 64 kB cache RAM, two 12 bits AD convertors with sampling rate 250 ksampl/sec.Using described equipment and the self calibrating method the estimated total stability ofthe system is 0.05 dB. The block diagram of the transmitter is in the Fig. 2.
741
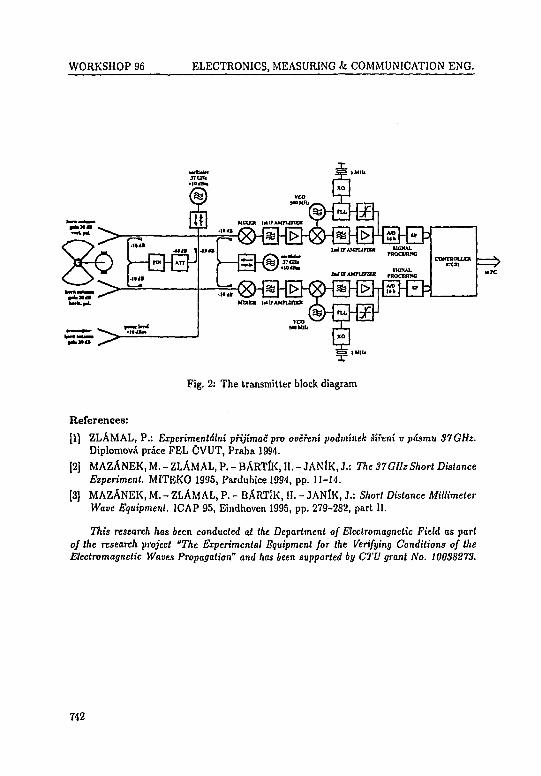
WORKSHOP 96 ELECTRONICS, MEASURING & COMMUNICATION ENG.
Fig. 2: The transmitter block diagram
References:
[1] ZLAMAL, P.: Experimentdlni prijimac" pro ovifeni podminek sifeni v pasmu 37 GHz.
Diplomova prdce FEL CVUT, Praha 1994.
[2] MAZANEK, M. - ZLAMAL, P. - BARTlK, H. - JANfK, J.: The 31 GHz Short Distance
Experiment. MITEKO 1995, Pardubice 1994, pp. 11-14.
[3] MAZANEK, M. - ZLAMAL, P. - BARTlK, H. - JANlK, J.: Short Distance MillimeterWave Equipment. ICAP 95, Eindhoven 1995, pp. 279-282, part II.
This research has been conducted at the Department of Electromagnetic Field as partof the research project "The Experimental Equipment for the Verifying Conditions of theElectromagnetic Wanes Propagation" and has been supported by CTU grant No. 10038273.
742
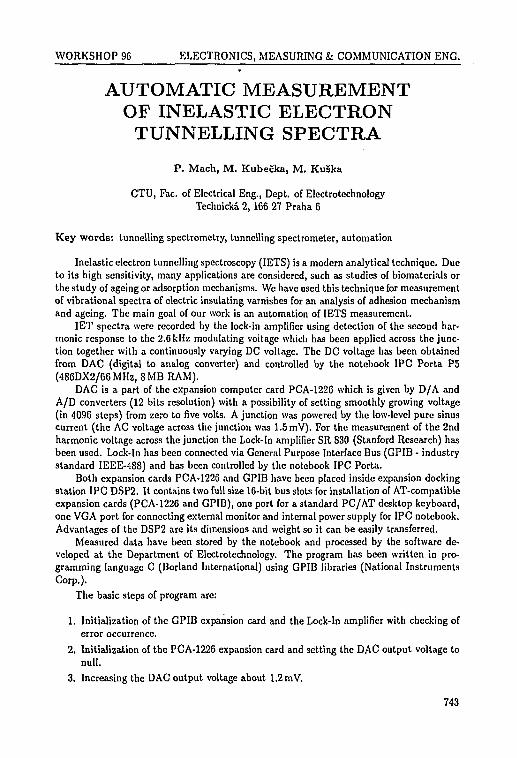
WORKSHOP 96 ELECTRONICS, MEASURING k COMMUNICATION ENG.
AUTOMATIC MEASUREMENTOF INELASTIC ELECTRON
TUNNELLING SPECTRA
P . Mach, M. Kubefka, M. KuSka
CTU, Fac. of Electrical Eng., Dept. of ElectrotechnologyTechnicka 2, 166 27 Praha 6
Key words: tunnelling spectiometry, tunnelling spectrometer, automation
Inelastic electron tunnelling spectroscopy (IETS) is a modern analytical technique. Dueto its high sensitivity, many applications are considered, such as studies of biomaterials orthe study of ageing or adsorption mechanisms. We have used this technique for measurementof vibrational spectra of electric insulating varnishes for an analysis of adhesion mechanismand ageing. The main goal of our work is an automation of IETS measurement.
IET spectra were recorded by the lock-in amplifier using detection of the second har-monic response to the 2.6 kHz modulating voitage which has been applied across the junc-tion together with a continuously varying DC voltage. The DC voltage has been obtainedfrom DAG (digital to analog converter) and controlled by the notebook IPC Porta P5(486DX2/66MHz, 8MB RAM).
DAC is a part of the expansion computer card PCA-1226 which is given by D/A andA/D converters (12 bits resolution) with a possibility of setting smoothly growing voltage(in 4096 steps) from zero to five volts. A junction was powered by the low-level pure sinuscurrent (the AC voltage across the junction was 1.5 mV). For the measurement of the 2ndharmonic voltage across the junction the Lock-In amplifier SR 830 (Stanford Research) hasbeen used. Lock-In has been connected via General Purpose Interface Bus (GPIB - industrystandard IEEE-488) and has been controlled by the notebook IPC Porta.
Both expansion cards PCA-1226 and GPIB have been placed inside expansion dockingstation IPC DSP2. It contains two full size 16-bit bus slots for installation of AT-compatibleexpansion cards (PCA-1226 and GPIB), one port for a standard PC/AT desktop keyboard,one VGA port for connecting external monitor and internal power supply for IPC notebook.Advantages of the DSP2 are its dimensions and weight so it can be easily transferred.
Measured data have been stored by the notebook and processed by the software de-veloped at the Department of Electrotechnology. The program has been written in pro-gramming language C (Borland International) using GPIB libraries (National InstrumentsCorp.).
The basic steps of program are:
1. Initialization of the GPIB expansion card and the Lock-In amplifier with checking oferror occurrence.
2. Initialization of the PCA-1226 expansion card and setting the DAC output voltage tonull.
3. Increasing the DAC output voltage about 1.2mV.
743
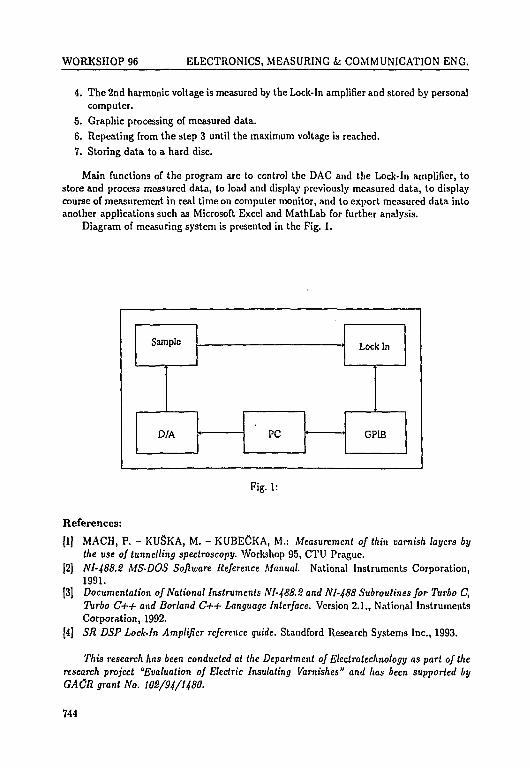
WORKSHOP 96 ELECTRONICS, MEASURING & COMMUNICATION ENG.
4. The 2nd harmonic voltage is measured by the Lock-In amplifier and stored by personalcomputer.
5. Graphic processing of measured data.
6. Repeating from the step 3 until the maximum voltage is reached.
7. Storing data to a hard disc.
Main functions of the program are to control the DAC and the Lock-In amplifier, tostore and process measured data, to load and display previously measured data, to displaycourse of measurement in real time on computer monitor, and to export measured data intoanother applications such as Microsoft Excel and MathLab for further analysis.
Diagram of measuring system is presented in the Fig. 1.
Sample
D/A PC
Lock In
GP1B
Fig. 1:
References:
[1] MACH, P. - KUSKA, M. - KUBECKA, M.: Measurement of thin varnish layers bythe use of tunnelling spectroscopy. Workshop 95, CTU Prague.
[2] NI-488.S MS-DOS Software Reference Manual. National Instruments Corporation,1991.
[3] Documentation of National Instruments NI-488.S and Nl-488 Subroutines for Turbo C,Turbo C++ and Borland C++ Language Interface. Version 2.1., National InstrumentsCorporation, 1992.
[4] SR DSP Lock-In Amplifier reference quide. Standford Research Systems Inc., 1993.
This research has been conducted at the Department of Electrolcchnology as part of theresearch project "Evaluation of Electric Insulating Varnishes" and has been supported byGACR grant No. 102/94/1480.
744
WORKSHOP 96 ELECTRONICS, MEASURING fc COMMUNICATION ENG.
CONTACTLESSCURRENT MEASUREMENT
P. Ripka, P. Kejik, P. KaSpar, K. Draxler
CTU, Fac. of Electrical Eng., Dept. of MeasurementsTechnicka 2, 166 27 Praha 6
Key words: current sensors, contactless measurements, current measurement
DC current sensors are usually based on Hall sensors in the airgap of the magnetic jokesurrounding the conductor. The mentioned principle works well for the current clamps with20 to 2000 A full-scale range and 1-2% precission. However, it is difficult to built currentsensor small in size, having high resolution or high precission and/or having high full-scalerange. Sensors based on Rogowski loops have problems with integrator DC stability. Thepresent paper discusses non-standard methods and instruments for contactless measurementod DC and low-frequency AC currents.
Fluxgate current clamps. The sensor consists of two L-shaped ferrite parts withsymmetrical winding and permalloy shielding. It is based on fluxgate principle: the magneticflux created by the measured current causes ansymmetry in the magnetic characteristisc ofthe sensor core, which creates second harmonic component in the sensor excitation current.0.1% linearity + hysterezis error, 0.01 mA p-p noise and long-term offset stability of 0.1 mAwas achieved [1]. The shielding suppresses the external fields and close currents, but slightlydegrades the sensor linearity and inctreases the sensitivity to the position of the measuredconductor.
Magnetometr ic methods. This method is the only possible one when there is nodirect access to the conductor, as in the case of underground cables. Parasitic currents flow-ing through the pipelines or building constructions as an effect of magnetic field variationsmay be also detected. In the case when not only the amplitude of the current, but also theposition of the conductor is not know and eventually should be determmined (full reverseproblem), magnetometric method requires vector measurement of the magnetioc field cre-ated by the current in at least two locations. Best method is to use fluxgate magnetometer.The sensors developed in our department have 100 pT p-p noise and 1 nT offset stability [2],
Large current detection by NMR Magnetic field in the hole in cylindrical trensducerof specific geometry is homogeneous and can be measured by a nutation method using NMRin flowing water. Small transducer developed at our department has 200 ppm uncertaintyand can be used up to 5kA. Using precise instrumentation, compensation for the back-conductor field and larger transducer size, 25 kA/100 ppm meter development is realistic.
DC/AC current comparator. Amorhous core DC current comparator with in-creased frequency range is in the development phase. The basic principle is similar to thementioned fluxgate current clamp, but the more complex magnetic circuit results in largerprecission: units of ppm error is typical. Detection core consists of two equal halves exci-tated in opposite direction to reduce the first harmonic voltage induced in detection winding.Magnetic shielding reduces the penetration of the Earth field and suppresses the effect ofcore nonhomogeneity on the sensor linearity.
745
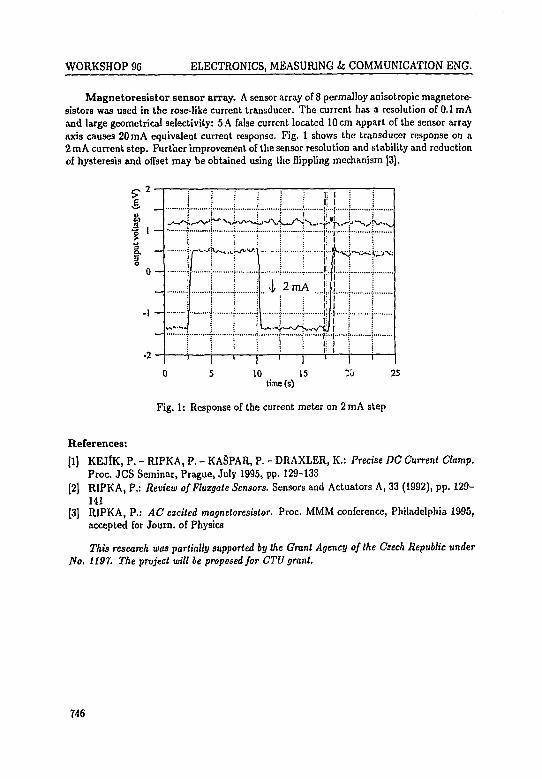
WORKSHOP 96 ELECTRONICS, MEASURING k COMMUNICATION ENG.
Magnetoresistor sensor array. A sensor array of 8 permalloy anisotropic magnetore-sistors was used in the rose-like current transducer. The current has a resolution of 0.1 mAand large geometrical selectivity: 5 A false current located 10 cm appart of the sensor arrayaxis causes 20 mA equivalent current response. Fig. 1 shows the transducer response on a2 mA current step. Further improvement of the sensor resolution and stability and reductionof hysteresis and offset may be obtained using the flippling mechanism [3).
iIo
-
;
!:p~,
11
2m,
i;i;
1;..i;..
r
r
r1
"-vxi;
0 ,
-1 —
0 5 10 IS O 25time (s)
Fig. 1: Response of the current meter on 2 mA step
References:[1] KEJfK, P. - RIPKA, P. - KASPAR, P. - DRAXLER, K.: Precise DC Current Clamp.
Proc. JCS Seminar, Prague, July 1995, pp. 129-133[2] RIPKA, P.: Review ofFluzgate Sensors. Sensors and Actuators A, 33 (1992), pp. 129-
141[3] RIPKA, P.: AC excited magnetoresistor. Proc. MMM conference, Philadelphia 1995,
accepted for Journ. of Physics
This research was partially supported by the Grant Agency of the Czech Republic underNo. 1197. The project will be proposed for CTU grant.
746

WORKSHOP 9G ELECTRONICS, MEASURING k COMMUNICATION ENG.
DYNAMIC TESTING OFA/D PLUG-IN BOARDS
M. Pokorny, V. Haasz, J . Roztofil
CTU, Fac. of Electrical Eng., Dept. of MeasurementsTechnicka 2,166 27 Praha 6
Key words: dynamic testing of A/D modules, effective bits measurement, sinewave curvefit test, virtual instruments
Knowledge of dynamic performance of A/D modules is necessary for application of thesemodules in complicated tasks. The dynamic quality of the used A/D converter is usually(in case of a sampling ADC) declared by a producer, but the dynamic characteristic of PCA/D plug-in boards or other A/D modules are not described in user manuals.
Number of effective bits is the most useful parameter for verifying dynamic performanceof plug-in A/D boards. This parameter quantifies globally most forms of sampling errors,distortion and system noise in A/D board.
The effective bits test is performed using spectrally pure sine wave generator. A fullscale sine wave from this generator is digitized by an A/D plug-in board. The measureddata samples are recorded and used for calculation of the idealized best fit sinewave. Thedifference between the ideal and the measured waveform is assumed to be error.
The number of effective bits ncj is usually defined as follows:
ncj = n - lo
where n - resolution of A/D converter, rmseaciuo| - rms error of the digitized signal,rmseidcai - rms error of the ideal n-bit converter. The rmseuai (assuming that quanti-zation noise is uniformly distributed and quantization errors are statistically independent)is given by
2~"Um (2)" V12
where Um - range of A/D converter and rmseactual is given by
rmseactM, = VE (3)
where E is calculated over the period of digitized data using the formula
1 N
E = -rr 2J \Xi< " Asm(ijtk + P) — C] (4)
Parameters A, C, u>, P correspond to amplitude, offset, frequency and phase of the fittedsine wave. Formula (4) is used to find the best sine wave by minimizing error E (see [1, 2]).
747
WORKSHOP 96 ELECTRONICS, MEASURING & COMMUNICATION ENG.
Two original algorithms were proposed for the parameter estimation of the idealizedsine wave. The first algorithm operates iteratively in two steps:
1. Calculation of At P, C from recordered waveform using an estimate of frequency wo
2. Calculation of more precise frequency value with parameters A, P, C (Regula-Falsimethod)
Iterative process is repeated until diference of two successive results is roughly zero.
The second algorithm is based on exact determination of frequency w and application ofthe fixed frequency algorithm (see [3]). Both algorithms were tested by simulated waveformand comparable results were obtained. The iterative method gives a more accurate resultsbut the time of calculation is much longer (detailed description in [4]).
The measurements performed proved that a dynamic performance of stand-alone sam-pling A/D converter (ADC) and that of a PC A/D plug-in board, which contains not onlya ADC but also a multiplexer and an amplifier, is not identical.
In our case the dynamic quality of A/D modules is characterised by the dependence ofeffective bits on frequency. The partial results were presented in [4].
Software tools for data acquisition and processing were developed in LabWindows/CVIenvironment.
Testing is performed on boards from Meilhaus, Axiom, Advantech and mainly on boardsfrom National Instruments. The PC plug-in boards were tested in one channel mode, and inmultichannel mode. Now we execute tests on Lab PC+ board from National Instruments.The dependence of ncj on frequency of input signal of the ADC used on this board is known(it is described in factory manual for the converter ADS 774), so that we can compare themeasured dependence with the dependence published by the producer.
Results of dynamic testing are very important in the development of high precisionvirtual instruments based on A/D plug-in modules.
References:
[1] PEETZ, D. E.: Dynamic Testing of Waveform Recorders. IEEE Trans. Instrum. Meas.,Vol. IM-23, No. 1, pp. 12-17, March 1983.
[2] Digital Methods in Waveform Metrology. NBS Special Publication #707, pp. 33-38,October 1985.
[3] FROHRING, B. J. - PEETZ, B. E. - UNKRICH, M. A. - BIRD, S. C : Wave-form Recorder Design for Dynamic Performance. Hewlett-Packard Journal, pp. 39-48,February 1988.
[4] ROZTOCIL, J. - POKORN?, M. - NAVARA, M. - VEDRAL, J.: Dynamic Testingof A/D Plug-in Boards. IMEKO Symposium, TC-4, pp. 245-249, Prague, September1994.
This research has been conducted at the Department of Measurement as part of theresearch project "The Investigation of Algorithms for Dynamic Measurements and the Spec-ification of Methods for Estimation of Errors of These Measurement by the Use of PCPlug-in Board Systems" and has been supported by Grant Agency of the Czech Republicgrant No. 102/93/0907.
748
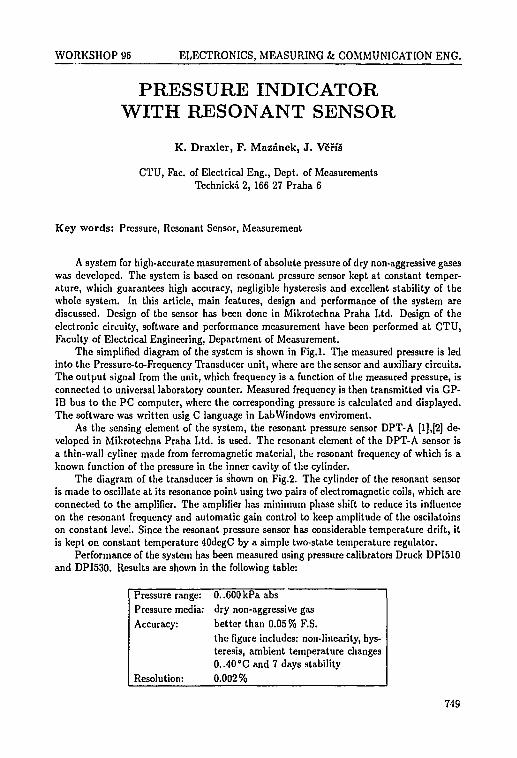
WORKSHOP 96 ELECTRONICS, MEASURING & COMMUNICATION ENG.
PRESSURE INDICATORWITH RESONANT SENSOR
K. Draxler, F. Mazanek, J. V5rf§
CTU, Fac. of Electrical Eng., Dept. of MeasurementsTechnicka 2, 166 27 Praha 6
Key words: Pressure, Resonant Sensor, Measurement
A system for high-accurate masurement of absolute pressure of dry non-aggressive gaseswas developed. The system is based on resonant pressure sensor kept at constant temper-ature, which guarantees high accuracy, negligible hysteresis and excellent stability of thewhole system. In this article, main features, design and performance of the system arediscussed. Design of the sensor has been done in Mikrotechna Praha Ltd. Design of theelectronic circuity, software and performance measurement have been performed at CTU,Faculty of Electrical Engineering, Department of Measurement.
The simplified diagram of the system is shown in Fig.l. The measured pressure is ledinto the Prcssure-to-Frequency Transducer unit, where are the sensor and auxiliary circuits.The output signal from the unit, which frequency is a function of the measured pressure, isconnected to universal laboratory counter. Measured frequency is then transmitted via GP-IB bus to the PC computer, where the corresponding pressure is calculated and displayed.The software was written usig C language in Lab Windows enviroment.
As the sensing element of the system, the resonant pressure sensor DPT-A [1],[2] de-veloped in Mikrotechna Praha Ltd. is used. The resonant element of the DPT-A sensor isa thin-wall cyliner made from ferromagnetic material, the resonant frequency of which is aknown function of the pressure in the inner cavity of the cylinder.
The diagram of the transducer is shown on Fig.2. The cylinder of the resonant sensoris made to oscillate at its resonance point using two pairs of electromagnetic coils, which areconnected to the amplifier. The amplifier has minimum phase shift to reduce its influenceon the resonant frequency and automatic gain control to keep amplitude of the oscilatoinson constant level. Since the resonant pressure sensor has considerable temperature drift, itis kept on constant temperature 40degC by a simple two-state temperature regulator.
Performance of the system has been measured using pressure calibrators Druck DPI510and DPI530. Results are shown in the following table:
Pressure range:Pressure media:Accuracy:
Resolution:
O..600kPa absdry non-aggressive gasbetter than 0.05% F.S.the figure includes: non-linearity, hys-teresis, ambient temperature changesO..4O°C and 7 days stability
0.002%
749
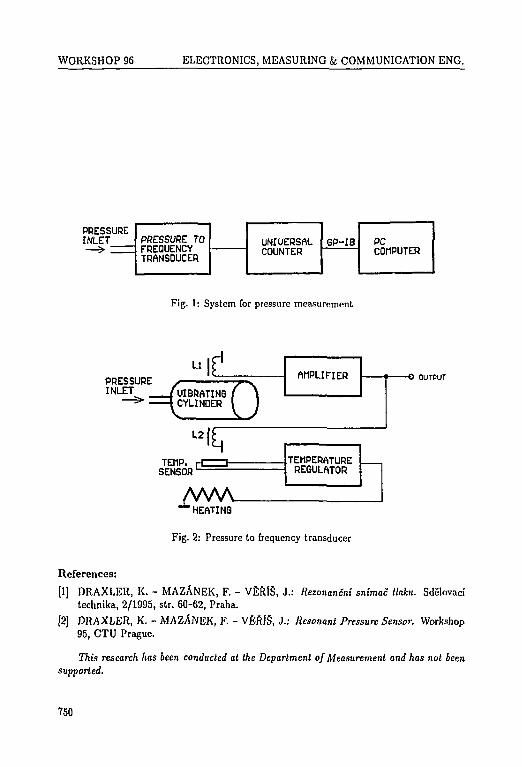
WORKSHOP 96 ELECTRONICS, MEASURING & COMMUNICATION ENG.
PRESSUREINLET PRESSURE TO
FREQUENCYTRANSDUCER
UNIVERSALCOUNTER
GP-rB PCCOMPUTER
Fig. 1: System for pressure measurement
PRESSUREINLET (UIBRATING
: CYLINDERKUIBRATING ( \CYLINDER I I
AMPLIFIER
U 2 I£TFMP. H 1
SENSOR'
AAAA
TEMPERATUREREGULATOR
- O OUTPUT
"HEATING
Fig. 2: Pressure to frequency transducer
References:
[1] DRAXLER, K. - MAZANEK, F. - VERfS, J.: Rezonancni snimac tlaku. Sdelovacitechnika, 2/1995, str. 60-62, Praha.
[2] DRAXLER, K. - MAZANEK, F. - VM1S, J.; Resonant Pressure Sensor. Workshop95, CTU Prague.
This research has been conducted at the Department of Measurement and has not beensupported.
750
WORKSHOP 96 ELECTRONICS, MEASURING fe COMMUNICATION ENG.
SYSTEM FOR ULTRASONIC RAILSTESTING AND ONE YEAR'SUTILISATION CONCLUSION
R. Balek, P . Janousek*, J . Krejca**
CTU, Fac. of Electrical Eng., Dept. of PhysicsTechnicka 2, 166 27 Praha 6
*CTU, Fac. of Electrical Eng., Dept. of PhysicsTechnicka 2, 166 27 Praha 6
**Research Institute of Railways Engineering, Dpt. of Nondestructive TestingNovodvorska 1698,142 00 Praha 4
Key words: rail, ultrasound, defectoscopy
There are many defects in rails especially in a transition zone bellow a rail head and inthe upper part of the web. The surveys of these defects see [1, 2].
One of the serious defect is a doubling of the web. The thickness of this crack is verysmall. So we cannot obtain any reflected signal from that defect. We only find, that thereflected signal from the end of the rail's foot called "end" echo, is attenuated.
In addition transverse cracks (the so called kidney cracks) can occur in the head. Theyare especially dangerous because they can occur in groups over short distance and can there-fore cause a short piece of rail to break out. These can be detected with angle probes. Weused 70° angle probes facing in opposite direction from the rolling surface. This arrangementis the most suitable for detection of defects with different orientation.
To be able to detect the described defects we designed a combined probe. This probeassembly contains one direct probe and angle twins having already been mentioned.
The coupling face is made from plastic and has to be changed after several thousandkilometres. One liter of coupling water required for the testing of 1 km is contained in aplastic bottle.
The control system cyclically drives transducers of the probe and evaluates receivedechoes. The founded defect is indicated acoustically and also optically on a display of thedevice. The repetition rate of the transmitters is 1 kHz. It was chosen according to velocityof the probe movement relative to the rail.
The 8 bite's processor Z80 is the heart of this system. This unit contains time measuringcircuits, interface, display, push buttons, input and output ports.
A menu offers so called "complex" mode when all transducers are cyclically excited.In "handy" mode the finding is done by a mean of one transducer. This mode serves forcareful aftcrfinding or supervision of the defect that was already found.
The gain of amplifiers, the timing of transmitters' circuits and the blocking of unwantedechoes is processor controlled. The time window, called monitor, is independently set foreach channel.
The distance of the defect from the rolling surface is determined by time delay of thereceived echo. This delay is compared to one, obtained a cycle before. The shorter delaymeans a defect.
751
WORKSHOP 96 ELECTRONICS, MEASURING k COMMUNICATION ENG.
What concerns of angle probes - received echo means a defect. Its distance is notmeasured.
The device is handled by four push buttons. The settled parameters are displayed. Thedefects are announced acoustically and by a mean of characters or signs on the display.
The described device together with proposed methodology offers exact evaluation of theposition, character and orientation almost all defects of rails. This system is much quickerand simpler than system with screen. In one year's application of this system a lot of newdefects were discovered e.g. cracks lying in the head of the rail and transverse cracks of theShalling type. The method of evaluation a flake was created and verified. Both mentionedmethods are going to be homologated.
This system was designed and manufactured as diploma project. Two years of experi-mental and research work of student and his tutors were spent.
References:
[1] BALEK, R. - JANOUSEK, P. - KREJCA, J.: Ultrazvukovy system pro nedeslrukiivnikontrolu kolejnic pp. 50-56. Sbornik Defektoskopie 93, Tabor 1993.
[2] OBRAZ, J.: Zkouseni materidlu uhrazvxikem. SNTL, Praha 1989.
This research has been conducted at the Department of Nondestructive Testing as partof the research project "Innovation of Devices and Technology for Nondestructive Testingof Rails" and has been supported by Czech Railways grant No. R-01S-610446.
752

WORKSHOP 96 ELECTRONICS, MEASURING fc COMMUNICATION ENG.
THE SATELLITE LASERRANGEFINDER FOR REMOTE
SENSING OF THE EARTH
A. Novotny, M. Cech, K. Hamal, H. Jelfnkova,I. Prochazka, M. Tawadrous*, H. Deebes*
CTU, Fac. of Nucl. Sci. & Phys. Eng., Dept. of Physical ElectronicsV Holesovickach 2, 180 00 Praha 8
•National Research Inst. of Astronomy & Geophysics, Space Dept.El Marsaad Str., Helwan, Egypt
Key words: satellite laser ranging, NASA, ESA, EUROLAS, geodesy, remote sensing,geophysics
The use of laser ranging to measure the distance of an Earth satellite is an attractivetechnique applied in geodesy, geophysics, remote sensing of the Earth and other applica-tions. The laser ranging precision has been improved from one metre in the seventies to asubcentimetre value in 1991. This increase in precision has been obtained mainly by short-ening the transmitted laser pulse, employing the higher resolution time interval meters andapplying faster optical detectors.
In 1974 a cooperative program was undertaken by the Hclwan Institute of Astronomyand Geophysics, the Czech Technical University, the Soviet Academy of Sciences and theSmithsonian Astrophysical Observatory, USA to set up a satellite laser ranging station inHelwan, Egypt. Since 1974 the quality and quantity of acquired data has continually im-proved, to the point where Helwan is now one of the fundamental stations in the globalnetwork and the only one permanently located on African continent [1]. The station wasincluded in the EUROLAS network in 1992 [2]. The technical description is available at,http://www.dgfi.badw-muenchen.de/edc/helwin.html. The existing SLR system [3], was un-able to cope with future demands for accuracy of ranging and range of the high orbitsatellites and will be replaced by a new system. The RMS of the normal point will be lessthan 10 mm with a range up to 20000 km.
Recently the number of satellites and scientific projects and applications related tosatellite laser ranging has increased dramatically. The new satellites ERS-1, ERS-2, Me-teor 3, Lageos 2, Topex/Poseidon, Stella, GPS 35, 36, Glonass will serve, among others,global ecology studies, new positioning and navigation techniques and general relativitystudies. In 1996 the Japanese space agency will launch the RIS experiment for atmosphericmonitoring, using satellite laser ranging techniques.
To meet the growing demand on generd station performance, ranging productivity,data quality and data interchange speed the station in Helwan has been upgraded during1994-1995 under the joint auspicies of NRIAG and CTU FNSPE.
According to the upgrade projects [4-6] presented at the 9th International Workshopin Canberra, Australia, November 1994, the objectives of the Phase A were to increase themaximal ranging distance up to 20 000 km by the introduction of visual guiding capability
753
WORKSHOP 96 ELECTRONICS, MEASURING fc COMMUNICATION ENG.
(full blind tracking until September 1995), to increase operation productivity by upgrad-ing the control system, tracking mount system (step motors, no encoders until the end ofJune 1995) and improve the communication facilities (full SLIP Internet connectivity, twoindependent Internet channels from the end of June 1995). Phase A has been completedthis year. Phase B objectives planned for 1996-1997 are to increase the ranging precisionfrom 2-3 centimeter levels to the subcentimeter value and to participate in the upcomingscientific project.
The operation of the SLR station in Helwan was not interrupted during Phase A.Acquired data was daily delivered to EDO (EUROLAS Data Center) to support the re-quirements of the scientific projects. The SLR Helwan is operated by scientist from CTUFNSPE for four months each year.
More detail information concerning the SLR global network, satellites with laser retrore-flectors, scientific projects and SLR data are available at URL:
http://www.dgfi.badw-muenchen.de/edc/edc.html (home page - EDC),http://gds.esrin.esa.it/7c8b5Jbb (ESA Earth Observation Guide & Directory Service)
and on WWW pages of the SGAPO GSFC NASA (The Space Geodesy k Altimetry ProjectOffice, Goddard Space Flight Center NASA) at URL:
http://cddis.gsfc.nasa.gOv/9S0.l/sgapo.html.
References:
[1] HAMAL, K. et al.: Satellite Ranging Using Picosecond Lasers, In: Proceedings of theCTU Workshop 93, Part B, CTU Prague, 1992.
[2] NOVOTNY, A. et al.: Satellite Laser Ranging Activities at EUROLAS Consortium,In: Proceedings of the CTU Workshop 93, Part C, CTU Prague 1993.
[3] HAMAL, K. et al.: Satellite Laser Station (7831) in Helwan 1992-1993, In: Proceed-ings of the 9th International Workshop on Laser Ranging Instrumentation, Canberra,Australia, November 1994.
[4] HAMAL, K. - PROCHAZKA, I. - TAWADROUS, M. Y. - MIKHAIL, J. S.: Helwan 2Satellite Laser Ranging Station, In: Proceedings of the 9th International Workshop onLaser Ranging Instrumentation, Canberra, Australia, November 1994.
[5] CECH, M.: Compact Laser Radar Control System with Aulolracking Capability, In:Proceedings of the 9th International Workshop on Laser Ranging Instrumentation, Can-berra, Australia, November 1994.
[6] NOVOTNY, A.: Internet Facilities and SLR Sites, In: Proceedings of the 9th Inter-national Workshop on Laser Ranging Instrumentation, Canberra, Australia, November1994.
This research has been conducted at the Department of Physical Electronics and at theSLR station Helwan. The joint research is supported by these grants:
1. Grant Agency of the Czech Republic 205/94/04402. National Research Institute of Astronomy and Geophysics, Helwan3. European Space Agency
754
WORKSHOP 96 ELECTRONICS, MEASURING fc COMMUNICATION ENG.
THE EXPERIMENTAL INTEGRATEDGPS/GLONASS RECEIVER
M. Broum, Z. Bilek, J . FiSer, P . Keller,P . Kovaf, L. Seidl, P. Vejraika, J . Zapotocny
CTU, Fac. of Electrical Eng., Dept. of RadioelectronicsTechnicka 2, 166 27 Praha 6
Key words: GPS/GLONASS
Satellite navigation is a very perspective and powerful means for position determination.User is able to determine his position by the receiving of signals from at least four navigationsatellites. There are two usable satellite navigation systems at present. It is the Americansystem GPS/NAVSTAR and Russian system GLONASS.
Both systems give precision of position determination within the order of tens of themeters,but this precision is unusable for some applications.
One method of improving results of satellite navigation is integration of both usedsystems GPS and GLONASS into one system. This integration can improve reliability andaccuracy because of greater number of visible satellites.
Integrated GPS-GLONASS receiver, which is able to receive and process signals of bothsystems, is developed at our department. The receiver is based on LSI integrated circuitsGP1010 and GP1020 made by GEC-PLESSEY Semiconductors. GP1010 is radiofrequencypart of GPS receiver. It includes a low noise preamplifier, two mixers, IF amplifiers and twooscillators with PLL.
The integrated circuit GP1020 contains six parallel digital correlators which are ableto proceed GPS and/or GLONASS signals. PC is used as a navigation computer, whichcontrols receiver and process measured pseudodistances and pseudoranges to count theposition of the user.
The input preamplifier and first mixer of the IC GP1010 is used for both GPS andGLONASS. The rest high frequency part of the GLONASS receiver is designed outside ofthe IC GP1010 (Fig. 1). The method of one bit quantization is user in the GLONASSreceiver design. A full digital signal processing follows
The frequency conversion of received signals to the GP1020 optimum frequency is pro-vided by digital means. The signals of each satellite are not transformed to the samefrequency because of complicated digital mixer circuit. The correction, which has to bedone in this case, will be done by the software means. The GP1020 allows to use one mixerfor up to three GLONASS satellites.
Two layer printed circuit board was designed. This BCP was made in DICOM, UherskeHradiste by surface mounted technology.
The signals of GPS satellites was received for the first time in the begining of November1995. The development of navigation software will follow. The problem of union of thesystem time bases and different geodetic systems of coordinates have to be solved in afuture.
755
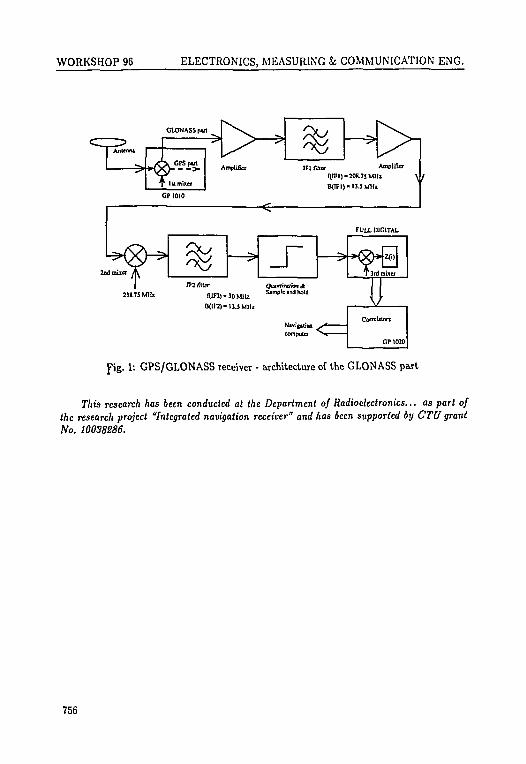
WORKSHOP 96 ELECTRONICS, MEASURING & COMMUNICATION ENG.
CP 1010
2ndmaer A
IF2ftHtr
fllf2)«30Mli2
Amplifier
l(TF1)-2(«.?SMHt
B(TFI)- 13.5 MTU
FULL DIGITAL
QuMtttbxthn JkSample tnd hold
Nivlgmltoo
fig. 1: GPS/GLONASS receiver - architecture of the GLONASS part
This research has been conducted at the Department of Radioelectronics... as part ofthe research project "Integrated navigation receiver" and has been supported by CTU grantNo. 10038286.
756
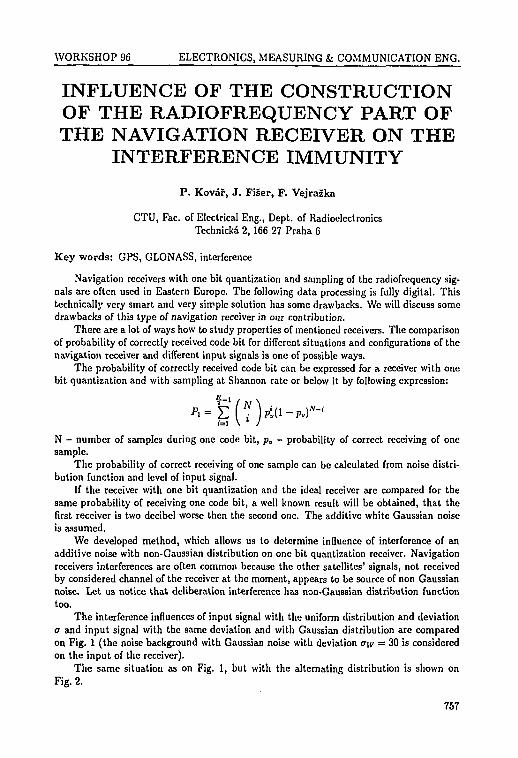
WORKSHOP 96 ELECTRONICS, MEASURING fc COMMUNICATION ENG.
INFLUENCE OF THE CONSTRUCTIONOF THE RADIOFREQUENCY PART OFTHE NAVIGATION RECEIVER ON THE
INTERFERENCE IMMUNITY
P. Kovar, J . Fiser, F. Vejrazka
CTU, Fac. of Electrical Eng., Dept. of RadioelectronicsTechnicka 2, 166 27 Praha 6
Key words: GPS, GLONASS, interference
Navigation receivers with one bit quantization and sampling of the radiofrequency sig-nals are often used in Eastern Europe. The following data processing is fully digital. Thistechnically very smart and very simple solution has some drawbacks. We will discuss somedrawbacks of this type of navigation receiver in our contribution.
There are a lot of ways how to study properties of mentioned receivers. The comparisonof probability of correctly received code bit for different situations and configurations of thenavigation receiver and different input signals is one of possible ways.
The probability of correctly received code bit can be expressed for a receiver with onebit quantization and with sampling at Shannon rate or below it by following expression:
N - number of samples during one code bit, pv - probability of correct receiving of onesample.
The probability of correct receiving of one sample can be calculated from noise distri-bution function and level of input signal.
If the receiver with one bit quantization and the ideal receiver are compared for thesame probability of receiving one code bit, a well known result will be obtained, that thefirst receiver is two decibel worse then the second one. The additive white Gaussian noiseis assumed.
We developed method, which allows us to determine influence of interference of anadditive noise with non-Gaussian distribution on one bit quantization receiver. Navigationreceivers interferences are often common because the other satellites' signals, not receivedby considered channel of the receiver at the moment, appears to be source of non Gaussiannoise. Let us notice that deliberation interference has non-Gaussian distribution functiontoo.
The interference influences of input signal with the uniform distribution and deviation(7 and input signal with the same deviation and with Gaussian distribution are comparedon Fig. 1 (the noise background with Gaussian noise with deviation aw = 30 is consideredon the input of the receiver).
The same situation as on Fig. 1, but with the alternating distribution is shown onFig. 2.
757
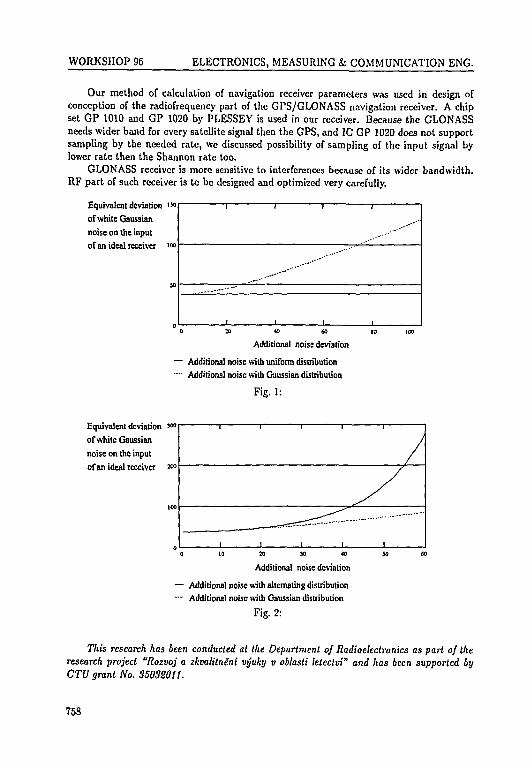
WORKSHOP 96 ELECTRONICS, MEASURING k COMMUNICATION ENG.
Our method of calculation of navigation receiver parameters was used in design ofconception of the radiofrequency part of the GPS/GLONASS navigation receiver. A chipset GP 1010 and GP 1020 by PLESSEY is used in our receiver. Because the GLONASSneeds wider band for every satellite signal then the GPS, and IC GP 1020 does not supportsampling by the needed rate, we discussed possibility of sampling of the input signal bylower rate then the Shannon rate too.
GLONASS receiver is more sensitive to interferences because of its wider bandwidth.RF part of such receiver is to be designed and optimized very carefully.
Equivalent deviation '*>of white Gaussiannoise on the inputof an ideal receiver ><*>
I 1
f
. . . . - • • " " "
1
1
1
Additional noise deviation
— Additional noise with uniform distribution
Additional noise with Gaussian distribution
Fig. 1:
Equivalent deviation **>
of white Gaussian
noise on the input
of an ideal receiver 2°°
1
1 1 1
/
/
1
Additional noise deviation
— Additional noise with alternating distribution
•-• Additional noise with Gaussian distribution
Fig. 2:
This research has been conducted at the Department of Radioelectronics as part of theresearch project "Rozvoj a zkvalitneni vyuky v oblasti letectvi" and has been supported byCTU grant No. 35032011.
758
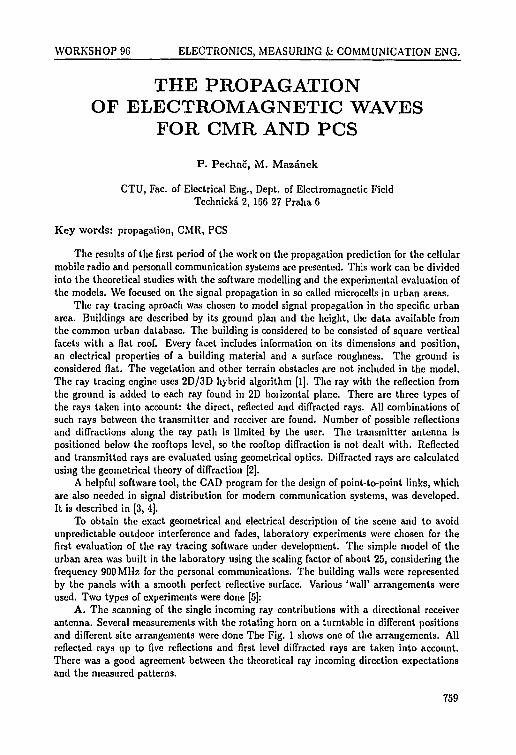
WORKSHOP 96 ELECTRONICS, MEASURING fc COMMUNICATION ENG.
THE PROPAGATIONOF ELECTROMAGNETIC WAVES
FOR CMR AND PCS
P. Pechac, M. Mazanek
CTU, Fac. of Electrical Eng., Dept. of Electromagnetic FieldTechnicka 2, 166 27 Praha 6
Key words: propagation, CMR, PCS
The results of the first period of the work on the propagation prediction for the cellularmobile radio and personall communication systems are presented. This work can be dividedinto the theoretical studies with the software modelling and the experimental evaluation ofthe models. We focused on the signal propagation in so called microcells in urban areas.
The ray tracing aproach was chosen to model signal propagation in the specific urbanarea. Buildings are described by its ground plan and the height, the data available fromthe common urban database. The building is considered to be consisted of square verticalfacets with a flat roof. Every facet includes information on its dimensions and position,an electrical properties of a building material and a surface roughness. The ground isconsidered flat. The vegetation and other terrain obstacles are not included in the model.The ray tracing engine uses 2D/3D hybrid algorithm [1]. The ray with the reflection fromthe ground is added to each ray found in 2D hoiizontal plane. There are three types ofthe rays taken into account: the direct, reflected and diffracted rays. All combinations ofsuch rays between the transmitter and receiver are found. Number of possible reflectionsand diffractions along the ray path is limited by the user. The transmitter antenna ispositioned below the rooftops level, so the rooftop diffraction is not dealt with. Reflectedand transmitted rays are evaluated using geometrical optics. Diffracted rays are calculatedusing the geometrical theory of diffraction [2].
A helpful software tool, the CAD program for the design of point-to-point links, whichare also needed in signal distribution for modern communication systems, was developed.It is described in [3, 4].
To obtain the exact geometrical and electrical description of the scene and to avoidunpredictable outdoor interference and fades, laboratory experiments were chosen for thefirst evaluation of the ray tracing software under development. The simple model of theurban area was built in the laboratory using the scaling factor of about 25, considering thefrequency 900 MHz for the personal communications. The building walls were representedby the panels with a smooth perfect reflective surface. Various 'wall' arrangements wereused. Two types of experiments were done [5]:
A. The scanning of the single incoming ray contributions with a directional receiverantenna. Several measurements with the rotating horn on a turntable in different positionsand different site arrangements were done The Fig. 1 shows one of the arrangements. Allreflected rays up to five reflections and first level diffracted rays are taken into account.There was a good agreement between the theoretical ray incoming direction expectationsand the measured patterns.
759
WORKSHOP 96 ELECTRONICS, MEASURING k COMMUNICATION ENG.
Fig. 1: The calculated and the measured ray paths
B . The measurement with an omnidirectional receiver antenna moving along the linepath in scaled street model. This experiment represents a signal coverage measurement. Thefast fading effect caused by the complex field vector superposition on the omnidirectionalreceiver antenna could be observed.
Scaled laboratory experiment can be successfully used for the modelling of the signalpropagation for the personal communication systems. The next step is the full implemen-tation of the model into a user-friendly program. More experiments with a consideration ofthe whole system of orthogonal polarisation and the non perfect reflectors should be done.Special equipment for both indoor and outdoor experiments on 900MHz is being prepared.
References:
[1] ATHANASIADOU, G. E. - NIX, A. R. - McGEEHAN, J. P.: A Ray Tracing Algorithmfor Microcellular and Indoor Propagation, Proceedings ICAP '95, pp. 231-235
[2] LUEBBERS, R.: Finite Conductivity Uniform GTD Versus Knife Edge DiffractionPrediction in of Propagation Path Loss, IEEE AP-32, No. 1, Jan.'84
[3] PECHAC, P. - HUDEC, P. - MAZANEK, M.: CAD program pro ndvrh vf ra-diorele'ovych tras 100 MHz-100 GHz, Poster 1995, Praha '95
[4] PECHAC, P. - HUDEC, P. - MAZANEK, M.: Ndvrh vf radiorele'ovych Iras do lOOGHz,Workshop CAE&CAD, C'VUT FEL Praha '95
[5] PECHAC, P. - MAZANEK, M.: Propagation Prediction in Microcells for UHF Per-sonal Communication Systems, 40. IWK, Ilmenau, Sept.'95
This research has been conducted at the Department of Electromagnetic Field as partof the research project "The Propagation of Electromagnetic Waves in CMR and PCS" andhas been supported by CTU grant No. 10038S72.
760
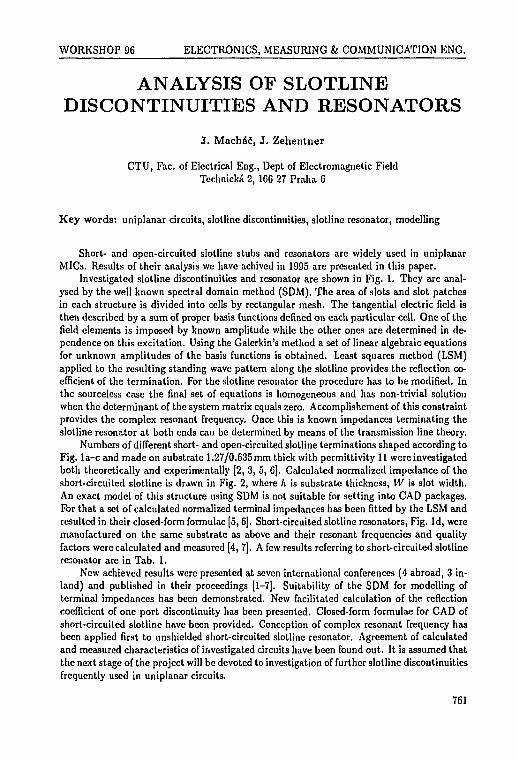
WORKSHOP 96 ELECTRONICS, MEASURING k COMMUNICATION ENG.
ANALYSIS OF SLOTLINEDISCONTINUITIES AND RESONATORS
J . MachaJ, J. Zehentner
CTU, Fac. of Electrical Eng., Dept of Electromagnetic FieldTechnicka 2, 1C6 27 Praha 6
Key words: uniplanar circuits, slotline discontinuities, slotline resonator, modelling
Short- and open-circuited slotline stubs and resonators are widely used in uniplanarMICs. Results of their analysis we have achived in 1995 are presented in this paper.
Investigated slotline discontinuities and resonator are shown in Fig. 1. They are anal-ysed by the well known spectral domain method (SDM). The area of slots and slot patchesin each structure is divided into cells by rectangular mesh. The tangential electric field isthen described by a sum of proper basis functions defined on each particular cell. One of thefield elements is imposed by known amplitude while the other ones are determined in de-pendence on this excitation. Using the Galerkin's method a set of linear algebraic equationsfor unknown amplitudes of the basis functions is obtained. Least squares method (LSM)applied to the resulting standing wave pattern along the slotline provides the reflection co-efficient of the termination. For the slotline resonator the procedure has to be modified. Inthe sourceless case the final set of equations is homogeneous and has non-trivial solutionwhen the determinant of the system matrix equals zero. Accomplishement of this constraintprovides the complex resonant frequency. Once this is known impedances terminating theslotline resonator at both ends can be determined by means of the transmission line theory.
Numbers of different short- and open-circuited slotline terminations shaped according toFig. la-c and made on substrate 1.27/0.635 mm thick with permittivity 11 were investigatedboth theoretically and experimentally [2, 3, 5, 6]. Calculated normalized impedance of theshort-circuited slotline is drawn in Fig. 2, where h is substrate thickness, W is slot width.An exact model of this structure using SDM is not suitable for setting into CAD packages.For that a set of calculated normalized terminal impedances has been fitted by the LSM andresulted in their closed-form formulae [5, 6]. Short-circuited slotline resonators, Fig. Id, weremanufactured on the same substrate as above and their resonant frequencies and qualityfactors were calculated and measured [4, 7]. A few results referring to short-circuited slotlineresonator are in Tab. 1.
New achieved results were presented at seven international conferences (4 abroad, 3 in-land) and published in their proceedings [1-7]. Suitability of the SDM for modelling ofterminal impedances has been demonstrated. New facilitated calculation of the reflectioncoefficient of one port discontinuity has been presented. Closed-form formulae for CAD ofshort-circuited slotline have been provided. Conception of complex resonant frequency hasbeen applied first to unshielded short-circuited slotline resonator. Agreement of calculatedand measured characteristics of investigated circuits have been found out. It is assumed thatthe next stage of the project will be devoted to investigation of further slotline discontinuitiesfrequently used in uniplanar circuits.
761
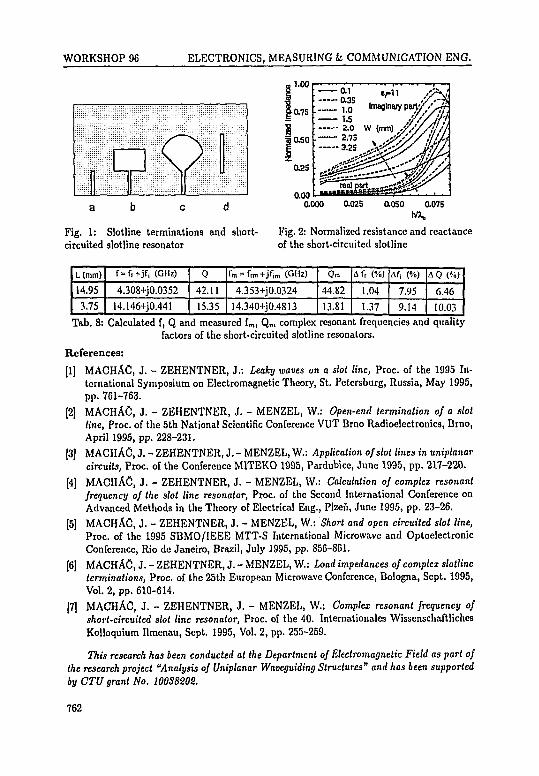
WORKSHOP 96 ELECTRONICS, MEASURING & COMMUNICATION ENG.
Fig. 1: Slotline terminations and short- Fig. 2: Normalized resistance and reactancecircuited slotline resonator of the short-circuited slotline
L(mm)
14.95
3.75
f=f,+jfi (GHz)
4.308+J0.0352
14.146+J0.441
Q
42.11
15.35
I'm = fmi +jfim (GHz)
4.353+J0.0324
14.340+J0.4813
Qm
44.82
13.81
A f, (%)
1.04
1.37
Af| (%)
7.95
9.14
A Q (%)
6.46
10.03Tab. 8: Calculated f, Q and measured fm, Qm complex resonant frequencies and quality
factors of the short-circuited slotline resonators.
References:
[1] MACHAC, J. - ZEHENTNER, J.: Leaky waves on a slot line, Proc. of the 1995 In-ternational Symposium on Electromagnetic Theory, St. Petersburg, Russia, May 1995,
pp. 761-763.
[2] MACHAC, J. - ZEHENTNER, J. - MENZEL, W.: Open-end termination of a slotline, Proc. of the 5th National Scientific Conference VUT Brno Radioelectronics, Brno,April 1995, pp. 228-231.
[3] MACHAC, J. - ZEHENTNER, J. - MENZEL, W.: Application of slot lines in uniplanar
circuits, Proc. of the Conference MITEKO 1995, Pardubice, June 1995, pp. 217-220.
[4] MACHAC, J. - ZEHENTNER, J. - MENZEL, W.: Calculation of complex resonantfrequency of the slot line resonator, Proc. of the Second International Conference onAdvanced Methods in the Theory of Electrical Eng., Plzen, June 1995, pp. 23-26.
[5] MACHAC, J. - ZEHENTNER, J. - MENZEL, W.: Short and open circuited slot line,Proc. of the 1995 SBMO/IEEE MTT-S International Microwave and OptoelectronicConference, Rio de Janeiro, Brazil, July 1995, pp. 856-861.
[6] MACHAC, J. - ZEHENTNER, J. - MENZEL, W.: Load impedances of complex slotlineterminations, Proc. of the 25th European Microwave Conference, Bologna, Sept. 1995,Vol. 2, pp. 610-614.
|7] MACHAC, J. - ZEHENTNER, J. - MENZEL, W.: Complex resonant frequency ofshort-circuited slot line resonator, Proc. of the 40. Internationales WissenschaftlichesKolloquium Ilmenau, Sept. 1995, Vol. 2, pp. 255-259.This research has been conducted at the Department of Electromagnetic Field as part of
the research project "Analysis of Uniplanar Waveguiding Structures" and has been supportedby CTU grant No. 100S8202.
762
WORKSHOP 96 ELECTRONICS, MEASURING fc COMMUNICATION ENG.
THE 37 GHzSHORT DISTANCE EXPERIMENT
H. Bart ik, M. Mazanek
CTU, Fac. of Electrical Eng., Dept. of Electromagnetic FieldTechnicka 2, 166 27 Praha 6
Key words: propagation, microwave
The Short Distance Experiment for measurement of the attenuation electromagneticwaves at 37 GHz frequency range and the results are described below.
Raindrops cause the absorption and scattering of the electromagnetic waves what isappeared as increasing of attenuation. The attenuation A as a function of a rainrate R isexpressed satisfactorily by the functional form
where a and 6 are tabulated coefficients for given frequency range and polarisation [1].The measuring system consists of the transmitter (vertical polarisation) and the receiver
(vertical polarisation); distance between them is 52 m. The raingauge, the control unit andthe PC for storing the data are also components of this system. The measure devices aresituated 35 m above the terrain at roofs of building CTU. The detail description of thesystem is in [2, 3].
The system was built up and the experiment started during spring 1994. The measure-ment started work in noncontinuous operation (when a rain started the system was switchedon and when a rain stopped, the system was switched off). Disadvantage of this operationwas that the data on beginning of measurement (several minutes) were devalued by chang-ing of parameters of receiver and transmitter until were achieved working temperatures. Itwas reason to change operation of measurement on continuous operation, that removed thisdisadvantage.
Measuring of the attenuation in the experimental line in non rainy days showed fluc-tuations of the attenuation [4]. These fluctuations are probably caused by the temperaturedependence of receiver and transmitter and represent limit of measurement of the attenua-tion due to mild rains.
Measured data including the attenuation and intensity of the rain are stored and statis-tical processed. Distribution of the attenuation is affected by the fluctuation of system, butis evident increasing of the mean value of everyday attenuation versus the mean value of theattenuation of the days without rain. Distribution of the intensity of rain shows very fastdecreasing of probability high intensity rains. Example of the distribution of the intensityof rain is shown in Fig. 1.
Accuracy of attenuation caused by rain in 37 GHz frequency range is influenced byfluctuation of measuring system, but statistic processing of measured data shows increasingof mean value of attenuation.
763
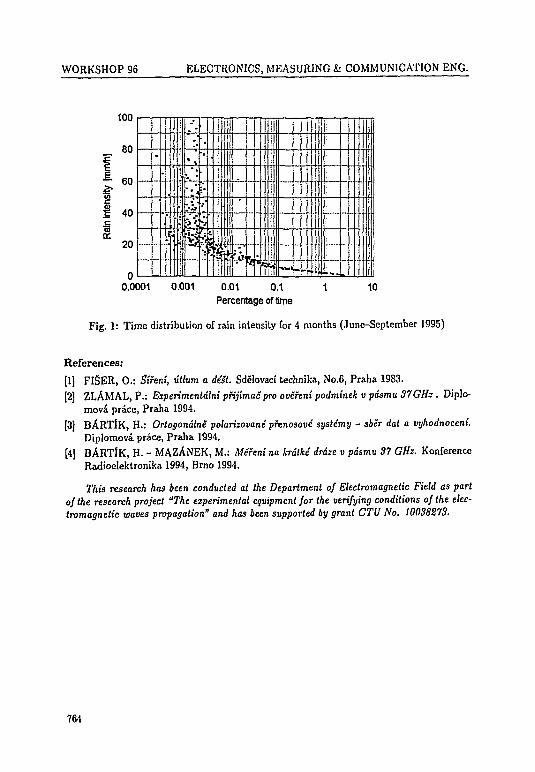
WORKSHOP 96 ELECTRONICS, MEASURING & COMMUNICATION ENG.
EC
100
80
60
40 -
20
0.0001 0.001 0.01 0.1
Percentage of lime
__
.....
_
•
- • " - • •
. . . . .
:
; - ' .
1 j j
| , t
.1 %i
•iN
•. i• • . j
i,.L
I
j
_ -
. .
j . __
[ ..„
. . . .
. . . . .
—p
n:
• —
L__
....
10
Fig. 1: Time distribution of rain intensity for 4 months (June-September 1995)
References:
[1] FISER, O.: Sifeni, ilium a de'st. Sdelovaci technika, No.6, Praha 1983.
[2] ZLAMAL, P.: Experimentdlni pfijimai pro ovefeni podminek v pdsmu 37GHz . Diplo-mova. pra.ce, Praha 1994.
[3] BARTJK, H.: Ortogondlne polarizavane pfenosove syste'my - sb£r dot a vyhodnoceni.
Diplomova prace, Praha 1994.
[4] BARTiK, H. - MAZANEK, M.: Mifeni na krdtke drdze v pdsmu 37 GHz. ^ConferenceRadioelektronika 1994, Brno 1994.
This research has been conducted at the Department of Electromagnetic Field as partof the research project "The experimental equipment for the verifying conditions of the elec-tromagnetic waves propagation" and has been supported by grant CTU No. 10038273.
764
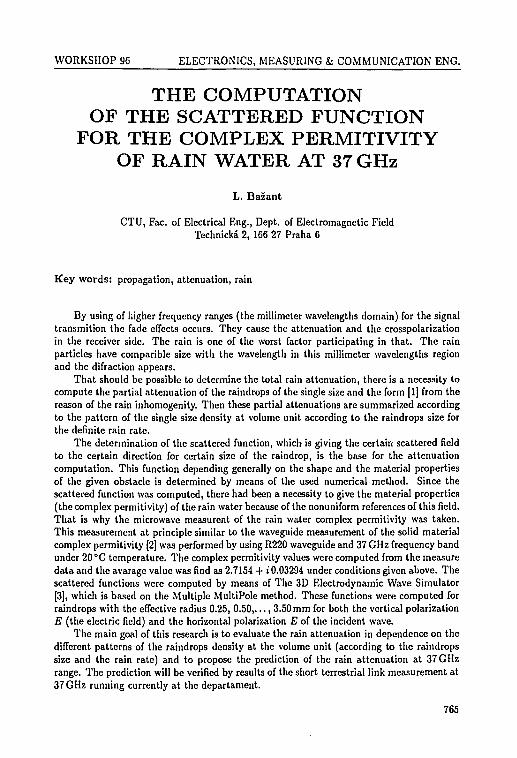
WORKSHOP 96 ELECTRONICS, MEASURING k COMMUNICATION ENG.
THE COMPUTATIONOF THE SCATTERED FUNCTION
FOR THE COMPLEX PERMITIVITYOF RAIN WATER AT 37 GHz
L. Bazant
CTU, Fac. of Electrical Eng., Dept. of Electromagnetic FieldTechnicka 2, 166 27 Praha 6
Key words: propagation, attenuation, rain
By using of higher frequency ranges (the millimeter wavelengths domain) for the signaltransmition the fade effects occurs. They cause the attenuation and the crosspolarizationin the receiver side. The rain is one of the worst factor participating in that. The rainparticles have comparible size with the wavelength in this millimeter wavelengths regionand the difraction appears.
That should be possible to determine the total rain attenuation, there is a necessity tocompute the partial attenuation of the raindrops of the single size and the form [1] from thereason of the rain inhomogenity. Then these partial attenuations are summarized accordingto the pattern of the single size density at volume unit according to the raindrops size forthe definite rain rate.
The determination of the scattered function, which is giving the certain scattered fieldto the certain direction for certain size of the raindrop, is the base for the attenuationcomputation. This function depending generally on the shape and the material propertiesof the given obstacle is determined by means of the used numerical method. Since thescattered function was computed, there had been a necessity to give the material properties(the complex permitivity) of the rain water because of the nonuniform references of this field.That is why the microwave mcasurent of the rain water complex permitivity was taken.This measurement at principle similar to the waveguide measurement of the solid materialcomplex permitivity [2] was performed by using R220 waveguide and 37 GHz frequency bandunder 20 "C temperature. The complex permitivity values were computed from the measuredata and the avarage value was find as 2.7154 + : 0.03294 under conditions given above. Thescattered functions were computed by means of The 3D Electrodynamic Wave Simulator[3], which is based on the Multiple MultiPole method. These functions were computed forraindrops with the effective radius 0.25, 0.50,..., 3.50 mm for both the vertical polarizationE (the electric field) and the horizontal polarization E of the incident wave.
The main goal of this research is to evaluate the rain attenuation in dependence on thedifferent patterns of the raindrops density at the volume unit (according to the raindropssize and the rain rate) and to propose the prediction of the rain attenuation at 37 GHzrange. The prediction will be verified by results of the short terrestrial link measurement at37 GHz running currently at the departament.
765
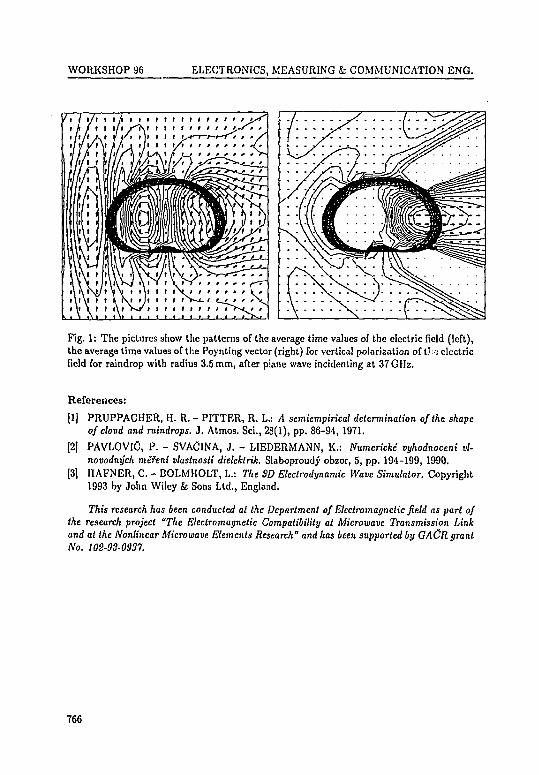
WORKSHOP 96 ELECTRONICS, MEASURING & COMMUNICATION ENG.
Fig. 1: The pictures show the patterns of the average time values of the electric field (left),the average time values of the Poynting vector (right) for vertical polarization of {.'•'. electricfield for raindrop with radius 3.5 mm, after plane wave incidenting at 37 GHz.
References:
[1] PRUPPACHER, H. R. - PITTER, R. L.: A semiempirical determination of the shapeof cloud and raindrops. J. Atmos. Sci., 28(1), pp. 86-94, 1971.
[2] PAVLOVIC, P. - SVACINA, J. - LIEDERMANN, K.: Numericke vyhodnoceni vl-novodnych mefeni vtastnosti dieleklrik. Slaboproudy obzor, 5, pp. 194-199, 1990.
[3] HAFNER, C. - BOLMHOLT, L.: The SD Electrodynamic Wave Simulator. Copyright1993 by John Wiley & Sons Ltd., England.
This research has been conducted at the Department of Electromagnetic field as part ofthe research project "The Electromagnetic Compatibility at Microwave Transmission Linkand at the Nonlinear Microwave Elements Research" and has been supported by GACR grantNo. 102-03-0937.
766
WORKSHOP 96 ELECTRONICS, MEASURING k COMMUNICATION ENG.
THE MATERIAL DIELECTRICCHARACTERISTIC MEASUREMENT
M. Mazanek, Z. Brychta, K. Hoffmann,K. Novotny, P . PechaS
CTU, Fac. of Electrical Eng., Dept. of Electromagnetic FieldTechnicka 2, 166 27 Praha 6
Key words: microwave measurement, permitivity
Different methods of the measurement of the dielectric characteristic of materials avail-able at the Department of Electromagnetic Field (DEF) of CTU are listed. Special attentionis devoted to the broadband microwave measurement using the correction method for thewaveguide measurement of reflection and transmission coefficient and discussion of the de-termining of the complex permitivity components.
The dielectric characteristic of materials can be measured by different methods whichdiffer by an accuracy, frequency band, system of measurement (waveguide, resonator, coax-ial, free space) etc. The methods are: the direct complex permitivity components measure-ment or their calculation from the material reflectivity and transmisivity measurement.
A. The waveguide method of the complex permitivity measurement available at theDEF:
1. Waveguide single frequency method of measurement by [1] including the appropriatesoftware for numerical processing of the measurement results is available on singlefrequency in the frequency bands 4-6 GHz, 6-8 GHz, 8-12 GHz, 12.4-18 GHz, (35-37GHz, 90-110 GHz).
2. Waveguide broadband method of measurement using the HP 8410 system was devel-oped at the DEF. This method is based on the automatic PC controlled vector networkanalyser with HP8410 [2] including the correction methods [3]. Waveguide test sets forthis measurement are in frequency bands 4-6 GHz, 6-8 GHz, 8-12.4 GHz, 12.4-18 GHzavailable. This measurement produce the measurement of reflection and transmissioncoefficients (S matrix). After the processing (using the correction methods based onthe precision calibration) the accuracy of these parameters measurement is better then1%. The next step is the calculation of complex permitivity components. It is neces-sary to include the correction of the frequency dependent of waveguide characteristicimpedance. Especially it is necessary to include the change of the waveguide diametersbetween individual bands. The synthesis of the layered (low-reflection) media can dueto the software [4] be done.
B . Free space reflectivity level measurement. This can be used for the total reflectivitylevel of the layered media measurement as well as for the reflectivity level of anechoicchambers testing. Generally speaking, the reflectivity level varies with position, polarisationand frequency and also depends on transmitting and receiving antenna radiation patterns.
767
WORKSHOP 96 ELECTRONICS, MEASURING fc COMMUNICATION ENG.
If the receiving level a [dB] will due to the reflections vary between levels b, c [dB], the totalreflectivity is then given by
R = ^ = A-rf^- where A = 10* and B = 1 0 ^Ei li +1
Free voltage standing wave ratio (VSWR) is one of the method which can be used [5].The source antenna is pointed to the measured surface. The probe antenna is moved lin-early along the surface and the interference pattern due to the direct and reflected field isrecorded. In the anechoic chambers the movement is usually transverse to the line betweenthe antennas but it could be as well as longitudinal. From the maximum ripple, b — c, ofthe received power reflectivity level can be calculated using equation above.
The total accuracy of the wave guide methods depends on the calibration set up andon the precision of the dimension of the materials under the test. Tiie vector measurementallow to calculate the complex permitivity components. The free space methods need goodattenuator, and/or linearity of the receiver. The negative influence of the antenna patterncan be solved by choosing a source antenna having higher gain and lower sidelobes with agood polarisation purity e.g. corrugated horn antenna.
The method described above are available at the Department of Electromagnetic Fieldof the CTU in Prague [6, 7]. The comparison of the single frequency measurement withbroadband correction method measurement and calculation with proper software processingis a good way to study the material properties and to support the synthesis and practicaldesign of layered structures.
References:
[1] PAVLOVIC, P. - LIEDERMANN, K. - SVACINA, J.: Numerickc vyhodnoceni vlnovod-nych me'reni vlastnosti dielektrik. Slaboproudy obzor, Vol. 51, 1990, No. 5, pp. 194-199
[2] HOFFMANN, K. - JEDLICKA, J.: Automatic PC Controlled Vector Network Analyserwith HP8410. MITEKO 95, Pardubice, June 1995, pp. 169-172
[3] HOFFMANN, K. - SKVOR, Z. - LEUZZI, G.: A New Correction Method for Non-coaxial Test Fixtures.
[4] NOVOTN¥, K.: Nizkoodraznd vrstvend ztrdtovd dielektrickd prostfedi. Scientific con-ference, Radioelectronics, Kosice, September 1994, pp. 52-56
[5] LEHTO, A. - TUOVINEN, J. - VALMU, II. - RAISANEN, A.: Anechoic chamberevaluation at 85 GHz. Helsinky University of Technology, Report S174, 1988
[6] PECHAC, P. - JANlK, J. - HUDEC, P. - MAZANEK, M.: Softwarovd podpora an-te'nnich mefeni. Konfercnce Radioelektronika 1994, Brno, April 1994, pp. 363-3G6
[7] MAZANEK, M. - PECIIAC, P.: Mercni prostoru sc snizenou odrazivosli v pasmumikrovln a mm vln. konfercnce Radioelektronika 1995, Brno, April 1995
This research has been conducted at the Department of Electromagnetic Field as partof the research project "Non Reflective Layered Media in 1-100 GHz Band" and has beensupported by CTU grant No. 8191.
The development of the correction method applied on the HP84IO has been supported byGrant Agency of the Czech Republic, grant No. 102-93-937 ("Electromagnetic Compatibilityin Microwave Transmission systems.,.")
768
WORKSHOP 96 ELECTRONICS, MEASURING k COMMUNICATION ENG.
FIRST EXPERIENCE WITH USINGA VME SYSTEM FOR MEASUREMENT
V. Haasz, M. Tutko
CTU, Fac. of Electrical Eng., Dept. of MeasurementsTcchnicka 2, 166 27 Praha 6
Key words: VME, OS/9, dynamical measurement
Systems with VME-bus are developing, measuring and control systems for industrialuse, which are usable in a number of different applications. General advantages of VME-bus are: high rate of data transfer (40 Mbyte/s), high noise and vibration immunity, anda structure, corresponding to real time operating system (multiuser, multitasking). Fromthese characteristics it follows that these systems are advantageous for real time measure-ment and data processing in industrial processes, especially in the case, when IBM PC/ATcompatible computers do not match speed and noise requirements.
The system at our disposal at Department of measurement contains two types of mea-suring boards: VMEbus board VAN8 and VMEbus carrier board for MODULbus boards.To this carrier it is possible to attach simple MODULbus boards, which can also be attachedto IBM PC/AT compatible computers via PC/AT carrier board. The general advantagesof MODULbus boards low price and wide offer of modules with different functions) areoutweighted by their excessive simplicity (no internal timer, no FIFO buffer, an externaltrigger signal cannot be used etc.). We use them to compare the quality of using thesesimple MODULbus boards at the VME system with that of the IBM PC/AT compatiblecomputer. The boards are compared from following points of view: internal noise, jitter,sampling rate, number of effective bits etc. The first experiences have shown, how manyproblems can arise.
MODUL bus boards used for the first tests are following:
8E8: 8 SE analog inputs, 8-bit resolution, conversion time 1 /is, end-of-conversion interrupt,8-channel multiplexer
12E8: 8 differetial analog inputs, 12-bit resolution, conversion time 12.5 fis, end-of-conversioninterrupt, 8-channel multiplexer.
Folloving problems were observed:
1. Measurement of maximal sampling rate with software triggering. The max-imum sampling rate is given by the speed of A/D converter or by the speed of themeasurement system, if this system is slower than the A/D converter. There are notimer or trigger input to use a hardware trigger, but the software trigger commandhas to be used. For evaluation of the sampling rate a short program loop was used(as short as possible). There is a trigger command in this loop for initializing theconversion. The sampling rate was determined from the number of samples per signalperiod.
769

WORKSHOP 96 ELECTRONICS, MEASURING fc COMMUNICATION ENG.
2. Measurement of a j i t te r . The next consequence of software triggering is the timeuncertainty between two samples. This jitter can arise owing to memory refresh orinterrupt rutines delay during sampling loop (some of RTOS minimize this influence).The ramp waveform signal was used for estimation of this kind of jitter. In ideal case«„—un_! = ••• = u2—uj = Au, where Ui , . . . ,u n are n samples per period of the rampwaveform. There is a long term nonlinearity, in the fact, but it can be determinedusing the sampling of a great number of periods. Because the influence of jitter andinternal noise have a random or pseudorandom character, the difference between twosuccessive samples without noise and jitter influence can be defined as
m mAu,- = £ A«i;- = ][)(u,j - ui+ij) t = 1,..., n - 1
i=i j=i
The internal noise can be determined for low rise speed of ramp. Then the of standarddeviation of delta u,j for measurement using the ramp with maximal useable rise speedand low rise speed can be considered as the influence of jitter.
3 . Measurement of internal noise. Internal noise arises owing to emission of electri-cal components and circuits placed in the measurement system (VME, PC/AT, etc.)The value of internal noise depends on the arrangement of input circuit and on theresistance of signal source or on the resistance, which is connected between low andground terminals (for differential input only). From this reason the measurement ofinternal noise were realised for different values of resistors, which were connected be-tween input and ground terminals (SE input) or high and low terminals and low andground terminals (differential input) (see [1]).
4. Measurement of the number of effective bits This method of determinationof dynamic quality of A/D conversion implicates influences of both jitter and noise(see [2]).
All the above mentioned measurements were performed for identical MODULbus boardsplaced on both VME and PC systems. All results of testing will be presented at Work-shop'96.
References:
[1] HAASZ, V. - KOCOUREK, P. - BRABENEC, J.: Methods for Comparing the Quality
of PC Plug-in Cards, IMEKO TC-4, Vienna 1992
[2] ROZTOCIL, J. - POKORNY, M. - NAVARA, M. - VEDRAL, J.: Dynamical Testing
of A/D Plug-in Boards, IMEKO TC-4, Prague 1995
[3] JANZ COMPUTER AG: VAN8, 12E8, 8E8: Hardware references
[4] MICROWARE SYS. CORP.: OS-9 Advanced System Software
This research has been conducted at the Department of Measurement as part of theresearch project "The Investigation of Algorithms for Dynamic Measurements and the Spec-ification of Methods for Estimation of Errors of These Measurement by the Use of PCPlug-in Board Systems" and has been supported by Grant Agency of the Czech Republicgrant No. 102/93/0907.
770
WORKSHOP 96 INDEX
INDEX
Abu Zumraar, R., 729Adamec, J., 309, 313, 347Adamec, L., 155Adamek, J., 39, 609Almasani, A., 487Anger, L., 917Antfeist, F., 671Attlova, J., 979Aubrecht, L., I l lAubrecht, V., 675, 679Austin, J., 287Autrata, R., 837
Baca, P., 605Bach, P., 465Balek, R., 751, 833Barborik, P., 237Bares, K., 899Bartak, M., 339Bartes, F., 1057Barthelemy, A., 835Bartik, H., 763Bartik, L., 561Bartl, J., 679Bartlova, M., 155, 675Bartusek, J., 1103, 1139Bauer, K., 479Bauer, Z., 511Baumruk, P., 323Bazant, L., 765Becka, J., 285Bednarik, M., 55, 57Bejcek, L., 735, 737Bern, J., 937Benda, V., 59, 125Bendl, J., 901Benes, B., 289BeneS, L., 19, 537Benes, M., 205Benes, P., 139, 939Benes, V., 37Beran, V., 1005, 1121Beran, Z., 1139Berka, L., 551
Berka, M., 271Berka, R., 293Bervid, P., 1143Bicak, J., 719Bila, J., 249Bila, N., 949Bilek, Z., 755Biolkova, V., 857Bittnar, Z., 423, 425, 495Bittner, J., 259Bobak, R., 1139Bocko, J., 433Bohm, J., 107, 109Borgi, S., 1035Bosacek, V., 627BouSka, P., 485, 617, 1015Bozek, V., 615Brustlova, J., 839Brabcc, J., 697Brachtl, M., 251Brandejs, J., 299Bris, P., 965Brodska, S., 151Broum, M., 755Broz, P., 439Bruha, 0., 333Brydita, Z., 767Bryknar, Z., 121Brzobohaty, J., 703, 879Bfezina, J., 523, 545, 597Bfezina, T., 649Bfichac, M., 653Bubeni'k, F., 35Budinsky, R., 63Buchal, A., 539, 545, 567, 589Bulvas, J., 489Burian, Z., 829
Cajthaml, K., 1037, 1039Calabek, M., 605Cejp, J., 595Cenek, M., 149, 1077Cepek, A., 197
771
WORKSHOP 96 INDEX
Cihlar, J., 263, 967Coufal, O., 155Cseplo, L., 555Cusan, P., 557Czesana, B., 911
Cada, R., 1027, 1029Cech, M., 753, 903Cechak, T., 159, 921, 955, 1063Cepera, M., 537Cermak, F., 1019Cermak, J., 453, 1035, 1037Cernocky, J., 709Cerny, F., 107, 915Cerny, J., 35Cerny, M., 449Cerny, R., 145, 353, 629, 631Cervenka, V., 1111Cerveny, M., 239Cesky, J., 991Ceska, M., 199Ceska, R., 587, 589Cihak, P., 517Cihakova, I., 1135Cochnaf, Z., 573Culi'k, J., 435
Dalik, J., 17Danecek, J., 245Danek, M., 935Danesova, J., 911Davfdek, V., 725Dedouch, K., 459Deebes, H., 753Dejmek, W., 97Demi, J., 247Demlova, M., 39, 163, 167Dittrichova, L., 99, 589Divis, L., 719Dlask, P., 1119Dlouha, E., 1089Dlouha, M., 119, 627Dlouhy, R., 907DobeS, J., 895Dobis, P., 839Dohnalek, J., 619Dolejs, J., 643, 645
DoleSal, J., 653, 699Dolezel, V., 445Dolozilek, M., 965Dorazil, E., 563, 567Costal, T., 713Douda, P., 327Drapal, P., 245Draxler, K., 687, 745, 749, 1097Drchalova, J., 629Drkal, F., 953Drkosova, J., 21Drlik, L., 1127Drochytka, R., 611Drska, L., 79, 81Druckmuller, M., 535Dub, P., 587Dupak, J., 599Durcak, M., 931Dvofacek, J., 299Dvorak, 1., 559Dvorak, P., 181, 849Dvorak, V., 221Dynybyl, V., 511, 1061
Ebel, M., 989Eck, V., 899Eckstein, J., 635
Fadrus, H., 927Fajman, P., 431Felkel, P., 253Fenclova, M., 167Fendrych, M., 263Feraidon, A., 1009Fiala, P., 821Fidler, J., 1025Fidler, V., 67Fiedler, R., 603Filip, J., 283Filipova, J., 247, 483Finsterle, J., 1077Fiser, J., 755, 757Flek, O., 167Foltiny, F., 821Forejt, M., 597, 1023Foret, R., 539Fort, I., 329, 331, 333
772
WORKSHOP 96 INDEX
Francu, J., 17Frank, H., 105Frankovi, E., 1141Freiberg, F., 1113Friedl, M., 177Friedl, Z., 153Fucik, 0. , 267Fucikova, J., 59Fuka, J., 697Fiirst, J., 19
Galas, I., 849Ganev, N., 551, 591Gcbauer, G., 967Gerlich, J., 663Gerndt, J., 73, 1061Glogar, A., 1103Glogar, M., 1139Glogar, P., 579Gosman, A., 949Gosmanova, G., 551, 591Gregor, J., 137, 685Gregor, T., 849, 851Grmcla, L., 157, 839Gross, B., 675, 677, 679, 681, 683Grossmanova, M., 1123Gruncl, M., 213Griinwald, A., 919, 943, 945Guy, O., 835
Haasz, V., 747, 769Habel, J., 689Hach, L., 191Hajek, J., 587Hajkr, J., 1125Hala, M., 1087, 1089Haluza, M., 349Hamal, K., 105, 753, 831, 903Hamata, V., 991Hamhalter, J., 41Hanak, J., 559, 613Hanak, V., 1063Handova, Z., 941Hanitz, F., 101Hanousek, K., 731Hanzalek, Z., 207Hanzl, V., 731
Harna, Z., 97Hartl, M., 455, 845Hartman, R., 555Hatschbach, P., 319, 323Havelka, L., 685Havelka, P., 897Havlf&k, M., 43Havlicek, S., 157Havlik, J., 705Havllk, V., 341, 353Hazdra, P., 881Hazdra, T., 167, 169Hejda, P., 279Hejtmanek, J., 119Helienek, E., 1141Hemerka, J., 953Heptner, T., 469Hermansky, B., 1065Hlavac, V., 171, 173, 183Hlavacek, J., 351Hlavacek, P., 1031, 1033Hlavaty, L., 43Hlousek, J., 593Hnatowicz, V., 915Hnilica, F., 579Hobzik, J., 317, 463Hof, M., 67Hoffmann, K., 767Hofman, P., 1051Hofreiter, M., 193Hojerova, M., 901Holecek, A., 259Holicky, M., 1001, 1003, 1015, 1019Hollay, P., 243Holoubek, P., 873Holy, S., 509, 917Honec, J., 711, 843Hong, H., 27Hora, V., 247Horacek, P., 697Horak, J., 19Hostomsky, S., 243Hosek, P., 1043HoSkova, S., 631Houdek, D., 465Housa, J., 465HouSka, A., 677, 681
773
WORKSHOP 96 INDEX
Hovorka, J., 1129Hrabanck, M., 617Hrad, J., 727Hradilova, J., 829Hrdousek, V., 1017Hron, M., 1065Hronkova-Lhotska, L., 169Hrouda, F., 613Hruba, I., 637, 821Hruska, T., 261Hfibek, P., 821, 825Hubacck, T., 355Hudec, R., 565, 567, 571, 1025Huml, M., 197Husak, R., 533Husek, P., 897Hutak, P., 673Hyniova, K., 189
Chab, V., 145Chadzitaskos, G., 103Chalupa, L., 673Chalupa, M., 981Charvat, M., 263Chmela, P., 823, 853Chmelfk, R., 841Chudoba, R., 495Chybik, J., 473Chysky, J., 901
Ingcduld, P., 337
Jakl, M., 97, 845JaV'ibek. J., 73Jak-.oovi, I., 137,685Jan, J., 531,891Janci'k, L., 511Jancba, D., 627Jani'cek, L., 1025Janos, J., 203Janousek, J., 661Janousek, P., 751Janousck, V., 199Janout, Z., 75Janova, D., 523, 529, 531, 589Janov<-c, J., 533Jaics, M., 357
Javfirek, J., CG3Jcch, C , 71Jelen, J., 61Jelinck, I., 243, 249Jelinkovi, II., 753, 903Jefabek, M., 233JeZek, J., 313Jicha, M., 357, 961Jilek, M., 319Jirak, J., 837Jirak, Z., 119Jirasek, V., 849Jirava, P., 1083, 1085Jirku, S., 317, 463Jirousek, P., 121Jiroul, L., 899Jirsik, M., 507Jiruse, J., 587Jincek, 0., 55, 89Jifina, M., 291Joanidis, A., 689Jouffrey, B., 527Junek, A., 1131Jurca, L, 1139Jurci, P., 595Jurova, M., 1055, 1103
Kabrt, P., 1037, 1039Kaderka, J., 871Kadlcak, J., 437Kadlec, F., 895Kadlec, P., 137Kadlccck, V., 639Kafka, J., 667Kalal, M., 847Kaloc, R., 689Kalousok, It., 09Kanaval, J., 511, 1061Kandus, D., 575Kapilanova, R., 1023Kaplan, I., 977Kapusla, P., 67Kargerova, M., 31Karlicky, P., 1083, 1085, 1089Karlik, M., 527Karpinski, L., USKaspar, P., 745
774

WORKSHOP 96 INDEX
Katolicky, J., 961Kavan, J., 1047Kavan, M., 1115Kavicka, F., 593Kazelle, J., 1077Kejhar, M., 869, 873Keji'k, P., 745Keller, P., 755Kerkovsky, M., 1143Kheilova, M., 95Kilian, P., 891Kirschner, M., 869Klecka, M., 653Klecka, T., 621Klema, J., 169Klicnik, M., 599Klima, M., 849Kluson, J., 1063Klvaiia, J., 1131Knizek, K., 119Kocian, M., 107Kocmanova, A., 1055, 1057Koci, J., 689Kodl, P., 183Kohoutek, R., 971Kolacek, K., 115Kolacny, J., 673Kolar, D., 201Kolaf, J., 469Kolafik, V., 867Kolfsko, J., 621Kolka, Z., 703Koller, J., I l lKomanec, R., 867Komrska, J., 817Koni&k, J., 75Konicek, Z., 941Konvalinka, P., 485, 625Konvickova, S., 913, 915, 923Kopincova, E., 33Kopinec, J., 163Kopfiva, P., 553Korab, V., 1101, 1127Kofmek, Z., 581Kos, J., 247Kostal, E., 721, 849Kotagka, L., 817
Kouba, Z., 163, 167, 169Koubska, P., 943Koufil, Z., 543Kout, J., 167Koutnik, J., 167Koutny, J., 995Koutny, V., 1049Kovaf, B., 185Kovaf, L., 861Kovaf, P., 755, 757Kovafik, R., 299Kozak, V., 1139Kozel, J., 321Kozel, K., 19, 321Kozisek, J., 125Krai, J., 507, 637, 821, 959Krai, L., 211Krai, M., 1035, 1037Kralik, M., 185Kralova, R., 109Kratky, J., 483Kraus, I., 551, 591Kraus, P., 981Kraus, S., 175Kravarik, J., 113, 115Krejca, J., 751Krejci, A., 115Krejci, J., 523, 525, 539, 545, 571, 597Krejcik, J., 941Krejcova, J., 523, 1023Kristof, P., 271Kropik, M., 1069Krops, S., 1073Kruis, J., 423Krysl, P., 417Kfemen, J., 991Kfesalek, V., 607Kfiha, V., 101Kffstek, V., 477, 479, 483, 491, 493Kfivak, P., 605Kfupka, I., 455, 845Kuba, A., 1139Kuba, J., 633, 671Kubak, J., 1043Kubalfk, J., 163Kubasta, J., 69, 71, 73, 75, 1065Kubecek, V., 67, 835, 903
775

WOEKSHOP 96 INDEX
Kubecka, M., 743Kubelik, M., 1061Kubes, P., 113, 115Kubik, F., 1139Kucera, D., 891Kucera, P., 23Ku£era, T., 209Kudlacek, I., 957Kudrnacova, I., 951Kukaii, V., 1017Kukla, Z., 535Kuklik, P., 501, 643, 645Kuklfkova, A., 643, 645Kukli'kova, J., 501Kflla, V., 317, 463Kulhanek, P., 117Kunovsky, J., 223, 971Kunz, J., 553Kiinzel, K., 655Kunzova, D., 917Kuska, M., 743Kustera, I., 589Kvasnicka, I., 585, 915, 1051Kvasfiak, E., 897Kveton, K., 77Kyncl, Z., 85Kytyr, J., 437
L. Vitek, J., 477Laciga, P., C65Lain, J., 307Lakomy, L., 995Lamboj, L., 951Lampa, P., 269, 271, 301Langmaier, F., 1031LapJik, Jr., L., 157Lapcik, Jr., t . , 135, 143Lapgfk, L., 135Lauschmann, H., 557Lavicky, M., 475Lazansky, J., 163, 167, 169Lebeda, O., 949Lchovec, F., nu:;i, 1085Leonardis, A., 171Lhotakova, Z., 929Lhotska, L., 167Lib.il, V., 185
Liedermann, K., 157Li'sal, M-, 63Liska, R., 25, 27Liska, M., 737, 819, 839Lizak, V., 665Lopour, F., 99Losinska, J., 1063Lowitova, 0., 485, 507, 515Lukas, P., 533Luxemburk, F., 1083, 1085, 1095
Maca, J., 421Maca, K., 573Macek.J., 321, 323, 325Macek, K., 533, 543, 549Macek, L., 943, 945, 1137Macek, T., 287Macik, K., 1113Macura, Z., 1127, 1133Madl, J., 1045, 1047, 1049, 1053Mach, P., 583, 743Macha, I., 105Maclia, I., 107, 109, 123, 151Machac, J., 761Machacek, J., 519Maier, K., 977Maixner, J., 635Makovicka, D., 1011Mala, J., 927Malinsky, K., S"Maly, J., 931Man, J., 537Mann, H., 219Mansfeldova, A., 973, 1081Marcian, F., 931Marecck, P., 21Margolin, L., 25Martinek, J., 897Martinek, P., 715Marvan, I., 167Maryska, J., 21Man'k, V., 163, 167, 169Masek, I., 135Matejka, F., 99, 589Matejka, K., 1067, 1069, 1071Matejovsky, J., 739Matcrna, A., 555
776
WORKSHOP 96 INDEX
Maticka, R., 1041Matousek, J., 135Matousek, P., 359Matuchova, M., 635Mazanek, R, 749, 1097Mazanek, M., 759, 763, 767McGoldrick, J., 1141Medek, J., 331Melichar, B., 275Micka, K., 605Micin, J., 963Michalec, J., 541,915Michalck, J.,547Mikisck, M., 1065Miksicek, L., 257Mikula, P., 533Mikulaskova, B., 135Mikulastik, M., 1139Mikulec, L , 1143Mindl, P., 659Mladek, M., 1033Mocek, T., 847Modry, S., 639, 1013Mollikova, E., 575Moos, P., 1079, 1081Morgan, G., 287Moudry, I., 615Moucha, V., 1013Mrazek, P., 253Mrkvicka, J., 695Miicka, V., 147Mucha, J., 1055Miiller, J., 181, 433Musil, V., 879Musilek.L., 921,955, 1061Muzak, J., 21
Nahodil, P., 213Naplava, P., 297Naprstek, J., 1007Navara, M,, 45, 893Navratil, C , 869Navratil, J., 475Navratil, P., 909Navratil, V., 91Nebojsa, A., 97, 587, 589Nedbal, I., 553
Nedoma, J., 17Nejedly, Z., 959Nemec, R., 285, 511Nemec, V., 225Nemecek, J., 857Nemecek, S., 107, 109Neumann, J., 991Neustupa, J., 29Nikolic, L., 873Novacek, V., 1139Novak, J., 21, 609, 641Novak, M., 467, 515, 617Novak, R., 107, 109, 585Novak, V., 47Novakova, D., 107, 585Novotny, A., 753Novotny, B., 447, 503, 609, 1085Novotny, K., 767, 905Novotny, M., 615Novy, R., 359, 953Nozicka, J., 309, 315, 347
Obratil, M., 339Obrazova, H., 917Obrtlik, K., 563Ohlidal, I., 843Ohh'dal, M., 843Oliva, V., 555Ondrusek, C , 649Osmera, P., 673, 963
Pacal, B., 565, 567Paclik, P., 185Pacesova, H., 1117Paduch, M., 113, 115Pajdla, T., 173, 179Palatka, P., 165Papankova, G., 565Papez, V., 151, 633Papezik, M., 223Papezova, S., 901Pan'zek, A., 901Pasta, J., 903Patocka, M., 673Patzak, B., 425Pavel, J., 107, 109Pavelka, J., 651, 661, 1139
777

WORKSHOP 96 INDEX
Pavelka, K., 195Pavelkova, D., 1103, 1139Pavlik, M., 1061Pavlfnek, V., 343Pech, Z., 187Pechac, P., 759, 767Peka, P., 121Pekarek, S., 101, 127Pekaf, M., 149Pelantova, E., 43Peringer, P., 203Pernikar, J., 1057Persia, M. S., 831Pertold, J., 247, 513Pesek, I., 83Peska, L., 675, 677, 679, 681, 683Petr, J., 671Petra&k, J., 823, 855PetraS, P., 823Petrova, R., 215Petroviiova, B., 911Petrtyl, M., 911Petruska, J., 457Pina, L., 847Pipkova, B., 1089Pfsa, P., 177Pisek, M., 1109PKtek, A., 505Pivonka, P., 139Planka, L., 731Plocek, J., 87Pluhacek, A., 245Podlesak, J., 729Podolka, L., 489, 1017Podrabsky, T., 567, 569Pochyly, F., 349Pokluda, J., 91, 93, 561Pokorny, J., 641Pokorny, M., 747Polach, S., 1071Polak, J., 563Polak, M., 1133Polasek, J., 299Pollak, P., 725Pondglicek, B., 39Ponizil, P., 93Pospichal, Z., 1077
Pospisil, J., 703, 981PospiSil, M., 147Pospisil, S., 73Pospfsil, S., 69, 71, 75, 123, 1065Potucek, Z., 121Prax, P., 963Prazak, D., 843Prech'k, V., 985Prochazka, I., 105, 753, 817, 831, 859,
903Prochazka, J., 247Prochazka, J., 483, 729Prochazka, P., 427, 429, 445, 1007Prokes, A., 857Prokes, F., 299Pryl, K., 941Pfeucil, L., 167, 169Preucil, M., 991Pribyl, J., 235Pfikryl, P., 145, 269, 271Ptacek, L., 535, 547Ptak, P., 45Pultar, M., 247Pume, D., 1013, 1015
Quadrat, O., 343
Rabova, Z., 203Razek, V., 1053Reinisch, M., 571Renda, M., 729Rieger, F., 329Richta, K., 241Richter, I., 827Richter, M., 711, 843Ripka, P., 745, 909Rolim, J., 273Rosenkranz, J., 101, 127Rott, J., 849Rozlo5nik, M., 21RoztoSl, J., 747Rudolf, J., 715Rukl, M., 285Ruller, T., 983Rus, B., 847Ruzicka, M., 541Ruzicka, P., 893
778

WORKSHOP 96 INDEX
Ruzickova, H., 17Ryndova, A., 9G5Rypl, D., 419Rysava, H., 929Rytif, V., 1139
Reficha, P., 623Ri'cny, V., 731
Sadovsky, Z., 1133Saha, P., 343, 1103Salyk, O., 139Samek, 0. , 859Sasko, J., 543Satrapa, L., 933Scibilia, M. R, 307Seborsky, S., 655Sedlacek, M., 739Sedlak, J., 995Sedlaf, J., 265Seidl, L., 755Sekanina, B., 451Servit, M., 229, 245Schmeidler, K., 971Schmidt, J., 229Schrofel, J., 829Schiirerova, E., 77Siegl, J., 553Sichrovsky, P., 885Silber, R., 147Simandl, P., 873Skalicky, J., 657Sklenak, S., 141, 143Sklenaf, J., 947Sklenaf, P., 353, 937Sklenka, C, 1067Skokan, J., 21Skofepova, J., 917Skrbek, B., 563Skrbek, M., 291, 295Skvan, V., 1135Slaby, P., 975, 1083, 1085Sladek, B., 697Sladek, I., 19Slamova, I., 35Slanina, Z., 213Slavik, O., 939
Smekal, Z., 707Smolka, P., 333Smutna, J., 523, 545, 597Smutny, V., 177Sobolik, V., 313Sochor, M., 541, 913Sokol, Z., 513Sopko, B., 105, 107, 109, 123, 151, 831Soucek, L., 321Soucek, P., 1043Soukup, F., 731Soukup, P., 197Soukup, V., 217Sovka, P., 725Spousta, J., 97, 99, 589Spumy, F., 881Stanek, Z., I l lStafikova, E., 995Stary, I., 187Stary, V., 549, 579Steidl, J., 577Steinberg, S., 27Stejskal, V., 893Straka, T., 689Strakos, Z., 21Streiblova, J., 911Strasak, P., 335Stfi'brsky, A., 189Studr.icka, J., 519Stupka, L., 107, 109Styblikova, R., 687Styblo, M., 21Suchanek, J., 915Sutner, O., 507, 617Svacina, J., 733Sveceny, R., 285Svoboda, J., 727Svoboda, P., 299Svoboda, T., 179Synackova, M., 1135
Safer, M., 213Safarik, P., 307, 315Salek, J., 927, 931Saloun, P., 281Salplachtova, E., 263Sandera, P., 91,93
779
WORKSHOP 96 INDEX
Sanovec, J., 1037, 1039Sarboch, J., 311Sasinka, 0. , 1125Sebesta, V., 705Sejba, T., 1069Sejnoha, J., 427, 429, 1007, 1009Senk, J., 137Senkyr, I., 971Sestak, J., 335Siba, J., 469Sikola, T., 97, 99, 587, 589Simak, B., 727Simek, Z., 131Simonik, I., 673, 963Simunek, M., 687Sinor, M-, 81Sitina, P., 729Skabrada, J., 989Skabrahova, D., 17Skoda, P., 599Slais, K., 153Slapal, J., 51Smarda, V., 605Smejkal, J., 1011Snorek, M., 243, 291, 297Soch, M., 289Sole, R, 711Spaniel, M., 509, 541Spinka, J., 837Sramek, B., 901Srytr, P., 947, 1137Stamberg, K., 939Stastny, B., 947Stastny, J., 107, 109Stedroii, M., 107, 109Stedry, F., 979Stefka, J., 589Stekl, I., 69Stepanek, P., 319Stepanek, R., 265Stepam'k, J., 971, 979Stepankova, O., 163, 167, 169Stepkova, D., 59Stetina, J., 593Sfovicek, P., 43Sulc, J., 349Sustrova, L., 949
Suta, D., 897Svabensky, O., 731Svajda, M., 865, 877Svec, M., 731Svejcar, J., 529, 537, 545, 563, 569, 597
Takacs, M., 319Talacko, J., 1041Tawadrous, M., 753Tax, P., 177Tayari, J., 883Teply, J., 155Terzijski, I., 613Tesaf, V., 305, 311, 319Tesner, L , 1045Tichy, J., 901Tlusty, J., 699Togelova, K., 645Togui, M., 645Tochacek, M., 441, 507Tolar, J., 43Toman, J., 631Tomanek, P., 839Tomaszewski, K., 113, 115Tomasko, J., 635Tomek, K., 1133Tomiak, Z., 123Touzin, J., 133Trdlicka, J., 231, 273Trlica, J., 343Trojan, S., 901Trtik, K., 483Trunec, M., 345, 571Tucek, K., 1065Tuma, J., 691Tuma, L., 99Tuma, M., 21Tusla, P., 77Tutko, M., 769Tvrdik, P., 231, 273Tykal, M., 843
Uhdeova, N., 839Uhlif, I., 901Uhlif, J., 725Urban, M., 117Urbanek, J., 1055
780
WORKSHOP 96 INDEX
Urbaskova, H., 993Ustohal, V., 547, 599
Vacek, J., 443Vacek, V., 63Vackaf, J., 1057Valasek, M., 467Valaskova, L., 723Valenta, R, 541Valenta, M., 277Valenta, P., 711, 843Valenta, R., 915Valka, L., 565Vandrovec, P., 239Vanek, T., 489Vanicek, I., 951Vanickova, M., 107, 109Vaiikova, M , 965Vasut, S., 965Vebr, L., 1083, 1089, 1091Vechet, S., 563Vejrazka, F., 755, 757Veljinova, V., 1139Verburg, T., 955Vefi's, J., 749, 1097Vesela, E., 77Veselka, F., 649Veselka, T., 689Vesely, M., 133, 141Vesely, V., 1125Vespalec, R., 131Veverka, B., 197Videcka, Z., 1057Visinka, R., 673Vitasek, J., 731Vitek, J. L., 481, 483, 491, 493, 497Vftek, K., 509Vftek, P., 497, 721Vlach, B., 565, 571, 575, 597Vlcek, J., 917, 1131Vlcek, M., 185Vlcek, T., 163, 167, 169Vobecky, J., 881Vobecky, M., 73, 75VodsloR, J., 337Vojtkulakova, Z., 525, 537, 567Vokurka, J., 907
Volf, J., 917, 1083, 1085Voltr, J., 959Vondrova, R., 911Vondrich, J., 463Vopalka, D., 939Voracek, J., 889Vorlicek, J.I., 1001, 1015Vozenflek, P., 661Vrablfk, A., 1139Vratislav, S., 119, 627Vrba, J., 905, 907Vrba, K., 717Vrba, R., 867Vrbova, M., 67Vrto, I., 273Vtfpil, J.. 913Vycital, J., 341Vyskocil, L., 107Vyskocil, S., 109VytlaCil, D., 499
W. Benz, K., 635Wald, F., 247, 513Wasserbauer, V., 21Weigel, J., 731WendrofF, B., 25Werner, T., 171Westman, E., 443Wilfert, 0., 857Winklerova, B., 1105Wohlgemuth, J., 613Wohlmuth, F., 669Wohlmuthova, A., 911Wolterbeek, H., 955
Zahradnik, P., 185Zahumensky, E., 1031Zalesky, J., 951Zalis, K., 693Zapletal, J., 49Zapotocny, J., 755Zaruba, J., 1017Zbofil, F., 223Zdrazil, V., 683Zehentner, J., 761Zeithammerova, J., 945Zeman, A., 83
781

WORKSHOP 96 INDEX
Zeman, J., 1065 Zolotarev, I., 461Zeman, T., 727 Zraly, M., 1107Zeman, V., 717 Zykan, P., 943, 1135Zemanek, P., 255 Zykan, P., 945Zemankova, A., 1093 Zyma, J., 1061Zemankova, H., 997Zem£ik, L., 547 Zabickova, I., 987Zemcik, P., 265 Zacek, J., 655Zikmund, T., 185 Zacek, K., 875Zima, P., 315 Zacek, M., 127Zimola, B., 1139 Za l a , J., 253, 279Zitek, P., 215 Zenisek, A., 17Zlamal, P., 741 Zitny, R., 335Zlatnik, C , 37
782


