Embed Size (px)
Citation preview

1
Workshopping AUSSE data: A guide for facilitators Marcia Devlin, Hamish Coates and Jillian Kinzie1
A guide to support institutional leaders facilitate discussions on using Australasian Survey of Student Engagement (AUSSE)2 data with university stakeholders.
About this guide
Purpose In essence, the AUSSE results provide information that universities can use to improve the quality of the undergraduate student experience and their learning outcomes. In considering how to put AUSSE data to use, it is important to understand what the results mean and to disseminate the findings to staff within universities who have the capacity to influence student engagement. Simply reporting AUSSE results will not, by itself, necessarily lead to action. Many institutions in the US who have used the equivalent National Survey of Student Engagement (NSSE) data have found that analysing and discussing the results at events such as retreats, staff development workshops and seminars, and first-year coordinator meetings, for example, are productive ways to stimulate action. This guide is designed to help institutional leaders facilitate such discussions about AUSSE data with various university stakeholders.
How the guide can be used This guide provides suggestions for leading a workshop or other discussion-based session on understanding, interpreting and taking action on AUSSE data. It suggests interpretative and enhancement approaches that are likely to help develop conversations about student engagement. We have included step-by-step instructions for facilitating a group session using the data provided in the Institution Report that each university receives. Each section contains a program that includes components such as an overview of the data report, general notes, suggestions for how a facilitator can prepare for discussions about various aspects of the AUSSE results and Institution Report, definitions of key terms, exercises, and suggested discussion points. Sample worksheets are provided to accompany the exercises. The guide is not prescriptive, but rather, offers suggestions that may be used in their entirety, adapted for use within an institution, or used as a basis for thinking about different strategies appropriate to a particular context.
1 Acknowledgement: This guide is based on one developed by Dr Jillian Kinzie as part of the USA NSSE. We are very grateful for her permission to adapt and use this guide, and for her input as co-author. 2 The Australasian Survey of Student Engagement (AUSSE) is run by the Australian Council for Educational Research (ACER) in collaboration with Australasian higher education institutions. For further information email [email protected].

2
Overview of the AUSSE
The concept of student engagement Student engagement is defined as students’ involvement with activities and conditions likely to generate high-quality learning. The concept of student engagement is based on the assumption that learning is influenced by how an individual student participates in educationally purposeful activities. While students are seen to be responsible for constructing their knowledge, learning is also understood to depend on institutions and staff generating conditions that stimulate and encourage student involvement. The concept has emerged from many decades of research into higher education student learning and development. In addition to confirming the importance of ensuring appropriate academic challenge, this research has emphasised the importance of examining students’ integration into institutional life and involvement in educationally relevant, beyond-class experiences. Student engagement measures are increasingly understood to be important for higher education quality. Measures of student engagement provide information about individuals’ intrinsic involvement with their learning, and the extent to which they are making use of available educational opportunities. According to research, student engagement data provides information on learning processes, is a reliable proxy for learning outcomes, and provides excellent diagnostic measures for learning enhancement activities.
What is the AUSSE and what does it do? The AUSSE provides quantitative information on the time and effort students devote to educationally purposeful activities and on students’ perceptions of the quality of other aspects of their university experience. The AUSSE was conducted for the first time in 2007. The AUSSE measures student engagement through the administration of the Student Engagement Questionnaire (SEQ) to an institutionally representative student sample. The SEQ is designed for administration in under 15 minutes in online or paper form. It has been validated for use in Australasian higher education. The SEQ provides measurement of six scales. Data on these areas of student engagement are included in the information provided to each institution:
Active Learning – students’ efforts to actively construct knowledge Academic Challenge – the extent to which expectations and assessments
challenge students to learn Student and Staff Interactions – the level and nature of students’ contact and
interaction with teaching staff Enriching Educational Experiences – students’ participation in broadening
educational activities Supportive Learning Environment – students’ feelings of legitimation within the
university community

3
Work Integrated Learning – integration of employment-focused work experiences into study.
With formative links to the North American National Survey of Student Engagement (NSSE), data from the AUSSE provides the opportunity for institutions to gather internationally comparable data focused on the quality of teaching and the learning environment. It thus provides each university with a valuable mechanism for improving the effectiveness of learning and teaching. The AUSSE complements existing evaluation processes within institutions. Linking the AUSSE results to other evaluation data, such as student evaluation of teaching and of student support, may help staff see its relevance. Providing accessible examples and resources to help staff increase student engagement may be beneficial. At a broad level, if contributions to improving student engagement are recognised and rewarded by institutions, this will do much to garner buy-in from individuals, teams and academic units within universities.
Introducing staff to student engagement and the AUSSE A useful first step is to ensure that the concepts of student engagement and effective educational practice, and their relevance to the particular audience in a particular workshop or other session, are clearly understood. The details provided above, on student engagement and on the AUSSE, may be helpful in providing an overview for audiences in most kinds of discussion-based sessions. Further general materials can be sourced from the NSSE.3 To introduce staff to the AUSSE, it is often helpful to ask session participants to identify the items in the first question of the Student Engagement Questionnaire that they believe are most important to student learning for a particular group of students. One common group used for this type of exercise is first-year students, but of course, the group(s) chosen will depend on institutional priorities. Using the original questionnaire for reference, participants might spend a short period of time in pairs or small groups discussing their perspectives on the importance of individual items. This conversation can also be focused around the worksheets included in this guide. For example, using Worksheet 2, participants can be asked to record their predictions of student responses to particular questions. The results from this informal exercise can then be used for comparison with an institution’s actual AUSSE results. The gaps between staff predictions and student responses can be a stimulating starting point for discussions about educational practice and institutional change.
3 See: http://nsse.iub.edu/institute

4
Working with the AUSSE reports
Overview This overview provides information for working with each of the presentations included in the AUSSE Institution Report. Each AUSSE Institution Report contains the following presentations:
Respondent characteristics Frequency distributions Item statistics Scale statistics.
Given the depth and breadth of data contained in an Institution Report, it will also usually be helpful to develop clear objectives and desired outcomes for a session in order to ensure that fruitful discussion can be achieved in the time available. Depending on which of the reports a discussion session might focus on, it may be helpful to make copies of selected survey results from an Institution Report prior to each group session as appropriate.

5
Report 1: Respondent characteristics
Purpose It is important to establish the validity of the data the institution receives. Respondent characteristics provide the means to determine how representative a sample is of a student population. Comparisons can also be made with targeted benchmark institutions.
Report overview The respondent characteristics report provides summary information on selected response, student and course characteristics. Information on response characteristics includes the actual sample size, the target response sample and the secured response sample. The target sample is smaller than the actual sample due to oversampling. Results for student and course characteristics are given for:
First-year and later-year students, and for all students combined Your institution (the column titled INST), and for all Australian (AUS), New
Zealand (NZ) and Australasian (AUSTL) institutions. Statistics reported for each characteristic include the:
Number (r) of responses Percentage (%) of responses.
Raw rather than weighted numbers are reported. See Figure 1 for a visual summary.

6
Figure 1 Interpretation notes for Report 1 – Respondent Characteristics Report

Preparation notes It might be helpful to prepare an institutional student body profile in advance of the session. It would also be advisable for a facilitator to be prepared to explain the terms ‘response rate’, ‘sample weighting’ and the AUSSE sample design. Your university’s planning, quality or statistics unit may be able to assist here. If the respondent characteristics are of particular interest to a group, the facilitator might lead an examination of how representative respondents are of the institution student body or of particular fields of study, for example. If the participants in a particular session are not in a position to judge how representative a sample are of the population(s) of interest, the facilitator should provide some information on this aspect of the data. It might be useful to explain that weighting is applied to all comparison reports and adjusts for respondents within universities by sex and enrolment status. Weights are calculated separately for first-year and later-year students. It might also be helpful to clarify that the determination of student year (‘first year’ or ‘later year’) is based on information provided by students in their survey response.
Possible exercises A potentially useful exercise is to review demographic features of student respondents. Suggested questions to use as the basis for discussion on the topic of respondent characteristics include:
Does the AUSSE sample reflect our student body profile? If the sample seems skewed, what cautions might be exercised? What generalisations are, or are not, possible based on these data? How does our institution’s response rate stack up against other
institutions?

Report 2: Frequency distributions
Purpose Reviewing frequencies with which students responded to particular items along with comparisons to selected peers and the entire AUSSE cohort provides an accessible basis for thinking through student engagement at your institution.
Report overview The frequency distributions report shows the distribution of students’ responses to each item’s response category presented on the Student Engagement Questionnaire (SEQ). The frequency distributions for the items are reported in the order in which they appear on the SEQ. Results are provided for:
First-year and later-year students, and for all students combined Your institution (the column titled INST), and for all Australian (AUS),
New Zealand (NZ), Australasian (AUSTL), and US and Canadian (USCA) institutions.
USCA figures are not available for all items. Statistics reported for each response category include the:
Raw number (r) of responses Weighted number (n) of responses in thousands (e.g. 1.5 equals 1500
responses) Weighted percentage (%) of responses.
Note that USCA raw (not weighted) numbers are also shown in thousands (r(K)) rather than units. See Figure 2 for a visual summary of the interpretation notes.

Figure 2 Interpretation notes for Report 2: Frequency distributions of item response categories

Preparation notes Review the frequency distributions report. It is not necessary to go into great depth when exploring these results. Asking questions for group discussion can help facilitate reflection and understanding among participants. Identify items that might be of greatest interest to the institution given its mission and goals or to the particular group attending the session. Consider presenting these percentages to participants as a way to capture their interest. Be prepared to explain the terms ‘sample weights’, ‘raw response numbers’, ‘weighted response numbers’, and ‘weighted percentages’.
Possible exercises Identify the most important items to the institution, faculty, department, unit, or group. The worksheets in this guide might be helpful in this exercise. One suggestion for working with frequency distributions contained in this sub-report is that the facilitator invites the group to identify percentages of ‘never’ responses that cause them some particular concern. These might then be ranked by the group in order of priority and as many as possible discussed in the time available. Equally, the group can be invited to identify items with ‘positive percents’ in which the majority of students report that they ‘very often’ or ‘often’ engage in this activity as examples of what the institution is doing well. A discussion of how and why these positive results might have come about might then be used to determine the ‘success factors’ that the institution might focus on to ensure they continue support. You can lead a discussion about whether the responses correlate with what the institution, unit, or department expected. For example, if an institution values ‘career advising for later-year students’, is it adequate for 30 per cent of the students at that level to report that they ‘never’ talked with a member of staff about career plans? You could invite participants to explore whether the percentage distributions are appropriate for items. Invite them to discuss how the distributions differ between your institution and other groupings of the data. You might lead group discussion on some or all of the following questions:
What results need attention? What results are reflective of our institutional type? How does our institution compare to others? Are there important differences between first- and later-year
responses that need to be followed up?

Report 3: Item statistics
Purpose Analysing item statistics helps review the mean scores for each survey item and compare institutional results against the AUSSE cohort and other comparison groups.
Report overview The item statistics report shows summary descriptive statistics for each of the AUSSE items. Item results are provided for:
First-year and later-year students, and for all students combined Your institution (the column titled INST), and for all Australian (AUS),
New Zealand (NZ), Australasian (AUSTL), and US and Canadian (USCA) institutions.
Items statistics are reported in the order in which they appear on the SEQ. The reporting metric for each item corresponds to the response scale, which is shown in the report. USCA figures are not available for all items. Results are reported for items in which the wording of certain items has been changed slightly for the Australasian context. The USCA figures for ‘all students’ have been computed by ACER. NSSE does not report combined year figures due to differences between these cohorts. Statistics reported for each item include the:
Weighted means (X) Weighted standard deviations (s) Weighted response numbers (n) in thousands (e.g. n=1.5 equals 1500
responses). Please note that USCA raw (not weighted) numbers are also shown in thousands (r(K)) rather than units. Effect differences are also reported. These statistics report the standardised difference between your institution’s results and results of various comparison groups. Generally, an effect size of 0.2 is considered ‘small’, an effect size of around 0.5 ‘medium’, and an effect size above this ‘large’. All but two items on the SEQ are positively worded, such that a negative result implies that your institution is lower than the comparative group and a positive result implies that your institution is higher than the comparative group. The interpretation should be reversed for the two negatively worded items: ‘Come to class without

completing readings or assignments’ and ‘Was unable to keep up to date with studies for work, personal or family reasons’. A large number of comparisons could be made between AUSSE items, and many different ‘statistically significant differences’ could be reported. Statistical significance is a function of sample size, the level of confidence required in an inference, and variation in the phenomenon being measured. A four-point response scale is used for most items on the SEQ. The standard deviations of these average around 0.9 units on the four-point scale, implying that with a sample size of 10, a difference of 0.9 or more is likely to reflect a ‘statistically significant difference’ between two item means. The required difference falls to 0.4 with a sample size of 50, and 0.2 with a sample size of 200. Other SEQ items have between five and eight response categories, and the standard deviations for these lie around 1.3 units on the response scale. For these, a difference of 1.4 between item means is likely to be statistically significant with a sample size greater than 10, 0.6 with a sample size of around 50, and 0.3 with a sample size of 200. It is important to re-iterate that as with all large-scale surveys, the AUSSE offers indicative rather than definitive evidence of the phenomena being measured. Results should be treated with caution, especially when sample sizes are small. Figure 3 presents a visual summary of these notes.
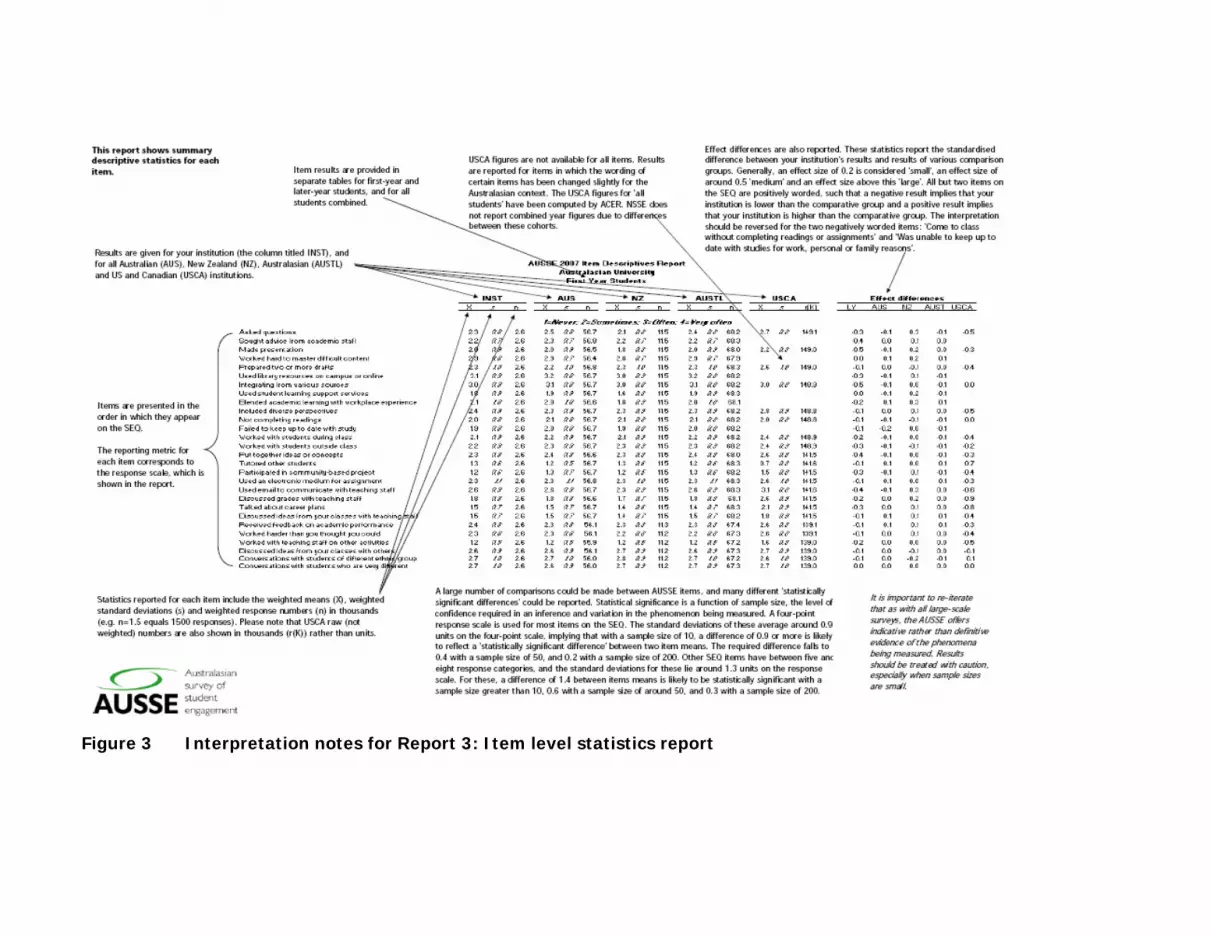
Figure 3 Interpretation notes for Report 3: Item level statistics report

Preparation notes Review the item statistics report. There is a lot of information in these reports, and it may be wise to be selective in what can be discussed with session participants in the time available. Look carefully at items with large effect sizes in the item statistics report. Make a note of these and use them to stimulate discussion with the group. Be prepared to explain the terms ‘sample weights’, ‘means’, ‘standard deviations’, ‘weighted response numbers’ and ‘effect differences’. Your university’s planning, quality or statistics unit may be able to assist here.
Possible exercises Ask the group to identify the most important items to the institution, faculty, department, unit, or group. The worksheets in this guide might be helpful in this exercise. The group might review the results for each item and identify distinctive patterns and trends, and determine which differences appear to be of practice significance. You can lead a discussion about whether the responses correlate with what the institution, unit, or department expected. For example, if an institution values ‘engaging students in using learning resources’, is it acceptable that activity may be lower on this dimension for later-year students compared to first-year students? Invite participants to explore if the mean results, variation and group differences are appropriate for these items. Invite them to discuss how the distributions differ between your institution and other groupings of the data.

Report 4: Scale statistics
Purpose Examination of AUSSE scale statistics helps focus discussion on the importance of student engagement and institutional improvement efforts in terms of the six defined areas of effective educational practice.
Report overview The scale statistics report shows descriptive statistics for each of the six AUSSE scales. Scale results are provided for:
First-year and later-year students, and for all students combined Your institution (the column titled INST), and for all Australian (AUS),
New Zealand (NZ), Australasian (AUSTL), and US and Canadian (USCA) institutions.
The USCA figures for all students have been computed by ACER. NSSE does not report combined year figures due to differences between these cohorts in the USA context. All AUSSE and NSSE scales contain the same items, except for the omission of a single item about independent study and self-designed majors, which was not included in the SEQ. Unlike NSSE, AUSSE Academic Challenge scale results are not adjusted for attendance type. No NSSE results are available for the Work Integrated Learning scale, which is unique to the AUSSE. Scale scores are calculated by converting item scores onto a metric running from 0 to 100 then taking the mean of items within each scale. While not the most psychometrically effective approach, this scoring algorithm is transparent, parsimonious and facilitates reporting. Statistics reported for each scale include the:
Weighted means (X) Weighted standard deviations (s) Weighted response numbers (n) in thousands (e.g. n=1.5 equals 1500
responses). Please note that USCA raw (not weighted) numbers are also shown in thousands (r(K)) rather than units. The scale means are graphed with 95 per cent confidence intervals. These have been adjusted for the multiple comparisons made during interpretation of the graphical information. See Figure 4 for further details.

Figure 4 Interpretation notes for Research Report 4: Scale level statistics report

Effect differences are also reported in both tabular and graphical format. These statistics report the standardised difference between your institution’s results and results of various comparison groups. Generally, an effect size of 0.2 is considered ‘small’, an effect size of around 0.5 ‘medium’, and an effect size above this ‘large’. All AUSSE scales are positively worded, such that a negative result implies that your institution is lower than the comparative group and a positive result implies that your institution is higher than the comparative group. A large number of comparisons could be made between AUSSE scales, and many different ‘statistically significant differences’ could be reported. Statistical significance is a function of sample size, the level of confidence required in an inference, and variation in the phenomenon being measured. The standard deviations of these scales range from 10 to 20 on the reporting scale, with an average of 15. As a guide, a difference of around 15 or more would likely be statistically significant with a sample size of 10, a difference of 7 or more with a sample size of 50, a difference of 5 or more with a sample size of 100, and a difference of 3.5 or more with a sample size of 200. It is important to re-iterate that as with all large-scale surveys, the AUSSE offers indicative rather than definitive evidence of the phenomena being measured. Results should be treated with caution, especially when sample sizes are small.
Preparation notes Review the scale statistics section of your AUSSE Institution Report. Make a note of areas of small and large difference. Examine and note particular patterns between various scales. Identify scores, patterns and trends that might be of greatest interest to the institution given its mission and goals or to the particular group attending the session. Consider presenting these separately to participants as a way to capture their interest. It might help to prepare and distribute a short summary of the focus of each scale, and a list of the survey items that contribute to the scale ( a list is located on page 40 of the Institution Report). Be prepared to explain the terms ‘sample weights’, ‘means’, ‘standard deviations’, ‘confidence intervals’, ‘weighted response numbers’ and ‘effect differences’. Your university’s planning, quality or statistics unit may be able to assist here.

The comparative data are intended to help institutions determine if the engagement of their typical student differs in a statistically significant and meaningful way from the average students in various comparison groups.
Possible exercises Discuss some of the following questions:
What patterns emerge from the scale results? What was surprising about the results? Which areas appear to be the areas of strength? Which areas need improvement? What assumptions about the university were confirmed or refuted? How does our institution perform, given our student and institutional
characteristics? How does our institution compare, given our student and institutional
characteristics? What are the important differences between first-year student
responses and later-year student responses?

Worksheet 1
Predicting AUSSE scale results This exercise is designed to facilitate consideration and discussion of the quality of the student experience from the perspective of staff, compared to the perspective of students. The six AUSSE scales are listed below. Select a scale of interest. You can record what you predict the combined score out of 100 will be. Similarly, you can record what you would prefer this score to be. Comparisons of your predictions and preferences to actual AUSSE results are then possible. You will need to refer to your AUSSE Institution Report to complete the exercise. Consider what the gaps between student responses and your predictions and preferences reveal about the quality of the student experience at your institution in relation to the particular scale you have chosen. What ideas might you have to address some of these gaps?
Percentage of ‘often’ and ‘very often’ responses
Student Engagement Questionnaire scales Prediction Preference Actual Active Learning
Student and Staff Interactions
Academic Challenge
Enriching Educational Experiences
Supportive Learning Environment
Work Integrated Learning


Worksheet 2
Predicting AUSSE item results This exercise is designed to facilitate consideration and discussion about the quality of the student experience from the perspective of staff, compared to the perspective of students. Items from the first section of the AUSSE are listed below.4 Select several items of interest from the table. You can use this worksheet to record what you predict the combined percentage of responses that say ‘often’ and ‘very often’ will be. Similarly, you can record what you would prefer this percentage to be. Comparisons of your predictions and preferences to actual AUSSE results are then possible. You will need to refer to your AUSSE Institution Report to complete the exercise. Consider what the gaps between student responses and your predictions and preferences reveal about the quality of the student experience at your institution. What ideas might you have to address some of these gaps?
4 Items used with permission from The College Student Report, National Survey of Student Engagement, Copyright 2001–07, The Trustees of Indiana University. Items adapted and validated for Australasia by the Australian Council for Educational Research (ACER).

Percentage of ‘often’ and
‘very often’ responses Student Engagement Questionnaire items
Pre- diction
Pre- ference
Actual
Asked questions in class or contributed to online discussions
Sought advice from academic staff
Made a class or online presentation
Worked hard to master difficult content
Prepared two or more drafts of an assignment before handing it in
Used library resources on campus or online
Worked on an essay or assignment that required integrating ideas or information from various sources
Used student learning support services
Blended academic learning with workplace experience
Included diverse perspectives (different races, religions, genders, political beliefs, etc.) in class discussions or written assignments
Come to class without completing readings or assignments
Was unable to keep up to date with studies for work, personal or family reasons
Worked with other students on projects during class
Worked with other students outside class to prepare assignments
Put together ideas or concepts from different subjects when completing assignments or during class discussions
Tutored or taught other university students (paid or voluntary)
Participated in a community-based project (e.g. volunteering) as part of your study
Used an electronic medium (e.g. Blackboard or WebCT) to discuss or complete an assignment
Used email to communicate with teaching staff
Discussed your grades or assignments with teaching staff
Talked about your career plans with teaching staff or advisors
Discussed ideas from your readings or classes with teaching staff outside class
Received prompt written or oral feedback from teachers on your academic performance
Worked harder than you thought you could to meet a teacher’s standards or expectations
Worked with teaching staff on activities other than coursework (committees, orientation, student organisations, etc.)
Discussed ideas from your readings or classes with others outside class (students, family members, co-workers, etc.)
Had conversations with students of a different ethnic group than your own
Had conversations with students who are very different from you in terms of their religious beliefs, political opinions or personal values


