Embed Size (px)
Citation preview
Am. J. Hum. Genet. 68:103–117, 2001
103
Worldwide Genetic Analysis of the CFTR RegionEva Mateu,1 Francesc Calafell,1 Oscar Lao,1 Batsheva Bonne-Tamir,2 Judith R. Kidd,3Andrew Pakstis,3 Kenneth K. Kidd,3 and Jaume Bertranpetit1
1Unitat de Biologia Evolutiva, Facultat de Ciencies de la Salut i de la Vida, Universitat Pompeu Fabra, Barcelona; 2Sackler Faculty ofMedicine, Tel Aviv University, Tel Aviv; and 3Department of Genetics, Yale University School of Medicine, New Haven
Mutations at the cystic fibrosis transmembrane conductance regulator gene (CFTR) cause cystic fibrosis, the mostprevalent severe genetic disorder in individuals of European descent. We have analyzed normal allele and haplotypevariation at four short tandem repeat polymorphisms (STRPs) and two single-nucleotide polymorphisms (SNPs)in CFTR in 18 worldwide population samples, comprising a total of 1,944 chromosomes. The rooted phylogenyof the SNP haplotypes was established by typing ape samples. STRP variation within SNP haplotype backgroundswas highest in most ancestral haplotypes—although, when STRP allele sizes were taken into account, differencesamong haplotypes became smaller. Haplotype background determines STRP diversity to a greater extent thanpopulations do, which indicates that haplotype backgrounds are older than populations. Heterogeneity amongSTRPs can be understood as the outcome of differences in mutation rate and pattern. STRP sites had higherheterozygosities in Africans, although, when whole haplotypes were considered, no significant differences remained.Linkage disequilibrium (LD) shows a complex pattern not easily related to physical distance. The analysis of thefraction of possible different haplotypes not found may circumvent some of the methodological difficulties of LDmeasure. LD analysis showed a positive correlation with locus polymorphism, which could partly explain theunusual pattern of similar LD between Africans and non-Africans. The low values found in non-Africans mayimply that the size of the modern human population that emerged “Out of Africa” may be larger than what previousLD studies suggested.
Introduction
The cystic fibrosis transmembrane conductance regula-tor gene (CFTR [MIM 602421]), also known as ABCC7(member number 7 of subfamily C of the ATP-bindingcassette [ABC] transporter gene family), was identifiedand cloned in 1989 (Kerem et al. 1989; Riordan et al.1989; Rommens et al. 1989). Since then, 1900 mutationsin CFTR that cause cystic fibrosis (CF [MIM 219700])have been reported (Cystic Fibrosis Mutation DataBase). Cystic fibrosis is the most common severe auto-somal recessive disease in patients of European descent,affecting 1/2,500 newborns, which implies a gene fre-quency for the disease of and a carrier frequencyq p .02of 1/25. The CFTR gene comprises 27 exons, spanning230 kb on the long arm of chromosome 7 (7q31.2), thatencode a 1,480–amino acid protein with chloride-chan-nel activity regulated by cyclic AMP. The most frequentCF mutation is a deletion of 3 bp at codon 508 (DF508
Received September 22, 2000; accepted for publication November1, 2000; electronically published December 4, 2000.
Address for correspondence and reprints: Dr. Jaume Bertranpetit,Unitat de Biologia Evolutiva, Facultat de Ciencies de la Salut i de laVida, Universitat Pompeu Fabra, Doctor Aiguader 80, 08003 Barce-lona, Catalonia, Spain. E-mail: [email protected]
q 2001 by The American Society of Human Genetics. All rights reserved.0002-9297/2001/6801-0010$02.00
mutation), and it accounts for almost 67% of the globalCF chromosomes. Only four other mutations (G542X,N1303K, G551D, and W1282X) have overall allele fre-quencies among CF chromosomes 11% (Estivill et al.1997). Most of the remaining mutations are rare or areconfined to specific populations.
Several short tandem repeat polymorphisms (STRPs,also known as microsatellites) and single-nucleotidepolymorphisms (SNPs) have been described within theCFTR gene. Both types of markers can be used to tracethe origin and evolution of the different CF mutations(Morral et al. 1994; Bertranpetit and Calafell 1996;Slatkin and Rannala 1997). SNPs can be used to definethe haplotypic frameworks on which CFTR mutationsoccurred. Faster-mutating STRPs can be used to esti-mate ages of mutations from the variability accumulatedin CF-mutated chromosomes.
The combination of several polymorphisms and thedetermination of haplotypes allows the estimation oflinkage disequilibrium (LD)—that is, the departurefrom the haplotypic frequencies expected under inde-pendent inheritance of the different markers. The studyof the distribution of LD patterns in different popula-tions can yield valuable information on population his-tory (Tishkoff et al. 1996, 1998; Kidd et al. 1998,2000). The power of LD as a tool for gene mapping inrelation to population demography can be explored as
104 Am. J. Hum. Genet. 68:103–117, 2001
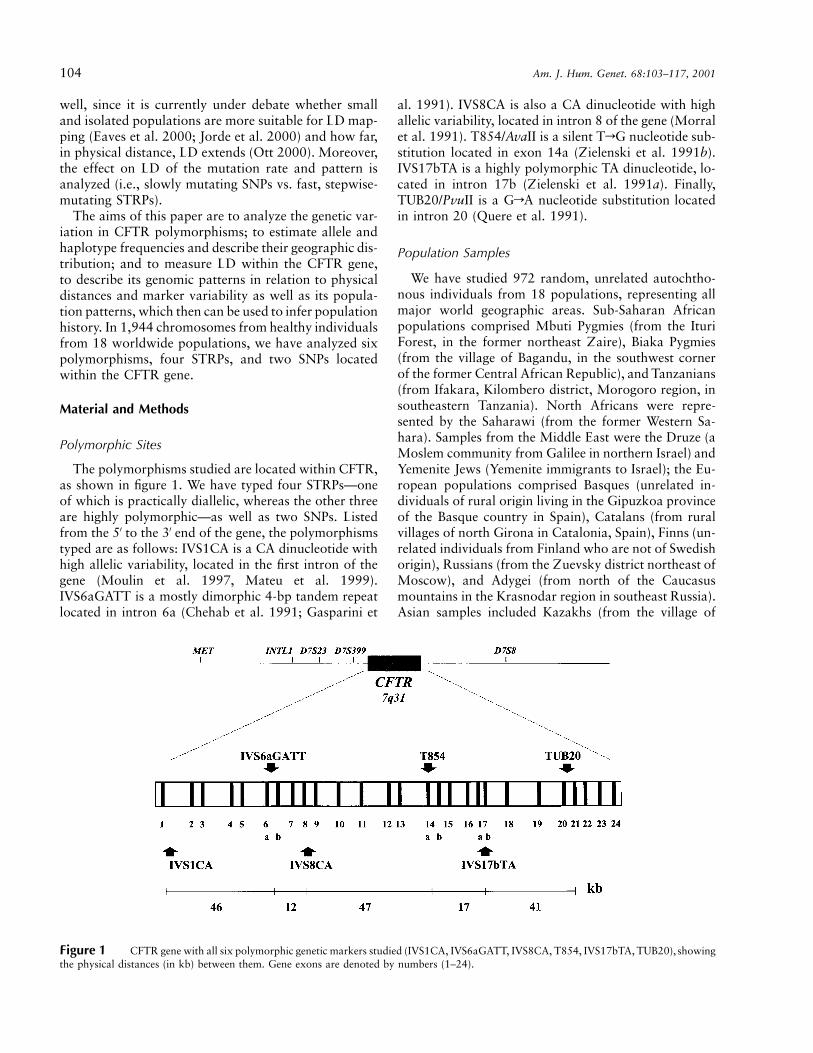
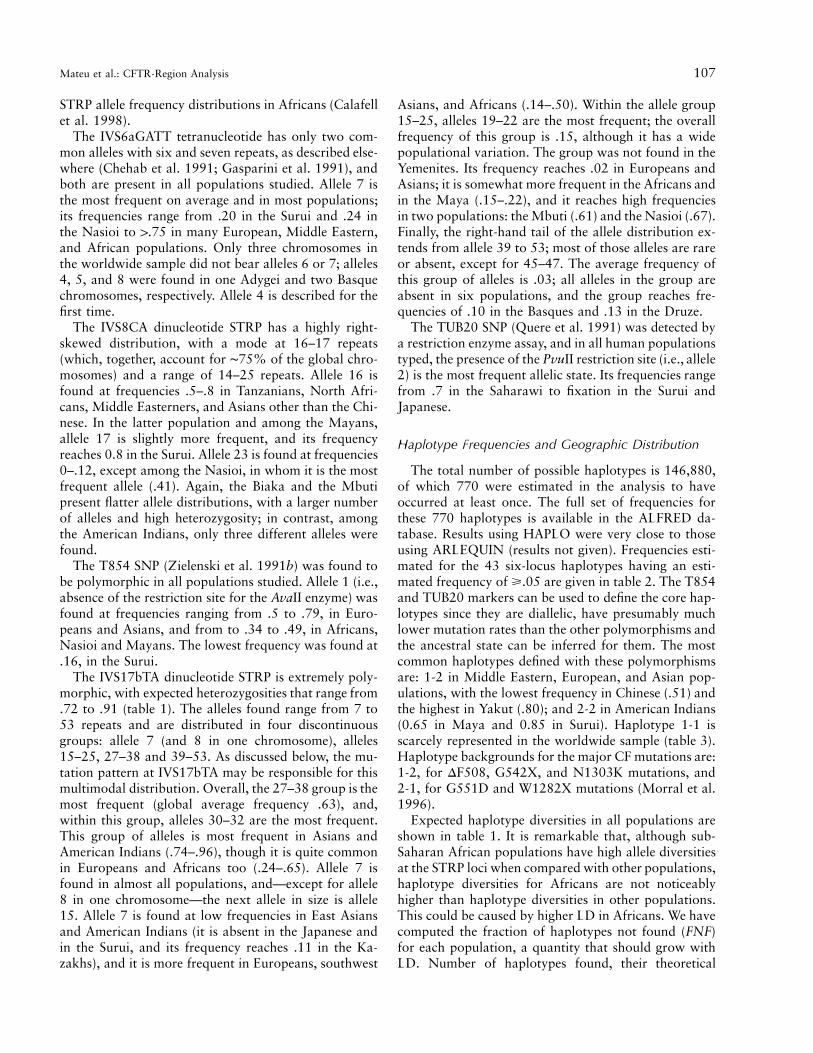
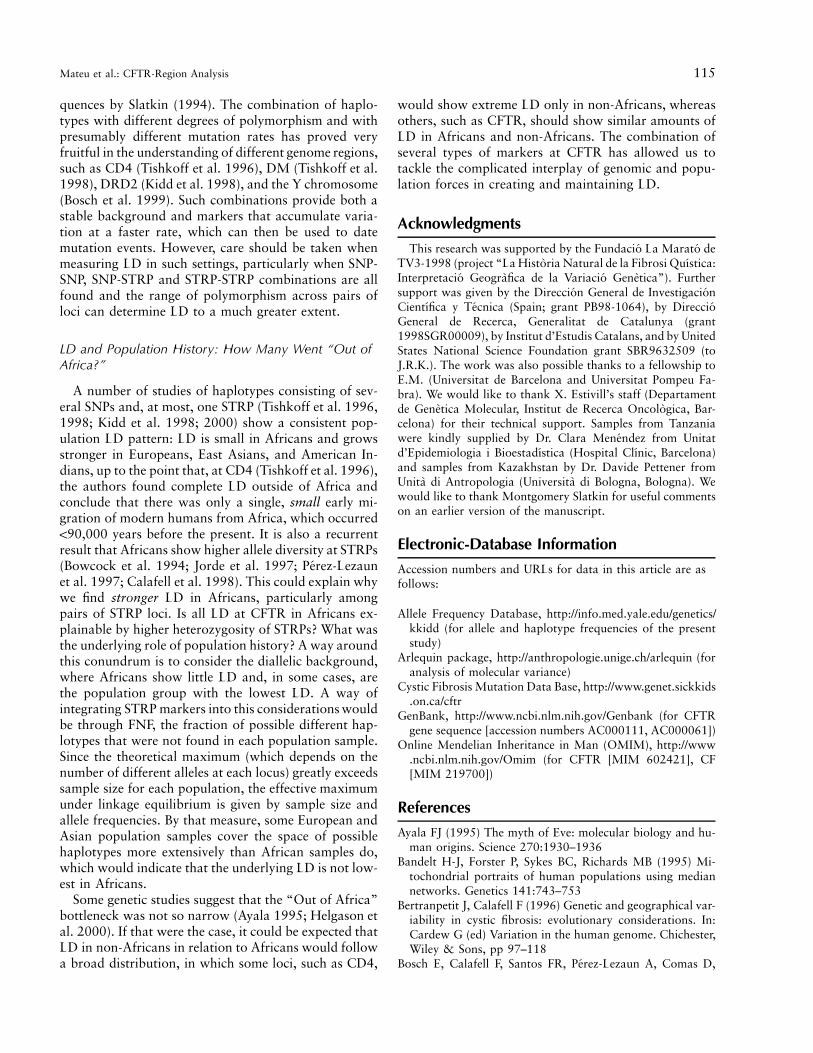
Figure 1 CFTR gene with all six polymorphic genetic markers studied (IVS1CA, IVS6aGATT, IVS8CA, T854, IVS17bTA, TUB20), showingthe physical distances (in kb) between them. Gene exons are denoted by numbers (1–24).
well, since it is currently under debate whether smalland isolated populations are more suitable for LD map-ping (Eaves et al. 2000; Jorde et al. 2000) and how far,in physical distance, LD extends (Ott 2000). Moreover,the effect on LD of the mutation rate and pattern isanalyzed (i.e., slowly mutating SNPs vs. fast, stepwise-mutating STRPs).
The aims of this paper are to analyze the genetic var-iation in CFTR polymorphisms; to estimate allele andhaplotype frequencies and describe their geographic dis-tribution; and to measure LD within the CFTR gene,to describe its genomic patterns in relation to physicaldistances and marker variability as well as its popula-tion patterns, which then can be used to infer populationhistory. In 1,944 chromosomes from healthy individualsfrom 18 worldwide populations, we have analyzed sixpolymorphisms, four STRPs, and two SNPs locatedwithin the CFTR gene.
Material and Methods
Polymorphic Sites
The polymorphisms studied are located within CFTR,as shown in figure 1. We have typed four STRPs—oneof which is practically diallelic, whereas the other threeare highly polymorphic—as well as two SNPs. Listedfrom the 5′ to the 3′ end of the gene, the polymorphismstyped are as follows: IVS1CA is a CA dinucleotide withhigh allelic variability, located in the first intron of thegene (Moulin et al. 1997, Mateu et al. 1999).IVS6aGATT is a mostly dimorphic 4-bp tandem repeatlocated in intron 6a (Chehab et al. 1991; Gasparini et
al. 1991). IVS8CA is also a CA dinucleotide with highallelic variability, located in intron 8 of the gene (Morralet al. 1991). T854/AvaII is a silent TrG nucleotide sub-stitution located in exon 14a (Zielenski et al. 1991b).IVS17bTA is a highly polymorphic TA dinucleotide, lo-cated in intron 17b (Zielenski et al. 1991a). Finally,TUB20/PvuII is a GrA nucleotide substitution locatedin intron 20 (Quere et al. 1991).
Population Samples
We have studied 972 random, unrelated autochtho-nous individuals from 18 populations, representing allmajor world geographic areas. Sub-Saharan Africanpopulations comprised Mbuti Pygmies (from the IturiForest, in the former northeast Zaire), Biaka Pygmies(from the village of Bagandu, in the southwest cornerof the former Central African Republic), and Tanzanians(from Ifakara, Kilombero district, Morogoro region, insoutheastern Tanzania). North Africans were repre-sented by the Saharawi (from the former Western Sa-hara). Samples from the Middle East were the Druze (aMoslem community from Galilee in northern Israel) andYemenite Jews (Yemenite immigrants to Israel); the Eu-ropean populations comprised Basques (unrelated in-dividuals of rural origin living in the Gipuzkoa provinceof the Basque country in Spain), Catalans (from ruralvillages of north Girona in Catalonia, Spain), Finns (un-related individuals from Finland who are not of Swedishorigin), Russians (from the Zuevsky district northeast ofMoscow), and Adygei (from north of the Caucasusmountains in the Krasnodar region in southeast Russia).Asian samples included Kazakhs (from the village of
Mateu et al.: CFTR-Region Analysis 105
Aktasty in the Almaty region in Kazakhstan, CentralAsia), Yakut (from the Yakutian Autonomous Republicof Russia, in eastern Siberia), Han Chinese (from south-ern China, collected in the San Francisco area), and Jap-anese (also collected in the San Francisco Bay area); thePacific was represented by the Melanesian Nasioi (fromBougainville in the Solomon Islands, Melanesia). TheAmerican Indians sampled were Mayans (from Yucatan,Mexico) and Rondonia Surui (southwest Amazon, Bra-zil). Sample sizes ranged from 46 (Nasioi) to 222(Basque) chromosomes, with a median of 108. T854/AvaII and TUB20/PvuII were also typed in six primates:two gorillas (Gorilla gorilla), one orangutan (Pongo pyg-maeus) and three common chimpanzees (Pan trog-lodytes).
DNA from five populations (Basques, Catalans, Tan-zanian, Kazakhs, and Saharawi) was extracted fromfresh blood of blood donors. Appropriate informed con-sent was obtained from human subjects. DNA samplesfor the other populations were obtained from lympho-blastoid cell lines maintained in the laboratory of J.R.K.and K.K.K. at Yale University. Fresh primate blood sam-ples were supplied by the Barcelona Zoo.
STRP Analysis
Typing methods for microsatellite IVS1CA are as de-scribed elsewhere (Mateu et al. 1999), where we re-ported allele frequencies for most of the current popu-lation set. The GATT tetranucleotide in intron 6a(IVS6aGATT) (Chehab et al. 1991) was analyzed byPCR amplification and electrophoresis of the productsin a 8% acrylamide gel. Microsatellites IVS8CA andIVS17bTA (Morral et al. 1991; Zielenski et al. 1991a)were analyzed in a multiplex reaction using the primersdescribed by Morral and Estivill (1992). PCR amplifi-cations were performed using 50 ng of genomic DNAin a final 10-ml volume. The CA repeats were amplifiedwith flanking primers I9D3 and I9R4, and the TA re-peats were amplified with flanking primers AT17D1.2and AT17R1.2. Markers I9D3 and AT17D1.2 were flu-orescently labeled. Amplification conditions for 30 cy-cles were as follows: denaturing at 957 for 30 s, an-nealing at 507 for 30 s, and extension at 657 for 45 s.PCR products were pooled, were combined with a sizestandard (ABI GS500 ROX) and a bromophenol blue–and formamide-based loading buffer, and were loadedon a standard 6% denaturing sequencing gel. Electro-phoresis was conducted using an ABI 377TM sequencer.GeneScan 672TM was used to collect the data, tracklanes, and measure fragment sizes. The number of CAand TA repeats was estimated by sequencing two CA-and four TA-homozygous individuals with differentfragment sizes for each loci. The sequencing reaction wasperformed with flanking primers I9R4 and AT17R1.2
and the DNA Sequencing KitTM (PE Biosystems) ac-cording to manufacturer’s specifications.
Analysis of SNPs
The T854/AvaII (2694 T/G) and TUB20/PvuII (4006-200 G/A) SNPs were analyzed by PCR amplification anddigestion with the appropriate restriction enzyme, as de-scribed by Dork et al. (1992).
Statistical Analysis
Allele frequencies were estimated by direct gene count-ing. Maximum-likelihood estimates of haplotype fre-quencies and their standard errors (jackknife method)were calculated from the multisite marker typing data,using the HAPLO program (Hawley and Kidd 1995),which implements the EM algorithm (Dempster et al.1977; Slatkin and Excoffier 1996). Tishkoff et al. (2000)confirmed, by direct haplotype typing, that the frequen-cies estimated with the EM algorithm were quite precisefor the common haplotypes.
Expected heterozygosities for loci and for the haplo-types were estimated as 1-Spi
2, where pi stands for alleleor haplotype frequencies. Analysis of molecular variance(AMOVA) (Excoffier et al. 1992) was performed withthe Arlequin package (Schneider et al. 2000).
In order to quantify the portion of the possible hap-lotype space that was not recovered in the populationsamples, we computed the fraction of extra haplotypes(FE) statistic suggested by Slatkin (2000), with somemodifications. As defined by Slatkin (2000),
(k 2 k )H minFE p ,(k 2 k )max min
where kH is the number of haplotypes found in the sam-ple, kmin is the minimum possible number of haplotypes(i.e., the number of alleles at the locus with the maximumnumber of different alleles), and kmax is the maximumpossible number of different haplotypes—that is, theproduct of the number of different alleles at each site.However, in our case, kmax greatly exceeds sample sizefor each population, and sample size becomes a limitingfactor in the number of different haplotypes that can beactually found. Therefore, we have used as kmax the ex-pected number of different haplotypes under linkageequilibrium, given the sample size and allele frequencies(ke). This value was obtained by sampling—at randomand independently—one allele at each locus, with prob-abilities equal to their population frequencies. This way,a number of random haplotypes equal to the originalsample sizes was reconstructed, and the number of dif-ferent haplotypes was counted. This procedure was re-peated 100,000 times, and the average number of dif-ferent haplotypes at each iteration was used to estimate
106 Am. J. Hum. Genet. 68:103–117, 2001
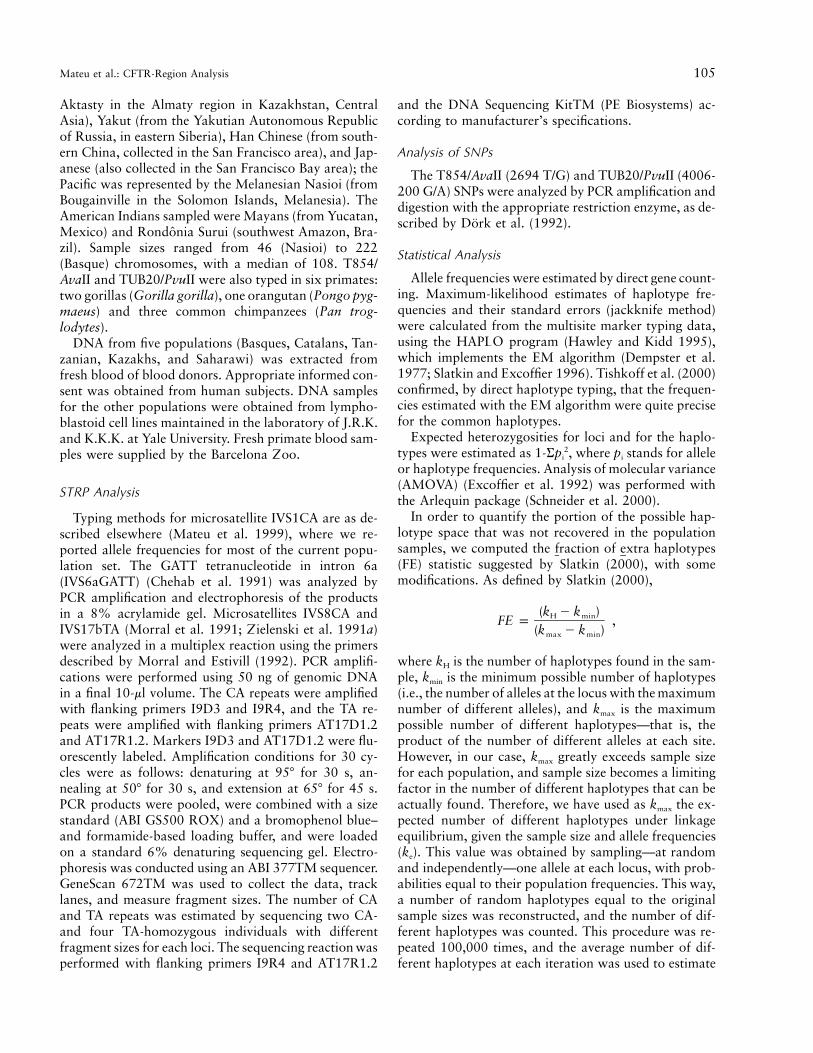
Table 1
Expected Heterozygosity, by Locus and Haplotype
Population IVS1CA IVS6aGATT IVS8CA T854 IVS17bTA TUB20 Haplotype
Sub-Saharan Africa:Biaka .90 .48 .83 .45 .81 .40 .966Mbuti .84 .50 .82 .49 .79 .24 .954Tanzanians .85 .35 .60 .46 .91 .18 .968
North Africa:Saharawi .82 .36 .35 .50 .79 .44 .961
Middle East:Yemenites .70 .32 .48 .33 .84 .24 .958Druze .64 .33 .40 .35 .82 .30 .902
Europe:Adygei .70 .28 .41 .42 .83 .34 .951Russians .77 .32 .50 .50 .70 .42 .948Finns .76 .40 .54 .41 .87 .32 .957Catalans .75 .37 .42 .44 .79 .38 .953Basques .73 .37 .45 .41 .88 .29 .967
Asia:Kazakhs .73 .47 .59 .49 .86 .14 .962Chinese .67 .50 .53 .50 .78 .05 .926Japanese .68 .41 .48 .40 .78 .00 .934Yakut .76 .39 .58 .34 .72 .05 .936
Pacific:Nasioi .79 .36 .75 .50 .78 .04 .901
America:Maya .59 .46 .53 .46 .84 .06 .933Surui .43 .32 .28 .26 .78 .00 .854
ke. Since we are interested in relating FE to LD, andsince FE as formulated by Slatkin (2000) should declinewith LD, we have used instead , whichFNF p 1 2 FEcan be interpreted as the fraction of haplotypes notfound.
Overall disequilibrium and all 15 pairwise disequili-bria were evaluated using the program HAPLO/P (Zhaoet al. 1997, 1999), which uses a permutation test toevaluate significance of deviation from random assort-ment of alleles and calculates the y coefficient to quantifythe deviation from randomness. Zhao et al. (1999) pro-posed the following estimate for y:
1 t 2 mˆ Îy p 2n ,( )n j
where m and j2 are the mean and variance of the em-pirical distribution of the likelihood-ratio test statisticsfrom the permuted samples, and t is the likelihood ratiostatistic for the observed sample. Asymptotically, the y
coefficient allows quantitative comparisons of deviationfrom randomness, in different populations and betweendifferent genetic systems. Physical distances (in kb) be-tween the six loci were based on the CFTR gene sequencepublished in GenBank (accession numbers AC000111and AC000061).
Results
Six polymorphisms (four STRPs and two SNPs) in theCFTR gene were typed in 972 individuals (1,944 chro-mosomes) from 18 populations. Allele frequencies foreach population and marker, as well as for the 770 hap-lotypes estimated to be present, are available on requestand have been deposited in ALFRED, the Allele Fre-quency Database.
Allele Frequencies and Geographic Distribution
IVS1CA allele frequencies had been reported for asubset of the current data (Mateu et al. 1999), and herewe present an increased data set for some populations(i.e., Biaka and Mbuti Pygmies, Druze, Yemenites, Ka-zakhs, Basques, and Catalans). The overall allele fre-quency distribution is unimodal, with a sharp mode at22 repeats and a smooth, left-skewed decline towardsthe ends of the distribution. The most extreme allelesfound were the 12 and 28 repeats; allele 13 was foundin a single Biaka individual and is reported here for thefirst time. Alleles 22 and 23 have been found in all pop-ulations studied. African populations presented a largernumber of alleles and higher heterozygosities at this lo-cus (table 1), because of a higher frequency of peripheralalleles, which seems to be a common feature in many
Mateu et al.: CFTR-Region Analysis 107
STRP allele frequency distributions in Africans (Calafellet al. 1998).
The IVS6aGATT tetranucleotide has only two com-mon alleles with six and seven repeats, as described else-where (Chehab et al. 1991; Gasparini et al. 1991), andboth are present in all populations studied. Allele 7 isthe most frequent on average and in most populations;its frequencies range from .20 in the Surui and .24 inthe Nasioi to 1.75 in many European, Middle Eastern,and African populations. Only three chromosomes inthe worldwide sample did not bear alleles 6 or 7; alleles4, 5, and 8 were found in one Adygei and two Basquechromosomes, respectively. Allele 4 is described for thefirst time.
The IVS8CA dinucleotide STRP has a highly right-skewed distribution, with a mode at 16–17 repeats(which, together, account for ∼75% of the global chro-mosomes) and a range of 14–25 repeats. Allele 16 isfound at frequencies .5–.8 in Tanzanians, North Afri-cans, Middle Easterners, and Asians other than the Chi-nese. In the latter population and among the Mayans,allele 17 is slightly more frequent, and its frequencyreaches 0.8 in the Surui. Allele 23 is found at frequencies0–.12, except among the Nasioi, in whom it is the mostfrequent allele (.41). Again, the Biaka and the Mbutipresent flatter allele distributions, with a larger numberof alleles and high heterozygosity; in contrast, amongthe American Indians, only three different alleles werefound.
The T854 SNP (Zielenski et al. 1991b) was found tobe polymorphic in all populations studied. Allele 1 (i.e.,absence of the restriction site for the AvaII enzyme) wasfound at frequencies ranging from .5 to .79, in Euro-peans and Asians, and from to .34 to .49, in Africans,Nasioi and Mayans. The lowest frequency was found at.16, in the Surui.
The IVS17bTA dinucleotide STRP is extremely poly-morphic, with expected heterozygosities that range from.72 to .91 (table 1). The alleles found range from 7 to53 repeats and are distributed in four discontinuousgroups: allele 7 (and 8 in one chromosome), alleles15–25, 27–38 and 39–53. As discussed below, the mu-tation pattern at IVS17bTA may be responsible for thismultimodal distribution. Overall, the 27–38 group is themost frequent (global average frequency .63), and,within this group, alleles 30–32 are the most frequent.This group of alleles is most frequent in Asians andAmerican Indians (.74–.96), though it is quite commonin Europeans and Africans too (.24–.65). Allele 7 isfound in almost all populations, and—except for allele8 in one chromosome—the next allele in size is allele15. Allele 7 is found at low frequencies in East Asiansand American Indians (it is absent in the Japanese andin the Surui, and its frequency reaches .11 in the Ka-zakhs), and it is more frequent in Europeans, southwest
Asians, and Africans (.14–.50). Within the allele group15–25, alleles 19–22 are the most frequent; the overallfrequency of this group is .15, although it has a widepopulational variation. The group was not found in theYemenites. Its frequency reaches .02 in Europeans andAsians; it is somewhat more frequent in the Africans andin the Maya (.15–.22), and it reaches high frequenciesin two populations: the Mbuti (.61) and the Nasioi (.67).Finally, the right-hand tail of the allele distribution ex-tends from allele 39 to 53; most of those alleles are rareor absent, except for 45–47. The average frequency ofthis group of alleles is .03; all alleles in the group areabsent in six populations, and the group reaches fre-quencies of .10 in the Basques and .13 in the Druze.
The TUB20 SNP (Quere et al. 1991) was detected bya restriction enzyme assay, and in all human populationstyped, the presence of the PvuII restriction site (i.e., allele2) is the most frequent allelic state. Its frequencies rangefrom .7 in the Saharawi to fixation in the Surui andJapanese.
Haplotype Frequencies and Geographic Distribution
The total number of possible haplotypes is 146,880,of which 770 were estimated in the analysis to haveoccurred at least once. The full set of frequencies forthese 770 haplotypes is available in the ALFRED da-tabase. Results using HAPLO were very close to thoseusing ARLEQUIN (results not given). Frequencies esti-mated for the 43 six-locus haplotypes having an esti-mated frequency of >.05 are given in table 2. The T854and TUB20 markers can be used to define the core hap-lotypes since they are diallelic, have presumably muchlower mutation rates than the other polymorphisms andthe ancestral state can be inferred for them. The mostcommon haplotypes defined with these polymorphismsare: 1-2 in Middle Eastern, European, and Asian pop-ulations, with the lowest frequency in Chinese (.51) andthe highest in Yakut (.80); and 2-2 in American Indians(0.65 in Maya and 0.85 in Surui). Haplotype 1-1 isscarcely represented in the worldwide sample (table 3).Haplotype backgrounds for the major CF mutations are:1-2, for DF508, G542X, and N1303K mutations, and2-1, for G551D and W1282X mutations (Morral et al.1996).
Expected haplotype diversities in all populations areshown in table 1. It is remarkable that, although sub-Saharan African populations have high allele diversitiesat the STRP loci when compared with other populations,haplotype diversities for Africans are not noticeablyhigher than haplotype diversities in other populations.This could be caused by higher LD in Africans. We havecomputed the fraction of haplotypes not found (FNF)for each population, a quantity that should grow withLD. Number of haplotypes found, their theoretical
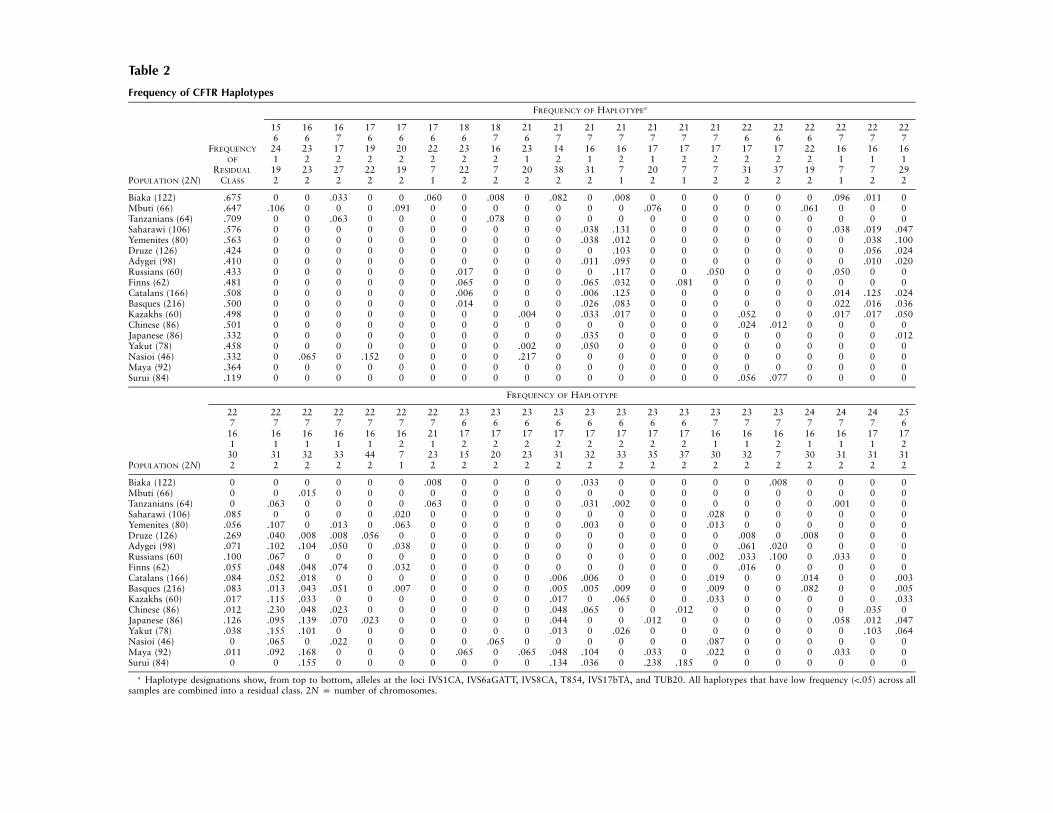
Table 2
Frequency of CFTR Haplotypes
FREQUENCY OF HAPLOTYPEa
15 16 16 17 17 17 18 18 21 21 21 21 21 21 21 22 22 22 22 22 226 6 7 6 6 6 6 7 6 7 7 7 7 7 7 6 6 6 7 7 7
FREQUENCY 24 23 17 19 20 22 23 16 23 14 16 16 17 17 17 17 17 22 16 16 16OF 1 2 2 2 2 2 2 2 1 2 1 2 1 2 2 2 2 2 1 1 1
RESIDUAL 19 23 27 22 19 7 22 7 20 38 31 7 20 7 7 31 37 19 7 7 29POPULATION (2N) CLASS 2 2 2 2 2 1 2 2 2 2 2 1 2 1 2 2 2 2 1 2 2
Biaka (122) .675 0 0 .033 0 0 .060 0 .008 0 .082 0 .008 0 0 0 0 0 0 .096 .011 0Mbuti (66) .647 .106 0 0 0 .091 0 0 0 0 0 0 0 .076 0 0 0 0 .061 0 0 0Tanzanians (64) .709 0 0 .063 0 0 0 0 .078 0 0 0 0 0 0 0 0 0 0 0 0 0Saharawi (106) .576 0 0 0 0 0 0 0 0 0 0 .038 .131 0 0 0 0 0 0 .038 .019 .047Yemenites (80) .563 0 0 0 0 0 0 0 0 0 0 .038 .012 0 0 0 0 0 0 0 .038 .100Druze (126) .424 0 0 0 0 0 0 0 0 0 0 0 .103 0 0 0 0 0 0 0 .056 .024Adygei (98) .410 0 0 0 0 0 0 0 0 0 0 .011 .095 0 0 0 0 0 0 0 .010 .020Russians (60) .433 0 0 0 0 0 0 .017 0 0 0 0 .117 0 0 .050 0 0 0 .050 0 0Finns (62) .481 0 0 0 0 0 0 .065 0 0 0 .065 .032 0 .081 0 0 0 0 0 0 0Catalans (166) .508 0 0 0 0 0 0 .006 0 0 0 .006 .125 0 0 0 0 0 0 .014 .125 .024Basques (216) .500 0 0 0 0 0 0 .014 0 0 0 .026 .083 0 0 0 0 0 0 .022 .016 .036Kazakhs (60) .498 0 0 0 0 0 0 0 0 .004 0 .033 .017 0 0 0 .052 0 0 .017 .017 .050Chinese (86) .501 0 0 0 0 0 0 0 0 0 0 0 0 0 0 0 .024 .012 0 0 0 0Japanese (86) .332 0 0 0 0 0 0 0 0 0 0 .035 0 0 0 0 0 0 0 0 0 .012Yakut (78) .458 0 0 0 0 0 0 0 0 .002 0 .050 0 0 0 0 0 0 0 0 0 0Nasioi (46) .332 0 .065 0 .152 0 0 0 0 .217 0 0 0 0 0 0 0 0 0 0 0 0Maya (92) .364 0 0 0 0 0 0 0 0 0 0 0 0 0 0 0 0 0 0 0 0 0Surui (84) .119 0 0 0 0 0 0 0 0 0 0 0 0 0 0 0 .056 .077 0 0 0 0
FREQUENCY OF HAPLOTYPE
22 22 22 22 22 22 22 23 23 23 23 23 23 23 23 23 23 23 24 24 24 257 7 7 7 7 7 7 6 6 6 6 6 6 6 6 7 7 7 7 7 7 6
16 16 16 16 16 16 21 17 17 17 17 17 17 17 17 16 16 16 16 16 17 171 1 1 1 1 2 1 2 2 2 2 2 2 2 2 1 1 2 1 1 1 2
30 31 32 33 44 7 23 15 20 23 31 32 33 35 37 30 32 7 30 31 31 31POPULATION (2N) 2 2 2 2 2 1 2 2 2 2 2 2 2 2 2 2 2 2 2 2 2 2
Biaka (122) 0 0 0 0 0 0 .008 0 0 0 0 .033 0 0 0 0 0 .008 0 0 0 0Mbuti (66) 0 0 .015 0 0 0 0 0 0 0 0 0 0 0 0 0 0 0 0 0 0 0Tanzanians (64) 0 .063 0 0 0 0 .063 0 0 0 0 .031 .002 0 0 0 0 0 0 .001 0 0Saharawi (106) .085 0 0 0 0 .020 0 0 0 0 0 0 0 0 0 .028 0 0 0 0 0 0Yemenites (80) .056 .107 0 .013 0 .063 0 0 0 0 0 .003 0 0 0 .013 0 0 0 0 0 0Druze (126) .269 .040 .008 .008 .056 0 0 0 0 0 0 0 0 0 0 0 .008 0 .008 0 0 0Adygei (98) .071 .102 .104 .050 0 .038 0 0 0 0 0 0 0 0 0 0 .061 .020 0 0 0 0Russians (60) .100 .067 0 0 0 0 0 0 0 0 0 0 0 0 0 .002 .033 .100 0 .033 0 0Finns (62) .055 .048 .048 .074 0 .032 0 0 0 0 0 0 0 0 0 0 .016 0 0 0 0 0Catalans (166) .084 .052 .018 0 0 0 0 0 0 0 .006 .006 0 0 0 .019 0 0 .014 0 0 .003Basques (216) .083 .013 .043 .051 0 .007 0 0 0 0 .005 .005 .009 0 0 .009 0 0 .082 0 0 .005Kazakhs (60) .017 .115 .033 0 0 0 0 0 0 0 .017 0 .065 0 0 .033 0 0 0 0 0 .033Chinese (86) .012 .230 .048 .023 0 0 0 0 0 0 .048 .065 0 0 .012 0 0 0 0 0 .035 0Japanese (86) .126 .095 .139 .070 .023 0 0 0 0 0 .044 0 0 .012 0 0 0 0 0 .058 .012 .047Yakut (78) .038 .155 .101 0 0 0 0 0 0 0 .013 0 .026 0 0 0 0 0 0 0 .103 .064Nasioi (46) 0 .065 0 .022 0 0 0 0 .065 0 0 0 0 0 0 .087 0 0 0 0 0 0Maya (92) .011 .092 .168 0 0 0 0 .065 0 .065 .048 .104 0 .033 0 .022 0 0 0 .033 0 0Surui (84) 0 0 .155 0 0 0 0 0 0 0 .134 .036 0 .238 .185 0 0 0 0 0 0 0
a Haplotype designations show, from top to bottom, alleles at the loci IVS1CA, IVS6aGATT, IVS8CA, T854, IVS17bTA, and TUB20. All haplotypes that have low frequency (!.05) across allsamples are combined into a residual class. 2N p number of chromosomes.
Mateu et al.: CFTR-Region Analysis 109
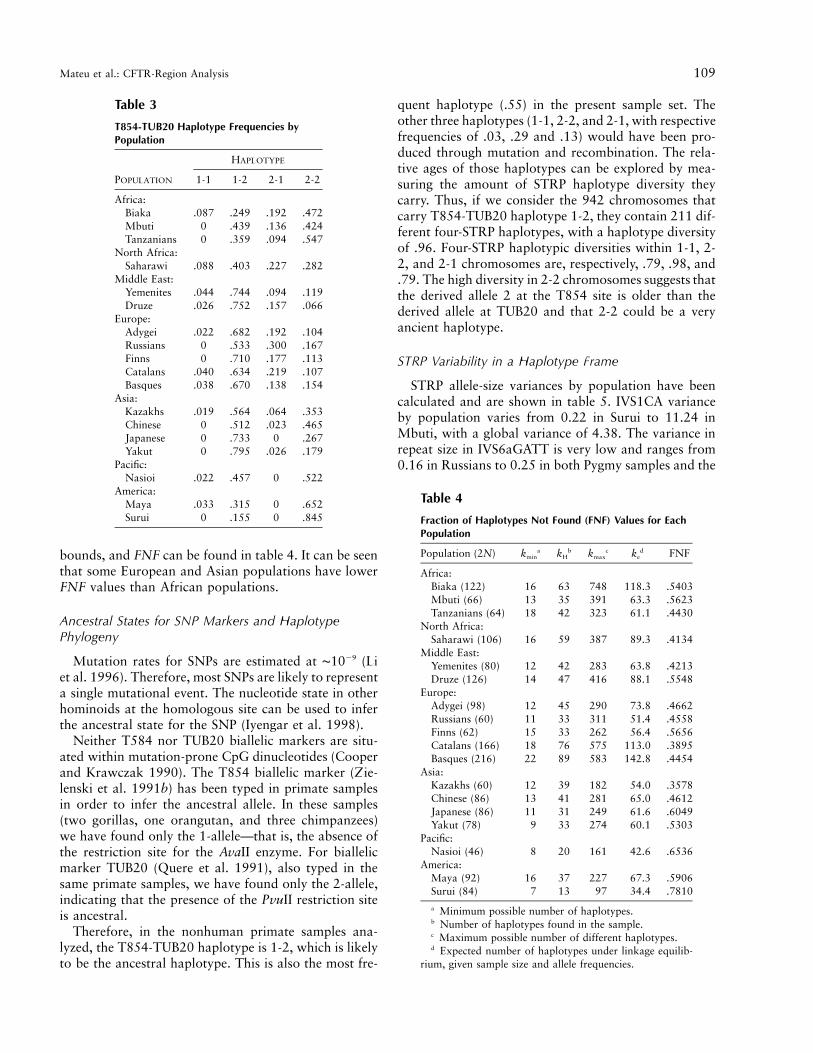
Table 3
T854-TUB20 Haplotype Frequencies byPopulation
POPULATION
HAPLOTYPE
1-1 1-2 2-1 2-2
Africa:Biaka .087 .249 .192 .472Mbuti 0 .439 .136 .424Tanzanians 0 .359 .094 .547
North Africa:Saharawi .088 .403 .227 .282
Middle East:Yemenites .044 .744 .094 .119Druze .026 .752 .157 .066
Europe:Adygei .022 .682 .192 .104Russians 0 .533 .300 .167Finns 0 .710 .177 .113Catalans .040 .634 .219 .107Basques .038 .670 .138 .154
Asia:Kazakhs .019 .564 .064 .353Chinese 0 .512 .023 .465Japanese 0 .733 0 .267Yakut 0 .795 .026 .179
Pacific:Nasioi .022 .457 0 .522
America:Maya .033 .315 0 .652Surui 0 .155 0 .845
Table 4
Fraction of Haplotypes Not Found (FNF) Values for EachPopulation
Population (2N) kmina kH
b kmaxc ke
d FNF
Africa:Biaka (122) 16 63 748 118.3 .5403Mbuti (66) 13 35 391 63.3 .5623Tanzanians (64) 18 42 323 61.1 .4430
North Africa:Saharawi (106) 16 59 387 89.3 .4134
Middle East:Yemenites (80) 12 42 283 63.8 .4213Druze (126) 14 47 416 88.1 .5548
Europe:Adygei (98) 12 45 290 73.8 .4662Russians (60) 11 33 311 51.4 .4558Finns (62) 15 33 262 56.4 .5656Catalans (166) 18 76 575 113.0 .3895Basques (216) 22 89 583 142.8 .4454
Asia:Kazakhs (60) 12 39 182 54.0 .3578Chinese (86) 13 41 281 65.0 .4612Japanese (86) 11 31 249 61.6 .6049Yakut (78) 9 33 274 60.1 .5303
Pacific:Nasioi (46) 8 20 161 42.6 .6536
America:Maya (92) 16 37 227 67.3 .5906Surui (84) 7 13 97 34.4 .7810
a Minimum possible number of haplotypes.b Number of haplotypes found in the sample.c Maximum possible number of different haplotypes.d Expected number of haplotypes under linkage equilib-
rium, given sample size and allele frequencies.
bounds, and FNF can be found in table 4. It can be seenthat some European and Asian populations have lowerFNF values than African populations.
Ancestral States for SNP Markers and HaplotypePhylogeny
Mutation rates for SNPs are estimated at ∼1029 (Liet al. 1996). Therefore, most SNPs are likely to representa single mutational event. The nucleotide state in otherhominoids at the homologous site can be used to inferthe ancestral state for the SNP (Iyengar et al. 1998).
Neither T584 nor TUB20 biallelic markers are situ-ated within mutation-prone CpG dinucleotides (Cooperand Krawczak 1990). The T854 biallelic marker (Zie-lenski et al. 1991b) has been typed in primate samplesin order to infer the ancestral allele. In these samples(two gorillas, one orangutan, and three chimpanzees)we have found only the 1-allele—that is, the absence ofthe restriction site for the AvaII enzyme. For biallelicmarker TUB20 (Quere et al. 1991), also typed in thesame primate samples, we have found only the 2-allele,indicating that the presence of the PvuII restriction siteis ancestral.
Therefore, in the nonhuman primate samples ana-lyzed, the T854-TUB20 haplotype is 1-2, which is likelyto be the ancestral haplotype. This is also the most fre-
quent haplotype (.55) in the present sample set. Theother three haplotypes (1-1, 2-2, and 2-1, with respectivefrequencies of .03, .29 and .13) would have been pro-duced through mutation and recombination. The rela-tive ages of those haplotypes can be explored by mea-suring the amount of STRP haplotype diversity theycarry. Thus, if we consider the 942 chromosomes thatcarry T854-TUB20 haplotype 1-2, they contain 211 dif-ferent four-STRP haplotypes, with a haplotype diversityof .96. Four-STRP haplotypic diversities within 1-1, 2-2, and 2-1 chromosomes are, respectively, .79, .98, and.79. The high diversity in 2-2 chromosomes suggests thatthe derived allele 2 at the T854 site is older than thederived allele at TUB20 and that 2-2 could be a veryancient haplotype.
STRP Variability in a Haplotype Frame
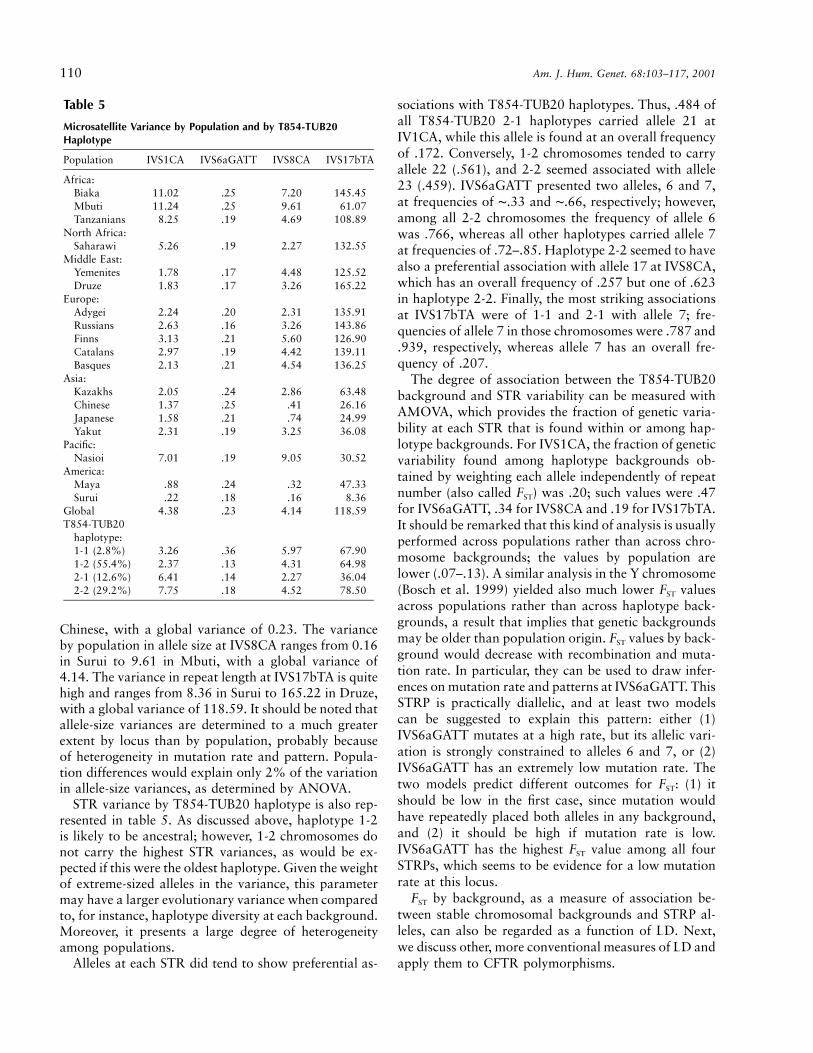
STRP allele-size variances by population have beencalculated and are shown in table 5. IVS1CA varianceby population varies from 0.22 in Surui to 11.24 inMbuti, with a global variance of 4.38. The variance inrepeat size in IVS6aGATT is very low and ranges from0.16 in Russians to 0.25 in both Pygmy samples and the
110 Am. J. Hum. Genet. 68:103–117, 2001
Table 5
Microsatellite Variance by Population and by T854-TUB20Haplotype
Population IVS1CA IVS6aGATT IVS8CA IVS17bTA
Africa:Biaka 11.02 .25 7.20 145.45Mbuti 11.24 .25 9.61 61.07Tanzanians 8.25 .19 4.69 108.89
North Africa:Saharawi 5.26 .19 2.27 132.55
Middle East:Yemenites 1.78 .17 4.48 125.52Druze 1.83 .17 3.26 165.22
Europe:Adygei 2.24 .20 2.31 135.91Russians 2.63 .16 3.26 143.86Finns 3.13 .21 5.60 126.90Catalans 2.97 .19 4.42 139.11Basques 2.13 .21 4.54 136.25
Asia:Kazakhs 2.05 .24 2.86 63.48Chinese 1.37 .25 .41 26.16Japanese 1.58 .21 .74 24.99Yakut 2.31 .19 3.25 36.08
Pacific:Nasioi 7.01 .19 9.05 30.52
America:Maya .88 .24 .32 47.33Surui .22 .18 .16 8.36
Global 4.38 .23 4.14 118.59T854-TUB20
haplotype:1-1 (2.8%) 3.26 .36 5.97 67.901-2 (55.4%) 2.37 .13 4.31 64.982-1 (12.6%) 6.41 .14 2.27 36.042-2 (29.2%) 7.75 .18 4.52 78.50
Chinese, with a global variance of 0.23. The varianceby population in allele size at IVS8CA ranges from 0.16in Surui to 9.61 in Mbuti, with a global variance of4.14. The variance in repeat length at IVS17bTA is quitehigh and ranges from 8.36 in Surui to 165.22 in Druze,with a global variance of 118.59. It should be noted thatallele-size variances are determined to a much greaterextent by locus than by population, probably becauseof heterogeneity in mutation rate and pattern. Popula-tion differences would explain only 2% of the variationin allele-size variances, as determined by ANOVA.
STR variance by T854-TUB20 haplotype is also rep-resented in table 5. As discussed above, haplotype 1-2is likely to be ancestral; however, 1-2 chromosomes donot carry the highest STR variances, as would be ex-pected if this were the oldest haplotype. Given the weightof extreme-sized alleles in the variance, this parametermay have a larger evolutionary variance when comparedto, for instance, haplotype diversity at each background.Moreover, it presents a large degree of heterogeneityamong populations.
Alleles at each STR did tend to show preferential as-
sociations with T854-TUB20 haplotypes. Thus, .484 ofall T854-TUB20 2-1 haplotypes carried allele 21 atIV1CA, while this allele is found at an overall frequencyof .172. Conversely, 1-2 chromosomes tended to carryallele 22 (.561), and 2-2 seemed associated with allele23 (.459). IVS6aGATT presented two alleles, 6 and 7,at frequencies of ∼.33 and ∼.66, respectively; however,among all 2-2 chromosomes the frequency of allele 6was .766, whereas all other haplotypes carried allele 7at frequencies of .72–.85. Haplotype 2-2 seemed to havealso a preferential association with allele 17 at IVS8CA,which has an overall frequency of .257 but one of .623in haplotype 2-2. Finally, the most striking associationsat IVS17bTA were of 1-1 and 2-1 with allele 7; fre-quencies of allele 7 in those chromosomes were .787 and.939, respectively, whereas allele 7 has an overall fre-quency of .207.
The degree of association between the T854-TUB20background and STR variability can be measured withAMOVA, which provides the fraction of genetic varia-bility at each STR that is found within or among hap-lotype backgrounds. For IVS1CA, the fraction of geneticvariability found among haplotype backgrounds ob-tained by weighting each allele independently of repeatnumber (also called FST) was .20; such values were .47for IVS6aGATT, .34 for IVS8CA and .19 for IVS17bTA.It should be remarked that this kind of analysis is usuallyperformed across populations rather than across chro-mosome backgrounds; the values by population arelower (.07–.13). A similar analysis in the Y chromosome(Bosch et al. 1999) yielded also much lower FST valuesacross populations rather than across haplotype back-grounds, a result that implies that genetic backgroundsmay be older than population origin. FST values by back-ground would decrease with recombination and muta-tion rate. In particular, they can be used to draw infer-ences on mutation rate and patterns at IVS6aGATT. ThisSTRP is practically diallelic, and at least two modelscan be suggested to explain this pattern: either (1)IVS6aGATT mutates at a high rate, but its allelic vari-ation is strongly constrained to alleles 6 and 7, or (2)IVS6aGATT has an extremely low mutation rate. Thetwo models predict different outcomes for FST: (1) itshould be low in the first case, since mutation wouldhave repeatedly placed both alleles in any background,and (2) it should be high if mutation rate is low.IVS6aGATT has the highest FST value among all fourSTRPs, which seems to be evidence for a low mutationrate at this locus.
FST by background, as a measure of association be-tween stable chromosomal backgrounds and STRP al-leles, can also be regarded as a function of LD. Next,we discuss other, more conventional measures of LD andapply them to CFTR polymorphisms.
Mateu et al.: CFTR-Region Analysis 111
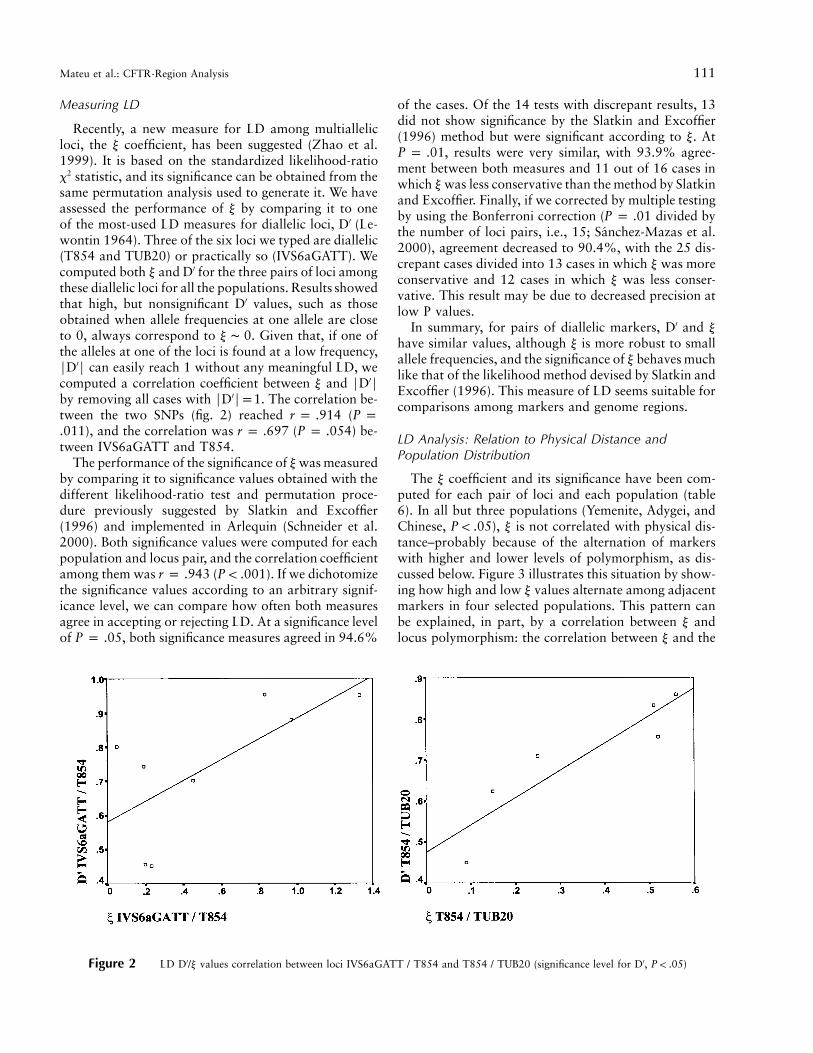
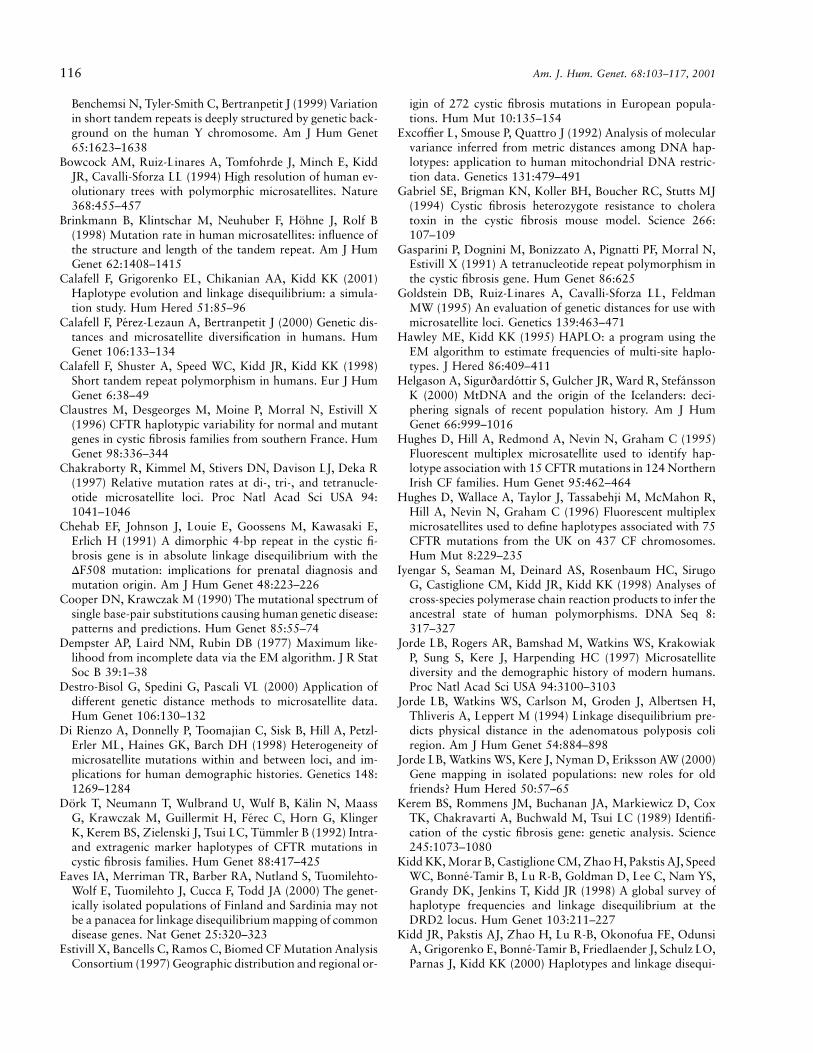
Figure 2 LD D′/y values correlation between loci IVS6aGATT / T854 and T854 / TUB20 (significance level for D′, )P ! .05
Measuring LD
Recently, a new measure for LD among multiallelicloci, the y coefficient, has been suggested (Zhao et al.1999). It is based on the standardized likelihood-ratiox2 statistic, and its significance can be obtained from thesame permutation analysis used to generate it. We haveassessed the performance of y by comparing it to oneof the most-used LD measures for diallelic loci, D′ (Le-wontin 1964). Three of the six loci we typed are diallelic(T854 and TUB20) or practically so (IVS6aGATT). Wecomputed both y and D′ for the three pairs of loci amongthese diallelic loci for all the populations. Results showedthat high, but nonsignificant D′ values, such as thoseobtained when allele frequencies at one allele are closeto 0, always correspond to y ∼ 0. Given that, if one ofthe alleles at one of the loci is found at a low frequency,FD′F can easily reach 1 without any meaningful LD, wecomputed a correlation coefficient between y and FD′Fby removing all cases with FD′Fp1. The correlation be-tween the two SNPs (fig. 2) reached (r p .914 P p
), and the correlation was ( ) be-.011 r p .697 P p .054tween IVS6aGATT and T854.
The performance of the significance of y was measuredby comparing it to significance values obtained with thedifferent likelihood-ratio test and permutation proce-dure previously suggested by Slatkin and Excoffier(1996) and implemented in Arlequin (Schneider et al.2000). Both significance values were computed for eachpopulation and locus pair, and the correlation coefficientamong them was ( ). If we dichotomizer p .943 P ! .001the significance values according to an arbitrary signif-icance level, we can compare how often both measuresagree in accepting or rejecting LD. At a significance levelof , both significance measures agreed in 94.6%P p .05
of the cases. Of the 14 tests with discrepant results, 13did not show significance by the Slatkin and Excoffier(1996) method but were significant according to y. At
, results were very similar, with 93.9% agree-P p .01ment between both measures and 11 out of 16 cases inwhich y was less conservative than the method by Slatkinand Excoffier. Finally, if we corrected by multiple testingby using the Bonferroni correction ( divided byP p .01the number of loci pairs, i.e., 15; Sanchez-Mazas et al.2000), agreement decreased to 90.4%, with the 25 dis-crepant cases divided into 13 cases in which y was moreconservative and 12 cases in which y was less conser-vative. This result may be due to decreased precision atlow P values.
In summary, for pairs of diallelic markers, D′ and y
have similar values, although y is more robust to smallallele frequencies, and the significance of y behaves muchlike that of the likelihood method devised by Slatkin andExcoffier (1996). This measure of LD seems suitable forcomparisons among markers and genome regions.
LD Analysis: Relation to Physical Distance andPopulation Distribution
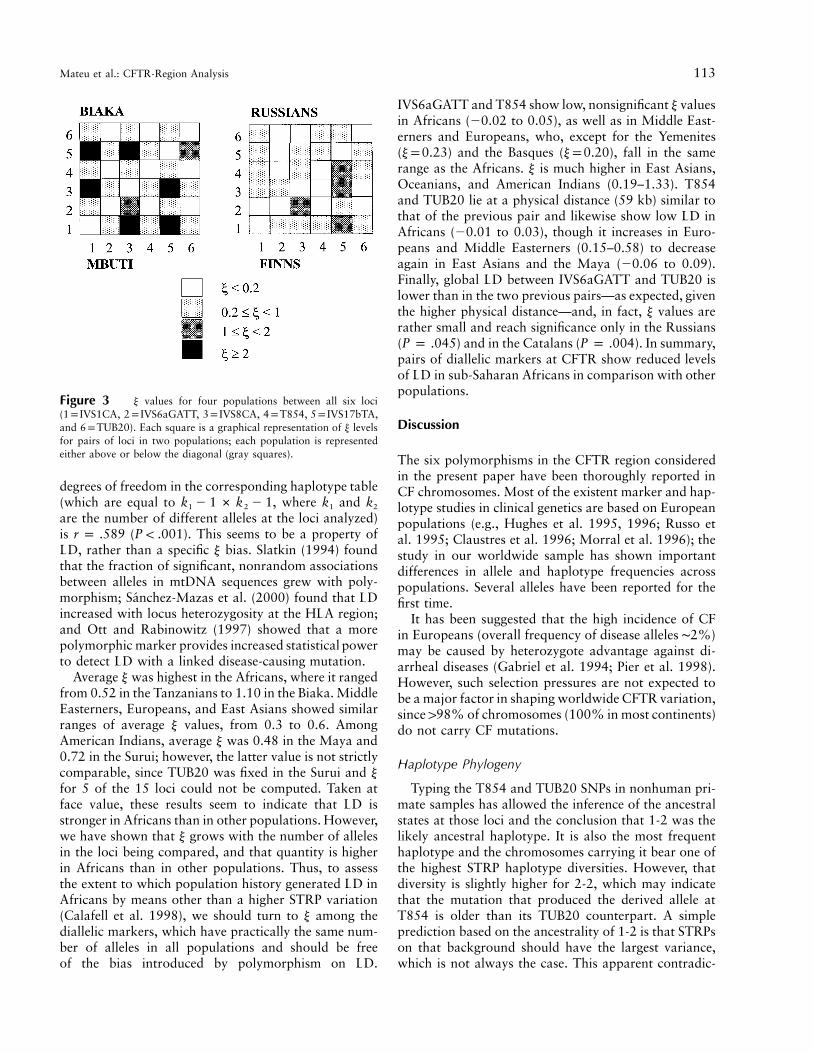
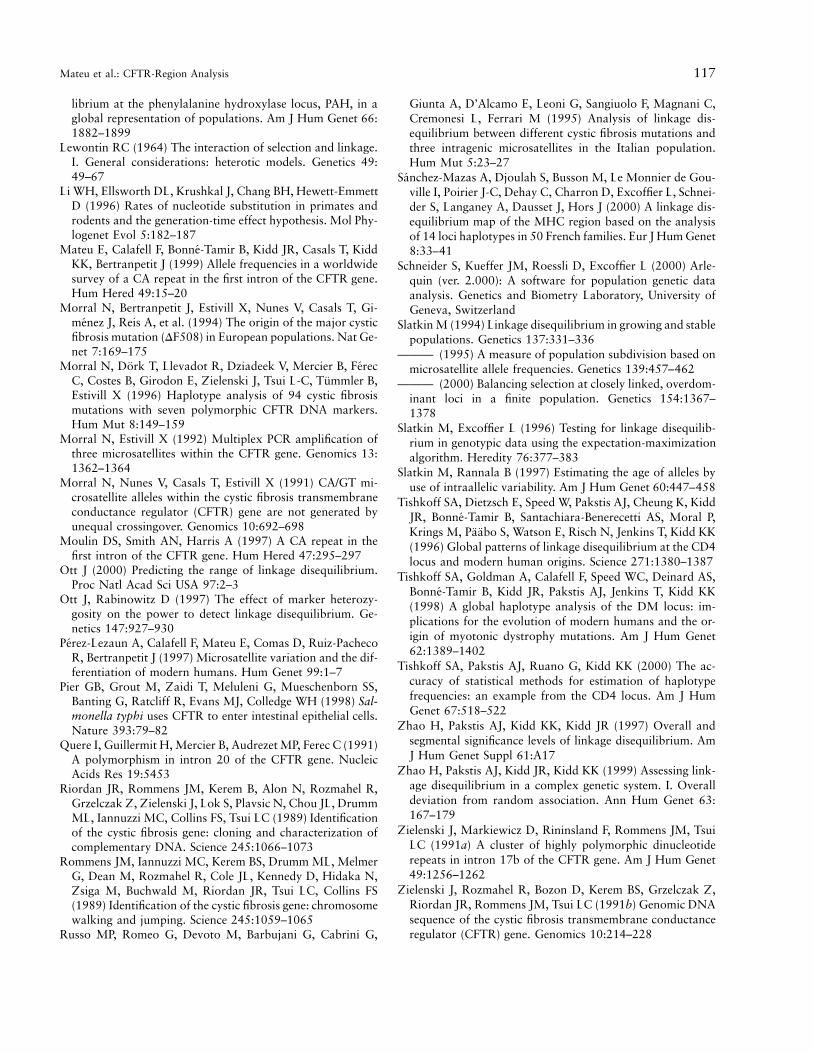
The y coefficient and its significance have been com-puted for each pair of loci and each population (table6). In all but three populations (Yemenite, Adygei, andChinese, ), y is not correlated with physical dis-P ! .05tance–probably because of the alternation of markerswith higher and lower levels of polymorphism, as dis-cussed below. Figure 3 illustrates this situation by show-ing how high and low y values alternate among adjacentmarkers in four selected populations. This pattern canbe explained, in part, by a correlation between y andlocus polymorphism: the correlation between y and the
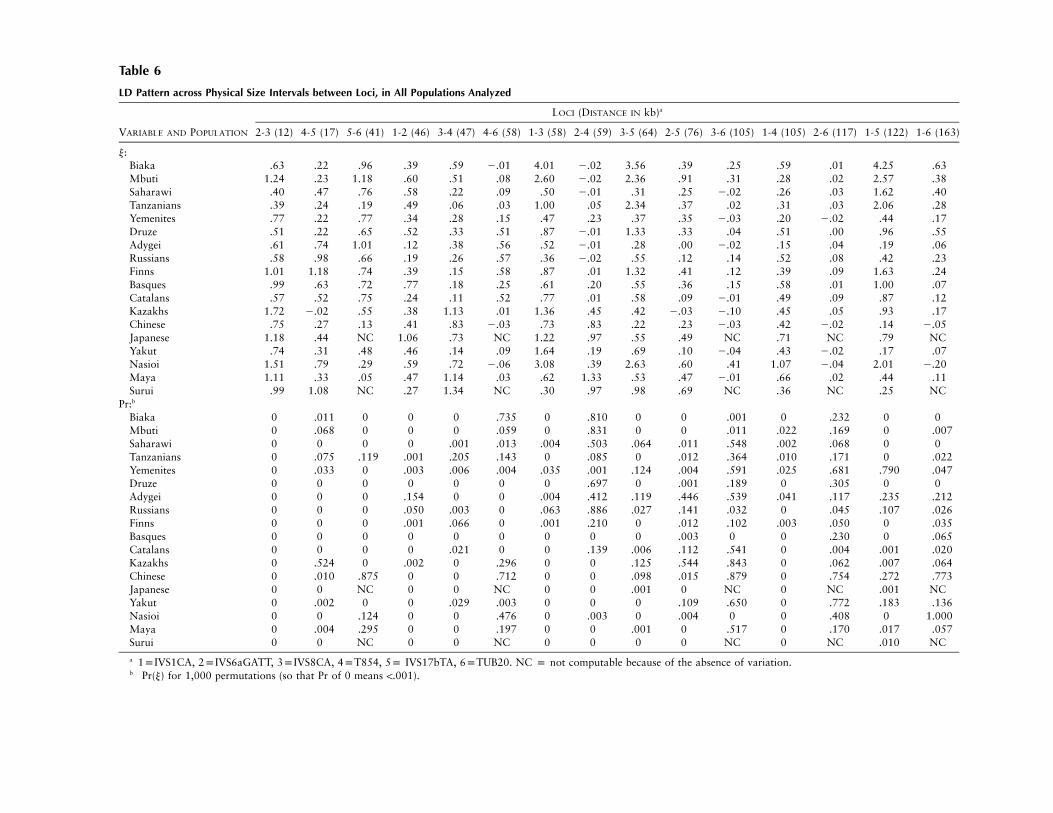
Table 6
LD Pattern across Physical Size Intervals between Loci, in All Populations Analyzed
VARIABLE AND POPULATION
LOCI (DISTANCE IN kb)a
2-3 (12) 4-5 (17) 5-6 (41) 1-2 (46) 3-4 (47) 4-6 (58) 1-3 (58) 2-4 (59) 3-5 (64) 2-5 (76) 3-6 (105) 1-4 (105) 2-6 (117) 1-5 (122) 1-6 (163)
y:Biaka .63 .22 .96 .39 .59 2.01 4.01 2.02 3.56 .39 .25 .59 .01 4.25 .63Mbuti 1.24 .23 1.18 .60 .51 .08 2.60 2.02 2.36 .91 .31 .28 .02 2.57 .38Saharawi .40 .47 .76 .58 .22 .09 .50 2.01 .31 .25 2.02 .26 .03 1.62 .40Tanzanians .39 .24 .19 .49 .06 .03 1.00 .05 2.34 .37 .02 .31 .03 2.06 .28Yemenites .77 .22 .77 .34 .28 .15 .47 .23 .37 .35 2.03 .20 2.02 .44 .17Druze .51 .22 .65 .52 .33 .51 .87 2.01 1.33 .33 .04 .51 .00 .96 .55Adygei .61 .74 1.01 .12 .38 .56 .52 2.01 .28 .00 2.02 .15 .04 .19 .06Russians .58 .98 .66 .19 .26 .57 .36 2.02 .55 .12 .14 .52 .08 .42 .23Finns 1.01 1.18 .74 .39 .15 .58 .87 .01 1.32 .41 .12 .39 .09 1.63 .24Basques .99 .63 .72 .77 .18 .25 .61 .20 .55 .36 .15 .58 .01 1.00 .07Catalans .57 .52 .75 .24 .11 .52 .77 .01 .58 .09 2.01 .49 .09 .87 .12Kazakhs 1.72 2.02 .55 .38 1.13 .01 1.36 .45 .42 2.03 2.10 .45 .05 .93 .17Chinese .75 .27 .13 .41 .83 2.03 .73 .83 .22 .23 2.03 .42 2.02 .14 2.05Japanese 1.18 .44 NC 1.06 .73 NC 1.22 .97 .55 .49 NC .71 NC .79 NCYakut .74 .31 .48 .46 .14 .09 1.64 .19 .69 .10 2.04 .43 2.02 .17 .07Nasioi 1.51 .79 .29 .59 .72 2.06 3.08 .39 2.63 .60 .41 1.07 2.04 2.01 2.20Maya 1.11 .33 .05 .47 1.14 .03 .62 1.33 .53 .47 2.01 .66 .02 .44 .11Surui .99 1.08 NC .27 1.34 NC .30 .97 .98 .69 NC .36 NC .25 NC
Pr:b
Biaka 0 .011 0 0 0 .735 0 .810 0 0 .001 0 .232 0 0Mbuti 0 .068 0 0 0 .059 0 .831 0 0 .011 .022 .169 0 .007Saharawi 0 0 0 0 .001 .013 .004 .503 .064 .011 .548 .002 .068 0 0Tanzanians 0 .075 .119 .001 .205 .143 0 .085 0 .012 .364 .010 .171 0 .022Yemenites 0 .033 0 .003 .006 .004 .035 .001 .124 .004 .591 .025 .681 .790 .047Druze 0 0 0 0 0 0 0 .697 0 .001 .189 0 .305 0 0Adygei 0 0 0 .154 0 0 .004 .412 .119 .446 .539 .041 .117 .235 .212Russians 0 0 0 .050 .003 0 .063 .886 .027 .141 .032 0 .045 .107 .026Finns 0 0 0 .001 .066 0 .001 .210 0 .012 .102 .003 .050 0 .035Basques 0 0 0 0 0 0 0 0 0 .003 0 0 .230 0 .065Catalans 0 0 0 0 .021 0 0 .139 .006 .112 .541 0 .004 .001 .020Kazakhs 0 .524 0 .002 0 .296 0 0 .125 .544 .843 0 .062 .007 .064Chinese 0 .010 .875 0 0 .712 0 0 .098 .015 .879 0 .754 .272 .773Japanese 0 0 NC 0 0 NC 0 0 .001 0 NC 0 NC .001 NCYakut 0 .002 0 0 .029 .003 0 0 0 .109 .650 0 .772 .183 .136Nasioi 0 0 .124 0 0 .476 0 .003 0 .004 0 0 .408 0 1.000Maya 0 .004 .295 0 0 .197 0 0 .001 0 .517 0 .170 .017 .057Surui 0 0 NC 0 0 NC 0 0 0 0 NC 0 NC .010 NC
a 1pIVS1CA, 2pIVS6aGATT, 3pIVS8CA, 4pT854, 5p IVS17bTA, 6pTUB20. NC p not computable because of the absence of variation.b Pr(y) for 1,000 permutations (so that Pr of 0 means !.001).
Mateu et al.: CFTR-Region Analysis 113
Figure 3 y values for four populations between all six loci(1pIVS1CA, 2pIVS6aGATT, 3pIVS8CA, 4pT854, 5pIVS17bTA,and 6pTUB20). Each square is a graphical representation of y levelsfor pairs of loci in two populations; each population is representedeither above or below the diagonal (gray squares).
degrees of freedom in the corresponding haplotype table(which are equal to , where k1 and k2k 2 1 # k 2 11 2
are the number of different alleles at the loci analyzed)is ( ). This seems to be a property ofr p .589 P ! .001LD, rather than a specific y bias. Slatkin (1994) foundthat the fraction of significant, nonrandom associationsbetween alleles in mtDNA sequences grew with poly-morphism; Sanchez-Mazas et al. (2000) found that LDincreased with locus heterozygosity at the HLA region;and Ott and Rabinowitz (1997) showed that a morepolymorphic marker provides increased statistical powerto detect LD with a linked disease-causing mutation.
Average y was highest in the Africans, where it rangedfrom 0.52 in the Tanzanians to 1.10 in the Biaka. MiddleEasterners, Europeans, and East Asians showed similarranges of average y values, from 0.3 to 0.6. AmongAmerican Indians, average y was 0.48 in the Maya and0.72 in the Surui; however, the latter value is not strictlycomparable, since TUB20 was fixed in the Surui and y
for 5 of the 15 loci could not be computed. Taken atface value, these results seem to indicate that LD isstronger in Africans than in other populations. However,we have shown that y grows with the number of allelesin the loci being compared, and that quantity is higherin Africans than in other populations. Thus, to assessthe extent to which population history generated LD inAfricans by means other than a higher STRP variation(Calafell et al. 1998), we should turn to y among thediallelic markers, which have practically the same num-ber of alleles in all populations and should be freeof the bias introduced by polymorphism on LD.
IVS6aGATT and T854 show low, nonsignificant y valuesin Africans (20.02 to 0.05), as well as in Middle East-erners and Europeans, who, except for the Yemenites(yp0.23) and the Basques (yp0.20), fall in the samerange as the Africans. y is much higher in East Asians,Oceanians, and American Indians (0.19–1.33). T854and TUB20 lie at a physical distance (59 kb) similar tothat of the previous pair and likewise show low LD inAfricans (20.01 to 0.03), though it increases in Euro-peans and Middle Easterners (0.15–0.58) to decreaseagain in East Asians and the Maya (20.06 to 0.09).Finally, global LD between IVS6aGATT and TUB20 islower than in the two previous pairs—as expected, giventhe higher physical distance—and, in fact, y values arerather small and reach significance only in the Russians( ) and in the Catalans ( ). In summary,P p .045 P p .004pairs of diallelic markers at CFTR show reduced levelsof LD in sub-Saharan Africans in comparison with otherpopulations.
Discussion
The six polymorphisms in the CFTR region consideredin the present paper have been thoroughly reported inCF chromosomes. Most of the existent marker and hap-lotype studies in clinical genetics are based on Europeanpopulations (e.g., Hughes et al. 1995, 1996; Russo etal. 1995; Claustres et al. 1996; Morral et al. 1996); thestudy in our worldwide sample has shown importantdifferences in allele and haplotype frequencies acrosspopulations. Several alleles have been reported for thefirst time.
It has been suggested that the high incidence of CFin Europeans (overall frequency of disease alleles ∼2%)may be caused by heterozygote advantage against di-arrheal diseases (Gabriel et al. 1994; Pier et al. 1998).However, such selection pressures are not expected tobe a major factor in shaping worldwide CFTR variation,since 198% of chromosomes (100% in most continents)do not carry CF mutations.
Haplotype Phylogeny
Typing the T854 and TUB20 SNPs in nonhuman pri-mate samples has allowed the inference of the ancestralstates at those loci and the conclusion that 1-2 was thelikely ancestral haplotype. It is also the most frequenthaplotype and the chromosomes carrying it bear one ofthe highest STRP haplotype diversities. However, thatdiversity is slightly higher for 2-2, which may indicatethat the mutation that produced the derived allele atT854 is older than its TUB20 counterpart. A simpleprediction based on the ancestrality of 1-2 is that STRPson that background should have the largest variance,which is not always the case. This apparent contradic-
114 Am. J. Hum. Genet. 68:103–117, 2001
tion can be explained by at least three reasons. First,variance accumulation may not be linear with time andcan even reach a plateau in which it ceases to grow withtime (Goldstein et al. 1995). If that is the case for someof the oldest backgrounds, then STRP allele size variancemay be a function of drift rather than of haplotype age(Di Rienzo et al. 1998). And, as we have seen that hap-lotype background determines STRP diversity to agreater extent than populations do, it is likely that hap-lotypes backgrounds are indeed older than populations.Second, the estimation of STRP allele-size variance hasitself a large variance (Slatkin 1995), which may be thereason why variance-based genetic distances seem notto perform as well as those that do not take into accountrepeat size (Perez-Lezaun et al. 1997; Calafell et al. 2000;Destro-Bisol et al. 2000). And third, an increase in STRPvariance can be brought by repeated mutation at thepresumed stable background or by recombination. Infact, a median network (Bandelt et al. 1995) constructedwith the STRP haplotypes in the T854-TUB20 2-2 back-ground showed two distinct and distantly related hap-lotype groups: a main group, with medium and largealleles at IVS17bTA, and a smaller group, with the 7allele at IVS17bTA. This suggests that the extreme 7allele could have been brought into a 2-2 backgroundby recombination, thus greatly increasing repeat-sizevariance.
STRP Heterogeneity and CFTR: An STRP Spectrum
There is a vast heterogeneity in the diversity (as mea-sured by heterozygosity or number of alleles) amongSTRPs, likely because of different mutation rates andpatterns. See, for example, the ranges given by Calafellet al. (1998) for 45 CA-repeat polymorphisms. Severalfeatures, such as motif length (Chakraborty et al. 1997)and number of repeats (Brinkmann et al. 1998), havebeen suggested as contributors to mutation-rate varia-bility across STRPs. Functional constraints can also playa role in determining number of repeats, as is exemplifiedby the disease-causing trinucleotide-repeat expansions.And yet, much of that heterogeneity is bound to bemissed, given how most of the STRPs in the largest datasets (the linkage-mapping sets, for instance) were ascer-tained. Generally, libraries were screened with long(CA)n probes, as a rapid way of finding highly poly-morphic markers. Thus, shorter, less polymorphicSTRPs, or those with other motifs, may be underrep-resented. In contrast, STRPs at CFTR were discoveredfrom the whole sequence of the gene, and, although theyare fewer, they may be a good, unbiased representationof STRP heterogeneity. We have typed all but one of theSTRPs found in CFTR, and the range of polymorphismis remarkable: from two alleles accounting for 99.8%of the chromosomes at IVS6aGATT to 36 different al-
leles, ranging from 7 to 53 repeats, at IVS17bTA, witha corresponding 500-fold increase in allele-size variance.
STR variability depending on minihaplotype T854-TUB20 gives FST values higher than FST values dependingon population. That is, STR allele frequency differenceswere greater between haplotype backgrounds than be-tween populations. This suggests that the SNP mutationevents that generated the haplotype backgrounds pre-date population differentiation processes.
The STRP analysis on a SNP haplotype backgroundhas allowed us to test two different models for mutationpattern at IVS6aGATT, and to reach the conclusion thatit has a slow mutation rate, rather than a faster mutationrate and tight allele-size constraints. The fact thatIVS6aGATT only has two alleles may be due to a lowmutation rate, meaning it would be like an SNP, or toa normal mutation rate with constrictions in mutationpattern. Moreover, dinucleotides appear to have muta-tion rates 1.5–2 times higher than the tetranucleotides(Chakraborty et al. 1997). The variation pattern sup-ports the first hypothesis, clarifying a debated point.
Genomic Effects on LD
LD, the nonrandom association of alleles at linkedloci, is a powerful tool in gene mapping. It is often as-sumed that LD reflects genetic, and thus, physical dis-tance (d), between a marker and a disease-causing mu-tation. However, differences in mutation rate can reversethe relation between LD and genetic distance amonggenetic markers (Calafell et al. 2001). Furthermore, ithas been shown by Jorde et al. (1994) that, in a studyof one locus in one population, there is a good corre-lation between LD and physical distance over 50–500kb distances; but they do not correlate significantly when
–60 kb. Kidd et al. (2000) showed that, in somed ! 50populations, LD extended much farther than in others.Our results show a very complex pattern of LD, amongthe various sites, that is not a simple linear function ofgenetic distance. Part of this pattern may be caused bythe relatively short genomic frame analyzed, in whichrecombination events may be rare and where the evo-lutionary variance of the effects of recombination maybe large. In that situation, the effect of recombinationbecomes less predictable, particularly in relation to phys-ical distance.
Allele diversity may also contribute to the LD patternobserved. Sanchez-Mazas et al. (2000) describes also acomplex pattern of LD throughout the MHC region ina French population, where the significance of LD is notnecessarily related to the physical distance between theloci they typed, but to allele diversity: pairs of loci withmore alleles show stronger LD. This matches our find-ings, as well as the simulations by Ott and Rabinowitz(1997) and the analysis of mtDNA control-region se-
Mateu et al.: CFTR-Region Analysis 115
quences by Slatkin (1994). The combination of haplo-types with different degrees of polymorphism and withpresumably different mutation rates has proved veryfruitful in the understanding of different genome regions,such as CD4 (Tishkoff et al. 1996), DM (Tishkoff et al.1998), DRD2 (Kidd et al. 1998), and the Y chromosome(Bosch et al. 1999). Such combinations provide both astable background and markers that accumulate varia-tion at a faster rate, which can then be used to datemutation events. However, care should be taken whenmeasuring LD in such settings, particularly when SNP-SNP, SNP-STRP and STRP-STRP combinations are allfound and the range of polymorphism across pairs ofloci can determine LD to a much greater extent.
LD and Population History: How Many Went “Out ofAfrica?”
A number of studies of haplotypes consisting of sev-eral SNPs and, at most, one STRP (Tishkoff et al. 1996,1998; Kidd et al. 1998; 2000) show a consistent pop-ulation LD pattern: LD is small in Africans and growsstronger in Europeans, East Asians, and American In-dians, up to the point that, at CD4 (Tishkoff et al. 1996),the authors found complete LD outside of Africa andconclude that there was only a single, small early mi-gration of modern humans from Africa, which occurred!90,000 years before the present. It is also a recurrentresult that Africans show higher allele diversity at STRPs(Bowcock et al. 1994; Jorde et al. 1997; Perez-Lezaunet al. 1997; Calafell et al. 1998). This could explain whywe find stronger LD in Africans, particularly amongpairs of STRP loci. Is all LD at CFTR in Africans ex-plainable by higher heterozygosity of STRPs? What wasthe underlying role of population history? A way aroundthis conundrum is to consider the diallelic background,where Africans show little LD and, in some cases, arethe population group with the lowest LD. A way ofintegrating STRP markers into this considerations wouldbe through FNF, the fraction of possible different hap-lotypes that were not found in each population sample.Since the theoretical maximum (which depends on thenumber of different alleles at each locus) greatly exceedssample size for each population, the effective maximumunder linkage equilibrium is given by sample size andallele frequencies. By that measure, some European andAsian population samples cover the space of possiblehaplotypes more extensively than African samples do,which would indicate that the underlying LD is not low-est in Africans.
Some genetic studies suggest that the “Out of Africa”bottleneck was not so narrow (Ayala 1995; Helgason etal. 2000). If that were the case, it could be expected thatLD in non-Africans in relation to Africans would followa broad distribution, in which some loci, such as CD4,
would show extreme LD only in non-Africans, whereasothers, such as CFTR, should show similar amounts ofLD in Africans and non-Africans. The combination ofseveral types of markers at CFTR has allowed us totackle the complicated interplay of genomic and popu-lation forces in creating and maintaining LD.
Acknowledgments
This research was supported by the Fundacio La Marato deTV3-1998 (project “La Historia Natural de la Fibrosi Quıstica:Interpretacio Geografica de la Variacio Genetica”). Furthersupport was given by the Direccion General de InvestigacionCientıfica y Tecnica (Spain; grant PB98-1064), by DireccioGeneral de Recerca, Generalitat de Catalunya (grant1998SGR00009), by Institut d’Estudis Catalans, and by UnitedStates National Science Foundation grant SBR9632509 (toJ.R.K.). The work was also possible thanks to a fellowship toE.M. (Universitat de Barcelona and Universitat Pompeu Fa-bra). We would like to thank X. Estivill’s staff (Departamentde Genetica Molecular, Institut de Recerca Oncologica, Bar-celona) for their technical support. Samples from Tanzaniawere kindly supplied by Dr. Clara Menendez from Unitatd’Epidemiologia i Bioestadıstica (Hospital Clınic, Barcelona)and samples from Kazakhstan by Dr. Davide Pettener fromUnita di Antropologia (Universita di Bologna, Bologna). Wewould like to thank Montgomery Slatkin for useful commentson an earlier version of the manuscript.
Electronic-Database Information
Accession numbers and URLs for data in this article are asfollows:
Allele Frequency Database, http://info.med.yale.edu/genetics/kkidd (for allele and haplotype frequencies of the presentstudy)
Arlequin package, http://anthropologie.unige.ch/arlequin (foranalysis of molecular variance)
Cystic Fibrosis Mutation Data Base, http://www.genet.sickkids.on.ca/cftr
GenBank, http://www.ncbi.nlm.nih.gov/Genbank (for CFTRgene sequence [accession numbers AC000111, AC000061])
Online Mendelian Inheritance in Man (OMIM), http://www.ncbi.nlm.nih.gov/Omim (for CFTR [MIM 602421], CF[MIM 219700])
References
Ayala FJ (1995) The myth of Eve: molecular biology and hu-man origins. Science 270:1930–1936
Bandelt H-J, Forster P, Sykes BC, Richards MB (1995) Mi-tochondrial portraits of human populations using mediannetworks. Genetics 141:743–753
Bertranpetit J, Calafell F (1996) Genetic and geographical var-iability in cystic fibrosis: evolutionary considerations. In:Cardew G (ed) Variation in the human genome. Chichester,Wiley & Sons, pp 97–118
Bosch E, Calafell F, Santos FR, Perez-Lezaun A, Comas D,
116 Am. J. Hum. Genet. 68:103–117, 2001
Benchemsi N, Tyler-Smith C, Bertranpetit J (1999) Variationin short tandem repeats is deeply structured by genetic back-ground on the human Y chromosome. Am J Hum Genet65:1623–1638
Bowcock AM, Ruiz-Linares A, Tomfohrde J, Minch E, KiddJR, Cavalli-Sforza LL (1994) High resolution of human ev-olutionary trees with polymorphic microsatellites. Nature368:455–457
Brinkmann B, Klintschar M, Neuhuber F, Hohne J, Rolf B(1998) Mutation rate in human microsatellites: influence ofthe structure and length of the tandem repeat. Am J HumGenet 62:1408–1415
Calafell F, Grigorenko EL, Chikanian AA, Kidd KK (2001)Haplotype evolution and linkage disequilibrium: a simula-tion study. Hum Hered 51:85–96
Calafell F, Perez-Lezaun A, Bertranpetit J (2000) Genetic dis-tances and microsatellite diversification in humans. HumGenet 106:133–134
Calafell F, Shuster A, Speed WC, Kidd JR, Kidd KK (1998)Short tandem repeat polymorphism in humans. Eur J HumGenet 6:38–49
Claustres M, Desgeorges M, Moine P, Morral N, Estivill X(1996) CFTR haplotypic variability for normal and mutantgenes in cystic fibrosis families from southern France. HumGenet 98:336–344
Chakraborty R, Kimmel M, Stivers DN, Davison LJ, Deka R(1997) Relative mutation rates at di-, tri-, and tetranucle-otide microsatellite loci. Proc Natl Acad Sci USA 94:1041–1046
Chehab EF, Johnson J, Louie E, Goossens M, Kawasaki E,Erlich H (1991) A dimorphic 4-bp repeat in the cystic fi-brosis gene is in absolute linkage disequilibrium with theDF508 mutation: implications for prenatal diagnosis andmutation origin. Am J Hum Genet 48:223–226
Cooper DN, Krawczak M (1990) The mutational spectrum ofsingle base-pair substitutions causing human genetic disease:patterns and predictions. Hum Genet 85:55–74
Dempster AP, Laird NM, Rubin DB (1977) Maximum like-lihood from incomplete data via the EM algorithm. J R StatSoc B 39:1–38
Destro-Bisol G, Spedini G, Pascali VL (2000) Application ofdifferent genetic distance methods to microsatellite data.Hum Genet 106:130–132
Di Rienzo A, Donnelly P, Toomajian C, Sisk B, Hill A, Petzl-Erler ML, Haines GK, Barch DH (1998) Heterogeneity ofmicrosatellite mutations within and between loci, and im-plications for human demographic histories. Genetics 148:1269–1284
Dork T, Neumann T, Wulbrand U, Wulf B, Kalin N, MaassG, Krawczak M, Guillermit H, Ferec C, Horn G, KlingerK, Kerem BS, Zielenski J, Tsui LC, Tummler B (1992) Intra-and extragenic marker haplotypes of CFTR mutations incystic fibrosis families. Hum Genet 88:417–425
Eaves IA, Merriman TR, Barber RA, Nutland S, Tuomilehto-Wolf E, Tuomilehto J, Cucca F, Todd JA (2000) The genet-ically isolated populations of Finland and Sardinia may notbe a panacea for linkage disequilibrium mapping of commondisease genes. Nat Genet 25:320–323
Estivill X, Bancells C, Ramos C, Biomed CF Mutation AnalysisConsortium (1997) Geographic distribution and regional or-
igin of 272 cystic fibrosis mutations in European popula-tions. Hum Mut 10:135–154
Excoffier L, Smouse P, Quattro J (1992) Analysis of molecularvariance inferred from metric distances among DNA hap-lotypes: application to human mitochondrial DNA restric-tion data. Genetics 131:479–491
Gabriel SE, Brigman KN, Koller BH, Boucher RC, Stutts MJ(1994) Cystic fibrosis heterozygote resistance to choleratoxin in the cystic fibrosis mouse model. Science 266:107–109
Gasparini P, Dognini M, Bonizzato A, Pignatti PF, Morral N,Estivill X (1991) A tetranucleotide repeat polymorphism inthe cystic fibrosis gene. Hum Genet 86:625
Goldstein DB, Ruiz-Linares A, Cavalli-Sforza LL, FeldmanMW (1995) An evaluation of genetic distances for use withmicrosatellite loci. Genetics 139:463–471
Hawley ME, Kidd KK (1995) HAPLO: a program using theEM algorithm to estimate frequencies of multi-site haplo-types. J Hered 86:409–411
Helgason A, Sigurðardottir S, Gulcher JR, Ward R, StefanssonK (2000) MtDNA and the origin of the Icelanders: deci-phering signals of recent population history. Am J HumGenet 66:999–1016
Hughes D, Hill A, Redmond A, Nevin N, Graham C (1995)Fluorescent multiplex microsatellite used to identify hap-lotype association with 15 CFTR mutations in 124 NorthernIrish CF families. Hum Genet 95:462–464
Hughes D, Wallace A, Taylor J, Tassabehji M, McMahon R,Hill A, Nevin N, Graham C (1996) Fluorescent multiplexmicrosatellites used to define haplotypes associated with 75CFTR mutations from the UK on 437 CF chromosomes.Hum Mut 8:229–235
Iyengar S, Seaman M, Deinard AS, Rosenbaum HC, SirugoG, Castiglione CM, Kidd JR, Kidd KK (1998) Analyses ofcross-species polymerase chain reaction products to infer theancestral state of human polymorphisms. DNA Seq 8:317–327
Jorde LB, Rogers AR, Bamshad M, Watkins WS, KrakowiakP, Sung S, Kere J, Harpending HC (1997) Microsatellitediversity and the demographic history of modern humans.Proc Natl Acad Sci USA 94:3100–3103
Jorde LB, Watkins WS, Carlson M, Groden J, Albertsen H,Thliveris A, Leppert M (1994) Linkage disequilibrium pre-dicts physical distance in the adenomatous polyposis coliregion. Am J Hum Genet 54:884–898
Jorde LB, Watkins WS, Kere J, Nyman D, Eriksson AW (2000)Gene mapping in isolated populations: new roles for oldfriends? Hum Hered 50:57–65
Kerem BS, Rommens JM, Buchanan JA, Markiewicz D, CoxTK, Chakravarti A, Buchwald M, Tsui LC (1989) Identifi-cation of the cystic fibrosis gene: genetic analysis. Science245:1073–1080
Kidd KK, Morar B, Castiglione CM, Zhao H, Pakstis AJ, SpeedWC, Bonne-Tamir B, Lu R-B, Goldman D, Lee C, Nam YS,Grandy DK, Jenkins T, Kidd JR (1998) A global survey ofhaplotype frequencies and linkage disequilibrium at theDRD2 locus. Hum Genet 103:211–227
Kidd JR, Pakstis AJ, Zhao H, Lu R-B, Okonofua FE, OdunsiA, Grigorenko E, Bonne-Tamir B, Friedlaender J, Schulz LO,Parnas J, Kidd KK (2000) Haplotypes and linkage disequi-
Mateu et al.: CFTR-Region Analysis 117
librium at the phenylalanine hydroxylase locus, PAH, in aglobal representation of populations. Am J Hum Genet 66:1882–1899
Lewontin RC (1964) The interaction of selection and linkage.I. General considerations: heterotic models. Genetics 49:49–67
Li WH, Ellsworth DL, Krushkal J, Chang BH, Hewett-EmmettD (1996) Rates of nucleotide substitution in primates androdents and the generation-time effect hypothesis. Mol Phy-logenet Evol 5:182–187
Mateu E, Calafell F, Bonne-Tamir B, Kidd JR, Casals T, KiddKK, Bertranpetit J (1999) Allele frequencies in a worldwidesurvey of a CA repeat in the first intron of the CFTR gene.Hum Hered 49:15–20
Morral N, Bertranpetit J, Estivill X, Nunes V, Casals T, Gi-menez J, Reis A, et al. (1994) The origin of the major cysticfibrosis mutation (DF508) in European populations. Nat Ge-net 7:169–175
Morral N, Dork T, Llevadot R, Dziadeek V, Mercier B, FerecC, Costes B, Girodon E, Zielenski J, Tsui L-C, Tummler B,Estivill X (1996) Haplotype analysis of 94 cystic fibrosismutations with seven polymorphic CFTR DNA markers.Hum Mut 8:149–159
Morral N, Estivill X (1992) Multiplex PCR amplification ofthree microsatellites within the CFTR gene. Genomics 13:1362–1364
Morral N, Nunes V, Casals T, Estivill X (1991) CA/GT mi-crosatellite alleles within the cystic fibrosis transmembraneconductance regulator (CFTR) gene are not generated byunequal crossingover. Genomics 10:692–698
Moulin DS, Smith AN, Harris A (1997) A CA repeat in thefirst intron of the CFTR gene. Hum Hered 47:295–297
Ott J (2000) Predicting the range of linkage disequilibrium.Proc Natl Acad Sci USA 97:2–3
Ott J, Rabinowitz D (1997) The effect of marker heterozy-gosity on the power to detect linkage disequilibrium. Ge-netics 147:927–930
Perez-Lezaun A, Calafell F, Mateu E, Comas D, Ruiz-PachecoR, Bertranpetit J (1997) Microsatellite variation and the dif-ferentiation of modern humans. Hum Genet 99:1–7
Pier GB, Grout M, Zaidi T, Meluleni G, Mueschenborn SS,Banting G, Ratcliff R, Evans MJ, Colledge WH (1998) Sal-monella typhi uses CFTR to enter intestinal epithelial cells.Nature 393:79–82
Quere I, Guillermit H, Mercier B, Audrezet MP, Ferec C (1991)A polymorphism in intron 20 of the CFTR gene. NucleicAcids Res 19:5453
Riordan JR, Rommens JM, Kerem B, Alon N, Rozmahel R,Grzelczak Z, Zielenski J, Lok S, Plavsic N, Chou JL, DrummML, Iannuzzi MC, Collins FS, Tsui LC (1989) Identificationof the cystic fibrosis gene: cloning and characterization ofcomplementary DNA. Science 245:1066–1073
Rommens JM, Iannuzzi MC, Kerem BS, Drumm ML, MelmerG, Dean M, Rozmahel R, Cole JL, Kennedy D, Hidaka N,Zsiga M, Buchwald M, Riordan JR, Tsui LC, Collins FS(1989) Identification of the cystic fibrosis gene: chromosomewalking and jumping. Science 245:1059–1065
Russo MP, Romeo G, Devoto M, Barbujani G, Cabrini G,
Giunta A, D’Alcamo E, Leoni G, Sangiuolo F, Magnani C,Cremonesi L, Ferrari M (1995) Analysis of linkage dis-equilibrium between different cystic fibrosis mutations andthree intragenic microsatellites in the Italian population.Hum Mut 5:23–27
Sanchez-Mazas A, Djoulah S, Busson M, Le Monnier de Gou-ville I, Poirier J-C, Dehay C, Charron D, Excoffier L, Schnei-der S, Langaney A, Dausset J, Hors J (2000) A linkage dis-equilibrium map of the MHC region based on the analysisof 14 loci haplotypes in 50 French families. Eur J Hum Genet8:33–41
Schneider S, Kueffer JM, Roessli D, Excoffier L (2000) Arle-quin (ver. 2.000): A software for population genetic dataanalysis. Genetics and Biometry Laboratory, University ofGeneva, Switzerland
Slatkin M (1994) Linkage disequilibrium in growing and stablepopulations. Genetics 137:331–336
——— (1995) A measure of population subdivision based onmicrosatellite allele frequencies. Genetics 139:457–462
——— (2000) Balancing selection at closely linked, overdom-inant loci in a finite population. Genetics 154:1367–1378
Slatkin M, Excoffier L (1996) Testing for linkage disequilib-rium in genotypic data using the expectation-maximizationalgorithm. Heredity 76:377–383
Slatkin M, Rannala B (1997) Estimating the age of alleles byuse of intraallelic variability. Am J Hum Genet 60:447–458
Tishkoff SA, Dietzsch E, Speed W, Pakstis AJ, Cheung K, KiddJR, Bonne-Tamir B, Santachiara-Benerecetti AS, Moral P,Krings M, Paabo S, Watson E, Risch N, Jenkins T, Kidd KK(1996) Global patterns of linkage disequilibrium at the CD4locus and modern human origins. Science 271:1380–1387
Tishkoff SA, Goldman A, Calafell F, Speed WC, Deinard AS,Bonne-Tamir B, Kidd JR, Pakstis AJ, Jenkins T, Kidd KK(1998) A global haplotype analysis of the DM locus: im-plications for the evolution of modern humans and the or-igin of myotonic dystrophy mutations. Am J Hum Genet62:1389–1402
Tishkoff SA, Pakstis AJ, Ruano G, Kidd KK (2000) The ac-curacy of statistical methods for estimation of haplotypefrequencies: an example from the CD4 locus. Am J HumGenet 67:518–522
Zhao H, Pakstis AJ, Kidd KK, Kidd JR (1997) Overall andsegmental significance levels of linkage disequilibrium. AmJ Hum Genet Suppl 61:A17
Zhao H, Pakstis AJ, Kidd JR, Kidd KK (1999) Assessing link-age disequilibrium in a complex genetic system. I. Overalldeviation from random association. Ann Hum Genet 63:167–179
Zielenski J, Markiewicz D, Rininsland F, Rommens JM, TsuiLC (1991a) A cluster of highly polymorphic dinucleotiderepeats in intron 17b of the CFTR gene. Am J Hum Genet49:1256–1262
Zielenski J, Rozmahel R, Bozon D, Kerem BS, Grzelczak Z,Riordan JR, Rommens JM, Tsui LC (1991b) Genomic DNAsequence of the cystic fibrosis transmembrane conductanceregulator (CFTR) gene. Genomics 10:214–228


