Embed Size (px)
Citation preview
R1EGIONAL OFFICE FOR THE WESTERN 1PACIFIC of the
World Health Or.ganization Manila
MANUAL ON THE RESEARCH PROCESS
Manila, Philippines November 1910
WPRO 012L
FIFTH REGIONAL SEMINAR ON NURSING Second Nursing Studies Seminar
Sponsored by the
WORLD HEALTH ORGANIZATION REGIONAL OFFICE FOR THE WESTERN PACIFIC
WPR/331/70
Manila, Philippines 15 July to 9 August 1969
MANUAL ON THE RESEARCH PROCESS.
NOT FOR SALE
PRINTED AND DISTRIBUTED
by the
REGIONAL OFFICE FOR THE WESTERN PACIFIC of the World Health Organization
Manila, Philippines November 1970
- i -
FOREWORD
The manual which follows is a product of the seminar. It is a reorganization of the working papers and the seminar lectures, modified and hopefully improved by the seminar discussion and subsequent reflection. As a result, it represents the efforts of many people.
First, we should like to acknowledge the contributions of the following individuals through their working papers:
Dr A.A. Angara, Health Manpower in Developing Countries: Problems and Approach to Planning;
Dr I.M. King, Application of Survey Method to Nurse Manpower Studies;
Dr V.l.A. Reinke,. The Research Process;
Dr W.A. Reinke, Conceptualization of Operations Research;
Dr I.J. Jeffery, Conduct of the Survey.
A summary of material on Health Practice Research prepal, by Dr G.J.A. Ferrand also proved useful.
Secondly, the manual bears ~~e strong imprint of the following lecture presentations:
Dr I.M. King, Nursing Research - A Conceptualization; Dr W.A. Reinke, Survey Objectives and Design; Dr I.M. King, Selection and Preparation of Instrwaents; Father Frank Lynch, Sociological Components of Surveys, Dr W.A. Reinke, Network Activity Analysis; Professor I.T. Cruz, Data Processing; Dr W.A. Reinke, Principles and Methods of Statistics; Dr W.A. Reinke, Operations Research.
Finally, the entire seminar staff and all of the participants must be recognized for the valuable insights which came from the many discussions that took place throughout the seminar period. The quality and clarity of the manual have been improved as a result.
- ii -
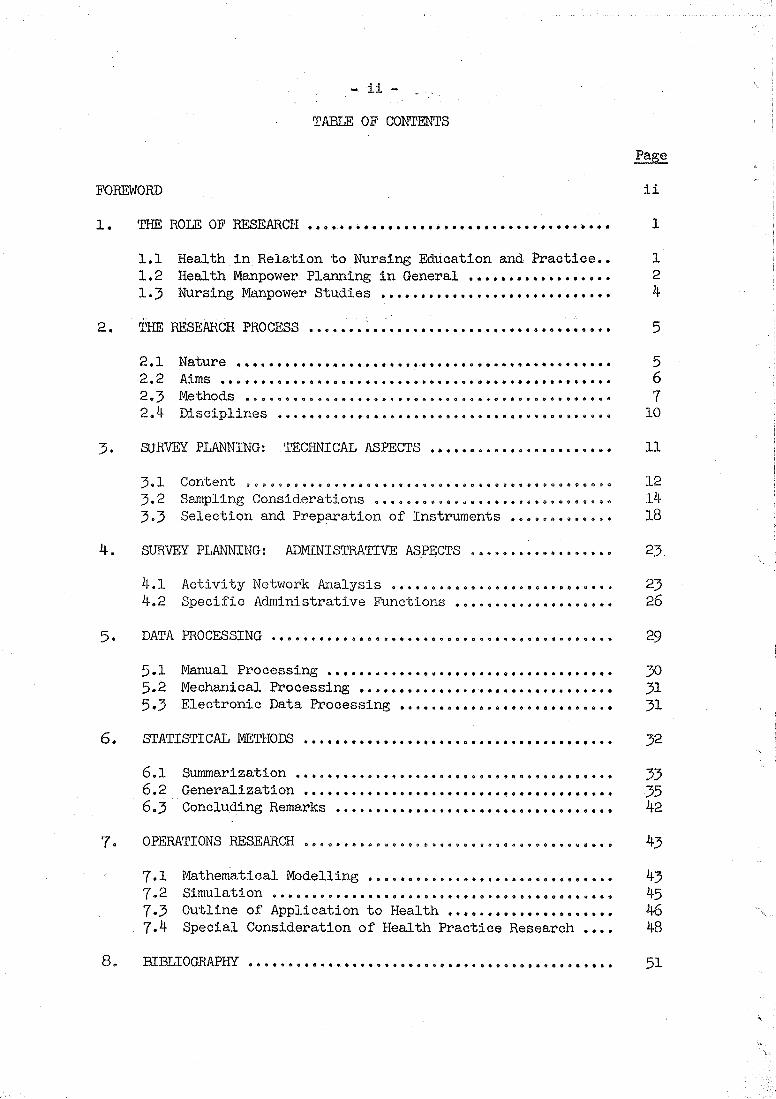
TABLE OF CONTENTS
FOREWORD
1.
2.
3.
4.
5.
6.
7.
8.
THE ROLE OF RESEARCH ••••••••••••••••••••••••••••••••••••••
1.1 1.2 1.3
Health in Relation to Nursing Education and Practice •• Health Manpower Planning in General •••••••••••••••••• Nursing Manpower Studies •••••••••••••••••••••••••••••
THE RESEARCH PROCESS ••••••••••••••••••••••••••••••••••••••
2.1 2.2 2.3 2.4
................................................. Nature Aims ............................... " ................ . Methods ............................ 0" • (t •••••••••••••••••
Disciplines ...•........•...................•... ., .....
SURVEY PLANNING: TECHNICAL ASPECTS •••••••••••••••••••••••
3.1 3.2 3·3
Content oe~teoo••~•••••••••oeoeooo•o;loo••••eoooeee$et~ee Sampling Considerations •••••••••••••••••••••••••••••• Selection and Preparation of Instruments •••••••••••••
SURVEY PLANNING: ADMINISTRATIVE ASPECTS ••••••••••••••••••
4.1 4.2
00004II)OlfQO&OOIJ0$4tOOO.!I)0$090$ Activity Network Analysis Specific Administrative Functions ••••••••• ~ •••••• Q •••
DATA PROCESSING ••••••••••••••••••••• ct •••••••••••••••••••••
5.1 5.2 5.3
Manual Processing ••••••••••••*v••••••••••••••••••••••
Mechanical Processing •••••••••••••••••••••••••••••••• Electronic Data Processing •••••••••••••••••••••••••••
STATISTICAL METHODS •••••••••••••••••••• 0 ••••••••••••••••••
6.1 6.2 6.3
Summarization ..•.••....••••..••••••••..•.••.. o • o •••••
Generalization ...•.............••...•.........•••.... Concluding Remarks ...................................
OPERATIONS RESEARCH o • o o o e o o • " " • • e • o o • • • o o o o • o o o • • e e e e ~ • o e •
7.1 7.2 7.3 7.4
Mathematical Modelling ••••••••••••••••••••••••••••••• Simulation ......•.........••....•.•......•.•......... Outline of Application to Health ••••••••••••••••••••• Special Consideration of Health Practice Research ••••
BIBU OGRAPIIY • • • • • • • • • • • •. • • • • • • • • • • .. • • • • • • • ••••••••••••••••
Pa~e
ii
1
1 2 4
5
5 6 7
10
11
12 14 18
23
23 26
29
30 31 31
32
33 35 42
43
43 45 46 48
51
1. THE ROIE OF RESEARCH
Nurses comprise a large and vital group of health professionals in countries around the world. Of all the individuals who make up the health team~ it is the nurse whose relationship with the patient and members of the family is the most concentrated and sustained. While this relationship holds firm~ changes in nursing practices have come with the introduction of new technologies in health care, increased emphasis on health practices research, changes in major health problems and the emergence of psychosocial factors as critical elements in health and illness. ~1eanwhile, educational changes have also occurred in several countries as nursing has been incorporated into general systems of education, thereby reducing the relative emphasis upon apprenticeship training in hospitals.
1.1 Health in Relati9n to Nursing Education and Practice
The scope of nursing is exceptionally broad. Nurses are not only responsible for care of the sick in hospitals 3 health centres and in the homes but also are responsible for practices that include prevention of disease, health teaching and local community planning for health programmes and services. Because of the variety of roles and responsibilities nurses accept, they are essential members of the health care team from the initial stage of planning to the stages of implementation and follow-up of health care. A corps of professional nurse leaders in each country is essential for participation in studies to aid in planning for changes in health care and in the way it is delivered to the people of a country.
The idea that health is more than the absence of disease was noted years ago in the World Health Organization's definition. For centuries, methods for determining illness, ways for preventing disease, and systems for reporting morbidity and mortality statistics have provided some information about health states of various populations. TI1ese have been indirect measures of health. Recently, some epidemiologic studies of health states and behaviour of populations have implied that environmental, economic and cultural factors as well as physiological imbalance influence changes in the levels of health and hence community perception of health problems. Systematic study of various factors related' to health is receiving serious attention in many countries. In this regard, the survey method is commonly used to identify needs and resources, demands for services, and supply of health personnel.
- 2 -
Nursing has had a short history of research into the nature of its practice in comparison to other disciplines. Charting a course for the future of nursing requires a look at the past and assessment of the present system of education for nursing practice. Thus, it is necessary to gather facts about present conditions existing in the field of nursing in a systematic way. When existing knowledge, records and expert judgment are combined with facts gathered through surveys about the supply, the needs and demands, the educational facilities and resources, this baseline information can be used to make decisions for planning for the future.
1.2 Health Manpower Planning in General
1.2.1 Objectives
The relative importance of the manpower component of health services makes this an especially vital subject of study and planning. Planning for health manpower generally has the following objectives:
(l) To obtain maximum productivity from the available manpower resources. In practice, this productivity is applied to high priority health activities.
(2) To plan for increments to the supply of health workers in accordance with changing demands.
(3) To provide a basis for establishing an adequate educational system which can meet future needs.
(4) To establish mechanisms for continuing manpower surveillance and implementation of plans.
1.2.2 Current situation
While all countries can support these objectives, the particular circumstances in which planning must take place will vary from one country to another. Broadly speaking, the developing countries may be classified into two composite types: (1) countries where development is at the initial stage, and {2) countries where development has already made some progress.
Within the fir~t type, the level of education is generally low and schools for the health disciplines are of recent origin with most of them catering to the auxiliary level. Health professionals are scarce. The auxiliaries and aides comprise varying proportions of poorly-trained multipurpose or single purpose workers. Countries belonging to this first type may have skeletal health plans, but the lack of material and manpower resources stifles implementation of their programmes.
- 3 -
In countries of the second type 1 education has developed a more solid base and technical schools~ including those for the health professions~ are in operation. A sizeable number of health professionals have been trained; nevertheless, other local conditions hamper their full utilization. The deterrents include low levels of pllblic revenue# inadequate provisions for work incentives~ and limited private practice opportunities. Instances might be cited in which the absence of plans for health manpower utilization permit concentration of training to the classical professions and thus the number of doctors, for example# exceeds the effective demand for their services. Many professionals occupy themselves with other occupations and many more seek job opportunities abroad. Eventually# the brain drain causes many jobs at home to be unfilled. Sub-professional categories cannot fill the gap because no plans have been developed for their training and legal barriers to their emploJ~ent may even exist.
1.2.3 Guidelines to manpower plan formulation
Manpower plan formulation poses a number of challenges and constraints but the following guidelines of general application may be useful:
(1) The study of the different manpower categories should not be conducted in isolation from each other. ~1e setting may differ in each country but the inter-relationships of these categories exist. For example, in some territories sub-professional medical officers tal<e up a number of the normal duties of the medically qualified.
(2) Each health manpower category including its sub-categories should be clearly defined and this should include the qualifications required as well as the duties or functions. For example, in one country, the government recognizes three types of physicians who qualify under a licensure ex~~ination; their differences lie in their technical education and in the geographic areas where they are permitted to practice.
(3) The substitutability of certain duties/functions as between the health professionals and between the professional al'ld sub-professional workers should be recognized. This principle finds particular application at present when the types of health activities are increasing while the manpower remains in short supply. It is recognized, for eX8.111ple, that many aspects in the health care of the aged can be delegated to trained non-medical workers.
- 4 -
(4) Manpower for health care may be increased in two ways, viz., increasing the number of the trained manpower in the different categories and increasing their functional productivity. Concerning the latter, Fein has calculated that in the United States of America, a 396 increase in productivity could raise the effective supply of physicians by the equivalent of one year's graduating class.
(5) Health practice studies should be promoted with a view to analyzing the roles and improving collaboration among the different manpower categories in the health care services. Validity of traditional practices needs re-examination and possibilities for innovation should be explored in the light of the current advances being made in technology, medicine and management.
(6) Further understanding should be sought of the demand component in health manpower planning, with particular reference to the means of quantifying the effects of socio-economic development3
etc.
1.3 Nursing Manpower Studies
It follows from the above that a study of nursing manpower in isolation from other factors that influence health will serve no useful purpose. It is necessary to study the entire spectrum of health needs and resources and then to factor out the r1ursing component.
At some point, of course, surveys specifically directed toward nurses will be necessary. As a minimum, these will be inventories of the number and characteristics (biographical, demographic, and occupational) of nurses. Ideally, they will go further to identify the content of nursing being provided relative to the changing population and its health problems. In this form, survey findings can be used to project changes in the delivery of health services and the role of nurses in those changes.
In any event, nursing surveys provide a systematic means of collection of facts and reasoned judgments, rather than offhand opinions, describing e~tsting manpower conditions. These findings can provide a useful basis for conclusions about the gap between what is and what should be, ar1d in turn can lead to racommendations for programmes desigr1ed to close the gap.
- 5-
2. 'IHE RESEARCH PROCESS
Nursing is service-oriented, therefore, nurses sometimes consider research to be beyond their realm of concern, or perhaps trrlderstanding~ In a very real sense, however, research is si1nply an extension of the problem-solving that we all do daily. If a question arises concerning the care of a patient or relationships with a colleague, we seek out a knowledgeable individual who can offer us a solution.
2.1 Nature
The research process is not unlike this, but complex problems typically have three complicating features. First, the solution does not yet exist and is thus not available for the asking; it must be discovered or developed. Secondly, major problems usually involve a number of ill-defined variables that are intertwined in some indefinite way. The third feature, follows from the first two in ti1at considerable time is generally required to produce t..he solution to a complex problem. As a result of these features, the research proces;:; is associated with the systematic approach to the manipulation, measurement, and analysis of relevant variables in order to answer important questions and to do so efficiently and unequivocably.
It follows that research is in essence a quest for insight. As such it involves more than the simple acquisition of knowledge, including in addition the intelligent interpretation of the nature and value of that knowledge. Recognition of both the acquisition and interpretation aspects is necessary to the understanding of not only the scope of the research process but of its d~1amics as well.
While our interests here concern the general principles of the research process, we are focussing our attention upon applied research related to health problems, especially those involving manpov1er planning. In this context, we define health practice research as the application of the scientific method in the planning, organization, and administration of health services. Its broad purpose is to promote the efficient and effective delivery of health services. In fulfilling this purpose, health practice research involves the development and employment of methodology to identify where and how improvements may be made and to support sound health services planning.
The conduct of research in this setting has at least three characteristics that must be recognized at the outset. In the first place, we are dealing with a community base rather than a laboratory base. In a laboratory setting, we postulate that a certain result can be achieved by controlling certain factors that produce that result.
- 6-
Having stated our hypothesis, we then enter the laboratory to test it. In the community, on the other hand, the relevant variables are sometimes less well-defined, often difficult to measure, and almost certainly impossible to control. These facts of life affect both the approach and the methodology employed.
Secondly, since the community base implies the study of human beings in a social setting, the interaction of the observer and the subject becomes an important element of concern in the research process. The association of cause and effect is not as automatic as in the laboratory. Data gathered in a household interview, for example, may be colored by the manner in which questions are asked, the frame of reference of the respondent, or his attitudes toward the interviewer.
The third characteristic, related to the second, is the distinction between observation and interpretation. Even if the interaction between the researcher and the subject is minimized so that behaviour is objectively observed and recorded, the value of the information may be lost at the succeeding stage of interpretation. 1he nurse may be observed giving the patient a drink of juice, for example 9 but this action in itself tells little about its physical necessity or the glimmer of satisfaction which this attention produced for the patient.
2.2 Aims
The preceding framework is sufficiently broad and flexible to encompass a number of possible aims. In its most rudimentary form research is purely exploratory, i.e., designed to identify crucial problem areas and to formulate meaningful questions. Once the questions are formulated, the aim of research naturally shifts to supplying their answers. This can take two forms: cognitive or normative. Research with a cognitive basis is essentially descriptive or analytical; in either eventthe aim is to acquire relevant, meaningful knowledge. Normative research is somewhat more refined in that it attempts to be prescriptive, i.e., to develop from the acquired knowledge optimal answers to the specified questions. Thus, we have a hierarchy of aims to consider:
(1) Formulation of questions
(2) Answering of questions
(a) Cognitive basis (descriptive, analytical)
{b) Normative basis (prescriptive)
- 7 -
To illustrate these distinctions, let us consider a given region that is proposing to introduce a family planning programme to its people. Not having the benefit of even limited previous experience, the regional planner cannot be sure of the crucial questions that should attract his attention. Is the problem he faces one of conwunity acceptance? Is it principally an organizational matter of the appropriate integration of health and family planning ser~ices? Or is it largely a question of training and retraining personnel? Perhaps all three points are equally vital. At this stage (1 above) the planner would benefit from some systematic exploratory probing in an effort to identify the key issues.
Later; having decided (let us say) that the organization question is of prime importance, he may seek to define the pattern of activities and the allocation of effort that develops with the introduction of family planning services. If the observations made result in findings that directly trigger appropriate administrative decisions, then the research is classified as descriptive under (2a) above. If, on the other hand, the findings lead to an analysis of differences in staffing patte~ns with an IUD programme in contrast to one based upon oral contraception, then the conclusions reached and action taken sterr1 from analytical research under (2a) above.
If the analysis extends beyond the conclusions reached from the observation of existing conditions to the development of recommendations for different, optimal staffing patterns 9 then the research is normative under (2b) above.
In considering the research process thus far, we have progressed from the superficial association between questions and answers to the deeper issues of formulating questions, producing findin~s, interpreting the findings in order to draw conclusions, and the development of recommendations from these conclusions. As the emphasis in research shifts from one of these aspects to another, we perceive a hierarchy of aims as we have indicated.
2.3 Methods
We now turn to the means available for carr•ying out research aims. Specific techniques are detailed in subsequent sections; our concern here, therefore, is the broader one of establishing the overall framework for categorizing research methodology. There are three aspects to consider: (1) the determination of current status, (2) analysis and interpretation, and (3) initiation and evaluation of change. These three points indicate that we must acquire knowledge as to where matters now stand, draw conclusions and develop recommendations about the future, and introduce change systematically in order to
- 8 -
verify those conclusions or consciously to alter them. Since the categories of metl1ods tend to parallel ti1e hierarchy of aims, the relative emphasis which a given piece of research places upon them will depend to a large extent upon the aims of that research.
2.3.1 Determination of current status
The assessment of current status can be accomplished eitl1er through compilations of existing information or through the collection of new data through special surveys. It seems ti1at more often than not there is a paucity of data, or at least data of the right kind; as a result emphasis is usually laid upon the design of efficient surveys to bridge these information gaps. Such an approach has merit and is discussed at length in later sections. Because of the time, effort, and cost involved, however, surveys are not to be taken lightly. We must seriously question how much their results will alt6r our conclusions and affect the course of action followed. Moreover, it is sometimes possible to obtain equivalent findings from a careful search of the literature or of existing records. This is especially true if a number of individual segments of information are systematically combined in epidemiological fashion in order to assemble a comprehensive model depicting the pattern of circumstances. TDen perhaps one or two small, inexpensive surveys will suffice to supply the missing links in our chain of knowledge.
2.3.2 Analysis and interpretation
The analysis and interpretation of data., however acquired, relate to matters of summarization and generalization. The first requirement of analysis is to reduce the mass of available data to a sensible summary form, i.e., to discern the forest from the trees. Having done this, the analyst is better able to generalize his findings from his small sample base to the larger universe or from the past and present to the future.
The process of analysis and interpretation may be based upon subjective jud~ent or objective appraisal. The latter, of course, is more scientific and respectable; as a result it attracts the bulk of our attention in this report.
Subjective judgment, however, is not always indefensible. Granted that professional.opinion has the danger of offering traditional, biased, and therefore unsatisfactory answers to important questions, it can nevertheless, reflect experienced intuition that goes beyond our present abilities to quantify and analyze objectively. In assessing the traditional role of women in a given society, for example, an experienced observer of that society can tell us much that could not be derived from an inadequate set of pseudo-quantitative social or cultural indicators.
- 9 -
2.3.3 Initiation and evaluation of chan~
The implementation of research findings, along with the continuing evaluation of the effects of change, form a subject of sufficient importance and scope to merit separate study leading to anoti1er report. It cannot be entirely omitted from the present context, however, lest we leave the impression that the kind of applied research with which v-re are dealing can be conducted for its O\tu sake, apart from the changes it yields in the delivery of health services.
Operations research techniques in the realm of mathematical modelling and simulation, along with various forms of statistical and economic analysis can go far in predicting the potential benefits of research. Realization of these benefits, however, requires the actual introduction of the indicated changes, and apart from the usual forces of inertia, this is difficult in the operational community setting where the variables of interest are seldom easily controlled or manipulated.
It is true., of course, that occasionally the opportunity arises for a natural experiment involving a few well-controlled variables. A ne~'l health centre is opened, for example, but otherwise, life goes on as before, thus permitting before-and-after comparisons. In other exceptional cases, there may be a limited number of variables present, and these are subject to manipulation. In such cases the researcher is advised to employ efficient factorial designs, Latin Squares, or perhaps randomized blocks. TI1ese circumstances are sufficiently rare
1 in the present context, though, that they merit mention only in passing •
In a somewhat greater proportion of circumstances, the number of important variables continues to be limited, but the possibility of manipulation is restricted. It may be politically impossible to withhold a service from one (control) community when it is offered to another (experimental) group, for example.
In recent years, many industrial operations have been lifted out2 of this dilemma by a procedure known as Evolutionary Operation (EVOP) •
According to this technique a series of minor but carefully designed adjustments are made in various process variables such as temperature, pressurell. etc. No single cycle of adjustments is likely to produce a
1cochran, W.G. and Cox, G.M., ~xperimental Design~_, 2nd Ed., Wiley, New York, 1957.
2Box, G.E.P. and N.R. Draper, Evolutionary 9J?era·t.ion: A Statistical Method for Process Improvement, Wiley, New York, 1969.
- 10 -
noticeable effect upon the process results~ but statistically significant (though physically minor) changes are likely to be achieved after a sufficiently large number of cycles. Further adjustments are then made in the direction indicated by the statistical evidence~ and the process of evolution continues until no further improvement can be induced .•
Naturally EVOP assumes the ability to control and to measure on a rather fine scale. It is not ideally suited, therefore~ to cases in which qualitative~ categorical measures such as "reported for work" and "failed to report" are used. Nevertheless, researchers in the social sciences would do well to become better acquainted with a technique that has proved so useful to the engineering sciences. EVOP is mentioned with this in mind, as well as to help emphasize the fact that research interest must extend beyond the "final" report of recommendations to the stage of operational innovation.
Indeed it might be argued that some of the attention directed at early data gathering via surveys in order to pinpoint the problem should be shifted to the evaluation of the solution. We know, for example 3 that the subordinate role of women in some cultures has led to a situation in which the number of male physicians is much larger than the number of qualified female healtl1 workers. ~1ile it may be desirable in these cases to document the nature and scope of the problem that we already know to exist, we must carefully assess the additional benefit that would be gained from such documentation. Might it not be better to develop an adequate information system to be used in the evaluation of the results achieved from the programmed solution during its implementation?
Important as it is to evaluate the effects of innovation, we ®lst add that practical situations characterized by a limited number of controllable variables that lead themselves to the EVOP procedure are uncommon. More often, we are forced to resort to the careful measurement of the many variables present, followed by the statistical analysis and adjustment for the influence of each.
2.4 Disciplines
We have viewed research as a dynamic process in which the focus at any moment is upon particular aims in a hierarchy. The classification of research methods has been developed accordingly. In describing the spectrum of methods it has perhaps become clear that a wide range of techniques is employed. As a result, there has been a tendency for specialists to develop along disciplinary lines. Specialists in survey methods require competence in the behavioural sciences as well as the branch of statistics associated with the principles of sampling.
- 11 -
Statistical analysts are knowledgeable in the methods of statistical estimation and testing as well as basic logic. Operations researchers must be well-versed in mathematics as well as mathematical statistics and probability. All three of these groups must have a basic knowledge of data processing and computers, but advances have been so rapid here that a fourth group of computer technologists is gaining in importance.
Generally the researcher, i.e., principal investigator, is affiliated with the field that has the problem being researched, such as nursing. The researcher, then, must be acquainted with, though not expert in, the technical aspects of epidemiologic and survey methods, data processing, statistics a~d operations research. It is upon this premise that the following sections are built.
3. SURVEY PLANNING: TECHNICAL ASPECTS
Any research effort begins with a certain amount of relevant factual information, along with some more tenuous opinions and assumptions about the existing state of affairs. The first step in the research process, then 3 is to organize the data and suppositions in a mAnner that indicates the nature and scope of the problem to be researched.
Consider the field of nursing manpovrer, for example. A researcher perhaps knows something about the munber of nurses of various kinds that have been graduated, and he can mal<::e a rough estimate of how many of these are currently active in nursing. He can probably obtain data concerning the size and distribution of population, hospitals, health units, and other utilizers of nursing personnel. He also has some opinions regarding present and future trends to combine with official plans and estimates.
Putting these and other facts and hunches together, the researcher can engage in some systematic speculation. Is the critical problem that of the productivity of employed nurses, the return of greater numbers to active status, or the training of additional numbers? Are prospects for the f\1ture more characterized by limited f\lnds for the provision of nursing services or by limited numbers of personnel to staff those services? Or is the burgeoning demand for services likely to outpace both monetary and personnel increases? If so, are new categories of less-skilled, less-expensive health workers called for? Are increases in nursing school enrolments most hampered by limited numbers of applicants, limitations on available faculty, or inadequate facilities and financial resources?
- 12 -
The preceding list of questions is far from exhaustive, but such probing eventually leads to a handful of critical issues, which in turn suggest the specific objectives of surveys needed to shed light on these issues. Available information, combined with various estimates and assumptions~ provide tentative answers to the questions. Naturally, the more inadequate the data and the weaker the assumptions, the more tentative are the answers. The areas of emphasis in the survey fall into place accordingly; we decide what data are to be obtained from whom about whom. It is here also that the dynamic nature of the research process becomes apparent, for an assumption accepted in one survey design may form the hypothesis to be tested in the next.
3.1 Content
Once the subject of a survey is established, the detailed plaru1ing for its conduct can beg:i.n. Five aspects should be included in this planning: (1) selection of appropriate variables to be measured; (2) identification of the target population; (3) specification of the data collection procedures; (4) provision for the analysis and interpretation of findings; and (5) consideration for the comrmmication and utilization of findings.
3.1.1 Selection of variables
Obviously the variables selected for study must be both relevant and measurable. Since the implications of this in practice are not always so clear, however, we shall illustrate this point with reference to a survey intended to determine the extent that nurses might be persuaded to remain active through provision of desirable working hours.
In this case the variables "working hours" and "activity status" are certainly relevant. The former is a direct independent variable that possibly influences the latter, resultant variable, which is therefore called dependent. We cannot stop here, however. There are other factors, such as age and marital status that are also likely to affect activity status; they must therefore be included in the analysis as indirect independent variables, even though they are not subject to control and thus are not of primary interest in the survey. The measurement of indirect independent variables in the study is especially important if they are correlated with the direct independent variables. Suppose, for example, the desirable working hours is associated with higher-paying supervisory positions. Failure to take account of the "position" variable may lead to an overestimation of the importance of working hours when status is really the dominant factor.
- 13 -
Earlier we noted that variables must be both relevant and measureable. Measurement may be quantitative or classificatory. If in the present illustration the age variable were measured numerically as 11age in years 11 it would be quantitative. On the other hand, the researcher might choose to classify respondents according to the age groups 20-24, 25-29, etc. Marital status and activity status are necessarily classificatory, leading to such categories as: single, married, widowed, divorced, active full time, active part time, and inactive.
3.1.2 Identification of target populatiop
The target population of interest must be identified with respect to its: (1) content, (2) units, (3) extent, and (4) time. Thus the target population might be defined to include: (1) a~ndividuals, (2) in single-unit households, (3) in the Philippines (4) on 1 July 1969. This would be distinguished from the target population of males (different content) residing in non-farm dwellings (different units) in Rizal province, Philippines (different extent) at any time in 1968 (different time).
3.1.3 Data collection procedures
The manner in which information is obtained from the population will depend upon the survey instruments to be used and the precision and accuracy required in the light of manpmver, time, and cost constraints. Hence, the meaning of precision and of accuracy should be clearly lli1derstood. Precise measures are reproducible, though perhaps inaccurate, whereas accurate measures are both precise and unbiased. If we intend to measure the average age of a group of women in their 4o's who invariably subtract three years from their true age, we will obtain a rather precise, though inaccurate, estimate understated by about three years. It is precise in that another sample of women from the same population would produce similar findings. If, on the other hand, we obtain the average age from a small random sample of birth certificates of females of all ages, we would obtain an imprecise, possibly inaccurate result because a disproportionate number of older women (say) were included by chance. Another sample might produce quite a different answer. In this case a large sample would produce results that would be both precise and accurate.
To summarize, accurate estimates come close to por·traying the true population characteristic, such as average age, whereas precise estimates can only be said to be reproducible, though possibly at a level apart from the true condition of the population. Therefore, accuracy is usually the keyword in surveys, al·U1ough precise, biased estimates can be tolerated if the researcher knows the magnitude of the bias and adjusts the findings accordingly.
- 14 -
The reproducibility aspect of accuracy leads to a consideration of the means for obtaining a representative view of the target population; this in turn leads to the subject of sampling. The freedom from bias required for accuracy comes largely from the careful selection and design of the instrument by which information is to be obtained. Thus the instrument developed should provide an honest picture of any individual to whom it is administered, while the sample design (which may call for a complete census) should guarantee that the individuals selected adequately reflect conditions in the population as a whole. For this reason the remainder of the discussion in tl1e present section will be addressed to the questions of sampling and the selection of survey instruments. In latter sections we shall proceed to the administration of the survey, as well as the processing, analysis and interpretation of findings.
3.2 Sampling Considerations
3.2.1 Factors in the census-or-sample decision
Researchers, like other individuals tend to abhor findings that are shrouded in uncertainty; they are tempted, tllerefore 3 to solicit information from tl1e entire target population. Since the acquisition of information inevitably requires time and money, however, the researcher is simultru1eously prompted to settle for a sample. ~<e calculations of the statistician may suggest that beyond a certain point the slight improvement in accuracy gained from additional sampling may be more than offset by the additional cost incurred. Likewise, a census may take so long to accomplish that the findings prove to be no longer timely.
In some cases sample results can be ~ accurate as well as less costly than censuses. To appreciate this, we must distinguish between sampling errors (of incomplete information) and non-sampling errors (of incorrect information). It is true that the larger tl1e proportion of the population providing information, the more representative the data are likely to be. Problems associated with the training and supervision of a large staff of information gatherers and checkers, however, may result in uneven quality of performance among staff members. Hence a systematic means of checking and comparing the quality of individual performance is required. In short, the minor benefits of complete information may be overbalanced by a degree of more subtle, less measurable incorrectness introduced into the data as a result.
- 15 -
To be weighed against the above considerations are a number of others that tend to favor complete enumeration. One is the desire to draw conclusions about several sub-groups within the target population. As we shall see below, a given degree of accuracy dictates a sample size that is nearly independent of the population size. As a result the required sample representation within each population sub-group may encompass such a large proportion of the total population that a more easily administered census may be proposed instead.
Another advantage of the census is the uniform demands that it imposes upon all members of the population. This can result in a greater willingness to comply with those demands and in turn greater public acceptance of the findings.
A further advantage accrues from the fact that all sampling error has been removed, and along wi·Ch it the need to call upon sophisticated statistical talent. As we have indicated, biases and other forms of non-sampling error continue to be at least as much a concern as with sampling, but in the absence of sampling error they tend to be more visible.
3 .. 2.2 1
Sam121e design
In case the decision is made to do a sample survey rather than a census, a choice must be made from a~ong a nurnber of different sampling schemes. In discussing these, we should bear in mind first the four informational units that relate the sample to the population and then the two criteria of good sample design. For the most part these considerations serve to summarize points made earlier. Although target populations may consist of inanimate items, such as days of hospital operation, we shall usually think in terms of populations of people.
(a) Listing Units
Sampling begins witi1 (1) listing units (sampling frames), and then proceeds through (2) selection units to (3) the observational units (respondents), from whom data are gathered with respect to (4) the analysis units. The sampling frames are listings to facilitate the selection process. For example, if the survey is to deal with nurses presently employed in hospitals in the Philippines, the sampling frame might be a listing of all such hospitals. On the other hand, it might be a registry of all active nurses modified by the exclusion of all nurses employed outside hospitals.
1For further elaboration see: Sampling Methods in Morbidity Survey
and Public Health Investigations, \iHO Technical Report Series No. 336, 1966.
- 16 -
The selection units are those units actually selected from the sampling frame. They might be# for example, the 25 hospitals selected from the listing of all hospitals in the Philippines.
The observational units are the respondents within each of the selection units. These might be the nursing supervisors in each of the 25 hospitals selected.
The analysis units are the individuals of ultimate concern in ·the study. In our illustration they are the individual nurses about whom information is to be obtained from the nursing supervisor respondents.
(b) Criteria of Good Sample Design
Turning now to the two criteria of good sample design though their implications are far-reaching, they can be expressed simply: (1) the sample design must be technically sound, and (2) its implementation must be practicable. With regard to the technical aspect, the implication is that the sample design should provide for measurements that yield sufficiently accurate information about relevant population variables in line with the survey objectives. So important is this requirement that it may force the survey aims to be adjusted to suit the technical feasibility of the sampling design. Ideally, for example, it may be desirable to elicit detailed information about all the registered nurses in the country. The ability to follow up non-respondents residing in other countries may be so limited, however, that this group must be handled separately with relatively modest objectives, an abbreviated set of variables, and more guarded conclusions based upon a low response rate.
The criterionof practicability relates to the feasibility and economy of administering the survey instrument in a manner which assures the desired level of accuracy. There is a real danger that a comprehensive, technically sound survey will be designed within the constraints of a very tight budget. This may result in a group of poorly-trained investigators hurrying about to administer carelessly a lengthy questionnaire to disinterested or antagonistic respondents with whom little rapport has been established.
A sample design based upon the principle of random sampling (or probability sampling) is preferred to sample selection by subjective judgment. In random sampling each individual is assigned a known probability of being selected, and it is only from such a design that statistically derived generalizations can be made from the sample to the population.
- 17 -
(c) Non-Random Sampling Schemes
In the light of the above limitation, forms of sample design not based upon probability are mentioned only briefly as forms to avoid apart from exceptional circtwstances. The first is haphazard sampling utilizing volunteer subjects. A second form relies upon expert opinion. While this can be valuable during the early stages of survey development, our inability to generalize from the opinions of experts makes them unacceptable in definite studies. Quota sampling is a third form of non-random selection and is especially dangerous in that it appears to be similar to legitimate stratified random srunpling discussed below. In quota sampling the target population is divided into segments~ such as age groups. The investigator is then instructed to obtain a quota of a specified number of responses from each subgroup. ~1e difficulty arises in that no rules are established for the means employed in filling each quota. This prevents the making of valid generalizations.
(d) Random Sampling Schemes
The most primitive form of random sampling is appropriately called simple random sampling. It involves the random selection of each item in the sample from the entire population~ usually with the aid of a table of random digits.
Systematic random samplin~ is a slight modification of tl1e above in that only the first sample is selected randomly; thereafter selection is according to the location of items in the population list in relation to the first item selected. For example, if a sample of 100 individuals were to be selected from a population of 700 by this method, a random digit between 1 and 7 would determine the first item selected from the list. Thereafter every 7th item would be chosen. This might result in the selection of.items 2, 9~ 16, etc. This method is easy to apply, and if ~~ere exists a certain trend in the characteristics of the items in the list,.the sample obtained is likel;y: to produce more precise results than a simple random sample due to the effect of stratification (see below). However, it can be ~angerous if the items follow some sort of cyclic pattern and if the interval of sampling happens to coincides with the cycle. If, for example, the 700 items in the population represented 700 consecutive days of hospital operation, the sampling scheme would cause only one day of the week to be sampled.
:;.:;
- 18 -
Cluster sampling is a modified form of random sampling often employed in area surveys based upon multi-stage selection schemes, If the target population consists of all adults in the entire country6 for instance 3 the selection process may begin with the random choice of a few states or provinces. At the next stage certain districts within these states would be selected. The process would continue until individual dwellings would be chosen from selected blocks. If cluster sampling were practiced6
not only the dwelling chosen but also those adjacent to it would be visited. In this way total travel time required to collect information would be reduced. At the same time, however, any neighbourhood characteristics in the blocks selected, which are likely to be similar to one another, would be included in the sample, making it less efficient than one widely spread over the whole geographic area.
Multi-phase sampling is a form to be distinguished from multi-stage sampling. To illustrate, a study of the nature and extent of part-time employment among registered nurses might begin with the random selection of hospitals to determine whether they employ part-time personnel. Among some of those who answer affirmatively, a second phase of sampling and questioning might be applied to the part time nurses themselves.
Finally, \'Te consider stratj.fied random sampling, which is designed to guarantee proper representation to certain important population sub-groups. Whereas a simple random sample of registered nurses is likely to include, by chance, graduates from a number of nursing schools, the school factor may be sufficiently important to justify stratification. In this case the decision would be made in advance concerning the number of graduates of each school to be included in the sample. Within each school selection would be random, so that in the end comparisons and generalizations could be made.
1 Selection and Preparation of Instruments
The selection of instruments that will gather data relevant to the problem identified is a basic component of the research design. If instruments are available, time, energy, and money may be saved. In
1For detailed information see: Young, P.V. (1966). Scientific Social Surveys and Research: an introduction to the background, content, methods, principles and analysis of social studies. EnglewoodCliffs, Prentice Hall.
- 19 -
many instances, because of the nature of the problem, one must construct his own instruments. Once again time, energy and money are conserved if criteria for selection of instruments to be used are established. In determining criteria, the following questions serve as guidelines: (1) Are data accessible? (2) Will the instrument gather accurate data? (3) Is the instrument relevant to the problem? (4) Will the instrw~ent provide economy of resources? Several fundamental methods for collecting data are as follows: (1) Search for documentary evidence from existing records such as life history data or statistics routinely compiled, (2) Observation methods such as those used by social anthropologists and the work measurement studies of nursing activities, (3) Questionnaires, (4) Interviews. The last three of the above will be the focus of the present discussion.
3.3.1 Observations
Observation is the watching of selected events, situations or persons and noting specific phenomena. An observer notes specific events relevant to his problem but does not participate in the events to be observed. If one wanted to conduct a study of activities performed by staff nurses to determine differences in their functions, for example, he would formulate an observation schedule on the basis of his research objectives. He would discuss the purpose of his study with the administrator and all individuals who would be involved in the study to explain the aims and to secure their permiss:i.on to conduct the study or their co-operation in participating in the study.
To illustrate the use of the above technique, consider the problem of utilization of professional registered nurses in one public hospital in a given community in 1969 as a basis for establishing staffing patterns. The questions of concern are: (1) ~1at activities are performed by nursing personnel in this hospital? (2) What kind of skills are required to perform the activities? (3) How much time is used to perform non-nursing functions, for example, clerical tasks, and housekeeping? (4) Are nurses performing tasks that do not require nursing knowledge and skills? Using criteria for selecting an instrument, the researcher asks whether or not data are accessible to study this problem and to answer these questions. If the response is affirmative, an instrument must be chosen. The problem at hand deals with a study of human behaviour in a natural dynamic setting. Thus a questionnaire or interviews will not solicit accurate data to answer the research questions. Instead., observation techniques are selected to collect the information. vlill observations provide economy of resources in studying the problem? The work sampling technique borrowed from industry and adapted to the study of nursing activities ~as provided an economical way .to study this problem. A manual was prepared some years ago
1united States Public Health Service, Ddvision of Nursing, How to Study Nursing Activities in a Patient Unit, USPHS Publication No. 340 Revised, 1964.
- 20 -
by the Division of Nursing, United States Public Health Service that describes the method for conducting these studies. The process is described in the manual in great detail and gives one example of preparation of instruments to be used along with statistical analysis.
Individuals selected to make the observations should be given knowledge of the purpose of the research and the objectives to be achieved. A training period follows in the use of the observation schedule. Good sensory equipment in observers is essential. The conditions under which events occur are specified. The observers try out the schedule to discover if there are problems of accurate recording, coding, etc. The facts to be observed are classified. Controlled observation includes a schedule of questions, a rating scale or check lists, and a scoring system. The reliability and validity of the observations are determined. Several aids used in observations are notebooks, sound recordings, pictures, etc.
3.3.2 The questionnaire
The purpose of using the questionnaire is to secure data that cannot be gathered in other ways because of cost, time or other limitations. There are two common types of questionnaires: (1) structured; (2) unstructured. In some instances a third type, called the pictorial form, is used to present questions in the form of pictures or drawings from which to choose a response. This is used with children and with adults who have limited reading ability.
The unstructured type of questionnaire is referred to as an open question. The respondent is asked a question for which he can give a free response; it permits him to express his opinions in detail without restrictions. This type gives a wide range of responses. One of the values in using this type of question is its use in exploring some hunches the investigator may have about his problem. It is often used initially by the researcher to get some ideas or opinions before he constructs his questionnaire. It may give some ideas about the way he will classify or categorize the data he will be seeking. One of the disadvantages of the open type of question is that classification and analysis are sometimes difficult. The open ended questionnaire is used to advantage when the researcher is seeking the knowledge and opinions of the respondents. The selection of the type of questionnaire to be used depends upon the problem to be studied.
- 21 -
For purposes of studying the supply of nurses in a nurse manpower study3 the structured~lEe of questionnaire is appropriate. This is called the closed type question whereby the investigator asks the respondent precise and simple questions. The. instructions to be followed by respondents are definite and easily understood. Some of the advantages in using this type of questionnaire are that the responses are easy to tabulate and analyze~ the instrument is easy to administer1 and the specific questions keep the respondent focused on specific items. An example of a closed question is: What was your age at your last birthday? A space is provided for the response. lhe question is clear and simple. In another form of question the respondent is asked to check the block for a yes or a no reply to the question. This type of questionnaire is used to collect information from a large number of respondents over a large geographic area, and seeks a large number of responses.
Some of the mechanics of constructing a questionnaire fall into several categories as follows:
(1) Directions to the respondent - clear and simple
e. g. - Please place a check mark :tn the blanlt space at the right of each item, or
Please complete the blank space at the left of each item.
(2) Wording of the questions - use of words that have similar meaning for all the respondents.
(3) Arrangement of questions - ease for respondent
(a) usually the simple, easy to answer t~~es of questions are placed first in the questionnaire;
~) arrange the questions that are in a time sequence in groups for ease in responding; .and
(c) arrange the questions that are in a subject sequence in groups.
(4) Length of the questionnaire - cover the subject but ask only those questions that are relevant to the problem being studied.
- 22 -
3.3.3 The interview1
This technique is used for several reasons but for our purpose will be limited to use as a research tool. Before selecting the interview as the technique to be used to collect data, the statement of the problem is essential. Is the interview the technique of choice to find answers to the research questions? If one wished to know for example, the opinions of nurses in the Department of Health about their roles, he might select the interview in conjunction with the questionnaire. The interview is used when there is a need for data that cannot be obtained by methods which do not involve a personal relationship. The interview is used to check on the reliability of a questionnaire.
Major purposes of interviewing include: (1) to secure information directly from individuals; (2) to collect personal data to get a variety of uniform responses to predetermined questions; (3) to secure data from individuals wl10 are secondary sources of information about persons or groups under study; (4) to aid in checking exte~al observations of behaviours.
Interviews, like questio~naires, are of two types: structured and unstructured. The structured interview introduces controls to permit collection of quantified comparable data from all individuals in the sample in a uniform manner. The unstructured interview is used commonly for exploratory purposes when the investigator is uncertain about the range and type of questions to be asked to answer the research questions.
If the interview is selected as the technique of choice to study a specific problem, a pretest of tl1e schedule will help to detect weaknesses in the questions and problems of communication with respondents. On the basis of the try-out, revisions may be made in the questions.
In connexion with interviews it is importru1t to remember that both the respondent and the interviewer are human. The respondent has certain rights that must be respected by the interviewer, such as the right to demand confidentiality, to qualify one 1 s ru1swers, to refuse to answer some questions. If the respondent asks for the purpose of the survey or the sponsor, he has a right to know. The way in which this information is given to the respondent will vary in different surveys.
~or further elaboration see: Richardson, S.A.,et al (1965), Interviewing: its forms and functions. New York, Basic Books.
- 23 -
4. SURVEY PLANNING - ADMINISTRATIVE ASPECTS
The conduct of research has administrative ramifications as well as the technical considerations associated with the research process. The administrative factors are obviously important and are so different in character from the technical matters that they are wortl1y of a separate report. We can hope herein only to sketch a few of the major points of interest.
4.1 Activlt~y· Network Analysis
At tl1e outset of any study the researcher should take time to identify all of the major activities in which he is about to engage, so that he may clearly comprehend the various study components$ understand the problems of timing the various phases of the study, and plan for the necessary staff, facilities, and finances. Various forms of activity network analysis have been developed for this purpose; we shall outline the simpl€:st of these: the Critical Path Hethod (CPM).
The technique deals Vfi th a group of activities to be accomplished in a limited period of time in a semi-ordered fashion. Presumably some tasks such as the training of interviewers, cannot commence until one or more other activities, such as recruitment of personnel, have been completed. Since each activity takes time, and dela;ys maybe encountered in awaiting the completion of certain critical tasks, the pattern of linkage of tasks and the total time required to complete the survey become important subjects for analysis.
The linkage aspect causes us to distinguish between activities and events. Activities are the time-consuming operations that reach end points, depicted as events, which permits other activities to begin. Thus "recruitment of a field director" is an activity which ends with the event "field director on job."
The description of CPM will be undertaken with the aid of a grossly oversimplified version of a nursing manpower study. As shov~ in the table below we begin by listing each of the necessary events in any order which comes to mind. Each event in the list is assigned a number sequentially, beginning with 0, the event which initiates the whole study.
- 24 -
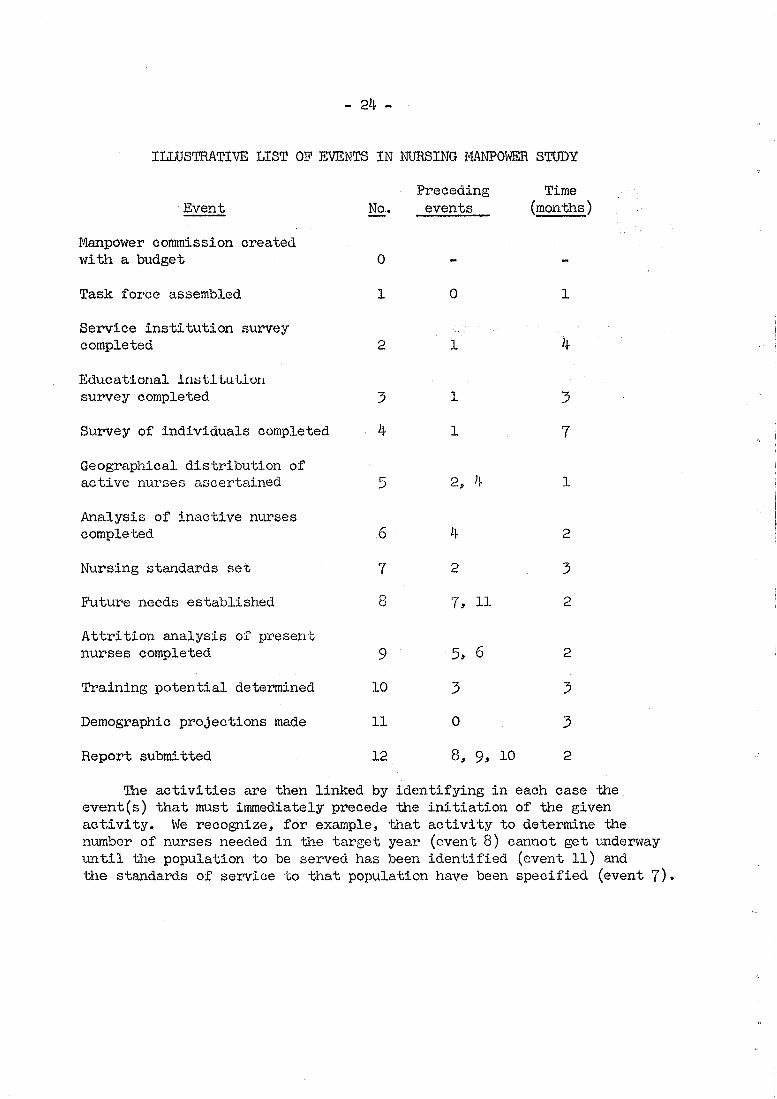
IIJ.,USTRATIVE LIST OF EVENTS IN NlJRSING IviANP0\4ER STUDY
·Event
Manpower commission created with a budget
Task force assembled
Service institution survey completed
Educational instltuLluH survey completed
Survey of individuals completed
Geographical distribution of active nurses ascertained
Analysis of inactive nurses completed
Nursing standards set
Future needs established
Attrition analysis of present nurses completed
Training potential determined
Demographic projections made
Report submitted
No.
0
1
2
3
4
5
6
7
8
9
10
11
12
Preceding events
0
1
1
1
2, 4
4
2
7, 11
5~ 6
3
0
8, 9, 10
Time (months)
1
4
3
7
1
2
3
2
2
3
3
2
The activities are then linked by identifying in each case the event(s) that must immediately precede the initiation of the given activity. We recognize, for example, that activity to determine the number of nurses needed in the target year (event 8) cannot get underway until the population to be served has been identified (event 11) and the standards of service to that population have been specified (event 7).
- 25 -
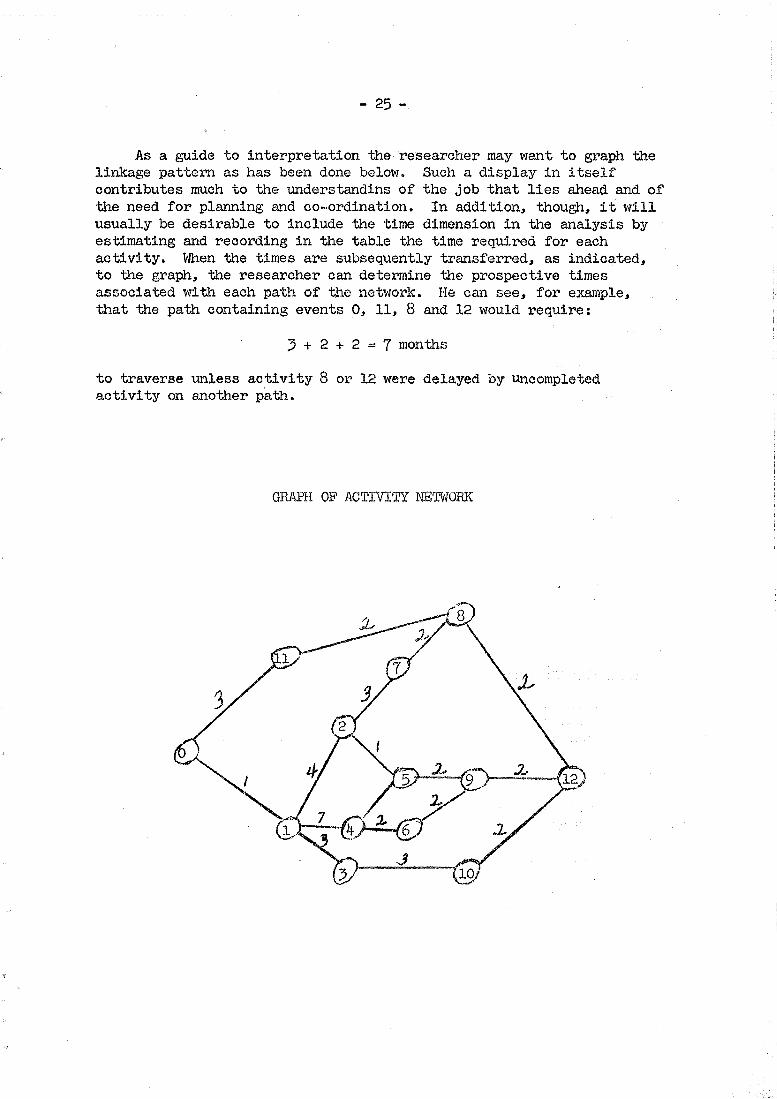
As a guide to interpretation the researcher may want to graph the linkage pattern as has been done below. Such a display in itself contributes much to the understandins of the job that lies ahead and of the need for planning and co-·ordination. In addition, though, it will usually be desirable to include the time dimension in the analysis by estimating and recording in the table the time required for each activity. When the times are subsequently transferred, as indicated, to the graph, the researcher can determine the prospective times associated l-'Ii th each path of the netwo1~k. He can see, for example, that the path containing events 0, 11, 8 and 12 would require:
3 + 2 + 2 = 7 months
to traverse unless activity 8 or 12 were delayed by Uncompleted activity on another path.
GRAPH OF ACTIVITY NETVWRK
.,.. 26 -
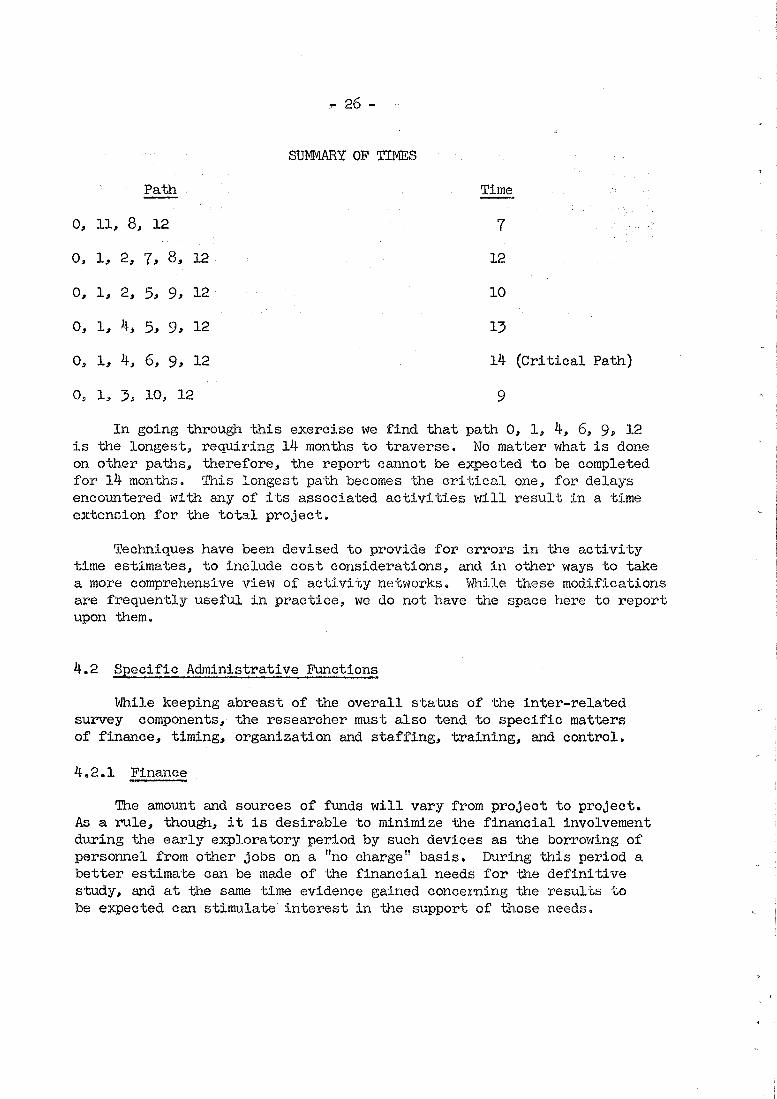
SUMMARY OF TIMES
Path Time
0, 11, 8, 12 7
0, 1, 2, 7, 8, 12 12
0, 1, 2, 5, 9, 12 10
0, 1, 4, 5, g, 12 13
0, 1, 4, 6, 9, 12 14 (Critical Path)
0, 1, 3, 10, 12 9
In going through this exercise we find that path 0, 1, 4, 6, 9, 12 is the longest., requiring 14 months to traverse. No matter what is done on other paths, therefore, the report catmot be expected to be completed for 14 months. This longest path becomes the critical one, for delays encountered with any of its associated activities will result in a time extension for the total project.
Techniques have been devised to provide for errors in the activity time estimates, to include cost considerations, and in other ways to take a more comprehensive view of activity networks. While these modifications are frequently useful in practice, we do not have the space r1ere to report upon them.
4.2 SEecific Administrative Functions
While keeping abreast of the overall status of the inter-related survey components, the researcher must also tend to specific matters of finance, timing, organization and staffing, training, and control.
4.2.1 Finance
The amount and sources of funds will vary from project to project. As a rule, though, it is desirable to minimize tlle financial involvement during the early exploratory period by such devices as tlle borrov1ing of personnel from other jobs on a "no charge" basis. During this period a better estimate can be made of the financial needs for the definitive study, and at the same time evidence gained concerning tlle results to be expected can stimulate interest in the support of those needs.
- 'Z7 -
Sometimes financial requirements can be reduced through the use of college students in connexion with their training programmes. ~:he attempt to cut costs should not be pushed so far, of course, that incompetent, disinterested personnel are employed.
The cost of financing a survey can also be reduced without any loss in accuracy of results if a well-considered statistical design has been produced for the survey.
4.2.2 Timing
The availability of financing has much to do with the scope of the survey plan and the time required to complete the study. Even in the absence of financial constraints, however, the question of timing bears careful scrutiny. Care!'ul planning is necessary to ensure stable conditions for the collection of information that is relevant to the survey objectives. In addition there are psychological overtones to the timing question; survey aims cannot be too far ahead of public or staff thinking.
4.2.3 Or5anization and staffins
Personnel are usually employed at three levels in a survey. The surver supervisor is responsible for the conduct of the survey. He is supported by field supervisors located at the widely scattered observation points. The recorders do the actual data collection at these points.
The role of the survey supervisor can be seen from his list of responsibilities, which include: (1) the production of survey forms such as data sheets and timetables; (2) the appointment of staff; (3) the assignment of staff duties; (4) the provision of supplies, travel accommodations, and other resources necessary to the performance of staff duties; (5) oversight of the conduct of the survey and prompt referral of major problems to the designers of the survey, and (6) the maintenance of good relations and communications with survey staff and the target population.
In order to carry out his responsibilities in line with the survey objectives, the survey supervisor should be present at the discussions leading to the precise definition of the survey objectives. Then he should become acquainted with the nature and rationale of the statistically designed sample to be drawn. Similarly, he should understand what data are to be provided by the SUl~ey and the manner in which they are to be analyzed.
- 28 -
The field advisors should also be well acquainted with the survey aims and design. They should attend briefing sessions with the survey supervisor in order that they will be uniform in their treatment of problems that arise in the field. Free-flowing lines of communication should exist between the field staff and the survey supervisor in order that exceptional problems will also be handled uniformly and promptly.
Inasmuch as the recorders are the direct point of contact with the providers of survey data, their qualifications must emphasize intelligent objectivity of observation and recording, as well as the minimization of undesirable interaction with respondents. These qualifications naturally require the attainment of some minimum level of understanding of the subject of study. Perhaps an upper limit of understanding must also be considered, for excessive knowledge and emotional involvement with a research question can lead to an undesireable interpretation and distortion of data according to the recorder's own pre-conceived hypotheses.
4.2.4 Training;
In listing the staffing requirements and outlining qualifications, we have already suggested some of the training considerations that necessarily follow. Some additional general points are noteworthy, however. First, we must remember that the survey field staff are probably not as acquainted with the professional jargon as the survey designers are. If by 11profile 11 we mean nsex, age, and weightll, there is less chance for misunderstanding if we say so. Every term used in training or in the survey itself should be simply and uniquely defined. Important definitions should be printed for reference and accessible to all concerned. As far as possible words should have their ordinary meanings.
Secondly, we should not overlook the pilot survey as an important means of demonstrating the success or failure of staff training. In analyzing the difficulties encountered in the pilot study, a clear distinction should be made between those attributable to the survey instrument used and those attributable to the user of the instrument.
Finally, we should recognize that training has a qualitative aspect as well as its quantitative one. It is true that upon completion of their training, recorders should be able to collect a certain quantity of data per day with a given level of accuracy. At the same time, however, they should be alert,bouyant, and constructively critical team members.
- 29 -
4.2.5 Control
At the time the survey staff have been recruited and trained# the pilot study has been completed~ and the definitive study design has been finalized, the researcher may be permitted a sigh of relief. He should not be permitted to relax his vigilance, however, some problems may not yet have arisen, and there is no guarantee that the field staff will automatically maintain a consistently high level and quality of performance.
This means first that conscious attention must be given throughout the survey to keep the lines of communication open. It also means that a systematic, on-going scheme must be installed for checking on the completeness and accuracy of data being collected. The scheme must be designed to identify particular forms of information that are proving troublesome and individual collectors of information ~~at may need special attention. To provide these controls efficiently a statistically designed sampling scheme is obviously necessary.
The attention to prompt feedback of information from the field carries with it the temptation to make unwarranted minor changes in the survey design in midstream. This must be resisted, since it destroys the stable conditions that are so important to a meaningful analysis later. However, if the feedback scheme reveals the need for a major change 1 the researcher can only be thankful that the danger signal was recognized3 make the necessary change, and separate the data as necessary during the analysis stage.
5. DATA PROOESSING
Concern for data processing and the analysis of survey findings should begin at the time the survey objectives are formulated. At . that early date the researcher should design in skeleton form the basic tables and graphs he intends to use in developing his preliminary conclusions and in making decisions about the application of more sophisticated forms of statistical analysis. These early plans for data processing and analysis will help to shape the design of the specific survey instruments employed. Indeed the instrument may contain built-in categorizations and coding of responses which will facilitate subsequent data processing immensely.
.. 30 -
5.1 Manual processing
Limited amounts of information can be processed manually to form useful tallies, cross-tabulations, and graphs. In order to tally the results on a given variable one divides the total range of data into perhaps as many as 6-10 groups. If ages in the survey range upwards from 20 years, for example, the categories 20-29, 30-39, etc., might be formed. Classificatory variables might be left as originally specified or further combined in some reasonable way. Then one-by-one the data are tallied in the appropriate categories and the resulting frequency distributions either tabulated or graphed.
Relationships between two variables are often summarized in twoway cross~tabulation5. Additional variables can be incorporated in n-way tabulations, but these tend to be rather confusing. On the other hand, two-way tables can be misleading because they fail to recognize the disproportionate indirect influence of other variables in certain categories, or cells. In any event, all tables should clearly display their contents with the aid of appropriate titles and headings. Each title should identify the "what, where, and when" of the information recorded. The following title satisfies these conditions: "Registered Nurses by Age Employed in Taiwan, JulY 1, 1969. 11
A large number of different graphical forms have been devised employing various scales. For our purpose we shall only distinguish briefly between those based upon an arithmetic scale and those employing a logarithmic scale. The former exhibit equal increments on an additive basis. Thus the interval from 1 to 2 is equal to those from 2 to 3, 3 to 4, etc. Similarly, the intervals 3 to 6, 6 to 9, 9 to 12, etc., are equal. On a logarit~~ic scale equal rates of change command equal intervals. Thus the inter-\Tals 1 to 2, 2 to 4, 4 to 8, etc., are equal, as are the intervals 3 to 9, 9 to 27, etc. It follows that the arithmetic scale is useful for depicting absolute differences, whereas the logarithmic scale is better suited for depicting rates and ratios.
Manual compilations of data are sometimes facilitated by the use of marginal punch cards. These are simply rectangular cards with a series of holes located near the edges. Each hole location is assigned the role of depicting the presence or absence of a particular condition. In case the condition is present a punch is used to remove the portion of the card between the hole and the edge. At the stage of tallying the cards are stacked on end and a long needle inserted through the specified hole location. When the needle is raised only those cards with the hole intact will follow along. For example, if the cards for nurses with post-basic education are identified with a punch in a certain location, then by passing a needle throu~1 that location all other nurses can be removed from the stack.
- 31 -
5.2 Mechanical Processing
Most often mechanical data processing is accomplished with the aid of IBM-type cards of 12 rows and 80 columns. Ten of the 12 rows iri a given column are used to identify the numbers 0 through 9 by means of holes punched in the appropriate positions. The other two rows are used for a variety of special purposes. Any number of columns may be combined to produce a field allocated to a unit of information. Thus age~ requiring two digits~ might be assigned to a field consisting of columns 7 and 8. A 24-year old would then have a "2" punched in column 7 and a "4" in column 8 of the card containing her information.
The holes are inserted by means of a keypunch machine with a keyboard that is not unlike that of a typewriter. By pressing the keys the operator produces holes rather than inked characters and does so at the rate of 6000 to 10 000 holes per hour~ provided tl1e data are in a form to permit her to operate at top speed. This again emphasizes the importance of preparing in advance for the data to be collected and recorded in a mruu~er that facilitates subsequent processing.
Once a test of punched cards have been prepared a number of operations can be performed at high speed on unit record equipment or electronic computers. Two of the more common forms of unit record equipment are the sorter and the tabulator. The former causes a set of cards to be separated according to the punches in a given column of interest. As the cards pass through the sorter they are deposited into appropriate bins~ and some machines are equipped with counters to record the number of cards entering each bin. Hence the sorter provides a rapid means of' generating the numbers to insert in hand-tallies and tabulations. The ·tabulator, on the other hand, generate~ tables mechanically once the cards have been sorted into proper order.
5.:;. Electronic Data Processing
Electronic computers handle punch cards at considerably higher speeds than unit record equipment, and they process data from magnetic tape even faster. Their greatest virtue, however, is the variety and complexity of computations and manipulations that they can perform with accuracy as well as speed.
To accomplish these feats, however, requires a unique and complex array of devices that respond to electronic impulses rather than the human voice. Otherwise, they do only what an individual with pencil and paper could be instructed to do-given time.
- 32 -
The computer hardware includes input and output units, as well as the central processing unit. The processor can "read"~ "compute", "commit to memory1
1 and "write." These seemingly human attributes actually mean that the processor can accept and attach meaning to holes in punched cards or spots on magnetic tape 1 perform basic arithmetic and logical operations, keep a record of the information it has "read" or the results of its computations, and transmit to magnetic tape, punch cards, or a high-speed printer any portion of this record.
Communication between the computer and its human user is perhaps the most difficult aspect of electronic data processing ·to understand, and certainly it is the source of most difficulties in practice; prior to perhaps 15 minutes of computer processing time may have gone several months of programming and testing of the processing procedures. Since the computer responds to electronic impulses rather than words, it is as if it speaks a language we shall call "Electro", whereas we speak English. Fortunately, one portion of the central processing unit consists of several "dictionaries" which can translate a number of languages into "Electro"~ but none of the traditional languages such as English, French or German are included. In order to communicate with the computer, therefore, we must learn a language that it can ·translate, such as "Fortran 11
• Then we can instruct the computer in "Fortran" to carry out our detailed directions, have these instructions translated into "Electron, and watch the computer go to work.
Since the stupid computer must be instructed in minute detail to do a rather complicated job it is not uncommon for us to overlook some details. Nor is it surprising that sometimes we unknowingly use a word incorrectly, which the computer of course translates literally. Then it takes considerable time and skill to figure out why the computer remains idle or produces a pile of nonsense. Even more serious is the case in which a small portion of nonsense is hidden within a mass of sensible-looking output.
It follows that the computer is ideally suited to the performance of repetitive operations on large masses of data. In view of its unexcelled accuracy we can be assured that if it once performs these operations successfully it can be relied upon to repeat them successfully at lightening-like speed.
6. STATISTICAL METHODS
The analysis and interpretation of a set of data inevitably requires summarization and usually requires generalization. If the data represent a sample of information from a larger universe we want to generalize our results to that universe. If they are to provide a basis for future projections, then we generalize in that sense.
- 33 -
6.1 Summarization
The most succinct form of summarization of a body of data consists of reducing the results to a single typical value. Reference to the typical value alone causes us to lose sight of tl1e character of the individual observations, however, therefore we also measure the degree of variation from the typical condition, as well as the pattern of tllat variation. Suppose, for example1 that we find tl~at a particular group of nurses typically work 36 hours per week with variation of as rauch as + 10 hours in individual cases. It would also be useful to know whether the pattern is such that the workweek of most nurses clusters around 36, the extreme cases of 26 and 46 hours being reported only rarely, or whether results throughout tlle entire range, 26 to 46, are common.
6.1.1 Average
The most common measures of the typical, or average, value are the median and the arithmetic mean. The median is tlle middle value of an array of data arranged in order of increasing or decreasing magnitude. The arithmetic mean gives consideration to the value of individual results~ which are symbolized as x1, X21 ••• X, ••• ~1 •
The letter N refers to tl1e number of values in tlle uni ve~se, wh'kreas n re:fers to the sample size. 'lhe arithmetic mean, J.Vl, is defined as:
or
M u =
M = s
Sum X N
Sum X n
where the subscripts u and s refer to the universe and sample respectively.
To illustrate, if a sample 6, 6, 7, 9, 12, the median is 7
M s
of 5 observations produces and the sample mean is:
- 6+6+7+9+12 - 5
= 8.
the results
Since the median is based upon an ordering of observations, whereas the aritl1metic mean reflects individual values, exceptional cases tend to distort the latter for more than the former. If in the above set of five observations the fifth value had been 52 instead of 12, the median would have been 7 as before, but the mean would have been atypical 16.
- 34 -
6.1.2 Standard deviation
A number of measures of variation have been proposed, but for reasons that need not concern us here one is especially useful and has become the standard where both the universe and the sample size are reasonably large. This standard deviation, S, has the seemingly arbitrary formulation:
s = fsum (X-M )2 u \ u
\I N
s s
2 Sum (X-M )
::= I S
n
Although the sample size is small in the above case of five numbers, for the sake of illustration we note that the individual values differ from the mean, 8, by the amounts -2, -2, -1, +1, and +4. Then:
ss = (-2) +(-2) +(-1) +(1) +(4) j. 2 2·2·-2-2
=\l 5.2
:::: 2.3
6.1.3 Normal distribution
Any given set of data may have its own peculiar pattern of variation, nevertheless, experience (supported by statistical theory) has shown that a graphed frequency distribution of the data very often displays a bellshaped curve with about 68 per cent. of the observations within ~1 standard deviation of the mean, 95 per cent. within ~2 standard deviations, and virtually all within±) standard deviations. So common is this phenomenon, in fact, that it has been labelled the normal distribution.
It happens that any normal distribution is uniquely defined and distinguished from others by its arithmetic mean and standard deviation. In order to relate a particular normal distribution to the generalized form, which has been tabulated and published in most statistics textbooks, we must insert the appropriate numerical values for M and S into the transformation formula: u u
z = V-M u
s u
- 35 -
This formula relates the generalized normal deviate, Z, to a value, V, of special interest in the particular normal distribution under· consideration. In order to illustrate the usc of this immensely important formula, consider a universe of households in which annual expenditures on health insurance are normally distributed with mean $260 and standard deviation $50. Two types of questions are often raised in such a situation: what proportion of households have expenditures above $400 (say), and what expenditure is exceeded by ten per cent. (say) of households?
The first question in effect specifies that V=$400, so that
400-260 z = 50
= 2.80
Reference to the table of generalized normal deviates indicates that in any normal distribution, a result which is 2.80 standard deviations above the mean is exceeded only three times in 1000. From this, we conclude that in the particular case under consideration the value $400 is exceeded by 0.3 per cent. of the households.
Referring to the normal table in response to the second question, we find that the value which is exceeded ten per cent. of the time lies 1.28 standard deviations above the mean; hence, Z = 1.28. Then
1.28 V-260 = -50
v = $32lJ..
The answer to the question is that ten per cent. of the households spend at least $324 annually on health insurance.
6.2 Generalization
The preceding illustration shows that a rather powerful and informative analysis can proceed from knowledge of two basic characteristics of normally distributed data. This form of analysis can also be the base for further generalization. Suppose we discovered, for example, that the mean annual household expenditure on health insurance is increasing yearly by $8, but the magnitude of variation about the mean is remaining unchanged. Can we estimate what proportion of households will be spending more tl1an $400 ten years from now?
- 36 -
By then the average will be $340, or $80 above the present level of' $260. Thus
z 400 - 340
50
= 1.20
The normal table indicates that the value Z = 1.20 is exceeded by 11.5 per cent. of' the time. As a result, we estimate that the proportion of' households spending at least $400 annually will rise from 0.3 per cent. to 11.5 per cent.
6.2.1 Tho standard error as a measure of sampling error
Probably the most important, though difficult form of' generalization is that which relates the circumstances found in a sample to those which exist in the population at large. In particular, we frequently seek to learn something about the average condition, M , in the universe on the basis of the average, M , calculated from gur . s sample observations.
In order to establish this relationship we must consider what would happen if we took not one, but a series of' samples, each of size n, from the same large universe. Specifically, let us suppose we were to determine the level of health insurance expenditures in a random sample of 25 households and then chose to repeat this process a number of' times. From each set of 25 observations we would obtain one sample mean, so that eventually the sample means themselves would f'orm a frequency distribution, just as the individual observations in the universe do. We would not necessarily expect the pattern of the two distributions to be the same, however.
In particular, let us consider how large the standard deviation of' the distribution of sample means might be. Presumably, it would be af'f'ected by the magnitude of variation, S , among the individual observations, because one sample of 25 obse~ations might, by chance, contain a preponderance of' households with relatively large expenditures, whereas the selection process in another sample might produce a preponderance of households with relatively low expenditures. If all households in the universe had similar levels of expenditure, this possibility would not arise. Likewise, if the number of observations in each sample were increased, we might expect a tendency for the households with hi~1 expenditures to be balanced by the entry into the sample of households with low expenditures. As a matter of' fact, the intuitively appealing notions above can be subjected to more rigorous mathematical analysis to show that the standard deviation of' the distribution of' sample means, S , (more commonly called the
m standard error of the mean) can be calculated as:
s m
s = u
~-;-
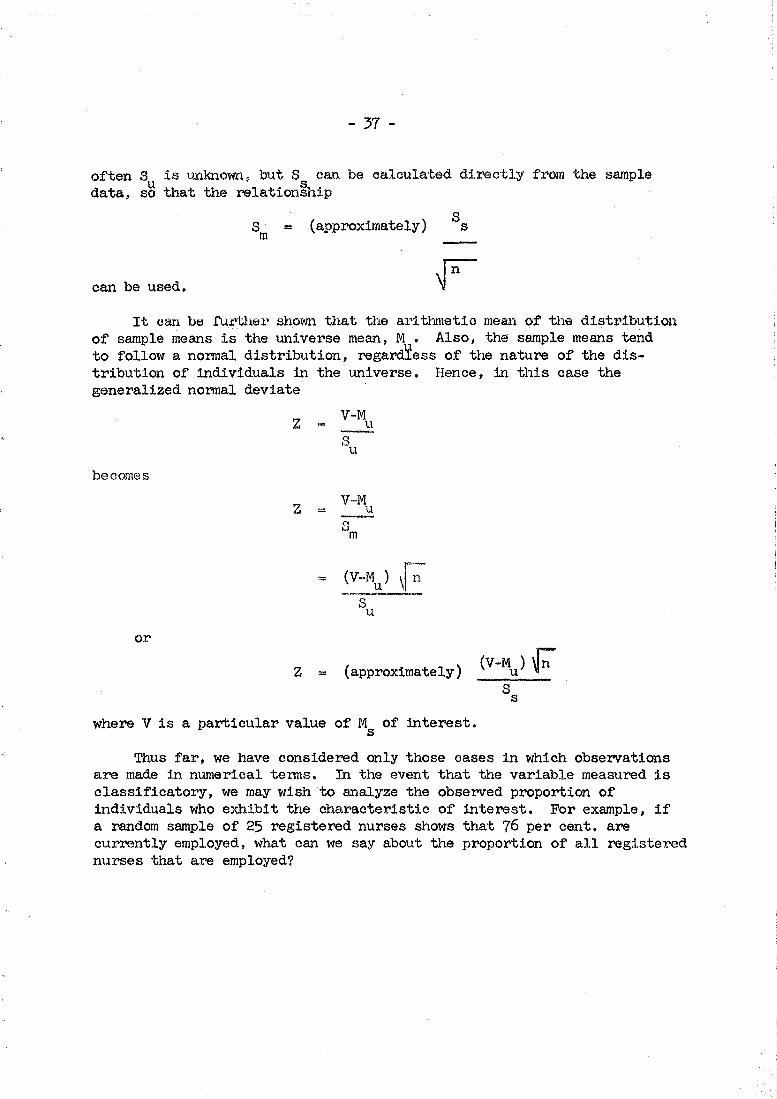
- 37 -
of'ten S is unknown, but S can be calculated directly from the sample data, s~ that the relation~hip
can be used.
S = (approximately) m
s s
fl It can be fuJ:•the:t' shown that the ari thmetio mean of the dist:t•ibution
of' sample means is the universe mean, M • Also, the sample means tend to :follow a normal distribution, regard~ess of the nature of the distribution of' individuals in the universe. Hence, in this case the generalized normal deviate
z V-M = u -s u
becomes
z V-M = u -s m
= (V-Mu) \In s u
or
z = (approximately)
where V is a particular value of M of interest. s
(V-Mu) rn s s
Thus far, we have considered only those cases in which observations are made in numerical terms. In the event that the variable measured is classificatory, we may wish to analyze the observed proportion of individuals who exhibit the characteristic of interest. For example, if a random sample of 25 registered nurses shows that 76 per cent. are currently employed, what can we say about the proportion of all registered nurses that are employed?
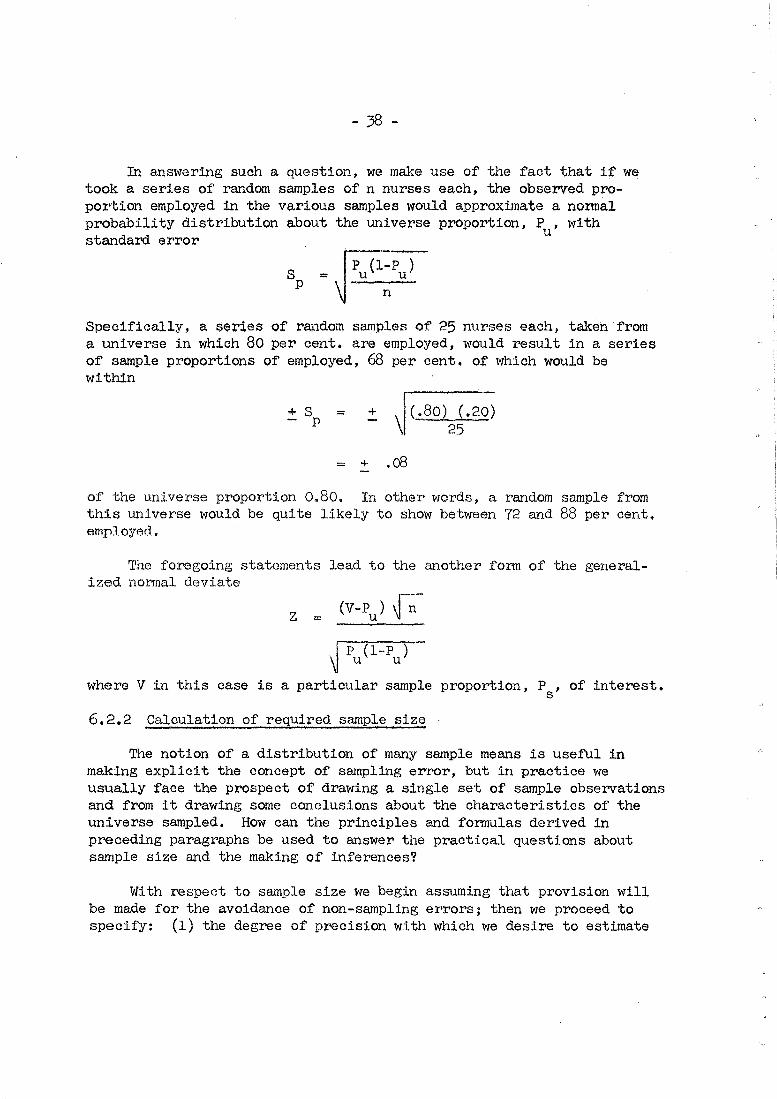
- 38 -
In answering such a question, we make use of the fact that if we took a series of random samples of n nurses each, the observed proportion employed in the various samples would approximate a normal probability distribution about the universe proportion, P , with
u standard error
s =~(1-P} p .J:.__U n
Specifically, a series of random samples of 25 nurses each, taken from a universe in which 80 per cent. are employed, would result in a series of sample proportions of employed, 68 per cent. of which would be within
-+- s = + \I < • 8o) 2~. 20) - p
= + .o8
of the universe proportion 0.80. In other words 1 a random sample from this universe would be quite likely to show between 72 and 88 per cent. employen.
The foregoing statements lead to the another form of the generalized normal deviate
z = (V-Pu) {-~-
~ P (1-P -) u u
where V in this case is a particular sample proportion, P , of interest. s
6.2.2 Calculation of required sample size
The notion of a distribution of many sample means is useful in making explicit the concept of sampling error, but in practice we usually face the prospect of drawing a single set of sample observations and from it drawing some conclusions about the characteristics of the universe sampled. How can the principles and formulas derived in preceding paragraphs be used to answer the practical questions about sample size and the making of inferences?
With respect to sample size we begin assuming that provision will be made for the avoidance of non-sampling errors; then we proceed to specify: (1) the degree of precision with which we desire to estimate
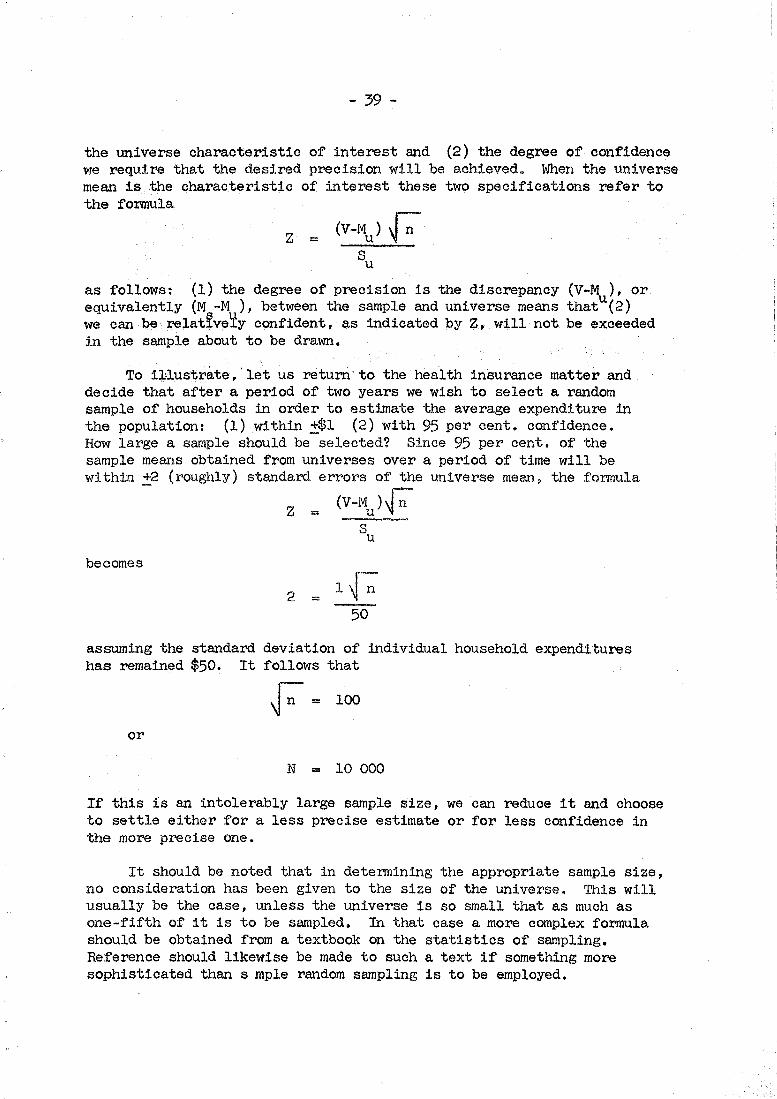
- 39 -
the universe characteristic of interest and (2) the degree of confidence we require that the desired precision will be achieved. When the universe mean is the characteristic of interest these two specifications refer to the formula
z = ~~)F su
as follows: (1) the degree of precision is the discrepancy (V-M ), or equivalently (M -M ), between the sample and universe means thatu(2) we can be relatfveYy confident, as indicated by Z, will not be exceeded in the sample about to be drawn.
To ilclustrate, 'let us return' to the health insurance matter and decide that after a period of two years we wish to select a random sample of households in order to estimate the average expenditure in the population: (1) within ~$1 (2) with 95 per cent. confidence. How large a sample should be selected? Since 95 per cent. of the sample means obtained from universes over a period of time will be within +2 (roughly) standard errors of the universe mean, the formula
- z = (v-Mu)F
becomes
2
s u
= 1 {~~ - 50
assuming the standard deviation of individual household expenditures has remained $50. It follows that
~ = 100
or
N = 10 000
If this is an intolerably large sample size, we can reduce it and choose to settle either for a less precise estimate or for less confidence in the more precise one.
It should be noted that in determining tr1e appropriate sample size, no consideration has been given to the size of the universe. This will usually be the case, unless the universe is so small that as much as one-fifth of it is to be sampled. In that case a more complex formula should be obtained from a textbook on the statistics of sampling. Reference should likewise be made to such a text if something more sophisticated than s mple random sampling is to be employed.
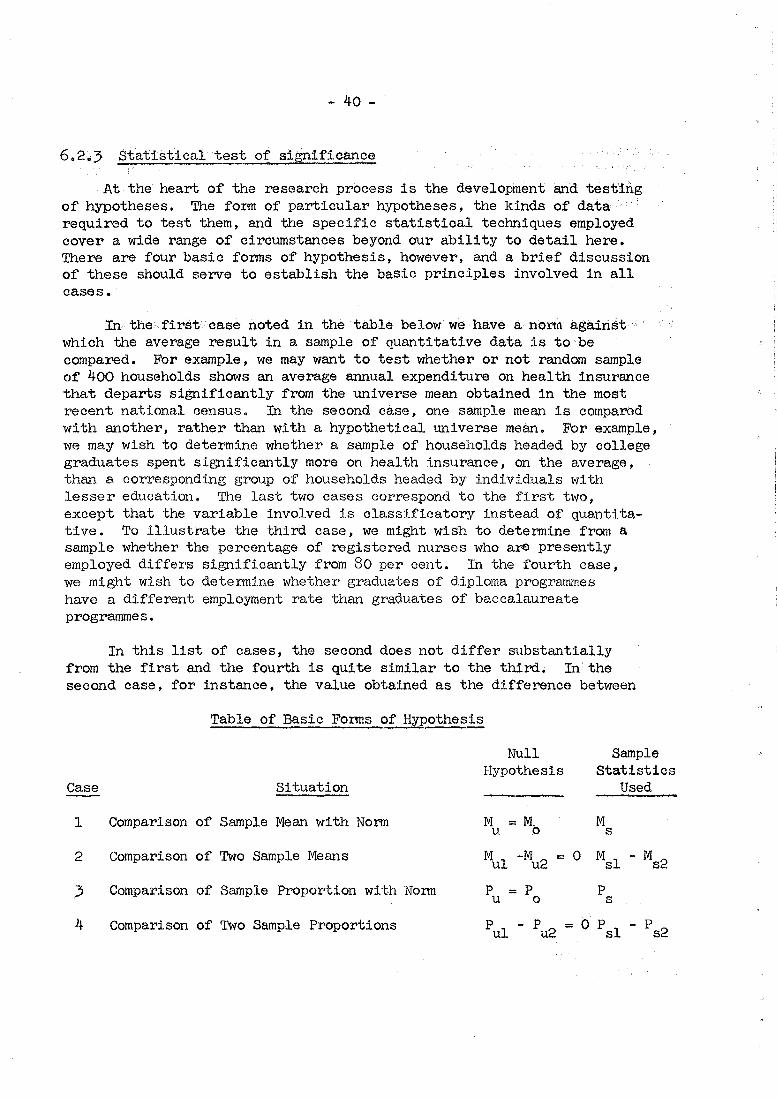
- 40...;
6.2.3 Statistical test of significance
·At the heart of the research process is the development and test'i!lg of hypotheses. The form of particular hypotheses, the kinds of data required to test them, and the specific statistical techniques employed cover a wide range of circumstances beyond our ability to detail here. There are four basic forms of hypothesis, however, and a brief discussion of these should serve to establish the basic principles involved in all cases.
In the first case noted in the table below we have a norm against which the average result in a sample of quantitative data is to be compared. For example, we may want to test whether or not random sample of 400 households shows an average annual expenditure on health insurance that departs significantly from the universe mean obtained in the most recent national census. In the second case, one sample mean is compared with another, rather than with a hypothetical universe mean. For example, we may wish to determine whether a sample of households headed by college graduates spent significantly more on health insurance, on the average, than a corresponding group of households headed by individuals with lesser education. The last two cases correspond to the first two, except that the variable involved is classificatory instead of quantitative. To illustrate the third case, we might wish to determine from a sample whether the percentage of registered nurses who are presently employed differs significantly from 80 per cent. In the fourth case, we might wish to determine whether graduates of diploma programmes have a different employment rate than graduates of baccalaureate programmes.
In this list of cases, the second does not differ substantially from the first and the fourth is quite similar to the third. In the second case, for instance, the value obtained as the difference between
Table of Basic Forms of HyEothesis
Null Sample Hypothesis Statistics
Case Situation Used - -1 Comparison of Sample Mean with Norm M = M. M
u 0 s
2 Comparison of Two Sample Means Mul -Mu2 = 0 Msl - Ms2
3 Comparison of Sample Proportion with Norm p = p p u 0 s
4 Comparison of Two Sample Proportions pul - pu2 = 0 psl- ps2
- 41 -
sample means (M -M 2
) could be conveniently noted as M and tested against the hypgihe~~s that the difference between mean~ in the two parent universes is zero. We would then have Case 1 with
M = Mul- Mu2 u
M = 0 0
M = M -M s sl s2
except that M now has two sources of sampling error instead of one. s
Whereas, we found earlier that
or, equivalently
we now have
s = s m u
F 81¥-_2 m - u
n
8 m 28 2 =• u
'J n
assuming that the size, n, of each sample is the same. A parallel line of reasoning could be followed in transforming a Case 4 situation into the Case 3 format.
To illustrate the actual procedure employed in the testing of hypotheses, let us consider the Case 1 situation in which the average health insurance expenditure in a random sample of 400 households is to be compared to the hypothetical value, $260. It is quite likely, of course, that the sample mean M obtained will differ by some amount from the value M = $260. This d~fference could be attributed to one of two factors:
0(1) sampling error alone, or (2) the possibility
that in fact the sample was not drawn from the assumed universe with mean $260, in which case we would have every right to expect to obtain a sample mean different from that value.
The logic followed in statistical inference is that we shall continue to support the first alternative, associated with sampling error, until our data show this possibility to be very unlikely. In order to make explicit what we mea.ri by "very unlikely'' , we must select a significance level to employ, say five per cent. Then we will support the null hypothesis until we find that a difference at
- 42 -
least as large as that observed between the sample result and that hypothesized has no more than five chances in 100 of occurring in circumstances in which the null hypothesis is true; in such cases, we conclude that it is false, recognizing that we have fewer than five chances in 100 of being wrong in this conclusion.
Applying the above logic to the case in question, we recall that 95 per cent. of the sample means obtained through repeated sampling from a universe will fall between values, V, that are roughly ~2 standard errors from the universe mean. We also suppose, as before, the S = $50. Then the formula
u r-···~
becomes
Z _ (V-M ) \! n - ~-·~--~~--
+2 =
s u
(V-M )\,r~-o f
s u -·-..
= i_v -26o) J.~og_ 50
When Z = ~2, V turns out to be $265, whereas Z = -2 produces V =$255. This leads us to the following decision rule: if a random sample of 400 households produces an average expenditure of between $255 and $265, conclude that the average expenditure in all households is not significantly different from $260; if the sample mean is not within these limits, however, the null hypothesis must be rejected.
6.3 Concluding remarks
This brief description of statistical methods has not been designed as an exhaustive exposition of all statistical techniques applicable to the research process in general or to health manpower studies in particular. Often the statistical analysis will involve no more than the clever display of relationships discovered in the data. Sometimes the need will arise for the ingenious conversion of the data into new, more meaningful variables; cost-benefit ratios serve as a currently popular case in point. On other occasions there will be the need for highly sophisticated multivariate analysis requiring advanced knowledge of statistics. The present report does not deal at length with any of these possibilities. In short, we have not tried to suggest how the researcher can become his own statistician. Instead, we have attempted to outline briefly the scope of concern of.the statistician and how he thinks about these matters in his realm of interest. As a result, perhaps the researcher can learn to communicate more effectively with the statistician.
- 43 -
7. OPERATIONS RESEARCH
In recent years a great deal of research has gone into the biological and technological aspects of the health field. The consequent explosion of medical knowledge has stimulated an increasing awareness of the need for research at the administrative level in order that this available knowledge will be used effectively in the planning, organization, and management of health services. It is natural, therefore, that considerable interest is being manifested among health professionals in the techniques of operations research, which have a growing record of successful application to industrial and military problems.
Although operations research is a rather young discipline, it has employed many techniques, such as time study and work measurement, that have been traditionally associated with the field of industrial engineering. Most closely associated with operations research itself are. mathematical modelling and simulation studies. Our discussion here will therefore focus upon these two areas.
7.1 Mathematical modelling
Since mathematical models are not inherently better than verbal descriptions of existing phenomena and rela~ionships, we must make explicit their contribution to understanding and to improved decision making. We shall do so with the aid of a model of nursing needs developed from a particular study. The model:
H = 20 + 0.5S + l.OI + 2.5T
indicates that on a given day ln a hospital ward the expected number of hours (H) of direct nursing service required is a function of the numbers of self-care (S) intermediate care (I), and intensive or total care (T) patients in the ward. More particularly it states that on the average these types of patients each require 0.5, 1.0, and 2.5 hours of such service per day respectively. In addition, 20 hours of administrative effort must be undertaken, regardless of patient load or mix. The model, therefore, indicatec the total number of nursing hours required for any given ward census, thereby permitting the assignment of nurses to the various wards in accordance with the anticipated needs of each.
To be useful, a model must be a realistic representation of the real world. If this requirement is satisfied, however, it makes apparent the implications of the conditions, described and perhaps allows prescription of the optimal circumstances to be sought. In particular, modelling provides: (1) the precise definition of problems and objectives; (2) explicit recognition of the major factors that are relevant; (3) the precise manner in which factors are assumed to be inter-related and contribute to the objectives, and (4) the basis for employing optimal solutions in the achievement of objectives.
- 44 -
In practice, the use of mathematical models is often conditioned by one of two things: (1) there may be economic or physical constraints to incorporate into the analysis, or (2) the basic model, reflecting only the typical form of association among factors, may have to be modified to recognize variability. TI1e first possibility is best illustrated by linear programming models, whereas the second leads to a discussion of regression and correlation analysis. TI1e latter is associated with the field of statistics, but as we have said operations research is not limited to a specific body of newly developed methodology.
7.1.1 Linear programming
Suppose that our objective is to obtain the maximum level of service (S) from a staff of health professionals (P) and auxiliaries (A). Suppose further that we have succeeded in quantifying the meaning of service and have determined as a result that each professional provides three times as much service as an auxiliary in a similar period of time. (The difficulty of achieving this quantification in a real situation indicates something about the problem of modelling in practice.) This means that:
S = 3P + A
The model by itself encourages us to increase staffing levels indiscriminately in order to obtain over-increasing levels of S. In fact, however, we would tmdoubtedly be restrained by such things as the cost of training health workers. Suppose, for example, that we must live within a budget of $800 000 which can be used to train professionals at $1500 each and/or auxiliaries at $400 each. This constraint, expressed mathematically as:
I
1500P + 4ooA L__ Boo ooo
serves to make infeasible some of the combinations of workers that we might have contemplated in attempting to maximize our objective function:
S = 3P +A
It is likely that other constraints that must be included would further block off the area of possible combinations; yet after allowing for all of these constraints, a number of feasible combinations may remain. Linear programming techniques are designed to provide efficient means of analyzing·the many alternatives in order ultimately to find what is guaranteed to be best in the sense that it maximizes the objective function. The techniques are widely applicable to models that are linear in nature, i.e., can be "graphed" as lines, planes, etc., rather than as curves or curved surfaces.
- 45 -
7.1.2 Regression and correlation analysis
To illustrate the principles of regression and correlation analysis we return to the model:
H = 20 + 0.5S + l.OI + 2.5T
We can see that if a ward has 5 self-care, 12 intermediate care and 7 total care patients, we can be expected to provide:
20 + (0.5) (5) + (1.0) (12) + (2.5) (7) =52
hours of nursing service.
Inasmuch as the patient categories are defined rather broadly, however, it is quite possible that a particular patient will actually require slightly more or less than the expected (average) time required for patients in his category. It is clear, therefore, that we must consider both the prediction of nursing needs indicated by the model and the degree of predicta~y which it provides. If we can be reasonably assured that the actual needs which materialize in the illustrative case will be within ~1 hour of 52, this is quite a differ~nt matter than if the prediction were only within ~ 15 hours.
In line with the above distinction, we can see the virtue of mathematical models constructed from empirical data in a manner by which the predicted results match up with the observed results as closely as possible in a well-defined statistical sense. The technique for producing such models is called regression analysis and the models themselves are regression equations.
Moreover, we can see the benefit of having an index to measure the degree of predictability provided by the model. Such an index is known as the coefficient of correlation and is calculated in a way which causes it always to be between -1 and 1. A coefficient of zero indicates that the model is of no use whatever as a predictor, while a coefficient of one or minus one is evidence of perfect accuracy in prediction.
7.2 Simulation
Some situations are so multi-faceted and complex that the development of a precise, detailed mathematical model to describe it is not worht the effort, if indeed it can be done at all. For example, the entry, waiting, care~ and departure of patients in an out-patient clinic may be influenced by more variables than we care to identify and relate to one another for purposes of determining, say, the m~~imill!l number of patients waiting for treatment at any time.
- 46 -
Instead, we could assign a clerk the task of observing and recording actual experience in the clinic over a long period of time. After analyzing the results, we might alter the staffing pattern and repeat the recording procedure. Ultimately we might arrive at the ideal · organization of services that would minimize patient waiting time, but a tremendous amount of time would have elapsed. Moreover, in the course of this experience we might be embarrassed to find that some of the organizational changes only served to make matters worse.
With the introduction of high-speed computers has come the opportunity to simulate this experience. The equivalent of several years of results of dealing with "pretend" patients and organizational schemes can be generated within a few minutes without inflicting the damage caused in reality of unwise actions.
To be useful of course, the computer simulation must adequately mimic the real-life .situation. At the heart of this is the use of computer-based random numbers. Suppose, for example, that in actual practice patients enter the clinic randomly at a rate that averages one entry every four minutes. This means that during any one-minute interval there is one chance in four that a patient will enter. To simulate this experience, the computer is inst~~cted to generate with equal likelihood the number 1, 2, 3, or 4. If by chance the number 11 1 11 is generated, the computer notes that a "patient" ha:;; entered the clinic; otherwise no entry is recorded. As all of the essential clinic activities are simulated in this way, the computer keeps track of them, much like the clerk in the previous case, and eventually presents a summary report for analytical purposes.
7.3 Outline of Application to Health
Having described the fabric of operations research in sufficient detail for our purposes, we proceed to list some of the health products that can be sewn from this material.
Problem Forms
Inventory
Allocation
Queuing
ILil!STRATIVE FORMS OF OPERATIONS RESEARCH APPLIED TO HEALTH PROBLEMS
~strative Applications
Control of Hospital Whole Blood Supply
Development of Health Centre Staffing Patterns
Hospital Admission Patterns and Their Effect upon Bed Utilization
Problem Forms -------Sequencing
Routing
Replacement
Competition
Search
- 47 -
1llu~trative Ap~lications
Scheduling of Programme Implementation with the Aid of CPM
Scheduling of Periodic Family Planning Clinics in a Number of Villages
Development of Vehicle Maintenance Policies
Budgeting for Certain Health Programmes in Competition with Education, Economic Development, and other Health Programmes
Audit of Hospital Performance
The listing is virtually self-explanatory, but two comments seem appropriate by way of interpretation. First, there is a lag in the application of oper~tions research techniques to health problems, suggested by the fact that not all of the suggested applications have been tried, even though each of the underlying problems is genuine. Secondly, we see that the most obvious and straightforward operations research applications involve well-defined and clearly-located administrative entities (such as hospital pharmacies or obstetrical wards) that deal with tangible factors (such as medicine or vehicles) that are easily quantified and subjected to mathematical manip11lation.
Most of the early industrial applications of operations research were lil~ewise in this realm. In recent years, however, the interest has been clearly shifting toward organizational and behavioural questions. As a result, we find a number of recent applications that concern the interplay between physical and human resources and the means of most effectively organizing these resources. In other words, we are no longer content to suppose that the calculated optimum combinations of physical resources will automatically produce ideal results apart from the organized human effort to mobilize these resources.
For us the consequence of the foregoing comments should be a recognition that a large reservoir of health problems of rather limited scope exist for which the operations research approach offers readymade undramatic solutions which nevertheless have a high potential pay-off. At the same time we face the challenge of imaginative and innovative applications of the approach to the broader, less tangible health problems that have previously defied rational solution or even full comprehension.
- 48 -
7.4 s2ecial Consideration of Health Practice Research
In order to put these thoughts onto a more concrete footing with reference to research in public health practice, let us consider the question of the comprehensive planning of a number of health programmes in a particular country or region. Conceptually, we have the inputoutput matrix below which indicates that the various programmes, if implemented in one alternative manner or another, would presumably improve the health status of the population to a specified extent in exchange for the utilization of various resources, both human and physical. Underlying these relationships, of course, are limitations upon the supply of each of the resources as well as the financial and organizational considerations that relate to their effective utilization.
In practice, even in the most developed countries, we simply do not have all the data to fill in the matrix, and we lack analytical competence to process rationally all that we do have. Let us start at the beginning therefore, and outline the various stages of information-gathering and analysis that might be contemplated. Initially, a country might find itself with manpower bottlenecks that are so obvious that they require little sophisticated analysis. If, for example, there is one nurse per 60 000 population f prin1a1-.y attention will be directed toward increasing the absolute number of nurses rather than toward selecting from a wide array of health programmes. At this stage, then, a simple descriptive operations research model will be useful in forecasting the effects over time of various migration patterns, development of new nursing programmes, etc. If costs could be assigned to the lack of nurses as well as to the training of recruitment of additional ones, a more sophisticated predictive model could be used to determine the optimal rate of increasing the supply.
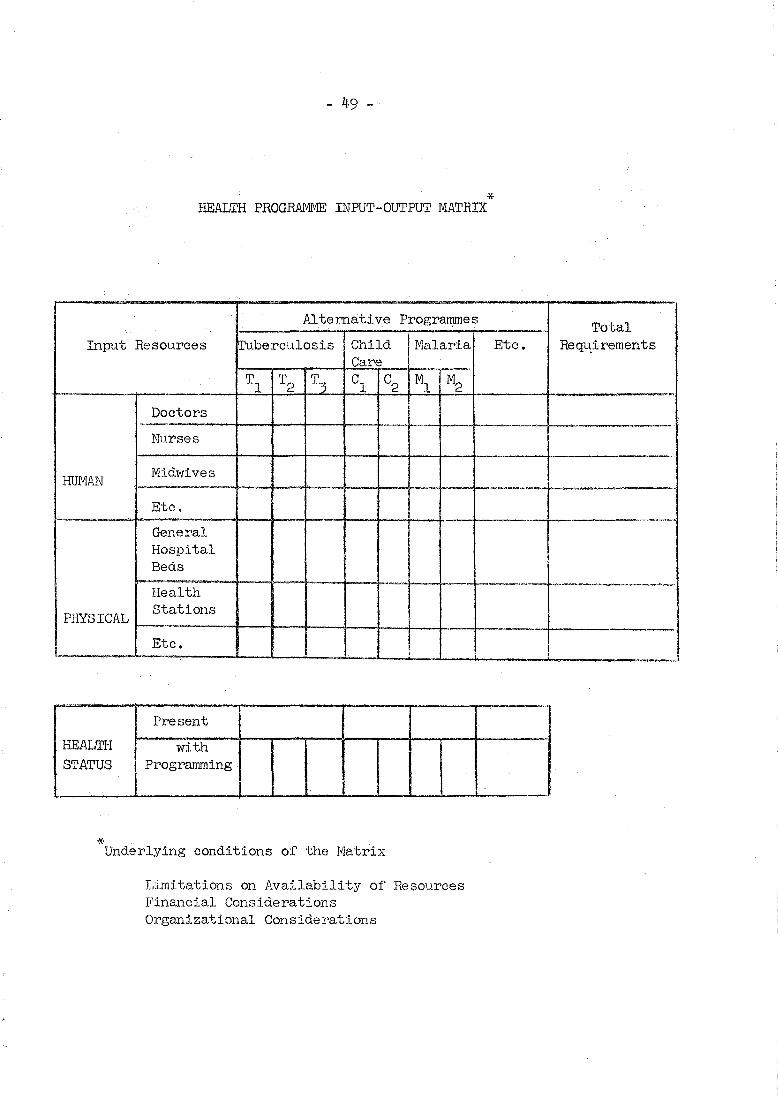
I
40 -- ./
* HEALTH PROGRAMME INPUT-OUTPUT MATRIX
·- ..
Alternative Programmes
Input Resources !Tuberculosis Child Malaria Care
Tl T2 cl c2 Ml M2 ~
T3
Doctors ... -Nurses
HUMAN Midwives
Etc.
General Hospital Beds
Health
PHYSICAL Stations
Etc. ;
Present
HEALTH with STATUS Programming .
I
* Underlying conditions of the Matrix
Limitations on Availability of Resources I''inancial Considerations Organizational Considerations
Total Etc. Req-qirements
..
I
I I
.• j
! !
--- [-----·----···---·! !
1
"'· ~ ~ --,.,.,..-~
---· • ,.,
- 52 -
King, I.M. (1968) A conceptual frame of reference for nursing. Nurs. Res. 17, 27-31.
Kingsbury, V. (1967) Nursing needs in Latin America. Hosp. Prog. 48, 43-47.
Kuruvilla, A. (1963) Research in nursing education. Working Paper No. 3, Scientific Group on Research in Nursing, Geneva, World Health Organization.
Levine, E. (1961) Factors affecting nurse staffing in a Federal and Non-Federal General Hospital. Milit. Med. 126, 540-546.
MacGuire, J., et al. (1968) Training for reality. 2. of demographic trends for the training of nurses. 117-120. Supplement.
The implications Nurs. Times, 64,
Meyer, B. & Heidgerken, L.E. (1962) Introduction to research in nursing. Philadelphia, J.B. Lippincott.
Mussallem, H.K. (1963) Trends in research in nursing (Canada and the United States of America). Working Paper No. 1, Scientific Group on Research in Nursing, Geneva, November 1963.
Pratt, R. (1963) Nursing service and research. Working Paper No. 2, Scientific Group on Research in Nursing, Geneva, November 1963.
Schwartz, D.R. (1966) The value of small local nursing studies. Amer. J. Nurs. 66, 1327-1329.
Senecal, J. (1965) Needs and difficulties of training health personnel in developing countries. Israel J. Med. Sci. l• 351-360.
Simmons, L.W. & Henderson, v. (1964) Nursing research: a survey and assessment. New York, Appleton-Century-Crofts.
Some trends in nursing research (1962) Abstracted from a paper prepared by H.C. Belcher and E.M. Vreeland. Quart. Rev. March 1962.
Werley, H.H. ed. (1962) Report on Nursing Research Conference held at Walter Reed Army Institute of Research, Washington, D.C., on 24 February-7 March 1959.
White, K.L. ed. (1965) Medical care research. Proceedings of the Symposium on Medical Care Research. Oxford, Pergamon Press.
World Health Organization, Regional Office for the Western Pacific (1965) Report on the First Regional Nursing Studies Seminar, 2-30 August 1965, Manila, Philippines.
- 53 -
II RESEARCH PROCESS : Methodological, Statistical, Data Processing
Bartlett, M.S. ed. (1960)Stochastic population models in ecology and epidemiology. London, Methuen & Co.
Bermosk, L.S. & Mordan, M.J. (1964) Interviewing in nursing. New York, Macmillan Company.
Bhatia, B.D. (1964) Interviewing as a teclmique in research. Nurs. J. India, 55, 15-16.
Bradford Hill, Sir A. (1967) Principles of medical statistics, 8th ed. London·, The Lancet.
Carol, B. (1968) Philosophy for operating a computer center. Pub. Hlth. Rep. 83, 372.
Catliff, G.C. (1964) Critical path analysis as an aid to hospital planning. Brit. Hosp. Soc. Serv. J. 120l~-1206.
Cohen, J. (1965) Routine morbidity statistics as a tool for defining public health priorities. Israel ~· Med. Sci. !• 457-460.
Connor, R.J. (1961) A work sampling study of variations in nursing work load. Hospitals, 35, No. 9, 40-48.
Critical path analysis (1968) Tr1e Hospital, 64, 231-233.
DeMarco, J.P. & Snavely, S.A. (1963) Nursing staffing with a data processing system. Amer. J. ~· 63, 122-125.
Fix, E. & Neyman, J. (1951) A simple stochastic model of recovery, relapse, death and loss of patients. Human Biol. 28, 205-241.
Galdston, I. ed. (1953) The epidemiology of health. A New York Academy of Medicine book. New York, Health Education Council.
Good, C.V. & Scates, D.E. (1954) Methods of research: educational, psychological, sociological. New York, Appleton-Century-Crofts.
Grube, E.F. (1967) Here is how work measurement works. Modern Hosp. loS, 119-121.
Hamacheck, D.D. (1967) Systems analysis precedes reasons for considering a computer. Hos~ Account. 21, 24-26.
Hansen, M.H.$et al. (1953) Sample survey methods and theory. Vol. 1. Methods and applications. New York, John Wiley & Sons.
- 54 -
Hansen, H.J. (1965) Reducing the work in work areas with time measurement data. Hospitals, 39, No. 22, 57-59.
Hess, I. & Srikantan, K.S. (1966) Some aspects of the probability sampling techniques of controlled selection. Hlth. Serv. Res. 1, 8-52. - -
Holliday, J. (1964) The exploratory study method. An aid to research design. Nurs. Res. 13, 37-44.
Howland, D. (1963) A hospital system model. Nurs. Res. 12, 232-236.
Howlan~ D. & McDowell, W.E. (1964) The measurement of patient care: A conceptual framework. Nur~. Res. 13~ lf-7.
Kahn, R.L. & Cannel, C.F. (1957) The dynamics of interviewing: theory, technique, and cases. New York, John Wiley & Sons.
Kish, L. (1965) Sampling organizations and groups of unequal si.zes • ./\mer. Soc. Rev. 30, 561~-572.
Levy, F.K.,et al. (1963) The ABCs of the critical path method. Harvard Bus • Rev. 98-1 o8 •
Mason, E.E. & Bulgren, W.G. (1964) Computer application in medicine. Springfield, Charles C. Tnomas.
Pair, N. (1964) Problems encountered in the conduct of nursing resources survey. J. Nurs. Educ. ~~ 27-29.
Pan American Health Organization (1966) Survey of schools of nursing in the Caribbean Area, March 1964 ~August 1965. Washington, D.C., Pan American Sanitary Bureau.
Parten, M. (1950) Surveys, polls, and samples: practical procedures. New Yorl~, Harper & Brothers.
Research methods applied to nursing (1968) Nurs. Mirror, 126, 14-15.
Revans, R.W. (1961) The measurement of supervisory attitudes. Manchester, Manchester Statistical Society.
Richardson, S.A.,et al. (1965) Interviewing: its forms and functions. New York, Basic Books.
Taube, M. (1961) Computers and common sense: the myth of thinking machines. New York, Columbia University Press.
- 55 -
Trinidad and Tobago. Mli1istry of Health (1968) Report on a quantitative and qualitative survey of nursing needs and resources. Trinidad, Government Printer.
U.S. National Center for Health Statistics (1964) Health survey procedure: concepts, questionnaire development and definitions in the health interview survey. USPHS Publ. No. 1000-Series 1-No. 2. Washington, D.C., u.s. Govt Printing Office.
Weckwerth, V.E. (1966) Determining bed needs from occupancy and census figures. Hospitals, 40, No. 1, 52-54.
Whlte, D. (1968) Computers in public health. Unpublished Document EURO 3092/4 of the Seminar on the Publin HeaJ.th Uses of Electronic Computers, London, 17-21 June 1968.
World Health Organization, Regional Office for Europe (1965) The application of automatic data-processing systems in health administration. Report on a uonference convened by the Hegional Office for Europe of WHO, Copenhagen. 17-21 November 19611 .•
World Health Organization (1968) Morbidity statistics. Twelfth Report of the WHO Expert Committee on Health 8tatistics. Technical Report Series No. 389. Geneva, World Health Organization.
III STUDIES : Manpower
American Public I-Ieal th Association (1968) Health manpower - summaries of selected papers from the 95th annual meetlng of the APHA held at Miami Beach, October 22-27, 1967. Pub. Hlth. Reo. 83, 184-188.
------------~- --Ave Lallemant, G. (1966) Work measurement: first step to better manpower management. k!_()Spitals, 39, No. 12, 67-71.
Baker, T.D. (1967) Health manpower in a developing economy: Taiwan, a case of study in planning. Baltimore, Johns Hopkins Press.
Baker, T.D. (1968) Dynamics of health manpower planning. Med. Care, !,t, 205-2ll. .
Bayer, A.E. (1967) Nurse supply: it's bGtter than wo thought. Modern Hosp. 109, No. 1, 75-79.
Black, I. & Outtier, M. (1968) A census of nursing personnel in community health. Canad. J. Pub. Hlth. 59, 1-5.
Brosseau, B.L.P. (1967) Problemas de main-d'oeuvre. L'hopital d 1 aujourd'hui, 13, No. 11, 14-18. ---
- 56 -
Canadian Nurses' Association (1968) Canadian nursing statistics, 1968. Ottawa, Canadian Nurses' Association.
Cavanaugh, J .A. (1964) Future health manpower needs in Latin America. Pub. Hlth. Rep. 79, 911-916.
Colombia. Ministry of Public Health (1967) Study of health manpower and medical education in Colombia. International Conference on Health Manpower and Medical Education (in 3 parts). Washington, D.C., Pan American Health Organization.
Darley, W. & Somers, A.R. (1967) Medicine, money, and manpower -the challenge to professional education. IV. New training for new needs. New Eng. J. Med. 276, 1471-1478.
Davis, R.G. (1966) Planning human resources development: educational models and schemata. Chicago, Rand McNally.
DeWitt, N. (1961) Education and professional employment in the USSR. Prepared for the National Science Foundation. Washington, D.C., U.S. Govt Printing Office.
Fein, R. (1967) The doctor shortage: an economic diagnosis. Washington, D.C., Brookings Institution.
Flint, R.T. & Spenseley, K.C. (1969) Recent issues in nursing manpower: a review. Nurs. HeE_. 18, 217-229.
Friedman, M. (1966) A source of manpower problems - working conditions in health institutions. Employ. Serv. Rev. l• No. 11, 40-41.
Fry, fi.G. (1967) Education and manpower for community health. Pittsburgh, University of Pittsburg Press.
Gales, K. & Wright, R.C. (1966) A survey of manpower demand forecasts for the social services. London, National Council of Social Service.
Ginsberg, E. (1967) Nursing and manpower realities. Nurs. Outlook, 15, No. ll, 26-29.
Hall, T.L. (1969) Health manpower in Peru: a case study in planning. Baltimore, Johns Hopkins Press.
Harbison, F. & Myers, C.A. (1965) Manpower and education: country studies in economic development. New York, McGraw-Hill.
Harrar, G.J. (1963) Making the most of human resources. Amer. J. Pub. Hlth. 53, 375-381.
- 57 -
Hiestand, D.L. (1966) Research into manpower for health services. Milbank Mem. Fund Quart. 44, 146-181.
Hyde, H. van Zile (1966) Manpower for the world's health. Report of the Institute on International Medical Education. J. Med. Educ. 41, Supplement, September 1966.
India, Institute of Applied Manpower Research (1966) Stock of nursing personnel in India. Manpower survey: health and medical manpower. New Delhi, The Institute.
James, G. (1967) Meeting the crisis in health manpower. Pub. Hlth. Rep. 82, 1035-1044. -
Jones, K. (1967) New light on the nursing shortage. Nurs. Times, 63, 1018-1020.
Kafuko, G.W. (1968) Organization of health services with limited professional manpower. Rehovoth Conference on Health Problems in Developing Countries, Israel, 15-23 August 1967. Israel J. Med. Sci. ~~ 599-613. .
Karefa-Smart, J. (1968) Health and manpower: interrelationship between health and socioeconomic development. Rehovoth Conference on Health Problems in Development States, 15-23 August 1967. Israel J. Med. Sci.~. 586-598. -~
Kissick, W.L. (1968) Effective utilization: the critical factor in health manpower. Amer. J. Pub. Hlth. 58, 23-29.
Kissick, W.L. (1967) Forecasting health manpower needs (in 2 parts). Hospital~, 41, No. 18, 47-51 and No. 19, 76-83.
Kissick, W.L. (1968) Health manpower in transition. lfdlbank Mem. Fund Quart. 46, 53-90.
Knowles, J.H. (1969) The quantity and quality of medical manpower: a review of medicine's current efforts. ~Med. Educ. 44, 81-118.
Lahav, E. (1967) Methodologic problems in health manpower research. New Engl. J. Med •. 277, 959-962.
Levine, E. (1969) Nurse manpower: yesterday, today, and tomorrow. Amer. J. Nurs. 69, 290-296.
Moxley, J.H. (1968) The predicament in health manpower. ~· 68, 1486-1490.
Amer. J. ~
Mussallem, H.K. (1967) Manpower problems in nursing. Canad. Nurs. 6~.' 25-28.
- 58 -
Mussallem# H.K. (1968) No lack of nurses - but a:-:shortage of nursing. Internat. Nurs. Re~. 15, No. 1, 35-49.
Olson, E.V. (1968) Health manpower. Needed: a shake-up in the status quo. Amer. J. Nurs. 68, 1491-1495.
Pence, S.A. (1967) Prudent management methods can create new manpower. Ho~pitals, 41, No. 11, 60-62.
Rosner, L.J. (1964) Some techniques for meeting personnel shortages. ~e.£~2"~~?..!,.!:11~.£· 54, 615-623.
Siegel, I.H. ed. (1967) Manpower tomorrow: prospects and priorities. Report on a conference commemorating two decades of service. New York, Augustus M. Kelley.
Sofoluwe, G.O. (1968) Nigerian health manpower needs. J. Soc. Hlth. (Nigeria) 3, 35-43.
Stahl, A.G. (1964) Manpower Development and Training Act. Concerns for nursing. Amer. J. Nurs. 64, No. 6, 112-115.
Taylor, C.E., et al. (1968) Health manpower planning in Turkey: an international research case study. Baltimore, Johns Hopkins Press.
U.S. Department of Health Education, and Welfare (1952-1962) Health manpower source book. Sections 1 to 19. Washington, D.C., U.S. Govt Printing Office. USPHS Publ. No. 263.
U.S. Department of Health Education, and Welfare (1968) Health resources statistics: health manpower and health facilities, 1968. Washington, D.C., U.S. Govt Printing Office. USPHS Publ. No. 1509.
U.S. Department of Labor (1968) Manpower programs and planning in economic development. Washington, D.C., Office of Labor Affairs.
U.S. National Advisory Commission on Health Manpower (1967) Report. Washington, D.C., U.S. Govt Printing Office. (2 volt~es).
Weiss, J.H. (1968) A job classification scheme for health manpower. Hlth Serv. Res. ~. 48-64.
World Health Organization (1965) World shortage of medical manpower. WHO Chron. 19, 47-55.
Yett, D.E. (1965) The supply of nurses: an economist's view. Hosp. Prog. 46, 88-102. --
- 59 -
STUDIES : Nursing Service: Public Health, Hospital; Nursing Education; Health Services; General
Arizona State Nurses' Association (1968) Interim Report No. 3 of the Joint Corrmittee to Study Nursing Needs and Resources in Arizona. Arizona Nurse, 21, 17-24. . -Arnstein, M.G. (1953) Guide for national studies of nursing resources. Bull. WHO, Supplement 7.
Borgotta, E.F. (1966) Research problems in evaluation of health service demonstrations. Milbank Mem. Fund Quart. 44, 182-201.
Brazilian Nursing Association (1963) Survey of needs and resources of nursing in Brazil. Rio de Janeiro, The Association.
Chang, M. (1964) How to survey a school of nursing. Internat. Nurs. Rev. 11, 45-46.
Clark, A.L. (1967) Expanding dimensions in nursing practice. ANA Reg._Clin. Conf. 317-322.
Creelman, L. (1968) Quality care in the right quantity: two decades of WHO nursing assistance. Internat. Nurs. Rev. 15, No. 2, 102-112.
Ferguson, J.E. (1967) Nursing education programs and their effect on staffing of hospitals. Hpsp. Fo~m, 10, 22-25.
Feyerherm, A.M. (1966) Nursing activity patterns: a guide to staffing. Nurs. Res. 15, 124-136.
Florence Nightingale International Foundation (1954) How to survey a school of nursing. A suggested method, illustrated with samples of five post-basic schools. Part II. London, International Council of Nurses.
Freeman, R.B. (1961) Measuring the effectiveness of public health nursing service. Nurs. Outlook, 2, 605-607.
Freeman# R.B. & Lowe, N. (1963) A method for appraising family public health nursing needs. Amer. J. Pub. Hlth. 53, 47-52.
Hockey, L. (1966) Feeling the pulse: a survey of district nursing in six areas. Cambridge, Queen's Institute of District Nursing.
Huffman, V.M. (1968) Selected findings from a study of activities of nursing personnel in six health units and municipal health departments in one province in Cwnadu. Canad. J. Pub. Hlth. 59, 65-68. --
- 60 -
Hyman, H. (1966) Survey design and analysis: principles, cases and procedures. Glencoe, Free Press.
Ireland, Down County Health Department (1967) Report on a community health study and research project in methodology in relation to the health services in an area in County Down, Northern Ireland, 1964-1967.
Israel, Ministry of Health (1967) Nursing activities study. Israel-1966. Jerusalem, Ministry of Health Nursing Unit.
Jelinek, R.C. (1966) A new approach to the analysis of nursing activities. Hospitals, 40, No. 19, 89-91.
Leeds Regional Hospital Board (1963) Work measurement as a basis for calculating nursing establishments. An analytical study. Leeds, Hospital Board.
Ludwig, D.J. & Humphrey, A. (1963) .Staffing by nursing hours per patient day. ~~' !.tl, 46-48.
MacGregor, F.C. (1967) Nursing in transition - challenge for the future. InteTUat. Nurs. Rev. 14, No. 6, 41-43.
Messick, J.M. & Aguilera, D.C. (1968) Realistic utilization: levels of' preparation. J. Psychiat. __ Nurs. 6, 133-137.
Mussallem, II.K. (1966) Studies on nursing in Canada. Unpublished document No. PA/66.174, Travelling Seminar on Nursing, USSR, 6-28 October 1966.
Reid, M. (1969) A study of the activities of auxiliary nursemidwives in Haryana, Punjab and Gujarat States, India, FebruaryDecember 1967. Unpublished document SEA/Nurs/130. New Delhi, WHO SEARO.
Roberts, D.E. & Hudson, H.H. (1964) How to study patient progress. Washington, D,C., U.S. Govt Printing Office. USPHS Publ. No. 1169.
Roberts~ D.E. & Hudson~ H.H. (1963) The staffing of public health and out-patient nursing services: methods of study. Geneva, World Health Organization. ~ffiO Public Health Paper No. 21.
Taylor, C.W. et al (1966) Selection and recruitment of nurses and nursing students: a review of research studies and practices. Salt Lake City, Utah University Press.
Thompson, J.B~ et al (1960) How queuing theory works for the hospital. Modem Hosp. 94, No. 3, 75-78~
'"j.
- 61 -
United Hospital Fund of New York. Training, Research and Special Studies Division (1967) Systems analysis and design of outpatient department, appointment and information systems. A special study in hospital systems and procedures. New York, The Fund.
u.s. Department of Labor (1966) Training health service workers: the critical challenge. Proceedings of the Conference on Job Development and Training for Workers in Health Services. Washington, D.C., U.S. Govt Printing Office.
U.S. Public Health Service, Division of Nursing (1964) How to study nursing activities in a patient unit. Washington, D.C., u.s. Govt Printing Office, USPHS Publ. No. 340 Revised.
u.s. Surgeon General's Consultant Group on Nursing (1963) Toward quality in nursing needs and goals. Washington, D.C., U.S. Govt Printing Office, USPHS Publ. No. 992.
Williams, w •• J., et al (1967) Slmulation modeling of a teaching hospital out-patient clinic. f:!:?spita];E_, 41, No. 21, 71-75.
Wolfe, H. & Young, J.P. ( 1965) Staffing the nursing unit. Part I. Controlled variable staffing. Part II. 'rl1e nml tiyle assignment technique. Nu.rs. Res. 14, 236-243, and 299-303.
World Health Organization, Regional Office for South-East Asia (1968) Report on conference related to the study of the activities of the auxiliary nurse-midwife in public health services in the states of Punjab, Haryana and Gujarat, India. Unpublished Document SEA/Nurse/128. New Delhi, WHO SEARO.
Young, M.A.C. (1967-1969) Review of research and studies related to health education practice (1961-1966). Society of Public Health Educators Monograph Nos. 23 - 28, 1967-1969.
IV SOCIO-CULTURAL ASPECTS OF RESEARCH
Benedict, R. (1935) Patterns of culture. London, Routledge & Kegan Paul.
Bogardus, E.S. & Brethorst, A.B. (1952) Sociology applied to nursing. Philadelphia, W.B. Saunders.
Glock, C.Y. ed. (1967) Survey research in the social sciences. New York, Russel Sage Foundation.
Good, C.V. & Scates, D.E. (1954) Methods of research: educational psychological, sociological. New York, Appleton-Century-Crofts.
- 62 -
Horton, P.B. (1965) Sociology and the health sciences. New York, McGraw-Hill.
Mead, M. ed. (1953) Cultural patterns and technical change. Paris, UNESCO.
Paul, B.D. (1955) Health, culture and community: case studies of public reactions to health programs. New York, Russell Sage Foundation.
Skipper, J.K. & Leonard, R.C. eds. (1965) Social interaction and patient care. Philadelphia, J.B. Lippincott.
Smoyak, S. (1968) Cultural incongruence: the effect of nurses' perceptions. Nurs. Forum, z, 234-247.
Young, P.V. (1966) Scientific social surveys and research: an introduction to the background, content, methods, principles and analysis of social studies. Englewood-Cliffs, Prentice-Hall.
V COMMUNICATION OF RESEARCH FINDINGS
Abdellah, F.G. & Levtne, E. (1965) Communication of research findings. Chap.9, pp. 383-393 of Better patient care through nursing research. New Yox~, Macmillan Company.
Ehrlich, E. & Murphy, D. (1964) Writing and researching term papers and reports: a new guide for students. New York, Bantam Books.
Gatner, E.S.M. & Cordasco, F. (1961) Research and report writing. New York, Barnes & Noble.
Trelease, S.F. (1951) The scientific paper: how to prepare it, how to write it. A handbook for students and research workers in all branches of science. Baltimore, Williams & Wilkins.
VI OPERATIONS RESEARCH
Ackoff, R.L. ed. (1961) Progress in operations research, Vol. 1. New York, John Wiley & Sons.
Andersen, S (1964) Operations research in public health. Publ. Hlth. Rep. 79, 297-305.
Duckworth, E. (1965) A guide to operational research. London, Methuen & Co.
'"' .. >
- 63 -
Flagle, C.D. (1964) Operations research in community services. Chap.l3 of Progress in operations research by R.L. Acoff & R.T. Eddison, Vol. 2. New York, John Wiley & Sons.
Horvath, W.J. (1964) British experience with operations research in the health services. J. Chron. Dis. 17, 779-788.
Oxford Regional Hospital Board. Operational Research Unit. (1962-1967). Nursing care in a modem hospital; Hospital outpatient services; Scheduling of student nurses with the aid of a computer; Measurement of nursing care. Oxford, Oxford Regional Hospital Board.
Oxford Regional Hospital Board. Operational Research Unit. (1966) Operational research in nursing: new dimensions in nursing and hospital administration. Oxford, The Board.
VII HEALTH PLANNING
Abel-Smith, B. (1967) An international study of health expenditure, and its relevance for health planning. Geneva, World Health Organization. WHO Public Health Papers No. 32.
Arnold, M.F., et al eds. (1966) Health program implementation through PERT. Administrative and educational uses. San Francisco, American Public Health Association.
Carlisle, B. (1965) How PERT simplifies management of hospital programs. Hospitals, 39, No. 24, 61-64.
Croft Long, E. (1965) Health objectives for the developing society. Responsibility of individual, physician, and community. Durham, Duke University Press.
Hall, T.L. (1966) Planning for health in Peru - new approaches to an old problem. Amer. J. Pub. ~· 56, 1296-1307.
Hilloboe, H.E. & Schaefer, M. (1966) Planning for community health by problem areas. Unpublished document No. NHP /INF /66.1, WHO Expert Committee on National Health Planning in Developing Countries, 27 September-3 October 1966, Geneva.
Holley, E.S. (1967) Nurses' involvement in health planning from the state level. ANA Reg. Clin. Conf. 19-24.
Mattison, B.F. (1968) Community health planning and the health professions. Arne~. J. Pub._fllth. 58, 1015-1021.
Murphy, M.I. (1967) Health planning and its implications for nursing practice. ANA Reg. Clin. Conf. 1-11.
- 64 -
Mushkin, S. & Reifman, L. (1964) Health programming in developing nations. In Proceedings of the Symposium on the Possibility of Operational Research in Developing Countries, pp. 299-325. Paris, Dunod.
f1ushkin, S. (1964) Health programming in developing nations. Internat. Dev. Rev. £, 7-12.
Perkins, R.F. (1968) Community health patterns. Amer. J. Pub. Hlth. 58, 1154-1161.
World Health Organization (1967) National health planning in developing countries. Report of a WHO Expert Committee. WHO Technical Report Series No. 350. Geneva, WHO.
World Health Organization (1961) Planning of public health services. Fourl:.h Rer.>u.r·l:. uf the Expert Committee on Public Health Administro.tion. WHO Technical Report Series No. 215, Geneva, 'VJHO.
HEALTH PLANNING : Economics of Health
Abel-Smith, B. (1968) Economics of health services. Unpublished duuurmmt EURO 0339/3 of the Oeminar on IIeo.lt.h F.conomico, Moocow, 25 June-5 July 1968.
Abel-Smith, B. (1963) Paying for healtll services: a study of the costs and sources of finance in six countries. vmo Public Health Paper No. 17~ Geneva, WHO.
Blanpain, J.E. (1968) Economics of health manpower. Unpublished document EURO 0339/6 of the Seminar on Health Economics, Moscow, 25 June-5 July 1968.
Crystal, R.A. & Brewster, A.W. (1966) Cost benefit and cost effectiveness analyses in the health field: an introduction. Inquiry, 3, No. 4, 3-13. -
Feldstein, M.S. (1967) Measuring the costs and benefits of health services. In: The efficiency of medical care: report on a symposium. Copenhagen, 4 - 8 July 1966. Document EURO 294.2.
Klarman, H.E. (1965) The economics of health. New York, Columbia University Press.
Pacl~er, A.H. (1968) Applying cost-effectiveness concepts to the commtmity health system. Operations Research, 16, 227-253.
- 65 -
Popov, G.A. (1968) Some principles of health planning in relation to health economics. Unpublished document EURO 0339)8 of the Seminar on Health Economics, Moscow, 25 June - 5 July 1968.
Rice, R.G. (1966) Analysis of the hospital as an economic organism. Mode~ Hosp. lo6, No. 4, 87-91.
University of Michigan, Bureau of Health Economics (1964) The economics of health and medical care: proceedings of the Conference on the Economics of Healtl1 and Medical Care, May 10-12, 1962. Ann Arbor, University of Michigan Press.
Weisbrod, B.A. (1961) Ecor1omics of public health: measuring the economic impact of diseases. Philadelphia, University of Pennsylvania Press.
World Health Organization, Regional Office for Europe (1968) Health economics: report on a seminar convened by WHO Regional Office for Europe, 25 June - 5 July 1968. Document EURO 0339.
Yett, D.E. (196'7) Research on health economics: Report of a survey. Washington, D.C., U.S. Public Health Service.