Embed Size (px)
Citation preview
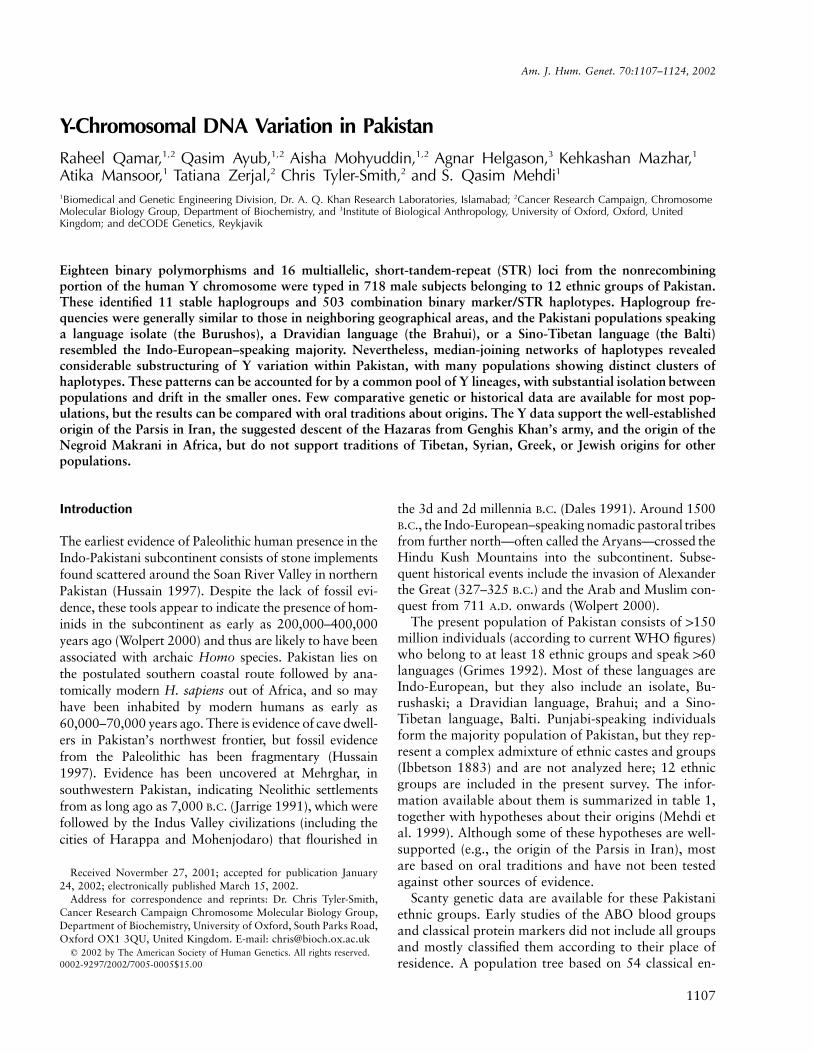
Am. J. Hum. Genet. 70:1107–1124, 2002
1107
Y-Chromosomal DNA Variation in PakistanRaheel Qamar,1,2 Qasim Ayub,1,2 Aisha Mohyuddin,1,2 Agnar Helgason,3 Kehkashan Mazhar,1Atika Mansoor,1 Tatiana Zerjal,2 Chris Tyler-Smith,2 and S. Qasim Mehdi1
1Biomedical and Genetic Engineering Division, Dr. A. Q. Khan Research Laboratories, Islamabad; 2Cancer Research Campaign, ChromosomeMolecular Biology Group, Department of Biochemistry, and 3Institute of Biological Anthropology, University of Oxford, Oxford, UnitedKingdom; and deCODE Genetics, Reykjavik
Eighteen binary polymorphisms and 16 multiallelic, short-tandem-repeat (STR) loci from the nonrecombiningportion of the human Y chromosome were typed in 718 male subjects belonging to 12 ethnic groups of Pakistan.These identified 11 stable haplogroups and 503 combination binary marker/STR haplotypes. Haplogroup fre-quencies were generally similar to those in neighboring geographical areas, and the Pakistani populations speakinga language isolate (the Burushos), a Dravidian language (the Brahui), or a Sino-Tibetan language (the Balti)resembled the Indo-European–speaking majority. Nevertheless, median-joining networks of haplotypes revealedconsiderable substructuring of Y variation within Pakistan, with many populations showing distinct clusters ofhaplotypes. These patterns can be accounted for by a common pool of Y lineages, with substantial isolation betweenpopulations and drift in the smaller ones. Few comparative genetic or historical data are available for most pop-ulations, but the results can be compared with oral traditions about origins. The Y data support the well-establishedorigin of the Parsis in Iran, the suggested descent of the Hazaras from Genghis Khan’s army, and the origin of theNegroid Makrani in Africa, but do not support traditions of Tibetan, Syrian, Greek, or Jewish origins for otherpopulations.
Introduction
The earliest evidence of Paleolithic human presence in theIndo-Pakistani subcontinent consists of stone implementsfound scattered around the Soan River Valley in northernPakistan (Hussain 1997). Despite the lack of fossil evi-dence, these tools appear to indicate the presence of hom-inids in the subcontinent as early as 200,000–400,000years ago (Wolpert 2000) and thus are likely to have beenassociated with archaic Homo species. Pakistan lies onthe postulated southern coastal route followed by ana-tomically modern H. sapiens out of Africa, and so mayhave been inhabited by modern humans as early as60,000–70,000 years ago. There is evidence of cave dwell-ers in Pakistan’s northwest frontier, but fossil evidencefrom the Paleolithic has been fragmentary (Hussain1997). Evidence has been uncovered at Mehrghar, insouthwestern Pakistan, indicating Neolithic settlementsfrom as long ago as 7,000 B.C. (Jarrige 1991), which werefollowed by the Indus Valley civilizations (including thecities of Harappa and Mohenjodaro) that flourished in
Received Novermber 27, 2001; accepted for publication January24, 2002; electronically published March 15, 2002.
Address for correspondence and reprints: Dr. Chris Tyler-Smith,Cancer Research Campaign Chromosome Molecular Biology Group,Department of Biochemistry, University of Oxford, South Parks Road,Oxford OX1 3QU, United Kingdom. E-mail: [email protected]
� 2002 by The American Society of Human Genetics. All rights reserved.0002-9297/2002/7005-0005$15.00
the 3d and 2d millennia B.C. (Dales 1991). Around 1500B.C., the Indo-European–speaking nomadic pastoral tribesfrom further north—often called the Aryans—crossed theHindu Kush Mountains into the subcontinent. Subse-quent historical events include the invasion of Alexanderthe Great (327–325 B.C.) and the Arab and Muslim con-quest from 711 A.D. onwards (Wolpert 2000).
The present population of Pakistan consists of 1150million individuals (according to current WHO figures)who belong to at least 18 ethnic groups and speak 160languages (Grimes 1992). Most of these languages areIndo-European, but they also include an isolate, Bu-rushaski; a Dravidian language, Brahui; and a Sino-Tibetan language, Balti. Punjabi-speaking individualsform the majority population of Pakistan, but they rep-resent a complex admixture of ethnic castes and groups(Ibbetson 1883) and are not analyzed here; 12 ethnicgroups are included in the present survey. The infor-mation available about them is summarized in table 1,together with hypotheses about their origins (Mehdi etal. 1999). Although some of these hypotheses are well-supported (e.g., the origin of the Parsis in Iran), mostare based on oral traditions and have not been testedagainst other sources of evidence.
Scanty genetic data are available for these Pakistaniethnic groups. Early studies of the ABO blood groupsand classical protein markers did not include all groupsand mostly classified them according to their place ofresidence. A population tree based on 54 classical en-
1108 Am. J. Hum. Genet. 70:1107–1124, 2002
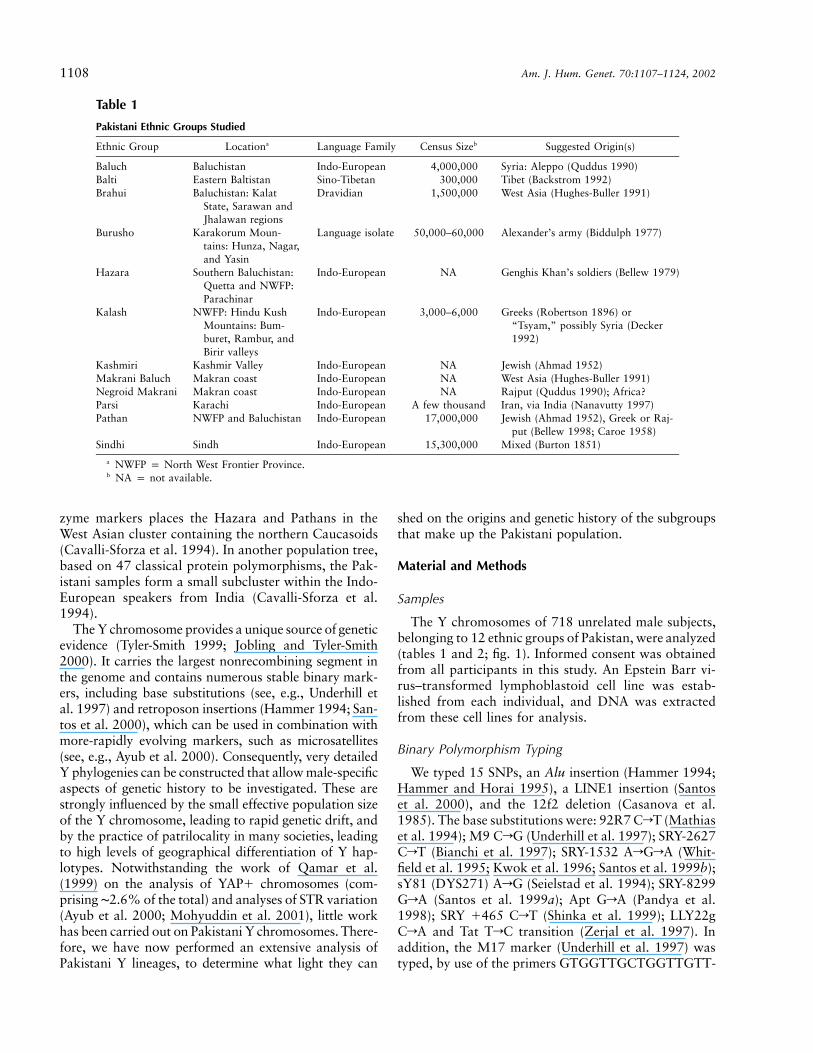
Table 1
Pakistani Ethnic Groups Studied
Ethnic Group Locationa Language Family Census Sizeb Suggested Origin(s)
Baluch Baluchistan Indo-European 4,000,000 Syria: Aleppo (Quddus 1990)Balti Eastern Baltistan Sino-Tibetan 300,000 Tibet (Backstrom 1992)Brahui Baluchistan: Kalat
State, Sarawan andJhalawan regions
Dravidian 1,500,000 West Asia (Hughes-Buller 1991)
Burusho Karakorum Moun-tains: Hunza, Nagar,and Yasin
Language isolate 50,000–60,000 Alexander’s army (Biddulph 1977)
Hazara Southern Baluchistan:Quetta and NWFP:Parachinar
Indo-European NA Genghis Khan’s soldiers (Bellew 1979)
Kalash NWFP: Hindu KushMountains: Bum-buret, Rambur, andBirir valleys
Indo-European 3,000–6,000 Greeks (Robertson 1896) or“Tsyam,” possibly Syria (Decker1992)
Kashmiri Kashmir Valley Indo-European NA Jewish (Ahmad 1952)Makrani Baluch Makran coast Indo-European NA West Asia (Hughes-Buller 1991)Negroid Makrani Makran coast Indo-European NA Rajput (Quddus 1990); Africa?Parsi Karachi Indo-European A few thousand Iran, via India (Nanavutty 1997)Pathan NWFP and Baluchistan Indo-European 17,000,000 Jewish (Ahmad 1952), Greek or Raj-
put (Bellew 1998; Caroe 1958)Sindhi Sindh Indo-European 15,300,000 Mixed (Burton 1851)
a NWFP p North West Frontier Province.b NA p not available.
zyme markers places the Hazara and Pathans in theWest Asian cluster containing the northern Caucasoids(Cavalli-Sforza et al. 1994). In another population tree,based on 47 classical protein polymorphisms, the Pak-istani samples form a small subcluster within the Indo-European speakers from India (Cavalli-Sforza et al.1994).
The Y chromosome provides a unique source of geneticevidence (Tyler-Smith 1999; Jobling and Tyler-Smith2000). It carries the largest nonrecombining segment inthe genome and contains numerous stable binary mark-ers, including base substitutions (see, e.g., Underhill etal. 1997) and retroposon insertions (Hammer 1994; San-tos et al. 2000), which can be used in combination withmore-rapidly evolving markers, such as microsatellites(see, e.g., Ayub et al. 2000). Consequently, very detailedY phylogenies can be constructed that allow male-specificaspects of genetic history to be investigated. These arestrongly influenced by the small effective population sizeof the Y chromosome, leading to rapid genetic drift, andby the practice of patrilocality in many societies, leadingto high levels of geographical differentiation of Y hap-lotypes. Notwithstanding the work of Qamar et al.(1999) on the analysis of YAP� chromosomes (com-prising ∼2.6% of the total) and analyses of STR variation(Ayub et al. 2000; Mohyuddin et al. 2001), little workhas been carried out on Pakistani Y chromosomes. There-fore, we have now performed an extensive analysis ofPakistani Y lineages, to determine what light they can
shed on the origins and genetic history of the subgroupsthat make up the Pakistani population.
Material and Methods
Samples
The Y chromosomes of 718 unrelated male subjects,belonging to 12 ethnic groups of Pakistan, were analyzed(tables 1 and 2; fig. 1). Informed consent was obtainedfrom all participants in this study. An Epstein Barr vi-rus–transformed lymphoblastoid cell line was estab-lished from each individual, and DNA was extractedfrom these cell lines for analysis.
Binary Polymorphism Typing
We typed 15 SNPs, an Alu insertion (Hammer 1994;Hammer and Horai 1995), a LINE1 insertion (Santoset al. 2000), and the 12f2 deletion (Casanova et al.1985). The base substitutions were: 92R7 CrT (Mathiaset al. 1994); M9 CrG (Underhill et al. 1997); SRY-2627CrT (Bianchi et al. 1997); SRY-1532 ArGrA (Whit-field et al. 1995; Kwok et al. 1996; Santos et al. 1999b);sY81 (DYS271) ArG (Seielstad et al. 1994); SRY-8299GrA (Santos et al. 1999a); Apt GrA (Pandya et al.1998); SRY �465 CrT (Shinka et al. 1999); LLY22gCrA and Tat TrC transition (Zerjal et al. 1997). Inaddition, the M17 marker (Underhill et al. 1997) wastyped, by use of the primers GTGGTTGCTGGTTGTT-
Qamar et al.: Y-Chromosomal DNA Variation in Pakistan 1109
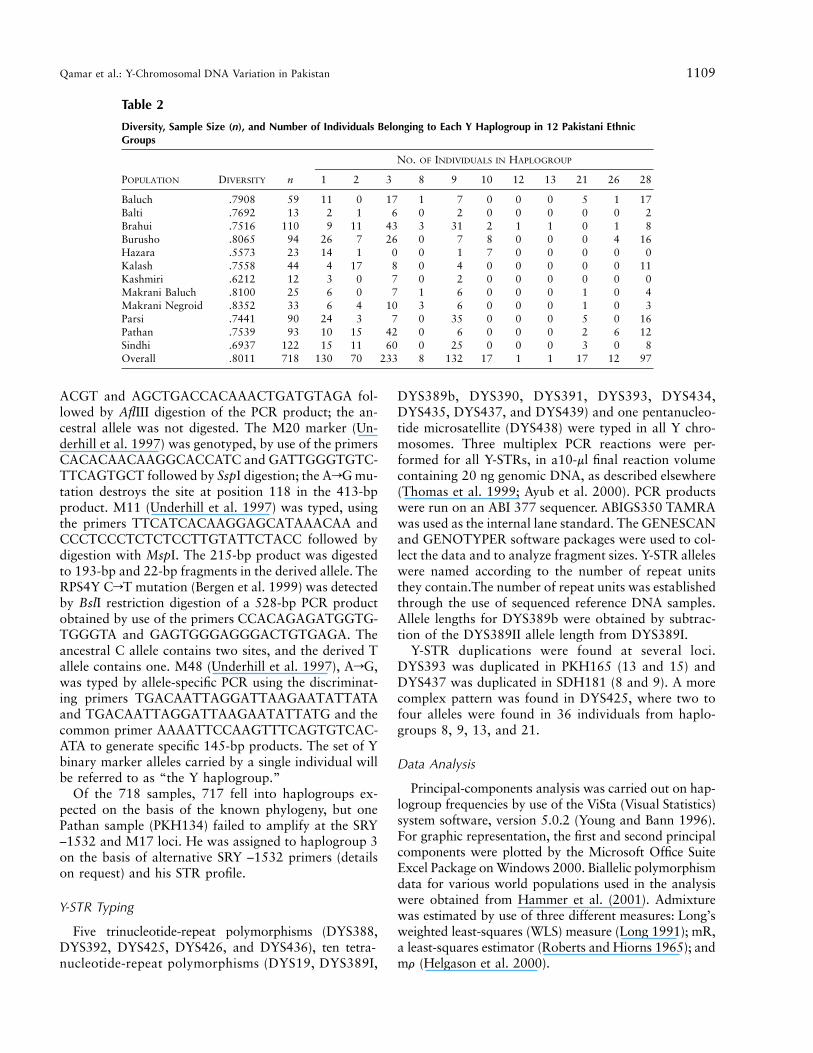
Table 2
Diversity, Sample Size (n), and Number of Individuals Belonging to Each Y Haplogroup in 12 Pakistani EthnicGroups
POPULATION DIVERSITY n
NO. OF INDIVIDUALS IN HAPLOGROUP
1 2 3 8 9 10 12 13 21 26 28
Baluch .7908 59 11 0 17 1 7 0 0 0 5 1 17Balti .7692 13 2 1 6 0 2 0 0 0 0 0 2Brahui .7516 110 9 11 43 3 31 2 1 1 0 1 8Burusho .8065 94 26 7 26 0 7 8 0 0 0 4 16Hazara .5573 23 14 1 0 0 1 7 0 0 0 0 0Kalash .7558 44 4 17 8 0 4 0 0 0 0 0 11Kashmiri .6212 12 3 0 7 0 2 0 0 0 0 0 0Makrani Baluch .8100 25 6 0 7 1 6 0 0 0 1 0 4Makrani Negroid .8352 33 6 4 10 3 6 0 0 0 1 0 3Parsi .7441 90 24 3 7 0 35 0 0 0 5 0 16Pathan .7539 93 10 15 42 0 6 0 0 0 2 6 12Sindhi .6937 122 15 11 60 0 25 0 0 0 3 0 8Overall .8011 718 130 70 233 8 132 17 1 1 17 12 97
ACGT and AGCTGACCACAAACTGATGTAGA fol-lowed by AflIII digestion of the PCR product; the an-cestral allele was not digested. The M20 marker (Un-derhill et al. 1997) was genotyped, by use of the primersCACACAACAAGGCACCATC and GATTGGGTGTC-TTCAGTGCT followed by SspI digestion; the ArG mu-tation destroys the site at position 118 in the 413-bpproduct. M11 (Underhill et al. 1997) was typed, usingthe primers TTCATCACAAGGAGCATAAACAA andCCCTCCCTCTCTCCTTGTATTCTACC followed bydigestion with MspI. The 215-bp product was digestedto 193-bp and 22-bp fragments in the derived allele. TheRPS4Y CrT mutation (Bergen et al. 1999) was detectedby BslI restriction digestion of a 528-bp PCR productobtained by use of the primers CCACAGAGATGGTG-TGGGTA and GAGTGGGAGGGACTGTGAGA. Theancestral C allele contains two sites, and the derived Tallele contains one. M48 (Underhill et al. 1997), ArG,was typed by allele-specific PCR using the discriminat-ing primers TGACAATTAGGATTAAGAATATTATAand TGACAATTAGGATTAAGAATATTATG and thecommon primer AAAATTCCAAGTTTCAGTGTCAC-ATA to generate specific 145-bp products. The set of Ybinary marker alleles carried by a single individual willbe referred to as “the Y haplogroup.”
Of the 718 samples, 717 fell into haplogroups ex-pected on the basis of the known phylogeny, but onePathan sample (PKH134) failed to amplify at the SRY–1532 and M17 loci. He was assigned to haplogroup 3on the basis of alternative SRY –1532 primers (detailson request) and his STR profile.
Y-STR Typing
Five trinucleotide-repeat polymorphisms (DYS388,DYS392, DYS425, DYS426, and DYS436), ten tetra-nucleotide-repeat polymorphisms (DYS19, DYS389I,
DYS389b, DYS390, DYS391, DYS393, DYS434,DYS435, DYS437, and DYS439) and one pentanucleo-tide microsatellite (DYS438) were typed in all Y chro-mosomes. Three multiplex PCR reactions were per-formed for all Y-STRs, in a10-ml final reaction volumecontaining 20 ng genomic DNA, as described elsewhere(Thomas et al. 1999; Ayub et al. 2000). PCR productswere run on an ABI 377 sequencer. ABIGS350 TAMRAwas used as the internal lane standard. The GENESCANand GENOTYPER software packages were used to col-lect the data and to analyze fragment sizes. Y-STR alleleswere named according to the number of repeat unitsthey contain.The number of repeat units was establishedthrough the use of sequenced reference DNA samples.Allele lengths for DYS389b were obtained by subtrac-tion of the DYS389II allele length from DYS389I.
Y-STR duplications were found at several loci.DYS393 was duplicated in PKH165 (13 and 15) andDYS437 was duplicated in SDH181 (8 and 9). A morecomplex pattern was found in DYS425, where two tofour alleles were found in 36 individuals from haplo-groups 8, 9, 13, and 21.
Data Analysis
Principal-components analysis was carried out on hap-logroup frequencies by use of the ViSta (Visual Statistics)system software, version 5.0.2 (Young and Bann 1996).For graphic representation, the first and second principalcomponents were plotted by the Microsoft Office SuiteExcel Package on Windows 2000. Biallelic polymorphismdata for various world populations used in the analysiswere obtained from Hammer et al. (2001). Admixturewas estimated by use of three different measures: Long’sweighted least-squares (WLS) measure (Long 1991); mR,a least-squares estimator (Roberts and Hiorns 1965); andmr (Helgason et al. 2000).
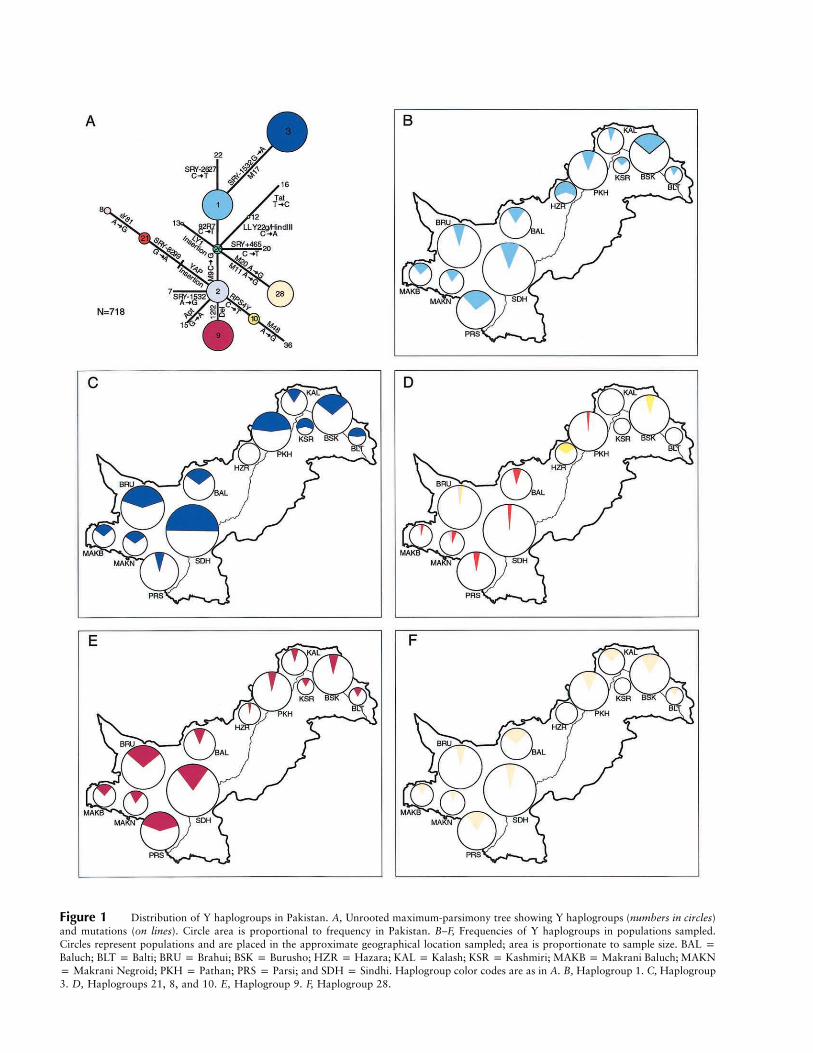
Figure 1 Distribution of Y haplogroups in Pakistan. A, Unrooted maximum-parsimony tree showing Y haplogroups (numbers in circles)and mutations (on lines). Circle area is proportional to frequency in Pakistan. B–F, Frequencies of Y haplogroups in populations sampled.Circles represent populations and are placed in the approximate geographical location sampled; area is proportionate to sample size. BAL pBaluch; BLT p Balti; BRU p Brahui; BSK p Burusho; HZR p Hazara; KAL p Kalash; KSR p Kashmiri; MAKB p Makrani Baluch; MAKNp Makrani Negroid; PKH p Pathan; PRS p Parsi; and SDH p Sindhi. Haplogroup color codes are as in A. B, Haplogroup 1. C, Haplogroup3. D, Haplogroups 21, 8, and 10. E, Haplogroup 9. F, Haplogroup 28.
Qamar et al.: Y-Chromosomal DNA Variation in Pakistan 1111
Analysis of molecular variance (AMOVA) was carriedout by use of the Arlequin package (Schneider et al.1997). AMOVA measures the proportions of mutationaldivergence found within and between populations, re-spectively. Although much of the variation at the rapidlymutating microsatellite loci is expected to have been pro-duced in the different Pakistani subpopulations, theunique mutation events at the binary loci are much olderand have not occurred in the context of the subdivisionof the Pakistani population. We devised the followingstrategy to exploit the maximum amount of relevantmutational information from the Y-chromosome hap-lotypes. STR variation within haplogroups was used tocalculate population pairwise FST values for each indi-vidual haplogroup. For each population pair, a weightedmean FST was calculated, where the value obtained foreach haplogroup was weighted according to the pro-portion of pairwise comparisons involving that haplo-group. In the absence of a particular haplogroup fromone population, A, of the pair A and B, FST was set to1, and the number of pairwise comparisons was takenas the number of chromosomes carrying that haplogroupin B. Values of FST based on STRs alone or on STRsplus binary markers, with binary markers given a 10-fold higher weighting, were calculated for comparison.In all of these analyses, the distance matrix used con-sisted of the number of steps by which each pair ofhaplotypes differed. Mantel tests for the significance ofcorrelations between FST values were carried out in Ar-lequin, and multidimensional scaling (MDS) plots wereconstructed by use of the SPSS version 7.0 softwarepackage.
Median-joining networks were constructed by Net-work 2.0b (Bandelt et al. 1999). A weighting schemewith a five-fold range was used in the construction ofthe networks. The weights assigned were specific foreach haplogroup and took into account the Y-STR var-iation across the haplogroup in the whole Pakistani pop-ulation. The following weights were used: variance 0-0.09, weight 5; variance 0.1-0.19, weight 4; variance0.2-0.49, weight 3; variance 0.5-0.99, weight of 2; andvariance �1.00, weight 1. Despite this, the network forhaplogroup 1 contained many high dimensional cubesand was resolved by applying the reduced median andmedian joining network methods sequentially. The re-duced median algorithm (Bandelt et al. 1995) was usedto generate a *.rmf file and the median joining networkmethod was applied to this file.
BATWING (Wilson and Balding 1998), BayesianAnalysis of Trees With Internal Node Generation, wasused to estimate the time to the most recent commonancestor (TMRCA) of a set of chromosomes. This pro-gram uses a Markov chain Monte Carlo procedure togenerate phylogenetic trees and associated parametervalues consistent with input data (a set of Y haplotypes)
and genetic and demographic models. The genetic modelassumes single-step mutations of the STRs and the dem-ographic model chosen was exponential growth from aninitially constant-sized population, with or without sub-division in different runs of the program. All 16 STRloci were used; locus-specific mutation rate prior prob-abilities based on the data of Kayser et al. (Kayser et al.2000) were constructed for the loci available as gammadistributions of the form gamma(a, b) where a p (1 �number of mutations observed by Kayser et al.), and bp (1 � number of meioses). For loci not investigatedby Kayser et al., the distribution gamma (1,416) wasused, which has a mean of 0.0024. A generation timeof 25 years was assumed. Thus the 95% confidence in-tervals given take into account uncertainty in mutationrate, population growth and (where appropriate) sub-division, but not generation time.
Results
Y-Chromosome Binary Polymorphisms
The 18 binary markers used identify 20 haplogroupsin worldwide populations (fig. 1A), but only 11 werefound in Pakistan, and 5 accounted for 92% of the sam-ple (fig. 1 and table 2). Haplogroups 1 and 9 were pre-sent in all Pakistani populations examined, haplogroup3 was present in all except the Hazaras, and haplogroup28 was present in all except the Hazaras and the Kash-miris. Southwestern populations show higher frequen-cies of hg 9 and the YAP� haplogroups 21 and 8 thannortheastern populations (figs. 1D–E), but, overall, littlegeographical clustering of haplogroup frequencies is ap-parent within the country.
Principal-Components Analysis
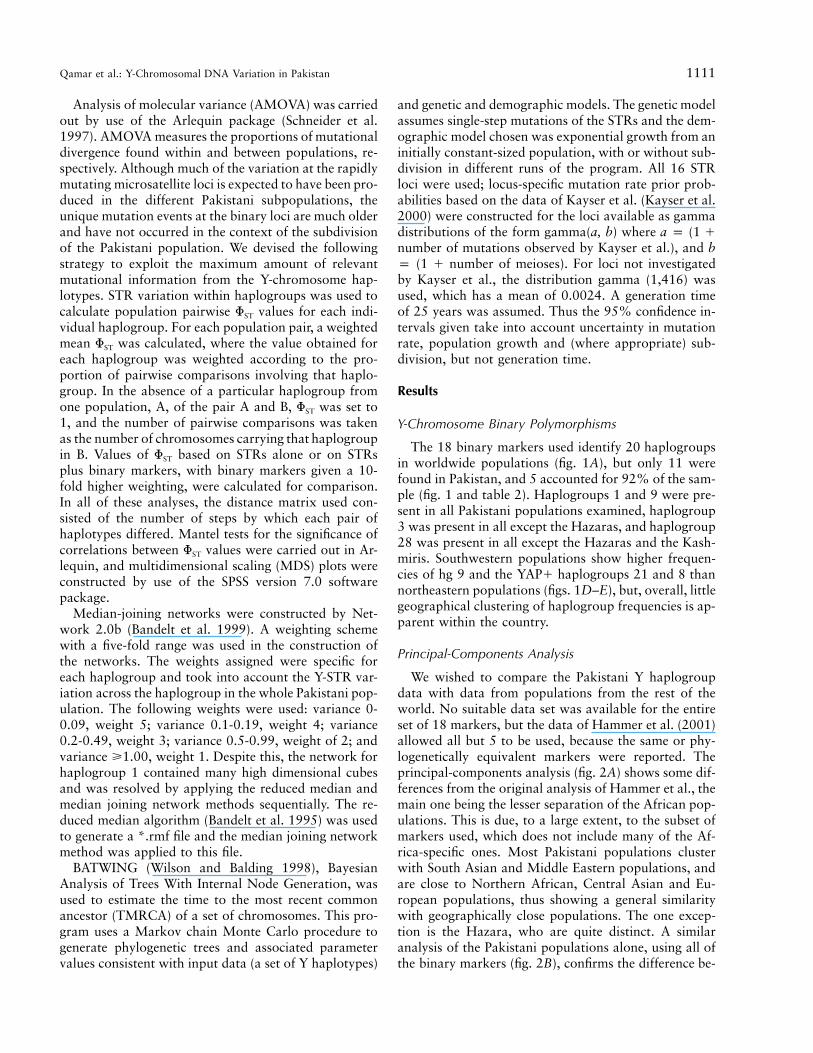
We wished to compare the Pakistani Y haplogroupdata with data from populations from the rest of theworld. No suitable data set was available for the entireset of 18 markers, but the data of Hammer et al. (2001)allowed all but 5 to be used, because the same or phy-logenetically equivalent markers were reported. Theprincipal-components analysis (fig. 2A) shows some dif-ferences from the original analysis of Hammer et al., themain one being the lesser separation of the African pop-ulations. This is due, to a large extent, to the subset ofmarkers used, which does not include many of the Af-rica-specific ones. Most Pakistani populations clusterwith South Asian and Middle Eastern populations, andare close to Northern African, Central Asian and Eu-ropean populations, thus showing a general similaritywith geographically close populations. The one excep-tion is the Hazara, who are quite distinct. A similaranalysis of the Pakistani populations alone, using all ofthe binary markers (fig. 2B), confirms the difference be-
1112 Am. J. Hum. Genet. 70:1107–1124, 2002
Figure 2 Principal-components analysis of Y haplogroup fre-quencies. A, World data using 13 markers. B, Pakistani data using 18markers. Population codes are as in figure 1. World data are shownas squares. Within Pakistan, Indo-European speakers are indicated byblackened triangles, Sino-Tibetan speakers by an unblackened triangle,Dravidian speakers by a circle, and the language-isolate Burusho bya diamond.
Table 3
Admixture Estimates
PAKISTANI
AND SOURCE
POPULATIONS
LONG’SWLS
ADMIXTURE
ESTIMATE
mR mr
Baluch:Syriaa �.08 �.1 0Pakistan 1.08 1.1 1
Balti:Tibetb �.06 �.11 0Pakistan 1.06 1.11 1
Burusho:Greecec �.29 �.22 0Pakistan 1.29 1.22 1
Hazara:Mongoliab .67 .52 .41Pakistan .33 .48 .59
Kalash:Greecec .4 .32 .23Pakistan .6 .68 .77
Kashmiri:Jewsa �.46 �.36 0Pakistan 1.46 1.36 1
Negroid Makrani:Sub-Saharan Africab .12 .12 .13Pakistan .88 .88 .88
Pathan:Greecec �.03 �.16 0Pakistan 1.03 1.16 1Jewsa �.22 �.55 0Pakistan 1.22 1.55 1
Parsis:Irand 1.21 1.06 1Pakistan �.21 �.06 0
a Hammer et al. 2000.b Karafet et al. 1999.c Rosser et al. 2000.d Quintana-Murci et al. 2001.
tween the Hazaras and the other populations and alsomore clearly shows the distinctness of the Kalash andthe Parsis. It is striking that the language isolate–speaking Burusho and the Dravidian-speaking Brahuisdo not stand out in these analyses.
Admixture Estimates
Hypotheses about population origins (table 1) can beconsidered as quantitative questions about admixture. Forexample, to test the possibility that the Baluch Y chro-mosomes have a Syrian origin, we can ask what propor-tion of the Baluch Ys are derived from Syria and whatproportion are from Pakistan (considered to be the Pak-istani sample minus the Baluch). Data on suggested sourcepopulations were taken from the literature and three mea-sures of admixture were calculated. The three estimatesgave broadly consistent results, with small systematic dif-ferences: typically mr 1 mR 1 Long’s WLS for the esti-mated contribution from the external source population(table 3). These results provide evidence for an external
contribution to the Hazaras, Kalash, Negroid Makrani,and Parsis but not to the other populations.
Y-Chromosome STR Polymorphisms
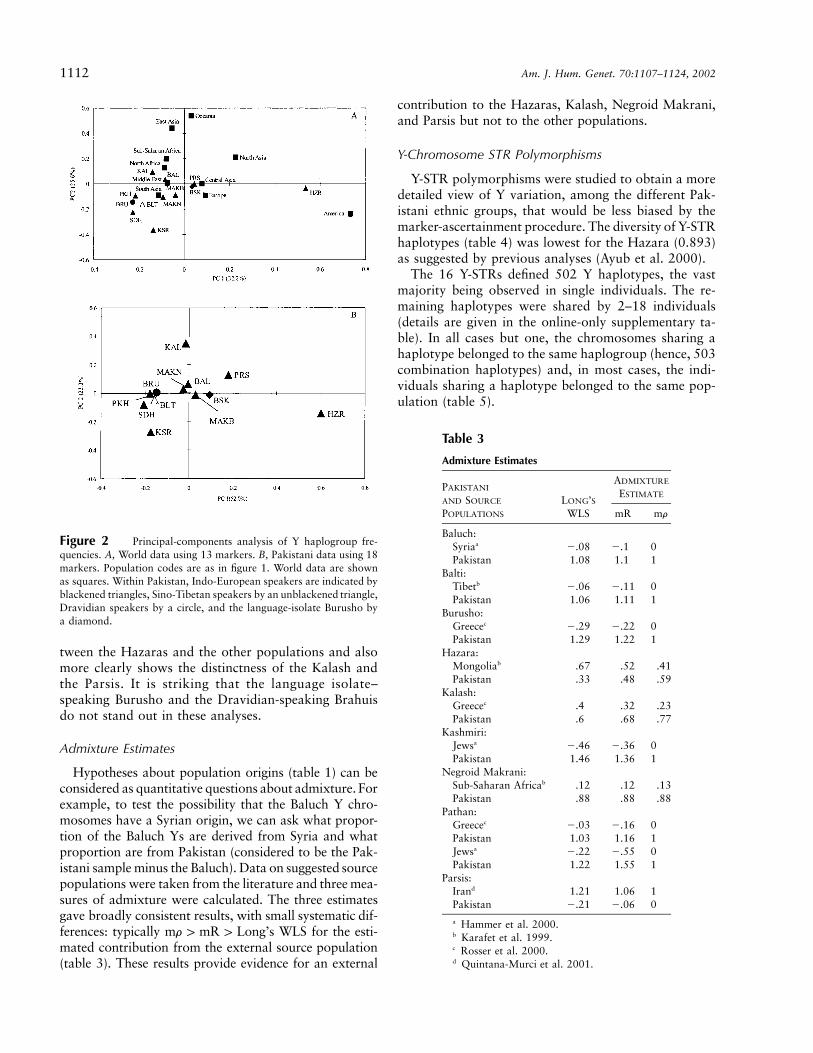
Y-STR polymorphisms were studied to obtain a moredetailed view of Y variation, among the different Pak-istani ethnic groups, that would be less biased by themarker-ascertainment procedure. The diversity of Y-STRhaplotypes (table 4) was lowest for the Hazara (0.893)as suggested by previous analyses (Ayub et al. 2000).
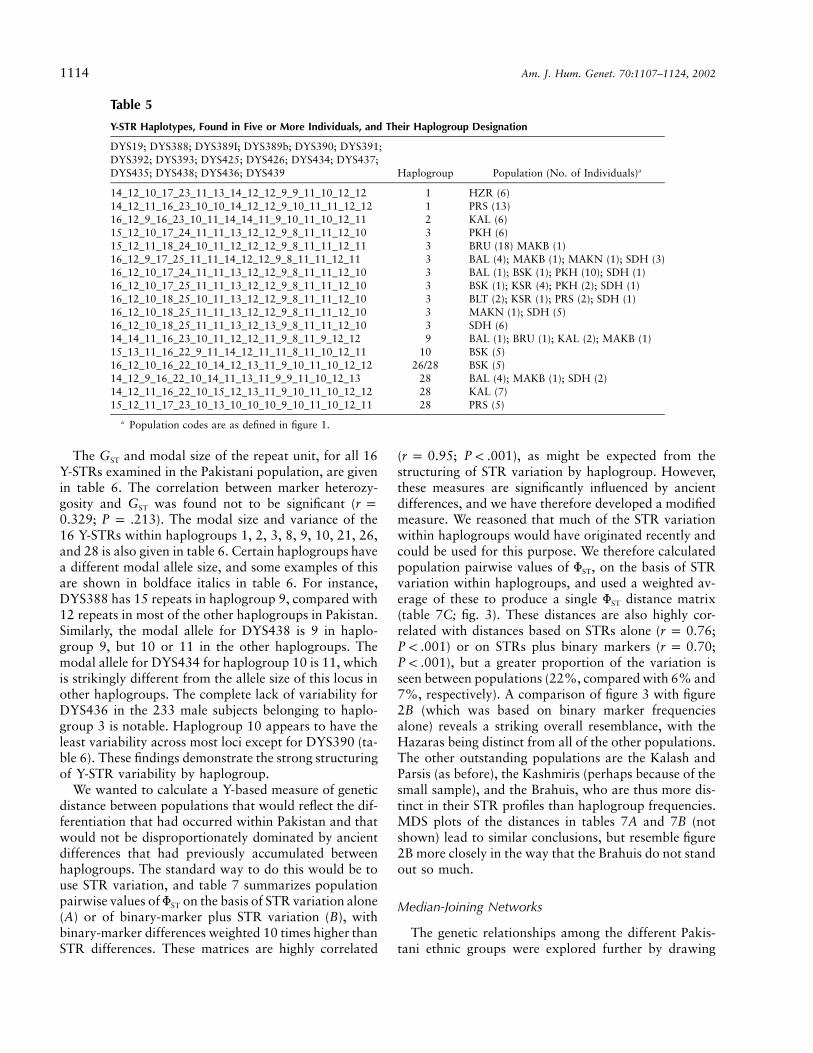
The 16 Y-STRs defined 502 Y haplotypes, the vastmajority being observed in single individuals. The re-maining haplotypes were shared by 2–18 individuals(details are given in the online-only supplementary ta-ble). In all cases but one, the chromosomes sharing ahaplotype belonged to the same haplogroup (hence, 503combination haplotypes) and, in most cases, the indi-viduals sharing a haplotype belonged to the same pop-ulation (table 5).
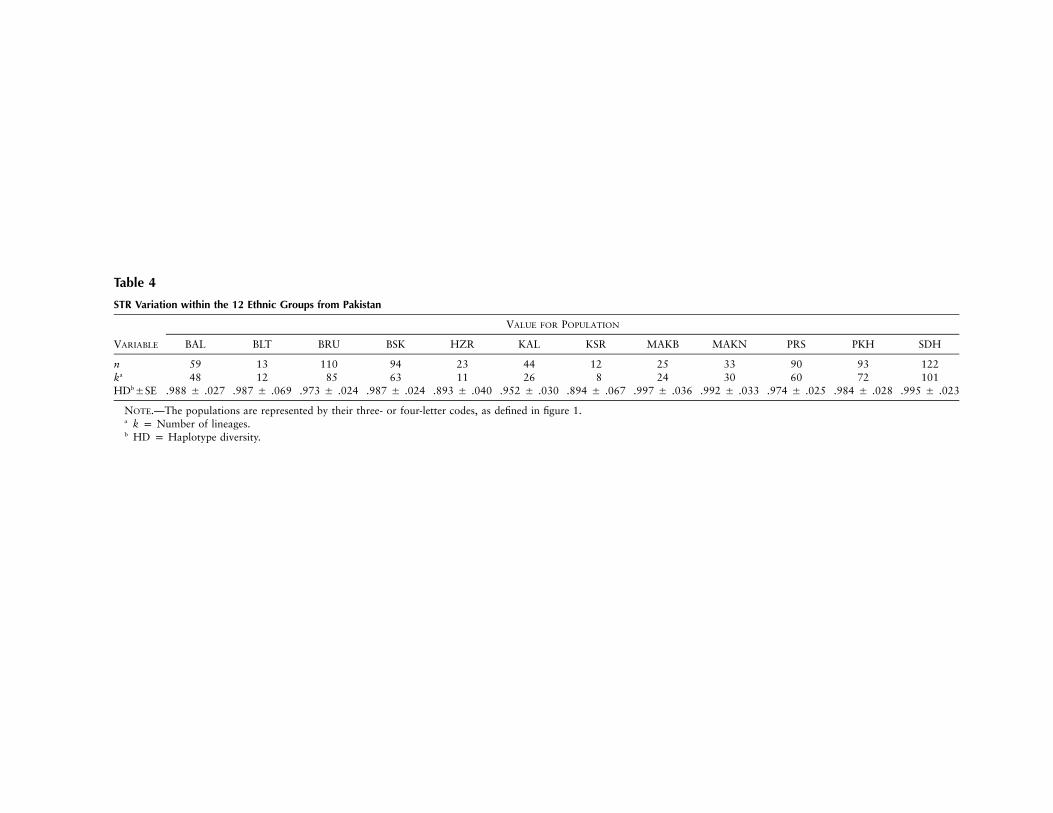
Table 4
STR Variation within the 12 Ethnic Groups from Pakistan
VARIABLE
VALUE FOR POPULATION
BAL BLT BRU BSK HZR KAL KSR MAKB MAKN PRS PKH SDH
n 59 13 110 94 23 44 12 25 33 90 93 122ka 48 12 85 63 11 26 8 24 30 60 72 101HDb�SE .988 � .027 .987 � .069 .973 � .024 .987 � .024 .893 � .040 .952 � .030 .894 � .067 .997 � .036 .992 � .033 .974 � .025 .984 � .028 .995 � .023
NOTE.—The populations are represented by their three- or four-letter codes, as defined in figure 1.a k p Number of lineages.b HD p Haplotype diversity.
1114 Am. J. Hum. Genet. 70:1107–1124, 2002
Table 5
Y-STR Haplotypes, Found in Five or More Individuals, and Their Haplogroup Designation
DYS19; DYS388; DYS389I; DYS389b; DYS390; DYS391;DYS392; DYS393; DYS425; DYS426; DYS434; DYS437;DYS435; DYS438; DYS436; DYS439 Haplogroup Population (No. of Individuals)a
14_12_10_17_23_11_13_14_12_12_9_9_11_10_12_12 1 HZR (6)14_12_11_16_23_10_10_14_12_12_9_10_11_11_12_12 1 PRS (13)16_12_9_16_23_10_11_14_14_11_9_10_11_10_12_11 2 KAL (6)15_12_10_17_24_11_11_13_12_12_9_8_11_11_12_10 3 PKH (6)15_12_11_18_24_10_11_12_12_12_9_8_11_11_12_11 3 BRU (18) MAKB (1)16_12_9_17_25_11_11_14_12_12_9_8_11_11_12_11 3 BAL (4); MAKB (1); MAKN (1); SDH (3)16_12_10_17_24_11_11_13_12_12_9_8_11_11_12_10 3 BAL (1); BSK (1); PKH (10); SDH (1)16_12_10_17_25_11_11_13_12_12_9_8_11_11_12_10 3 BSK (1); KSR (4); PKH (2); SDH (1)16_12_10_18_25_10_11_13_12_12_9_8_11_11_12_10 3 BLT (2); KSR (1); PRS (2); SDH (1)16_12_10_18_25_11_11_13_12_12_9_8_11_11_12_10 3 MAKN (1); SDH (5)16_12_10_18_25_11_11_13_12_13_9_8_11_11_12_10 3 SDH (6)14_14_11_16_23_10_11_12_12_11_9_8_11_9_12_12 9 BAL (1); BRU (1); KAL (2); MAKB (1)15_13_11_16_22_9_11_14_12_11_11_8_11_10_12_11 10 BSK (5)16_12_10_16_22_10_14_12_13_11_9_10_11_10_12_12 26/28 BSK (5)14_12_9_16_22_10_14_11_13_11_9_9_11_10_12_13 28 BAL (4); MAKB (1); SDH (2)14_12_11_16_22_10_15_12_13_11_9_10_11_10_12_12 28 KAL (7)15_12_11_17_23_10_13_10_10_10_9_10_11_10_12_11 28 PRS (5)
a Population codes are as defined in figure 1.
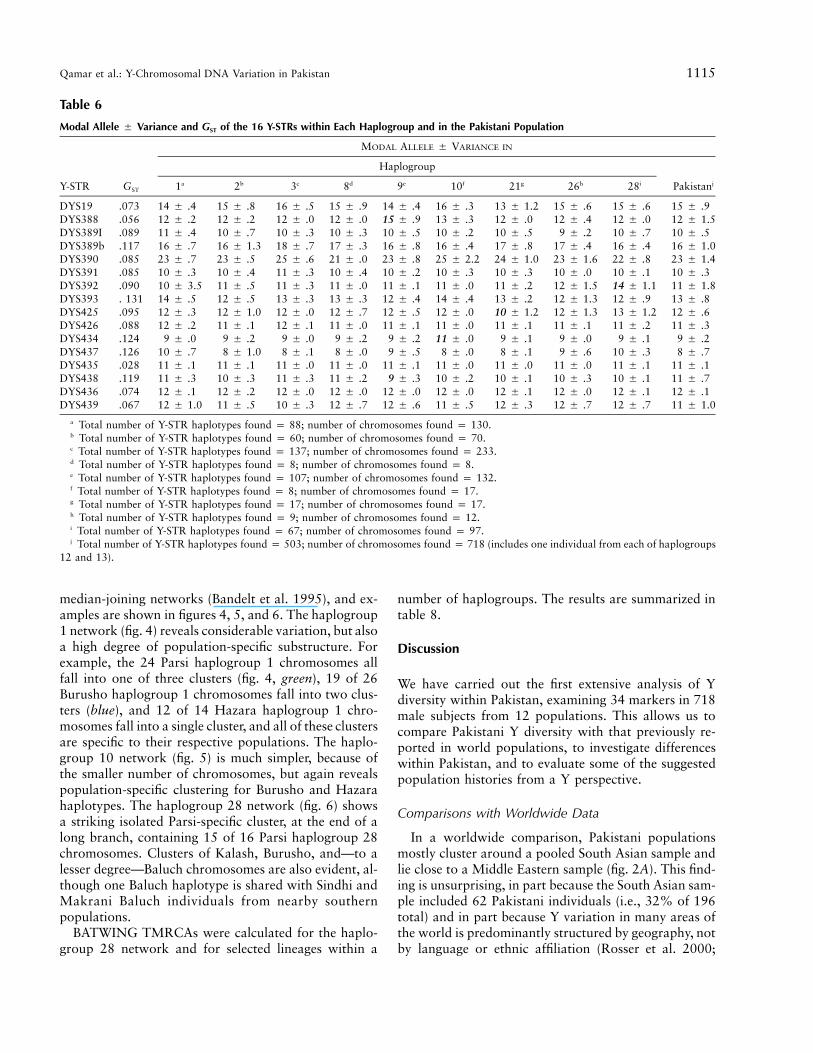
The and modal size of the repeat unit, for all 16GST
Y-STRs examined in the Pakistani population, are givenin table 6. The correlation between marker heterozy-gosity and was found not to be significant (G r pST
; ). The modal size and variance of the0.329 P p .21316 Y-STRs within haplogroups 1, 2, 3, 8, 9, 10, 21, 26,and 28 is also given in table 6. Certain haplogroups havea different modal allele size, and some examples of thisare shown in boldface italics in table 6. For instance,DYS388 has 15 repeats in haplogroup 9, compared with12 repeats in most of the other haplogroups in Pakistan.Similarly, the modal allele for DYS438 is 9 in haplo-group 9, but 10 or 11 in the other haplogroups. Themodal allele for DYS434 for haplogroup 10 is 11, whichis strikingly different from the allele size of this locus inother haplogroups. The complete lack of variability forDYS436 in the 233 male subjects belonging to haplo-group 3 is notable. Haplogroup 10 appears to have theleast variability across most loci except for DYS390 (ta-ble 6). These findings demonstrate the strong structuringof Y-STR variability by haplogroup.
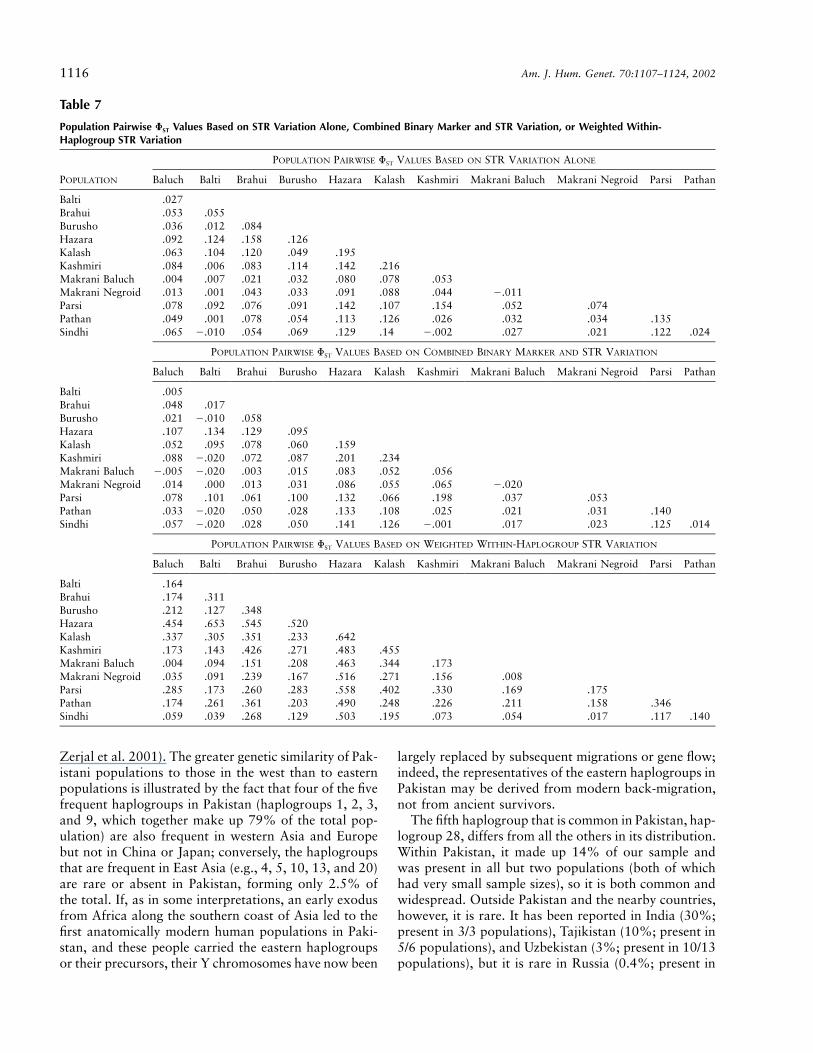
We wanted to calculate a Y-based measure of geneticdistance between populations that would reflect the dif-ferentiation that had occurred within Pakistan and thatwould not be disproportionately dominated by ancientdifferences that had previously accumulated betweenhaplogroups. The standard way to do this would be touse STR variation, and table 7 summarizes populationpairwise values of on the basis of STR variation aloneFST
(A) or of binary-marker plus STR variation (B), withbinary-marker differences weighted 10 times higher thanSTR differences. These matrices are highly correlated
( ; ), as might be expected from ther p 0.95 P ! .001structuring of STR variation by haplogroup. However,these measures are significantly influenced by ancientdifferences, and we have therefore developed a modifiedmeasure. We reasoned that much of the STR variationwithin haplogroups would have originated recently andcould be used for this purpose. We therefore calculatedpopulation pairwise values of , on the basis of STRFST
variation within haplogroups, and used a weighted av-erage of these to produce a single distance matrixFST
(table 7C; fig. 3). These distances are also highly cor-related with distances based on STRs alone ( ;r p 0.76
) or on STRs plus binary markers ( ;P ! .001 r p 0.70), but a greater proportion of the variation isP ! .001
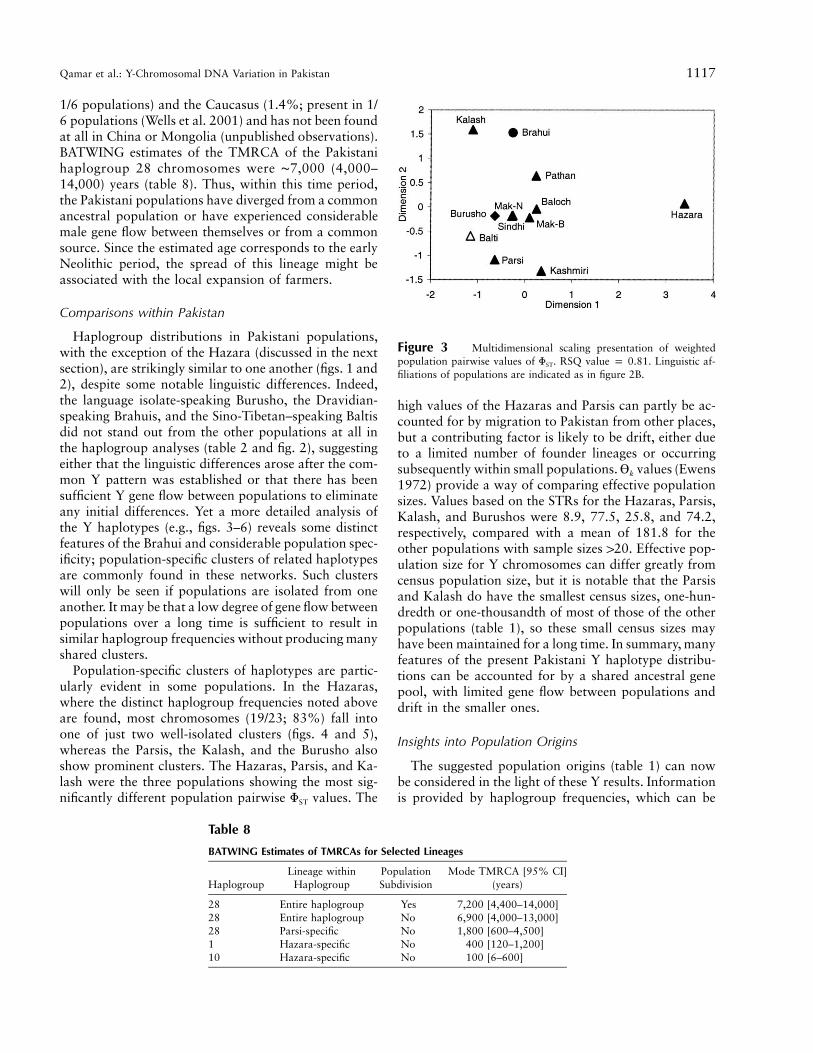
seen between populations (22%, compared with 6% and7%, respectively). A comparison of figure 3 with figure2B (which was based on binary marker frequenciesalone) reveals a striking overall resemblance, with theHazaras being distinct from all of the other populations.The other outstanding populations are the Kalash andParsis (as before), the Kashmiris (perhaps because of thesmall sample), and the Brahuis, who are thus more dis-tinct in their STR profiles than haplogroup frequencies.MDS plots of the distances in tables 7A and 7B (notshown) lead to similar conclusions, but resemble figure2B more closely in the way that the Brahuis do not standout so much.
Median-Joining Networks
The genetic relationships among the different Pakis-tani ethnic groups were explored further by drawing
Qamar et al.: Y-Chromosomal DNA Variation in Pakistan 1115
Table 6
Modal Allele � Variance and GST of the 16 Y-STRs within Each Haplogroup and in the Pakistani Population
Y-STR GST
MODAL ALLELE � VARIANCE IN
Haplogroup
1a 2b 3c 8d 9e 10f 21g 26h 28i Pakistanj
DYS19 .073 14 � .4 15 � .8 16 � .5 15 � .9 14 � .4 16 � .3 13 � 1.2 15 � .6 15 � .6 15 � .9DYS388 .056 12 � .2 12 � .2 12 � .0 12 � .0 15 � .9 13 � .3 12 � .0 12 � .4 12 � .0 12 � 1.5DYS389I .089 11 � .4 10 � .7 10 � .3 10 � .3 10 � .5 10 � .2 10 � .5 9 � .2 10 � .7 10 � .5DYS389b .117 16 � .7 16 � 1.3 18 � .7 17 � .3 16 � .8 16 � .4 17 � .8 17 � .4 16 � .4 16 � 1.0DYS390 .085 23 � .7 23 � .5 25 � .6 21 � .0 23 � .8 25 � 2.2 24 � 1.0 23 � 1.6 22 � .8 23 � 1.4DYS391 .085 10 � .3 10 � .4 11 � .3 10 � .4 10 � .2 10 � .3 10 � .3 10 � .0 10 � .1 10 � .3DYS392 .090 10 � 3.5 11 � .5 11 � .3 11 � .0 11 � .1 11 � .0 11 � .2 12 � 1.5 14 � 1.1 11 � 1.8DYS393 . 131 14 � .5 12 � .5 13 � .3 13 � .3 12 � .4 14 � .4 13 � .2 12 � 1.3 12 � .9 13 � .8DYS425 .095 12 � .3 12 � 1.0 12 � .0 12 � .7 12 � .5 12 � .0 10 � 1.2 12 � 1.3 13 � 1.2 12 � .6DYS426 .088 12 � .2 11 � .1 12 � .1 11 � .0 11 � .1 11 � .0 11 � .1 11 � .1 11 � .2 11 � .3DYS434 .124 9 � .0 9 � .2 9 � .0 9 � .2 9 � .2 11 � .0 9 � .1 9 � .0 9 � .1 9 � .2DYS437 .126 10 � .7 8 � 1.0 8 � .1 8 � .0 9 � .5 8 � .0 8 � .1 9 � .6 10 � .3 8 � .7DYS435 .028 11 � .1 11 � .1 11 � .0 11 � .0 11 � .1 11 � .0 11 � .0 11 � .0 11 � .1 11 � .1DYS438 .119 11 � .3 10 � .3 11 � .3 11 � .2 9 � .3 10 � .2 10 � .1 10 � .3 10 � .1 11 � .7DYS436 .074 12 � .1 12 � .2 12 � .0 12 � .0 12 � .0 12 � .0 12 � .1 12 � .0 12 � .1 12 � .1DYS439 .067 12 � 1.0 11 � .5 10 � .3 12 � .7 12 � .6 11 � .5 12 � .3 12 � .7 12 � .7 11 � 1.0
a Total number of Y-STR haplotypes found p 88; number of chromosomes found p 130.b Total number of Y-STR haplotypes found p 60; number of chromosomes found p 70.c Total number of Y-STR haplotypes found p 137; number of chromosomes found p 233.d Total number of Y-STR haplotypes found p 8; number of chromosomes found p 8.e Total number of Y-STR haplotypes found p 107; number of chromosomes found p 132.f Total number of Y-STR haplotypes found p 8; number of chromosomes found p 17.g Total number of Y-STR haplotypes found p 17; number of chromosomes found p 17.h Total number of Y-STR haplotypes found p 9; number of chromosomes found p 12.i Total number of Y-STR haplotypes found p 67; number of chromosomes found p 97.j Total number of Y-STR haplotypes found p 503; number of chromosomes found p 718 (includes one individual from each of haplogroups
12 and 13).
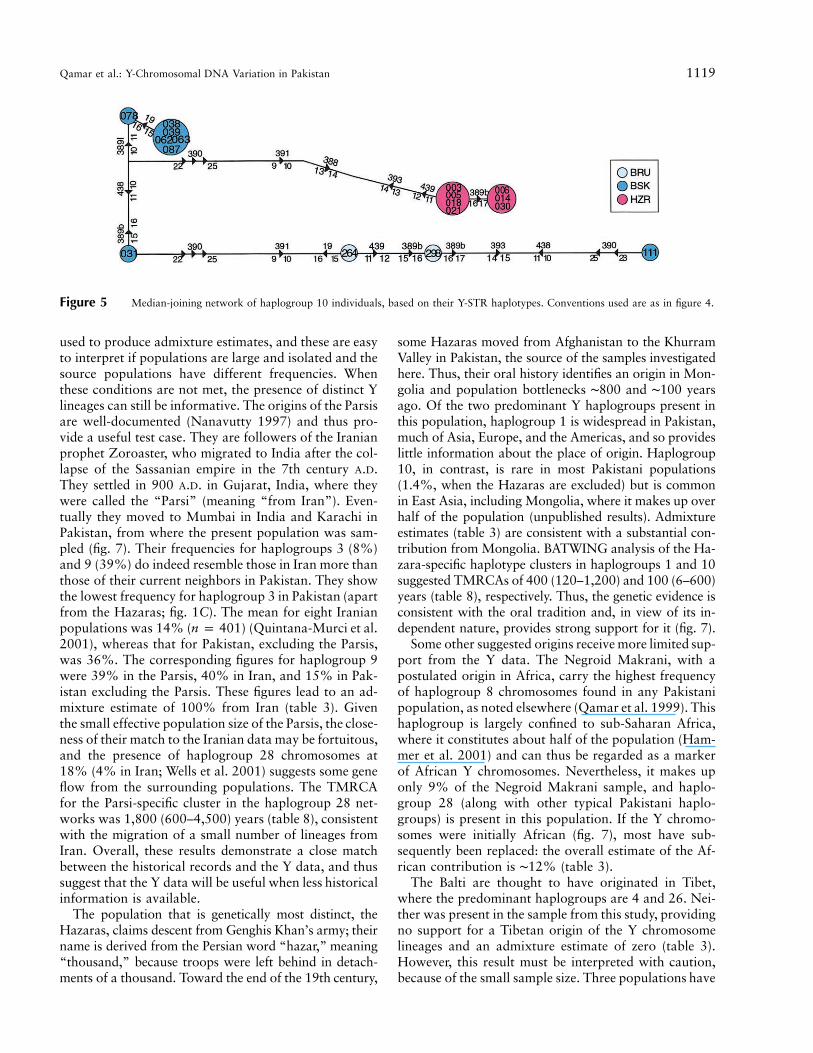
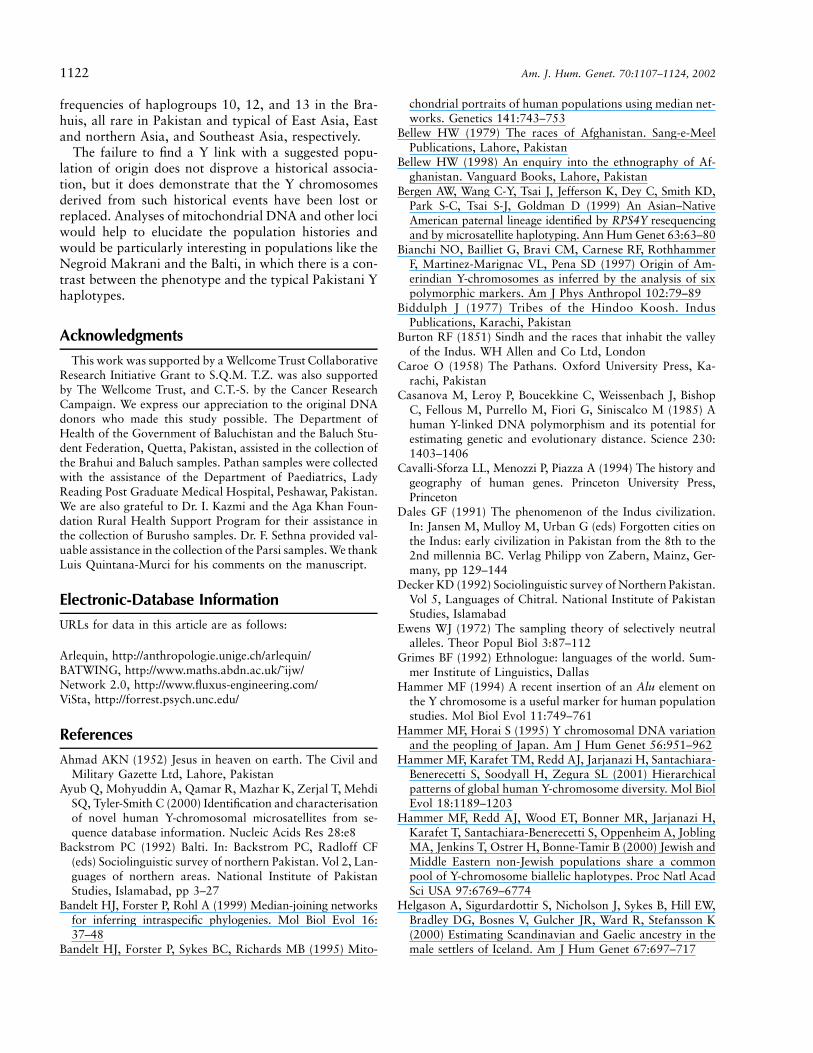
median-joining networks (Bandelt et al. 1995), and ex-amples are shown in figures 4, 5, and 6. The haplogroup1 network (fig. 4) reveals considerable variation, but alsoa high degree of population-specific substructure. Forexample, the 24 Parsi haplogroup 1 chromosomes allfall into one of three clusters (fig. 4, green), 19 of 26Burusho haplogroup 1 chromosomes fall into two clus-ters (blue), and 12 of 14 Hazara haplogroup 1 chro-mosomes fall into a single cluster, and all of these clustersare specific to their respective populations. The haplo-group 10 network (fig. 5) is much simpler, because ofthe smaller number of chromosomes, but again revealspopulation-specific clustering for Burusho and Hazarahaplotypes. The haplogroup 28 network (fig. 6) showsa striking isolated Parsi-specific cluster, at the end of along branch, containing 15 of 16 Parsi haplogroup 28chromosomes. Clusters of Kalash, Burusho, and—to alesser degree—Baluch chromosomes are also evident, al-though one Baluch haplotype is shared with Sindhi andMakrani Baluch individuals from nearby southernpopulations.
BATWING TMRCAs were calculated for the haplo-group 28 network and for selected lineages within a
number of haplogroups. The results are summarized intable 8.
Discussion
We have carried out the first extensive analysis of Ydiversity within Pakistan, examining 34 markers in 718male subjects from 12 populations. This allows us tocompare Pakistani Y diversity with that previously re-ported in world populations, to investigate differenceswithin Pakistan, and to evaluate some of the suggestedpopulation histories from a Y perspective.
Comparisons with Worldwide Data
In a worldwide comparison, Pakistani populationsmostly cluster around a pooled South Asian sample andlie close to a Middle Eastern sample (fig. 2A). This find-ing is unsurprising, in part because the South Asian sam-ple included 62 Pakistani individuals (i.e., 32% of 196total) and in part because Y variation in many areas ofthe world is predominantly structured by geography, notby language or ethnic affiliation (Rosser et al. 2000;
1116 Am. J. Hum. Genet. 70:1107–1124, 2002
Table 7
Population Pairwise FST Values Based on STR Variation Alone, Combined Binary Marker and STR Variation, or Weighted Within-Haplogroup STR Variation
POPULATION
POPULATION PAIRWISE FST VALUES BASED ON STR VARIATION ALONE
Baluch Balti Brahui Burusho Hazara Kalash Kashmiri Makrani Baluch Makrani Negroid Parsi Pathan
Balti .027Brahui .053 .055Burusho .036 .012 .084Hazara .092 .124 .158 .126Kalash .063 .104 .120 .049 .195Kashmiri .084 .006 .083 .114 .142 .216Makrani Baluch .004 .007 .021 .032 .080 .078 .053Makrani Negroid .013 .001 .043 .033 .091 .088 .044 �.011Parsi .078 .092 .076 .091 .142 .107 .154 .052 .074Pathan .049 .001 .078 .054 .113 .126 .026 .032 .034 .135Sindhi .065 �.010 .054 .069 .129 .14 �.002 .027 .021 .122 .024
POPULATION PAIRWISE FST VALUES BASED ON COMBINED BINARY MARKER AND STR VARIATION
Baluch Balti Brahui Burusho Hazara Kalash Kashmiri Makrani Baluch Makrani Negroid Parsi Pathan
Balti .005Brahui .048 .017Burusho .021 �.010 .058Hazara .107 .134 .129 .095Kalash .052 .095 .078 .060 .159Kashmiri .088 �.020 .072 .087 .201 .234Makrani Baluch �.005 �.020 .003 .015 .083 .052 .056Makrani Negroid .014 .000 .013 .031 .086 .055 .065 �.020Parsi .078 .101 .061 .100 .132 .066 .198 .037 .053Pathan .033 �.020 .050 .028 .133 .108 .025 .021 .031 .140Sindhi .057 �.020 .028 .050 .141 .126 �.001 .017 .023 .125 .014
POPULATION PAIRWISE FST VALUES BASED ON WEIGHTED WITHIN-HAPLOGROUP STR VARIATION
Baluch Balti Brahui Burusho Hazara Kalash Kashmiri Makrani Baluch Makrani Negroid Parsi Pathan
Balti .164Brahui .174 .311Burusho .212 .127 .348Hazara .454 .653 .545 .520Kalash .337 .305 .351 .233 .642Kashmiri .173 .143 .426 .271 .483 .455Makrani Baluch .004 .094 .151 .208 .463 .344 .173Makrani Negroid .035 .091 .239 .167 .516 .271 .156 .008Parsi .285 .173 .260 .283 .558 .402 .330 .169 .175Pathan .174 .261 .361 .203 .490 .248 .226 .211 .158 .346Sindhi .059 .039 .268 .129 .503 .195 .073 .054 .017 .117 .140
Zerjal et al. 2001). The greater genetic similarity of Pak-istani populations to those in the west than to easternpopulations is illustrated by the fact that four of the fivefrequent haplogroups in Pakistan (haplogroups 1, 2, 3,and 9, which together make up 79% of the total pop-ulation) are also frequent in western Asia and Europebut not in China or Japan; conversely, the haplogroupsthat are frequent in East Asia (e.g., 4, 5, 10, 13, and 20)are rare or absent in Pakistan, forming only 2.5% ofthe total. If, as in some interpretations, an early exodusfrom Africa along the southern coast of Asia led to thefirst anatomically modern human populations in Paki-stan, and these people carried the eastern haplogroupsor their precursors, their Y chromosomes have now been
largely replaced by subsequent migrations or gene flow;indeed, the representatives of the eastern haplogroups inPakistan may be derived from modern back-migration,not from ancient survivors.
The fifth haplogroup that is common in Pakistan, hap-logroup 28, differs from all the others in its distribution.Within Pakistan, it made up 14% of our sample andwas present in all but two populations (both of whichhad very small sample sizes), so it is both common andwidespread. Outside Pakistan and the nearby countries,however, it is rare. It has been reported in India (30%;present in 3/3 populations), Tajikistan (10%; present in5/6 populations), and Uzbekistan (3%; present in 10/13populations), but it is rare in Russia (0.4%; present in
Qamar et al.: Y-Chromosomal DNA Variation in Pakistan 1117
Figure 3 Multidimensional scaling presentation of weightedpopulation pairwise values of FST. RSQ value p 0.81. Linguistic af-filiations of populations are indicated as in figure 2B.
Table 8
BATWING Estimates of TMRCAs for Selected Lineages
HaplogroupLineage within
HaplogroupPopulationSubdivision
Mode TMRCA [95% CI](years)
28 Entire haplogroup Yes 7,200 [4,400–14,000]28 Entire haplogroup No 6,900 [4,000–13,000]28 Parsi-specific No 1,800 [600–4,500]1 Hazara-specific No 400 [120–1,200]10 Hazara-specific No 100 [6–600]
1/6 populations) and the Caucasus (1.4%; present in 1/6 populations (Wells et al. 2001) and has not been foundat all in China or Mongolia (unpublished observations).BATWING estimates of the TMRCA of the Pakistanihaplogroup 28 chromosomes were ∼7,000 (4,000–14,000) years (table 8). Thus, within this time period,the Pakistani populations have diverged from a commonancestral population or have experienced considerablemale gene flow between themselves or from a commonsource. Since the estimated age corresponds to the earlyNeolithic period, the spread of this lineage might beassociated with the local expansion of farmers.
Comparisons within Pakistan
Haplogroup distributions in Pakistani populations,with the exception of the Hazara (discussed in the nextsection), are strikingly similar to one another (figs. 1 and2), despite some notable linguistic differences. Indeed,the language isolate-speaking Burusho, the Dravidian-speaking Brahuis, and the Sino-Tibetan–speaking Baltisdid not stand out from the other populations at all inthe haplogroup analyses (table 2 and fig. 2), suggestingeither that the linguistic differences arose after the com-mon Y pattern was established or that there has beensufficient Y gene flow between populations to eliminateany initial differences. Yet a more detailed analysis ofthe Y haplotypes (e.g., figs. 3–6) reveals some distinctfeatures of the Brahui and considerable population spec-ificity; population-specific clusters of related haplotypesare commonly found in these networks. Such clusterswill only be seen if populations are isolated from oneanother. It may be that a low degree of gene flow betweenpopulations over a long time is sufficient to result insimilar haplogroup frequencies without producing manyshared clusters.
Population-specific clusters of haplotypes are partic-ularly evident in some populations. In the Hazaras,where the distinct haplogroup frequencies noted aboveare found, most chromosomes (19/23; 83%) fall intoone of just two well-isolated clusters (figs. 4 and 5),whereas the Parsis, the Kalash, and the Burusho alsoshow prominent clusters. The Hazaras, Parsis, and Ka-lash were the three populations showing the most sig-nificantly different population pairwise FST values. The
high values of the Hazaras and Parsis can partly be ac-counted for by migration to Pakistan from other places,but a contributing factor is likely to be drift, either dueto a limited number of founder lineages or occurringsubsequently within small populations. values (EwensVk
1972) provide a way of comparing effective populationsizes. Values based on the STRs for the Hazaras, Parsis,Kalash, and Burushos were 8.9, 77.5, 25.8, and 74.2,respectively, compared with a mean of 181.8 for theother populations with sample sizes 120. Effective pop-ulation size for Y chromosomes can differ greatly fromcensus population size, but it is notable that the Parsisand Kalash do have the smallest census sizes, one-hun-dredth or one-thousandth of most of those of the otherpopulations (table 1), so these small census sizes mayhave been maintained for a long time. In summary, manyfeatures of the present Pakistani Y haplotype distribu-tions can be accounted for by a shared ancestral genepool, with limited gene flow between populations anddrift in the smaller ones.
Insights into Population Origins
The suggested population origins (table 1) can nowbe considered in the light of these Y results. Informationis provided by haplogroup frequencies, which can be
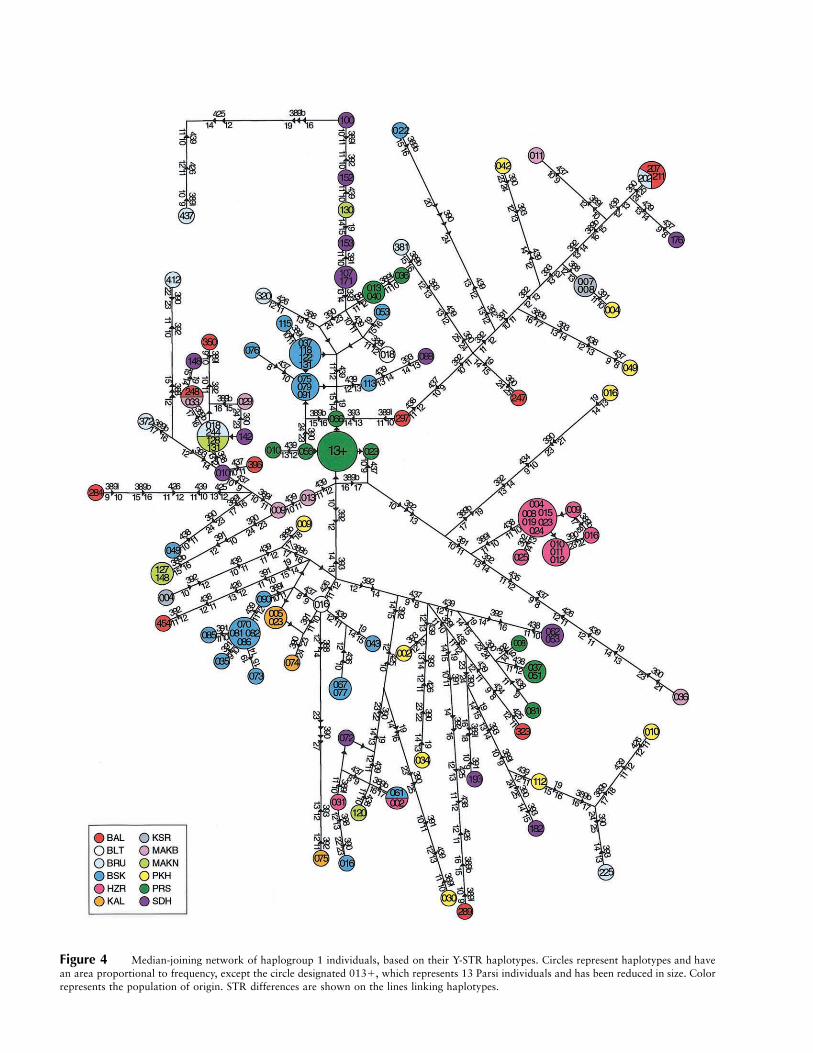
Figure 4 Median-joining network of haplogroup 1 individuals, based on their Y-STR haplotypes. Circles represent haplotypes and havean area proportional to frequency, except the circle designated 013�, which represents 13 Parsi individuals and has been reduced in size. Colorrepresents the population of origin. STR differences are shown on the lines linking haplotypes.
Qamar et al.: Y-Chromosomal DNA Variation in Pakistan 1119
Figure 5 Median-joining network of haplogroup 10 individuals, based on their Y-STR haplotypes. Conventions used are as in figure 4.
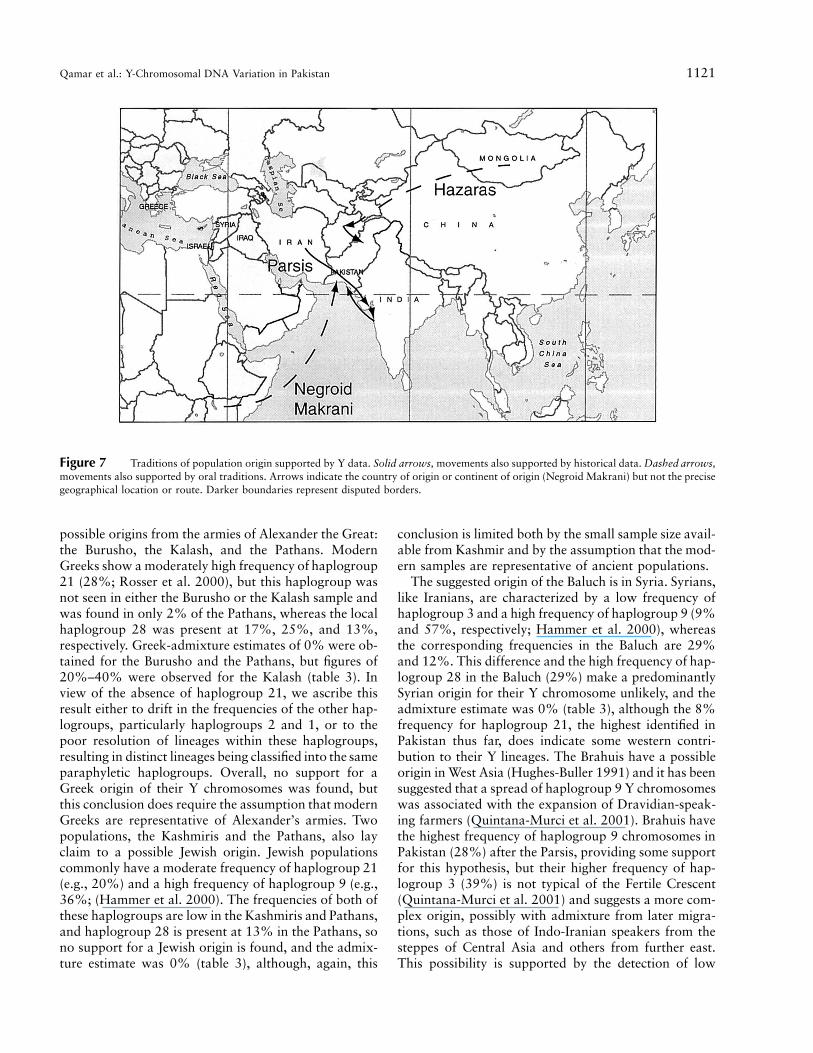
used to produce admixture estimates, and these are easyto interpret if populations are large and isolated and thesource populations have different frequencies. Whenthese conditions are not met, the presence of distinct Ylineages can still be informative. The origins of the Parsisare well-documented (Nanavutty 1997) and thus pro-vide a useful test case. They are followers of the Iranianprophet Zoroaster, who migrated to India after the col-lapse of the Sassanian empire in the 7th century A.D.They settled in 900 A.D. in Gujarat, India, where theywere called the “Parsi” (meaning “from Iran”). Even-tually they moved to Mumbai in India and Karachi inPakistan, from where the present population was sam-pled (fig. 7). Their frequencies for haplogroups 3 (8%)and 9 (39%) do indeed resemble those in Iran more thanthose of their current neighbors in Pakistan. They showthe lowest frequency for haplogroup 3 in Pakistan (apartfrom the Hazaras; fig. 1C). The mean for eight Iranianpopulations was 14% ( ) (Quintana-Murci et al.n p 4012001), whereas that for Pakistan, excluding the Parsis,was 36%. The corresponding figures for haplogroup 9were 39% in the Parsis, 40% in Iran, and 15% in Pak-istan excluding the Parsis. These figures lead to an ad-mixture estimate of 100% from Iran (table 3). Giventhe small effective population size of the Parsis, the close-ness of their match to the Iranian data may be fortuitous,and the presence of haplogroup 28 chromosomes at18% (4% in Iran; Wells et al. 2001) suggests some geneflow from the surrounding populations. The TMRCAfor the Parsi-specific cluster in the haplogroup 28 net-works was 1,800 (600–4,500) years (table 8), consistentwith the migration of a small number of lineages fromIran. Overall, these results demonstrate a close matchbetween the historical records and the Y data, and thussuggest that the Y data will be useful when less historicalinformation is available.
The population that is genetically most distinct, theHazaras, claims descent from Genghis Khan’s army; theirname is derived from the Persian word “hazar,” meaning“thousand,” because troops were left behind in detach-ments of a thousand. Toward the end of the 19th century,
some Hazaras moved from Afghanistan to the KhurramValley in Pakistan, the source of the samples investigatedhere. Thus, their oral history identifies an origin in Mon-golia and population bottlenecks ∼800 and ∼100 yearsago. Of the two predominant Y haplogroups present inthis population, haplogroup 1 is widespread in Pakistan,much of Asia, Europe, and the Americas, and so provideslittle information about the place of origin. Haplogroup10, in contrast, is rare in most Pakistani populations(1.4%, when the Hazaras are excluded) but is commonin East Asia, including Mongolia, where it makes up overhalf of the population (unpublished results). Admixtureestimates (table 3) are consistent with a substantial con-tribution from Mongolia. BATWING analysis of the Ha-zara-specific haplotype clusters in haplogroups 1 and 10suggested TMRCAs of 400 (120–1,200) and 100 (6–600)years (table 8), respectively. Thus, the genetic evidence isconsistent with the oral tradition and, in view of its in-dependent nature, provides strong support for it (fig. 7).
Some other suggested origins receive more limited sup-port from the Y data. The Negroid Makrani, with apostulated origin in Africa, carry the highest frequencyof haplogroup 8 chromosomes found in any Pakistanipopulation, as noted elsewhere (Qamar et al. 1999). Thishaplogroup is largely confined to sub-Saharan Africa,where it constitutes about half of the population (Ham-mer et al. 2001) and can thus be regarded as a markerof African Y chromosomes. Nevertheless, it makes uponly 9% of the Negroid Makrani sample, and haplo-group 28 (along with other typical Pakistani haplo-groups) is present in this population. If the Y chromo-somes were initially African (fig. 7), most have sub-sequently been replaced: the overall estimate of the Af-rican contribution is ∼12% (table 3).
The Balti are thought to have originated in Tibet,where the predominant haplogroups are 4 and 26. Nei-ther was present in the sample from this study, providingno support for a Tibetan origin of the Y chromosomelineages and an admixture estimate of zero (table 3).However, this result must be interpreted with caution,because of the small sample size. Three populations have
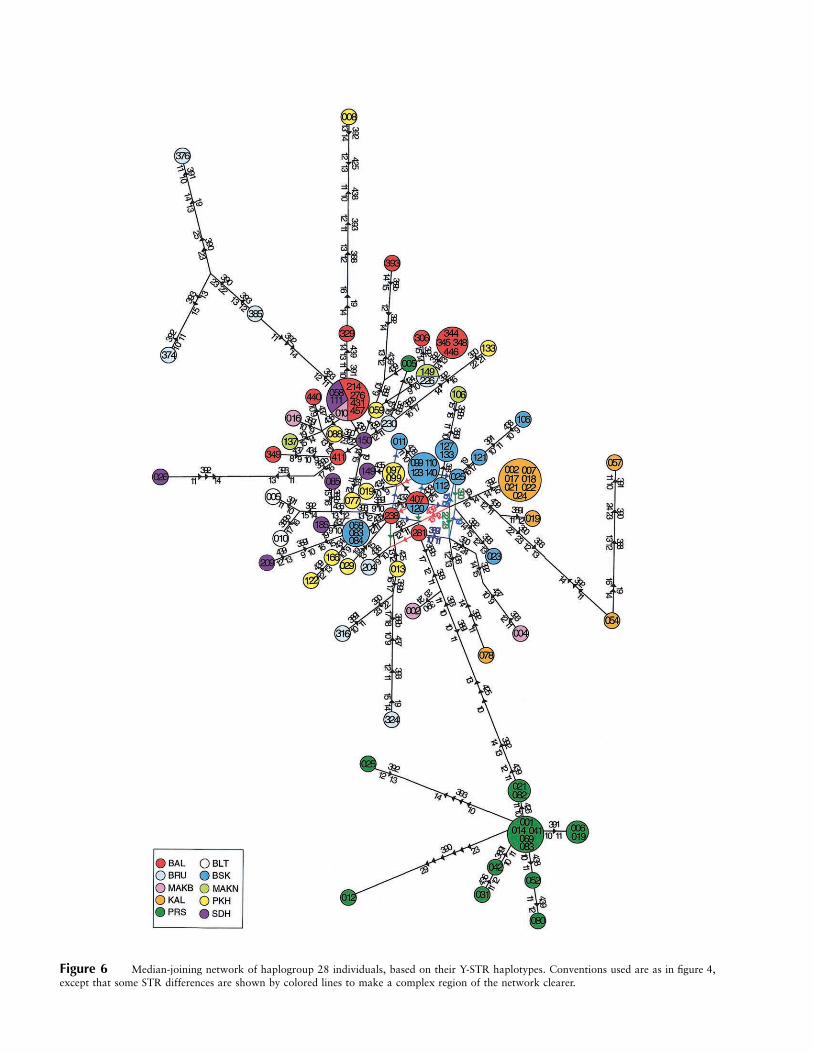
Figure 6 Median-joining network of haplogroup 28 individuals, based on their Y-STR haplotypes. Conventions used are as in figure 4,except that some STR differences are shown by colored lines to make a complex region of the network clearer.
Qamar et al.: Y-Chromosomal DNA Variation in Pakistan 1121
Figure 7 Traditions of population origin supported by Y data. Solid arrows, movements also supported by historical data. Dashed arrows,movements also supported by oral traditions. Arrows indicate the country of origin or continent of origin (Negroid Makrani) but not the precisegeographical location or route. Darker boundaries represent disputed borders.
possible origins from the armies of Alexander the Great:the Burusho, the Kalash, and the Pathans. ModernGreeks show a moderately high frequency of haplogroup21 (28%; Rosser et al. 2000), but this haplogroup wasnot seen in either the Burusho or the Kalash sample andwas found in only 2% of the Pathans, whereas the localhaplogroup 28 was present at 17%, 25%, and 13%,respectively. Greek-admixture estimates of 0% were ob-tained for the Burusho and the Pathans, but figures of20%–40% were observed for the Kalash (table 3). Inview of the absence of haplogroup 21, we ascribe thisresult either to drift in the frequencies of the other hap-logroups, particularly haplogroups 2 and 1, or to thepoor resolution of lineages within these haplogroups,resulting in distinct lineages being classified into the sameparaphyletic haplogroups. Overall, no support for aGreek origin of their Y chromosomes was found, butthis conclusion does require the assumption that modernGreeks are representative of Alexander’s armies. Twopopulations, the Kashmiris and the Pathans, also layclaim to a possible Jewish origin. Jewish populationscommonly have a moderate frequency of haplogroup 21(e.g., 20%) and a high frequency of haplogroup 9 (e.g.,36%; (Hammer et al. 2000). The frequencies of both ofthese haplogroups are low in the Kashmiris and Pathans,and haplogroup 28 is present at 13% in the Pathans, sono support for a Jewish origin is found, and the admix-ture estimate was 0% (table 3), although, again, this
conclusion is limited both by the small sample size avail-able from Kashmir and by the assumption that the mod-ern samples are representative of ancient populations.
The suggested origin of the Baluch is in Syria. Syrians,like Iranians, are characterized by a low frequency ofhaplogroup 3 and a high frequency of haplogroup 9 (9%and 57%, respectively; Hammer et al. 2000), whereasthe corresponding frequencies in the Baluch are 29%and 12%. This difference and the high frequency of hap-logroup 28 in the Baluch (29%) make a predominantlySyrian origin for their Y chromosome unlikely, and theadmixture estimate was 0% (table 3), although the 8%frequency for haplogroup 21, the highest identified inPakistan thus far, does indicate some western contri-bution to their Y lineages. The Brahuis have a possibleorigin in West Asia (Hughes-Buller 1991) and it has beensuggested that a spread of haplogroup 9 Y chromosomeswas associated with the expansion of Dravidian-speak-ing farmers (Quintana-Murci et al. 2001). Brahuis havethe highest frequency of haplogroup 9 chromosomes inPakistan (28%) after the Parsis, providing some supportfor this hypothesis, but their higher frequency of hap-logroup 3 (39%) is not typical of the Fertile Crescent(Quintana-Murci et al. 2001) and suggests a more com-plex origin, possibly with admixture from later migra-tions, such as those of Indo-Iranian speakers from thesteppes of Central Asia and others from further east.This possibility is supported by the detection of low
1122 Am. J. Hum. Genet. 70:1107–1124, 2002
frequencies of haplogroups 10, 12, and 13 in the Bra-huis, all rare in Pakistan and typical of East Asia, Eastand northern Asia, and Southeast Asia, respectively.
The failure to find a Y link with a suggested popu-lation of origin does not disprove a historical associa-tion, but it does demonstrate that the Y chromosomesderived from such historical events have been lost orreplaced. Analyses of mitochondrial DNA and other lociwould help to elucidate the population histories andwould be particularly interesting in populations like theNegroid Makrani and the Balti, in which there is a con-trast between the phenotype and the typical Pakistani Yhaplotypes.
Acknowledgments
This work was supported by a Wellcome Trust CollaborativeResearch Initiative Grant to S.Q.M. T.Z. was also supportedby The Wellcome Trust, and C.T.-S. by the Cancer ResearchCampaign. We express our appreciation to the original DNAdonors who made this study possible. The Department ofHealth of the Government of Baluchistan and the Baluch Stu-dent Federation, Quetta, Pakistan, assisted in the collection ofthe Brahui and Baluch samples. Pathan samples were collectedwith the assistance of the Department of Paediatrics, LadyReading Post Graduate Medical Hospital, Peshawar, Pakistan.We are also grateful to Dr. I. Kazmi and the Aga Khan Foun-dation Rural Health Support Program for their assistance inthe collection of Burusho samples. Dr. F. Sethna provided val-uable assistance in the collection of the Parsi samples. We thankLuis Quintana-Murci for his comments on the manuscript.
Electronic-Database Information
URLs for data in this article are as follows:
Arlequin, http://anthropologie.unige.ch/arlequin/BATWING, http://www.maths.abdn.ac.uk/˜ijw/Network 2.0, http://www.fluxus-engineering.com/ViSta, http://forrest.psych.unc.edu/
References
Ahmad AKN (1952) Jesus in heaven on earth. The Civil andMilitary Gazette Ltd, Lahore, Pakistan
Ayub Q, Mohyuddin A, Qamar R, Mazhar K, Zerjal T, MehdiSQ, Tyler-Smith C (2000) Identification and characterisationof novel human Y-chromosomal microsatellites from se-quence database information. Nucleic Acids Res 28:e8
Backstrom PC (1992) Balti. In: Backstrom PC, Radloff CF(eds) Sociolinguistic survey of northern Pakistan. Vol 2, Lan-guages of northern areas. National Institute of PakistanStudies, Islamabad, pp 3–27
Bandelt HJ, Forster P, Rohl A (1999) Median-joining networksfor inferring intraspecific phylogenies. Mol Biol Evol 16:37–48
Bandelt HJ, Forster P, Sykes BC, Richards MB (1995) Mito-
chondrial portraits of human populations using median net-works. Genetics 141:743–753
Bellew HW (1979) The races of Afghanistan. Sang-e-MeelPublications, Lahore, Pakistan
Bellew HW (1998) An enquiry into the ethnography of Af-ghanistan. Vanguard Books, Lahore, Pakistan
Bergen AW, Wang C-Y, Tsai J, Jefferson K, Dey C, Smith KD,Park S-C, Tsai S-J, Goldman D (1999) An Asian–NativeAmerican paternal lineage identified by RPS4Y resequencingand by microsatellite haplotyping. Ann Hum Genet 63:63–80
Bianchi NO, Bailliet G, Bravi CM, Carnese RF, RothhammerF, Martinez-Marignac VL, Pena SD (1997) Origin of Am-erindian Y-chromosomes as inferred by the analysis of sixpolymorphic markers. Am J Phys Anthropol 102:79–89
Biddulph J (1977) Tribes of the Hindoo Koosh. IndusPublications, Karachi, Pakistan
Burton RF (1851) Sindh and the races that inhabit the valleyof the Indus. WH Allen and Co Ltd, London
Caroe O (1958) The Pathans. Oxford University Press, Ka-rachi, Pakistan
Casanova M, Leroy P, Boucekkine C, Weissenbach J, BishopC, Fellous M, Purrello M, Fiori G, Siniscalco M (1985) Ahuman Y-linked DNA polymorphism and its potential forestimating genetic and evolutionary distance. Science 230:1403–1406
Cavalli-Sforza LL, Menozzi P, Piazza A (1994) The history andgeography of human genes. Princeton University Press,Princeton
Dales GF (1991) The phenomenon of the Indus civilization.In: Jansen M, Mulloy M, Urban G (eds) Forgotten cities onthe Indus: early civilization in Pakistan from the 8th to the2nd millennia BC. Verlag Philipp von Zabern, Mainz, Ger-many, pp 129–144
Decker KD (1992) Sociolinguistic survey of Northern Pakistan.Vol 5, Languages of Chitral. National Institute of PakistanStudies, Islamabad
Ewens WJ (1972) The sampling theory of selectively neutralalleles. Theor Popul Biol 3:87–112
Grimes BF (1992) Ethnologue: languages of the world. Sum-mer Institute of Linguistics, Dallas
Hammer MF (1994) A recent insertion of an Alu element onthe Y chromosome is a useful marker for human populationstudies. Mol Biol Evol 11:749–761
Hammer MF, Horai S (1995) Y chromosomal DNA variationand the peopling of Japan. Am J Hum Genet 56:951–962
Hammer MF, Karafet TM, Redd AJ, Jarjanazi H, Santachiara-Benerecetti S, Soodyall H, Zegura SL (2001) Hierarchicalpatterns of global human Y-chromosome diversity. Mol BiolEvol 18:1189–1203
Hammer MF, Redd AJ, Wood ET, Bonner MR, Jarjanazi H,Karafet T, Santachiara-Benerecetti S, Oppenheim A, JoblingMA, Jenkins T, Ostrer H, Bonne-Tamir B (2000) Jewish andMiddle Eastern non-Jewish populations share a commonpool of Y-chromosome biallelic haplotypes. Proc Natl AcadSci USA 97:6769–6774
Helgason A, Sigurdardottir S, Nicholson J, Sykes B, Hill EW,Bradley DG, Bosnes V, Gulcher JR, Ward R, Stefansson K(2000) Estimating Scandinavian and Gaelic ancestry in themale settlers of Iceland. Am J Hum Genet 67:697–717
Qamar et al.: Y-Chromosomal DNA Variation in Pakistan 1123
Hughes-Buller R (1991) Imperial gazetteer of India: provincialseries, Baluchistan. Sang-e-Meel, Lahore, Pakistan
Hussain J (1997) A history of the peoples of Pakistan towardsindependence. Oxford University Press, Karachi, Pakistan
Ibbetson D (1883) Panjab castes. Sang-e-Meel, Lahore, PakistanJarrige JF (1991) Mehrgarh: its place in the development of
ancient cultures in Pakistan. In: Jansen M, Mulloy M, UrbanG (eds) Forgotten cities on the Indus: early civilization inPakistan from the 8th to the 2nd millennia BC. Verlag Phi-lipp von Zabern, Mainz, Germany, pp 34–50
Jobling MA, Tyler-Smith C (2000) New uses for new haplo-types: the human Y chromosome, disease and selection.Trends Genet 16:356–362
Karafet TM, Zegura SL, Posukh O, Osipova L, Bergen A, LongJ, Goldman D, Klitz W, Harihara S, de Knijff P, Wiebe V,Griffiths RC, Templeton AR, Hammer MF (1999) AncestralAsian source(s) of new world Y-chromosome founder hap-lotypes. Am J Hum Genet 64:817–831
Kayser M, Roewer L, Hedman M, Henke L, Henke J, BrauerS, Kruger C, Krawczak M, Nagy M, Dobosz T, Szibor R, deKnijff P, Stoneking M, Sajantila A (2000) Characteristics andfrequency of germline mutations at microsatellite loci fromthe human Y chromosome, as revealed by direct observationin father/son pairs. Am J Hum Genet 66:1580–1588
Kwok C, Tyler-Smith C, Mendonca BB, Hughes I, BerkovitzGD, Goodfellow PN, Hawkins JR (1996) Mutation analysisof the 2 kb 5′ to SRY in XY females and XY intersex subjects.J Med Genet 33:465–468
Long JC (1991) The genetic structure of admixed populations.Genetics 127:417–428
Mathias N, Bayes M, Tyler-Smith C (1994) Highly informativecompound haplotypes for the human Y chromosome. HumMol Genet 3:115–123
Mehdi SQ, Qamar R, Ayub Q, Kaliq S, Mansoor A, Ismail M,Hammer MF, Underhill PA, Cavalli-Sforza LL (1999) Theorigins of Pakistani populations: evidence from Y chromo-some markers. In: Papiha SS, Deka R, Chakraborty R (eds)Genomic diversity: applications in human population genet-ics. Kluwer Academic/Plenum Publishers, New York, pp83–90
Mohyuddin A, Ayub Q, Qamar R, Zerjal T, Helgason A, MehdiSQ, Tyler-Smith C (2001) Y-chromosomal STR haplotypes inPakistani populations. Forensic Sci Int 118:141–146
Nanavutty P (1997) The Parsis. National Book Trust, NewDelhi, India
Pandya A, King TE, Santos FR, Taylor PG, Thangaraj K, SinghL, Jobling MA, Tyler-Smith C (1998) A polymorphic humanY-chromosomal G to A transition found in India. Ind J HumGenet 4:52–61
Qamar R, Ayub Q, Khaliq S, Mansoor A, Karafet T, MehdiSQ, Hammer MF (1999) African and Levantine origins ofPakistani YAP� Y chromosomes. Hum Biol 71:745–755
Quddus SA (1990) The tribal Baluchistan. Ferozsons (Pvt) Ltd,Lahore, Pakistan
Quintana-Murci L, Krausz C, Zerjal T, Sayar SH, Hammer MF,Mehdi SQ, Ayub Q, Qamar R, Mohyuddin A, RadhakrishnaU, Jobling MA, Tyler-Smith C, McElreavey K (2001) Y-chro-mosome lineages trace diffusion of people and languages insouthwestern Asia. Am J Hum Genet 68:537–542
Roberts DF, Hiorns R (1965) Methods of analysis of the geneticcomposition of a hybrid population. Hum Biol 37:38–43
Robertson GS (1896) The Kafirs of the Hindu-Kush. OxfordUniversity Press, Karachi, Pakistan
Rosser ZH, Zerjal T, Hurles ME, Adojaan M, Alavantic D,Amorim A, Amos W, et al (2000) Y-chromosomal diversityin Europe is clinal and influenced primarily by geography,rather than by language. Am J Hum Genet 67:1526–1543
Santos FR, Carvalho-Silva DR, Pena SDJ (1999a) PCR-basedDNA profiling of human Y chromosomes. In: Epplen JT,Lubjuhn T (eds) Methods and tools in biosciences and med-icine. Birkhauser Verlag, Basel, Switzerland, pp 133–152
Santos FR, Pandya A, Kayser M, Mitchell RJ, Liu A, Singh L,Destro-Bisol G, Novelletto A, Qamar R, Mehdi SQ, Adhi-kari R, Knijff P, Tyler-Smith C (2000) A polymorphic L1retroposon insertion in the centromere of the human Y chro-mosome. Hum Mol Genet 9:421–430
Santos FR, Pandya A, Tyler-Smith C, Pena SD, Schanfield M,Leonard WR, Osipova L, Crawford MH, Mitchell RJ (1999b)The central Siberian origin for native American Y chromo-somes. Am J Hum Genet 64:619–628
Schneider S, Kueffer J-M, Roessli D, Excoffier L (1997) Ar-lequin ver 1.1: a software for population genetic data anal-ysis. Genetics and Biometry Laboratory, University of Ge-neva, Switzerland
Seielstad MT, Hebert JM, Lin AA, Underhill PA, Ibrahim M,Vollrath D, Cavalli-Sforza LL (1994) Construction of hu-man Y-chromosomal haplotypes using a new polymorphicA to G transition. Hum Mol Genet 3:2159–1261
Shinka T, Tomita K, Toda T, Kotliarova SE, Lee J, Kuroki Y,Jin DK, Tokunaga K, Nakamura H, Nakahori Y (1999) Ge-netic variations on the Y chromosome in the Japanese pop-ulation and implications for modern human Y chromosomelineage. J Hum Genet 44:240–245
Thomas MG, Bradman N, Flinn HM (1999) High throughputanalysis of 10 microsatellite and 11 diallelic polymorphismson the human Y-chromosome. Hum Genet 105:577–581
Tyler-Smith C (1999) Y-chromosomal DNA markers. In: Pa-piha SS, Deka R, Chakraborty R (eds) Genomic diversity:applications in human population genetics. Kluwer Aca-demic/Plenum Publishers, New York, pp 65–73
Underhill PA, Jin L, Lin AA, Mehdi SQ, Jenkins T, VollrathD, Davis RW, Cavalli-Sforza LL, Oefner PJ (1997) Detectionof numerous Y chromosome biallelic polymorphisms by de-naturing high-performance liquid chromatography. GenomeRes 7:996–1005
Wells RS, Yuldasheva N, Ruzibakiev R, Underhill PA, EvseevaI, Blue-Smith J, Jin L, et al (2001) The Eurasian heartland:a continental perspective on Y-chromosome diversity. ProcNatl Acad Sci USA 98:10244–10249
Whitfield LS, Sulston JE, Goodfellow PN (1995) Sequence var-iation of the human Y chromosome. Nature 378:379–380
Wilson IJ, Balding DJ (1998) Genealogical inference from mi-crosatellite data. Genetics 150:499–510
Wolpert S (2000) A new history of India. Oxford UniversityPress, New York
Young FW, Bann CM (1996) A visual statistics system. In:Stine RA, Fox J (eds) Statistical computing environments forsocial researches. Sage Publications, New York, pp 207–236

1124 Am. J. Hum. Genet. 70:1107–1124, 2002
Zerjal T, Beckman L, Beckman G, Mikelsaar AV, Krumina A,Kucinskas V, Hurles ME, Tyler-Smith C (2001) Geograph-ical, linguistic, and cultural influences on genetic diversity:Y-chromosomal distribution in Northern European popu-lations. Mol Biol Evol 18:1077–1087
Zerjal T, Dashnyam B, Pandya A, Kayser M, Roewer L, Santos
FR, Schiefenhovel W, Fretwell N, Jobling MA, Harihara S,Shimizu K, Semjidmaa D, Sajantila A, Salo P, Crawford MH,Ginter EK, Evgrafov OV, Tyler-Smith C (1997) Genetic re-lationships of Asians and Northern Europeans, revealed byY-chromosomal DNA analysis. Am J Hum Genet 60:1174–1183


