Embed Size (px)
Citation preview
Zemmouri earthquake rupture zone (Mw 6.8, Algeria):
Aftershocks sequence relocation and 3D velocity model
A. Ayadi,1 C. Dorbath,2,5 F. Ousadou,1 S. Maouche,1 M. Chikh,3 M. A. Bounif,4
and M. Meghraoui5
Received 4 July 2007; revised 9 April 2008; accepted 18 June 2008; published 4 September 2008.
[1] We analyze the aftershocks sequence of the Zemmouri thrust faulting earthquake(21 May 2003, Mw 6.8) located east of Algiers in the Tell Atlas. The seismic sequencelocated during�2 months following the mainshock is made of more than 1500 earthquakesand extends NE–SW along a �60-km fault rupture zone crossing the coastline. Theearthquake relocation was performed using handpicked P and S phases located with thetomoDD in a detailed 3D velocity structure of the epicentral area. Contrasts betweenvelocity patches seem to correlate with contacts between granitic–volcanic basement rocksand the sedimentary formation of the eastern Mitidja basin. The aftershock sequenceexhibits at least three seismic clouds and awell-defined SE-dippingmain fault geometry thatreflects the complex rupture. The distribution of seismic events presents a clear contrastbetween a dense SW zone and a NE zone with scattered aftershocks. We observe that themainshock locates between the SW and NE seismic zones; it also lies at the NNS–SSEcontact that separates a basement block to the east and sedimentary formations to the west.The aftershock distribution also suggests fault bifurcation at the SW end of the faultrupture, with a 20-km-long �N 100� trending seismic cluster, with a vertical faultgeometry parallel to the coastline juxtaposed. Another aftershock cloud may correspondto 75� SE dipping fault. The fault geometry and related SW branches may illustrate theinterference between pre-existing fault structures and the SW rupture propagation. Therupture zone, related kinematics, and velocity contrasts obtained from the aftershocksdistribution are in agreement with the coastal uplift and reflect the characteristics of an activezone controlled by convergent movements at a plate boundary.
Citation: Ayadi, A., C. Dorbath, F. Ousadou, S. Maouche, M. Chikh, M. A. Bounif, and M. Meghraoui (2008), Zemmouri earthquake
rupture zone (Mw 6.8, Algeria): Aftershocks sequence relocation and 3D velocity model, J. Geophys. Res., 113, B09301,
doi:10.1029/2007JB005257.
1. Introduction
[2] Large and moderate earthquakes are followed byaftershock sequences that may reveal the mainshock rupturezone. Since Thurber [1983], several tomographic studies ofsource areas of strong earthquakes have been performed invarious active tectonic domains, demonstrating the contri-bution of local earthquake tomography to constrain activetectonic structures and the rupture process. Recently,Zhang and Thurber [2003] developed a double-differencetomography method, based on hypoDD [Waldhauser andEllsworth, 2000], using absolute and relative P and S-wavetravel time data. This improvement allows a better assess-
ment of the 3D crustal velocity model and enhances theseismic event location in comparison to standard localearthquake tomographies. The application of the double-difference seismic tomography (tomoDD) to seismogenicareas has been largely restricted to strike-slip faulting regimes(such as the Hayward fault in California, Zhang and Thurber[2003]. Examples of reverse or normal earthquake faultstudies using this method include the 2004 (Mw = 6.6) mid-Niigata prefecture earthquake (Japan, Kato et al. [2005]) andthe 1994 (Mw = 6.7) Arthur’s Pass earthquake (New Zealand,Bannister et al. [2006]).[3] The Tell Atlas of northern Algeria is an EW trending
thrust and fold belt situated along the Africa-Eurasia plateboundary (Figures 1a and 1b). This active zone generatedthe 1980 El Asnam thrust fault earthquake (Ms 7.3), whichexhibited a complex pattern of thrust and fold structuresimaged by a dense aftershocks sequence [Ouyed et al.,1981; Yielding et al., 1989; Chiarabba et al., 1997](Figure 1a). The Zemmouri earthquake (Mw 6.8) thataffected the Tell Atlas in 2003 presents a faulting geometrycomparable with the El Asnam seismic event. The seismicitycatalogue sinceAD1365makes nomention of the occurrence
JOURNAL OF GEOPHYSICAL RESEARCH, VOL. 113, B09301, doi:10.1029/2007JB005257, 2008ClickHere
for
FullArticle
1Centre de Recherche en Astronomie Astrophysique et Geophysique,Algiers, Algeria.
2Institut de Recherche pour le Developpement, France.3Centre de Genie Parasismique, Algiers, Algeria.4Universite des Sciences et de la Technologie Houari Boumedienne,
Algiers, Algeria.5UMR 7516, Institut de Physique du Globe, Strasbourg, France.
Copyright 2008 by the American Geophysical Union.0148-0227/08/2007JB005257$09.00
B09301 1 of 15
of a large seismic event in the Zemmouri region [Mokraneet al., 1994] and no surface faulting was identified in theearthquake area.[4] Geodetic measurements (tape, DGPS, and conven-
tional leveling) of the 50-km-long coastal uplift (�0.55 m)lead us to construct a dislocation model with a SE dippingreverse fault mechanism [Meghraoui et al., 2004]. Accord-ing to the inversion of body waves and the analysis ofaftershocks sequence, the Zemmouri event was associatedwith a SE-dipping, 50–60-km-long reverse fault [Delouis etal., 2004; Bounif et al., 2004]. The rupture propagatedbilaterally from the hypocenter. By combining P and Stravel-times provided by CRAAG (Centre de Recherche enAstronomie, Astrophysique et Geophysique) National net-work together with the master events of 27, 28, and 29 May2003 with M 5.8, M 5.0, and M 5.8 respectively, the mainshock was relocated offshore near the coast at 36.85�N,3.65�E [Bounif et al., 2004]. This coastal epicenter suggestsrupture along a previously unidentified offshore fault, whichmakes constraining the geometry of the fault from geodeticand geologic observations difficult.[5] During the two months following the main shock,
seismic activity was monitored by 25 temporary seismicstations, which recorded a large number (�2500) of after-shocks. Here, we use the aftershocks of the Zemmouriearthquake to illuminate the faulting geometry and velocitystructure. We invert absolute and differential times to solveseparately for 3D P- and S-wave velocity structure andrevised hypocenters using double-difference tomography(tomoDD) [Zhang and Thurber, 2003]. We also determinerevised focal mechanisms for the aftershock sequence andcompute a regional stress tensor.
2. Tectonic Framework
[6] Several disastrous earthquakes, including the 2003Zemmouri earthquake, have damaged Algiers region andnorth-central Algeria in the past (2 January 1365, 3 February1716, 2 March 1825, 2 January 1867, 29 October 1989,4 September 1996) [Harbi et al., 2004] (Figure 1a). From thestress tensor inversion of CMT focal mechanism solutions,Stich et al. [2003] note a dominant NW-SE compression innorthern Algeria. Global models of plate movements infer 5–6mm/year of convergence of Africa toward Eurasia [Argus etal., 1989] of which the Tell Atlas accommodates 2–3 mm/year of shortening along the main thrust system of the plateboundary zone [Meghraoui and Doumaz, 1996] (Figure 1a,inset).[7] The Tell Atlas of northern Algeria is primarily formed
by a complex system of thrusts and nappes showing asouthern vergence and corresponding to Eocene and earlyMiocene tectonic episodes [Wildi, 1983]. These pre-Neogeneunits are made of Mesozoic and Cenozoic flyschs unitslying for instance on the Blida schists massifs. The over-thrusting formations also include metamorphic massifsmade of granite, gneiss, and micaschists mainly visible inthe Kabylie block near the earthquake area (Figure 1b).Intrusions of volcanic (Calco-Alkalin basaltic formation)units near Cap Djinet suggest the likely existence of activesubduction in the Miocene [Maury et al., 2000]. Post-nappetectonic episodes are responsible for the Neogene andQuaternary basins and show predominant NNW–SSE com-
pression and thrust faulting and folding affecting lateQuaternary deposits [Meghraoui, 1988].[8] The Zemmouri earthquake affected the easternmost
part of the Neogene and Quaternary Mitidja Basin. Thebasin contains intensely folded geological units associatedwith reverse faults and uplifted marine and alluvial terraces[Meghraoui, 1988]. The earthquake was also associatedwith failures of cliffs, rock fall, landslides, and liquefactionin the epicentral zone [Ayadi et al., 2003]. The Mitidja basinis rimmed by prominent EW to ENE–WSW trending lateQuaternary faults visible in the Blida fold-and-thrust systemto the south, and by the Sahel active fold to the north. Thewestern end of the Mitidja Basin experienced an Mw 6.0 in29 October 1989, which revealed a complex reverse faultinggeometry associated with the Tipaza-Chenoua fold andthrust structure [Meghraoui, 1991]. The aftershock studyindicated the presence of a NW dipping reverse NE–SWtrending fault that extends offshore [Bounif et al., 2003], ascenario comparable with the Zemmouri earthquake butwith an antithetic NW dip (Figure 1a). In both cases, theearthquake faults are oblique to the coastline and correlatewell with inland active zones. Primary surface fault was notobserved during either the 1989 Tipaza or 2003 Zemmouriearthquakes. According to the main shock location, the zoneof maximum macroseismic intensity, the coastal uplift, andthe SE dipping fault plane of the focal mechanism, it islikely that the 2003 Zemmouri event took place on a faultsegment oblique to the coast in continuation of the southernMitidja basin thrust fault system.
3. Data Collection and Inversion Method
[9] Between 23 May and 31 July 2003, approximately2500 aftershocks with magnitude Md � 1, including threelarge events with Md � 5, were recorded by a temporarynetwork (Figure 2a). The 25 digital seismic stations operatedby CRAAG and CGS (Centre de Genie Parasismique) weredeployed in the epicentral area, between Algiers and Dellys(Figure 1b). All of them were equipped with short periodthree-component sensors and synchronized on GPS time.Nine seismic stations were recording continuously with a75-Hz sampling rate, and all other stations were set ontriggered mode. As shown in Figure 2a, this dense networkcovered the entire area affected by the aftershock sequence,from the coast to 20 km inland.[10] More than 1000 of the recorded events were located
(Figure 2a). The localization has been made using carefulmanual P and S readings from the temporary network withhypoinverse program [Klein, 1978], using the 1D velocitymodel of Bezzeghoud et al. [1994] and Bounif et al. [2003].Reading precision is estimated to be 0.02 to 0.03 s for P-waves and about 0.05 s for S-waves. The magnitudes werecalculated using coda length with the coefficients given byOuyed [1981]. The aperture of the seismic array is far fromideal because of the offshore location of about a third of thehypocenters. For tomographic inversion, we use a subset of929 events with high-quality locations, low rms, and verti-cal and horizontal uncertainties (rms � 0.2, erh � 2.5, erz �2.5), and a minimum of 2 S arrivals to better constrain thedepth.[11] The travel-times of the selected aftershocks and the
corresponding hypocenter catalogue were used for a
B09301 AYADI ET AL.: ZEMMOURI EARTHQUAKE (ALGERIA)
2 of 15
B09301
tomographic inversion using the double-difference tomogra-phy method developed by Zhang and Thurber [2003]. Thismethod uses both the absolute and relative arrival times in ajoint solution for hypocentral parameters and P and S wave3D velocity structure. It improves the accuracy of the velocitystructure near the sources and produces earthquake locationswith a relative location quality equivalent to that obtained byhypoDD [Waldhauser and Ellsworth, 2000]. This improve-
ment is particularly useful for our study, where, because ofthe offshore location of the fault, the seismic azimuthal gapcan exceed 180�.[12] The double difference (DD) earthquake location
algorithm is based on the assumption that if the hypocentralseparation between a pair of earthquakes is small comparedto the event-station distance and the scale length of thevelocity heterogeneity, then the ray paths between the
Figure 1. (a) Seimotectonic map of the Tell Atlas of north-central Algeria [Meghraoui, 1988] andlargest instrumentally recorded events that occurred near Alger [Harbi et al., 2004]. Focal mechanismsare global CMT Harvard solutions; red and light blue solutions are mainshock (red star) and mainaftershocks of the Zemmouri earthquake sequence, respectively; dark blue mechanism corresponds to ElAsnam major earthquake. The black frame shows the boundaries of Figure 1b. Inset: Location of thestudy area within the Africa-Eurasia plate boundary and related convergence rate [Nocquet and Calais,2004]. (b) Geology and active tectonics of the North-Central Algeria [Meghraoui, 1988]. The red star isthe epicentre of the 21 May 2003 Zemmouri earthquake [Bounif et al., 2004]; see also major aftershocksin Figure 2a. Qm: Quaternary marine terraces; Qa: Quaternary alluvial deposits; Pl: Neogene sedimentaryunits; V: Neogene volcanic fields; Sn: Nappes of flyschs and limestone (Cenozoic and Mesozoic); Sg:Paleozoic granitic basement; lines with black triangles: active thrust fault; simple lines: pre-quaternaryfault.
B09301 AYADI ET AL.: ZEMMOURI EARTHQUAKE (ALGERIA)
3 of 15
B09301
source region and a common station are similar along theentire ray path [Frechet, 1985; Got et al., 1994]. Thus forclosely spaced events, we assume that the path anomaliesdue to velocity heterogeneity are location-independent. Thedouble difference technique minimizes the residuals betweenobserved and calculated travel time differences for pairs ofearthquakes at common stations by iteratively adjusting thevector difference between the hypocenters. However loca-tions of earthquakes far apart may be biased because ofvelocity heterogeneities. The use of absolute arrival times inthe tomoDD method provides valuable information on
absolute locations and on broad-scale velocity heterogeneity,while the use of differential times improves the velocitymodel in the source region relative to standard tomographymethods [Zhang and Thurber, 2003].[13] From the 929 selected events, we obtained �12,200
absolute travel times (�50% each for P and S waves), andfrom these constructed 238,000 differential travel times forevent pairs with inter-event distances of less than 10 km.This distance choice is determined by the 70-km length ofthe aftershock cloud and the 80-km maximal event-stationdistance.
Figure 2. (a) Map view of the aftershocks from 25 May to 31 July, 2003, on a topographic (SRTM)background. The seismic stations used are displayed by triangles, blue for CRAAG, red for CGS. Themainshock location (red star) and 3 largest aftershocks (blue stars) are presented with their focalmechanism. (b) Map view of the relocated aftershocks with the position of the grid nodes used in thetomography study. The rotation is 33� anticlockwise.
B09301 AYADI ET AL.: ZEMMOURI EARTHQUAKE (ALGERIA)
4 of 15
B09301
[14] The inversion grid chosen after routine tests ispresented in Figure 2b. It is rotated 33� anticlockwise,allowing the Y nodes to be almost parallel to the 57�Edipping fault plane. Rotation of the inversion grid does notchange the results of the inversion. The distance betweenthe nodes is, from the surface down to the maximal depth ofthe hypocenters, 6 km, as well as along the X and Ydirections in the central part of the grid. After 20 iterations,the weighted rms travel time residual was reduced to0.05 seconds. The initial P velocity model is interpolatedfrom the 1D models from previous studies [Ouyed, 1981;Bezzeghoud et al., 1994; Bounif et al., 2003] and usedfor the initial hypocentral location. Initial S velocities aredirectly calculated from P by applying a constant 1.73 Vp/Vsratio. An inversion of the travel-time data for a 1D velocitymodel did not provide significant changes to this simpleinitial model.[15] Numerous tests have been performed to check the
robustness of the 3D solution. We ran tomoDD in LSQRmode and chose a damping at each iteration that results incondition number values between 40 and 50 [Waldhauser,2001]. Several inversions were performed with variousstrategies of weighting absolute data relatively to differen-tial data. Various distances between the grid nodes weretested in order to get the best trade-off between grid spacingand data resolution. We use the derivative weight sum(DWS) at each node as a measure of the raypath coverage.Thereafter, the iso-value 25, considered to be the limit forresolved structures [Bannister et al., 2006], is drawn on allfigures.[16] Resolution modeling with independent checkerboard
tests for Vp and Vs are presented in Figure A1. In thesetests, the calculated synthetic absolute and differentialtravel-times are included only for the same data distributionas for the real data. Following the standard procedure, weadd uniformly distributed random noise to the synthetic datain the interval ±0.025 s for P waves and ±0.05 s for Swaves. The inverted models are obtained with the sameinversion scheme as the real data set and starting from thesame 1D model. The synthetic input P- and S-wave velocitymodels consist of 6 � 6 � 6 km patches with velocitiesalternatively +5% and �5% compared to the normal startingmodel (Top figures, Figure A1). Recovered P and S wavemodels are presented underneath. It is clear that features arewell recovered in the center of the two upper layers. At12 km depth, we observe some smearing of the recoveredpatche, due to the much smaller density of rays.
4. Tomography Results
[17] The results of the tomography are presented in thethree figures. Relocated hypocenters are shown scaled by
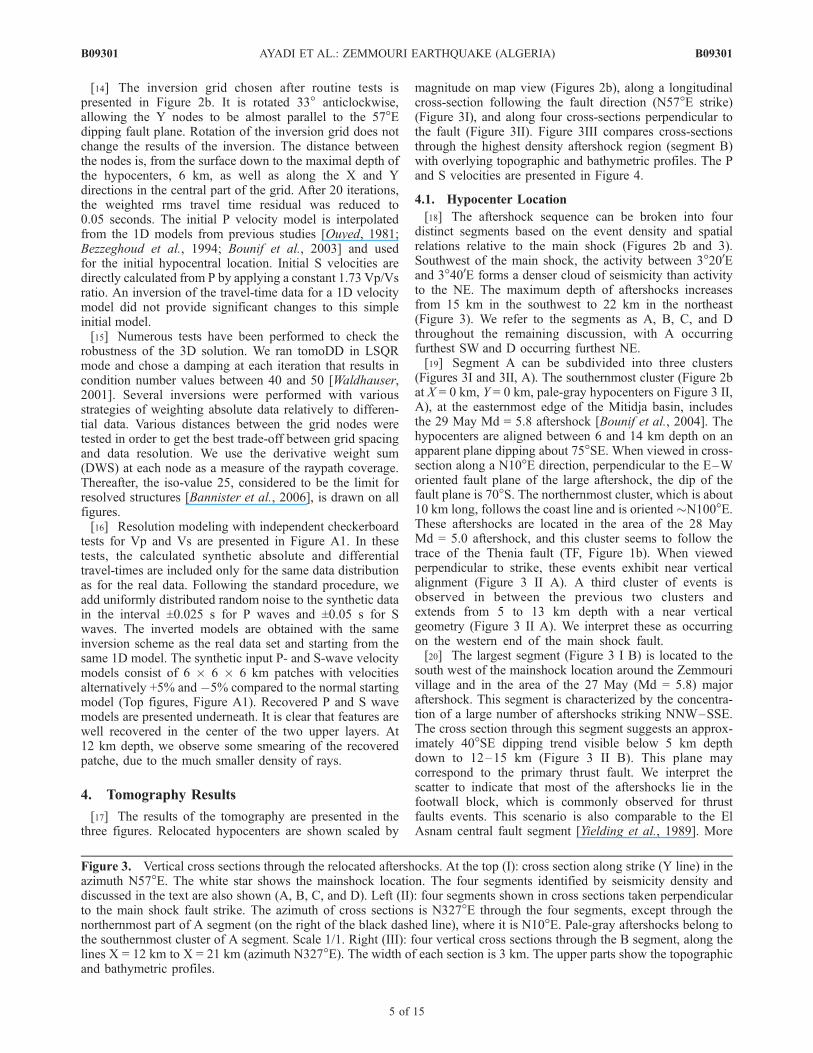
magnitude on map view (Figures 2b), along a longitudinalcross-section following the fault direction (N57�E strike)(Figure 3I), and along four cross-sections perpendicular tothe fault (Figure 3II). Figure 3III compares cross-sectionsthrough the highest density aftershock region (segment B)with overlying topographic and bathymetric profiles. The Pand S velocities are presented in Figure 4.
4.1. Hypocenter Location
[18] The aftershock sequence can be broken into fourdistinct segments based on the event density and spatialrelations relative to the main shock (Figures 2b and 3).Southwest of the main shock, the activity between 3�200Eand 3�400E forms a denser cloud of seismicity than activityto the NE. The maximum depth of aftershocks increasesfrom 15 km in the southwest to 22 km in the northeast(Figure 3). We refer to the segments as A, B, C, and Dthroughout the remaining discussion, with A occurringfurthest SW and D occurring furthest NE.[19] Segment A can be subdivided into three clusters
(Figures 3I and 3II, A). The southernmost cluster (Figure 2bat X = 0 km, Y = 0 km, pale-gray hypocenters on Figure 3 II,A), at the easternmost edge of the Mitidja basin, includesthe 29 May Md = 5.8 aftershock [Bounif et al., 2004]. Thehypocenters are aligned between 6 and 14 km depth on anapparent plane dipping about 75�SE. When viewed in cross-section along a N10�E direction, perpendicular to the E–Woriented fault plane of the large aftershock, the dip of thefault plane is 70�S. The northernmost cluster, which is about10 km long, follows the coast line and is oriented �N100�E.These aftershocks are located in the area of the 28 MayMd = 5.0 aftershock, and this cluster seems to follow thetrace of the Thenia fault (TF, Figure 1b). When viewedperpendicular to strike, these events exhibit near verticalalignment (Figure 3 II A). A third cluster of events isobserved in between the previous two clusters andextends from 5 to 13 km depth with a near verticalgeometry (Figure 3 II A). We interpret these as occurringon the western end of the main shock fault.[20] The largest segment (Figure 3 I B) is located to the
south west of the mainshock location around the Zemmourivillage and in the area of the 27 May (Md = 5.8) majoraftershock. This segment is characterized by the concentra-tion of a large number of aftershocks striking NNW–SSE.The cross section through this segment suggests an approx-imately 40�SE dipping trend visible below 5 km depthdown to 12–15 km (Figure 3 II B). This plane maycorrespond to the primary thrust fault. We interpret thescatter to indicate that most of the aftershocks lie in thefootwall block, which is commonly observed for thrustfaults events. This scenario is also comparable to the ElAsnam central fault segment [Yielding et al., 1989]. More
Figure 3. Vertical cross sections through the relocated aftershocks. At the top (I): cross section along strike (Y line) in theazimuth N57�E. The white star shows the mainshock location. The four segments identified by seismicity density anddiscussed in the text are also shown (A, B, C, and D). Left (II): four segments shown in cross sections taken perpendicularto the main shock fault strike. The azimuth of cross sections is N327�E through the four segments, except through thenorthernmost part of A segment (on the right of the black dashed line), where it is N10�E. Pale-gray aftershocks belong tothe southernmost cluster of A segment. Scale 1/1. Right (III): four vertical cross sections through the B segment, along thelines X = 12 km to X = 21 km (azimuth N327�E). The width of each section is 3 km. The upper parts show the topographicand bathymetric profiles.
B09301 AYADI ET AL.: ZEMMOURI EARTHQUAKE (ALGERIA)
5 of 15
B09301
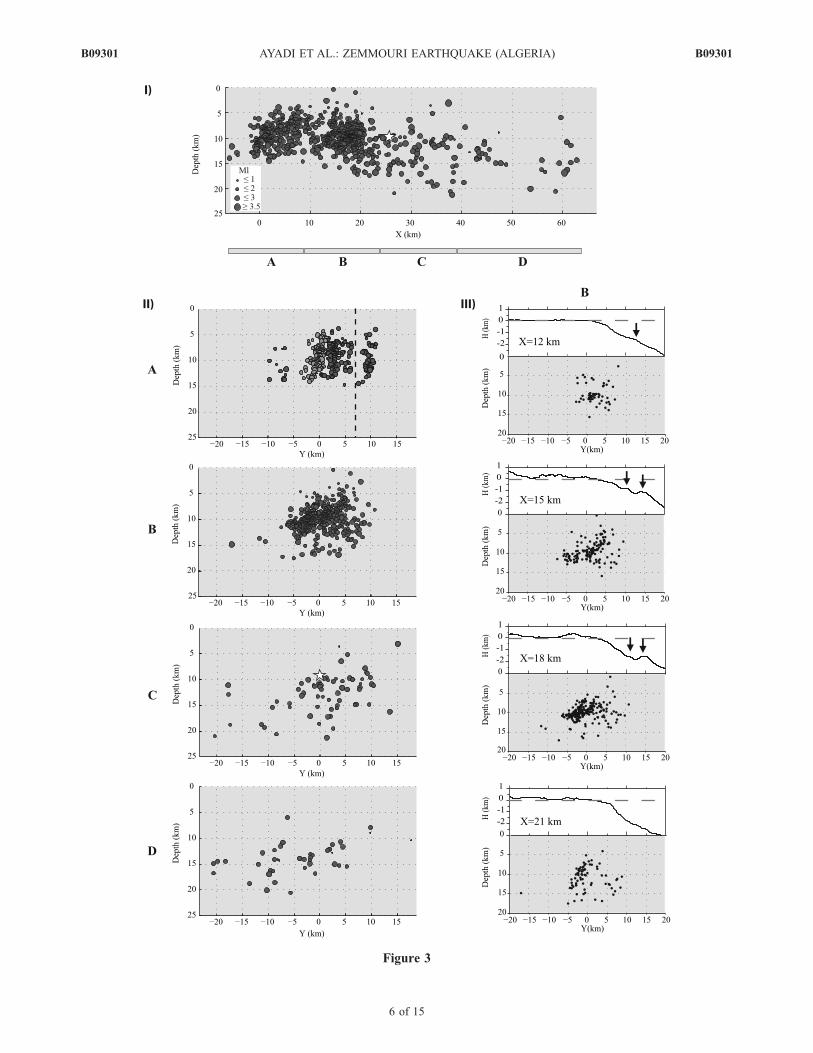
Figure 3
B09301 AYADI ET AL.: ZEMMOURI EARTHQUAKE (ALGERIA)
6 of 15
B09301
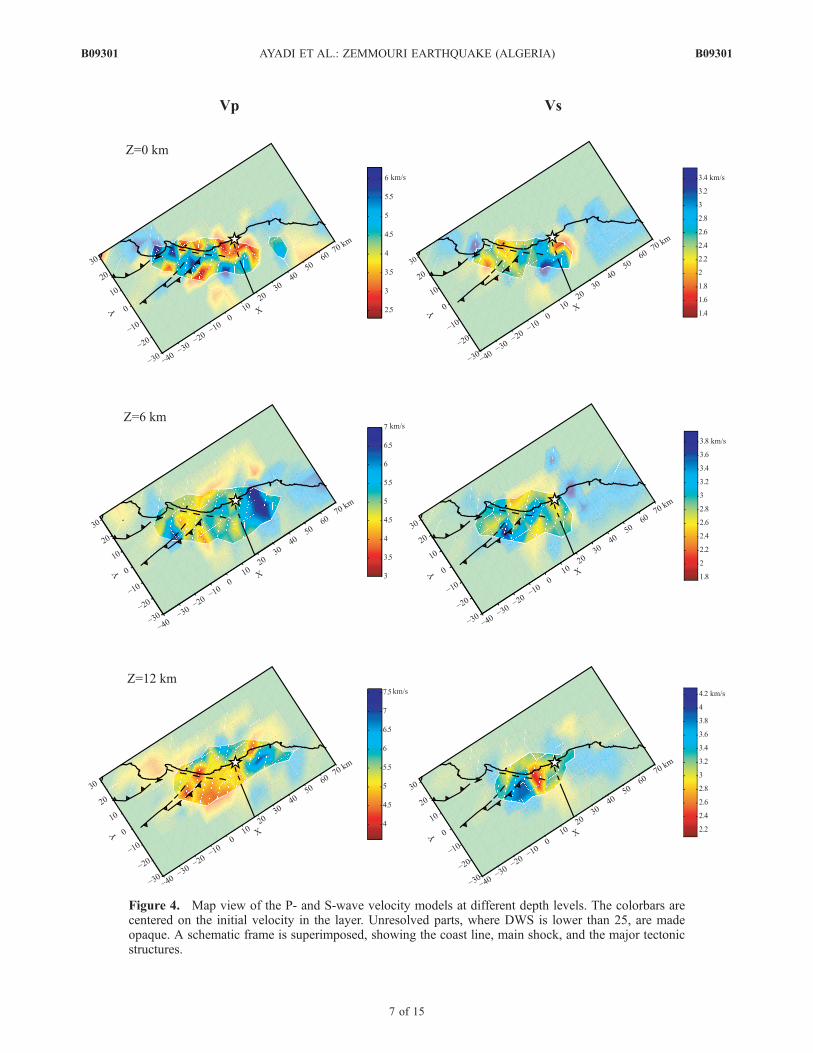
Figure 4. Map view of the P- and S-wave velocity models at different depth levels. The colorbars arecentered on the initial velocity in the layer. Unresolved parts, where DWS is lower than 25, are madeopaque. A schematic frame is superimposed, showing the coast line, main shock, and the major tectonicstructures.
B09301 AYADI ET AL.: ZEMMOURI EARTHQUAKE (ALGERIA)
7 of 15
B09301
detailed cross sections (Figure 3 III, X = 12 to 21 km),reveal a more complex image of the rupture zone. Onprofile X = 12 km, a little scarp can be observed on thesea floor at Y = 12 km (see the arrows in Figure 3 III) andmay coincide with the surface extension of the 40�–45�SEdipping seismicity. Along X = 15 km and X = 18 km, twoscarps are observed on the topographic profile and appear tocoincide with the surface extension of two parallel seismicclusters and likely related fault planes dipping again 40�–45�SE. The inferred dip of the seismicity clusters is com-parable to the 44�SE dipping Harvard-CMT fault planesolution. The scarp morphology is not clearly observed onthe profile X = 21 km, although the SE dipping fault plane isdefined by the seismicity. It is important to note that in allcross sections, the extension of aftershocks toward thesurface reaches the seafloor at a maximum of 8 to 10 kmfrom the shoreline in the epicentral zone of the Mw = 6.8earthquake.[21] Segments C and D are located NE of the main shock
(Figures 2 and 3). In this easternmost part, the aftershockdistribution becomes more scattered and extends deeper.The sparseness of activity is a real feature of the aftershocksequence and is not due to data selection for tomography(Figures 2a and 2b). The deepest hypocenters are locatedashore, where depths are well controlled by local seismicstations. However it is clear that some shallow smallmagnitude earthquakes may have been eliminated duringthe initial localization stage. In the C segment there is apossible �45�SE dipping alignment to the seismicity. The8 to 10 km depth for the main shock is consistent with thefault plane defined by the aftershocks on the C segment,with the aftershocks lying in the footwall block.
4.2. Velocity
[22] Six tomographic images are displayed in Figure 4showing the P- and S-wave velocity models obtained bytomoDD at depth levels 0, 6 and 12 km. For each layer, thevelocity scale is centered on the initial velocity used in theinversion process for this specific layer. Unresolved parts,where DWS are lower than 25, are made opaque.
[23] At the surface, high P-wave velocities are observedunder CapMatifou where the basement outcrops (Figure 1b).A low velocity strip is observed along the western border ofthe Mitidja basin. Neogene units and overlying marineterraces around Zemmouri (Figure 1b) are marked by lowvelocities. The S-wave velocities are low in the MitidjaQuaternary basin and higher in the Tell Atlas (basementrocks).[24] At 6 km depth, a high P velocity zone is observed in
the eastern part of the images, where the basement ispresent. The eastern termination of the Mitidja basin isunderlined by lower P velocity and higher S velocity. Thesimplest image corresponds to the 12 km depth layer, wherea high P velocity zone to the east juxtaposes a large lowvelocity region to the west. This region corresponds to lowS velocity around Boumerdes and high velocity west of theBlida thrust system (Figure 1a).
5. Focal Mechanisms and Regional Stress Tensor
[25] Following Rivera and Cisternas [1990], we deter-mined the best fitting stress tensor based on inversion ofP-waves polarities, azimuths to the stations and the take-off angles. We selected events with at least 9 polarities andused 57 reliable aftershocks, whose focal mechanism can beconstructed with nomore than one wrong polarity. This resultin nearly 600 polarities and related parameters for use in thestress tensor inversion.[26] The fault plane solutions of 30 aftershocks presented
in Figure 5, computed following Rivera and Cisternas[1990] method, were constructed without any inconsistentpolarities. The parameters defining the nodal planes, azi-muth, dip and rake according to Aki’s convention [Aki andRichards, 1980] are presented in Table 1 for the full set. Thecomplete focal mechanisms, including polarities, are pre-sented in Figure B1.[27] The majority of the solutions are reverse mecha-
nisms, resembling the main shock and two of the threelargest aftershocks. This is particularly true in the epicentralzone and the eastern side of the aftershock cloud. At theeastern extremity of the seismic cloud, some events show
Figure 5. Fault mechanisms of 30 aftershocks, compatible with the deduced stress tensor presented inthe inset.
B09301 AYADI ET AL.: ZEMMOURI EARTHQUAKE (ALGERIA)
8 of 15
B09301
reverse faulting on planes striking about NS. Some strike-slip and normal faulting solutions are however foundespecially at the westernmost end of the aftershocks cloud.Perhaps these events occurred on pre-existing faults reac-tivated by the major event.[28] The stress tensor is inset in Figure 5. The shape factor
R, represents the ratio between (sz-sx) and (sy-sx). R < 0corresponds to a reverse stress regime with (sz = s3), R > 1corresponds to a normal faulting stress field with (sz = s1),and 0 < R < 1 represents a strike-slip regime with (sz = s2).For the Zemmouri region, R = �1.5 indicating a reversestress regime. The stress tensor obtained has a nearlyhorizontal N350�E maximum principal stress (s1) direction,a nearly vertical minimum principal stress (s3) direction anda nearly horizontal N80�E intermediate principal stress (s2)direction. This finding is consistent with the stress tensorobtained from the inversion of focal mechanisms along theplate boundary [Stich et al., 2003] (see Figure 1a, inset). Innorthern Algeria NE–SW trending reverse and thrust fault-ing is the predominant feature present along the Tell Atlas,controlling the morphology of the Mitidja and ChelifQuaternary basins (Figures 1a and 1b) [Meghraoui, 1988].The stress tensor obtained from the Zemmouri earthquakesequence is similar to that obtained by inversion for theChenoua-Tipasa earthquake of October 29th 1990, M = 6.0,[Bounif et al., 2004] with local data. The principal stressdirection differs by 12� from the median P-axis orientation
(N338�E) of thrust and strike-slip events found by Braunmilllerand Bernardi [2005] with regional data.
6. Discussion and Conclusion
6.1. Fault Geometry
[29] The spatial distribution of relocated aftershocksallows us to differentiate four seismic segments on the mainfault and two clusters occurring on secondary faults (Figure 3).Seismicity along segment A, at the western end of theaftershocks cloud, exhibits a nearly vertical geometrybetween 4 and 14 km. Seismicity along segment B, betweenBoumerdes and the main shock location, occurs from thesurface to 18 km, with most activity focused between 5 and13 km depth. These aftershocks likely enclose a 40 to 50�SEdipping en echelon fault system with strands separated by3 km (Figure 3 III). The activity abruptly decreases east of themain shock however up to Cap Djinet (C segment), where a45�SE dipping plane can be seen between 3 and 23 kmdepth. The last segment D is poorly constrained becausemost aftershocks lie offshore. Two clusters are observedon both sides of the main fault in the A segment. Thenorthernmost cluster is aligned along the Cap Matifoucoast, while the southernmost cluster is more concentratedsouth of the main shock fault. Both display nearly verticalplanes from 5–6 to 14 km depth (Figure 3 II A).[30] Following the Harvard CMT solution, we have taken
a value of N57�E for the strike of the fault responsible of theZemmouri major earthquake. This azimuth is in good
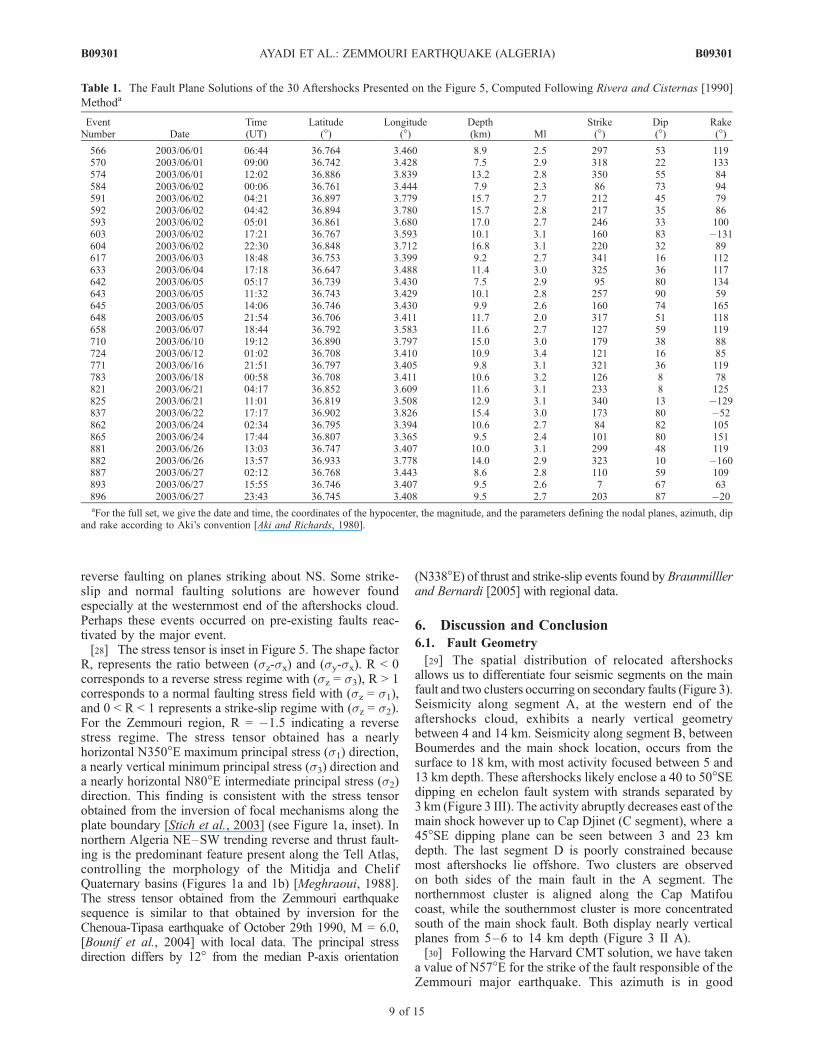
Table 1. The Fault Plane Solutions of the 30 Aftershocks Presented on the Figure 5, Computed Following Rivera and Cisternas [1990]
Methoda
EventNumber Date
Time(UT)
Latitude(�)
Longitude(�)
Depth(km) Ml
Strike(�)
Dip(�)
Rake(�)
566 2003/06/01 06:44 36.764 3.460 8.9 2.5 297 53 119570 2003/06/01 09:00 36.742 3.428 7.5 2.9 318 22 133574 2003/06/01 12:02 36.886 3.839 13.2 2.8 350 55 84584 2003/06/02 00:06 36.761 3.444 7.9 2.3 86 73 94591 2003/06/02 04:21 36.897 3.779 15.7 2.7 212 45 79592 2003/06/02 04:42 36.894 3.780 15.7 2.8 217 35 86593 2003/06/02 05:01 36.861 3.680 17.0 2.7 246 33 100603 2003/06/02 17:21 36.767 3.593 10.1 3.1 160 83 �131604 2003/06/02 22:30 36.848 3.712 16.8 3.1 220 32 89617 2003/06/03 18:48 36.753 3.399 9.2 2.7 341 16 112633 2003/06/04 17:18 36.647 3.488 11.4 3.0 325 36 117642 2003/06/05 05:17 36.739 3.430 7.5 2.9 95 80 134643 2003/06/05 11:32 36.743 3.429 10.1 2.8 257 90 59645 2003/06/05 14:06 36.746 3.430 9.9 2.6 160 74 165648 2003/06/05 21:54 36.706 3.411 11.7 2.0 317 51 118658 2003/06/07 18:44 36.792 3.583 11.6 2.7 127 59 119710 2003/06/10 19:12 36.890 3.797 15.0 3.0 179 38 88724 2003/06/12 01:02 36.708 3.410 10.9 3.4 121 16 85771 2003/06/16 21:51 36.797 3.405 9.8 3.1 321 36 119783 2003/06/18 00:58 36.708 3.411 10.6 3.2 126 8 78821 2003/06/21 04:17 36.852 3.609 11.6 3.1 233 8 125825 2003/06/21 11:01 36.819 3.508 12.9 3.1 340 13 �129837 2003/06/22 17:17 36.902 3.826 15.4 3.0 173 80 �52862 2003/06/24 02:34 36.795 3.394 10.6 2.7 84 82 105865 2003/06/24 17:44 36.807 3.365 9.5 2.4 101 80 151881 2003/06/26 13:03 36.747 3.407 10.0 3.1 299 48 119882 2003/06/26 13:57 36.933 3.778 14.0 2.9 323 10 �160887 2003/06/27 02:12 36.768 3.443 8.6 2.8 110 59 109893 2003/06/27 15:55 36.746 3.407 9.5 2.6 7 67 63896 2003/06/27 23:43 36.745 3.408 9.5 2.7 203 87 �20aFor the full set, we give the date and time, the coordinates of the hypocenter, the magnitude, and the parameters defining the nodal planes, azimuth, dip
and rake according to Aki’s convention [Aki and Richards, 1980].
B09301 AYADI ET AL.: ZEMMOURI EARTHQUAKE (ALGERIA)
9 of 15
B09301
agreement with the �60� orientation of the envelope of theaftershock cloud. Except for Delouis et al. [2004] whoadvocate a N70�E strike from their waveform modeling,other authors have used strikes of around 55� as fixedparameters for their modeling (Table 2).[31] In the central part of the aftershocks distribution,
where the activity is the strongest (B segment in Figure 3 II,X = 15–21 km on Figure 3 III), the dip of the aftershockcloud is well defined at 40� to 50�SE. These values arecomparable to the 40� to 47� found for all models of themainshock, except for Braunmiller and Bernardi [2005]who obtained a 25�SE dipping fault (Table 2). The faultcomplexity is obvious on cross-section X = 18 km, wheretwo dipping parallel clusters that coincide spatially with twoscarps are observed on the bathymetric profile. We observethat the NW cluster is most active on X = 15 km profile,while only the SE cluster is active on X = 21 km profile.Since the Zemmouri earthquake occurred on the northeast-ern continuation of the en-echelon fault system borderingthe Mitidja basin to the south (Figure 1b), it would not besurprising to observe the same en-echelon fault systemoffshore. A comparable surface faulting geometry is ob-served for the nearby 1980 El Asnam earthquake[Meghraoui and Doumaz, 1996]. Whatever the dip takenbetween 40� and 50�, the fault geometry and related seis-micity reaches the seafloor at a distance less than 10 km fromthe shoreline in the epicentral zone. A comparable result isobtained from the inversion of InSAR data and surfacedisplacement field, which is best fit by a N57� striking faultdipping 45� and reaching the seafloor at 8 km from the shoreline (S. Belabbes et al., Rupture parameters of the 21 May2003, Mw 6.8, Zemmouri (Northern Algeria) earthquakededuced from InSAR, submitted to Journal of GeophysicalResearch, 2008).[32] Deverchere et al. [2004] draw a flat-ramp fault
connecting the rupture plane at 7 km depth to the faultsscarps that they map 15 to 25 km offshore and which theyconsider as associated to the earthquake rupture. Howeverthis interpretation is not supported by the coastal upliftdistribution [Meghraoui et al., 2004] and surface deforma-tion revealed by the InSAR analysis (Belabbes et al., sub-mitted manuscript, 2008). In addition, aftershocks locatedabove 7 km on segments B and C of Figure 3 do not show anychange in the fault dip when compared with the deeperseismic events, as would be expected in a ramp-flat system.The interpretation of Deverchere et al. [2004] is also incon-sistent with the GPS data inversion of Semmane et al. [2005]or the regional moment tensor analysis of Braunmiller andBernardi [2005].
[33] The total length of the aftershock cloud observed twomonths after the main shock is 65 km, but, ten days afterthe main shock it was only 50 km [Bounif et al., 2004].The 15 km extension of the seismicity corresponds to aNE migration. In contrast, the strike and depth distributionof the aftershocks did not change with time. Our aftershockrelocations by tomoDD in a 3D velocity model differslightly from those obtained previously by hypoDD [Bounifet al., 2004]. The clearest difference is observed on thelocation of the northwesternmost aftershocks (between CapMatifou and Boumerdes) which are now clearly aligned,strengthening the hypothesis of a fault branch parallel to theThenia fault (Figure 1b). This alignment is consistent withthe �N100�E trending rupture inferred from the INSARdata where the related surface displacement suggests 0.15 mright-lateral slip at depth (Belabbes et al., submitted man-uscript, 2008).[34] The maximum depth of seismicity increases along
strike from 15 km to the southwest to 23 km in thenortheast, which is different from the previous location of12 km to 18 km in Bounif et al. [2004]. Although the upper5 km do not show significant seismicity, the minimum depthof hypocenters is problematic particularly for the D segmentwhere seismic events are too far offshore and thereforedifficult to record and localize. Since the lack of seismicityin the upper 10 km to the NE could correspond to an area ofa future large event, data from OBS would have been usefulto constrain hypocenter depths. Alternatively, the lack ofseismicity could be due to the fact that the shallow part ofthe fault slipped during the main rupture, as proposed byDelouis et al. [2004].
6.2. Imaging the Fault Zone From Velocity Structures
[35] In spite of the high tectonic complexity of theBoumerdes region, some correlations may be highlightedbetween geological units and velocity structures. Basementoutcrops in the Cap Matifou region are related to higher Pvelocities in the upper crust. At the same depths, lowervelocities correspond to Quaternary filling of the MitidjaBasin and to marine terraces (Figure 1b).[36] The 12 km depth layer of tomographic images
(Figure 4) presents the simplest pattern, with a bimodaldistribution of P velocities: a well marked low velocity zone(Vp = 4.5 to 5 km/s) to the west, a normal to slightly highervelocity zone (Vp = 6 to 6.8 km/s) to the east. The transitionbetween these two velocity structures is clearly seen alongstrike on the Y = 0 km Vp and Vs cross sections (Figure 6).We have to note here that the seismicity is primarily takingplace on a dipping plane, so that the vertical velocity profile
Table 2. Synthesis of Main Shock Parametersa
SourceLat(�)
Long(�)
Depth(km)
Strike(�)
Dip(�)
Rake(�)
Mo(1019Nm)
Harvard-CMT 36.93 3.58 9 57 44 71 2.01USGS 36.89 3.78 9 54 47 88 1.30Yagi (2003) 36.83* 3.65* – 54 47 86 2.40Delouis et al. [2004] 36.83* 3.65* – 70 40 95 2.90Meghraoui et al. [2004] 36.83* 3.65* – 54 50 88 2.80Braunmiller andBernardi [2005]
36.83* 3.65* 18 62 25 82
(Belabbes et al.,submitted manuscript, 2008)
36.83* 3.65* – 57 45 89 2.16
aThe epicentral coordinates with * are taken from Bounif et al. [2004]. Yagi’s model available at: //iisee.kenken.go.jp/staff/yagi/eq/algeria20030521/algeria2003521.html.
B09301 AYADI ET AL.: ZEMMOURI EARTHQUAKE (ALGERIA)
10 of 15
B09301
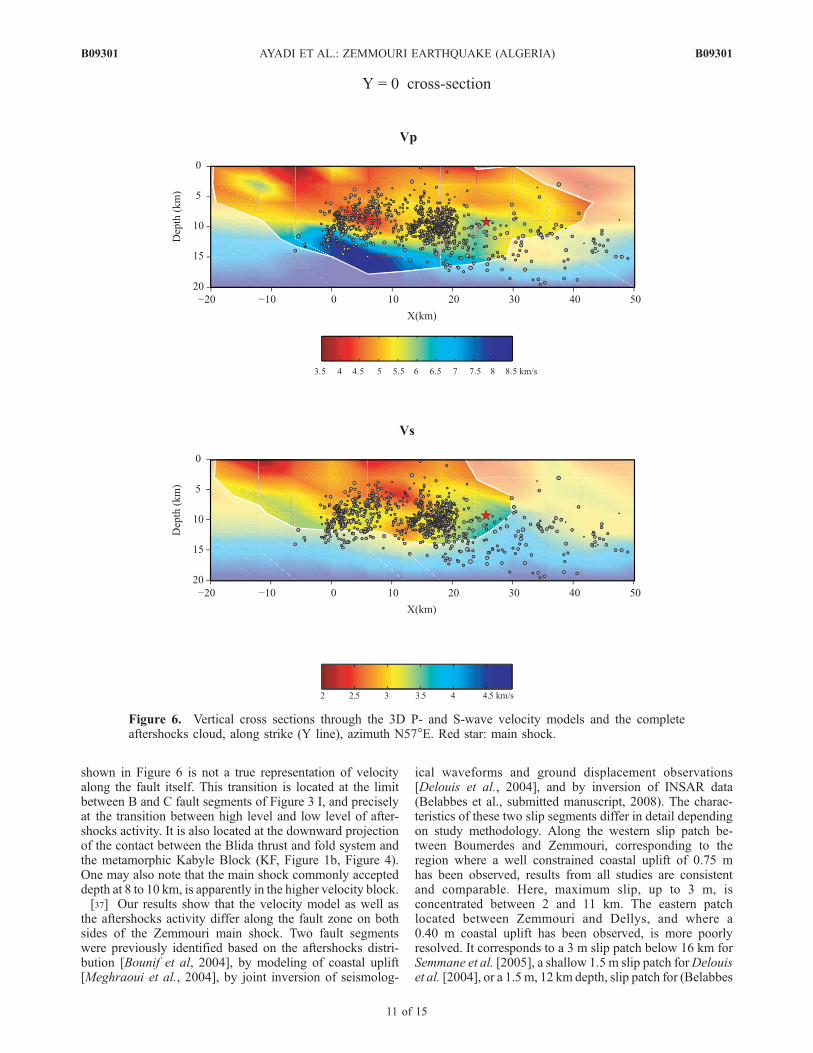
shown in Figure 6 is not a true representation of velocityalong the fault itself. This transition is located at the limitbetween B and C fault segments of Figure 3 I, and preciselyat the transition between high level and low level of after-shocks activity. It is also located at the downward projectionof the contact between the Blida thrust and fold system andthe metamorphic Kabyle Block (KF, Figure 1b, Figure 4).One may also note that the main shock commonly accepteddepth at 8 to 10 km, is apparently in the higher velocity block.[37] Our results show that the velocity model as well as
the aftershocks activity differ along the fault zone on bothsides of the Zemmouri main shock. Two fault segmentswere previously identified based on the aftershocks distri-bution [Bounif et al, 2004], by modeling of coastal uplift[Meghraoui et al., 2004], by joint inversion of seismolog-
ical waveforms and ground displacement observations[Delouis et al., 2004], and by inversion of INSAR data(Belabbes et al., submitted manuscript, 2008). The charac-teristics of these two slip segments differ in detail dependingon study methodology. Along the western slip patch be-tween Boumerdes and Zemmouri, corresponding to theregion where a well constrained coastal uplift of 0.75 mhas been observed, results from all studies are consistentand comparable. Here, maximum slip, up to 3 m, isconcentrated between 2 and 11 km. The eastern patchlocated between Zemmouri and Dellys, and where a0.40 m coastal uplift has been observed, is more poorlyresolved. It corresponds to a 3 m slip patch below 16 km forSemmane et al. [2005], a shallow 1.5 m slip patch forDelouiset al. [2004], or a 1.5m, 12 km depth, slip patch for (Belabbes
Figure 6. Vertical cross sections through the 3D P- and S-wave velocity models and the completeaftershocks cloud, along strike (Y line), azimuth N57�E. Red star: main shock.
B09301 AYADI ET AL.: ZEMMOURI EARTHQUAKE (ALGERIA)
11 of 15
B09301
et al., submitted manuscript, 2008). It is interesting to notethat the low velocity zones observed on Vp and Vs profiles(Figure 6), even if they are not drawn along fault dip,correspond to the maximum slip zones of Delouis et al.[2004] final model. This observation leads us to suggest thatthe presence of asperities on the fault is probably related tothe geologic structure as well.[38] In the El Asnam case study, aftershocks concentrated
at the edge of a high velocity basement and on the footwallblock bordering this unit [Ouyed et al., 1981; Yielding et al.,1989]. On the basis of velocity structures across theEl Asnam earthquake area, Chiarabba et al. [1997] con-clude that fault segmentation and geometrical discontinu-ities observed along strike are controlled by pre-existingstructures imaged by tomography. For the Zemmouri sourcezone, velocity structure along the fault below 5 km seems tocontrol the seismic activity, but in contrast to what isgenerally observed, the zones of higher activity and themaximum slip [Delouis et al., 2004] correlate with thelower velocities. Comparable observations by Kato et al.[2005] on the 2004 Mid-Niigata prefecture reverse faulttype earthquake however show the largest aftershocks andmost activity in a slightly low Vp zone, as do we.
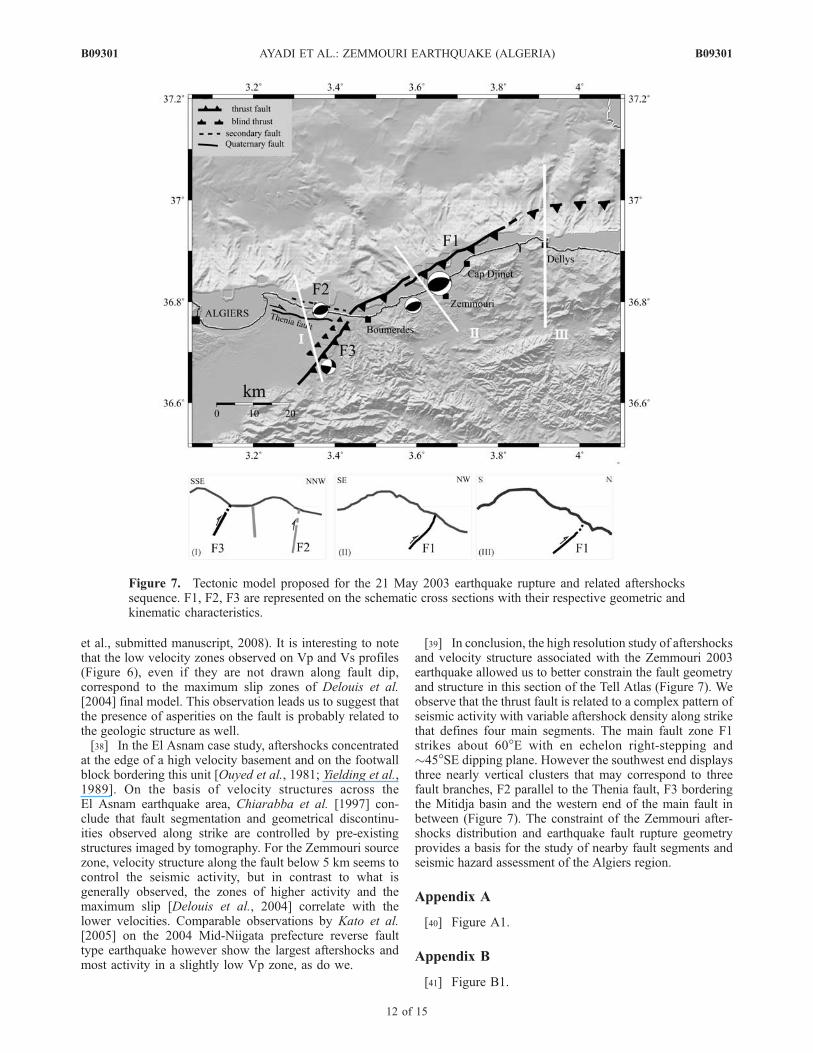
[39] In conclusion, the high resolution study of aftershocksand velocity structure associated with the Zemmouri 2003earthquake allowed us to better constrain the fault geometryand structure in this section of the Tell Atlas (Figure 7). Weobserve that the thrust fault is related to a complex pattern ofseismic activity with variable aftershock density along strikethat defines four main segments. The main fault zone F1strikes about 60�E with en echelon right-stepping and�45�SE dipping plane. However the southwest end displaysthree nearly vertical clusters that may correspond to threefault branches, F2 parallel to the Thenia fault, F3 borderingthe Mitidja basin and the western end of the main fault inbetween (Figure 7). The constraint of the Zemmouri after-shocks distribution and earthquake fault rupture geometryprovides a basis for the study of nearby fault segments andseismic hazard assessment of the Algiers region.
Appendix A
[40] Figure A1.
Appendix B
[41] Figure B1.
Figure 7. Tectonic model proposed for the 21 May 2003 earthquake rupture and related aftershockssequence. F1, F2, F3 are represented on the schematic cross sections with their respective geometric andkinematic characteristics.
B09301 AYADI ET AL.: ZEMMOURI EARTHQUAKE (ALGERIA)
12 of 15
B09301
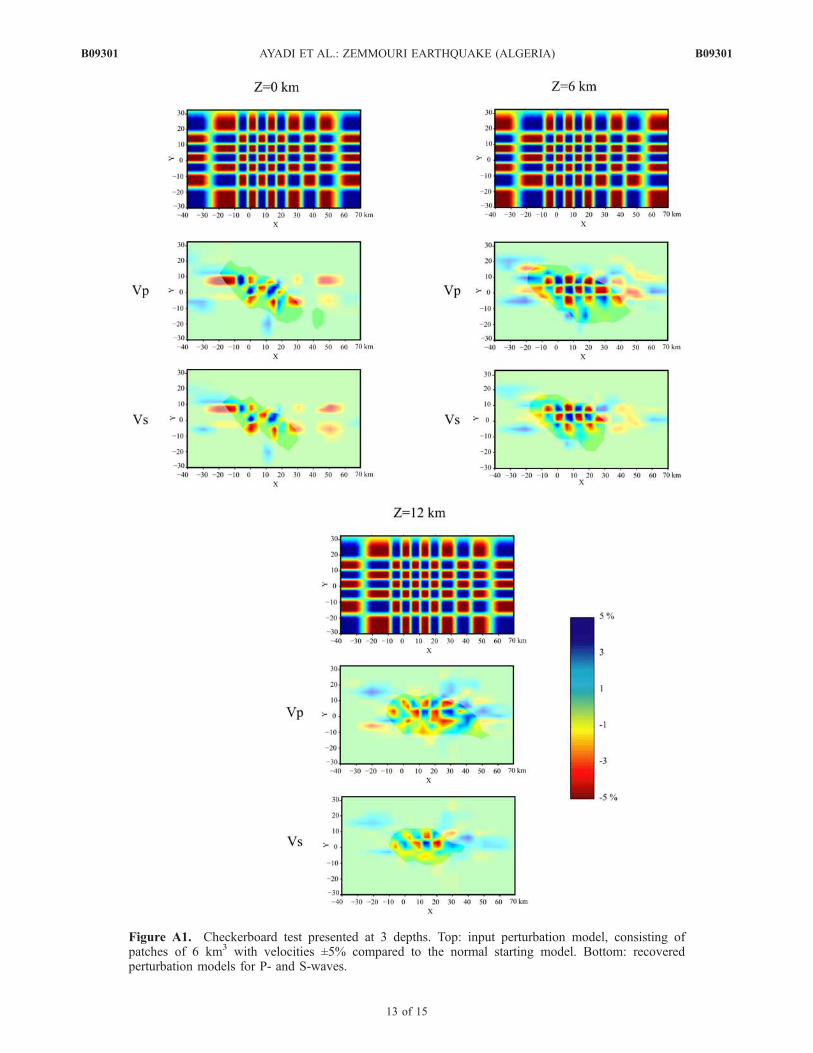
Figure A1. Checkerboard test presented at 3 depths. Top: input perturbation model, consisting ofpatches of 6 km3 with velocities ±5% compared to the normal starting model. Bottom: recoveredperturbation models for P- and S-waves.
B09301 AYADI ET AL.: ZEMMOURI EARTHQUAKE (ALGERIA)
13 of 15
B09301
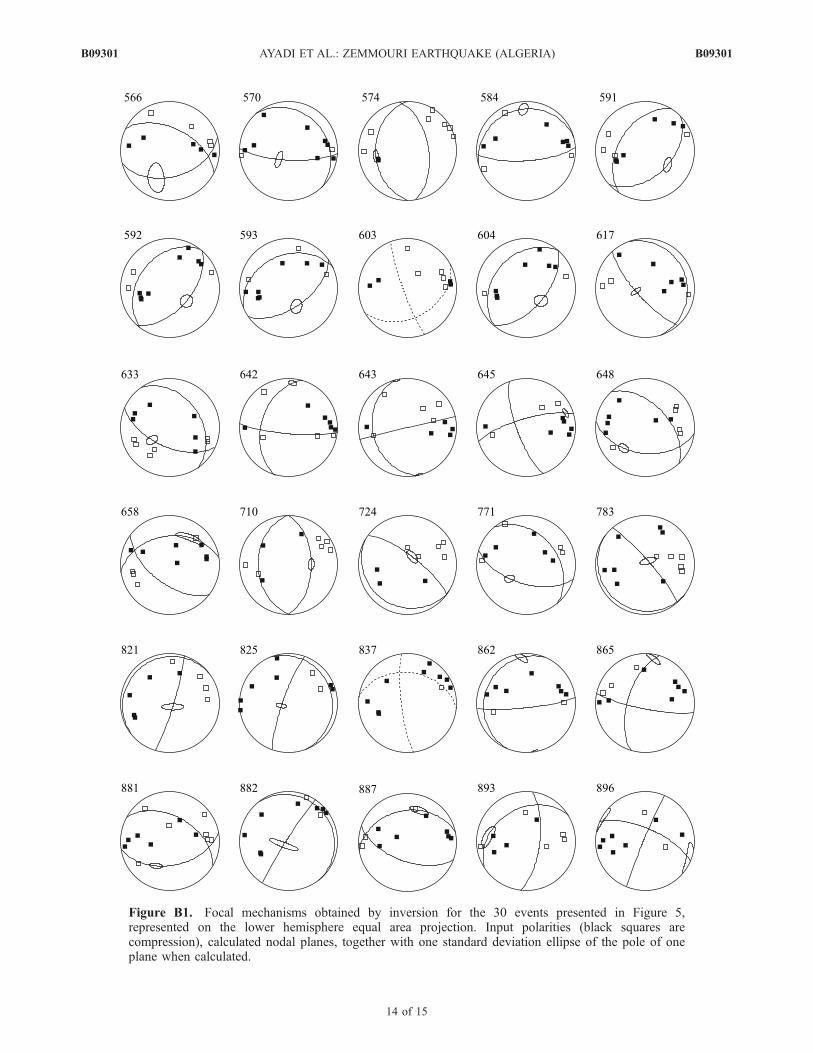
Figure B1. Focal mechanisms obtained by inversion for the 30 events presented in Figure 5,represented on the lower hemisphere equal area projection. Input polarities (black squares arecompression), calculated nodal planes, together with one standard deviation ellipse of the pole of oneplane when calculated.
B09301 AYADI ET AL.: ZEMMOURI EARTHQUAKE (ALGERIA)
14 of 15
B09301
[42] Acknowledgments. We are grateful to the local authorities inAlgeria and Centre de Recherche en Astronomie Astrophysique et Geo-physique for the logistical support during the field investigations. We thankRoss Stein for detailed and constructive comments that substantiallyimproved this manuscript, as well as an anonymous reviewer for his/herhelpful suggestions and extensive improvement of the text. We thank SamirBelabbes and Cakir Ziyadin (ITU, Turkey) for their assistance in preparingfigures and Jacques Deverchere (Brest University) for providing thedetailed bathymetry of the earthquake area. Some of the figures wereprepared using the public domain GMT software [Wessel and Smith, 1998].This work was supported by the INSU research project ACI Cat-Nat‘‘Risque sismique de la region d’Alger’’.
ReferencesAki, K., and P. G. Richards (1980), Quantitative seismology: Theory andmethods, W.H. Freeman & Co., San Fransisco, vol. 1, pp. 557.
Argus, D. F., R. G. Gordon, C. Demets, and S. Stein (1989), Closure of theAfrica–Eurasia–North America plate motion circuit and tectonics of theGloria fault, J. Geophys. Res., 94(B5), 5585–5602.
Ayadi, A., S. Maouche, A. Harbi, and M. Meghraoui (2003), Strong Alger-ian earthquake strikes near capital city, Eos Trans. AGU, 84(50), 561–568.
Bannister, S., C. Thurber, and J. Louie (2006), Detailed fault structurehighlighted by finely relocated aftershocks Arthur’s Pass, New Zealand,Geophys. Res. Lett., 33, L18315, doi:10.1029/2006GL027462.
Bezzeghoud, M., A. Ayadi, A. Sebaı, and H. Benhallou (1994), Seismo-genic zones survey by Algerian Telemetred Seismological Network, Casestudy of Rouina earthquake of January 19th, 1992, Phys. Earth PlanetInter., 84, 235–246.
Bounif, A., et al. (2004), The 21 May 2003 Zemmouri (Algeria) earthquakeMw = 6.8: Relocation and aftershocks sequence analysis, Geophys. Res.Lett., 31, L19606, doi:10.1029/2004GL020586.
Bounif, A., M. Bezzeghoud, L. Dorbath, D. Legrand, A. Deschamps,L. Rivera, and H. Benhallou (2003), Seismic source study of the 1989,October 29, Chenoua (Algeria) earthquake from aftershocks, broad-bandand strong motion records, Ann. Geophys., 46(4), 625–646.
Braunmiller, J., and F. Bernardi (2005), The 2003 Boumerdes, Algeriaearthquake: Regional moment tensor analysis, Geophys. Res. Lett., 32,L06305, doi:10.1029/2004GL022038.
Chiarabba, C., A. Amato, and M. Meghraoui (1997), Tomographic imagesof the El Asnam fault zone and evolution of the seismogenic thrust-related fold, J. Geophys. Res., 102(B11), 24,485–24,498.
Delouis, B., M. Valee, M. Meghraoui, E. Calais, S. Maouche, K. Lammali,A. Mahsas, P. Briole, F. Benhamouda, and K. Yelles (2004), Slipdistribution of the 2003 Boumerdes–Zemmouri earthquake, Algeria,from teleseismic, GPS, and coastal uplift data, Geophys. Res. Lett., 31,L18607, doi:10.1029/2004GL020687.
Deverchere, J., et al. (2005), Active thrust faulting offshore Boumerdes,Algeria, and its relations to the 2003 Mw 6.9 earthquake, Geophys. Res.Lett., 32, L04311, doi:10.1029/2004GL021646.
Frechet, J. (1985), Sismogenese et doublets sismiques, these d’Etat, Univ.Sci. Et Med. De Grenoble, France, 206 pp.
Got, J.-L., J. Frechet, and F. W. Klein (1994), Deep fault plane geometryinferred from multiple relative relocation beneath the south flank ofKilauea, J. Geophys. Res., 99(B8), 15,375–15,386.
Harbi, A., S. Maouche, A. Benouar, D. Panza, and G. F. Benhallou (2004),Seismicity and tectonics structures in the site of Algiers and its surround-ings: A step towards microzonation, Pure Appl. Geophys., 161, 949–967.
Kato, A. E., N. Kurashimo, S. Hirata, T. Sakai, S. Iwasaki, and T. Kanazawa(2005), Imaging the source region of the 2004 mid-Niigata prefectureearthquake and the evolution of a seismogenic thrust-related fold, Geo-phys. Res. Lett., 32, L07307, doi:10.1029/2005GL022366.
Klein, F. W. (1978), Hypocentres location programm HYPOINVERS,Open-file Rep. 78–694 (US Geological Survey, Boulder, CO, USA).
Maury, R. C., et al. (2000), Post-collisional Neogene magmatism of theMediterranean Maghreb margin: A consequence of slab breakoff, C. R.Acad. Sci. Paris, 331, 159–173.
Meghraoui, M. (1988), Geologie des zones sismiques du nord de l’Algerie:tectonique active, paleoseismologie et synthese sismotectonique. Ph.D.thesis., Univ. Paris-Orsay, Paris, France, 356 pp.
Meghraoui, M. (1991), Blind reverse faulting system associated with theMont Chenoua Tipasa earthquake of the 29th October 1989 (north-centralAlgeria), Terra Nova, 3, 84–93.
Meghraoui, M., and F. Doumaz (1996), Earthquake induced flooding andpaleoseismicity of the El Asnam (Algeria) fault-related fold, J. Geophys.Res., 101(B8), 17,617–17,644.
Meghraoui, M., S. Maouche, B. Chemaa, Z. Cakir, A. Aoudia, A. Harbi,P. J. Alasset, A. Ayadi, Y. Bouhadad, and F. Benhamouda (2004), Coastaluplift and thrust faulting associated with theMw = 6.8 Zemmouri (Algeria)earthquake of 21 May, 2003, Geophys. Res. Lett., 31, L19605,doi:10.1029/2004GL020466.
Mokrane, A., A. Ait Messaoud, A. Sebai, A. Ayadi, M. Bezzeghoud, andH. Benhallou (1994), Les seismes en Algerie de 1365 a 1992, edited bythe Centre de Recherche en Astronomie Astrophysique et Geophysique,Algiers, Algeria, 227 pp.
Nocquet, J. M., and E. Calais (2004), Geodetic measurements of crustaldeformation in the Western Mediterranean and Europe, Pure Appl. Geo-phys., 161(3), 661–681.
Ouyed, M. (1981), Le tremblement de terre d’El Asnam du 10 Octobre1980: Etude des repliques, Doctorat de 3eme Cycle, thesis, Univ. DeGrenoble, Grenoble, France, 227 pp.
Ouyed, M., M. Meghraoui, A. Cisternas, A. Deschamps, J. Dorel, J. Frechet,R. Gaulon, D. Hatzfeld, and H. Philip (1981), Seismotectonics of the ElAsnam earthquake, Nature, 292, 26–31.
Rivera, L., and A. Cisternas (1990), Stress tensor and fault plane solutionsfor a population of earthquakes, Bull. Seismol. Soc. Am., 80, 600–614.
Semmane, F., M. Campillo, and F. Cotton (2005), Fault location and sourceprocess of the Boumerdes, Algeria, earthquake inferred from geodeticand strong motion data, Geophys. Res. Lett., 32, L01305, doi:10.1029/2004GL021268.
Stich, D., C. J. Ammon, and J. Morales (2003), Moment tensor solutionsfor small and moderate earthquakes in the Ibero-Maghreb region,J. Geophys. Res., 108(B3), 2148, doi:10.1029/2002JB002057.
Thurber, C. (1983), Earthquake location and three-dimensional crustalstructure in the Coyote Lake area, central California, J. Geophys. Res.,88(B10), 8226–8236.
Waldhauser, F. (2001), hypoDD–A program to compute double-differencehypocenter locations, U.S. Geol. Surv. Open File Rep., 01-113, 25.
Waldhauser, F., and W. L. Ellsworth (2000), A double difference earthquakelocation algorithm: Method and application to the northern Haywardfault, California, Bull. Seismol. Soc. Am., 90, 1353–1368.
Wessel, P., and H. F. Smith (1998), New, improved version of the genericmapping tools released, Eos Trans. AGU, 79, 579.
Wildi, W. (1983), La chaıcirc;ne tello-rifaine (Algerie, Maroc, Tunisie):Structure, stratigraphie et evolution du Trias au Miocene, Rev. Geol.Dyn. Geogr. Phys., 24, 201–297.
Yielding, G., M. Ouyed, G. C. P. King, and D. Hatzfeld (1989), Activetectonics of the Algerian Atlas mountains—Evidence from aftershocks ofthe 1980 El Asnam earthquake, Geophys. J. Int., 99(3), 761–788.
Zhang, H., and C. H. Thurber (2003), Double-difference tomography: themethod and its application to the Hayward fault, California, Bull. Seis-mol. Soc. Am., 93(5), 1875–1889.
�����������������������A. Ayadi, S. Maouche, and F. Ousadou, Centre de Recherche en
Astronomie Astrophysique et Geophysique, route de l’observatoire, BP 63,Bouzareah, 16340 Algiers, Algeria.M. A. Bounif, Universite des Sciences et de la Technologie Houari
Boumedienne, Institut des Sciences de la Terre, BP 32, El Alia, Bab-Ezzouar, 16111 Algiers, Algeria.M. Chikh, Centre de Genie Parasismique, Rue Kaddour Rahim, BP 252,
Hussein Dey, 16040 Algiers, Algeria.C. Dorbath, EOST, 5 rue Rene Descartes, 67000 Strasbourg Cedex,
France. ([email protected])M. Meghraoui, UMR 7516, Institut de Physique du Globe, Strasbourg,
France.
B09301 AYADI ET AL.: ZEMMOURI EARTHQUAKE (ALGERIA)
15 of 15
B09301


