Embed Size (px)
Citation preview
Small-scale Forest Economics, Management and Policy, 2(2): 185-210, 2003
ZimFlores: A Model to Advise Co-management of the Mafungautsi Forest in Zimbabwe
Ravi Prabhua, Mandy Haggithb, Happyson Mudavanhua, Robert Muetzelfeldtc, Wavell Standa-Gundaa
, and Jerome K.Vanclayd
a CIFOR Southern and Eastern Africa Office, 73 Harare Drive, Mount Pleasant, Harare, Zimbabwe b worldforests, 95 Achmelvich, Lochinver, Sutherland, Scotland IV27 4JB, UK c CISA, School of Informatics, University of Edinburgh, Scotland EH8 9LE, UK d Southern Cross University, PO Box 157, Lismore NSW 2480, Australia
ZimFlores (version 4) is the outcome of a participatory modelling process and seeks to provide a shared factual basis for exploring land-use options for the communal lands surrounding the Mafungautsi forest. The ZimFlores experience underscores the importance of a sharing a common problem and a common location in which all participants have an interest. Participatory modelling has proved an effective way to consolidate a diverse body of knowledge and make it accessible. Results demonstrate the importance of model outputs that are diagnostic, and which offer insights into the issues under consideration.1 Keywords: participatory modelling, FLORES, alternative land-use options, Miombo, Zimbabwe
INTRODUCTION This paper describes the background to, and evolution of the Zimbabwe Forest Land Oriented Resource Envisioning System (ZimFlores). It provides an overview of the model, and documents key assumptions that may influence its behaviour. It explains how people and biophysical resources are represented in the model, and concludes by explaining plans to further test and improve the model.
1 Many people contributed in many ways to help realize ZimFlores. Some of the people who
contributed include Elias Ayuk, Ivan Bond, Ephraim Chabayanzara, Muyeye Chambwera, Vijay Datadin, Wil de Jong, Peter Frost, James Gambiza, Jode Garbe, Peter Gondo, Emmanuel Guveya, Chiedza Gwata, John Hansell, Gideon Kamumvuri, Godwin Kowero, Dominic Kwesha, Chris Legg, Tim Lynam, Hilton Madevu, Simba Mandota, Everisto Mapedza, Frank Matose, Gutura Matoso, Chipo Mlambo, John Mudekwe, Maxwell Mukwekwerere, Dorcas Mungwari, Tendayi Mutimukuru, Mkhululi Ngwenya, Richard Nyirenda, Bill Ritchie, Lizwelabo Sibanda, Manasa Sibanda, Fergus Sinclair, Jivas Sithutha, Jasper Taylor, Michael Thomas, Zivanai Tsvuura and Steve Twomlow. We are grateful to the UK’s Department for International Development (DFID) and the European Community for financial support of this project.
185
R. Prabhu et al. 186
ZimFlores attempts to simulate impacts on local people’s livelihoods and on forest resources, of processes of communication, collaboration and social learning, in response to changes in resource access regulations and other interventions. ZimFlores evolved through a series of learning cycles to scope, conceptualise, build, refine and test the model. Much of ZimFlores was constructed during four workshops held between September 2000 and February 2001. It was demonstrated at the World Bank Rural Week in Washington DC, during 23-26 April 2001. Work on ZimFlores continues, and the description presented here does not represent that final nature of the model. Instead, this report draws out the lessons learned in reaching the current state, and speculates on future developments for the model.
The Mafungautsi (‘Ma-funga-ut-si’) area was chosen as a case study for FLORES because of existing resource-use conflicts and on-going interest by several agencies including the Center for International Forest Research (CIFOR), the Southern Alliance for Indigenous Resources (SAFIRE), the World-Wide Fund for Nature (WWF) and the International Union for Conservation of Nature and Natural Resources (IUCN). Many people live near the Mafungautsi State Forest, and make considerable demands on forest resources for fuel, construction materials, and non-timber forest products. For several years, CIFOR’s Adaptive Co-Management (ACM) project has conducted research in the Mafungautsi forest on the relationship between the people, the forest resources, and the government authority (the Forestry Commission).
Mafungautsi State Forest lies within the Zambezi Valley in Gokwe district in the western part of Zimbabwe. The forest lies on a large plateau (82,000 ha), is unfenced and is surrounded by village communities. Some of these communities lived on the plateau before it was designated a State forest in 1954. In the late 1990s, Resource Management Committees (RMCs) were established in an attempt to solve conflict over forest resources. Communities participating in RMCs have access to forest resources via an agreement between the state and the villagers.
The Mafungautsi area is culturally diverse, as it is a ‘new settlement’ area, the site of a ‘resource sharing’ experiment between Forestry Commission and local communities. Agriculture (mainly maize and cotton) and livestock grazing are the dominant land uses. The forest is an important source of thatch grass (Hyperrhenia sp. and Hyperthelia sp.), broom grass (Aristida junciformis), honey, mushrooms, insects (especially mopane worm)2 and fruit. However, the area is also important as a catchment for Lake Kariba, as a World Heritage Area and National Park, and for tourism and safari hunting (the ‘big five’, Cape Buffalo, Elephant, Lion, Leopard and Rhinoceros occur in the area). Some of the key management issues pertinent to the model are collaborative management, rural development, and conservation.
THE FIRST ATTEMPT AT A MODEL The ZimFlores process involved a series of workshops, the first of which was held at Camp Selous in the Gwayi Conservancy (south-western Zimbabwe) during April-May 2000. During the workshop, participants were (re)-introduced to the FLORES
2 Mopane worms are the larval stage of an emperor moth (Colophospermum mopane) and may
make a significant contribution to rural diets (Timberlake 1996).
ZimFlores: A Model to Advise Co-management of the Mafungautsi Forest 187
concept (Vanclay 2003), informed about developments since the Bukittinggi workshop (Vanclay et al. 2003), and shown the current status of the Rantau Pandan (Sumatra) version of the model (Haggith et al. 2003a). Participants were taught the basics of model-building with Simile3, and worked in small teams to specify and outline components for a Miombo version of FLORES. The aim of the workshop was to consider the general applicability of the FLORES approach, to evaluate the Rantau Pandan version, and to create a new version for a Miombo situation. Specific issues for the Miombo are summarized in Table 1. Table 1. Selected issues, options and indicators identified by participants at the Camp Selous workshop
Issue Policy lever Performance indicator Deforestation Population density Population age profile Timber–wildlife conflict
Resource sharing Incentives for migration Enforcement of rules Alternative employment
Deforestation Children in school (%) Health and nutrition
Participants recognised that the human interventions are pivotal in shaping the nature of the Miombo, and documented a range of activities of people in communal lands that may affect land cover:
• Clearing: cutting trees, burning felled trees and removing stumps; • Cropping: ploughing, planting, weeding, fertilizing (with forest litter, crop
residues, manure, termitarium soil, or inorganic fertilizer), protecting, harvesting, processing and selling produce;
• Gardening: cultivating, planting, weeding, watering, harvesting, processing, selling vegetables and fruits;
• Livestock: herding, collecting and storing ‘stover’ (by-products from fields, e.g. maize stems);
• Collecting forest products: fuelwood, construction wood, wild fruit (including honey and mushrooms), game, fibres, making items, selling products;
• Household maintenance: collecting water, preparing food, maintaining infrastructure;
• Maintaining social relations: meetings, brewing (beer); and • Off-farm employment.
Workshop participants found that FLORES offered a logical approach and a useful framework for addressing these issues and for modelling at the landscape scale in the Miombo situation. However, customising FLORES to a dramatically different situation requires more than new coefficients for component equations; it requires major revision or completely new sub-models. Participants found that it was often expedient to build sub-models afresh, rather than attempting to adapt existing components. Fortunately, this approach is facilitated by the ‘plug-and-play’ facility
3 Simile is a modelling environment (Muetzelfeldt and Massheder 2003) available from
http://www.simulistics.com.
R. Prabhu et al. 188
provided within Simile (Muetzelfeldt and Taylor 2001). The first iteration created a long specification which was complex and intractable to model. However, participants recognised that such an unfocussed ‘shopping list’ is unproductive, and identified the need for a more pragmatic view of key decisions influencing land use and society in the study area. An executable version of a Miombo FLORES was not completed, but participants departed Camp Selous with the conviction that it was possible to achieve and desirable to use the FLORES framework and the Simile platform.
Representatives from WWF, IUCN, SAFIRE and the Forestry Commission participated in a follow-up seminar in Harare, to discuss findings and prognoses with workshop participants. WWF in particular, expressed a strong interest in helping to develop a local version of FLORES, as well as a strong desire to use it in their work. Participants agreed that the Mafungautsi Forest area provided a fertile case study, and that CIFOR’s ACM project should coordinate development of a FLORES model for the area.
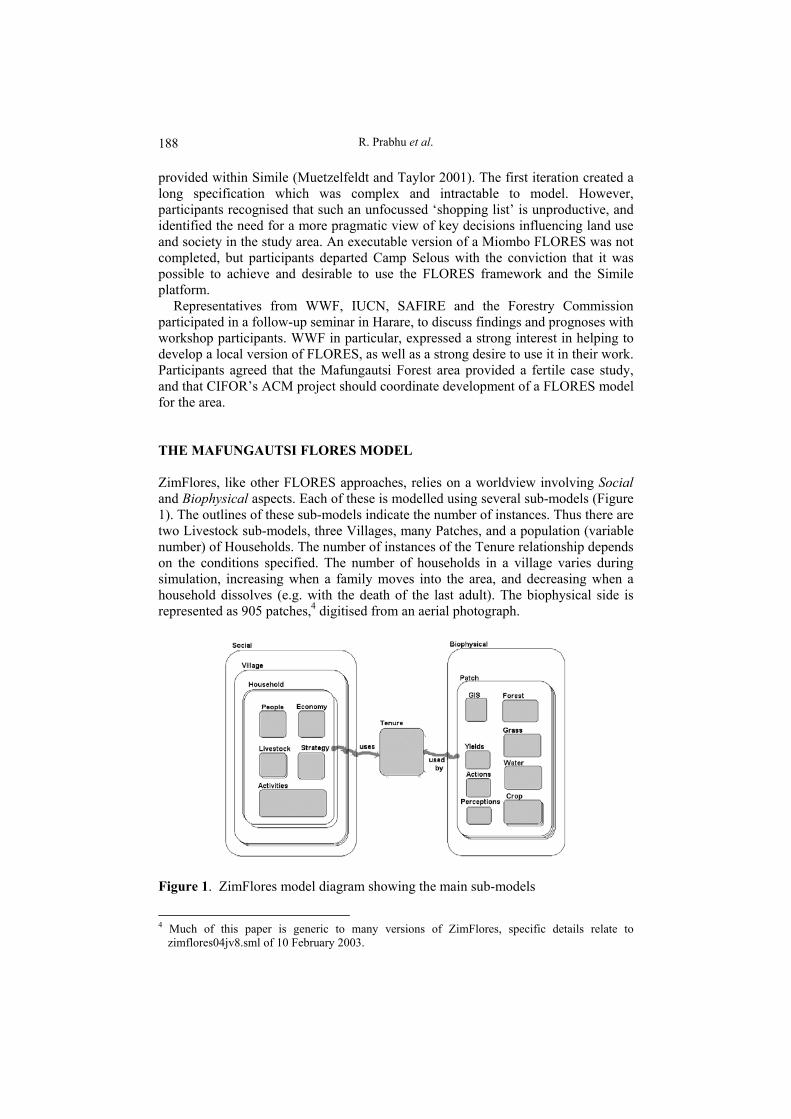
THE MAFUNGAUTSI FLORES MODEL ZimFlores, like other FLORES approaches, relies on a worldview involving Social and Biophysical aspects. Each of these is modelled using several sub-models (Figure 1). The outlines of these sub-models indicate the number of instances. Thus there are two Livestock sub-models, three Villages, many Patches, and a population (variable number) of Households. The number of instances of the Tenure relationship depends on the conditions specified. The number of households in a village varies during simulation, increasing when a family moves into the area, and decreasing when a household dissolves (e.g. with the death of the last adult). The biophysical side is represented as 905 patches,4 digitised from an aerial photograph.
Figure 1. ZimFlores model diagram showing the main sub-models
4 Much of this paper is generic to many versions of ZimFlores, specific details relate to
zimflores04jv8.sml of 10 February 2003.
ZimFlores: A Model to Advise Co-management of the Mafungautsi Forest 189
ZimFlores Overview, Model Structure and Dynamics Figure 1 shows the framework structure of the FLORES model, with the social aspects on the left, the biophysical aspects on the right, and the tenure arrangements in the middle.
The dynamics and behaviour of each household is modelled in five sub-models: 1. The sub-model People deals with the changing population dynamics within
the household, as children are born and household members die. It does this using four classes to represent children, adult males, adult females and elderly people.
2. The sub-model Economy handles the economic status of the household, using a single currency (‘dosh’: daily ordinary subsistence per household), which puts all household resources on a single basis.
3. The sub-model Livestock represents the dynamics of the household’s herd of livestock. It is placed here (rather than in the Biophysical sub-model) since each household has its own herd, which may be grazed on any of the land available to a household, or may be tethered near the household and fed by hand.
4. The sub-model Strategy is responsible for determining the lifestyle strategy of each household, by representing the relative priority given to each of seven activities (such as growing maize, growing cotton, or pole collection).
5. The sub-model Activities is responsible for determining the week-by-week decisions taken by a household. These primarily relate to the allocation of household labour resources to various activities, but include non-labour decisions, such as choice of crop to plant and allocation of cattle to grazing land.
Biophysical dynamics attempt to simulate natural and anthropogenic changes on three categories of land: State forest, privately-owned and communal land. The Social components of the model have access to the biophysical resources via tenure relations and resource access regulations. The tenure arrangements recognise individual holdings of gardens and arable land, village common grazing and woodlands. Resource access regulations include RMC-controlled permit systems for some forest resources, and Forest Protection Unit (FPU, a unit within the Forestry Commission) enforcement of rules limiting access to others. The rules can vary in the degree to which they are enforced.
Three categories of soil are recognised: sandy, clay and ‘rich’ soils. Rich soils are anthropogenic, having been enriched by the addition of organic matter, and used exclusively for gardening. Sandy and clay soils may be used to cultivate maize or cotton (depending on a household’s strategy), may be left fallow, or may remain as grassland.
The dynamics of these biophysical aspects are modelled as four components: 1. The Forest sub-model simulates woodland dynamics on State forest land. It is
based on an existing model (Gambiza et al. 2000), that relies on four size classes: ‘gullivers’ (i.e. saplings), poles, medium trees and large trees. It allows trees to revert to smaller classes after fire.
R. Prabhu et al. 190
2. The Grass sub-model is based on a generic model of plant growth. Grass is important for thatch, and for cattle grazing.
3. The Water sub-model influences the growth of grass, since occasional droughts have a major influence on people and their livelihoods.
4. The Crop sub-model recognises three crops: a food crop (maize); a cash crop (cotton); and vegetables (home garden). A patch can have only one of these, and the allocation of a crop to a patch is determined in the strategic decision-making sub-model of the household that owns the patch.
Two additional entities are present on the biophysical side: the GIS sub-model contains fixed patch-level attributes (e.g. patch area and soil type), and the Perceptions sub-model records owner’s perceptions about each patch of land. It may not seem intuitively obvious that these perceptions should sit amongst biophysical attributes, but it is appropriate, as owners have perceptions about each patch of land.
Households and patches are joined by a Tenure association. This allows for two types of tenure: ownership of a patch by a household; and access to common land. The main role of the tenure association is to channel information flows from patch to household and vice versa. Three types of information are transferred:
1. Perceptions carry information about patches to the households that own them. 2. Actions carry information about weekly decisions from each household to
their patches. 3. Yields carry information of harvests from patches to the households that own
them. ZimFlores deals with two rhythms:
1. Annual. Most social aspects of the model (including policy lever interventions) are considered strategic and are modelled with an annual time step.
2. Weekly. The biophysical side operates on a weekly time-step to allow modelling of crops and soil moisture. Social interaction with these biophysical aspects is through weekly activity decisions influenced by the household strategy and perceived seasonal trends.
Some experiments were made with an hourly time-step in a wild-fire sub-model, but these were discarded in an attempt to make the model more tractable (Haggith et al. 2003b).
Assumptions Implicit in ZimFlores The model formulation relies on several key assumptions:
• The landscape is modelled as patches of land with biophysical resources. • Human society is modelled as households within villages. • Access by social agents to the resources in the land patches is defined by
tenure relations, which are dynamic over time. • Humans affect the biophysical patches by actions, which are driven by their
perceptions of plot conditions and their strategy. The primary feedback from
ZimFlores: A Model to Advise Co-management of the Mafungautsi Forest 191
the biophysical model to the social sub-model, is in the form of yields of field and forest products, in response to the human activities.
• The smallest decision-making unit is the household. • Decision-making within households can be modelled effectively at two levels:
strategic decisions being taken annually and labour allocation decisions weekly.
• Strategic decision-making can be modelled by assessing a set of livelihood options in the light of household needs and resources, resulting in a priority ordering of the options.
• The value of forest products, crops, money and other consumable resources can be measured using a generic economic unit, ‘dosh’ (daily ordinary subsistence per household) as a common currency.
• The strategic resources available to a household are land, livestock, labour, ‘dosh’ and social capital, which are interchangeable.
• Monthly labour allocation can be modelled by sharing available labour across a set of activities according to the priority ordering which resulted from the strategic decision.
• Marketing of resources is modelled as a simple conversion of yields to the common currency.
• Debt and credit are not subject to limits. • Off-farm employment is only achievable by emigration.
Social Aspects Within ZimFlores The model deals with a single Resource Management Committee. There are three villages in the model, each led by a Sabukhu5. Within each village, there is a population6 of households. New households can be formed by marriages and by immigration. Households disband if everyone leaves or dies. Within each household there are several sub-models dealing with the People, Economy, Strategy, Activities and Livestock of the Household. People sub-model This sub-model represents the demography and health of the household, i.e. children, women, men, and ‘old or infirm’ (Figure 2). It deals with the basic dynamics of birth, ‘coming of age’, age and chronic illness, departure and death. Hatched variables (e.g. ‘health care’ at top right) are provided by other parts of ZimFlores. Thick arrows (‘flows’) show where individuals move from one category (‘compartment’) to another. Thin arrows (‘influences’) show where information is used in another calculation. Note that this is not an illustration of the sub-model, but is the actual sub-model which runs within Simile.
5 Village headman. 6 A population is a Simile construct that allows the number of instances of a sub-model to vary
during a simulation.
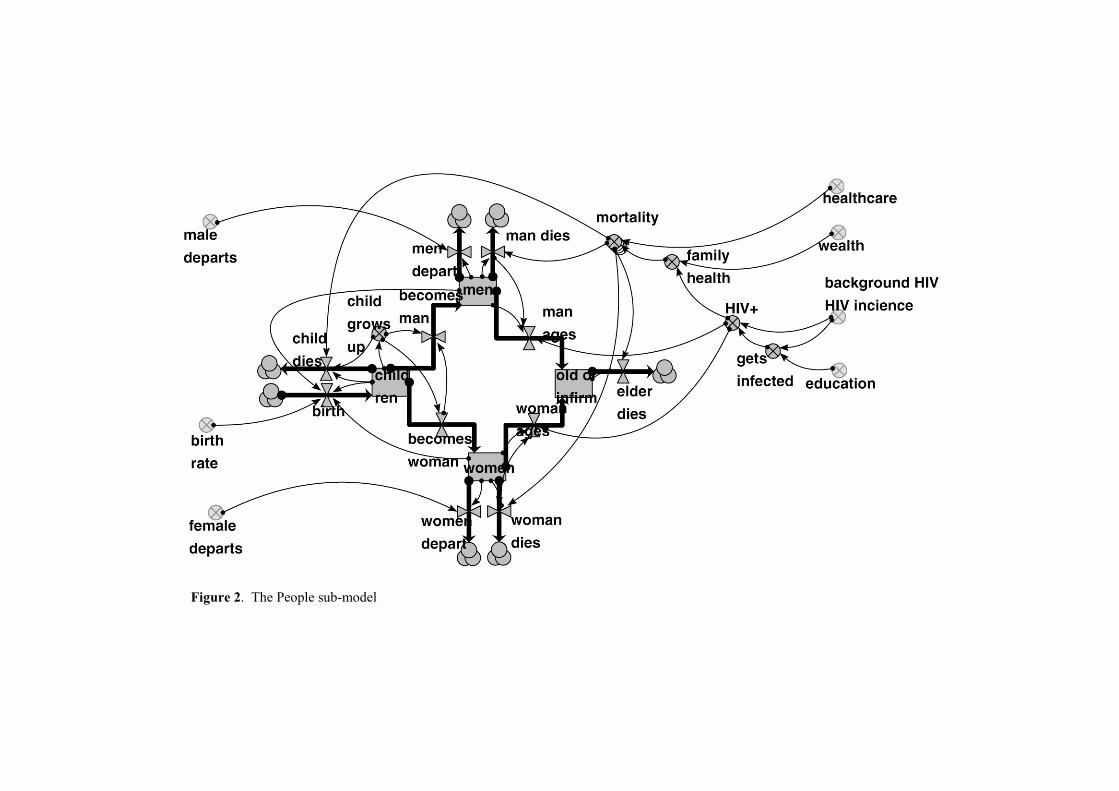
Figure 2. The People sub-model
ZimFlores: A Model to Advise Co-management of the Mafungautsi Forest 193
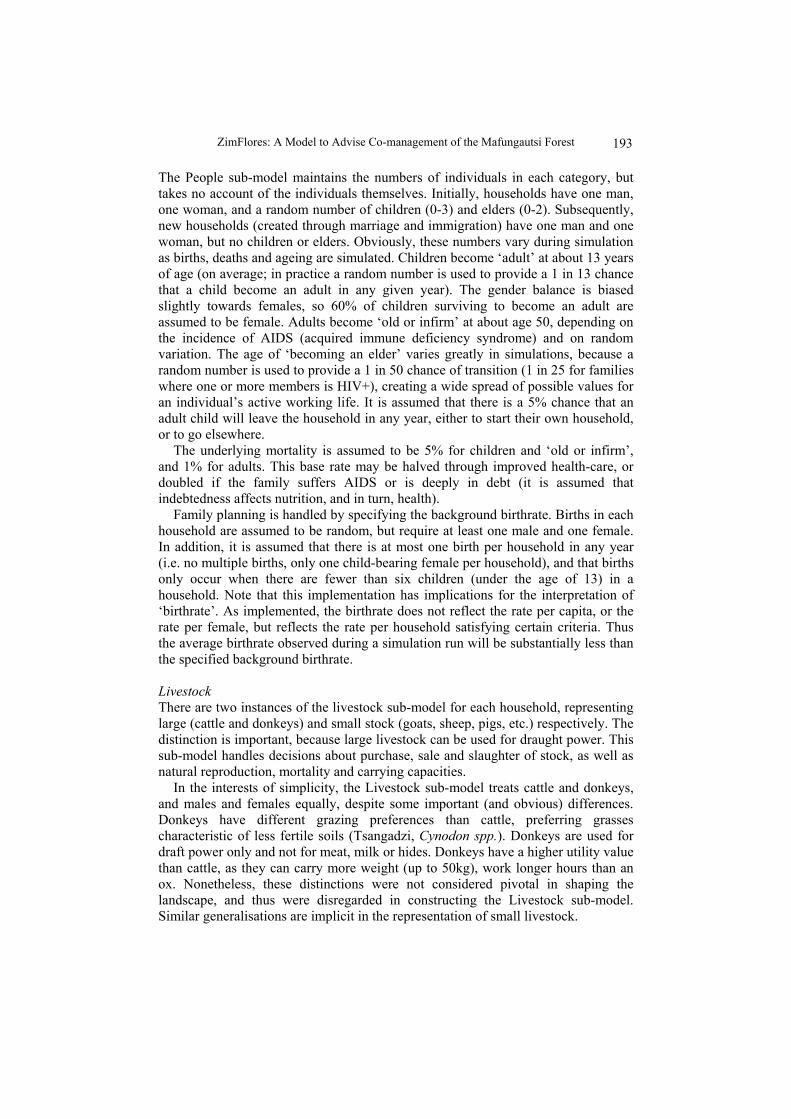
The People sub-model maintains the numbers of individuals in each category, but takes no account of the individuals themselves. Initially, households have one man, one woman, and a random number of children (0-3) and elders (0-2). Subsequently, new households (created through marriage and immigration) have one man and one woman, but no children or elders. Obviously, these numbers vary during simulation as births, deaths and ageing are simulated. Children become ‘adult’ at about 13 years of age (on average; in practice a random number is used to provide a 1 in 13 chance that a child become an adult in any given year). The gender balance is biased slightly towards females, so 60% of children surviving to become an adult are assumed to be female. Adults become ‘old or infirm’ at about age 50, depending on the incidence of AIDS (acquired immune deficiency syndrome) and on random variation. The age of ‘becoming an elder’ varies greatly in simulations, because a random number is used to provide a 1 in 50 chance of transition (1 in 25 for families where one or more members is HIV+), creating a wide spread of possible values for an individual’s active working life. It is assumed that there is a 5% chance that an adult child will leave the household in any year, either to start their own household, or to go elsewhere.
The underlying mortality is assumed to be 5% for children and ‘old or infirm’, and 1% for adults. This base rate may be halved through improved health-care, or doubled if the family suffers AIDS or is deeply in debt (it is assumed that indebtedness affects nutrition, and in turn, health).
Family planning is handled by specifying the background birthrate. Births in each household are assumed to be random, but require at least one male and one female. In addition, it is assumed that there is at most one birth per household in any year (i.e. no multiple births, only one child-bearing female per household), and that births only occur when there are fewer than six children (under the age of 13) in a household. Note that this implementation has implications for the interpretation of ‘birthrate’. As implemented, the birthrate does not reflect the rate per capita, or the rate per female, but reflects the rate per household satisfying certain criteria. Thus the average birthrate observed during a simulation run will be substantially less than the specified background birthrate.
Livestock There are two instances of the livestock sub-model for each household, representing large (cattle and donkeys) and small stock (goats, sheep, pigs, etc.) respectively. The distinction is important, because large livestock can be used for draught power. This sub-model handles decisions about purchase, sale and slaughter of stock, as well as natural reproduction, mortality and carrying capacities.
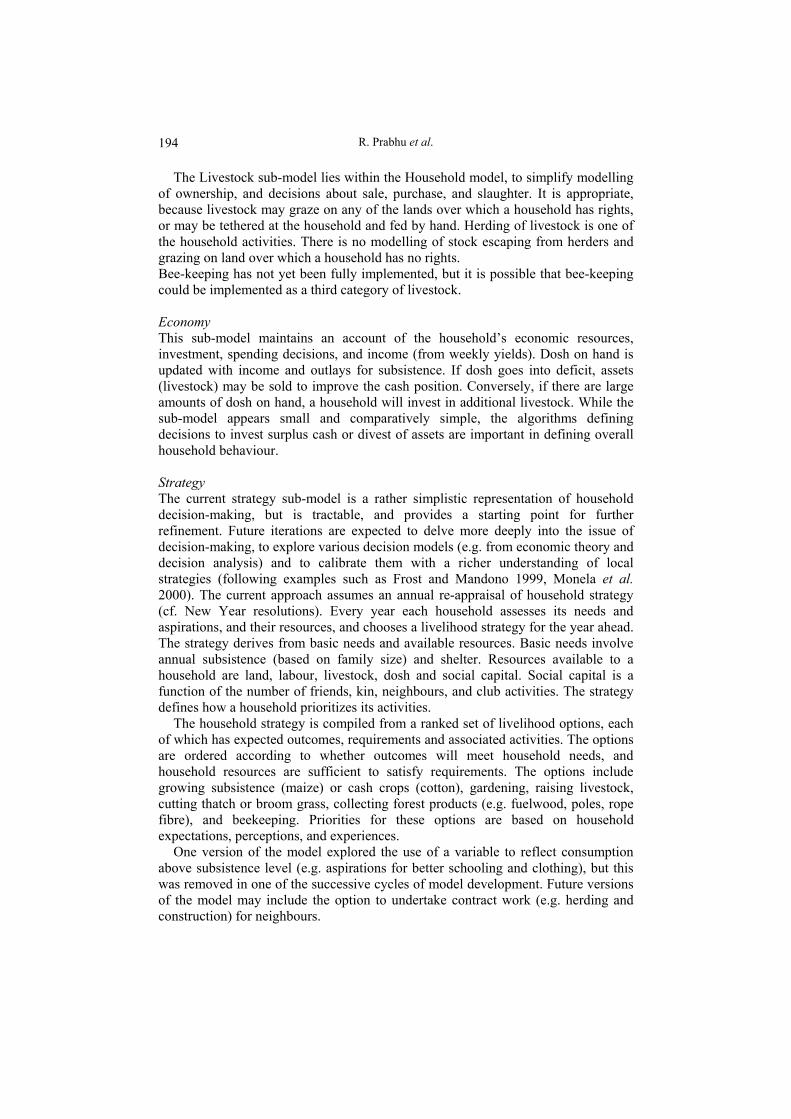
In the interests of simplicity, the Livestock sub-model treats cattle and donkeys, and males and females equally, despite some important (and obvious) differences. Donkeys have different grazing preferences than cattle, preferring grasses characteristic of less fertile soils (Tsangadzi, Cynodon spp.). Donkeys are used for draft power only and not for meat, milk or hides. Donkeys have a higher utility value than cattle, as they can carry more weight (up to 50kg), work longer hours than an ox. Nonetheless, these distinctions were not considered pivotal in shaping the landscape, and thus were disregarded in constructing the Livestock sub-model. Similar generalisations are implicit in the representation of small livestock.
R. Prabhu et al. 194
The Livestock sub-model lies within the Household model, to simplify modelling of ownership, and decisions about sale, purchase, and slaughter. It is appropriate, because livestock may graze on any of the lands over which a household has rights, or may be tethered at the household and fed by hand. Herding of livestock is one of the household activities. There is no modelling of stock escaping from herders and grazing on land over which a household has no rights. Bee-keeping has not yet been fully implemented, but it is possible that bee-keeping could be implemented as a third category of livestock. Economy This sub-model maintains an account of the household’s economic resources, investment, spending decisions, and income (from weekly yields). Dosh on hand is updated with income and outlays for subsistence. If dosh goes into deficit, assets (livestock) may be sold to improve the cash position. Conversely, if there are large amounts of dosh on hand, a household will invest in additional livestock. While the sub-model appears small and comparatively simple, the algorithms defining decisions to invest surplus cash or divest of assets are important in defining overall household behaviour. Strategy The current strategy sub-model is a rather simplistic representation of household decision-making, but is tractable, and provides a starting point for further refinement. Future iterations are expected to delve more deeply into the issue of decision-making, to explore various decision models (e.g. from economic theory and decision analysis) and to calibrate them with a richer understanding of local strategies (following examples such as Frost and Mandono 1999, Monela et al. 2000). The current approach assumes an annual re-appraisal of household strategy (cf. New Year resolutions). Every year each household assesses its needs and aspirations, and their resources, and chooses a livelihood strategy for the year ahead. The strategy derives from basic needs and available resources. Basic needs involve annual subsistence (based on family size) and shelter. Resources available to a household are land, labour, livestock, dosh and social capital. Social capital is a function of the number of friends, kin, neighbours, and club activities. The strategy defines how a household prioritizes its activities.
The household strategy is compiled from a ranked set of livelihood options, each of which has expected outcomes, requirements and associated activities. The options are ordered according to whether outcomes will meet household needs, and household resources are sufficient to satisfy requirements. The options include growing subsistence (maize) or cash crops (cotton), gardening, raising livestock, cutting thatch or broom grass, collecting forest products (e.g. fuelwood, poles, rope fibre), and beekeeping. Priorities for these options are based on household expectations, perceptions, and experiences.
One version of the model explored the use of a variable to reflect consumption above subsistence level (e.g. aspirations for better schooling and clothing), but this was removed in one of the successive cycles of model development. Future versions of the model may include the option to undertake contract work (e.g. herding and construction) for neighbours.
ZimFlores: A Model to Advise Co-management of the Mafungautsi Forest 195
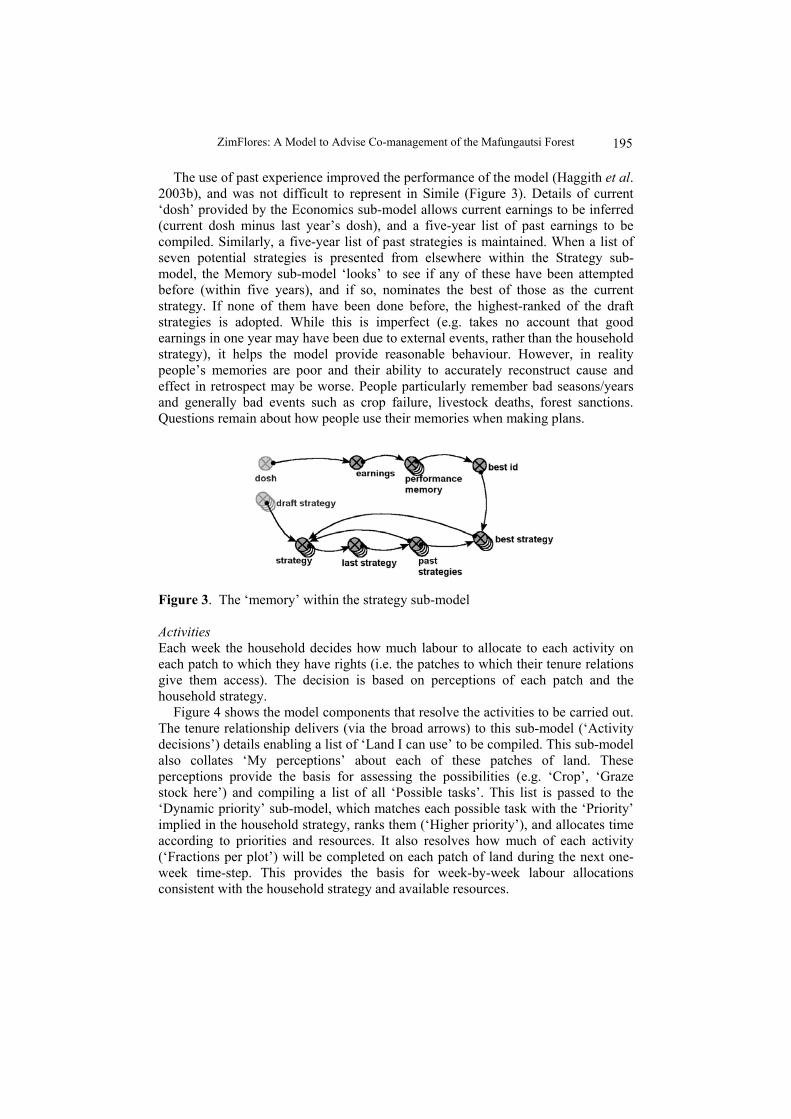
The use of past experience improved the performance of the model (Haggith et al. 2003b), and was not difficult to represent in Simile (Figure 3). Details of current ‘dosh’ provided by the Economics sub-model allows current earnings to be inferred (current dosh minus last year’s dosh), and a five-year list of past earnings to be compiled. Similarly, a five-year list of past strategies is maintained. When a list of seven potential strategies is presented from elsewhere within the Strategy sub-model, the Memory sub-model ‘looks’ to see if any of these have been attempted before (within five years), and if so, nominates the best of those as the current strategy. If none of them have been done before, the highest-ranked of the draft strategies is adopted. While this is imperfect (e.g. takes no account that good earnings in one year may have been due to external events, rather than the household strategy), it helps the model provide reasonable behaviour. However, in reality people’s memories are poor and their ability to accurately reconstruct cause and effect in retrospect may be worse. People particularly remember bad seasons/years and generally bad events such as crop failure, livestock deaths, forest sanctions. Questions remain about how people use their memories when making plans.
Figure 3. The ‘memory’ within the strategy sub-model Activities Each week the household decides how much labour to allocate to each activity on each patch to which they have rights (i.e. the patches to which their tenure relations give them access). The decision is based on perceptions of each patch and the household strategy.
Figure 4 shows the model components that resolve the activities to be carried out. The tenure relationship delivers (via the broad arrows) to this sub-model (‘Activity decisions’) details enabling a list of ‘Land I can use’ to be compiled. This sub-model also collates ‘My perceptions’ about each of these patches of land. These perceptions provide the basis for assessing the possibilities (e.g. ‘Crop’, ‘Graze stock here’) and compiling a list of all ‘Possible tasks’. This list is passed to the ‘Dynamic priority’ sub-model, which matches each possible task with the ‘Priority’ implied in the household strategy, ranks them (‘Higher priority’), and allocates time according to priorities and resources. It also resolves how much of each activity (‘Fractions per plot’) will be completed on each patch of land during the next one-week time-step. This provides the basis for week-by-week labour allocations consistent with the household strategy and available resources.
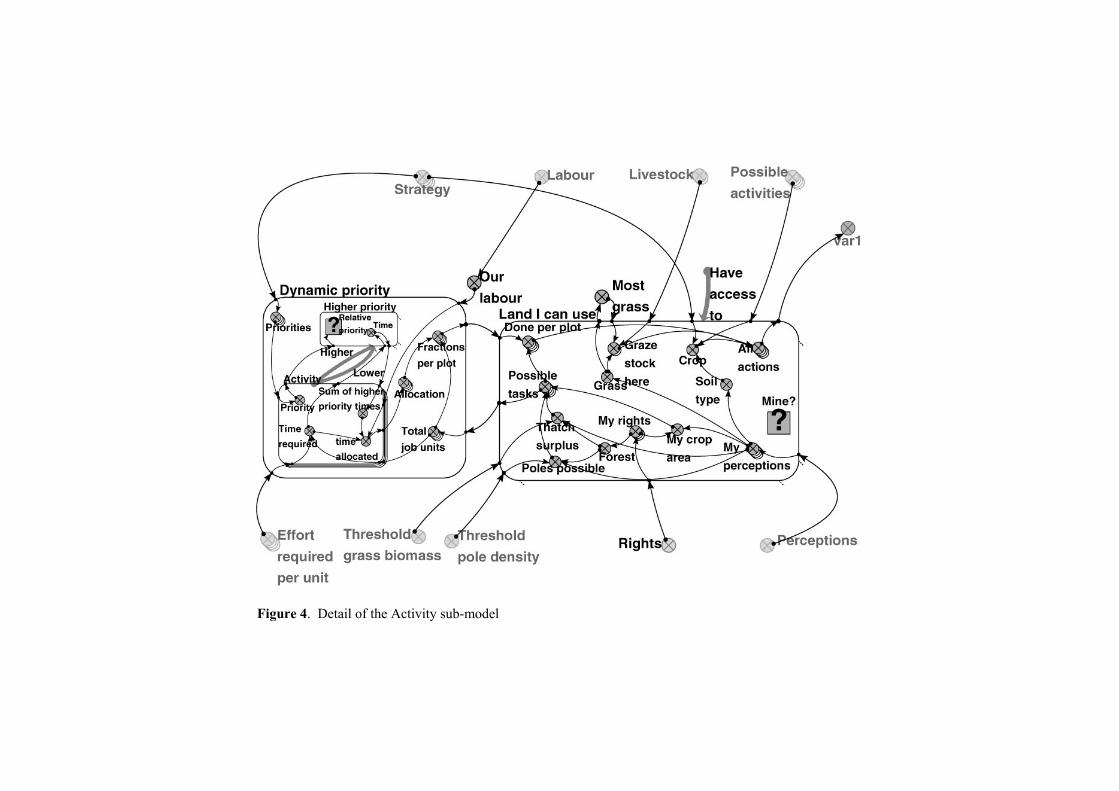
Figure 4. Detail of the Activity sub-model
ZimFlores: A Model to Advise Co-management of the Mafungautsi Forest 197
Adequacy of the social sub-model The Social sub-model as described and implemented, is simultaneously an over-simplistic approximation of the society it attempts to represent, and a tangled mass of relationships that have been tedious to check, test and evaluate. Some consider the diagram (of which Figure 4 is an extract) a ‘horrendogram’ while others consider that it is ‘beginning to approach the complexity needed’. It remains an open question whether the Social sub-model represents a necessary and sufficient model of social dynamics in the Mafungautsi area. Experience suggests that all these components are necessary for the envisaged applications of the model; whether they are sufficient remains to be seen.
Some limitations are easily recognised. For instance, the people sub-model (Figure 2) provides the minimal level of detail necessary to estimate labour budgets and subsistence needs, but it does not allow gender bias in schooling of children, and provides a weak basis for modelling the effort involved in caring for the infirm. Household strategy is revisited only once a year, and there is no possibility for the strategy to evolve during the year (e.g. in response to unfolding crop development). All households ‘remember’ their performance for five years, with no discrimination of good or poor performance. Only seven activities are contemplated, and of these, some (e.g. 5 = beekeeping) are only partially implemented. Priorities for all activities within a strategy are equal, and no discrimination is made between harvesting (which is always a top priority) and other activities.
Nonetheless, the current version of ZimFlores seems a good compromise between essential detail and ease of understanding, but it is likely that some applications of the model will require additional detail to be added.
Biophysical Aspects Within ZimFlores The biophysical side of ZimFlores deals with the fields, gardens, vleis7, and forest around the villages. It includes:
• agricultural aspects, including crop models for maize, cotton and garden crops;
• grassland aspects, including a model of grass growth and livestock grazing; • forest aspects, including a model of tree growth timber harvesting (poles and
firewood) and non-timber forest products (NTFPs); and • other biophysical aspects including water and wildlife.
These aspects are implemented in such a way that a given patch of land can be forest, grass, a combination of forest and grass (i.e. woodland), or one of three crops (maize, cotton, garden). While forest with grass is accommodates, other combinations of these aspects cannot coexist. Water A simple soil water balance is modelled from rainfall (by recycling historic records), runoff and drainage (based on three broad soil types). The sub-model is important to
7 Vleis (known as Dambos elsewhere in southern Africa) are seasonally-inundated wetlands
dominated by grasses and sedges. They may be valley bottoms or depressions forming natural drainage systems with or without a distinct stream.
R. Prabhu et al. 198
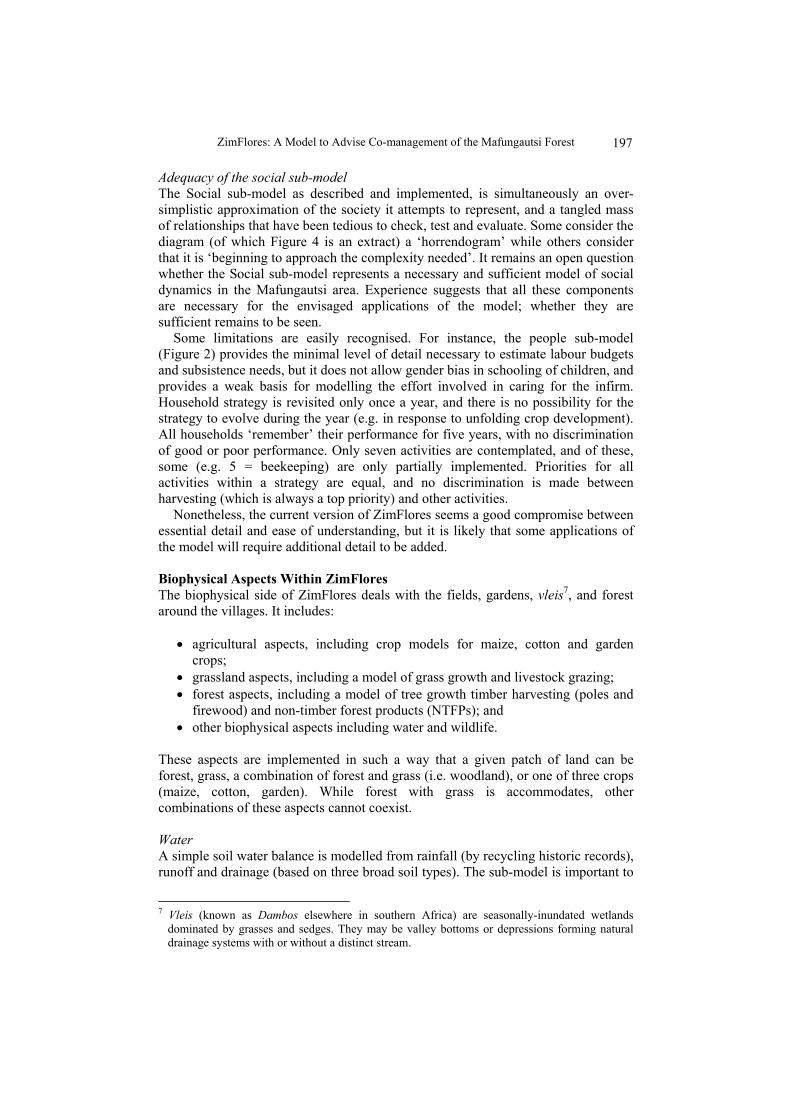
biophysical dynamics because soil moisture is often limiting (Mafungautsi rainfall is about 800 mm/year, with a marked dry season during May to November). A simple water balance (Figure 5) serves to integrate rainfall and soil type in way convenient for other sub-models (Grass, Crop and Forest). Experiments with a more complex model involving evapotranspiration offered indifferent outputs at the landscape scale, suggesting that this simple approach is adequate for a first iteration.
Saturated
Dry
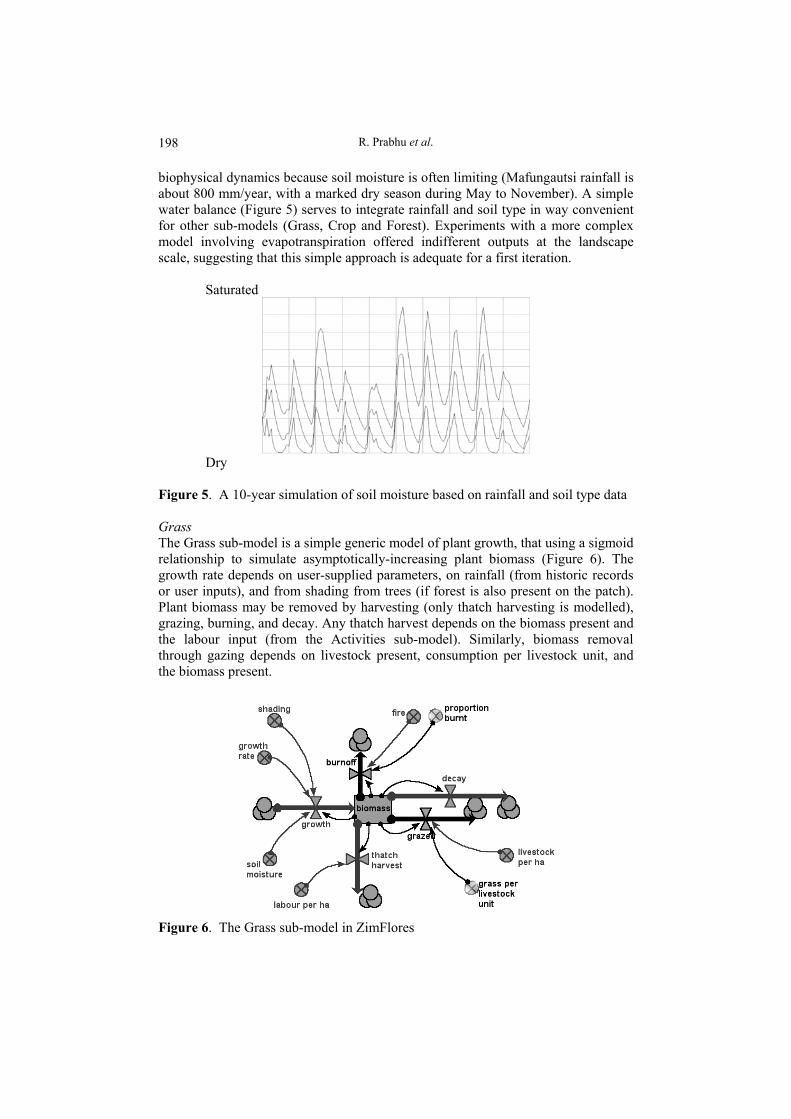
Figure 5. A 10-year simulation of soil moisture based on rainfall and soil type data Grass The Grass sub-model is a simple generic model of plant growth, that using a sigmoid relationship to simulate asymptotically-increasing plant biomass (Figure 6). The growth rate depends on user-supplied parameters, on rainfall (from historic records or user inputs), and from shading from trees (if forest is also present on the patch). Plant biomass may be removed by harvesting (only thatch harvesting is modelled), grazing, burning, and decay. Any thatch harvest depends on the biomass present and the labour input (from the Activities sub-model). Similarly, biomass removal through gazing depends on livestock present, consumption per livestock unit, and the biomass present.
Figure 6. The Grass sub-model in ZimFlores
ZimFlores: A Model to Advise Co-management of the Mafungautsi Forest 199
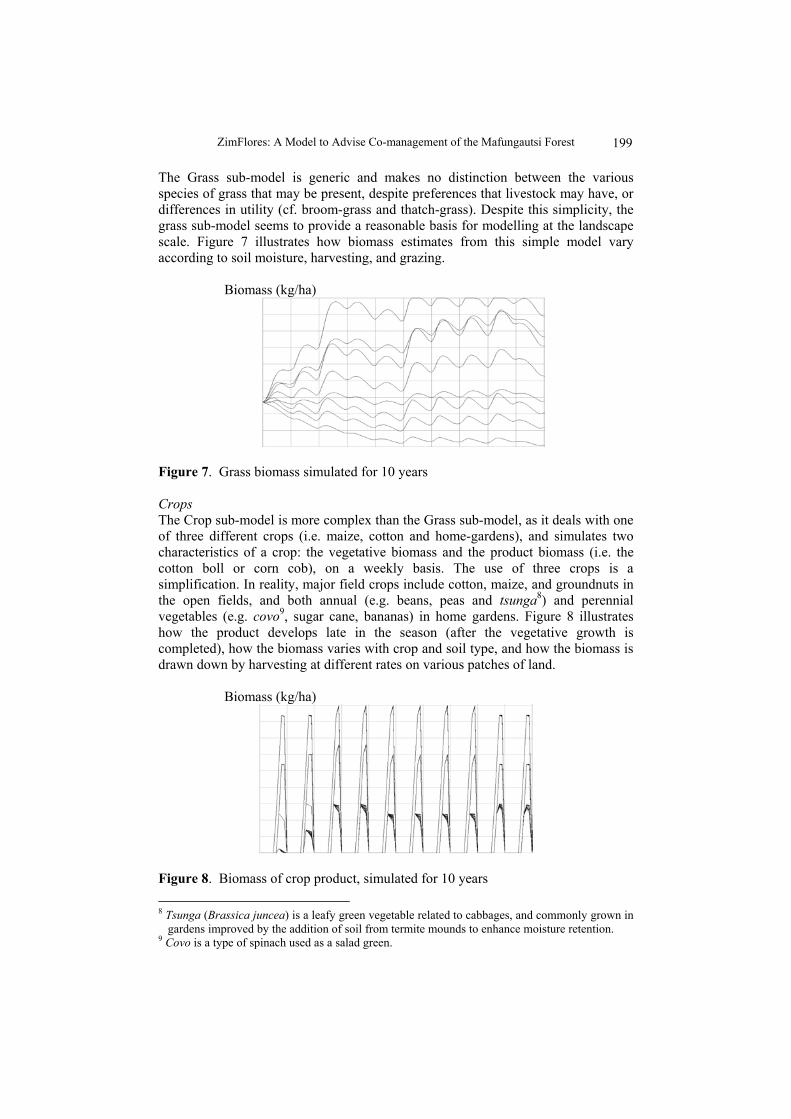
The Grass sub-model is generic and makes no distinction between the various species of grass that may be present, despite preferences that livestock may have, or differences in utility (cf. broom-grass and thatch-grass). Despite this simplicity, the grass sub-model seems to provide a reasonable basis for modelling at the landscape scale. Figure 7 illustrates how biomass estimates from this simple model vary according to soil moisture, harvesting, and grazing.
Biomass (kg/ha)
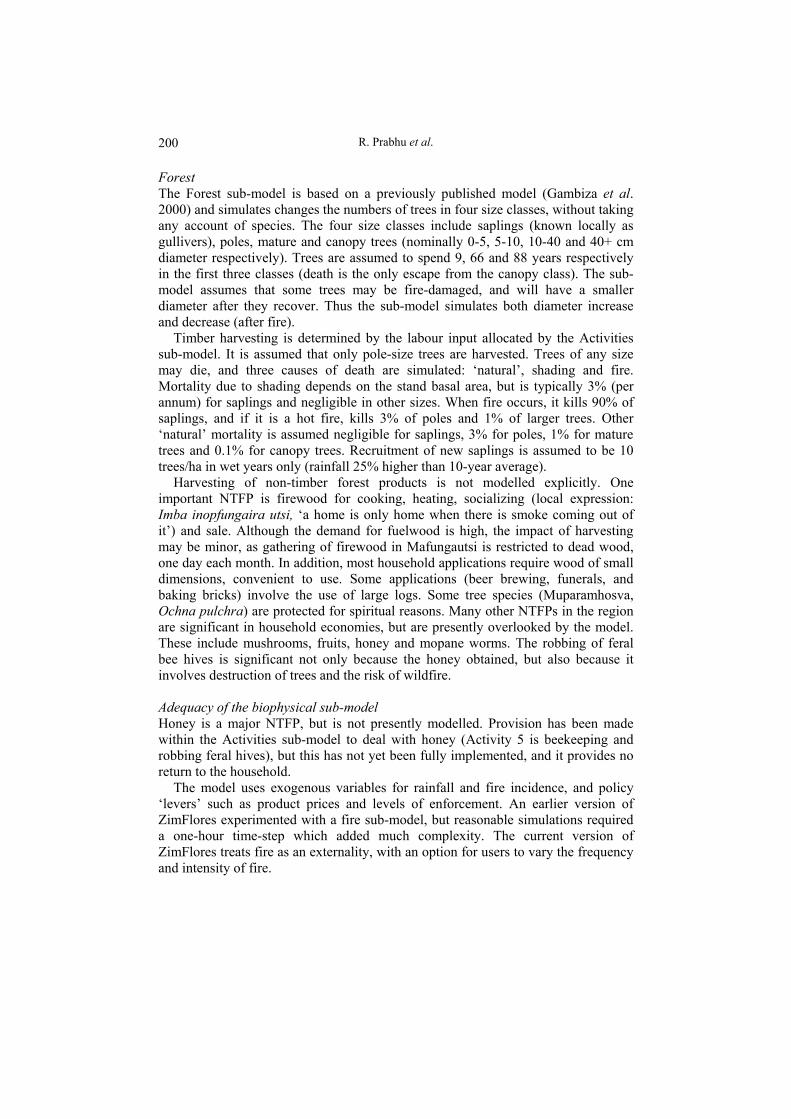
Figure 7. Grass biomass simulated for 10 years Crops The Crop sub-model is more complex than the Grass sub-model, as it deals with one of three different crops (i.e. maize, cotton and home-gardens), and simulates two characteristics of a crop: the vegetative biomass and the product biomass (i.e. the cotton boll or corn cob), on a weekly basis. The use of three crops is a simplification. In reality, major field crops include cotton, maize, and groundnuts in the open fields, and both annual (e.g. beans, peas and tsunga8) and perennial vegetables (e.g. covo9, sugar cane, bananas) in home gardens. Figure 8 illustrates how the product develops late in the season (after the vegetative growth is completed), how the biomass varies with crop and soil type, and how the biomass is drawn down by harvesting at different rates on various patches of land.
Biomass (kg/ha)
Figure 8. Biomass of crop product, simulated for 10 years 8 Tsunga (Brassica juncea) is a leafy green vegetable related to cabbages, and commonly grown in
gardens improved by the addition of soil from termite mounds to enhance moisture retention. 9 Covo is a type of spinach used as a salad green.
R. Prabhu et al. 200
Forest The Forest sub-model is based on a previously published model (Gambiza et al. 2000) and simulates changes the numbers of trees in four size classes, without taking any account of species. The four size classes include saplings (known locally as gullivers), poles, mature and canopy trees (nominally 0-5, 5-10, 10-40 and 40+ cm diameter respectively). Trees are assumed to spend 9, 66 and 88 years respectively in the first three classes (death is the only escape from the canopy class). The sub-model assumes that some trees may be fire-damaged, and will have a smaller diameter after they recover. Thus the sub-model simulates both diameter increase and decrease (after fire).
Timber harvesting is determined by the labour input allocated by the Activities sub-model. It is assumed that only pole-size trees are harvested. Trees of any size may die, and three causes of death are simulated: ‘natural’, shading and fire. Mortality due to shading depends on the stand basal area, but is typically 3% (per annum) for saplings and negligible in other sizes. When fire occurs, it kills 90% of saplings, and if it is a hot fire, kills 3% of poles and 1% of larger trees. Other ‘natural’ mortality is assumed negligible for saplings, 3% for poles, 1% for mature trees and 0.1% for canopy trees. Recruitment of new saplings is assumed to be 10 trees/ha in wet years only (rainfall 25% higher than 10-year average).
Harvesting of non-timber forest products is not modelled explicitly. One important NTFP is firewood for cooking, heating, socializing (local expression: Imba inopfungaira utsi, ‘a home is only home when there is smoke coming out of it’) and sale. Although the demand for fuelwood is high, the impact of harvesting may be minor, as gathering of firewood in Mafungautsi is restricted to dead wood, one day each month. In addition, most household applications require wood of small dimensions, convenient to use. Some applications (beer brewing, funerals, and baking bricks) involve the use of large logs. Some tree species (Muparamhosva, Ochna pulchra) are protected for spiritual reasons. Many other NTFPs in the region are significant in household economies, but are presently overlooked by the model. These include mushrooms, fruits, honey and mopane worms. The robbing of feral bee hives is significant not only because the honey obtained, but also because it involves destruction of trees and the risk of wildfire. Adequacy of the biophysical sub-model Honey is a major NTFP, but is not presently modelled. Provision has been made within the Activities sub-model to deal with honey (Activity 5 is beekeeping and robbing feral hives), but this has not yet been fully implemented, and it provides no return to the household.
The model uses exogenous variables for rainfall and fire incidence, and policy ‘levers’ such as product prices and levels of enforcement. An earlier version of ZimFlores experimented with a fire sub-model, but reasonable simulations required a one-hour time-step which added much complexity. The current version of ZimFlores treats fire as an externality, with an option for users to vary the frequency and intensity of fire.
ZimFlores: A Model to Advise Co-management of the Mafungautsi Forest 201
ZIMFLORES IMPLEMENTATION AND OUTPUTS The novelty of ZimFlores (and other FLORES models) is not their sub-models, which tend to be simplistic generalisations of work pioneered elsewhere, but rather the complexity that arises when these sub-models are linked together and allowed to interact, especially within an individual-based framework (households, patches of land). While the behaviour of the sub-models in isolation is of little interest, it is important to establish that their predictions are reasonable, and that the linkages between the individual sub-models make sense and represent current understanding of the interactions between the components in question. While this sounds simple, it can be challenging to provide a reasonable evaluation of the individual components of a FLORES model.
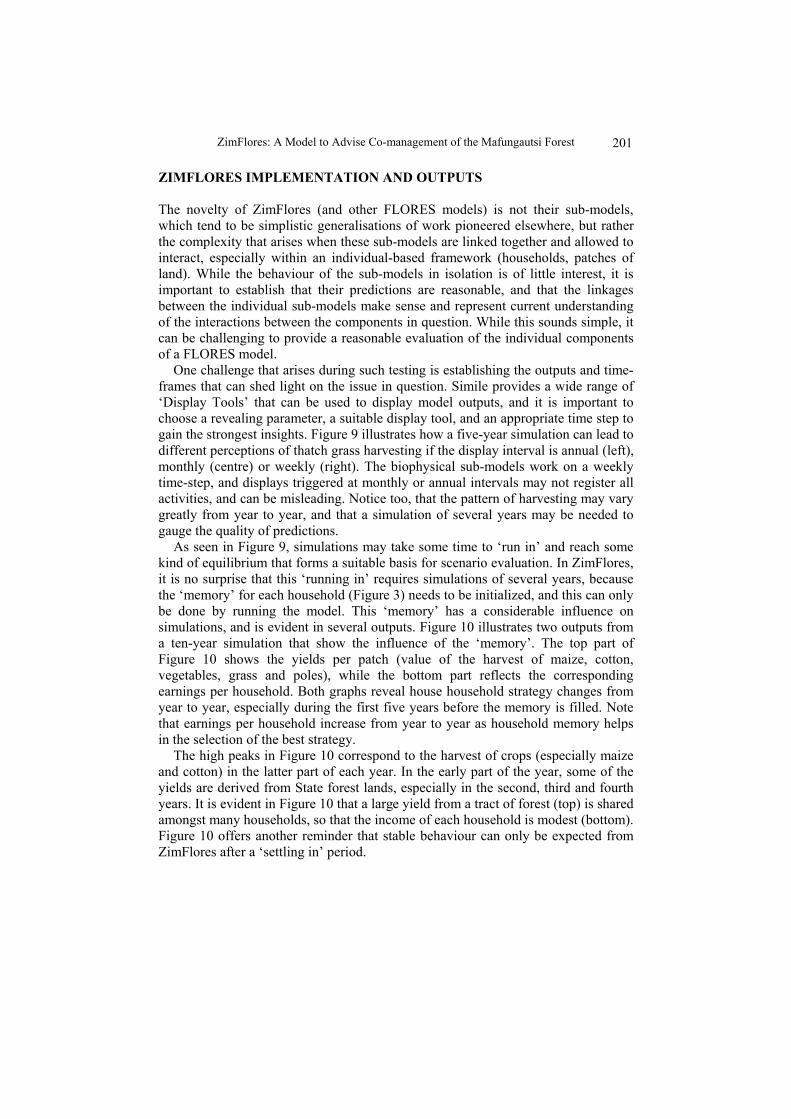
One challenge that arises during such testing is establishing the outputs and time-frames that can shed light on the issue in question. Simile provides a wide range of ‘Display Tools’ that can be used to display model outputs, and it is important to choose a revealing parameter, a suitable display tool, and an appropriate time step to gain the strongest insights. Figure 9 illustrates how a five-year simulation can lead to different perceptions of thatch grass harvesting if the display interval is annual (left), monthly (centre) or weekly (right). The biophysical sub-models work on a weekly time-step, and displays triggered at monthly or annual intervals may not register all activities, and can be misleading. Notice too, that the pattern of harvesting may vary greatly from year to year, and that a simulation of several years may be needed to gauge the quality of predictions.
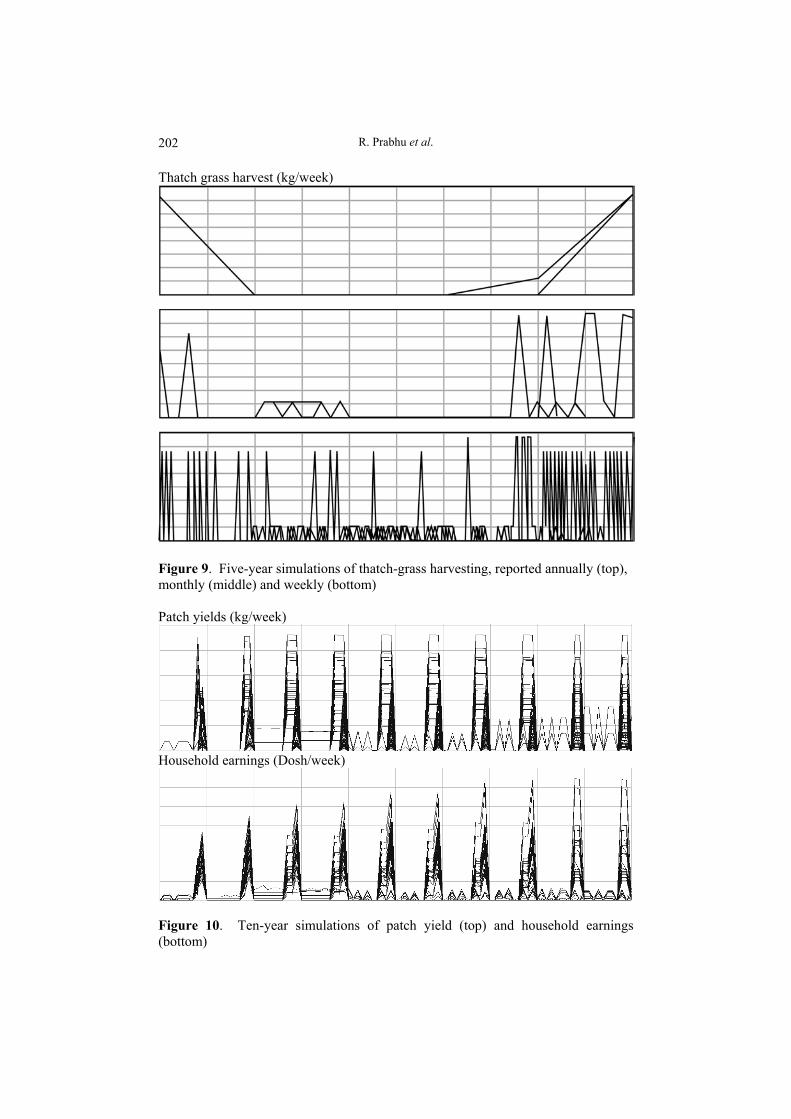
As seen in Figure 9, simulations may take some time to ‘run in’ and reach some kind of equilibrium that forms a suitable basis for scenario evaluation. In ZimFlores, it is no surprise that this ‘running in’ requires simulations of several years, because the ‘memory’ for each household (Figure 3) needs to be initialized, and this can only be done by running the model. This ‘memory’ has a considerable influence on simulations, and is evident in several outputs. Figure 10 illustrates two outputs from a ten-year simulation that show the influence of the ‘memory’. The top part of Figure 10 shows the yields per patch (value of the harvest of maize, cotton, vegetables, grass and poles), while the bottom part reflects the corresponding earnings per household. Both graphs reveal house household strategy changes from year to year, especially during the first five years before the memory is filled. Note that earnings per household increase from year to year as household memory helps in the selection of the best strategy.
The high peaks in Figure 10 correspond to the harvest of crops (especially maize and cotton) in the latter part of each year. In the early part of the year, some of the yields are derived from State forest lands, especially in the second, third and fourth years. It is evident in Figure 10 that a large yield from a tract of forest (top) is shared amongst many households, so that the income of each household is modest (bottom). Figure 10 offers another reminder that stable behaviour can only be expected from ZimFlores after a ‘settling in’ period.
R. Prabhu et al. 202
Thatch grass harvest (kg/week)
Figure 9. Five-year simulations of thatch-grass harvesting, reported annually (top), monthly (middle) and weekly (bottom) Patch yields (kg/week)
Household earnings (Dosh/week)
Figure 10. Ten-year simulations of patch yield (top) and household earnings (bottom)
ZimFlores: A Model to Advise Co-management of the Mafungautsi Forest 203
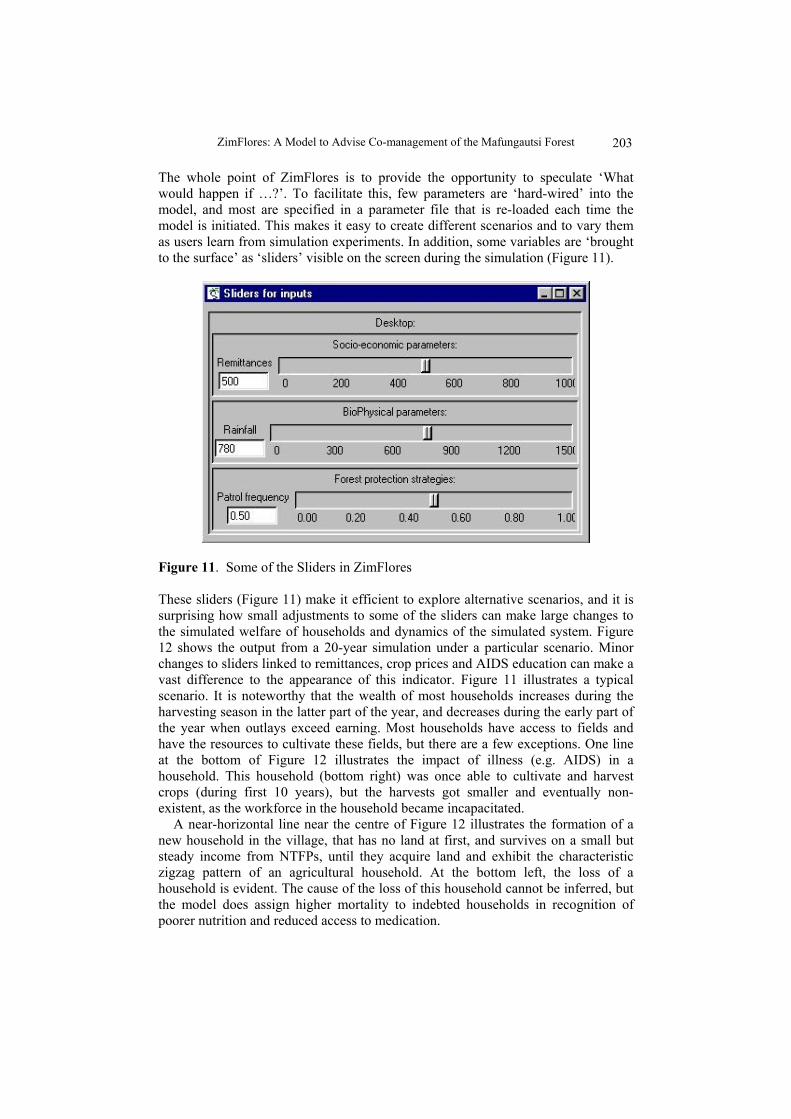
The whole point of ZimFlores is to provide the opportunity to speculate ‘What would happen if …?’. To facilitate this, few parameters are ‘hard-wired’ into the model, and most are specified in a parameter file that is re-loaded each time the model is initiated. This makes it easy to create different scenarios and to vary them as users learn from simulation experiments. In addition, some variables are ‘brought to the surface’ as ‘sliders’ visible on the screen during the simulation (Figure 11).
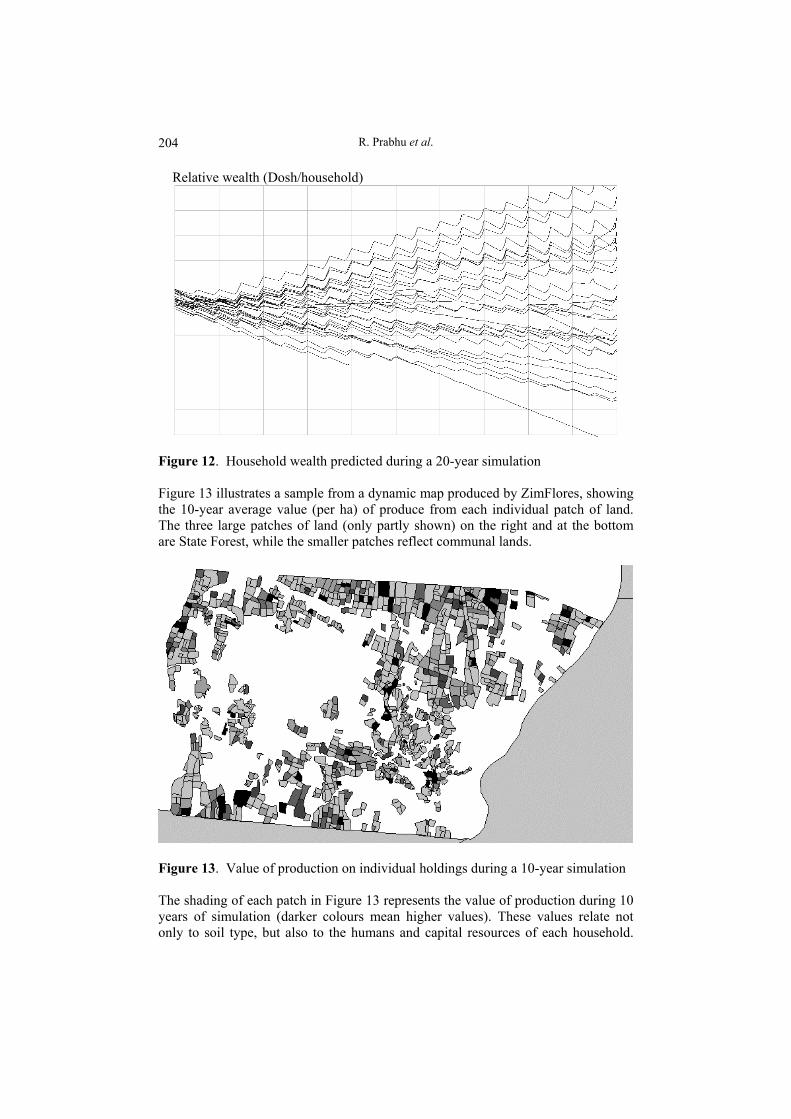
Figure 11. Some of the Sliders in ZimFlores These sliders (Figure 11) make it efficient to explore alternative scenarios, and it is surprising how small adjustments to some of the sliders can make large changes to the simulated welfare of households and dynamics of the simulated system. Figure 12 shows the output from a 20-year simulation under a particular scenario. Minor changes to sliders linked to remittances, crop prices and AIDS education can make a vast difference to the appearance of this indicator. Figure 11 illustrates a typical scenario. It is noteworthy that the wealth of most households increases during the harvesting season in the latter part of the year, and decreases during the early part of the year when outlays exceed earning. Most households have access to fields and have the resources to cultivate these fields, but there are a few exceptions. One line at the bottom of Figure 12 illustrates the impact of illness (e.g. AIDS) in a household. This household (bottom right) was once able to cultivate and harvest crops (during first 10 years), but the harvests got smaller and eventually non-existent, as the workforce in the household became incapacitated.
A near-horizontal line near the centre of Figure 12 illustrates the formation of a new household in the village, that has no land at first, and survives on a small but steady income from NTFPs, until they acquire land and exhibit the characteristic zigzag pattern of an agricultural household. At the bottom left, the loss of a household is evident. The cause of the loss of this household cannot be inferred, but the model does assign higher mortality to indebted households in recognition of poorer nutrition and reduced access to medication.
R. Prabhu et al. 204
Relative wealth (Dosh/household)
Figure 12. Household wealth predicted during a 20-year simulation Figure 13 illustrates a sample from a dynamic map produced by ZimFlores, showing the 10-year average value (per ha) of produce from each individual patch of land. The three large patches of land (only partly shown) on the right and at the bottom are State Forest, while the smaller patches reflect communal lands.
Figure 13. Value of production on individual holdings during a 10-year simulation The shading of each patch in Figure 13 represents the value of production during 10 years of simulation (darker colours mean higher values). These values relate not only to soil type, but also to the humans and capital resources of each household.
ZimFlores: A Model to Advise Co-management of the Mafungautsi Forest 205
Many of the ‘valuable’ patches of land belong to households with other land holdings, and illustrate where the cash crop cotton is grown (while subsistence maize is grown on the other patch available to the household). The scenario that produced this map resulted in a labour deficit (a 10-year simulation showed an aggregate labour surplus of 4%, but there was usually a shortage of labour), so high value production requires not only sufficient good land, but also sufficient people to work it, especially during critical times (planting, harvesting). ZIMFLORES VERSUS REALITY Having outlined the structure and illustrated the performance of ZimFlores, it is timely to re-examine how well it reflects the reality of Mafungautsi. Tenure of Land and Other Resources Resource access arrangements vary greatly in different parts of the region (Campbell 1996, Campbell and Matose 2000, Mukamuri et al. 2003), and according to the nature of the resource. Some arrangements are in a state of flux, as the emerging processes of co-management lead to some fine-tuning of regulations about access to resources on forest lands. Regulations have been set by the RMC and by the Forest Protection Unit (FPU) of the Forestry Commission. Enforcement of regulations varies for different resources and over time, and can be influenced by extreme weather events (e.g. hunting may be tolerated during drought, but not at other times; pole cutting may be tolerated after a bountiful harvest, when poles are needed for granaries).
Access to resources (e.g. by permits) is not the same for all people. Social capital is important in getting access to permits for finite resources. For example, some (Shangwe)10 households make a significant part of their livelihood from thatch grass and may get disproportionate access to RMC permits when they are issued in early May (most people are busy with maize harvest at that time). Some people are FPU informants and are virtually immune from sanctions for breaking regulations. Some examples of resource access regulations and enforcement status:
• Grazing in forest. permitted, not controlled by FPU. • Grazing on vleis. limited to early wet season, restricted (to protect thatch
grass) later in season. Enforced by Sabukhus (or RMC). • Grazing on common land. Forbidden in wet season; allowed in dry season;
strictly enforced by Sabukhu. • Grazing on fields. Must be open for grazing in dry season, closed in wet;
Enforced by households (wet season) and Sabukhu (dry season). Collaborating and Conflicting with Other Households Previous FLORES models have made the simplistic assumption that decision-making occurs independently of other households. There are different levels of interaction that could be included in the model, characterised as communication (passing information), co-ordination (doing day to day activities together), and
10 The Shangwe are the people who first settled the Mafungautsi area in the 1800s.
R. Prabhu et al. 206
collaboration (embarking on longer term joint ventures). Conflicts should also be considered.
The basic requirement for handling interactions is to include a relation sub-model between households in the model. An example would be a relation called ‘kinship’, which would link households with their relatives. ‘Neighbours’ would link households with adjacent fields. Other alternatives include relations between households which are carrying out the same activity, for example growing cotton, to represent the kind of clubs and other less formal groups of people who get together to collaborate. ZimFlores includes a limited implementation of a bee-keeping club that is effective at promoting bee-keeping, even though it provides no return to the household.
Communication Information passing between households may influence strategic decisions. Information about crop yields achieved by others, the cost of hired labour, the availability of surplus labour in a relative’s household, or the possibility of using a neighbour’s draught animals in exchange for some other resource, may all influence a household’s strategy. Crop information comes from the government (or Agritex11) and may be shared in clubs and with neighbours. Information about prices, school fees, resource-use regulations and RMC activities comes from village leadership and is shared amongst friends and neighbours. Information passing between households is necessary for any ‘copying’ of innovation. Co-ordination It is common for households to work together instead of doing everything alone. A group of people may work together to prepare fields for planting, with everyone first working on one household’s field, the next day working on another’s, and so on. Likewise, trips to the forest to collect firewood, thatch grass or to herd livestock may be done in groups rather than alone. Such co-ordination involves short-term agreements to work together. Modelling this requires the decisions of several households to be resolved in conjunction. Collaboration Collaboration between households involves joint ventures. For instance, a group of young men may decide to learn how to grow a new crop such as cotton; a group of people may deciding to keep bees together by forming a club; or a group of relatives may agree to help each other with money for schooling. Collaboration implies a long-term commitment to coordinate activities and share resources. The impact in terms of the model is that clumps of households would adopt similar strategies instead of each household deciding its strategy independently. Other impacts could include reductions in the costs of some inputs, and greater exchangeability of resources. People get information, improved access to resources, and social capital from collaboration.
11 Agritex is the Government of Zimbabwe Agricultural Technical and Extension Service.
ZimFlores: A Model to Advise Co-management of the Mafungautsi Forest 207
Conflict Interactions between households are not limited to ‘positive’ collaborations. Conflicts and disagreements are also opportunities for learning and adapting. This may be important to the model and if so, could be incorporated. For example, unequal access to decision-makers like RMCs causes conflict which leads to unequal enforcement of rules. Common pool resource management More sophisticated forms of collaboration include the emergence of new common pool resource (CPR) institutions, such as agreements to limit individual use of resources to enable fair sharing by all others with the same interests. CPR arrangements might therefore be seen as the result of enduring, community-wide collaborations. Adapting to new opportunities and learning In reality, people continuously learn and change their practices and this should be reflected in the model. ZimFlores already deals with memory of past performance. Further improvements may be possible by modelling anticipation of the future, and augmenting the strategic decision-making process with the capacity to consider a new opportunity. Most standard economics models of decision-making involve anticipated costs and benefits of options. The period of anticipation can vary indefinitely, as can the factors anticipated. Most people’s ability to predict the future is not much better than their ability to remember the past. Other aspects of the future may be more important, notably children and old age, hopes and aspirations, and fears or expectations. Questions remain about how people bring the future into their planning, and how this can be included in a simulation model.
Choosing from a fixed list of options is not a good basis for learning. The space of possible strategy options within which adaptations can be found needs to be dynamic. In other words, it is going to be essential to allow the appearance of new livelihood opportunities in the model. Then there needs to be a way for households to discover the new opportunities, and recognise them as new. Such discovery is not uniform. Perhaps an innovative household will begin doing something new, and discover that it is an improvement and then the new idea might infect other household’s options (through collaboration pathways, perhaps). Perhaps the model should include education, extension and marketing processes, which can cause change from outside. The heuristics that households use to come to strategic decisions need to adapt to the new possibilities. The model may also need to deal with the reluctance of households to change strategies. Given the abstract nature of these issues, it may be best to explore them through particular case studies (e.g. see Haggith and Prabhu 2003, Haggith et al. 2003c, Standa-Gunda et al. 2003).
THE WAY FORWARD: FURTHER ENHANCEMENTS The most important thing about implementation is to view it as just one step in an iterative cycle of model development (e.g. Forrester 1961, Morecroft and Sterman 1994, Kim 1995, Sterman 2000). The process so far, for example at the Camp Selous workshop, has involved stepping through these phases in a rather haphazard
R. Prabhu et al. 208
way, and it would be beneficial to return to them and work rigorously through them. At the moment, different people in the team may have different views of the purpose of the modelling exercise, and different core hypotheses, or may still be unclear on these issues.
Achieving a clear consensus on these topics may help to energise the process. However, the focus should be sufficiently broad to allow people to see the process as relevant to their own agenda, and should not be focused so specifically as to exclude stakeholders. Key steps here include:
1. articulating the purpose of the model, the issues to be addressed, and the focus
of the stakeholders; 2. agreeing on the scope of the model, by defining bounds on issues and
timelines; 3. conceptualising the core system dynamics and articulating hypotheses to form
the basis of the model; 4. formulating the model through repeated cycles of specifying, implementing
and checking the model; 5. calibrating and testing the model by testing content (parameters and
equations), behaviour, user relevance and sensitivity; and 6. using the model, evaluating impacts, reflecting on the implications, and
documenting findings.
ZimFlores is currently at a stage where several variants exist. These should be reviewed to collate the effective idealisations. In addition, the graphical representation could use some ‘tidying up’, and this needs to be done consultatively to avoid loss of ‘ownership’ by those who helped to develop the model to its present stage. Finally, the model warrants careful calibration and testing. This testing should involve:
1. Testing content by rigorously questioning each model parameter and equation, matching it to the knowledge and data of the Mafungautsi sites.
2. Testing behaviour with systematic tests of the model, including multiple simulations with a range of scenarios to check for bizarre and unreasonable results. Extreme scenarios may be especially diagnostic in this regard.
3. Testing relevance to users, by establishing that the model interface and implementation are such that it sheds light on the questions that stakeholders are likely to ask of the model.
4. Testing sensitivity of model outputs to minor perturbations to internal parameters and user inputs.
If major adjustments are made to the model at any point during these four steps, it is probably appropriate to abandon further testing and move smartly to another iteration. The better the model is, the more testing is warranted. If the model is robust enough to survive the previous levels of tests then sensitivity analysis can be used to reveal which variables are key factors in producing important behaviour changes. If bizarre behaviour is revealed, the origins of which are not understood, then sensitivity analysis can be enlightening.
ZimFlores: A Model to Advise Co-management of the Mafungautsi Forest 209
Ideally each step in the process should involve documentation, but at the very least, having completed a model, tested it and maybe applied it, time should be taken to reflect on what has been learned, and this should be documented.
There is no such thing as a perfect model, so having reached the end of the cycle and learned some valuable lessons, the model development cycle should begin again with step 1. Having moved through the entire cycle once, it should become much easier for the team to articulate the model focus, clarify the boundary of the model, and formulate hypotheses of expected dynamics which will in turn lead to a much improved model. It is important not to get stuck trying to implement a complex version of the model in the first instance, as this can be time consuming, and make the testing stage much more difficult. It is more fruitful, in the longer term, to be highly selective about the elements implemented initially, before the first calibration and testing. Good progress in those initial stages allow a rapid cycle back through the loop, and having gained experience and insights, be better able as a team to enhance the model in the second and subsequent cycles.
Several important insights have been gained through the construction of ZimFlores. The ZimFlores experience underscores the importance of agreeing on a specific location in which all participants have an interest. It has demonstrated that participatory modelling can be effective in quickly consolidating a diverse body of knowledge and making it accessible in a practical way. The experience has shown the importance of effective scoping (Haggith et al. 2003), and of the need to idealize concepts effectively (Haggith and Prabhu 2003). Finally results presented in this paper demonstrate the importance of carefully identifying outputs that are diagnostic, and which offer insights into the issues under consideration. REFERENCES Campbell, B.M. ed. (1996), The Miombo in Transition: Woodlands and Welfare in Africa, Center
for International Forestry Research, Bogor. Campbell, B.M. and Matose, F. (2000), Institutions and Natural Resources in the Miombo Region,
CIFOR/EC/SADC Miombo Woodlands Research Brief No. 5, May 2000. Forrester, J.W. (1961), Industrial Dynamics, Pegasus Communications, Waltham MA. Frost, P.G.H. and Mandono, A. (1999), Improving Rural Livelihoods in Semi-Arid Regions
Through Management of Micro-Catchments, Working paper No. 12, Institute of Environmental Studies, University of Zimbabwe.
Gambiza, J., Bond, W., Frost, P.G.H., Higgins, S. (2000), ‘A simulation model of miombo woodland dynamics under different management regimes’, Ecological Economics, 33: 353-368.
Haggith, M. and Prabhu, R. (2003), ‘Unlocking complexity: The importance of idealisation in simulation modelling’, Small-scale Forest Economics, Management and Policy, 2(2): 293-312.
Haggith, M., Muetzelfeldt, R.I. and Taylor, J. (2003a), ‘Modelling decision-making in rural communities at the Forest Margin’, Small-scale Forest Economics, Management and Policy, 2(2): 241-258.
Haggith, M., Prabhu, R., Mudavanhu, H., Matose, F., Mutimukuru, T., Nyirenda, R. and Standa-Gunda, W. (2003b), ‘The challenges of effective model scoping: A FLORES case study from the Mafungautsi Forest margins, Zimbabwe’, Small-scale Forest Economics, Management and Policy, 2(2): 155-169.
Haggith, M., Prabhu, R., Colfer, C., Ritchie, B., Thomson, A. and Mudavanhu, H. (2003c), ‘Infectious ideas: Modelling the diffusion of ideas across social networks’, Small-scale Forest Economics, Management and Policy, 2(2): 225-239.
R. Prabhu et al. 210
Kim, D.H. (1995), Systems Thinking Tools, Pegasus Communications, Cambridge, MA. Monela, G.C., Kajembe, G.C., Kaoneka, A.R.S. and Kowero, G. (2000), ‘Household livelihood
strategies in the Miombo Woodland of Tanzania: Emerging trends’, Tanzania Journal of Forestry and Nature Conservation, 73: 17-33.
Morecroft, J.D.W. and Sterman, J.D. eds. (1994), Modeling for Learning Organisations, Productivity Press, Portland, OR.
Muetzelfeldt, R. and Massheder, J. (2003), ‘The Simile visual modelling environment’, European Journal of Agronomy, 18(3-4): 345-358.
Mukamuri, B.B., Campbell, B.M., and Kowero, G. (2003), ‘Local organisations and natural resource management in the face of economic hardships: A case study from Zimbabwe’, Tanzania Journal of Forestry and Nature Conservation, 75, in press.
Standa-Gunda, W., Mutimukuru, T., Nyirenda, R., Haggith, M. and Vanclay, J.K. (2003), ‘Participatory modelling to enhance social learning, collective action and mobilization among users of the Mafungautsi Forest, Zimbabwe’, Small-scale Forest Economics, Management and Policy, 2(2): 313-326.
Sterman, J.D. (2000), Business Dynamics: Systems Thinking and Modeling for a Complex World, McGraw-Hill, New York.
Vanclay, J.K. (2003), ‘Why model landscapes at the level of households and fields?’, Small-scale Forest Economics, Management and Policy, 2(2): 121-134.
Vanclay, J.K., Haggith, M. and Colfer, C. (2003), ‘Participation and model-building: Lessons learned from the Bukittinggi workshop’, Small-scale Forest Economics, Management and Policy, 2(2): 135-154.


