Embed Size (px)
Citation preview

Developmental Biology 318 (2008) 112–125
Contents lists available at ScienceDirect
Developmental Biology
j ourna l homepage: www.e lsev ie r.com/deve lopmenta lb io logy
Zonula occludens-1 (ZO-1) is involved in morula to blastocyst transformationin the mouse
Hehai Wang, Tianbing Ding, Naoko Brown, Yasutoshi Yamamoto, Lawrence S. Prince, Jeff Reese, B.C. Paria ⁎Division of Neonatology, Department of Pediatrics, Vanderbilt University Medical Center, 1125 MRB IV, 2215 B. Garland Avenue, Nashville, TN-37232-0656, USA
⁎ Corresponding author. Fax: +1 615 322 4704.E-mail address: [email protected] (B.C. Paria).
0012-1606/$ – see front matter © 2008 Elsevier Inc. Aldoi:10.1016/j.ydbio.2008.03.008
A B S T R A C T
A R T I C L E I N F OArticle history:
It is unknown whether or n Received for publication 14 April 2007Revised 13 February 2008Accepted 6 March 2008Available online 20 March 2008Keywords:Murine embryoMorulaBlastocystBlastomereElectroporationTight junctionZonula occludens-1
ot tight junction formation plays any role in morula to blastocyst transformationthat is associated with development of polarized trophoblast cells and fluid accumulation. Tight junctions area hallmark of polarized epithelial cells and zonula occludens-1 (ZO-1) is a known key regulator of tightjunction formation. Here we show that ZO-1 protein is first expressed during compaction of 8-cell embryos.This stage-specific appearance of ZO-1 suggests its participation in morula to blastocyst transition. Consistentwith this idea, we demonstrate that ZO-1 siRNA delivery inside the blastomeres of zona-weakened embryosusing electroporation not only knocks down ZO-1 gene and protein expressions, but also inhibits morula toblastocyst transformation in a concentration-dependent manner. In addition, ZO-1 inactivation reduced theexpression of Cdx2 and Oct-4, but not ZO-2 and F-actin. These results provide the first evidence that ZO-1 isinvolved in blastocyst formation from the morula by regulating accumulation of fluid and differentiation ofnonpolar blastomeres to polar trophoblast cells.
© 2008 Elsevier Inc. All rights reserved.
Introduction
Normal preimplantation embryonic development to the blastocyststage is critical to the process of initiation of implantation andpregnancy. Any defects in the blastocyst lead to defective implantationand infertility. Considering this crucial role of the blastocyst, it is notclearly understood how a blastocyst is formed from a morula stageembryo. Following fertilization of oocytes by sperm, one-cell embryosundergo successive mitotic cell divisions that direct them to developto 2-cell, 4-cell, 8-cell, 16-cell (morula) and 32 or more-cell(blastocyst) stages. Soon after development of the 8-cell embryo inthe mouse, the blastomeres begin to form junctions with one another,leading to formation of the morula. The morula then undergoesdifferentiation to the blastocyst stage where a fluid-filled blastocoelappears within the embryo. The blastocyst stage is a milestone inembryonic life because it has two distinctive cell lineages and gainsthe ability to implant. The outer polar single-celled layer of an earlyblastocyst is known as the trophectoderm (TE) that surrounds theblastocoel and a small cluster of nonpolar cells called the inner cellmass (ICM). Later, the ICM gives rise to two more cell lineages, theepiblast and the primitive endoderm (PE) or hypoblast at the lateblastocyst stage. Differentiation of blastomeres is important becausefollowing blastocyst implantation trophoblast cells go on to contribute
l rights reserved.
the fetal components of the placenta, while cells of the ICM andhypoblast form the fetus and yolk sac (Johnson and McConnell, 2004;Yamanaka et al., 2006), respectively.
Most of our current knowledge on the mechanism of blastocystformation has come from studies performed in mouse embryos. Thesestudies have revealed that blastocyst formation involves a complexseries of events occurring in a precise temporal sequence. Sincepreimplantation stage embryos grow well in defined culture mediamade of balanced salt solution outside the reproductive tract, factorsproduced by embryos at various stages of their development areconsidered to be important for embryos to achieve the blastocyststage. Emerging evidence indicates that blastocyst formation occurs asa result of gradual polarization of certain blastomeres as the 8-cellstage embryo undergoes compaction and morula stages of theirdevelopment (Johnson and McConnell, 2004). Polarization of someblastomeres is established by junction formation between cells attheir lateral surface (Ziomek and Johnson, 1980; Fleming et al., 2001).Among these junctions, notables are adherens and tight junctions.These junctions are made of multi-protein complexes and connectcells at their lateral surfaces generating a layer of polarized cells thatline cavities and tissues (Farquhar and Palade, 1963).
E-cadherin, an integral membrane component of the adherensjunction, is necessary for formation of the trophectoderm epitheliumsince E-cadherin null embryos undergo compaction but fail to formblastocysts with trophoblast cells. Interestingly, however, E-cadherinnull embryos undergo trophoblast outgrowth in vitro suggesting at

113H. Wang et al. / Developmental Biology 318 (2008) 112–125
least part of the differentiation program for epithelial biogenesisoccurs in E-cadherin null embryos (Larue et al., 1994). The questionthen naturally arises as to the contribution of the tight junction in theformation of a blastocyst with trophectodermal epithelium. Previousstudies have demonstrated that the tight junction is a complex sealbetween adjoining epithelial cells. It is considered to be at leastbifunctional: it limits the diffusion of solutes through the paracellularpathway (barrier function) and maintains epithelial cell polaritybuilding a fence between the apical and basolateral membranes (fencefunction). The integral membrane proteins of the tight junction areoccludin and claudins. The peripheral membrane proteins of tightjunctions are ZO-1, ZO-2 and ZO-3 (Tsukita et al., 2001). Among theseTJ proteins, the temporal and spatial expression patterns of occludinand ZO-1 have been investigated at different stages of preimplanta-tion development. While occludin and ZO-1α+ are first assembled atcell–cell membrane contact sites between blastomeres in the latemorula stage (Sheth et al., 1997, 2000), ZO-1α− is initially noted aspunctate sites at the cell–cell contacts of compacted 8-cell stageembryos (Fleming et al., 1989; Sheth et al., 1997). The timing ofoccludin and ZO-1α+ expression in latemorulae indicates that they areprobably involved in the final events of morula to blastocyst formation(Sheth et al., 1997, 2000). Preimplantation embryos devoid of occludin,ZO-2 or ZO-3 developed normally to the blastocyst stage suggestingthat this protein is dispensable for morula to blastocyst transforma-tion (Saitou et al., 2000; Adachi et al., 2006; Xu et al., 2008). However,there is no functional study to showwhether or not ZO-1 is needed forblastocyst formation.
To study the importance of ZO-1 during the time of blastocystformation we report the knock-down of endogenous ZO-1 geneexpression in late-stage mouse embryos using small interfering RNAs(siRNA) against ZO-1. When early 8-cell embryos were electroporatedwith ZO-1 siRNAs, these embryos developed to the morula stage withreduced or no expression of membranous ZO-1 protein but did notundergo blastocyst formation within 24 h of culture. These resultssuggest that ZO-1 protein may be necessary to maintain the integrityof the trophectoderm layer that is essential for cellular and fluidcompartment formation in blastocysts.
Materials and methods
Animals
Adult male and female CD-1 mice were purchased from Charles River Laboratories(Wilmington, MA). They were kept in a light–dark cycle (14 h light:10 h dark) in theLaboratory Animal Facility of Vanderbilt University (Nashville, TN) with unlimitedaccess to water and food according to the Institutional guidelines on the care and use oflaboratory animals.
Embryo collection and culture
Female mice were paired overnight with fertile males of the same strain. Finding ofa copulation plug the following morning indicated the 1st day (day 1) of pregnancy.Preimplantation embryos from 2-cell to blastocyst stages [2-cell (day 2 at 0900 h fromoviducts); 4-cell (day 3 at 0300 h from oviducts); 8-cell (day 3 at 1030 and 1300 h fromoviducts); early morula (day 3 at 1800 from oviducts), late morula (day 4 at 0100 h fromoviducts and uteri) and blastocysts (day 4 at 0900 h from uteri)] were collected byflushing oviducts and uteri (Paria et al., 1993) with potassium simplex optimizedmedium with amino acids (KSOMaa) (Lawitts and Biggers, 1991). All mediumcomponents were purchased from Sigma (St. Louis, MO) unless stated otherwise.Embryos were cultured in groups of 6–10 in microdrops (25 μl) of KSOMaa under siliconoil in a humidified atmosphere of 5% CO2/95% air at 37 °C (Paria and Dey, 1990).
Optimization of mouse embryo electroporation (EP) parameters
We first standardized the method of electroporation using the cell fusioninstrument (BTX, ECM 2001; San Diego, CA) that can effectively introduce siRNA insidea zona-encased embryo. Since the normal embryo is protected by zona pellucida, wedecided to use the siPORT™ (AM8990 or AM8990G; Ambion, Austin, TX) as anelectroporation buffer because this buffer is developed for transfecting siRNA into hard-to-transfect cells and has components to ensure high cell viability and enhanceddelivery of siRNAs. Using this buffer, we next standardized the electroporationparameters such as voltage, number of pulses, pulse duration and repeats. The embryos
were electroporated in a flat electrode chamber supplied by BTX Inc. The postelectroporation embryo survival rate and developmental potentials were chosen as theend-point measurements. First, we determined the DC voltage (DCV) requirement forelectroporation using 2-cell and 8-cell embryos by passing a series of DC voltage (from20–100DCVwith 10 V intervals)while setting the 1ms pulse length,1 pulse number and0 repeats. In our initial studies we used 2-cell stage embryos to test the electroporationinstrument because previous reports havedemonstrated that application of electricfieldcauses blastomere fusion at the 2-cell stage (Cheong et al., 1991). Based on the over 50%embryo survival rate and blastocyst formation rate of cultured electroporated embryos,an optimized DCV was selected for testing other electroporation parameters (i.e. pulselength, pulse number and repeats). We next established other electroporationparameters keeping DCV unchanged. After repeated trials, we optimized an electro-poration condition (DC 20 V; 1 ms, 3 pulses, 0 repeat) that we later applied to examinethe incorporation of siRNA in zona weakened 2- and early 8-cell embryos usingSilencer®Cy3-labeled negative siRNA control #1 (Cat. no. 4621; Ambion). Followingelectroporation, the embryos were cultured in vitro in KSOMaa and checked for theirsurvival and the presence of Cy3 florescence inside blastomeres at 24 h intervals.
Embryo electroporation with custom siRNA
Freshly collected early 8-cell stage embryoswerewashed thoroughly and incubated≈10–12 s in prewarmed acid Tyrode's solution (T1788, Sigma) to weaken the zonapellucida (Grabarek et al., 2002) rather than remove it. These embryos were thentransferred to and kept in the pre-made KSOMaa drops in a Petri dish covered withsilicon oil. At the same time, the cell fusion instrument was turned on and siRNA stockswere diluted in siPORT™ electroporation buffer (AM8990 or AM8990G; Ambion) beforeelectroporation. While Silencer® negative control #1 (Cat. no. 4611; Ambion) was usedas siRNA control, the blank siPORT™ electroporation buffer was used as electroporationcontrol. The negative control siRNA is comprised of a 19 bp scrambled sequence with 3′dt overhang. These sequences have no significant homology to any known genesequences of mouse, rat or human and have no non-specific effects on gene expression(information provided by the Ambion Company).
The custom-made ZO-1 siRNA (mouse; Cat. no. sc-29832; Santa Cruz Biotechnol-ogy, Santa Cruz, CA) were first prepared as a stock solution according to the instructionsprovided by themanufacturer, and kept at −20 °C. Right before electroporation, the ZO-1siRNA was diluted into different concentrations in siPORT™ electroporation buffer. Asuitably sized drop of the diluted siRNA solutionwas added between the two electrodesfixed in an electroporation chamber. The embryos were linearly arranged in thechamber so that they were equidistant between the two electrodes with about equalspace interval between the two neighboring embryos. A series of direct electrical squarepulses (i.e. 20 DC voltage/1 ms pulse length/3 pulses/0 repeats) were given to theembryos. After electroporation, the embryoswerewashed and cultured in fresh KOSM-aamedia. Approximately 2 h after electroporation, embryos were observed for theirsurvival under a Nikon SMZ800 stereo microscope. All apparently non-degeneratingembryos were cultured in vitro for 24 h to 48 h to study their subsequent development.Experiments were repeated several times and stages of embryonic development werechecked at 24 h intervals and photographed. A group of electroporated embryos afterculture for 24 h were processed for immunofluorescence staining for ZO-1 andE-cadherin protein expression.
Determination of cell number
Embryos from each treatment group were treated at the end of each experimentwith DAPI (4′, 6′-diamidino-2-phenylindole; 10 μg/ml) for 30 min at room temperaturein a humidified chamber. Following DAPI treatment, embryos were washed withphosphate-buffered saline (PBS), mounted onto glass slides and examined under afluorescence microscope.
Immunofluorescence detection of E-cadherin, ZO-1, ZO-2, Caudal-related homeobox 2(Cdx2), POU-family transcription factor, Oct-4, and filamentous-actin (F-actin) in embryos
The primary antisera used included a rat monoclonal E-cadherin antibody, agenerous gift from Dr. Rolf Kemler, Max-Planck-Institut for Immunbiologie, Freiburg,German), a rabbit polyclonal ZO-1 antibody (Cat. no. 61-7300, Zymed LaboratoriesInc.) that detects ZO-1α− and ZO-1α+ isoforms, a rabbit polyclonal anti-ZO-2 (Cat. no.71-1400, Zymed Laboratories Inc.), a mouse monoclonal anti-Cdx2 (Cat. no. MU-392A-UC, BioGenex), and a goat polyclonal anti-Oct-4 (Cat. no. SC-8628, Santa CruzBiotechnology). Embryos were first fixed in 4% paraformaldehyde in PBS containing0.2% BSA for at least 30 min and washed twice in fresh PBS. Fixed embryos werethen permeabilized (PBS with 0.25% Tween-20 and 0.1% BSA), washed and incubatedwith primary antisera (ZO-1, 1:150 dilution; ZO-2, 1:150; E-cadherin, 1:100; Cdx2,1:60; Oct-4, 1:60 dilutions) overnight at 4 °C in a humidified chamber. At the end ofincubation, embryos were washed 3 times to remove excess primary antibodies andincubated again with TRITC conjugated goat anti-rabbit IgG or TRITC-conjugated goatanti-rat IgG or FITC-conjugated secondary antibodies for 1 h at room temperature.Texas red-labeled phalloidin (Cat. no. T-7471, Molecular Probes) was used for F-actinstaining. Embryos were next washed with fresh PBS 3 times; the first wash containedDAPI for nuclear staining. Non-specific staining was determined by processingembryos as described above in the absence of primary antiserum. Embryos weremounted on a glass slide with Fluoro G to prevent photobleaching and were sealedwith nail polish. The localization of all proteins was visualized under either a Nikon

Fig. 1. ZO-1 protein expression is stage-specific in developing mouse embryos freshly collected from the reproductive tracts during preimplantation period of pregnancy. All images(40×) are representative of at least three experiments. A) The localization of ZO-1 (TRITC-labeling) was observed in cell–cell contact sites starting from compacted 8-cell stage andonwards. Membranous localization of this protein is indicatedwith arrow head. The nuclei were stained with DAPI. Stages of preimplantation embryos stained for ZO-1 are: 2-cell (a),4-cell (b), uncompacted 8-cell (c), compacted 8-cell (d), 16-cell (e), 30-cell (f), and blastocyst (g). Blastocysts stained in the absence of primary antibody are shown in picture h. B)Optical sections showed localization of ZO-1 in cell-cell contact sites of a compacted 8-cell stage embryo (a) and blastocyst (b). TE, Trophectoderm; ICM, Inner Cell Mass.
114 H. Wang et al. / Developmental Biology 318 (2008) 112–125

115H. Wang et al. / Developmental Biology 318 (2008) 112–125
Eclipse TS100 microscope equipped with X-Cite 120 for fluorescence and a DigiFirecamera for photography or a Zeiss Axiovert 200 microscope equipped with ApoTomeoptical sectioning and appropriate filters.
RNA extraction, reverse transcription (RT) and quantitative real-time polymerasechain reaction
Total RNA was extracted from pooled embryos (10 embryos/group) from eachtreatment group [control scramble siRNAand threedosage (400,800 and1200nM)of ZO-1siRNAs] using a previously described protocol (Paria et al., 1993). Briefly, total RNA waspreparedusing sodiumdodecyl sulphate/phenol/chloroformbuffers after addition of E. colirRNA (20 μg) as a carrier in each tube. Total RNA equivalent to two and half embryos fromeach group was subjected to reverse transcription for complementary DNA synthesis withSuperScript III RT using random hexamers according to the manufacturer's protocol(Invitrogen). The primer pairs used for PCR are as follows: 5′-TTCAAAGTCTGCAGAGACAA-TAGC-3′ (forward) and 5′-TCACATTGCTTAGTCCAGTTCC-3′ (reverse) for ZO-1; 5′-CCATGGGCGCGGACTATCTGA-3′ (forward) and 5′-CTGTGGCGGGGAGGTTTGACTTG-3′(reverse) for ZO-2, and 5′-GCTTGCTGGTGAAAAGGACCTCTCGAAG-3′ (forward) and 5′-CCCTGAAGTACTCATTATAGTCAAGGGCAT-3′ (reverse) for hypoxanthine–guanine phos-phoribosyl transferase 1 (hprt1), a house-keeping gene (Mamo et al., 2007). Each primerpair was validated by performing electrophoresis and melting temperature analysis of thePCR product to ensure the correct size of PCR product and the absence of primer dimers.Standard concentration curves were also done for each primer pair used. All samples wererun in triplicate fromat least 3 independent experiments. All PCRexperimentswere carriedout using an iQ™5 Real-time PCR Detection System (Bio-Rad Laboratories, Hercules, CA)with SYBR Green detection. 40 cycles of a two-step PCR sequence were performed, andcritical threshold values (CT) were measured for each sample (Benjamin et al., 2007).Expression levels of target genes in each sample were compared to hprt1. Differences inexpression between each group were compared by one-way ANOVA and Tukeys post-hocanalysis. Fold-change for each gene was calculated using the 2−ΔΔCT method.
Statistics
Each experiment was repeated at least three times and results were reported asmean±S.E.M. For each treatment within an experiment, more than 8 high qualityembryos were used. The data were first tested for significant differences by ANOVA andlater significant differences among multiple treatment groups were determined byLeast Squares Means test. The significance level was set at pb0.05.
Results
Expression of ZO-1 and E-cadherin proteins in 2-cell to blastocyst stagesof mouse embryos
We first examined stage-specific embryonic ZO-1 protein expres-sion by immunofluorescence staining from the 2-cell to the blastocyst
Fig. 2. E-cadherin is localized at cell–cell contact sites in all developing stages of mouse empregnancy. Membranous localization of this protein (TRITC-labeling) is indicated with arrowstained with DAPI. Stages of preimplantation embryos stained for E-cadherin are: 2-cell (a),primary antibody are shown in picture f. TE, Trophectoderm; ICM, Inner Cell Mass.
stage. In a parallel set of experiments using embryos from the samebatch, E-cadherin protein localization was also performed as a markerof epithelial adherens junctions. ZO-1 expression was not observed inthe 2-cell (Fig. 1Aa) and 4-cell (Fig. 1Ab) stage embryos even thoughclear membranous localization of E-cadherin was observed at theseembryonic developmental stages at their cell–cell contact sites (Figs. 2aand b). ZO-1 expression was first observed at the 8-cell stage embryos.However, not all the 8-cell stage embryos showed ZO-1 expression.While early uncompacted 8-cell embryos showed no expression (Fig.1Ac), late compacted 8-cell embryos first exhibited punctate accumula-tion of ZO-1 in cell–cell contactingmembranes (Fig.1Ad). This punctatelocalization of ZO-1 in cell–cell contact sites betweenblastomeres of the8-cell stage embryos was also confirmed by high resolution opticalsections of embryos (Fig. 1Ba). Once ZO-1 started to accumulate in thecell membrane, its localization continued and strengthened in the 16-cell stage (Fig. 1Ae), late morula (Fig. 1Af) and blastocyst stages (Figs.1Ag and Bb). No specific immunoreactivity was observed whenblastocysts were incubated with secondary antibody in the absence ofprimary antibody (Fig. 1h). Similar patterns of ZO-1 localization werealso previously demonstrated (Fleming et al., 1989; Sheth et al., 1997).Strong membranous E-cadherin protein localization persisted in the 8-cell stage (Fig. 2c), morula (Fig. 2d) and blastocyst (Fig. 2e) stages of theembryo. Blastocysts incubated with secondary antibody in the absenceof primary antibody showed no specific immunostaining (Fig. 2f). Thisanalysis revealed that while E-cadherin was present in all develop-mental stages of the preimplantation embryo, ZO-1 was expressedonly during the late 8-cell stage and onwards. Based on this stage-specific ZO-1 expression pattern, the morula to blastocyst conversionevent seems to be a unique model to study the role of this protein incellular differentiation process during preimplantation embryonicdevelopment.
We next studied ZO-1 function by suppressing ZO-1 expressionusing RNA interference technology that has been widely used for theanalysis of gene function in plants, invertebrates andmammalian cells(Sharp, 2001; Hannon, 2002). Recently, this technique has beenapplied in mouse embryos to study the role of specific gene functionin preimplantation embryonic development (Wianny and Zernicka-Goetz, 2000; Grabarek et al., 2002; Haraguchi et al., 2004; Soares et al.,2005). In most of these studies, siRNAs were microinjected at the
bryos freshly collected from the reproductive tracts during preimplantation period ofhead. All images (40×) are representative of at least three experiments. The nuclei were4-cell (b), 8-cell (c), morula (d) and blastocyst (e). Blastocysts stained in the absence of

116 H. Wang et al. / Developmental Biology 318 (2008) 112–125
oocyte or one-cell stage. More recently, Grabarek and coworkers(Grabarek et al., 2002) demonstrated an electroporation technique tointroduce siRNA in later stages of the preimplantation embryo. Basedon their technique, we first attempted to establish electroporationconditions for zona-weakened 2- and 8-cell embryos using controlCy3-labeled siRNA. Use of Cy3-labeled siRNA offered the advantagethat incorporation of Cy3 can be visualized under a fluorescencemicroscope which will confirm incorporation of siRNA inside eachblastomere.
Fig. 3. A) The level of autofluorescence in various stages of embryonic development whendetected using the filter that was used to visualize Cy3- or TRITC-color. The embryonic stageslevel in various stages of embryonic development when 2-cell embryos were electroporated wcell (a), fused 2-cell (b), 4-cell (c), 8-cell/morula (d), and blastocyst (e). C) Cy3 fluorescence lewith Cy3-labeled control siRNA and cultured for 48 h. a, autofluorescence level in 8-cell emelectroporationwith Cy3-labeled control siRNA; c and d, Cy-3 fluorescence level in in vitro grembryos with Cy3-labeled control siRNA. TE, Trophectoderm; ICM, Inner Cell Mass.
Set up of electroporation conditions for siRNA incorporation intopreimplantation embryos
In a series of trials, we determined the optimal parameters forelectroporating Cy3-labeled control siRNA (10 μM) first in zona-weakened 2-cell stage embryos. The parameters for optimal electro-poration were fixed at three 1 ms pulses, each of DC 20 V. Followingelectroporationwithout or with control siRNA, embryos were culturedfor72h to theblastocyst stage tomonitorconsequencesof electroporation
2-cell embryos were only electroporated and cultured for 72 h. Autofluorescence was(40×) are: 2-cell (a), 4-cell (b), 8-cell/morula (c), and blastocyst (d). B) Cy3 fluorescenceith Cy3-labeled control siRNA and cultured for 72 h. The embryonic stages (40×) are: 2-
vel in the 8-cell, morula and blastocyst stages when 8-cell embryos were electroporatedbryos prior to electroporation; b, Cy3 fluorescence level in 8-cell stage embryos afterownmorula and blastocyst stages, respectively, following electroporation of 8-cell stage

Fig. 4. A) Embryonic survival rate following electroporation (EP) of 8-cell stage embryosin the presence or absence of control and ZO-1 siRNAs. The numbers on top of each barindicate the number of embryos survived/number of embryos electroporated. Numberwithin the parenthesis indicates number of experiments. Vertical bars indicate the S.E.M. ZO-1 siRNAs were used at three concentrations, 400, 800 and 1200 nM. ControlsiRNA was used at only 1600 nM. Statistical comparisons were made by ANOVA andLeast Square Means test (*pb0.05). B) Incidence of blastocyst formation afterelectroporation of ZO-1 siRNA into 8-cell stage embryos. The numbers on top of eachbar indicate the number of blastocysts developed/number of embryos survived afterelectroporation. Number within the parenthesis indicates number of experiments.Vertical bars indicate the S.E.M. ZO-1 siRNAs were used at three concentrations, 400,800 and 1200 nM. Control siRNA was used at only 1600 nM. Statistical comparisonswere made using ANOVA followed by Least Squares Means test (*pb0.05). C) Effects ofZO-1 siRNA on blastomere number in the morula stage embryo. After termination ofculture, morulae were stained with DAPI for the purpose of counting blastomerenumbers. Number within the bar indicates number of morulae used to determineblastomere number. Vertical bars indicate the S.E.M. Statistical comparisons were madeusing ANOVA followed by Least Squares Means test (*pb0.05).
117H. Wang et al. / Developmental Biology 318 (2008) 112–125
on embryonic development and the level of fluorescence in laterstages of these developing embryos in culture. The majority ofembryos in both groups [electroporation without (33/37; 89%) andwith (39/46; 85%) control siRNA] undergo normal development to theblastocyst stage. The embryos that were subjected to electroporationalone exhibited low levels of autofluorescence at any stage of theirsubsequent development to the blastocyst stage. In Fig. 3A the level ofautofluorescence in various stages of embryonic development isshown when 2-cell embryos were only electroporated and culturedfor 72 h. In contrast, strong Cy3 fluorescence was detected in 2-cellstage embryos right after electroporation (Fig. 3Ba) of Cy3 labeledcontrol siRNA. This electroporation procedure also resulted in fusionof blastomeres in some of the 2-cell stage embryos (Fig. 3Bb) showingthe efficacy of application of electric field as demonstrated earlier(Cheong et al., 1991). These embryos also showed strong Cy3fluorescence (Fig. 3Bb). However, a gradual decrease in intensity ofthe Cy3 fluorescence was apparent with the progression of theembryonic development [4-cell (Fig. 3Bc); 8-cell/morula (Fig. 3Bd);blastocyst (Fig. 3Be)]. In subsequent experiments, these electropora-tion parameters when applied to the zona-weakened early 8-cell stageembryos resulted in successful incorporation of Cy3-labeled controlsiRNA inside embryos (Fig. 3C). The 8-cell stage embryos that weresubjected to electroporation alone showed low levels of autofluores-cence following the procedure (Fig. 3Ca). In contrast, Cy3 fluorescencewas strong in the 8-cell stage embryos following electroporation ofembryos with Cy3-labeled control siRNA (Fig. 3Cb). These embryosfrom both groups when cultured in vitro for 24 h developed normallyto the stage of either morulae or blastocysts. These embryos stilldisplayed Cy3 fluorescence but with reduced levels (Figs. 3Cc and d).Through these findings, we understood that siRNA concentration isnot maintained at same level inside the embryo for a long period oftime. However, the above described results also indicate that thiscontrol RNA is not toxic to the embryo because the majority of theseembryos when cultured in vitro developed to the blastocyst stagewithno visible abnormality.
Based on the preliminary success with control siRNA incorpora-tion, we proceeded to examine efficacy of ZO-1 siRNA in suppressionof ZO-1 protein expression and the process of morula to blastocysttransformation.
Deferred blastocyst formation from early 8-cell stage embryos inpresence of ZO-1 siRNA
Zona-weakened early 8-cell stage embryos were electroporatedwith custom made ZO-1 siRNA mixture (mixture of three siRNAcreated against mouse ZO-1 sequences) at three concentrations (0.4,0.8 and 1.2 μM). Following electroporation, embryos were initiallycultured in vitro for 2 h to examine their survival. As expected, weobserved that roughly 93% (90–95%) of these electroporated embryosin all groups showed no sign of noticeable degeneration under a stereomicroscope (Fig. 4A). Morphologically normal embryos were thencultured in vitro for an additional period of 24 h and theirdevelopmental stages were recorded at the end of the culture.
As shown in Fig. 4B, ZO-1 siRNA reduced the percentage ofblastocyst formation from 8-cell stage embryos after 24 h of culture ina dose-dependent manner. ZO-1 siRNA at 400–1200 nM concentra-tions significantly decreased the percentage of blastocyst formationcompared to control groups where 8-cell embryos were electro-porated with or without control siRNA. Almost 69–80% of 8-cellembryos reached the blastocyst stage in control groups in the absenceor presence of high concentration (1600 nM) of control siRNA. Underour culture conditions, the percentage of 8-cell embryos thatdeveloped into blastocyst in the control siRNA group (69%, 44/64)was slightly lower, but insignificant (pN0.05), compared to theelectroporation alone control group (80%, 45/56). In contrast, when8-cell embryos were electroporated with the lowest concentration
(400 nM) of ZO-1 siRNA, only 34% (19/56) of embryos developed intoblastocysts. The percentage of blastocyst formation further declinedwith the increase in concentrations of ZO-1 siRNA for electroporation;14% (8/56) at 800 nM and 4% (2/45) at 1200 nM (Fig. 4B). Most of theembryonic developmental arrest in ZO-1 siRNA-treated groupsoccurred at later than the 8-cell stage. Cell numbers of thesedevelopmentally arrested embryos were inversely linked with the

118 H. Wang et al. / Developmental Biology 318 (2008) 112–125
increasing concentrations of the ZO-1 siRNAs (Fig. 4C). Morulae thatdeveloped from 8-cell embryos in control groups without or withcontrol siRNAs had an average of 20–30 blastomeres (Fig. 4C). Incontrast, morulae formed in ZO-1 siRNA-treated groups had decreasednumber of blastomeres compared to control groups (Fig. 4C). Theaverage number of blastomeres in morulae formed in the ZO-1 siRNAelectroporated groups was approximately 21, 12 and 11, respectively,at 400, 800 and 1200 nM concentrations (Fig. 4C). These defects wereconsidered significant and reproducible. The embryonic develop-mental stages and their morphological appearances after 24 h ofculture in the presence or absence of control siRNA and variousconcentrations of ZO-1 siRNA are presented in Fig. 5. While most ofthese embryos in all groups lookmorphologically normal under visualinspection, a few embryos from highest concentration of ZO-1 siRNA(Fig. 5) showed some sign of degeneration.
Fig. 5. Electroporation (EP) of ZO-1 siRNA into 8-cell stage embryos perturbs the developmenare presented. The 8-cell stage embryos were electroporated with buffer [EP control] (a), c1200 nM (e).
ZO-1 siRNA down-regulates ZO-1, but not ZO-2, gene expression
To assess the efficiency of our approach that ZO-1 siRNAspecifically down regulates ZO-1 gene expression, we performedReal-time PCR to quantify ZO-1 and ZO-2 mRNA levels in ZO-1 siRNA-treated (400, 800 and 1200 nM) embryos. Control embryos wereelectroporated with a negative scrambled siRNA. As shown in Fig. 6,ZO-1 siRNA decreased ZO-1, but not ZO-2, mRNA levels compared tocontrol siRNA-treated group. The level of ZO-1 mRNA at the lowestconcentration of ZO-1 siRNA (400 nM) was not significantly differentfrom the control siRNA-treated group. However, significant (pb0.05)reduction in ZO-1 mRNA levels was observed at 800 nM and 1200 nMconcentrations of ZO-1 siRNA as compared to the control siRNA-treated group. No significant (pN0.05) change in ZO-2 gene expressionlevel was noticed among embryos electroporatedwith control or ZO-1
t of embryos. Photographs (20×) of representative embryos for each experimental groupontrol siRNA (b), and ZO-1 siRNA at three concentrations, 400 nM (c), 800 nM (d) and

Fig. 6. ZO1 siRNA inhibits ZO-1 gene expression but has no effect on ZO-2 expression.RNA was isolated from embryos treated with three concentrations of ZO-1 siRNA (400,800 and 1200 nM). Control embryos were treated with negative sequence siRNA. Geneexpression was measured by Real-time PCR, expressed as fold-change (mean±S. D.),and normalized to control. Control siRNA (ctrl) was used at only 1600 nM. Statisticalcomparisons were made using ANOVA and Tukeys post hoc analysis (*pb0.05, n=3).Dotted line indicates 100% of control.
119H. Wang et al. / Developmental Biology 318 (2008) 112–125
siRNAs. These results ensure the specific ZO-1 siRNA effects on ZO-1gene expression in embryos.
ZO-1 siRNA specifically suppresses ZO-1 protein expression in embryos
Analysis of ZO-1 expression by immunofluorescence showed thatZO-1 is strikingly suppressed in embryos 24 h after electroporationwith ZO-1 siRNA (Fig. 7A). The ZO-1 siRNA-treated embryos showedeither complete or partial loss of ZO-1 immunolabeling from thecell membrane (Fig. 7A). The morula stage embryos developed fromthe control siRNA-treated group showed clear circumferential ZO-1labeling (Figs. 7Aa and b). The morula stage embryos at lowestconcentration (400 nM) of ZO-1 siRNA showed either partial orcomplete loss of ZO-1 localization from the membrane (Figs. 7Ac andd). Embryos electroporated with 800 and 1200 nM ZO-1 siRNAshowed almost complete absence of ZO-1 immunolabeling from thecell surface [800 nM (Figs. 7Ae and f) and 1200 nM (Figs. 7Ag and h)].To confirm the specificity of ZO-1 knock down using these ZO-1siRNAs, we analyzed the distribution of E-cadherin proteins in someof these ZO-1 siRNA electroporated embryos at the same time point atwhich we observed ZO-1 knockdown. ZO-1 knockdown apparentlyhas no effect on E-cadherin expression (Fig. 7B). Membranous E-cadherin localization was observed in embryos obtained from alltreatment groups regardless of their developmental stages (Fig. 7B).In a separate study, we performed ZO-1 and E-cadherin doubleimmunofluorescence staining in the same embryos obtained from alltreatment groups. Individual and combined images of ZO-1 (green)and E-cadherin (red) double immunofluorescence staining are shownin Fig. 8. This analysis also revealed that while E-cadherinwas presentin morulae obtained from all treatment groups, ZO-1 was only ex-pressed in morulae obtained from control siRNA group. These resultsare not surprising since adherens junction formation does not dependon tight junction formation (Gumbiner et al., 1988).
In an additional set of experiments, we attempted to determine theeffects of ZO-1 downregulation on the expression and distribution ofZO-2, another tight junctional protein (Tsukita et al., 2001), F-actin, aconstituent of the cytoskeleton (Claessens et al., 2006), and twoknown transcription factors, Cdx2 and Oct-4, involved in lineagespecification in early embryos (Niwa et al., 2005). Immunolocalizationof ZO-2, F-actin, Cdx2 and Oct-4 in vivo grown morulae andblastocysts were shown in Figs. 9A, 10A and 11A, respectively.Membranous localization of ZO-2 (Fig. 9A) and F actin (Figs. 9A, 10Aand 11A) was observed in both the in vivo grown morula and
blastocyst stages. The majority, but not all, blastomeres of the morulashowed nuclear localization of Cdx2 (Fig. 10Aa). Unlike Cdx2, Oct-4(Fig.11Aa) stainingwas noted in nuclei of all blastomeres at themorulastage. While Cdx2 expression was largely observed in nuclei of theoutside blastomeres (Fig. 10Ad), Oct-4 was mainly expressed in nucleiof blastomeres of ICM, at the blastocyst stage (Fig. 11Ad). However, afew nuclei of trophoblast cells of the blastocyst still showed the lowlevel of Oct-4 expressions (Fig. 11Ad). These expression patterns ofCdx2 and Oct-4 are consistent with the previous argument that thesetwo transcription factors play a major role in the segregation of twocell lineages, the ICM and TE, during blastocyst formation (Niwa et al.,2005). We considered that downregulation of ZO-1 expression couldeffect the expression of Cdx2 and Oct-4, but not ZO-2 and F-actin. Weused only the morula stage embryos from control siRNA and twodosages of ZO-1 siRNA electroporated groups since it was not possibleto obtain blastocysts after electroporation of ZO-1 siRNAs. In controlelectroporation group, we noted normal expression of ZO-2 (Figs. 9Baand c), F-actin (Figs. 9Bb and c, 10Bb and c and 11Bb and c), Cdx2 (Figs.10Ba and c) and Oct-4 (Figs. 11Ba and c) in morulae. Likewise, weobserved no change in the pattern of ZO-2 (Figs. 9Bd and f) and F-actin(Figs. 9Be and f,10Be and f and 11Be and f) localization in control siRNAelectroporated group. In contrast, while ZO-2 expression (Figs. 9Bgand i) showed no change, the expression of Cdx2 (Figs. 10Bg and i) andOct-4 (Figs. 11Bg and i) was considerably reduced in morulae obtainedfrom the lowest dose of ZO-1 siRNA electroporated group. Thesefindings provide evidence that inhibition of ZO-1 expression does notinfluence ZO-2 and F-actin expression and distribution, but decreasesCdx2 and Oct-4 protein expression.
When a few of these morulae from all groups were cultured for anadditional 24 h (a total period of 48 h), all embryos in control groupsreached the blastocyst stage while a few of the morula stage embryosshowed blastocoel formation in lower doses (400 nM) of ZO-1 siRNA.The embryos treated with highest concentrations underwent degen-eration by 48 h (data not presented).
Discussion
The current study was initiated to investigate the presumedinvolvement of ZO-1 in the process of 8-cell stage to blastocystformation. Given the first observed membranous localization of ZO-1in the 8-cell stage embryos and onwards, ZO-1 associated tightjunction formation is considered to be important for blastocystformation. Our results of ZO-1 knockdown and reduction in blastocystformation by ZO-1 siRNA revealed an important role of ZO-1 ininitiating blastocyst formation from the morula.
Based on the information accumulated over the years, it isreasonably clear that gradual formation of first adherens and nexttight junctions in the outside cells of the morula help to form thetrophectoderm layer and retention of fluid inside the embryo. Thus,inhibition of one of these phenomena should inhibit blastocystformation. Indeed, E-cadherin knockout embryos fail to develop pastthe morula stage (Larue et al., 1994; Ohsugi et al., 1997). However, theactual role of E-cadherin in early stages of embryonic developmentstill remained unknown in this model because of residual maternaltranscripts in embryos (Larue et al., 1994). Thus, we wonderedwhether tight junction formation in outside cells of the morula isimportant for the formation of the trophectoderm and blastocoel. Toaddress this issue we electroporated early 8-cell stage embryos withZO-1 siRNAs to silence ZO-1 expression in later developmental stages.We found that suppression of ZO-1 did not prevent 8-cell embryosfrom undergoing compaction. However, the majority of thesecompacted embryos did not reach the blastocyst stage by 24 h. Onlya few embryos in lower dose reached the blastocyst stage with a smallblastocoel. The developmental potential of each embryo appeared tocorrelate with the expression pattern of ZO-1. A small percentage ofembryos that had weak expression for ZO-1 may be showing retarded

Fig. 7. A)Electroporationof ZO-1 siRNAat the8-cell stage embryoeffectively suppresses ZO-1expression fromthemorula stage embryos. Photographs (40×) of two representative embryos foreach experimental group are presented. All images are representative of at least three experiments. The nuclei were stained with DAPI. a and b, morula from control siRNA group; c and d;morulae from 400 nM ZO-1 siRNA group; e and f; morulae from 800 nMZO-1 siRNA group; g and h,morulae from 1200 nMZO-1 siRNA group. B) Electroporation of ZO-1 siRNA at the 8-cellstage embryo didnot perturb E-cadherin expression from themorula stage embryos. Photographs (40×) of two representative embryos for each experimental group are presented. All imagesare representative of at least three experiments. The nuclei were stained with DAPI. a and b, morula from control siRNA group; c and d; morulae from 400 nM ZO-1 siRNA group; e and f;morulae from 800 nM ZO-1 siRNA group; g and h, morulae from 1200 nM ZO-1 siRNA group.
120 H. Wang et al. / Developmental Biology 318 (2008) 112–125
development and will reach to the blastocyst stage upon furtherculture. However, this study does not provide information how longsiRNA effects can persist. In this regard, it has been demonstrated thatgene silencing by this method in mouse embryos can persist forseveral days (Soares et al., 2005). This effect of ZO-1 siRNAs was alsospecific since suppression of ZO-1 did not disturb ZO-2 mRNAexpression and the localization of E-cadherin, ZO-2 and F-actinproteins in these embryos. In addition, our study also indicates that inthe absence of ZO-1, E-cadherin and ZO-2 might support 8-cell stageembryos to reach to the compaction stage. If this is the case, it can bespeculated that ZO-1 has its own function in the window of morula toblastocyst formation. Since ZO-3 knock outmice are normal and fertile(Adachi et al., 2006) and ZO-2 knock out embryos die shortly afterimplantation due to an arrest in early gastrulation (Xu et al., 2008),ZO-2 and ZO-3 functions in blastocyst formation are dispensable.However, the function of ZO-1 is unknown at this stage. Our results,however, suggest that loss-of-function of ZO-1 resulted in decreasedexpression of Cdx2 and Oct-4. In this regard, it has been demonstratedthat an interaction between Cdx2 and Oct3/4 determines the first
differentiation event of mammalian development (Niwa et al., 2005).Collectively, the results suggest that one cause of failure or delay inmorula to blastocyst transformation in ZO-1 siRNA electroporatedembryos is decreased expression of lineage specific genes Cdx2 andOct-4.
This work shows a possible role of ZO-1 in blastocyst formationbut it needs to be placed in context with previous studies in embryosas well as in various epithelial cell lines. It has been demonstrated inepithelial cell lines that TJ formation was delayed but not abolishedwhen ZO-1 was knocked down or abolished (Umeda et al., 2006).However, suppression of ZO-2 in ZO-1 and ZO-3-deficient cellssuccessfully stopped TJ formation (Umeda et al., 2006). Since ZO-3 isnot required for TJ formation (Adachi et al., 2006; Umeda et al.,2006) and possibly not redundant with ZO-1 and/or ZO-2 (Itoh et al.,1999), the question remains as to the redundancy of ZO-1 and ZO-2.In this regard, Umeda and coworkers (2006) showed that ZO-1 andZO-2 appear to be functionally redundant but they can alsoindependently determine whether and where claudins are polymer-ized. In our study, we only suppressed ZO-1 expression but not ZO-2.
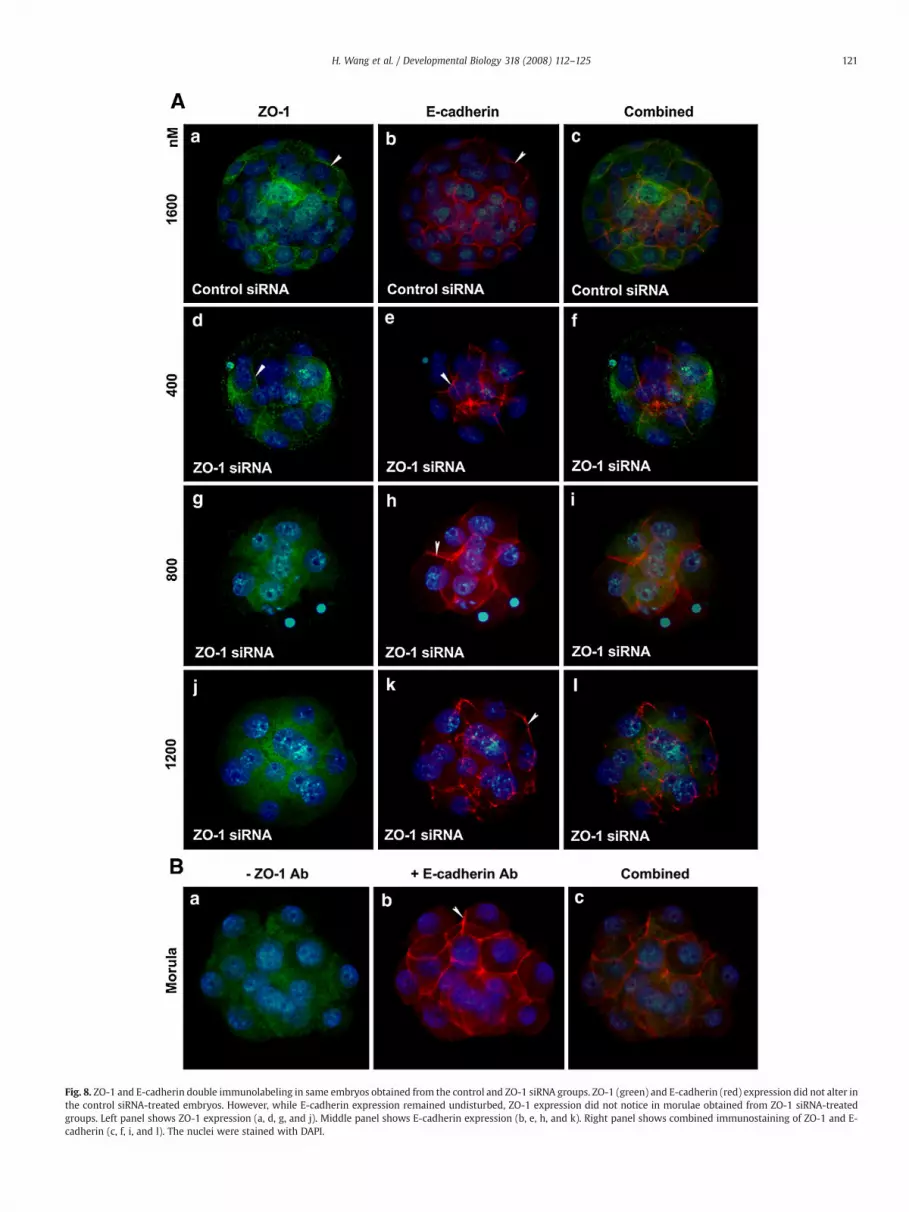
Fig. 8. ZO-1 and E-cadherin double immunolabeling in same embryos obtained from the control and ZO-1 siRNA groups. ZO-1 (green) and E-cadherin (red) expression did not alter inthe control siRNA-treated embryos. However, while E-cadherin expression remained undisturbed, ZO-1 expression did not notice in morulae obtained from ZO-1 siRNA-treatedgroups. Left panel shows ZO-1 expression (a, d, g, and j). Middle panel shows E-cadherin expression (b, e, h, and k). Right panel shows combined immunostaining of ZO-1 and E-cadherin (c, f, i, and l). The nuclei were stained with DAPI.
121H. Wang et al. / Developmental Biology 318 (2008) 112–125

Fig. 9. Immunolocalization of ZO-2 (green) and F-actin (red) in the same morula and blastocyst stage embryos. A) Morulae and blastocysts were freshly collected from thereproductive tracts on days 3 and 4 of pregnancy. B) Morulae were obtained after electroporation of controls and one dosage of ZO-1 siRNAs. The nuclei were stained with DAPI.Membranous localization of these proteins is indicated with arrow head. TE, Trophectoderm; ICM, Inner Cell Mass.
122 H. Wang et al. / Developmental Biology 318 (2008) 112–125

Fig. 10. Immunolocalization of Cdx2 (green) and F-actin (red) in the same morula and blastocyst stage embryos. A) Morulae and blastocysts were freshly collected from thereproductive tracts on days 3 and 4 of pregnancy. B) Morulae were obtained after electroporation of control and one dosage of ZO-1 siRNAs. The nuclei were stained with DAPI.Membranous localization of these proteins is indicated with arrow head. TE, Trophectoderm; ICM, Inner Cell Mass.
123H. Wang et al. / Developmental Biology 318 (2008) 112–125

Fig. 11. Immunolocalization of Oct-4 (green) and F-actin (red) in the same morula and blastocyst stage embryos. A) Morulae and blastocysts were freshly collected from thereproductive tracts on days 3 and 4 of pregnancy. B) Morulae were obtained after electroporation of control and one dosage of ZO-1 siRNAs. The nuclei were stained with DAPI.Localization of these proteins is indicated with arrow head. TE, Trophectoderm; ICM, Inner Cell Mass.
124 H. Wang et al. / Developmental Biology 318 (2008) 112–125

125H. Wang et al. / Developmental Biology 318 (2008) 112–125
However, we know that occludin first assembles in the outer cells ofthe late morula when both ZO-1 and ZO-2 are present (Sheth et al.,2000). This suggests that the occludin/ZO-1 or ZO-2 complexes mayplay an important role in TJ formation in outer cells of the morula.Since the absence of occludin (Saitou et al., 2000), some of claudins(Furuse et al., 2002; Nitta et al., 2003; Gow et al., 2004), ZO-2 (Xu etal., 2008) and ZO-3 (Adachi et al., 2006; Xu et al., 2008) does notaffect blastocyst formation, single knockout of ZO-1 or knockout ofZO-1 and ZO-2 in combination will be required to understand thedefinitive role of these TJ proteins in embryo development andblastocyst formation. In this regard a recent study (Madan et al.,2007) has demonstrated that blockage of Na/K-ATPase α1 subunitexpression by microinjecting fertilized 1-cell stage embryos with Na/K-ATPase β1 siRNA resulted in inhibition of morula to blastocystformation by inhibiting Na/K-ATPase β1 protein expression togetherwith aberrant expression of Na/K-ATPase α1 and tight junctionproteins, ZO-1 and occludin.
The current study is the first to assign a function of ZO-1 in theprocess of morula to blastocyst conversion. Disruption of ZO-1-mediated tight junction formation leads to arrest of embryonicdevelopment at the morula stage without further differentiation ofoutside and inside cells to the trophectoderm and inner cell mass. Ithas been well established that construction of an epithelial layer firstrequires the formation of cadherin-based adherens junctions thathelps to build later tight junctions (Gumbiner et al., 1988). These twojunctional networks jointly regulate the strength of adhesion betweencells permitting epithelia to meet the functional needs of the tissue.Our study demonstrates that in the absence of ZO-1, E-cadherin-basedjunctions do not provide enough support to the outer cells of themorula to initiate fluid accumulation inside the embryo.
Acknowledgments
The support of the National Cooperative Program on Trophoblast–Maternal Tissue Interactions is gratefully acknowledged. This workwas supported by the National Institutes of Health grants UO-1HD042636 and HD044741 (to BCP).Wewould like to thank Dr. Mark R.Frey for his help in optical sectioning of embryos.
References
Adachi, M., Inoko, A., Hata, M., Furuse, K., Umeda, K., Itoh, M., Tsukita, S., 2006. Normalestablishment of epithelial tight junctions in mice and cultured cells lackingexpression of ZO-3, a tight-junction MAGUK protein. Mol. Cell. Biol. 26,9003–9015.
Benjamin, J.T., Smith, R.J., Halloran, B.A., Day, T.J., Kelly, D.R., Prince, L.S., 2007. FGF-10 isdecreased in bronchopulmonary dysplasia and suppressed by Toll-like receptoractivation. Am. J. Physiol., Cell Mol. Physiol. 292, L550–L558.
Cheong, H.T., Taniguchi, T., Hishinuma, M., Takahashi, Y., Kanagawa, H., 1991. Effects ofvarious electric fields on the fusion and in vitro development of mouse two-cellembryos. Theriogenology 36, 875–885.
Claessens, M.M., Bathe, M., Frey, E., Bausch, A.R., 2006. Actin-binding proteinssensitively mediate F-actin bundle stiffness. Nat. Mater. 5, 748–753.
Farquhar, M.G., Palade, G.E., 1963. Junctional complexes in various epithelia. J. Cell Biol.17, 375–412.
Fleming, T.P., McConnell, J., Johnson, M.H., Stevenson, B.R., 1989. Development of tightjunctions de novo in the mouse early embryos: control of assembly of the tightjunction-specific protein, ZO-1. J. Cell Biol. 108, 1407–1418.
Fleming, T.P., Sheth, B., Fesenko, I., 2001. Cell adhesion in the preimplantationmammalian embryo and its role in trophectoderm differentiation and blastocystmorphogenesis. Front. Biosci. 6, 1000–1007.
Furuse, M., Hata, M., Furuse, K., Yoshida, Y., Haratake, A., Sugitani, Y., Noda, T., Kubo, A.,Tsukita, S., 2002. Claudin-based tight junctions are crucial for the mammalian
epidermal barrier: a lesson from claudin-1-deficient mice. J. Cell Biol. 156,1099–1111.
Grabarek, J.B., Plusa, B., Glover, D.M., Zernicka-Goetz, M., 2002. Efficient delivery ofdsRNA into zona-encased mouse oocytes and preimplantation embryos byelectroporation. Genesis 32, 269–276.
Gow, A., Davies, C., Southwood, C.M., Frolenkov, G., Chrustowski, M., Ng, L., Yamauchi, D.,Marcus, D.C., Kachar, B., 2004. Deafness in Claudin-11-null mice reveals the criticalcontribution of basal cell tight junctions to stria vascularis function. J. Neurosci. 24,7051–7062.
Gumbiner, B., Stevenson, B., Grimaldi, A., 1988. The role of the cell adhesion moleculeuvomorulin in the formation andmaintenance of the epithelial junctional complex.J. Cell Biol. 107, 1575–1587.
Hannon, G.J., 2002. RNA interference. Nature 418, 494–498.Haraguchi, S., Saga, Y., Naito, K., Inoue, H., Seto, A., 2004. Specific gene silencing in the
preimplantation stage mouse embryo by an siRNA expression vector system. Mol.Reprod. Dev. 68, 17–24.
Itoh, M., Furuse, M., Morita, K., Kubota, K., Saitou, M., Tsukita, S., 1999. Direct binding ofthree tight junction-associated MAGUKs, ZO-1, ZO-2 and ZO-3 with the COOHtermini of claudins. J. Cell Biol. 147, 1351–1363.
Johnson, M.H., McConnell, J.M.L., 2004. Lineage allocation and cell polarity duringmouse embryogenesis. Sem. Cell Dev. Biol. 15, 583–597.
Larue, L., Ohsugi, M., Hirchenhain, J., Kemler, R., 1994. E-cadherin null mutant embryosfail to form a trophectoderm epithelium. Proc. Natl. Acad. Sci. U. S. A. 91, 8263–8267.
Lawitts, J.A., Biggers, J.D., 1991. Optimization of mouse embryo culture media usingsimplex methods. J. Reprod. Fertil. 91, 543–556.
Madan, P., Rose, K., Watson, A.J., 2007. Na/K-ATPase β1 subunit expression is requiredfor blastocyst formation and normal assembly of trophectoderm tight junction-associated proteins. J. Biol. Chem. 282, 12127–12134.
Mamo, S., Gal, A.B., Bodo, S., Dinnyes, A., 2007. Quantitative evaluation and selection ofreference genes in mouse oocytes and embryos cultured in vivo and in vitro. BMCDev. Biol. 7, 14.
Nitta, T., Hata, M., Gotoh, S., Seo, Y., Sasak, H., Hashimoto, N., Furuse, M., Tsukita, S., 2003.Size-selective loosening of the blood–brain barrier in claudin-5-deficient mice. J.Cell Biol. 161, 653–660.
Niwa, H., Toyooka, Y., Shimosato, D., Strumpf, D., Takahashi, K., Yagi, R., Rossant, J., 2005.Interaction between Oct3/4 and Cdx2 determines trophectoderm differentiation.Cell 123, 917–929.
Ohsugi, M., Larue, L., Schwartz, H., Kemler, R., 1997. Cell-junction and cytoskeletalorganization in mouse blastocysts lacking E-cadherin. Dev. Biol. 185, 261–271.
Paria, B.C., Dey, S.K., 1990. Preimplantation embryo development in vitro: cooperativeinteractions among embryo and role of growth factors. Proc. Natl. Acad. Sci. U. S. A.87, 4756–4760.
Paria, B.C., Das, S.K., Andrews, G.K., Dey, S.K., 1993. Expression of epidermal growthfactor receptor gene is regulated in the blastocyst during delayed implantation inthe mouse. Proc. Natl. Acad. Sci. U. S. A. 90, 55–59.
Saitou, M., Furuse, M., Sasaki, H., Schulzke, J., Fromm,M., Takano, H., Noda, T., Tsukita, S.,2000. Complex phenotype of mice lacking occludin, a component of tight junctionstrands. Mol. Biol. Cell 11, 4131–4142.
Sharp, P.A., 2001. RNA interference—2001. Genes Dev. 15, 485–490.Sheth, B., Fesenko, I., Collins, J.E., Moran, B., Wild, A.E., Anderson, J.M., Fleming, T.P., 1997.
Tight junction assembly during mouse blastocyst formation is regulated by lateexpression of ZO-1 α+ isoform. Development 124, 2027–2037.
Sheth, B., Moran, B., Anderson, J.M., Fleming, T.P., 2000. Post-translational control ofoccludin membrane assembly in mouse trophectoderm: a mechanism to regulatetiming of tight junction biogenesis and blastocyst formation. Development 127,831–840.
Soares, M.L., Haraguchi, S., Torres-Padilla, M., Kalmar, T., Carpenter, L., Bell, G., Morrison,A., Ring, C.A., Clarke, N.J., Glover, D.M., Zernicka-Goetz, M., 2005. Functional studiesof signaling pathways in peri-implantation development of the mouse embryo byRNAi. BMC Dev. Biol. 5, 28–37.
Tsukita, S., Furuse, M., Itoh, M., 2001. Multifunctional strands in tight junctions. Nat.Rev., Mol. Cell. Biol. 2, 285–293.
Umeda, K., Ikenouchi, J., Katahira-Tayama, S., Furuse, K., Sasaki, H., Nakayama, M.,Matsui, T., Tsukita, S., Furuse, M., Tsukita, S., 2006. ZO-1 and ZO-2 independentlydetermine where claudins are polymerized in tight-junction strand formation. Cell126, 741–754.
Wianny, F., Zernicka-Goetz, M., 2000. Specific interference with gene function bydouble-stranded RNA in early mouse development. Nat. Cell Biol. 2, 70–75.
Xu, J., Jaya Kausalya, P., Phua, D.C.Y., Ali, S.M., Hossain, Z., Hunziker, W., 2008. Earlyembryonic lethality of mice lacking ZO-2, but not ZO-3, reveals critical and non-redundant roles for individual ZO proteins in mammalian development. Mol. Cell.Biol. 28, 1669–1678.
Yamanaka, Y., Raiston, A., Stephenson, R.O., Rossant, J., 2006. Cell and molecularregulation of the mouse blastocyst. Dev. Dyn. 235, 2301–2314.
Ziomek, C.A., Johnson, M.H., 1980. Cell surface interactions induce polarization of mouse8-cell blastomeres at compaction. Cell 21, 935–942.


