Embed Size (px)
Citation preview
1-1
***
1-1McGraw-Hill/IrwinUnderstanding Business, 8e © 2008 The McGraw-Hill Companies, Inc., All Rights
Reserved.
Nickels McHugh McHughNickels McHugh McHugh
**
1
CH
AP
TE
R*
* *
Managing Managing Within The Within The Dynamic Dynamic Business Business
Environment: Environment: Taking Risks Taking Risks and Making and Making
ProfitsProfits
1-2
***
Learning goalsLearning goals• DDescribe the relationship of business’s profit to risk assumption escribe the relationship of business’s profit to risk assumption
and discuss how business and nonprofit organizations add to the and discuss how business and nonprofit organizations add to the standard of living and quality of life for all.standard of living and quality of life for all.
• EExplain the importance of entrepreneurship to the wealth of an xplain the importance of entrepreneurship to the wealth of an economy.economy.
• EExamine how the economic environment and taxes affect xamine how the economic environment and taxes affect businesses.businesses.
• IIllustrate how the technological environment has affected llustrate how the technological environment has affected businesses.businesses.
• IIdentify various ways in which businesses can meet and beat dentify various ways in which businesses can meet and beat competition.competition.
• DDemonstrate how the social environment has changed and tell emonstrate how the social environment has changed and tell what the reaction of the business community has been.what the reaction of the business community has been.
• AAnalyze what businesses must do to meet the global challenge, nalyze what businesses must do to meet the global challenge, which includes war and terrorism.which includes war and terrorism.
• RReview how trends from the past are being repeated in the eview how trends from the past are being repeated in the present and what such trends will mean for tomorrow’s college present and what such trends will mean for tomorrow’s college graduate.graduate.
1-3
***
Business & EntrepreneurshipBusiness & Entrepreneurship• BusinessBusiness
• ProfitProfit
• EntrepreneurEntrepreneur
• Match Risk With ProfitMatch Risk With Profit• RevenueRevenue
• LossLoss
• Standard of Living/Quality Standard of Living/Quality of Lifeof Life
• StakeholdersStakeholders
• Nonprofit OrganizationsNonprofit Organizations
1-4
***
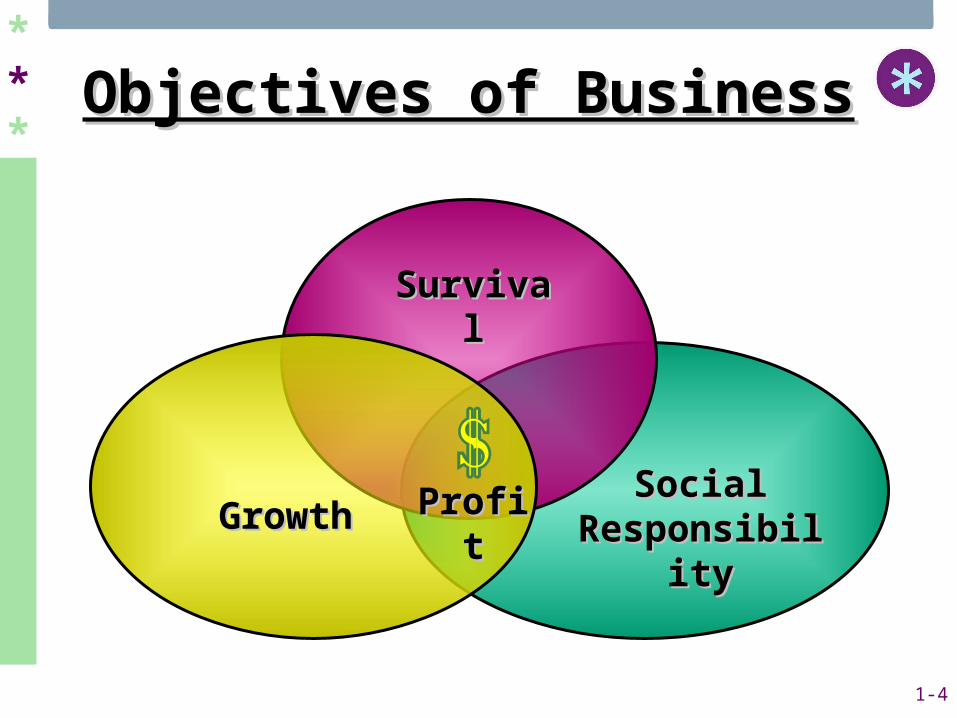
Objectives of BusinessObjectives of Business
SurvivalSurvival
GrowthGrowthSocial Social
ResponsibilityResponsibilityProfitProfit
1-5
***
Creating Wealth:Creating Wealth:Factors of ProductionFactors of Production
• LandLand
• LaborLabor
• CapitalCapital
• EntrepreneurshipEntrepreneurship
• KnowledgeKnowledge
1-6
***
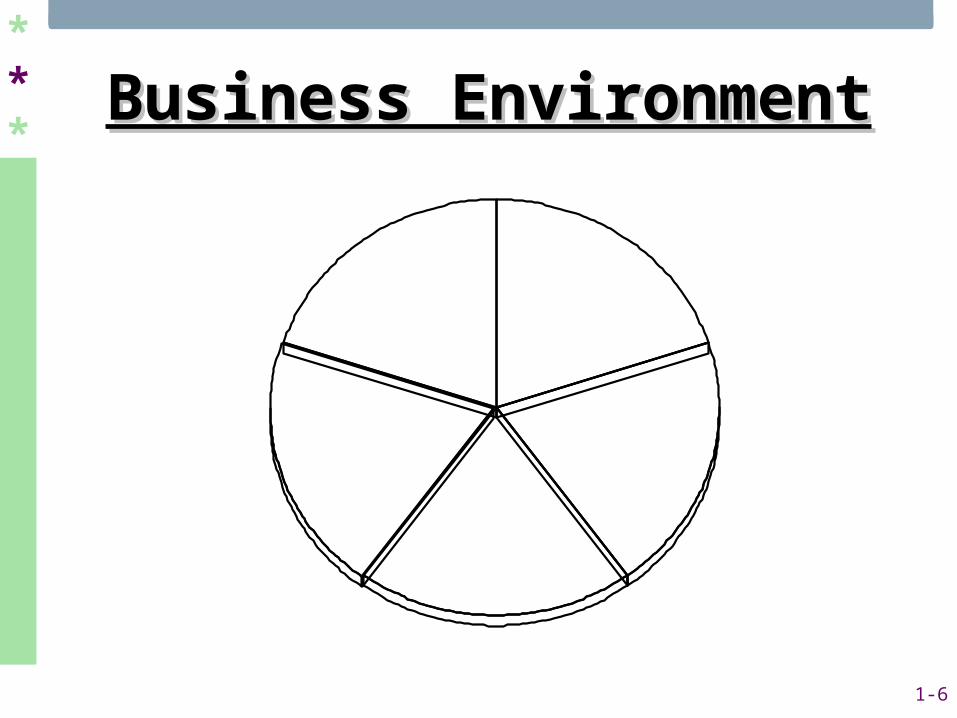
Business EnvironmentBusiness Environment
Global Business
Social
Competitive
Technology
Economic & Legal
1-7
***
Economic &Economic & Legal EnvironmentLegal Environment
$Minimum taxes and regulationsMinimum taxes and regulations
$Freedom of ownershipFreedom of ownership
$Contract lawsContract laws
$Tradable currencyTradable currency
$Elimination/minimization of Elimination/minimization of
corruptioncorruption
1-8
***
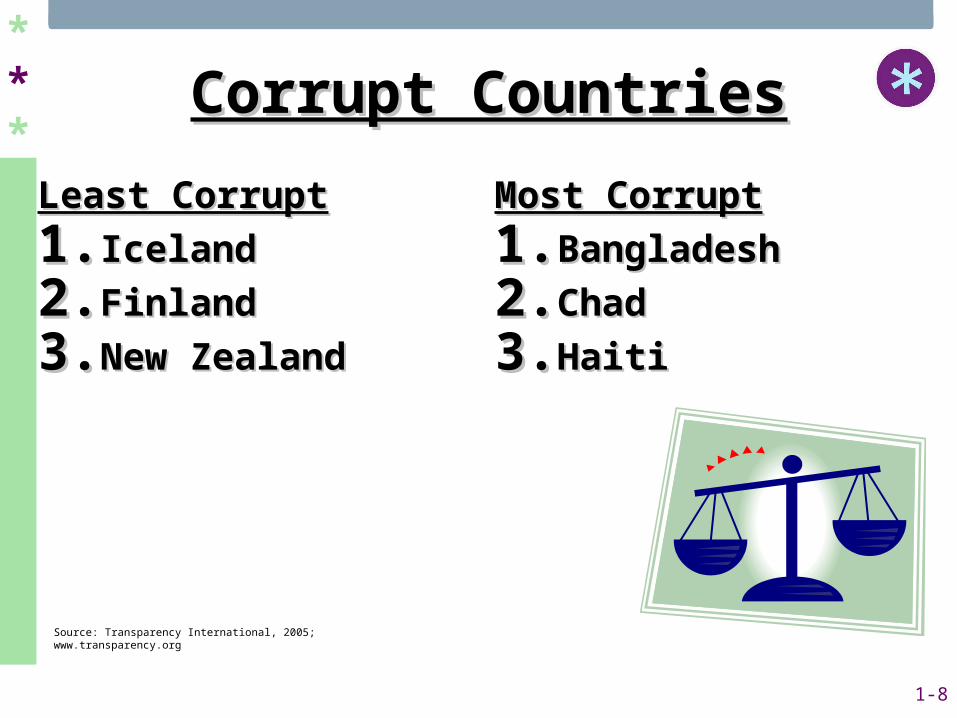
Corrupt CountriesCorrupt Countries
Least CorruptLeast Corrupt
1.1. IcelandIceland
2.2. FinlandFinland
3.3. New ZealandNew Zealand
Most CorruptMost Corrupt
1.1. BangladeshBangladesh
2.2. ChadChad
3.3. HaitiHaiti
Source: Transparency International, 2005; www.transparency.org
1-9
***
• ProductivityProductivity
• E-CommerceE-Commerce
• Responsiveness Responsiveness to Customerto Customer
Technological Environment Technological Environment
1-10
***
Identity TheftIdentity Theft
• Total number of identity theft Total number of identity theft victims in 2005 – 255,565victims in 2005 – 255,565
• Top four ways how victims Top four ways how victims information was misused:information was misused:1.1. Credit card fraudCredit card fraud
2.2. Phone/utilities fraudPhone/utilities fraud
3.3. Bank fraudBank fraud
4.4. Employment-related fraudEmployment-related fraudSource: Identity Theft: Victim Complaint Data, 2005, Federal Trade Commission; www.consumer.gov/idtheft

1-11
***
ID Theft—Protective StepsID Theft—Protective Steps
• ““Focus on the cheap and easy way Focus on the cheap and easy way to keep an eye on your accounts”to keep an eye on your accounts”• Free Credit ReportsFree Credit Reports
• Guard Your NumberGuard Your Number
• Shred Shred
• Bug CongressBug Congress To pass ultimate protection: A credit To pass ultimate protection: A credit
freeze anytime you want one. freeze anytime you want one.
Source: Money, August 2005
1-12
***
Competitive EnvironmentCompetitive Environment
• Customer Customer ExpectationsExpectations
• Restructure/EmpowerRestructure/Empower
1-13
***
• U.S. Bottled Water Sales in Past 15 U.S. Bottled Water Sales in Past 15 Years Increased more than four-fold Years Increased more than four-fold to $9.8 Billionto $9.8 Billion
• From October 2004 to September From October 2004 to September 2005, top bottle water flavors were:2005, top bottle water flavors were:
Blend, Lemon, Lime, and AppleBlend, Lemon, Lime, and Apple
Consumer TrendsConsumer Trends
Source: Business & Economic Review, Jan.-Mar. 2002; Beverage Marketing Corporation, bottledwater.org, 2004 stats; Productscan Online; datamonitor.com, November 9, 2005
1-14
*** Social EnvironmentSocial Environment
• Diversity/MulticulturalDiversity/Multicultural
• Aging/Graying of Aging/Graying of
AmericaAmerica
• Two-Income FamiliesTwo-Income Families
• Single-Parent FamiliesSingle-Parent Families
1-15
***
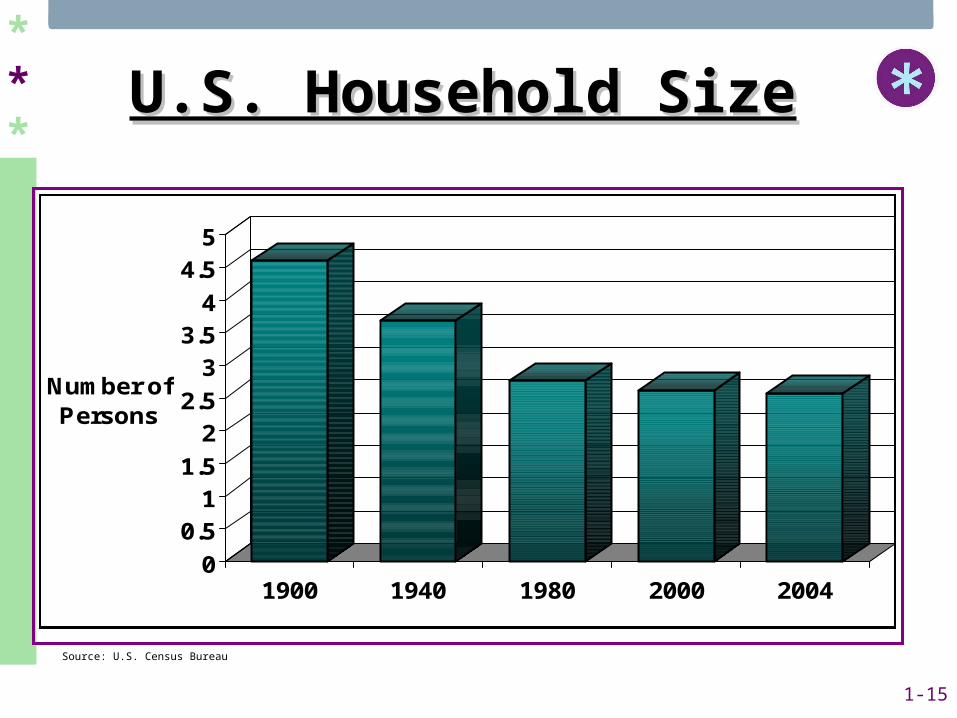
U.S. Household SizeU.S. Household Size
0
0.5
1
1.5
2
2.5
3
3.5
4
4.5
5
Number of Persons
1900 1940 1980 2000 2004
Source: U.S. Census Bureau
1-16
***
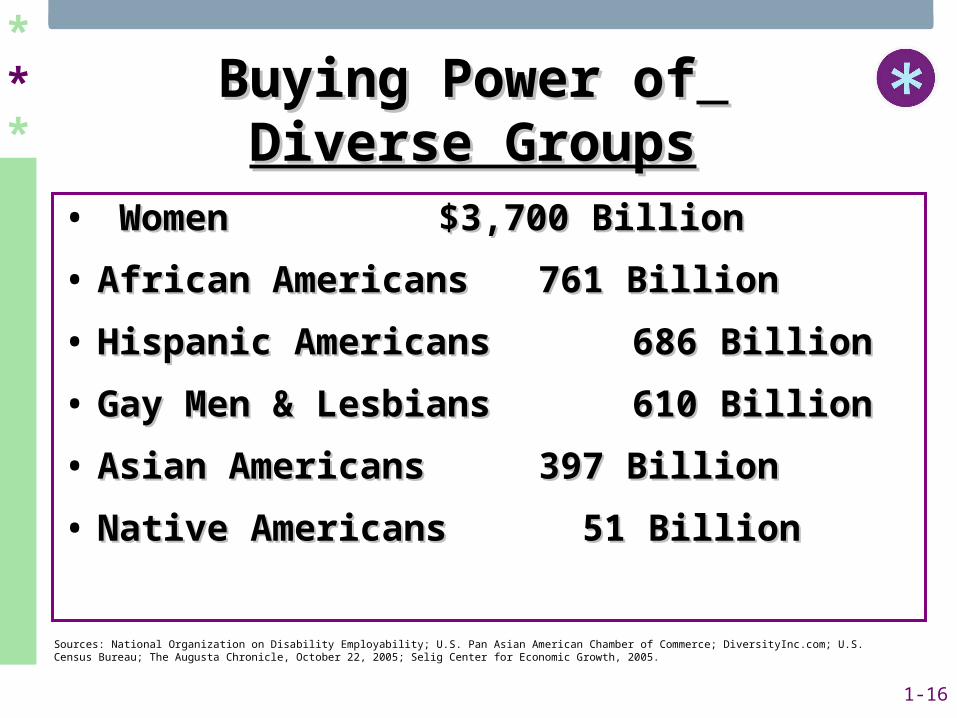
Buying Power ofBuying Power of Diverse GroupsDiverse Groups
Sources: National Organization on Disability Employability; U.S. Pan Asian American Chamber of Commerce; DiversityInc.com; U.S. Census Bureau; The Augusta Chronicle, October 22, 2005; Selig Center for Economic Growth, 2005.
• WomenWomen $3,700 Billion $3,700 Billion
• African AmericansAfrican Americans 761 Billion 761 Billion
• Hispanic AmericansHispanic Americans 686 Billion 686 Billion
• Gay Men & LesbiansGay Men & Lesbians 610 Billion 610 Billion
• Asian AmericansAsian Americans 397 Billion 397 Billion
• Native AmericansNative Americans 51 Billion 51 Billion
1-17
***
2121stst Century Century Diversity IssuesDiversity Issues
• RaceRace
• GenderGender
• EthnicityEthnicity
• DisabilityDisability
• AgeAge
• LanguageLanguage
• ReligionReligion
• SexualSexual OrientationOrientation
Source: U.S. Equal Employment Opportunity Commission
1-18
***
ImmigrationImmigration• In 2005, roughly 35 million immigrants In 2005, roughly 35 million immigrants
lived in the U.S. as compared to less lived in the U.S. as compared to less than 25 million 10 years ago.than 25 million 10 years ago.
• According to a November 2005 poll, According to a November 2005 poll, 60 percent of Americans favor a 60 percent of Americans favor a barrier built along the US-Mexico barrier built along the US-Mexico Border.Border.
• About 49 percent believe that a child About 49 percent believe that a child born to an illegal alien in the U.S. born to an illegal alien in the U.S. should be granted a US citizenshipshould be granted a US citizenship
Source: Center for Immigration Studies; RasmussenReports.com
***
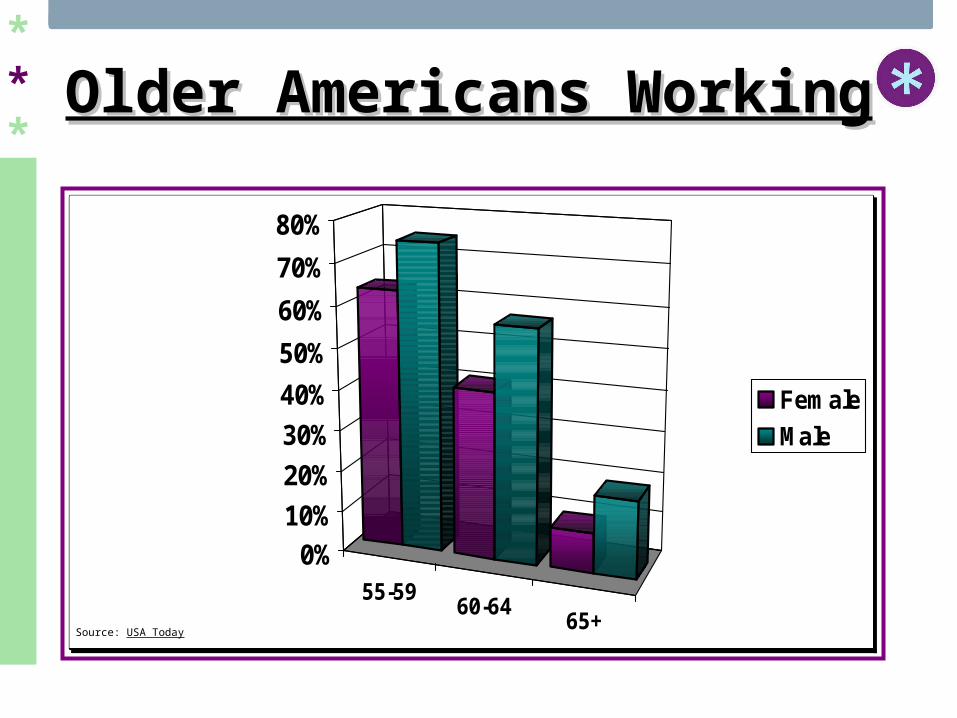
Older Americans WorkingOlder Americans Working
55-5960-64
65+
0%10%
20%
30%
40%
50%
60%
70%
80%
Female
Male
Source: USA Today
1-20
***
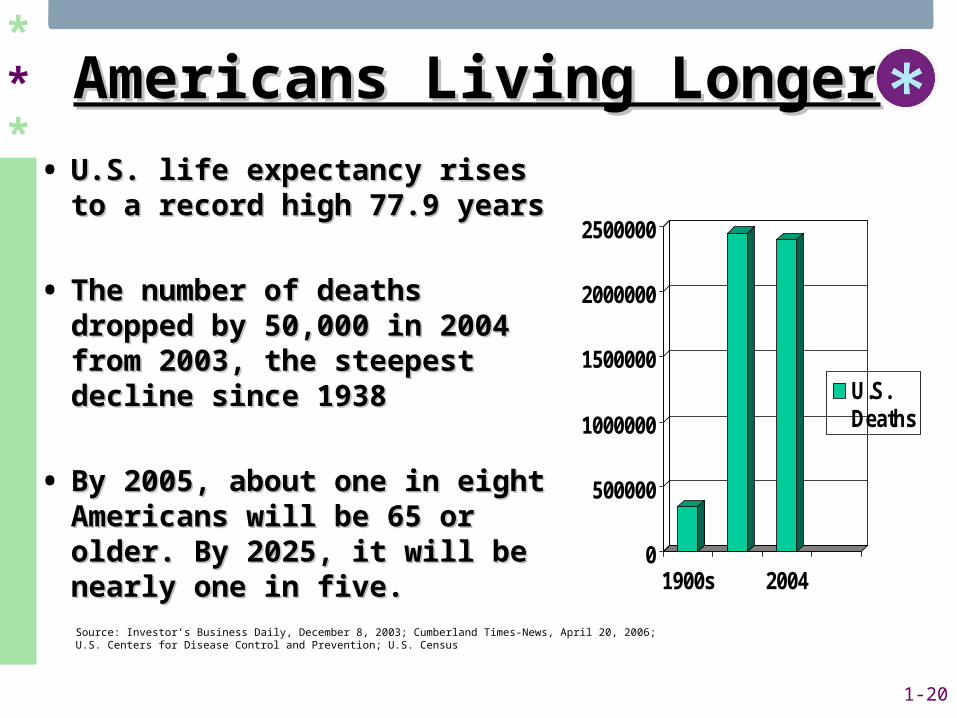
Americans Living LongerAmericans Living Longer
• U.S. life expectancy rises to a U.S. life expectancy rises to a record high 77.9 yearsrecord high 77.9 years
• The number of deaths dropped The number of deaths dropped by 50,000 in 2004 from 2003, by 50,000 in 2004 from 2003, the steepest decline since 1938the steepest decline since 1938
• By 2005, about one in eight By 2005, about one in eight Americans will be 65 or older. Americans will be 65 or older. By 2025, it will be nearly one in By 2025, it will be nearly one in five.five.
0
500000
1000000
1500000
2000000
2500000
1900s 2004
U.S.Deaths
Source: Investor’s Business Daily, December 8, 2003; Cumberland Times-News, April 20, 2006; U.S. Centers for Disease Control and Prevention; U.S. Census
1-21
***
Exurbs: Exurbs: Growth of Outer SuburbsGrowth of Outer Suburbs
• Northeasterners are moving south and Northeasterners are moving south and west, and west coast residents are west, and west coast residents are moving inland.moving inland.
• The states that gained the most The states that gained the most residents: Florida, Arizona, Nevadaresidents: Florida, Arizona, Nevada
• The states that lost the most residents: The states that lost the most residents: New York, California, IllinoisNew York, California, Illinois
Source: Cumberland Times-News, April 21, 2006; U.S. Census Bureau
1-22
***
Global EnvironmentGlobal Environment
• International Competition and Free TradeInternational Competition and Free Trade
• Improvements in Transportation Improvements in Transportation and Communicationand Communication
• War & TerrorismWar & Terrorism
• Global ChangesGlobal Changes
1-23
***
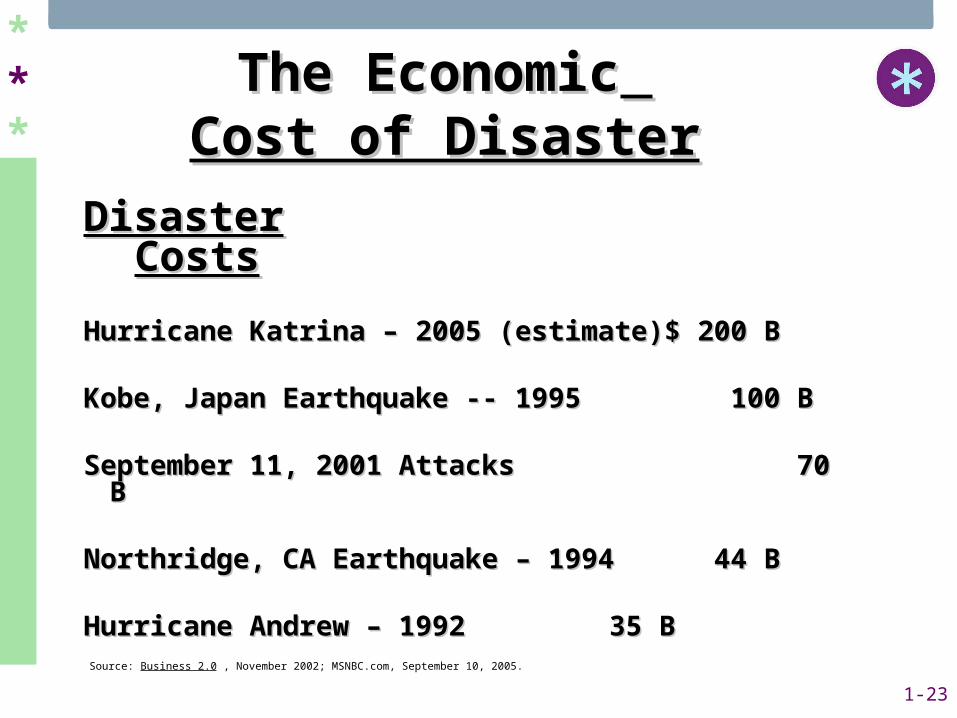
DisasterDisaster CostsCosts
Hurricane Katrina – 2005 (estimate)$ 200 B Hurricane Katrina – 2005 (estimate)$ 200 B
Kobe, Japan Earthquake -- 1995 100 BKobe, Japan Earthquake -- 1995 100 B
September 11, 2001 Attacks 70 BSeptember 11, 2001 Attacks 70 B Northridge, CA Earthquake – 1994 44 BNorthridge, CA Earthquake – 1994 44 B
Hurricane Andrew – 1992Hurricane Andrew – 1992 35 B 35 B
The EconomicThe Economic Cost of DisasterCost of Disaster
Source: Business 2.0 , November 2002; MSNBC.com, September 10, 2005.
1-24
***
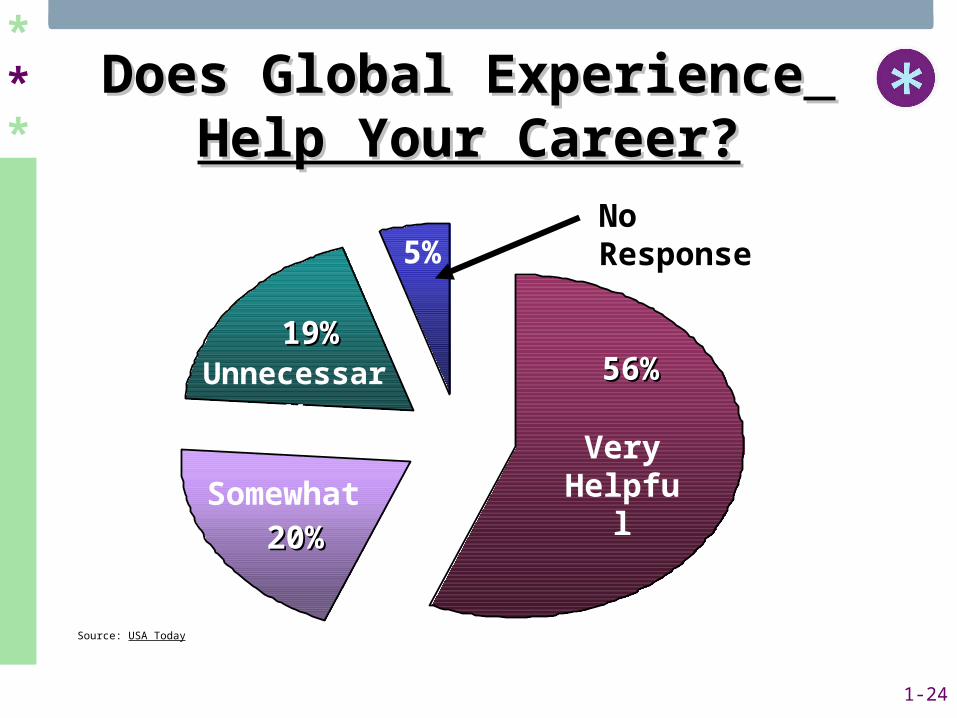
19%19%
Does Global ExperienceDoes Global Experience Help Your Career?Help Your Career?
20%20%
56%56%
Source: USA Today
5%
Very HelpfulSomewhat
Unnecessary
No Response
1-25
***
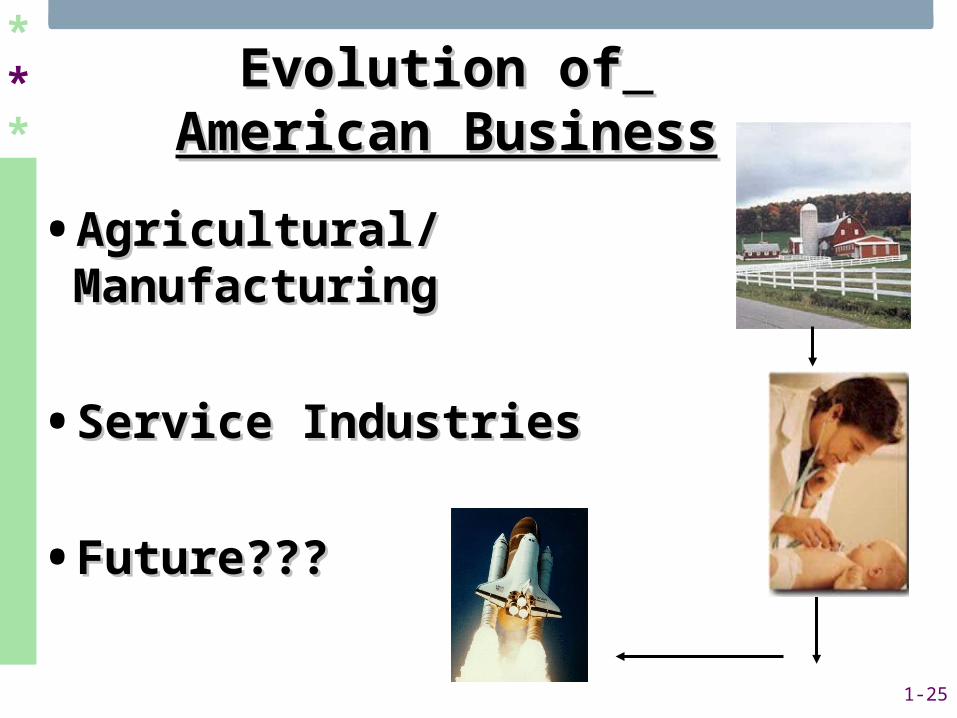
Evolution ofEvolution of American BusinessAmerican Business
• Agricultural/ManufacturingAgricultural/Manufacturing
• Service IndustriesService Industries
• Future???Future???
1-26
***
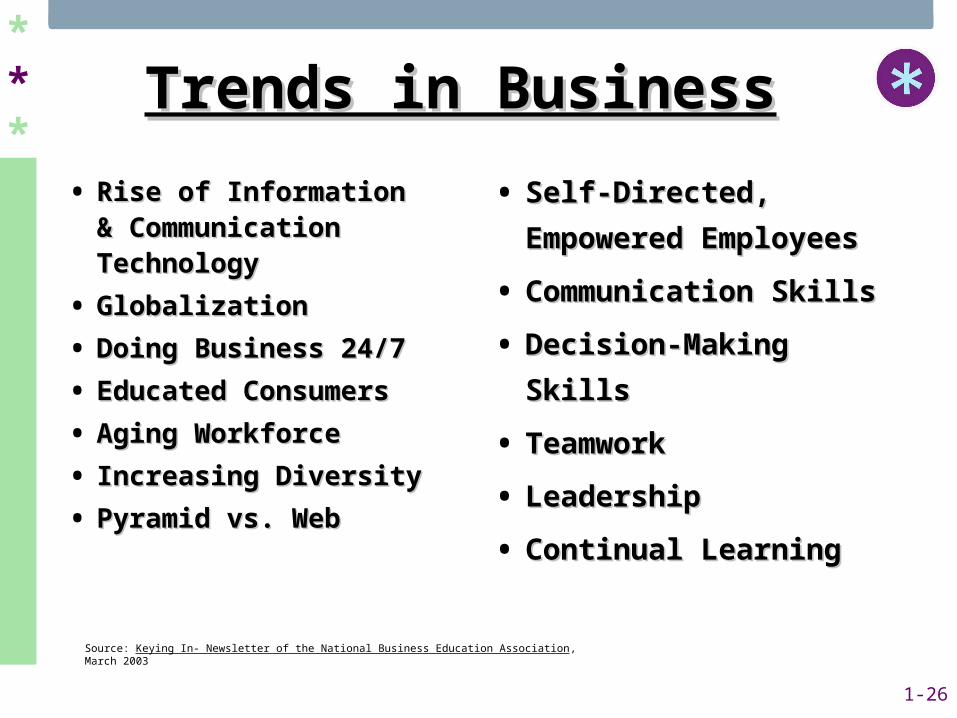
• Rise of Information & Rise of Information & Communication Communication TechnologyTechnology
• GlobalizationGlobalization
• Doing Business 24/7Doing Business 24/7
• Educated ConsumersEducated Consumers
• Aging WorkforceAging Workforce
• Increasing DiversityIncreasing Diversity
• Pyramid vs. WebPyramid vs. Web
Trends in BusinessTrends in Business
Source: Keying In- Newsletter of the National Business Education Association, March 2003
• Self-Directed, Self-Directed,
Empowered Empowered
EmployeesEmployees
• Communication SkillsCommunication Skills
• Decision-Making SkillsDecision-Making Skills
• TeamworkTeamwork
• LeadershipLeadership
• Continual LearningContinual Learning
1-27
***
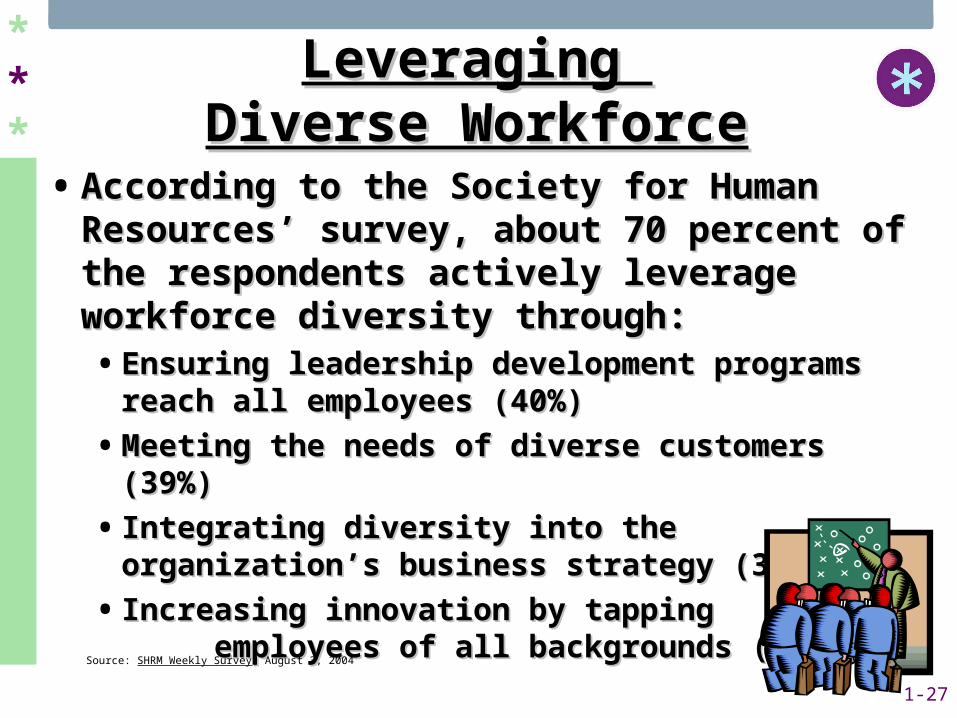
Leveraging Leveraging Diverse WorkforceDiverse Workforce
• According to the Society for Human According to the Society for Human Resources’ survey, about 70 percent of the Resources’ survey, about 70 percent of the respondents actively leverage workforce respondents actively leverage workforce diversity through:diversity through:• Ensuring leadership development programs reach Ensuring leadership development programs reach
all employees (40%)all employees (40%)
• Meeting the needs of diverse customers (39%)Meeting the needs of diverse customers (39%)
• Integrating diversity into the organization’s Integrating diversity into the organization’s business strategy (35%)business strategy (35%)
• Increasing innovation by tapping Increasing innovation by tapping employees of all backgrounds (34%)employees of all backgrounds (34%)
Source: SHRM Weekly Survey, August 3, 2004
1-28
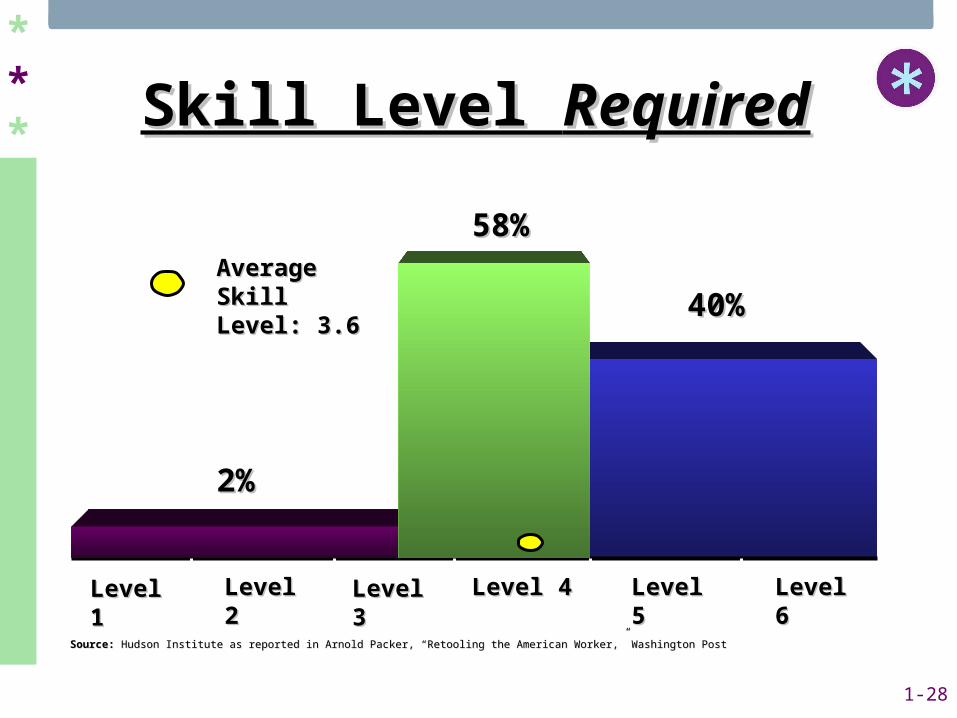
*** Skill Level Skill Level RequiredRequired
Level 1Level 1 Level 2Level 2 Level 3Level 3 Level 4Level 4 Level 5Level 5 Level 6Level 6
Source: Source: Hudson Institute as reported in Arnold Packer, “Retooling the American Worker,” Washington Post Hudson Institute as reported in Arnold Packer, “Retooling the American Worker,” Washington Post
Average Skill Average Skill Level: 3.6Level: 3.6
2%2%
58%58%
40%40%
1-29
***
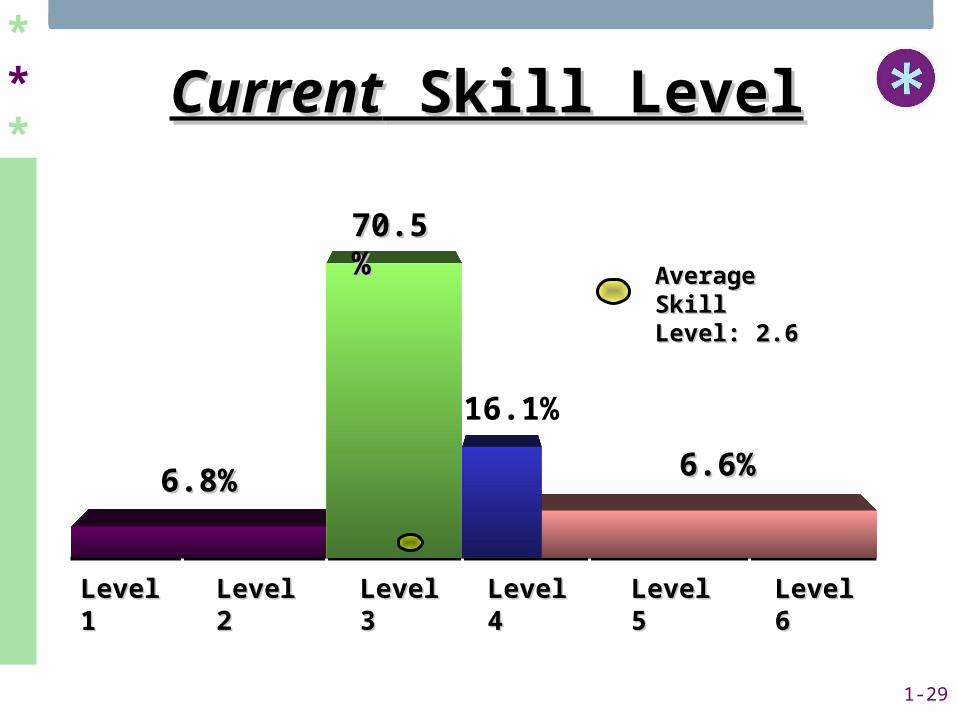
CurrentCurrent Skill Level Skill Level
Level 1Level 1 Level 2Level 2 Level 3Level 3 Level 4Level 4 Level 5Level 5 Level 6Level 6
Average Skill Average Skill Level: 2.6Level: 2.6
6.8%6.8%
70.5%70.5%
6.6%6.6%
16.1%