Embed Size (px)
Citation preview
HHEALTHY, EALTHY, FFIT & IT & SSTRONGTRONG
JULY 2007JULY 2007
2
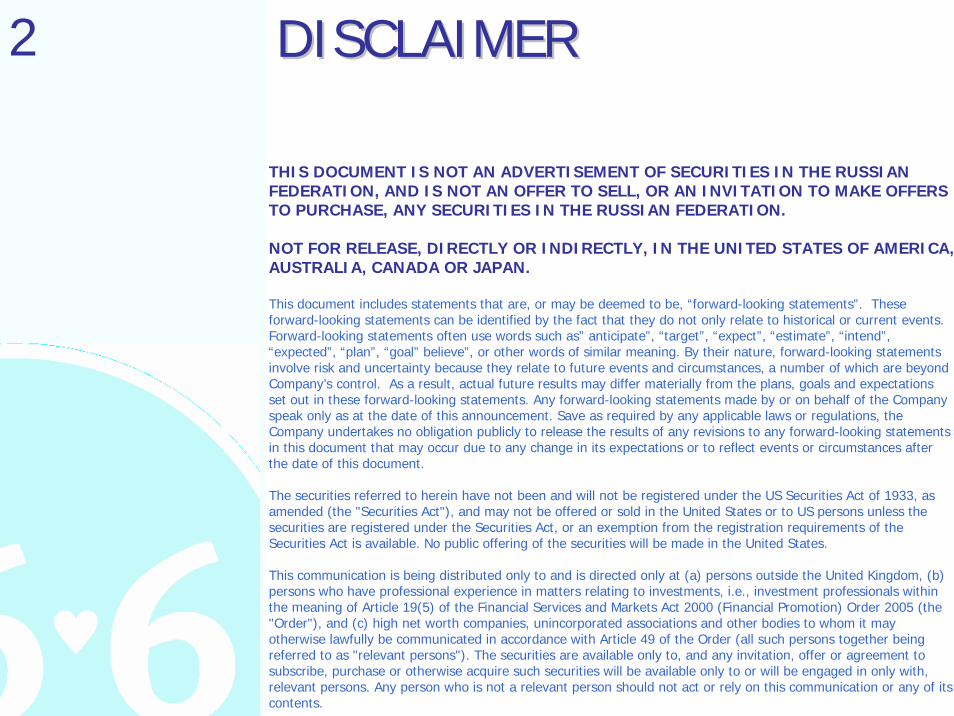
THIS DOCUMENT IS NOT AN ADVERTISEMENT OF SECURITIES IN THE RUSSIAN FEDERATION, AND IS NOT AN OFFER TO SELL, OR AN INVITATION TO MAKE OFFERS TO PURCHASE, ANY SECURITIES IN THE RUSSIAN FEDERATION.
NOT FOR RELEASE, DIRECTLY OR INDIRECTLY, IN THE UNITED STATES OF AMERICA, AUSTRALIA, CANADA OR JAPAN.
This document includes statements that are, or may be deemed to be, “forward-looking statements”. These forward-looking statements can be identified by the fact that they do not only relate to historical or current events. Forward-looking statements often use words such as” anticipate”, “target”, “expect”, “estimate”, “intend”, “expected”, “plan”, “goal” believe”, or other words of similar meaning. By their nature, forward-looking statements involve risk and uncertainty because they relate to future events and circumstances, a number of which are beyond Company’s control. As a result, actual future results may differ materially from the plans, goals and expectations set out in these forward-looking statements. Any forward-looking statements made by or on behalf of the Company speak only as at the date of this announcement. Save as required by any applicable laws or regulations, the Company undertakes no obligation publicly to release the results of any revisions to any forward-looking statements in this document that may occur due to any change in its expectations or to reflect events or circumstances after the date of this document.
The securities referred to herein have not been and will not be registered under the US Securities Act of 1933, as amended (the "Securities Act"), and may not be offered or sold in the United States or to US persons unless the securities are registered under the Securities Act, or an exemption from the registration requirements of the Securities Act is available. No public offering of the securities will be made in the United States.
This communication is being distributed only to and is directed only at (a) persons outside the United Kingdom, (b) persons who have professional experience in matters relating to investments, i.e., investment professionals within the meaning of Article 19(5) of the Financial Services and Markets Act 2000 (Financial Promotion) Order 2005 (the "Order"), and (c) high net worth companies, unincorporated associations and other bodies to whom it may otherwise lawfully be communicated in accordance with Article 49 of the Order (all such persons together being referred to as "relevant persons"). The securities are available only to, and any invitation, offer or agreement to subscribe, purchase or otherwise acquire such securities will be available only to or will be engaged in only with, relevant persons. Any person who is not a relevant person should not act or rely on this communication or any of its contents.
DISCLAIMERDISCLAIMER

3 36.6 AT GLANCE36.6 AT GLANCE
2002 2003 2004 2005
Others
Manufacturing
Retail
Net Sales Market Cap529
Net ProfitEBITDA
We strive to be Russia’s leading health & beauty retailer and to become the preferred source of medicines and health & beauty products for Russian consumers
USD millions
2006
Medical Services
81.9134.3
203.2
386.2
52.8
60.8
79.4
99.0
10.5
13,1
15.9
22.7
33.4
16.043.9
58.8
305
211
148119
144228
448
712
2004 2005 2006 Jul`07
72
2003
15.313.6
18.821.0
25.5
20062002 2003 2004 2005
3.31.0 1.1 8.3
34.5
2002 2003 2004 2005 2006
$9
$89
4
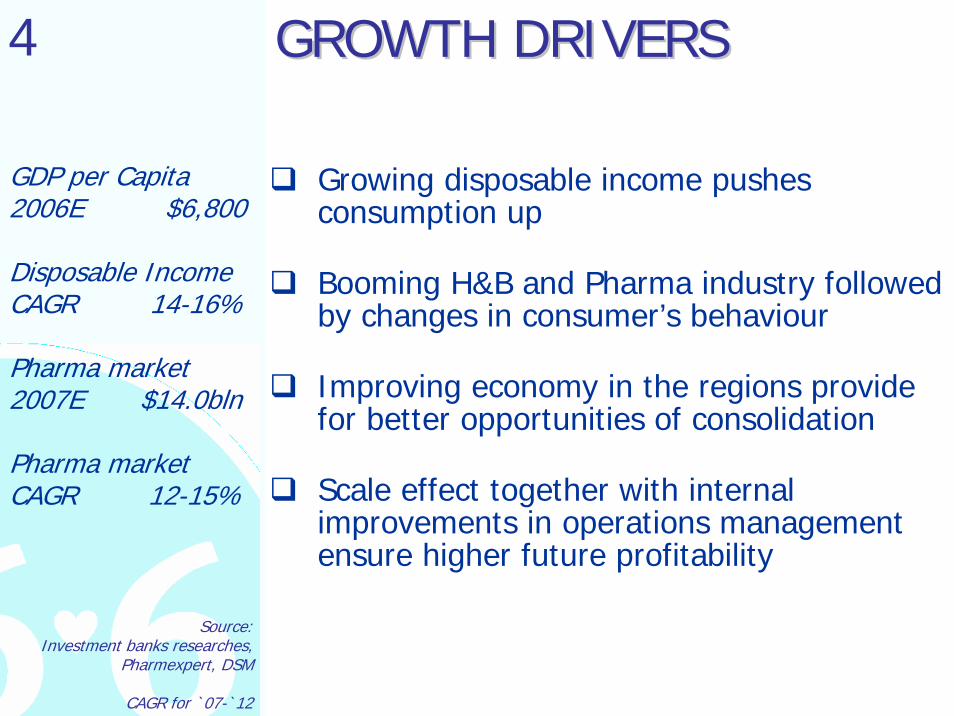
Growing disposable income pushes consumption up
Booming H&B and Pharma industry followed by changes in consumer’s behaviour
Improving economy in the regions provide for better opportunities of consolidation
Scale effect together with internal improvements in operations management ensure higher future profitability
GROWTH DRIVERSGROWTH DRIVERS
GDP per Capita 2006E $6,800
Disposable Income CAGR 14-16%
Pharma market 2007E $14.0bln
Pharma market CAGR 12-15%
Source: Investment banks researches,
Pharmexpert, DSM
CAGR for `07-`12
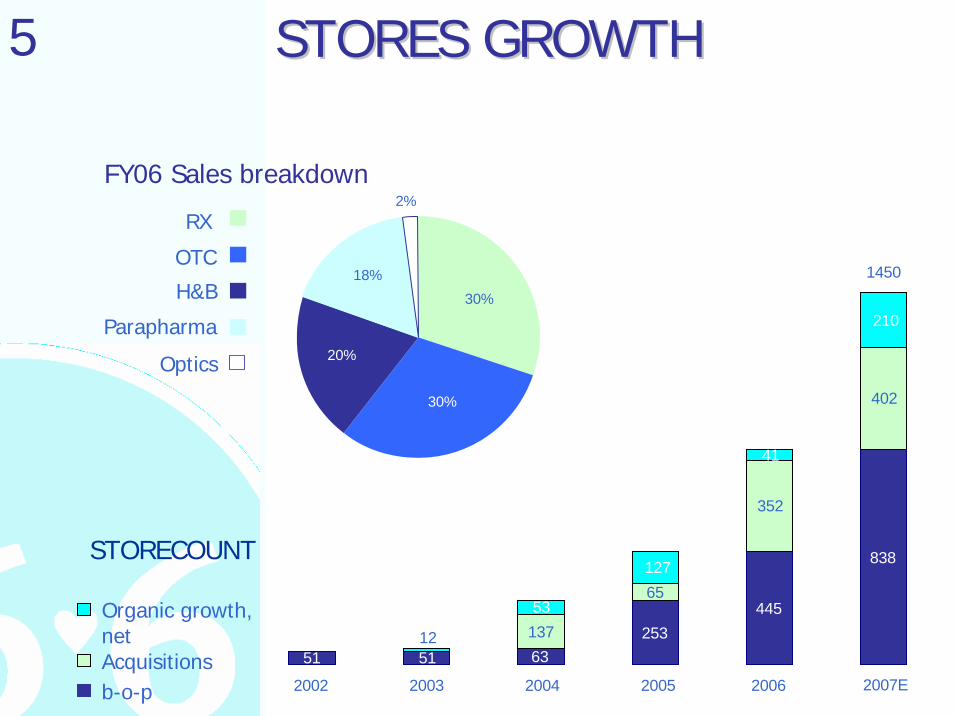
5
STORECOUNT
STORES GROWTHSTORES GROWTH
Organic growth,netAcquisitionsb-o-p
RX
OTC
H&B
Parapharma
Optics
FY06 Sales breakdown
51 63253
445
838
137
65
352
402
51
53
127
41
210
12
2002 2003 2004 2005 2006 2007E
1450
30%
30%
20%
18%
2%
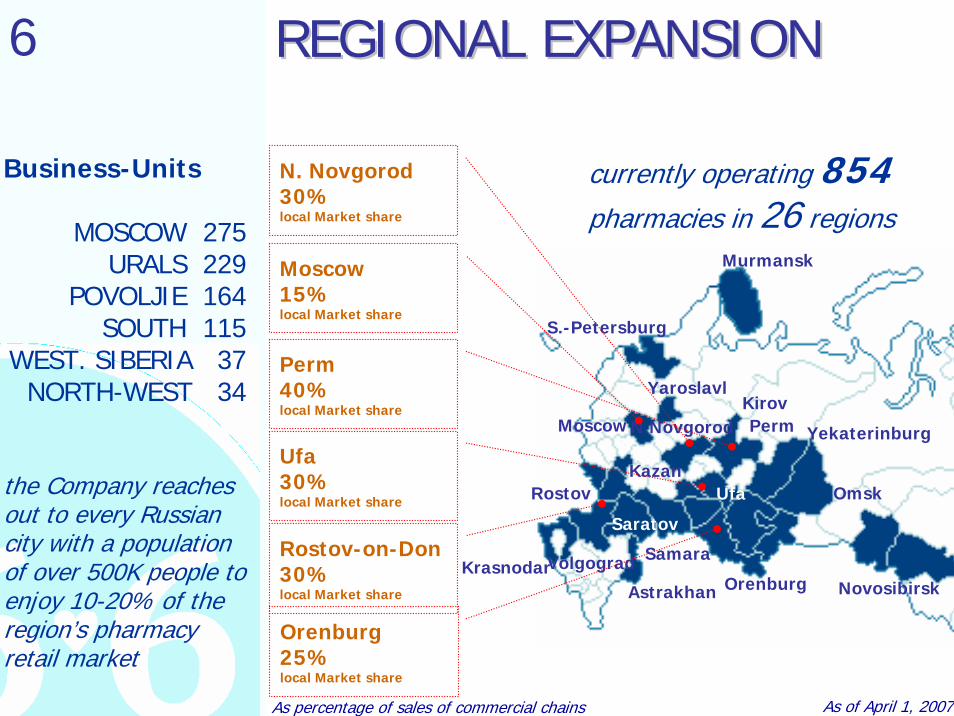
6 REGIONAL EXPANSIONREGIONAL EXPANSION
Murmansk
N.NovgorodMoscow
Kazan
Samara
S.-Petersburg
Ufa
Volgograd
Saratov
Perm
Novosibirsk
Rostov
Yekaterinburg
Yaroslavl
Krasnodar
Omsk
Kirov
currently operating 854 pharmacies in 26 regions
Business-Units
MOSCOW 275URALS 229
POVOLJIE 164SOUTH 115
WEST. SIBERIA 37NORTH-WEST 34
the Company reaches out to every Russian city with a population of over 500K people to enjoy 10-20% of the region’s pharmacy retail market
As of April 1, 2007
Moscow 15%local Market share
N. Novgorod30% local Market share
Perm 40%local Market share
Ufa 30%local Market share
Rostov-on-Don 30%local Market share
Orenburg
Orenburg 25%local Market share
Astrakhan
As percentage of sales of commercial chains
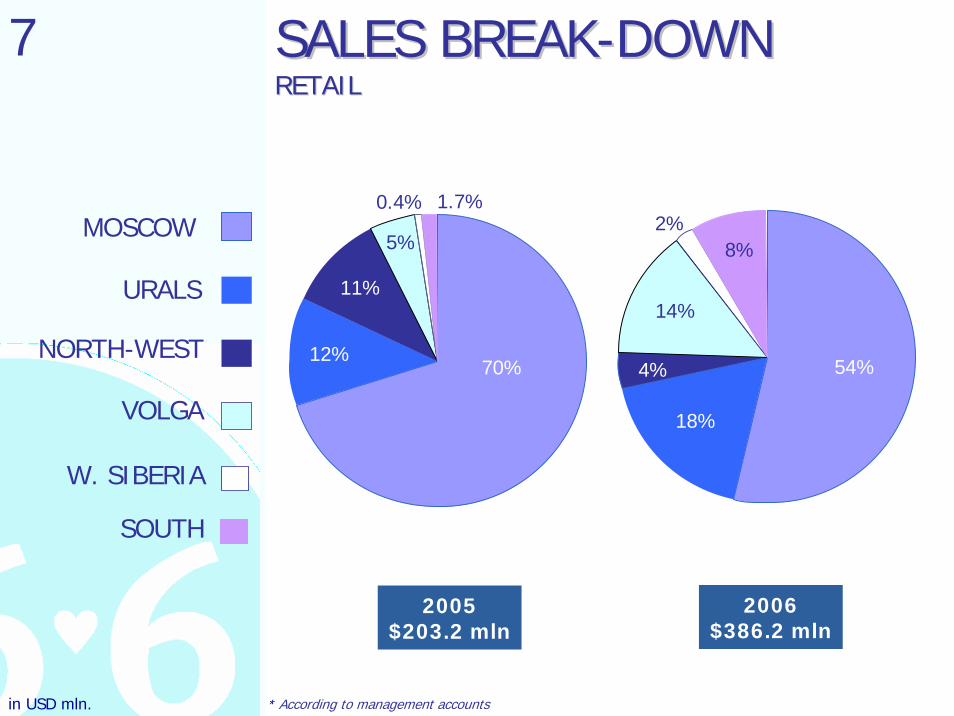
7 SALES BREAKSALES BREAK--DOWNDOWNRETAILRETAIL
2005$203.2 mln
70%12%
11%
5%
0.4% 1.7%
54%
18%
4%
14%
2%8%
2006$386.2 mln
* According to management accounts
MOSCOW
URALS
NORTH-WEST
VOLGA
W. SIBERIA
SOUTH
in USD mln.
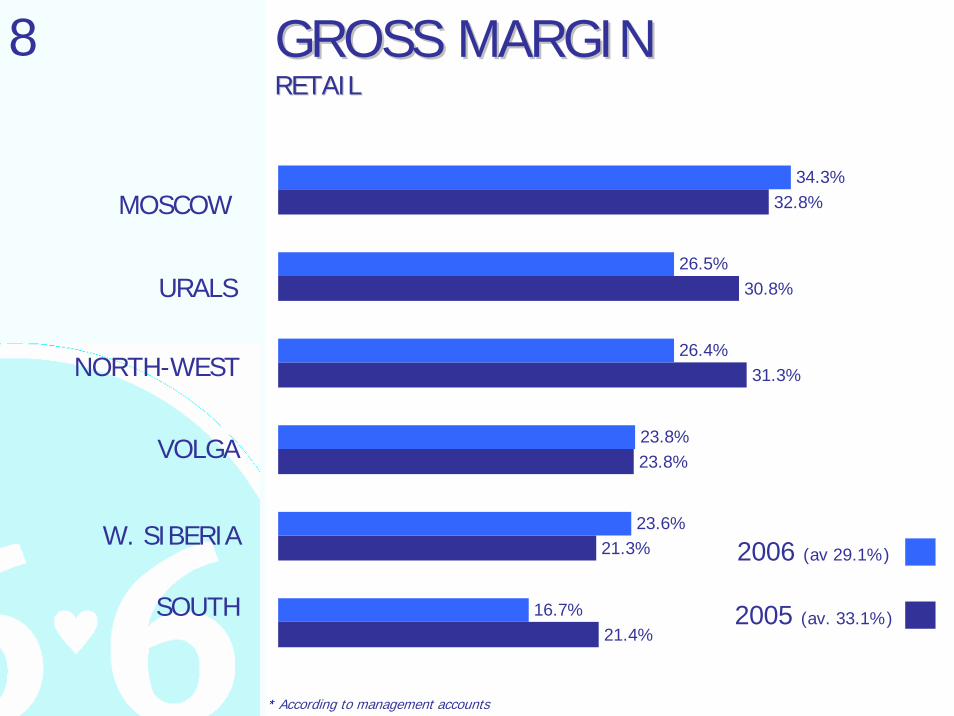
8 GROSS MARGINGROSS MARGINRETAILRETAIL
MOSCOW
URALS
NORTH-WEST
VOLGA
W. SIBERIA
SOUTH
* According to management accounts
21.4%
21.3%
23.8%
31.3%
30.8%
32.8%
16.7%
23.6%
23.8%
26.4%
26.5%
34.3%
2006 (av 29.1%)
2005 (av. 33.1%)
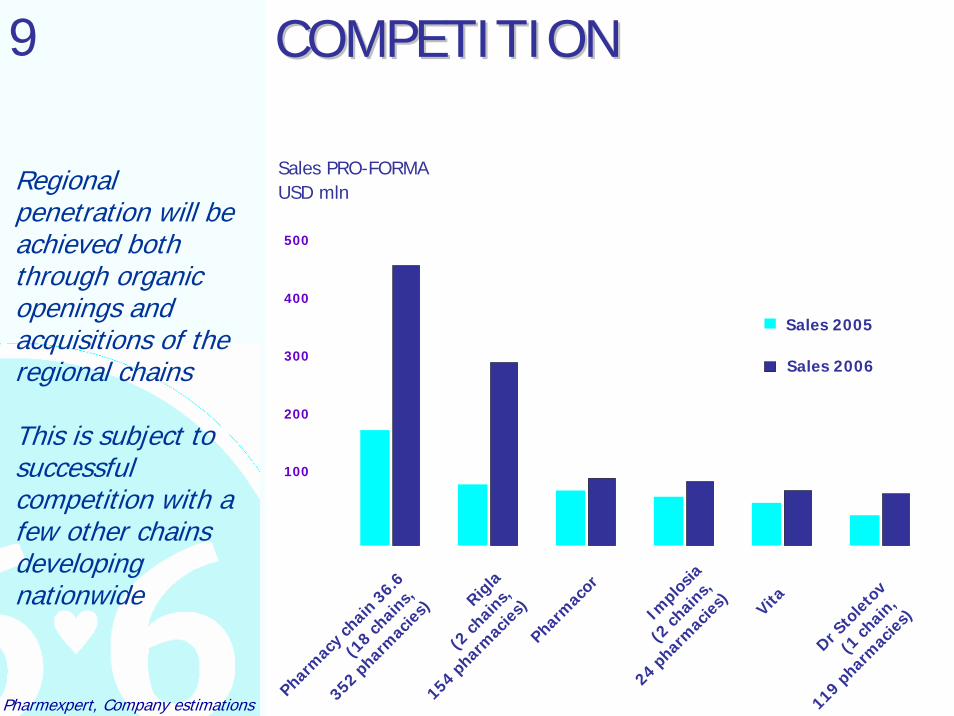
9 COMPETITIONCOMPETITION
Regional penetration will be achieved both through organic openings and acquisitions of the regional chains
This is subject to successful competition with a few other chains developing nationwide
Pharmexpert, Company estimations
100
200
300
400
500
Pharm
acy c
hain36.6
(18 ch
ains,
352 phar
mac
ies) Rig
la
(2 ch
ains,
154 phar
mac
ies)
Pharm
acor
Implo
sia
(2 ch
ains,
24 phar
mac
ies)
Vita
Dr Sto
letov
(1 ch
ain,
119 phar
mac
ies)
Sales 2005
Sales PRO-FORMAUSD mln
Sales 2006
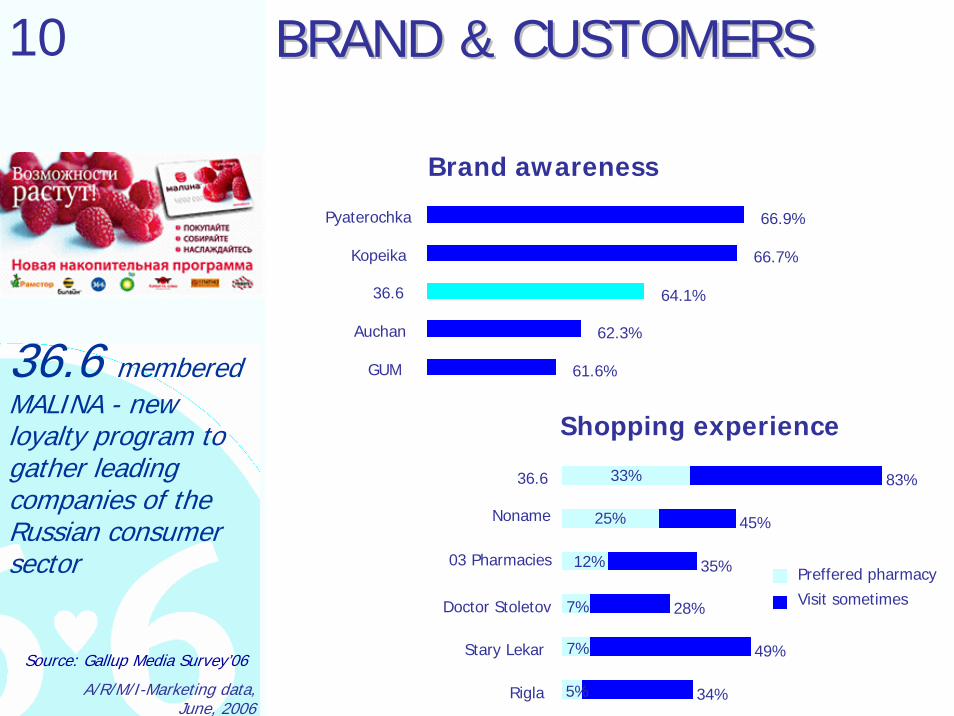
10 BRAND & CUSTOMERSBRAND & CUSTOMERS
Source: Gallup Media Survey’06
A/R/M/I-Marketing data, June, 2006
61.6%
62.3%
64.1%
66.7%
66.9%
GUM
Auchan
36.6
Kopeika
Pyaterochka
34%5%
49%7%
28%
35%
45%
83%
7%
12%
25%
33%
Doctor Stoletov
03 Pharmacies
Noname
36.6
Rigla
Stary Lekar
Preffered pharmacy
Visit sometimes
Brand awareness
Shopping experience
36.6 memberedMALINA - new loyalty program to gather leading companies of the Russian consumer sector
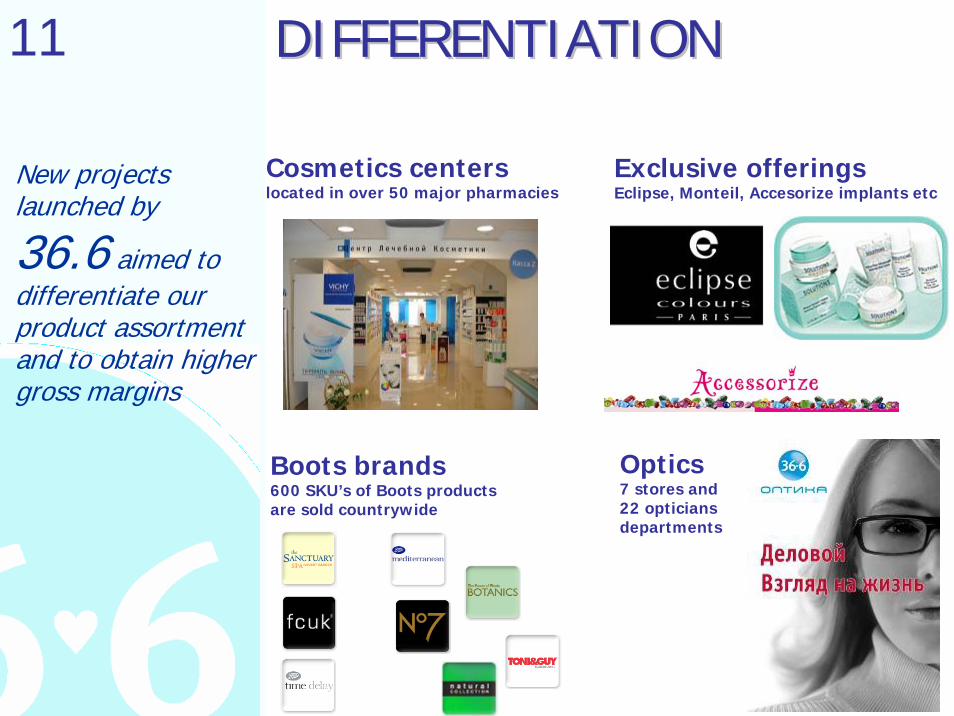
11 DIFFERENTIATIONDIFFERENTIATION
Cosmetics centerslocated in over 50 major pharmacies
Optics7 stores and 22 opticians departments
Boots brands600 SKU’s of Boots products are sold countrywide
New projects launched by
36.6 aimed to differentiate our product assortment and to obtain higher gross margins
Exclusive offeringsEclipse, Monteil, Accesorize implants etc
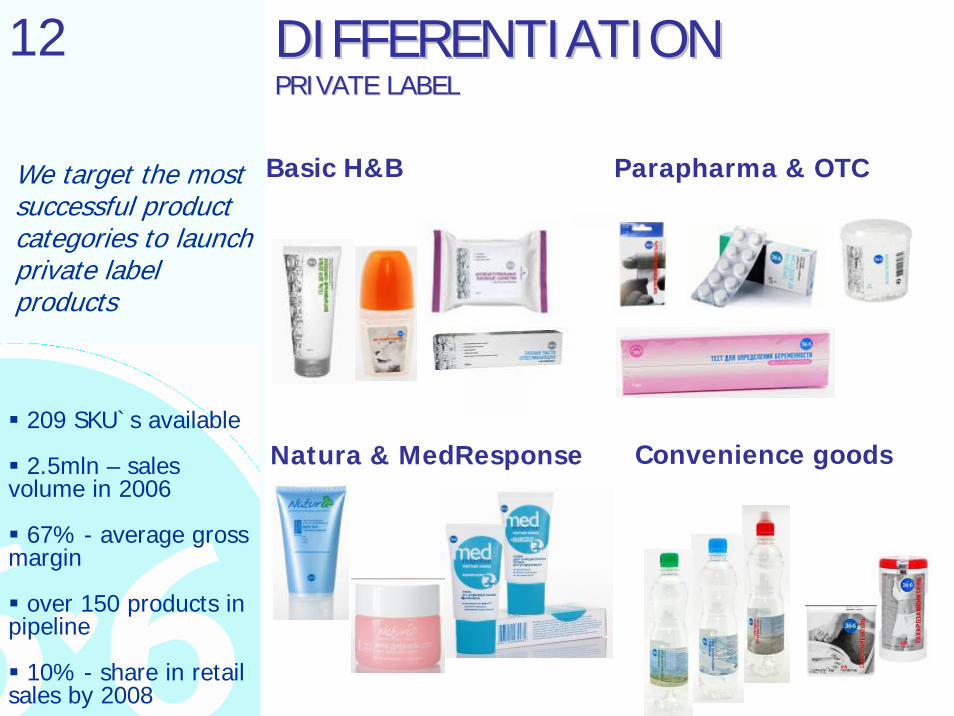
12
Basic H&B
Natura & MedResponse
Parapharma & OTCWe target the most successful product categories to launch private label products
209 SKU`s available
2.5mln – sales volume in 2006
67% - average gross margin
over 150 products in pipeline
10% - share in retail sales by 2008
DIFFERENTIATION DIFFERENTIATION PRIVATE LABELPRIVATE LABEL
Convenience goods
13 DIVERSIFICATIONDIVERSIFICATIONMEDICAL SERVICESMEDICAL SERVICES
Market
fragmented with no potential core for consolidation
non-satiated rapidly growing demand
disturbed national healthcare system
Rationale/Strategy
realize synergies between retail and medical services businesses by launching a chained operator in “masstige” market segment
In July 2006 we acquired one of the best Moscow private clinics providing medical, surgical and dental services through EMC & EDC as well as full-scale laboratory
FY`06SALES $21mlnEBITDA 22%
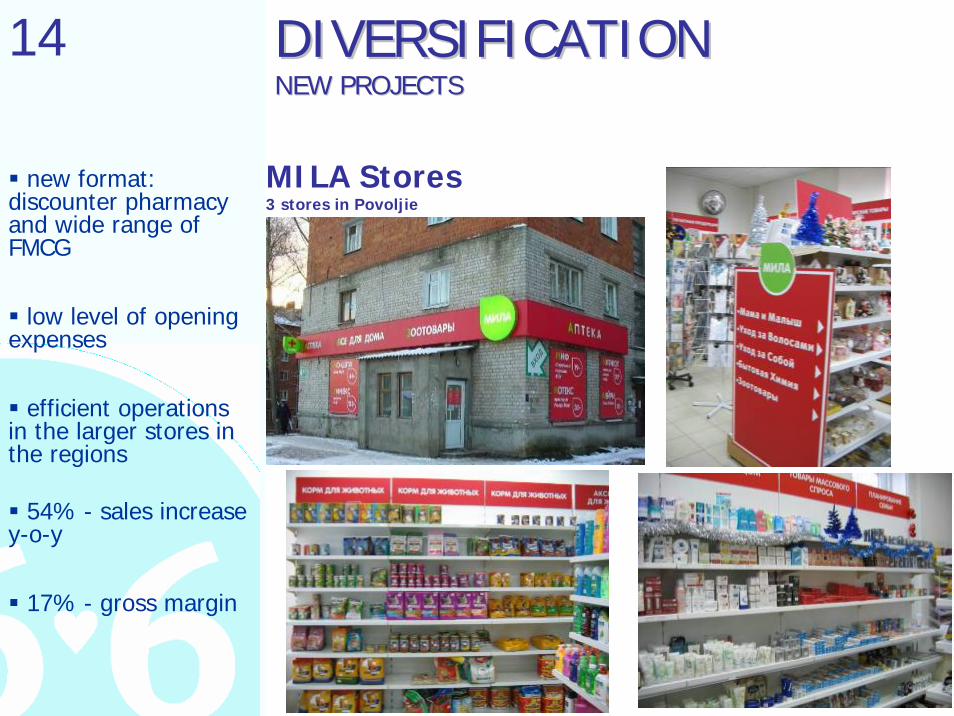
14 DIVERSIFICATIONDIVERSIFICATIONNEW PROJECTSNEW PROJECTS
MILA Stores3 stores in Povoljie
new format: discounter pharmacy and wide range of FMCG
low level of opening expenses
efficient operations in the larger stores in the regions
54% - sales increase y-o-y
17% - gross margin
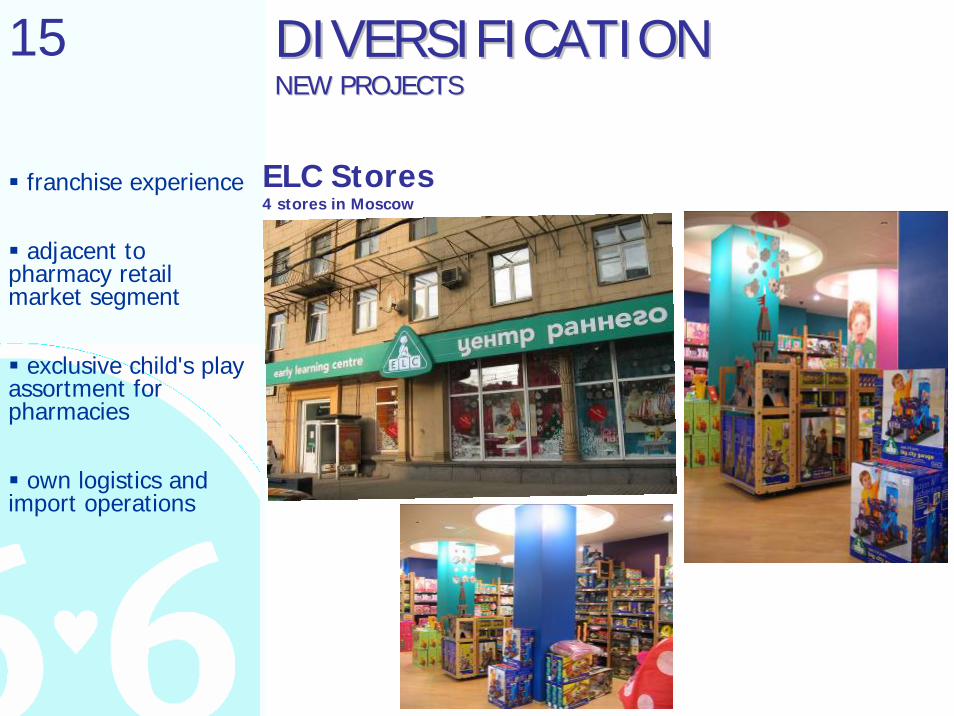
15 DIVERSIFICATIONDIVERSIFICATIONNEW PROJECTSNEW PROJECTS
ELC Stores4 stores in Moscow
franchise experience
adjacent to pharmacy retail market segment
exclusive child's play assortment for pharmacies
own logistics and import operations
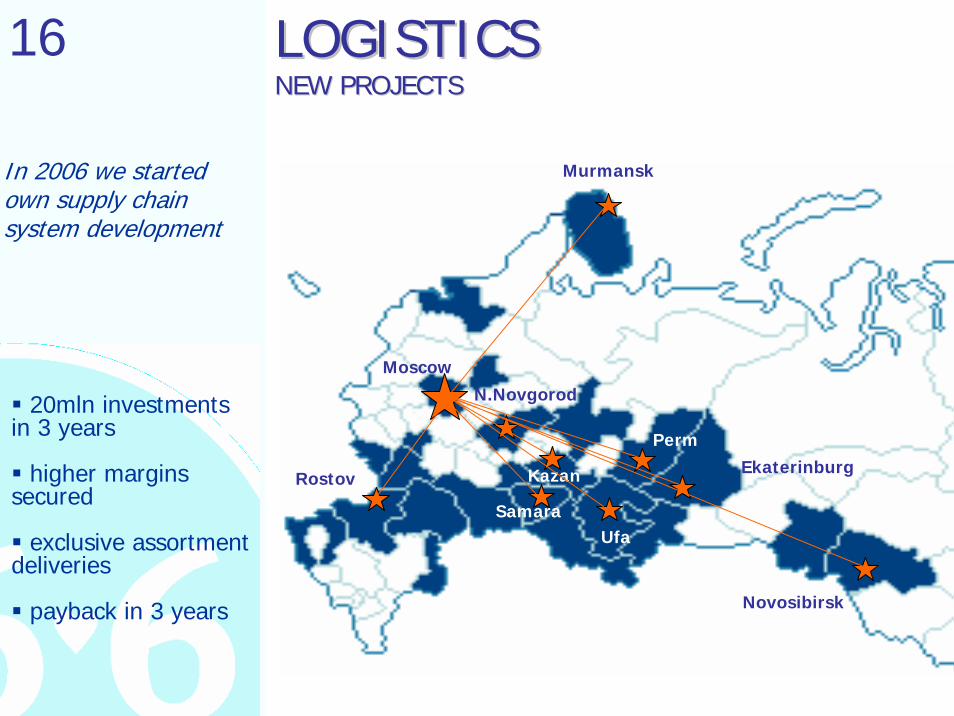
16
In 2006 we started own supply chain system development
Murmansk
N.NovgorodMoscow
Kazan
SamaraUfa
Perm
Novosibirsk
RostovEkaterinburg
20mln investments in 3 years
higher margins secured
exclusive assortment deliveries
payback in 3 years
LOGISTICSLOGISTICSNEW PROJECTSNEW PROJECTS
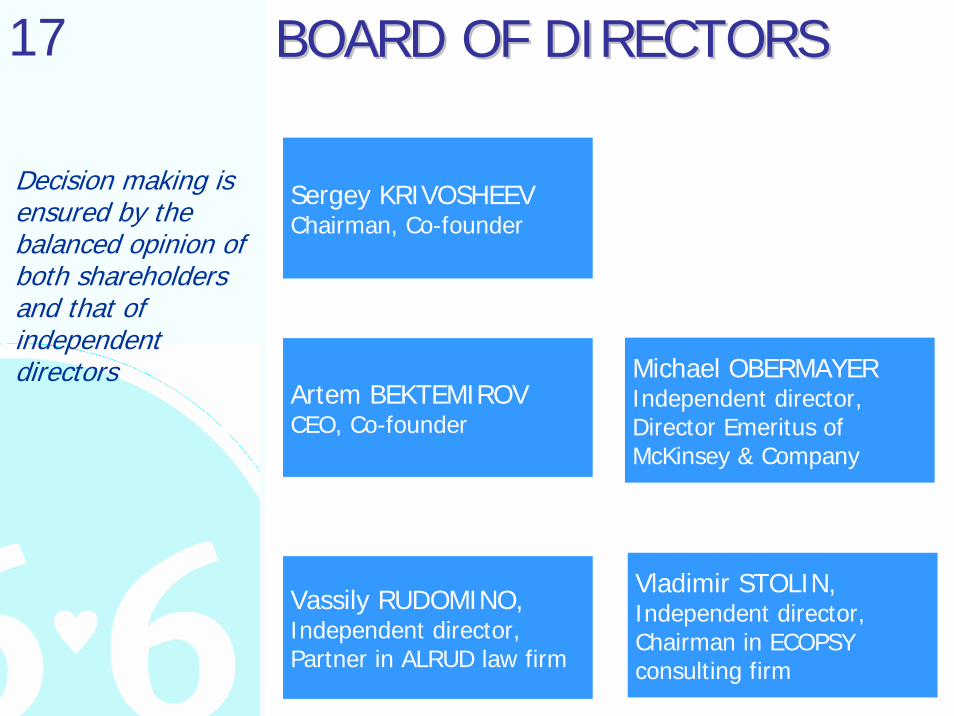
17
Michael OBERMAYERIndependent director,Director Emeritus of McKinsey & Company
Vladimir STOLIN,Independent director,Chairman in ECOPSY consulting firm
Sergey KRIVOSHEEVChairman, Co-founder
Artem BEKTEMIROVCEO, Co-founder
Vassily RUDOMINO,Independent director,Partner in ALRUD law firm
Decision making is ensured by the balanced opinion of both shareholders and that of independent directors
BOARD OF DIRECTORSBOARD OF DIRECTORS
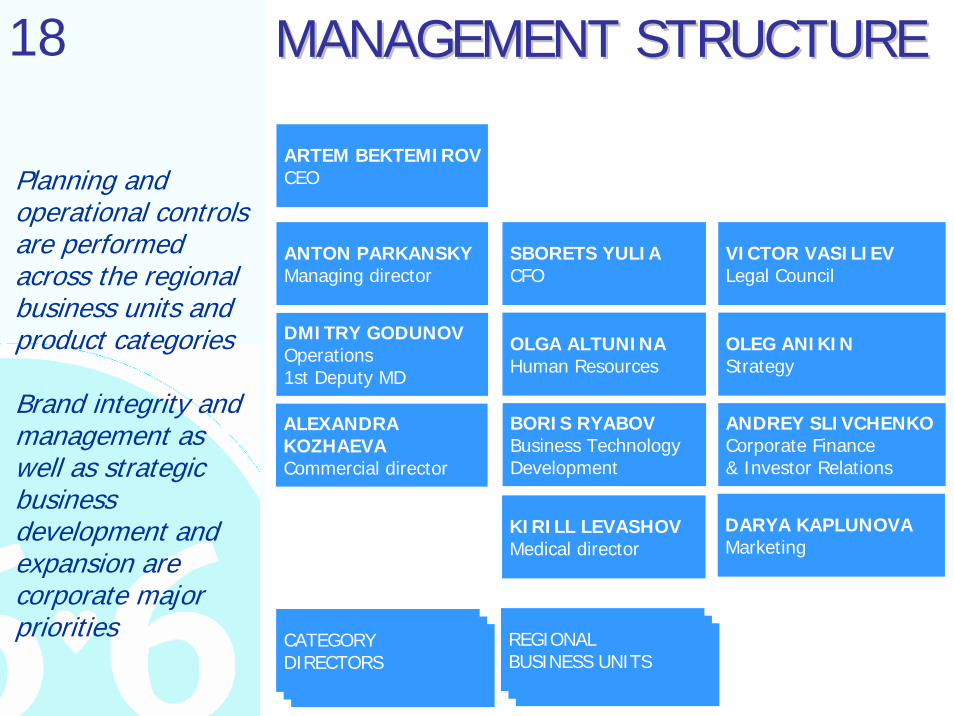
18
ARTEM BEKTEMIROVCEO
SBORETS YULIACFO
ANDREY SLIVCHENKOCorporate Finance& Investor Relations
OLEG ANIKINStrategy
BORIS RYABOVBusiness TechnologyDevelopment
OLGA ALTUNINAHuman Resources
DMITRY GODUNOVOperations1st Deputy MD
VICTOR VASILIEVLegal Council
ANTON PARKANSKYManaging director
CATEGORYDIRECTORS
REGIONALBUSINESS UNITS
MANAGEMENT STRUCTUREMANAGEMENT STRUCTURE
Planning and operational controls are performed across the regional business units and product categories
Brand integrity and management as well as strategic business development and expansion are corporate major priorities
DARYA KAPLUNOVAMarketing
ALEXANDRA KOZHAEVACommercial director
KIRILL LEVASHOVMedical director
19
APPENDIXFINANCIALS & ANALYSIS
Please note:reporting under IFRS since 2002 auditor Deloitte
data by segments requires certain adjustments
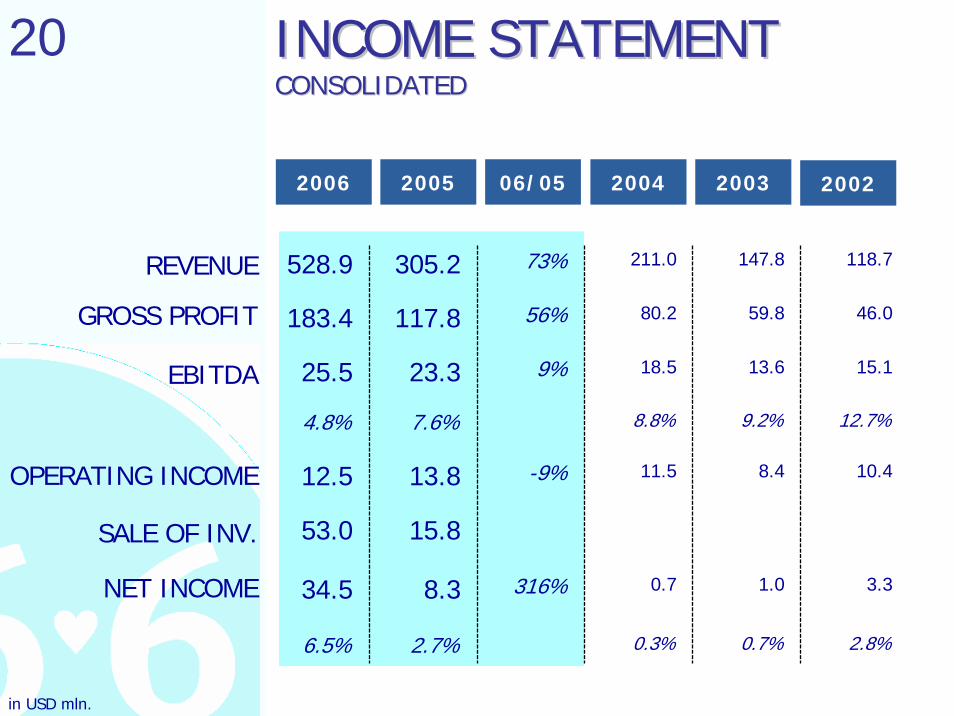
20 INCOME STATEMENTINCOME STATEMENTCONSOLIDATEDCONSOLIDATED
528.9 305.2 73% 211.0 147.8
80.2 59.8
13.6
9.2%
8.4
53.0 15.8
1.0
0.7%
18.5
8.8%
11.5
0.7
0.3%
118.7
183.4 46.0
15.1
12.7%
10.4
3.3
2.8%
25.5
4.8%
12.5
34.5
117.8
6.5%
56%
9%
-9%
316%
23.3
7.6%
13.8
8.3
2.7%
REVENUE
GROSS PROFIT
EBITDA
OPERATING INCOME
SALE OF INV.
NET INCOME
2004 2003 06/052005 2006 2002
in USD mln.
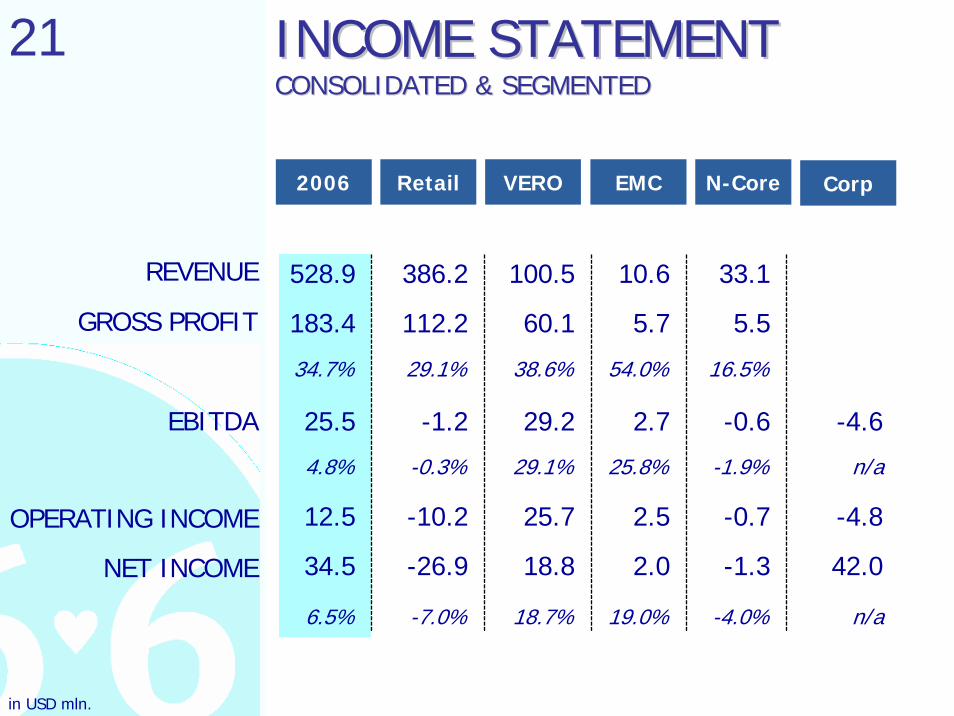
21 INCOME STATEMENTINCOME STATEMENTCONSOLIDATED & SEGMENTEDCONSOLIDATED & SEGMENTED
528.9 386.2 100.5 10.6 33.1
5.7 5.5
34.7% 29.1% 38.6% 54.0% 16.5%
-0.6
-1.9%
-0.7
-1.3
-4.0%
2.7
25.8%
2.5
2.0
19.0%
183.4
-4.6
n/a
-4.8
42.0
n/a
25.5
4.8%
12.5
34.5
112.2
6.5%
60.1
29.2
29.1%
25.7
18.8
18.7%
-1.2
-0.3%
-10.2
-26.9
-7.0%
REVENUE
GROSS PROFIT
EBITDA
OPERATING INCOME
NET INCOME
EMC N-Core VERORetail 2006 Corp
in USD mln.
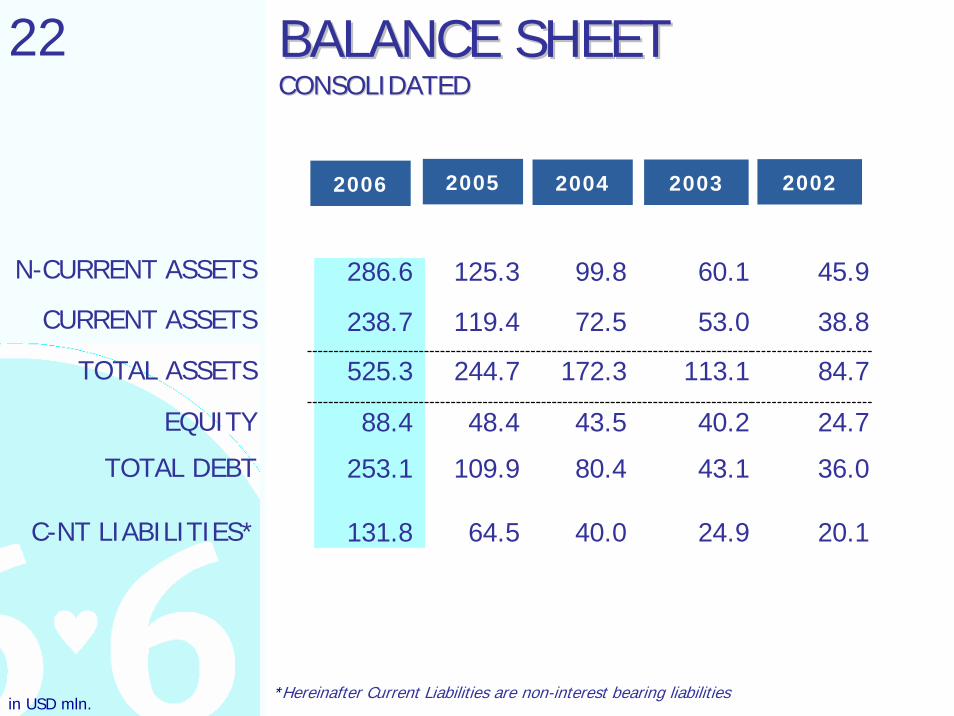
22 BALANCE SHEETBALANCE SHEETCONSOLIDATEDCONSOLIDATED
*Hereinafter Current Liabilities are non-interest bearing liabilities
286.6 125.3 45.9
238.7 119.4
244.7
48.4
109.9
64.5
525.3
38.8
84.7
24.788.4
253.1
131.8
36.0
20.1
99.8 60.1
72.5
172.3
43.5
80.4
40.0
53.0
113.1
40.2
43.1
24.9
N-CURRENT ASSETS
CURRENT ASSETS
TOTAL ASSETS
EQUITY
TOTAL DEBT
C-NT LIABILITIES*
200420052006 2003 2002
in USD mln.
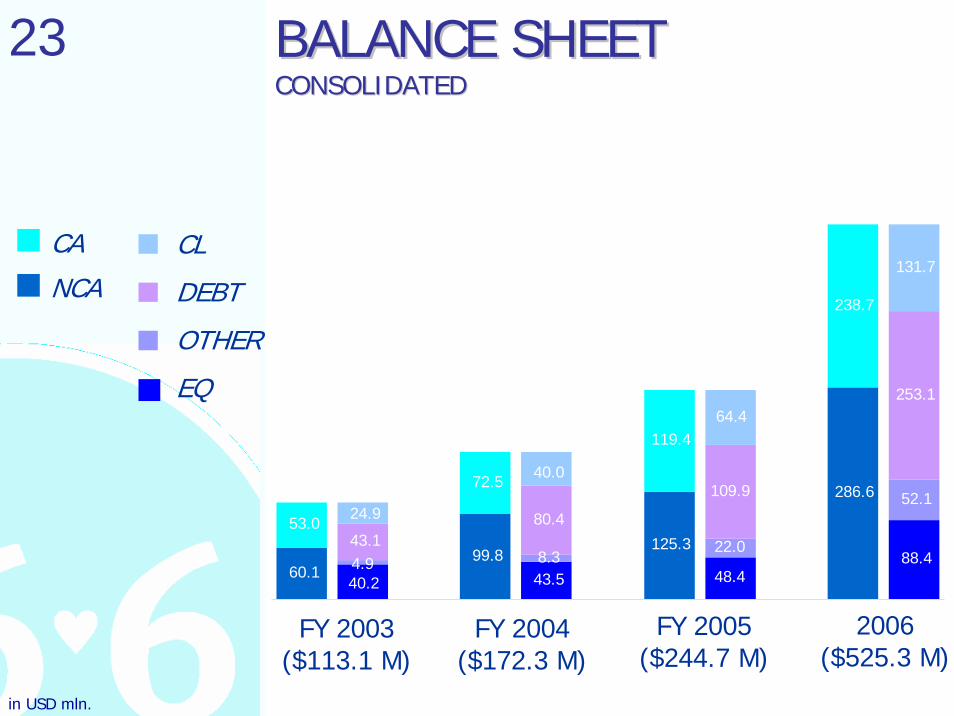
23
FY 2004($172.3 M)
CA
NCA
CL
DEBT
OTHER
EQ
FY 2003($113.1 M)
FY 2005($244.7 M)
BALANCE SHEETBALANCE SHEETCONSOLIDATEDCONSOLIDATED
2006($525.3 M)
88.4
286.6
48.4
125.3
43.599.8
40.260.1
52.1
238.7
22.0
119.4
8.3
72.5
53.0
253.1
109.9
43.1
131.7
64.4
24.9
4.9
80.4
40.0
in USD mln.
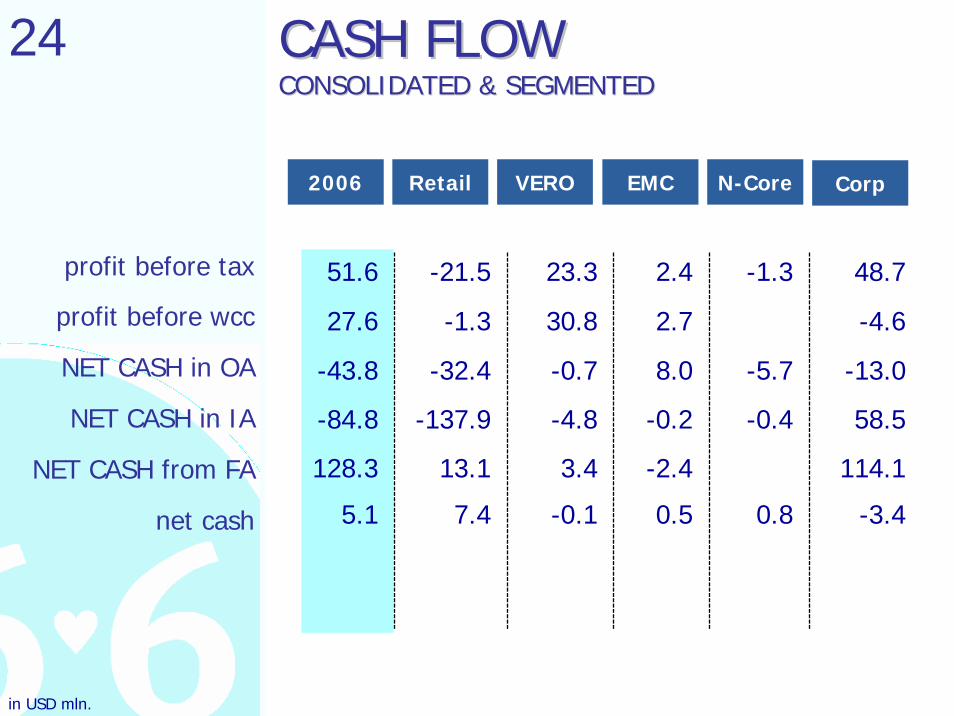
24 CASH FLOWCASH FLOWCONSOLIDATED & SEGMENTEDCONSOLIDATED & SEGMENTED
profit before tax
profit before wcc
NET CASH in OA
NET CASH in IA
NET CASH from FA
net cash
EMC N-Core VERORetail 2006 Corp
51.6 -21.5 23.3 2.4 -1.3
2.7
-43.8 -32.4 -0.7 8.0 -5.7 -13.0
-0.4
0.8
-0.2
-2.4
0.5
48.7
27.6 -4.6
58.5
114.1
-3.4
-84.8
128.3
5.1
-1.3 30.8
-4.8
3.4
-0.1
-137.9
13.1
7.4
in USD mln.
25
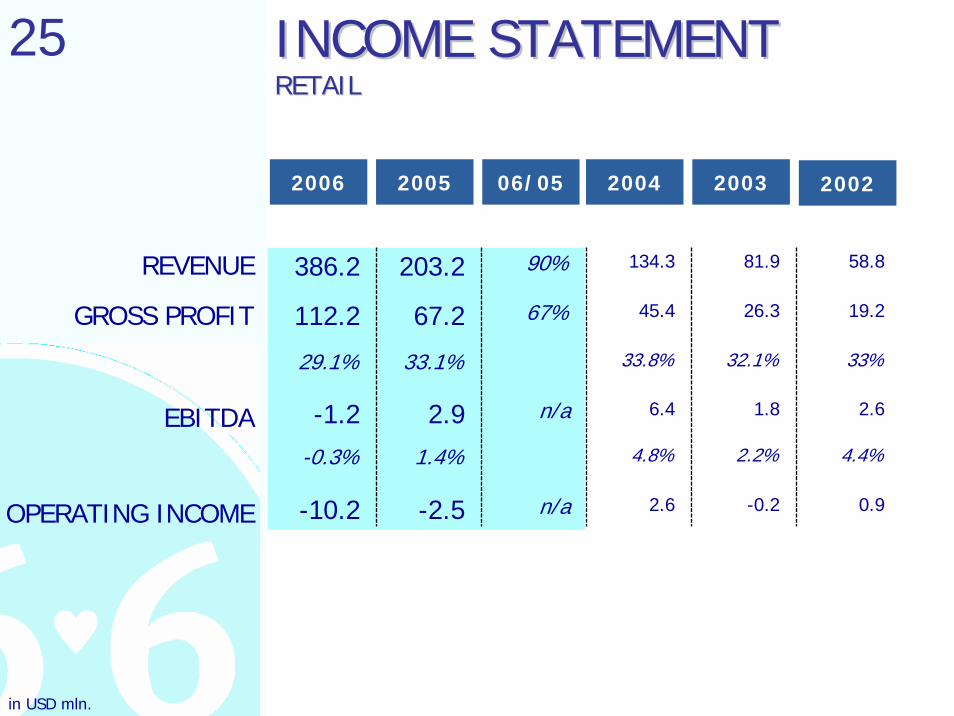
386.2 203.2 90% 134.3 81.9 58.8
112.2 45.4
33.8%
6.4
4.8%
2.6
29.1%
19.226.3
32.1%
1.8-1.22.2%
33%
2.6
4.4%-0.3%
-0.2 0.9-10.2
67%
n/a
n/a
67.2
33.1%
2.91.4%
-2.5
INCOME STATEMENTINCOME STATEMENTRETAILRETAIL
REVENUE
GROSS PROFIT
EBITDA
OPERATING INCOME
2004 2003 06/052005 2006 2002
in USD mln.
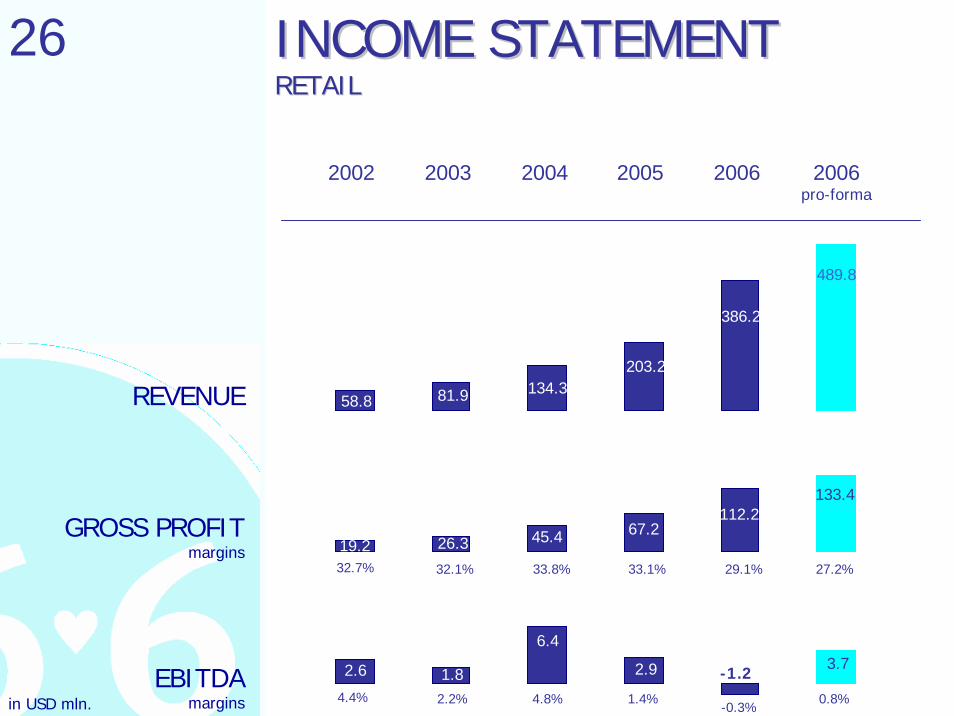
26 INCOME STATEMENTINCOME STATEMENTRETAILRETAIL
REVENUE
GROSS PROFITmargins
EBITDAmargins
19.2 26.3 45.4 67.2112.2
133.4
58.8 81.9 134.3203.2
386.2
489.8
2002 2003 2004 2005 2006 2006pro-forma
2.6 1.8
6.4
2.9 -1.2 3.7
32.7% 32.1% 33.8% 33.1% 29.1% 27.2%
4.4% 2.2% 4.8% 1.4% 0.8%-0.3%in USD mln.
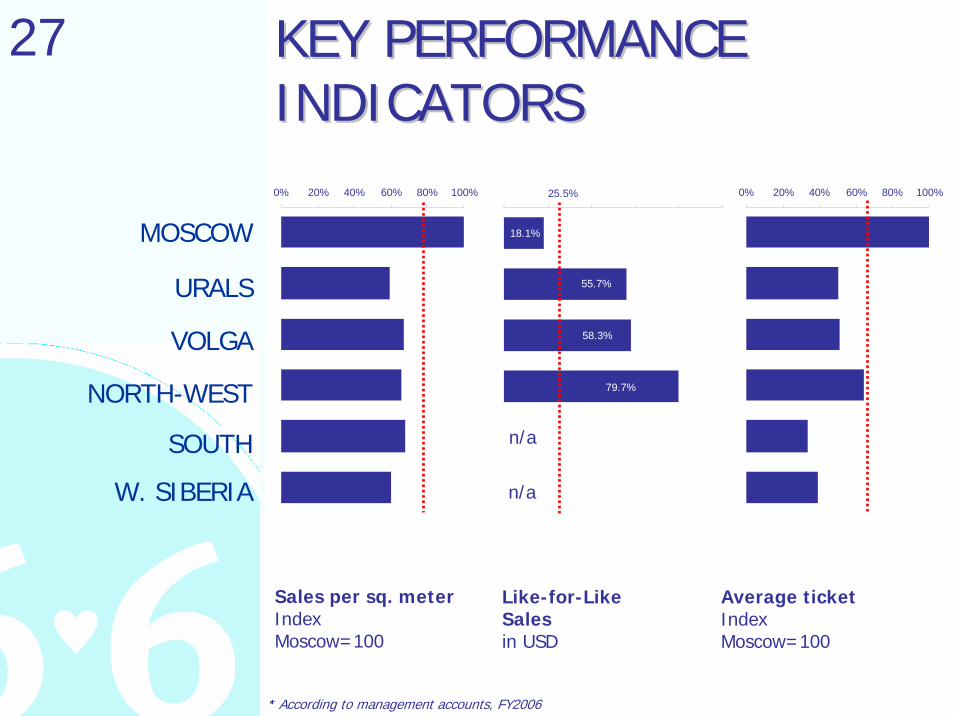
27 KEY PERFORMANCE KEY PERFORMANCE INDICATORSINDICATORS
MOSCOW
URALS
VOLGA
NORTH-WEST
SOUTH
W. SIBERIA
Sales per sq. meterIndexMoscow=100
Like-for-Like Salesin USD
Average ticketIndexMoscow=100
* According to management accounts, FY2006
0% 20% 40% 60% 80% 100%0% 20% 40% 60% 80% 100% 25.5%
18.1%
55.7%
58.3%
79.7%
n/a
n/a
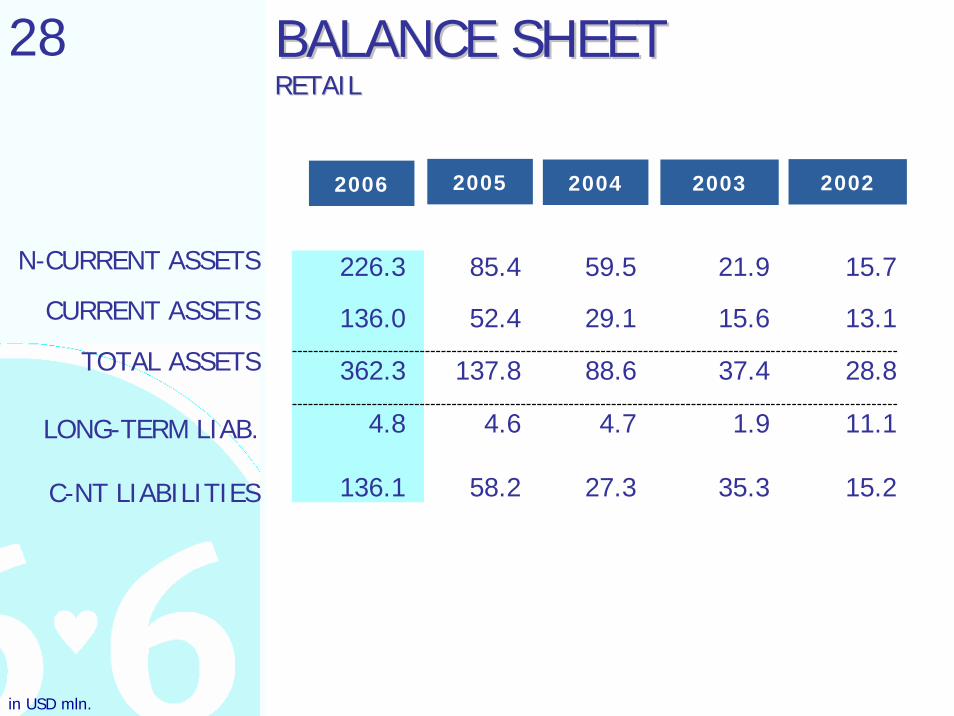
28
226.3 85.4
136.0 52.4
137.8
4.6
58.2
362.3
4.8
136.1
59.5 21.9 15.7
29.1 13.1
28.8
11.1
15.2
88.6
4.7
27.3
1.9
35.3
15.6
37.4
BALANCE SHEETBALANCE SHEETRETAILRETAIL
N-CURRENT ASSETS
CURRENT ASSETS
TOTAL ASSETS
LONG-TERM LIAB.
C-NT LIABILITIES
2004 200320052006 2002
in USD mln.
29
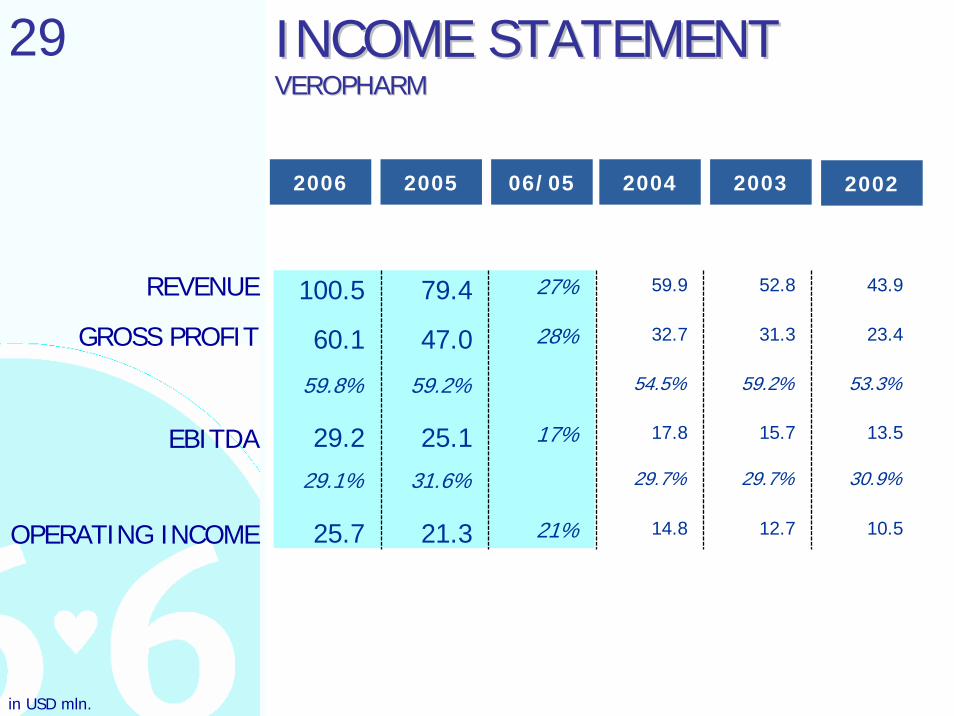
100.5 79.4 27% 59.9 52.8 43.9
60.1 32.7
54.5%
17.8
29.7%
14.8
59.8%
23.431.3
59.2%
15.729.229.7%
53.3%
13.5
30.9%29.1%
12.7 10.525.7
28%
17%
21%
47.0
59.2%
25.131.6%
21.3
INCOME STATEMENTINCOME STATEMENTVEROPHARMVEROPHARM
REVENUE
GROSS PROFIT
EBITDA
OPERATING INCOME
06/052005 2006 2004 2003 2002
in USD mln.
30
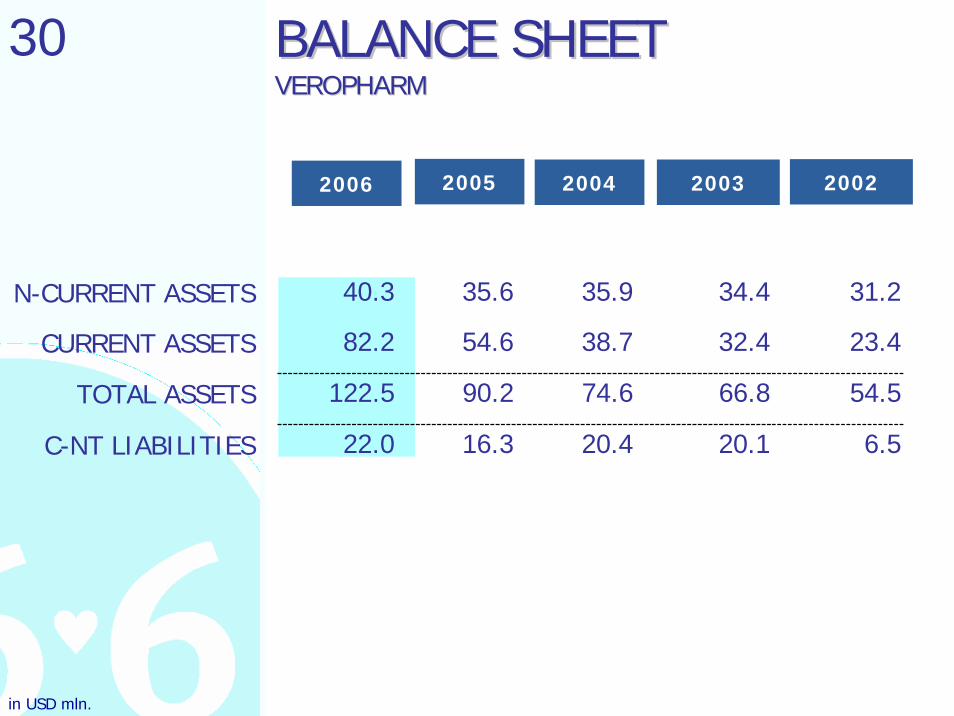
40.3 35.6
82.2 54.6
90.2
16.3
122.5
22.0
35.9 34.4 31.2
38.7 23.4
54.5
6.5
74.6
20.4 20.1
32.4
66.8
BALANCE SHEETBALANCE SHEETVEROPHARMVEROPHARM
N-CURRENT ASSETS
CURRENT ASSETS
TOTAL ASSETS
C-NT LIABILITIES
2004 200320052006 2002
in USD mln.
31
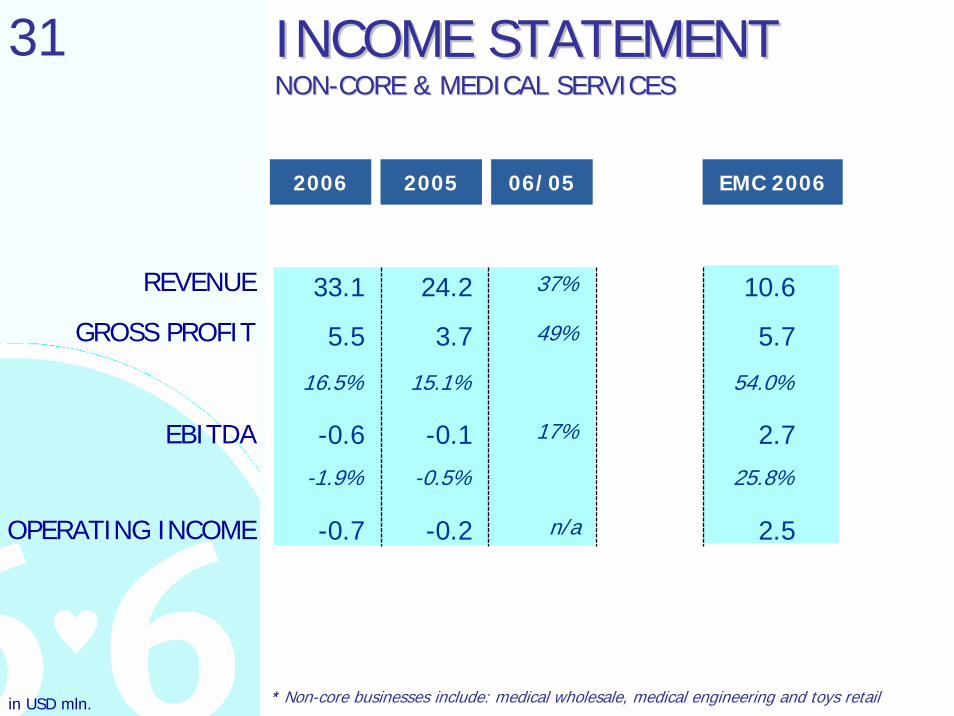
33.1 24.2 37%
5.5
16.5%
-0.6-1.9%
-0.7
49%
17%
n/a
3.7
15.1%
-0.1-0.5%
-0.2
10.6
5.7
54.0%
2.725.8%
2.5
INCOME STATEMENTINCOME STATEMENTNONNON--CORE & MEDICAL SERVICESCORE & MEDICAL SERVICES
REVENUE
GROSS PROFIT
EBITDA
OPERATING INCOME
06/052005 2006 EMC 2006
* Non-core businesses include: medical wholesale, medical engineering and toys retail in USD mln.
32
Address: 119530, Moscow,Ochakovskoe shosse, 10-2-1
Tel.: +7 (495) 792-5207Fax: +7 (495) 792-5206E-mail: [email protected]
www.pharmacychain366.com
HEALTHY, FIT & STRONGHEALTHY, FIT & STRONG