Embed Size (px)
Citation preview


Table of contents


I dedicate this end-of-degree project, first of all, to all my ERASMUS friends who always made sure I had a good time at the end of a hard day’s work. The year I spent with them will not be easily forgotten.
Secondly, I have to thank all my closest friends for simply being there for me at all times even if we are few thousand kilometers apart.
To my parents who have always done everything in their power to ensure I have a good education, among many other important things. To my uncle, cousins, sisters and grandmother who have always supported me and advised me. To Fede and my aunt, who relentlessly guide and teach me.
To Algore’s An Inconvient Truth which sparked my interest in climate change and especially renewable energies.
And finally, to Stefano and Cristina who kindly taught me and helped me in everything from day 1, despite my awful Italian.

Under the pressure to achieve the goals set by the “20-20-20 target”, European countries
must find efficient ways to cut down energy consumption in all sectors of society. The
building industry accounts for over 40% of the total EU energy consumption and 36%
of CO2 emissions and therefore it is an area of great potential.
Initiatives like the EPBD recast oblige member states to push towards making new and
existing constructions net-zero energy buildings (NZEBs). Annex 59 of the ECBCS
arises from the need to investigate HVAC solutions for high performing buildings. Its
goal is to analyse the impact of high temperature cooling and low temperature heating
on energy consumption.
The investigation process in this thesis involved the modelling and modifying of a state-
of-the-art Canadian NZEB with DesignBuilder. Changing the dwelling’s HVAC
system, and taking into account a recently developed concept called ‘entrasy’, it was
possible to demonstrate that high temperature heating and low temperature cooling
HVAC systems decrease energy consumption considerably.


The objective of the thesis is to investigate different solutions for HVAC and energy
systems in high performing buildings in order to analyse their effect in terms of energy
demand, delivered energy, primary energy and energy cost so to find out the most
suitable ones from an energetic and economic point of view.
The investigation is limited to residential buildings in Canada, although the results can
be extrapolated to any building situated in a “cold” environment.
This thesis is conceived as part of the International Energy Agency’s (IEA) research
programme. It specifically falls under Annex 59 of the Energy Conservation in
Buildings & Community Systems (ECBCS).
(http://www.ecbcs.org/annexes/annex59.htm)
Energy efficiency in buildings has gained importance over the last years due mainly to
three reasons.
• Political: European policies like the “20-20-20 target” are pushing countries
from the EU towards sustainable energy usage.
• Economical: Subject to the current energy crisis, the energy efficiency market is
growing in all sectors of society. The building industry specially, due to its
volume - 117,000,000 households in the U.S. alone in 2009 (U.S. Census
Bureau) -, has huge economical potential in this area.
• Social: In the last 50 years, awareness of effects like global warming and climate
change has changed society’s attitude towards energy consumption. Responsible
energy usage is called for.
Analysing the effects of different energy systems in residential buildings is crucial to
understanding the building’s energetic behaviour and performance in order to minimize
energy consumption.
HVAC: Heating, ventilation, and air conditioning
DD: Degree-days; a measurement designed to reflect the demand for energy needed to
heat a building. It is derived from measurements of outside air temperature.
Internal gains: gains due to the activity of people within a dwelling, lighting systems
and equipment.
COP: coefficient of performance; ratio of heating or cooling provided to electrical
energy consumed.
PEF: Primary Energy Factor. Accounts for energy transportation and generation losses.
RSI: Thermal resistance of a material.
U-value: overall heat transfer coefficient; thermal transmittance.
MV: Mechanical ventilation
NV: Natural ventilation
ECM: Electronically commuted motor
HRV: heat recovery ventilator
ACH: Air Changes per Hour. Number of times the room’s volume is filled with fresh
air per hour.
IEA: International Energy Agency
ECBCS: Energy Conservation in Buildings & Community Systems
DB: DesignBuilder


Even though the European Union has legislated in the area of energy policy for many
years, the introduction of mandatory energy policies was only approved in 2005 and
carried out in 2007 with the Treaty of Lisbon.
The Green Paper published by the European Commission in 2006, proposes a common
European energy policy that ensures a reliable, sustainable, competitive and secure
energy supply. To fulfil this goal the Member States are asked to do everything in their
power to:
• Promote renewable energy sources and energy efficiency to combat climate
change;
• Reduce imported hydrocarbons dependence, to create a competitive internal
energy market;
• Ensure energy supply, coordinating energy supply and demand on an
international scale
Regarding the construction industry at a European level, data shows that buildings are
responsible for over 40% of the total EU energy consumption and 36% of CO2
emissions (ec.europa.eu). The construction sector has to accommodate the ever-growing
population while minimizing the scaling energy consumption and CO2 emissions. A set
of guidelines, issued by the European Union, encourage reduction in energy
consumption, promoting the use of renewable energy sources and thus fighting climate
change.
The plan was launched in March 2007 and adopted by the European Parliament on
December 2008 after months of tough negotiations between the member countries. The
so called “energy package” focuses on emissions cuts, renewable sources and energy
efficiency.
The European Commission presented a series of proposals setting ambitious targets of
greenhouse gases reduction:
• To reduce emissions of greenhouse gases by 20% by 2020.
• To increase energy efficiency in order to save 20% of the EU’s energy
consumption by 2020.
• To reach 20% of renewable energy in the total energy consumption in the EU by
2020.
• To reach 10% of biofuel usage in the total consumption of vehicles by 2020.
The Commission has prepared several proposals for implementing these objectives,
most of which can be found in the "climate-energy package" of January 23, 2008.
On November 13, 2008, the Commission also made public a Second Strategic Energy
Review, which contains a new set of proposals. They tend to focus primarily on the
issues of energy security, thus integrating the proposals relating to the "20-20-20 by
2020".
The first European directive on energy performance, or the EPBD (Energy Performance
Building Directive), 2002/91/EC, was born after the first draft of the Kyoto Protocol.
This treaty, signed in December 1997 by more than 180 countries, sets binding
obligations on industrialized countries to reduce emissions of greenhouse gases.
Since 2002, the EPBD has described a common framework from which individual
Member States are able to develop and adopt their own national laws.
In particular, this Directive requires four aspects that need to be integrated into the
national legislature of all countries:
• The adoption of a methodology for calculating the energy performance of
buildings;
• The definition of minimum energy requirements for each Member State;
• The introduction of Energy Performance Certificates (EPCs) for new and
existing buildings;
• Regular inspection of heating / cooling systems.
After eight years of the publication of the EPBD, the European Parliament sees the need
to enrich it to better address the "20-20-20 targets". In fact, it was supplemented by the
EPBD recast 2010/31/EU, published in the Official European Journal of the 18th of
June, and entered into force from the 9th of July 2010. It provides some key changes
compared to the original directive:
• Many explanations and concepts are further clarified in order to facilitate the
interpretation and application of the rules
• Introduction of minimum performance requirements: The 2002 EPBD only
explained how to assess the energy performance by showing a maximum level
of energy consumption without specifying minimum levels of performance.
The new directive is divided into 31 articles, among which the following that concern
our topic must be highlighted:
• Adoption of a methodology for calculating the energy performance of buildings
(Art. 3);
• Establishment of minimum energy performance requirements (Art. 4);
• Calculation of optimal levels of cost as a function of the minimum energy
performance (Art. 5);
• New buildings (Art. 6);
• Existing Buildings (Art. 7);
• Requirements for heating systems for the construction industry (Art. 8);
• Near zero energy buildings (Art. 9);
• Financial incentives and market barriers (Art. 10);
• The Energy Performance Certificate (EPC) (Articles 11-14);
The EPBD recast introduces one particular innovative and fundamental concept, crucial
to this thesis, that will be covered extensively in chapter 3. For the first time, buildings
with high-energy performance (EP) and low energy demand are introduced at a
legislative level. Article 9 of the EPBD recast requires that Member States should
ensure that:
• By 31 December 2020, all new buildings are nearly zero-energy buildings;
• From 31 December 2018, new buildings occupied and owned by public
authorities of the latter are nearly zero-energy buildings;
The European Directive (EPBD recast) defines the energy performance of a building as
"the amount of energy, calculated or measured, needed to meet the energy demand
associated with normal use of the building, including, in particular, the energy used for
heating, cooling, ventilation, domestic hot water and lighting."
In general, the energy performance index EP expresses the primary energy consumption
of a building against its total useful floor area or gross volume per year, expressed
respectively in kWh/m2year or kWh/m3year depending on the building’s intended use.
According to the different needs, the EP index can be broken down to “partial energy
performance” indices:
• EP, w = Energy Performance Indicator for winter heating;
• EP, DHW = Energy Performance Indicator for production of domestic hot water;
• EP, s = Energy Performance Indicator for summer air conditioning;
• EP, app = Energy Performance Indicator for artificial lighting and/or appliances.
Combinations of these indices are used to assess the energy performance of a building.
As a general rule, the final EP should be the sum of all of the above.
In order to define the energy class of a building, each country must establish limit
values for each class, taking into account climatic zones.
In practice, not all partial indices are considered when calculating the final EP since the
last two (EP,s and EP,app) are not specified by normative references.
The Italian energy performance index is simplified to the sum EP = EP,w + EP,DHW.
It is possible to find out the energy performance class of the building, in terms of
winter heating, with the following table:
Class Aw+ < 0,25 EP,wlim 0,25 EP,wlim ≤ Class Aw < 0,50 EP,wlim 0,50 EP,wlim ≤ Class Bw < 0,75 EP,wlim 0,75 EP,wlim ≤ Class Cw < 1,00 EP,wlim 1,00 EP,wlim ≤ Class Dw < 1,25 EP,wlim 1,25 EP,wlim ≤ Class Ew < 1,75EP,wlim 1,75 EP,wlim ≤ Class Fw< 2,50 EP,wlim
Class Gw ≥ 2,50 EP,wlim
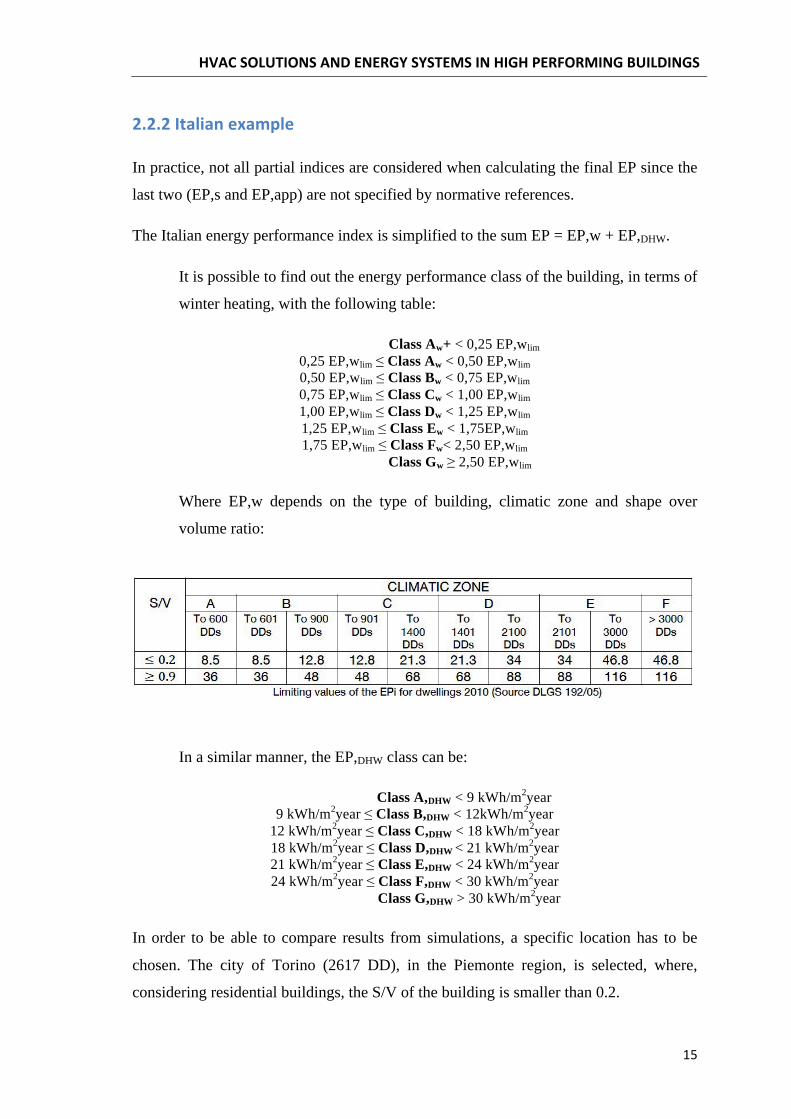
Where EP,w depends on the type of building, climatic zone and shape over
volume ratio:
In a similar manner, the EP,DHW class can be:
Class A,DHW < 9 kWh/m2year 9 kWh/m2year ≤ Class B,DHW < 12kWh/m2year
12 kWh/m2year ≤ Class C,DHW < 18 kWh/m2year 18 kWh/m2year ≤ Class D,DHW < 21 kWh/m2year 21 kWh/m2year ≤ Class E,DHW < 24 kWh/m2year 24 kWh/m2year ≤ Class F,DHW < 30 kWh/m2year
Class G,DHW > 30 kWh/m2year
In order to be able to compare results from simulations, a specific location has to be
chosen. The city of Torino (2617 DD), in the Piemonte region, is selected, where,
considering residential buildings, the S/V of the building is smaller than 0.2.
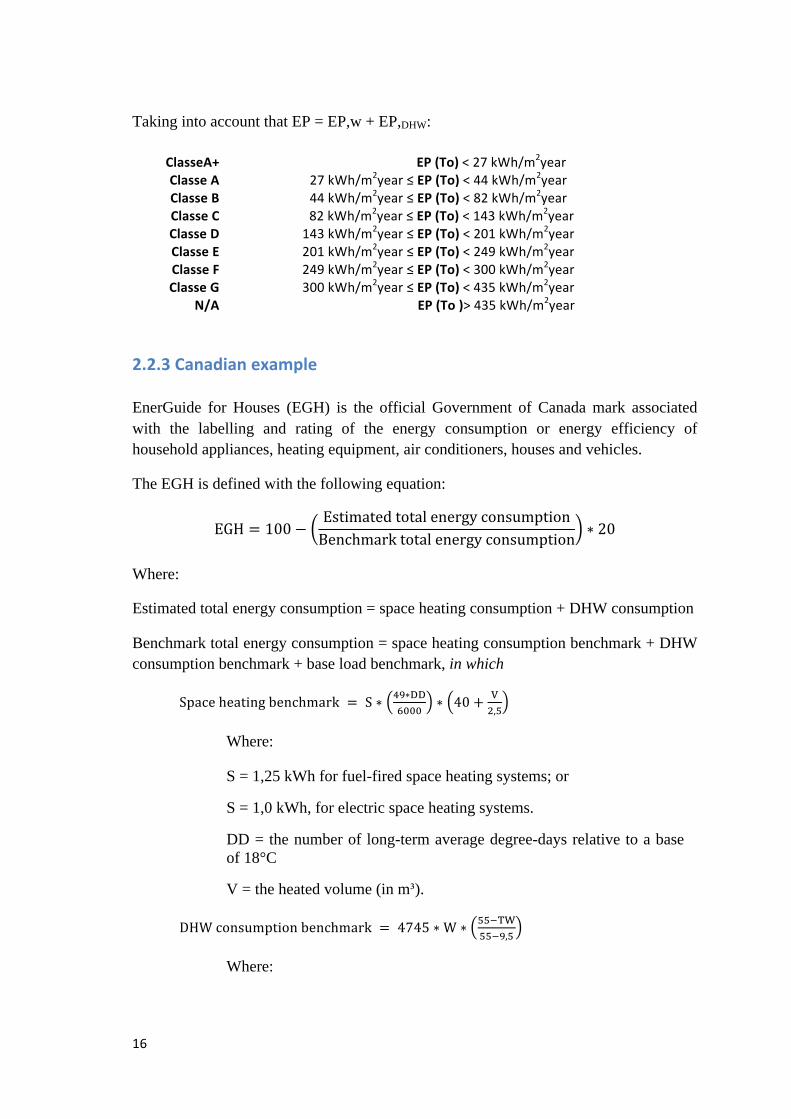
Taking into account that EP = EP,w + EP,DHW:
EnerGuide for Houses (EGH) is the official Government of Canada mark associated with the labelling and rating of the energy consumption or energy efficiency of household appliances, heating equipment, air conditioners, houses and vehicles.
The EGH is defined with the following equation:
Where:
Estimated total energy consumption = space heating consumption + DHW consumption
Benchmark total energy consumption = space heating consumption benchmark + DHW consumption benchmark + base load benchmark, in which
Where:
S = 1,25 kWh for fuel-fired space heating systems; or
S = 1,0 kWh, for electric space heating systems.
DD = the number of long-term average degree-days relative to a base of 18°C
V = the heated volume (in m³).
Where:
W = 1.72 kWh for fuel-fired DHW systems; or
W = 1.075 kWh for electric DHW systems.
TW = local water mains or deep-soil temperature in ºC.
Base load benchmark = 8760 kWh
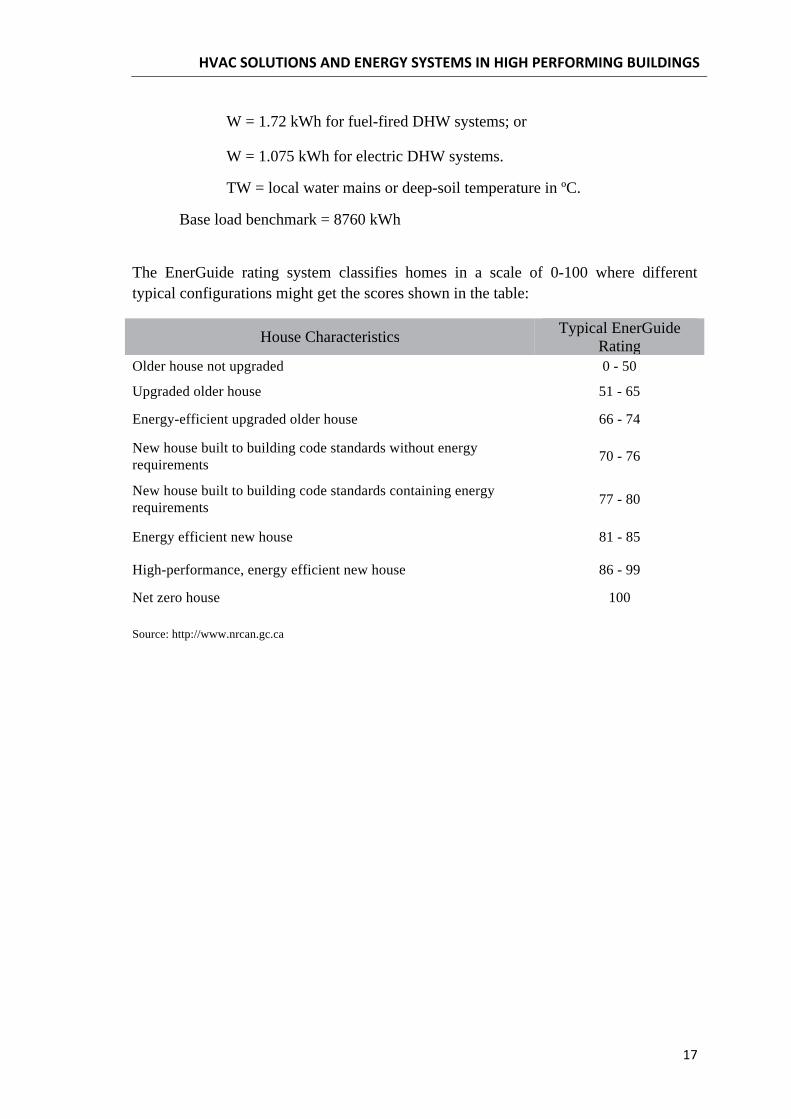
The EnerGuide rating system classifies homes in a scale of 0-100 where different typical configurations might get the scores shown in the table:
House Characteristicscs Typical EnerGuide Rating
erGuing
Older house not upgraded 0 - 50
Upgraded older house 51 - 65
Energy-efficient upgraded older house 66 - 74
New house built to building code standards without energy requirements 70 - 76
New house built to building code standards containing energy requirements 77 - 80
Energy efficient new house 81 - 85
High-performance, energy efficient new house 86 - 99
Net zero house 100 Source: http://www.nrcan.gc.ca

As seen in the previous chapter, nearly zero energy buildings are introduced for the first
time at the regulatory level by the EPBD recast 2010/31/EU. A nearly zero-energy
building is defined as “a building that has a very high energy performance. The nearly
zero or very low amount of energy required should be covered to a very significant
extent by energy from renewable sources, including energy from renewable sources
produced on-site or nearby”.
From this definition it is clear that the aim of these buildings is focused on self-
sufficiency, where:
Energy produced ≥ Energy consumed
However, some critics argue that the definition given by the new European directive is
very poor as it speaks of "almost zero" and does not define a precise threshold energy
performance index.
More than twenty interpretations of Zero Energy Building can be found, differing in:
• Unit of measurement (final delivered energy, primary energy, exergy, CO2
emissions)
• Types of energy consumption (heating, cooling, ventilation, etc.)
• Sources used for energy production (renewable, partial use of fossil fuels)
• Connection to electric grid (off-grid, on-grid)
The term passive house is introduced in 1988 by Wolfgang Feist, the founder and
director of the Passivhaus Institut in Darmstadt, Germany, and by Bo Adamson, Lund
University, Sweden.
The concept of a ‘passive house’ is fundamental to better understand nearly zero energy
houses. As the PHIUS (Passive House Institute US) puts it, “a building constructed
using passive house principles is a very well-insulated, virtually air-tight building that is
primarily heated by passive solar gain and by internal gains from people, electrical
equipment, etc.”
The idea behind this kind of house is the exploitation of natural resources such as solar
radiation, wind, ground temperature etc. in order to minimize the building’s final energy
requirements. Optimally, the energy demand will be almost zero. This type of building
is studied more in-depth in the next chapter, 3.1.3.
There are very simple passive systems, such as windows, or more complex ones like
Trombe walls. In any case, the implementation of each system must be analysed
according to the site’s climatic characteristics.
The singular reduction in energy demand in passive buildings is achieved through a
variety of strategies including superinsulation, orientation and internal layout of the
house, a low S/V ratio and the use of passive solar components.
For example, the building’s super-insulated envelope minimizes dispersion losses,
allowing space-heating demand to be covered mainly by ‘free’ contributions: solar and
internal gains. On the other hand, superinsulation may cause overheating in summer;
therefore each building must be studied carefully. Some fundamental design criteria
have been outlined since the birth of the concept of a passive house.
Criteria relating to buildings in general:
• Building shape: The S/V ratio is the ratio between the dispersing surface and the
heated volume. The lower, the more compact the building, and therefore the
lower the transmission losses;
• Internal distribution: Rooms requiring most heat should be located in the south
part while service areas in the north part;
• Buffered environments: Unconditioned environments that are at an intermediate
temperature between the internal and external environments. These
environments buffer or ‘cushion’ the environments acoustically and thermally;
• The building orientation: It must be oriented south as solar radiation is highest
during winter and lowest during summer (northern hemisphere);
• Window size: It must be such as to maximize solar gains but minimize thermal
losses. The window’s performance depends primarily on weather and thermal
and optical characteristics.
Criteria related to highly efficient houses:
• Superinsulation: To significantly reduce heat loss by transmission, the thermal
transmittance must be less than 0.15 W/m2K for opaque components, and less
than 0.80 W/m2K for the transparent components;
• Control of thermal bridges: They can account for significant heat loss, therefore
attention must be paid; either insulating joints or avoiding thermal bridges
altogether (thermal bridge free design);
• Thermal inertia: Thermal inertia depends on the thermal mass and specific heat
of building materials chosen for the envelope. The choice of the inertial
response of the building should be carried out in relation to its function;
• Air tightness: Infiltration losses are minimized with high air tightness. Air
leakage through cracks and joints should be less than 0.6 ACH @ 50 Pa,
measured by a blower-door test;
• Passive air-conditioning: These systems capture solar radiation and transfer it to
the environment in the form of heat (solar greenhouses, Trombe walls…);
• Low-emissivity glazing: In order to keep the heat indoors, transparent
components must be filled with insulating gasses such as argon or krypton and
have as many sheets of glazing as possible, typically three or four. The
window’s U-value should be lower than 0.8 W/m2K and a solar factor of around
50%;
• Sun protection: Mobile shading devices, like overhangs or blinds, are crucial to
prevent overheating in summer due to excessive solar gains. Innovative
techniques also make it possible to control solar radiation with the actual glazing
component.
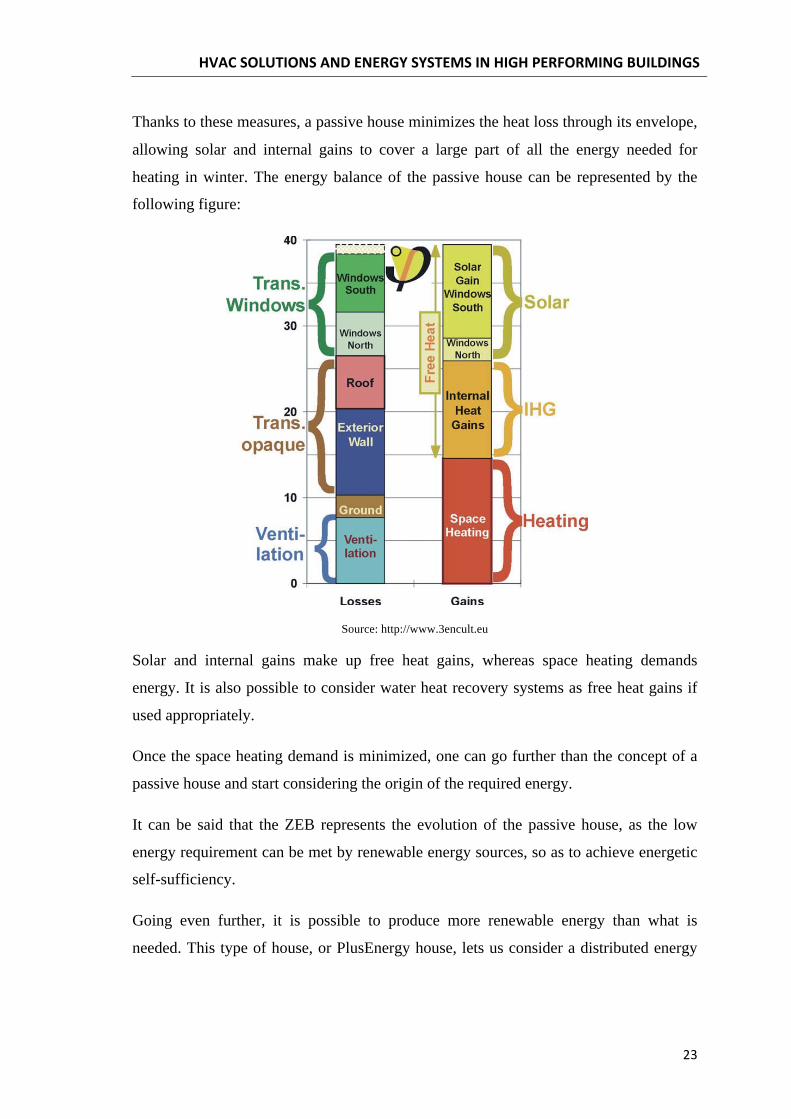
Thanks to these measures, a passive house minimizes the heat loss through its envelope,
allowing solar and internal gains to cover a large part of all the energy needed for
heating in winter. The energy balance of the passive house can be represented by the
following figure:
Source: http://www.3encult.eu
Solar and internal gains make up free heat gains, whereas space heating demands
energy. It is also possible to consider water heat recovery systems as free heat gains if
used appropriately.
Once the space heating demand is minimized, one can go further than the concept of a
passive house and start considering the origin of the required energy.
It can be said that the ZEB represents the evolution of the passive house, as the low
energy requirement can be met by renewable energy sources, so as to achieve energetic
self-sufficiency.
Going even further, it is possible to produce more renewable energy than what is
needed. This type of house, or PlusEnergy house, lets us consider a distributed energy
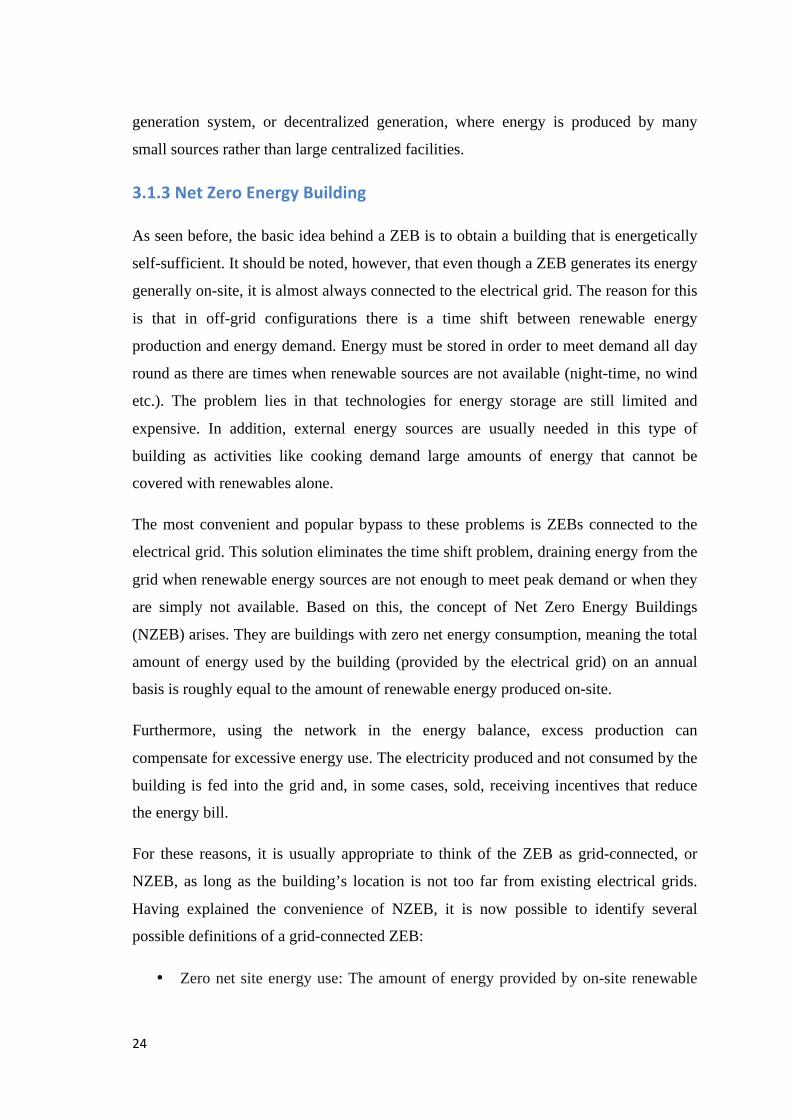
generation system, or decentralized generation, where energy is produced by many
small sources rather than large centralized facilities.
As seen before, the basic idea behind a ZEB is to obtain a building that is energetically
self-sufficient. It should be noted, however, that even though a ZEB generates its energy
generally on-site, it is almost always connected to the electrical grid. The reason for this
is that in off-grid configurations there is a time shift between renewable energy
production and energy demand. Energy must be stored in order to meet demand all day
round as there are times when renewable sources are not available (night-time, no wind
etc.). The problem lies in that technologies for energy storage are still limited and
expensive. In addition, external energy sources are usually needed in this type of
building as activities like cooking demand large amounts of energy that cannot be
covered with renewables alone.
The most convenient and popular bypass to these problems is ZEBs connected to the
electrical grid. This solution eliminates the time shift problem, draining energy from the
grid when renewable energy sources are not enough to meet peak demand or when they
are simply not available. Based on this, the concept of Net Zero Energy Buildings
(NZEB) arises. They are buildings with zero net energy consumption, meaning the total
amount of energy used by the building (provided by the electrical grid) on an annual
basis is roughly equal to the amount of renewable energy produced on-site.
Furthermore, using the network in the energy balance, excess production can
compensate for excessive energy use. The electricity produced and not consumed by the
building is fed into the grid and, in some cases, sold, receiving incentives that reduce
the energy bill.
For these reasons, it is usually appropriate to think of the ZEB as grid-connected, or
NZEB, as long as the building’s location is not too far from existing electrical grids.
Having explained the convenience of NZEB, it is now possible to identify several
possible definitions of a grid-connected ZEB:
• Zero net site energy use: The amount of energy provided by on-site renewable
energy sources is equal to the amount of energy used by the building.
• Zero net source energy use: This ZEB generates the same amount of energy as is
used, including the energy lost in the transmission lines. These ZEBs must
generate more electricity than zero net site energy buildings to account for this
loss.
• Net zero energy emissions: The carbon emissions generated from on-site or off-
site fossil fuel use are balanced by the amount of on-site renewable energy
production. Other definitions include not only the carbon emissions generated
by the building during use, but also those generated in its construction.
• Net zero cost: The cost of purchasing energy is balanced by income from sales
of electricity to the grid of electricity generated on-site.
• Net off-site zero energy use: A building may be considered a ZEB if 100% of
the energy it purchases comes from renewable energy sources, even if the
energy is generated off the site.
The ‘Zero net source energy use’ definition seems to be the most popular among
building designers and the official definition for the European Parliament Committee of
Industry, Research and Energy.
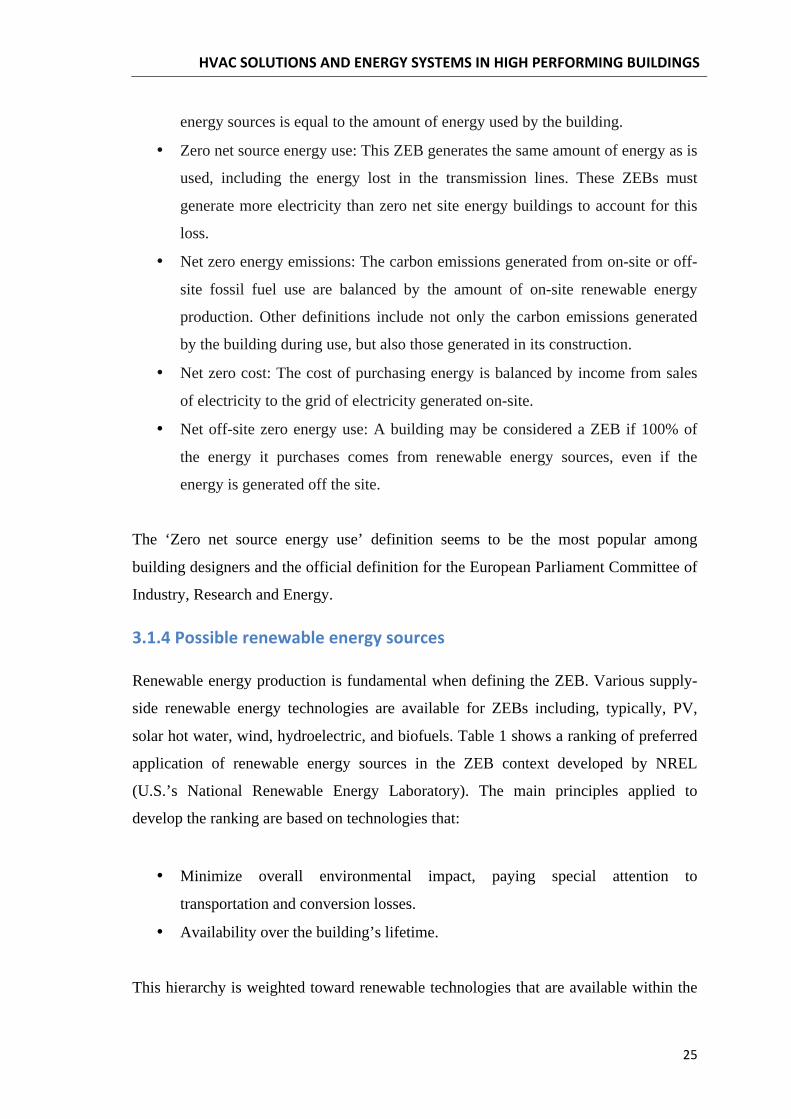
Renewable energy production is fundamental when defining the ZEB. Various supply-
side renewable energy technologies are available for ZEBs including, typically, PV,
solar hot water, wind, hydroelectric, and biofuels. Table 1 shows a ranking of preferred
application of renewable energy sources in the ZEB context developed by NREL
(U.S.’s National Renewable Energy Laboratory). The main principles applied to
develop the ranking are based on technologies that:
• Minimize overall environmental impact, paying special attention to
transportation and conversion losses.
• Availability over the building’s lifetime.
This hierarchy is weighted toward renewable technologies that are available within the
building footprint and at the site. Rooftop PV and solar water heating are the most
applicable supply-side technologies for widespread application of ZEBs.
Option Number ZEB Supply-Side Options Examples
0 Reduce site energy use through low-energy building technologies
Daylighting, high-efficiency HVAC equipment, natural ventilation, evaporative cooling, etc.
On-Site Supply Options
1 Use renewable energy sources available within the building’s footprint
PV, solar hot water, and wind located on the building.
2 Use renewable energy sources available at the site
PV, solar hot water, low-impact hydro, and wind located on-site, but not on the building.
Off-Site Supply Options
3 Use renewable energy sources available off site to generate energy on site
Biomass, wood pellets, ethanol, or biodiesel that can be imported from off site, or waste streams from on-site processes that can be used on-site to generate electricity and heat.
4 Purchase off-site renewable energy sources
Utility-based wind, PV, emissions credits, or other “green” purchasing options. Hydroelectric is sometimes considered.
Table 1: Ranking of renewable energy sources. Source: Torcellini P.,Pless.S., Zero Energy Buildings: A critical look at the definition, California, 2006 On-site supply options are clearly more favourable and therefore they must be
considered and integrated into the design of a ZEB.
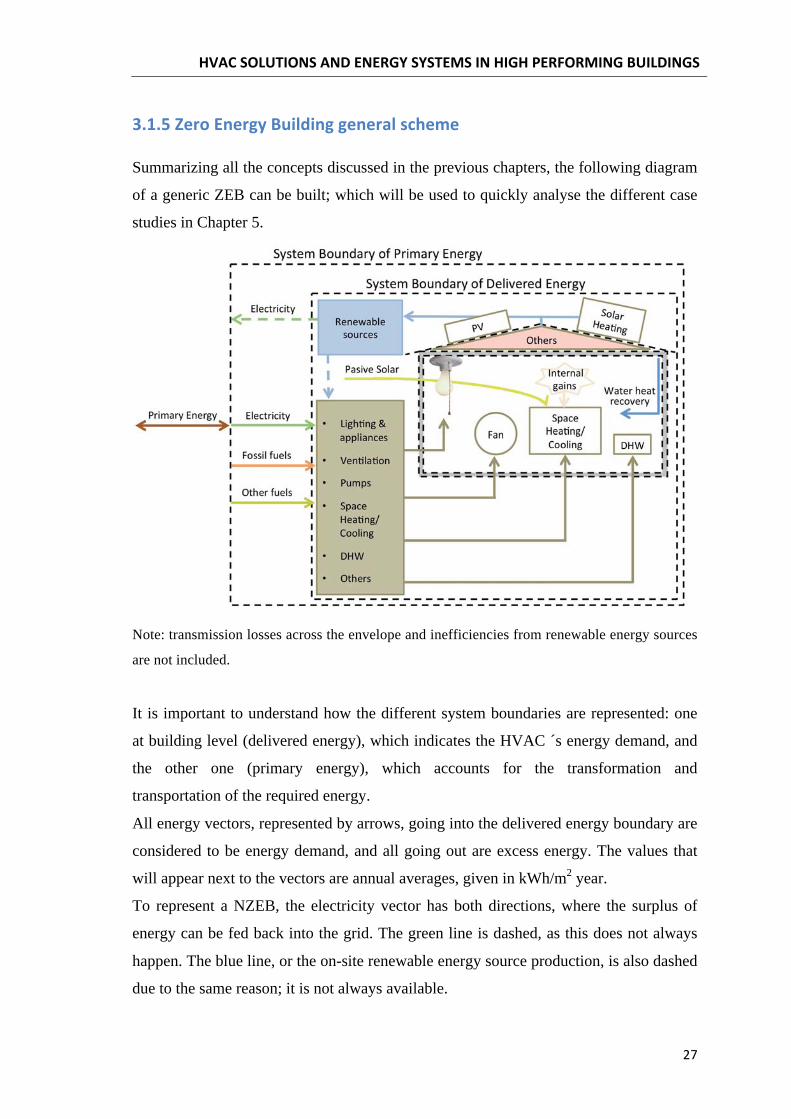
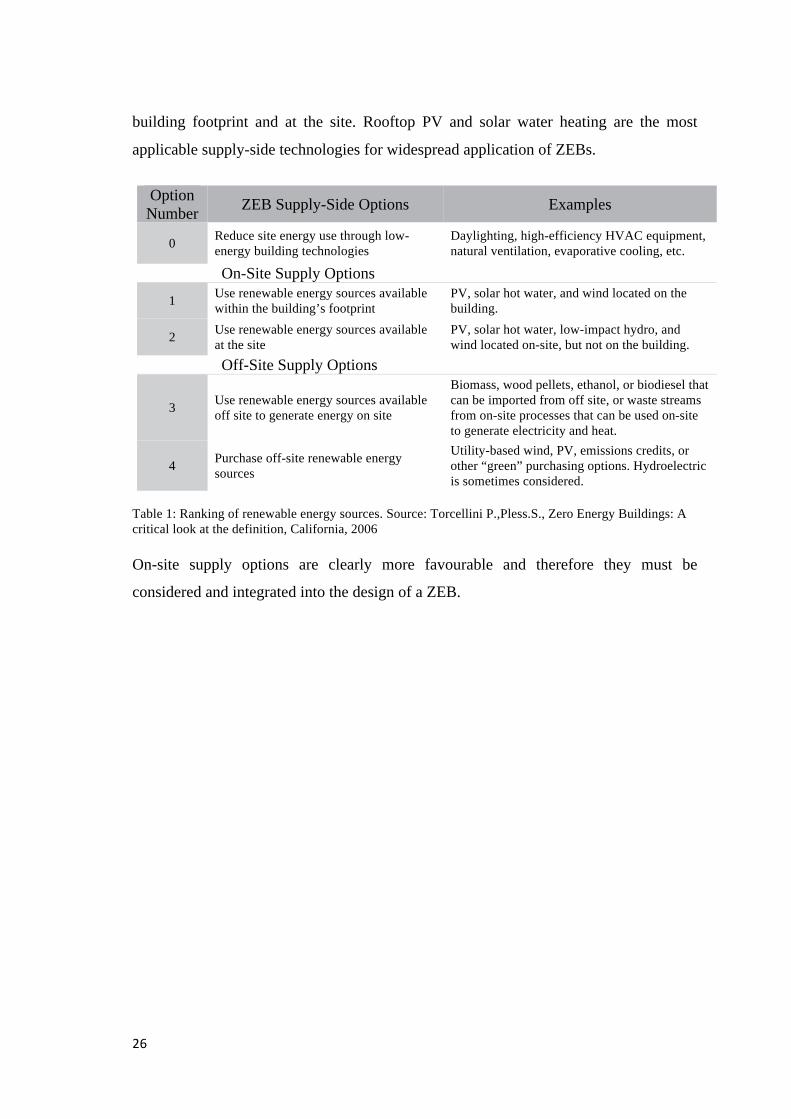
Summarizing all the concepts discussed in the previous chapters, the following diagram
of a generic ZEB can be built; which will be used to quickly analyse the different case
studies in Chapter 5.
Note: transmission losses across the envelope and inefficiencies from renewable energy sources
are not included.
It is important to understand how the different system boundaries are represented: one
at building level (delivered energy), which indicates the HVAC ´s energy demand, and
the other one (primary energy), which accounts for the transformation and
transportation of the required energy.
All energy vectors, represented by arrows, going into the delivered energy boundary are
considered to be energy demand, and all going out are excess energy. The values that
will appear next to the vectors are annual averages, given in kWh/m2 year.
To represent a NZEB, the electricity vector has both directions, where the surplus of
energy can be fed back into the grid. The green line is dashed, as this does not always
happen. The blue line, or the on-site renewable energy source production, is also dashed
due to the same reason; it is not always available.
The main brown block lists the building’s different energy requirements (heating,
cooling, etc.) where two inputs (on-site renewable energy sources, and off-site energy
sources) and one output (appliances, heating systems etc.) can be found. As the diagram
can represent any NZEB, the type of delivered energy required by each system is not
shown, although this will be clarified when discussing the different case studies (PART
3).
Solar heating, PV, water heat recovery systems etc. are included in the diagram
although it does not mean that all NZEB include these systems.
The primary energy arrow is also shown with two arrowheads as depending on the
building, it can supply more energy than it demands over a year. The REHVA Journal
(May 2009) expresses this concept with the following formula:
Where,
Edel,i and Eexp,i are the imported and exported primary energy.
fdel,i and fexp,i are the respective conversion factors.
The subscript "i" indicates the presence of different energy distributors.
In the first section of this chapter the EPBD recast’s definition of nearly zero energy
buildings has been described. Now it is necessary to go deeper into the regulatory
guidelines that relate specifically to nNZEB (nearly Net Zero Energy Buildings).
Moving towards nNZEB is not just a European goal; countries like USA and Canada
specially, are also pushing forwards in this area. The "Obama Plan", for example,
requires all buildings to be zero energy all over the U.S. from 2030.
Another pioneering country is the United Kingdom, which has promoted in 2006 a
program that, from 2016, involves the construction of Carbon Neutral or Zero Carbon
buildings, also promoting measures to improve the energy efficiency of the envelope of
existing buildings.
Europe is also promoting the development of nearly zero energy buildings through the
birth of the European Directive 2010/31/EU although it is lagging slightly behind the
U.K. in accomplishing the requirements of the Kyoto Protocol.
The EPBD recast 2010/31/EU devotes the entire 9th article to the European objectives
concerning nearly zero energy buildings. In particular, it is stipulated that:
• By 31 December 2020, all new buildings have to be nearly zero-energy
buildings;
• From 31 December 2018, new buildings occupied by public authorities and their
properties have to be nearly zero-energy buildings.
Member States should also draw up national plans to increase the number of nearly zero
energy buildings. These national plans may include targets differentiated by building
type. Member States shall also, following the example of the public sector, define
policies, adopt measures, fix objectives and promote refurbishment of existing buildings
into nZEB, informing the Commission of their national plans.
National plans must include the following elements:
• Detailed definition of nearly zero-energy buildings, by the member states, at a
national, regional or local level, with a numeric indicator of primary energy
consumption in kWh/m2 per year. Primary energy factors used for the
determination of the primary energy consumption can be based on national or
regional yearly average values and account for relevant European standards;
• Intermediate targets for improving the energy performance of new buildings by
2015;
• Information on policies and financial measures undertaken to promote nearly
zero-energy buildings, including details on the use of renewable energy sources
in new buildings and existing buildings undergoing a major renovation.
The Commission evaluates each member state’s national plans and in particular the
adequacy of the measures in relation to the objectives of the Directive. The Commission
may request further and more specific information in which case, the Member State
concerned shall provide the requested information or propose amendments within nine
months of the Commission's request. Following the assessment, the Commission may
issue a recommendation.
By December 31, 2012 and every three years thereafter, the Commission shall publish a
report on the progress made by the Member States to increase the number of nearly zero
energy buildings. On the basis of this report, the Commission shall draw up an action
plan and, if necessary, propose measures and best practice plans in relation to the
effective transformation, in terms of costs, of existing buildings into nearly zero energy
buildings.
The International Energy Agency (IEA) is an intergovernmental organization that acts
as a policy adviser to its member states. In 2008, this agency set up a specific working
task, "Towards Net Zero Energy Solar Buildings" (SHC Task 40 / ECBCS annex 52),
which aims to find a global definition of ‘NZEB’ that can be shared internationally. Its
main objectives are:
• To establish an internationally agreed understanding on net zero energy
buildings
• To identify and refine a suite of design tools to support industry adoption
• To develop and test innovative, whole building net-zero solution sets for cold,
moderate and hot climates with exemplary architecture and technologies
With regard to the design criteria for a nearly zero energy home, as outlined in section
3.1.2, it must be a building with low energy consumption based on the ideas that
support the passive house. The ZEB takes these steps further by integrating renewable
energy production into the design.
As a general rule, it can be said that there are three ways to the ZEB:
• Energy saving regarding the building’s envelope;
• Energy efficiency regarding the building’s installations and systems;
• Production of energy from renewable sources.
It is worth noting that there are no universal architectural solutions as each house is
conditioned to its own geographical circumstances. This means that the building must
be in close relationship with its climatic context, materials available, local culture etc.,
taking advantage of its surroundings as far as possible.
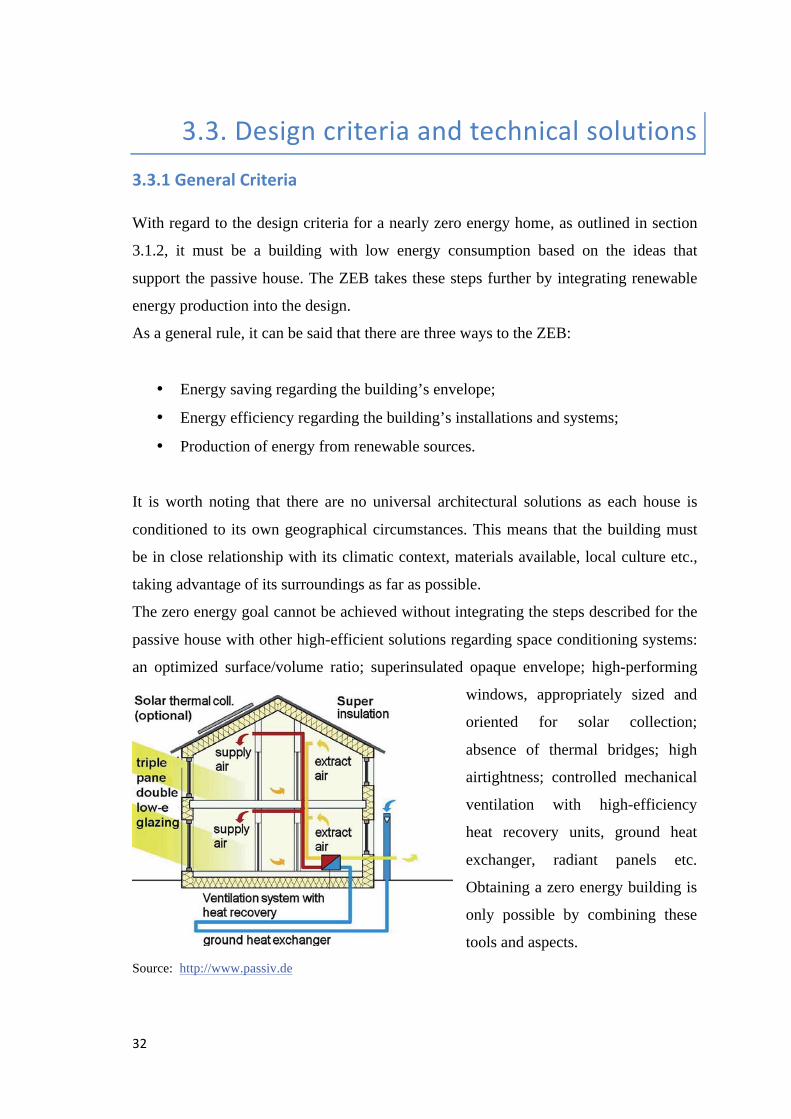
The zero energy goal cannot be achieved without integrating the steps described for the
passive house with other high-efficient solutions regarding space conditioning systems:
an optimized surface/volume ratio; superinsulated opaque envelope; high-performing
windows, appropriately sized and
oriented for solar collection;
absence of thermal bridges; high
airtightness; controlled mechanical
ventilation with high-efficiency
heat recovery units, ground heat
exchanger, radiant panels etc.
Obtaining a zero energy building is
only possible by combining these
tools and aspects. Source: http://www.passiv.de
This section will go through a brief analysis of the possible design solutions with regard
to the building’s HVAC system, in order to understand and apply some of them to the
case studies analysed in the second part of this paper.
To obtain a zero-energy building, high-efficiency power plants are needed to further
reduce the energy demand. Popular and available generation systems are, for example:
• Heat pumps: uses electrical energy to transfer heat from one environment at a
lower temperature to one at a higher temperature or vice versa. It can be used for
both heating/cooling and DHW generation, where most of the energy for heating
comes from the external environment, and only a fraction comes from
electricity, giving the system an equivalent efficiency, or COP, of more than 3.
To further reduce the energy consumption, they are often combined with
geothermal probes. These ground-source heat pumps (GSHP) generally exploit
the temperature difference between ground water (at constant temperature) and
the outside (see Chapter 7.3);
• High efficiency condensing boiler: retrieves most of the latent heat of the fumes
expelled by the fireplace;
• Cell combustion: allows to obtain electricity directly from certain substances,
typically hydrogen and oxygen, without any thermal combustion process;
• Cogeneration: Simultaneous production of electrical and thermal energy;
Generation systems are not the only mechanisms that allow lower energy consumption.
Terminal or distribution apparatus also play a key role, as demonstrated in the second
part of the paper. Only the most efficient and popular systems are listed bellow:
• Radiant panels: heating systems based on radiation; usually in the form of
under-floor heating panels. Chilled beams are also available when considering
cooling requirements;
• Fan coil units: a device consisting of heating and/or cooling coils and a fan; not
connected to ductwork;
• Air handling units (AHU): device containing a blower, heating or cooling
elements, filter racks or chambers, humidifiers/dehumidifiers, sound attenuators,
and dampers (these last two elements are mainly used in large, non-residential
buildings). AHU units distribute conditioned air throughout the building via
ductwork.
Mechanical ventilation systems, like the last two, are often equipped with heat recovery
systems, in order to avoid thermal losses related to the replacement of air. This is
fundamental given that, once transmission losses are reduced, ventilation losses gain
great importance. Thanks to mechanical ventilation systems, airflow rates can be
controlled minimizing ventilation losses while increasing internal comfort. These
systems can recover up to 90% of the thermal energy contained in the discharged air.
It should be noted that a mechanical ventilation system can be compatible with other
distribution systems, like radiant panels, as it may only be responsible for the number of
air changes per hour (ach) and not heating and cooling loads.
AHUs and fan coil units can also include economizers. An economizer is a damper
opening that draws up to 100% of outside air when the outside air is cooler than the
temperature inside the building, thereby providing free cooling. An outdoor air
economy cycle can reduce cooling energy requirements by 20% to 30%.
In addition, a zero energy building has to achieve energetic self-sufficiency with on-site
(where possible) renewable energy generation.
The technologies currently most in use are:
• Wind turbines: utilizes wind power to produce electricity;
• Photovoltaic (PV) systems: uses solar radiation to produce electricity;
• Solar heating system: it captures solar radiation and converts it into heat, which
is used both for space heating and DHW. Trombe walls and Building Integrated
Photovoltaic and Thermal systems (BIPV-T; system which merges PV and
thermal systems) are configurations that can be included in this category;
• Biomass-fuelled systems like boilers or cogeneration plants;

Finally, lighting and appliances must also be taken into account, as the energy demand
associated can be large:
• Lights and appliances with low energy consumption: A+, A++ and A+++ energy
efficiency classes;
• Home automation systems: these are systems that automatically control
appliances that adjust the amount of solar radiation, temperature etc.


The IEA (International Energy Agency) Energy in Buildings and Communities
Programme (EBC, formerly ECBCS) carries out research and development activities
toward near-zero energy and carbon emissions in the built environment.
Annex 59 of the ECBCS states that “the aim of building and HVAC systems is to
maintain suitable indoor climate quality, including required temperature, humidity and
indoor air quality. Theoretically any heating source with higher temperature than indoor
environment can supply heat in winter and vice versa for cooling sources in summer.
Since the temperature of heating sources and cooling sources influences HVAC energy
consumption directly, the concept of high temperature cooling and low temperature
heating is rooted in the idea of reducing temperature difference between heating
sources/cooling sources and indoor environment.” (Minimizing ΔT in HVAC Systems for
High Energy Efficiency in Buildings, Sept. 2011; Proposal for a new IEA ECBCS‐Annex 59)
“After an intensive study, we (Qun Chen, Xin-Gang Liang and Zeng-Yuan Guo; Department
of Engineering Mechanics, Tsinghua University, China) found that all transport processes
contain two different types of physical quantities due to the existing irreversibility, i.e.,
the conserved ones and the non-conserved ones, and the loss or dissipation in the non-
conserved quantities can then be used as the measurements of the irreversibility in the
transport process.”
If the transportation of electricity is analysed, one comes to the conclusion that even
though the electric charge and the total energy is conserved; due to Joule losses, some
electric energy is transformed into thermal energy. This electrical energy dissipation
rate is often regarded as the irreversibility measurement of the electric conduction
process. Similarly, for the transportation of a viscous fluid, both the momentum and the
mass of the fluid are conserved, whereas the fluid’s mechanical energy, including both
the potential and kinetic energies, is turned into thermal energy, due to viscous
dissipation. Consequently, the mechanical energy dissipation is a common measure of
irreversibility in a fluid flow process.
However, “an irreversibility in a heat transfer process seems to have its own
particularity as the heat energy always remains constant and it doesn’t appear to be clear
what the non-conserved quantity is in a heat transfer process” (Chen et al., 2011). Based
on the analogy between electrical and heat conductions, Guo et al. (2007) made a
comparison between electrical conduction and heat conduction as shown in the
following table.
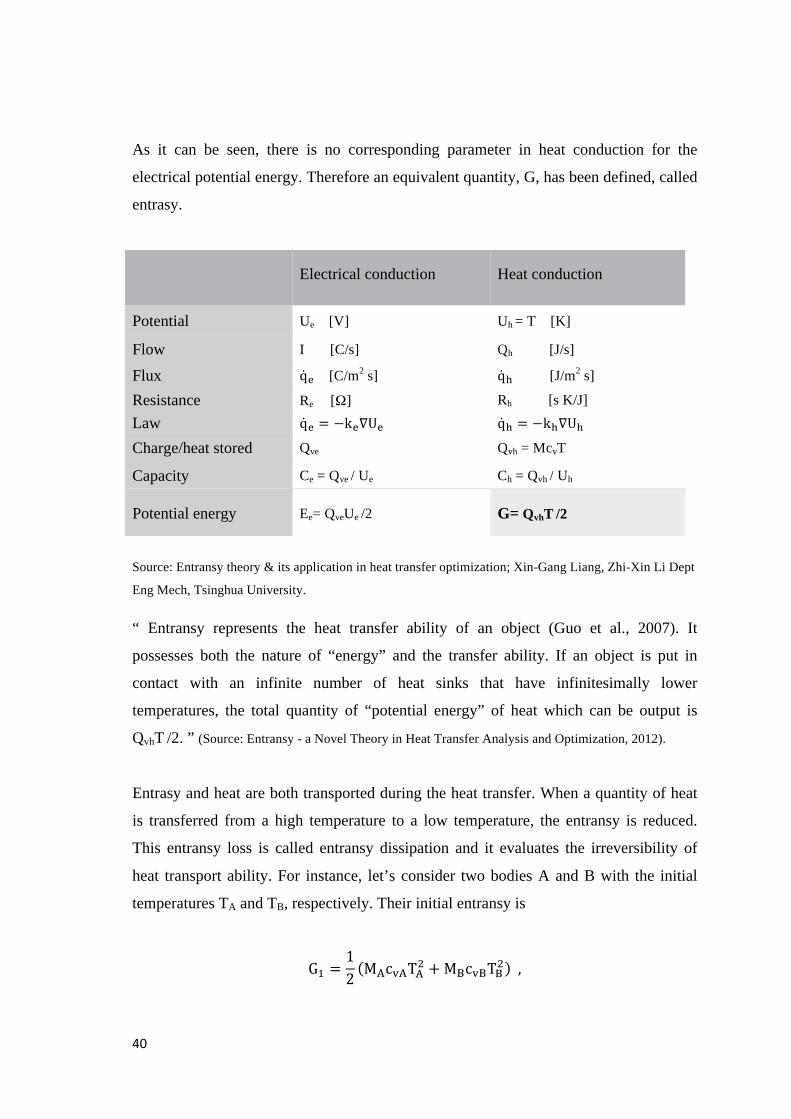
As it can be seen, there is no corresponding parameter in heat conduction for the
electrical potential energy. Therefore an equivalent quantity, G, has been defined, called
entrasy.
Electrical conduction Heat conduction
Potential Ue [V] Uh = T [K]
Flow I [C/s] Qh [J/s]
Flux [C/m2 s] [J/m2 s]
Resistance Re [Ω] Rh [s K/J]
Law
Charge/heat stored Qve Qvh = McvT
Capacity Ce = Qve / Ue Ch = Qvh / Uh
Potential energy Ee= QveUe /2 G= QvhT /2
Source: Entransy theory & its application in heat transfer optimization; Xin-Gang Liang, Zhi-Xin Li Dept
Eng Mech, Tsinghua University.
“ Entransy represents the heat transfer ability of an object (Guo et al., 2007). It
possesses both the nature of “energy” and the transfer ability. If an object is put in
contact with an infinite number of heat sinks that have infinitesimally lower
temperatures, the total quantity of “potential energy” of heat which can be output is
QvhT /2. ” (Source: Entransy - a Novel Theory in Heat Transfer Analysis and Optimization, 2012).
Entrasy and heat are both transported during the heat transfer. When a quantity of heat
is transferred from a high temperature to a low temperature, the entransy is reduced.
This entransy loss is called entransy dissipation and it evaluates the irreversibility of
heat transport ability. For instance, let’s consider two bodies A and B with the initial
temperatures TA and TB, respectively. Their initial entransy is
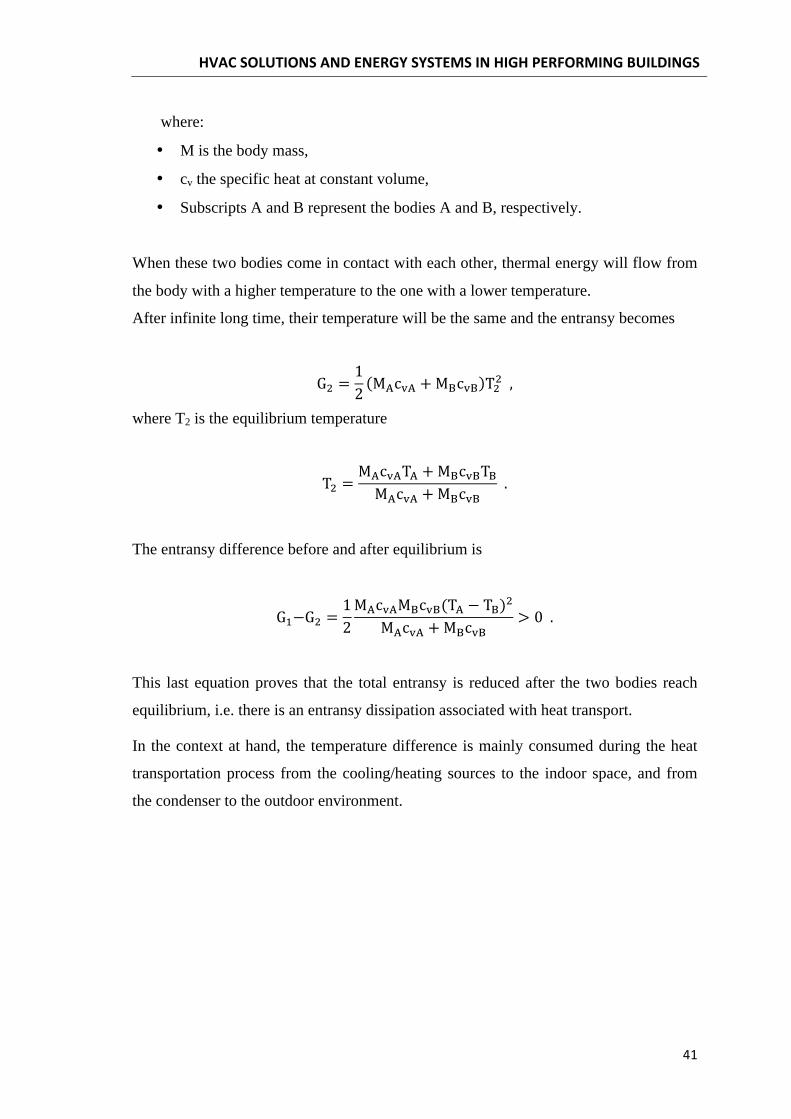
where:
• M is the body mass,
• cv the specific heat at constant volume,
• Subscripts A and B represent the bodies A and B, respectively.
When these two bodies come in contact with each other, thermal energy will flow from
the body with a higher temperature to the one with a lower temperature.
After infinite long time, their temperature will be the same and the entransy becomes
where T2 is the equilibrium temperature
The entransy difference before and after equilibrium is
This last equation proves that the total entransy is reduced after the two bodies reach
equilibrium, i.e. there is an entransy dissipation associated with heat transport.
In the context at hand, the temperature difference is mainly consumed during the heat
transportation process from the cooling/heating sources to the indoor space, and from
the condenser to the outdoor environment.
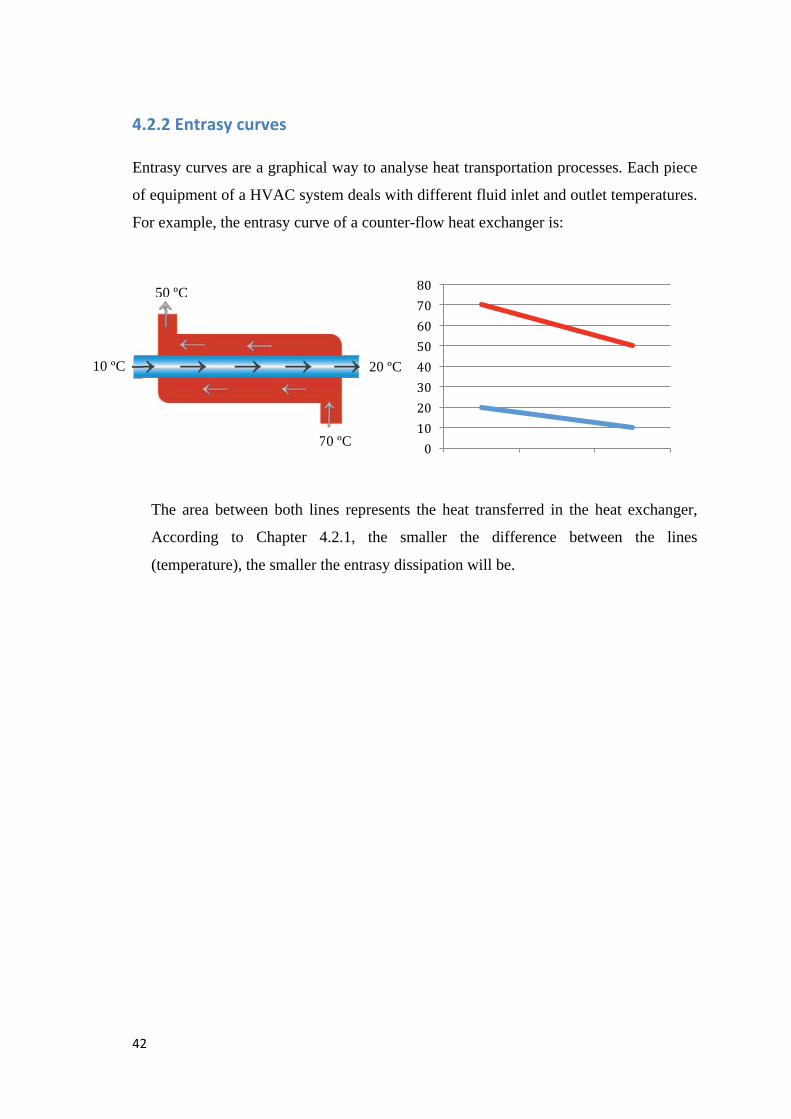
Entrasy curves are a graphical way to analyse heat transportation processes. Each piece
of equipment of a HVAC system deals with different fluid inlet and outlet temperatures.
For example, the entrasy curve of a counter-flow heat exchanger is:
The area between both lines represents the heat transferred in the heat exchanger,
According to Chapter 4.2.1, the smaller the difference between the lines
(temperature), the smaller the entrasy dissipation will be.
50 ºC
70 ºC
10 ºC 20 ºC
50 ºC
70 ºC


An exhaustive investigation process was carried out in order to pick possible houses to
be analysed. The selection criteria used was simple: existing passive houses. That said,
it was important to find the building’s architectural plans in order to model the house
accurately.
The final candidates are listed bellow:
1. Riverdale NetZero Project
2. ÉcoTerra
3. Now House
4. Avalon Discovery 3
5. Inspiration: The Minto ecohome
6. The Green Dream Home
7. Abondance Montréal: le Soleil
8. The Laebon CHESS Project
9. Harmony House
10. EchoHaven
11. Urban Ecology
Each house’s technical specifications can be found in Annex A.
Considering the objectives of this paper; candidate number 5 (Inspiration: The Minto
echome) was thought to be the most suitable house for the following reasons:
• Space heating and DHW are mainly supplied by natural gas-driven heating
systems;
• AHU distribution system;
• Negligible cooling loads;
• Mechanical ventilation;
• Information available.
This house is part of a Canadian initiative called CMHC's EQuilibrium™ Sustainable
Housing Demonstration. EQuilibrium™ is a national sustainable housing demonstration
initiative, led by Canada Mortgage and Housing Corporation (CMHC), designed to
address occupant health and comfort, energy efficiency and renewable energy
production, resource conservation, reduced environmental impact and affordability.
“The Minto ecohome began with an Integrated Design Charrette (or planning session)
carried out by Minto Developments Ltd. The session resulted in a shopping list of more
than 300 improvements over conventional home design.” (http://www.cmhc-schl.gc.ca)
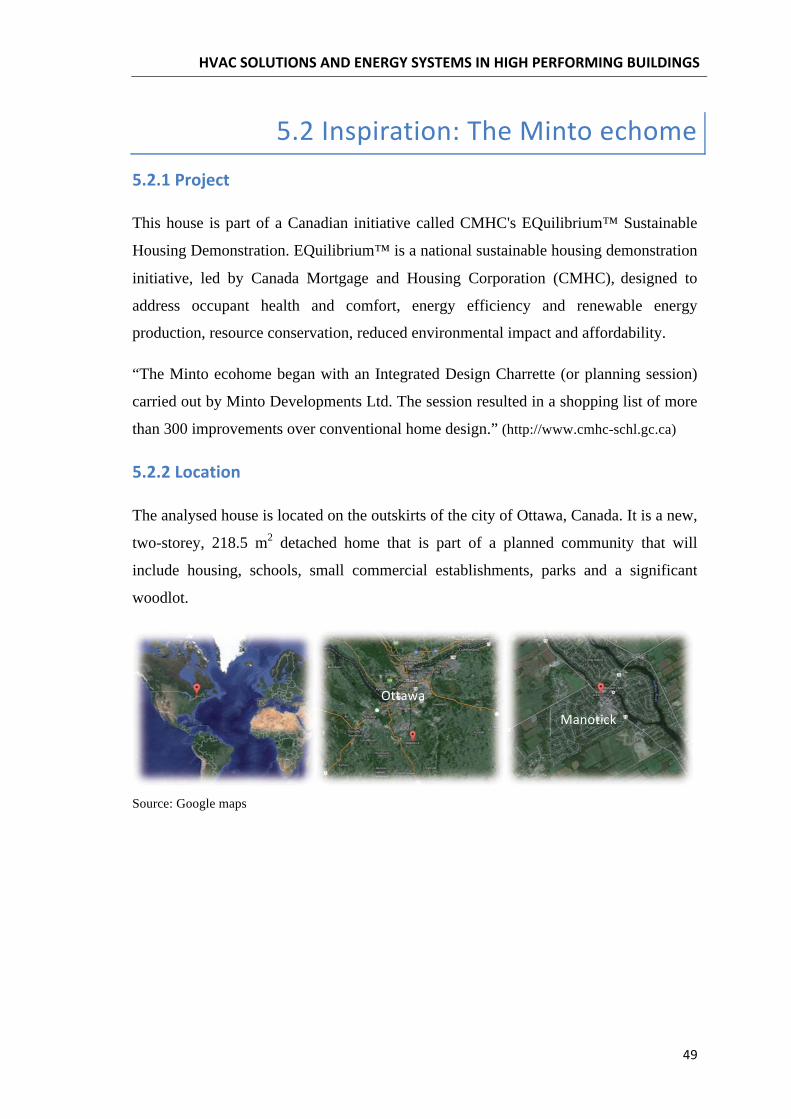
The analysed house is located on the outskirts of the city of Ottawa, Canada. It is a new,
two-storey, 218.5 m2 detached home that is part of a planned community that will
include housing, schools, small commercial establishments, parks and a significant
woodlot.
Source: Google maps
Fluctuant monthly average temperatures characterize this region where heating degree-
days predominate over cooling degree-days:
Average outdoor temperatures Building design temperatures
January -10.8ºC January -22.0ºC
April 5.7ºC July 28.5ºC
July 20.9ºC Heating DD (base 18ºC) 4,602
October 7.8ºC Cooling DD (base 18ºC) 244.6
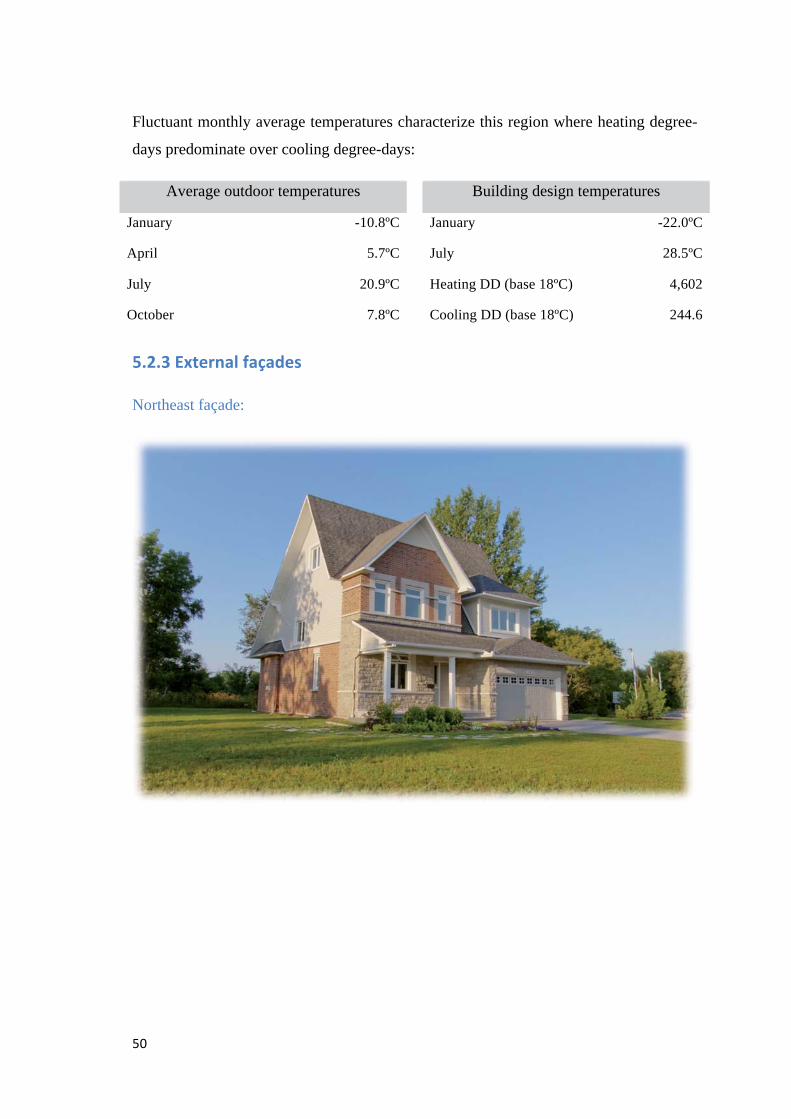
Northeast façade:
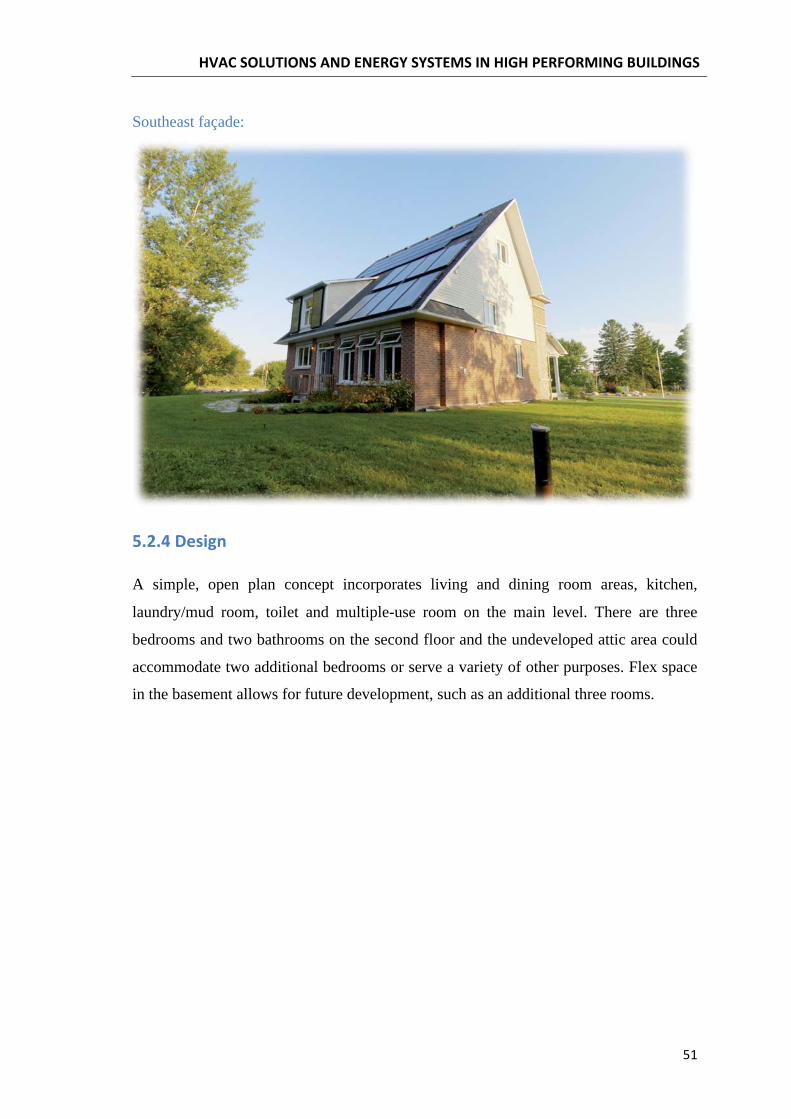
Southeast façade:
A simple, open plan concept incorporates living and dining room areas, kitchen,
laundry/mud room, toilet and multiple-use room on the main level. There are three
bedrooms and two bathrooms on the second floor and the undeveloped attic area could
accommodate two additional bedrooms or serve a variety of other purposes. Flex space
in the basement allows for future development, such as an additional three rooms.
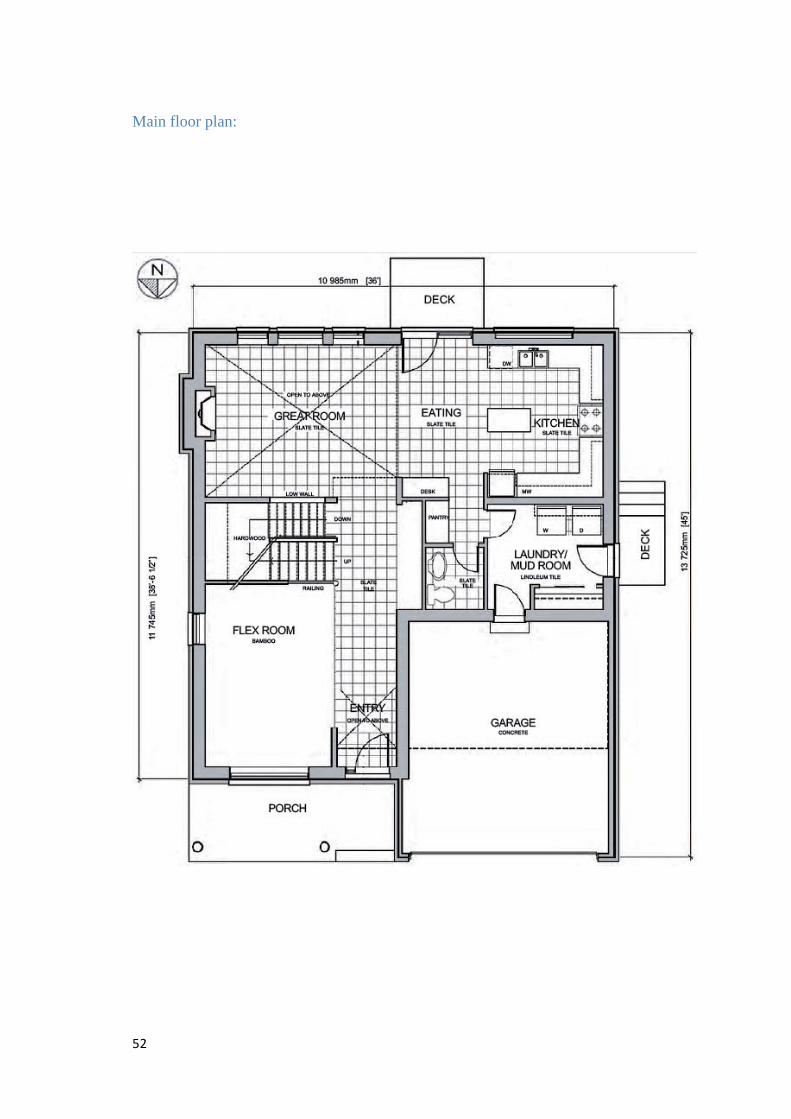
Main floor plan:
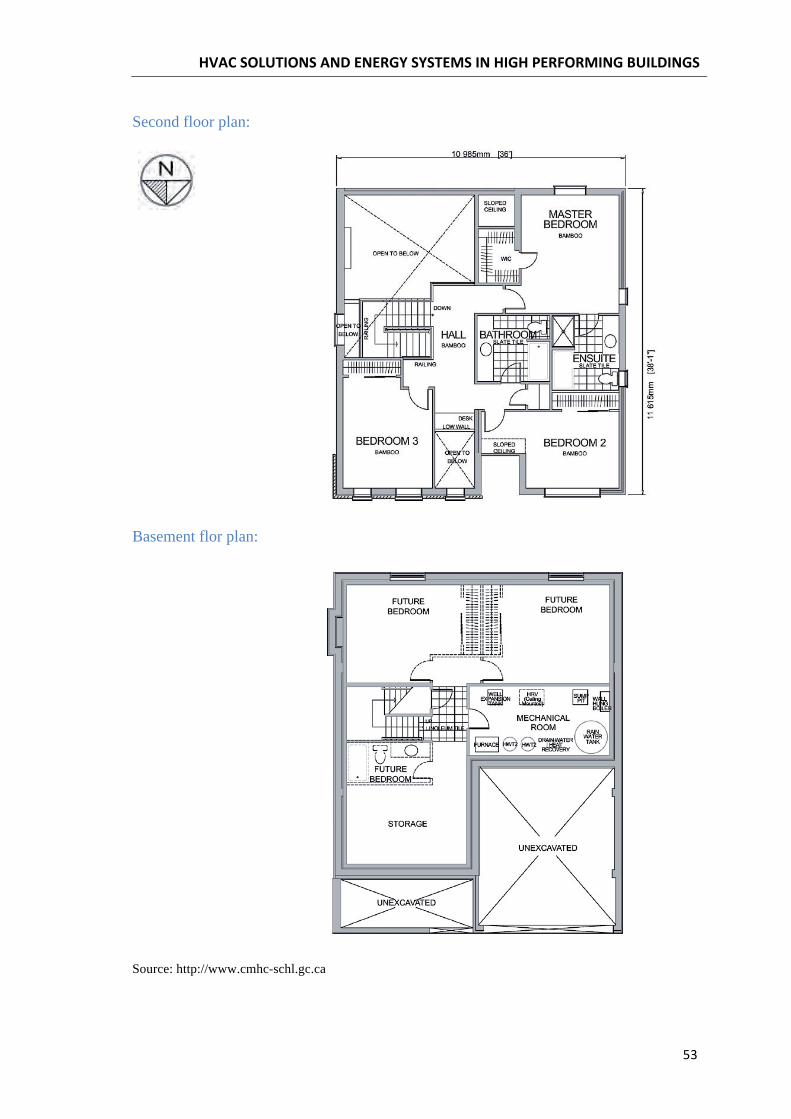
Second floor plan:
Basement flor plan:
Source: http://www.cmhc-schl.gc.ca
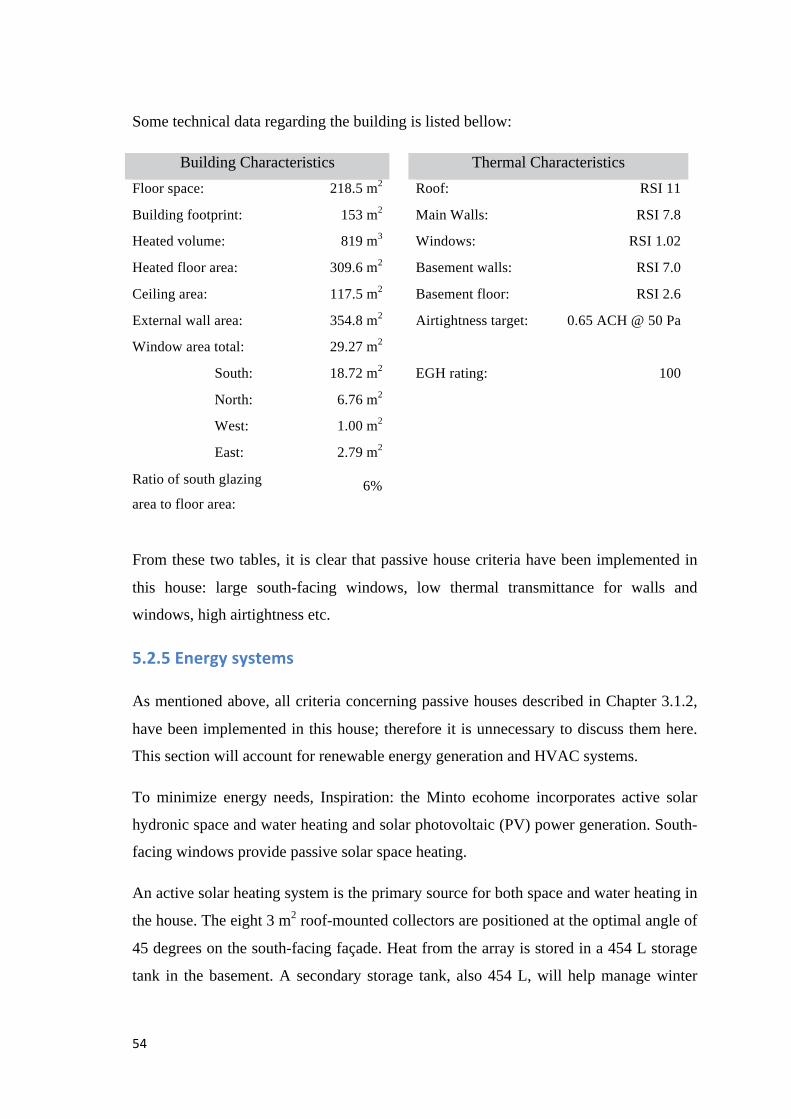
Some technical data regarding the building is listed bellow:
Building Characteristics Thermal Characteristics Floor space: 218.5 m2 Roof: RSI 11
Building footprint: 153 m2 Main Walls: RSI 7.8
Heated volume: 819 m3 Windows: RSI 1.02
Heated floor area: 309.6 m2 Basement walls: RSI 7.0
Ceiling area: 117.5 m2 Basement floor: RSI 2.6
External wall area: 354.8 m2 Airtightness target: 0.65 ACH @ 50 Pa
Window area total: 29.27 m2
South: 18.72 m2 EGH rating: 100
North: 6.76 m2 West: 1.00 m2 East: 2.79 m2
Ratio of south glazing
area to floor area: 6%
From these two tables, it is clear that passive house criteria have been implemented in
this house: large south-facing windows, low thermal transmittance for walls and
windows, high airtightness etc.
As mentioned above, all criteria concerning passive houses described in Chapter 3.1.2,
have been implemented in this house; therefore it is unnecessary to discuss them here.
This section will account for renewable energy generation and HVAC systems.
To minimize energy needs, Inspiration: the Minto ecohome incorporates active solar
hydronic space and water heating and solar photovoltaic (PV) power generation. South-
facing windows provide passive solar space heating.
An active solar heating system is the primary source for both space and water heating in
the house. The eight 3 m2 roof-mounted collectors are positioned at the optimal angle of
45 degrees on the south-facing façade. Heat from the array is stored in a 454 L storage
tank in the basement. A secondary storage tank, also 454 L, will help manage winter
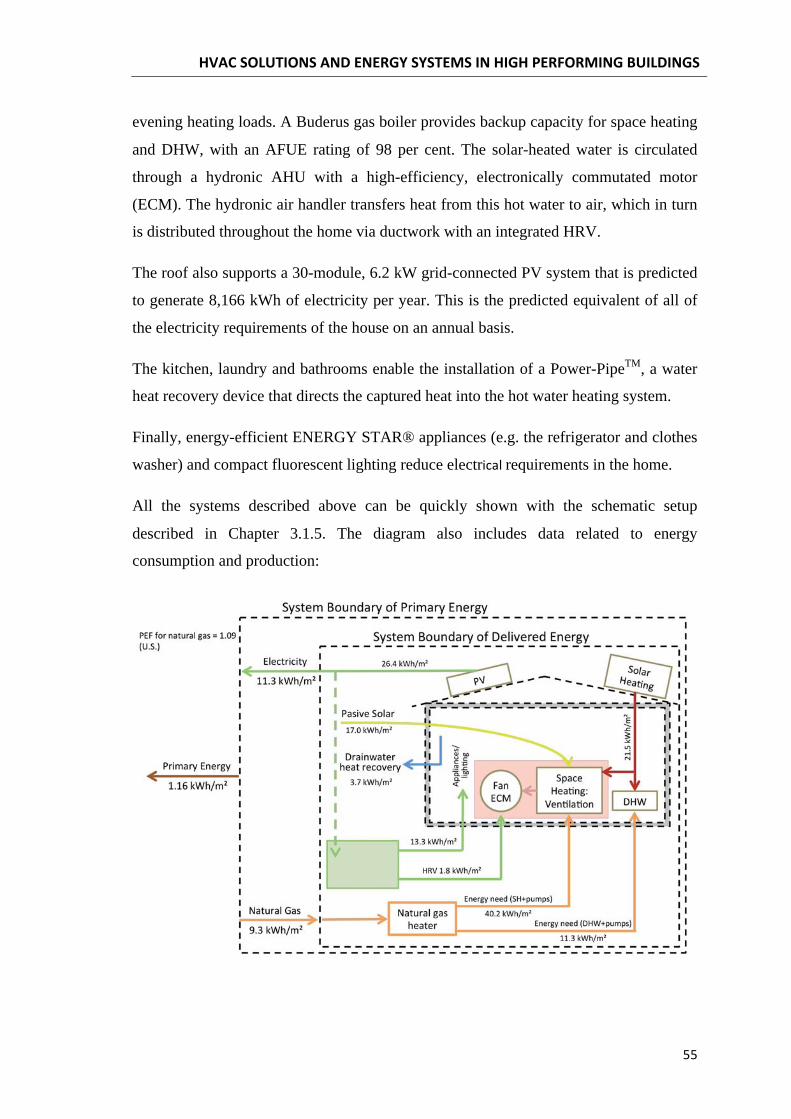
evening heating loads. A Buderus gas boiler provides backup capacity for space heating
and DHW, with an AFUE rating of 98 per cent. The solar-heated water is circulated
through a hydronic AHU with a high-efficiency, electronically commutated motor
(ECM). The hydronic air handler transfers heat from this hot water to air, which in turn
is distributed throughout the home via ductwork with an integrated HRV.
The roof also supports a 30-module, 6.2 kW grid-connected PV system that is predicted
to generate 8,166 kWh of electricity per year. This is the predicted equivalent of all of
the electricity requirements of the house on an annual basis.
The kitchen, laundry and bathrooms enable the installation of a Power-PipeTM, a water
heat recovery device that directs the captured heat into the hot water heating system.
Finally, energy-efficient ENERGY STAR® appliances (e.g. the refrigerator and clothes
washer) and compact fluorescent lighting reduce electr requirements in the home.
All the systems described above can be quickly shown with the schematic setup
described in Chapter 3.1.5. The diagram also includes data related to energy
consumption and production:
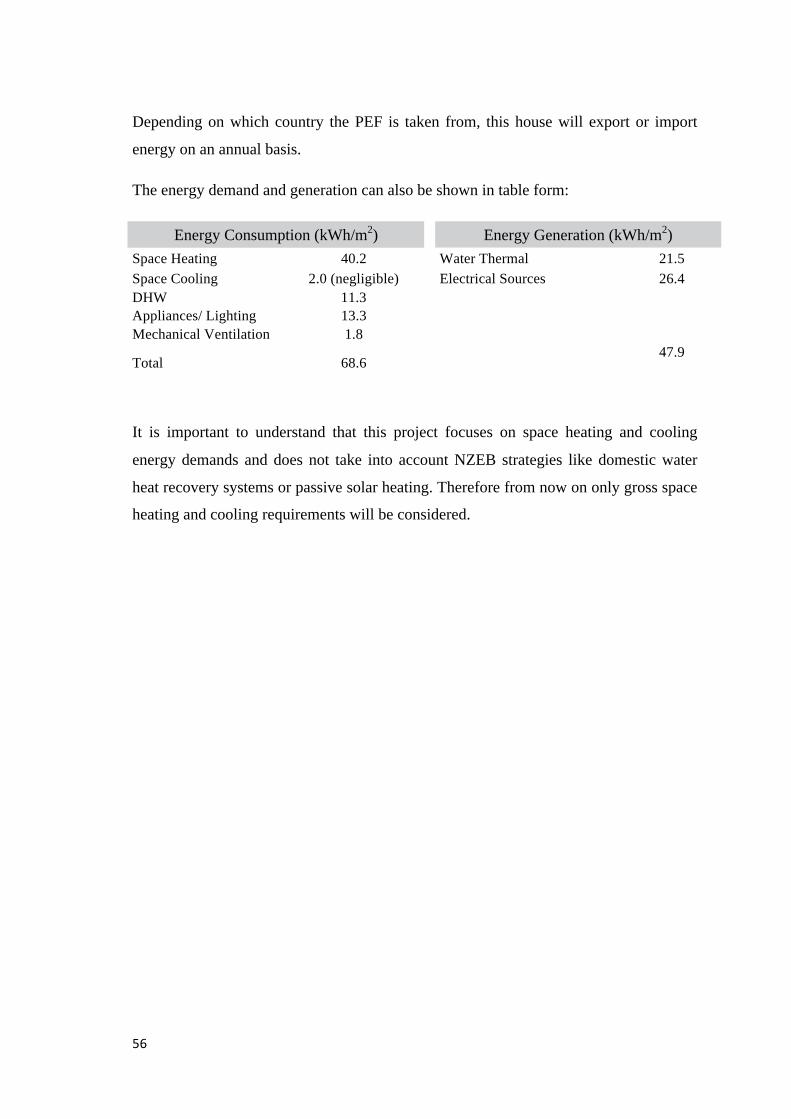
Depending on which country the PEF is taken from, this house will export or import
energy on an annual basis.
The energy demand and generation can also be shown in table form:
Energy Consumption (kWh/m2) Energy Generation (kWh/m2) Space Heating 40.2 Water Thermal 21.5 Space Cooling 2.0 (negligible) Electrical Sources 26.4 DHW 11.3 Appliances/ Lighting 13.3 Mechanical Ventilation 1.8
Total 68.6 47.9
It is important to understand that this project focuses on space heating and cooling
energy demands and does not take into account NZEB strategies like domestic water
heat recovery systems or passive solar heating. Therefore from now on only gross space
heating and cooling requirements will be considered.


DesignBuilder is a powerful simulation toolbox that lets the user model HVAC,
daylighting, airflows, costs, energy and carbon emissions. It has been developed around
the idea of giving EnergyPlus a user-friendly graphical interface. The version used for
this thesis was initially 3.4 but as the investigation unfolded, further capabilities were
needed which were available in a beta version of 4.0.
With DesignBuilder it was possible to build an accurate model of Inspiration: The
Minto ecohome while obtaining valid results from the EnergyPlus modelling engine.
All figures shown in this chapter are taken from DB.
EnergyPlus is an energy analysis and thermal load simulation program developed in
2001 from two simulation programs: DOE-2 and BLAST, created by the Department of
Energy (DOE) and the Department of Defence (DOD) respectively. The version of
EnergyPlus used in this thesis is 8.1.0, which is organized in 600 modules, 200 of which
are related to HVAC systems.
In order to design a sustainable building one must take into account all energetic
aspects, environmental impact and economic feasibility. From the energy point of view,
it is essential to be able to predict as precisely as possible the building’s behaviour
under changing boundary conditions such as climate or occupancy. For this reason, a
study based on the thermal power of the heating system (in kW), calculated in steady
state conditions, is not a precise option. A more accurate result is obtained when using
monthly average values, as the simulation is much more dynamic allowing climatic and
occupancy variations. It can therefore be said that, logically, the higher the time steps
used in the simulation, the better the results.
As mentioned above, predicting the building’s behaviour is essential to design a NZEB,
since it is necessary to assess the dynamics concerning:
• Outdoor climate;
• Renewable energy production;
• Plant operation;
• Availability and cost of energy sources.
It is also possible to evaluate the effects of building orientation and its thermal mass
distribution.
This software allows designers to compare results from different alternatives regarding
design and power plant setup.
In particular, the dynamic energy simulation allows designers to:
• Estimate thermal loads and energy consumption of heating and cooling;
• Evaluate different solutions for the building’s envelope;
• Evaluate thermal and visual comfort;
• Calculate the power consumption of artificial lighting;
• Estimate the renewable energy production.
For these reasons, the EnergyPlus software was used in the thesis.
The next few paragraphs are devoted to the input data needed to model a building.
Even though DesignBuilder has been used for all models, EnergyPlus is the simulation
engine and therefore its working must be described.
The weather and climate data is selected from a list and downloaded automatically from
the Internet in the form of a file with the extension .epw (Energy Plus weather data file).
The weather file used for Inspiration: The Minto ecohome is
CAN_ON_Ottawa.716280_CWEC. From this file it is possible to extract all the climatic
data required for the simulation, like winter and summer design days or hourly outdoor
temperature. A .stat file is also provided along with the climate file which contains
statistics relating to meteorological conditions.
To construct the geometrical model of the building, it has to be divided into thermal
zones, each of which is delimited by a series of opaque and transparent surfaces. These
surfaces are constructed by assembling several layers of different materials where it is
possible to include air gaps, doors, windows, vents and different types of shielding (e.g.
blinds).
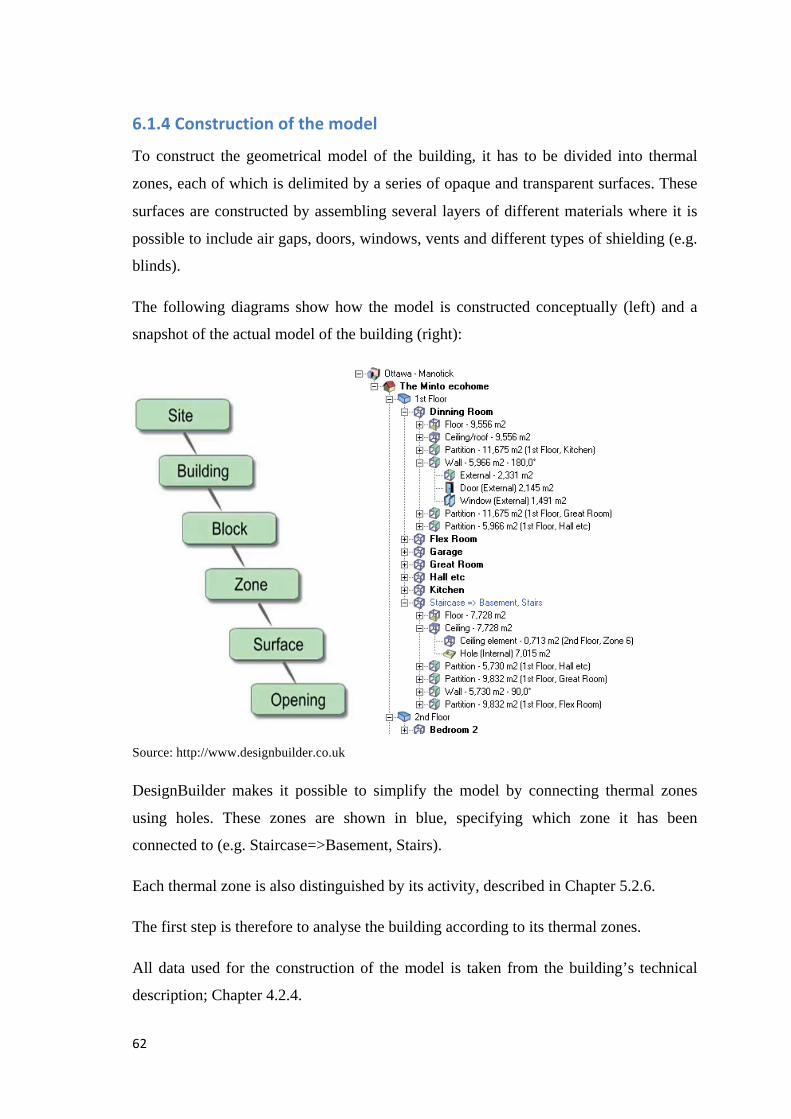
The following diagrams show how the model is constructed conceptually (left) and a
snapshot of the actual model of the building (right):
Source: http://www.designbuilder.co.uk
DesignBuilder makes it possible to simplify the model by connecting thermal zones
using holes. These zones are shown in blue, specifying which zone it has been
connected to (e.g. Staircase=>Basement, Stairs).
Each thermal zone is also distinguished by its activity, described in Chapter 5.2.6.
The first step is therefore to analyse the building according to its thermal zones.
All data used for the construction of the model is taken from the building’s technical
description; Chapter 4.2.4.
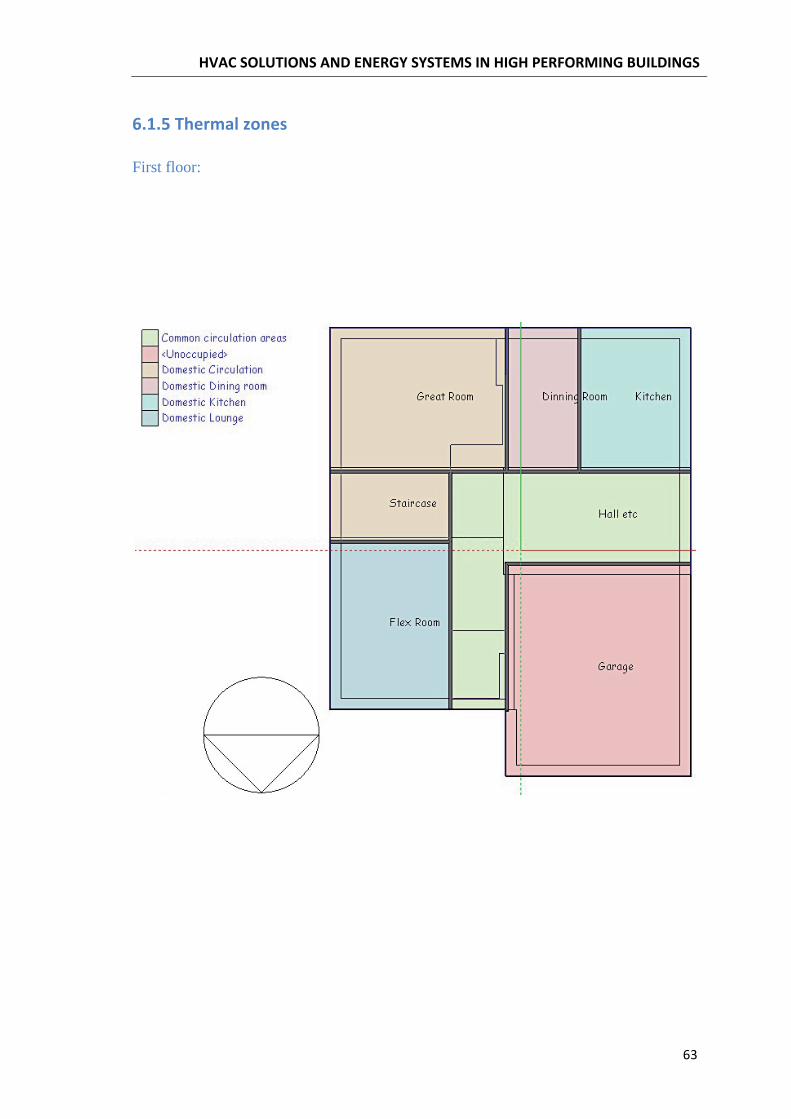
First floor:
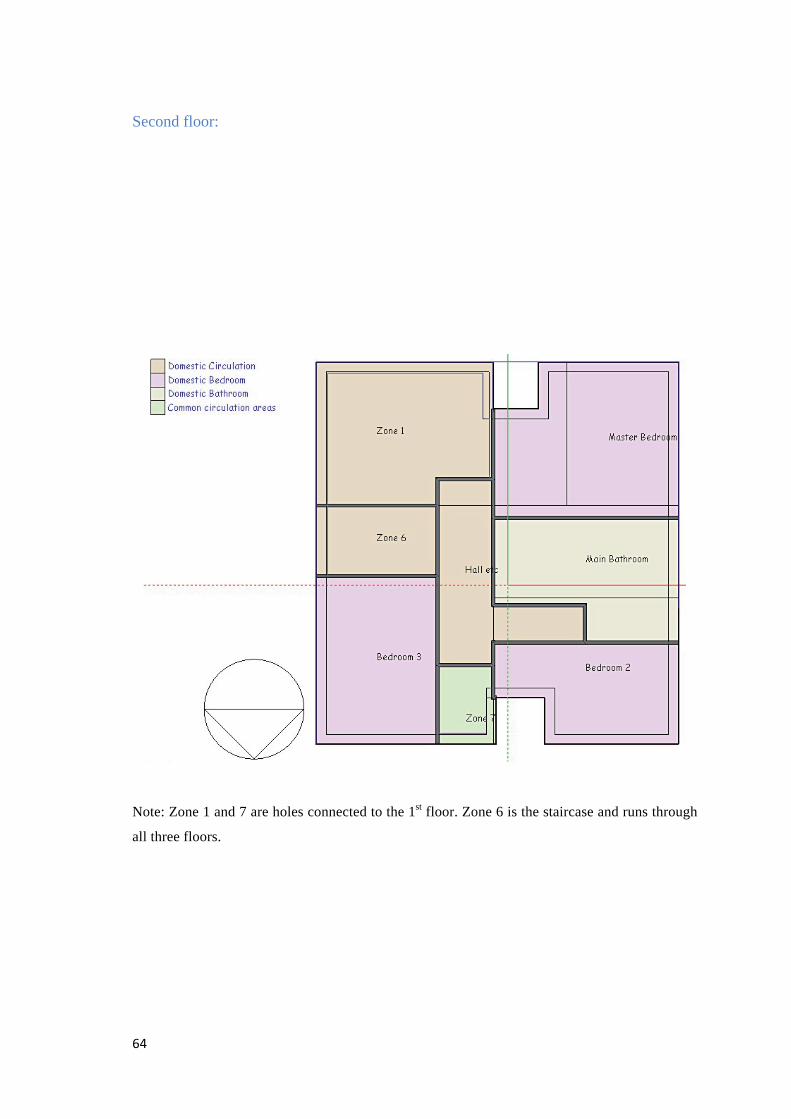
Second floor:
Note: Zone 1 and 7 are holes connected to the 1st floor. Zone 6 is the staircase and runs through
all three floors.
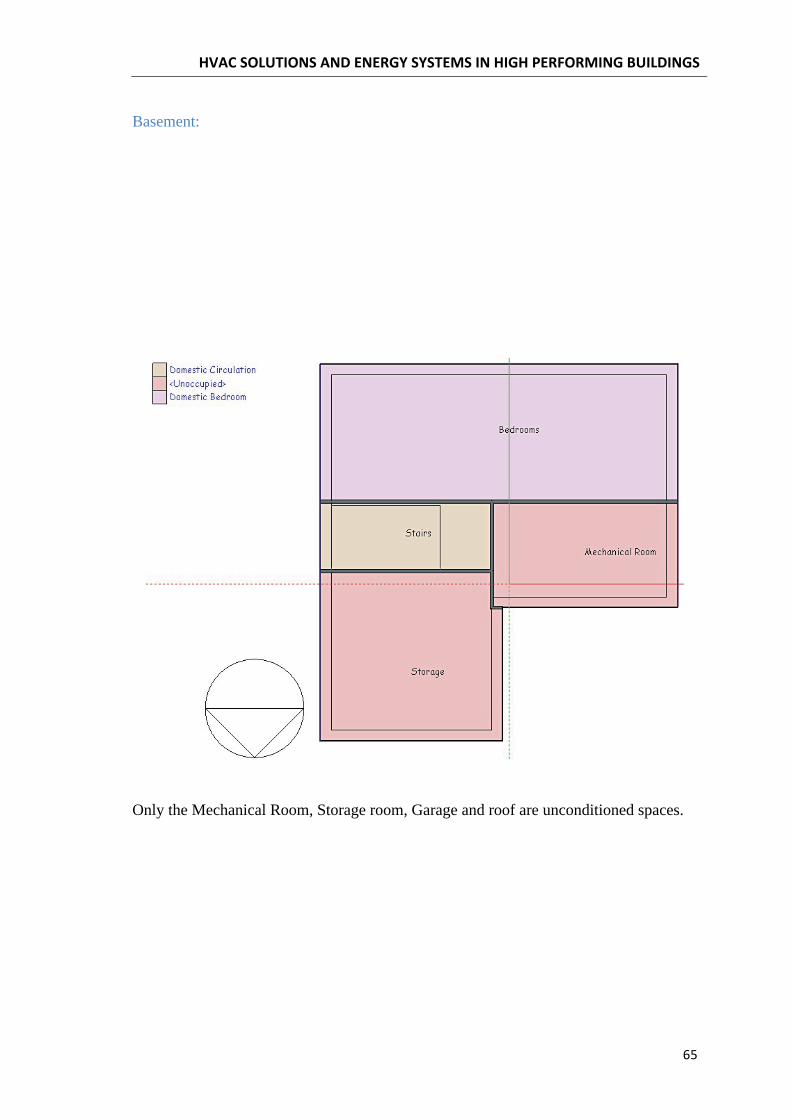
Basement:
Only the Mechanical Room, Storage room, Garage and roof are unconditioned spaces.
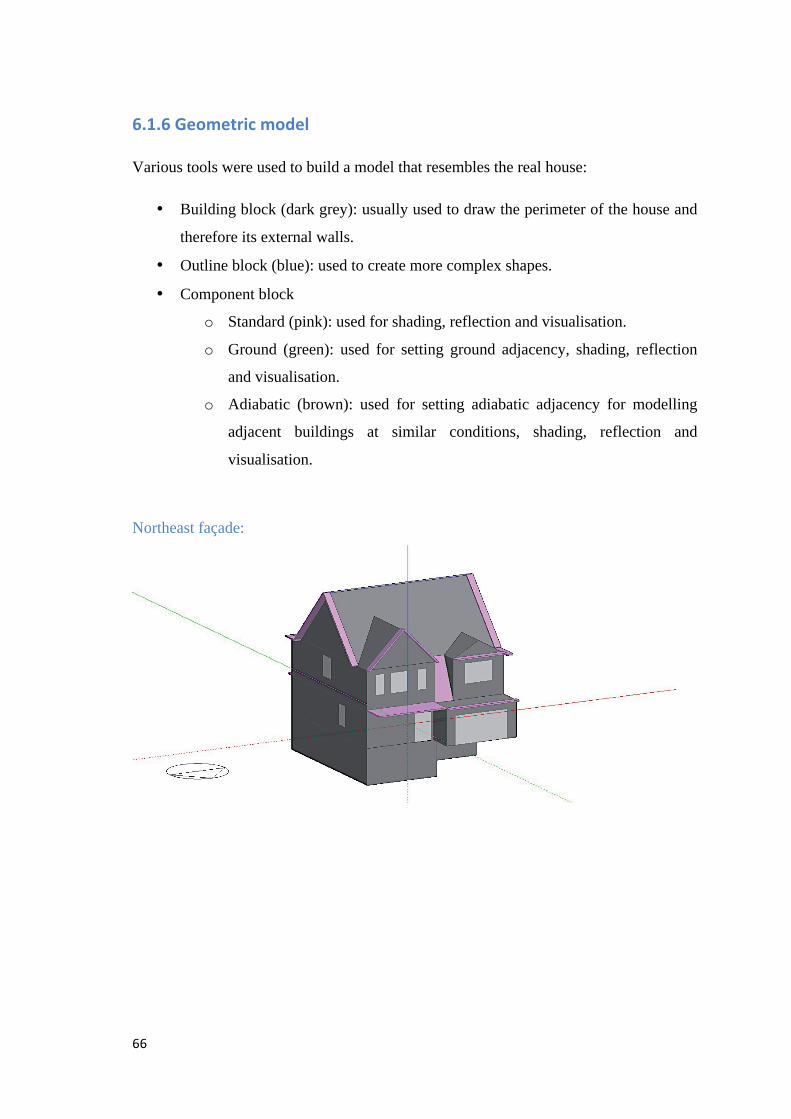
Various tools were used to build a model that resembles the real house:
• Building block (dark grey): usually used to draw the perimeter of the house and
therefore its external walls.
• Outline block (blue): used to create more complex shapes.
• Component block
o Standard (pink): used for shading, reflection and visualisation.
o Ground (green): used for setting ground adjacency, shading, reflection
and visualisation.
o Adiabatic (brown): used for setting adiabatic adjacency for modelling
adjacent buildings at similar conditions, shading, reflection and
visualisation.
Northeast façade:
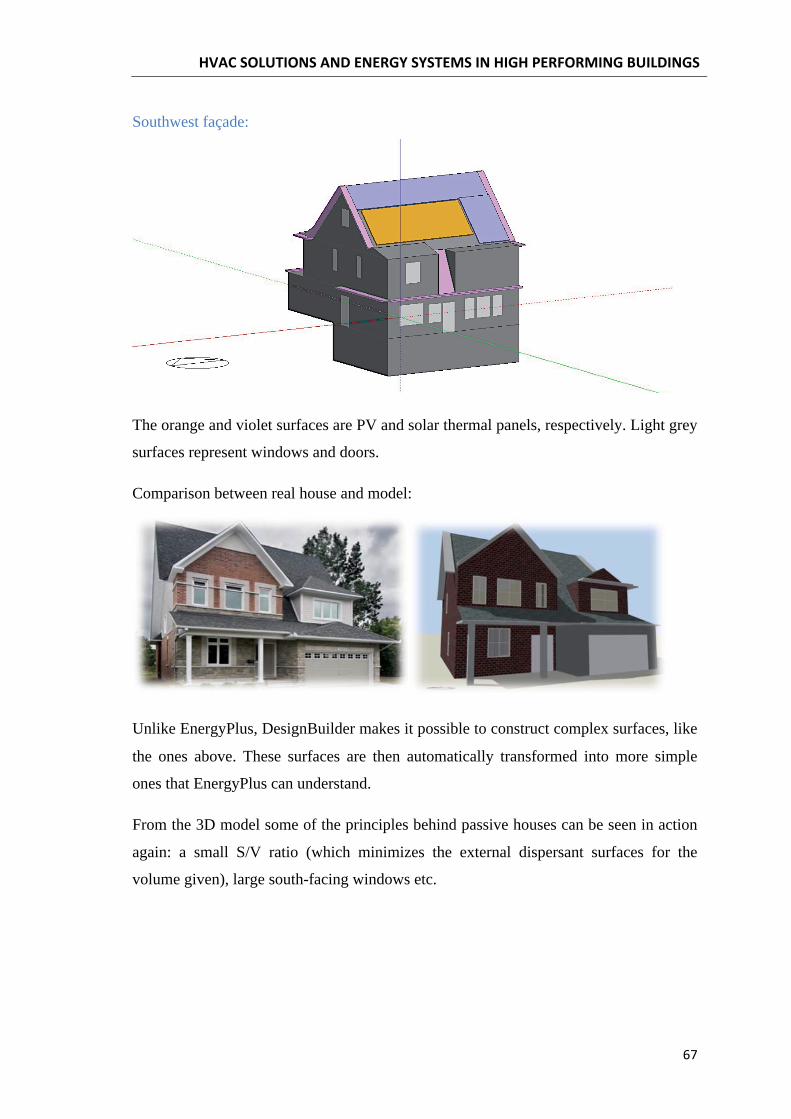
Southwest façade:
The orange and violet surfaces are PV and solar thermal panels, respectively. Light grey
surfaces represent windows and doors.
Comparison between real house and model:
Unlike EnergyPlus, DesignBuilder makes it possible to construct complex surfaces, like
the ones above. These surfaces are then automatically transformed into more simple
ones that EnergyPlus can understand.
From the 3D model some of the principles behind passive houses can be seen in action
again: a small S/V ratio (which minimizes the external dispersant surfaces for the
volume given), large south-facing windows etc.
DesignBuilder minimizes user input with templates. These templates are preloaded with
relevant information regarding:
• Occupancy (people/m2);
• DHW consumption rate (L/m2 day);
• Metabolic activity;
• Equipment usage (W/m2);
• Minimum fresh air (l/s person);
• Heating and cooling setpoint temperatures (ºC);
• Target illuminance (lux);
• Schedules
• Other
All bullet points are self-explanatory except for heating and cooling setpoint
temperatures and schedules, which will be analysed in the next sections; 5.1.8 and 5.1.9.
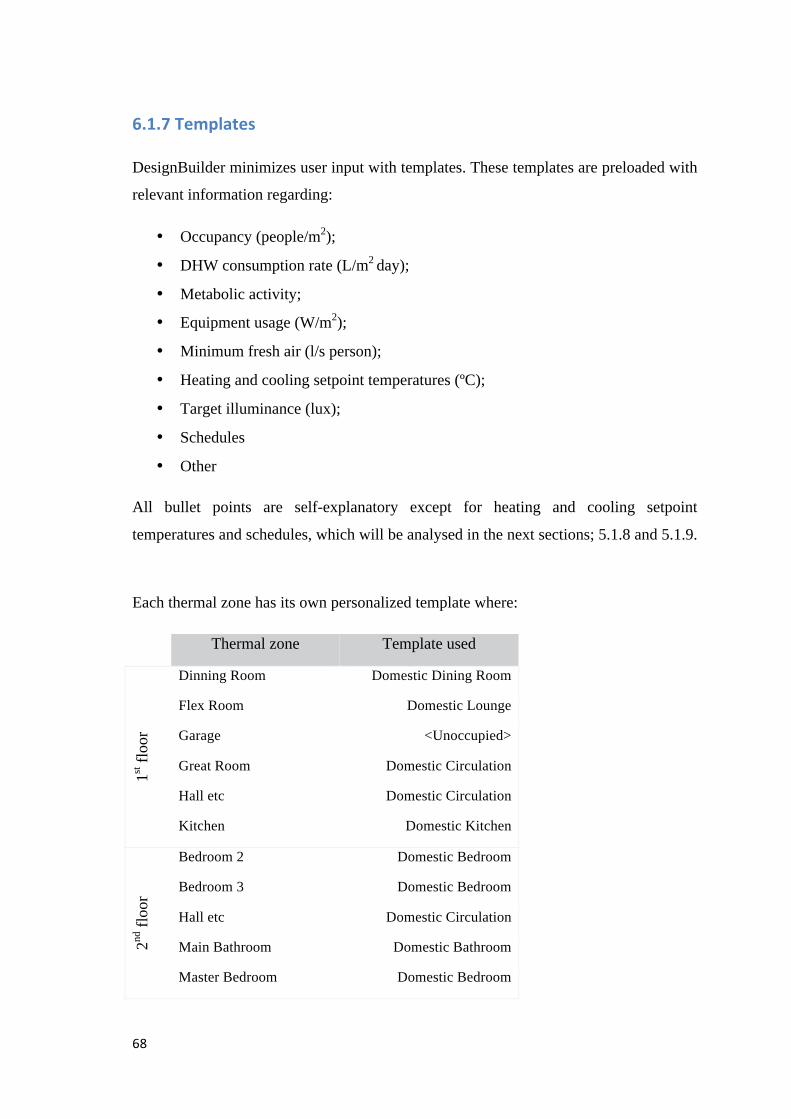
Each thermal zone has its own personalized template where:
Thermal zone Template used
1st fl
oor
Dinning Room Domestic Dining Room
Flex Room Domestic Lounge
Garage <Unoccupied>
Great Room Domestic Circulation
Hall etc Domestic Circulation
Kitchen Domestic Kitchen
2nd fl
oor
Bedroom 2 Domestic Bedroom
Bedroom 3 Domestic Bedroom
Hall etc Domestic Circulation
Main Bathroom Domestic Bathroom
Master Bedroom Domestic Bedroom
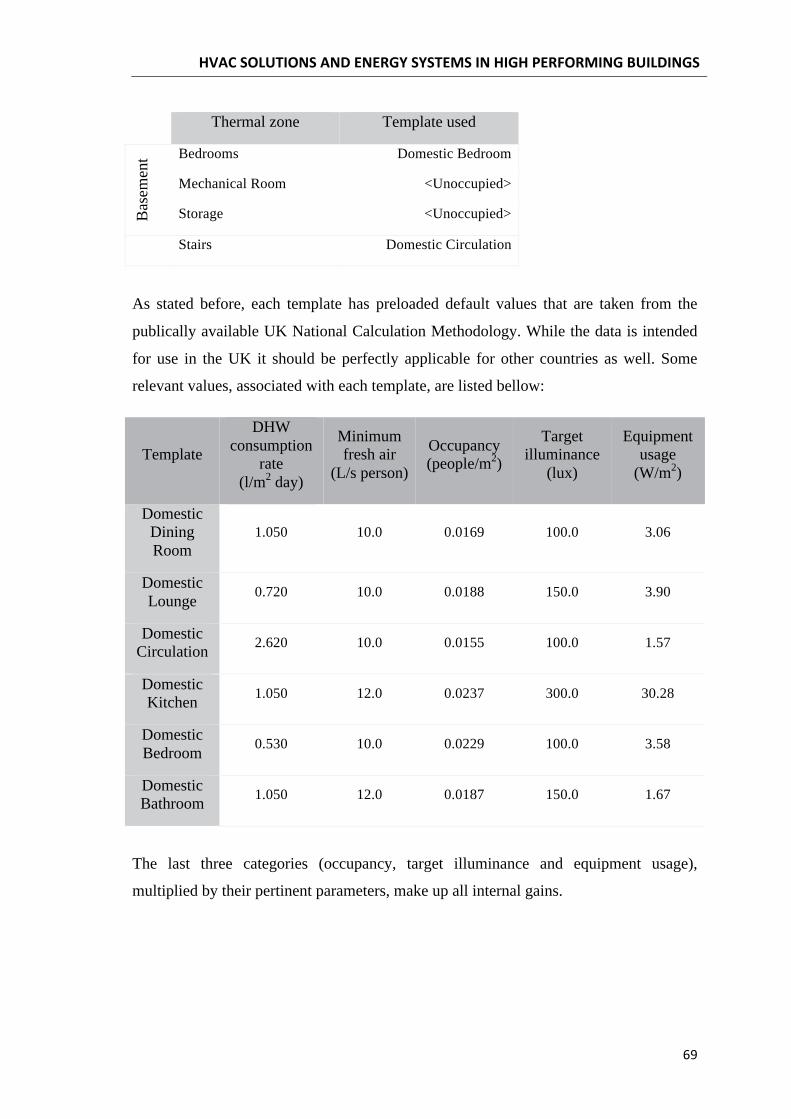
Thermal zone Template used B
asem
ent Bedrooms Domestic Bedroom
Mechanical Room <Unoccupied>
Storage <Unoccupied>
Stairs Domestic Circulation
As stated before, each template has preloaded default values that are taken from the
publically available UK National Calculation Methodology. While the data is intended
for use in the UK it should be perfectly applicable for other countries as well. Some
relevant values, associated with each template, are listed bellow:
Template
DHW consumption
rate (l/m2 day)
Minimum fresh air
(L/s person)
Occupancy (people/m2)
Target illuminance
(lux)
Equipment usage
(W/m2)
Domestic Dining Room
1.050 10.0 0.0169 100.0 3.06
Domestic Lounge 0.720 10.0 0.0188 150.0 3.90
Domestic Circulation 2.620 10.0 0.0155 100.0 1.57
Domestic Kitchen 1.050 12.0 0.0237 300.0 30.28
Domestic Bedroom 0.530 10.0 0.0229 100.0 3.58
Domestic Bathroom 1.050 12.0 0.0187 150.0 1.67
The last three categories (occupancy, target illuminance and equipment usage),
multiplied by their pertinent parameters, make up all internal gains.
Heating and cooling setpoint and setback temperatures are the same for all conditioned
spaces. The setpoint temperature defines the ideal air temperature within the space
whereas the setback temperature designates the temperature at which the heating system
must be turned on during unoccupied periods like holidays or weekends. At each time
step and for each thermal zone, the software calculates the necessary energy input from
the HVAC system in order to maintain the setpoint temperature. It is for this reason that
annual results can be very different with small variations of the setpoint.
• Heating setpoint temperature: 18 ºC
• Heating setback temperature: 12 ºC
• Cooling setpoint temperature: 25 ºC
• Cooling setback temperature: 28 ºC
Schedules are used in DesignBuilder to define:
• Occupancy times;
• Equipment, lighting and HVAC operation times;
• Transparency of component blocks (usually seasonal).
When loading a template, the corresponding schedule is also loaded for each category
listed above. Schedules typically modulate parameters using a factor scaling from 0 to
1. A value of 1 means that, in that period of time, devices are fully operational or that
all people are inside the conditioned space. The maximum values given in 5.1.7 (e.g.
people/m2) are multiplied by the values in the schedule to obtain the actual value that is
used at each time step in the simulation.
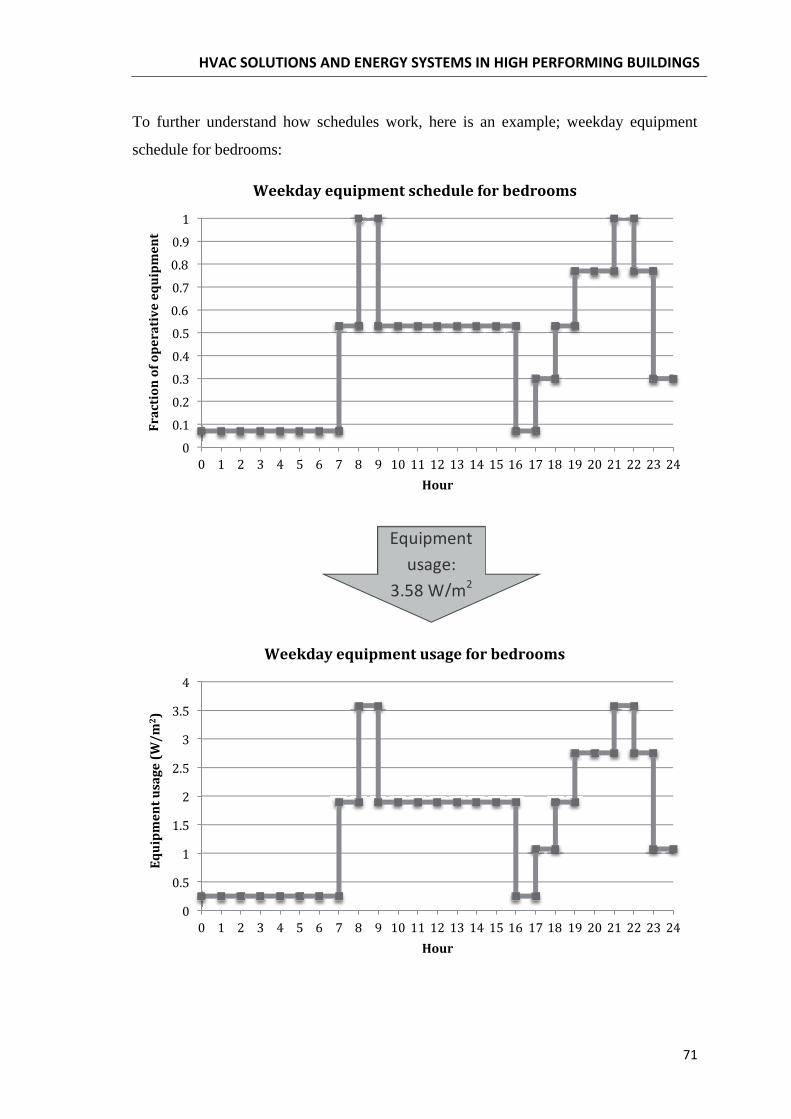
To further understand how schedules work, here is an example; weekday equipment
schedule for bedrooms:
For heating and cooling, the schedule works slightly differently where:
• 0: equipment off;
• 0.5: equipment controlled using setback temperature;
• 1: equipment controlled using setpoint temperature.
It is also possible to have a schedule with numbers greater than 1, but these are usually
used when defining HVAC systems (e.g. outlet temperature always 80 ºC). This type of
schedule is described in 5.1.11.
All schedules regarding occupancy, equipment, lighting, mechanical ventilation, DHW,
heating and cooling are listed in Annex B.
DesignBuilder gives 5 options when choosing the outside air definition method:
• 1-By zone: The air flow rate in m3/s is calculated from the ach data using:
m3/s = ach x ZoneVolume/3600,
Where, ZoneVolume is the actual air volume of the space.
• 2-Min fresh air (Per person): Maximum natural ventilation rate is defined using
minimum fresh air requirements per person (see 5.1.7). The air flow rate in m3/s
is calculated as:
m3/s = MinFreshAir x NumberPeople/1000
Where, NumberPeople = Occupancy density (people/m2) * Zone floor area (m2). MinFreshAir is the minimum fresh air rate per person (l/s/person).
• 3-Min fresh air (Per area): Maximum natural ventilation rate is defined using
minimum fresh air requirements per person (see 5.1.7). The air flow rate in m3/s
is calculated as:
m3/s = l/s-m2 x ZoneFloorArea/1000
Where, ZoneFloorArea is the actual floor area of the space. MinFreshAir is the minimum fresh air rate per floor area (l/s-m2).
• 4-Min fresh air (Sum per person + per area): Maximum natural ventilation rate
is defined using minimum fresh air requirements per person for both (see 5.1.7).
The air flow rate in m3/s is calculated as:
m3/s = (l/s-m2 x ZoneFloorArea + MinFreshAir x NumberPeople)/1000
Where, ZoneFloorArea is the actual floor area of the space. MinFreshAir is the minimum fresh air rate per floor area (l/s-m2). NumberPeople = Occupancy density (people/m2) * Zone floor area (m2). MinFreshAir is the minimum fresh air rate per person (l/s/person).
• 5-Min fresh air (Max per person and per area): Maximum natural ventilation rate
is defined using minimum fresh air requirements per person for both (see 5.1.7).
The air flow rate in m3/s is calculated as:
m3/s = Maximum of (l/s-m2 x ZoneFloorArea/1000) and (MinFreshAir x NumberPeople/1000)
Where, ZoneFloorArea is the actual floor area of the space. MinFreshAir is the minimum fresh air rate per floor area (l/s-m2). NumberPeople = Occupancy density (people/m2) * Zone floor area (m2). MinFreshAir is the minimum fresh air rate per person (l/s/person).
Option number 2 (Min fresh air per person) was chosen for the initial simulation of
Inspiration: The Minto ecohome.
As mentioned in 5.1.8, mechanical ventilation also uses schedules to modulate its
behaviour. As it couldn’t be otherwise, mechanical ventilation follows the occupancy
schedules.
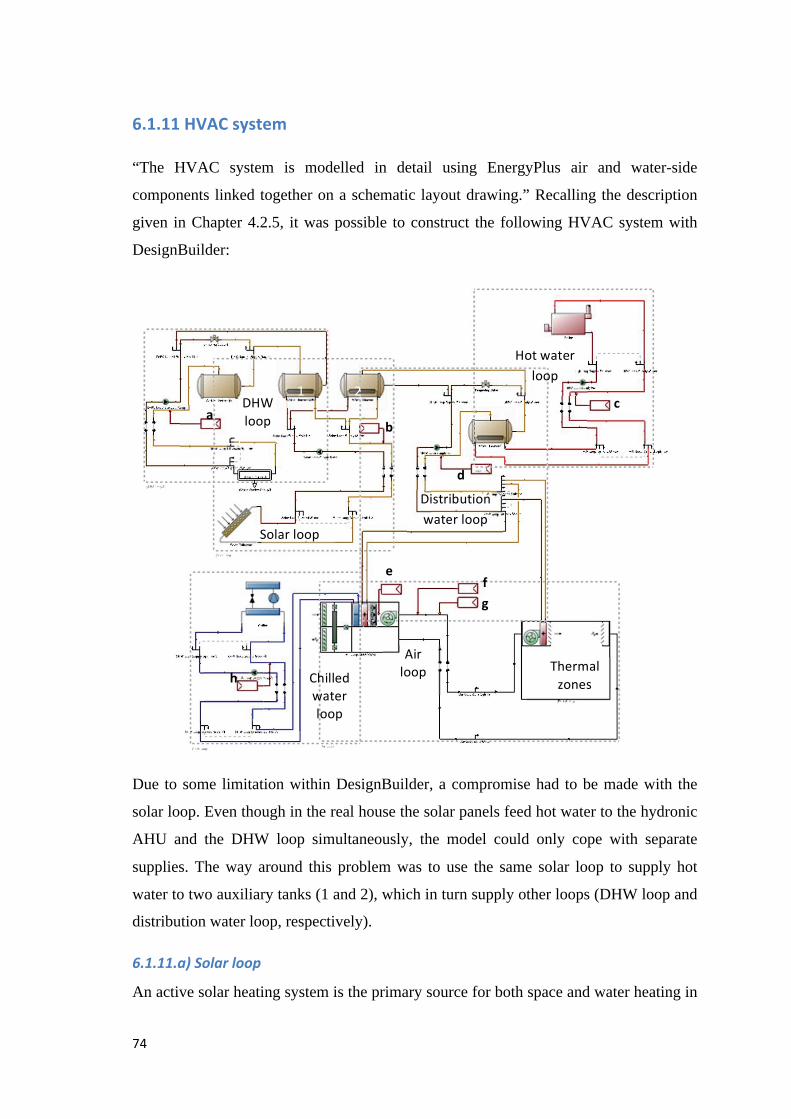
“The HVAC system is modelled in detail using EnergyPlus air and water-side
components linked together on a schematic layout drawing.” Recalling the description
given in Chapter 4.2.5, it was possible to construct the following HVAC system with
DesignBuilder:
Due to some limitation within DesignBuilder, a compromise had to be made with the
solar loop. Even though in the real house the solar panels feed hot water to the hydronic
AHU and the DHW loop simultaneously, the model could only cope with separate
supplies. The way around this problem was to use the same solar loop to supply hot
water to two auxiliary tanks (1 and 2), which in turn supply other loops (DHW loop and
distribution water loop, respectively).
An active solar heating system is the primary source for both space and water heating in
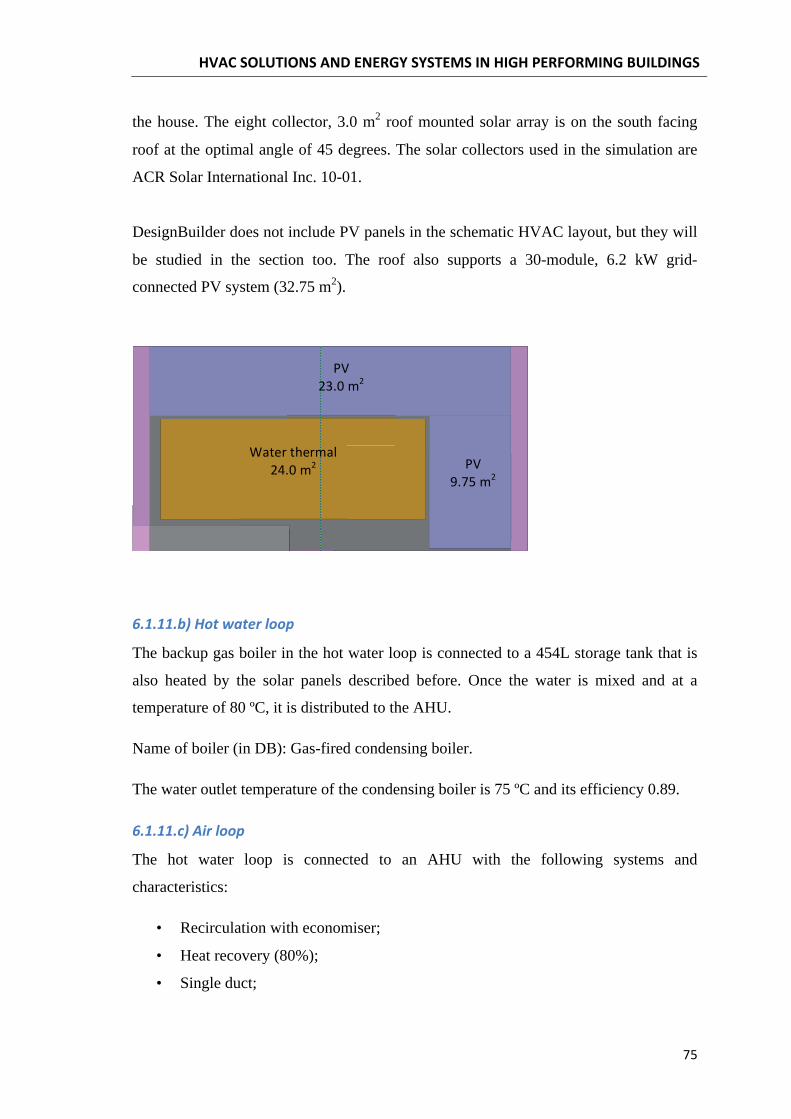
the house. The eight collector, 3.0 m2 roof mounted solar array is on the south facing
roof at the optimal angle of 45 degrees. The solar collectors used in the simulation are
ACR Solar International Inc. 10-01.
DesignBuilder does not include PV panels in the schematic HVAC layout, but they will
be studied in the section too. The roof also supports a 30-module, 6.2 kW grid-
connected PV system (32.75 m2).
The backup gas boiler in the hot water loop is connected to a 454L storage tank that is
also heated by the solar panels described before. Once the water is mixed and at a
temperature of 80 ºC, it is distributed to the AHU.
Name of boiler (in DB): Gas-fired condensing boiler.
The water outlet temperature of the condensing boiler is 75 ºC and its efficiency 0.89.
The hot water loop is connected to an AHU with the following systems and
characteristics:
• Recirculation with economiser;
• Heat recovery (80%);
• Single duct;

• VAV (Variable Air Volume) reheat;
• Variable speed fan;
• Humidifier.
All thermal zones are heated by the same AHU.
Even though the cooling loads are negligible in the real house, a chilled water loop was
included to corroborate this from the model point of view.
Name of air-source chiller (in DB): Air cooled default.
The water outlet temperature of the chiller is 6.67 ºC and its reference COP 5.5.
The setpoint manager is the main mechanism through which the behaviour of HVAC
system loops is controlled. All HVAC loops require at least one setpoint manager to
specify the calculated or scheduled outlet value of the loop, generally outlet
temperature.
These are the setpoint managers concerning our HVAC system:
Setpoint manager Loop Description
a DHW loop Domestic hot water setpoint temperature: Always 55.00 ºC
b Solar loop Hot Water flow setpoint temperature: Always 80.0 ºC
c Hot water loop Hot Water flow setpoint temperature: Always 80.0 ºC
d Auxiliary loop Hot Water flow setpoint temperature: Always 80.0 ºC
e Air loop Humidifier setpoint: Always 0.4 (minimum humidity ratio)
f & g Air loop Multizone heating and cooling average (temperature)
h Chilled water loop Chilled water flow setpoint temperature: Always 6 ºC
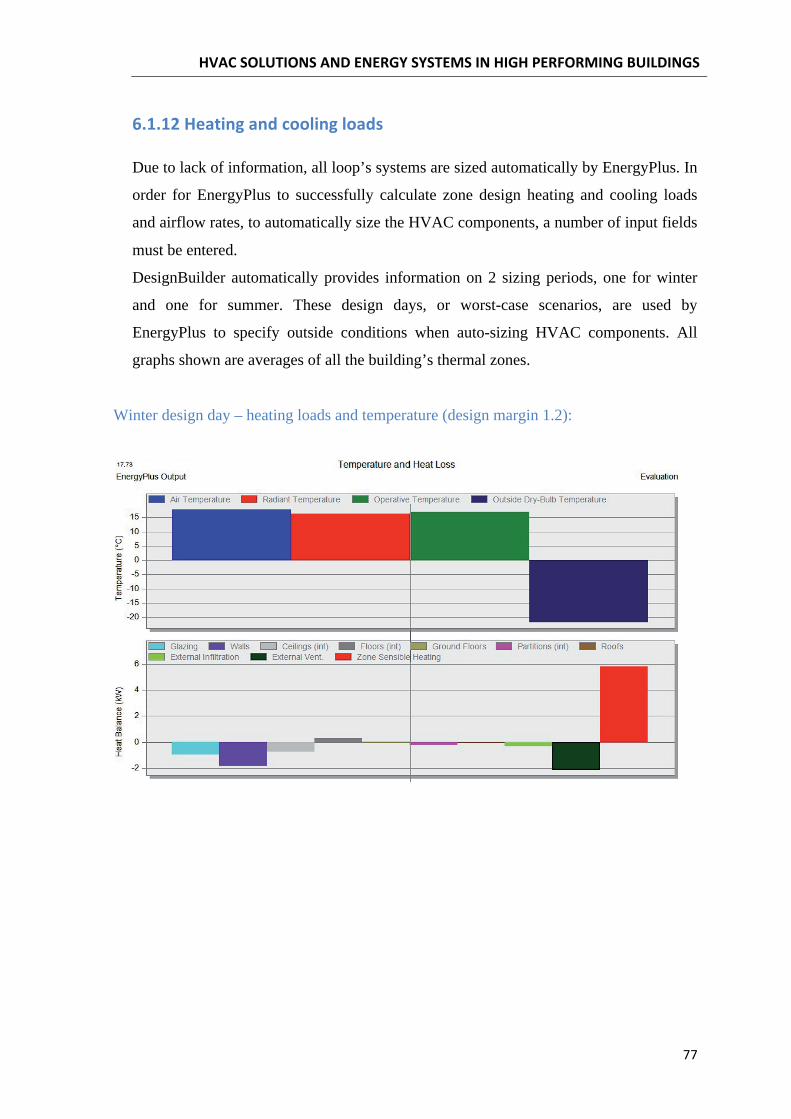
Due to lack of information, all loop’s systems are sized automatically by EnergyPlus. In
order for EnergyPlus to successfully calculate zone design heating and cooling loads
and airflow rates, to automatically size the HVAC components, a number of input fields
must be entered.
DesignBuilder automatically provides information on 2 sizing periods, one for winter
and one for summer. These design days, or worst-case scenarios, are used by
EnergyPlus to specify outside conditions when auto-sizing HVAC components. All
graphs shown are averages of all the building’s thermal zones.
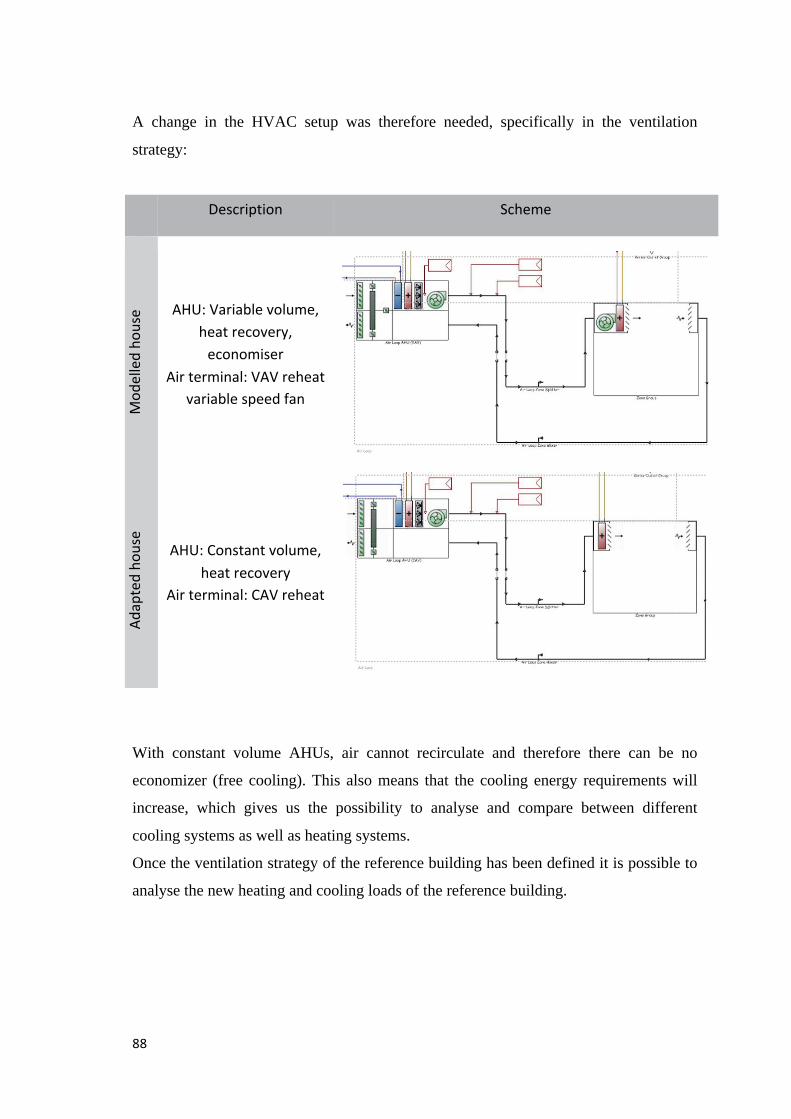
Winter design day – heating loads and temperature (design margin 1.2):
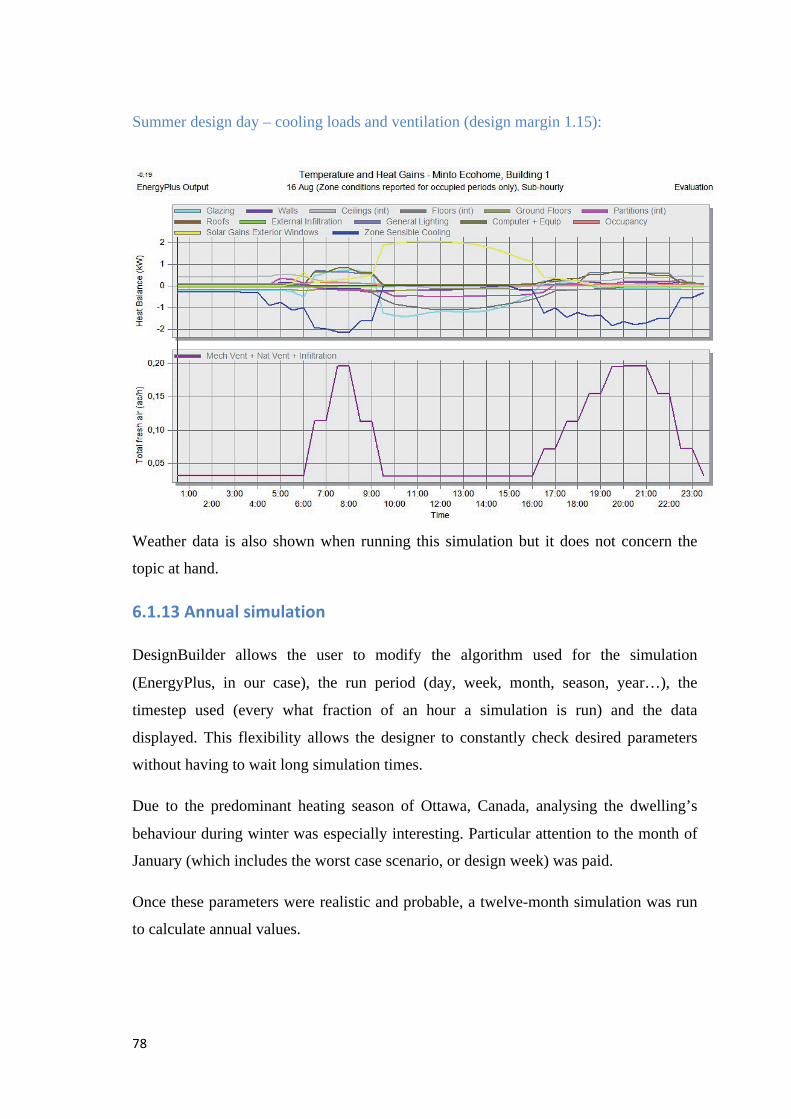
Summer design day – cooling loads and ventilation (design margin 1.15):
Weather data is also shown when running this simulation but it does not concern the
topic at hand.
DesignBuilder allows the user to modify the algorithm used for the simulation
(EnergyPlus, in our case), the run period (day, week, month, season, year…), the
timestep used (every what fraction of an hour a simulation is run) and the data
displayed. This flexibility allows the designer to constantly check desired parameters
without having to wait long simulation times.
Due to the predominant heating season of Ottawa, Canada, analysing the dwelling’s
behaviour during winter was especially interesting. Particular attention to the month of
January (which includes the worst case scenario, or design week) was paid.
Once these parameters were realistic and probable, a twelve-month simulation was run
to calculate annual values.
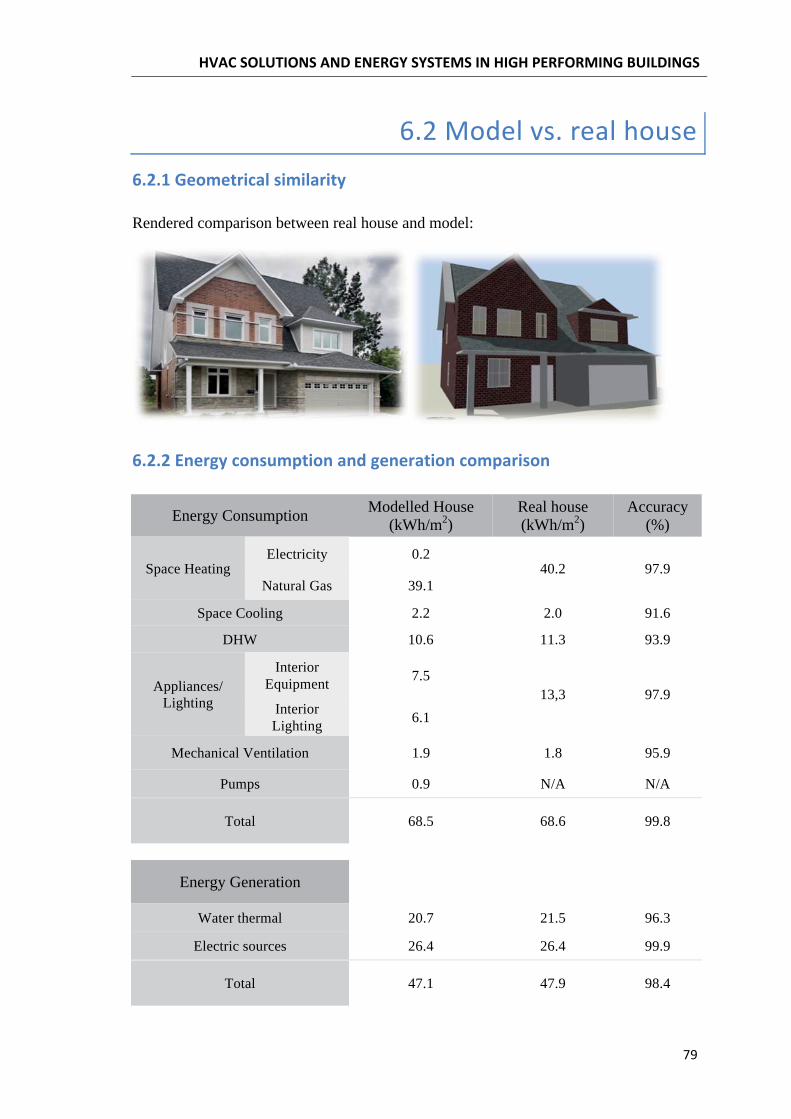
Rendered comparison between real house and model:
Energy Consumption Modelled House (kWh/m2)
Real house (kWh/m2)
Accuracy (%)
Space Heating Electricity 0.2
40.2 97.9 Natural Gas 39.1
Space Cooling 2.2 2.0 91.6
DHW 10.6 11.3 93.9
Appliances/ Lighting
Interior Equipment 7.5
13,3 97.9 Interior Lighting 6.1
Mechanical Ventilation 1.9 1.8 95.9
Pumps 0.9 N/A N/A
Total 68.5 68.6 99.8
Energy Generation
Water thermal 20.7 21.5 96.3
Electric sources 26.4 26.4 99.9
Total 47.1 47.9 98.4

From the results, it can be confidently said that Inspiration: The Minto ecohome has
been accurately modelled, even though experts might argue that some of the parameters
used to arrive to these results were not suitable. It must be emphasised that this thesis is
not devoted to the modelling of a real house but to HVAC solutions within a dwelling.
For this reason, the core part of this paper is Part 3.


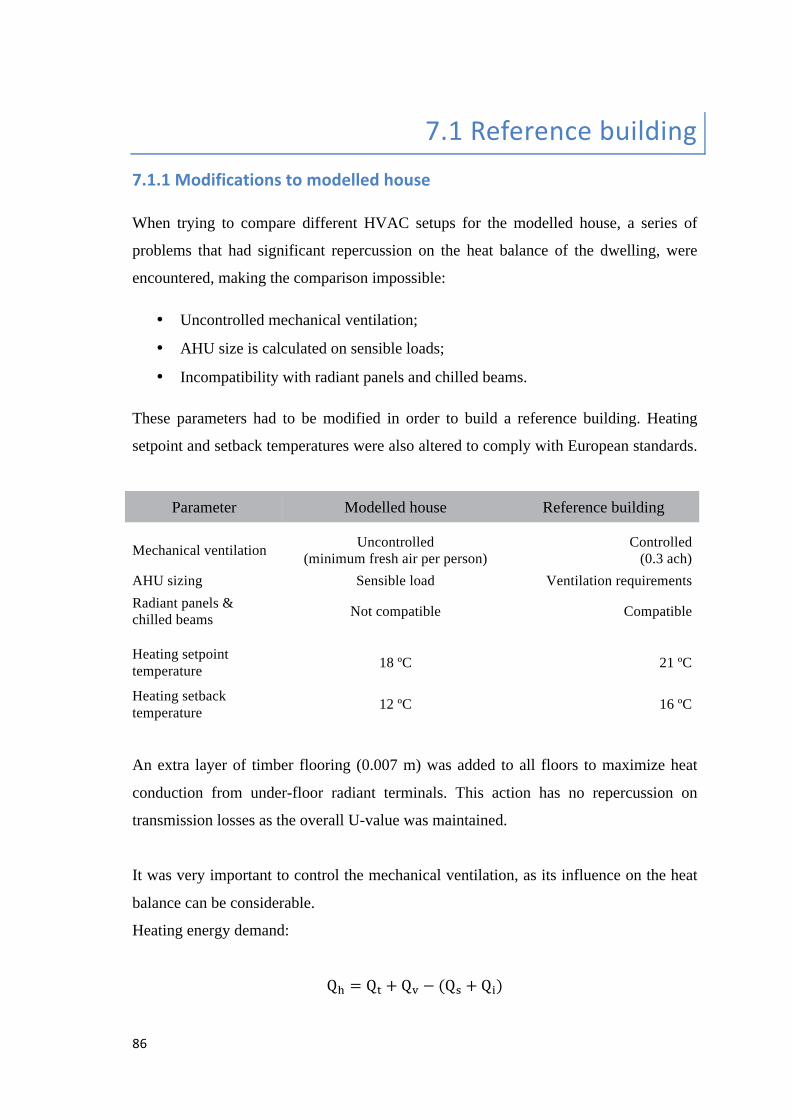
When trying to compare different HVAC setups for the modelled house, a series of
problems that had significant repercussion on the heat balance of the dwelling, were
encountered, making the comparison impossible:
• Uncontrolled mechanical ventilation;
• AHU size is calculated on sensible loads;
• Incompatibility with radiant panels and chilled beams.
These parameters had to be modified in order to build a reference building. Heating
setpoint and setback temperatures were also altered to comply with European standards.
Parameter Modelled house Reference building
Mechanical ventilation Uncontrolled (minimum fresh air per person)
Controlled (0.3 ach)
AHU sizing Sensible load Ventilation requirements Radiant panels & chilled beams Not compatible Compatible
Heating setpoint temperature 18 ºC 21 ºC
Heating setback temperature 12 ºC 16 ºC
An extra layer of timber flooring (0.007 m) was added to all floors to maximize heat
conduction from under-floor radiant terminals. This action has no repercussion on
transmission losses as the overall U-value was maintained.
It was very important to control the mechanical ventilation, as its influence on the heat
balance can be considerable.
Heating energy demand:
Where,
• Qt is transmission losses;
• Qs is solar gains;
• Qi is internal gains;
• Qv is ventilation losses
Ventilation losses:
Where,
• is the heat capacity of air per volume = 1200 J/(m3K);
• is the time-average airflow rate in m3/h;
• is the temperature adjustment factor with value ≠0 when supply temperature
is not equal to the temperature of the external environment, such as in case of
pre-heating, pre-cooling or heat recovery;
• for air infiltration an natural ventilation.
To control this, a reasonable number of air changes per hour had to be chosen. Once the
annual simulation for the modelled house had been run, the average ventilation rate of
all conditioned zones was calculated, with a result of approximately 0.3. This value was
adopted for the reference building and all derived houses. Unlike in the modelled house,
where mechanical ventilation followed the occupancy schedule, for the reference
building the schedule chosen was ‘ON’ (always functioning).
The sizing method of the air-handling unit had to therefore change from sensible loads
to ventilation requirement. Predictably, there will be a higher energy demand as the
AHU will now try to maintain a constant air change rate rather than meet heating loads
only. This step had also associated difficulties, as it is not possible to size on ventilation
requirements while using VAV reheat variable speed fans.
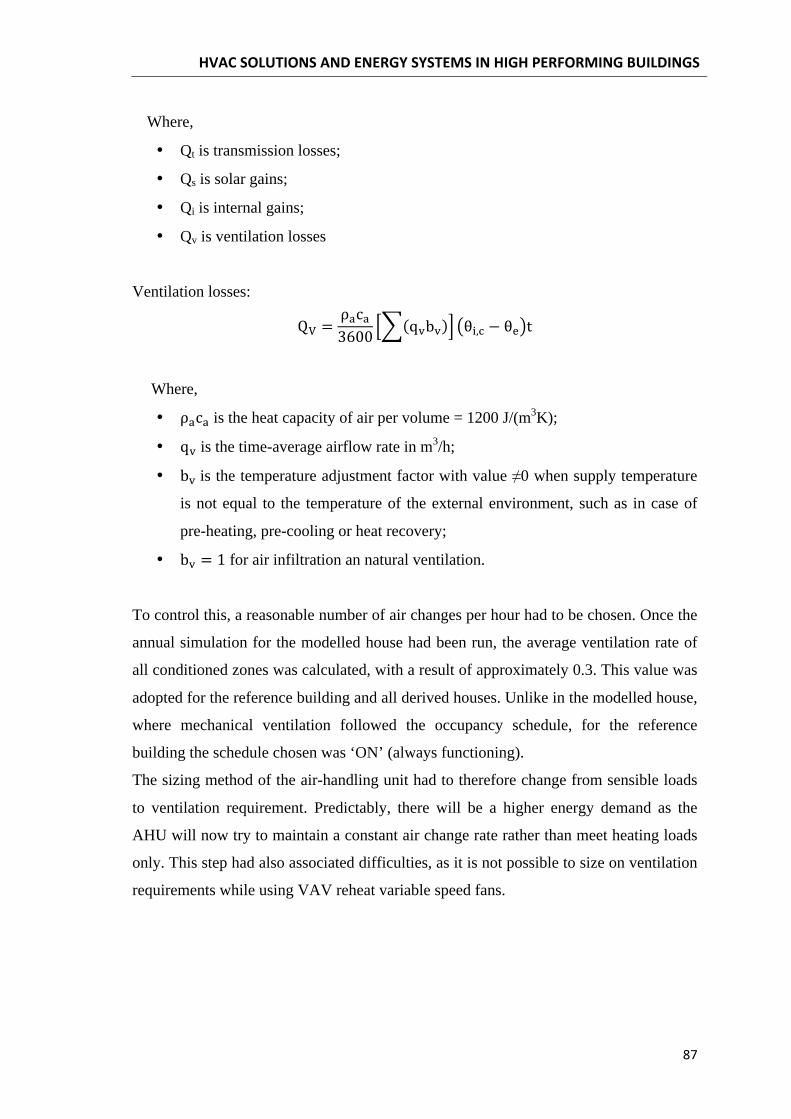
A change in the HVAC setup was therefore needed, specifically in the ventilation
strategy:
With constant volume AHUs, air cannot recirculate and therefore there can be no
economizer (free cooling). This also means that the cooling energy requirements will
increase, which gives us the possibility to analyse and compare between different
cooling systems as well as heating systems.
Once the ventilation strategy of the reference building has been defined it is possible to
analyse the new heating and cooling loads of the reference building.
As expected, the overall sensible heating load (7.68 kW; red) has grown, as the
ventilation losses (dark green) have increased due to the ventilation strategy and its
schedule. For the same reason, maximum cooling loads also enlarge to 2.77 kW.
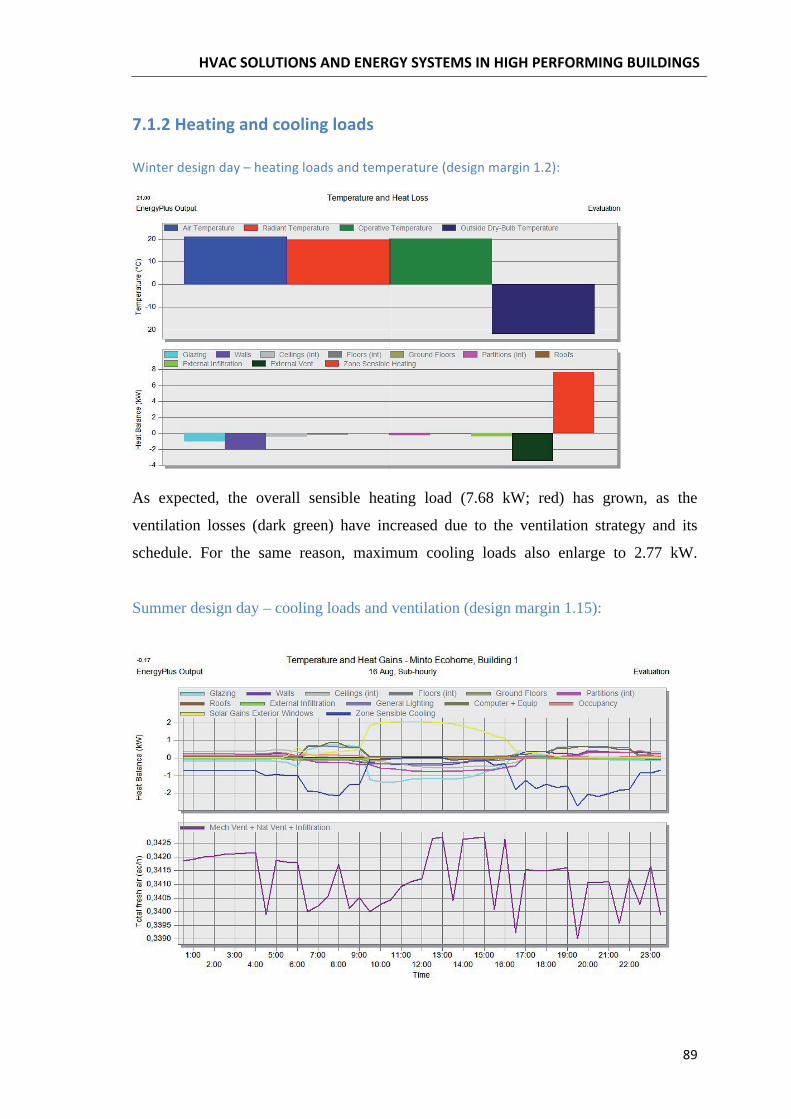
Summer design day – cooling loads and ventilation (design margin 1.15):
The peaks in the ventilation rate are due to environmental factors, unvented spaces and
transients, although if one takes a closer look at the scale, one can see that the
fluctuation is very small; almost negligible.
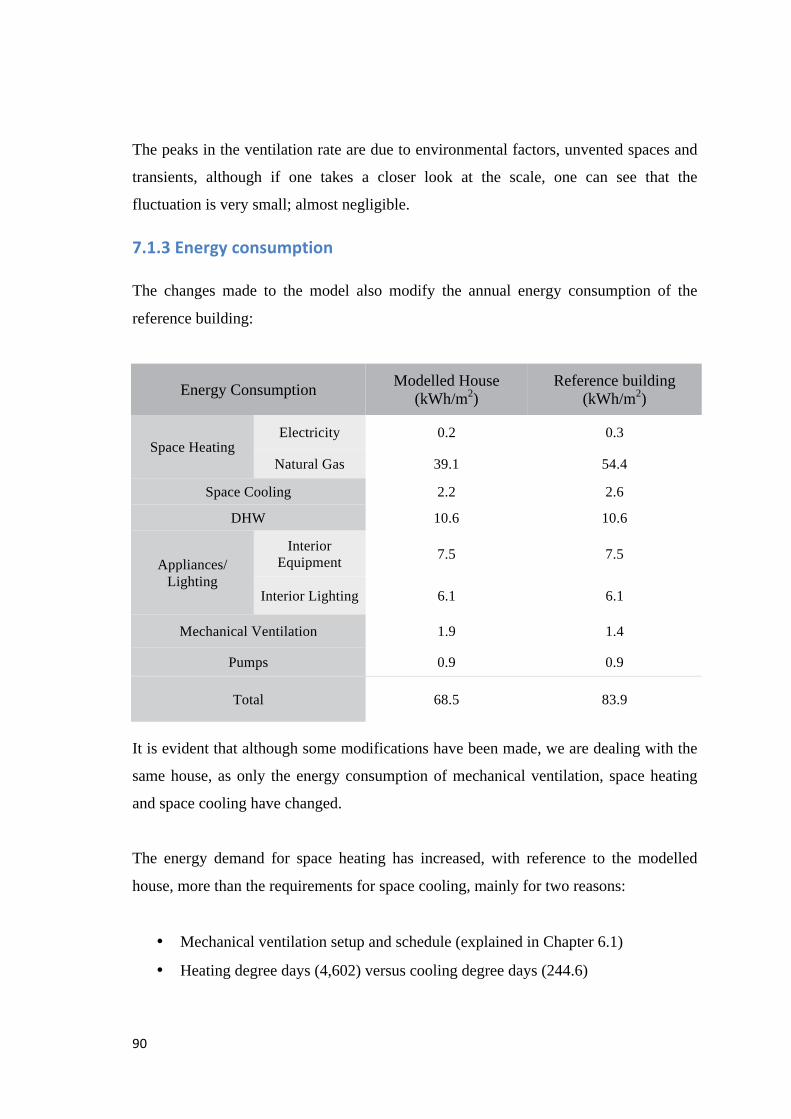
The changes made to the model also modify the annual energy consumption of the
reference building:
Energy Consumption Modelled House (kWh/m2)
Reference building (kWh/m2)
Space Heating Electricity 0.2 0.3
Natural Gas 39.1 54.4
Space Cooling 2.2 2.6
DHW 10.6 10.6
Appliances/ Lighting
Interior Equipment 7.5 7.5
Interior Lighting 6.1 6.1
Mechanical Ventilation 1.9 1.4
Pumps 0.9 0.9
Total 68.5 83.9
It is evident that although some modifications have been made, we are dealing with the
same house, as only the energy consumption of mechanical ventilation, space heating
and space cooling have changed.
The energy demand for space heating has increased, with reference to the modelled
house, more than the requirements for space cooling, mainly for two reasons:
• Mechanical ventilation setup and schedule (explained in Chapter 6.1)
• Heating degree days (4,602) versus cooling degree days (244.6)
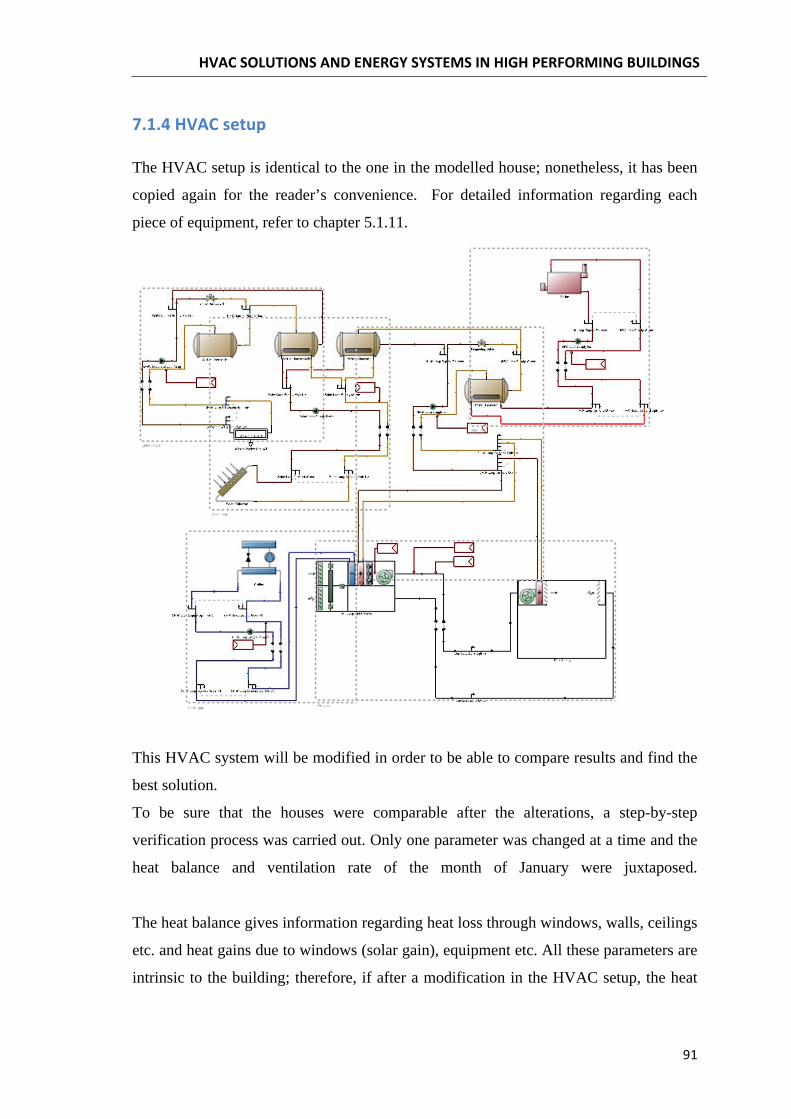
The HVAC setup is identical to the one in the modelled house; nonetheless, it has been
copied again for the reader’s convenience. For detailed information regarding each
piece of equipment, refer to chapter 5.1.11.
This HVAC system will be modified in order to be able to compare results and find the
best solution.
To be sure that the houses were comparable after the alterations, a step-by-step
verification process was carried out. Only one parameter was changed at a time and the
heat balance and ventilation rate of the month of January were juxtaposed.
The heat balance gives information regarding heat loss through windows, walls, ceilings
etc. and heat gains due to windows (solar gain), equipment etc. All these parameters are
intrinsic to the building; therefore, if after a modification in the HVAC setup, the heat
balance remains the same, one can confidently say that the two configurations can be
compared.
This analysis can be found in Annex C.
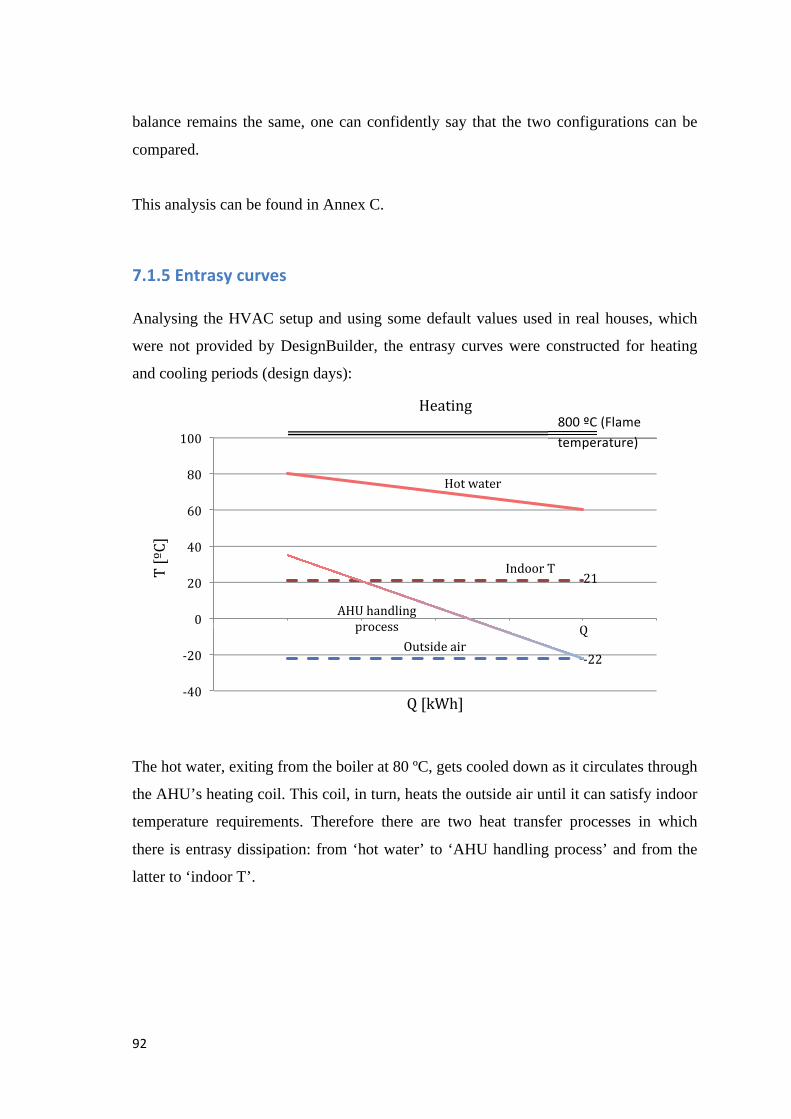
Analysing the HVAC setup and using some default values used in real houses, which
were not provided by DesignBuilder, the entrasy curves were constructed for heating
and cooling periods (design days):
The hot water, exiting from the boiler at 80 ºC, gets cooled down as it circulates through
the AHU’s heating coil. This coil, in turn, heats the outside air until it can satisfy indoor
temperature requirements. Therefore there are two heat transfer processes in which
there is entrasy dissipation: from ‘hot water’ to ‘AHU handling process’ and from the
latter to ‘indoor T’.
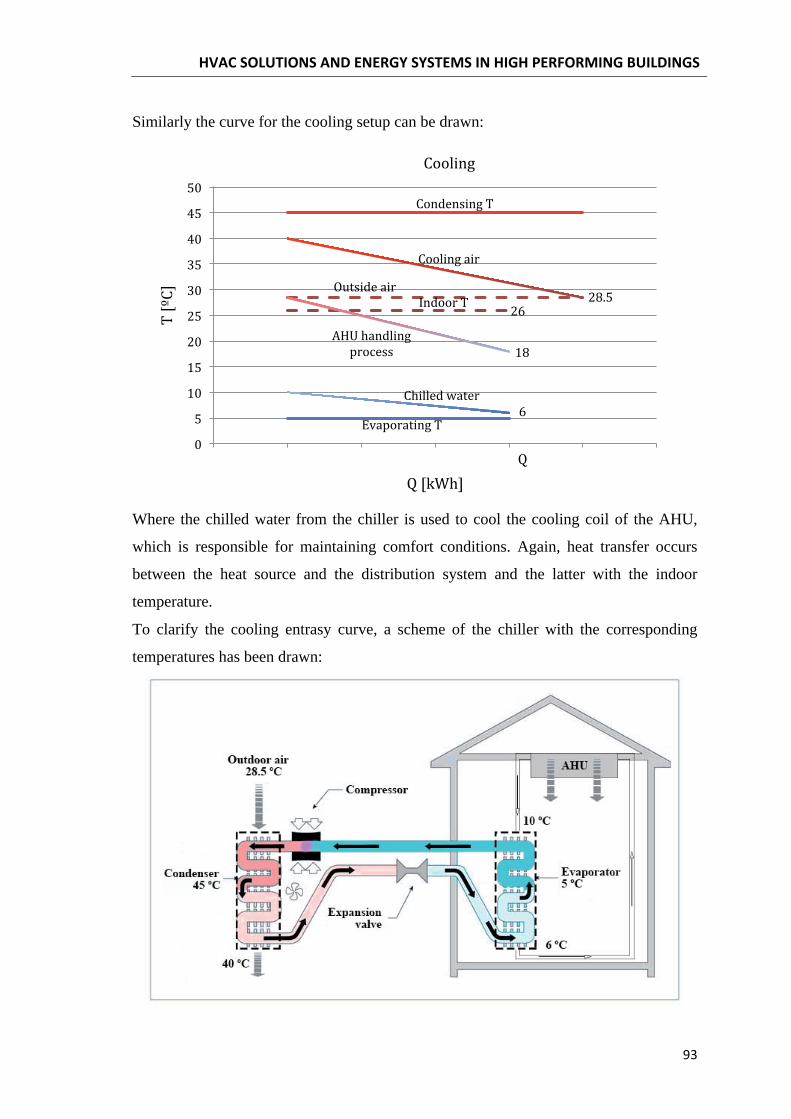
Similarly the curve for the cooling setup can be drawn:
Where the chilled water from the chiller is used to cool the cooling coil of the AHU,
which is responsible for maintaining comfort conditions. Again, heat transfer occurs
between the heat source and the distribution system and the latter with the indoor
temperature.
To clarify the cooling entrasy curve, a scheme of the chiller with the corresponding
temperatures has been drawn:
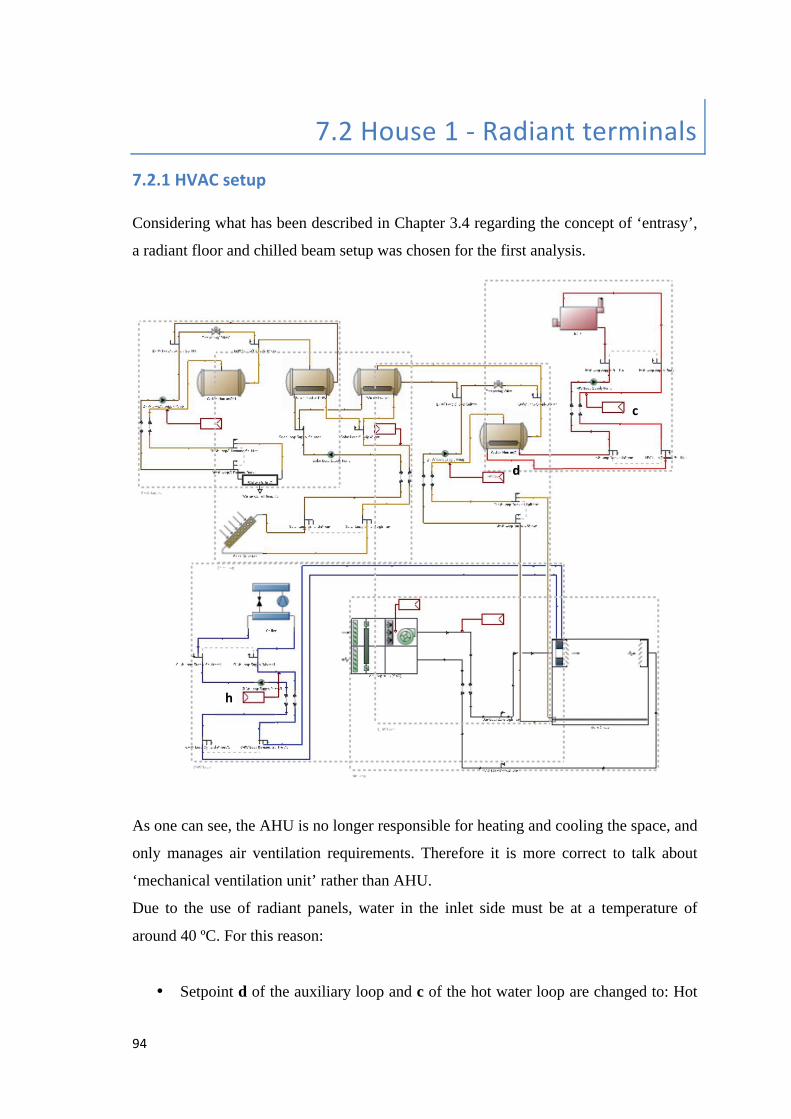
Considering what has been described in Chapter 3.4 regarding the concept of ‘entrasy’,
a radiant floor and chilled beam setup was chosen for the first analysis.
As one can see, the AHU is no longer responsible for heating and cooling the space, and
only manages air ventilation requirements. Therefore it is more correct to talk about
‘mechanical ventilation unit’ rather than AHU.
Due to the use of radiant panels, water in the inlet side must be at a temperature of
around 40 ºC. For this reason:
• Setpoint d of the auxiliary loop and c of the hot water loop are changed to: Hot
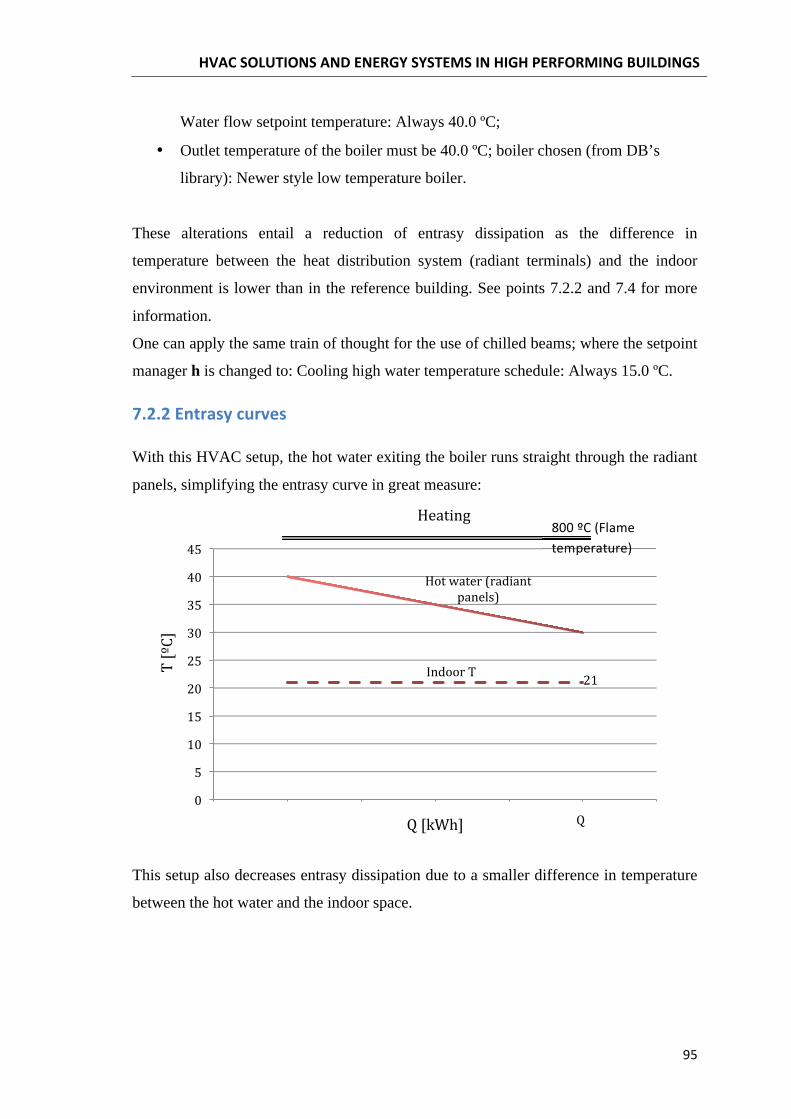
Water flow setpoint temperature: Always 40.0 ºC;
• Outlet temperature of the boiler must be 40.0 ºC; boiler chosen (from DB’s
library): Newer style low temperature boiler.
These alterations entail a reduction of entrasy dissipation as the difference in
temperature between the heat distribution system (radiant terminals) and the indoor
environment is lower than in the reference building. See points 7.2.2 and 7.4 for more
information.
One can apply the same train of thought for the use of chilled beams; where the setpoint
manager h is changed to: Cooling high water temperature schedule: Always 15.0 ºC.
With this HVAC setup, the hot water exiting the boiler runs straight through the radiant
panels, simplifying the entrasy curve in great measure:
This setup also decreases entrasy dissipation due to a smaller difference in temperature
between the hot water and the indoor space.
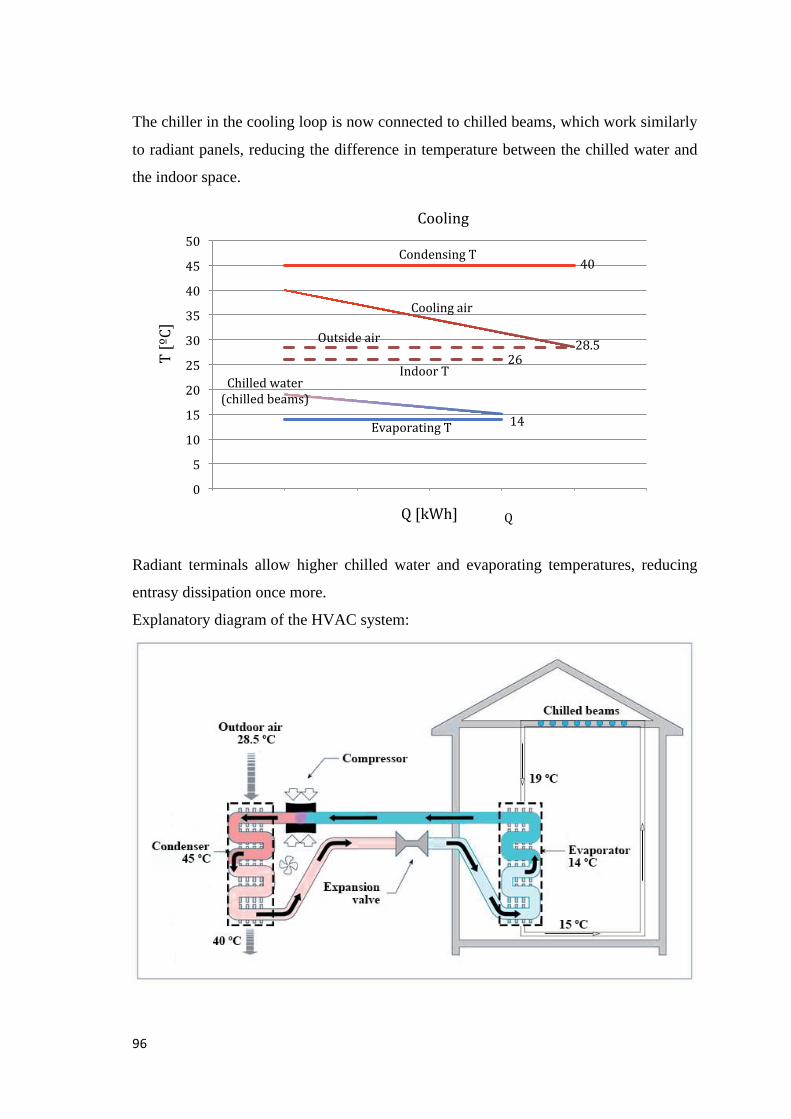
The chiller in the cooling loop is now connected to chilled beams, which work similarly
to radiant panels, reducing the difference in temperature between the chilled water and
the indoor space.
Radiant terminals allow higher chilled water and evaporating temperatures, reducing
entrasy dissipation once more.
Explanatory diagram of the HVAC system:
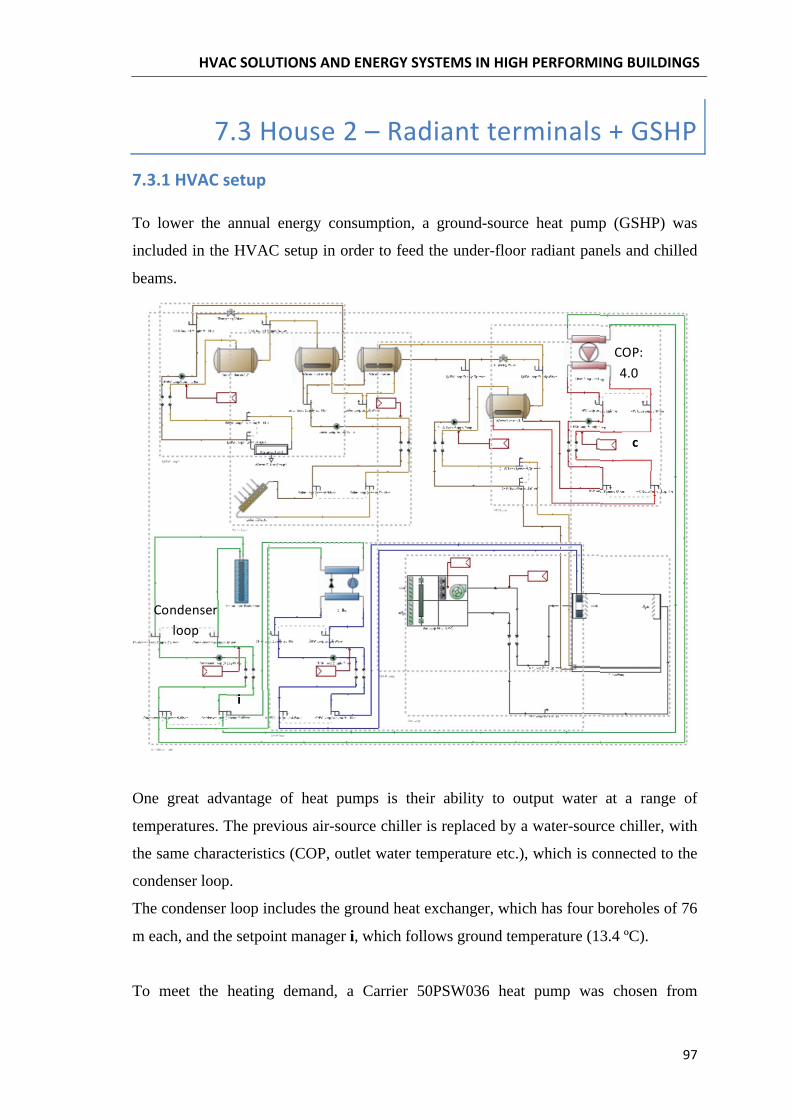
To lower the annual energy consumption, a ground-source heat pump (GSHP) was
included in the HVAC setup in order to feed the under-floor radiant panels and chilled
beams.
One great advantage of heat pumps is their ability to output water at a range of
temperatures. The previous air-source chiller is replaced by a water-source chiller, with
the same characteristics (COP, outlet water temperature etc.), which is connected to the
condenser loop.
The condenser loop includes the ground heat exchanger, which has four boreholes of 76
m each, and the setpoint manager i, which follows ground temperature (13.4 ºC).
To meet the heating demand, a Carrier 50PSW036 heat pump was chosen from
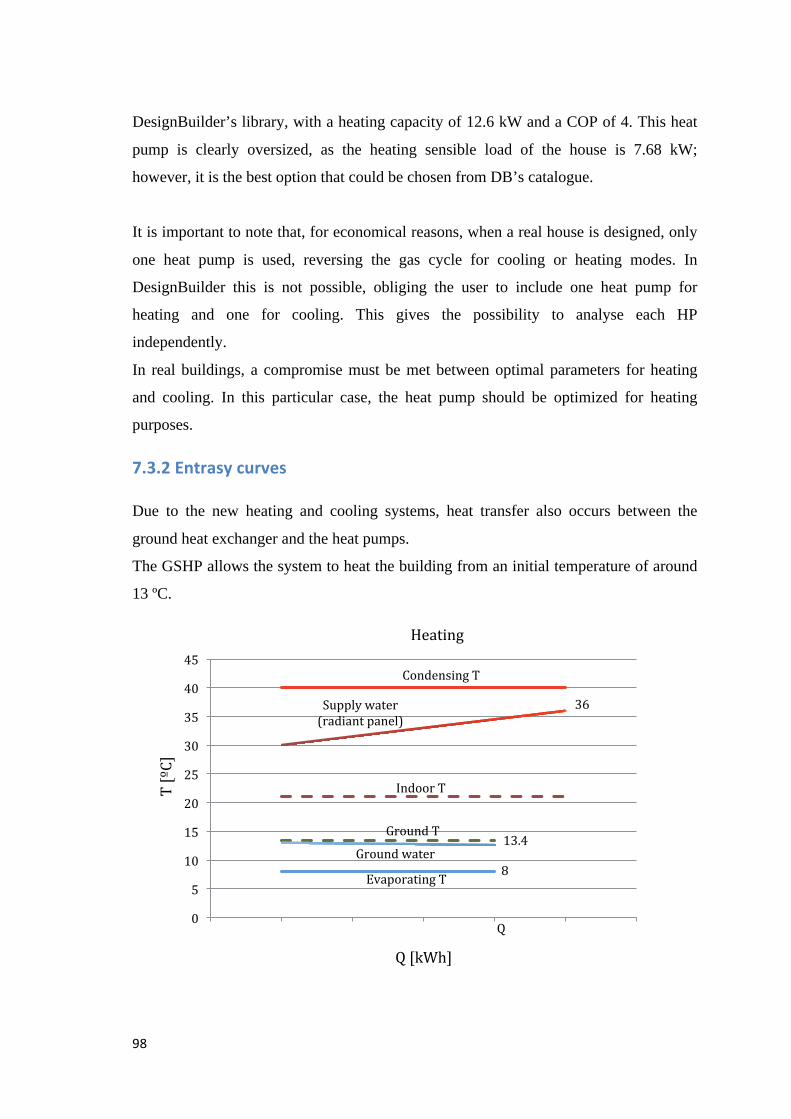
DesignBuilder’s library, with a heating capacity of 12.6 kW and a COP of 4. This heat
pump is clearly oversized, as the heating sensible load of the house is 7.68 kW;
however, it is the best option that could be chosen from DB’s catalogue.
It is important to note that, for economical reasons, when a real house is designed, only
one heat pump is used, reversing the gas cycle for cooling or heating modes. In
DesignBuilder this is not possible, obliging the user to include one heat pump for
heating and one for cooling. This gives the possibility to analyse each HP
independently.
In real buildings, a compromise must be met between optimal parameters for heating
and cooling. In this particular case, the heat pump should be optimized for heating
purposes.
Due to the new heating and cooling systems, heat transfer also occurs between the
ground heat exchanger and the heat pumps.
The GSHP allows the system to heat the building from an initial temperature of around
13 ºC.
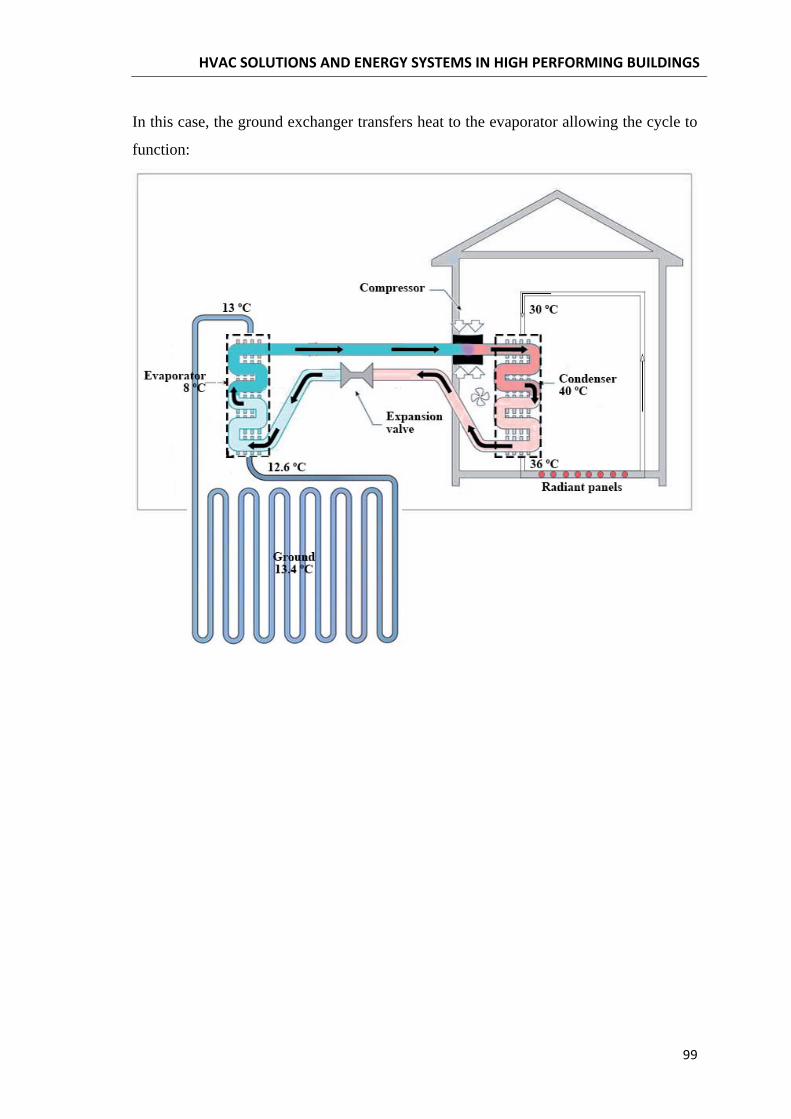
In this case, the ground exchanger transfers heat to the evaporator allowing the cycle to
function:
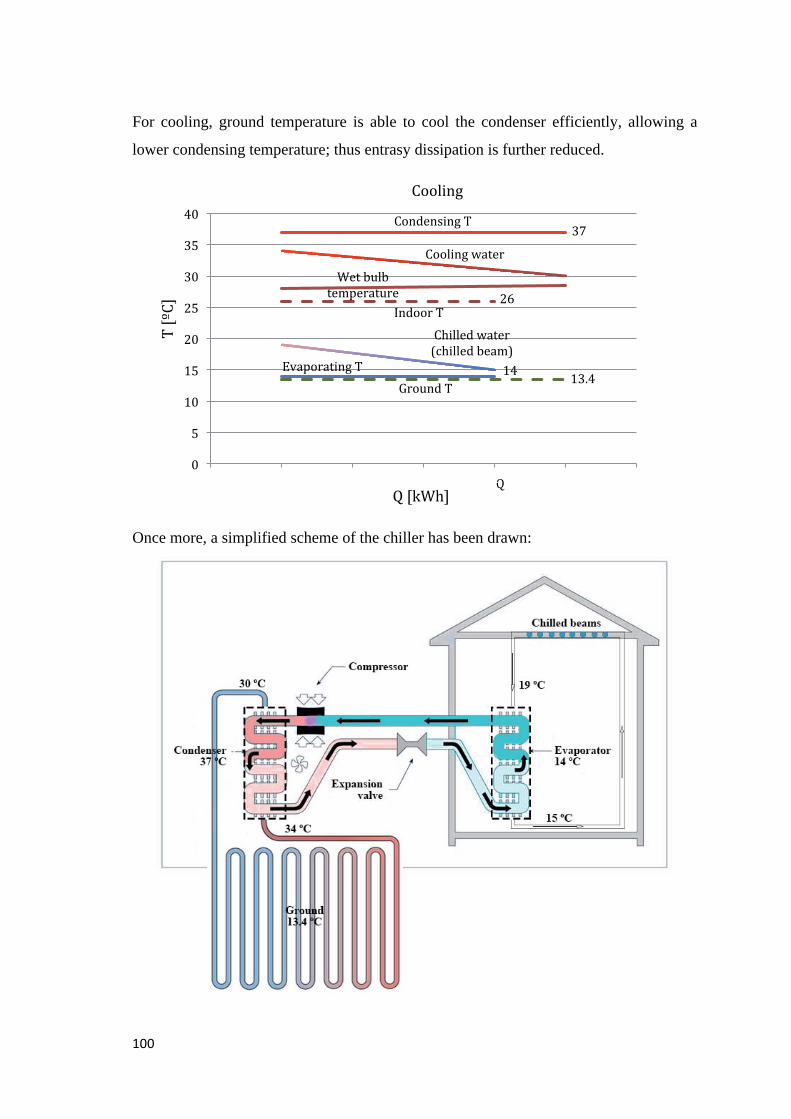
For cooling, ground temperature is able to cool the condenser efficiently, allowing a
lower condensing temperature; thus entrasy dissipation is further reduced.
Once more, a simplified scheme of the chiller has been drawn:
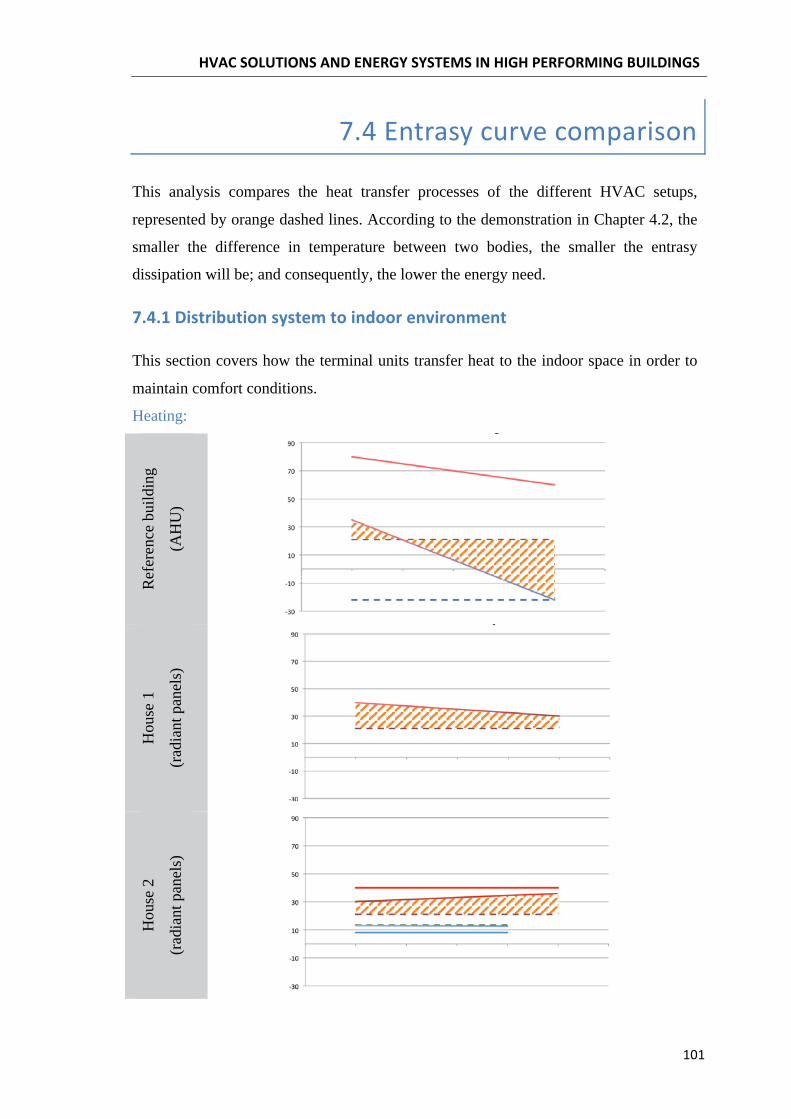
This analysis compares the heat transfer processes of the different HVAC setups,
represented by orange dashed lines. According to the demonstration in Chapter 4.2, the
smaller the difference in temperature between two bodies, the smaller the entrasy
dissipation will be; and consequently, the lower the energy need.
This section covers how the terminal units transfer heat to the indoor space in order to
maintain comfort conditions.
Heating:
Ref
eren
ce b
uild
ing
(AH
U)
Hou
se 1
(rad
iant
pan
els)
Hou
se 2
(rad
iant
pan
els)
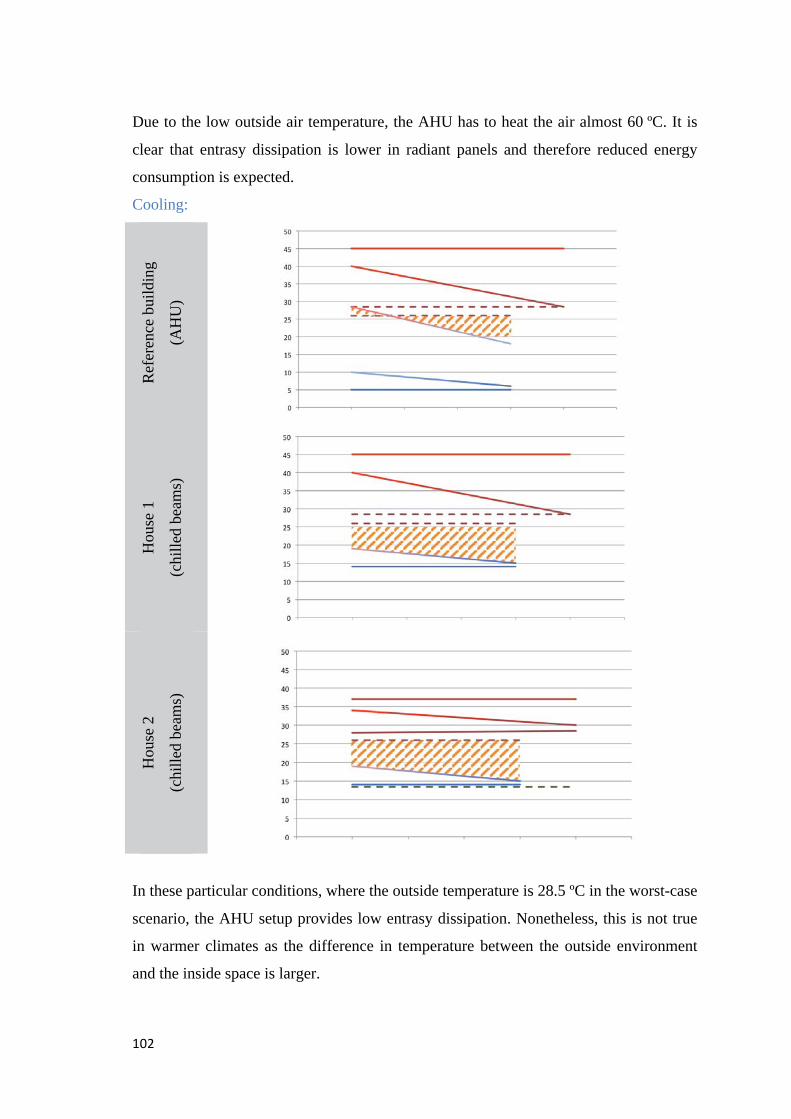
Due to the low outside air temperature, the AHU has to heat the air almost 60 ºC. It is
clear that entrasy dissipation is lower in radiant panels and therefore reduced energy
consumption is expected.
Cooling:
Ref
eren
ce b
uild
ing
(AH
U)
Hou
se 1
(chi
lled
beam
s)
Hou
se 2
(chi
lled
beam
s)
In these particular conditions, where the outside temperature is 28.5 ºC in the worst-case
scenario, the AHU setup provides low entrasy dissipation. Nonetheless, this is not true
in warmer climates as the difference in temperature between the outside environment
and the inside space is larger.
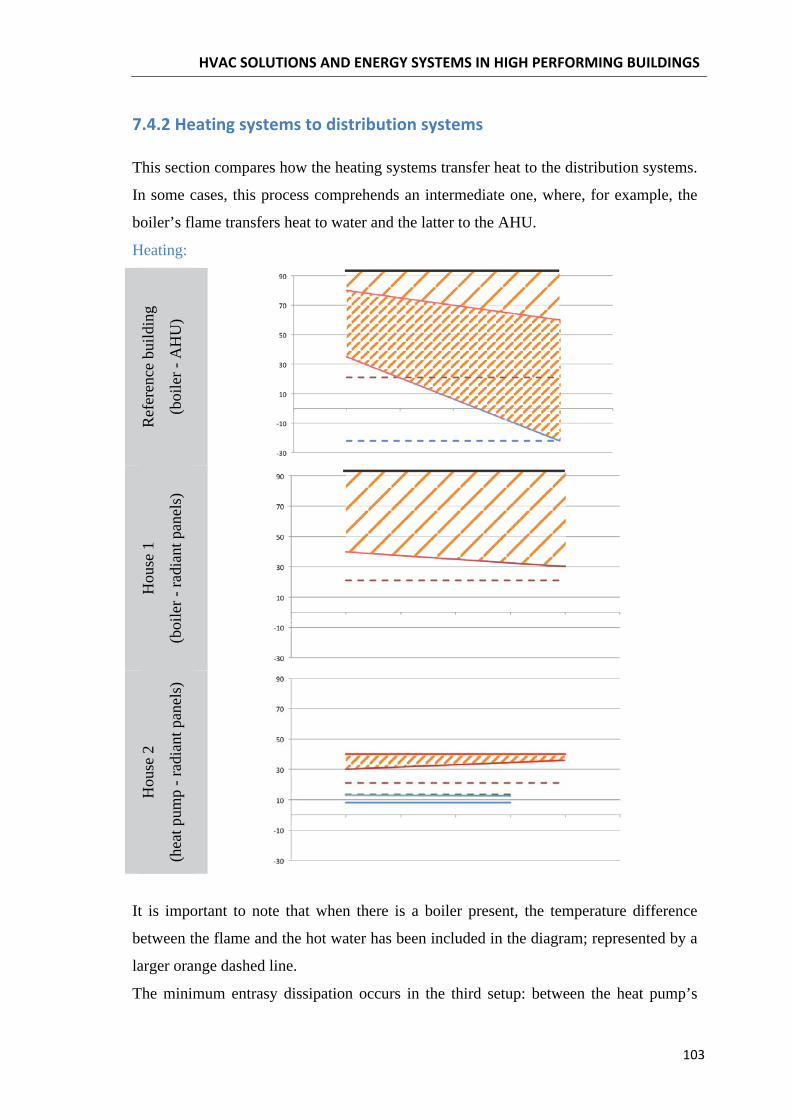
This section compares how the heating systems transfer heat to the distribution systems.
In some cases, this process comprehends an intermediate one, where, for example, the
boiler’s flame transfers heat to water and the latter to the AHU.
Heating:
Ref
eren
ce b
uild
ing
(boi
ler -
AH
U)
Hou
se 1
(boi
ler -
radi
ant p
anel
s)
Hou
se 2
(hea
t pum
p - r
adia
nt p
anel
s)
It is important to note that when there is a boiler present, the temperature difference
between the flame and the hot water has been included in the diagram; represented by a
larger orange dashed line.
The minimum entrasy dissipation occurs in the third setup: between the heat pump’s
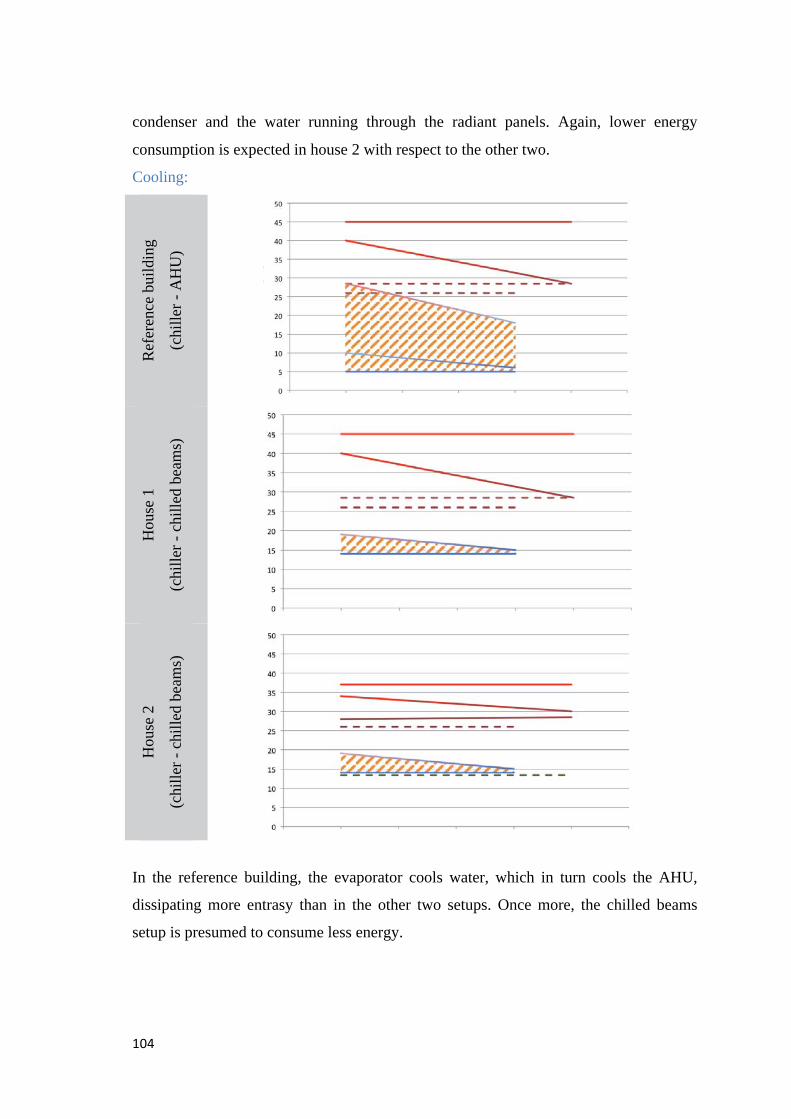
condenser and the water running through the radiant panels. Again, lower energy
consumption is expected in house 2 with respect to the other two.
Cooling:
Ref
eren
ce b
uild
ing
(chi
ller -
AH
U)
Hou
se 1
(chi
ller -
chi
lled
beam
s)
Hou
se 2
(chi
ller -
chi
lled
beam
s)
In the reference building, the evaporator cools water, which in turn cools the AHU,
dissipating more entrasy than in the other two setups. Once more, the chilled beams
setup is presumed to consume less energy.
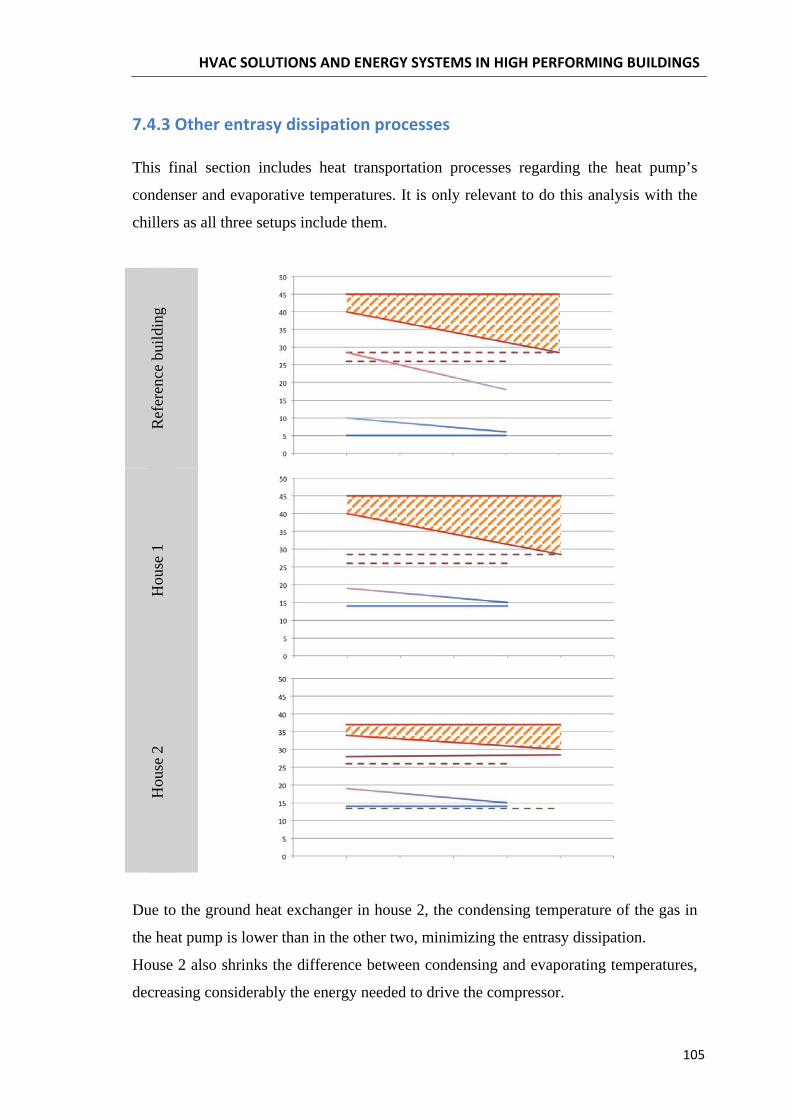
This final section includes heat transportation processes regarding the heat pump’s
condenser and evaporative temperatures. It is only relevant to do this analysis with the
chillers as all three setups include them.
Ref
eren
ce b
uild
ing
Hou
se 1
Hou
se 2
Due to the ground heat exchanger in house 2, the condensing temperature of the gas in
the heat pump is lower than in the other two, minimizing the entrasy dissipation.
House 2 also shrinks the difference between condensing and evaporating temperatures,
decreasing considerably the energy needed to drive the compressor.
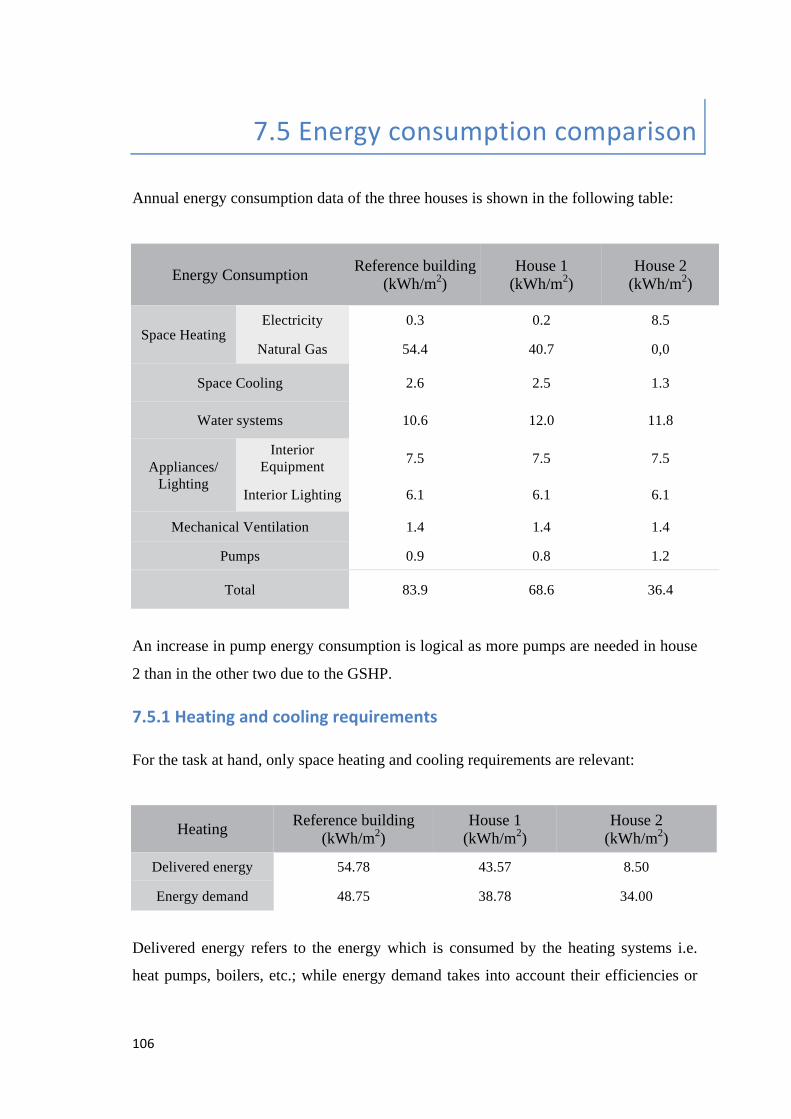
Annual energy consumption data of the three houses is shown in the following table:
Energy Consumption Reference building (kWh/m2)
House 1 (kWh/m2)
House 2 (kWh/m2)
Space Heating Electricity 0.3 0.2 8.5
Natural Gas 54.4 40.7 0,0
Space Cooling 2.6 2.5 1.3
Water systems 10.6 12.0 11.8
Appliances/ Lighting
Interior Equipment 7.5 7.5 7.5
Interior Lighting 6.1 6.1 6.1
Mechanical Ventilation 1.4 1.4 1.4
Pumps 0.9 0.8 1.2
Total 83.9 68.6 36.4
An increase in pump energy consumption is logical as more pumps are needed in house
2 than in the other two due to the GSHP.
For the task at hand, only space heating and cooling requirements are relevant:
Heating Reference building (kWh/m2)
House 1 (kWh/m2)
House 2 (kWh/m2)
Delivered energy 54.78 43.57 8.50
Energy demand 48.75 38.78 34.00
Delivered energy refers to the energy which is consumed by the heating systems i.e.
heat pumps, boilers, etc.; while energy demand takes into account their efficiencies or
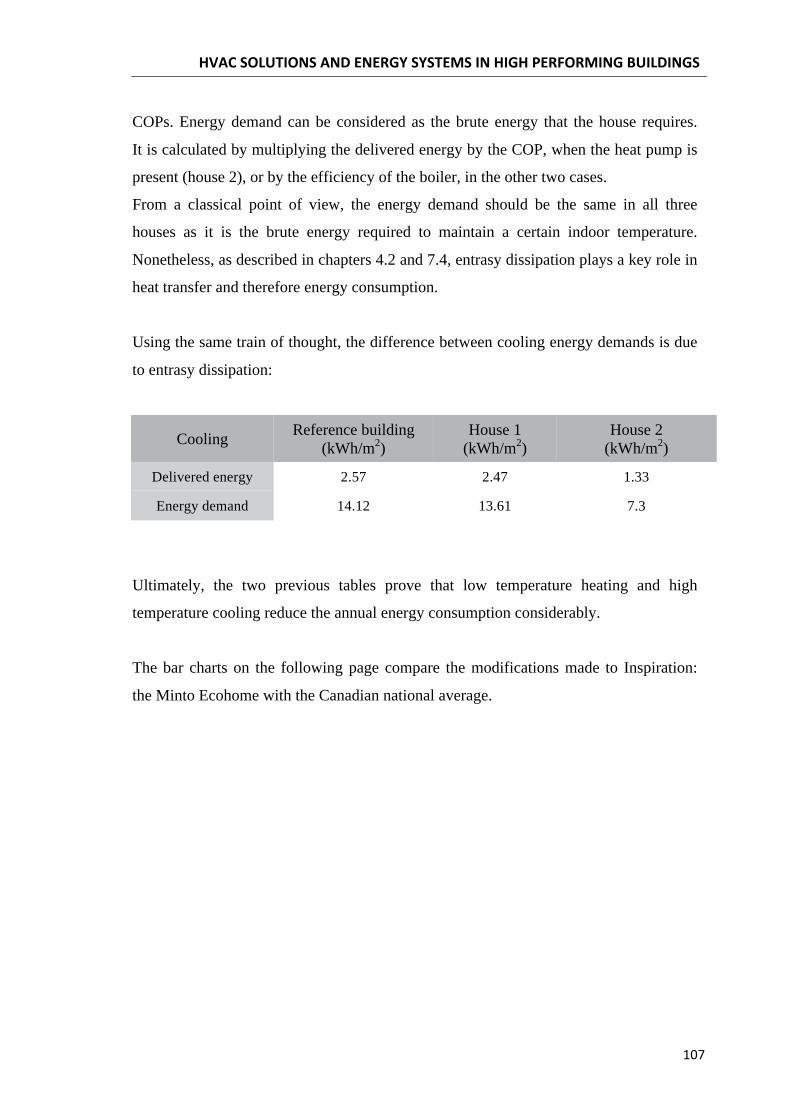
COPs. Energy demand can be considered as the brute energy that the house requires.
It is calculated by multiplying the delivered energy by the COP, when the heat pump is
present (house 2), or by the efficiency of the boiler, in the other two cases.
From a classical point of view, the energy demand should be the same in all three
houses as it is the brute energy required to maintain a certain indoor temperature.
Nonetheless, as described in chapters 4.2 and 7.4, entrasy dissipation plays a key role in
heat transfer and therefore energy consumption.
Using the same train of thought, the difference between cooling energy demands is due
to entrasy dissipation:
Cooling Reference building (kWh/m2)
House 1 (kWh/m2)
House 2 (kWh/m2)
Delivered energy 2.57 2.47 1.33
Energy demand 14.12 13.61 7.3
Ultimately, the two previous tables prove that low temperature heating and high
temperature cooling reduce the annual energy consumption considerably.
The bar charts on the following page compare the modifications made to Inspiration:
the Minto Ecohome with the Canadian national average.
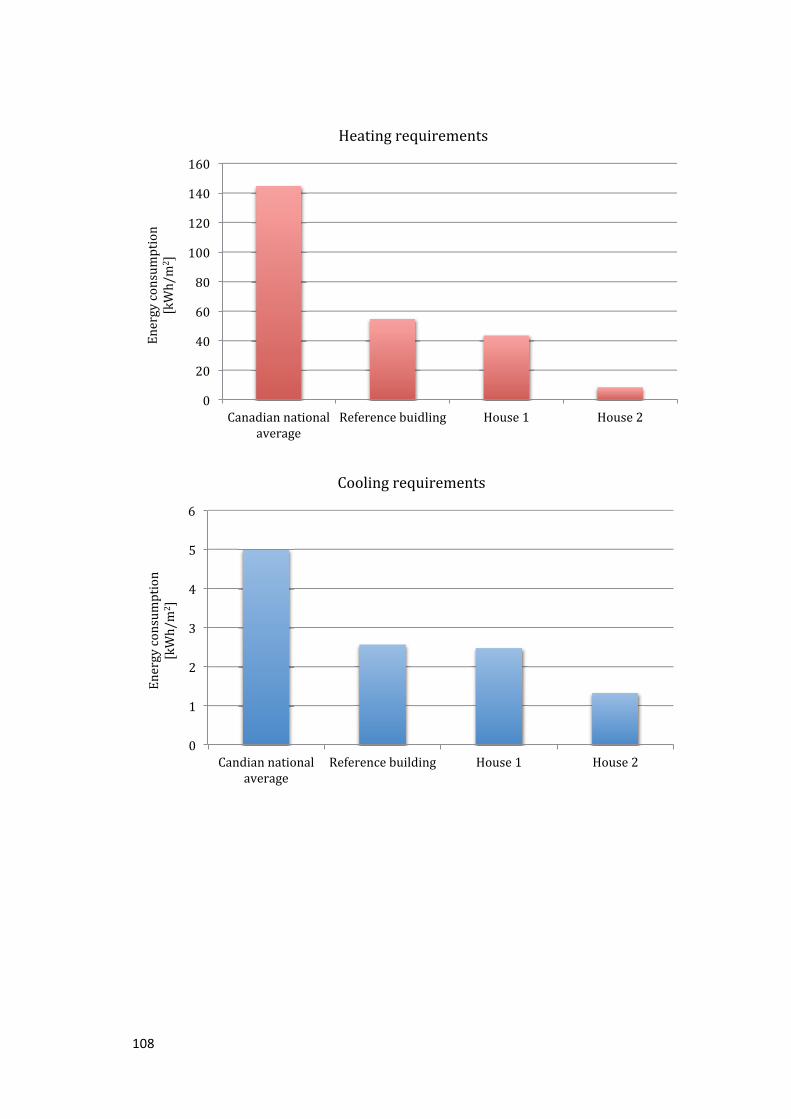
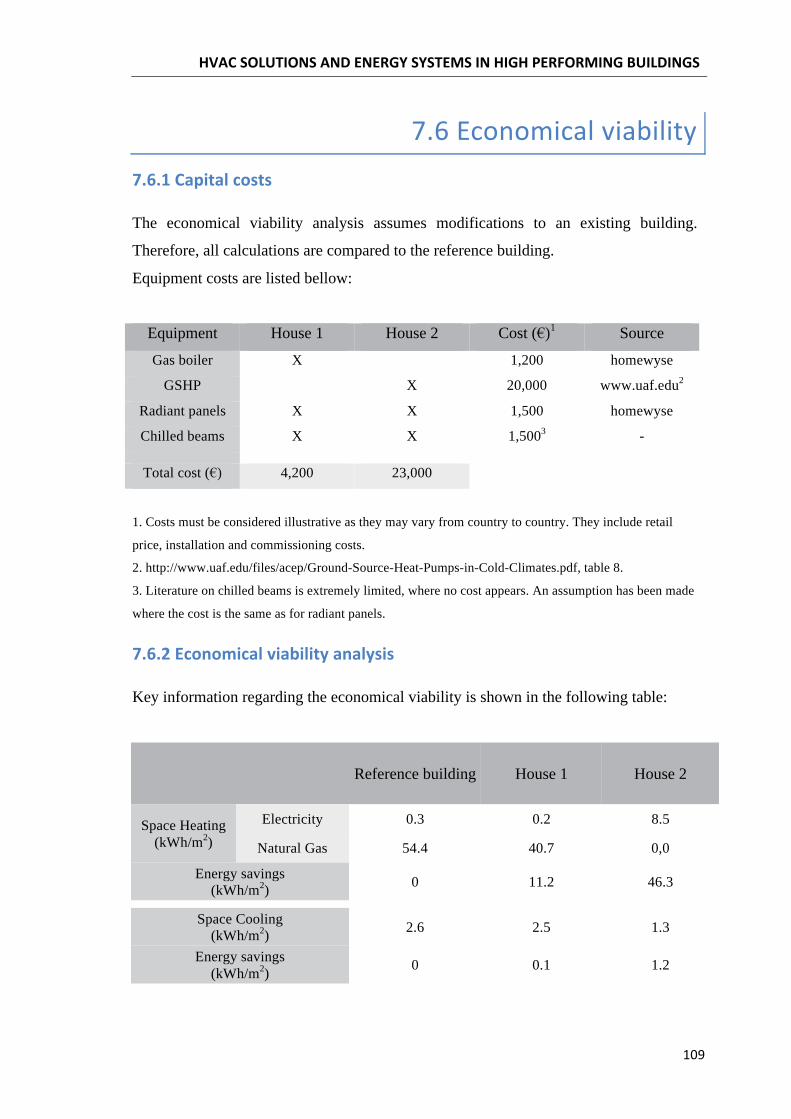
The economical viability analysis assumes modifications to an existing building.
Therefore, all calculations are compared to the reference building.
Equipment costs are listed bellow:
Equipment House 1 House 2 Cost (€)1 Source
Gas boiler X 1,200 homewyse
GSHP X 20,000 www.uaf.edu2
Radiant panels X X 1,500 homewyse
Chilled beams X X 1,5003 -
Total cost (€) 4,200 23,000
1. Costs must be considered illustrative as they may vary from country to country. They include retail
price, installation and commissioning costs.
2. http://www.uaf.edu/files/acep/Ground-Source-Heat-Pumps-in-Cold-Climates.pdf, table 8.
3. Literature on chilled beams is extremely limited, where no cost appears. An assumption has been made
where the cost is the same as for radiant panels.
Key information regarding the economical viability is shown in the following table:
Reference building House 1 House 2
Space Heating (kWh/m2)
Electricity 0.3 0.2 8.5
Natural Gas 54.4 40.7 0,0
Energy savings (kWh/m2) 0 11.2 46.3
Space Cooling (kWh/m2) 2.6 2.5 1.3
Energy savings (kWh/m2) 0 0.1 1.2
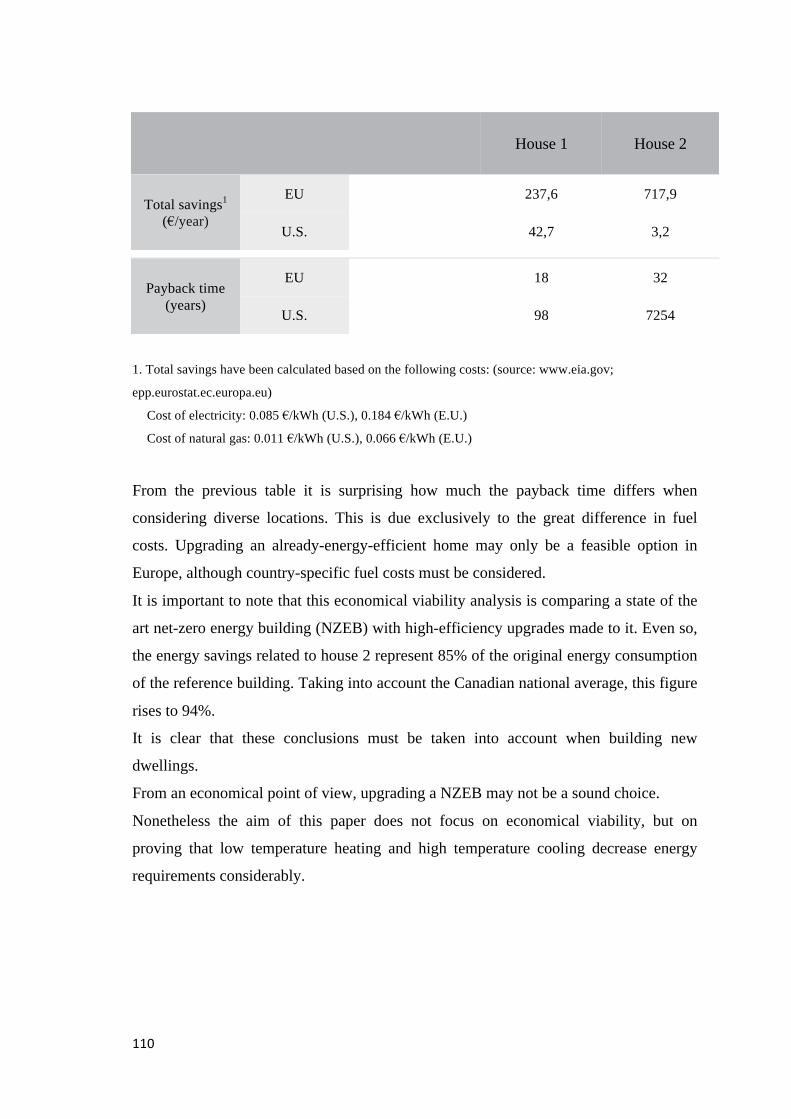
House 1 House 2
Total savings1 (€/year)
EU 237,6 717,9
U.S. 42,7 3,2
Payback time (years)
EU 18 32
U.S. 98 7254
1. Total savings have been calculated based on the following costs: (source: www.eia.gov;
epp.eurostat.ec.europa.eu)
Cost of electricity: 0.085 €/kWh (U.S.), 0.184 €/kWh (E.U.)
Cost of natural gas: 0.011 €/kWh (U.S.), 0.066 €/kWh (E.U.)
From the previous table it is surprising how much the payback time differs when
considering diverse locations. This is due exclusively to the great difference in fuel
costs. Upgrading an already-energy-efficient home may only be a feasible option in
Europe, although country-specific fuel costs must be considered.
It is important to note that this economical viability analysis is comparing a state of the
art net-zero energy building (NZEB) with high-efficiency upgrades made to it. Even so,
the energy savings related to house 2 represent 85% of the original energy consumption
of the reference building. Taking into account the Canadian national average, this figure
rises to 94%.
It is clear that these conclusions must be taken into account when building new
dwellings.
From an economical point of view, upgrading a NZEB may not be a sound choice.
Nonetheless the aim of this paper does not focus on economical viability, but on
proving that low temperature heating and high temperature cooling decrease energy
requirements considerably.
Countries around the globe are becoming aware of the necessity to integrate high-
efficiency HVAC systems into buildings in order to cut down energy consumption and
carbon emissions and comply with goals like the “20-20-20 target” for European state
members. Many investigation projects are been carried out in order to improve HVAC
and energy systems. As part of Annex 59 of the ECBCS, this thesis has successfully
arrived to some conclusions crucial to the project:
From the results one can conclude that that entrasy dissipation strongly influences
energy consumption, making high temperature heating and low temperature cooling
HVAC systems the most energy-efficient systems available. In addition, the equipment
at use does not represent a high capital cost, with relatively small payback times,
especially if upgrading a typical dwelling.


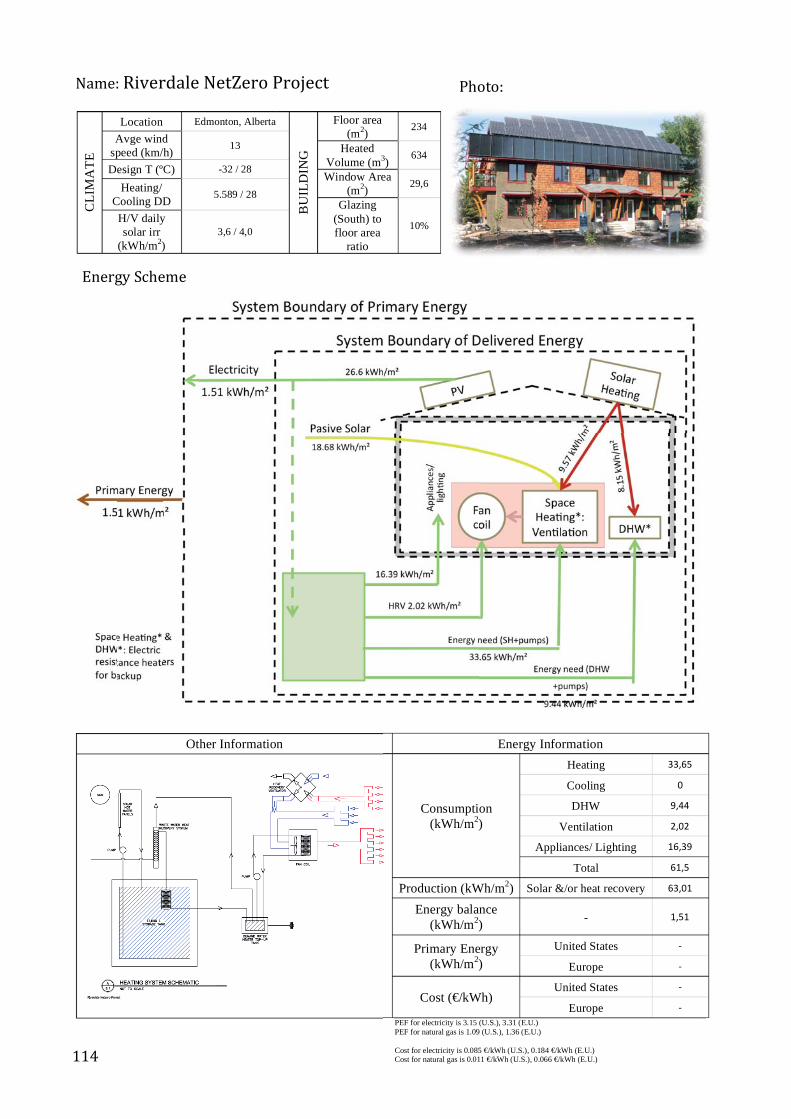
BU
ILD
ING
Floor area (m2) 234
Heated Volume (m3) 634
Window Area (m2) 29,6
Glazing (South) to floor area
ratio
10%
CLI
MA
TE
Location Edmonton, Alberta
Avge wind speed (km/h) 13
Design T (ºC) -32 / 28
Heating/ Cooling DD 5.589 / 28
H/V daily solar irr
(kWh/m2) 3,6 / 4,0
Other Information Energy Information
Consumption (kWh/m2)
Heating
Cooling DHW
Ventilation Appliances/ Lighting
Total
Production (kWh/m2) Solar &/or heat recovery
Energy balance (kWh/m2) -
Primary Energy (kWh/m2)
United States
Europe
Cost (€/kWh) United States
Europe PEF for electricity is 3.15 (U.S.), 3.31 (E.U.) PEF for natural gas is 1.09 (U.S.), 1.36 (E.U.) Cost for electricity is 0.085 €/kWh (U.S.), 0.184 €/kWh (E.U.) Cost for natural gas is 0.011 €/kWh (U.S.), 0.066 €/kWh (E.U.)
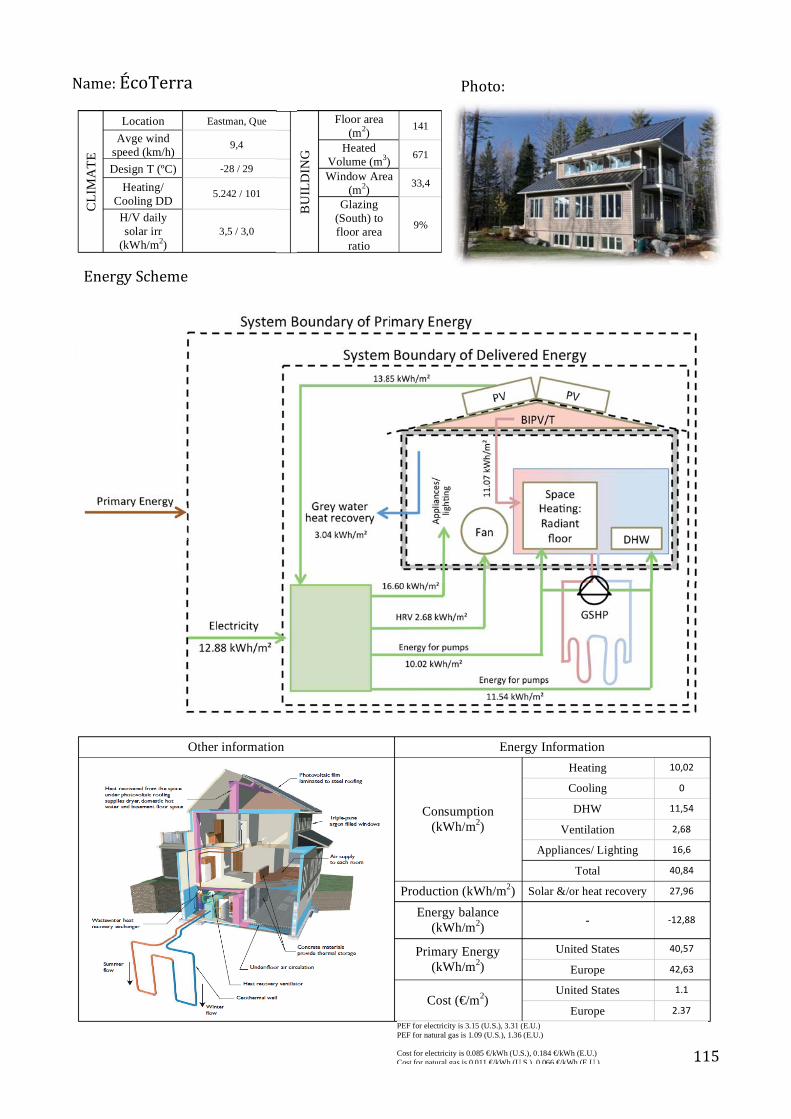
BU
ILD
ING
Floor area (m2) 141
Heated Volume (m3) 671
Window Area (m2) 33,4
Glazing (South) to floor area
ratio
9%
CLI
MA
TE
Location Eastman, Que
Avge wind speed (km/h) 9,4
Design T (ºC) -28 / 29
Heating/ Cooling DD 5.242 / 101
H/V daily solar irr
(kWh/m2) 3,5 / 3,0
Other information Energy Information
Consumption (kWh/m2)
Heating Cooling DHW
Ventilation Appliances/ Lighting
Total
Production (kWh/m2) Solar &/or heat recovery
Energy balance (kWh/m2) -
Primary Energy (kWh/m2)
United States
Europe
Cost (€/m2) United States
Europe PEF for electricity is 3.15 (U.S.), 3.31 (E.U.) PEF for natural gas is 1.09 (U.S.), 1.36 (E.U.) Cost for electricity is 0.085 €/kWh (U.S.), 0.184 €/kWh (E.U.) Cost for natural gas is 0.011 €/kWh (U.S.), 0.066 €/kWh (E.U.)
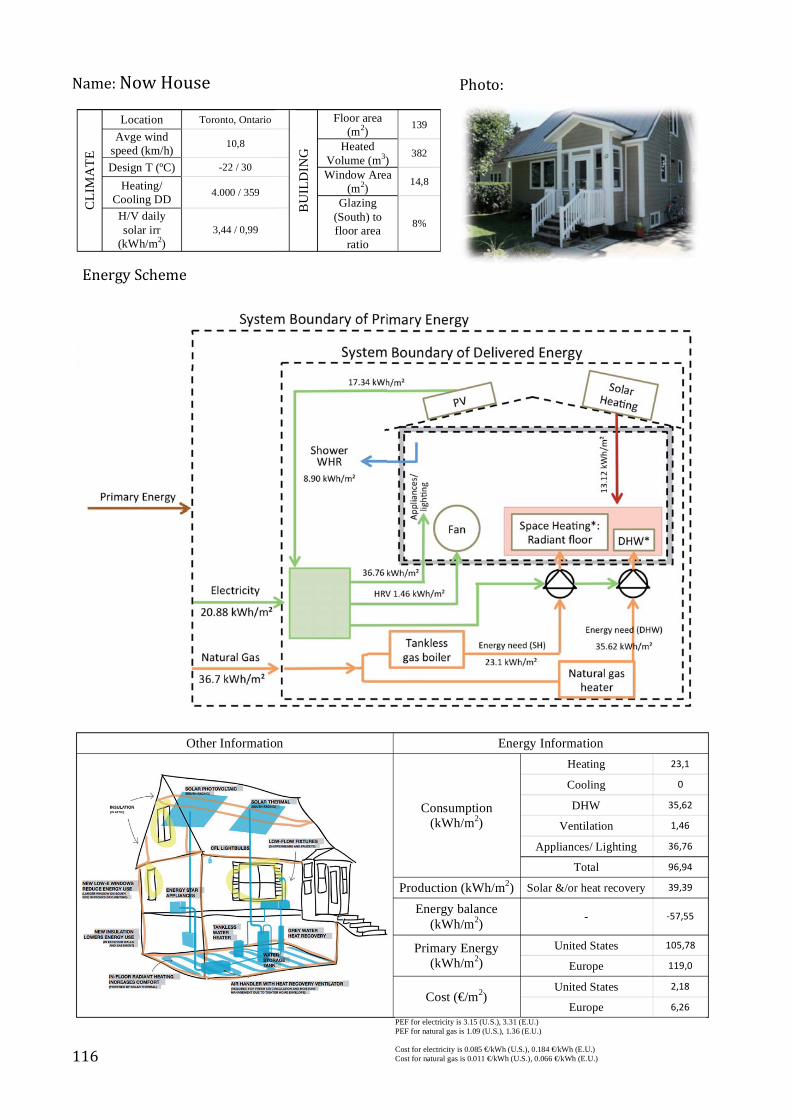
BU
ILD
ING
Floor area (m2) 139
Heated Volume (m3) 382
Window Area (m2) 14,8
Glazing (South) to floor area
ratio
8%
CLI
MA
TE
Location Toronto, Ontario
Avge wind speed (km/h) 10,8
Design T (ºC) -22 / 30
Heating/ Cooling DD 4.000 / 359
H/V daily solar irr
(kWh/m2) 3,44 / 0,99
Other Information Energy Information
Consumption (kWh/m2)
Heating Cooling
DHW Ventilation
Appliances/ Lighting Total
Production (kWh/m2) Solar &/or heat recovery
Energy balance (kWh/m2) -
Primary Energy (kWh/m2)
United States
Europe
Cost (€/m2) United States
Europe PEF for electricity is 3.15 (U.S.), 3.31 (E.U.) PEF for natural gas is 1.09 (U.S.), 1.36 (E.U.) Cost for electricity is 0.085 €/kWh (U.S.), 0.184 €/kWh (E.U.) Cost for natural gas is 0.011 €/kWh (U.S.), 0.066 €/kWh (E.U.)
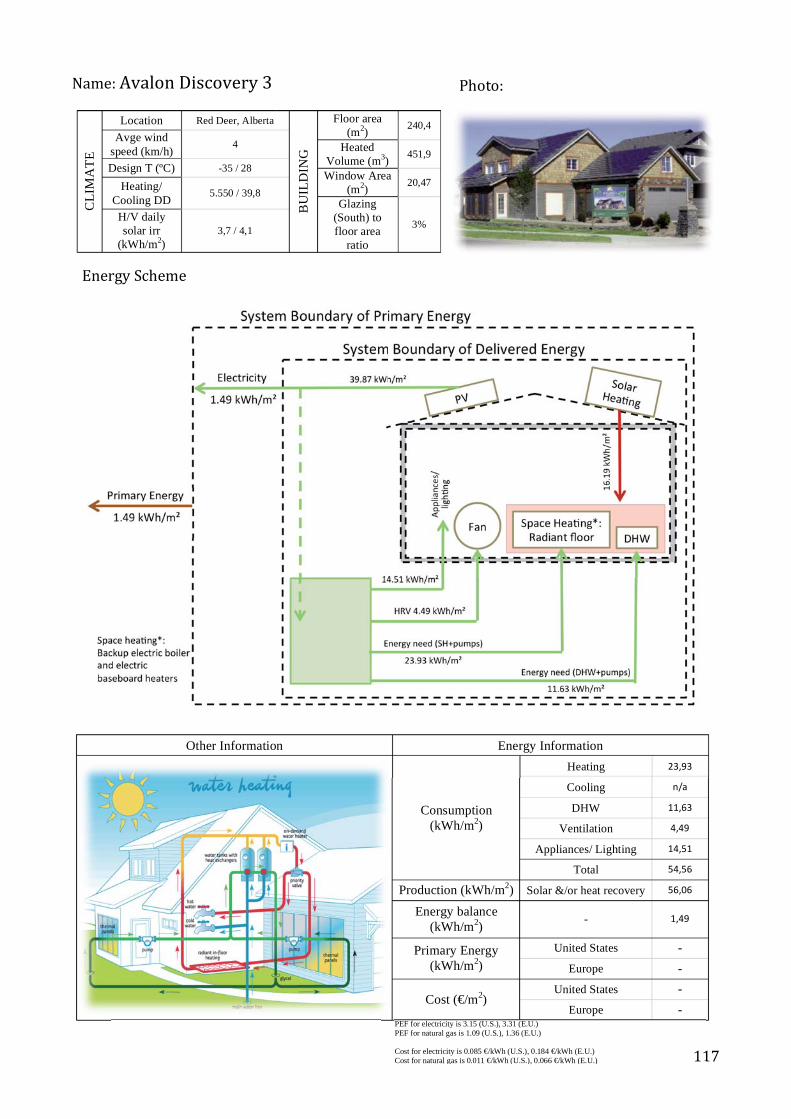
BU
ILD
ING
Floor area (m2) 240,4
Heated Volume (m3) 451,9
Window Area (m2) 20,47
Glazing (South) to floor area
ratio
3%
CLI
MA
TE
Location Red Deer, Alberta Avge wind
speed (km/h) 4
Design T (ºC) -35 / 28
Heating/ Cooling DD 5.550 / 39,8
H/V daily solar irr
(kWh/m2) 3,7 / 4,1
Other Information Energy Information
Consumption (kWh/m2)
Heating Cooling
DHW Ventilation
Appliances/ Lighting Total
Production (kWh/m2) Solar &/or heat recovery
Energy balance (kWh/m2) -
Primary Energy (kWh/m2)
United States - Europe -
Cost (€/m2) United States -
Europe - PEF for electricity is 3.15 (U.S.), 3.31 (E.U.) PEF for natural gas is 1.09 (U.S.), 1.36 (E.U.) Cost for electricity is 0.085 €/kWh (U.S.), 0.184 €/kWh (E.U.) Cost for natural gas is 0.011 €/kWh (U.S.), 0.066 €/kWh (E.U.)
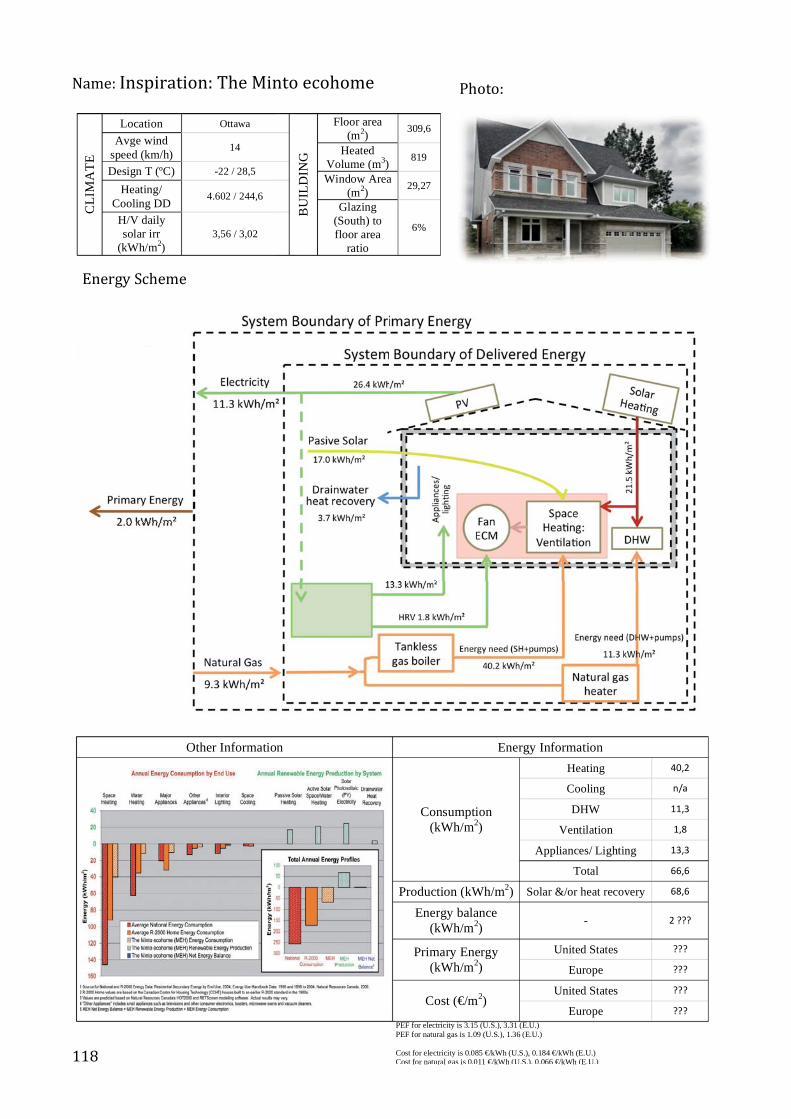
BU
ILD
ING
Floor area (m2) 309,6
Heated Volume (m3) 819
Window Area (m2) 29,27
Glazing (South) to floor area
ratio
6%
CLI
MA
TE
Location Ottawa Avge wind
speed (km/h) 14
Design T (ºC) -22 / 28,5
Heating/ Cooling DD 4.602 / 244,6
H/V daily solar irr
(kWh/m2) 3,56 / 3,02
Other Information Energy Information
Consumption (kWh/m2)
Heating Cooling
DHW Ventilation
Appliances/ Lighting Total
Production (kWh/m2) Solar &/or heat recovery
Energy balance (kWh/m2) -
Primary Energy (kWh/m2)
United States
Europe
Cost (€/m2) United States
Europe PEF for electricity is 3.15 (U.S.), 3.31 (E.U.) PEF for natural gas is 1.09 (U.S.), 1.36 (E.U.) Cost for electricity is 0.085 €/kWh (U.S.), 0.184 €/kWh (E.U.) Cost for natural gas is 0.011 €/kWh (U.S.), 0.066 €/kWh (E.U.)
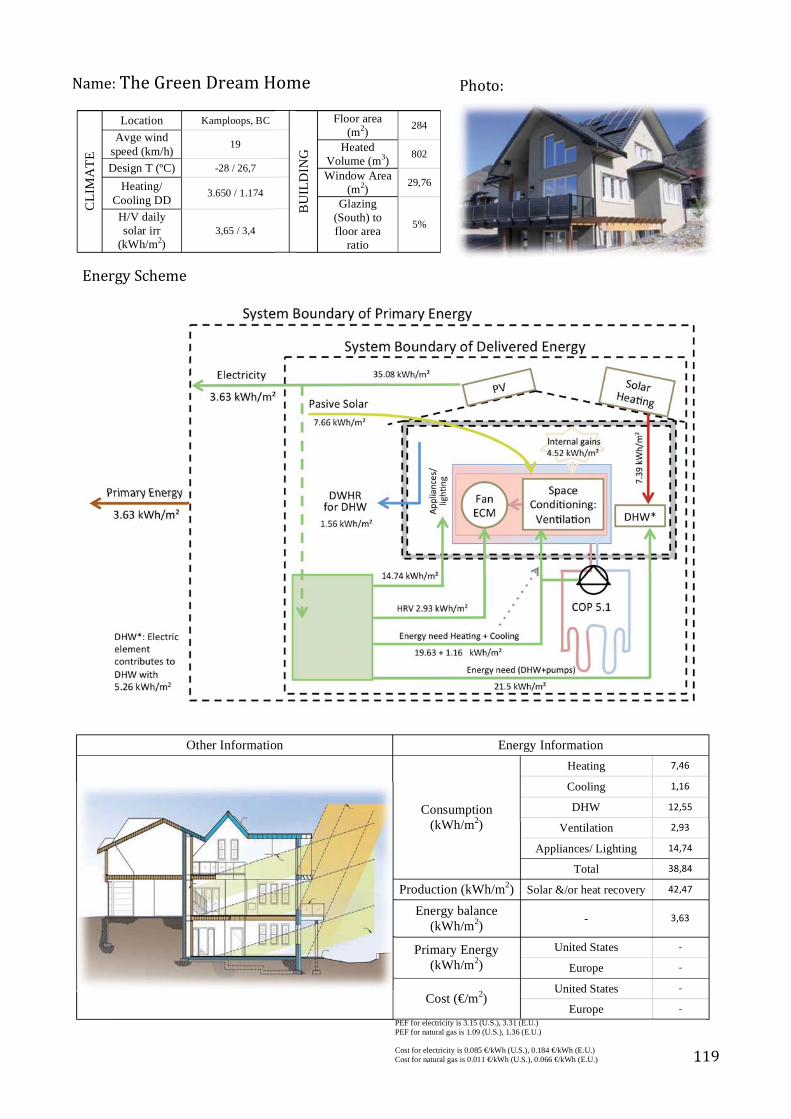
BU
ILD
ING
Floor area (m2) 284
Heated Volume (m3) 802
Window Area (m2) 29,76
Glazing (South) to floor area
ratio
5%
CLI
MA
TE
Location Kamploops, BC Avge wind
speed (km/h) 19
Design T (ºC) -28 / 26,7
Heating/ Cooling DD 3.650 / 1.174
H/V daily solar irr
(kWh/m2) 3,65 / 3,4
Other Information Energy Information
Consumption (kWh/m2)
Heating
Cooling DHW
Ventilation
Appliances/ Lighting Total
Production (kWh/m2) Solar &/or heat recovery
Energy balance (kWh/m2) -
Primary Energy (kWh/m2)
United States
Europe
Cost (€/m2) United States
Europe PEF for electricity is 3.15 (U.S.), 3.31 (E.U.) PEF for natural gas is 1.09 (U.S.), 1.36 (E.U.) Cost for electricity is 0.085 €/kWh (U.S.), 0.184 €/kWh (E.U.) Cost for natural gas is 0.011 €/kWh (U.S.), 0.066 €/kWh (E.U.)
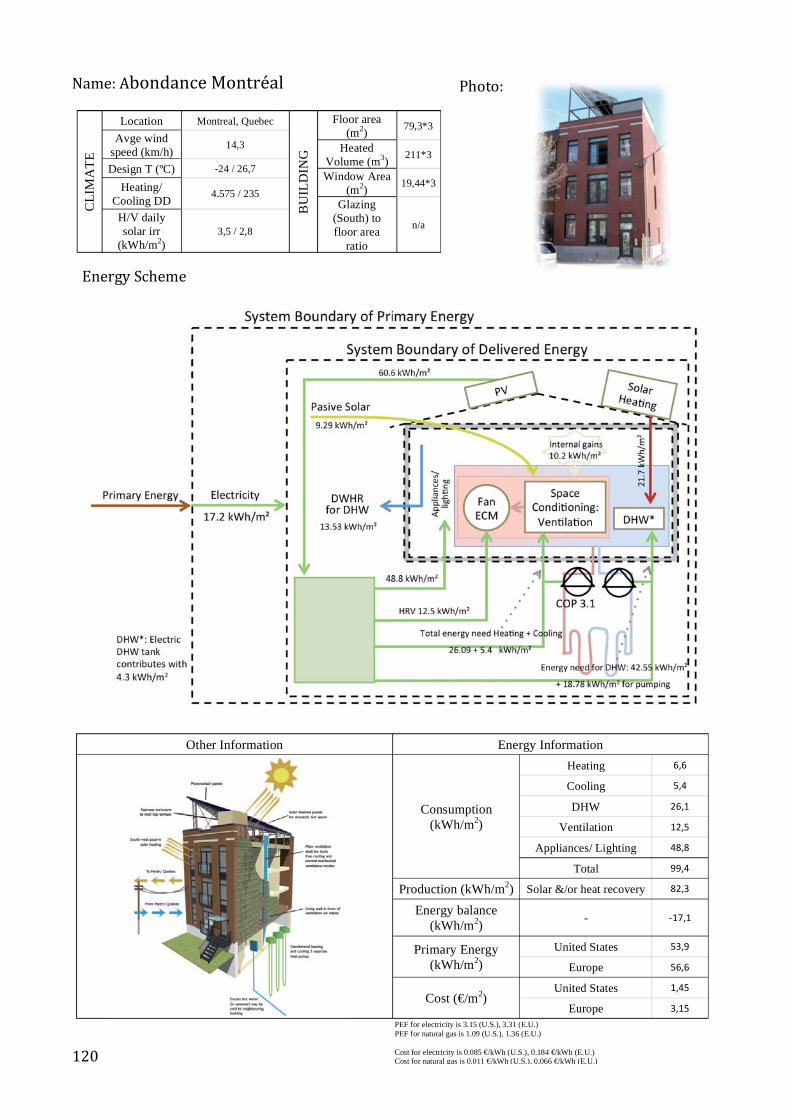
BU
ILD
ING
Floor area (m2) 79,3*3
Heated Volume (m3) 211*3
Window Area (m2) 19,44*3
Glazing (South) to floor area
ratio
n/a
CLI
MA
TE
Location Montreal, Quebec
Avge wind speed (km/h) 14,3
Design T (ºC) -24 / 26,7
Heating/ Cooling DD 4.575 / 235
H/V daily solar irr
(kWh/m2) 3,5 / 2,8
Other Information Energy Information
Consumption (kWh/m2)
Heating Cooling
DHW Ventilation
Appliances/ Lighting
Total
Production (kWh/m2) Solar &/or heat recovery
Energy balance (kWh/m2) -
Primary Energy (kWh/m2)
United States
Europe
Cost (€/m2) United States
Europe PEF for electricity is 3.15 (U.S.), 3.31 (E.U.) PEF for natural gas is 1.09 (U.S.), 1.36 (E.U.) Cost for electricity is 0.085 €/kWh (U.S.), 0.184 €/kWh (E.U.) Cost for natural gas is 0.011 €/kWh (U.S.), 0.066 €/kWh (E.U.)
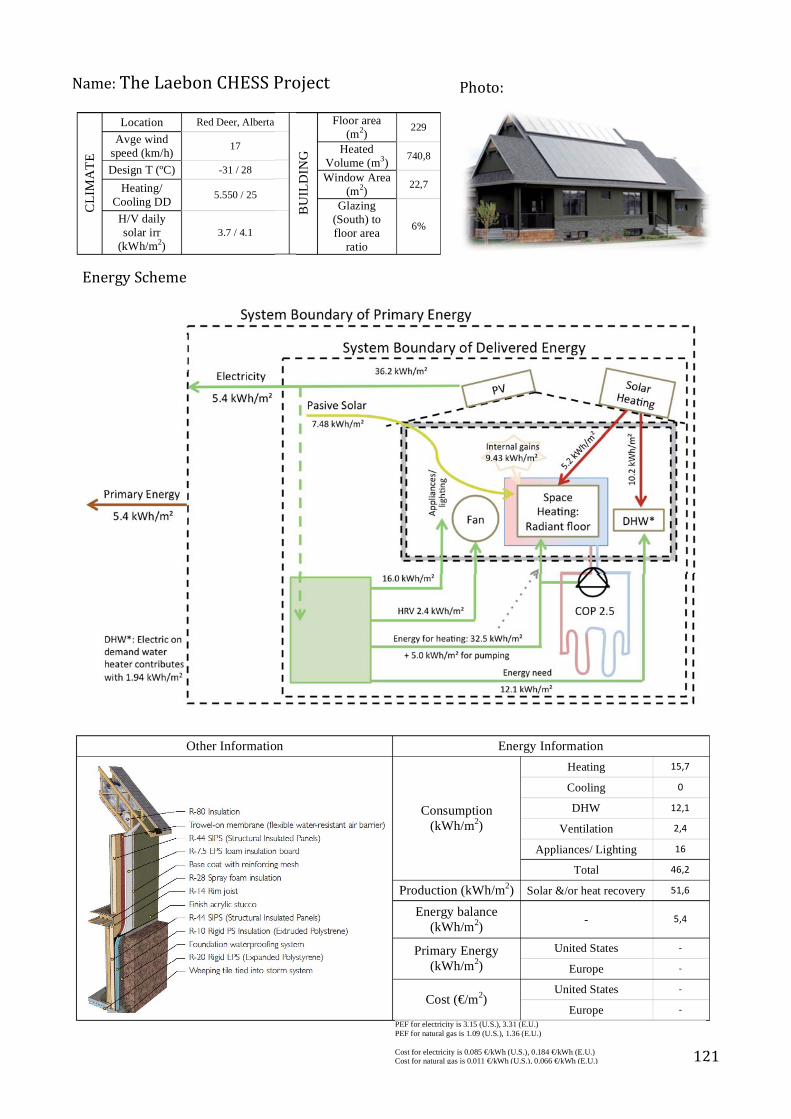
BU
ILD
ING
Floor area (m2) 229
Heated Volume (m3) 740,8
Window Area (m2) 22,7
Glazing (South) to floor area
ratio
6%
CLI
MA
TE
Location Red Deer, Alberta
Avge wind speed (km/h) 17
Design T (ºC) -31 / 28
Heating/ Cooling DD 5.550 / 25
H/V daily solar irr
(kWh/m2) 3.7 / 4.1
Other Information Energy Information
Consumption (kWh/m2)
Heating
Cooling DHW
Ventilation
Appliances/ Lighting Total
Production (kWh/m2) Solar &/or heat recovery
Energy balance (kWh/m2) -
Primary Energy (kWh/m2)
United States
Europe
Cost (€/m2) United States
Europe PEF for electricity is 3.15 (U.S.), 3.31 (E.U.) PEF for natural gas is 1.09 (U.S.), 1.36 (E.U.) Cost for electricity is 0.085 €/kWh (U.S.), 0.184 €/kWh (E.U.) Cost for natural gas is 0.011 €/kWh (U.S.), 0.066 €/kWh (E.U.)
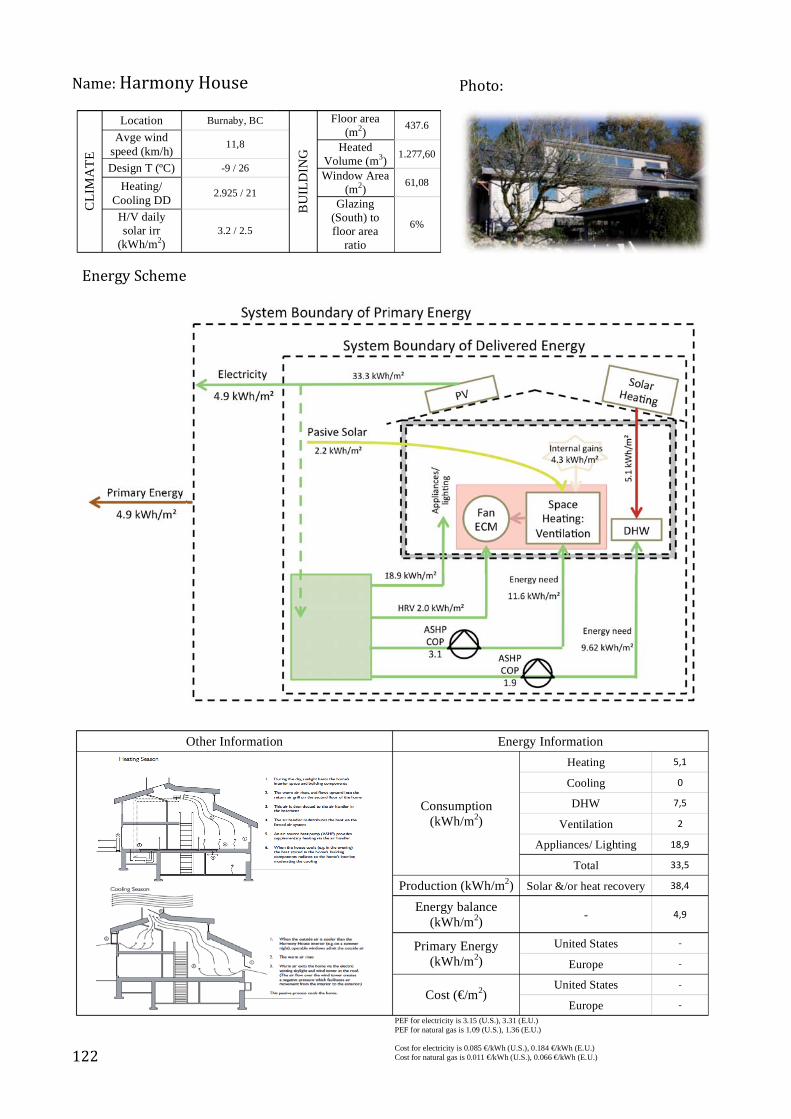
BU
ILD
ING
Floor area (m2) 437.6
Heated Volume (m3) 1.277,60
Window Area (m2) 61,08
Glazing (South) to floor area
ratio
6%
CLI
MA
TE
Location Burnaby, BC Avge wind
speed (km/h) 11,8
Design T (ºC) -9 / 26
Heating/ Cooling DD 2.925 / 21
H/V daily solar irr
(kWh/m2) 3.2 / 2.5
Other Information Energy Information
Consumption (kWh/m2)
Heating
Cooling DHW
Ventilation Appliances/ Lighting
Total
Production (kWh/m2) Solar &/or heat recovery
Energy balance (kWh/m2) -
Primary Energy (kWh/m2)
United States
Europe
Cost (€/m2) United States
Europe PEF for electricity is 3.15 (U.S.), 3.31 (E.U.) PEF for natural gas is 1.09 (U.S.), 1.36 (E.U.) Cost for electricity is 0.085 €/kWh (U.S.), 0.184 €/kWh (E.U.) Cost for natural gas is 0.011 €/kWh (U.S.), 0.066 €/kWh (E.U.)
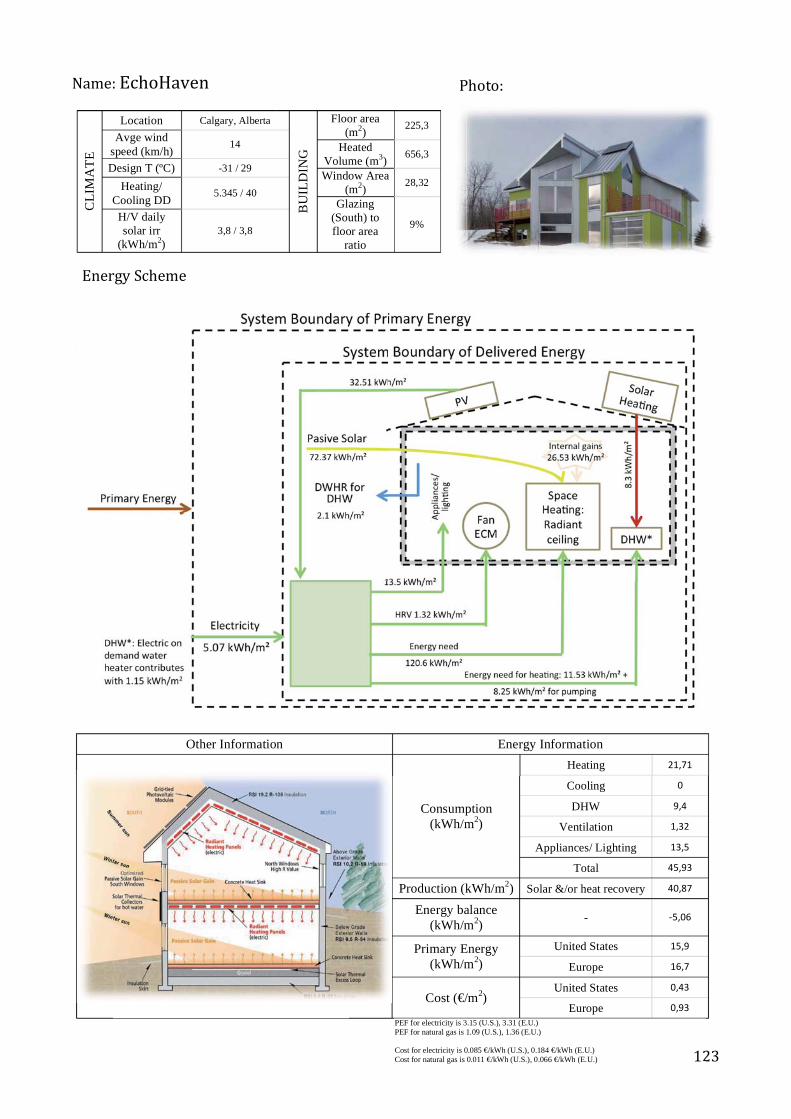
BU
ILD
ING
Floor area (m2) 225,3
Heated Volume (m3) 656,3
Window Area (m2) 28,32
Glazing (South) to floor area
ratio
9%
CLI
MA
TE
Location Calgary, Alberta Avge wind
speed (km/h) 14
Design T (ºC) -31 / 29
Heating/ Cooling DD 5.345 / 40
H/V daily solar irr
(kWh/m2) 3,8 / 3,8
Other Information Energy Information
Consumption (kWh/m2)
Heating Cooling
DHW Ventilation
Appliances/ Lighting Total
Production (kWh/m2) Solar &/or heat recovery
Energy balance (kWh/m2) -
Primary Energy (kWh/m2)
United States
Europe
Cost (€/m2) United States
Europe PEF for electricity is 3.15 (U.S.), 3.31 (E.U.) PEF for natural gas is 1.09 (U.S.), 1.36 (E.U.) Cost for electricity is 0.085 €/kWh (U.S.), 0.184 €/kWh (E.U.) Cost for natural gas is 0.011 €/kWh (U.S.), 0.066 €/kWh (E.U.)
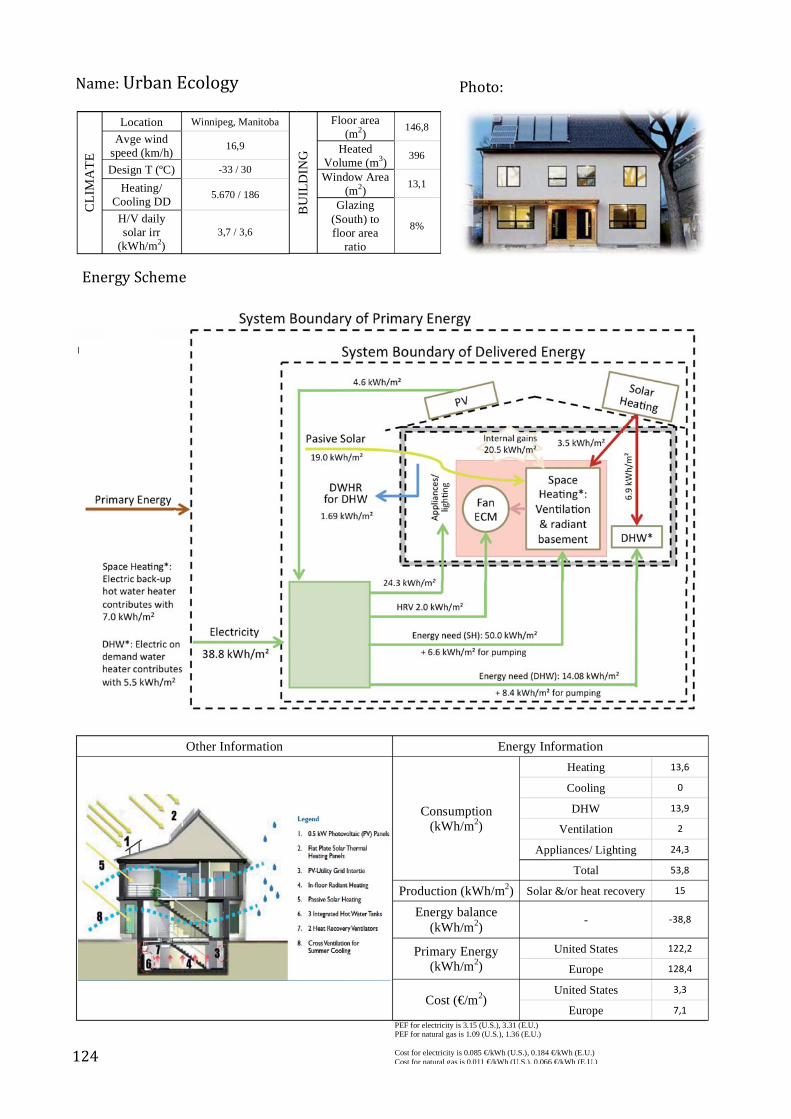
BU
ILD
ING
Floor area (m2) 146,8
Heated Volume (m3) 396
Window Area (m2) 13,1
Glazing (South) to floor area
ratio
8%
CLI
MA
TE
Location Winnipeg, Manitoba
Avge wind speed (km/h) 16,9
Design T (ºC) -33 / 30
Heating/ Cooling DD 5.670 / 186
H/V daily solar irr
(kWh/m2) 3,7 / 3,6
Other Information Energy Information
Consumption (kWh/m2)
Heating Cooling
DHW Ventilation
Appliances/ Lighting Total
Production (kWh/m2) Solar &/or heat recovery
Energy balance (kWh/m2) -
Primary Energy (kWh/m2)
United States
Europe
Cost (€/m2) United States
Europe PEF for electricity is 3.15 (U.S.), 3.31 (E.U.) PEF for natural gas is 1.09 (U.S.), 1.36 (E.U.) Cost for electricity is 0.085 €/kWh (U.S.), 0.184 €/kWh (E.U.) Cost for natural gas is 0.011 €/kWh (U.S.), 0.066 €/kWh (E.U.)


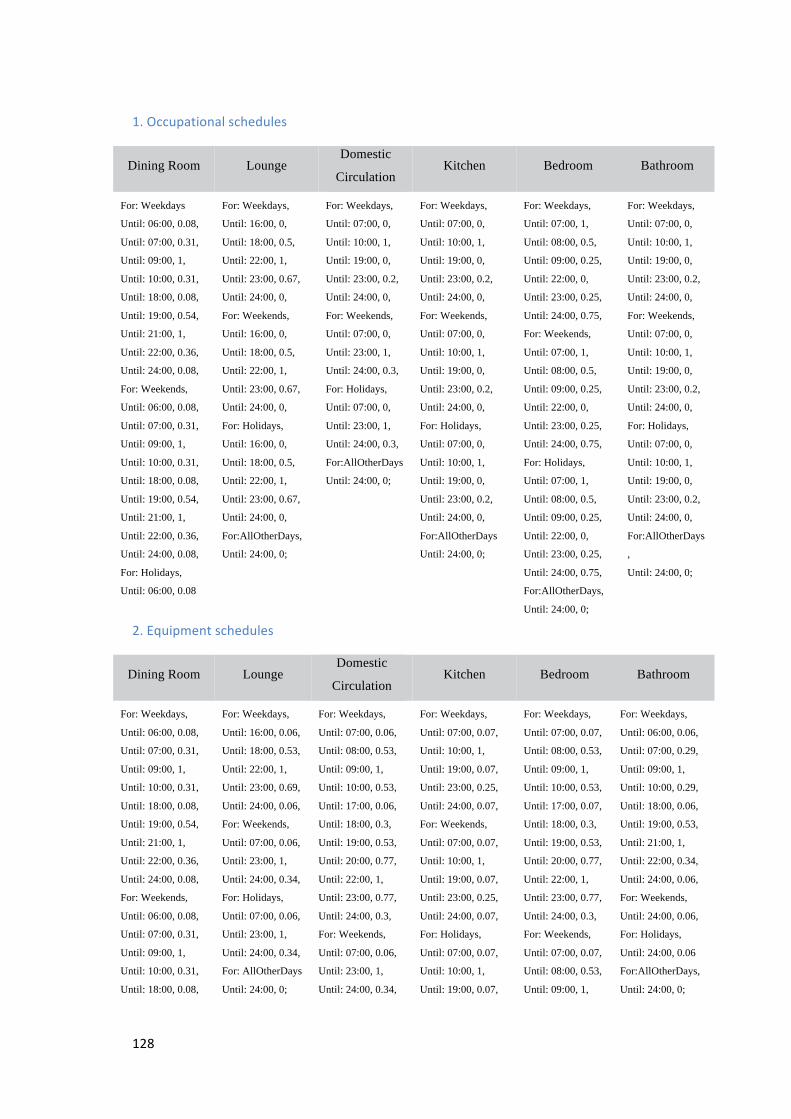
Dining Room Lounge Domestic
Circulation Kitchen Bedroom Bathroom
For: Weekdays
Until: 06:00, 0.08,
Until: 07:00, 0.31,
Until: 09:00, 1,
Until: 10:00, 0.31,
Until: 18:00, 0.08,
Until: 19:00, 0.54,
Until: 21:00, 1,
Until: 22:00, 0.36,
Until: 24:00, 0.08,
For: Weekends,
Until: 06:00, 0.08,
Until: 07:00, 0.31,
Until: 09:00, 1,
Until: 10:00, 0.31,
Until: 18:00, 0.08,
Until: 19:00, 0.54,
Until: 21:00, 1,
Until: 22:00, 0.36,
Until: 24:00, 0.08,
For: Holidays,
Until: 06:00, 0.08
For: Weekdays,
Until: 16:00, 0,
Until: 18:00, 0.5,
Until: 22:00, 1,
Until: 23:00, 0.67,
Until: 24:00, 0,
For: Weekends,
Until: 16:00, 0,
Until: 18:00, 0.5,
Until: 22:00, 1,
Until: 23:00, 0.67,
Until: 24:00, 0,
For: Holidays,
Until: 16:00, 0,
Until: 18:00, 0.5,
Until: 22:00, 1,
Until: 23:00, 0.67,
Until: 24:00, 0,
For:AllOtherDays,
Until: 24:00, 0;
For: Weekdays,
Until: 07:00, 0,
Until: 10:00, 1,
Until: 19:00, 0,
Until: 23:00, 0.2,
Until: 24:00, 0,
For: Weekends,
Until: 07:00, 0,
Until: 23:00, 1,
Until: 24:00, 0.3,
For: Holidays,
Until: 07:00, 0,
Until: 23:00, 1,
Until: 24:00, 0.3,
For:AllOtherDays
Until: 24:00, 0;
For: Weekdays,
Until: 07:00, 0,
Until: 10:00, 1,
Until: 19:00, 0,
Until: 23:00, 0.2,
Until: 24:00, 0,
For: Weekends,
Until: 07:00, 0,
Until: 10:00, 1,
Until: 19:00, 0,
Until: 23:00, 0.2,
Until: 24:00, 0,
For: Holidays,
Until: 07:00, 0,
Until: 10:00, 1,
Until: 19:00, 0,
Until: 23:00, 0.2,
Until: 24:00, 0,
For:AllOtherDays
Until: 24:00, 0;
For: Weekdays,
Until: 07:00, 1,
Until: 08:00, 0.5,
Until: 09:00, 0.25,
Until: 22:00, 0,
Until: 23:00, 0.25,
Until: 24:00, 0.75,
For: Weekends,
Until: 07:00, 1,
Until: 08:00, 0.5,
Until: 09:00, 0.25,
Until: 22:00, 0,
Until: 23:00, 0.25,
Until: 24:00, 0.75,
For: Holidays,
Until: 07:00, 1,
Until: 08:00, 0.5,
Until: 09:00, 0.25,
Until: 22:00, 0,
Until: 23:00, 0.25,
Until: 24:00, 0.75,
For:AllOtherDays,
Until: 24:00, 0;
For: Weekdays,
Until: 07:00, 0,
Until: 10:00, 1,
Until: 19:00, 0,
Until: 23:00, 0.2,
Until: 24:00, 0,
For: Weekends,
Until: 07:00, 0,
Until: 10:00, 1,
Until: 19:00, 0,
Until: 23:00, 0.2,
Until: 24:00, 0,
For: Holidays,
Until: 07:00, 0,
Until: 10:00, 1,
Until: 19:00, 0,
Until: 23:00, 0.2,
Until: 24:00, 0,
For:AllOtherDays
,
Until: 24:00, 0;
Dining Room Lounge Domestic
Circulation Kitchen Bedroom Bathroom
For: Weekdays,
Until: 06:00, 0.08,
Until: 07:00, 0.31,
Until: 09:00, 1,
Until: 10:00, 0.31,
Until: 18:00, 0.08,
Until: 19:00, 0.54,
Until: 21:00, 1,
Until: 22:00, 0.36,
Until: 24:00, 0.08,
For: Weekends,
Until: 06:00, 0.08,
Until: 07:00, 0.31,
Until: 09:00, 1,
Until: 10:00, 0.31,
Until: 18:00, 0.08,
For: Weekdays,
Until: 16:00, 0.06,
Until: 18:00, 0.53,
Until: 22:00, 1,
Until: 23:00, 0.69,
Until: 24:00, 0.06,
For: Weekends,
Until: 07:00, 0.06,
Until: 23:00, 1,
Until: 24:00, 0.34,
For: Holidays,
Until: 07:00, 0.06,
Until: 23:00, 1,
Until: 24:00, 0.34,
For: AllOtherDays
Until: 24:00, 0;
For: Weekdays,
Until: 07:00, 0.06,
Until: 08:00, 0.53,
Until: 09:00, 1,
Until: 10:00, 0.53,
Until: 17:00, 0.06,
Until: 18:00, 0.3,
Until: 19:00, 0.53,
Until: 20:00, 0.77,
Until: 22:00, 1,
Until: 23:00, 0.77,
Until: 24:00, 0.3,
For: Weekends,
Until: 07:00, 0.06,
Until: 23:00, 1,
Until: 24:00, 0.34,
For: Weekdays,
Until: 07:00, 0.07,
Until: 10:00, 1,
Until: 19:00, 0.07,
Until: 23:00, 0.25,
Until: 24:00, 0.07,
For: Weekends,
Until: 07:00, 0.07,
Until: 10:00, 1,
Until: 19:00, 0.07,
Until: 23:00, 0.25,
Until: 24:00, 0.07,
For: Holidays,
Until: 07:00, 0.07,
Until: 10:00, 1,
Until: 19:00, 0.07,
For: Weekdays,
Until: 07:00, 0.07,
Until: 08:00, 0.53,
Until: 09:00, 1,
Until: 10:00, 0.53,
Until: 17:00, 0.07,
Until: 18:00, 0.3,
Until: 19:00, 0.53,
Until: 20:00, 0.77,
Until: 22:00, 1,
Until: 23:00, 0.77,
Until: 24:00, 0.3,
For: Weekends,
Until: 07:00, 0.07,
Until: 08:00, 0.53,
Until: 09:00, 1,
For: Weekdays,
Until: 06:00, 0.06,
Until: 07:00, 0.29,
Until: 09:00, 1,
Until: 10:00, 0.29,
Until: 18:00, 0.06,
Until: 19:00, 0.53,
Until: 21:00, 1,
Until: 22:00, 0.34,
Until: 24:00, 0.06,
For: Weekends,
Until: 24:00, 0.06,
For: Holidays,
Until: 24:00, 0.06
For:AllOtherDays,
Until: 24:00, 0;
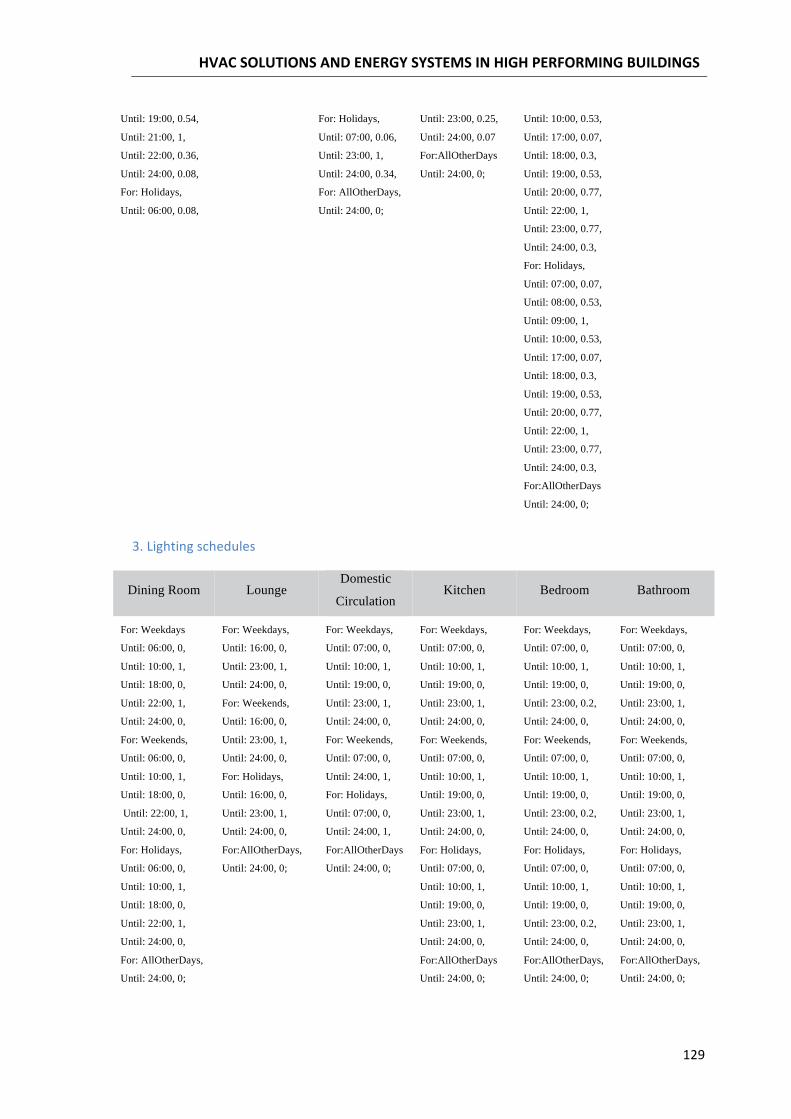
Until: 19:00, 0.54,
Until: 21:00, 1,
Until: 22:00, 0.36,
Until: 24:00, 0.08,
For: Holidays,
Until: 06:00, 0.08,
For: Holidays,
Until: 07:00, 0.06,
Until: 23:00, 1,
Until: 24:00, 0.34,
For: AllOtherDays,
Until: 24:00, 0;
Until: 23:00, 0.25,
Until: 24:00, 0.07
For:AllOtherDays
Until: 24:00, 0;
Until: 10:00, 0.53,
Until: 17:00, 0.07,
Until: 18:00, 0.3,
Until: 19:00, 0.53,
Until: 20:00, 0.77,
Until: 22:00, 1,
Until: 23:00, 0.77,
Until: 24:00, 0.3,
For: Holidays,
Until: 07:00, 0.07,
Until: 08:00, 0.53,
Until: 09:00, 1,
Until: 10:00, 0.53,
Until: 17:00, 0.07,
Until: 18:00, 0.3,
Until: 19:00, 0.53,
Until: 20:00, 0.77,
Until: 22:00, 1,
Until: 23:00, 0.77,
Until: 24:00, 0.3,
For:AllOtherDays
Until: 24:00, 0;
Dining Room Lounge Domestic
Circulation Kitchen Bedroom Bathroom
For: Weekdays
Until: 06:00, 0,
Until: 10:00, 1,
Until: 18:00, 0,
Until: 22:00, 1,
Until: 24:00, 0,
For: Weekends,
Until: 06:00, 0,
Until: 10:00, 1,
Until: 18:00, 0,
Until: 22:00, 1,
Until: 24:00, 0,
For: Holidays,
Until: 06:00, 0,
Until: 10:00, 1,
Until: 18:00, 0,
Until: 22:00, 1,
Until: 24:00, 0,
For: AllOtherDays,
Until: 24:00, 0;
For: Weekdays,
Until: 16:00, 0,
Until: 23:00, 1,
Until: 24:00, 0,
For: Weekends,
Until: 16:00, 0,
Until: 23:00, 1,
Until: 24:00, 0,
For: Holidays,
Until: 16:00, 0,
Until: 23:00, 1,
Until: 24:00, 0,
For:AllOtherDays,
Until: 24:00, 0;
For: Weekdays,
Until: 07:00, 0,
Until: 10:00, 1,
Until: 19:00, 0,
Until: 23:00, 1,
Until: 24:00, 0,
For: Weekends,
Until: 07:00, 0,
Until: 24:00, 1,
For: Holidays,
Until: 07:00, 0,
Until: 24:00, 1,
For:AllOtherDays
Until: 24:00, 0;
For: Weekdays,
Until: 07:00, 0,
Until: 10:00, 1,
Until: 19:00, 0,
Until: 23:00, 1,
Until: 24:00, 0,
For: Weekends,
Until: 07:00, 0,
Until: 10:00, 1,
Until: 19:00, 0,
Until: 23:00, 1,
Until: 24:00, 0,
For: Holidays,
Until: 07:00, 0,
Until: 10:00, 1,
Until: 19:00, 0,
Until: 23:00, 1,
Until: 24:00, 0,
For:AllOtherDays
Until: 24:00, 0;
For: Weekdays,
Until: 07:00, 0,
Until: 10:00, 1,
Until: 19:00, 0,
Until: 23:00, 0.2,
Until: 24:00, 0,
For: Weekends,
Until: 07:00, 0,
Until: 10:00, 1,
Until: 19:00, 0,
Until: 23:00, 0.2,
Until: 24:00, 0,
For: Holidays,
Until: 07:00, 0,
Until: 10:00, 1,
Until: 19:00, 0,
Until: 23:00, 0.2,
Until: 24:00, 0,
For:AllOtherDays,
Until: 24:00, 0;
For: Weekdays,
Until: 07:00, 0,
Until: 10:00, 1,
Until: 19:00, 0,
Until: 23:00, 1,
Until: 24:00, 0,
For: Weekends,
Until: 07:00, 0,
Until: 10:00, 1,
Until: 19:00, 0,
Until: 23:00, 1,
Until: 24:00, 0,
For: Holidays,
Until: 07:00, 0,
Until: 10:00, 1,
Until: 19:00, 0,
Until: 23:00, 1,
Until: 24:00, 0,
For:AllOtherDays,
Until: 24:00, 0;
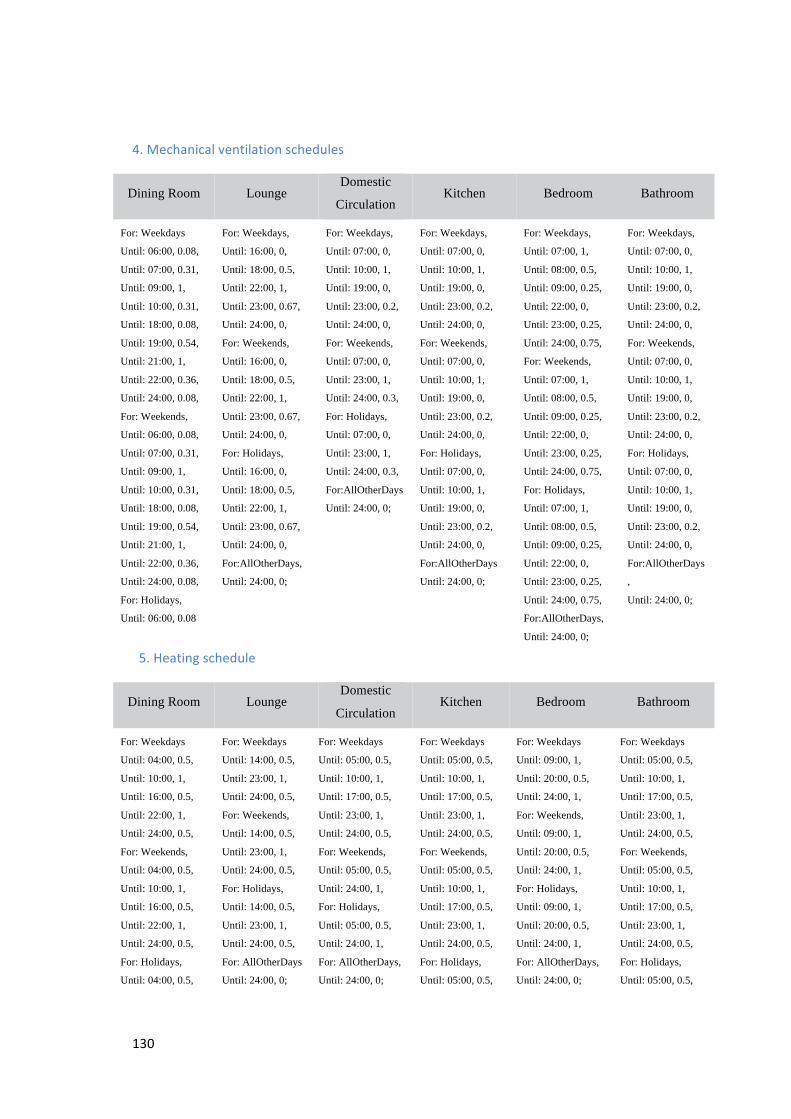
Dining Room Lounge Domestic
Circulation Kitchen Bedroom Bathroom
For: Weekdays
Until: 06:00, 0.08,
Until: 07:00, 0.31,
Until: 09:00, 1,
Until: 10:00, 0.31,
Until: 18:00, 0.08,
Until: 19:00, 0.54,
Until: 21:00, 1,
Until: 22:00, 0.36,
Until: 24:00, 0.08,
For: Weekends,
Until: 06:00, 0.08,
Until: 07:00, 0.31,
Until: 09:00, 1,
Until: 10:00, 0.31,
Until: 18:00, 0.08,
Until: 19:00, 0.54,
Until: 21:00, 1,
Until: 22:00, 0.36,
Until: 24:00, 0.08,
For: Holidays,
Until: 06:00, 0.08
For: Weekdays,
Until: 16:00, 0,
Until: 18:00, 0.5,
Until: 22:00, 1,
Until: 23:00, 0.67,
Until: 24:00, 0,
For: Weekends,
Until: 16:00, 0,
Until: 18:00, 0.5,
Until: 22:00, 1,
Until: 23:00, 0.67,
Until: 24:00, 0,
For: Holidays,
Until: 16:00, 0,
Until: 18:00, 0.5,
Until: 22:00, 1,
Until: 23:00, 0.67,
Until: 24:00, 0,
For:AllOtherDays,
Until: 24:00, 0;
For: Weekdays,
Until: 07:00, 0,
Until: 10:00, 1,
Until: 19:00, 0,
Until: 23:00, 0.2,
Until: 24:00, 0,
For: Weekends,
Until: 07:00, 0,
Until: 23:00, 1,
Until: 24:00, 0.3,
For: Holidays,
Until: 07:00, 0,
Until: 23:00, 1,
Until: 24:00, 0.3,
For:AllOtherDays
Until: 24:00, 0;
For: Weekdays,
Until: 07:00, 0,
Until: 10:00, 1,
Until: 19:00, 0,
Until: 23:00, 0.2,
Until: 24:00, 0,
For: Weekends,
Until: 07:00, 0,
Until: 10:00, 1,
Until: 19:00, 0,
Until: 23:00, 0.2,
Until: 24:00, 0,
For: Holidays,
Until: 07:00, 0,
Until: 10:00, 1,
Until: 19:00, 0,
Until: 23:00, 0.2,
Until: 24:00, 0,
For:AllOtherDays
Until: 24:00, 0;
For: Weekdays,
Until: 07:00, 1,
Until: 08:00, 0.5,
Until: 09:00, 0.25,
Until: 22:00, 0,
Until: 23:00, 0.25,
Until: 24:00, 0.75,
For: Weekends,
Until: 07:00, 1,
Until: 08:00, 0.5,
Until: 09:00, 0.25,
Until: 22:00, 0,
Until: 23:00, 0.25,
Until: 24:00, 0.75,
For: Holidays,
Until: 07:00, 1,
Until: 08:00, 0.5,
Until: 09:00, 0.25,
Until: 22:00, 0,
Until: 23:00, 0.25,
Until: 24:00, 0.75,
For:AllOtherDays,
Until: 24:00, 0;
For: Weekdays,
Until: 07:00, 0,
Until: 10:00, 1,
Until: 19:00, 0,
Until: 23:00, 0.2,
Until: 24:00, 0,
For: Weekends,
Until: 07:00, 0,
Until: 10:00, 1,
Until: 19:00, 0,
Until: 23:00, 0.2,
Until: 24:00, 0,
For: Holidays,
Until: 07:00, 0,
Until: 10:00, 1,
Until: 19:00, 0,
Until: 23:00, 0.2,
Until: 24:00, 0,
For:AllOtherDays
,
Until: 24:00, 0;
Dining Room Lounge Domestic
Circulation Kitchen Bedroom Bathroom
For: Weekdays
Until: 04:00, 0.5,
Until: 10:00, 1,
Until: 16:00, 0.5,
Until: 22:00, 1,
Until: 24:00, 0.5,
For: Weekends,
Until: 04:00, 0.5,
Until: 10:00, 1,
Until: 16:00, 0.5,
Until: 22:00, 1,
Until: 24:00, 0.5,
For: Holidays,
Until: 04:00, 0.5,
For: Weekdays
Until: 14:00, 0.5,
Until: 23:00, 1,
Until: 24:00, 0.5,
For: Weekends,
Until: 14:00, 0.5,
Until: 23:00, 1,
Until: 24:00, 0.5,
For: Holidays,
Until: 14:00, 0.5,
Until: 23:00, 1,
Until: 24:00, 0.5,
For: AllOtherDays
Until: 24:00, 0;
For: Weekdays
Until: 05:00, 0.5,
Until: 10:00, 1,
Until: 17:00, 0.5,
Until: 23:00, 1,
Until: 24:00, 0.5,
For: Weekends,
Until: 05:00, 0.5,
Until: 24:00, 1,
For: Holidays,
Until: 05:00, 0.5,
Until: 24:00, 1,
For: AllOtherDays,
Until: 24:00, 0;
For: Weekdays
Until: 05:00, 0.5,
Until: 10:00, 1,
Until: 17:00, 0.5,
Until: 23:00, 1,
Until: 24:00, 0.5,
For: Weekends,
Until: 05:00, 0.5,
Until: 10:00, 1,
Until: 17:00, 0.5,
Until: 23:00, 1,
Until: 24:00, 0.5,
For: Holidays,
Until: 05:00, 0.5,
For: Weekdays
Until: 09:00, 1,
Until: 20:00, 0.5,
Until: 24:00, 1,
For: Weekends,
Until: 09:00, 1,
Until: 20:00, 0.5,
Until: 24:00, 1,
For: Holidays,
Until: 09:00, 1,
Until: 20:00, 0.5,
Until: 24:00, 1,
For: AllOtherDays,
Until: 24:00, 0;
For: Weekdays
Until: 05:00, 0.5,
Until: 10:00, 1,
Until: 17:00, 0.5,
Until: 23:00, 1,
Until: 24:00, 0.5,
For: Weekends,
Until: 05:00, 0.5,
Until: 10:00, 1,
Until: 17:00, 0.5,
Until: 23:00, 1,
Until: 24:00, 0.5,
For: Holidays,
Until: 05:00, 0.5,
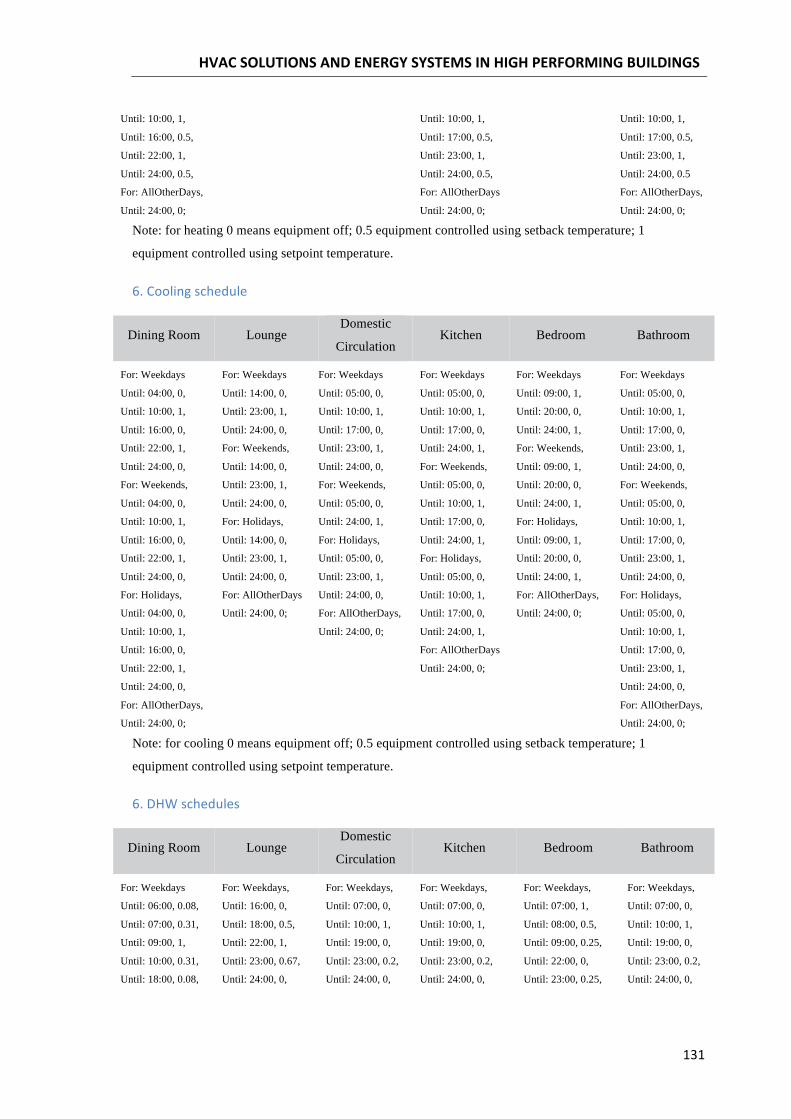
Until: 10:00, 1,
Until: 16:00, 0.5,
Until: 22:00, 1,
Until: 24:00, 0.5,
For: AllOtherDays,
Until: 24:00, 0;
Until: 10:00, 1,
Until: 17:00, 0.5,
Until: 23:00, 1,
Until: 24:00, 0.5,
For: AllOtherDays
Until: 24:00, 0;
Until: 10:00, 1,
Until: 17:00, 0.5,
Until: 23:00, 1,
Until: 24:00, 0.5
For: AllOtherDays,
Until: 24:00, 0;
Note: for heating 0 means equipment off; 0.5 equipment controlled using setback temperature; 1
equipment controlled using setpoint temperature.
Dining Room Lounge Domestic
Circulation Kitchen Bedroom Bathroom
For: Weekdays
Until: 04:00, 0,
Until: 10:00, 1,
Until: 16:00, 0,
Until: 22:00, 1,
Until: 24:00, 0,
For: Weekends,
Until: 04:00, 0,
Until: 10:00, 1,
Until: 16:00, 0,
Until: 22:00, 1,
Until: 24:00, 0,
For: Holidays,
Until: 04:00, 0,
Until: 10:00, 1,
Until: 16:00, 0,
Until: 22:00, 1,
Until: 24:00, 0,
For: AllOtherDays,
Until: 24:00, 0;
For: Weekdays
Until: 14:00, 0,
Until: 23:00, 1,
Until: 24:00, 0,
For: Weekends,
Until: 14:00, 0,
Until: 23:00, 1,
Until: 24:00, 0,
For: Holidays,
Until: 14:00, 0,
Until: 23:00, 1,
Until: 24:00, 0,
For: AllOtherDays
Until: 24:00, 0;
For: Weekdays
Until: 05:00, 0,
Until: 10:00, 1,
Until: 17:00, 0,
Until: 23:00, 1,
Until: 24:00, 0,
For: Weekends,
Until: 05:00, 0,
Until: 24:00, 1,
For: Holidays,
Until: 05:00, 0,
Until: 23:00, 1,
Until: 24:00, 0,
For: AllOtherDays,
Until: 24:00, 0;
For: Weekdays
Until: 05:00, 0,
Until: 10:00, 1,
Until: 17:00, 0,
Until: 24:00, 1,
For: Weekends,
Until: 05:00, 0,
Until: 10:00, 1,
Until: 17:00, 0,
Until: 24:00, 1,
For: Holidays,
Until: 05:00, 0,
Until: 10:00, 1,
Until: 17:00, 0,
Until: 24:00, 1,
For: AllOtherDays
Until: 24:00, 0;
For: Weekdays
Until: 09:00, 1,
Until: 20:00, 0,
Until: 24:00, 1,
For: Weekends,
Until: 09:00, 1,
Until: 20:00, 0,
Until: 24:00, 1,
For: Holidays,
Until: 09:00, 1,
Until: 20:00, 0,
Until: 24:00, 1,
For: AllOtherDays,
Until: 24:00, 0;
For: Weekdays
Until: 05:00, 0,
Until: 10:00, 1,
Until: 17:00, 0,
Until: 23:00, 1,
Until: 24:00, 0,
For: Weekends,
Until: 05:00, 0,
Until: 10:00, 1,
Until: 17:00, 0,
Until: 23:00, 1,
Until: 24:00, 0,
For: Holidays,
Until: 05:00, 0,
Until: 10:00, 1,
Until: 17:00, 0,
Until: 23:00, 1,
Until: 24:00, 0,
For: AllOtherDays,
Until: 24:00, 0;
Note: for cooling 0 means equipment off; 0.5 equipment controlled using setback temperature; 1
equipment controlled using setpoint temperature.
Dining Room Lounge Domestic
Circulation Kitchen Bedroom Bathroom
For: Weekdays
Until: 06:00, 0.08,
Until: 07:00, 0.31,
Until: 09:00, 1,
Until: 10:00, 0.31,
Until: 18:00, 0.08,
For: Weekdays,
Until: 16:00, 0,
Until: 18:00, 0.5,
Until: 22:00, 1,
Until: 23:00, 0.67,
Until: 24:00, 0,
For: Weekdays,
Until: 07:00, 0,
Until: 10:00, 1,
Until: 19:00, 0,
Until: 23:00, 0.2,
Until: 24:00, 0,
For: Weekdays,
Until: 07:00, 0,
Until: 10:00, 1,
Until: 19:00, 0,
Until: 23:00, 0.2,
Until: 24:00, 0,
For: Weekdays,
Until: 07:00, 1,
Until: 08:00, 0.5,
Until: 09:00, 0.25,
Until: 22:00, 0,
Until: 23:00, 0.25,
For: Weekdays,
Until: 07:00, 0,
Until: 10:00, 1,
Until: 19:00, 0,
Until: 23:00, 0.2,
Until: 24:00, 0,
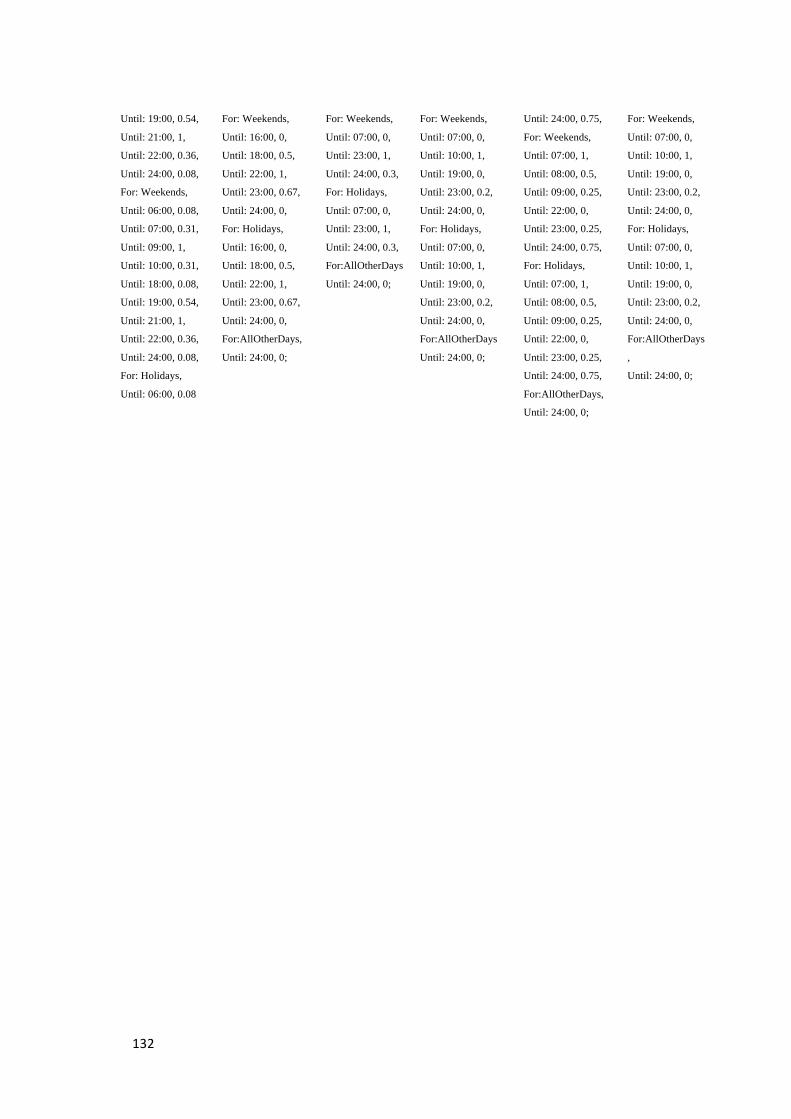
Until: 19:00, 0.54,
Until: 21:00, 1,
Until: 22:00, 0.36,
Until: 24:00, 0.08,
For: Weekends,
Until: 06:00, 0.08,
Until: 07:00, 0.31,
Until: 09:00, 1,
Until: 10:00, 0.31,
Until: 18:00, 0.08,
Until: 19:00, 0.54,
Until: 21:00, 1,
Until: 22:00, 0.36,
Until: 24:00, 0.08,
For: Holidays,
Until: 06:00, 0.08
For: Weekends,
Until: 16:00, 0,
Until: 18:00, 0.5,
Until: 22:00, 1,
Until: 23:00, 0.67,
Until: 24:00, 0,
For: Holidays,
Until: 16:00, 0,
Until: 18:00, 0.5,
Until: 22:00, 1,
Until: 23:00, 0.67,
Until: 24:00, 0,
For:AllOtherDays,
Until: 24:00, 0;
For: Weekends,
Until: 07:00, 0,
Until: 23:00, 1,
Until: 24:00, 0.3,
For: Holidays,
Until: 07:00, 0,
Until: 23:00, 1,
Until: 24:00, 0.3,
For:AllOtherDays
Until: 24:00, 0;
For: Weekends,
Until: 07:00, 0,
Until: 10:00, 1,
Until: 19:00, 0,
Until: 23:00, 0.2,
Until: 24:00, 0,
For: Holidays,
Until: 07:00, 0,
Until: 10:00, 1,
Until: 19:00, 0,
Until: 23:00, 0.2,
Until: 24:00, 0,
For:AllOtherDays
Until: 24:00, 0;
Until: 24:00, 0.75,
For: Weekends,
Until: 07:00, 1,
Until: 08:00, 0.5,
Until: 09:00, 0.25,
Until: 22:00, 0,
Until: 23:00, 0.25,
Until: 24:00, 0.75,
For: Holidays,
Until: 07:00, 1,
Until: 08:00, 0.5,
Until: 09:00, 0.25,
Until: 22:00, 0,
Until: 23:00, 0.25,
Until: 24:00, 0.75,
For:AllOtherDays,
Until: 24:00, 0;
For: Weekends,
Until: 07:00, 0,
Until: 10:00, 1,
Until: 19:00, 0,
Until: 23:00, 0.2,
Until: 24:00, 0,
For: Holidays,
Until: 07:00, 0,
Until: 10:00, 1,
Until: 19:00, 0,
Until: 23:00, 0.2,
Until: 24:00, 0,
For:AllOtherDays
,
Until: 24:00, 0;


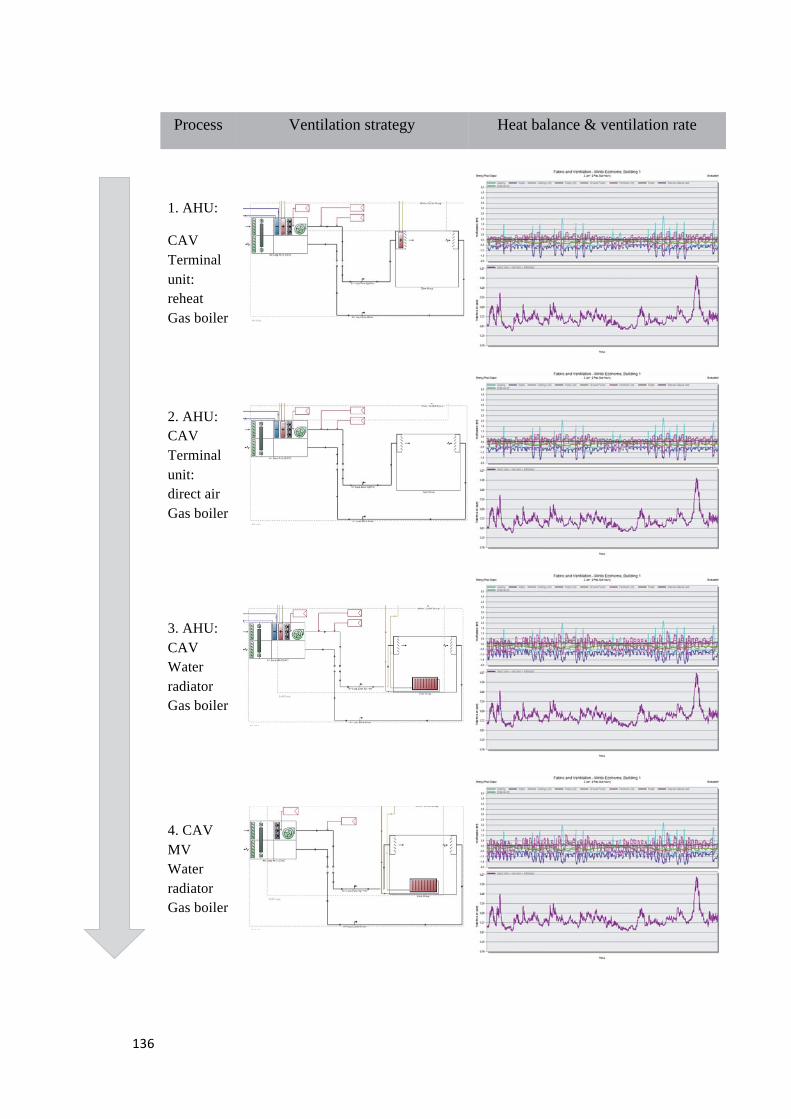
Process Ventilation strategy Heat balance & ventilation rate
1. AHU:
CAV Terminal unit: reheat Gas boiler
2. AHU: CAV Terminal unit: direct air Gas boiler
3. AHU: CAV Water radiator Gas boiler
4. CAV MV Water radiatorGas boiler
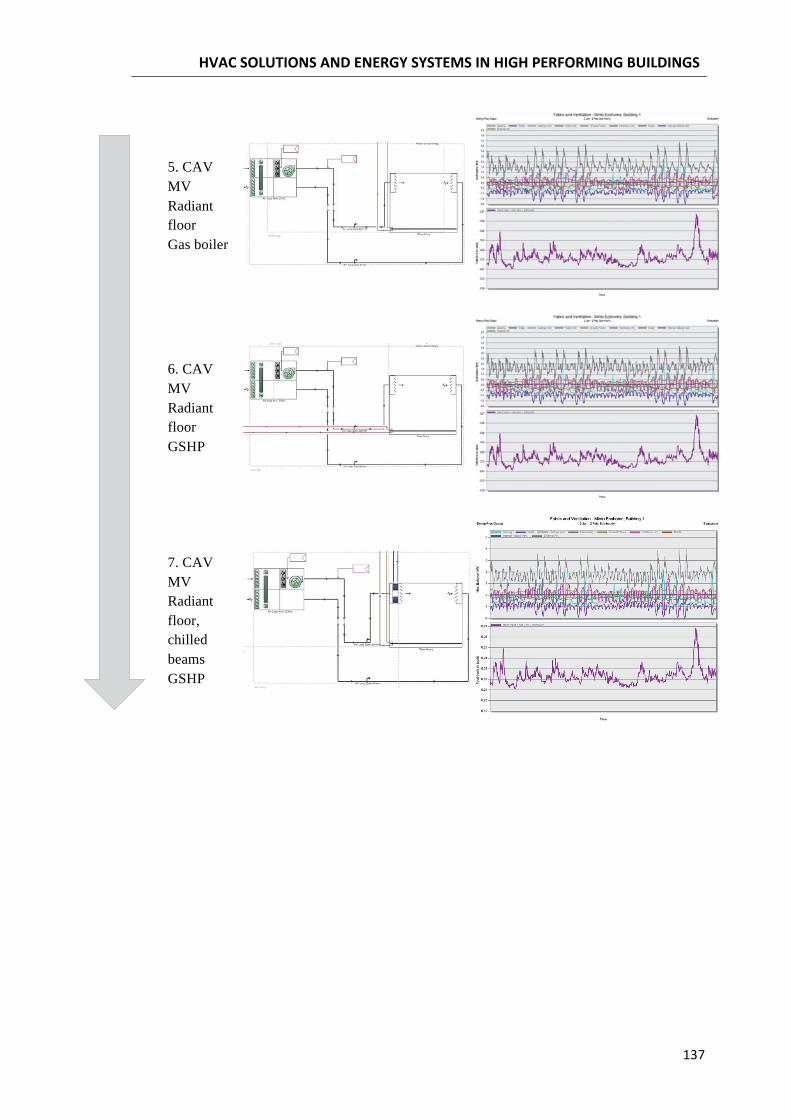
5. CAV MV Radiant floor Gas boiler
6. CAV MV Radiant floor GSHP
7. CAV MV Radiant floor, chilled beams GSHP

http://www.designbuilder.co.uk
http://www.schl.ca/
http://www.peci.org/
http://www.architecture.com/RIBA/Aboutus/SustainabilityHub/
http://www.annex59.com/
http://www.ecbcs.org/annexes/annex59.htm
http://oee.nrcan.gc.ca
http://www76.statcan.gc.ca
http://www.martinenergetics.com/how-they-work.html
http://www.3encult.eu
http://www.passiv.de
http://www.cmhc-schl.gc.ca
www.eia.gov
epp.eurostat.ec.europa.eu
Kurtnitski J., Allard F., Braham D., Goeders G., Heiselberg P., Jagemar L., Kosonen R., Lebrun J., Mazzarella L., Railio J., Seppänen O., Schmidt M., Virta M., “How to define nearly net zero Energy buildings nZEB – REHVA proposal for uniformed national implementation of EPBD recast”, in The Rehva European HVAC Journal, v. 48, n.3, pp. 6-12, May 2011;
Torcellini P., S. Pless S., Deru M., Crawley D., “Zero Energy Buildings: A Critical Look at the Definition_”, National Renewable Energy Laboratory, August 2006;
Pless S., Torcellini P., “Net-Zero Energy Buildings: A Clasification System based on Renewable Energy Supply Options”, National Renewable Energy Laboratory, July 2009;
Mario Sisinni, “Portable, Exhaustive, Reliable, Flexible and Optimised approach to Monitoring and Evaluation of building eneRgy performance”, PERFORMER project, January 2014;
Unknown, “Benchmarking Regulations on Energy Efficiency of Buildings”, REHVA, April 2010;
Unknown, “EnerGuide for New Houses: Administrative and Technical Procedures”, Natural Resources Canada, January 2005;
Burkhard Sanner, “Ground Source Heat Pump: A Guide Book”, EGEC, 2008;
Mike Taitano, “Air Conditioning and Refrigeration System Evaluation Guide”, June 2008;
Unknown, “Domestic Ground Source Heat Pumps: Design and installation of closed-loop systems”, GSHP association, 2007;
Unknown, “A Buyer’s Guide for Residential Ground Source Heat Pump Systems”, Canadian GeoExchange Coalition, 2009;
Jason Meyer, Dominique Pride, Jonathan O’Toole, Colin Craven, Vanessa Spencer, “Ground-Source Heat Pumps in Cold Climates”, Alaska Center for Energy and Power & Cold Climate Housing Research Center, May 2011;
Kurt Roth, John Dieckmann, Robert Zogg, James Brodrick, “Chilled Beam Cooling”, ASHRAE, September 2007;
Kevin M. Pope P.E., Jason Leffingwell, Ken Bauter, “Chilled Beams”, ASHRAE, May 2010; Unknown, “Ground-Source Heat Pump Project Annalysis”, Natural Resources Canada, 2005; Zhitao Zheng, Ying Xu, Liping Wang, Linfang Zhang, Jianghui Dong, “Design of ground source heat pump system based on energy-saving solar”, Anhui University of Science and Technology, School of Computer Science, Engineering and Mathematics;
Unknown, “Minimizing ΔT in HVAC Systems for High Energy Efficiency in Buildings”, IEA, September 2011;
Michal Pomianowski, Ongun Berk Kazaci, “Heating /cooling systems in Denmark”, Aalborg University, Danish Technical University;
Qun Chen, Xin-Gang Liang and Zeng-Yuan Guo, “Entransy - a Novel Theory in
Heat Transfer Analysis and Optimization”, Tsinghua University;
Marco Perino, Alfonso Capozzoli, Gianluca Serale, “HEATING AND COOLING SYSTEMS IN ITALY”, TEBE research group, Politecnico di Torino,;
Varena Marie Barthelmes, “Nearly Zero Energy Building: progettazione energetica orientate alla cost-optimality”, Politecnico di Torino, February 2014.