Embed Size (px)
Citation preview

2003 Prentice Hall Business Publishing, PowerPoint supplement to Management Accounting, 4rd ed., Atkinson, Kaplan, and Young, prepared by Terry M. Lease, Ph.D., CPA, Sonoma State University
External Financial Control:Financial Ratio Analysis
Chapter 12

2003 Prentice Hall Business Publishing, PowerPoint supplement to Management Accounting, 4rd ed., Atkinson, Kaplan, and Young, prepared by Terry M. Lease, Ph.D., CPA, Sonoma State University
12-FA-2
External Financial Control Tools• For many years analysts have studied
organizations using external financial control tools, divided into two broad groups: Common size statements (vertical analysis):
• Balance Sheet• Income Statement
Financial Ratios:
♦ Profitability♦ Efficiency♦ Financial leverage
♦ Liquidity♦ Asset use
(Productivity)♦ Market Value

2003 Prentice Hall Business Publishing, PowerPoint supplement to Management Accounting, 4rd ed., Atkinson, Kaplan, and Young, prepared by Terry M. Lease, Ph.D., CPA, Sonoma State University
12-FA-3
Common Size Balance Sheet (1 of 2)
• The common size balance sheet has two purposes: To identify trends in a company’s balance
sheet components over time• For example, is working capital increasing or
decreasing over time?
To compare balance sheet components of similar organizations
• For example, is this organization holding more debt than similar organizations?

2003 Prentice Hall Business Publishing, PowerPoint supplement to Management Accounting, 4rd ed., Atkinson, Kaplan, and Young, prepared by Terry M. Lease, Ph.D., CPA, Sonoma State University
12-FA-4
Common Size Balance Sheet (2 of 2)
• In a common size balance sheet Each item on the asset side of the balance
sheet is expressed as a percent of total assets Each item on the liabilities and shareholders’
equity side of the balance sheet is expressed as a percent of the total liabilities and shareholders’ equity

2003 Prentice Hall Business Publishing, PowerPoint supplement to Management Accounting, 4rd ed., Atkinson, Kaplan, and Young, prepared by Terry M. Lease, Ph.D., CPA, Sonoma State University
12-FA-5
Common Size Income Statement• The common size income statement provides
many valuable insights by identifying each of the cost elements as a percentage of sales
• This provides guidance to management and investors of the opportunities and potential to reduce costs
• Again it is useful to consider both the trend of these individual items through time and the comparison of these items with a competitor

2003 Prentice Hall Business Publishing, PowerPoint supplement to Management Accounting, 4rd ed., Atkinson, Kaplan, and Young, prepared by Terry M. Lease, Ph.D., CPA, Sonoma State University
12-FA-6
Profitability Ratios (1 of 5)
• Return on Assets= Net income Total Assets
A measure of the return generated by the assets Independent of how the assets are financed
• Return on Common Equity = Net income Common Equity A ratio that measures the return to the organization’s
shareowners Reflects the effect of financial leverage
• Occurs when the organization uses fixed income capital (like debt) in its capital structure
• Financial leverage increases returns to the shareowners when the organization is profitable and reduces returns when it is unprofitable

2003 Prentice Hall Business Publishing, PowerPoint supplement to Management Accounting, 4rd ed., Atkinson, Kaplan, and Young, prepared by Terry M. Lease, Ph.D., CPA, Sonoma State University
12-FA-7
Profitability Ratios (2 of 5)
• Economic Value Added®
Computes the return to shareowners that exceeds the minimum return on investment that shareowners require
The calculation, beyond the scope of this text, requires an adjustment of GAAP income for its conservatism, a calculation of the organization’s weighted average cost of capital, and a calculation of the investment level in the organization
• Examples of adjustments include: research and development and advertising are capitalized and expensed, goodwill is not written off, and the effect of the deferred income tax calculation is reversed

2003 Prentice Hall Business Publishing, PowerPoint supplement to Management Accounting, 4rd ed., Atkinson, Kaplan, and Young, prepared by Terry M. Lease, Ph.D., CPA, Sonoma State University
12-FA-8
Profitability Ratios (3 of 5)
• Market Value Added ®
Computes the excess of market value of the firm over total historical investments
An estimate of the organization’s cumulative value creation for shareowners
• The calculation of market value added is beyond the scope of this text
• Earnings Per Share (EPS)= (Net income – preferred dividends)
weighted average number of shares outstanding
• The weighted average number of shares outstanding during the year is readily available since organizations are required to report it in their financial statements

2003 Prentice Hall Business Publishing, PowerPoint supplement to Management Accounting, 4rd ed., Atkinson, Kaplan, and Young, prepared by Terry M. Lease, Ph.D., CPA, Sonoma State University
12-FA-9
Profitability Ratios (4 of 5)
• Earnings Per Share (cont.) EPS is perhaps one of the most widely quoted financial
measures of performance It is the monetary unit return to the investor from
holding the organization’s common stock Fully diluted EPS computes the EPS as if all
outstanding financial instruments that are convertible to stock (e.g., stock options and convertible debt) were exercised
• Organizations are required to report fully diluted earnings per share in their annual reports
• Dividend Yield Ratio= Dividends per share market price per share

2003 Prentice Hall Business Publishing, PowerPoint supplement to Management Accounting, 4rd ed., Atkinson, Kaplan, and Young, prepared by Terry M. Lease, Ph.D., CPA, Sonoma State University
12-FA-10
Profitability Ratios (5 of 5)
• Dividend Yield Ratio (cont.) Measures the cash return on the market price of a share This is an important measure of shareowner return for
shareowners that value dividends• The other element of shareowner return is the
appreciation in share value A low level of this ratio implies that either growth or the
underlying value of the company’s assets are supporting the share price since no shareowner would be satisfied with a low return
• Some people expect the amount of dividends paid to increase after recent changes in the tax law
» The affect on dividend yield is unclear since this and other changes may increase stock prices

2003 Prentice Hall Business Publishing, PowerPoint supplement to Management Accounting, 4rd ed., Atkinson, Kaplan, and Young, prepared by Terry M. Lease, Ph.D., CPA, Sonoma State University
12-FA-11
Efficiency Ratios (1 of 3)
• Gross Profit Margin= Gross Profit Sales Measures the proportion of each sales dollar that is
consumed by manufacturing costs• For this reason, analysts use the gross profit margin
as a measure of manufacturing efficiency The gross margin residual is what is available to cover
all the non-manufacturing expenditures and to pay interest and taxes
• Operating Profit Margin= Earnings before Interest & Taxes Sales

2003 Prentice Hall Business Publishing, PowerPoint supplement to Management Accounting, 4rd ed., Atkinson, Kaplan, and Young, prepared by Terry M. Lease, Ph.D., CPA, Sonoma State University
12-FA-12
Efficiency Ratios (2 of 3)
• Operating Profit Margin (cont.) Computes the proportion of each sales dollar that is
available to pay interest and taxes and provide a return to shareowners
• The relevance of the word operating in the name of this ratio is that revenues or expenses that are deemed to be unusual or non-operating items are not included in computing this ratio
• Net Profit Margin= Net Income Sales Computes the proportion of total revenues that are
available for distribution to the shareholders

2003 Prentice Hall Business Publishing, PowerPoint supplement to Management Accounting, 4rd ed., Atkinson, Kaplan, and Young, prepared by Terry M. Lease, Ph.D., CPA, Sonoma State University
12-FA-13
Efficiency Ratios (3 of 3)
• Net Profit Margin (cont.) When this ratio is negative, as a result of a net loss, it
is frequently not reported or reported as N/A (not applicable) since it cannot be interpreted in the same manner as a positive net profit margin

2003 Prentice Hall Business Publishing, PowerPoint supplement to Management Accounting, 4rd ed., Atkinson, Kaplan, and Young, prepared by Terry M. Lease, Ph.D., CPA, Sonoma State University
12-FA-14
Financial Leverage Ratios (1 of 2)
• Debt/Equity Ratio= Total Debt Total Equity A measure of financial risk The higher the ratio the more financial risk
• Because interest must be paid on debt irrespective of the organization’s profitability
• While standards for what is an appropriate debt/equity ratio vary across industries, values between 50% and 70% are common
• Debt Ratio= Total Debt Total Equity Another measure of financial risk

2003 Prentice Hall Business Publishing, PowerPoint supplement to Management Accounting, 4rd ed., Atkinson, Kaplan, and Young, prepared by Terry M. Lease, Ph.D., CPA, Sonoma State University
12-FA-15
Financial Leverage Ratios (2 of 2)
• Debt Ratio (cont.) As in the case of the debt/equity ratio, the standards
for what is an appropriate value vary across industries• Values between 33% and 66% are common

2003 Prentice Hall Business Publishing, PowerPoint supplement to Management Accounting, 4rd ed., Atkinson, Kaplan, and Young, prepared by Terry M. Lease, Ph.D., CPA, Sonoma State University
12-FA-16
Liquidity Ratios (1 of 4)
• Current Ratio= Current assets Current liabilities A measure of short run liquidity It measures the organization’s ability to cover its short-
term liabilities• The liabilities that are due in the upcoming fiscal
year• Although the norm varies from industry to industry,
a value of 2 is often considered to be appropriate
• Quick Ratio= (Current assets – Inventory) Current liabilities Another measure of short run liquidity

2003 Prentice Hall Business Publishing, PowerPoint supplement to Management Accounting, 4rd ed., Atkinson, Kaplan, and Young, prepared by Terry M. Lease, Ph.D., CPA, Sonoma State University
12-FA-17
Liquidity Ratios (2 of 4)
• Quick Ratio (cont.) The major difference between this and the current ratio
is that the value of inventory is excluded in the calculation of the quick ratio on the grounds that inventory cannot be easily liquidated to pay current liabilities
• Although the norm for an appropriate current ratio varies from industry to industry, a value of 1 is often considered to be appropriate
• Times Interest Earned Ratio= EBIT Interest expense This is another measure of financial risk

2003 Prentice Hall Business Publishing, PowerPoint supplement to Management Accounting, 4rd ed., Atkinson, Kaplan, and Young, prepared by Terry M. Lease, Ph.D., CPA, Sonoma State University
12-FA-18
Liquidity Ratios (3 of 4)
• Times Interest Earned Ratio (cont.) Since interest payments are contractual and required,
this ratio provides insights into the organization’s ability to meet its interest payments
• Since interest is paid with cash, not income, the times interest earned ratio may not be a good indicator of the organization’s ability to pay interest
• Free Cash Flow Net cash flow from operations – net cash flows from
investment activities – cash dividends paid Measures the excess of cash flow generated by
operations over the amount of cash required to make investments to sustain the organization and pay dividends

2003 Prentice Hall Business Publishing, PowerPoint supplement to Management Accounting, 4rd ed., Atkinson, Kaplan, and Young, prepared by Terry M. Lease, Ph.D., CPA, Sonoma State University
12-FA-19
Liquidity Ratios (4 of 4)
• Free Cash Flow (cont.)• In effect it is residual or excess cash
Analysts originally viewed free cash flow as problematic since it represented funds that organizations might use speculatively
Over time this original meaning has changed and analysts now view free cash flow as a measure of the organization’s liquidity

2003 Prentice Hall Business Publishing, PowerPoint supplement to Management Accounting, 4rd ed., Atkinson, Kaplan, and Young, prepared by Terry M. Lease, Ph.D., CPA, Sonoma State University
12-FA-20
Asset Use (Productivity) Ratios (1 of 6)
• Accounts Receivable Turnover= Credit sales Accounts receivable Management’s ability to minimize inventory, accounts
receivable, and other elements of working capital, for a given level of sales activity enhances the organization’s ability to reduce working capital and increase return on investment
• For many organizations the investment in inventory and accounts receivable can be significant
However, a high turnover number is not necessarily good• Since granting trade credit is often a sales
inducement, high turnover measures for accounts receivable may signal an organization that is managing its credit terms too tightly and losing sales

2003 Prentice Hall Business Publishing, PowerPoint supplement to Management Accounting, 4rd ed., Atkinson, Kaplan, and Young, prepared by Terry M. Lease, Ph.D., CPA, Sonoma State University
12-FA-21
Asset Use (Productivity) Ratios (2 of 6)
• Accounts Receivable Turnover (cont.) To compute the accounts receivable turnover we need
a statistic that is not commonly provided in the organization’s financial statements: the proportion of sales that are credit sales
• For large organizations it is reasonably safe to assume that all sales are credit sales – so the analyst replaces credit sales with sales in the numerator of the accounts receivable turnover ratio
Factoring (selling) some A/R improves the turnover ratio, but tends to be evidence of an organization that has cash flow problems

2003 Prentice Hall Business Publishing, PowerPoint supplement to Management Accounting, 4rd ed., Atkinson, Kaplan, and Young, prepared by Terry M. Lease, Ph.D., CPA, Sonoma State University
12-FA-22
Asset Use (Productivity) Ratios (3 of 6)
• Accounts Receivable Turnover (cont.)• Moreover, since the cash obtained from factoring
receivables will appear in the free cash flow statement, factoring compromises the interpretation of the cash management implications of the free cash flow number
Organizations that face highly varying demand over the year will experience highly fluctuating levels of accounts receivable
• These organizations use average accounts receivable held to compute the accounts receivable turnover ratio
2003 Prentice Hall Business Publishing, PowerPoint supplement to Management Accounting, 4rd ed., Atkinson, Kaplan, and Young, prepared by Terry M. Lease, Ph.D., CPA, Sonoma State University
12-FA-23
Asset Use (Productivity) Ratios (4 of 6)
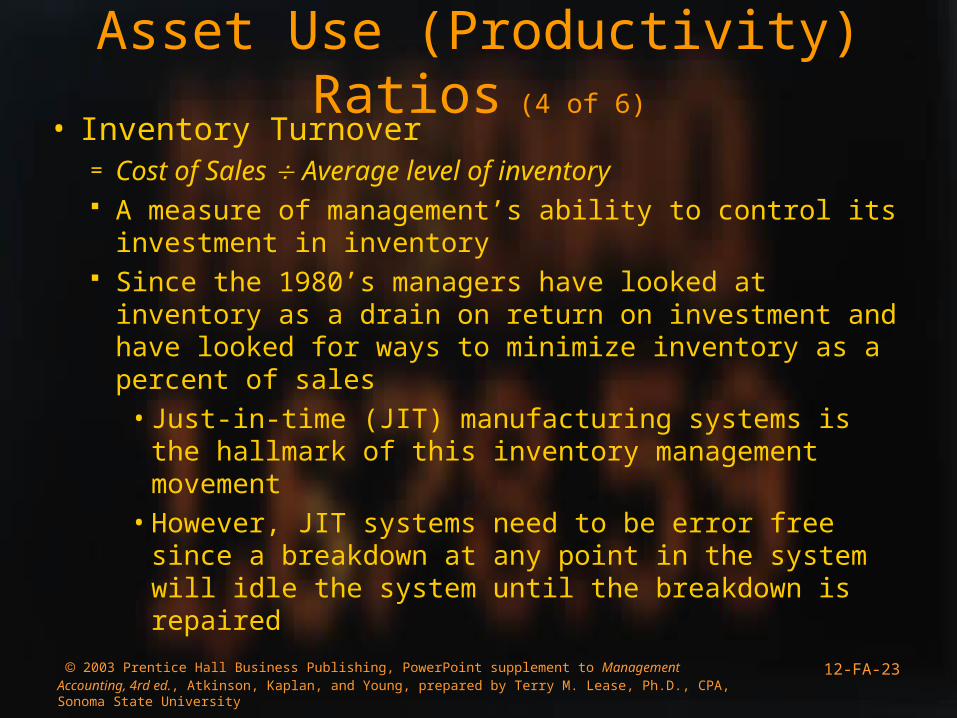
• Inventory Turnover= Cost of Sales Average level of inventory A measure of management’s ability to control its
investment in inventory Since the 1980’s managers have looked at inventory
as a drain on return on investment and have looked for ways to minimize inventory as a percent of sales
• Just-in-time (JIT) manufacturing systems is the hallmark of this inventory management movement
• However, JIT systems need to be error free since a breakdown at any point in the system will idle the system until the breakdown is repaired

2003 Prentice Hall Business Publishing, PowerPoint supplement to Management Accounting, 4rd ed., Atkinson, Kaplan, and Young, prepared by Terry M. Lease, Ph.D., CPA, Sonoma State University
12-FA-24
Asset Use (Productivity) Ratios (5 of 6)
• Inventory Turnover (cont.) Organizations that face seasonal demand where
inventory levels vary widely over the year use average inventory held during the year
The inventory turnover ratio uses cost of sales rather than sales in the numerator
• Inventory is measured at cost; consistency requires that cost be used in the numerator
• Total Asset Turnover= Sales Total assets Measures management’s ability to use assets
effectively to generate sales

2003 Prentice Hall Business Publishing, PowerPoint supplement to Management Accounting, 4rd ed., Atkinson, Kaplan, and Young, prepared by Terry M. Lease, Ph.D., CPA, Sonoma State University
12-FA-25
Asset Use (Productivity) Ratios (6 of 6)
• Total Asset Turnover (cont.) Holding too many assets will increase the capital
invested in the organization and lower the return to capital
• Asset use is the primary focus of the economic value added (EVA) measure discussed earlier
• Fixed Asset Turnover= Sales Net fixed assets Works with the inventory turnover ratio and the
accounts receivable turnover ratio to further explain the elements of the total asset turnover ratio

2003 Prentice Hall Business Publishing, PowerPoint supplement to Management Accounting, 4rd ed., Atkinson, Kaplan, and Young, prepared by Terry M. Lease, Ph.D., CPA, Sonoma State University
12-FA-26
Market Value Ratios (1 of 3)
• Price earnings (P/E) ratio= Market price of common stock earnings per share One of the most widely quoted market statistics
• The P/E ratio cannot be computed when the company shows a loss
The P/E ratio indicates the number of years that, at the current earnings rate, it would take for the sum of earnings to equal share price
• A high value indicates expectations for growth
• Market value to book value= Market value per share Book value per share Computes the value that the market attributes to an
organization as a proportion of its measured assets
2003 Prentice Hall Business Publishing, PowerPoint supplement to Management Accounting, 4rd ed., Atkinson, Kaplan, and Young, prepared by Terry M. Lease, Ph.D., CPA, Sonoma State University
12-FA-27
Market Value Ratios (2 of 3)
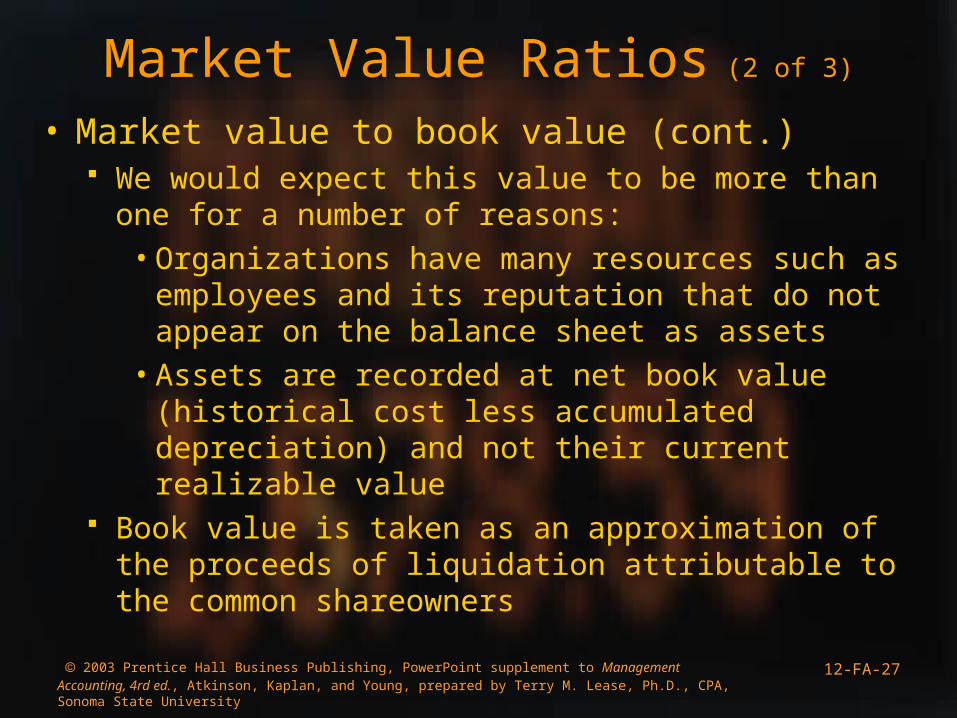
• Market value to book value (cont.) We would expect this value to be more than one for a
number of reasons:• Organizations have many resources such as
employees and its reputation that do not appear on the balance sheet as assets
• Assets are recorded at net book value (historical cost less accumulated depreciation) and not their current realizable value
Book value is taken as an approximation of the proceeds of liquidation attributable to the common shareowners

2003 Prentice Hall Business Publishing, PowerPoint supplement to Management Accounting, 4rd ed., Atkinson, Kaplan, and Young, prepared by Terry M. Lease, Ph.D., CPA, Sonoma State University
12-FA-28
Market Value Ratios (3 of 3)
• Market value to book value (cont.)• Therefore, the ratio reflects the premium over book
value that the market assigns to the organization• When this ratio falls below 1 it signals that the
market believes that the organization’s liquidation value is higher than its value as an ongoing business

2003 Prentice Hall Business Publishing, PowerPoint supplement to Management Accounting, 4rd ed., Atkinson, Kaplan, and Young, prepared by Terry M. Lease, Ph.D., CPA, Sonoma State University
12-FA-29
Ratio Trends and Comparative Values• Individual ratio values are not meaningful in isolation
The trends of these values and their comparison to industry averages puts the ratios in context and supports interpretation
• Financial ratio analysis provides an interesting first step in evaluating an organizations performance
• In spite of limitations, analysts continue to use and interpret financial ratios This widespread use reflects the belief that these ratios
provide important insights• Particularly if combined with other information such as
information gleaned about the organization’s strategic initiatives and information such as that contained in a balanced scorecard

2003 Prentice Hall Business Publishing, PowerPoint supplement to Management Accounting, 4rd ed., Atkinson, Kaplan, and Young, prepared by Terry M. Lease, Ph.D., CPA, Sonoma State University
12-FA-30
Limitations of FinancialRatio Analysis (1 of 3)
• Financial ratio analysis, however, has some limitations: Comparing an organization that is in a single line of
business with an organization that is a competitor but has multiple lines of business is likely to be a meaningless comparison of unlike organizations
Even though organizations might be comparable because they are in similar lines of business, they may use different accounting conventions making ratio comparisons between the two organizations meaningless

2003 Prentice Hall Business Publishing, PowerPoint supplement to Management Accounting, 4rd ed., Atkinson, Kaplan, and Young, prepared by Terry M. Lease, Ph.D., CPA, Sonoma State University
12-FA-31
Limitations of FinancialRatio Analysis (2 of 3)
Interpreting trends in a single organization’s financial ratio may be difficult because of the effect of unknown economic or competitive forces on the organization
It may be difficult to determine an appropriate or acceptable value for a particular ratio, particularly if the industry is in a recession
When there are strong seasonality effects, making comparisons with financial data that is a snapshot of its financial activities at the organization’s year-end may be meaningless
When organizations manipulate or misrepresent their financial information, the financial ratios drawn from these data will be misleading

2003 Prentice Hall Business Publishing, PowerPoint supplement to Management Accounting, 4rd ed., Atkinson, Kaplan, and Young, prepared by Terry M. Lease, Ph.D., CPA, Sonoma State University
12-FA-32
Limitations of FinancialRatio Analysis (3 of 3)
Like all numbers based on historical results, financial ratios look backward
• It may be difficult or even meaningless to use past data to predict future performance
Because they are backward looking, financial ratios ignore an organization’s strategic initiatives and may misrepresent future results resulting from current initiatives
• Despite these limitations analysts continue to use and interpret financial ratios This widespread use reflects the belief that these ratios
provide important insights

2003 Prentice Hall Business Publishing, PowerPoint supplement to Management Accounting, 4rd ed., Atkinson, Kaplan, and Young, prepared by Terry M. Lease, Ph.D., CPA, Sonoma State University
12-FA-33
If you have any comments or suggestions concerning this PowerPoint presentation,
please contact:Terry M. Lease
([email protected])Sonoma State University


![Physiology 4rd Ed - L. Costanzo - BRS[1]](https://img.pdfslide.net/doc/110x75/55cf9ae4550346d033a3e4d8/physiology-4rd-ed-l-costanzo-brs1.jpg)