Embed Size (px)
Citation preview
skyline marketing© 2003 Skyline Marketing Group, Inc. All rights reserved.
U.S. DC Power Market Brief
December, 2003
skyline marketing© 2003 Skyline Marketing Group, Inc. All rights reserved.
Meet John Celentano• 30 years in telecom• Involved with telecom power for 25 years • Broad experience in carrier, supplier, and consulting
environments• Research/strategy consulting on public network
infrastructure markets• Supported clients through campaigns worth billions in
sales• Advises equipment manufacturers, service providers,
and investor groups worldwide• Publishes research reports and articles on DC power,
and quoted often in business and trade press
skyline marketing© 2003 Skyline Marketing Group, Inc. All rights reserved.
Discussion Format
• Telecom Market Overview
• DC Power Application Drivers
• Telecom DC Power Market Outlook
• Strategic Considerations
skyline marketing© 2003 Skyline Marketing Group, Inc. All rights reserved.
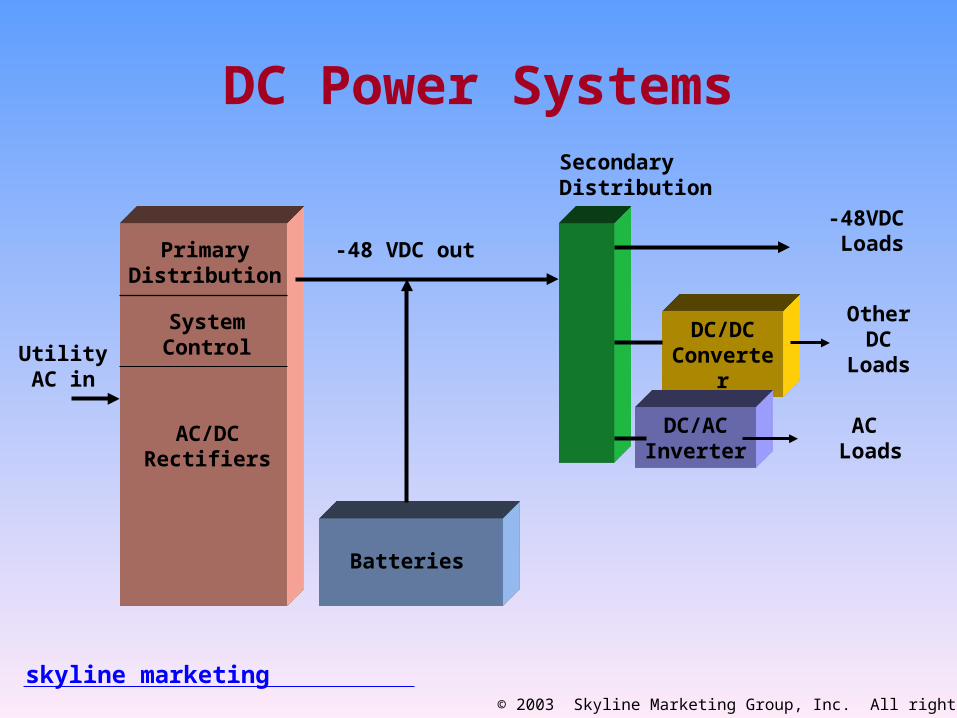
DC Power Systems
PrimaryDistribution
SystemControl
Batteries
UtilityAC in
-48 VDC out
AC/DCRectifiers
-48VDC Loads
DC/DCConverter
DC/ACInverter
AC Loads
OtherDC
Loads
SecondaryDistribution
skyline marketing© 2003 Skyline Marketing Group, Inc. All rights reserved.
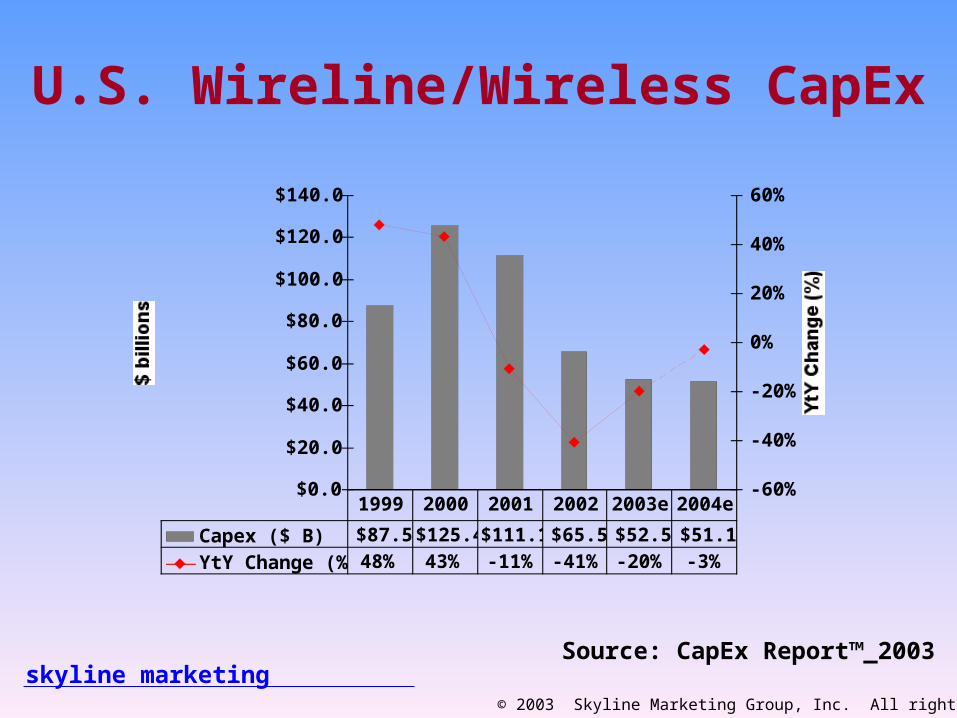
U.S. Wireline/Wireless CapEx
$0.0
$20.0
$40.0
$60.0
$80.0
$100.0
$120.0
$140.0
$ billions
-60%
-40%
-20%
0%
20%
40%
60%
YtY Change (%)
Capex ($ B) $87.5 $125.4 $111.1 $65.5 $52.5 $51.1
YtY Change (%) 48% 43% -11% -41% -20% -3%
1999 2000 2001 2002 2003e 2004e
Source: CapEx Report™_2003
skyline marketing© 2003 Skyline Marketing Group, Inc. All rights reserved.
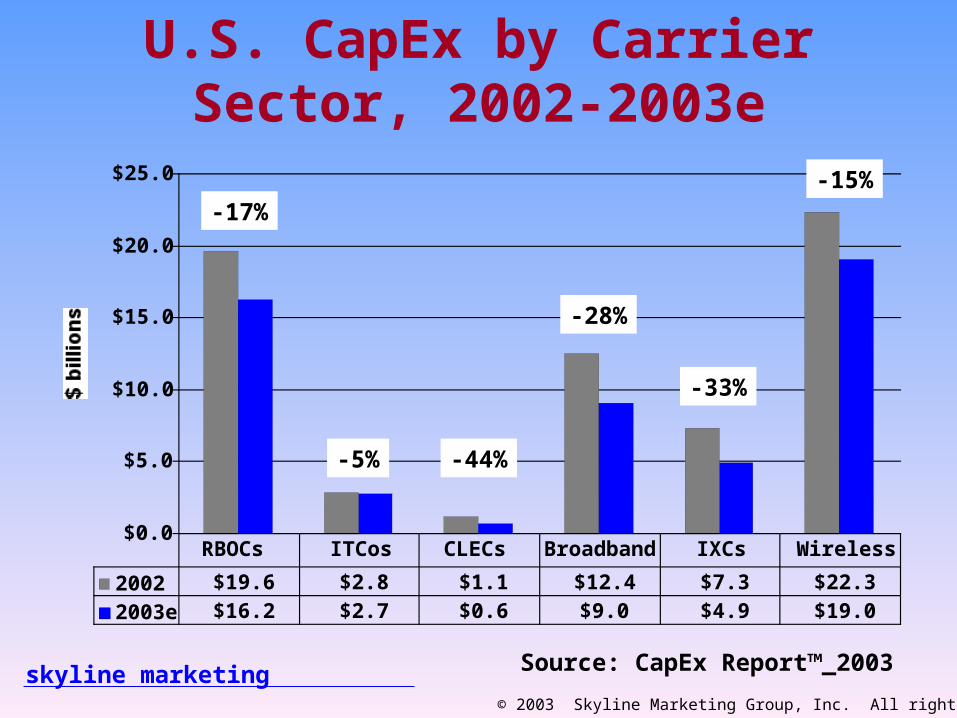
U.S. CapEx by Carrier Sector, 2002-2003e
$0.0
$5.0
$10.0
$15.0
$20.0
$25.0
$ billions
2002 $19.6 $2.8 $1.1 $12.4 $7.3 $22.3
2003e $16.2 $2.7 $0.6 $9.0 $4.9 $19.0
RBOCs ITCos CLECs Broadband IXCs Wireless
-17%
-5% -44%
-28%
-33%
-15%
Source: CapEx Report™_2003
skyline marketing© 2003 Skyline Marketing Group, Inc. All rights reserved.
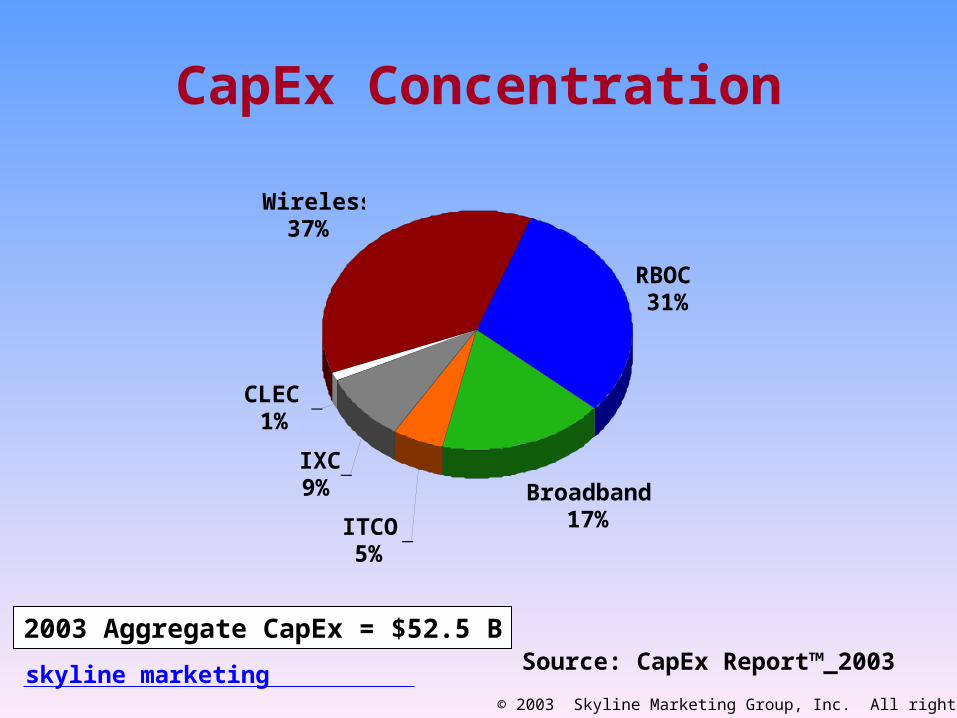
CapEx Concentration
RBOC31%
Broadband17%ITCO
5%
IXC9%
CLEC1%
Wireless37%
2003 Aggregate CapEx = $52.5 BSource: CapEx Report™_2003
skyline marketing© 2003 Skyline Marketing Group, Inc. All rights reserved.
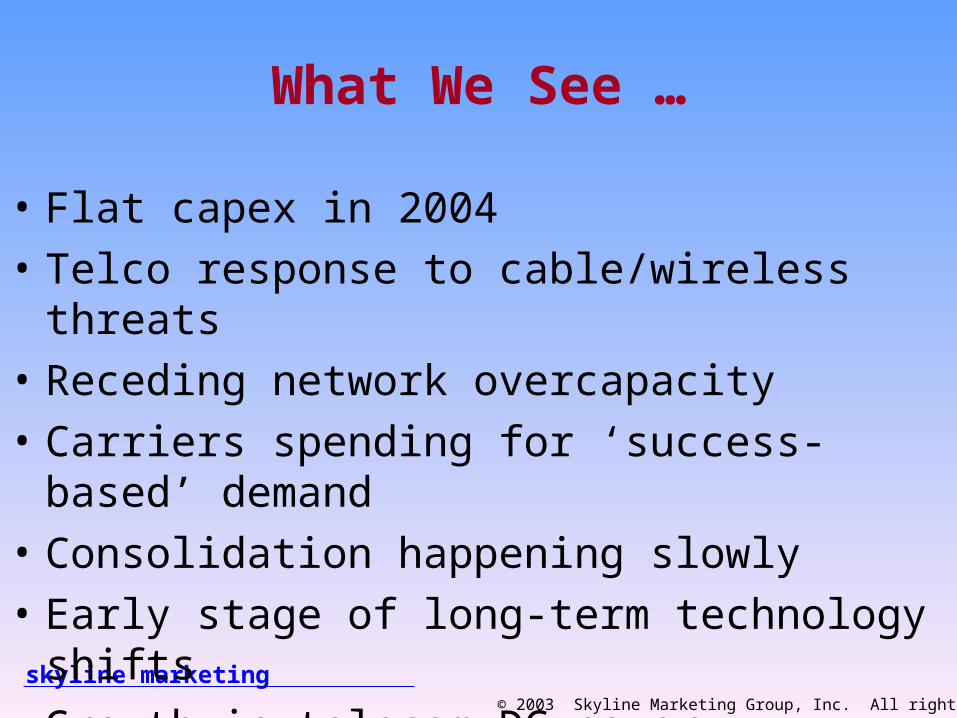
What We See …
• Flat capex in 2004
• Telco response to cable/wireless threats
• Receding network overcapacity
• Carriers spending for ‘success-based’ demand
• Consolidation happening slowly
• Early stage of long-term technology shifts
• Growth in telecom DC power
skyline marketing© 2003 Skyline Marketing Group, Inc. All rights reserved.
End Equipment Bright Spots
• Broadband Access
• FTTP
• C2P Migration
• Wireless
skyline marketing© 2003 Skyline Marketing Group, Inc. All rights reserved.
Broadband Access
skyline marketing© 2003 Skyline Marketing Group, Inc. All rights reserved.
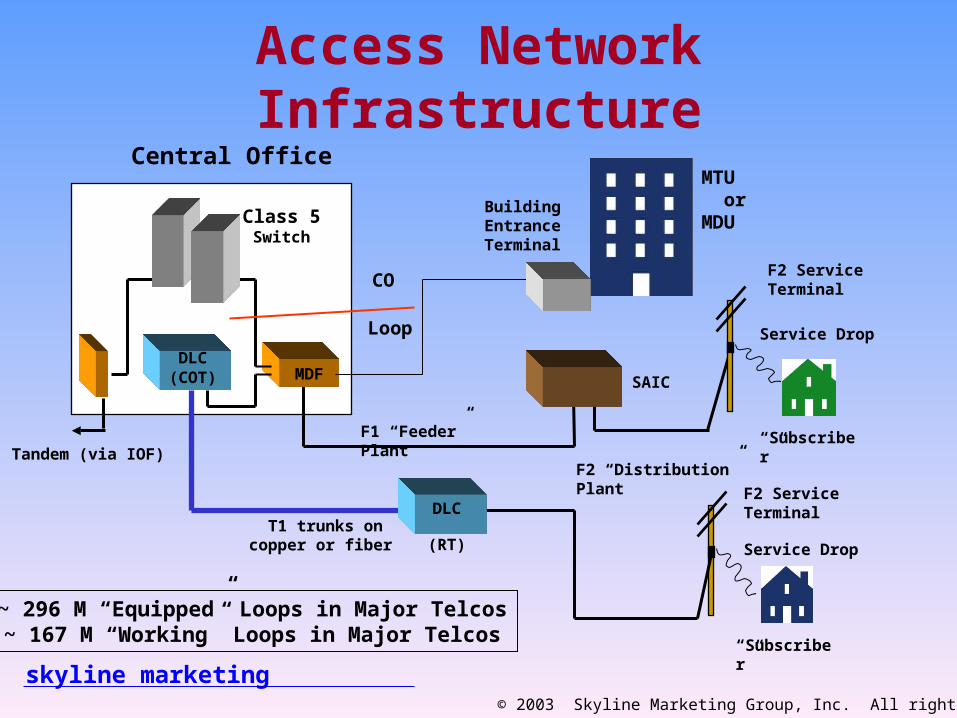
Access Network Infrastructure
“Subscriber”
MDF
F1 “Feeder” Plant
F2 “Distribution” Plant
Service Drop
F2 Service Terminal
Tandem (via IOF)
T1 trunks on copper or fiber
DLC(COT)
Central Office
Service Drop
F2 Service Terminal
BuildingEntranceTerminal
“Subscriber”
MTU orMDUClass 5
Switch
CO
Loop
~ 296 M “Equipped” Loops in Major Telcos~ 167 M “Working” Loops in Major Telcos
DLC (RT)
SAIC
skyline marketing© 2003 Skyline Marketing Group, Inc. All rights reserved.
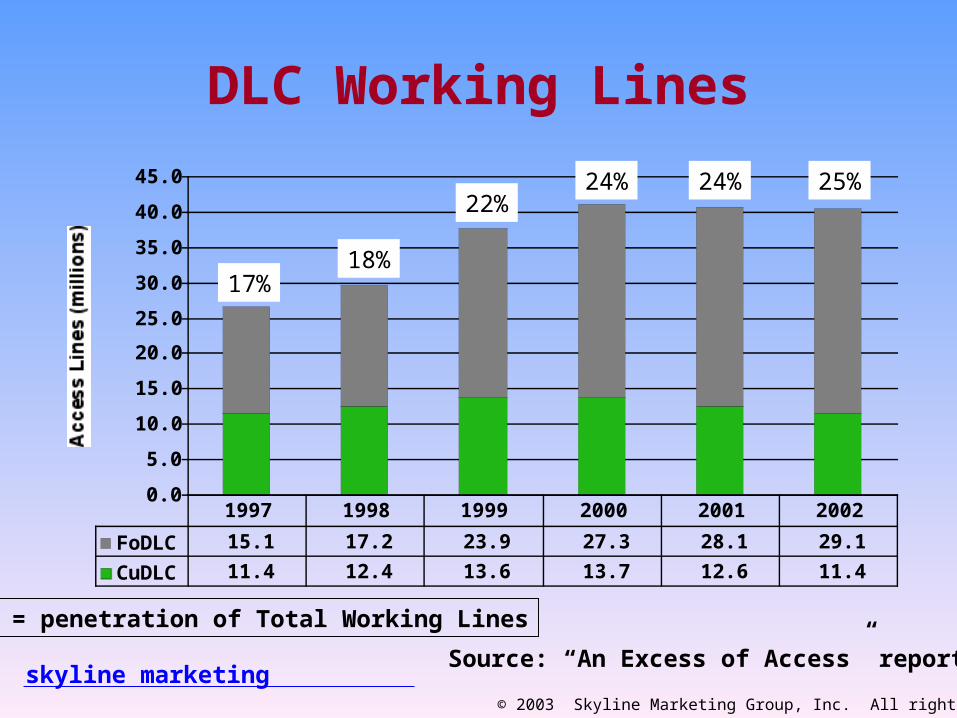
DLC Working Lines
0.0
5.0
10.0
15.0
20.0
25.0
30.0
35.0
40.0
45.0
FoDLC 15.1 17.2 23.9 27.3 28.1 29.1
CuDLC 11.4 12.4 13.6 13.7 12.6 11.4
1997 1998 1999 2000 2001 2002
17%18%
22%24% 24%
% = penetration of Total Working Lines
25%
Source: “An Excess of Access” report
skyline marketing© 2003 Skyline Marketing Group, Inc. All rights reserved.
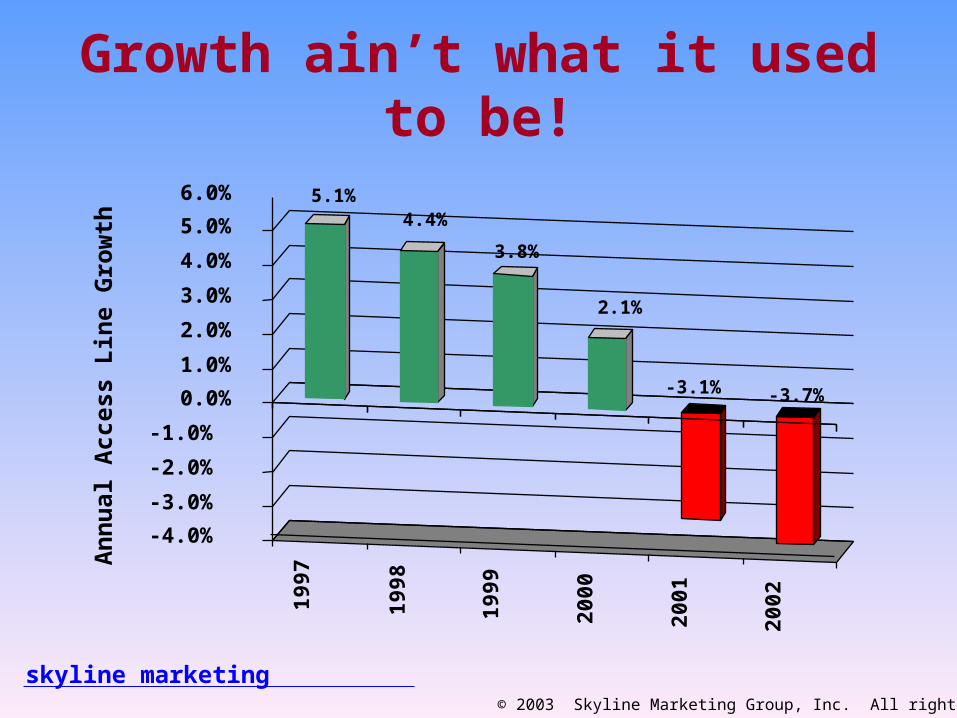
Growth ain’t what it used to be!
19
97
19
98
19
99
20
00
20
01
20
02
5.1%4.4%
3.8%
2.1%
-3.1% -3.7%
-4.0%
-3.0%
-2.0%
-1.0%
0.0%
1.0%
2.0%
3.0%
4.0%
5.0%
6.0%
An
nual
Acc
ess
Lin
e G
row
th
skyline marketing© 2003 Skyline Marketing Group, Inc. All rights reserved.
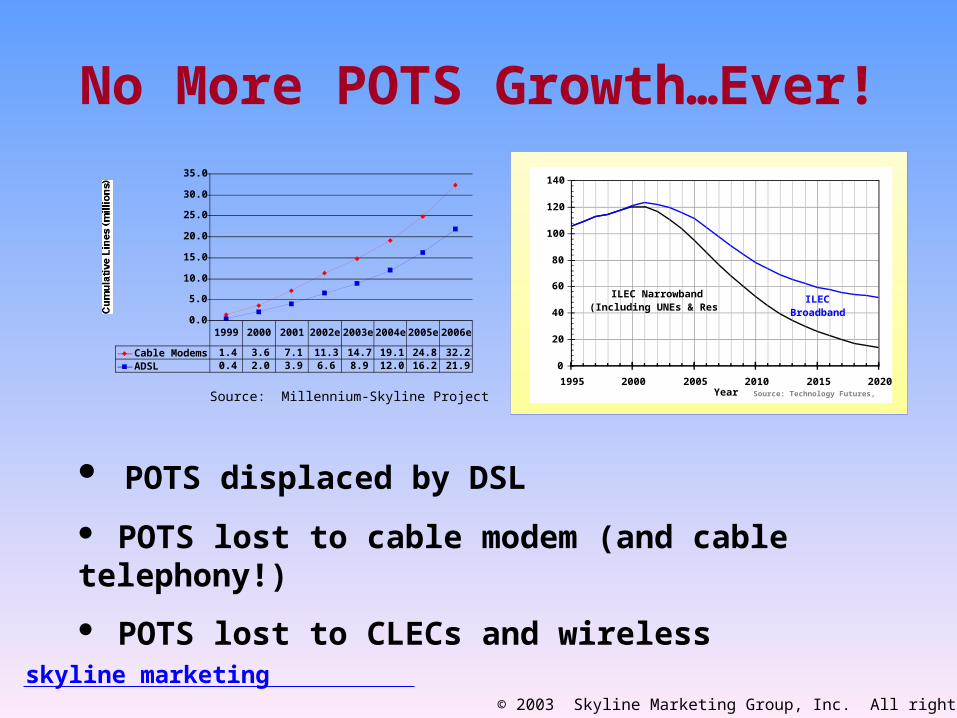
No More POTS Growth…Ever!
0.0
5.0
10.0
15.0
20.0
25.0
30.0
35.0
Cable Modems 1.4 3.6 7.1 11.3 14.7 19.1 24.8 32.2ADSL 0.4 2.0 3.9 6.6 8.9 12.0 16.2 21.9
1999 2000 2001 2002e 2003e 2004e 2005e 2006e
0
20
40
60
80
100
120
140
1995 2000 2005 2010 2015 2020Year
Millions of Access Lines
ILEC Narrowband(Including UNEs & Resale)
Source: Technology Futures, Inc.
Competitive Impacts 2002
ILECBroadband
POTS displaced by DSL
POTS lost to cable modem (and cable telephony!)
POTS lost to CLECs and wireless
Source: Millennium-Skyline Project
skyline marketing© 2003 Skyline Marketing Group, Inc. All rights reserved.
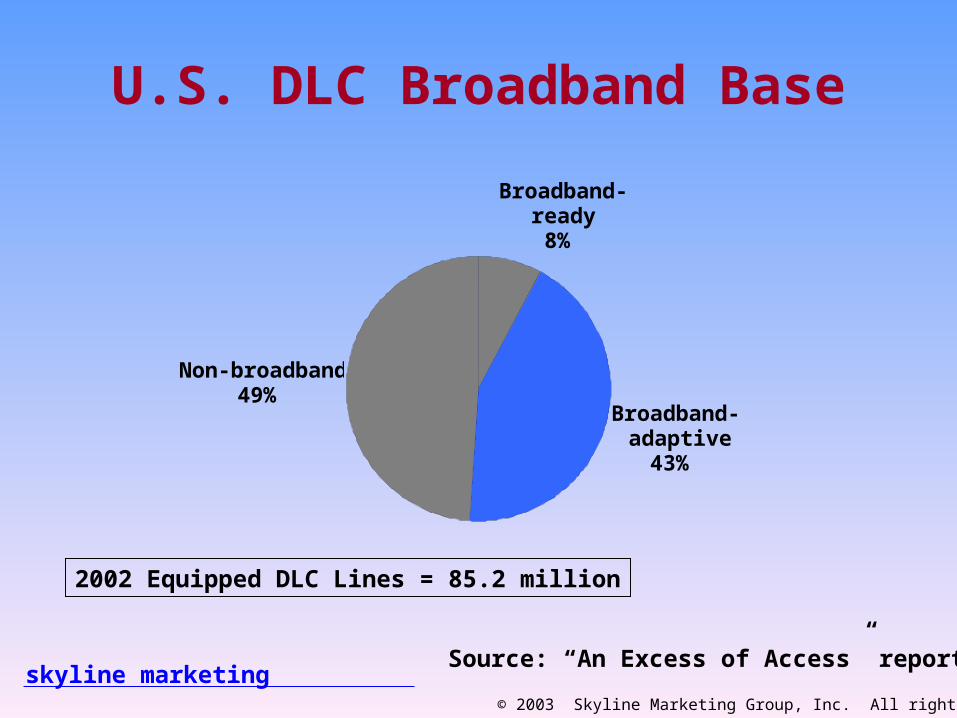
U.S. DLC Broadband Base
Broadband-ready
8%
Broadband-adaptive
43%
Non-broadband49%
2002 Equipped DLC Lines = 85.2 million
Source: “An Excess of Access” report
skyline marketing© 2003 Skyline Marketing Group, Inc. All rights reserved.
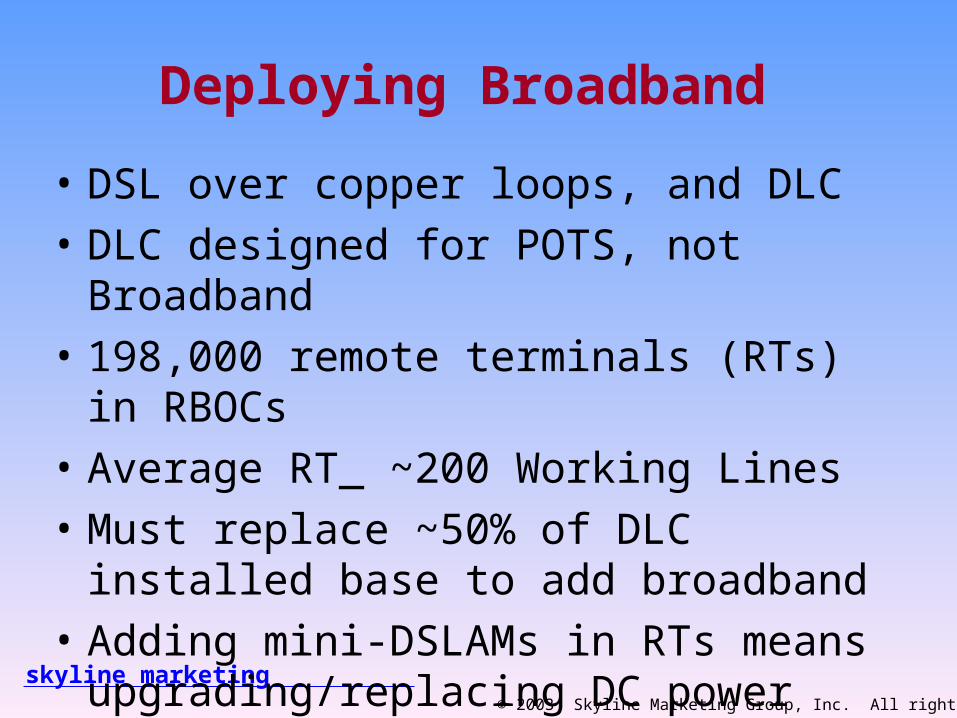
Deploying Broadband
• DSL over copper loops, and DLC
• DLC designed for POTS, not Broadband
• 198,000 remote terminals (RTs) in RBOCs
• Average RT_ ~200 Working Lines
• Must replace ~50% of DLC installed base to add broadband
• Adding mini-DSLAMs in RTs means upgrading/replacing DC power
skyline marketing© 2003 Skyline Marketing Group, Inc. All rights reserved.
Fiber-to-the-Premise (FTTP)
skyline marketing© 2003 Skyline Marketing Group, Inc. All rights reserved.
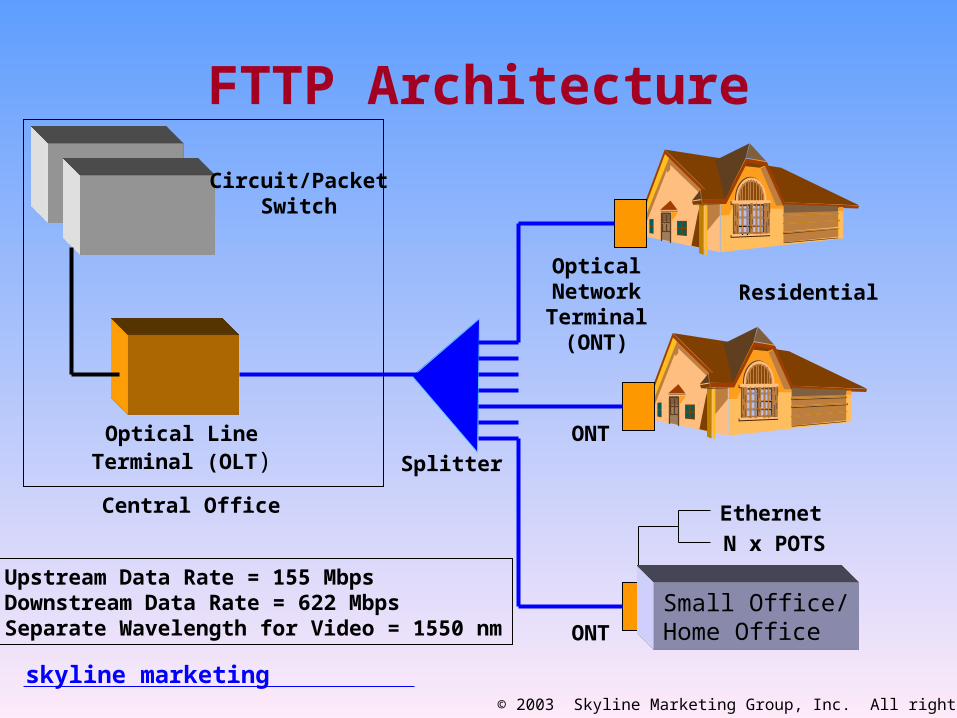
FTTP Architecture
Circuit/PacketSwitch
Optical LineTerminal (OLT) Splitter
Central Office
ResidentialOpticalNetworkTerminal
(ONT)
ONT
ONT
Ethernet
N x POTS
Small Office/Home Office
Upstream Data Rate = 155 MbpsDownstream Data Rate = 622 MbpsSeparate Wavelength for Video = 1550 nm
skyline marketing© 2003 Skyline Marketing Group, Inc. All rights reserved.
Circuit-to-Packet (C2P) Migration
skyline marketing© 2003 Skyline Marketing Group, Inc. All rights reserved.
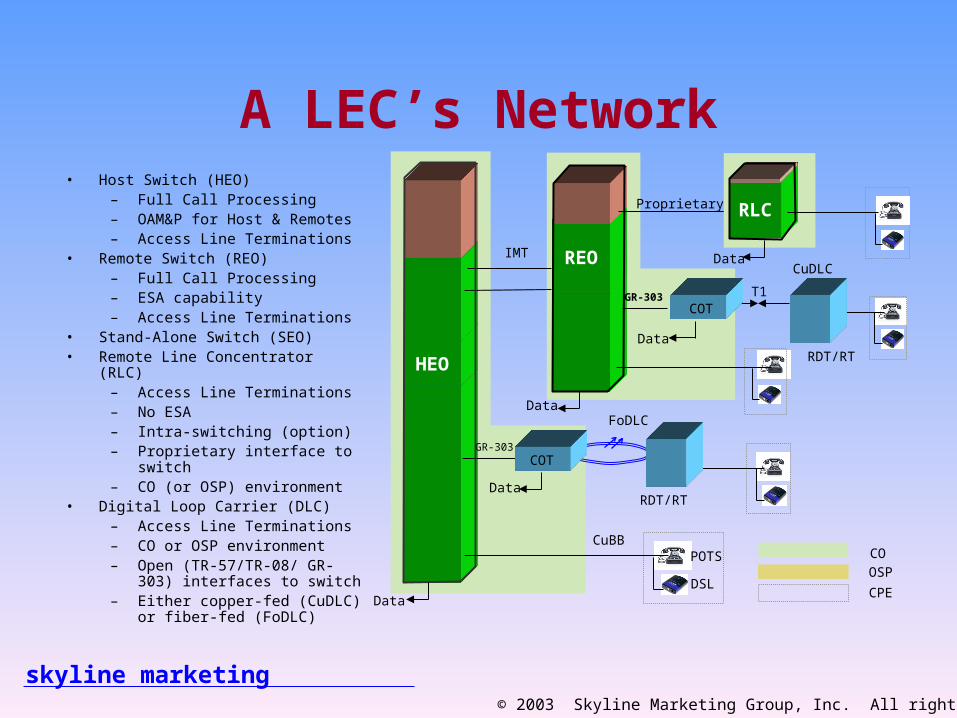
A LEC’s Network• Host Switch (HEO)
– Full Call Processing– OAM&P for Host & Remotes– Access Line Terminations
• Remote Switch (REO) – Full Call Processing– ESA capability– Access Line Terminations
• Stand-Alone Switch (SEO)• Remote Line Concentrator (RLC)
– Access Line Terminations – No ESA– Intra-switching (option)– Proprietary interface to switch– CO (or OSP) environment
• Digital Loop Carrier (DLC)– Access Line Terminations – CO or OSP environment– Open (TR-57/TR-08/ GR-303)
interfaces to switch– Either copper-fed (CuDLC) or
fiber-fed (FoDLC)
HEO
REO
GR-303
Proprietary
IMT
Data
GR-303
Data
Data
Data
RLC
Data
CO
OSP
CPE
POTS
DSL
T1
CuDLC
FoDLC
CuBB
COT
COT
RDT/RT
RDT/RT
skyline marketing© 2003 Skyline Marketing Group, Inc. All rights reserved.
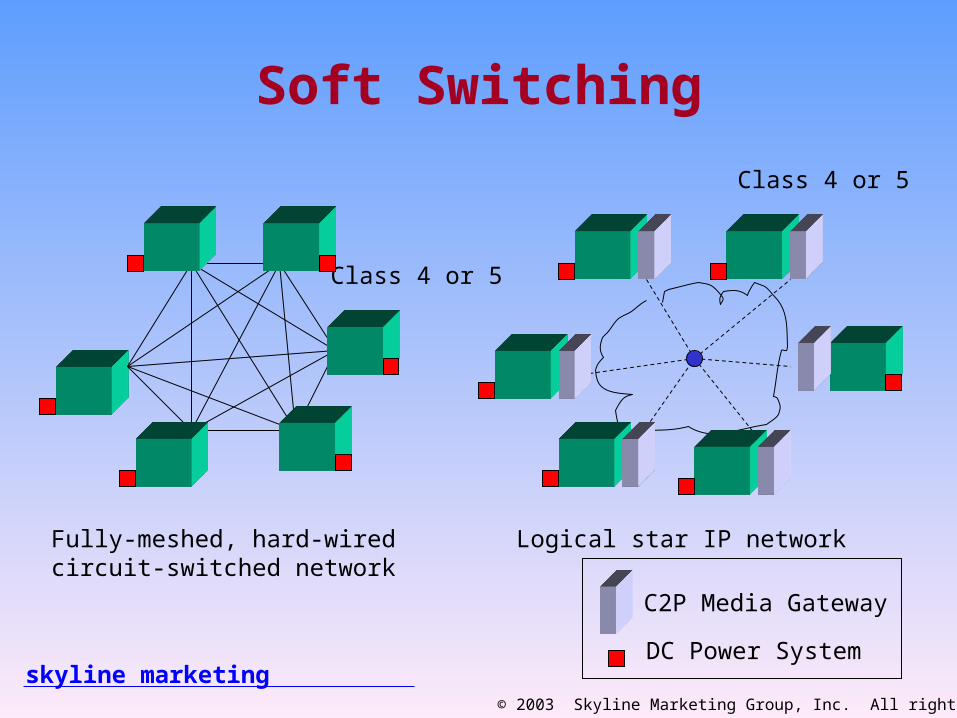
Soft Switching
Fully-meshed, hard-wiredcircuit-switched network
Logical star IP network
Class 4 or 5
Class 4 or 5
C2P Media Gateway
DC Power System
skyline marketing© 2003 Skyline Marketing Group, Inc. All rights reserved.
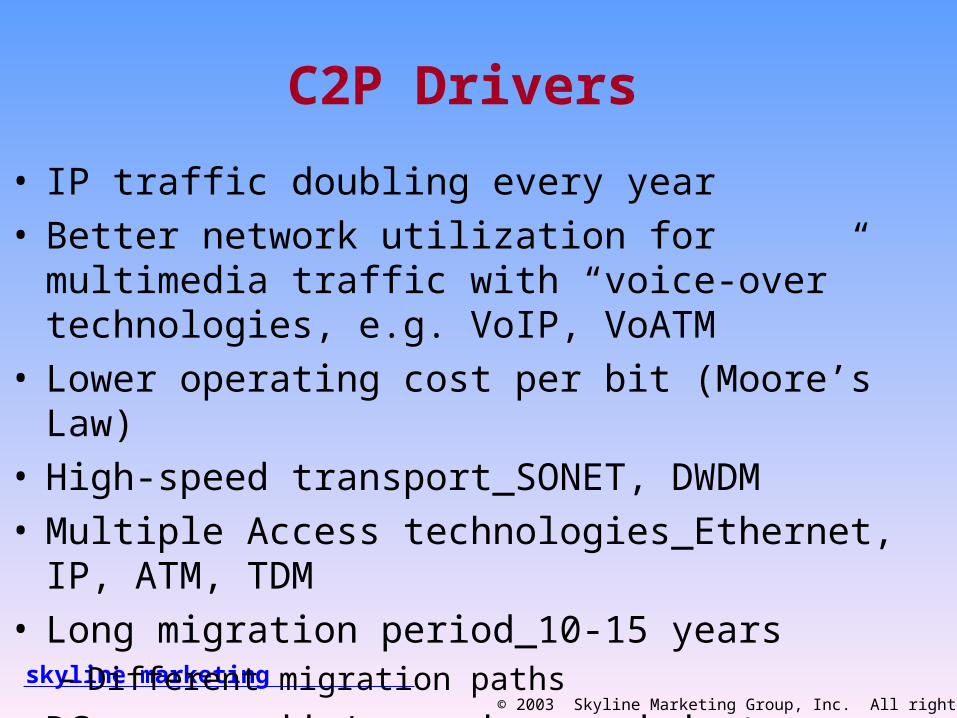
C2P Drivers
• IP traffic doubling every year• Better network utilization for multimedia traffic with
“voice-over” technologies, e.g. VoIP, VoATM• Lower operating cost per bit (Moore’s Law)• High-speed transport_SONET, DWDM• Multiple Access technologies_Ethernet, IP, ATM, TDM• Long migration period_10-15 years
– Different migration paths
• DC power adds/upgrades needed at every EO
skyline marketing© 2003 Skyline Marketing Group, Inc. All rights reserved.
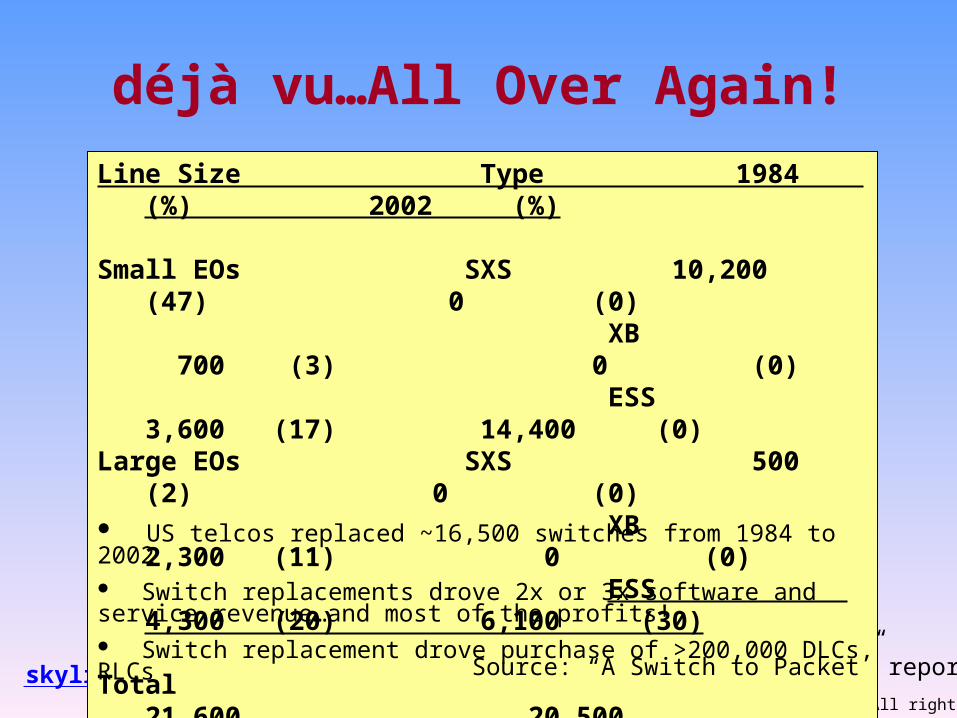
déjà vu…All Over Again!
Line Size Type 1984 (%) 2002 (%)
Small EOs SXS 10,200 (47) 0 (0) XB 700 (3) 0 (0) ESS 3,600 (17) 14,400 (0)Large EOs SXS 500 (2) 0 (0) XB 2,300 (11) 0 (0) ESS 4,300 (20) 6,100 (30)
Total 21,600 20,500
US telcos replaced ~16,500 switches from 1984 to 2002 Switch replacements drove 2x or 3x software and service revenue…and most of the profits! Switch replacement drove purchase of >200,000 DLCs, RLCs
Source: “A Switch to Packet” report
skyline marketing© 2003 Skyline Marketing Group, Inc. All rights reserved.
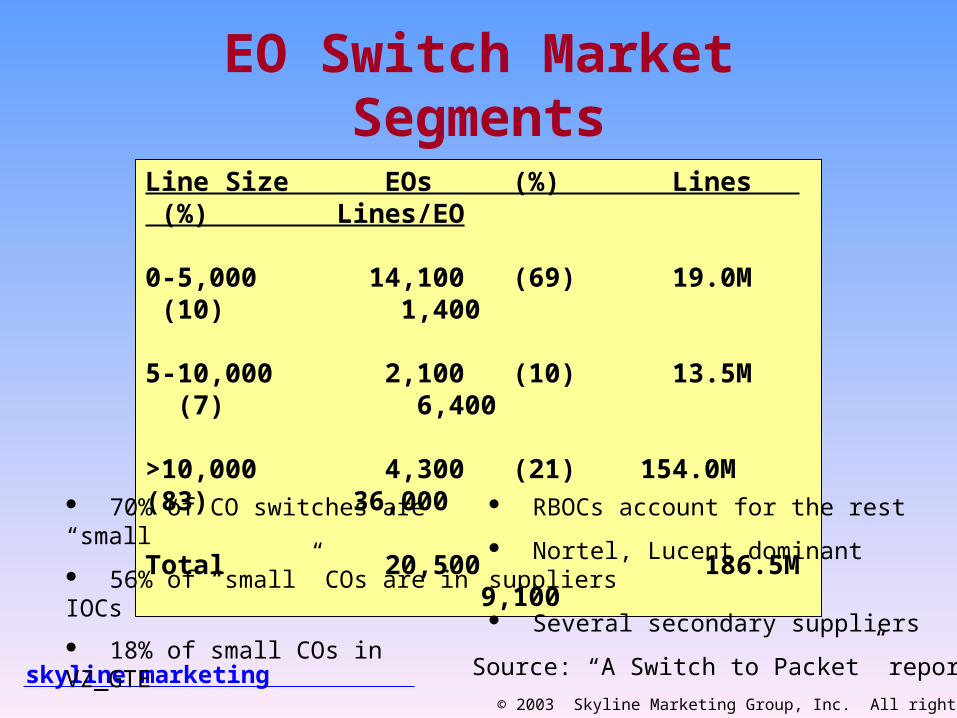
EO Switch Market Segments
Line Size EOs (%) Lines (%) Lines/EO
0-5,000 14,100 (69) 19.0M (10) 1,400
5-10,000 2,100 (10) 13.5M (7) 6,400
>10,000 4,300 (21) 154.0M (83) 36,000
Total 20,500 186.5M 9,100
70% of CO switches are “small”
56% of “small” COs are in IOCs
18% of small COs in VZ_GTE
RBOCs account for the rest
Nortel, Lucent dominant suppliers
Several secondary suppliers
Source: “A Switch to Packet” report
skyline marketing© 2003 Skyline Marketing Group, Inc. All rights reserved.
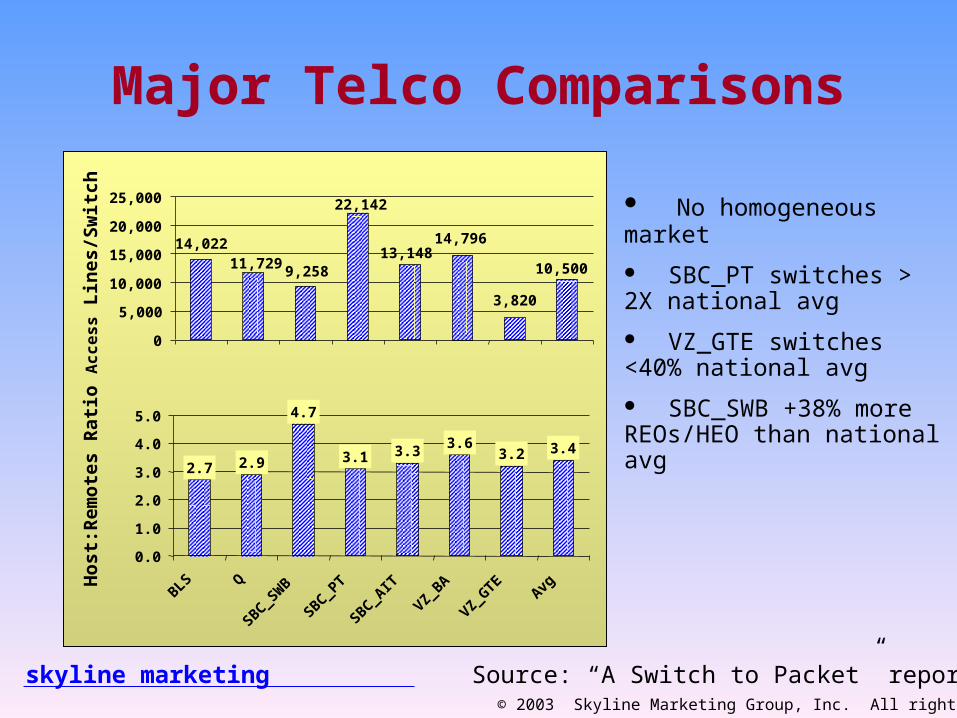
Major Telco Comparisons
10,500
3,820
14,79613,148
22,142
9,25811,72914,022
0
5,000
10,000
15,000
20,000
25,000
Acc
ess
Lin
es/S
wit
ch
3.43.23.63.33.1
4.7
2.92.7
0.0
1.0
2.0
3.0
4.0
5.0
BLS Q
SBC_S
WB
SBC_P
T
SBC_A
IT
VZ_BA
VZ_GTE
Avg
Hos
t:R
emot
es R
atio
No homogeneous market
SBC_PT switches > 2X national avg
VZ_GTE switches <40% national avg
SBC_SWB +38% more REOs/HEO than national avg
Source: “A Switch to Packet” report
skyline marketing© 2003 Skyline Marketing Group, Inc. All rights reserved.
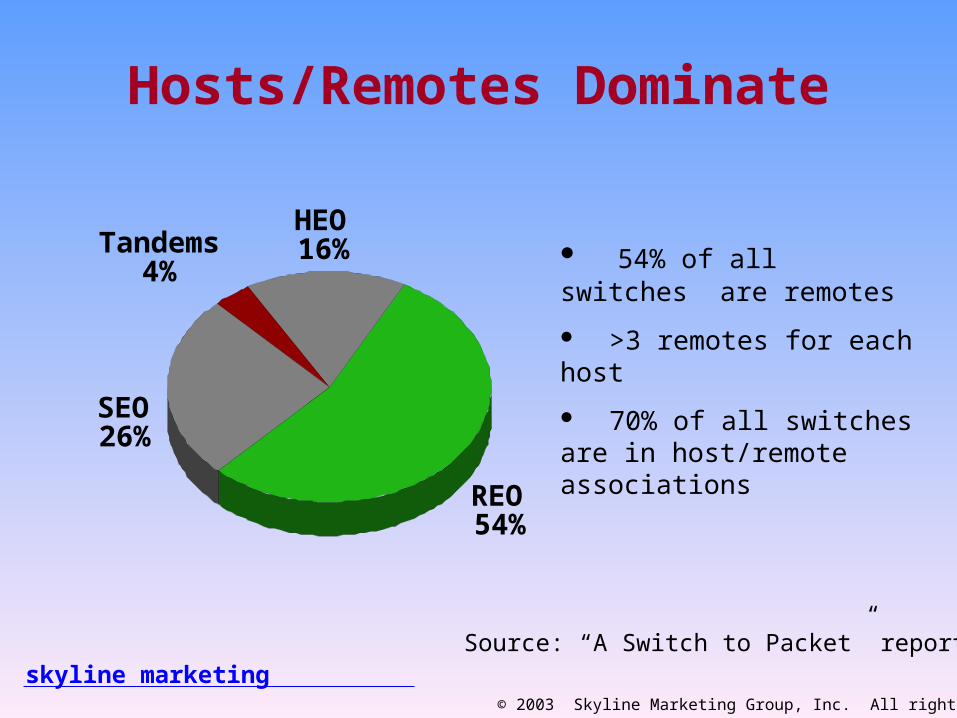
Hosts/Remotes Dominate
HEO16%
REO54%
SEO26%
Tandems4%
54% of all switches are remotes
>3 remotes for each host
70% of all switches are in host/remote associations
Source: “A Switch to Packet” report
skyline marketing© 2003 Skyline Marketing Group, Inc. All rights reserved.
Wireless
skyline marketing© 2003 Skyline Marketing Group, Inc. All rights reserved.
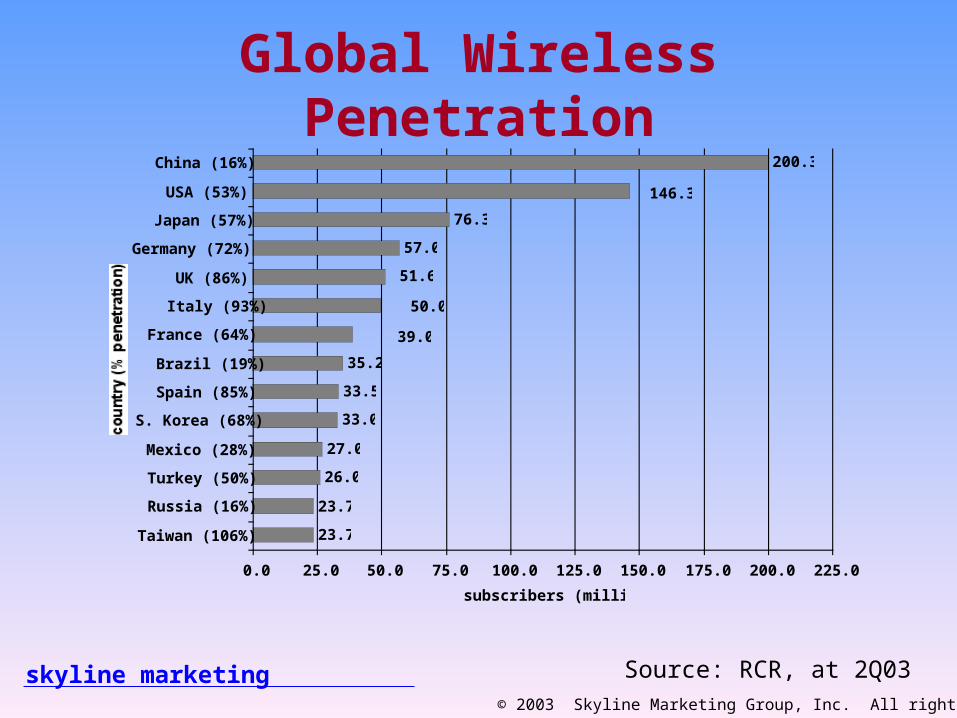
Global Wireless Penetration200.3
76.3
57.0
35.2
33.5
33.0
27.0
26.0
23.7
23.7
51.6
39.0
50.0
146.3
0.0 25.0 50.0 75.0 100.0 125.0 150.0 175.0 200.0 225.0
China (16%)
USA (53%)
Japan (57%)
Germany (72%)
UK (86%)
Italy (93%)
France (64%)
Brazil (19%)
Spain (85%)
S. Korea (68%)
Mexico (28%)
Turkey (50%)
Russia (16%)
Taiwan (106%)
subscribers (millions)
Source: RCR, at 2Q03
skyline marketing© 2003 Skyline Marketing Group, Inc. All rights reserved.
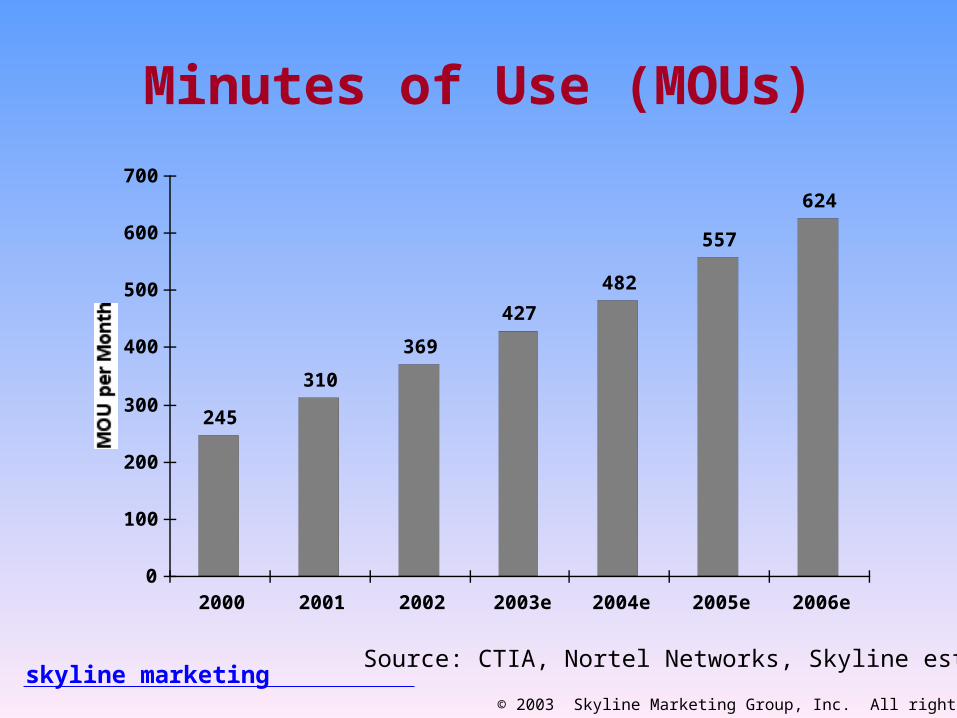
245
310
369
427
482
557
624
0
100
200
300
400
500
600
700
2000 2001 2002 2003e 2004e 2005e 2006e
Source: CTIA, Nortel Networks, Skyline est.
Minutes of Use (MOUs)
skyline marketing© 2003 Skyline Marketing Group, Inc. All rights reserved.
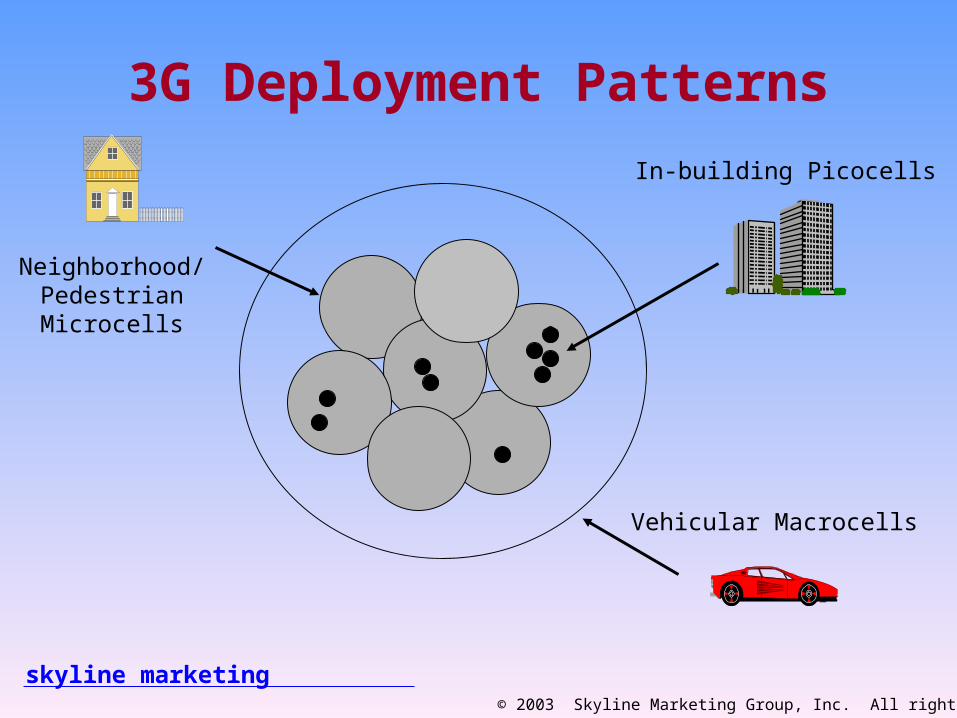
In-building Picocells
Neighborhood/PedestrianMicrocells
Vehicular Macrocells
3G Deployment Patterns
skyline marketing© 2003 Skyline Marketing Group, Inc. All rights reserved.
0
25,000
50,000
75,000
100,000
125,000
150,000
0
25,000
50,000
75,000
100,000
125,000
150,000
175,000
200,000
225,000
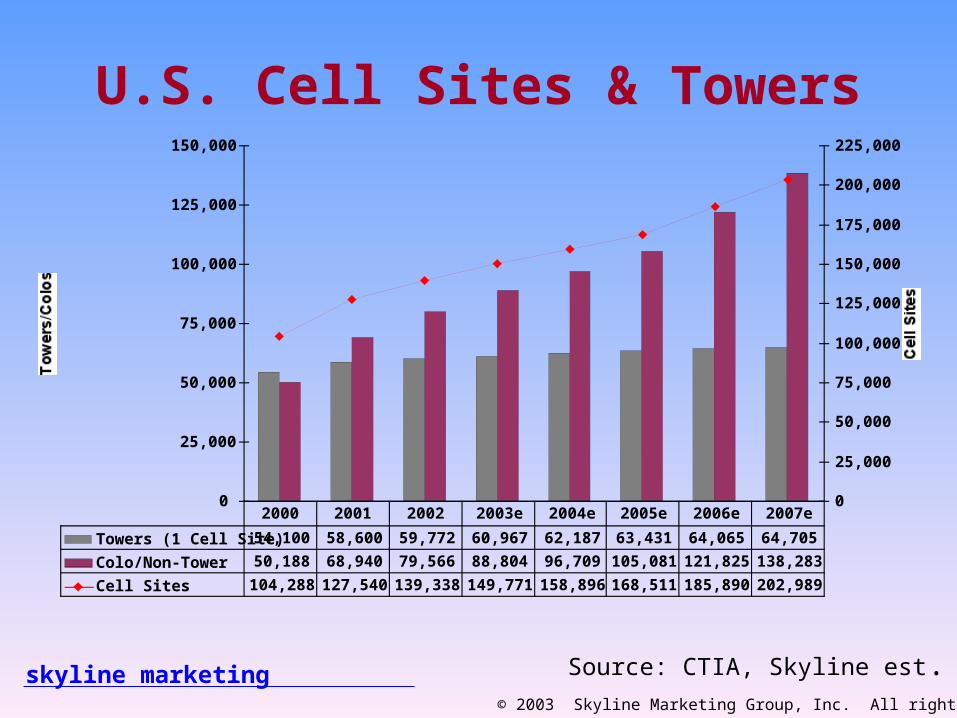
Towers (1 Cell Site) 54,100 58,600 59,772 60,967 62,187 63,431 64,065 64,705
Colo/Non-Tower 50,188 68,940 79,566 88,804 96,709 105,081 121,825 138,283
Cell Sites 104,288 127,540 139,338 149,771 158,896 168,511 185,890 202,989
2000 2001 2002 2003e 2004e 2005e 2006e 2007e
Source: CTIA, Skyline est.
U.S. Cell Sites & Towers
skyline marketing© 2003 Skyline Marketing Group, Inc. All rights reserved.
DC Power Market
skyline marketing© 2003 Skyline Marketing Group, Inc. All rights reserved.
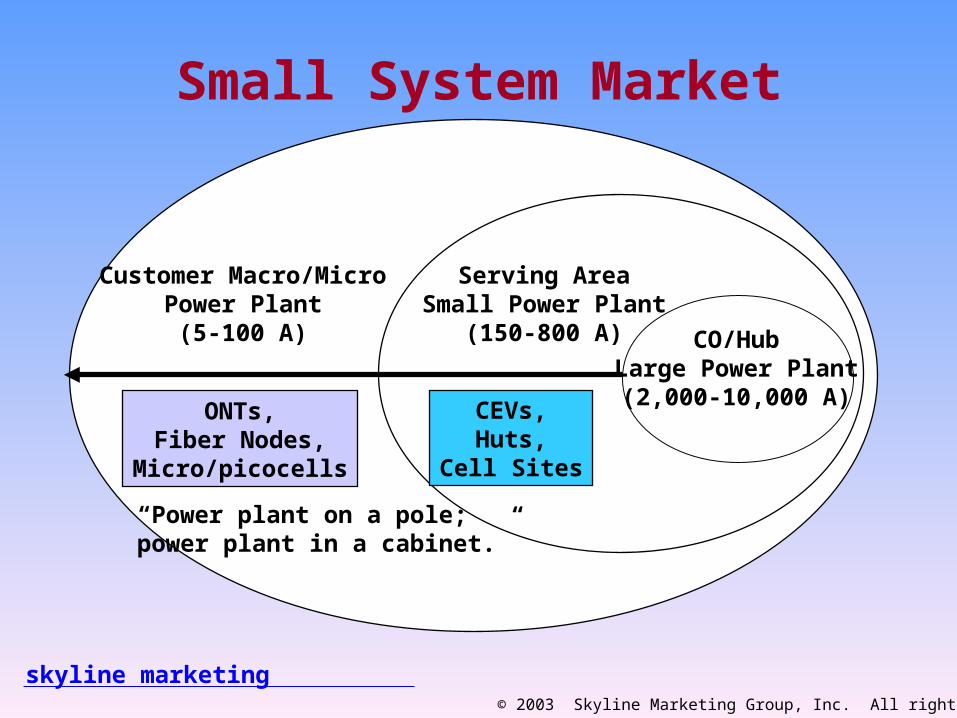
Small System Market
Serving AreaSmall Power Plant
(150-800 A)
Customer Macro/MicroPower Plant
(5-100 A)
CEVs,Huts,
Cell Sites
ONTs,Fiber Nodes,
Micro/picocells
“Power plant on a pole;power plant in a cabinet.”
CO/HubLarge Power Plant
(2,000-10,000 A)
skyline marketing© 2003 Skyline Marketing Group, Inc. All rights reserved.
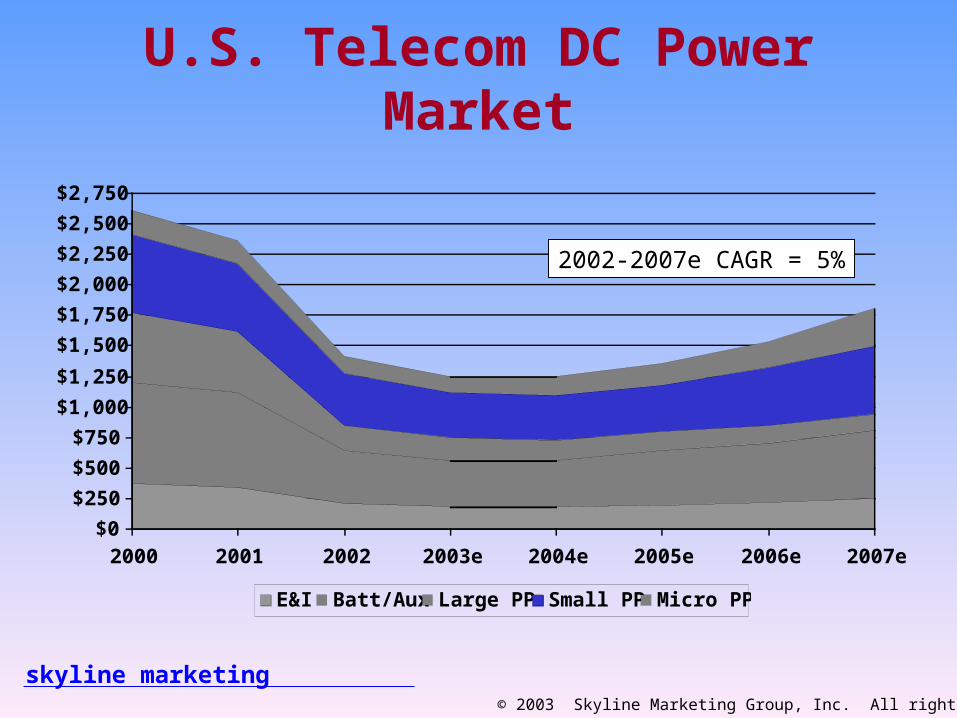
U.S. Telecom DC Power Market
$0
$250
$500
$750
$1,000
$1,250
$1,500
$1,750
$2,000
$2,250
$2,500
$2,750
2000 2001 2002 2003e 2004e 2005e 2006e 2007e
E&I Batt/Aux Large PP Small PP Micro PP
2002-2007e CAGR = 5%
skyline marketing© 2003 Skyline Marketing Group, Inc. All rights reserved.
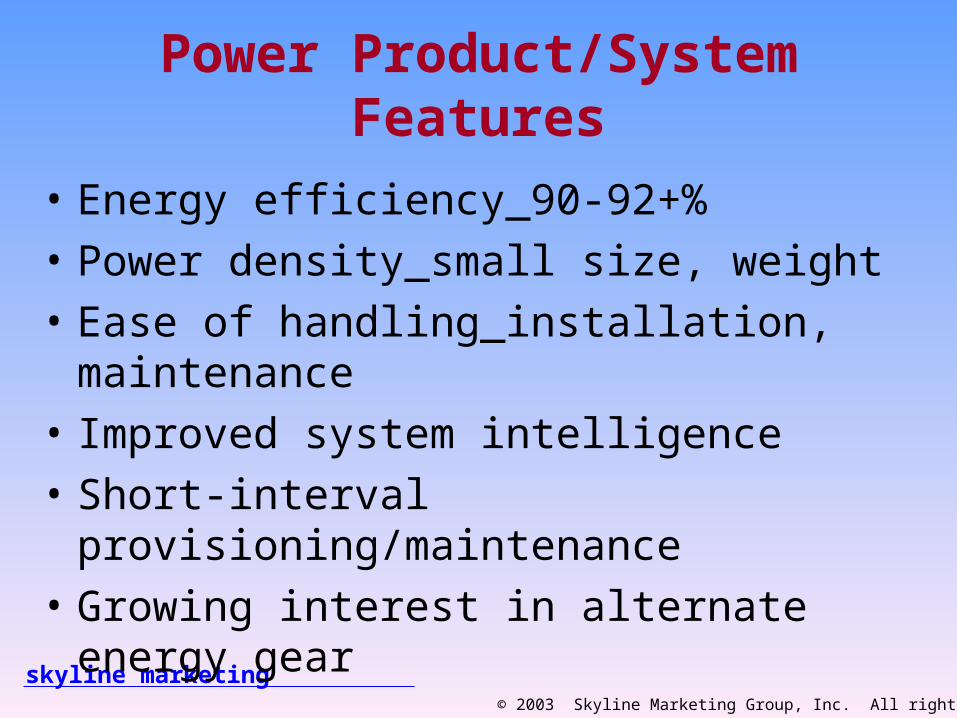
Power Product/System Features
• Energy efficiency_90-92+%
• Power density_small size, weight
• Ease of handling_installation, maintenance
• Improved system intelligence
• Short-interval provisioning/maintenance
• Growing interest in alternate energy gear
skyline marketing© 2003 Skyline Marketing Group, Inc. All rights reserved.
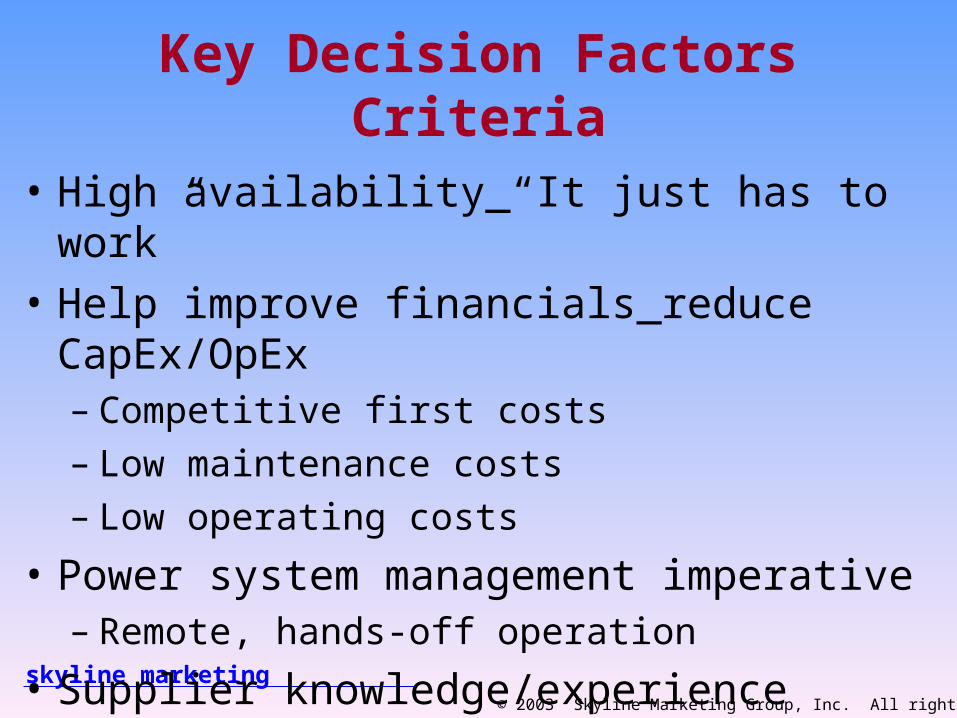
Key Decision Factors Criteria
• High availability_“It just has to work”
• Help improve financials_reduce CapEx/OpEx– Competitive first costs– Low maintenance costs– Low operating costs
• Power system management imperative– Remote, hands-off operation
• Supplier knowledge/experience dependency
skyline marketing© 2003 Skyline Marketing Group, Inc. All rights reserved.
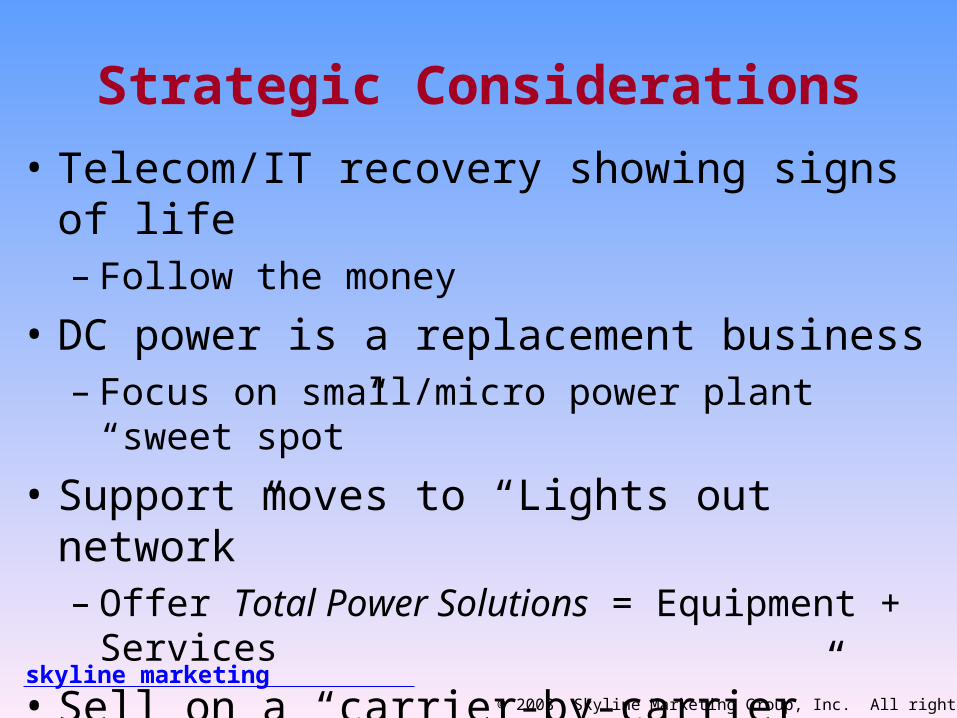
Strategic Considerations
• Telecom/IT recovery showing signs of life– Follow the money
• DC power is a replacement business– Focus on small/micro power plant “sweet spot”
• Support moves to “Lights out network”– Offer Total Power Solutions = Equipment + Services
• Sell on a “carrier-by-carrier” basis– Every carrier is different– Help carriers’ achieve their operating goals
skyline marketing© 2003 Skyline Marketing Group, Inc. All rights reserved.
Skyline Marketing Groupwww.skylinemarketing.com
We help you make your numbers!!


![Trade Show Marketing [Skyline Exhibits]](https://img.pdfslide.net/doc/110x75/5552e0bbb4c905014c8b4d96/trade-show-marketing-skyline-exhibits.jpg)