Embed Size (px)
Citation preview
Joanne M. Ottone, FCAS, MAAA
© 2004 Towers Perrin
California Workers’ Compensation Impact of Recent Legislation
CAS 2004 ANNUAL MEETING
November 14-17, 2004
Montreal, Quebec

2© 2004 Towers Perrin
AB 749 Statutory Benefit Changes
Well-established methodologies for these types of changes
Use wage distribution to quantify impact of changing minimum and maximum wages on average benefit payment
0.00
0.02
0.04
0.06
0.08
0.10
0.12
0.14
0.16
0.18
0 200 400 600 800 1000
Minimum wage
Maximum wage

3© 2004 Towers Perrin
AB 749 Statutory Benefit Changes (continued)
Use distribution of PD ratings to estimate impact of changing number of weeks per PD %
0%
2%
4%
6%
8%
10%
12%
14%
16%
18%
PDR Percentage
Pe
rce
nta
ge
of
Cla
ims
Source: WCIRB

4© 2004 Towers Perrin
AB 749 Statutory Benefit Changes (continued)
Number of Weeks of PD by PD Rating
0
100
200
300
400
500
600
700
800
0.25 12.75 25.25 37.75 50.25 62.75 75.25 87.75
PD Rating
Nu
mb
er
of
We
ek
s
Pre-2004 Injuries 2004 Injuries

5© 2004 Towers Perrin
AB 749 Statutory Benefit Changes – Cost Estimates
Effective Date
Impact on Indemnity – Excluding Utilization
Impact
Impact on Indemnity –
Including Utilization
ImpactImpact on Total
Losses
1/1/2003 9.1% 11.3% 4.4%
1/1/2004 9.3% 11.7% 5.6%
1/1/2005 4.8% 6.0% 2.8%
1/1/2006 4.7% 5.8% 2.7%
Increased claim frequency associated with increases in benefits is documented in several studies

6© 2004 Towers Perrin
AB 227 Vocational Rehabilitation Repeal
Vocational rehabilitation makes up about 15% of indemnity benefits
Education vouchers estimated to cost 14% of current voc rehab costs
All Other Indemnity
85%Voc
Rehab15%
Total savings of 13% of indemnity costs – or 5% of total losses
Savings13%
All Other Indemnity
85%
Vouchers2%
Before After
Source: WCIRB
Indemnity Benefits

7© 2004 Towers Perrin
SB 899 TD Duration Cap
TD benefits limited to 104 weeks within a period of 2 years from the date of the first TD payment – with exceptions for certain types of injuries
Date of Injury
Date of First TD
Date of First TD Payment
104 Week Limit
X

8© 2004 Towers Perrin
SB 899 TD Duration Cap
Temporary disability benefits make up about 15% of total losses
Approximately 15% of all TD benefits are estimated to be eliminated by the 104 week cap – for savings on total losses of 2.2%
WCIRB also assumes there will be reduced frequency of claims due to imposition of cap – total estimated savings of 2.5%
0.00%
5.00%
10.00%
15.00%
20.00%
25.00%
30.00%
35.00%
40.00%
45.00%
50.00%
Number of TD Days
Pe
rce
nta
ge
of
Cla
ims
104 week cap
9© 2004 Towers Perrin
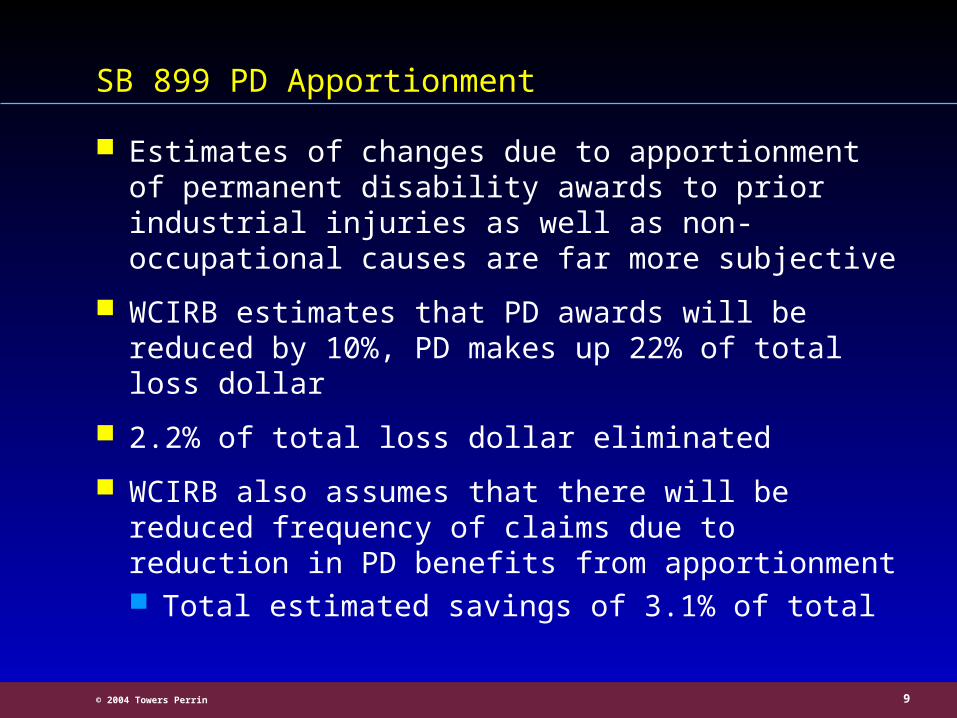
SB 899 PD Apportionment
Estimates of changes due to apportionment of permanent disability awards to prior industrial injuries as well as non-occupational causes are far more subjective
WCIRB estimates that PD awards will be reduced by 10%, PD makes up 22% of total loss dollar
2.2% of total loss dollar eliminated
WCIRB also assumes that there will be reduced frequency of claims due to reduction in PD benefits from apportionment Total estimated savings of 3.1% of total
10
© 2004 Towers Perrin
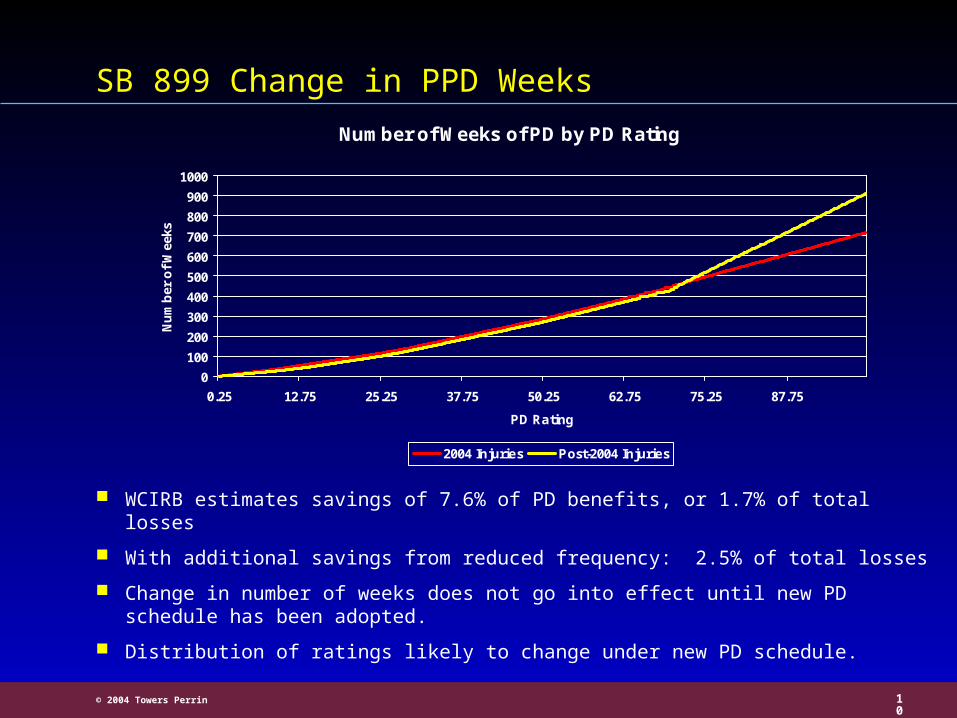
SB 899 Change in PPD Weeks
WCIRB estimates savings of 7.6% of PD benefits, or 1.7% of total losses
With additional savings from reduced frequency: 2.5% of total losses
Change in number of weeks does not go into effect until new PD schedule has been adopted.
Distribution of ratings likely to change under new PD schedule.
Number of Weeks of PD by PD Rating
0
100
200
300
400
500
600
700
800
900
1000
0.25 12.75 25.25 37.75 50.25 62.75 75.25 87.75
PD Rating
Nu
mb
er o
f W
eeks
2004 Injuries Post-2004 Injuries
11
© 2004 Towers Perrin
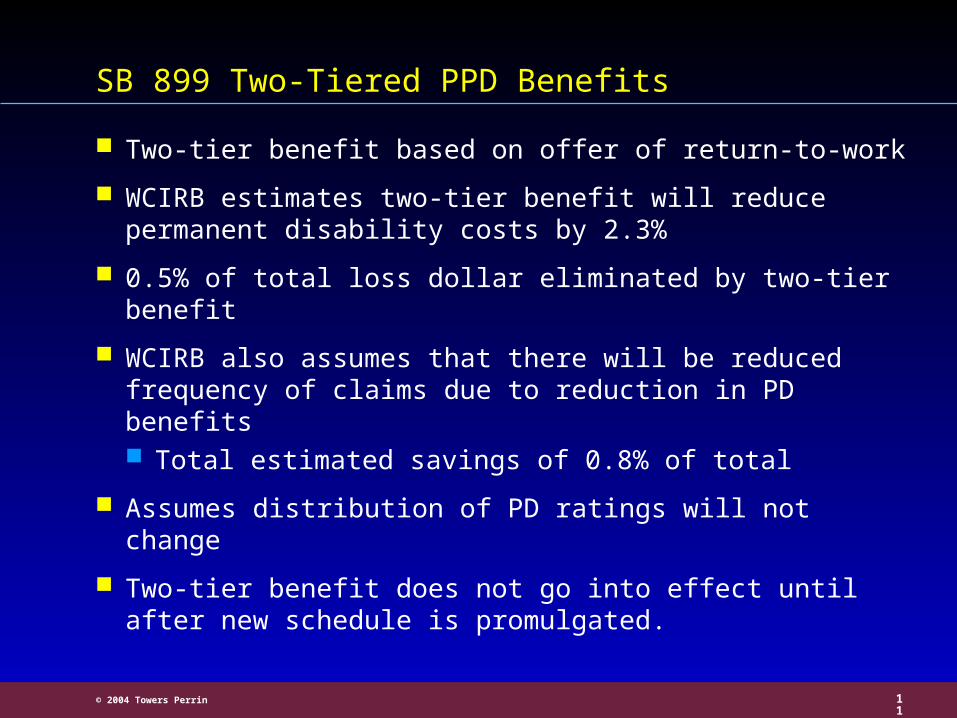
SB 899 Two-Tiered PPD Benefits
Two-tier benefit based on offer of return-to-work
WCIRB estimates two-tier benefit will reduce permanent disability costs by 2.3%
0.5% of total loss dollar eliminated by two-tier benefit
WCIRB also assumes that there will be reduced frequency of claims due to reduction in PD benefits Total estimated savings of 0.8% of total
Assumes distribution of PD ratings will not change
Two-tier benefit does not go into effect until after new schedule is promulgated.

12
© 2004 Towers Perrin
SB 899 New PD Schedule
New schedule to be promulgated by Administrative Director Nature of injury shall incorporate AMA guidelines 5th
edition Diminished future earning capacity shall be numeric
formula — based on data and findings from RAND study
Schedule hasn’t been promulgated yet, so impact is unknown

13
© 2004 Towers Perrin
SB 899 – Summary of Indemnity Impacts
Provision Impact on Total Losses
Cap on TD Duration -2.5%
PD Changes Effective Now:Apportionment
-3.1%
Total Excluding PD Changes Effective Later
-5.6%
PD Changes Effective Later:ScheduleChange in Number of WeeksTwo-Tier
Unknown-2.5%*-0.8%*
Total Including PD Changes Effective Later ~9%
Source: WCIRB

14
© 2004 Towers Perrin
Reform Implications on Loss Reserves - Indemnity
New PD schedule applicable to claims where there has been no comprehensive medical-legal report or no report by a treating physician indicating the existence of permanent disability
Apportionment provisions apply regardless of date of injury – but “shall not constitute good cause to reopen or rescind, alter, or amend any existing order, decision, or award of the Workers’ Compensation Appeals Board”
When is an order an “order”? Legal decision already made which gives broad
definition to term May limit applicability of provisions to existing claims

15
© 2004 Towers Perrin
Impact of Apportionment on Unpaid Indemnity
WCIRB estimates savings on unpaid indemnity by assuming that all unpaid permanent disability benefits will be reduced by 10%
Accident Year Impact on Ultimate Indemnity
Impact on Unpaid Indemnity
1999 -0.3% -1.4%
2000 -0.7% -2.2%
2001 -1.7% -3.7%
2002 -2.8% -4.2%
2003 -4.0% -4.5%
16
© 2004 Towers Perrin
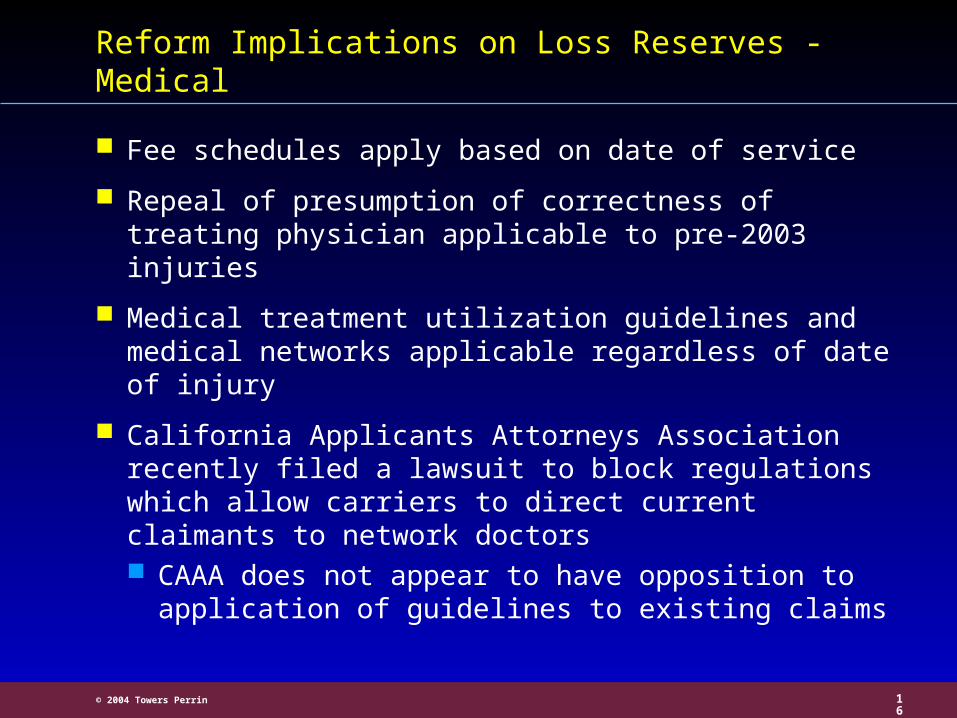
Reform Implications on Loss Reserves - Medical
Fee schedules apply based on date of service
Repeal of presumption of correctness of treating physician applicable to pre-2003 injuries
Medical treatment utilization guidelines and medical networks applicable regardless of date of injury
California Applicants Attorneys Association recently filed a lawsuit to block regulations which allow carriers to direct current claimants to network doctors CAAA does not appear to have opposition to
application of guidelines to existing claims

17
© 2004 Towers Perrin
Impact of Fee Schedule Changes
ComponentPercentage of Medical Costs
Impact of Fee Schedule
Impact on Unpaid Medical
Inpatient Hospital
11.0% +8% +0.9%
Outpatient Surgery Centers
16.5% -41% -6.8%
Pharmacy 7.2% -37% -2.7%
Official Medical Fee Schedule
50.2% -5%
CYs 2004&2005
-0.6%
[-2.5% of% Expected Paid in
2004 (14%) and 2005 (10%)]
Source: WCIRB

18
© 2004 Towers Perrin
Impact of Treating Physician Presumption Repeal
Impact on reserves should be for pre-2003 injuries only
Quantification of impact based on modifying assumptions in rate level calculations
Savings estimates range from 1.4% to 6.7% of unpaid medical, depending on accident year
Unpaid Medical Loss Ratios - Impact of Repeal of PTP
0.00
0.10
0.20
0.30
0.40
0.50
1994 1995 1996 1997 1998 1999 2000 2001 2002Accident Year
Before PTP Impact After PTP Impact
Source: WCIRB
19
© 2004 Towers Perrin
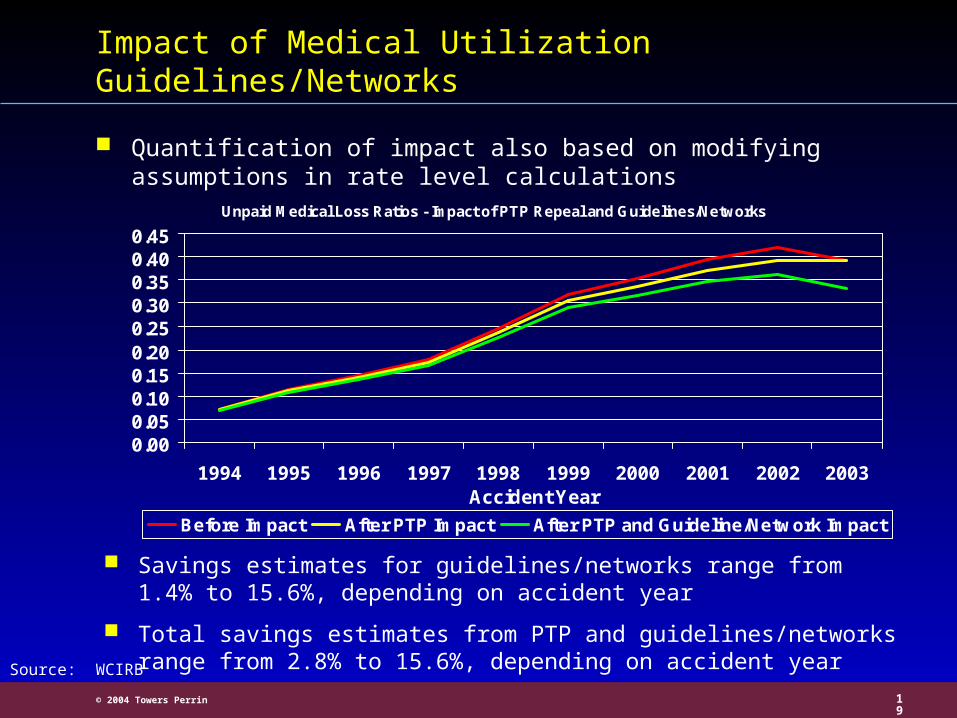
Impact of Medical Utilization Guidelines/Networks
Quantification of impact also based on modifying assumptions in rate level calculations
Savings estimates for guidelines/networks range from 1.4% to 15.6%, depending on accident year
Total savings estimates from PTP and guidelines/networks range from 2.8% to 15.6%, depending on accident year
Unpaid Medical Loss Ratios - Impact of PTP Repeal and Guidelines/Networks
0.000.050.100.150.200.250.300.350.400.45
1994 1995 1996 1997 1998 1999 2000 2001 2002 2003Accident Year
Before Impact After PTP Impact After PTP and Guideline/Network Impact
Source: WCIRB

20
© 2004 Towers Perrin
Summary of Impact of Reforms on Unpaid Medical
Component Savings Estimate
Fee Schedules -9.2%
Primary Treating Physician -3.1%
Medical Utilization Guidelines/Networks
-7.1%
Total -18.3%
Assumes industry distribution of unpaid medical by accident year
21
© 2004 Towers Perrin
Impact of Reforms on Loss Reserves – Other Considerations
Impact on development patterns
Impact on trends
Double-counting