Embed Size (px)
Citation preview

© 2006 Prentice Hall, Inc. 6 – 1
Managing Quality Ch6Managing Quality Ch6
Production Planning and Production Planning and ControlControl

© 2006 Prentice Hall, Inc. 6 – 2
Quality and StrategyQuality and Strategy
Managing quality supports Managing quality supports differentiation, low cost, and differentiation, low cost, and response strategiesresponse strategies
Quality helps firms increase sales Quality helps firms increase sales and reduce costsand reduce costs
Building a quality organization is a Building a quality organization is a demanding taskdemanding task
© 2006 Prentice Hall, Inc. 6 – 3
Ways Quality Improves Ways Quality Improves ProductivityProductivity
Improved Improved QualityQuality
Increased Increased ProfitsProfits
Increased productivity
Lower rework and scrap costs
Lower warranty costs
Reduced Costs
Improved response
Higher Prices
Improved reputation
Sales Gains

© 2006 Prentice Hall, Inc. 6 – 4
The Flow of Activities The Flow of Activities Necessary to Achieve TQMNecessary to Achieve TQM
Organizational PracticesLeadership, Mission statement, Effective operating procedures, Staff support,
TrainingYields: What is important and what is to be accomplished
Quality PrinciplesCustomer focus, Continuous improvement, Benchmarking, Just-in-time,
Tools of TQMYields: How to do what is important and to be accomplished
Employee FulfillmentEmpowerment, Organizational commitmentYields: Employee attitudes that can accomplish what is important
Customer SatisfactionWinning orders, Repeat customersYields: An effective organization with a competitive advantage

© 2006 Prentice Hall, Inc. 6 – 5
Defining QualityDefining Quality
The totality of features and The totality of features and characteristics of a product or characteristics of a product or
service that bears on its ability to service that bears on its ability to satisfy stated or implied needssatisfy stated or implied needs
American Society for QualityAmerican Society for Quality
Quality Definition

© 2006 Prentice Hall, Inc. 6 – 6
Different ViewsDifferent Views
User-basedUser-based – better performance, more – better performance, more featuresfeatures
Manufacturing-basedManufacturing-based – conformance to – conformance to standards, making it right the first timestandards, making it right the first time
Product-basedProduct-based – specific and – specific and measurable attributes of the product measurable attributes of the product

© 2006 Prentice Hall, Inc. 6 – 7
Implications of QualityImplications of Quality
1.1. Company reputationCompany reputation Perception of new productsPerception of new products
Employment practicesEmployment practices
Supplier relationsSupplier relations
2.2. Product liabilityProduct liability Reduce riskReduce risk
3.3. Global implicationsGlobal implications Improved ability to competeImproved ability to compete

© 2006 Prentice Hall, Inc. 6 – 8
Key Dimensions of QualityKey Dimensions of QualityKey Dimensions of QualityKey Dimensions of Quality PerformancePerformance FeaturesFeatures ReliabilityReliability ConformanceConformance DurabilityDurability ServiceabilityServiceability Aesthetics (Aesthetics (es-thet-ik) Perceived qualityPerceived quality ValueValue

© 2006 Prentice Hall, Inc. 6 – 9
Malcolm Baldrige National Malcolm Baldrige National Quality AwardQuality Award
Established in 1988 by the U.S. Established in 1988 by the U.S. governmentgovernment
Designed to promote TQM practicesDesigned to promote TQM practices
Recent winnersRecent winnersThe 2013 Baldrige Award recipients—listed with their category
—are:Pewaukee School District, Pewaukee, Wis. (education)Baylor Regional Medical Center at Plano, Plano, Texas
(health care)*Sutter Davis Hospital, Davis, Calif. (health care)

© 2006 Prentice Hall, Inc. 6 – 10
Baldrige CriteriaBaldrige Criteria
Applicants are evaluated on:Applicants are evaluated on:
Categories PointsLeadership 120Strategic Planning 85Customer & Market Focus 85Information & Analysis 90Human Resource Focus 85Process Management 85Organizational Results 450

© 2006 Prentice Hall, Inc. 6 – 11
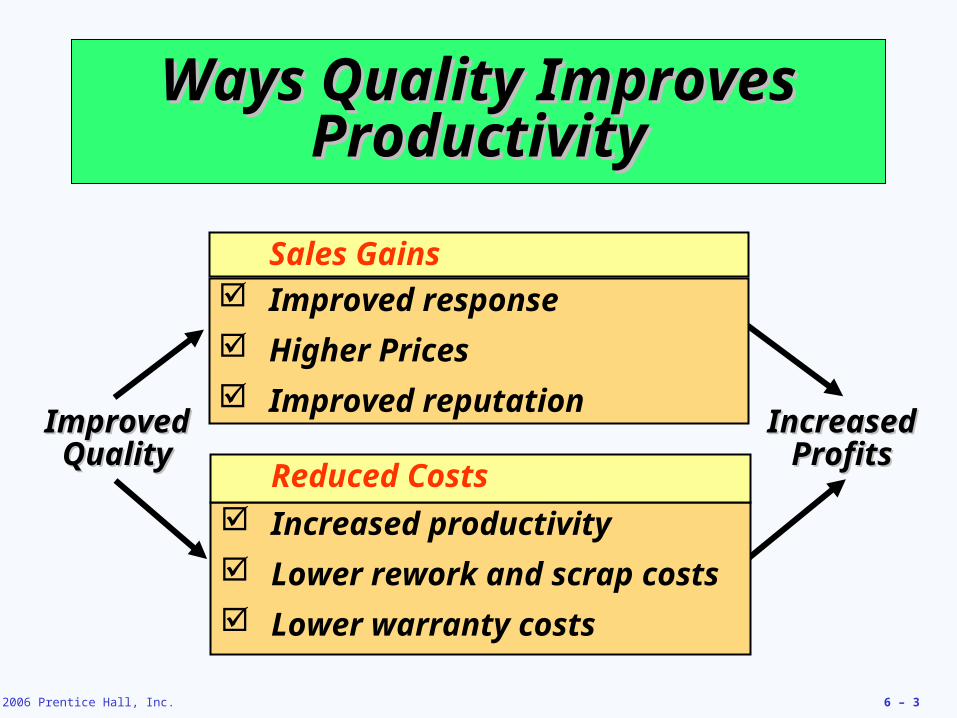
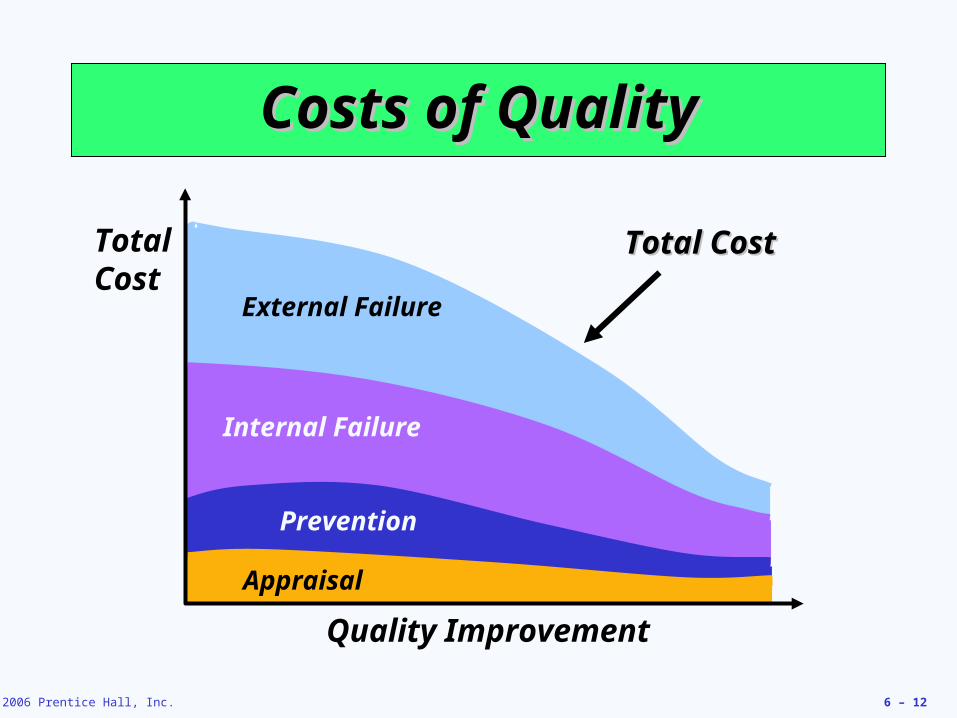
Costs of QualityCosts of Quality
Prevention costsPrevention costs - reducing the - reducing the potential for defectspotential for defects
Appraisal costsAppraisal costs - evaluating - evaluating products, parts, and servicesproducts, parts, and services
Internal failureInternal failure - producing defective - producing defective parts or service before deliveryparts or service before delivery
External costsExternal costs - defects discovered - defects discovered after deliveryafter delivery
© 2006 Prentice Hall, Inc. 6 – 12
External Failure
Internal Failure
Prevention
Costs of QualityCosts of Quality
Appraisal
Total Cost
Quality Improvement
Total CostTotal Cost

© 2006 Prentice Hall, Inc. 6 – 13
Leaders in QualityLeaders in Quality
W. Edwards DemingW. Edwards Deming 14 Points for 14 Points for ManagementManagement
Joseph M. JuranJoseph M. Juran Top management Top management commitment, fitness for commitment, fitness for useuse
Armand FeigenbaumArmand Feigenbaum Total Quality ControlTotal Quality Control
Philip B. CrosbyPhilip B. Crosby Quality is FreeQuality is Free

© 2006 Prentice Hall, Inc. 6 – 14
Ethics and Quality Management
Operations managers must deliver Operations managers must deliver healthy, safe, quality products and healthy, safe, quality products and servicesservices
Poor quality risks injuries, lawsuits, Poor quality risks injuries, lawsuits, recalls, and regulationrecalls, and regulation
Organizations are judged by how they Organizations are judged by how they respond to problemsrespond to problems

© 2006 Prentice Hall, Inc. 6 – 15
TQM
Encompasses entire organization, from Encompasses entire organization, from supplier to customersupplier to customer
Stresses a Stresses a commitmentcommitment by management by management to have a to have a continuingcontinuing, companywide , companywide drive toward excellencedrive toward excellence in all aspects in all aspects of products and services that are of products and services that are important to the customerimportant to the customer
© 2006 Prentice Hall, Inc. 6 – 16
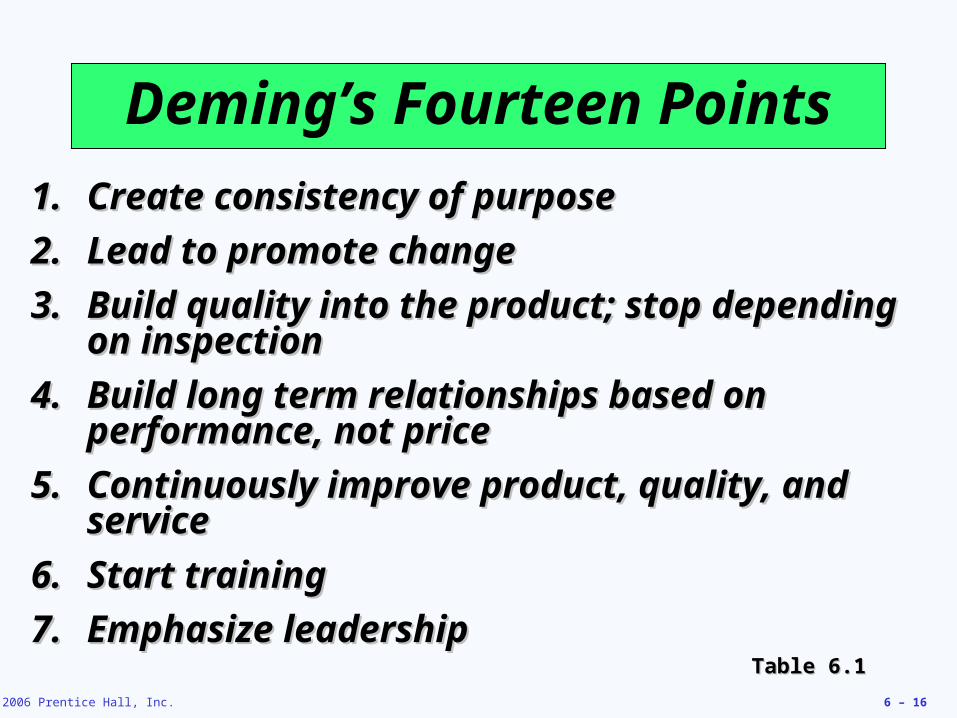
Deming’s Fourteen Points
1.1. Create consistency of purposeCreate consistency of purpose
2.2. Lead to promote changeLead to promote change
3.3. Build quality into the product; stop depending Build quality into the product; stop depending on inspectionon inspection
4.4. Build long term relationships based on Build long term relationships based on performance, not priceperformance, not price
5.5. Continuously improve product, quality, and Continuously improve product, quality, and serviceservice
6.6. Start trainingStart training
7.7. Emphasize leadershipEmphasize leadershipTable 6.1Table 6.1

© 2006 Prentice Hall, Inc. 6 – 17
Deming’s Fourteen Points
8.8. Drive out fearDrive out fear
9.9. Break down barriers between departmentsBreak down barriers between departments
10.10. Stop lecturing workersStop lecturing workers
11.11. Support, help, improveSupport, help, improve
12.12. Remove barriers to pride in workRemove barriers to pride in work
13.13. Institute a vigorous program of education and Institute a vigorous program of education and self-improvementself-improvement
14.14. Put everybody in the company to work on the Put everybody in the company to work on the transformationtransformation
Table 6.1Table 6.1

© 2006 Prentice Hall, Inc. 6 – 18
Seven Concepts of TQM
Continuous improvementContinuous improvement
Six SigmaSix Sigma
Employee empowermentEmployee empowerment
BenchmarkingBenchmarking
Just-in-time (JIT)Just-in-time (JIT)
Taguchi conceptsTaguchi concepts
Knowledge of TQM toolsKnowledge of TQM tools

© 2006 Prentice Hall, Inc. 6 – 19
Continuous Improvement
Represents continual improvement of Represents continual improvement of all processes all processes
Involves all operations and work Involves all operations and work centers including suppliers and centers including suppliers and customerscustomersPeople, Equipment, Materials, ProceduresPeople, Equipment, Materials, Procedures

© 2006 Prentice Hall, Inc. 6 – 20
2. DoTest the
plan
3. CheckIs the plan working?
4. ActImplement
the plan
1.PlanIdentify the
improvement and make
a plan
Shewhart’s PDCA ModelShewhart’s PDCA Model

© 2006 Prentice Hall, Inc. 6 – 21
Six SigmaSix Sigma
Originally developed by Motorola, Six Originally developed by Motorola, Six Sigma refers to an extremely high Sigma refers to an extremely high measure of process capabilitymeasure of process capability
A Six Sigma capable process will return A Six Sigma capable process will return no more than 3.4 defects per million no more than 3.4 defects per million operations (DPMO)operations (DPMO)
Highly structured approach to process Highly structured approach to process improvementimprovement
© 2006 Prentice Hall, Inc. 6 – 22
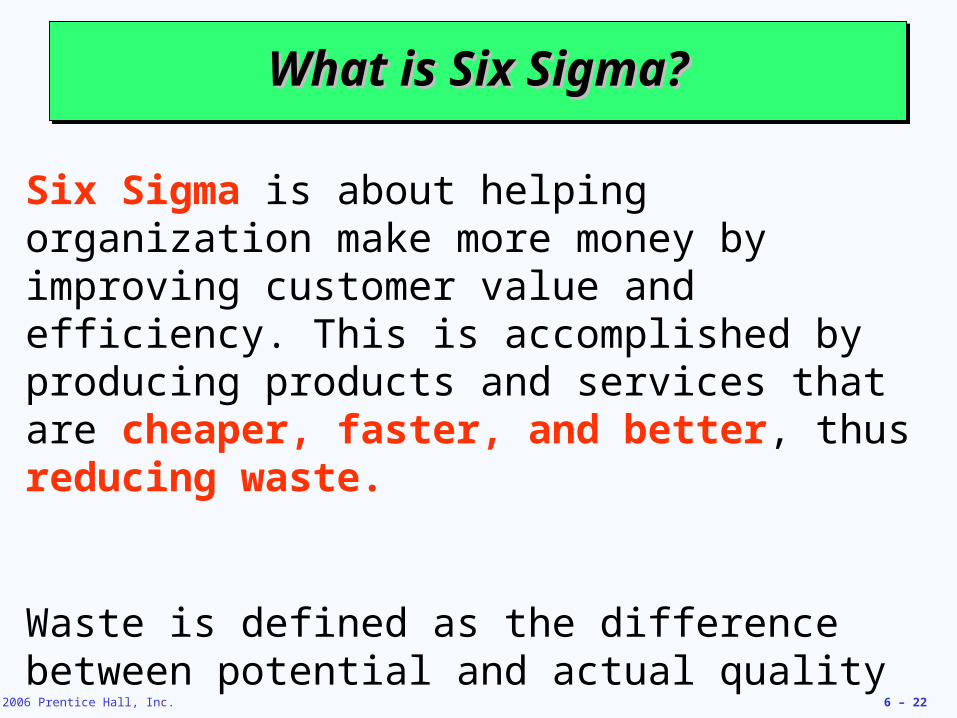
What is Six Sigma?What is Six Sigma?What is Six Sigma?What is Six Sigma?
Six Sigma is about helping organization make more money by improving customer value and efficiency. This is accomplished by producing products and services that are cheaper, faster, and better, thus reducing waste.
Waste is defined as the difference between potential and actual quality

© 2006 Prentice Hall, Inc. 6 – 23
Core Philosophy of Six SigmaCore Philosophy of Six Sigmais based on the Key Concepts is based on the Key Concepts Core Philosophy of Six SigmaCore Philosophy of Six Sigmais based on the Key Concepts is based on the Key Concepts
• Think in terms of key Think in terms of key business processes, business processes, customer requirements, and overall strategic customer requirements, and overall strategic objectivesobjectives..
• Focus on Focus on corporate sponsorscorporate sponsors responsible responsible for championing projects, support team for championing projects, support team activities, help to overcome resistance to activities, help to overcome resistance to change, and obtaining resources.change, and obtaining resources.
• Emphasize quantifiable measures such as Emphasize quantifiable measures such as defects per million opportunities (dpmo)defects per million opportunities (dpmo) that that can be applied to all parts of an can be applied to all parts of an organizationorganization

© 2006 Prentice Hall, Inc. 6 – 24
Core Philosophy of Six SigmaCore Philosophy of Six Sigmais based on the Key Concepts (Cont.)is based on the Key Concepts (Cont.)
Core Philosophy of Six SigmaCore Philosophy of Six Sigmais based on the Key Concepts (Cont.)is based on the Key Concepts (Cont.)
• Ensure that Ensure that appropriate metricsappropriate metrics are are identified early and focus on business identified early and focus on business results, thereby providing incentives and results, thereby providing incentives and accountability.accountability.
• Provide Provide extensive trainingextensive training followed by followed by project team deployment project team deployment
• Create highly qualified process improvement Create highly qualified process improvement expertsexperts (“green belts,” “black belts,” and (“green belts,” “black belts,” and “master black belts”) who can apply “master black belts”) who can apply improvement tools and lead teams.improvement tools and lead teams.
• Stretch objectives for improvementStretch objectives for improvement..

© 2006 Prentice Hall, Inc. 6 – 25
What Is Six Sigma? – Sigma ScaleSix Sigma Is A Statistical Unit Of Measure That Reflects Process CapabilitySix Sigma Is A Statistical Unit Of Measure That Reflects Process Capability
DPMODPMO
6 3.4
5 230
4 6,210
3 66,800
2 308,000
1 697,672
ProcessCapability
Errors/Defects Per Million Opportunities
6e
Most Service Organizations Are
~ 3 Sigma
© 2006 Prentice Hall, Inc. 6 – 26
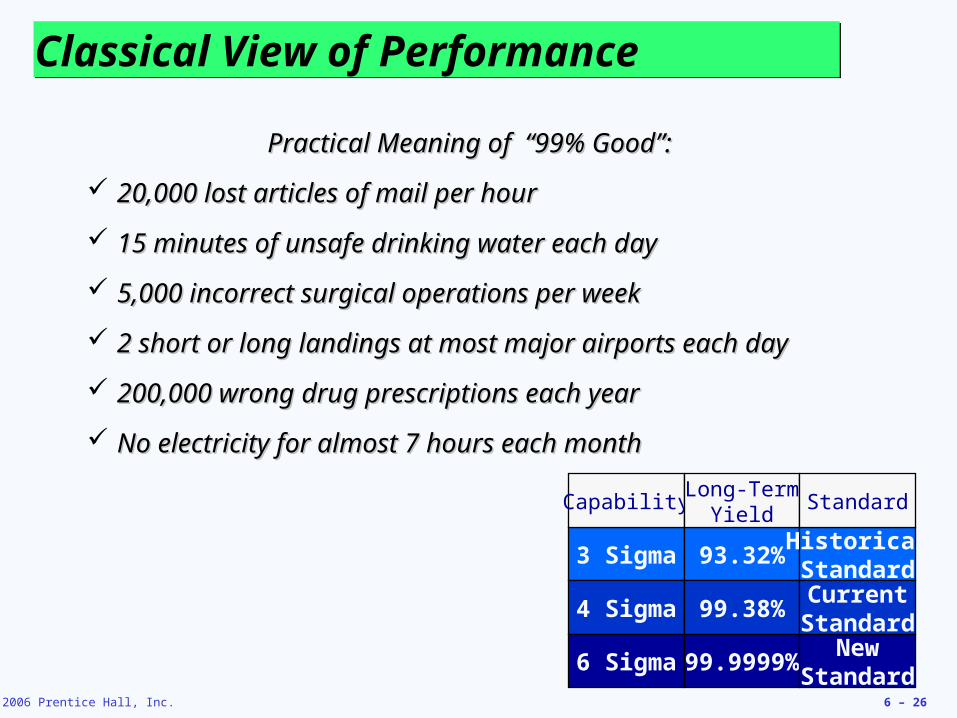
Classical View of PerformanceClassical View of Performance
Practical Meaning of “99% Good”:Practical Meaning of “99% Good”:
20,000 lost articles of mail per hour20,000 lost articles of mail per hour
15 minutes of unsafe drinking water each day15 minutes of unsafe drinking water each day
5,000 incorrect surgical operations per week5,000 incorrect surgical operations per week
2 short or long landings at most major airports each day2 short or long landings at most major airports each day
200,000 wrong drug prescriptions each year200,000 wrong drug prescriptions each year
No electricity for almost 7 hours each monthNo electricity for almost 7 hours each month
3 Sigma
4 Sigma
6 Sigma
93.32%
99.38%
99.9999%
HistoricalStandardCurrent
StandardNew
Standard
CapabilityLong-Term
YieldStandard

© 2006 Prentice Hall, Inc. 6 – 27
Impact of Six SigmaImpact of Six SigmaImpact of Six SigmaImpact of Six Sigma
• Difference between 4 and 6 sigma:
• Phone without service 4 hours vs 9 sec/month
• 1 non-confirming package in 3 truck loads vs 5,000
• From 3 to 4 sigma improvements 10 folds
• From 4 to 5 sigma improvements 30 folds
• From 5 to 6 sigma improvements 70 folds

© 2006 Prentice Hall, Inc. 6 – 28
Six SigmaSix Sigma
1.1. Define critical outputs Define critical outputs and identify gaps for and identify gaps for improvementimprovement
2.2. Measure the work and Measure the work and collect process datacollect process data
3.3. Analyze the dataAnalyze the data
4.4. Improve the processImprove the process
5.5. Control the new process to Control the new process to make sure new performance make sure new performance is maintainedis maintained
DMAIC ApproachDMAIC Approach

© 2006 Prentice Hall, Inc. 6 – 29
Six Sigma ImplementationSix Sigma Implementation
Emphasize DPMO as a standard metricEmphasize DPMO as a standard metric Provide extensive trainingProvide extensive training Focus on corporate sponsor support Focus on corporate sponsor support
(Champions)(Champions) Create qualified process improvement Create qualified process improvement
experts (Black Belts, Green Belts, etc.)experts (Black Belts, Green Belts, etc.) Set stretch objectivesSet stretch objectives
This cannot be accomplished without a major commitment from top level management

© 2006 Prentice Hall, Inc. 6 – 30
Employee EmpowermentEmployee Empowerment
Getting employees involved in product and Getting employees involved in product and process improvementsprocess improvements 85% of quality problems are due to process and 85% of quality problems are due to process and
materialmaterial TechniquesTechniques
Build communication networks that include Build communication networks that include employeesemployees
Develop open, supportive supervisorsDevelop open, supportive supervisors Move responsibility to employeesMove responsibility to employees Build a high-morale organizationBuild a high-morale organization Create formal team structuresCreate formal team structures

© 2006 Prentice Hall, Inc. 6 – 31
Quality CirclesQuality Circles
Group of employees who meet regularly Group of employees who meet regularly to solve problems (brainstorming to solve problems (brainstorming sessions)sessions)
The group members are trained in The group members are trained in planning, problem solving, and planning, problem solving, and statistical methodsstatistical methods
Often led by a facilitatorOften led by a facilitator
Very effective when done properlyVery effective when done properly

© 2006 Prentice Hall, Inc. 6 – 32
Use internal
benchmarking
if you’re big
enough
BenchmarkingBenchmarking
Selecting Selecting best practicesbest practices to use as a to use as a standard for performancestandard for performance
Determine what to benchmarkDetermine what to benchmark Form a benchmark teamForm a benchmark team Identify benchmarking partnersIdentify benchmarking partners Collect and analyze benchmarking informationCollect and analyze benchmarking information Take action to match or exceed the benchmarkTake action to match or exceed the benchmark

© 2006 Prentice Hall, Inc. 6 – 33
Best Practices for Resolving Best Practices for Resolving Customer ComplaintsCustomer Complaints
Make it easy for clients to complainMake it easy for clients to complain Respond quickly to complaintsRespond quickly to complaints Resolve complaints on first contactResolve complaints on first contact Use computers to manage complaintsUse computers to manage complaints Recruit the best for customer service jobsRecruit the best for customer service jobs

© 2006 Prentice Hall, Inc. 6 – 34
Just-in-Time (JIT)Just-in-Time (JIT)
Relationship to quality:Relationship to quality:
JIT cuts the cost of qualityJIT cuts the cost of quality
JIT improves qualityJIT improves quality
Better quality means Better quality means less inventory and less inventory and better, easier-to-employ JIT systembetter, easier-to-employ JIT system

© 2006 Prentice Hall, Inc. 6 – 35
Just-in-Time (JIT)Just-in-Time (JIT) ‘‘PullPull’ system of production scheduling ’ system of production scheduling
including supply managementincluding supply management Production only when signaledProduction only when signaled
Allows reduced inventory levelsAllows reduced inventory levels Inventory costs money and hides process and Inventory costs money and hides process and
material problemsmaterial problems
Encourages improved process and product Encourages improved process and product qualityquality

© 2006 Prentice Hall, Inc. 6 – 36
Just-In-Time (JIT) ExampleJust-In-Time (JIT) Example
ScrapUnreliable Vendors
Capacity Imbalances
Work in process inventory level
(hides problems)

© 2006 Prentice Hall, Inc. 6 – 37
Just-In-Time (JIT) ExampleJust-In-Time (JIT) Example
Reducing inventory revealsReducing inventory revealsproblems so they can be solvedproblems so they can be solved
ScrapUnreliable Vendors
Capacity Imbalances
© 2006 Prentice Hall, Inc. 6 – 38
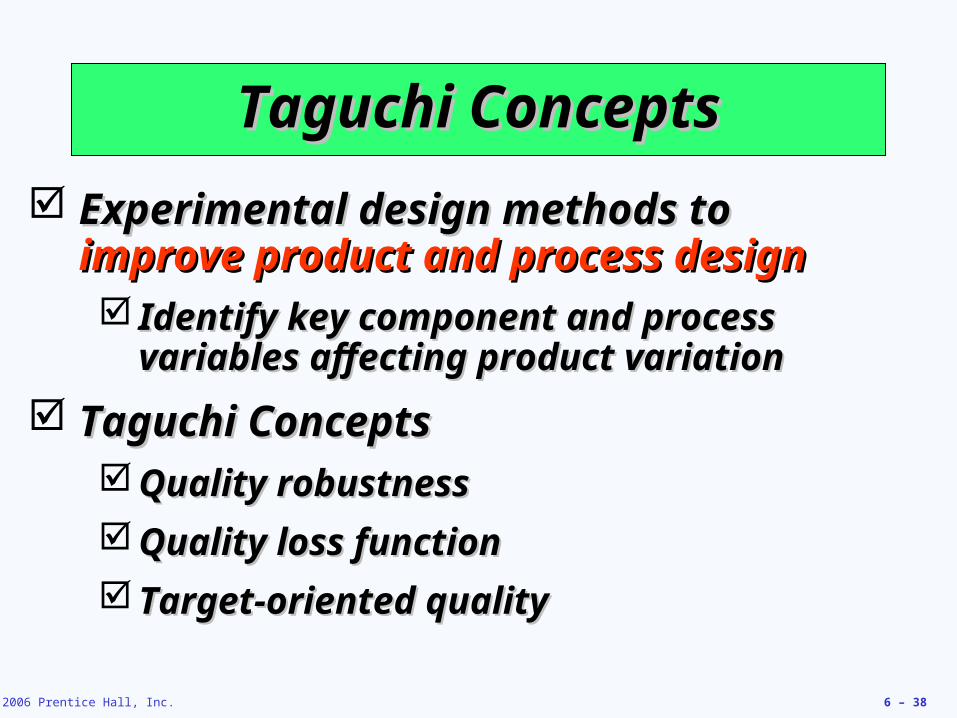
Taguchi ConceptsTaguchi Concepts
Experimental design methods to Experimental design methods to improve product and process designimprove product and process design Identify key component and process Identify key component and process
variables affecting product variationvariables affecting product variation
Taguchi ConceptsTaguchi Concepts Quality robustnessQuality robustness
Quality loss functionQuality loss function
Target-oriented qualityTarget-oriented quality

© 2006 Prentice Hall, Inc. 6 – 39
Quality RobustnessQuality Robustness
Ability to Ability to produce products uniformlyproduce products uniformly in in adverse manufacturing and environmental adverse manufacturing and environmental conditionsconditions Remove the effects of adverse conditionsRemove the effects of adverse conditions
Small variations in materials and process do Small variations in materials and process do not destroy product qualitynot destroy product quality

© 2006 Prentice Hall, Inc. 6 – 40
Quality Loss FunctionQuality Loss Function Shows that Shows that costs increasecosts increase as the product as the product
moves away from what the customer moves away from what the customer wantswants
Costs include customer dissatisfaction, Costs include customer dissatisfaction, warranty and service, internal scrap and warranty and service, internal scrap and repair, and costs to societyrepair, and costs to society
Traditional conformance specifications Traditional conformance specifications are too simplisticare too simplistic

© 2006 Prentice Hall, Inc. 6 – 41
Unacceptable
Poor
Good
Best
Quality Loss FunctionQuality Loss FunctionHigh lossHigh loss
Loss (to Loss (to producing producing organization, organization, customer, customer, and society)and society)
Low lossLow loss
FrequencyFrequency
LowerLower TargetTarget UpperUpper
SpecificationSpecification
Target-oriented quality Target-oriented quality yields more product in yields more product in the “best” categorythe “best” category
Target-oriented quality Target-oriented quality brings product toward brings product toward the target valuethe target value
Conformance-oriented Conformance-oriented quality keeps products quality keeps products within 3 standard within 3 standard deviationsdeviations
L = DL = D22CCwherewhere
L =L = loss to loss to societysocietyD =D = distance from distance from target valuetarget valueC =C = cost of cost of deviationdeviation

© 2006 Prentice Hall, Inc. 6 – 42
Tools of TQMTools of TQM Tools for Generating IdeasTools for Generating Ideas
Check sheetsCheck sheetsScatter diagramsScatter diagramsCause and effect diagramsCause and effect diagrams
Tools to Organize the DataTools to Organize the DataPareto chartsPareto chartsFlow chartsFlow charts
Tools for Identifying ProblemsTools for Identifying ProblemsHistogramHistogramStatistical process control chartStatistical process control chart

© 2006 Prentice Hall, Inc. 6 – 43
Seven Tools for TQMSeven Tools for TQM(a)(a) Check SheetCheck Sheet: An organized method of recording data: An organized method of recording data
Month Lost Departure Mechanical Overbooked Other
Luggage Delay
January 1 2 3 3 1
February 3 3 0 1 0
March 2 5 3 2 3
April 5 4 4 0 2
May 4 7 2 3 0
June 3 8 1 1 1
July 6 6 3 0 2
August 7 9 0 3 0
September 4 7 3 0 2
October 3 11 2 3 0
November 2 10 1 0 0
December 4 12 2 0 1
Total 44 84 24 16 12

© 2006 Prentice Hall, Inc. 6 – 44
Seven Tools for TQMSeven Tools for TQM
(b)(b) Scatter Diagram:Scatter Diagram: A graph of the value A graph of the value of one variable vs. another variableof one variable vs. another variable
Late PassengersLate Passengers
De
par
ture
De
lay
sD
ep
artu
re D
ela
ys

© 2006 Prentice Hall, Inc. 6 – 45
Seven Tools for TQMSeven Tools for TQM(c)(c) Cause and Effect DiagramCause and Effect Diagram: A tool that identifies process : A tool that identifies process
elements (causes) that might effect an outcomeelements (causes) that might effect an outcome
Equipment Personnel
Procedure
Material
Other
Aircraft late to gateLate arrival
Gate occupied
Mechanical failuresLate pushback tug
WeatherAir traffic
Late food serviceLate fuel
Late baggage to aircraft
Gate agents cannot process passengers quickly enoughToo few agents
Agents undertrainedAgents undermotivated
Agents arrive at gate late
Late cabin cleaners
Late or unavailable cockpit crewsLate or unavailable cabin crews
Poor announcement of departuresWeight and balance sheet late
Delayed checkin procedureConfused seat selection
Passengers bypass checkin counterChecking oversize baggage
Issuance of boarding pass
Acceptance of late passengersCutoff too close to departure time
Desire to protect late passengersDesire to help company’s income
Poor gate locations
DelayedFlightDeparture

© 2006 Prentice Hall, Inc. 6 – 46
Seven Tools for TQMSeven Tools for TQM
(d)(d) Pareto ChartsPareto Charts: A graph to identify and plot : A graph to identify and plot problems or defects in descending order of problems or defects in descending order of frequencyfrequency
Fre
qu
en
cyF
req
ue
ncy
Pe
rce
nt
Pe
rce
nt
AA BB CC DD EE
Cause Percentage of Incidents
Cumulative Percentage
Late passengers
53.3 53.3
Waiting for pushback
15.0 68.3
Waiting for fuel
11.3 79.6
Late weight andbalance sheet
8.7 88.3

© 2006 Prentice Hall, Inc. 6 – 47
Seven Tools for TQMSeven Tools for TQM(e)(e) Flow Charts (Process Diagrams):Flow Charts (Process Diagrams): A chart that describes A chart that describes
the steps in a processthe steps in a process
Passenger Arrives
Ticket No Wait for For Flight Appropriate Flight
Yes
Check Yes Excess Luggage Carry-on
No
Issue Boarding Pass
Passenger Boards Airplane

© 2006 Prentice Hall, Inc. 6 – 48
Seven Tools for TQMSeven Tools for TQM(f)(f) Histogram:Histogram: A distribution showing the frequency of A distribution showing the frequency of
occurrence of a variableoccurrence of a variable
0
0.5
1
1.5
2
2.5
3
3.5
1 2 3 4 5 6 7
Occurrences per Month
Fre
qu
en
cy
© 2006 Prentice Hall, Inc. 6 – 49
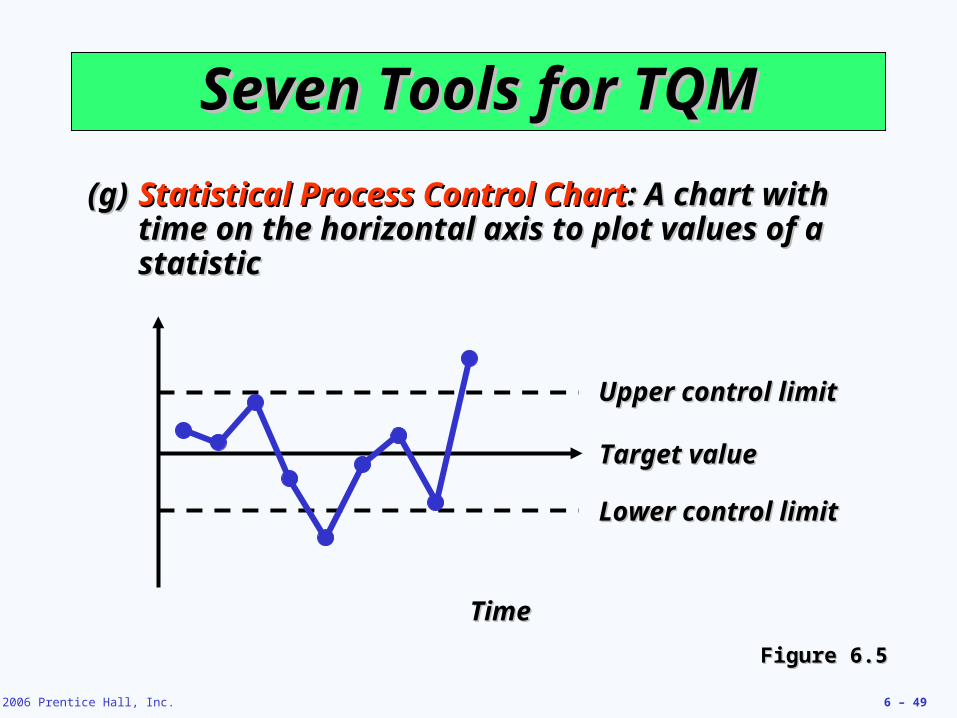
Seven Tools for TQMSeven Tools for TQM
(g)(g) Statistical Process Control ChartStatistical Process Control Chart: A chart with : A chart with time on the horizontal axis to plot values of a time on the horizontal axis to plot values of a statisticstatistic
Figure 6.5Figure 6.5
Upper control limitUpper control limit
Target valueTarget value
Lower control limitLower control limit
TimeTime
© 2006 Prentice Hall, Inc. 6 – 50
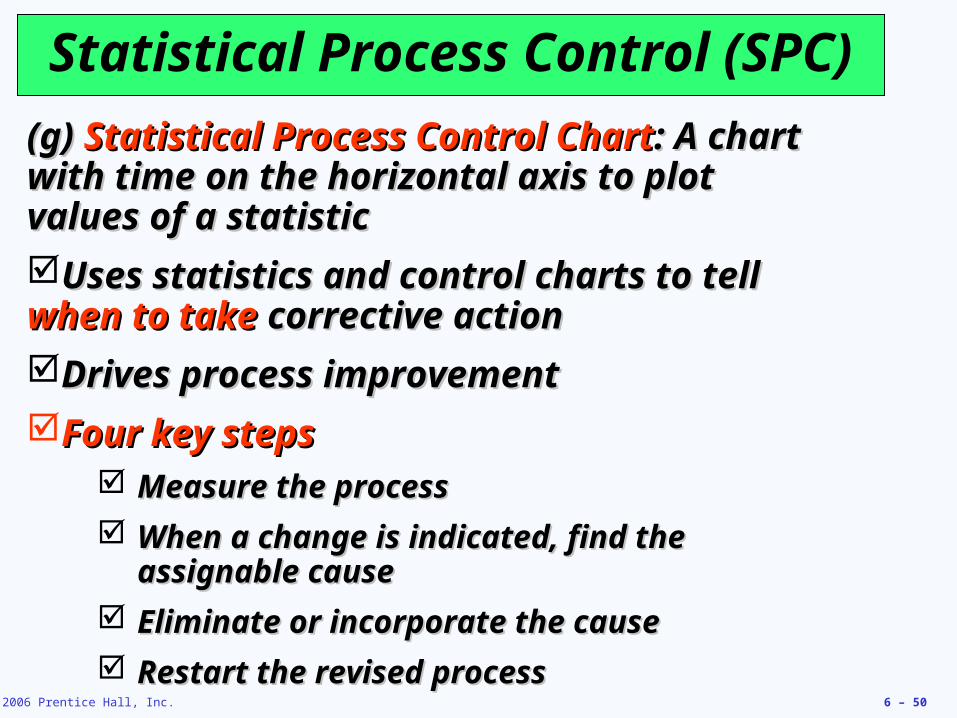
Statistical Process Control (SPC)
(g) (g) Statistical Process Control ChartStatistical Process Control Chart: A chart : A chart with time on the horizontal axis to plot values with time on the horizontal axis to plot values of a statisticof a statistic
Uses statistics and control charts to tell Uses statistics and control charts to tell when to takewhen to take corrective action corrective action
Drives process improvementDrives process improvement
Four key stepsFour key steps Measure the processMeasure the process
When a change is indicated, find the When a change is indicated, find the assignable causeassignable cause
Eliminate or incorporate the causeEliminate or incorporate the cause
Restart the revised processRestart the revised process

© 2006 Prentice Hall, Inc. 6 – 51
An SPC ChartAn SPC Chart
Upper control limitUpper control limit
Coach’s target valueCoach’s target value
Lower control limitLower control limit
Game numberGame number
| | | | | | | | |
11 22 33 44 55 66 77 88 99
20%20%
10%10%
0%0%
Plots the percent of free throws missedPlots the percent of free throws missed

© 2006 Prentice Hall, Inc. 6 – 52
InspectionInspection
Involves examining items to see if an Involves examining items to see if an item is good or defectiveitem is good or defective
Detect a defective productDetect a defective product Does not correct deficiencies in process Does not correct deficiencies in process
or productor product It is expensiveIt is expensive
IssuesIssues When to inspect?When to inspect? Where in process to inspect?Where in process to inspect?

© 2006 Prentice Hall, Inc. 6 – 53
When and Where to InspectWhen and Where to Inspect
1.1. At the supplier’s plant while the supplier is At the supplier’s plant while the supplier is producingproducing
2.2. At your facility upon receipt of goods from At your facility upon receipt of goods from the supplierthe supplier
3.3. Before costly or irreversible processesBefore costly or irreversible processes
4.4. During the step-by-step production During the step-by-step production processesprocesses
5.5. When production or service is completeWhen production or service is complete
6.6. Before delivery from your facilityBefore delivery from your facility
7.7. At the point of customer contactAt the point of customer contact

© 2006 Prentice Hall, Inc. 6 – 54
InspectionInspection
Many problemsMany problems Worker fatigueWorker fatigue
Measurement errorMeasurement error
Process variabilityProcess variability
Cannot inspect quality into a productCannot inspect quality into a product
Robust design, empowered employees, and Robust design, empowered employees, and sound processes are better solutionssound processes are better solutions

© 2006 Prentice Hall, Inc. 6 – 55
Source InspectionSource Inspection
Also known as source controlAlso known as source control
The next step in the process is The next step in the process is your customeryour customer
Ensure perfect product to your Ensure perfect product to your customercustomer
Poka-yoke is the concept of foolproof devices or techniques designed to pass only acceptable product

© 2006 Prentice Hall, Inc. 6 – 56
Service Industry InspectionService Industry Inspection
OrganizationOrganization What is What is InspectedInspected StandardStandard
Jones Law OfficeJones Law Office Receptionist Receptionist performanceperformance
BillingBilling
AttorneyAttorney
Is phone answered by the Is phone answered by the second ringsecond ring
Accurate, timely, and Accurate, timely, and correct formatcorrect format
Promptness in returning Promptness in returning callscalls
Table 6.4Table 6.4

© 2006 Prentice Hall, Inc. 6 – 57
Service Industry InspectionService Industry Inspection
OrganizationOrganization What is What is InspectedInspected StandardStandard
Hard Rock HotelHard Rock Hotel Reception Reception deskdesk
DoormanDoorman
RoomRoom
MinibarMinibar
Use customer’s nameUse customer’s name
Greet guest in less than 30 Greet guest in less than 30 secondsseconds
All lights working, spotless All lights working, spotless bathroombathroom
Restocked and charges Restocked and charges accurately posted to billaccurately posted to bill
Table 6.4Table 6.4

© 2006 Prentice Hall, Inc. 6 – 58
Service Industry InspectionService Industry Inspection
OrganizationOrganization What is What is InspectedInspected StandardStandard
Arnold Palmer Arnold Palmer HospitalHospital
BillingBilling
PharmacyPharmacy
LabLab
NursesNurses
AdmissionsAdmissions
Accurate, timely, and Accurate, timely, and correct formatcorrect format
Prescription accuracy, Prescription accuracy, inventory accuracyinventory accuracy
Audit for lab-test accuracyAudit for lab-test accuracy
Charts immediately Charts immediately updatedupdated
Data entered correctly and Data entered correctly and completelycompletely
Table 6.4Table 6.4

© 2006 Prentice Hall, Inc. 6 – 59
Service Industry InspectionService Industry Inspection
OrganizationOrganization What is What is InspectedInspected StandardStandard
Hard Rock CafeHard Rock Cafe BusboyBusboy
BusboyBusboy
WaiterWaiter
Serves water and bread Serves water and bread within 1 minutewithin 1 minute
Clears all entrée items and Clears all entrée items and crumbs prior to dessertcrumbs prior to dessert
Knows and suggest Knows and suggest specials and dessertsspecials and desserts
Table 6.4Table 6.4

© 2006 Prentice Hall, Inc. 6 – 60
Service Industry InspectionService Industry Inspection
OrganizationOrganization What is What is InspectedInspected StandardStandard
Nordstrom’s Nordstrom’s Department Department StoreStore
Display areasDisplay areas
StockroomsStockrooms
SalesclerksSalesclerks
Attractive, well-organized, Attractive, well-organized, stocked, good lightingstocked, good lighting
Rotation of goods, Rotation of goods, organized, cleanorganized, clean
Neat, courteous, very Neat, courteous, very knowledgeableknowledgeable
Table 6.4Table 6.4
© 2006 Prentice Hall, Inc. 6 – 61
TQM In ServicesTQM In Services
Service quality is more difficult to Service quality is more difficult to measure than the quality of goodsmeasure than the quality of goods
Service quality perceptions depend Service quality perceptions depend on on Intangible differences between Intangible differences between
productsproducts
Intangible expectations customers Intangible expectations customers have of those productshave of those products

© 2006 Prentice Hall, Inc. 6 – 62
Service QualityService Quality
The Operations Manager must The Operations Manager must recognize:recognize:
1.1. The tangible component of The tangible component of services is importantservices is important
2.2. The service process is importantThe service process is important
3.3. The service is judged against the The service is judged against the customer’s expectationscustomer’s expectations
4.4. Exceptions will occurExceptions will occur

© 2006 Prentice Hall, Inc. 6 – 63
Determinants of Service Quality
ReliabilityReliability
ResponsivenessResponsiveness
CompetenceCompetence
AccessAccess
CourtesyCourtesy
CommunicationCommunication
CredibilityCredibility
SecuritySecurity
Understanding/ Understanding/ knowing the knowing the customercustomer
TangiblesTangibles

© 2006 Prentice Hall, Inc. 6 – 64
Questions???Questions???